Experimental investigation of a heat pump assisted drum drying system using propane (R290) as working fluid Espen Storslett Master of Energy Use and Energy Planning Supervisor: Trygve Magne Eikevik, EPT Department of Energy and Process Engineering Submission date: June 2018 Norwegian University of Science and Technology

Welcome message from author
This document is posted to help you gain knowledge. Please leave a comment to let me know what you think about it! Share it to your friends and learn new things together.
Transcript
Experimental investigation of a heatpump assisted drum drying system usingpropane (R290) as working fluid
Espen Storslett
Master of Energy Use and Energy Planning
Supervisor: Trygve Magne Eikevik, EPT
Department of Energy and Process Engineering
Submission date: June 2018
Norwegian University of Science and Technology

ii
Project description Project description, page 1 of 2
iii
Project description, page 2 of 2
iv
Preface This master thesis compromising 30 ECT credits is done in the final semester of the two-year
Master of Science engineering program at the Norwegian University of Science and
Technology (NTNU) in Trondheim. The project goal is to experimentally investigate the
suitability of utilizing R290 (propane) as working fluid in replacement of R134a in a heat pump
assisted drum dryer. This is done by extensive theoretical research, laboratory experiments and
rebuilding of a mass-produced drum dryer. In preparation for this master thesis, a specialization
project on the same subject compromising 15 ECT credits, has been completed during the
preceding semester.
I would like to thank my supervisors Prof. Trygve Magne Eikevik and Dr. Ignat Tolstorebrov
for teaching and guidance throughout the project. Also, I would like to thank Inge Håvard
Rekstad for help with administrative tasks in cohesion with the NTNU Thermal Engineering
Laboratory, as well as Helge Laukholm and Reidar Tellebon for technical support regarding
the test rig and instrumentation. Finally, I wish to thank my co-students for the past five years
for making my time at the university a time to remember.
_________________________
Espen Storslett

v
Abstract Drum dryers has been used for drying fabric for a long time. Drying is performed by heating
air causing the relative humidity to fall before blowing the heated air through wet fabric in a
rotating drum. The moisture removed from the fabric can be rejected to the ambient along with
the heated air or condensed to be collected or drained. Conventional drum dryer’s heats air
using an electric heater or combustion. This means of heating is energy consuming and requires
relatively high temperatures for efficient drying.
Heat pump assisted drum dryers utilizes heat pump technology to condense the removed
moisture and reheat the air in a closed loop. This technology provides higher energy efficiency
and the possibility of drying at lower temperatures. Heat pump assisted drum dryers has mainly
used environmental unfriendly refrigerants, such as CFC and HFC gases. The use of CFC gases
has already been banned by the European Union as well as all other countries ratifying the
Montreal Protocol. As HFC gases have high GWP-values they are to be banned by the EU
shortly in new systems.
Due to the fact that hydrocarbons such as propane feature excellent properties as refrigerants,
offer zero ODP and very low GWP they appear to be the ideal substitute for HFCs.
This thesis describes the rebuild and experimental investigation of a mass-produced heat pump
assisted drum dryer utilizing the HFC gas R134a as refrigerant to utilizing propane (R290) as
refrigerant. Instrumentation and sensors has been adapted to the system, and a series of
experiments performed before and after the rebuild, providing an extensive documentation of
system performance.
The results show that providing installation of commercially available compressors for propane,
the use of propane in heat pump assisted drum dryers does not deteriorate system performance
and can be implemented without excessive changes in system design. By redesigning the
capillary tube, the COP of the heat pump were found to increase by 6%.

vi
Sammendrag Tørketromler har blitt brukt til å tørke tøy i lang tid. Tørking gjennomføres ved at luft varmes
opp slik at relativ fuktighet i luften faller, for så å blåses gjennom vått tøy i en roterende
trommel. Fuktigheten som fjernes fra tøyet kan avgis til omgivelsene sammen med avkastluften,
eller kondenseres for å samles i en beholder eller føres til avløp. Konvensjonelle tørketromler
varmer luften ved bruk av et elektrisk varmeelement eller ved forbrenning. Slik oppvarming er
lite energieffekt, og krever relativt høy temperatur for effektiv tørking.
Varmepumpeassisterte tørketromler benytter varmepumpeteknologi til å kondensere
fuktigheten som er fjernet fra klærne og å gjenoppvarme luften i en lukket syklus. Denne
teknologien gir høyere energieffektivitet og mulighet for effektiv tørking ved lavere
temperaturer. Varmepumpeassisterte tørketromler har i hovedsak benyttet miljøskadelige KFK
og HFK gasser som arbeidsmedier. Bruk av KFK gasser er allerede forbudt i EU og alle andre
land som har signert Montreal-protokollen. På grunn av den sterke klimapåvirkningen fra HFK
gasser vil det innen kort tid bli forbud mot bruk av disse i nye systemer i EU.
Ettersom enkelte hydrokarboner slik som propan har utmerkede egenskaper som arbeidsmedier,
ingen ozon-ødeleggende effekt og svært lavt potensiale som klimagasser fremstår de som
ideelle alternativer for HFK gasser.
Denne rapporten beskriver ombygning og eksperimentelle undersøkelser av en masseprodusert
varmepumpeassistert tørketrommel som fra fabrikk benytter HFK gassen R134a som
arbeidsmedie til å benytte propan (R290) som arbeidsmedie. Systemet har blitt instrumentert
og en serie eksperimenter har blitt gjennomført på systemet før og etter ombygning. Gjennom
eksperimentene har systemets ytelser blitt utførlig dokumentert.
Resultatene viser at ved å installere en kommersielt tilgjengelig kompressor utviklet for propan,
opprettholdes systemets ytelser og energieffektivitet. Dermed kan propan implementeres som
arbeidsmedie med kun små endringer i utførelsen av systemet. Ved å tilpasse kapillarrøret til
propan ble det funnet øning i varmepumpens COP på 6%. .

vii
Contents
Project description ...................................................................................................................................ii
Preface ..................................................................................................................................................... iv
Abstract .................................................................................................................................................... v
Sammendrag ........................................................................................................................................... vi
List of symbols ......................................................................................................................................... ix
List of terms ............................................................................................................................................. xi
1 Introduction ..................................................................................................................................... 1
1.1 Limitations and premises ......................................................................................................... 1
2 Theory ............................................................................................................................................. 3
2.1 Drum dryers ............................................................................................................................. 3
Conventional air vented dryers ........................................................................................ 6
Conventional condensing dryers ..................................................................................... 6
Thermoelectric dryers ...................................................................................................... 7
Air cycle heat pump dryers .............................................................................................. 7
Heat pump assisted dryers ............................................................................................... 8
2.2 The heat pump cycle for drum dryers ...................................................................................... 9
2.3 Refrigerants ........................................................................................................................... 13
2.4 Comparison of properties of R134a and R290 ...................................................................... 14
2.5 Publications on propane in HPDD ........................................................................................ 17
2.6 Safety regulations .................................................................................................................. 19
2.7 Consequences on system design ............................................................................................ 19
2.8 Important equipment for propane .......................................................................................... 20
2.9 Drying and dehumidification ................................................................................................. 21
Operating schemes and control parameters ................................................................... 24
3 Materials and method .................................................................................................................... 25
3.1 Overview of the drum dryer .................................................................................................. 25
3.2 Equipment ............................................................................................................................. 28
Compressor .................................................................................................................... 29
Heat exchangers............................................................................................................. 30
Refrigerant charge ......................................................................................................... 30
3.3 Experimental setup and procedure ........................................................................................ 31
Standardized procedure ................................................................................................. 33
3.4 Rebuild .................................................................................................................................. 34
3.5 Instrumentation ...................................................................................................................... 35
viii
Calibration ..................................................................................................................... 41
3.6 Data processing ..................................................................................................................... 42
Calculation of absolute humidity and mixing ratio ....................................................... 42
Other calculations .......................................................................................................... 44
4 Experiments ................................................................................................................................... 48
4.1 Overview ............................................................................................................................... 48
4.2 Results and discussion ........................................................................................................... 50
Drying process ............................................................................................................... 50
Heat exchange and temperature development ............................................................... 54
System performance ...................................................................................................... 63
Drying kinetics .............................................................................................................. 68
Charge optimization ...................................................................................................... 70
Capillary tube accommodation ...................................................................................... 73
Overall performance ...................................................................................................... 79
4.3 Reliability and assumptions ................................................................................................... 80
COP calculation ............................................................................................................. 81
SMER calculation .......................................................................................................... 82
4.4 Comparison between R134a and R290 ................................................................................. 82
5 Further work and improvements ................................................................................................... 83
6 Conclusion ..................................................................................................................................... 85
References ............................................................................................................................................. 86
List of figures ......................................................................................................................................... 89
List of tables .......................................................................................................................................... 91
Appendix .................................................................................................................................................. 1
APPENDIX A: MATERIALS COMPETABILITY OF PROPANE ................................................ A1
APPENDIX B: LIST OF EXPERIMENTS ...................................................................................... B1
APPENDIX C: DATA SHEET: RECHI 39E073B ........................................................................... C1
APPENDIX D: DATA SHEET: TECUMSEH AE4430U-FZ1A ..................................................... D1
APPENDIX E: RISK ASSESSMENT .............................................................................................. E1
ix
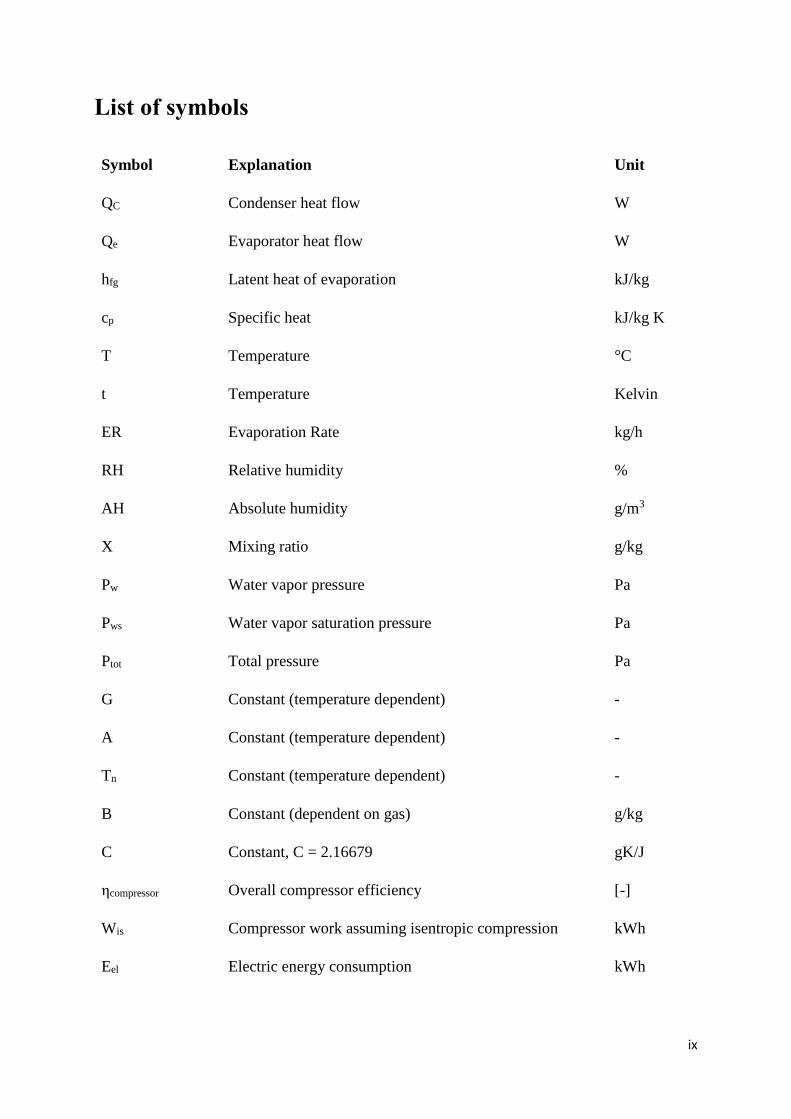
List of symbols
Symbol Explanation Unit
QC Condenser heat flow W
Qe Evaporator heat flow W
hfg Latent heat of evaporation kJ/kg
cp Specific heat kJ/kg K
T Temperature °C
t Temperature Kelvin
ER Evaporation Rate kg/h
RH Relative humidity %
AH Absolute humidity g/m3
X Mixing ratio g/kg
Pw Water vapor pressure Pa
Pws Water vapor saturation pressure Pa
Ptot Total pressure Pa
G Constant (temperature dependent) -
A Constant (temperature dependent) -
Tn Constant (temperature dependent) -
B Constant (dependent on gas) g/kg
C Constant, C = 2.16679 gK/J
ηcompressor Overall compressor efficiency [-]
Wis Compressor work assuming isentropic compression kWh
Eel Electric energy consumption kWh
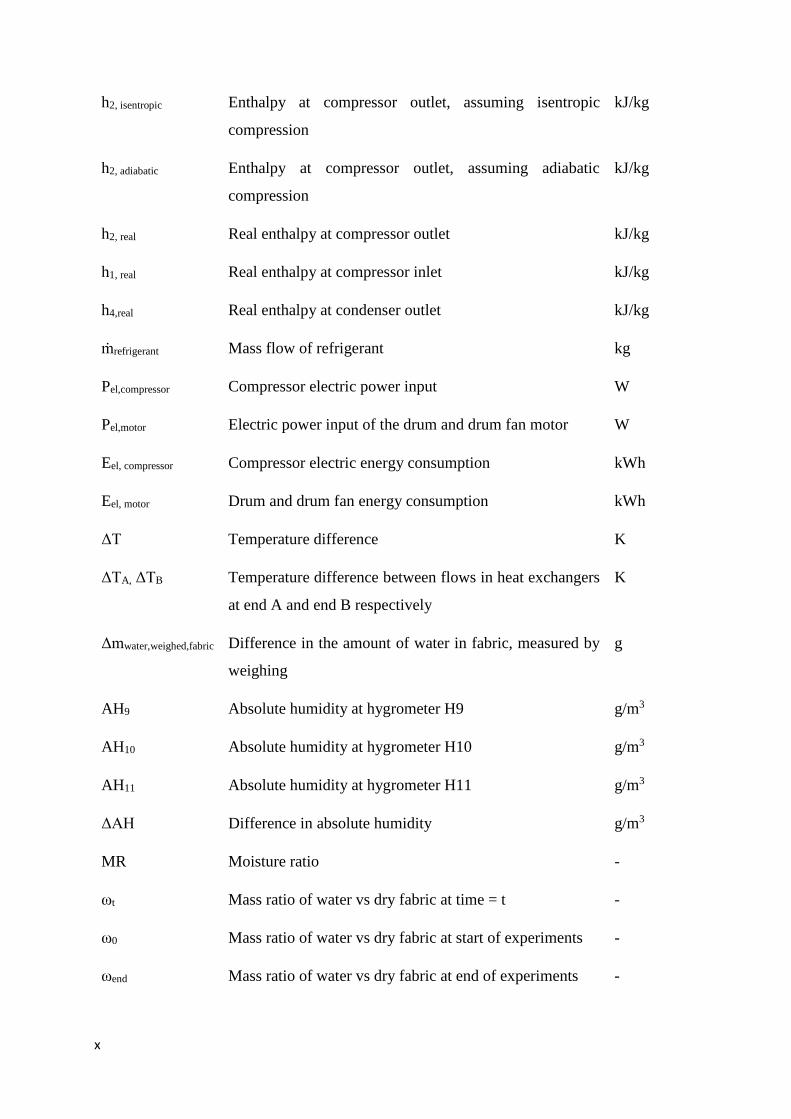
x
h2, isentropic Enthalpy at compressor outlet, assuming isentropic
compression
kJ/kg
h2, adiabatic Enthalpy at compressor outlet, assuming adiabatic
compression
kJ/kg
h2, real Real enthalpy at compressor outlet kJ/kg
h1, real Real enthalpy at compressor inlet kJ/kg
h4,real Real enthalpy at condenser outlet kJ/kg
mrefrigerant Mass flow of refrigerant kg
Pel,compressor Compressor electric power input W
Pel,motor Electric power input of the drum and drum fan motor W
Eel, compressor Compressor electric energy consumption kWh
Eel, motor Drum and drum fan energy consumption kWh
ΔT Temperature difference K
ΔTA, ΔTB Temperature difference between flows in heat exchangers
at end A and end B respectively
K
Δmwater,weighed,fabric Difference in the amount of water in fabric, measured by
weighing
g
AH9 Absolute humidity at hygrometer H9 g/m3
AH10 Absolute humidity at hygrometer H10 g/m3
AH11 Absolute humidity at hygrometer H11 g/m3
ΔAH Difference in absolute humidity g/m3
MR Moisture ratio -
ωt Mass ratio of water vs dry fabric at time = t -
ω0 Mass ratio of water vs dry fabric at start of experiments -
ωend Mass ratio of water vs dry fabric at end of experiments -
xi
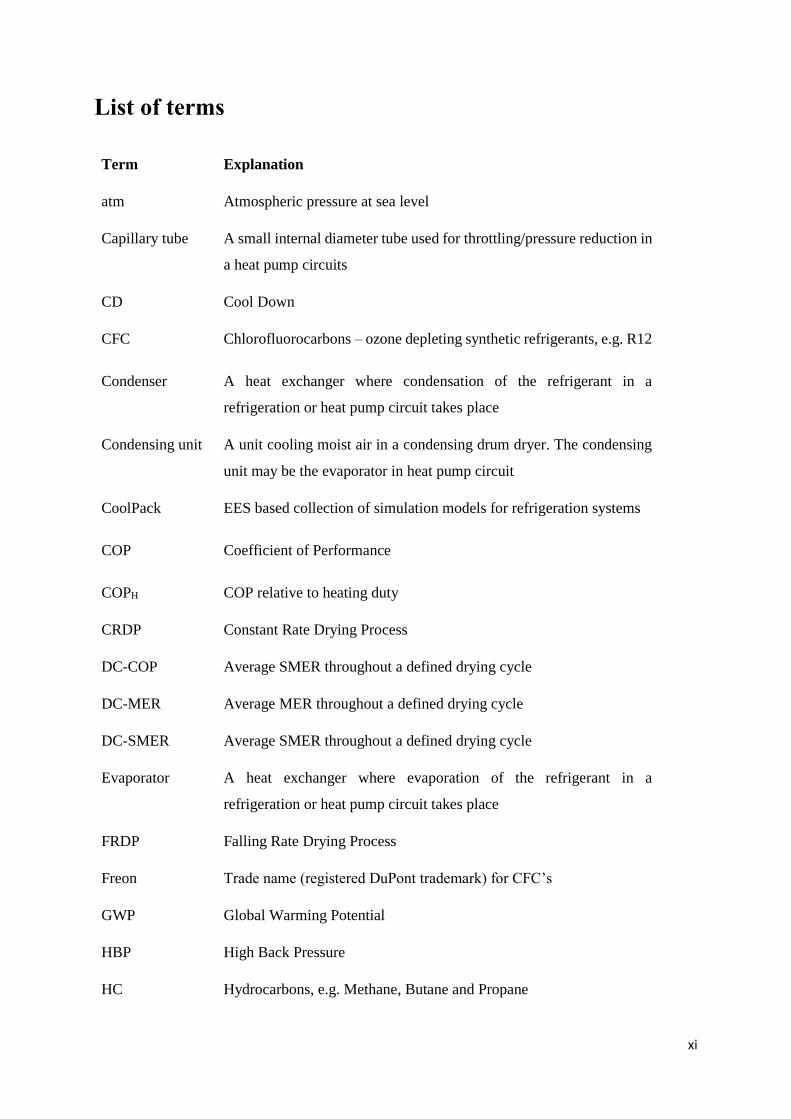
List of terms
Term Explanation
atm Atmospheric pressure at sea level
Capillary tube A small internal diameter tube used for throttling/pressure reduction in
a heat pump circuits
CD Cool Down
CFC Chlorofluorocarbons – ozone depleting synthetic refrigerants, e.g. R12
Condenser A heat exchanger where condensation of the refrigerant in a
refrigeration or heat pump circuit takes place
Condensing unit A unit cooling moist air in a condensing drum dryer. The condensing
unit may be the evaporator in heat pump circuit
CoolPack EES based collection of simulation models for refrigeration systems
COP Coefficient of Performance
COPH COP relative to heating duty
CRDP Constant Rate Drying Process
DC-COP Average SMER throughout a defined drying cycle
DC-MER Average MER throughout a defined drying cycle
DC-SMER Average SMER throughout a defined drying cycle
Evaporator A heat exchanger where evaporation of the refrigerant in a
refrigeration or heat pump circuit takes place
FRDP Falling Rate Drying Process
Freon Trade name (registered DuPont trademark) for CFC’s
GWP Global Warming Potential
HBP High Back Pressure
HC Hydrocarbons, e.g. Methane, Butane and Propane
xii
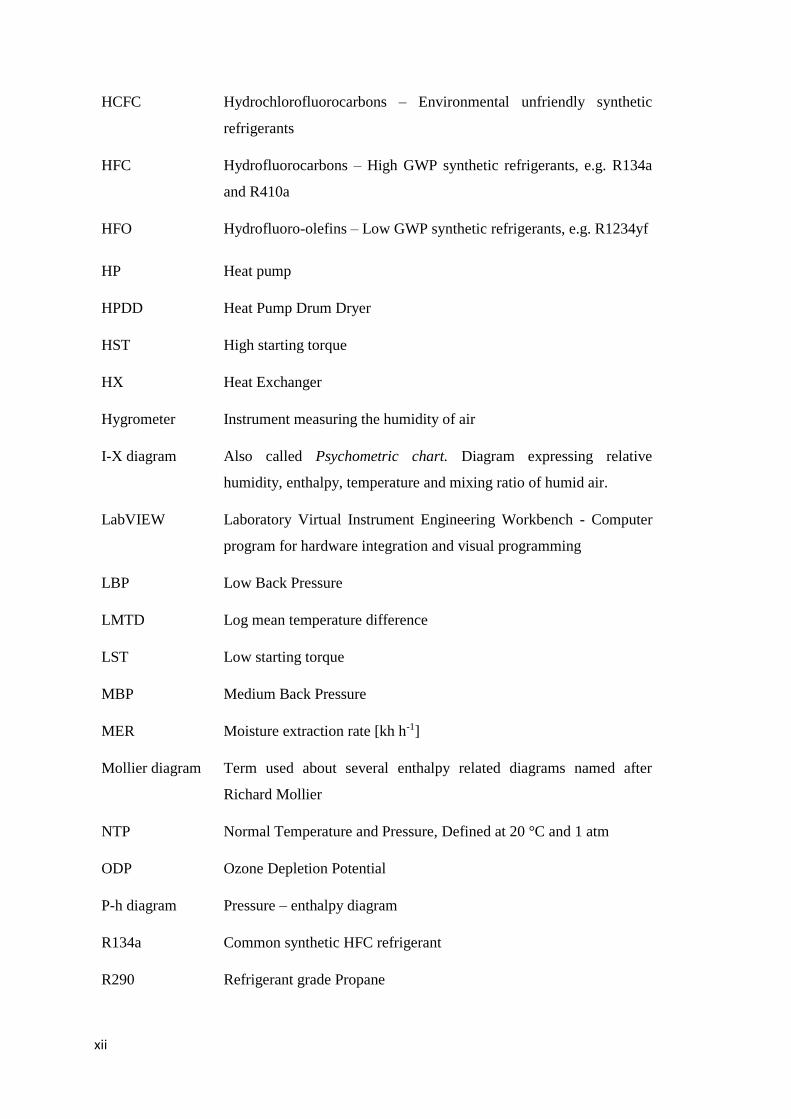
HCFC Hydrochlorofluorocarbons – Environmental unfriendly synthetic
refrigerants
HFC Hydrofluorocarbons – High GWP synthetic refrigerants, e.g. R134a
and R410a
HFO Hydrofluoro-olefins – Low GWP synthetic refrigerants, e.g. R1234yf
HP Heat pump
HPDD Heat Pump Drum Dryer
HST High starting torque
HX Heat Exchanger
Hygrometer Instrument measuring the humidity of air
I-X diagram Also called Psychometric chart. Diagram expressing relative
humidity, enthalpy, temperature and mixing ratio of humid air.
LabVIEW Laboratory Virtual Instrument Engineering Workbench - Computer
program for hardware integration and visual programming
LBP Low Back Pressure
LMTD Log mean temperature difference
LST Low starting torque
MBP Medium Back Pressure
MER Moisture extraction rate [kh h-1]
Mollier diagram Term used about several enthalpy related diagrams named after
Richard Mollier
NTP Normal Temperature and Pressure, Defined at 20 °C and 1 atm
ODP Ozone Depletion Potential
P-h diagram Pressure – enthalpy diagram
R134a Common synthetic HFC refrigerant
R290 Refrigerant grade Propane

xiii
SMER Specific Moisture Extraction Rate [kg kWh-1]
TEWI Total Equivalent Warming Impact
Thermistor Temperature dependent resistor used for temperature measurement
Thermocouple Temperature sensor consisting of two dissimilar electrical conductors,
producing temperature dependent voltage
VI Virtual Instrument

1
1 Introduction First patented in 1986[1] as “heat pump closed loop drying”, heat pump assisted dryers has
been researched for more than 30 years. Unfortunately, the heat pump cycle has mainly featured
environmental unfriendly HFC and CFC gasses. With questions being raised concerning both
the environmental and human health impact of HFO’s[2], propane, along with other natural
refrigerants, seems promising as an environmental friendly substitute for HFC’s and CFC’s.
By 2006, about 2% of the Norwegian households total energy consume were consumed by
drying of clothes in drum dryers. 46% of the Norwegian households stated that they did have
drum dryer or drying cabinet, an increase by 15% since 1990 [3]. As the European electricity
mix by 2014 still cause 276 grams of CO2 emissions per kWh, reduced energy consumes by
drum dryers pose a large potential for reduction in climate gas emissions.
1.1 Limitations and premises
This project is based on rebuilding an existing heat pump assisted drum dryer, currently placed
in the laboratory at the Department of Energy and Process Engineering at NTNU Gløshaugen
in Trondheim, Norway. The drum dryer is acquired ahead of this project; thus, the choice of
drum dryer cannot be influenced by findings during the project.
The facilities used for this study is connected to a large laboratory used for several other
experiments. Therefore, there is no possibility of ambient air temperature and humidity control
specific to this study. Heating, cooling and air exchange rates in the laboratory are controlled
by building management without consideration to this specific study.
Although there are several other refrigerants that pose interesting as alternatives to R134a, this
project is limited to investigation of R290(propane) as working fluid.

2
There will be made no attempt of reprogramming the factory set user programs. Drum, fans and
compressor will be controlled by manual switches.
The drum dryer selected for this study is a Bosch Serie 4 WTW86298SN. It is a heat pump
assisted condensation dryer charged with 220g R134a refrigerant. Maximum capacity is 8 kg
dry weigh fabric.
3
2 Theory This chapter briefly explains the theoretical background for this study, and provides an update
on the current development regarding heat pump assisted drum dryers using R290.
2.1 Drum dryers
The principle operation of drum dryers is a three-step process. First air is heated, causing the
relative humidity of the heated air to fall. Then the heated air is blown across the wet fabrics,
absorbing moisture. Thirdly the moist air is removed from the drum. Difference in partial vapor
pressure between the initially saturated air near the wet fabrics and the relatively dry heated air
provides a driving force for drying[4]. Throughout this process, the drum is rotated to allow air
to come into contact with the wet fabrics.
There is a wide range of different drum dryer designs commercially and technologically
available. There is a trade-off between investment cost and energy efficiency, as well as drying
time and degradation of the dried fabric. Though this study will investigate properties of only
heat pump assisted drum dryers, a brief overview of other designs will be given, in order to
provide better understanding of the energy efficiency challenges.
From a consumer standpoint, the energy efficiency of drum dryers may be compared by
checking the product data sheet for the drum dryer. It is important to compare energy consume
obtained by the same test standard. There are two relevant standards of test procedures for drum
dryers in affect today. The United States Department of Energy (US DOE) D1/D2 test
procedure [5], and The Association of Home Appliance Manufacturers (AHAM) test
procedure[6].
One of the earliest articles found on using heat pumps to assist drum dryers offers a list of
design constraints and expectations[4]. This article has been used as reference for several later
studies. As design temperatures for the original dryer is unknown, design temperatures from
this article is included as a reference. Table 1 shows the mentioned values.
4
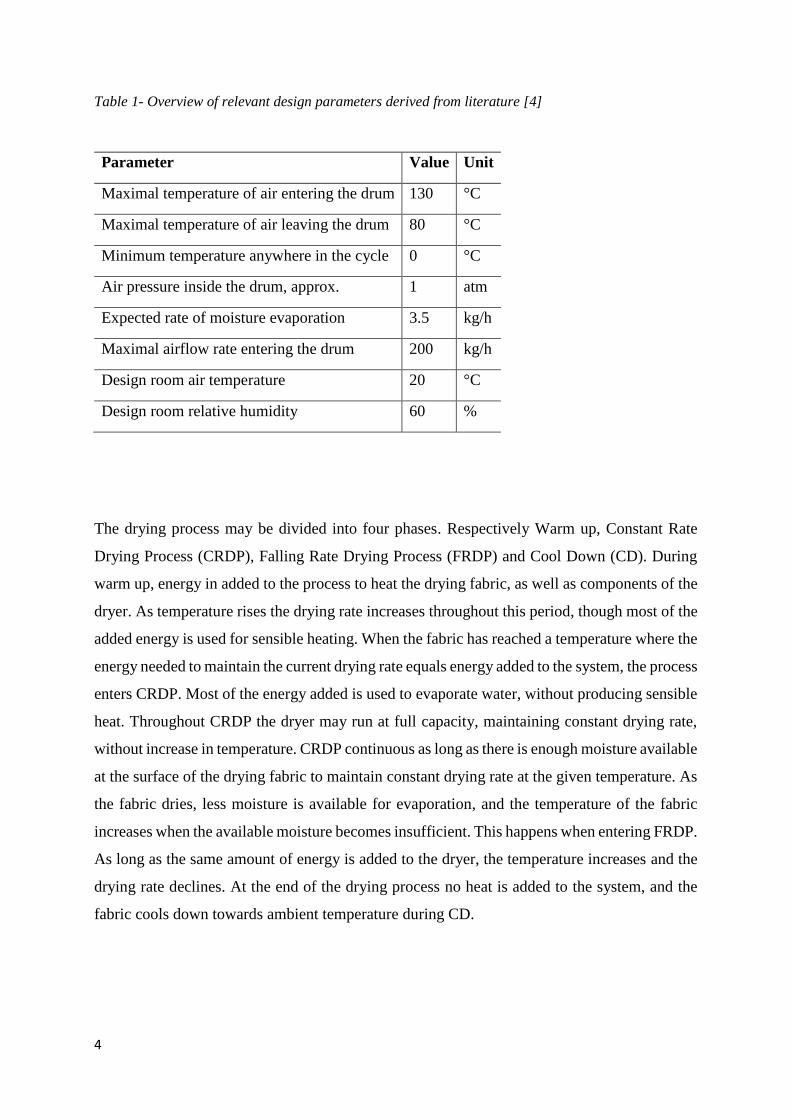
Table 1- Overview of relevant design parameters derived from literature [4]
Parameter Value Unit
Maximal temperature of air entering the drum 130 °C
Maximal temperature of air leaving the drum 80 °C
Minimum temperature anywhere in the cycle 0 °C
Air pressure inside the drum, approx. 1 atm
Expected rate of moisture evaporation 3.5 kg/h
Maximal airflow rate entering the drum 200 kg/h
Design room air temperature 20 °C
Design room relative humidity 60 %
The drying process may be divided into four phases. Respectively Warm up, Constant Rate
Drying Process (CRDP), Falling Rate Drying Process (FRDP) and Cool Down (CD). During
warm up, energy in added to the process to heat the drying fabric, as well as components of the
dryer. As temperature rises the drying rate increases throughout this period, though most of the
added energy is used for sensible heating. When the fabric has reached a temperature where the
energy needed to maintain the current drying rate equals energy added to the system, the process
enters CRDP. Most of the energy added is used to evaporate water, without producing sensible
heat. Throughout CRDP the dryer may run at full capacity, maintaining constant drying rate,
without increase in temperature. CRDP continuous as long as there is enough moisture available
at the surface of the drying fabric to maintain constant drying rate at the given temperature. As
the fabric dries, less moisture is available for evaporation, and the temperature of the fabric
increases when the available moisture becomes insufficient. This happens when entering FRDP.
As long as the same amount of energy is added to the dryer, the temperature increases and the
drying rate declines. At the end of the drying process no heat is added to the system, and the
fabric cools down towards ambient temperature during CD.
5
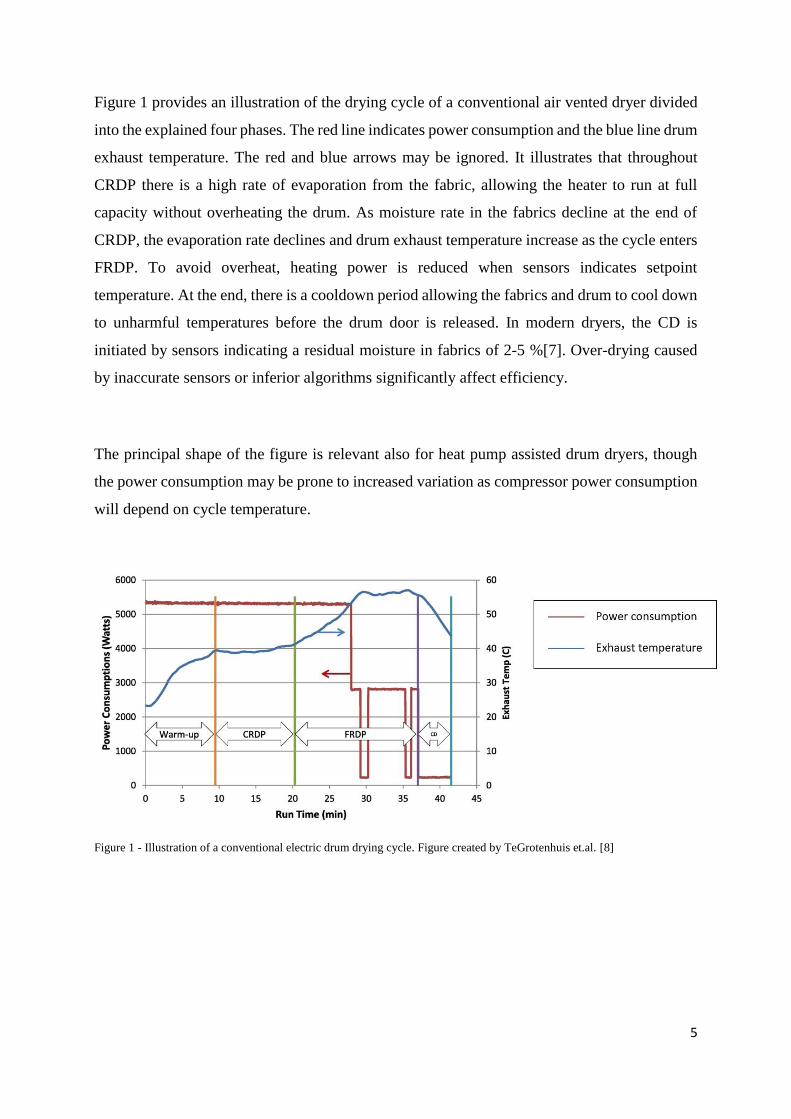
Figure 1 provides an illustration of the drying cycle of a conventional air vented dryer divided
into the explained four phases. The red line indicates power consumption and the blue line drum
exhaust temperature. The red and blue arrows may be ignored. It illustrates that throughout
CRDP there is a high rate of evaporation from the fabric, allowing the heater to run at full
capacity without overheating the drum. As moisture rate in the fabrics decline at the end of
CRDP, the evaporation rate declines and drum exhaust temperature increase as the cycle enters
FRDP. To avoid overheat, heating power is reduced when sensors indicates setpoint
temperature. At the end, there is a cooldown period allowing the fabrics and drum to cool down
to unharmful temperatures before the drum door is released. In modern dryers, the CD is
initiated by sensors indicating a residual moisture in fabrics of 2-5 %[7]. Over-drying caused
by inaccurate sensors or inferior algorithms significantly affect efficiency.
The principal shape of the figure is relevant also for heat pump assisted drum dryers, though
the power consumption may be prone to increased variation as compressor power consumption
will depend on cycle temperature.
Figure 1 - Illustration of a conventional electric drum drying cycle. Figure created by TeGrotenhuis et.al. [8]
6
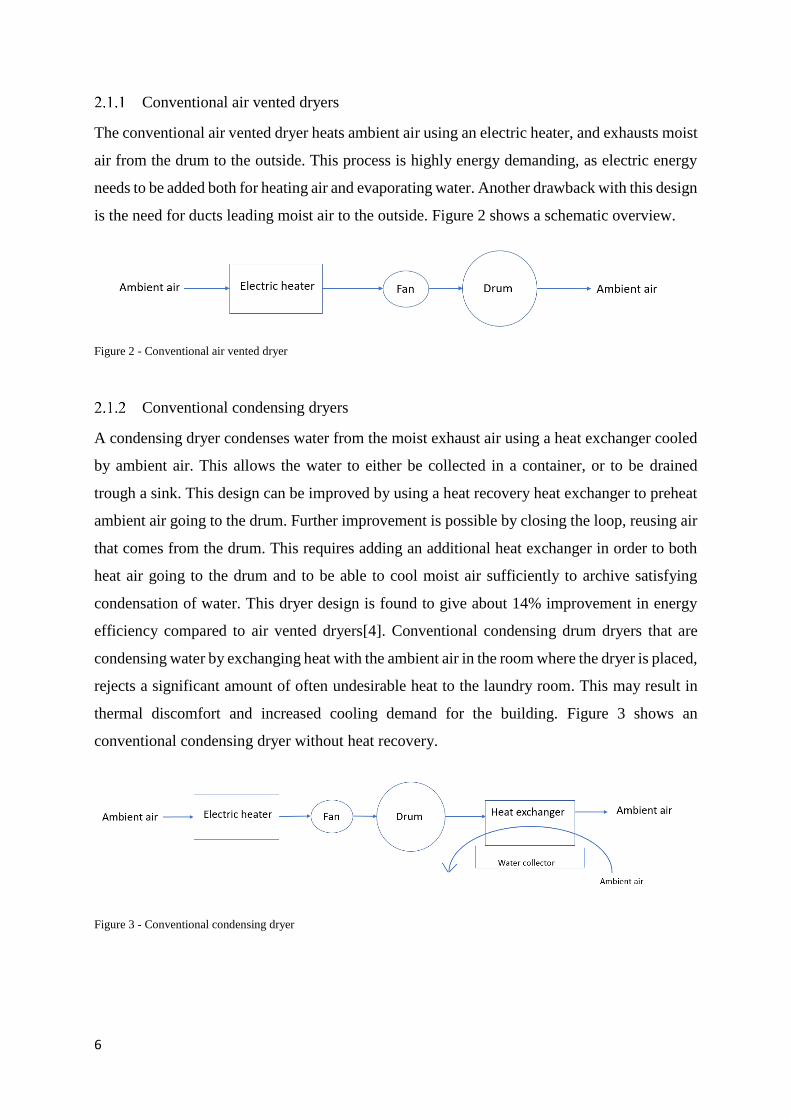
Conventional air vented dryers
The conventional air vented dryer heats ambient air using an electric heater, and exhausts moist
air from the drum to the outside. This process is highly energy demanding, as electric energy
needs to be added both for heating air and evaporating water. Another drawback with this design
is the need for ducts leading moist air to the outside. Figure 2 shows a schematic overview.
Figure 2 - Conventional air vented dryer
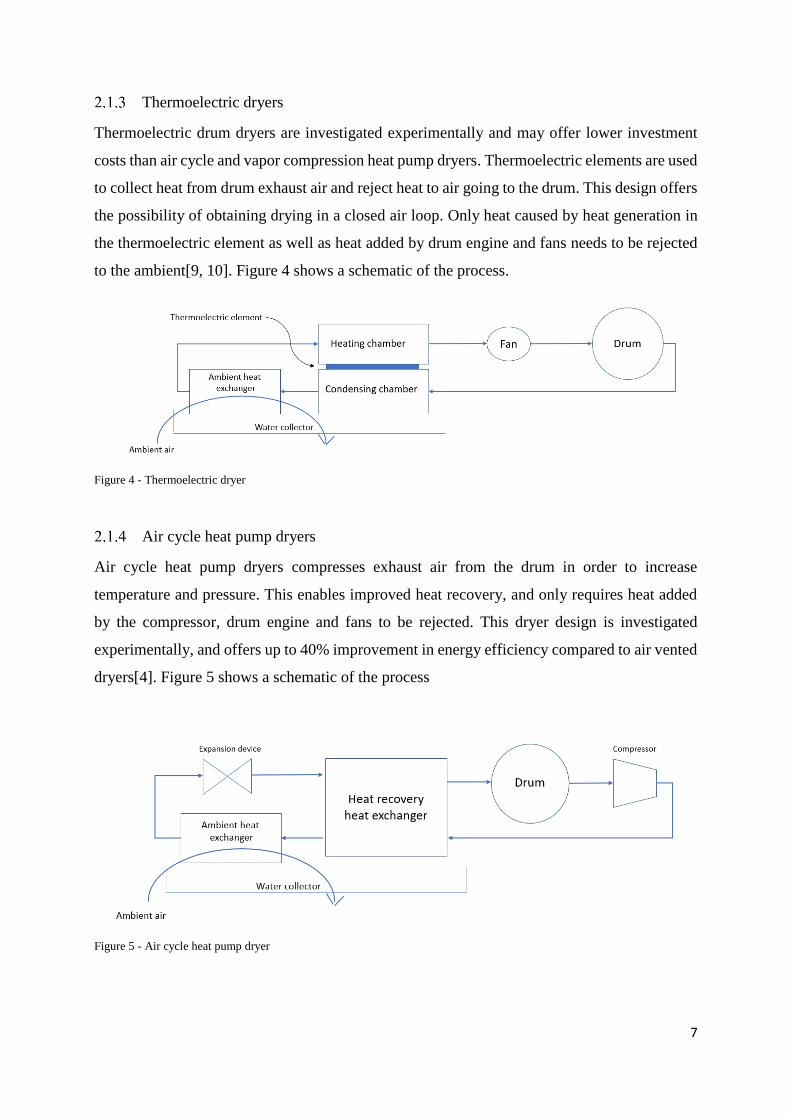
Conventional condensing dryers
A condensing dryer condenses water from the moist exhaust air using a heat exchanger cooled
by ambient air. This allows the water to either be collected in a container, or to be drained
trough a sink. This design can be improved by using a heat recovery heat exchanger to preheat
ambient air going to the drum. Further improvement is possible by closing the loop, reusing air
that comes from the drum. This requires adding an additional heat exchanger in order to both
heat air going to the drum and to be able to cool moist air sufficiently to archive satisfying
condensation of water. This dryer design is found to give about 14% improvement in energy
efficiency compared to air vented dryers[4]. Conventional condensing drum dryers that are
condensing water by exchanging heat with the ambient air in the room where the dryer is placed,
rejects a significant amount of often undesirable heat to the laundry room. This may result in
thermal discomfort and increased cooling demand for the building. Figure 3 shows an
conventional condensing dryer without heat recovery.
Figure 3 - Conventional condensing dryer
7
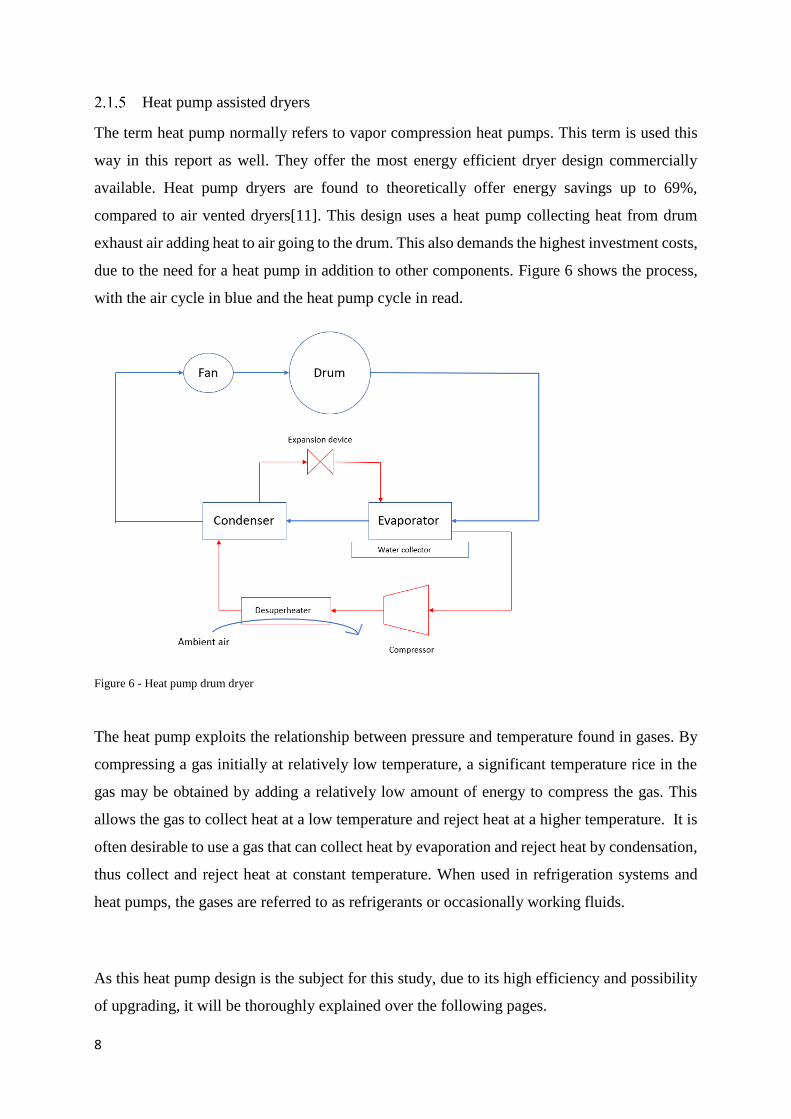
Thermoelectric dryers
Thermoelectric drum dryers are investigated experimentally and may offer lower investment
costs than air cycle and vapor compression heat pump dryers. Thermoelectric elements are used
to collect heat from drum exhaust air and reject heat to air going to the drum. This design offers
the possibility of obtaining drying in a closed air loop. Only heat caused by heat generation in
the thermoelectric element as well as heat added by drum engine and fans needs to be rejected
to the ambient[9, 10]. Figure 4 shows a schematic of the process.
Figure 4 - Thermoelectric dryer
Air cycle heat pump dryers
Air cycle heat pump dryers compresses exhaust air from the drum in order to increase
temperature and pressure. This enables improved heat recovery, and only requires heat added
by the compressor, drum engine and fans to be rejected. This dryer design is investigated
experimentally, and offers up to 40% improvement in energy efficiency compared to air vented
dryers[4]. Figure 5 shows a schematic of the process
Figure 5 - Air cycle heat pump dryer
8
Heat pump assisted dryers
The term heat pump normally refers to vapor compression heat pumps. This term is used this
way in this report as well. They offer the most energy efficient dryer design commercially
available. Heat pump dryers are found to theoretically offer energy savings up to 69%,
compared to air vented dryers[11]. This design uses a heat pump collecting heat from drum
exhaust air adding heat to air going to the drum. This also demands the highest investment costs,
due to the need for a heat pump in addition to other components. Figure 6 shows the process,
with the air cycle in blue and the heat pump cycle in read.
Figure 6 - Heat pump drum dryer
The heat pump exploits the relationship between pressure and temperature found in gases. By
compressing a gas initially at relatively low temperature, a significant temperature rice in the
gas may be obtained by adding a relatively low amount of energy to compress the gas. This
allows the gas to collect heat at a low temperature and reject heat at a higher temperature. It is
often desirable to use a gas that can collect heat by evaporation and reject heat by condensation,
thus collect and reject heat at constant temperature. When used in refrigeration systems and
heat pumps, the gases are referred to as refrigerants or occasionally working fluids.
As this heat pump design is the subject for this study, due to its high efficiency and possibility
of upgrading, it will be thoroughly explained over the following pages.
9
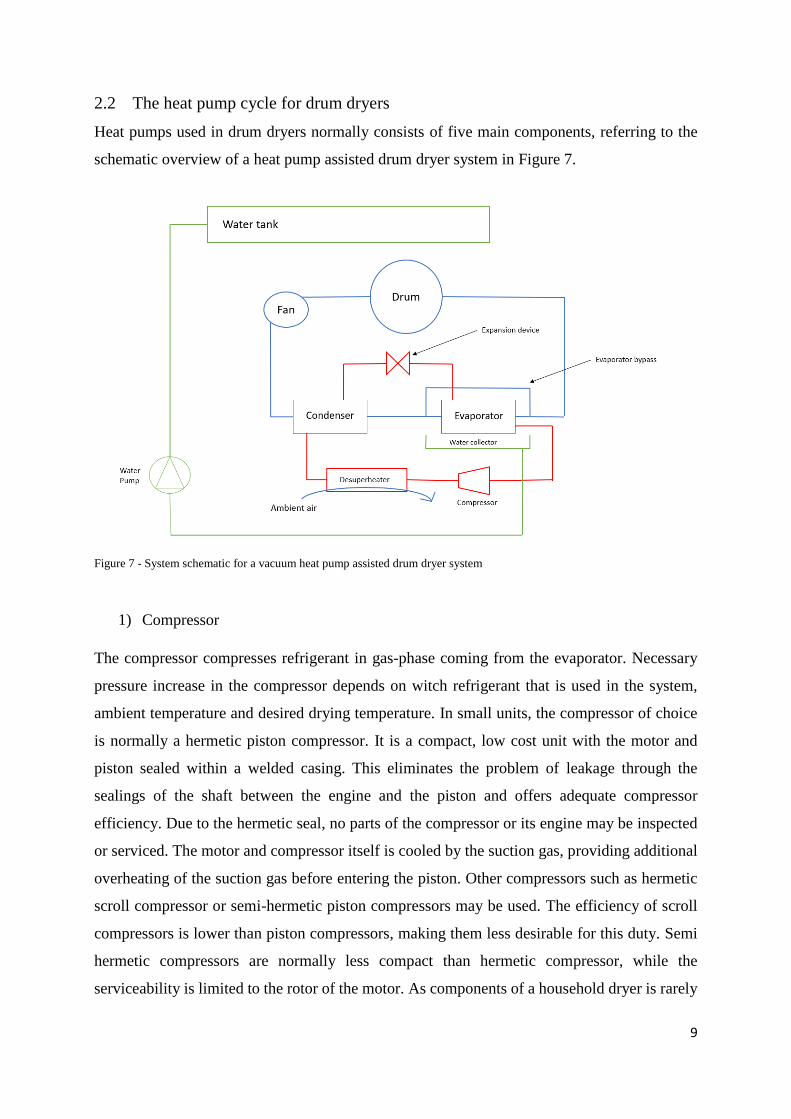
2.2 The heat pump cycle for drum dryers
Heat pumps used in drum dryers normally consists of five main components, referring to the
schematic overview of a heat pump assisted drum dryer system in Figure 7.
Figure 7 - System schematic for a vacuum heat pump assisted drum dryer system
1) Compressor
The compressor compresses refrigerant in gas-phase coming from the evaporator. Necessary
pressure increase in the compressor depends on witch refrigerant that is used in the system,
ambient temperature and desired drying temperature. In small units, the compressor of choice
is normally a hermetic piston compressor. It is a compact, low cost unit with the motor and
piston sealed within a welded casing. This eliminates the problem of leakage through the
sealings of the shaft between the engine and the piston and offers adequate compressor
efficiency. Due to the hermetic seal, no parts of the compressor or its engine may be inspected
or serviced. The motor and compressor itself is cooled by the suction gas, providing additional
overheating of the suction gas before entering the piston. Other compressors such as hermetic
scroll compressor or semi-hermetic piston compressors may be used. The efficiency of scroll
compressors is lower than piston compressors, making them less desirable for this duty. Semi
hermetic compressors are normally less compact than hermetic compressor, while the
serviceability is limited to the rotor of the motor. As components of a household dryer is rarely
10
serviced during its lifetime, the semi hermetic compressor is not the obvious choice for these
appliances. Semi hermetic compressors are frequently used in medium size system.
2) Condenser
The condenser is a heat exchanger adding heat to the air going to the drum, through condensing
of the refrigerant. Due to its relatively compact size, low pressure loss and simple design, tube
and fin heat exchangers are widely used in heat pump dryers. The refrigerant flows within the
tubes of the heat exchanger, while air flows over its fins. As with all heat exchangers, the
condenser causes a pressure drop in both the refrigerant circuit and air circuit. The pressure
drop in the refrigerant circuit is dependent on the diameter, length, geometry and roughness of
the tubing, while the pressure drop in the air circuit mainly depends on the size and shape of
the fins. Though an excessively large condenser is desirable to obtain minimum temperature
difference between the refrigerant and air, the excessive size would also cause excessive
pressure drop that will have to be overcome by the compressor and air fan.
3) Pressure release system/valve
In larger heat pumps a thermostatic controlled valve releases pressure before the refrigerant
enters the condenser. I small scale heat pumps with somewhat lower energy efficiency demands
simpler systems are often used to release pressure in order to maintain low investment costs.
The most common device is a capillary tube, because of its simple design, low cost and
durability. A capillary tube is simply a tube with a very small internal cross-sectional area. The
pressure loss is set by the internal diameter and the tube length. As the capillary tube is a static
device with no moving parts, it may not be controlled during operation to accommodate for
changing conditions. Proper selection of capillary tube is crucial for system performance. Due
to the complex behavior of two phase flows, theoretical calculation of capillary tube length and
diameter only serves as a preliminary selection. Testing is necessary to optimize the final
selection.
11
4) Evaporator
The evaporator is a heat exchanger collecting heat from drum exhaust air. In most cases, a tube
and fin heat exchanger are used, as with the condenser. The same trade-off between temperature
difference and pressure loss as for the condenser also applies for the evaporator. Note that the
evaporator in the heat pump cycle is the condenser in the drying cycle, as the heat pump collects
heat from condensation and cooling of moist exhaust air from the drum. In this report,
condenser and evaporator always refers to the heat pump cycle.
5) Desuperheater
In closed-loop systems, a desuperheater in necessary to remove latent heat from the system.
The desuperheater is essentially a heat exchanger releasing heat to ambient air. In larger
systems, it can also be cooled by water. In home appliances, heat losses by conduction and air
leaks through the casing is often sufficient to remove latent heat from the system. A small
temperature-controlled fan blowing air across the compressor exhaust pipe and the compressor
itself may make an actual heat exchanger redundant.
Larger and more sophisticated heat pump systems may feature several other components in
order to boost energy efficiency by a few percent. These components include suction-gas heat
exchanger, subcooler and overheater[12]. For systems such as drum dryers the addition of these
components does not seem to be cost worthy.
Hybrid systems, featuring an electric heater in addition to the heat pump to shorten warm-up
time might be used. This will lower the energy efficiency and increase peak power demand, but
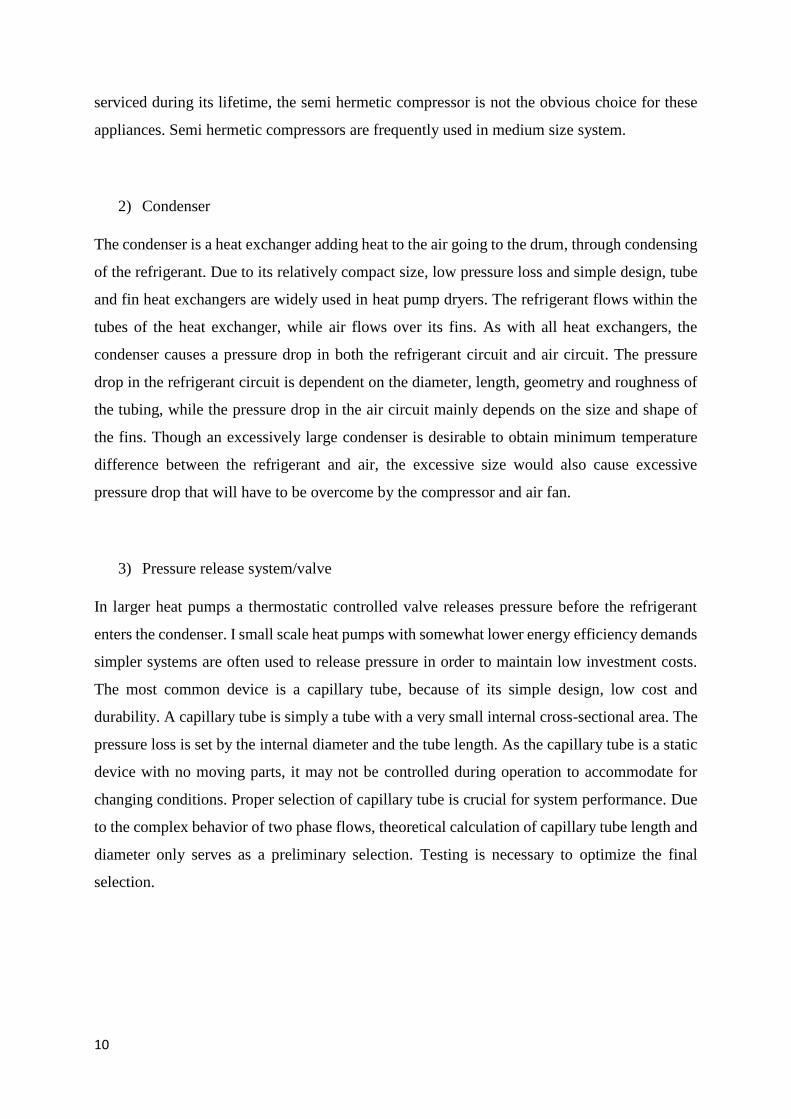
shorten drying time[8]. A system sketch of hybrid system is shown in Figure 8.
12
Figure 8 - Hybrid heat pump dryer including electric heater
The main drawback related to heat pump assisted drum dryers is use of refrigerants with high
ODP and GWP potential. This creates high impact on environment, due to the fact that such
type of systems are widely used all over the world.
The application of environmentally friendly refrigerants, increased energy efficiency, lowered
drying temperatures and decreased heat rejection to the laundry room needs to make up for this
drawbacks for a heat pump drum dryer to be desirable.
13
2.3 Refrigerants
Several natural refrigerants are environmental friendlier alternatives to HFC gases. Although
HFO’s and HCFC’s may feature lower GWP values than HFC’s, they may not automatically
be regarded as environmentally friendly[13]. Both the environmental impact, flammability,
combustion products, toxicity, decomposition products and production process of these gases
are being questioned.
R717(Ammonia/NH3), R600(Isobutane), R744(Carbon-dioxide/CO2) and R290 (Propane) are
all environmental friendly refrigerants, that may substitute HFC’s. They all have zero ODP and
very low GWP compared to HFCs. Ammonia pose excellent thermodynamic properties but are
toxic and have a strong odor. Only a few grams of ammonia per cubic meter of air pose a danger
of death by poisoning and the odor caused by lower concentrations may cause anxiety and
people to evacuate. Therefor ammonia is not regarded as suitable for household appliances that
are not efficiently ventilated to the outside or have the possibility of a scrubber system. As
ammonia corrodes copper, it may not be used as a drop-in in systems with copper parts. Also,
hermetic compressors for ammonia would have to be made without copper windings in the
motor. Carbon-dioxide is an excellent alternative but requires very high pressure compared to
R134a. A drum dryer using CO2 as working fluid has been developed at NTNU, providing
auspicious results[14]. The stable operating conditions of a drum dryer allows a CO2 heat pump
to run efficiently without sophisticated design or excessive amount of components.
Unfortunately, the high pressure components needed are costly compared to the moderate
pressure components used with HFCs, making CO2 drum dryers disproportionately expensive.
Isobutane has many of the same qualities and drawbacks as propane, especially regarding
flammability. The critical temperature is higher than for propane and R134a. By its
thermodynamic properties, it is interesting as a substitute for R410a, and are used in domestic
chillers.
Propane is non-toxic, odorless and operates at moderate pressures similar to R134a and offers
similar thermodynamic properties as R134a. Its flammability concerns in hermetic systems may
easily be constrained by charge minimization and the use of properly designed compressors.
Subsequently, is the most promising replacement for R134a.
14
2.4 Comparison of properties of R134a and R290
Both R134a and R290 is common refrigerants used in different applications. While R134a is a
synthetic fabricated gas invented for use in refrigeration systems, R290 is a natural hydrocarbon
found in the earth’s crust.
R134a (1,1,1,2-Tetrafluoroethane) is one of the most commonly used refrigerants in small scale
heat pumps, automotive AC-units, chillers and dryers[15]. Providing oil change or hydrocarbon
blend, it can be used as drop-in replacement for R12[16, 17]. According to ASHRAE
classifications it is not classified as dangerous, hazardous, toxic or flammable, and has very
good thermodynamic properties[18]. R134a and others HFC-gasses were considered an
environmental friendly alternative replacing ozone-depleting CFC-gasses that were banned by
the Montreal Protocol[19]. Due to the awareness of climate changes, R134a is no longer
considered environmental friendly due to its high GWP value[20].
R134a is also referred to as HFC-134a, when use as refrigerant is not specified. Several other
synonyms are commonly and sometimes imprecisely used in trade and everyday speech.
R290 (Propane) is a common hydrocarbon, classified as a natural working fluid when used in
refrigeration systems and heat pumps. At room temperature and ambient pressure propane is a
colorless and odorless highly flammable gas. It is widely used as fuel for heating and
combustion engines, and is an important raw material for petrochemical industry[21]. It offers
low GWP and suitable thermodynamic properties making it interesting as substitute for R134a.
As use of propane in refrigeration systems requires higher level of purity than what is often the
case with commercially available propane, refrigeration grade propane is consequently referred
to as R290 in this report[22]. While propane sold as fuel includes an additive providing a
distinctive smell, R290 does not include this additive, making it completely odorless. Although
specifications for R290 is not found in international standards, some general data for
hydrocarbon refrigerants are found in the German DIN8960 standard[23].
15
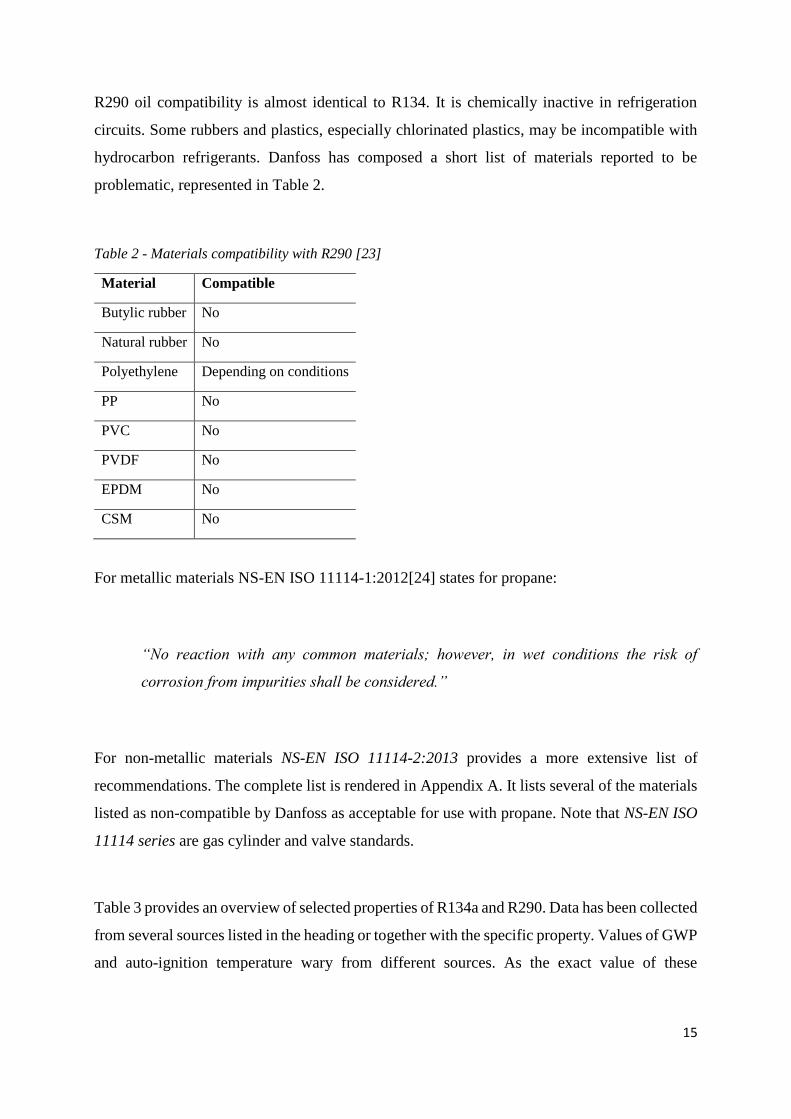
R290 oil compatibility is almost identical to R134. It is chemically inactive in refrigeration
circuits. Some rubbers and plastics, especially chlorinated plastics, may be incompatible with
hydrocarbon refrigerants. Danfoss has composed a short list of materials reported to be
problematic, represented in Table 2.
Table 2 - Materials compatibility with R290 [23]
Material Compatible
Butylic rubber No
Natural rubber No
Polyethylene Depending on conditions
PP No
PVC No
PVDF No
EPDM No
CSM No
For metallic materials NS-EN ISO 11114-1:2012[24] states for propane:
“No reaction with any common materials; however, in wet conditions the risk of
corrosion from impurities shall be considered.”
For non-metallic materials NS-EN ISO 11114-2:2013 provides a more extensive list of
recommendations. The complete list is rendered in Appendix A. It lists several of the materials
listed as non-compatible by Danfoss as acceptable for use with propane. Note that NS-EN ISO
11114 series are gas cylinder and valve standards.
Table 3 provides an overview of selected properties of R134a and R290. Data has been collected
from several sources listed in the heading or together with the specific property. Values of GWP
and auto-ignition temperature wary from different sources. As the exact value of these
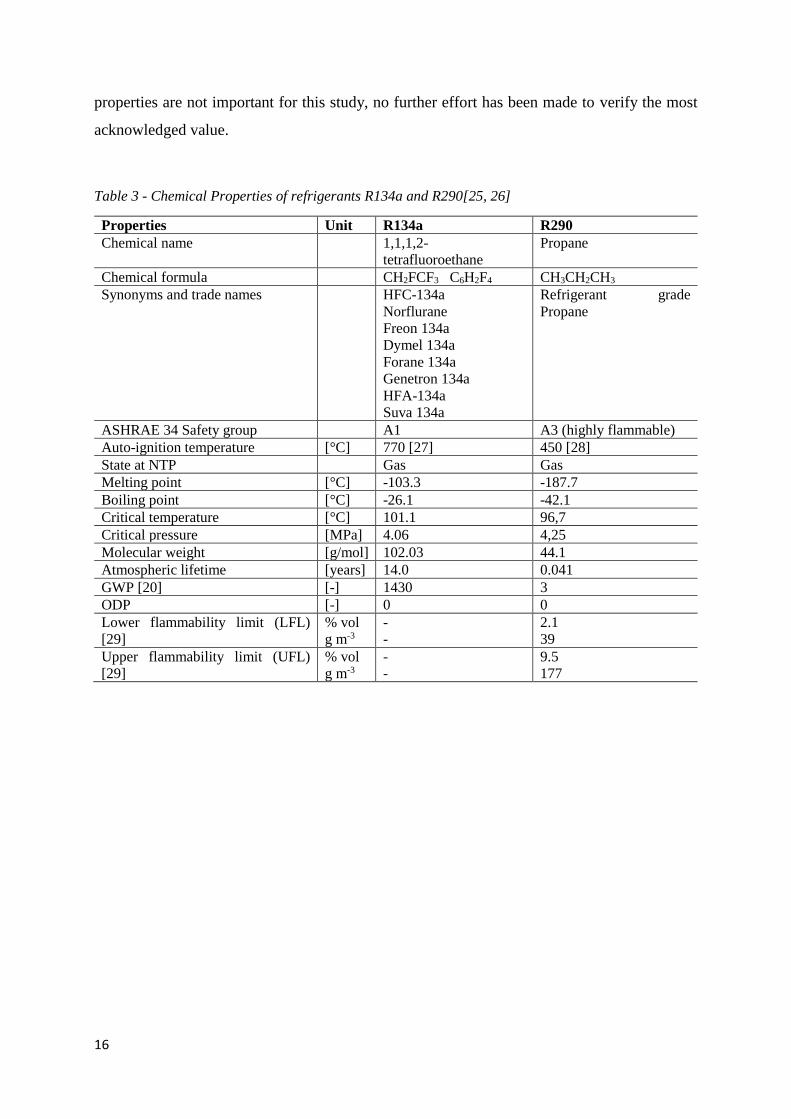
16
properties are not important for this study, no further effort has been made to verify the most
acknowledged value.
Table 3 - Chemical Properties of refrigerants R134a and R290[25, 26]
Properties Unit R134a R290
Chemical name 1,1,1,2-
tetrafluoroethane
Propane
Chemical formula CH2FCF3 C6H2F4 CH3CH2CH3
Synonyms and trade names HFC-134a
Norflurane
Freon 134a
Dymel 134a
Forane 134a
Genetron 134a
HFA-134a
Suva 134a
Refrigerant grade
Propane
ASHRAE 34 Safety group A1 A3 (highly flammable)
Auto-ignition temperature [°C] 770 [27] 450 [28]
State at NTP Gas Gas
Melting point [°C] -103.3 -187.7
Boiling point [°C] -26.1 -42.1
Critical temperature [°C] 101.1 96,7
Critical pressure [MPa] 4.06 4,25
Molecular weight [g/mol] 102.03 44.1
Atmospheric lifetime [years] 14.0 0.041
GWP [20] [-] 1430 3
ODP [-] 0 0
Lower flammability limit (LFL)
[29]
% vol
g m-3
-
-
2.1
39
Upper flammability limit (UFL)
[29]
% vol
g m-3
-
-
9.5
177
17
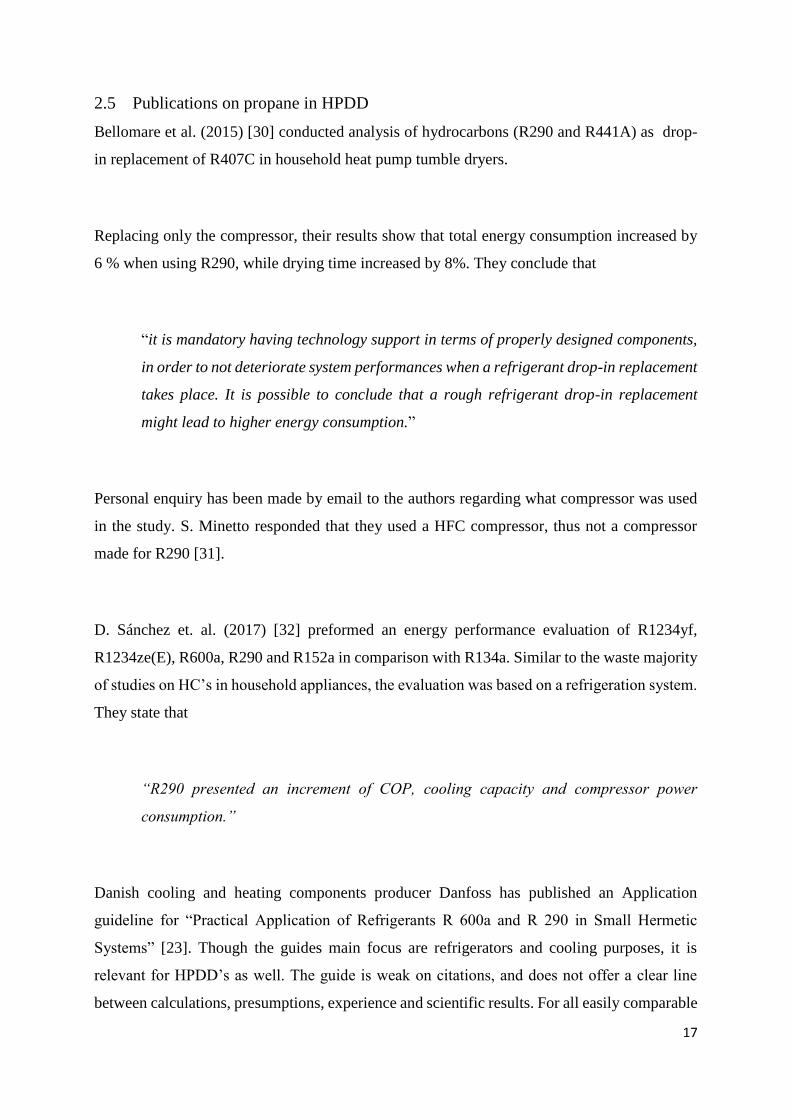
2.5 Publications on propane in HPDD
Bellomare et al. (2015) [30] conducted analysis of hydrocarbons (R290 and R441A) as drop-
in replacement of R407C in household heat pump tumble dryers.
Replacing only the compressor, their results show that total energy consumption increased by
6 % when using R290, while drying time increased by 8%. They conclude that
“it is mandatory having technology support in terms of properly designed components,
in order to not deteriorate system performances when a refrigerant drop-in replacement
takes place. It is possible to conclude that a rough refrigerant drop-in replacement
might lead to higher energy consumption.”
Personal enquiry has been made by email to the authors regarding what compressor was used
in the study. S. Minetto responded that they used a HFC compressor, thus not a compressor
made for R290 [31].
D. Sánchez et. al. (2017) [32] preformed an energy performance evaluation of R1234yf,
R1234ze(E), R600a, R290 and R152a in comparison with R134a. Similar to the waste majority
of studies on HC’s in household appliances, the evaluation was based on a refrigeration system.
They state that
“R290 presented an increment of COP, cooling capacity and compressor power
consumption.”
Danish cooling and heating components producer Danfoss has published an Application
guideline for “Practical Application of Refrigerants R 600a and R 290 in Small Hermetic
Systems” [23]. Though the guides main focus are refrigerators and cooling purposes, it is
relevant for HPDD’s as well. The guide is weak on citations, and does not offer a clear line
between calculations, presumptions, experience and scientific results. For all easily comparable
18
data, the guide checks out as correct, and offers an extent of relevant data regarding application
of R290.
Tecumseh Products Company LLC has published “Guidelines for the utilization of R600a and
R290”[33]. It offers practical guidelines for design and operation of refrigeration units utilizing
R290, with special care concerning use of Tecumseh’s products. Relevant to this study they
state about capillary tube selection:
“capillary tubes selected for R404A applications should be adequate as a preliminary
selection for R290. As with any capillary tube selection, system testing is necessary to
determine the proper final selection.”
Tecumseh has also published a “Technical Bulletin” on hydrocarbons [34] and SECOP an
application guideline for R600a and R290 in small hermetic systems [35]. This documents
contain roughly the same information as the ones stated above.
19
2.6 Safety regulations
R134a is comprised by the EU F-gas Regulation, regulating production, usage and disposal of
climate affecting HFC-gasses. R290 is not an HFC gas and is therefore not comprised by the
regulation. This makes it legally less complicated to handle R290, in terms of certification of
service personnel and collection of used gas[20].
IEC 60335-2-89:2010, paragraph 22.105, which is also adopted ass a Norwegian NEK standard
states that[36]:
“The mass of refrigerant in appliances which use flammable refrigerant in their cooling
system shall not exceed 150 g in each separate refrigerant circuit.”
R290 is classified as a flammable refrigerant. There has been reported that the limit is likely to
be moved to 500 g by 2018[37], but this has not been verified by other sources. Readers may
note that according to LFL and UFL in Table 3, a charge of 150 g propane released into a small
laundry room assumed to contain about 6 m3 of air will not provide a flammable mixture, while
500 g propane released into the same unvented room will be highly flammable.
2.7 Consequences on system design
By theoretical basis, when redesigning a R134s system for R290 the materials and dimensions
of heat exchangers, tubing, filters and similar components does not need to be changed. The
compressor needs to be substituted to a compressor designed for R290, featuring a slight
decrease in displacement and spark-free design. The mass of refrigerant charge may be reduced
by about 40%. To obtain efficient and reliable operation, capillary tube replacement is
recommended.
The amount of changes to a factory production line necessary to successfully implement R290
as refrigerant in heat pump drum dryers is limited to compressor installation and system
charging, as well as capillary tube design.
20
2.8 Important equipment for propane
Great efforts have been made to identify a commercially available compressor suited for use
with R290 within the desired temperature range. Specifications of compressors from the
following producers has been examined: Danfoss Compressors/SECOP, Konor
Electromechanics Co., Emerson Climate Technologies, Toshiba, Hitachi, Tecumseh, Sanyo,
Denso, Dorin, Bock and Mycom
Only Tecumseh are found to produce high back pressure (HBP) R290 compressors within the
desired power range. HBP compressor are preferred to meet efficiency demands, and to be
flexible regarding high temperature testing.
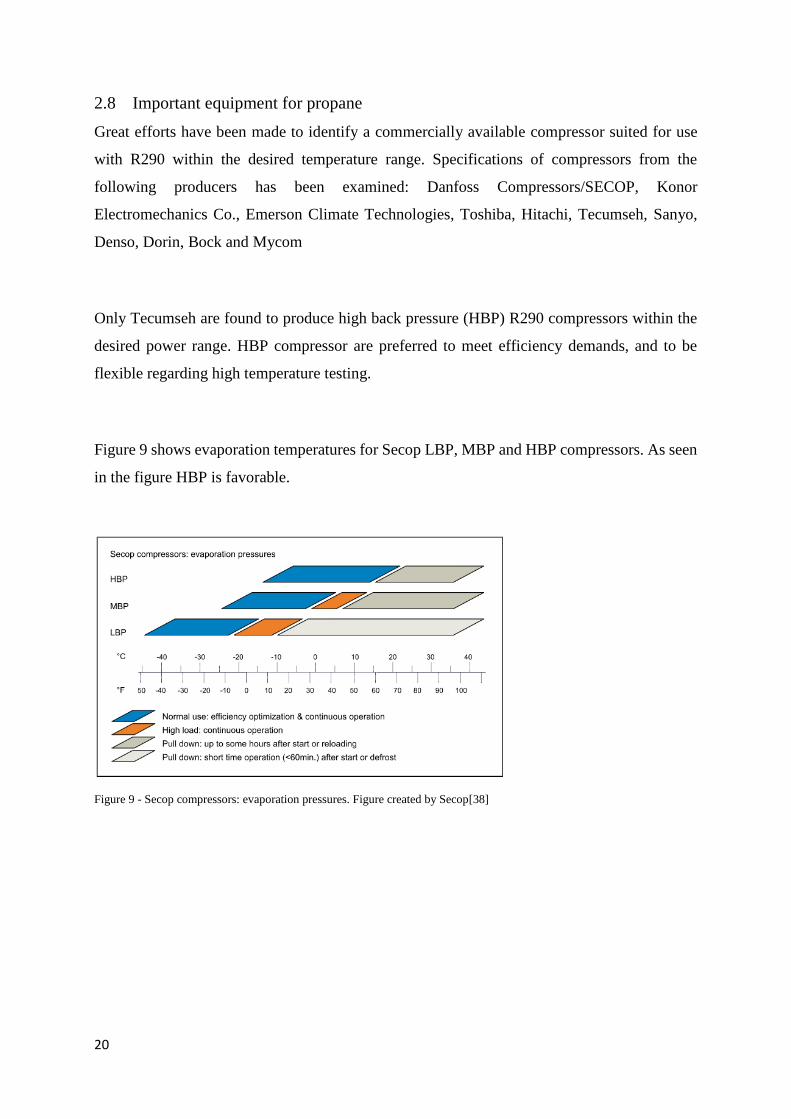
Figure 9 shows evaporation temperatures for Secop LBP, MBP and HBP compressors. As seen
in the figure HBP is favorable.
Figure 9 - Secop compressors: evaporation pressures. Figure created by Secop[38]
21
2.9 Drying and dehumidification
As mentioned, the driving force for drying of fabric in drum dryers are the difference in partial
vapor pressure between dry air blown into the dryer and saturated air close to the fabrics. As
relative humidity is defined as the ratio between the partial vapor pressure and the saturation or
equilibrium vapor pressure, the relative humidity of the air needs to be much less than 100% in
order to obtain drying.
The amount of water that an amount of air can hold without condensation is dependent on
temperature and pressure. For a given pressure, this relationship can be expressed in a
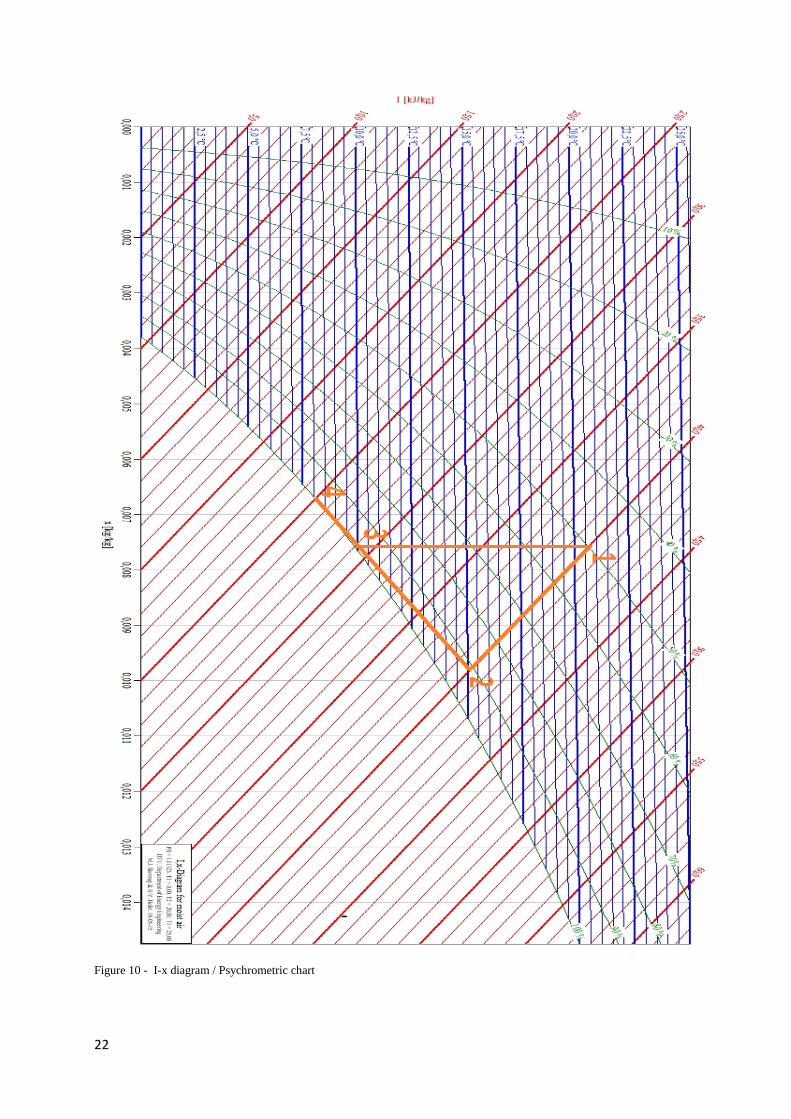
psychrometric chart, or an I-x diagram. As air pressure in the air cycle is close to ambient
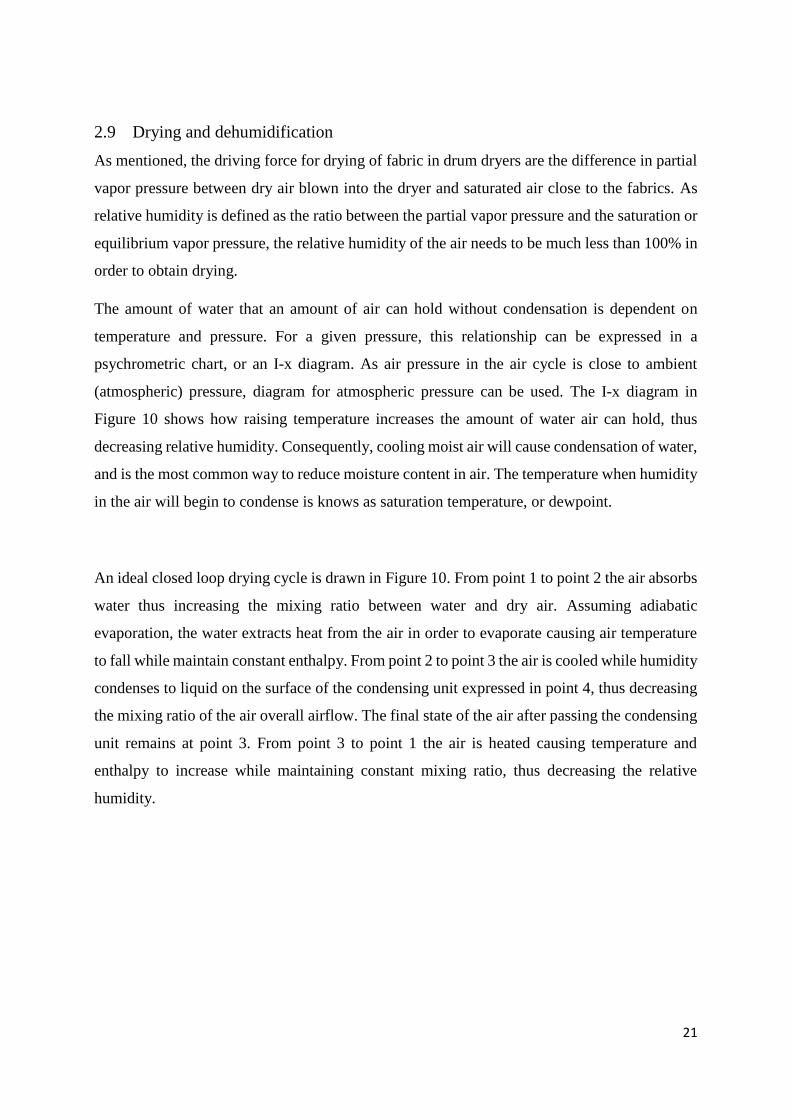
(atmospheric) pressure, diagram for atmospheric pressure can be used. The I-x diagram in
Figure 10 shows how raising temperature increases the amount of water air can hold, thus
decreasing relative humidity. Consequently, cooling moist air will cause condensation of water,
and is the most common way to reduce moisture content in air. The temperature when humidity
in the air will begin to condense is knows as saturation temperature, or dewpoint.
An ideal closed loop drying cycle is drawn in Figure 10. From point 1 to point 2 the air absorbs
water thus increasing the mixing ratio between water and dry air. Assuming adiabatic
evaporation, the water extracts heat from the air in order to evaporate causing air temperature
to fall while maintain constant enthalpy. From point 2 to point 3 the air is cooled while humidity
condenses to liquid on the surface of the condensing unit expressed in point 4, thus decreasing
the mixing ratio of the air overall airflow. The final state of the air after passing the condensing
unit remains at point 3. From point 3 to point 1 the air is heated causing temperature and
enthalpy to increase while maintaining constant mixing ratio, thus decreasing the relative
humidity.
22
Figure 10 - I-x diagram / Psychrometric chart
23
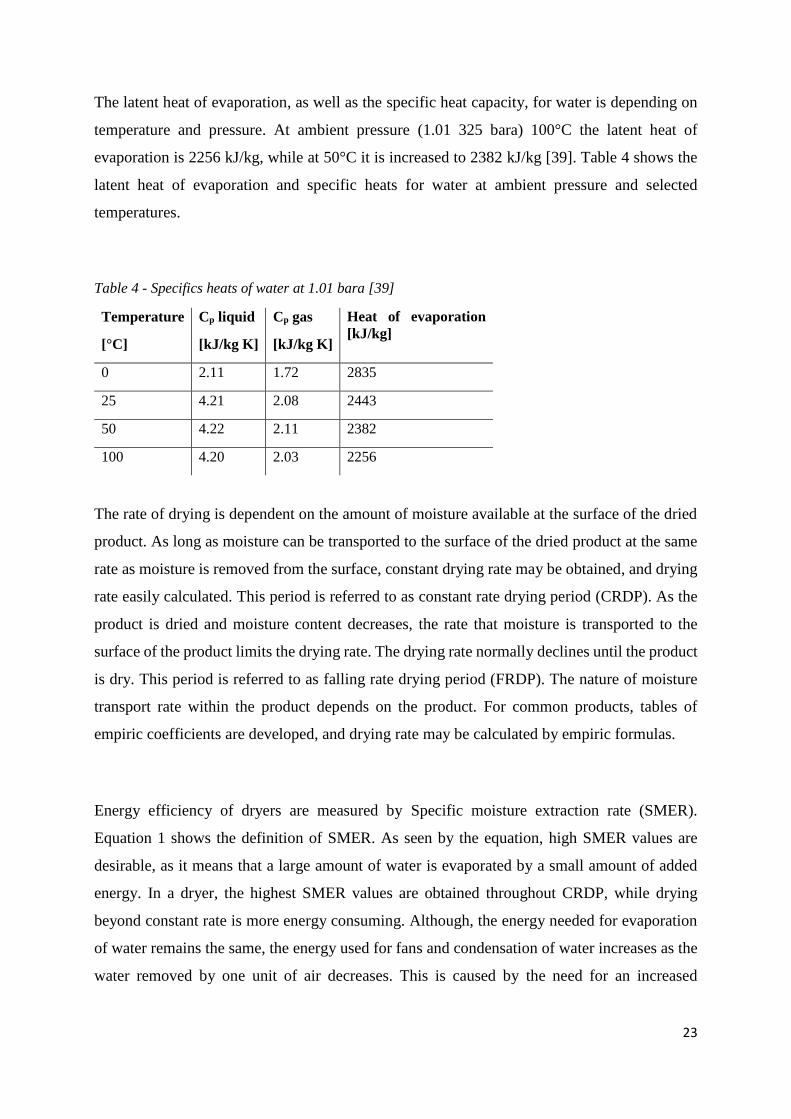
The latent heat of evaporation, as well as the specific heat capacity, for water is depending on
temperature and pressure. At ambient pressure (1.01 325 bara) 100°C the latent heat of
evaporation is 2256 kJ/kg, while at 50°C it is increased to 2382 kJ/kg [39]. Table 4 shows the
latent heat of evaporation and specific heats for water at ambient pressure and selected
temperatures.
Table 4 - Specifics heats of water at 1.01 bara [39]
Temperature
[°C]
Cp liquid
[kJ/kg K]
Cp gas
[kJ/kg K]
Heat of evaporation
[kJ/kg]
0 2.11 1.72 2835
25 4.21 2.08 2443
50 4.22 2.11 2382
100 4.20 2.03 2256
The rate of drying is dependent on the amount of moisture available at the surface of the dried
product. As long as moisture can be transported to the surface of the dried product at the same
rate as moisture is removed from the surface, constant drying rate may be obtained, and drying
rate easily calculated. This period is referred to as constant rate drying period (CRDP). As the
product is dried and moisture content decreases, the rate that moisture is transported to the
surface of the product limits the drying rate. The drying rate normally declines until the product
is dry. This period is referred to as falling rate drying period (FRDP). The nature of moisture
transport rate within the product depends on the product. For common products, tables of
empiric coefficients are developed, and drying rate may be calculated by empiric formulas.
Energy efficiency of dryers are measured by Specific moisture extraction rate (SMER).
Equation 1 shows the definition of SMER. As seen by the equation, high SMER values are
desirable, as it means that a large amount of water is evaporated by a small amount of added
energy. In a dryer, the highest SMER values are obtained throughout CRDP, while drying
beyond constant rate is more energy consuming. Although, the energy needed for evaporation
of water remains the same, the energy used for fans and condensation of water increases as the
water removed by one unit of air decreases. This is caused by the need for an increased
24
difference in vapor pressure between the air and the dried product to achieve satisfying drying
rates[40].
1) 𝑆𝑀𝐸𝑅 = 𝐴𝑚𝑜𝑢𝑛𝑡 𝑜𝑓 𝑤𝑎𝑡𝑒𝑟 𝑒𝑣𝑎𝑝𝑜𝑟𝑎𝑡𝑒𝑑
𝐸𝑛𝑒𝑟𝑔𝑦 𝑖𝑛𝑝𝑢𝑡 𝑡𝑜 𝑡ℎ𝑒 𝑑𝑟𝑦𝑒𝑟, [kg/kWh]
Operating schemes and control parameters
Excessive temperatures and uneven drying may cause quality degradation of dried products.
Especially products such as food and timber are vulnerable to degradation during drying[41].
For drum dryers, maximum temperature is set by the type and quality of fabric that is dried.
Degradation and excessive wear on the fabric and other parts of clothes that is dried, such as
elastic bands and prints, may be caused by high drying temperatures. Lowered drying
temperatures may increase the lifetime of frequently dried fabric and clothes, thereby reducing
environmental impact from this industry, as well as consumer costs. To a large extent, uneven
drying is avoided using a rotating drum ensuring even airflow through the clothes.
25
3 Materials and method
3.1 Overview of the drum dryer
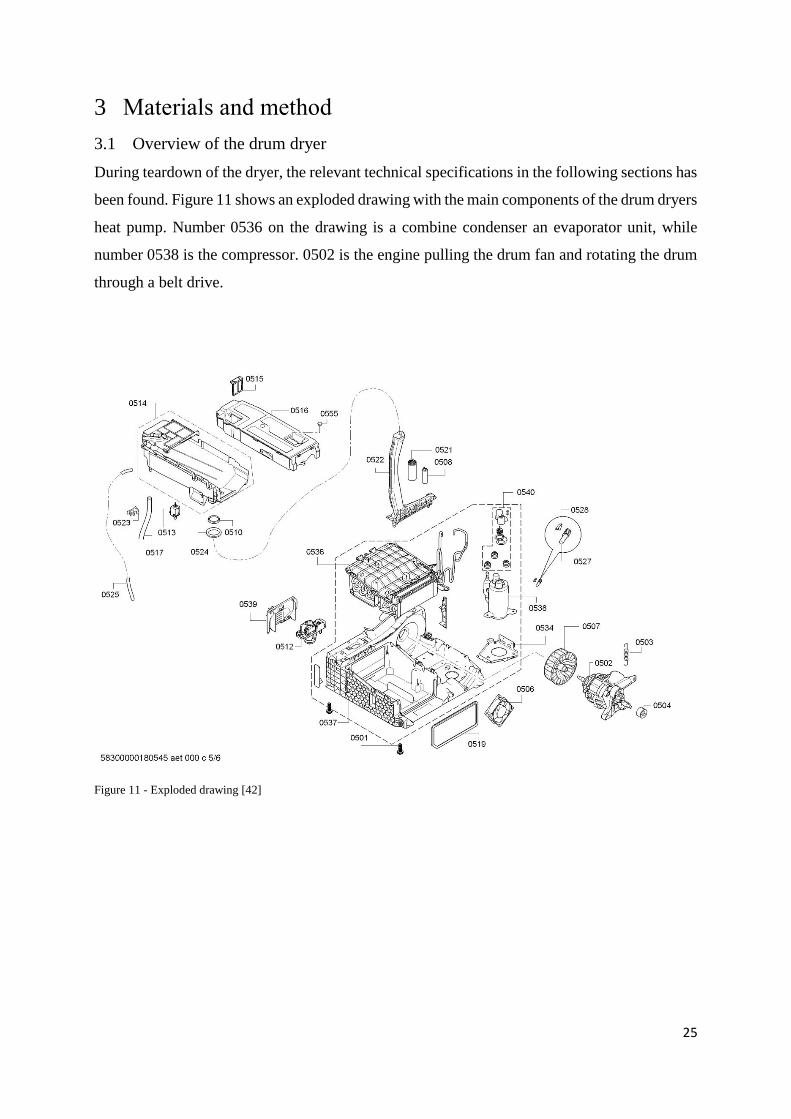
During teardown of the dryer, the relevant technical specifications in the following sections has
been found. Figure 11 shows an exploded drawing with the main components of the drum dryers
heat pump. Number 0536 on the drawing is a combine condenser an evaporator unit, while
number 0538 is the compressor. 0502 is the engine pulling the drum fan and rotating the drum
through a belt drive.
Figure 11 - Exploded drawing [42]
26
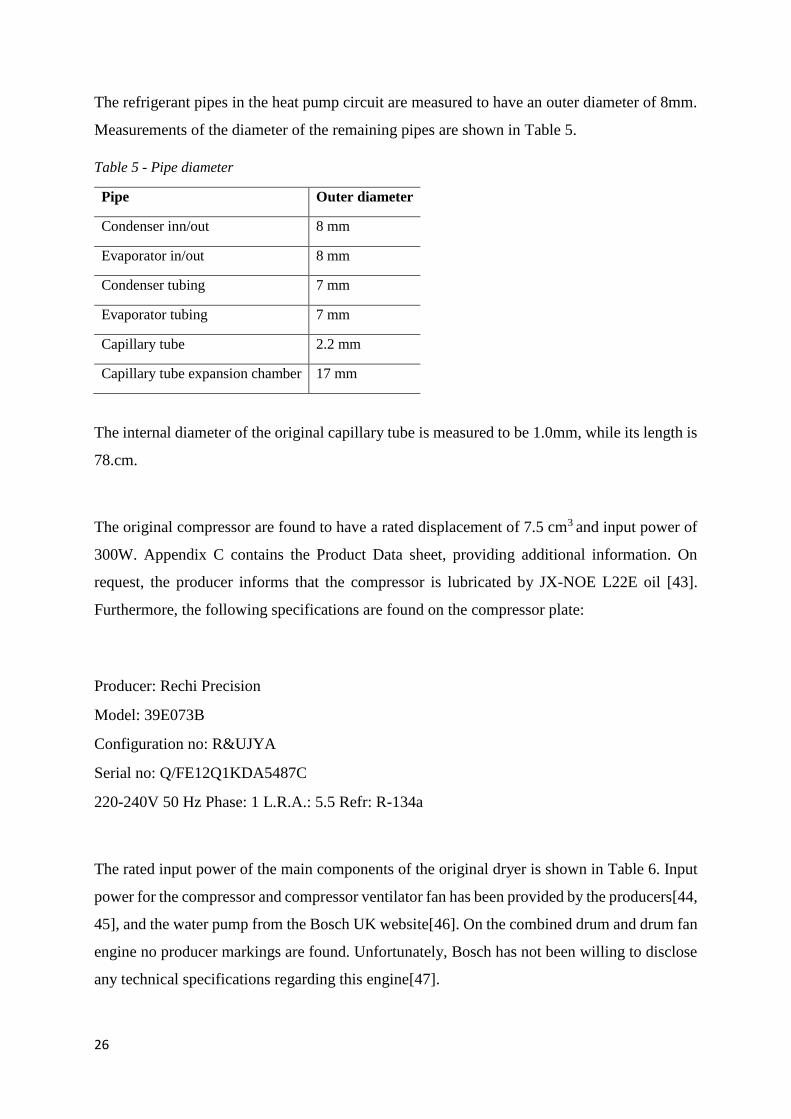
The refrigerant pipes in the heat pump circuit are measured to have an outer diameter of 8mm.
Measurements of the diameter of the remaining pipes are shown in Table 5.
Table 5 - Pipe diameter
Pipe Outer diameter
Condenser inn/out 8 mm
Evaporator in/out 8 mm
Condenser tubing 7 mm
Evaporator tubing 7 mm
Capillary tube 2.2 mm
Capillary tube expansion chamber 17 mm
The internal diameter of the original capillary tube is measured to be 1.0mm, while its length is
78.cm.
The original compressor are found to have a rated displacement of 7.5 cm3 and input power of
300W. Appendix C contains the Product Data sheet, providing additional information. On
request, the producer informs that the compressor is lubricated by JX-NOE L22E oil [43].
Furthermore, the following specifications are found on the compressor plate:
Producer: Rechi Precision
Model: 39E073B
Configuration no: R&UJYA
Serial no: Q/FE12Q1KDA5487C
220-240V 50 Hz Phase: 1 L.R.A.: 5.5 Refr: R-134a
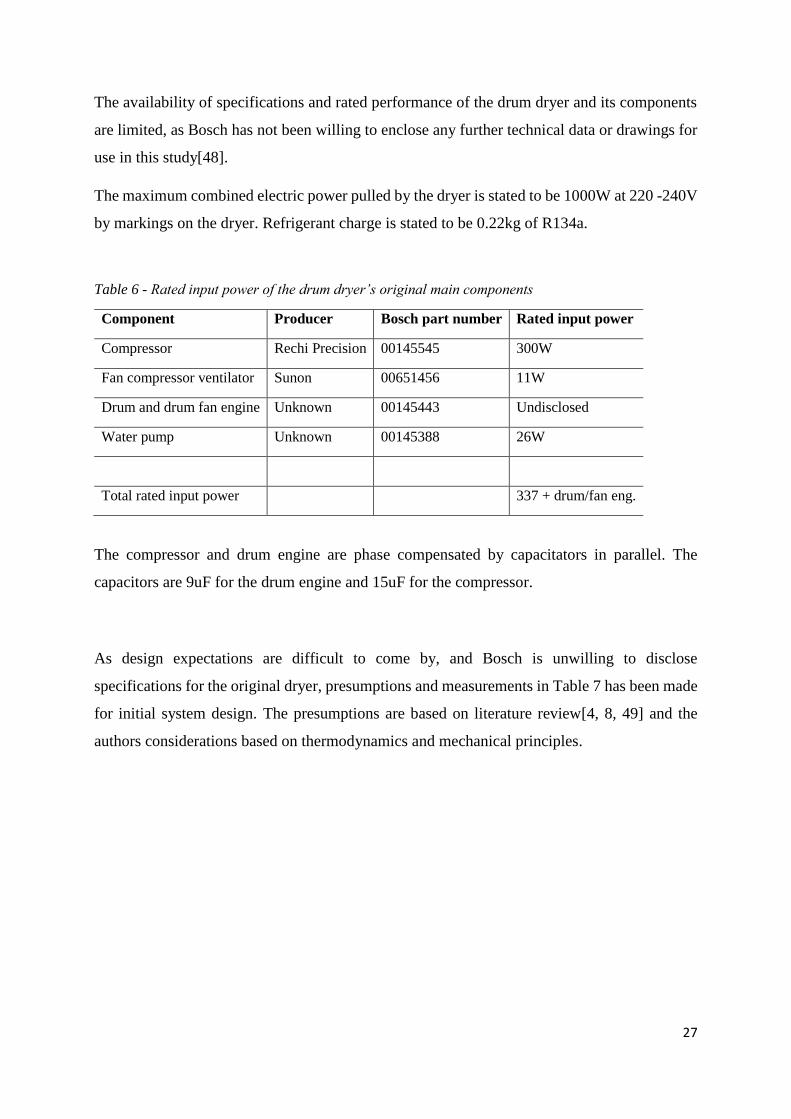
The rated input power of the main components of the original dryer is shown in Table 6. Input
power for the compressor and compressor ventilator fan has been provided by the producers[44,
45], and the water pump from the Bosch UK website[46]. On the combined drum and drum fan
engine no producer markings are found. Unfortunately, Bosch has not been willing to disclose
any technical specifications regarding this engine[47].
27
The availability of specifications and rated performance of the drum dryer and its components
are limited, as Bosch has not been willing to enclose any further technical data or drawings for
use in this study[48].
The maximum combined electric power pulled by the dryer is stated to be 1000W at 220 -240V
by markings on the dryer. Refrigerant charge is stated to be 0.22kg of R134a.
Table 6 - Rated input power of the drum dryer’s original main components
Component Producer Bosch part number Rated input power
Compressor Rechi Precision 00145545 300W
Fan compressor ventilator Sunon 00651456 11W
Drum and drum fan engine Unknown 00145443 Undisclosed
Water pump Unknown 00145388 26W
Total rated input power 337 + drum/fan eng.
The compressor and drum engine are phase compensated by capacitators in parallel. The
capacitors are 9uF for the drum engine and 15uF for the compressor.
As design expectations are difficult to come by, and Bosch is unwilling to disclose
specifications for the original dryer, presumptions and measurements in Table 7 has been made
for initial system design. The presumptions are based on literature review[4, 8, 49] and the
authors considerations based on thermodynamics and mechanical principles.
28
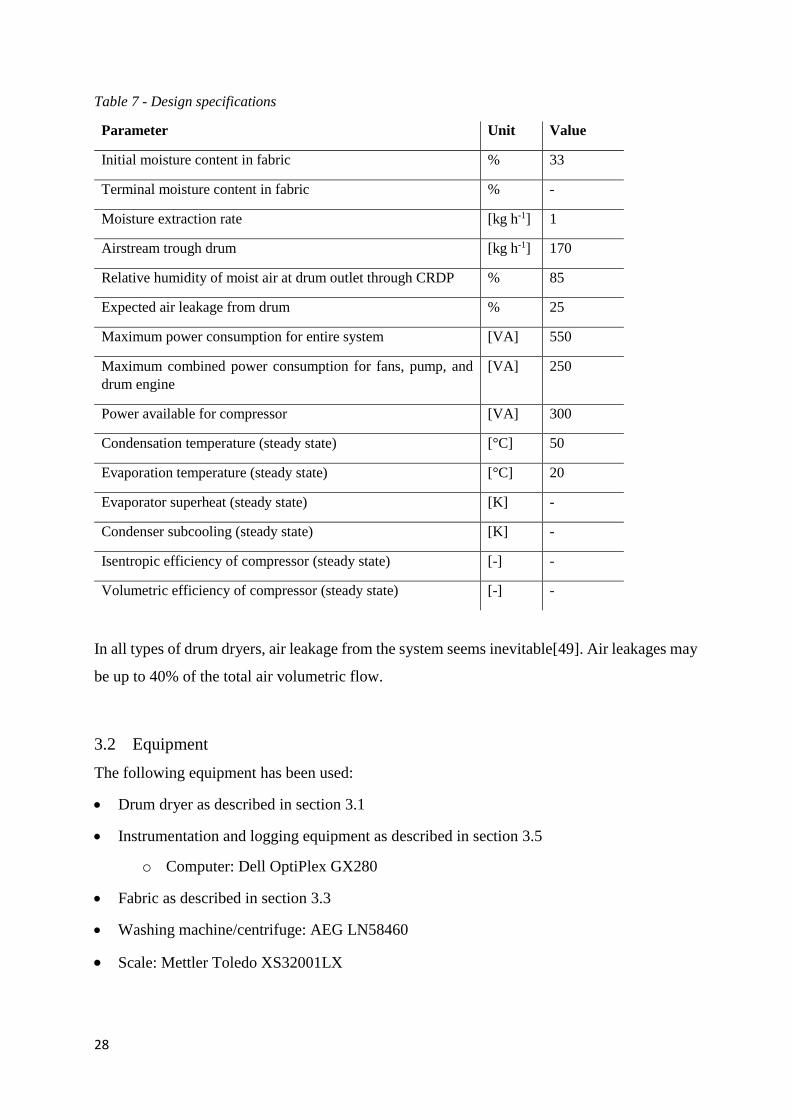
Table 7 - Design specifications
Parameter Unit Value
Initial moisture content in fabric % 33
Terminal moisture content in fabric % -
Moisture extraction rate [kg h-1] 1
Airstream trough drum [kg h-1] 170
Relative humidity of moist air at drum outlet through CRDP % 85
Expected air leakage from drum % 25
Maximum power consumption for entire system [VA] 550
Maximum combined power consumption for fans, pump, and
drum engine
[VA] 250
Power available for compressor [VA] 300
Condensation temperature (steady state) [°C] 50
Evaporation temperature (steady state) [°C] 20
Evaporator superheat (steady state) [K] -
Condenser subcooling (steady state) [K] -
Isentropic efficiency of compressor (steady state) [-] -
Volumetric efficiency of compressor (steady state) [-] -
In all types of drum dryers, air leakage from the system seems inevitable[49]. Air leakages may
be up to 40% of the total air volumetric flow.
3.2 Equipment
The following equipment has been used:
• Drum dryer as described in section 3.1
• Instrumentation and logging equipment as described in section 3.5
o Computer: Dell OptiPlex GX280
• Fabric as described in section 3.3
• Washing machine/centrifuge: AEG LN58460
• Scale: Mettler Toledo XS32001LX
29
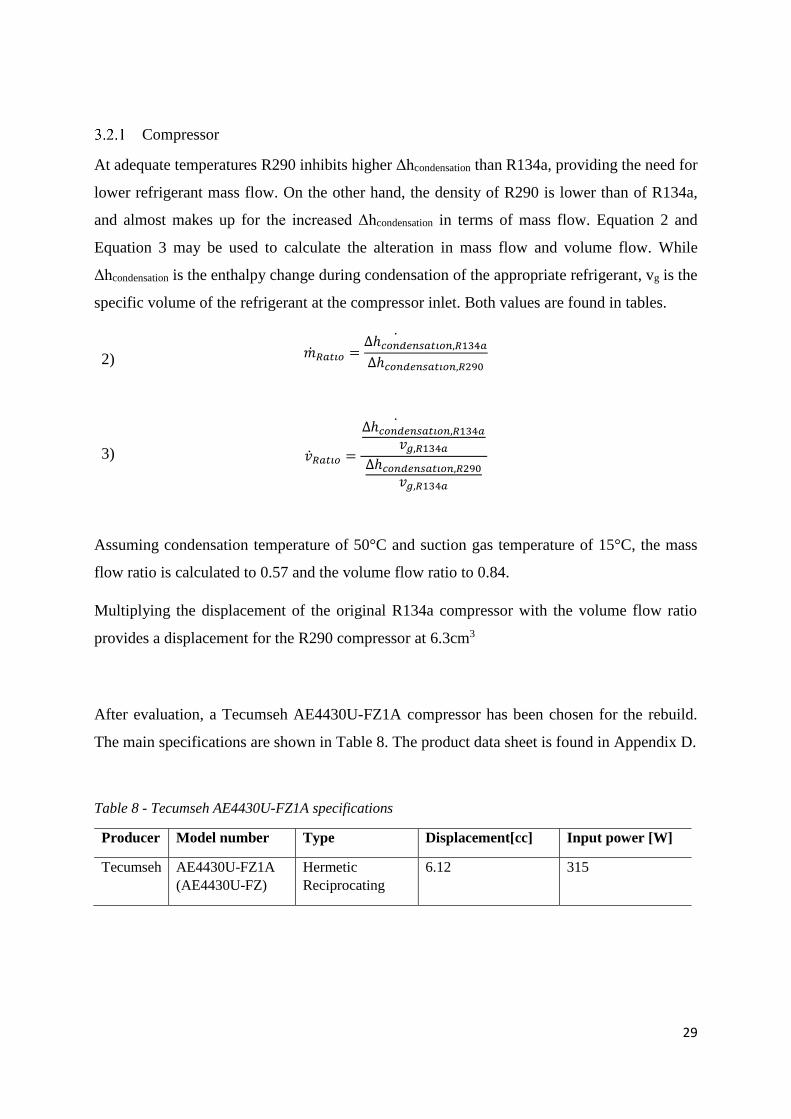
Compressor
At adequate temperatures R290 inhibits higher Δhcondensation than R134a, providing the need for
lower refrigerant mass flow. On the other hand, the density of R290 is lower than of R134a,
and almost makes up for the increased Δhcondensation in terms of mass flow. Equation 2 and
Equation 3 may be used to calculate the alteration in mass flow and volume flow. While
Δhcondensation is the enthalpy change during condensation of the appropriate refrigerant, vg is the
specific volume of the refrigerant at the compressor inlet. Both values are found in tables.
2) ��𝑅𝑎𝑡𝑖𝑜 =∆ℎ𝑐𝑜𝑛𝑑𝑒𝑛𝑠𝑎𝑡𝑖𝑜𝑛,𝑅134𝑎
∆ℎ𝑐𝑜𝑛𝑑𝑒𝑛𝑠𝑎𝑡𝑖𝑜𝑛,𝑅290
3) ��𝑅𝑎𝑡𝑖𝑜 =
∆ℎ𝑐𝑜𝑛𝑑𝑒𝑛𝑠𝑎𝑡𝑖𝑜𝑛,𝑅134𝑎
𝑣𝑔,𝑅134𝑎
∆ℎ𝑐𝑜𝑛𝑑𝑒𝑛𝑠𝑎𝑡𝑖𝑜𝑛,𝑅290
𝑣𝑔,𝑅134𝑎
Assuming condensation temperature of 50°C and suction gas temperature of 15°C, the mass
flow ratio is calculated to 0.57 and the volume flow ratio to 0.84.
Multiplying the displacement of the original R134a compressor with the volume flow ratio
provides a displacement for the R290 compressor at 6.3cm3
After evaluation, a Tecumseh AE4430U-FZ1A compressor has been chosen for the rebuild.
The main specifications are shown in Table 8. The product data sheet is found in Appendix D.
Table 8 - Tecumseh AE4430U-FZ1A specifications
Producer Model number Type Displacement[cc] Input power [W]
Tecumseh AE4430U-FZ1A
(AE4430U-FZ)
Hermetic
Reciprocating
6.12 315
30
Heat exchangers
The original heat exchangers are assumed to be adequate for R290. They are both counter flow
fin and tube types. Although the sizing is not optimal for R290, the original heat exchangers
will not be altered. Sintef has developed a computer program for design of heat exchangers,
named HXsim. At the time of writing, a license and working edition of HXsim has not been
obtained despite efforts to do so.
Refrigerant charge
The traditional way of calculation refrigerant charge is by dividing the internal volume of the
high-pressure side components and tubing by the specific volume of liquid refrigerant. The
fraction is stated by Equation 4. Determining the internal volume of the components may be
complicated and prone to measurement errors if not stated by the producer.
4) 𝑚𝑅𝑒𝑓𝑟𝑖𝑔𝑒𝑟𝑎𝑛𝑡 =
𝐻𝑖𝑔ℎ − 𝑝𝑟𝑒𝑠𝑠𝑢𝑟𝑒 𝑠𝑖𝑑𝑒 𝑖𝑛𝑡𝑒𝑟𝑛𝑎𝑙 𝑣𝑜𝑙𝑢𝑚𝑒
𝐿𝑖𝑞𝑢𝑖𝑑 𝑟𝑒𝑓𝑟𝑖𝑔𝑒𝑟𝑎𝑛𝑡 𝑠𝑝𝑒𝑠𝑖𝑓𝑖𝑐 𝑣𝑜𝑙𝑢𝑚𝑒
Assuming that the length of tubing at the high-pressure side of the system remains the same,
the ideal R290 charge may be calculated from the original R134a charge. Equation 5 may be
used. mR134a is the factory charge of R134a, while vl is the specific volume of saturated liquid
refrigerant at condensation temperature.
5) 𝑚𝑅290 = 𝑚𝑅134𝑎 ∙
𝑣𝑙,𝑅134𝑎
𝑣𝑙,𝑅290
Assuming 50°C condensation temperature, R290 charge is 91g. The factory R134a charge is
220g.
Multiplying refrigerant charge with the refrigerants GWP value provides the total global
warming potential of the charge expressed in CO2 equivalents. Based on the values above, the
R134a charge equivalents 295kg CO2, while the R290 charge equivalents 0.273kg CO2.
However the charge should be optimized with respect to working conditions and size of heat
exchangers.
31
3.3 Experimental setup and procedure
To ensure comparable results, the drum dryer has been modified so that the compressor,
compressor cooling fan, drum engine and drum fan is controlled by mechanical switches. This
ensures that the programming of the original control does not influence the results. The switches
are on/off, meaning that the speed of the electric motors cannot be altered.
The wiring is made so that one switch controls the compressor and compressor cooling fan, and
one switch controls the rotation engine and fan. The compressor cooling fan can be unplugged
manually. As the drum and fan is run by a combined motor and combined shaft, drum rotational
speed and fan speed is fixed to each other. The pump draining the water collector is controlled
by a manual switch that needs to be depressed continuously for the pump to run.
The tests are run with a test load of 2.632 kg fabric, consisting of various cotton. The fabric is
then socked in water, and centrifuged at up to 1400 rpm in a AEG LN58460 washing machine
to ensure adequate moisture distribution. The moisture content mimics the residual moisture
after a standard washing program in an ordinary washing machine. The fabric is then weighed
and loaded into the dryer. The compressor cooling fan are unplugged during experiments, and
temperatures monitored by the operator to ensure unharmful temperatures. Four different
experimental setups has been applied;
Setup 1: Fabric centrifuged at 1400 rpm. The dryer is run for 80 minutes. The fabric is the taken
out for the dryer and weighed.
Setup 2: Fabric centrifuged at 1400 rpm. The dryer is run for 80 minutes. Every 10 minutes the
fabric is taken out of the dryer and weighed. The compressor is shut down during weighing.
Setup 3: Fabric centrifuged at 1400 rpm. The dryer is run for 120 minutes. The fabric is then
taken out of the dryer and weighed.
32
Setup 4: Fabric centrifuged at 600rpm. The dryer is run for 80 minutes. The fabric is the taken
out for the dryer and weighed.
The amount of water removed from the fabric by the dryer can be calculated as the difference
in weight before and after drying. To allow for calculation of leakage from the dryer, the
condensed water is collected and weighed. Since there is no sump for the pump in the water
collection tray, the tray is filled with water and pumped down to the level achievable by the
pump before experiments. During experiments, the pump is run repetitively while the water is
collected to ensure that the evaporator is not submerged, thus affecting results. At the end of
experiments, the pump is run until the water level has again reached the minimum level
achievable by the pump, ensuring that the amount of water collected for weighing is equal to
the amount condensed during drying.
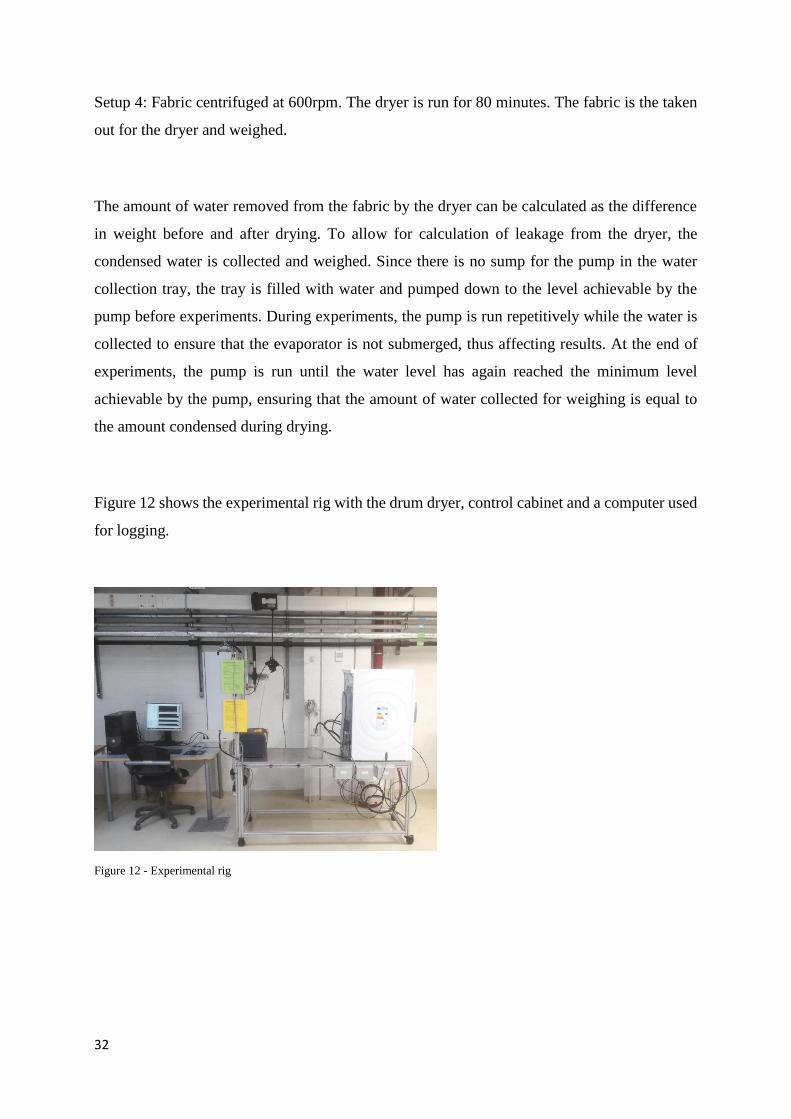
Figure 12 shows the experimental rig with the drum dryer, control cabinet and a computer used
for logging.
Figure 12 - Experimental rig
33
Standardized procedure
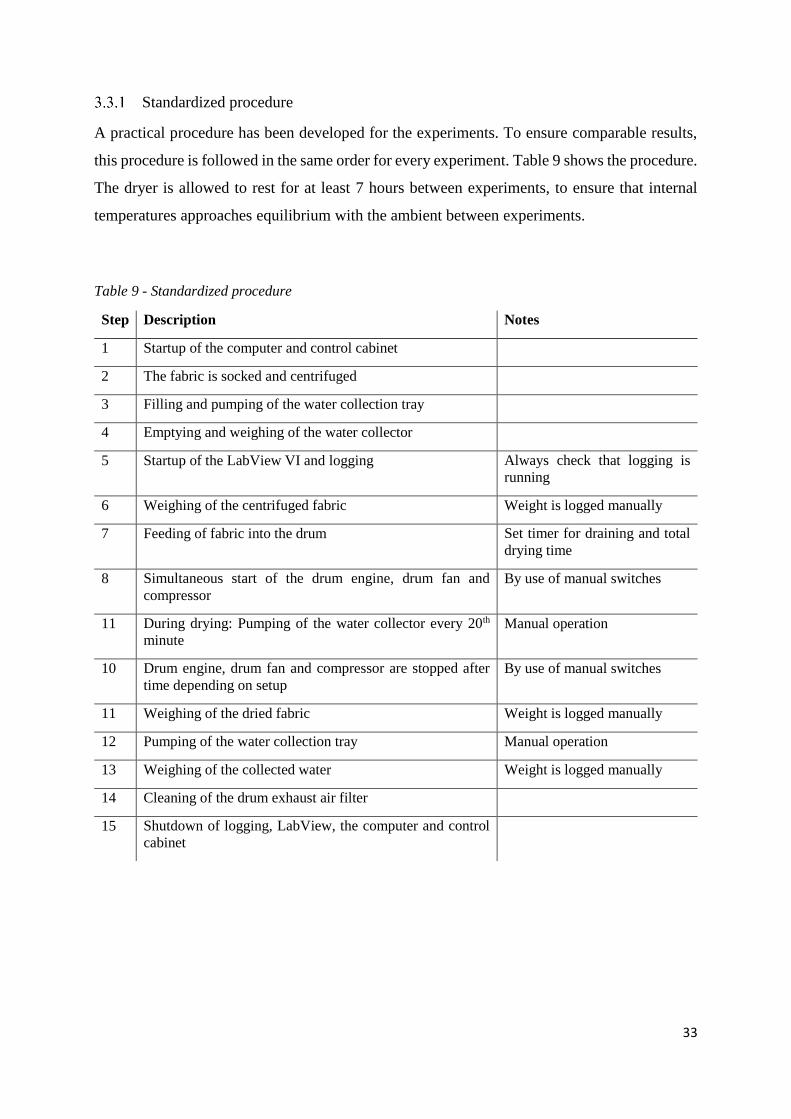
A practical procedure has been developed for the experiments. To ensure comparable results,
this procedure is followed in the same order for every experiment. Table 9 shows the procedure.
The dryer is allowed to rest for at least 7 hours between experiments, to ensure that internal
temperatures approaches equilibrium with the ambient between experiments.
Table 9 - Standardized procedure
Step Description Notes
1 Startup of the computer and control cabinet
2 The fabric is socked and centrifuged
3 Filling and pumping of the water collection tray
4 Emptying and weighing of the water collector
5 Startup of the LabView VI and logging Always check that logging is
running
6 Weighing of the centrifuged fabric Weight is logged manually
7 Feeding of fabric into the drum Set timer for draining and total
drying time
8 Simultaneous start of the drum engine, drum fan and
compressor
By use of manual switches
11 During drying: Pumping of the water collector every 20th
minute
Manual operation
10 Drum engine, drum fan and compressor are stopped after
time depending on setup
By use of manual switches
11 Weighing of the dried fabric Weight is logged manually
12 Pumping of the water collection tray Manual operation
13 Weighing of the collected water Weight is logged manually
14 Cleaning of the drum exhaust air filter
15 Shutdown of logging, LabView, the computer and control
cabinet
34
3.4 Rebuild
To allow the compressor to be changed the R134a system was emptied, instrumentation
connected to the heat pump circuit removed and the pipes cut as close to the original compressor
are possible. Then the compressor was removed, and cabinet and compressor mountings
adapted to fit the new R290 compressor. The R290 compressor were mounted within the
original cabinet, maintaining almost the same amount of air leaks and insulation as before,
minimizing the change in heat loss compared to the R134a system. Due to the increased outer
dimensions of the R290 compressor, the compressor cooling fan had to be removed from its
mountings. As the fan is mounted in an opening in the casing, the fan is temporarily placed over
the opening for experiments to avoid influencing heat loss. The fan has not been run for any
experiments other than initial system behavior tests.
The pipes connected to the compressor were bent and adapted to fit the new compressor, before
being soldered to the suction and discharge pipes. A valve was soldered to the process pipe of
the compressor, to serve as a service valve for experiments. To obtain a hermetically sealed
system permitted for non-laboratory use, this pipe would have to be sealed by soldering.
The thermocouples removed prior to the rebuild were reinstalled in the same position using the
same fastening and insulation method as before. The pressure sensors were reconnected to the
same connectors as before. Prior to recharge, the system was pressure-teste with nitrogen for
16 hours and all joints and connections inspected using soapy water.
Initially, the system was charged with 100g of R290, including refrigerant left in the pipes
between the canister and the service valve. The first experiment revealed excessive overheating
at the compressor suction pipe, suggesting that the charge was less than ideal. A extra charge
of 15g R290 were added to the system, making the total charge 115g. At this charge the
overheating was considered to be ideal at 2-4 K overheat. Further charge optimizing is
performed in section 4.2.5.
35
3.5 Instrumentation
The original drum dryer has been somewhat modified, and sensors mounted for previous
experiments made by other students. Sensor values are logged using a LabVIEW program
originally designed for a CO2 HPDD by technicians at the NTNU laboratory. The program has
been edited to provide the desired data for this thesis. Sensor values are logged and saved as
Excel-files for analysis, at a time interval set to 2 seconds. Due to processing time, the real time
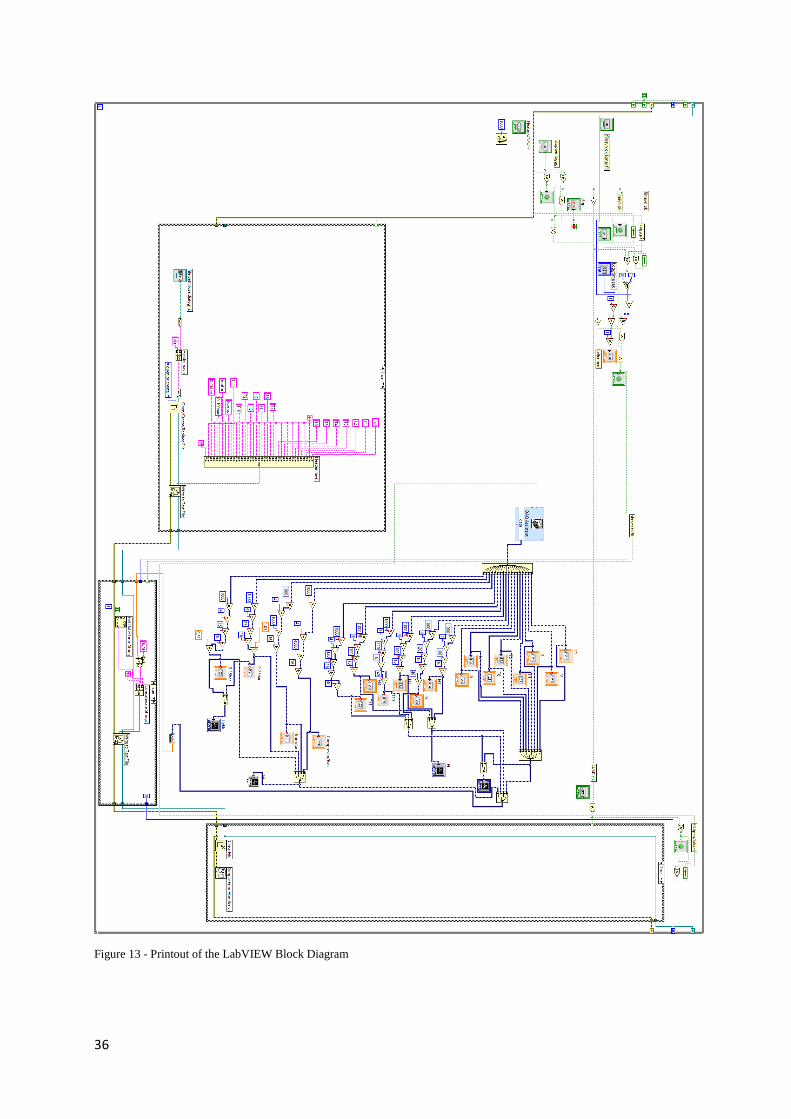
interval is approximately 3 seconds. The LabVIEW block diagram is shown in Figure 13.
Data acquisition is done using National instruments cDAQ-9178. NI cDAQ-9178 provides a
USB interface compliable with almost all computers available.
In addition to the sensors connected to the drum dryer, input power is measured by a transducer
connected to the feed wires. Input power for the combined drum/ drum fan engine and the
compressor is measured separately. Measurements are performed using a DEIF TAP-210DG/3
transducer.
36
Figure 13 - Printout of the LabVIEW Block Diagram
37
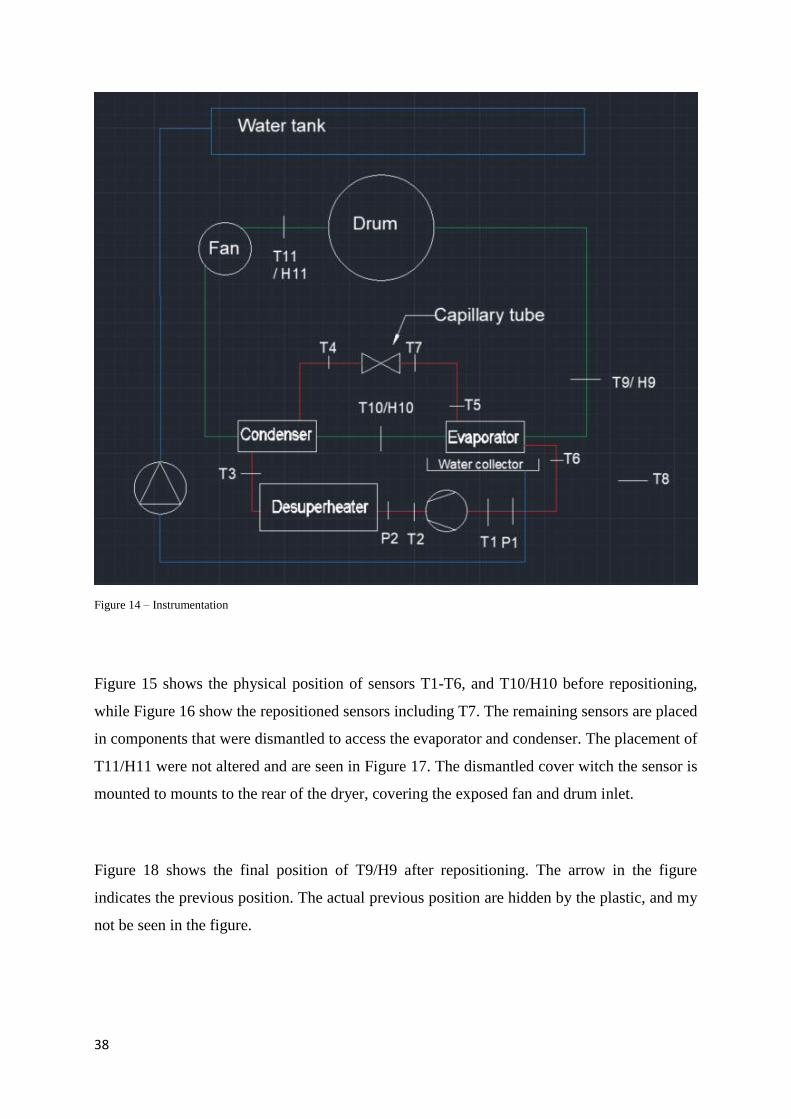
As seen in Figure 14 the system is equipped with several thermistors and hygrometers. T1-T7
are thermistors attached to the pipes of the heat pump circuit. The thermistors are partially
insulated against the ambient. T8 thermistor is not in use. It is “stored” in the cable tray, where
it may serve as a reference of the ambient temperature close to the drum dryer. T9/H9, T10/H10
and T11/H11 are combined thermocouples and hygrometers. They are placed in the airstream
of the dryer circuit as shown in the figure.
The sensors used for previous studies includes thermistors T1 – T6, and the combined
thermocouples/hygrometers T9-T11/H9-H11. The placement of this sensors has been evaluated
after processing initial experiments, and the physical placement of several sensors has been
altered as the placement were not optimal for correct measurements. This includes sensor
H9/T9, H10/T10 and T5. Thermistor T7 has been placed in the previous position of T5. The
schematic placement of all sensors, except T7, remain the same. Pressure sensors P1 and P2
has been added to the system.
Ideally, an air flow meter would be placed in the airstream. Unfortunately, no laminar flow is
found in the airstream of the drum dryer. I.e. airflow would have to be measured in turbulent
flow, providing at best unreliable measurements.
The temperature and humidity in the airstream (T9/H9, T10/H10 and T11/H11) are measured
using VAISALA Humidity and temperature transmitters with Remote Probes.
Pressure is measured using a Druck PTX 110/W pressure transmitter at low pressure (P1) and
an Endress+Hauser Cerabar PMC731 digital pressure transmitter at high pressure (P2).
Calibrated pressure range is respectively 0-16 bara and 0-40 bara.
38
Figure 14 – Instrumentation
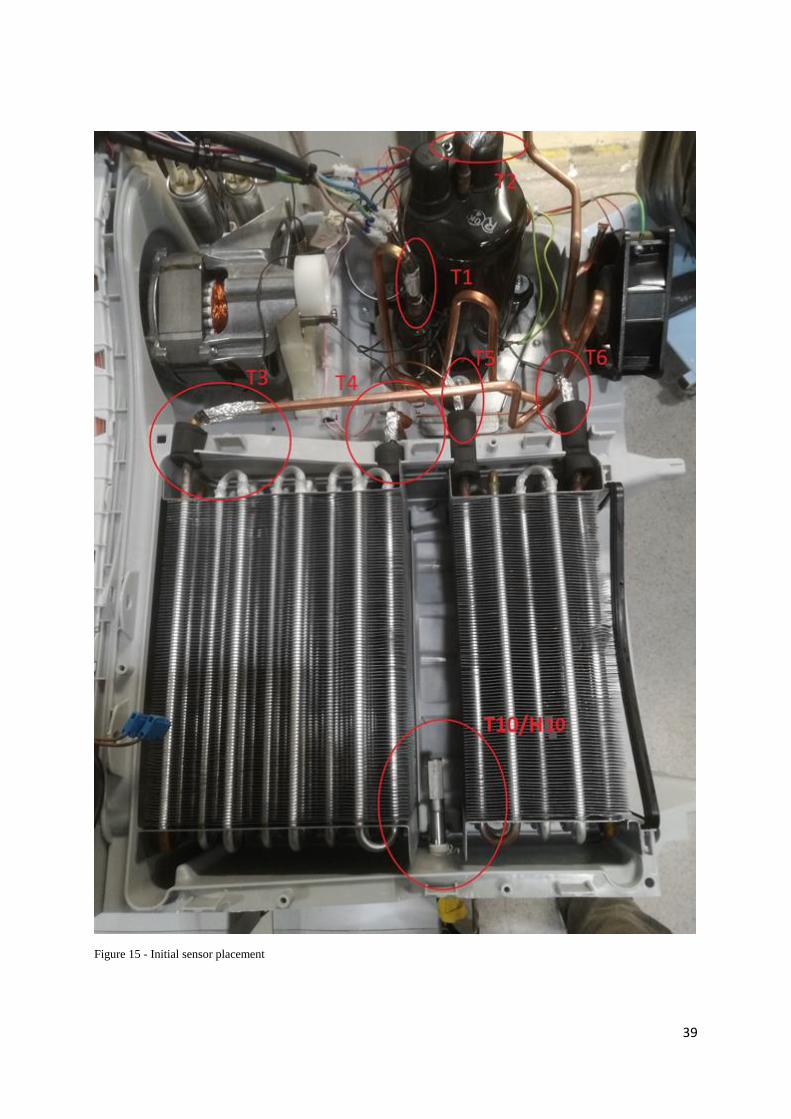
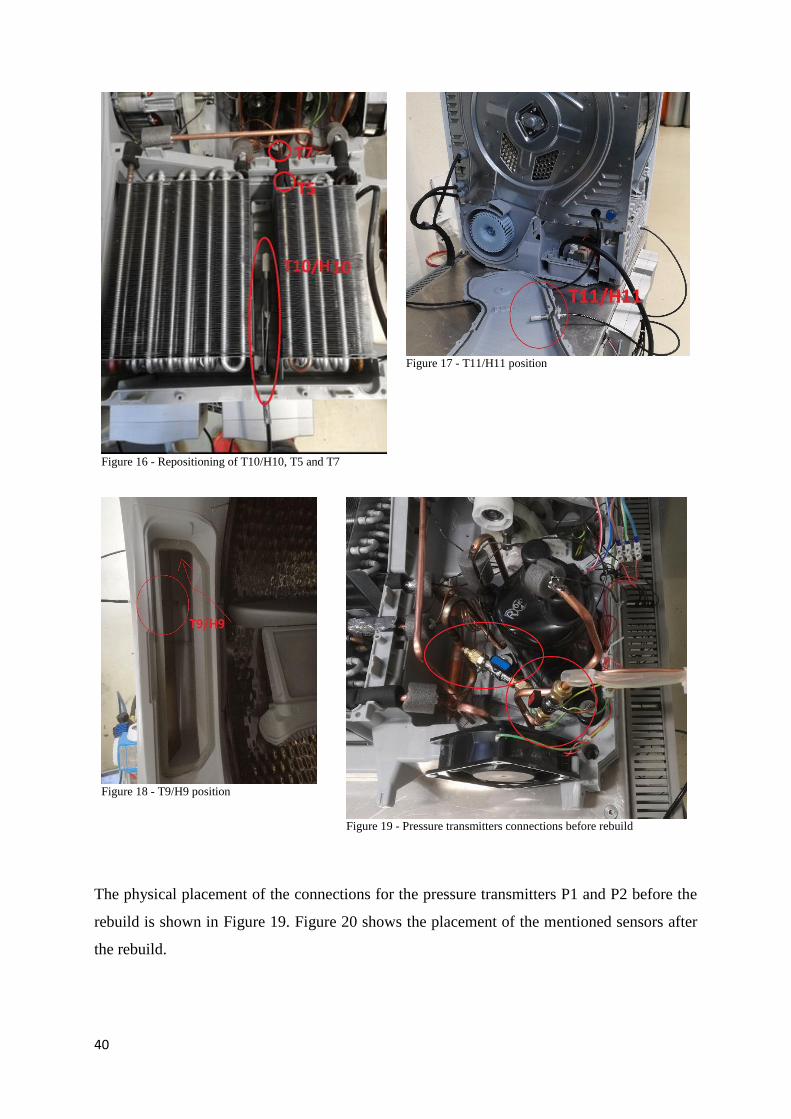
Figure 15 shows the physical position of sensors T1-T6, and T10/H10 before repositioning,
while Figure 16 show the repositioned sensors including T7. The remaining sensors are placed
in components that were dismantled to access the evaporator and condenser. The placement of
T11/H11 were not altered and are seen in Figure 17. The dismantled cover witch the sensor is
mounted to mounts to the rear of the dryer, covering the exposed fan and drum inlet.
Figure 18 shows the final position of T9/H9 after repositioning. The arrow in the figure
indicates the previous position. The actual previous position are hidden by the plastic, and my
not be seen in the figure.
39
Figure 15 - Initial sensor placement
40
Figure 16 - Repositioning of T10/H10, T5 and T7
Figure 17 - T11/H11 position
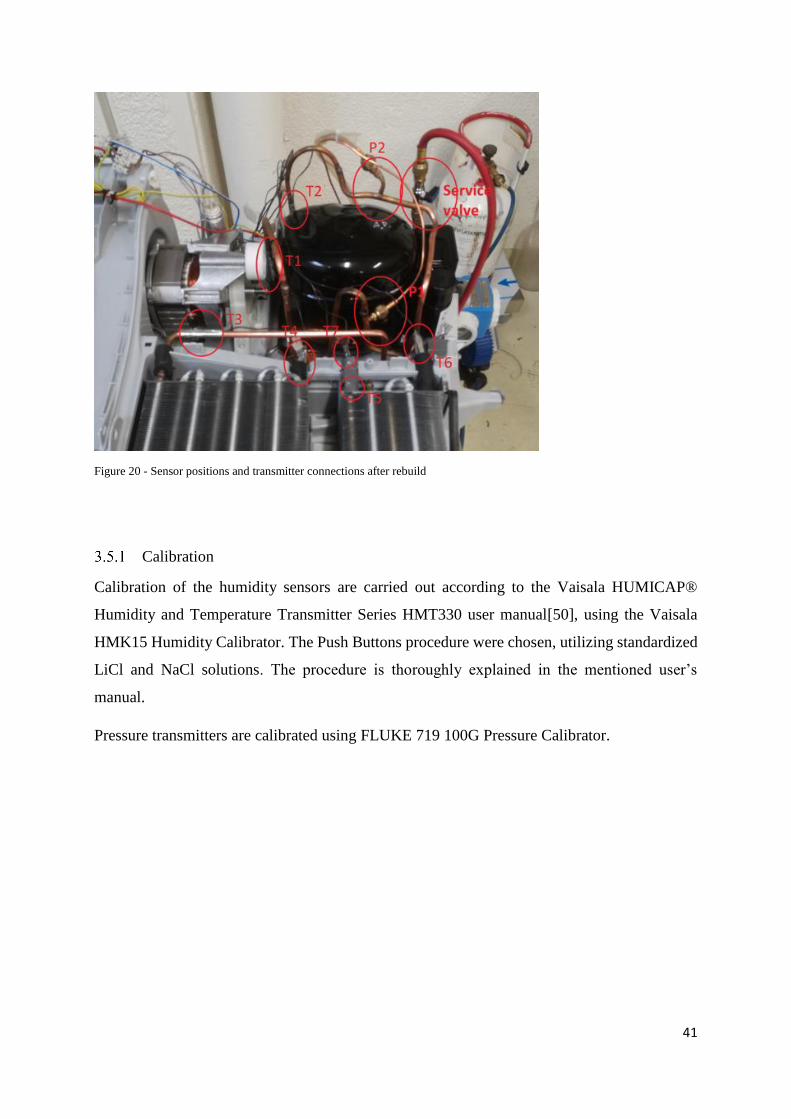
The physical placement of the connections for the pressure transmitters P1 and P2 before the
rebuild is shown in Figure 19. Figure 20 shows the placement of the mentioned sensors after
the rebuild.
Figure 18 - T9/H9 position
Figure 19 - Pressure transmitters connections before rebuild
41
Figure 20 - Sensor positions and transmitter connections after rebuild
Calibration
Calibration of the humidity sensors are carried out according to the Vaisala HUMICAP®
Humidity and Temperature Transmitter Series HMT330 user manual[50], using the Vaisala
HMK15 Humidity Calibrator. The Push Buttons procedure were chosen, utilizing standardized
LiCl and NaCl solutions. The procedure is thoroughly explained in the mentioned user’s
manual.
Pressure transmitters are calibrated using FLUKE 719 100G Pressure Calibrator.
42
3.6 Data processing
Data acquired during experiments are processed in order to calculate relevant parameters that
can not be measured directly.
Calculation of absolute humidity and mixing ratio
Humidity in air is often measured by a hygrometer measuring the relative humidity, i.e. the
portion of humidity in the air relative to the humidity of saturated air at the same temperature.
Proper post processing and discussion of collected data requires computerized calculation of
absolute humidity and mixing ratio from relative humidity measurements. The humidity
conversation formulas in the following paragraphs are published by VAISALA, the producer
of the hygrometers used in this thesis[51].
Relative humidity is defined by Equation 6, where RH is the relative humidity in percent, Pw is
the water vapor pressure and Pws is the water vapor saturation pressure.
6 ) 𝑅𝐻 =𝑃𝑤
𝑃𝑤𝑠∙ 100% [%]
Equation 6 may be rewritten to Equation 7, for calculation of Pw from Pws and RH.
7 ) 𝑃𝑤 = 𝑃𝑤𝑠 ∙𝑅𝐻
100%
Within the limited temperature range that is relevant to this thesis, the water vapor saturation
pressure (Pws) may be calculated from Equation 8. A, G and Tn are constants found in Table 10,
while t is the temperature in degrees Celsius.
8 ) 𝑃𝑤𝑠 = 𝐴 ∙ 10(
𝐺∙𝑇𝑇+𝑇𝑛
)∙ 102 [𝑃𝑎]
43
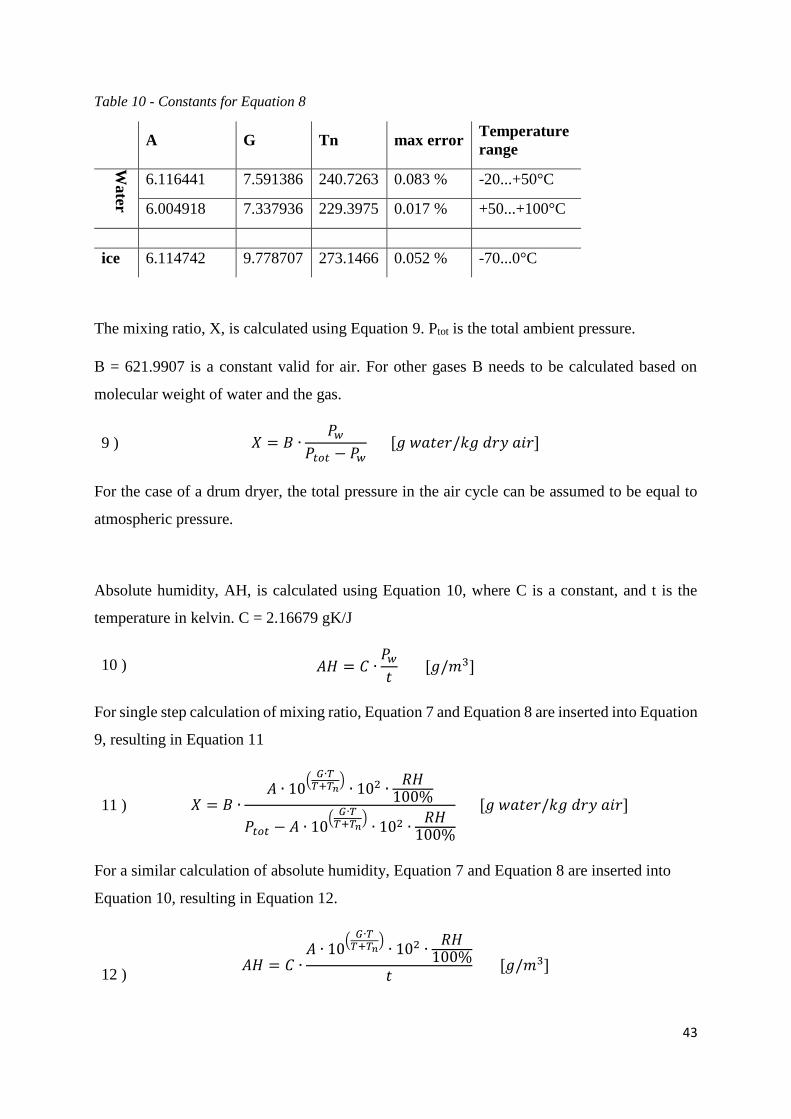
Table 10 - Constants for Equation 8
A G Tn max error Temperature
range
Water
6.116441 7.591386 240.7263 0.083 % -20...+50°C
6.004918 7.337936 229.3975 0.017 % +50...+100°C
ice 6.114742 9.778707 273.1466 0.052 % -70...0°C
The mixing ratio, X, is calculated using Equation 9. Ptot is the total ambient pressure.
B = 621.9907 is a constant valid for air. For other gases B needs to be calculated based on
molecular weight of water and the gas.
9 ) 𝑋 = 𝐵 ∙𝑃𝑤
𝑃𝑡𝑜𝑡 − 𝑃𝑤 [𝑔 𝑤𝑎𝑡𝑒𝑟/𝑘𝑔 𝑑𝑟𝑦 𝑎𝑖𝑟]
For the case of a drum dryer, the total pressure in the air cycle can be assumed to be equal to
atmospheric pressure.
Absolute humidity, AH, is calculated using Equation 10, where C is a constant, and t is the
temperature in kelvin. C = 2.16679 gK/J
10 ) 𝐴𝐻 = 𝐶 ∙𝑃𝑤
𝑡 [𝑔/𝑚3]
For single step calculation of mixing ratio, Equation 7 and Equation 8 are inserted into Equation
9, resulting in Equation 11
11 ) 𝑋 = 𝐵 ∙𝐴 ∙ 10
(𝐺∙𝑇
𝑇+𝑇𝑛)
∙ 102 ∙𝑅𝐻
100%
𝑃𝑡𝑜𝑡 − 𝐴 ∙ 10(
𝐺∙𝑇𝑇+𝑇𝑛
)∙ 102 ∙
𝑅𝐻100%
[𝑔 𝑤𝑎𝑡𝑒𝑟/𝑘𝑔 𝑑𝑟𝑦 𝑎𝑖𝑟]
For a similar calculation of absolute humidity, Equation 7 and Equation 8 are inserted into
Equation 10, resulting in Equation 12.
12 ) 𝐴𝐻 = 𝐶 ∙
𝐴 ∙ 10(
𝐺∙𝑇𝑇+𝑇𝑛
)∙ 102 ∙
𝑅𝐻100%
𝑡 [𝑔/𝑚3]
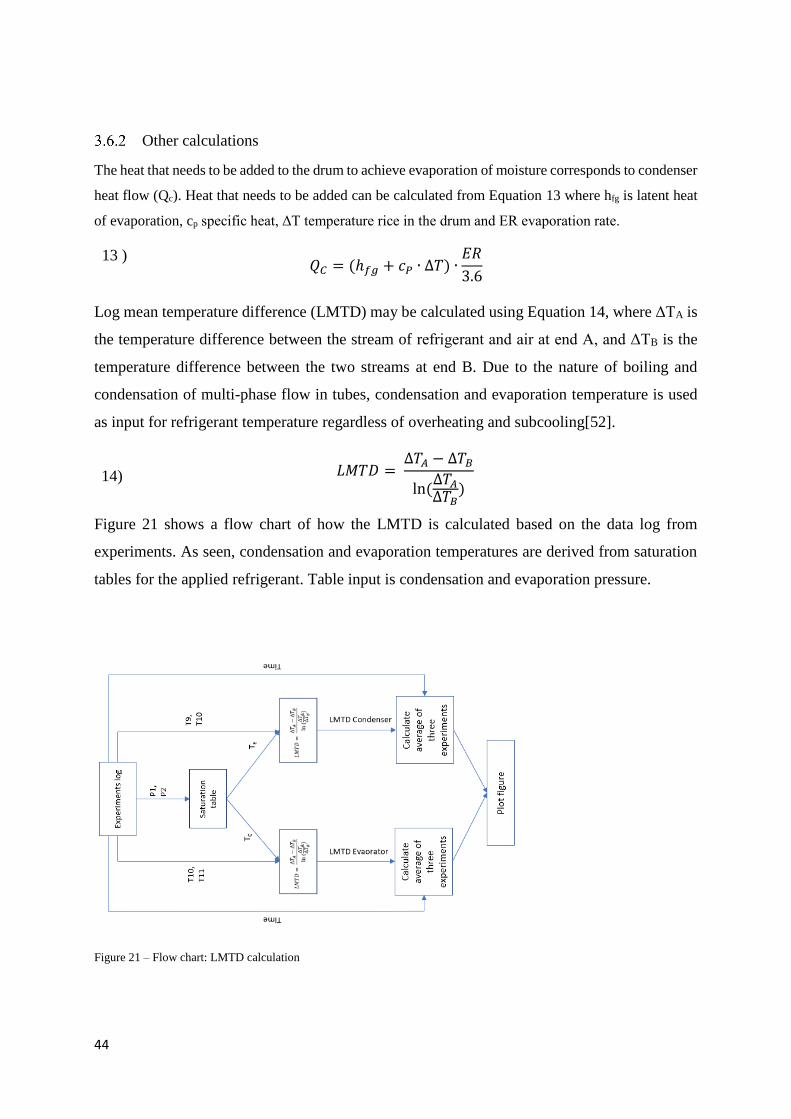
44
Other calculations
The heat that needs to be added to the drum to achieve evaporation of moisture corresponds to condenser
heat flow (Qc). Heat that needs to be added can be calculated from Equation 13 where hfg is latent heat
of evaporation, cp specific heat, ΔT temperature rice in the drum and ER evaporation rate.
13 ) 𝑄𝐶 = (ℎ𝑓𝑔 + 𝑐𝑃 ∙ ∆𝑇) ∙
𝐸𝑅
3.6
Log mean temperature difference (LMTD) may be calculated using Equation 14, where ΔTA is
the temperature difference between the stream of refrigerant and air at end A, and ΔTB is the
temperature difference between the two streams at end B. Due to the nature of boiling and
condensation of multi-phase flow in tubes, condensation and evaporation temperature is used
as input for refrigerant temperature regardless of overheating and subcooling[52].
14) 𝐿𝑀𝑇𝐷 = ∆𝑇𝐴 − ∆𝑇𝐵
ln (∆𝑇𝐴
∆𝑇𝐵)
Figure 21 shows a flow chart of how the LMTD is calculated based on the data log from
experiments. As seen, condensation and evaporation temperatures are derived from saturation
tables for the applied refrigerant. Table input is condensation and evaporation pressure.
Figure 21 – Flow chart: LMTD calculation
45
The instantaneous Coefficient of performance (COPH) for the heat pump may be calculated
from measurements using Equation 15. COPH annotates that COP relative to heating duty is
used. Qc is evaporator heat transfer rate, Pel, compressor the electric power input to the compressor
motor, h2, real the tabulated enthalpy at the compressor outlet, h4, real the tabulated enthalpy at the
condenser outlet and mrefrigerant the mass-flow of refrigerant.
15)
𝐶𝑂𝑃𝐻 =𝑄𝑒
𝑃𝑒𝑙,𝑐𝑜𝑚𝑝𝑟𝑒𝑠𝑠𝑜𝑟=
ℎ2,𝑟𝑒𝑎𝑙 − ℎ4,𝑟𝑒𝑎𝑙
𝑃𝑒𝑙,𝑐𝑜𝑚𝑝𝑟𝑒𝑠𝑠𝑜𝑟
𝑚𝑟𝑒𝑓𝑟𝑖𝑔𝑒𝑟𝑎𝑛𝑡
Total compressor efficiency is calculated using Equation 16. Wis is the amount of work
necessary assuming isentropic compression, Eel is the real electric energy input to the
compressor motor, h2,isentropic is the enthalpy after compression assuming isentropic
compression, h1,real is the real enthalpy at the compressor inlet, h2, adiabatic is the enthalpy after
compression assuming real adiabatic compression,
16) 𝜂𝑐𝑜𝑚𝑝𝑟𝑒𝑠𝑠𝑜𝑟 =𝑊𝑖𝑠
𝐸𝑒𝑙=
ℎ2,𝑖𝑠𝑒𝑛𝑡𝑟𝑜𝑝𝑖𝑐 − ℎ1,𝑟𝑒𝑎𝑙
ℎ2,𝑎𝑑𝑖𝑎𝑏𝑎𝑡𝑖𝑐 − ℎ1,𝑟𝑒𝑎𝑙=
ℎ2,𝑖𝑠𝑒𝑛𝑡𝑟𝑜𝑝𝑖𝑐 − ℎ1,𝑟𝑒𝑎𝑙
𝑃𝑒𝑙,𝑐𝑜𝑚𝑝𝑟𝑒𝑠𝑠𝑜𝑟
��𝑟𝑒𝑓𝑟𝑖𝑔𝑒𝑟𝑎𝑛𝑡
Calculating h2,isentropic is done using P-t and P-s tables for the applied refrigerant. The steps are
shown in Figure 22.
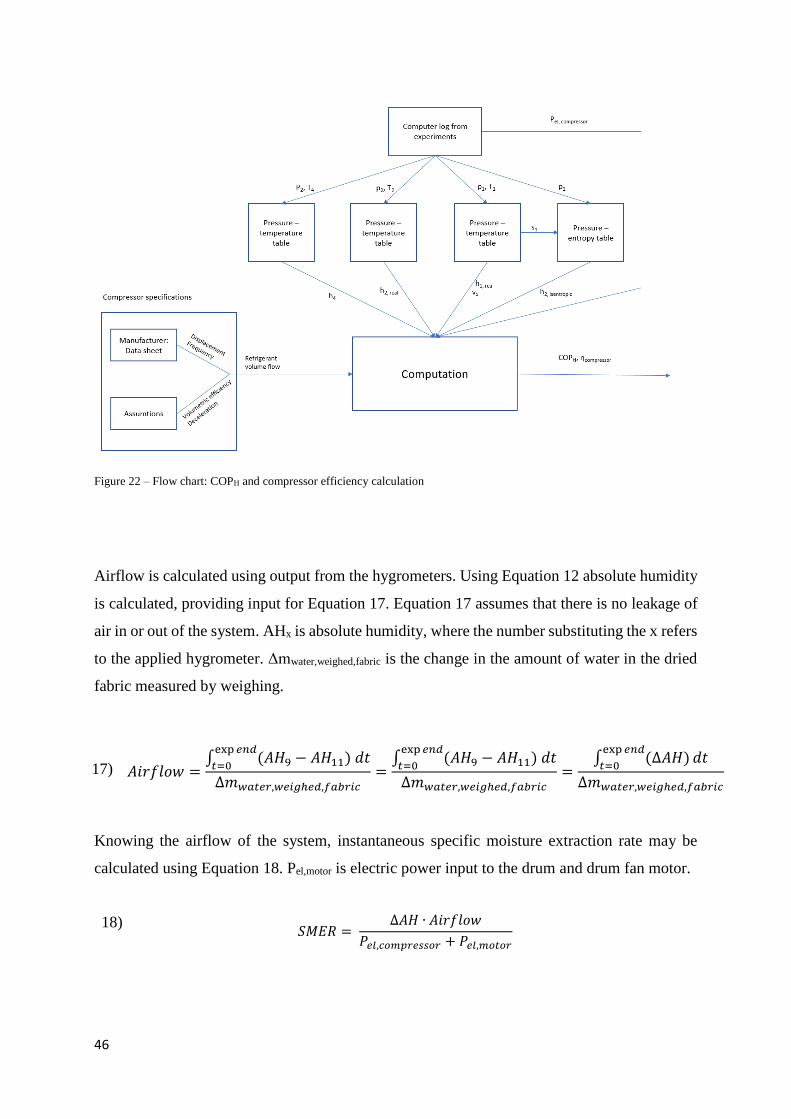
46
Figure 22 – Flow chart: COPH and compressor efficiency calculation
Airflow is calculated using output from the hygrometers. Using Equation 12 absolute humidity
is calculated, providing input for Equation 17. Equation 17 assumes that there is no leakage of
air in or out of the system. AHx is absolute humidity, where the number substituting the x refers
to the applied hygrometer. Δmwater,weighed,fabric is the change in the amount of water in the dried
fabric measured by weighing.
17) 𝐴𝑖𝑟𝑓𝑙𝑜𝑤 =∫ (𝐴𝐻9 − 𝐴𝐻11) 𝑑𝑡
exp 𝑒𝑛𝑑
𝑡=0
∆𝑚𝑤𝑎𝑡𝑒𝑟,𝑤𝑒𝑖𝑔ℎ𝑒𝑑,𝑓𝑎𝑏𝑟𝑖𝑐=
∫ (𝐴𝐻9 − 𝐴𝐻11) 𝑑𝑡exp 𝑒𝑛𝑑
𝑡=0
∆𝑚𝑤𝑎𝑡𝑒𝑟,𝑤𝑒𝑖𝑔ℎ𝑒𝑑,𝑓𝑎𝑏𝑟𝑖𝑐=
∫ (∆𝐴𝐻)exp 𝑒𝑛𝑑
𝑡=0𝑑𝑡
∆𝑚𝑤𝑎𝑡𝑒𝑟,𝑤𝑒𝑖𝑔ℎ𝑒𝑑,𝑓𝑎𝑏𝑟𝑖𝑐
Knowing the airflow of the system, instantaneous specific moisture extraction rate may be
calculated using Equation 18. Pel,motor is electric power input to the drum and drum fan motor.
18) 𝑆𝑀𝐸𝑅 =
∆𝐴𝐻 ∙ 𝐴𝑖𝑟𝑓𝑙𝑜𝑤
𝑃𝑒𝑙,𝑐𝑜𝑚𝑝𝑟𝑒𝑠𝑠𝑜𝑟 + 𝑃𝑒𝑙,𝑚𝑜𝑡𝑜𝑟
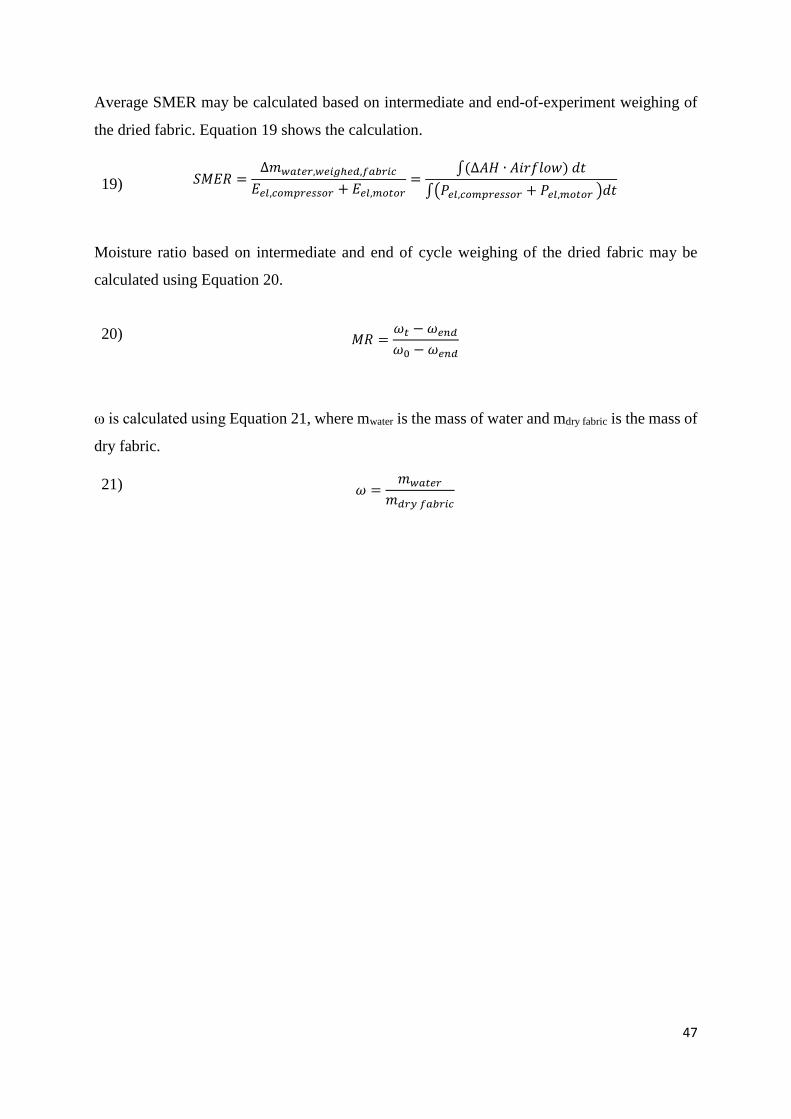
47
Average SMER may be calculated based on intermediate and end-of-experiment weighing of
the dried fabric. Equation 19 shows the calculation.
19) 𝑆𝑀𝐸𝑅 =∆𝑚𝑤𝑎𝑡𝑒𝑟,𝑤𝑒𝑖𝑔ℎ𝑒𝑑,𝑓𝑎𝑏𝑟𝑖𝑐
𝐸𝑒𝑙,𝑐𝑜𝑚𝑝𝑟𝑒𝑠𝑠𝑜𝑟 + 𝐸𝑒𝑙,𝑚𝑜𝑡𝑜𝑟=
∫(∆𝐴𝐻 ∙ 𝐴𝑖𝑟𝑓𝑙𝑜𝑤) 𝑑𝑡
∫(𝑃𝑒𝑙,𝑐𝑜𝑚𝑝𝑟𝑒𝑠𝑠𝑜𝑟 + 𝑃𝑒𝑙,𝑚𝑜𝑡𝑜𝑟 )𝑑𝑡
Moisture ratio based on intermediate and end of cycle weighing of the dried fabric may be
calculated using Equation 20.
20) 𝑀𝑅 =𝜔𝑡 − 𝜔𝑒𝑛𝑑
𝜔0 − 𝜔𝑒𝑛𝑑
ω is calculated using Equation 21, where mwater is the mass of water and mdry fabric is the mass of
dry fabric.
21) 𝜔 =𝑚𝑤𝑎𝑡𝑒𝑟
𝑚𝑑𝑟𝑦 𝑓𝑎𝑏𝑟𝑖𝑐

48
4 Experiments A series of experiments has been performed during the fall of 2017 and the spring of 2018. The
results are presented in this chapter, along with evaluation of the presented results. To avoid
confusing, the terms DC-COP and DC-SMER is introduced. The terms refers to the average
COP and SMER throughout one drying cycle according to setup 1 defined in Section 3.3.
Superior values of DC-COP and DC-SMER will define the best performing refrigerant at this
duty. Average COP and average SMER is used regarding the average values of repetitive
experiments.
4.1 Overview
Table 11 shows an overview of valid experiments providing the data for the evaluation of the
system.
A large quantity of experiments has been performed to investigate system behavior and to check
for errors, leaks and instabilities. The results of these experiments are not satisfactory accurate
and reliable to be included as data for this thesis, and are not mentioned in the table. A complete
list of experiments is found in Appendix B.
COP calculation relies on data from the pressure transmitters, hence COP is not calculated for
experiments performed prior the pressure transmitter installation. SMER listed is the table is
calculated from the weight of the fabric before and after drying, and the measured power
consumption. Experiments according to setup 2 is performed with intermediate weighing of the
fabric. SMER in these experiments are influence by the repetitive shutdown and startups and
are not therefor not listed in Table 11. In reference to the table, the “Original” capillary tube is
78.5cm with an internal diameter of 1.00mm. Note that the table lists the experiments
chronologically based on when they are performed. Repetitive experiments on the same charge
level is therefore not necessarily listed in subsequent order.
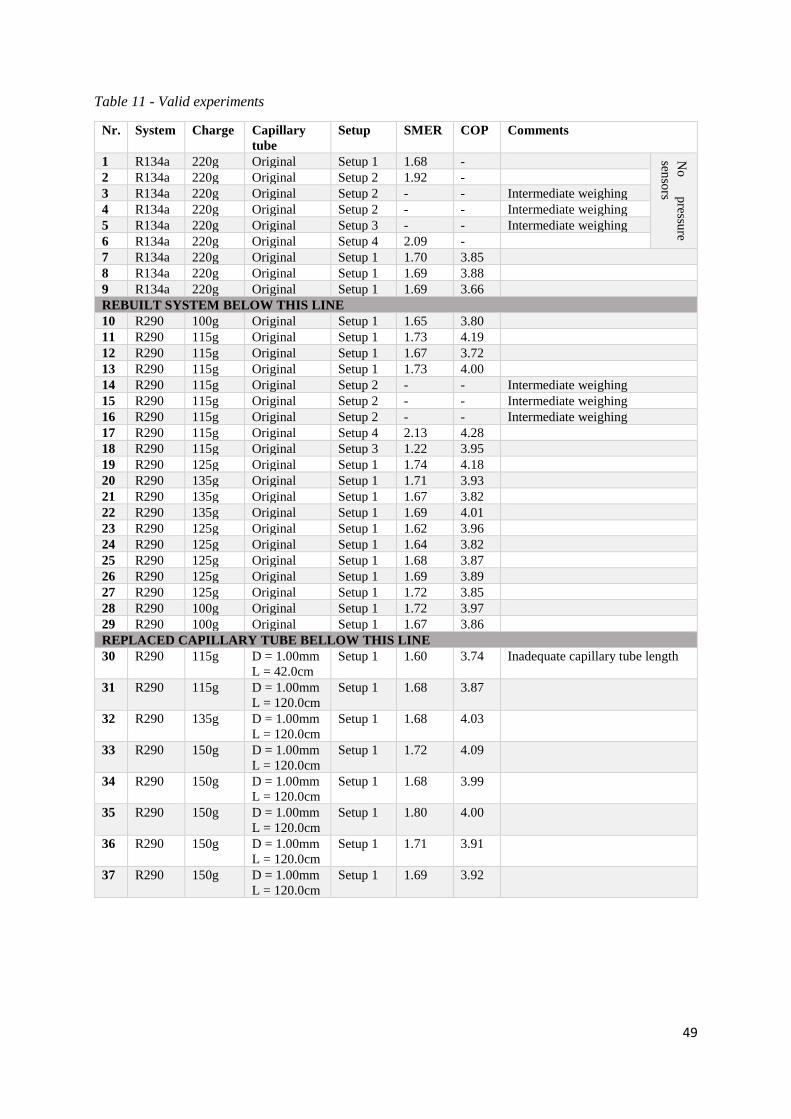
49
Table 11 - Valid experiments
Nr. System Charge Capillary
tube
Setup SMER COP Comments
1 R134a 220g Original Setup 1 1.68 - No
p
ressure
senso
rs
2 R134a 220g Original Setup 2 1.92 -
3 R134a 220g Original Setup 2 - - Intermediate weighing
4 R134a 220g Original Setup 2 - - Intermediate weighing
5 R134a 220g Original Setup 3 - - Intermediate weighing
6 R134a 220g Original Setup 4 2.09 -
7 R134a 220g Original Setup 1 1.70 3.85
8 R134a 220g Original Setup 1 1.69 3.88
9 R134a 220g Original Setup 1 1.69 3.66
REBUILT SYSTEM BELOW THIS LINE
10 R290 100g Original Setup 1 1.65 3.80
11 R290 115g Original Setup 1 1.73 4.19
12 R290 115g Original Setup 1 1.67 3.72
13 R290 115g Original Setup 1 1.73 4.00
14 R290 115g Original Setup 2 - - Intermediate weighing
15 R290 115g Original Setup 2 - - Intermediate weighing
16 R290 115g Original Setup 2 - - Intermediate weighing
17 R290 115g Original Setup 4 2.13 4.28
18 R290 115g Original Setup 3 1.22 3.95
19 R290 125g Original Setup 1 1.74 4.18
20 R290 135g Original Setup 1 1.71 3.93
21 R290 135g Original Setup 1 1.67 3.82
22 R290 135g Original Setup 1 1.69 4.01
23 R290 125g Original Setup 1 1.62 3.96
24 R290 125g Original Setup 1 1.64 3.82
25 R290 125g Original Setup 1 1.68 3.87
26 R290 125g Original Setup 1 1.69 3.89
27 R290 125g Original Setup 1 1.72 3.85
28 R290 100g Original Setup 1 1.72 3.97
29 R290 100g Original Setup 1 1.67 3.86
REPLACED CAPILLARY TUBE BELLOW THIS LINE
30 R290 115g D = 1.00mm
L = 42.0cm
Setup 1 1.60 3.74 Inadequate capillary tube length
31 R290 115g D = 1.00mm
L = 120.0cm
Setup 1 1.68 3.87
32 R290 135g D = 1.00mm
L = 120.0cm
Setup 1 1.68 4.03
33 R290 150g D = 1.00mm
L = 120.0cm
Setup 1 1.72 4.09
34 R290 150g D = 1.00mm
L = 120.0cm
Setup 1 1.68 3.99
35 R290 150g D = 1.00mm
L = 120.0cm
Setup 1 1.80 4.00
36 R290 150g D = 1.00mm
L = 120.0cm
Setup 1 1.71 3.91
37 R290 150g D = 1.00mm
L = 120.0cm
Setup 1 1.69 3.92
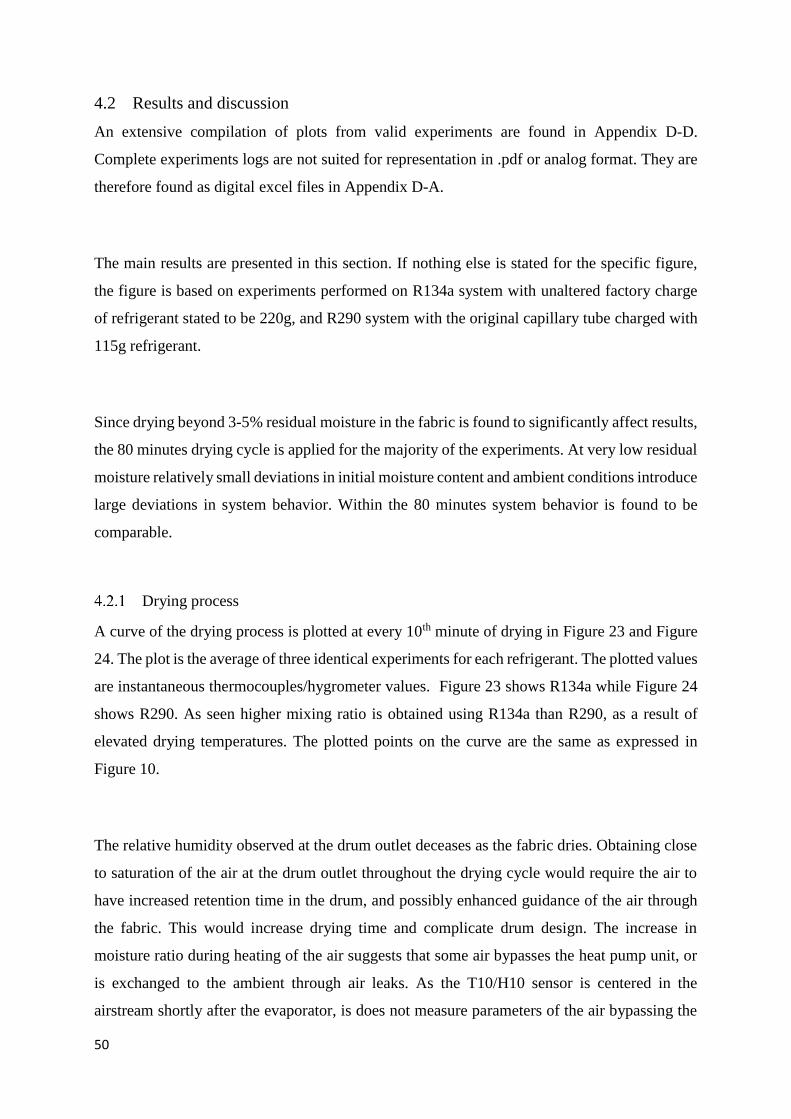
50
4.2 Results and discussion
An extensive compilation of plots from valid experiments are found in Appendix D-D.
Complete experiments logs are not suited for representation in .pdf or analog format. They are
therefore found as digital excel files in Appendix D-A.
The main results are presented in this section. If nothing else is stated for the specific figure,
the figure is based on experiments performed on R134a system with unaltered factory charge
of refrigerant stated to be 220g, and R290 system with the original capillary tube charged with
115g refrigerant.
Since drying beyond 3-5% residual moisture in the fabric is found to significantly affect results,
the 80 minutes drying cycle is applied for the majority of the experiments. At very low residual
moisture relatively small deviations in initial moisture content and ambient conditions introduce
large deviations in system behavior. Within the 80 minutes system behavior is found to be
comparable.
Drying process
A curve of the drying process is plotted at every 10th minute of drying in Figure 23 and Figure
24. The plot is the average of three identical experiments for each refrigerant. The plotted values
are instantaneous thermocouples/hygrometer values. Figure 23 shows R134a while Figure 24
shows R290. As seen higher mixing ratio is obtained using R134a than R290, as a result of
elevated drying temperatures. The plotted points on the curve are the same as expressed in
Figure 10.
The relative humidity observed at the drum outlet deceases as the fabric dries. Obtaining close
to saturation of the air at the drum outlet throughout the drying cycle would require the air to
have increased retention time in the drum, and possibly enhanced guidance of the air through
the fabric. This would increase drying time and complicate drum design. The increase in
moisture ratio during heating of the air suggests that some air bypasses the heat pump unit, or
is exchanged to the ambient through air leaks. As the T10/H10 sensor is centered in the
airstream shortly after the evaporator, is does not measure parameters of the air bypassing the
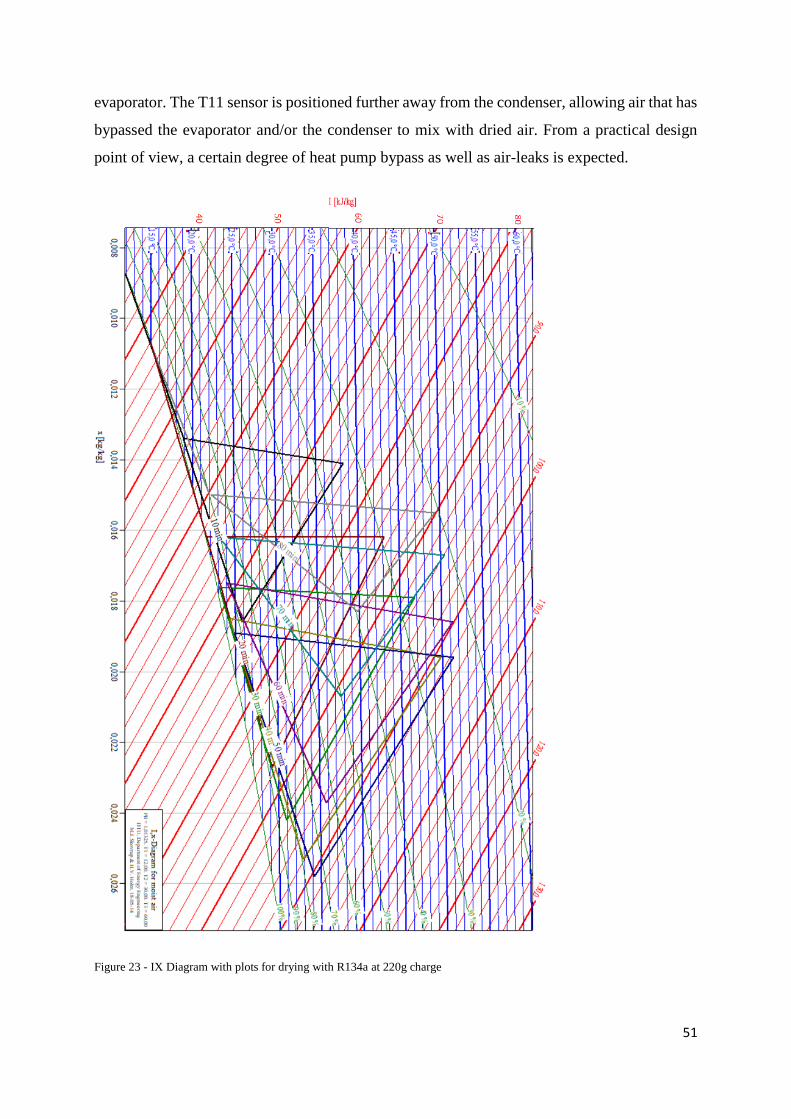
51
evaporator. The T11 sensor is positioned further away from the condenser, allowing air that has
bypassed the evaporator and/or the condenser to mix with dried air. From a practical design
point of view, a certain degree of heat pump bypass as well as air-leaks is expected.
Figure 23 - IX Diagram with plots for drying with R134a at 220g charge
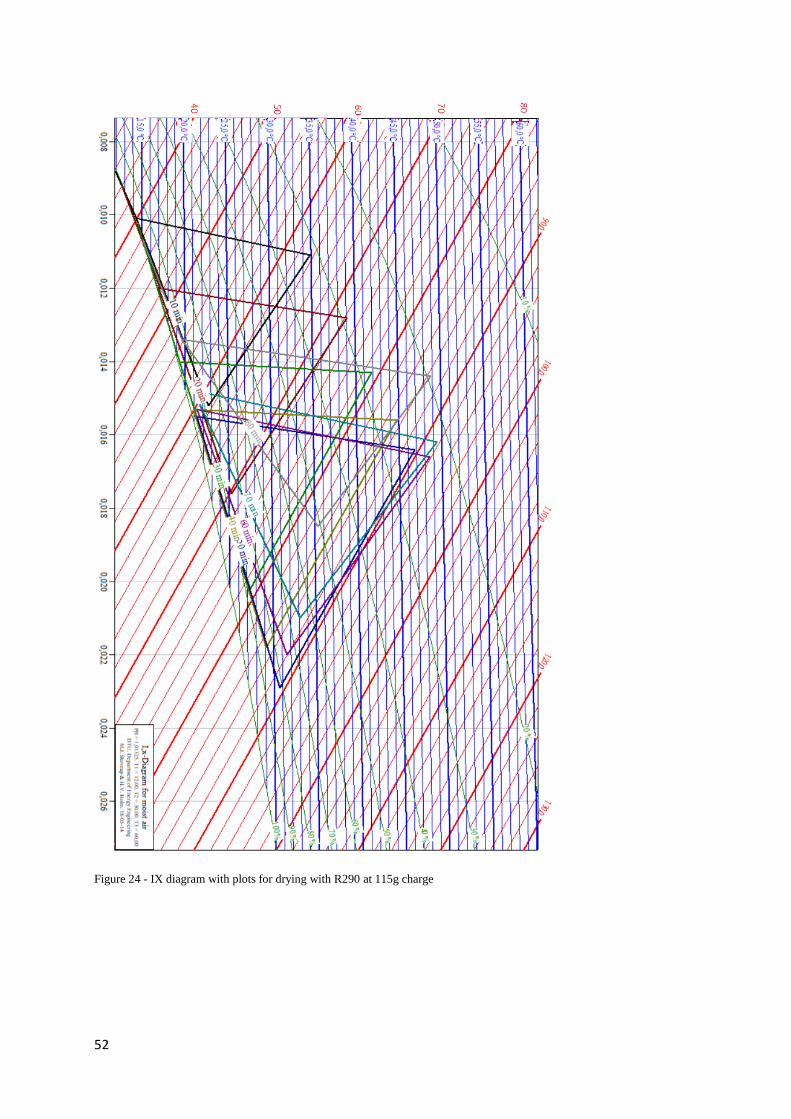
52
Figure 24 - IX diagram with plots for drying with R290 at 115g charge
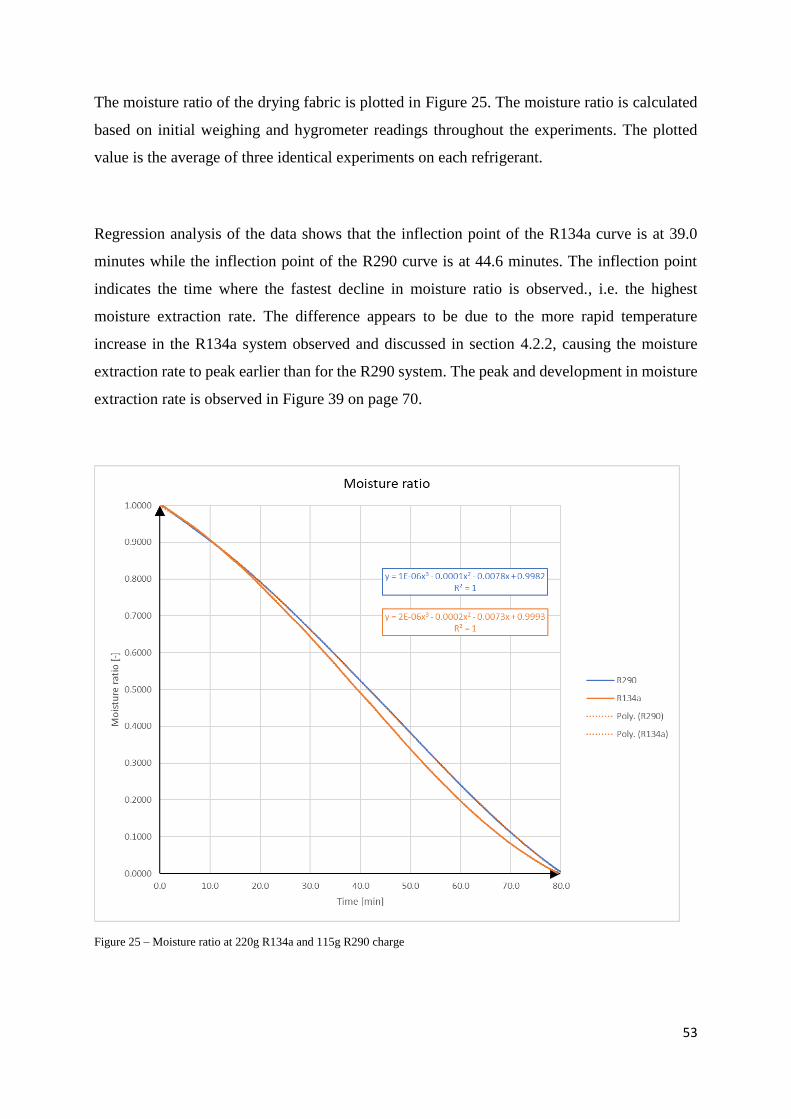
53
The moisture ratio of the drying fabric is plotted in Figure 25. The moisture ratio is calculated
based on initial weighing and hygrometer readings throughout the experiments. The plotted
value is the average of three identical experiments on each refrigerant.
Regression analysis of the data shows that the inflection point of the R134a curve is at 39.0
minutes while the inflection point of the R290 curve is at 44.6 minutes. The inflection point
indicates the time where the fastest decline in moisture ratio is observed., i.e. the highest
moisture extraction rate. The difference appears to be due to the more rapid temperature
increase in the R134a system observed and discussed in section 4.2.2, causing the moisture
extraction rate to peak earlier than for the R290 system. The peak and development in moisture
extraction rate is observed in Figure 39 on page 70.
Figure 25 – Moisture ratio at 220g R134a and 115g R290 charge
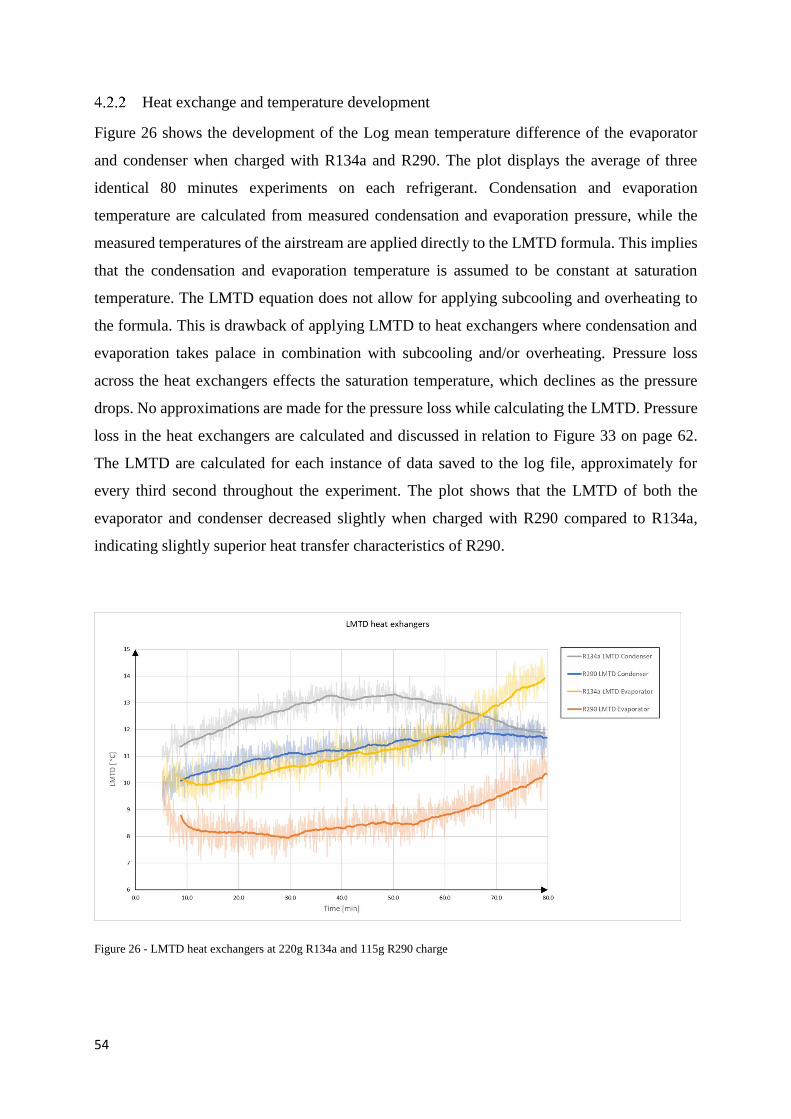
54
Heat exchange and temperature development
Figure 26 shows the development of the Log mean temperature difference of the evaporator
and condenser when charged with R134a and R290. The plot displays the average of three
identical 80 minutes experiments on each refrigerant. Condensation and evaporation
temperature are calculated from measured condensation and evaporation pressure, while the
measured temperatures of the airstream are applied directly to the LMTD formula. This implies
that the condensation and evaporation temperature is assumed to be constant at saturation
temperature. The LMTD equation does not allow for applying subcooling and overheating to
the formula. This is drawback of applying LMTD to heat exchangers where condensation and
evaporation takes palace in combination with subcooling and/or overheating. Pressure loss
across the heat exchangers effects the saturation temperature, which declines as the pressure
drops. No approximations are made for the pressure loss while calculating the LMTD. Pressure
loss in the heat exchangers are calculated and discussed in relation to Figure 33 on page 62.
The LMTD are calculated for each instance of data saved to the log file, approximately for
every third second throughout the experiment. The plot shows that the LMTD of both the
evaporator and condenser decreased slightly when charged with R290 compared to R134a,
indicating slightly superior heat transfer characteristics of R290.
Figure 26 - LMTD heat exchangers at 220g R134a and 115g R290 charge
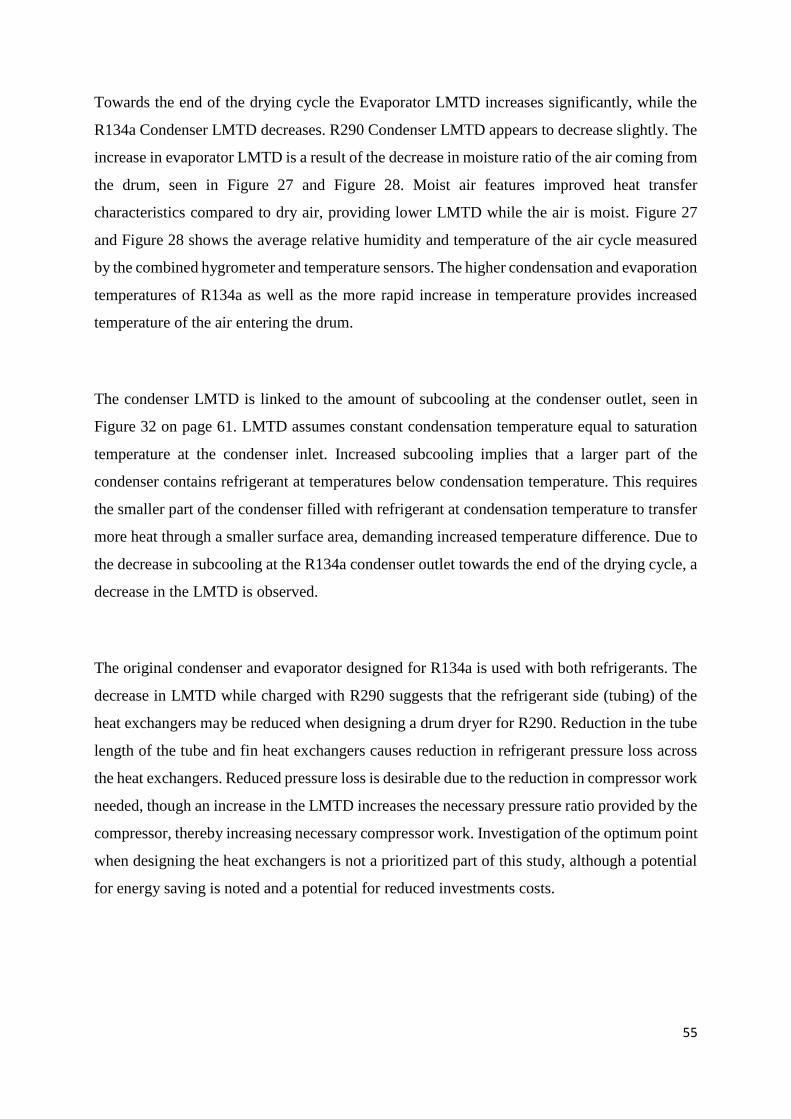
55
Towards the end of the drying cycle the Evaporator LMTD increases significantly, while the
R134a Condenser LMTD decreases. R290 Condenser LMTD appears to decrease slightly. The
increase in evaporator LMTD is a result of the decrease in moisture ratio of the air coming from
the drum, seen in Figure 27 and Figure 28. Moist air features improved heat transfer
characteristics compared to dry air, providing lower LMTD while the air is moist. Figure 27
and Figure 28 shows the average relative humidity and temperature of the air cycle measured
by the combined hygrometer and temperature sensors. The higher condensation and evaporation
temperatures of R134a as well as the more rapid increase in temperature provides increased
temperature of the air entering the drum.
The condenser LMTD is linked to the amount of subcooling at the condenser outlet, seen in
Figure 32 on page 61. LMTD assumes constant condensation temperature equal to saturation
temperature at the condenser inlet. Increased subcooling implies that a larger part of the
condenser contains refrigerant at temperatures below condensation temperature. This requires
the smaller part of the condenser filled with refrigerant at condensation temperature to transfer
more heat through a smaller surface area, demanding increased temperature difference. Due to
the decrease in subcooling at the R134a condenser outlet towards the end of the drying cycle, a
decrease in the LMTD is observed.
The original condenser and evaporator designed for R134a is used with both refrigerants. The
decrease in LMTD while charged with R290 suggests that the refrigerant side (tubing) of the
heat exchangers may be reduced when designing a drum dryer for R290. Reduction in the tube
length of the tube and fin heat exchangers causes reduction in refrigerant pressure loss across
the heat exchangers. Reduced pressure loss is desirable due to the reduction in compressor work
needed, though an increase in the LMTD increases the necessary pressure ratio provided by the
compressor, thereby increasing necessary compressor work. Investigation of the optimum point
when designing the heat exchangers is not a prioritized part of this study, although a potential
for energy saving is noted and a potential for reduced investments costs.
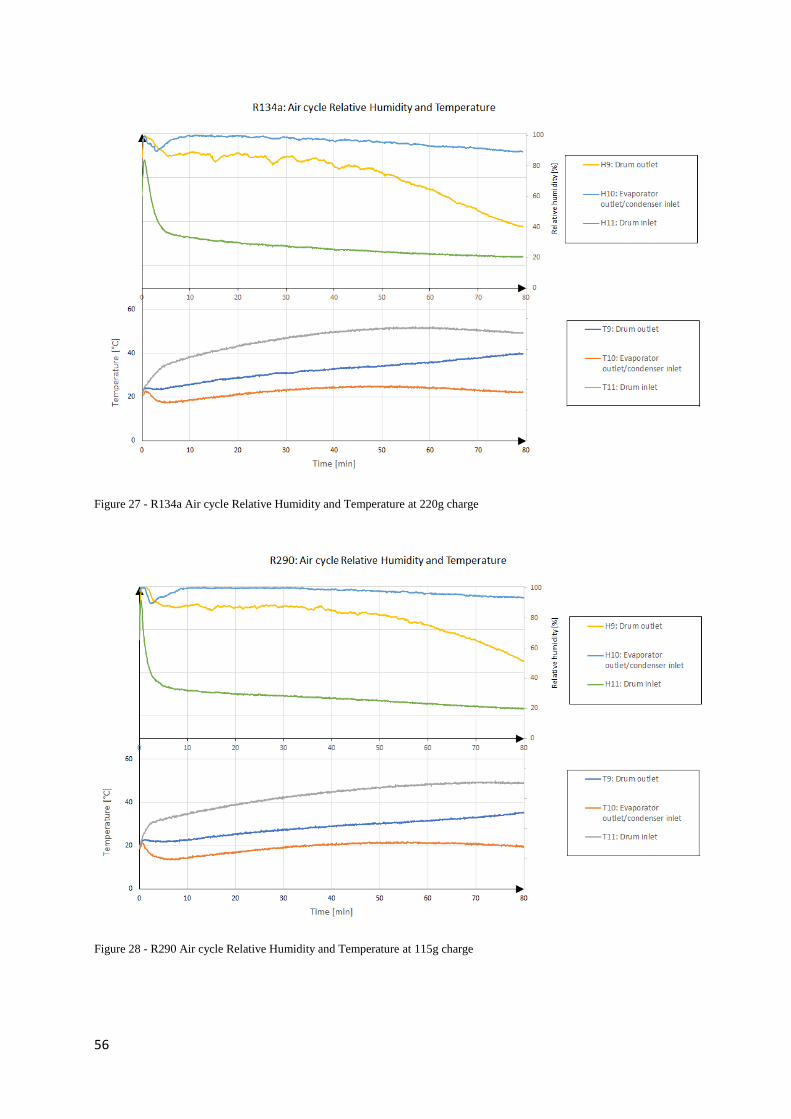
56
Figure 27 - R134a Air cycle Relative Humidity and Temperature at 220g charge
Figure 28 - R290 Air cycle Relative Humidity and Temperature at 115g charge
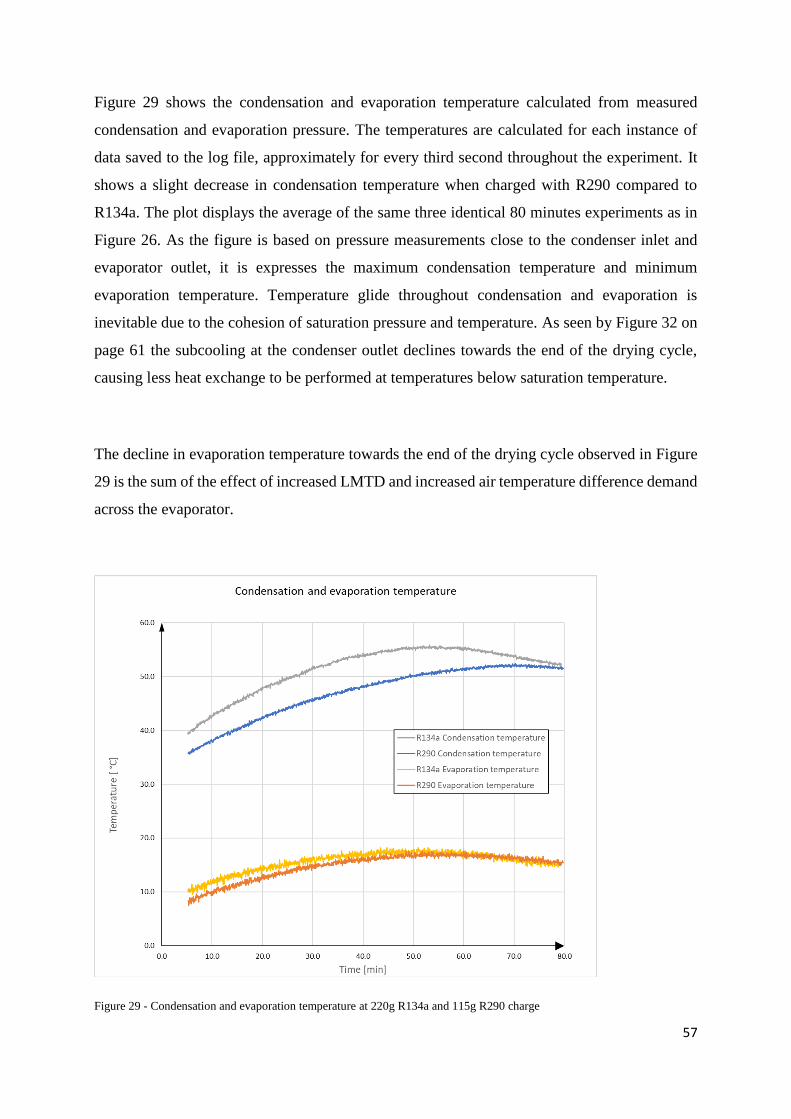
57
Figure 29 shows the condensation and evaporation temperature calculated from measured
condensation and evaporation pressure. The temperatures are calculated for each instance of
data saved to the log file, approximately for every third second throughout the experiment. It
shows a slight decrease in condensation temperature when charged with R290 compared to
R134a. The plot displays the average of the same three identical 80 minutes experiments as in
Figure 26. As the figure is based on pressure measurements close to the condenser inlet and
evaporator outlet, it is expresses the maximum condensation temperature and minimum
evaporation temperature. Temperature glide throughout condensation and evaporation is
inevitable due to the cohesion of saturation pressure and temperature. As seen by Figure 32 on
page 61 the subcooling at the condenser outlet declines towards the end of the drying cycle,
causing less heat exchange to be performed at temperatures below saturation temperature.
The decline in evaporation temperature towards the end of the drying cycle observed in Figure
29 is the sum of the effect of increased LMTD and increased air temperature difference demand
across the evaporator.
Figure 29 - Condensation and evaporation temperature at 220g R134a and 115g R290 charge
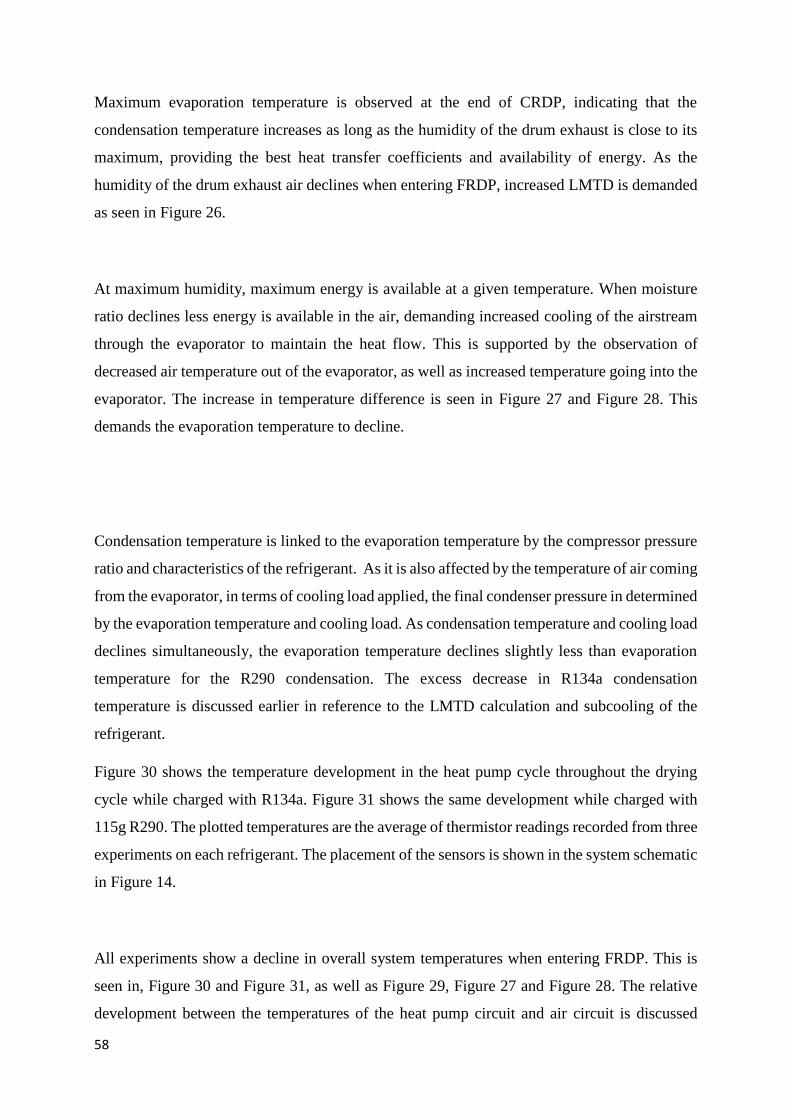
58
Maximum evaporation temperature is observed at the end of CRDP, indicating that the
condensation temperature increases as long as the humidity of the drum exhaust is close to its
maximum, providing the best heat transfer coefficients and availability of energy. As the
humidity of the drum exhaust air declines when entering FRDP, increased LMTD is demanded
as seen in Figure 26.
At maximum humidity, maximum energy is available at a given temperature. When moisture
ratio declines less energy is available in the air, demanding increased cooling of the airstream
through the evaporator to maintain the heat flow. This is supported by the observation of
decreased air temperature out of the evaporator, as well as increased temperature going into the
evaporator. The increase in temperature difference is seen in Figure 27 and Figure 28. This
demands the evaporation temperature to decline.
Condensation temperature is linked to the evaporation temperature by the compressor pressure
ratio and characteristics of the refrigerant. As it is also affected by the temperature of air coming
from the evaporator, in terms of cooling load applied, the final condenser pressure in determined
by the evaporation temperature and cooling load. As condensation temperature and cooling load
declines simultaneously, the evaporation temperature declines slightly less than evaporation
temperature for the R290 condensation. The excess decrease in R134a condensation
temperature is discussed earlier in reference to the LMTD calculation and subcooling of the
refrigerant.
Figure 30 shows the temperature development in the heat pump cycle throughout the drying
cycle while charged with R134a. Figure 31 shows the same development while charged with
115g R290. The plotted temperatures are the average of thermistor readings recorded from three
experiments on each refrigerant. The placement of the sensors is shown in the system schematic
in Figure 14.
All experiments show a decline in overall system temperatures when entering FRDP. This is
seen in, Figure 30 and Figure 31, as well as Figure 29, Figure 27 and Figure 28. The relative
development between the temperatures of the heat pump circuit and air circuit is discussed
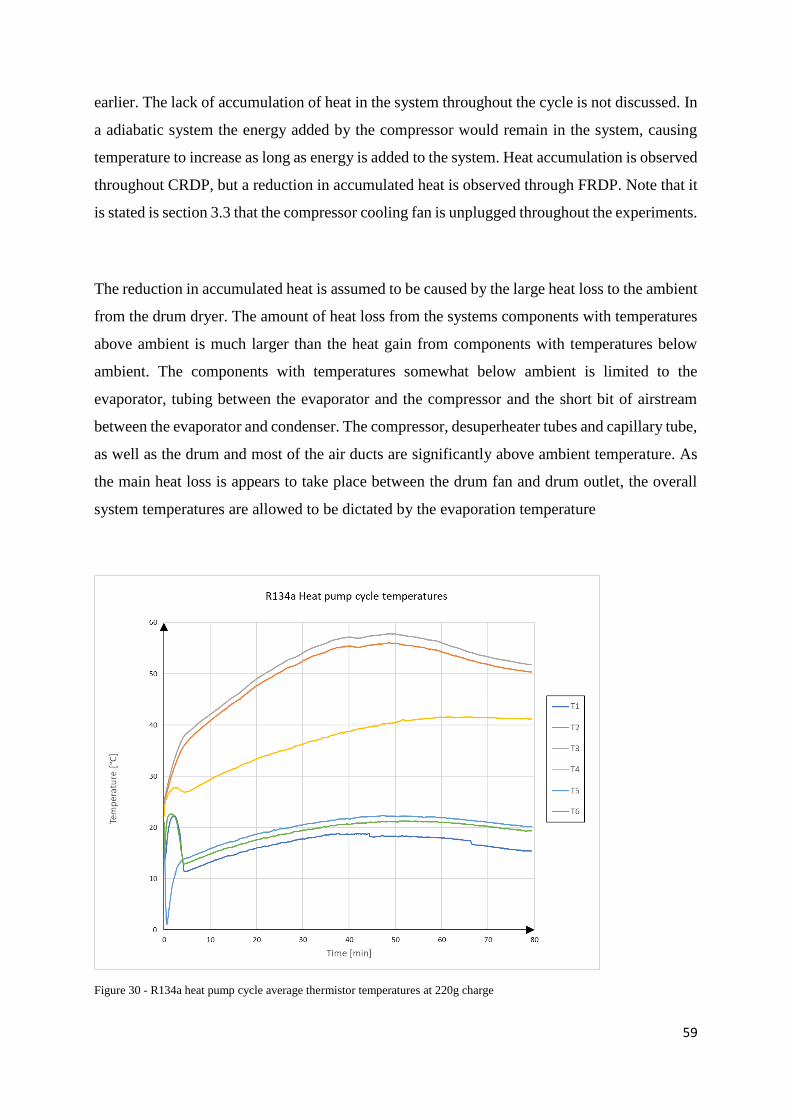
59
earlier. The lack of accumulation of heat in the system throughout the cycle is not discussed. In
a adiabatic system the energy added by the compressor would remain in the system, causing
temperature to increase as long as energy is added to the system. Heat accumulation is observed
throughout CRDP, but a reduction in accumulated heat is observed through FRDP. Note that it
is stated is section 3.3 that the compressor cooling fan is unplugged throughout the experiments.
The reduction in accumulated heat is assumed to be caused by the large heat loss to the ambient
from the drum dryer. The amount of heat loss from the systems components with temperatures
above ambient is much larger than the heat gain from components with temperatures below
ambient. The components with temperatures somewhat below ambient is limited to the
evaporator, tubing between the evaporator and the compressor and the short bit of airstream
between the evaporator and condenser. The compressor, desuperheater tubes and capillary tube,
as well as the drum and most of the air ducts are significantly above ambient temperature. As
the main heat loss is appears to take place between the drum fan and drum outlet, the overall
system temperatures are allowed to be dictated by the evaporation temperature
Figure 30 - R134a heat pump cycle average thermistor temperatures at 220g charge
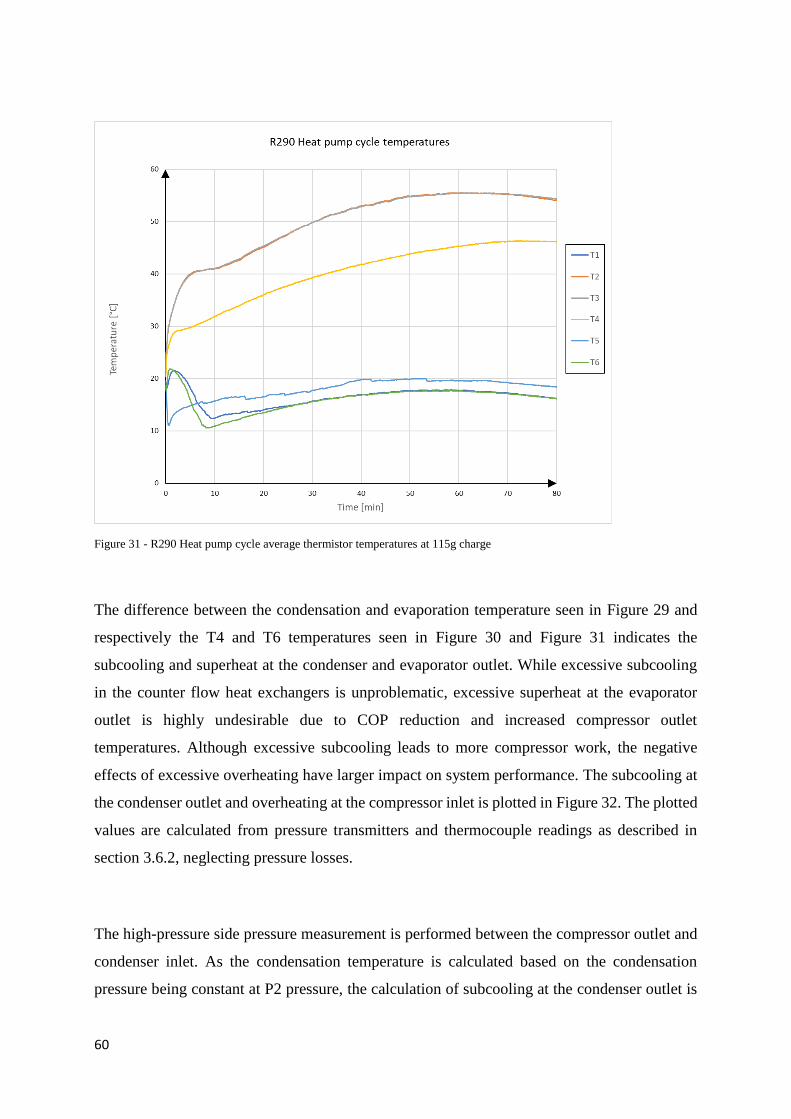
60
Figure 31 - R290 Heat pump cycle average thermistor temperatures at 115g charge
The difference between the condensation and evaporation temperature seen in Figure 29 and
respectively the T4 and T6 temperatures seen in Figure 30 and Figure 31 indicates the
subcooling and superheat at the condenser and evaporator outlet. While excessive subcooling
in the counter flow heat exchangers is unproblematic, excessive superheat at the evaporator
outlet is highly undesirable due to COP reduction and increased compressor outlet
temperatures. Although excessive subcooling leads to more compressor work, the negative
effects of excessive overheating have larger impact on system performance. The subcooling at
the condenser outlet and overheating at the compressor inlet is plotted in Figure 32. The plotted
values are calculated from pressure transmitters and thermocouple readings as described in
section 3.6.2, neglecting pressure losses.
The high-pressure side pressure measurement is performed between the compressor outlet and
condenser inlet. As the condensation temperature is calculated based on the condensation
pressure being constant at P2 pressure, the calculation of subcooling at the condenser outlet is
61
assumed to overpredict real subcooling. Maintaining overheating at the compressors cylinder
inlet valve is imperial to avoid destroying the compressor. Hermetic suction gas cooled
compressors are used in the drum dryer, providing additional overheating between the
compressor and cylinder inlet. This allows for operation at low overheating at the compressor
inlet.
Figure 32 - Subcooling at the condenser outlet and overheating at the evaporator outlet at 220g R134a and 115g R290 charge
Charge adjustment in order to obtain ideal superheating at the evaporator outlet and compressor
inlet after rebuilding is discussed in section 3.4 as well as in section 4.2.6. The development of
subcooling and overheating, as well as heat transfer and saturation temperatures are discussed
earlier in this chapter.
Observation that evaporator inlet temperature (T5) is higher than the evaporator outlet
temperature (T6) indicates significant pressure loss in the evaporator. Assuming no pressure
loss, the evaporator outlet temperature should be higher than the inlet temperature due to
refrigerant temperature glide and overheating at the outlet. As discussed earlier, the pressure
loss is dependent on the size of the evaporator.
Neglecting pressure loss between the evaporator outlet and the P1 pressure transmitter fitting,
as well as refrigerant temperature glide, pressure loss is calculated based on evaporator inlet
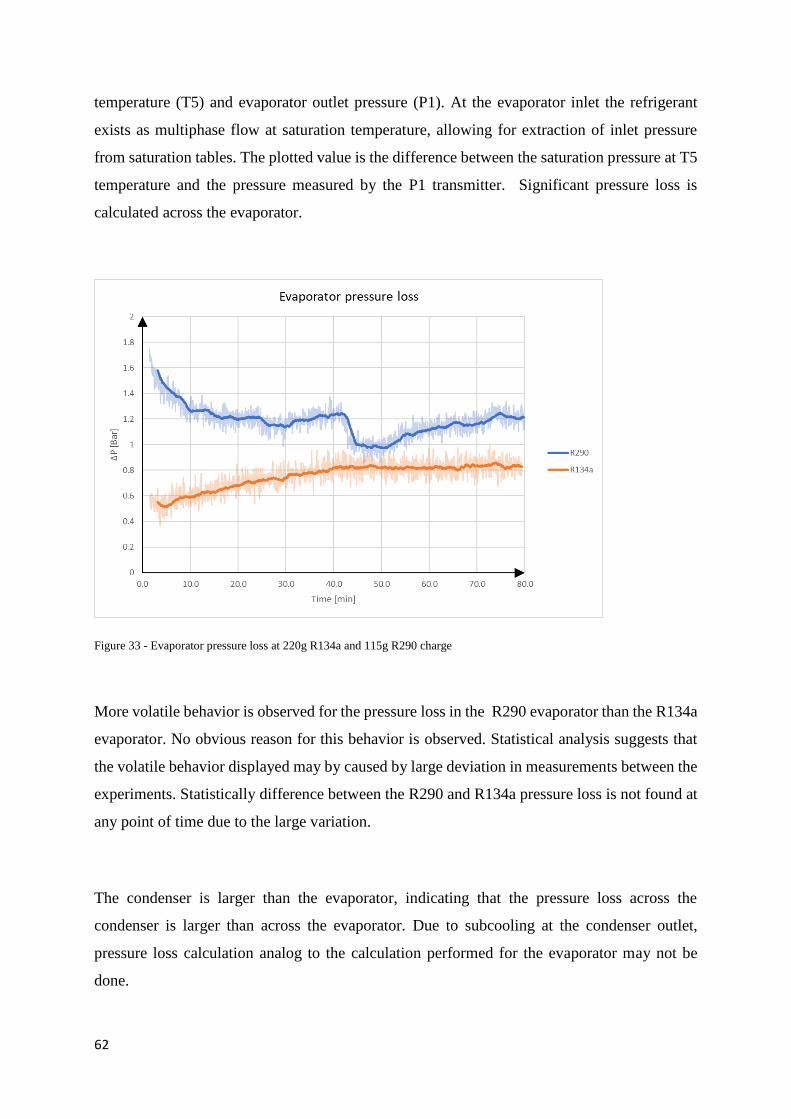
62
temperature (T5) and evaporator outlet pressure (P1). At the evaporator inlet the refrigerant
exists as multiphase flow at saturation temperature, allowing for extraction of inlet pressure
from saturation tables. The plotted value is the difference between the saturation pressure at T5
temperature and the pressure measured by the P1 transmitter. Significant pressure loss is
calculated across the evaporator.
Figure 33 - Evaporator pressure loss at 220g R134a and 115g R290 charge
More volatile behavior is observed for the pressure loss in the R290 evaporator than the R134a
evaporator. No obvious reason for this behavior is observed. Statistical analysis suggests that
the volatile behavior displayed may by caused by large deviation in measurements between the
experiments. Statistically difference between the R290 and R134a pressure loss is not found at
any point of time due to the large variation.
The condenser is larger than the evaporator, indicating that the pressure loss across the
condenser is larger than across the evaporator. Due to subcooling at the condenser outlet,
pressure loss calculation analog to the calculation performed for the evaporator may not be
done.
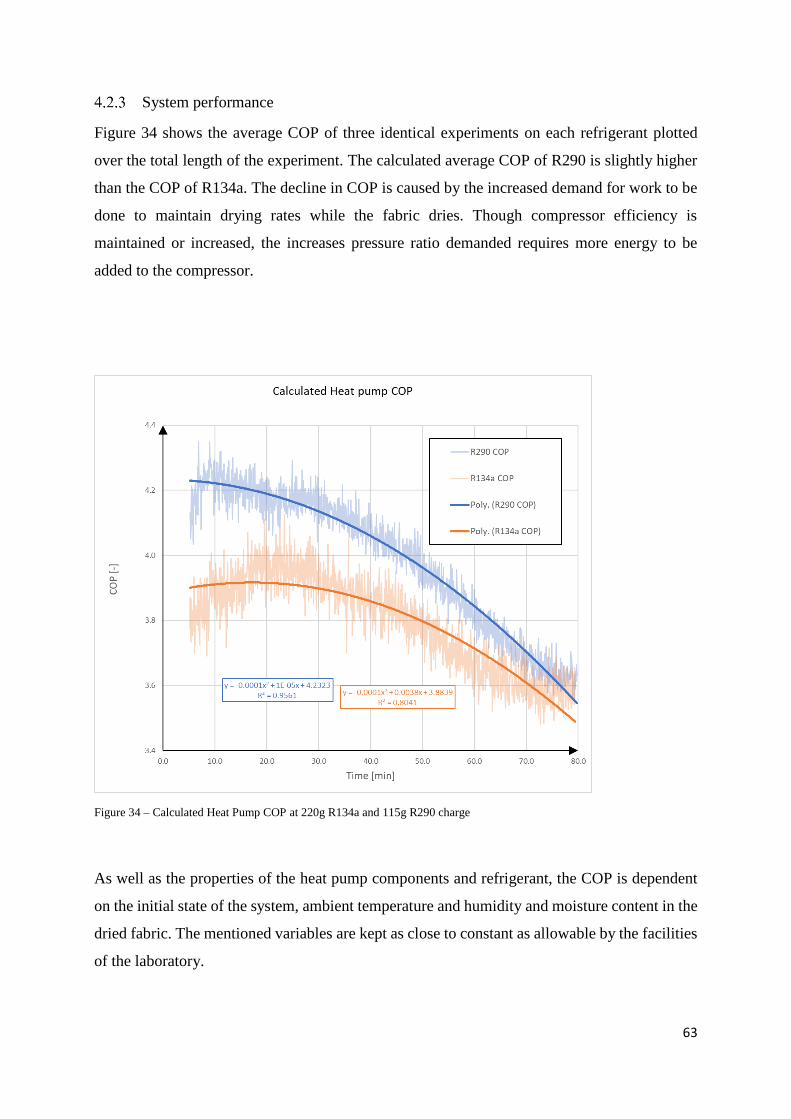
63
System performance
Figure 34 shows the average COP of three identical experiments on each refrigerant plotted
over the total length of the experiment. The calculated average COP of R290 is slightly higher
than the COP of R134a. The decline in COP is caused by the increased demand for work to be
done to maintain drying rates while the fabric dries. Though compressor efficiency is
maintained or increased, the increases pressure ratio demanded requires more energy to be
added to the compressor.
Figure 34 – Calculated Heat Pump COP at 220g R134a and 115g R290 charge
As well as the properties of the heat pump components and refrigerant, the COP is dependent
on the initial state of the system, ambient temperature and humidity and moisture content in the
dried fabric. The mentioned variables are kept as close to constant as allowable by the facilities
of the laboratory.
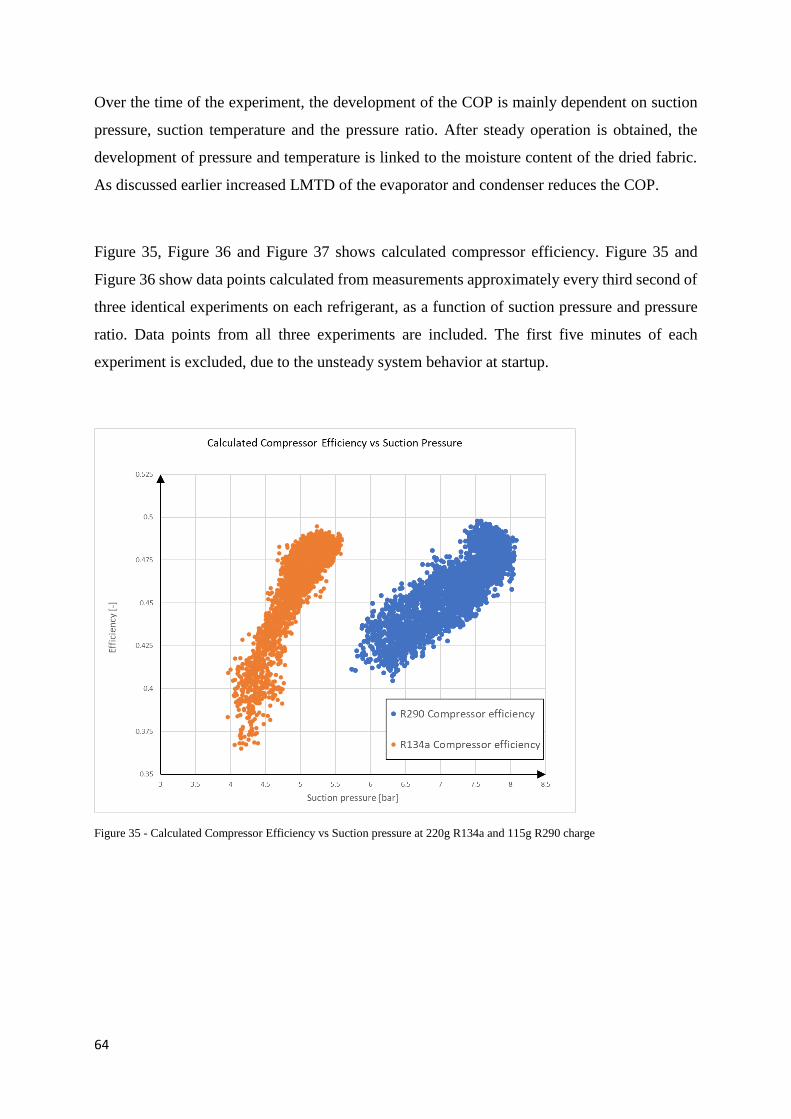
64
Over the time of the experiment, the development of the COP is mainly dependent on suction
pressure, suction temperature and the pressure ratio. After steady operation is obtained, the
development of pressure and temperature is linked to the moisture content of the dried fabric.
As discussed earlier increased LMTD of the evaporator and condenser reduces the COP.
Figure 35, Figure 36 and Figure 37 shows calculated compressor efficiency. Figure 35 and
Figure 36 show data points calculated from measurements approximately every third second of
three identical experiments on each refrigerant, as a function of suction pressure and pressure
ratio. Data points from all three experiments are included. The first five minutes of each
experiment is excluded, due to the unsteady system behavior at startup.
Figure 35 - Calculated Compressor Efficiency vs Suction pressure at 220g R134a and 115g R290 charge
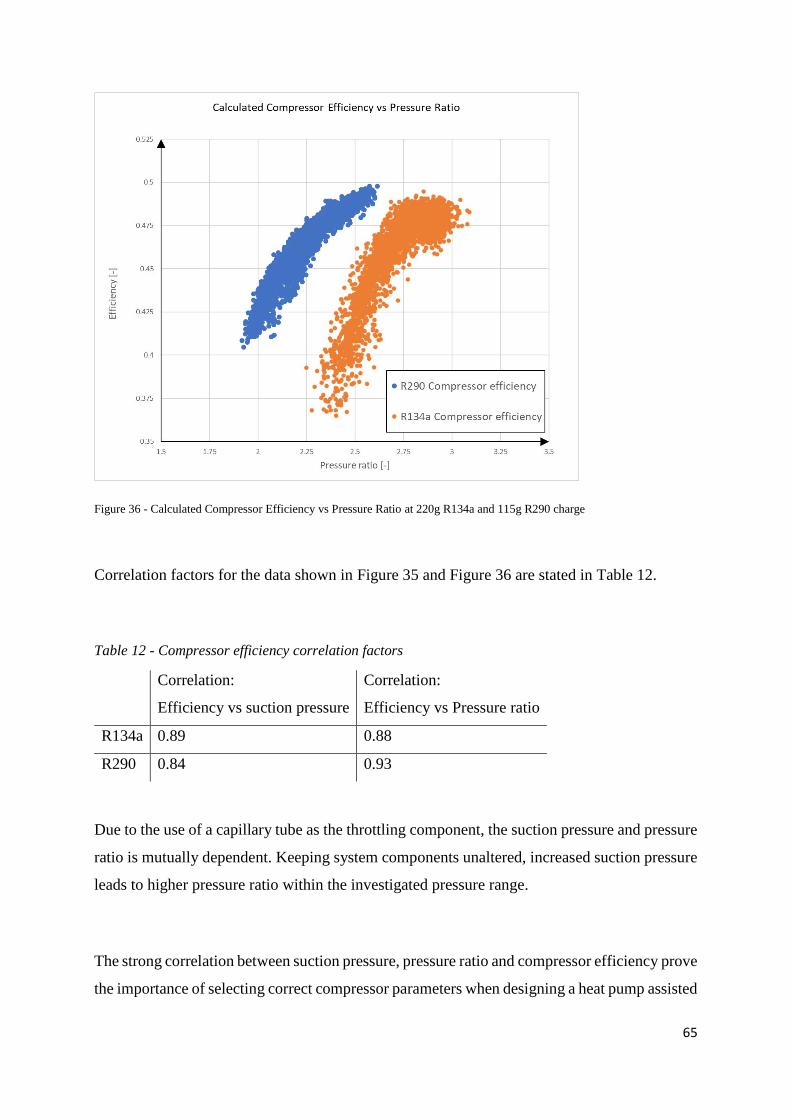
65
Figure 36 - Calculated Compressor Efficiency vs Pressure Ratio at 220g R134a and 115g R290 charge
Correlation factors for the data shown in Figure 35 and Figure 36 are stated in Table 12.
Table 12 - Compressor efficiency correlation factors
Correlation:
Efficiency vs suction pressure
Correlation:
Efficiency vs Pressure ratio
R134a 0.89 0.88
R290 0.84 0.93
Due to the use of a capillary tube as the throttling component, the suction pressure and pressure
ratio is mutually dependent. Keeping system components unaltered, increased suction pressure
leads to higher pressure ratio within the investigated pressure range.
The strong correlation between suction pressure, pressure ratio and compressor efficiency prove
the importance of selecting correct compressor parameters when designing a heat pump assisted
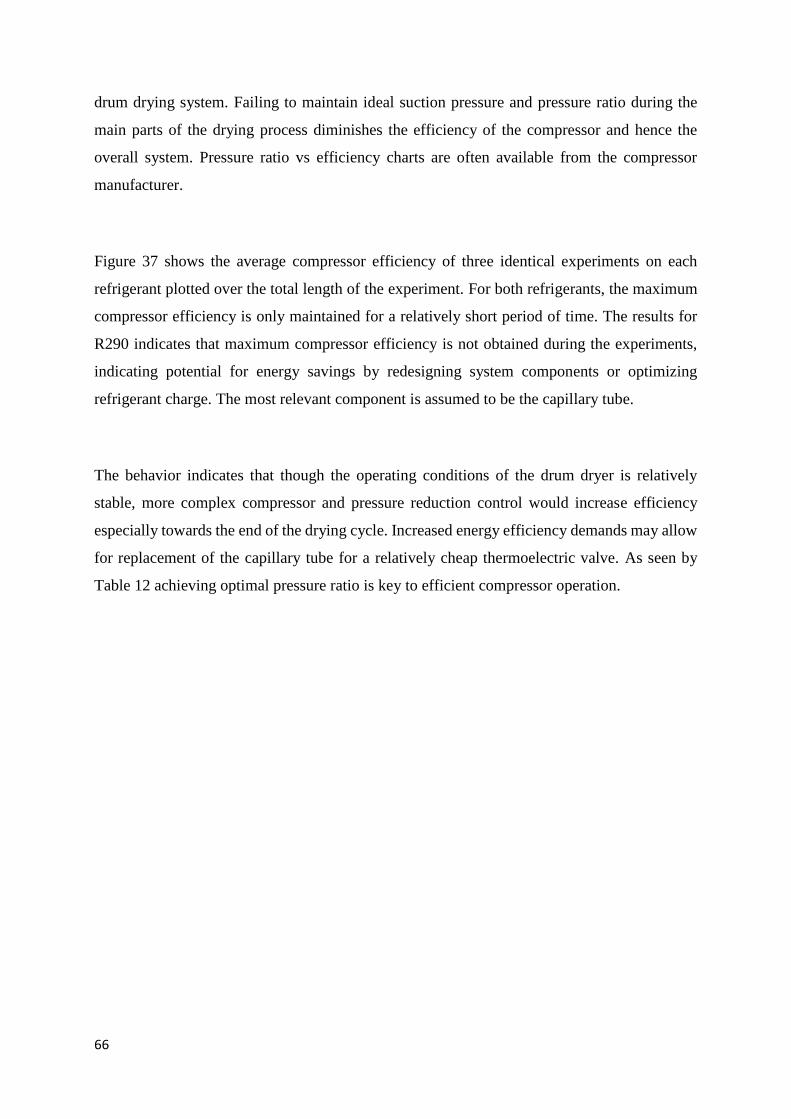
66
drum drying system. Failing to maintain ideal suction pressure and pressure ratio during the
main parts of the drying process diminishes the efficiency of the compressor and hence the
overall system. Pressure ratio vs efficiency charts are often available from the compressor
manufacturer.
Figure 37 shows the average compressor efficiency of three identical experiments on each
refrigerant plotted over the total length of the experiment. For both refrigerants, the maximum
compressor efficiency is only maintained for a relatively short period of time. The results for
R290 indicates that maximum compressor efficiency is not obtained during the experiments,
indicating potential for energy savings by redesigning system components or optimizing
refrigerant charge. The most relevant component is assumed to be the capillary tube.
The behavior indicates that though the operating conditions of the drum dryer is relatively
stable, more complex compressor and pressure reduction control would increase efficiency
especially towards the end of the drying cycle. Increased energy efficiency demands may allow
for replacement of the capillary tube for a relatively cheap thermoelectric valve. As seen by
Table 12 achieving optimal pressure ratio is key to efficient compressor operation.
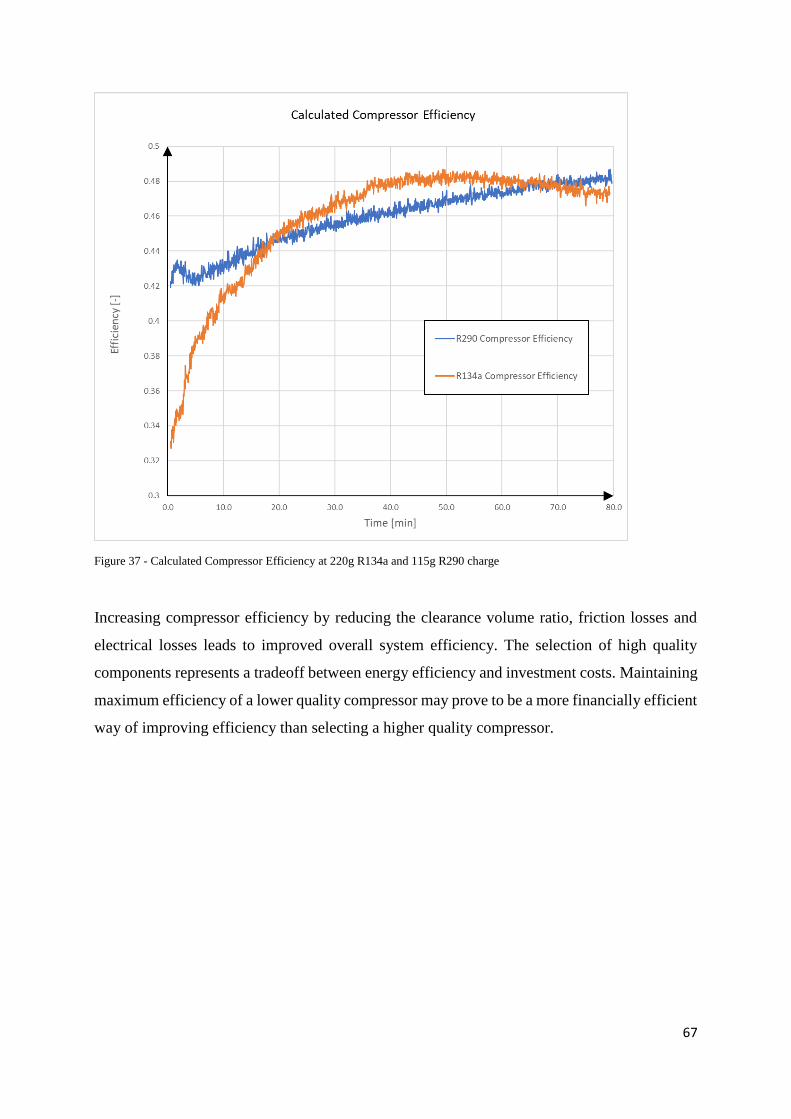
67
Figure 37 - Calculated Compressor Efficiency at 220g R134a and 115g R290 charge
Increasing compressor efficiency by reducing the clearance volume ratio, friction losses and
electrical losses leads to improved overall system efficiency. The selection of high quality
components represents a tradeoff between energy efficiency and investment costs. Maintaining
maximum efficiency of a lower quality compressor may prove to be a more financially efficient
way of improving efficiency than selecting a higher quality compressor.
68
Drying kinetics
The average DC-SMER obtained by the R134a system is 1.69 kg/kWh, while the highest
average DC-SMER obtained by the R290 system is 1.71 at 115g charge. This is an increase of
1%.
Figure 38 shows the Specific moisture extraction rate (SMER), based on hygrometer
measurements. The SMER are calculated for each instance of data saved to the log file,
approximately for every third second throughout the experiment. The plotted value is the
average of three identical experiments on each refrigerant. To improve readability, the actual
data is faded in the background, while regression lines are drawn in the foreground.
The absolute value of SMER is vulnerable to errors in the calculated airflow and air leaks of
the system. As airflow and air leaks due to the fixed fan speed and static ambient conditions are
assumed to be constant, the relative development of SMER do not share this vulnerability. To
adjust for errors caused by deviations in air leaks and small changes in sensor positions caused
by rebuilding and adjustments, hygrometer SMER from each experiment is calibrated against
SMER calculated from fabric weigh. This is done by calculating an equivalent airflow for each
experiment, and using this airflow for SMER calculation.
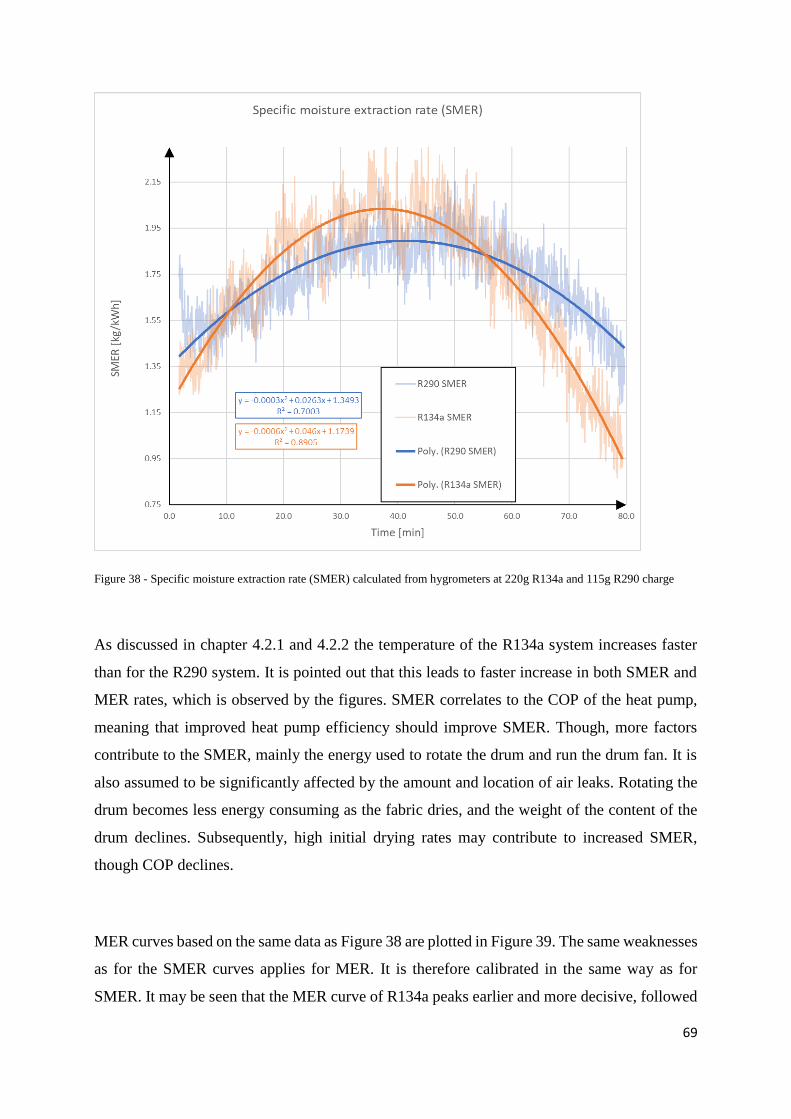
69
Figure 38 - Specific moisture extraction rate (SMER) calculated from hygrometers at 220g R134a and 115g R290 charge
As discussed in chapter 4.2.1 and 4.2.2 the temperature of the R134a system increases faster
than for the R290 system. It is pointed out that this leads to faster increase in both SMER and
MER rates, which is observed by the figures. SMER correlates to the COP of the heat pump,
meaning that improved heat pump efficiency should improve SMER. Though, more factors
contribute to the SMER, mainly the energy used to rotate the drum and run the drum fan. It is
also assumed to be significantly affected by the amount and location of air leaks. Rotating the
drum becomes less energy consuming as the fabric dries, and the weight of the content of the
drum declines. Subsequently, high initial drying rates may contribute to increased SMER,
though COP declines.
MER curves based on the same data as Figure 38 are plotted in Figure 39. The same weaknesses
as for the SMER curves applies for MER. It is therefore calibrated in the same way as for
SMER. It may be seen that the MER curve of R134a peaks earlier and more decisive, followed
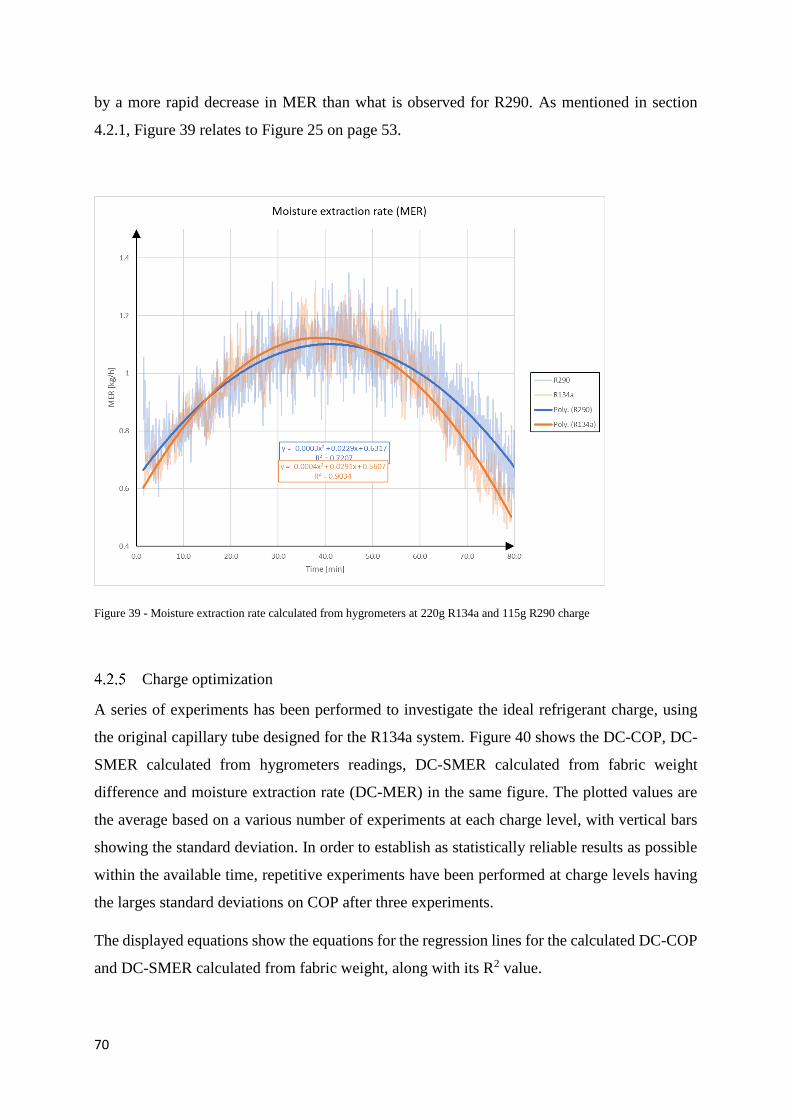
70
by a more rapid decrease in MER than what is observed for R290. As mentioned in section
4.2.1, Figure 39 relates to Figure 25 on page 53.
Figure 39 - Moisture extraction rate calculated from hygrometers at 220g R134a and 115g R290 charge
Charge optimization
A series of experiments has been performed to investigate the ideal refrigerant charge, using
the original capillary tube designed for the R134a system. Figure 40 shows the DC-COP, DC-
SMER calculated from hygrometers readings, DC-SMER calculated from fabric weight
difference and moisture extraction rate (DC-MER) in the same figure. The plotted values are
the average based on a various number of experiments at each charge level, with vertical bars
showing the standard deviation. In order to establish as statistically reliable results as possible
within the available time, repetitive experiments have been performed at charge levels having
the larges standard deviations on COP after three experiments.
The displayed equations show the equations for the regression lines for the calculated DC-COP
and DC-SMER calculated from fabric weight, along with its R2 value.
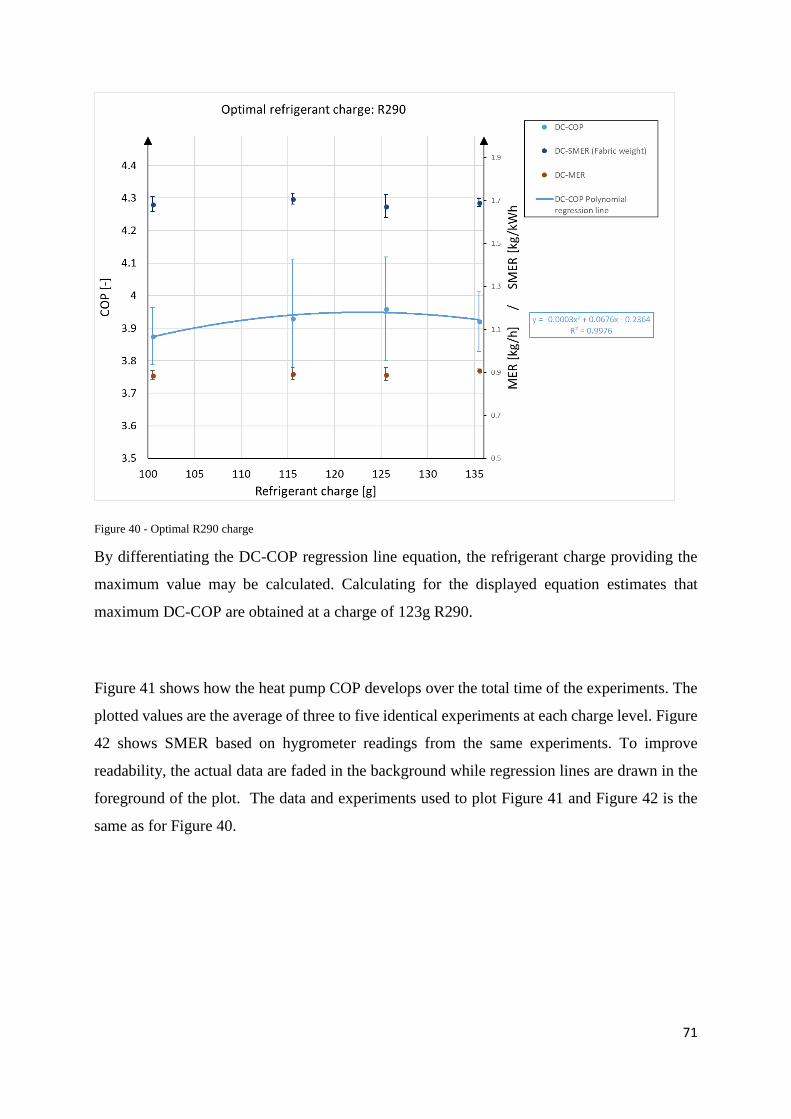
71
Figure 40 - Optimal R290 charge
By differentiating the DC-COP regression line equation, the refrigerant charge providing the
maximum value may be calculated. Calculating for the displayed equation estimates that
maximum DC-COP are obtained at a charge of 123g R290.
Figure 41 shows how the heat pump COP develops over the total time of the experiments. The
plotted values are the average of three to five identical experiments at each charge level. Figure
42 shows SMER based on hygrometer readings from the same experiments. To improve
readability, the actual data are faded in the background while regression lines are drawn in the
foreground of the plot. The data and experiments used to plot Figure 41 and Figure 42 is the
same as for Figure 40.
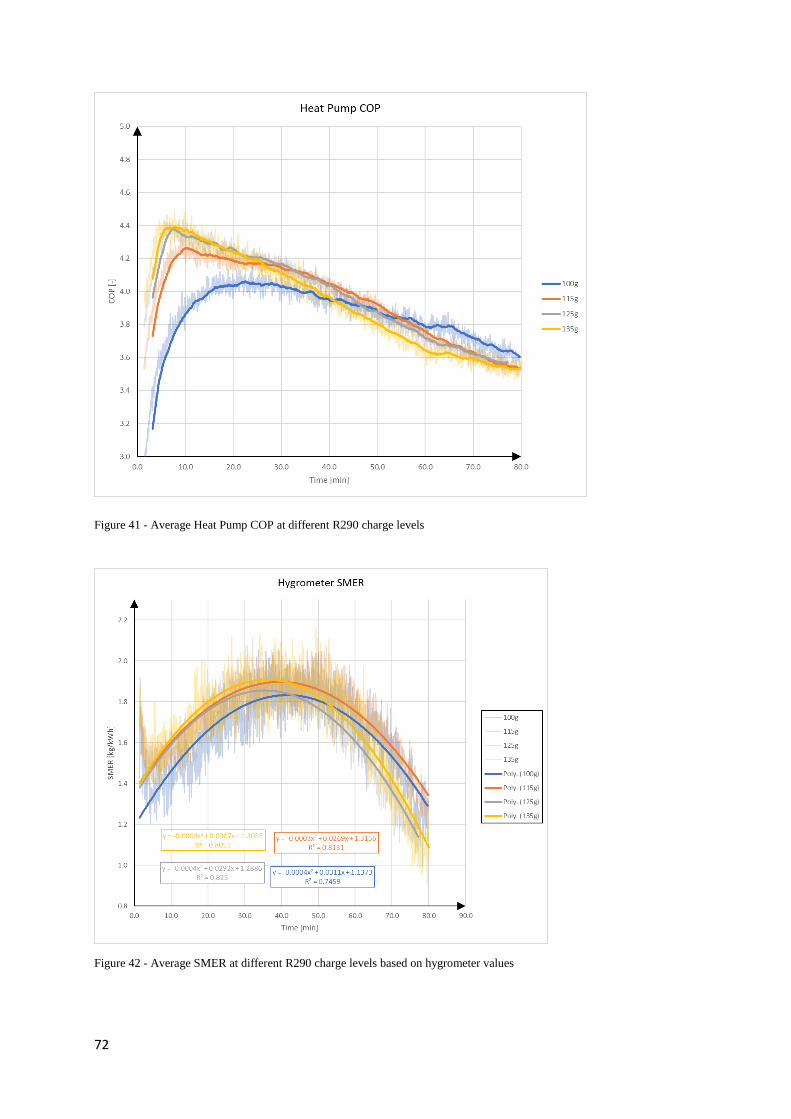
72
Figure 41 - Average Heat Pump COP at different R290 charge levels
Figure 42 - Average SMER at different R290 charge levels based on hygrometer values
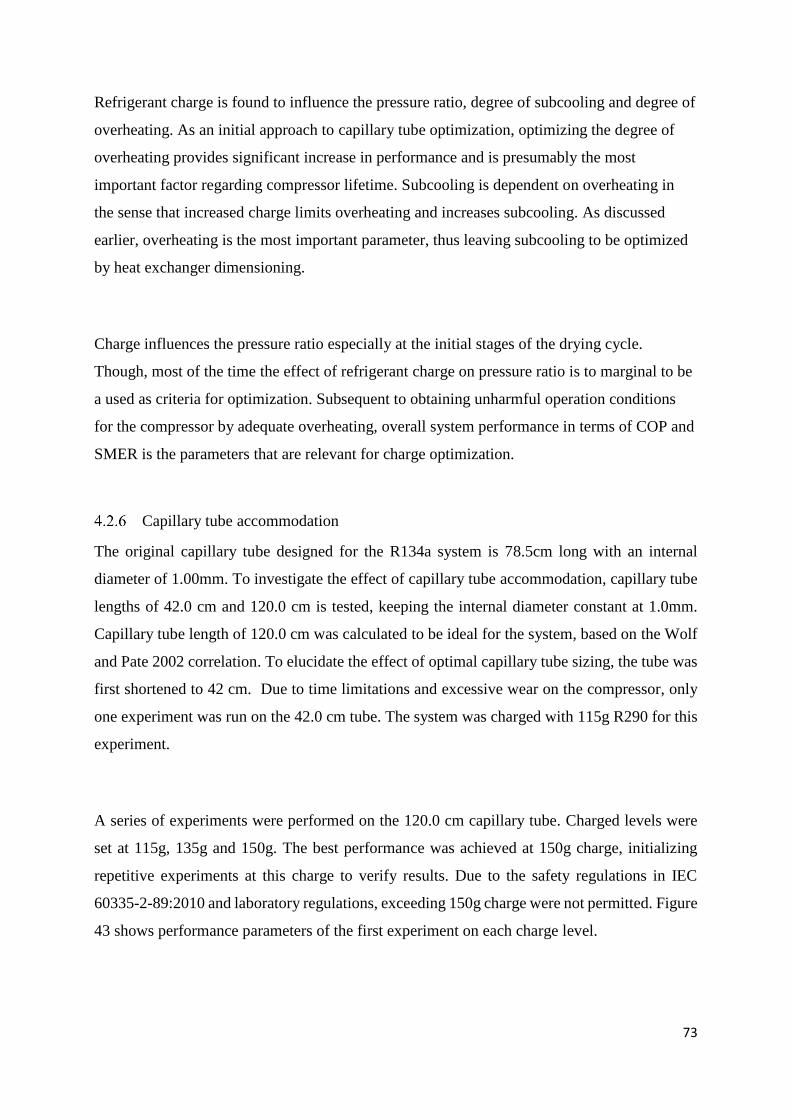
73
Refrigerant charge is found to influence the pressure ratio, degree of subcooling and degree of
overheating. As an initial approach to capillary tube optimization, optimizing the degree of
overheating provides significant increase in performance and is presumably the most
important factor regarding compressor lifetime. Subcooling is dependent on overheating in
the sense that increased charge limits overheating and increases subcooling. As discussed
earlier, overheating is the most important parameter, thus leaving subcooling to be optimized
by heat exchanger dimensioning.
Charge influences the pressure ratio especially at the initial stages of the drying cycle.
Though, most of the time the effect of refrigerant charge on pressure ratio is to marginal to be
a used as criteria for optimization. Subsequent to obtaining unharmful operation conditions
for the compressor by adequate overheating, overall system performance in terms of COP and
SMER is the parameters that are relevant for charge optimization.
Capillary tube accommodation
The original capillary tube designed for the R134a system is 78.5cm long with an internal
diameter of 1.00mm. To investigate the effect of capillary tube accommodation, capillary tube
lengths of 42.0 cm and 120.0 cm is tested, keeping the internal diameter constant at 1.0mm.
Capillary tube length of 120.0 cm was calculated to be ideal for the system, based on the Wolf
and Pate 2002 correlation. To elucidate the effect of optimal capillary tube sizing, the tube was
first shortened to 42 cm. Due to time limitations and excessive wear on the compressor, only
one experiment was run on the 42.0 cm tube. The system was charged with 115g R290 for this
experiment.
A series of experiments were performed on the 120.0 cm capillary tube. Charged levels were
set at 115g, 135g and 150g. The best performance was achieved at 150g charge, initializing
repetitive experiments at this charge to verify results. Due to the safety regulations in IEC
60335-2-89:2010 and laboratory regulations, exceeding 150g charge were not permitted. Figure
43 shows performance parameters of the first experiment on each charge level.
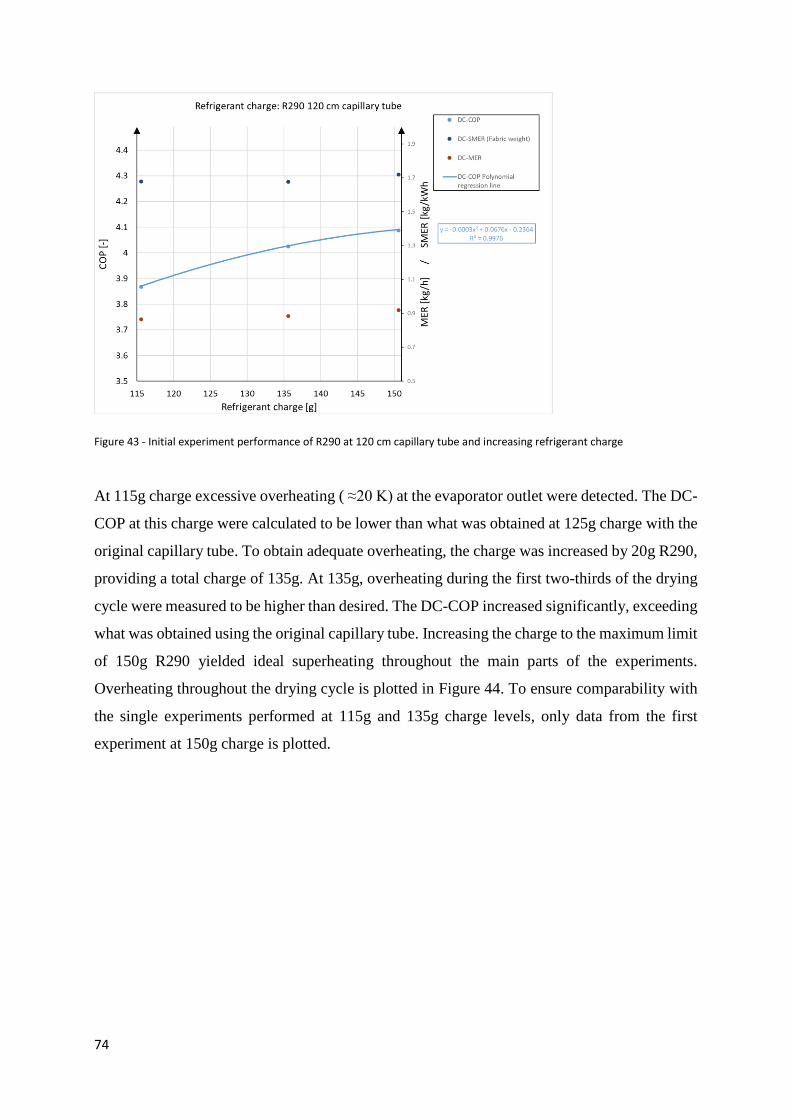
74
Figure 43 - Initial experiment performance of R290 at 120 cm capillary tube and increasing refrigerant charge
At 115g charge excessive overheating ( ≈20 K) at the evaporator outlet were detected. The DC-
COP at this charge were calculated to be lower than what was obtained at 125g charge with the
original capillary tube. To obtain adequate overheating, the charge was increased by 20g R290,
providing a total charge of 135g. At 135g, overheating during the first two-thirds of the drying
cycle were measured to be higher than desired. The DC-COP increased significantly, exceeding
what was obtained using the original capillary tube. Increasing the charge to the maximum limit
of 150g R290 yielded ideal superheating throughout the main parts of the experiments.
Overheating throughout the drying cycle is plotted in Figure 44. To ensure comparability with
the single experiments performed at 115g and 135g charge levels, only data from the first
experiment at 150g charge is plotted.
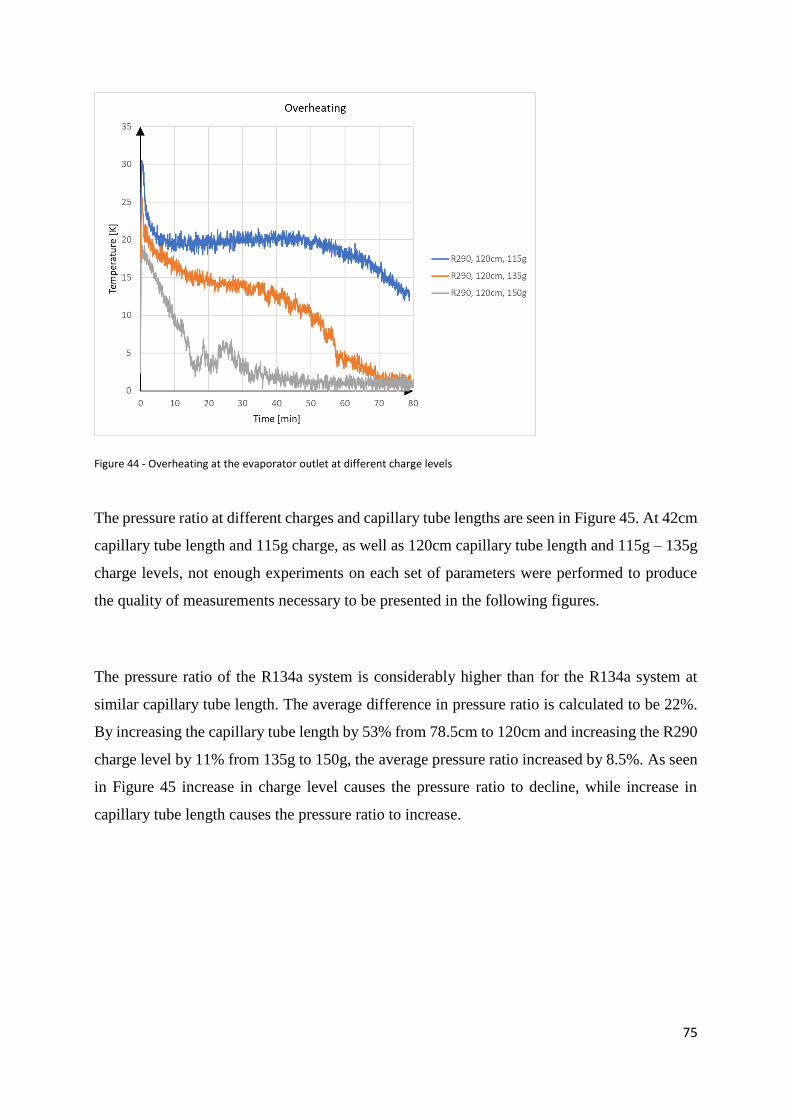
75
Figure 44 - Overheating at the evaporator outlet at different charge levels
The pressure ratio at different charges and capillary tube lengths are seen in Figure 45. At 42cm
capillary tube length and 115g charge, as well as 120cm capillary tube length and 115g – 135g
charge levels, not enough experiments on each set of parameters were performed to produce
the quality of measurements necessary to be presented in the following figures.
The pressure ratio of the R134a system is considerably higher than for the R134a system at
similar capillary tube length. The average difference in pressure ratio is calculated to be 22%.
By increasing the capillary tube length by 53% from 78.5cm to 120cm and increasing the R290
charge level by 11% from 135g to 150g, the average pressure ratio increased by 8.5%. As seen
in Figure 45 increase in charge level causes the pressure ratio to decline, while increase in
capillary tube length causes the pressure ratio to increase.
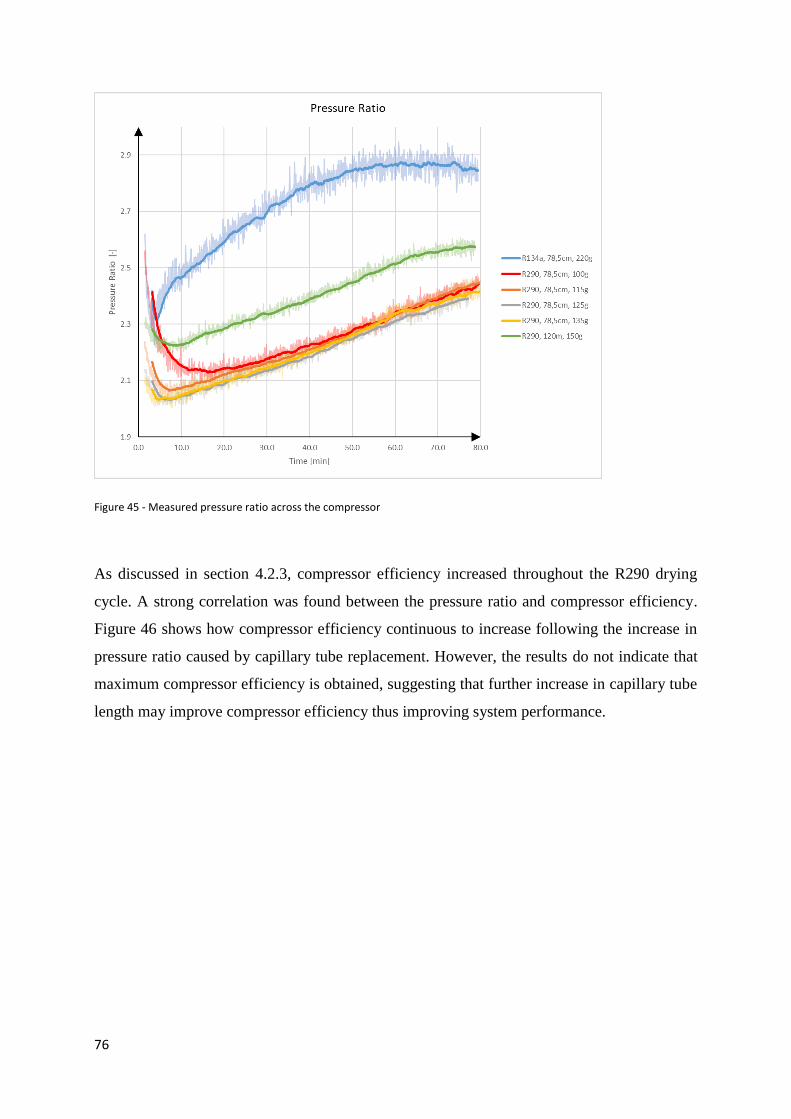
76
Figure 45 - Measured pressure ratio across the compressor
As discussed in section 4.2.3, compressor efficiency increased throughout the R290 drying
cycle. A strong correlation was found between the pressure ratio and compressor efficiency.
Figure 46 shows how compressor efficiency continuous to increase following the increase in
pressure ratio caused by capillary tube replacement. However, the results do not indicate that
maximum compressor efficiency is obtained, suggesting that further increase in capillary tube
length may improve compressor efficiency thus improving system performance.
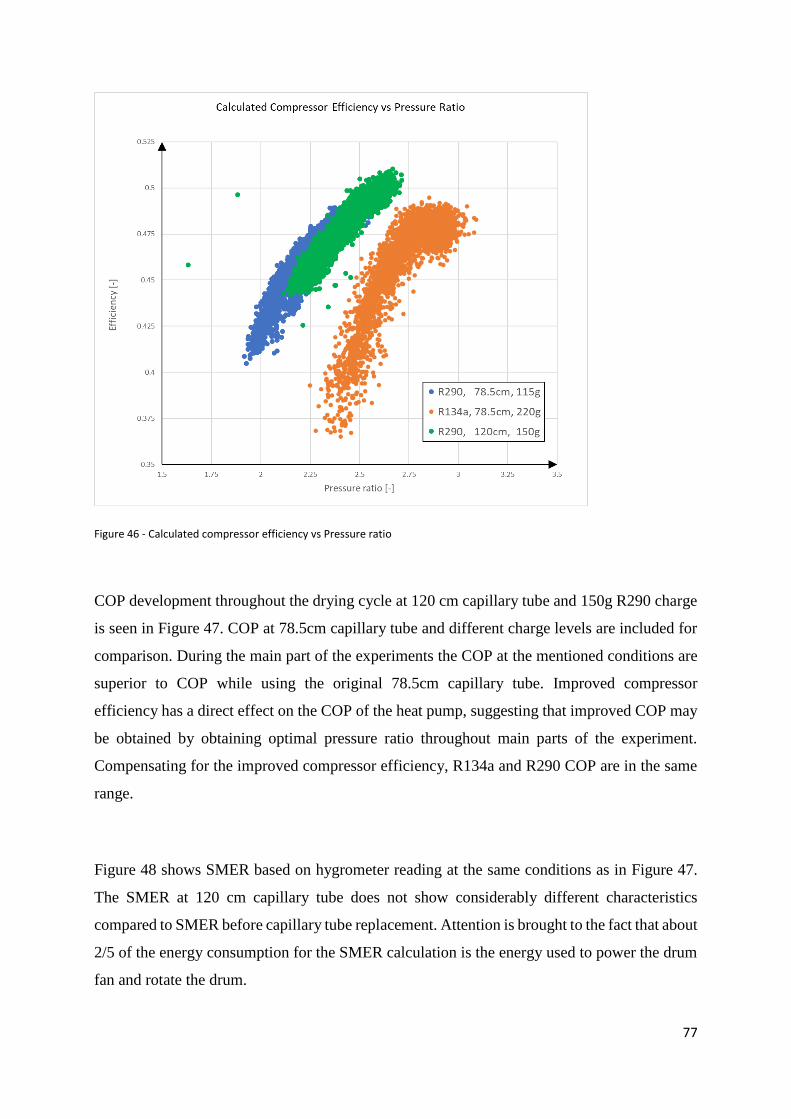
77
Figure 46 - Calculated compressor efficiency vs Pressure ratio
COP development throughout the drying cycle at 120 cm capillary tube and 150g R290 charge
is seen in Figure 47. COP at 78.5cm capillary tube and different charge levels are included for
comparison. During the main part of the experiments the COP at the mentioned conditions are
superior to COP while using the original 78.5cm capillary tube. Improved compressor
efficiency has a direct effect on the COP of the heat pump, suggesting that improved COP may
be obtained by obtaining optimal pressure ratio throughout main parts of the experiment.
Compensating for the improved compressor efficiency, R134a and R290 COP are in the same
range.
Figure 48 shows SMER based on hygrometer reading at the same conditions as in Figure 47.
The SMER at 120 cm capillary tube does not show considerably different characteristics
compared to SMER before capillary tube replacement. Attention is brought to the fact that about
2/5 of the energy consumption for the SMER calculation is the energy used to power the drum
fan and rotate the drum.
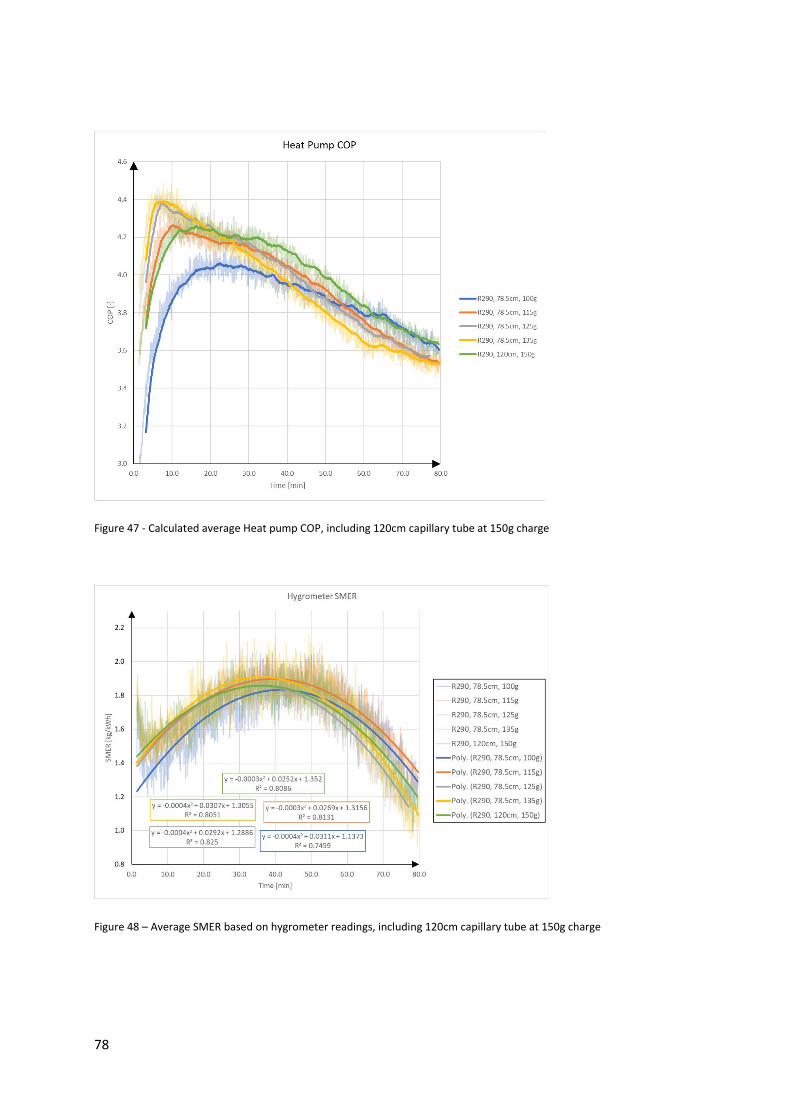
78
Figure 47 - Calculated average Heat pump COP, including 120cm capillary tube at 150g charge
Figure 48 – Average SMER based on hygrometer readings, including 120cm capillary tube at 150g charge
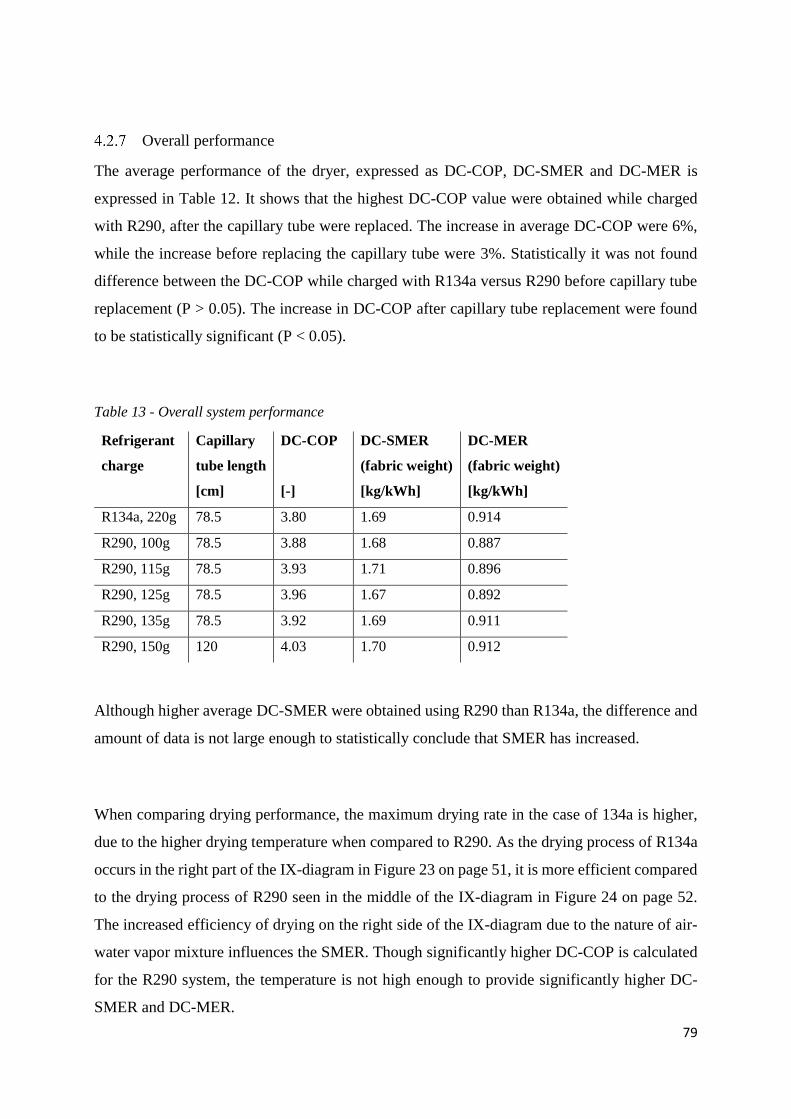
79
Overall performance
The average performance of the dryer, expressed as DC-COP, DC-SMER and DC-MER is
expressed in Table 12. It shows that the highest DC-COP value were obtained while charged
with R290, after the capillary tube were replaced. The increase in average DC-COP were 6%,
while the increase before replacing the capillary tube were 3%. Statistically it was not found
difference between the DC-COP while charged with R134a versus R290 before capillary tube
replacement (P > 0.05). The increase in DC-COP after capillary tube replacement were found
to be statistically significant (P < 0.05).
Table 13 - Overall system performance
Refrigerant
charge
Capillary
tube length
[cm]
DC-COP
[-]
DC-SMER
(fabric weight)
[kg/kWh]
DC-MER
(fabric weight)
[kg/kWh]
R134a, 220g 78.5 3.80 1.69 0.914
R290, 100g 78.5 3.88 1.68 0.887
R290, 115g 78.5 3.93 1.71 0.896
R290, 125g 78.5 3.96 1.67 0.892
R290, 135g 78.5 3.92 1.69 0.911
R290, 150g 120 4.03 1.70 0.912
Although higher average DC-SMER were obtained using R290 than R134a, the difference and
amount of data is not large enough to statistically conclude that SMER has increased.
When comparing drying performance, the maximum drying rate in the case of 134a is higher,
due to the higher drying temperature when compared to R290. As the drying process of R134a
occurs in the right part of the IX-diagram in Figure 23 on page 51, it is more efficient compared
to the drying process of R290 seen in the middle of the IX-diagram in Figure 24 on page 52.
The increased efficiency of drying on the right side of the IX-diagram due to the nature of air-
water vapor mixture influences the SMER. Though significantly higher DC-COP is calculated
for the R290 system, the temperature is not high enough to provide significantly higher DC-
SMER and DC-MER.
80
4.3 Reliability and assumptions
Though verified and calibrated, all measurements are prone to errors caused by uncertainty of
the instrumentation as well as influence by the ambient and non-homogenous flows and
conditions. The highest level of reliability in this study are achieved by weighing of the fabric,
as the only uncertainty of the weighing is the uncertainty of the scale. Therefor there should be
attached great importance to results based on weighing of the fabric.
Assumptions have had to be made according to the compressors volumetric efficiency
(clearance volume) and deceleration of the electric motor. These parameters in combination
with the compressor displacement and synchronous speed are used to calculate the refrigerant
volume flow, and in turn the refrigerant mass flow.
Throughout the initial phase of the experiments unsteady behavior is observed. Since study of
transient behavior at startup is not a prioritized part of this study, the first one to five minutes
of data from experiments are normally excluded from the presented figures. Volatile transient
behavior increases the required amplitude of the figure axis, obscuring important trends
throughout the main parts of the experiments. The observed transient behavior does not fit to
the applied regression equations, diminishing the scientific value of combining the transient
data with the main experimental data.
Though not prioritized in this study, the possible energy efficiency and wear rate improvements
from the study of transient behavior should not be neglected. Measures such as introducing an
electric heater to shorten the duration of transient behavior or improve conditions may be
reasonable.
81
COP calculation
COP are calculated based on pressure and temperature measurements. There are two pressure
transmitters installed in the system, on each side of the compressor. This means that pressure
drop across each component and between most of the thermistors is not measured. Installation
of additional pressure transmitters would require additional taps to be soldered to the system,
possible affecting comparability to the original system. The decision has been made not to
install additional pressure transmitters, and to neglect pressure loss in heat exchangers and
tubing.
As for the temperature transmitters the temperature is measured on the outside of the tubes.
Though the transmitters are insulated from the ambient, readings at excessively high and low
temperatures are likely to be somewhat affected by ambient temperature. This is indicated by
the lack of superheating at the compressor outlet. Importantly, efforts have been made to
maintain the same level of errors and ambient influence throughout all experiments. This
ensures comparability of measurements and calculations on the original and rebuild system.
82
SMER calculation
Calculation of SMER from hygrometer values is based on multiplying the measured humidity
of the air by the airstream. As no part of the airstream may be assumed to be laminar, the airflow
needs to be calculated to be used to calculate SMER from hygrometer values. An equivalent
airflow is therefore calculated by comparing the difference in measured air humidity across the
drum to moisture evaporation measured by weighing of the fabric. As this calculation does not
account for air leaks, bypass air etc., the equivalent airstream may only be used for calculations
based on the same hygrometers readings.
As the hygrometer readings are susceptible to errors caused by air leaks, bypass air etc., the
SMER calculated from fabric weight should be the values used for evaluation of the total
efficiency of the system. As weighing during experiments affects results, the SMER calculated
from hygrometer values provides the best possible intermittent data.
Collection and weighing of the condensed water shows a large amount of escaped water from
the system. Leakage in the range of 20 – 40% of the initial water content has been observed,
indicating significant air exchange rates to the ambient. Some effect is observed by the sealing
of air leaks and attention to details while assembling the drum dryer.
4.4 Comparison between R134a and R290
Even though heat exchangers, fan and drum sizing are not optimized for R290 duty, R290 on
average outperforms R134a on both COP and SMER. Statistically, only COP increase may be
concluded. The experimental results does not suggest any deterioration of performance
parameters subsequent to implementation of R290 in the drum dryer.

83
5 Further work and improvements A considerable amount of data has been collected during this study. More than half a million
data points has been collected and processed to create a solid basis for conclusions. The most
prominent limitation regarding testing of different parameters is the need for cooling of the
system between experiments. This need limits the amount of experiments to one experiment
per day. Forced cooling of the system by use of fans has been tested but are not found improve
cooling sufficiently to increase experiment frequency.
By measuring the compressor surface temperature as well as air temperature surrounding the
compressor, a valid estimate for compressor heat loss may be calculated. In turn, this allows for
the calculation of overheating of the refrigerant between the compressor inlet and cylinder inlet,
improving the foundation for charge optimization. Alternatively, a literature review on the
subject may be performed, providing the necessary statistical data.
Applying a test regime of selected capillary tube lengths and charges, allows for the ideal
combination of capillary tube length and charge may be calculated by statistical regression
analysis of the collected data. It is suggested to develop a simulation model prior to selecting
the parameters of the test regime. By applying the simulation model, improved quality in the
selection of parameters may be obtained.
Prolonging the period of time where the maximum COP and SMER is obtained improves
energy efficiency. Introducing an electric heater to the heat pump circuit appears to possibly
improve drying rates and energy efficiency during warm up. Introduction of the heater may be
performed by coiling a resistor around the refrigerant tube. Insulation against the ambient is
important to ensure that the added heat is transferred to the refrigerant.
To improve the understanding of air leaks and their influence on drying performance,
investigation of air leaks and heat rejection is relevant. Application of thermography may serve
as an initial suggestion to the qualities and rates of air that is exchanged. It is suggested that the
sealing of air leaks combined with improved insulation of the drum dryer may drastically
84
improve SMER. It seems that the HPDD is built as a conventional condensing drum dryer, only
replacing the condensing unit and air heater with a heat pump. Carefully redesigning the
complete HPDD taking into account the importance of retaining the air in a closed loop may
reduce energy consumption and improve drying rates.
The results indicate that optimizing the condenser and evaporator sizing to fit operation with
R290 may improve efficiency by reducing pressure loss. Simulation of different heat exchanger
designs using e.g. HXsim may be beneficial. The reduction in COP due to reduced subcooling
must be taken into account.
A summarized list of tasks proposed for further work on this topic follows. The order may be
treated as a guideline to priority ranking
- Development and verification of a simulation model to simulate different parameters
and control regimes
- Capillary tube optimization
- Heat exchanger optimization
- Investigate the nature of air leaks and their effect on system performance
- Introduction of an electrical heater in order to obtain high COP and SMER rates at
earlier stages of drying
85
6 Conclusion Energy efficiency is key to achieving the reduction in greenhouse gas emissions needed to
preserve the Earth’s climate. Unfortunately, the positive effect of energy efficiency may be
diminished by the use of climate affecting chemicals such as HFC refrigerants. By maintaining
and improving energy efficiency while implementing environmental and climate friendly
refrigerants, a substantial refinement towards substantial heating and refrigeration may be
obtained.
R290 is well-suited to substitute R134a in heat pump assisted drum dryers. Providing
compressor replacement implementation of R290 can be done without diminishing COP or
SMER values, thus achieving the same level of energy efficiency as systems utilizing R134a.
By proper replacement of the capillary tube, improvement of the R290 heat pump COP may be
obtained, releasing additional potential for energy efficiency improvement. 6% improvement
in COP was obtained during experiments.
The combination of maintained energy efficiency and a tremendous reduction in the refrigerants
global warming potential provides a significant decrease in the environmental impact of the
drum dryer.
The results of this study indicate that the drawbacks of implementing R290 as refrigerant in
heat pump assisted drum dryers are limited to the flammability of R290. For applications where
the risk of ignition is not impending, applying R290 is an obvious choice.

86
References 1. Goldberg, M., Heat pump closed loop drying. 1986, Google Patents.
2. Greenpeace, HFOs: the new generation of F-gases. 2016.
3. Hane Marit Dalen, B.M.L., Formålsfordeling av husholdningenes elektrisitetsforbruk i
2006 - Utvikling over tid 1990 - 2006 2009, Statistics Norway.
4. Braun, J.E., P.K. Bansal, and E.A. Groll, Energy efficiency analysis of air cycle heat
pump dryers. International Journal of Refrigeration, 2002. 25(7): p. 954-965.
5. Code of Federal Regulations - PART 430 - ENERGY CONSERVATION PROGRAM
FOR CONSUMER PRODUCTS - Title 10 -Energy - CHAPTER II -DEPARTMENT OF
ENERGY. SUBCHAPTER D -ENERGY CONSERVATION, U.S.D.o. Energy, Editor.
2017: Goverment Publishing office [US].
6. Association of Home Appliance Manufacturers, W., DC (2009), Household Tumble
Type Clothes Dryers, in HLD-1-2009.
7. TeGrotenhuis, W., Clothes Dryer Automatic Termination Sensor Evaluation - Volume
1: Characterization of Energy Use in Residential Clothes Dryers 2014, Pacific
Northwest National Laboratory.
8. TeGrotenhuis, W., et al., Modeling and design of a high efficiency hybrid heat pump
clothes dryer. Applied Thermal Engineering, 2017. 124: p. 170-177.
9. Patel, V.K., et al., Experimental evaluation and thermodynamic system modeling of
thermoelectric heat pump clothes dryer. Applied Energy, 2018. 217: p. 221-232.
10. Gluesenkamp, K., Thermoelectric Clothes Dryer - 2016 Building Technologies Office
Peer Review. 2016, Oak Ridge National Laboratory.
11. Gopalnarayanan, S. and R. Radermacher, Heat-pump assisted dryer using refrigerant
mixtures -- Batch mode drying. Conference: American Society of Heating, Refrigerating
and Air-Conditioning Engineers (ASHRAE) winter meeting, Philadelphia, PA (United
States), 24-28 Feb 1997; Other Information: PBD: 1997; Related Information: Is Part
Of ASHRAE transactions: Technical and symposium papers, 1997. Volume 103, Part
1; PB: 1136 p. 1997: American Society of Heating, Refrigerating and Air-Conditioning
Engineers, Inc., Atlanta, GA (United States). Medium: X; Size: pp. 888-898.
12. Stene, J. Lecture series TEP4260 at Norwegian University of Science and Technology
(NTNU). 2017.
13. Ciconkov, R., Refrigerants: There is still no vision for sustainable solutions.
International Journal of Refrigeration, 2018. 86: p. 441-448.
14. Elnan, Å., Development of new heat pump cloth drum dryer with CO2 as working fluid,
in Department of Energy and Process Engineering. 2011, Norwegian University of
Science and Technology.
15. Akre-Aas, J., HFO kuldemedier. 2016.
16. Ravikumar, T.S. and D. Mohan Lal, On-road performance analysis of
R134a/R600a/R290 refrigerant mixture in an automobile air-conditioning system with
mineral oil as lubricant. Energy Conversion and Management, 2009. 50(8): p. 1891-
1901.
17. Tashtoush, B., M. Tahat, and M.A. Shudeifat, Experimental study of new refrigerant
mixtures to replace R12 in domestic refrigerators. Applied Thermal Engineering, 2002.
22(5): p. 495-506.
18. AGA, SIKKERHETSDATABLAD Tetraflourethan (R134a).
19. Montreal Protocol on Substances that Deplete the Ozone Layer (with annex).
Concluded at Montreal on 16 September 1987, U.N.-T. Series, Editor. 1989, United
Nations: Montreal.
87
20. REGULATION (EU) No 517/2014 OF THE EUROPEAN PARLIAMENT AND OF THE
COUNCIL of 16 April 2014 on fluorinated greenhouse gases and repealing Regulation
(EC) No 842/2006, in 842/2006, T.E.P.A.T.C.O.T.E. UNION, Editor. 2014: Official
Journal of the European Union.
21. Propan, in Store norske leksikon. 2009.
22. R290 Refrigerant Grade Propane - High quality natural refrigerant. 2017/09/12];
Available from:
https://www.lindeus.com/internet.lg.lg.usa/en/images/Linde%20R290%20Refrigerant
%20Grade%20Propane138_11493.pdf?v=.
23. Danfoss - Practical Application of Refrigerants R 600a and R 290 in Small Hermetic
Systems - Application Guideline. 2009.
24. NS-EN ISO 11114-1:2012 Gas cylinders - Compatibility of cylinder and valve materials
with gas contents - Part 1: Metallic materials.
25. Aylward, G.H., SI chemical data / Gordon Aylward and Tristan Findlay, ed. T.J.V.
Findlay. 2007, Milton, Qld: John Wiley & Sons Australia.
26. Calm, J.M. and G. Hourahan, Refrigerant data update. Hpac Engineering, 2007. 79(1):
p. 50-64.
27. AFROX, MATERIAL SAFETY DATA SHEET (MSDS) R134A. 2011.
28. NATIONAL REFRIGERANTS, I., Safety Data Shet - R290 PROPANE. 2015.
29. SECOP. Natural Refrigerants - Hydrocarbons – Isobutane (R600a) and Propane
(R290). 2017/10/04]; Available from: https://www.secop.com/solutions/natural-
refrigerants/.
30. Bellomare, F. and S. Minetto, Experimental Analysis of Hydrocarbons as Drop-in
Replacement in Household Heat Pump Tumble Dryers. Energy Procedia, 2015. 81: p.
1212-1221.
31. Minetto, S., Compressor used for HC experiments, E. Storslett, Editor.
32. Sánchez, D., et al., Energy performance evaluation of R1234yf, R1234ze(E), R600a,
R290 and R152a as low-GWP R134a alternatives. International Journal of
Refrigeration, 2017. 74(Supplement C): p. 269-282.
33. Tecumseh, Guidelines for the utilization of R600a and R290. 2011.
34. Tecumseh Technical Bulletin - Hydrocarbons.
35. SECOP Application guideline - Practical application of refrigerants R600a and R290
in small hermetic systems. 2011.
36. NEK IEC 60335-2-89:2010 Husehold and similar electrical appliances - Safety - Part
2-89: Particular requireents for commercial refrigerating appliances with an
incorporated or remote refrigerant unit og compressor, N. IEC, Editor. 2010.
37. McLaughlin, C. Hydrocarbon limit likely to move to 500 grams by 2018. 08/12/2016
08/09/2017]; Available from:
http://hydrocarbons21.com/articles/7322/hydrocarbon_limit_likely_to_move_to_500_
grams_by_2018.
38. Secop. N-series in Detail. [cited 2017 10/23]; Available from:
https://www.secop.com/products/product-portfolio/serie/n-series/.
39. IPU & Department of Mechanical Engineering - Technical University of Denmark,
CoolPack. 2000 - 2012.
40. Bhandari, B., Handbook of Industrial Drying, Fourth Edition Edited by A. S. Mujumdar.
Drying Technology, 2015. 33(1): p. 128-129.
41. Kian Jon, C. and C. Siaw Kiang, Heat Pump Drying Systems, in Handbook of Industrial
Drying, Third Edition. 2006, CRC Press.
88
42. Bosch Spare Part Finder Detail Page - Tumble dryer WTW86298SN/20. 11/07/2017];
Available from: http://www.bosch-home.co.uk/customer-service/care-protection-and-
parts/WTW86298SN/20#/TabsTogglebox=spare-section-3/Togglebox=tb0538/.
43. Lee, T., Compressor oil, E. Storslett, Editor. 2018.
44. SUNON, SUNON Specification for apporval - DP203A 2123LST.GN. 2005.
45. Rechi Precision Co. LTD. Rotary Compressor. 10/31/2017]; Available from:
http://www.rechi.com/en/webProductsEN.do?method=getCompressor.
46. Pump Water pump 230V, 26W, 50Hz. 11/07/2017]; Available from: http://www.bosch-
home.co.uk/store/00145388.
47. Donna, Bosch Q&A, E. Storslett, Editor. 2017.
48. Eriksen, J., VS: Kontakt kundeservice Bosch12.09.2017 - [email protected]
[InteractionID:2e0761c9-1c12-4dd1-850c-9753386e77ee], E. Storslett, Editor. 2017.
49. Bansal, P., A. Mohabir, and W. Miller, A novel method to determine air leakage in heat
pump clothes dryers. Energy, 2016. 96: p. 1-7.
50. VAISALA, Vaisala HUMICAP Humidity and Temperature Transmitter Series
HMT330 User's Guide. 2013.
51. VAISALA Humidity Conversation Formulas - Calculation formulas for humidity.
2013.
52. Nellis, G. and S.A. Klein, Heat Transfer. 2009: Cambridge University Press.
53. NS-EN ISO 11114-2:2013 - Gas cylinders -Compatibility of cylinder and valve
materials with gas contents -Part 2: Non-metallic materials.

89
List of figures Figure 1 - Illustration of a conventional electric drum drying cycle. Figure created by TeGrotenhuis
et.al. [8] ................................................................................................................................................... 5
Figure 2 - Conventional air vented dryer ................................................................................................ 6
Figure 3 - Conventional condensing dryer .............................................................................................. 6
Figure 4 - Thermoelectric dryer .............................................................................................................. 7
Figure 5 - Air cycle heat pump dryer ...................................................................................................... 7
Figure 6 - Heat pump drum dryer ............................................................................................................ 8
Figure 7 - System schematic for a vacuum heat pump assisted drum dryer system ............................... 9
Figure 8 - Hybrid heat pump dryer including electric heater ................................................................ 12
Figure 9 - Secop compressors: evaporation pressures. Figure created by Secop[38]............................ 20
Figure 10 - I-x diagram / Psychrometric chart ..................................................................................... 22
Figure 11 - Exploded drawing [42] ....................................................................................................... 25
Figure 12 - Experimental rig ................................................................................................................. 32
Figure 13 - Printout of the LabVIEW Block Diagram .......................................................................... 36
Figure 14 – Instrumentation .................................................................................................................. 38
Figure 15 - Initial sensor placement ...................................................................................................... 39
Figure 16 - Repositioning of T10/H10, T5 and T7................................................................................ 40
Figure 17 - T11/H11 position ................................................................................................................ 40
Figure 18 - T9/H9 position .................................................................................................................... 40
Figure 19 - Pressure transmitters connections before rebuild ............................................................... 40
Figure 20 - Sensor positions and transmitter connections after rebuild ................................................ 41
Figure 21 – Flow chart: LMTD calculation .......................................................................................... 44
Figure 22 – Flow chart: COPH and compressor efficiency calculation ................................................. 46
Figure 23 - IX Diagram with plots for drying with R134a at 220g charge ........................................... 51
Figure 24 - IX diagram with plots for drying with R290 at 115g charge .............................................. 52
Figure 25 – Moisture ratio at 220g R134a and 115g R290 charge ........................................................ 53
Figure 26 - LMTD heat exchangers at 220g R134a and 115g R290 charge ......................................... 54
Figure 27 - R134a Air cycle Relative Humidity and Temperature at 220g charge ............................... 56
Figure 28 - R290 Air cycle Relative Humidity and Temperature at 115g charge ................................. 56
Figure 29 - Condensation and evaporation temperature at 220g R134a and 115g R290 charge .......... 57
Figure 30 - R134a heat pump cycle average thermistor temperatures at 220g charge .......................... 59
Figure 31 - R290 Heat pump cycle average thermistor temperatures at 115g charge ........................... 60
Figure 32 - Subcooling at the condenser outlet and overheating at the evaporator outlet at 220g R134a
and 115g R290 charge ........................................................................................................................... 61
Figure 33 - Evaporator pressure loss at 220g R134a and 115g R290 charge ........................................ 62
Figure 34 – Calculated Heat Pump COP at 220g R134a and 115g R290 charge .................................. 63
Figure 35 - Calculated Compressor Efficiency vs Suction pressure at 220g R134a and 115g R290
charge .................................................................................................................................................... 64
Figure 36 - Calculated Compressor Efficiency vs Pressure Ratio at 220g R134a and 115g R290 charge
............................................................................................................................................................... 65
Figure 37 - Calculated Compressor Efficiency at 220g R134a and 115g R290 charge ........................ 67
Figure 38 - Specific moisture extraction rate (SMER) calculated from hygrometers at 220g R134a and
115g R290 charge .................................................................................................................................. 69
Figure 39 - Moisture extraction rate calculated from hygrometers at 220g R134a and 115g R290
charge .................................................................................................................................................... 70
Figure 40 - Optimal R290 charge .......................................................................................................... 71
90
Figure 41 - Average Heat Pump COP at different R290 charge levels ................................................. 72
Figure 42 - Average SMER at different R290 charge levels based on hygrometer values ................... 72
Figure 43 - Initial experiment performance of R290 at 120 cm capillary tube and increasing
refrigerant charge .................................................................................................................................. 74
Figure 44 - Overheating at the evaporator outlet at different charge levels ........................................ 75
Figure 45 - Measured pressure ratio across the compressor................................................................ 76
Figure 46 - Calculated compressor efficiency vs Pressure ratio ............................................................ 77
Figure 47 - Calculated average Heat pump COP, including 120cm capillary tube at 150g charge ....... 78
Figure 48 – Average SMER based on hygrometer readings, including 120cm capillary tube at 150g
charge .................................................................................................................................................... 78
91
List of tables Table 1- Overview of relevant design parameters derived from literature [4] ........................................ 4
Table 2 - Materials compatibility with R290 [23] ................................................................................. 15
Table 3 - Chemical Properties of refrigerants R134a and R290[25, 26] ............................................... 16
Table 4 - Specifics heats of water at 1.01 bara [39] .............................................................................. 23
Table 5 - Pipe diameter ......................................................................................................................... 26
Table 6 - Rated input power of the drum dryer’s original main components ........................................ 27
Table 7 - Design specifications ............................................................................................................. 28
Table 8 - Tecumseh AE4430U-FZ1A specifications ............................................................................ 29
Table 9 - Standardized procedure .......................................................................................................... 33
Table 10 - Constants for Equation 8 ...................................................................................................... 43
Table 11 - Valid experiments ................................................................................................................ 49
Table 12 - Compressor efficiency correlation factors ........................................................................... 65
Table 13 - Overall system performance ................................................................................................ 79

Appendix A large quantity of sensor data is logged and processed as a part of this thesis. Due to the vast amount
of data points, the logs are not applicable for analog representation. Therefore, appendix D-A to D-D
only exist in digital format. This is also the case for the LabView VI. If you wish to obtain these
appendixes, please contact the author.
Printed appendixes: Appendix A: Materials compatibility of propane
Appendix B: List of experiments
Appendix C: Data Sheet: Rechi 39E073B
Appendix D: Data Sheet: Tecumseh AE4430U-FZ1A
Appendix E: Risk Assessment
Digital appendixes: Appendix D-A: Excel: Experiments log (.zip)
Appendix D-B: LabVIEW VI: LabVIEW Tørketrommel 2018
Appendix D-C: Risk Assessment Report
Appendix D-D: Excel: Processed logs (.zip)


APPENDIX A: MATERIALS COMPETABILITY OF PROPANE
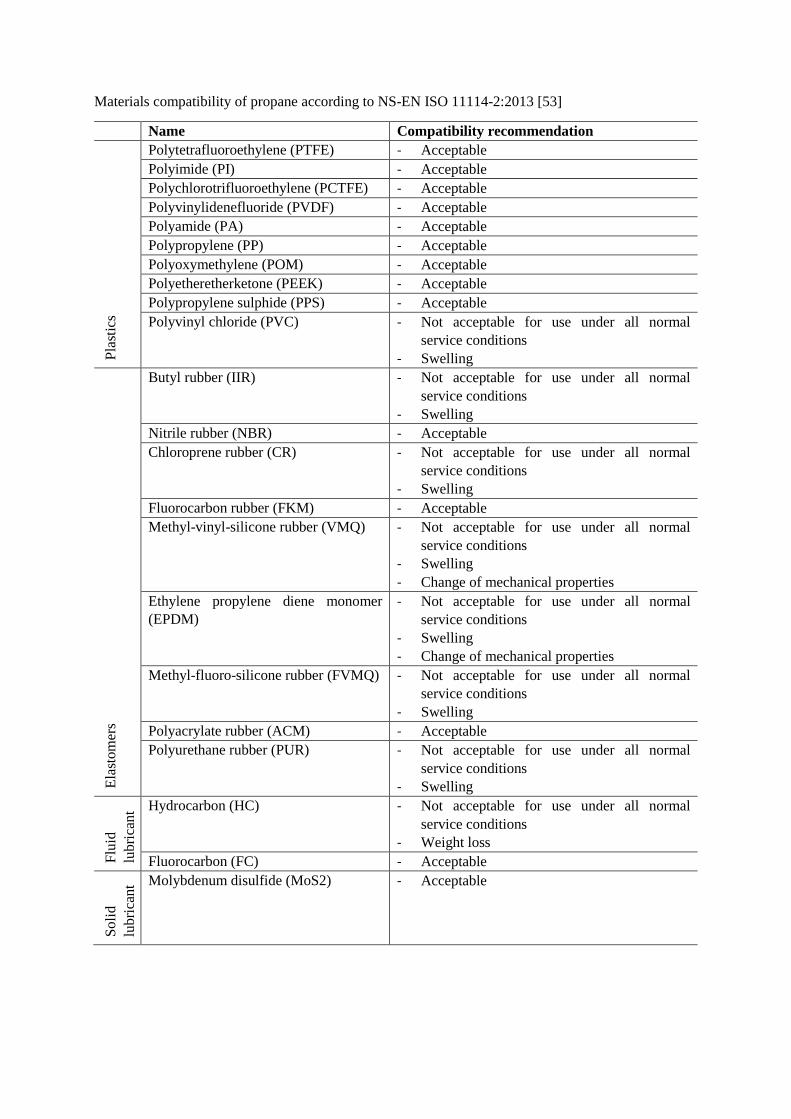
Materials compatibility of propane according to NS-EN ISO 11114-2:2013 [53]
Name Compatibility recommendation
Pla
stic
s
Polytetrafluoroethylene (PTFE) - Acceptable
Polyimide (PI) - Acceptable
Polychlorotrifluoroethylene (PCTFE) - Acceptable
Polyvinylidenefluoride (PVDF) - Acceptable
Polyamide (PA) - Acceptable
Polypropylene (PP) - Acceptable
Polyoxymethylene (POM) - Acceptable
Polyetheretherketone (PEEK) - Acceptable
Polypropylene sulphide (PPS) - Acceptable
Polyvinyl chloride (PVC) - Not acceptable for use under all normal
service conditions
- Swelling
Ela
stom
ers
Butyl rubber (IIR) - Not acceptable for use under all normal
service conditions
- Swelling
Nitrile rubber (NBR) - Acceptable
Chloroprene rubber (CR) - Not acceptable for use under all normal
service conditions
- Swelling
Fluorocarbon rubber (FKM) - Acceptable
Methyl-vinyl-silicone rubber (VMQ) - Not acceptable for use under all normal
service conditions
- Swelling
- Change of mechanical properties
Ethylene propylene diene monomer
(EPDM)
- Not acceptable for use under all normal
service conditions
- Swelling
- Change of mechanical properties
Methyl-fluoro-silicone rubber (FVMQ) - Not acceptable for use under all normal
service conditions
- Swelling
Polyacrylate rubber (ACM) - Acceptable
Polyurethane rubber (PUR) - Not acceptable for use under all normal
service conditions
- Swelling
Flu
id
lub
rica
nt Hydrocarbon (HC) - Not acceptable for use under all normal
service conditions
- Weight loss
Fluorocarbon (FC) - Acceptable
So
lid
lub
rica
nt Molybdenum disulfide (MoS2) - Acceptable
APPENDIX B: LIST OF EXPERIMENTS
All experiments performed as part of the master thesis is listed in this appendix. The table
displays the date, reference code/file name, refrigerant and comments. Experiments included in
Table 11 is highlighted in grey, and the number referring to Table 11 is stated in the first
column. In cases where the length of the experiment deviates from the standard setups, the
length of the experiment is stated together with the setup defining the other parameters of the
experiment.
The reference code/file name is used when processing experiments logs. It is a unique code for
each experiment applied as the name of the file containing the original experiments log. It is
used as a reference code when processing experimental data and can be used to track the
calculations preceding the data presented in the thesis.
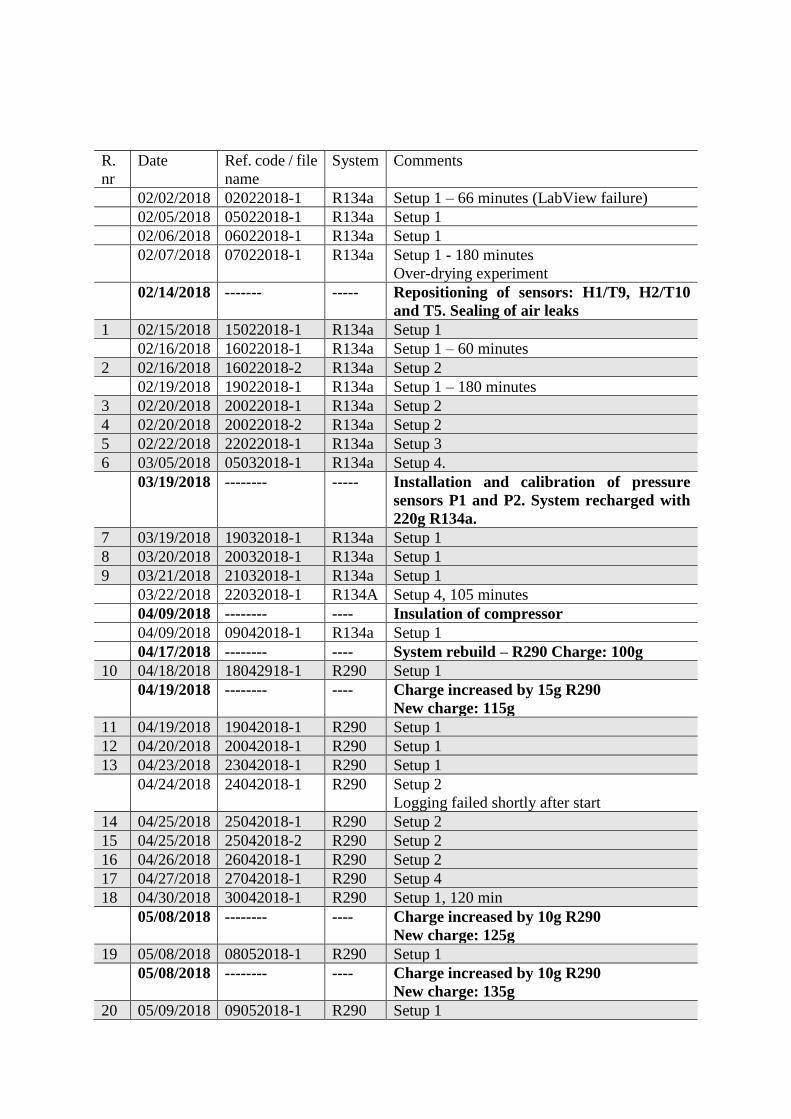
R.
nr
Date Ref. code / file
name
System Comments
02/02/2018 02022018-1 R134a Setup 1 – 66 minutes (LabView failure)
02/05/2018 05022018-1 R134a Setup 1
02/06/2018 06022018-1 R134a Setup 1
02/07/2018 07022018-1 R134a Setup 1 - 180 minutes
Over-drying experiment
02/14/2018 ------- ----- Repositioning of sensors: H1/T9, H2/T10
and T5. Sealing of air leaks
1 02/15/2018 15022018-1 R134a Setup 1
02/16/2018 16022018-1 R134a Setup 1 – 60 minutes
2 02/16/2018 16022018-2 R134a Setup 2
02/19/2018 19022018-1 R134a Setup 1 – 180 minutes
3 02/20/2018 20022018-1 R134a Setup 2
4 02/20/2018 20022018-2 R134a Setup 2
5 02/22/2018 22022018-1 R134a Setup 3
6 03/05/2018 05032018-1 R134a Setup 4.
03/19/2018 -------- ----- Installation and calibration of pressure
sensors P1 and P2. System recharged with
220g R134a.
7 03/19/2018 19032018-1 R134a Setup 1
8 03/20/2018 20032018-1 R134a Setup 1
9 03/21/2018 21032018-1 R134a Setup 1
03/22/2018 22032018-1 R134A Setup 4, 105 minutes
04/09/2018 -------- ---- Insulation of compressor
04/09/2018 09042018-1 R134a Setup 1
04/17/2018 -------- ---- System rebuild – R290 Charge: 100g
10 04/18/2018 18042918-1 R290 Setup 1
04/19/2018 -------- ---- Charge increased by 15g R290
New charge: 115g
11 04/19/2018 19042018-1 R290 Setup 1
12 04/20/2018 20042018-1 R290 Setup 1
13 04/23/2018 23042018-1 R290 Setup 1
04/24/2018 24042018-1 R290 Setup 2
Logging failed shortly after start
14 04/25/2018 25042018-1 R290 Setup 2
15 04/25/2018 25042018-2 R290 Setup 2
16 04/26/2018 26042018-1 R290 Setup 2
17 04/27/2018 27042018-1 R290 Setup 4
18 04/30/2018 30042018-1 R290 Setup 1, 120 min
05/08/2018 -------- ---- Charge increased by 10g R290
New charge: 125g
19 05/08/2018 08052018-1 R290 Setup 1
05/08/2018 -------- ---- Charge increased by 10g R290
New charge: 135g
20 05/09/2018 09052018-1 R290 Setup 1
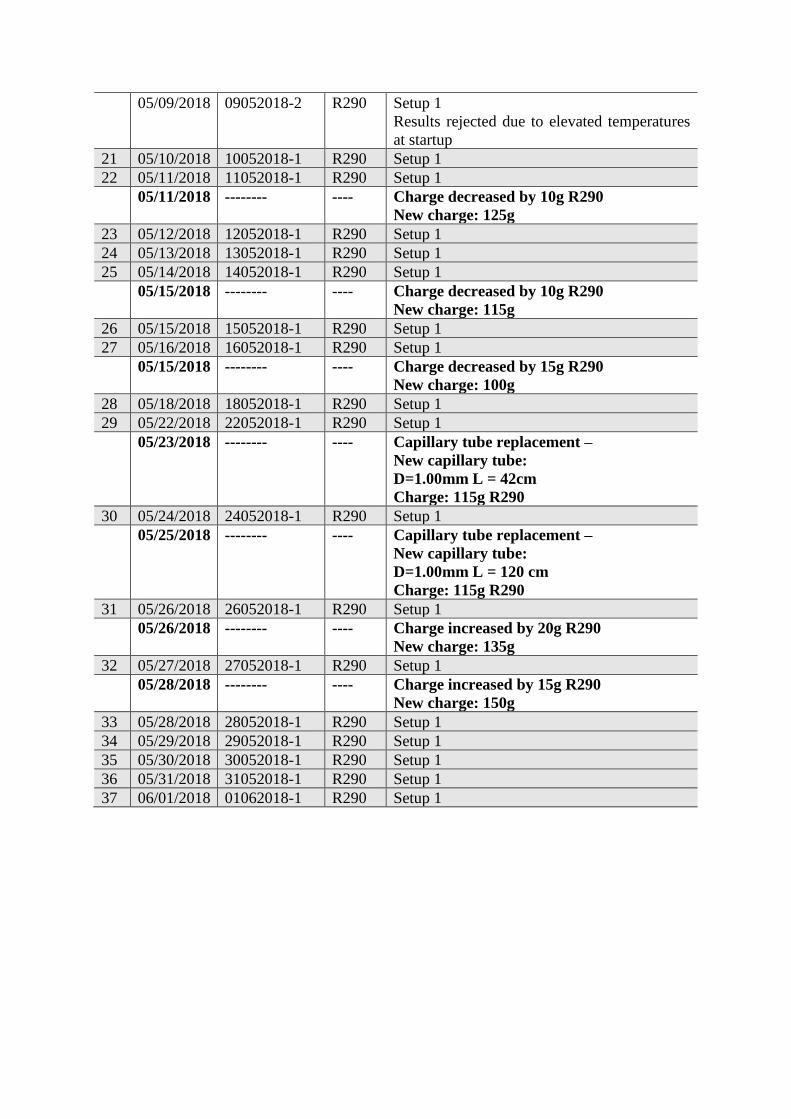
05/09/2018 09052018-2 R290 Setup 1
Results rejected due to elevated temperatures
at startup
21 05/10/2018 10052018-1 R290 Setup 1
22 05/11/2018 11052018-1 R290 Setup 1
05/11/2018 -------- ---- Charge decreased by 10g R290
New charge: 125g
23 05/12/2018 12052018-1 R290 Setup 1
24 05/13/2018 13052018-1 R290 Setup 1
25 05/14/2018 14052018-1 R290 Setup 1
05/15/2018 -------- ---- Charge decreased by 10g R290
New charge: 115g
26 05/15/2018 15052018-1 R290 Setup 1
27 05/16/2018 16052018-1 R290 Setup 1
05/15/2018 -------- ---- Charge decreased by 15g R290
New charge: 100g
28 05/18/2018 18052018-1 R290 Setup 1
29 05/22/2018 22052018-1 R290 Setup 1
05/23/2018 -------- ---- Capillary tube replacement –
New capillary tube:
D=1.00mm L = 42cm
Charge: 115g R290
30 05/24/2018 24052018-1 R290 Setup 1
05/25/2018 -------- ---- Capillary tube replacement –
New capillary tube:
D=1.00mm L = 120 cm
Charge: 115g R290
31 05/26/2018 26052018-1 R290 Setup 1
05/26/2018 -------- ---- Charge increased by 20g R290
New charge: 135g
32 05/27/2018 27052018-1 R290 Setup 1
05/28/2018 -------- ---- Charge increased by 15g R290
New charge: 150g
33 05/28/2018 28052018-1 R290 Setup 1
34 05/29/2018 29052018-1 R290 Setup 1
35 05/30/2018 30052018-1 R290 Setup 1
36 05/31/2018 31052018-1 R290 Setup 1
37 06/01/2018 01062018-1 R290 Setup 1


APPENDIX C: DATA SHEET: RECHI 39E073B


APPENDIX D: DATA SHEET: TECUMSEH AE4430U-FZ1A
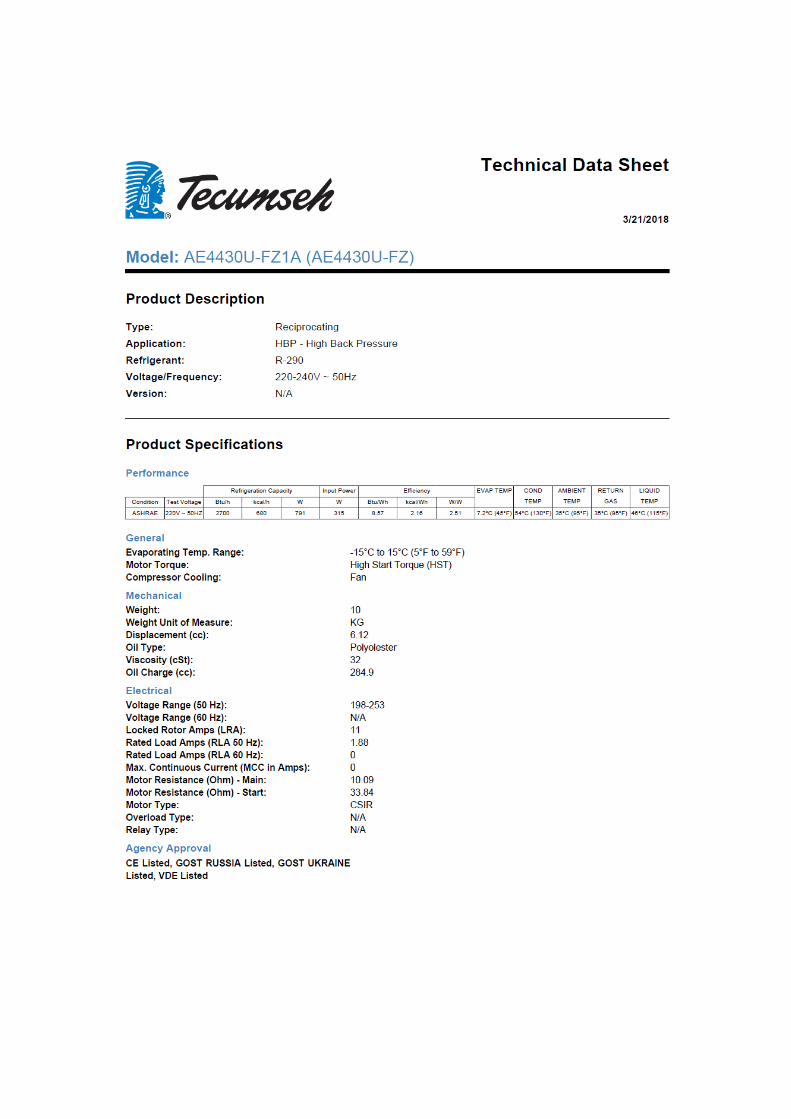

APPENDIX E: RISK ASSESSMENT

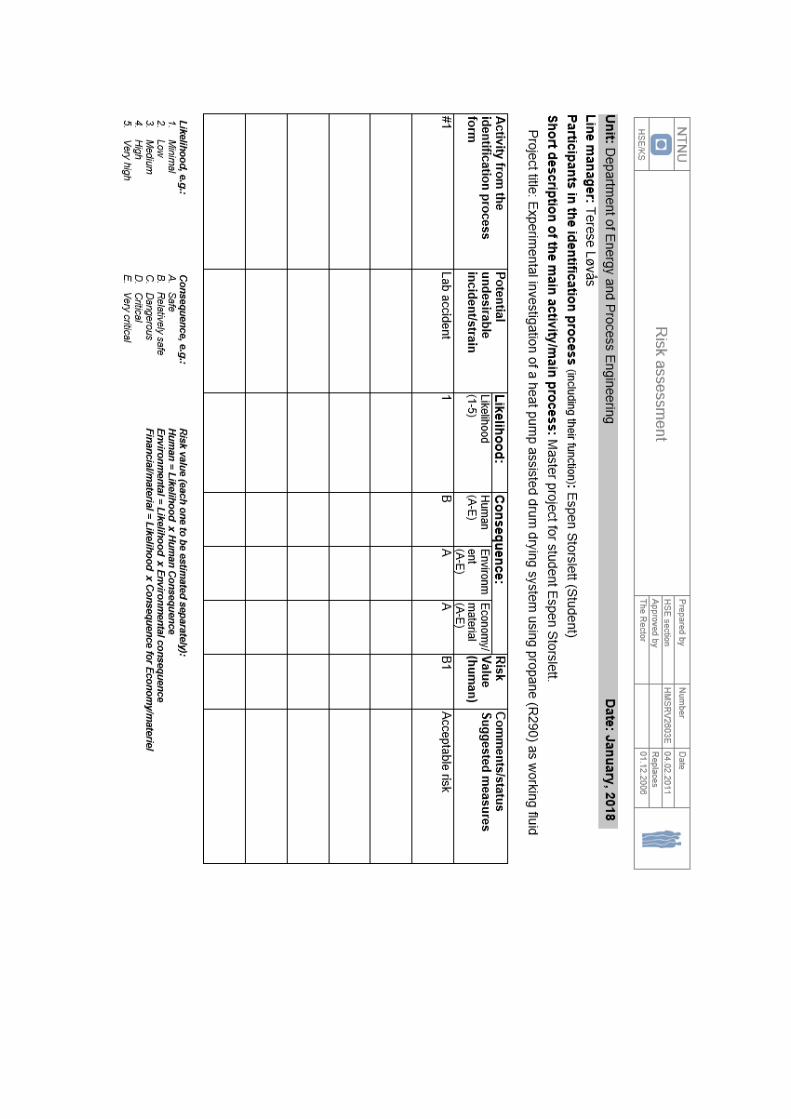
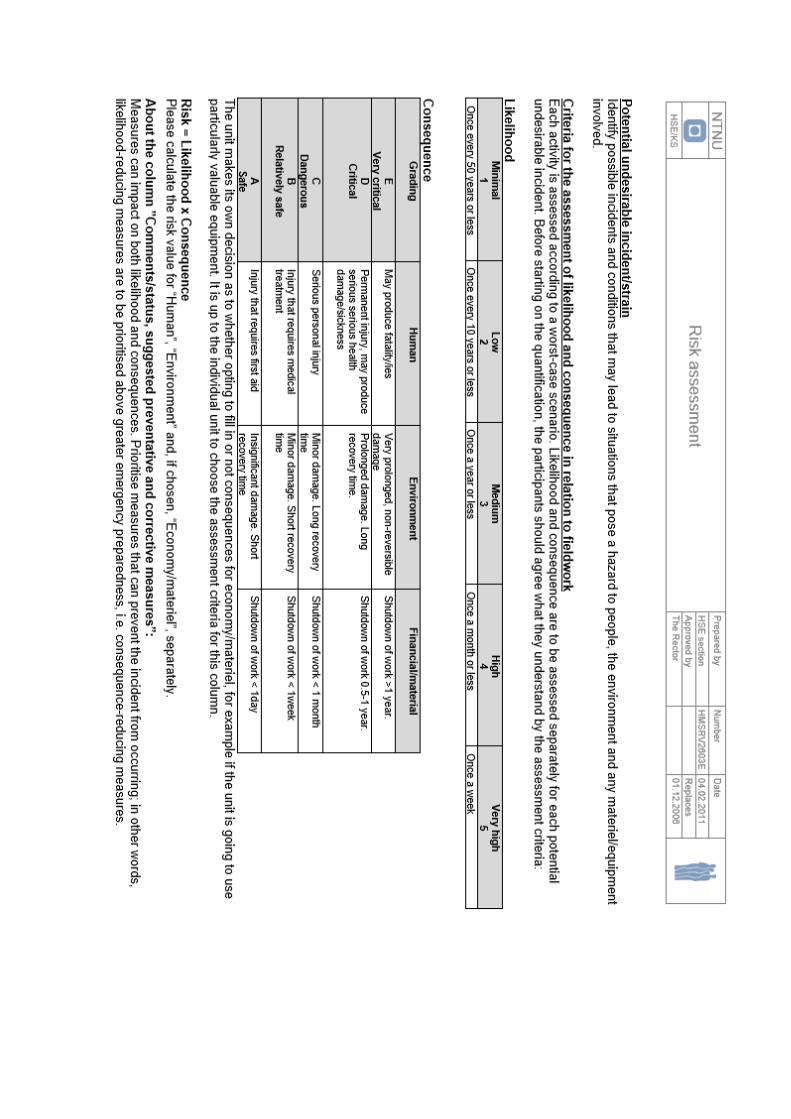
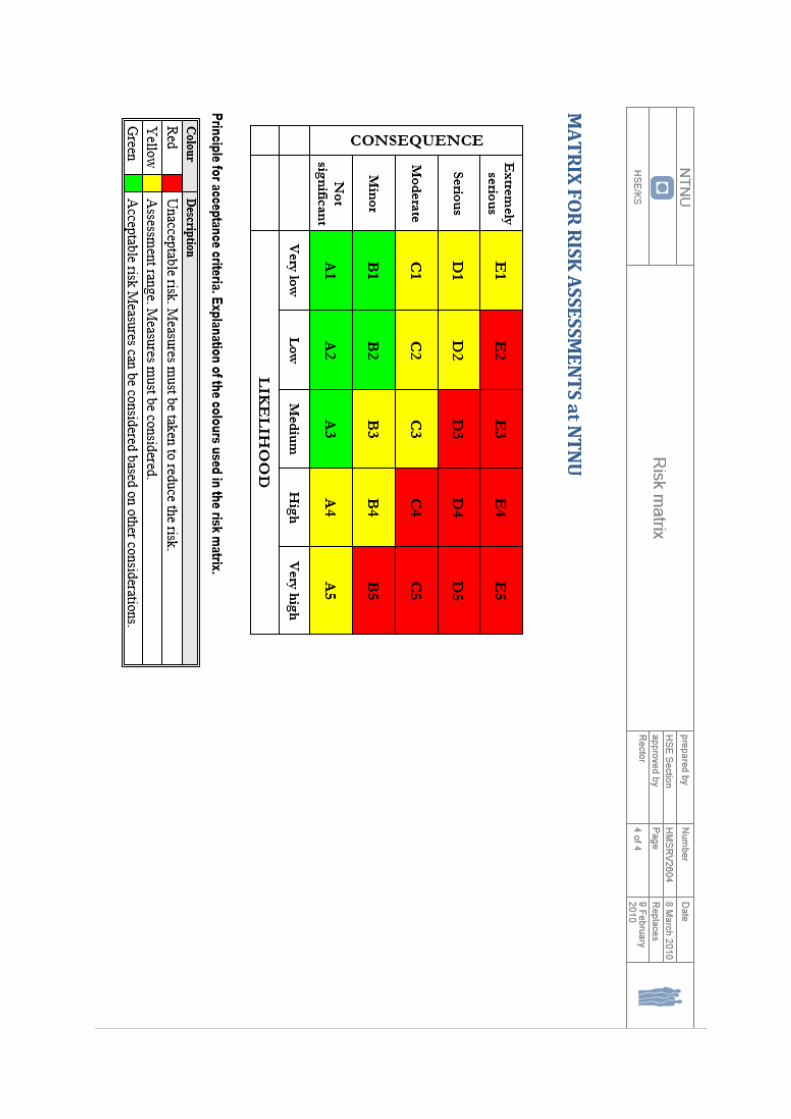
Related Documents