EXPERIMENTAL INVESTIGATION AND NUMERICAL MODELLING OF HYDROGEN EXPOSED PIEZOELECTRIC ACTUATORS FOR FUEL INJECTOR APPLICATIONS by Yadvinder Singh B.Tech. (Mechanical), Jamia Millia Islamia University, 2007 Thesis Submitted in Partial Fulfillment of the Requirements for the Degree of Master of Applied Science in the School of Engineering Science Faculty of Applied Sciences Yadvinder Singh 2013 SIMON FRASER UNIVERSITY Spring 2013 All rights reserved. However, in accordance with the Copyright Act of Canada, this work may be reproduced, without authorization, under the conditions for “Fair Dealing.” Therefore, limited reproduction of this work for the purposes of private study, research, criticism, review and news reporting is likely to be in accordance with the law, particularly if cited appropriately.

Welcome message from author
This document is posted to help you gain knowledge. Please leave a comment to let me know what you think about it! Share it to your friends and learn new things together.
Transcript
EXPERIMENTAL INVESTIGATION AND
NUMERICAL MODELLING OF HYDROGEN
EXPOSED PIEZOELECTRIC ACTUATORS FOR
FUEL INJECTOR APPLICATIONS
by
Yadvinder Singh
B.Tech. (Mechanical), Jamia Millia Islamia University, 2007
Thesis Submitted in Partial Fulfillment
of the Requirements for the Degree of
Master of Applied Science
in the
School of Engineering Science
Faculty of Applied Sciences
Yadvinder Singh 2013
SIMON FRASER UNIVERSITY
Spring 2013
All rights reserved. However, in accordance with the Copyright Act of Canada, this work may
be reproduced, without authorization, under the conditions for “Fair Dealing.” Therefore, limited reproduction of this work for the
purposes of private study, research, criticism, review and news reporting is likely to be in accordance with the law, particularly if cited appropriately.
ii
Approval
Name: Yadvinder Singh
Degree: Master of Applied Science (Engineering Science)
Title of Thesis: Experimental investigation and numerical modelling of hydrogen exposed piezoelectric actuators for fuel injector applications
Examining Committee:
Chair: Gary Wang, Professor
Nimal Rajapakse Senior Supervisor Professor
Erik Kjeang Supervisor Assistant Professor
Siamak Arzanpour Internal Examiner Assistant Professor
Date Defended/Approved: March 27, 2013
iii
Partial Copyright Licence
iv
Abstract
Piezoelectric actuators are increasingly used for the electronic control of fuel injector
opening valves. Hydrogen is considered an attractive clean alternative fuel for
automobile and power generation applications. Current understanding of the
performance of piezoelectric actuators in a hydrogen environment is very limited. This
work is aimed at experimentally investigating the performance of hydrogen-exposed
piezoelectric actuators under conditions directly relevant to a hydrogen-based fuel
injector. The performance is assessed with both quasi-static and dynamic electric loads.
It is found that up to 12 weeks of continuous exposure to hydrogen at 100°C and 10
MPa has a negligible effect on the actuator stroke when testing is conducted at
temperatures of 5-80°C. Cyclic exposure and exposure done on fatigue cycled actuators
also yields similar results. Microstructure and dielectric investigations confirm this
behavior. The reason for a negligible effect of hydrogen is attributed to the presence of a
protective ceramic insulation around the lateral surface of actuators which deactivates
the hydrogen diffusion mechanism. A fully-coupled 3-D FEM-based numerical model of a
Thermo-Electro-Mechanical continuum in hydrogen environment is developed using the
‘Equation Based Modeling’ feature of COMSOL Multiphysics. The model provides a
useful tool for understanding the localized responses of the actuators in hydrogen
environment and to predict their durability and applicability under different conditions.
Keywords: Piezoelectricity; actuator stroke; fuel injector; hydrogen; diffusion in solids; finite element method

v
Dedication
This work is dedicated to my family which was
always a pillar of support and a source of
strength for me in my good and bad times. I
also wish to dedicate this work to the family of
Mr. Mohinder Nijjar who supported me when I
needed it the most and without whom this
degree would never have been possible. Last but
not the least, this work is dedicated to my
friends, Abhimanyu, Tarun, Santosh, Kapil,
Partha and Tanumay, who were a guiding light
and an encouraging force behind my decision to
pursue a master’s degree

vi
Acknowledgements
First and foremost, I would like to acknowledge my thesis supervisors, Dr. Nimal
Rajapakse and Dr. Erik Kjeang, for giving me this opportunity in the first place and
providing me with invaluable guidance and support during the course of my thesis work.
I am also thankful to Dr. Rajapakse for providing me with financial assistance through his
NSERC research grant.
I am grateful to Westport Innovations Inc. for providing an in-kind support to my project.
The guidance and assistance given by David Mumford, Muhammed Tahir, Johhny
Veliath and Bradley Takaki is particularly acknowledged.
I am also thankful to my colleagues, Ali Shafiei, Carmen Oprea, Mohamed Senousy,
Mohammad Nouroz Islam at the University of British Columbia, Yasothorn Sapsathiarn
at the Simon Fraser University and Dr. Santosh Kapuria at IIT Delhi for taking time out of
their busy schedules to address my demands for guidance and support.
And finally, I am thankful to all my friends at the University for helping me with research
problems. The discussions, in particular with my roommate Abhishek Nanjundappa
during the stressful times, were always comforting and meaningful.
Yadvinder Singh
vii
Table of Contents
Approval .......................................................................................................................... ii Partial Copyright Licence ............................................................................................... iii Abstract .......................................................................................................................... iv Dedication ....................................................................................................................... v Acknowledgements ........................................................................................................ vi Table of Contents .......................................................................................................... vii List of Tables .................................................................................................................. ix List of Figures.................................................................................................................. x List of Symbols .............................................................................................................. xiii List of Acronyms ............................................................................................................ xv
1. Introduction .......................................................................................................... 1 1.1. Piezoelectric Materials ............................................................................................ 2 1.2. PZT Ceramics ........................................................................................................ 6 1.3. Piezoelectric Stack Actuators ................................................................................. 8 1.4. Piezoelectric Stack Actuators in Fuel Injectors ..................................................... 11 1.5. Self-Heat Generation in Piezoelectric Stack Actuators ......................................... 14 1.6. Hydrogen in IC Engines ........................................................................................ 15 1.7. Literature Review ................................................................................................. 17
1.7.1. Experimental Investigation ........................................................................ 17 1.7.2. Numerical Modelling .................................................................................. 20
1.8. Scope of the Present Work ................................................................................... 21
2. Experimental Investigation ................................................................................ 23 2.1. Experimental Procedure ....................................................................................... 23
2.1.1. Hydrogen Exposure .................................................................................. 24 2.1.2. Testing ...................................................................................................... 25 2.1.3. Experimental Challenges .......................................................................... 30
2.2. Experimental Results and Discussion ................................................................... 33 2.2.1. Performance of Unexposed Actuators ....................................................... 33 2.2.2. Self-heating in Unexposed Actuators ........................................................ 39 2.2.3. Comparison of PI and KCI Actuators ......................................................... 43 2.2.4. Performance of Actuators after Continuous and Cyclic Hydrogen
Exposure .................................................................................................. 44 2.2.5. Explanation for Negligible Hydrogen Effects on Actuator
Performance ............................................................................................. 46 2.2.6. Performance of Fatigue Cycled - Hydrogen Exposed Actuators ................ 48 2.2.7. Microstructure and Dielectric Investigation ................................................ 50
2.3. Summary of Experimental Results ........................................................................ 51
3. Numerical Modelling........................................................................................... 53 3.1. Linear Thermo-Electro-Mechanical Material Behaviour ........................................ 53 3.2. Hydrogen Diffusion in PZT .................................................................................... 56 3.3. Effect of Hydrogen on PZT Material Properties ..................................................... 57 3.4. Numerical Solution using ‘Equation Based Modelling’ in COMSOL ...................... 59
viii
3.5. Model Description ................................................................................................. 60 3.6. Numerical Results and Discussion ....................................................................... 63
3.6.1. Case Study I – Unexposed Actuators ........................................................ 63 3.6.2. Case Study II – Hydrogen Exposed Actuators........................................... 65
3.7. COMSOL Model Validation with In-house Thermo-Electro-Mechanical FE Model ................................................................................................................... 69
3.8. Summary of Numerical Results ............................................................................ 70
4. Conclusions ........................................................................................................ 72 4.1. Summary and Conclusions ................................................................................... 72 4.2. Recommendations for Future Work ...................................................................... 74
References ................................................................................................................... 76
Appendices .................................................................................................................. 80 Appendix A. Material Properties of PI 885.91 actuators ................................ 81 Appendix B. FE Formulation of the In-house Thermo-Electro-
Mechanical Model ................................................................................................ 83

ix
List of Tables
Table 2.1. Characteristics of PI-885.91 actuators ......................................................... 24
x
List of Figures
Figure 1.1 Direct and Converse piezoelectric effects along with their coupling variables ........................................................................................................ 2
Figure 1.2 Experimental demonstration of: (a) Direct piezoelectric effect; and (b) Converse piezoelectric effect ......................................................................... 3
Figure 1.3 PZT perovskite structure in: (a) Cubic phase at T > Tc; and (b) Tetragonal phase at T < Tc ................................................................ 8
Figure 1.4 Typical distribution of forces and displacements generated by a piezoelectric actuator at different applied electrical inputs and mechanical boundary conditions. ................................................................... 9
Figure 1.5 (a) Bimorph cantilevered piezoelectric actuator; and (b) Piezoelectric disk undergoing expansion due to applied electric voltage ........................... 10
Figure 1.6 Cross-section of a piezoelectric stack actuator. ........................................... 11
Figure 1.7 Schematic of a piezoelectric actuator based fuel injector. ............................ 12
Figure 2.1 Image of PI-885.91 actuator depicting its external features .......................... 23
Figure 2.2 (a) Continuous and (b) Cyclic exposure approaches .................................... 24
Figure 2.3 Schematic of test rig .................................................................................... 25
Figure 2.4 Typical quasi-static driving signal ................................................................. 26
Figure 2.5 Dynamic driving signal with DC offset .......................................................... 27
Figure 2.6 Sinusoidal driving signal with duty cycle ....................................................... 28
Figure 2.7 Half-trapezoidal driving signal with 25 % duty cycle ..................................... 28
Figure 2.8 Spring-mass model of test system ............................................................... 31
Figure 2.9 Quasi-static stroke-voltage relationship of unexposed actuator for different ambient temperatures .................................................................... 33
Figure 2.10 Quasi-static stroke-temperature relationship of unexposed actuator for different applied voltages. ....................................................................... 34
Figure 2.11 Variation of d33 with applied quasi-static voltage at different ambient temperatures for an unexposed actuator. .................................................... 35
Figure 2.12 Variation of d33 with ambient temperature at different applied quasi-static voltages for an unexposed actuator. ................................................... 35
xi
Figure 2.13 Quasi-static piezoelectric hysteresis of unexposed actuator at 20°C .......... 36
Figure 2.14 Effect of sinusoidal driving signal frequency on dynamic stroke of unexposed actuator for different driving voltages at 20°C ............................ 37
Figure 2.15 Effect of positive DC offset on dynamic stroke of unexposed actuator for different applied voltages at 20°C ........................................................... 37
Figure 2.16 Effect of duty cycle percentage on dynamic stroke of unexposed actuator for different applied voltages at 20°C ............................................. 38
Figure 2.17 Effect of rise time percentage on dynamic stroke of unexposed actuator for different applied voltages at 20°C ............................................. 39
Figure 2.18 Temperature rise and dynamic stroke during continuous sinusoidal electric loading under different applied voltages at frequencies; a) 100 Hz; b) 150 Hz; and c) 200 Hz ....................................................................... 40
Figure 2.19 Variation of steady-state temperature with; a) applied voltage; and b) frequency .......................................................................................... 41
Figure 2.20 Comparison of experimental and theoretical steady-state temperature rise for a continuous 120 Vpp sinusoidal signal at 20°C ............ 43
Figure 2.21 Comparative thermal performance of PI and KCI actuators; (a) temperature dependence of quasi-static stroke at 1.8 kV/mm applied electric field; and (b) temperature increase due to self-heating under 200 Hz sinusoidal dynamic excitation .......................................................... 43
Figure 2.22 Effect of continuous hydrogen exposure on actuator stroke at 20°C under; a) quasi-static; and b) 100 Hz sinusoidal dynamic electrical loading....... .................................................................................................. 44
Figure 2.23 Effect of cyclic hydrogen exposure on quasi-static stroke at 20°C .............. 45
Figure 2.24 a) Cross-section of a typical bulk study sample under hydrogen exposure; and b) mechanism governing diffusion of hydrogen into PZT sample ................................................................................................. 47
Figure 2.25 Comparison of hydrogen diffusion mechanism in bulk sample and PI actuator..... .................................................................................................. 48
Figure 2.26 Hydrogen exposure effects on the quasi–static performance of cycled actuator at 20°C ........................................................................................... 48
Figure 2.27 Normalized dynamic stroke of PI actuators during fatigue cycling ............... 49
Figure 2.28 Micrographs of lateral surface of; (a) new PI actuators; and (b) after their 12 week hydrogen (100°C, 10 MPa) exposure ..................................... 50
xii
Figure 3.1 Hydrogen exposure conditions for a single PZT stack actuator layer ........... 57
Figure 3.2 Simplified relation for the dependence of d33 on H-atoms concentration approximated from the results of Wu et al [5] ......................... 58
Figure 3.3 3-D model of a single PZT layer depicting its dimensions, polarization and prescribed boundary conditions ............................................................ 60
Figure 3.4 Mesh independence analysis: (a) Variation of overall actuator stroke with mesh size when C0=0ppm, T0=20°C and V0=120 Volts; and (b) z-displacement profiles after 10 min. along the x-axis on the top surface of PZT layer for different mesh sizes when C0=2ppm, T0=20°C and V0=100 Volts ........................................................................... 62
Figure 3.6 Comparison of experimentally measured and numerically evaluated quasi-static stroke-temperature relationship at 100 Volts for an unexposed actuator ..................................................................................... 64
Figure 3.7 (a) Location of analysis points on the top surface of the model; and (b) Concentration time-history at the analysis points when T0=80°C and C0=2ppm ..................................................................................................... 65
Figure 3.9 Displacement time-history at the analysis points for T0=20°C and 80°C, C0=2ppm and V0=100 Volts ............................................................... 67
Figure 3.10 (a) Concentration profiles; and (b) Displacement profiles; along x-axis on the top surface of PZT layer at different times when C0=2 ppm, T0=20°C and V0=100 Volts ........................................................................... 68
Figure 3.11 (a) Displacement time-history at the analysis points; and (b) Displacement profiles along x-axis on the top surface of PZT layer at different times; when C0=1 ppm, T0=20°C and V0=100 Volts ....................... 69
Figure 3.12 Stroke-voltage relationship at 20°C under static electric loading obtained from COMSOL model and in-house MATLAB program ................. 70

xiii
List of Symbols
σ Mechanical stress
E Electric field
T Temperature, temperature rise from stress-free state
ϵ Mechanical strain
D Electric displacement, Diffusion coefficient of H-atoms in PZT
S Entropy density
s Elastic compliance coefficient
d Piezoelectric strain coefficient
α Thermal strain coefficient
ε Absolute dielectric coefficient
p Pyroelectric coefficient
ρ Mass density
Cv Specific heat at constant volume
Tref Reference temperature
αv A material constant dependent on ρ, Cv and Tref
mdip Electric dipole moment
qdip Magnitude of each dipole charge
ddip Distance of separation between dipole charges
P Electric polarization
PS Spontaneous electric polarization
Tc Curie temperature
V Electric potential at a point in continuum, applied voltage on actuator
t Thickness of a single layer of a stack actuator, time
Ec Coercive electric field
δT, ∆T Actuator temperature rise at time t during a dynamic operation
δT∞, ∆T∞ Actuator temperature rise at steady state during a dynamic operation
τ Time constant
Ve Total active volume of actuator
A Total surface area of actuator
Pr Remnant polarization
Vpp Peak-to-peak driving voltage

xiv
Tp Time period of periodic signal
Td Time period of driving signal
dt Duty cycle
Vr Voltage amplitude in a trapezoidal signal
Tr Time taken to reach Vr
Df Displacement hysteresis
C Capacitance of the actuator, H-atoms concentration
f Applied voltage frequency
Overall heat convection coefficient
A1 Actuator’s surface area exposed to the ambient air
b Mechanical body force
u, v, w Mechanical displacement
φe Electric body charge density
q Heat flux
φt Heat source density
c Elastic stiffness
e Piezoelectric stress coefficient
λ Thermal stress coefficient
Thermal conductivity coefficient
Boundary surface of the continuum
n Outward unit normal to the boundary
Prescribed surface traction
Prescribed Surface charge
Prescribed surface flux out
hv Convection heat transfer coefficient at the surface
Tf Ambient fluid temperature w.r.t. the stress-free state temperature
J H-atoms diffusion flux
Δt Time interval

xv
List of Acronyms
MEMS Microelectromechanical Systems
ICE Internal Combustion Engine
PZT Lead Zirconate Titanate
HPDI High-Pressure Direct Injection
HCNG Hydrogen-enriched Compressed Natural Gas
GHG Greenhouse Gases
KCI Kinetic Ceramics Inc.
AC Alternating Current
DC Direct Current
FE Finite Element
FD Finite Difference
UBC University of British Columbia
CERC Clean Energy Research Center
DVRT Differential Variable Reluctance Transducer
RTD Resistance Temperature Detector
DAQ Data Acquisition Card
SEM Scanning Electron Microscope
EDS Electron Dispersive X-ray Spectroscopy
PDE Partial Differential Equation
FEM Finite Element Method
1
1. Introduction
Smart materials, also known as intelligent or adaptive materials, are a special
class of engineering materials which exhibit coupling between multiple physical domains.
Due to this coupling, a stimulus provided in one physical domain can produce a
response in another physical domain. The coupled domains may be mechanical,
electrical, thermal, magnetic, chemical, and so on. Piezoelectric materials, shape
memory alloys, electroactive polymers, fiber optics, magnetostrictive materials and
electrochomic materials are a few example materials that exhibit such coupling and
therefore, fall under the category of smart materials. An engineering system that utilizes
the coupling properties of smart materials to provide functionality is called a smart
material system [16]. Past 2-3 decades have witnessed an increased utilization of the
smart material systems in diverse engineering applications. From the aircrafts to the
microelectromechanical systems (MEMS), from the automobiles to the computers and
from the health monitoring of machines to the treatment of cardiovascular diseases in
humans, there is an expansive list of disciplines which have benefitted from the distinct
functionalities offered by the smart material systems.
This chapter discusses one such type of smart material system - a stack actuator
based on the piezoelectric material. The application of interest is fuel injectors for Direct-
Ignition Internal Combustion Engines (ICEs) running on a hydrogen fuel. An overview of
the fundamental nature of material and coupling along with the various physical
processes involved during the use of piezoelectric actuator in a hydrogen-based fuel
injector are presented. The advantages and challenges arising due to the use of such
systems in this particular application are outlined. Scope for the current project is defined
keeping in mind the project objectives and previous research done in this area.
2
1.1. Piezoelectric Materials
Certain materials when subjected to an applied mechanical stress, experience
the development of an electric charge within them. This mechanical-to-electrical coupling
was discovered by Pierre and Jacques Curie in 1880 when they were studying the effect
of pressure on natural single-crystal structures like quartz, topaz and Rochelle salt [17].
It was later termed as direct piezoelectricity due to the fact that it had been discovered
before the discovery, in 1881 by Lippmann, of an electrical-to-mechanical coupling
termed as converse piezoelectricity and exhibited by the same materials. Both these
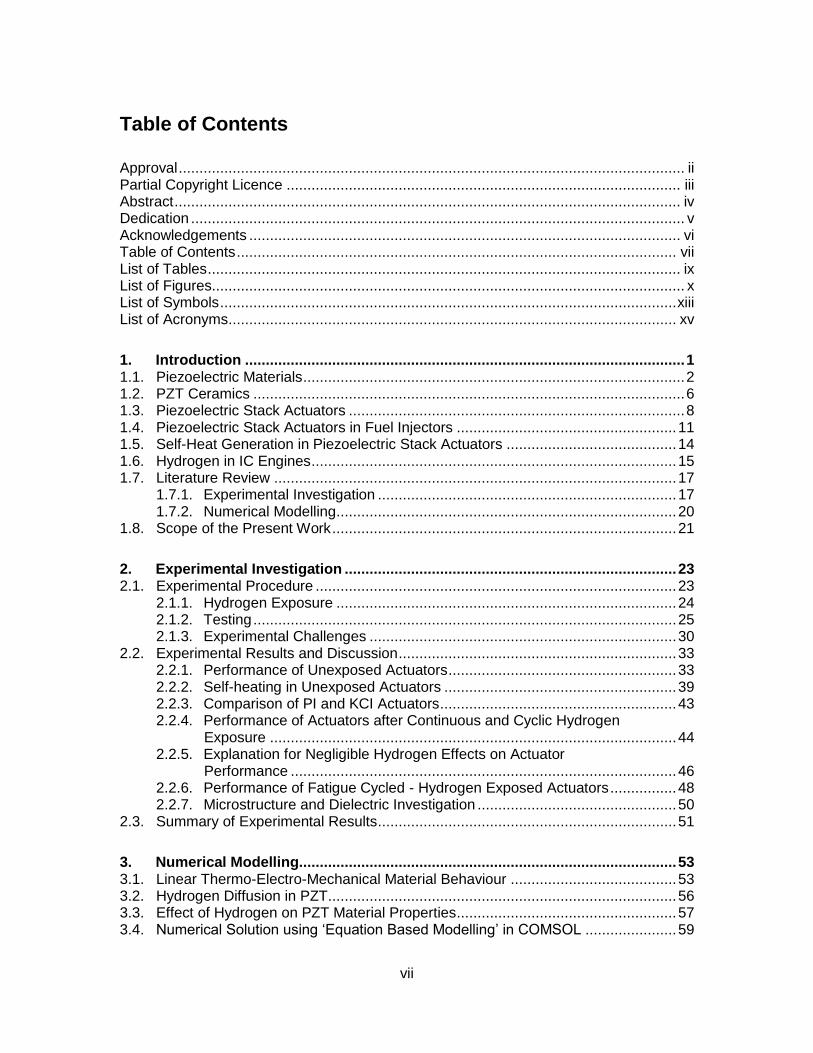
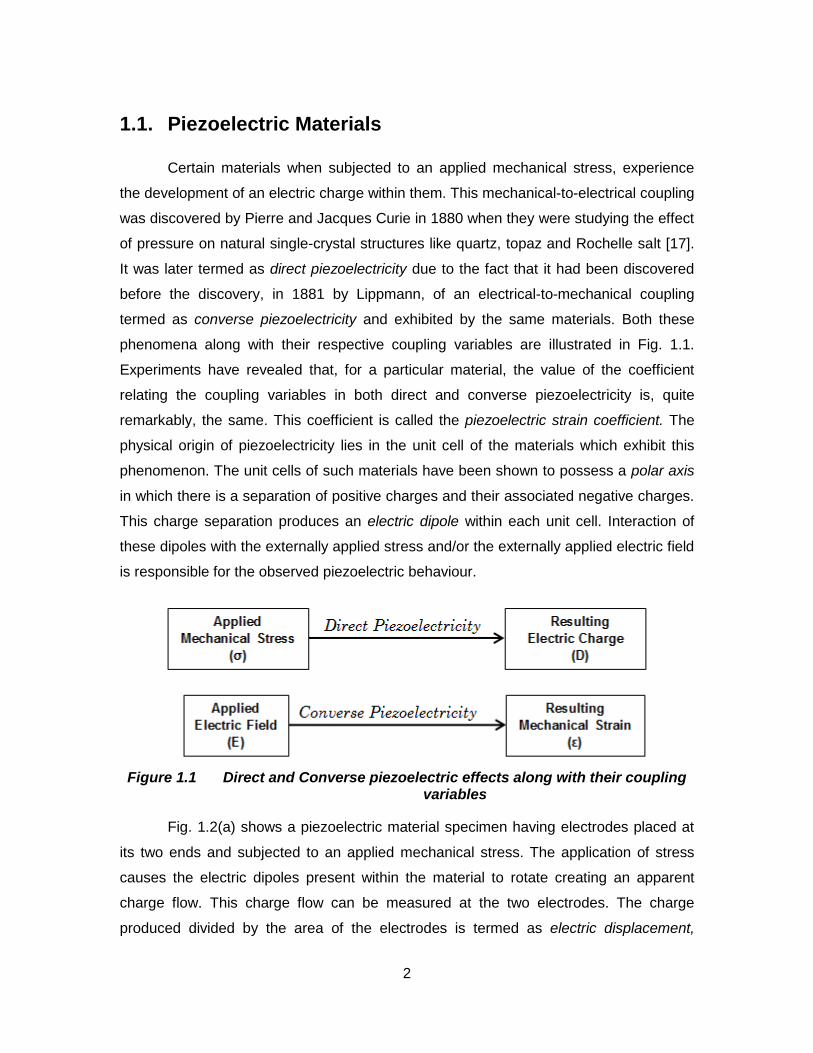
phenomena along with their respective coupling variables are illustrated in Fig. 1.1.
Experiments have revealed that, for a particular material, the value of the coefficient
relating the coupling variables in both direct and converse piezoelectricity is, quite
remarkably, the same. This coefficient is called the piezoelectric strain coefficient. The
physical origin of piezoelectricity lies in the unit cell of the materials which exhibit this
phenomenon. The unit cells of such materials have been shown to possess a polar axis
in which there is a separation of positive charges and their associated negative charges.
This charge separation produces an electric dipole within each unit cell. Interaction of
these dipoles with the externally applied stress and/or the externally applied electric field
is responsible for the observed piezoelectric behaviour.
Figure 1.1 Direct and Converse piezoelectric effects along with their coupling variables
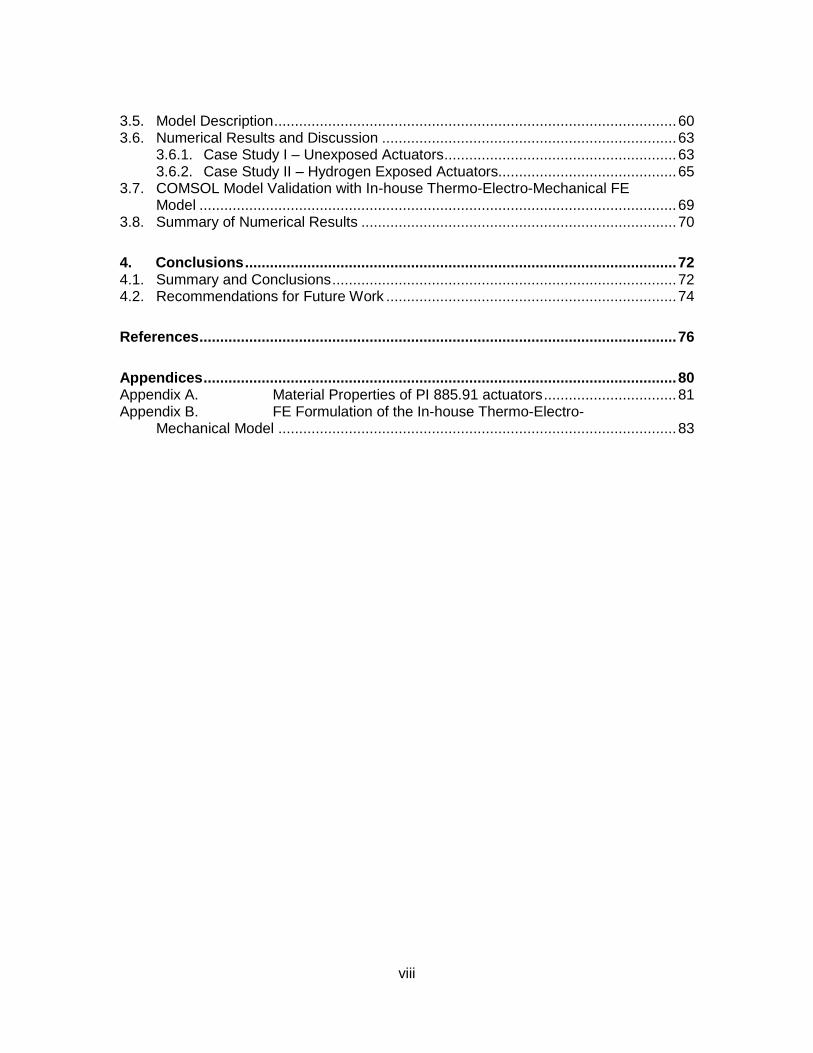
Fig. 1.2(a) shows a piezoelectric material specimen having electrodes placed at
its two ends and subjected to an applied mechanical stress. The application of stress
causes the electric dipoles present within the material to rotate creating an apparent
charge flow. This charge flow can be measured at the two electrodes. The charge
produced divided by the area of the electrodes is termed as electric displacement,
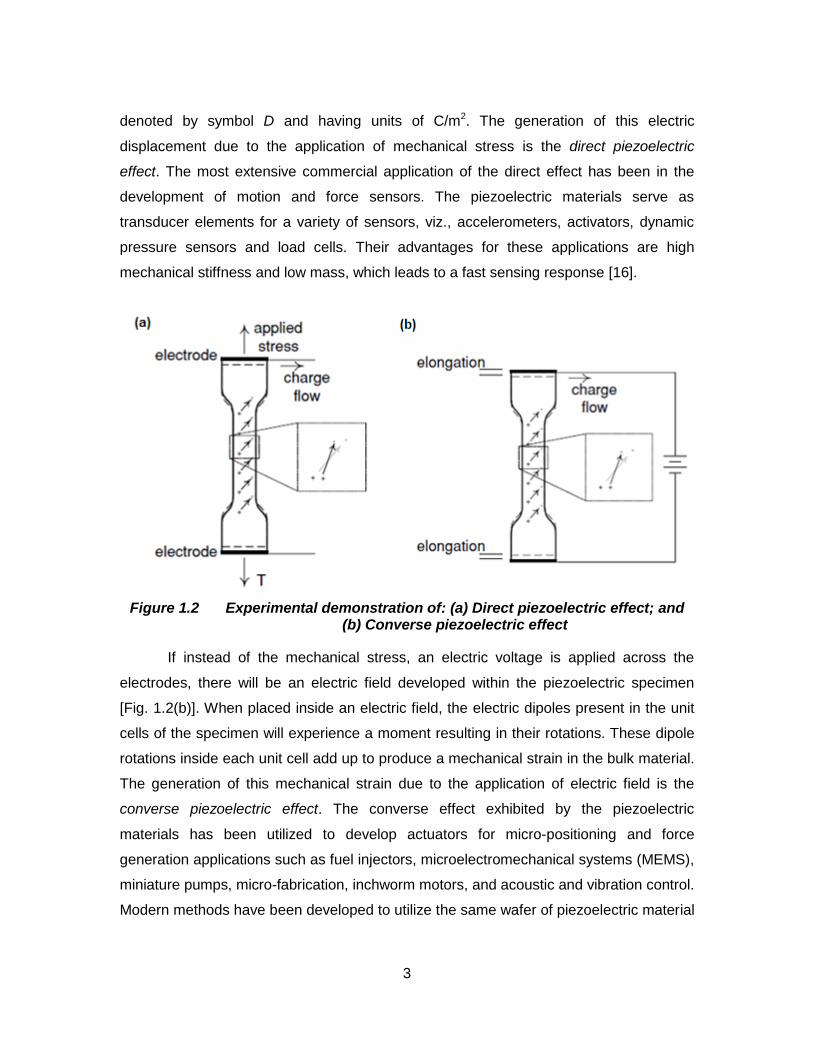
3
denoted by symbol D and having units of C/m2. The generation of this electric
displacement due to the application of mechanical stress is the direct piezoelectric
effect. The most extensive commercial application of the direct effect has been in the
development of motion and force sensors. The piezoelectric materials serve as
transducer elements for a variety of sensors, viz., accelerometers, activators, dynamic
pressure sensors and load cells. Their advantages for these applications are high
mechanical stiffness and low mass, which leads to a fast sensing response [16].
Figure 1.2 Experimental demonstration of: (a) Direct piezoelectric effect; and (b) Converse piezoelectric effect
If instead of the mechanical stress, an electric voltage is applied across the
electrodes, there will be an electric field developed within the piezoelectric specimen
[Fig. 1.2(b)]. When placed inside an electric field, the electric dipoles present in the unit
cells of the specimen will experience a moment resulting in their rotations. These dipole
rotations inside each unit cell add up to produce a mechanical strain in the bulk material.
The generation of this mechanical strain due to the application of electric field is the
converse piezoelectric effect. The converse effect exhibited by the piezoelectric
materials has been utilized to develop actuators for micro-positioning and force
generation applications such as fuel injectors, microelectromechanical systems (MEMS),
miniature pumps, micro-fabrication, inchworm motors, and acoustic and vibration control.
Modern methods have been developed to utilize the same wafer of piezoelectric material
4
simultaneously, as both a sensor and an actuator, thus simplifying the design of vibration
control systems [16].
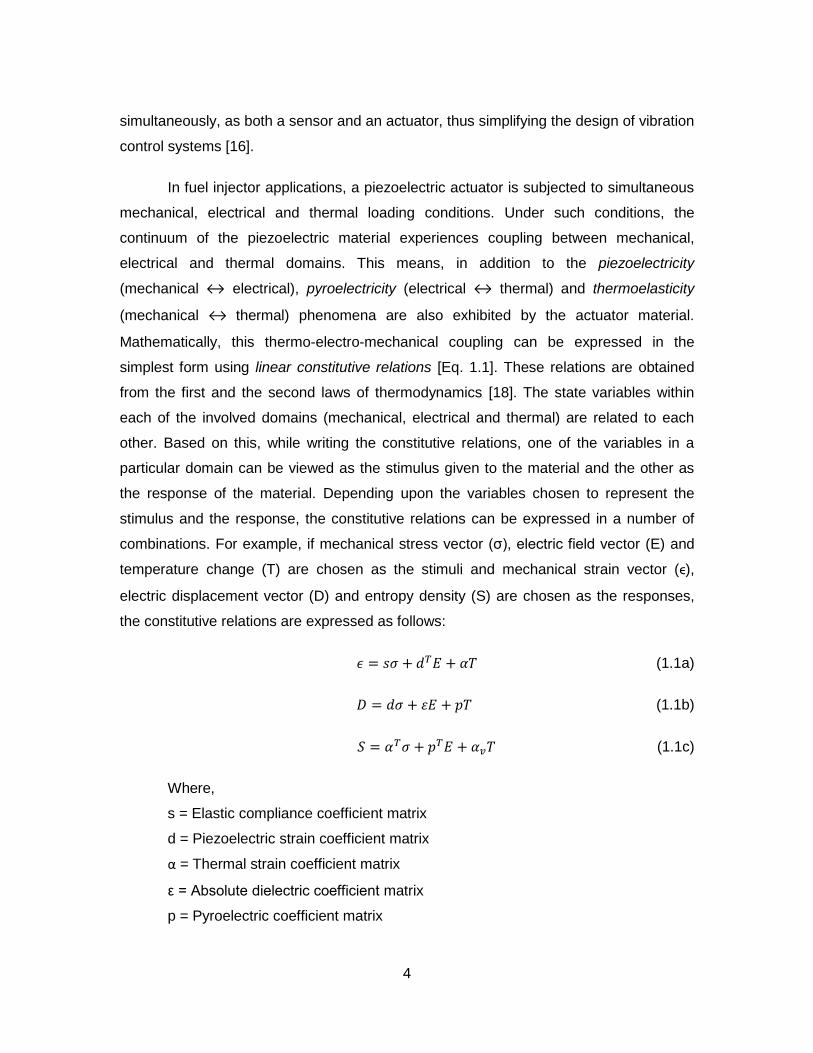
In fuel injector applications, a piezoelectric actuator is subjected to simultaneous
mechanical, electrical and thermal loading conditions. Under such conditions, the
continuum of the piezoelectric material experiences coupling between mechanical,
electrical and thermal domains. This means, in addition to the piezoelectricity
(mechanical ↔ electrical), pyroelectricity (electrical ↔ thermal) and thermoelasticity
(mechanical ↔ thermal) phenomena are also exhibited by the actuator material.
Mathematically, this thermo-electro-mechanical coupling can be expressed in the
simplest form using linear constitutive relations [Eq. 1.1]. These relations are obtained
from the first and the second laws of thermodynamics [18]. The state variables within
each of the involved domains (mechanical, electrical and thermal) are related to each
other. Based on this, while writing the constitutive relations, one of the variables in a
particular domain can be viewed as the stimulus given to the material and the other as
the response of the material. Depending upon the variables chosen to represent the
stimulus and the response, the constitutive relations can be expressed in a number of
combinations. For example, if mechanical stress vector (σ), electric field vector (E) and
temperature change (T) are chosen as the stimuli and mechanical strain vector (ϵ),
electric displacement vector (D) and entropy density (S) are chosen as the responses,
the constitutive relations are expressed as follows:
(1.1a)
(1.1b)
(1.1c)
Where,
s = Elastic compliance coefficient matrix
d = Piezoelectric strain coefficient matrix
α = Thermal strain coefficient matrix
ε = Absolute dielectric coefficient matrix
p = Pyroelectric coefficient matrix
5
αv = A material constant dependent on density (ρ), specific heat at constant
volume (Cv) and reference temperature (Tref) of the material
Superscripted symbols (dT, αT and pT) in Eq. 1.1 represent the transposes of the
coefficient matrices. It is important to note that the variable T in the above equation is not
the absolute temperature of a point in the continuum. Rather, it represents the
temperature relative to the reference temperature (Tref) at which all the material
properties are defined. It should also be noted that, due to the electromechanical
coupling, the material properties of piezoelectric materials are a function of the
mechanical and electrical boundary conditions. This means that for the elastic
compliance coefficient (s), the values will be different under open and closed circuit
electrical boundary conditions and for the dielectric coefficient (ε), the values will be
different under stress-free and strain-free mechanical boundary conditions. In Eq. 1.1,
short-circuit (E=0) and stress-free (σ=0) values, measured at temperature Tref, are used
for s and ε respectively.
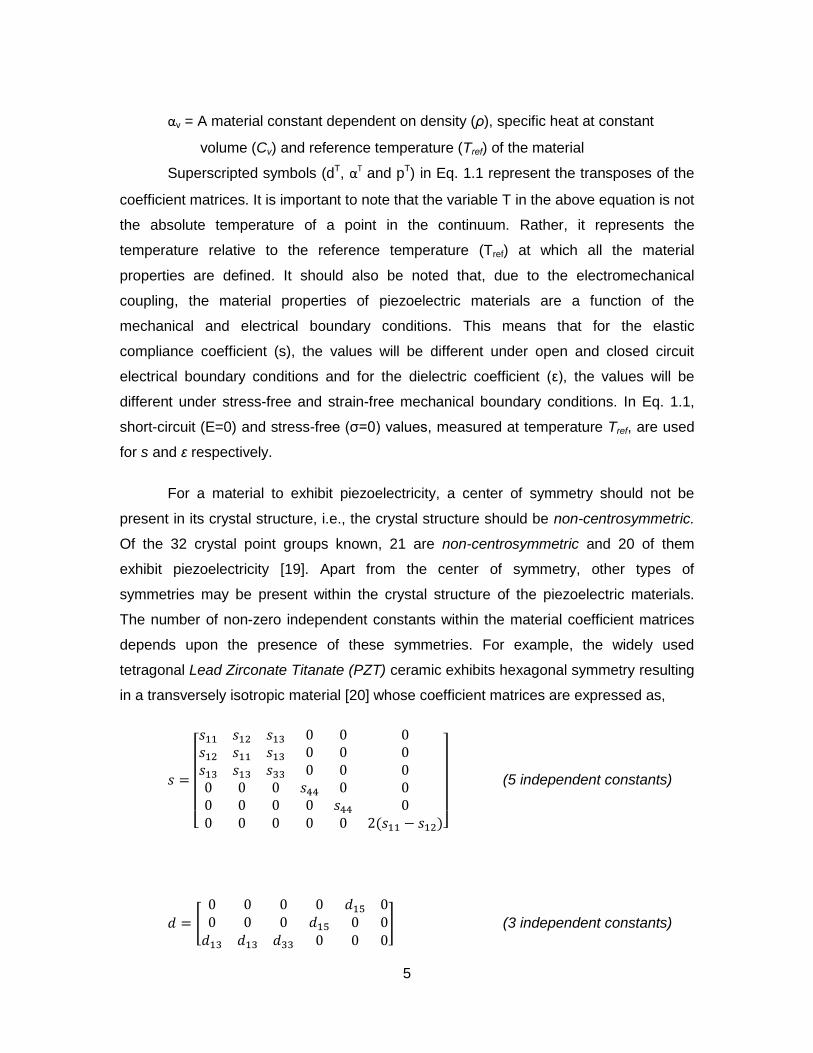
For a material to exhibit piezoelectricity, a center of symmetry should not be
present in its crystal structure, i.e., the crystal structure should be non-centrosymmetric.
Of the 32 crystal point groups known, 21 are non-centrosymmetric and 20 of them
exhibit piezoelectricity [19]. Apart from the center of symmetry, other types of
symmetries may be present within the crystal structure of the piezoelectric materials.
The number of non-zero independent constants within the material coefficient matrices
depends upon the presence of these symmetries. For example, the widely used
tetragonal Lead Zirconate Titanate (PZT) ceramic exhibits hexagonal symmetry resulting
in a transversely isotropic material [20] whose coefficient matrices are expressed as,
[ ]
(5 independent constants)
[
] (3 independent constants)
6
[
] (2 independent constants)
1.2. PZT Ceramics
As mentioned in the previous section, the unit cells of certain materials possess
electric dipoles. An electric dipole moment vector is associated with each dipole
as follows:
(1.2)
Where,
= Magnitude of each dipole charge
= Distance of separation between charges
is directed from the negative to the positive charge within the dipole. In the
presence of an external electric field, these dipoles tend to align themselves with the
direction of the electric field. The process of dipole alignment is termed as polarization.
The vector sum of all the dipole moments per unit volume of the material is a physical
quantity known as polarization (P). Polarization represents the bulk effect of the dipoles
present within the unit cells. Normally, in the absence of an external electric field, the
dipoles are oriented randomly within the material and the net polarization (a vector sum)
of the material is zero. There are, however, certain exceptions and there exists a class of
materials which have a permanent, non-zero polarization even in the absence of an
electric field. Such materials are termed as Ferroelectrics and are said to possess a
spontaneous polarization (PS) [11]. The ferroelectrics have extremely high dielectric
constants and are, therefore, an ideal material for making capacitors. When heated
above a certain critical temperature, known as Curie temperature, the electric dipoles
within the unit cells cease to exist and the ferroelectrics lose their spontaneous
polarization.
All ferroelectric materials, having spontaneous polarizations, are also known to
exhibit piezoelectricity [22]. Lead Zirconate Titanate (PZT) ceramics belong to this class
7
of materials. Since their discovery in 1954, the PZT ceramics have become the most
widely used ceramic material for the applications based on piezoelectric phenomenon
[23]. For the actuator applications, in particular, the PZT ceramics are desirable due to
their fast, reliable and precise performance [24,25,26]. Compared to the other
ferroelectric ceramics, these ceramics possess, (a) higher electromechanical coupling;
(b) higher Curie temperature, permitting a higher temperature range during operation;
and (c) wider range of dielectric constants. Moreover, their manufacturing process is
simpler as they can be easily poled by applying an external electric field. [20,27].
The manufacture of synthetic piezoelectric materials typically begins with a
mixture of the constituent materials in powdered form. For PZT, this mixture consists of
lead (Pb), zirconium (Zr) and titanium (Ti). The processing of piezoelectric ceramic
typically begins by heating the powders to temperatures in the range 1200-1500°C. The
heated materials are then formed and dimensioned with conventional methods resulting
in the ceramic wafers of thickness 50-300 µm. After cooling, the wafers of an unpoled
piezoelectric ceramic are obtained. The wafer material does not exhibit any piezoelectric
coupling due to the fact that the electric dipoles are pointing in random directions within
the material. The dipoles are oriented in a particular direction by a process called Poling.
During poling, the piezoelectric material is heated above its Curie temperature and then
placed in a strong electric field. Heating of the materials allows the dipoles to rotate
freely and the electric field produces an alignment of the dipoles along the direction of
the electric field. Quickly reducing the temperature and removing the electric field
produces a material whose electric dipoles are oriented in the same direction referred to
as the Poling Direction of the piezoelectric material. Electrodes are placed by painting a
thin metallic paint onto the surface on the wafers. The wafers can be cut further using a
diamond saw and joined with other layers to produce a multilayer stack actuator [16].
PZT ceramics are binary solid solutions of Lead Zirconate (PbZrO3) and Lead
Titanate (PbTiO3). They have a perovskite structure with each unit cell consisting of Pb2+
ions at the corners, O2- ions at the face centers and a Zr4+/Ti4+ ion at the centroid [Fig.
1.3]. Above the Curie temperature (Tc), the PZT perovskite structures are cubic. At lower
temperatures, they may be tetragonal or rhombohedral depending upon their
composition. Of our interest in the present study are the tetragonal PZT perovskites. In
the tetragonal phase, the central Zr4+/Ti4+ ion is slightly displaced relative to the plane of
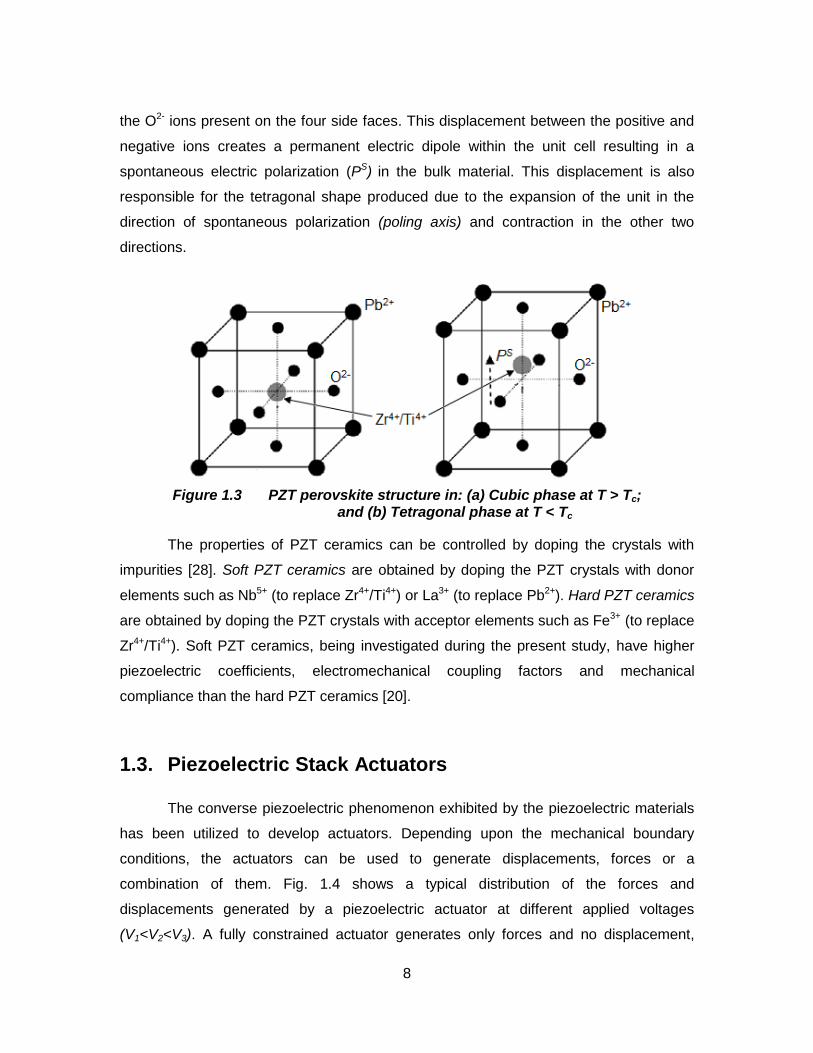
8
the O2- ions present on the four side faces. This displacement between the positive and
negative ions creates a permanent electric dipole within the unit cell resulting in a
spontaneous electric polarization (PS) in the bulk material. This displacement is also
responsible for the tetragonal shape produced due to the expansion of the unit in the
direction of spontaneous polarization (poling axis) and contraction in the other two
directions.
Figure 1.3 PZT perovskite structure in: (a) Cubic phase at T > Tc; and (b) Tetragonal phase at T < Tc
The properties of PZT ceramics can be controlled by doping the crystals with
impurities [28]. Soft PZT ceramics are obtained by doping the PZT crystals with donor
elements such as Nb5+ (to replace Zr4+/Ti4+) or La3+ (to replace Pb2+). Hard PZT ceramics
are obtained by doping the PZT crystals with acceptor elements such as Fe3+ (to replace
Zr4+/Ti4+). Soft PZT ceramics, being investigated during the present study, have higher
piezoelectric coefficients, electromechanical coupling factors and mechanical
compliance than the hard PZT ceramics [20].
1.3. Piezoelectric Stack Actuators
The converse piezoelectric phenomenon exhibited by the piezoelectric materials
has been utilized to develop actuators. Depending upon the mechanical boundary
conditions, the actuators can be used to generate displacements, forces or a
combination of them. Fig. 1.4 shows a typical distribution of the forces and
displacements generated by a piezoelectric actuator at different applied voltages
(V1<V2<V3). A fully constrained actuator generates only forces and no displacement,
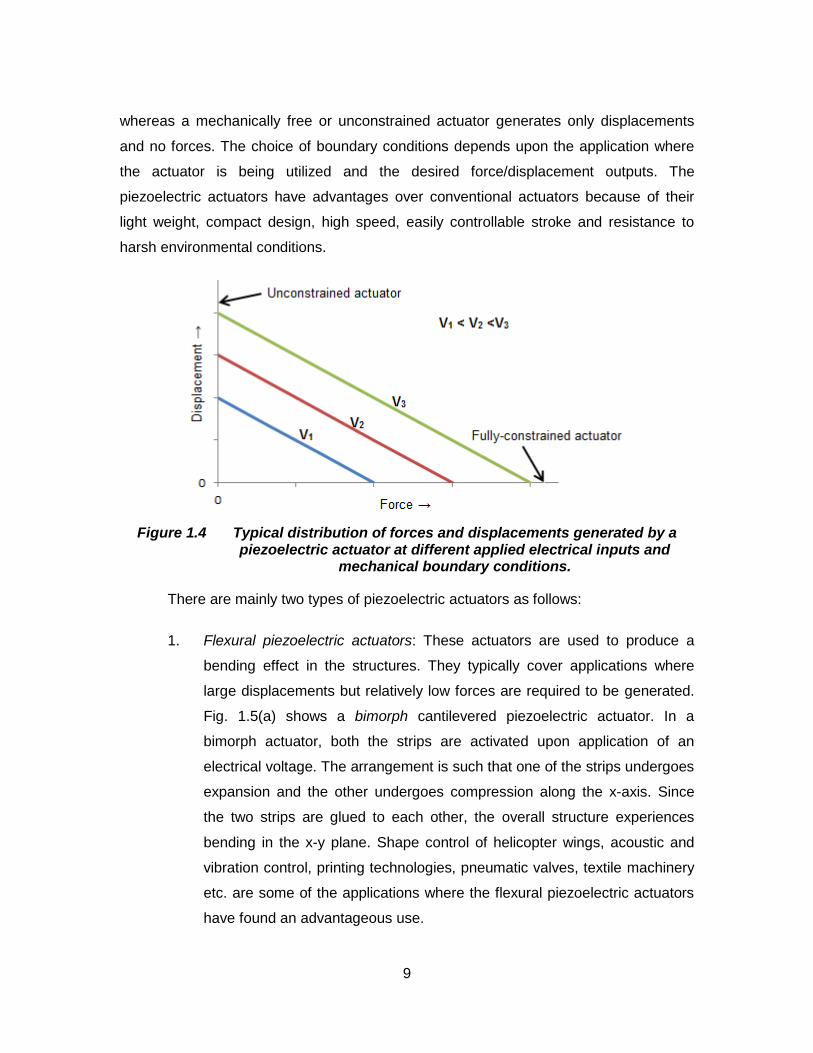
9
whereas a mechanically free or unconstrained actuator generates only displacements
and no forces. The choice of boundary conditions depends upon the application where
the actuator is being utilized and the desired force/displacement outputs. The
piezoelectric actuators have advantages over conventional actuators because of their
light weight, compact design, high speed, easily controllable stroke and resistance to
harsh environmental conditions.
Figure 1.4 Typical distribution of forces and displacements generated by a piezoelectric actuator at different applied electrical inputs and
mechanical boundary conditions.
There are mainly two types of piezoelectric actuators as follows:
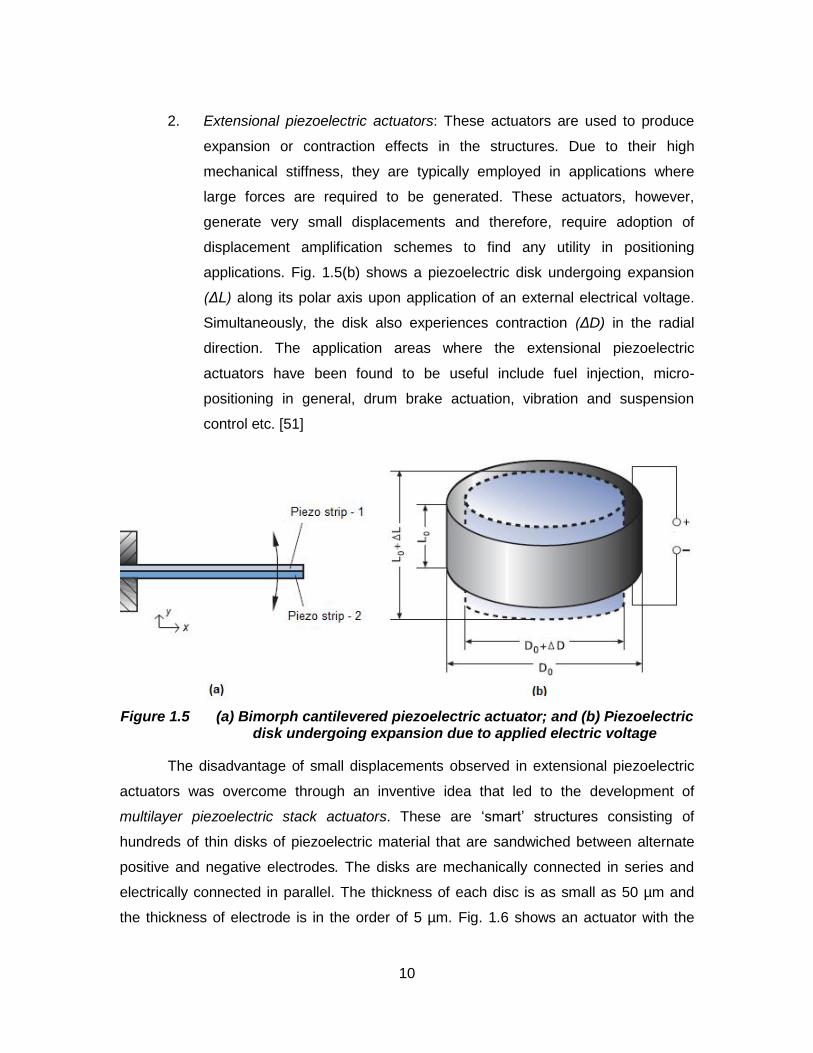
1. Flexural piezoelectric actuators: These actuators are used to produce a
bending effect in the structures. They typically cover applications where
large displacements but relatively low forces are required to be generated.
Fig. 1.5(a) shows a bimorph cantilevered piezoelectric actuator. In a
bimorph actuator, both the strips are activated upon application of an
electrical voltage. The arrangement is such that one of the strips undergoes
expansion and the other undergoes compression along the x-axis. Since
the two strips are glued to each other, the overall structure experiences
bending in the x-y plane. Shape control of helicopter wings, acoustic and
vibration control, printing technologies, pneumatic valves, textile machinery
etc. are some of the applications where the flexural piezoelectric actuators
have found an advantageous use.
10
2. Extensional piezoelectric actuators: These actuators are used to produce
expansion or contraction effects in the structures. Due to their high
mechanical stiffness, they are typically employed in applications where
large forces are required to be generated. These actuators, however,
generate very small displacements and therefore, require adoption of
displacement amplification schemes to find any utility in positioning
applications. Fig. 1.5(b) shows a piezoelectric disk undergoing expansion
(ΔL) along its polar axis upon application of an external electrical voltage.
Simultaneously, the disk also experiences contraction (ΔD) in the radial
direction. The application areas where the extensional piezoelectric
actuators have been found to be useful include fuel injection, micro-
positioning in general, drum brake actuation, vibration and suspension
control etc. [51]
Figure 1.5 (a) Bimorph cantilevered piezoelectric actuator; and (b) Piezoelectric disk undergoing expansion due to applied electric voltage
The disadvantage of small displacements observed in extensional piezoelectric
actuators was overcome through an inventive idea that led to the development of
multilayer piezoelectric stack actuators. These are ‘smart’ structures consisting of
hundreds of thin disks of piezoelectric material that are sandwiched between alternate
positive and negative electrodes. The disks are mechanically connected in series and
electrically connected in parallel. The thickness of each disc is as small as 50 µm and
the thickness of electrode is in the order of 5 µm. Fig. 1.6 shows an actuator with the
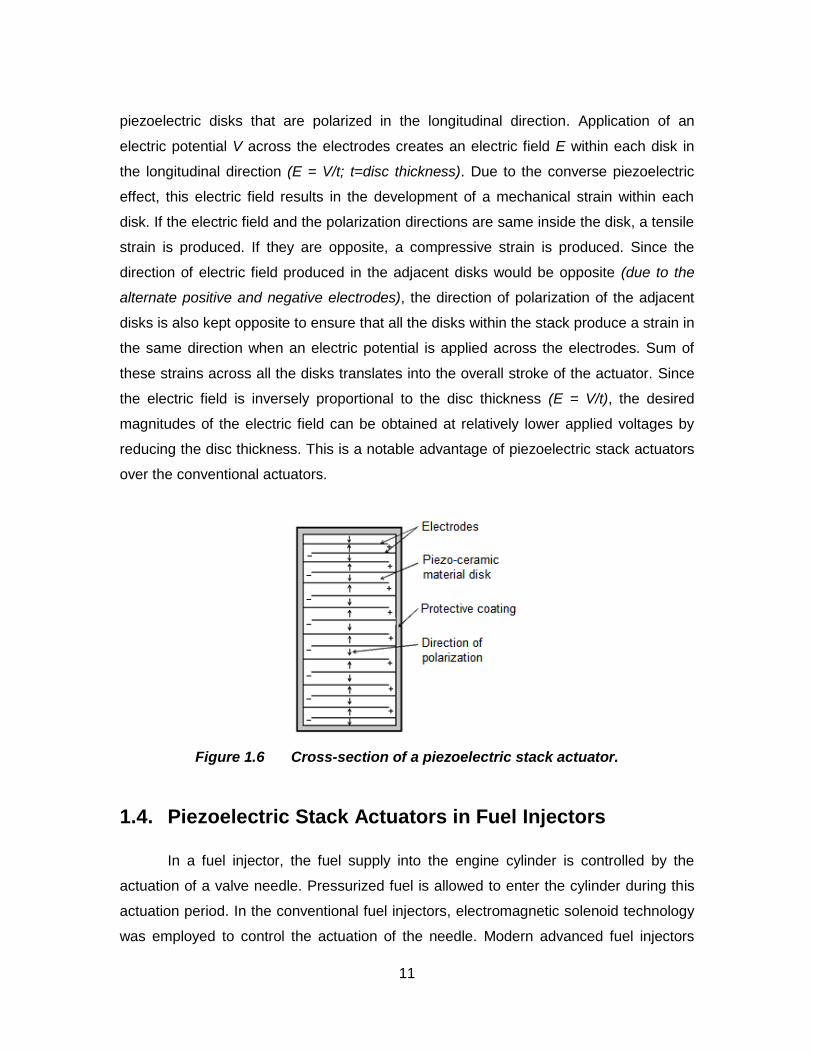
11
piezoelectric disks that are polarized in the longitudinal direction. Application of an
electric potential V across the electrodes creates an electric field E within each disk in
the longitudinal direction (E = V/t; t=disc thickness). Due to the converse piezoelectric
effect, this electric field results in the development of a mechanical strain within each
disk. If the electric field and the polarization directions are same inside the disk, a tensile
strain is produced. If they are opposite, a compressive strain is produced. Since the
direction of electric field produced in the adjacent disks would be opposite (due to the
alternate positive and negative electrodes), the direction of polarization of the adjacent
disks is also kept opposite to ensure that all the disks within the stack produce a strain in
the same direction when an electric potential is applied across the electrodes. Sum of
these strains across all the disks translates into the overall stroke of the actuator. Since
the electric field is inversely proportional to the disc thickness (E = V/t), the desired
magnitudes of the electric field can be obtained at relatively lower applied voltages by
reducing the disc thickness. This is a notable advantage of piezoelectric stack actuators
over the conventional actuators.
Figure 1.6 Cross-section of a piezoelectric stack actuator.
1.4. Piezoelectric Stack Actuators in Fuel Injectors
In a fuel injector, the fuel supply into the engine cylinder is controlled by the
actuation of a valve needle. Pressurized fuel is allowed to enter the cylinder during this
actuation period. In the conventional fuel injectors, electromagnetic solenoid technology
was employed to control the actuation of the needle. Modern advanced fuel injectors
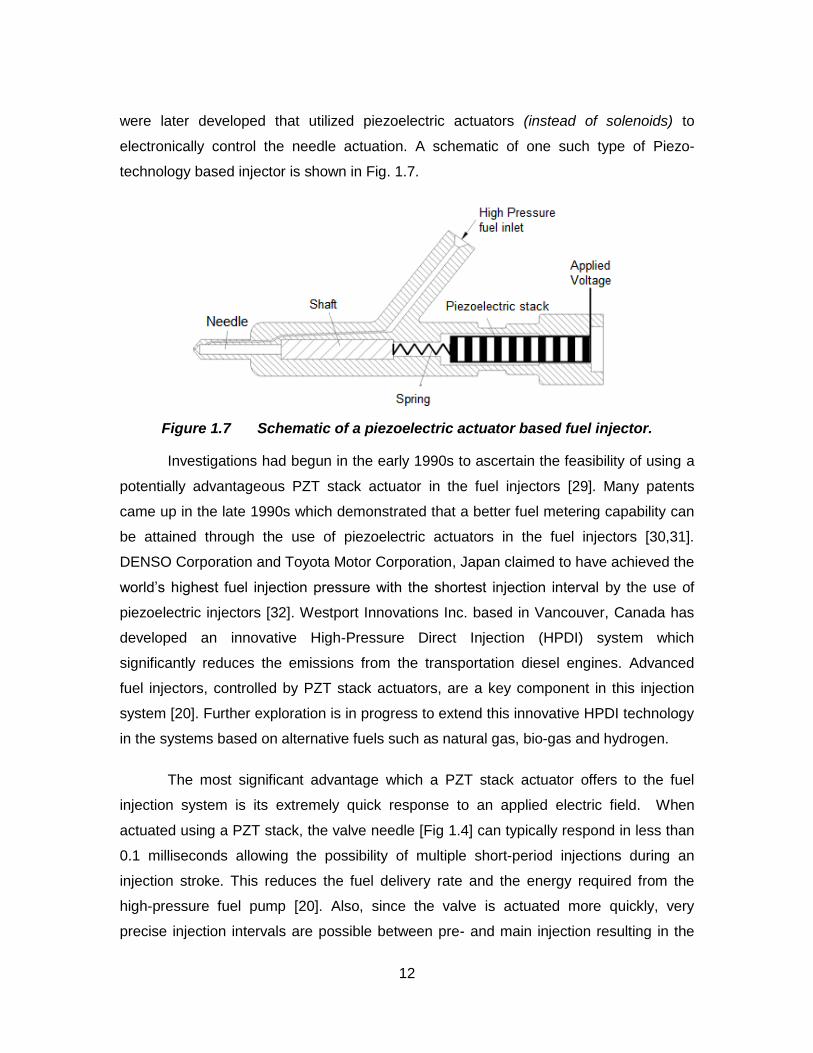
12
were later developed that utilized piezoelectric actuators (instead of solenoids) to
electronically control the needle actuation. A schematic of one such type of Piezo-
technology based injector is shown in Fig. 1.7.
Figure 1.7 Schematic of a piezoelectric actuator based fuel injector.
Investigations had begun in the early 1990s to ascertain the feasibility of using a
potentially advantageous PZT stack actuator in the fuel injectors [29]. Many patents
came up in the late 1990s which demonstrated that a better fuel metering capability can
be attained through the use of piezoelectric actuators in the fuel injectors [30,31].
DENSO Corporation and Toyota Motor Corporation, Japan claimed to have achieved the
world’s highest fuel injection pressure with the shortest injection interval by the use of
piezoelectric injectors [32]. Westport Innovations Inc. based in Vancouver, Canada has
developed an innovative High-Pressure Direct Injection (HPDI) system which
significantly reduces the emissions from the transportation diesel engines. Advanced
fuel injectors, controlled by PZT stack actuators, are a key component in this injection
system [20]. Further exploration is in progress to extend this innovative HPDI technology
in the systems based on alternative fuels such as natural gas, bio-gas and hydrogen.
The most significant advantage which a PZT stack actuator offers to the fuel
injection system is its extremely quick response to an applied electric field. When
actuated using a PZT stack, the valve needle [Fig 1.4] can typically respond in less than
0.1 milliseconds allowing the possibility of multiple short-period injections during an
injection stroke. This reduces the fuel delivery rate and the energy required from the
high-pressure fuel pump [20]. Also, since the valve is actuated more quickly, very
precise injection intervals are possible between pre- and main injection resulting in the
13
reduction of fuel consumption and emissions by up to 15 % [1]. Unlike the fixed valve
needle stroke in a conventional solenoid-based electromagnetic injection system, the
needle stroke can be varied in the injectors where piezoelectric actuators are used by
varying the applied voltage. This enables a better control over the valve opening and
provides flexibility in choosing the optimal injection profiles. Experiments conducted by
Siemens VDO and Volkswagen have revealed that a better fuel efficiency in the diesel
engines can be achieved by increasing the injection pressure of the fuel pump [1]. But as
the injection pressure increases, the diesel engine becomes louder due to knocking.
This can be avoided by the use of piezoelectric actuators thereby making the engine not
only quieter but also more economical. Another advantage which the piezoelectric
actuators bring to the fuel injectors is the reduction of applied electrical voltage to a
range of below 200 Volts. This is possible because the piezoelectric stack actuator is
made up of thin ceramic layers in which the desired electric field can be achieved by
applying a relatively smaller voltage [1]. Overall, the advantages of using piezoelectric
actuators over the conventional electromagnetic solenoid technology are that they
provide an optimized injection system which is quieter, more powerful, more economical
and less polluting.
In order to obtain a substantial amount of stroke from the stack actuators, they
have to be subjected to relatively high electric field magnitudes (~2.4 kV/mm) which are
much greater than the typical coercive electric field Ec values. This means going into the
region of non-linear response of the actuators to the applied electric field. This is not
desirable, particularly for the fuel injector application requiring precise positioning of the
needle, and puts additional requirements on the control systems. Due to the operational
requirements of fuel injection systems, the actuators are subjected to high frequencies
(>100 Hz) and high temperatures (up to 120°C). The dynamic operation at high
frequencies and high electric field magnitudes causes self-heat generation inside the
actuators. This self-heat combined with the high operational temperatures can
accelerate material aging. It may also produce thermal stresses which can lead to a
structural failure by debonding the interface between the ceramic layer and electrodes
[33]. The PZT ceramics have low fracture toughness (less than 1 MPa √m) and
therefore, a strong propensity for cracking. This characteristic also poses a challenge in
designing suitable actuators for the dynamic operation expected in a fuel injector.
14
1.5. Self-Heat Generation in Piezoelectric Stack Actuators
During a dynamic operation of a PZT stack actuator, self-heating phenomenon is
observed even in the linear range of operation. It is caused by energy losses such as
mechanical damping and dielectric loss. Ferroelectric hysteresis loss, believed to be
caused by domain switching, is the major contributor to the dielectric loss [14,41,42].
The temperature rise in the PZT actuators due to self-heat generation can substantially
affect their overall performance and durability, and may limit their applications.
Electromechanical coupling coefficients, resonance frequencies and oscillation
amplitudes of piezoelectric elements are some of the important characteristics that can
get affected due to self-heating resulting in an unreliable actuator performance [43].
From an operational point of view, self-heating has a direct effect on current
consumption and total displacement of an actuator [44]. Therefore, self-heat generation
in a PZT stack actuator can be a serious issue in the fuel injection applications where a
precise accuracy is required.
The mechanism of self-heating in piezoelectric materials was theoretically
modelled by Zheng et al [45]. Their model was based on the law of energy conservation
and the assumption that the rate of heat generation was directly proportional to the
frequency and hysteresis loss per driving cycle per unit volume. The model provided a
closed-form solution of temperature increase during a dynamic operation and
represented it in the form of classical exponential variation with respect to time as
⁄ (1.3)
where and are the actuator’s temperature rise at time t and at steady state
respectively. is a time constant dependent on the actuator material and geometry. The
effect of heat dissipation from the actuator by convection and/or radiation was later
added to this model by Lesieutre et al [46]. A more comprehensive model based on a
similar approach and relevant to the fuel injection application was developed by Senousy
et al [47]. This model accounted for different parameters such as geometry, magnitude
and frequency of applied electric field, duty cycle percentage and surrounding
properties.
15
Experimental investigations to study the effect of actuator geometry on self-
heating were performed by Zheng et al [45]. Five different actuator sizes with varying
layer thicknesses were tested under different operating conditions at room temperature.
The steady state temperature rise was found to increase linearly with the ratio Ve/A
(Ve and A are the total active volume and the total surface area of the actuator,
respectively). The steady state temperature rise was also found to increase with
increased applied electric field and frequency.
1.6. Hydrogen in IC Engines
The present day transportation sector is heavily reliant on fossil fuels such as
gasoline and diesel. Fossil fuel combustion releases large amounts of greenhouse
gases, the most significant being carbon dioxide. Presence of these greenhouse gases
in the earth’s atmosphere does not allow the heat coming from the sun to escape out of
the atmosphere, thereby resulting in the increase of earth’s average temperature. This
phenomenon is termed as global warming and the use of fossil fuels in the transportation
sector is a major contributor to it. The global warming is receiving a world-wide attention
as a significant environmental problem. In addition to the greenhouse gases, the
combustion of fossil fuels also produces other air pollutants, such as nitrogen
oxides, sulfur dioxide, volatile organic compounds and heavy metals. These pollutants
can prove to be hazardous to the human and animal health as well as the global
ecosystem. Another concern associated with an excessive dependency on the fossil
fuels is energy security. The fossil fuels are limited in supply and are getting depleted
quickly due to their accelerated global consumption. Therefore, an unprecedented
interest currently exists in the transportation sector to find alternatives to the fossil fuels
that are renewable and produce minimal amounts of greenhouse gases and other
harmful pollutants. Natural gas, bio-fuels, hydrogen and electricity are amongst the
primary candidates being explored for this purpose.
Hydrogen as an energy source for vehicles is still being developed but is
extremely promising. Combustion of hydrogen in automobiles produces no greenhouse
gases or air pollutants except for traces of nitrogen oxides (NOx) when burned in IC
engines. This makes hydrogen a clean and environmentally friendly fuel. Hydrogen can
16
be produced from diverse sources using a variety of process technologies. Hydrogen-
containing compounds such as fossil fuels, biomass or even water can be a source of
hydrogen [35]. There is, therefore, a tremendous scope for localized production of
hydrogen which can curtail the dependencies that exist in the form of petroleum imports.
This would help towards achieving a global energy security. There are, however, certain
challenges that need to be addressed before a commercial utilization of hydrogen as a
transportation fuel gets widespread acceptance. Due to its relatively low volumetric
energy density, transportation, storage and delivery to the point of use can be one of the
significant costs and energy inefficiencies associated with using hydrogen as an energy
carrier. Hydrogen is also highly reactive chemically and diffuses into almost every
material. A vehicle powered with hydrogen may use it directly for running the IC engines
or convert it into electricity using fuel cells. In both cases, hydrogen is stored on-board
and can be used to replenish the IC engine or fuel cell just like a traditional diesel or
gasoline engine.
An early attempt to use hydrogen in the IC engines was made by N. A. Otto in
1860s when he reportedly used a synthetic producer gas for fuel, which probably had a
hydrogen content of over 50%. Due to the development of safe gasoline engines,
hydrogen received very little attention as a transportation fuel for IC engines in the
following years. It remained, however, the fuel of choice for rocket engines because of
its highest energy-to-weight ratio compared to any other fuel. The properties which make
hydrogen a suitable combustible fuel for an IC engine are:
Wide range of flammability allowing for a wide range of fuel-air-
mixtures
Low ignition energy
Small quenching distance
High auto-ignition temperature allowing for higher compression ratios
High flame speed
High diffusivity resulting in a uniform air-fuel mixture
Hydrogen’s lower ignition energy, wider flammability range and shorter quenching
distance, however, can cause a problem of premature ignition in the IC engines.
Premature ignition occurs when the fuel mixture in the combustion chamber becomes
17
ignited before ignition by the spark plug, and results in an inefficient, rough running
engine. Backfire conditions can also develop if the premature ignition occurs near the
fuel intake valve and the resultant flame travels back into the induction system. Also,
hydrogen has a very low density resulting in a bulkier storage system and a low power
output compared to the gasoline and diesel engines [36].
Westport Power Inc., Vancouver is the leading Canadian developer of internal
combustion engine technology based on clean-burning fuels such as natural gas,
hydrogen and Hydrogen-enriched Compressed Natural Gas (HCNG). Westport has
been developing hydrogen-based internal combustion engine technology since early
2000 and is collaborating with Ford and BMW in this area. Westport’s HCNG engines
run on 20% hydrogen (by volume) and 80% natural gas. These engines emit 65% less
nitrogen oxides (NOx), 80% less particulate matter and about 10 tonnes per year less
greenhouse gases (GHG) than similar sized engine using gasoline or diesel fuel.
1.7. Literature Review
1.7.1. Experimental Investigation
The performance of piezoelectric stack actuators under conditions that are
similar to the operating conditions of a fuel injector has received some attention in the
past. Quasi-static thermo-electro-mechanical performance of cylindrical actuators made
from soft PZT material and manufactured by Kinetic Ceramics Inc. (KCI) was
investigated by Li et al [2] over a temperature range of -30 °C to 125 °C under driving-
electric fields varying from 0.3 to 1.8 kV/mm. They reported that the electrically-induced
stroke of the actuator increased steadily with temperature. At higher applied electric
fields, a non-linear transition zone existed in the stroke-temperature plot over the
temperature range 25-50°C. The dielectric constant was also found to increase with
temperature. The actuator stroke showed a bilinear dependence on the applied electric
field with a point of inflection occurring at 0.3 kV/mm in the stroke-driving field plot. The
preload dependence of the stroke was found to be negligible up to 30 MPa.
A comprehensive investigation of the dynamic thermo-electro-mechanical
performance of smaller sized actuators from the same manufacturer (KCI) was carried
18
out by Senousy et al [3]. The actuator response was studied over a temperature range of
-30°C to 80°C under sinusoidal and trapezoidal AC electric fields of up to 2.8 kV/mm,
frequencies of up to 400 Hz and various duty cycles, rise times and DC offset voltages.
At low frequencies (≤100 Hz), the relationship of dynamic stroke to applied electric field
as well as temperature followed a trend similar to that of the quasi-static stroke reported
by Li et al [2]. Although the dynamic stroke showed a positive increase with increasing
frequencies (above 100 Hz) and decreasing rise times, the accuracy of the observed
relationships is debatable due to the presence of system vibrations caused by
resonance. The biased DC offset voltage was found to slightly affect the dynamic stroke
of PZT actuators by reducing the extrinsic contribution due to non-180° domain walls. In
addition to performance testing, the temperature increase due to self-heat generation
during a dynamic operation and its effect on the actuator response was also studied.
Self-heating was found to increase non-linearly with both applied electric fields and
frequencies. Although the duty cycle had almost no effect on the dynamic stroke, it
linearly increased the self-heat generation inside the actuators.
Fatigue responses of PZT stacks (Noliac, Denmark) under semi-bipolar electric
cycling were experimentally investigated by Wang et al [4]. The stacks were cycled for
more than 108 cycles using a 100 Hz semi-bipolar sine wave with an electric field range
of +4.5/−0.9 kV/mm. Significant reductions in piezoelectric and dielectric responses
were observed during the cycling. Possible damage mechanisms including electrode
delamination, pores and etch grooves were revealed during microstructure
investigations.
Although the experiments conducted by Li et al [2], Senousy et al [3] and Wang
et al [4] were targeted towards the fuel injector applications, they all were performed in
an air environment. The impact of the type of fuel on the PZT stack actuator
performance was not assessed during these studies. This was mainly due to the reason
that the injector can be sealed completely from traditional hydrocarbon fuels and there is
no chemical reaction with PZT. This, however, is not true for hydrogen-based fuel
injectors due to the fact that hydrogen is highly diffusive and chemically reactive.
Past studies have indicated that hydrogen can have deleterious effects on the
properties and microstructure of the PZT material. Experiments conducted by Wu et al
19
[5] have shown that the piezoelectric properties (piezoelectric constant d33) and the
ferroelectric properties (remnant polarization Pr) of a bulk PZT material are strongly
influenced by the content of hydrogen trapped inside. According to their results, the
values of both d33 and Pr increased respectively by 45.3% and 27.3% when the
concentration of trapped hydrogen (Ct) inside PZT increased to 1.1 wppm. These values,
however, began to decrease when Ct was increased further and at Ct = 2.1 wppm, the
PZT material was found to have lost its ferroelectric nature i.e. Pr =0. It was also found
that at Ct = 2.1 wppm, the resistivity of PZT ceramics is less than 109 Ωm where the
material becomes a semiconductor. The dielectric constant and the dielectric loss of the
PZT ceramics was also reported to have increased with the rise of Ct. Peng et al [6]
observed hydrogen-induced initiation and growth of micro-cracks along the grain
boundaries of PZT. Wang et al [7] observed reduction in the values of mechanical
properties (strength & fracture toughness) with increased hydrogen content inside PZT.
Alvine et al [53] investigated the structural and compositional changes occurring in thin
(50 nm) PZT films under hydrogen exposure conditions (13.8 MPa, 100°C) comparable
to a typical fuel injector. After 24 hours of hydrogen treatment, they observed hydrogen-
induced blistering on the surface of bare PZT films and PZT films with Pd electrodes.
They also observed significant mixing of Pd layer into the PZT film along with migration
of Pb into the Pd layer. According to their results, the absorption of hydrogen into PZT
increased due to the presence of Pd layer. Recent studies conducted by Shafiei et al [8,
9, 10] indicate changes in the microstructure and electrical properties (capacitance,
resistance, dissipation factor) of hydrogen treated PZT material. They also observed that
the degradation in PZT is accelerated by the presence of electrodes. The degradation
consisted of the development of a porous layer just beside the electrodes on the PZT
surface, detachment of the electrodes from the PZT and extensive damage to the Ag/Pd
electrodes. According to Shafiei et al [9], a new structure is possibly formed in PZT upon
exposure to hydrogen. Protons are expected to be the constituents of this new structure,
and the changes in the electrical properties can be attributed to their presence. It should
be noted that all of the above mentioned studies have been conducted on bulk PZT
material.
From the above results obtained for the bulk PZT material, it is expected that the
performance of PZT-based stack actuators in a hydrogen environment will be different
20
from that in air. The differences, however, may not be exactly similar to those observed
in these studies. This is because, unlike the bulk material, a PZT-based stack actuator is
a more complex structure containing multiple PZT layers, electrodes, protective coating
etc. which may further complicate the interaction between actuator and hydrogen [Fig.
1.6]. Therefore, in order to effectively utilize the PZT-based piezoelectric actuator
technology in the fuel injectors of hydrogen-based IC engines, it is imperative that a
comprehensive understanding of the behaviour of these actuators under applicable
hydrogen environment and loading conditions is developed. The present research effort
is the first experimental attempt aimed at gaining this understanding.
1.7.2. Numerical Modelling
In addition to the experimental work, finite element (FE) modelling has been used
in the past to theoretically predict the behaviour of piezoelectric materials. These models
utilize the constitutive relations to incorporate the coupling effects exhibited by these
materials. A comprehensive survey of the finite element modelling of piezoelectric
materials for adaptive structure applications was provided by Benjeddou [37]. Senousy
et al [38] developed a 2-D fully-coupled linear thermo-electro-mechanical finite element
model based on the weighted-residual principle. This model was later extended to
account for the non-linear material behaviour caused by non-linear constitutive relations
and/or domain switching effects [39]. It successfully predicted the experimentally
obtained D3-E3 and -E3 hysteresis loops at different applied electric field magnitudes,
stress preloads and temperatures. It also provided a better prediction of the ‘butterfly
loops’ than the previous models. Sapsathiarn et al [40] developed a finite difference (FD)
model to simulate the non-linear diffusion process of hydrogen in the PZT material. This
FD model was later coupled to the linear thermo-electro-mechanical FE model [38] and
included the dependence of d33 on hydrogen concentration as reported by Wu et al [5].
This model was used to theoretically analyse the time-histories and spatial profiles of
temperature, hydrogen concentration and displacement within the PZT stack actuator
layer exposed to hydrogen.
These 2-D models were developed for a single layer in a stack actuator
assuming plane stress conditions in one of the lateral directions. This assumption is
useful enough for predicting the trends in an actuator response but does not completely

21
simulate the real-world conditions in which the actuator has comparable lateral
dimensions and therefore, no plane stress conditions. This means that it is necessary to
develop a 3-D finite element model in order to fully simulate the actual physics involved
when a piezoelectric stack actuator is run in hydrogen environments. This has also been
attempted for the first time in the present research effort.
1.8. Scope of the Present Work
Based on the literature review presented in the previous section, it is evident that
the current understanding of thermo-electro-mechanical performance of PZT-based
stack actuators in hydrogen environment under conditions relevant to fuel injection
systems is still in its infancy. Further research efforts are necessary to answer some of
the critical research questions before a commercial implementation of this technology is
pursued. Therefore, this thesis has two main objectives:
1. To experimentally study the thermo-electro-mechanical performance of PZT-
based stack actuators under operating conditions relevant to the fuel
injection systems after exposing the actuators to relevant hydrogen
environment conditions.
2. To theoretically model the response of a 3-dimensional hydrogen-exposed
piezoelectric actuator using linear thermo-electro-mechanical constitutive
relations.
A comparison between the experimental results from the first objective and the
theoretical results from the second objective is also presented.
The organization of this thesis is as follows: in Chapter 2, the thermo-electro-
mechanical performance of soft PZT-based stack actuators manufactured by PI
Ceramic, Germany is experimentally investigated. The actuators, after exposure to
relevant hydrogen environment conditions, are examined under both quasi-static and
dynamic applied voltages of 10-120 Volts magnitude over a temperature range 5-
80°C. The effect of different applied frequencies, excitation waveforms, duty cycles,
rise times and DC offset voltages on the actuator performance is also studied.
Additionally, self-heating in the actuators under different applied voltage magnitudes
22
and frequencies is investigated. The observed results are also validated by carrying
out microstructure and dielectric investigations.
In Chapter 3, a 3-dimensional finite element model of a single PZT stack actuator
layer exposed to hydrogen environment is presented. Concentration gradient is
assumed to be the driving force responsible for causing diffusion of hydrogen atoms
into the PZT layer. The diffused hydrogen atoms affect the piezoelectric strain
coefficient d33 of the PZT as per the experimental results reported by Wu et al [5].
This model takes into account a full coupling between mechanical, electrical, thermal
and diffusion variables. It is also a non-linear model due to the dependency of
coefficient d33 on hydrogen concentration variable. The conclusions of the present
study and the recommendations for future work are presented in Chapter 4.
23
2. Experimental Investigation
2.1. Experimental Procedure
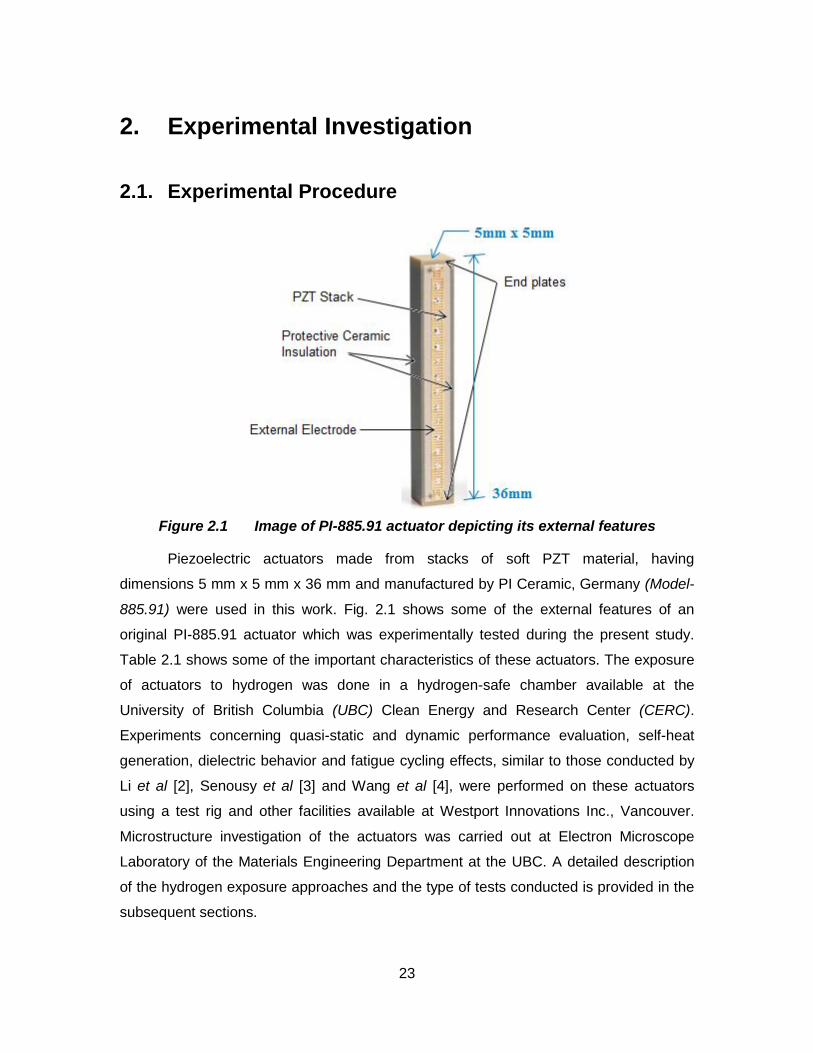
Figure 2.1 Image of PI-885.91 actuator depicting its external features
Piezoelectric actuators made from stacks of soft PZT material, having
dimensions 5 mm x 5 mm x 36 mm and manufactured by PI Ceramic, Germany (Model-
885.91) were used in this work. Fig. 2.1 shows some of the external features of an
original PI-885.91 actuator which was experimentally tested during the present study.
Table 2.1 shows some of the important characteristics of these actuators. The exposure
of actuators to hydrogen was done in a hydrogen-safe chamber available at the
University of British Columbia (UBC) Clean Energy and Research Center (CERC).
Experiments concerning quasi-static and dynamic performance evaluation, self-heat
generation, dielectric behavior and fatigue cycling effects, similar to those conducted by
Li et al [2], Senousy et al [3] and Wang et al [4], were performed on these actuators
using a test rig and other facilities available at Westport Innovations Inc., Vancouver.
Microstructure investigation of the actuators was carried out at Electron Microscope
Laboratory of the Materials Engineering Department at the UBC. A detailed description
of the hydrogen exposure approaches and the type of tests conducted is provided in the
subsequent sections.
24
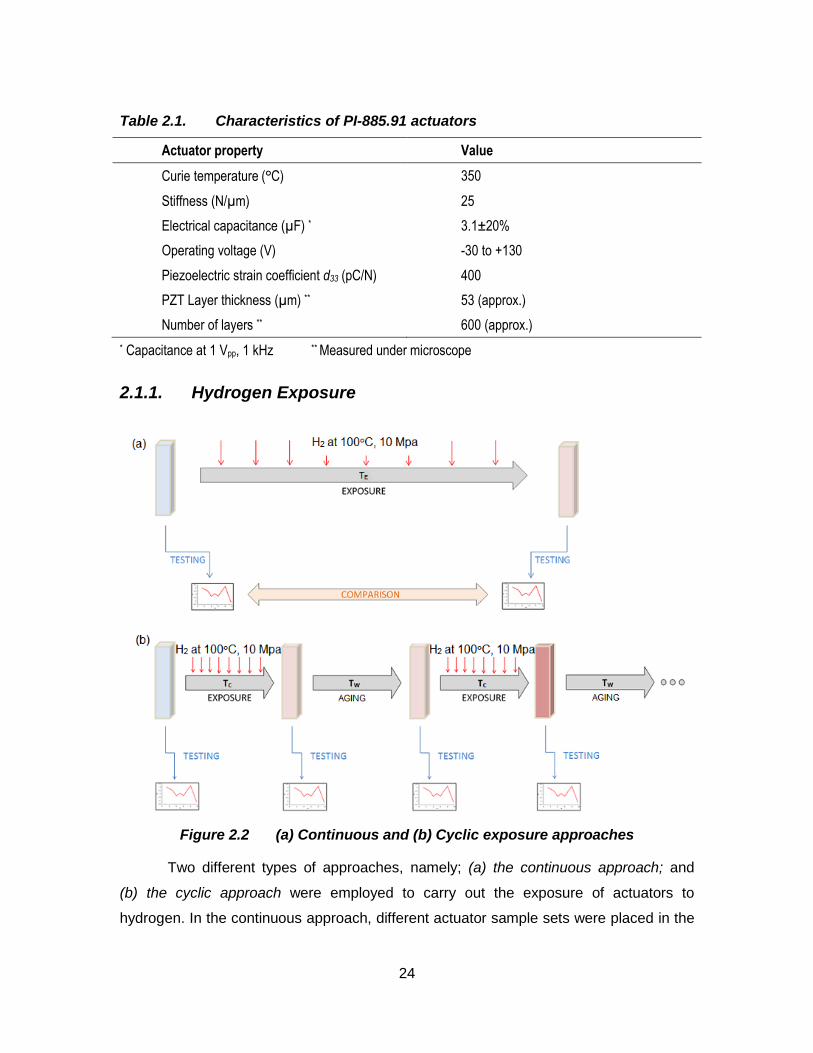
Table 2.1. Characteristics of PI-885.91 actuators
Actuator property Value
Curie temperature (°C) 350
Stiffness (N/µm) 25
Electrical capacitance (µF) * 3.1±20%
Operating voltage (V) -30 to +130
Piezoelectric strain coefficient d33 (pC/N) 400
PZT Layer thickness (µm) ** 53 (approx.)
Number of layers ** 600 (approx.)
* Capacitance at 1 Vpp, 1 kHz ** Measured under microscope
2.1.1. Hydrogen Exposure
Figure 2.2 (a) Continuous and (b) Cyclic exposure approaches
Two different types of approaches, namely; (a) the continuous approach; and
(b) the cyclic approach were employed to carry out the exposure of actuators to
hydrogen. In the continuous approach, different actuator sample sets were placed in the
25
hydrogen chamber continuously for a time duration TE = 4, 9 and 12 weeks. Each
sample set was withdrawn from the chamber after the completion of desired exposure
duration following which the testing was conducted. In the cyclic approach, one sample
set was placed in the chamber for time TC = 4 weeks Tested after withdrawal Kept
outside the chamber for aging at room temperature for time TW = 4 weeks Tested
again for aging effects Placed back into the chamber to repeat the same cycle. Both
the approaches are graphically illustrated in Fig. 2.2. The temperature and pressure
inside the chamber were maintained at 100°C and 10 MPa respectively for all exposures
and were chosen according to the practical conditions expected in a typical fuel injector
[8]. Each sample set consisted of two actuators.
2.1.2. Testing
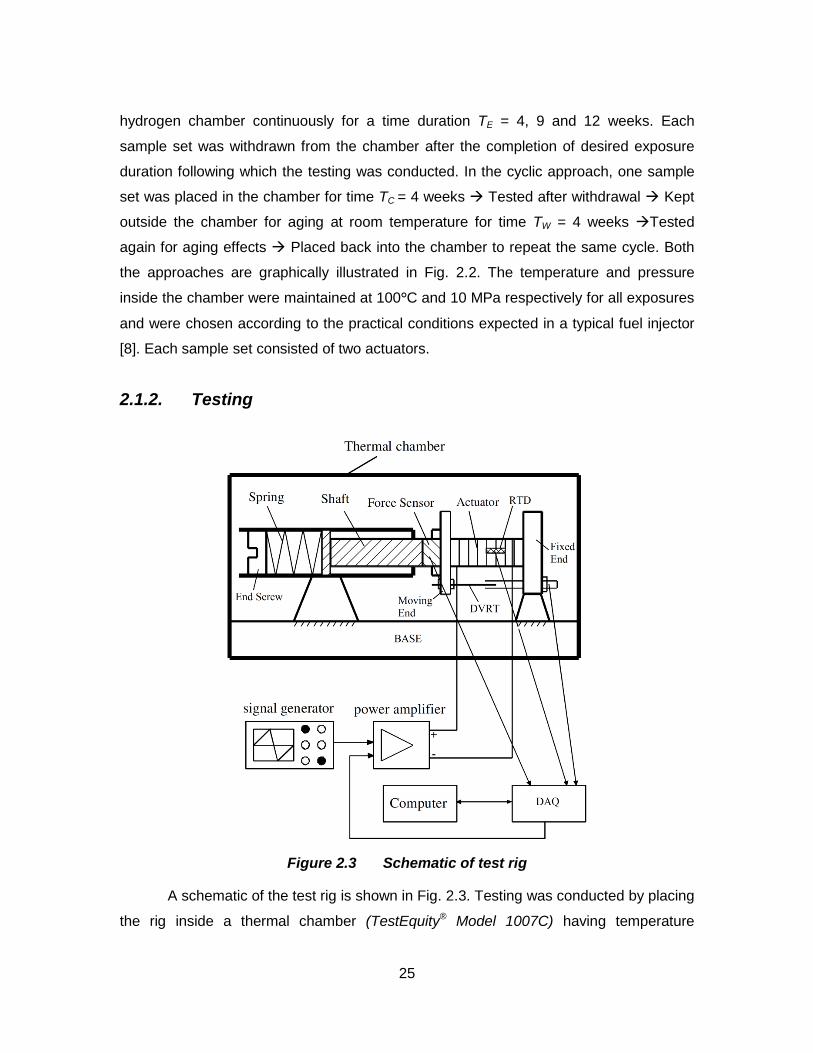
Figure 2.3 Schematic of test rig
A schematic of the test rig is shown in Fig. 2.3. Testing was conducted by placing
the rig inside a thermal chamber (TestEquity® Model 1007C) having temperature
26
controlled to ±0.1°C. The actuator was mounted in a groove on the moving end such that
its polar axis was aligned with the axis of the shaft. Using an end screw and a spring (k =
25 N/mm), a compressive preload was applied to the actuator in order to tighten it
between the moving end and the fixed end. Such a preload is also present in fuel
injectors for the purpose of alignment, counteracting stress concentrations and other
design requirements [3,4]. Preload of approx. 2 MPa was applied during quasi-static
loading and approx. 15 MPa during dynamic loading which was measured using a force
sensor (Futek®) placed between the shaft and the moving end. The elongation or
contraction of the actuator, due to the applied electric voltage, causes a displacement of
the moving end w.r.t. the fixed end. This displacement is the actuator stroke and was
measured using a Differential Variable Reluctance Transducer (DVRT) (Microstrain®)
having a resolution of ±0.1 µm. A Resistance Temperature Detector (RTD) was attached
to the surface of the actuator to measure its surface temperature. The electrical energy
in the form of voltage for driving the actuator was provided by a power amplifier. Output
voltage from the power amplifier was controlled either manually using a signal generator
(Agilent®) or automatically using a Data Acquisition Card (DAQ) (National Instruments®).
Measurements, in the form of voltage signals, from force sensor, DVRT and RTD were
input simultaneously into the DAQ and fed to the computer software (LabView®) where
they were interpreted in terms of their real physical units after applying suitable
calibration scaling.
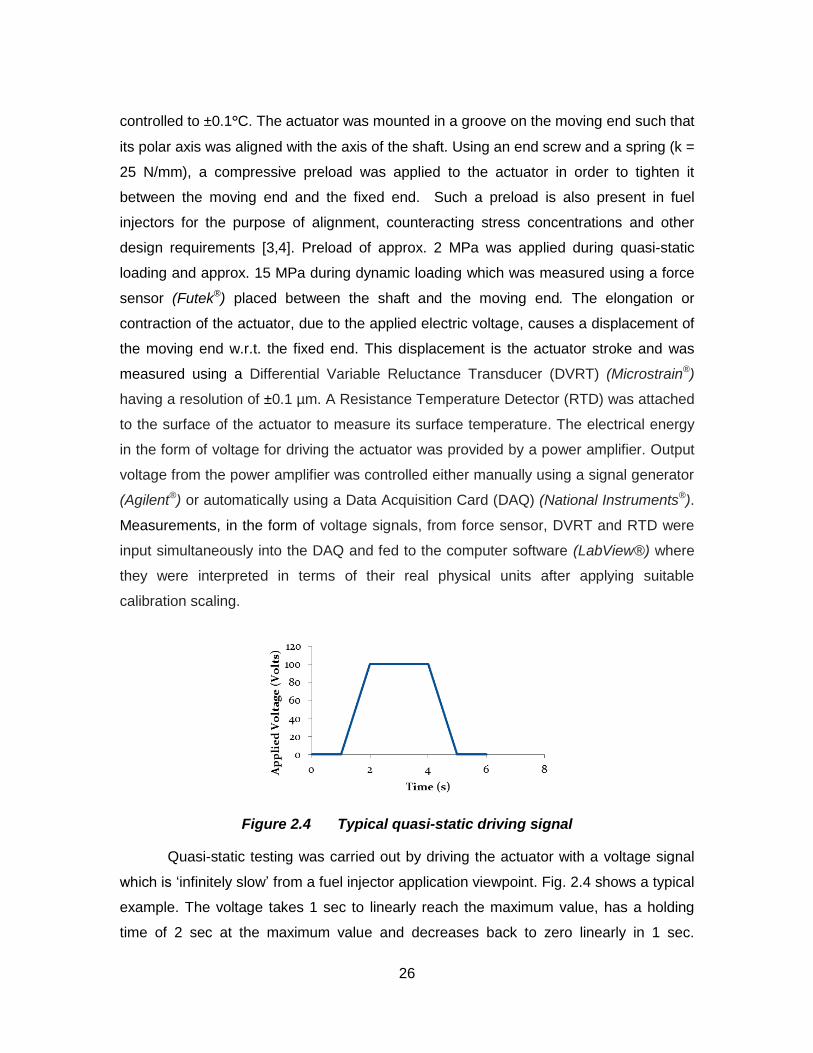
Figure 2.4 Typical quasi-static driving signal
Quasi-static testing was carried out by driving the actuator with a voltage signal
which is ‘infinitely slow’ from a fuel injector application viewpoint. Fig. 2.4 shows a typical
example. The voltage takes 1 sec to linearly reach the maximum value, has a holding
time of 2 sec at the maximum value and decreases back to zero linearly in 1 sec.
27
Actuator stroke was measured at different voltages (10-120V) and ambient temperatures
(5-80°C).
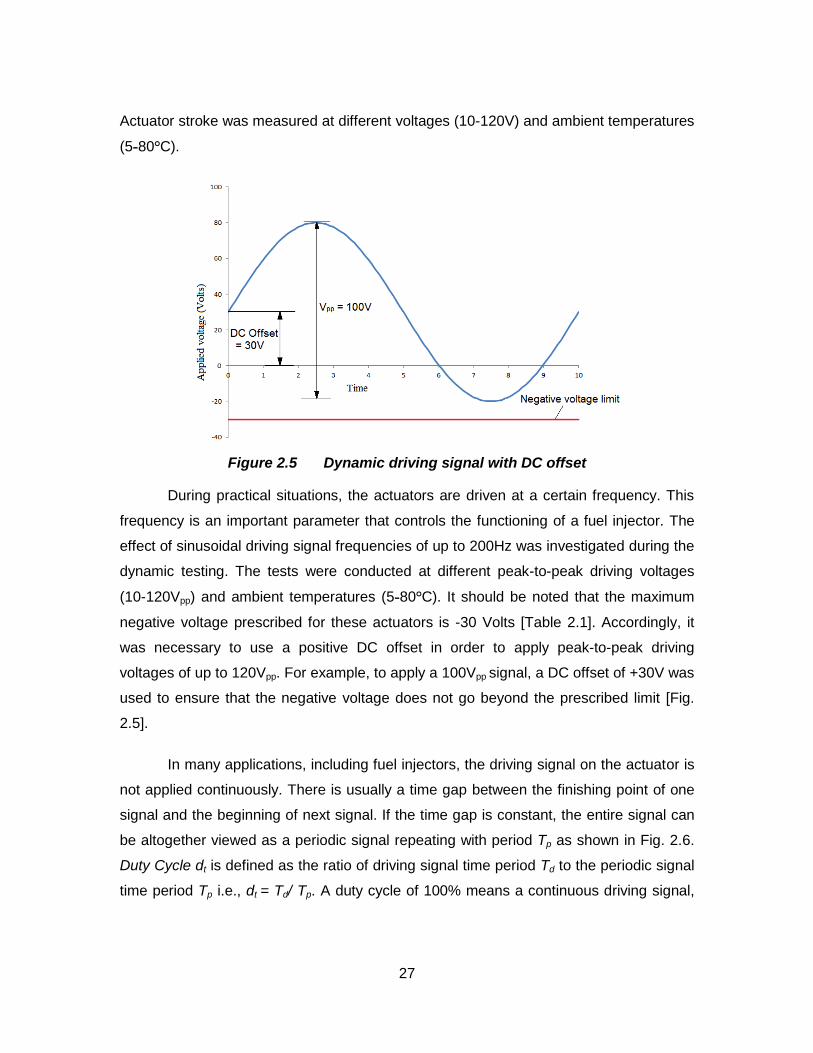
Figure 2.5 Dynamic driving signal with DC offset
During practical situations, the actuators are driven at a certain frequency. This
frequency is an important parameter that controls the functioning of a fuel injector. The
effect of sinusoidal driving signal frequencies of up to 200Hz was investigated during the
dynamic testing. The tests were conducted at different peak-to-peak driving voltages
(10-120Vpp) and ambient temperatures (5-80°C). It should be noted that the maximum
negative voltage prescribed for these actuators is -30 Volts [Table 2.1]. Accordingly, it
was necessary to use a positive DC offset in order to apply peak-to-peak driving
voltages of up to 120Vpp. For example, to apply a 100Vpp signal, a DC offset of +30V was
used to ensure that the negative voltage does not go beyond the prescribed limit [Fig.
2.5].
In many applications, including fuel injectors, the driving signal on the actuator is
not applied continuously. There is usually a time gap between the finishing point of one
signal and the beginning of next signal. If the time gap is constant, the entire signal can
be altogether viewed as a periodic signal repeating with period Tp as shown in Fig. 2.6.
Duty Cycle dt is defined as the ratio of driving signal time period Td to the periodic signal
time period Tp i.e., dt = Td/ Tp. A duty cycle of 100% means a continuous driving signal,
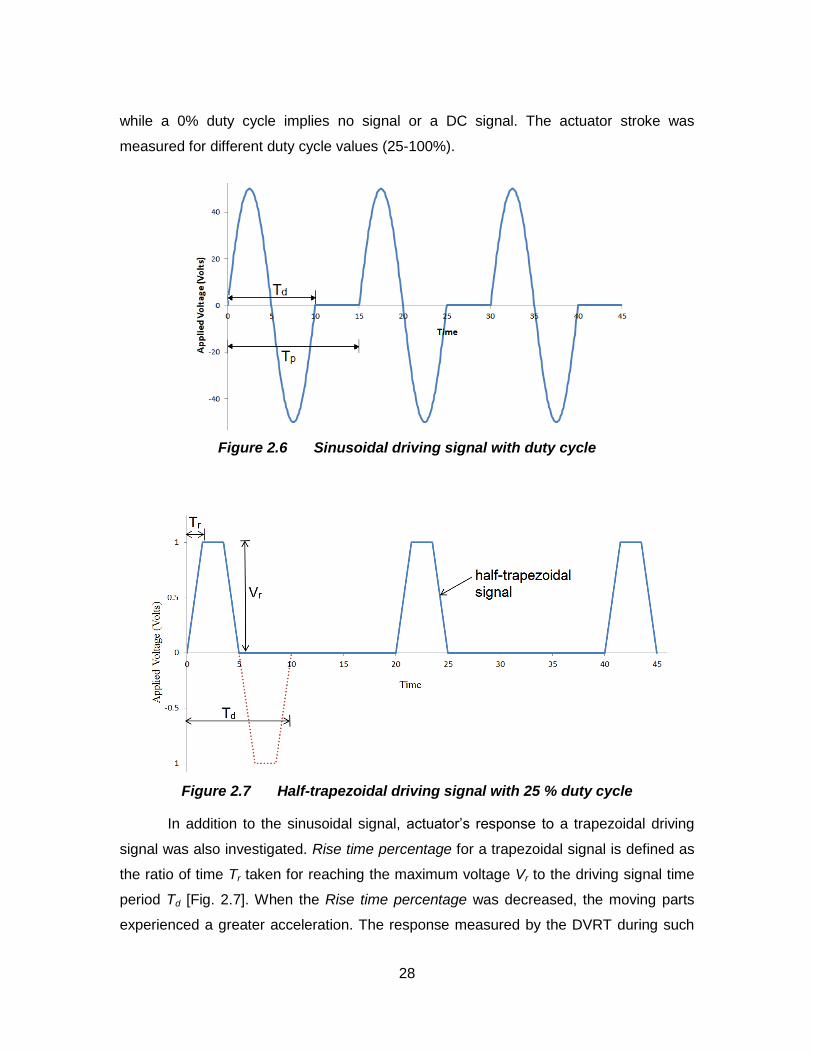
28
while a 0% duty cycle implies no signal or a DC signal. The actuator stroke was
measured for different duty cycle values (25-100%).
Figure 2.6 Sinusoidal driving signal with duty cycle
Figure 2.7 Half-trapezoidal driving signal with 25 % duty cycle
In addition to the sinusoidal signal, actuator’s response to a trapezoidal driving
signal was also investigated. Rise time percentage for a trapezoidal signal is defined as
the ratio of time Tr taken for reaching the maximum voltage Vr to the driving signal time
period Td [Fig. 2.7]. When the Rise time percentage was decreased, the moving parts
experienced a greater acceleration. The response measured by the DVRT during such
29
tests was overlapped with vibrations caused by the inertia of moving parts. In order to
detect the actuator stroke most accurately, a half-trapezoidal signal was applied at a
25% duty cycle allowing sufficient time for the vibrations to damp out. Tests were
conducted to investigate the dependence of the actuator stroke on the Rise time
percentage (2.5-20%) at different voltages Vr and frequencies (or time period Td).
During a dynamic operation involving continuous electrical loading-unloading
cycles, there are piezoelectric and dielectric hysteresis losses in a piezoelectric actuator.
These losses result in self-heat generation within the actuator material causing its
temperature to rise. When operated at typical fuel injection frequencies, there can be a
significant amount of temperature increase that can affect the properties of the PZT
material. The effect of driving signal voltage and frequency on this temperature increase
was also investigated during the dynamic tests.
The general step-by-step procedure for conducting all type of tests was:
1. Mounting the piezoelectric actuator on the moving end.
2. Preloading the actuator to the desired value by tightening the spring using the end screw.
3. Performing a check to make sure that all the sensors are properly mounted and give correct pre-test outputs.
4. Choosing the desired driving voltage signal depending on the type of test to be performed.
5. Firing the actuator with the chosen signal from the power amplifier controlled by signal generator or DAQ.
6. Recording data from all the sensors using DAQ.
Additionally, a few tests were also conducted to examine the effects of hydrogen
exposure on the dielectric response of the actuators. This was done using a high-
resolution impedance analyser LCR817 (Instek®).
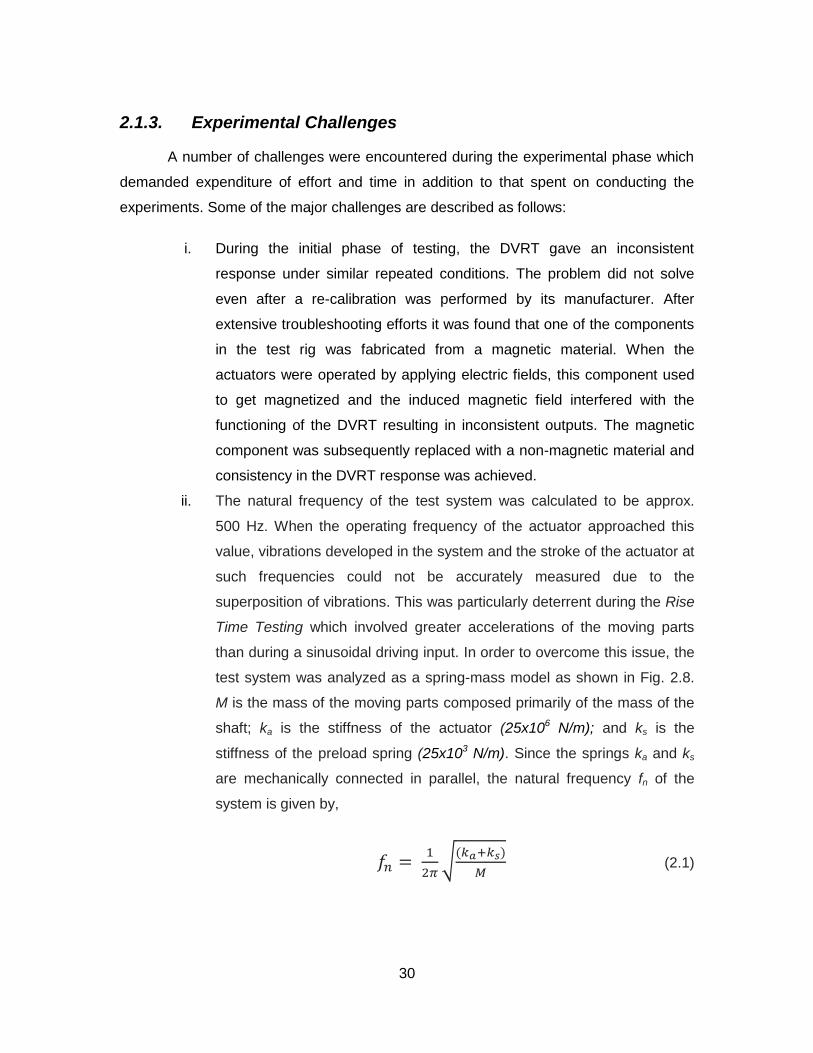
30
2.1.3. Experimental Challenges
A number of challenges were encountered during the experimental phase which
demanded expenditure of effort and time in addition to that spent on conducting the
experiments. Some of the major challenges are described as follows:
i. During the initial phase of testing, the DVRT gave an inconsistent
response under similar repeated conditions. The problem did not solve
even after a re-calibration was performed by its manufacturer. After
extensive troubleshooting efforts it was found that one of the components
in the test rig was fabricated from a magnetic material. When the
actuators were operated by applying electric fields, this component used
to get magnetized and the induced magnetic field interfered with the
functioning of the DVRT resulting in inconsistent outputs. The magnetic
component was subsequently replaced with a non-magnetic material and
consistency in the DVRT response was achieved.
ii. The natural frequency of the test system was calculated to be approx.
500 Hz. When the operating frequency of the actuator approached this
value, vibrations developed in the system and the stroke of the actuator at
such frequencies could not be accurately measured due to the
superposition of vibrations. This was particularly deterrent during the Rise
Time Testing which involved greater accelerations of the moving parts
than during a sinusoidal driving input. In order to overcome this issue, the
test system was analyzed as a spring-mass model as shown in Fig. 2.8.
M is the mass of the moving parts composed primarily of the mass of the
shaft; ka is the stiffness of the actuator (25x106 N/m); and ks is the
stiffness of the preload spring (25x103 N/m). Since the springs ka and ks
are mechanically connected in parallel, the natural frequency fn of the
system is given by,
√
(2.1)
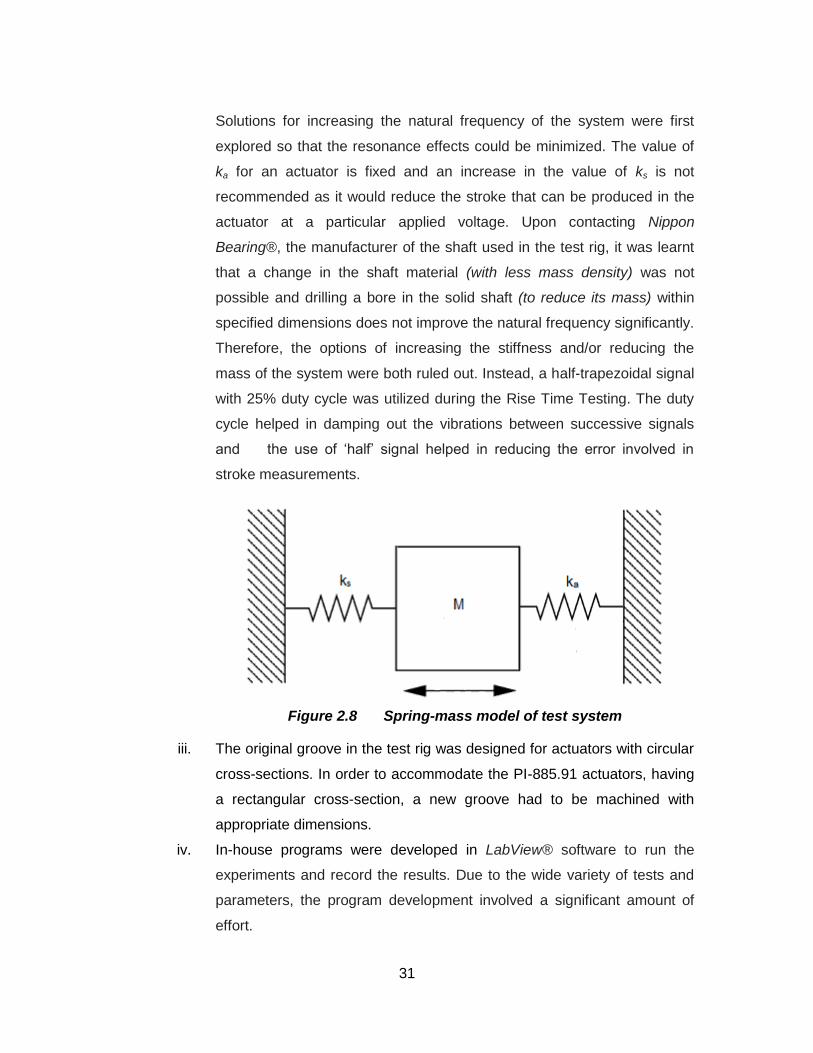
31
Solutions for increasing the natural frequency of the system were first
explored so that the resonance effects could be minimized. The value of
ka for an actuator is fixed and an increase in the value of ks is not
recommended as it would reduce the stroke that can be produced in the
actuator at a particular applied voltage. Upon contacting Nippon
Bearing®, the manufacturer of the shaft used in the test rig, it was learnt
that a change in the shaft material (with less mass density) was not
possible and drilling a bore in the solid shaft (to reduce its mass) within
specified dimensions does not improve the natural frequency significantly.
Therefore, the options of increasing the stiffness and/or reducing the
mass of the system were both ruled out. Instead, a half-trapezoidal signal
with 25% duty cycle was utilized during the Rise Time Testing. The duty
cycle helped in damping out the vibrations between successive signals
and the use of ‘half’ signal helped in reducing the error involved in
stroke measurements.
Figure 2.8 Spring-mass model of test system
iii. The original groove in the test rig was designed for actuators with circular
cross-sections. In order to accommodate the PI-885.91 actuators, having
a rectangular cross-section, a new groove had to be machined with
appropriate dimensions.
iv. In-house programs were developed in LabView® software to run the
experiments and record the results. Due to the wide variety of tests and
parameters, the program development involved a significant amount of
effort.
32
v. National Instruments® data acquisition card DAQCard-6062E was
originally used for recording the input data from the sensors and
controlling the output signals from the power amplifier. This card got
damaged during the later stages of testing. NI USB-6009 data acquisition
card had to be used in its place to complete the remaining tests. The NI
USB-6009 had a much lower input sampling rate of 48 kS/s compared to
500 kS/s of the DAQCard-6062E.This necessitated modifications in
majority of the LabView® programs that were written to control the tests.
The NI USB-6009 also had lower unipolar output range of 0 to +5V
(insufficient for running the complete set of tests) compared to the bipolar
±10V range of the DAQCard-6062E. An Agilent® signal generator was,
therefore, used to provide the required full-range, bipolar output voltage.
The use of signal generator, however, introduced a manual step into an
otherwise automated operation. Finally, by taking these necessary
actions, all the planned tests were completed.
vi. As few of the experimental facilities had to be shared with other groups,
the scheduling of experiments required some extra consideration. The
Materials Engineering group at UBC was conducting a parallel study in
which actuators had to be exposed inside the hydrogen-safe chamber,
located at CERC, which could simultaneously accommodate a maximum
of three actuators. The thermal chamber, at Westport Innovations Inc.,
had to be vacated on an ad hoc basis when their industrial projects
demanded its use.
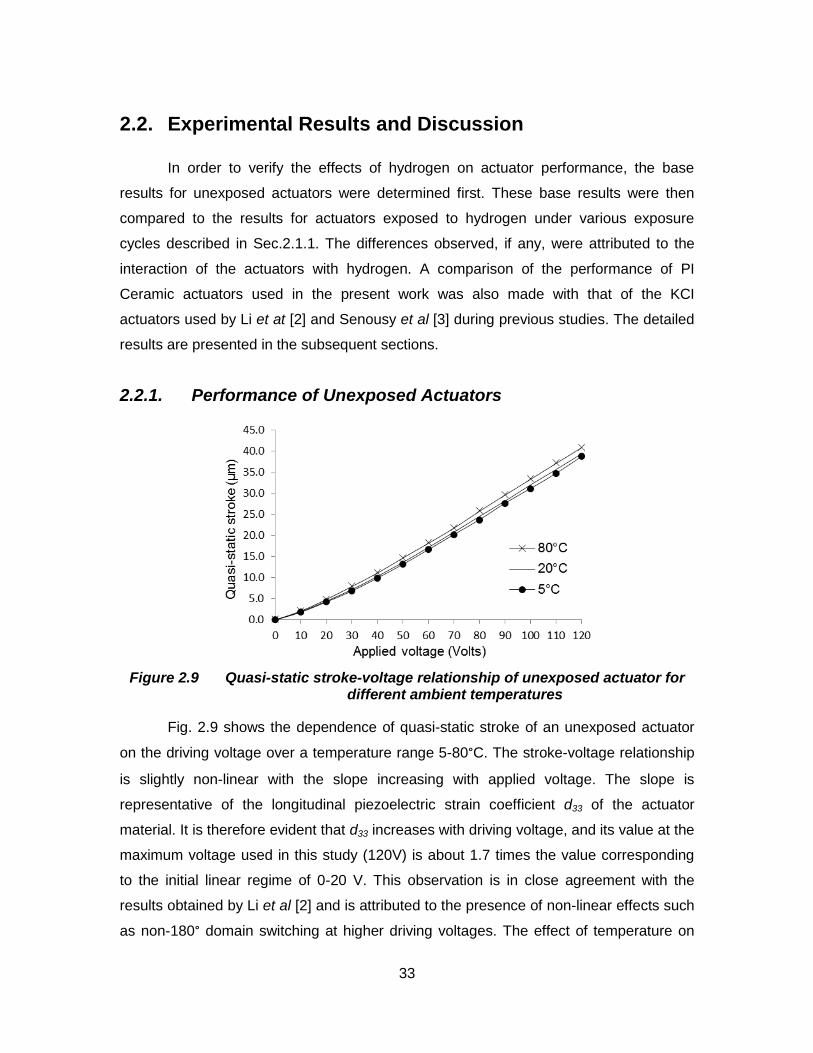
33
2.2. Experimental Results and Discussion
In order to verify the effects of hydrogen on actuator performance, the base
results for unexposed actuators were determined first. These base results were then
compared to the results for actuators exposed to hydrogen under various exposure
cycles described in Sec.2.1.1. The differences observed, if any, were attributed to the
interaction of the actuators with hydrogen. A comparison of the performance of PI
Ceramic actuators used in the present work was also made with that of the KCI
actuators used by Li et at [2] and Senousy et al [3] during previous studies. The detailed
results are presented in the subsequent sections.
2.2.1. Performance of Unexposed Actuators
Figure 2.9 Quasi-static stroke-voltage relationship of unexposed actuator for different ambient temperatures
Fig. 2.9 shows the dependence of quasi-static stroke of an unexposed actuator
on the driving voltage over a temperature range 5-80°C. The stroke-voltage relationship
is slightly non-linear with the slope increasing with applied voltage. The slope is
representative of the longitudinal piezoelectric strain coefficient d33 of the actuator
material. It is therefore evident that d33 increases with driving voltage, and its value at the
maximum voltage used in this study (120V) is about 1.7 times the value corresponding
to the initial linear regime of 0-20 V. This observation is in close agreement with the
results obtained by Li et al [2] and is attributed to the presence of non-linear effects such
as non-180° domain switching at higher driving voltages. The effect of temperature on
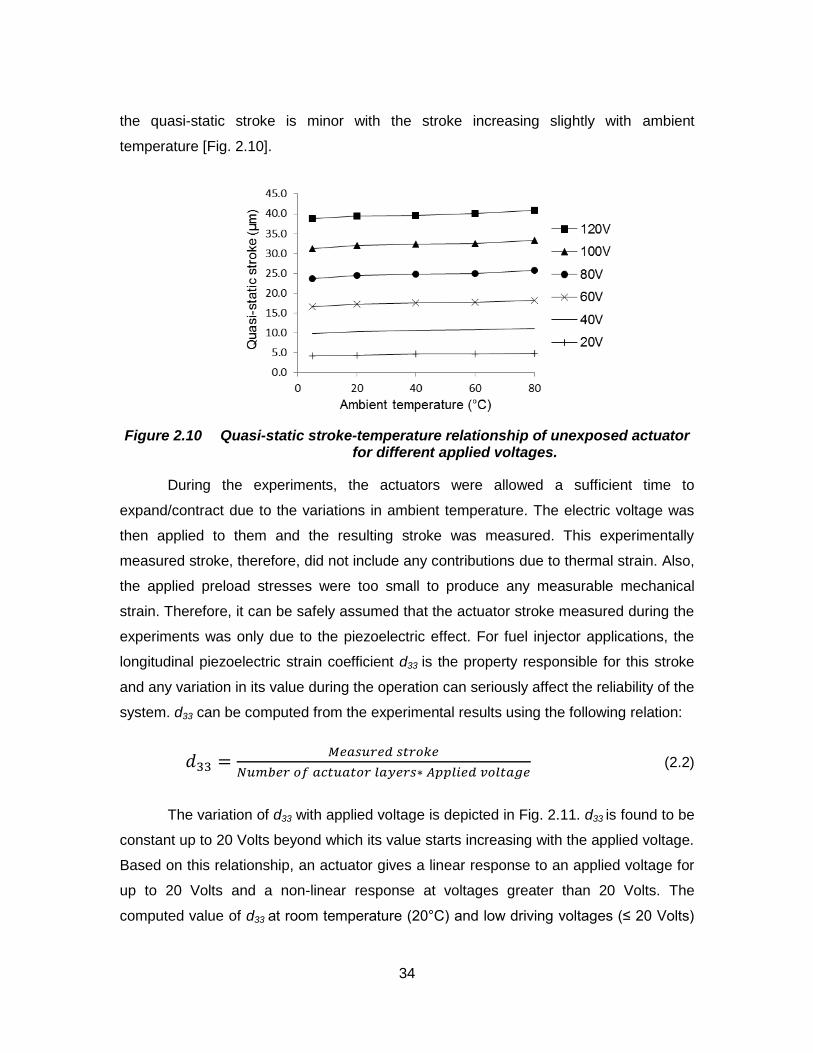
34
the quasi-static stroke is minor with the stroke increasing slightly with ambient
temperature [Fig. 2.10].
Figure 2.10 Quasi-static stroke-temperature relationship of unexposed actuator for different applied voltages.
During the experiments, the actuators were allowed a sufficient time to
expand/contract due to the variations in ambient temperature. The electric voltage was
then applied to them and the resulting stroke was measured. This experimentally
measured stroke, therefore, did not include any contributions due to thermal strain. Also,
the applied preload stresses were too small to produce any measurable mechanical
strain. Therefore, it can be safely assumed that the actuator stroke measured during the
experiments was only due to the piezoelectric effect. For fuel injector applications, the
longitudinal piezoelectric strain coefficient d33 is the property responsible for this stroke
and any variation in its value during the operation can seriously affect the reliability of the
system. d33 can be computed from the experimental results using the following relation:
(2.2)
The variation of d33 with applied voltage is depicted in Fig. 2.11. d33 is found to be
constant up to 20 Volts beyond which its value starts increasing with the applied voltage.
Based on this relationship, an actuator gives a linear response to an applied voltage for
up to 20 Volts and a non-linear response at voltages greater than 20 Volts. The
computed value of d33 at room temperature (20°C) and low driving voltages (≤ 20 Volts)
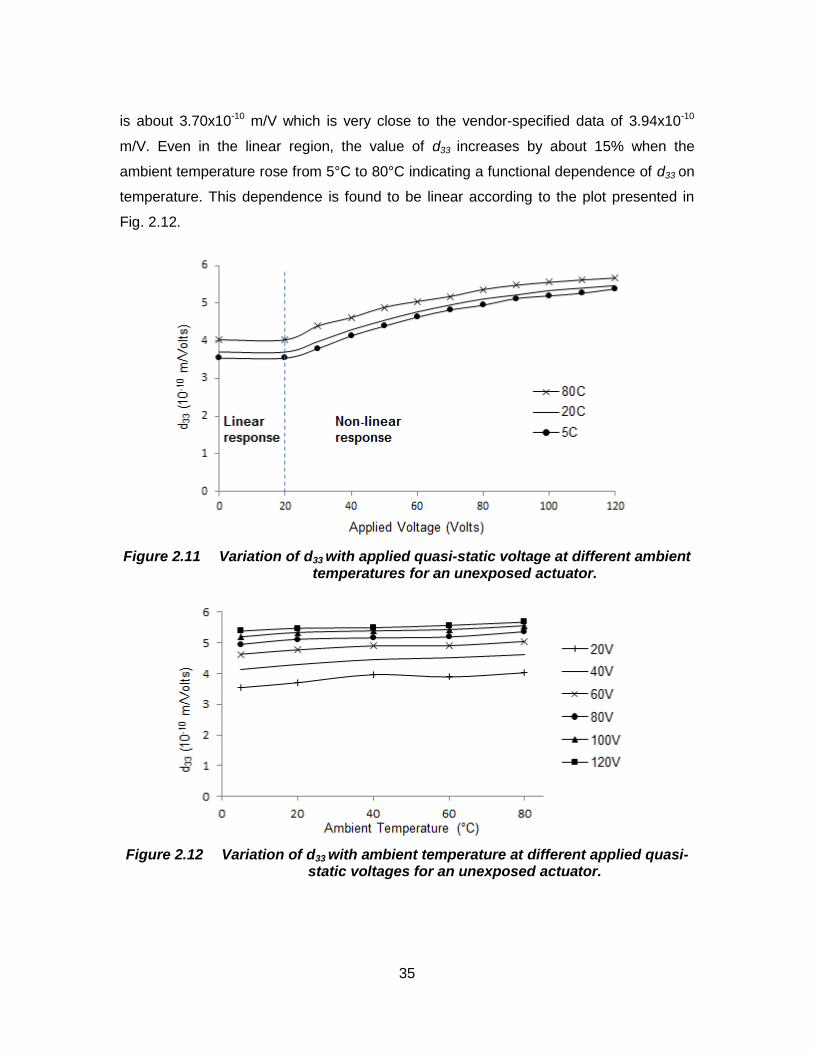
35
is about 3.70x10⁻¹⁰ m/V which is very close to the vendor-specified data of 3.94x10⁻¹⁰
m/V. Even in the linear region, the value of d33 increases by about 15% when the
ambient temperature rose from 5°C to 80°C indicating a functional dependence of d33 on
temperature. This dependence is found to be linear according to the plot presented in
Fig. 2.12.
Figure 2.11 Variation of d33 with applied quasi-static voltage at different ambient temperatures for an unexposed actuator.
Figure 2.12 Variation of d33 with ambient temperature at different applied quasi-static voltages for an unexposed actuator.
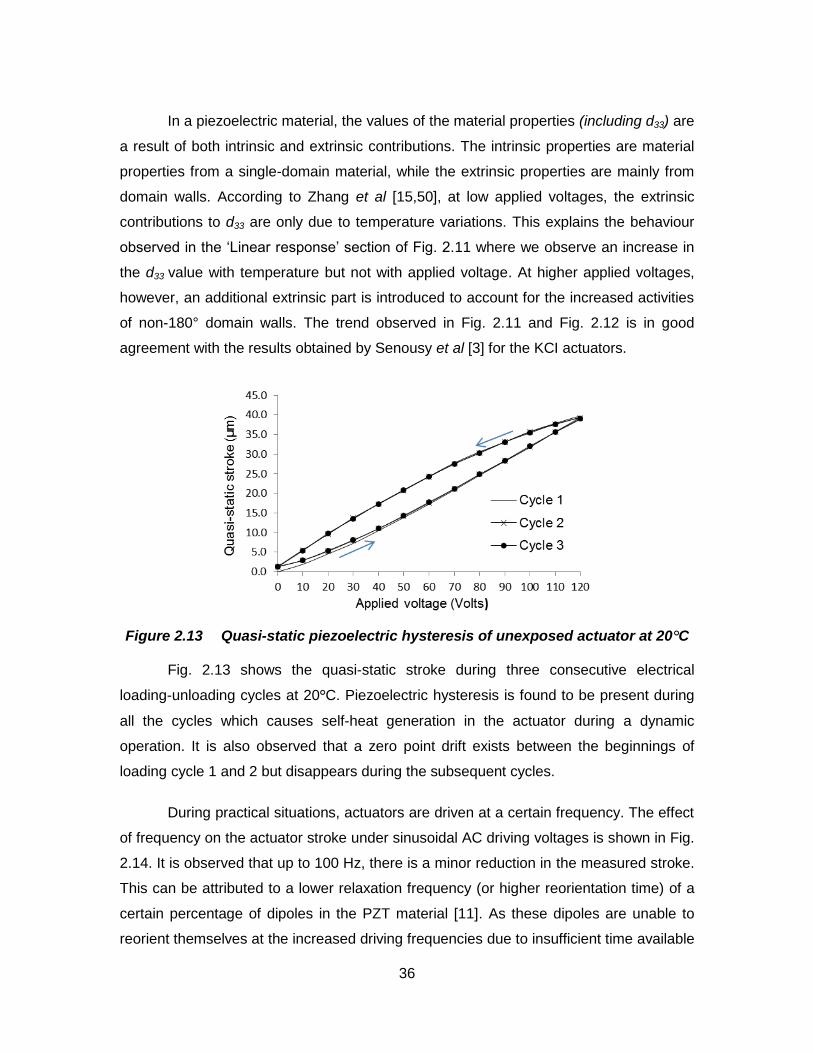
36
In a piezoelectric material, the values of the material properties (including d33) are
a result of both intrinsic and extrinsic contributions. The intrinsic properties are material
properties from a single-domain material, while the extrinsic properties are mainly from
domain walls. According to Zhang et al [15,50], at low applied voltages, the extrinsic
contributions to d33 are only due to temperature variations. This explains the behaviour
observed in the ‘Linear response’ section of Fig. 2.11 where we observe an increase in
the d33 value with temperature but not with applied voltage. At higher applied voltages,
however, an additional extrinsic part is introduced to account for the increased activities
of non-180° domain walls. The trend observed in Fig. 2.11 and Fig. 2.12 is in good
agreement with the results obtained by Senousy et al [3] for the KCI actuators.
Figure 2.13 Quasi-static piezoelectric hysteresis of unexposed actuator at 20°C
Fig. 2.13 shows the quasi-static stroke during three consecutive electrical
loading-unloading cycles at 20°C. Piezoelectric hysteresis is found to be present during
all the cycles which causes self-heat generation in the actuator during a dynamic
operation. It is also observed that a zero point drift exists between the beginnings of
loading cycle 1 and 2 but disappears during the subsequent cycles.
During practical situations, actuators are driven at a certain frequency. The effect
of frequency on the actuator stroke under sinusoidal AC driving voltages is shown in Fig.
2.14. It is observed that up to 100 Hz, there is a minor reduction in the measured stroke.
This can be attributed to a lower relaxation frequency (or higher reorientation time) of a
certain percentage of dipoles in the PZT material [11]. As these dipoles are unable to
reorient themselves at the increased driving frequencies due to insufficient time available
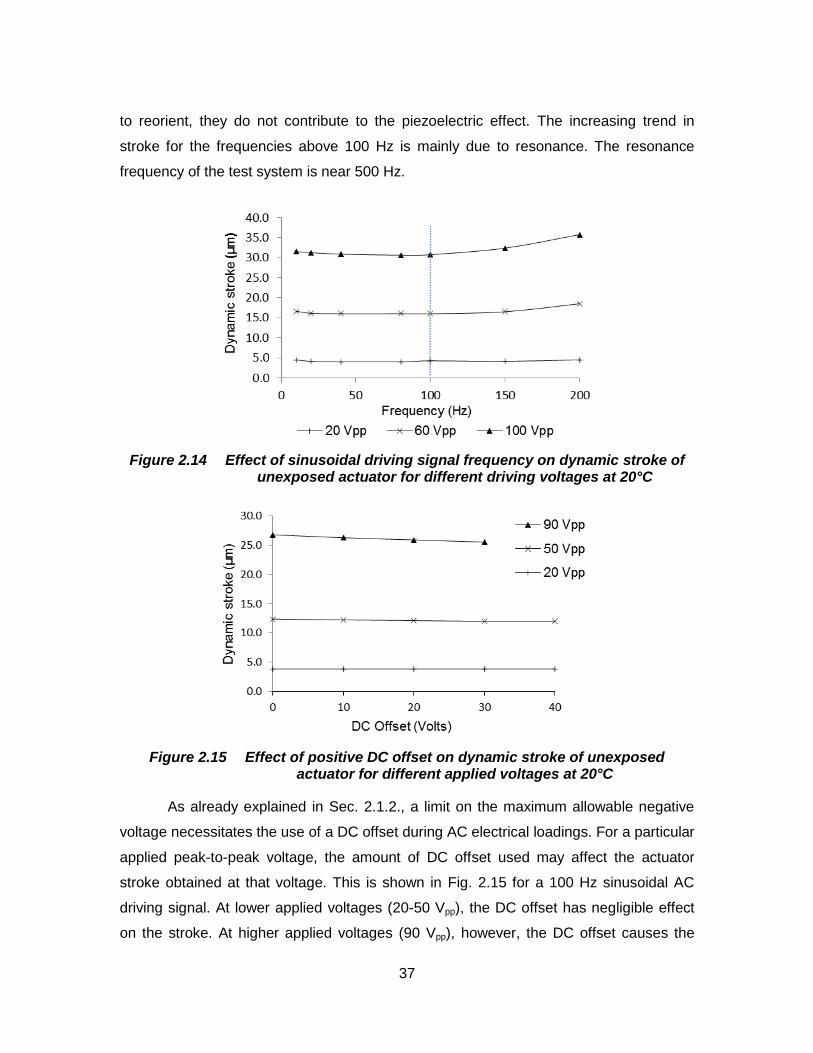
37
to reorient, they do not contribute to the piezoelectric effect. The increasing trend in
stroke for the frequencies above 100 Hz is mainly due to resonance. The resonance
frequency of the test system is near 500 Hz.
Figure 2.14 Effect of sinusoidal driving signal frequency on dynamic stroke of unexposed actuator for different driving voltages at 20°C
Figure 2.15 Effect of positive DC offset on dynamic stroke of unexposed actuator for different applied voltages at 20°C
As already explained in Sec. 2.1.2., a limit on the maximum allowable negative
voltage necessitates the use of a DC offset during AC electrical loadings. For a particular
applied peak-to-peak voltage, the amount of DC offset used may affect the actuator
stroke obtained at that voltage. This is shown in Fig. 2.15 for a 100 Hz sinusoidal AC
driving signal. At lower applied voltages (20-50 Vpp), the DC offset has negligible effect
on the stroke. At higher applied voltages (90 Vpp), however, the DC offset causes the
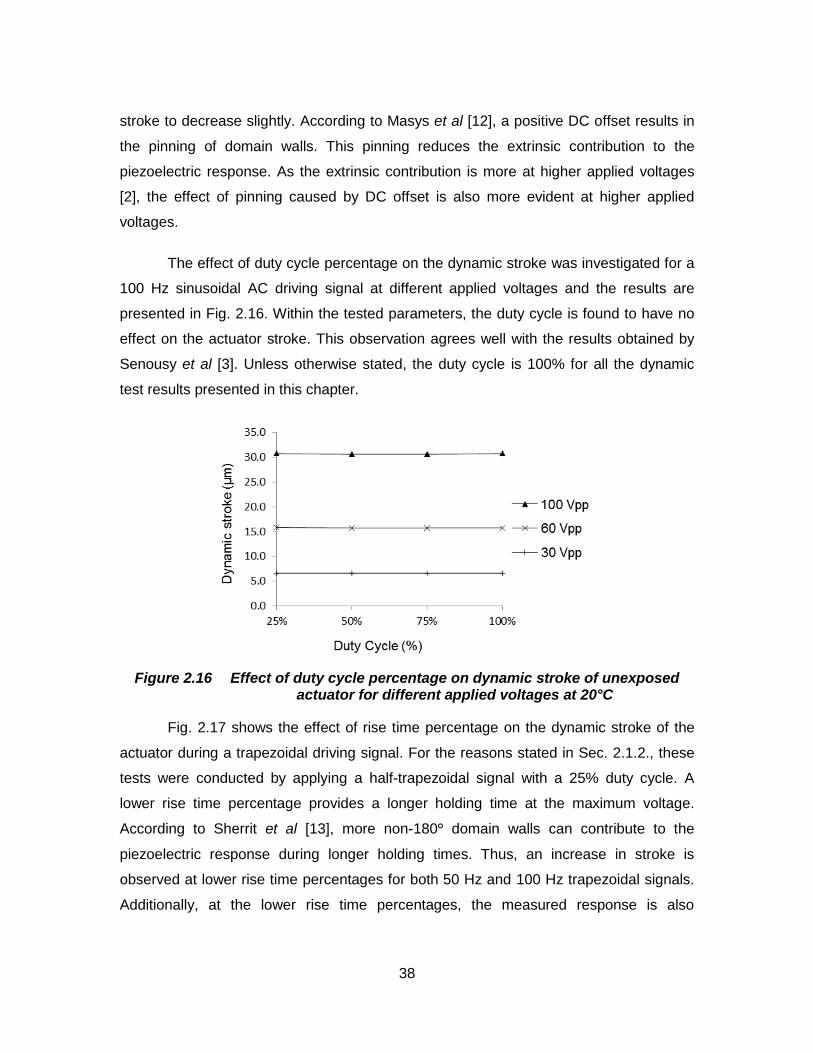
38
stroke to decrease slightly. According to Masys et al [12], a positive DC offset results in
the pinning of domain walls. This pinning reduces the extrinsic contribution to the
piezoelectric response. As the extrinsic contribution is more at higher applied voltages
[2], the effect of pinning caused by DC offset is also more evident at higher applied
voltages.
The effect of duty cycle percentage on the dynamic stroke was investigated for a
100 Hz sinusoidal AC driving signal at different applied voltages and the results are
presented in Fig. 2.16. Within the tested parameters, the duty cycle is found to have no
effect on the actuator stroke. This observation agrees well with the results obtained by
Senousy et al [3]. Unless otherwise stated, the duty cycle is 100% for all the dynamic
test results presented in this chapter.
Figure 2.16 Effect of duty cycle percentage on dynamic stroke of unexposed actuator for different applied voltages at 20°C
Fig. 2.17 shows the effect of rise time percentage on the dynamic stroke of the
actuator during a trapezoidal driving signal. For the reasons stated in Sec. 2.1.2., these
tests were conducted by applying a half-trapezoidal signal with a 25% duty cycle. A
lower rise time percentage provides a longer holding time at the maximum voltage.
According to Sherrit et al [13], more non-180° domain walls can contribute to the
piezoelectric response during longer holding times. Thus, an increase in stroke is
observed at lower rise time percentages for both 50 Hz and 100 Hz trapezoidal signals.
Additionally, at the lower rise time percentages, the measured response is also
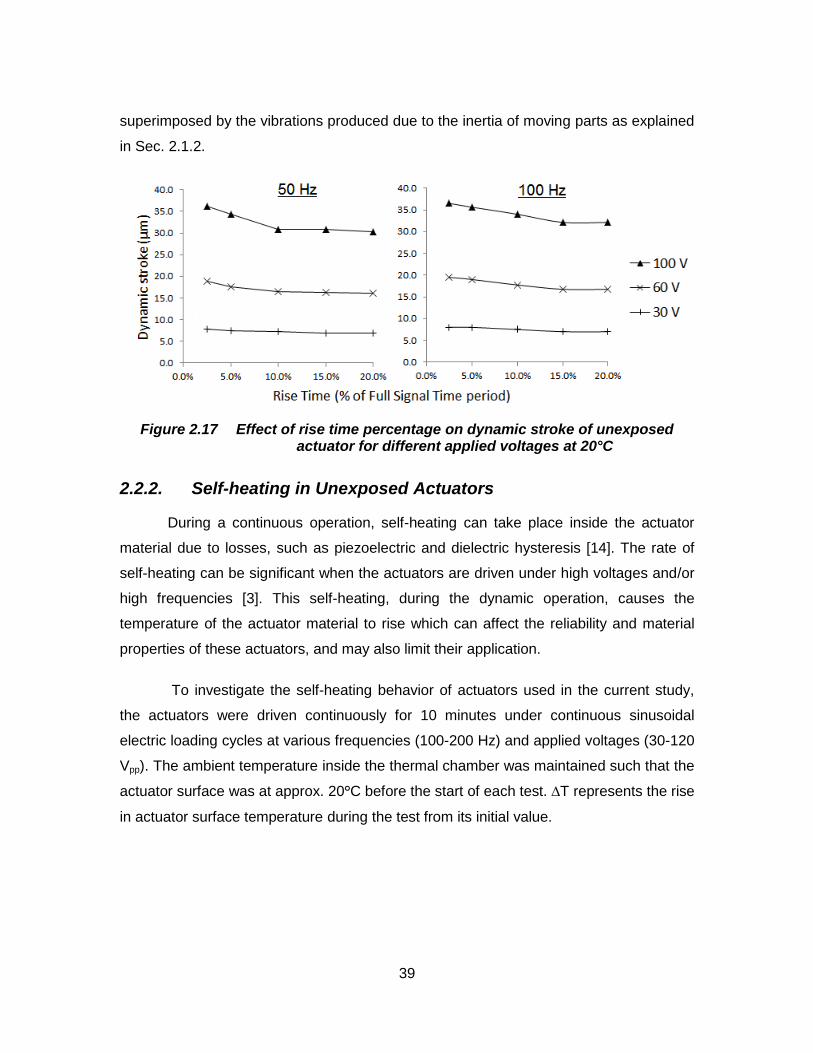
39
superimposed by the vibrations produced due to the inertia of moving parts as explained
in Sec. 2.1.2.
Figure 2.17 Effect of rise time percentage on dynamic stroke of unexposed actuator for different applied voltages at 20°C
2.2.2. Self-heating in Unexposed Actuators
During a continuous operation, self-heating can take place inside the actuator
material due to losses, such as piezoelectric and dielectric hysteresis [14]. The rate of
self-heating can be significant when the actuators are driven under high voltages and/or
high frequencies [3]. This self-heating, during the dynamic operation, causes the
temperature of the actuator material to rise which can affect the reliability and material
properties of these actuators, and may also limit their application.
To investigate the self-heating behavior of actuators used in the current study,
the actuators were driven continuously for 10 minutes under continuous sinusoidal
electric loading cycles at various frequencies (100-200 Hz) and applied voltages (30-120
Vpp). The ambient temperature inside the thermal chamber was maintained such that the
actuator surface was at approx. 20°C before the start of each test. ∆T represents the rise
in actuator surface temperature during the test from its initial value.
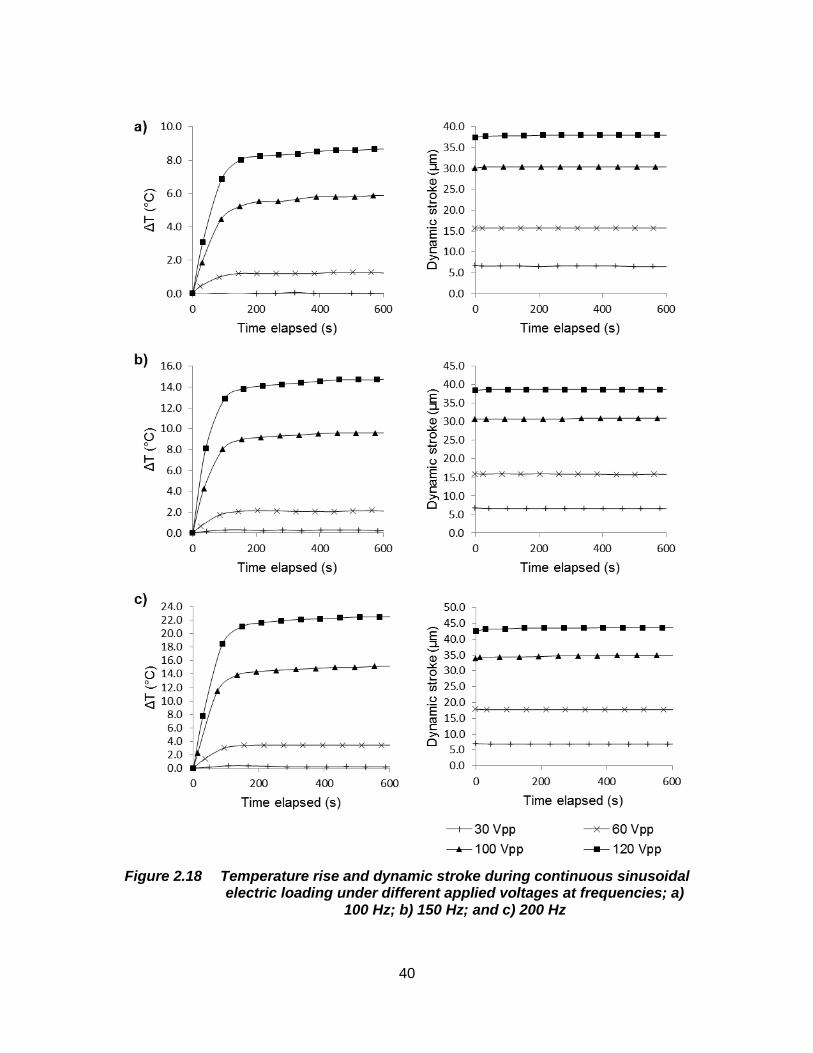
40
Figure 2.18 Temperature rise and dynamic stroke during continuous sinusoidal electric loading under different applied voltages at frequencies; a)
100 Hz; b) 150 Hz; and c) 200 Hz
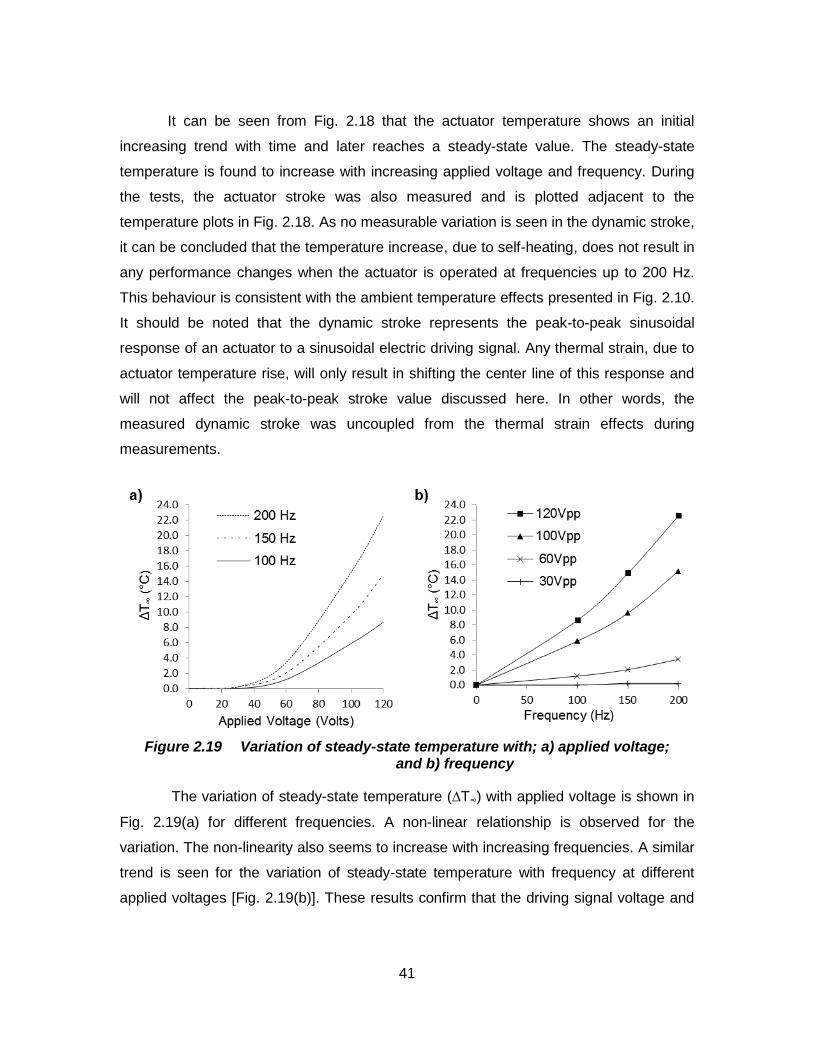
41
It can be seen from Fig. 2.18 that the actuator temperature shows an initial
increasing trend with time and later reaches a steady-state value. The steady-state
temperature is found to increase with increasing applied voltage and frequency. During
the tests, the actuator stroke was also measured and is plotted adjacent to the
temperature plots in Fig. 2.18. As no measurable variation is seen in the dynamic stroke,
it can be concluded that the temperature increase, due to self-heating, does not result in
any performance changes when the actuator is operated at frequencies up to 200 Hz.
This behaviour is consistent with the ambient temperature effects presented in Fig. 2.10.
It should be noted that the dynamic stroke represents the peak-to-peak sinusoidal
response of an actuator to a sinusoidal electric driving signal. Any thermal strain, due to
actuator temperature rise, will only result in shifting the center line of this response and
will not affect the peak-to-peak stroke value discussed here. In other words, the
measured dynamic stroke was uncoupled from the thermal strain effects during
measurements.
Figure 2.19 Variation of steady-state temperature with; a) applied voltage; and b) frequency
The variation of steady-state temperature (∆T∞) with applied voltage is shown in
Fig. 2.19(a) for different frequencies. A non-linear relationship is observed for the
variation. The non-linearity also seems to increase with increasing frequencies. A similar
trend is seen for the variation of steady-state temperature with frequency at different
applied voltages [Fig. 2.19(b)]. These results confirm that the driving signal voltage and
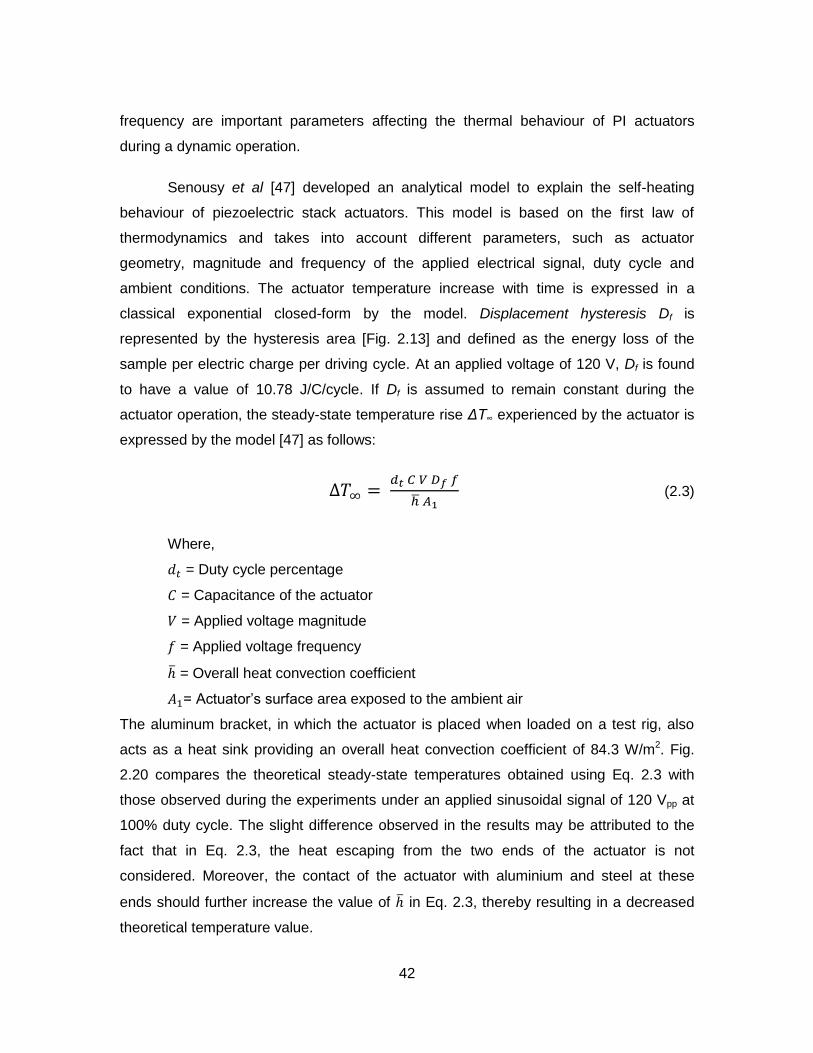
42
frequency are important parameters affecting the thermal behaviour of PI actuators
during a dynamic operation.
Senousy et al [47] developed an analytical model to explain the self-heating
behaviour of piezoelectric stack actuators. This model is based on the first law of
thermodynamics and takes into account different parameters, such as actuator
geometry, magnitude and frequency of the applied electrical signal, duty cycle and
ambient conditions. The actuator temperature increase with time is expressed in a
classical exponential closed-form by the model. Displacement hysteresis Df is
represented by the hysteresis area [Fig. 2.13] and defined as the energy loss of the
sample per electric charge per driving cycle. At an applied voltage of 120 V, Df is found
to have a value of 10.78 J/C/cycle. If Df is assumed to remain constant during the
actuator operation, the steady-state temperature rise ΔT∞ experienced by the actuator is
expressed by the model [47] as follows:
(2.3)
Where,
= Duty cycle percentage
= Capacitance of the actuator
= Applied voltage magnitude
= Applied voltage frequency
= Overall heat convection coefficient
= Actuator’s surface area exposed to the ambient air
The aluminum bracket, in which the actuator is placed when loaded on a test rig, also
acts as a heat sink providing an overall heat convection coefficient of 84.3 W/m2. Fig.
2.20 compares the theoretical steady-state temperatures obtained using Eq. 2.3 with
those observed during the experiments under an applied sinusoidal signal of 120 Vpp at
100% duty cycle. The slight difference observed in the results may be attributed to the
fact that in Eq. 2.3, the heat escaping from the two ends of the actuator is not
considered. Moreover, the contact of the actuator with aluminium and steel at these
ends should further increase the value of in Eq. 2.3, thereby resulting in a decreased
theoretical temperature value.
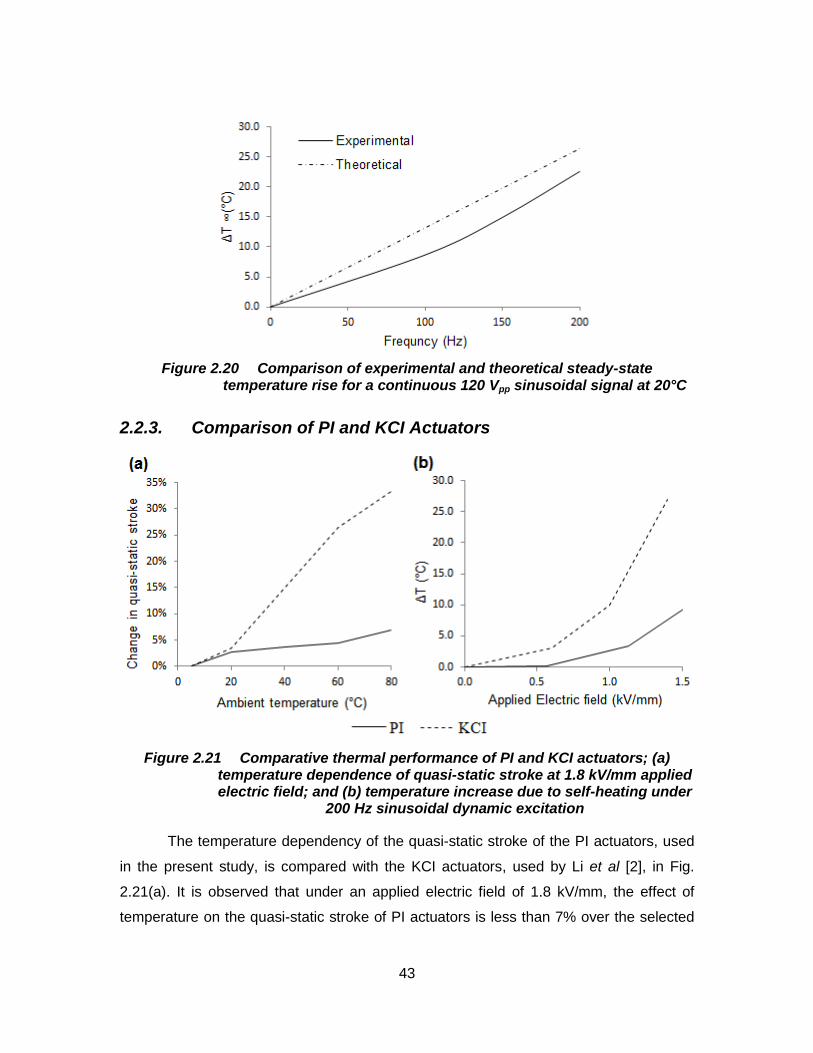
43
Figure 2.20 Comparison of experimental and theoretical steady-state temperature rise for a continuous 120 Vpp sinusoidal signal at 20°C
2.2.3. Comparison of PI and KCI Actuators
Figure 2.21 Comparative thermal performance of PI and KCI actuators; (a) temperature dependence of quasi-static stroke at 1.8 kV/mm applied electric field; and (b) temperature increase due to self-heating under
200 Hz sinusoidal dynamic excitation
The temperature dependency of the quasi-static stroke of the PI actuators, used
in the present study, is compared with the KCI actuators, used by Li et al [2], in Fig.
2.21(a). It is observed that under an applied electric field of 1.8 kV/mm, the effect of
temperature on the quasi-static stroke of PI actuators is less than 7% over the selected
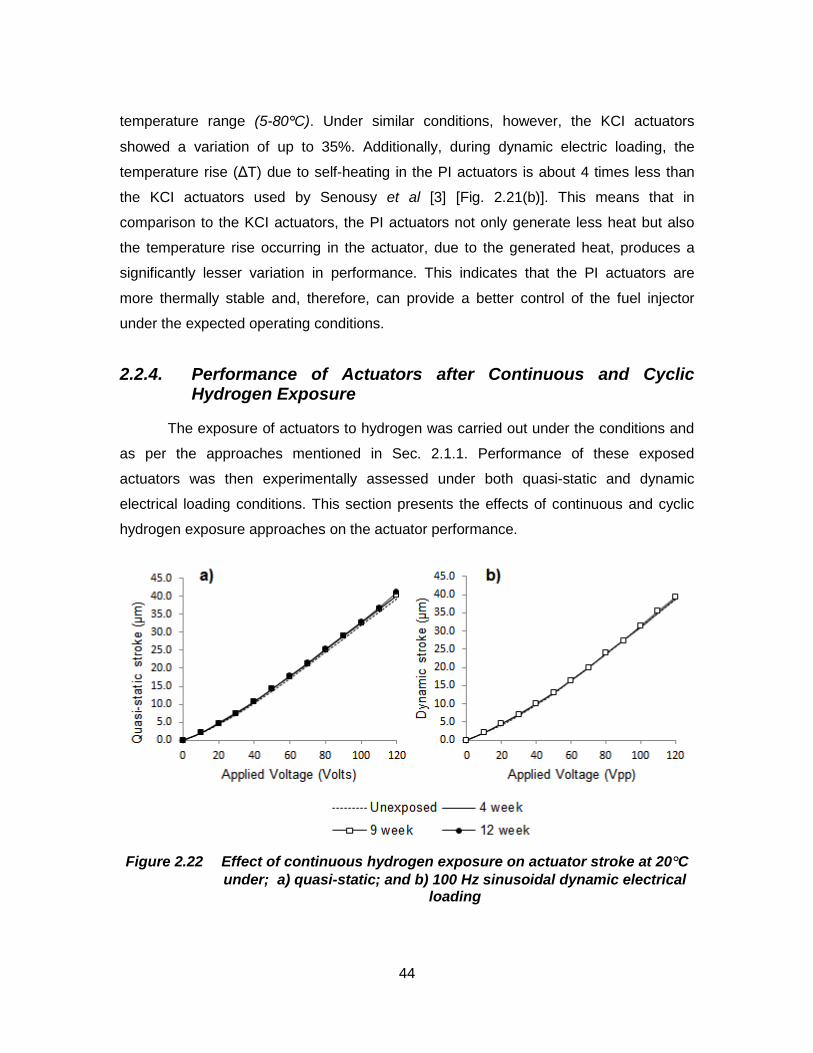
44
temperature range (5-80°C). Under similar conditions, however, the KCI actuators
showed a variation of up to 35%. Additionally, during dynamic electric loading, the
temperature rise (ΔT) due to self-heating in the PI actuators is about 4 times less than
the KCI actuators used by Senousy et al [3] [Fig. 2.21(b)]. This means that in
comparison to the KCI actuators, the PI actuators not only generate less heat but also
the temperature rise occurring in the actuator, due to the generated heat, produces a
significantly lesser variation in performance. This indicates that the PI actuators are
more thermally stable and, therefore, can provide a better control of the fuel injector
under the expected operating conditions.
2.2.4. Performance of Actuators after Continuous and Cyclic Hydrogen Exposure
The exposure of actuators to hydrogen was carried out under the conditions and
as per the approaches mentioned in Sec. 2.1.1. Performance of these exposed
actuators was then experimentally assessed under both quasi-static and dynamic
electrical loading conditions. This section presents the effects of continuous and cyclic
hydrogen exposure approaches on the actuator performance.
Figure 2.22 Effect of continuous hydrogen exposure on actuator stroke at 20°C
under; a) quasi-static; and b) 100 Hz sinusoidal dynamic electrical loading
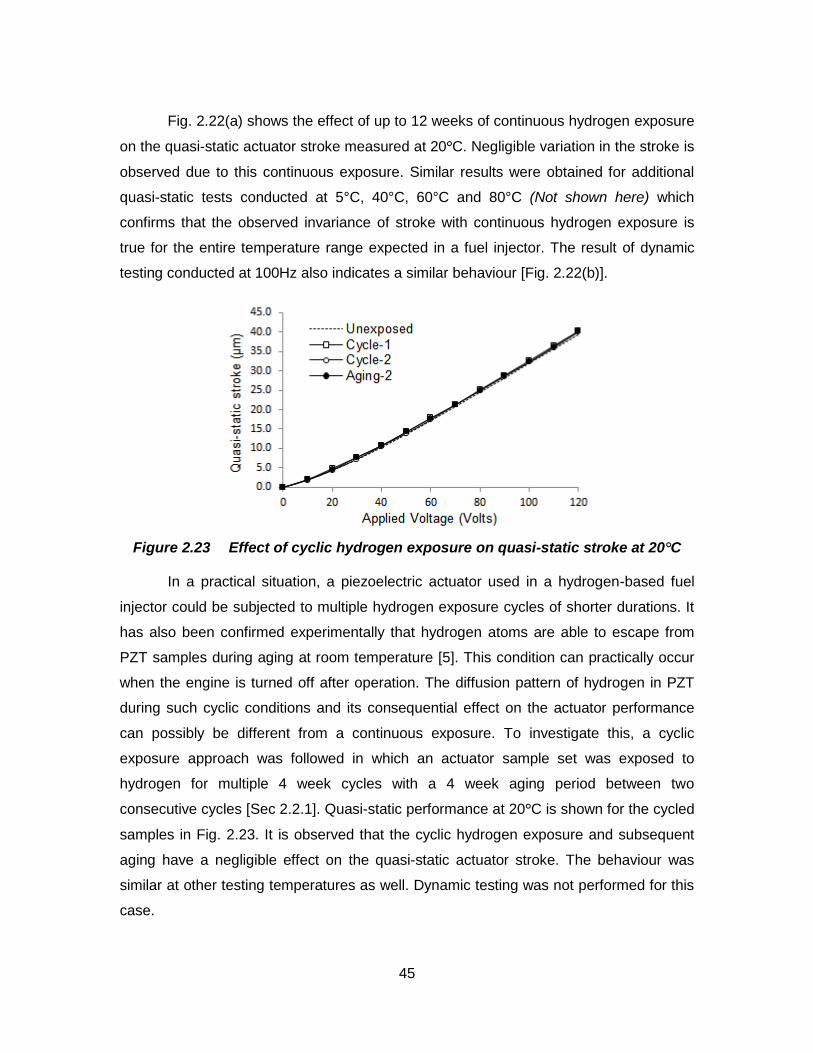
45
Fig. 2.22(a) shows the effect of up to 12 weeks of continuous hydrogen exposure
on the quasi-static actuator stroke measured at 20°C. Negligible variation in the stroke is
observed due to this continuous exposure. Similar results were obtained for additional
quasi-static tests conducted at 5°C, 40°C, 60°C and 80°C (Not shown here) which
confirms that the observed invariance of stroke with continuous hydrogen exposure is
true for the entire temperature range expected in a fuel injector. The result of dynamic
testing conducted at 100Hz also indicates a similar behaviour [Fig. 2.22(b)].
Figure 2.23 Effect of cyclic hydrogen exposure on quasi-static stroke at 20°C
In a practical situation, a piezoelectric actuator used in a hydrogen-based fuel
injector could be subjected to multiple hydrogen exposure cycles of shorter durations. It
has also been confirmed experimentally that hydrogen atoms are able to escape from
PZT samples during aging at room temperature [5]. This condition can practically occur
when the engine is turned off after operation. The diffusion pattern of hydrogen in PZT
during such cyclic conditions and its consequential effect on the actuator performance
can possibly be different from a continuous exposure. To investigate this, a cyclic
exposure approach was followed in which an actuator sample set was exposed to
hydrogen for multiple 4 week cycles with a 4 week aging period between two
consecutive cycles [Sec 2.2.1]. Quasi-static performance at 20°C is shown for the cycled
samples in Fig. 2.23. It is observed that the cyclic hydrogen exposure and subsequent
aging have a negligible effect on the quasi-static actuator stroke. The behaviour was
similar at other testing temperatures as well. Dynamic testing was not performed for this
case.
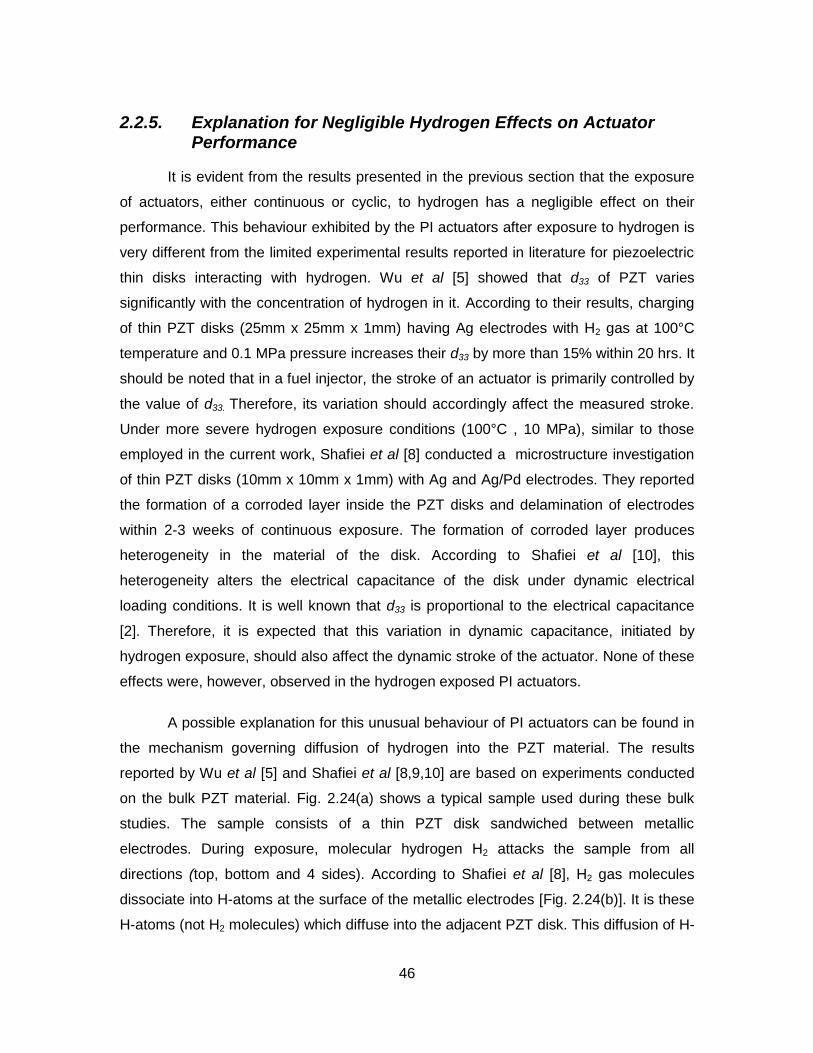
46
2.2.5. Explanation for Negligible Hydrogen Effects on Actuator Performance
It is evident from the results presented in the previous section that the exposure
of actuators, either continuous or cyclic, to hydrogen has a negligible effect on their
performance. This behaviour exhibited by the PI actuators after exposure to hydrogen is
very different from the limited experimental results reported in literature for piezoelectric
thin disks interacting with hydrogen. Wu et al [5] showed that d33 of PZT varies
significantly with the concentration of hydrogen in it. According to their results, charging
of thin PZT disks (25mm x 25mm x 1mm) having Ag electrodes with H2 gas at 100°C
temperature and 0.1 MPa pressure increases their d33 by more than 15% within 20 hrs. It
should be noted that in a fuel injector, the stroke of an actuator is primarily controlled by
the value of d33. Therefore, its variation should accordingly affect the measured stroke.
Under more severe hydrogen exposure conditions (100°C , 10 MPa), similar to those
employed in the current work, Shafiei et al [8] conducted a microstructure investigation
of thin PZT disks (10mm x 10mm x 1mm) with Ag and Ag/Pd electrodes. They reported
the formation of a corroded layer inside the PZT disks and delamination of electrodes
within 2-3 weeks of continuous exposure. The formation of corroded layer produces
heterogeneity in the material of the disk. According to Shafiei et al [10], this
heterogeneity alters the electrical capacitance of the disk under dynamic electrical
loading conditions. It is well known that d33 is proportional to the electrical capacitance
[2]. Therefore, it is expected that this variation in dynamic capacitance, initiated by
hydrogen exposure, should also affect the dynamic stroke of the actuator. None of these
effects were, however, observed in the hydrogen exposed PI actuators.
A possible explanation for this unusual behaviour of PI actuators can be found in
the mechanism governing diffusion of hydrogen into the PZT material. The results
reported by Wu et al [5] and Shafiei et al [8,9,10] are based on experiments conducted
on the bulk PZT material. Fig. 2.24(a) shows a typical sample used during these bulk
studies. The sample consists of a thin PZT disk sandwiched between metallic
electrodes. During exposure, molecular hydrogen H2 attacks the sample from all
directions (top, bottom and 4 sides). According to Shafiei et al [8], H2 gas molecules
dissociate into H-atoms at the surface of the metallic electrodes [Fig. 2.24(b)]. It is these
H-atoms (not H2 molecules) which diffuse into the adjacent PZT disk. This diffusion of H-
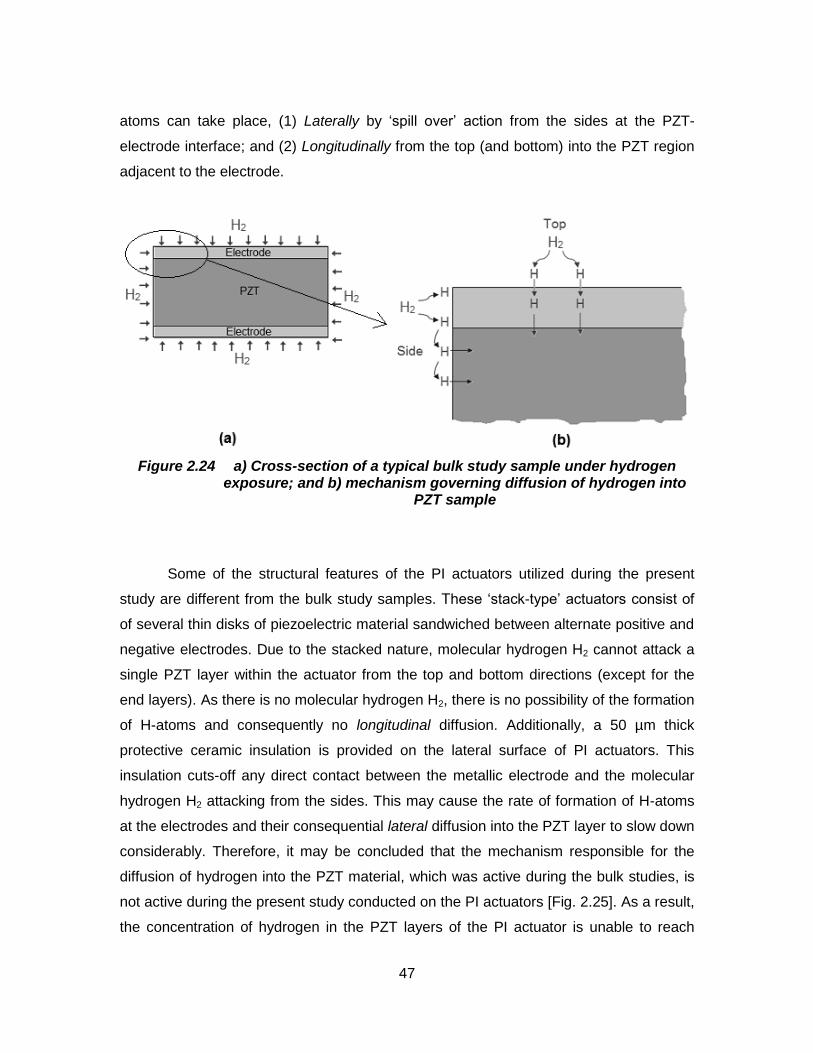
47
atoms can take place, (1) Laterally by ‘spill over’ action from the sides at the PZT-
electrode interface; and (2) Longitudinally from the top (and bottom) into the PZT region
adjacent to the electrode.
Figure 2.24 a) Cross-section of a typical bulk study sample under hydrogen exposure; and b) mechanism governing diffusion of hydrogen into
PZT sample
Some of the structural features of the PI actuators utilized during the present
study are different from the bulk study samples. These ‘stack-type’ actuators consist of
of several thin disks of piezoelectric material sandwiched between alternate positive and
negative electrodes. Due to the stacked nature, molecular hydrogen H2 cannot attack a
single PZT layer within the actuator from the top and bottom directions (except for the
end layers). As there is no molecular hydrogen H2, there is no possibility of the formation
of H-atoms and consequently no longitudinal diffusion. Additionally, a 50 µm thick
protective ceramic insulation is provided on the lateral surface of PI actuators. This
insulation cuts-off any direct contact between the metallic electrode and the molecular
hydrogen H2 attacking from the sides. This may cause the rate of formation of H-atoms
at the electrodes and their consequential lateral diffusion into the PZT layer to slow down
considerably. Therefore, it may be concluded that the mechanism responsible for the
diffusion of hydrogen into the PZT material, which was active during the bulk studies, is
not active during the present study conducted on the PI actuators [Fig. 2.25]. As a result,
the concentration of hydrogen in the PZT layers of the PI actuator is unable to reach
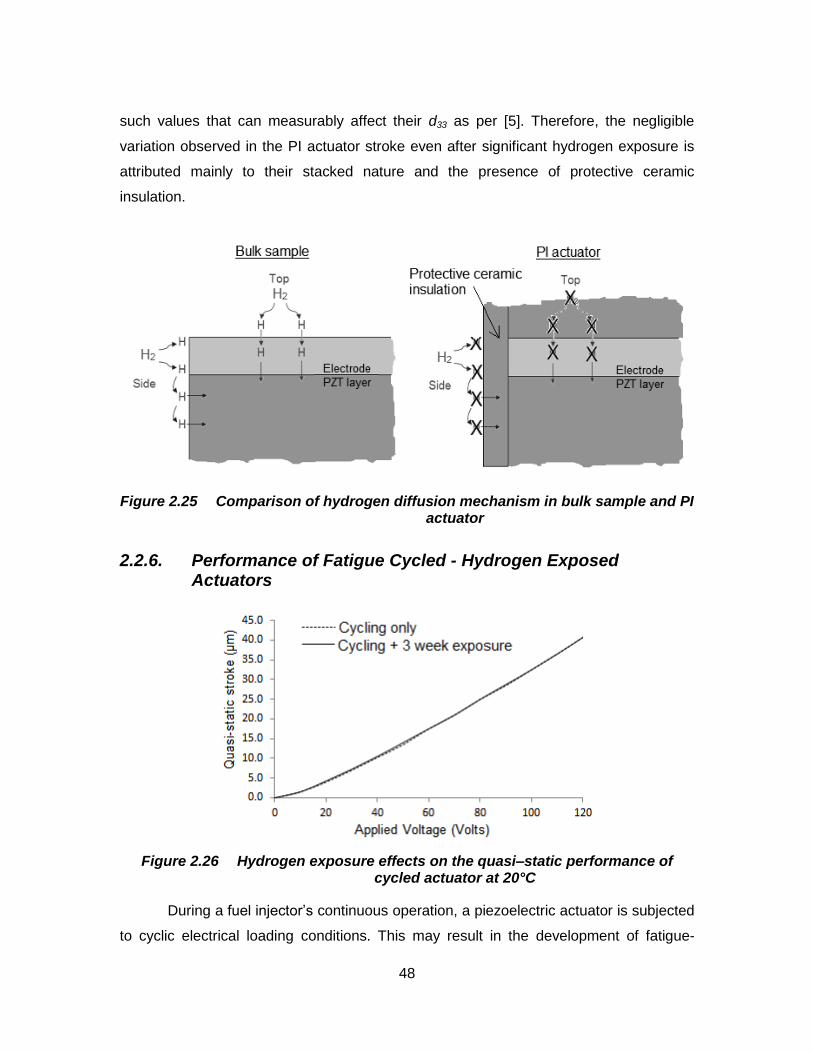
48
such values that can measurably affect their d33 as per [5]. Therefore, the negligible
variation observed in the PI actuator stroke even after significant hydrogen exposure is
attributed mainly to their stacked nature and the presence of protective ceramic
insulation.
Figure 2.25 Comparison of hydrogen diffusion mechanism in bulk sample and PI actuator
2.2.6. Performance of Fatigue Cycled - Hydrogen Exposed Actuators
Figure 2.26 Hydrogen exposure effects on the quasi–static performance of cycled actuator at 20°C
During a fuel injector’s continuous operation, a piezoelectric actuator is subjected
to cyclic electrical loading conditions. This may result in the development of fatigue-
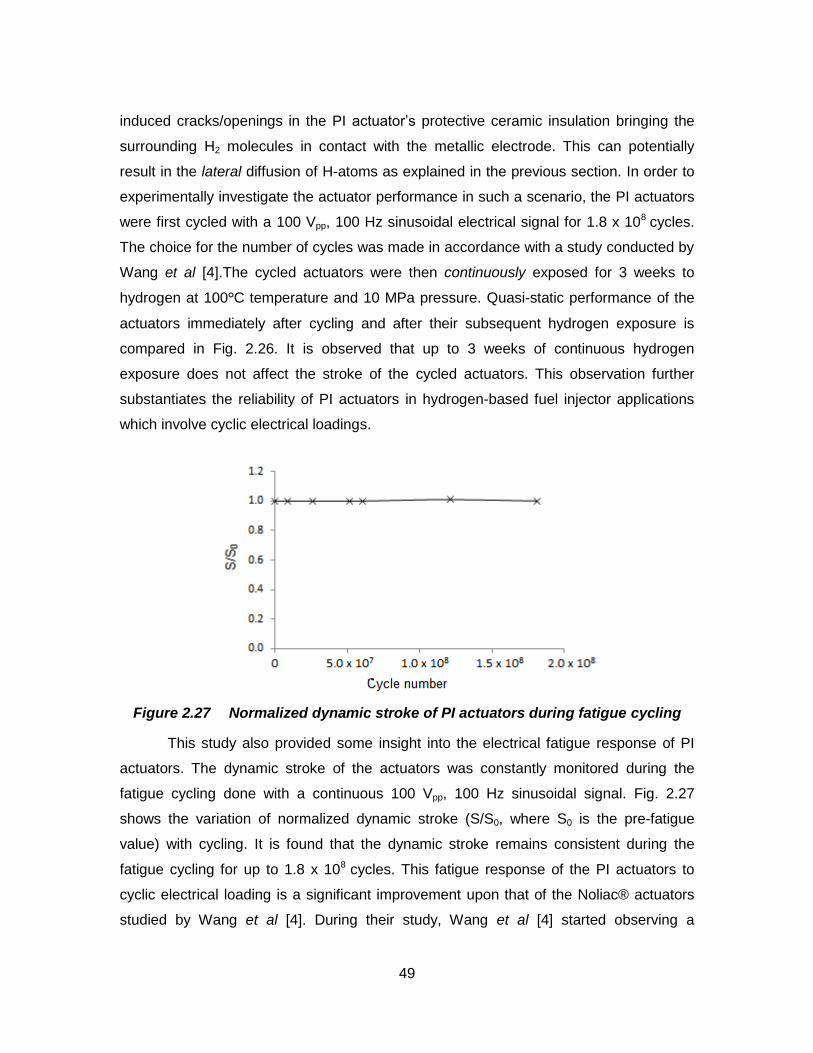
49
induced cracks/openings in the PI actuator’s protective ceramic insulation bringing the
surrounding H2 molecules in contact with the metallic electrode. This can potentially
result in the lateral diffusion of H-atoms as explained in the previous section. In order to
experimentally investigate the actuator performance in such a scenario, the PI actuators
were first cycled with a 100 Vpp, 100 Hz sinusoidal electrical signal for 1.8 x 10⁸ cycles.
The choice for the number of cycles was made in accordance with a study conducted by
Wang et al [4].The cycled actuators were then continuously exposed for 3 weeks to
hydrogen at 100°C temperature and 10 MPa pressure. Quasi-static performance of the
actuators immediately after cycling and after their subsequent hydrogen exposure is
compared in Fig. 2.26. It is observed that up to 3 weeks of continuous hydrogen
exposure does not affect the stroke of the cycled actuators. This observation further
substantiates the reliability of PI actuators in hydrogen-based fuel injector applications
which involve cyclic electrical loadings.
Figure 2.27 Normalized dynamic stroke of PI actuators during fatigue cycling
This study also provided some insight into the electrical fatigue response of PI
actuators. The dynamic stroke of the actuators was constantly monitored during the
fatigue cycling done with a continuous 100 Vpp, 100 Hz sinusoidal signal. Fig. 2.27
shows the variation of normalized dynamic stroke (S/S0, where S0 is the pre-fatigue
value) with cycling. It is found that the dynamic stroke remains consistent during the
fatigue cycling for up to 1.8 x 10⁸ cycles. This fatigue response of the PI actuators to
cyclic electrical loading is a significant improvement upon that of the Noliac® actuators
studied by Wang et al [4]. During their study, Wang et al [4] started observing a
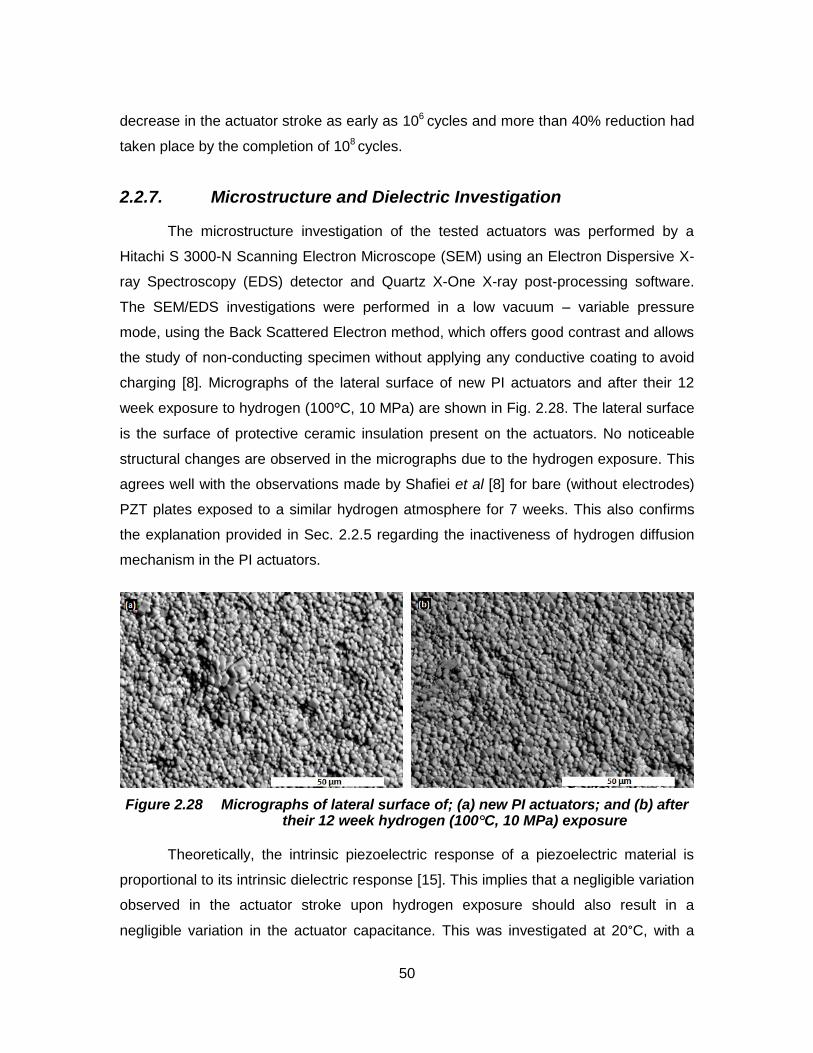
50
decrease in the actuator stroke as early as 106 cycles and more than 40% reduction had
taken place by the completion of 108 cycles.
2.2.7. Microstructure and Dielectric Investigation
The microstructure investigation of the tested actuators was performed by a
Hitachi S 3000-N Scanning Electron Microscope (SEM) using an Electron Dispersive X-
ray Spectroscopy (EDS) detector and Quartz X-One X-ray post-processing software.
The SEM/EDS investigations were performed in a low vacuum – variable pressure
mode, using the Back Scattered Electron method, which offers good contrast and allows
the study of non-conducting specimen without applying any conductive coating to avoid
charging [8]. Micrographs of the lateral surface of new PI actuators and after their 12
week exposure to hydrogen (100°C, 10 MPa) are shown in Fig. 2.28. The lateral surface
is the surface of protective ceramic insulation present on the actuators. No noticeable
structural changes are observed in the micrographs due to the hydrogen exposure. This
agrees well with the observations made by Shafiei et al [8] for bare (without electrodes)
PZT plates exposed to a similar hydrogen atmosphere for 7 weeks. This also confirms
the explanation provided in Sec. 2.2.5 regarding the inactiveness of hydrogen diffusion
mechanism in the PI actuators.
Figure 2.28 Micrographs of lateral surface of; (a) new PI actuators; and (b) after their 12 week hydrogen (100°C, 10 MPa) exposure
Theoretically, the intrinsic piezoelectric response of a piezoelectric material is
proportional to its intrinsic dielectric response [15]. This implies that a negligible variation
observed in the actuator stroke upon hydrogen exposure should also result in a
negligible variation in the actuator capacitance. This was investigated at 20°C, with a
51
1.275 Volt and 100 Hz signal, using a high-resolution impedance analyser LCR817
(Instek®). It was found that a continuous hydrogen exposure of up to 12 weeks does not
produce any measurable variation in the capacitance (or the dielectric constant ε33). This
result theoretically validates the behaviour observed in the PI actuators.
2.3. Summary of Experimental Results
Quasi-static and dynamic thermo-electro-mechanical performance of PI 885.91
soft, PZT-based stack actuators under different operating conditions, relevant to a typical
Hydrogen-based fuel injector, was experimentally investigated in this chapter. The
relationship between the observed actuator stroke and applied voltage, frequency, DC-
offset, duty cycle and rise time followed a similar trend as reported previously by Li et al
[2] and Senousy et al [3] for the studies conducted on KCI actuators. However, in
comparison to the KCI actuators, the PI actuators used in the present study showed a
better thermal stability, lower heat generation and smaller hysteresis. The results
obtained from the self-heating tests revealed that the temperature rise due to self-
heating increased non-linearly with both driving voltage and frequency, which also is
consistent with the findings of Senousy et al [3]. The actuators were exposed to
hydrogen at 100°C temperature and 10 MPa pressure following; (a) Continuous
approach - for up to 12 weeks; and (b) Cyclic approach - for multiple 4 week exposure
cycles with a 4 week aging period between two consecutive cycles. Both these exposure
approaches had a negligible effect on the quasi-static and dynamic performance of the
PI actuators when tested within the temperature range 5-80°C. This behaviour was
attributed mainly to the presence of a protective ceramic insulation layer on the lateral
surface of the PI actuators which deactivated the mechanism responsible for hydrogen
diffusion into the PZT layers, thereby preventing any consequential variation in the
actuator performance. This was further confirmed by microstructure and dielectric
investigations that showed negligible microstructure and capacitance variations
respectively in the actuators after 12 weeks of continuous hydrogen exposure. Finally,
fatigue cycling of the actuators was carried out to potentially introduce any
cracks/openings in the ceramic insulation which may activate the hydrogen diffusion
mechanism. After a fatigue cycling of 1.8 x 10⁸ cycles with a 100 Vpp, 100 Hz sinusoidal
electrical signal followed by a 3 week hydrogen exposure, the performance of the PI

52
actuators was still unaltered. The electrical fatigue response of the PI actuators also
remained consistent during the entire cycling which is a significant improvement upon
previously reported results for the Noliac® actuators [4].

53
3. Numerical Modelling
3.1. Linear Thermo-Electro-Mechanical Material Behaviour
In a 3-dimensional Cartesian co-ordinate system, the governing equations for
thermo-electro-mechanical response of a piezoelectric material are given by [38],
(3.1a)
(3.1b)
(3.1c)
Where,
= Mechanical displacement vector
= Electric displacement vector
= Heat flux vector
= Mechanical stress tensor
= Mechanical body force vector
= Electric body charge density
= Heat source density
= Entropy density
= Reference temperature of the material equal to 20°C
= Mass density of the material
In the above equation set, Eqs.3.1 (a-c) represents mechanical, electrical and thermal
equilibria respectively.
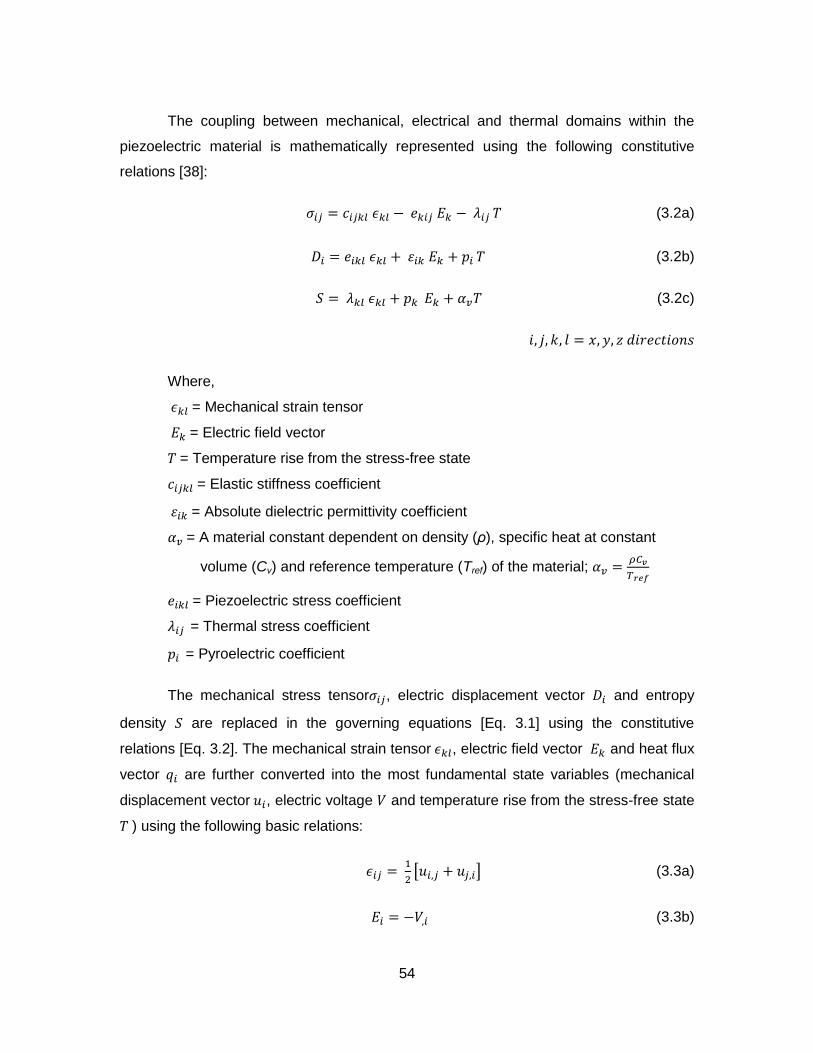
54
The coupling between mechanical, electrical and thermal domains within the
piezoelectric material is mathematically represented using the following constitutive
relations [38]:
(3.2a)
(3.2b)
(3.2c)
Where,
= Mechanical strain tensor
= Electric field vector
= Temperature rise from the stress-free state
= Elastic stiffness coefficient
= Absolute dielectric permittivity coefficient
= A material constant dependent on density (ρ), specific heat at constant
volume (Cv) and reference temperature (Tref) of the material;
= Piezoelectric stress coefficient
= Thermal stress coefficient
= Pyroelectric coefficient
The mechanical stress tensor , electric displacement vector and entropy
density are replaced in the governing equations [Eq. 3.1] using the constitutive
relations [Eq. 3.2]. The mechanical strain tensor , electric field vector and heat flux
vector are further converted into the most fundamental state variables (mechanical
displacement vector , electric voltage and temperature rise from the stress-free state
) using the following basic relations:
[ ] (3.3a)
(3.3b)

55
(3.3c)
Where,
= Thermal conductivity coefficient
Finally, a set of partial differential equations expressed in terms of the most
fundamental state variables ( are obtained. This set of equations is then
required to be solved for the variables at every point in the continuum at all
times.
In order to obtain the solution for the partial differential equations, both initial
conditions and boundary conditions for a given problem need to be specified. On a
boundary , the admissible boundary condition equations can be expressed in the
following forms:
Mechanical: or (3.4a)
Electrical: or (3.4b)
Thermal: or (3.4c)
Where,
= Prescribed surface displacement vector
= Outward unit normal vector to the boundary
= Prescribed surface traction vector
= Prescribed surface electric potential
= Prescribed Surface charge
= Prescribed surface temperature w.r.t. the stress-free state temperature
= Prescribed surface flux out
= Convection heat transfer coefficient
= Ambient fluid temperature w.r.t. the stress-free state temperature
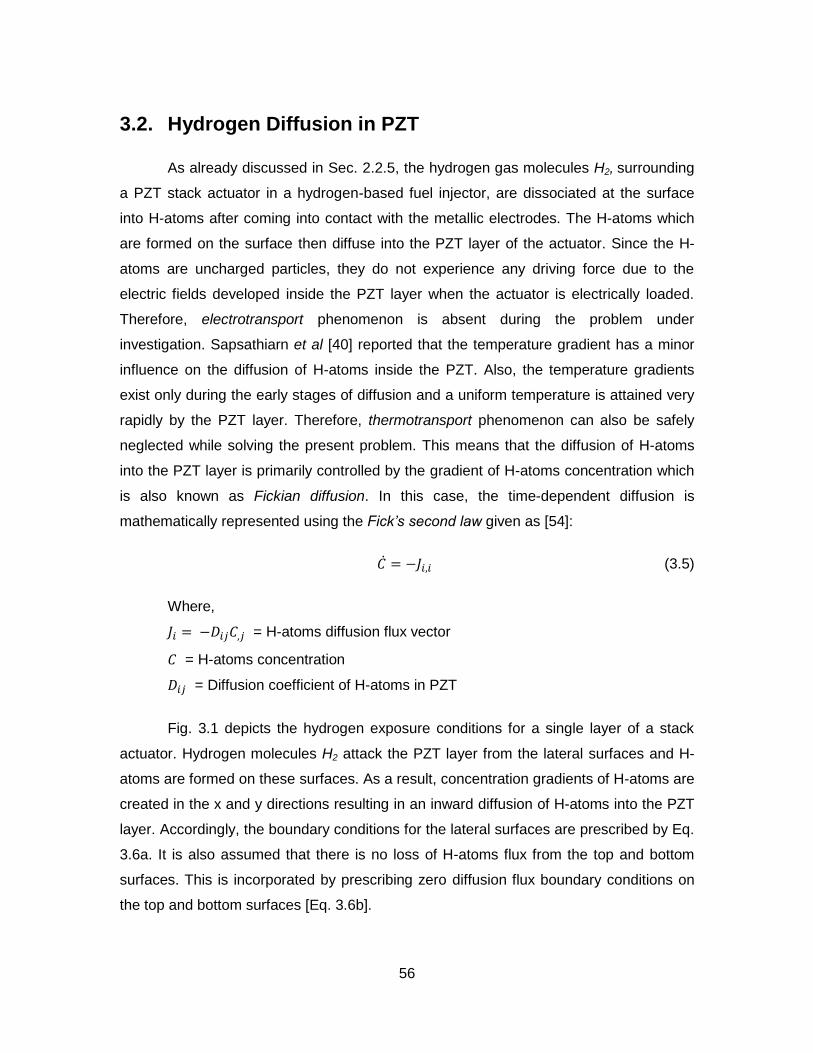
56
3.2. Hydrogen Diffusion in PZT
As already discussed in Sec. 2.2.5, the hydrogen gas molecules H2, surrounding
a PZT stack actuator in a hydrogen-based fuel injector, are dissociated at the surface
into H-atoms after coming into contact with the metallic electrodes. The H-atoms which
are formed on the surface then diffuse into the PZT layer of the actuator. Since the H-
atoms are uncharged particles, they do not experience any driving force due to the
electric fields developed inside the PZT layer when the actuator is electrically loaded.
Therefore, electrotransport phenomenon is absent during the problem under
investigation. Sapsathiarn et al [40] reported that the temperature gradient has a minor
influence on the diffusion of H-atoms inside the PZT. Also, the temperature gradients
exist only during the early stages of diffusion and a uniform temperature is attained very
rapidly by the PZT layer. Therefore, thermotransport phenomenon can also be safely
neglected while solving the present problem. This means that the diffusion of H-atoms
into the PZT layer is primarily controlled by the gradient of H-atoms concentration which
is also known as Fickian diffusion. In this case, the time-dependent diffusion is
mathematically represented using the Fick’s second law given as [54]:
(3.5)
Where,
= H-atoms diffusion flux vector
= H-atoms concentration
= Diffusion coefficient of H-atoms in PZT
Fig. 3.1 depicts the hydrogen exposure conditions for a single layer of a stack
actuator. Hydrogen molecules H2 attack the PZT layer from the lateral surfaces and H-
atoms are formed on these surfaces. As a result, concentration gradients of H-atoms are
created in the x and y directions resulting in an inward diffusion of H-atoms into the PZT
layer. Accordingly, the boundary conditions for the lateral surfaces are prescribed by Eq.
3.6a. It is also assumed that there is no loss of H-atoms flux from the top and bottom
surfaces. This is incorporated by prescribing zero diffusion flux boundary conditions on
the top and bottom surfaces [Eq. 3.6b].
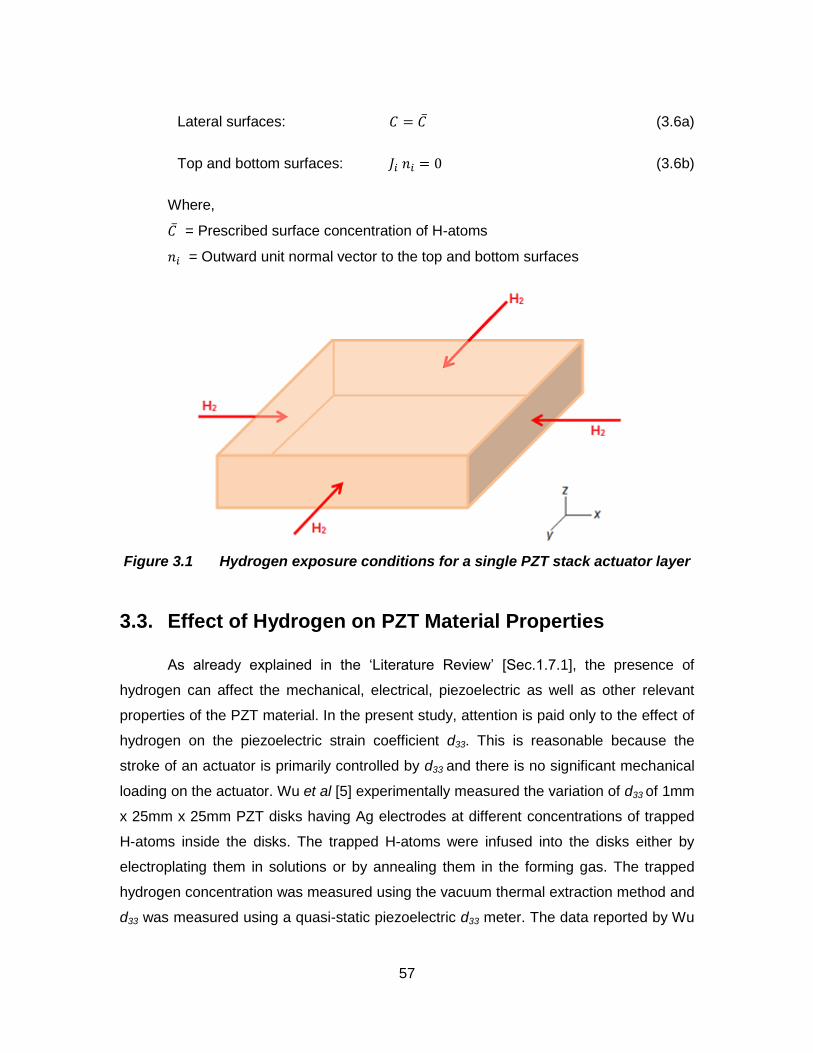
57
Lateral surfaces: (3.6a)
Top and bottom surfaces: (3.6b)
Where,
= Prescribed surface concentration of H-atoms
= Outward unit normal vector to the top and bottom surfaces
Figure 3.1 Hydrogen exposure conditions for a single PZT stack actuator layer
3.3. Effect of Hydrogen on PZT Material Properties
As already explained in the ‘Literature Review’ [Sec.1.7.1], the presence of
hydrogen can affect the mechanical, electrical, piezoelectric as well as other relevant
properties of the PZT material. In the present study, attention is paid only to the effect of
hydrogen on the piezoelectric strain coefficient d33. This is reasonable because the
stroke of an actuator is primarily controlled by d33 and there is no significant mechanical
loading on the actuator. Wu et al [5] experimentally measured the variation of d33 of 1mm
x 25mm x 25mm PZT disks having Ag electrodes at different concentrations of trapped
H-atoms inside the disks. The trapped H-atoms were infused into the disks either by
electroplating them in solutions or by annealing them in the forming gas. The trapped
hydrogen concentration was measured using the vacuum thermal extraction method and
d33 was measured using a quasi-static piezoelectric d33 meter. The data reported by Wu
58
et al [5] is approximated by a smooth curve as shown in Fig. 3.2; where is the
piezoelectric strain coefficient in the absence of hydrogen. This relationship has been
utilized in the present modelling work to represent a functional dependence of d33 on H-
atoms concentration inside PZT.
Figure 3.2 Simplified relation for the dependence of d33 on H-atoms concentration approximated from the results of Wu et al [5]
According to Wu et al [5], when H-atom enters PZT unit cell, it can occupy four
possible sites to bond with O-atoms. The occupation of the most stable site results in the
formation of H-O dipole which is favourably aligned with the host polarization. This
enhances the spontaneous polarization of the PZT which consequently enhances its
value of d33. It should, however, be noted that the H-atom is a shallow donor impurity in
the piezoelectric crystals. Therefore, if the H-atoms concentration in the PZT becomes
too high, the material begins to behave more like a conductor and its piezoelectric
properties (d33) will be degraded. This explains the trend observed in Fig. 3.2.
It is important to note that the relationship depicted in Fig. 3.2 is for d33 and not
e33. Mathematically, e33 and e31 are a function of d33. Therefore, any variation in d33
caused by H-atoms concentration will affect both e33 and e31. Since the constitutive
relations [Eq. 3.2] are expressed in the e-form, it is necessary to apply suitable
conversions in order to accurately incorporate the hydrogen effects in the model.

59
3.4. Numerical Solution using ‘Equation Based Modelling’ in COMSOL
The ‘Equation Based Modelling’ feature of COMSOL Multiphysics® provides a
flexible technique to solve simultaneous Partial Differential Equations (PDEs) in space
and time. The solution procedure is based on the Finite Element Method (FEM). It
provides a convenient way to solve those physical systems for which the predefined
modules are not commercially available. The present problem, involving coupled
mechanical, electrical, thermal and diffusion effects, is one such example. Typically in
such situations, a user is required to code a complete FEM solution program. The
‘Equation Based Modelling’ feature eliminates this coding requirement from the
modelling work, thereby significantly reducing the user effort involved.
The governing PDEs for a given problem can be expressed in either strong form
or weak form. Depending upon the problem, the PDEs may also be linear or non-linear.
In order to accommodate these variations present in the PDEs, the ‘Equation Based
Modelling’ feature comes with three options [48]:
1. COEFFICIENT FORM PDE – To express strong form and linear PDEs
2. GENERAL FORM PDE - To express strong form and non-linear PDEs
3. WEAK FORM PDE - To express weak form PDEs
In modelling the present problem, the governing PDEs for mechanical, electrical and
thermal equilibria [Eq. 3.1] and the Fickian diffusion [Eq. 3.5] are to be simultaneously
solved for fields. These PDEs are expressed in their strong forms.
Moreover, as mentioned in Sec. 3.3, one of the material properties (d33) is dependent
upon a variable (C). This introduces non-linearity into the system of equations. Due to
these reasons, the ‘General Form PDE’ option is chosen for modelling the present work.
In order to use this option, mass coefficients, damping coefficients, flux vectors and
source terms, present in the governing PDEs, are supplied by the user in the form of
expressions. The user also supplies the expressions for the initial conditions and the
applicable boundary conditions. Geometry creation, meshing and solving is performed
using the software like any other commercial package. Since the treatment of the
problem is purely mathematical and the results are the spatial and temporal values of
the involved variables, the user is required to post-process these values in order to
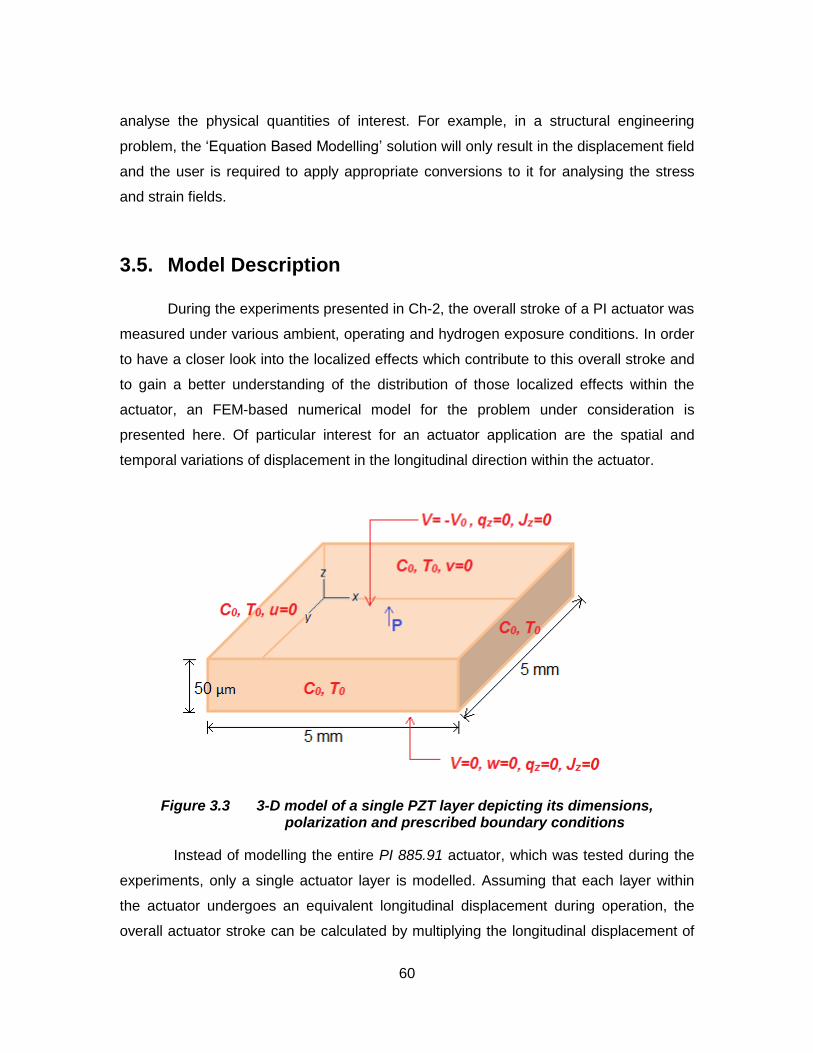
60
analyse the physical quantities of interest. For example, in a structural engineering
problem, the ‘Equation Based Modelling’ solution will only result in the displacement field
and the user is required to apply appropriate conversions to it for analysing the stress
and strain fields.
3.5. Model Description
During the experiments presented in Ch-2, the overall stroke of a PI actuator was
measured under various ambient, operating and hydrogen exposure conditions. In order
to have a closer look into the localized effects which contribute to this overall stroke and
to gain a better understanding of the distribution of those localized effects within the
actuator, an FEM-based numerical model for the problem under consideration is
presented here. Of particular interest for an actuator application are the spatial and
temporal variations of displacement in the longitudinal direction within the actuator.
Figure 3.3 3-D model of a single PZT layer depicting its dimensions, polarization and prescribed boundary conditions
Instead of modelling the entire PI 885.91 actuator, which was tested during the
experiments, only a single actuator layer is modelled. Assuming that each layer within
the actuator undergoes an equivalent longitudinal displacement during operation, the
overall actuator stroke can be calculated by multiplying the longitudinal displacement of
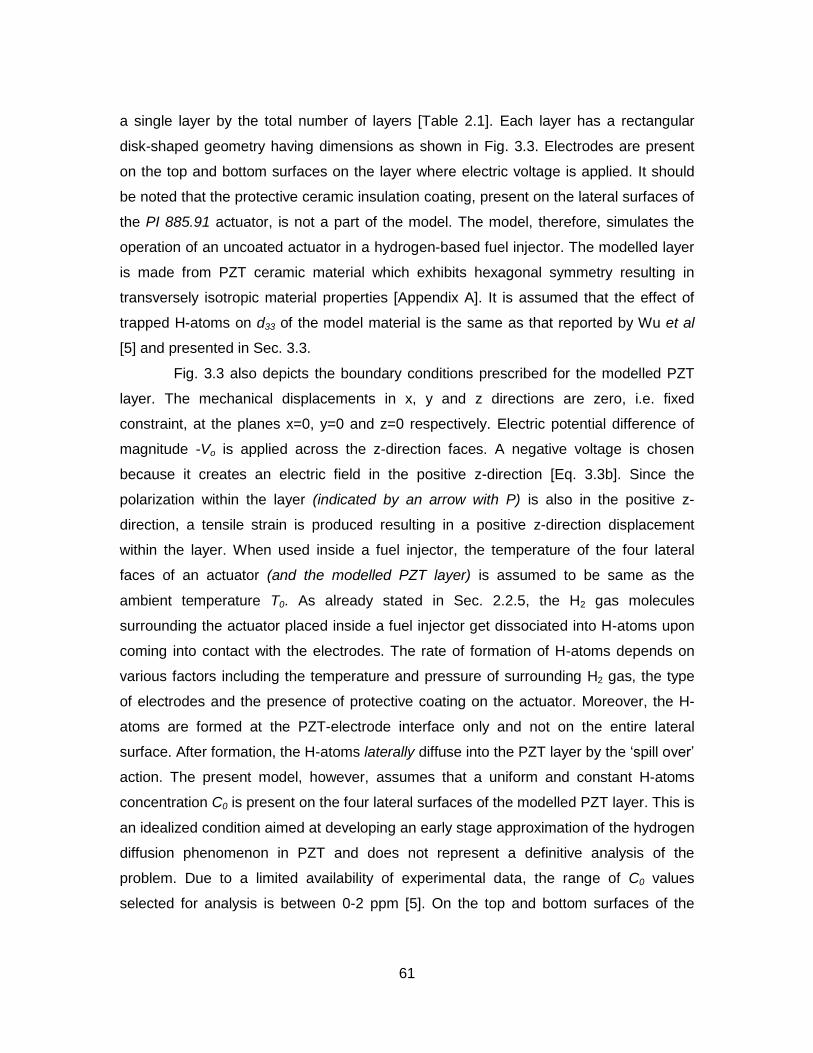
61
a single layer by the total number of layers [Table 2.1]. Each layer has a rectangular
disk-shaped geometry having dimensions as shown in Fig. 3.3. Electrodes are present
on the top and bottom surfaces on the layer where electric voltage is applied. It should
be noted that the protective ceramic insulation coating, present on the lateral surfaces of
the PI 885.91 actuator, is not a part of the model. The model, therefore, simulates the
operation of an uncoated actuator in a hydrogen-based fuel injector. The modelled layer
is made from PZT ceramic material which exhibits hexagonal symmetry resulting in
transversely isotropic material properties [Appendix A]. It is assumed that the effect of
trapped H-atoms on d33 of the model material is the same as that reported by Wu et al
[5] and presented in Sec. 3.3.
Fig. 3.3 also depicts the boundary conditions prescribed for the modelled PZT
layer. The mechanical displacements in x, y and z directions are zero, i.e. fixed
constraint, at the planes x=0, y=0 and z=0 respectively. Electric potential difference of
magnitude -Vo is applied across the z-direction faces. A negative voltage is chosen
because it creates an electric field in the positive z-direction [Eq. 3.3b]. Since the
polarization within the layer (indicated by an arrow with P) is also in the positive z-
direction, a tensile strain is produced resulting in a positive z-direction displacement
within the layer. When used inside a fuel injector, the temperature of the four lateral
faces of an actuator (and the modelled PZT layer) is assumed to be same as the
ambient temperature T0. As already stated in Sec. 2.2.5, the H2 gas molecules
surrounding the actuator placed inside a fuel injector get dissociated into H-atoms upon
coming into contact with the electrodes. The rate of formation of H-atoms depends on
various factors including the temperature and pressure of surrounding H2 gas, the type
of electrodes and the presence of protective coating on the actuator. Moreover, the H-
atoms are formed at the PZT-electrode interface only and not on the entire lateral
surface. After formation, the H-atoms laterally diffuse into the PZT layer by the ‘spill over’
action. The present model, however, assumes that a uniform and constant H-atoms
concentration C0 is present on the four lateral surfaces of the modelled PZT layer. This is
an idealized condition aimed at developing an early stage approximation of the hydrogen
diffusion phenomenon in PZT and does not represent a definitive analysis of the
problem. Due to a limited availability of experimental data, the range of C0 values
selected for analysis is between 0-2 ppm [5]. On the top and bottom surfaces of the
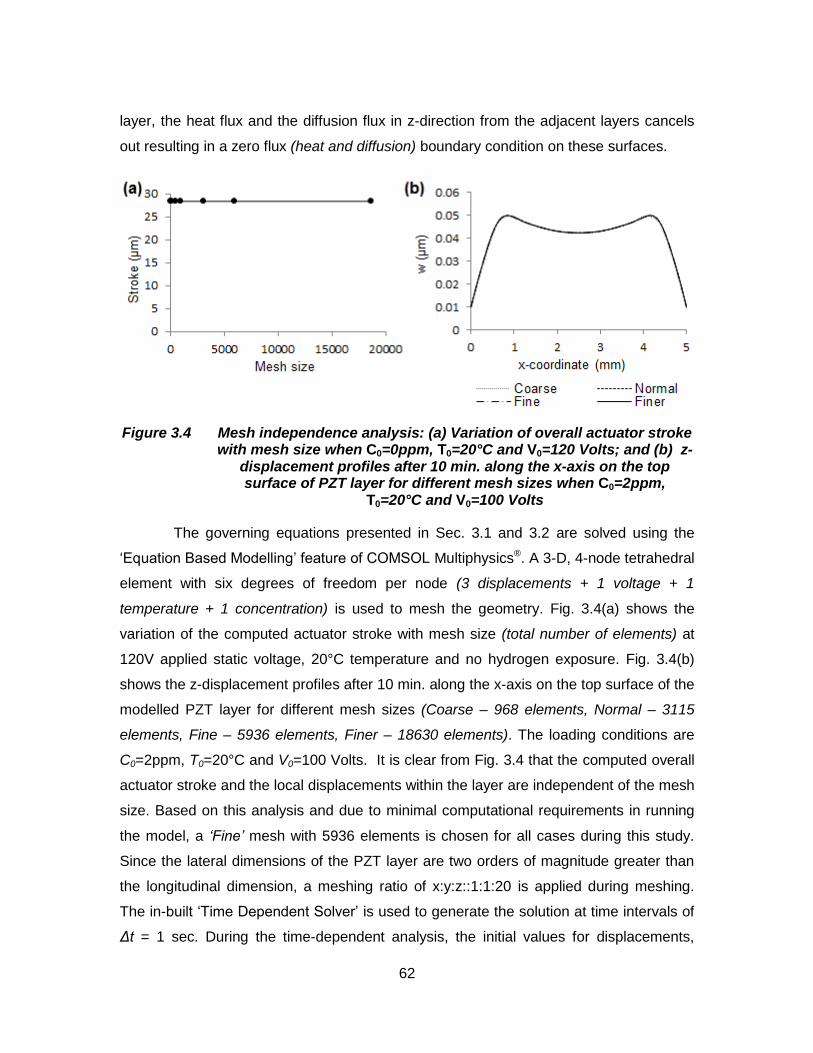
62
layer, the heat flux and the diffusion flux in z-direction from the adjacent layers cancels
out resulting in a zero flux (heat and diffusion) boundary condition on these surfaces.
Figure 3.4 Mesh independence analysis: (a) Variation of overall actuator stroke with mesh size when C0=0ppm, T0=20°C and V0=120 Volts; and (b) z-
displacement profiles after 10 min. along the x-axis on the top surface of PZT layer for different mesh sizes when C0=2ppm,
T0=20°C and V0=100 Volts
The governing equations presented in Sec. 3.1 and 3.2 are solved using the
‘Equation Based Modelling’ feature of COMSOL Multiphysics®. A 3-D, 4-node tetrahedral
element with six degrees of freedom per node (3 displacements + 1 voltage + 1
temperature + 1 concentration) is used to mesh the geometry. Fig. 3.4(a) shows the
variation of the computed actuator stroke with mesh size (total number of elements) at
120V applied static voltage, 20°C temperature and no hydrogen exposure. Fig. 3.4(b)
shows the z-displacement profiles after 10 min. along the x-axis on the top surface of the
modelled PZT layer for different mesh sizes (Coarse – 968 elements, Normal – 3115
elements, Fine – 5936 elements, Finer – 18630 elements). The loading conditions are
C0=2ppm, T0=20°C and V0=100 Volts. It is clear from Fig. 3.4 that the computed overall
actuator stroke and the local displacements within the layer are independent of the mesh
size. Based on this analysis and due to minimal computational requirements in running
the model, a ‘Fine’ mesh with 5936 elements is chosen for all cases during this study.
Since the lateral dimensions of the PZT layer are two orders of magnitude greater than
the longitudinal dimension, a meshing ratio of x:y:z::1:1:20 is applied during meshing.
The in-built ‘Time Dependent Solver’ is used to generate the solution at time intervals of
Δt = 1 sec. During the time-dependent analysis, the initial values for displacements,
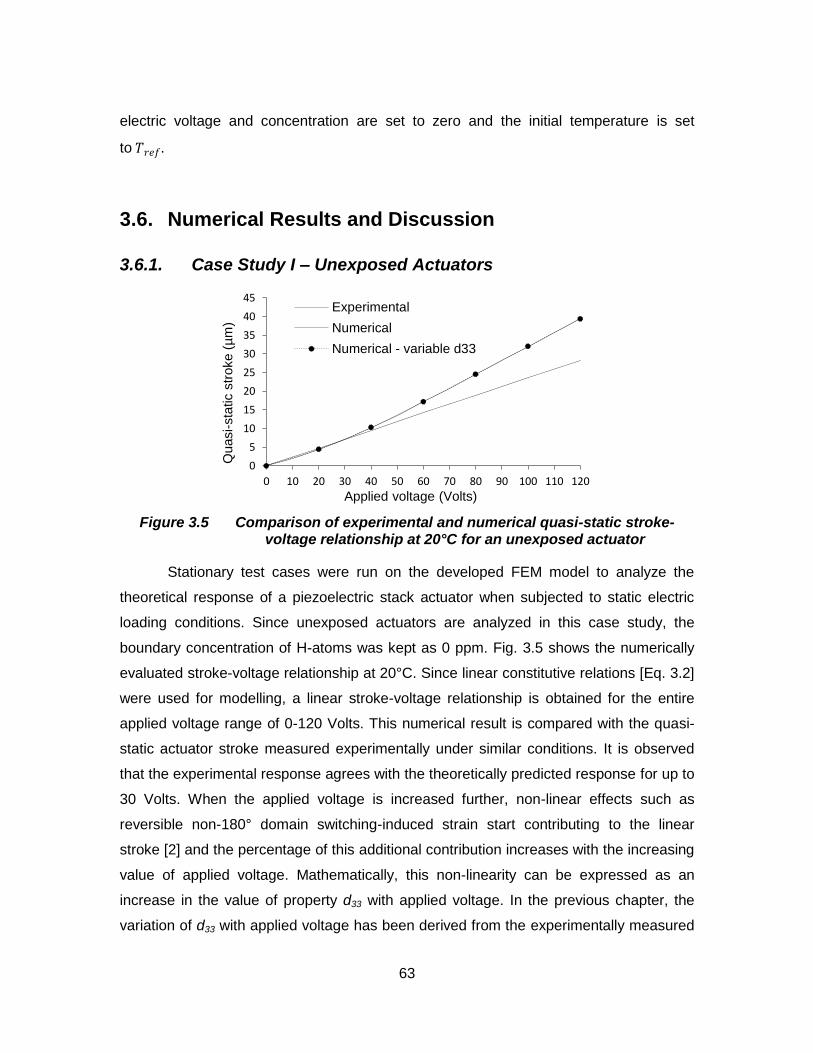
63
electric voltage and concentration are set to zero and the initial temperature is set
to .
3.6. Numerical Results and Discussion
3.6.1. Case Study I – Unexposed Actuators
Figure 3.5 Comparison of experimental and numerical quasi-static stroke-voltage relationship at 20°C for an unexposed actuator
Stationary test cases were run on the developed FEM model to analyze the
theoretical response of a piezoelectric stack actuator when subjected to static electric
loading conditions. Since unexposed actuators are analyzed in this case study, the
boundary concentration of H-atoms was kept as 0 ppm. Fig. 3.5 shows the numerically
evaluated stroke-voltage relationship at 20°C. Since linear constitutive relations [Eq. 3.2]
were used for modelling, a linear stroke-voltage relationship is obtained for the entire
applied voltage range of 0-120 Volts. This numerical result is compared with the quasi-
static actuator stroke measured experimentally under similar conditions. It is observed
that the experimental response agrees with the theoretically predicted response for up to
30 Volts. When the applied voltage is increased further, non-linear effects such as
reversible non-180° domain switching-induced strain start contributing to the linear
stroke [2] and the percentage of this additional contribution increases with the increasing
value of applied voltage. Mathematically, this non-linearity can be expressed as an
increase in the value of property d33 with applied voltage. In the previous chapter, the
variation of d33 with applied voltage has been derived from the experimentally measured
0
5
10
15
20
25
30
35
40
45
0 10 20 30 40 50 60 70 80 90 100 110 120
Quasi-
sta
tic s
troke (
µm
)
Applied voltage (Volts)
Experimental
Numerical
Numerical - variable d33
64
values of actuator stroke [Sec. 2.2.1]. When these variable values of d33 are used to run
different cases in the model, the numerically obtained results match exactly with the
experiments as shown in Fig. 3.5. This indicates that in order to make a more accurate
prediction of the experimentally observed behaviour, the present model must be
upgraded to incorporate a functional dependence of d33 on the applied voltage.
Figure 3.6 Comparison of experimentally measured and numerically evaluated quasi-static stroke-temperature relationship at 100 Volts for an
unexposed actuator
An interesting behaviour is observed when the model is used to analyze the
effect of ambient temperature on the actuator stroke. In a fully-coupled model, thermal
strains occurring due to a change in temperature also contribute to the calculated stroke
in addition to the piezoelectric effect due to the applied voltage. When these thermal
strains are present, the numerically evaluated stroke is found to decrease linearly with
increasing temperature as shown in Fig. 3.6. The decrease is due a negative value of
the thermal expansion coefficient (α3) in z-direction for the PI Ceramic actuators. This is
purposely engineered to compensate for an increase observed in the d33 value with
increasing temperatures [49]. During the experiments, the actuators were allowed
sufficient time to expand/contract due to the variations in ambient temperature. A quasi-
static electric voltage was then applied to them and the resulting stroke was measured.
This experimentally measured stroke [Fig. 3.6] was, therefore, only due to the
piezoelectric effect and did not include any contributions from the thermal strain. To
make an appropriate comparison with the experimental results, the thermal expansion
coefficients were set to zero in the model thereby neglecting any thermal strains. When
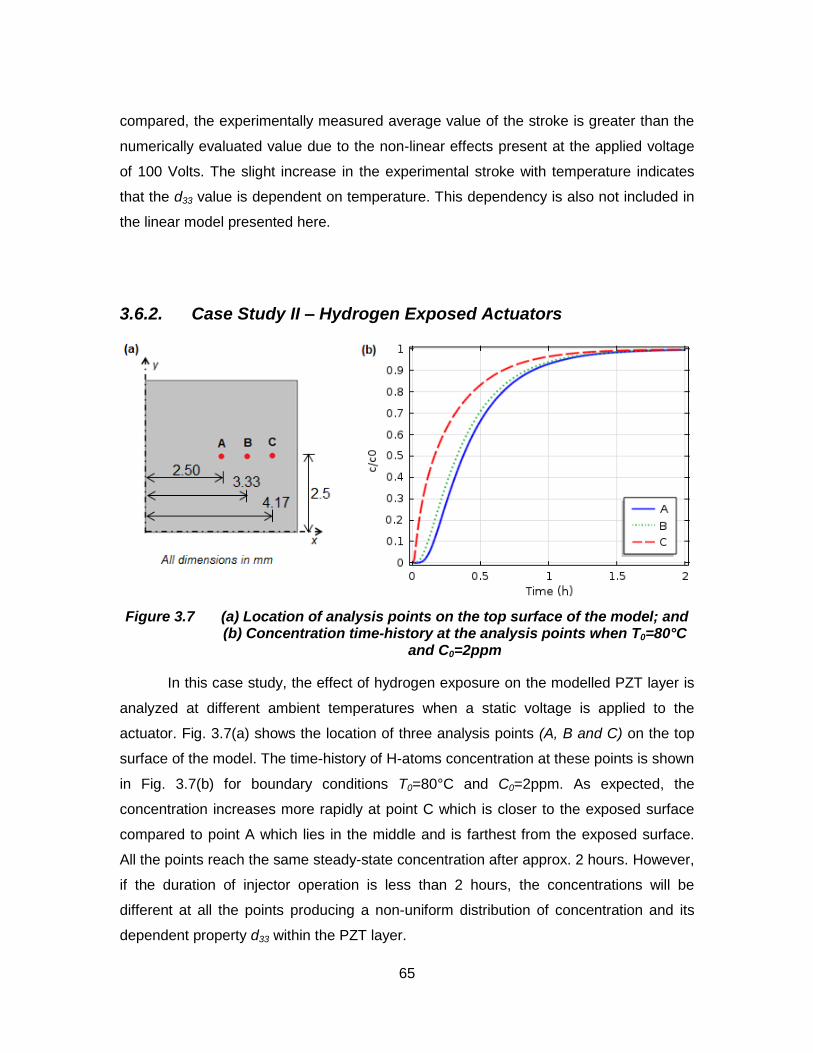
65
compared, the experimentally measured average value of the stroke is greater than the
numerically evaluated value due to the non-linear effects present at the applied voltage
of 100 Volts. The slight increase in the experimental stroke with temperature indicates
that the d33 value is dependent on temperature. This dependency is also not included in
the linear model presented here.
3.6.2. Case Study II – Hydrogen Exposed Actuators
Figure 3.7 (a) Location of analysis points on the top surface of the model; and (b) Concentration time-history at the analysis points when T0=80°C
and C0=2ppm
In this case study, the effect of hydrogen exposure on the modelled PZT layer is
analyzed at different ambient temperatures when a static voltage is applied to the
actuator. Fig. 3.7(a) shows the location of three analysis points (A, B and C) on the top
surface of the model. The time-history of H-atoms concentration at these points is shown
in Fig. 3.7(b) for boundary conditions T0=80°C and C0=2ppm. As expected, the
concentration increases more rapidly at point C which is closer to the exposed surface
compared to point A which lies in the middle and is farthest from the exposed surface.
All the points reach the same steady-state concentration after approx. 2 hours. However,
if the duration of injector operation is less than 2 hours, the concentrations will be
different at all the points producing a non-uniform distribution of concentration and its
dependent property d33 within the PZT layer.
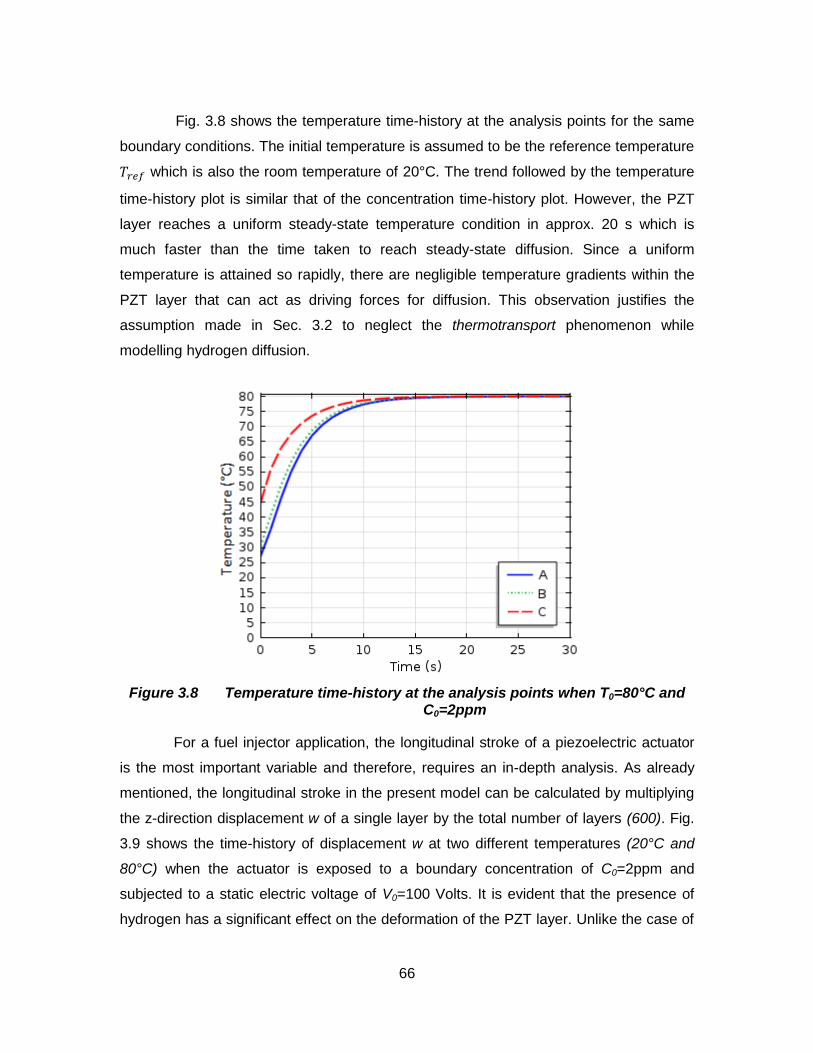
66
Fig. 3.8 shows the temperature time-history at the analysis points for the same
boundary conditions. The initial temperature is assumed to be the reference temperature
which is also the room temperature of 20°C. The trend followed by the temperature
time-history plot is similar that of the concentration time-history plot. However, the PZT
layer reaches a uniform steady-state temperature condition in approx. 20 s which is
much faster than the time taken to reach steady-state diffusion. Since a uniform
temperature is attained so rapidly, there are negligible temperature gradients within the
PZT layer that can act as driving forces for diffusion. This observation justifies the
assumption made in Sec. 3.2 to neglect the thermotransport phenomenon while
modelling hydrogen diffusion.
Figure 3.8 Temperature time-history at the analysis points when T0=80°C and C0=2ppm
For a fuel injector application, the longitudinal stroke of a piezoelectric actuator
is the most important variable and therefore, requires an in-depth analysis. As already
mentioned, the longitudinal stroke in the present model can be calculated by multiplying
the z-direction displacement w of a single layer by the total number of layers (600). Fig.
3.9 shows the time-history of displacement w at two different temperatures (20°C and
80°C) when the actuator is exposed to a boundary concentration of C0=2ppm and
subjected to a static electric voltage of V0=100 Volts. It is evident that the presence of
hydrogen has a significant effect on the deformation of the PZT layer. Unlike the case of
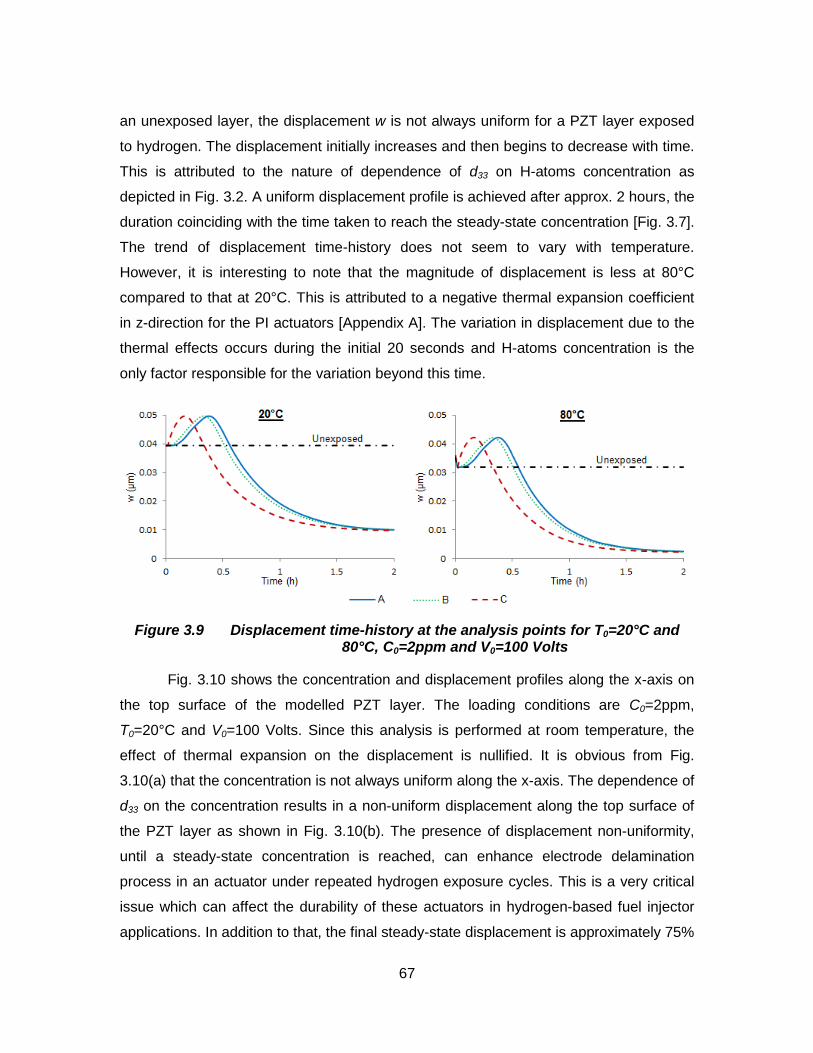
67
an unexposed layer, the displacement w is not always uniform for a PZT layer exposed
to hydrogen. The displacement initially increases and then begins to decrease with time.
This is attributed to the nature of dependence of d33 on H-atoms concentration as
depicted in Fig. 3.2. A uniform displacement profile is achieved after approx. 2 hours, the
duration coinciding with the time taken to reach the steady-state concentration [Fig. 3.7].
The trend of displacement time-history does not seem to vary with temperature.
However, it is interesting to note that the magnitude of displacement is less at 80°C
compared to that at 20°C. This is attributed to a negative thermal expansion coefficient
in z-direction for the PI actuators [Appendix A]. The variation in displacement due to the
thermal effects occurs during the initial 20 seconds and H-atoms concentration is the
only factor responsible for the variation beyond this time.
Figure 3.9 Displacement time-history at the analysis points for T0=20°C and 80°C, C0=2ppm and V0=100 Volts
Fig. 3.10 shows the concentration and displacement profiles along the x-axis on
the top surface of the modelled PZT layer. The loading conditions are C0=2ppm,
T0=20°C and V0=100 Volts. Since this analysis is performed at room temperature, the
effect of thermal expansion on the displacement is nullified. It is obvious from Fig.
3.10(a) that the concentration is not always uniform along the x-axis. The dependence of
d33 on the concentration results in a non-uniform displacement along the top surface of
the PZT layer as shown in Fig. 3.10(b). The presence of displacement non-uniformity,
until a steady-state concentration is reached, can enhance electrode delamination
process in an actuator under repeated hydrogen exposure cycles. This is a very critical
issue which can affect the durability of these actuators in hydrogen-based fuel injector
applications. In addition to that, the final steady-state displacement is approximately 75%
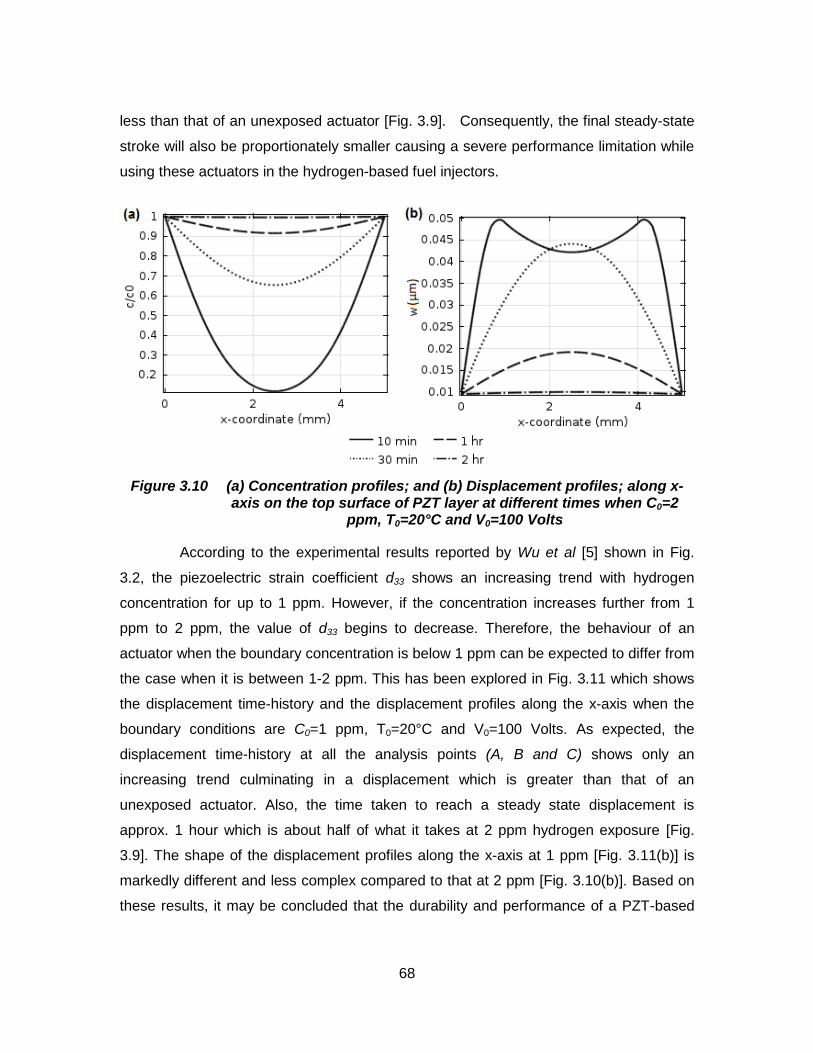
68
less than that of an unexposed actuator [Fig. 3.9]. Consequently, the final steady-state
stroke will also be proportionately smaller causing a severe performance limitation while
using these actuators in the hydrogen-based fuel injectors.
Figure 3.10 (a) Concentration profiles; and (b) Displacement profiles; along x-axis on the top surface of PZT layer at different times when C0=2
ppm, T0=20°C and V0=100 Volts
According to the experimental results reported by Wu et al [5] shown in Fig.
3.2, the piezoelectric strain coefficient d33 shows an increasing trend with hydrogen
concentration for up to 1 ppm. However, if the concentration increases further from 1
ppm to 2 ppm, the value of d33 begins to decrease. Therefore, the behaviour of an
actuator when the boundary concentration is below 1 ppm can be expected to differ from
the case when it is between 1-2 ppm. This has been explored in Fig. 3.11 which shows
the displacement time-history and the displacement profiles along the x-axis when the
boundary conditions are C0=1 ppm, T0=20°C and V0=100 Volts. As expected, the
displacement time-history at all the analysis points (A, B and C) shows only an
increasing trend culminating in a displacement which is greater than that of an
unexposed actuator. Also, the time taken to reach a steady state displacement is
approx. 1 hour which is about half of what it takes at 2 ppm hydrogen exposure [Fig.
3.9]. The shape of the displacement profiles along the x-axis at 1 ppm [Fig. 3.11(b)] is
markedly different and less complex compared to that at 2 ppm [Fig. 3.10(b)]. Based on
these results, it may be concluded that the durability and performance of a PZT-based
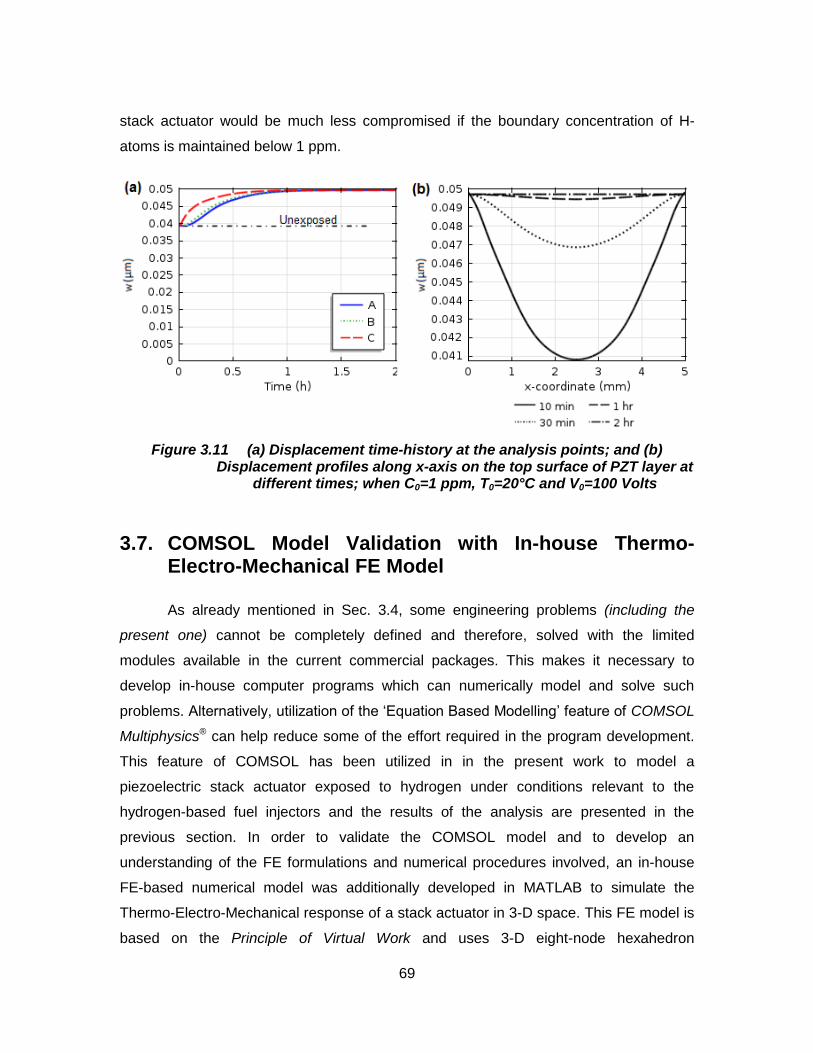
69
stack actuator would be much less compromised if the boundary concentration of H-
atoms is maintained below 1 ppm.
Figure 3.11 (a) Displacement time-history at the analysis points; and (b) Displacement profiles along x-axis on the top surface of PZT layer at
different times; when C0=1 ppm, T0=20°C and V0=100 Volts
3.7. COMSOL Model Validation with In-house Thermo-Electro-Mechanical FE Model
As already mentioned in Sec. 3.4, some engineering problems (including the
present one) cannot be completely defined and therefore, solved with the limited
modules available in the current commercial packages. This makes it necessary to
develop in-house computer programs which can numerically model and solve such
problems. Alternatively, utilization of the ‘Equation Based Modelling’ feature of COMSOL
Multiphysics® can help reduce some of the effort required in the program development.
This feature of COMSOL has been utilized in in the present work to model a
piezoelectric stack actuator exposed to hydrogen under conditions relevant to the
hydrogen-based fuel injectors and the results of the analysis are presented in the
previous section. In order to validate the COMSOL model and to develop an
understanding of the FE formulations and numerical procedures involved, an in-house
FE-based numerical model was additionally developed in MATLAB to simulate the
Thermo-Electro-Mechanical response of a stack actuator in 3-D space. This FE model is
based on the Principle of Virtual Work and uses 3-D eight-node hexahedron
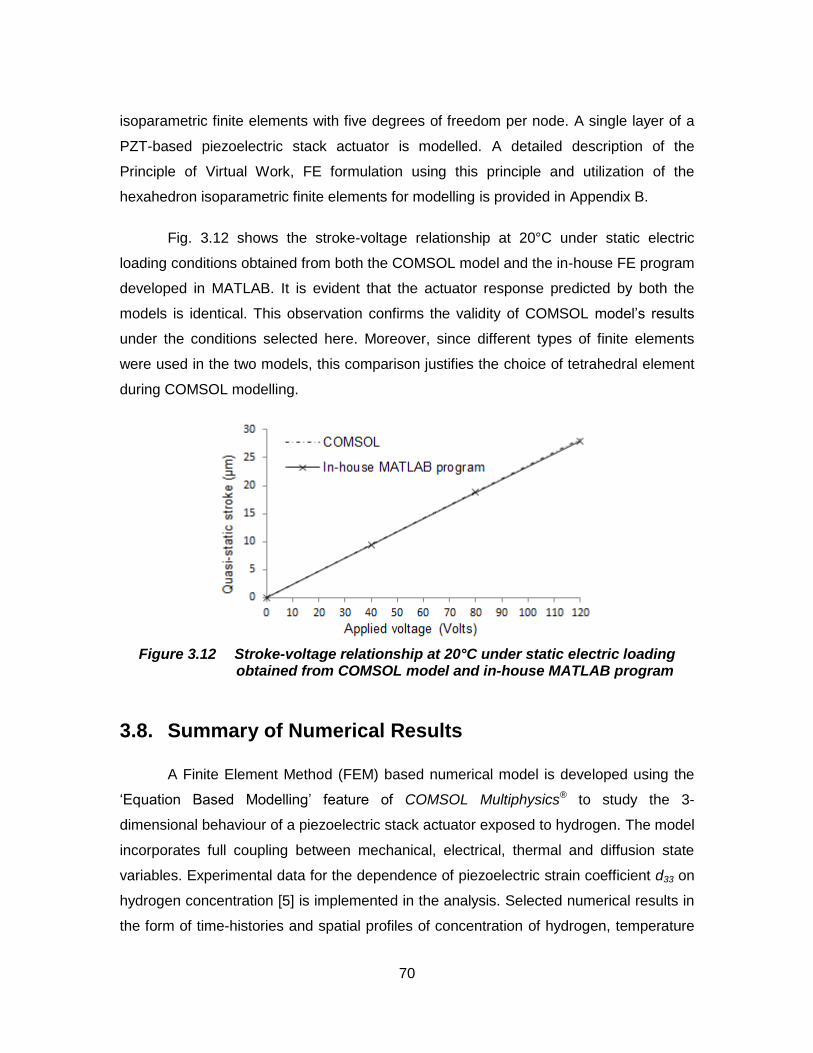
70
isoparametric finite elements with five degrees of freedom per node. A single layer of a
PZT-based piezoelectric stack actuator is modelled. A detailed description of the
Principle of Virtual Work, FE formulation using this principle and utilization of the
hexahedron isoparametric finite elements for modelling is provided in Appendix B.
Fig. 3.12 shows the stroke-voltage relationship at 20°C under static electric
loading conditions obtained from both the COMSOL model and the in-house FE program
developed in MATLAB. It is evident that the actuator response predicted by both the
models is identical. This observation confirms the validity of COMSOL model’s results
under the conditions selected here. Moreover, since different types of finite elements
were used in the two models, this comparison justifies the choice of tetrahedral element
during COMSOL modelling.
Figure 3.12 Stroke-voltage relationship at 20°C under static electric loading obtained from COMSOL model and in-house MATLAB program
3.8. Summary of Numerical Results
A Finite Element Method (FEM) based numerical model is developed using the
‘Equation Based Modelling’ feature of COMSOL Multiphysics® to study the 3-
dimensional behaviour of a piezoelectric stack actuator exposed to hydrogen. The model
incorporates full coupling between mechanical, electrical, thermal and diffusion state
variables. Experimental data for the dependence of piezoelectric strain coefficient d33 on
hydrogen concentration [5] is implemented in the analysis. Selected numerical results in
the form of time-histories and spatial profiles of concentration of hydrogen, temperature
71
and actuator stroke are presented for conditions relevant to hydrogen-based fuel
injectors. When a PI-885.91 actuator is subjected to external temperature increase, a
steady-state temperature along with a uniform temperature profile is attained by the
actuator within approx. 20 sec. The diffusion of hydrogen is relatively slower and it takes
approx. 2 hrs to reach a steady-state concentration. Based on these findings, it is
concluded that the effect of temperature gradient on diffusion is negligible and, therefore,
the assumption to neglect thermotransport in the model is justified. The stroke of an
actuator is significantly influenced by the presence of hydrogen within the actuator.
When exposed to a low hydrogen concentration (≤1 ppm), the steady-state stroke is
greater than the stroke of an unexposed actuator indicating a positive effect on the
actuator performance. At higher hydrogen concentrations (1-2 ppm), however, a
significant non-uniformity of stroke is found within an actuator layer which can potentially
cause electrode delamination. Moreover, the final steady-state stroke is substantially
lower than the stroke of an unexposed actuator resulting in a highly compromised
actuator performance which may limit their use in the fuel injector applications. A
comparison between experimentally measured and numerically evaluated relationships
of the actuator stroke with applied voltage and ambient temperature under static electric
loading and unexposed conditions is also presented. The comparison highlights the
need of adding non-linear effects (dependence of d33 on voltage and temperature) to the
present model in order to predict the actuator behaviour more accurately.
72
4. Conclusions
4.1. Summary and Conclusions
The major findings and conclusions of the present research effort are
summarized as follows:
1. A comprehensive experimental investigation of both quasi-static and dynamic
thermo-electro-mechanical performance of PZT-based stack actuators under
operating conditions relevant to hydrogen-based fuel injection systems is
provided in this thesis. PI-885.91 model of actuators manufactured by PI
Ceramics, Germany were selected to carry out this study. The experimental
findings provide a better understanding of the response of these actuators under
different controlling parameters, such as voltage, frequency, rise time, duty cycle
and DC offset of the driving signal. The effect of environmental parameters, such
as ambient temperature and exposure to hydrogen, on the actuator performance
is also determined. Dependence of piezoelectric strain coefficient d33 on the
experimental parameters is derived and self-heating phenomenon during a
dynamic operation is also investigated. Microstructure evolution and dielectric
behaviour is correlated to some of the observed results. It is found that:
a) The actuator stroke-voltage relationship is slightly non-linear with the slope
increasing with applied voltage. This is attributed to the presence of non-
linear effects such as non-180° domain switching at higher driving voltages.
The increase in the stroke of the PI actuators with ambient temperature,
however, is very minor within the tested temperature range of 5-80°C. The
dynamic stroke shows a minor reduction with applied signal frequency for
up to 100 Hz. The effect of DC offset voltage on the dynamic stroke is
observed only at higher applied voltages where the DC offset causes the
stroke to decrease slightly due to the pinning of domain walls. The duty
cycle is found to have no effect on the actuator stroke. A lower rise time
73
percentage of the applied dynamic voltage provides a longer holding time
at the maximum voltage producing an increase in the stroke at lower rise
times.
b) The piezoelectric strain coefficient d33 is constant with the applied voltage
for up to 20 Volts but increases linearly with the ambient temperature in the
range 5-80°C. This shows that at low applied voltages (≤ 20 Volts), the
extrinsic contributions to d33 are only due to temperature variations. An
additional extrinsic contribution to d33 is introduced at higher voltages due
to an increased activity of non-180° domain walls induced by these
voltages.
c) Self-heating in the PI actuators was experimentally investigated under a
sinusoidal electric loading at different applied voltages (30-120 Vpp) and
frequencies (100-200 Hz). The steady-state temperature attained by the
actuators showed a non-linear increase with both applied voltage and
frequency. It is also found that the increase in the actuator temperature due
to self-heating does not produce any performance changes when operated
at frequencies up to 200 Hz.
d) Continuous exposure of the PI actuators to hydrogen at 100°C temperature
and 10 MPa pressure for up to 12 weeks has a negligible effect on their
performance when tested within the temperature range 5-80°C. Cyclic
exposure, consisting of multiple 4 week exposure cycles with a 4 week
aging period between two consecutive cycles, also does not induce any
performance variations. This resistance to hydrogen is attributed mainly to
the presence of a protective ceramic insulation layer on the lateral surface
of the PI actuators which deactivates the mechanism responsible for
hydrogen diffusion into the internal PZT layers. No changes to the
actuator’s microstructure and dielectric properties are observed during the
hydrogen exposure.
e) The electrical fatigue response of the PI actuators remains consistent for up
to 1.8 x 10⁸ cycles when cycled with a 100 Vpp, 100 Hz sinusoidal electrical
signal. Exposure of the cycled actuators to hydrogen for 3 weeks does
produce any performance variation which indicates that the fatigue cycling
74
does not introduce any cracks/openings in the ceramic insulation which
may activate the hydrogen diffusion mechanism.
2. A numerical model to predict the thermo-electro-mechanical response of a single
PZT-layer of the PI-885.91 stack actuators when exposed to hydrogen is
presented in this thesis. The model is based on the Finite Element Method (FEM)
and is developed using the ‘Equation Based Modelling’ feature of COMSOL
Multiphysics®. This model is a first attempt to incorporate full coupling between
mechanical, electrical, thermal and diffusion variables in a 3-D space. Based on
the results obtained from selected case studies, the major findings from the
model are as follows:
a) When subjected to an ambient temperature different from the initial room
temperature, the PZT layer quickly reaches a steady-state temperature in
approx. 20 sec. On the other hand, the diffusion of hydrogen (H-atoms) into
the layer is much slower and a steady-state concentration is attained in
approx. 2 hrs. This suggests that the contribution of thermotransport
phenomenon, caused by the presence of temperature gradients, to the
hydrogen diffusion flux is negligible.
b) The stroke of an actuator is significantly influenced by the presence of
hydrogen within the actuator. The effects, however, may be different
depending upon the value of hydrogen concentration to which the PZT-
layer is exposed. Below a boundary concentration of 1 ppm, the stroke of
an actuator increases due to the presence of hydrogen producing a positive
effect on the actuator performance. Between 1-2 ppm boundary
concentrations, the effects on performance are highly deleterious that may
result in a compromised actuator performance and its possible damage due
to electrode delamination.
4.2. Recommendations for Future Work
To gain a deeper understanding of the behaviour of piezoelectric stack actuators
in hydrogen-based fuel injectors, the following suggestions are made for future work:
75
(1) In the present study, the exposure of the actuators to hydrogen and their
performance testing was not conducted simultaneously. When an actuator is
operated inside a hydrogen environment, the presence of induced electric, stress
and thermal fields can possibly complicate the diffusion of hydrogen into the
actuator’s PZT layers. This can be explored by building a hydrogen-safe test-rig
to carry out the experiments in the presence of hydrogen.
(2) Piezoelectric ceramics are brittle and susceptible to cracking under cyclic
electric-field and/or mechanical loading [52]. The extremely low rise times
demanded by the fuel injectors can further aggravate this propensity for cracking.
A comprehensive investigation of the fatigue behaviour of actuators under
loading conditions relevant to a typical fuel injector is necessary to ascertain the
durability of the proposed actuators. For the reasons given in (1), this fatigue
testing should, ideally, be performed in a hydrogen environment.
(3) The comparison of experimental and numerical results done in Ch-3 showed that
the response of the actuators can be non-linear due to the dependence of
material properties (such as d33) on the ambient and controlling variables. This
dependency needs to be functionally quantified based on the available literature
and included in the model in order to make a more accurate prediction of the
actuator behaviour.
76
References
[1] Scharf A., “Prize-Winning Piezo, Piezo-Actuators in Fuel Injection Systems”, EPCOS technical articles 2006 (http://www.epcos.com).
[2] Li F.X., Rajapakse R.K.N.D., Mumford D., Gadala M., “Quasi-static thermo-electromechanical behaviour of piezoelectric stack actuators”, Smart Materials and Structures 17 (2008) 015049.
[3] Senousy M.S., Li F.X., Mumford D., Gadala M., Rajapakse R.K.N.D., “Thermo-electro-mechanical Performance of Piezoelectric Stack Actuators for Fuel Injector Applications”, Journal of Intelligent Material Systems and Structures 20 (2009) 387.
[4] Wang H., Cooper T.A., Lin H.T., Wereszczak A.A., “Fatigue responses of lead zirconate titanate stacks under semibipolar electric cycling with mechanical preload”, J. Appl. Phys. 108 (2010) 084107.
[5] Wu M., Huang H., Chu W., Guo L., Qiao L., Xu J., Zhang T.Y., “Tuning the ferroelectric and piezoelectric properties of 0.91Pb(Zn1/3Nb2/3)O3-0.09PbTiO3 single crystals and lead zirconate titanate ceramics by doping hydrogen”, J. Phys. Chem. C114 (2010) 9955–9960.
[6] Peng X., Su Y.J., Gao K.W., Qiao L.J., Chu W.Y., “Hydrogen fissure in PZT ferroelectric ceramic”, Mater. Lett. 58 (2004) 2073–2075.
[7] Wang Y., Chu W.Y., Qiao L.J., Su Y.J., “Hydrogen-induced delayed fracture of PZT ceramics during dynamic charging under constant load”, Mater. Sci. Eng., B98 (2003) 1–5.
[8] Shafiei A.,Oprea C., Troczynski T., “Investigation of the Effects of High-Pressure Hydrogen on Pb(Zr,Ti)O3 (PZT) Ceramics” J. Am. Ceram. Soc. 95 [2] (2012) 782–787
[9] Shafiei A.,Oprea C., Alfantazi A., Troczynski T., “In situ monitoring of the effects of hydrogen on Pb(Zr,Ti)O3 structure” Journal of Applied Physics 109 (2011) 114108
[10] Shafiei A., Nickchi T., Oprea C., Alfantazi A., Troczynski T., “Investigation of hydrogen effects on the properties of Pb(Zr,Ti)O3 in tetragonal phase using water electrolysis technique” Applied Physics Letters 99 (2011) 212903
77
[11] Callister W.D., Rethwisch D.G., “Fundamentals of Materials Science and Engineering” John Wiley and Sons Inc., 2008
[12] Masys A.J., Ren W., Yang G., Mukherjee B.K., “Piezoelectric strain in lead zirconatetitante ceramics as a function of electric field, frequency, and dc bias” Journal of Applied Physics 94 (2003) 1155
[13] Sherrit S., Van Nice D.B., Graham J.T., Mukherjee B.K., Wiederick H.D., “Domain wall motion in piezoelectric materials under high stress” Proceedings of the Eighth IEEE International Symposium on Applications of Ferroelectrics (1992)167.
[14] Ochi A., Takahashi S., Tagami S., “Temperature characteristics for multilayer piezoelectric ceramic actuator” Japanese Journal of Applied Physics (1985) 24:209
[15] Zhang Q. M. et al, “Direct evaluation of domain-wall and intrinsic contributions to the dielectric and piezoelectric response and their temperature dependence on lead zirconate–titanate ceramics” Journal of Applied Physics 75 (1994) 454–9
[16] Leo D.J., “Engineering Analysis of Smart Material Systems” John Wiley and Sons Inc., 2007
[17] Cady W.G., “Piezoelectricity” McGraw-Hill, 1946
[18] Ikeda T., “Fundamentals of Piezoelectricity” Oxford University Press Inc., 1996
[19] Uchino K., “Piezoelectric Actuators and Ultrasonic Motors” Kluwer Academic Publishers, 1997
[20] Youssef M.S.S., “Experimental Investigation and Theoretical Modelling of Piezoelectric Actuators used in Fuel Injectors” Ph.D. thesis, The University of British Columbia, 2009
[21] Lines M., Glass A., “Principles and applications of ferroelectrics and related materials” Clarendon Press, 1979
[22] Pokharel B.P., Karki N.R., “Electrical Engineering Materials” Alpha Science International Ltd, 2007
[23] Fujishima S., “The history of ceramic filters” IEEE Transactions on Ultrasonics, Ferroelectrics and Frequency Control, 2000; 47:1
[24] Jäker P., “Electro-Mechanical Characterization of High-Performance Piezoactuators” Proceedings of SPIE, 1997; 3039:670
[25] Ardelean E.V., Cole D.G., Clark R.L., “High performance 'V-stack" piezoelectric actuator” Journal of Intelligent Material Systems and Structures, 2004; 15:879
78
[26] Chen Q., Yao D.J., Kim C.J., Carman G.P., “Frequency response of an inchworm motor fabricated with micromachined interlocking surface mesoscale actuator device (MAD)” Proceedings of SPIE, 1998; 3329:768
[27] Haertling G.H., “Ferroelectric Ceramics: History and Technology” Journal of the American Ceramic Society, 1999; 82:797
[28] Uchino K., “Ferroelectric Devices” Marcel Dekker Inc., 2000
[29] Wolff A., Cramer D., Hellebrand H., Probst I., Lubitz K., “Optical two channel elongation measurement of PZT piezoelectric multilayer stack actuators” IEEE International Symposium on Applications of Ferroelectrics, 1994
[30] Gromek B., Shen J.J., “Multiple stack piezoelectric actuator for a fuel injector” United States Patent, Patent Number 6,345,771, 2000
[31] Takase S., “Piezoelectric actuator and fuel-injection apparatus using the actuator” United States Patent, Patent Number 6-155-500, 1999
[32] Fujii A., Toyao T., “Piezoelectric actuators with high reliability for diesel injection valve” 10th International Conference on New Actuators, 2006
[33] Aburatani H., Harada S., Uchino K., Furuta A., Fuda Y., “Destruction mechanisms in ceramic multilayer actuators” Japanese Journal of Applied Physics, 1994
[34] Nuffer J., Bein T., “Application of piezoelectric materials in transportation industry” Global Symposium on Innovative Solutions for the Advancement of the Transport Industry, 2006
[35] US Department of Energy website (http://www.hydrogen.energy.gov)
[36] Lanz A., Heffel J., Messer C., “Hydrogen Fuel Cell Engines and Related Technologies” Course, College of the Desert, 2001
[37] Benjeddou A., “Advances in piezoelectric finite element modelling of adaptive structural elements: a survey” Journal of Computers and Structures, 2000, Vol. 76, Pg. 347-363
[38] Senousy M. S., Gadala M. S., Rajapakse R.K.N.D., “Coupled finite element modelling of piezothermoelastic materials” Proceedings of SPIE, 2007, Vol. 6526, Pg. 65260H1-11
[39] Senousy M. S., Rajapakse R.K.N.D., Gadala M. S., “A Temperature-Dependent Two-Step Domain-Switching Model for Ferroelectric Materials” Acta Materialia, 2009
[40] Sapsathiarn Y., Rajapakse R.K.N.D., “Modelling of Hydrogen Diffusion in a Piezoceramic with Temperature Gradient” IEEE International Symposium on Applications of Ferroelectrics - ISAF, 2011
79
[41] Uchino K., Hirose S., “Loss mechanisms in piezoelectrics: How to measure different losses separately” IEEE Transactions on Ultrasonics, Ferroelectrics, and Frequency Control, 2001
[42] Yao K., Uchino K., Xu Y., Dong S., Lim L.C., “Compact piezoelectric stacked actuators for high power applications” IEEE Transactions on Ultrasonics, Ferroelectrics, and Frequency Control, 2000
[43] Keoschkerjan R., Harutyunyan M., Wurmus H., “Analysis of self-heating phenomenon of piezoelectric microcomponents actuated harmonically” Microsystem Technologies, 2002
[44] Ronkanen P., Kallio P., Vilkko M., Koivo H.N., “Self heating of piezoelectric actuators: Measurement and compensation” International Symposium on Micro-NanoMechatronics and Human Sci., 2004
[45] Zheng J., Takahashi S., Yoshikawa S., Uchino K., de Vries J.W.C., “Heat generation in multilayer piezoelectric actuators” Journal of the American Ceramic Society, 1996
[46] Lesieutre G.A., Fang L., Koopmann G.H., Pai S.P., Yoshikawa S., “Heat generation of a piezoceramic induced-strain actuator embedded in a glass/epoxy composite panel” Smart Structures and Materials, 1996
[47] Senousy M. S., Rajapakse R.K.N.D., Mumford D., Gadala, M. S., “Self-heat generation in piezoelectric stack actuators used in fuel injectors” Journal of Smart Materials and Structures, 2009
[48] “COMSOL Multiphysics® Modelling Guide” Version 3.5a, 2008
[49] “Piezoelectric Actuators – COMPONENTS, TECHNOLOGIES, OPERATION” (www.piceramic.com)
[50] Zhang Q.M., Wang H., Zhao J., “Effect of Driving Field and Temperature on the Response Behavior of Ferroelectric Actuator and Sensor Materials” Journal of Intelligent Material Systems and Structures,1995
[51] Safari A., Akdogan E.K., “Piezoelectric Actuators and Acoustic Materials for Transducer Applications” Springer, 2008
[52] Shindo Y., Narita F., Horiguchi K., Magara Y., Yoshida M., “Electric fracture and polarization switching properties of piezoelectric ceramic PZT studied by the modified small punch test” Acta Materialia, 2003
[53] Alvine K.J., Shutthanandan V., Bennett W. D., Bonham C. C., Skorski D., Pitman S. G., Dahl M. E., Henager C. H., “High-Pressure Hydrogen Materials Compatibility of Piezoelectric Films” Applied Physics Letters, 2010
[54] Mehrer H., “Diffusion in Solids” Springer, 2007

80
Appendices
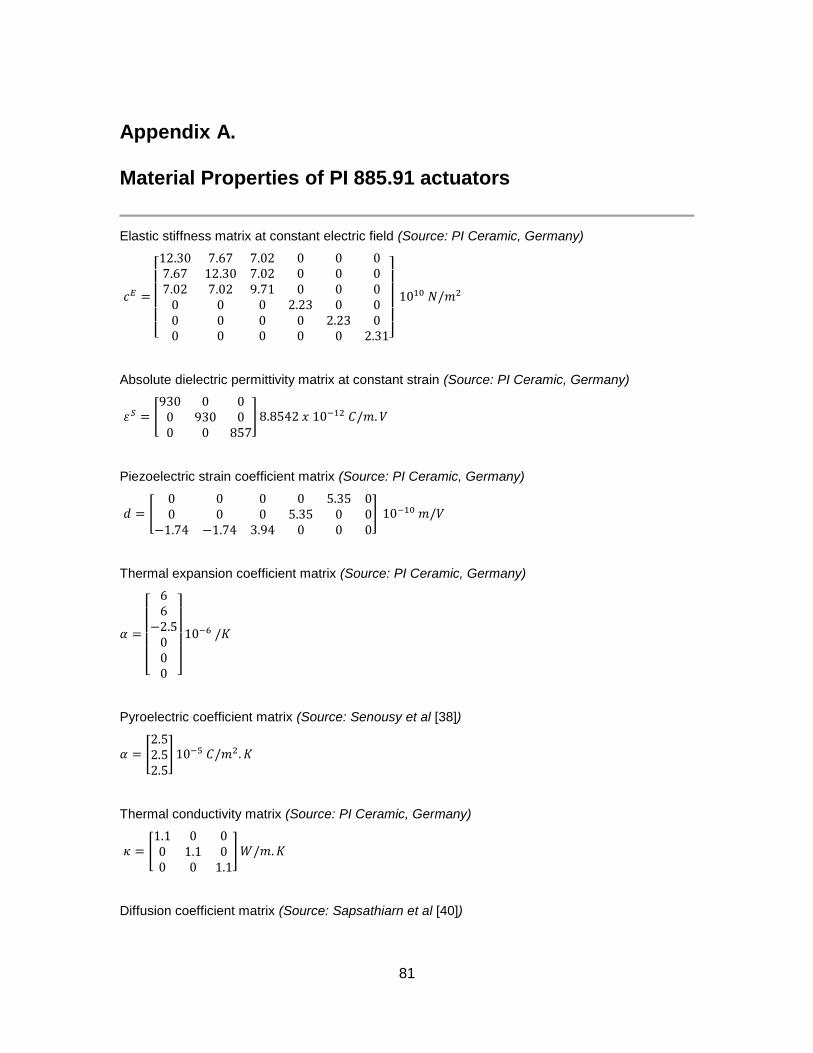
81
Appendix A. Material Properties of PI 885.91 actuators
Elastic stiffness matrix at constant electric field (Source: PI Ceramic, Germany)
[ ]
Absolute dielectric permittivity matrix at constant strain (Source: PI Ceramic, Germany)
[
]
Piezoelectric strain coefficient matrix (Source: PI Ceramic, Germany)
[
]
Thermal expansion coefficient matrix (Source: PI Ceramic, Germany)
[
]
Pyroelectric coefficient matrix (Source: Senousy et al [38])
[
]
Thermal conductivity matrix (Source: PI Ceramic, Germany)
[
]
Diffusion coefficient matrix (Source: Sapsathiarn et al [40])
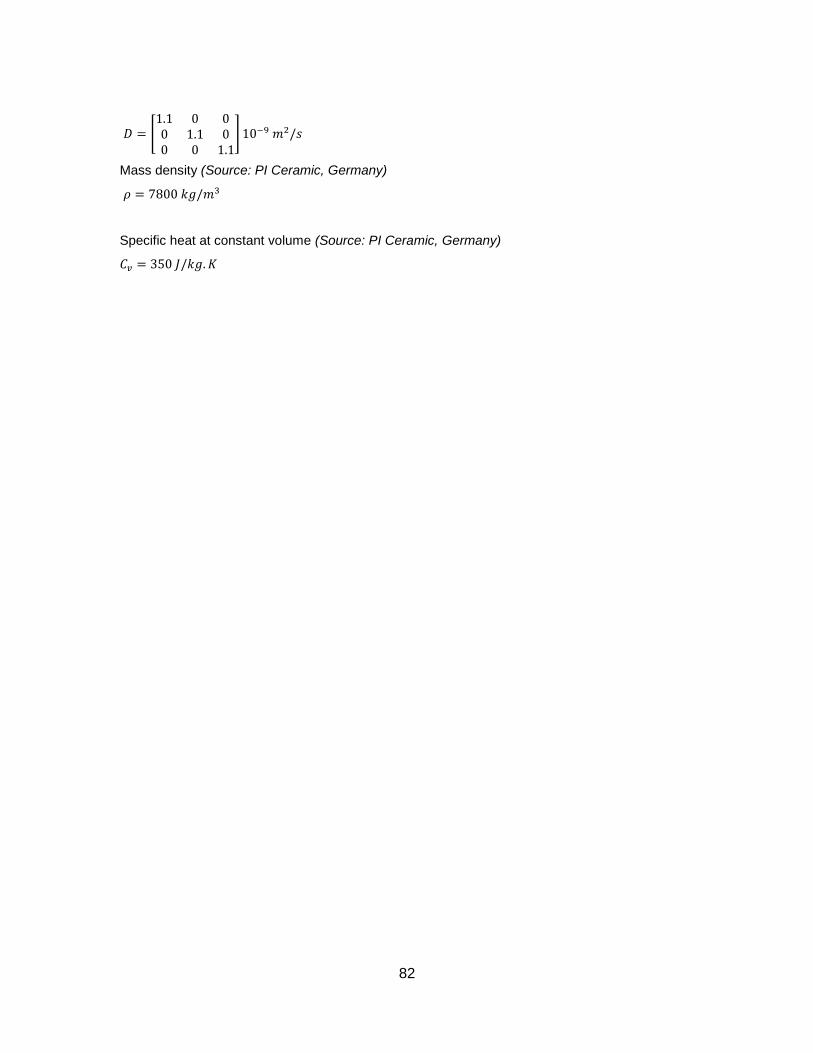
82
[
]
Mass density (Source: PI Ceramic, Germany)
Specific heat at constant volume (Source: PI Ceramic, Germany)

83
Appendix B. FE Formulation of the In-house Thermo-Electro-Mechanical Model
APPLICATION OF THE PRINCIPLE OF VIRTUAL WORK:
Upon subjecting a piezoelectric material volume Ω to virtual displacements , virtual
electric potential change ( ) and virtual temperature change ( ) and thereafter, applying the Principle of Virtual Work to the Thermo-Electro-Mechanical governing equations given in Chapter-3 [Eq. 3.1] gives the following result:
∫ ( )
∫ ( )
∫ ( )
(B.1)
Upon expanding the terms inside brackets we get
∫
∫
∫
∫
∫
∫
∫
∫
(B.2)
, and are divergences of stress tensor, electric displacement vector and heat flux
vector respectively that are integrated over the volume Ω. Application of Divergence Theorem to these terms over the volume Ω and surface Π yields
∫ ∫
∫
∫
∫
∫
∫
∫
∫
∫
∫
(B.3)
Substituting the boundary condition equations [Eq. 3.4] inside surface integrals we get
∫ ∫
∫
∫
∫
∫
∫ ∫ ∫
∫
∫
∫
(B.4)
By reversing the tensor subscripts, we can write
[ ] (B.5a)
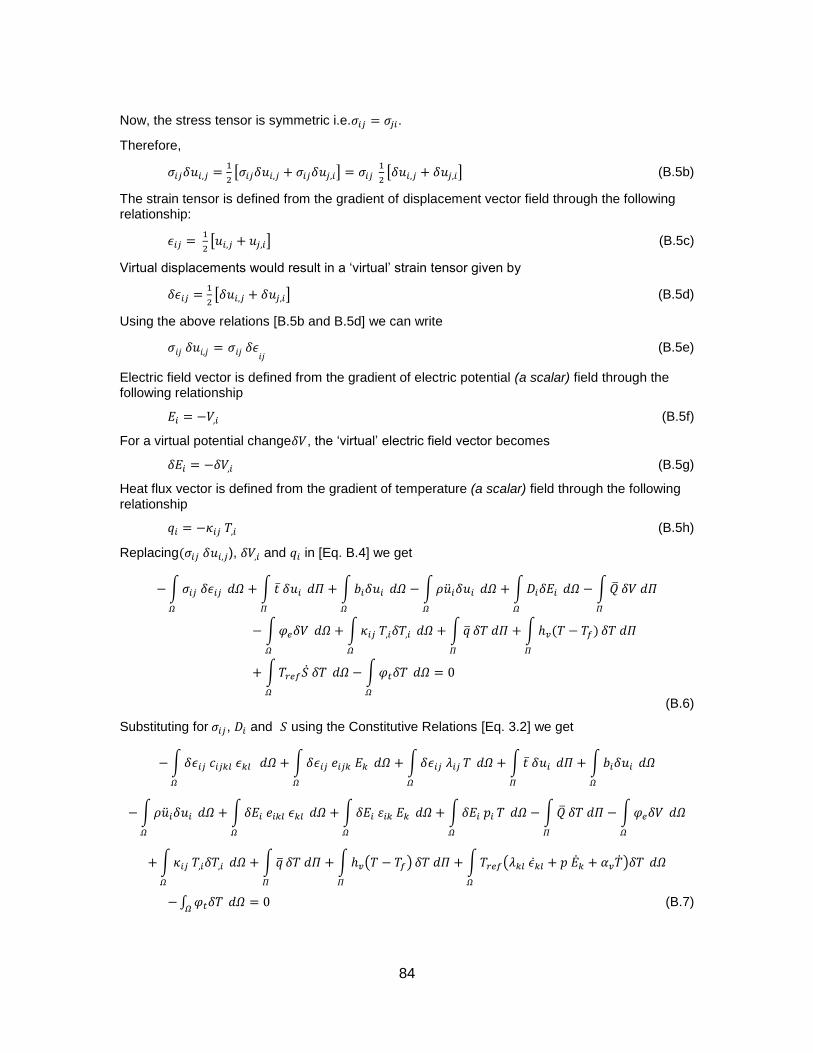
84
Now, the stress tensor is symmetric i.e. .
Therefore,
[ ]
[ ] (B.5b)
The strain tensor is defined from the gradient of displacement vector field through the following relationship:
[ ] (B.5c)
Virtual displacements would result in a ‘virtual’ strain tensor given by
[ ] (B.5d)
Using the above relations [B.5b and B.5d] we can write
(B.5e)
Electric field vector is defined from the gradient of electric potential (a scalar) field through the following relationship
(B.5f)
For a virtual potential change , the ‘virtual’ electric field vector becomes
(B.5g)
Heat flux vector is defined from the gradient of temperature (a scalar) field through the following relationship
(B.5h)
Replacing ), and in [Eq. B.4] we get
∫ ∫
∫
∫
∫
∫
∫
∫ ∫
∫
∫
∫
(B.6)
Substituting for , and using the Constitutive Relations [Eq. 3.2] we get
∫ ∫
∫
∫
∫
∫
∫
∫
∫
∫
∫
∫ ∫
∫ ( )
∫ ( )
∫
(B.7)
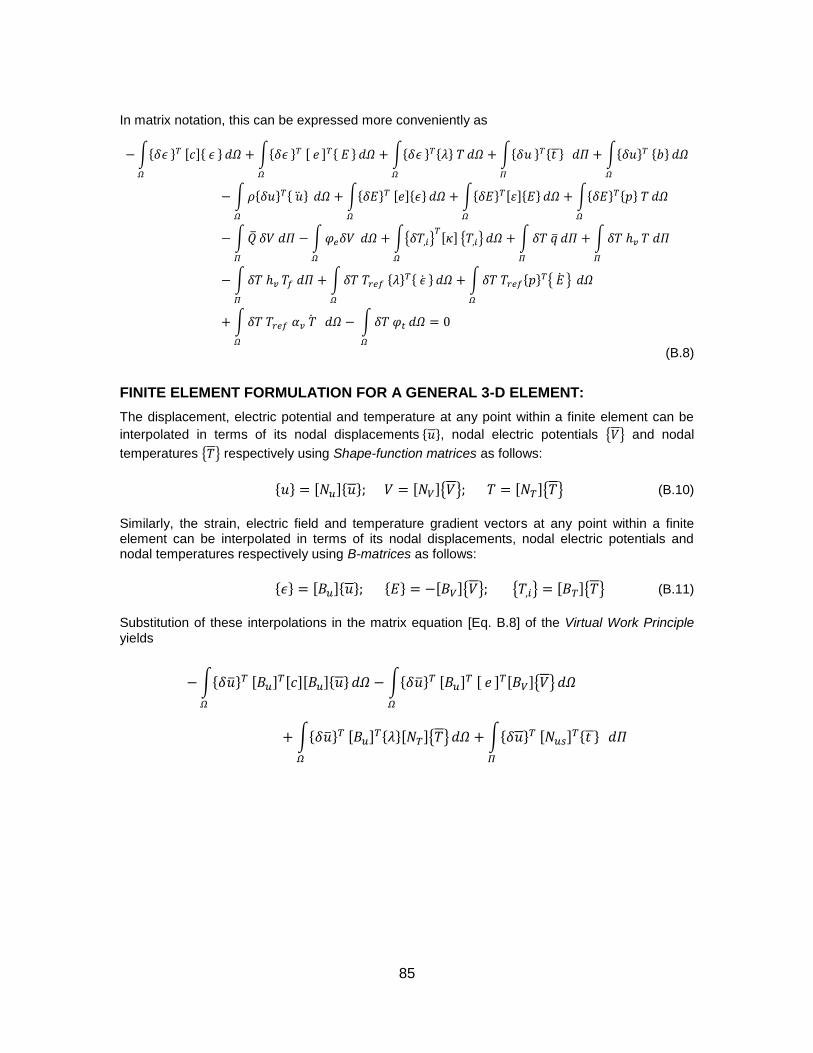
85
In matrix notation, this can be expressed more conveniently as
∫{ } [ ]{ } ∫{ }
[ ] { }
∫{ } { }
∫{ } { }
∫{ } { }
∫ { } { }
∫{ } [ ]{ }
∫{ } [ ]{ }
∫{ } { }
∫
∫ ∫{ } [ ] { }
∫
∫
∫
∫ { } { }
∫ { } {
}
∫
∫
(B.8)
FINITE ELEMENT FORMULATION FOR A GENERAL 3-D ELEMENT:
The displacement, electric potential and temperature at any point within a finite element can be
interpolated in terms of its nodal displacements { }, nodal electric potentials { } and nodal
temperatures { } respectively using Shape-function matrices as follows:
{ } [ ]{ } [ ]{ } [ ]{ } (B.10)
Similarly, the strain, electric field and temperature gradient vectors at any point within a finite element can be interpolated in terms of its nodal displacements, nodal electric potentials and nodal temperatures respectively using B-matrices as follows:
{ } [ ]{ } { } [ ]{ } { } [ ]{ } (B.11)
Substitution of these interpolations in the matrix equation [Eq. B.8] of the Virtual Work Principle yields
∫{ } [ ]
[ ][ ]{ } ∫{ } [ ]
[ ] [ ]{ }
∫{ } [ ]
{ }[ ]{ }
∫{ } [ ]
{ }
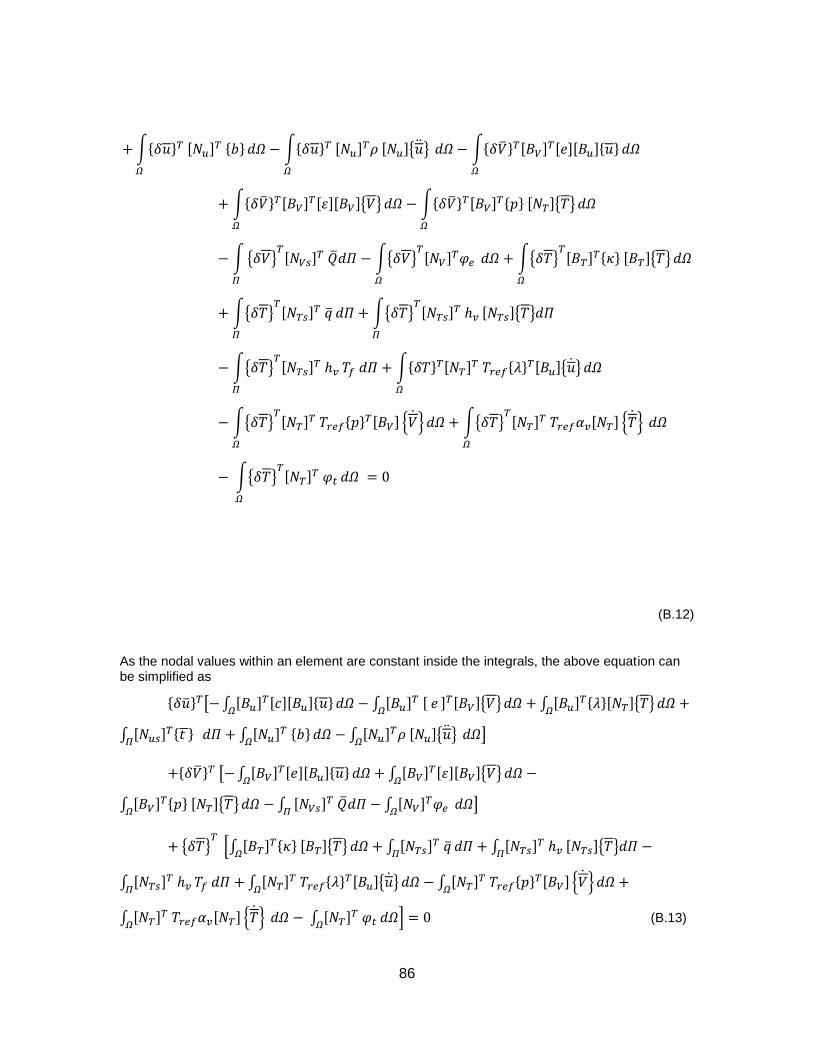
86
∫{ } [ ]
{ }
∫{ } [ ]
[ ]{ }
∫{ } [ ] [ ][ ]{ }
∫{ } [ ] [ ][ ]{ }
∫{ } [ ] { } [ ]{ }
∫{ } [ ]
∫{ } [ ]
∫{ } [ ]
{ } [ ]{ }
∫{ } [ ]
∫{ } [ ]
[ ]{ }
∫{ } [ ]
∫{ } [ ] { }
[ ]{ }
∫{ } [ ]
{ } [ ] { }
∫{ } [ ]
[ ] { }
∫{ } [ ]
(B.12)
As the nodal values within an element are constant inside the integrals, the above equation can be simplified as
{ } [ ∫ [ ] [ ][ ]{ } ∫ [ ]
[ ] [ ]{ }
∫ [ ]
{ }[ ]{ }
∫ [ ] { }
∫ [ ]
{ }
∫ [ ]
[ ]{ }
]
{ } [ ∫ [ ] [ ][ ]{ }
∫ [ ]
[ ][ ]{ }
∫ [ ] { } [ ]{ }
∫ [ ]
∫ [ ]
]
{ } [∫ [ ]
{ } [ ]{ }
∫ [ ]
∫ [ ]
[ ]{ }
∫ [ ]
∫ [ ]
{ } [ ]{ }
∫ [ ]
{ } [ ] { }
∫ [ ] [ ] { }
∫ [ ]
] (B.13)
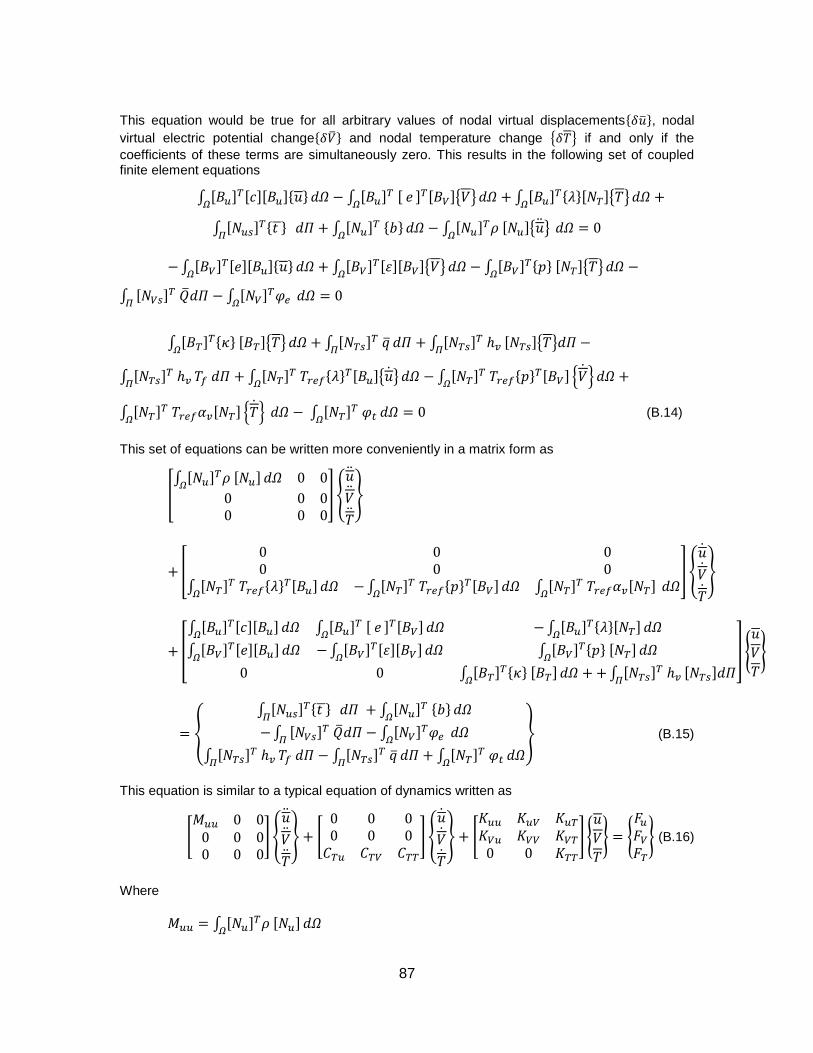
87
This equation would be true for all arbitrary values of nodal virtual displacements{ }, nodal
virtual electric potential change{ } and nodal temperature change { } if and only if the
coefficients of these terms are simultaneously zero. This results in the following set of coupled finite element equations
∫ [ ] [ ][ ]{ } ∫ [ ]
[ ] [ ]{ }
∫ [ ]
{ }[ ]{ }
∫ [ ] { }
∫ [ ]
{ }
∫ [ ]
[ ]{ }
∫ [ ] [ ][ ]{ }
∫ [ ]
[ ][ ]{ }
∫ [ ]
{ } [ ]{ }
∫ [ ]
∫ [ ]
∫ [ ] { } [ ]{ }
∫ [ ]
∫ [ ]
[ ]{ }
∫ [ ]
∫ [ ]
{ } [ ]{ }
∫ [ ]
{ } [ ] { }
∫ [ ] [ ] { }
∫ [ ]
(B.14)
This set of equations can be written more conveniently in a matrix form as
[∫ [ ]
[ ]
] {
}
[
∫ [ ] { }
[ ]
∫ [ ]
{ } [ ]
∫ [ ] [ ]
] {
}
[
∫ [ ] [ ][ ]
∫ [ ] [ ]
[ ]
∫ [ ]
{ }[ ]
∫ [ ] [ ][ ]
∫ [ ]
[ ][ ]
∫ [ ] { } [ ]
∫ [ ] { } [ ]
∫ [ ]
[ ]
] {
}
{
∫ [ ] { }
∫ [ ]
{ }
∫ [ ]
∫ [ ]
∫ [ ]
∫ [ ]
∫ [ ]
} (B.15)
This equation is similar to a typical equation of dynamics written as
[
]{
} [
] {
} [
] {
} {
} (B.16)
Where
∫ [ ] [ ]
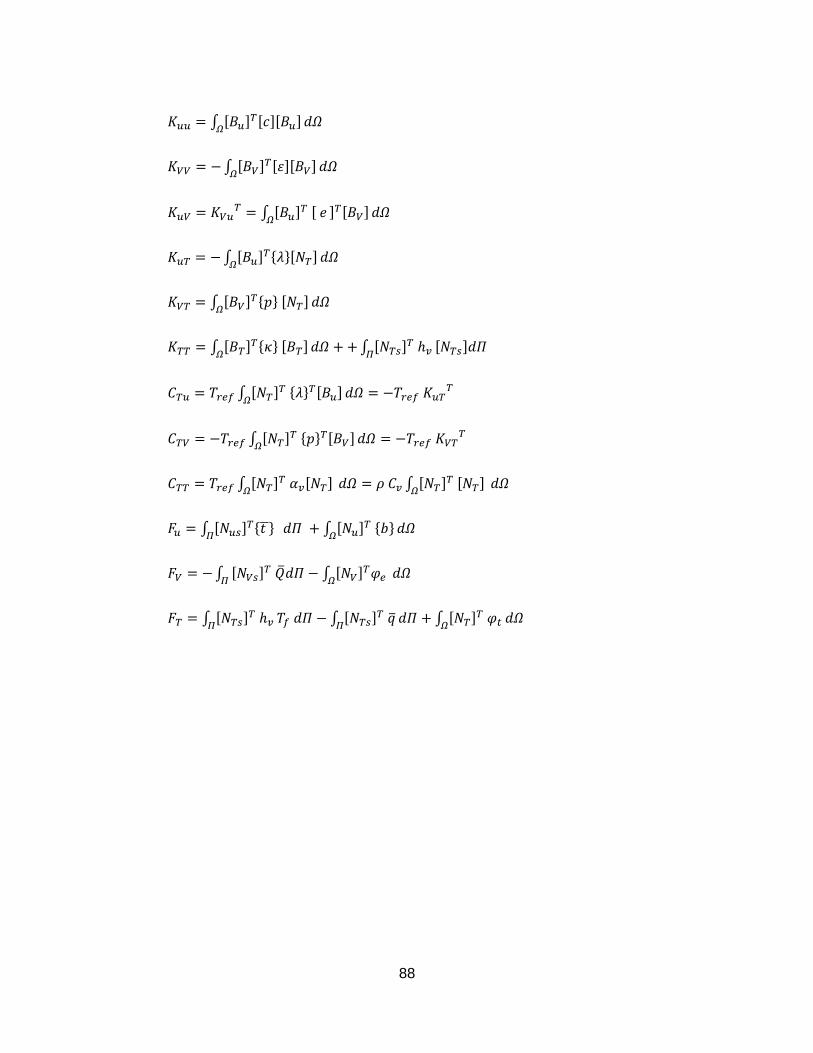
88
∫ [ ] [ ][ ]
∫ [ ] [ ][ ]
∫ [ ]
[ ] [ ]
∫ [ ] { }[ ]
∫ [ ] { } [ ]
∫ [ ] { } [ ]
∫ [ ]
[ ]
∫ [ ] { } [ ]
∫ [ ] { } [ ]
∫ [ ] [ ]
∫ [ ]
[ ]
∫ [ ] { }
∫ [ ]
{ }
∫ [ ]
∫ [ ]
∫ [ ]
∫ [ ]
∫ [ ]

89
3-DIMENSIONAL, 8-NODE HEXAHEDRON, ISOPARAMETRIC ELEMENT
The Shape Functions of a 3-D 8-node hexahedron element (shown in the Fig. above) are defined in the analysis plane as follows:
For a corresponding 8-node element in the physical plane (x,y,z ≡ r,s,t), the position of any point within the element can be approximated in terms of its nodal positions using the Shape Functions defined in the analysis plane as follows:
[ ]
{
}
[ ]
{
}
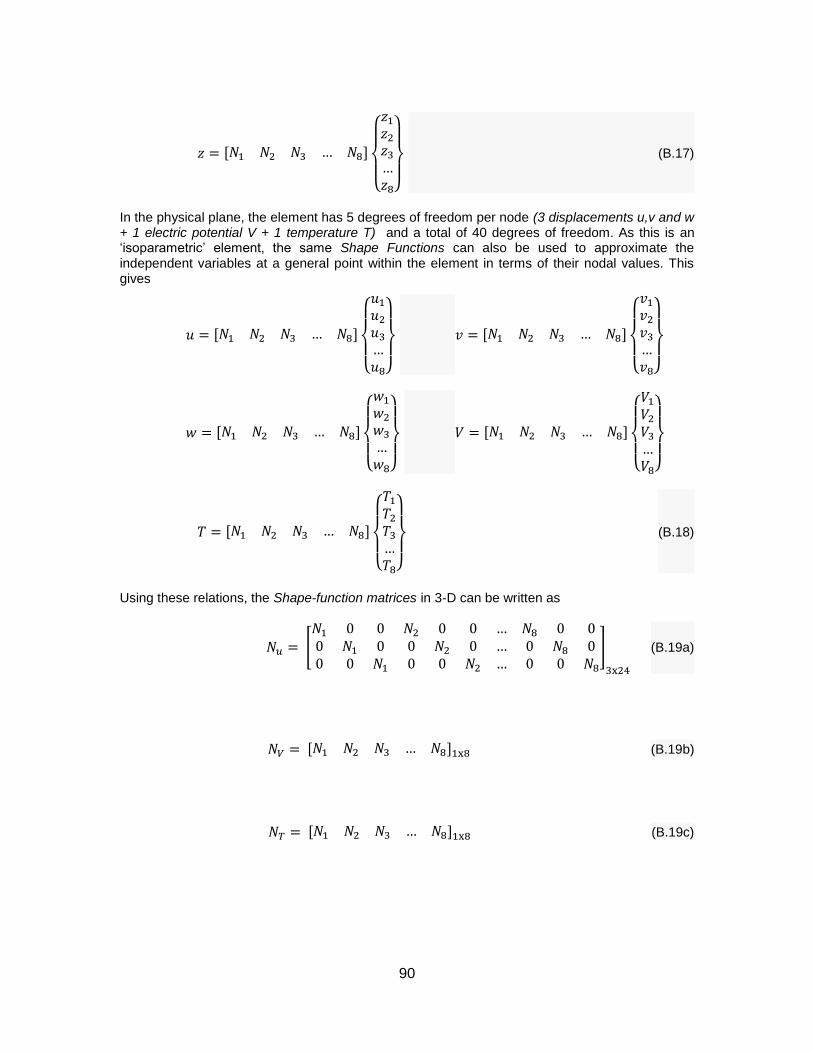
90
[ ]
{
}
(B.17)
In the physical plane, the element has 5 degrees of freedom per node (3 displacements u,v and w + 1 electric potential V + 1 temperature T) and a total of 40 degrees of freedom. As this is an ‘isoparametric’ element, the same Shape Functions can also be used to approximate the independent variables at a general point within the element in terms of their nodal values. This gives
[ ]
{
}
[ ]
{
}
[ ]
{
}
[ ]
{
}
[ ]
{
}
(B.18)
Using these relations, the Shape-function matrices in 3-D can be written as
[
]
(B.19a)
[ ] (B.19b)
[ ] (B.19c)
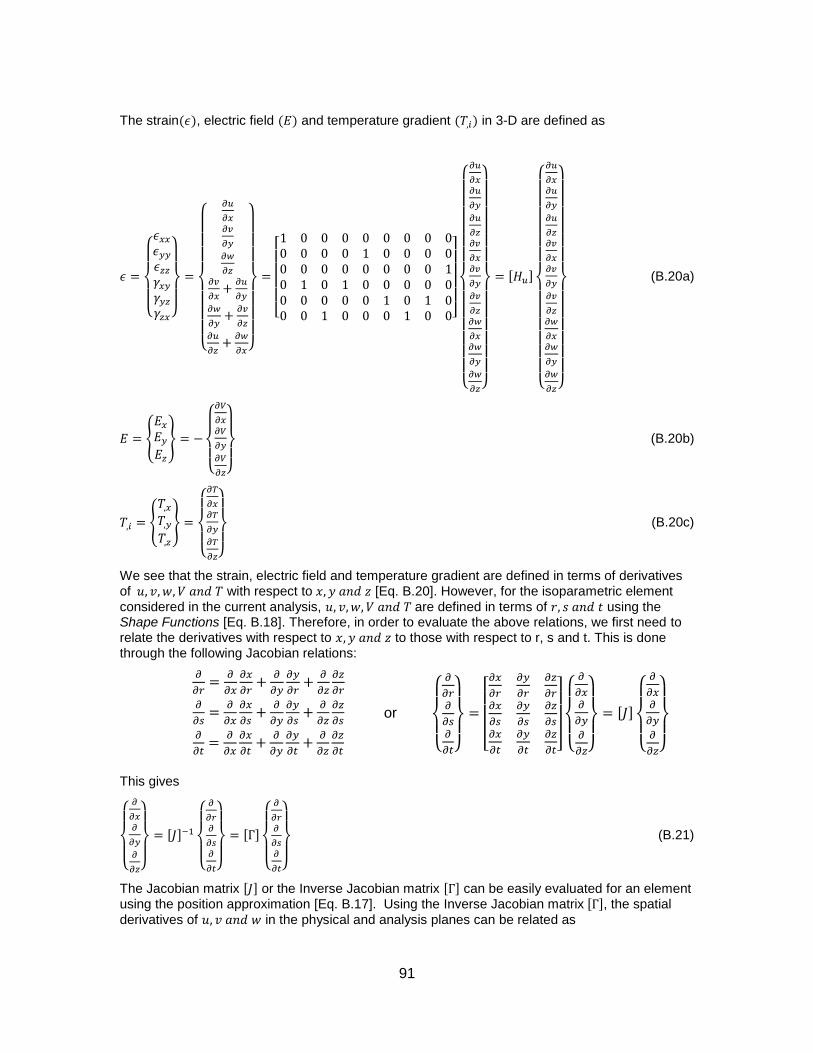
91
The strain , electric field and temperature gradient in 3-D are defined as
{
}
{
}
[ ]
{
}
[ ]
{
}
(B.20a)
{
}
{
}
(B.20b)
{
}
{
}
(B.20c)
We see that the strain, electric field and temperature gradient are defined in terms of derivatives of with respect to [Eq. B.20]. However, for the isoparametric element
considered in the current analysis, are defined in terms of using the Shape Functions [Eq. B.18]. Therefore, in order to evaluate the above relations, we first need to relate the derivatives with respect to to those with respect to r, s and t. This is done through the following Jacobian relations:
or
{
}
[
]
{
}
[ ]
{
}
This gives
{
}
[ ]
{
}
[ ]
{
}
(B.21)
The Jacobian matrix [ ] or the Inverse Jacobian matrix [ ] can be easily evaluated for an element using the position approximation [Eq. B.17]. Using the Inverse Jacobian matrix [ ], the spatial
derivatives of in the physical and analysis planes can be related as

92
{
}
[
[ ] [ ] [ ]
[ ] [ ] [ ]
[ ] [ ] [ ]]
{
}
[ ]
{
}
(B.22)
Applying the approximation for displacements [Eq. B.18] we get
{
}
[
]
{
}
[ ]
{
}
(B.23)
The definitions of strain [Eq. B.20a, B.22, and B.23] and mechanical B-matrix [Eq. B.11] give
[ ] [ ] [ ]
{
}
[ ]
{
}
(B.24a)
Therefore, the mechanical B-matrix is given by
[ ] [ ] [ ] [ ] (B.24b)
93
The electrical and thermal B-matrices can be obtained using a similar procedure to give
{
}
{
}
[ ]
{
}
[ ]
[
]
{
}
[ ][ ]
{
}
[ ]
{
}
(B.25a)
[ ] [ ] [ ] (B.25b)
{
}
{
}
[ ]
{
}
[ ]
[
]
{
}
[ ][ ]
{
}
[ ]
{
}
(B.26a)
[ ] [ ][ ] (B.26b)
Note: In this problem,[ ] [ ]
Related Documents