- 1 - Experimental Evidence for the Attraction of Matter by Electromagnetic Waves Hans Lidgren Le Mirabeau, 2 ave des Citronniers, MC 98000, Monaco Rickard Lundin Swedish Institute of Space Physics, Box 812, 981 28 Kiruna, Sweden [email protected] Received_________________________; accepted_____________________

Welcome message from author
This document is posted to help you gain knowledge. Please leave a comment to let me know what you think about it! Share it to your friends and learn new things together.
Transcript

- 1 -
Experimental Evidence for the Attraction of Matter by Electromagnetic
Waves
Hans Lidgren
Le Mirabeau, 2 ave des Citronniers, MC 98000, Monaco
Rickard Lundin
Swedish Institute of Space Physics, Box 812, 981 28 Kiruna, Sweden
Received_________________________; accepted_____________________

- 2 -
ABSTRACT
We present measurement results demonstrating that a conducting lead sphere exposed to
electromagnetic (e/m) waves in the infrared (IR) regime, is attracted by e/m waves. The
result may seem surprising and against conventional wisdom that electromagnetic wave
forcing should lead to a repulsive force. Nonetheless, all our experiments show that the
attractive force can be determined quantitatively, and that they are reproducible. Our
experiment setup is a Cavendish torsion-balance experiment with lead spheres, one of the
spheres intermittently irradiated by IR light. Because the Cavendish experiment is well
known, simple, and readily available, the results can be easily verified or falsified.
However, to avoid Bernoulli and other external forcing effects, the entire experimental
setup should be placed in a vacuum chamber. In our case the experiments were
performed at ! 4·10-7
mbar. One of the 20 g lead spheres was intermittently irradiated by
infrared radiation from a lamp covered by an aluminium foil. Two independent
experiments (V1 and V2) are described. Besides showing that wave energy and
momentum transfer leads to attraction, we also describe some experimental requirements
and constraints. The lamp was powered on during 10 or 12 s, the power changing
between 8, 16, and 26 W. All measurements, including those affected by lamp out-
gassing, shows that the attracting force on the lead sphere increases with increasing
irradiative energy. From the V2 experiment, preceded by lamp “baking” to eliminate
repulsive out-gassing forces, the irradiative energy 8.7 Ws on the sphere resulted in a
total force 2.9±0.5·10-9 (N). From the V2 experiment we also derive a power law relation
between incident radiation energy (W) and the attractive force, corresponding to
F = 2.8·10!10W
1.1, with R
2=0.95.
Subject headings: Electromagnetic wave forcing; mass-attraction; Cavendish experiment

- 3 -
1. Introduction
A rigid body irradiated by electromagnetic waves is subject to forcing. On a
macroscopic scale, electromagnetic wave forcing can result in heating, energy and
momentum transfer. Electromagnetic (e/m) waves illuminating a surface may be
reflected, become absorbed, and/or lead to secondary wave emission. The surface
properties of a body, defined by their absorption-, emission-, and albedo coefficients,
are generally frequency-dependent.
A Poynting flux describes the propagation of e/m waves in a certain direction. However,
inherent in such a description is that because e/m waves move in a certain direction,
wave-forcing results in momentum transfer in the same direction. This may be referred
to as Maxwell’s radiation pressure, i.e. e/m energy and momentum transfer results in a
repulsive force on the body, here denoted the Repulsive Radiation Pressure-force (RRP-
force).
Attempts to quantify and experimentally verify the RRP-force dates back to the late
19th and early 20th century. Maxwell presented the theory of radiation pressure in 1871.
Thirty years later an experiment by Lebedeev (1901) came close by 20% of the
theoretical value, the reflected radiation from a thin foil exerting a larger repulsive force
than the absorbed radiation. A follow-up foil experiment (Nicholz and Hull, 1903) in
low vacuum provided even better agreement with the radiation pressure theory.
Contemporary research on radiation forcing utilizes primarily coherent (laser) light,
consider effects on the atomic scale. This has lead to applications in low-temperature
physics (Wineland and Itano, 1987, Cohen-Tannodji et al., 1990) and nanotechnology
(Fedosov et al., 2007). However, macroscopic effects of radiation pressure on solid
bodies are mainly considered as an RRP-force, like on satellites (Hughes, 1977). In
view of the results presented here, the theory of solar light forcing of satellites should be
reconsidered. The lack of studies on solid bodies may be due to the fact that the feeble
radiation force on heavy targets is notoriously difficult to measure. Cavendish torsion
balance experiments to determine the gravitational constant must be designed to avoid
"anomalous" external influences, but under less controlled environments they should
have been subject to the external forcing described here. As a result the torsion balance
technique to test gravity in laboratories have been very carefully designed to eliminate
as much as possible external and internal induced perturbations, in particular those
caused by radiation/temperature effects. Results from advanced gravitational tests are

- 4 -
now available, making it possible to determine violations from gravity down to
separation distances of 10-8
m (Grundach, 2005).
Considering the "unconventional" way the forcing described in this report works, it is
only natural for physicists to associate it with environmental effects such as Bernouilles
airflow. A proper forcing experiment therefore requires not only vacuum, but also a
controlled electromagnetic environment. The apparatus and environment used in this
experiment does not match the requirements required for gravity experiments. However,
first of all our experiments are performed in vacuum. Furthermore, the electromagnetic
force applied in our experiment is higher compared to the feeble gravitation force
between two lead balls in a gravitation experiment. In fact, our apparatus and
environmental constraints are quite adequate for testing the impact of electromagnetic
radiation forcing. Finally, the experiment set up is simple enough for any trained
physicist to confirm or falsify our results in most physics laboratory with access to a
vacuum chamber.
Neither classical e/m field theory nor quantum field theory implies that e/m-radiation
leads to an attractive force of neutral bodies. However, the physics of magnetized
plasma provides an alternative avenue in this respect, because plasma wave-induced
ponderomotive forces (e.g. Allan et al., 1990, Li and Temerin, 1993) may lead to
attractive forces under special circumstances (Lundin and Guglielmi, 2006).
2. Experimental Results
The experimental setup, a Cavendish torsion balance experiment, has been modified to
enable determination of the radiation force caused by an encapsulated lamp placed in
front of one of the lead spheres. To avoid potential air-streaming (Bernoulli) effects, the
experiment is placed in vacuum at !4·10-7
mbar. The radiation force from the
encapsulated lamp was then derived from the pendulum offset. By encapsulating the
light source by aluminium foil, the radiation becomes absorbed by the foil, the "lamp"
now radiating isotropic in the infrared regime.
The Cavendish Unit from Leybold Didactic Gmbh, is a torsion pendulum consisting of
two (20g ± 0.5g) lead spheres, placed on the ends (c/c 100 mm) of a light weight
aluminium "boom", and suspended in the centre by a 26 cm long torsion band made
from bronze. The pendulum period is 616 ± 3 s. This yields a torsion coefficient of
9.81·105 (Nm/radian). The "boom" is mounted inside a vacuum chamber of glass. The

- 5 -
pendulum is equipped with a concave mirror. An infrared light pointer, 75±1 cm from
the mirror, along with an IR position detector, indicates the oscillation of the pendulum.
The detector enables the values to be automatically recorded and plotted in real-time by
a computer. A plotted displacement of 1 mm is equal to a true motion of 0.067 mm. The
centre of a 35 W halogen lamp, covered by aluminium foil, is placed 15±2 mm in front
of one of the lead spheres. The power-on period of the lamp varies from 10 to 12
seconds. A diagrammatic representation of the radiation experiment using a Cavendish
torsion pendulum is shown in figure 1.
The vacuum system, from Edwards High Vacuum International, is a turbomolecular
pump backed by a rotary vane vacuum pump. Included in the system is also a nitrogen-
cooling unit. The system provides a vacuum of !3.4·10-7
mbar. The equivalent mass of
the energies used in the experiments, maximum 35 W for 20 seconds, is less than 10-14
kg and hence neglected.
Using only one radiation source in the experiments will result in asymmetric forces.
Initially, only the lead sphere in front of the radiation source will be affected. It will
initially also have a small effect on the axis of rotation of the balance and increase the
oscillation period. These effects have been considered in the results. Electromagnetic
forcing will also depend on the changing distance between the lamp and the lead sphere.
The radiation decay versus time of the lamp has consequences for the experiment, as
will be discussed later.
Forces between charges are strong and may affect the experiment results. Charges
between the lead sphere and the lamp affect the oscillation amplitude. Charges also
often change the equilibrium position of the balance. It was possible to detect when
charges destructively interfered with the results of the experiments. The Cavendish
torsion balance has been connected to the ground during all experiments. It has also
been discharged when charges have been detected, or at least once every day when
experiments were performed.
In the vacuum experiment, the lamp was placed inside the vacuum chamber. If the lamp
were switched on after more than 6-12 hours of inactivity, there would be a flow of gas
molecules towards the pendulum spheres, pushing the closest pendulum sphere away
from the lamp. To decrease the effects of these repulsive forces, the lamp was “baked”
at high temperatures before performing an experiment.
As a lamp in vacuum only looses energy by radiation, experiments in vacuum are
affected by radiation much longer than under normal air pressure. The decaying

- 6 -
radiation from a lamp therefore affects the experiment during a much longer time
period, typically several tens of minutes, but also (experiment V2) for at least an hour.
Differences in decay time between the two vacuum experiments presented here are
mainly related with the lamp+foil. Experiments using an "unbaked" lamp+foil (V1) lead
to gas releases and faster lamp decay. The two experiments are therefore not only
independent of each other, but they have different radiation decay curves, and the V1
experiment demonstrates the effect a repulsive gas flow has on the experiment.
The oscillation of the torsion pendulum is essentially un-damped in vacuum due to
extremely small frictional losses. Together with the need of “baking” the lamp before
carrying out the experiments, the pendulum was rarely at rest at equilibrium when
placed in vacuum. The pendulum is either accelerated or decelerated by the lamp
radiation. Depending of the pendulum phase when the lamp was switched on, towards
or away, the pendulum amplitude will be either damped or enhanced. Furthermore,
because of the lamp radiation decay, forcing may extend over several pendulum cycles,
leading to alternating acceleration and deceleration forcing. Consequently, the net
increase/decrease of the pendulum amplitude depends on the radiation decay curve, the
quicker the decay time, the larger the instantaneous forcing, and the higher the increase
or decrease in pendulum amplitude. Finally, the net irradiation also depends on the
pendulum amplitude, i.e. the distance between the radiation source and the lead ball.
Because of the physical size of the radiation source, the target illumination does not go
with 1/r2, where r is the distance between source and target, but rather with 1/r for small
r. Acceleration towards the radiation source, and alternating forcing by the radiation
decay is readily discernable in the experimental results (Figs 2 and 3).
In experiment V1, see Fig. 2, the influence of the radiation of gas molecules from the
aluminium foil of the lamp during an experiment was tested. No “baking” was done
during the last 12 hours before this experiment was performed. In this experiment, the
lamp was illuminated 3 times. First the lamp power was on for 10 seconds at 5V, i.e.
!9W (!90 Ws). After approximately one hour, the lamp power was on again for 10
seconds but now at 10V, i.e. !26W (!260 Ws). After approximately another two and a
half hours, the lamp power was on for the third time during 10 seconds but now only at
8V, i.e. !18W (180 Ws). Notice from the pendulum amplitude response for three
irradiation periods that radiation prevails for at least one pendulum period. Moreover,
the more energy stored in the lamp foil, the longer the time for significant lamp forcing.

- 7 -
The lamp decay time may in fact be determined from the decaying pendulum amplitude.
For experiment (1) we get the following expressions for the lamp decay:
I=Io·exp(-0,0039/t), where Io may be derived from the total energy acquired (P·!t), i.e.
by the electric power (P) during a time !T. A normalized response of the lamp based on
the above time constant is depicted by red curves in Fig. 2. Dashed lines give the power
on time for the three cases.
The first period with lamp power-on, 10 seconds at 5V, i.e. "9W nominal power, started
immediately after the pendulum sphere, leaving the lamp, passed equilibrium. This
illumination reduced the initial amplitude-maximum by 3mm. Notice that radiation of
gas molecules from the aluminium foil of the lamp apparently reduced the amplitude
shift of the attractive radiation force of the lamp during the first illumination period.
When the pendulum sphere oscillates to the lamp-side, the amplitude is about the same
as in the latter maxima. In this case, the radiation of gas molecules from the aluminium
foil of the lamp apparently compensated for the attractive radiation force of the lamp.
The second power-on period, 10 seconds at 10V, i.e. "26W nominal power, also started
immediately after the pendulum sphere, leaving the lamp, passed equilibrium. This
reduced the initial amplitude-maximum by 9mm. When the pendulum sphere oscillates
back to the other side, the initial amplitude of the pendulum sphere increased by 2mm.
In this case, the attractive radiation force of the lamp was stronger than the
counteracting radiation of gas pressure from the lamp. When the pendulum sphere turns
to the maximum amplitude the next time, the decayed lamp radiation decelerates the
pendulum sphere, decreasing the amplitude by 1mm. After that no more forcing effects,
was observable. Notice the deflection difference between the first and second irradiation
period, the first period affected more by outgassing effects than the second period.
The third power-on period, 10 seconds at 8V, i.e. "18W nominal power, started
immediately after the pendulum sphere, now approaching the lamp, passed equilibrium.
In this case the pendulum amplitude increased substantially, reaching its highest
maximum. Moving towards the next minimum, the lamp continuous to attract the
pendulum sphere. Notice the pendulum asymmetry with respect to the equilibrium line,
the minima being closer to equilibrium than the maxima. The subsequent maxima
decrease reflects a combination of lamp decay and increasing distance to the lamp.
Conversely, the minute difference between subsequent minima is a consequence of a
greater distance to the lamp. The radiation of the lamp affects the system for almost 15
minutes with half of the initial increase of the amplitude remaining in the system. The

- 8 -
reason for this is that the second illumination of the lamp at 10V, i.e. !26 W nominal
power, served as bake-out of gas molecules at a higher power level, with less gas
molecules remaining at the lower (!18 W) power level.
In experiment V2, “baking” of the lamp was done at 12V, i.e. 35W. To minimize the
radiation of gas molecules from the aluminium foil of the lamp, during the experiment,
the lamp was illuminated at only 10V, i.e. !26W nominal effect, see figure 3. The
power-on period of the lamp was 12 seconds, starting when the pendulum sphere passed
equilibrium approaching the lamp. As we can see in Fig. 3, the pendulum sphere more
than doubled its amplitude after the power-on period. However, when the pendulum
sphere oscillates back again, the attractive force of the lamp, still hot and radiating,
decelerates the pendulum sphere and restores almost exactly its initial amplitude. When
the pendulum sphere turns at its maximum amplitude again, the still-radiating lamp
accelerates the pendulum sphere, increasing its amplitude again. The radiation of the
lamp affects the system for essentially an hour, with half of the initial increase of the
amplitude remaining in the system. From the pendulum response in the V2 experiment
we may now determine the decay of the radiation source versus time. From Fig. 4,
illustrating the pendulum displacement versus time, we may determine the radiation
decay of the lamp. We note that the pendulum displacement versus time fits very well
(R2=0.91) with an exponential decaying curve, characteristic of lamp-cooling. Notice
that this curve only applies to experiment 2. For experiment 1 the exponential decay
falls off more rapidly. From the lamp displacement curve we may now derive the
radiative power on the sphere versus time, noting that the total energy (312 Ws) should
corresponds to the integral of the radiation curve versus time:
I t( ) = I0 exp !at( ) t " t0 , where I0 is the radiated power at t=t
0 and a is the decay
constant. Setting t0 = 0 in the V2 experiment we obtain: a = 0,0011 (s-1); I
0 ! 0.34 (W).
From of the pendulum displacements observed and using the torsion coefficient of the
pendulum (9,81·105 Nm/radian), we can derive the radiative forcing in the V1 and V2
experiments. Considering first the displacements from experiment V2 (312 Ws), we
derive the force versus time from the displacement values in Fig. 4. The average
accumulated force Fk derived for each time interval "t, is plotted in Fig. 5. Least square
fitting to an exponential function gives: Fk=9.3·10-10exp(-0.00113·tk) with R2=0.91. The
total force is achieved by accumulating the force values in Fig. 5. In a similar manner

- 9 -
we can from the average force derive the force versus time, i.e. F(t)=3.5·10-12 exp(-
0.0012·t), with R2=0,93.
Notice that individual measurement values in Fig. 5 represent the average forces
accumulated over a time interval, the radiation force acting in an accelerating- (towards
the lamp) or decelerating (away from the lamp) sense. The distance to the lamp is here
assumed to be constant, which means we have not taken into account for the larger
attraction near maximum compared to the weaker attraction near minimum (further
away from the lamp). The influence of the distance to the lamp is modelled in the
companion paper (Lundin and Lidgren 2010). The sum of the averaged forces in Fig. 5,
and the integral force derived from the exponential function F(t), give the following
results:
Sum of force measurements (fig. 5): Fk
k=1
10
! = 2.3 ± 0.5( )·10"9(N )
Integral force (exponential curve): F(t)dt0
4000
! = 2.9 ± 0.6( )·10"9(N )
Under the assumption that the lamp is a point source that radiates isotropic, the radiation
intensity will decrease by 1/r2, where r is the distance between the lamp and the sphere.
In reality the lamp has a finite size, and the radiation will reach the sphere at various
distances and angle of incidences. Taking into account for the above we derive a
geometric factor G=0.028 that should be applied to the total radiative power and energy
input to the sphere. This means that for the V2 experiment the total energy input to the
sphere is 8.74 J. The corresponding energy input for the V1 experiment is 2.49, 8.74,
and 5.98 J, respectively. Based on the total true pendulum deviations observed from V1:
0.58, 1.23, and 1.10 mm respectively we derive in a similar way as for the V2
experiment the following forces: 5.9·10-10, 1.2·10-9, and 1.1·10-9 N, respectively. The
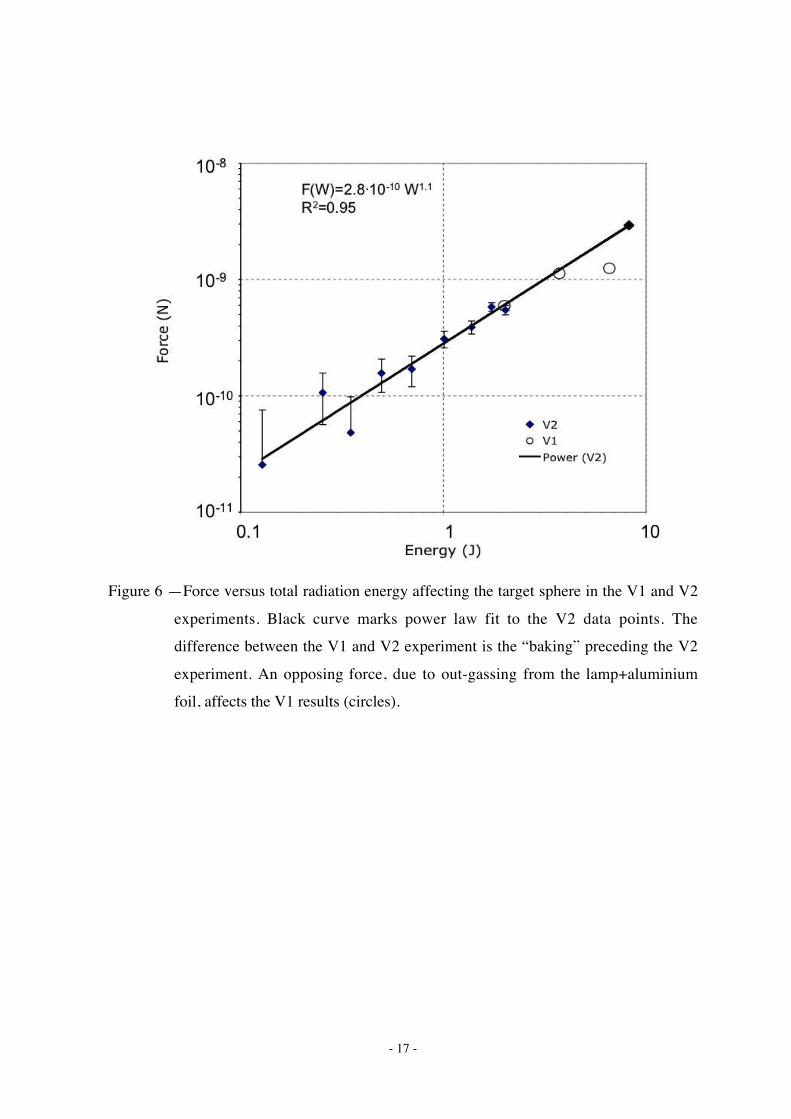
four total force values (V1 and V2), together with the partial force values (Fig. 5) are
plotted in Fig. 6. Circles in Fig. 6 mark V1 values. Notice that the V1 force
corresponding to 5.98 J, falls well below the integral value for V2. This is consistent
with the fact that the V1 experiment was done without lamp baking; the repulsive force
from gas/material ejection from the lamp+aluminium foil opposing the lamp attraction
force. Nevertheless, a clear trend from the four individual forcing experiments is
obtained, i.e. the total force increases with total energy received by the sphere, the

- 10 -
power law curve (F=2.8·10-10·W1.1) suggestive of a linear relation between radiative
energy input and total force.
3. Conclusions
A series of Cavendish experiments, two of them discussed in more detail here,
demonstrate quite convincingly that e/m radiation may exert an attractive force on
matter. The experiment is surprisingly simple, a Cavendish torsion pendulum setup, the
pendulum comprising two 20 g lead spheres, one of the spheres illuminated by infrared
radiation. Unambiguous results are obtained when the Cavendish experiment is placed
in vacuum. The vacuum in our experiment, !3.4·10-7
mbar, implies that airflow can be
completely discarded. Only radiative forces can significantly influence the lead-spheres
in vacuum. Without radiative forcing, the pendulum moves essentially unperturbed for
many hours. The lack of convective (air) cooling in vacuum implies that a clean (baked)
radiation source (the lamp) cools very slowly. For instance, the radiation from the
source in experiment V2 decreased exponentially with a decay constant !830 s. Notice
that the long forcing period implies attraction that works in two ways, with and against
the torsion spring force. The net force after seven oscillations (Fig 3) is therefore the
result of a series of consecutive acceleration and deceleration periods.
We estimated the total force on the pendulum based on the total power input (e.g. 12W
during 12 s) and the subsequent decay of the radiation source (up to seven oscillation
periods). A least square power law fit of the total intergrated-, and partial (within "t)
forces give the following equation describing the attractive force versus electromagnetic
energy input:
F = 2.8·10!10·W
1.1R2=0.95
The V1 data point that departs from the above relation is due to gas/material releases
from the radiation source. These releases lead to a repulsive force. Baking the lamp+foil
is therefore essential for the experiment. Nevertheless, there should be no problem to
repeat the experiment, let alone to verify that electromagnetic radiation on a lead sphere
leads to an attractive force.
In a companion paper (Lundin and Lidgren, 2010), we describe how e/m-wave
ponderomotive forcing may apply to the above experimental findings. The theory is
based on an analogy with ponderomotive wave forcing of magnetized plasma (Lundin
and Guglielmi, 2006), the Miller force leading to attraction below-, and repulsion above
- 11 -
the plasma gyro-frequency. The theoretical force derived (3.8·10-9
N) is close to the
force measured in vacuum: 2.3±0.4·10-9 N (summation method), and 2.9±0.5·10-9 N
(integrated from curve).
REFERENCES
Allan, W., J. R. Manuel, and E. M. Poulter, 1990, Geophys. Res. Lett., 17, 917
Cohen-Tannoudji C. N., Phillips, William D., 1990, Physics Today, 43, 10, 33-40
Fedosov I. V., I. S. Nefedov, B. N. Khlebtsov, V. V. Tuchin, 2007, Proceedings of the
SPIE, 6536, 65360
Grundach J., 2005, New Journal of Physics. 7, 205, (http://www.njp.org/)
Hughes S., 1977, Planetary and Space Science, 25, 9, 809
Li, X., and M. Temerin1993, Geophys. Res. Lett., 20, 13
Lundin R, and H. Lidgren, arXiv, 2010, submitted
Lundin R., and A. Guglielmi, 2006, Space Sci. Rev., DOI 10.1007/s11214-006-8314-8
Lebedev P., 1901, Annalen der Physik, 1901
Nichols, E.F & Hull, G.F. 1903, The Astrophysical Journal,17,5, 315
Miller M. A., 1958, Radiophysics (Russia), 1, 110
Wineland D. J., W. M. Itano, 1987, Physics Today, 40, 34

- 12 -
Figure 1. Diagrammatic representation of the Cavendish torsion pendulum placed in the
vacuum chamber. The lamp covered by aluminium foil is placed inside the
vacuum chamber in front of one of the lead spheres. The IR pointer and position
detector is placed outside the vacuum chamber

- 13 -
Figure 2. —The Cavendish V1 vacuum experiment. The experiment encompasses three
lamp irradiation sequences (marked red), initiated at three different times (dots
and dashed vertical lines). The sequence comprises irradiation by 9W for 10 s;
by 26W during 10 s; and by 18W during 10 s. The figure illustrates clearly the
effect of an attracting force during the irradiation periods.
Vacuum Experiment 1
0
5
10
15
20
25
30
35
40
45
50
55
60
65
70
75
80
3600 5400 7200 9000 10800 12600 14400 16200 18000 19800
Elapsed time (s)
Lam
p i
rrad
. ;
Pen
dulu
m !
S (
mm
)

- 14 -
Figure 3. —The Cavendish V2 vacuum experiment. The force associated with the
decaying radiation source, derived from the torsion pendulum displacement
versus time, illustrated by the red curve.
Vacuum experiment 2
0
5
10
15
20
25
30
35
40
45
50
55
60
65
70
75
6000 7000 8000 9000 10000 11000 12000 13000 14000
Time (s)
F (
x10
13 N
) !
S (
mm
)
Force

- 15 -
Figure 4 Pendulum displacement curve versus elapsed time for the V2 experiment. !max
and !min mark the maximum and minimum pendulum offset (!S) with respect
to equilibrium. Dashed curve marks the least square fitted exponential function
to the data points. Ordinate error bars mark the !S measurement error. The
exponential displacement decay replicates the presumed exponential decay of
the radiation source.

- 16 -
Figure 5. Force versus elapsed time derived from the average displacements of the
pendulum amplitude during 1/2 cycle time intervals (!t). Data points mark the
accumulated force within a time interval !t (abscissa bar). Ordinate error bars
correspond to the standard deviation offset from exponential function fit.
- 17 -
Figure 6 —Force versus total radiation energy affecting the target sphere in the V1 and V2
experiments. Black curve marks power law fit to the V2 data points. The
difference between the V1 and V2 experiment is the “baking” preceding the V2
experiment. An opposing force, due to out-gassing from the lamp+aluminium
foil, affects the V1 results (circles).
Related Documents


![Understanding the Law of Attraction - 2nd Law of Attraction [Bootcamp]](https://static.cupdf.com/doc/110x72/58ecbcb91a28ab44238b460f/understanding-the-law-of-attraction-2nd-law-of-attraction-bootcamp.jpg)