Multimedia Systems 7: 486–499 (1999) Multimedia Systems c Springer-Verlag 1999 Experimental evaluation of loss perception in continuous media ? Duminda Wijesekera 1 , Jaideep Srivastava 1 , Anil Nerode 2 , Mark Foresti 3 1 Department of Computer Science, University of Minnesota, Minneapolis, MN 55455, USA (e-mail: {wijesek,srivasta}@cs.umn.edu, [email protected]) 2 Institute for Intelligent Machines, Cornell University, Ithaca, NY 14853, USA 3 Rome Laboratory, Griffis Air Force Base, Rome, NY 14853, USA Abstract. Perception of multimedia quality, specified by quality-of-service (QoS) metrics, can be used by system designers to optimize customer satisfaction within resource bounds enforced by general-purpose computing platforms. Media losses, rate variations and transient synchronization losses have been suspected to affect human perception of multimedia quality. This paper presents metrics to measure such defects, and results of a series of user experiments that justify such speculations. Results of the study provide bounds on losses, rate variations and transient synchroniza- tion losses as a function of user satisfaction, in the form of Likert values. It is shown how these results can be used by algorithm designers of underlying multimedia systems. Key words: Quality of service – User studies – Media losses – Metrics 1 Introduction Multimedia systems, characterized by integrated computer- controlled generation, manipulation, presentation, storage and communication of independent discrete and continuous- media (CM) data [SGN96], have to compete for the same clientele that has already been accustomed to high standards set by radio and broadcast television. It is a challenge to provide services comparable to broadcast TV on general- purpose computing platforms, since the former is based on an architecture supported by dedicated channels. Fortunately, due to inherent limitations of human perception, some loss of quality can be tolerated. Hence, it is sufficient to pro- vide multimedia services to be within such tolerable limits. The goodness of a presentation is called its quality of ser- vice (QoS) in the multimedia literature. While a number of mathematical measures of QoS have been proposed in the literature [WS96, Tow93], there is hardly any work on val- idating them through measurements of human perception. ? This work is supported by Air Force contract number F30602-96-C- 0130 to Honeywell Inc, via subcontract number B09030541/AF to the Uni- versity of Minnesota, and DOD MURI grant DAAH04-96-10341 to Cornell University Correspondence to : J. Srivastava The need for performing such studies has been expressed in a number of papers, e.g., [SGN96, Geo96, SB96]. The cur- rent paper reports results of some experiments in measuring human tolerance to lossy media. Two widely quoted papers on user studies of multi- media systems are [Ste96] and [AFKN94]. Based on an extensive study, [Ste96] concluded that audio-video lip- synchronization errors of 80 ms were undetectable, up to 120 ms were detectable but tolerated, and above 120 ms were irritating. For audio-pointer synchronization, the re- spective limits were 200 and 1000 ms. In [AFKN94], per- ceptual effects of different frame rates were investigated for audio-visual clips with high temporal, audio and video con- tent, i.e., having high-speed action. Both these experiments were carried out for lossless CM streams. During the prototyping and demonstration phases of a multimedia testbed [HRKHS96], we noticed that missing a few media units does not result in considerable user dis- content, provided that not too many media units are missed consecutively, and such misses occur infrequently. We also noticed that CM streams could drift in and out of synchro- nization without noticeable user dissatisfaction. Based on these observations, we were inspired to investigate the per- ceptual tolerance to discontinuity caused by media losses and repetitions, and to that of varying degrees of missyn- chronization across streams. Following the methodology of [Ste96], we designed a mathematical model and metrics to measure stream continuity and synchronization in the pres- ence of media losses [WS96]. This paper reports the results of a user study to validate those metrics, and consequently, quantify human tolerance of transient continuity and syn- chronization losses with respect to audio and video. This study yielded a number of interesting observations concerning the human perception of the quality of CM pre- sentations, of which the main ones are listed below. – The pattern of user sensitivity varies, depending on the type of defect. – Viewer discontent for aggregate video losses gradually increases with the amount of loss. – For other types of losses and missynchronizations, there is initially a sharp rise in user discontent up to a certain value of the defect, and then the discontent plateaus.

Welcome message from author
This document is posted to help you gain knowledge. Please leave a comment to let me know what you think about it! Share it to your friends and learn new things together.
Transcript
Multimedia Systems 7: 486–499 (1999) Multimedia Systemsc© Springer-Verlag 1999
Experimental evaluation of loss perception in continuous media?
Duminda Wijesekera1, Jaideep Srivastava1, Anil Nerode2, Mark Foresti 3
1 Department of Computer Science, University of Minnesota, Minneapolis, MN 55455, USA (e-mail:{wijesek,srivasta}@cs.umn.edu, [email protected])2 Institute for Intelligent Machines, Cornell University, Ithaca, NY 14853, USA3 Rome Laboratory, Griffis Air Force Base, Rome, NY 14853, USA
Abstract. Perception of multimedia quality, specified byquality-of-service (QoS) metrics, can be used by systemdesigners to optimize customer satisfaction within resourcebounds enforced by general-purpose computing platforms.Media losses, rate variations and transient synchronizationlosses have been suspected to affect human perception ofmultimedia quality. This paper presents metrics to measuresuch defects, and results of a series of user experimentsthat justify such speculations. Results of the study providebounds on losses, rate variations and transient synchroniza-tion losses as a function of user satisfaction, in the form ofLikert values. It is shown how these results can be used byalgorithm designers of underlying multimedia systems.
Key words: Quality of service – User studies – Media losses– Metrics
1 Introduction
Multimedia systems, characterized by integrated computer-controlled generation, manipulation, presentation, storageand communication of independent discrete and continuous-media (CM) data [SGN96], have to compete for the sameclientele that has already been accustomed to high standardsset by radio and broadcast television. It is a challenge toprovide services comparable to broadcast TV on general-purpose computing platforms, since the former is based onan architecture supported by dedicated channels. Fortunately,due to inherent limitations of human perception, some lossof quality can be tolerated. Hence, it is sufficient to pro-vide multimedia services to be within such tolerable limits.The goodnessof a presentation is called its quality of ser-vice (QoS) in the multimedia literature. While a number ofmathematical measures of QoS have been proposed in theliterature [WS96, Tow93], there is hardly any work on val-idating them through measurements of human perception.
? This work is supported by Air Force contract number F30602-96-C-0130 to Honeywell Inc, via subcontract number B09030541/AF to the Uni-versity of Minnesota, and DOD MURI grant DAAH04-96-10341 to CornellUniversityCorrespondence to: J. Srivastava
The need for performing such studies has been expressed ina number of papers, e.g., [SGN96, Geo96, SB96]. The cur-rent paper reports results of some experiments in measuringhuman tolerance to lossy media.
Two widely quoted papers on user studies of multi-media systems are [Ste96] and [AFKN94]. Based on anextensive study, [Ste96] concluded that audio-video lip-synchronization errors of 80 ms were undetectable, up to120 ms were detectable but tolerated, and above 120 mswere irritating. For audio-pointer synchronization, the re-spective limits were 200 and 1000 ms. In [AFKN94], per-ceptual effects of different frame rates were investigated foraudio-visual clips with high temporal, audio and video con-tent, i.e., having high-speed action.
Both these experiments were carried out for lossless CMstreams. During the prototyping and demonstration phases ofa multimedia testbed [HRKHS96], we noticed that missinga few media units does not result in considerable user dis-content, provided that not too many media units are missedconsecutively, and such misses occur infrequently. We alsonoticed that CM streams could drift in and out of synchro-nization without noticeable user dissatisfaction. Based onthese observations, we were inspired to investigate the per-ceptual tolerance to discontinuity caused by media lossesand repetitions, and to that of varying degrees of missyn-chronization across streams. Following the methodology of[Ste96], we designed a mathematical model and metrics tomeasure stream continuity and synchronization in the pres-ence of media losses [WS96]. This paper reports the resultsof a user study to validate those metrics, and consequently,quantify human tolerance of transient continuity and syn-chronization losses with respect to audio and video.
This study yielded a number of interesting observationsconcerning the human perception of the quality of CM pre-sentations, of which the main ones are listed below.
– The pattern of user sensitivity varies, depending on thetype of defect.
– Viewer discontent for aggregate video losses graduallyincreases with the amount of loss.
– For other types of losses and missynchronizations, thereis initially a sharp rise in user discontent up to a certainvalue of the defect, and then the discontent plateaus.
487
– Rate fluctuations fall somewhere in between, and our ex-periments indicate that humans are much more sensitiveto audio losses than to video losses.
– At a video playout rate of 30 frames per second, averageloss below 17/100 is imperceptible, between 17/100 and23/100 is tolerated, and above 23/100 is unacceptable.
– While video content is always continuous, i.e., there isalways some picture on the screen, audio content can becontinuous or bursty. Music is continuous, while speechis bursty, i.e., there are talk-spurts interspersed with peri-ods of silence. Any experiment on audio continuity mustaccount for this. We did not consider thisa priori, andhence ended up mostly eliminating silence from the au-dio. The only observation we have in this regard is thatan average of 21/100 silence elimination does not re-sult in user discontent. However, this issue needs to bestudied in much greater detail.
– Consecutive video loss of two video frames in 100 doesnot cause user dissatisfaction. However, losing two con-secutive video frames is noticed by most users, and oncethis threshold is reached there is not much room for qual-ity degradation due to consecutive losses.
– Consecutive loss of up to three frames was unnoticeablefor audio.
– Humans are not very sensitive to video rate variations,in contrast to the high degree of sensitivity to audio.Our results indicate that even a 20% rate variation in anewscast-type video does not result in significant userdissatisfaction. The results with audio rate variations isquite different. Even about 5% rate variation in audio isnoticed by most observers.
– Momentary rate variation in the audio stream seemedamusing for a short time, but it soon resulted in beingconsidered an annoyance, and participants concentratedmore on the defect than the audio content.
– At aggregate audio-video synchronization loss of about20/100, human tolerance plateaus. This figure is aboutthree frames for consecutive audio-video synchronizationloss. These results are consistent with the findings of[Ste96], where a constant missynchronization of about120 ms is noticed but accepted by most participants, butabout 200 ms constant missynchronization is consideredan annoyance.
Our results can be used by algorithm designers in twoways. Firstly, given a level of consumer satisfaction, theycan be used to compute the maximum permissible defect ofeach type. Secondly, in a situation where avoidance of alltypes of defects is not possible, the tabulated results can beused to choose to sustain one kind of defect over any other,that results in minimal user discontent.
The rest of the paper is organized as follows. Section 2describes our metrics for continuity and synchronization.Section 3 describes the experimental setup and methodol-ogy. Sections 4 through 7 analyze experimental results. Fi-nally, Sect. 8 describes overall conclusions that can be drawnfrom our experiments, potential use of the results, and ourongoing work in this area. Section 9 contains a concludingsummary.
2 Metrics for continuous media
This section summarizes the continuity and synchronizationmetrics used in our experiments, details of which are pro-vided in [WS96].
2.1 Metrics for continuity
Continuity of a CM stream is metrized by three components;namely rate, drift and content. The ideal rate of flow andthe maximum permissible deviation from it constitute ourrate parameters. Given the ideal rate and the beginning timeof a CM stream, there is an ideal time for a given LDUto arrive/be displayed. For the purposes of describing thesemetrics, envision the evolution of a CM stream as a train ofslots with successive slot numbers, where each slot can befilled with some unit of data, such as a video frame (referredto as logical data units – LDUs in the uniform framework of[SB96]). In aperfectstream, these LDUs will appear at thebeginning of theslot time, and, in a lossless stream, there isan ideal sequence of LDUs to appear in a slot: i.e., theith
slot should contain theith LDU. Given the non-determinismthat exists in systems, theith LDU may not appear in theith slot. This results in sequencing losses, measured in termsof aggregate loss factor (ALF)and consecutive loss factor(CLF). Also, due to timing delays, the LDUs may not appearat the beginning of their slot time. This results in timingdeviations measured in terms ofaggregate drift factor (ADF)andconsecutive drift factor (CDF).
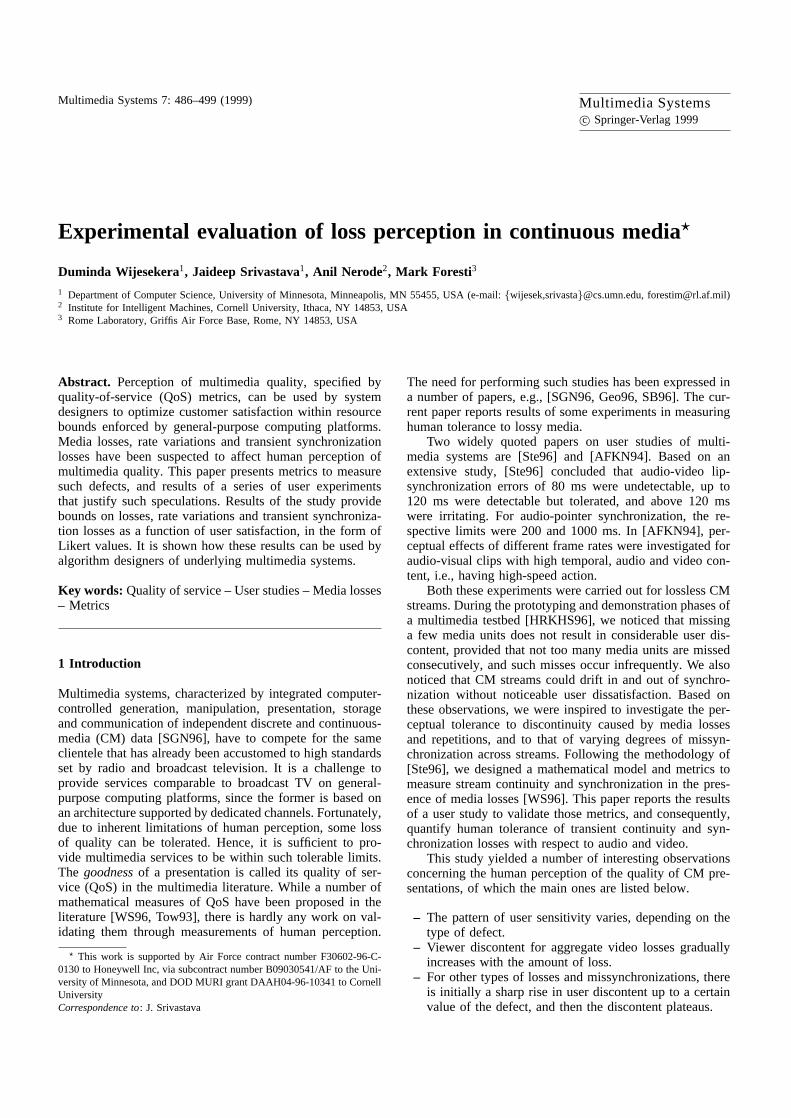
In order to define losses, we defineunit sequencingloss(USL). To define unit sequencing loss, envision a CMstream as a train of slots with successive slot numbers, asgiven in Fig. 1. Some slots may be filled with LDUs. Wedefine a USL only for slots that are non-empty, i.e., theyare filled with some LDU. Supposes(k) is the LDU at slots((i)) of streams(·). Suppose the immediately previous non-empty slot to slots((i)) is slot s((i − l)), wherel > 0, andit is occupied by LDUs(j). In case there are no skips, re-peats or misses, if slots((i)) is occupied by LDUs(k), thenslot s((i − l)) should be occupied by LDUs(k − l). Hence,the USL incurred at slots((i)) due to skips and repeats is‖k − l − j‖. The USL due to missing LDU at slots((i))is (l − 1), precisely because there are (l − 1) empty slotsin between slotss((i)) and s((i − l)). Hence the maximumof sequencing loss due to skips, repeats and misses at slots((i)), sayUSL(i), is max{‖k− l−j‖, l−1}. Consequently,we define max{‖k−l−j‖, l−1} to be theUSLat slots((i)).In order to measure the sequencing loss at the beginning of astream, we assume that every stream has a hypothetical slots((−1)) with number−1, containing a hypothetical mediagranules(−1).
Now, we use USLs to specify sequencing profiles. Oursequencing profile specifies allowable average and burstyUSLs, which are specified by theALF and theCLF .
An ALF of n/m for a stream means thatn is the sumof USLs allowed within any window ofm successive slotsfor LDUs, i.e., max{∑i+m
k=i {USL(k) : USL(k) 6=⊥} ≤ nfor any i ≥ 1. TheCLF is the maximum sum of non-zeroCLFs, i.e., max{∑i+l
k=i{USL(k) : USL(k) 6=⊥, ∀k (i ≤k ≤ i + l)} : i, l ≥ 1} ≤ CLF .
488
should have LDUsk−l
missing media LDU forl − 1 slots
LDU LDUs(j) s(k)
Slot s((i))Slot s((i − l))
missingLDU
missing
LDU
Fig. 1. Unit sequencing loss
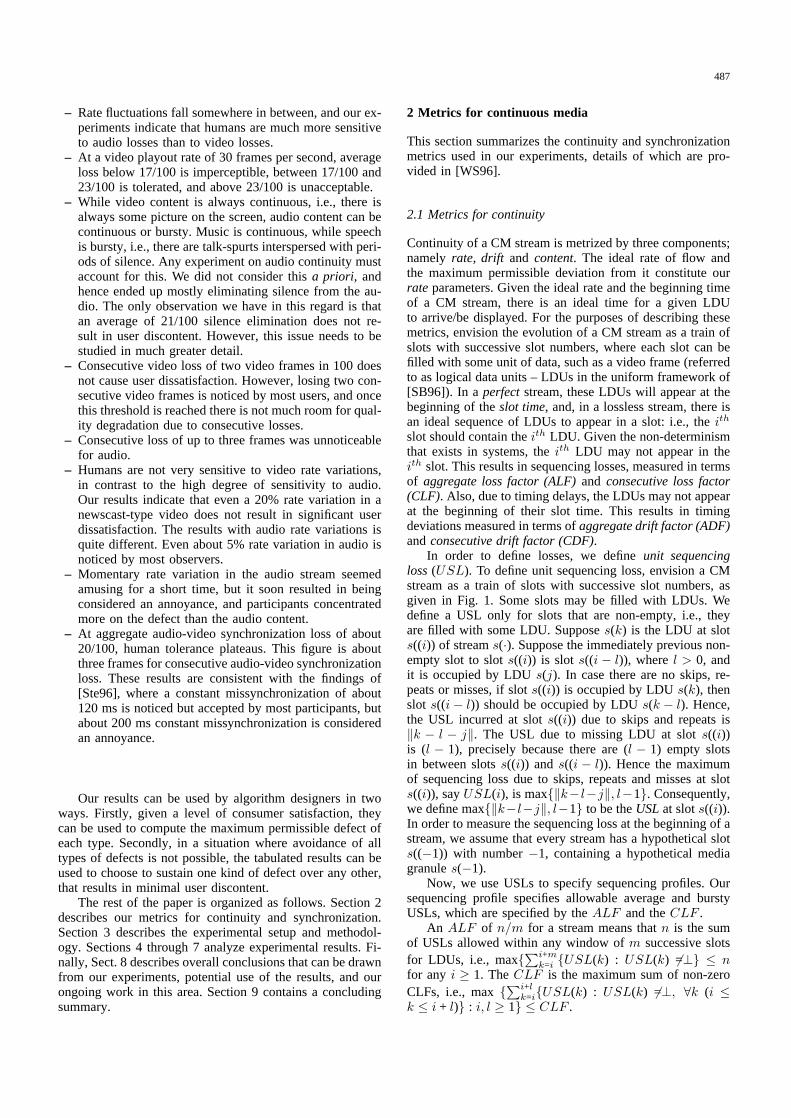
Key : : Drifts
: Valid Interval of time for a LDU to begin
T2 T3 T4 T5 T6 T7
t2 t3t4 t5
t1
T1 to T6: Ideal points of time for LDUs to appear.
t1 to t6: Where LDUs actually appeared.
T1
Fig. 2. Drifts in a stream
Definition (rate profile): Let s(i), s(i + 1), ..., etc. be suc-cessive slots for a streams(·), where the starting time forslot s(i) is ti. Streams(·) is defined to have a rate profile(ρ, σ) iff ∀i ti+1 ∈ [ti + 1
ρ+σ , ti + 1ρ−σ ].
Definition (unit granule drift): Unit granule drift at slots(i), UGD(i), is defined as the time difference between thenominal start time,Ti, of slot s(i) and its actual startingtime, ti, i.e., UGD(i) = ‖ti − Ti‖.
Figure 2 shows examples of these concepts. If the LDUs(j) is omitted, thentj is undefined, i.e.,⊥, and hence‖tj − Tj‖ and UGD(j) are undefined. Using the sequenceof UGD′s {UGD(i) : i ≥ 1}, we can define the drift profile(ADF, CDF ). An ADF of d//m means that no consecu-tive m granules can have a sum of more thand time unitsof granule drift, i.e.,
∑i+mk=i {UGD(k) : UGD(k) 6=⊥} ≤ d
for any i ≥ 1. A CDF of d′ means that the sum of con-secutive non zero delays can be at mostd′ time units, i.e.,max{∑i+l
k=i{UGD(k) : UGD(k) > 0 ∀k (i ≤ k ≤ i + l)} :i, l ≥ 1} ≤ d′.
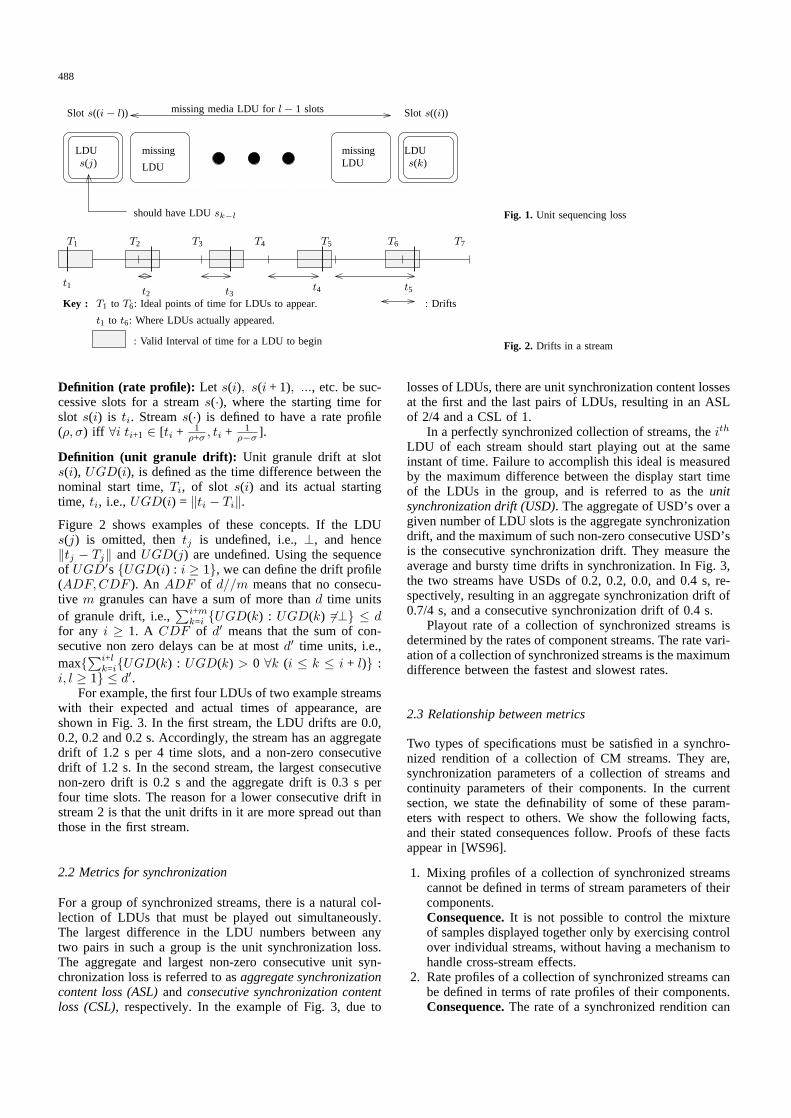
For example, the first four LDUs of two example streamswith their expected and actual times of appearance, areshown in Fig. 3. In the first stream, the LDU drifts are 0.0,0.2, 0.2 and 0.2 s. Accordingly, the stream has an aggregatedrift of 1.2 s per 4 time slots, and a non-zero consecutivedrift of 1.2 s. In the second stream, the largest consecutivenon-zero drift is 0.2 s and the aggregate drift is 0.3 s perfour time slots. The reason for a lower consecutive drift instream 2 is that the unit drifts in it are more spread out thanthose in the first stream.
2.2 Metrics for synchronization
For a group of synchronized streams, there is a natural col-lection of LDUs that must be played out simultaneously.The largest difference in the LDU numbers between anytwo pairs in such a group is the unit synchronization loss.The aggregate and largest non-zero consecutive unit syn-chronization loss is referred to asaggregate synchronizationcontent loss (ASL)and consecutive synchronization contentloss (CSL), respectively. In the example of Fig. 3, due to
losses of LDUs, there are unit synchronization content lossesat the first and the last pairs of LDUs, resulting in an ASLof 2/4 and a CSL of 1.
In a perfectly synchronized collection of streams, theith
LDU of each stream should start playing out at the sameinstant of time. Failure to accomplish this ideal is measuredby the maximum difference between the display start timeof the LDUs in the group, and is referred to as theunitsynchronization drift (USD). The aggregate of USD’s over agiven number of LDU slots is the aggregate synchronizationdrift, and the maximum of such non-zero consecutive USD’sis the consecutive synchronization drift. They measure theaverage and bursty time drifts in synchronization. In Fig. 3,the two streams have USDs of 0.2, 0.2, 0.0, and 0.4 s, re-spectively, resulting in an aggregate synchronization drift of0.7/4 s, and a consecutive synchronization drift of 0.4 s.
Playout rate of a collection of synchronized streams isdetermined by the rates of component streams. The rate vari-ation of a collection of synchronized streams is the maximumdifference between the fastest and slowest rates.
2.3 Relationship between metrics
Two types of specifications must be satisfied in a synchro-nized rendition of a collection of CM streams. They are,synchronization parameters of a collection of streams andcontinuity parameters of their components. In the currentsection, we state the definability of some of these param-eters with respect to others. We show the following facts,and their stated consequences follow. Proofs of these factsappear in [WS96].
1. Mixing profiles of a collection of synchronized streamscannot be defined in terms of stream parameters of theircomponents.Consequence.It is not possible to control the mixtureof samples displayed together only by exercising controlover individual streams, without having a mechanism tohandle cross-stream effects.
2. Rate profiles of a collection of synchronized streams canbe defined in terms of rate profiles of their components.Consequence.The rate of a synchronized rendition can
489
0 Sec 0.2 Sec
2.0 3.0 4.0Ideal timeto appear
Time ofappearance
Drift
LDU 1 LDU 5 LDU 6LDU 3
0.2 Sec 0.2 Sec
Unit Loss 0 1 1 0
Aggregate Drift = 0.6/4Consecutive Drift = 0.6Aggregate Loss = 2/4Consecutive Loss = 2
Drift
appearanceTime of
0.2 Sec 0.2 Sec0 Sec 0 Sec
LDU 2 LDU 3 LDU 5 LDU 7
Unit Loss 1 0 1 1
Aggregate Drift = 0.4/4Consecutive Drift = 0.2Aggregate Loss = 3/4Consecutive Loss = 2
SyncDrift 0.2Loss 0 10
1.0
0 0.4Unit10.2
t1(2) = 1.8t1(1) = 1.0 t1(3) = 2.8
Stream 1
t1(4) = 3.8
Stream 2
t2(4) = 4.2t2(1) = 1.2 t2(2) = 2.0 t2(3) = 2.8
Aggregate Sync Drift = 0.8/4Consecutive Sync Drift =0.4
Consecutive Sync Loss =1Aggregate Sync Loss = 2/4
Fig. 3. Two example streams used to explain metrics
be controlled by controlling rendition rates of its com-ponent streams.
3. Except for the perfect case, the synchronization drift pro-file of a collection of streams is not definable in termsof the drift profiles of its components, although the ag-gregate synchronization drifts can be bounded by driftprofiles of component streams.Consequence.It is possible to control average timingdrifts in a synchronized rendition by controlling timingdrifts of its component streams.
4. Consecutive synchronization drift of a collection of syn-chronized streams is not definable in terms of the driftprofiles of its component streams.Consequence.It is not possible to control bursty timingdrifts between a collection of synchronized streams bycontrolling the individual timing drifts of its componentstreams.
3 Experimental design
Originally, we planned to measure and validate the tolera-ble ranges of all our metrics. Due to the inability to controltiming precisely on computers, we decided to use profession-ally edited pre-recorded segments of audio and video. Eventhe professional editing equipment was unable to control theappearance of video and corresponding audio to millisec-ond time granularity. Hence, we focused only on testing forcontent and rate parameters. Recent work by [SNL95] hasshown that this can be done using a specialized hardwareboard attached to a Sun workstation. We have received thisboard from Schmidt et al., and plan to use it in our futurework.
Our experiments consisted of eight sets; aggregate andconsecutive content losses of audio, video and synchroniza-tion were six of them, and rate variations in the audio andvideo streams were the remaining two. Of the eight sets,three consisted of audio-only segments, another three con-
sisted of video-only segments, and the remaining two con-sisted of audio and video segments.
3.1 Design concerns and the pilot study
Several issues in survey design and psychological evalua-tions arise in carrying out user evaluation of human per-ception. A key issue is the proper design of the evaluationinstrument, i.e., the survey form, so that the data collectedcan be used to test the hypotheses; minimizing the effectsof extraneous variables and participant bias, and avoidingconveying designer bias to the participants. In our design,we have strived to achieve these goals. In designing our ex-periment, the experimental methodology and techniques ofanalysis used in [Ste96, AFKN94] have been useful to us.
In order to evaluate potential suitability of our exper-imental methodology and design to the intended task, weconducted a pilot study with about ten participants. The re-sults of this study and professional help [Molly Fiedler, per-sonal communication] made us change many things in thequestionnaire, video tapes, and the environment in whichthe experiment was carried out. In the tape, we decided tofirst show a clip in its perfect form. This helps each par-ticipant establish a baseline against which to evaluate thequality of the other tapes. This was essential due to the factthat TV and broadcast media that our participants are mostfamiliar with do not usually have the kind of defects thatwe wanted observed. We provided a potential list of defects,some of which were not in our clips. This was done becausemany participants do not use the same words to describe adefect, and anipso factodefect categorization leads to toomany categories. Clips with varying amounts of defects ofthe same type were grouped together, with a clip having noerror included in the group. Each experiment containing au-dio, video or both was identified as such, to ensure that theabsence of either media type not be considered a defect.
In the design of the survey, we had to make substantialchanges after the pilot study. It was determined that the sur-
490
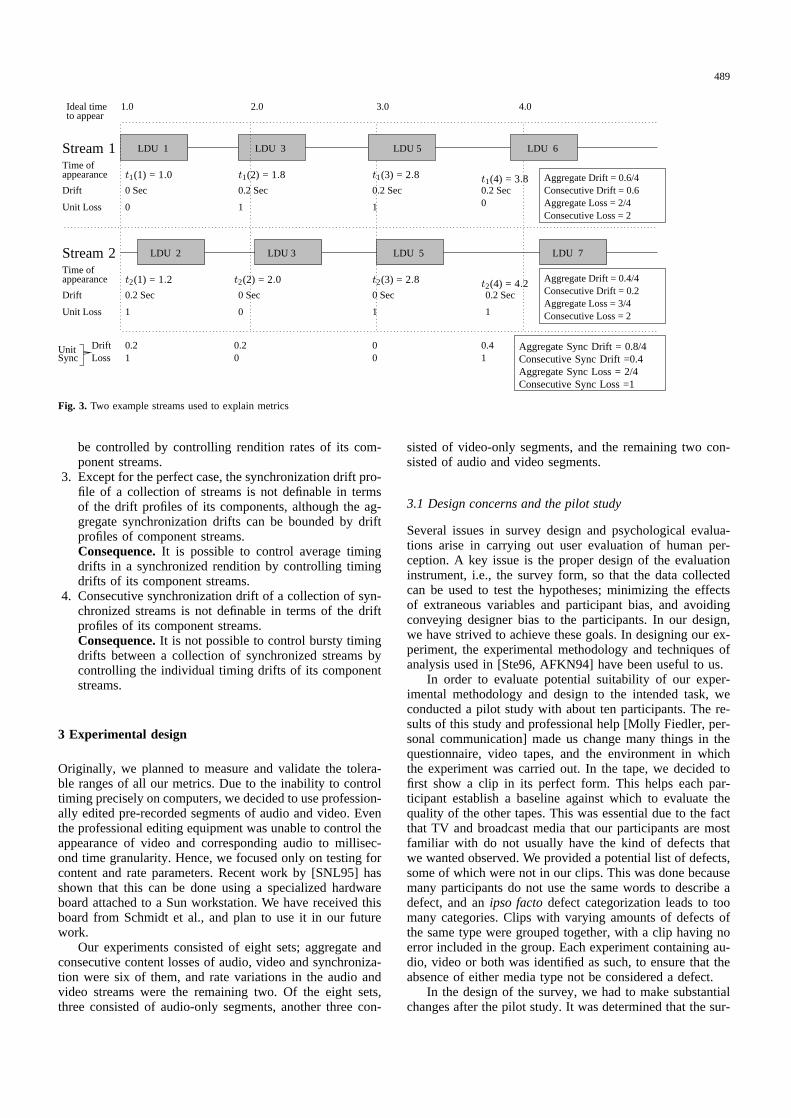
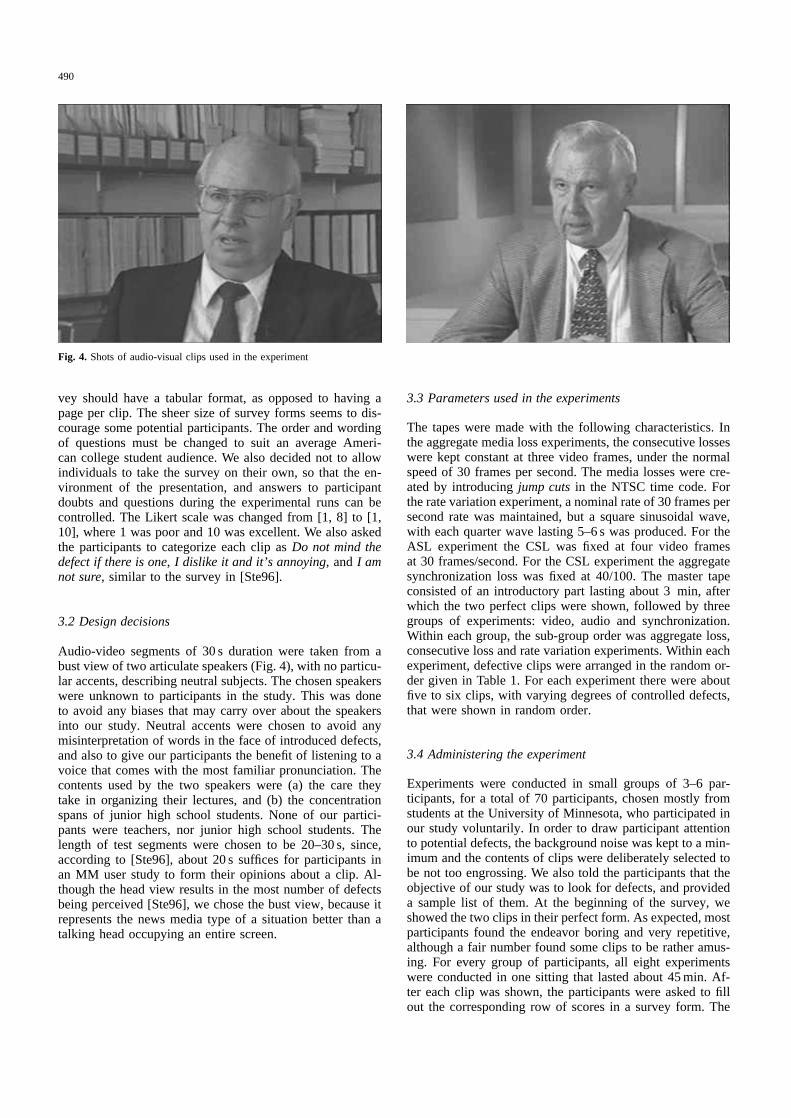
Fig. 4. Shots of audio-visual clips used in the experiment
vey should have a tabular format, as opposed to having apage per clip. The sheer size of survey forms seems to dis-courage some potential participants. The order and wordingof questions must be changed to suit an average Ameri-can college student audience. We also decided not to allowindividuals to take the survey on their own, so that the en-vironment of the presentation, and answers to participantdoubts and questions during the experimental runs can becontrolled. The Likert scale was changed from [1, 8] to [1,10], where 1 was poor and 10 was excellent. We also askedthe participants to categorize each clip asDo not mind thedefect if there is one, I dislike it and it’s annoying, andI amnot sure, similar to the survey in [Ste96].
3.2 Design decisions
Audio-video segments of 30 s duration were taken from abust view of two articulate speakers (Fig. 4), with no particu-lar accents, describing neutral subjects. The chosen speakerswere unknown to participants in the study. This was doneto avoid any biases that may carry over about the speakersinto our study. Neutral accents were chosen to avoid anymisinterpretation of words in the face of introduced defects,and also to give our participants the benefit of listening to avoice that comes with the most familiar pronunciation. Thecontents used by the two speakers were (a) the care theytake in organizing their lectures, and (b) the concentrationspans of junior high school students. None of our partici-pants were teachers, nor junior high school students. Thelength of test segments were chosen to be 20–30 s, since,according to [Ste96], about 20 s suffices for participants inan MM user study to form their opinions about a clip. Al-though the head view results in the most number of defectsbeing perceived [Ste96], we chose the bust view, because itrepresents the news media type of a situation better than atalking head occupying an entire screen.
3.3 Parameters used in the experiments
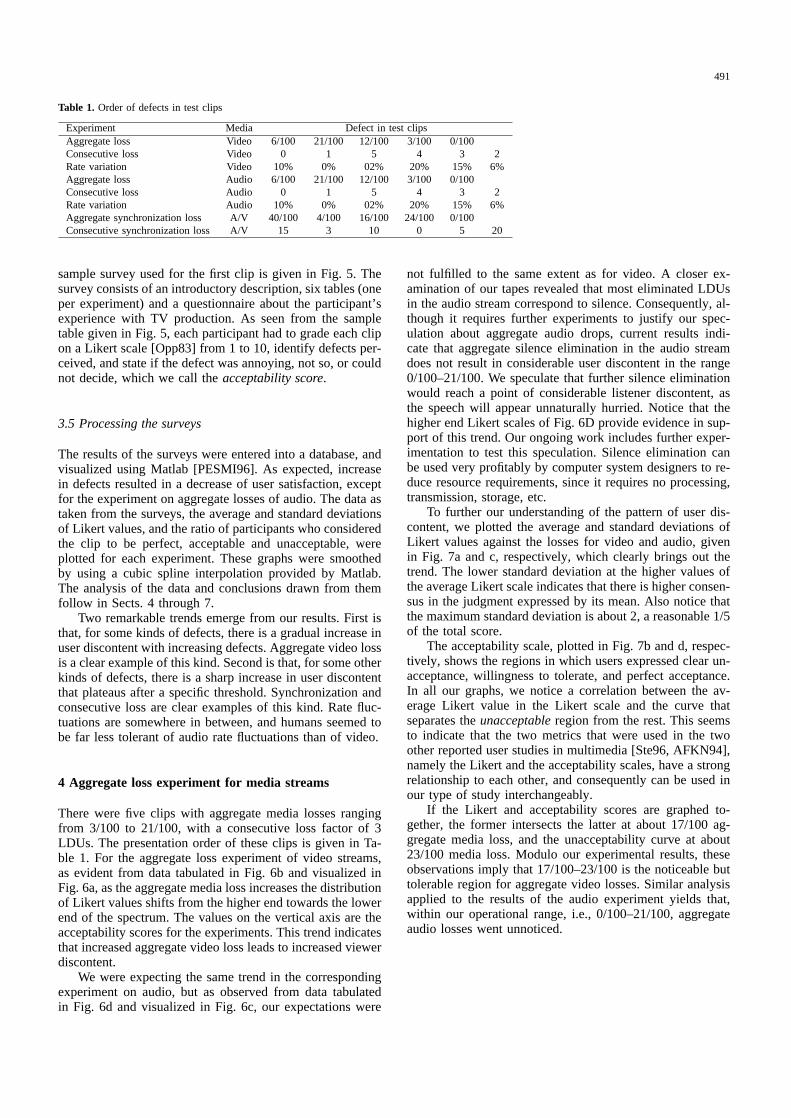
The tapes were made with the following characteristics. Inthe aggregate media loss experiments, the consecutive losseswere kept constant at three video frames, under the normalspeed of 30 frames per second. The media losses were cre-ated by introducingjump cutsin the NTSC time code. Forthe rate variation experiment, a nominal rate of 30 frames persecond rate was maintained, but a square sinusoidal wave,with each quarter wave lasting 5–6 s was produced. For theASL experiment the CSL was fixed at four video framesat 30 frames/second. For the CSL experiment the aggregatesynchronization loss was fixed at 40/100. The master tapeconsisted of an introductory part lasting about 3 min, afterwhich the two perfect clips were shown, followed by threegroups of experiments: video, audio and synchronization.Within each group, the sub-group order was aggregate loss,consecutive loss and rate variation experiments. Within eachexperiment, defective clips were arranged in the random or-der given in Table 1. For each experiment there were aboutfive to six clips, with varying degrees of controlled defects,that were shown in random order.
3.4 Administering the experiment
Experiments were conducted in small groups of 3–6 par-ticipants, for a total of 70 participants, chosen mostly fromstudents at the University of Minnesota, who participated inour study voluntarily. In order to draw participant attentionto potential defects, the background noise was kept to a min-imum and the contents of clips were deliberately selected tobe not too engrossing. We also told the participants that theobjective of our study was to look for defects, and provideda sample list of them. At the beginning of the survey, weshowed the two clips in their perfect form. As expected, mostparticipants found the endeavor boring and very repetitive,although a fair number found some clips to be rather amus-ing. For every group of participants, all eight experimentswere conducted in one sitting that lasted about 45 min. Af-ter each clip was shown, the participants were asked to fillout the corresponding row of scores in a survey form. The
491
Table 1. Order of defects in test clips
Experiment Media Defect in test clipsAggregate loss Video 6/100 21/100 12/100 3/100 0/100Consecutive loss Video 0 1 5 4 3 2Rate variation Video 10% 0% 02% 20% 15% 6%Aggregate loss Audio 6/100 21/100 12/100 3/100 0/100Consecutive loss Audio 0 1 5 4 3 2Rate variation Audio 10% 0% 02% 20% 15% 6%Aggregate synchronization loss A/V 40/100 4/100 16/100 24/100 0/100Consecutive synchronization loss A/V 15 3 10 0 5 20
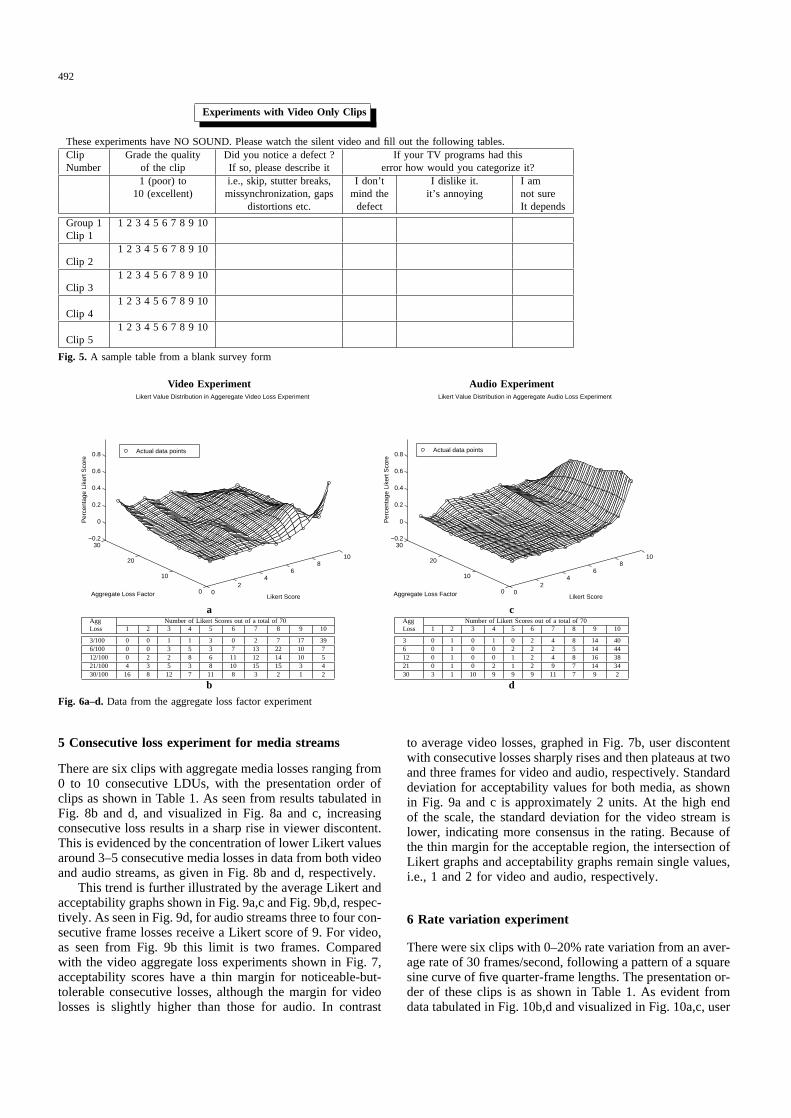
sample survey used for the first clip is given in Fig. 5. Thesurvey consists of an introductory description, six tables (oneper experiment) and a questionnaire about the participant’sexperience with TV production. As seen from the sampletable given in Fig. 5, each participant had to grade each clipon a Likert scale [Opp83] from 1 to 10, identify defects per-ceived, and state if the defect was annoying, not so, or couldnot decide, which we call theacceptability score.
3.5 Processing the surveys
The results of the surveys were entered into a database, andvisualized using Matlab [PESMI96]. As expected, increasein defects resulted in a decrease of user satisfaction, exceptfor the experiment on aggregate losses of audio. The data astaken from the surveys, the average and standard deviationsof Likert values, and the ratio of participants who consideredthe clip to be perfect, acceptable and unacceptable, wereplotted for each experiment. These graphs were smoothedby using a cubic spline interpolation provided by Matlab.The analysis of the data and conclusions drawn from themfollow in Sects. 4 through 7.
Two remarkable trends emerge from our results. First isthat, for some kinds of defects, there is a gradual increase inuser discontent with increasing defects. Aggregate video lossis a clear example of this kind. Second is that, for some otherkinds of defects, there is a sharp increase in user discontentthat plateaus after a specific threshold. Synchronization andconsecutive loss are clear examples of this kind. Rate fluc-tuations are somewhere in between, and humans seemed tobe far less tolerant of audio rate fluctuations than of video.
4 Aggregate loss experiment for media streams
There were five clips with aggregate media losses rangingfrom 3/100 to 21/100, with a consecutive loss factor of 3LDUs. The presentation order of these clips is given in Ta-ble 1. For the aggregate loss experiment of video streams,as evident from data tabulated in Fig. 6b and visualized inFig. 6a, as the aggregate media loss increases the distributionof Likert values shifts from the higher end towards the lowerend of the spectrum. The values on the vertical axis are theacceptability scores for the experiments. This trend indicatesthat increased aggregate video loss leads to increased viewerdiscontent.
We were expecting the same trend in the correspondingexperiment on audio, but as observed from data tabulatedin Fig. 6d and visualized in Fig. 6c, our expectations were
not fulfilled to the same extent as for video. A closer ex-amination of our tapes revealed that most eliminated LDUsin the audio stream correspond to silence. Consequently, al-though it requires further experiments to justify our spec-ulation about aggregate audio drops, current results indi-cate that aggregate silence elimination in the audio streamdoes not result in considerable user discontent in the range0/100–21/100. We speculate that further silence eliminationwould reach a point of considerable listener discontent, asthe speech will appear unnaturally hurried. Notice that thehigher end Likert scales of Fig. 6D provide evidence in sup-port of this trend. Our ongoing work includes further exper-imentation to test this speculation. Silence elimination canbe used very profitably by computer system designers to re-duce resource requirements, since it requires no processing,transmission, storage, etc.
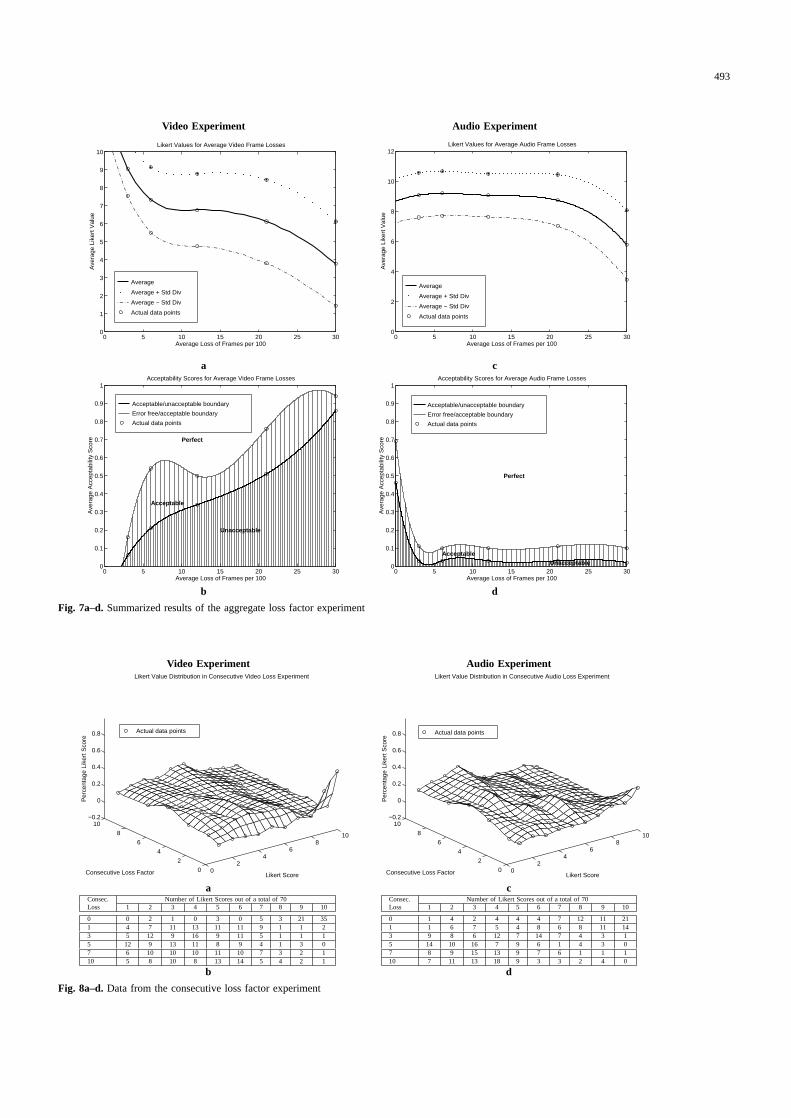
To further our understanding of the pattern of user dis-content, we plotted the average and standard deviations ofLikert values against the losses for video and audio, givenin Fig. 7a and c, respectively, which clearly brings out thetrend. The lower standard deviation at the higher values ofthe average Likert scale indicates that there is higher consen-sus in the judgment expressed by its mean. Also notice thatthe maximum standard deviation is about 2, a reasonable 1/5of the total score.
The acceptability scale, plotted in Fig. 7b and d, respec-tively, shows the regions in which users expressed clear un-acceptance, willingness to tolerate, and perfect acceptance.In all our graphs, we notice a correlation between the av-erage Likert value in the Likert scale and the curve thatseparates theunacceptableregion from the rest. This seemsto indicate that the two metrics that were used in the twoother reported user studies in multimedia [Ste96, AFKN94],namely the Likert and the acceptability scales, have a strongrelationship to each other, and consequently can be used inour type of study interchangeably.
If the Likert and acceptability scores are graphed to-gether, the former intersects the latter at about 17/100 ag-gregate media loss, and the unacceptability curve at about23/100 media loss. Modulo our experimental results, theseobservations imply that 17/100–23/100 is the noticeable buttolerable region for aggregate video losses. Similar analysisapplied to the results of the audio experiment yields that,within our operational range, i.e., 0/100–21/100, aggregateaudio losses went unnoticed.
492
Experiments with Video Only Clips
These experiments have NO SOUND. Please watch the silent video and fill out the following tables.Clip Grade the quality Did you notice a defect ? If your TV programs had thisNumber of the clip If so, please describe it error how would you categorize it?
1 (poor) to i.e., skip, stutter breaks, I don’t I dislike it. I am10 (excellent) missynchronization, gaps mind the it’s annoying not sure
distortions etc. defect It depends
Group 1 1 2 3 4 5 6 7 8 9 10Clip 1
1 2 3 4 5 6 7 8 9 10Clip 2
1 2 3 4 5 6 7 8 9 10Clip 3
1 2 3 4 5 6 7 8 9 10Clip 4
1 2 3 4 5 6 7 8 9 10Clip 5
Fig. 5. A sample table from a blank survey form
Video Experiment Audio Experiment
Actual data points
02
46
810
0
10
20
30−0.2
0
0.2
0.4
0.6
0.8
Likert ScoreAggregate Loss Factor
Per
cent
age
Like
rt S
core
Likert Value Distribution in Aggeregate Video Loss Experiment
Actual data points
02
46
810
0
10
20
30−0.2
0
0.2
0.4
0.6
0.8
Likert ScoreAggregate Loss Factor
Per
cent
age
Like
rt S
core
Likert Value Distribution in Aggeregate Audio Loss Experiment
a cAgg Number of Likert Scores out of a total of 70Loss 1 2 3 4 5 6 7 8 9 10
3/100 0 0 1 1 3 0 2 7 17 396/100 0 0 3 5 3 7 13 22 10 712/100 0 2 2 8 6 11 12 14 10 521/100 4 3 5 3 8 10 15 15 3 430/100 16 8 12 7 11 8 3 2 1 2
Agg Number of Likert Scores out of a total of 70Loss 1 2 3 4 5 6 7 8 9 10
3 0 1 0 1 0 2 4 8 14 406 0 1 0 0 2 2 2 5 14 4412 0 1 0 0 1 2 4 8 16 3821 0 1 0 2 1 2 9 7 14 3430 3 1 10 9 9 9 11 7 9 2
b d
Fig. 6a–d.Data from the aggregate loss factor experiment
5 Consecutive loss experiment for media streams
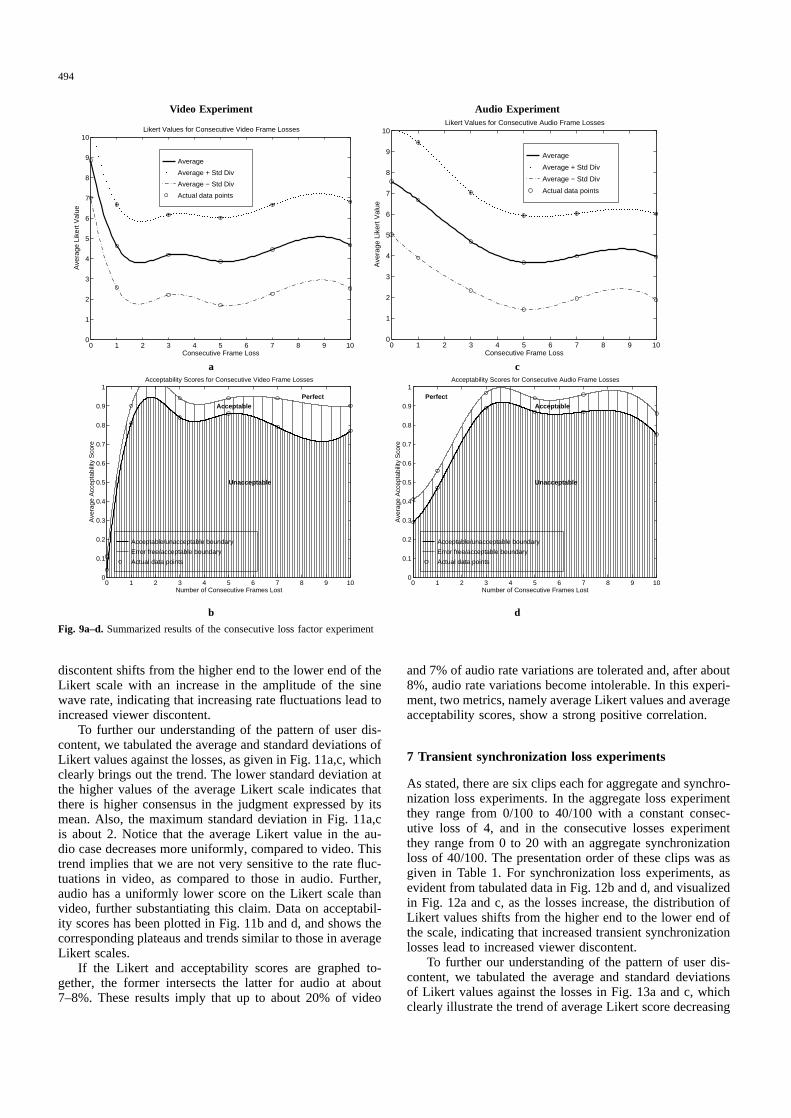
There are six clips with aggregate media losses ranging from0 to 10 consecutive LDUs, with the presentation order ofclips as shown in Table 1. As seen from results tabulated inFig. 8b and d, and visualized in Fig. 8a and c, increasingconsecutive loss results in a sharp rise in viewer discontent.This is evidenced by the concentration of lower Likert valuesaround 3–5 consecutive media losses in data from both videoand audio streams, as given in Fig. 8b and d, respectively.
This trend is further illustrated by the average Likert andacceptability graphs shown in Fig. 9a,c and Fig. 9b,d, respec-tively. As seen in Fig. 9d, for audio streams three to four con-secutive frame losses receive a Likert score of 9. For video,as seen from Fig. 9b this limit is two frames. Comparedwith the video aggregate loss experiments shown in Fig. 7,acceptability scores have a thin margin for noticeable-but-tolerable consecutive losses, although the margin for videolosses is slightly higher than those for audio. In contrast
to average video losses, graphed in Fig. 7b, user discontentwith consecutive losses sharply rises and then plateaus at twoand three frames for video and audio, respectively. Standarddeviation for acceptability values for both media, as shownin Fig. 9a and c is approximately 2 units. At the high endof the scale, the standard deviation for the video stream islower, indicating more consensus in the rating. Because ofthe thin margin for the acceptable region, the intersection ofLikert graphs and acceptability graphs remain single values,i.e., 1 and 2 for video and audio, respectively.
6 Rate variation experiment
There were six clips with 0–20% rate variation from an aver-age rate of 30 frames/second, following a pattern of a squaresine curve of five quarter-frame lengths. The presentation or-der of these clips is as shown in Table 1. As evident fromdata tabulated in Fig. 10b,d and visualized in Fig. 10a,c, user
493
Video Experiment Audio Experiment
Average
Average + Std Div
Average − Std Div
Actual data points
0 5 10 15 20 25 300
1
2
3
4
5
6
7
8
9
10
Average Loss of Frames per 100
Ave
rage
Lik
ert V
alue
Likert Values for Average Video Frame Losses
Average
Average + Std Div
Average − Std Div
Actual data points
0 5 10 15 20 25 300
2
4
6
8
10
12
Average Loss of Frames per 100
Ave
rage
Lik
ert V
alue
Likert Values for Average Audio Frame Losses
a c
Acceptable/unacceptable boundary
Error free/acceptable boundary
Actual data points
0 5 10 15 20 25 300
0.1
0.2
0.3
0.4
0.5
0.6
0.7
0.8
0.9
1
Ave
rage
Acc
epta
bilit
y S
core
Average Loss of Frames per 100
Acceptability Scores for Average Video Frame Losses
Unacceptable
Acceptable
Perfect
Acceptable/unacceptable boundary
Error free/acceptable boundary
Actual data points
0 5 10 15 20 25 300
0.1
0.2
0.3
0.4
0.5
0.6
0.7
0.8
0.9
1A
vera
ge A
ccep
tabi
lity
Sco
re
Average Loss of Frames per 100
Acceptability Scores for Average Audio Frame Losses
UnacceptableAcceptable
Perfect
b d
Fig. 7a–d.Summarized results of the aggregate loss factor experiment
Video Experiment Audio Experiment
Actual data points
02
46
810
0
2
4
6
8
10−0.2
0
0.2
0.4
0.6
0.8
Likert ScoreConsecutive Loss Factor
Per
cent
age
Like
rt S
core
Likert Value Distribution in Consecutive Video Loss Experiment
Actual data points
02
46
810
0
2
4
6
8
10−0.2
0
0.2
0.4
0.6
0.8
Likert ScoreConsecutive Loss Factor
Per
cent
age
Like
rt S
core
Likert Value Distribution in Consecutive Audio Loss Experiment
a cConsec. Number of Likert Scores out of a total of 70Loss 1 2 3 4 5 6 7 8 9 10
0 0 2 1 0 3 0 5 3 21 351 4 7 11 13 11 11 9 1 1 23 5 12 9 16 9 11 5 1 1 15 12 9 13 11 8 9 4 1 3 07 6 10 10 10 11 10 7 3 2 110 5 8 10 8 13 14 5 4 2 1
Consec. Number of Likert Scores out of a total of 70Loss 1 2 3 4 5 6 7 8 9 10
0 1 4 2 4 4 4 7 12 11 211 1 6 7 5 4 8 6 8 11 143 9 8 6 12 7 14 7 4 3 15 14 10 16 7 9 6 1 4 3 07 8 9 15 13 9 7 6 1 1 110 7 11 13 18 9 3 3 2 4 0
b d
Fig. 8a–d.Data from the consecutive loss factor experiment
494
Video Experiment Audio Experiment
Average
Average + Std Div
Average − Std Div
Actual data points
0 1 2 3 4 5 6 7 8 9 100
1
2
3
4
5
6
7
8
9
10
Consecutive Frame Loss
Ave
rage
Lik
ert V
alue
Likert Values for Consecutive Video Frame Losses
Average
Average + Std Div
Average − Std Div
Actual data points
0 1 2 3 4 5 6 7 8 9 100
1
2
3
4
5
6
7
8
9
10
Consecutive Frame Loss
Ave
rage
Lik
ert V
alue
Likert Values for Consecutive Audio Frame Losses
a c
Acceptable/unacceptable boundary
Error free/acceptable boundary
Actual data points
0 1 2 3 4 5 6 7 8 9 100
0.1
0.2
0.3
0.4
0.5
0.6
0.7
0.8
0.9
1
Ave
rage
Acc
epta
bilit
y S
core
Number of Consecutive Frames Lost
Acceptability Scores for Consecutive Video Frame Losses
Unacceptable
AcceptablePerfect
Acceptable/unacceptable boundary
Error free/acceptable boundary
Actual data points
0 1 2 3 4 5 6 7 8 9 100
0.1
0.2
0.3
0.4
0.5
0.6
0.7
0.8
0.9
1
Ave
rage
Acc
epta
bilit
y S
core
Number of Consecutive Frames Lost
Acceptability Scores for Consecutive Audio Frame Losses
Unacceptable
AcceptablePerfect
b d
Fig. 9a–d.Summarized results of the consecutive loss factor experiment
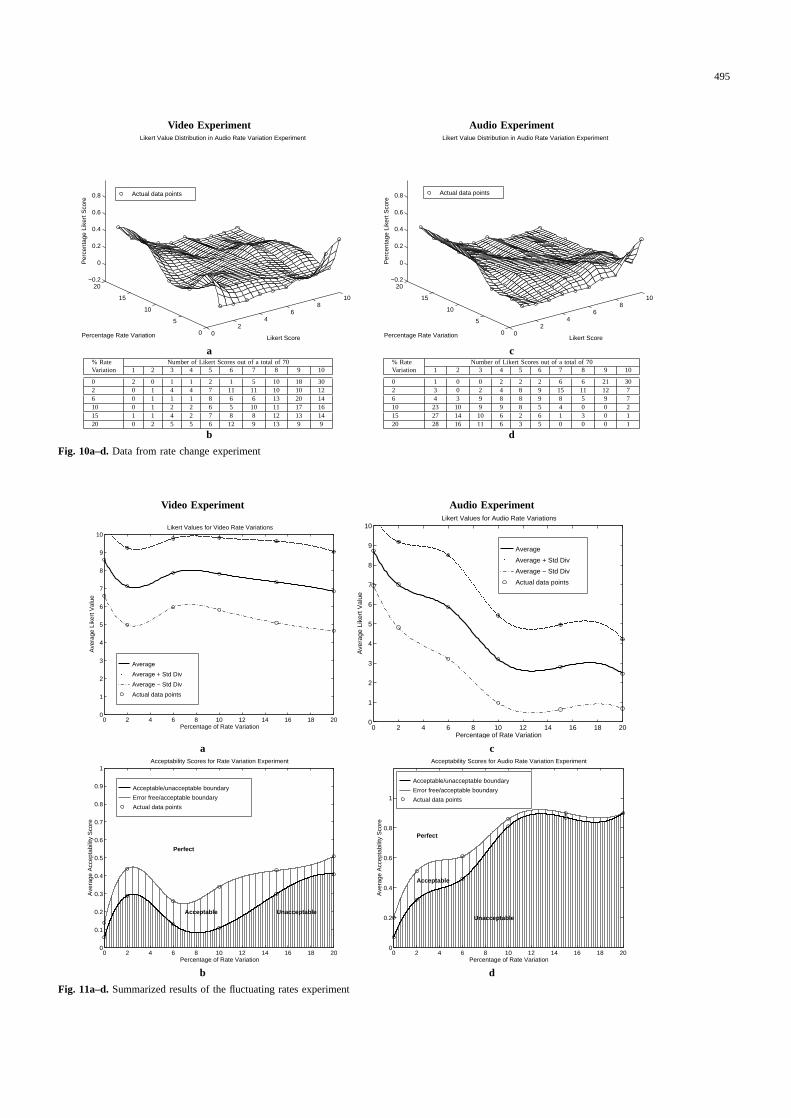
discontent shifts from the higher end to the lower end of theLikert scale with an increase in the amplitude of the sinewave rate, indicating that increasing rate fluctuations lead toincreased viewer discontent.
To further our understanding of the pattern of user dis-content, we tabulated the average and standard deviations ofLikert values against the losses, as given in Fig. 11a,c, whichclearly brings out the trend. The lower standard deviation atthe higher values of the average Likert scale indicates thatthere is higher consensus in the judgment expressed by itsmean. Also, the maximum standard deviation in Fig. 11a,cis about 2. Notice that the average Likert value in the au-dio case decreases more uniformly, compared to video. Thistrend implies that we are not very sensitive to the rate fluc-tuations in video, as compared to those in audio. Further,audio has a uniformly lower score on the Likert scale thanvideo, further substantiating this claim. Data on acceptabil-ity scores has been plotted in Fig. 11b and d, and shows thecorresponding plateaus and trends similar to those in averageLikert scales.
If the Likert and acceptability scores are graphed to-gether, the former intersects the latter for audio at about7–8%. These results imply that up to about 20% of video
and 7% of audio rate variations are tolerated and, after about8%, audio rate variations become intolerable. In this experi-ment, two metrics, namely average Likert values and averageacceptability scores, show a strong positive correlation.
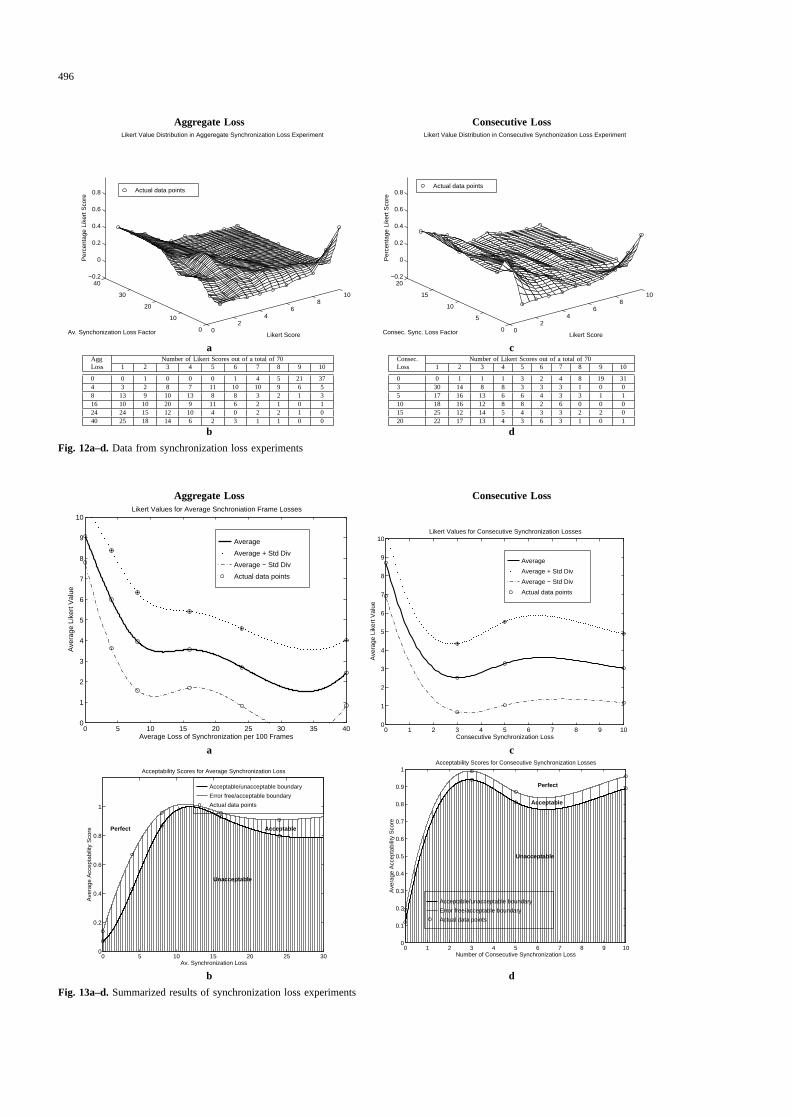
7 Transient synchronization loss experiments
As stated, there are six clips each for aggregate and synchro-nization loss experiments. In the aggregate loss experimentthey range from 0/100 to 40/100 with a constant consec-utive loss of 4, and in the consecutive losses experimentthey range from 0 to 20 with an aggregate synchronizationloss of 40/100. The presentation order of these clips was asgiven in Table 1. For synchronization loss experiments, asevident from tabulated data in Fig. 12b and d, and visualizedin Fig. 12a and c, as the losses increase, the distribution ofLikert values shifts from the higher end to the lower end ofthe scale, indicating that increased transient synchronizationlosses lead to increased viewer discontent.
To further our understanding of the pattern of user dis-content, we tabulated the average and standard deviationsof Likert values against the losses in Fig. 13a and c, whichclearly illustrate the trend of average Likert score decreasing
495
Video Experiment Audio Experiment
Actual data points
02
46
810
0
5
10
15
20−0.2
0
0.2
0.4
0.6
0.8
Likert ScorePercentage Rate Variation
Per
cent
age
Like
rt S
core
Likert Value Distribution in Audio Rate Variation Experiment
Actual data points
02
46
810
0
5
10
15
20−0.2
0
0.2
0.4
0.6
0.8
Likert ScorePercentage Rate Variation
Per
cent
age
Like
rt S
core
Likert Value Distribution in Audio Rate Variation Experiment
a c% Rate Number of Likert Scores out of a total of 70Variation 1 2 3 4 5 6 7 8 9 10
0 2 0 1 1 2 1 5 10 18 302 0 1 4 4 7 11 11 10 10 126 0 1 1 1 8 6 6 13 20 1410 0 1 2 2 6 5 10 11 17 1615 1 1 4 2 7 8 8 12 13 1420 0 2 5 5 6 12 9 13 9 9
% Rate Number of Likert Scores out of a total of 70Variation 1 2 3 4 5 6 7 8 9 10
0 1 0 0 2 2 2 6 6 21 302 3 0 2 4 8 9 15 11 12 76 4 3 9 8 8 9 8 5 9 710 23 10 9 9 8 5 4 0 0 215 27 14 10 6 2 6 1 3 0 120 28 16 11 6 3 5 0 0 0 1
b d
Fig. 10a–d.Data from rate change experiment
Video Experiment Audio Experiment
Average
Average + Std Div
Average − Std Div
Actual data points
0 2 4 6 8 10 12 14 16 18 200
1
2
3
4
5
6
7
8
9
10
Percentage of Rate Variation
Ave
rage
Lik
ert V
alue
Likert Values for Video Rate Variations
Average
Average + Std Div
Average − Std Div
Actual data points
0 2 4 6 8 10 12 14 16 18 200
1
2
3
4
5
6
7
8
9
10
Percentage of Rate Variation
Ave
rage
Lik
ert V
alue
Likert Values for Audio Rate Variations
a c
Acceptable/unacceptable boundary
Error free/acceptable boundary
Actual data points
0 2 4 6 8 10 12 14 16 18 200
0.1
0.2
0.3
0.4
0.5
0.6
0.7
0.8
0.9
1
Ave
rage
Acc
epta
bilit
y S
core
Percentage of Rate Variation
Acceptability Scores for Rate Variation Experiment
UnacceptableAcceptable
Perfect
Acceptable/unacceptable boundary
Error free/acceptable boundary
Actual data points
0 2 4 6 8 10 12 14 16 18 200
0.2
0.4
0.6
0.8
1
Ave
rage
Acc
epta
bilit
y S
core
Percentage of Rate Variation
Acceptability Scores for Audio Rate Variation Experiment
Unacceptable
Acceptable
Perfect
b d
Fig. 11a–d.Summarized results of the fluctuating rates experiment
496
Aggregate Loss Consecutive Loss
Actual data points
02
46
810
0
10
20
30
40−0.2
0
0.2
0.4
0.6
0.8
Likert ScoreAv. Synchonization Loss Factor
Per
cent
age
Like
rt S
core
Likert Value Distribution in Aggeregate Synchronization Loss Experiment
Actual data points
02
46
810
0
5
10
15
20−0.2
0
0.2
0.4
0.6
0.8
Likert ScoreConsec. Sync. Loss Factor
Per
cent
age
Like
rt S
core
Likert Value Distribution in Consecutive Synchonization Loss Experiment
a cAgg Number of Likert Scores out of a total of 70Loss 1 2 3 4 5 6 7 8 9 10
0 0 1 0 0 0 1 4 5 21 374 3 2 8 7 11 10 10 9 6 58 13 9 10 13 8 8 3 2 1 316 10 10 20 9 11 6 2 1 0 124 24 15 12 10 4 0 2 2 1 040 25 18 14 6 2 3 1 1 0 0
Consec. Number of Likert Scores out of a total of 70Loss 1 2 3 4 5 6 7 8 9 10
0 0 1 1 1 3 2 4 8 19 313 30 14 8 8 3 3 3 1 0 05 17 16 13 6 6 4 3 3 1 110 18 16 12 8 8 2 6 0 0 015 25 12 14 5 4 3 3 2 2 020 22 17 13 4 3 6 3 1 0 1
b d
Fig. 12a–d.Data from synchronization loss experiments
Aggregate Loss Consecutive Loss
Average
Average + Std Div
Average − Std Div
Actual data points
0 5 10 15 20 25 30 35 400
1
2
3
4
5
6
7
8
9
10
Average Loss of Synchronization per 100 Frames
Ave
rage
Lik
ert V
alue
Likert Values for Average Snchroniation Frame Losses
Average
Average + Std Div
Average − Std Div
Actual data points
0 1 2 3 4 5 6 7 8 9 100
1
2
3
4
5
6
7
8
9
10
Consecutive Synchronization Loss
Ave
rage
Lik
ert V
alue
Likert Values for Consecutive Synchronization Losses
a c
Acceptable/unacceptable boundary
Error free/acceptable boundary
Actual data points
0 5 10 15 20 25 300
0.2
0.4
0.6
0.8
1
Ave
rage
Acc
epta
bilit
y S
core
Av. Synchronization Loss
Acceptability Scores for Average Synchronization Loss
Unacceptable
AcceptablePerfect
Acceptable/unacceptable boundary
Error free/acceptable boundary
Actual data points
0 1 2 3 4 5 6 7 8 9 100
0.1
0.2
0.3
0.4
0.5
0.6
0.7
0.8
0.9
1
Ave
rage
Acc
epta
bilit
y S
core
Number of Consecutive Synchronization Loss
Acceptability Scores for Consecutive Synchronization Losses
Unacceptable
Acceptable
Perfect
b d
Fig. 13a–d.Summarized results of synchronization loss experiments
497
with increased synchronization losses. As in the case of con-secutive media loss experiments, there is a sharp increase inthe acceptability values which plateaus around 12/100 and3 for average and consecutive losses respectively.
The acceptability scale, visualized in Fig. 13b and d,shows the regions in which users expressed clear intoler-ance, willingness to tolerate, and perfect acceptance. Thisscale also sharply decreases and plateaus at 12/100 and 3for average and consecutive losses. These correspond to thepeaks in the two figures.
The intersections for average Likert and acceptabilitycurves indicate that 6/100-7/100 is the range for tolerableaverage synchronization losses, and a single frame is thetolerance limit for consecutive synchronization losses.
As in all other graphs, we notice a clear correlation be-tween the average Likert value and the curve that separatesthe unacceptableregion from the rest on the acceptabilityscale, indicating a strong correlation between them in syn-chronization experiments.
8 Further inferences and usage of experimental results
This section provides some further inferences from our ex-perimental data, their projected usefulness, and our ongoingwork in this area.
8.1 Further inference from experimental results
As stated, two remarkable trends emerge from our results.First is that, for some defects, there is a gradual increasein user discontent with increasing defects. Aggregate videoloss is a clear example of this kind. Second is that, forsome defects, there is a sharp increase of user discontent thatplateaus after a specific value. Synchronization and consecu-tive losses are clear examples of this kind. Rate fluctuationsare somewhere in between, and humans seem to be far lesstolerant to audio rate fluctuations than to video. Althoughwe generally concur with the synchronization experimentalresults obtained in [Ste96], based on our observations, we be-lieve that not all QoS experiments are going to result in suchclear-cut boundaries for distinguishability, tolerance and un-acceptability for QoS metrics, but they gradually decreasethroughout a continuous spectrum of values. This trend isclearly evidenced in our aggregate loss experiment for video,and also in the rate experiments of [AFKN94].
In addition to determining the acceptable ranges for someof our QoS parameters, we can also determine their relativeimportance. For example, we can directly compare the Likertvalues of aggregate video losses and aggregate synchroniza-tion losses to determine the loss ranges where one of themis more crucial than the other. Some of the potential benefitsof these comparisons are discussed in Sect. 8.2.
8.2 Use of experimental results
Our findings can be used in multimedia testbed designs intwo different ways. First, given a Likert value, or an ac-ceptability score that would characterize the requireddegree
of user satisfaction, it is possible to determine the toleranceto a given defect. For example, with a 0.8 Likert value,a video stream can sustain a 20/100 average loss, 1 con-secutive loss, and up to 20% rate variation. For the audiostream, these parameters are 30/100 aggregate silence elim-ination, 0.7 s worth of consecutive sample losses, and about10% rate variation. For audio-video synchronization, theyare about 7/100 aggregate losses and one consecutive loss.For a given level of user satisfaction, the tolerances of aset of defects, such as the media and synchronization lossesinvestigated in the present paper, can be used directly as lim-iting values for the corresponding defects. For example, for80% user satisfaction, we may have 20/100 as the maximumpermissible aggregate video loss.
Second, in designing algorithms we can assign relativeweights to these losses. For example, comparing the averageLikert values of video loss with consecutive synchronizationloss, it is clear that the unacceptability region for the for-mer is below that of the latter, and therefore dropping videoframes on the average is preferable to losing synchroniza-tion consecutively. To compute relative weights for differentparameters, we may assign them weights proportional to theaverage of some user preference parameter such as the av-erage of all Likert values assigned for that parameter, whichcan be achieved for the given testbed. For example, if a de-signed testbed can only deliver with an aggregate video lossof 10/100, and a consecutive synchronization loss of 5, com-pute the average of the Likert values over [0, 10/100] for theaggregate video loss and over [0, 6] for the CSL. Supposethat the former is 7 and the latter is 5.5, then assign these asweights of importance during dynamic playout management.A potential usage of such weights is that the parameter thatcarries the smallest weight in the range of operation can beignored in order to avoiding defaulting on ones with higherweights.
8.3 Comparison with existing work
Parameters of human tolerance to audio-video and audio-pointer synchronization were obtained in [Ste96]. They werecategorized as undetectable, detected-but-tolerable, and in-tolerable errors. These parameters are for lossless streams.In a CM client-server paradigm, streams may be deliveredthrough a network. At the lower levels of the protocol stack,the network can drop packets, and, in order to recover fromloss, some kind of retransmission is necessary. This may in-duce intolerable delays and jitters in the CM stream. Supposeinstead that the application itself allows for a lossy mediastream, through some QoS-based loss characteristics of CMstreams, then the retransmission may be unnecessary, and,consequently the delay and jitter at the application level, andthe bandwidth at the network level can be saved. Our param-eters can be used to compute such QoS-based LDU drops atthe application level.
Another observation we have is that, in our testbed, audioand video drift in and out of synchronization, as opposed tobehaving statically. Granted that, if maximum drifts werewithin the limits reported in [Ste96], then the static limitsstated therein would apply. However, we postulated that,for transient missynchronizations, the participants would be
498
more forgiving. As the reported data indicates, this is notthe case.
[AFKN94] categorizes audio-visual clips ashigh andlow in audio, video and temporal dimensions, referred totherein asvideo classification schemas (VCS). They measurethe perceptual importance of each dimension in conveyingthe total message contained in clips across to the intendedviewer. For example, sports footage and talk shows are con-sidered high and low in the temporal dimension, respec-tively. Such a classification, while rich in semantics and itsrelevance to human perception, requires some extra effort,and the servers need to be enriched to understand their sig-nificance. This may mean extra effort by the producers orsome other intermediate personnel. In this respect, our testclips should be considered low in the temporal dimensionand (perhaps) video dimension, but high in audio dimension.The reported study categorizes the effect of playout rateson audio-visual demonstrations with different VCS schemavalues. This study, while important, does not cover the lossparameters, transient mis synchronizations, and rate fluctua-tions, all of which can happen during audio-visual display.The Likert scores of [AFKN94] is from 1 to 7, whereas ourscale is from 1 to 10. In addition, we also use the scale of[Ste96]. One of the advantages of this study is the block de-sign of the experiment, in which the combined effect of mul-tiple parameter variations on perception were determined,whereas, in our experiment, we have only determined theeffects of individual parameters.
8.4 Limitations of the current experimentand our ongoing work
The aggregate loss experiment for audio needs to be redonewith appropriate clips, since we eliminated silence ratherthan speech. We are also in the process of comparing ourresults with known perceptual studies of silence elimination.Another parameter we would like to know is the perceptualdifference between skipping video frames versus repeatingthe same frame. These are different policies, between whichour current metrics do not distinguish.
Secondly, we would like to understand the combined ef-fect of our parameters on human perception. In this respect,combining our results with those of other studies to obtain acombined Likert scale as a function with multiple inputs asdefects will be most beneficial. We are also planning a block-designed factorial [Edw85] experiment involving more QoSparameters. As stated, this involves having a sufficiently ran-domized experiment where the participant’s boredom doesnot affect their judgment. Some of our ongoing work ad-dresses this issue in detail. The benefits of such a study aresignificant in the implementation of multimedia testbeds, asgiven below.
– It allows the prioritization of user needs.– It allows for the most beneficial dynamic QoS adjust-
ments [AFKN94].– It adds up to building a comprehensive user-level QoS
metric for multimedia [Sta96].– It helps in resource management [Sta96].– It helps in exception handling and fault tolerance [Nai96].
– It can be used in multimedia server design.
We are also in the process of enhancing the Tcl/Tk-based[Wel95, Ous94] Berkeley Continuous Media Toolkit (CMT)[SRY93] to enhance its performance by using our new-foundtolerances to defects reported in this paper. In this work, wesee a clear need for a comprehensive QoS metric.
9 Conclusions
Based on the observation that (1) loss of media content, (2)rate variations and (3) the degree of transient missynchro-nizations result in user discontent in multimedia presenta-tions, we designed metrics to measure these phenomena. Auser study was carried out to substantiate our initial observa-tions, and thereby validate the assumptions that underly ourmodel. The results of this study and its analysis have beenpresented. Finally, the usage of our experimental results inmultimedia system design has been discussed.
References
[AFKN94] Aptekar RT, Fisher JA, Kisimov V, Nieshlos H (1994) Dis-tributed Multimedia:User Perception and Dynamic QoS. InSPIE 2188:226–234
[Edw85] Edwards AE (1985) Experimental Design In PsychologicalResearch, 5th edition. Harper & Row, New York
[Geo96] Georganas ND (1996) Synchronization issues in multimediapresentational and conversational applications. In Proceedingsof the 1996 Pacific Workshop on Distributed Multimedia Sys-tems (DMS’96), June 1996, Hong Kong, invited talk
[HRKHS96] Huang J, Richardson J, Kenchamanna-Hosekote DR, Srivas-tava J (1996) Presto: Final technical report. Technical report,Honeywell Technology Center, Minneapolis, MN
[Nai96] Naik K (1996) Exception handling and fault-tolerence inmultimedia synchronization. IEEE J Sel Areas Commun14(1):196–211
[Opp83] Oppenheim AN (1983) Questionnaire Design and AttitudeMeasurement. Heinemann, London
[Ous94] Ousterhout JK (1994) Tcl and the Tk Toolkit. Addison-Wesley, Reading, Mass.
[PESMI96] Part-Enander E, Sjoberg A, Melin B, Isaksson P (1996) TheMatlab Handbook. Addison-Wesley, Reading, Mass.
[SNL95] Schmidt B, Northcutt J, Lam M (1995) A Method and Ap-paratus for Measuring Media Synchronization. In Gusella R,Little, TDC (eds) Proceedings of the 5th International Work-shop on Networks and Operatiing System Support for Videoand Audio (NOSDAV ’95) volume 5, April 1995, Durham,N.H., pp 203–214
[SRY93] Smith B, Rowe L, Yen S (1993) A Tcl/Tk Continuous MediaPlayer. In Proceedings of the Tcl-Tk Workshop, June 1993,Berkeley, CA
[Sta96] Staehli RA (1996) Quality of Service Specification for Re-source Management in Multimedia. PhD thesis. Oregon Grad-uate Institute of Science and Technology, OR
[Ste96] Steinmetz R (1996) Human perception of jitter and mediasynchronization. IEEE J Sel Areas Commun 14(1):61–72
[SB96] Steinmetz R, Blakowski G (1996) A media synchronizationsurvey: Reference model, specification and case studies. IEEEJ Sel Areas Commun 14(1):5–35
[SGN96] Steinmetz R, Georganas ND, Nakagawa T (1996) Guest edi-torial: Synchronization issues in multimedia communications.IEEE J Sel Areas Commun 14(1):1–4
[Tow93] Towsley D (1993) Providing quality of service in packetswitched networks. In Donatiello L, Nelson R (eds) Per-formance Evaluation of Computer Communication Systems.Springer, Berlin Heidelberg New York, pp 560–586
499
[Wel95] Welch B (1995) Practical Programming in Tcl and Tk. Pren-tice Hall, Englewood Cliffs, N.J.
[WS96] Wijesekera D, Srivastava J (1996) Quality of Service (QoS)Metrics for Continuous Media. Multimedia Tools Appl3(1):127–166
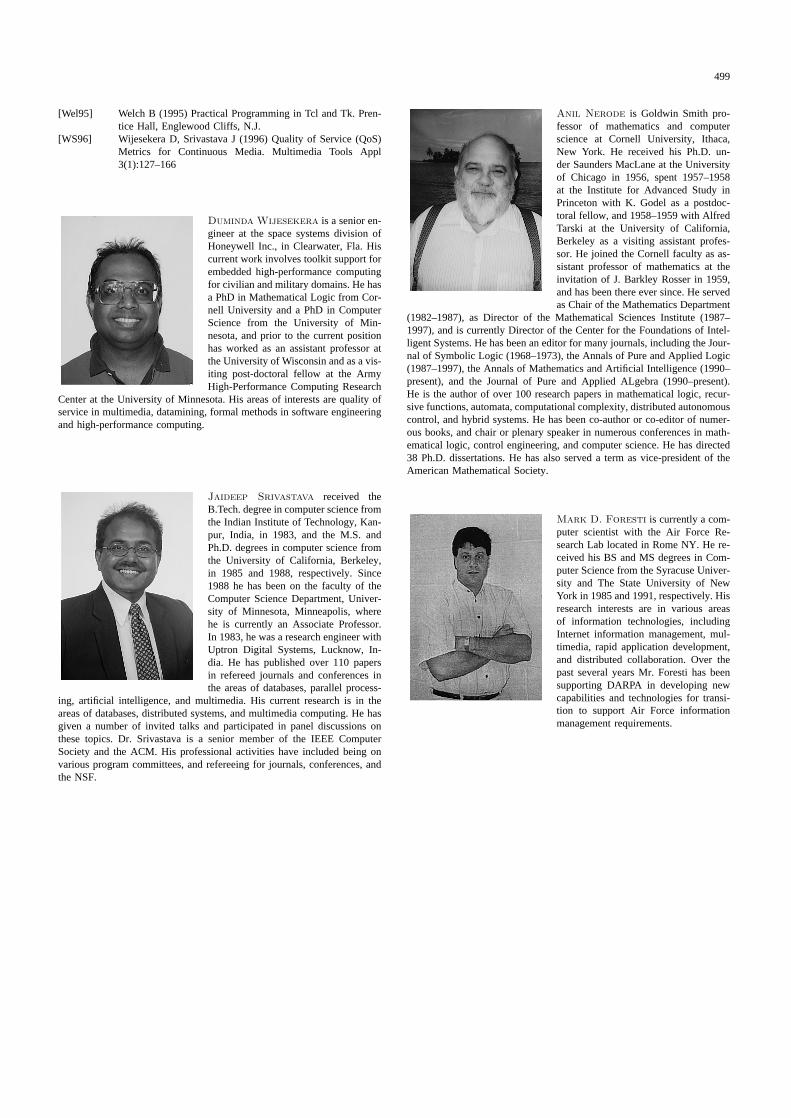
Duminda Wijesekera is a senior en-gineer at the space systems division ofHoneywell Inc., in Clearwater, Fla. Hiscurrent work involves toolkit support forembedded high-performance computingfor civilian and military domains. He hasa PhD in Mathematical Logic from Cor-nell University and a PhD in ComputerScience from the University of Min-nesota, and prior to the current positionhas worked as an assistant professor atthe University of Wisconsin and as a vis-iting post-doctoral fellow at the ArmyHigh-Performance Computing Research
Center at the University of Minnesota. His areas of interests are quality ofservice in multimedia, datamining, formal methods in software engineeringand high-performance computing.
Jaideep Srivastava received theB.Tech. degree in computer science fromthe Indian Institute of Technology, Kan-pur, India, in 1983, and the M.S. andPh.D. degrees in computer science fromthe University of California, Berkeley,in 1985 and 1988, respectively. Since1988 he has been on the faculty of theComputer Science Department, Univer-sity of Minnesota, Minneapolis, wherehe is currently an Associate Professor.In 1983, he was a research engineer withUptron Digital Systems, Lucknow, In-dia. He has published over 110 papersin refereed journals and conferences inthe areas of databases, parallel process-
ing, artificial intelligence, and multimedia. His current research is in theareas of databases, distributed systems, and multimedia computing. He hasgiven a number of invited talks and participated in panel discussions onthese topics. Dr. Srivastava is a senior member of the IEEE ComputerSociety and the ACM. His professional activities have included being onvarious program committees, and refereeing for journals, conferences, andthe NSF.
Anil Nerode is Goldwin Smith pro-fessor of mathematics and computerscience at Cornell University, Ithaca,New York. He received his Ph.D. un-der Saunders MacLane at the Universityof Chicago in 1956, spent 1957–1958at the Institute for Advanced Study inPrinceton with K. Godel as a postdoc-toral fellow, and 1958–1959 with AlfredTarski at the University of California,Berkeley as a visiting assistant profes-sor. He joined the Cornell faculty as as-sistant professor of mathematics at theinvitation of J. Barkley Rosser in 1959,and has been there ever since. He servedas Chair of the Mathematics Department
(1982–1987), as Director of the Mathematical Sciences Institute (1987–1997), and is currently Director of the Center for the Foundations of Intel-ligent Systems. He has been an editor for many journals, including the Jour-nal of Symbolic Logic (1968–1973), the Annals of Pure and Applied Logic(1987–1997), the Annals of Mathematics and Artificial Intelligence (1990–present), and the Journal of Pure and Applied ALgebra (1990–present).He is the author of over 100 research papers in mathematical logic, recur-sive functions, automata, computational complexity, distributed autonomouscontrol, and hybrid systems. He has been co-author or co-editor of numer-ous books, and chair or plenary speaker in numerous conferences in math-ematical logic, control engineering, and computer science. He has directed38 Ph.D. dissertations. He has also served a term as vice-president of theAmerican Mathematical Society.
Mark D. Foresti is currently a com-puter scientist with the Air Force Re-search Lab located in Rome NY. He re-ceived his BS and MS degrees in Com-puter Science from the Syracuse Univer-sity and The State University of NewYork in 1985 and 1991, respectively. Hisresearch interests are in various areasof information technologies, includingInternet information management, mul-timedia, rapid application development,and distributed collaboration. Over thepast several years Mr. Foresti has beensupporting DARPA in developing newcapabilities and technologies for transi-tion to support Air Force informationmanagement requirements.
Related Documents