Experimental analysis of pressurised humidification tower for humid air gas turbine cycles. Part B: Correlation of experimental data A.A. Pedemonte, A. Traverso * , A.F. Massardo Thermochemical Power Group (TPG), Dipartimento di Macchine, Sistemi Energetici e, Trasporti (DIMSET), Universita ` di Genova, Via Montallegro 1, 16145 Genova, Italy Received 21 November 2006; accepted 27 October 2007 Available online 22 November 2007 Abstract One of the most interesting methods of water introduction in a gas turbine circuit is represented by the humid air turbine cycle (HAT). In the HAT cycle, the humidification can be provided by a pressurised saturator (i.e.: humidification tower or saturation tower), this solution being known to offer several attractive features. This work is focused on an experimental study of a pressurised humidification tower, with structured packing inside. After a description of the test rig, carried out in part A, this part B is concerned with the attempt to correlate all data points collected. Two different approaches have been used, the first based on polynomial correlation and the second using a set of new non-dimensional groups. The first correlation is shown to better fit the data, having lower standard deviation, but the second provides better interpretation of physics: the latter is able to capture the air outlet temperature with a standard deviation r = 2.8 K. The correlations are useful for describing the off-design behaviour of the pressurised saturation tower and they can be used as generalised representations of the behaviour of structured packing humidification towers for HAT application, at least within the investigated operational range. Ó 2007 Elsevier Ltd. All rights reserved. Keywords: HAT; EvGT; Humidification tower; Saturator; Experimental analysis; Correlation 1. Introduction Land-based simple-cycle gas turbines are well-known for their compactness, flexibility and rapidity of installa- tion, despite the fact that they are affected by relatively poor efficiencies due to the high exhaust temperatures. The development of combined cycles solved this problem, but these cycles require a bulky and expensive steam plant, which makes them not directly suitable for distributed power generation. On the other hand, mixed gas–steam cycles are able to overcome these problems, showing good performance and competitive costs also at sizes well below 50 MW: so far, the most successful ‘‘mixed” plants on the market have been the Cheng cycle [1] and GE STIG cycle [2]. Nevertheless, there are several ways of introducing steam into a mixed cycle between the compressor and the expander: the HAT cycle is surely one of the best-known configurations [3], but new options are currently under development, such as the VAST cycle [4]. Regarding the HAT cycle, several University and Indus- try studies from all over the world have shown its remark- able potential in terms of performance and reduced cost of electricity for small and mid-size power generation plants. Part A of the present work presents the four most signifi- cant experiments and test rigs on humid air cycles, and then it provides a detailed description of the MOSAT test rig (MOdular SATurator, Fig. 1), constructed and operated at TPG of the University of Genoa. The 162 experimental results have been presented and discussed only from a qual- itative point of view. This part B, on the other hand, aims at concentrating these 162 data points into one single cor- relation, in order to also provide a quantitative description of the phenomena within the saturator. 1359-4311/$ - see front matter Ó 2007 Elsevier Ltd. All rights reserved. doi:10.1016/j.applthermaleng.2007.10.031 * Corresponding author. Tel.: +39 010 353 2455; fax: +39 010 353 2566. E-mail address: [email protected] (A. Traverso). www.elsevier.com/locate/apthermeng Available online at www.sciencedirect.com Applied Thermal Engineering 28 (2008) 1623–1629

Welcome message from author
This document is posted to help you gain knowledge. Please leave a comment to let me know what you think about it! Share it to your friends and learn new things together.
Transcript
Available online at www.sciencedirect.com
www.elsevier.com/locate/apthermeng
Applied Thermal Engineering 28 (2008) 1623–1629
Experimental analysis of pressurised humidification tower for humidair gas turbine cycles. Part B: Correlation of experimental data
A.A. Pedemonte, A. Traverso *, A.F. Massardo
Thermochemical Power Group (TPG), Dipartimento di Macchine, Sistemi Energetici e, Trasporti (DIMSET), Universita di Genova,
Via Montallegro 1, 16145 Genova, Italy
Received 21 November 2006; accepted 27 October 2007Available online 22 November 2007
Abstract
One of the most interesting methods of water introduction in a gas turbine circuit is represented by the humid air turbine cycle (HAT).In the HAT cycle, the humidification can be provided by a pressurised saturator (i.e.: humidification tower or saturation tower), thissolution being known to offer several attractive features. This work is focused on an experimental study of a pressurised humidificationtower, with structured packing inside. After a description of the test rig, carried out in part A, this part B is concerned with the attempt tocorrelate all data points collected. Two different approaches have been used, the first based on polynomial correlation and the secondusing a set of new non-dimensional groups. The first correlation is shown to better fit the data, having lower standard deviation, butthe second provides better interpretation of physics: the latter is able to capture the air outlet temperature with a standard deviationr = 2.8 K. The correlations are useful for describing the off-design behaviour of the pressurised saturation tower and they can be usedas generalised representations of the behaviour of structured packing humidification towers for HAT application, at least within theinvestigated operational range.� 2007 Elsevier Ltd. All rights reserved.
Keywords: HAT; EvGT; Humidification tower; Saturator; Experimental analysis; Correlation
1. Introduction
Land-based simple-cycle gas turbines are well-knownfor their compactness, flexibility and rapidity of installa-tion, despite the fact that they are affected by relativelypoor efficiencies due to the high exhaust temperatures.The development of combined cycles solved this problem,but these cycles require a bulky and expensive steam plant,which makes them not directly suitable for distributedpower generation. On the other hand, mixed gas–steamcycles are able to overcome these problems, showing goodperformance and competitive costs also at sizes well below50 MW: so far, the most successful ‘‘mixed” plants on themarket have been the Cheng cycle [1] and GE STIG cycle[2]. Nevertheless, there are several ways of introducing
1359-4311/$ - see front matter � 2007 Elsevier Ltd. All rights reserved.
doi:10.1016/j.applthermaleng.2007.10.031
* Corresponding author. Tel.: +39 010 353 2455; fax: +39 010 353 2566.E-mail address: [email protected] (A. Traverso).
steam into a mixed cycle between the compressor and theexpander: the HAT cycle is surely one of the best-knownconfigurations [3], but new options are currently underdevelopment, such as the VAST cycle [4].
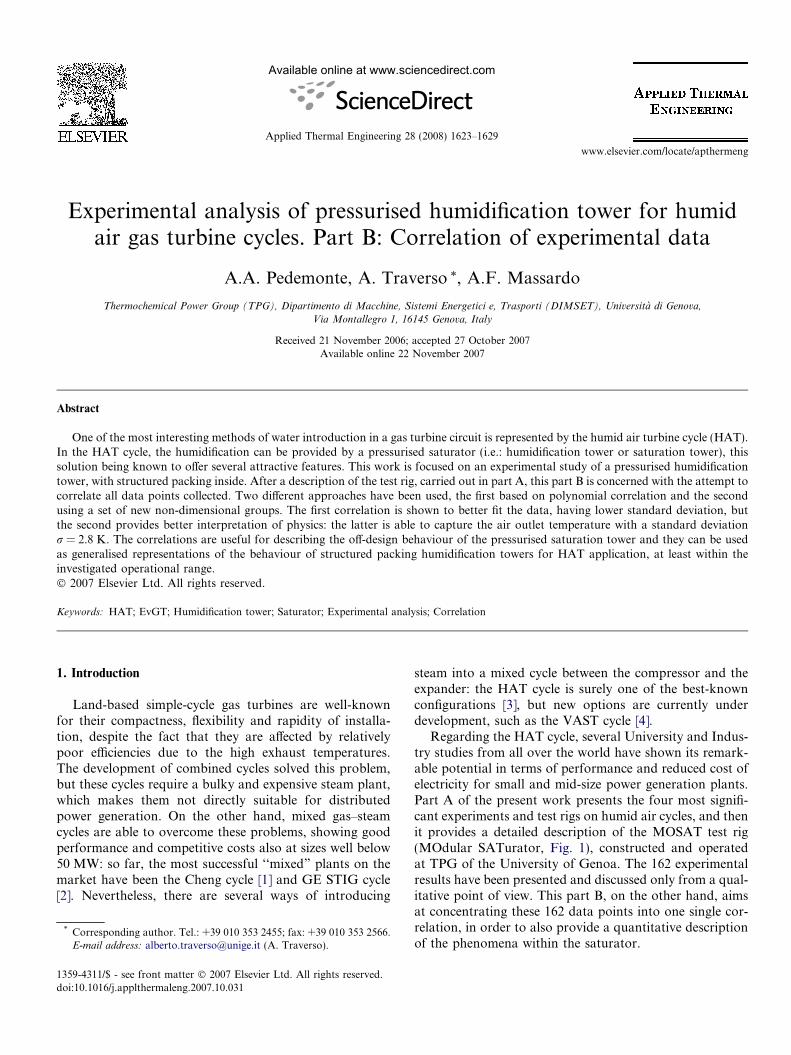
Regarding the HAT cycle, several University and Indus-try studies from all over the world have shown its remark-able potential in terms of performance and reduced cost ofelectricity for small and mid-size power generation plants.Part A of the present work presents the four most signifi-cant experiments and test rigs on humid air cycles, and thenit provides a detailed description of the MOSAT test rig(MOdular SATurator, Fig. 1), constructed and operatedat TPG of the University of Genoa. The 162 experimentalresults have been presented and discussed only from a qual-itative point of view. This part B, on the other hand, aimsat concentrating these 162 data points into one single cor-relation, in order to also provide a quantitative descriptionof the phenomena within the saturator.
Nomenclature
cp specific heat at constant pressure (kJ/kg K)D inner diameter of saturator (= 0.08 m)G inlet dry air/gas flow (kgG/s)h enthalpy per unit mass (kJ/kg)h0 enthalpy per unit mass of dry air/gas (kJ/kgG)L inlet water flow (kgW/s)L/G inlet water mass flow over inlet dry air/gas mass
flow ratio (kgW/kgG)M mass flow (kg/s)N number of measurementsng non-dimensional group of propertiesP pressure (bar)T temperature (K)Tadim non-dimensional outlet air temperatureTsat inlet air/gas adiabatic saturation temperature
(K)u effective air/gas velocity (m/s)Y absolute humidity (kgW/kgG)
Greek symbols
DHerror non-dimensional error in enthalpy balance (kW/kW)
Dhetri water triple point vaporization enthalpy (be-tween quality 0 and 1) (= 2501 kJ/kgW)
DTadim non-dimensional temperature difference
/eq equivalent diameter of inner channels of struc-tured packing (=0.017 m)
l dynamic viscosity (Pa s)m void fraction of structured packing (=0.97)q density (kg/m3)r standard deviation of outlet air/gas temperature
(K)# average angle of inner channels of structured
packing (= 0.56 rad)
Subscripts
c calculatedG dry air/gasin saturator inletm measuredout saturator outlettri water triple pointV steamW Water1 air inlet into saturator2 air outlet from saturator3 water inlet into saturator4 water outlet from saturator
1624 A.A. Pedemonte et al. / Applied Thermal Engineering 28 (2008) 1623–1629
An important objective of the experimental campaignwas the definition of a correlation capable of describingthe thermodynamic behaviour of the saturator; such a cor-relation must provide the outlet flow properties once theinlet properties are known. In this respect, such a correla-
1
2
3
4
L≡MWin, TWin
MWout TWout
G≡MGin, TGin
MGout TGout
Fig. 1. Scheme of MOSAT test rig for testing saturators with structuredinternal packing modules.
tion is useful for predicting the off-design behaviour ofthe saturation tower.
The coefficients present in the correlations have beendetermined through an optimisation algorithm used tominimize the mean square error, i.e. the standard deviationof predictions compared with measurements. The function‘‘lsqcurvefit” available in the Matlab� Optimization Tool-box [5] has been used: the related algorithm is presented in[6,7].
First of all, attention is focused on identifying the mostinfluential inlet properties, after which a polynomial corre-lation is defined, in order to establish an estimation for theattainable accuracy.
Secondly, based on the experimental knowledge and theresults from the polynomial correlation, a non-dimensionalapproach is undertaken. Thus, a final correlation employ-ing some non-dimensional numbers is obtained.
2. Polynomial correlation of experimental data
In this case, the objective is to identify a polynomial ableto correlate the outlet flow temperature with the most influ-ential inlet properties.
The above mentioned polynomial can be written as in(1), where
Tadim = TGout/Ttri represents the non-dimensional outletair temperature
A.A. Pedemonte et al. / Applied Thermal Engineering 28 (2008) 1623–1629 1625
x1, x2, . . . are inlet properties involved in the thermody-namic process, and c0, c1, c2, . . . are numerical coefficientsto be determined by minimization of the mean square error
T adim ¼ c0 þ c1 � x1 þ c2 � x21 þ c3 � x3
1 þ c4 � x2
þ c5 � x22 þ c6 � x3
2 þ � � � ð1Þ
In Table 1 the mean standard deviation, defined in (2), isshown for 10 different choices of correlating variable(s).The analysis is limited to the case of P = 3 bar absolute.
r ¼
ffiffiffiffiffiffiffiffiffiffiffiffiffiffiffiffiffiffiffiffiffiffiffiffiffiffiffiffiPðT c � T mÞ2
N
sð2Þ
The mean standard deviations shown in the first seven rowsof Table 1 are evaluated with one single correlating param-eter, in descending order of r.
The first attempt is made with x1 = 1 constant in orderto estimate the maximum possible error.
The following trials 2–7 are useful for establishing theorder of influence for each property considered. Resultsshow the main influence on outlet air temperature is givenby inlet water temperature (No. 7). In fact the main stan-dard deviation associated with this temperature is percepti-bly smaller than the others.
Outlet water temperature (No. 6) has been tested forcompleteness, but it will not used in the correlation, as itrepresents an outlet parameter.
L/G ratio (No. 5), or the same ratio corrected by therelated cp (No. 4, such a parameter may be useful to gener-alise the correlations to fluids other than air and water), isthe second best parameter to correlate the outlet airtemperature.
The parameters showing the least influence are the inletadiabatic saturation temperature (No. 2) and inlet air tem-perature (No. 3): both can only slightly improve the stan-dard deviation of case No. 1.
This first part of the analysis shows that the outlet airtemperature is influenced by, in descending order of impor-tance, the inlet water temperature TWin, the L/G or cpWL/cpGG ratio, the inlet air/gas temperature TGin.
After assessing each parameter separately, the combinedeffects of these parameters are presented in trials Nos. 8–10:
Table 1Parameters and resulting standard deviations for 10 different trialscorrelating the 54 data points at P = 3 bar absolute
No. x1, x2, x3 r (K)
1 x1 = 1 8.42 x1 = Tsat/Ttri 8.13 x1 = TGin/Ttri 8.14 x1 = (cpW � L)/(cpG � G) 7.95 x1 = L/G 7.96 x1 = TWout/Ttri 7.97 x1 = TWin/Ttri 4.08 x1 = TGin/Ttri; x2 = (cpW � L)/(cpG � G) 3.19 x1 = TWin/Ttri; x2 = (cpW � L)/(cpG � G); x3 = Tsat/Ttri 2.0
10 x1 = TWin/Ttri; x2 = (cpW � L)/(cpG � G); x3 = TGin/Ttri 1.9
the last set of parameters show the best standard deviation,and it is thus the most promising one.
Likewise the same analysis can be carried out in the 4and 5 bar tests, with the same conclusions.
Once the set of properties which can best be used to cap-ture the behaviour of the saturator in terms of outlet airtemperature have been defined, the polynomial correlationcan be extended to all the three pressure levels considered,by the introduction of an additional parameter taking intoaccount the actual pressure of the test. Considering thegeneral formulation in (1), the final polynomial is definedby coefficients shown in Table 2.
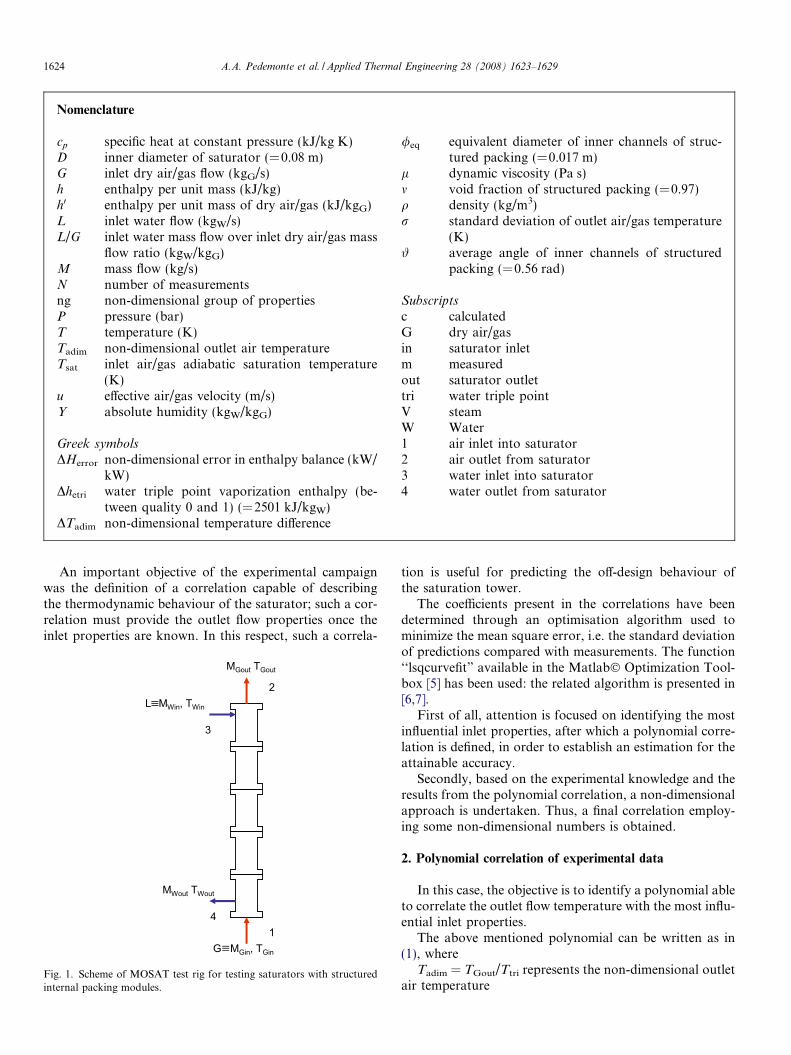
The analysis of the error obtained through this generalpolynomial correlation shows that (Fig. 2) about 80% ofdata points are captured with a precision of ±3 K. How-ever, there are a few cases where the error in temperaturemay exceed ±6 K. It should be reminded that this resulthas been obtained with no filtration of the input datapoints, i.e. all of them have been used.
In order to increase the accuracy of the correlation, con-sidering possible measuring errors, a second attempt hasbeen made by applying a filter to the experimental datapoints.
From a thermodynamic point of view, one of the bestways to identify ‘‘rough” data points is to check theenthalpy balance, by assuming adiabatic transformation.In this case the enthalpy balance error is defined in (3):the differences between outlet and inlet enthalpies arenon-dimensionalised with respect to the enthalpy of evapo-ration of the water consumed, this being a sort of ‘‘heatload” of the saturator.
DH error ¼ðmG2h02 þ mW4h4Þ � ðmW3h3 þ mG1h01Þ
ðmW3 � mW4Þ � Dhetri
ð3Þ
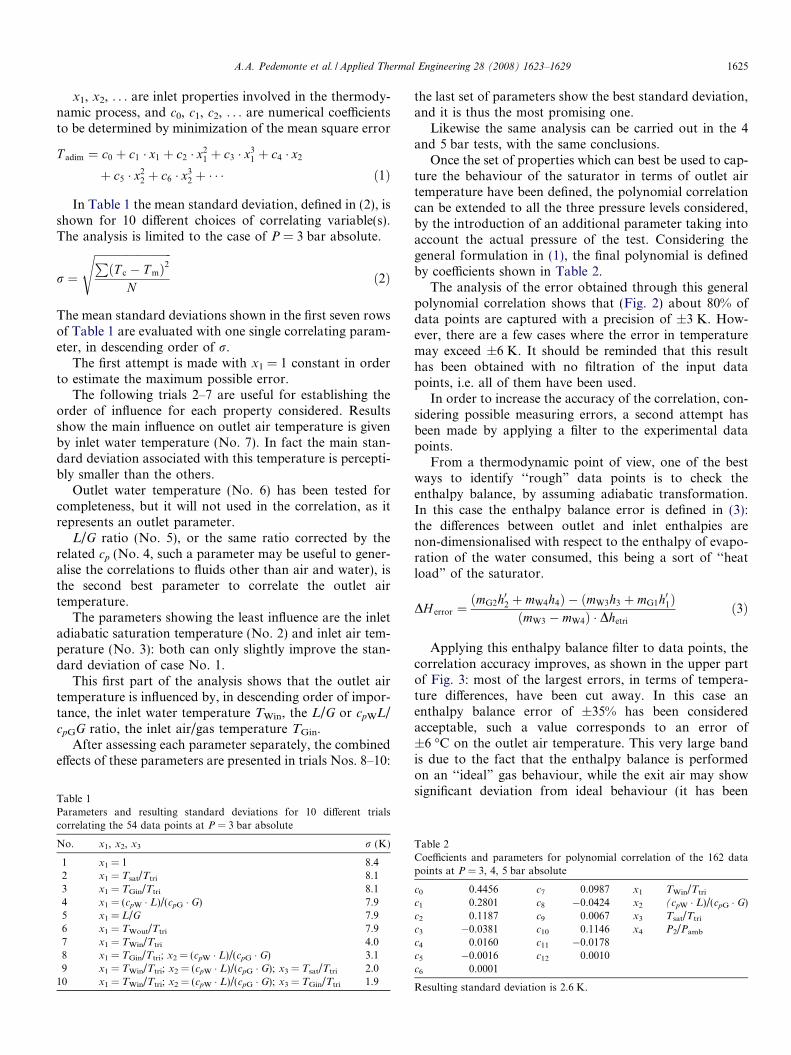
Applying this enthalpy balance filter to data points, thecorrelation accuracy improves, as shown in the upper partof Fig. 3: most of the largest errors, in terms of tempera-ture differences, have been cut away. In this case anenthalpy balance error of ±35% has been consideredacceptable, such a value corresponds to an error of±6 �C on the outlet air temperature. This very large bandis due to the fact that the enthalpy balance is performedon an ‘‘ideal” gas behaviour, while the exit air may showsignificant deviation from ideal behaviour (it has been
Table 2Coefficients and parameters for polynomial correlation of the 162 datapoints at P = 3, 4, 5 bar absolute
c0 0.4456 c7 0.0987 x1 TWin/Ttri
c1 0.2801 c8 �0.0424 x2 (cpW � L)/(cpG � G)c2 0.1187 c9 0.0067 x3 Tsat/Ttri
c3 �0.0381 c10 0.1146 x4 P2/Pamb
c4 0.0160 c11 �0.0178c5 �0.0016 c12 0.0010c6 0.0001
Resulting standard deviation is 2.6 K.
Fig. 3. Frequency distribution of error in outlet air temperature and filtered data points (blue = accepted, red = rejected): filter on enthalpy balance(top, r = 2.1 K) and filter on exit relative humidity (bottom, r = 2.5 K). (For interpretation of the references to colour in this figure legend, the reader isreferred to the web version of this article.)
Fig. 2. Error of correlated outlet air temperature against experimental measurement: frequency distribution (left) and cumulative probability curve (right).r = 2.6 K.
1626 A.A. Pedemonte et al. / Applied Thermal Engineering 28 (2008) 1623–1629
shown and discussed in part A of the present work thatthe exit air average relative humidity is around 110%):small differences in the humidity content of exit air maycause large errors in the overall enthalpy balance of satu-rators. Moreover, as shown in Fig. 3, non-acceptable
points (red crosses) are only those with positive enthalpybalance error, which is clearly a consequence of the highersteam content in outgoing air respect to an ‘‘ideal” behav-iour. Thus, this criterion does not look suitable for filter-ing the data points.
A.A. Pedemonte et al. / Applied Thermal Engineering 28 (2008) 1623–1629 1627
An alternative approach is to filter the data points byconsidering the measured relative humidity. In this case,the exit measured relative humidity is compared to theaverage value of 110% for all the data points: differenceslarger than 10% have been considered as the maximumacceptable threshold. Despite the fact that this criterionmay be questionable, it is founded on the belief that, dueto the very large available surface for heat and mass trans-fer in the test rig, the exit air should be always in saturatedconditions. Thus, if a ‘‘real” relative humidity has to bearound 110%, there cannot be significant departure fromthat value. Part A discusses the presence of a few datapoints with relative humidity lower than 100%: thesepoints are rejected because, despite the fact that they rep-resent a feasible working point for the saturator, they arenot desirable as the saturator aims to evaporate as muchwater as possible into the air stream. Thus, it can be statedthat this criterion limits the correlation to all working con-ditions where the outlet air is fully saturated: this approachis used as a reference filter for correlating the data points.The results obtained by applying this filter to all datapoints is shown in the lower part of Fig. 3, and the coeffi-cients of the related polynomial correlation are shown inTable 3.
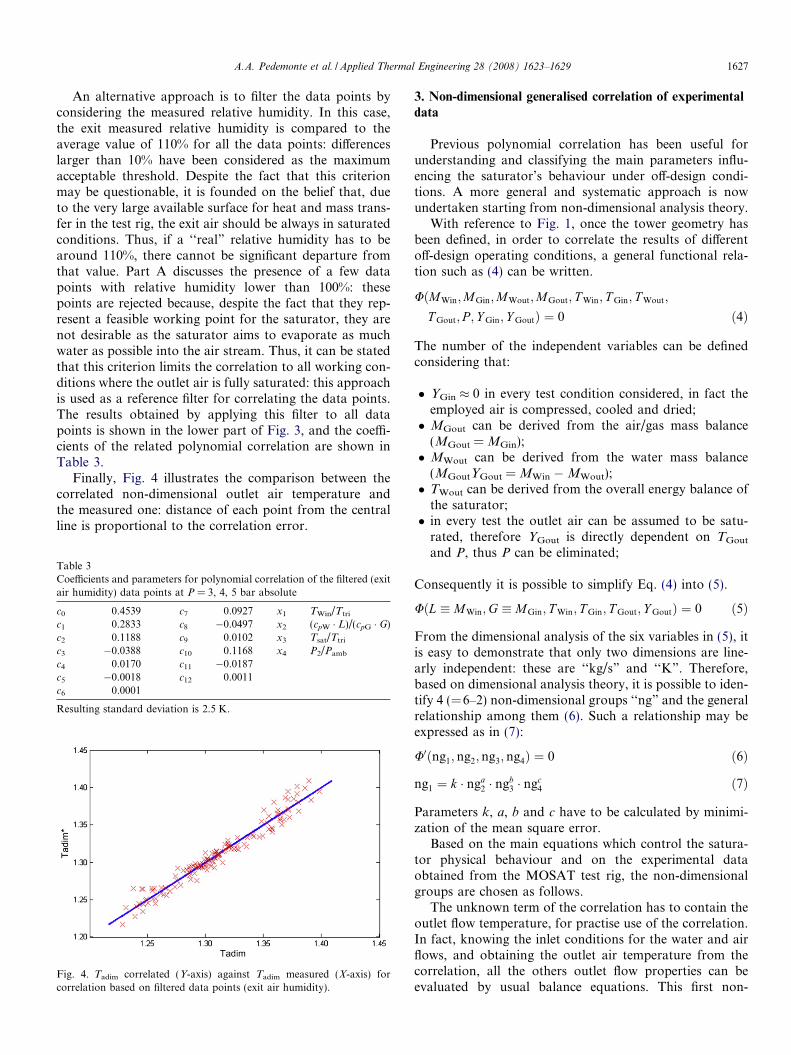
Finally, Fig. 4 illustrates the comparison between thecorrelated non-dimensional outlet air temperature andthe measured one: distance of each point from the centralline is proportional to the correlation error.
Table 3Coefficients and parameters for polynomial correlation of the filtered (exitair humidity) data points at P = 3, 4, 5 bar absolute
c0 0.4539 c7 0.0927 x1 TWin/Ttri
c1 0.2833 c8 �0.0497 x2 (cpW � L)/(cpG � G)c2 0.1188 c9 0.0102 x3 Tsat/Ttri
c3 �0.0388 c10 0.1168 x4 P2/Pamb
c4 0.0170 c11 �0.0187c5 �0.0018 c12 0.0011c6 0.0001
Resulting standard deviation is 2.5 K.
Fig. 4. Tadim correlated (Y-axis) against Tadim measured (X-axis) forcorrelation based on filtered data points (exit air humidity).
3. Non-dimensional generalised correlation of experimental
data
Previous polynomial correlation has been useful forunderstanding and classifying the main parameters influ-encing the saturator’s behaviour under off-design condi-tions. A more general and systematic approach is nowundertaken starting from non-dimensional analysis theory.
With reference to Fig. 1, once the tower geometry hasbeen defined, in order to correlate the results of differentoff-design operating conditions, a general functional rela-tion such as (4) can be written.
UðMWin;MGin;MWout;MGout; T Win; T Gin; T Wout;
T Gout; P ; Y Gin; Y GoutÞ ¼ 0 ð4Þ
The number of the independent variables can be definedconsidering that:
� YGin � 0 in every test condition considered, in fact theemployed air is compressed, cooled and dried;� MGout can be derived from the air/gas mass balance
(MGout = MGin);� MWout can be derived from the water mass balance
(MGoutYGout = MWin �MWout);� TWout can be derived from the overall energy balance of
the saturator;� in every test the outlet air can be assumed to be satu-
rated, therefore YGout is directly dependent on TGout
and P, thus P can be eliminated;
Consequently it is possible to simplify Eq. (4) into (5).
UðL � MWin;G � MGin; T Win; T Gin; T Gout; Y GoutÞ ¼ 0 ð5Þ
From the dimensional analysis of the six variables in (5), itis easy to demonstrate that only two dimensions are line-arly independent: these are ‘‘kg/s” and ‘‘K”. Therefore,based on dimensional analysis theory, it is possible to iden-tify 4 (=6–2) non-dimensional groups ‘‘ng” and the generalrelationship among them (6). Such a relationship may beexpressed as in (7):
U0ðng1; ng2; ng3; ng4Þ ¼ 0 ð6Þ
ng1 ¼ k � nga2 � ngb
3 � ngc4 ð7Þ
Parameters k, a, b and c have to be calculated by minimi-zation of the mean square error.
Based on the main equations which control the satura-tor physical behaviour and on the experimental dataobtained from the MOSAT test rig, the non-dimensionalgroups are chosen as follows.
The unknown term of the correlation has to contain theoutlet flow temperature, for practise use of the correlation.In fact, knowing the inlet conditions for the water and airflows, and obtaining the outlet air temperature from thecorrelation, all the others outlet flow properties can beevaluated by usual balance equations. This first non-
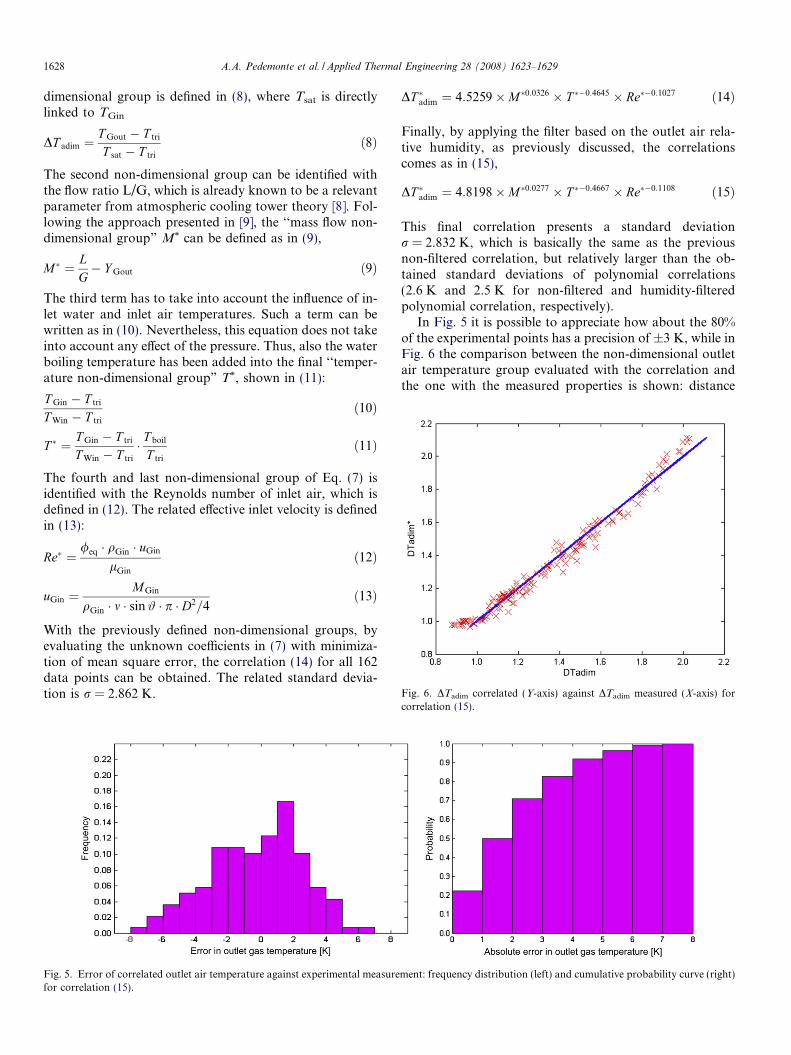
Fig. 6. DTadim correlated (Y-axis) against DTadim measured (X-axis) forcorrelation (15).
1628 A.A. Pedemonte et al. / Applied Thermal Engineering 28 (2008) 1623–1629
dimensional group is defined in (8), where Tsat is directlylinked to TGin
DT adim ¼T Gout � T tri
T sat � T tri
ð8Þ
The second non-dimensional group can be identified withthe flow ratio L/G, which is already known to be a relevantparameter from atmospheric cooling tower theory [8]. Fol-lowing the approach presented in [9], the ‘‘mass flow non-dimensional group” M* can be defined as in (9),
M� ¼ LG� Y Gout ð9Þ
The third term has to take into account the influence of in-let water and inlet air temperatures. Such a term can bewritten as in (10). Nevertheless, this equation does not takeinto account any effect of the pressure. Thus, also the waterboiling temperature has been added into the final ‘‘temper-ature non-dimensional group” T*, shown in (11):
T Gin � T tri
T Win � T tri
ð10Þ
T � ¼ T Gin � T tri
T Win � T tri
� T boil
T tri
ð11Þ
The fourth and last non-dimensional group of Eq. (7) isidentified with the Reynolds number of inlet air, which isdefined in (12). The related effective inlet velocity is definedin (13):
Re� ¼/eq � qGin � uGin
lGin
ð12Þ
uGin ¼MGin
qGin � m � sin# � p � D2=4ð13Þ
With the previously defined non-dimensional groups, byevaluating the unknown coefficients in (7) with minimiza-tion of mean square error, the correlation (14) for all 162data points can be obtained. The related standard devia-tion is r = 2.862 K.
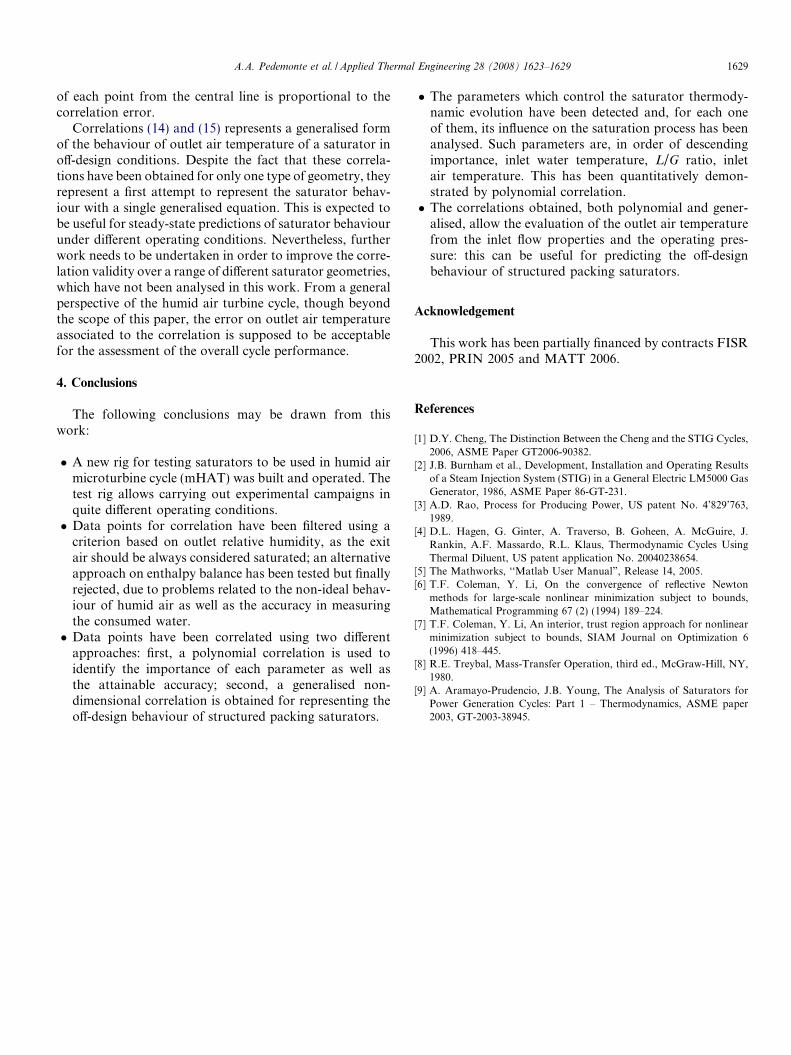
Fig. 5. Error of correlated outlet air temperature against experimental measurefor correlation (15).
DT �adim ¼ 4:5259�M�0:0326 � T ��0:4645 � Re��0:1027 ð14Þ
Finally, by applying the filter based on the outlet air rela-tive humidity, as previously discussed, the correlationscomes as in (15),
DT �adim ¼ 4:8198�M�0:0277 � T ��0:4667 � Re��0:1108 ð15Þ
This final correlation presents a standard deviationr = 2.832 K, which is basically the same as the previousnon-filtered correlation, but relatively larger than the ob-tained standard deviations of polynomial correlations(2.6 K and 2.5 K for non-filtered and humidity-filteredpolynomial correlation, respectively).
In Fig. 5 it is possible to appreciate how about the 80%of the experimental points has a precision of ±3 K, while inFig. 6 the comparison between the non-dimensional outletair temperature group evaluated with the correlation andthe one with the measured properties is shown: distance
ment: frequency distribution (left) and cumulative probability curve (right)
A.A. Pedemonte et al. / Applied Thermal Engineering 28 (2008) 1623–1629 1629
of each point from the central line is proportional to thecorrelation error.
Correlations (14) and (15) represents a generalised formof the behaviour of outlet air temperature of a saturator inoff-design conditions. Despite the fact that these correla-tions have been obtained for only one type of geometry, theyrepresent a first attempt to represent the saturator behav-iour with a single generalised equation. This is expected tobe useful for steady-state predictions of saturator behaviourunder different operating conditions. Nevertheless, furtherwork needs to be undertaken in order to improve the corre-lation validity over a range of different saturator geometries,which have not been analysed in this work. From a generalperspective of the humid air turbine cycle, though beyondthe scope of this paper, the error on outlet air temperatureassociated to the correlation is supposed to be acceptablefor the assessment of the overall cycle performance.
4. Conclusions
The following conclusions may be drawn from thiswork:
� A new rig for testing saturators to be used in humid airmicroturbine cycle (mHAT) was built and operated. Thetest rig allows carrying out experimental campaigns inquite different operating conditions.� Data points for correlation have been filtered using a
criterion based on outlet relative humidity, as the exitair should be always considered saturated; an alternativeapproach on enthalpy balance has been tested but finallyrejected, due to problems related to the non-ideal behav-iour of humid air as well as the accuracy in measuringthe consumed water.� Data points have been correlated using two different
approaches: first, a polynomial correlation is used toidentify the importance of each parameter as well asthe attainable accuracy; second, a generalised non-dimensional correlation is obtained for representing theoff-design behaviour of structured packing saturators.
� The parameters which control the saturator thermody-namic evolution have been detected and, for each oneof them, its influence on the saturation process has beenanalysed. Such parameters are, in order of descendingimportance, inlet water temperature, L/G ratio, inletair temperature. This has been quantitatively demon-strated by polynomial correlation.� The correlations obtained, both polynomial and gener-
alised, allow the evaluation of the outlet air temperaturefrom the inlet flow properties and the operating pres-sure: this can be useful for predicting the off-designbehaviour of structured packing saturators.
Acknowledgement
This work has been partially financed by contracts FISR2002, PRIN 2005 and MATT 2006.
References
[1] D.Y. Cheng, The Distinction Between the Cheng and the STIG Cycles,2006, ASME Paper GT2006-90382.
[2] J.B. Burnham et al., Development, Installation and Operating Resultsof a Steam Injection System (STIG) in a General Electric LM5000 GasGenerator, 1986, ASME Paper 86-GT-231.
[3] A.D. Rao, Process for Producing Power, US patent No. 4’829’763,1989.
[4] D.L. Hagen, G. Ginter, A. Traverso, B. Goheen, A. McGuire, J.Rankin, A.F. Massardo, R.L. Klaus, Thermodynamic Cycles UsingThermal Diluent, US patent application No. 20040238654.
[5] The Mathworks, ‘‘Matlab User Manual”, Release 14, 2005.[6] T.F. Coleman, Y. Li, On the convergence of reflective Newton
methods for large-scale nonlinear minimization subject to bounds,Mathematical Programming 67 (2) (1994) 189–224.
[7] T.F. Coleman, Y. Li, An interior, trust region approach for nonlinearminimization subject to bounds, SIAM Journal on Optimization 6(1996) 418–445.
[8] R.E. Treybal, Mass-Transfer Operation, third ed., McGraw-Hill, NY,1980.
[9] A. Aramayo-Prudencio, J.B. Young, The Analysis of Saturators forPower Generation Cycles: Part 1 – Thermodynamics, ASME paper2003, GT-2003-38945.
Related Documents