CHEMISTRY EXPERIMENT REPORT SOLUBILITY AS A FUNCTION OF TEMPERATURE [experiment title] Waskitarini Darmiyanti 3315133616 REGULAR CLASS OF CHEMISTRY EDUCATION 2013

Welcome message from author
This document is posted to help you gain knowledge. Please leave a comment to let me know what you think about it! Share it to your friends and learn new things together.
Transcript
CHEMISTRY
EXPERIMENT REPORT
SOLUBILITY AS A FUNCTION OF TEMPERATURE
[experiment title]
Waskitarini Darmiyanti
3315133616
REGULAR CLASS OF CHEMISTRY EDUCATION 2013
FACULTY OF MATHEMATICS AND NATURAL SCIENCE
UNIVERSITAS NEGERI JAKARTA
SOLUBILITY AS A FUNCTION OF TEMPERATURE
I. PURPOSE
1. Determine the solubility of the substance at
various temperatures
2. Determine heat differential solvent
3. Determine the effect of temperature on the
solubility of a substance
4. Understanding the relationship between
temperature graph with solubility
5. Determine the average dissolution heat at
different temperature
II. THEORY
In a saturated solution of a proper balance
between the molecules of a substance soluble and
insoluble. The balance can be written as follows:
A(p) A(l)
(1)
A(l) : soluble molecules
A(p) : insoluble molecules
The equilibrium constant for the dissolution
process:
K = a2 / A2 = a2 / 1 = ys ms
(2)
a2 : activity of soluble substances
A2 : liveliness insoluble substances, which took the
price of 1 for solids in the standard state
ys : the activity coefficient of the dissolved
substance
ms : kemolalan zat yang larut yang karena larutan
jenuh disebut kelarutan
solubility is the amount of substance that can
be dissolved in a solvent to form a saturated
solution. As for how to determine the solubility of
a substance is to take a certain amount of pure
solvent, such as 1 liter. Then estimate the amount
of a substance that can form a supersaturated
solution is characterized by the presence of
insoluble solids. Having shaken or stirred
equilibrium will occur between substances that
dissolve substances insoluble (Atkins, 1994).
Equilibrium constant relationship with the process
temperature is given by van't Hoff reaction isobar:
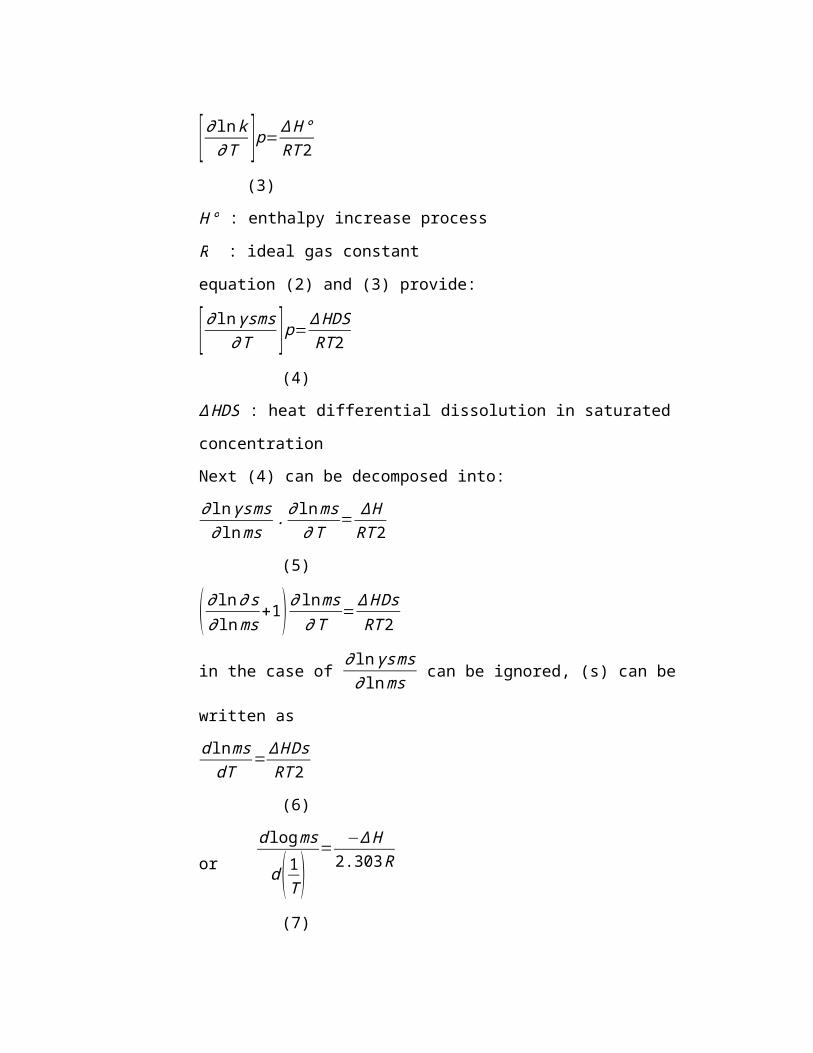
[∂lnk∂T ]p=∆H°RT2
(3)
H° : enthalpy increase processR : ideal gas constantequation (2) and (3) provide:
[∂lnγsms∂T ]p=∆HDSRT2
(4)
∆HDS : heat differential dissolution in saturated concentration
Next (4) can be decomposed into:
∂lnγsms∂lnms
.∂lnms∂T
=∆HRT2
(5)
(∂ln∂s∂lnms+1)∂lnms∂T
=∆HDsRT2
in the case of ∂lnγsms∂lnms can be ignored, (s) can be
written as
dlnmsdT
=∆HDsRT2
(6)
or dlogms
d(1T)=
−∆H2.303R
(7)
Thus ΔH Ds can be determined from the direction
of the tangent to the curve log ms to 1 / T.
If ΔH Ds does not depend on the temperature,
the graph of log ms versus 1 / T will be linear and
integration of equation (7) between the temperatures
T1 and T2 provide:
log ms (T2 )ms(T1)
=∆Hds2.303R .
T2−T1T2.T1
(8)
III. TOOLS AND MATERIALS
Tools:
1. Beaker 1000 mL 1 piece
2. Large test tube (sheath) 1 piece
3. Large test tube 1 piece
4. Stir bar circumference 1 piece
5. Thermometer 100 ℃ 1 piece
6. Pipette volume 10 mL 1 piece
7. Erlenmeyer flask 230 mL 1 piece
8. flask 100 mL 1 piece
9. Pipette volume 25 mL 1 piece
Materials:
1. oxalic acid
2. NaOH (Sodium Hydroxide) 0.5 M
IV. WORK CHART
Make a saturated solution of oxalic acid in a way:
1. Fill water into the tube up to approximately 20
mL, heat until approximately 60 deg C,
dissolving oxalic acid, so the solution becomes
saturated.
2. Then enter the large tube containing a
saturated solution into a large sheath tube and
input into the beaker containing water at room
temperature.
3. A fill tube with a stir bar and thermometer
circumference, as shown in the picture.
Information:
A: large test tube
B: sheat tube
C: sstir bar circumference
D: Thermometer
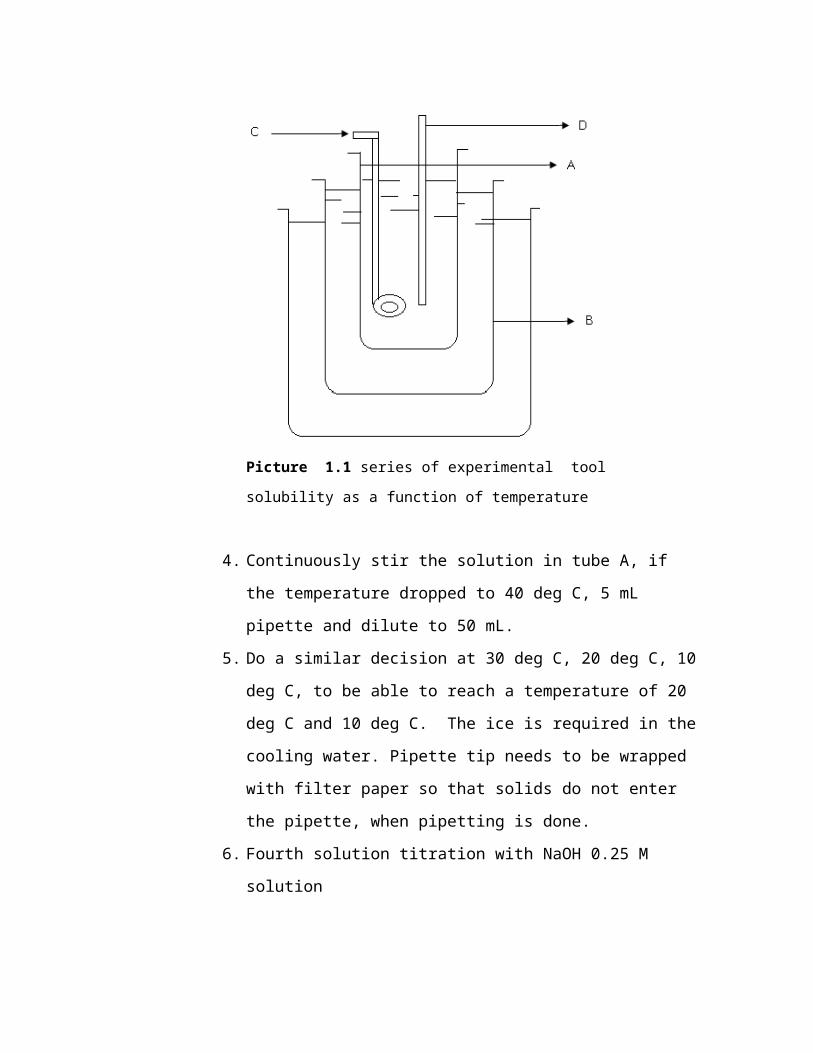
Picture 1.1 series of experimental tool
solubility as a function of temperature
4. Continuously stir the solution in tube A, if
the temperature dropped to 40 deg C, 5 mL
pipette and dilute to 50 mL.
5. Do a similar decision at 30 deg C, 20 deg C, 10
deg C, to be able to reach a temperature of 20
deg C and 10 deg C. The ice is required in the
cooling water. Pipette tip needs to be wrapped
with filter paper so that solids do not enter
the pipette, when pipetting is done.
6. Fourth solution titration with NaOH 0.25 M
solution
a. Determine the solubility of oxalic acid in
the four aforementioned temperature
b. Compute the average heat dissolving the
route (10 deg C - 20 deg C), (20 deg C –
30 deg C), and (30 deg C – 40 deg C).
c. Create logarithmic graphs solubility
versus 1/T and determine the heat of
dilution chart.
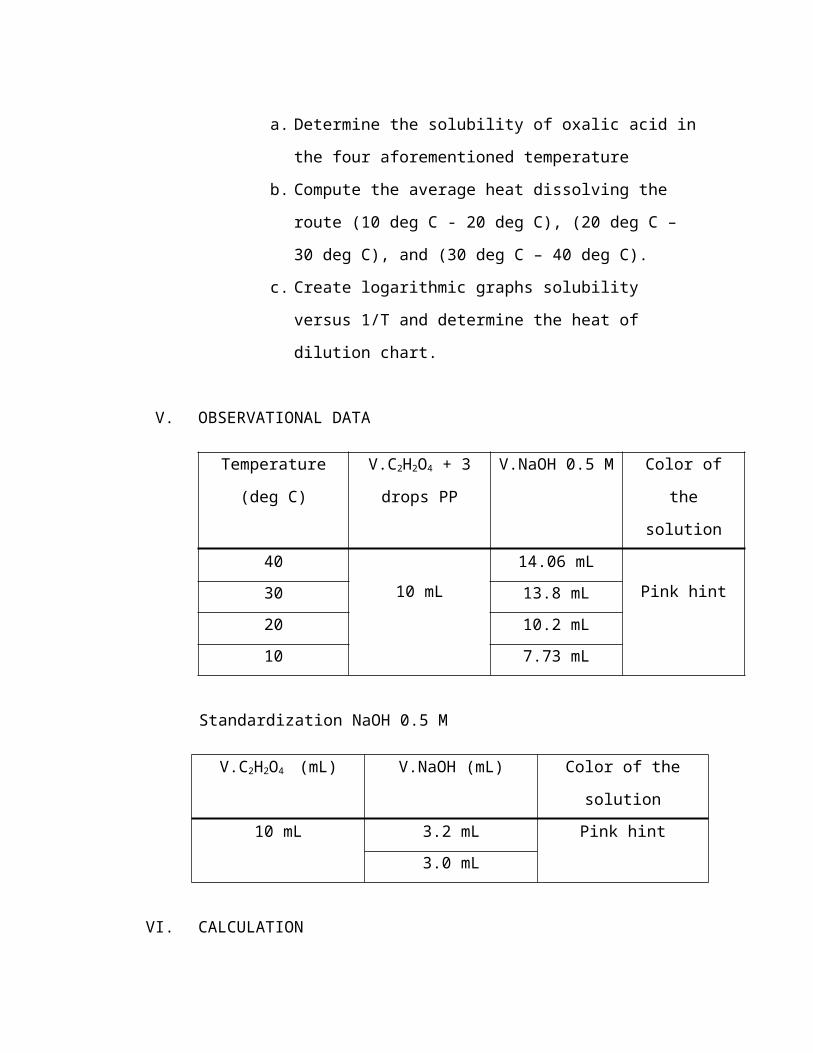
V. OBSERVATIONAL DATA
Temperature
(deg C)
V.C2H2O4 + 3
drops PP
V.NaOH 0.5 M Color of
the
solution40
10 mL14.06 mL
Pink hint30 13.8 mL20 10.2 mL10 7.73 mL
Standardization NaOH 0.5 M
V.C2H2O4 (mL) V.NaOH (mL) Color of the
solution10 mL 3.2 mL Pink hint
3.0 mL
VI. CALCULATION
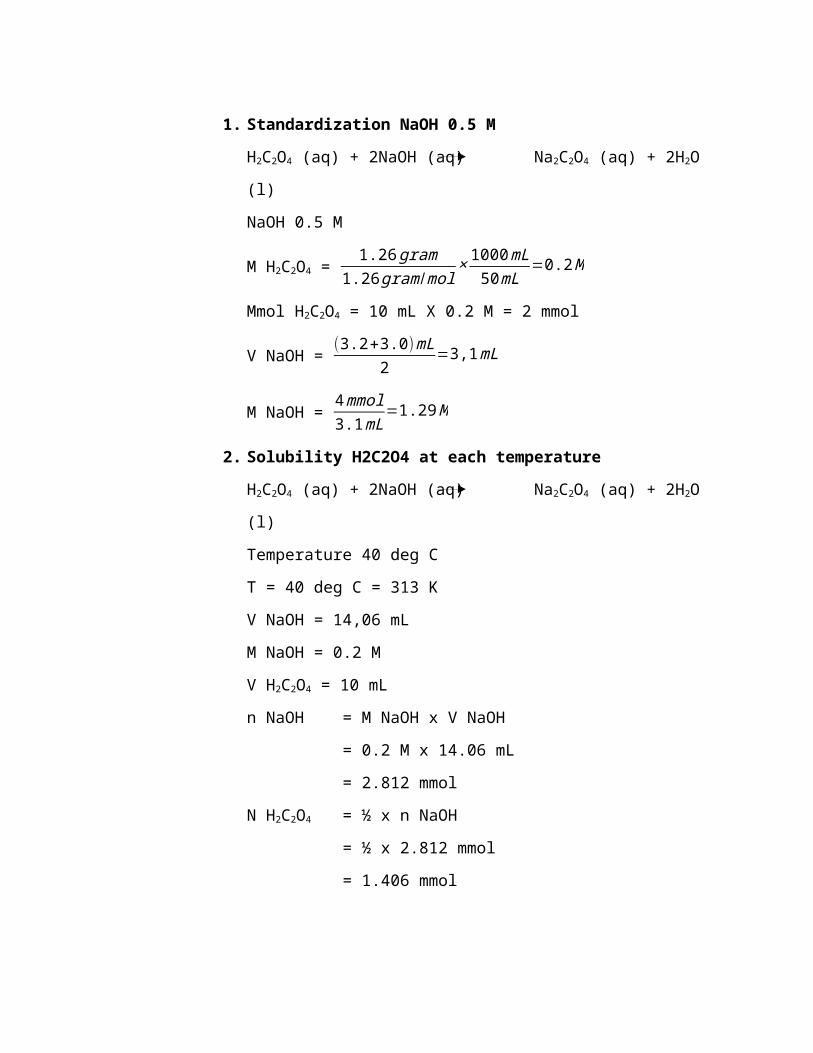
1. Standardization NaOH 0.5 M
H2C2O4 (aq) + 2NaOH (aq) Na2C2O4 (aq) + 2H2O
(l)
NaOH 0.5 M
M H2C2O4 = 1.26gram
1.26gram /mol× 1000mL
50mL=0.2M
Mmol H2C2O4 = 10 mL X 0.2 M = 2 mmol
V NaOH = (3.2+3.0)mL2
=3,1mL
M NaOH = 4mmol3.1mL=1.29M
2. Solubility H2C2O4 at each temperature
H2C2O4 (aq) + 2NaOH (aq) Na2C2O4 (aq) + 2H2O
(l)
Temperature 40 deg C
T = 40 deg C = 313 K
V NaOH = 14,06 mL
M NaOH = 0.2 M
V H2C2O4 = 10 mL
n NaOH = M NaOH x V NaOH
= 0.2 M x 14.06 mL
= 2.812 mmol
N H2C2O4 = ½ x n NaOH
= ½ x 2.812 mmol
= 1.406 mmol
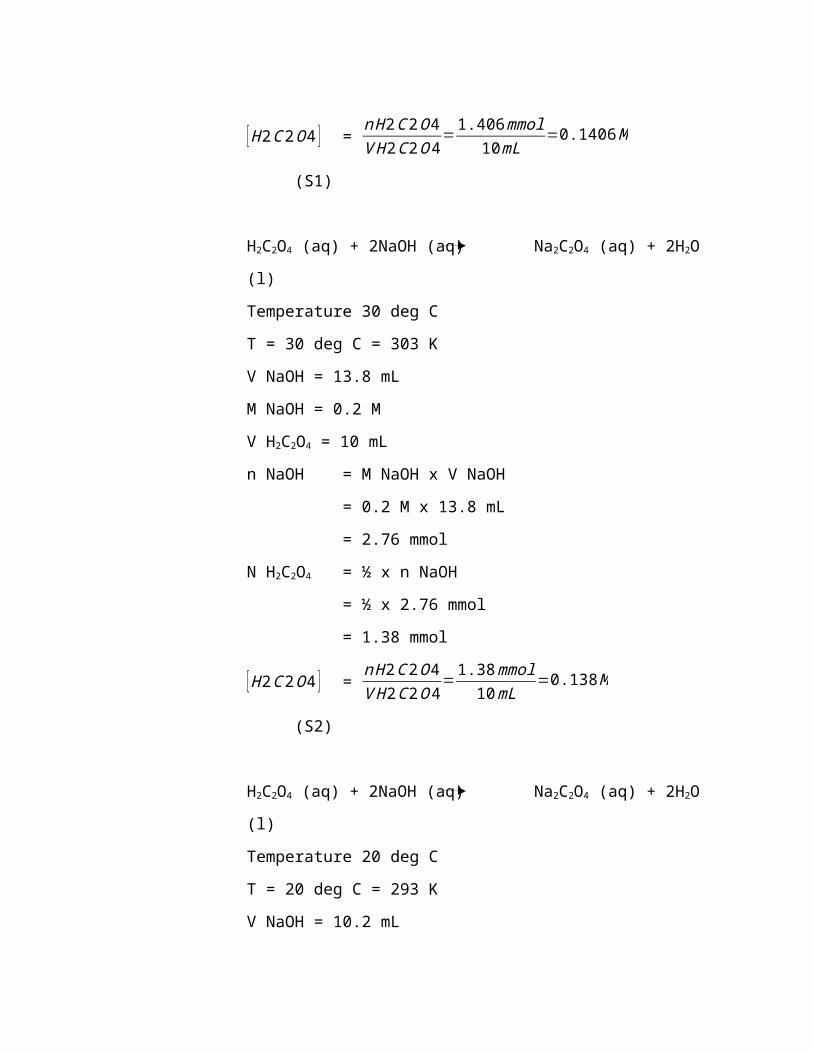
[H2C2O4 ] = nH2C2O4VH2C2O4=1.406mmol
10mL=0.1406M
(S1)
H2C2O4 (aq) + 2NaOH (aq) Na2C2O4 (aq) + 2H2O
(l)
Temperature 30 deg C
T = 30 deg C = 303 K
V NaOH = 13.8 mL
M NaOH = 0.2 M
V H2C2O4 = 10 mL
n NaOH = M NaOH x V NaOH
= 0.2 M x 13.8 mL
= 2.76 mmol
N H2C2O4 = ½ x n NaOH
= ½ x 2.76 mmol
= 1.38 mmol
[H2C2O4 ] = nH2C2O4VH2C2O4=1.38mmol10mL
=0.138M
(S2)
H2C2O4 (aq) + 2NaOH (aq) Na2C2O4 (aq) + 2H2O
(l)
Temperature 20 deg C
T = 20 deg C = 293 K
V NaOH = 10.2 mL
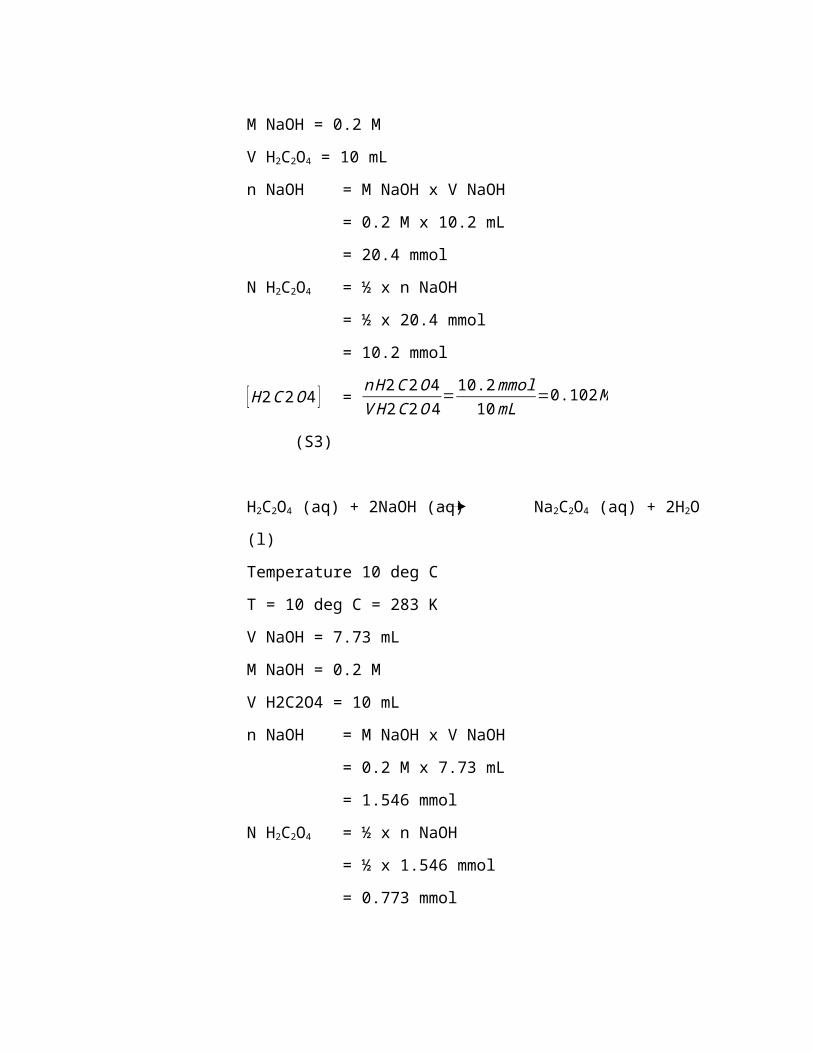
M NaOH = 0.2 M
V H2C2O4 = 10 mL
n NaOH = M NaOH x V NaOH
= 0.2 M x 10.2 mL
= 20.4 mmol
N H2C2O4 = ½ x n NaOH
= ½ x 20.4 mmol
= 10.2 mmol
[H2C2O4 ] = nH2C2O4VH2C2O4=10.2mmol10mL
=0.102M
(S3)
H2C2O4 (aq) + 2NaOH (aq) Na2C2O4 (aq) + 2H2O
(l)
Temperature 10 deg C
T = 10 deg C = 283 K
V NaOH = 7.73 mL
M NaOH = 0.2 M
V H2C2O4 = 10 mL
n NaOH = M NaOH x V NaOH
= 0.2 M x 7.73 mL
= 1.546 mmol
N H2C2O4 = ½ x n NaOH
= ½ x 1.546 mmol
= 0.773 mmol
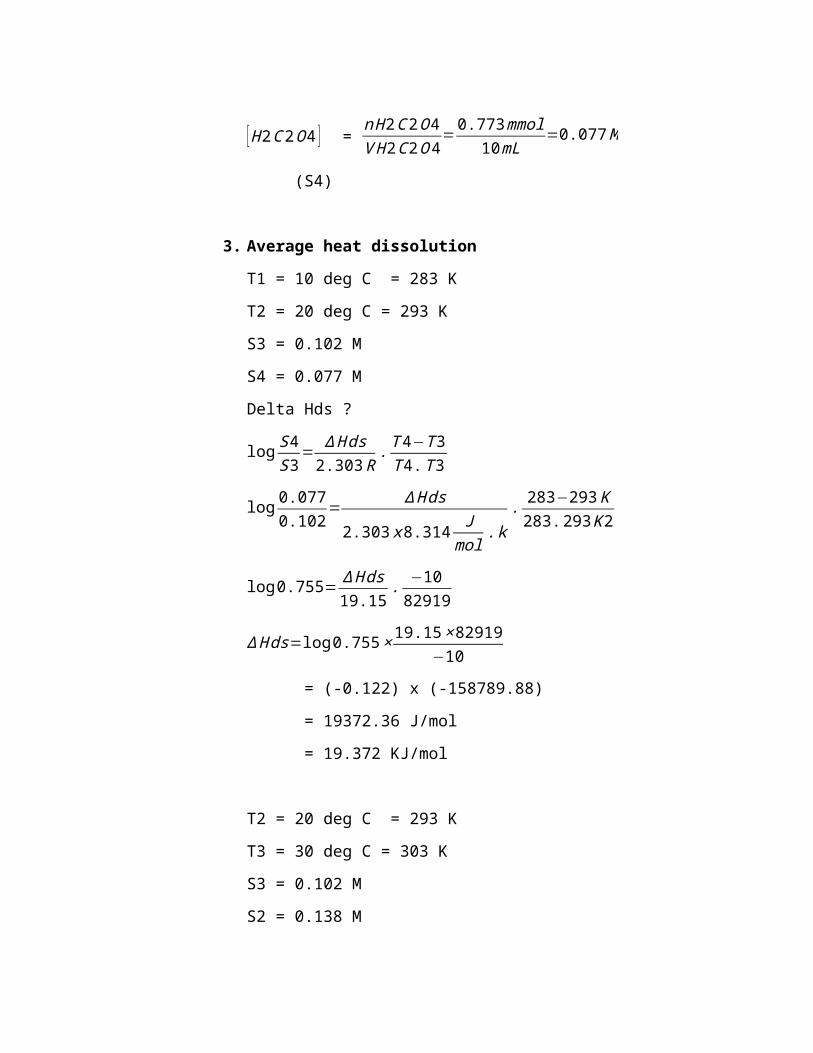
[H2C2O4 ] = nH2C2O4VH2C2O4=0.773mmol
10mL=0.077M
(S4)
3. Average heat dissolution
T1 = 10 deg C = 283 K
T2 = 20 deg C = 293 K
S3 = 0.102 M
S4 = 0.077 M
Delta Hds ?
log S4S3
=∆Hds2.303R
.T4−T3T4.T3
log 0.0770.102
=∆Hds
2.303x8.314 Jmol .k
. 283−293K283.293K2
log0.755= ∆Hds19.15
. −1082919
∆Hds=log0.755×19.15×82919−10
= (-0.122) x (-158789.88)
= 19372.36 J/mol
= 19.372 KJ/mol
T2 = 20 deg C = 293 K
T3 = 30 deg C = 303 K
S3 = 0.102 M
S2 = 0.138 M
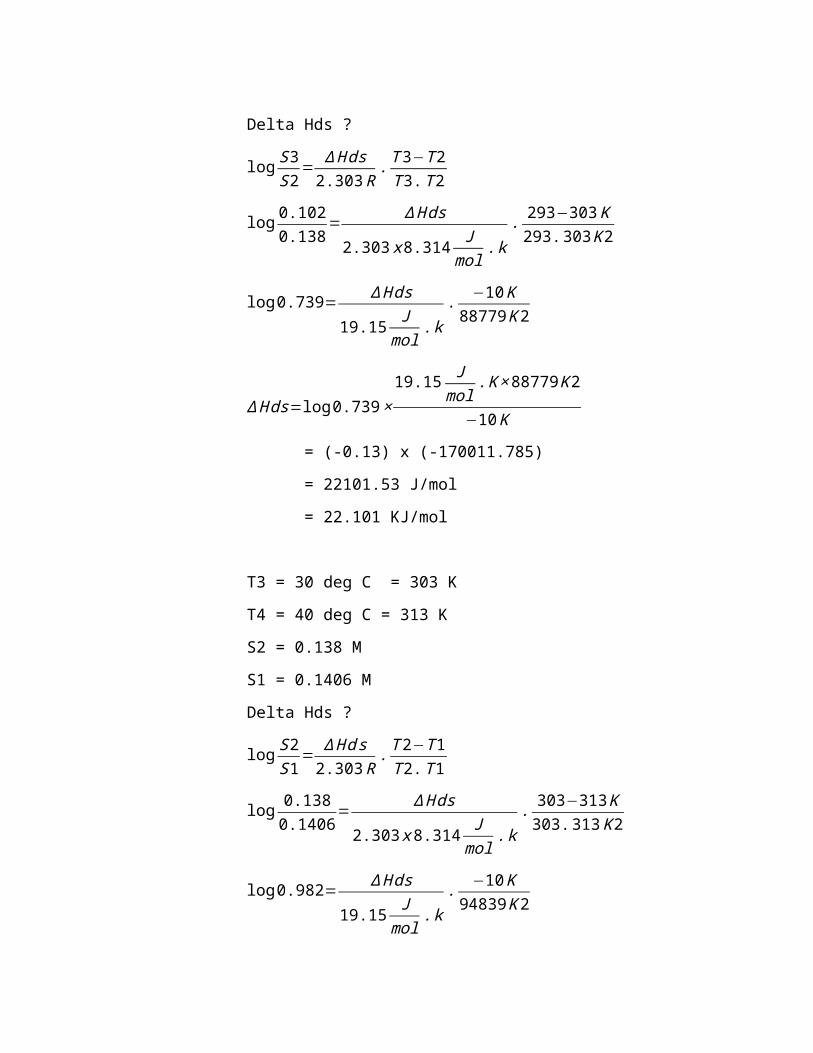
Delta Hds ?
log S3S2
=∆Hds2.303R
.T3−T2T3.T2
log 0.1020.138
= ∆Hds
2.303x8.314 Jmol .k
. 293−303K293.303K2
log0.739= ∆Hds
19.15 Jmol .k
. −10K88779K2
∆Hds=log0.739×19.15 J
mol.K×88779K2
−10K = (-0.13) x (-170011.785)
= 22101.53 J/mol
= 22.101 KJ/mol
T3 = 30 deg C = 303 K
T4 = 40 deg C = 313 K
S2 = 0.138 M
S1 = 0.1406 M
Delta Hds ?
log S2S1
=∆Hds2.303R
.T2−T1T2.T1
log 0.1380.1406
=∆Hds
2.303x8.314 Jmol .k
. 303−313K303.313K2
log0.982=∆Hds
19.15 Jmol .k
. −10K94839K2
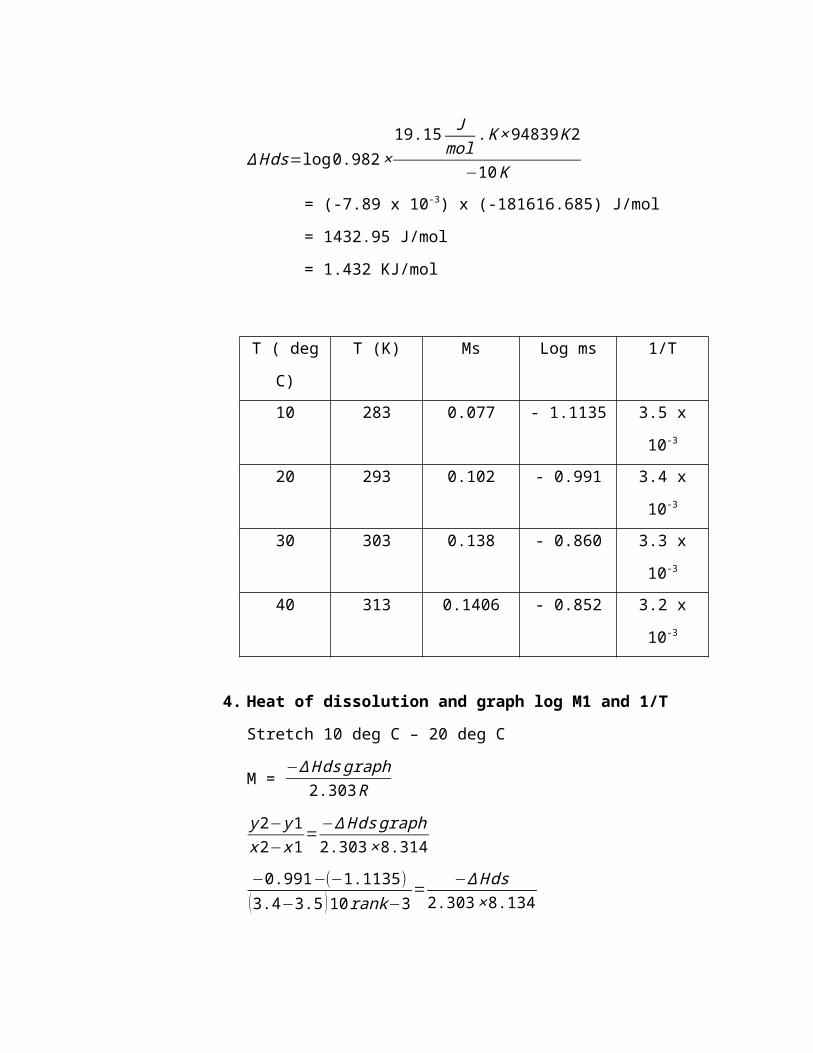
∆Hds=log0.982×19.15 J
mol.K×94839K2
−10K = (-7.89 x 10⁻³) x (-181616.685) J/mol
= 1432.95 J/mol
= 1.432 KJ/mol
T ( deg
C)
T (K) Ms Log ms 1/T
10 283 0.077 - 1.1135 3.5 x
10-3
20 293 0.102 - 0.991 3.4 x
10-3
30 303 0.138 - 0.860 3.3 x
10-3
40 313 0.1406 - 0.852 3.2 x
10-3
4. Heat of dissolution and graph log M1 and 1/T
Stretch 10 deg C – 20 deg C
M = −∆Hdsgraph2.303R
y2−y1x2−x1
=−∆Hdsgraph2.303×8.314
−0.991−(−1.1135)
(3.4−3.5 )10rank−3= −∆Hds2.303×8.134
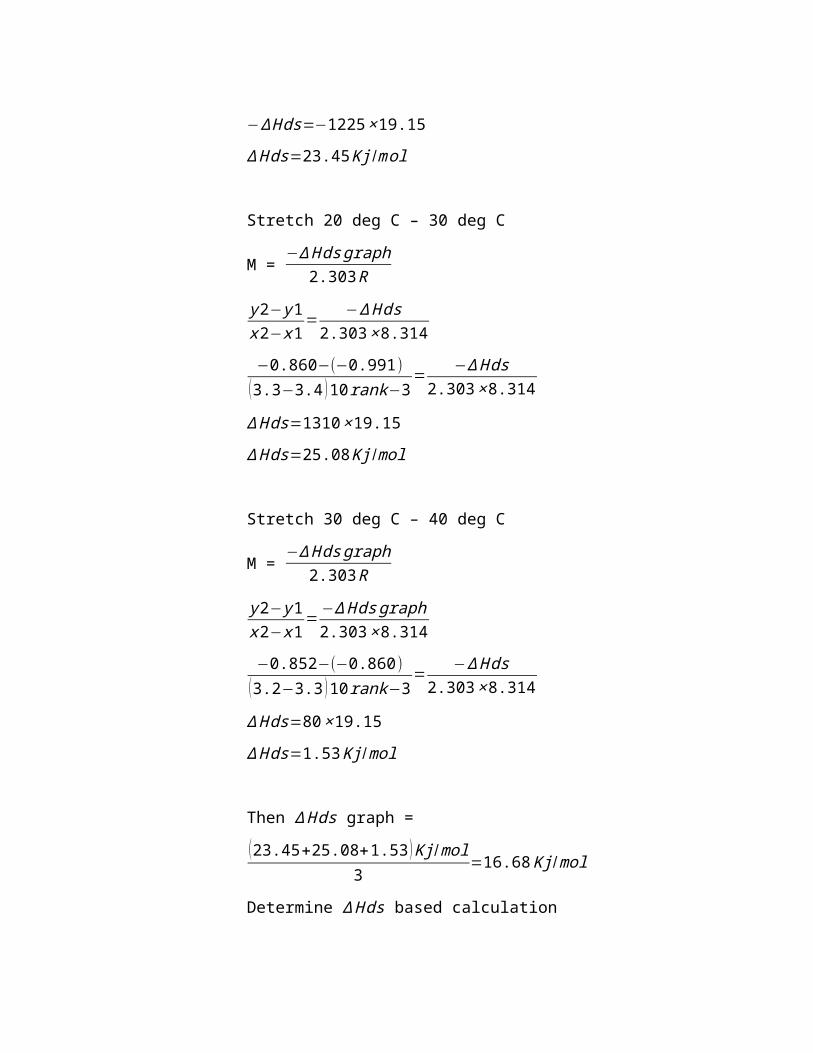
−∆Hds=−1225×19.15∆Hds=23.45Kj /mol
Stretch 20 deg C – 30 deg C
M = −∆Hdsgraph2.303R
y2−y1x2−x1
=−∆Hds
2.303×8.314−0.860−(−0.991)
(3.3−3.4 )10rank−3=
−∆Hds2.303×8.314
∆Hds=1310×19.15∆Hds=25.08Kj /mol
Stretch 30 deg C – 40 deg C
M = −∆Hdsgraph2.303R
y2−y1x2−x1
= −∆Hdsgraph2.303×8.314
−0.852−(−0.860)
(3.2−3.3 )10rank−3=
−∆Hds2.303×8.314
∆Hds=80×19.15∆Hds=1.53Kj/mol
Then ∆Hds graph =(23.45+25.08+1.53)Kj/mol
3=16.68Kj/mol
Determine ∆Hds based calculation
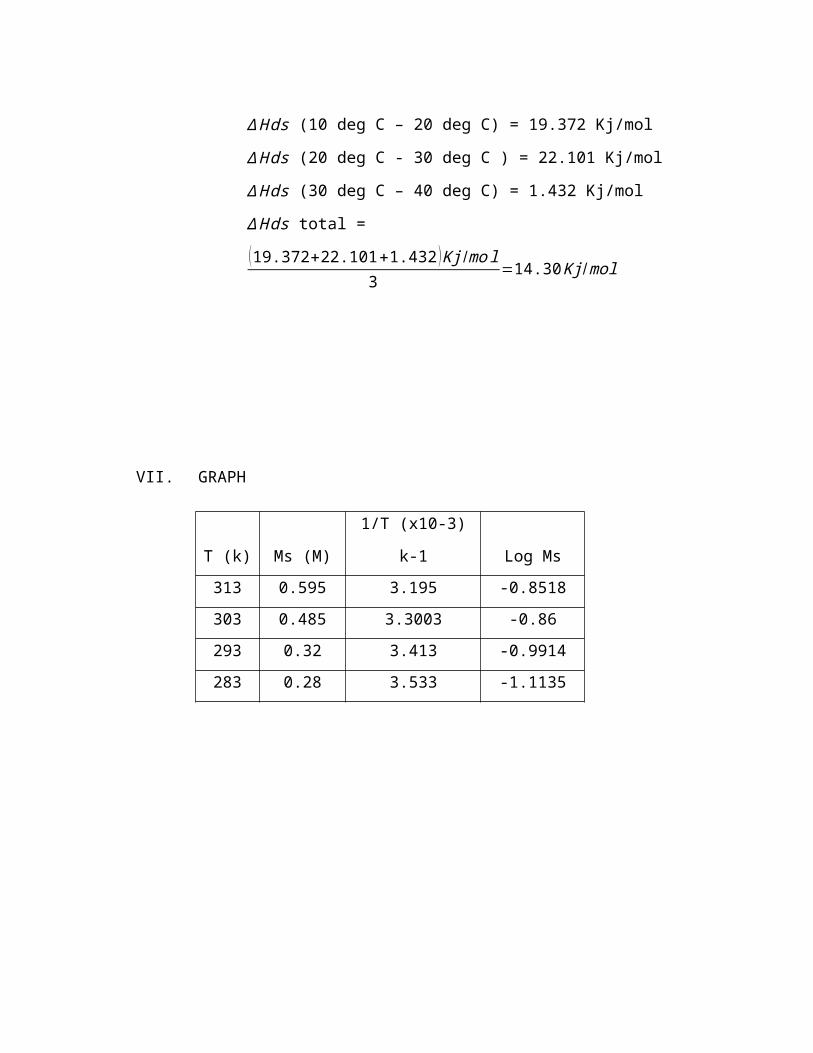
∆Hds (10 deg C – 20 deg C) = 19.372 Kj/mol∆Hds (20 deg C - 30 deg C ) = 22.101 Kj/mol∆Hds (30 deg C – 40 deg C) = 1.432 Kj/mol∆Hds total =(19.372+22.101+1.432 )Kj /mol
3=14.30Kj/mol
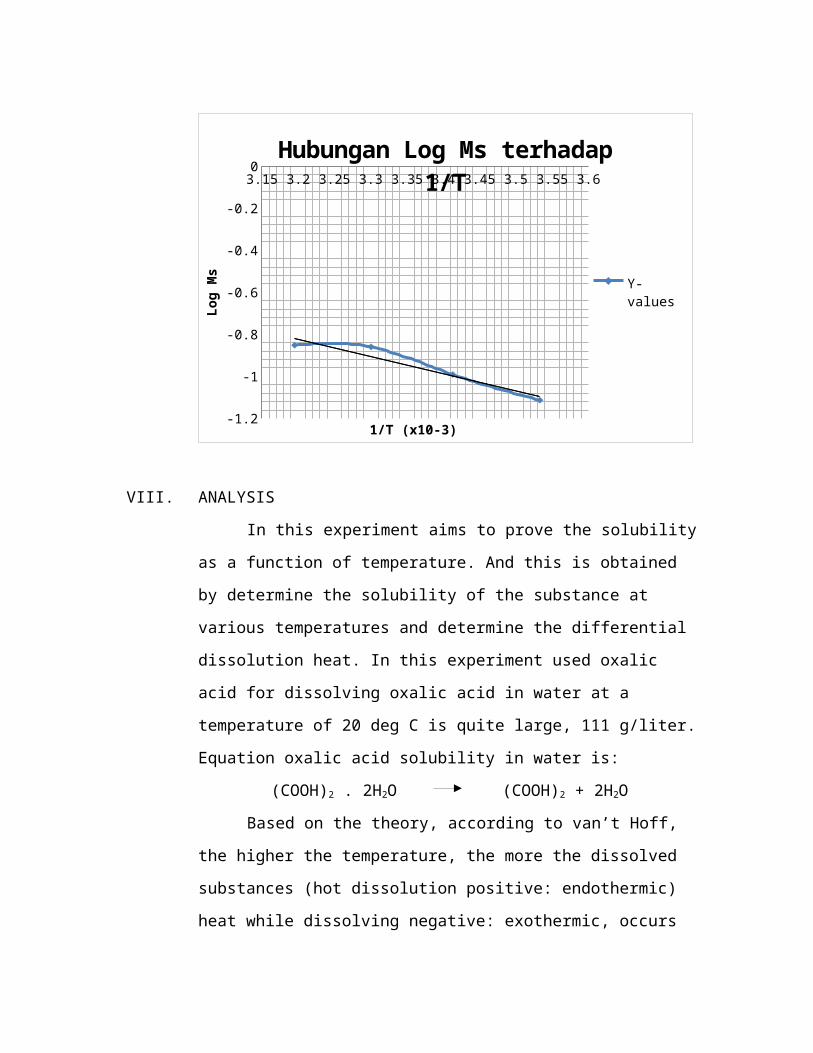
VII. GRAPH
T (k) Ms (M)
1/T (x10-3)
k-1 Log Ms313 0.595 3.195 -0.8518303 0.485 3.3003 -0.86293 0.32 3.413 -0.9914283 0.28 3.533 -1.1135
3.15 3.2 3.25 3.3 3.35 3.4 3.45 3.5 3.55 3.6
-1.2
-1
-0.8
-0.6
-0.4
-0.2
0Hubungan Log Ms terhadap
1/T
Y-values
1/T (x10-3)
Log
Ms
VIII. ANALYSIS
In this experiment aims to prove the solubility
as a function of temperature. And this is obtained
by determine the solubility of the substance at
various temperatures and determine the differential
dissolution heat. In this experiment used oxalic
acid for dissolving oxalic acid in water at a
temperature of 20 deg C is quite large, 111 g/liter.
Equation oxalic acid solubility in water is:
(COOH)2 . 2H2O (COOH)2 + 2H2O
Based on the theory, according to van’t Hoff,
the higher the temperature, the more the dissolved
substances (hot dissolution positive: endothermic)
heat while dissolving negative: exothermic, occurs
when dissolved substances on the wane when the
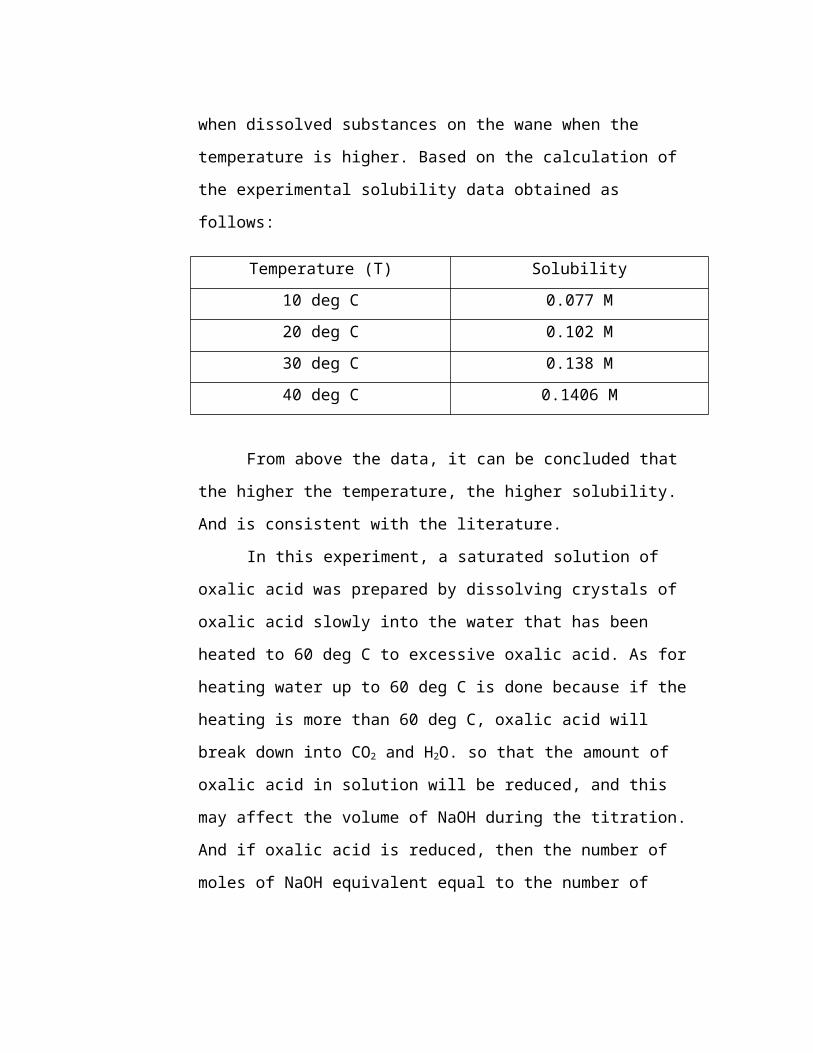
temperature is higher. Based on the calculation of
the experimental solubility data obtained as
follows:
Temperature (T) Solubility10 deg C 0.077 M20 deg C 0.102 M30 deg C 0.138 M40 deg C 0.1406 M
From above the data, it can be concluded that
the higher the temperature, the higher solubility.
And is consistent with the literature.
In this experiment, a saturated solution of
oxalic acid was prepared by dissolving crystals of
oxalic acid slowly into the water that has been
heated to 60 deg C to excessive oxalic acid. As for
heating water up to 60 deg C is done because if the
heating is more than 60 deg C, oxalic acid will
break down into CO2 and H2O. so that the amount of
oxalic acid in solution will be reduced, and this
may affect the volume of NaOH during the titration.
And if oxalic acid is reduced, then the number of
moles of NaOH equivalent equal to the number of
moles of oxalic acid equivalent will be reduced as
well.
After reaching a temperature of 60 deg C and
becomes saturated or not dissolved yet, be cooling
until the temperature reaches 40 deg C, 30 deg C, 20
deg C, 10 deg C. cooling of the solution is done by
adding ice cubes. Any decrease in temperature of 10
deg C, 10 mL diluted in 100 mL volumetric flask,
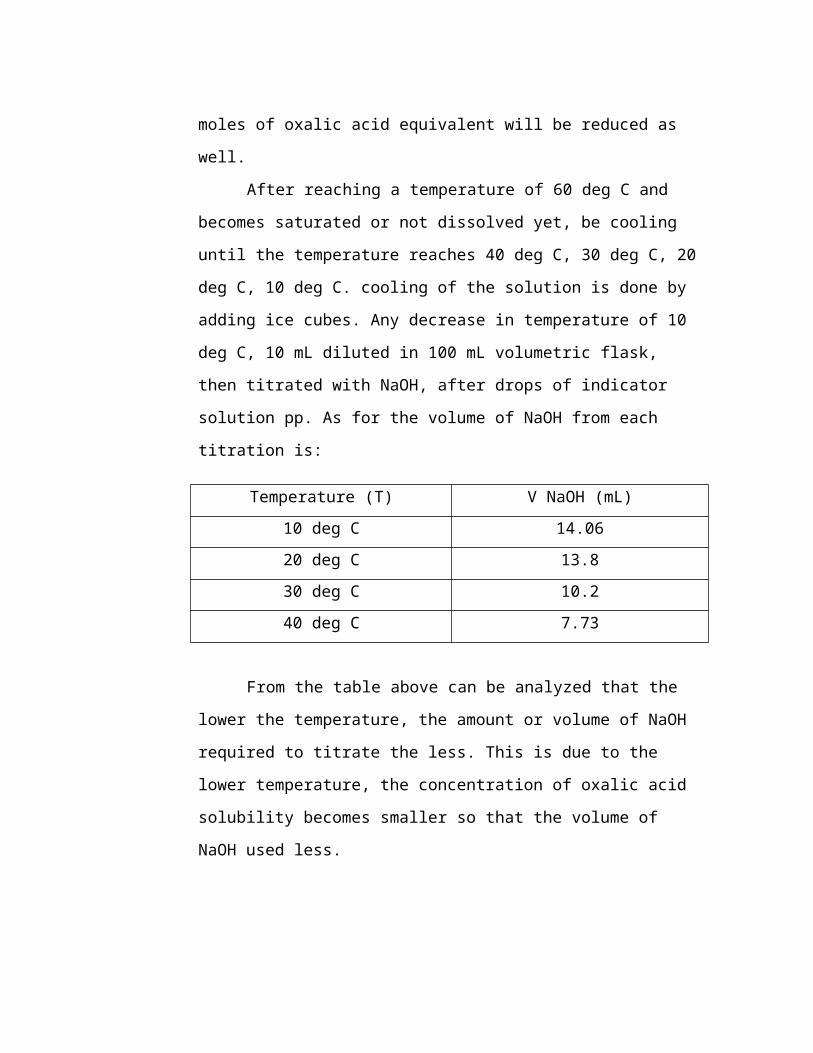
then titrated with NaOH, after drops of indicator
solution pp. As for the volume of NaOH from each
titration is:
Temperature (T) V NaOH (mL)10 deg C 14.0620 deg C 13.830 deg C 10.240 deg C 7.73
From the table above can be analyzed that the
lower the temperature, the amount or volume of NaOH
required to titrate the less. This is due to the
lower temperature, the concentration of oxalic acid
solubility becomes smaller so that the volume of
NaOH used less.
The method used to determine the delta H sector
in the reaction can be done by law Van Haff by
equation:
dlnmsdT
=∆HDsRT2 , which later on became an integral
logs=−∆H
2.303RT+C
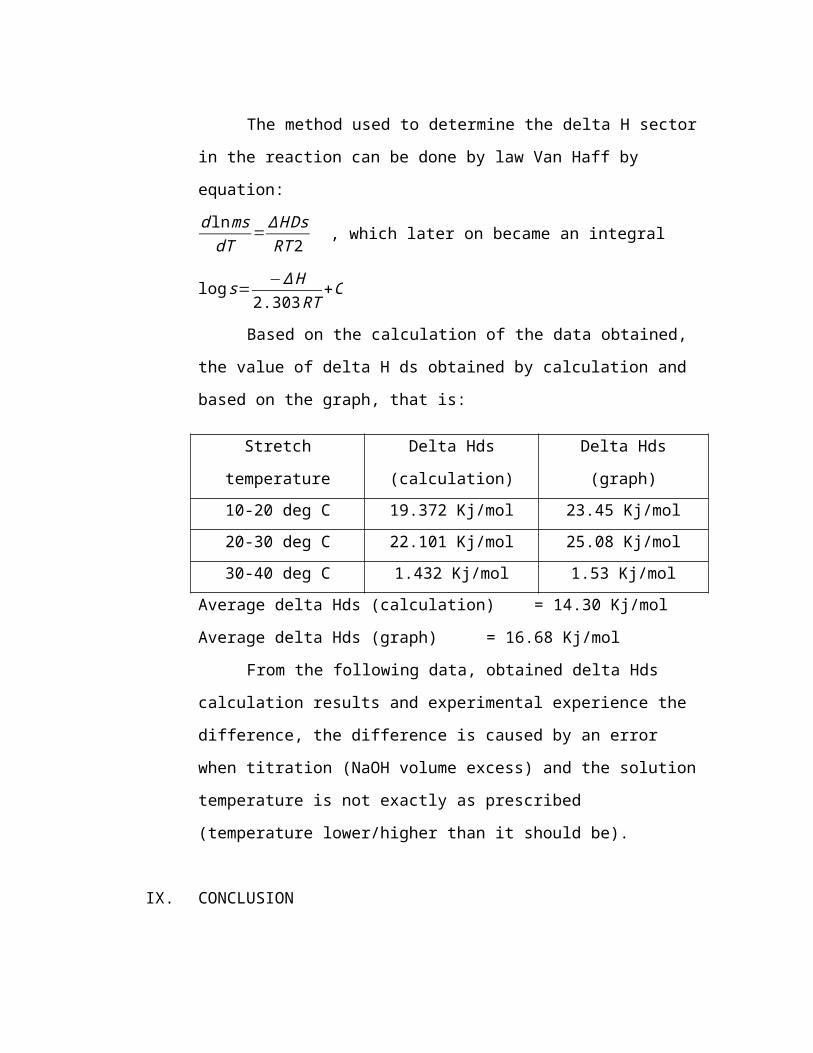
Based on the calculation of the data obtained,
the value of delta H ds obtained by calculation and
based on the graph, that is:
Stretch
temperature
Delta Hds
(calculation)
Delta Hds
(graph)10-20 deg C 19.372 Kj/mol 23.45 Kj/mol20-30 deg C 22.101 Kj/mol 25.08 Kj/mol30-40 deg C 1.432 Kj/mol 1.53 Kj/mol
Average delta Hds (calculation) = 14.30 Kj/mol
Average delta Hds (graph) = 16.68 Kj/mol
From the following data, obtained delta Hds
calculation results and experimental experience the
difference, the difference is caused by an error
when titration (NaOH volume excess) and the solution
temperature is not exactly as prescribed
(temperature lower/higher than it should be).
IX. CONCLUSION
1. Solubility is the maximum amount of dissolved
substance/can be dissolved in a solvent to form
a saturated solution.
2. Ms value at reach temperature is:
10 deg C = 0.077 M
20 deg C = 0.102 M
30 deg C = 0.138 M
40 deg C = 0.1406 M
3. The higher temperature, the greater solubility
of the substance. Solubility is propotional to
the temperature.
4. The higher temperature, the volume of NaOH
required to titrate the less.
5. The titration aims to determine the equivalent
point when added H2C2O4 pp indicator turned
purple hint.
6. Differential heating value proportional to the
temperature, the greater the differential
heating value greater solubility of the
substance.
7. Delta H ds based calculation is 14.30 Kj/mol,
while the delta H ds is based on the graph is
16.68 Kj/mol.
X. BIBLIOGRAPHY
Alberty, Robert A. 1991. Kimia Fisik. Jakarta:
Erlangga.
Atkins, PW. 1999. Kimia Fisik Jilid I, Edisi Lima. Jakarta:
Erlangga.
Daniel, F. 1992. Kimia Fisik I. Jakarta: Erlangga.
Sutardjo. 1989. Kimia Fisik. Jakarta: Bina Aksara
Vogel. 1990. Buku Teks Anorganik Kualitatif. Jakarta:
PT.Kalman Media Pustaka
Related Documents