applied sciences Article Experiment-Based Fatigue Behaviors and Damage Detection Study of Headed Shear Studs in Steel–Concrete Composite Beams Jun Xu 1 , Huahuai Sun 2, * , Weizhen Chen 1 and Xuan Guo 2 Citation: Xu, J.; Sun, H.; Chen, W.; Guo, X. Experiment-Based Fatigue Behaviors and Damage Detection Study of Headed Shear Studs in Steel–Concrete Composite Beams. Appl. Sci. 2021, 11, 8297. https:// doi.org/10.3390/app11188297 Academic Editor: Dario De Domenico Received: 3 August 2021 Accepted: 3 September 2021 Published: 7 September 2021 Publisher’s Note: MDPI stays neutral with regard to jurisdictional claims in published maps and institutional affil- iations. Copyright: © 2021 by the authors. Licensee MDPI, Basel, Switzerland. This article is an open access article distributed under the terms and conditions of the Creative Commons Attribution (CC BY) license (https:// creativecommons.org/licenses/by/ 4.0/). 1 Department of Bridge Engineering, Tongji University, Shanghai 200092, China; [email protected] (J.X.); [email protected] (W.C.) 2 College of Civil Science and Engineering, Yangzhou University, Yangzhou 225127, China; [email protected] * Correspondence: [email protected] Abstract: Many in-service bridges with steel–concrete composite beams are currently aging and experiencing performance deterioration. Under long-term cyclic loads from traffic on bridges, headed shear studs in steel–concrete composite beams are vulnerable to fatigue damage. The comprehensive understanding of fatigue behaviors and the feasible detection of fatigue damage of headed shear studs is, thus, crucial for the accurate numerical simulation of the fatigue crack propagation process. The paper, thus, experimentally investigates the fatigue behaviors of headed shear studs through push-out tests of three specimens. The fatigue failure modes and cyclic strain evolution of specimens are analyzed. The fatigue lives of headed shear studs are compared with the S–N curves of the AASHTO, Eurocode 4 and BS5400 codes. The fatigue crack details of shear studs in push-out tests are then detected using the ultrasonic non-destructive testing. The results show that the root fracture is the main fatigue failure mode of shear studs under fatigue loading. The fatigue life estimations based on the three current codes (i.e., AASHTO, Eurocode 4 and BS5400) can be safely guaranteed only with different safety redundancies. The strain at the shear stud with fatigue damage shows a consistent increasing trend followed by decreasing behavior after reaching the peak value with the loading cycles. Moreover, the feasibility of the ultrasonic non-destructive testing with the combination of a strain measurement for fatigue crack details detection of headed shear studs in composite beams is proved. Keywords: headed shear studs; push-out test; fatigue failure modes; strain evolution; fatigue crack; ultrasonic non-destructive testing 1. Introduction Steel–concrete composite beams have been widely constructed in many bridges in recent decades [1]. Shear connectors are used to provide a mechanism for longitudinal shear transfer across the steel and concrete interface. Among different kinds of shear connectors, the most frequently used type is headed shear studs because of the installation efficiency and economic considerations [2]. So far, a growing number of composite bridges are gradually entering the aging period. Subjected to long-term cyclic loads from traffic on bridges, headed shear studs in steel–concrete composite beams are vulnerable to fatigue failures. However, the present understanding of fatigue behaviors and damage detection of headed shear studs is still incomprehensive. The fatigue damage of the headed shear studs is, thus, becoming ever more prominent, and an in-depth study on the problem appears more and more crucial. Since the first engineering application of shear connectors, the fatigue problem has always been a vital factor in the design, given the connection geometry and welding imperfections [3]. The study on fatigue characteristics of headed shear studs originated in Appl. Sci. 2021, 11, 8297. https://doi.org/10.3390/app11188297 https://www.mdpi.com/journal/applsci

Welcome message from author
This document is posted to help you gain knowledge. Please leave a comment to let me know what you think about it! Share it to your friends and learn new things together.
Transcript
applied sciences
Article
Experiment-Based Fatigue Behaviors and Damage DetectionStudy of Headed Shear Studs in Steel–ConcreteComposite Beams
Jun Xu 1, Huahuai Sun 2,* , Weizhen Chen 1 and Xuan Guo 2
�����������������
Citation: Xu, J.; Sun, H.; Chen, W.;
Guo, X. Experiment-Based Fatigue
Behaviors and Damage Detection
Study of Headed Shear Studs in
Steel–Concrete Composite Beams.
Appl. Sci. 2021, 11, 8297. https://
doi.org/10.3390/app11188297
Academic Editor: Dario De Domenico
Received: 3 August 2021
Accepted: 3 September 2021
Published: 7 September 2021
Publisher’s Note: MDPI stays neutral
with regard to jurisdictional claims in
published maps and institutional affil-
iations.
Copyright: © 2021 by the authors.
Licensee MDPI, Basel, Switzerland.
This article is an open access article
distributed under the terms and
conditions of the Creative Commons
Attribution (CC BY) license (https://
creativecommons.org/licenses/by/
4.0/).
1 Department of Bridge Engineering, Tongji University, Shanghai 200092, China; [email protected] (J.X.);[email protected] (W.C.)
2 College of Civil Science and Engineering, Yangzhou University, Yangzhou 225127, China;[email protected]
* Correspondence: [email protected]
Abstract: Many in-service bridges with steel–concrete composite beams are currently aging andexperiencing performance deterioration. Under long-term cyclic loads from traffic on bridges, headedshear studs in steel–concrete composite beams are vulnerable to fatigue damage. The comprehensiveunderstanding of fatigue behaviors and the feasible detection of fatigue damage of headed shearstuds is, thus, crucial for the accurate numerical simulation of the fatigue crack propagation process.The paper, thus, experimentally investigates the fatigue behaviors of headed shear studs throughpush-out tests of three specimens. The fatigue failure modes and cyclic strain evolution of specimensare analyzed. The fatigue lives of headed shear studs are compared with the S–N curves of theAASHTO, Eurocode 4 and BS5400 codes. The fatigue crack details of shear studs in push-out tests arethen detected using the ultrasonic non-destructive testing. The results show that the root fracture isthe main fatigue failure mode of shear studs under fatigue loading. The fatigue life estimations basedon the three current codes (i.e., AASHTO, Eurocode 4 and BS5400) can be safely guaranteed only withdifferent safety redundancies. The strain at the shear stud with fatigue damage shows a consistentincreasing trend followed by decreasing behavior after reaching the peak value with the loadingcycles. Moreover, the feasibility of the ultrasonic non-destructive testing with the combination of astrain measurement for fatigue crack details detection of headed shear studs in composite beamsis proved.
Keywords: headed shear studs; push-out test; fatigue failure modes; strain evolution; fatigue crack;ultrasonic non-destructive testing
1. Introduction
Steel–concrete composite beams have been widely constructed in many bridges inrecent decades [1]. Shear connectors are used to provide a mechanism for longitudinalshear transfer across the steel and concrete interface. Among different kinds of shearconnectors, the most frequently used type is headed shear studs because of the installationefficiency and economic considerations [2]. So far, a growing number of composite bridgesare gradually entering the aging period. Subjected to long-term cyclic loads from traffic onbridges, headed shear studs in steel–concrete composite beams are vulnerable to fatiguefailures. However, the present understanding of fatigue behaviors and damage detection ofheaded shear studs is still incomprehensive. The fatigue damage of the headed shear studsis, thus, becoming ever more prominent, and an in-depth study on the problem appearsmore and more crucial.
Since the first engineering application of shear connectors, the fatigue problem hasalways been a vital factor in the design, given the connection geometry and weldingimperfections [3]. The study on fatigue characteristics of headed shear studs originated in
Appl. Sci. 2021, 11, 8297. https://doi.org/10.3390/app11188297 https://www.mdpi.com/journal/applsci
Appl. Sci. 2021, 11, 8297 2 of 18
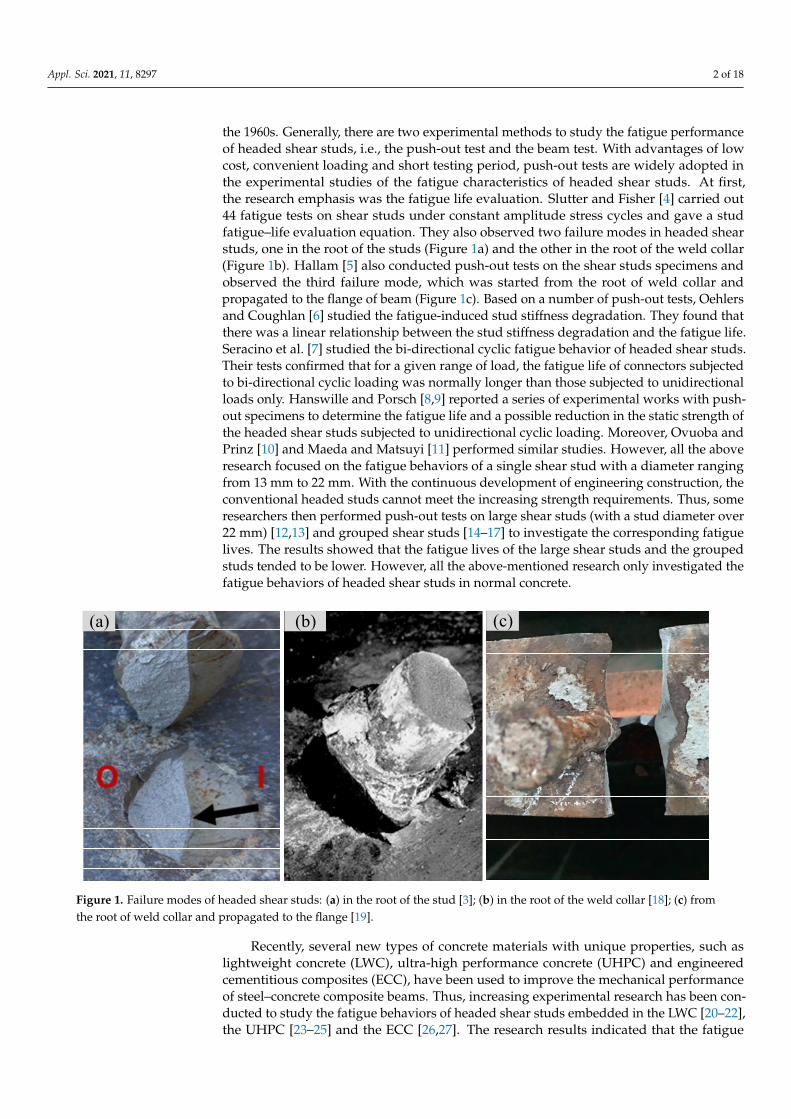
the 1960s. Generally, there are two experimental methods to study the fatigue performanceof headed shear studs, i.e., the push-out test and the beam test. With advantages of lowcost, convenient loading and short testing period, push-out tests are widely adopted inthe experimental studies of the fatigue characteristics of headed shear studs. At first,the research emphasis was the fatigue life evaluation. Slutter and Fisher [4] carried out44 fatigue tests on shear studs under constant amplitude stress cycles and gave a studfatigue–life evaluation equation. They also observed two failure modes in headed shearstuds, one in the root of the studs (Figure 1a) and the other in the root of the weld collar(Figure 1b). Hallam [5] also conducted push-out tests on the shear studs specimens andobserved the third failure mode, which was started from the root of weld collar andpropagated to the flange of beam (Figure 1c). Based on a number of push-out tests, Oehlersand Coughlan [6] studied the fatigue-induced stud stiffness degradation. They found thatthere was a linear relationship between the stud stiffness degradation and the fatigue life.Seracino et al. [7] studied the bi-directional cyclic fatigue behavior of headed shear studs.Their tests confirmed that for a given range of load, the fatigue life of connectors subjectedto bi-directional cyclic loading was normally longer than those subjected to unidirectionalloads only. Hanswille and Porsch [8,9] reported a series of experimental works with push-out specimens to determine the fatigue life and a possible reduction in the static strength ofthe headed shear studs subjected to unidirectional cyclic loading. Moreover, Ovuoba andPrinz [10] and Maeda and Matsuyi [11] performed similar studies. However, all the aboveresearch focused on the fatigue behaviors of a single shear stud with a diameter rangingfrom 13 mm to 22 mm. With the continuous development of engineering construction, theconventional headed studs cannot meet the increasing strength requirements. Thus, someresearchers then performed push-out tests on large shear studs (with a stud diameter over22 mm) [12,13] and grouped shear studs [14–17] to investigate the corresponding fatiguelives. The results showed that the fatigue lives of the large shear studs and the groupedstuds tended to be lower. However, all the above-mentioned research only investigated thefatigue behaviors of headed shear studs in normal concrete.
Appl. Sci. 2021, 11, x FOR PEER REVIEW 2 of 18
Since the first engineering application of shear connectors, the fatigue problem has always been a vital factor in the design, given the connection geometry and welding im-perfections [3]. The study on fatigue characteristics of headed shear studs originated in the 1960s. Generally, there are two experimental methods to study the fatigue perfor-mance of headed shear studs, i.e., the push-out test and the beam test. With advantages of low cost, convenient loading and short testing period, push-out tests are widely adopted in the experimental studies of the fatigue characteristics of headed shear studs. At first, the research emphasis was the fatigue life evaluation. Slutter and Fisher [4] carried out 44 fatigue tests on shear studs under constant amplitude stress cycles and gave a stud fatigue–life evaluation equation. They also observed two failure modes in headed shear studs, one in the root of the studs (Figure 1a) and the other in the root of the weld collar (Figure 1b). Hallam [5] also conducted push-out tests on the shear studs specimens and observed the third failure mode, which was started from the root of weld collar and prop-agated to the flange of beam (Figure 1c). Based on a number of push-out tests, Oehlers and Coughlan [6] studied the fatigue-induced stud stiffness degradation. They found that there was a linear relationship between the stud stiffness degradation and the fatigue life. Seracino et al. [7] studied the bi-directional cyclic fatigue behavior of headed shear studs. Their tests confirmed that for a given range of load, the fatigue life of connectors subjected to bi-directional cyclic loading was normally longer than those subjected to unidirectional loads only. Hanswille and Porsch [8,9] reported a series of experimental works with push-out specimens to determine the fatigue life and a possible reduction in the static strength of the headed shear studs subjected to unidirectional cyclic loading. Moreover, Ovuoba and Prinz [10] and Maeda and Matsuyi [11] performed similar studies. However, all the above research focused on the fatigue behaviors of a single shear stud with a diameter ranging from 13 mm to 22 mm. With the continuous development of engineering con-struction, the conventional headed studs cannot meet the increasing strength require-ments. Thus, some researchers then performed push-out tests on large shear studs (with a stud diameter over 22 mm) [12,13] and grouped shear studs [14–17] to investigate the corresponding fatigue lives. The results showed that the fatigue lives of the large shear studs and the grouped studs tended to be lower. However, all the above-mentioned re-search only investigated the fatigue behaviors of headed shear studs in normal concrete.
(a) (b) (c)
Figure 1. Failure modes of headed shear studs: (a) in the root of the stud [3]; (b) in the root of the weld collar [18]; (c) from the root of weld collar and propagated to the flange [19].
Recently, several new types of concrete materials with unique properties, such as lightweight concrete (LWC), ultra-high performance concrete (UHPC) and engineered ce-mentitious composites (ECC), have been used to improve the mechanical performance of steel–concrete composite beams. Thus, increasing experimental research has been con-ducted to study the fatigue behaviors of headed shear studs embedded in the LWC [20–
Figure 1. Failure modes of headed shear studs: (a) in the root of the stud [3]; (b) in the root of the weld collar [18]; (c) fromthe root of weld collar and propagated to the flange [19].
Recently, several new types of concrete materials with unique properties, such aslightweight concrete (LWC), ultra-high performance concrete (UHPC) and engineeredcementitious composites (ECC), have been used to improve the mechanical performanceof steel–concrete composite beams. Thus, increasing experimental research has been con-ducted to study the fatigue behaviors of headed shear studs embedded in the LWC [20–22],the UHPC [23–25] and the ECC [26,27]. The research results indicated that the fatigue
Appl. Sci. 2021, 11, 8297 3 of 18
strength of studs in the LWC and ECC was lower than that of studs in normal concrete.However, the studs in the UHPC improved the fatigue performance compared to nor-mal concrete. Compared with push-out tests, large-scale beam tests are more accurateto capture the actual fatigue behaviors of headed shear studs [28]. Hence, some studiesinvestigated the fatigue performance of headed shear studs through the testing of beamspecimens [3,19,29]. Comparing the beam test results with a larger dataset for headed shearstuds in the above studies, the potential of studs in the beam tests in terms of the relativefatigue performance is apparent.
With the deepening of research, some studies then adopted numerical methods tobetter analyze the behaviors of headed shear studs in steel–concrete composite beams.For example, Lam and El-Lobody [30] proposed an effective numerical model to simu-late the load–slip behavior and the shear capacity of shear studs in the push-out tests.Okada et al. [14] studied the failure mode and shear strength of grouped shear studsbased on a push-out test of shear studs and numerically simulated the test results usingthe finite element analysis. Their numerical models provided a better understanding ofthe different failure modes observed during experimental testing and, hence, the shearcapacity of headed shear studs. Mia and Bhowmick [31] then presented a finite element-based approach using a push-out specimen to the fatigue life estimation of headed shearstuds. Both the crack initiation and crack propagation life were estimated. However, itis noteworthy to point out that all the finite element analyses in the above studies wereconducted aiming at the parametric comparison, not the simulation of the fatigue push-outtest process. The precise simulation of the fatigue push-out test process (i.e., fatigue crackpropagation process) by the finite element analysis is too complicated [16]. To the authors’knowledge, there is only one published research concerning the numerical simulation ofthe fatigue crack propagation process of shear studs in push-out test. In our previous re-search work [32], a numerical method was presented to calculate the stress intensity factorusing the crack box technique and M integral method, and it applied to study the fatiguebehavior of headed shear studs. It was found that the crack propagation in the stud shankwas a composite state of the opening mode crack and the sliding mode crack. However, thenumerical method in the preliminary study did not reach the step to be valid for simulatingthe fatigue crack propagation process of shear studs. It lacks detailed fatigue crack data ofshear studs in the push-out tests to support the progress of the numerical method.
To develop an accurate numerical simulation of fatigue crack propagation, it is indis-pensable to dynamically inspect the fatigue crack of headed shear studs in push-out tests.However, there are too few studies on fatigue damage inspection of headed shear studs.Ovuoba and Prinz [33] chiseled away the concrete surrounding shear studs and carried outa stud crack inspection on two in situ bridges, using magnetic particle inspection and dyepenetrant testing. However, their methods had to remove the concrete covered in shearstuds; therefore, it was not feasible to dynamically detect stud cracks in push-out tests. Liuand Roeck [34] proposed a fatigue damage detection method using a numerical simulationon the basis of the local modal curvature and the wavelet transform modulus maxima.Their study only focused on the global fatigue failure of shear studs, not the fatigue crackdetails. Through an experimental and theoretical analysis, Ma et al. [35] demonstrated thatthe cumulative plastic damage can be estimated semi-quantitatively via the variations ofthe self-magnetic leakage field curve, which is beneficial for the fatigue damage assessmentfor steel. Nobile and Saponaro [36] detected fatigue damage of notched metal specimensby monitoring the electrical resistance change in real-time. Moreover, several methods ofdestructive and non-destructive testing were adopted to analyze concrete properties [37].However, the inspection methods mentioned above are all not suitable for the detectionof the fatigue crack propagation process of shear studs in push-out tests or real bridges.There is no effective non-destructive detection method to monitor the fatigue crack detailsof shear studs, which limits the development of a numerical simulation of the fatigue crackpropagation process.
Appl. Sci. 2021, 11, 8297 4 of 18
In this case, a series of cyclic push-out tests are conducted to study the detailed fatiguebehaviors and the feasible fatigue damage detection of headed shear studs in steel–concretecomposite beams. The fatigue failure modes and cyclic strain evolution of specimens areanalyzed with test results. The fatigue lives are estimated by different current design codesand compared with actual values. The fatigue crack details of headed shear studs in push-out tests are detected by the ultrasonic non-destructive testing. The study provides insightsto assist in developing an accurate numerical simulation of fatigue crack propagation ofheaded shear studs in steel–concrete composite beams.
2. Experimental Study2.1. Test Specimens Details
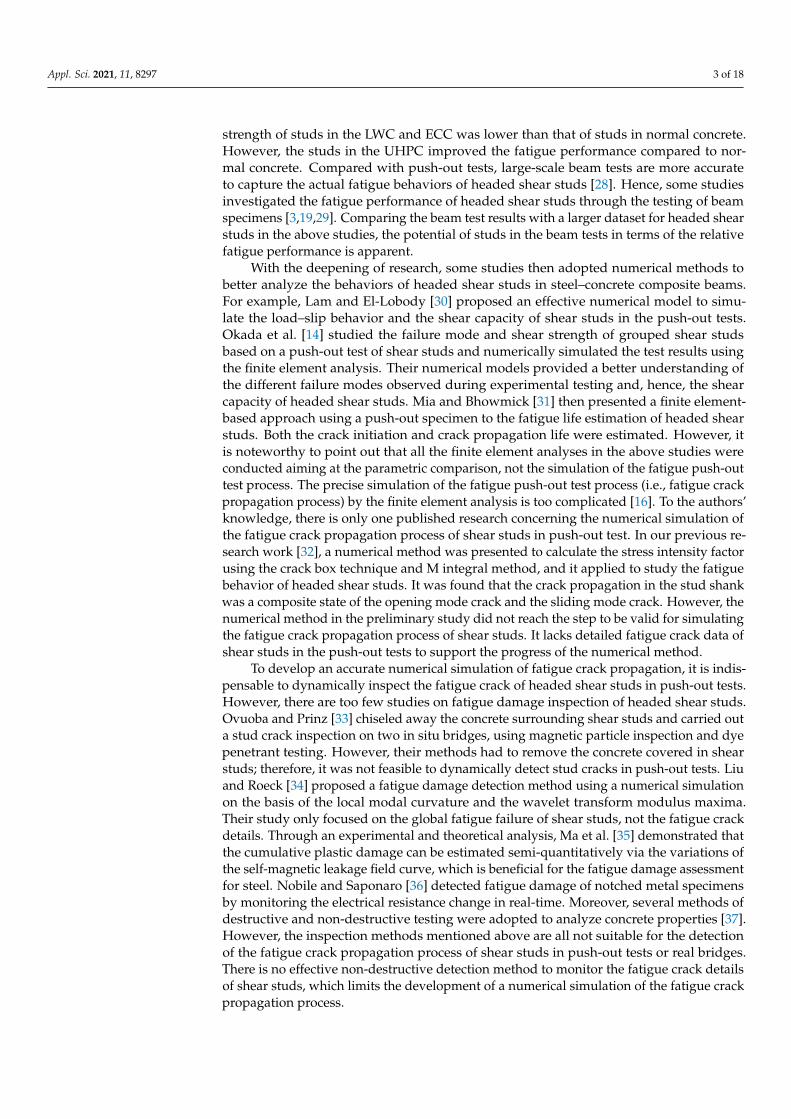
According to the relevant provisions of Eurocode 4 [38] and the actual layout of railwaycomposite beams, three push-out specimens numbered as S-1, S-2 and S-3, were fabricated.The geometric details of push-out specimens are shown in Figure 2, including an H-shapedsteel column, eight headed shear studs and two normal concrete slabs. The height of theH-shaped steel column was 580 mm, and the width was 228 mm. The thickness of theflange and web plates of the H-shaped steel column was 14 mm. The upper side of webplate was chamfered to ensure that the load could be transferred to the two flange platessmoothly. In each specimen, there were two rows of studs in the concrete slabs on bothsides, and each row had two studs. The headed shear studs were welded on the steelflange plates, which were named as No. 1 to No. 8 in order (Figure 2a). The stud size wasdesigned according to the actual size in composite beams, with the height of 180 mm andthe diameter of 22 mm. The vertical and transverse stud spacing in specimens was 200 mmand 90 mm, separately. The size of each concrete slab was 600 mm × 600 mm × 240 mmto ensure that the shear studs could be wrapped in it (Figure 2). The chosen geometry forconcrete slabs was based on the actual sizes of railway composite beams. According to theactual reinforcement situation of composite beams, the HRB335 hot-rolled ribbed bars witha diameter of 20 mm were also arranged in the concrete slabs. To prevent friction of thesteel–concrete interface, each steel flange plate was greased before the concrete casting. Athick steel plate (30 mm in thickness) was set on the top of the H-shaped steel column toevenly distribute the vertical load (Figure 2d).
2.2. Material Properties
The concrete slabs of push-out specimens were composed of C35 concrete. The char-acteristic value of concrete compressive strength of cube specimens (150 mm × 150 mm× 150 mm) after curing for 28 days under standard conditions (temperature 20 ± 2 ◦C,relative humidity no less than 95%) was 35 MPa [39]. The elastic modulus of the concretematerial was 3.15 × 10⁴ MPa. The H-shaped steel column and the load distribution platewere fabricated with Q345q steel [40] consistent with the actual structure. The headed shearstuds were composed of Grade 4.6 steel, and the reinforcement structural reinforcementbars were HRB335 [39]. The material properties of different types of steel are summarizedin Table 1.
Table 1. Material properties of steel column, shear studs and reinforcement bars.
Material Yield Strength(MPa)
Tensile Strength(MPa)
Elastic Modulus(MPa)
H-shaped steel column 345 490 2.05 × 10⁵
Headed shear studs 240 400 2.05 × 10⁵
Reinforcement bars 335 455 2.00 × 10⁵
Appl. Sci. 2021, 11, 8297 5 of 18Appl. Sci. 2021, 11, x FOR PEER REVIEW 5 of 18
240 240228
708
600
19521
0
710
1(7)
2(8)
3(5)
4(6)
7(5)
1(3)
8(6)
2(4)
150
200
150
100
8030
A A
A-A
320194 194
255
9025
5
600
195210
200 1414
(a) (b)
(c) (d)H-shaped
steel column
Cyclic loading P
Concrete slabHeaded stud
φ22
Figure 2. Geometric details of push-out specimens (unit: mm): (a) front view; (b) side view; (c) A–A view; (d) 3D drawing of specimens.
2.2. Material Properties The concrete slabs of push-out specimens were composed of C35 concrete. The char-
acteristic value of concrete compressive strength of cube specimens (150 mm×150 mm×150 mm) after curing for 28 days under standard conditions (temperature 20 ± 2 °C, relative humidity no less than 95%) was 35 MPa [39]. The elastic modulus of the concrete material was 3.15 × 10⁴ MPa. The H-shaped steel column and the load distribution plate were fab-ricated with Q345q steel [40] consistent with the actual structure. The headed shear studs were composed of Grade 4.6 steel, and the reinforcement structural reinforcement bars were HRB335 [39]. The material properties of different types of steel are summarized in Table 1.
Table 1. Material properties of steel column, shear studs and reinforcement bars.
Material Yield Strength
(MPa) Tensile Strength
(MPa) Elastic Modulus
(MPa) H-shaped steel column 345 490 2.05 × 10⁵
Headed shear studs 240 400 2.05 × 10⁵ Reinforcement bars 335 455 2.00 × 10⁵
2.3. Test Instruments and Setup A load cell was installed in the center of the steel load distribution plate to capture
the loading details during the static and fatigue tests (Figure 3). The relative slip between the H-shaped steel column and concrete slabs of the specimen was measured using two linear variable differential transformers (LVDTs). The two LVDTs were vertically installed on the top of concrete slabs. The LVDTs were mounted on the concrete slabs, and the measuring tips were attached to the L-shaped steel plate fixed to the flange of the steel
Figure 2. Geometric details of push-out specimens (unit: mm): (a) front view; (b) side view; (c) A–Aview; (d) 3D drawing of specimens.
2.3. Test Instruments and Setup
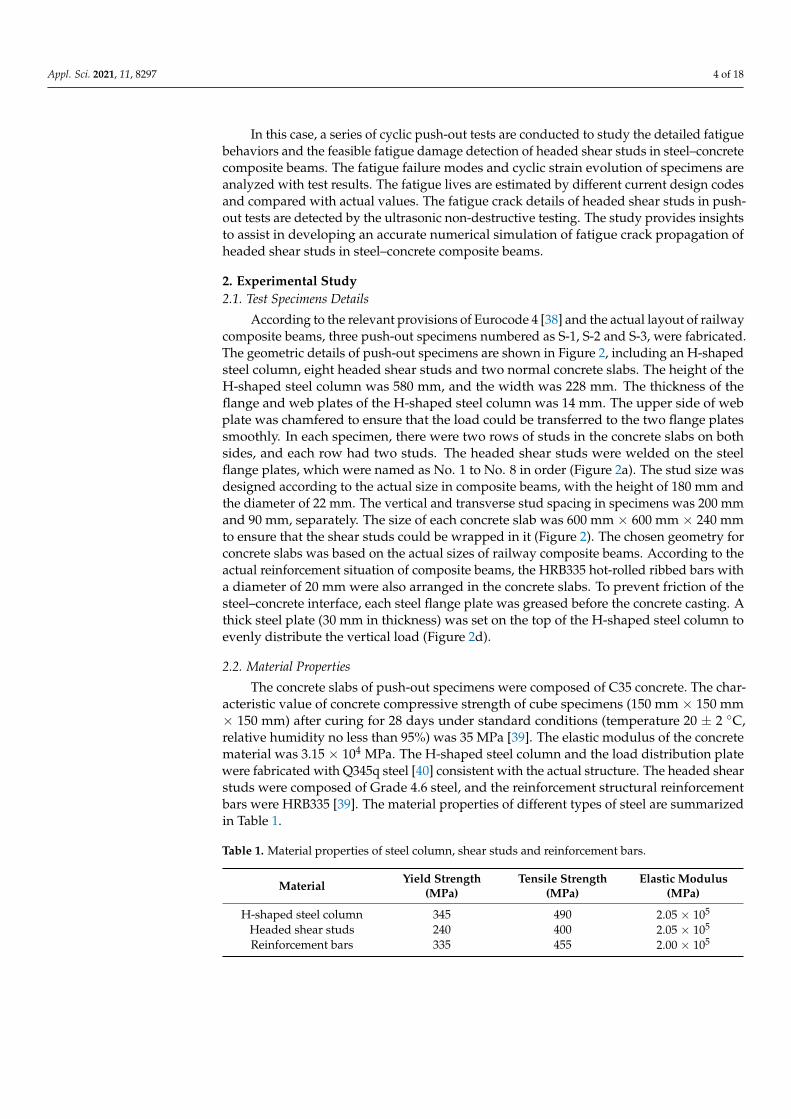
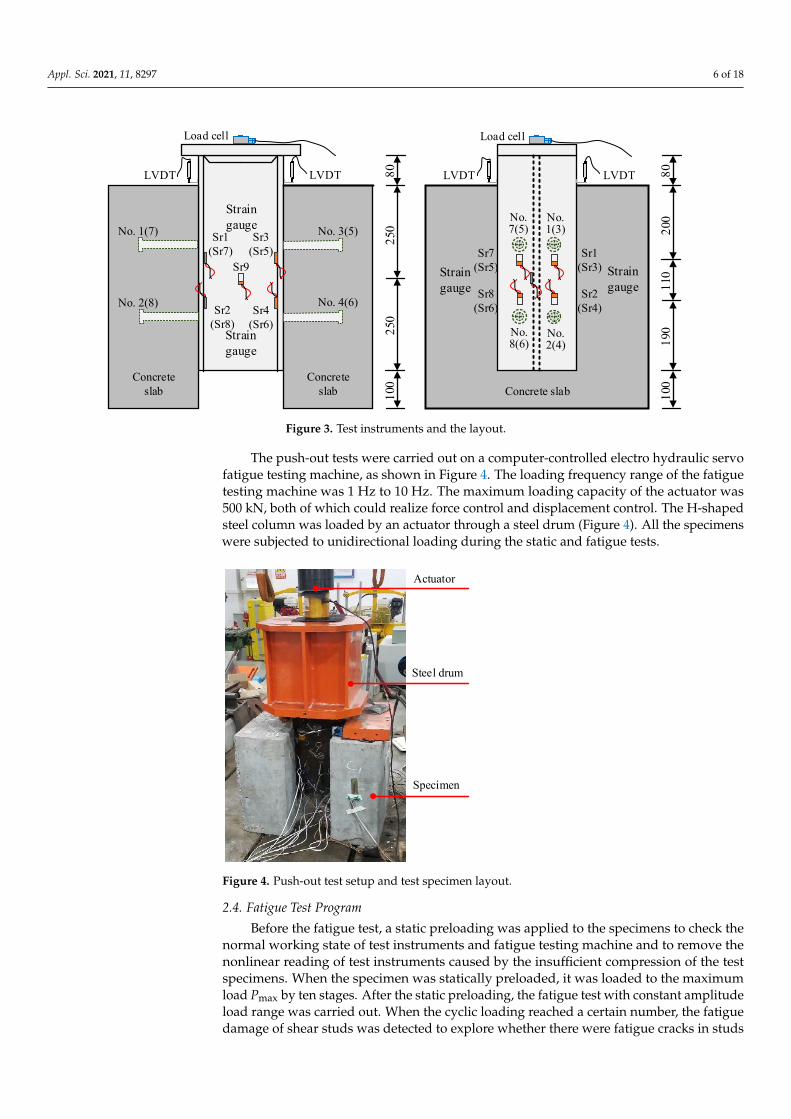
A load cell was installed in the center of the steel load distribution plate to capturethe loading details during the static and fatigue tests (Figure 3). The relative slip betweenthe H-shaped steel column and concrete slabs of the specimen was measured using twolinear variable differential transformers (LVDTs). The two LVDTs were vertically installedon the top of concrete slabs. The LVDTs were mounted on the concrete slabs, and themeasuring tips were attached to the L-shaped steel plate fixed to the flange of the steelcolumn (Figure 3). Additionally, unidirectional strain gauges were applied to allow forlocal strain measurements. A total of nine strain gauges were set on the H-shaped steelcolumn of the specimen. They were mainly arranged on the surface of the web and flangeplates (Figure 3). One strain gauge was arranged in the middle of the web plate to observethe global deformation, with a vertical distance 250 mm to the bottom of the steel column.The remaining eight strain gauges were arranged on the inner side of the flange plate atthe headed shear studs location to measure shear stresses transferred through the studs.The strain gauges were named Sr1 to Sr8 in order corresponding to the stud number.Figure 3 shows the detailed layout of test instruments, including the load cell, LVDTs andstrain gauges.
Appl. Sci. 2021, 11, 8297 6 of 18
Appl. Sci. 2021, 11, x FOR PEER REVIEW 6 of 18
column (Figure 3). Additionally, unidirectional strain gauges were applied to allow for local strain measurements. A total of nine strain gauges were set on the H-shaped steel column of the specimen. They were mainly arranged on the surface of the web and flange plates (Figure 3). One strain gauge was arranged in the middle of the web plate to observe the global deformation, with a vertical distance 250 mm to the bottom of the steel column. The remaining eight strain gauges were arranged on the inner side of the flange plate at the headed shear studs location to measure shear stresses transferred through the studs. The strain gauges were named Sr1 to Sr8 in order corresponding to the stud number. Fig-ure 3 shows the detailed layout of test instruments, including the load cell, LVDTs and strain gauges.
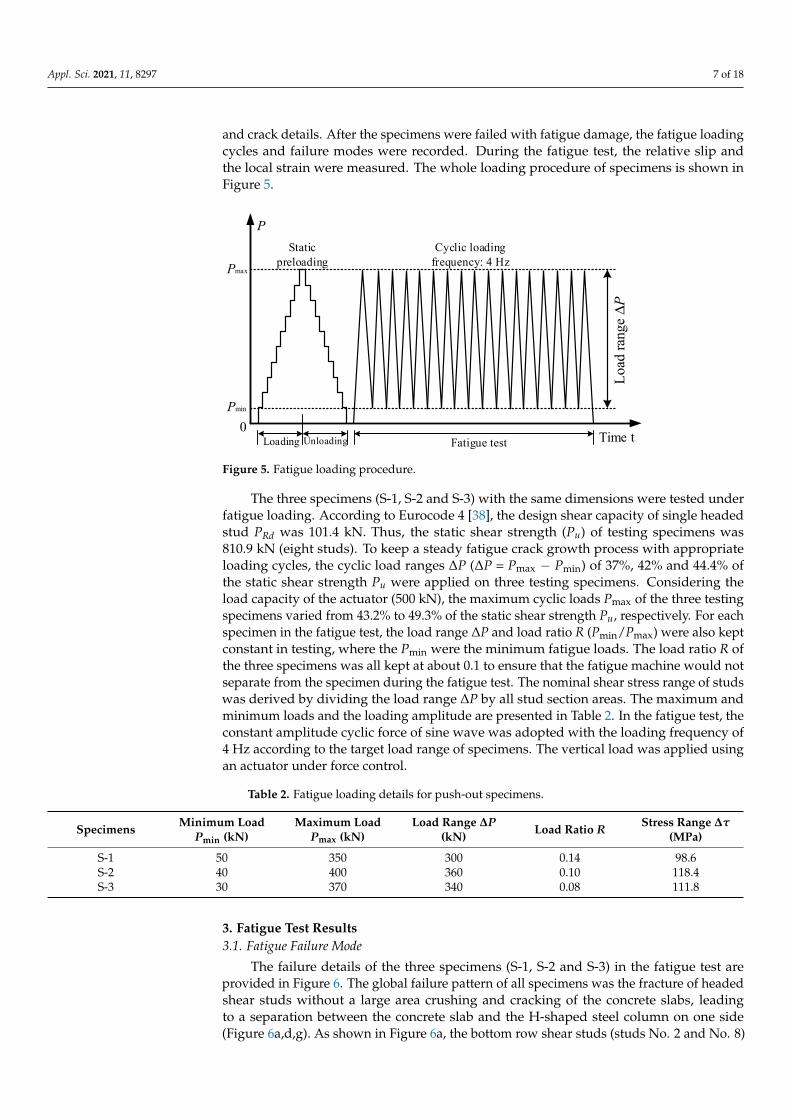
The push-out tests were carried out on a computer-controlled electro hydraulic servo fatigue testing machine, as shown in Figure 4. The loading frequency range of the fatigue testing machine was 1 Hz to 10 Hz. The maximum loading capacity of the actuator was 500 kN, both of which could realize force control and displacement control. The H-shaped steel column was loaded by an actuator through a steel drum (Figure 4). All the specimens were subjected to unidirectional loading during the static and fatigue tests.
2.4. Fatigue Test Program Before the fatigue test, a static preloading was applied to the specimens to check the
normal working state of test instruments and fatigue testing machine and to remove the nonlinear reading of test instruments caused by the insufficient compression of the test specimens. When the specimen was statically preloaded, it was loaded to the maximum load Pmax by ten stages. After the static preloading, the fatigue test with constant amplitude load range was carried out. When the cyclic loading reached a certain number, the fatigue damage of shear studs was detected to explore whether there were fatigue cracks in studs and crack details. After the specimens were failed with fatigue damage, the fatigue load-ing cycles and failure modes were recorded. During the fatigue test, the relative slip and the local strain were measured. The whole loading procedure of specimens is shown in Figure 5.
No. 1(7)
No. 2(8)
No. 3(5)
No. 4(6)
No. 7(5)
No. 1(3)
No. 8(6)
No. 2(4)
LVDTLVDT
Strain gauge
Sr1(Sr7)
Sr2(Sr8)
Sr3(Sr5)
Sr4(Sr6)
Sr7(Sr5)
Sr1(Sr3)
Sr8(Sr6)
Sr2(Sr4)
LVDT LVDT
Strain gauge
Strain gauge
Strain gauge
250
250
100
190
200
100
110
8080
Load cell Load cell
Concrete slab
Concrete slab Concrete slab
Sr9
Figure 3. Test instruments and the layout. Figure 3. Test instruments and the layout.
The push-out tests were carried out on a computer-controlled electro hydraulic servofatigue testing machine, as shown in Figure 4. The loading frequency range of the fatiguetesting machine was 1 Hz to 10 Hz. The maximum loading capacity of the actuator was500 kN, both of which could realize force control and displacement control. The H-shapedsteel column was loaded by an actuator through a steel drum (Figure 4). All the specimenswere subjected to unidirectional loading during the static and fatigue tests.
Appl. Sci. 2021, 11, x FOR PEER REVIEW 7 of 18
Actuator
Steel drum
Specimen
Figure 4. Push-out test setup and test specimen layout.
Time t
P
Loading Unloading Fatigue test
Pmax
0Pmin
Cyclic loadingfrequency: 4 Hz
Static preloading
Load
rang
e ΔP
Figure 5. Fatigue loading procedure.
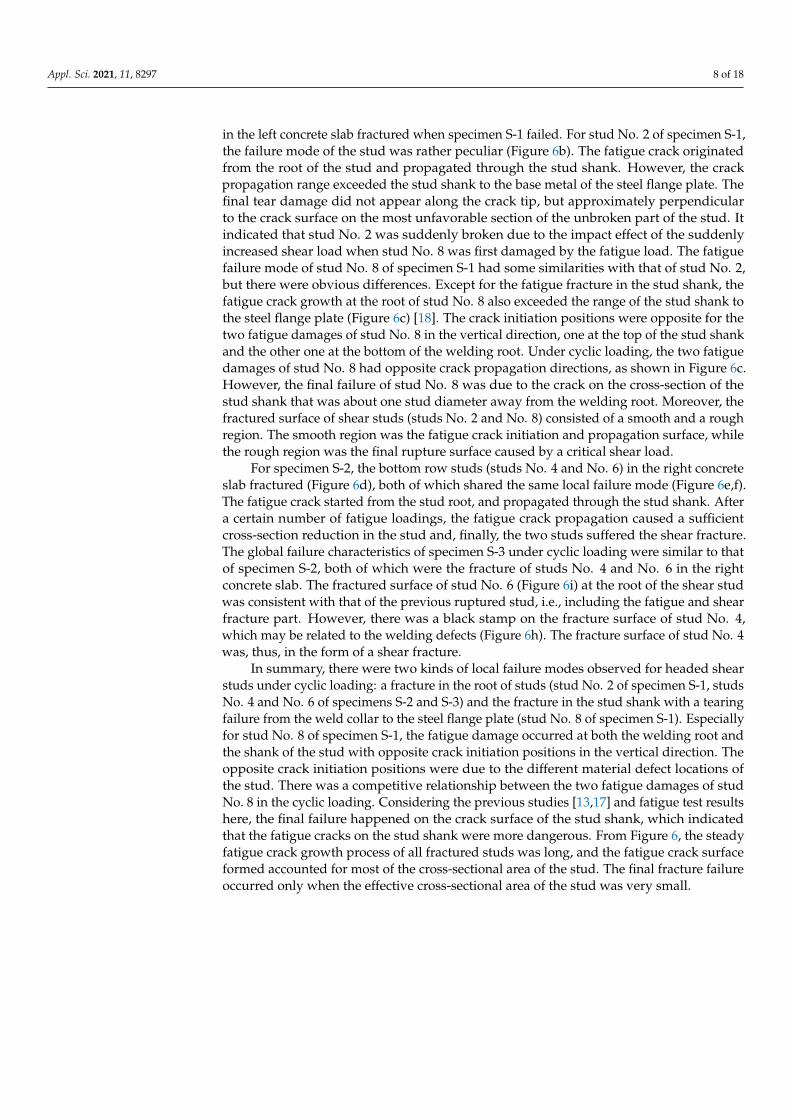
The three specimens (S-1, S-2 and S-3) with the same dimensions were tested under fatigue loading. According to Eurocode 4 [38], the design shear capacity of single headed stud PRd was 101.4 kN. Thus, the static shear strength (Pu) of testing specimens was 810.9 kN (eight studs). To keep a steady fatigue crack growth process with appropriate loading cycles, the cyclic load ranges ΔP (ΔP = Pmax − Pmin) of 37%, 42% and 44.4% of the static shear strength Pu were applied on three testing specimens. Considering the load capacity of the actuator (500 kN), the maximum cyclic loads Pmax of the three testing specimens varied from 43.2% to 49.3% of the static shear strength Pu, respectively. For each specimen in the fatigue test, the load range ΔP and load ratio R (Pmin/Pmax) were also kept constant in test-ing, where the Pmin were the minimum fatigue loads. The load ratio R of the three speci-mens was all kept at about 0.1 to ensure that the fatigue machine would not separate from the specimen during the fatigue test. The nominal shear stress range of studs was derived by dividing the load range ΔP by all stud section areas. The maximum and minimum loads and the loading amplitude are presented in Table 2. In the fatigue test, the constant amplitude cyclic force of sine wave was adopted with the loading frequency of 4 Hz ac-cording to the target load range of specimens. The vertical load was applied using an ac-tuator under force control.
Figure 4. Push-out test setup and test specimen layout.
2.4. Fatigue Test Program
Before the fatigue test, a static preloading was applied to the specimens to check thenormal working state of test instruments and fatigue testing machine and to remove thenonlinear reading of test instruments caused by the insufficient compression of the testspecimens. When the specimen was statically preloaded, it was loaded to the maximumload Pmax by ten stages. After the static preloading, the fatigue test with constant amplitudeload range was carried out. When the cyclic loading reached a certain number, the fatiguedamage of shear studs was detected to explore whether there were fatigue cracks in studs
Appl. Sci. 2021, 11, 8297 7 of 18
and crack details. After the specimens were failed with fatigue damage, the fatigue loadingcycles and failure modes were recorded. During the fatigue test, the relative slip andthe local strain were measured. The whole loading procedure of specimens is shown inFigure 5.
Appl. Sci. 2021, 11, x FOR PEER REVIEW 7 of 18
Actuator
Steel drum
Specimen
Figure 4. Push-out test setup and test specimen layout.
Time t
P
Loading Unloading Fatigue test
Pmax
0Pmin
Cyclic loadingfrequency: 4 Hz
Static preloading
Load
rang
e ΔP
Figure 5. Fatigue loading procedure.
The three specimens (S-1, S-2 and S-3) with the same dimensions were tested under fatigue loading. According to Eurocode 4 [38], the design shear capacity of single headed stud PRd was 101.4 kN. Thus, the static shear strength (Pu) of testing specimens was 810.9 kN (eight studs). To keep a steady fatigue crack growth process with appropriate loading cycles, the cyclic load ranges ΔP (ΔP = Pmax − Pmin) of 37%, 42% and 44.4% of the static shear strength Pu were applied on three testing specimens. Considering the load capacity of the actuator (500 kN), the maximum cyclic loads Pmax of the three testing specimens varied from 43.2% to 49.3% of the static shear strength Pu, respectively. For each specimen in the fatigue test, the load range ΔP and load ratio R (Pmin/Pmax) were also kept constant in test-ing, where the Pmin were the minimum fatigue loads. The load ratio R of the three speci-mens was all kept at about 0.1 to ensure that the fatigue machine would not separate from the specimen during the fatigue test. The nominal shear stress range of studs was derived by dividing the load range ΔP by all stud section areas. The maximum and minimum loads and the loading amplitude are presented in Table 2. In the fatigue test, the constant amplitude cyclic force of sine wave was adopted with the loading frequency of 4 Hz ac-cording to the target load range of specimens. The vertical load was applied using an ac-tuator under force control.
Figure 5. Fatigue loading procedure.
The three specimens (S-1, S-2 and S-3) with the same dimensions were tested underfatigue loading. According to Eurocode 4 [38], the design shear capacity of single headedstud PRd was 101.4 kN. Thus, the static shear strength (Pu) of testing specimens was810.9 kN (eight studs). To keep a steady fatigue crack growth process with appropriateloading cycles, the cyclic load ranges ∆P (∆P = Pmax − Pmin) of 37%, 42% and 44.4% ofthe static shear strength Pu were applied on three testing specimens. Considering theload capacity of the actuator (500 kN), the maximum cyclic loads Pmax of the three testingspecimens varied from 43.2% to 49.3% of the static shear strength Pu, respectively. For eachspecimen in the fatigue test, the load range ∆P and load ratio R (Pmin/Pmax) were also keptconstant in testing, where the Pmin were the minimum fatigue loads. The load ratio R ofthe three specimens was all kept at about 0.1 to ensure that the fatigue machine would notseparate from the specimen during the fatigue test. The nominal shear stress range of studswas derived by dividing the load range ∆P by all stud section areas. The maximum andminimum loads and the loading amplitude are presented in Table 2. In the fatigue test, theconstant amplitude cyclic force of sine wave was adopted with the loading frequency of4 Hz according to the target load range of specimens. The vertical load was applied usingan actuator under force control.
Table 2. Fatigue loading details for push-out specimens.
Specimens Minimum LoadPmin (kN)
Maximum LoadPmax (kN)
Load Range ∆P(kN) Load Ratio R Stress Range ∆τ
(MPa)
S-1 50 350 300 0.14 98.6S-2 40 400 360 0.10 118.4S-3 30 370 340 0.08 111.8
3. Fatigue Test Results3.1. Fatigue Failure Mode
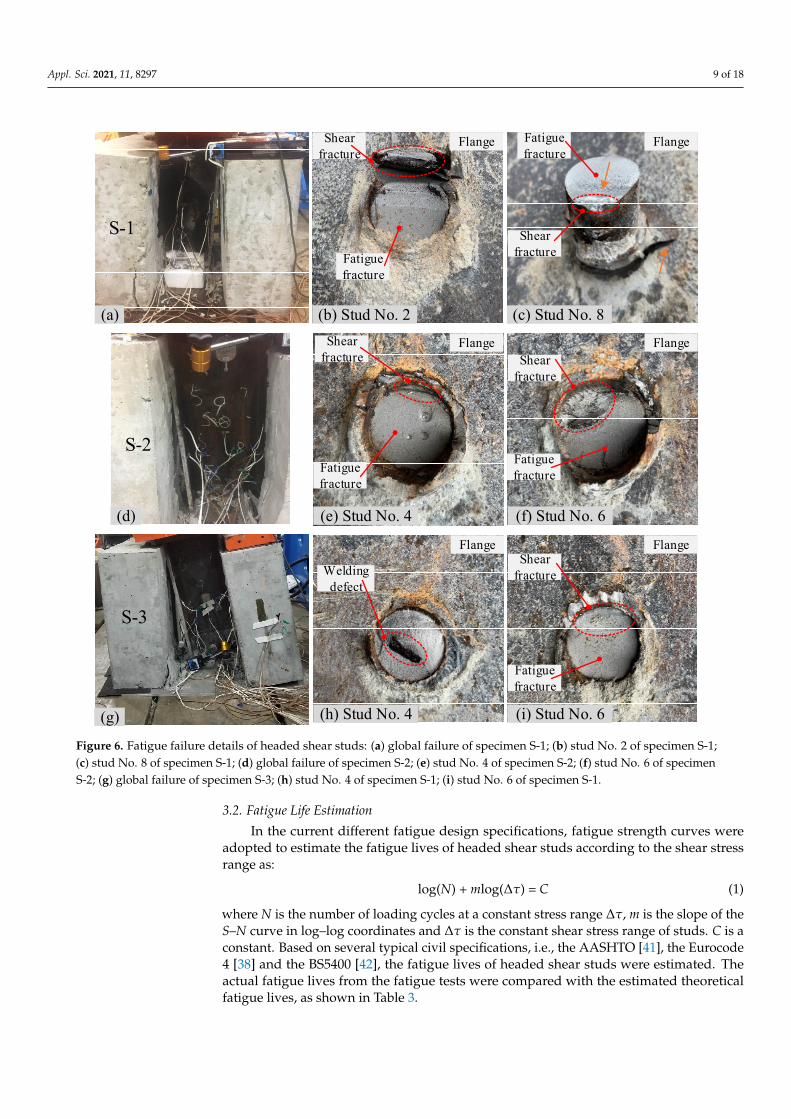
The failure details of the three specimens (S-1, S-2 and S-3) in the fatigue test areprovided in Figure 6. The global failure pattern of all specimens was the fracture of headedshear studs without a large area crushing and cracking of the concrete slabs, leadingto a separation between the concrete slab and the H-shaped steel column on one side(Figure 6a,d,g). As shown in Figure 6a, the bottom row shear studs (studs No. 2 and No. 8)
Appl. Sci. 2021, 11, 8297 8 of 18
in the left concrete slab fractured when specimen S-1 failed. For stud No. 2 of specimen S-1,the failure mode of the stud was rather peculiar (Figure 6b). The fatigue crack originatedfrom the root of the stud and propagated through the stud shank. However, the crackpropagation range exceeded the stud shank to the base metal of the steel flange plate. Thefinal tear damage did not appear along the crack tip, but approximately perpendicularto the crack surface on the most unfavorable section of the unbroken part of the stud. Itindicated that stud No. 2 was suddenly broken due to the impact effect of the suddenlyincreased shear load when stud No. 8 was first damaged by the fatigue load. The fatiguefailure mode of stud No. 8 of specimen S-1 had some similarities with that of stud No. 2,but there were obvious differences. Except for the fatigue fracture in the stud shank, thefatigue crack growth at the root of stud No. 8 also exceeded the range of the stud shank tothe steel flange plate (Figure 6c) [18]. The crack initiation positions were opposite for thetwo fatigue damages of stud No. 8 in the vertical direction, one at the top of the stud shankand the other one at the bottom of the welding root. Under cyclic loading, the two fatiguedamages of stud No. 8 had opposite crack propagation directions, as shown in Figure 6c.However, the final failure of stud No. 8 was due to the crack on the cross-section of thestud shank that was about one stud diameter away from the welding root. Moreover, thefractured surface of shear studs (studs No. 2 and No. 8) consisted of a smooth and a roughregion. The smooth region was the fatigue crack initiation and propagation surface, whilethe rough region was the final rupture surface caused by a critical shear load.
For specimen S-2, the bottom row studs (studs No. 4 and No. 6) in the right concreteslab fractured (Figure 6d), both of which shared the same local failure mode (Figure 6e,f).The fatigue crack started from the stud root, and propagated through the stud shank. Aftera certain number of fatigue loadings, the fatigue crack propagation caused a sufficientcross-section reduction in the stud and, finally, the two studs suffered the shear fracture.The global failure characteristics of specimen S-3 under cyclic loading were similar to thatof specimen S-2, both of which were the fracture of studs No. 4 and No. 6 in the rightconcrete slab. The fractured surface of stud No. 6 (Figure 6i) at the root of the shear studwas consistent with that of the previous ruptured stud, i.e., including the fatigue and shearfracture part. However, there was a black stamp on the fracture surface of stud No. 4,which may be related to the welding defects (Figure 6h). The fracture surface of stud No. 4was, thus, in the form of a shear fracture.
In summary, there were two kinds of local failure modes observed for headed shearstuds under cyclic loading: a fracture in the root of studs (stud No. 2 of specimen S-1, studsNo. 4 and No. 6 of specimens S-2 and S-3) and the fracture in the stud shank with a tearingfailure from the weld collar to the steel flange plate (stud No. 8 of specimen S-1). Especiallyfor stud No. 8 of specimen S-1, the fatigue damage occurred at both the welding root andthe shank of the stud with opposite crack initiation positions in the vertical direction. Theopposite crack initiation positions were due to the different material defect locations ofthe stud. There was a competitive relationship between the two fatigue damages of studNo. 8 in the cyclic loading. Considering the previous studies [13,17] and fatigue test resultshere, the final failure happened on the crack surface of the stud shank, which indicatedthat the fatigue cracks on the stud shank were more dangerous. From Figure 6, the steadyfatigue crack growth process of all fractured studs was long, and the fatigue crack surfaceformed accounted for most of the cross-sectional area of the stud. The final fracture failureoccurred only when the effective cross-sectional area of the stud was very small.
Appl. Sci. 2021, 11, 8297 9 of 18Appl. Sci. 2021, 11, x FOR PEER REVIEW 10 of 18
(a) (b) Stud No. 2 (c) Stud No. 8
(d) (e) Stud No. 4 (f) Stud No. 6
(g) (h) Stud No. 4 (i) Stud No. 6
FlangeFlange
FlangeFlange
FlangeFlange
S-1
S-2
S-3
Shear fracture
Fatigue fracture
Fatigue fracture
Shear fracture
Fatigue fracture
Shear fracture Shear
fracture
Fatigue fracture
Shear fracture
Fatigue fracture
Welding defect
Figure 6. Fatigue failure details of headed shear studs: (a) global failure of specimen S-1; (b) stud No. 2 of specimen S-1; (c) stud No. 8 of specimen S-1; (d) global failure of specimen S-2; (e) stud No. 4 of specimen S-2; (f) stud No. 6 of specimen S-2; (g) global failure of specimen S-3; (h) stud No. 4 of specimen S-1; (i) stud No. 6 of specimen S-1.
It can be seen from Table 3 that the actual fatigue lives obtained from the push-out tests were larger than the estimated fatigue lives based on different codes. The actual fa-tigue lives of specimens S-1 and S-2 were 11.9 and 10.9 times of the estimated fatigue lives from AASHTO, respectively. Compared with the Eurocode 4, the actual fatigue lives of the two specimens were 3.4 and 4.0 times of the corresponding estimated fatigue lives. According to Table 3, the actual fatigue lives of specimens S-1 and S-2 were 1.4 and 1.6 times of the estimated fatigue lives of the BS5400, separately. Figure 7 shows the stud fatigue lives from the push-out tests with the S–N curves recommended in the AASHTO LRFD, the Eurocode 4 and the BS5400. In all the three codes, the safe fatigue life estimation of headed shear studs can be guaranteed. The safety redundancies of the three specifica-tions were different. Compared with the S–N curves of the BS5400 and the Eurocode 4, the AASHTO fatigue life evaluations had much more safety redundancies. It can be found that the push-out test results were closer to the S–N curve of the BS5400 than the other two curves.
Figure 6. Fatigue failure details of headed shear studs: (a) global failure of specimen S-1; (b) stud No. 2 of specimen S-1;(c) stud No. 8 of specimen S-1; (d) global failure of specimen S-2; (e) stud No. 4 of specimen S-2; (f) stud No. 6 of specimenS-2; (g) global failure of specimen S-3; (h) stud No. 4 of specimen S-1; (i) stud No. 6 of specimen S-1.
3.2. Fatigue Life Estimation
In the current different fatigue design specifications, fatigue strength curves wereadopted to estimate the fatigue lives of headed shear studs according to the shear stressrange as:
log(N) + mlog(∆τ) = C (1)
where N is the number of loading cycles at a constant stress range ∆τ, m is the slope of theS–N curve in log–log coordinates and ∆τ is the constant shear stress range of studs. C is aconstant. Based on several typical civil specifications, i.e., the AASHTO [41], the Eurocode4 [38] and the BS5400 [42], the fatigue lives of headed shear studs were estimated. Theactual fatigue lives from the fatigue tests were compared with the estimated theoreticalfatigue lives, as shown in Table 3.
Appl. Sci. 2021, 11, 8297 10 of 18
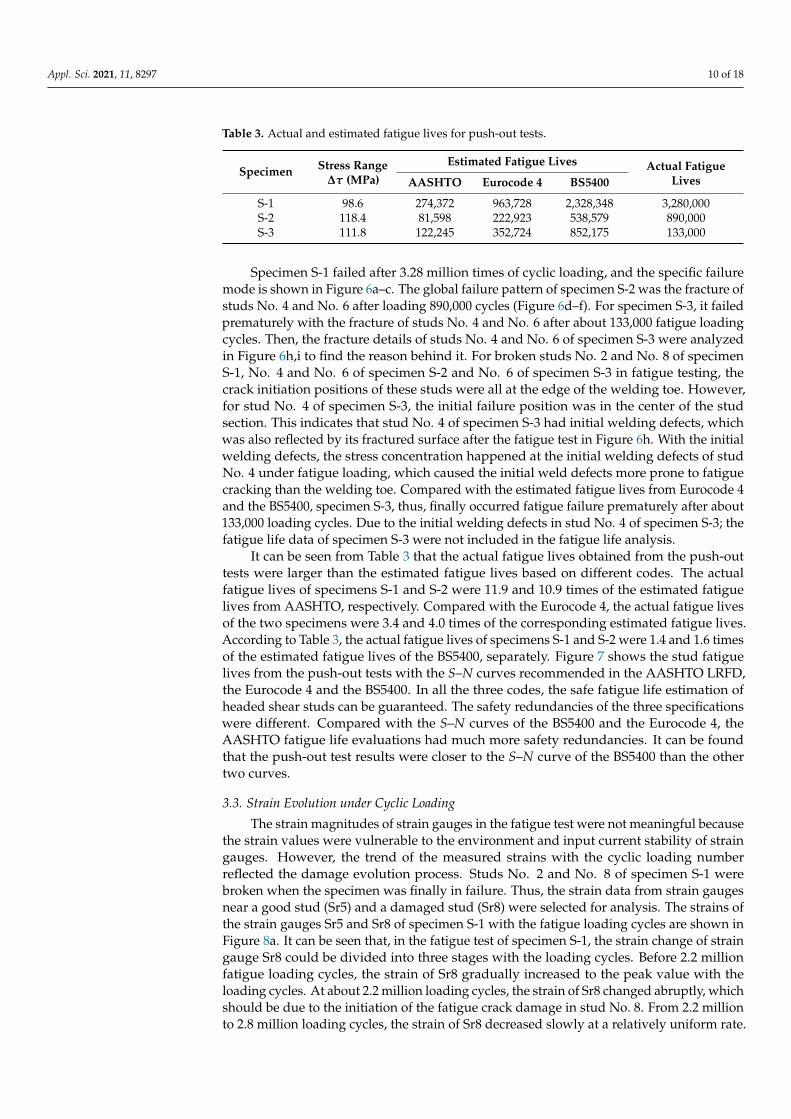
Table 3. Actual and estimated fatigue lives for push-out tests.
Specimen Stress Range∆τ (MPa)
Estimated Fatigue Lives Actual FatigueLivesAASHTO Eurocode 4 BS5400
S-1 98.6 274,372 963,728 2,328,348 3,280,000S-2 118.4 81,598 222,923 538,579 890,000S-3 111.8 122,245 352,724 852,175 133,000
Specimen S-1 failed after 3.28 million times of cyclic loading, and the specific failuremode is shown in Figure 6a–c. The global failure pattern of specimen S-2 was the fracture ofstuds No. 4 and No. 6 after loading 890,000 cycles (Figure 6d–f). For specimen S-3, it failedprematurely with the fracture of studs No. 4 and No. 6 after about 133,000 fatigue loadingcycles. Then, the fracture details of studs No. 4 and No. 6 of specimen S-3 were analyzedin Figure 6h,i to find the reason behind it. For broken studs No. 2 and No. 8 of specimenS-1, No. 4 and No. 6 of specimen S-2 and No. 6 of specimen S-3 in fatigue testing, thecrack initiation positions of these studs were all at the edge of the welding toe. However,for stud No. 4 of specimen S-3, the initial failure position was in the center of the studsection. This indicates that stud No. 4 of specimen S-3 had initial welding defects, whichwas also reflected by its fractured surface after the fatigue test in Figure 6h. With the initialwelding defects, the stress concentration happened at the initial welding defects of studNo. 4 under fatigue loading, which caused the initial weld defects more prone to fatiguecracking than the welding toe. Compared with the estimated fatigue lives from Eurocode 4and the BS5400, specimen S-3, thus, finally occurred fatigue failure prematurely after about133,000 loading cycles. Due to the initial welding defects in stud No. 4 of specimen S-3; thefatigue life data of specimen S-3 were not included in the fatigue life analysis.
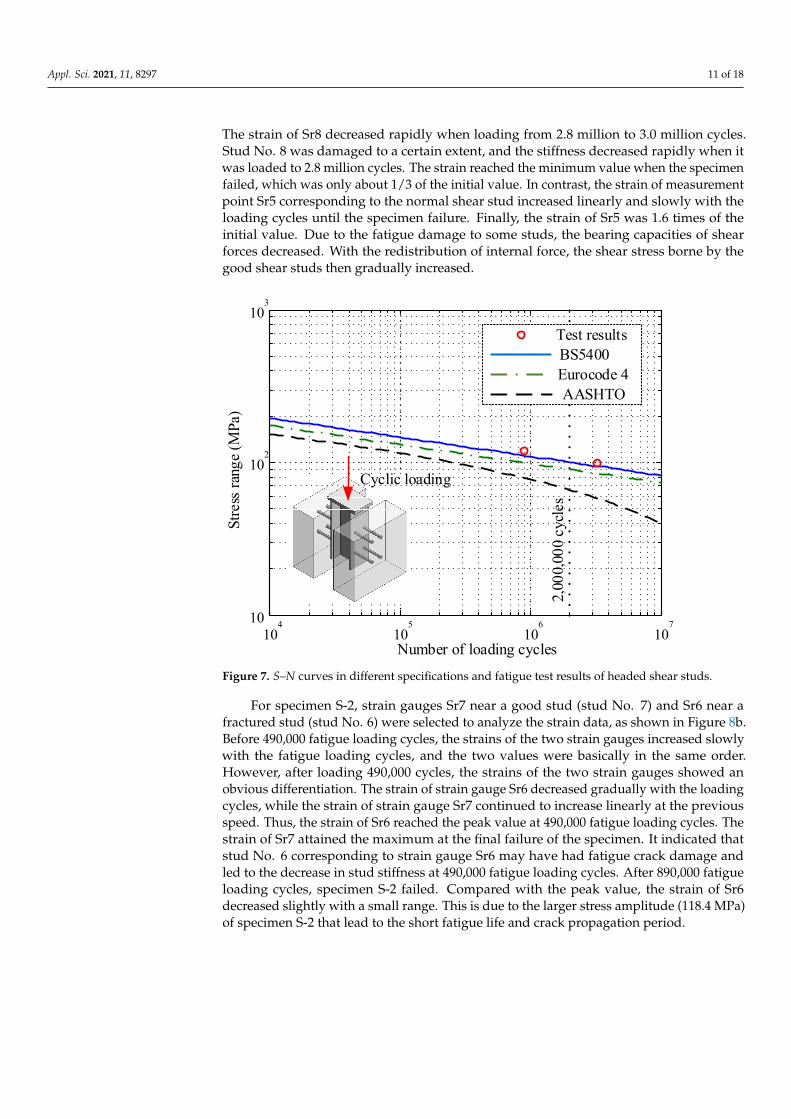
It can be seen from Table 3 that the actual fatigue lives obtained from the push-outtests were larger than the estimated fatigue lives based on different codes. The actualfatigue lives of specimens S-1 and S-2 were 11.9 and 10.9 times of the estimated fatiguelives from AASHTO, respectively. Compared with the Eurocode 4, the actual fatigue livesof the two specimens were 3.4 and 4.0 times of the corresponding estimated fatigue lives.According to Table 3, the actual fatigue lives of specimens S-1 and S-2 were 1.4 and 1.6 timesof the estimated fatigue lives of the BS5400, separately. Figure 7 shows the stud fatiguelives from the push-out tests with the S–N curves recommended in the AASHTO LRFD,the Eurocode 4 and the BS5400. In all the three codes, the safe fatigue life estimation ofheaded shear studs can be guaranteed. The safety redundancies of the three specificationswere different. Compared with the S–N curves of the BS5400 and the Eurocode 4, theAASHTO fatigue life evaluations had much more safety redundancies. It can be foundthat the push-out test results were closer to the S–N curve of the BS5400 than the othertwo curves.
3.3. Strain Evolution under Cyclic Loading
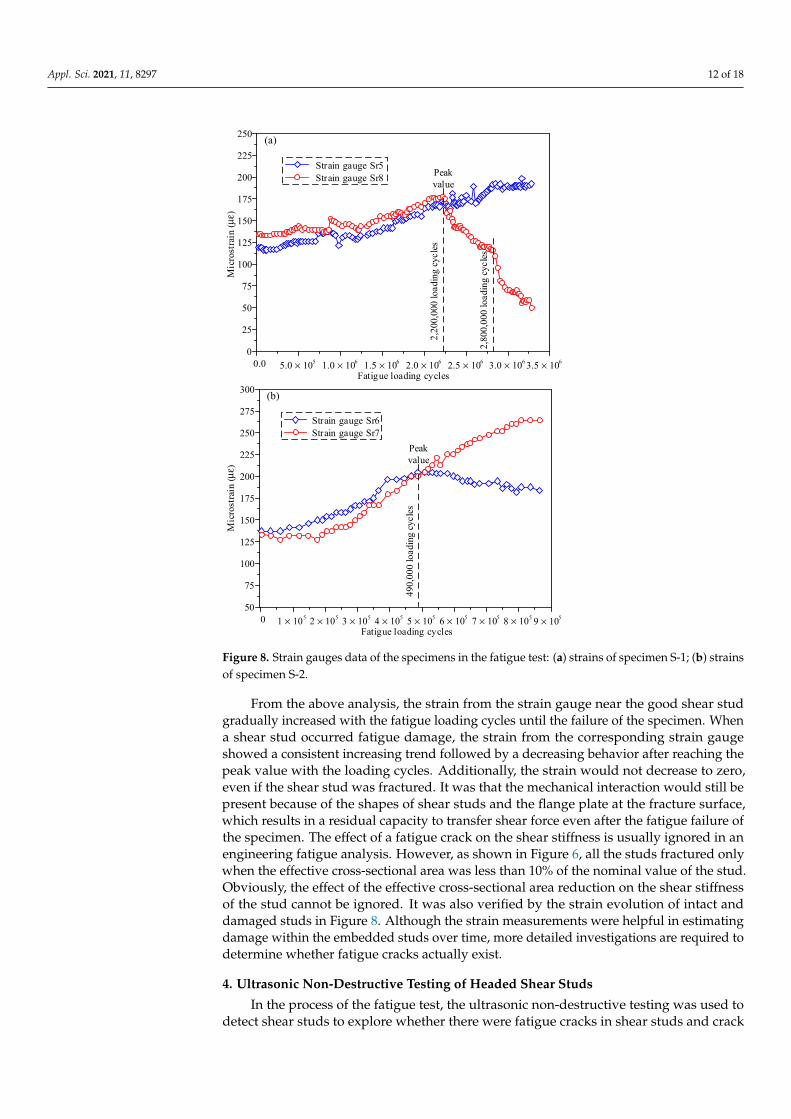
The strain magnitudes of strain gauges in the fatigue test were not meaningful becausethe strain values were vulnerable to the environment and input current stability of straingauges. However, the trend of the measured strains with the cyclic loading numberreflected the damage evolution process. Studs No. 2 and No. 8 of specimen S-1 werebroken when the specimen was finally in failure. Thus, the strain data from strain gaugesnear a good stud (Sr5) and a damaged stud (Sr8) were selected for analysis. The strains ofthe strain gauges Sr5 and Sr8 of specimen S-1 with the fatigue loading cycles are shown inFigure 8a. It can be seen that, in the fatigue test of specimen S-1, the strain change of straingauge Sr8 could be divided into three stages with the loading cycles. Before 2.2 millionfatigue loading cycles, the strain of Sr8 gradually increased to the peak value with theloading cycles. At about 2.2 million loading cycles, the strain of Sr8 changed abruptly, whichshould be due to the initiation of the fatigue crack damage in stud No. 8. From 2.2 millionto 2.8 million loading cycles, the strain of Sr8 decreased slowly at a relatively uniform rate.
Appl. Sci. 2021, 11, 8297 11 of 18
The strain of Sr8 decreased rapidly when loading from 2.8 million to 3.0 million cycles.Stud No. 8 was damaged to a certain extent, and the stiffness decreased rapidly when itwas loaded to 2.8 million cycles. The strain reached the minimum value when the specimenfailed, which was only about 1/3 of the initial value. In contrast, the strain of measurementpoint Sr5 corresponding to the normal shear stud increased linearly and slowly with theloading cycles until the specimen failure. Finally, the strain of Sr5 was 1.6 times of theinitial value. Due to the fatigue damage to some studs, the bearing capacities of shearforces decreased. With the redistribution of internal force, the shear stress borne by thegood shear studs then gradually increased.
Appl. Sci. 2021, 11, x FOR PEER REVIEW 11 of 18
104
105
106
10710
102
103
Number of loading cycles
Stre
ss ra
nge (
MPa
)
Cyclic loading
2,00
0,00
0 cy
cles
BS5400Eurocode 4AASHTO
Test results
Figure 7. S–N curves in different specifications and fatigue test results of headed shear studs.
3.3. Strain Evolution under Cyclic Loading The strain magnitudes of strain gauges in the fatigue test were not meaningful be-
cause the strain values were vulnerable to the environment and input current stability of strain gauges. However, the trend of the measured strains with the cyclic loading number reflected the damage evolution process. Studs No. 2 and No. 8 of specimen S-1 were bro-ken when the specimen was finally in failure. Thus, the strain data from strain gauges near a good stud (Sr5) and a damaged stud (Sr8) were selected for analysis. The strains of the strain gauges Sr5 and Sr8 of specimen S-1 with the fatigue loading cycles are shown in Figure 8a. It can be seen that, in the fatigue test of specimen S-1, the strain change of strain gauge Sr8 could be divided into three stages with the loading cycles. Before 2.2 million fatigue loading cycles, the strain of Sr8 gradually increased to the peak value with the loading cycles. At about 2.2 million loading cycles, the strain of Sr8 changed abruptly, which should be due to the initiation of the fatigue crack damage in stud No. 8. From 2.2 million to 2.8 million loading cycles, the strain of Sr8 decreased slowly at a relatively uni-form rate. The strain of Sr8 decreased rapidly when loading from 2.8 million to 3.0 million cycles. Stud No. 8 was damaged to a certain extent, and the stiffness decreased rapidly when it was loaded to 2.8 million cycles. The strain reached the minimum value when the specimen failed, which was only about 1/3 of the initial value. In contrast, the strain of measurement point Sr5 corresponding to the normal shear stud increased linearly and slowly with the loading cycles until the specimen failure. Finally, the strain of Sr5 was 1.6 times of the initial value. Due to the fatigue damage to some studs, the bearing capacities of shear forces decreased. With the redistribution of internal force, the shear stress borne by the good shear studs then gradually increased.
Figure 7. S–N curves in different specifications and fatigue test results of headed shear studs.
For specimen S-2, strain gauges Sr7 near a good stud (stud No. 7) and Sr6 near afractured stud (stud No. 6) were selected to analyze the strain data, as shown in Figure 8b.Before 490,000 fatigue loading cycles, the strains of the two strain gauges increased slowlywith the fatigue loading cycles, and the two values were basically in the same order.However, after loading 490,000 cycles, the strains of the two strain gauges showed anobvious differentiation. The strain of strain gauge Sr6 decreased gradually with the loadingcycles, while the strain of strain gauge Sr7 continued to increase linearly at the previousspeed. Thus, the strain of Sr6 reached the peak value at 490,000 fatigue loading cycles. Thestrain of Sr7 attained the maximum at the final failure of the specimen. It indicated thatstud No. 6 corresponding to strain gauge Sr6 may have had fatigue crack damage andled to the decrease in stud stiffness at 490,000 fatigue loading cycles. After 890,000 fatigueloading cycles, specimen S-2 failed. Compared with the peak value, the strain of Sr6decreased slightly with a small range. This is due to the larger stress amplitude (118.4 MPa)of specimen S-2 that lead to the short fatigue life and crack propagation period.
Appl. Sci. 2021, 11, 8297 12 of 18Appl. Sci. 2021, 11, x FOR PEER REVIEW 12 of 18
0.0 5.0 × 10⁵ 1.0 × 10⁶ 1.5 × 10⁶ 2.0 × 10⁶ 2.5 × 10⁶ 3.0 × 10⁶ 3.5 × 1060
25
50
75
100
125
150
175
200
225
250
Fatigue loading cycles
Mic
rost
rain
()
με
(a)
Strain gauge Sr5 Strain gauge Sr8 Peak
value
2,20
0,00
0 lo
adin
g cy
cles
2,80
0,00
0 lo
adin
g cy
cles
0 1 × 10⁵ 2 × 10⁵ 3 × 10⁵ 4 × 10⁵ 5 × 10⁵ 6 × 10⁵ 7 × 10⁵ 8 × 10⁵ 9 × 10550
75
100
125
150
175
200
225
250
275
300
Fatigue loading cycles
Mic
rost
rain
()
με
(b)
Peak value
Strain gauge Sr6 Strain gauge Sr7
490,
000
load
ing
cycl
es
Figure 8. Strain gauges data of the specimens in the fatigue test: (a) strains of specimen S-1; (b) strains of specimen S-2.
For specimen S-2, strain gauges Sr7 near a good stud (stud No. 7) and Sr6 near a fractured stud (stud No. 6) were selected to analyze the strain data, as shown in Figure 8b. Before 490,000 fatigue loading cycles, the strains of the two strain gauges increased slowly with the fatigue loading cycles, and the two values were basically in the same or-der. However, after loading 490,000 cycles, the strains of the two strain gauges showed an obvious differentiation. The strain of strain gauge Sr6 decreased gradually with the load-ing cycles, while the strain of strain gauge Sr7 continued to increase linearly at the previ-ous speed. Thus, the strain of Sr6 reached the peak value at 490,000 fatigue loading cycles. The strain of Sr7 attained the maximum at the final failure of the specimen. It indicated that stud No. 6 corresponding to strain gauge Sr6 may have had fatigue crack damage and led to the decrease in stud stiffness at 490,000 fatigue loading cycles. After 890,000 fatigue loading cycles, specimen S-2 failed. Compared with the peak value, the strain of Sr6 de-creased slightly with a small range. This is due to the larger stress amplitude (118.4 MPa) of specimen S-2 that lead to the short fatigue life and crack propagation period.
From the above analysis, the strain from the strain gauge near the good shear stud gradually increased with the fatigue loading cycles until the failure of the specimen. When a shear stud occurred fatigue damage, the strain from the corresponding strain gauge showed a consistent increasing trend followed by a decreasing behavior after reaching the peak value with the loading cycles. Additionally, the strain would not decrease to zero, even if the shear stud was fractured. It was that the mechanical interaction would still be present because of the shapes of shear studs and the flange plate at the fracture surface, which results in a residual capacity to transfer shear force even after the fatigue failure of the specimen. The effect of a fatigue crack on the shear stiffness is usually ignored in an
Figure 8. Strain gauges data of the specimens in the fatigue test: (a) strains of specimen S-1; (b) strainsof specimen S-2.
From the above analysis, the strain from the strain gauge near the good shear studgradually increased with the fatigue loading cycles until the failure of the specimen. Whena shear stud occurred fatigue damage, the strain from the corresponding strain gaugeshowed a consistent increasing trend followed by a decreasing behavior after reaching thepeak value with the loading cycles. Additionally, the strain would not decrease to zero,even if the shear stud was fractured. It was that the mechanical interaction would still bepresent because of the shapes of shear studs and the flange plate at the fracture surface,which results in a residual capacity to transfer shear force even after the fatigue failure ofthe specimen. The effect of a fatigue crack on the shear stiffness is usually ignored in anengineering fatigue analysis. However, as shown in Figure 6, all the studs fractured onlywhen the effective cross-sectional area was less than 10% of the nominal value of the stud.Obviously, the effect of the effective cross-sectional area reduction on the shear stiffnessof the stud cannot be ignored. It was also verified by the strain evolution of intact anddamaged studs in Figure 8. Although the strain measurements were helpful in estimatingdamage within the embedded studs over time, more detailed investigations are required todetermine whether fatigue cracks actually exist.
4. Ultrasonic Non-Destructive Testing of Headed Shear Studs
In the process of the fatigue test, the ultrasonic non-destructive testing was used todetect shear studs to explore whether there were fatigue cracks in shear studs and crack
Appl. Sci. 2021, 11, 8297 13 of 18
details. The existence of cracks in shear studs would cause the discontinuity of the steelmaterial, which would lead to the inconsistency of acoustic impedance. The ultrasonicwave would be reflected at the interface of two kinds of media with different acousticimpedance [43].
4.1. Ultrasonic Non-Destructive Testing Equipment and Distance–Amplitude Curve
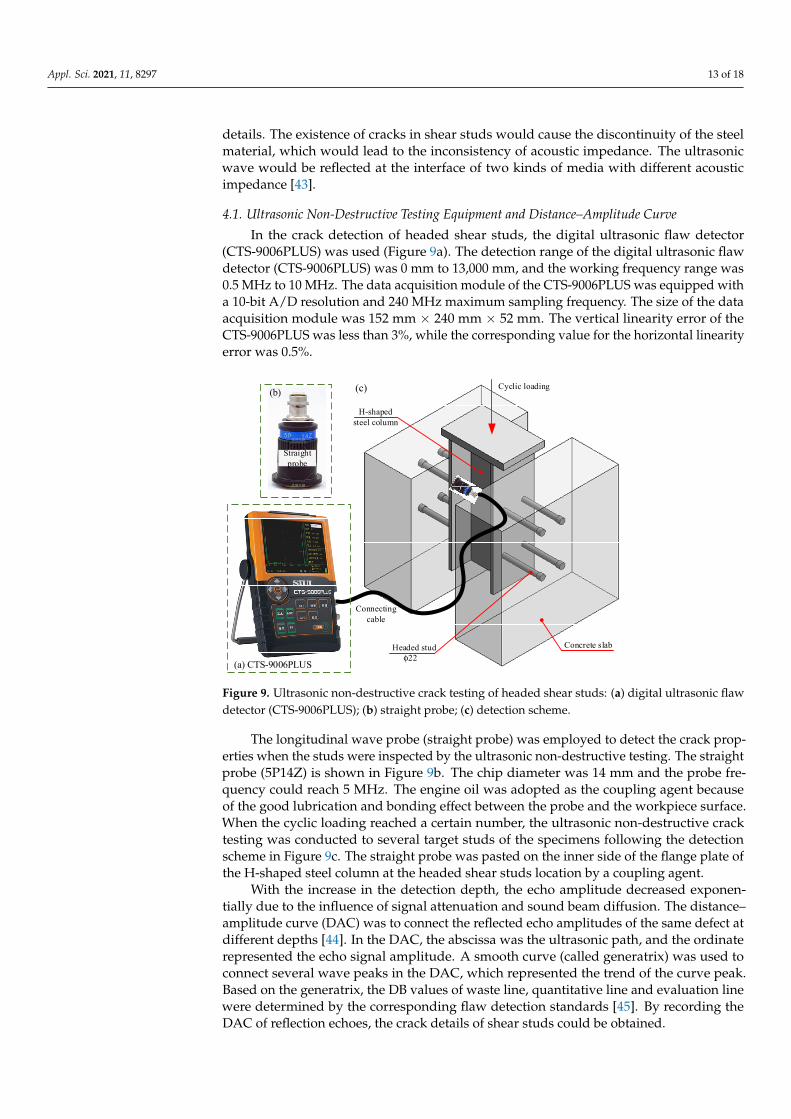
In the crack detection of headed shear studs, the digital ultrasonic flaw detector(CTS-9006PLUS) was used (Figure 9a). The detection range of the digital ultrasonic flawdetector (CTS-9006PLUS) was 0 mm to 13,000 mm, and the working frequency range was0.5 MHz to 10 MHz. The data acquisition module of the CTS-9006PLUS was equipped witha 10-bit A/D resolution and 240 MHz maximum sampling frequency. The size of the dataacquisition module was 152 mm × 240 mm × 52 mm. The vertical linearity error of theCTS-9006PLUS was less than 3%, while the corresponding value for the horizontal linearityerror was 0.5%.
Appl. Sci. 2021, 11, x FOR PEER REVIEW 13 of 18
engineering fatigue analysis. However, as shown in Figure 6, all the studs fractured only when the effective cross-sectional area was less than 10% of the nominal value of the stud. Obviously, the effect of the effective cross-sectional area reduction on the shear stiffness of the stud cannot be ignored. It was also verified by the strain evolution of intact and damaged studs in Figure 8. Although the strain measurements were helpful in estimating damage within the embedded studs over time, more detailed investigations are required to determine whether fatigue cracks actually exist.
4. Ultrasonic Non-Destructive Testing of Headed Shear Studs In the process of the fatigue test, the ultrasonic non-destructive testing was used to
detect shear studs to explore whether there were fatigue cracks in shear studs and crack details. The existence of cracks in shear studs would cause the discontinuity of the steel material, which would lead to the inconsistency of acoustic impedance. The ultrasonic wave would be reflected at the interface of two kinds of media with different acoustic impedance [43].
4.1. Ultrasonic Non-Destructive Testing Equipment and Distance–Amplitude Curve In the crack detection of headed shear studs, the digital ultrasonic flaw detector (CTS-
9006PLUS) was used (Figure 9a). The detection range of the digital ultrasonic flaw detec-tor (CTS-9006PLUS) was 0 mm to 13,000 mm, and the working frequency range was 0.5 MHz to 10 MHz. The data acquisition module of the CTS-9006PLUS was equipped with a 10-bit A/D resolution and 240 MHz maximum sampling frequency. The size of the data acquisition module was 152 mm × 240 mm × 52 mm. The vertical linearity error of the CTS-9006PLUS was less than 3%, while the corresponding value for the horizontal linear-ity error was 0.5%.
(a) CTS-9006PLUS
(b)
Straight probe
(c)
H-shaped steel column
Cyclic loading
Concrete slabHeaded studφ22
Connecting cable
Figure 9. Ultrasonic non-destructive crack testing of headed shear studs: (a) digital ultrasonic flaw detector (CTS-9006PLUS); (b) straight probe; (c) detection scheme.
The longitudinal wave probe (straight probe) was employed to detect the crack prop-erties when the studs were inspected by the ultrasonic non-destructive testing. The straight probe (5P14Z) is shown in Figure 9b. The chip diameter was 14 mm and the probe frequency could reach 5 MHz. The engine oil was adopted as the coupling agent because of the good lubrication and bonding effect between the probe and the workpiece surface. When the cyclic loading reached a certain number, the ultrasonic non-destructive crack testing was conducted to several target studs of the specimens following the detection
Figure 9. Ultrasonic non-destructive crack testing of headed shear studs: (a) digital ultrasonic flawdetector (CTS-9006PLUS); (b) straight probe; (c) detection scheme.
The longitudinal wave probe (straight probe) was employed to detect the crack prop-erties when the studs were inspected by the ultrasonic non-destructive testing. The straightprobe (5P14Z) is shown in Figure 9b. The chip diameter was 14 mm and the probe fre-quency could reach 5 MHz. The engine oil was adopted as the coupling agent becauseof the good lubrication and bonding effect between the probe and the workpiece surface.When the cyclic loading reached a certain number, the ultrasonic non-destructive cracktesting was conducted to several target studs of the specimens following the detectionscheme in Figure 9c. The straight probe was pasted on the inner side of the flange plate ofthe H-shaped steel column at the headed shear studs location by a coupling agent.
With the increase in the detection depth, the echo amplitude decreased exponen-tially due to the influence of signal attenuation and sound beam diffusion. The distance–amplitude curve (DAC) was to connect the reflected echo amplitudes of the same defect atdifferent depths [44]. In the DAC, the abscissa was the ultrasonic path, and the ordinaterepresented the echo signal amplitude. A smooth curve (called generatrix) was used toconnect several wave peaks in the DAC, which represented the trend of the curve peak.Based on the generatrix, the DB values of waste line, quantitative line and evaluation linewere determined by the corresponding flaw detection standards [45]. By recording theDAC of reflection echoes, the crack details of shear studs could be obtained.
Appl. Sci. 2021, 11, 8297 14 of 18
4.2. Crack Detection Results of Headed Shear Studs
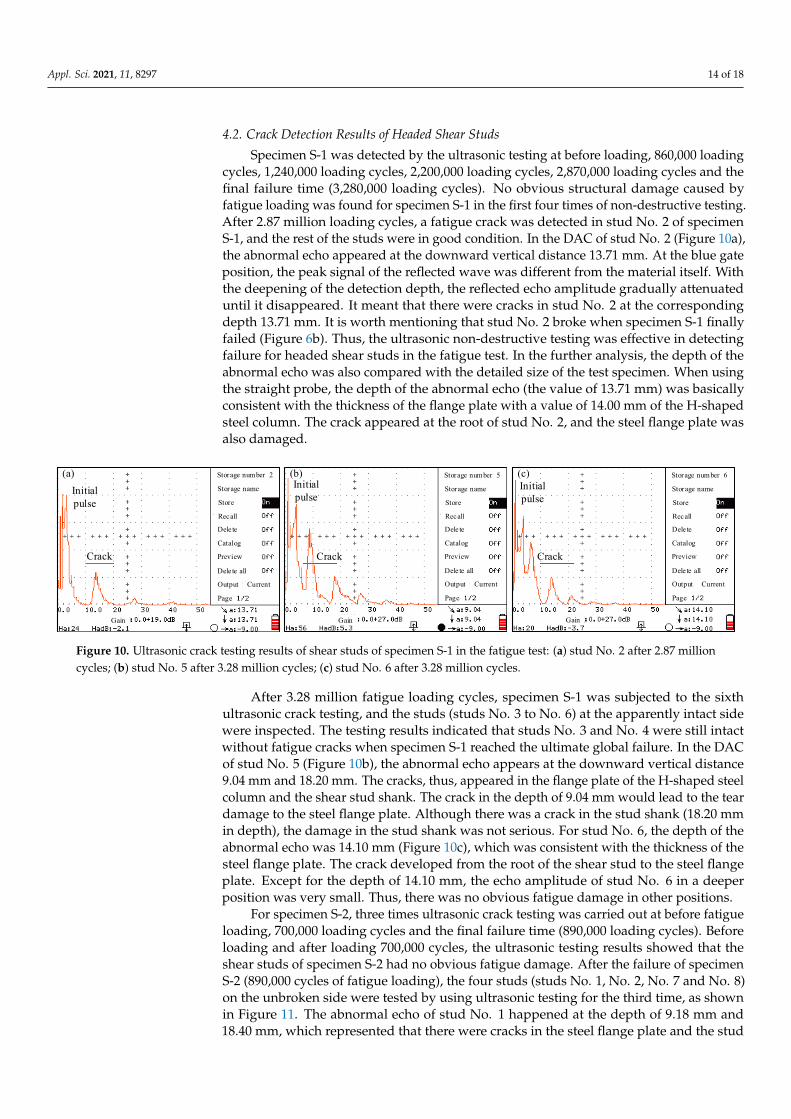
Specimen S-1 was detected by the ultrasonic testing at before loading, 860,000 loadingcycles, 1,240,000 loading cycles, 2,200,000 loading cycles, 2,870,000 loading cycles and thefinal failure time (3,280,000 loading cycles). No obvious structural damage caused byfatigue loading was found for specimen S-1 in the first four times of non-destructive testing.After 2.87 million loading cycles, a fatigue crack was detected in stud No. 2 of specimenS-1, and the rest of the studs were in good condition. In the DAC of stud No. 2 (Figure 10a),the abnormal echo appeared at the downward vertical distance 13.71 mm. At the blue gateposition, the peak signal of the reflected wave was different from the material itself. Withthe deepening of the detection depth, the reflected echo amplitude gradually attenuateduntil it disappeared. It meant that there were cracks in stud No. 2 at the correspondingdepth 13.71 mm. It is worth mentioning that stud No. 2 broke when specimen S-1 finallyfailed (Figure 6b). Thus, the ultrasonic non-destructive testing was effective in detectingfailure for headed shear studs in the fatigue test. In the further analysis, the depth of theabnormal echo was also compared with the detailed size of the test specimen. When usingthe straight probe, the depth of the abnormal echo (the value of 13.71 mm) was basicallyconsistent with the thickness of the flange plate with a value of 14.00 mm of the H-shapedsteel column. The crack appeared at the root of stud No. 2, and the steel flange plate wasalso damaged.
Appl. Sci. 2021, 11, x FOR PEER REVIEW 14 of 18
scheme in Figure 9c. The straight probe was pasted on the inner side of the flange plate of the H-shaped steel column at the headed shear studs location by a coupling agent.
With the increase in the detection depth, the echo amplitude decreased exponentially due to the influence of signal attenuation and sound beam diffusion. The distance–ampli-tude curve (DAC) was to connect the reflected echo amplitudes of the same defect at dif-ferent depths [44]. In the DAC, the abscissa was the ultrasonic path, and the ordinate rep-resented the echo signal amplitude. A smooth curve (called generatrix) was used to con-nect several wave peaks in the DAC, which represented the trend of the curve peak. Based on the generatrix, the DB values of waste line, quantitative line and evaluation line were determined by the corresponding flaw detection standards [45]. By recording the DAC of reflection echoes, the crack details of shear studs could be obtained.
4.2. Crack Detection Results of Headed Shear Studs Specimen S-1 was detected by the ultrasonic testing at before loading, 860,000 load-
ing cycles, 1,240,000 loading cycles, 2,200,000 loading cycles, 2,870,000 loading cycles and the final failure time (3,280,000 loading cycles). No obvious structural damage caused by fatigue loading was found for specimen S-1 in the first four times of non-destructive test-ing. After 2.87 million loading cycles, a fatigue crack was detected in stud No. 2 of speci-men S-1, and the rest of the studs were in good condition. In the DAC of stud No. 2 (Figure 10a), the abnormal echo appeared at the downward vertical distance 13.71 mm. At the blue gate position, the peak signal of the reflected wave was different from the material itself. With the deepening of the detection depth, the reflected echo amplitude gradually attenuated until it disappeared. It meant that there were cracks in stud No. 2 at the corre-sponding depth 13.71 mm. It is worth mentioning that stud No. 2 broke when specimen S-1 finally failed (Figure 6b). Thus, the ultrasonic non-destructive testing was effective in detecting failure for headed shear studs in the fatigue test. In the further analysis, the depth of the abnormal echo was also compared with the detailed size of the test specimen. When using the straight probe, the depth of the abnormal echo (the value of 13.71 mm) was basically consistent with the thickness of the flange plate with a value of 14.00 mm of the H-shaped steel column. The crack appeared at the root of stud No. 2, and the steel flange plate was also damaged.
Storage number 2
Storage name
Store
Recall
Dele te
Catalog
Preview
Dele te all
Output Current
Page
Gain
(a)Initial pulse
Crack
Storage number 5
Storage name
Store
Recall
Dele te
Catalog
Preview
Dele te all
Output Current
Page
Gain
(b)Initial pulse
Crack
Storage number 6
Storage name
Store
Recall
Dele te
Catalog
Preview
Dele te all
Output Current
Page
Gain
(c)Initial pulse
Crack
Figure 10. Ultrasonic crack testing results of shear studs of specimen S-1 in the fatigue test: (a) stud No. 2 after 2.87 million cycles; (b) stud No. 5 after 3.28 million cycles; (c) stud No. 6 after 3.28 million cycles.
After 3.28 million fatigue loading cycles, specimen S-1 was subjected to the sixth ul-trasonic crack testing, and the studs (studs No. 3 to No. 6) at the apparently intact side were inspected. The testing results indicated that studs No. 3 and No. 4 were still intact without fatigue cracks when specimen S-1 reached the ultimate global failure. In the DAC of stud No. 5 (Figure 10b), the abnormal echo appears at the downward vertical distance 9.04 mm and 18.20 mm. The cracks, thus, appeared in the flange plate of the H-shaped steel column and the shear stud shank. The crack in the depth of 9.04 mm would lead to the tear damage to the steel flange plate. Although there was a crack in the stud shank
Figure 10. Ultrasonic crack testing results of shear studs of specimen S-1 in the fatigue test: (a) stud No. 2 after 2.87 millioncycles; (b) stud No. 5 after 3.28 million cycles; (c) stud No. 6 after 3.28 million cycles.
After 3.28 million fatigue loading cycles, specimen S-1 was subjected to the sixthultrasonic crack testing, and the studs (studs No. 3 to No. 6) at the apparently intact sidewere inspected. The testing results indicated that studs No. 3 and No. 4 were still intactwithout fatigue cracks when specimen S-1 reached the ultimate global failure. In the DACof stud No. 5 (Figure 10b), the abnormal echo appears at the downward vertical distance9.04 mm and 18.20 mm. The cracks, thus, appeared in the flange plate of the H-shaped steelcolumn and the shear stud shank. The crack in the depth of 9.04 mm would lead to the teardamage to the steel flange plate. Although there was a crack in the stud shank (18.20 mmin depth), the damage in the stud shank was not serious. For stud No. 6, the depth of theabnormal echo was 14.10 mm (Figure 10c), which was consistent with the thickness of thesteel flange plate. The crack developed from the root of the shear stud to the steel flangeplate. Except for the depth of 14.10 mm, the echo amplitude of stud No. 6 in a deeperposition was very small. Thus, there was no obvious fatigue damage in other positions.
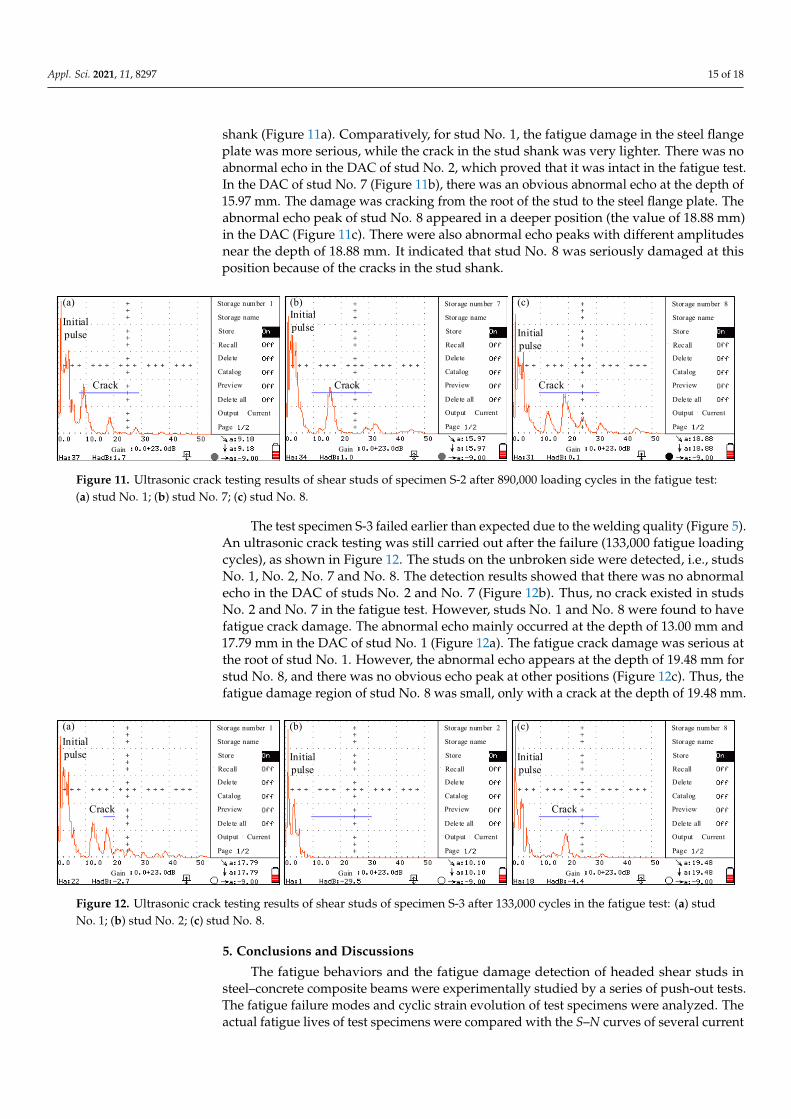
For specimen S-2, three times ultrasonic crack testing was carried out at before fatigueloading, 700,000 loading cycles and the final failure time (890,000 loading cycles). Beforeloading and after loading 700,000 cycles, the ultrasonic testing results showed that theshear studs of specimen S-2 had no obvious fatigue damage. After the failure of specimenS-2 (890,000 cycles of fatigue loading), the four studs (studs No. 1, No. 2, No. 7 and No. 8)on the unbroken side were tested by using ultrasonic testing for the third time, as shownin Figure 11. The abnormal echo of stud No. 1 happened at the depth of 9.18 mm and18.40 mm, which represented that there were cracks in the steel flange plate and the stud
Appl. Sci. 2021, 11, 8297 15 of 18
shank (Figure 11a). Comparatively, for stud No. 1, the fatigue damage in the steel flangeplate was more serious, while the crack in the stud shank was very lighter. There was noabnormal echo in the DAC of stud No. 2, which proved that it was intact in the fatigue test.In the DAC of stud No. 7 (Figure 11b), there was an obvious abnormal echo at the depth of15.97 mm. The damage was cracking from the root of the stud to the steel flange plate. Theabnormal echo peak of stud No. 8 appeared in a deeper position (the value of 18.88 mm)in the DAC (Figure 11c). There were also abnormal echo peaks with different amplitudesnear the depth of 18.88 mm. It indicated that stud No. 8 was seriously damaged at thisposition because of the cracks in the stud shank.
Appl. Sci. 2021, 11, x FOR PEER REVIEW 15 of 18
(18.20 mm in depth), the damage in the stud shank was not serious. For stud No. 6, the depth of the abnormal echo was 14.10 mm (Figure 10c), which was consistent with the thickness of the steel flange plate. The crack developed from the root of the shear stud to the steel flange plate. Except for the depth of 14.10 mm, the echo amplitude of stud No. 6 in a deeper position was very small. Thus, there was no obvious fatigue damage in other positions.
For specimen S-2, three times ultrasonic crack testing was carried out at before fatigue loading, 700,000 loading cycles and the final failure time (890,000 loading cycles). Before loading and after loading 700,000 cycles, the ultrasonic testing results showed that the shear studs of specimen S-2 had no obvious fatigue damage. After the failure of specimen S-2 (890,000 cycles of fatigue loading), the four studs (studs No. 1, No. 2, No. 7 and No. 8) on the unbroken side were tested by using ultrasonic testing for the third time, as shown in Figure 11. The abnormal echo of stud No. 1 happened at the depth of 9.18 mm and 18.40 mm, which represented that there were cracks in the steel flange plate and the stud shank (Figure 11a). Comparatively, for stud No. 1, the fatigue damage in the steel flange plate was more serious, while the crack in the stud shank was very lighter. There was no ab-normal echo in the DAC of stud No. 2, which proved that it was intact in the fatigue test. In the DAC of stud No. 7 (Figure 11b), there was an obvious abnormal echo at the depth of 15.97 mm. The damage was cracking from the root of the stud to the steel flange plate. The abnormal echo peak of stud No. 8 appeared in a deeper position (the value of 18.88 mm) in the DAC (Figure 11c). There were also abnormal echo peaks with different ampli-tudes near the depth of 18.88 mm. It indicated that stud No. 8 was seriously damaged at this position because of the cracks in the stud shank.
Storage number 1
Storage name
Store
Recall
Dele te
Catalog
Preview
Dele te all
Output Current
Page
Gain
(a)
Initial pulse
Crack
Storage number 7
Storage name
Store
Recall
Dele te
Catalog
Preview
Dele te all
Output Current
Page
Gain
(b)Initial pulse
Crack
Storage number 8
Storage name
Store
Recall
Dele te
Catalog
Preview
Dele te all
Output Current
Page
Gain
(c)
Crack
Initial pulse
Figure 11. Ultrasonic crack testing results of shear studs of specimen S-2 after 890,000 loading cycles in the fatigue test: (a) stud No. 1; (b) stud No. 7; (c) stud No. 8.
The test specimen S-3 failed earlier than expected due to the welding quality (Figure 5). An ultrasonic crack testing was still carried out after the failure (133,000 fatigue loading cycles), as shown in Figure 12. The studs on the unbroken side were detected, i.e., studs No. 1, No. 2, No. 7 and No. 8. The detection results showed that there was no abnormal echo in the DAC of studs No. 2 and No. 7 (Figure 12b). Thus, no crack existed in studs No. 2 and No. 7 in the fatigue test. However, studs No. 1 and No. 8 were found to have fatigue crack damage. The abnormal echo mainly occurred at the depth of 13.00 mm and 17.79 mm in the DAC of stud No. 1 (Figure 12a). The fatigue crack damage was serious at the root of stud No. 1. However, the abnormal echo appears at the depth of 19.48 mm for stud No. 8, and there was no obvious echo peak at other positions (Figure 12c). Thus, the fa-tigue damage region of stud No. 8 was small, only with a crack at the depth of 19.48 mm.
Figure 11. Ultrasonic crack testing results of shear studs of specimen S-2 after 890,000 loading cycles in the fatigue test:(a) stud No. 1; (b) stud No. 7; (c) stud No. 8.
The test specimen S-3 failed earlier than expected due to the welding quality (Figure 5).An ultrasonic crack testing was still carried out after the failure (133,000 fatigue loadingcycles), as shown in Figure 12. The studs on the unbroken side were detected, i.e., studsNo. 1, No. 2, No. 7 and No. 8. The detection results showed that there was no abnormalecho in the DAC of studs No. 2 and No. 7 (Figure 12b). Thus, no crack existed in studsNo. 2 and No. 7 in the fatigue test. However, studs No. 1 and No. 8 were found to havefatigue crack damage. The abnormal echo mainly occurred at the depth of 13.00 mm and17.79 mm in the DAC of stud No. 1 (Figure 12a). The fatigue crack damage was serious atthe root of stud No. 1. However, the abnormal echo appears at the depth of 19.48 mm forstud No. 8, and there was no obvious echo peak at other positions (Figure 12c). Thus, thefatigue damage region of stud No. 8 was small, only with a crack at the depth of 19.48 mm.
Appl. Sci. 2021, 11, x FOR PEER REVIEW 16 of 18
Storage number 1
Storage name
Store
Recall
Dele te
Catalog
Preview
Dele te all
Output Current
Page
Gain
(a)Initial pulse
Crack
Storage number 2
Storage name
Store
Recall
Dele te
Catalog
Preview
Dele te all
Output Current
Page
Gain
(b)
Initial pulse
Storage number 8
Storage name
Store
Recall
Dele te
Catalog
Preview
Dele te all
Output Current
Page
Gain
(c)
Crack
Initial pulse
Figure 12. Ultrasonic crack testing results of shear studs of specimen S-3 after 133,000 cycles in the fatigue test: (a) stud No. 1; (b) stud No. 2; (c) stud No. 8.
5. Conclusions and Discussions The fatigue behaviors and the fatigue damage detection of headed shear studs in
steel–concrete composite beams were experimentally studied by a series of push-out tests. The fatigue failure modes and cyclic strain evolution of test specimens were analyzed. The actual fatigue lives of test specimens were compared with the S–N curves of several cur-rent design codes. The ultrasonic non-destructive testing was also adopted to detect the fatigue crack details of the shear studs. With the above investigations, the following con-clusions can be drawn: (1) The root fracture was the main fatigue failure mode for headed shear studs under
cyclic fatigue loading. Based on all the three current codes (i.e., AASHTO, Eurocode 4 and BS5400), the safe fatigue life estimation of headed shear studs can be guaran-teed only with different safety redundancies.
(2) The strain at the good shear stud gradually increased with the fatigue loading cycles until the failure of the specimen. The strain at the shear stud with fatigue damage showed a consistent increasing trend followed by decreasing behavior after reaching the peak value with the loading cycles. The strain measurements were helpful to es-timate the fatigue damage to the embedded studs.
(3) With the combination of a strain measurement, the ultrasonic non-destructive testing for fatigue crack detection of headed shear studs was feasible. The fatigue crack lo-cation of headed shear studs under cyclic loads can be measured. The fatigue behaviors, including the failure modes, the fatigue lives, the cyclic strain
evolution and the fatigue crack details of headed shear studs, were experimentally inves-tigated. The feasibility of the ultrasonic non-destructive testing with the combination of a strain measurement for shear studs crack detection in push-out tests was proved. How-ever, there is still a lack of detailed monitoring of the fatigue crack growth process of shear studs. Thus, in future studies, the ultrasonic non-destructive testing should be applied to monitor the fatigue crack growth process of headed shear studs in push-out tests or actual in-service composite bridges. With the dynamical inspection of fatigue crack details, the further development of our previous numerical method [32] for the accurate simulation of the fatigue crack propagation process and mechanical principles of failure modes of headed shear studs in steel–concrete composite beams will be conducted.
Author Contributions: Conceptualization, J.X. and H.S.; methodology, J.X. and H.S.; experiments, J.X. and H.S.; investigation, J.X., H.S. and X.G.; writing—original draft preparation, H.S. and J.X.; writing—review and editing, W.C. and X.G.; visualization, X.G.; supervision, W.C.; All authors have read and agreed to the published version of the manuscript.
Funding: The research was financially supported by the scientific research fund of the Yangzhou University through grant no. 137,012,308, for which the corresponding author is most grateful.
Conflicts of Interest: The authors declare no conflict of interest.
Figure 12. Ultrasonic crack testing results of shear studs of specimen S-3 after 133,000 cycles in the fatigue test: (a) studNo. 1; (b) stud No. 2; (c) stud No. 8.
5. Conclusions and Discussions
The fatigue behaviors and the fatigue damage detection of headed shear studs insteel–concrete composite beams were experimentally studied by a series of push-out tests.The fatigue failure modes and cyclic strain evolution of test specimens were analyzed. Theactual fatigue lives of test specimens were compared with the S–N curves of several current
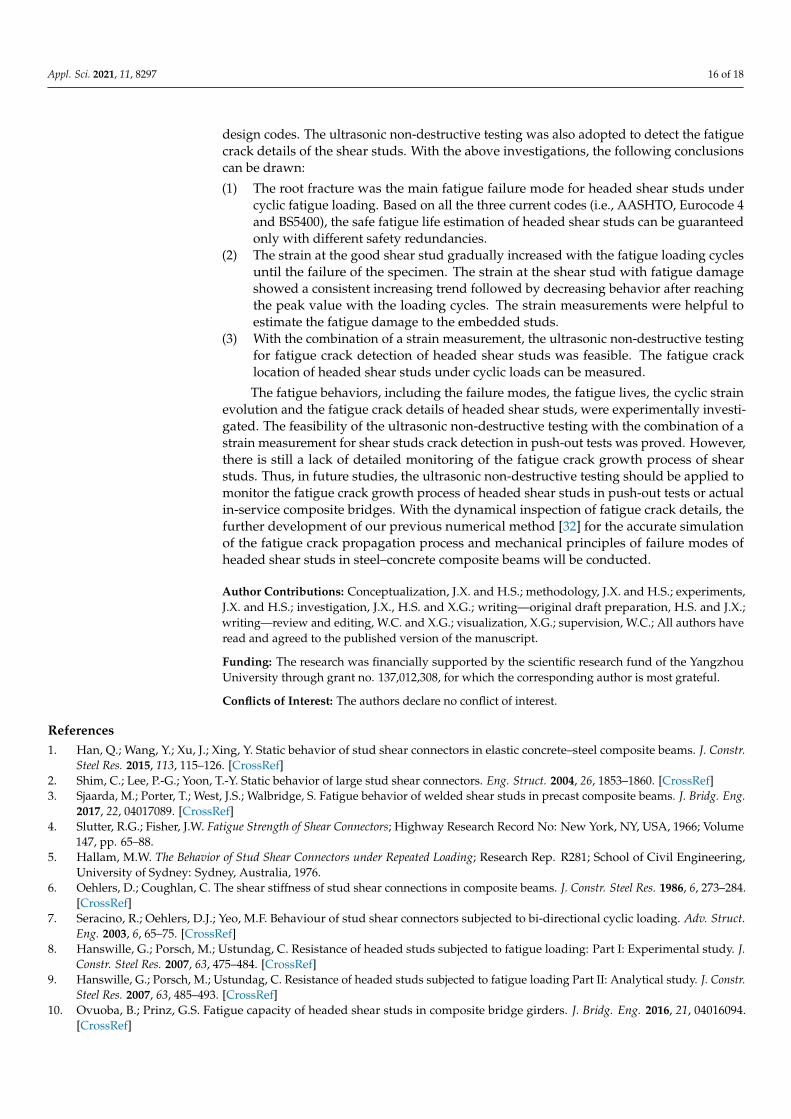
Appl. Sci. 2021, 11, 8297 16 of 18
design codes. The ultrasonic non-destructive testing was also adopted to detect the fatiguecrack details of the shear studs. With the above investigations, the following conclusionscan be drawn:
(1) The root fracture was the main fatigue failure mode for headed shear studs undercyclic fatigue loading. Based on all the three current codes (i.e., AASHTO, Eurocode 4and BS5400), the safe fatigue life estimation of headed shear studs can be guaranteedonly with different safety redundancies.
(2) The strain at the good shear stud gradually increased with the fatigue loading cyclesuntil the failure of the specimen. The strain at the shear stud with fatigue damageshowed a consistent increasing trend followed by decreasing behavior after reachingthe peak value with the loading cycles. The strain measurements were helpful toestimate the fatigue damage to the embedded studs.
(3) With the combination of a strain measurement, the ultrasonic non-destructive testingfor fatigue crack detection of headed shear studs was feasible. The fatigue cracklocation of headed shear studs under cyclic loads can be measured.
The fatigue behaviors, including the failure modes, the fatigue lives, the cyclic strainevolution and the fatigue crack details of headed shear studs, were experimentally investi-gated. The feasibility of the ultrasonic non-destructive testing with the combination of astrain measurement for shear studs crack detection in push-out tests was proved. However,there is still a lack of detailed monitoring of the fatigue crack growth process of shearstuds. Thus, in future studies, the ultrasonic non-destructive testing should be applied tomonitor the fatigue crack growth process of headed shear studs in push-out tests or actualin-service composite bridges. With the dynamical inspection of fatigue crack details, thefurther development of our previous numerical method [32] for the accurate simulationof the fatigue crack propagation process and mechanical principles of failure modes ofheaded shear studs in steel–concrete composite beams will be conducted.
Author Contributions: Conceptualization, J.X. and H.S.; methodology, J.X. and H.S.; experiments,J.X. and H.S.; investigation, J.X., H.S. and X.G.; writing—original draft preparation, H.S. and J.X.;writing—review and editing, W.C. and X.G.; visualization, X.G.; supervision, W.C.; All authors haveread and agreed to the published version of the manuscript.
Funding: The research was financially supported by the scientific research fund of the YangzhouUniversity through grant no. 137,012,308, for which the corresponding author is most grateful.
Conflicts of Interest: The authors declare no conflict of interest.
References1. Han, Q.; Wang, Y.; Xu, J.; Xing, Y. Static behavior of stud shear connectors in elastic concrete–steel composite beams. J. Constr.
Steel Res. 2015, 113, 115–126. [CrossRef]2. Shim, C.; Lee, P.-G.; Yoon, T.-Y. Static behavior of large stud shear connectors. Eng. Struct. 2004, 26, 1853–1860. [CrossRef]3. Sjaarda, M.; Porter, T.; West, J.S.; Walbridge, S. Fatigue behavior of welded shear studs in precast composite beams. J. Bridg. Eng.
2017, 22, 04017089. [CrossRef]4. Slutter, R.G.; Fisher, J.W. Fatigue Strength of Shear Connectors; Highway Research Record No: New York, NY, USA, 1966; Volume
147, pp. 65–88.5. Hallam, M.W. The Behavior of Stud Shear Connectors under Repeated Loading; Research Rep. R281; School of Civil Engineering,
University of Sydney: Sydney, Australia, 1976.6. Oehlers, D.; Coughlan, C. The shear stiffness of stud shear connections in composite beams. J. Constr. Steel Res. 1986, 6, 273–284.
[CrossRef]7. Seracino, R.; Oehlers, D.J.; Yeo, M.F. Behaviour of stud shear connectors subjected to bi-directional cyclic loading. Adv. Struct.
Eng. 2003, 6, 65–75. [CrossRef]8. Hanswille, G.; Porsch, M.; Ustundag, C. Resistance of headed studs subjected to fatigue loading: Part I: Experimental study. J.
Constr. Steel Res. 2007, 63, 475–484. [CrossRef]9. Hanswille, G.; Porsch, M.; Ustundag, C. Resistance of headed studs subjected to fatigue loading Part II: Analytical study. J. Constr.
Steel Res. 2007, 63, 485–493. [CrossRef]10. Ovuoba, B.; Prinz, G.S. Fatigue capacity of headed shear studs in composite bridge girders. J. Bridg. Eng. 2016, 21, 04016094.
[CrossRef]
Appl. Sci. 2021, 11, 8297 17 of 18
11. Maeda, Y.; Matsuyi, S. Effects of Concrete Placing Direction on Static and Fatigue Strengths of Stud; Technology Reports of the OsakaUniversity: Osaka, Japan, 1983; pp. 397–406.
12. Badie, S.S.; Tadros, M.K.; Kakish, H.F.; Splittgerber, D.L.; Baishya, M.C. Large shear studs for composite action in steel bridgegirders. J. Bridg. Eng. 2002, 7, 195–203. [CrossRef]
13. Lee, P.-G.; Shim, C.-S.; Chang, S.-P. Static and fatigue behavior of large stud shear connectors for steel–concrete composite bridges.J. Constr. Steel Res. 2005, 61, 1270–1285. [CrossRef]
14. Okada, J.; Yoda, T.; Lebet, J.P. A study of the grouped arrangements of stud connectors on shear strength behavior. J. Struct. Mech.Earthq. Eng. 2006, 23, 75S–89S. [CrossRef]
15. Shim, C.S.; Lee, P.G.; Kim, D.W.; Chung, C.H. Effects of group arrangement on the ultimate strength of stud shear connection.In Proceedings of the International Conference on Composite Construction in Steel and Concrete IV; Leon, R.T., Perea, T., Rassati, C.A.,Lange, J., Eds.; ASCE: Reston, VA, USA, 2008; pp. 92–101.
16. Xu, C.; Sugiura, K.; Su, Q.T. Fatigue behavior of the group stud shear connectors in steel-concrete composite bridges. J. BridgeEng. 2018, 23, 04018055. [CrossRef]
17. Huh, B.; Lam, C.; Tharmabala, B. Effect of shear stud clusters in composite girder bridge design. Can. J. Civ. Eng. 2015, 42,259–272. [CrossRef]
18. Oehlers, D.J.; Seracino, R.; Yeo, M.F. Fatigue behaviour of composite steel and concrete beams with stud shear connections. Prog.Struct. Eng. Mater. 2000, 2, 187–195. [CrossRef]
19. Chen, J.; Zhang, H.; Yu, Q.-Q. Static and fatigue behavior of steel-concrete composite beams with corroded studs. J. Constr. SteelRes. 2019, 156, 18–27. [CrossRef]
20. Ollgaard, J.G.; Slutter, R.G.; Fisher, J.W. Shear strength stud connect. lightweight normal-weight concrete. Aisc Eng. J. 1971, 8,56–64.
21. Xu, H.Y.; Tang, X.B. Research on the fatigue performance of lightweight aggregate concrete headed stud connectors. J. Railw. Eng.Soc. 2013, 176, 97–101. (In Chinese)
22. Xu, C.; Su, Q.; Masuya, H. Static and fatigue behavior of the stud shear connector in lightweight concrete. Int. J. Steel Struct. 2018,18, 569–581. [CrossRef]
23. Kim, J.-S.; Kwark, J.; Joh, C.; Yoo, S.-W.; Lee, K.-C. Headed stud shear connector for thin ultrahigh-performance concrete bridgedeck. J. Constr. Steel Res. 2015, 108, 23–30. [CrossRef]
24. Cao, J.; Shao, X.; Deng, L.; Gan, Y. Static and fatigue behavior of short-headed studs embedded in a thin ultrahigh-performanceconcrete layer. J. Bridge Eng. 2017, 22, 04017005. [CrossRef]
25. Kruszewski, D.; Wille, K.; Zaghi, A.E. Push-out behavior of headed shear studs welded on thin plates and embedded in UHPC.Eng. Struct. 2018, 173, 429–441. [CrossRef]
26. Qian, S.; Li, V.C. Influence of concrete material ductility on shear response of stud connections. ACI Mater. J. 2006, 103, 60–66.27. Liu, Y.; Zhang, Q.; Bao, Y.; Bu, Y. Static and fatigue push-out tests of short headed shear studs embedded in Engineered
Cementitious Composites (ECC). Eng. Struct. 2018, 182, 29–38. [CrossRef]28. Mafipour, M.S.; Tatlari, S.; Azad, A.R.G.; Shahverdi, M.; Mohammadi, S. Fatigue behavior of headed stud shear connectors in
steel-concrete composite bridge girders. In Proceedings of the 3rd International Conference on Applied Research in StructuralEngineering and Constructional Management, Tehran, Iran, 26–27 June 2019.
29. Balkos, K.D.; Sjaarda, M.; West, J.S.; Walbridge, S. Static and fatigue tests of steel-precast composite beam specimens withthrough-bolt shear connectors. J. Bridg. Eng. 2019, 24, 04019036. [CrossRef]
30. El-Lobody, E.; Lam, D. Finite element analysis of steel-concrete composite girders. Adv. Struct. Eng. 2003, 6, 267–281. [CrossRef]31. Mia, M.; Bhowmick, A.K. A finite element based approach for fatigue life prediction of headed shear studs. Structures 2019, 19,
161–172. [CrossRef]32. Xu, J.; Sun, H.; Xie, Z.; Sun, J. Fatigue behaviour study of the shear stud using crack box technology and m integral method. Int. J.
Steel Struct. 2019, 19, 1249–1259. [CrossRef]33. Ovuoba, B.; Prinz, G. Investigation of residual fatigue life in shear studs of existing composite bridge girders following decades
of traffic loading. Eng. Struct. 2018, 161, 134–145. [CrossRef]34. Liu, K.; De Roeck, G. Damage detection of shear connectors in composite bridges. Struct. Health Monit. 2009, 8, 345–356.
[CrossRef]35. Ma, X.; Su, S.; Wang, W.; Yang, Y. Experimental and theoretical analysis of the correlation between cumulative plastic damage
and SMFL of structural steel under low cycle fatigue. J. Magn. Magn. Mater. 2021, 538, 168292. [CrossRef]36. Nobile, R.; Saponaro, A. Real-time monitoring of fatigue damage by Electrical Resistance Change method. Int. J. Fatigue 2021,
151, 106404. [CrossRef]37. Lehner, P.; Gołaszewski, J. Relationship of different properties from non-destructive testing of heavy concrete from magnetite and
serpentinite. Materials 2021, 14, 4288. [CrossRef] [PubMed]38. ENV 1994, Design of Composite Steel and Concrete Structures-Part 2: General Rules and Rules for Bridges; European Committee for
Standardization: Brussels, Belgium, 2005.39. Ministry of Housing and Urban-Rural Development of the People’s Republic of China. Code for Design of Concrete Structures; GB
50010-2010; China Architecture & Building Press: Beijing, China, 2015.40. Structural Steel for Bridge; GB/T 714-2015; Standardization Administration of China: Beijing, China, 2015.

Appl. Sci. 2021, 11, 8297 18 of 18
41. LRFD Bridge Design Specifications, 6th ed.; AASHTO: Washington, DC, USA, 2012.42. Steel, Concrete and Composite Bridges-Part 10: Code of Practice for Fatigue; BS5400; British Standards Institute: London, UK, 1980.43. Krautkrämer, J.; Krautkrämer, H. Ultrasonic Testing of Materials; 4th Fully Revised Edition; Springer: New York, NY, USA; Berlin,
Germany, 1990.44. Matlack, K.H.; Kim, J.-Y.; Jacobs, L.; Qu, J. Review of second harmonic generation measurement techniques for material state
determination in metals. J. Nondestruct. Eval. 2014, 34, 273. [CrossRef]45. American Society for Nondestructive Testing. Nondestructive Testing Handbook, 3rd ed.; Ultrasonic Testing: Columbus, OH, USA,
2007; Volume 7.
Related Documents