8 EUROPEAN COMMISSION THEME 8 Environment and energy EU Member State experiences with sustainable development indicators ▲ 2004 EDITION

Welcome message from author
This document is posted to help you gain knowledge. Please leave a comment to let me know what you think about it! Share it to your friends and learn new things together.
Transcript
8E U R O P E A NC O M M I S S I O N
THEME 8Environmentandenergy
EU Member Stateexperiences with
sustainable development indicators
▲
20
04
ED
ITIO
N
A great deal of additional information on the European Union is available on the Internet.It can be accessed through the Europa server (http://europa.eu.int).
Luxembourg: Office for Official Publications of the European Communities, 2004
ISBN 92-894-5054-1ISSN 1725-0803
© European Communities, 2004
Europe Direct is a service to help you find answers to your questions about the European Union
New freephone number:
00 800 6 7 8 9 10 11
1
ACKNOWLEDGEMENTS
This document is the final report to Eurostat remitted by ECOTEC in November 2002 in the framework of the Sustainable Development Indicator (SDI) project.
For further information, you may contact: Pascal WOLFF – Project Manager Unit F3 Environment and Sustainable Developement Statistical Office of the European Communities (EUROSTAT) L-2920 Luxembourg Tel: +352-4301-33660 Fax: +352-4301-30039 Email: [email protected]
or ECOTEC Research and Consulting Limited 13b Avenue de Tervuren B-1040 Brussels Belgium Tel: +32 (0)2 743 8949 Fax: +32 (0)2 732 7111 www.ecotec.com
The views expressed in this document are the author’s and do not necessarily reflect the opinion of the European Commission.
EU Member State Experiences with Sustainable Development Indicators
2
TABLE OF CONTENTS
ACKNOWLEDGEMENTS
PREFACE .................................................................................................................................3 EXECUTIVE SUMMARY.......................................................................................................4 1.0 INTRODUCTION .........................................................................................................9
1.1 Objectives of the Study.................................................................................................... 9 1.2 Methodology and Context ...............................................................................................9 1.3 Report Structure ............................................................................................................ 10
2.0 POLICY BACKGROUND.......................................................................................... 11 2.1 Introduction................................................................................................................... 11 2.2 The Evolution of Sustainable Development within Global Policy .................................. 11 2.3 The Evolution of Sustainable Development within EU Policy........................................ 12
3.0 STRATEGIES AND PROGRAMMES FOR SD AT MEMBER STATE LEVEL ... 14 3.1 Introduction................................................................................................................... 14 3.2 Member State Level Analysis – UNCSD Testing Phase Participants.............................. 14 3.3 Member State Analysis Level – Non-UNCSD Testing Phase Participants...................... 22
4.0 MEMBER STATE SDI METHODOLOGIES........................................................... 31 4.1 Introduction................................................................................................................... 31 4.2 Member State Level Analysis – UNCSD Testing Phase Participants.............................. 35 4.3 Member State Level Analysis – Non-UNCSD Testing Phase Participants...................... 55
5.0 INTER-DIMENSIONAL ASSESSMENT OF SD...................................................... 70 5.1 Introduction................................................................................................................... 70 5.2 Member State Level Analysis ........................................................................................ 72
6.0 CONCLUSIONS.......................................................................................................... 75 6.1 Introduction................................................................................................................... 75 6.2 Stages of Development .................................................................................................. 75 6.3 Approaches Used........................................................................................................... 76 6.4 Interpretation of Sustainable Development .................................................................... 77 6.5 Consultation/Awareness-Raising Efforts........................................................................ 77
7.0 BIBLIOGRAPHY........................................................................................................ 79 8.0 SUSTAINABLE DEVELOPMENT WEBSITES....................................................... 85 9.0 TABLE OF ACRONYMS........................................................................................... 88 ANNEX I: HEADLINE SDI SETS......................................................................................... 91
EU Member State Experiences with Sustainable Development Indicators
3
PREFACE
At the Gothenburg Summit on 15-16 June 2001, the European Council agreed on a strategy for sustainable development, based on the principle that the economic, social and environmental effects of all policies should be examined in a coordinated way and taken into account in decision-making. In order to evaluate implementation and progress, the Sustainable Development Strategy foresees the development of a set of sustainable development indicators.
The European Council also invited Member States to draw up their own national strategies. A number of Member States have already done so, and have identified a set of indicators for these strategies. These reflect the Member States’ own sustainable development priorities, which may differ from those at EU level.
As part of the process to identify an appropriate EU set of sustainable development indicators, Eurostat commissioned a report on the experiences of the 15 EU Member States in this area, and the processes involved. This study was carried out by Ecotec Research and Consulting Ltd.
As priorities change, new issues emerge and new international commitments are entered into, the sets of indicators may change over time. This study provides an overview of the process up to October 2002. It is hoped that this study may provide some insight which prove to be useful for those countries that have yet to develop their own strategies and identify relevant indicators.
Rainer Muthmann
Head of Unit F3 Environment and Sustainable Development
EU Member State Experiences with Sustainable Development Indicators
4
EXECUTIVE SUMMARY
Objectives and Methodology of the Study
Study objectives
This study for EUROSTAT, the Statistical Office of the European Communities, aims to advance the methodological understanding of the way in which sustainable development indicators (SDIs) are being developed and used across the fifteen Member States and the extent to which they complement sustainable development (SD) actions at the EU level.
Study methodology
The report has been compiled on the basis of an extensive review of reports and internet-based resources from across the Member States. In addition, key stakeholders were contacted directly in order to both deepen and broaden the level of analysis.
Policy Background
International policy
A definition of SD
Agenda 21
The UNCSD and its National SDI Testing Phase
Sustainable development first gained prominence in the 1987 Report Our Common Future which first articulated a now widely-used definition of the term:
“Development that meets the needs of the present without compromising the ability of future generations to meet their own needs”
The 1992 Rio Earth Summit led to the elaboration of Agenda 21 – a framework for making development socially, economically and environmentally sustainable in the 21st Century. To aid its implementation at national, regional and local levels, the UN Commission on Sustainable Development (UNCSD) was established. In 1996, the UNCSD launched an important multi-annual testing programme, aimed at furthering the level of understanding on SDI formulation. Six EU Member States (Austria, Belgium, Finland, France, Germany and the United Kingdom) participated in this testing process.
The evolution of SD within EU policy
Adoption of an EU SD Strategy by the Gothenburg Council
Successive Acts and Treaties over the past two decades have reinforced the importance of SD within EU policy. The Cardiff European Council in June 1998 introduced the concept of integrating environmental concerns into broader policy-making. Progress continued in the period thereafter, culminating in the adoption of an EU Sustainable Development Strategy by the Gothenburg European Council in June 2001. As a first step, four priority areas (climate change, transport, public health and natural resources) were identified, with associated objectives/measures to help guide future policy development. Seven headline indicators are to be used to help evaluate implementation of the strategy in the European Commission’s Annual Synthesis Report.
EU Member State Experiences with Sustainable Development Indicators
5
Member State Sustainable Development Strategies
Importance of SD Strategies
SDIs are a tool to assess progress towards sustainability-related goals and to raise awareness and understanding of SD-related issues among both decision-makers and the wider public. It is therefore very important that SDIs are viewed within the context of national and international SD strategies and legislative actions.
Early starters in Strategy formulation
Significant impetus provided by the Gothenburg Summit
SD Strategy elaboration occurred in the early 1990s in several Member States (Finland and the United Kingdom) followed by others (Belgium, France, Ireland and Luxembourg) during the middle and latter parts of the decade. The 2001 Gothenburg European Council invited the remaining Member States to draw up their own national SD strategies. As a result, significant work in this sphere has taken place over the last twelve months, with Austria, Denmark, Germany, Greece, Italy, Portugal, Spain and Sweden all producing strategies. The process is now underway in the case of the Netherlands.
Revision of SD Strategies
Several Member States (e.g. Belgium, Denmark, Sweden and the United Kingdom) have revised or updated their strategies or have indicated their intention to do so. This reflects both the dynamic nature of SD (with a corresponding need for strategies to be revised to reflect change) and a desire on the part of new Governments within several Member States to have an SD strategy more in line with their political philosophy and priorities.
Public consultation exercises
The process of elaborating national SD strategies has often been accompanied by major public consultation/awareness-raising exercises, with many fora allowing the wider public as well as interest groups within society to have an input into the process. In the case of several Member States innovative Internet-based discussion portals have been developed, allowing a wide outreach to key stakeholders.
Member State Sustainable Development Indicators
A definition of an indicator
Key early role of the UNCSD in developing SDIs
Increased involvement of both the EU and Member States
An indicator can be defined as: ‘a parameter, or a value derived from a set of parameters, that points to, provides information about and/or describes the state of a phenomenon. It has a significance beyond that directly associated with the parameter value.’1
Early experiences with the development of SDIs were predominantly based around the activities of international bodies such as the UNCSD, which organised the National SDI Testing Exercise.
More recently however the focus of activity in the sphere of SDI formulation has shifted, firstly to the EU-level, but latterly also to the level of individual Member States.
1 * Source: Lowell Flanders, Assistant Director (UN Division for SD) at the conference Sustainable Development of Coastal Zones and Instruments for its Evaluation, Germany, 23-26 Oct. 2000
EU Member State Experiences with Sustainable Development Indicators
6
The link between SDIs and Member State SD Strategies
Reducing the number of SDIs after the production of an initial set
Member State stages of development with respect to SDI formulation closely follow the timing of their SD Strategy. Those Member States which formulated SD Strategies relatively early have on the whole tended to be front-runners in terms of their SDI formulation. The only exceptions in this regard are Portugal and Sweden which produced SDI sets prior to elaborating an SD Strategy. Member State SDI sets tend to reflect the priorities laid out within the National SD Strategies. There has also been a tendency in several Member States (e.g. Belgium, France, Germany and Luxembourg) to initially produce a very large SDI set (often including several hundred SDIs) and then reduce the number on the grounds of both relevance to the national situation and data availability.
Involvement of the EPA or Ministry of Environment
Formal or informal co-ordination structures
In most Member States it is the Ministry of the Environment (or equivalent organisation) or Environmental Protection Agency (EPA) which is responsible for leading the formulation of SDI sets. In several Member States however there are either formal or informal co-ordination structures which bring together various actors (both governmental and non-governmental), helping to achieve a greater degree of wider involvement in SDI formulation and use.
Trade-offs in SDI formulation and use
Policy-driven or Statistics-driven approaches
There are several trade-offs involved with SDI formulation and use. One relates to the issue of whether the SDI set is policy-driven (i.e. closely mirroring SD policy) or statistics-driven (i.e. designed to ensure the highest availability and quality of data). The overall tendency across Member States appears to be for a policy-driven focus, but one which does not completely overlook practical issues of data availability. Another important trade-off is that of stability versus change in SDI sets. On the one hand, SD is a dynamic concept, reflecting changing circumstances, pressures and opportunities. As things change, then so must SD policy and the related SDI sets. On the other hand however, the only way to accurately measure progress towards SD is to have a fairly stable set of SDIs which can be measured against a baseline. In this regard, most Member States tend to be willing to make changes to their SDI sets, whilst maintaining a solid core of SDIs existing over an extended time horizon.
Interdimensionality
The need for an interdimensional assessment of SD
Institutional interdimensionality
Viewing SD only in terms of its different dimensions (environmental, economic and social) fails to bring out the complex interdependencies and interactions that exist between the three dimensions. To measure progress towards SD, SDIs must also be inter-dimensional, offering explicit linkages between the dimensions of SD and allowing sustainability to be assessed in a more holistic fashion.
It is also important that institutional inter-dimensionality (the effect of policies in one area on other policy areas) and the wider implications in terms of SD is reflected in both SD strategies and initiatives. In all MSs there are examples of policies enacted by a ministry with specific sectoral responsibilities which have potentially significant effects in terms of SD across many different policy fields.
EU Member State Experiences with Sustainable Development Indicators
7
Conclusions
Benefits of UNCSD Testing Phase
‘Demonstration Effect’ for non-participants
Stages of Development:
Overall, the six Member States which participated in the UNCSD Testing Phase appear slightly more advanced in the formulation of SDI sets, in that it has led to a more robust methodological and procedural approach. Equally however, several of the non-participating Member States have benefited from the ‘demonstration effect’ of the experience gained in the six UNCSD participants, and from methodological activities undertaken at the EU and global level. They have also been better able to harmonise their strategies to the EU-level priorities, post-Gothenburg.
Importance of World Summit on Sustainable Development
The Johannesburg World Summit on SD has also provided a substantial impetus for strategising, operationalising and assessing SD. Significant activities in relation to both broader SD strategy development and more specific work on SDIs were undertaken in the months preceding the summit.
Major recent efforts with SDI formulation in several Member States
Certain Member States still more advanced but some evidence of convergence
Substantial efforts on SDI formulation are currently underway in a number of different Member States. Germany has recently published a final SDI set and Greece, Ireland, Italy and Spain are all scheduled to publish sets in the near future. Several of these have already published draft SDI sets as part of ongoing consultation exercises. It is therefore possible to conclude that while certain Member States are more advanced than others in the formulation and use of SDIs, there has been a process of convergence across the EU-15.
Using SDIs to measure strategy implementation
Approaches Used:
In most Member States, the development of SDI sets is expressly linked to the drafting of National SD Strategies. SDI sets are often intended to measure the implementation of the strategies’ aims and objectives. The priorities and areas of emphasis in the SD Strategies are therefore major influences on the types of SDIs selected. The DPSIR-approach is widely used.
3-pillar approach versus more holistic models
Several Member States (e.g. Austria, Denmark, Germany, Italy, Spain and the United Kingdom) have avoided a model of SD based on the three pillar (Environment-Economy-Society) approach but rather have characterised SD in a more integrated and holistic fashion, often based on those SD themes which have been identified as being nationally important.
Headline and regional level SDI sets
Denmark, Germany, Sweden and the UK have all produced ‘headline’ sets of around 15-20 SDIs for ease of interpretation and accessibility to decision-makers and the general public. Websites are the usual means of dissemination for these headline sets. In addition, three Member States (Belgium, Germany and the United Kingdom) are also formulating regional-level SDI sets.
Broad interpretation
Interpretation of Sustainable Development:
Most Member States have adopted a broad interpretation of SD, encompassing economic and social themes in addition to environmental ones. The only possible
EU Member State Experiences with Sustainable Development Indicators
8
of SD exceptions in this regard are Denmark, Italy and Portugal which only have a limited selection of non-environmental indicators.
More inter-dimensionality within SDIs based on a more holistic SD interpretation?
There is some evidence to suggest that those Member States adopting a more holistic interpretation of SD have a greater acknowledgement of inter-dimensionality within both their SD Strategy and also their SDI sets. However, several of the Member States using the ‘three-pillar’ approach have also made explicit efforts to allow for an inter-dimensional element within their SDI structure.
Outward as well as inward dimension to both SD and SDIs
Achieving SD within broader Government policies and institutions
Although all Member States have strong ‘inward looking’ strategies and SDI sets, most also have an international outlook. This is evidenced by a commitment to both adhere to international environment agreements (such as the Kyoto Protocol) and to support international development assistance. Several Member States (e.g. Ireland, the Netherlands and the UK) have attempted to achieve greater SD within both sectoral Government policies and the actual institutional working of Government itself. This has also had (or will have) implications in terms of SDI formulation and application.
Strong stakeholder and public consultation efforts
Consultation/Awareness-Raising Efforts:
Efforts to involve wider stakeholders and the public in the formulation of SDIs are strong in most Member States. There are several formalised ‘working groups’ bringing together different stakeholders from Government Ministries and wider society (e.g. NGOs, the social partners, the private sector, academia and regional and local-level administrations).
Successful public consultation periods
Web-discussion portals aiding dissemination and debate
Many Member States have organised public consultation periods where a wide range of interested stakeholders and general public have been able to comment on draft SD Strategies and/or SDI sets. These consultation periods have on the whole been successful, raising the profile of SD/SDI activities and leading to improved outputs through the range of comments received. Several Member States (e.g. Austria and Germany) have developed innovative Web-discussion portals which have allowed the wider public and academia to easily access SDI-related resources and also to add their own input to the debate.
German success with public dissemination through the Environment Barometer
Germany is leading efforts to present SDI-based assessments to the general public in a clear, interesting and informative format. This is taking place through its high profile German Environment Barometer which receives regular coverage on German national television and discussion within the print media.
SDIs have also enjoyed good media coverage in the UK over the last twelve months.
EU Member State Experiences with Sustainable Development Indicators
9
1.0 INTRODUCTION
1.1 Objectives of the Study
This study, carried out for Eurostat by ECOTEC Research and Consulting Limited, aims to advance the methodological understanding of the way in which sustainable development indicators (SDIs) are being developed and used in EU Member States (MSs) and the extent to which they complement Sustainable Development (SD) actions at the EU level. More broadly, it is hoped that this study will contribute towards moving the focus of the debate on SDIs from an international level to a more EU and MS-oriented approach.
The report presents a comparative analysis of approaches to the development and application of SDIs across all 15 MSs. In particular, it documents the current2 state of play in MSs as well as offering findings on the extent to which there are commonalities and/or diverging approaches in terms of the methodologies used for MS SDI formulation. It also covers specific issues such as whether current methodologies allow for an inter-dimensional approach to the measurement of SD.
1.2 Methodology and Context
This report has been compiled on the basis of an extensive literature review of documents produced by Governments and other stakeholders across MSs. In total around 80 different publications have been studied as well as a significant number of web-based resources.
Project resource constraints mean that no face-to-face interviews have been carried out to deepen the level of analysis. Having said that, the available report-based resources which were meant to constitute the entire factual basis for this report were not as useful as expected. In particular, the information which they contained was sometimes only of a very superficial or ‘promotional’ nature or was not comparable to that available for other MSs. Therefore, although it was not originally foreseen, stakeholders involved in SDI formulation were contacted across the MSs in an attempt to deepen the level of analysis and/or to obtain more up-to-date information. In addition, a significant amount of highly relevant information was provided by members of EUROSTAT’s SDI Task Force. The author gratefully acknowledges the contribution made by Task Force members in this regard.
It is important however to point out that this report does not offer a similar level of analysis for all EU MSs. The situation in certain MSs has intentionally been analysed in more detail than in others. There are two main reasons for this. Firstly, certain MSs are more advanced in the field of SD and SDIs than others, so there is more information to present and discuss. Secondly, on a more practical level, there is a great deal of variation between MSs in the amount of information which is available on SDIs and its usefulness to a study such as this. We have tried wherever possible to balance this out so that we present as homogeneous an analysis as possible (e.g. through carrying out extensive Web-based searches and stakeholder consultations for those MSs where there is little or no report-based information).
2 situation at end of 2002
EU Member State Experiences with Sustainable Development Indicators
10
1.3 Report Structure
The structure of this Final Report is as follows:
Section 2: Policy Background sets the study in its broad context. The global rise to prominence of SD over the past fifteen years is outlined as well as the development of SD policies at the EU level.
Section 3: Strategies and Programmes for SD at the MS Level documents the current strategies and legislative actions underway within the fifteen MSs covered within this report.
Section 4: Member State SDI Methodologies looks in detail at the different SDI methodologies being used within the EU. The issues covered include inter alia participation in the CSD Testing Phase, the criteria of selection, specific frameworks, the institutions which are involved, whether SDI development appears to be statistics or policy driven, efforts to involve the media and the general public as well as planned forthcoming initiatives. In addition, a table provides a summary of the situation across all 15 MSs.
Section 5: An Inter-dimensional Assessment of SD provides an assessment on whether MS SDI frameworks appear to have an implicit or explicit inter-dimensional aspect to them. It also discusses the important issue of institutional inter-dimensionality.
Section 6: Conclusions presents the findings of the analysis.
Section 7: Bibliography lists the various different publications that have been used to compile this report.
Section 8: Sustainable Development Websites offers hyperlinks to the web-based resources used within this report.
SECTION 9: TABLE OF ACRONYMS LISTS THE MAIN ACRONYMS AND OTHER ABBREVIATIONS USED IN THE REPORT.
Annex I: Headline SDI Sets provides unabridged lists of the Headline SDI sets for the four Member States having such sets.
EU Member State Experiences with Sustainable Development Indicators
11
2.0 POLICY BACKGROUND
2.1 Introduction
SDIs are a tool which help practitioners to assess progress towards the achievement of sustainability-related goals as well as raising the awareness and understanding of particular SD-related issues amongst both decision-makers and the wider public.3 It is therefore important that SDIs are viewed within the context of national and international SD strategies and legislative actions, the implementation of which they are meant to measure.
Before examining the MS-level policy initiatives in the field of SD (Section 3.0) and then the current status of SDI development across MSs in Section 4.0, it is appropriate to outline the broader context. This chapter therefore documents the global institutionalisation of SD over the past fifteen years, and the contemporary EU-level situation.
2.2 The Evolution of Sustainable Development within Global Policy
The term ‘sustainable development’ first gained major prominence in the 1987 report Our Common Future (also commonly known as the Brundtland Report), which was published by the World Commission on Environment and Development (WCED). The report articulated a definition of SD which is still widely used today:
‘Development that meets the needs of the present without compromising the ability of future generations to meet their own needs.’
The report highlighted three fundamental components to SD:
v environmental protection;
v economic growth; and
v social equity.
Five years on from this Report, the United Nations Conference on Environment and Development (UNCED) (‘Earth Summit’) took place in Rio de Janeiro, Brazil. The objectives of the conference were to build upon the achievements of the Brundtland Report, in order to respond to pressing global environmental problems and to agree major treaties on biodiversity, climate change and forest management.
One of the agreements concluded at the Earth Summit was Agenda 21 which is a blueprint on how to make development socially, economically and environmentally sustainable in the 21st century. Agenda 21 provides a framework for tackling today’s social and environmental problems, including air pollution, deforestation, biodiversity loss, health, overpopulation, poverty, energy consumption, waste production and transport issues. The UN Commission on Sustainable Development (UNCSD) was created in December 1992 to help ensure effective implementation of Agenda 21 at the local, national, regional and international levels. In 1996
3 For a more precise definition of an indicator and their value as a tool, please see Box 4.1 in Section 4.1.
EU Member State Experiences with Sustainable Development Indicators
12
the UNCSD launched a national testing programme, whereby 22 volunteer countries from around the globe (including six EU Member States4) undertook methodological and consultative work designed to further the level of understanding on SDI formulation. This important activity is outlined in more detail in Box 4.3 in Section 4.1. The UNCSD also served as the central organising body for the World Summit on Sustainable Development (WSSD, or Rio+10), held in Johannesburg, South Africa from 26 August to 4 September 2002.
2.3 The Evolution of Sustainable Development within EU Policy
SD was first introduced as an explicit objective of the European Community in the Single European Act (1987). The requirement for environmental considerations to be integrated into all Community policies was added in the 1992 Treaty on European Union (Maastricht Treaty) and reinforced in the 1997 Treaty of Amsterdam.
The Cardiff European Council in June 1998 asked several Council formations to report on their steps towards integration of environmental concerns into their policies. This included a requirement to produce indicators to monitor progress. Eighteen months later in December 1999, the European Council session in Helsinki invited the European Commission ‘to prepare a proposal for a long-term strategy dovetailing policies for economically, socially and ecologically sustainable development to be presented to the European Council in June 2001.’
In response, the European Commission produced a Communication which presented a proposal for an EU strategy for SD.5 This was considered by the European Council at their summit in Gothenburg in June 2001. The resulting outcome emphasised that the Union’s SD Strategy is based on the principle that the economic, social and environmental effects of all policies should be examined in a co-ordinated way and taken into account in decision-making. It agreed a strategy for SD which completed the EU’s political commitment to economic and social renewal, and added an environmental dimension to the Lisbon strategy to establish a new approach to policy making. It noted that the European Commission will evaluate implementation of the SD strategy in its annual synthesis report, on the basis of a number of headline indicators, which were to be agreed by the Council in time for the Barcelona Spring European Council 2002 (see below). As a first step, the European Council identified four priority areas with associated objectives and measures as general guidance for future policy development (including the sphere of indicators). The four priority areas are:
v Climate change;
v Transport;
v Public health; and
v Natural resources.
4 Austria, Belgium, Finland, France, Germany and the United Kingdom. 5 COM(2001)264 Final
EU Member State Experiences with Sustainable Development Indicators
13
Following on from the call at the Gothenburg European Council for environmental indicators in these four policy areas, the following headline indicators were selected for the Barcelona European Council on 15-16 March 2002:
Combating climate change: 1. Greenhouse gases emissions (6 gases), in absolute terms (related to Kyoto target); and
2. Share of renewables in electricity consumption.
Ensuring sustainable transport: 3. Volume of transport versus GDP (passengers - km, freight in Tonne - km); and
4. Modal split of transport (passengers - km, freight in Tonne- km).
Addressing threats to public health:
5. Urban population exposure to air pollution
Managing natural resources more responsibly: 6. Municipal waste collected, landfilled and incinerated, in kg/inhabitant.
General economic background: 7. Energy intensity of the economy (energy consumption / GDP).
In addition to these seven indicators (or 13 when sub-indicators are included), 42 structural indicators were agreed upon by the Laeken European Council (December 2001) and were documented in the Communication from the Commission at the Spring European Council in Barcelona. This Synthesis Report covers the 5 domains of employment, innovation, economic reform, social cohesion and environment.
EU Member State Experiences with Sustainable Development Indicators
14
3.0 STRATEGIES AND PROGRAMMES FOR SD AT MEMBER STATE LEVEL
3.1 Introduction
Within the EU it is still not compulsory to have a SD strategy, but at Gothenburg in June 2001, The European Council, invited MSs to draw up their own national SD strategies. By then however, the majority of MSs had already conducted significant work in this area, with the production of various SD strategies and policies. However, due to the meaning of SD being so contextualised socio-culturally, each country’s definition will differ according to its culture and society. It is therefore appropriate to briefly examine the development and content of SD strategies and current activities in each MS.
The analysis of MSs (both in this Section and in the following Section 4.0 on MS SDI Methodologies) has been split into two parts. Those MSs which participated in the UNCSD indicator testing phase are covered first, followed by the remaining MSs.
3.2 Member State Level Analysis – UNCSD Testing Phase Participants
3.2.1 Austria
Austria published its SD strategy in April 2002 following a comprehensive stakeholder consultation exercise. A working group of around 40 different people was formed to assist with the strategy’s formulation. This working group contained a broad range of different stakeholders, including various federal ministries, representatives from the state (Länder) and district levels, social partners, different interest groups and NGOs. The first major output of this Working Group was the production of the Green-book: Making Austria’s Future Sustainable which was produced in the run-up to, and subsequently presented at, the EU Gothenburg Summit. It offers an initial consensus on the most important cornerstones, levels of activity and broad structural objectives of Austrian policy on SD. It was an orientation framework but not a strategy, since it did not include concrete quantifiable objectives, overall measures, implementation deadlines, indicators and processes for evaluating the achievement of objectives.
The working group met on three occasions and discussed the ‘minimum standards’ for the Austrian SD strategy and current unsustainable practices in Austria, as well as fixing the most important objectives of the strategy. On the basis of these discussions and the public contributions to the debate, an editorial team of around 15 people drafted the broad structure of the strategy.6
The SD strategy is structured around four interlinked areas of activity:
v Quality of life in Austria: tasks for today and tomorrow; v Austria as a dynamic location for business: success through innovation and networking;
6 See http://www.nachhaltigkeit.at/kaffeehaus/index_dez2001.html
EU Member State Experiences with Sustainable Development Indicators
15
v Austria as a place to live: protection of diversity and quality; and v Austria’s responsibility: an active role in Europe and the wider world.
Each of these areas of activity has five different objectives. These are based upon a very broad and inclusive definition of SD. This is reflected both in the fact that numerous social and economic objectives are stated as well as environmental ones, and the strategy has a definite foreign development theme.
3.2.2 Belgium
Belgium has a relatively complex Government system insofar as it is a federal state consisting of three communities (French, Flemish, and German-speaking) and three regions (Wallonia, Flanders and Brussels). This means that several bodies (the Federal State, the Regions, and the Communities) share powers. Each one of these 3 has its own legislative and executive bodies, however when policy falls within the sphere of national interest, the Federal government retains absolute authority. This has somewhat complicated the implementation of a SD strategy and hence the development of appropriate indicators because of the need to involve different tiers of government.
In 1997, the Belgian Federal Parliament adopted an Act on the Co-ordination of a Federal Sustainable Development Policy. Due to SD falling within the sphere of ‘national interest’, the Act primarily falls within the remit of the Federal State. Nevertheless, due to the importance of SD at all levels (from international to local), the Regions and Communities, as well as provinces also have powers that are essential for successful implementation of SD. Co-ordination and joint deliberation are therefore vital between all the authorities involved. The purpose of the Act was to create a legal and institutional framework to support a process of SD planning at the federal government level. The legislation provides 4 main instruments to institutionalise SD into Belgium’s policy-making. They are:
v An Interdepartmental Committee for SD, which drafts the Federal SD Plan;
v A Federal SD Council, which advises the Government on the SD Plan;
v A Federal Report on SD, published by the Bureau Federal du Plan every 2 years; and
v A Federal Plan for SD, which is reviewed every 4 years.
The 4-year plan, worked out within the general framework and laid down by Agenda 21, is implemented to improve the effectiveness and internal coherence of Belgian policy on SD. It co-ordinates the various different sectoral economic, social and environmental plans and policies applying at the Federal level, in order to impose overall coherence, so that they all contribute to SD. It is however, the regions that are responsible for implementing the SD strategy and publishing a set of indicators to assess their success (see section 4.2.3). The Bureau Federal du Plan then assesses the national state of the implementation of SD in Belgium every 2 years.
The choice of economic, environmental and social themes on which to target the plan was essentially determined by two criteria. Firstly, whether there was Federal competence in these issues and, secondly, whether the themes corresponded to priorities already expressed in the
EU Member State Experiences with Sustainable Development Indicators
16
Government’s programme or in the demands of major social pressure groups. The choice also followed logically from themes set out within the first Federal SD Report.
Following a change in government in 1999, the importance of SD, and a cross-sectoral approach, within the political agenda increased. Accordingly, harmonisation of economic, ecological and social policies became a key objective of government policy. The first federal plan for SD was drafted and approved by the Federal Council for SD (composed of representatives of the major social groups and stakeholders) in September 2000. This defining 4 year strategy for the implementation of SD in Belgium is based around 4 key actions:
v Actions on patterns of consumption and production;
v Actions on poverty and social exclusion/over-indebtedness/environmental health;
v Actions on agriculture/marine environment/biodiversity; and
v Actions on energy/transport/ozone/climate change.
The Bureau Federal du Plan identifies 5 main criteria that policy makers should consider within each of these 4 actions. Together these differ from classical environmental and development actions. The criteria are:
v World-wide conscience: the principle of communal responsibility;
v Long term vision;
v Integration of the three pillars of SD;
v Recognition of scientific uncertainties: the precautionary principle; and
v Active and responsible approach: public participation.
The Second Federal Report for SD is currently being prepared and is scheduled to be completed by the end of 2002. It will include a section dedicated to the description of the current status of SD in Belgium in relation to activities at the international level. This analysis will be based upon a selection of SDIs (see Section 4.2.3).
3.2.3 Finland
The Finnish Government has been at the forefront of attempts to turn SD from an idealistic concept to reality. As early as 1990, when SD was still more of a concept, the Council of State presented a report entitled 'Sustainable Development and Finland' to the Finnish Parliament. A second report, called 'Finnish Action for Sustainable Development', was prepared by the Finnish National Commission on SD in 1995. The current Government programme (Council of State Decision-in-Principle on the Promotion of Ecological Sustainability, June 1998) on SD is Finland’s 3rd comprehensive document outlining national measures to be taken to promote SD. It is designed to promote ecological sustainability and the economic and social and cultural preconditions for achieving this objective. The programme sets a framework policy and guides actors in planning, decision-making, and other activities within the scope of the strategic objectives and key action for SD. These sectors are:
EU Member State Experiences with Sustainable Development Indicators
17
v Finland's role in international co-operation;
v Products, production and consumption;
v Energy economy;
v Regional structure, urban structure and transport;
v Rural areas and use of renewable resources; and
v Research and education.
The latest programme was discussed by the Finnish National Commission for SD. This institution was established in 1993 to co-ordinate the different measures on SD at different levels. This is especially important as the SD Programme is supplemented by various documents and programmes which interpret and emphasise SD objectives from their own specific perspectives. Some of these programmes have cross-jurisdictional scope and have been prepared as an inter-ministerial co-operative effort. Hence the members of the Commission represent Finnish society as broadly as possible, i.e. the Parliament, public administration including local authorities, business and industry, labour unions, the scientific community, NGOs, interest groups representing different sectors of society and the media. Finland's two official languages have also been taken into account in the representation, as well as the Finnish indigenous people (the Sami). Finally this institution is the body that monitors progress towards SD through the implementation of the different programmes that are being put into effect by various organisations and institutions.
Regionally, Finland is very active in the preparation and adoption of a regional Baltic and Nordic Agenda 21 strategy. The strategies emphasise the dominant role of the ecological dimension of SD, which seems to be common throughout Scandinavia.
3.2.4 France
France has recently produced a new National Strategy for Sustainable Development which was presented at the World Summit on Sustainable Development in Johannesburg. The strategy was published by the ministry responsible for the environment, known now as the Ministry of Ecology and Sustainable Development. This strategy replaces the previous version, which was implemented in 1996 and had 35 proposals under 8 topic headings:
v Involving government authorities;
v Placing people at the heart of policy making;
v Transparency and evaluation;
v Citizenship and education;
v Mobilising economic players;
v Strengthening the role of civil society;
v Spatial planning; and
EU Member State Experiences with Sustainable Development Indicators
18
v Promoting safe, clean, energy-efficient technology.
The French SD Commission is an independent advisory body working under the direct authority of the Ministry of Ecology and Sustainable Development. The Commission was created in 1993 with a role of promoting debate on the subject of SD amongst civil society in France. Whilst not an overall co-ordinating body, it does play an important role with the promotion of SD within French society. For a period after its creation, it focussed on producing and disseminating numerous different analyses and documents attempting to help translate the abstract concept of SD into a concrete reality. Nowadays however, it is a high-level multi-disciplinary panel, consisting of different representatives from French society (encompassing scientists, economists, lawyers, teachers, the liberal professions, farmers and trade unionists etc.). It is meant to act as an interface between experts and civil society, and regularly produces reports for the Prime Minister on a range of different subjects, many of which are relevant to SD.
The French Institute for the Environment (IFEN) is a public establishment subordinated to the Ministry of Ecology and Sustainable Development. Since 1997 it has been working on the development of SD indicators at a national level and testing the current theoretical framework to make sure it is flexible enough to be applied to indicator development. (see Section 4.2.5).
3.2.5 Germany
There is a long tradition of environmental policy in Germany, with the First Environment Programme being established in 1971. Promoting SD in Germany is less well established but since 1994 it has been implicitly enshrined within the Basic Law (the German Constitution), through the Government’s responsibility for protecting the ‘natural basis for life’ and ‘responsibility for future generations’.
The German Federal Environmental Agency’s (UBA) 1997 study "Sustainable Germany – Towards an Environmentally Sound Development" is a key German policy document in the sphere of SD. It is a comprehensive report which points the way to long-term environmental development, but also including social and economic dimensions. The study focuses on the following five areas:
v Energy Use;
v Mobility;
v Food Production;
v Material Flow Management; and
v Consumption Patterns.
The study looked at these five areas in an integrated fashion and postulated the likely environmental status of Germany in the year 2010, depending on which (of three different) development path is taken. A follow up study “Sustainable Development in Germany – Towards an Environmentally Friendly Development” was published in 2002.
EU Member State Experiences with Sustainable Development Indicators
19
Germany has formulated a National Sustainable Development Strategy, entitled Perspectives for Germany: Our Strategy for a Sustainable Development.7 The strategy, which was formally adopted on 17 April 2002, sets out the following broad priority areas:
v Efficient use of energy – effect protection of climate;
v Safeguarding mobility – taking care of the environment; v Healthy (food) production – healthy eating;
v Structuring demographic change; v Changing old structures – developing new ideas;
v Innovative businesses – successful economy; v Reducing the demands on land; and
v Assuming a global responsibility.
The strategy is currently focussing on the first three areas. Areas of activity, incorporating conceptualisation, objectives and measures, have been produced, with a particular focus on these three areas. The other areas will be covered in more detail in the coming years. The strategy includes a chapter containing 21 key (headline) indicators for measuring progress towards sustainable development, most of them with quantified targets. More information on this is presented in Section 4.2.6). Elaboration of the strategy has involved intensive stakeholder discussions as well as public participation. A monitoring and updating of the strategy is planned every two years, starting in 2004.
3.2.6 United Kingdom:
In 1994, the UK published its first SD strategy: "Sustainable Development: The UK Strategy". However, after coming to power in 1997, the current Government announced its intention to prepare a new strategy. A consultation document:" Opportunities for Change", and a summary leaflet for the general public were published in February 1998, and in May 1999, the UK Government published "A Better Quality of Life: A Strategy for SD for the UK". In preparing this Strategy, the Government built on the achievements of the 1994 strategy, but also introduced a new approach, which emphasised the social dimension of SD alongside the existing themes of economic issues, the environment and resource use. The Strategy has four main aims: v Social progress which recognises the needs of everyone; v Effective protection of the environment; v Prudent use of natural resources; and v Maintenance of high and stable levels of economic growth and employment.
Future priorities for the UK are:
7 Perspektiven für Deutschland: Unsere Strategie für eine nachhaltige Entwicklung.
EU Member State Experiences with Sustainable Development Indicators
20
v More investment in people and equipment for a competitive economy; v Reducing the level of social exclusion; v Promoting a transport system which provides choice, and also minimises environmental
harm and reduces congestion; v Improving the larger towns and cities to make them better places to live and work; v Directing development and promoting agricultural practices to protect and enhance the
countryside and wildlife; v Improving energy efficiency and tackling waste; and v Working with others to achieve SD internationally.
The Government's policies will also take account of ten principles and approaches which reflect key SD themes, some of which are established legal principles, others more approaches to decision making:
v Putting people at the centre; v Taking a long term perspective; v Taking account of costs and benefits; v Creating an open and supportive economic system; v Combating poverty and social exclusion; v Respecting environmental limits; v The precautionary principle; v Using scientific knowledge; v Transparency, information participation and access to justice; and v Making the polluter pay.
It is planned that the UK’s 1999 SD Strategy will be updated in the near future. It is currently envisaged that this will take place in 2004.
As proposed in the UK SD Strategy, the Government has established the Sustainable Development Commission. It consists of 22 members, drawn from a wide range of backgrounds and from all parts of the United Kingdom. Its role is to advocate sustainable development across all sectors in the UK, review progress towards it, and build consensus on the actions needed if further progress is to be achieved. However, the main co-ordination role for all aspects of SD policy (including SDIs) lies with the Department of Environment, Food and Rural Affairs.
The Government has also affirmed its commitment to SD in the next Spending Review (budget allocation). SD issues must now be considered and reflected in the bids for funding of different Government departments. Each Government Department is required to produce an SD report, in which they should explain the SD dimension to their work, how it has influenced priorities and how policy agreement targets relate to it. The national headline indicators (see Section 4.2.7) are playing a key role in this approach. In June 2002 DEFRA published 'Foundations for Our Future - DEFRA's Sustainable Development Strategy'.8 Similarly, the Department for Work
8 This includes 22 indicators of which most are either headline or core national indicators (see Section 4.2.7)
EU Member State Experiences with Sustainable Development Indicators
21
and Pensions, responsible for national employment policy, has produced its first annual report on sustainable development 'Sustainable Development, Energy and Environment' (October 2001), and the Department for Trade and Industry also produced an SD strategy (October 2000).
Decentralisation of power is another important influence on UK SD policy. This applies both to the new devolved administrations in Scotland, Wales and Northern Ireland, the strengthened regional structures in England and local government throughout the country. The new devolved administrations in Scotland, Wales and Northern Ireland now have the opportunity to design policies for SD which reflect their particular circumstances. In April 2002, the Scottish Executive published an SD Planning Document outlining the devolved Government’s policy towards SD.9 It identified three SD priorities:
v Resource Use;
v Energy; and
v Travel
The document presents actions, indicators and targets for these three priority areas. More information on this is presented in Section 4.2.7. Wales has also been active in formulating policies to promote SD. In January 2000 a consultation on a draft Sustainable Development Scheme was launched by the Welsh Assembly. Assembly Members considered the consultation responses in plenary sessions in September 2000 and it was adopted unanimously by the Assembly in November 2000. The Sustainable Development Scheme commits the Assembly to integrate SD, over time, into everything it does. This requires:
v Reviewing all policies, programmes and grant schemes over a 5 year period to align them with SD objectives;
v overhauling appraisal mechanisms and criteria;
v ensuring all new policies, projects, programmes, etc. reflect sustainable development objectives; and
v looking at how the Assembly conducts its own operations.
Following the adoption of the Scheme, the Welsh Assembly Government proposed an initial set of 12 sustainable development indicators (see Section 4.2.7). Northern Ireland is also planning to issue a Sustainable Development Strategy. To this end, it published a Discussion Paper on Proposals for a SD Strategy in May 2002. A public consultation exercise is taking place until 30th September 2002, after which point public responses will be analysed and a final SD Strategy for Northern Ireland published. This will include SDIs (see Section 4.2.7).
Each of the nine English regions is developing its own Sustainable Development Framework in consultation and co-operation with regional stakeholders and partners. These are designed to
9 Scottish Executive Environment Group (April 2002) Meeting the Needs … Priorities, Actions and Targets for Sustainable Development in Scotland, Edinburgh.
EU Member State Experiences with Sustainable Development Indicators
22
provide a comprehensive assessment of SD progress and policies in each region and include SDIs (see Section 4.2.7).
3.3 Member State Analysis Level – Non-UNCSD Testing Phase Participants
3.3.1 Denmark
The Danish National Strategy for SD presents Denmark’s intentions, with regard to ensuring “a society in balance” both nationally and internationally, so future generations will have a least the same opportunities as those that are present today.
The former Social Democratic- Liberal government produced the first version of the Strategy, which underwent a public consultation in April/May 2001 and was published in June 2001. The change in Government in Denmark in November 2001 brought about a more free-market oriented administration with more emphasis on the cost-side and the use of economic – market-based - instruments instead of standard regulation. The new Liberal-Conservative government produced a new version of the SD strategy in June 2002. The new Strategy, entitled “Denmark’s Sustainable Development Strategy: A Shared Future – Balanced Development is based on Denmark’s responsibility, not only to its own people, but also to the rest of the world. The strategy was produced by the Inter-ministerial Group for Sustainable Development with the Environmental Protection Agency acting as secretariat.
The strategy’s aim is to establish a framework for a societal development, which secures economic and social development along with a high level of environmental protection. The strategy takes into account that SD is a common international goal and that Denmark has a strong obligation with regard to promoting such development at the international level.
Denmark’s Sustainable Development Strategy is based on 8 core objectives, which are:
v The welfare society must be developed and economic growth must be decoupled from environmental impacts;
v There must be a safe and healthy environment for everyone, and we must maintain a high level of protection;
v We must secure a high degree of bio-diversity and protect ecosystems;
v Resources must be used more efficiently;
v We must take action at an international level;
v Environmental considerations must be taken into account in all sectors;
v The market must support sustainable development; and
Sustainable development is a shared responsibility and we must measure progress.
Each part of the Danish SD strategy ends with some perspectives regarding future development in that area. This is partly due to the nature of SD, which is a dynamic process requiring reconsideration of the aims on a regular basis, and partly due to the lack of data in certain key areas.
EU Member State Experiences with Sustainable Development Indicators
23
Sustainable development can only be assured if the development is measured. Due to this, the Danish Government presented a set of indicators strongly linked to the SD Strategy. This set of indicators underwent a public consultation exercise in May 2002. The public consultation is a result of the recognition that SD cannot be obtained without the participation of local authorities and citizens, since they have the most detailed knowledge about local aspects and thus play an important role in securing SD. More information on this indicator set is presented in Section 4.3.1.
3.3.2 Greece
The Greek National Strategy for Sustainable Development was finalised by the Ministry of Environment, Physical Planning and Public Works in May 2002 and approved by the Ministerial Council in June 2002. The strategy was elaborated in active collaboration with the Inter-ministerial Coordinating Committee, which, acting as the National Preparatory Committee for the WSSD, gathered representatives from a number of Ministries as well as from the National Centre for Environment and Sustainable. Other stakeholders, such as local governments, entrepreneurs, academia and NGO’s were involved in the process through workshops.
The Strategy aims to provide clear directions for achieving environmental sustainable policies in the country, and to guide the future work in the field of environment for the next decade. In doing so, it deals with five main challenges:
v National prosperity;
v Social cohesion and solidarity;
v Rational use of natural resources;
v High quality of the environment along with economic growth; and
v Expansion within the context of environmental and social sustainability.
The Strategy further establishes that the three pillars of Sustainable Development should be bridged together through action at different sectoral policy levels. For each sector the document sets the country’s background, the NSSD objectives and the intended actions to accomplish them.
The Greek government expects to fully implement and review the NSSD before 2010. Progress will be monitored based on the EU’s sustainable development indicators programme.
3.3.3 Ireland
Ireland published its SD strategy “Sustainable Development- A Strategy for Ireland” in 1997. The principal purpose of this document is to provide a comprehensive analysis and framework which will allow SD to be taken forward more systematically in Ireland. To institutionalise SD further, the document put forward the idea that each Ministry should have its own SD Task Manager.
EU Member State Experiences with Sustainable Development Indicators
24
The overall aim of this strategy is to ensure that economy and society in Ireland can develop to their full potential within a well-protected environment, without compromising the quality of that environment, and with responsibility towards present and future generations and the wider international community.
Since the publication of the strategy, COMHAR (The National Sustainable Development Partnership) has been in established in early 1999. This is the forum for national consultation and dialogue on all issues surrounding Ireland's pursuit of sustainable development. Included in its remit are:
v Advancement of the national agenda for sustainable development; v Evaluating progress in this regard; v Assistance in devising suitable mechanisms and advising on implementation; and v Contributing to the formation of a national consensus in these regards.
To measure and assess whether Ireland is moving towards or away from sustainability, the Strategy states that a series of environmental quality indicators will be prepared by 1998. However, the strategy goes one step further than just the development of indicators and states that those that are devised are ‘intended in the long-term to qualify, from a sustainable development perspective, the standard information of traditional National Accounts’. The emphasis at first was on the 3 issues of eutrophication, the urban environment and waste.
3.3.4 Italy
Italy has been slow in publishing a national strategy for SD. However, given the international pressure, especially leading up to the World Summit in Johannesburg, a National Strategy for SD was finally approved on 2nd August 2002 by the Interministerial Committee for Economic Planning (CIPE) and is now available on the Ministry of Environment’s Website.10
SD came to prominence in Italy after the 1992 Earth Summit. However, it has been the environmental pillar of SD that has received prominence. This can be seen in the development of Italy’s Environmental Action Plan in the late 1990s. Many of the issues covering sustainability in Italy have an urban bias, hence most developments that have occurred with sustainability policy and indicators development have been in urban areas. The main issues that Italy are concerned about within this Action Plan are:
v Air; v Energy; v Green taxes; v Noise; v Transport; v Waste; and v Water.
10 See: http://www.minambiente.it/SVS/johannesburg/docs/strategia_azione_ambientale.pdf
EU Member State Experiences with Sustainable Development Indicators
25
These issues have therefore helped to define the shape of the new strategy. However, Italy did have the benefit of attending Gothenburg without a formal strategy and so the new strategy also includes issues on Biodiversity, and Natural Resources Management, and has re-defined some of the above issues under the broader heading of Climate Change. Hence the priorities set out in the new strategy resemble the priorities set out at Gothenburg.
Also covered in the introduction to the strategy is the institutional dimension of SD. Although Italy sees this branch as implicit within the other 3 (as do many other countries), issues such as access to information and public participation are covered. Other institutional issues that are important to Italy are environmental policy reform, increasing public awareness and training, stricter adoption of the Amsterdam Treaty by integrating environmental issues more into politics and the development of scientific and technological resources.
3.3.5 Luxembourg
Since the 1990s, the Government in Luxembourg has aimed its policies and strategies towards more sustainable development. In 1997, the Government proposed a draft National Plan for SD, and, in 1999, Luxembourg adopted the SD strategy ”Plan National pour un Développement Durable” (National Plan for SD). It is based on three principles of equal importance, which are:
v Economic efficiency; v Social solidarity; and v Protection of the environment.
Each of these principles is broken down further into a sectoral analysis where they list the common problems along with the actions and combative instruments that could be used.
The Ministry of Environment has just elaborated a draft law on SD, establishing a clearly defined process and instruments to monitor the progress made towards SD in Luxembourg. This project foresees different bodies defining and monitoring progress towards SD and, if ratified, will introduce several important new bodies and procedures. The discussion of this draft in Luxembourg’s Parliament started in September 2002. The key elements of this draft bill are:
v The drafting of an Action Plan for SD (replacing/updating the current National Strategy for SD) which would be a political document written every 4 years by the Government (with the Ministry of the Environment responsible for writing and co-ordinating it). The report would describe the main objectives (e.g. more fairness, better biodiversity etc.) as well as defining priority domains (e.g. transport, economic diversification etc.);
v The drafting of a National Report on the Implementation of SD which is a descriptive (not political) report written every 2 years under the aegis of the Interdepartmental Committee for SD(see below). It would contain:
(i) A description and an analysis of the situation of SD in Luxembourg, taking into account developments at the international level in this field;
(ii) A description, analysis and evaluation based on SDIs of the political measures taken in favour of a more sustainable development; and
EU Member State Experiences with Sustainable Development Indicators
26
(iii) A description of what might be the situation in the case of an unchanged policy and in the case of targeted policies in favour of SD (scenarios);
SDIs would be a part of this two-yearly report but would themselves be updated annually;
v A Council ('Conseil Supérieur pour le Développement Durable') bringing together SD stakeholders (administrations, NGOs, trade unions, employers organizations, scientists and experts etc.). This Council should be a discussion forum on SD giving advice to the Government and other interested bodies; and
v A Committee ('Commission Interdépartementale du Développement Durable') made up of representatives of different Ministries (or more accurately one representative of each Minister in that one Minster can rule more than one Ministry in Luxembourg). This would be the most important body since it is hoped that through it the concept of SD will be integrated into all policy areas. This Committee would also be responsible for producing the national report on the implementation of SD as well as giving a framework to the Action Plan for SD.
3.3.6 The Netherlands
The promotion of SD is enshrined within the Dutch Constitution:
‘The public authorities shall endeavour to ensure a good quality-of-life in the Netherlands, and to protect and enhance the living environment.’ (Article 21).
Since 1989 the environmental policy of the Netherlands has been laid down in the National Environmental Policy Plan (NEPP) produced by the Ministry of Environment, Housing and Spatial Planning (VROM). The Third National Environmental Policy Plan (NEPP3), published in 1998, sets out the vision for Dutch environmental policy for the period 1999-2002 and also includes broader SD issues. The philosophy behind the plan is that living in a sustainable environment is actually possible without unacceptable negative consequences in society. The plan is based on the following guiding principles: v SD (the environmental, economic and social quality dimensions are managed in a
balanced way); v Prevention (adverse affects of activities must be prevented); v Precaution (not waiting until scientific evidence has been provided to take action against
serious threats); v Prevention at source; v The Polluter Pays Principle; and v ALARA (As Low As Reasonably Achievable; the best protection that can be reasonably
demanded).
Although the NEPP3 is still in force, work has already begun on developing its successor (NEPP4). A draft strategy has been produced with the title ‘Where there’s a will there’s a world – working on sustainability’. The new document, which is still to be ratified by Parliament, outlines the strategies the Netherlands has chosen in order to resolve several long-standing
EU Member State Experiences with Sustainable Development Indicators
27
environmental problems. These include external safety, climate change, adverse effects on biodiversity as well as health risks caused by chemical substances. New problems resulting from technological innovations including problems around genetically modified organisms have also been included in the new agenda. In addition, NEPP4 presents future policy guidelines and looks at those areas where strong financial support will be necessary in the future.
In early 2001 the Dutch Cabinet decided to formulate a National Strategy for Sustainable Development (‘Nationale Strategie voor Duurzame Ontwikkeling’, NSDO). To this end, an interdepartmental body was formed, guided by a ministerial steering group, led by the Prime Minister. The ministers for Environment, for Economic Affairs and for City Development and Integration have been permanent members of the steering group and other ministers have participated on an ad hoc basis. The steering group decided that the current government would publish an overview of sustainable development policies in five key thematic areas and would indicate which SD problems it thought would influence the emerging policy debate over the next decade. The subjects selected include:
v population (aging of the population and immigration);
v climate (including energy policy and mobility);
v water (the specific issues in a country with a large area below sea level);
v biodiversity (including agriculture); and
v the development of a knowledge-based economy.
Furthermore, the Dutch Government has concluded that all policy areas should be underpinned by the notion of sustainable development. In this respect the Dutch approach is similar to the EU-level approach as defined by the Gothenburg European Council (see Section 2.3). SD-related targets are being selected for the next five or ten years and SDIs for measurement of these are currently being defined (see Section 4.3.6).
The Dutch Cabinet decided to start the process of reviewing the SD Strategy in public and listing the numerous SD initiatives of municipalities, provinces, business and citizens and their organisations. This led to an overview of Dutch society’s thoughts and initiatives on SD which was presented to Parliament in the Spring of 2002. The previous Dutch Government prepared the structure for an updated SD Strategy that is now being formulated by its successor, following the parliamentary elections which took place in May 2002. It is also thought that the UN World Summit on Sustainable Development"(WSSD), Conference in Johannesburg has also had an influence on the content of this updated strategy.
3.3.7 Portugal
Portugal’s National Strategy for Sustainable Development (ENDS) was published in draft format for public discussion on 5th June 2002. The public consultation was scheduled to last until 5th August 2002, thereby allowing its finalisation prior to the WSSD in Johannesburg.
EU Member State Experiences with Sustainable Development Indicators
28
The ENDS was produced by the Ministry of Environment and Land-Use Management but other ministries were also consulted during the drafting phase. Part of this internal consultation took place through a Task Force which has been set up in the Instituto do Ambiente (Portuguese Environmental Institute) and is designed to help produce the ENDS. The Task Force consists of eight members of staff from the Instituto do Ambiente who meet on a daily basis as well as broader stakeholders from other government ministries and civil society who join the meetings on a monthly basis. In addition, Portugal’s National Council for Environment and Sustainable Development (CNADS), which is a consultative body attached to the Ministry of Environment, offered advice and opinions on different aspects of sustainable development during the formulation of the ENDS. CNADS was formed at the end of March 1998 and has 31 members, one-third of whom are from the public (Government) sector and two-thirds from non-governmental bodies.11
The ENDS has been designed to reflect international policy developments in the field of sustainable development - most notably the EU Gothenburg Summit and the WSSD held in Johannesburg in August/September 2002. In particular, the International Relations Department (GRI) of the Instituto do Ambiente follows international developments in the SD sphere and provided information in this regard for the formulation of the ENDS.
3.3.8 Spain
The Spanish SD strategy was released shortly after the Gothenburg Summit at the same time as SD was on the European agenda. The Spanish practitioners therefore have had the benefit of high-level international input into their strategy. Since its publication major areas of activity have been put into action such as urban revitalisation, integration of public transport and environmental issues. The strategy has a 25-year vision, however objectives, themes and indicators (set out in the consultation document) will be updated every 5 years thus responding to the dynamic nature of SD.
The strategy is mainly based on the 27 principles discussed in the UN Rio Declaration (1992). Specifically, the strategy has some underlining themes that are fundamental for Spain to achieve SD. Of most importance is the operational objective which advocates strong inter-institutional co-operation and integrating SD within different horizontal and vertical policies. This is not just limited to public entities but includes private institutions as well as social agents and organisations. This is achieved through an easy to use website where anyone can input their views. Other objectives are: v The right to a healthy life and harmony with nature; v Equity between all countries and their right to develop in order to achieve conservation,
protection and re-establishment of natural resources;
11 The following public sector bodies are represented: the Ministries of Health, Social Equipment, Economy and Finances, Science and Technology, Environment and Land-Use Planning, Education and Foreign Affairs as well as the Superior Institute of Agronomy. The non-public representatives include NGOs, local communities, industry, commerce and utilities, agriculture, socio-professional societies, trade unions and universities as well as several elected members.
EU Member State Experiences with Sustainable Development Indicators
29
v Integration of environmental issues into the SD process, especially through the exploration of new technologies;
v Incorporation of precautionary principles and measures; v Incorporating environmental costs and benefits into decision making; v Guarantee information access and participation; v Promotion of production services and sustainable consumption; v Co-responsibility of the different decision-takers (not makers), public authorities and the
public opinion to adopt decisions in common; v Balance and coherence in territorial development. Economic and social cohesion is one
of the fundamentals of democratic countries; and v The development of SDIs.
The strategy outlines several different consultation processes and interaction between different ministries, private institutions and the public. This process is co-ordinated by a ‘Permanent Observatory’ which consists of an analysis unit and a variable panel of experts. A database of documents and information, accessible to the general public, will also be produced and maintained by the observatory. The main functions of the observatory will be to: v Investigate, analyse and study specific themes on interesting aspects of SD; v Manage, maintain, and use the indicator system and associated databases; v Prepare all scientific activities related to management of the SD strategy; v Network with other institutes and organisations specialising in investigation work or
development of databases, based on co-operation and co-ordination; and v Be the main point of reference for co-operation and interchange with organisations that
have similar functions internationally, within the EU, and locally within Spain.
The permanent observatory is responsible for preparing and updating the SD strategy, elaborating working documents, and developing the final document, under the supervision of the corresponding administrative bodies.
3.3.9 Sweden
The Swedish SD strategy was published in April 2002. It was prepared by the Ministry of Environment, but encompasses ecological, economic, and social (including cultural) aspects of SD. Participation is historically strong in Sweden, hence the local level perspective is of major importance and a broad consultative process concerning the strategy was undertaken in the autumn of 2001. It is envisaged that the strategy will be further developed following on from the experiences gained from the Johannesburg Summit and a new version will be produced in 2003.
The aim is to hand over a society to the next generation in which major environmental problems have been solved. The strategy is based on the experiences gained from the Environment Bill “Swedish Environmental Quality Objectives- An Environmental Policy for a Sustainable Sweden” (1997), and the 1997 Action Programme "Ecological Sustainability". In order to
EU Member State Experiences with Sustainable Development Indicators
30
assure a good living environment and prosperity for future generations, the Government has set three objectives for ecological sustainability: v Protection of the environment and human health; v Efficient use of resources; and v Assured sustainable supplies.
Within this Action Programme there is a clear emphasis on the ecological and environmental dimension of SD. However, in recent years, actions have increasingly incorporated economic, social, and cultural considerations and it is hoped that this will also be accounted for in the new strategy.
The SD strategy will therefore use the strong foundations of environmental policy that are currently in place in Sweden, where 15 measurable National Environmental Quality objectives, describing the state of the environment, including natural and cultural assets, have been established.
On a wider European level, Sweden was instrumental in putting the issue of SD back on the European agenda. They took the lead during their presidency and it was at the Gothenburg Summit held in June 2001 that the 4 main priorities of an EU-level strategy were agreed.
EU Member State Experiences with Sustainable Development Indicators
31
4.0 MEMBER STATE SDI METHODOLOGIES
4.1 Introduction
“The problem when assessing sustainability is not a lack of data or knowledge, but the difficulty of selecting the relevant information and condensing it in
such a way that general and meaningful conclusions can be drawn.”12
The ever-greater emphasis being placed on the achievement of SD over the past fifteen years has raised a series of practical and methodological issues. Clearly, if decision-makers wish to achieve SD then they need to have information with which they can measure the current state-of-play as well as progress towards targets. It is here that one encounters a paradox. On the one hand, there is an abundance of information and sources, and these continue to proliferate at an astounding rate. On the other hand, however, we seldom have readily at hand the specific information we need for good decision-making. For information to be useful it has to be in a form that can easily be assimilated by busy decision-makers. It is within this context that indicators have emerged as a crucial tool for the achievement of SD.
12 Page 223, Sustainable Germany – Towards an Environmentally Sound Development, German Federal Environment Agency (1997).
Box 4.1: What is an Indicator?
'An indicator is a parameter, or a value derived from a set of parameters, that points to, provides information about and/or describes the state of a phenomenon. It has a significance beyond that directly associated with the parameter value.'*
Indicators are aggregates of raw and processed data which helps us to quantify and simplify phenomena and understand complex realities. They are a tool for operationalising sustainability and offer a number of different advantages in the SD sphere: v achievement of more effective public and private policy making; v measurement of progress towards stated SD policy goals; v sounding the alarm in time to prevent economic, social or environmental damage; and v stimulation of debate and focussing attention on SD.
Whether an indicator is useful or not depends very much on context. For example, the rate of desertification is an important measure for many countries in Africa but is of limited importance in Europe. A careful selection process is needed to determine what is a relevant indicator in a given context—whether it is a region, an institution or a sector of the economy. During this process, indicators are selected based on context-specific conditions and general selection criteria.
Indicators for SD are usually of three major classes: environmental, social and economic. Some organizations (including the EU) add institutional indicators as a separate class. In addition to these classes, some indicator sets are further categorised based on whether the factor being indicated is a pressure on the natural environment, is indicative of the state or condition of the environment and whether it measures the extent of social responses to pressures and changing conditions. The essence of the pressure-state-response (PSR) framework is that it may help establish a causal linkage between factors of pressure, stress and response, linkages that could be ignored in narrow sectoral analyses.
* Source: Lowell Flanders, Assistant Director (UN Division for SD) at the conference Sustainable Development of Coastal Zones and Instruments for its Evaluation, Germany, 23-26 Oct. 2000.
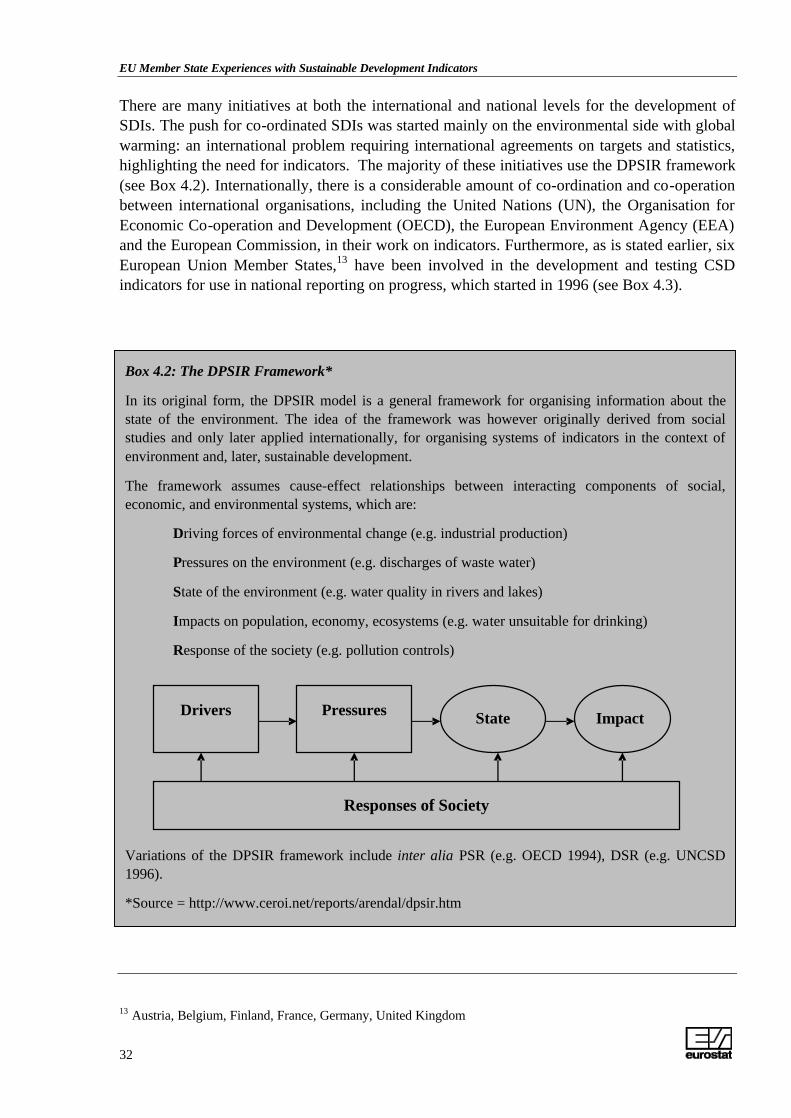
EU Member State Experiences with Sustainable Development Indicators
32
There are many initiatives at both the international and national levels for the development of SDIs. The push for co-ordinated SDIs was started mainly on the environmental side with global warming: an international problem requiring international agreements on targets and statistics, highlighting the need for indicators. The majority of these initiatives use the DPSIR framework (see Box 4.2). Internationally, there is a considerable amount of co-ordination and co-operation between international organisations, including the United Nations (UN), the Organisation for Economic Co-operation and Development (OECD), the European Environment Agency (EEA) and the European Commission, in their work on indicators. Furthermore, as is stated earlier, six European Union Member States,13 have been involved in the development and testing CSD indicators for use in national reporting on progress, which started in 1996 (see Box 4.3).
13 Austria, Belgium, Finland, France, Germany, United Kingdom
Box 4.2: The DPSIR Framework*
In its original form, the DPSIR model is a general framework for organising information about the state of the environment. The idea of the framework was however originally derived from social studies and only later applied internationally, for organising systems of indicators in the context of environment and, later, sustainable development.
The framework assumes cause-effect relationships between interacting components of social, economic, and environmental systems, which are:
• Driving forces of environmental change (e.g. industrial production)
• Pressures on the environment (e.g. discharges of waste water)
• State of the environment (e.g. water quality in rivers and lakes)
• Impacts on population, economy, ecosystems (e.g. water unsuitable for drinking)
• Response of the society (e.g. pollution controls)
Variations of the DPSIR framework include inter alia PSR (e.g. OECD 1994), DSR (e.g. UNCSD 1996).
*Source = http://www.ceroi.net/reports/arendal/dpsir.htm
Responses of Society
Drivers Pressures State Impact
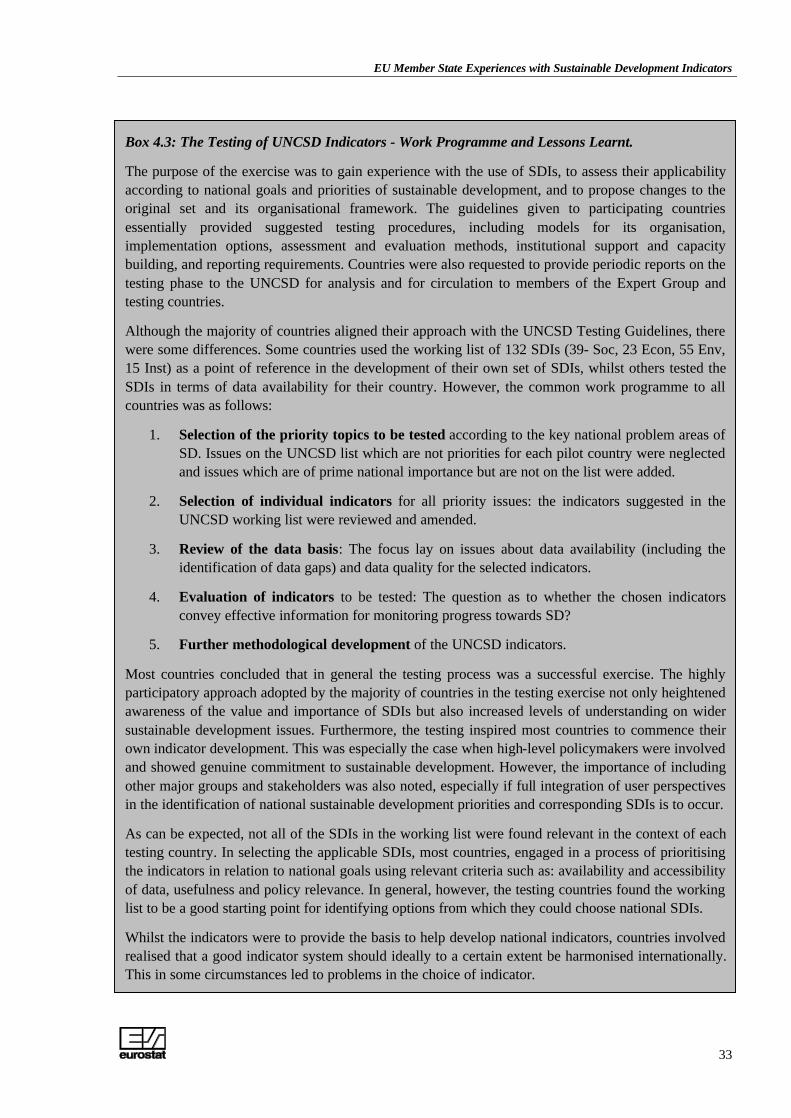
EU Member State Experiences with Sustainable Development Indicators
33
Box 4.3: The Testing of UNCSD Indicators - Work Programme and Lessons Learnt.
The purpose of the exercise was to gain experience with the use of SDIs, to assess their applicability according to national goals and priorities of sustainable development, and to propose changes to the original set and its organisational framework. The guidelines given to participating countries essentially provided suggested testing procedures, including models for its organisation, implementation options, assessment and evaluation methods, institutional support and capacity building, and reporting requirements. Countries were also requested to provide periodic reports on the testing phase to the UNCSD for analysis and for circulation to members of the Expert Group and testing countries.
Although the majority of countries aligned their approach with the UNCSD Testing Guidelines, there were some differences. Some countries used the working list of 132 SDIs (39- Soc, 23 Econ, 55 Env, 15 Inst) as a point of reference in the development of their own set of SDIs, whilst others tested the SDIs in terms of data availability for their country. However, the common work programme to all countries was as follows:
1. Selection of the priority topics to be tested according to the key national problem areas of SD. Issues on the UNCSD list which are not priorities for each pilot country were neglected and issues which are of prime national importance but are not on the list were added.
2. Selection of individual indicators for all priority issues: the indicators suggested in the UNCSD working list were reviewed and amended.
3. Review of the data basis: The focus lay on issues about data availability (including the identification of data gaps) and data quality for the selected indicators.
4. Evaluation of indicators to be tested: The question as to whether the chosen indicators convey effective information for monitoring progress towards SD?
5. Further methodological development of the UNCSD indicators.
Most countries concluded that in general the testing process was a successful exercise. The highly participatory approach adopted by the majority of countries in the testing exercise not only heightened awareness of the value and importance of SDIs but also increased levels of understanding on wider sustainable development issues. Furthermore, the testing inspired most countries to commence their own indicator development. This was especially the case when high-level policymakers were involved and showed genuine commitment to sustainable development. However, the importance of including other major groups and stakeholders was also noted, especially if full integration of user perspectives in the identification of national sustainable development priorities and corresponding SDIs is to occur.
As can be expected, not all of the SDIs in the working list were found relevant in the context of each testing country. In selecting the applicable SDIs, most countries, engaged in a process of prioritising the indicators in relation to national goals using relevant criteria such as: availability and accessibility of data, usefulness and policy relevance. In general, however, the testing countries found the working list to be a good starting point for identifying options from which they could choose national SDIs.
Whilst the indicators were to provide the basis to help develop national indicators, countries involved realised that a good indicator system should ideally to a certain extent be harmonised internationally. This in some circumstances led to problems in the choice of indicator.
EU Member State Experiences with Sustainable Development Indicators
35
4.2 Member State Level Analysis – UNCSD Testing Phase Participants
4.2.1 Introduction
As in Section 3.0 on MS Strategies and Programmes for SD, the remainder of this section is split into two with the MSs who participated in the UNCSD Testing Phase covered before those that were not involved in this exercise.
It should be pointed out however that it does not necessarily follow that those MSs which participated in the UNCSD Testing Phase are the most advanced MSs in formulating and implementing SDI methodologies. Nor is it necessarily the case that MSs which started the process of SDI formulation work at a comparatively early date are more advanced than those which started later. Indeed, as this section shows, in certain cases those MSs which have only recently commenced activities in this field have enjoyed certain benefits such as learning from the experiences of other MSs as well as the work which is underway at the EU level.
4.2.2 Austria
Significant work on SDI development has been undertaken in Austria in recent years. Austria was one of the six EU Member States to participate in the CSD testing phase. Its activities in the sphere of SDI formulation can therefore be seen as having begun in earnest in 1996.
The two key selection criteria used by Austria when selecting SDIs during the testing phase were the relevance of the SDIs to Austria and the availability of data. In addition, there was a desire to uncover SDIs relevant to Austria’s specific circumstances and needs, particularly in the areas of transport, energy and tourism. These three areas are of particular importance in Austria largely because of the particular sustainable development demands posed by the alpine environment. The major north-south transportation routes linking Germany and Italy pose specific problems as does the tourism industry (concentrated in alpine areas) and energy generation sector (which exploits the energy generation potential of the alpine environment).
Since the CSD testing phase came to an end, work on SDI development has continued in Austria, with a broad range of stakeholders involved. An activity which resulted from testing the UNCSD indicators should be mentioned: the Austrian work on eco-efficiency, in which the subject was interpreted in a broad sense with the aim of making a first step in the direction of sustainability indicators.
Discussions on testing the UN-CSD indicators showed that a correct interpretation of an indicator implies the consideration of different factors behind the described phenomenon. For example, an increase in the total amount of waste collected may have various causes: population growth, better collection systems, improved awareness, rise in consumption, growing number of households, etc.
EU Member State Experiences with Sustainable Development Indicators
36
The Ministry of the Environment published the brochure "Eco-efficiency" ("Ökologisch wirtschaften")14 giving diagrams on selected issues (the economy as a whole, municipal waste, energy, agriculture, industry and transport) and showing the development of various parameters as an index. The simultaneous representation of the development of selected economic, social and environmental parameters underlines their interlinkages and thus illustrates the sustainability impact of each issue.
This publication is to be seen as a contribution to the study of methods for assessing the interaction between different sectoral environmental, social and economic developments and as a first step to the establishment of indicators for sustainable development.
Recent activities in Austria in the field of SDIs have focussed on the selection and systemization of a set of indicators for inclusion in the country’s SD Strategy published in April 2002 (see Section 3.2.1). The strategy contains a description of necessary steps for its implementation as well as 48 different SDIs, aimed at monitoring the 20 guiding targets. These 48 indicators should be used in reports on progress in the implementation process, to show whether the targets fixed will be reached.
Although they cover all three pillars of SDI, the indicators are organised around the four broad areas of activity identified in the SD strategy:
v Quality of Life in Austria (14 indicators);
v Austria as a Dynamic Location for Business (11 indicators);
v Austria as a Place to Live (19 indicators); and
v Austria’s Responsibility (4 indicators).
All four priority areas (climate change, transport, public health and natural resources) of the Gothenburg Summit are comprehensively covered within the indicator set. This is perhaps in part a reflection of the fact that the indicator set was finalised following the Gothenburg Summit.
Additional indicators for Sustainable Development need to be developed to provide a solid basis for decision-making on all levels and to contribute to a self-regulating sustainability of integrated environment and development systems. The strategy stipulates that a set of SDIs, based on a systematic approach, and effective tools for communication shall be developed.
Austria will develop tools for the communication of the monitoring results. The decision whether the tool might be a set of headline indicators or not has not taken yet.
14 http://gpool.lfrz.at/gpool/main.cgi?catid=18027&rq=cat&tfqs=catt&catt=_umwelt
EU Member State Experiences with Sustainable Development Indicators
37
4.2.3 Belgium
Belgium started its development of SD indicators in 1995 when they hosted an International Workshop on Indicators of Sustainable Development organised with the Government of Costa Rica, UNEP and SCOPE (Scientific Committee on Problems of the Environment). The workshop launched the UNCSD testing phase for which they volunteered (to test mainly the environmental indicators) in mid 1996. The aim of the test was to report on the existing information systems and their compatibility with the UNCSD indicators and also to evaluate of the usefulness of methodology sheets of the UNCSD regarding environmental SDIs for Belgium. Throughout the testing, difficulties arose in deciding which indicators (from the UNCSD list) were applicable to Belgium’s environment, and also who would be the main monitoring body, giving the complexities of the political system.
From their experiences of being involved in the UNCSD testing phase, Belgium is still actively developing a set of SDIs at the federal level. The indicators will be based on the 4 key actions identified in the First Federal Plan for SD (see Section 3.2.2 above). The Inter-departmental Committee for SD is responsible for the implementation of this plan and has created a working group to progressively identify SDIs to be used within this implementation exercise. The working group started its work in May 2002. The focus of the work is on identifying response indicators to measure the implementation of the First Federal Plan for SD, though there will also be broader SDIs linked to the objectives of the plan. It is not currently possible to identify when the Working Group will produce a complete SDI set, though it should in principle emerge before the start of 2004, i.e. before the start of the next stage of the Federal Plan for SD.
The Federal SD Council, which is an advisory body representing key social groups at a federal level, produced an expert opinion on SDIs for the Belgian Government. It described the international, European and Belgian context in the sphere of SDIs and put forward nine key recommendations to improve the situation in Belgium with regard to indicators. This are listed in Box 4.5 below.
The Federal Plan for Sustainable Development was adopted prior to the Gothenburg Summit and consequently it was clearly not possible to elaborate it explicitly on the basis of the conclusions and priorities from the Summit. Nevertheless, the themes of the EU SD Strategy are for most part also found within the Federal Plan for SD. In addition, work on SDIs undertaken by the working group of the Inter-departmental Committee for SD is being inspired by international work on SDIs and amongst other things will take into consideration SDIs relevant to the Gothenburg priorities.
EU Member State Experiences with Sustainable Development Indicators
38
The SSTC is setting up a consultation body (or ‘Platform’) called ‘Indicators of Sustainable Development’. This entity is led by four people from four different institutions, representing different levels of power within Belgium:
Box 4.5: The Nine Key Recommendations of the Federal Council for SD (CFDD) to Improve the SDI Situation in Belgium
1. The political objectives of SD have been determined, but there is a need to ensure that they are followed-up, implemented in a concrete way and integrated into existing politics.
2. Communication needs to be more effective between the different actors in the SD field and the producers and users of SDIs.
3. SD is a competence of many different levels of power. The co-ordination of the producers of institutional data needs to be improved. The CFDD believes that the Federal Planning Bureau could assume the institutional co-ordinating function and have responsibility for the production of SDIs.
4. As the Federal Plan for Sustainable Development demands, a focal point for SDIs needs to be put in place in every federal ministry.
5. The research into SD and in particular into SDIs needs to be co-ordinated. In parallel, an interface between the political users and the scientists needs to exist. The platform for scientific consultation of the Federal Services for Scientific, Technical and Cultural Affairs (SSTC) ‘indicators for SD’ can continue to assume this role.
6. The means and the current scientific structures need to be reinforced and stabilised. A structure which is institutionally and judicially stable needs to determine responsibilities, activities and objectives.
7. The participation of Belgium in the international processes of indicator formulation need to be reinforced.
8. Indicators can be the means of increasing awareness and communication, they can help achieve a more concrete concept of SD which is closer to the public and to decision-makers. It is positive that the Federal SD Report is built around SDIs. There should be consensus on the investments for communication and adjustment.
9. Because they are called upon to become the tools for the adjustment of public opinion and political communication, the SDIs defined politically for following progress in the sphere of SD need to be the object of a political debate which is open and transparent. Participation is one of the elements that can contribute to a certain democratic legitimacy of the SDIs. The CFDD wishes to contribute to the concrete implementation of this process. The implementation of the public consultation could be conferred on the CFDD, after having learnt the lessons of the consultation organised through the first project of the Federal Plan for SD.
Source: Page 2, Avis sur les indicateurs de développement durable, Conseil Fédéral du Développement Durable, Brussels, 16th April 2002. Available online at: www.belspo.be/frdocfdd/fr/pubfr/avis/2002a03f.pdf
EU Member State Experiences with Sustainable Development Indicators
39
v The Federal Planning Bureau (representing the Federal Government);
v The Brussels Institute for the Management of the Environment (representing the Brussels Region);
v The Institute of Management and Physical Planning (IGEAT) of the Free University of Brussels (representing the region of Wallonia); and
v The Institute for Labour of the Catholic University of Leuven (representing the region of Flanders).
The consultation body has the following objectives:
v Organising exchanges between actors involved in the development and use of SDIs;
v Stimulating consultation between on the one hand, the researchers involved in the development and use of SDIs and on the other hand, potential users of these SDIs;
v Improving access to the results of research into SDIs; and
v Contributing to the creation of new capacity in Belgium for the development and use of SDIs.
Over the course of its first year of existence, the consultation body has undertaken the following activities:
v Organisation of seminars targeted at researchers in order to promote exchanges between these actors and to increase research capacity in the sphere of SDIs;
v Organisation of a seminar allowing the meeting of and dialogue between the scientific, administrative, political and civil society groups; and
v The creation and update of an internet site15 presenting a wide range of information in relation to the activities and of the consultation body and on general topics in relation to SD.
The Second Federal Report on SD is currently being drafted (with completion expected by the end of 2002) and part of it will contain a description of SD in Belgium on the basis of international activities (see Section 3.2.2). This will be based on a set of different SDIs.
Belgium’s three different regions are themselves also currently undertaking activities in relation to SDI formulation:
v Flemish Regional indicators, demographic and environmental indicators are published annually in VRIND. The Flemish Government created a database - Functional Regional Database, (FRED) - to cover all types of indicators relevant to policy. All Flemish agencies concerned with environment and sustainable development policies have access to this database.
15 See: www.belspo.be/platformisd
EU Member State Experiences with Sustainable Development Indicators
40
v The Walloon State of the Environment, published every two years, is a tool for decision-making to both the public and private sectors in Wallonia. The 2000 publication analyses a set of environmental indicators as a preliminary reference document for the debate ahead on the development of a more appropriate set of indicators. The Walloon Government is also developing a central database of environmental data and indicators.
v In the Brussels Region, the implementation of existing plans includes the use of indicators to assess the performance of policies and actions launched in the fields of SD. Since October 1996, an environmental statistical observatory has also been created to collect data and produce indicators.
4.2.4 Finland
Finland has been at the forefront of strategising SD and has accumulated considerable experience with the formulation of SDIs, starting with its participation in the UNCSD testing procedure in 1996 (See Box 4.3). This testing phase proved a great success for Finland, in that it kick-started the formulation of their SDIs within the SD strategy renewal which was taking place at the time. Along with other UNCSD test procedure participants, one of the main problems for Finland was to decide whether the SDIs they were testing were for international or national purposes. This resulted in part from a lack of guidance from the UNCSD as to whether they wanted participating countries to report on all SDIs or whether they could just select a subset of SDIs relevant to their national circumstances (the so-called ‘shopping list approach’). In the end, Finland tested as many indicators as they could given the data available (81 from 132), but then decided to report only on the ones relevant to Finland (a total of 57, comprising 13 social, 14 economic and 30 environmental).
The first set of indicators were developed over 2 years and published in April 2000, after consultations in 1999. Finland concentrates its indicator set on issues that are relevant nationally rather than internationally. The main institution co-ordinating the developments was the Finnish Ministry of the Environment, although other ministries were very much involved, including the Ministries for: Trade and Industry, Transport and Communication, Agriculture and Forestry, Labour, Interior, Social Affairs and Health, Education, Foreign Affairs. Along with these, the Finnish Environment Institute, Statistics Finland and the Government Economics Research Institute were all also involved. The procedure was co-ordinated through a Working Group on Indicators.
In choosing the SDIs comments and suggestions were requested from NGOs and experts as well as the Finnish SD Commission. Apart from the experiences with the CSD Testing Phase, Finland also used their experience from the development of Forestry Management and Environmental Transport Indicators. However the main driver was the development of the SD programme within Finland, thus the indicators are very relevant to different policies set by the participating ministries. In addition, efforts were made to make the SDIs accessible to all decision makers and the public.
The publication on indicators (2000) is therefore very clear and easy to cross-reference and is split into both the 3 familiar branches of SD, and then also into sub-themes (6 environmental, 5 economic and 9 Socio-cultural), with each sub theme having 3-4 indicators. The sub-themes are:
EU Member State Experiences with Sustainable Development Indicators
41
v Climate change v Production and consumption v Ozone layer depletion v Demographic developments v Acidification v Lifestyle and illness v Eutrophication v The workforce v Biodiversity v Social problems and equality issues v Toxic contamination v Education, research and participation v Economic development v Access to information v Environmental policy instruments v Cultural heritage v Natural resources v Ethnic minorities v Community structure and transport v Development co-operation.
In total there are 21 environmental indicators, 29 economic and 33 social-cultural indicators. Unlike other Scandinavian countries, which place a strong emphasis on environmental sustainability, the Finnish indicators place more of an emphasis on the Socio-cultural branch of SD. Of the 83 indicators established 51 (61%) are also used by other countries and so have an international dimension to them.
The proportion is even better when looked at from the European strategic perspective set out in the Gothenburg summit. The Finnish indicators cover 3 out of the 4 themes explicitly and partially cover the issue of public health. In total these themes are covered by 18 indicators of which 12 can be compared internationally.
Current activities in Finland are centred around updating the national SDI set. The current SDI set being revised though the actual number of finalised SDIs is likely to remain relatively constant. The overall framework for the SDIs will also stay broadly the same. The 20 different sub-themes (see above) will remain, but a new issue of ‘environmental health’ is to be added. In addition, the order of the SDIs themselves is to be changed as to give greater prominence to the socio-cultural dimension. The Finnish Environment Institute (FEI) has monitored the number of ‘hits’ on the pages of individual SDIs on its website to gauge the most and least popular SDIs. This information was also used to inform the updating exercise. This whole exercise is being accompanied by public information/marketing activities, consisting of an interactive internet portal (currently under construction) and the production of explanatory leaflets.
The FEI has also interviewed several Finnish politicians to introduce the SDIs to them personally and also to receive feedback from high-level policy-makers. The feedback was very positive – in general the Members of Parliament were very satisfied with the SDI set and did not view the large number of SDIs as being problematic. Their suggestions have also been taken into account in the SDI update exercise.
4.2.5 France
France was one of the countries that took part in the testing of the UNCSD indicators (See Box 4.3), volunteering due to national interest. The testing programme was consistent with their national SD strategy, developed in 1996, and studies previously carried out by the French Institute of the
EU Member State Experiences with Sustainable Development Indicators
42
Environment (IFEN). As well as testing themselves, France was also involved in twinning with Tunisia in this programme in 1997-1998. France is also currently co-operating with Morocco in the analysis of a set of SDIs proposed by the Mediterranean Commission for Sustainable Development. This shows France’s commitment to their international responsibility, as twinning allows further sharing of knowledge and experiences.
The results of the UNCSD testing found that of the 111 indicators that France analysed, 53 indicators were used in France on a regular basis and 55 were not used on a regular basis but did have at least partial data availability. The 53 indicators that are used in France can be broken down into the following:
v 19 Social indicators are used regularly particularly with regards to combating poverty, and population dynamics and sustainability. These are produced by statistical institutes.
v 11 Economic indicators are used regularly and also produced by statistical institutes and the Ministries of Economy, Finance, and Industry and Spatial Planning and Ecology and Sustainable Development.
v 21 Environmental indicators are used regularly, collected through the Ministry of Environment.
v Only 2 Institutional indicators are calculated on a regular basis.
One of the comments that France made about the testing programme and the UNCSD indicators is that they do not deal with the issues of SD sufficiently specifically. In particular, France believed that the SDIs were not sufficiently integrated, with an artificial distinction between the themes (Social, Economic, Environmental & Institutional). As a result of this, since 1997, IFEN, which has considerable previous experience of developing environmental indicators, has been working on the preparation of SDIs at a national level using an original methodological approach based on the integration of the different dimensions of SD. To date it has produced five different reports on this topic.
Working groups of experts representing the economic, social, and environmental spheres were appointed by IFEN to discuss the framework and development of methods. In order to avoid juxtaposition of the 3 dimensions of SD, indicator development is structured in ‘axes’ and ‘modules’. The main ideas are: balanced growth and eco-efficiency of production; constant attention to maintenance and restoration of critical capital (including human, natural and institutional capital), good links between local and global, satisfaction of future generations' needs (applying the precautionary principle and adaptability).
Each of the working groups had to define the most pertinent indicators for the modules for which they were responsible. In a second phase, a restricted working group met to propose an operational indicator set, centred on questions judged to be most important. 307 indicators, illustrating the main themes in each of the (then) 9 modules, were identified and published in November 2001: IFEN, Etudes et Travaux no 35: Proposition d'Indicateurs de Developpement Durable pour la France16.
16 A full list and description of the indicators can be found at: http://www.ifen.fr/pages/et35.pdf.
EU Member State Experiences with Sustainable Development Indicators
43
Within module 1, 38 indicators were identified, 29 in module 2, 34 in module 3, 52 in module 4, 20 in module 5, 40 in module 6, 29 in module 7, 26 in module 8, and 39 in module 9. The Gothenburg priorities were not particularly well covered within these 307 SDIs.
The next stage of work in the sphere of SDIs in France was a public consultation exercise, consisting of both a questionnaire-based survey of 300 people and consultations through IFEN’s website. The SDI set was reduced in number and currently consists of 47 indicators. It was scheduled to be presented in the form of a short (4 page) briefing note by the Ministry of Ecology and SD at the WSSD. The original approach, based on axes and modules, has been continued with SDIs are included within a framework of 5 key ‘axes’ and 10 modules both of which reflect French SD priorities. The precise structure and current allocation of SDIs is as follows:
Axis 1: Sustainable Growth v Module 1: Ensuring eco-efficient growth (6);
v Module 2: Structuring production with a concern for respecting the environment (5);
Axis 2: Preservation of Heritage and Critical Resources v Module 3: Sustainable use of resources (3);
v Module 4: Maintaining and passing on our human, natural and cultural heritage (7);
Axis 3: From the Local to the Global v Module 5: Distribution and spatial inequality (3);
v Module 6: France’s relations with the rest of the world (3);
Axis 4: Satisfying the Needs of the Present Generation v Module 7: Inequality and exclusion (4);
v Module 8: Unsatisfactory behaviour (4);
Axis 5: The Long-Term and Future Generations v Module 9: Principles of responsibility and caution (4); and
v Module 10: Vulnerability and adapting to the unforeseen (5).
Dynamic Socio-Economic Principles (3 indicators)17
The key principles underpinning this SDI selection have been the priorities identified in the EU Sustainable Development Strategy (See Section 2.3) and the Lisbon Strategy. Furthermore, consideration has been given to ensuring coherence with both the EU’s headline environmental indicators (see Section 2.3) and the Structural Indicators (which also contain social and economic
17 These three SDIs do not belong to any of the five axes.
EU Member State Experiences with Sustainable Development Indicators
44
indicators). Interlinkages with these two indicator sets will be discussed in the final French publication on SDIs (see below).
The finalised SDI set is due to be published in Autumn 2002. It is foreseen that a more detailed publication of around 200 pages will be published in both French and English by the end of 2002. This will offer a more detailed analysis of the 50 SDIs, including data (graphs, tables and maps) as well as a commentary (definition, relevance, analysis of current trends and likely future developments).
4.2.6 Germany
Germany was one of the five EU Member States to participate in the UNCSD SDI testing phase. This participation, which began in 1996, constituted the first major efforts in Germany towards the development of SDIs. Germany’s participation was based on a desire to realise the following objectives:
• Analysis of the SDIs proposed by the UNCSD list vis-à-vis their practical national implementation (above all data availability over a certain time horizon) and their political relevance and utility for Germany;
• Further development and improvement of the UNCSD concept via the process of trial and error and international co-operation;
• Promotion of a national debate on SD and its assessment via indicators; • Promotion of the dialogue with all actors (scientific community, major groups) and their
active integration in the UNCSD testing phase; and • Forming the basis of national indicator systems.
Germany also saw its participation as being important to evaluate the entire UNCSD concept against the background of its specific situation as an industrialised country. They sought to identify missing indicators in the UNCSD list and to further investigate methodological questions, such as, the question of interlinkages between the dimensions of sustainable development (Interdimensionality – see Section 5.0) or the question of aggregation and identification of key (or ‘headline’) indicators.
The Federal Ministry for the Environment, Nature Conservation and Nuclear Safety was in charge of the entire political co-ordination of the testing of UNCSD indicators. However, several other different bodies were also involved in the testing phase:
• An Interministerial Working Group (IMA), consisting of representatives from all German Federal Ministries, was set up for the testing, under the auspices of the Federal Environment Ministry. A key reason for the creation of the IMA was to allow a broader definition of SD, encompassing also economic and social criteria.
• The Federal Environmental Agency and the Federal Statistical Office provided support concerning organisational co-ordination, data collection and processing as well as methodological questions. A co-ordination team with representatives from the Federal
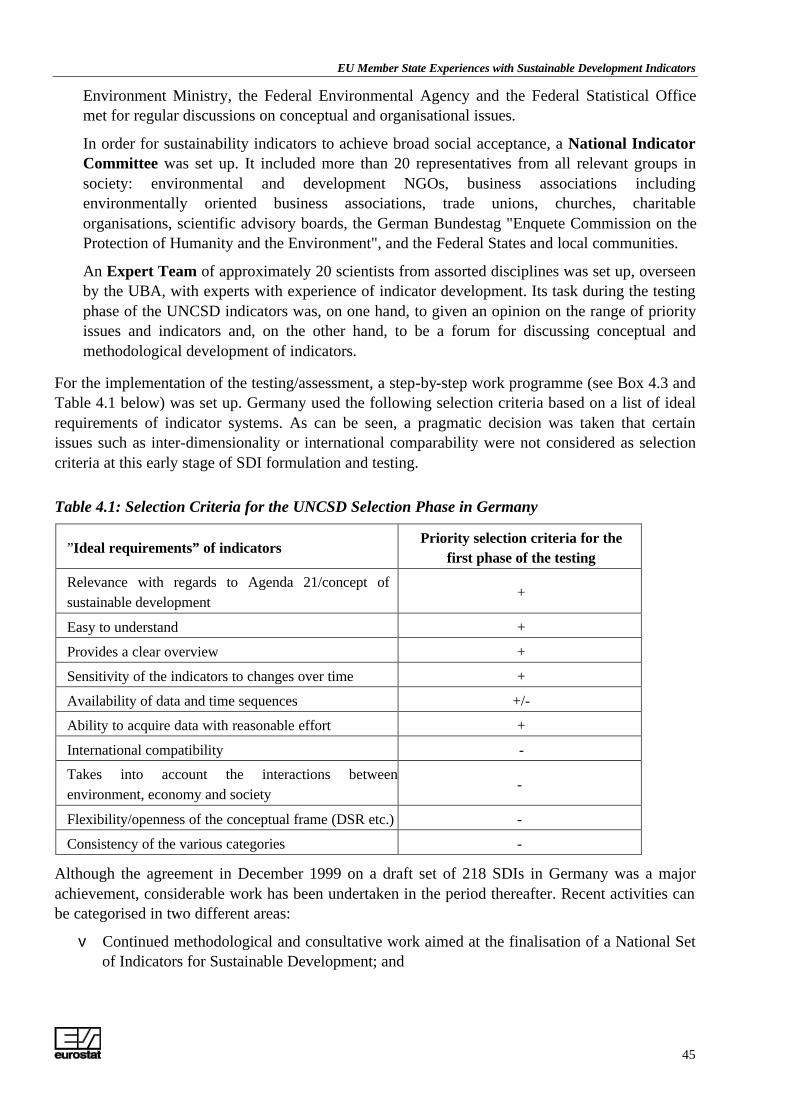
EU Member State Experiences with Sustainable Development Indicators
45
Environment Ministry, the Federal Environmental Agency and the Federal Statistical Office met for regular discussions on conceptual and organisational issues.
• In order for sustainability indicators to achieve broad social acceptance, a National Indicator Committee was set up. It included more than 20 representatives from all relevant groups in society: environmental and development NGOs, business associations including environmentally oriented business associations, trade unions, churches, charitable organisations, scientific advisory boards, the German Bundestag "Enquete Commission on the Protection of Humanity and the Environment", and the Federal States and local communities.
• An Expert Team of approximately 20 scientists from assorted disciplines was set up, overseen by the UBA, with experts with experience of indicator development. Its task during the testing phase of the UNCSD indicators was, on one hand, to given an opinion on the range of priority issues and indicators and, on the other hand, to be a forum for discussing conceptual and methodological development of indicators.
For the implementation of the testing/assessment, a step-by-step work programme (see Box 4.3 and Table 4.1 below) was set up. Germany used the following selection criteria based on a list of ideal requirements of indicator systems. As can be seen, a pragmatic decision was taken that certain issues such as inter-dimensionality or international comparability were not considered as selection criteria at this early stage of SDI formulation and testing.
Table 4.1: Selection Criteria for the UNCSD Selection Phase in Germany
”Ideal requirements” of indicators Priority selection criteria for the
first phase of the testing Relevance with regards to Agenda 21/concept of sustainable development
+
Easy to understand +
Provides a clear overview +
Sensitivity of the indicators to changes over time +
Availability of data and time sequences +/-
Ability to acquire data with reasonable effort +
International compatibility -
Takes into account the interactions between environment, economy and society
-
Flexibility/openness of the conceptual frame (DSR etc.) -
Consistency of the various categories -
Although the agreement in December 1999 on a draft set of 218 SDIs in Germany was a major achievement, considerable work has been undertaken in the period thereafter. Recent activities can be categorised in two different areas:
v Continued methodological and consultative work aimed at the finalisation of a National Set of Indicators for Sustainable Development; and
EU Member State Experiences with Sustainable Development Indicators
46
v More public-awareness oriented work based upon the German Environment Barometer and the German Environment Index (DUX).
It is appropriate to now examine each of these in turn:
Germany’s National Set of Indicators for Sustainable Development:
In September 2000 an SDI Research (R&D) Project was launched under the joint stewardship of both the BMU18 and UBA, with a research institute contracted to provide technical assistance. The purpose of this project was to undertake methodological work aimed at the finalisation of a National Set of Sustainable Development Indicators. To guide this research project, the Inter-ministerial Working Group (IMA) of the CSD-Testing Phase (see above) was reactivated. It co-ordinates the key final and intermediate results of the research project. All departments of the Federal Government are represented on the IMA. The research project has three major aims:
• the elaboration of a national set of about 60-80 SDIs on the basis of the CSD-Testing Phase as well as other national and international indicator works;
• the creation of a limited set of about 20 headline SDIs; and • the elaboration of special indicator sets for the three priority areas of the national SD strategy
(energy use, sustainable mobility and food production).
To give the required input to the elaboration of the national SD strategy with its ambitious timeframe, the project had to start with the development of the headline indicators. On the basis of an innovative proposal for the structure of themes and sub-themes for SD, which is different from the three-dimension structure used in the CSD-Testing Phase, a proposal of about 20 indicators was made. In particular, it was decided to adopt an approach based not on the ‘3-Pillar Model’ but rather a more holistic one corresponding with the Brundtland definition of the satisfaction of fundamental needs and the demands which this places on environment and resources. They are organised under four different headings and 21 sub-themes.
The headline indicators were discussed and further developed with various stakeholder groups and interested parties within society as part of the overall discussion of the strategy. For this purpose a web-based discussion forum was created, more detailed discussions were held with NGOs and written comments of different stakeholders were taken into account. The BMU considers its discussions with stakeholder groups over the structure and selection of headline SDIs to have been successful.
The set of headline SDIs has been published in Chapter D of the German SD Strategy (see Section 3.2.5) under the slogan ‘21 Indicators for the 21st Century’. 19 Due to the fact that the system was imposed to measure Germany’s status regarding sustainable development, the SDIs are mostly ‘state indicators’ according to the DPSIR framework. They are listed in Annex I.
18 The BMU was in overall charge of this project. 19 See www.dialog-nachhaltigkeit.de
EU Member State Experiences with Sustainable Development Indicators
47
Now that the headline indicator set has been published, attention has switched to finalising the more comprehensive set of 60-80 SDIs. The broad structure and sub-structure of this SDI system has already been determined following inter alia discussions at the IMA level. The SDIs will be taken from the draft set of 218 SDIs of the CSD-Testing Phase (see above) as well as from international indicator systems so as to maximise coherence. The system will cover several (as yet undefined) key themes from the national SD strategy within a PSR framework (see Box 4.2). The SDIs will be used to monitor and communicate the implementation of the National Sustainable Development Strategy in a more detailed fashion.
Aside from these activities at the national level in Germany, sets of regional SDIs are being developed by the Länder (Federal States). To coordinate future work in this area, the Conference of Environmental Ministers has established a working group on SDIs.
The Environment Barometer:
The Environment Barometer, along with the related German Environment Index, DUX (see Box 4.6 below) is the most high profile and publicly recognised area of SDI work in Germany. The Environment Barometer was conceived in 1998 as part of the ‘Draft programme for priority areas in Environmental Policy’. After extensive political discussions, it was decided later in 1998 to include the Barometer in the German Government’s ‘Yearly Economic Report’.
The Environment Barometer consists of six different indicators in the following areas:
v Climate v Air v Soil
v Water v Energy v Raw Materials
These indicators are presented in more detail in Table 4.2 below.
The Environment Barometer seeks to provide a clear measurement of environmental well-being within Germany. Although the indicators are all environmental ones, there is a broad sustainable development rationale to the Barometer. The reason for this is the fact that the Barometer has been explicitly designed to act as a counterweight to the more established measures used for the economic and social dimensions of sustainable development, namely the level of gross domestic product, the rate of inflation and the level of unemployment.
The methodological work associated with the development of each indicator is still underway, but it is already proving to be a valuable tool, especially in the sphere of raising public awareness and interest in environmental sustainability.
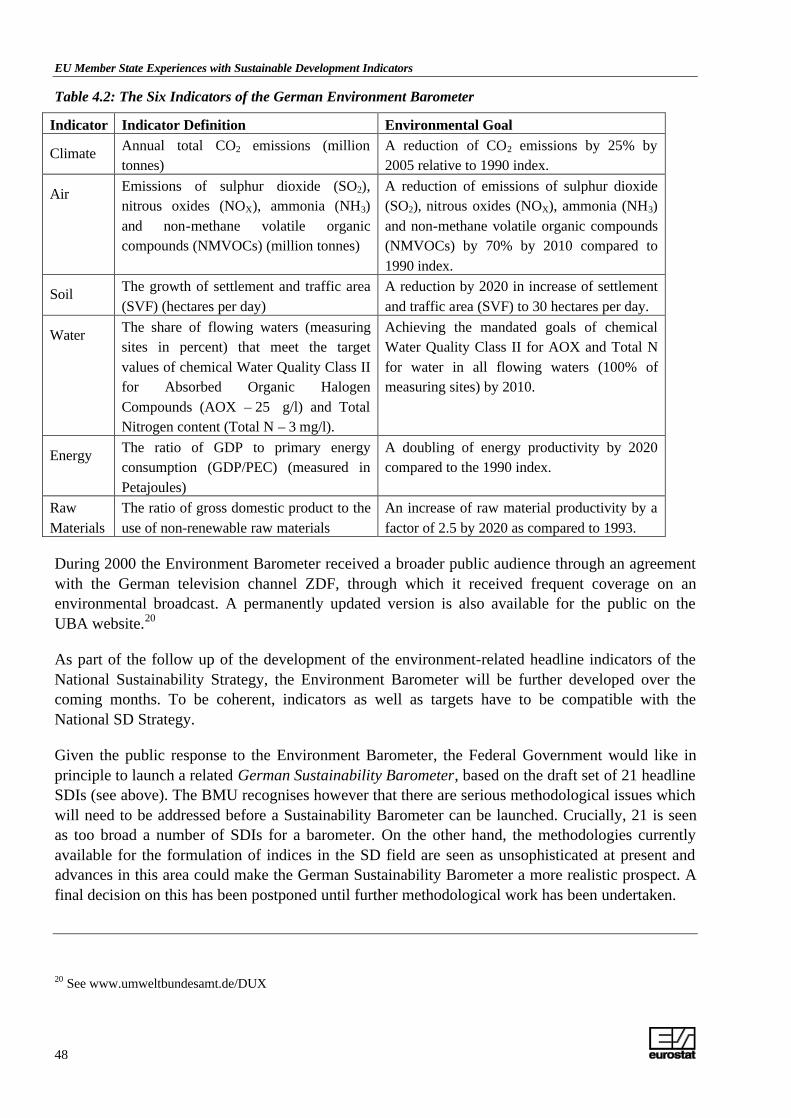
EU Member State Experiences with Sustainable Development Indicators
48
Table 4.2: The Six Indicators of the German Environment Barometer
Indicator Indicator Definition Environmental Goal
Climate Annual total CO2 emissions (million tonnes)
A reduction of CO2 emissions by 25% by 2005 relative to 1990 index.
Air Emissions of sulphur dioxide (SO2), nitrous oxides (NOX), ammonia (NH3) and non-methane volatile organic compounds (NMVOCs) (million tonnes)
A reduction of emissions of sulphur dioxide (SO2), nitrous oxides (NOX), ammonia (NH3) and non-methane volatile organic compounds (NMVOCs) by 70% by 2010 compared to 1990 index.
Soil The growth of settlement and traffic area (SVF) (hectares per day)
A reduction by 2020 in increase of settlement and traffic area (SVF) to 30 hectares per day.
Water The share of flowing waters (measuring sites in percent) that meet the target values of chemical Water Quality Class II for Absorbed Organic Halogen Compounds (AOX – 25 µg/l) and Total Nitrogen content (Total N – 3 mg/l).
Achieving the mandated goals of chemical Water Quality Class II for AOX and Total N for water in all flowing waters (100% of measuring sites) by 2010.
Energy The ratio of GDP to primary energy consumption (GDP/PEC) (measured in Petajoules)
A doubling of energy productivity by 2020 compared to the 1990 index.
Raw Materials
The ratio of gross domestic product to the use of non-renewable raw materials
An increase of raw material productivity by a factor of 2.5 by 2020 as compared to 1993.
During 2000 the Environment Barometer received a broader public audience through an agreement with the German television channel ZDF, through which it received frequent coverage on an environmental broadcast. A permanently updated version is also available for the public on the UBA website.20
As part of the follow up of the development of the environment-related headline indicators of the National Sustainability Strategy, the Environment Barometer will be further developed over the coming months. To be coherent, indicators as well as targets have to be compatible with the National SD Strategy.
Given the public response to the Environment Barometer, the Federal Government would like in principle to launch a related German Sustainability Barometer, based on the draft set of 21 headline SDIs (see above). The BMU recognises however that there are serious methodological issues which will need to be addressed before a Sustainability Barometer can be launched. Crucially, 21 is seen as too broad a number of SDIs for a barometer. On the other hand, the methodologies currently available for the formulation of indices in the SD field are seen as unsophisticated at present and advances in this area could make the German Sustainability Barometer a more realistic prospect. A final decision on this has been postponed until further methodological work has been undertaken.
20 See www.umweltbundesamt.de/DUX
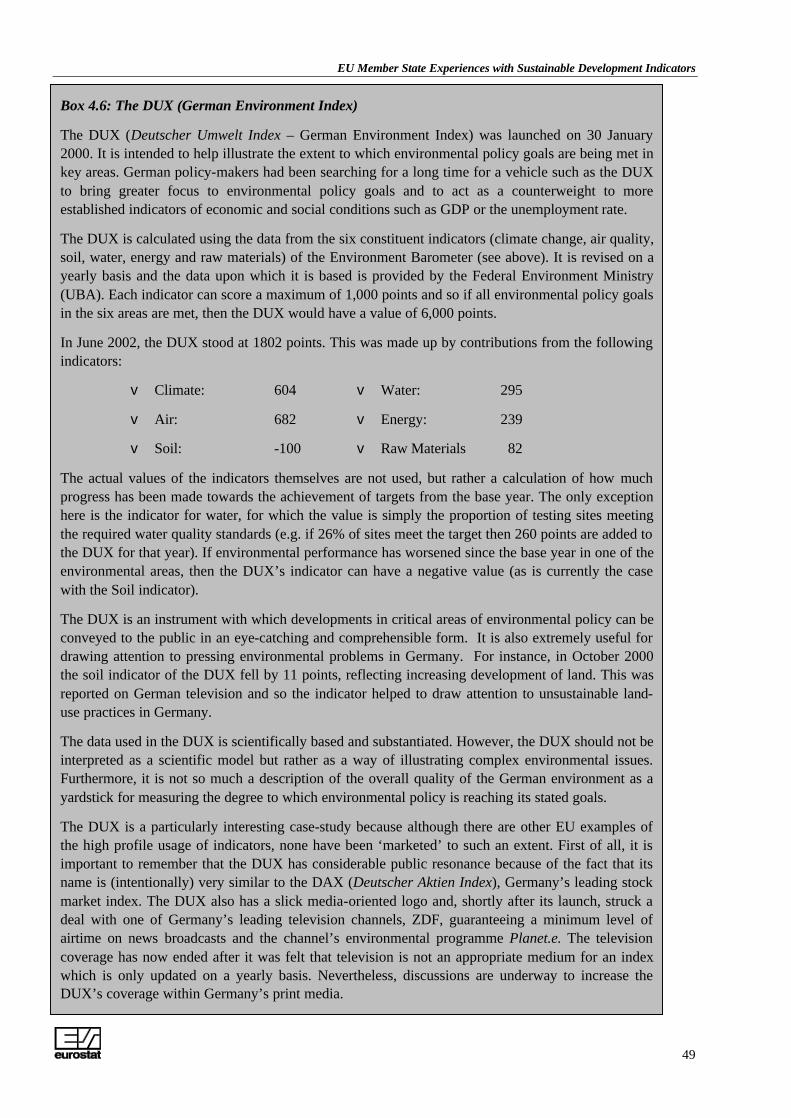
EU Member State Experiences with Sustainable Development Indicators
49
Box 4.6: The DUX (German Environment Index)
The DUX (Deutscher Umwelt Index – German Environment Index) was launched on 30 January 2000. It is intended to help illustrate the extent to which environmental policy goals are being met in key areas. German policy-makers had been searching for a long time for a vehicle such as the DUX to bring greater focus to environmental policy goals and to act as a counterweight to more established indicators of economic and social conditions such as GDP or the unemployment rate.
The DUX is calculated using the data from the six constituent indicators (climate change, air quality, soil, water, energy and raw materials) of the Environment Barometer (see above). It is revised on a yearly basis and the data upon which it is based is provided by the Federal Environment Ministry (UBA). Each indicator can score a maximum of 1,000 points and so if all environmental policy goals in the six areas are met, then the DUX would have a value of 6,000 points.
In June 2002, the DUX stood at 1802 points. This was made up by contributions from the following indicators:
v Climate: 604 v Water: 295
v Air: 682 v Energy: 239
v Soil: -100 v Raw Materials 82
The actual values of the indicators themselves are not used, but rather a calculation of how much progress has been made towards the achievement of targets from the base year. The only exception here is the indicator for water, for which the value is simply the proportion of testing sites meeting the required water quality standards (e.g. if 26% of sites meet the target then 260 points are added to the DUX for that year). If environmental performance has worsened since the base year in one of the environmental areas, then the DUX’s indicator can have a negative value (as is currently the case with the Soil indicator).
The DUX is an instrument with which developments in critical areas of environmental policy can be conveyed to the public in an eye-catching and comprehensible form. It is also extremely useful for drawing attention to pressing environmental problems in Germany. For instance, in October 2000 the soil indicator of the DUX fell by 11 points, reflecting increasing development of land. This was reported on German television and so the indicator helped to draw attention to unsustainable land-use practices in Germany.
The data used in the DUX is scientifically based and substantiated. However, the DUX should not be interpreted as a scientific model but rather as a way of illustrating complex environmental issues. Furthermore, it is not so much a description of the overall quality of the German environment as a yardstick for measuring the degree to which environmental policy is reaching its stated goals.
The DUX is a particularly interesting case-study because although there are other EU examples of the high profile usage of indicators, none have been ‘marketed’ to such an extent. First of all, it is important to remember that the DUX has considerable public resonance because of the fact that its name is (intentionally) very similar to the DAX (Deutscher Aktien Index), Germany’s leading stock market index. The DUX also has a slick media-oriented logo and, shortly after its launch, struck a deal with one of Germany’s leading television channels, ZDF, guaranteeing a minimum level of airtime on news broadcasts and the channel’s environmental programme Planet.e. The television coverage has now ended after it was felt that television is not an appropriate medium for an index which is only updated on a yearly basis. Nevertheless, discussions are underway to increase the DUX’s coverage within Germany’s print media.
EU Member State Experiences with Sustainable Development Indicators
50
4.2.7 United Kingdom
The UK has significant ongoing initiatives in the sphere of SDIs at both the national, regional (including Northern Ireland, Scotland and Wales) and local levels. To offer a clear presentation of these activities at different levels, this analysis is split into two sub-sections: National Level Activities and Regional/Local Level Activities. It should however be borne in mind that there are clear interlinkages and inter-dependencies between SDI activities at different levels in the UK, as is explained below.
National Level Activities:
The UK was one of the first countries to develop SDIs. Its first set was published about the same time as the UNCSD set and included around 120 SDIs. These were intended to act as a preliminary set to generate debate on SDI development, both nationally and internationally. With this intention, the UK also set up the Indicator Working Group to review the outcomes of the debate and to produce recommendations on the next set of SDIs. This working group was supported by other smaller specialised groups that also had their input into the debate. These groups included the Indicator Sub-Group of the UK Round Table on Sustainable Development, the Environmental Statistics Advisory Group and the Central and Local Intelligence Partnership. All of these groups are made up of representatives from central government departments, local authorities, regulatory agencies, non-governmental organisations and technical and scientific experts. This original set of 120 indicators had a strong environment and economic focus and were reviewed over a one year period (May 1997 to April 1998), by 7 sub-groups within the following areas:
v The overall framework; v Global atmosphere, air quality, energy, transport and tourism indicators; v Economic, health, and overseas trade indicators; v Water quality and resources indicators; v Land use, landscape and soil indicators; v Waste indicators; and v Wildlife and habitat indicators.
Later in 1996, the UK decided to participate in the UNCSD testing programme. For efficient and effective testing it was decided that the existing system in place to monitor and review the national SDI set, would also be used to test the UNCSD set. Of the 132 UNCSD indicators published, the UK decide to test 51 (28 environmental, 9 economic, 12 social and 2 institutional). Many of the indicators not selected were either irrelevant to the UK or were better covered by the national set. In this way it was thought that there could be a two way learning process were the UK could take experiences from the UNCSD set and vice-versa.
One of the main recommendations that the groups suggested was that the present set of SDIs need to be redeveloped in the light of the revised SD strategy. Thus the new set of about 150 SDIs were developed and published as part of the new SD strategy “A Better Quality of Life” in 1999. These were then re-published in more detail along with a headline set in “Quality of life Counts” later that year. This set of 147 was broken down into 15 headline and 132 core indicators.

EU Member State Experiences with Sustainable Development Indicators
51
The core set of 132 indicators can be broadly broken down into the following branches of SD: 65 environmental, 40 social and 27 economic indicators. At the same time however it must be noted that many of the indicators could easily fit into more than one of these.
Within the UK, however, it has been decided not to classify the SDI’s according to the different dimensions of SD, but rather into themes and then into ‘families’. Thus the indicators can be broken into the following themes, and their corresponding ‘families’:
Theme 1: Sustainable Economy: covering efficient use of resources, economic stability and competitiveness, education and skills of the population, employment and equal opportunities, ethical trading, action by producers and consumers in priority areas (the home, home appliances, food and drink, personal transport, tourism and leisure):
A- Doing more or less: improving resource efficiency (7 Core (C), 1 Headline (H)), B- Economic stability and competitiveness (5C, 2H) C- Developing skills and rewarding work, (11C, 2H) D- Sustainable production and consumption (21C, 0H)
Theme 2: Building Sustainable Communities: local economic vitality and equity between communities in the UK, health, access to services, culture and sport, housing, planning and design, local environmental quality, crime, institutional arrangements and participation:
E- Promoting economic vitality and employment (5C, 1H), F- Better health for all (4C, 1H), G- Travel (5C, 1H), J- Access (6C, 1H), K- Shaping our surroundings (9C, 2H), L- Involvement and stronger institutions (3C, 0H),
Theme 3: Managing The Environment And Resources: indicators covering persistent pollutants, climate change and energy, air quality, fresh water, seas oceans and coasts, soil, landscape and wildlife, forests, minerals extraction and use:
M- An integrated approach (4C, 0H), N- Climate change and energy supply (5C, 1H), P- Air and atmosphere (5C, 1H), Q- Freshwater (6C, 1H), R- Seas oceans and coasts (5C, 0H), S- Landscape and wildlife (15C, 1H)
Theme 4: Sending The Right Signals: indicators on the mechanisms by which SD can be put into practice, through government setting an example, through policy instruments like taxes and regulation, through information and campaigns to change people’s behaviour:
T- Sending the right signals (9C, 0H)
EU Member State Experiences with Sustainable Development Indicators
52
Theme 5: International Co-operation And Development: measures of global population and global poverty, aid to developing countries, implementation of international agreements, comparison of UK resource consumption with that of other countries:
U- International co-operation and development (7C, 0H)
In addition, the indicators (including the headline ones) each have a unique link to a specific reference in the SD Strategy, outlining a particular objective.21
The intention of the 15 headline indicators is to focus public attention on what SD means, and to give a broad overview of whether the UK is achieving ‘a better quality of life for everyone, now and for generations to come’. Taken together they are seen as a ‘Quality of Life Barometer’. This barometer has enjoyed considerable coverage in both the print and broadcast media. The UK headline indicators are listed in Annex I.
National-level SDI activities in the UK are now co-ordinated by the Department for the Environment, Food and Rural Affairs (DEFRA). In addition, there is a Government Statistical Service Working Group on Indicators of Sustainable Development and although it has not met for a long time, a meeting is planned for the near future to consider the level of progress with those SDIs which were not fully established when the UK’s SD Strategy was published in 1999. SDIs are also reviewed by an Inter-Departmental Steering Group for the UK Government’s Annual Report on SD (‘Achieving a Better Quality of Life’). During this process, the presentation, interpretation and assessment of progress for each of the fifteen headline indicators are discussed with the relevant Government Departments.
The UK government looked at many different indicator types, from the UN Human development index approach to the “ecological footprint” method developed by the WWF. However, it was thought that these new innovative methods did not meet the certain scientific and technical criteria, which an indicator also needs to satisfy credibility at all levels. The criteria of the indicators set was based on the requirements that they should:
v be representative; v be scientifically valid; v be simple and easy to interpret; v show trends over time; v give early warning about irreversible trends where possible; v be sensitive to the changes it is meant to indicate; v be based on readily available data or be available at reasonable cost; v be based on data adequately documented and of known quality; v be capable of being updated at regular intervals; and v have a target level or guideline against which to compare it.
21 See www.sustainable-development.gov.uk/sustainable/quality99/annexa.htm
EU Member State Experiences with Sustainable Development Indicators
53
As well as these criteria the government felt that a balance should be reached between indicators reflecting key issues and policy needs, and them standing the test of time. For this reason the indicators are linked to objectives which feed back into policy and are not actually tied to specific policies. However, at the same time, there is consensus that there needs to be some level in flexibility so that they can be adapted in response to important new issues (such as the discovery of the ozone hole in the mid 1980s), or where they can be improved. On a more longer-term basis, the UK is looking to overhaul the national indicator set. This will probably be undertaken in parallel to an update of the UK’s SD Strategy in 2004. It is possible that the approach will be oriented more in line with the OECD concept of SDIs to measure the decoupling of environmental pressure from economic growth, but at the time of writing no firm decision had been taken.
Like Germany, the UK has also been successful in generating a considerable amount of media interest in SDI activities. There was a significant level of coverage in both the print and broadcast media of the publication of the SD Annual Report22 and an awareness-raising leaflet on the ‘Quality of Life Barometer’ in March 2002. This included specific coverage of the SDIs in several newspapers and television programmes.
Regional/Local Level Activities:
In addition to activities in the indicator sphere at the national level in the UK, significant work is being undertaken at the regional and local levels. It is important however to emphasise that these activities are closely linked to work being undertaken at the national level (see above). All the SDI sets produced by devolved/regional administrations take into account the national SDI set (conversely, the national set was originally produced taking strong account of issues in Wales, Scotland and Northern Ireland). Regional SDI sets are consistent with those in the national headline or wider core set - it is more a question of regional priorities than significant differences in the SDIs themselves. Moreover, DEFRA has close contact with the devolved administrations, maintains a watching brief on SDI formulation, and will take account of the work by devolved/regional administrations when reviewing the national SDI set.
The Scottish Executive launched a consultation exercise based on a discussion document, Checking for Change, in May 2001. The exercise asked for views on how progress towards more sustainable development could be measured using indicators. Many responses were received and on the basis of these it was concluded that Scottish SDIs must be:
v Reflective of Scotland’s circumstances and, in particular, the distinctive Scottish priorities of resource use, energy and travel;
v Comparable with other indicator systems as used in other parts of the United Kingdom, Europe and at the global level; and
v Applicable at the local level.
22 Department of Environment, Food and Rural Affairs (March 2002), Achieving a Better Quality of Life - Review of Progress towards Sustainable Development Government Annual Report 2001, DEFRA Publications, London.
EU Member State Experiences with Sustainable Development Indicators
54
Following this consultation exercise, a set of 24 SDIs was published in the Scottish Executive’s April 2002 SD Planning Document. The SDIs were organised around the following themes:
v Resource Use (11 indicators)
v Energy (2)
v Travel (4)
v Social Justice (7)
Some of the SDIs have been already been given targets and others will receive targets following the completion of ongoing methodological work. The SDI set itself is also only seen as provisional and will be reviewed in 2003 on the basis of emerging opinion (especially following the Johannesburg WSSD).
SDI activities in Wales have been based around the elaboration of the country’s Sustainable Development Scheme (see section 3.2.6). A consultation document was published in September 2000 and contained an initial set of 81 indicators including 20 headline indicators. Many of these were also found in the UK SD Strategy’s indicator list (see above). Following a consultation exercise, a shortened set of 12 headline indicators was adopted in March 2001. Nine of these also belong to the headline set for the UK as a whole (see above). As with the situation in Scotland, the SDIs are only seen as an initial set as additional methodological work is likely to lead to changes to the current set and the adoption of additional ones.
Northern Ireland is planning in the first instance to measure progress towards sustainability by using the 15 headline indicators found in the UK SD Strategy (see above). There is however recognition that these are not necessarily either the best or only measures of local sustainability-related issues. The Northern Ireland Assembly is therefore planning to launch a public consultation exercise for the formulation of SDIs. This will take the same form as similar consultation exercises already completed in Scotland and Wales with the publication of a discussion document and subsequent public discussion period.
In its report, Regional Quality of Life Counts, the UK Government presented regional values for thirteen of the fifteen23 UK national headline indicators. In addition to this, as part of their Sustainable Development Frameworks (see Section 3.2.6) each of the nine English regions are currently developing their own SDI sets – which may differ from the UK national headline sets. In July 2000 a handbook Local Quality of Life Counts was published which offers ideas for measuring sustainable development and quality of life in local communities.
It contains 29 indicators, some of which local authorities can use for reporting on their Local Agenda 21 and Community Strategies. The indicators build on the extensive work already carried out at local and national levels and have been developed by a joint initiative between local and central government and were tested in about 30 local authorities. The indicators are based on local
23 Further methodological work is still required to be able to present regional information for the headline indicators Greenhouse Gas Emissions and Populations of Wild Birds.
EU Member State Experiences with Sustainable Development Indicators
55
versions of some of the national SDIs, including some of the 15 headline indicators, and also on a number of other indicators developed by local authorities and Local Agenda 21 groups.
4.3 Member State Level Analysis – Non-UNCSD Testing Phase Participants
4.3.1 Denmark
Denmark undertook significant activities in the sphere of SDIs at the time of the publication of the national SD strategy (March 2001) with the issuing of a discussion paper on SDIs in April 2001. The purpose of this paper was to ‘establish a set of indicators anchored in public debate’. Any viewpoints aired prior to 1st August 2001 were considered in the selection of the SDIs. A total of 75 NGOs, business and labour organisations, experts and members of the general public commented on the discussion paper. Whilst the responses varied a lot, overall the public consultation was regarded as a success with many interesting viewpoints and ideas put forward. The output of this exercise was a set of just under 100 suggested SDIs split between a strategic (headline) set and a broader operational set.
Following the publication of a revised SD Strategy, the “National Strategy for Sustainable Development: Shared Future – Balanced Development” in June 2002 (see Section 3.3.1) the Liberal-Conservative Danish government published a report in August 2002 which includes a set of SDIs to serve the purpose of measuring progress towards SD.24 The SDIs are closely coupled to the SD strategy, and aim to monitor the progress towards SD at local, national and international level. Prior to its publication, this report underwent an additional public consultation exercise in May 2002 with the report being widely disseminated in both print and electronic forms.
To secure SD at all of the above mentioned levels, Denmark’s SDI report is inspired by other countries activities with SDIs as well as from international SDI exercises. Accordingly, Denmark has developed an approach which attempts to achieve a balanced set of SDIs that are relevant at a national level but allows comparison at an international level. This ensures that interests at all policy levels are taken into consideration, and that the public is represented along with political interests.
Due to the policy-oriented nature of Danish SDI formulation, two sets of inter-linked indicators have been developed, a strategic set and an operational set:
v The strategic set consists of 14 key indicators, which covers all aspects included in the strategy for SD, and is designed to allow decision-makers and the public an easy way of measuring progress towards SD.
v The operational set consists of 90 indicators, which give a detailed description of the progress and results in all areas covered in the SD strategy. Since the indicators are closely linked to the
24 See: Indicator Report: A Shared Future – Balanced Development, Denmark’s National Strategy for Sustainable Development, The Danish Government, August 2002.
EU Member State Experiences with Sustainable Development Indicators
56
strategy, they are organised in a cross-cutting and a sectoral part, instead of being organised within the three branches of SD. The indicators are therefore organised in the following way:
Cross-cutting Areas: - Climate change (9 indicators)
- Biodiversity – protection and access to nature (7)
- Environment and human health – Chemicals, Environmental pollution, foods, health and safety and physical indoor conditions (12)
- Resources and Resource efficiency (8)
- Denmark’s International activities (3)
- Measures and knowledge base (5)
- Public participation and Local Agenda 21 (1)
Sectoral Areas: - Food production – food safety, agriculture and fisheries (13 indicators)
- Forestry (4)
- Industry, trade and services (7)
- Transport (8)
- Energy (6)
- Urban- and housing development (7)
The strong Scandinavian tradition for environmental protection and the fact that the Danish Environmental Protection Agency was the lead institution within the Inter-ministerial Group for SD which produced both the SD strategy and related SDIs have helped to bias the final SDI set towards the environmental dimension of SD. This environmental bias, which is in accordance with the aims of the priorities identified by the Gothenburg European Council (see Section 2.3), means that it will be relatively easily for Denmark to adjust their efforts to be in line with EU priorities.
Denmark envisages that the emphasis on public involvement in the formulation and use of SDIs will continue now that the official set has been published. The SDIs have been made available in print form and a website is planned where all information relating to SD will be available in the public domain. The overarching objective here is that the public are involved in the debate on the dynamic nature of SD. Any future work to further adopt the indicators to the development of Danish society, will also be accessible to the public. A final report on SDIs in Denmark is set to be published in October 2002. As a result of the dynamic nature of SD, it is planned that the SDIs be revised and updated on a yearly basis.
EU Member State Experiences with Sustainable Development Indicators
57
4.3.2 Greece
To the date of publication of this report, Greece has no available SDIs. A Report on Sustainable Development Indicators should be produced by the end of 2003 by the Hellenic National Centre for Environment and Sustainable Development. The report should specify further activity in the field of SDI.
4.3.3 Ireland
The Policy Agreement for a Government of Renewal (published in December 1994) states the Government's commitment to working towards a new set of indicators of sustainable economic development, taking account of environmental and social factors, and to be used alongside existing measures of economic activity such as GDP. Hence the development of SDIs in Ireland can be seen as having been driven by policy. As a response, the 1997 Irish SD Strategy included the remit to devise suitable indicators that in the long term, are intended to qualify, from an SD perspective, the standard information of traditional National Accounts.
Apart from the traditional macroeconomic indicators (e.g. GDP or the rate of inflation), the use of indicators is not well established or developed in Ireland. Indeed, only in 1994, with the publication of the National Development Strategy 1994-1999 called, the “Community Support Framework” (CSF) did the issue come to prominence. A primary objective of the CSF is to enhance economic performance through sustainable growth and development within this framework. The development of indicators for the CSF, therefore will have repercussions on Ireland’s SDI formulation. Within the CSF Framework, the following are some of the areas that were highlighted as important for SD within Ireland:
v Agriculture, Forestry and Rural Development; v Fisheries; v Tourism; v Transport; v Energy; and v Environment.
Following on from this, Ireland’s Economic and Social Research Institute (ESRI) were commissioned by the Ministry of Environment to undertake a study. This study discussed in particular 3 main types of environmental indicators that could be used in Ireland. They are:
v Environmental Indicators for Individual Themes: Most international work on indicator methodology has focused on this area, developing a foundation for the development of more sophisticated indicators in the future. The indicators can be expressed in physical terms and the choice of themes may reflect environmental aims and priorities at national, regional or local levels. An example is the OECD's core set of indicators. Many such indicators could be assembled for Ireland, without a significant data problem.
v Environmentally Adjusted (or Green) National Income: This method would extend the measurement of national income to take account of important environmental
EU Member State Experiences with Sustainable Development Indicators
58
considerations. National income is a measure of economic activity rather than well-being. It ignores the depletion of natural assets and the negative impact on welfare of environmental damage which has not been remedied. It also reflects "defensive expenditure", i.e. expenditure to prevent or correct pollution -and maintain the environmental status quo - as output rather than costs.
However, there are no easy ways to adjust national accounts. Monetary valuation of depletion and degradation, judgement on whether/the extent to which human-made capital can substitute for natural assets, and methodologies for dealing with defensive expenditures in an integrated framework are all still largely at an experimental stage.
v National sustainability indicators: These are related to green national income and have similar data requirements, but go further in terms of estimating national change in assets over time. The national savings rate adjusted for depletion and degradation of environmental assets would be the appropriate national sustainability indicator to use alongside GDP. Where the change in assets, measured by the adjusted savings rate, is positive when averaged over a period of years, society is on a sustainable path. However, the difficulties of measurement associated above with green national income also arise here.
Another weakness with National Income Accounting is that it does not include social indicators, and therefore does not adequately measure welfare. The essential purposes of social indicators are to focus on the distribution of economic resources, and to extend traditional economic measurements to include non-economic aspects of social life. As SD measures economic, environment and social aspects, there is a need in this model to include social indicators.
Within Ireland’s context, the list of Social Indicators developed by the OECD provides a useful starting point for the development of social indicators for Ireland. This contains 33 indicators covering health, education, employment, quality of working life, distribution of income and wealth, leisure, physical environment, social environment and personal safety. It is broadly applicable across developed countries and generally feasible in measurement terms.
Since this study, methodological development of an indicator set has continued, with the release of indicators for the rural environment (2001), transport (2001) and general environmental indicators (1999). This work culminated in the publication of “Ireland’s Environment - A Millennium Report” in 2000.25
The current programme of indicator development is underway again in Ireland. This was pushed in particular by the World Summit in Johannesburg in August/September 2002. The Ministry of the Environment had hoped that by the Summit there would be a key set of 20 SDIs to measure the progress of SD in Ireland.
25 It is foreseen that this report will be updated in 2004.
EU Member State Experiences with Sustainable Development Indicators
59
Given that these developments have occurred after the Gothenburg Summit, it is to be hoped that all of the criteria set out should be included, especially climate change and transport, which have already been identified as key issues nationally, not just within Europe.
4.3.4 Italy
The development of SDIs has been slow in Italy. A likely reason for this is the delay in the publication of the National Strategy for SD, which was finally approved by the CIPE on 2nd August 2002 (see Section 3.3.4). Italy was not involved in any of the major international SDI testing exercises, but did undertake activities in recent years in relation to methodological and operationalisation aspects of SDI formulation. For example, the Italian National Statistics Institute (ISTAT) was involved in the Friends of the Chair Group, which was created by the UN Statistical Commission in 2001 and was designed to provide support in reaching consensus ahead of the Johannesburg World Summit on SD. This involved undertaking research projects on environmental statistics and environmental accounting, with the objective of producing better indicators.
With reference to urban environmental indicators, since 1996, an indicator set has been developed to measure environmental problems in urban areas. This project has been run by ISTAT’s Department of Social Statistics (DISS), within the framework of a major initiative called the Environment Methodology and Statistics Project (DISS/1). Indicators on the urban environment were developed for 22 major Italian cities, covering 10 million people. From 2000 (reference year), the survey has covered 103 municipalities. The objective of the survey, which is updated annually, is to build up indicator data sets for the improvement of basic environmental statistics and the development of information systems able to capture and highlight the most important environmental issues at the local level. The indicators are therefore essential to monitor the integration of environmental priorities into sectoral policies. The indicators focus on environmental issues, although implicitly the social and economic dimensions of SD are covered given the inter-dimensional nature of many of the indicators chosen. There are 188 indicators spread across 8 main themes:
v Air (13 indicators); v Energy (23); v Green areas (30); v Noise (23); v Transport (55); v Waste (32); v Water (11); and v Population and Territory (1).
The model used to develop the indicator sets is the DPSIR one (see Box 4.2). It therefore looks at the pressure put onto the urban environment by the economy (in this case) and measures the impact and responses of the State. The development of these indicators is a positive step in the development of a more holistic set of SDIs. Indeed it is likely that this will form the foundation of the current work on SD and SDI’s in Italy, which at present is at a discussion stage.
EU Member State Experiences with Sustainable Development Indicators
60
Due to the development of these indicators taking place prior to the Gothenburg Summit, the EU’s priorities (see Section 2.3) are not explicitly accounted for. However given that the priorities of climate change, public health and transport have long been part of the urban agenda, these indicators will be able to monitor how Italy’s urban areas are meeting the objectives set. On top of this, given the emphasis put on Natural Resource Management within the current strategy, which was developed for the 2002 Johannesburg Summit, indicators will naturally cover this area, given the benefit of knowing the EU priorities.
4.3.5 Luxembourg
The foundations of the Luxembourg Government’s policy to measure SD are identified as good statistics, Cost-Benefit Analyses, scientific information and comparable and reliable indicators. The Luxembourg Plan for SD was formally adopted in 1999 and SDIs were recognised as a key part of the process of monitoring the implementation of the strategy. The key institution in terms of indicator formulation is the Ministry of the Environment (MoE). A decision was taken that all environmental indicators will be formulated by the MoE and so STATEC (Luxembourg’s National Statistical Institute) has no meaningful role in the formulation of SDIs.
The development of indicators is policy driven, so that Luxembourg can implement the declarations made at the Earth Summit in 1992. In total 59 SDIs (18 social, 22 economic, and 19 environmental), were developed as an integral part of the SD plan in 1999. They were based on the UNCSD list of indicators, but adapted to the conditions, activities, and priorities for SD in Luxembourg as well as practical and methodological concerns such as data availability.
In August 2002, Luxembourg published a revised set of 27 SDIs. Some of these are taken from the list of 59 SDIs (see above) presented in the SD Strategy, some are variants of SDIs from this list and others are completely new. This followed a consultation exercise where the Ministry of Environment published a draft set of 16 SDIs. Several different administrations came forward with remarks and also suggestions for additional SDIs. The Ministry of Economic Affairs thought that the economic pillar of SD was under represented in the draft list. Accordingly, new SDIs were added in order to obtain a balance of social, economic and environmental indicators. Afterwards, the Ministry with responsibility for housing came forward and wanted to add an indicator on housing difficulties. Later, the Ministry in charge of work conditions insisted on introducing an SDI on industrial accidents. The objective of achieving an even representation of the 3 pillars of SD, meant the Ministry of the Environment finished with 27 indicators: 9 social, 9 economic and 9 environmental.
These 27 indicators are a departure from the original list of 59 SDIs published in the 1999 National Plan for SD (see above). In fact, even the first list of 16 indicators already contained new or revised indicators since the MoE had discussed the original 59 indicators in summer 2001 with colleagues from the National Statistics Institute (for the social indicators) and with the Ministry of Economic Affairs (for the economic indicators). These institutions already suggested modifications or to drop some indicators due to a lack of pertinent and accurate data.
It is important that the current 27 SDIs are not seen as headline indicators. Initially, it was thought that the 16 SDIs chosen would constitute a kind of headline set insofar as the MoE wanted to
EU Member State Experiences with Sustainable Development Indicators
61
produce/estimate/calculate values for all 59 indicators but then only publish the limited set of 16. They were not however to be called 'headline indicators' but rather simply distinguished as indicators with a higher priority compared to the others which were described as 'second best choice'. Now however, Luxembourg does not intend to produce/calculate/estimate all of the 59 indicators because of developments since Summer 2001 and the fact that it would be wasted effort to produce indicators that would perhaps never be used or published.
The 27 indicator set matches well with the priorities set out at the Gothenburg Summit. Of the 4 priorities (see Section 3.3) all, except Natural Resource Management are implicitly met through the different types of indicators present. There is also an aspect of inter-dimensionality within each priority.
4.3.6 The Netherlands
In 1991, the Dutch Government published environmental indicators for the first time, in the Environmental Programme 1992-1995 (VROM, 1991). The indicators are used as communication instruments to inform the Parliament and the public about the performance of environmental policy in the Netherlands. The indicators and the related environmental targets were formulated through a national discussion process and the development of a consensus on environmental problems involving all stakeholders. The Environmental Programme (EP) is an annual publication by the Ministry of Housing, Spatial Planning and the Environment (VROM), which outlines the progress of environmental policy in the previous year and presents the plans of the government for the next four years. In the first Dutch National Environmental Policy Plan (NEPP, VROM 1989), environmental policy focuses on three main areas: v The main problems experienced in the Netherlands (the so-called ‘Theme Area’); v The target group approach (the actors in society that contribute significantly to
environmental problems); and v The spatial area-oriented policy (regional differences in environmental pressure and
(desired) environmental quality). VROM developed a set of environmental indicators to help assess the implementation of the NEPP (in the three above areas) and to communicate the results of environmental policy to the general public and parliament. Indicators for the ‘theme area’ were published for the first time in the EP92-95 (VROM 1991) and included data from 1980 to the present. Indicators supporting the target group approach were published for the first time in the EP94-97 (VROM 1993). Currently, the EP does not contain indicators that focus on spatial area-oriented policy. The indicators are:
EU Member State Experiences with Sustainable Development Indicators
62
Theme Indicators: Target group indicators: v Climate change v Agriculture v Depletion of the ozone layer v Traffic and transport v Acidification v Industry v Eutrophication v Electricity power stations v Disposal of solid waste v Refineries v Dispersion of toxic substances v Building trade v Disturbance of the local environment
(noise and odour nuisance) v Consumers
The theme and target group indicators give insight into developments in environmental pressure in the Netherlands and, whenever possible, they are connected to environmental policy goals. The indicators in the Environment Programme present results which correspond to the Dutch environmental policy. The National Institute of Public Health and Environment has been responsible for an annual update of the indicators since 1993. The following principles underlie the current set of indicators: v The indicators focus on the implementation of environmental policy in the Netherlands. v For every theme and target group, one indicator is presented. By presenting highly
aggregated information, stripped of minor details, the parliament and the general public gain a better understanding of the essential aspects of environmental policy.
v The indicators show developments in environmental pressure (except disturbances that focus on effect), rather than developments in environmental quality or effects. Although the theme approach addresses all parts of the causal chain from emissions to effects, the policy, as formulated in the NEPP, focuses mainly on environmental pressure for most themes. Environmental pressure is related to the policy goals formulated in the NEPP.
v The indicators follow agreements between the Ministry, the Central Bureau of Statistics, the Emission Registration Office, the National Institute of Public Health and Environment, the Environment Inspectorate and other actors, concerning: definitions of emissions, target groups, the Netherlands and the determination and use of data. This ensures consistency between indicators in the Environment Programme, the Environmental Outlook, the Environmental Balance and the yearly Emissions Report.
After their initial development, the indicators were evaluated on two occasions. These evaluations resulted in several changes to the indicators. The most important reasons for adjusting the indicators were: new scientific data, changes in the availability of emissions data, adjustments to agreements on definitions of target groups and changes in methodologies for calculating data on emissions.
Unfortunately, little information is available on the current status of SDI formulation in the Netherlands. It is clear however that SDIs are being selected from a provisional set formulated earlier. These will show whether the Netherlands is on a sustainable development path. To this end,
EU Member State Experiences with Sustainable Development Indicators
63
related targets are being selected for the next five or ten years to assess progress towards SD in specific thematic areas.
4.3.7 Portugal
The first major efforts in Portugal towards the formulation of a national SDI set took place in the late 1990s and culminated with the publication of a Proposal for a System of Indicators of Sustainable Development in 2000.26 It was produced by the Ministry of Environment and Land-Use Management but other Ministries were also involved in its formulation. It contains 132 different SDIs, covering environmental (72 indicators), economic (29 indicators), social (22 indicators) and institutional (9 indicators) themes. There is therefore a clear environmental bias in the indicator set, perhaps reflecting the role of the Ministry of Environment and Land-use Management as the lead institution. The indicators themselves are organised into a PSR framework with 36 pressure indicators, 55 state indicators and 41 response indicators. For each indicator a fact sheet is presented which outlines a description of the indicator, the unit of measurement, the relationship with the concept of SD, the interlinkage with other indicators, targets set, methodology, periodicity and data sources. In addition, data is presented for each indicator for the preceding years. There is no set of headline SDIs although in the 2000 State of the Environment Report, Portugal used the official OECD/EU headline environmental indicators.
The SDI set contained within the Proposal for a System of Indicators of Sustainable Development has not been formalised into official government policy since its publication in 2000. The SDIs have however been updated and used in annual State of the Environment Reports. Portugal is therefore in the same position as Sweden insofar as it developed an indicator set prior to producing an SD strategy (see Section 3.3.7). Once the National Sustainable Development Strategy (ENDS) is finalised, it is expected that the SDI set will be adapted to meet the Strategy’s reporting and evaluation needs and then formally adopted as Government policy.
4.3.8 Spain
Like Italy, the formulation of SDI’s in Spain is very recent phenomenon. SDIs have been developed very much in co-ordination with the National Strategy for SD. In this sense they have followed a path similar to the UK, with many of the indicators being more focused than in other MSs. Due to the developments taking place recently, Spain has benefited from the opportunity to share experiences with other MSs who have been more proactive and thus are more experienced in this area.
The national strategy is structured around 7 key themes rather than the traditional economic social and environmental dimensions. Each of these themes has been allocated a set of indicators to measure its progress. Currently the number of indicators in Spain is 66. These can broadly be
26 See http://www.iambiente.pt/sids/sids.pdf
EU Member State Experiences with Sustainable Development Indicators
64
broken down into 10 Social, 24 Economic and 32 environmental. However, since these are presented thematically, many of the indicators can be placed in more than one of these dimensions.
The themes are:
v Economic growth, employment and competition (19 SDIs); v Management of natural resources and conservation of biodiversity (15); v Professional training, investigation and technological innovation (4); v Social and territorial cohesion (4); v Fight against climate change and the pollution of the atmosphere (7); v Sustainable tourism (9); and v Management and reduction of waste (8).
One of the key issues in the development of Spanish indicators is that the information they are presenting must be continuous, coherent and must take into account and reflect the territorial diversity that exists in Spain.
A key operational objective of the Spanish Strategy is to achieve a high-level of co-operation between institutions both horizontally and vertically. Central Government plays a pivotal role in articulating and pushing the SD Strategy objectives forward. The part of the Strategy where all the SD-related guidelines are presented also includes specific guidelines on SDIs, with emphasis especially on the actions that politicians need to take to operationalise both SD and their accompanying SDIs. Indeed, this is one of the reasons that the SDIs are grouped around the above seven themes, so as to avoid conflict at the political level.
Since the concept of SD is an open and dynamic process, the Spanish strategy and SDI development involves certain evaluation criteria, along with application proceedings and the presentation of results. The basics for managing them are:
- Evaluation and characterisation of the phenomena and factors that affect SD;
- Develop and improve the knowledge gained by the evaluation;
- Evaluate also the strategy itself, to see if the steps that have been taken have had the desired effects; and
- Establish all conditions and first orientations for further operationalisation, revision or re-formulation of the strategy.
4.3.9 Sweden
Sweden has worked in an opposite manner to most other MSs in developing a SDI set, in that they produced a set of indicators before publishing a national SD strategy. The development of these indicators therefore contributed to the discussions and work in relation to the development of a Swedish strategy for SD. The lead institution was the Ministry of the Environment, with inputs from the ministries of Health and Social Affairs, Industry and Trade, Finance and Statistics Sweden and the Environmental Protection Agency.
EU Member State Experiences with Sustainable Development Indicators
65
Since the concept of SD in Sweden is so embedded in ecological issues, the development of these indicators have been linked to a set of 12 Green Headline Indicators that were published in 1999by the Swedish Environmental Advisory Council. They were designed to ‘provide the public and decision-makers with easily available and concise information about the progress being made in the transition to an ecologically sustainable society in Sweden’. The twelve indicators are listed in Annex I. Other studies and experiences have also been taken into account, including, the experience of developing spatial planning indicators and other studies undertaken by the Swedish Environmental Advisory Council.
The present set (published in May 2001) of Swedish indicators consists of 30 existing measures (where data is already available), which can be broadly categorised into the 3 branches of SD as, 10 environmental, 12 economic and 8 social. However, the indicators are presented as themes of sustainability rather than in these dimensions. This is because;
“Sustainability indicators are generally designed to illustrate the economic, environmental and social dimensions of SD. There is a danger in categorising a set of indicators strictly by these dimensions since the same phenomena can often be viewed from several perspectives”27
The themes of sustainability are:
v Efficiency v Adaptability v Contribution and Equality v Values and resources for coming generations
Within these themes, the indicators encompass economic, environmental and social dimensions. The approach considers how qualitative increases in the components of efficiency, contribution and equality and adaptability strengthen the values for coming generations to continue and expand SD. Hence the indicators within these themes can be measure the following:
v Indicators on Efficiency focus on resource use from different perspectives. Resource productivity is undoubtedly one of the key issues in a transition to a sustainable society.
v Indicators on Contribution and Equality encompass the distributional aspects of development, in terms of sharing both the burdens and benefits in different areas. Many of these indicators deal with traditional economic and social welfare issues; additional data reflect the interest in promoting changes in production and consumption patterns in a more sustainable direction.
v Indicators on Adaptability illustrate actions today that will influence the situation in coming years. These indicators represent different views of the current composition of investments in relation to achieving greater flexibility and efficiency tomorrow.
27 Statistics Sweden & Swedish Environmental protection Agency (2001)- Sustainable Development Indicators for Sweden: a First Set 2001, Stockholm, (Page 7).
EU Member State Experiences with Sustainable Development Indicators
66
v The last set of indicators focus on Values and resources for coming generations, or what might be termed manoeuvrability. These indicators emphasise the economic, ecological and human resources passed on to future generations.
A limited number of indicators was desired to create a manageable set. This is mainly because the target group it was aimed at (policy makers-politicians/civil servants and the public) need something brief and focussed. However, by being so concise and focussed, the report does miss out on the intricacies of some of the data and analysis of indicators. Many of the indicators that have been chosen are though comparable at the international level.
The criteria used for selecting indicators were fairly pragmatic. First of all, an indicator should be informative and relevant in terms of Sweden’s sustainability. Secondly, the data should be readily available in official statistical datasets and, if possible and appropriate, be annual data available over a longer time horizon. Finally, a reasonable balance between social, economic and environmental indicators is also desirable.
In the process of selection many indicators were discussed (see www.scb.se/eng/omscb/eu/eu.asp). Some of the desired indicators were excluded because of lack of data. In determining the indicators it was necessary to determine what measures were most important as well as catered for in terms of data that relates to choices and concerns of everyday life.
Due to the indicators being developed without a national SD Strategy and also their development occurring before the Gothenburg Summit the indicators are not strong at measuring the agreed EU priorities (see section 2.3). The priorities that are covered relatively well are climate change and public health. The lack of transport indicators (only 1) is disappointing, especially for such a large country. This is also true for management of natural resources, as indicators are not explicit enough in this area.

EU Member State Experiences with Sustainable Development Indicators
67
Table 4.3 - A Summary of SDI Evolution in the 13 Member States Studied
Country Headline Set?
Broader Set that could measure SD?
Economic and Social
Indicators?
Clear Evidence of Interdimensionality?
Lead Institution Other Bodies Involved Formalised Co-ordination Group?
Austria No 48 indicators to monitor progress to targets are fixed. A broader set of SDIs is under development.
Yes – good coverage
Yes, many of the SDIs cover 2 or more dimensions.
Federal Ministry of Agriculture, Forestry, Environment & Water Management
Federal Environment Agency & Representatives from the Länder social partners, NGOs etc. Committee for a Sustainable Austria (the federal ministries and interest groups each nominate one or two members)
Yes – a Working Group
Belgium No Yes, but not yet finalised (number unknown)
Yes, (how many of each not known)
No Federal Government: Inter-departmental Committee for SD
Federal Council for SD Yes- Interdepartmental Committee for SD
Platform for SDIs
Denmark Yes, 14 key indicators
Yes, 90 core indicators
Yes but poor when compared to Environment
Yes, many indicators broadly cover at least 2 dimensions
Inter-ministerial Group for SD (with the Danish Environmental Protection Agency as the Secretariat)
Inter-ministerial Group for Sustainable Development
No
Finland No Yes, 83 (21- Env, 29- Econ, 33 Soc)
Yes all dimensions are explicitly stated.
Yes, but mainly between environment & economy. The social indicators are more free-standing
Ministry of the Environment
Ministries for Labour, Interior, Trade & Industry, Transport & Communication, Agriculture & Forestry, Education, Foreign Affairs, Social affairs & Health
Yes- Finnish National Commission on SD
France No Previously 307 now reduced to 47
Yes Yes, extremely strong inter-dimensionality
French Institute of the Environment
Ministry of Ecology and Sustainable Development
No
Germany Yes – 25 SDIs
218- but to be shortened to 60-80
Yes Not clear but likely Federal Environment Ministry (BMU)
Federal Statistical Office, NGOs, business associations, trade unions, churches, charities, scientific advisory boards, Länder & municipalities.
Yes – the Inter-ministerial Working Group (IMA)
Key: Env= Environment, Econ= Economic, Soc= Social.
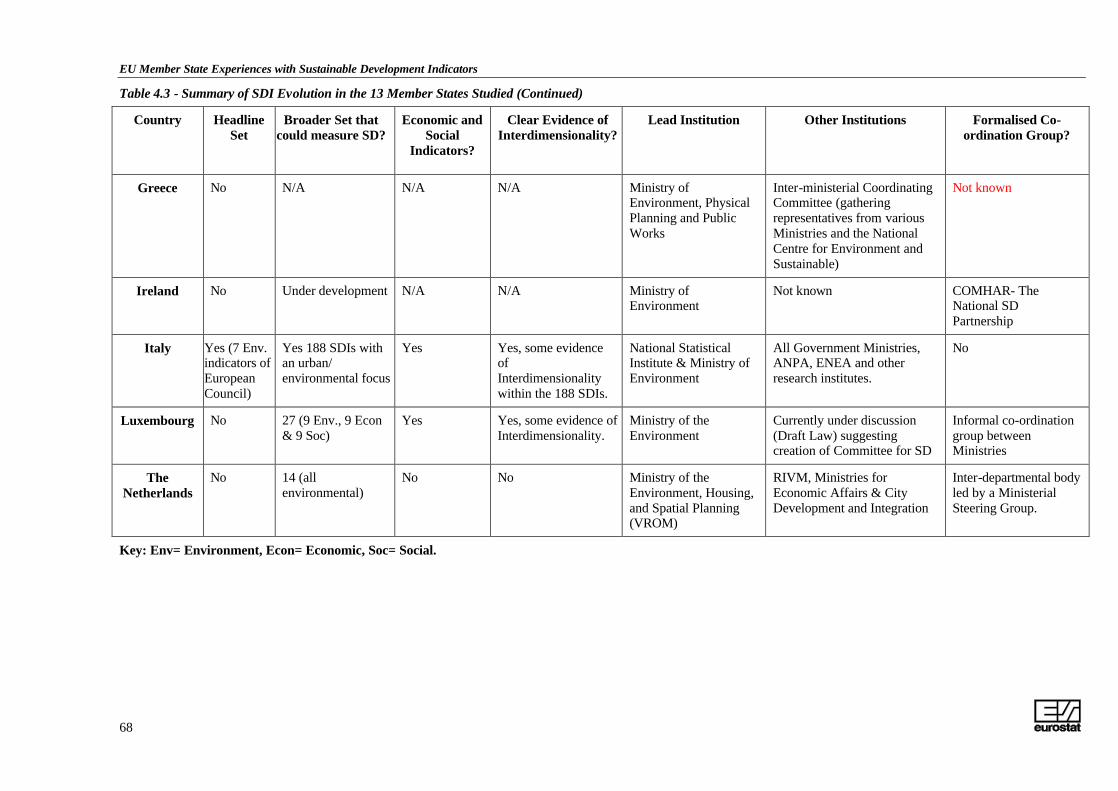
EU Member State Experiences with Sustainable Development Indicators
68
Table 4.3 - Summary of SDI Evolution in the 13 Member States Studied (Continued)
Country Headline Set
Broader Set that could measure SD?
Economic and Social
Indicators?
Clear Evidence of Interdimensionality?
Lead Institution Other Institutions Formalised Co-ordination Group?
Greece No N/A N/A
N/A
Ministry of Environment, Physical Planning and Public Works
Inter-ministerial Coordinating Committee (gathering representatives from various Ministries and the National Centre for Environment and Sustainable)
Not known
Ireland No Under development N/A N/A Ministry of Environment
Not known COMHAR- The National SD Partnership
Italy Yes (7 Env. indicators of European Council)
Yes 188 SDIs with an urban/ environmental focus
Yes Yes, some evidence of Interdimensionality within the 188 SDIs.
National Statistical Institute & Ministry of Environment
All Government Ministries, ANPA, ENEA and other research institutes.
No
Luxembourg No 27 (9 Env., 9 Econ & 9 Soc)
Yes Yes, some evidence of Interdimensionality.
Ministry of the Environment
Currently under discussion (Draft Law) suggesting creation of Committee for SD
Informal co-ordination group between Ministries
The Netherlands
No 14 (all environmental)
No No Ministry of the Environment, Housing, and Spatial Planning (VROM)
RIVM, Ministries for Economic Affairs & City Development and Integration
Inter-departmental body led by a Ministerial Steering Group.
Key: Env= Environment, Econ= Economic, Soc= Social.
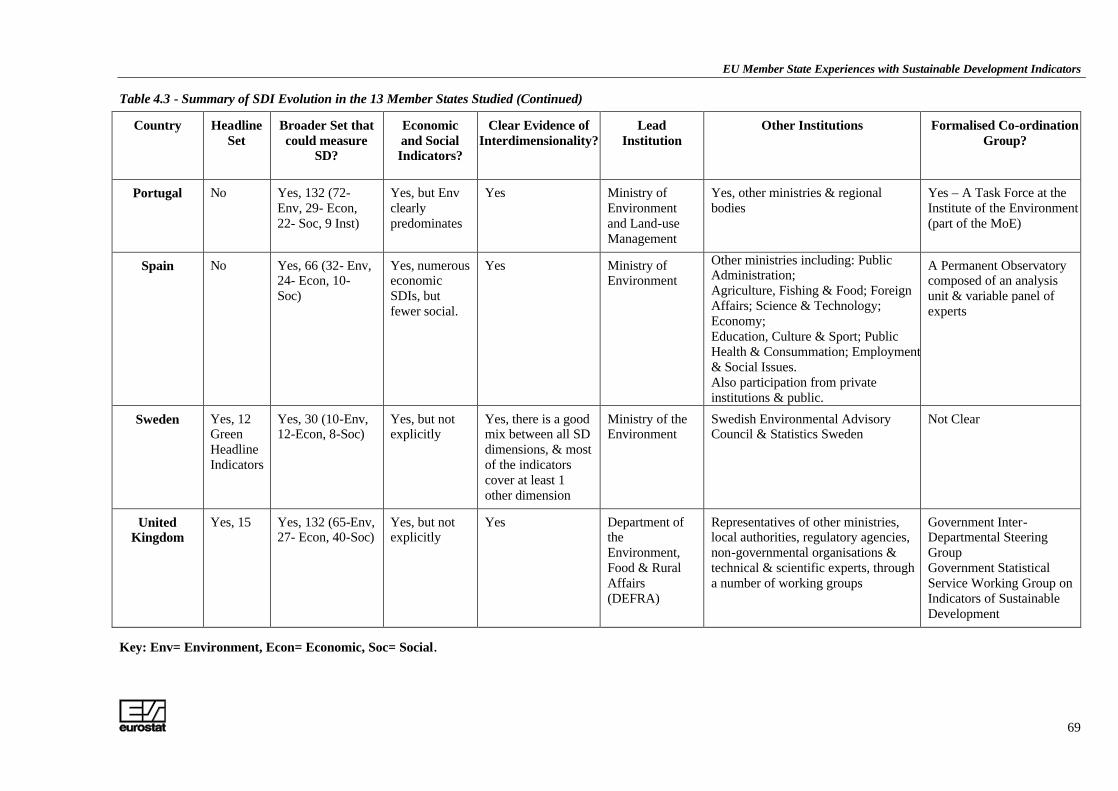
EU Member State Experiences with Sustainable Development Indicators
69
Table 4.3 - Summary of SDI Evolution in the 13 Member States Studied (Continued)
Country Headline Set
Broader Set that could measure
SD?
Economic and Social Indicators?
Clear Evidence of Interdimensionality?
Lead Institution
Other Institutions Formalised Co-ordination Group?
Portugal No Yes, 132 (72- Env, 29- Econ, 22- Soc, 9 Inst)
Yes, but Env clearly predominates
Yes Ministry of Environment and Land-use Management
Yes, other ministries & regional bodies
Yes – A Task Force at the Institute of the Environment (part of the MoE)
Spain No Yes, 66 (32- Env, 24- Econ, 10- Soc)
Yes, numerous economic SDIs, but fewer social.
Yes Ministry of Environment
Other ministries including: Public Administration; Agriculture, Fishing & Food; Foreign Affairs; Science & Technology; Economy; Education, Culture & Sport; Public Health & Consummation; Employment & Social Issues. Also participation from private institutions & public.
A Permanent Observatory composed of an analysis unit & variable panel of experts
Sweden Yes, 12 Green Headline Indicators
Yes, 30 (10-Env, 12-Econ, 8-Soc)
Yes, but not explicitly
Yes, there is a good mix between all SD dimensions, & most of the indicators cover at least 1 other dimension
Ministry of the Environment
Swedish Environmental Advisory Council & Statistics Sweden
Not Clear
United Kingdom
Yes, 15 Yes, 132 (65-Env, 27- Econ, 40-Soc)
Yes, but not explicitly
Yes Department of the Environment, Food & Rural Affairs (DEFRA)
Representatives of other ministries, local authorities, regulatory agencies, non-governmental organisations & technical & scientific experts, through a number of working groups
Government Inter-Departmental Steering Group Government Statistical Service Working Group on Indicators of Sustainable Development
Key: Env= Environment, Econ= Economic, Soc= Social.
EU Member State Experiences with Sustainable Development Indicators
70
5.0 INTER-DIMENSIONAL ASSESSMENT OF SD
5.1 Introduction
SD is sometimes viewed in terms of three separate dimensions: environment, economy and the social dimension 28. But by its very definition SD is underpinned by the complex interactions and interdependencies between the three dimensions. An approach which does not take these interdependencies into account, but instead deals with each dimension separately, is simply a ‘bundling’ of the three broad sectoral policy fields under an artificial and misleading ‘umbrella’ of something falsely described as SD.
This clearly has important consequences in terms of the measurement of SD and resulting work in the field of SDIs. Therefore to measure the progress towards SD, SDIs must therefore also be inter-dimensional in their scope. SDIs need to offer explicit linkages between the three dimensions of SD to allow sustainability to be measured in a more holistic fashion. Accordingly, SDIs which cover two or more dimensions of sustainability need to be developed and used. Table 5.1 below provides examples of inter-dimensional SDIs.
Inter-dimensionality also needs to be considered when examining the particular demands which the operationalisation of SD has on a country’s institutional structures. This is because in all MSs policies enacted by a ministry with specific sectoral responsibilities can have potentially significant effects in terms of sustainability across many different policy fields. Examples and perspectives on institutional inter-dimensionality are given in Box 5.1. Given the importance of inter-dimensionality, the remainder of this Section attempts to examine whether there is an inter-dimensional aspect to each of the Member States’ policies towards SDIs.:
28 Sometimes an institutional pillar is added as a fourth dimension.
Box 5.1: Institutional Inter-dimensionality – Examples and Perspectives
Whether at EU, MS, regional or local level, policy interventions inevitably have a range of secondary effects which impact both upon other policy areas and broader areas of society. For example, reducing climate change is normally the responsibility of the Ministry of Environment or equivalent body. However, other ministries have responsibility for policies which influence emissions of greenhouse gases. The Ministry of Finance generally sets the level of fuel taxation, a key determinant of the marginal cost of private transport and therefore also carbon dioxide emissions. Equally, in many MSs, ministries other than the Ministry of Environment are responsible for power generation which is another key contributor to global warming. This example and many others have far-reaching implications in terms of the pursuit of SD. It is imperative that different ministries and public bodies tackle issues and formulate policies within a consultative and collaborative framework, taking into account the complex inter-dependencies that exist between the different dimensions of SD at an institutional policy-making level. SDIs are a valuable tool in this respect to highlight the possible inter-dimensional implications of policy formulation on achieving SD.
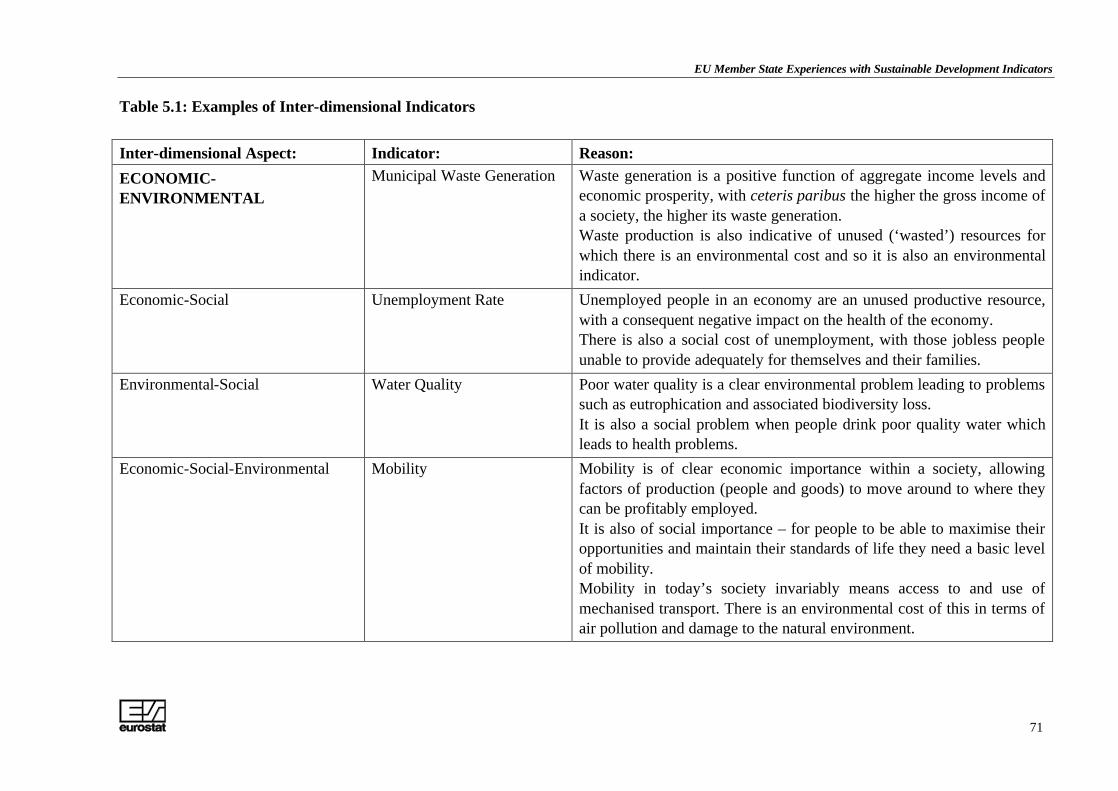
EU Member State Experiences with Sustainable Development Indicators
71
Table 5.1: Examples of Inter-dimensional Indicators
Inter-dimensional Aspect: Indicator: Reason: ECONOMIC-ENVIRONMENTAL
Municipal Waste Generation Waste generation is a positive function of aggregate income levels and economic prosperity, with ceteris paribus the higher the gross income of a society, the higher its waste generation. Waste production is also indicative of unused (‘wasted’) resources for which there is an environmental cost and so it is also an environmental indicator.
Economic-Social Unemployment Rate Unemployed people in an economy are an unused productive resource, with a consequent negative impact on the health of the economy. There is also a social cost of unemployment, with those jobless people unable to provide adequately for themselves and their families.
Environmental-Social Water Quality Poor water quality is a clear environmental problem leading to problems such as eutrophication and associated biodiversity loss. It is also a social problem when people drink poor quality water which leads to health problems.
Economic-Social-Environmental Mobility Mobility is of clear economic importance within a society, allowing factors of production (people and goods) to move around to where they can be profitably employed. It is also of social importance – for people to be able to maximise their opportunities and maintain their standards of life they need a basic level of mobility. Mobility in today’s society invariably means access to and use of mechanised transport. There is an environmental cost of this in terms of air pollution and damage to the natural environment.
EU Member State Experiences with Sustainable Development Indicators
72
5.2 Member State Level Analysis
5.2.1 Austria
Inter-dimensionality is definitely visible within the Austrian SDI set. There are several reasons why this is the case. Firstly, the structure of the Austrian SD Strategy (and also the accompanying set of 48 SDIs) is not based around a three-pillar approach, but rather a more holistic one organised around four different areas of activity (with corresponding objectives). Secondly, Austria has had a very broad range of stakeholders, from all groups within society, involved in consultations about its forthcoming SD strategy. Thirdly, going back as far as the CSD Testing Phase, Austria has placed significant importance on SDIs related to its particular geographic circumstances, notably the Alps which are both fragile from an ecosystem point-of-view but also a major economic resource. It is to be expected that this trade-off between economic and environmental concerns (such as in terms of trans-Alpine transport routes and the tourism industry) will result in some sort of inter-dimensionality present within the SDI selection.
5.2.2 Belgium
It is difficult to assess the inter-dimensionality of Belgium’s SDIs since as yet there is no official published set. Belgium is currently developing a set which will include both social and economic indicators as well as environmental ones, so there is certainly potential for inter-dimensionality to be present.
5.2.3 Denmark
The inter-dimensional aspect is addressed through the insistence on the interrelation between the 3 pillars of SD, which states that one pillar cannot go without the others. Indeed the Danish SD Strategy (from which SDI activities stem) is based upon a sectoral and cross-cutting approach rather than a rigid insistence on a focus on the three pillars of SD, thereby ensuring from the start a holistic and inter-dimensional approach.
One of the Danish SD Strategy’s cross-cutting themes is Environment and Health and includes SDIs which could arguably belong to any of the three dimensions. There are also other examples of explicit inter-dimensionality within both the Strategy and SDI selection.
5.2.4 Finland
Whilst using a thematic approach in organising their indicators, at a broader level, Finland has defined each indicator as environmental, social or economic. In most cases, many of the economic ones can also be identified as either social or environmental. However when looking at it the other way, only the social indicators cut across other dimensions. Also there are no clear indicators that cut across all 3 dimensions. As in the case of Denmark, the lead institution in the evolution of SDIs has been an environmental institution, so although other areas perhaps cut into environment, the environmental indicators do not necessarily cross into other dimensions. This has occurred despite a wide consultative process.
EU Member State Experiences with Sustainable Development Indicators
73
5.2.5 France
France’s proposed set of 47 SDIs (due to be published in Autumn 2002) is highly inter-dimensional. This is clearly a result of the innovative and holistic approach to SDI development which France has used, with SDIs structured within a framework of 10 different modules which are themselves organised within five key ‘axes’, reflecting key priorities of French SD policy. Each one of the 10 modules contains SDIs which are at least two-dimensional.
5.2.6 Germany
Germany’s national set of headline SDIs (see Section 4.2.6) contains several SDIs which can be classed as having an inter-dimensional theme. However, the wider set of 60-80 SDIs which will be used to measure implementation of the National SD Strategy have yet to be published so it is not possible to identify whether there is an explicit or implicit inter-dimensional theme. Nevertheless, there is evidence to suggest that this will be present. Firstly, a wide range of stakeholders from various groups within society were involved in the consultation process and in the formalised inter-ministerial working group (IMA). Secondly, the decision on the part of the Federal Government to adopt an approach to SD based not on the ‘3-Pillar Model’ but rather a more holistic one corresponding with the Brundtland definition of the satisfaction of fundamental needs and the demands which this places on resources tends to indicate that there will be an inter-dimensional aspect.
5.2.7 Greece
It is difficult to comment on inter-dimensionality since Greece does not yet have an agreed SDI set. Nevertheless, based on the observation of the existent methodological work (see Section 3.3.2) it is likely that the environment and social pillars of sustainable development will be emphasised in relation to the economic one.
5.2.8 Ireland
It is difficult to comment on the inter-dimensionality of Irish SDIs since as yet there is no set. However given that within the national SD strategy the focus is on environment and economic development, it is likely that these 2 dimensions will be the focus of SDIs. This is reinforced by the fact that the lead institution is the Ministry of the Environment.
5.2.9 Italy
Indicator formulation is presently, as in the case of France, at the discussion stage. The lead institution, like many other countries is the Ministry of the Environment. Given the urban bias of the national strategy, it is likely that many indicators will cover economic development and environmental problems. One indicator that will definitely have a 3 dimensional edge will be transport, which is a large part of Italy’s strategy.
5.2.10 Luxembourg
There is evidence of some inter-dimensionality in Luxembourg’s current set of 27 SDIs, but this is not as evident as in other Member States.
EU Member State Experiences with Sustainable Development Indicators
74
5.2.11 The Netherlands
There is not sufficient information on current activities in the field of SD and related indicators to make a decision on whether an inter-dimensional approach is being followed.
5.2.12 Portugal
There is an implicit recognition of inter-dimensionality in the Portuguese set of 132 SDIs but the fact that the list is dominated by environmental indicators means that this issue is not strongly covered. At a conceptual/theoretical level, there is a recognition on the part of the Instituto do Ambiente of the importance of inter-dimensionality and they are following methodological work at the international level in this regard.
5.2.13 Spain
At this early stage in the development of indicators, there is a strong emphasis on the economic and environment dimensions of SD. The social dimension is very weak in the Spanish strategy. The indicators that are present, although being organised into themes, still have a one-dimensional look to them. If there is any strong inter-dimensionality then it is between economic and environment indicators.
5.2.14 Sweden
In the Swedish publication it is stated that “there is a danger in categorising a set of indicators strictly by these dimensions since the same phenomena can often be viewed from several perspectives”. Hence like other Scandinavian countries they have chosen to structure the set of 30 indicators under themes. Within these themes, the indicators encompass economic, environmental and social dimensions. Obviously, there are trade-offs as well as synergy effects, within and among the variables composing the different indicators – especially over longer time periods. However, they do illustrate some of the linkages among the different indicators by cross-referencing where possible. Also a cross-reference matrix, showing which indicators can be linked to more than one category is presented. However at the most, this only presents a two-dimensional crosscut.
5.2.15 United Kingdom
The three pillars of SD: social, economic, and environment, are clearly defined, however, there is a major emphasis on integrated analysis and indicators so as to demonstrate progress or its absence on the difficult task of achieving environmental and social improvements at the same time as economic growth. The categorisation between the four SD objectives is somewhat arbitrary, as the issues in many cases are cross-cutting in their own right. However, the aim is not to provide a definitive allocation but to elaborate on the range of elements that need to be taken into account in achieving SD. In practice, because of the crosscutting nature of the issues and objectives, many of the indicators – arguably the better indicators – reflect more than one issue.
EU Member State Experiences with Sustainable Development Indicators
75
6.0 CONCLUSIONS
6.1 Introduction
This section presents conclusions on the analysis of Member State experiences with SDIs as well as the inter-linkage between SDIs and the various national SD Strategies which now exist in either draft or finalised form. The conclusions are structured around the following four themes:
v Stages of Development;
v Approaches Used;
v Interpretation of Sustainable Development; and
v Consultation/Awareness-Raising Efforts.
6.2 Stages of Development
• Although the correlation is not absolute, it does appear that the six Member States which participated in the CSD Testing Phase are more advanced in the formulation of SDI sets than those Member States which did not participate. Of the participants, only Belgium has not published an SDI set (in at least draft form).
• It is certainly true that participation in the UNCSD Testing Phase has led to a more robust methodological and procedural approach in all of the Member States concerned.
• Equally however, several of the non-participating Member States have benefited from the ‘demonstration effect’ of the experience gained in the six CSD participants as well as methodological activities undertaken at the EU and global level. In addition, they have been able to better harmonise their strategies to the EU-level priorities in the SD sphere post-Gothenburg.
• The World Summit on Sustainable Development, which took place in Johannesburg, South Africa in August/September 2002, also provided a substantial impetus for strategising, operationalising and assessing SD. Significant activities in relation to both broader SD strategy development and more specific work on SDIs were undertaken in the months preceding the summit.
• Substantial efforts are currently underway with SDI formulation in a number of different Member States. Germany and Austria have recently published finalised SDI sets and France, Greece, Ireland, Italy and Spain are all scheduled to publish finalised sets in the near future. Several of these have already published draft SDI sets as part of ongoing consultation exercises.
• Greece is the only Member State which has failed to undertake co-ordinated activities towards the formulation of SDIs.
EU Member State Experiences with Sustainable Development Indicators
76
• It is therefore possible to conclude that whilst certain Member States are still more advanced than others in the formulation and use of SDIs, there has been a process of convergence across the EU-15, excluding Greece.
6.3 Approaches Used
• In most Member States, the development of SDI sets is expressly linked to the drafting of National SD Strategies and the formulation of SDI sets is frequently intended to facilitate measurement of the degree to which the strategies’ aims and objectives are being realised. The principal exceptions here are Portugal and Sweden which both developed a SDI set prior to their SD strategy.
• The priorities and areas of emphasis in the SD Strategies are therefore major influences on the types of SDIs selected.
• The DPSIR-approach is widely used, implicitly or explicitly, across all Member States when formulating specific SDI sets. A possible reason for this is the lack of internationally-accepted alternative methodologies for indicator development.
• Several Member States (e.g. Belgium, France, Germany and Luxembourg) have first elaborated a very large SDI set (often including several hundred SDIs) and have then reduced the number of SDIs on the grounds of both relevance to the national situation and data availability.
• Several Member States (e.g. Austria, Denmark, France, Germany, Italy, Spain and the UK) have avoided a model of SD based on the three pillar (Environment-Economy-Society) approach but rather have characterised SD in a more integrated and holistic fashion, often based on those SD themes which have been identified as being nationally important.
• There are several trade-offs involved with SDI formulation and use:
- Whether the SDI set is policy-driven (i.e. closely mirroring SD policy) or statistics-driven (i.e. designed to ensure the highest availability and quality of data)? The overall tendency across Member States in this regard appears to be for a policy-driven focus, but one which does not completely overlook practical issues of data availability.
- Whether the SDI set used within a Member State is stable or dynamic? On the one hand, SD is a dynamic concept, reflecting changing circumstances, pressures and opportunities. As things change, then so must SD policy and the related SDI sets. On the other hand however, the only way to accurately measure progress towards SD is to have a fairly stable set of SDIs which can be measured against a baseline. In this regard, most Member States appear to be willing to make changes to their SDI sets, whilst maintaining a solid core of SDIs existing over an extended time horizon.
EU Member State Experiences with Sustainable Development Indicators
77
• Denmark, Germany, Sweden and the UK have all produced ‘headline’ sets of around 15-20 SDIs for ease of accessibility to decision-makers and the general public in interpretation. Websites are the usual means of dissemination for these headline sets.
• Three Member States (Belgium, Germany and the United Kingdom) are formulating regional-level SDI sets in addition to their national-level sets. In Belgium, the three regions of Brussels, Flanders and Wallonia have SDI sets and in Germany, sets of regional SDIs are under development at the level of the Länder (Federal States). Major efforts are currently underway in the UK aimed at the formulation of regional-level SDI sets (including sets for Scotland, Wales and Northern Ireland). No other examples of significant regional- or local-level SDI formulation are available across the EU-15.
6.4 Interpretation of Sustainable Development
• Most Member States have adopted a broad interpretation of SD, encompassing economic and social themes in addition to environmental ones. The only possible exceptions in this regard are Denmark, Italy and Portugal which both only have a limited selection of non-environmental indicators.
• There is some evidence to suggest that those Member States adopting a more holistic interpretation of SD (see Section 6.3 above) have a greater acknowledgement of inter-dimensionality within both their SD Strategy and also their SDI sets. However, several of the Member States which have adopted the ‘three-pillar’ approach have also made explicit efforts to allow for an inter-dimensional element within their SDI structure.
• Although all Member States have strong ‘inward looking’ SD strategies and SDI sets, entwined in their respective socio-cultural environments, most also have an international outlook. This is evidenced by a commitment to both adhere to international environment agreements (such as the Kyoto Protocol) and to support international development assistance.
• Several Member States (e.g. Ireland, the Netherlands and the UK) have attempted to achieve greater SD within both sectoral Government policies and the actual institutional working of Government itself. This has also had (or will have) implications in terms of SDI formulation and application.
6.5 Consultation/Awareness-Raising Efforts
• Efforts to involve wider stakeholders in the formulation of SDIs are strong in most Member States. There are also a number of examples of attempts to involve the general public within SDI formulation.
• Many Member States have organised formalised ‘working groups’ which have brought together various different stakeholders from Government Ministries and wider society (e.g. NGOs, the social partners, the private sector, academia and regional and local-level administrations).
EU Member State Experiences with Sustainable Development Indicators
78
• Many Member States have organised fixed-length public consultation periods where a wide range of interested stakeholders or the general public have been able to comment on draft SD Strategies and/or SDI sets. These consultation periods have on the whole been judged as having been highly successful. Not only have they often raised the profile of SD/SDI activities, but the range of valuable comments received have often led to substantially improved outputs.
• Several Member States (e.g. Austria and Germany) have successfully designed and used innovative Web-discussion portals which allow, in particular the wider public and academia, to easily access SDI-related resources and also to make their own input into the debate. Other Member States (e.g. the Netherlands) are currently planning such a discussion platform.
• Germany is leading efforts to present SDI-based assessments to the general public in a clear, interesting and informative format. This is taking place through its high profile German Environment Barometer and the related DUX (German Environment Index) which have both received monthly coverage on German national television and discussion within the print media. SDIs have also enjoyed good media coverage in the UK over the last twelve months.
EU Member State Experiences with Sustainable Development Indicators
79
7.0 BIBLIOGRAPHY
General:
Council of the European Union (2001) Strategy for Sustainable Development (follow-up of the environment-related aspects of Gothenburg), Brussels.
Commission of the European Communities (2001) A Sustainable Europe for a Better World: A European Strategy for Sustainable Development: COM (2001)264 Final, Brussels.
European Commission DG Regional Policy and Cohesion (1999) Environment and Development: A Guide for the Ex-ante Evaluations of the Environmental Impacts of Regional Development Programmes, Brussels.
European Environment Agency (2001) The European Environment Agency Focuses on EU-Policy in its Approach to Sustainable Development Indicators, Copenhagen.
EUROSTAT (2001) Measuring Progress Towards a more Sustainable Europe: Proposed Indicators for Sustainable Development, Luxembourg.
EUROSTAT (2001) Key Indicators for Sustainable Development: 42nd Meeting of the Statistical Programme Committee, Luxembourg.
EUROSTAT & EFTA (1999) Pragmatic Approaches on how to Link Pressure and Response Indicators: Meeting of the Working Group - Statistics of the Environment, Luxembourg.
Meadows, D (1998) Indicators and Information Systems for Sustainable Development: A Report to the Balaton Group, The Sustainability Institute.
UNCED (1993) Agenda 21: Programme of Action for Sustainable Development, UN, New York.
UNCSD (2001) Indicators of Sustainable Development: Guidelines and Methodologies, UN, New York.
UNEP (2001) The System of 130 Indicators for the Sustainable Development in the Mediterranean Region: Record of the Workshop in Sophia Antipolis 11-12 December 2000, Sophia Antipolis.
WCED (1987) Our Common Future, Oxford University Press, Oxford.
Austria:
Bundesministerium für Land- und Forstwirtschaft, Umwelt und Wasserwirtschaft (April 2002) Österreichs Zukunft Nachhaltig Gestalten – Die Österreichische Strategie zur Nachhaltigen Entwicklung, Vienna.
EU Member State Experiences with Sustainable Development Indicators
80
Bundesministerium für Land- und Forstwirtschaft, Umwelt und Wasserwirtschaft (2001) Österreichs Zukunft Nachhaltig Gestalten – Grünbuch für eine österreichische Strategie zur Nachhaltigen Entwicklung, Vienna.
Bundesministerium für Umwelt, Jugend und Familie (1999) Umweltindikatoren für Österreich. Regionale und nationale Maßzahlen zur Dokumentation der Umweltsituation auf dem Weg zu einer nachhaltigen Entwicklung. Conference Papers of the Workshop held on 16-17. November 1998 at Schloß Wilhelminenberg, Vienna.
Fiala, I (2001) Eco-Efficiency Indicators as a Step to Indicators of Sustainable Development?, Vienna.
Belgium:
Conseil Fédéral du Développement Durable (16th April 2002) Avis sur les indicateurs de développement durable, Brussels.
Federal Planning Bureau, Belgium (1999) Federal Report on Sustainable Development, Brussels.
Federal Government of Belgium (2000) Federal Plan for Sustainable Development: 2000-2004, Brussels.
Gouzée N, Zuinen N & Willems S (1999) Développement durable: un projet à l’échelle mondiale, Brussels
Regional Government of Wallonia (2000) The State of the Environment- Wallonia, Namur.
Task Force Développement Durable (1999) Sur la voie d’un développement durable?: Rapport fédéral sur le Développement durable, Brussels.
Denmark:
The Danish Government (August 2002) Indicator Report – A Shared Future – Balanced Development, Denmark’s National Strategy for Sustainable Development, Copenhagen.
The Danish Government (June 2002) A Shared Future – Balanced Development, Denmark’s National Strategy for Sustainable Development, Copenhagen.
The Danish Government (2001) Prudent Development- A Shared Responsibility, A Danish National Strategy for Sustainable Development, Copenhagen.
The Danish Government (2001) Set of Indicators for Denmark’s Strategy for Sustainable Development - A Discussion Paper, Copenhagen.
Ministry of Environment and Energy (1999) The Environment in Denmark 1999 - Selected Indicators, Copenhagen.
EU Member State Experiences with Sustainable Development Indicators
81
Ministry of Environment and Energy (1998) The Environment in Denmark - Selected Indicators, Copenhagen.
Finland:
Finnish Environment Institute (2000) Signs of Stability: Finland’s Indicators for Sustainable Development 2000, Helsinki.
Government of Finland (No Date) Council of State Decision in Principle on the Promotion of Ecological Sustainability, Helsinki.
Ministry of Environment (2000) Finland: Country Experience Report on The Promotion of Sustainable Development and on the Councils For Sustainable Development, Helsinki.
France:
Institute Français de L’Environment (2001) Etudes et Travaux no 35: Proposition d'Indicateurs de Developpement Durable pour la France, Orléans.
Institute Français de L’Environment (1998) Testing United Nations Indicators of Sustainable Development - Report produced by France, Orléans
Ministère de L’Aménagement Du Territoire et de L’Environnement (1999) Rapport D’Activité, Paris.
Germany:
Bundesministerium für Umwelt, Naturschutz und Reaktorsicherheit (2002) Perspektiven für Deutschland: Unsere Strategie für eine nachhaltige Entwicklung, Berlin.
Umwelt Bundesamt (1997) Sustainable Germany - Towards an Environmentally Sound Development, Berlin.
Greece:
Ministry for the Environment, Physical Planning and Public Works (2002) National Strategy for Sustainable Development: Greece, Athens.
Ireland:
Environmental Protection Agency (1999) Environment in Focus - A Discussion Document on Key National Environmental Indicators, Dublin.
Ministry of the Environment (1999) Ireland’s Environment: State of the Environment Report, Dublin.
Ministry of the Environment (1997) Sustainable Development - A Strategy for Ireland, Dublin.
EU Member State Experiences with Sustainable Development Indicators
82
Weyman, G (2000) Indicators for Sustainable Development, Dublin Institute of Technology, Dublin.
Italy:
Barney G.O, Bogdonoff P & Qu W (1998) Sustainable Development for Italy, Part I: An Integrated Model-Based Report, Millennium Institute Professional Paper #17, Millennium Institute, Arlington.
Ministero Dell’Ambiente (No Date) Strategia D’Azione Ambientale Per Lo Sviluppo Sostenibile in Italia, Rome.
Luxembourg:
Ministère de l’Environment (2002) Indicateurs de Développement Durable pour le Luxembourg, Luxembourg.
Ministère de l’Environment (1999) Plan National Pour Un Developpement Durable, Luxembourg.
The Netherlands:
VROM (1989) National Environmental Policy Programme, Tweede Kamer.
VROM (1991) Environmental Programme 1992 –1995, Tweede Kamer.
VROM (1993) Environmental Programme 1994 – 1997, Tweede Kamer.
VROM (1996) Environmental Programme 1997- 2000, Tweede Kamer.
VROM (2000) Where There’s a Will There’s a World - Working on Sustainability; Draft 4th National Environmental Policy Plan, Summary, Amsterdam.
National Institute of Public Health and the Environment (2000) Environmental Balance 2000, A Review of the State of the Environment in the Netherlands, Amsterdam.
Portugal:
Direcção Geral do Ambiente (2000) Proposta para um Sistema de Indicadores de Desenvolvimento Sustentável, Amadora.
Direcção Geral do Ambiente (June 2000) Guia de Acompanhamento e Avaliação Ambiental para o QCA III, Lisbon.
Spain:
Ministry of Environment (No date) Estrategia Española de Desarrollo Sostenible, Madrid.
EU Member State Experiences with Sustainable Development Indicators
83
Sweden:
Committee on Environmental Objectives (2000) The Future Environment - Our Common Responsibility, Stockholm.
Government of Sweden (2002) Sweden’s National Strategy for Sustainable Development 2002, Stockholm.
Government of Sweden (1997) Ecological Sustainability; Government Communication 1999/98:13, Sundsvall.
Ministry of the Environment (2001) Towards a Swedish National Strategy for Sustainable Development Fact Sheet, Stockholm
Ministry of the Environment (2000) De Facto: Environmental Objectives - Our Generation’s Responsibility, Stockholm.
Ministry of the Environment (1988) Key Indicators for Ecologically Sustainable Development - A Proposal from the Swedish Environmental Advisory Council, Stockholm
Statistics Sweden & the Swedish Environmental Protection Agency (2001) Sustainable Development Indicators for Sweden; A First Set 2001, Stockholm.
Swedish Environmental Advisory Council (1999) Green Headline Indicators - Monitoring Progress Towards Ecological Sustainability, Stockholm
United Kingdom:
Custance, J (2001) The Development of National, Regional and Local Indicators of Sustainable Development in the UK, DEFRA, London.
Department of Environment, Food and Rural Affairs (June 2002) Foundations for Our Future - DEFRA's Sustainable Development Strategy, DEFRA, London.
Department of Environment, Food and Rural Affairs (March 2002) Achieving a Better Quality of Life - Review of Progress towards Sustainable Development, Government Annual Report 2001, DEFRA Publications, London.
Department of Environment, Transport and the Regions (2002) Achieving a Better Quality of Life - Review of Progress towards Sustainable Development Government Annual Report 2001, DETR Free Literature, London.
Department of Environment, Transport and the Regions (2000) Quality of Life Counts: Indicators for a Strategy for Sustainable Development for the UK: A Baseline Assessment, HMSO, London.
Department of Environment, Transport and the Regions (2000) Regional Quality of Life Counts, HMSO, London.
EU Member State Experiences with Sustainable Development Indicators
84
Department of Environment, Transport and the Regions (2000) Local Quality of Life Counts, HMSO, London.
Department of Environment, Transport and the Regions (1999) A Better Quality of Life: A Strategy for Sustainable Development for the UK: A Baseline Assessment, HMSO, London.
Department of the Environment (March 1996) Indicators of Sustainable Development for the United Kingdom, HMSO, London.
Department of Trade and Industry (October 2000) DTI Sustainable Development Strategy: A Strategy for Simultaneously Securing Economic Growth and Environmental Protection, HMSO, London.
Scottish Executive Environment Group (April 2002) Meeting the Needs … Priorities, Actions and Targets for Sustainable Development in Scotland, Paper 2002/14, Scottish Executive, Edinburgh.
Scottish Executive (May 2001) Checking for Change - Report of the Consultation. An Analysis of Responses to a Consultation on Sustainable Development Indicators for Scotland, Scottish Executive, Edinburgh.
Welsh Assembly (March 2002) Sustainable Development Indicators for Wales 2002, Statistical Bulletin SB 36/2002, Welsh Assembly Government, Cardiff.
Welsh Assembly (March 2001) A Sustainable Wales – Measuring the Difference, Cardiff.
Welsh Assembly (November 2000) A Sustainable Wales – Learning to Live Differently, Statutory Document, Cardiff.
Welsh Assembly (January 2000) A Sustainable Wales – Learning to Live Differently, Consultation Document, Cardiff.
Department of the Environment of the Northern Ireland Assembly (May 2002) Promoting Sustainable Living – A Discussion Paper on Proposals for a Sustainable Development Strategy for Northern Ireland, Northern Ireland Assembly, Belfast.
EU Member State Experiences with Sustainable Development Indicators
85
8.0 SUSTAINABLE DEVELOPMENT WEBSITES
General: http://europa.eu.int/comm/eurostat Eurostat http://www.eea.eu.int European Environment Agency http://eionet.eea.eu.int European Environment Information and Observation Network http://iisd1.iisd.ca/measure/default.htm International Institute for Sustainable Development/ http://www.un.org/esa/sustdev/isd.htm United Nations Commission on Sustainable Development http://www.johannesburgsummit.org Johannesburg World Summit on SD http://europa.eu.int/comm/environment/eussd/index.htm
European Commission SD Strategy Site
www.oecd.org Organisation for Economic Co-operation and Development
Austria: www.nachhaltigkeit.at Austrian Government SD Portal http://www.oestat.gv.at Austrian Statistical Central Office http://www.lebensministerium.at Federal Ministry of Agriculture, Forestry, Environment and
Water Management
Belgium: http://www.belspo.be/frdocfdd Federal Council for Sustainable Development http://www.belspo.be/platformisd Belgian Inter-institutional ‘Platform’ on Indicators of
Sustainable Development
http://www.statbel.fgov.be Statistics Belgium http://www.plan.be Federal Planning Bureau http://www.minsoc.fgov.be Federal Ministry of Social Affairs, Public Health and
Environment
http://www.environment.fgov.be Federal Department of the Environment http://www.lin.vlaanderen.be Flemish Department of the Environment and Infrastructure http://www.vmm.be Flemish Environment Agency http://environnement.wallonie.be/cgi/dgrne/ plateforme_dgrne/visiteur/frames.cfm
Wallonian General Directorate of Natural Resources and Environment
http://www.ibgebim.be Brussels Institute for Environmental Management http://www.cidd.be Interdepartmental Commission for SD
Denmark: http://www.mim.dk/index.htm Ministry of the Environment http://www.mst.dk Environmental Protection Agency http://www.dst.dk/dst/dstframeset_800.asp Statistics Denmark
EU Member State Experiences with Sustainable Development Indicators
86
Finland: http://www.vyh.fi/eng/environ/sustdev/tmkeng.htm
Finnish National Commission on Sustainable Development
http://www.vyh.fi/eng/moe/moe.html Ministry of the Environment http://www.vyh.fi/eng/fei/fei.html Finnish Environment Institute http://www.tilastokeskus.fi Centre for Statistics
France: http://www.ifen.fr French Environment Institute http://www.environnement.gouv.fr French Environment Ministry http://www.insee.fr/fr/home/home_page.asp National Institute of Statistics and Economic Studies
Germany: www.bmu.de Federal Ministry of the Environment, Nature Protection and
Nuclear Safety
http://www.umweltbundesamt.de Federal Environment Agency http://www.dialog-nachhaltigkeit.de German National SD Discussion Portal http://www.nachhaltigkeitsrat.de German SD Council http://www.destatis.de Federal Statistical Office
Greece: http://www.minenv.gr Hellenic Ministry for the Environment, Physical Planning
and Public Works http://www.statistics.gr/ie.htm National Statistical Service http://www.ntua.gr National Technical University of Athens
Ireland: http://www.environ.ie Department of the Environment and Local Government http://www.comhar-nsdp.ie Comhar, The National Sustainable Development Partnership http://www.cso.ie Central Statistics Office
Italy: http://www.minambiente.it/Sito/home.asp Ministry of the Environment http://www.istat.it National Institute of Statistics
Luxembourg: http://www.mev.etat.lu Ministry of the Environment http://www.statec.lu Central Service of Statistics and Economic Studies
EU Member State Experiences with Sustainable Development Indicators
87
The Netherlands: http://www.rivm.nl National Institute of Public Health and the Environment http://www.minvrom.nl Ministry of Housing, Spatial Planning and the Environment http://www.cbs.nl Central Office of Statistics
Portugal: http://www.ambiente.gov.pt Ministry of the Environment http://www.dga.min-amb.pt/pls/ia/homepage Directorate General for the Environment http://www.iambiente.pt/pls/ia/homepage Institute of the Environment http://www.ine.pt/index.htm National Statistics Institute
Spain: http://www.mma.es Ministry of the Environment http://www.ine.es National Statistics Institute
Sweden: http://miljo.regeringen.se Ministry of the Environment http://www.scb.se Statistics Sweden
United Kingdom: http://www.sustainable-development.gov.uk UK Government SD Portal http://www.defra.gov.uk Department of the Environment, Food and Rural Affairs http://www.sd-commission.gov.uk Sustainable Development Commission http://www.sustainable.scotland.gov.uk Scottish Government SD Portal http://www.wales.gov.uk/themessustainabledev/index.htm
National Assembly for Wales SD Site
http://www.statistics.gov.uk UK Government National Statistics Website
EU Member State Experiences with Sustainable Development Indicators
88
9.0 TABLE OF ACRONYMS
ALARA As Low as Reasonably Achievable
ANPA Agenzia Nazionale per la Protezione dell'Ambiente (Italian National Environmental Protection Agency)
BMU Bundesministerium für Umwelt (German Federal Environment Ministry)
CFDD Conseil Fédéral du Développement Durable (Belgian Federal Council for Sustainable Development)
CIDD Interdepartmental Committee for Sustainable Development
CIPE Comitato Interministeriale per la Programmazione Economica (Italian Interministerial Committee for Economic Planning)
CNADS Conselho Nacional do Ambiente e do Desenvolvimento Sustentável (Portuguese National Council for the Environment and Sustainable Development)
CSF Community Support Framework- The National Development Plan for Ireland 1994-1999
DPSIR Driving forces, Pressures, States, Impacts, Responses
DAX Deutscher Aktien Index (German Stock Exchange Index)
DISS Dipartimento delle Statistiche Sociali (ISTAT’s Department of Social Statistics)
DUX Deutscher Umwelt Index (German Environment Index)
EEA European Environment Agency
EC European Community
EFTA European Free Trade Area
ENDS Estratégia National de Desenvolvimento Sustentável (Portuguese National Sustainable Development Strategy)
ENEA Ente per le Nuove Tecnologie, L'Energia e l'Ambiente (Italian Body for New Technology, Energy and the Environment)
EPA Environmental Protection Agency
ESRI Economic and Social Research Institute
EU European Union
FEI Finnish Environment Institute
FRED Functional Regional Database
GDP Gross Domestic Product
IFEN Institut francais de l'environnement (French Environment Institute)
IMA Interministerielle Arbeitskreis (German Inter-ministry Working Group)
ISTAT Instituto Nazionale di Statistica (Italian National Statistics Institute)
EU Member State Experiences with Sustainable Development Indicators
89
JRC Joint Research Centre
MoE Ministry of the Environment
MS Member State
NEPP (Dutch) National Environment Policy Plan
NGO Non-Governmental Organisation
NSDO Nationale Strategie voor Duurzame Ontwikkeling (Dutch National Strategy for SD)
NUTS Nomenclature des Unités Territoriales Statistiques (EU Regions Nomenclature of Territorial Units for Statistics)
OECD Organisation for Economic Co-operation and Development
PSR Pressure State Response
R&D Research and Development
RIVM Rijksinstituut voor Volksgezondheid en Milieu (Dutch National Institute for Public Health and the Environment)
SCOPE Scientific Committee on Problems of the Environment
SD Sustainable Development
SDI Sustainable Development Indicator
SSTC Services fédéraux des affaires scientifiques, techniques et culturelles (Belgian Federal Service for Scientific, Technical and Cultural Affairs)
STATEC Service Central de la Statistique et des Études Économiques (Luxembourg’s Central Service of Statistics and Economic Studies)
TF Task Force
UBA Umwelt Bundesamt (German Federal Environment Agency)
UK United Kingdom
UN United Nations
UNCED United Nations Conference on Environment and Development
UNEP United Nations Environment Programme
UNCSD United Nations Commission on Sustainable Development
VRIND Vlaamse Regionale Indicatoren (Flemish Regional Indicators)
VROM Ministerie van Volkshuisvesting, Ruimtelijke Ordening en Milieubeheer (Dutch Ministry of Housing, Spatial Planning and the Environment)
WCED World Commission on Environment and Development
WSSD World Summit on Sustainable Development
WWF World Wildlife Fund For Nature
ZDF Zweite Deutsche Fernsehen (National German Television Channel)
EU Member State Experiences with Sustainable Development Indicators
91
ANNEX I: HEADLINE SDI SETS
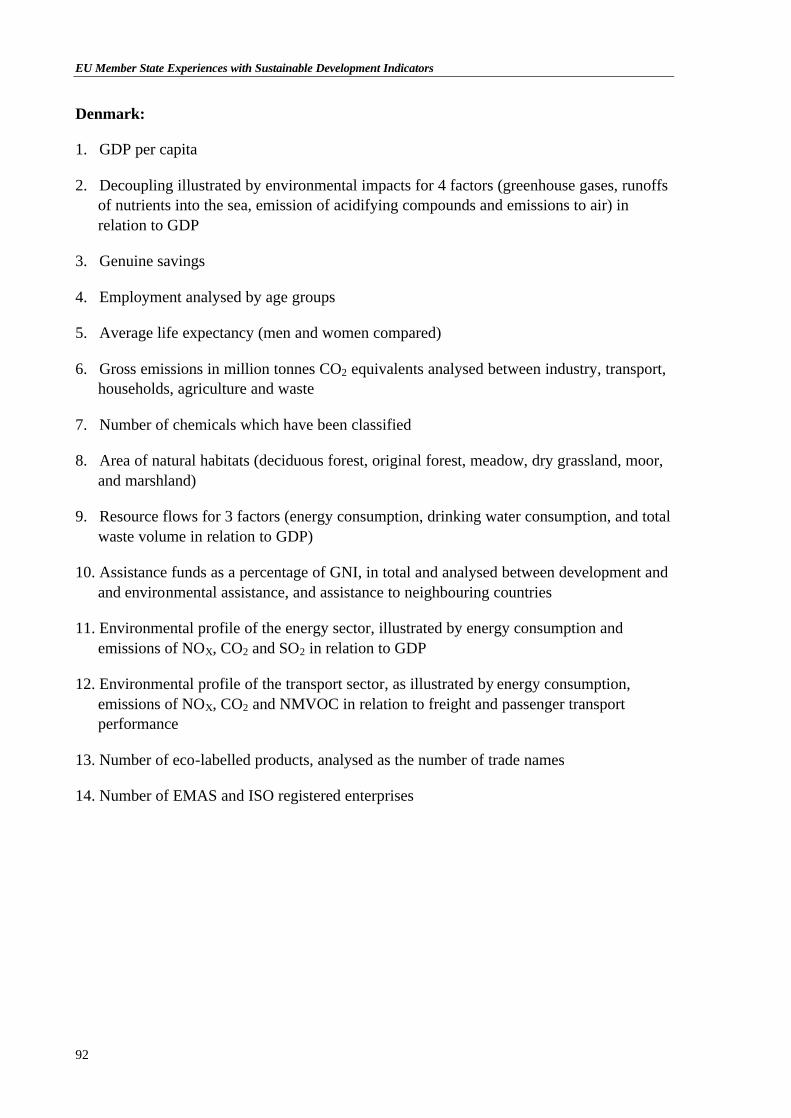
EU Member State Experiences with Sustainable Development Indicators
92
Denmark:
1. GDP per capita
2. Decoupling illustrated by environmental impacts for 4 factors (greenhouse gases, runoffs of nutrients into the sea, emission of acidifying compounds and emissions to air) in relation to GDP
3. Genuine savings
4. Employment analysed by age groups
5. Average life expectancy (men and women compared)
6. Gross emissions in million tonnes CO2 equivalents analysed between industry, transport, households, agriculture and waste
7. Number of chemicals which have been classified
8. Area of natural habitats (deciduous forest, original forest, meadow, dry grassland, moor, and marshland)
9. Resource flows for 3 factors (energy consumption, drinking water consumption, and total waste volume in relation to GDP)
10. Assistance funds as a percentage of GNI, in total and analysed between development and and environmental assistance, and assistance to neighbouring countries
11. Environmental profile of the energy sector, illustrated by energy consumption and emissions of NOX, CO2 and SO2 in relation to GDP
12. Environmental profile of the transport sector, as illustrated by energy consumption, emissions of NOX, CO2 and NMVOC in relation to freight and passenger transport performance
13. Number of eco-labelled products, analysed as the number of trade names
14. Number of EMAS and ISO registered enterprises
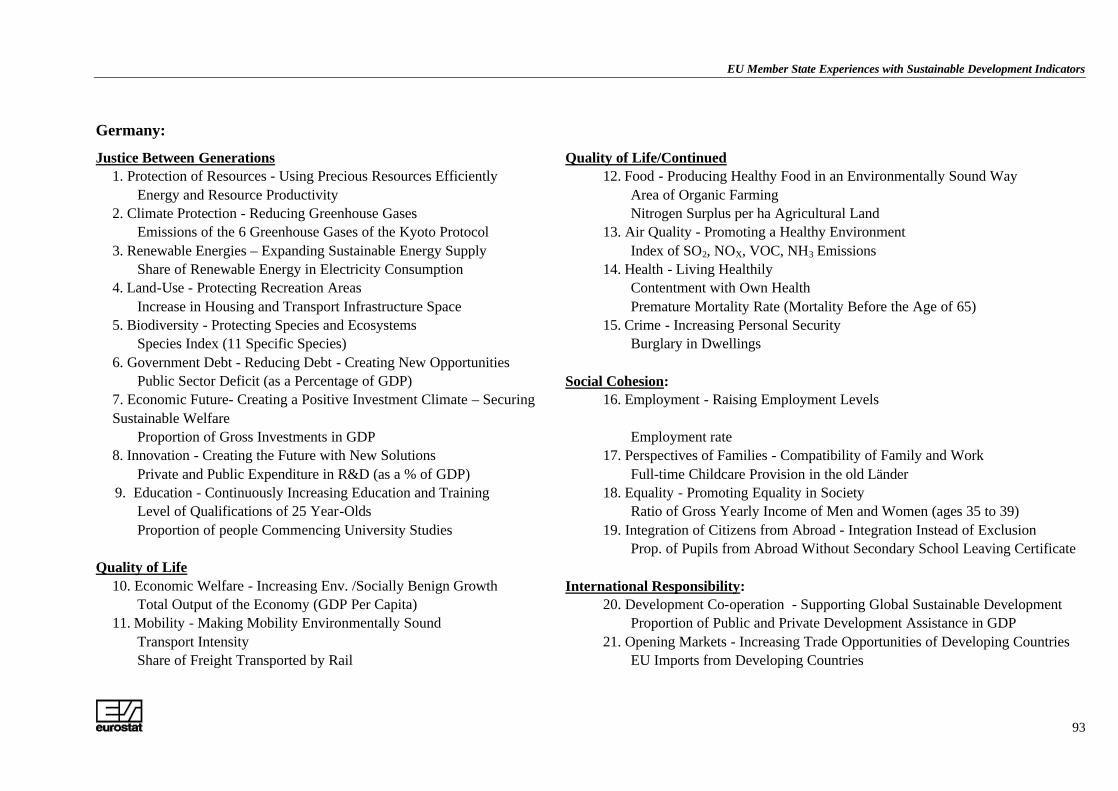
EU Member State Experiences with Sustainable Development Indicators
93
Germany:
Justice Between Generations Quality of Life/Continued 1. Protection of Resources - Using Precious Resources Efficiently 12. Food - Producing Healthy Food in an Environmentally Sound Way Energy and Resource Productivity Area of Organic Farming 2. Climate Protection - Reducing Greenhouse Gases Nitrogen Surplus per ha Agricultural Land Emissions of the 6 Greenhouse Gases of the Kyoto Protocol 13. Air Quality - Promoting a Healthy Environment 3. Renewable Energies – Expanding Sustainable Energy Supply Index of SO2, NOX, VOC, NH3 Emissions Share of Renewable Energy in Electricity Consumption 14. Health - Living Healthily 4. Land-Use - Protecting Recreation Areas Contentment with Own Health Increase in Housing and Transport Infrastructure Space Premature Mortality Rate (Mortality Before the Age of 65) 5. Biodiversity - Protecting Species and Ecosystems 15. Crime - Increasing Personal Security Species Index (11 Specific Species) Burglary in Dwellings 6. Government Debt - Reducing Debt - Creating New Opportunities Public Sector Deficit (as a Percentage of GDP) Social Cohesion: 7. Economic Future- Creating a Positive Investment Climate – Securing
Sustainable Welfare 16. Employment - Raising Employment Levels
Proportion of Gross Investments in GDP Employment rate 8. Innovation - Creating the Future with New Solutions 17. Perspectives of Families - Compatibility of Family and Work Private and Public Expenditure in R&D (as a % of GDP) Full-time Childcare Provision in the old Länder 9. Education - Continuously Increasing Education and Training 18. Equality - Promoting Equality in Society Level of Qualifications of 25 Year-Olds Ratio of Gross Yearly Income of Men and Women (ages 35 to 39) Proportion of people Commencing University Studies 19. Integration of Citizens from Abroad - Integration Instead of Exclusion Prop. of Pupils from Abroad Without Secondary School Leaving Certificate Quality of Life 10. Economic Welfare - Increasing Env. /Socially Benign Growth International Responsibility: Total Output of the Economy (GDP Per Capita) 20. Development Co-operation - Supporting Global Sustainable Development 11. Mobility - Making Mobility Environmentally Sound Proportion of Public and Private Development Assistance in GDP Transport Intensity 21. Opening Markets - Increasing Trade Opportunities of Developing Countries Share of Freight Transported by Rail
EU Imports from Developing Countries
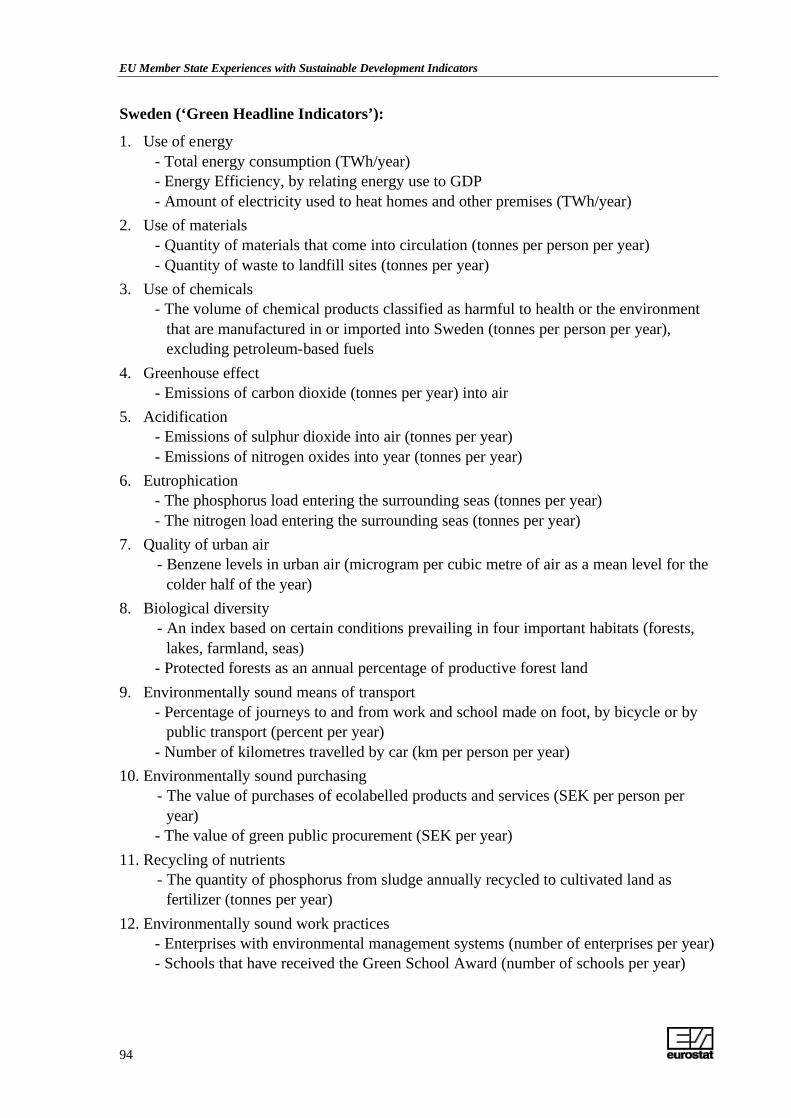
EU Member State Experiences with Sustainable Development Indicators
94
Sweden (‘Green Headline Indicators’):
1. Use of energy - Total energy consumption (TWh/year) - Energy Efficiency, by relating energy use to GDP - Amount of electricity used to heat homes and other premises (TWh/year) 2. Use of materials - Quantity of materials that come into circulation (tonnes per person per year) - Quantity of waste to landfill sites (tonnes per year) 3. Use of chemicals - The volume of chemical products classified as harmful to health or the environment
that are manufactured in or imported into Sweden (tonnes per person per year), excluding petroleum-based fuels
4. Greenhouse effect - Emissions of carbon dioxide (tonnes per year) into air 5. Acidification - Emissions of sulphur dioxide into air (tonnes per year) - Emissions of nitrogen oxides into year (tonnes per year) 6. Eutrophication - The phosphorus load entering the surrounding seas (tonnes per year) - The nitrogen load entering the surrounding seas (tonnes per year) 7. Quality of urban air - Benzene levels in urban air (microgram per cubic metre of air as a mean level for the
colder half of the year) 8. Biological diversity - An index based on certain conditions prevailing in four important habitats (forests,
lakes, farmland, seas) - Protected forests as an annual percentage of productive forest land 9. Environmentally sound means of transport - Percentage of journeys to and from work and school made on foot, by bicycle or by
public transport (percent per year) - Number of kilometres travelled by car (km per person per year) 10. Environmentally sound purchasing - The value of purchases of ecolabelled products and services (SEK per person per
year) - The value of green public procurement (SEK per year) 11. Recycling of nutrients - The quantity of phosphorus from sludge annually recycled to cultivated land as
fertilizer (tonnes per year) 12. Environmentally sound work practices - Enterprises with environmental management systems (number of enterprises per year) - Schools that have received the Green School Award (number of schools per year)
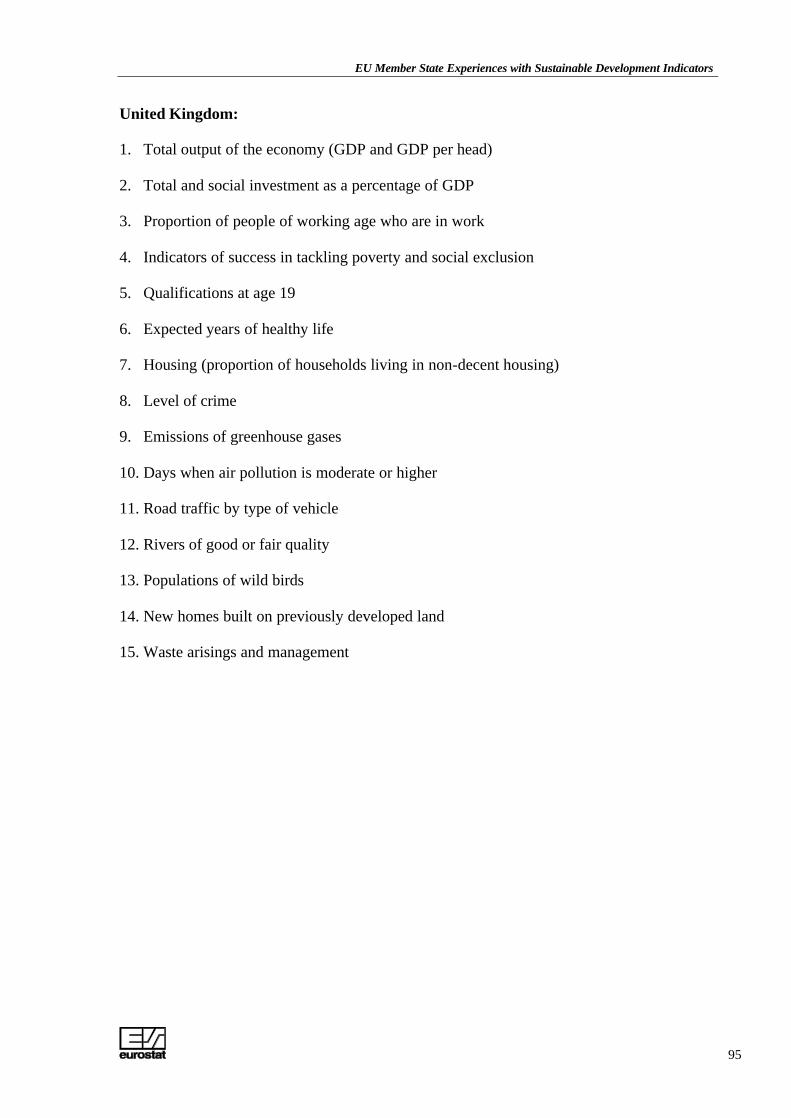
EU Member State Experiences with Sustainable Development Indicators
95
United Kingdom:
1. Total output of the economy (GDP and GDP per head)
2. Total and social investment as a percentage of GDP
3. Proportion of people of working age who are in work
4. Indicators of success in tackling poverty and social exclusion
5. Qualifications at age 19
6. Expected years of healthy life
7. Housing (proportion of households living in non-decent housing)
8. Level of crime
9. Emissions of greenhouse gases
10. Days when air pollution is moderate or higher
11. Road traffic by type of vehicle
12. Rivers of good or fair quality
13. Populations of wild birds
14. New homes built on previously developed land
15. Waste arisings and management
Related Documents


