International Journal of Teaching and Learning in Higher Education 2018, Volume 30, Number 3, 506-521 http://www.isetl.org/ijtlhe/ ISSN 1812-9129 Experiences of the Teaching-Learning Environment and Approaches to Learning: Testing the Structure of the “Experiences of Teaching and Learning” Inventory in Relation to Earlier Analyses Evangelia Karagiannopoulou and Fotios Milienos University of Ioannina This study examines the structure of the inventory, the second part of the Experiences of Teaching and Learning Questionnaire (ETLQ). Three hundred and sixty-four students participated in the study. To strengthen the validation of the ETL, the short version of Approaches to Learning included in the ETLQ was substituted by its widely-used, full-version Approaches and Study Skills Inventory for Students (ASSIST). Exploratory and confirmatory factor analyses tested the factor structure of the inventory. Twenty questions covered four factors: “Congruence and coherence in course organization,” “Teaching for understanding and encouraging learning,” “Support from other students,” and “Integrative learning and critical thinking”. Appropriate associations between these factors and (a) the subscales comprising the deep, surface, and strategic scales (b) acquired knowledge, generic skills, and (c) self-evaluation supported the validation of the instruments. The factors seem highly similar to those reported in previous studies and Cronbach coefficients were appropriate. The study suggests the ETL as a valuable instrument to be used across cultures and different contexts. Introduction During the last three decades the educational literature has focused on the effect of the academic environment on how students learn and, recently, on the importance of powerful teaching-learning environments that can be expected to cultivate and reward students’ understanding (McCune & Entwistle, 2011). These studies belong in the tradition of the development of student-centered environments that enhance students’ learning (Biggs & Tang, 2011). Most of the studies carried out in the research tradition of student learning have used self-report instruments which emerged from research that has been carried out by research centers in higher education in various countries (e.g. in the UK, Belgium and Finland). These research groups were aiming at finding ways of improving the quality of learning in higher education and also of making links with academic achievement. Students’ approaches to learning appear at the heart of all these studies and are being seen as an important construct in considering effective teaching and course design (Diseth, 2007; Gijbels, Segers, & Struyf, 2008). Approaches consist of a complex entity involving both the ways of studying generally adopted by students and their experiences of the academic environment. Among the most widely used research instruments to evaluate the learning context and approaches to learning are those developed by the Edinburgh group (e.g., Entwistle, 2009; Entwistle & Ramsden, 1983; the ETL project, see http://www.etl.tla.ed.ac.uk). The present study provides indications of the use of the “Experiences of Teaching and Learning” (the second part of the Experience of Teaching and Learning Questionnaire, ETLQ) as a valid instrument that explores students’ experiences of the environment, associations among the dimensions of the learning environment, and approaches to learning, acquired knowledge, generic skills, and self-evaluation, and thus supports the validity of the “Experiences of Teaching and Learning Inventory” (ETL) inventory. Perceptions of the Learning Environment and Approaches The educational literature discusses three major approaches: deep, surface, and strategic (Entwistle, McCune, & Walker, 2001). These concern either the development of personal meaning (deep approach), the routine memorization and unreflective study strategies to cope with exam demands (surface approach), or the use of strategies to achieve high grades (strategic approach). The central idea was the distinction between deep and surface approaches to learning (Marton & Säljö, 1976), which differentiated the student’s intentions (to understand for oneself or to reproduce material for the teacher or examiner) and the learning processes used to fulfill those intentions (Marton, 1975; Marton, Hounsell, & Entwistle, 1984). Intention (a concept equivalent to motivation) is expressed in one of the subscales for each approach; the remaining subscales depict the relevant processes. In particular, seeking meaning, achieving, and fearing failure correspond to deep, strategic, and surface approaches respectively. A range of studies has shown that students’ experiences of the academic context have a crucial influence on approaches to learning. A positive perception seems to be positively related to a deep approach and negatively related to a surface approach to learning (Baeten, Kyndt, Struyven, & Dochy, 2010;

Welcome message from author
This document is posted to help you gain knowledge. Please leave a comment to let me know what you think about it! Share it to your friends and learn new things together.
Transcript
International Journal of Teaching and Learning in Higher Education 2018, Volume 30, Number 3, 506-521 http://www.isetl.org/ijtlhe/ ISSN 1812-9129
Experiences of the Teaching-Learning Environment and Approaches to Learning:
Testing the Structure of the “Experiences of Teaching and Learning” Inventory in
Relation to Earlier Analyses
Evangelia Karagiannopoulou and Fotios Milienos University of Ioannina
This study examines the structure of the inventory, the second part of the Experiences of Teaching
and Learning Questionnaire (ETLQ). Three hundred and sixty-four students participated in the
study. To strengthen the validation of the ETL, the short version of Approaches to Learning included in the ETLQ was substituted by its widely-used, full-version Approaches and Study Skills Inventory
for Students (ASSIST). Exploratory and confirmatory factor analyses tested the factor structure of
the inventory. Twenty questions covered four factors: “Congruence and coherence in course organization,” “Teaching for understanding and encouraging learning,” “Support from other
students,” and “Integrative learning and critical thinking”. Appropriate associations between these
factors and (a) the subscales comprising the deep, surface, and strategic scales (b) acquired
knowledge, generic skills, and (c) self-evaluation supported the validation of the instruments. The
factors seem highly similar to those reported in previous studies and Cronbach coefficients were
appropriate. The study suggests the ETL as a valuable instrument to be used across cultures and different contexts.
Introduction
During the last three decades the educational
literature has focused on the effect of the academic
environment on how students learn and, recently, on the
importance of powerful teaching-learning environments
that can be expected to cultivate and reward students’
understanding (McCune & Entwistle, 2011). These
studies belong in the tradition of the development of
student-centered environments that enhance students’
learning (Biggs & Tang, 2011). Most of the studies
carried out in the research tradition of student learning
have used self-report instruments which emerged from
research that has been carried out by research centers in
higher education in various countries (e.g. in the UK,
Belgium and Finland). These research groups were
aiming at finding ways of improving the quality of
learning in higher education and also of making links
with academic achievement. Students’ approaches to
learning appear at the heart of all these studies and are
being seen as an important construct in considering
effective teaching and course design (Diseth, 2007;
Gijbels, Segers, & Struyf, 2008). Approaches consist of
a complex entity involving both the ways of studying
generally adopted by students and their experiences of
the academic environment. Among the most widely
used research instruments to evaluate the learning
context and approaches to learning are those developed
by the Edinburgh group (e.g., Entwistle, 2009;
Entwistle & Ramsden, 1983; the ETL project, see
http://www.etl.tla.ed.ac.uk). The present study provides
indications of the use of the “Experiences of Teaching
and Learning” (the second part of the Experience of
Teaching and Learning Questionnaire, ETLQ) as a
valid instrument that explores students’ experiences of
the environment, associations among the dimensions of
the learning environment, and approaches to learning,
acquired knowledge, generic skills, and self-evaluation,
and thus supports the validity of the “Experiences of
Teaching and Learning Inventory” (ETL) inventory.
Perceptions of the Learning Environment and
Approaches
The educational literature discusses three major
approaches: deep, surface, and strategic (Entwistle,
McCune, & Walker, 2001). These concern either the
development of personal meaning (deep approach), the
routine memorization and unreflective study strategies to
cope with exam demands (surface approach), or the use
of strategies to achieve high grades (strategic approach).
The central idea was the distinction between deep and
surface approaches to learning (Marton & Säljö, 1976),
which differentiated the student’s intentions (to
understand for oneself or to reproduce material for the
teacher or examiner) and the learning processes used to
fulfill those intentions (Marton, 1975; Marton, Hounsell,
& Entwistle, 1984). Intention (a concept equivalent to
motivation) is expressed in one of the subscales for each
approach; the remaining subscales depict the relevant
processes. In particular, seeking meaning, achieving, and
fearing failure correspond to deep, strategic, and surface
approaches respectively.
A range of studies has shown that students’
experiences of the academic context have a crucial
influence on approaches to learning. A positive
perception seems to be positively related to a deep
approach and negatively related to a surface approach to
learning (Baeten, Kyndt, Struyven, & Dochy, 2010;
Karagiannopoulou and Milienos Experiences of Teaching and Learning Inventory 507
Karagiannopoulou & Milienos, 2013; Karagiannopoulou
& Christodoulides, 2005; Kreber, 2003; Lawless &
Richardson, 2002; Parpala, Lindblom-Ylänne,
Komulainen, Litmanen, & Hirsto, 2010; Richardson,
2005; Richardson & Price, 2003; Sadlo & Richardson,
2003). For example, inappropriate assessment has been
positively correlated with the surface approach (Lizzio,
Wilson, & Simons, 2002; Marton & Säljö, 1997;
Trigwell & Prosser, 1991a). Also, Sadlo and Richardson
(2003) found that clear goals and standards and
appropriate assessment are negatively correlated with
any of the aspects comprising the surface approach.
Lizzio et al. (2002) and Karagiannopoulou and
Christodoulides (2005) found that students’ perceptions
of good teaching influence the deep approach to learning.
However, research has failed to indicate a consistent
relationship between a deep approach and positive
perceptions of the academic context (e.g., good teaching;
see Asikainen & Gijbels, 2017; Entwistle, 2009). Recent
studies have indicated that the perceived quality of
teaching tends to be positively correlated with deep and
strategic approaches and negatively correlated with a
surface approach (Diseth, 2007; Diseth, Pallesen,
Brunborg, & Larsen, 2010). Diseth, Pallesen, Hovland,
and Larsen (2006) presented a model in which “good
teaching” predicted deep, surface (negative relation) and
strategic approaches to learning, whereas “clear goals
and standards” predicted a strategic approach while
“appropriate workload” predicted both deep and surface
approaches. All these elements should be accounted from
the constructive alignment perspective (Biggs, 1996;
Biggs & Tang, 2011), ensuring that teaching, assessment,
and every aspect of the teaching-learning environment
are aligned to constructivist principles of learning (Xu,
2004). From this perspective, the development of a
questionnaire that explores the aspects of the
environment that seems most likely to affect students’
engagement with studying and learning (Entwistle,
McCune, & Hounsell, 2003) appears of crucial
importance for our understanding of effective teaching.
Besides, some qualitative studies have suggested the
idea of a “meeting of minds” as a cognitive-emotional
experience (Karagiannopoulou & Entwistle, 2013).
Experiences of tutors who are passionate for their subject,
authentic, supportive, and encouraging of students'
learning seem to come along with personal understanding
(Entwistle, Karagiannopoulou, Ólafsdóttir, & Walker,
2016); and experiences of negative nature seem to regress
students in their learning (Karagiannopoulou, 2010;
Karagiannopoulou & Entwistle, 2015).
Experiences of the Teaching-Learning Environment
and Achievement
Few studies have found a positive correlation between
an overall measure of experiences of the learning
environment and assigned marks for coursework
(Richardson & Price, 2003) or between GPA and good
teaching (Lizzio et al., 2002; Karagiannopoulou &
Christodoulides, 2005; Karagiannopoulou & Milienos,
2015). Most recent studies indicate (Diseth, 2007;
Karagiannopoulou & Milienos, 2015) a significant
correlation between examination grades and teaching
quality and appropriate workload, but this relation was not
confirmed by techniques of structural equation modeling,
nor did it include measures of approaches to learning.
The Experiences of Teaching and Learning
Questionnaire
The ETL, the validity of which is tested in the
present study, is the second part of the ETLQ that has
drawn on Student Learning Research. It was developed
as a part of the research project, “Enhancing teaching-
learning environments in undergraduate courses” (the
ETL project; see http://www.etl.tla.ed.ac.uk), which
investigated ways in which findings from research could
be used to create a learner-centred learning environment
for students (Entwistle et al., 2003). To develop the
questionnaire an extensive review of the literature and
also an analysis of earlier inventories measuring
students’ perceptions of teaching and of learning
environments were carried out by a range of researchers
(Entwistle, 2003; Entwistle, McCune, & Hounsell, 2002;
Steis, Maeyer, Gijbels, & Van Petegem, 2012).
The ETLQ has five sections. In particular, the first
section is the Approaches to Learning and Studying
Inventory (not used in the present study). The second
part, ETL, covers the students’ perceptions of the
teaching and learning they had experienced on the
course unit. The third section (not used in the present
study), Demands Made by the Course Unit, asks about
the demands that students felt the course unit made in
terms of knowledge requirements and learning
processes. The fourth section, What You Learned from
This Course Unit, paralleled those aspects in relation to
what they felt they had actually gained from the unit,
i.e., concerning knowledge and generic skills, and this
section has been used in the present study as an
outcome variable. The last section was a single item
asking students how well they had felt they had done in
the courses they had taken (self-evaluation); this has
been used in the particular study as an outcome.
The second part of the ETLQ, Experiences of
Teaching and Learning (ETL), which is at the heart of
this study (testing each validation) consists of four
subscales namely: Organization and Structure, Teaching
and Learning, Students and Teachers, and Assessment
and Other Set Work. Entwistle et al. (2003) and Xu
(2004) reported that the most consistent set of substantial
correlations relate all but one (peer support) of the
perceptions subscales to students’ ratings on the

Karagiannopoulou and Milienos Experiences of Teaching and Learning Inventory 508
knowledge the students believed they had achieved, and
most of these subscales also relate to students’ ratings of
gains in their processes of learning. Concerning self-
rating of attainment, Xu (2004) found that most of the
subscales (except “student support” and “assessment for
understanding”) included in students’ perceptions of the
teaching-learning environment were correlated with a
self-rating of attainment. Concerning associations
between perceptions and approaches, all studies indicate
that positive experiences link to deep and strategic
approaches (Entwistle et al., 2003; Parpala, Lindblom-
Ylänne, Komulainen, & Entwistle, 2013; Xu, 2004).
However, the results are not consistent. Xu (2004) found
strong patterns only for the deep approach, with
“Assessing for Understanding” and “Teaching for
Engagement in Studying” being the strongest. Entwistle
et al. (2003) found that the strongest patterns showed
associations of deep and surface approach with the
perceptions; the highest values show a deep approach
associated with “Encouraging Learning and Assessing
Understanding” while a surface approach was associated
with “(Lack of) Interest Evoked.” Concerning the
strategic subscales, “Monitoring studying” was most
closely associated with “Encouraging learning,”
“Assessment feedback,” “Assessing understanding,” and
“Staff support”; a similar, but less strong, pattern was
found for organized studying and effort management
(strategic subscales). In the same line, Parpala et al.
(2013) reported strong positive correlations among a
“Deep approach,” “Organized studying,” “Intention to
understand,” and all of the six factors reflecting students’
perceptions of the teaching-learning environment
(“Teaching for understanding,” “Alignment,” “Staff
enthusiasm and support,” “Interest and relevance,”
“Constructive feedback,” and “Support from other
students”). They also reported negative correlations of
the six factors with a surface approach with the strongest
patterns to show links between surface approach and
“Teaching for understanding” and “Alignment.” The
strongest positive and negative correlation of experiences
with deep and surface approaches concerned “Interest
and relevance.” Overall, the research findings are in the
same line while slight variations are due to heterogeneity
of the sample or to different cultures. In line with Parpala
et al.’s (2013) findings, Herrmann, Bager-Elsborg, and
Parpala (2016), using the LEARN questionnaire (based
on the ETL), found relations between all of the factors of
the learning environment with the three approaches with
the strongest patterns to concern the deep and strategic
approach (organized effort).
There are only a few studies (Entwistle et al., 2003;
McCune, 2003; Parpala et al., 2013; Xu, 2004) that
have explored the factor structure of the ETL
questionnaire (included in the ETLQ), all of which
report various challenges (e.g., Parpala et al., 2013;
Steis et al., 2012). Although most of the studies seem to
indicate a conflicting factor structure, a close look at
them indicate high similarity. In particular, Entwistle et
al. (2003) suggest a five-factor structure in a UK
sample: “Organization and structure,” “Encouraging
learning,” “Assessment and assignments,” “Supportive
climate,” and “Evoking interest.” Xu (2004) in a
Chinese sample of undergraduate students also reports
five factors: “Engagement,” “Supportiveness,”
“Understanding,” “Challenge and support,” “Clarity
and choice,” and “Assessment focus.” More recent
studies suggest a six factor solution. Entwistle (2009)
identifies the following factors: “Congruence and
coherence in the course unit as a whole,” “Teaching for
understanding,” “Staff enthusiasm and support,”
“Constructive feedback,” “Support from other
students,” and “Interest and enjoyment generated by the
course.” A recent study (Parpala et al., 2013), where
both UK and Finnish data were analyzed, suggests a
short version (that includes 21 items from the ETL)
with a six factor solution, namely, “Teaching for
understanding,” “Alignment,” “Staff enthusiasm and
support,” “Interest and relevance,” “Constructive
feedback,” and “Support from other students.” Most
recently, Herrmann et al. (2016) confirmed the factor
structure of this Finnish version of the ETL, with a
Danish sample. Also, Rytkonen, Parpala, Lindblom-
Ylänne, Virtanen, and Postareff (2012) used the Finnish
version of 21 items and suggested four factors:
“Relevance and evoking interest, Constructive
feedback, Peer support and Alignment.” This version
ended up to a further reduced and modified version by
Asikainen, Parpala, Lindblom-Ylänne, Vanthournout,
and Goertjens (2014); they suggested a factor,
“Teaching for understanding,” to be comprised by items
identical to those in the “Relevance and invoking
interest” mentioned by Rytkonen et al. (2012). Besides,
Steis et al. (2012) confirmed the factor structure of a
shortened (25-items) version of the ETL. However,
they had failed to confirm the full version (40 items).
They suggested a six-factor structure, namely, “Aims
and congruence; Teaching for understanding; Assessing
understanding; Staff enthusiasm and support; Student
support; and Interest and enjoyment.”
In spite the diversity in factor structure of the ETL,
Parpala et al. (2013) have reported it as a robust and reliable
instrument for use across countries at either the degree level
or the single course module level; they note though that the
psychometric properties remain to be further explored.
The present study aims to test the factor structure of
a translated version of part 2 (ETL) of the Experiences of
Teaching and Learning Questionnaire (ETLQ),
consisting of 40 items (Entwistle, 2005). Furthermore,
the validation of the ETL was tested by the use of
Approaches and Study Skills Inventory for Students
(ASSIST, http://www.etl.tla.ed.ac.uk) instead of its short
version included in the ETLQ, used in previous studies
Karagiannopoulou and Milienos Experiences of Teaching and Learning Inventory 509
(e.g. Parpala et al., 2013). The use of the full version of
the instrument that measures approaches to learning
(ASSIST), instead of the short one included in the
ETLQ, draws on the “open” discussion about the
accurate measuring of students’ approaches by short
versions in different contexts and disciplines. Also, this
decision draws on the difficulty of the questionnaires to
grasp the nuanced picture of students’ learning,
particularly where they focus on specific aspects of any
approach, which is often the case with the short versions
of the questionnaires. The ASSIST has been a widely-
used instrument with good psychometric qualities
explored by a range of studies (see Diseth, 2001;
Karagiannopoulou & Milienos, 2013); most of the
studies report psychometric assets and raise very few
limitations. On the other hand, the short version of it (the
ALSI included in the ETLQ) has been used in a small
number of studies, and recent updated short versions of
the ASSIST (see Entwistle, 2009) seem to raise an issue
of the appropriateness of the ALSI as a “strong” short
version (of the ASSIST). Moreover, the ASSIST has
been checked for its psychometric characteristics, in this
particular sample, in a previous study (Karagiannopoulou
& Milienos, 2013).
In particular, the present study tests the factorial
structure of the ETL and explores its associations with
(a) approaches to learning at a subscale level explored by
ASSIST (b) knowledge and generic skills acquired, and
(c) self-evaluation; the (b) and (c) are included in the
ETLQ. In line with the use of the ASSIST, associations
with outcomes were used to support validation since,
apart from the very first ones listed above, there is a lack
of studies indicating links between ETL and outcomes.
Associations between the above variables (if similar to
original research) would lend strength to the
appropriateness of the use of the instrument in a different
culture, especially in a context where evaluations are not
necessarily welcome and research in students’ learning is
scarce. We assume that the expected associations among
ETL, approaches to learning, knowledge acquired, skills
acquired and self-evaluation, will support the use of this
instrument across cultures as a robust one. The good
psychometric properties of the ETL on a sample of
students who are not familiar with reflections on their
learning and academic environment, in terms of
evaluation in Higher Education, will further support the
validity of the instrument.
Method
Participants
The sample consists of 364 undergraduate students
(97 first-year, 91 second-year, 75 third-year, and 101
fourth-year students) studying in a Department of
Philosophy, Education, and Psychology. The average
age was 20.42 years (sd=1.88) and the majority were
female (88.1%). The number of students participating
in the current study is similar, although a bit smaller, to
that reported by Entwistle et al. (2003) and Xu (2004).
Instruments
ETLQ. The study focuses on the validation of part
2 of the ETLQ (for the relevant project, see
http://www.etl.tla.ed.ac.uk) that explores ETL. Other
sections of the ETLQ used in the present study are the
following: the knowledge and generic skills acquired
and self-evaluation. The ETL consists of 40 items that
correspond to four subscales: Organization and
Structure (e.g., The topics seemed to follow each other
in a way that made sense to me), Teaching and
Learning (e.g., We were encouraged to look for links
between the courses), Students and Teachers (e.g., I
enjoyed being involved in this course unit), and
Assessment and other set work (e.g., I could see how
the set work fitted in with what we were supposed to
learn). In the present study only 31 out of the 40 items
were used as relevant to the syllabus of the particular
department (see Table 1). The exclusion of so many
items met the need to get valid answers by the students
since the experience of evaluation questionnaires used
by the particular institution revealed many of the
students to quit or just skim through the questionnaires
in case they came across a number of questions
irrelevant to the particular course they attended. As a
result, we decided to keep a “tight” version of the ETL
that directly fit to their experiences.
Items 3, 5, 10, 14, 20, 32, 35, 37, 40 (32-40 in
our version; see the last part of Table 1) from the
original questionnaire were not included in the
version we used because they were viewed as
irrelevant to the department. In particular, they
concerned (a) student’s choice over the material they
had to study (32, 33 in our version; see also
Herrmann et al., 2016) (b) different types of teaching
in the context of a particular course and the use of
web pages (35, 36 in our version ) (c) aspects of
encouragement that effectively improve students’
learning and performance in the particular course
(34, 37 in our version) and (d) forms of assessment
and constructive feedback on any set work that had
to be submitted (38, 39, 40 in our version). All of
these items depict inherent differences underlying
the Greek and the UK higher education. For
example, Greek social science students almost never
get (a) different types of teaching (lectures is almost
always the case), (b) compulsory set-work, and (c)
systematic feedback. Moreover, students do not refer
to an academic advisor and are not expected to have
consistent contact with a tutor (there is not course
tutor in undergraduate studies).

International Journal of Teaching and Learning in Higher Education 2018, Volume 30, Number 3, 506-521 http://www.isetl.org/ijtlhe/ ISSN 1812-9129
Table 1
Experiences of Teaching and Learning Questionnaire
Items from the original scale included in the present study
Congruence and coherence in course organization (mean=15.40, sd=3.96, a= .69)
1 It was clear to me what I was supposed to learn in courses. (MSAa=0.775)
2 The topics seemed to follow each other in a way that made sense to me. (MSA=0.848)
3 The course unit was well organized and ran smoothly. (MSA=0. 882)
4 What we were taught seemed to match what we were supposed to learn. (MSA=0.861)
5 It was clear to me what was expected in the exams. (MSA=0.794)
Teaching for understanding and encouraging learning (mean=43.9, sd=9.2, a=.85)
6 We were encouraged to look for links between the courses. (MSA=0.916)
7 I can imagine myself working in the subject area covered by the courses I have been taught. (MSA=0.836)
8 On most of the courses, I was prompted to think about how well I was learning and how I might
improve. (MSA=0.88)
9 I could see the relevance of most of what we were taught in the courses. (MSA=0.922)
10 We weren’t just given information; staff explained how knowledge is developed in this subject. (MSA=0.912)
11 The teaching encouraged me to rethink my understanding of some aspects of the subject. (MSA=0.92)
12 Plenty of examples and illustrations were given to help us to grasp things better. (MSA=0.889)
13 Courses have given me a sense of what goes on “behind the scenes” in this subject area. (MSA=0.913)
14 Teaching helped me to think about the evidence underpinning different views. (MSA=0.947)
15 Teaching encouraged me to relate what I learned to issues in the wider world. (MSA=0.948)
16 Staff were patient in explaining things which seemed difficult to grasp. (MSA=0.891)
17 Students’ views were valued in courses. (MSA=0.923)
18 Staff helped us to see how you are supposed to think and reach conclusions in this subject. (MSA=0.937)
Support from other students (Items included in the questionnaire used in the present study concerned
Experiences and Support from either students or teachers) (mean=23.0, sd=5.29, a=.73)
19 Students supported each other and tried to give help when it was needed. (MSA=0.799)
20 I found most of what I learned in courses really interesting. (MSA=0.93)
21 Staff tried to share their enthusiasm about the subject with us. (MSA=0. 929)
22 Talking with other students helped me to develop my understanding. (MSA=0.843)
23 I enjoyed being involved in this course unit. (MSA=0.941)
24 I found I could generally work comfortably with other students. (MSA=0.763)
25 Courses provided plenty of opportunities for me to discuss important ideas. (MSA=0.905)
Integrative learning and critical thinking (mean=22.96, sd=4.19, a=.70)
26 The handouts and other materials we were given helped me to understand the courses. (MSA=0.9)
27 I could see how the set work fitted in with what we were supposed to learn. (MSA=0.823)
28 You had really to understand the subject to get good marks in most of the courses. (MSA=0.827)
29 Doing the set work helped me to think about how evidence is used in this subject. (MSA=0832)
30 To do well in courses, you had to think critically about the topics. (MSA=0.854)
31 The set work helped me to make connections to my existing knowledge or experience. (MSA=0.866)
Items from the original scale excluded in the present study
32 We were given a lot of choice over what we went about learning
33 We were allowed some choice over what aspects of the subject to concentrate on
34 On this unit, I was prompted to think about how well I was learning and how I might improve
35 The different types of teaching (lectures, tutorials, labs etc) supported each other well
36 The web pages provided by staff helped me to understand the topics better
37 I was encouraged to think about how best to tackle the set work
38 The feedback given on my work helped me to improve my ways of learning and studying
39 Staff gave me the support I needed to help me to complete the set work for this course unit
40 The feedback given on my set-work helped to clarify things I hadn’t fully understood. a Measure of Sampling Adequacy
Karagiannopoulou and Milienos Experiences of Teaching and Learning Inventory 511
The fourth section focuses on “What was learned
from the course” (eight questions). In the present study,
only the questions focused on (a) Knowledge and subject-
specific skills (three questions, e.g. knowledge and
understanding about the topics covered) and (b) Generic
skills (three questions, e.g. ability to work with other
students) were included. The two questions focused on
information skills were excluded as inappropriate. Again,
answer scores were added for the two subscales.
At the end of the questionnaire, students were
asked to rate themselves objectively based on the
marks, grades, and comments they had been given in
the course of their studies (self-evaluation). Answers
were ranged from 1 (badly) to 9 (very well).
ASSIST
ASSIST consists of three sections, and the second
addresses “Approaches to Studying.” The “Approaches
to Studying” included in the ASSIST is a more recent
version of the Approaches to Studying Inventory (ASI)
originally developed by Entwistle and Ramsden (1983),
which has been used in a large number of studies. The
52-item instrument, used in the pre-set study, includes
three main scales measuring a deep approach, a surface
approach, and a strategic approach to learning. The
deep approach consists of four subscales: seeking
meaning (e.g., Before tackling a problem or
assignment, I first try to work out what lies behind it),
relating ideas (e.g., I try to relate ideas I come across to
those in other topics or other courses whenever
possible), use of evidence (e.g., I look at the evidence
carefully and try to reach my own conclusion about
what I’m studying), and interest in ideas (e.g.,
Regularly I find myself thinking about ideas from
lectures when I’m doing other things). The surface
approach consists of four subscales: lack of purpose
(e.g., Often I find myself wondering whether the work I
am doing here is really worthwhile), unrelated
memorizing (e.g., I find I have to concentrate on just
memorizing a good deal of what I have to learn),
syllabus-boundness (e.g., I tend to read very little
beyond what is actually required to pass) and, fear of
failure (e.g., Often I feel I’m drowning in the sheer
amount of material we’re having to cope with). The
strategic approach consists of five subscales: organized
study (e.g., I manage to find conditions for studying
which allow me to get on with my work), time
management (e.g., I organize my study time carefully to
make the best use of it), alertness to assessment
demands (e.g., When working on an assignment, I’m
keeping in mind how best to impress the marker),
achieving (e.g., It’s important to me to feel that I’m
doing as well as I really can on the courses here) and,
monitoring effectiveness (e.g., I go over the work I’ve
done carefully to check the reasoning and that it makes
sense). Although most studies have good psychometric
properties, for all of the three scales and the subscales
consisting each of them there are limitations in the use
of two of the strategic subscales. “Alertness to
assessment demands” and “Monitoring effectiveness”
subscales, included in the strategic approach, seem to
load inappropriately (e.g. Byrne, Flood, & Willis, 2004;
Diseth, 2001; Valadas, Goncalves, & Faisca, 2010),
suggesting the exploration of the validation of the
questionnaire for each particular sample. Such a
limitation has been associated with different
experiences of students through the years of study.
Besides, the Cronbach’s reliability coefficients of some
of the subscales were relatively low, but were expected
in case of psychological constructs (Byrne et al., 2004;
Diseth, 2001; Karagiannopoulou & Christodoulides,
2005; Kreber, 2003; Valadas et al., 2010).
Procedure
A standard translation back procedure ensured that
the meaning of each statement was expressed in the
Greek version of the scales. Two social science
academics who had graduated from UK Universities
translated the questionnaire into Greek. A Greek
lecturer who had been working in a UK University for a
long time back-translated the questionnaire. The
academics involved in the translation clarified
differences in wording. In the Greek version of the
questionnaire, the “Experiences of Teaching and
Learning” (2nd section of the ETLQ) and the “What
You Learned from This Course Unit” (4th section of the
ETLQ) maintained the original structure. The students
answered the questions with reference to the overall
courses they had attended during their study in the
particular department. The original scale referred to a
particular course module. However, Parpala et al.
(2013) clearly suggest the appropriateness of the use of
the questionnaire at the degree subject level. In the
present study, the questionnaires were printed and
distributed during psychology lectures in the second
academic semester. Students were asked to respond to
the items using the same scale as in the original ETLQ.
Statistical Analysis
Exploratory (EFA) and confirmatory factor
analysis (CFA) explored the properties of ETLQ. We
randomly divided the sample into two equal parts; we
contacted an EFA on the first half of our sample and
confirmed (using CFA) the derived factor solution on
the other half (for the appropriateness of this approach,
see, e.g. Gerbing & Hamilton, 1996; Byrne, 2010;
Kline, 2011; Raykov & Marcoulides, 2006;
Karagiannopoulou and Milienos Experiences of Teaching and Learning Inventory 512
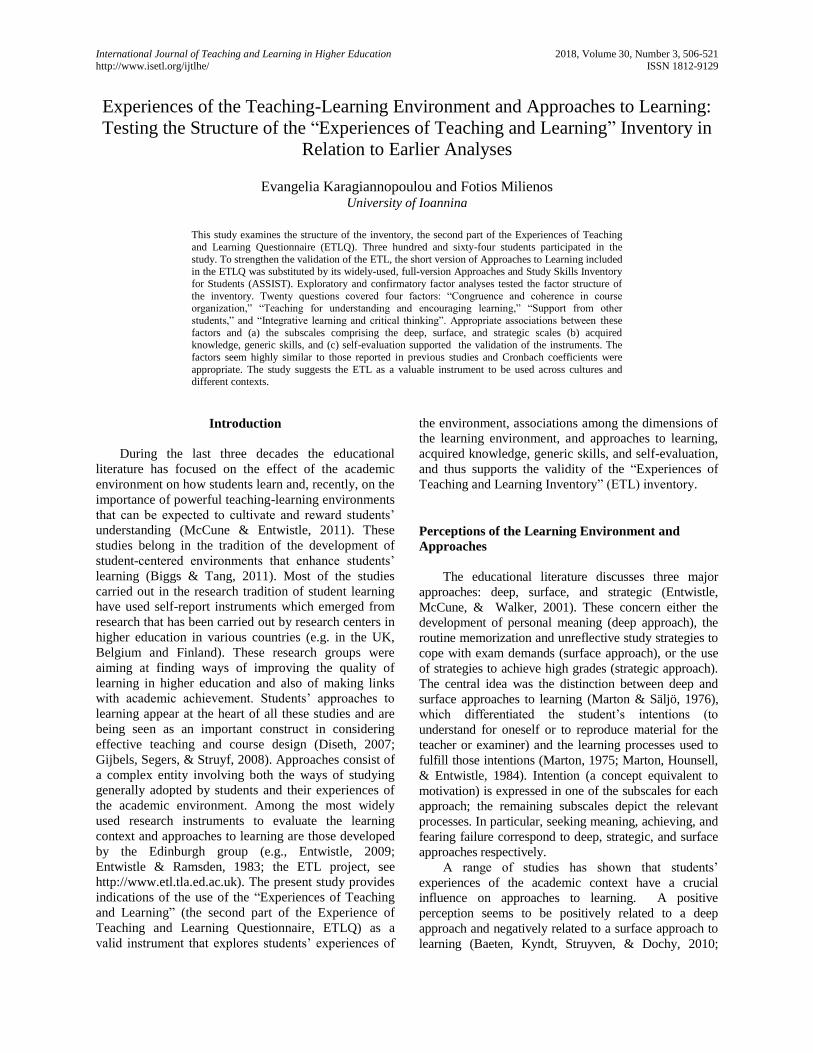
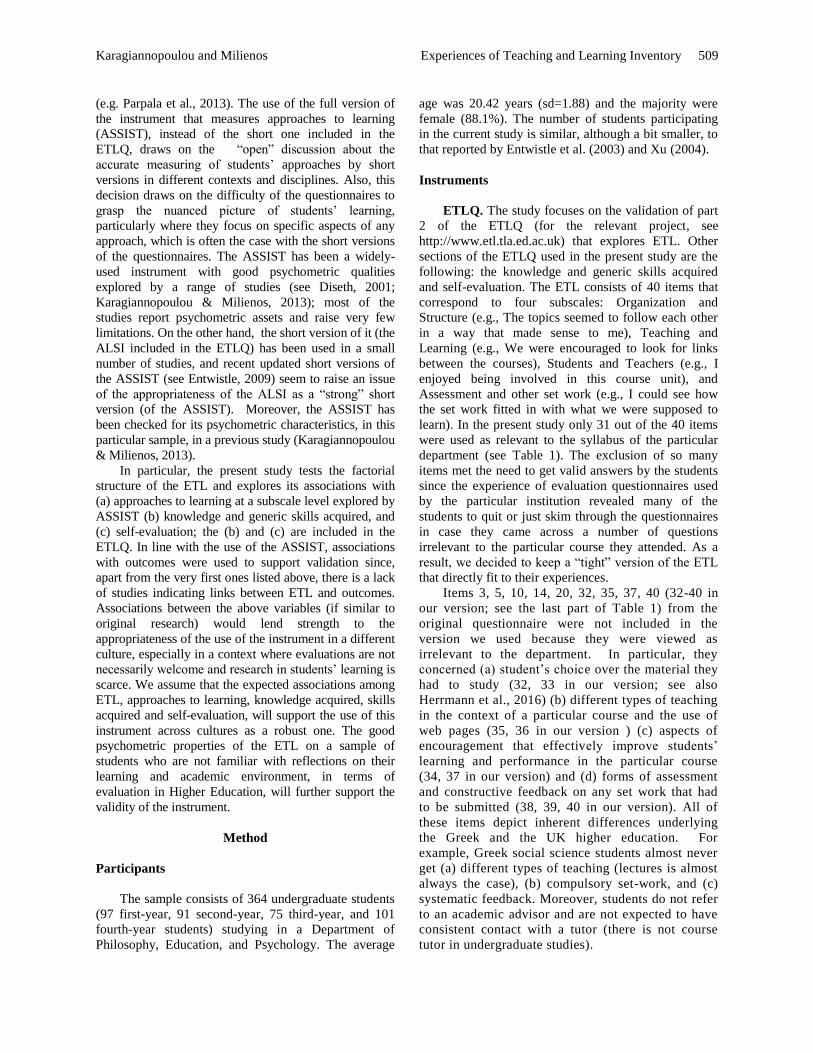
Figure 1
The Scree plots with the random eigenvalues (Parallel Analysis)
Worthington & Whittaker, 2006; the study uses SPSS
and Amos for the data analysis).
Results
First, we explored the Cronbach’s Alpha reliability
coefficients for the four subscales “Congruence and
coherence in course organization” (α=0.69), “Teaching
for understanding and encouraging learning” (α=0.85),
“Support from other students” (α=0.73), and
“Integrative learning and critical thinking” (α=0.70).
The reliability coefficients for two of the subscales
were considered acceptable (0.85 and 0.73; e.g.
Nunnally & Bernstein, 1994), while the remaining were
of moderate level (note also that these two subscales
consist of fewer variables; see Table 1).
EFA and CFA
An orthogonal model using the Principal Axis
Factoring (PAF; e.g. Kahn, 2006) extraction method on
the correlation matrix explored the factor structure of the
ETLQ. The PAF extraction method, along with a Promax
(oblique) rotation, contributed to the analysis; no
“extreme” outliers were detected. The Principal
Component (PC) is also an appropriate extraction method,
and most of the time these two methods, i.e., PC and PAF,
offer equivalent results, particularly if there are high
correlations among the items, the number of items is large,
or the number of common factors is small (e.g., Johnson &
Wichern, 2002; Rencher, 1995). KMO equals 0.83 and
therefore meets most of the proposed acceptable values
(e.g., Kaiser, 1974). The Measures of Sampling Adequacy
of our items range from 0.763 to 0.948 (Table 1) and
therefore are sufficient for our purposes.
The 8 factors (deduced by the Kaiser rule) explain
the 57.8% of data variability. Note that Kaiser rule
often overestimates the number of factors (especially
when the number of items is large, (e.g., Kahn, 2006),
and hence it is necessary to consider other decision
rules, as, for example, the scree test and parallel
analysis. The scree plot (Figure 1a) does not support the
existence of 8 factors; parallel analysis (e.g. Horn,
1965) suggests retaining 4 factors since the fifth
eigenvalue is the first (real) smaller eigenvalue than the
corresponding random (simulated) eigenvalue.
Furthermore, according to the pattern matrix of the
eight-factor model, it can be seen that at most two items
load on the last four factors; this fact also supports the
existence of four underlying factors.
Hence, the next step is to study a model with 4
factors, which explains the 34.7% of the total variance.
The pattern and structure matrix of this model (not
included here due to space limitations) reveal that items
4, 7-9, 20, 21, and 23 do not load on any factor
(loadings<0.35 or have low cross-loadings); therefore,
these seven items should be excluded from our 4 factor
model. Note also that the items 25-28 have very low
loadings (less than 0.40) and these loading become
smaller (i.e. less than 0.35) after the exclusion of the
above seven items; thus, these 4 items are also excluded
from our analysis.
The new model (without the above 11 items)
explains now the 40.2% (Table 2) of the variance, while
the four factor solution is supported again by the
parallel analysis and to some extent, by the scree plot
(Figure 1b). The new Cronbach’s Alphas for the four
subscales became 0.66, 0.83, 0.71 and 0.62,
respectively. Based on the rotated solution (Table 2) it
can be seen that the expected factor structure for the

Karagiannopoulou and Milienos Experiences of Teaching and Learning Inventory 513
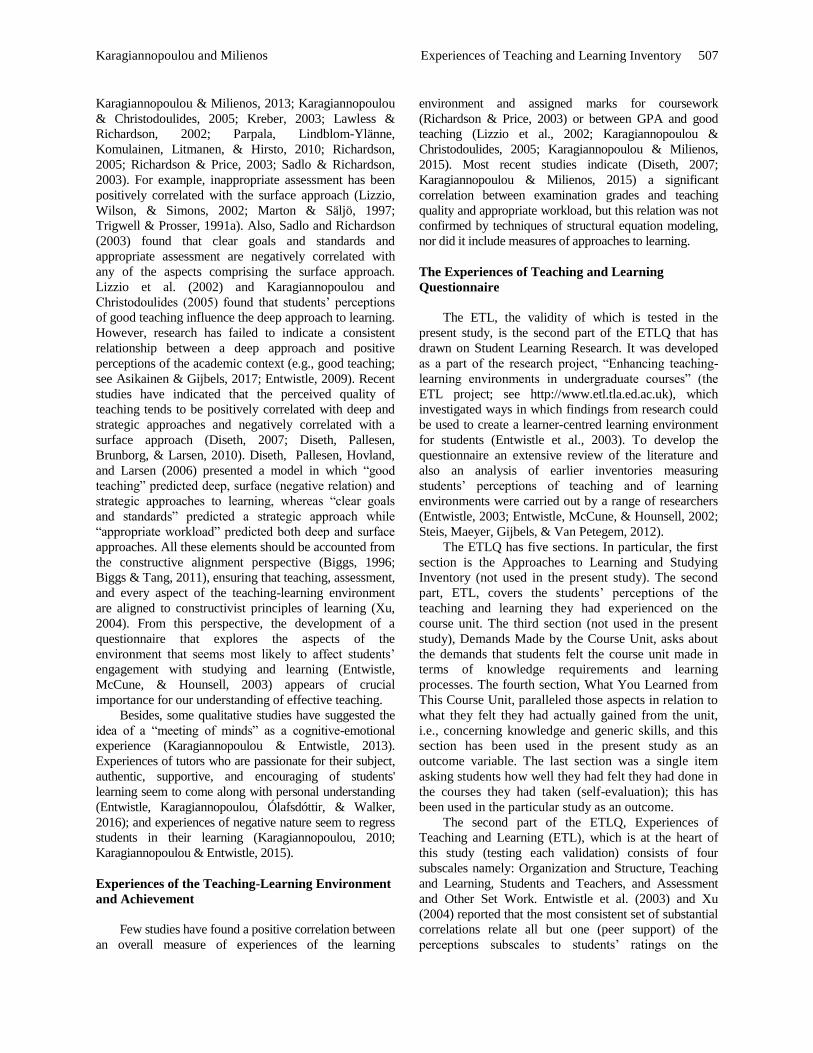
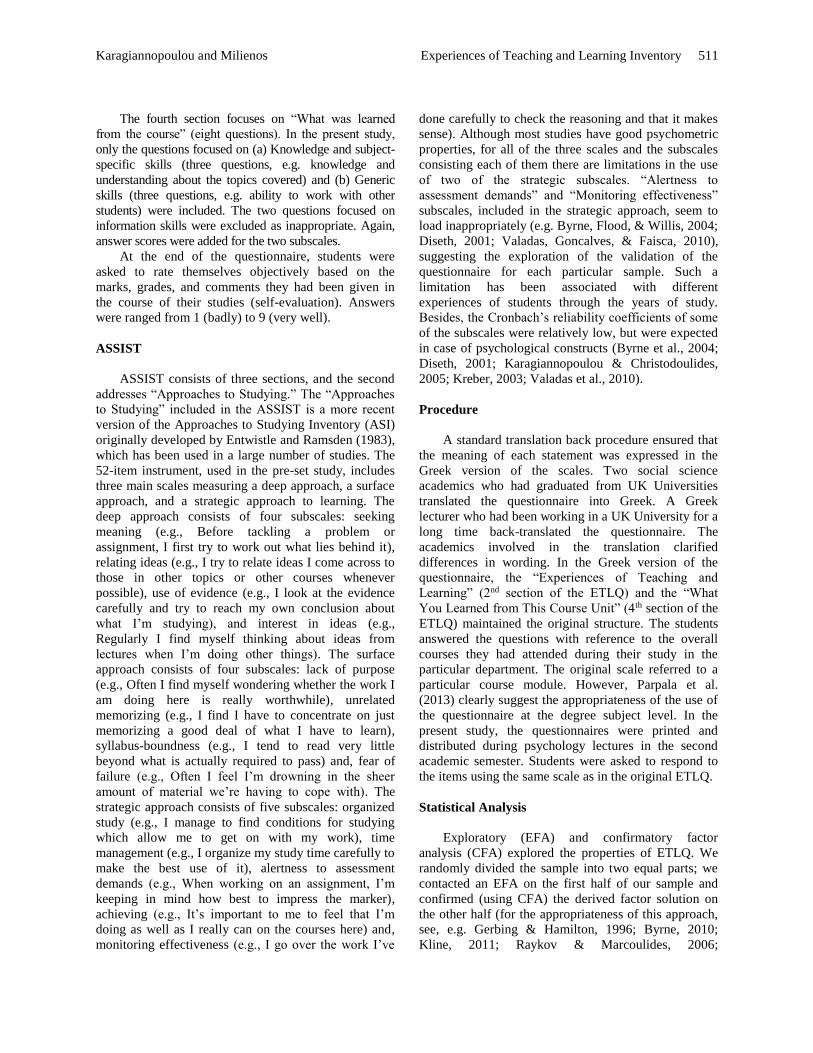
Figure 2
The verified model by CFA, on the second half of our sample; the un-standardized estimates, standard error of the
estimates (in parentheses) and standardized estimates for each path and the variance of the error variables, are included
four subscales is verified by our data (the new KMO
equals again 0.83). Before proceeding to CFA, it should
also be mentioned that the correlations among the four
factors (see the last part of Table 2) are all in moderate
and positive levels (between factor 1 and factor 3 is
found the greatest correlation).
Hence, the above procedure leads us to include 4
items in the first subscale (1-3 and 5), 10 items in the
second subscale (6 and 10-18), 3 items in the third
subscale (19, 22 and 24) and 3 items in the fourth subscale
(29-31). Figure 2 illustrates the model we are going to
verify (using CFA); potentially correlated factors are used.
The accuracy of our model is assessed by the
following tests and descriptive fit indices (e.g. Raykov &
Marcoulides, 2006): Chi-square=176.26 (p=0.24),
CFI=0.92, GFI=0.90 and RMSEA=0.02. Therefore, the
null hypotheses that our model fit the sample equally
well with the full model is not rejected (p=0.24>0.05);
the value of RMSEA is less than 0.05 (also, 0.05 does
not belong to the 90% confidence interval) while CFI
and GFI are greater than 0.90. The regression
coefficients of the model (using the GLS estimation
method) are all positive and statistical significant (Figure
2). The greatest standardized effects are found from:
factor 1 to items 2 and 3, factor 2 to items 16 and 18,
factor 3 to items 19 and 24, and factor 4 to item 31. The
only no-significant covariances among the four
underlying factors are that between factor 1 and factor 3
and 4; the correlations are all positive while this between
factor 1 and 2 is the most significant.

Karagiannopoulou and Milienos Experiences of Teaching and Learning Inventory 514
Table 2
EFA of “Experiences of Teaching and Learning” (PAF extraction/Promax rotation)
and the Correlations Among the 4 Factors.
Patterna Structurea
Item Component Component
1 2 3 4 1 2 3 4
1 .629 .544
2 .600 .403 .664
3 .513 .522 .643
5 .588 .533
6 .507 .617 .449
10 .575 .503
11 .645 .580
12 .511 .551
13 .547 .543
14 .508 .567 .371
15 .559 .620 .384
16 .459 .534 .419
17 .608 .564
18 .709 .667
19 .705 .708
22 .479 .508
24 .861 .836
29 .677 .677
30 .440 .483
31 .621 .653
Correlations
1 1 .252 .494 .275
2 .252 1 .323 .056
3 .494 .323 1 .136
4 .275 .056 .136 1 a. Loadings below .35 not seen.
Correlations
Before studying the correlations, it is necessary to
confirm the underlying factor structure of the ASSIST in
our whole sample (Karagiannopoulou & Milienos, 2013,
also studied the psychometric properties of ASSIST on
the current population). Previous studies indicated that
the subscales “Alertness to Assessment demands” and
“Monitoring effectiveness” fail to load appropriately on
the strategic approach (Byrne et al., 2004; Diseth, 2001).
Our results are in accordance with these findings (i.e.,
“Alertness to assessment demands” loads on the surface
approach, and “Monitoring effectiveness” has low cross-
loadings on the deep and strategic approach).
Consequently, we excluded these two subscales from the
analysis. Hence, the descriptive fit indices of our model
are the following: Chi-square=134.83 (df=41, p<0.01),
CFI=0.90, GFI=0.93, and RMSEA=0.08. Most of these
indices lie in acceptable intervals, whereas RMSEA
reveals a poor fit on our data.
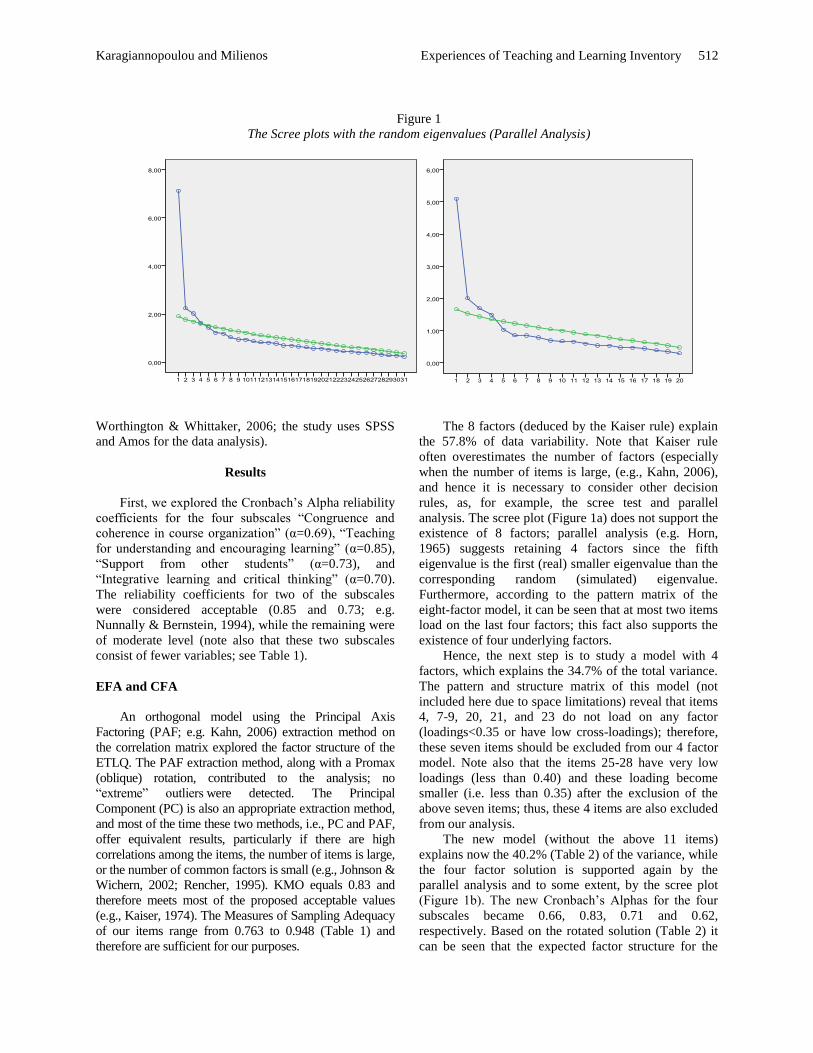
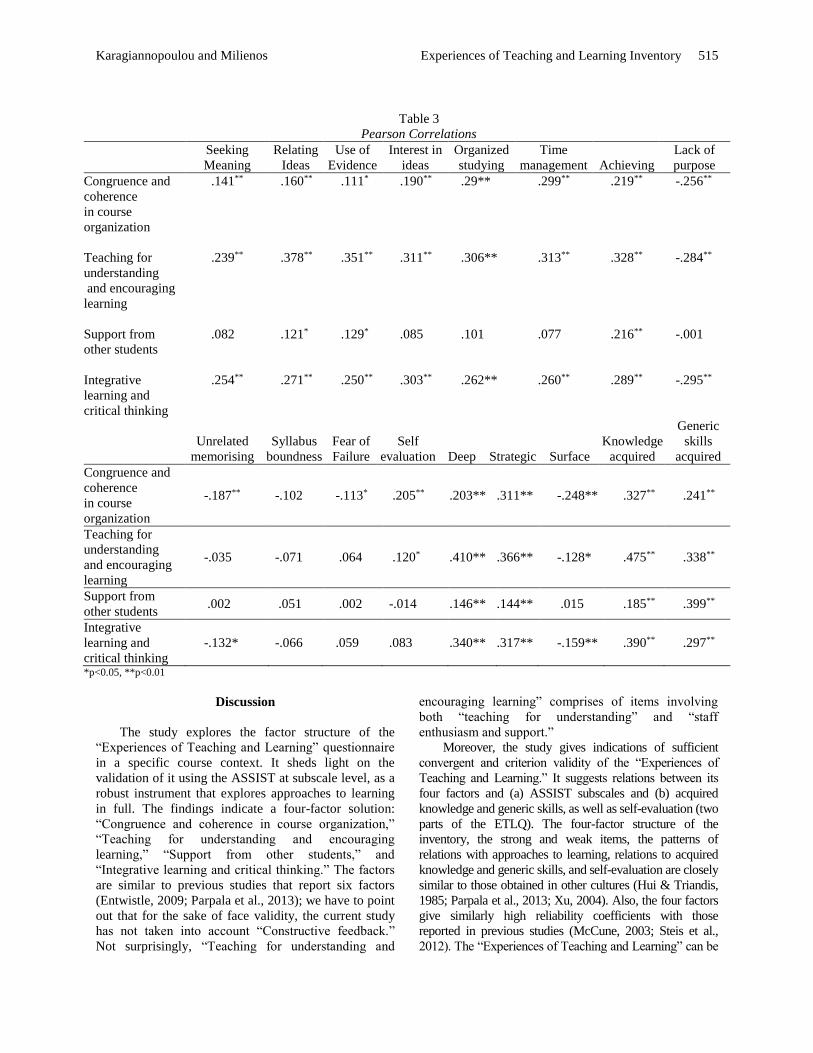
Table 3 indicates the Pearson correlation coefficient
among the subscales (composite scores) of the
instruments used in the present study. Note that this table
includes all of the correlations between the four
subscales of ETL and the rest of the variables used in the
present study. Hence, it can be seen (Table 3) that the
great majority of the observed correlations are positive;
the most significant positive correlations are found
among the subscale, “Teaching for understanding and
encouraging learning,” and the majority of the deep and
strategic subscales and the two variables depicting
“knowledge” and “generic skills” acquired. Besides, of
similar sizes are the correlations between “Integrative
learning and critical thinking” and one deep (interest in
ideas) and one strategic (achieving) subscale and the two
estimated outcomes, “knowledge” and “generic skills”
acquired. Besides, “Congruence and coherence in course
organization” give a positive correlation with
“Knowledge acquired”; “Support from other students” is
only similarly highly correlated with “generic skills”
acquired. On the other hand, the most significant
negative correlations are among the four subscales of
students’ perceptions of the teaching-learning
environment and the surface subscale “Lack of purpose.”
Karagiannopoulou and Milienos Experiences of Teaching and Learning Inventory 515
Table 3
Pearson Correlations
Seeking
Meaning
Relating
Ideas
Use of
Evidence
Interest in
ideas
Organized
studying
Time
management Achieving
Lack of
purpose
Congruence and
coherence
in course
organization
.141** .160** .111* .190** .29** .299** .219** -.256**
Teaching for
understanding
and encouraging
learning
.239** .378** .351** .311** .306** .313** .328** -.284**
Support from
other students
.082 .121* .129* .085 .101 .077 .216** -.001
Integrative
learning and
critical thinking
.254** .271** .250** .303** .262** .260** .289** -.295**
Unrelated
memorising
Syllabus
boundness
Fear of
Failure
Self
evaluation Deep Strategic Surface
Knowledge
acquired
Generic
skills
acquired
Congruence and
coherence
in course
organization
-.187** -.102 -.113* .205** .203** .311** -.248** .327** .241**
Teaching for
understanding
and encouraging
learning
-.035 -.071 .064 .120* .410** .366** -.128* .475** .338**
Support from
other students .002 .051 .002 -.014 .146** .144** .015 .185** .399**
Integrative
learning and
critical thinking
-.132* -.066 .059 .083 .340** .317** -.159** .390** .297**
*p<0.05, **p<0.01
Discussion
The study explores the factor structure of the
“Experiences of Teaching and Learning” questionnaire
in a specific course context. It sheds light on the
validation of it using the ASSIST at subscale level, as a
robust instrument that explores approaches to learning
in full. The findings indicate a four-factor solution:
“Congruence and coherence in course organization,”
“Teaching for understanding and encouraging
learning,” “Support from other students,” and
“Integrative learning and critical thinking.” The factors
are similar to previous studies that report six factors
(Entwistle, 2009; Parpala et al., 2013); we have to point
out that for the sake of face validity, the current study
has not taken into account “Constructive feedback.”
Not surprisingly, “Teaching for understanding and
encouraging learning” comprises of items involving
both “teaching for understanding” and “staff
enthusiasm and support.”
Moreover, the study gives indications of sufficient
convergent and criterion validity of the “Experiences of
Teaching and Learning.” It suggests relations between its
four factors and (a) ASSIST subscales and (b) acquired
knowledge and generic skills, as well as self-evaluation (two
parts of the ETLQ). The four-factor structure of the
inventory, the strong and weak items, the patterns of
relations with approaches to learning, relations to acquired
knowledge and generic skills, and self-evaluation are closely
similar to those obtained in other cultures (Hui & Triandis,
1985; Parpala et al., 2013; Xu, 2004). Also, the four factors
give similarly high reliability coefficients with those
reported in previous studies (McCune, 2003; Steis et al.,
2012). The “Experiences of Teaching and Learning” can be
Karagiannopoulou and Milienos Experiences of Teaching and Learning Inventory 516
seen as a high context sensitive instrument for use across
cultures; most of the items that did not contribute to the
model “meet” integral aspects of teaching, assessment, and
learning that involve demands about which students seemed
to be unclear (Karagiannopoulou, 2010; Karagiannopoulou
& Entwistle, 2013). Also, the condensed category,
“Teaching for understanding and encouraging learning,”
that brings together items from “Teaching for
understanding” and “Staff enthusiasm and support,” is in
line with previous findings (Karagiannopoulou, 2010;
Karagiannopoulou & Entwistle, 2013, 2015).
The use of a subscale rather than a scale level to
measure approaches to learning allowed us to shed light
on aspects of convergent validity of the ETL in terms of
the relations between its four factors and the set of
variables included in the present study which disappear
in the correlation set at scale level. The four factors of the
ETL give quite strong significant associations only with
a single surface subscale “lack of purpose,” whereas
there are only few weak correlations with the rest of the
subscales of the surface approach. Such a finding
possibly depicts the psychometric weakness of the
surface scale. A range of studies report lower reliability
of the surface scale (see Asikainen et al., 2014; Gijbels,
2005; Karagiannopoulou & Christodoulides, 2009;
Karagiannopoulou & Milienos, 2015) and weak loadings
of some of its subscales (Entwistle et al., 2001).
Moreover, the few strong relations of “support from
other students” with “achieving” (strategic subscale), and
generic skills possibly depict an instrumental use of such
a relation with peers rather than a real cooperation with
peers (Lindblom-Ylänne, 2003). The use of subscales for
the validation of the ETL sheds light on the relations
between perceptions of the teaching-learning
environment, learning motives, and processes. Not
surprisingly, the less strong correlations involve links
between the four factors of the “Experiences of Teaching
and Learning” and the intention/motives for studying—
namely seeking meaning, achieving, and fear of failure—
for deep, strategic, and surface approach, respectively.
Besides, the stronger correlations involve the relevant
processes (the rest subscales comprising the deep and
strategic scales but not the surface), which can be seen as
reactions to teaching.
Items that Failed to Remain in the Model
The analysis supports the validity of the ETL as a
context sensitive instrument. The items that failed to
remain in the model refer to “obscure” aspects of the
particular course. Some of the items do not load on any
factor (items 4, 7-9, 20, 21, 23), and some give low
loadings (items 25-28). In particular, the failure of
items 20, 21, 23 and 25, that concern enjoyment and
interest, to load on any factor may indicate that these
items are of a quite different kind. They can be seen as
more to do with students as individuals rather than as
reactions to the teaching they have experienced. Also,
questions 27 (I could see how the set work fitted in with
what we were supposed to learn) and 28 (You had
really to understand the subject to get good marks in
most of the courses) concerned assessment. The failure
of these items to contribute to the model may well be
interpreted as a consequence of students’ unclear
perceptions of exam demands and inconsistency
between teaching and assessment (Karagiannopoulou,
2010; Karagiannopoulou & Entwistle, 2013;
Karagiannopoulou & Milienos, 2013). In line with this
interpretation about students’ unclear perceptions of
what they were supposed to learn, question 4 (What we
were taught seemed to match what we were supposed to
learn), question 8 (On most of the courses, I was
prompted to think about how well I was learning and
how I might improve), question 9 (Staff tried to share
their enthusiasm about the subject with us) and question
26 (The handouts and other materials we were given
helped me to understand the courses), focused on
teaching and learning, do not load on any factor.
Question 7 (I can imagine myself working in the
subject area covered by the courses I have been taught)
may be seen as irrelevant because this particular joint
degree does not correspond well to the labor market.
Students may have difficulty in seeing the relevance of
the material and the contribution of teaching to their
improvement as students. Besides, the variation of
experiences among course modules may make it
difficult for students to answer questions posed on a
more general level (concerning the whole range of
courses they have taken).
In our study the factor, “Teaching for understanding
and encouraging learning,” brings together items from
“Teaching for understanding” and “Staff enthusiasm and
support”: two factors presented as separate in previous
studies (Entwistle, 2009; Parpala et al., 2013). Items 25
and 27 (in the original version/ 16 and17 in our version)
seem to be strong items loading on “Staff enthusiasm and
support” in Parpala et al. (2013), Herrmann et al. (2016),
and Entwistle’s (2009) studies. These items plus items 22
(in the original version/ 20 in our version) (Xu, 2004)
and 28 (in the original version/ 18 in our version)
(McCune, 2003; Xu, 2004) that originally loaded on
“stuff enthusiasm and support” (see also Parpala et al.
2013) load on “teaching for understanding and
integrating learning” in our study. Herrmann et al. (2016)
supported this finding. They reported that the item “the
staff helped us to see how we are supposed to think and
reach conclusions in this subject” loaded on “staff
enthusiasm and support” while on “teaching for
understanding” in Parpala’s study. Recent studies
indicate that good teaching relates to the teacher’s
enthusiasm. A “meeting of minds”—as a relational
experience where students’ experiences with enthusiastic
Karagiannopoulou and Milienos Experiences of Teaching and Learning Inventory 517
tutors who teach for understanding, value their views,
and show concern about their development—has been
found to come along with deep learning and personal
understanding (Karagiannopoulou & Entwistle, 2013,
2015; Rowe, Fitness, & Wood, 2013). Although the
questions excluded after the analysis were many, the
number of items (20 items) included in our version is
similar to that suggested by previous studies (21 items
with Herrmann et al., 2016; Parpala et al., 2013) and also
to the 25-item version used by Steis et al. (2012). Also,
most of the 20 items that remained in the version
presented in the present study are strong items that
appear in a most recent version of the “Experiences of
Teaching and Learning” (15 items, Entwistle, 2009).
Items 22, 25, 27, 28 (in our version) appear in most
versions (Herrmann et al., 2016; Parpala et al., 2013).
Drawing on both our study and Parpala et al. (2013)
study, we suggest that questions 9 (I could see the
relevance of what we were taught in this course unit) and
28 (You had really to understand the subject to get good
marks in this course unit; see items 11 and 34 in the
original version/ 9, 28 in our version) are weak items. In
consistency with Parpala et al. (2013) and Entwistle
(2009), these items failed to remain in our version.
Associations with Approaches to Learning,
Knowledge and Skills Acquired, and Self-Evaluation
In our attempt to support the validation of the
“Experiences of Teaching and Learning,” approaches to
learning were not explored by the relevant inventory (ALSI)
included in the ETLQ but by its full version, ASSIST. The
subscales comprising each approach allowed us to get a
more complete picture of the associations between the
academic context and the particular elements of deep,
strategic, and surface approaches in a sample of students
who were not familiar with course evaluation. The
convergent validity of the ETL was supported by consistent
statistically significant positive and negative correlations
between most of its factors and (a) the subscales included in
the deep and strategic scales and (b) the only one surface
subscale (lack of purpose), respectively (Entwistle et al.,
2003; Parpala et al., 2013; Xu, 2004). The study reveals
expected positive associations with deep and strategic
subscales. However, the strong pattern of associations
between only one surface subscale, namely, lack of purpose,
and the four factors included in the “Experiences of
Teaching and Learning” possibly reveal the problematic
structure of the scale (Asikainen et al., 2014) and the
difficulties in the interpretation of the surface scale. The
relevant literature suggests that the items describing the
surface scale are of two kinds, “memorizing” and “lack of
purpose.” Lack of purpose depicts an implicit negative
motive (personal communication with Noel Entwistle, 1st of
August 2017). Thus, the perceptions of the teaching
environment may impact students’ implicit motive, namely,
lack of purpose, but fail to have an effect on the processes,
such as unrelated memorizing employed by students, on
their attitudes, such as syllabus-boundness, and on
motivation, such as fear of failure. Such suggestions are in
line with the stable dimension of approaches (see
Karagiannopoulou & Milienos, 2013).
The study supports previous findings that associations
between “support from other students” and approaches to
learning comprise a less statistically significant set of
correlations (see Entwistle et al., 2003; Parpala et al.,
2013). However, we found a strong correlation between
“support from other students” and students’ motivation to
achieve (strategic subscale) and also very low correlations
between “support from other students” and all of the deep
and strategic subscales. Such associations possibly indicate
that students are more likely to depend on other students
than “to be truly promoted by a real” cooperation with
peers (Lindblom-Ylänne, 2003). The findings support the
validity of the instrument to the extent that they are
supported by studies in the SAL tradition. Moreover, the
correlations identified do not indicate causal relations but
only associations. The “Teaching for understanding and
encouraging learning” is the environmental subscale that
gives the strongest sets of correlations, with most of the
deep and strategic subscales and the strongest negative
correlation with “lack of purpose” (surface subscale). The
next strongest factor is “Integrative learning and critical
thinking” (Entwistle et al. 2003; Karagiannopoulou &
Milienos, 2013; Parpala et al. 2013).
Further support to the validation of the “Experiences
of Teaching and Learning” is brought by the associations
between its four factors and the other sections included in
the ETLQ that involve estimated learning outcomes and
student’s self-evaluation. The study indicates a quite
strong pattern of associations between almost all of the
four perceptions of the teaching-learning environment and
“Knowledge” and “Generic skills” acquired. This is
inconsistent with previous studies (Entwistle et al., 2003;
Xu, 2004), which suggest such strong correlations only for
“Teaching understanding and encouraging learning.”
Besides, support to the “Experiences of Teaching and
Learning” as a context sensitive instrument comes from
higher correlation between self-evaluation and
“congruence and coherence” (most of the items in this
factor involved even implicitly the learning required for
exam success). Both of the above sets of associations are
well supported by a previous study indicating the
contribution of “congruence and coherence” and “teaching
for understanding” to achievement through the deep and
surface approaches (Karagiannopoulou & Milienos, 2015).
Limitations and Future Research
Although the present study is not a large-scale study
and our sample comes from a particular department, the
study supports the appropriateness of the use of the
Karagiannopoulou and Milienos Experiences of Teaching and Learning Inventory 518
“Experiences of Teaching and Learning” in the current
Greek sample as a context-sensitive instrument. The range
of correlations between aspects of the academic
environment and elements of approaches depicted in the
relevant subscales seem to keep alive the discussion about
the subscales comprising each approach as conceptual
entities that provide a more detailed picture of students’
learning. Future research towards the development of a
version of “Experiences of Teaching and Learning” with
general value would be useful to focus on associations
with elements (depicted in subscales) of the approaches in
which perceptions of the teaching-learning environment
have an impact, improving also the validity of the surface
scale. This proposal draws on Trigwell and Prosser’s
suggestion that experiences of the teaching-learning
environment and approaches are aspects of the same
underlying phenomenon and so are simultaneously present
in students’ awareness (Trigwell & Prosser, 1991a,
1991b). A focus on failure of perceptions of the teaching-
learning environment to relate to particular elements of the
surface approach sheds light on the ongoing discussion
about students having developed a particular approach by
the time they enter the university (Asikainen et al., 2014;
Asikainen & Gijbels, 2017), which hardly changes in the
course of their study. It is suggested that the “Experiences
of Teaching and Learning” (the second section of the
ETLQ) offers a valuable instrument that measures
students’ perceptions of the teaching-learning
environment, although its psychometric properties have to
be tested in different contexts; some items are likely to fail
to contribute to particular versions in different contexts.
However, most of the studies so far have led to shortened
versions but not to “amended” items supporting the face
and content validity of them. Future research may be
directed towards the use of item-relation analysis, instead
of correlation designs, for the development of a short
version of ETL with general value.
References
Asikainen, H., & Gijbels, D. (2017). Do students
develop towards more deep approaches to learning
during studies? A systematic review on the
development of students’ deep and surface
approaches to learning in higher education.
Educational Psychology Review, 29(2), 205-235.
doi:10.1007/s10648-017-9406-6
Asikainen, H., Parpala, A., Lindblom-Ylänne, S.,
Vanthournout, G., & Goertjens, L. (2014). The
development of approaches to learning and
perceptions of the teaching-learning environment
during bachelor level studies and their relation to
study success. Higher Education Studies, 4(4), 24-
36. doi:10.5539/hes.v4n4p24
Baeten, M., Kyndt, E., Struyven, K., & Dochy, P.
(2010). Using student-centered learning
environments to stimulate deep approaches to
learning: Factors encouraging or discouraging their
effectiveness. Educational Research Review, 5,
243-260. doi:10.1016/j.edurev.2010.06.001
Biggs, J. (1996). Enhancing teaching through
constructive alignment. Higher Education, 32, 347-
364. doi:10.1007/BF00138871
Biggs, J., & Tang, C. (2011). Teaching for quality
learning at university. Buckingham, UK: The
Society for Research into Higher Education and
Open University Press.
Byrne, B. M. (2010). Structural equation modeling with
AMOS: Basic concepts, applications and
programming (2nd ed). New York, NY:
Routledge/Taylor and Francis.
Byrne, M., Flood, B., & Willis, P. (2004).Validation of the
approaches and study skills inventory for students
(ASSIST) using accounting students in the USA and
Ireland: A research note. Accounting Education, 13,
449-459. doi:10.1080/0963928042000306792
Diseth, A. (2001). Validation of a Norwegian version of
the Approaches and Study Skills Inventory for
Students (ASSIST): An application of structural
equation modeling. Scandinavian Journal of
Educational Research, 45, 381-394.
doi:10.1080/00313830120096789
Diseth, A. (2007). Approaches to learning, course
experience and examination grade among
undergraduate psychology students: Testing of
mediator effects and construct validity. Studies in
Higher Education, 32, 373-388.
doi:10.1080/03075070701346949
Diseth, A., Pallesen, S., Brunborg, G. S., & Larsen, S.
(2010). Academic achievement among first
semester undergraduate psychology students: The
role of course experience, effort, motives and
learning strategies. Higher Education, 59, 335-
352. doi:10.1007/s10734-009-9251-8
Diseth, A., Pallesen, S, Hovland, A., & Larsen, S.
(2006). Course experience, Approaches to learning
and academic achievement. Education & Training,
48, 156-169. doi:10.1108/00400910610651782
Entwistle, N. (2003). Concepts and conceptual
frameworks underpinning the ETL Project
(Occasional Report no. 3). Retrieved from
www.ed.ac.uk/etl/publications.html
Entwistle, N. (2005). Enhancing teaching-learning
environments in undergraduate courses in
electronic-engineering: An introduction to the ETL
project. International Journal of Electrical
Engineering Education, 42, 1-7.
Entwistle, N. (2009). Teaching for understanding at
university: Deep approaches and distinctive ways of
thinking. Basingstoke, Hampshire, UK: Palgrave
Macmillan.

Karagiannopoulou and Milienos Experiences of Teaching and Learning Inventory 519
Entwistle, N. J., Karagiannopoulou, E., Ólafsdóttir, A.,
& Walker, P. (2016). Research into student
learning and university teaching: Changing
perspectives. In J. Case & J. Huisman (Eds.),
Investigating Higher Education: A Critical Review
of Research Contributions (pp. 190-208). London,
UK: Routledge.
Entwistle, N. J., McCune, V., & Hounsell, J. (2002).
Approaches to studying and perceptions of
university teaching-learning environments:
Concepts, measures and preliminary findings
(Occasional Report no.1). Retrieved from
www.ed.ac.uk/etl/publications.html
Entwistle, N. J., McCune, V. & Hounsell, J. (2003).
Investigating ways of enhancing university teaching-
learning environments: Measuring students’
approaches to studying and perceptions of teaching.
In E. De Corte, L.Verschaffel, N.Entwistle, & J. van
Merrienboer (Eds.), Unravelling basic components
and dimensions of powerful learning environments.
(pp. 89-108). Oxford, UK: Elsevier.
Entwistle, N. J., McCune, V., & Walker, P. (2001).
Conceptions, styles, and approaches within higher
education: Analytical abstractions and everyday
experience. In R. J. Sternberg & L. F. Zhang
(Eds.), Perspectives on thinking, learning and
cognitive styles (pp. 103-136). Mahwah, NJ:
Lawrence Erlbaum Associates.
Entwistle, N. J., & Ramsden, P. (1983). Understanding
student learning. London, UK: Croom Helm.
Gerbing, D. W., & Hamilton, J. G. (1996). Viability of
exploratory factor analysis as a precursor to
confirmatory factor analysis. Structural Equation
Modeling: A Multidisciplinary Journal, 3, 62-72.
doi: 10.1080/10705519609540030
Gijbels, D. (2005). Effects of new learning
environments: Taking students’ perceptions,
approaches to learning and assessment into
account. Maastricht, NL: University Press.
Gijbels, D., Segers, M., & Struyf, E. (2008).
Constructivist learning environments and the
(im)possibility to change students’ perceptions of
assessment demands and approaches to learning.
Instructional Science, 36, 431-443.
doi:10.1007/s11251-008-9064-7
Herrmann, K., Bager-Elsborg, A., & Parpala, A. (2016).
Measuring perceptions of the learning environment
and approaches to learning: validation of the learn
questionnaire. Scandinavian Journal of
Educational Research, 61, 526-539.
doi:10.1080/00313831.2016.1172497
Horn, J. L. (1965). A rationale and test for the number
of factors in factor analysis. Psychometrica, 30,
179-185. doi:10.1007/BF02289447
Hui, C. H., & Triandis, H. C. (1985). Measurement in
cross-cultural psychology: A review and
comparison of strategies. Journal of Cross-
Cultural Psychology, 16, 131-152.
doi:10.1177/0022002185016002001
Johnson, R. A., & Wichern, D. W. (2002). Applied
multivariate statistical analysis. Upper Saddle
River, NJ: Prentice Hall.
Kahn, J. H. (2006). Factor analysis in counseling
psychology research, training, and practice:
Principles, advances, and applications. The
Counseling Psychologist, 34, 684-718.
doi:10.1177/0011000006286347
Kaiser, H. F. (1974). An index of factorial simplicity.
Psychometrika, 39, 31-36. doi:10.1007/BF02291575
Karagiannopoulou, E. (2010). Effects of classroom
learning experiences and examination type on
students’ learning. Psychology: Journal of the
Hellenic Psychological Society, 17(4), 325-342.
Karagiannopoulou, E., & Christodoulides, P. (2005).
The impact of Greek University students'
perceptions of their learning environment on
approaches to studying and academic outcomes.
International Journal of Educational Research, 43,
329-350. doi:10.1016/j.ijer.2006.05.002
Karagiannopoulou, E., & Christodoulides, P. (2009).
The approaches and study skills inventory for
students: Validity and reliability in a Greek sample.
In A. Brouzos, P. Misailides & A. Efklides (Eds).
Scientific annals of the Psychological Society of
Northern Greece. (p. 217-243). Athens, R: Ellinika
Grammata (in Greek).
Karagiannopoulou, E., & Entwistle, N. (2013).
Influences on personal understanding: Approaches
to learning, perceptions of assessment, and the
“meeting of minds”. Psychology Teaching Review,
13, 80-96.
Karagiannopoulou, E., & Entwistle, N. (2015). Students
transferring to personal understanding through a
meeting of minds. Presented at Biannual EARLI
Conference, Limassol, Cyprus.
Karagiannopoulou, E., & Milienos, F.S. (2013). Exploring
the relationship between experienced students'
preference for open- and closed-book examinations,
approaches to learning and achievement. Educational
Research and Evaluation, 19, 271-296. doi:
10.1080/13803611.2013.765691
Karagiannopoulou, E, & Milienos, F.S. (2015). Testing
two path models to explain relationships between
experiences of the learning environment,
approaches to learning and achievement.
Educational Psychology, 35, 26-52. doi:
10.1080/01443410.2014.895800
Kline, R. B. (2011). Principles and practice of
structural equation modeling (3rd ed). New York,
NY: Guilford Press.
Kreber, C. (2003). The relationship between students’
course perception and their approaches to studying in
Karagiannopoulou and Milienos Experiences of Teaching and Learning Inventory 520
undergraduate science courses: A Canadian experience.
Higher Education Research and Development, 22, 57-
70. doi:10.1080/0729436032000058623
Lawless, C., & Richardson, J. T. E. (2002). Approaches
to studying and perceptions of academic quality in
distance education. Higher Education, 44, 257-282.
doi:10.1023/A:1016315114558
Lindblom-Ylänne, S. (2003). Broadening an understanding
of the phenomenon of dissonance. Studies in Higher
Education, 28, 63-77. doi:10.1080/03075070309306
Lizzio, A., Wilson, K., & Simons, R. (2002). University
students’ perceptions of the learning environment
and academic outcomes: Implications for theory
and practice. Studies in Higher Education, 27, 27-
52. doi:10.1080/03075070120099359
Marton, F. (1975). On non-verbatim learning: 1. Level
of processing and level of outcome. Scandinavian
Journal of Psychology, 16, 273-279.
doi:10.1111/j.1467-9450.1975.tb00193.x
Marton, F., Hounsell, D., & Entwistle, N. (1984). The
experience of learning. Edinburgh: Scottish
Academic Press.
Marton, F., & Saljo, R. (1976). On qualitative
differences in learning I: Outcome and process.
British Journal of Educational Psychology, 46, 4-
11. doi:10.1111/j.2044-8279.1976.tb02980.x
Marton, F., & Säljö, R. (1997). Approaches to learning.
In F. Marton, D. Hounsell & N. Entwistle (Eds.)
The experience of learning. (2nd ed.) (pp. 39-58).
Edinburgh: Scottish Academic Press.
McCune, V. (2003). Promoting high-quality learning:
perspectives from the ETL project. Paper presented
at the14th Conference on University and College
Pedagogy of the Norwegian Network in Higher
Education, Fredrikstad, Norway.
McCune, V., & Entwistle, N. (2011). Cultivating the
disposition to understand in 21st century university
education. Learning and Individual Differences,
21, 303-310. doi:10.1016/j.lindif.2010.11.017
Nunnally, J. C., & Bernstein, I. H. (1994). Psychometric
theory (3rd ed.). New York, NY: McGraw-Hill.
Parpala, A., Lindblom-Ylänne, S., Komulainen, E., &
Entwistle,, N. (2013). Assessing students’ experiences of
teaching-learning environments and approaches to
learning: Validation of a questionnaire used in different
countries and varying contexts. Learning Environments
Research, 16, 201-215. doi: 10.1007/s10984-013-9128-8
Parpala, A., Lindblom-Ylänne, S., Komulainen, E.,
Litmanen, T., & Hirsto, L. (2010). Students'
approaches to learning and their experiences of the
teaching–learning environment in different disciplines.
British Journal of Educational Psychology, 80, 269-
282. doi:10.1348/000709909X476946
Raykov, T., & Marcoulides, G. A. (2006). A first course
in structural equation modeling (2nd ed). Mahwah,
New Jersey: Lawrence Erlbaum Associates Inc.
Rencher, A. C. (1995). Methods of multivariate
analysis. Charlottesville, VA; John Wiley & Sons.
Richardson, J. T. E. (2005). Students’ perceptions
of academic quality and approaches to studying
in distance education. British Journal of
Educational Psychology, 31, 7-27. doi:
10.1080/0141192052000310001
Richardson, J. T. E., & Price, L. (2003). Approaches to
studying and perceptions of academic quality in
electronically delivered courses. British Journal of
Educational Psychology, 34, 45-56. doi:10.1111/1467-
8535.00303
Rowe, A., Fitness, J., & Wood, L. (2013). University
student and lecturer perceptions of positive
emotions in learning. International Journal of
Qualitative Studies in Education, 28, 1-20.
doi:10.1080/09518398.2013.847506
Rytkonen, H., Parpala, A., Lindblom-Ylänne, S.,
Virtanen, V., & Postareff, L. (2012). Factors
affecting bioscience students’ academic
achievement. Instructional Science, 40, 241-256.
doi:10.1007/s11251-011-9176-3
Sadlo, G., & Richardson, J. T. E. (2003). Approaches to
studying and perceptions of the academic
environment in students following problem-based
and subject-based curricula. Higher Education
Research and Development, 22, 253-274.
doi:10.1080/0729436032000145130
Steis, A., De Mayer, S., Gijbels, D., & Van
Petegem, P. (2012). Instructional development
for teachers in higher education: effects on
students’ perceptions of the teaching-learning
environment. British Journal of Educational
Psychology, 82, 398-419. doi:10.1111/j.2044-
8279.2011.02032.x
Trigwell, K., & Prosser, M. (1991a). Improving the
quality of student learning: the influence of
learning context and student approaches to learning
outcomes. Higher Education, 22, 251-66.
doi:10.1007/BF00132290
Trigwell, K., & Prosser, M. (1991b). Relating
approaches to study and quality of learning
outcomes at the course level. British Journal of
Educational Psychology, 61, 265-75.
doi:10.1111/j.2044-8279.1991.tb00984.x
Valadas, S. C., Goncalves, F. R., & Faisca, L. M.
(2010). Approaches to study in higher education
Portuguese students: A Portuguese version of the
Approaches and Study Skills Inventory for
Students (ASSIST). Higher Education, 59, 259-
275. doi:10.1007/s10734-009-9246-5
Worthington, R. L., & Whittaker, T. A. (2006). Scale
development research: A content analysis and
recommendations for best practices. The
Counseling Psychologist, 34, 806-838.
doi:10.1177/0011000006288127
Karagiannopoulou and Milienos Experiences of Teaching and Learning Inventory 521
Xu, R. (2004). Chinese mainland students' experiences
of teaching and learning at a Chinese university:
some emerging findings. Paper presented at BERA
2004, Manchester, UK.
____________________________
EVANGELIA KARAGIANNOPOULOU is Associate
Professor of Educational Psychology at the University of
Ioannina, Greece. She is Associate Fellow of the British
Psychological Society (AFBPsS). Her main research
interests concern University students’ learning and
understanding, learning environment, student-tutor
relationship, academic emotions and emotion regulation.
She has published a number of book chapters and articles in
international journals.
FOTIOS S. MILIENOS is Lecturer in Statistics, at the
University of Ioannina, Greece. His research interests
include cure rate models, start-up demonstration test,
pattern waiting times and scan statistics.
Related Documents