EXPERIENCES AND INFLUENCES OF WOMEN DIRECTORS Submitted by Zena Burgess B.A., Grad. Dip. Ed. Psych., M.Ed., M.B.A., F.A.P.S. A thesis submitted in total fulfilment of the requirements of the degree of Doctorate of Philosophy School of Psychology Faculty of Arts & Science Australian Catholic University Research Services Locked Bag 4115 Fitzroy, Victoria 3065 Australia 15 January 2003

Welcome message from author
This document is posted to help you gain knowledge. Please leave a comment to let me know what you think about it! Share it to your friends and learn new things together.
Transcript

EXPERIENCES AND INFLUENCES OF WOMEN DIRECTORS
Submitted by Zena Burgess
B.A., Grad. Dip. Ed. Psych., M.Ed., M.B.A., F.A.P.S.
A thesis submitted in total fulfilment of the requirements of the degree of
Doctorate of Philosophy
School of Psychology
Faculty of Arts & Science
Australian Catholic University Research Services Locked Bag 4115
Fitzroy, Victoria 3065 Australia
15 January 2003

Experiences and Influences of Women Directors
Acknowledgments Page i
Acknowledgments
Many people have provided me with assistance during the development of this thesis,
but none more than Professor Barry Fallon. I am certain I owe a debt to Barry as my
supervisor, as a role model of an academic, as a colleague, and as a friend. I feel I have
learned much about both content and process through Barry, and have found the experience of
pleasure through discovery. For all these reasons I am extremely grateful.
Special thanks are also due to the women company directors and their male colleagues
who contributed their valuable time to provide the data for the thesis, especially those women
who participated in the follow-up study.
Thank you to my friends and colleagues Liz Jolley, Fay Oberklaid, Jim McLennan, and
Helen Kalaboukas for reading and commenting on parts of the thesis, and for the
encouragement you have provided me with over the years. You have supported me in
practical and emotional ways and you have my gratitude.
For the patient support of my sons and especially the good humour and practical help of
my partner Robert, I offer my sincere thanks.
I would also like to acknowledge Professor Phyllis Tharenou for supervising the 1995
survey and associated analysis.
I hope the completion of this project is not an ending but rather a new beginning.

Experiences and Influences of Women Directors
Statement of Sources Page ii
Statement of Sources
This thesis contains no material published elsewhere or extracted in whole or in part from a thesis by which I have qualified for or been awarded another degree or diploma.
No other person’s work has been used without due acknowledgment in the main text of the thesis.
This thesis has not been submitted for the award of any degree or diploma in any other tertiary institution.
All research procedures reported in the thesis received the approval of the relevant Ethics/Safety Committees (where required).
Signed:
Dated:

Experiences and Influences of Women Directors
Abstract Page iii
Abstract
The present research provides the first analyses of Australian women directors from the
perspective of social identity theory. The overall objective of the research program is to
confirm the validity of social identity theory to the study of women on corporate boards and
in doing so, add to the limited knowledge regarding successful women directors. An aim of
the research was to identify factors that are significant in the social identity of women who are
successful directors of corporate boards. These factors were revealed through a longitudinal
study (over six years) of changes in the demographic characteristics of the women and their
board positions. Factors were revealed through their perceptions of their effectiveness as an
ostensibly minority (female) board member. Similarities in stereotyped attitudes to men and
women board directors confirmed their status as an ingroup member. Through identification
of significant factors in women’s success as board directors it is hoped to assist both
individual women who are striving for success on corporate boards and organisations who
wish to make more effective use of women on their boards.
Five studies examined various aspects of women directors’ experiences and influences
through three survey instruments that were used to collect data over a period of six years. A
survey design allowed the gathering of detailed data on a variety of items thought to be
relevant to women’s experiences of being directors and allowed the data collected to be
oriented to a theoretical framework. Thus, a survey design was deemed superior to common
alternatives of analysis of archival company annual report data or re-analysis of data collected
by executive search companies for a study of corporate directors.
A survey of 572 Australian women directors in 1995 identified many characteristics of
women directors. A profile of a typical Australian women director was constructed and
compared to international research on women directors covering a similar period (e.g., Burke,
1994b; Catalyst, 1993; Holton, Rabbets & Scrivener, 1993). An examination of differences

Experiences and Influences of Women Directors
Abstract Page iv
between the characteristics of executive and nonexecutive women directors confirmed that the
two director roles could be perceived as distinct groups.
A further survey of the women six years later examined changes in their characteristics
and board experiences. Of the 298 women who had agreed to follow-up research, 59 surveys
were returned as no longer at the same address, 23 women indicated that they were no longer
on a corporate board, and 32 were current corporate directors. Changes in the women’s
profiles that the directors had attained through increased board memberships and more central
board roles were interpreted as indicators of success. Based on research by Cejka and Eagly
(1999), similarities and differences in stereotypical attitudes of men and women directors
were examined in relation to social identity theory. Factors in nonexecutive women directors’
identification as board directors, their perceptions of their ability to contribute as board
directors, and their behaviour as a board directors were assessed by measures from Karasawa
(1991) and Westphal and Milton (2000).
The present research program demonstrated the value of social identity theory as a
vehicle for understanding Australian women director’s experiences on corporate boards. For
the present research, social identity theory provided insights into how successful Australian
women directors perceive themselves and other members of their ingroup of board directors.
By contributing to a deeper understanding of successful women directors, it is hoped that a
greater number of women will be able to successfully join ingroups of board directors,
thereby breaking down the barriers to women.

Experiences and Influences of Women Directors
Contents Page v
Contents
Acknowledgments......................................................................................................................i
Statement of Sources ................................................................................................................ii
Abstract ....................................................................................................................................iii
Contents.....................................................................................................................................v
List of figures ............................................................................................................................x
List of tables ..............................................................................................................................x
Chapter 1
1. Introduction ....................................................................................................................1 1.1. Corporate Boards and their Directors ...........................................................................2
1.1.1. Boards of Governance ............................................................................................2 1.1.2. Roles of Board Directors ........................................................................................3 1.1.3. Different Types of Directors...................................................................................4 1.1.4. Composition of Corporate Boards..........................................................................7 1.1.5. Diversity through Minority Board Directors ..........................................................9
1.2. Women as Minority Board Directors ............................................................................9 1.2.1. Numbers of Women on Boards of Directors ........................................................10 1.2.2. International Comparisons....................................................................................11
1.3. Studies of Women Corporate Directors ......................................................................12 1.3.1. Reviews of Research on Corporate Boards ..........................................................12 1.3.2. Reports from Industry Surveys.............................................................................13 1.3.3. Women Directors across Industry Categories ......................................................14 1.3.4. Analyses of Women’s Representation on Boards ................................................15 1.3.5. Correlation and Regression Studies......................................................................16 1.3.6. Interview-Based Studies .......................................................................................19 1.3.7. Commentaries and Anecdotal Reports .................................................................21 1.3.8. Summary of Research on Women on Boards.......................................................22
1.4. The Present Research Program ...................................................................................23 1.4.1. Theoretical Perspectives .......................................................................................24 1.4.2. Social Identity Theory ..........................................................................................27 1.4.3. Social Identity Theory Applied to Women Directors...........................................28
1.5. Studies in the Present Research Program....................................................................30 1.5.1. Study 1: Characteristics of Women Board Directors in Australia .......................30 1.5.2. Study 2: Nonexecutive Directors as a Distinct In-Group Category .....................31 1.5.3. Study 3: Longitudinal Study of Successful Women Directors.............................32 1.5.4. Study 4 Stereotypes of Male and Female Directors .............................................32 1.5.5. Study 5 Nonexecutive Director Social Identity and Influence .............................33
1.6. Research Design..........................................................................................................33 1.6.1. Quantitative versus Qualitative Research.............................................................34 1.6.2. Correlational Field Studies ...................................................................................34 1.6.3. Survey Design ......................................................................................................35
1.7. Summary .....................................................................................................................37

Experiences and Influences of Women Directors
Contents Page vi
Chapter 2
2. Characteristics of Women Board Directors in Australia .........................................39 2.1. Introduction .................................................................................................................39
2.1.1. What are the Characteristics of Australian Women Directors?............................39 2.1.2. Do Australian Women Board Directors Differ From Other Countries? ..............41
2.2. Method of Sample Definition and Data Collection.....................................................43 2.2.1. Sample Definition.................................................................................................43 2.2.2. Sample Representativeness...................................................................................45 2.2.3. Reducing Small Business Owners in the Sample.................................................46 2.2.4. Survey Variables ..................................................................................................47 2.2.5. Method of Analysis ..............................................................................................48
2.3. Characteristics of Australian Women Directors..........................................................48 2.3.1. Individual Variables .............................................................................................48 2.3.2. Interpersonal Variables.........................................................................................63 2.3.3. Organisational Variables ......................................................................................68 2.3.4. Summary...............................................................................................................75
2.4. Australian Women Board Directors Compared to Other Countries ...........................75 2.4.1. Director’s age .......................................................................................................76 2.4.2. Highest level of education ....................................................................................76 2.4.3. Marital status ........................................................................................................77 2.4.4. Numbers of children .............................................................................................78 2.4.5. Director’s salaries .................................................................................................78 2.4.6. Summary...............................................................................................................79
2.5. Discussion ...................................................................................................................79 2.5.1. Sample Representativeness...................................................................................79 2.5.2. Limitations and Future Research..........................................................................80 2.5.3. Conclusion............................................................................................................81
Chapter 3
3. Nonexecutive Directors as a Distinct In-Group Category ........................................82 3.1. Introduction .................................................................................................................82
3.1.1. Individual Factors .................................................................................................84 3.1.2. Interpersonal Factors ............................................................................................86 3.1.3. Organisational Factors..........................................................................................89
3.2. Method ........................................................................................................................89 3.2.1. Respondents and Data Collection.........................................................................89 3.2.2. Measures...............................................................................................................90 3.2.3. Analysis ................................................................................................................95
3.3. Results .........................................................................................................................96 3.3.1. Hypothesis 1 .........................................................................................................97 3.3.2. Hypothesis 2 .........................................................................................................98 3.3.3. Hypothesis 3 .........................................................................................................98
3.4. Discussion ...................................................................................................................99 3.4.1. Individual Factors .................................................................................................99 3.4.2. Interpersonal Factors ..........................................................................................101 3.4.3. Organisational Factors........................................................................................102
3.5. Limitations of the Study and Future Research..........................................................103 3.6. Conclusion.................................................................................................................104

Experiences and Influences of Women Directors
Contents Page vii
Chapter 4
4. Longitudinal Study of Successful Women Directors...............................................106 4.1. Introduction ...............................................................................................................106
4.1.1. Highest Level of Education ................................................................................109 4.1.2. Managerial Level................................................................................................109 4.1.3. Total Directorships .............................................................................................110 4.1.4. Concurrent Directorships....................................................................................110 4.1.5. Director Position.................................................................................................111 4.1.6. Partner Relationship ...........................................................................................111 4.1.7. Basis of Recruitment ..........................................................................................112 4.1.8. Board Chair Gender............................................................................................112 4.1.9. Employment Industry .........................................................................................113 4.1.10. Board Employees................................................................................................113 4.1.11. Board Corporation Type.....................................................................................113 4.1.12. Board Directors ..................................................................................................114
4.2. Method ......................................................................................................................114 4.2.1. Six-year Follow-up Sample Selection ................................................................114 4.2.2. Survey Design and Measures .............................................................................117 4.2.3. Survey Returns and Representativeness .............................................................120 4.2.4. Method of Data Analysis....................................................................................122
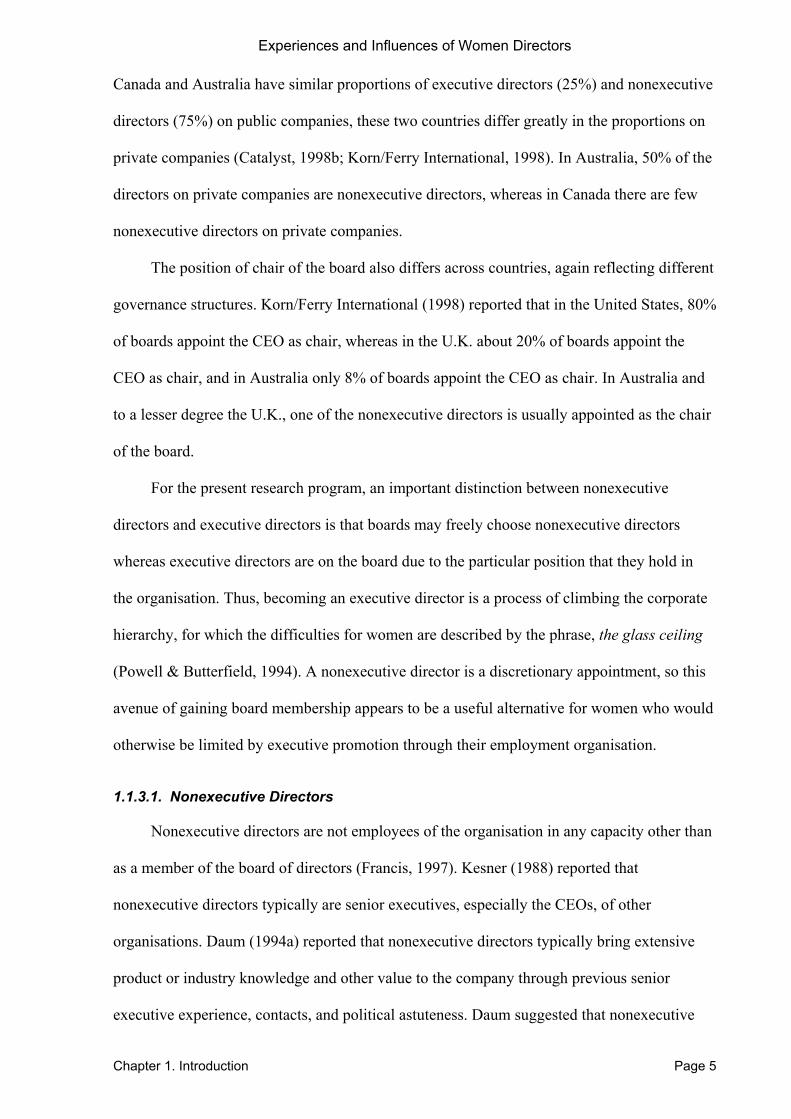
4.3. Results .......................................................................................................................123 4.3.1. Director Age .......................................................................................................123 4.3.2. Highest Level of Education ................................................................................124 4.3.3. Managerial Level................................................................................................125 4.3.4. Total Directorships .............................................................................................126 4.3.5. Concurrent Directorships....................................................................................127 4.3.6. Director Position.................................................................................................128 4.3.7. Partner Relationship ...........................................................................................129 4.3.8. Basis of Recruitment ..........................................................................................130 4.3.9. Board Chair Gender............................................................................................130 4.3.10. Employment Industry .........................................................................................131 4.3.11. Board Employees................................................................................................132 4.3.12. Board Corporation Type.....................................................................................133 4.3.13. Board Directors ..................................................................................................134
4.4. Discussion .................................................................................................................135 4.4.1. Highest Level of Education ................................................................................135 4.4.2. Managerial Level................................................................................................136 4.4.3. Total Directorships .............................................................................................136 4.4.4. Concurrent Directorships....................................................................................137 4.4.5. Director Position.................................................................................................137 4.4.6. Partner Relationship ...........................................................................................137 4.4.7. Basis of Recruitment ..........................................................................................138 4.4.8. Board Chair Gender............................................................................................138 4.4.9. Employment Industry .........................................................................................138 4.4.10. Board Employees................................................................................................139 4.4.11. Board Corporation Type.....................................................................................139 4.4.12. Board Directors ..................................................................................................139
4.5. General Discussion....................................................................................................140 4.6. Limitations and Future Research ..............................................................................142 4.7. Conclusion.................................................................................................................144

Experiences and Influences of Women Directors
Contents Page viii
Chapter 5
5. Stereotypes of Male and Female Directors ..............................................................146 5.1. Introduction ...............................................................................................................146
5.1.1. Stereotypes in the Workplace .............................................................................149 5.1.2. Hypothesis 1 – Men and Women Directors Share the Same Stereotypes ..........154 5.1.3. Hypothesis 2 – Stereotypes Differ on Physical Characteristics .........................154 5.1.4. Hypothesis 3 – Stereotypes Have Similar Personality Characteristics...............154 5.1.5. Hypothesis 4 – Stereotypes Have Similar Cognitive Characteristics.................155
5.2. Method ......................................................................................................................155 5.2.1. Sample Selection ................................................................................................155 5.2.2. Survey Design and Measures .............................................................................156 5.2.3. Method of Data Analysis....................................................................................157
5.3. Results .......................................................................................................................158 5.3.1. Women’s and Men’s Perceptions of Stereotypical Directors.............................158 5.3.2. Differences Between Female and Male Stereotype Characteristics...................161
5.4. Discussion .................................................................................................................162 5.4.1. Hypothesis 1 – Men and Women Directors Share the Same Stereotypes ..........162 5.4.2. Hypothesis 2 – Stereotypes Differ on Physical Characteristics .........................163 5.4.3. Hypothesis 3 – Stereotypes Have Similar Personality Characteristics...............165 5.4.4. Hypothesis 4 – Stereotypes Have Similar Cognitive Characteristics.................165
5.5. General Discussion....................................................................................................166 5.6. Limitations and Future Research ..............................................................................168 5.7. Conclusion.................................................................................................................170
Chapter 6
6. Nonexecutive Director Social Identity and Influence..............................................172 6.1. Introduction ...............................................................................................................172
6.1.1. Identification with the Board..............................................................................174 6.1.2. Perceived Ability to Contribute..........................................................................175 6.1.3. Board Dynamics and Perceived Ability to Contribute .......................................177 6.1.4. Significance of Gender .......................................................................................178
6.2. Method ......................................................................................................................179 6.2.1. Sample Selection and Size..................................................................................179 6.2.2. Dependent Measures...........................................................................................180 6.2.3. Independent Measures ........................................................................................185 6.2.4. Multiple Regressions ..........................................................................................187
6.3. Results .......................................................................................................................188 6.3.1. Regression 1: Identification with the Board.......................................................188 6.3.2. Regression 2: Perceived Ability to Contribute ...................................................189 6.3.3. Regression 3: Advice to the CEO and Director Characteristics.........................191 6.3.4. Regression 4: Advice to the CEO and Board Dynamics ....................................192 6.3.5. Regressions 5-7: Significance of Gender ...........................................................193
6.4. Discussion .................................................................................................................194 6.4.1. Identification with the Board..............................................................................194 6.4.2. Perceived Ability to Contribute..........................................................................198 6.4.3. Frequency of Advice to the CEO .......................................................................201 6.4.4. Significance of Gender .......................................................................................203
6.5. General Discussion....................................................................................................204 6.6. Limitations and Future Research ..............................................................................206 6.7. Conclusion.................................................................................................................208

Experiences and Influences of Women Directors
Contents Page ix
Chapter 7
7. Summary and Conclusions ........................................................................................210 7.1. Introduction ...............................................................................................................210 7.2. Study 1: Characteristics of Australian Women Board Directors ..............................212 7.3. Study 2: Nonexecutive Directors as a Distinct In-Group Category..........................213 7.4. Study 3: Longitudinal Study of Successful Women Directors .................................215 7.5. Study 4: Stereotypes of Male and Female Directors.................................................216 7.6. Study 5: Nonexecutive Director Social Identity and Influence.................................218 7.7. Limitations of the Research Program........................................................................219 7.8. Implications of the Research Program ......................................................................221 7.9. Suggestions for Future Research...............................................................................222 7.10. Conclusions ...............................................................................................................223
Bibliography .........................................................................................................................225
Appendices
Appendix A. Ethics Approval from the Human Research Ethics Committee...............247
Appendix B. 1995 Letter to Participants...........................................................................250
Appendix C. 1995 Survey Instrument ...............................................................................251
Appendix D. Alphabetical List of 1995 Survey Items and Derived Variables...............261
Appendix E. 2001 Women Participants Letters and Consent Forms.............................269
Appendix F. 2001 Survey Instrument for Women Participants.....................................273
Appendix G. 2001 Letters to Men Participants and Consent Forms..............................280
Appendix H. 2001 Survey Instrument for Men Participants ..........................................282
Appendix I. Alphabetical List of 2001 Survey Items and Derived Variables...............287
Appendix J. List of additional publications .....................................................................294

Experiences and Influences of Women Directors
List of figures Page x
List of figures
Figure 1.1 Women's representation on United States Fortune 500 companies ........................10
Figure 1.2 Psychological and behavioural continua related to social identity salience (after Haslam, 2001)...........................................................................................................................29
List of tables
Table 2.1 Sources and Response Rates for Women Directors Located for the 1995 Sample..45
Table 2.2 Director Age .............................................................................................................49
Table 2.3 Highest Level of Education ......................................................................................50
Table 2.4 Country of Birth .......................................................................................................51
Table 2.5 Immigration Year .....................................................................................................51
Table 2.6 Organisation, Occupation, and Employment Tenure ...............................................52
Table 2.7 Managerial Level of Full-Time Positions ................................................................54
Table 2.8 Senior Management Years .......................................................................................55
Table 2.9 Total Directorship Years .........................................................................................56
Table 2.10 Total Directorships .................................................................................................57
Table 2.11 Total Annual Salary................................................................................................58
Table 2.12 Total Directorship Remuneration...........................................................................59
Table 2.13 Director Position.....................................................................................................60
Table 2.14 Partner Relationship ...............................................................................................61
Table 2.15 Partner in the Same Industry ..................................................................................61
Table 2.16 Number of Dependent Children .............................................................................62
Table 2.17 Financial Responsibility for Children ....................................................................63
Table 2.18 Basis of Recruitment ..............................................................................................64
Table 2.19 Board Gender Proportion .......................................................................................65
Table 2.20 Work Colleagues Gender Proportion .....................................................................66
Table 2.21 Managerial Gender Proportion...............................................................................66
Table 2.22 Years Worked with Women Managers ..................................................................67
Table 2.23 Years Worked with Women Directors ...................................................................68
Table 2.24 Employment Industry .............................................................................................69
Table 2.25 Occupation Category..............................................................................................70
Table 2.26 Employment Employees.........................................................................................70
Table 2.27 Board Employees....................................................................................................71
Table 2.28 Board Corporation Type.........................................................................................72

Experiences and Influences of Women Directors
List of tables Page xi
Table 2.29 Board Directors ......................................................................................................73
Table 2.30 Board Meeting Frequency ......................................................................................74
Table 2.31 Director Time Commitment ...................................................................................74
Table 2.32 International Comparisons of Director Ages..........................................................76
Table 2.33 International Comparisons of Education ................................................................77
Table 2.34 International Comparisons of Marital Status..........................................................77
Table 2.35 International Comparisons of Numbers of Children ..............................................78
Table 2.36 International Comparisons of Salaries ...................................................................79
Table 3.1 Psychometric Data for Each Multi-item Scale Measure ..........................................95
Table 3.2 Logistic Regression Analysis for Nonexecutive versus Executive Directors ..........97
Table 4.1 Director’s Agreement to Follow-Up by Highest Level of Education ....................115
Table 4.2 Director’s Agreement to Follow-Up by Total Annual Salary ................................116
Table 4.3 Director’s Agreement to Follow-Up by Managerial Level ....................................116
Table 4.4 Director’s Agreement to Follow-Up by Employment Industry .............................117
Table 4.5 Women Director Responses by Total Directorship Remuneration ........................121
Table 4.6 Director Age in 1995 and 2001 ..............................................................................124
Table 4.7 Highest Level of Education in 1995 and 2001 .......................................................124
Table 4.8 Managerial Level in 1995 and 2001.......................................................................125
Table 4.9 Total Directorships in 1995 and 2001 ....................................................................126
Table 4.10 Concurrent Directorships in 1995 and 2001.........................................................127
Table 4.11 Director Position in 1995 and 2001......................................................................129
Table 4.12 Partner Relationship in 1995 and 2001 ................................................................129
Table 4.13 Basis of Recruitment in 1995 and 2001 ...............................................................130
Table 4.14 Board Chair Gender in 1995 and 2001.................................................................131
Table 4.15 Employment Industry in 1995 and 2001 ..............................................................132
Table 4.16 Board Employees in 1995 and 2001.....................................................................133
Table 4.17 Board Corporation Types in 1995 and 2001 ........................................................134
Table 4.18 Board Directors in 1995 and 2001 .......................................................................135
Table 5.1 Attributes included in Gender-Stereotypic Dimensions.........................................156
Table 5.2 Alpha Coefficients of Gender-Stereotypic Dimensions .........................................157
Table 5.3 Women’s and Men’s Perceptions of a Stereotypical Female Director...................159
Table 5.4 Women’s and Men’s Perceptions of a Stereotypical Male Director ......................159
Table 5.5 Statistics for the Mixed Between-Within Subject Analysis of Variance ...............160
Table 5.6 Women’s Perceptions of Female and Male Director Stereotypes..........................161
Table 5.7 Men’s Perceptions of Female and Male Director Stereotypes ...............................162
Table 6.1 Correlations between Minority Influence Scale Items ...........................................183
Table 6.2 Correlations between Dependent Variables ...........................................................184

Experiences and Influences of Women Directors
List of tables Page xii
Table 6.3 Dependent Variable Correlations with Director Characteristics ............................185
Table 6.4 Dependent Variable Correlations with Board-Related Characteristics ..................187
Table 6.5 Correlations between Identification with the Board Regression Variables............188
Table 6.6 Multiple Regression Coefficients for Identification with the Board ......................189
Table 6.7 Correlations between Perceived Ability to Contribute Variables ..........................190
Table 6.8 Multiple Regression Coefficients for Perceived Ability to Contribute ..................190
Table 6.9 Correlations between Frequency of Advice to the CEO Variables........................191
Table 6.10 Multiple Regression Coefficients for Frequency of Advice to the CEO..............192
Table 6.11 Correlations between Frequency of Advice to the CEO Variables......................192
Table 6.12 Multiple Regression Coefficients for Frequency of Advice to the CEO..............193
Table 6.13 Dependent Variable Correlations with Gender-Related Variables ......................194

Experiences and Influences of Women Directors
Chapter 1. Introduction Page 1
Chapter 1
1. INTRODUCTION
Researchers comment on the inequitable representation of men and women on corporate
boards as the pinnacle of the glass ceiling phenomenon (Bradshaw & Wicks, 2000; Daily,
Certo, & Dalton, 2000; Israeli & Talmud, 1997), however some women do gain appointments
as board members and some appear to be quite successful. Extensive research over many
years, commencing with Burson-Marsteller (1977) in the U.S.A., and as recently as the Equal
Opportunity in the Workplace Agency (EOWA, 2002) in Australia, document the poor
representation of women on corporate boards. Some organisations provide annual surveys of
corporate directors, noting the slightly positive but unencouraging trends to gradually appoint
more women directors. For example, Catalyst (1998c) regularly surveys the U.S. Fortune 500
corporations and Korn/Ferry International (1999) regularly surveys large Australian
organisations. Several researchers propose arguments for the value of women on corporate
boards, although such arguments seem to rely on few studies providing empirical evidence
and few theoretical arguments (Burke & Mattis, 2000).
The present research takes a somewhat different approach from the “looking-from-the-
outside-in arguments” of most researchers in the topic. Little appears to be known about those
few women who do achieve board membership, how they view themselves, and how effective
they may be at influencing board decisions. The present research seeks a more detailed
understanding of women who are apparently successful board directors.
An improved understanding of how boards are structured and how women successfully
operate within them should assist the construction of arguments for women that are persuasive
to corporate boards. Successful arguments for women directors require an approach that
appeals to current male-dominated corporate boards, which may be counter to the general
“diversity is good” argument. Observations of successful women’s characteristics may also

Experiences and Influences of Women Directors
Chapter 1. Introduction Page 2
guide individual women in demonstrating appropriate characteristics to make them more
desirable as board members.
The present research project; (a) surveys a significant sample of women who are
directors of corporate boards, (b) confirms that nonexecutive directors are a distinct category
of directors, (c) observes changes in their characteristics over six years, (d) seeks an
understanding of these women through the stereotypes they hold about themselves and male
directors, and (e) examines aspects of their identification with the board and their potential to
influence the board.
1.1. Corporate Boards and their Directors
As a background to the issue of women directors, it is worthwhile to review current
understandings of corporate boards and their directors.
1.1.1. Boards of Governance
Corporate governance is subject to extensive research by business and academia to find
optimal ways of achieving competitive advantage (Fleischer, Hazard & Klipper, 1988;
Francis, 1997; Gillies, 1992). Bosch (1995) defined a board of directors as the peak governing
body of a company that is responsible for the continuing success of the organisation. Bosch
(1996) emphasised that directors wield ultimate power and influence over the direction of the
company, with ramifications for shareholders, employees, and the industry. Elgart (1983)
described how through board initiatives and approvals, company policy and procedures are
created or changed, new products developed, and new markets entered.
Coulson-Thomas (1993) suggested the personal attributes for the ideal director might
include such characteristics as integrity, wisdom, authority, judgement, leadership, courage,
independence, tact, diplomacy, and optimism. Mace (1971) emphasised that directors need
practical competencies and skills, including knowledge of financial and ethical aspects of
business, and vision of business strategy and policy. Izraeli and Talmud (1998) claimed that

Experiences and Influences of Women Directors
Chapter 1. Introduction Page 3
most directors are generalists that are expected to exhibit good judgement and broad
perspective; people with a varied business background who can make good decisions in
uncertain times, whilst managing the expectations of stakeholders.
Bosch (1995) suggested that the knowledge, skills, and abilities of directors largely
determine the quality of board decisions and the commitment of the directors. Bosch (1996)
noted that, in Australia, the demands on company directors to date have been marginal, but
the growing competitiveness of industry has resulted in performance pressures on these elite
groups. Gillies (1992) argued that to maintain and enhance the quality of corporate
governance, it is important for the composition of the board of directors to reflect current
knowledge and business practices.
Management and boards of directors may not see the role of the board in exactly the
same way. Mace (1971) suggested that management should consider the board a source of
advice and counsel, whereas Parkinson (1993) claimed that owners and other stakeholders
consider that the board should monitor the quality of management decision making. Hill
(1995) suggested that successful boards balance the managerial view of boards with the
monitoring and financial control desired by the owners. Cassell (1997) suggested that, as in
other levels of organisational functioning, corporate boards appear to benefit from diversity.
1.1.2. Roles of Board Directors
The definitions of the roles of directors are broad, involving many and varied tasks,
situations, and relationships. Izraeli and Talmud (1998) stated that a director needs to
demonstrate accountability to stakeholders, and contribute to the resolution of internal
problems and conflicts in the organisation.
Directors of corporate boards perform three fundamental functions: monitoring or
control, service or advice, and resource dependence or resource acquisition (Lorsch &
MacIver, 1989). In the monitoring or control role, directors act as representatives or
fiduciaries of the stockholders, ensuring that CEO and top management performance reflects

Experiences and Influences of Women Directors
Chapter 1. Introduction Page 4
external interests. The service or advice role is based on directors holding relevant and related
experience to guide corporate strategy and advise the CEO and top managers on
administrative and other managerial issues. Johnson, Daily, and Ellstrand (1996) elaborated
on the resource dependence or resource acquisition role as a means of facilitating the
continuance or acquisition of resources critical to the corporation’s success. Directors’
independence from top management, especially independence of the CEO, was regarded as a
major factor in their effectiveness in performing these roles.
1.1.3. Different Types of Directors
The present research program examined factors relating to types of directors, as the
different types may have significant differences. For example, directors who are perceived as
independent from the CEO may have greater power than those that are regarded as
subservient to the CEO.
Directors of boards are commonly classified as either of two types. In Australia, the two
types are called nonexecutive directors and executive directors (Korn/Ferry International,
1999), however the terms for these two types of directors vary from country to country. In the
United States, a nonexecutive director is often called an outside or outsider director and an
executive director is often called an inside or insider director (Catalyst, 1998c). In Canada, the
respective terms for nonexecutive and executive directors are unrelated and related directors
(Catalyst, 1998b). In the U.K., the two types of directors are also called nonexecutive
directors and executive directors (Holton, 2000), although there appears to be differences in
roles from their Australian counterparts.
Subtle differences in the relative power and status of executive directors and
nonexecutive directors that are apparent between countries probably reflect varying role
expectations and governance structures. For instance, Holton (2000) commented on the “less
important” nonexecutive director’s role in the U.K, whereas Australians generally consider
the nonexecutive directors along with the CEO to have the important roles. Although both
Experiences and Influences of Women Directors
Chapter 1. Introduction Page 5
Canada and Australia have similar proportions of executive directors (25%) and nonexecutive
directors (75%) on public companies, these two countries differ greatly in the proportions on
private companies (Catalyst, 1998b; Korn/Ferry International, 1998). In Australia, 50% of the
directors on private companies are nonexecutive directors, whereas in Canada there are few
nonexecutive directors on private companies.
The position of chair of the board also differs across countries, again reflecting different
governance structures. Korn/Ferry International (1998) reported that in the United States, 80%
of boards appoint the CEO as chair, whereas in the U.K. about 20% of boards appoint the
CEO as chair, and in Australia only 8% of boards appoint the CEO as chair. In Australia and
to a lesser degree the U.K., one of the nonexecutive directors is usually appointed as the chair
of the board.
For the present research program, an important distinction between nonexecutive
directors and executive directors is that boards may freely choose nonexecutive directors
whereas executive directors are on the board due to the particular position that they hold in
the organisation. Thus, becoming an executive director is a process of climbing the corporate
hierarchy, for which the difficulties for women are described by the phrase, the glass ceiling
(Powell & Butterfield, 1994). A nonexecutive director is a discretionary appointment, so this
avenue of gaining board membership appears to be a useful alternative for women who would
otherwise be limited by executive promotion through their employment organisation.
1.1.3.1. Nonexecutive Directors
Nonexecutive directors are not employees of the organisation in any capacity other than
as a member of the board of directors (Francis, 1997). Kesner (1988) reported that
nonexecutive directors typically are senior executives, especially the CEOs, of other
organisations. Daum (1994a) reported that nonexecutive directors typically bring extensive
product or industry knowledge and other value to the company through previous senior
executive experience, contacts, and political astuteness. Daum suggested that nonexecutive

Experiences and Influences of Women Directors
Chapter 1. Introduction Page 6
directors should be unrelated to the CEO and independent from the actions of top
management.
In the United States, a subcategory of nonexecutive directors called affiliated directors
has been defined to identify outside directors who have a personal or professional interest in
the actions of the CEO and top management. In Australia, the concept of affiliated
nonexecutive directors is not formally recognised, although listings of affiliations that
directors hold are published that show connections with other organisations that may be
interested in the actions of the CEO and top management (Korn/Ferry International, 1999).
Hill (1995) suggested that nonexecutive directors on U.K. boards often represent the interests
of institutional shareholders, but will usually not be employees of the institutions to avoid
conflicts of interest that might otherwise arise.
1.1.3.2. Executive Directors
Executive directors are employees of the organisation and achieve board membership
because of their position in the organisation. Kesner (1988) stated that typically the CEO and
the chief finance officer (CFO) would be executive directors. Catalyst (1998c) defined inside
directors as officers of a company who serve as members of its board who may be people that
hold senior appointments in the company, or they may be the owners or family members of
the owners. Kesner (1988) noted that “insiders” could also be retired executives of the
company. Bilimoria and Piderit (1994) also included relatives of current and former directors
in their definition of inside directors. Although executive directors offer the board high levels
of familiarity with policy, procedures, and staff, they hold appointments on the board because
they either work for the company or are one of the owners.
In summary, there are differences between nonexecutive directors and executive
directors between different countries and particularly the relative power of nonexecutive
directors and executive directors. However, for the present research it is assumed that
nonexecutive directors are not employed by the organisation in any capacity other than as a

Experiences and Influences of Women Directors
Chapter 1. Introduction Page 7
board director, while executive directors are employees of the organisation, particularly its top
management and the CEO. The distinctiveness of nonexecutive directors as a classification in
Australia is tested in Chapter 3.
1.1.4. Composition of Corporate Boards
The average number of directors on boards of large Australian corporations has been
stable over fifteen years at eight members, with two executive directors and six nonexecutive
directors (Korn/Ferry International, 1995, 1999). Private companies have fewer directors than
public corporations, with typically three executive directors and three nonexecutive directors.
As Australian companies grow in size, the number of nonexecutive directors increases, but the
number of executive directors typically remains constant. Bosch (1995) reported that the size
of Australian boards is comparable to those in the United Kingdom and New Zealand, but
smaller than boards of the United States. In the United States, the average size of a board is
twelve members, although the number of directors on boards is reducing (Catalyst, 1998c).
In Australia, there is an emphasis on improving the proportion of nonexecutive directors
on boards. Korn/Ferry International (1994) reported that nonexecutive director appointments
have increased from 30% at the beginning of the 1980s to 75% in 1994. Francis (1997)
suggested that the increased demand for nonexecutive directors reflects (a) a growing
recognition of board responsibilities; (b) a growing perception of director accountability; and
(c) a need for broad, objective, and independent views.
Although the size of boards in Australia is more similar to that of Great Britain than the
United States, board ratios of nonexecutive and executive directors in Australia are more
consistent with the United States. In Britain, executive directors appear to occupy twice as
many board seats as their counterparts in Australia (Hill, 1995). Nevertheless, Bosch (1995)
suggested that all three countries show a trend towards increasing the number of nonexecutive
directors on the board.

Experiences and Influences of Women Directors
Chapter 1. Introduction Page 8
In Australia, Bosch (1995) reported that the proportion of nonexecutive directors is
higher in publicly listed companies, statutory corporations, credit unions, and charities than
private companies, or subsidiaries of overseas companies. Korn/Ferry International (1997a)
reported that privately held companies tend to have equal numbers of nonexecutive and
executive directors. In all private organisations, the managing director or CEO and the
financial director usually hold executive director appointments, whereas government boards
typically are comprised of nearly all nonexecutive directors, sometimes even excluding the
CEO. Korn/Ferry International (1997a) found that of government boards in Australia, 25%
did not include the CEO, and in New Zealand, only 14% of government boards included the
CEO as a member of the board.
In pursuit of greater independence for boards, a nonexecutive director may be appointed
as board chair. Korn/Ferry International (1997a) found that in Australia, 92% of respondents
had a nonexecutive chair, rising to 98% in the largest publicly listed companies. In contrast,
Korn/Ferry International reported that a nonexecutive director is appointed as chair of the
board in only 14% of companies in the United Kingdom and 19% of companies in the United
States.
In summary, Australian corporate boards reflect a combination of characteristics found
in boards of other countries. Australian corporate boards are smaller than United States
boards, but are similar to the board sizes found in other countries, particularly the United
Kingdom and New Zealand. Australian corporate boards have a similar composition of
nonexecutive directors and executive directors to the United States, although the composition
differs from other countries such as the United Kingdom. Australian corporate boards appear
to lead the way in separate appointments for the chairman and the CEO, a separation of roles
towards which other countries are still moving. As a whole, Australian corporate boards show
sufficient similarities to make comparisons with other countries a useful exercise, however as
all countries also show variations, simple comparisons are not a basis for firm conclusions.

Experiences and Influences of Women Directors
Chapter 1. Introduction Page 9
Comparisons are made between the sample used in the present research program and the
composition of corporate boards in Australia that has been documented by other researchers.
Characteristics of boards reported by women directors in the present research would be
expected to be similar to those reported by other researchers.
1.1.5. Diversity through Minority Board Directors
Many researchers advocate greater demographic diversity and in particular for more
women on boards (Bilimoria & Wheeler, 1997; Bradshaw & Wicks, 2000; Daily, Certo, &
Dalton, 2000l; Israeli & Talmud, 1997). Burke and Mattis (2000) described the growing body
of research that focuses on the potential for women to contribute to optimal corporate
governance, and the difficulties women face in becoming board members to demonstrate their
potential. However, as Sheridan (2001) argued, little is known about what prompts individuals
to become members of boards or how women come to be accepted on boards of directors.
Corporate boards are often viewed as homogeneous groups, commonly of men
(Leighton & Thain, 1993), who are part of an elite group who share board memberships,
socioeconomic backgrounds, university education, educational and professional training, and
views on business (Useem, 1984).
1.2. Women as Minority Board Directors
The majority of literature on women board directors is concerned with the low levels of
representation of women compared to men. The apparent assumptions are that a higher
proportion of women is desirable and that a convincing enough argument will cause
corporations to change board appointment practices to more readily accept women (Burke &
Mattis, 2000). Women board directors are often nonexecutive directors, and new women
directors are likely to continue to be nonexecutive directors until significant numbers of
women executives reach CEO or CFO status. Unfortunately as Johnson et al. (1996) found
there are no proven arguments for the value of nonexecutive directors to corporate

Experiences and Influences of Women Directors
Chapter 1. Introduction Page 10
governance, regardless of their gender. Mattis (2000) reported that despite the lack of
evidence to support a business case, corporate boards and CEOs are slowly accepting the
proposition that women nonexecutive directors are positive for corporate governance.
1.2.1. Numbers of Women on Boards of Directors
The two commonly reported statistics about women’s board representation are the
percentage of board seats held by women, and the percentage of organisations that have a
woman on their board (Singh & Vinnicombe, 2001). Research by Catalyst (1998c) shows a
much lower percentage of board seats held by women than the percentage of companies with
a woman on their board (see Figure 1.1).
Figure 1.1 Women's representation on United States Fortune 500 companies
Data from Catalyst documents the difference between the percentages of Fortune 500
board seats held by women and the numbers of Fortune 500 companies with one or more
women on their board. Catalyst (1998c) suggested a positive trend, with the number of
Women's Representation on U.S. Fortune 500 Companies (Catalyst, 1998c)
0
50
100
150
200
250
300
350
400
450
500
1993 1994 1995 1996 1997 1998
Year
0
10
20
30
40
50
60
70
80
90
100
Estimated One Woman Two Women Three or more % Board Seats
Fort
une
500
com
pani
es w
ith a
wom
an d
irect
or
% T
otal
boa
rd s
eats
hel
d by
wom
en

Experiences and Influences of Women Directors
Chapter 1. Introduction Page 11
companies with a woman board director rising from 69% in 1993 to a relatively healthy 86%
in 1998. However, the trend for total number of seats held is not impressive, with the total
number of seats held by women rising from 8.3% in 1993 to a meagre 11.1% in 1998. One
can understand researchers’ disappointment with the number of appointments of women
directors. Clearly, men occupy most board seats; prompting researchers to suggest that the
few women appointed to boards are likely to be “tokens” (Bilimoria, 2000; Scherer, 1997;
Webber, 1996). Australia also exhibits low representation of women on board seats
(Korn/Ferry International, 1999) with women comprising 8.3% of all directors, and only 1.3%
of executive directors.
1.2.2. International Comparisons
Detailed comparisons between the statistics across countries are problematic due to
large differences in the survey samples. For instance, in the United States, researchers
commonly use the Fortune 500 as routinely surveyed by Catalyst as a sample population.
However, when Catalyst (1998b) attempted to replicate their research in Canada using the
Financial Post 500 as the source of a sample they found serious shortcomings compared to the
Fortune 500. Catalyst attempted to compensate by introducing additional organisations into
their sample (the top 20 financial institutions, top 20 life insurance companies, and the top 20
crown companies). The attempt to compensate for the different samples was of such limited
success that Catalyst (1998b) reported many of the statistics separately for the different
groups. Although Catalyst made comparisons between their adjusted Canadian sample and the
Fortune 500 sample, it is not clear that such comparisons are valid.
The size of the companies making up the Fortune 500 are so large that they dwarf the
companies that necessarily make up the samples in other countries. As the Fortune 500
companies are so large, it is questionable whether a comparison between the Fortune 500 and
any sample from another country will be a valid comparison between countries. Any such
comparison is likely to be clouded by the differences between the sizes of the organisations in

Experiences and Influences of Women Directors
Chapter 1. Introduction Page 12
the samples. For instance, one of the most widely reported indicators that an organisation will
have a women director is a large organisation size (Burke, 2000a; Catalyst, 1998b; Harrigan,
1981; Singh & Vinnicombe, 2001), however the relationship between organisation size and
the presence of a woman director is bound to vary across countries.
In summary, comparisons of women’s representation across countries are fraught with
difficulties, of which a great difficulty will be the different sizes of organisations in the
respective samples. To make meaningful comparisons between countries, great care needs to
be taken to hold other significant factors constant.
1.3. Studies of Women Corporate Directors
1.3.1. Reviews of Research on Corporate Boards
Whereas extensive research has been conducted into women’s managerial advancement
(Burke & McKeen, 1992; Mainiero, 1994a; Tharenou, 1997b; Ragins & Sundstrom, 1989),
few studies have considered the status of women who are directors of corporate boards (Burke
& Mattis, 2000). Studies of board directors that do not make distinctions of gender are
relatively frequent (as described in Johnson, Daily & Ellstrand, 1996, and Pettigrew, 1992),
however studies of women corporate directors are less frequent (Bilimoria & Wheeler, 1997;
Burke & Mattis, 2000).
Bilimoria and Wheeler’s (1997) review recommended that more empirical research
needed to be undertaken on corporate women directors, and suggested that consideration of
boardroom dynamics, particularly changes to boardroom structures and practices were needed
to improve women's status and representation. Bilimoria’s (2000) recent review of empirical
studies on the area concluded that the lack of theoretically rigorous studies impeded the
discovery of patterns and conclusions regarding women’s value on corporate boards. The
shortage of theoretically based studies may reflect general limitations in theoretical
approaches to research on women in management raised by Fagenson (1990a).

Experiences and Influences of Women Directors
Chapter 1. Introduction Page 13
Overall, so little rigorous research exists that Bilimoria (2000) stated that there has been
little advancement in understanding about the antecedents, dynamics and consequences of
gender diversity on boards, despite several years of publications of demographics and other
empirical surveys. Reviews highlighted the need for further studies of women on corporate
boards, although they differ as to recommended priorities and methodologies for future
research. The lack of studies on Australian women company directors and the absence of
detailed empirical data suggested the value of a research program to examine aspects of
women directors’ status on corporate boards in Australia.
1.3.2. Reports from Industry Surveys
Commercial surveys such as Ashridge in the U.K. (Holton, Rabbetts & Schrivener,
1993), Catalyst in the U.S. (1998c) and Canada (1998b), and Korn/Ferry International (1999)
in Australia and New Zealand regularly provide demographic data on women’s representation
on company boards. In Australia, Korn/Ferry International conducts an annual survey of over
100 organisations, including 35 companies with a turnover of more than $1.5 billion, that
covers most industry groupings, to monitor boards, directors’ issues, and demographics. As
part of Korn/Ferry International’s surveys, they include a brief section on women directors is
included. In the United States, Catalyst collects data annually on the Fortune 500 companies,
focussing on women’s representation on company boards. Catalyst recently commenced an
annual Canadian survey, also focussing on women’s representation on company boards by
collecting data from the Financial Post 500 plus the top 20 financial, 20 life insurance, and 20
public (crown owned) companies. The Ashridge Management Group (Holton, 2000) surveys
the United Kingdom Times Top 200 companies every four years, examining trends in
women’s representation on company boards. The commercial surveys are a rich source of
longitudinal data on the trends in board composition, and basic demographics on the
characteristics of women ion the boards surveyed.

Experiences and Influences of Women Directors
Chapter 1. Introduction Page 14
1.3.3. Women Directors across Industry Categories
Many authors have established that women directors have not been appointed to
company boards uniformly across all industry sectors (for example, Mattis, 1997, in the
United States, Holton et al., 1993, in the United Kingdom, McGregor, 1997, in New Zealand,
and Izraeli & Talmud, 1997, in Israel). Elgart (1983) suggested that women directors are
absent from the boards of companies in certain industries because women directors were more
likely to be appointed to industries servicing women and in certain industries the companies
were larger rather than smaller. Other reasons given have been that some industries (a) are
more progressive than others (Harrigan, 1981), (b) are in later phases of the product life cycle
(Fryxell & Lerner, 1989), (c) have female-oriented managerial hierarchies (Harrigan, 1981),
(d) market to women consumers (Mitchell, 1984), (e) have a need to comply with equal
employment legislation (Korn/Ferry International, 1993), or (f) have a need for companies to
appear as women-friendly or socially-responsible organisations (Ibrahim & Angelidis, 1993).
Mattis (1997) provided examples of the sort of organisations in the United States and Canada
that appoint women directors as companies producing soap, cosmetics, toys, sporting goods,
drugs, and banks and insurance firms. Holton & Rabbetts (1989) found that women directors
were less likely to be appointed to industries with majorities of male employees such as
communications, transportation, manufacturing, energy, or engineering companies.
In Australia, Korn/Ferry International (1995) found that women have highest
representation in industries with a substantial percentage of female employees such as in
finance and investment areas (27%), and retail and services areas (18%). The smallest
representation of women directors is in industries that have a majority of male employees
such as transport and distribution (3.4%), and mining and resources (1.2%). The finance and
investment industries, and retail and service industries, in directing their marketing efforts to
women, may have found it useful to have women board members.

Experiences and Influences of Women Directors
Chapter 1. Introduction Page 15
1.3.4. Analyses of Women’s Representation on Boards
Several empirical studies have analysed archival data or secondary data in an attempt to
extend the understanding of women's board representation (Burke & Kurucz, 1998; Kesner,
1988; McGregor, 2000; Conroy, 2000; Mitchell, 1984). Two of the studies (Burke, 1995;
Mattis, 1993) provided detailed analysis of United States data from Catalyst (1993). Other
studies have used survey methodology to seek responses from the women (Burke, 1994b;
Pajo, McGregor & Cleland, 1997; Sheridan, 2001). Researchers conclude that the profile of
women company directors was moving towards well educated, professional directors, and
there were increasing opportunities for women to advance to corporate director positions.
In the early 1980's, Mitchell (1984) analysed the situation in Canada based on a survey
of 384 corporations obtained from commercial directories of directors, annual reports, and
media surveys. Mitchell’s Canadian study provided information on directorships by industry
sector, the reasons women directors thought they had been appointed to the board, and their
views of their contributions to boards. The study also described factors of satisfaction and
dissatisfaction for the women directors sampled. Mitchell was encouraged by a significant
positive change in the small numbers of women directors, arguing that it demonstrated a
change in corporate attitudes.
Burke and Kurucz (1998) reported on a more recent Canadian study of demographic
data about women directors based on published information from the report on Business Top
1,000 Canadian companies for 1996 and the 1997 Financial Post Directory of Directors. Data
collected included current job title, age, education level, marital status, and type of board
appointment held. Burke and Kurucz lamented the relative absence of women on corporate
boards, despite their sample being such a talented, educated, and successful group.
Stephenson and Rakow (1993) published the only study that specifically examined
women who held multiple board appointments. Directors were identified through published
directories from Dun and Bradstreet and Standard and Poor, and were based on the largest

Experiences and Influences of Women Directors
Chapter 1. Introduction Page 16
corporations in the United States at that time. The demographic characteristics of the women
were analysed by primary occupation, education level, and broad industry type. Women
directors were believed to facilitate information transfer within a network of companies. It
was found that multiple directorships were held either in the same industry (e.g., two financial
institutions) or in different industries with a clear association (e.g., financial and industrial).
Stephenson and Rakow concluded that, in proportion to their overall numbers, women were
more likely to be directors in industries where companies had a relatively high inter-
dependence (such as retail and utilities) than in industries where companies were relatively
independent of each other (such as service, transport, and banks).
1.3.5. Correlation and Regression Studies
Only a few studies were found that used multivariate statistics to examine aspects of
women’s board status (Bilimoria & Piderit, 1994; Fryxell & Lerner, 1989; Harrigan, 1981;
Ibrahim & Angelidis, 1994; Kesner, 1988; Talmud & Izraeli, 1998).
Harrigan (1981) conducted a landmark study of 112 companies that examined the
proportion of women on company boards compared to company sales volume, total number
of employees, board type, and ratio of female managers to total managers. A probability
model constructed by Harrigan indicated that the average probability of a firm electing at least
one woman director was 20.5% based on size. The larger a firm was in sales volume, the
more likely a female director was to be appointed. Female director appointments were
positively related to the ratio of female managers to total managers. The study examined the
appointment of both executive and nonexecutive directors, and found that there was a greater
probability of women executive directors being appointed in smaller rather than larger firms.
Women were more likely to be members of boards in companies with higher sales volume
and with a high ratio of women middle managers, but executive directors were more likely to
come from companies with fewer employees. Hence, Harrigan (1981) found that organisation

Experiences and Influences of Women Directors
Chapter 1. Introduction Page 17
size and the extent of women in the management hierarchy were positively related to having
women directors on boards.
Fryxell and Lerner (1989) examined both organisational and social responsiveness
aspects of boards. The study considered representation of both women and other minorities in
senior management, and on boards of directors, correlating representation with company
performance for 113 United States companies listed by the Council for Economic Priorities.
Significant correlations were found between numbers of women on the board and other
minority representation. Multivariate analysis of financial performance, organisational
characteristics, and environmental characteristics indicated that the representation of women
on boards was positively associated with advertising intensity and organisation size. The
findings of Fryxell and Lerner were consistent with those of Harrigan (1981), who found that
women's representation on boards of larger firms was greater than on boards of smaller firms.
Kesner (1988) explored board director’s representation on corporate boards by
examining director types, director tenure, and gender in relation to subcommittee
membership. Kesner’s sample comprised 250 companies from the Fortune 500 of 1983,
across 27 different industries, with chi-square analysis used for initial tests and multivariate
modelling used in subsequent analyses. Kesner found that gender was not related to
membership of committees within boards, however women were less likely to serve on
executive committees. Furthermore, due to their having less progression in the corporate
world compared to men, women were more likely to be appointed as outsider directors, be
from business backgrounds, and have less tenure.
Bilimoria and Piderit (1994) further examined women's board roles by conducting a
follow-up study inspired by Kesner (1988). Logistic analysis was used to test specific
hypotheses predicting aspects of board subcommittee membership. Although Bilimoria and
Piderit used a similar sample to Kesner, some of their findings differed. Bilimoria and Piderit
found male directors had a higher likelihood of membership of a compensation committee

Experiences and Influences of Women Directors
Chapter 1. Introduction Page 18
than did female directors, and male nonexecutive directors were preferred over female
nonexecutive directors for audit committees. Women directors’ board experience was equal or
greater than that of their male counterparts and women directors were in non-business
occupations more often than male directors were. However, similar to Kesner, Bilimoria and
Piderit found that female directors had less board tenure and were appointed more often as
outsider directors than insider directors compared to male directors. Bilimoria & Piderit
(1994) suggested the results show a pattern of bias following traditional sex-gender typing.
Male directors were over-represented on committees related to central governance issues,
whereas men and women directors were represented equally on committees perceived as
dealing with less central governance issues. Overall, Bilimoria and Piderit concluded that
there appeared to be evidence of gender-based bias in selection, with male directors selected
for the most important committees and women directors selected for lower status committees
associated with the company’s social standing.
Ibrahim and Angelidis (1994) examined 398 male and female directors for gender
differences in directors' levels of corporate social responsiveness. Ibrahim and Angelidis used
ANOVA techniques to establish that differences existed between men and women in relation
to economic and discretionary components of their Corporate Social Responsiveness
Orientation Scale. The study found that women directors were more philanthropically driven
compared to more economically driven male directors. Both male and female directors were
similar on the legal and ethic dimensions of corporate governance. The finding of greater
sensitivity exhibited by women directors to corporate social responsiveness is backed up by
the observation by other researchers that social sensitivity appears to be a major reason for the
appointment of women to boards (Bilimoria, 2000; Selby, 2000).
Talmud and Izraeli (1998) published a study on the issues of director performance for
women and men in Israel using a multivariate design. The sample consisted of 98 women and
127 men who responded to a survey sent to companies listed by the Tel Aviv stock exchange.

Experiences and Influences of Women Directors
Chapter 1. Introduction Page 19
The study examined structural and institutional factors as explanations for differences
between men and women directors’ concerns about board performance, using hierarchical
linear regression analysis. Women directors were more concerned about their skill levels as
directors and felt a greater need to prove themselves when compared to male directors. Men,
in contrast, were concerned about obtaining sufficient information to fulfil their role as a
director.
Overall, there appears to be a lack of focus and a corresponding lack of theoretical
framework with correlation and regression studies of women directors. The themes were an
interest in subcommittee membership, the type of companies that have woman directors on
the board, and associations between the presence of women directors and the integrity of
corporate governance.
1.3.6. Interview-Based Studies
Several qualitative studies examined the personal experiences and contribution of
women directors to boards. Bilimoria and Huse (1997) conducted a qualitative study
comparing experiences of two women members of boards of directors of corporations from
each of the United States and Norway. The four women reported their contributions as (a)
providing new ideas; (b) providing broadness of perspective; (c) satisfying stakeholder
pressures; (d) building positive relationships; (e) providing resources and intelligence; (f)
focusing on issues and concerns not usually part of board business, including women's issues;
and (g) providing a role model to women employees of the company. The Norwegian women
directors were more aware of gender-related boardroom processes and structures, and were
more openly feminist in terms of what they expressed. The two United States women
directors, in contrast, emphasised fitting into the expected behaviours of the corporate world.
The two Norwegian women directors made explicit comments about sexual behaviours as a
norm in the boardroom and were aware of exclusion dynamics on the board. The two United
States women directors were more focused on being professional and gaining power and

Experiences and Influences of Women Directors
Chapter 1. Introduction Page 20
respect, and were conscious of uneven gender based power distributions but denied the
existence of any cliques which excluded them. It is unclear how likely the authors considered
that the views expressed by these four women were representative of inherent cultural
differences or how much they were the coincidental views of two women from each country.
Vinnicombe, Singh, and Sturges (2000) interviewed a sample of twelve directors (six
women and six men) from a British telecommunications company about their career
development experiences to ascertain explanations for their career achievements. Interviews
of 1½ hours with each director were analysed to gain an understanding of the individual
experiences of the directors through identifying common concepts and themes. Three career
development factors emerged from the interview analysis: finding a mentor, taking on
challenges, and becoming visible. The conclusions of the research were that the career
development patterns were similar for both genders of directors in the company examined.
Huse (1998) conducted a study of 20 women company directors in Scandinavia. The
study used group discussion and interviews to obtain data about the women's backgrounds,
their board experiences, and advice that should be given to women seeking board
appointments. The women participating in the sample were between 40-50 years of age, with
two respondents over 60 years. Fourteen of the women had industry experience and college
level education. Five of the women held graduate university degrees (law, management, or
political science) and one held a PhD. The women's backgrounds included banking, financial
services, sports administration, public administration, large corporations, and management
consulting. The boards on which women in the sample were appointed included the largest
corporations in Norway and Sweden, as well as boards of small privately owned firms,
universities, banks, service industries, sports, public companies, and particular event boards.
The majority of women were married, one had never married, and four were divorced. Seven
of the women had children, and two were grandmothers. Huse’s profile of the Scandinavian

Experiences and Influences of Women Directors
Chapter 1. Introduction Page 21
women directors as middle aged, well educated, highly experienced, married women with
children, is consistent with women directors from other countries.
Huse (1998) used narrative story-telling analysis to identify several themes that were
then grouped. The women’s perceptions of things that were important to male directors were:
(a) nurturing of contacts, (b) maintaining “old boy’s” networks, (c) authority, (d) prestige,
(e) power, and (f) creating alliances. The women’s perceptions were that (a) tokenism could
be made to work to their advantage, (b) sacrifices in social life were necessary, (c) they were
wiser and more diligent about board business than were male directors, (d) they created a
respect for soft "values", and (e) they created a respect for women's contribution to the
boardroom. Women perceived that they were excluded from cliques, that they sought
companionship and support from other women on the board, and that sexual dynamics in the
boardroom were always present. In terms of advice to women seeking board appointments,
the women stressed the need for candidates to be active and visible in forums related to board
opportunities. The women directors thought that they had to accept that they were not going
to be accepted as equals with the men, but sought to make themselves effective according to
their own strengths. The views of these Scandinavian women, particularly in acknowledging
sexual dynamics in the boardroom, were consistent with the Norwegian women reported by
Bilimoria and Huse (1997).
All women directors in these interview-based studies all exhibited common
characteristics of being middle aged, well educated, and highly experienced, but differed in
adapting to the cultural norms of their respective countries. They all appeared to be highly
motivated strong individuals who were not afraid of taking on challenges and promoting their
talents.
1.3.7. Commentaries and Anecdotal Reports
Anecdotal investigations of the experiences of prominent women directors have
focused on the success of women in becoming members of boards and the challenges women

Experiences and Influences of Women Directors
Chapter 1. Introduction Page 22
identify for future women directors (Collins, 1978; Marshall, 1995; Schwartz, 1980; Von
Glinow & Mercer, 1988). Some commentators concerned with the representation of women
directors on boards appear to have encouraged respondents to take a positive view of
opportunities for women as directors (Naff, 1994; Ray, 1995; Romano, 1993; Segal &
Zellner, 1992; Zeugner, 1993). Other commentators have made recommendations to assist
companies and women prepare themselves for directorships, and attempt to encourage a
positive long-term view of women’s opportunities (Burke, 1994b; Daum, 1994a; Holton,
1995a; Lear, 1994; Nelton, 1987; Tifft, 1994). The focus of the reports has been the economic
and social basis for supporting increased representation of women on corporate boards. The
overall thrust of the commentaries and anecdotes was that women should have greater
representation on company boards with the predominant assumption that gender diversity on
boards of directors was desirable.
1.3.8. Summary of Research on Women on Boards
Bilimoria and Wheeler (1997) argued that the limited research on women directors had
failed to examine systematically why women are under-represented on boards of directors.
Most of the research on women directors has concentrated on establishing the numbers of
women on various corporate boards, and on gathering demographic and benchmark
information describing the women (Catalyst, 1995a; Holton, 1995c; Mattis, 1997). Studies
have drawn conclusions from small samples of women directors, for example in the United
Kingdom the sample used by Ashridge (Holton, 2000) is less than 100 women. Many studies
fail to compare women directors with their male counterparts, or have only drawn simple
comparisons of male and female directors (Vinnicombe, Singh & Sturges, 2000).
Several studies have been conducted without a theoretical framework, such as Elgart
(1983) and Kesner (1988). Some have relied on limited non-parametric statistical analyses,
such as McGregor (1997) and Mitchell (1984), who obtained extensive survey data that was
then only analysed with simple percentages. Furthermore, no understanding of women

Experiences and Influences of Women Directors
Chapter 1. Introduction Page 23
nonexecutive directors and executive directors as distinct groups appears to have been
obtained. Sheridan (2001) suggested that research on Australian women directors to date has
been primarily anecdotal. The present research appears to break new ground, being a
comprehensive multivariate examination of women board directors and their experiences.
1.4. The Present Research Program
Women directors have an elite status in the corporate world and are conspicuous
because they are so rare. Little appears to be known about them (e.g., their characteristics
such as personal traits) or their influences on the board. Korn/Ferry International (1998), as
part of their annual review of directors of boards, performs what little systematic research
exists on women directors of Australian boards. Hill (1995) noted that the practical
difficulties of investigation of elites restrict the information that can be collected.
The aim of the present research is to build a comprehensive picture of successful
Australian women directors. The initial step is to identify the Australian women directors and
record characteristics that might be predictors of success. Their characteristics are also
compared to available Australian and international data. The focus is on the discretionary
appointment of women nonexecutive directors, so it was though necessary to justify the
discrimination between executive directors and nonexecutive directors as distinct categories.
Without a clear definition of a successful board director, a longitudinal study over six years
was selected as a simple means of defining success; women who were still corporate directors
six years later must in some sense be successful. A comparison of stereotypical perceptions of
directors by the women and their male colleagues was used to confirm the success of these
women in becoming members of their ingroup of board directors. Finally, three aspects of
self-perceptions of social identity and influence, from identification with the board as an
abstract entity to their personal interactions with the CEO, were examined.

Experiences and Influences of Women Directors
Chapter 1. Introduction Page 24
1.4.1. Theoretical Perspectives
Boards of directors are perhaps a unique group for which to apply social psychological
theory. Whereas social psychology has formed many theories dealing with workgroup
interactions, several aspects of corporate boards make them different from typical
workgroups.
Corporate boards meet infrequently, usually at most about once per month. The amount
of contact different board members have with each other between board meetings will vary
markedly. Executive directors will usually meet each other on a daily basis over operational
matters. Although some nonexecutive directors may meet each other frequently on an
informal basis (e.g., as members of clubs or other institutions), and some will meet each other
frequently as directors of other boards, many nonexecutive directors may have little or no
contact between board meetings.
Corporate boards are unlike typical workgroups that have a single superior and a
relatively clear purpose. Corporate boards, as the pinnacle of the corporation, have no clear
superior and must determine strategic purposes for the corporation below them. Typically,
executive directors represent operational aspects of the organisation, particularly financial
performance, that are subordinate to the board. Some directors may represent superordinate
purposes, such as owners’ or shareholders’ interests. Some directors may represent other
stakeholder groups, such as employees or customers.
Unlike typical groups, where intragroup cohesiveness is common and intergroup
dynamics are salient, with corporate boards intragroup dynamics are important. Intergroup
dynamics of boards are usually managed either by individual board members representing
significant outgroups or by executive directors negotiating intergroup relationships on behalf
of the board. Corporate board intragroup dynamics are likely to be complex and transient,
with the salience of any grouping varying with the issue at hand.

Experiences and Influences of Women Directors
Chapter 1. Introduction Page 25
In addition to the challenges posed by the unique nature of corporate boards, the study
of women in board director positions also requires special attention. Although the topic of
women in organisations and management is relatively well developed (Acker, 1990b),
theoretical frameworks of gender in organisations such as Acker (1990a) may not be the best
candidates. The gender imbalance on most corporate boards appears to be more extreme than
in most organisations. Nonexecutive women on company boards are not necessarily part of a
management team and are not even from the same organisation for which they serve as a
director. Fagenson (1990a) however, drew attention to the need for a robust theoretical basis
for the study of women in organisations with her proposal for a gender-organisation-system
approach.
Of numerous social psychology theories addressing the effects of gender composition
on workgroups, several candidates for a research foundation are; the Similarity-Attraction
paradigm (Byrne, 1971), Social Contact theory (Blau, 1977; Kanter, 1977), Group
Competition perspective (Blalock, 1967), Relative Deprivation (Crosby, 1982), and Social
Identity theory (Haslam, 2001; Turner, 1991).
Similarity attraction theory suggests that individuals are attracted to others from whom
they expect to gain positive outcomes as a result of interaction (Tolbert, Graham & Andrews,
1999). Researchers argue that readily apparent demographic characteristics such as age,
gender, and race are commonly used as indexes of similarity. Tolbert, Graham, and Andrews
state that groups are simple collections of people with like similarities, with subjective states
and behavioural predispositions improving as group size increases. Corporate boards clearly
are comprised of strong individuals with group affiliations that are likely to affect natural
inclinations towards others with similar personal traits. According to Tolbert et al., similarity
attraction theory offers little in modelling complex group interactions.
Social contact theory rests on two assumptions: that increased rates of social interaction
among individuals will lead to the formation of affective ties to members of a given social

Experiences and Influences of Women Directors
Chapter 1. Introduction Page 26
group, and that such ties affect individuals’ attitudes toward the group as a whole (Tolbert et
al., 1999). Social contact theory focuses on the impact of numerical proportions on group
dynamics, and neglects the impact of social prestige and status. Corporate boards are likely to
be very conscious of social prestige and status, from the special nature of the CEO and Chair
to the likelihood that some nonexecutive directors will represent the interests of owners or
majority shareholders.
Group competition theory focuses on the impact of group proportions in a similar
manner to social contact theory, but also fails to distinguish between numerical and social
dominance (Tolbert et al., 1999). Group competition theory specifies a different outcome
from social contact theory for the effects of increasing outgroup size. Similar to social contact
theory, group competition theory does not appear to offer a rich enough model for analysis of
corporate boards.
Relative deprivation theory suggests that the level of internal satisfaction for both men
and women will increase with an increase in the proportion of women in a group (Tolbert et
al., 1999). However, the observation that women are consistently under-represented on
corporate boards indicates that the presence of women may threaten male directors’ internal
level of satisfaction. Relative deprivation theory also fails to address intragroup processes
such as responses to changes in ingroup and outgroup proportions. The possible contradiction
between the theoretical model and male director’s presumed internal satisfaction regarding
women, and the lack of support for the transient nature of group dynamics that is likely on
boards, suggests alternative theories are better suited for research on women directors.
Social identity theory assumes that much, if not most, social behaviour is driven by
individuals’ needs to protect and enhance their self-esteem or self-image (Tolbert et al.,
1999). An individual’s self-image reflects both an interpersonal component, based on unique
personal characteristics, and an intergroup component, based on various social groupings and
their perceived social status. The social identity salience of various ingroups exists on a

Experiences and Influences of Women Directors
Chapter 1. Introduction Page 27
continuum between low salience, whereby behaviour follows personal belief structures, to
high salience, whereby social conformity overrides personal beliefs. The recognition of social
groupings relies on self-categorisation theory to describe the multiple categories of group
membership to which people assign themselves.
Social identity theory provides a rich model to cater for the complex interactions that
directors are likely to exhibit on corporate boards. The ability of social identity theory to deal
with a continuum between interpersonal and intergroup salience accommodates the gender-
organisation-system proposal of Fagenson (1990a). Fagenson described how women’s gender,
organisation structure, and the systemic framework in which the organisation operates could
jointly affect women’s behaviour in top management positions. Social identity theory appears
to be a social psychological theory that addresses issues such as the ones raised by Fagenson.
1.4.2. Social Identity Theory
Social identity theory is founded on a well-documented tendency to demonstrate
favouritism to the ingroup, particularly to the detriment of outgroups (Haslam, 2001). In
addition, the basis for the ingroup/outgroup categorisation isn’t so important, the mere act of
individuals categorising themselves as group members is sufficient for ingroup favouritism
(Turner, 1975). Researchers argue that the act of self-categorisation to a group, also referred
to as social categorisation, requires members to cognitively assign meaning to their
membership in terms of a distinct and positively valued social identity (Tajfel, 1972).
Social identity theory deals with intergroup behaviour arising from social categorisation
in cognitive and motivational terms, as members define themselves by salient categorisations
and seek to maximise self-esteem by positively differentiating their ingroup from the
comparative outgroup. The important finding of social identity theory is that group members’
frame their quest for positive distinctiveness in terms of “we” rather than “I” in order to feel
good about who and what they are. Efforts to improve the social standing of the ingroup may
be more important and more effective in improving members’ self-esteem, than efforts to

Experiences and Influences of Women Directors
Chapter 1. Introduction Page 28
improve individual outcomes. However, social identity theory notes that this tendency to
favour the ingroup over self and indulge in outgroup differentiation is not automatic, but is
dependent on particular social psychological circumstances or group salience (Haslam, 2001).
According to social identity theory, behaviour in general can be represented in terms of
a bipolar continuum between a person acting solely as an individual and a person’s actions
being solely determined by their group membership (Tajfel, 1978). Figure 1.2 illustrates this
continuum between individual and group social identity, and the impact on perception,
behaviour, and the resultant psychological processes. Individuals typically identify with a
multi-dimensional array of groups (occupational, religious, political, etc.), so the salience of a
social identity at any point in time will vary with the context (Tolbert et al., 2000).
1.4.3. Social Identity Theory Applied to Women Directors
Gender is one of the most common ingroup/outgroup categorisations, and as
demonstrated earlier in this chapter, women are clearly in the minority on most corporate
boards. Women directors are typically in a minority group that similarity-attraction theory
suggests should leave them with the undesirable status of ineffectual tokens. Yet, individual
women directors show considerable success despite their membership of the apparently
unattractive minority grouping of a woman board member.
Social identity theory offers some answers to the apparent contradiction of successful
minorities with the possibility that multiple social categorisations may be active
simultaneously. The salience of any particular categorisation is likely to dictate the influence
the woman director is able to wield. Thus, astute women directors will seek to identify
themselves with majority groupings that are effective on the board or other more attractive
minority groupings to deliver their message. If she could successfully redefine perceptions of
herself to be part of a salient ingroup then other similarities to this group may override the
effects of gender as the criteria for categorisation. Successful women board directors are

Experiences and Influences of Women Directors
Chapter 1. Introduction Page 29
likely to be routinely accepted by male directors as “one of us” on the basis of other
categorisations apart from gender.
Figure 1.2 Psychological and behavioural continua related to social identity salience (after
Haslam, 2001)
Westphal and Milton (2000) describe several ways in which demographic minorities
might recast perceptions to focus on other categorisations as the salient grouping. In addition
to the superordinate categorisation of the majority of directors being shareholders, other
attributes might be whether they were appointed prior to the current CEO, their duration on
the board, their relationships with other directors via other boards, their industry background,
Social identity salience
low high
Psychological correlate
continuum
personalidentity
socialidentitycontinuum
Perceived social reality
individualbased
groupbasedcontinuum
Behaviour type
interpersonalbehaviour
intergroupbehaviourcontinuum
Psychological process
groupmembercontinuum
individual
depersonalisation

Experiences and Influences of Women Directors
Chapter 1. Introduction Page 30
their functional background, and their educational background. According to social identity
theory, in adopting alternative categorisations the women directors will be inclined to redefine
themselves in terms of the chosen grouping. If the women have successfully sublimated
gender as a salient categorisation, then we might find these women’s stereotypes of corporate
directors is similar to those of men from the same ingroup.
1.5. Studies in the Present Research Program
The overall objective of the research is to confirm the value of social identity theory to
the study of women on corporate boards and in doing so, add to the body of knowledge
regarding successful women directors. The present research program commences with an
analysis of the demographics of the women, confirming that they are representative in an
international context, and then perform higher-order analysis to examine some more
sophisticated questions. Although the two director types of executive and nonexecutive are
defined by their relationship with the corporation, there may be other significant factors that
confirm they are distinct social psychological categories. As definitions of success for boards
and their directors are elusive, the women who have been directors over a six-year period may
demonstrate characteristics that could be regarded as defining them as successful. If these
women are successful members of an ingroup of board directors, then they should hold shared
stereotypes with male directors. Social identity theory suggests that the characteristics that are
salient under different aspects of social identity, from the board as an abstract ingroup,
through perceptions of themselves as contributing board members, to their interactions with
the CEO, should differ.
1.5.1. Study 1: Characteristics of Women Board Directors in Australia
The purpose of Study 1 was to create a profile of the personal, interpersonal, and
organisational characteristics of Australian women directors. Commercial surveys in Australia
such as Korn/Ferry International (1999), and even recently EOWA (2002a), provide few

Experiences and Influences of Women Directors
Chapter 1. Introduction Page 31
detailed descriptions of the characteristics of Australian women directors. It was thought
important to provide a comprehensive profile of these women to better understand and
support the following studies. A profile of the women directors in the survey also allows
comparisons with international literature, to observe similarities and differences between the
Australian women and their international counterparts.
1.5.2. Study 2: Nonexecutive Directors as a Distinct In-Group Category
The aim of Study 2 was to confirm the significance of the similarities and differences
between women nonexecutive and women executive directors in Australia. The study tested
specific hypotheses from the data set concerning the differences between Australian women
nonexecutive and women executive directors in relation to their individual characteristics, and
interpersonal and organisational circumstances.
The appointment of women nonexecutive directors is at the discretion of the board,
which must make a deliberate decision to appoint a member of what is usually a minority
group to the board. In contrast to nonexecutive directors, the appointment of women executive
directors to the board is determined by the women gaining promotion to a sufficiently senior
level. For women executive directors, different factors and constraints apply that are
paraphrased by the term “glass ceiling.” Beyond these definitional differences, there may be
other social or psychological differences between nonexecutive directors and executive
directors. Executive director women pursue a path of climbing the corporate ladder, while
nonexecutive director women take a more lateral path of gaining acceptance on a board. Some
ambitious executive directors may take on additional board roles as nonexecutive directors.
The study tested hypotheses concerning the differences between Australian women
nonexecutive and women executive directors in relation to their individual characteristics, and
interpersonal and organisational circumstances using logistic regression analysis.

Experiences and Influences of Women Directors
Chapter 1. Introduction Page 32
1.5.3. Study 3: Longitudinal Study of Successful Women Directors
Study 3 follows up on a sample of 298 women directors who were surveyed in 1995 to
assess what changes in their board status have occurred. Executive directors may have
progressed on to become nonexecutive directors. Nonexecutive directors may have increased
in status by holding more simultaneous appointments on boards of larger organisations. In
their progression, the women’s individual circumstances, interpersonal relationships, and
organisational context could have changed. Changes in the women’s demographic profile and
careers as corporate directors are analysed using non-parametric statistics according to
individual, interpersonal, and organisational characteristics.
1.5.4. Study 4 Stereotypes of Male and Female Directors
Study 4 provided an analysis of how women directors and their male peers view the
characteristics of corporate directors. Men are most likely to be employed in occupations
thought to require self assertion and a desire for achievement, whereas women are more likely
to be employed in occupations reflecting a concern for others and selflessness (Cejka &
Eagly, 1999). Stereotypes describe expectations about people. Differences between
perceptions of stereotypes are likely to reveal the extent of conformance to ingroup norms.
If male directors are perceived as having more skills that are relevant to the board
director role than female directors then the assumption of board directorships as a male-
dominated role will be supported. However, Carli (1989) demonstrated that the assumption of
male competence compared to females could be influenced when group members are
presented with evidence of a female with superior expertise on a given task. If the stereotypes
of both male and female directors are perceived as similar on skills that are relevant to the
board director role then there is a possibility of women sublimating their gender differences
and making other role-relevant characteristics salient.
To the author’s knowledge, no studies have specifically identified the set of
characteristics associated with women directors compared to men directors. The gender-

Experiences and Influences of Women Directors
Chapter 1. Introduction Page 33
stereotyped attitudes of women directors and their male peers were compared using non-
parametric statistics. Similarities and differences were highlighted, and the implications were
discussed.
1.5.5. Study 5 Nonexecutive Director Social Identity and Influence
Study 5 examined how the social identity of women directors is related to different
factors, depending on the social context that is salient. Three different contexts were
examined: the woman’s relationship with the board as an ingroup member, the woman’s
perceptions of her ability to contribute to the board, and the woman’s interactions with the
CEO of the board. A scale from Karasawa (1991) that measures social identification with a
group provided a measure to investigate the women’s perception as ingroup members.
Westphal and Milton’s (2000) study on minority influence on corporate boards, provided a
scale and additional items to investigate the women’s perceptions of their ability to contribute
to the board and provide advice to the CEO of the board. Multiple regression was used to
evaluate what factors were important to these successful women directors in different board-
related social contexts.
1.6. Research Design
According to Sommer and Sommer (1991), the choice of a research design is dependent
on the research purpose, research questions, research period, and available resources. The
research method adopted must be suited to the research questions to be considered. Given that
the hypotheses have been deduced from a theoretical framework, a traditional hypothetical-
deductive research model was employed for the present research program. Creswell (1994)
described how quantitative data are used to test theories that either will be supported or will
have lack of support from the gathered data.

Experiences and Influences of Women Directors
Chapter 1. Introduction Page 34
1.6.1. Quantitative versus Qualitative Research
Creswell (1994) stated that proponents of quantitative research argue for the scientific
superiority of quantitative methods compared with qualitative research methods. Superiority
of quantitative research has been claimed as the basis of objectivity derived from controlled
measurement (Berg, 1995) and from the ability to rigorously analyse the data collected.
Creswell (1994) also puts the contrasting view that qualitative data provides a more subjective
and personal consideration of the research phenomena, with an in-depth understanding more
clearly derivable from qualitative data.
Only a small number of empirical studies have been conducted on the women who are
company directors. Researchers have relied on data from annual reports and anecdotal reports
concerning women’s board experience, as discussed previously. Most empirical research has
been based on corporate boards rather than on the women as individuals. It was judged that a
major advance in understanding of the research area would result from a methodology that
allowed multivariate statistical analysis techniques to assess the relative importance of a range
of factors. Therefore, a quantitative approach to the research questions was adopted using the
method described by Mitchell (1985) as a correlational field study.
1.6.2. Correlational Field Studies
Mitchell ( 1985) described a correlational field study as a study that examines
relationships among independent and dependent variables of interest in a natural, as distinct
from a laboratory, setting. Sekaran (1992) explained that a correlational field study usually
calculates the relationship between two or more sets of variables using multivariate analysis.
For the present research program, a correlational field study supported the use of multivariate
analysis to assess the roles, influences, and attributes of women directors.
Mitchell (1985) noted that correlational field studies have limitations, particularly an
inability to argue for causal links and a lack of in-depth explanation of findings. Mitchell also
noted many shortcomings in previous survey-based research studies of organisational issues,

Experiences and Influences of Women Directors
Chapter 1. Introduction Page 35
including unreliable measures, small sample size, low powered statistical tests, use of non-
random samples of convenience, and a lack of meaningful responses. A single survey by its
nature is also gathering only cross-sectional or contemporaneous data, which denies any
attempt to infer causality from the results.
To overcome some of the limitations of a correlational field study attempts were made
in the construction and analysis of the survey to minimise the disadvantages of a survey-based
correlational field study design, as outlined by Mitchell (1985). Established theories, such as
social identity theory (Haslam, 2001) and self-categorisation theory (Turner, 1991), were used
to guide the choice of theoretical constructs to measure and propositions to test. Measures
with different response formats, such as mixing multiple-choice and binary responses were
used to reduce the effects of spurious common method covariance, although this could not be
eliminated due to the cross-sectional nature of the data. A relatively large initial sample (572
responses) provided satisfactory power for statistical analyses. Multivariate analysis
procedures of logistic regression and multiple regression were used to examine joint and
relative relationships among sets of variables.
Furthermore, longitudinal data was also collected on the demographic and situational
profile of women directors. Data were collected at two periods: 1995 and 2001. There were
572 women in the first data collection with 298 women who agreed to be part of follow up
research. For comparative purposes, a sample of men directors was also surveyed as part of
the second data collection. By using a longitudinal design, both predictive and reciprocal
relationships can be examined, and the disadvantages outlined by Mitchell (1985) could be
reduced.
1.6.3. Survey Design
Three surveys were used to collect data for all five studies. A survey design allowed the
gathering of detailed data on a variety of items thought to be relevant to women’s experiences
of being directors, collection of data on men directors’ board experiences, and allowed the

Experiences and Influences of Women Directors
Chapter 1. Introduction Page 36
data collected to be oriented to a theoretical framework. Thus, a survey design was deemed
superior to the common alternatives of analysis of archival company annual report data or re-
analysis of data collected by other research companies.
Hill (1995) warned that there were practical difficulties associated with sampling
company directors. He argued that the information that can be collected is restricted which in
turn restricts the number of topics that can be researched. A self administered survey was
considered a superior survey design compared to relying on company directory information
(or secondary data as per Conroy, 2000), or the bias that can arise from using a convenience
sample of personal contacts (as reported by Hill, 1995). For the purposes of the present
studies the survey items were derived from previous research on minority company directors
(Westphal & Milton, 2000), research on women directors (Burke, 1995; Mattis 1993), and
research on women executives (Tharenou & Conroy, 1994). As the subject area is relatively
underdeveloped, the theoretical predictions and implications of the studies must be regarded
as tentative.
A self-report survey procedure allowed the collection of a large national sample of
women directors on Australian boards across all states and territories that could not have been
achieved through a qualitative design. The time and cost effectiveness of a self-report survey
allowed a large sample of responses to be gathered that would have been implausible to
administer by another method across a large continent such as Australia.
Sekaran (1992) described an advantage of a good survey procedure as supporting
inferences about the general applicability of the results to a larger population (external
validity) from which the sample is drawn. A closed question format was chosen, as per Hinkin
(1995), on the basis of being able to test the propositions derived from the theoretical models,
plus having higher return rates, ease of scoring, coding, tabulation, and analysis. A survey
also allows respondents time to reflect on the questions contained in the survey and provide
considered responses. Hinkin (1995) reported common criticisms of self-administered surveys

Experiences and Influences of Women Directors
Chapter 1. Introduction Page 37
as being concerns about common method covariance, the validity and reliability of measures,
the time taken to obtain returns, and low response rates.
1.7. Summary
Corporate boards of governance and their directors provide a unique context for the
application of social psychological theory. As a group, corporate boards meet infrequently
although individual directors might meet as often as daily. There are two clearly labelled
types of group members in executive directors and nonexecutive directors, however these two
labels may obscure much complexity, especially with the varying allegiances to stakeholders
that nonexecutive directors may hold. In Australia, there are usually two official leaders
within the group, the CEO, and the (usually nonexecutive director) Chair. Boards carry
responsibility for the organisations they serve, with no clear superior but a range of potentially
conflicting stakeholders. Corporate boards and their members have no reliable measure of
their effectiveness or success apart from a sometimes-tenuous link with the long-term success
of the organisation.
Women’s low representation on corporate boards is well documented by many
researchers, with some researchers going as far as suggesting that the few women on boards
(often only one) may be ineffectual “tokens.” Many researchers argue for greater acceptance
of women on boards based on the principle that diversity is a sound business strategy.
However, despite the apparent merits of the diversity argument, limited progress is apparent
in growing the number of women on boards. Despite this background, anecdotal and
interview-based evidence suggests there are some very effective women on boards for whom
no one would level the insult that such women are tokens. A lack of empirical research and
rigorous theoretical frameworks is blamed for the conceptual gap between women’s low
representation on boards, the difficulty in convincing boards to adopt more women, and the
existence of many successful individual women directors.

Experiences and Influences of Women Directors
Chapter 1. Introduction Page 38
Social identity theory appears to be a theoretical framework with which to investigate
the various aspects of women’s representation on corporate boards in Australia. Commencing
with an extensive survey to capture as many women directors as possible and confirm the
sample's representativeness against international research, the sample was re-surveyed after a
six-year period to try to detect successful women directors. Several analytical studies
examined these Australian women directors to determine whether nonexecutive directors
really are a distinct category from executive directors, to confirm whether the women who are
still directors after six years can be regarded as successful, to assess whether the apparently
successful women have become members of an ingroup of board directors, and to determine
the factors that are important to successful women directors in various social contexts.
By gaining a better understanding of women directors, particularly those who are
apparently successful, future research may be able to determine what attributes women must
learn to display to be attractive for selection as board members, and what attributes they need
to cultivate to remain as effective board members. A better understanding of the factors that
make women directors successful may also help future researchers build more attractive
arguments for corporations to convince them of the desirability of appointing more women to
their boards.

Experiences and Influences of Women Directors
Chapter 2. Characteristics of Women Board Directors in Australia Page 39
Chapter 2
2. CHARACTERISTICS OF WOMEN BOARD DIRECTORS IN AUSTRALIA
The aims of the present chapter were to describe a profile of the characteristics of
Australian women directors and compare their characteristics, as far as practical, with those of
their counterparts from other countries. The profile sheds some light on the characteristics of
the few women who gain board appointments in Australia.
2.1. Introduction
The chapter is in two parts: the first part being a profile of Australian women directors
from a sample of 325 directors taken in 1995, and the second part being comparisons between
the 1995 sample and profiles of women directors reported in the international literature for a
similar period.
2.1.1. What are the Characteristics of Australian Women Directors?
As described in the first chapter, a review of the research on women company directors
demonstrates a paucity of empirical studies on characteristics associated with being a director.
In Australia, Korn/Ferry International performs the only regular research on boards of
directors, although it does not focus on women directors. The Equal Opportunity for Women
in the Workplace Agency (EOWA, 2002a) have just commenced surveying Australian women
directors, modelled on Catalyst publications (1998a, 1998c). Other demographic data have
been gleaned from occasional reports in the literature. A recent study by Sheridan (2001)
surveyed the characteristics of women directors of publicly listed companies using a survey
instrument provided by Professor Ronald Burke of York University, Canada.
Korn/Ferry International publishes an annual study of boards of directors drawn from
organisations that agree to participate. However, a dramatic decline is apparent over a few
years in the number of organisations participating from 194 organisations in 1994 (Korn/Ferry
International, 1995), to 82 Australian organisations in 1998 (Korn/Ferry International, 1999).

Experiences and Influences of Women Directors
Chapter 2. Characteristics of Women Board Directors in Australia Page 40
The types of organisations surveyed include publicly listed (51%), public unlisted (25%),
private (10%), and government (14%). Organisations tend to be large by Australian standards,
with only 11% recording revenue of less than $50 million and only 14% with less than 250
employees. The organisations covered all industries and included organisations whose
ownership lay in other countries. The average size of the boards was eight directors, including
an average of two executive directors. Although the organisations were already large by
Australian standards, Korn/Ferry International also report separately on the top 15 percent of
companies (over $2 billion revenue and 5000 employees), presumably to create a sample more
comparable with the United States benchmark of the Fortune 500. Korn/Ferry International
does not state the number of women surveyed. From estimates based on statements in their
1999 report, there appeared to be about 30 women holding approximately 50 board positions.
Characteristics of women directors reported by Korn/Ferry International were median age,
industry, organisation type, professional background, and managerial level.
Sheridan (2001) published a survey of the characteristics of 46 women directors
identified from Australian Stock Exchange lists of Australian owned publicly listed
companies. She did not state any other demographics about the organisations from which the
women responded. Characteristics of women directors reported by Sheridan were average age,
marital status, children, salary, education, multiple directorships, occupation type, and
professional background.
EOWA (2002a) surveyed 152 of the largest Australian corporations in 2002 and found
96 board seats held by women directors. No attempt was made to detect women who held
more than one board seat. The only demographic data stated was the corporation’s industry.
The present chapter reports on a survey of 325 women directors conducted in 1995. The
women directors held 507 board positions on publicly listed (13%), public unlisted (14%),
private (30%), government (18%), and not-for-profit (25%) organisations. There was a
considerable difference in the size of the organisations reported by Korn/Ferry International

Experiences and Influences of Women Directors
Chapter 2. Characteristics of Women Board Directors in Australia Page 41
(1996) and the present sample. Korn/Ferry International, reporting on 154 large Australian
organisations covering 50 board positions held by women, found only 25% had less than 250
employees. The present sample covering a far larger number of organisations, accounting for
606 board positions held by women, found 64% had less than 200 employees. Both surveys
captured a similar number of large organisations: sixteen organisations had more than 8000
employees in the present study, and seventeen had 5000 employees in the Korn/Ferry
International (1996) study. The organisations reported in both the present study and
Korn/Ferry International covered all industries and had an average board size of eight
directors. Characteristics collected by the present survey covered individual attributes and
interpersonal relationships. The present survey also collected several characteristics of the
woman’s employment organisation and the organisations of which she was a board member to
illustrate organisational contexts.
2.1.2. Do Australian Women Board Directors Differ From Other Countries?
Where possible in the present chapter, the profile of characteristics of the women
company directors is compared to other Australian and international data. Most researchers
noted the tendency for large corporations to have large boards and large boards to be most
likely to appoint a woman (e.g., Elgart, 1983; Fryxell & Lerner, 1989). It was also apparent
that large organisations and large boards dominated the characteristics of the samples of other
countries. To create a sample more comparable with those available from international
empirical studies, women directors in the present sample indicating a board size of fewer than
five directors were omitted from further analysis.
Catalyst (1993) reported on the characteristics of the women in the first of their annual
surveys of women directors from the United States Fortune 500 list, but did not report on
women’s characteristics in any later surveys. Catalyst did not state their total sample size in
1993, although they stated they augmented their sample with data from annual reports,
presumably to increase the coverage to the whole of the Fortune 500/Service 500 list. In later

Experiences and Influences of Women Directors
Chapter 2. Characteristics of Women Board Directors in Australia Page 42
years Catalyst relied on annual reports and proxy statements for coverage of the full 500
(Catalyst, 1998c). Using the discussion of their research method in 1993, their sample size was
estimated from a statement of a 41% response rate from 394 questionnaires at 160 women.
Catalyst (1993) also mentioned additional information was gathered on 304 female directors,
but did not describe whether the additional information included their characteristics. Catalyst
reported percentages rather than frequencies, so we do not know the number of people in the
sample who answered each question. Other surveys, including the current study, show a
variation in the number of responses for each question. Catalyst’s sample of the Fortune 500
was biased towards large organisations and such bias may affect the reported characteristics of
the women directors in their sample.
Burke (1994b) based his Canadian sample on 278 responses from a sample drawn from
the 1992 edition of the Financial Post’s Directory of Directors. No demographics were stated
about the organisations from which the women responded. Of the responses received, 259
reported their age, 251 reported their education level, 255 reported their salary, 277 reported
their marital status, 271 reported on the presence of children, and 185 of those with children
reported on the numbers of children.
Holton et al. (1993) identified their United Kingdom sample of women directors from
the Times Top 200 list of the largest private sector industrial companies. Industrial sectors
covered were service (49%) including retailers, and with percentages not stated,
communication/transport, manufacturing, and energy. The 51 women identified were listed
individually. The only characteristics reported across the whole sample were the individual
women’s ages and the average number of children across the sample. Holton et al. stated that
their sample was biased towards large private industrial organisations and such bias may affect
the reported characteristics of the women directors.
Pajo, McGregor and Cleland (1997) replicated the method of Burke’s (1994) survey of
women directors in New Zealand. The top 200 New Zealand companies were selected from a

Experiences and Influences of Women Directors
Chapter 2. Characteristics of Women Board Directors in Australia Page 43
list published by Management magazine on the basis of revenue. The listing included a range
of public and private companies, subsidiaries of overseas companies, producer boards,
cooperatives, and state-owned enterprises. Women directors were identified from annual
reports backed up by letters to companies where the gender of directors was unclear. A total of
31 useable responses were received. The characteristics reported were age, ethnicity, the
presence of dependants, education level, industry, profession, functional expertise, occupation,
directors’ fees, and an indication of the top total income received by directors. Pajo et al. also
included items for the method by which the director’s name was brought to the attention of the
board, and the importance of various factors in their selection as a director.
Talmud and Izraeli (1998) surveyed 98 women from the publicly traded Israeli
corporations on the Tel-Aviv Stock Exchange. They did not state any other demographics
about the organisations from which the women responded. Characteristics reported were
average age, average years of education, presence of a university degree and type of degree,
average years of board experience, own company share ownership, shareholder relationships,
proportion of executive directors, and employment status.
In summary, few surveys of women directors include demographic information on the
women and their employment organisations, or the boards and the organisations that they
serve. The only relatively frequently reported items reported are age, education, marital status,
numbers of children, and salary. Some reports support a simple comparison between the
women directors of Australia and their counterparts in the United States, Canada, the United
Kingdom, New Zealand, and Israel.
2.2. Method of Sample Definition and Data Collection
2.2.1. Sample Definition
To be able to draw inferences about the characteristics of women directors in Australia
the data needed to be a representative sample of Australian women directors. In the absence

Experiences and Influences of Women Directors
Chapter 2. Characteristics of Women Board Directors in Australia Page 44
of any ready reference for the total population of women directors and only a few partial
reference sets, a representative subset had to be assembled for the present sample.
Korn/Ferry International (1995) estimated the population of Australian women directors
to be about 4,000. However, to identify these women directors, the Business Who’s Who of
Australia (Beck, 1995) and Jobson’s Yearbook of Australian Companies 1995/96 (McBride,
1995) were the only references which provided names and contact details. In cases where the
gender of the director was unclear from the listing, the company was contacted by telephone
and clarification sought. The two references only yielded 1,555 women directors; these
references were augmented with personal contacts and inquiries to professional associations
and executive search companies.
Of the professional associations, the Australian Institute of Company Directors declined
to participate in the research program. The Professional Nonexecutive Directors Association
would not divulge the names of directors on their database, but agreed to forward the
questionnaire directly to their women directors. Although the organisation stated that they had
108 women directors on their database, I was unable to confirm whether there were any
overlaps with women directors identified from other sources. Using all sources, 1,859
Australian women company directors were located. Identification of the remaining 2,000 of
the total 4,000 women directors that Korn/Ferry International (1995) estimated remained
elusive.
A pilot survey was conducted on a sample sourced from personal contacts and the first
100 women directors from the Business Who’s Who of Australia (Beck, 1995). Responses to
questions from the pilot survey were used to rephrase or re-format questions that appeared to
be unclear or a source of confusion to respondents. The women directors during the pilot
expressed a high level of interest, which may reflect the isolation some expressed about being
the sole woman on a company board. The introductory letter and final survey instrument are
included in appendices B and C respectively.

Experiences and Influences of Women Directors
Chapter 2. Characteristics of Women Board Directors in Australia Page 45
To enhance the return rate, questionnaires included a postage-paid self-addressed
envelope. Apart from the women managed directly by the Professional Nonexecutive
Directors Association, all women directors who had not responded after 20 days were sent a
follow-up letter that included an additional survey. A further 20 days later, women directors
who had still not responded were sent a second follow-up letter and survey. A preliminary
check to ensure that respondents were current women board directors was performed by two
questions (“What is your sex?” and “Are you currently on a Board of Directors of a
company?”). Using the described procedure, an overall return rate of 31% was obtained – see
Table 2.1.
Table 2.1 Sources and Response Rates for Women Directors Located for the 1995 Sample
Sample source Sample
Size Number of respondents
Proportion of total
The Business Who’s Who of Australia (1995) 1459 369 64.5%
Jobson’s Year Book of Australian Companies (1995) 96 46 8.0%
Professional Nonexecutive Directors Association 108 78 13.6%
Australian Institute of Credit Union Directors 93 34 5.9%
AMROP International 73 21 3.7%
Waite Consulting Pty Ltd 23 17 3.0%
Personal contacts 7 7 1.2%
Totals 1859 572 100 %
2.2.2. Sample Representativeness
The Business Who’s Who of Australia (Beck, 1995) was the only reference that
contained sufficient information for a thorough check of the representativeness of the
respondents. As the Business Who’s Who of Australia also provided nearly two-thirds of the
respondents, it was used to check the sample representativeness. Women directors who
responded to the survey were statistically compared to those that did not return the

Experiences and Influences of Women Directors
Chapter 2. Characteristics of Women Board Directors in Australia Page 46
questionnaire. Chi-square tests investigated whether respondents and non-respondents
differed in terms of geographic location of companies, year of establishment of company,
total number of company employees, capital issued, company revenue, or industry category.
The results of the chi-square tests showed no significant differences across the respondents
and the non-respondents, except for industry category.
There were significant differences between the industry categories of the respondents
and other women directors in the Business Who’s Who of Australia (Beck, 1995) (χ2 (9,
N = 1659) = 53.45, p < .001). Respondents in the sample were more likely to be in the
industries of mining, transportation, retail trade, finance and insurance, and public
administration. Women directors in the Business Who’s Who of Australia, who did not reply
were more likely to be in construction, manufacturing, wholesale trade, and services
industries.
By establishing that the sample data exhibited representativeness in all aspects except
for industry category, inferences can be made that the characteristics and traits identified in
the sample can be extended to the greater population of women directors in Australia.
2.2.3. Reducing Small Business Owners in the Sample
Frequencies and totals were calculated for the responses to survey questions. An initial
assessment of the results led to the conclusion that even though the sample was representative
of the Business Who’s Who of Australia (Beck, 1995), in the attempt to locate all women
directors in Australia, women directors of small businesses dominated the sample. Of the 572
responses, the average board size was only six directors, whereas the literature raised an
expectation of eight directors. Investigation showed that 39% of the sample were executive
directors, and of these, 50% reported that their basis of recruitment was ownership of the
company. The available literature had produced a much lower expectation of the proportion of
executive directors (less than 20%) and an expectation that most executive directors would be
employees of the board’s organisation, not the owners.

Experiences and Influences of Women Directors
Chapter 2. Characteristics of Women Board Directors in Australia Page 47
The women who were executive directors due to their ownership of the company and
were from small boards were apparently small business owners. Further investigation showed
that these women directors of small businesses appeared to have quite different characteristics
from women directors of large corporations. The small business owners were not the focus of
the research program. The small business owners were eliminated from the sample by
excluding directors who were only on boards of four or less directors.
The reduced sample comprised 325 of the 572 women directors and was more
consistent with expectations from the Australian literature (such as Korn/Ferry International,
1996) and more comparable with international studies of women directors. Analysis of the
revised sample showed an average board size of eight directors, with 23% that were executive
directors, and of the executive director group only 24% that had obtained their position
through ownership of the company. Although the numbers of executive directors were slightly
higher than expectations, in other respects the data was consistent with expectations. The
responses from the reduced sample to the survey questionnaire are summarised in Tables 2.2
to 2.31.
2.2.4. Survey Variables
The survey questionnaire chiefly used multi-item scales, with some binary measures. An
alphabetical listing of survey items is provided in Appendix D. The variables used in the
analysis were in four broad categories. In addition to three categories from Ragins and
Sundstrom (1989) of individual, interpersonal, and organisational characteristics.
The most important item measured was the position the director held on the boards for
which the director was a member. A multiple-part question allowed for up to three boards.
Possible director positions were 1 (Chair – Executive), 2 (Chair – Nonexecutive), 3
(Managing Director), 4 (Director – Executive), 5 (Director – Nonexecutive), and 6
(Secretary). The item allowed for a distinction between nonexecutive directors and executive

Experiences and Influences of Women Directors
Chapter 2. Characteristics of Women Board Directors in Australia Page 48
directors, and identified those few women who were in the ultimate positions of chair of the
board or managing director (chief executive officer).
2.2.5. Method of Analysis
The profile of women directors was obtained using descriptive statistics such as totals,
percentages, medians, and means. International comparisons were obtained by comparing
percentages, medians, and means between the relevant studies.
2.3. Characteristics of Australian Women Directors
The characteristics of Australian women directors are categorised as individual
variables, interpersonal variables, or organisational variables.
2.3.1. Individual Variables
Individual variables pertain to the women director as an individual in her own right,
independent of interpersonal relationships or organisational environment.
2.3.1.1. Director Age
Women directors’ age is a commonly reported characteristic by most researchers.
Collecting the item allowed confirmation of the sample representativeness against other
Australian sources (e.g., Korn/Ferry International, 1996) and international samples. Age is
also a common control variable that is likely to influence the director’s status regardless of
gender or other characteristics. The item was gathered using a 12-point ordinal scale with
five-year intervals from 1 (less than 25 years) to 12 (over 70 years) – see Table 2.2.
Women directors were generally middle-aged, with over a quarter (27%) of the sample
aged between 45 and 49 years, and nearly two-thirds (64%) aged between 40 and 54 years.
Their average age was estimated at 47 years old, with 66% less than 50 years old.
Women directors in the present sample were a good match with those reported by
Korn/Ferry International (1997a), with a mode of 41 to 55 with 73% under 50, and Sheridan

Experiences and Influences of Women Directors
Chapter 2. Characteristics of Women Board Directors in Australia Page 49
(2001), who found women directors varied in age from 28 years to 75 years, with an average
age of 45.
Table 2.2 Director Age
Years Frequency %
25 to 29 2 0.6
30 to 34 19 5.8
35 to 39 42 12.9
40 to 44 65 20.0
45 to 49 88 27.1
50 to 54 54 16.6
55 to 59 22 6.8
60 to 64 19 5.8
65 to 69 10 3.1
Over 70 4 1.2
Total 325 100%
2.3.1.2. Highest Level of Education
The woman director’s highest level of educational attainment is a commonly reported
characteristic by most researchers. Collecting this item allowed comparison with international
samples. Education level is also a common control variable that is likely to influence the
director’s status regardless of gender or other characteristics. The item was an 11-point
ordinal scale ranging from 1 (some secondary school) to 11 (doctorate) from Tharenou and
Conroy (1994) – see Table 2.3.
Women directors were generally well educated, with over two-thirds (69%) having an
undergraduate degree or higher qualification. Diploma and TAFE (tertiary non-university)
qualifications were noticeably less popular than all other post-secondary qualifications,
although adding them in results in a figure of 81% having a university or similar qualification.
Over one-third (39%) had post-graduate qualifications.

Experiences and Influences of Women Directors
Chapter 2. Characteristics of Women Board Directors in Australia Page 50
Table 2.3 Highest Level of Education
Education level Frequency %
Some secondary school 5 1.5
Year 10/School Certificate/Intermediate 21 6.5
Year 12/HSC/Leaving/Matriculation 35 10.8
TAFE college course 17 5.2
Associate Diploma 3 0.9
Undergraduate Diploma 21 6.5
Undergraduate degree 96 29.6
Postgraduate Diploma/Honours 36 11.1
MBA 23 7.1
Masters degree 45 13.9
Doctorate/PhD 22 6.8
Total 324 100%
Korn/Ferry International does not report on the education level of women directors.
Sheridan (2001) found that 80% of respondents had university qualifications and 37% had
post-graduate qualifications. Sheridan did not state whether she included a separate TAFE
qualification category, however as her study was based on a Canadian questionnaire by Burke
(1994b) it is likely that the Australian TAFE qualifications were included in the university
category.
2.3.1.3. Country of Birth
Australia is a relatively young country with a large migrant population and many
organisations that have their head office overseas. Respondents were asked to indicate their
country of birth as a means of detecting if they were migrants. Twelve country classifications
of 1 (Australia), 2 (New Zealand), 3 (Other Oceania countries), 4 (United Kingdom and
Ireland), 5 (Other European countries), 6 (The Middle East and North Africa), 7 (South East
Asia), 8 (North East Asia), 9 (Southern Asia), 10 (USA and Canada), 11 (The Middle and
South Americas), and 12 (Africa) were available – see Table 2.4.

Experiences and Influences of Women Directors
Chapter 2. Characteristics of Women Board Directors in Australia Page 51
Table 2.4 Country of Birth
Country Frequency %
Australia 245 75.4
New Zealand 10 3.1
United Kingdom and Ireland 28 8.6
Other European countries 12 3.7
Middle East and North Africa 2 0.6
South East Asia 6 1.8
USA and Canada 14 4.3
Africa 8 2.5
Total 325 100%
Three-quarters of women directors (75%) were born in Australia. Of those women
directors born outside of Australia (25%), most were from English-speaking countries (65%).
2.3.1.4. Immigration Year
Further discrimination was sought as to whether the migrant was a recent arrival as a
person possibly transferred from another country to head up an Australian subsidiary, or a less
recent arrival possibly because of mass post-war immigrations. Respondents were asked to
indicate if they were migrants and, if so, the year of their migration. Immigration year was a 6-
point item from 1 (prior to 1971) to 6 (1991 to survey date)– see Table 2.5.
Table 2.5 Immigration Year
Year of arrival Frequency %
Prior to 1971 40 50.0
Between 1971 – 1975 7 8.8
Between 1976 – 1980 11 13.8
Between 1981 – 1985 11 13.8
Between 1986 – 1990 6 7.5
Arrived after 1991 5 6.3
Total 80 100%

Experiences and Influences of Women Directors
Chapter 2. Characteristics of Women Board Directors in Australia Page 52
A response option of 7 for not applicable was provided to avoid confusion for
respondents who did not read the question correctly. Half of those women directors born
outside of Australia (50%) had been in Australia for more than 25 years. Little evidence is
apparent that women directors are recent “imports” from other countries, rather they appear to
be long standing Australian citizens.
2.3.1.5. Career Tenure
Data concerning three aspects of woman director’s career were collected: her
organisation tenure, her occupation tenure, and her employment tenure. Organisation tenure
was the number of years in full-time employment in her present organisation. Occupation
tenure was the number of years in full-time employment in her present occupation.
Employment tenure was the number of years in full-time employment over her entire lifetime.
All three aspects of tenure were measured by 10-item ordinal scales from 1 (Less than one
year) to 10 (35 or more years) – see Table 2.6.
Table 2.6 Organisation, Occupation, and Employment Tenure
Organisation Occupation Employment Tenure Frequency % Frequency % Frequency %
< 2 years 68 22.1 43 14.0 2 0.6
2 to 5 years 41 13.4 45 14.7 5 1.6
5 to 10 years 82 26.7 81 26.4 19 6.0
10 to 20 years 77 25.1 86 28.0 123 38.7
20 to 30 years 29 9.5 40 13.0 133 41.8
> 30 years 10 3.3 12 4.0 36 11.3
Totals 307 100% 307 100% 318 100%
The duration of a woman director’s employment with their current organisation did not
appear to be a significant indicator of board membership. There was a fairly even spread of
tenures from the short-term (< 2 years, 22%) to the moderately long-term (10 to 20 years,

Experiences and Influences of Women Directors
Chapter 2. Characteristics of Women Board Directors in Australia Page 53
25%). Only with very long organisation tenures (> 20 years, 13%) was there a significant
reduction in board membership in the sample.
The duration women directors spent in their current occupation also displayed a wide
spread between the short-term (< 2 years, 14%) and long-term (20 to 30 years, 13%).
However, there was a noticeable peak at both the 5 to 10 years and 10 to 20 years categories,
suggesting that most women spend at least 5 years in an occupation before gaining board
membership. A decline in board membership was noticeable by those women who have spent
20 years or more in their occupation, with very few (4%) remaining that spent more than 30
years in their occupation.
Although the length of time women spent in full-time employment displayed a clear
tendency for greater than 10 years (92%) duration, this may be more a reflection of the age of
the women. Their age distribution (less than 30 years, 0.6%; 31 to 34 years, 6%; 35 to 44
years, 33%; 45 to 54 years, 44%; and 55 or more years, 17%, from Table 2.2) shows a similar
distribution to their employment tenure (Table 2.6), and suggests that the women’s’ full-time
employment started at an average age of 25 years.
Over 90% of women board directors had at least 10 years full-time employment,
suggesting that years of full time employment was a definite requirement before they were
eligible for board membership. However, it seemed to matter little how long they had spent in
their current occupation and even less with their current organisation, both showing an even
spread of responses. That the duration with their current organisation is of little importance
should not be surprising considering that most of the women are nonexecutive directors.
2.3.1.6. Managerial Level
The level of managerial seniority that the woman had achieved was measured at three
points: her current position, her last full-time position, and her second-last full-time position.
An 8-point ordinal scale of 1 (Non-Supervisor/Non-Manager), 2 (Supervisor/Leading
Hand/Foreman/Forewoman), 3 (Lower Level Manager), 4 (Middle Level Manager), 5 (Senior

Experiences and Influences of Women Directors
Chapter 2. Characteristics of Women Board Directors in Australia Page 54
Level Manager), 6 (Executive), 7 (Divisional Head), to 8 (Chief Executive Officer) was used
for each measurement point – see Table 2.7.
Comparing the managerial levels of positions currently held by women directors showed
the anticipated results that the majority of women (72%) were chief executive officers,
divisional heads, or executives.
Table 2.7 Managerial Level of Full-Time Positions
Current position Last position Second-last position Managerial level Frequency % Frequency % Frequency %
Chief executive officer 83 25.9 66 20.5 22 6.9
Divisional head 50 15.6 47 14.6 52 16.4
Executive 98 30.5 73 22.7 56 17.6
Senior level manager 29 9.0 51 15.8 52 16.4
Middle level manager 24 7.5 29 9.0 46 14.5
Lower level manager 9 2.8 21 6.5 29 9.1
Supervisor 5 1.6 8 2.5 11 3.5
Non supervisor/Non manager
23 7.2 27 8.4 50 15.7
Totals 321 100% 322 100% 318 100%
Women director’s career progression is also evident from a comparison of the positions
held in their current, last, and second-last jobs. Women directors were less likely to be chief
executive officers or executives in their last full-time job than in their current job, and the
likelihood was reduced further with the second-last full-time job. Conversely, women
directors were more likely to have held senior level manager or lower positions in their last
full-time job than in their current job, and again even more likely to have lower managerial
level with the second-last full-time job. However, the category of Divisional head did not
demonstrate a career progression, staying relatively constant at 14 to 16% across the current,
last, and second-last positions.
Korn/Ferry International (1996) reported that 15% of the women directors were current
CEOs or chief operating officers of another company, although three years later Korn/Ferry

Experiences and Influences of Women Directors
Chapter 2. Characteristics of Women Board Directors in Australia Page 55
International (1999) reported that 31% directors were current CEOs or chief operating officers
of another company and 29% were executives of other companies. The present study found
similar figures, with 29% of women directors reporting that they were currently CEOs and
31% reporting that they were currently executives. The present study also found 16%
classified as divisional heads. Without the divisional head classification presumably the
numbers of CEOs and/or executives would have been higher.
2.3.1.7. Senior Management Years
The number of years that the woman was in senior management positions before
accepting a board directorship was measured as a potential indicator of director status. A 5-
point ordinal scale from 1 (0 to 4 years) to 5 (20 or more years) was used to measure senior
management years – see Table 2.8.
Table 2.8 Senior Management Years
Years Frequency %
0 to 4 146 46.5
5 to 9 109 34.7
10 to 14 42 13.4
15 to 19 6 1.9
20 or more 11 3.5
Total 314 100%
Nearly half (47%) of the women had fewer than 5 years of senior management
experience and most (81%) had fewer than 10 years experience before appointment to a board.
The apparent lack of senior management experience may support the notion that boards cannot
find sufficient numbers of experienced women and accept women with only a moderate
amount of senior management experience.

Experiences and Influences of Women Directors
Chapter 2. Characteristics of Women Board Directors in Australia Page 56
2.3.1.8. Total Directorship Years
The number of years that the woman has been serving on boards of directors is a likely
indicator of director status. A 6-point ordinal scale from 1 (0) to 6 (More than 12 years)
measured the item – see Table 2.9.
Table 2.9 Total Directorship Years
Years Frequency %
0 1 0.3
1 to 3 101 31.1
4 to 6 83 25.5
7 to 9 62 19.1
10 to 12 36 11.1
More than 12 42 12.9
Total 325 100%
Over half of the women (57%) had fewer than 7 years board experience, and nearly a
third (31%) having fewer than 4 years experience. No contingent of long-serving directors
was observed, with only 13% serving for more than 12 years on boards. It would be
interesting to compare such figures with the corresponding statistics for male board directors
to see if they exhibit a similar profile, or whether the apparent high frequency of newly
appointed women directors is an effect of raised awareness of boards to include female
representation.
2.3.1.9. Total Directorships
The total number of boards that the woman has served on is a likely indicator of director
status. A 5-point ordinal scale measured the item from 1 (None) to 5 (More than 6 boards) –
see Table 2.10.
Although most women (58%) held appointments on only one or two boards, there were
substantial numbers (17%) serving on five or more boards. The women who were on five or

Experiences and Influences of Women Directors
Chapter 2. Characteristics of Women Board Directors in Australia Page 57
more boards were likely to have been among the contingent of long-serving directors (24%
serving more than 10 years) that was apparent from Table 2.9.
Table 2.10 Total Directorships
Number of boards Frequency %
1 to 2 189 58.2
2 to 4 82 25.2
5 to 6 27 8.3
More than 6 27 8.3
Total 325 100%
Sheridan (2001) reported that on average, her sample of women directors held 1.7
directorships of publicly-listed companies, 2.2 directorships of other companies, and 1
directorship of not-for-profit companies. Presuming that the numbers were meant to be added,
a total of 4.9 directorships were held on average by the women in Sheridan’s sample. The
sample of 46 directors from Sheridan, being a sample of women from large publicly listed
companies, probably overlaps with the 54 directors in the present sample that held five or
more directorships.
2.3.1.10. Total Annual Salary
The financial position of the woman director was thought to be a likely factor in director
status, with a financially well-off woman being more likely to pursue the career enhancing
activities required to gain board membership. Either the woman’s own salary, or that of her
partner, was thought likely to establish the required level of financial freedom. Salaries for the
women respondents and their partners was obtained from one two-part question: “Please
indicate the total annual salary range for yourself alone in column 1 and for your
spouse/partner alone in column 2.” The twin ten-point item allowed for responses from 1
(under $45,000) to 10 (over $125,000) – see the summarised results in Table 2.11.

Experiences and Influences of Women Directors
Chapter 2. Characteristics of Women Board Directors in Australia Page 58
Table 2.11 Total Annual Salary
Director salary Partner salary Salary Frequency % Frequency %
Under $45,000 50 16.7 49 22.4
$45,001 to $65,000 46 15.4 31 14.1
$65,001 to $85,000 23 7.6 20 9.2
$85,001 to $105,000 37 12.3 19 8.7
$105,001 to $125,000 38 12.7 30 13.7
Over $125,000 106 35.3 70 32.0
Totals 300 100% 219 100%
Over one-third (35%) of women directors report a salary of over $125,000 per annum.
Under $125,000 per annum, salaries were fairly evenly spread with only one noticeable dip at
$65,00-$85,000 per annum. A substantial number of women (17%) with salaries under
$45,000 per annum were recorded; presumably the directors with lower total salaries,
including their directorship remuneration, were “professional” directors with no other income.
The director’s partners exhibited a similar profile with nearly one-third (32%) earning
over $125,000 per annum. A greater percentage of the partners (22%) earned under $45,000
per annum. The women directors appeared to be paid more than their spouses are, with more
directors at the top end (over $125,000) and fewer directors at the lower end (under $45,000).
Sheridan (2001) reported that the annual level of compensation (base plus bonus pay) of
women directors were in the ranges of less than $100,000 (9%), $100,000 to $300,000 (49%),
$300,000 to $500,000 (30%), and $500,000 to $1,000,000 (12%). The 1995 study presented
salary questions in a different format from Sheridan, breaking salary into components of total
salary and director remuneration. The differences in the reported salaries may be partly due to
the different samples; Sheridan’s sample being confined to publicly list companies and the
present sample including all types of organisations, including not-for-profit bodies. The 91%
of Sheridan’s 46 directors of large corporations that received over $100,000 may have been
included in the 106 directors in the present sample that earned over $125,000.

Experiences and Influences of Women Directors
Chapter 2. Characteristics of Women Board Directors in Australia Page 59
2.3.1.11. Total Directorship Remuneration
The total remuneration that the woman director receives for her directorships was
thought to be a likely factor in director status. A 12-point ordinal scale measured the item
from 1 (Nil) to 12 (Over $47,000) – see the summarised results in Table 2.12. Over one-third
(36%) of women directors receive no remuneration for their directorships. However, there is a
considerable group (17%) earning over $47,000 for their directorships that probably includes
chairs of the boards.
Table 2.12 Total Directorship Remuneration
Remuneration Frequency %
Nil 113 36.2
Under $2,000 26 8.3
$2,000 to $7,000 28 9.0
$7,001 to $17,000 36 11.5
$17,001 to $27,000 28 9.0
$27,001 to $37,000 14 4.5
$37,001 to $47,000 13 4.2
Over $47,000 54 17.3
Totals 312 100%
2.3.1.12. Director Position
The director’s board position is the most significant indicator of board status, with the
chair and the CEO being the most influential members of the board. A 6-point item allowed
for common board positions of 1 (Chair - Executive), 2 (Chair - Nonexecutive), 3 (Managing
Director), 4 (Director - Executive), 5 (Director - Nonexecutive), and 6 (Secretary) – see Table
2.13. Expecting that some women would serve on more than one board, provision was made
for respondents to nominate up to three board positions they occupied.
The most frequently reported board position (64%) was that of nonexecutive director.
Clearly most directors’ second and subsequent positions would be as a nonexecutive as it is

Experiences and Influences of Women Directors
Chapter 2. Characteristics of Women Board Directors in Australia Page 60
expected that they would only be employed as an executive at any one company at a time.
Few women managed to achieve the position of chair or managing director (15%).
Table 2.13 Director Position
Board position Frequency %
Executive Chair 25 4.1
Nonexecutive Chair 39 6.4
Managing Director 29 4.8
Executive Director 109 17.9
Nonexecutive Director 389 64.2
Secretary 15 2.5
Total 606 100%
Note: Respondents could give up to three responses to cover the boards they served.
Korn/Ferry International (1993) found that 80% of the women were nonexecutive
directors and 20% executive directors. Collapsing the positions in the present study, 71%
were nonexecutive directors and 29% executive directors (assuming that the position of
secretary is an executive director position).
2.3.1.13. Partner Relationship
Many researchers report various forms of marital status. Collecting data for the item
allowed comparison with international samples. A single 6-point item allowed for several
common states of partner relationships of 1 (Married), 2 (Living together), 3 (Divorced), 4
(Separated but not divorced), 5 (Single), 6 (Widowed) – see Table 2.14. Most of the women
directors (81%) were either married or had been married (divorced, separated, or widowed).
Only 27% were living alone (divorced, separated, single, or widowed), so presumably most
did not find their partner an impediment to their career.
Sheridan (2001) reported that 80% of women directors were married or in a defacto
relationship, 9% were divorced, 7% were widowed, and 4% were single. The present sample
found 74% of women directors were married or living together, 9% were divorced, 4% were

Experiences and Influences of Women Directors
Chapter 2. Characteristics of Women Board Directors in Australia Page 61
widowed, and 10% were single. The apparent difference in the numbers of single women
directors is likely to be an artefact of the low numbers of respondents in Sheridan’s study, with
only two women in the single category.
Table 2.14 Partner Relationship
Relationship Frequency %
Married 210 64.6
Living together 29 8.9
Divorced 29 8.9
Separated 9 2.8
Single 34 10.5
Widowed 14 4.3
Total 325 100%
2.3.1.14. Partner in the Same Industry
A more likely possible indicator of director status than the presence of a partner
relationship is the likelihood that their relationship could be leveraged by the woman director
if the partner was working in the same industry. A simple 3-point item of 1 (No), 2 (Yes), and
3 (No spouse/partner) captured the variable – see Table 2.15.
Of the women directors with a partner (88%), only a quarter (25%) had partners in the
same industry. There was no clear evidence of partners as springboards into board positions or
networks in the same industry.
Table 2.15 Partner in the Same Industry
Response Frequency %
No 188 58.0
Yes 64 19.8
No spouse/partner 72 22.2
Total 324 100%

Experiences and Influences of Women Directors
Chapter 2. Characteristics of Women Board Directors in Australia Page 62
2.3.1.15. Number of Dependent Children
Several researchers reported the numbers of women director’s children. Although most
researchers do not discriminate between dependent and independent children, the numbers of
dependent children might be a stronger indicator of director status than children, regardless of
dependency. A single 7-point item measured the number of dependent children for which the
woman director was responsible. Response categories were from 0 (none) to 6 (six or more) –
see Table 2.16.
Just over half (56%) of the women had no dependent children. Of those women who did
have dependent children, most (78%) had only one or two dependent children. A substantial
reduction in women with four or more dependent children was apparent, but the decline is
probably in line with current community norms.
Sheridan (2001) reported that 76% of women directors had children. The 1995 sample
found only 44% of women directors had dependent children. The apparent discrepancy may be
due to Sheridan’s respondents reporting on all children, whether dependent or not, whereas the
present study made the distinction of only asking for dependent children.
Table 2.16 Number of Dependent Children
Number of children Frequency %
None 181 55.7
One 52 16.0
Two 61 18.8
Three 25 7.7
Four 4 1.2
Five 1 0.3
Six or more 1 0.3
Total 325 100%

Experiences and Influences of Women Directors
Chapter 2. Characteristics of Women Board Directors in Australia Page 63
2.3.1.16. Financial Responsibility for Dependent Children
Financial responsibility for dependent children was thought to be a possible indicator of
director status. A woman burdened by financial responsibilities was thought less likely to
indulge in the career enhancing activities required to gain board membership. Measurement of
the item was based on Tharenou and Conroy’s (1994) study of managerial advancement.
Responses for the question “Do you share financial responsibility for these dependent
children and other dependents with anyone else?” were from 1 (No, I do not contribute
directly to the finances) to 5 (No, I contribute all the finances) – see Table 2.17. A response
option of 6 for no dependents was provided to avoid confusion for respondents who did not
read the question correctly.
Most women (86%) indicated that they take at least half, if not all, the financial
responsibility for their dependent children. Almost 40% take on the major or all financial
responsibility for their children. Apparently they are able to combine the requirements of a
board director and of being a “breadwinner” for the children.
Table 2.17 Financial Responsibility for Children
Responsibility Frequency %
No direct contribution 4 2.8
Minor contribution 16 11.1
50/50 joint contribution 68 47.2
Major contribution 34 23.6
All financial responsibility 22 15.3
Total 144 100%
2.3.2. Interpersonal Variables
Interpersonal variables describe the interaction between the individual and other
individuals or organisations.

Experiences and Influences of Women Directors
Chapter 2. Characteristics of Women Board Directors in Australia Page 64
2.3.2.1. Basis of Recruitment
The method by which the woman gained board membership was thought to be a possible
indicator of director status. The item was measured by a 7-point nominal scale of 1 (Invitation
by the chair), 2 (Invitation by director/executive), 3 (Election), 4 (Ownership of the company),
5 (Family affiliation), 6 (Informal networking), and 7 (Through being a consultant to the
company) – see Table 2.18.
Table 2.18 Basis of Recruitment
Basis of recruitment Frequency %
Invitation by chair 129 30.1
Invitation by director/ executive 93 21.7
Election 91 21.3
Ownership of company 55 12.9
Family affiliation 25 5.8
Informal networking 26 6.1
Being a consultant 9 2.1
Total 428 100%
Note: Respondents could give up to three responses to cover the boards they served.
Over half of the directors (52%) were appointed to the board by invitation from the chair
or another director/executive. After recruitment by invitation, the reasons for recruitment
quickly declined, with the next most frequent means of appointment being by election (21%)
and ownership of the company (13%).
2.3.2.2. Board Chair Gender
The similarity of the woman’s gender with that of the board chair was thought to be a
possible indicator of director status. The item was measured by a 2-point nominal scale of 1
(No) and 2 (Yes). The chair of the board was usually a male (89%), leaving few (11%) female
chairs.

Experiences and Influences of Women Directors
Chapter 2. Characteristics of Women Board Directors in Australia Page 65
2.3.2.3. Employment CEO Gender
The similarity of the woman’s gender with that of her CEO was thought to be a possible
indicator of the likelihood of her becoming a board director. The item was measured by a 2-
point nominal scale of 1 (No) and 2 (Yes). The CEO of the director’s employment
organisation was usually male (73%), however over one quarter (27%) of the organisations
had female CEOs.
2.3.2.4. Board Gender Proportion
The proportion of men and women on the board was thought to be a possible indicator
of director status. The item was measured by a 5-point ordinal scale of 1 (All women),
2 (A majority of women and a minority of men), 3 (About 50% women and 50% men),
4 (A majority of men and a minority of women), and 5 (All men) – see Table 2.19.
Most of the women directors (79%) were appointed to male dominated boards. Only a
few (6%) of the directors were appointed to boards in which the women were a majority.
Table 2.19 Board Gender Proportion
Gender proportion Frequency %
All women 10 1.6
A majority of women and a minority of men 24 3.9
About 50% women and 50% men 95 15.4
A majority of men and a minority of women 402 65.3
All men 85 13.8
Total 616 100%
Note: Respondents could give up to three responses to cover the boards they served.
2.3.2.5. Work Colleagues Gender Proportion
The proportion of men and women in the director’s work environment was thought to
be a possible indicator of the likelihood of being a board director. The item was measured by
a 5-point ordinal scale of 1 (All female), 2 (Majority female, minority male), 3 (About 50%
male and 50% female), 4 (Majority male, minority female), and 5 (All male) – see Table 2.20.

Experiences and Influences of Women Directors
Chapter 2. Characteristics of Women Board Directors in Australia Page 66
Table 2.20 Work Colleagues Gender Proportion
Gender proportion Frequency %
All female 22 6.8
Majority female, minority male 69 21.4
About 50% male and 50% female 90 28.0
Majority male, minority female 115 35.7
All male 26 8.1
Total 322 100%
Gender proportions in the work environment of the women directors indicated that 28%
of the women work in a female-majority environment and 44% work in a male-majority
environment.
2.3.2.6. Managerial Gender Proportion
The proportion of men and women in the managerial hierarchy of the director’s work
environment was thought to be a possible indicator of the likelihood of becoming a board
director. The item was measured by a 5-point ordinal scale of 1 (All women), 2 (A majority of
women and a minority of men), 3 (About 50% women and 50% men), 4 (A majority of men
and a minority of women), and 5 (All men) – see Table 2.21.
Table 2.21 Managerial Gender Proportion
Gender proportion Frequency %
All women 21 6.6
A majority of women and a minority of men 33 10.3
About 50% women and 50% men 61 19.1
A majority of men and a minority of women 170 53.3
All men 34 10.7
Total 319 100%
Gender proportions in the work environment of the women directors indicated a
noticeable domination by men in the managerial hierarchy, with 64% of the women working

Experiences and Influences of Women Directors
Chapter 2. Characteristics of Women Board Directors in Australia Page 67
in a male-majority managerial hierarchy, although 17% of women worked in a female-
majority managerial hierarchy.
2.3.2.7. Years Worked with Women Managers
The length of time that the woman director had worked closely with a woman manager
in her employment organisation was thought to be a possible indicator of the likelihood of
becoming a board director. The item was measured by a 5-point ordinal scale of 1 (Not
worked with a woman manager), 2 (Less than 12 months), 3 (1 up to 2 years), 4 (2 up to 4
years), and 5 (4 or more years) – see Table 2.22.
Table 2.22 Years Worked with Women Managers
Duration Frequency %
Not worked with a woman manager 163 51.1
Less than 12 months 21 6.6
1 up to 2 years 22 6.9
2 up to 4 years 18 5.6
4 or more years 95 29.8
Total 319 100%
The data showed a bipolar distribution with one half (51%) of women directors having
not worked closely with a woman manager, but nearly a third (30%) having worked closely
with a woman manager for 4 or more years.
2.3.2.8. Years Worked with Women Directors
The length of time that the woman director had worked closely with other women board
members was thought to be a possible indicator of board status. The item was measured by a
6-point ordinal scale of 1 (Not at all), 2 (Less than 1 year), 3 (1 to 2 years), 4 (3 to 4 years), 5
(5 or more years) – see Table 2.23. A response option of 6 for not applicable was provided to
allow for women who had no other women board members on the board. Over half (53%) of
the women had worked closely with other woman board members.

Experiences and Influences of Women Directors
Chapter 2. Characteristics of Women Board Directors in Australia Page 68
Table 2.23 Years Worked with Women Directors
Duration Frequency %
Not at all 65 20.2
Less than 1 year 35 10.9
1 to 2 years 41 12.7
3 to 4 years 40 12.4
5 or more years 54 16.8
Not applicable 87 27.0
Total 322 100%
2.3.3. Organisational Variables
Organisational variables describe the organisational environment in which the woman
director operates.
2.3.3.1. Employment Industry
The similarity of the industry in which the woman was employed and the industry of the
board’s organisation was thought to be a possible indicator of director status. The
employment industry was measured using an 11-item nominal scale of industry types
according to the Australian Standard Industrial Classification (Australian Bureau of
Statistics, 1988). The response options were 1 (Mining), 2 (Manufacturing), 3 (Electricity, gas
and water), 4 (Construction), 5 (Wholesale and retail trade), 6 (Transport and storage), 7
(Communication), 8 (Finance, property and business services), 9 (Public administration and
defence), 10 (Community services), 11 (Recreation, personal and other services) – see Table
2.24.
The women directors were employed in a range of industries, with the most frequent
being “finance, property, and business services” at 31%. Few women directors came from the
industries of “mining,” “electricity, gas and water,” “construction,” and “transport and

Experiences and Influences of Women Directors
Chapter 2. Characteristics of Women Board Directors in Australia Page 69
storage,” all with low frequencies of 2% or less each. However, a nonexecutive director may
work in a different industry to the company of the board of which she is a member.
Table 2.24 Employment Industry
Industry Frequency %
Mining 6 1.9
Manufacturing 19 5.9
Electricity, gas and water 6 1.9
Construction 7 2.2
Wholesale and retail trade 28 8.8
Transport and storage 5 1.6
Communication 41 12.8
Finance, property and business services 98 30.6
Public administration and defence 23 7.2
Community services 51 15.9
Recreation, personal and other services 36 11.3
Total 320 100%
2.3.3.2. Occupation Category
The woman director’s occupation category was thought to be a possible indicator of
director status, with a positive association between occupations requiring a high skill level.
The Australian Standard Classification of Occupations (Department of Employment and
Industrial Relations, 1987) is an 8-point ordinal scale with brief explanations of the type of
work performed under each of the categories that was used to measure the type of occupation
in which the respondents work. The scale was numerically graduated in descending order
from an evaluation of the differences in skills and knowledge in each occupational category –
see Table 2.25.
Most women directors (57%) were managers or administrators, with most of the
remainder (38%) being professionals. As might be expected none of the directors listed their
occupation as tradesperson, plant and machine operator/driver, or labourer and related worker.

Experiences and Influences of Women Directors
Chapter 2. Characteristics of Women Board Directors in Australia Page 70
Table 2.25 Occupation Category
Occupation category Frequency %
Manager and administrator 182 56.5
Professional 123 38.2
Para-professional 8 2.5
Clerk 8 2.5
Salesperson and personal service worker 1 0.3
Total 322 100%
2.3.3.3. Employment Employees
The similarity between the sizes of the woman’s employing organisation and the
board’s organisation in numbers of employees was thought to be a possible indicator of
director status. A 10-point scale from 1 (less than 25 employees) to 10 (more than 8,000
employees) measured the size of the organisation that employed the woman – see Table 2.26.
Table 2.26 Employment Employees
Employees Frequency %
Less than 25 68 21.6
25 to 50 31 9.8
51 to 100 42 13.3
101 to 200 47 14.9
201 to 500 27 8.6
501 to 1000 26 8.3
1001 to 2000 18 5.7
2001 to 4000 19 6.0
4001 to 8000 7 2.2
More than 8000 30 9.5
Total 315 100%
Most women directors (60%) were employed in small to medium-sized organisations of
fewer than 200 people. The high frequency of women directors in small organisations is likely
to be a result of the large sample and reflect the far larger numbers of small organisations in

Experiences and Influences of Women Directors
Chapter 2. Characteristics of Women Board Directors in Australia Page 71
the community. A relatively large number of women (10%) employed by large organisations
with more than 8,000 employees was noticed, suggesting that women from very large
organisations are attractive as board directors.
2.3.3.4. Board Employees
The similarity between the sizes of the organisation and the woman’s employing
organisation in numbers of employees was thought to be a possible indicator of director
status. A 10-point scale from 1 (less than 25 employees) to 10 (more than 8,000 employees)
measured the size of the organisation that board governed – see Table 2.27.
Table 2.27 Board Employees
Employees Frequency %
Less than 25 67 20.7
25 to 50 51 15.7
51 to 100 50 15.4
101 to 200 38 11.7
201 to 500 41 12.7
501 to 1000 23 7.1
1001 to 2000 12 3.7
2001 to 4000 15 4.6
4001 to 8000 12 3.7
More than 8000 16 4.6
Total 325 100%
Over half (52%) of the women were on boards of organisations with fewer than 100
employees. As noted previously, the high frequency of women directors in small organisations
may simply reflect the large numbers of small organisations in the community. However, the
decline in the numbers of women directors as the organisation becomes larger appears to halt
for organisation of greater then 1,000 employees. The numbers of large organisations in the
community must decline as the organisations become larger and so the steady numbers of
women directors for large organisations may reflect international observations that large

Experiences and Influences of Women Directors
Chapter 2. Characteristics of Women Board Directors in Australia Page 72
organisations tend to appoint more women directors. In comparing the Director’s organisation
size (Table 2.26) with the Board’s organisation size, it is apparent that twice as many women
directors are employed by organisations of greater than 8,000 employees (9.5%) as there are
women directors on boards of organisations of larger size (4.6%). Employees of large
organisations appear to find positions on the boards of smaller organisations.
2.3.3.5. Board Corporation Type
The type of organisation for which the woman is a director was thought to be a possible
indicator of director status. The item was measured by a 7-point scale from 1 (Publicly listed),
2 (Public unlisted), 3 (Private), 4 (Trust), 5 (Partnership), 6 (Statutory authority), to 7 (Not
for profit) – see Table 2.28.
Table 2.28 Board Corporation Type
Corporation type Frequency %
Publicly listed 65 12.8
Public unlisted 72 14.2
Private company 120 23.7
Trust 25 4.9
Partnership 6 1.2
Statutory authority 92 18.1
Not for profit 127 25.0
Total 507 100%
Note: Respondents could give up to three responses to cover the boards they served.
Women directors were relatively evenly spread across organisation types, with the
exception that trusts and partnerships had very few women on their boards.
Korn/Ferry International (1996) reported that 56% of women directors were on public
company boards and 44% were on government boards, with no other categories mentioned. In
contrast, the present sample that found 27% of women directors were on public company
boards, 18% were on statutory authority (government) boards, 30% were on private company
boards (including trusts and partnerships), and 25% were on not-for-profit organisation

Experiences and Influences of Women Directors
Chapter 2. Characteristics of Women Board Directors in Australia Page 73
boards. The differences are probably due to the different natures of the samples: Korn/Ferry
International sampling predominantly large corporations and the present sample covering a
wider cross-section of organisations.
2.3.3.6. Board Directors
The number of directors on a board, of which the director was a member, was thought to
be a possible indicator of director status. The item was measured by a 7-point item with
response categories of 1 (2 to 4), 2 (5 to 7), 3 (8 to 10), 4 (11 to 13), 5 (14 to 16), 5 (17 to 19),
and 6 (20 or more). Boards of greater than 11 directors were collapsed in Table 2.29. Women
from board sizes of less than five were dropped from the sample as discussed earlier.
Table 2.29 Board Directors
Number of directors Frequency %
5 to 7 145 44.6
8 to 10 112 34.5
11 or more 68 20.9
Total 325 100%
The present sample found an estimated average board size of eight members, although
more women directors came from boards of fewer than eight directors. The greater frequency
of boards with less than eight directors probably reflects that smaller organisations with
smaller boards are more common regardless of gender.
Korn/Ferry International (1996) reported that the average board size across all
companies was eight, although they did not report the average board size of those companies
with a woman on the board. Sheridan (2001) reported that the average board size across all
publicly listed companies is 5 to 6 members within a range of 3 to 15 members. Sheridan
neglected to mention the average board size of the boards for her sample.

Experiences and Influences of Women Directors
Chapter 2. Characteristics of Women Board Directors in Australia Page 74
2.3.3.7. Director Board Obligations
The level of obligations imposed on a woman director measured by the board’s meeting
frequency and director’s time commitment was thought to be a possible indicator of director
status. Two ordinal scales measured board obligations. Board meeting frequency was a 6-
point scale from 1 (Weekly) to 6 (Annually) – see Table 2.30, and director’s time commitment
was a 9-point scale from 1 (0 to 5 hours) to 9 (More than 40 hours) – see Table 2.31.
Table 2.30 Board Meeting Frequency
Frequency Frequency %
Weekly 16 4.9
Monthly 219 67.6
Bimonthly 47 14.5
Quarterly 29 9.0
Half-yearly 8 2.5
Annually 5 1.5
Total 324 100%
Table 2.31 Director Time Commitment
Hours Frequency %
0 to 5 175 54.2
6 to 10 89 27.6
11 to 15 23 7.1
16 to 20 17 5.3
21 to 25 4 1.2
26 to 30 2 0.6
31 to 35 3 0.9
36 to 40 2 0.6
More than 40 8 2.5
Total 323 100%
Most women (68%) attended board meetings monthly and the majority (82%) spent 10
hours or fewer per week on board business per week. The few (2.5%) spending more than 40

Experiences and Influences of Women Directors
Chapter 2. Characteristics of Women Board Directors in Australia Page 75
hours per week on board business were probably executives with a particular role, such as
board secretary, of servicing the board.
Korn/Ferry International (1995) states the average time spent on board matters by
nonexecutive directors was 24 days per year. Assuming an eight hour day, 24 days equates to
192 hours per year. In comparison, five hours per week assuming a 48-week working year
equates to 240 hours per year. So the figure of 0-5 hours per week corresponds well with the
average reported by Korn/Ferry International.
2.3.4. Summary
Overall, the profile of Australian women directors is that they appeared to be well-
educated successful executives who had worked many years in the workforce. Board positions
were often offered to them soon after they gained executive status, and often to the boards of
companies of a smaller size to the one in which they were employed.
2.4. Australian Women Board Directors Compared to Other Countries
Comparisons between Australian women directors and their international counterparts
provide a way to affirm or dismiss perceptions about the success or otherwise that Australian
women have had in gaining board appointments. Given that there are few similarities in
survey methods or items between researchers (Burke & Mattis, 2000), detailed analyses
cannot be made, but interesting comparisons can still be presented on a few items.
Comparisons of the characteristics of Australian women directors with those reported in
the literature from other countries are summarised in Tables 2.28 to 2.32. Only five
characteristics (age, education level, marital status, numbers of children, and salary) were
reported frequently enough by other researchers to provide useful comparative data for a
similar period.

Experiences and Influences of Women Directors
Chapter 2. Characteristics of Women Board Directors in Australia Page 76
2.4.1. Director’s age
The age of Australian women directors is similar to those in other countries, with the
exception of women directors in the United States – see Table 2.32. In the United States, in
1991, women directors from Fortune 500 companies were mostly aged between 50 and 59
years, and 98% were aged over 40 years (Catalyst, 1993). In Canada, Burke (1994b) reported
that most women from a survey based on the 1992 Canadian Financial Post Directory of
Directors were aged between 46 and 50, with only 70% aged over 41. In Britain, most women
directors of large corporations were aged between 45 and 49 years, with 87% aged 40 years or
more (Holton et al., 1993). In New Zealand, most women directors were aged between 41 and
50 years (Pajo et al. 1997). The average age of Israeli women directors was 47 years (Talmud
& Izraeli, 1998).
Table 2.32 International Comparisons of Director Ages
Country Australiaa U.S.A.b Canadac U.K.d N.Z.e Israelf
Sample size 325 ~160g 259 47 31 98
Median age 45-49 50-59 46-50 49-50 41-50 -
Mean age 47 56 47 51 - 47
% over 40 years old 81% 98% 70% 87% 84% -
Note. A dash in a cell of the table signifies that the corresponding data item was not reported. a Present study e Pajo, McGregor, and Cleland, 1997 b Catalyst, 1993 f Talmud and Izraeli, 1998 c Burke, 1994b g Sample size estimated from method description d Holton, Rabbetts, and Scrivener, 1993
2.4.2. Highest level of education
The highest level of education of Australian women directors compares well with the
United States and Canadian studies, although women directors appear to be a little more
highly educated – see Table 2.33. Catalyst’s (1993) U.S.A. study, and Burke’s (1994b)
Canadian study agree very closely on the educational level reached by North American
directors at 89% and 88% respectively holding undergraduate degrees. The New Zealand

Experiences and Influences of Women Directors
Chapter 2. Characteristics of Women Board Directors in Australia Page 77
sample of Pajo et al. (1997) shows an extraordinarily high number (83%) of women directors
with postgraduate degrees compared to other countries, with Canadian and Australian data
agreeing on 39-41%. In Israel, the Israeli women appear to be somewhat less educated, with
Talmud and Izraeli (1998) reporting that only 68% hold a university degree. However, that
may have been due to inherent differences in the structure of tertiary education between the
countries. For instance, if TAFE qualifications, associate diplomas, and undergraduate
diplomas are excluded from the Australian study then the resultant figure for tertiary
qualifications is only 69%, very close to the Israeli figure.
Table 2.33 International Comparisons of Education
Country Australiaa U.S.A.b Canadac N.Z.d Israele
Sample size 324 ~160f 251 30 98
Tertiary Qualification 81% 89% 88% 93% 68%
Postgraduate Qualification 39% - 41% 83% -
Note. A dash in a cell of the table signifies that the corresponding data item was not reported. a Present study d Pajo, McGregor, and Cleland, 1997 b Catalyst, 1993 e Talmud and Izraeli, 1998 c Burke, 1994b f Sample size estimated from method description
2.4.3. Marital status
The Australian sample compares well with Catalyst’s (1993) U.S.A. sample and the
Canadian sample of Burke (1994b), with 65-71% of all samples agreeing on the common item
of “married” – see Table 2.34. Descriptions of marital status other than “Married” varied too
much between surveys to provide a useful basis for comparison.
Table 2.34 International Comparisons of Marital Status
Country Australiaa U.S.A.b Canadac
Sample size 325 ~160d 251
Married 65% 69% 71% a Present study c Burke, 1994b b Catalyst, 1993 d Sample size estimated from method description

Experiences and Influences of Women Directors
Chapter 2. Characteristics of Women Board Directors in Australia Page 78
2.4.4. Numbers of children
The current study differed from overseas studies in that it measured numbers of
dependent children, whereas the overseas studies did not discriminate and reported all
children. It may explain the difference in numbers of women directors with children; 44% of
Australia women had dependent children, compared to over 70% of women with any children
in the U.S.A. and Canada – see Table 2.35. However, those Australian directors with children
appeared to have larger families (average 2.9 children) than their Canadian (average 2.4
children) or U.K. (average 2.5 children) counterparts.
Table 2.35 International Comparisons of Numbers of Children
Country Australiaa U.S.A.b Canadac U.K.d N.Z.e
Sample size 325 ~160f 259 47 31
Any children 44% 74% 71% - 55%
Mean number of children 2.9 - 2.4 2.5 -
Mode 2 2 2 - -
Note. A dash in a cell of the table signifies that the corresponding data item was not reported. a Present study d Holton, Rabbetts, and Scrivener, 1993 b Catalyst, 1993 e Pajo, McGregor, and Cleland, 1997 c Burke, 1994b f Sample size estimated from method description
2.4.5. Director’s salaries
Comparison of salaries across countries is difficult due to fluctuations in exchange rates
and the effects of inflation over time. To help with comparison the salaries have been
categorised into arbitrary ranges of Low, Moderate, Higher, and Top (see – Table 2.36).
A notable difference between Australia and Canada appears to be a higher proportion of
directors in the low salary category in Australia. The apparent difference may be due to the
samples: the Australian sample covers small businesses and not-for-profit organisations, and
the Canadian sample mainly comprises large corporations. Note that no attempt at currency
conversion has been attempted.

Experiences and Influences of Women Directors
Chapter 2. Characteristics of Women Board Directors in Australia Page 79
Table 2.36 International Comparisons of Salaries
Country Australiaa U.S.A. b Canadac N.Z. d
Sample size 300 ~160e 255 31
Low salary < $45,000 17% - < $50,000
8% -
Moderate salary
$45,000–$85,000 23%
< $100,000 31%
$50,000–$100,000 31% -
Higher salary
$85,000–$125,000 25%
$100,000–$200,00040%
$100,000–$200,000 45% -
Top salary > $125,000 35%
> $200,000 29%
> $200,000 16%
> $200,00033%
Note. A dash in a cell of the table signifies that the corresponding data item was not reported. a Present study d Pajo, McGregor, and Cleland, 1997 b Catalyst, 1993 e Sample size estimated from method description c Burke, 1994b
2.4.6. Summary
Australian women directors were similar to their international counterparts on the
readily comparable characteristics of age, education level, marital status and numbers of
children. The notable exceptions were higher ages of women directors in the United States and
a high incidence of postgraduate qualifications of New Zealand.
The international comparison of salaries, although interesting, is difficult to interpret
with any reliability. Australian salaries appear to be closest to those of Canada. For
meaningful conclusions to be drawn from comparative data requires a cross-nation study
designed to collect data at the same time using the same survey instrument taking exchange
rates and relative costs of living into the calculations.
2.5. Discussion
2.5.1. Sample Representativeness
The sample of 325 women directors from boards of greater than four directors compares
well with the limited Australian literature on the characteristics of women board directors and

Experiences and Influences of Women Directors
Chapter 2. Characteristics of Women Board Directors in Australia Page 80
the international literature. From the representativeness of the present sample based on
common items, we can infer that the additional items covered by the present survey are also
representative of women directors.
2.5.2. Limitations and Future Research
The study represents a “first” in Australia that identified important information that
needs to be obtained in future studies. The study generated a useful contribution to
information about which Australian women directors can be compared. However, there were
inherent limitations of the study.
At the time of data collection, it was deemed important to concentrate on data that
reflected the women’s own history, experiences, and opportunities. A lack of organisational
demographic information about the gender proportions of the organisation, sales volume and
company structure may limit the inferences that could be drawn. The data may also suffer
from a shortage of information about women directors' experiences before gaining their first
board appointment and specific expertise that they gained through board appointments.
The use of ordinal scales instead of numeric interval responses limited the flexibility of
analysis of the data. For example, the average age of the women had to be estimated from the
midpoints of the five-year intervals. A lack of standards for categorical items such as partner
relationship and industry limited the comparisons that could be made with other literature,
although this is an international problem not limited to this thesis. The exploratory nature of
the survey resulted in many items that could have produced fatigue in the respondents.
If a CEO appointment positions a person well for future nonexecutive director
appointment but women rarely make it to CEO, then future studies may like to consider the
converse, whether a nonexecutive director appointment assists a woman’s career progression
ultimately to a CEO position. Future studies might also like to consider whether there is
significant status in large and/or publicly listed corporations, because if there is then it might
be easier for women to obtain director roles with lesser status small private or government

Experiences and Influences of Women Directors
Chapter 2. Characteristics of Women Board Directors in Australia Page 81
organisations. Areas for future research also include the regular collection of profile data to
assess changes in women's board membership patterns and board positions, including
committee membership, and representation across industry categories. Collection of data
about the company as well as about the individual women directors would add significantly to
the profile of women directors in Australia.
An examination of women’s board roles, functions, opportunities, and responsibilities
once appointed may provide greater insight into women directors on Australian boards. One
previous study has examined activities on the board through subcommittee membership
(Bilimoria & Piderit, 1994). A survey of shareholder and senior officer perceptions of the
company before appointment and some time after the appointment of a woman director may
also provide interesting data about the shareholder perception of women in governance roles.
2.5.3. Conclusion
The present sample provides an extensive profile of Australian women directors. It
seems that the typical Australian woman director is an outstanding executive working in a
large organisation, in which she rose rapidly and gained visibility to be offered a board
appointment. The women appear well qualified by education and experience to contribute to
corporate governance.

Experiences and Influences of Women Directors
Chapter 3. Nonexecutive Directors as a Distinct In-Group Category Page 82
Chapter 3
3. NONEXECUTIVE DIRECTORS AS A DISTINCT IN-GROUP CATEGORY
3.1. Introduction
The discretionary nature of nonexecutive director appointments is of special interest to
women directors. Women who attempt to become board directors through executive
promotions face the well documented “glass ceiling.” Nonexecutive director appointments
offer women another path to the board: one that may hold some hopes for bypassing the glass
ceiling. Nonexecutive directors achieve their board membership through invitation because of
the strategic knowledge, experience, and/or contacts they bring to the corporation (Hill,
1995), so if women can invoke one of these other categories they might avoid the executive
career hurdle. Executive directors on the other hand are employees of the corporation, and
achieve their board membership because of the position they hold in the corporation (Francis,
1997). Executive directors are part of its operational management team, and interact on a
daily basis. Nonexecutive directors are supposed to be independent of the corporation,
especially its senior management, and are likely to interact infrequently on a formal basis
(perhaps only monthly), although possibly more frequently on an informal basis.
Social identity theory prompts a consideration of the characteristics that are salient in a
particular social context. The research question arises for boards of directors as to whether the
apparent distinction between nonexecutive directors and executive directors truly is distinct,
and is therefore a potentially salient categorisation. Self-categorisation theory suggests that a
crucial determinant of social category salience is comparative and normative fit (Haslam,
2001), thus providing a basis to assess the categorisation of executive directors and
nonexecutive directors for potential salience.
Executive directors may perceive themselves as having a significantly more intimate
knowledge of the corporation’s operations and its immediate issues compared to nonexecutive

Experiences and Influences of Women Directors
Chapter 3. Nonexecutive Directors as a Distinct In-Group Category Page 83
directors. Nonexecutive directors may perceive themselves as having significantly more
strategic knowledge of the corporation’s marketplace and its business context compared to
executive directors. Executive directors may perceive that it is normal to put the interests of
management and the employees above those of the shareholders in order to achieve long-term
success. Nonexecutive directors may perceive that it is normal to put the interests of
shareholders above those of management and the employees in order to achieve success.
When significant differences in characteristics exist between executive directors and
nonexecutive directors, in addition to the presumed attitudinal differences suggested above,
self-categorisation theory’s meta-contrast principle of minimising non-salient characteristics
may have effect (Haslam, 2001). For example, an executive director may have some similar
personal interests as some of the nonexecutive directors. However, the potentially salient
characteristic of similar personal interests may be minimised if the executive director
perceives the categorisation as an executive or nonexecutive director as salient to ingroup or
outgroup identity. The present study attempts to detect whether the categorisation of executive
directors and nonexecutive directors forms distinct groups based on “objective” (non-
attitudinal) characteristics.
The aim of the present study was to examine whether nonexecutive directors can be
considered a distinct ingroup category. Possible salient characteristics of nonexecutive
directors were about themselves (individual factors), about their relationships with others
(interpersonal factors), and how much their organisational context (organisational factors)
might influence perceptions. To the author’s knowledge, the present study was the first study
to attempt to explore the social identity characteristics of women directors using the
distinction of director types.
Studies from the United States (Catalyst, 1998c), Britain (Holton, 2000), Canada
(Catalyst, 1998b), and Australia (Korn/Ferry International, 1999) provide periodic surveys of
women directors with some demographic, experiential, and organisational characteristics.

Experiences and Influences of Women Directors
Chapter 3. Nonexecutive Directors as a Distinct In-Group Category Page 84
However, they offer few distinctions between executive directors and nonexecutive directors,
and do not analyse the data from a theoretical basis. Studies of the correlates of women
directors’ board representation (Singh & Vinnicombe, 2000; McGregor, 1997) have rarely
examined situational factors or evaluated the relative importance of individual and situational
factors. The aim of the present study is to add to understanding of women board directors by
assessing the relative salience of factors related to nonexecutive directors and executive
directors, based on social identity theory using an Australian sample.
Women company directors in Australia hold only 4% of board positions (Korn/Ferry
International, 1996). Boards of governance of Australian companies usually consist of a
mixture of nonexecutive directors, and a small number of senior executive staff from within
the company itself, called executive directors (Korn/Ferry International, 1995). Women
nonexecutive directors can be freely selected (invited, elected), whereas women executive
directors are usually on the board because they work for the company or are the owners. As
there are so few top executive women (Catalyst, 1998a; EOWA, 2002b), the choice of
executive directors in an individual company is limited to very few, if any, women.
3.1.1. Individual Factors
Women have been thought to gain nonexecutive director status by anticipated pathways
such as education and top leadership jobs (Singh & Vinnicombe, 2001; Mattis, 1997).
According to Becker (1985), investments in education, work experience, on the job training,
expectations, allocation of time between work and home responsibilities, and job effort are
examples of human capital investments. Gender differences between human capital
investments consistently had a positive relationship to nonexecutive director status. Age,
education, and managerial advancement not only reflect knowledge and skill, but also make
the women visible, signalling to decision-makers that women are suitable as board members,
and reducing perceived risks. Consistent with similarity-attraction theories (Baron & Pfeffer,
1994) and homosocial reproduction approaches (Kanter, 1987), authors have suggested that

Experiences and Influences of Women Directors
Chapter 3. Nonexecutive Directors as a Distinct In-Group Category Page 85
directors are appointed from older men who are similar in social characteristics and
demographics (Leighton & Thain, 1993; Westphal & Zajac, 1995).
Individuals’ knowledge and skills are important influences on their self-perception, and
others’ perceptions of them. Human capital theory proposes that investments in human capital
such as education and organisation tenure, result in economic advantages of advancement and
higher salaries (Becker, 1993). Investments in human capital increase women's skills and
knowledge for senior positions, and bring them to the attention of decision-makers. Women
may need to invest substantially in human capital in order to come to the attention of
decision-makers for board positions. Women executive directors are likely to have substantial
human capital to reach high management levels, however once at a senior management level,
political skill rather than human capital may be more important (Mainiero, 1994b). Women
nonexecutive directors are likely to require greater levels of human capital to achieve the
skills, knowledge, and visibility to be freely chosen for boards. Women nonexecutive
directors may therefore have greater investments in human capital than women executive
directors. Human capital investments increase visibility, networks, and public profile that are
seen as important for director selection (Howe & McRae, 1991; Singh, Vinnicombe &
Sturges, 2000).
The human capital variables selected for the present study comprised those reflecting
knowledge through developmental activities (e.g., education) and skill through length of
experience (age and organisation tenure). In addition, managerial advancement, CEO
experience, and work continuity were examined as a form of human capital. Researchers and
commentators suggest that CEOs prefer board members who have CEO experience (Burke,
1994c; Maitland, 1999). Hence, women selected for boards were likely to have advanced
considerably in management, ideally to CEO level. Managerial advancement reflected both
the skill and knowledge for board work, and the senior levels needed for consideration for
appointment to boards. It is argued that women nonexecutive directors, freely chosen for

Experiences and Influences of Women Directors
Chapter 3. Nonexecutive Directors as a Distinct In-Group Category Page 86
boards, were likely to have had higher managerial levels especially CEO experience
throughout their careers than the women executive directors.
Other personal variables considered in the present study were exploratory in nature.
Partner relationship and numbers of dependent children were taken into account. As the hours
involved in board work per week are low, and attendance is at stipulated times, it was not
thought that family duties would restrict board representation for nonexecutive directors.
However for executive directors, board duties may affect an already busy executive career
leaving little time for partners and dependent children.
Hypothesis 1 proposes that human capital investments of age, education, organisation
tenure, managerial advancement and CEO experience would be better predictors of
nonexecutive director group membership than individual situational factors of work
continuity and their home environment (partner relationship and number of dependent
children).
3.1.2. Interpersonal Factors
Lack of interpersonal support and gender dissimilarity is likely to create barriers for
women to be influential on boards, and limit their advancement to top management positions.
Although social factors, such as networks, were likely to be important, interpersonal factors
were rarely directly measured in studies of women's board appointments. The social factors
considered in prior studies were expressed in terms of career support (Singh & Vinnicombe,
2001) and women's similarity to other members of the board (Smith, 1994). The present study
considered interpersonal support from general perspectives, examining career encouragement
from senior people, colleagues, from others in the employment organisation, and specific
support from a mentor.
Social similarity may be important for board influence. Social similarities mean that
individuals would often have shared values and attitudes, and derive their self-esteem from
group membership (Jackson, Stone & Alvarez, 1992). Individuals are attracted to, and

Experiences and Influences of Women Directors
Chapter 3. Nonexecutive Directors as a Distinct In-Group Category Page 87
preferred those similar to themselves (Byrne, 1971). Similarity leads to self-validation, ease of
communication, and trusting relationships (Kanter, 1977). The preference for those that are
perceived as similar is particularly prevalent in situations of uncertainty and lack of
familiarity (Baron & Pfeffer, 1994). Choosing whom to appoint to boards is an uncertain
situation as there are likely to be a range of factors that dictate whether individuals make
effective board members.
Westphal and Zajac (1995) found that appointment as company director was influenced
by similarity with the existing members of the board and the chief executive officer,
supporting similarity-attraction principles. Similarity was in terms of leadership and
communication styles, age, functional background, similarity, and educational level. Lorsch
and MacIver (1989) examined new director selection and change in large United States
industrial and service firms over three years, and suggested that relatively powerful boards
facilitate the appointment of demographically similar new directors.
The present study measured gender similarity from several perspectives. Two items
relating to gender similarity to the women's own employing organisations (male managerial
hierarchy, male-stereotyped position) should be more salient for executive directors. Two
items relating to gender similarity to the board (board gender proportion, years worked with
women directors) should be more salient for nonexecutive directors
Women are automatically dissimilar to most board members because of their gender.
The fact that they are women, and thus dissimilar, may of course have been a factor in
nonexecutive directors gaining appointment to the board. However, often only one woman is
appointed to a board (Korn/Ferry International, 1997a). A survey of Canadian women
directors (Mitchell, 1984) found that women directors acknowledged that their appointment to
the board was a combination of gender and their public visibility, recognising their “token”
status. The three most common reasons women thought they were appointed were their
community profile (23%), the increasing representation of women (21%), and their business

Experiences and Influences of Women Directors
Chapter 3. Nonexecutive Directors as a Distinct In-Group Category Page 88
expertise (14%). Overall, it seems that gender dissimilarity to the board results in women
being selected as the first “token” woman for the board. However once appointed, other
characteristics of the woman may become salient that allow the woman to join an ingroup of
the board.
However, gender similarity usually helped executive women rise in rank in management
(Konrad & Pfeffer, 1991; Tharenou, 1995). Women rose to upper manager, executive and
chief executive officer ranks when in more female-oriented managerial hierarchies. Hence, it
is likely that more women executive directors would be appointed to boards when women
worked in organisations with female-oriented managerial hierarchies. The woman may have
more opportunity to demonstrate characteristics and behaviours that would be attractive to
senior management. In addition, working in a male-stereotyped position may lead to greater
visibility and ultimately the woman being selected for a board position (Pfeffer, Davis-Blake,
& Julius, 1995).
The other category of interpersonal variables considered in the present study was career
support. Women who gained support from a mentor and encouragement for their careers from
others (colleagues, superiors) may have persisted long enough in their attempts to rise to top
management ranks to eventually gain board membership as an executive director. An
interview study by Vinnicombe, Singh, and Sturges (2000) identified the importance of
visibility and suggested that an important factor in gaining visibility was gaining mentoring.
An additional means of gaining organisational visibility may be to work in a position that is
normally regarded as male stereotyped (Hogg, 2000).
Hypothesis 2 proposes that interpersonal factors relating to board gender composition
and relationships with board members would be better predictors of nonexecutive director
group membership than interpersonal factors relating to employment environment of career
encouragement, career mentoring, and gender composition of the work environment.

Experiences and Influences of Women Directors
Chapter 3. Nonexecutive Directors as a Distinct In-Group Category Page 89
3.1.3. Organisational Factors
The nature of the organisation in which an executive director was employed is likely to
be related to her appointment to board positions. The present study considered both structural
and developmental organisational factors. The woman’s employment sector (public/private) is
likely to be a factor as to whether they serve on boards as nonexecutive directors or executive
directors. The public sector (government, community services) has a higher proportion of
women top executives than does the private, profit-making sector (International Labour
Organization, 1997). Hence, women who had been appointed to boards may be more likely to
be executives in the public sector than in the private sector.
The other major category of organisational variables examined was developmental.
Women who had participated in more training and development and challenging work
assignments throughout their careers may develop greater visibility for board selection and
thereby establish credibility as potential ingroup members with other executives. They may
become more visible to decision-makers that promote women to board positions. Vinnicombe,
Singh, and Sturges (2000) also identified the importance of high-profile work assignments as
an important factor in gaining visibility.
Hypothesis 3 proposes that organisational factors relating to structural opportunities of
occupation category and employment sector would be better predictors of nonexecutive
director group membership than developmental factors of training and development and
challenging work assignments.
3.2. Method
3.2.1. Respondents and Data Collection
The survey respondents and method of data collection was described in Chapter 2.
Briefly, 572 Australian women directors responded, which was a survey return rate of 31%.
The sample comprised 224 executive directors (39%) and 348 nonexecutive directors (61%).

Experiences and Influences of Women Directors
Chapter 3. Nonexecutive Directors as a Distinct In-Group Category Page 90
Analysis of sample distribution against data from the Business Who’s Who of Australia (Beck,
1995) confirmed that the sample was representative of Australian women directors.
3.2.2. Measures
3.2.2.1. Dependent Variable – Director Type
A dichotomous variable called director type was formed by collapsing the director
position responses of Chair - Executive, Managing Director, Director - Executive, and
Secretary into a category of Executive Director, and the responses of Chair - Non Executive
and Director - Non Executive into a category of Nonexecutive Director.
3.2.2.2. Independent Variables
Several survey items were used as independent variables. The variables director age,
highest level of education, organisation tenure, partner relationship, number of dependent
children, board gender proportion, years worked with women directors, and occupation
category are described in Appendix D. Where scales were formed the commonly accepted
cut-off level for Cronbach's alpha acceptability of 0.7 was used (Pallant, 2001).
3.2.2.3. Managerial Advancement
A managerial advancement scale was defined in the present study as a measure of
human capital relevant to managerial careers. A review of managerial advancement studies
found that managerial level, salary, and promotions were the three most commonly used
measures of advancement (Judge & Bretz, 1994; Tharenou, Latimer & Conroy, 1994; Turban
& Dougherty, 1994). As nonexecutive board appointees may be retired executives, the
managerial level items examine prior managerial levels reached using the managerial levels of
current position, last position, and second-last position. Tracking the managerial level of these
positions could serve as an indirect indicator of the women’s managerial advancement as well
as identifying the levels through which they had progressed. The number of managerial and
career promotions was regarded as a good indicator of managerial advancement. The

Experiences and Influences of Women Directors
Chapter 3. Nonexecutive Directors as a Distinct In-Group Category Page 91
director’s total annual salary is also likely to be a useful indicator of managerial advancement.
A total of six items (managerial level of current position, managerial level of last position,
managerial level of second-last position, managerial promotions, career promotions, and total
annual salary) were used for the managerial advancement scale. As the six items were scored
on different measures, a scale was formed from the z-score equivalents of the survey items.
The scale demonstrated adequate reliability with a Cronbach’s alpha of .82 for the sample –
see Table 3.1.
3.2.2.4. Work Continuity
A scale that measured the continuity of the woman’s working life was derived from two
yes/no items (continuous full-time employment and part-time work) and a multiple-choice
item for the total duration of work breaks, from 1 (no breaks) to 5 (10 or more years), that
were based on Tharenou & Conroy (1994). The alpha reliability for the measure was a
satisfactory .79 for the sample – see Table 3.1.
3.2.2.5. CEO Experience
A dichotomous variable measuring CEO experience was constructed from the items
managerial level of current position, managerial level of last position, and managerial level of
second last position, where at least one of the positions was Chief Executive Officer.
3.2.2.6. Career Encouragement
A career encouragement scale was derived from three 7-point ordinal items measuring
frequency from 1 (Never) to 7 (Eleven or more times) from Tharenou and Conroy (1994). The
three items were:
(ix) To what extent has a person more senior in position than yourself inside your organisation encouraged you in your career development (e.g., in promotion or advancement within or outside your organisation/department)?
(x) To what extent have colleague(s) at the same level as yourself within your organisation/department encouraged you in your career development (e.g., in promotion or advancement within your organisation/ department)?
(xi) To what extent have you been encouraged by others in your organisation to apply for, or express interest in, promotion when opportunities become available?

Experiences and Influences of Women Directors
Chapter 3. Nonexecutive Directors as a Distinct In-Group Category Page 92
The scale examined the amount of encouragement individuals reported receiving from
colleagues and more senior staff to assist advancement and promotion, both within and
outside their organisations. Tharenou and others (Tharenou, 1997c; Tharenou & Conroy,
1994; Tharenou et al., 1994) showed that the measure emerged as a separate factor distinct
from measures of training and development, and challenging work that were also used in the
present study. Convergent and discriminant validity of the career encouragement scale was
demonstrated with reasonable Cronbach alpha reliability coefficients obtained in previous
studies of .75 to .80. The alpha coefficient for the present study was .83 – see Table 3.1.
3.2.2.7. Mentor Support
A mentor support scale was derived from eighteen 5-point ordinal items from 1 (not at
all) to 5 (to a very large extent) that measured the extent of agreement with statements
concerning their relationship with a mentor (Dreher & Ash, 1990). Items were prefaced with
the phrase “This person has”. Some sample items were:
(i) Given or recommended you for challenging assignments that presented opportunities to learn new skills.
(vi) Protected you from working with other managers or work units before you knew about their likes/dislikes, options on controversial topics, and the nature of the political environment.
(xvii) Served as a role model.
Dreher and Ash achieved an alpha value of .95. The reliability of the mentor support
scale in the present study was comparable to that achieved by Dreher and Ash (1990) with an
alpha coefficient of .92, as shown in Table 3.1.
3.2.2.8. Male Managerial Hierarchy
Male managerial hierarchy was three items adapted from Tharenou and Conroy (1994)
that measured the extent to which men occupied senior positions in the managerial hierarchy
of the organisation that employed the woman. Tharenou and Conroy’s male managerial
hierarchy scale was shown to have unidimensional factor structure, and convergent and

Experiences and Influences of Women Directors
Chapter 3. Nonexecutive Directors as a Distinct In-Group Category Page 93
divergent validity, but to have moderate to low reliability at .71 and .64 (Tharenou, 1995;
Tharenou & Conroy, 1994; Tharenou et al., 1994).
Male managerial hierarchy in the present study consisted of managerial hierarchy
gender proportions, work colleagues' gender proportions, and employment organisation CEO
gender. The 5-point response scale for the first two items ranged from 1 (all women) to 5 (all
men). An example item was “What is the proportion of men and women in the
managerial/supervisory hierarchy in your local organisation?” Chief executive officer gender
was a binary response. The scale constructed from the z-scores of the three items
demonstrated acceptable reliability with an alpha coefficient for the present example of .70.
3.2.2.9. Male-Stereotyped Position
The extent to which the woman’s current position was regarded as male-stereotyped
was derived from the results of earlier research that assessed the extent to which respondents’
current position was gender-typed (Konrad & Pfeffer, 1991; Pfeffer et al., 1995; Tharenou &
Conroy, 1994). The three dichotomous items were women previously appointed to director’s
organisation position, women usually occupy director’s organisation position, and women
previously appointed to director’s organisation level. The alpha coefficient for the present
sample was .71. A positive score indicated a male-stereotyped position.
3.2.2.10. Employment Sector
Employment sector in which the woman was employed was measured by a 2-point
nominal scale of 1 (private) and 2 (public). The category of private sector was created by
collapsing the employment industry responses of (a) mining; (b) manufacturing; (c)
electricity, gas and water; (d) construction; (e) wholesale and retail trade; (f) transport and
storage; (g) communication; (h) finance, property and business services; and (i) recreation,
personal, and other services. Collapsing responses to the remaining two industries of (a)
public administration and defence, and (b) community services created a category of public
sector.

Experiences and Influences of Women Directors
Chapter 3. Nonexecutive Directors as a Distinct In-Group Category Page 94
3.2.2.11. Training and Development
The training and development scale consisted of six 7-point items developed by
Tharenou and colleagues (Tharenou, 1995; Tharenou & Conroy, 1994; Tharenou et al., 1994).
The scale measured the extent of participation in training and development courses, group
representation at outside meetings, acting in higher positions, participation in organisational
committees, and selection panels. Evidence for the scale’s unidimensional factor structure,
and convergent and divergent validity, has been given (Tharenou, 1997c). Evidence for the
scale’s reliability was obtained by two separate test administrations of the training and
development scale which provided alpha coefficients of .79 (Time 1) and .77 (Time 2), with
test-retest reliability over time of .65 (Tharenou, 1997c). In another study, a reliability of .81
was found (Tharenou & Conroy, 1994). In the present study, the Cronbach alpha was .76 –
see Table 3.1.
All items had responses ranging from 1 (never) to 7 (eleven or more times). Some
sample items were:
(i) How many times in your career have you interviewed staff for selection/promotion? (iv) How many times in your career have you attended management
training/development courses run by outside organisations/departments? (vi) How often have you acted for 3 months or more in a higher position in your career?
3.2.2.12. Challenging Work
Challenging work consisted of two 7-point items developed by Tharenou and Conroy
(1994) measuring the extent to which the respondent had been involved in work of a
challenging nature in their present position. Responses measured frequency from 1 (never) to
7 (eleven or more times). The items were:
(vii) When you first entered your present job, to what extent were you involved in challenging work assignments? (ie, in the first 3 months in present job)
(viii) How often has your present job since then involved challenging work assignments?

Experiences and Influences of Women Directors
Chapter 3. Nonexecutive Directors as a Distinct In-Group Category Page 95
The scale emerged as a distinct factor in previous factor analyses from training and
development, and career encouragement (Tharenou, 1997c). Evidence for the reliability of the
scale was the alpha value of .77 (Tharenou & Conroy, 1994). The challenging work scale had
a satisfactory reliability, but was lower than the reliability coefficients reported in earlier
studies (Tharenou, 1995; Tharenou et al., 1994). A similar alpha level of .72 was found for the
present sample – see Table 3.1.
Table 3.1 Psychometric Data for Each Multi-item Scale Measure
Scale
No. of items
M
S.D.
Cronbach’s Alpha
N a
Managerial advancement 6 0.00 b 0.73 .82 570
Work continuity 3 0.00 b 0.84 .79 567
Career encouragement 3 3.00 1.71 .83 547
Mentor support 18 2.86 1.24 .92 572
Male managerial hierarchy 3 0.00 b 0.80 .70 569
Male-stereotyped position 3 0.00 b 0.79 .71 568
Training and development 6 4.52 1.37 .76 558
Challenging work 2 5.09 1.78 .72 550 a The number of cases varied across the measures as not all of the respondents completed all items in the scale. b The means for managerial advancement, work continuity, male managerial hierarchy, and male-stereotyped position scales result from composite items being first standardised as z-scores prior to summing the items.
3.2.3. Analysis
Logistic regression is used to predict group membership from a set of variables when
the dependent variable is dichotomous (Tabachnick & Fidell, 1996). Logistic regression does
not depend on assumptions about the distribution of the predictors such as that they are
normally distributed, linearly related, or of equal variance within each group. The technique
of logistic regression is an appropriate technique when the distribution of responses on the
dependent variable may be non-linear for one or more of the independent variables. Logistic
regression also regression allows a mix of continuous (interval), nominal and dichotomous

Experiences and Influences of Women Directors
Chapter 3. Nonexecutive Directors as a Distinct In-Group Category Page 96
variables. The accuracy of logistic regression may be assessed by the extent to which cases
are correctly classified into their groups from the resulting regression equation.
The SPSS version 11 logistic regression program was used for analysis, with the
independent variables entered in the logistic regression in three steps. The individual variables
of director age, highest level of education, managerial advancement, work continuity, CEO
experience, partner relationship, and number of dependent children were entered first. The
interpersonal variables of career encouragement, mentor support, male managerial hierarchy,
male-stereotyped position, board gender proportion, and years worked with women directors
were entered second. The organisational variables of occupation category, employment sector,
training and development, and challenging work were entered last.
3.3. Results
Of the cases submitted for processing, 70 cases were deleted with missing values,
leaving 204 executive directors and 298 nonexecutive directors for analysis. Entry of the
individual independent variables produced a statistically reliable model (χ2 (8, N = 502) =
64.9, p < .001). Entry of the interpersonal independent variables improved the model with a
significant chi-square improvement (χ2 (6, N = 502) = 33.1, p < .001). Entry of the
organisation independent variables also improved the model with a further significant chi-
square improvement (χ2 (4, N = 502) = 33.3, p < .001) – see Table 3.2.
A satisfactory rate of prediction was achieved from the final model, with 81.9% of the
nonexecutive directors being correctly classified and 59.8% of the executive directors being
correctly classified, or an overall correct classification rate of 72.9%. Intermediate
probabilities were 77.9% for nonexecutive directors and 42.2% for executive directors with
the first step, and 79.2% for nonexecutive directors and 54.9% for executive directors with the
second step.

Experiences and Influences of Women Directors
Chapter 3. Nonexecutive Directors as a Distinct In-Group Category Page 97
Table 3.2 Logistic Regression Analysis for Nonexecutive versus Executive Directors
Variable B S.E. Wald Sig. Exp(B)
Individual variables
Director’s age .160* .077 4.282 .039 1.173
Highest level of education .159*** .044 12.872 .000 1.172
Managerial advancement .509* .214 5.672 .017 1.664
Work continuity .064 .158 .163 .687 1.066
Organisation tenure -.072 .067 1.147 .284 .930
CEO experience -.327 .300 1.187 .276 .721
Partner relationship .023 .076 .090 .764 1.023
Number of dependent children -.068 .214 .101 .751 .934
After Step 1with df = 8, χ2 = 64.9, p < .001
Interpersonal variables
Career encouragement -.072 .071 1.051 .305 .930
Mentor support -.261** .098 7.115 .008 .771
Male managerial hierarchy -.249 .161 2.392 .122 .779
Male-stereotyped position .130 .151 .742 .389 1.139
Board gender proportion .411** .140 8.636 .003 1.509
Years worked with women directors .154* .077 4.038 .044 1.167
After Step 2 with ∆ df = 6, χ2 improvement = 33.1, p < .001
Organisational variables
Occupation category .290* .121 5.756 .016 1.336
Employment sector 1.207** .382 9.997 .002 3.344
Training and development .156 .103 2.279 .131 1.169
Challenging work -.236*** .073 10.456 .001 .790
After Step 3 with ∆ df = 4, χ2 improvement = 33.3, p < .001
Constant -2.765 1.212 5.207 .022 .063
Note: After step 1, 63.3% of directors were correctly classified. After step 2, 69.3% of directors were correctly classified. After step 3, 72.9% of directors were correctly classified. * p < .05, ** p < .01, *** p < .001.
3.3.1. Hypothesis 1
Hypothesis 1 proposed that human capital investments of age, education, organisation
tenure, managerial advancement and CEO experience would be better predictors of

Experiences and Influences of Women Directors
Chapter 3. Nonexecutive Directors as a Distinct In-Group Category Page 98
nonexecutive director group membership than individual situational factors of work
continuity and their home environment (partner relationship and number of dependent
children). Hypothesis 1 was supported; women nonexecutive directors were older, had higher
education levels, and had achieved more managerial advancement than executive directors.
Nonexecutive and executive directors were not significantly different on other human capital
variables of work continuity, organisation tenure, or CEO experience. Relationships with
partners and numbers of dependent children also were not significant.
3.3.2. Hypothesis 2
Hypothesis 2 proposed that interpersonal factors relating to board gender composition
and relationships with board members would be better predictors of nonexecutive director
group membership than interpersonal factors relating to employment environment of career
encouragement, career mentoring, and gender composition of the work environment.
Hypothesis 2 was supported; interpersonal relationships distinguished nonexecutive directors
from executive directors. Interestingly, women nonexecutive directors were dissimilar in
general to the board, being more likely to be on boards with a majority of male directors than
were executive directors. The support of a mentor was a significant differentiator between
nonexecutive directors and executive directors, but in the negative sense. Executive directors
were significantly more likely to have an influential mentor than nonexecutive directors.
Women nonexecutive directors were also more likely to have worked longer with other
women board members than executive directors.
Career encouragement from others was not a significant differentiator. The gender-
orientation of the woman’s employment organisation also did not appear to be significant,
with neither male managerial hierarchy nor male-stereotyped positions showing significance.
3.3.3. Hypothesis 3
Hypothesis 3 proposed that organisational factors relating to structural opportunities of
occupation category and employment sector would be better predictors of nonexecutive

Experiences and Influences of Women Directors
Chapter 3. Nonexecutive Directors as a Distinct In-Group Category Page 99
director group membership than developmental factors of training and development, and
challenging work assignments. Hypothesis 3 was supported; organisational structural
opportunities differentiated the nonexecutive directors from executive directors in that women
nonexecutive directors had experienced less challenging work than executive directors and
tended to work more in public sector employment. The executive directors were more likely
to be managers and administrators than the nonexecutive directors were (a low score is the
highest category). There was no significant difference between nonexecutive and executive
directors on training and development.
3.4. Discussion
The aim of the present study was to determine whether the categorisations of executive
and nonexecutive might be salient identities for directors. Although self-identity theory does
not require significant similarities between members of salient groups, self-categorisation
theory suggests that shared characteristics are likely to predispose directors to identify with
groups comprising similar members. Moreover, the principles of group maintenance and
cohesion should induce boards to choose nonexecutive directors who appear likely to support
or adopt group attitudes (Haslam, 2001).
3.4.1. Individual Factors
The analysis revealed that nonexecutive directors were significantly older than
executive directors. Age is often a readily observable characteristic to other people, and most
people are sensitive to it in themselves. Board members looking for nonexecutive directors
are likely to be aware of their identity as older people. Although boards may tolerate young
rising executive directors for other visible factors, for nonexecutive directors they are likely to
look for older candidates. Women desiring to become a nonexecutive director and thereby
adopt the social identity of a nonexecutive director are also likely to be aware of their own age
and its relative fit with the stereotype of a nonexecutive director. Age, being a characteristic

Experiences and Influences of Women Directors
Chapter 3. Nonexecutive Directors as a Distinct In-Group Category Page 100
that is readily noticeable, may add to the salience of an executive-director/nonexecutive-
director categorisation. Kesner (1988) suggested older age was also consistent with women
developing a high industry profile to be recognised as a candidate for appointment to boards.
Nonexecutive directors were significantly more highly educated than executive
directors. Although the education level an individual has reached is not a visible
characteristic, it is an attribute that is readily evident from an individual’s resume and often
becomes evident to others after a modicum of conversation. Westphal and Zajac (1995)
suggested that education, particularly advanced degrees, were a potentially salient
characteristic. If corporate boards do value a high level of education and select nonexecutive
directors on this basis then this may well be a salient characteristic. Executive directors may
have reached their position in the corporation through many years of hard work without
necessarily gaining a high level of education. When potential nonexecutive directors,
including current and former executive directors, consider directorships on other corporations
they may be conscious of their relatively modest education despite their accomplishments in
their employment organisation. These aspiring nonexecutive directors may complete
advanced qualifications (eg. MBAs) to conform to the perceived social identity of a
nonexecutive director of another corporation.
A traditional way of nonexecutive directors getting onto boards is reported as by being,
or having been, a chief executive officer or top executive (Lorsch & MacIver, 1989; Mattis,
1997). It was thus expected that women who had been in senior executive ranks over their last
three positions, had gained the greater number of career and managerial promotions, and had
the greatest salary will be those offered nonexecutive director board appointments. Executive
directors are likely to have risen relatively rapidly to the position of seniority that earns them
a seat on the board.
Interestingly CEO experience was also not a significant differentiator between women
nonexecutive directors and executive directors. Unlike male nonexecutive directors, who are

Experiences and Influences of Women Directors
Chapter 3. Nonexecutive Directors as a Distinct In-Group Category Page 101
frequently reported to be former CEOs, women appear to be accepted without having made it
to the top of an organisation as a CEO.
The woman’s relationship with their partner and the number of dependent children did
not appear to make a difference between nonexecutive directors and executive directors. As
work continuity did not appear to be a differentiator between nonexecutive directors and
executive directors, presumably both groups showed a similar history of near-continuous full-
time work. The women’s tenure with their current organisation was also not a significant
factor.
3.4.2. Interpersonal Factors
A finding of the study was that women nonexecutive directors report less mentor
support. Nonexecutive directors were significantly different from executive directors in that
they did not appear to find the support of a mentor a factor in gaining a board appointment.
Women nonexecutive directors may have needed less mentor support and sought less
assistance from mentors, similar to men who have reached top levels (Burt, 1992; Schor,
1997).
Executive directors, who are earlier in their career development than nonexecutive
directors, might value their mentor, whereas nonexecutive directors have progressed to the
point where a mentor is no longer important. Women nonexecutive directors may have
needed less mentor support and relied more on their expertise, credibility, and visibility from
their age, education, and managerial advancement than executive directors, to advance onto
company boards.
The finding that women nonexecutive directors were appointed more to boards with a
majority of males suggests that women might be appointed as “tokens.” Women executive
directors gain their position through promotion within their organisation, so it is unlikely that
these women would be “tokens,” having worked their way up the management hierarchy
through internal promotions. This effect suggests that token nonexecutive director appointees

Experiences and Influences of Women Directors
Chapter 3. Nonexecutive Directors as a Distinct In-Group Category Page 102
would find themselves in an outgroup on the board in that the board would choose someone
whom they do not identify, to suit other purposes.
Women nonexecutive board directors had a positive link with the number of years of
working with other women directors. When women have strong interpersonal ties, they have
sponsors for their mobility (Izraeli & Talmud, 1997). Working closely for substantial periods
with women board members most likely provides the nonexecutive director with strong ties to
other women directors. Working with other women board members may also provide
opportunities for learning the norms, rules, and values of the boardroom.
Neither the amount of career encouragement received from people within her
employment organisation, the extent to which men occupied senior positions in the
managerial hierarchy, nor the extent to which the woman’s current position was male-
stereotyped was a significant factor in distinguishing nonexecutive directors from executive
directors.
3.4.3. Organisational Factors
A finding in the study was that executive women were more likely to be in higher
occupational categories (i.e., managers and administrators) than nonexecutive women. The
means for occupational categories indicated that executive women overall were managers and
administrators; i.e., the nonexecutive directors were more likely to come from the significant
alternative category of professionals. Nonexecutive directors, being older than executive
directors, are more likely to be retired and therefore may be no longer managers or
administrators, and may now perceive themselves to be “professional” directors.
Being a nonexecutive director was also related to being employed in organisations in
the public sector. The nonexecutive directors worked in the public sector (community
services, government) more than the executive directors. Executive directors, of course, are
employed in the same employment sector as the board’s organisation.

Experiences and Influences of Women Directors
Chapter 3. Nonexecutive Directors as a Distinct In-Group Category Page 103
Challenging work (initial and subsequent work assignments) was less important for
nonexecutive directors than executive directors. This probably reflects the developmental
stage of executive directors versus nonexecutive directors. Executive directors are likely to be
developing their managerial skills and therefore value challenging work assignments.
Nonexecutive directors on the other hand are more likely to have experienced sufficient
challenging work assignments to see them as no longer having much personal value.
The extent of participation in training and development courses, outside meetings,
acting in higher positions, organisational committees, and selection panels was not a relevant
factor.
3.5. Limitations of the Study and Future Research
A limitation was that the measures used in the study were self-report items. Self-report
measures can have weaknesses of reliability and validity (Hinkin, 1995). For instance, asking
women to estimate the extent that their managerial hierarchy or position was male-stereotyped
are highly subjective assessments. Future research should increase the reliability of
observations by using measures that are more objective, especially for situational variables.
Future research should consider adding more items regarding the organisations of which
women are board members so that other questions such as the following could be addressed.
Are women more likely to be appointed to boards when the business strategy of the company
suggests they would fulfil organisational needs (as suggested by Harrigan, 1981; Holton &
Rabbetts, 1989; and Mitchell, 1984)? The present study did not fully explore the
characteristics of the companies to which women were appointed as board members.
The study suggested that nonexecutive director women's social capital was important in
their selection to boards, through having long-term links with other women directors.
However, the study did not examine the influence of social capital (e.g., networks). Burt
(1992) suggested that women require close networks, especially of other women, and strong
sponsors to advance to top positions. Since women are outsiders and lack legitimacy, they

Experiences and Influences of Women Directors
Chapter 3. Nonexecutive Directors as a Distinct In-Group Category Page 104
needed to borrow the social capital of their sponsors, and gain a large disconnected network.
Future research should examine women's networks links, and the nature of their board
sponsors. The study examined mentor support for career advancement, rather than
sponsorship for board appointment.
The study examined what might help women gain appointment and influence as
nonexecutive directors as opposed to executive directors. Future research should compare
male and female nonexecutive directors with male and female executive directors to assess
the differences between the factors linked to men and women in nonexecutive director roles.
The factors that affect women’s effectiveness and men’s effectiveness on boards as
nonexecutive directors are likely to be different (e.g., long-standing network links, social
similarity).
3.6. Conclusion
At the individual level, women should be encouraged to enhance their human capital,
especially education and managerial advancement. Women also need to increase their social
capital by developing networks of other women directors. Women also need to work in
organisations that give them a greater opportunity, such as the public sector.
In conclusion, the results of the study suggested that women were appointed as
nonexecutive directors to boards based on their human capital, their social capital, and
opportunity. Women who had more skill, knowledge, and expertise for executive work from
age, education, and managerial advancement were more likely to be nonexecutive directors
than executive directors were. Women who had more social capital, through long-term
contacts with women directors, were more likely to be nonexecutive directors than executive
directors were. The public sector also presented opportunities for women to be appointed as
nonexecutive board members. However, women may be appointed as nonexecutive directors
to fulfil a token requirement as indicated by their prevalence on male-majority boards.

Experiences and Influences of Women Directors
Chapter 3. Nonexecutive Directors as a Distinct In-Group Category Page 105
The study demonstrated that there were significant differences between nonexecutive
directors and executive directors in Australia. These differences support a categorisation of
nonexecutive directors versus executive directors as distinct groups that are potentially salient
in terms of social identity theory.

Experiences and Influences of Women Directors
Chapter 4. Longitudinal Study of Successful Women Directors Page 106
Chapter 4
4. LONGITUDINAL STUDY OF SUCCESSFUL WOMEN DIRECTORS
4.1. Introduction
Having identified a substantial sample of women corporate directors and confirmed that
the distinction between executive directors and nonexecutive directors is valid for this sample,
the next challenge was to identify the successful women directors. As discussed in Chapter 1,
there is no clear measure of director success (Johnson, Daily, & Ellstrand, 1996), so a simple
definition was made that women who were still directors six years later are successful. In
addition, as directors as a study group pose difficulties in terms of administering experimental
interventions (Hill, 1995), it was thought that significant changes in the women's
characteristics may give clues as to factors in their success.
There does not appear to be any longitudinal studies of women directors. The few
studies that compare women directors over time are annual descriptions of statistical changes
in the demographic composition of women directors by periodically re-sampling women
directors who happen to be on the boards of top corporations (e.g. Catalyst, 1998b, 1998c;
Korn/Ferry International, 1999; Holton, 2000). The researcher could not find any studies that
tracked the same sample of women directors over time.
Many authors lament the lack of success of women in gaining significant numbers of
appointments to corporate boards (e.g. Bilimoria, 2000;Burke & Mattis, 2000; Singh &
Vinnicombe, 2001). Some authors also express scepticism that some of the women who are
appointed to boards may not have earned the position on merit and may be mere “tokens”
(e.g. Barr, 1996; Scherer, 1997). The present study examines a group of women who were
board directors in 1995, and again in 2001, as likely examples of successful women directors.
These women are likely to perceive themselves as members of an ingroup of board directors.

Experiences and Influences of Women Directors
Chapter 4. Longitudinal Study of Successful Women Directors Page 107
The notion of an ingroup of board directors is likely to be subject to the meta-contrast
principles of categorisation described by Haslam (2001). The salience of the ingroup may
vary depending on whether the board is of a small, relatively insignificant company or a
major multinational corporation. Being a member of a board of a small company is likely to
have salience only under a limited set of circumstances and therefore be of limited influence
on how the woman perceives herself. However, being a member of a board of a major
multinational corporation might have broad salience in a wide range of circumstances, and
would have significant influence on how the woman perceives herself.
In performing a longitudinal study, there is an assumption that changes or even lack of
changes that are detected during the intervening period will be significant. However, the
researcher could not apply any experimental interventions to the sample over the intervening
years, so factors in their success may not be detected. Some of the women directors may have
already established an appropriate level of identity with an ingroup of boards of directors and
will not exhibit any significant change. However, most of the women are expected to be
asserting themselves in their identity of a board director and so should exhibit change as they
align themselves with their perceptions of the ingroup.
In forming hypotheses about the way that women might change in attempting to match
perceptions of themselves with perceptions of the ingroup, the attributes of nonexecutive
directors rather than executive directors were used as a guide. Most directors will have only
one substantive employment organisation and therefore, by definition, are limited to one
executive director position at any one time. In Australia, this executive director position will
typically be that of Chief Executive Office or Chief Financial Officer (Korn/Ferry
International, 1995). The salient social identity of an executive director is more often likely to
be that of a CEO or CFO rather than their identity as a board member. However,
appointments to nonexecutive director positions are more likely to be at the discretion of a
board that seeks out people who conform to that board’s social identity.

Experiences and Influences of Women Directors
Chapter 4. Longitudinal Study of Successful Women Directors Page 108
According to Korn/Ferry International (1999), nonexecutive directors on boards of
larger companies hold more directorships than those of smaller ones. Korn/Ferry International
(1999) reported that boards are comprised mostly of current (26%) or retired (29%) CEOs,
and current (21%) or retired (16%) executives. Over half (59%) of the directors of large
corporations describe themselves as professional directors (those with two or more paid
directorships). The most usual (39%) tenure was 1-3 years, and the next most frequent (26%)
tenure was 4-6 years. In addition, just over 40% of the companies surveyed had one or more
nonexecutive directors resign during the year. Of the CEOs that held nonexecutive director
positions (on other boards), over half (52%) held two or more other board appointments. On
an average board, there was a maximum of six directorships held by any one director
(Korn/Ferry International, 1999).
Corporate boards of directors provide a novel opportunity for the study of ingroup
relations. Recent research has focussed on corporate boards, of which many are reported to
function as “old boys’ clubs” (Leighton & Thain, 1993). The debatable effectiveness of
corporate boards and what constitutes appropriate board responsibilities has been a subject of
research (Gillies, 1992), as has been the explanations of ingroup solidarity (Tolbert et al.,
1999). Patton and Baker (1987) referred to corporate board ingroup solidarity as a “let’s not
rock the boat” mentality. Patton and Baker provided a number of explanations for corporate
board ingroup solidarity such as; (a) the dual authority of a CEO who is also a board chair, (b)
board members who are CEOs of other companies, and (c) board members valuing their
social ties with the other members. Patton and Baker’s reasoning suggests that directors
actively protect their status as ingroup members and that their self esteem may be based on
their identification as a board director with its associated social status. Such explanations
imply that the social identity category of board director may be highly salient for many
directors.

Experiences and Influences of Women Directors
Chapter 4. Longitudinal Study of Successful Women Directors Page 109
4.1.1. Highest Level of Education
As the women in the sample are apparently successful, having held board directorships
in 1995 and 2001, it may be reasonably assumed that they have established a level of social
identification with the ingroup of board directors. According to Haslam (2001), when people
self-categorise as members of an ingroup, they will actively strive to conform to their
perception of attributes of the ingroup. With respect to educational level, one researcher found
that women directors are more highly educated than male directors (Burke, 1994c). However,
this is likely to be a strategy to get them noticed or appear credible. Once accepted as a board
member they are likely to play down their educational qualifications in an attempt to match
their perceptions of the ingroup. A report of OECD Principles of Corporate Governance in
Korn/Ferry International (1999) suggests that the educational requirement of directors is that
“board members acquire…and remain abreast of relevant new laws, regulations and changing
commercial risks” (p. 24). Such a requirement is unlikely to induce a director to improve their
formal academic qualifications. Therefore, unless the salient ingroup happens to be
significantly more highly educated than the woman, she is unlikely to pursue further
educational qualifications for fear of distancing her social identity from that of the ingroup.
Hypothesis 1 proposes that the women directors will not significantly increase their
educational qualifications between 1995 and 2001.
4.1.2. Managerial Level
Korn/Ferry International (1999) reported that in 1998, over 90% of board directors were
current or former CEOs or executive (26% were current CEOs of other companies, 29% were
retired CEOs, 21% were current executives, and 16% were retired executives). From Study 1,
Characteristics of Women Board Directors in Australia, over 70% of the women from the
sample already had a managerial level of executive or above. If most of the women in the
sample already conform to the managerial level of the majority of board directors, then they

Experiences and Influences of Women Directors
Chapter 4. Longitudinal Study of Successful Women Directors Page 110
are unlikely to feel compelled to advance in managerial level to meet perceptions regarding
the ingroup of board directors.
Hypothesis 2 proposes that the women directors will not significantly advance in
managerial level between 1995 and 2001.
4.1.3. Total Directorships
According to Korn/Ferry International (1999), the most usual tenure was 1-3 years
(39%), and the next most frequent tenure was 4-6 years (26%). In addition, just over 40% of
the companies surveyed had one or more nonexecutive directors resign during the year. At the
same time, over half (59%) described themselves as professional directors (those with two or
more paid directorships). With this reported level of turnover in directorships, it is likely that
the social identity of a successful board director will include a record of accomplishment of
past directorships.
Women directors are likely to seek to build their record of board directorships in order
to increase their identification with the ingroup of board directors. As the women directors
improve perceptions of themselves as members of the ingroup of board directors, they are
likely to be offered further opportunities for board directorships and thus provided with an
opportunity to increase their total board directorships.
Hypothesis 3 proposes that the total number of board appointments held by the women
will significantly increase between 1995 and 2001.
4.1.4. Concurrent Directorships
According to Korn/Ferry International (1999), nonexecutive directors on boards of
larger companies hold more directorships than those of smaller ones. Of the CEOs that held
nonexecutive director positions (on other boards), over half (52%) held two or more other
board appointments. On an average board, the maximum number of directorships that were
held by any one director was six.

Experiences and Influences of Women Directors
Chapter 4. Longitudinal Study of Successful Women Directors Page 111
If the women perceive that their identity as board directors is related to holding multiple
concurrent board directorships, then they are likely to be more active in their pursuit of
multiple board appointments. As they become recognised as members of an ingroup of board
directors, they are likely to be in greater demand to participate as directors on corporate
boards. The number of concurrent board directorships they hold is then likely to increase in
response, up to the maximum number of concurrent boards that they can reasonably service.
Hypothesis 4 proposes that the number of concurrent board appointments held by the
women will significantly increase between 1995 and 2001.
4.1.5. Director Position
Australia may be unique in that it is now the norm for the Chair and CEO to be separate
(Korn/Ferry International, 1999). Therefore, in Australia the identity of a successful
nonexecutive director is likely to include multiple directorships with at least one board chair
position. Women directors who perceive that a board chair position is a salient attribute of a
successful corporate director will actively seek out additional board positions in the
anticipation that at least one of these board positions will in turn include the position of board
chair.
Hypothesis 5 proposes that of the women’s board positions there will be a significant
increase in the number of board chair positions held between 1995 and 2001.
4.1.6. Partner Relationship
Early research on U.K. women directors by Holton et al. (1993) found that women’s
partners were often prominent businessmen that may have facilitated their admission to
corporate boards. However, in Australia there does not appear to be any connection between
board directorships and the status of partner relationships. The male-dominated nature of
boards is likely to give rise to an ingroup attitude that partners are ancillary to the social
identity of a corporate director. The nature of the women’s relationships with their partners is

Experiences and Influences of Women Directors
Chapter 4. Longitudinal Study of Successful Women Directors Page 112
unlikely to have any bearing on their social identity as board directors. Therefore, no
significant change is expected in partner relationships.
Hypothesis 6 proposes that the women’s relationships with their partners will not
change significantly between 1995 and 2001.
4.1.7. Basis of Recruitment
As women directors become perceived as members of the ingroup of board directors,
the basis of their recruitment to board positions would shift to that of reputation (who they are
perceived to be) rather than merit (who they are). However, the extent of any change in
recruitment will depend on how much they were perceived as part of the ingroup in 1995
compared to perceptions of their ingroup status in 2001, and how many new directorships
they have gained.
Hypothesis 7 proposes that there will be a significant difference in the basis of
recruitment of the women to board positions in 2001 from the basis of recruitment in 1995.
4.1.8. Board Chair Gender
Although these women are likely to be perceived as members of the ingroup of board
directors, it is unlikely to have a significant effect on the gender of the board chair, notwith-
standing that many board chair positions are likely to be held by these successful women. The
gender of the board chair is unlikely to be a factor in the perception of a salient ingroup of
board directors. Therefore, any change in the gender of the board chairs is likely to be
coincidental. However, if there was to be a significant change in the board chair’s gender this
might imply that individual familiarity between a female board chair and the woman director
might be more salient that the social identity.
Hypothesis 8 proposes that there will be no significant difference in the gender of the
board chairs of boards between 1995 and 2001, notwithstanding any new board chair
positions the women gain in accordance with Hypothesis 5.

Experiences and Influences of Women Directors
Chapter 4. Longitudinal Study of Successful Women Directors Page 113
4.1.9. Employment Industry
The social identity of board directors generally is expected to be independent of the
director’s employment industry. However, within individual boards the salience of the
director’s employment industry may be salient. Board directors are likely to be offered board
positions in industries in which they have prior experience. Overall, being a member of a
social ingroup of board directors is unlikely to have any significant influence on the industry
in which the women work. The social identity of a salient group of board directors is unlikely
to cause women to change industry.
Hypothesis 9 proposes that there will be no significant difference in the employment
industries of the women directors between 1995 and 2001.
4.1.10. Board Employees
The social identity of being a board director is likely to include the ambition to pursue
directorships on the presumably more prestigious boards of larger organisations. The women
are likely to be more active in seeking out prestigious board directorships to enhance their
self-esteem. As the women become perceived as members of an ingroup of board directors,
they may be more likely to receive additional offers of board directorships, including offers of
directorships on boards of larger organisations. It is expected that the women will take up
these offers of directorships on the boards of larger organisations and so the apparent
organisation size of the boards will appear to increase significantly.
Hypothesis 10 proposes that the women directors will hold board seats on significantly
larger organisations in 2001 than they did in 1995.
4.1.11. Board Corporation Type
The women who do adopt the social identity of a board director are likely to seek out
and receive more offers of directorships of higher-profile prestigious boards. It is argued that
these higher-profile prestigious boards are more commonly the boards of publicly listed

Experiences and Influences of Women Directors
Chapter 4. Longitudinal Study of Successful Women Directors Page 114
corporations and statutory authorities than other organisations such as public unlisted, private,
trust, and not for profit organisations.
Hypothesis 11 proposes that the women directors in 2001 will hold significantly more
positions on publicly visible organisations (publicly listed corporations and statutory
authorities) than those held in 1995.
4.1.12. Board Directors
Women’s perception of the social identity of a board director is unlikely to be connected
to the size of boards. Although women who are members of an ingroup of board directors are
likely to change boards over six years, and change to more prestigious boards on higher-
profile organisations, this will not show as a significant effect on board size. The board size of
most reasonably large organisations appears to be static at eight directors (Korn/Ferry
International, 1999). However, there is some speculation in the literature (e.g. Catalyst,
1998c) that some board positions are created by expanding the board size by one specifically
to accommodate a woman board member.
Hypothesis 12 proposes that the sizes of the boards in 2001 will not be significantly
different from the sizes of the boards in 1995.
4.2. Method
4.2.1. Six-year Follow-up Sample Selection
Of the 572 women directors who responded to the 1995 study, 298 women (52%)
agreed to participate in follow-up research. The original sample of 572 women was compared
to the follow-up sample of 298 women to determine whether it was a representative subset.
Chi-square tests investigated whether the women who agreed or declined to follow-up
research differed due to (i) age, (ii) highest education level, (iii) total board directorships, (iv)
total board directorship years, (v) senior management years, (vi) total directorship

Experiences and Influences of Women Directors
Chapter 4. Longitudinal Study of Successful Women Directors Page 115
remuneration, (vii) employment industry, (viii) managerial level of current position, (ix) total
annual salary, (x) employment organisation size, and (xi) state of residence.
The results of the chi-square tests showed significant differences between those women
who agreed to follow-up research and those who declined for (a) highest education level – see
Table 4.1, (b) total annual salary – see Table 4.2, (c) managerial level of current position – see
Table 4.3, and (d) employment industry – see Table 4.4.
More directors (56%) with an education level of Year 12 through to a Masters Degree
agreed to follow-up research than those with a lower level of education of Year 10 or less
(34%) or higher level of education of a Doctorate/PhD (48%). A chi-square test confirmed the
differences in follow-up agreement rates by level of education were significant (χ2 (10, N =
570) = 18.57, p = .046).
Table 4.1 Director’s Agreement to Follow-Up by Highest Level of Education
Declined Agreed Education level Frequency % Frequency %
Some Secondary School 9 64.3 5 35.7
Year 10/School Certificate/Intermediate 43 66.2 22 33.8
Year 12/HSC/Leaving/Matriculation 42 48.8 44 51.2
TAFE College Course 14 43.8 18 56.3
Associate Diploma 2 20.0 8 80.0
Undergraduate Diploma 19 45.2 23 54.8
Undergraduate Degree 75 48.4 80 51.6
Postgraduate Diploma/Honours 22 39.3 34 60.7
MBA 12 41.4 17 58.6
Masters Degree 20 37.0 34 63.0
Doctorate/PhD 14 51.9 13 48.1
Total 272 47.7 298 52.3
Directors who had a total annual salary of over $65,000 were significantly more likely
to have agreed to follow-up research than those with a lower total annual salary
(χ2 (5, N = 526) = 17.08, p = .004).

Experiences and Influences of Women Directors
Chapter 4. Longitudinal Study of Successful Women Directors Page 116
Table 4.2 Director’s Agreement to Follow-Up by Total Annual Salary
Declined Agreed Salary Frequency % Frequency %
Under $45,000 66 27.5 50 17.5
$45,001 to $65,000 55 22.9 50 17.5
$65,001 to $85,000 21 8.8 33 11.5
$85,001 to $105,000 21 8.8 35 12.2
$105,001 to $125,000 16 6.6 40 13.9
Over $125,000 61 25.4 78 27.3
Totals 240 100% 286 100%
Directors who’s managerial level in their current position was chief executive officer or
divisional head were significantly more likely to have agreed to follow-up research than those
with a lower managerial level (χ2 (7, N = 565) = 23.36, p < .001).
Table 4.3 Director’s Agreement to Follow-Up by Managerial Level
Declined Agreed Managerial level Frequency % Frequency %
Chief executive officer 54 19.9 82 28.0
Divisional head 22 8.1 45 15.4
Executive 90 33.1 95 32.4
Senior level manager 39 14.3 30 10.2
Middle level manager 23 8.5 21 7.2
Lower level manager 12 4.4 5 1.7
Supervisor 7 2.6 3 1.0
Non supervisor/ Non manager 25 9.2 12 4.1
Totals 272 100% 293 100%
Directors with a “white collar” employment industry of (a) communication; (b) finance,
property and business services; (c) public administration and defence; (d) community
services; (e) recreation, personal and other services; or (f) the mining industry, were
significantly more likely to have agreed to follow-up research than those of other industries
(χ2 (10, N = 564) = 41.22, p < .001).

Experiences and Influences of Women Directors
Chapter 4. Longitudinal Study of Successful Women Directors Page 117
Overall, the follow-up sample appeared to be a reasonable representation of the 1995
sample, with the bias that the directors who agreed to a follow-up were (a) better educated, (b)
had a higher salary, (c) tended more to be CEOs and division heads, and (d) were more likely
to be from “white collar” industries or the mining industry, than those directors who declined
the opportunity for follow-up research. Perhaps this cohort of directors recognised greater
value in academic research. Their characteristics of higher education, managerial position,
and salary may also better typify a stereotypical board director, and so they may have had a
stronger social identity as a board director, thereby feeling more confident of participating in
follow-up research.
Table 4.4 Director’s Agreement to Follow-Up by Employment Industry
Declined Agreed Industry Frequency % Frequency %
Mining 2 0.7 9 3.1
Manufacturing 50 18.5 30 10.2
Electricity, gas, and water 3 1.1 3 1.0
Construction 19 7.0 6 2.0
Wholesale and retail trade 51 18.9 35 11.9
Transport and storage 14 5.2 5 1.7
Communication 21 7.8 41 13.9
Finance, property, and business services 50 18.5 85 28.9
Public administration and defence 10 3.7 16 5.4
Community services 26 9.6 35 11.9
Recreation, personal, and other services 24 8.9 29 9.9
Total 270 100% 294 100%
4.2.2. Survey Design and Measures
The present study was designed to be a longitudinal study of the changes in personal,
interpersonal, and organisational characteristics of the women directors over the six-year
period. The survey repeated many of the survey items on the 1995 survey with some minor
changes. Appendix D lists the 1995 survey items and Appendix I lists the 2001 survey items.

Experiences and Influences of Women Directors
Chapter 4. Longitudinal Study of Successful Women Directors Page 118
The survey letters to women are in Appendix E, the survey instrument for women is in
Appendix F, the survey letters to men are in Appendix G, and the survey instrument for men
is in Appendix H.
Items that were changed from categorical responses to numeric responses were (a)
board directors, (b) director age, (c) years worked with women managers, (d) years worked
with women directors, (e) senior management years, (f) total directorship years, and (g) total
directorships.
Items that had minor grammatical improvements to their wording were (a) basis of
recruitment, (a) board chair gender, (b) board corporation type, (c) board employees, (d)
board gender proportion, (e) current board member, (f) employment CEO gender, (g)
employment employees, (g) employment salary, (h) financial responsibility for dependents, (i)
managerial gender proportion, (j) partner relationship, and (k) work colleagues gender
proportion.
Many board-related items provided for up to seven responses to allow for up to seven
boards on which the directors might serve. In particular the 1995 item total directorship
remuneration was changed to the board-specific item, directorship remuneration. The
response categories for the director’s board position item was simplified from six response
categories to four by combining chair executive and managing director as chief executive
officer, and removing secretary.
Follow-up detail requested for some board-related items was more clearly identified as
pertaining to the board of the organisation with the greatest number of employees. The board
for which these answers were given is termed the “focal board” in the study for convenience
and compatibility with Westphal and Milton (2000).
Some items were altered to a form that was believed to be more useful for analysis.
Number of dependent children was changed to number of children, to be compatible with
other research on corporate directors. Age of dependent children (allowing only three

Experiences and Influences of Women Directors
Chapter 4. Longitudinal Study of Successful Women Directors Page 119
children) was changed to child age categories (allowing up to four age ranges plus a response
of fully independent). Board meeting frequency was changed to focal board formal meeting
frequency, an extra response category of fortnightly was added, and an extra item of focal
board director meeting frequency to allow for more frequent meetings than just board
meetings.
Several new items were introduced to facilitate analysis for analysis in later studies.
New items were (a) reason no longer a director, (b) university degree, (c) MBA or similar, (d)
functional background, (e) concurrent directorships, (f) concurrent board years, (g)
nonexecutive director years, (h) nonexecutive director boards, (i) board industry, (j) board
CEO gender, and (k) board chair and CEO is the same person.
Several new items focussed on the board of the largest organisation (by number of
employees) of which the woman was a director. New items were (a) executive committee
member, (b) focal board directors predate CEO, (c) focal board directorship predates CEO,
(d) focal board directorship years, (e) focal board members from same university, (f) focal
board members in same industry, (g) focal board members on other boards with director, (h)
focal board sells into employment industry, (i) focal board members with MBA or similar, (j)
focal board members with no university, (k) focal board members with same functional
background, and (l) focal board women directors.
Four new scales were introduced to the 2001 questionnaire, two that measured gender
role stereotypes from Cejka and Eagly (1999), the social identification scale of Karasawa
(1991), and the board influence scale from Westphal and Milton (2000). These scales are
analysed in detail in chapters 5 and 6.
In an attempt to obtain a broader view of the boards on which women held a seat, each
woman was asked to invite a male colleague to complete a survey on their experience as a
director. An additional survey was created for male directors that had fewer items by dropping

Experiences and Influences of Women Directors
Chapter 4. Longitudinal Study of Successful Women Directors Page 120
items regarding family environment, salary, gender proportions, and board-related items
already covered by the questionnaire for females.
Each woman director received a survey package consisting of an explanatory letter with
instructions, consent forms, the questionnaires, and reply paid envelopes. The instructions
asked the woman to give a questionnaire to one of the male directors. The questionnaires were
clearly marked and colour-coded, one colour for the female directors and another colour for
the male director.
4.2.3. Survey Returns and Representativeness
Of the mail-out to the 2001 sample of 298 women, 59 of the surveys were returned with
an indication that the women were no longer known at that address. Most of the women in
1995 gave a follow-up address of a company for which they were a director. Six years later
most of them had moved on and the companies would not divulge a forwarding address (if
known). An attempt was made to locate those women through searching for their names on
the current database on the Business Who’s Who of Australia [Dun & Bradstreet, November
2001]. Thirteen of the women were located again and sent another copy of the survey. The
second posting yielded a further three completed surveys.
Of the women completing the surveys, 21 indicated that they were no longer on a
company board. Two women who telephoned the researcher commented that their loss of
directorship was not of their choice, rather that their retirement was due to changes in the
composition and election process of the board. A total of 32 completed returns were received
from current women directors.
Of the 298 surveys sent out eight men completed and returned the survey. These
responses provided seven cases where a man and a woman from the same board returned
completed surveys. The overall return rate for the survey was a satisfactory 20%.
The 32 responses from women who were still board members were analysed to
determine whether they were representative of the 298 women directors of the 2001 follow-up

Experiences and Influences of Women Directors
Chapter 4. Longitudinal Study of Successful Women Directors Page 121
sample. Chi-square tests for independence were used to confirm that the 2001 sample was a
representative subset of the 1995 sample. Items tested for sample representativeness were (a)
director age, (b) highest level of education, (c) total board directorships, (d) total board
directorship years, (e) senior management years, (f) directorship remuneration, (g)
employment industry, (h) managerial level of current position, (i) total annual salary, (j)
employment organisation size, and (k) the director’s state of residence obtained from the
postal address.
Only the chi-square test of total directorship remuneration showed a significant
variation between the 32 responses and the sample of 298 women directors– see Table 2.12.
Although there was statistical significance to the differences (χ2 (4, N = 285) = 19.42,
p < .001), there was no apparent rationale for the differences. Those with nil remuneration
reduced from 44% to 16% of the sample and those receiving up to $7,000 increased from 14%
to 36%. However, the proportion of directors receiving $7,001 to $22,000 decreased, while
those receiving $22,001 to $47,000 increased, and those receiving over $47,000 decreased.
Table 4.5 Women Director Responses by Total Directorship Remuneration
No response Responded Remuneration Frequency % Frequency %
Nil 111 43.7 5 16.1
Under $7,000 36 14.2 11 35.5
$7,001 to $22,000 37 14.6 3 9.7
$22,001 to $47,000 31 12.2 9 29.0
Over $47,000 39 15.4 3 9.7
Totals 254 100% 31 100%
Therefore, the sample of 32 current women directors is regarded as a representative
subset of the 298 directors who agreed to follow-up research, with the variation in
directorship remuneration regarded as a spurious inconclusive result.

Experiences and Influences of Women Directors
Chapter 4. Longitudinal Study of Successful Women Directors Page 122
4.2.4. Method of Data Analysis
To compare the differences between the women and their boards over the two periods of
1995 and 2001, several two-sample statistical tests were necessary. Both the 1995 data and
the 2001 data contain a related sample of women directors, and an independent sample of
boards on which the women hold positions.
The women directors are a related sample because they are the same people who were
surveyed in 1995. However, the boards on which they are directors are regarded as an
independent sample because it is not known whether the boards that they were on in 1995 are
the same as the boards that they were on in 2001. In fact, the data shows there was a high
turnover in their boards between 1995 and 2001, so we know that most of the boards they
were on in 2001 are not the same ones they were on in 1995. Therefore, independent sample
statistical techniques were used to evaluate significance for attributes of the boards and the
women’s positions on boards.
In addition, the data contains items measured on nominal, ordinal, and interval scales.
The survey items are a mixture of nominal (eg. board position), ordinal (eg. organisation size
on a non-linear categorical scale), and interval (eg. director’s age) items. Some items that
were surveyed with an interval scale in 2001 (eg. number of board directorships) have been
analysed with ordinal statistical techniques to match the 1995 form of the item (e.g., an
ordinal scale of uneven intervals).
Nominal data for the related sample of the women directors were analysed for
significance with the chi-square test for independence. Although the McNemar test was
considered to test for significance of related sample nominal data, it requires dichotomous
variables (Siegel, 1956). None of the data in the sample were suitable for the McNemar test,
forcing a reliance on the chi-square test. Nominal data for the independent sample of the
boards were also analysed by the chi-square test. The Fisher exact probability test was
considered as an alternative for independent sample nominal data, but it requires dichotomous

Experiences and Influences of Women Directors
Chapter 4. Longitudinal Study of Successful Women Directors Page 123
variables (Siegel, 1956). Only one item was suitable for the Fisher test (board chair’s gender),
so the results of the Fisher test was reported in addition to the chi-square result for that item.
Ordinal data for the related sample of the women directors were analysed for
significance with the Wilcoxon signed ranks test. Ordinal data for the independent sample of
the boards were analysed with both the Mann-Whitney U test and the Kolmogorov-Smirnov
test. Interval data for the related sample of the women directors were analysed with the t test.
There was no suitable interval data for the independent sample of the boards (Siegel, 1956).
The SPSS version 11 software package was used for analysis. Assumptions underlying
the use of statistical techniques have been observed. The sample was representative of the
total population of women directors. Independence of observation was assumed as the survey
was separately administered to individual women directors without any information regarding
the other participants in the sample. Although the responses to questionnaire items were not
necessarily normally distributed, the sample size of women directors was large enough (30+)
to tolerate reasonable deviance from normality (Pallant, 2001).
4.3. Results
Survey responses from the two sample periods are given below with descriptive
statistics and the appropriate tests for significance of changes.
4.3.1. Director Age
The director’s age demonstrated the expected result that the women recorded their ages
as six years older than they were in 1995 – see Table 4.6 (one woman did not reveal her age in
2001). The mean change in age categories across all women was 1.2 which, with 5-year
categories, equates to six years as expected. As the director’s age was measured in 5-year
intervals, a paired-samples t test was used to test for significance. The paired-samples t test
confirmed, that the difference was significant (t (30) = 11.06, p < .001).

Experiences and Influences of Women Directors
Chapter 4. Longitudinal Study of Successful Women Directors Page 124
Table 4.6 Director Age in 1995 and 2001
1995 2001 Age Frequency % Frequency %
30 to 34 years 1 3.1 - -
35 to 39 years 3 9.4 1 3.2
40 to 44 years 7 21.9 3 9.7
45 to 49 years 10 31.3 5 16.1
50 to 54 years 6 18.8 9 29.0
55 to 59 years 2 6.3 7 22.6
60 to 64 years 2 6.3 2 6.5
65 to 69 years 1 3.1 2 6.5
over 70 years - - 2 6.5
Totals 32 100% 31 100%
4.3.2. Highest Level of Education
The director’s highest level of education was identical to that recorded in 1995 – see
Table 4.7. None of the directors increased their level of formal qualifications over the six
years. As there was no change, there was no point in testing for significance.
Table 4.7 Highest Level of Education in 1995 and 2001
1995 2001 Highest level of education Frequency % Frequency %
Year 12/HSC/Leaving/Matriculation 4 12.5 4 12.5
TAFE college course 1 3.1 1 3.1
Undergraduate Diploma 4 12.5 4 12.5
Undergraduate Degree 13 40.6 13 40.6
Postgraduate Diploma/Honours 4 12.5 4 12.5
MBA 1 3.1 1 3.1
Masters Degree 2 6.3 2 6.3
Doctorate/PhD 3 9.4 3 9.4
Totals 32 100% 32 100%

Experiences and Influences of Women Directors
Chapter 4. Longitudinal Study of Successful Women Directors Page 125
4.3.3. Managerial Level
Numerous changes in the managerial level of the director’s current position since 1995
are evident – see Table 4.8. One woman who did not reveal her managerial level in 1995
reported that she was now an executive in 2001. Two divisional heads and two executives
from 1995 did not reveal their managerial level in 2001. As the data is in nominal categories,
a chi-square test was considered appropriate to test for significance. To achieve expected
frequencies of 5 or greater, the categories of senior level manager, middle level manager, and
lower level manager were combined. The chi-square test then confirmed that overall the
changes were significant (χ2 (4, N = 59) = 13.4, p = .010).
The substantial changes in the categories of divisional head and non-supervisor/non-
manager prompted detailed investigation. Three of the divisional heads from 1995 indicated
that they were executives in 2001, one became a senior level manager, one became a non-
supervisor/non-manager, and two did not state their managerial level in 2001. The exodus
from the category of divisional manager in 2001 suggests that this label was no longer
fashionable as a description of a managerial level.
Table 4.8 Managerial Level in 1995 and 2001
1995 2001 Managerial Level Frequency % Frequency %
Chief executive officer 7 22.6 8 28.6
Divisional head 7 22.6 0 0.0
Executive 12 38.7 9 32.1
Senior level manager 2 6.5 3 10.7
Middle level manager 2 6.5 0 0.0
Lower level manager 1 3.2 2 7.1
Non supervisor/Non manager 0 0.0 6 21.4
Totals 31 100% 28 100%
The non-supervisors/non-managers in 2001 comprised a divisional head, two
executives, two senior managers, and a lower level manager from 1995. Respondents

Experiences and Influences of Women Directors
Chapter 4. Longitudinal Study of Successful Women Directors Page 126
apparently did not interpret the managerial level of non-supervisor/non-manager as a low
managerial level as its order, under lower level manager, implied. The non-supervisors/non-
managers category appeared to be interpreted as a retirement or “professional” category.
Other managerial categories appeared to be interpreted as expected. The new (eighth)
CEO in 2001 was an executive in 1995. The two middle level managers from 1995 shifted to
the adjacent categories of senior level manager and lower level manager in 2001.
Dropping the now-defunct category of divisional head and the ambiguous category of
non-supervisor/non-manager level, a chi-square test of the remaining categories suggested
that the changes in managerial levels were not significant (χ2 (2, N = 46) = .409, p = .815).
4.3.4. Total Directorships
A distinct shift in the total number of board directorships held was apparent since 1995
– see Table 4.9. A detailed comparison of responses confirmed that all directors reported
either the same or a greater number of boards than they did in 1995, as expected. As this data
is ordinal, a Wilcoxon signed ranks test was used to test for significance. The Wilcoxon
signed ranks test confirmed that the changes were significant (Z (32) = 3.61, p < .001).
Table 4.9 Total Directorships in 1995 and 2001
1995 2001 Number of boards Frequency % Frequency %
1 to 2 17 53.1 11 34.4
3 to 4 11 34.4 7 21.9
5 to 6 3 9.4 5 15.6
More than 6 1 3.1 9 28.1
Totals 32 100% 32 100%
In 1995, the allowable responses for the number of boards were categorised, as per
Table 4.9, so the total number of boards across the sample could not be calculated precisely.
However, estimating the total number from the response ranges, suggests there were between
72 and 103 or more boards, with a mid-point of about 90 boards. In 2001, a numeric response

Experiences and Influences of Women Directors
Chapter 4. Longitudinal Study of Successful Women Directors Page 127
was requested so the exact number of boards could be calculated, resulting in a figure of 157
boards. Thus, the women increased the number of board memberships that they had held by
about 60% over the six years. The average increase in the number of boards per director,
across the 32 women over the six years, was approximately two additional boards.
4.3.5. Concurrent Directorships
The number of concurrent board directorships held by the women in 1995 could not be
directly obtained from the questionnaire, as it had no suitable question. However, the number
of concurrent board directorships could be deduced from the number of responses to some
multiple response items. Several questions, such as the board size, allowed for answers for up
to three boards. Therefore, directors who were on one or two boards concurrently could be
identified reasonably accurately. However, the women who responded on the three boards
allowed for by the item may have been on more boards. Of the 32 directors in the sample, 12
responded on the three boards allowed in 1995. To attempt to detect greater than three boards,
two other multiple response items were analysed (basis of recruitment and board corporation
type). Although these items did not indicate any particular board, women could respond to
any of seven possible categories. Analysis of these items revealed four women who gave four
responses out of the seven responses possible and so appeared to be on at least four boards.
The estimates for 1995 and the values for 2001 are shown in Table 4.10.
Table 4.10 Concurrent Directorships in 1995 and 2001
1995 2001 Number of boards Frequency % Frequency %
1 9 28.1 14 43.8
2 11 34.4 7 21.9
3 8 25.0 4 12.5
4 or more 4 12.5 7 21.9
Totals 32 100% 32 100%

Experiences and Influences of Women Directors
Chapter 4. Longitudinal Study of Successful Women Directors Page 128
The total number of board directorships concurrently held for 1995 appears to be at least
71. However, the number of women with four board directorships for 1995 is a minimum
value, so it is possible there were more than four women with four or more concurrent board
directorships. Therefore, the total number of board directorships concurrently held for 1995 is
likely to be more than 71 and the total number for 2001 was 82.
There appeared to be a reduction in the number of concurrent board directorships, with
an increase in the number of women with only one board directorship, and a decrease in the
number of women with two or three board directorships. As this data is ordinal, a Wilcoxon
signed ranks test was used to test for significance. The Wilcoxon signed ranks test on this
imprecise data suggested that the changes were not significant (Z (32) = .484, p = .628).
Therefore, the average number of concurrent board directorships across the 32 women was
regarded as stable, with an average of about two and one half directorships per woman.
4.3.6. Director Position
To allow comparison of director’s board positions between 1995 and 2001, some board
positions recorded in 1995 were re-categorised. The 1995 positions of chair executive and
managing director were re-categorised as chief executive officer, and the 1995 position of
secretary was included in the 2001 category of executive director. Comparing the resultant
board positions for 1995 and 2001, several changes in directors’ board positions were evident
– see Table 4.11. As the board position categories are nominal, a chi-square test is the most
appropriate to test for significance. The chi-square test confirmed that the changes were
significant (χ2 (3, N = 145) = 10.3, p = .016).
The 11 nonexecutive chair positions were held by eight women, of which only two were
also CEOs or had any previous CEO experience. The woman that was the only nonexecutive
chair in 1995 was the chair of three boards in 2001 and had no CEO experience. Therefore, it
appears that for these women having a CEO position was not a criterion for also gaining a
nonexecutive chair position.

Experiences and Influences of Women Directors
Chapter 4. Longitudinal Study of Successful Women Directors Page 129
Table 4.11 Director Position in 1995 and 2001
1995 2001 Board Position Frequency % Frequency %
Non Executive Chair 1 1.5 11 13.9
Chief Executive Officer 7 10.6 4 5.1
Executive Director 8 12.1 4 5.1
Non Executive Director 50 75.8 60 75.9
Totals 66 100% 79 100%
4.3.7. Partner Relationship
Several changes in the director’s relationships with their partners occurred since 1995 –
see Table 4.12. Two of the directors who were “living together” in 1995 were “married” by
2001. Of the married directors in 1995, by 2001 one was “divorced,” two were “separated,”
and one was “widowed.” The divorced woman in 1995 described herself as “single” in 2001.
As the partner relationship categories are nominal, a chi-square test is appropriate for testing
significance. To ensure that expected frequencies were 5 or greater, the categories of
divorced, separated, single, and widowed were combined. The changes in partner
relationships, although apparently quite real, were not statistically significant according to a
chi-square test (χ2 (2, N = 64) = 2.03, p = .363).
Table 4.12 Partner Relationship in 1995 and 2001
1995 2001 Partner Relationship Frequency % Frequency %
Married 22 68.8 20 62.5
Living together 7 21.9 5 15.6
Divorced 1 3.1 1 3.1
Separated 0 0.0 2 6.3
Single 0 0.0 1 3.1
Widowed 2 6.3 3 9.4
Totals 32 100% 32 100%
Experiences and Influences of Women Directors
Chapter 4. Longitudinal Study of Successful Women Directors Page 130
4.3.8. Basis of Recruitment
Few changes in the basis of recruitment were evident between 1995 and 2001 – see
Table 4.13. As the categories for the basis of recruitment are nominal, a chi-square test is
appropriate for testing significance. To ensure that expected frequencies were 5 or greater, the
categories of ownership of company and family affiliation were combined, and the categories
of informal networking and being a consultant were also combined. A chi-square test
confirmed that the changes were not significant (χ2 (4, N = 126) = .543, p = .969). The lower
number of responses (47) in 1995 was due to the question being presented once without
reference to any particular boards, although multiple responses were allowed. In 2001, the
question was presented for each of the up to seven boards allowed for in 2001
Table 4.13 Basis of Recruitment in 1995 and 2001
1995 2001 Basis of Recruitment Frequency % Frequency %
Invitation by chair 17 36.2 26 32.9
Invitation by director/ executive 8 17.0 16 20.3
Election 8 17.0 16 20.3
Ownership of company 7 14.9 9 11.4
Family affiliation 0 0.0 1 1.3
Informal networking 7 14.9 10 12.7
Being a consultant 0 0.0 1 1.3
Totals 47 100% 79 100%
4.3.9. Board Chair Gender
Substantial changes in the gender of the board chair were evident between 1995 and
2001 – see Table 4.14. As gender is a nominal category, both chi-square and Fisher exact
probability tests are appropriate to test for significance. The chi-square test suggested that the
changes were significant (χ2 (1, N = 112) = 4.88, p = .027), which was confirmed by the
Fisher test probability (p = .028).

Experiences and Influences of Women Directors
Chapter 4. Longitudinal Study of Successful Women Directors Page 131
Table 4.14 Board Chair Gender in 1995 and 2001
1995 2001 – all boards 2001 – boards not chaired Gender Frequency % Frequency % Frequency %
Male 28 90.3 57 70.4 57 81.4
Female 3 9.7 24 29.6 13 18.6
Totals 31 100% 81 100% 70 100%
Detailed examination revealed that of the three board chairs whose gender was given as
female in 1995 none of them was from the sample of women directors. (The one woman from
the 1995 sample who was a board chair failed to answer the item regarding the gender of the
board chair.) However, in 2001, of the 24 female board chairs, the women in the sample held
11 of the board chairs. The high proportion of female board chairs in 2001 who also happened
to be the sample respondents may have skewed the comparison with the 1995 sample
resulting in a false conclusion of significant changes. To test the degree by which the sample
was biased by the presence of these successful women in the sample, the 11 boards were
removed from the sample and the test for significance re-run. Of the remaining boards, shown
as “2001 – boards not chaired” in Table 4.14, a chi-square test showed that the changes in the
gender of the other board chairs, although noticeable, was not significant (χ2 (1, N = 101) =
1.28, p = .259). The Fisher probability test confirmed the lack of significance (p = .378).
4.3.10. Employment Industry
Few changes in the directors’ employment industry were apparent since 1995 – see
Table 4.15, although a detailed comparison of responses revealed more changes than are
apparent from the table.
As the employment industry categories are nominal, a chi-square test is appropriate for
testing significance. To ensure that expected frequencies were 5 or greater, several categories
were combined. In an attempt to maximise significance, the category of mining was combined
with public administration and defence, and the categories of manufacturing, electricity, gas,

Experiences and Influences of Women Directors
Chapter 4. Longitudinal Study of Successful Women Directors Page 132
and water, construction, and communication were also combined. A chi-square test suggested
that the changes were not significant (χ2 (4, N = 61) = 1.02, p = .907).
Table 4.15 Employment Industry in 1995 and 2001
1995 2001 Industry Frequency % Frequency %
Mining 2 6.3 2 6.9
Manufacturing 1 3.1 1 3.4
Electricity, gas, and water 1 3.1 1 3.4
Construction 1 3.1 1 3.4
Communication 3 9.4 1 3.4
Finance, property, and business services 13 40.6 12 41.4
Public administration and defence 1 3.1 3 10.3
Community services 5 15.6 4 13.8
Recreation, personal, and other services 5 15.6 4 13.8
Totals 32 100% 29 100%
4.3.11. Board Employees
The numbers of employees of the organisations of the boards on which the women held
their directorships appear to have increased since 1995 – see Table 4.16. The categories
measuring board organisation size are ordinal as the uneven categories prevent them from
being interval. The boards are an independent sample, as the boards were not identified. The
Mann-Whitney U or the Kolmogorov-Smirnov tests are appropriate to test for significance of
ordinal independent samples. The result for the Mann-Whitney U test (Z (149) = 1.74, p =
.082) differed from the Kolmogorov-Smirnov test (Z (149) = 1.65, p = .009), however
together the results of the two tests suggested that the changes were significant.
It is not clear whether the organisations have grown in size over six years, or the women
have been appointed to boards of other larger organisations, as the boards on which the
women are directors are not identified. However, most of the women appear to have changed
boards over the six years, so it is likely that these are new larger organisations. One director

Experiences and Influences of Women Directors
Chapter 4. Longitudinal Study of Successful Women Directors Page 133
who was on the boards of three organisations of 101 to 200 employees in 1995, by 2001 was
on the boards of six organisations of more than 500 employees (one of 501 to 1000
employees, one of 2001 to 4000 employees, two of 4001 to 8000 employees, and two of 8000
employees).
Table 4.16 Board Employees in 1995 and 2001
1995 2001 Employees Frequency % Frequency %
Less than 25 24 35.8 27 32.9
25 to 50 8 11.9 8 9.8
51 to 100 10 14.9 11 13.4
101 to 200 17 25.4 4 4.9
201 to 500 2 3.0 6 7.3
501 to 1000 1 1.5 8 9.8
1001 to 2000 3 4.5 3 3.7
2001 to 4000 1 1.5 6 7.3
4001 to 8000 1 1.5 6 7.3
More than 8000 0 0.0 3 3.7
Totals 67 100% 82 100%
4.3.12. Board Corporation Type
Although there were some changes in the types of organisations of which the women
were board members between 1995 and 2001, a trend was not apparent – see Table 4.17. As
the board organisation type categories are nominal, a chi-square test is appropriate for testing
significance. To ensure that expected frequencies were 5 or greater, the categories of private
and trust were combined. A chi-square test suggested that the changes were not significant
(χ2 (4, N = 124) = 4.24, p = .374).
To attempt to detect significant changes the organisation types were re-categorised into
high-profile (Publicly listed and Statutory authority) and low-profile (Public unlisted, Private,

Experiences and Influences of Women Directors
Chapter 4. Longitudinal Study of Successful Women Directors Page 134
Trust, and Not for profit). With this re-categorisation a chi-square test still failed to suggest
significant changes (χ2 (1, N = 124) = 3.91, p = .272).
Table 4.17 Board Corporation Types in 1995 and 2001
1995 2001 Corporation type Frequency % Frequency %
Publicly Listed 4 8.7 13 16.7
Public Unlisted 11 23.9 11 14.1
Private 6 13.0 16 20.5
Trust 3 6.5 3 3.8
Statutory Authority 9 19.6 19 24.4
Not for Profit 13 28.3 16 20.5
Totals 46 100% 78 100%
Although there appears to be a greater number of organisation types in 2001 (78) than
1995 (46), the difference is due to different forms of the question in 2001 and 1995. In 1995
the question was asked without reference to any particular boards and allowed multiple
responses. In 2001, the question was asked in respect to each of the up to seven boards for
which responses were invited. The different presentation of the question in 2001 elicited a
greater number of responses, including duplicate responses for different boards that would not
have emerged in 1995. Therefore, the difference in the total number of organisation types is
not meaningful.
4.3.13. Board Directors
Some changes in board sizes occurred between 1995 and 2001 – see Table 4.18. A
change in Australian legislation since 1995 allowed a new minimum board size of one
director. There appeared to be a consolidation around 8 to 10 directors as the most frequent
board size. Some larger board sizes of 14 or more directors appeared that are due to some of
the women gaining directorships on large statutory authorities and not for profit organisations.

Experiences and Influences of Women Directors
Chapter 4. Longitudinal Study of Successful Women Directors Page 135
As the board size categories are ordinal (the uneven categories preventing them from
being interval), and the boards are an independent sample (the boards were not identified),
either the Mann-Whitney U test or the Kolmogorov-Smirnov test appeared appropriate to test
for significance. The result for the Mann-Whitney U test (Z (148) = .058, p = .954) differed a
little from the Kolmogorov-Smirnov test (Z (148) = .523, p = .947), however they suggested
that the changes were not significant.
Table 4.18 Board Directors in 1995 and 2001
1995 2001 Number of directors Frequency % Frequency %
1 - - 1 1.2
2 to 4 8 11.9 9 11.1
5 to 7 22 32.8 23 28.4
8 to 10 19 28.4 32 39.5
11 to 13 18 26.9 9 11.1
14 or more 0 0.0 7 8.6
Totals 67 100% 81 100%
4.4. Discussion
4.4.1. Highest Level of Education
Hypothesis 1 proposed that the women directors would not significantly increase their
educational qualifications between 1995 and 2001. The hypothesis was supported in that there
was no change in educational qualifications in 2001 from those held in 1995.
It might be interesting to compare this group of women with norms for other senior
executives to determine whether another group of 32 senior executives would also fail to
complete any academic courses over a six-year period. If it emerged that it would be expected
that a group of 32 senior executives would increase their academic qualifications then the
social identity theory that members will not stray from the perceptions of the ingroup norms

Experiences and Influences of Women Directors
Chapter 4. Longitudinal Study of Successful Women Directors Page 136
would be reinforced. However, at an anecdotal level it is believed unlikely that senior
executives complete academic courses at a high enough rate to differ from the sample.
4.4.2. Managerial Level
Hypothesis 2 proposed that the women directors would not significantly advance in
managerial level between 1995 and 2001. Investigation of this hypothesis was inconclusive.
There were significant changes between 1995 and 2001, particularly an exodus from the title
of divisional manager and an emergence of non-supervisor/non-manager as a popular
category. The title of “divisional head” appeared to be out of favour in 2001, with no women
responding that their level is that of divisional head. The emergence of women responding
that their managerial level is that of non-supervisor/non-manager going from zero to six might
be understandable if those six women considered themselves now to be professional directors
who no longer have any direct reports. It is unclear whether these changes should be
interpreted as an advance in managerial level. Further analysis that excluded the categories of
divisional head and non-supervisor/non-manager suggested that the managerial level changes
were not significant.
4.4.3. Total Directorships
Hypothesis 3 proposed that the total number of board appointments held by the women
would significantly increase between 1995 and 2001. Analysis supported the hypothesis, with
a significant increase in the total number of board directorships since 1995.
That the total board directorships increased by 60% while there was little if any increase
in the number of concurrent directorships indicates that there was a high rate of turnover of
directorships. An interpretation of the high rate of turnover might be that some women were
now being sought as directors for other boards thereby actively enhancing their identity as a
member of the ingroup of board directors.

Experiences and Influences of Women Directors
Chapter 4. Longitudinal Study of Successful Women Directors Page 137
4.4.4. Concurrent Directorships
Hypothesis 4 proposed that the number of concurrent board appointments held by the
women would have significantly increased between 1995 and 2001. Analysis of the available
data did not support the hypothesis. As there was no item in 1995 that measured concurrent
board directorships, other items were used to deduce the 1995 values. Analysis suggested that
there was no significant change.
If the Korn/Ferry International (1999) report that 52% of CEOs had more than two
concurrent directorships is indicative of the norm for all directors, then the average number of
boards positions held by women in the sample of two and a half directorships may be
regarded as normal. Social identity theory suggests that the women will not attempt to stray
from the perceived norms of the ingroup (Haslam, 2001).
4.4.5. Director Position
Hypothesis 5 proposed that of the women’s board positions there would be a significant
increase in the number of board chair positions held between 1995 and 2001. Analysis of
director positions supported this hypothesis. There was a dramatic increase in the number of
nonexecutive board chairs, from one in 1995 to 11 in 2001. Other board positions showed a
reduction in CEO and Executive Director positions. These women had clearly shifted from
executive roles to nonexecutive roles. Of interest was the observation that having a CEO
position did not appear to be a prerequisite to obtaining a nonexecutive chair position. Of the
eight women who held the 11 nonexecutive chair positions, only two had CEO experience. It
appears that these women differ from the stereotype of a male nonexecutive director, in not
being a past CEO.
4.4.6. Partner Relationship
Hypothesis 6 proposed that the women’s relationships with their partners would not
change significantly between 1995 and 2001. Analysis of the data supported the hypothesis.

Experiences and Influences of Women Directors
Chapter 4. Longitudinal Study of Successful Women Directors Page 138
Although several changes had occurred since 1995, the changes were not statistically
significant.
4.4.7. Basis of Recruitment
Hypothesis 7 proposed that there would be a significant difference in the basis of
recruitment of the women to board positions in 2001 from the basis of recruitment in 1995.
Analysis of the data did not support the hypothesis. The few changes in the Basis of
Recruitment item were not statistically significant.
Response categories for this item may not have discriminated adequately between
reputation and merit as the basis of recruitment. The response categories also might have been
inadequate to detect an increase in reputation as the basis for recruitment, as women’s
salience as a member of the ingroup increases.
4.4.8. Board Chair Gender
Hypothesis 8 proposed that there would be no significant difference in the gender of the
board chair of boards between 1995 and 2001, notwithstanding that many board chair
positions are likely to be held by the successful women in the sample. Analysis of the data
supported the hypothesis. Although an analysis of all changes did show significance, the
significance appeared due to the success of some of the women in gaining the position of
board chair. Removing the bias that the sample included respondents whom had secured
board chair positions by 2001, revealed no significant changes in the gender of the board
chair.
4.4.9. Employment Industry
Hypothesis 9 proposed that there would be no significant difference in the employment
industries of the women directors between 1995 and 2001. Analysis of the data supported the
hypothesis. The few changes in employment industry were not statistically significant.

Experiences and Influences of Women Directors
Chapter 4. Longitudinal Study of Successful Women Directors Page 139
It is expected that senior executives do not change their employment industry often.
Social identity theory suggests that if the board of directors is perceived to be comprised of
people from a particular industry then members are more likely to come from that industry
and will not move to another industry.
4.4.10. Board Employees
Hypothesis 10 proposed that the women directors would hold board seats on
significantly larger organisations in 2001 than they did in 1995. Analysis of the data support
the hypothesis, the women were on the boards of significantly larger organisations in 2001.
The large increase in the total number of directorships held (60% increase over six years
– see section 4.3.4) tends to suggest that most changes of organisation size were the result of
changes of boards. Reinforcing this proposition is the observation that the large increases in
organisation sizes occurred at a time when most organisations in Australia were downsizing.
4.4.11. Board Corporation Type
Hypothesis 11 proposed that the women directors in 2001 would hold significantly more
positions on publicly visible organisations (publicly listed corporations and statutory
authorities) than those held in 1995. Analysis of the data failed to support the hypothesis.
There was no significant difference in the types of corporations of which the women were
board directors.
Item response categories may not have been appropriate to capture the high profile
versus low profile nature of the hypothesis. A more direct question about perceived
organisation profile or board prestige may have yielded a different outcome.
4.4.12. Board Directors
Hypothesis 12 proposed that the sizes of the boards in 2001 would not be significantly
different from the sizes of the boards in 1995. Analysis of the data supported the hypothesis.
There was no significant difference in the sizes of the boards of which the women were

Experiences and Influences of Women Directors
Chapter 4. Longitudinal Study of Successful Women Directors Page 140
directors. Although not significant, there was a noticeable shift to larger boards of 8 to 10
directors as the norm for board size.
4.5. General Discussion
The women in the present study clearly are successful board directors, having increased
the number of their board directorships, gaining more board chair positions, and gaining
positions on boards of larger organisations over a period of six years.
While social identity theory is now well established, there does not appear to have been
any prior applications of it to corporate boards. However, the responsiveness of social identity
to social context is a well-documented aspect of the theory (Hogg, 2000). The importance of
ingroup access is vital to women if they want to maintain or enhance their board status.
Ingroup membership means that the woman is able to overcome the effects of homophily
(Ibarra, 1992). According to Ibarra’s research, men prefer to have the same gender networks.
Given the strength of men’s homophilic tendency, it is not surprising that women have
barriers to overcome to gain directorships (Oakley, 2000) and to be effective on the board
(Bilimoria & Huse, 1997).
Leighton (2000) in his reflections on being a director described ingroup formation and
change in social identity as a rapid and influential process. “The moment an outsider is
appointed to the board and accepts his or her first directors fee, a director becomes part of a
social group, subject to a host of pressures, obligations, rewards, and liabilities, many of them
subtle and unstated, most notably the locus of power in the organization. Independence
becomes a relative concept, to be used sparingly by the director depending on a number of
factors.” (p. 257)
In an attempt to provide a theoretical framework for understanding women directors’
experience, Vinnicombe, Singh, and Sturges (2000) focussed on career development theory.
An interview study found three distinguishing characteristics of successful careers: mentoring,
challenging work, and visibility. Although Vinnicombe et al. explain their findings in terms of

Experiences and Influences of Women Directors
Chapter 4. Longitudinal Study of Successful Women Directors Page 141
career development theory, an alternative theoretical framework is social identity theory.
Mentoring serves the purpose of modelling salient characteristics and shapes the woman into
styles, behaviour, and attitudes to match the ingroup. For example, one of the women quoted
states “He steered me quite heavily towards creating a bit of the company I could make my
own…with his help I started to understand it better…I singled myself out with his help” (p.
64). Having challenging work allows women to accumulate experiences that make them peers
with men, and demonstrates their similarity in terms of technical skills and knowledge.
Another woman stated “…my job was to handle all the customer complaints that came
through to either his office or to the chairman’s office…that was a turning point because I
learnt about the company and I learnt about the industry…I was exposed to all the directors”
(p. 68).
Terry and Hogg (1996) identified that any change that affects self-categorisation also
leads to changes to individual attitudes and behaviour. Although the women directors in the
Vinnicombe et al. (2000) sample did not specifically state that they needed to adopt a style
with which the men felt comfortable, there is evidence from other research that the style or
approach that senior women adopt in the workplace is influenced by the prevailing culture
(Mainiero 1994b; Ragins, Townsend, & Mattis, 1998). Therefore, to be part of the ingroup of
directors the women had to ensure that their self-categorisations and behaviour matched the
ingroup norms. Another director in the Vinnicombe et al. sample described the lead up to her
joining the directors’ ingroup. “The job with headquarters meant I had to travel to London a
lot, which meant I got involved with group headquarters. I suppose that created openings and
got you noticed” (p.65). Such experiences of ingroup membership or testing the fit between
oneself and the ingroup would also have an impact on the women at an individual level.
Few studies examine women’s experiences on boards and the present study appears to
be the first longitudinal study of one group of women corporate directors across two periods.
Therefore, using social identity theory as the basis of the study is somewhat speculative. The

Experiences and Influences of Women Directors
Chapter 4. Longitudinal Study of Successful Women Directors Page 142
results of this study are encouraging for the application of psychological theory to women
directors and the importance that such theory can add to an understating of the social
behaviour on corporate boards. Future research should attempt to extend the theoretical basis.
Social identity theory proposes that once women directors perceive themselves to be
sufficiently part of the ingroup, they will not strive to advance themselves further towards a
stereotypical ideal of a board director. Rather, once they identify as a board director, they may
resist furthering their status relative to other board members for fear of being perceived as no
longer a member of the ingroup. This paradigm of women directors is in contrast to most of
the literature that portrays women directors generally as ever striving to prove themselves
against their male peers (McGregor, 2000).
4.6. Limitations and Future Research
A sample of 32 women directors, starting from an original sample of 572 in 1995, was
disappointing. Although the 1995 sample of 572 directors yielded 298 women for follow-up,
locating these women six years later proved difficult. The finding that the total number of
board directorships had increased by an average of about two directorships per woman
confirmed that board directorships were a volatile occupation. Considering that the average
number of concurrent board directorships held was approximately two and a half, suggested
that most of the women will have changed their board directorships over the six years. Many
women from the 1995 sample were likely to be no longer with the board that they were
members of in 1995. It was fortunate that sufficient directors could be traced to yield the final
sample of 32 directors. Future research should consider more frequent sampling than six years
to allow more chance of tracking directors as they move.
The study was fortunate to have obtained responses from 21 women who were no
longer members of a corporate board, however it may have been valuable to better understand
the circumstances leading to this outcome. Future research should consider more frequent
sampling than six years to help detect and understand changes in a volatile area.

Experiences and Influences of Women Directors
Chapter 4. Longitudinal Study of Successful Women Directors Page 143
A limitation of the longitudinal study was the extensive use of categorical responses in
the 1995 study when numeric responses were possible. Although categorical responses were
sufficient for a description of the characteristics of the women in 1995, the categorical
responses did not give enough precision to make accurate conclusions about the changes over
the six years. Future research that may lead to a longitudinal study should use numeric
responses instead of categorical wherever practical.
The self-report survey was likely to be a limitation in two ways. In the attempt to ask
sufficient questions to detect significant changes, it is likely that a considerable number of
directors may have considered the survey too time-consuming to answer. On the other hand,
trying to foresee questions that were likely to uncover significant changes was likely to
imperfect, and there is bound to be some information of significance that was not captured.
Future research that included follow-up interviews would give the opportunity to discover
additional information of significance and may help compensate for significant changes that
may have occurred between sampling periods but not been captured by the survey. However,
judging by the questions on the director’s age and highest educational level items, the answers
to the self-report survey that were given appeared to be accurate, and may not have suffered
from the social desirability bias that can affect self-report surveys.
A limitation of the study was that the boards of the organisations of which the women
were members were not identified. Although the women directors were positively (and
confidentially) identified, the boards of which they were members were not tracked. Boards
reported on by the women in 1995 could be inferred to include the organisation to which the
survey was addressed, but other boards reported on were completely anonymous. Although
the researcher knew the identity of the board to which the survey was addressed in 1995,
some directors gave a follow-up address that did not indicate a board. So in 2001, few of the
boards could be reliably identified.

Experiences and Influences of Women Directors
Chapter 4. Longitudinal Study of Successful Women Directors Page 144
Apparent changes in board characteristics could have come from changes in the board
and the corporation, or from the woman changing to a different board and corporation. Given
that it is likely that most women had changed boards over the six years, it is likely that
substantial board and organisation changes could be attributed to the likelihood that a
different board and corporation is being reported. Although frequent surveys of directors
would help in this regard, some means of identifying the board should be considered. At the
time of design of the present survey, it was considered that asking the directors to identify
their boards might have been considered a sensitive privacy issue that would have been
counterproductive to the survey.
A limitation of the study was that it only tracked women, so changes could not be
identified as being peculiar to women or common to both men and women directors. Social
identity theory suggests that changes are likely to be different for men and women, as men
would naturally be members of an ingroup on male-dominated boards while women would
naturally be members of an outgroup. Future research should consider tracking men and
women directors, especially if they were paired on the same boards. However, with the
relatively high rates of change observed, the divergent paths that they would inevitably take
might work against simple conclusions.
4.7. Conclusion
The present study was the first Australian study to compare characteristics of women
directors over a six-year period. The research clearly demonstrates the ability of Australian
women to advance in corporate boardrooms over a six-year period. The women in the sample
are clearly successful members of the ingroup of corporate directors, conforming to salient
aspects of this social identity.
The women in the sample appear to have overcome all major hurdles suggested by
previous researchers such as a dominant male culture (Bradshaw & Wicks, 2000) external
social pressures that reinforce male dominance of boardrooms (Izraeli & Talmud, 1997),

Experiences and Influences of Women Directors
Chapter 4. Longitudinal Study of Successful Women Directors Page 145
traditional recruitment practices (Karpin, 1995), and exclusion from informal networks
(Sinclair, 1998). Social identity theory appears to hold some answers as to how these women,
having risen above these obstacles to be perceived as board directors, maintain that identity,
and progress to become more successful.

Experiences and Influences of Women Directors
Chapter 5. Stereotypes of Male and Female Directors Page 146
Chapter 5
5. STEREOTYPES OF MALE AND FEMALE DIRECTORS
5.1. Introduction
Social identity theory suggests that as people adopt a social identity of an ingroup, their
individual characteristics will become less salient and they will adopt the views, behaviour,
and values of the ingroup. The cognitive representation (traits and attributes) of either an
ingroup or outgroup that is shared by members of a group or by members of another group,
may be considered a stereotype (Haslam, 2001). In the ingroup situation, gender will become
less salient if it is not a defining trait of the group. The present study investigated the
attributes that are common to the perceptions of both men and women directors. It also
identifies the attributes that form salient stereotypes of directors as an occupational category
by an ingroup of board directors. It describes the areas of consensus and divergence between
men and women directors on gender based director stereotypes.
Hogg (2000) argued that experiences in work groups formed perceptions of social
identity and sense of self. For some people, the characteristics of identities based on work-
related attributes can be more salient than personal characteristics such as gender, race, or age.
In an organisational context, Hogg pointed out that intergroup behaviour can exist between
organisations at the broadest level but also between divisions, units or professional groups
depending on self-categorisation based on salient characteristics related to context.
Haslam (2001) argued that the advantages of a social identity-based view of stereotypes
was that it provided an analysis of the stereotype phenomenon that takes into consideration
both social and cognitive factors. As part of social identity theory, Haslam and his research
group (Haslam, Oakes, Reynolds & Turner, 1999) provided an explanation of the process of
stereotyping. They applied ideas about stereotypes to decision making, intergroup conflict,
power, communication, and leadership. Haslam (2001), in describing shared social identity

Experiences and Influences of Women Directors
Chapter 5. Stereotypes of Male and Female Directors Page 147
and consensual group decisions, considered how and under which circumstances group
members decide upon the defining characteristics of the “ingroup and relevant outgroups in
the process of developing a shared construct of social reality.” (p. 168)
The central argument of Haslam’s (2001) analysis is that consensus on stereotypes by
ingroup members is a consequence of the depersonalisation process. Social identity processes
serve to highlight perceptions of ingroup similarity and outgroup dissimilarity over time.
Haslam noted that a weakness of many social psychological studies is that they are
experimental studies of stereotypes conducted at one instant of time. The social identity that is
salient is a result of manipulations by the researchers, with little opportunity for participants to
develop their own shared perception of social identity over time. Therefore, one of the
strengths of the present study is that it was a field study amongst a group that was expected to
have already developed prior perceptions of social identity and associated stereotypes.
Tajfel (1981) argued that social stereotypes are those “perceptions that are shared by
large numbers of people within social groups and entities” (p.147). Through an emphasis on
group characteristics and values, individual characteristics and values are de-emphasised, and
the group member takes on the group identity as their own. Haslam (2001) argued that once a
social identity becomes salient a stronger awareness of ingroup and outgroup homogeneity is
built. In turn, ingroup and outgroup homogeneity is reinforced and further accentuated by
processes of social identity based social influence (Haslam, 2001).
Hogg and Mullin (1999), in acknowledging the role that self-categorisation plays in
social identity, presented an argument that self-categorisation also serves to reduce
uncertainty about one’s subjective perceptions, attitudes, and behaviours. Both Cejka and
Eagly (1999), and Hogg (2000) acknowledged that the drive to reduce uncertainty is a normal
human motivation. The drive to reduce uncertainty serves to reinforce one’s personal sense of
status and is a way to identify one’s ingroup (Hogg, 2000). Making subjective judgements
about one’s self-concept creates confidence in how to behave and manage expectations (Hogg

Experiences and Influences of Women Directors
Chapter 5. Stereotypes of Male and Female Directors Page 148
2000). Using generalisations about others is a means to simplify information processing and
responding. Stereotypes are more likely to be relied on when the decisions to be made are
evaluative, and fewer resources and information on which to base decisions are available
(Macrae, Milne, & Bodenhausen, 1994).
Haslam, Turner, et al. (1998) conducted a series of studies that demonstrated that
consensus about stereotypes is derived from social interaction. Haslam (2001) used these
student-based studies to support the argument that the process of stereotyping relies on
cognitive accounts about outgroups and that the same process also shapes a person’s self-
categorisation regarding their ingroup
Social identity theory has also been applied to extend understanding of the socio-
demographic diversity of organisations. Homogeneous workgroups may strengthen ingroup
prototypes, social attractiveness, ingroup identification, and norm compliance. Homogeneity
is particularly effective when ingroup norms are consistent with wider social demographics
and social system norms (Hogg, 2000). However, in an organisational or workgroup setting a
person who is part of a minority group is likely to be perceived in terms of their minority
status, and as such receive stereotyped expectations and treatment from the dominant group.
According to Hogg (2000), minority status such as gender may result in women being
classified and perceived in terms of their gender, and be subject to stereotypical expectations
and treatment from the dominant ingroup. Hogg argued that the probability of a woman
receiving stereotyped responses is greater if the woman’s employment position converges
with a gender-typed employment classification. According to Brewer and Miller (1996), the
reverse can occur; when there is inconsistency between minority status and gender
classification differentiation between stereotypical categories are more likely to be made.
When there is little convergence between minority group status and the employment
classification, employees will acknowledge differences within both the minority group and
the employment classification. In such situations, generalisations and stereotypes are

Experiences and Influences of Women Directors
Chapter 5. Stereotypes of Male and Female Directors Page 149
inconsistent with reality and will be avoided or minimised (Hogg, 2000). However, during
periods of uncertainty, groups will strive towards homogeneity and socio-demographic
minorities are more likely to be marginalised.
Stereotypes can be reinforced and enhanced by factors that increase the awareness of a
shared social identity of a group of perceivers (Bar-Tal, 1998), and by group interactions
based on a shared social identity that is relevant to stereotype (Haslam, 2001). In the present
study, it is proposed that if the women were successful members of the ingroup then their
perceptions of the salient attributes of the stereotypes would agree with the men, but if they
were in an outgroup their perceptions would differ from the men.
5.1.1. Stereotypes in the Workplace
Cejka and Eagly (1999) have explored occupational stereotypes through the
development of social role theory. Social role theory provides an explanation of women’s lack
of social influence in task oriented groups. The workplace is an example of a place in which
task oriented interaction occurs, so that women’s lack of social influence is explained by
social structural factors of status and roles. Carli and Eagly (1999) argued that role
expectations about male and female behaviour explain variations in social position held by
men and women, rather than the variations being a result of individual, cultural, and historical
explanations. Carli and Eagly (1999) attributed the sex segregation of occupations to the
social roles assigned to men and women. Cejka and Eagly (1999) extended the understanding
of stereotype from an individual level to a system level and related it to gender-based
divisions of occupation categorisation. Lockheed (1985) conducted a meta-analysis of 64 data
sets from 29 studies of influence in mixed gender groups and concluded that men have more
influence over others than did women. The explanation he gave of women’s reduced
influence is that gender affects expectations of performance, and that men are expected to
demonstrate superior performance. Wiggins (1992) found men’s roles are associated with
self-assertion and a desire for achievement.

Experiences and Influences of Women Directors
Chapter 5. Stereotypes of Male and Female Directors Page 150
Carli and Eagly (1999) reported that men were more likely to be found in occupations
considered consistent with “agentic” personality characteristics whereas the women were
more likely to be found in occupations consistent with “communal” personality
characteristics. Carli and Eagly gave examples of men's agentic personality characteristics as
more assertive, independent, competitive, daring, and courageous. Examples of women's
communal personality characteristics were more gentle, kind, supportive, expressive,
affectionate, and tactful.
Boards of directors are assumed to be a male-dominated occupation so it would be
expected that the male-oriented agentic characteristics would be perceived as necessary for
occupational success. Board directors who have worked alongside a woman as a boardroom
colleague may understand that women are capable of agentic characteristics, but other male
directors are likely to associate these characteristics with other males. Directors of corporate
boards, like any other ingroup, are likely to rely on stereotyped notions of women as directors
unless they have evidence to the contrary.
The proposition that exposure and experience changes stereotypes is supported by a
study by Eagly and Karau (1991). Eagly and Karau analysed the results of 58 studies of
gender and leadership behaviour in small groups. There was a small to moderate tendency for
men to emerge as leaders compared to women, although women were found to be stronger
than men on social facilitation. Eagly and Karau concluded that men and women were
perceived differently, and therefore behaved differently, with men’s leadership decreasing for
tasks involving complex social interactions. In addition, the longer the interaction, the less the
tendency for men to emerge as leaders. The explanation for the finding by the researchers was
that there was a possible weakening of the gender based leadership stereotype. The weakening
of the stereotyped ideas may reflect the lessening of gender as a salient characteristic as the
amount of information group members have about each other grows with time. The above
explanation is consistent with the research on women directors by Burke (1994c) that found

Experiences and Influences of Women Directors
Chapter 5. Stereotypes of Male and Female Directors Page 151
those CEOs who had a women board member were more positive about women’s contribution
to the board than those who had not.
Carli and Eagly (1999) suggested that as factors of group cohesion and social concerns
become more important to groups, women’s contribution to these areas becomes more
important. Another way to conceptualise the explanation is to argue that as the women
become ingroup members common concerns and interests outweigh a focus on gender as a
defining group characteristic. The women directors may indeed use their facilitative skills to
become part of the ingroup to overcome initial experiences of gender based stereotyping.
Carli and Eagly (1999) argued that the sex segregation of roles that require different
behaviours facilitate the development of gender-based stereotypes and gender-based
occupational groupings. The argument is made that workplace experience may be more likely
to reinforce existing notions of occupation and gender-based characteristics. Occupational
categorisation by gender has been reported to exist from childhood and adolescence with
males being more fixed in stereotyped views than females (Miller & Budd, 1999). Schein,
Mueller, Lituchy, and Liu (1996) examined the perceptions of characteristics required for
occupations and reported the problems experienced by those who attempted to traverse
gender-based occupational areas. However, not all research appears to report negative
consequences. Williams (1992) studied men in female dominated occupations based on “in-
depth” interviews. Williams described the men’s careers as “glass escalators”, their difference
to the majority of female members demonstrating that men were more likely to be perceived
as having greater leadership skills than women. The conclusion drawn was that regardless of
group gender composition men were significantly more likely to attribute leadership qualities
to other men than to women.
Recent research by Diekman and Eagly (2000) examined a series of experiments
regarding the stereotypes held of men and women in the past, the present, and the anticipated
future changes in the stereotype characteristics. The researchers found that stereotypes about

Experiences and Influences of Women Directors
Chapter 5. Stereotypes of Male and Female Directors Page 152
women suggest that they are seen as a dynamic group whereas the stereotypes of men are
comparatively unchanging. The analysis demonstrated through the stereotypes of present
women that they are seen as more masculine compared to women in past eras. For women,
there is a trend towards greater masculine characteristics, especially in the area of personality,
which will increase into the future. The changing characteristics that were associated with
women included both positive characteristics and negative characteristics associated with
men. On the other hand, men were not perceived as developing greater feminine
characteristics, with no consistent view from the various samples. Men and women were
perceived as converging strongly in their masculine personality characteristics, and also to
some extent in their masculine cognitive, physical, and feminine personality characteristics.
The changes in attributes that were forecast are explained as a result of “the association of
male-dominated occupations with masculine personality characteristics and the move of
women into these occupations” (p. 1182).
Thus, Diekman and Eagly (2000) have shown that stereotypes can respond to beliefs
that the characteristics of a group are changing in a direction that leads to a reduction of
disadvantage for members of the stereotyped group. Burke (2000c) gives an example of a
positive stereotype in relation to women on boards when one male CEO comments “in well-
run corporations today women have been directors for many years. Women are selected based
on the same criteria as the men and are expected to perform the same functions as men – that
is – they are supposed to protect the interest of the shareholders” (p.184). Fondas (2000)
presented a contrasting view about women directors as a stereotyped group in commenting on
the gender bias and the power threat the women pose for groups of male directors. Although
her paper does not refer to social identity theory, Fondas argued that having women directors
on the board does not support CEO power and legitimacy within the organisation. Specifically
Fondas (2000) cited research that demonstrated that CEO domination was less likely when
there were more women directors on the boards. It appears possible that the women board

Experiences and Influences of Women Directors
Chapter 5. Stereotypes of Male and Female Directors Page 153
members become part of and strengthen the power base of the other directors, diluting the
influence of the CEO. Similarly, another study by Fondas and Sassalos (2000) reported that
the greater the number of women on the board the greater the influence the board had over
managerial decisions. However, Fondas used Catalyst (1995b) reports of the views of CEOs
to argue that women directors have a token role in enhancing the organisation’s legitimacy in
the eyes of shareholders rather than a role that reflects their membership of the board ingroup.
The present study extends the research of Cejka and Eagly (1999), and Diekman and
Eagly (2000) by applying their scales in the context of Australian board directors. Rather than
study perceptions of stereotypes amongst psychology students and members of the public, the
present study collected perceptions of occupational stereotypes from a group of current male
and female company directors.
Research on occupational stereotypes appears to be a neglected area in Australia with a
literature search revealing only one study, by Di Pietro (2000). Di Pietro studied a large
number of occupational stereotypes held by students. Di Pietro found that occupational
prestige was associated with masculine personality and cognitive attributes, and success was
associated with masculine cognitive characteristics. An important finding was that the gender
of the employee that was being rated was unrelated to ratings given for stereotype dimensions
for each occupation. Di Pietro concluded that occupational success is linked with particular
stereotypic dimensions rather than the predominant gender of the people in that occupational
grouping.
Women directors hold positions in a highly gender-segregated occupational group.
Women directors it can be argued are in a gender incongruent occupation. Social role theory
(Cejka & Eagly, 1999) suggests there would be differences between men and women as to
how the occupation would be perceived; yet, it may well be that the notions of a stereotype
have been mellowed by experience. The view that there is a stereotyped view of male or
female company directors has not, to the writer’s knowledge been a subject of research in

Experiences and Influences of Women Directors
Chapter 5. Stereotypes of Male and Female Directors Page 154
management or social psychology. The present study challenges the notion of a company
director as a stereotyped male-gender occupation. For the sample of directors in the present
study, their experience and exposure to women appeared to have led to a gender inclusive
view of the board director occupation. Presumably, this is based on interaction and social
contact with the women directors as colleagues. Using the scales of Cejka and Eagly (1999)
several hypotheses were formed.
5.1.2. Hypothesis 1 – Men and Women Directors Share the Same Stereotypes
Hypothesis 1 proposes that men and women directors will not differ significantly in
their perceptions of stereotypes of male and female directors.
The existence of salient ingroups of board directors will be demonstrated by a reduction
in salience of individual characteristics and the common identification of a stereotype of a
board director. Moreover, the identification of a common stereotype will be so salient that it
will transcend gender differences so that both men and women demonstrate a consensus on
characteristics of the stereotypes of male and female directors.
5.1.3. Hypothesis 2 – Stereotypes Differ on Physical Characteristics
Hypothesis 2 proposes that the stereotypes of male and female directors will differ
significantly on masculine and feminine physical characteristics.
Physical characteristics will not be a salient feature of the stereotype of board directors.
It is unlikely that an idealised stereotype of the physical characteristics will be relevant to
directors. It is more likely that the directors will be aware of the differing physical forms of
male and female directors, but regard differing physical forms as largely irrelevant for the
conduct of board business.
5.1.4. Hypothesis 3 – Stereotypes Have Similar Personality Characteristics
Hypothesis 3 proposes that the stereotypes of male and female directors will be similar
on masculine and feminine personality characteristics.

Experiences and Influences of Women Directors
Chapter 5. Stereotypes of Male and Female Directors Page 155
Personality characteristics will be a salient feature of the stereotype of board directors. It
is likely that the personalities of directors will be an important feature of a board director’s
characteristics. Perceived similarity of style and characteristics has been found to be important
for board selection as a board seeks to appoint people seen as similar to the majority
(Bradshaw & Wicks, 2000). The ability of board members to work constructively with each
other is likely to be regarded as much as a function of their personality as any other
characteristics. The importance of compatible personalities is likely to lead to idealised
stereotypes of acceptable (ingroup) board director personalities regardless of gender.
5.1.5. Hypothesis 4 – Stereotypes Have Similar Cognitive Characteristics
Hypothesis 4 proposes that the stereotypes of male and female directors will be similar
on masculine and feminine cognitive characteristics.
Cognitive characteristics will be a salient feature of the stereotype of board directors. It
is likely that the way board directors think will be an important indicator of their ability to
work together effectively as directors. This similarity of thinking or cognitive characteristics
is likely to be regarded as vital to acceptance as a board director and so it is likely that
idealised stereotypes of acceptable (ingroup) board director cognitive characteristics will have
been identified.
5.2. Method
5.2.1. Sample Selection
The sample was the 32 women who had been directors in 1995 and returned surveys
indicating that they were current board directors in 2001. Eight men directors also returned
surveys after being requested to participate in the research project by the women directors in
the sample. The 32 women came from an original sample of 572 women directors identified
from business listings in 1995. The researcher has no reason to believe that these women are
related or know of each other’s involvement in the research, and as such are considered an

Experiences and Influences of Women Directors
Chapter 5. Stereotypes of Male and Female Directors Page 156
independent sample. Each of the eight men directors were selected by one of the responding
women, so although some of the women knew one of the men, as a group the men are also
regarded as an independent random sample.
Of the 32 women who were current board directors, 28 completed the board director
stereotype questions. Of the eight men who returned surveys, all completed the board director
stereotype questions. However, some respondents (both women and men) did not complete all
items that were part of the survey instrument.
5.2.2. Survey Design and Measures
A gender-stereotype scale from Cejka and Eagly (1999) was used to assess stereotypes
of female and male board directors held by the women and men in the sample. Cejka and
Eagly developed a scale with 56 attributes, with each attribute assessed on a 5-point Likert-
type scale. Cejka and Eagly grouped the 56 attributes into six stereotypic dimensions – see
Table 5.1. The present study presented the set of attributes twice in the survey, once
requesting a ranking on the likelihood that the average Australian female board director would
possess each attribute, and again for the average Australian male board director.
Table 5.1 Attributes included in Gender-Stereotypic Dimensions
Dimension Attributes Masculine Physical
Athletic, Brawny, Burly, Muscular, Physically strong, Physically vigorous, Rugged, Tall
Feminine Physical
Beautiful, Cute, Dainty, Gorgeous, Petite, Pretty, Sexy, Soft voice
Masculine Personality
Adventurous, Aggressive, Competitive, Courageous, Daring, Dominant, Stands up under pressure, Unexcitable
Feminine Personality
Affectionate, Cooperative, Emotional, Forgiving, Gentle, Helpful to others, Kind, Nurturing, Outgoing, Sensitive, Sentimental, Sociable, Supportive, Sympathetic, Understanding of others, Warm in relations with others
Masculine Cognitive
Analytical, Exact, Good at abstractions, Good at problem solving, Good at reasoning, Good with numbers, Mathematical, Quantitatively skilled
Feminine Cognitive
Artistic, Creative, Expressive, Imaginative, Intuitive, Perceptive, Tasteful, Verbally skilled

Experiences and Influences of Women Directors
Chapter 5. Stereotypes of Male and Female Directors Page 157
Cejka and Eagly (1999) surveyed 144 introductory psychology students to validate their
gender-stereotype scale. Alpha coefficients calculated by Cejka and Eagly for each of the six
dimensions were satisfactorily high – see Table 5.2. Di Pietro (2000) replicated the study of
Cejka and Eagly using an Australian sample of 103 undergraduate psychology students and
found similar levels of reliability.
Cronbach alpha coefficients for the 40 respondents in the present study are also
satisfactory, ranging from a low of .79 for masculine personality to highs of .93 for feminine
personality. These coefficients are similar to those of Cejka and Eagly, and those of Di Pietro,
with lowest coefficients for masculine personality of .84 and .78 respectively, and with
highest coefficients for feminine personality of .95 and .94 respectively.
Table 5.2 Alpha Coefficients of Gender-Stereotypic Dimensions
Gender-Stereotypic Dimension
Survey Sample Masculine Physical
Feminine Physical
Masculine Personality
Feminine Personality
Masculine Cognitive
Feminine Cognitive
Cejka & Eagly (1999) .95 .90 .84 .95 .90 .85
Di Pietro (2000) .92 .92 .78 .94 .89 .84
Current study .93 .92 .79 .93 .86 .87
5.2.3. Method of Data Analysis
In comparing the women directors to the men directors, the two groups were treated as
independent samples. Although there was an association between each man and one of the
women, in that the women had chosen a man to complete the survey, the strength of this
association was considered weak enough for the assumption of independent samples. In
comparing responses between the female stereotypes and the male stereotypes for each
independent group, the two sets of responses were treated as related samples. Each respondent
gave answers to the questions regarding the female stereotype and the male stereotype on the

Experiences and Influences of Women Directors
Chapter 5. Stereotypes of Male and Female Directors Page 158
same survey, and so since on a case-by-case basis each person was the same, these responses
were clearly related.
As the measures were conducted with an ordinal Likert-type scale, the data is ordinal
and so non-parametric tests of significance were used. To test for the differences between the
independent samples of women’s and men’s perceptions of stereotypical female and male
directors the Mann-Whitney U test was used. The Wilcoxon test was used to test for the
significance of differences between related samples for female stereotypes and male
stereotypes.
Although these tests are correct for the ordinal data available, their restriction to
analysis of only one dependent variable (characteristic) increases the likelihood of introducing
a Type 2 error (rejection of the null hypothesis). To counter the risk of a Type 2 error, the
higher order test of a mixed between-within subject analysis of variance test was used to
simultaneously test responses from women and men across the female and male stereotypes.
Although this test requires interval data, the ordinal data meets most of the assumptions of the
test and previous researchers have treated the data as sufficiently reliable for higher-order
analysis (for example the analysis of Cejka and Eagly, 1999).
5.3. Results
5.3.1. Women’s and Men’s Perceptions of Stereotypical Directors
Women respondents and men respondents differed on several gender-stereotypic
dimensions of the stereotypical female director, and the stereotypical male director. Details of
differences between gender-stereotypic dimensions are shown in Table 5.3 and Table 5.4.
Men and women did not differ on their perceptions of a stereotypical female director
except for the masculine cognitive dimension. Women attributed higher masculine cognitive
attributes to the stereotypical female director than did men.

Experiences and Influences of Women Directors
Chapter 5. Stereotypes of Male and Female Directors Page 159
Table 5.3 Women’s and Men’s Perceptions of a Stereotypical Female Director
Women’s responses Men’s responses Gender-Stereotypic Dimensions of a Female Director N Mean N Mean
Significance of Differences
Masculine Physical 27 1.87 7 1.75 .415
Feminine Physical 27 2.03 6 2.08 .815
Masculine Personality 28 3.16 8 2.99 .357
Feminine Personality 27 3.11 8 2.79 .102
Masculine Cognitive 28 3.72 8 3.26 .034
Feminine Cognitive 27 3.35 8 3.27 .921
Men and women differed on their perceptions of a stereotypical male director on the
masculine cognitive dimension. Women attributed higher masculine cognitive and masculine
personality attributes to the stereotypical male director than the men. Interestingly the women
rated both the stereotypical female director and the stereotypical male director higher on
masculine cognitive attributes than did the men. Thus, the women appeared to have a higher
perception of board directors on the masculine cognitive dimension regardless of gender.
Table 5.4 Women’s and Men’s Perceptions of a Stereotypical Male Director
Women’s responses Men’s responses Gender-Stereotypic Dimensions of a Male Director N Mean N Mean
Significance of Differences
Masculine Physical 24 2.42 8 2.53 .948
Feminine Physical 25 1.48 7 1.70 .240
Masculine Personality 26 3.43 8 2.94 .061
Feminine Personality 26 2.44 8 2.70 .300
Masculine Cognitive 26 3.71 8 3.09 .031
Feminine Cognitive 26 2.66 8 3.09 .077
Men and women also differed on masculine personality, and feminine cognitive
dimensions, although the significance of the differences for these dimensions was borderline
(p < .1). Women attributed higher masculine personality to the stereotypical male director

Experiences and Influences of Women Directors
Chapter 5. Stereotypes of Male and Female Directors Page 160
than the men, and men attributed higher feminine cognitive attributes to the stereotypical male
director than the women.
Table 5.5 Statistics for the Mixed Between-Within Subject Analysis of Variance
Between-Subjects Factor Within-Subjects Factors
Gender N Stereotype Dimensions Mean Std Deviation
Women 24 Female Masculine Physical 1.96 .544 Feminine Physical 2.03 .686 Masculine Personality 3.13 .544 Feminine Personality 3.12 .453 Masculine Cognitive 3.70 .465 Feminine Cognitive 3.39 .463
Male Masculine Physical 2.42 .862 Feminine Physical 1.45 .490 Masculine Personality 3.48 .526 Feminine Personality 2.40 .567 Masculine Cognitive 3.70 .612 Feminine Cognitive 2.65 .679
Men 6 Female Masculine Physical 1.54 .281 Feminine Physical 2.08 .600 Masculine Personality 3.00 .285 Feminine Personality 2.89 .327 Masculine Cognitive 3.29 .534 Feminine Cognitive 3.44 .473
Male Masculine Physical 2.54 .445 Feminine Physical 1.65 .527 Masculine Personality 3.00 .518 Feminine Personality 2.76 .504 Masculine Cognitive 3.06 .585 Feminine Cognitive 3.19 .247
Although an analysis of individual gender-stereotypic dimensions revealed some
differences between the women respondents and the men respondents, it does indicate
whether the overall differences were significant. A mixed between-within subject analysis of
variance test was conducted to compare the differences between women and men respondents
to the gender-role stereotype items for both the female and male stereotypes. The women and
men respondents were the two independent groups studied. The ratings for the gender-role

Experiences and Influences of Women Directors
Chapter 5. Stereotypes of Male and Female Directors Page 161
stereotype items on both the female and male stereotypes were used as the within-sample
dependent variables. The means and standards deviations for the dependent variables are
presented in Table 5.5. There was no significant difference between the women and the men
respondents (F (1, 28) = .255, p = .618) on their perceptions of the stereotypical directors.
5.3.2. Differences Between Female and Male Stereotype Characteristics
Women’s perceptions of the female and male stereotypes of board directors differed on
all the gender-stereotypic dimensions except for masculine cognitive – see Table 5.6. As
might be expected, women attributed higher gender-stereotypic attributes in accordance with
the gender of the stereotype (eg. males stereotypes scored higher on masculine physical while
female stereotypes scored higher on feminine physical). The women respondents appeared to
be very gender-aware in their assessment of the stereotypes, except for the masculine
cognitive dimension.
Table 5.6 Women’s Perceptions of Female and Male Director Stereotypes
Female Stereotype Male Stereotype Gender-Stereotypic Dimensions of
Women’s Responses N Mean N Mean Significance of
Differences
Masculine Physical 27 1.87 24 2.42 .008
Feminine Physical 27 2.03 25 1.48 .000
Masculine Personality 28 3.16 26 3.43 .013
Feminine Personality 27 3.11 26 2.44 .000
Masculine Cognitive 28 3.72 26 3.71 .714
Feminine Cognitive 27 3.35 26 2.66 .000
Men’s perceptions of female and male stereotypes of board directors appeared to differ
only on the physical gender-stereotypic dimensions – see Table 5.7. As might be expected,
men attributed higher gender-stereotypic attributes in accordance with the gender of the
stereotype (i.e. males stereotypes scored higher on masculine physical while female
stereotypes scored higher on feminine physical). The men respondents only appeared to be
gender-aware in their assessment of the stereotypes on the physical dimensions.

Experiences and Influences of Women Directors
Chapter 5. Stereotypes of Male and Female Directors Page 162
Table 5.7 Men’s Perceptions of Female and Male Director Stereotypes
Female Stereotype Male Stereotype Gender-Stereotypic Dimension of
Men’s Responses N Mean N Mean Significance of
Differences
Masculine Physical 7 1.75 8 2.53 .028
Feminine Physical 6 2.08 7 1.70 .043
Masculine Personality 8 2.99 8 2.94 .573
Feminine Personality 8 2.79 8 2.70 .343
Masculine Cognitive 8 3.26 8 3.09 .478
Feminine Cognitive 8 3.27 8 3.09 .325
There appeared to be consensus between women and men that there were no significant
differences between the female and male stereotypes on the masculine cognitive dimension
despite differences or a lack of agreement on all other gender-stereotypic dimensions.
5.4. Discussion
5.4.1. Hypothesis 1 – Men and Women Directors Share the Same Stereotypes
Hypothesis 1 proposed that men and women directors would not differ significantly in
their perceptions of stereotypes of male and female directors. The hypothesis was supported.
Despite differences between the men’s and women’s perceptions on the masculine cognitive
dimension, overall the differences between the women respondents and the men respondents
were not significant.
Although we know the women are a representative sample of successful women
directors, the sample of men directors may not be representative of all men directors. The
women chose the men directors who participated in the survey, therefore the men were likely
to be sympathetic towards the women directors and more likely to hold similar perceptions of
the stereotypes. A survey of men who are representative of successful men directors,
especially those from boards without a woman director, may reveal greater differences on

Experiences and Influences of Women Directors
Chapter 5. Stereotypes of Male and Female Directors Page 163
stereotypes. However, the present result supports the notion that the men and women were
both members of the same ingroup.
There were considerable similarities between men and women directors of the
perceptions of male and female directors, except in the area of cognitive attributes. Women
company directors attributed higher masculine cognitive attributes to the stereotype of a
female director than did men. The present finding is consistent with the findings in the recent
research by Diekman and Eagly (2000). Diekman and Eagly found that when participants
directly compared stereotypes of men and women, the groups predicted similar masculine
personality and cognitive characteristics for a future time period. The researchers concluded
that there was a perceptual convergence of characteristics occurring.
Cejka and Eagly (1999) found that occupations gained prestige and status to the extent
that they were associated with masculine personality or cognitive characteristics. It is likely
that the role of corporate board director fits a perception of a professional occupation in which
masculine personality and cognitive characteristics are important. The women directors are
probably anxious to be perceived as having similar cognitive characteristics as the men and
thereby rate the female stereotype higher to match their elevated perception of the male’s
masculine cognitive abilities.
Bradshaw and Wicks (2000) argued that it is not that women lack experience,
credentials, or skills to contribute, but that they lack similarities to other board members. The
men surveyed in the present research perceived that female stereotypes were similar in most
respects except for the physical dimensions. In the present sample, which admittedly may not
be representative of all men directors, following the argument presented by Bradshaw and
Wicks, the men directors surveyed would have been quite receptive to more women directors.
5.4.2. Hypothesis 2 – Stereotypes Differ on Physical Characteristics
Hypothesis 2 proposed that the stereotypes of male and female directors would differ
significantly on masculine and feminine physical characteristics. The hypothesis was

Experiences and Influences of Women Directors
Chapter 5. Stereotypes of Male and Female Directors Page 164
supported. There were significant differences between the female stereotype and the male
stereotype on masculine physical, and feminine physical attributes for both women
respondents and men respondents.
The differences between female and male stereotypes on physical attributes were
consistent with previous research. Cejka and Eagly (1999) found that physical characteristics
were perceived as least important to occupational success, although masculine physical
attributes were found to be slightly more important in general. In the Cejka and Eagly sample,
occupational prestige lessened to the extent that gender-related physical attributes were
thought to be essential for occupational success. However, in female dominated occupations
(occupational categories where 75% or more of the incumbents were female) success was
thought to require feminine physical and feminine personality qualities. Similarly,
occupational success in male dominated occupations (occupational categories where 75% or
more of the incumbents were male) was seen as requiring masculine physical and masculine
personality qualities. However, Cejka and Eagly concluded that physical attributes were
associated with gender distribution rather than being a determinant of occupational success.
Physical attributes did not predict the attractiveness of the occupation.
The findings were consistent with an earlier Australian study by Di Pietro (2000). Di
Pietro found the masculine physical dimension was positively correlated to the proportion of
males within the occupation for most of the occupations rated. Di Pietro found that men and
women were significantly different on all gender stereotypic dimensions except for the
masculine cognitive dimension. Differences between men and women on other dimensions
were as might be expected. The average Australian woman was rated significantly higher on
feminine physical, feminine personality, and feminine cognitive dimensions, however the
average Australian man was rated significantly higher on only the masculine physical and
masculine personality dimensions. Although women received a higher rating than men for the
masculine cognitive dimension, the difference in the ratings was not significant.

Experiences and Influences of Women Directors
Chapter 5. Stereotypes of Male and Female Directors Page 165
5.4.3. Hypothesis 3 – Stereotypes Have Similar Personality Characteristics
Hypothesis 3 proposed that the stereotypes of male and female directors would be
similar on masculine and feminine personality characteristics. Responses from the men
respondents supported the hypothesis, but not the women respondents. The men did not
perceive significant differences between the female stereotype and the male stereotype on
masculine personality or feminine personality characteristics. However, the women did
perceive significant differences between the female stereotype and the male stereotype on
both masculine personality and feminine personality.
Although the men did not appear to perceive significant differences on personality
dimensions, other researchers have suggested that CEOs (usually men) are aware of the
effects of women’s personalities on board behaviour. Bradshaw, Murray, and Wolpin (1992)
reported that CEOs on boards with women directors were more likely to report “power
sharing” rather than “CEO domination.” There was also a higher likelihood of a common
board vision, strategic planning, and a greater number of board meetings. Such effects are
possibly a result of personality attributes rather than physical or cognitive attributes.
A possible explanation for the men reporting similar personality attributes while the
women did not might be social desirability. Although the instructions for the men did say the
survey was confidential and to send it back directly to the researcher, the fact that the men
were selected by their women colleagues may have influenced their answers. The men may
have given answers that they thought were complimentary to their women colleagues. The
women were apparently conscious of personality differences between male and female
directors.
5.4.4. Hypothesis 4 – Stereotypes Have Similar Cognitive Characteristics
Hypothesis 4 proposed that the stereotypes of male and female directors would be
similar on masculine and feminine cognitive characteristics. The hypothesis was partially
supported. Both women and men respondents perceived the female stereotype and the male

Experiences and Influences of Women Directors
Chapter 5. Stereotypes of Male and Female Directors Page 166
stereotype to be similar on masculine cognitive attributes. However, the women respondents
perceived significant differences between the female stereotype and the male stereotype on
feminine cognitive attributes, although men respondents did not perceive significant
differences on these attributes.
The masculine cognitive dimension was notable in that it was the single gender-
stereotypic dimension on which both the women and men agreed that there were no
differences between the female and male stereotypes. In other words, if there was a dimension
on which gender was not salient to the stereotype of a board director then it was the masculine
cognitive dimension. The likelihood that the masculine cognitive dimension is the salient
defining gender-stereotypic dimension for board directors is reinforced by the observation that
this was the only dimension on which the women and men differed on their perceptions of a
female stereotype. The women ranked the female stereotype significantly higher on the
masculine cognitive dimension than the men did, however the women also ranked the male
stereotype significantly higher on the masculine cognitive dimension compared to the men.
The finding suggests that the women perceived the masculine cognitive dimension as
particularly important, ranking both the female and male stereotypes significantly higher that
the men, but still in agreement that there were no significant differences between either
stereotype. The women appeared to have an elevated perception of the men’s cognitive
abilities and wanted to perceive their own at the same high level.
5.5. General Discussion
Overall women and men agreed in their perceptions of a stereotypical female, and also
agreed on the stereotypical male director. However, when examining their perceptions of the
differences between female and male stereotypes some interesting differences were apparent.
The women perceived significant differences between female and male stereotypes on all
dimensions except masculine cognitive, while the men perceived that the only significant
differences between female and male stereotypes were on physical dimensions. Thus, the

Experiences and Influences of Women Directors
Chapter 5. Stereotypes of Male and Female Directors Page 167
women appeared to be very conscious of the importance of parity with men on the masculine
cognitive dimension, while accepting of differences between female and male directors on all
other dimensions. The men on the other hand, were aware of the differences between female
and male directors on the physical dimensions, but did not appear to perceive significant
differences on other dimensions.
The women’s apparent focus on the masculine cognitive could be interpreted as a focus
on the content of a board director’s role and perhaps being less attentive to the relationship
(personality dimensions) perspective of a board director’s role. However, the women are
successful board directors; over the period of six years since 1995, they have increased the
number of their board directorships, have gained more board chair positions, and have gained
positions on boards of larger organisations. So it appears that the speculative arguments of
researchers such as Bradshaw and Wicks (2000) that social similarity to board directors is
more important than experience, credentials, and skills may not be valid for these women.
Demographic similarity has been found to influence work team formation (Jackson,
Stone, & Alvarez, 1992) and superior-subordinate dyads (Tsui, Egan, & O’Reilly, 1992), with
perceived and actual similarity influencing individual’s self-esteem from perceived group
membership. Tsui et al (1992) found that demographic similarity provided a basis of salient
characteristics for group membership in that people favour demographically similar
individuals. Westphal and Zajac (1995) argued that people create and affiliate with
homogeneous groups to enhance personal self-esteem and identity. That the women in the
present study perceive significant differences between the male and female stereotypes on the
personality dimensions, and both women and men directors perceive significant differences
on the physical dimensions, diminishes the apparent importance of demographic similarity for
this sample. Although there is likely to be an element of social compatibility, the personality
dimensions may be more important for obtaining an appointment to a board, but less so once
the women were established on boards.

Experiences and Influences of Women Directors
Chapter 5. Stereotypes of Male and Female Directors Page 168
Social identity theory suggests that some attributes of a role will be salient in certain
contexts while others are not. Presumably, the women perceive that retaining personality
differences from the men is more useful on the board than if they exhibited similar personality
characteristics to the men. The men also perceived that they were similar on feminine
cognitive attributes while the women did not. However, both the women and men agreed on
the masculine cognitive attributes, while women went further and elevated the masculine
cognitive attributes for both the female and male stereotypes. Such agreement between
women and men, and the emphasis by women on masculine cognitive attributes points
strongly to the relevance of masculine cognitive attributes as salient characteristics of board
directors. The salience of masculine cognitive attributes is likely to reflect in their identity as
board directors. Burke (2000c) reported that women directors attribute their success to
knowledge and skill rather than social influences.
5.6. Limitations and Future Research
The most obvious limitation of this study is an assumption that the men surveyed are
representative of all men directors. As the men were chosen by the women respondents, it is
likely that they chose men who they had sufficiently close relationships to confidently ask to
complete the survey. There is likely to be considerable bias in this sampling technique,
however the present study is only part of the larger study of women directors and was seen as
a prudent method to gain access to a sample of men directors. In addition to the likely bias in
the sample of men, the small number of men respondents (eight) was a limitation in the
statistical power of the tests. A larger sample, comparable in size to the sample of women
would have also helped the validity of comparisons.
Future research on the similarities and differences between women and men directors
should strive to obtain a representative sample of men directors, although obtaining adequate
samples is one of the major challenges to research on board directors (Hill, 1995). However,
the preceding studies in the present research program demonstrated that the present sample of

Experiences and Influences of Women Directors
Chapter 5. Stereotypes of Male and Female Directors Page 169
women is representative of successful women directors, and so the conclusions should be
sound for other successful women directors.
From comments written on the surveys, some of the respondents did not understand the
value in ranking all of the attributes. The idea that a woman might be described as “burly” or
a man as “dainty” appeared to offend some respondents. Some examples of comments written
on the surveys were “irrelevant,” “this is rubbish,” “silly,” and “stupid questions, not worthy
of an answer.” The objections to some of the descriptions manifested in some women not
answering the items on stereotypes and some men ranking only a portion of the attributes.
Although most respondents did complete the survey items, the partial completion of some
attributes might have had a negative impact on the robustness of the scale, although this is not
evident from the calculation of alpha coefficients of the scale dimensions. Di Pietro (2000)
found that the unexcitable description from the masculine personality attributes on the Cejka
and Eagly (1999) scale was an issue with her survey of psychology students. Future research
employing this scale for the types of people in this sample should elaborate on the importance
of ranking all attributes to counter likely objections to the relevance of some of the
descriptions given for the stereotype subjects.
The survey of the board director stereotypes presented 112 attributes to be ranked on a
5-point Likert-type scale for both the female and male stereotypes. For women respondents
these represented only two survey items on a 71-item survey covering other aspects of their
career as successful board directors. Response fatigue may have been a reason for some of the
women not ranking the attributes. Diekman and Eagly (2000), in an adaptation of the Cejka
and Eagly (1999) scale for a large sample of 954 participants, used only 36 of the original 56
attributes for university students, and only 24 attributes for the general public. Further
research studying stereotypes should consider a smaller more focussed survey to avoid the
possibility of respondent fatigue.

Experiences and Influences of Women Directors
Chapter 5. Stereotypes of Male and Female Directors Page 170
The broad-based gender-stereotypic scale of Cejka and Eagly (1999) may have been too
general to detect some of the more subtle differences between women and men board
directors. With only the masculine cognitive dimension emerging as the salient common
dimension of the shared stereotype, further refinement of this dimension may have value. The
apparent agreement between women and men over the shared stereotypes may have little
relevance if the overall stereotypes as presented were too simplistic. Comments from some of
the respondents regarding the relevance of the questions imply other more relevant attributes
describing the stereotypes may have been possible to construct. Further research regarding
stereotypes of board directors might consider constructing a scale more focussed on items of
relevance to board directors that might have the ability to detect more subtle differences.
5.7. Conclusion
The present study indicates that successful women board directors perceive that
masculine cognitive attributes are the salient characteristics of the ingroup of board directors.
This in contrast to the speculation of many authors who suggest that personal homogeneity to
the CEO and other board members is of the greatest importance for women to be selected as
board directors (Westphal & Milton, 2000). Of course, the women in the present study were
appointed to their first board over six years ago, so the salience of masculine cognitive
attributes will reflect their perceptions of what is currently important to their identity as board
directors. The current salience of masculine cognitive attributes does not necessarily indicate
the important factors in their transition from an outgroup of women who aspire to be board
directors to an ingroup of successful board directors.
The apparent difference between women and men over perceptions of personality
characteristics may suggest an explanation as to what helped women make the transition to
acceptance by the ingroup of successful board directors. The women in the sample perceived
that they had significant differences from the men on personality characteristics while the men
thought they were similar to the women. The women in the sample may be sufficiently adept

Experiences and Influences of Women Directors
Chapter 5. Stereotypes of Male and Female Directors Page 171
at varying personality perceptions and their associated image management so that whilst the
men perceive them as similar, in line with the speculation of authors on the need for
homogeneity to gain acceptance (Bradshaw & Wicks, 2000), the women understand the
power of using their personality differences when necessary to advantage.
Social identity theory and its treatment of stereotypes appears to be valuable in
analysing group perceptions in an area that has been of great interest to researchers but elusive
in achieving firm conclusions. The finding of this study that masculine cognitive attributes are
the salient feature of the social identity of board directors and allows women to overcome
gender differences by making this dimension salient should agree with most researchers.
However, the obtaining of empirical evidence for this conclusion is a new aspect of the
research on women board directors and a novel application of field-based research into social
identity theory.

Experiences and Influences of Women Directors
Chapter 6. Nonexecutive Director Social Identity and Influence Page 172
Chapter 6
6. NONEXECUTIVE DIRECTOR SOCIAL IDENTITY AND INFLUENCE
6.1. Introduction
Boards of directors provide a rich area for the application of social identity theory due
to the variety of potentially salient ingroups and their corresponding outgroups. The salience
of an ingroup categorisation depends on the perceptions by the ingroup members of
corresponding outgroups (Haslam, 2001). For boards of directors, some potentially salient
outgroups could be the top management, employees, shareholders, customers, competitors,
government, and the public. Each director may have a different perception of the salience of
each of these outgroups in their role as a director. For example, the CEO is likely to perceive
top management differently from nonexecutive directors, while nonexecutive directors who
are appointed by majority shareholders are likely to perceive those shareholders differently
from other directors.
On another level, the board itself will consist of several subgroups that may be salient in
different contexts. The board is typically comprised of executive directors and nonexecutive
directors, of which both groups may at times view the other as an outgroup. The board may
also have an executive committee and other committees as ingroups with other directors who
are not committee members as outgroups. Several directors may have functional or industry
expertise in common and regard other directors without that functional or industry expertise
as an outgroup (Westphal & Milton, 2000). The challenge for effective directors is to be
aware of ingroup and outgroup categorisations that are salient in any particular context, and
manage perceptions to ensure that they are part of whatever is the currently dominant ingroup.
Nonexecutive directors are pertinent for the present study, as their enduring success is likely
to be a function of their ongoing identity as a member of an ingroup of board directors.

Experiences and Influences of Women Directors
Chapter 6. Nonexecutive Director Social Identity and Influence Page 173
Many researchers have identified the importance of developmental opportunities for
potential women directors to increase their visibility and networking opportunities. Daily,
Certo, and Dalton (2000) reported that there were numerous studies to demonstrate that
women’s opportunities to be part of corporate boards were restricted because they had limited
job and development opportunities to prepare them for board appointments. In social identity
terms, such developmental opportunities would provide women with the opportunity to
demonstrate through communication style and behaviour that they can fit in with an ingroup
of board directors, sharing the values and attitudes of members of the dominant ingroup.
Haslam (2001) identified five important purposes of organisational communication that
are relevant to board interactions. Communication is used (a) to exert influence over others,
(b) to reduce uncertainty between people, (c) to obtain information on work performance, (d)
to organise and arrange group operations, and (e) to build social capital. All of these purposes
are likely to occur on a board. According to Turner (1991), the ability to achieve any of the
five possible communication outcomes is dependent on self-categorisation effects and the
existence of shared social categories. McGarty, Turner, Oakes, and Haslam (1993)
demonstrated that shared social categories are needed before a person is perceived as
legitimate to influence another’s social reality and reduce their level of uncertainty.
Leighton (2000) argued for the importance of board homogeneity based on shared social
backgrounds because homogeneity can eliminate “painful and fractious discussion, speeding
and simplifying the process of working together towards a consensus” (p. 259). In contrast,
Mattis (1997) presented a range of findings to support the value of gender diversity in
reducing inward-looking decision making and fostering a greater openness to alternative
ideas. However Burke (1994c), in supporting greater gender diversity, cautions that CEOs
expressed concern that greater diversity could result in communication difficulties and
prolong board processes. The ability of board members to function effectively is dependent on
their ability to harness strategies of social influence such as those identified by Haslam

Experiences and Influences of Women Directors
Chapter 6. Nonexecutive Director Social Identity and Influence Page 174
(2001), particularly shared social characteristics to communicate ideas, to establish and
maintain a shared purpose, and to manage social and affiliation needs.
Westphal and Milton (2000) examined whether people who were minorities on boards,
such as women, could overcome their inherent barriers to influence boards by demonstrating
salient, shared social characteristics. By pursuing strategies to diminish the board’s focus on
the director’s minority attributes, such as gender, they could become effective ingroup
members through a perception of salient shared similarities. Westphal and Milton argued that
if the majority of the directors shared a common characteristic, a director who is in a minority
could still influence the majority through successfully appealing to the majority on the basis
of that other shared characteristic. Westphal and Milton examined several potential minority
and common characteristics across a sample of directors at Fortune 500 companies to support
their proposition that minority directors could effectively influence board decision-making.
6.1.1. Identification with the Board
Abundant research proves that women directors are in the minority of most boards of
directors (e.g., Catalyst, 1993-1998; Holton, 2000; Korn/Ferry International, 1993-1999;
Singh & Vinnicombe, 2001). Yet to perceive themselves as members of an ingroup of a
board, women must overcome gender differences by making other characteristics salient. The
barriers that women face are likely to be similar to the barriers other minority groups face
(Westphal & Milton, 2000). The present study attempts to identity salient factors in women’s
social identity with the board of which she is a director, thereby offering the opportunity to
overcome the demographic factor of gender.
According to self-categorisation theory, a demographic minority may re-categorise
themselves as an ingroup member depending on the categories that are perceived to be salient
(Haslam, 2001). The categories that are perceived to be salient can change with context.
People can hold multiple social categorisations and associated social identities, and group
identities can change over time depending on the dominant characteristics (Tsui, Egan &

Experiences and Influences of Women Directors
Chapter 6. Nonexecutive Director Social Identity and Influence Page 175
O’Reilly, 1992). Social context, topic of conversation, and psychological groups have been
identified by researchers as a basis for group affiliation and categorisation (Brewer, 1991).
Shared salient characteristics build social capital between people and fulfil the need for
affiliation with similar others (Haslam, 2001). Shared characteristics enable people to
strengthen their self-identity and meet self-esteem needs. However, social identity is a
continuum between personal identity and group identity. Frequency of personal contact
heightens knowledge of, and awareness of, individual characteristics and thereby decreases
social identity with an ingroup that is based on depersonalisation of individual characteristics
(Haslam, 2001). Directors who have relationships with directors on other boards may perceive
their membership of a particular focal board as less salient than their membership of a more
general categorisation of board directors.
Hypothesis 1 proposes that social identification with a focal board will be based on
shared personal characteristics between focal board members rather than on organisational
factors such as frequency of contact with board members.
6.1.2. Perceived Ability to Contribute
What are the significant factors that give the women directors the perception that they
are able to contribute to board discussions? Although women may identify as board directors,
do they perceive themselves as effective contributors to the board or are they, as some authors
fear, tokens that may participate in board meetings but are ineffective or limited in their
contribution (Bilimoria & Piderit, 1994). Presumably, women who have a strong sense of
identity as a board member will believe they have an ability to contribute. Other directors who
perceive themselves to be on the board due to their relationships with board members may
perceive themselves as less able to contribute. The present study attempts to determine what
factors are significant in assisting successful women directors perceive that they are capable
of contributing to board discussions and strategic decision making.

Experiences and Influences of Women Directors
Chapter 6. Nonexecutive Director Social Identity and Influence Page 176
Westphal and Milton (2000) studied the effectiveness of minority groups, including
women, on board decision making. Westphal and Milton described an effective
communication strategy for minorities when presenting ideas as using a reference to shared
characteristics that they have in common with the majority of the board. By emphasizing
shared characteristics they make these attributes salient and thereby reestablish their
acceptance as a board member. For example, a minority board member might appeal to their
shared understanding of the target industry.
Bradshaw and Wicks (2000), in an interview study with women on Canadian boards,
identified one of the strategies used by women directors to gain influence was to use unique
expert knowledge and demonstrate an understanding of both the industry and the company.
One quote from a woman director interviewed was “It’s a combination of doing your
homework and being competent” (p. 202). Bilimoria and Huse (1997) also identified a
strategy used by Norwegian and American women directors as presenting as knowledgeable
experts that were accepted as part of the ingroup.
For women directors, their relationships with male directors can be complex and
potentially confusing (Bilimoria, 2000). Bilimoria suggests women are expected to provide
strategic input on women’s product and market issues. Mattis (1997) reported that CEOs in
her sample suggested that women directors’ roles include positively influencing recruitment
and retention of women in the company. Burke (1997) reported that some women are
expected to add a woman’s perspective to the board. Adams (1993, cited in Bilimoria, 2000)
suggests some men may be uncomfortable in socialising with women and may find it difficult
to communicate informally. Selby (2000) suggests that women directors need to overcome
other directors’ sense of discomfort before they can effectively contribute. Given such issues,
it would be more effective for women to appeal to shared social identity, dismissing their
gender differences, rather than to rely on personal relationships with other directors.

Experiences and Influences of Women Directors
Chapter 6. Nonexecutive Director Social Identity and Influence Page 177
Hypothesis 2 proposes that the women’s perceived ability to contribute will be based on
their social identity as board directors rather than their relationships with other board
directors.
6.1.3. Board Dynamics and Perceived Ability to Contribute
Boards of directors are organisational units in which the dynamics of the board are just
as important as the contributions of individual members (Hill, 1995). The present study
measured director effectiveness on one dimension of many possible director roles, that of
advice to the CEO. The study attempts to determine whether women directors’ behaviour is
predicated more on their identity as a board director, or from pragmatics based on the
behaviour of the board with respect to the CEO.
Board effectiveness relies on the ability of board members to make decisions on behalf
of the shareholders that will lead to growth of the company. Johnson, Daily, and Ellstrand
(1996) elaborated on the service role of directors as “… advising the CEO and top managers
on administrative and other managerial issues, as well as more actively initiating and
formulating strategy” (p. 410). Maitlis and Clegg (1998) asserted that “CEOs may need to get
information, advice or financial resources from directors in order to make decisions or take
action” (p. 4). Daily, Certo, and Dalton (2000) argued that to fulfil the service and expertise
roles directors must “serve as sounding boards and sources of advice and counsel to the
CEO” (p. 15). The frequency with which the director gives advice to the CEO then is a
valuable measure of director influence.
The basis of board decision making is the communication between the board members.
In fact, the argument against diversity on boards is that people from different backgrounds
will have difficulty communicating within the board context (Burke, 2000c; Leighton, 2000).
Haslam (2001) argued that ingroup identification leads to shared styles of communication,
ingroup codes of communication, and shared implicit meaning between ingroup members.
Haslam provided an example of the use of acronyms and abbreviations amongst group

Experiences and Influences of Women Directors
Chapter 6. Nonexecutive Director Social Identity and Influence Page 178
members, where the acronym or abbreviation may have little meaning outside of the ingroup
and can serve to highlight group status.
Bradshaw and Wicks (2000) invited women directors to describe their view of the
contributions they make to their boards. In each of the views of success presented by the
women there was a strong theme of communication effectiveness through understanding
board dynamics. Some examples of comments were: “You have to find your place to be
heard, it takes about two to three years to do that,” and “I have to fit into this environment if I
don’t want to be squashed like a moth… you know, dead. That’s the reality” (p.205).
Bradshaw and Wicks found that board success was a balance between behaving like one of
the dominant ingroup and remaining invisible so as not to disrupt communication processes
and board functioning.
Hypothesis 3 proposes that the frequency of giving advice to the CEO will be based
more on board dynamics than on women’s perceptions of their identity as board directors.
6.1.4. Significance of Gender
Many researchers have commented on the importance of diversity to boards and the
significance of gender diversity in board composition (Bilimoria & Wheeler, 1997; Mattis,
2000). Other authors (Bilimoria & Piderit, 1994; Mattis, 2000) have commented on the barrier
that gender appears to present to aspiring women directors. However, few authors (Pearce &
Zahra, 1992; Ibrahim & Angelidis, 1994) have studied the affect of a woman’s gender in
performing effectively as a board director. The present study attempts to determine the
gender-related factors that are significant to successful women board directors.
Interview studies and reports from women directors such as Selby (2000), Huse (1998),
and Burke (2000b) indicate that women directors consider their gender to be of less
importance on the board than their expertise or business background. It is argued that women
must suppress their minority characteristic to identify with the board, to perceive that they
have the ability to contribute, and to give advice to the CEO effectively.

Experiences and Influences of Women Directors
Chapter 6. Nonexecutive Director Social Identity and Influence Page 179
Hypothesis 4 proposed that gender is not a significant factor for either identification
with the board, perceived ability to contribute, or frequency of advice to the CEO.
6.2. Method
6.2.1. Sample Selection and Size
The sample for the present study consisted of 25 women nonexecutive directors who
participated in follow-up research as part of a six-year longitudinal study on women corporate
directors. The women had been board directors in the first year of the study (1995) and
confirmed that they were current nonexecutive directors on the follow-up survey in 2001.
These women are regarded as successful corporate directors who have passed the challenges
of appointment to boards and now focus on their status as effective board members.
The women in the present sample were part of an original sample of 572 Australian
women directors identified from various business listings in 1995, of which 298 agreed to
follow-up research. Six years later, 52 of the women were located and returned surveys,
although only 32 were directors in 2001. The 32 women are regarded as a sample of
successful directors as they significantly increased their number of board directorships
between 1995 and 2001, and gained significantly more board chair positions during this time.
The women were given the opportunity to report on demographic information for up to
seven boards on which they were a director. The respondents were instructed to select the
largest organisation by number of employees of which they were a director as the focal board.
Additional items were then asked regarding social identity factors and scales from Karasawa
(1991), and Westphal and Milton (2000). Of these 32 directors, 7 were executive directors on
their focal board, leaving only 25 nonexecutive directors of focal boards.
Only nonexecutive directors were included in the present study for two reasons. The
women’s identity as a board director was expected to be more salient with respect to the
dependent variables for nonexecutive directors than executive directors. Similarly, previous

Experiences and Influences of Women Directors
Chapter 6. Nonexecutive Director Social Identity and Influence Page 180
research on director contribution and influence by Westphal and Milton (2000) also focussed
on the effects of minority status with respect to outside (nonexecutive) directors. Executive
directors were expected to consider their salient role as that of a senior manager of the
organisation rather than that of board member. Executive directors were expected to be secure
in their status as members of an ingroup of board directors, while nonexecutive directors may
have some ambiguity about themselves as members of an ingroup.
6.2.2. Dependent Measures
Three separate dependent measures were identified with respect to social identity
salience and influence. The salience of social identity with the board of directors was regarded
as the foundation of the director’s effectiveness. Building on that foundation, the next level of
director effectiveness was regarded as their self-perceived ability to contribute, arising out of
their social identity as a board member. Finally, their self-reported frequency of providing the
CEO with advice on strategic issues was regarded as direct confirmation of director
effectiveness, arising from their social identity as a board director. Such dependent measures
also progressively shift the focus from the board as a salient ingroup, to focus on the woman’s
interpersonal relationships within the board, and then her individual relationship with the
CEO. Thus, we should observe a shift in salience from group identity-related factors to
interpersonal factors.
6.2.2.1. Identification with the Board Scale
To assess social identification with the board several measures of social identification
listed in Haslam (2001) were considered. Karasawa’s (1991) two-component measure was
believed to be most suitable for administration to board directors. Although Karasawa
developed the scale to examine Japanese undergraduate students’ identification with their
school, the nature and wording of the questions were readily adaptable to boards of directors.
The wording was changed for the present sample of board directors by replacing references to
“student” with “director” and “this school” with “the board.” For example, “Would you feel

Experiences and Influences of Women Directors
Chapter 6. Nonexecutive Director Social Identity and Influence Page 181
good if you were described as a typical student of this school” became “Would you feel good
if you were described as a typical director of the board”, and “How often do you refer to this
school when you introduce yourself” became “How often do you refer to the board when you
introduce yourself.”
Karasawa developed two components of the scale to differentiate between students’
identification with the school as a salient group and their identification with other students at
the interpersonal level. Similarly for board directors, it was intended to differentiate between
directors’ identification with the board as a group and their identification with other directors.
Karasawa’s two-component measure consists of a five-item “identification with group” sub-
scale and a two-item “identification with group members” sub-scale. Each item was scored in
a similar fashion to Karasawa (1991), on 7-point Likert type scales, ranging from -3 (strongly
negative) to +3 (strongly positive).
The first sub-scale, Identification with the Board, had adequate reliability with a
Cronbach’s alpha value of .77. Karasawa (1991) only reported the results of the factor
analysis in developing the scale. Cronbach’s alpha for the scale was not reported.
The second sub-scale, Identification with Board Members, was not reliable with a
Cronbach’s alpha of .16. A correlation analysis between the two items on the second sub-
scale confirmed a very low correlation (r = .09). The wording of one of the items (“Where do
most of your best friends come from, this board or not?”) was probably not appropriate for
mature directors (mean age 54 years) who would already have well-established social
networks. Most directors had been on their focal boards for a relatively short time (mean
duration 6 years) and for many directors their identity with the board would have little effect
on their friendships. For some directors, their membership of the board may have even been a
result of their pre-existing friendships rather than new friendships being a result of their board
membership.

Experiences and Influences of Women Directors
Chapter 6. Nonexecutive Director Social Identity and Influence Page 182
Correlational analysis found a significant correlation (r = .45, p = .024) between the
Identification with the Board sub-scale and the other Identification with Board Members item
(“Are there many directors of this board who have influenced your thoughts and
behaviours?”). This item had a mean score of +1 indicating that a considerable number of
directors had influenced respondents’ thoughts and behaviour. However, an attempt to add
this item to the Identification with the Board sub-scale reduced the reliability of the scale, so
the Identification with the Board sub-scale was retained as the dependent variable without
modification.
6.2.2.2. Perceived Ability to Contribute Scale
Westphal and Milton (2000) developed a minority influence scale to explore the
influence of minorities on corporate boards. The minority statuses of interest to Westphal and
Milton were functional background, industry background, educational background, race, and
most importantly for the present study, gender. For the present study with an Australian
sample, race was not considered a significant factor, however functional background, industry
background, and educational background were all considered relevant for inclusion.
Carpenter and Westphal (2001) divided the minority influence scale of Westphal and
Milton (2000) into three sub-scales: a “perceived ability to contribute” sub-scale, a “board
monitoring” sub-scale, and a “board advice interactions” sub-scale. For example, an item
from the perceived ability to contribute sub-scale is “To what extent are you capable of
contributing to board discussions on strategic issues”, an item from the board monitoring sub-
scale is “To what extent does the board monitor top management strategic decision making”,
and an item from the board advice interactions sub-scale is “To what extent does the CEO
solicit board assistance in the formulation of corporate strategy”.
Each item was scored on a 5-point Likert type scale from 1 (minimal) to 5 (maximum),
with the exception of the last item of the board monitoring sub-scale that sought a numeric

Experiences and Influences of Women Directors
Chapter 6. Nonexecutive Director Social Identity and Influence Page 183
response. Westphal and Milton (2000) reported a Cronbach’s alpha for the overall scale of
.89. However, for the present sample Cronbach’s alpha for the overall scale was only .45.
Carpenter and Westphal (2001) reported separate Cronbach’s alphas for the perceived
ability to contribute sub-scale of .88, the board monitoring sub-scale of .92, and the board
advice interactions sub-scale of .89. For the present sample the corresponding Cronbach’s
alphas were .86, .12, and .16 respectively. A correlation analysis of the items confirmed
significant correlations between the items on the perceived ability to contribute sub-scale, but
no significant correlations for the other two sub-scales – see Table 6.1.
Table 6.1 Correlations between Minority Influence Scale Items
Perceived ability
to contribute Board
monitoring Board advice
Scale Items 1 2 3 4 1 2 3 1 2
Perceived ability to contribute sub-scale
1. Capable of contribution to discussions 1.00
2. Sufficient knowledge for discussions .65** 1.00
3. Capable of adding insight to focal board .57** .67** 1.00
4. Capable of contribution to decision making .57** .49* .72** 1.00
Board monitoring sub-scale
1. Board monitors management decisions .34 .32 .28 .42* 1.00
2. Board evaluates CEO performance .48* .56** .40 .38 .21 1.00
3. Board defers to CEO judgement -.04 .01 .27 -.12 .00 -.05 1.00
Board advice interactions sub-scale
1. Board CEO solicits assistance .28 .13 .36 .03 .12 .02 .52** 1.00
2. Nonexecutive directors are a sounding board .48* .36 .31 .37 .51* .31 -.15 .14 1.00
3. Frequency of advice to the CEO .47* .43* .16 .28 .09 .32 -.19 .24 .25
* Correlation is significant at the 0.05 level. ** Correlation is significant at the 0.01 level.
For the present study, measures of the directors’ self-perceptions are the important
dependent variables rather than the board’s behaviour as represented by the board monitoring
sub-scale. The perceived ability to contribute sub-scale measures directors’ perceptions of
their ability to contribute to board discussions regarding corporate strategy. The board

Experiences and Influences of Women Directors
Chapter 6. Nonexecutive Director Social Identity and Influence Page 184
monitoring sub-scale measures the director’s perceptions of board behaviour, not of their own
behaviour. The board advice interactions sub-scale measures both the director’s perceptions
of CEO behaviour and the director’s own behaviour. The third item of the board advice
interactions sub-scale that measures the director’s activity in providing advice to the CEO was
thought to be particularly relevant. The frequency of advice to the CEO was thought to be a
useful means to gauge the outcome of the logical progression from social identity through
self-perceptions of ability to communication to actual frequency of communications.
The dependent variables chosen for the present study from the minority influence scale
of Westphal (Carpenter & Westphal, 2001; Westphal & Milton, 2000) were the perceived
ability to contribute sub-scale and the frequency of advice to the CEO item.
6.2.2.3. Correlations between Dependent Variables
Correlations were calculated between three dependent variables to confirm that they
were not measuring similar things, as evidenced by a high correlation. The proposition of the
present study was that perceived ability to contribute follows social identification with the
board, and advice to the CEO follows a perceived ability to contribute, therefore some
correlation was expected.
Table 6.2 Correlations between Dependent Variables
Dependent Variables Identification
with group Perceived ability
to contribute Frequency of
advice to the CEO
Identification with the board 1.00
Perceived ability to contribute .35 1.00
Frequency of advice to the CEO .17 .40 1.00
Note: None of the correlations were significant at the 0.05 level.
Calculation of correlations between the three dependent variables shows correlation
suggesting a relationship, but not high enough to suggest that the items should be combined as
a scale – see Table 5.2. The correlation analysis supports the proposition of a relationship

Experiences and Influences of Women Directors
Chapter 6. Nonexecutive Director Social Identity and Influence Page 185
between identification with the board, perceived ability to contribute, and frequency of advice
to the CEO.
6.2.3. Independent Measures
Numerous independent measures were taken of the director’s situation including age,
education, employment situation, background as a director, and board situation. Correlations
between independent variables that might relate to the director’s identity as a board director
are given in Table 6.3.
Table 6.3 Dependent Variable Correlations with Director Characteristics
Dependent variables
Independent variables Identification with the board
Perceived ability to contribute
Frequency of advice to the CEO
Director age .46* -.04 -.20 Highest level of education -.09 .20 -.17 Number of functional backgrounds .04 .09 .37 Employment salary -.36 -.08 .04 Total directorships .05 .38* -.22 Concurrent directorships .07 .38* -.17 Nonexecutive director boards .06 .38* -.23 Senior management years .33 .24 .02 Total directorship years .10 -.19 -.05 Concurrent directorship years -.22 -.20 .01 Nonexecutive director years -.10 -.29 -.40*
* Correlation is significant at the 0.05 level.
Numerous items were measured regarding the woman’s identity as a director of the
focal board. Items relating to number of board members (e.g. “How many other women are on
this board?”) were normalised by converting them to percentages of the total count of
directors. Items were also created to represent minority status and social identity status.
For the purposes of their study on minority directors, Westphal and Milton (2000)
defined the concept of a minority based on earlier research by Moscovici and Faucheux in
1972, and Nemeth in 1980. A minority director was defined as “an individual who has a
salient attitude, belief, or social feature, such as a demographic characteristic, that is

Experiences and Influences of Women Directors
Chapter 6. Nonexecutive Director Social Identity and Influence Page 186
possessed by less than 50 percent of the group” (p. 367). Directors may be in the minority in
one characteristic (e.g., gender), while being in the majority on other characteristics (e.g.,
industry background). Minority status was coded as a dichotomous variable. For example, on
the basic characteristic of gender the women would be in the minority if over half of the other
directors were men. Using another example, the director would be in the minority if most of
the other directors did not have a MBA but they did, or if they did not have a MBA but most
of the other directors did.
Some of the variables measuring minority status in the present sample exhibited a poor
distribution with only a few cases not in the minority. For example, few directors on the same
board went to the same university. Westphal and Milton (2000) enhanced the distribution of
the common characteristic of shared university background by using a concept of “Ivy
League” universities that is unfortunately not readily transferable to Australia. However, from
a social identity perspective, it is not whether a director is in the minority or not that matters,
it is whether the director identifies with the relevant in-group. To reinforce the salience of a
director characteristic in terms of board identity as few as one other director may be sufficient
to validate the characteristic. The status of the potential social identity salience of a
characteristic was coded as a dichotomous variable to signify if there was at least one other
similar director. For example, on the basic characteristic of gender the women might socially
identify with the board (e.g. the board accepts women) if at least one of the other directors
was a woman. Using another example, the women might socially identify if they and at least
one of the other directors had a MBA, or if they did not have a MBA and neither did at least
one of the other directors.
Correlations between independent variables relating to the director’s identity as a
director of the focal board are given in Table 6.4.

Experiences and Influences of Women Directors
Chapter 6. Nonexecutive Director Social Identity and Influence Page 187
Table 6.4 Dependent Variable Correlations with Board-Related Characteristics
Dependent variables
Independent variables Identification with the board
Perceived ability to contribute
Frequency of advice to the CEO
Focal board directors -.04 .31 -.17 Focal board directorship years .03 -.08 .15 Focal board directorship remuneration .19 .15 -.02 Focal board sells into employment industry .08 -.16 -.35 Focal board formal meeting frequency -.32 .20 -.16 Focal board director meeting frequency -.34* -.03 -.11 Executive committee member .19 .25 .08 Percentage directors predate CEO ‡ .36* -.15 .06 Percentage members on other boards † -.41* -.49** -.25 Social identity via other boards -.22 -.28 -.24 Percentage members in same industry .36* -.17 -.09 Minority industry -.23 .08 .09 Social identity via industry .12 -.36* -.21 Percentage members functional background .32 -.12 -.25 Minority functional background -.39* .07 .19 Social identity via functional background .14 -.24 -.47* Percentage members from same university .35 -.17 -.23 Minority same university -.35 .19 .30 Social identity via same university .51* .04 -.11 Percentage members university background § -.32 .06 -.27 Minority university background .26 .03 .03 Percentage members with MBA or similar -.14 -.30 -.07 Minority MBA or similar -.12 -.08 -.17 Social identity via MBA or similar .07 .36 .14
* Correlation is significant at the 0.05 level. ** Correlation is significant at the 0.01 level. ‡ Only one woman was in a minority with respect to having been appointed after the CEO. † No women shared enough boards with other members to have other than a minority status. § All women had at least one other matching director who had or had not been to university.
6.2.4. Multiple Regressions
A standard multiple regression was performed for each of the three dependent variables
of the identification with the board, perceived ability to contribute, and frequency of advice to
the CEO. When entering an independent variable into the regression analysis for which there

Experiences and Influences of Women Directors
Chapter 6. Nonexecutive Director Social Identity and Influence Page 188
was a choice of percentage, minority or social identity transformations, the variant with the
highest correlation with the dependent variable was used.
All multiple regressions were run with 95% confidence limits, although the small
sample size makes this confidence limit questionable. The sample size is discussed further in
the section on limitations. Multiple regression assumptions regarding multicollinearity,
outliers, normality, linearity, homoscedasticity, and independence of residuals were checked
using the facilities of the SPSS package. Residuals scatterplots and normal probability plots
were checked for assumptions of normality, linearity, and homoscedasticity. Mahalanobis
distances were calculated using an alpha level of .001.
6.3. Results
6.3.1. Regression 1: Identification with the Board
A standard multiple regression was performed with the identification with the board
scale as the dependent variable and other measures from the survey as the independent
variables. Some independent variables were transformed as described in the method section.
Eliminating independent variables that were non-significant contributors as coefficients
resulted in a multiple regression equation with four significant coefficients. All correlations
between variables were satisfactory at less than .7 – see Table 6.5.
Table 6.5 Correlations between Identification with the Board Regression Variables
Independent Variables Independent Variables
Dependent Variable 1 2 3 4
1. Percentage members in same industry .36* 1.00
2. Percentage members on other boards -.41* .33 1.00
3. Senior management years .33 .06 .10 1.00
4. Executive committee member .19 -.22 -.10 -.21 1.00
* Correlation is significant at the 0.05 level.

Experiences and Influences of Women Directors
Chapter 6. Nonexecutive Director Social Identity and Influence Page 189
Multiple regression assumptions regarding multicollinearity, outliers, normality,
linearity, homoscedasticity, and independence of residuals were all within acceptable limits
(Pallant, 2001; Tabachnick & Fidell, 1996). A test of collinearity returned respectable
tolerances of greater than .8 for all coefficients. A residuals scatterplot and a normal
probability plot suggested adequate normality, linearity, and homoscedasticity. No outliers
were evident, from either the residuals scatterplot or the Mahalanobis distances.
The multiple regression model provided a satisfactory result with an adjusted R Square
of .60 (adjusted R Square was reported due to the small sample size). An ANOVA of the
model also returned a satisfactory result, F (4, 20) = 8.43, p = .001. The only limitation of the
multiple regression was the sample size as discussed in the limitations section. Coefficients of
the multiple regression equation show significant contributions – see Table 6.6.
Table 6.6 Multiple Regression Coefficients for Identification with the Board
Independent measures Mean Standard Deviation
B (unstd.)
Std. Error
Beta (std.)
p (sig.)
Percentage members in same industry 24.57 24.35 .025 .006 .615 .001
Percentage members on other boards 2.48 7.54 -.081 .020 -.614 .001
Senior management years 8.00 6.52 .066 .022 .429 .009
Executive committee member 1.48 .51 .688 .290 .352 .031
6.3.2. Regression 2: Perceived Ability to Contribute
A standard multiple regression was performed with the perceived ability to contribute
scale as the dependent variable and other measures from the survey as the independent
variables. Some independent variables were transformed as described in the method section.
Eliminating independent variables that were non-significant contributors as coefficients
resulted in a multiple regression equation with five significant coefficients. All correlations
between variables were satisfactory at less than .7 – see Table 6.7.

Experiences and Influences of Women Directors
Chapter 6. Nonexecutive Director Social Identity and Influence Page 190
Table 6.7 Correlations between Perceived Ability to Contribute Variables
Independent Variables Independent Variables
Dependent Variable 1 2 3 4 5
1. Years worked with women directors -.40* 1.00
2. Percentage members on other boards -.49** -.16 1.00
3. Executive committee member .25 .21 -.10 1.00
4. Concurrent directorships .38* -.15 -.06 -.32 1.00
5. Social identity via functional background -.24 -.08 -.08 .10 -.18 1.00
* Correlation is significant at the 0.05 level. ** Correlation is significant at the 0.01 level.
Multiple regression assumptions regarding multicollinearity, outliers, normality,
linearity, homoscedasticity, and independence of residuals were all within acceptable limits
(Pallant, 2001; Tabachnick & Fidell, 1996). A test of collinearity returned satisfactory
tolerances of greater than .8 for all coefficients. A residuals scatterplot and a normal
probability plot suggested adequate normality, linearity, and homoscedasticity. No outliers
were evident, from either the residuals scatterplot or the Mahalanobis distances.
The multiple regression model provided a satisfactory result with an adjusted R Square
of .72 (adjusted R Square is reported due to the small sample size). An ANOVA of the model
also returned a satisfactory result, F (5, 19) = 10.68, p < .001. The only limitation of the
multiple regression was the sample size as discussed in the limitations section. Coefficients of
the multiple regression equation show significant contributions – see Table 6.8.
Table 6.8 Multiple Regression Coefficients for Perceived Ability to Contribute
Independent measures Mean Standard Deviation
B (unstd.)
Std. Error
Beta (std.)
p (sig.)
Years worked with women directors 6.45 5.09 -.061 .014 -.545 .001
Percentage members on other boards 2.48 7.54 -.040 .009 -.528 .001
Executive committee member 1.48 .51 .505 .147 .452 .004
Concurrent directorships 2.92 2.53 .081 .030 .357 .017
Social identity via functional background .63 .50 -.345 .145 -.299 .032

Experiences and Influences of Women Directors
Chapter 6. Nonexecutive Director Social Identity and Influence Page 191
6.3.3. Regression 3: Advice to the CEO and Director Characteristics
A standard multiple regression was performed with Frequency of Advice to the CEO as
the dependent variable and measures from the survey as the independent variables. Some
independent variables were transformed as described in the method section. Eliminating
independent variables that were non-significant contributors as coefficients resulted in a
multiple regression equation with four significant coefficients. All correlations between
variables were satisfactory at less than .7 – see Table 6.9.
Table 6.9 Correlations between Frequency of Advice to the CEO Variables
Independent Variables Independent Variables
Dependent Variable 1 2 3 4
1. Social identity via functional background -.47* 1.00
2. Nonexecutive director years -.40* -.23 1.00
3. Social identity via other boards -.24 -.08 -.11 1.00
4. Percentage members university background -.27 -.25 .21 -.12 1.00
* Correlation is significant at the 0.05 level.
Multiple regression assumptions regarding multicollinearity, outliers, normality,
linearity, homoscedasticity, and independence of residuals were all within acceptable limits
(Pallant, 2001; Tabachnick & Fidell, 1996). A test of collinearity returned satisfactory
tolerances of greater than .8 for all coefficients. A residuals scatterplot and a normal
probability plot suggested adequate normality, linearity, and homoscedasticity. No outliers
were evident, from either the residuals scatterplot or the Mahalanobis distances.
The multiple regression model provided a satisfactory result with an adjusted R Square
of .68 (adjusted R Square was reported due to the small sample size). An ANOVA of the
model also returned a satisfactory result, F (4, 18) = 10.54, p < .001. The only limitation of
the multiple regression was the sample size as discussed in the limitations section.
Coefficients of the multiple regression equation show significant contributions – see Table
6.10.

Experiences and Influences of Women Directors
Chapter 6. Nonexecutive Director Social Identity and Influence Page 192
Table 6.10 Multiple Regression Coefficients for Frequency of Advice to the CEO
Independent measures Mean Standard Deviation
B (unstd.)
Std. Error
Beta (std.)
p (sig.)
Social identity via functional background .63 .50 -8.259 1.620 -.722 .000
Nonexecutive director years 9.68 4.55 -.651 .174 -.524 .002
Social identity via other boards .12 .33 -6.894 2.324 -.404 .010
Percentage members university background 73.38 27.91 -.080 .029 -.393 .015
6.3.4. Regression 4: Advice to the CEO and Board Dynamics
A standard multiple regression was performed with frequency of advice to the CEO as
the dependent variable and adding focal board behaviour items as well as measures from the
survey as the independent variables. Some independent variables were transformed as
described in the method section. Eliminating independent variables that were non-significant
contributors as coefficients resulted in a multiple regression equation with three significant
coefficients. All correlations between variables were satisfactory at less than .7 – see Table
6.11.
Table 6.11 Correlations between Frequency of Advice to the CEO Variables
Independent Variables Independent Variables
Dependent Variable 1 2 3
1. Focal board defers to CEO judgement -.19 1.00
2. Focal board CEO solicits assistance .24 .52** 1.00
3. Number of functional backgrounds .37 .13 -.02 1.00
** Correlation is significant at the 0.01 level.
Multiple regression assumptions regarding multicollinearity, outliers, normality,
linearity, homoscedasticity, and independence of residuals were all within acceptable limits
(Pallant, 2001; Tabachnick & Fidell, 1996). A test of collinearity returned satisfactory
tolerances of greater than .7 for all coefficients. A residuals scatterplot and a normal

Experiences and Influences of Women Directors
Chapter 6. Nonexecutive Director Social Identity and Influence Page 193
probability plot suggested adequate normality, linearity, and homoscedasticity. No outliers
were evident, from either the residuals scatterplot or the Mahalanobis distances.
The multiple regression model provided a satisfactory result with an adjusted R Square
of .28 (adjusted R Square was reported due to the small sample size). An ANOVA of the
model also returned a satisfactory result, F (3, 20) = 3.57, p < .036. The only limitation of the
multiple regression was the sample size as discussed in the limitations section. Coefficients of
the multiple regression equation show significant contributions – see Table 6.12.
Table 6.12 Multiple Regression Coefficients for Frequency of Advice to the CEO
Independent measures Mean Standard Deviation
B (unstd.)
Std. Error
Beta (std.)
p (sig.)
Focal board defers to CEO judgement 3.28 .89 -3.287 1.430 -.517 .034
Focal board CEO solicits assistance 4.24 .66 4.404 1.903 .516 .033
Number of functional backgrounds 1.92 1.67 1.510 .655 .444 .034
6.3.5. Regressions 5-7: Significance of Gender
Noting that regressions 1 through 4 above failed to identify a regression equation with a
significant coefficient related to gender, further exploratory regressions were conducted to
attempt to identify any significant gender-related items that could explain the variance in the
dependent variables. A correlation analysis of the gender-related independent variables
against the dependent variables revealed only one significant correlation – see Table 6.13.
None of the regressions for the dependent variables of identification with the board,
perceived ability to contribute, or frequency of advice to the CEO produced an equation with
a significant gender-related coefficient. Eliminating least significant coefficients continued
until only the constant remained (R = 0) in all three regressions against the dependent
variables.

Experiences and Influences of Women Directors
Chapter 6. Nonexecutive Director Social Identity and Influence Page 194
Table 6.13 Dependent Variable Correlations with Gender-Related Variables
Dependent variables
Independent variables Identification with the board
Perceived ability to contribute
Frequency of advice to the CEO
Employment CEO gender -.04 .07 .01
Managerial gender proportion -.28 .11 .08
Work colleagues gender proportion -.15 .17 .02
Years worked with women managers .13 -.18 .19
Years worked with women directors .31 -.40* .05
Focal board gender proportion -.08 -.04 -.29
Focal board CEO gender .13 -.19 .15
Focal board chair gender .19 .16 -.11
Focal board women members .00 .13 .16
Percentage women members .01 -.22 .14
Minority women members -.11 -.03 -.01
Social identity via women members .23 .01 .26
* Correlation is significant at the 0.05 level.
6.4. Discussion
6.4.1. Identification with the Board
Hypothesis 1 proposed that social identification with a focal board would be based on
shared personal characteristics between focal board members rather than on organisational
factors such as frequency of contact with board members. The hypothesis was supported as
two of the three positive factors (percentage members in same industry, senior management
years) represented shared personal characteristics. The negative factor (percentage members
on other boards) represented additional contact with other board members rather than a
personal characteristic.
The four factors that emerged from the multiple regression as predictors of the women’s
identification with the board explained 60% of the variability in Karasawa’s (1991)
identification with group sub-scale. Other factors showed significant correlation but they did
not contribute significantly to the regression. As the present sample was smaller than

Experiences and Influences of Women Directors
Chapter 6. Nonexecutive Director Social Identity and Influence Page 195
recommended for multiple regression, some of these other factors might prove to be
significant contributors to the regression in a larger sample.
6.4.1.1. Percentage Members in Same Industry
The percentage of board members that worked in the same industry as the woman
contributed most to the regression with a beta coefficient of .615. Being from the same
industry provides a shared social identity with other directors. The more that board members
are from the same industry, the more that the woman may identify with the board as a subset
of industry members. Thus, a shared identity with one group (industry members) could give
rise to another shared identity (the board).
Westphal and Milton (2000) quoted Spender as coining the term “industry recipes” in
1989 for the tendency of managers from the same industry to have shared beliefs and
strategies. Haslam (2001) argued that shared social identity is reflected in communication
content and style. Communication is one means through which people can demonstrate their
ingroup status compared with outgroup members. Westphal and Milton cited research that
demonstrates that shared social identity based on industry can have other consequences in
terms of evaluating decisions about acquisitions, shared perceptions of environmental threat,
and the evaluation of performance criteria. Such findings point to the challenges facing
women directors whose industry background is outside that of other board members. On the
other hand, the social identity explanation of industry background as a potentially salient
characteristic supports the findings of Mattis (2000). In an interview study of CEOs that
responded to Catalyst’s 1995 survey, Mattis indicated that the business background sought for
board appointments was “industrial experience in a top-drawer manufacturing company with
a global presence” and “significant general management experience” (p.49).
6.4.1.2. Percentage Members on Other Boards
The percentage of board members that were on other boards with the woman
contributed an almost identical amount to the regression as percentage of board members that

Experiences and Influences of Women Directors
Chapter 6. Nonexecutive Director Social Identity and Influence Page 196
worked in the same industry, but with a negative beta coefficient of -.614. However, as this is
a negative contribution the converse argument applies: the fewer board members that were on
other boards with the woman, the greater the woman’s identification with the focal board.
This may be related to the effect that Karasawa (1991) sought to distinguish that of
identification with a group member as opposed to the group itself. Identification with the
board is a demonstration of social identity, however identification with a board member is a
demonstration of interpersonal relationships. As social identity is a continuum between
interpersonal identity and group identity (Haslam, 2001), it can be expected that an increase in
relationships with other board members will reduce the salience of the woman’s identification
with the board.
6.4.1.3. Senior Management Years
The number of years the woman spent in a senior management position before
accepting a board directorship contributed significantly to identification with the board, with a
beta coefficient of .429. Presumably, other board members have a spent a considerable
amount of time in a senior management position and this gives the woman a shared sense of
identity from which to form her identity as a board member. Leighton (2000) argued that it is
a circumstance of labour market history that there are few women directors, pointing to the
demographics of women’s participation in the labour force and their attainment of higher
degrees. Leighton argued that age and experience are critical factors for board work, and that
there are few women who have the age and experience for the role. The relatively few women
who do have the experience may be aware of this as a relatively unique asset that assists them
identify with the category of board director.
6.4.1.4. Executive Committee Member
Being a member of the board’s executive committee contributed significantly to
identification with the board, with a beta coefficient of .352. Bilimoria and Piderit (1994), in a
study of U.S. women directors, found that women were more likely to serve on the less

Experiences and Influences of Women Directors
Chapter 6. Nonexecutive Director Social Identity and Influence Page 197
central subcommittees of the board such as public affairs and were unlikely to be on central
committees such as the executive committee. Being a member of the inner sanctum of the
executive board is likely to contribute to a heightened sense of identity with the board.
6.4.1.5. Other Factors
Other factors that had a significant correlation but did not emerge as significant
contributors to the present regression were:
• Director age – presumably other directors on the board are of a similar age. Age has been
found to be a significant influence in previous research (Holton, 2000; Leighton, 2000; Pynes,
2000)
• Focal board director meeting frequency – with a negative correlation, the less the women
meet other directors, the greater their identity with the board. Frequent meetings with
directors are likely to increase the salience of interpersonal relationships and thereby reduce
the salience of the social identity of the board.
• Percentage board directors predate CEO – if the woman forms one of several of an “old
guard” of directors who predate the CEO’s appointment, her identification with the board is
likely to be enhanced. Westphal and Zajac (1995) conducted a study of director appointments
that found that when CEOs are influential they appoint people who are demographically
similar to them. The demographic similarity of a group of directors appointed by the same
CEO is likely to heighten social identification with the board. If the CEO is a relative
newcomer then the salience of the directors’ identity with the board may be increased, with
the new CEO and possibly new top management as a new threatening intra-board outgroup.
• Minority functional background – with a negative correlation, this suggests the women do
not want to be in the minority with respect to their functional background (the percentage of
members sharing a functional background with the woman showed a positive, although not
significant, correlation). A majority of directors with a similar functional background shared
with the woman is likely to heighten her social identification with the board.

Experiences and Influences of Women Directors
Chapter 6. Nonexecutive Director Social Identity and Influence Page 198
• Social identity via same university – if the woman shared a university with at least one
other director then her sense of identification with the board was increased. Westphal and
Milton (2000) also identified shared university institutions, particularly “Ivy League”
universities, as a salient characteristic for board identification.
From the results of the multiple regression, it appeared that the women have a greater
sense of social identity with the board when they share some personal attributes with other
directors such as industry or length of senior management experience. Significant correlations
on other personal attributes such as age, time of appointment with respect to the CEO,
functional background, and having attended the same university supported the above
hypothesis. The converse is that contact with other directors that is on the basis of
relationship-related attributes, such as meeting directors on other boards, and including
significant correlations, frequency of meeting directors, decreases their sense of identity with
the board. Nevertheless, being an executive committee member also clearly facilitates board
identification.
6.4.2. Perceived Ability to Contribute
Hypothesis 2 proposed that the women’s perceived ability to contribute would be based
on their social identity as board directors rather than their relationships with other board
directors. The hypothesis was supported as one of the positive factors (concurrent board
directorships) represent social identity as a board director, and the two of the negative factors
(years worked with women directors, percentage members on other boards) represent
relationships with other board directors.
The five factors that emerged as predictors of the women’s perceived ability to
contribute explained 72% of the variability in Westphal’s (Carpenter & Westphal, 2001;
Westphal & Milton, 2000) perceived ability to contribute sub-scale. Several other factors
demonstrated significant correlation but they did not contribute significantly to the regression.

Experiences and Influences of Women Directors
Chapter 6. Nonexecutive Director Social Identity and Influence Page 199
As the present sample was smaller than recommended for multiple regression, some of these
other factors might prove to be significant contributors to the regression in a larger sample.
6.4.2.1. Years Worked With Women Directors
The number of years that the women had worked with other women directors
contributed most to the regression, with a beta coefficient of -.545. However, this is a negative
contribution so the length of time that women worked with other women directors decreased
their perceived ability to contribute. From studies by Bilimoria and Huse (1997), and
Bradshaw and Wicks (2000), it appears that women value highly a position as a unique
knowledgeable expert. However, a lengthy amount of time working with other women
directors may diminish their perception of themselves as having a unique ability to contribute.
6.4.2.2. Percentage Members on Other Boards
The percentage of board members that were on other boards with the woman
contributed a similar amount to the regression as working with other women directors, with a
beta coefficient of -.528. As this was a negative contribution, it also suggested that the fewer
the number of board members that were on other boards with the woman, the greater her
perceived ability to contribute. The women’s perception of having a unique ability to
contribute may be reduced by sharing other boards with directors on the focal board.
6.4.2.3. Executive Committee Member
The woman’s status as an executive committee member made a positive contribution to
the regression, with a beta coefficient of .452. Clearly, being a member of the executive
committee increases the woman’s perceived ability to contribute. Being a member of the
executive committee is a special position accorded to relatively few board directors and is
likely to increase the woman’s perception of making a special contribution.

Experiences and Influences of Women Directors
Chapter 6. Nonexecutive Director Social Identity and Influence Page 200
6.4.2.4. Concurrent Directorships
The number of concurrent board directorships that the women held made a positive
contribution to the regression, with a beta coefficient of .357. Note that the positive effect of
multiple board memberships is in contradiction to the negative effect of sharing boards with
other members. The women’s perceived ability to contribute is enhanced by being a director
on other boards that she does not share with members on the focal board. Being on several
boards concurrently is likely to increase the woman’s perception of being able to make a
special contribution to the board. If those other boards are not shared with other women
directors then the woman is likely to perceive her contribution as unique.
6.4.2.5. Social Identity via Functional Background
The existence of at least one other board member with the same functional background
made a negative contribution to the regression, with a beta coefficient of -.299. This suggests
that the women find having someone else of the same functional background on the board
decreases their perceived ability to contribute. The woman’s perception of having a unique
contribution to make to the board is likely to decrease if her functional background is
common with another board member.
6.4.2.6. Other Factors
Other factors with a significant correlation that did not emerge as contributors to the
present regression were:
• Total board directorships (and nonexecutive director boards) – the more boards the
woman was on, the more her perceived ability to contribute. These factors are similar to the
factor in the regression of the number of concurrent board directorships that the woman held.
• Social identity via industry – similar to the existence of at least one other board member
with the same functional background, the existence of at least one other board member with
the same industry background also decreased the woman’s perceived ability to contribute.

Experiences and Influences of Women Directors
Chapter 6. Nonexecutive Director Social Identity and Influence Page 201
From the multiple regression results, it appeared that the women have a greater
perceived ability to contribute when they operate as “loners”, without sharing other boards or
functional backgrounds with other directors, or even having worked for a lengthy time with
other women directors. This generalisation was further supported by a significant negative
correlation on the existence of other members with the same industry background. Enhancing
the women’s perceived ability to contribute is the number of their board directorships,
whether counted as concurrent, total or nonexecutive director board memberships. Being an
executive committee member also clearly facilitated a perceived ability to contribute.
6.4.3. Frequency of Advice to the CEO
Hypothesis 3 proposed that the frequency of giving advice to the CEO would be based
more on board dynamics than on women’s perceptions of their identity as board directors.
A regression performed with social identity related factors resulted in four factors
emerging as predictors of the frequency of giving advice to the CEO. These factors explained
68% of the variability in the frequency of giving advice to the CEO as per Westphal’s
(Carpenter & Westphal, 2001; Westphal & Milton, 2000) frequency of advice to the CEO
item. No other factors showed significant correlation, however as the all the coefficients were
negative and the hypothesis suggests board dynamics will be more relevant than social
identity a further regression was performed with measures of board behaviour-related factors.
The second regression resulted in three factors that explained only 28% of the variability in
the frequency of giving advice to the CEO item, however for this regression two of the
coefficients were positive.
6.4.3.1. Social Identity via Functional Background
The existence of at least one other board member with the same functional background
made a negative contribution to the social identity-related regression, with a beta coefficient
of -.722. Similar to the reduction in the perceived ability to contribute scale, the existence of
at least one other board member with the same functional background reduced the number of

Experiences and Influences of Women Directors
Chapter 6. Nonexecutive Director Social Identity and Influence Page 202
times that the woman advised the CEO. Some authors (Bilimoria & Huse, 1997; Bradshaw &
Wicks, 2000) have reported that women directors believe their expert knowledge is one of
their most valuable assets to bring to the board. The existence of another board member with
similar functional expertise may reduce their inclination to advise the CEO on strategic
matters.
6.4.3.2. Nonexecutive Director Years
The number of years that the woman had been a nonexecutive director made a negative
contribution to the social identity-related regression, with a beta coefficient of -.524. This is
an interesting result, that the greater the number of years that the woman had been a
nonexecutive director, the less frequent their advice to the CEO. Unlike age, which had a
positive correlation with board identity, and number of boards including nonexecutive
directorships, which had a positive correlation with perceived ability to contribute, the
number of years that the woman had been a nonexecutive director was a negative factor.
6.4.3.3. Social Identity via Other Boards
The existence of board members that were on other boards with the woman made a
negative contribution to the social identity-related regression, with a beta coefficient of -.404.
This is similar to identification with the board and perceived ability to contribute, where the
percentage of board members that were on other boards with the woman had a negative effect.
6.4.3.4. Percentage Members with University Background
The percentage of board members that had been to university made a negative
contribution to the social identity-related regression, with a beta coefficient of -.393. The
more board members that had been to university the less the frequency of the woman’s advice
to the CEO. The fewer board members that had been to university the more women perceived
that they had valuable advice for the CEO (88% of the women directors had been to
university).

Experiences and Influences of Women Directors
Chapter 6. Nonexecutive Director Social Identity and Influence Page 203
6.4.3.5. Focal Board Defers to CEO Judgement
The factor for how much the focal board defers to the CEO’s judgement on final
strategic decisions made a negative contribution to the board behaviour-related regression,
with a beta coefficient of -.517. The more that board members deferred to the CEO the less
that the women directors give advice to the CEO.
6.4.3.6. Focal Board CEO Solicits Assistance
The factor for how much the CEO solicits assistance from the focal board in the
formulation of corporate strategy contributed an almost identical amount to the board
behaviour-related regression as the factor for the focal board deferring to the CEO’s
judgement, but with a positive beta coefficient of .516. The more that the CEO solicits
assistance from the focal board the more that the women directors give advice to the CEO.
6.4.3.7. Number of Functional Backgrounds
A count of the directors’ different functional backgrounds made a positive contribution
to the board behaviour-related regression, with a beta coefficient of .444. Having a broad base
of functional expertise on which to draw increased the frequency with which the woman gave
advice to the CEO on final strategic decisions.
6.4.3.8. Other Factors
No other significant factors were found for the frequency of advice to the CEO item.
The factor with the next highest correlation was the perceived ability to contribute scale
(r = .40, p = .069). The director’s perceived ability to contribute was positively correlated to
frequency with which they gave advice to the CEO, although it did not emerge as a significant
contributor in either regression.
6.4.4. Significance of Gender
Hypothesis 4 proposed that gender is not a significant factor for either identification
with the board, perceived ability to contribute, or frequency of advice to the CEO. The

Experiences and Influences of Women Directors
Chapter 6. Nonexecutive Director Social Identity and Influence Page 204
hypothesis was supported in that only one regression had a significant gender-related
coefficient and an attempt to find other significant gender-related coefficients failed. The sole
gender-related factor in the perceived ability to contribute regression, years worked with
women directors, may not have been significant because of its relationship to gender. The
years worked with women directors is an interpersonal-relationship factor that may have
represented a more general factor for years worked with directors, including male directors,
that was not measured. The years worked with women directors was a negative contribution
to the regression, similar to the other negative interpersonal-relationship contribution factor of
the percentage of members that were also on other boards with the director. The similarity of
these two factors in the regression suggests that it is the interpersonal-relationship nature of
the years worked with women directors factor rather than its relationship to gender that was
salient.
Mattis (2000) demonstrated through her study of CEO views that once a woman is
appointed to the board her gender ceased to be a salient characteristic. The majority of CEOs
in her sample did not expect the contributions of the directors to differ because of gender.
Either the CEOs studied by Mattis were extremely enlightened or the women directors they
appointed were successful in making sure that gender was not perceived as a salient
difference from other directors. Burke (2000b) suggested that women on boards try to change
the focus to be on their competence on the board rather than gender.
6.5. General Discussion
Overall, the results demonstrate the relevance of social identity theory for consideration
of women nonexecutive directors’ identity with the board and their perceived ability to
contribute to board discussions on strategic issues. Social identity theory provided an
adequate explanation for the women directors’ perceptions of themselves. The women’s
actual behaviour in terms of their frequency of advising the CEO demonstrated a pragmatic
awareness of the board dynamics, particularly with the receptiveness or otherwise of the CEO

Experiences and Influences of Women Directors
Chapter 6. Nonexecutive Director Social Identity and Influence Page 205
to advice from the board. Prior research has not addressed in a systematic way the issues
associated with board dynamics for women directors, although a few studies touch on specific
aspects. For example, Across the Board (1994) reported that male directors were more careful
about what they said or did when women were present and found that women enhanced
discussion through their interpersonal skills. Rosener (1990) suggested that women provided
an alternative transformational model of leadership.
An unanticipated finding was the high correlation between focal board CEO gender and
best friends come from focal board (r = .52, p = .008). The high correlation suggests that the
women directors were more likely to have their best friends on the board if the CEO was a
woman. Was one of these best friends the CEO? The present survey did not have a response
category for the director to indicate that they might have gained membership of the board via
invitation from the CEO (it had a response for invitation by the Chair). There was no
significant correlation between focal board chair gender and best friends come from focal
board.
The findings of the present study appear to contradict those of Westphal and Milton
(2000) on director inter-board networking. Westphal and Milton found that “minority
directors are more influential if they have direct or indirect social network ties to majority
directors through common memberships on other boards” (p. 366). However, Westphal and
Milton did not limit themselves to women as minorities and included race, educational
background, functional background, and industry background as minority categories. By
including several other minority categories Westphal and Milton gathered an impressively
large sample (526 directors), but women only appeared to have made up 11% of the sample.
However, Westphal and Milton did find a positive effect for the influence of gender-based
minorities as the number of common board memberships with other, majority directors
increased. The present study did not differentiate whether the other directors with whom the
women shared a common board membership were in the majority or not on the focal board.

Experiences and Influences of Women Directors
Chapter 6. Nonexecutive Director Social Identity and Influence Page 206
6.6. Limitations and Future Research
The present research offers some fascinating insights into factors affecting women
directors’ social identity with their boards, their perceived ability to contribute and their
frequency of contributing advice to CEOs. However, a concern is the small sample upon
which the analyses have been performed. Further research that conducts a similar line of
inquiry with a larger sample would be invaluable.
Having only 25 women in the sample presented a limitation for powerful statistical
analyses such as multiple regression. Stevens (1996) recommended about 15 subjects per
predictor. Tabachnick and Fidell (1996) suggested a simple rule of at least 50 cases, and a
more complex indicator that under ideal circumstances with large effect sizes would allow as
few as 23 cases. The current sample is unlikely to conform to the ideal assumptions of lack of
skew in dependent variables, large effect sizes, and low measurement error from reliable
variables, so results derived from the statistical analyses must be regarded as tentative.
However, as it was believed to be innovative research never before performed on such a
group, the results of such statistical analyses were expected to be informative, if not
definitive.
Karasawa (1991) was concerned to distinguish between identification with the group
and identification with group members. Corporate boards also should be very concerned to
ensure that their directors identify with the board and the organisation it governs. Corporate
boards should guard against directors who identify more with other directors than the board
itself or the organisation. Having directors who identify with the other directors may be
conducive to harmonious working relationships, but that may not result in the best decisions
for the board’s corporation. Reliable measures to distinguish between identification with the
board and identification with other board members are likely to be invaluable.
The difference in findings between the present study and that of Westphal and Milton
(2000) regarding the effect of common board memberships between directors should be

Experiences and Influences of Women Directors
Chapter 6. Nonexecutive Director Social Identity and Influence Page 207
investigated further. If the director’s identity with other directors was salient then common
board memberships are likely to have a positive effect. However, if the director’s identity
with the board as a whole is salient then common board memberships between individual
directors may be counter productive as the present study suggests. As Westphal and Milton
comment, the appointment of directors who lack social ties with existing board members
could have implications for practices regarding director selection and board processes (p.
393). Clarification of the effect of common board memberships and/or social ties with
existing board members, at least in Australia, should have a bearing on corporate governance
policy.
Some of the effects described in the present survey may not be peculiar to women.
Further research should also examine these effects for male directors, attempting to detect
whether the male directors may be in a minority category. A comparison between male and
female directors on the effects described in the present survey would have added greatly to the
understanding of whether these were general effects or effects that are specific to women.
The somewhat arbitrary definition by the present survey of the focal board as the largest
board by number of the organisation’s employees may not have been optimal. Respondents’
identity with a board may vary with other factors than that of the largest organisation.
Providing some means by which the respondent can nominate the board with which they have
the greatest identification may provide improved results.
All surveys were self-administered, so responses may not be completely accurate.
Substantial scope for errors and self-report bias exists in evaluating topics that may carry
emotional content for some of the respondents, and with respondents who may not put the
time and care into their responses that respondents with less time-pressure may provide.
Westphal and Milton (2000) identified the limited coverage of likely director influence
tactics as a weakness of their study. Similarly, the present study is limited in its coverage of
likely factors in women’s identification as a board director, their perceptions of ability, and

Experiences and Influences of Women Directors
Chapter 6. Nonexecutive Director Social Identity and Influence Page 208
their behaviour as a board director. The present study and future studies will hopefully add to
an understanding of board directors and board dynamics to assist more effective
investigations of this elusive group.
6.7. Conclusion
The hypotheses predicated on social identity theory appear to be well supported.
Women directors’ identification with the board was a factor of shared personal characteristics
such as working in the same industry, having the same functional background, or having gone
to the same university as other directors. These characteristics are likely indicators of shared
group identities that support the sublimation of individual characteristics and allow the
director to perceive the board as a salient group. On the other hand, the negative factors in the
women’s identification with the board such as contact with individuals on other common
boards and frequency of contact with directors generally would raise the salience of the other
directors as individuals, thereby reducing the salience of the board as an ingroup.
However, social identity is a between-groups phenomenon that describes attitudes and
likely interactions between an ingroup and salient outgroups. When salience is shifted from
inter-group relationships to intra-group relationships, we expect different factors to become
salient. The other analyses in the present study that focus on perceived ability to contribute
and frequency of advice to the CEO can be interpreted as shifting the salience from the group
as a whole to focus on the director’s likely interactions with the group, and then the director’s
interactions with the CEO respectively. Thus, we see a shift away from the factors that were
salient for the director’s identification with the board. With the director’s perceived ability to
contribute, the existence of other directors with the same industry or functional background
now becomes a negative factor, and the positive factor of the number of directorships is
related to the woman’s identity as a director generally, not specifically as a director of the
focal board. With the director’s frequency of advice to the CEO, all of the social identity-
related factors are negative, and the positive factors are the interpersonal factors to what

Experiences and Influences of Women Directors
Chapter 6. Nonexecutive Director Social Identity and Influence Page 209
extent the CEO solicits assistance and how secure the director feels with a broad base of
numerous functional backgrounds to work from.
Membership of the executive committee is unsurprisingly a positive factor in both the
women’s identity with the board and her perceived ability to contribute. Membership of the
ingroup of the executive committee is an example of meta-categorisation at work, whereby
membership of a salient sub-group (the executive committee) will reinforce the salience of
membership of the higher order group (the board as a whole). However, for the strongly
interpersonal measure of frequency of advice to the CEO, even membership of the executive
committee was not a significant factor.
That only one gender-related factor emerged in any of the analyses, and that factor may
have been more related to interpersonal relationships than gender, reinforces the notion that
successful women directors have avoided their gender being a salient characteristic during
board discussions. The finding that gender-related factors do not appear to be significant also
accords with social identity theory which would immediately place the woman in an outgroup
on a typically male-dominated board.

Experiences and Influences of Women Directors
Chapter 7. Summary and Conclusions Page 210
Chapter 7
7. SUMMARY AND CONCLUSIONS
7.1. Introduction
Boards of directors are a unique group for a psychological study. Corporate boards are
the pinnacle of a corporation with no clear superior and must determine business purposes for
the corporation below (Mattis, 1997; Sheridan, 2001). The amount of contact board members
have with each other between board meetings will vary markedly, with executive directors
meeting daily and nonexecutive directors meeting much less frequently, typically monthly or
less. Corporate board intragroup ingroup and outgroup dynamics are likely to be complex and
transient, with intragroup cohesiveness and intergroup (other board) dynamics likely to be
low. In addition to the challenges posed by the unique nature of corporate boards, the study of
women in board director positions also requires special attention as described by Fagenson
(1990a) with her proposal for a gender-organisation-system approach.
A review of available research on women directors found that while many researchers
contributed to the debate regarding the low representation of women directors on boards and
the value that women might contribute to boards, many articles were based on secondary data.
Of those studies based on primary data, most had proceeded without the grounding of a
theoretical framework. Previous research results had often been analysed with limited non-
parametric statistical techniques. Burke and Mattis (2000) stressed the importance for future
research of developing a theoretical framework for the analysis of gender diversity on
corporate boards.
Several theoretical frameworks were considered for the present research program: the
Similarity-Attraction paradigm (Byrne, 1971), Social Contact theory (Blau, 1977; Kanter,
1977), Group Competition perspective (Blalock, 1967), Relative Deprivation (Crosby, 1982),
and Social Identity theory (Haslam, 2001; Turner, 1991). Against the challenging demands of

Experiences and Influences of Women Directors
Chapter 7. Summary and Conclusions Page 211
corporate board dynamics, social identity theory was thought most appropriate, with its
concept of multiple possible ingroups whose salience is on a continuum between purely
interpersonal and purely group-oriented corresponding to the approach described by Fagenson
(1990a). Other theories were considered too simplistic for the complexities under study. Both
similarity attraction theory and group competition theory offer little for modelling complex
group interactions (Tolbert, Graham & Andrews, 1999). Social contact theory neglects the
impact of social prestige and status, considered integral to boards with the CEO and Chair and
the likelihood that some nonexecutive directors will represent the interests of owners or
majority shareholders. Relative deprivation theory contradicts observations of male director’s
presumed low level of internal satisfaction regarding women and lacks support for analysing
gender-related group dynamics. Tolbert et al (1999) also found that social identity was
superior as it provided explanations most consistent with previous empirical findings.
An understanding of the functions of corporate boards, the roles of directors, the
composition of typical boards, and previous research calling for greater diversity on boards
through the acceptance of women directors, were an integral part the research program. The
distinction between executive directors (also called inside directors) and nonexecutive
directors (also called outside directors) was examined. The characteristics of these two types
of directors were sufficiently different to constitute two distinct groups within a typical board.
In Australia, women are usually nonexecutive directors and are typically in the minority on
boards (Korn/Ferry International, 1999).
The research program consisted of five studies. The first was to detail the characteristics
of Australian women board directors and validate their profile against the available literature.
The next study was to confirm that nonexecutive directors were indeed a distinct group from
executive directors. A follow-up study on directors after an interval of several years identified
those successful women directors and their characteristics. A study analysing stereotypical
perceptions of male and female directors determined the likely salience of male/female group

Experiences and Influences of Women Directors
Chapter 7. Summary and Conclusions Page 212
attitudes. Finally, a study confirmed significant factors in the directors’ identification with the
board, their perceived ability to contribute, and their behaviour with respect to the CEO along
an interpersonal to group-oriented continuum.
7.2. Study 1: Characteristics of Australian Women Board Directors
A study of the characteristics of Australian women board directors was important from
at least two viewpoints. Surveys of the characteristics of Australian women directors have
relied on relatively small populations of fewer than 50 directors (Korn/Ferry International,
1999; Sheridan, 2001). Comparisons of the characteristics of Australian women directors and
reported characteristics of women directors from other countries should help understand the
general applicability of the current research program.
Unlike the U.S., where large populations of women directors and board positions are
regularly monitored (Mattis, 2000), Australian women directors have received comparatively
little attention. Korn/Ferry International invites Australian organisations to participate in
regular surveys, but must rely on relatively low numbers of participants. For example, in their
1998 sample, Korn/Ferry International (1999) surveyed 82 organisations, of which there
appeared to be about 30 women holding approximately 50 board positions.
The present research program identified 1,859 Australian women company directors
using several business directories (e.g., Business Who’s Who of Australia, Beck, 1995) and
other professional sources (e.g., Professional Nonexecutive Directors Association). A self-
report survey mailed out in 1995 received 572 useful responses, however the average board
size was only 6 directors and half of the 39% of sample that were executive directors reported
that they were owners of the company. The comprehensive search for women directors had
apparently captured a large number of small owner-operated businesses. As the research
sought larger organisations and larger boards where gender of the director might be a salient
discriminating characteristic, responses from women on organisations with boards of four or

Experiences and Influences of Women Directors
Chapter 7. Summary and Conclusions Page 213
less directors were dropped. The resulting 325 women directors held 507 board positions on
public (27%), private (30%), government (18%), and not-for-profit (25%) organisations.
Based on available literature covering a similar era, the Australian women directors
were compared to women directors from the U.S. (Catalyst, 1993), Canada (Burke, 1994b),
the U.K. (Holton, Rabbetts, & Scrivener, 1993), New Zealand (Pajo, McGregor, & Cleland,
1997), and Israel (Talmud & Izraeli, 1998). Women were of similar ages (median ages 41-50)
with the exception of U.S. women who appeared to be a little older (median age 50-59).
Women appeared to have similar levels of education, with 81-89% being tertiary qualified,
with possible differences in Israel (only 68%) and New Zealand (93% tertiary qualified and
83% with postgraduate qualifications). Australian women were usually married (65%),
consistent with the U.S. (69%) and Canada (71%), and had similar numbers of children (mode
2, means of 2.4-2.9).
Many additional characteristics of Australian women directors were analysed although
they were not readily comparable with available literature. The most frequent managerial
level reported was executive (31%), followed by CEO (30%). Most of the women (92%) had
been in full-time employment for more than 10 years, but many of them had been in their
current occupation (55%) or organisation (62%) for fewer than 10 years. Most of the women
(81%) also had fewer than 10 years of senior management experience before their board
appointment and 76% had only been on boards for fewer than 10 years. Overall, Australian
women directors appeared to be well-educated successful executives who had worked many
years in the workforce and had been rewarded with board positions soon after they gained
executive status.
7.3. Study 2: Nonexecutive Directors as a Distinct In-Group Category
One of the distinguishing attributes of board directors is whether they are an executive
(inside) director or a nonexecutive (outside) director, yet there is little discussion in the
literature of differences between executive and nonexecutive women directors. Social identity

Experiences and Influences of Women Directors
Chapter 7. Summary and Conclusions Page 214
theory prompted a consideration of whether the potential distinction between executive
directors and nonexecutive directors is truly distinct and is therefore a potentially salient
categorisation in the context of the sample of Australian women directors.
Possible salient characteristics of directors about themselves (individual factors), about
their relationships with others (interpersonal factors), and their organisational context
(organisational factors) were analysed to determine influence on self-perceptions. Logistic
regression, testing three hypotheses regarding group membership with different factors,
revealed significant differences between nonexecutive and executive directors.
Nonexecutive directors were older, had higher education levels, and had achieved more
managerial advancement than executive directors. However, nonexecutive and executive
directors did not differ significantly on other human capital variables of work continuity and
organisation tenure. Interestingly, CEO experience did not emerge as significant differentiator
despite its reported importance (Mattis, 1997). Perhaps CEO experience is not something that
many Australian women directors have had, regardless of whether they are executive directors
or nonexecutive directors. Australian boards may be selecting women who do not have CEO
title but have other relevant experience, like current U.S. practice (Gutner, 2001).
Relationships with partners and numbers of dependent children were also not significant.
Women nonexecutive directors were more likely to be on boards with a majority of male
directors than executive directors, and were more likely to have worked longer with other
women board members than executive directors.
While career encouragement was not a significant differentiator, the support of a mentor
was significant, with executive directors more likely to have an influential mentor than
nonexecutive directors. Organisational structural opportunities were significant in that
nonexecutive directors tended to work more in public sector employment, while executive
directors were more likely to be managers and administrators than the nonexecutive directors.
There was no significant difference between nonexecutive and executive directors on training

Experiences and Influences of Women Directors
Chapter 7. Summary and Conclusions Page 215
and development, although executive directors experienced more challenging work than
nonexecutive directors. Nonexecutive directors had enough significant differences from
executive directors to be confirmed as a distinct category.
7.4. Study 3: Longitudinal Study of Successful Women Directors
A longitudinal study of women directors was valuable from two aspects. No previous
research could be identified that tracked the same sample of women directors over time, and
by definition women who remained as board directors for a significant period must be
regarded as successful. Previous studies that compared women directors over time were
actually samples of organisations over time and the corresponding changes in demographics
of the women who served as directors at the time (e.g., Catalyst, 1995a, etc.). Although much
is written about the business case for women directors (Daily, Certo & Dalton, 2000), the
characteristics of a successful woman director (Bilimoria, 2000), or even a successful man
director, remains ill defined (Francis, 1997). However, with the suspicion that some women
are appointed as “tokens” (Scherer, 1997), a definition of a successful director has value. For
the present research, a simplistic assumption is that women who served as directors over a
significant period were successful board members.
Several hypotheses were formulated regarding changes in characteristics that might
accrue in the women over the six-year period of the research program. Some characteristics
were hypothesised not to change, as their improvement in any respect (e.g., an increase in
educational qualifications) may shift the director away from the stereotypical norms of the
ingroup. Some other characteristics were hypothesised to change, as any improvement (e.g.,
promotion to board chair) will be regarded as positive by ingroup norms.
Of the 1995 sample of 572 women directors, 298 women agreed to follow-up research.
Six years later, 52 of the women were located and returned surveys, although only 32 of these
women were still on boards in 2001. The 32 women in the 2001 sample clearly demonstrated
that they were successful board directors, having increased the number of their board

Experiences and Influences of Women Directors
Chapter 7. Summary and Conclusions Page 216
directorships, gained more board chair positions, and gained directorships of larger
organisations over the six-year period. The women showed no significant change in their
education level, managerial level, employment industry, or the types of organisations of
which they were directors. These observations supported the social identity theory that when
people perceive themselves to be part of an ingroup, they will not strive to advance
themselves in directions that stray from their perceptions of a stereotypical ingroup member
(Haslam, 2001).
7.5. Study 4: Stereotypes of Male and Female Directors
Social identity theory suggests that as people adopt the social identity of an ingroup,
their individual characteristics will become less salient and they will adopt the views,
behaviour, and values of the ingroup (Haslam, 2001). If women directors are truly successful
board members, they should share similar perceptions of stereotypes of directors as their male
counterparts. Cejka and Eagly (1999) developed a scale providing six stereotypic dimensions
that allowed exploration of physical attributes, personality attributes, and cognitive attributes
of gender-oriented stereotypes. The Cejka and Eagly scale was applied twice; once in the
context of a typical female director and once in the context of a typical male director so that
the salience of stereotypical male and female director attributes could be determined.
In addition to the 32 women in the 2001 sample of directors, survey returns from male
directors who were solicited by the women directors in the sample allowed a comparison of
women and men directors. Men and women agreed on their perceptions of a stereotypical
female director except for the masculine cognitive dimension, with women attributing higher
masculine cognitive attributes to the stereotypical female director. Men and women also
agreed on their perceptions of a stereotypical male director except for the masculine cognitive
dimension, with women again attributing higher masculine cognitive attributes. The women
apparently had a higher perception of board directors on the masculine cognitive dimension
regardless of gender. However, a mixed between-within subjects ANOVA suggested that the

Experiences and Influences of Women Directors
Chapter 7. Summary and Conclusions Page 217
differences between men and women’s perceptions of the stereotypes were not significant
overall.
Comparisons of women’s perceptions between the stereotypes of male and female
directors confirmed that the women perceived that both stereotypes were similar on masculine
cognitive attributes, but differed on all other attributes. Men however, thought the stereotypes
of male and female directors were similar on cognitive and personality attributes, but not
physical attributes. Both the men and women perceived that the stereotypes of male and
female directors differed on physical attributes and so presumably physical attributes are not
salient characteristics for a board director. The men and women disagreed on their perceptions
of male and female personality characteristics. However, as the women recruited the men
respondents, social desirability may have influenced the men’s responses. The men may have
unwittingly given different answers from those of the women, thinking that their responses
would be complimentary. The men and women also differed on their perceptions of feminine
cognitive attributes between male and female stereotypes, so these attributes too were unlikely
to be salient. However, the perceptions of both the men and women agreed on masculine
cognitive attributes between male and female stereotypes, so these appear to be the salient
characteristics for board directors.
The 2001 sample of women directors appeared to perceive themselves as members of
the ingroup of board directors as they shared similar perceptions of stereotypes of board
directors with men directors. The men and women agreed on their perceptions of male and
female director stereotypes, and they agreed that male and female directors would differ on
physical attributes and be similar on masculine cognitive attributes. The men directors should
regard the 32 women as successful if they conformed to the masculine cognitive attributes of
the stereotypes, and accept the women differing on physical attributes.

Experiences and Influences of Women Directors
Chapter 7. Summary and Conclusions Page 218
7.6. Study 5: Nonexecutive Director Social Identity and Influence
Social identification as a board director should be more often salient for nonexecutive
directors than executive directors. Executive directors may often consider their salient role as
that of a senior executive (CEO or CFO) of the organisation rather than that of board member,
and they should be secure in their status as a board director. However, nonexecutive directors
may have some ambiguity about themselves with respect to their salient role and their status
as members of the ingroup of board directors. In a study of network ties and board influence,
Westphal and Milton (2000) chose to focus on the effects of minority status for nonexecutive
(outside) directors.
Social identity salience is a continuum between ingroup identity and interpersonal
identity (Haslam, 2001). Three measures covered scenarios from the director’s social
identification with the board as an abstract entity, her perceived capability as a director to
contribute to the board, and her frequency of interactions with the CEO in providing advice.
Multiple regression allowed confirmation of the types of factors that would contribute to
social identification in the three different scenarios. Of particular interest was the
contribution, if any, of specific gender-related factors to the social identification of these
successful women directors.
Hypotheses based on social identity and self-categorisation theories were supported.
The personal characteristics of the director that were common with other group members
contributed positively to social identification with the board, whereas increased contact with
individual board members was a negative factor. The women’s social identity as a board
director was a positive contributor to her perceived ability to contribute to the board, whereas
interpersonal relationships with other directors were negative factors. However, for her
frequency of providing advice to the CEO, the interpersonal factors of the behaviour of the
CEO with respect to the board and the breadth of the woman’s functional background were
positive contributors, whereas social identity with the board was a negative contributor.

Experiences and Influences of Women Directors
Chapter 7. Summary and Conclusions Page 219
No gender-related factors could be found to support any of the three hypotheses under
consideration. This finding is consistent with both Mattis (2000), who found that once a
woman is appointed to the board her gender ceases to be a salient characteristic, and Burke
(2000b), who suggested that women on boards want to be known for their competence on the
board rather than their gender. Overall, the results demonstrate the value of social identity
theory for consideration of women nonexecutive directors’ identity and their potential to
influence the board, providing an adequate explanation for perceptions of themselves.
7.7. Limitations of the Research Program
A fundamental limitation with the research program was that all the measures used in
the study were self-report items, which are of course subjective and may be inaccurate.
Further research might use a variety of other measures to ensure the accuracy of data. For
example, secondary data could be analysed to determine the number of and duration of
directorships and board composition. Interviews with the women and other directors could
confirm the correct interpretation of items and reduce the incidence of socially desirable
responses. Qualitative interviews may reveal interpretations of the responses that are not
evident from a statistical analysis of the data.
A limitation of the research program was that in concentrating on women directors it
gave little attention to comparative men directors. Some of the effects noted in the research
are ambiguous as to whether they are peculiar to women or are common to both men and
women directors. A broader set of surveys that included equal numbers of men and women
directors would have helped distinguish the factors that are unique to women in their attempts
at board success.
Following up the women after an interval of six years was a limitation in that many
more of them had moved on than had been anticipated, leaving a smaller sample for the
longitudinal study than desired. Unfortunately, privacy restrictions prevent the pursuit of
women who left their organisation without a forwarding address. Future research that uses a

Experiences and Influences of Women Directors
Chapter 7. Summary and Conclusions Page 220
longitudinal design should consider re-surveying sooner than six years to reduce sample loss
and/or specifying additional identifiers (e.g., home address, telephone numbers, e-mail
addresses, etc) to allow the women to be traced without violating privacy restrictions.
A limitation of combining a longitudinal study in an exploratory analysis breaking new
ground such as the present research program is that items with the most research value could
not be foreseen during creation of the first survey in 1995. Although the 1995 survey was
based on an understanding of literature at the time, upon analysis of the 1995 data a clearer
understanding of Australian women directors and their boards was obtained. Unfortunately
for a longitudinal study detection of changes are limited to the items presented in the first
survey. For example, the literature reported marital status and numbers of children of women
directors and it seemed prudent to include such items on the first survey. Although similar
items were included on the 2001 survey, analysis of them only served to confirm expectations
that they would change little over the years and had no predictive value regarding the women
and their directorships. Subsequent research in the area could learn from the results obtained
to date and create new survey instruments that include items of greater value.
An assumption was made in the current research program that the 2001 survey would be
reliably understood by the follow-up sample as many of the items followed the 1995 survey.
However, numerous new items were added to the 2001 survey that were not pre-tested on
women directors before being administered to the follow-up sample. This oversight
manifested itself in a lower response rate than was desired to the director stereotype scales,
where some of the respondents apparently took offence at some of the trite descriptions (e.g.,
“dainty” for male directors). A pre-test may have detected this problem and allowed the
survey to be constructed in a way that may have overcome respondent resistance (e.g., with
instructions that reassured the respondent that this was a generic scale and not to take offence
at some descriptions). Future research should avoid this oversight with longitudinal surveys.

Experiences and Influences of Women Directors
Chapter 7. Summary and Conclusions Page 221
In terms of social identity, the present research had a limitation in that it did not have a
reliable measure of identification with board directors. The distinction between a director’s
identification with the board as a salient group and their identification with individual
directors is likely to be vital to understanding quality of decision making. A board whose
members identify with each other but not the board as a whole may be more likely to make
self-serving decisions. Corporate boards are understood to have a prime purpose to make
strategic decisions for the good of the organisation and its shareholders, not for the individuals
who sit on the board (Lorsch & MacIver, 1989). Future research should attempt to identify a
reliable measure of identification with board directors to detect this effect.
7.8. Implications of the Research Program
While the present research does not deal directly with the issue of increasing the number
of women on corporate boards that is so common in the research literature (Bilimoria, 2000;
Singh & Vinnicombe, 2001) and the popular press (e.g., Eaglesham, 2002; Gutner, 2001),
some of the findings here may help women find success. Those women attempting to appear
to be more acceptable board candidates should be aware of the need to develop numerous
traits that can be used as a basis for establishing social identity. Women should avoid relying
too much on interpersonal relationships no matter how valuable they may be in getting initial
introductions. Women should be careful about appearing so outstanding that they make the
men feel uncomfortable and therefore will not be accepted as part of the ingroup. Women
should understand that the phenomenon of outstanding people making groups uncomfortable
is not necessarily a gender-related issue; it is a general principle of ingroup categorisation that
also applies to outstanding men. By nurturing a broad range of traits that can become salient
in different contexts, women can establish and maintain identification with the ingroup
despite their gender and other individual differences.
Boards and organisations that are seeking women directors should understand that
acceptance of women can occur on a number of different levels. Not all of the board members

Experiences and Influences of Women Directors
Chapter 7. Summary and Conclusions Page 222
have to be CEOs or former CEOs. Potential candidates may have many other attributes such
as industry or functional experience and expertise that are sufficient for their acceptance as a
board member. Organisations should be wary of candidates who are sponsored by particular
directors, including the CEO, but may not have substantial other attributes of value.
Organisations need to consider whether the candidate’s allegiance will be to the organisation
and its board or to the sponsoring director (or CEO).
Although corporate boards and women directors are a novel research area with many
atypical group characteristics, the findings of this research program demonstrate that a
psychological theory such as social identity theory is applicable. Social identity theory
adequately addresses the concerns of Fagenson (1990a) and others (e.g., Bilimoria, 2000) that
specific theory to deal with the particular context of women directors might be required, along
with the attendant limitations which specific-context theory brings. Women directors, despite
being a subject area of some emotional debate, are not significantly different from other
psychological subject groups and can be examined within the framework provided by robust
psychological principles now available.
7.9. Suggestions for Future Research
The present research program focussed on the personal experiences of women directors.
Although, other research has attempted to link directors with organisation performance with
little success (Johnson, Daily, & Ellstrand, 1996), a definition of director success other than
that used by the present research program of surviving for significant period should be
determined. Social identity theory, in proving to be applicable to the study of women
corporate directors, might be of value in widening the scope to include more robust measures
of success linked to organisation performance.
In addition to attempting to understand the predictors of board success, value is likely to
accrue from understanding factors in board failure or lack of success. The women who were
no longer board members after a significant period might also be fertile ground for lessons

Experiences and Influences of Women Directors
Chapter 7. Summary and Conclusions Page 223
learnt. A longitudinal study that examines why women are no longer board members may
provide just as much insight as a study of “successful” women directors.
The apparent difference in findings between the present research and that of Westphal
and Milton (2000) regarding the effect of common board memberships and/or social ties with
existing board members should be investigated. It is generally believed that extensive director
networking is beneficial to boards (Holton, 2000). However, if as the present research found
and social identity theory implies, that interpersonal ties lower identification with the board
and perceived ability to contribute, such social ties might be counterproductive. Clarification
should be sought as to whether the apparent counterproductive nature of social ties is a
phenomenon of women directors or a more general effect that also applies to men directors.
This could be a vital issue with a bearing on corporate governance policy.
The lack of detailed research on the topic of corporate board functioning and their
directors may have resulted in survey items that were imprecise. The surveys may have felt to
some respondents like a “shotgun” approach as its exploratory nature attempted to find items
of relevance. It is hoped that future researchers will take the present findings into account to
formulate more precise questions in the future with the hope of obtaining a more detailed
understanding of women’s significant experiences and how they relate to board success.
7.10. Conclusions
The present research program provides a systematic investigation of an unusual
phenomenon in Australia – women corporate directors. The primary outcomes have been to
identify new information previously unknown about Australian women directors, their boards,
factors in their identification with boards, and their perceptions of stereotypical directors. The
research also points to the value of social identity and self-categorisation principles as a
theoretical underpinning for the research area.
Pynes (2000) describes three objectives of exploratory studies. Firstly, such studies
meet the needs of the researcher by satisfying curiosity and desire for understanding.

Experiences and Influences of Women Directors
Chapter 7. Summary and Conclusions Page 224
Secondly, that studies act as a pilot to indicate whether further extensive research is justified.
Thirdly, to develop appropriate research methods for the area under consideration.
The present research program seeks to fulfil all the above criteria. The topic arose from
the researcher’s personal curiosity about Australian women directors. Who are they? What are
they like? How do they do their board work in the context of the “boy’s club” mentality that is
widely believed to dominate boardrooms. The studies in the research program promoted a
broader and in depth understanding of the topic and offered some insights as to the differences
between women in nonexecutive director and executive director roles.
The sample of women under study appeared similar to women directors in other
countries so the results might be applicable internationally. The women were well-educated
senior managers who had worked many years in the workforce, gaining board positions soon
after their promotion to executive status. Most were not CEOs or former CEOs, suggesting
that the requirement that male directors have CEO experience does not necessarily apply to
women. Whether the women directors were initially appointed as tokens or not is a moot
point, as a reasonable number of them had proven to be successful. The key to their success
appeared to be an ability to highlight enough salient characteristics to become accepted as part
of the ingroup of board directors, and particularly to display masculine cognitive attributes.
Social identity theory appears to be valuable in analysing director perceptions in an area
that has been of great interest to researchers but elusive in achieving firm conclusions. Certain
findings of this study should prompt further research, whilst other findings are consistent with
previous studies. For example, the finding that interpersonal ties with other directors may be
counterproductive to board functioning needs further examination, while the finding that
masculine cognitive attributes are salient features of social identity should confirm current
understandings. The obtaining of empirical evidence for these findings is a valuable addition
to the research on women board directors and a unique application of social identity theory.

Experiences and Influences of Women Directors
Bibliography Page 225
Bibliography
Acker, J. (1990a). Hierarchies, jobs, and bodies: A theory of gendered organizations. Gender
and Society, 4 (2), 139-158.
Acker, J. (1990b). Women and stratification: A review of recent literature. Contemporary
Sociology, 9, 25-34.
Across the Board. (1994). Gender chill? September, 1.
Ashburner, L. (1993). Women on boards and authorities in the National Health Service.
Women in Management Review, 8 (2), 89.
Australian Bureau of Statistics (1988). Australian Standard Industrial Classification (ASIC).
Canberra: Australian Government Publishing Service.
Australian Bureau of Statistics (1993). The labour force Australia. Canberra: Australian
Government Publishing Service.
Australian Bureau of Statistics (1996). 1996 census of population and housing. Canberra:
Australian Government Publishing Service.
Baron, J. N., & Pfeffer, J. (1994). The social psychology of organizations and inequality.
Social Psychology Quarterly, 57, 190-209.
Barr, S. (1996). Up against the glass. Management Review, 85, 9, 12-18.
Bar-Tal, D. (1998). Group beliefs as an expression of social identity. In S. Worchel, J.F.
Morales, D. Paez, & J. C. Deschamps (Eds.), Social Identity: International
Perspectives, 92-113. London: Sage.
Beck, P. (1995). The business who's who of Australia (29 Ed.). Chatswood, NSW: Riddell
Information Services Pty Ltd.
Becker, G. S. (1985). Human capital, effort and the sexual division of labour. Journal of
Labor Economics, 3, 533-558.
Becker, G. S. (1993). Human capital. Chicago: University of Chicago Press.
Becker, G. S. (1995). Human capital and economic growth. Prague Economic Papers,
Quarterly Journal of Economic Theory and Policy, 3, 223-228.

Experiences and Influences of Women Directors
Bibliography Page 226
Bem, S. L. (1981). Bem Sex-Role Inventory: Professional manual. California: Consulting
Psychologists Press Inc.
Berg, B. L. (1995). Qualitative research methods for the social sciences. Sydney: Allyn and
Bacon.
Betz, N. E. (1987). Use of discriminant analysis in counseling psychology research. Journal
of Counseling Psychology, 34, 393-403.
Bilimoria, D. (2000). Building the business case for women corporate directors. In R. J. Burke
& M. C. Mattis (Eds.), Women on corporate boards of directors (pp. 25-40). The
Netherlands: Kluwer Academic Publishers.
Bilimoria, D., & Huse, M. (1997). A qualitative comparison of the boardroom experiences of
U.S. and Norwegian women corporate directors. International Review of Women and
Leadership, 3 (2), 63-76.
Bilimoria, D., & Piderit, S. K. (1994). Board committee membership: Effects of sex-based
bias. Academy of Management Journal, 37, 1453-1477.
Bilimoria, D., & Wheeler, J. V. (1997). Women corporate directors: Current research and
future directions. (unpublished manuscript). Department of Organizational Behavior,
Weatherboard School of Management, Case Western Reserve University.
Blalock, H. (1967). Toward a theory of minority group relations. New York: Capricorn.
Blau, P. (1977). A macrosociological theory of social structure. American Journal of
Sociology, 83, 26-54.
Bosch, H. (1995). The director at risk. South Australia: Pitman.
Bosch, H. (1996). Access to independent advice. Australian Accountant, 66, March, 20-21.
Bradshaw, P., & Wicks, D. (1995). Women in the boardroom: Two interpretations.
Unpublished manuscript. Faculty of Administrative Studies, York University.
Bradshaw, P., & Wicks, D. (2000). The experiences of white women on corporate boards in
Canada: Compliance and non-compliance to hegemonic masculinity. In R. J. Burke &
M. C. Mattis (Eds.), Women on corporate boards of directors (pp. 97-109). The
Netherlands: Kluwer Academic Publishers.

Experiences and Influences of Women Directors
Bibliography Page 227
Bradshaw, P., Murray V. V., & Wolpin, J. (1992). Women on boards of nonprofit
organizations: What difference do they make? Paper presented at ARNOVA
conference, October.
Brewer, M. B. (1993). The role of distinctiveness in social identity and group behaviour. In
M. A. Hogg & D. Abrams (Eds.), Group motivation: Social psychological perspectives
(pp.1-16). London: Harvester Wheatsheaf.
Brewer, M. B. (1996). Managing diversity: The role of social identities. In S. Jackson & M.
Ruderman (Eds.), Diversity in work teams (pp.47-68). Washington, D.C.: American
Psychological Corporation.
Brewer, M. B., & Harasty, A. S. (1996). Seeing groups as entities: The role of perceiver
motivation. In E. T. Higgins & R. M. Sorrentino (Eds.), Handbook of motivation and
cognition (Vol 3: The interpersonal context: pp.47-68). New York: Guilford.
Brewer, M. B., & Miller, N. (1996). Intergroup relations. Milton Keyes: UK Open University
Press.
Burke, R. J. (1994a). Benefits of women on corporate boards of directors as reported by male
CEOs. Psychological Reports, 75, 329-330.
Burke, R. J. (1994b). Women on corporate boards of directors: Forces for change? Women in
Management Review, 9 (1), 27-31.
Burke, R. J. (1994c). Women on corporate boards of directors: Views of Canadian chief
executive officers. Women in Management Review, 9 (5), 3-10.
Burke, R. J. (1995). Why are there so few women corporate directors? Women and men see it
differently. International Review of Women and Leadership, 1, 55-60.
Burke, R. J. (1997). Women directors' activism on corporate boards of directors: Thriving or
surviving? International Review of Women and Leadership, 3, 77-84.
Burke, R. J. (2000a). Company size, board size and numbers of women corporate directors. In
R. J. Burke & M. C. Mattis (Eds.), Women on corporate boards of directors (pp. 157-
167). The Netherlands: Kluwer Academic Publishers.

Experiences and Influences of Women Directors
Bibliography Page 228
Burke, R. J. (2000b). Women on Canadian corporate boards of directors: Still a long way to
go. In R. J. Burke & M. C. Mattis (Eds.), Women on corporate boards of directors (pp.
97-109). The Netherlands: Kluwer Academic Publishers.
Burke, R. J. (2000c). Women on corporate boards of directors: Understanding the context. In
R. J. Burke & M. C. Mattis (Eds.), Women on corporate boards of directors (pp. 179-
196). The Netherlands: Kluwer Academic Publishers.
Burke, R. J., & Kurucz, E. (1998). Demographic characteristics of Canadian women corporate
directors. Psychological Reports, 83, 461-462.
Burke, R. J., & Mattis, M. C. (2000). Women corporate boards of directors: Where do we go
from here? In R. J. Burke & M. C. Mattis (Eds.), Women on corporate boards of
directors (pp. 3-10). The Netherlands: Kluwer Academic Publishers.
Burke, R. J., & McKeen, C. (1992). Women in management. In C. L. Cooper & I. T.
Robertson (Eds.), International review of industrial and organizational psychology (pp.
245-282). New York: Wiley.
Burke, R. J., & McKeen, C. A. (1993). Career priority patterns among managerial and
professional women. Applied Psychology: An International Review, 42, 341-352.
Burson-Marsteller, (1977). Study of women directors. New York: Burson-Marsteller.
Burt, R. S. (1992). Structural holes: The social structure of competition. Cambridge, MA:
Harvard University Press.
Burton, C., & Ryall, C. (1995). Enterprising nation: Reviewing Australia's managers to meet
the challenges of the Asia-Pacific century: Managing for diversity. Canberra: Australian
Government Publishing Service.
Byrne, D. (1969). Attitudes and attraction. In L. Berkowitz (Ed.), Advances in experimental
social psychology (Vol. 4, pp. 35-89). New York: Academic Press.
Byrne, D. E. (1971). The attraction paradigm. New York: Academic Press.
Carli, L. L. (1989). Gender differences in interaction style and influence. Journal of
Personality and Social Psychology, 56, 565-576.

Experiences and Influences of Women Directors
Bibliography Page 229
Carli, L. L., & Eagly, A. H. (1999). Gender effects on influence and emergent leadership. In
G. N. Powell (Ed.), Handbook of Gender and Work (pp. 203-222).Thousand Oakes,
C.A.: Sage.
Carpenter, M. A., & Westphal, J. D. (2001). The strategic context of external network ties:
Examining the impact of director appointments on board involvement in strategic
decision making, Academy of Management Journal, 44, 639-660.
Cassell, C. (1997). The business case for equal opportunities: Implications for women in
management. Women in Management Review, 12, 11-17.
Castles, I., & Cook, W. (1995). Australian and New Zealand standard industrial
classification. Canberra: Australian Bureau of Statistics.
Catalyst. (1993). Women on corporate boards: The challenge of change. New York: Catalyst.
Catalyst. (1995a). Catalyst census - Female board directors of the Fortune 500. New York:
Catalyst.
Catalyst. (1995b). The CEO view: Women on corporate boards. New York: Catalyst.
Catalyst. (1998a). 1998 census of women corporate officers and top earners. New York:
Catalyst.
Catalyst. (1998b). Women board directors of Canada. New York: Catalyst.
Catalyst. (1998c). Women board directors of the Fortune 500. New York: Catalyst.
Catalyst. (1998d). Women now hold over ten percent of Fortune 500 board seats. Corporate
Board, 19, 27-29.
Cejka, M. A., & Eagly, A. H. (1999). Gender-stereotypic images of occupations correspond to
the sex segregation of employment. Personality and Social Psychology Bulletin, 25, 4,
413-423.
Collins, E. G. C. (1978). A woman in the boardroom: An interview with Joan Ganz Cooney.
Harvard Business Review, 56, January-February, 77-86.

Experiences and Influences of Women Directors
Bibliography Page 230
Conroy, D. K. (2000). Public sector board composition in Australia: Leading the way. In R. J.
Burke & M. C. Mattis (Eds.), Women on corporate boards of directors (pp. 213-235).
The Netherlands: Kluwer Academic Publishers.
Coulson-Thomas, C. (1993). Developing directors: Building an effective boardroom team.
London and New York: McGraw Hill.
Cox, T. (1991). The multicultural organization. Academy of Management Executive, 5, 34-47.
Crain, R., & Snyder, D. (1998). Where are the women? A question for big business. Harvard
Business Review, 56, January-February, 77-86.
Creswell, J. W. (1994). Research design - qualitative and quantitative approaches. Thousand
Oaks: Sage Publications.
Crosby, F. (1982). Relative deprivation and working women. New York: Oxford University
Press.
Daily, C. M. (1995). The relationship between board composition and leadership structure and
bankruptcy reorganization outcomes. Journal of Management, 21, 1041-1056.
Daily, C. M., & Schwenk, C. (1996). Chief executive officers, top management teams, and
boards of directors: Congruent or countervailing forces? Journal of Management, 22,
185-208.
Daily, C. M., Certo, S. T., & Dalton, D. R. (1999). A decade of corporate women: Some
progress in the boardroom, none in the executive suite. Strategic Management Journal,
20, 93-99.
Daily, C. M., Certo, S. T., & Dalton, D. R. (2000). The future of corporate women: Progress
toward the executive suite and the boardroom? In R. J. Burke & M. C. Mattis (Eds.),
Women on corporate boards of directors (pp. 11-23). The Netherlands: Kluwer
Academic Publishers.
Daum, J. H. (1994a). Demand is rising for women directors. Directors and Boards, 19, 48-49.
Daum, J. H. (1994b). Women directors at work. Directors and Boards, 19, 50-54.
Department of Employment and Industrial Relations. (1987). Australian standard
classification of occupations. Canberra: Australian Government Publishing Service.

Experiences and Influences of Women Directors
Bibliography Page 231
Di Pietro, L. (2000). An investigation of the gender stereotypic dimensions contributing to
occupational stress. Honours thesis: University of Melbourne.
Diekman, A. B., & Eagly, A. H. (2000). Stereotypes as dynamic constructs: Women and men
of the past, present and future. Personality and Social Psychology Bulletin, 26, 1171-
1188.
Dreher, G. F., & Ash, R. A. (1990). A comparative study of mentoring among men and
women in managerial, professional, and technical positions. Journal of Applied
Psychology, 75, 539-546.
Dun & Bradstreet. (1992). Reference book of corporate managers. Parsippany: Dun and
Bradstreet.
Dun & Bradstreet. (November 2001). The business who's who of Australia [On-line].
Available: http://bww.dnb.com.au/default.asp.
Eaglesham, J. (2002). Sexism in the city: Investment banker to address shortage of female
directors. Financial Times, London, June 14, p. 3.
Eagly, A.H., & Karau, S.J. (1991). Gender and the effectiveness of leaders: A meta-analysis.
Journal of Personality and Social Psychology, 60, 685-710.
Elgart, L. D. (1983). Women on Fortune 500 Boards. California Management Review, 25,
121-127.
EOWA. (2002a). Australian census of women board directors. Sydney: Equal Opportunity for
Women in the Workplace Agency.
EOWA. (2002b). Australian census of women executive managers. Sydney: Equal
Opportunity for Women in the Workplace Agency.
Etches, N. P. (1994). Formation of executive directors' and non-executive directors' working
parties on corporate governance. Financial Regulation Report, December, 22-23.
Fagenson, E. A. (1990a). At the heart of women in management research: Theoretical and
methodological approaches and their biases. Journal of Business Ethics, 9, 31-38.
Fagenson, E. A. (1990b). Perceived masculine and feminine attributes as a function of sex and
level in the organizational hierarchy. Journal of Applied Psychology, 75, 204-211.

Experiences and Influences of Women Directors
Bibliography Page 232
Ferguson, A. (1996). All change at the top. Business Review Weekly, July.
Ferris, G. R., Buckley, M. R., & Allen, G. M. (1992). Promotion systems in organizations.
Human Resource Planning, 15, 47-68.
Fleischer, A., Hazard, G. C., & Klipper, M. Z. (1988). Board games: The changing shape of
corporate power. Boston, Mass: Little Brown and Company.
Fondas, N. (2000). Women on boards of directors: Gender bias or power threat? In R. J.
Burke & M. C. Mattis (Eds.), Women on corporate boards of directors (pp. 171-179).
The Netherlands: Kluwer Academic Publishers.
Fondas, N., & Sassalos, S. (2000). A different voice in the boardroom: How the presence of
women directors affects boardroom influence over management. Global Focus, 12 (2),
13-22.
Ford, J. (1996). "I didn't start out intending to bring in a non-executive director. I really just
wanted someone to talk to". Director, 49, 58-63.
Francis, I. (1997). Future direction: The power of the competitive board. Victoria, Australia:
Pitman Publishing.
Fryxell, G. E., & Lerner, L. D. (1989). Contrasting corporate profiles: Women and minority
representation in top management positions. Journal of Business Ethics, 8, 341-352.
Gillies, J. M. (1992). Boardroom renaissance. Toronto: McGraw-Hill.
Green, E., & Cassell, C. M. (1996). Women managers, gendered cultural processes and
organisational change. Gender, Work and Organisation, 3, 3.
Gutner, T. (2001). Wanted: More diverse directors. Business Week, New York, April 30,
p. 134.
Harrigan, K. R. (1981). Numbers and positions of women elected to corporate boards.
Academy of Management Journal, 24, 619-625.
Haslam, S. A. (2001). Psychology in organisations: The social identity approach. London:
Sage Publications.

Experiences and Influences of Women Directors
Bibliography Page 233
Haslam, S. A., Oakes, P. J., McGarty, C., Turner, J. C., Reynolds, K. J., & Eggins, R. A.
(1996). Stereotyping and social influence: The mediation of stereotype applicability and
sharedness by the views of ingroup and outgroup members. British Journal of Social
Psychology, 35, 369-397.
Haslam, S. A., Oakes, P. J., Reynolds, K. J., & Turner, J. C. (1999). Social identity salience
and the emergence of stereotype consensus. Personality and Social Psychology Bulletin,
25, 809-818.
Haslam, S. A., Turner, J. C., Oakes, P. J., Reynolds, K. J., Eggins, R. A., Nolan, M., &
Tweedie, J. (1998). When do stereotypes become really consensual? Investigating the
group-based dynamics of the consensualization process. European Journal of Social
Psychology, 28, 755-776.
Heidrick & Struggles, Inc. (1978). Director data: Characteristics of outside directors.
Chicaco: Heidrick & Struggles.
Helsell, N. (1996). An executive director's toolbox. Foundation News and Commentary, 37,
51.
Hill, S. (1995). The social organisation of boards of directors. British Journal of Sociology,
42, 246-278.
Himelstein, L, & Forest, S. A. (1997). Breaking through. Business Week, February 17, 64.
Hinkin, T. R. (1995). A review of scale development practices in the study of organizations.
Journal of Management, 21, 967-988.
Hogg, M. A. (2000). Social identity and self-categorization processes in organizational
contexts. Academy of Management Review, 25, 121-141.
Hogg, M. A., & Mullin, B. A. (1999). Joining groups to reduce uncertainty: Subjective
uncertainty reduction and group identification. In D. Abrams & M. A. Hogg (Eds.),
Social identity and social cognition (pp 249-279). Oxford, Blackwell.
Holahan, C. K., & Gilbert, L. A. (1979). Conflict between major life roles: Women and men
in dual career couples. Human Relations, 32, 451-467.
Holton, V. D. (1995a). Corporate governance report surveying the situation for women
directors in the UK. Corporate Governance, 3, 102-107.

Experiences and Influences of Women Directors
Bibliography Page 234
Holton, V. D. (1995b). Women and equal opportunities: Creating a level playing field. Equal
Opportunities, 31, 904-907.
Holton, V. D. (1995c). Women on the boards of Britain's top 200 companies. Women in
Management Review, 10, 16-20.
Holton, V. D. (2000). Taking a seat on the board: Women directors in Britain. In R. J. Burke
& M. C. Mattis (Eds.), Women on corporate boards of directors (pp. 145-155). The
Netherlands: Kluwer Academic Publishers.
Holton, V. D., & Rabbetts, J. (1989). Pow(d)er in the Board Room: Report of a survey of
women on the boards of top UK industrial companies. England: Ashridge Management
Research Group.
Holton, V. D., Rabbetts, J., & Schrivener, S. (1993). Women on the boards of Britain's top
200 companies: A progress report. Berkhamsted, England: Ashridge Management
Research Group.
Howe, E., & McRae, S. (1991). Women on the board. London: Policy Studies Institute.
Huse, M. (1998). How women directors challenge existing theories of boards of directors.
Paper presented at the Academy of Management Conference, San Diego, CA.
Ibarra, H. (1992). Homophily and differential returns: Sex differences in network structure
and access in an advertising firm. Administrative Science Quarterly, 37, 422-447.
Ibarra, H. (1993). Personal networks of women and minorities in management: A conceptual
framework. Academy of Management Review, 18, 57-87.
Ibarra, H. (1995). Race , opportunity and diversity of social circles in managerial networks.
Academy of Management Journal, 38, 673-703.
Ibrahim, N. A., & Angelidis, J. P. (1994). Effect of board members' gender on corporate
social responsiveness orientation. Journal of Applied Business Research, 10, 35-40.
International Labour Organization. (1997). Breaking through the glass ceiling: Women in
management. Geneva: International Labour Office.

Experiences and Influences of Women Directors
Bibliography Page 235
Izraeli, D. N. (2000). The paradox of affirmative action for women directors in Israel. In R. J.
Burke & M. C. Mattis (Eds.), Women on corporate boards of directors (pp. 75-96). The
Netherlands: Kluwer Academic Publishers.
Izraeli, D. N., & Talmud, I. (1997). Getting aboard: Mode of recruitment and gender
composition - the case of women directors in Israel. International Review of Women and
Leadership, 3, 26-45.
Izraeli, D. N., & Talmud, I. (1998). The gender of social capital and director recruitment to
corporate boards. Paper presented at the Academy of Management Conference, San
Diego, CA.
Jackson, S., Stone, V., & Alvarez, E. (1992). Socialization amidst diversity: The impact of
demographics on work team oldtimers and newcomers. In B. M. Staw & L. L.
Cummings (Eds.), Research in Organizational Behaviour (15th Ed., pp. 45-109).
Greenwich, CT: JAI Press.
Jick, T. D. (1983). Mixing qualitative and quantitative methods: Triangulation in action. In J.
Van Maanen (Ed.), Qualitative methodology (pp. 135-148). Beverley Hills, CA: Sage.
Johnson, J. L., Daily, C. M., & Ellstrand, A. E. (1996). Boards and directors: A review and
research agenda. Journal of Management, 22, 409-438.
Johnston, P. (1997). Women still locked out of the boardroom. The Weekly Telegraph, No.
285, 42.
Judge, T. A., & Bretz, R. D. (1994). Political influence processes and career success. Journal
of Management, 20, 43-65.
Kanter, R. M. (1977). Men and women of the corporation. New York: Basic Books.
Kanter, R. M. (1987). Men and women of the corporation revisited. Management Review, 76,
14-16.
Kaplan, G. (1996). The meagre harvest: The Australian women’s movement 1950s-1990s.
Sydney: Allen and Unwin.
Karasawa, M. (1991). Toward and assessment of social identity: The structure of group
identification and its effects on in-group evaluations. British Journal of Social
Psychology, 30, 293-307.

Experiences and Influences of Women Directors
Bibliography Page 236
Karpin. (1995). Enterprising nation: Renewing Australia’s managers to meet the challenges
of the Asia-Pacific century. (Report of the industry taskforce on leadership and
management skills). Canberra: Australian Government Publishing Service.
Kellerher, D., Finestone, P., & Lowy, A. (1986). Managerial learning: First notes from an
unstudied frontier, Group and Organisation Studies, 11, 169-202.
Kesner, I. F. (1988). Directors' characteristics and committee membership: An investigation
of type, occupation, tenure, and gender. Academy of Management Journal, 31, 66-84.
Konrad, A. M., & Pfeffer, J. (1991). Understanding the hiring of women and minorities in
educational institutions. Sociology of Education, 64, 141-157.
Korn/Ferry International. (1994). Boards of directors in Australia (Thirteenth Study Ed.).
Sydney, Australia: Korn/Ferry International.
Korn/Ferry International. (1995). Boards of directors in Australia (Fourteenth Study Ed.).
New York: Korn/Ferry International.
Korn/Ferry International. (1996). Boards of directors in Australia (Fifteenth Study Ed.).
Sydney, Australia: Korn/Ferry International.
Korn/Ferry International. (1997a). Boards of directors in Australasia (1st Ed.). Sydney:
Korn/Ferry International.
Korn/Ferry International. (1997b). More women on board? Executive Female, 20, 27.
Korn/Ferry International. (1998). Boards of directors in Australasia (2nd Ed.). Sydney:
Korn/Ferry International.
Korn/Ferry International. (1999). Boards of directors in Australia and New Zealand. Sydney:
Korn/Ferry International.
Kram, K. E. (1983). Phases of the mentor relationship. Academy of Management Journal, 26,
608-625.
Lear, R. W. (1994). Here come the women directors. Chief Executive, 93, April, 10.
Experiences and Influences of Women Directors
Bibliography Page 237
Leighton D. (2000). Making boards work: Recruiting for balance, competence and results. In
R. J. Burke & M. C. Mattis (Eds.), Women on corporate boards of directors (pp. 253-
261). The Netherlands: Kluwer Academic Publishers.
Leighton D., & Thain, D. (1993). Selecting new directors. Business Quarterly, 57, 16-25.
Lenney, E. (1991). Sex Roles. In J. P. Robinson, P. R. Shaver, & L. S. Wrightman (Eds.),
Measures of personality and social psychological attitudes (p. 573-660). London:
Academic Press.
Lockheed, M. E. (1985). Sex and social influence: A meta analysis guided by theory. In J.
Berger & M. Z Elditch, Jr. (Eds.), Status, rewards and influence: How expectations
organize behavior. (p. 406-429). San Francisco: Jossey-Bass.
Lorsch, J. W., & MacIver, E. (1989). Pawns or potentates: The reality of America's corporate
boards. Boston, Mass: Harvard Business School Press.
Mace, M. (1971). Directors: Myth and reality. Boston: Harvard Business School Press.
Macrae, C. N., Milne, A. B., & Bodenhausen, G. V. (1994). Stereotypes as energy-saving
devices: A peek inside the cognitive toolbox. Journal of Personality and Social
Psychology, 64, 37-47.
Main, B. G. M., & Johnston, J. (1993). Remuneration committees and corporate governance.
Accounting and Business Research, 23, 351-362.
Mainiero, L. A. (1994a). Getting anointed for advancement: The case of executive women.
Academy of Management Executive, 8, 53-67.
Mainiero, L. A. (1994b). On breaking the glass ceiling: The political seasoning of powerful
women executives. Organizational Dynamics, 72, 5-20.
Maitland, A. (1999). Struggle for a seat at the top: Management women directors. Financial
Times, London, March 23, p. 20.
Maitlis, S., & Clegg, C. (1998). Taking from the top: How CEOs influence (and fail to
influence) their boards. Unpublished manuscript.

Experiences and Influences of Women Directors
Bibliography Page 238
Marcus-Newhall, A., Miller, N., Holtz, R., & Brewer, M. B. (1993). Cross cultural category
membership with role assignment: A means of reducing intergroup bias. British journal
of social psychology, 32, 124-146.
Marshall, J. (1995). Working at senior management and board levels: Some of the issues for
women. Women in Management Review, 10, 21-25.
Mattis, M. C. (1993). Women directors: Progress and opportunities for the future. Business
and the Contemporary World, 140-156.
Mattis, M. C. (1997). Women on corporate boards: Two decades of research. International
Review of Women and Leadership, 3, 11-25.
Mattis, M. C. (2000). Women corporate directors in the United States. In R. J. Burke & M. C.
Mattis (Eds.), Women on corporate boards of directors (pp. 43-56). The Netherlands:
Kluwer Academic Publishers.
McBride, B. (1995). Jobson's yearbook of Australian companies 1995/96. Chatswood, NSW:
Riddell Information Services Pty Ltd.
McGarty, C., Turner, J. C., Oakes, P. J., & Haslam, S. A. (1993). The creation of uncertainty
in the influence process: The roles of stimulus information and disagreement with
similar others. European Journal of Social Psychology, 23, 17-38.
McGregor, J. (1997). Making the good woman visible: The issue of profile in New Zealand
corporate directorship. International Review of Women and Leadership, 3, 1-10.
McGregor, J. (2000). The New Zealand experiment – training to be on a board as a director.
In R. J. Burke & M. C. Mattis (Eds.), Women on corporate boards of directors (pp. 129-
144). The Netherlands: Kluwer Academic Publishers.
Miller, L., & Budd, J. (1999). The development of occupational sex-role stereotypes,
occupational preferences and academic subject preferences in children at ages 8, 12, and
16. Educational Psychology, 19, 17-35.
Mitchell, M. (1984). A profile of the Canadian woman director. Business Quarterly, Spring,
121-127.
Mitchell, T. R. (1985). An evaluation of the validity of correlational research conducted in
organisations. Academy of Management Review, 10, 192-205.

Experiences and Influences of Women Directors
Bibliography Page 239
Morrison, A. M., White, R. P., Van Velsor, E., & the Center for Creative Leadership (1992).
Breaking the glass ceiling: Can women reach the top of America’s largest
corporations? Addison-Wesley, Reading, MA.
Naff, K. C. (1994). Though the glass ceiling: Prospects for the advancement of women in the
Federal civil service. Public Administration Review, 54, 507-514.
National Foundation of Women Business Owners. (1996). Women-owned businesses in the
United States: 1996 Fact Sheet.
Nelton, S. (1987). Women at war with each other. Nations Business, 75, 58.
Nunnally, J. C. (1976). Psychometric theory (2nd Ed.). New York: McGraw-Hill.
Oakley, J. (2000). Gender-based barriers to senior management positions: Understanding the
scarcity of female CEOs. Journal of Business Ethics, 27, 321-334.
Pajo, K., McGregor, J., & Cleland, J. (1997). Profiling the pioneers: Women directors on New
Zealand's corporate boards. Women in Management Review, 12, 174-181.
Pallant, J. (2001). SPSS survival manual: a step by step guide to data analysis using SPSS.
Crows Nest, Australia: Allen & Unwin.
Parkinson, J. E. (1993). Corporate power and responsibility: Issues in the theory of corporate
law. New York: Oxford University Press.
Patton, A., & Baker, J. C. (1987). Why directors won’t rock the boat. Harvard Business
Review, 65, 10-12,16,18.
Pearce, J., & Zahra, S. (1992). Board composition from a strategic contingency perspective.
Journal of Management Studies, 29, 411-438.
Pearce, K. A., Terry, D., & Tharenou, P. (1994). Person-centered and situational variables as
predictors of women's aspirations to manage. Unpublished manuscript.
Pettigrew, A. M. (1992). On studying managerial elites. Strategic Management Journal, 13,
162-182.
Pfeffer, J., & Salancik, G. R. (1978). The external control of organizations: A resource
dependence perspective. Harper & Row, New York.

Experiences and Influences of Women Directors
Bibliography Page 240
Pfeffer, J., Davis-Blake, A., & Julius, D. J. (1995). The effect of affirmative action officer
salary changes on managerial diversity: Efficiency wages or status? Industrial
Relations, 34, 73-94.
Pipes, S. (1996). Glass ceiling? So what? Chief Executive, April, 16.
Pollak, M. (2000). Catalyst corporate board placement: New seats at the table. In R. J. Burke
& M. C. Mattis (Eds.), Women on corporate boards of directors (pp. 97-109). The
Netherlands: Kluwer Academic Publishers.
Powell, G. N., & Butterfield, D. A. (1994). Investigating the “glass ceiling” phenomenon: An
empirical study of actual promotions to top management, Academy of Management
Journal, 37, 68-86.
Price, D., & Barrell, J. (1980). An experiential approach with quantitative methods: A
research paradigm. Journal of Humanistic Psychology, 20, 259-268.
Pynes, J. E. (2000). Are women underrepresented as leaders of nonprofit organizations?
Review of Public Personnel Administration, Spring 2000, 35-49.
Ragins, B. R., & Sundstrom, E. (1989). Gender and power in organizations: A longitudinal
perspective. Psychological Bulletin, 105, 51-88.
Ragins, B. R., Townsend, B., & Mattis, M. (1998). Gender gap in the executive suite: CEOs
and female executives report on breaking the glass ceiling. Academy of Management
Executive, 12 (1), 28-42.
Ray, P. S. (1995). Adding director to your resume. Management Review, March, 49-51.
Romano, C. (1993). All-a-board! The composition of the boardroom is changing - albeit
slowly. Management Review, 82, October, 5.
Rosenbaum, J. E. (1984). Career mobility in a corporate hierarchy. New York: Academic
Press.
Rosener, J. B. (1990). Ways women lead. Harvard Business Review, 68, 119-125.
Schein, V., Mueller, R., Lituchy, T., & Liu, J. (1996). Think manager, think male: A global
phenomenon? Journal of Organisational Behaviour, 17, 33-41.

Experiences and Influences of Women Directors
Bibliography Page 241
Scherer, K. (1997). Women directors: Talent before gender. Corporate Board, 18, 1-5.
Schonfield, E. (1994). A fissure in the glass ceiling, Fortune, September 5, 15.
Schor, S. M. (1997). Separate and unequal: The nature of women's and men's career-building
relationships. Business Horizons, September-October, 51-58.
Schwartz, F. N. (1980). "Invisible" resource: Women for boards. Harvard Business Review,
58, March-April, 6-8, 12-13, 18.
Schwartz, F. N., & Harrison, P. (1986). Beyond the first generation of women directors: On
the other side of the roadblock. Directors and Boards, 11, 39-41.
Segal, A. T., & Zellner, W. (1992). Corporate women: Progress? Sure. But the playing field is
still far from level. Business Week, 8 June, 74-83.
Sekaran, U. (1992). Research methods for business: A skill building approach. New York:
John Wiley & Sons.
Selby, C. C. (2000). From male locker room to co-executive director board room: A twenty-
five year perspective. In R. J. Burke & M. C. Mattis (Eds.), Women on corporate boards
of directors (pp. 97-109). The Netherlands: Kluwer Academic Publishers.
Sheridan, A. (2001). A view from the top: Women on the boards of public companies.
Corporate Governance, May. MCB Press.
Shilton, J., McGregor, J., & Tremaine, M. (1996). Feminizing the boardroom: A study of the
effects of corporatization on the number and status of women directors in New Zealand
companies. Women in Management Review, 11, 20-26.
Shultz, S. F. (1995). Women directors – The outmoded myths. Directorship, 21, 6, 8-10.
Siegel, S. (1956). Nonparametric statistics for the behavioural sciences. Japan: McGraw Hill.
Sinclair, A. (1998). Doing leadership differently. Australia: Melbourne University Press.
Singh, V., & Vinnicombe, S. (2001). Index of female directors on the top 100 company
boards 2001. Unpublished manuscript.
Smith, A. (1994). Storming the board: What's holding women back? Management, 41, 42-47.

Experiences and Influences of Women Directors
Bibliography Page 242
Sommer, B., & Sommer, R. (1991). A practical guide to behavioral research: Tools and
techniques. New York: Oxford University Press.
Spence, A. M. (1973). Job market signaling. Quarterly Journal of Economics, 83, 355-375.
Spence, A. M. (1974). Market signaling: The information transfer of hiring and related
processes. Cambridge, MA: Harvard University Press.
Standard & Poor. (1992). Standard & Poor's register of corporations, directors and
executives. New York: Standard & Poor's Corporation.
Stearns, L. B., & Mizruchi, M. S. (1993). Board composition and corporate financing: The
impact of financial institution representation of borrowing. Academy of Management
Journal, 36, 603-618.
Stephenson, K., & Rakow, S. (1993). Female representation in U.S. centralized private sector
planning: The case of overlapping directorships. Journal of Economic Issues, 27, 459-
470.
Stevens, J. (1996). Applied multivariate statistics for the social sciences (3rd Ed.). Mahway,
NJ: Lawrence Erlbaum.
Still, L. V. (1994). Where to from here? Women in management. Women in Management
Review, 9, 3-10.
Still, L. V., McGregor, J., & Dewe, P. (1994). Room at the top? A comparison of the
employment status of women in management in Australia and New Zealand.
International Journal of Employment Studies, 2, 267-287.
Strober, M. H. (1990). Human capital theory: Implications for HR managers. Industrial
Relations, 29, 214-359.
Stumpf, S. A., & London, M. (1981). Management promotions: Individual and organisational
factors influencing the decision process. Academy of Management Review, 6, 539-549.
Sweetman, K. J. (1996). Women in boardrooms: Increasing numbers qualify to serve.
Harvard Business Review, 74, 13.
Tabachnick, B. G. G., & Fidell, L. S. (1996). Using multivariate statistics (3rd Ed.). New
York: Harper Collins.

Experiences and Influences of Women Directors
Bibliography Page 243
Tajfel, H. (1974). Social identity and intergroup behaviour. Social Science Information, 13,
65-93.
Tajfel, H. (1978). Interindividual behaviour and intergroup behaviour. In H. Tajfel (Ed.),
Differentiation between social groups: Studies in the social psychology of intergroup
relations (pp. 27-60). London: Academic Press.
Tajfel, H. (1979). Individuals and groups in social psychology. British Journal of Social and
Clinical Psychology, 18, 183-190.
Tajfel, H. (1981). Social stereotypes and social groups. In J. C. Turner & H. Giles (Eds.),
Intergroup Behaviour. Oxford: Blackwell.
Tajfel, H. (1982). Social identity and intergroup relations. Cambridge: Cambridge University
Press.
Tajfel, H., & Turner, J. (1985). The social identity theory of intergroup behaviour. In S.
Worchel & W. G. Austin (Eds.), Psychology of intergroup relations (pp. 7-24).
Chicago: Nelson-Hall.
Talmud, I., & Izraeli, D. (1998). The relationship between gender and performance issues of
concern to directors: Correlates or institution? Journal of Organizational Behavior, 20,
459-474.
Terry, D. J., & Hogg, M. A. (1996). Group norms and the attitude-bahiour relationship: A role
for group identification. Personality and Social Psychology Bulletin, 22, 776-793.
Tharenou, P. (1995). Correlates of women's chief executive status: Comparisons with men
chief executives and women top managers. Journal of Career Development, 21, 201-
212.
Tharenou, P. (1997a). Explanations of managerial career advancement. Australian
Psychologist, 32, March, 19-28.
Tharenou, P. (1997b). Managerial career advancement. In C. L. Cooper & I. T. Robertson
(Eds.), International Review of Industrial and Organisational Psychology. New York:
Wiley.
Tharenou, P. (1997c). Organisational, job and personal predictors of employee participation in
training and development. Applied Psychology: An International Review, 46, 111-134.

Experiences and Influences of Women Directors
Bibliography Page 244
Tharenou, P. (1998). Predictors of advancing in management. In G. Griffin (Ed.),
Management theory and practice (pp. 358-378). Melbourne: MacMillan.
Tharenou, P., & Conroy, D. K. (1994). Men and women managers' advancement: Personal or
situational determinants? Applied Psychology: An International Review, 43, 5-31.
Tharenou, P., Latimer, S., & Conroy, D. (1994). How do you make it to the top? An
examination of influences on women's and men's managerial advancement. Academy of
Management Journal, 37, 899-931.
Thomas, R. R. (1990). From affirmative action to affirming diversity. Harvard Business
Review, 68, 2, 107-117.
Tifft, S. E. (1994). Board gains. Working Woman, 19, 36-38, 70, 74-75.
Tolbert, P. S., Graham, M. E., & Andrews, A. O. (1999). Group gender composition and work
group relations: Theories, evidence, and issues. In G. N. Powell (Ed.), Handbook of
gender and work (pp. 179-202). Sage Publications, Thousand Oaks, California.
Tsui, A. S., Egan, T. D., & O’Reilly, C. A. (1992). Being different: Relational demography
and organizational attachment. Administrative Science Quarterly, 37, 549-579.
Turban, D. B., & Dougherty, T. W. (1994). Role of protege personality in receipt of
mentoring and career success. Academy of Management Journal, 37, 688-702.
Turner, J. C., & Oakes, P. J. (1986). The significance of the social identity concept for social
psychology with reference to individualism, interactionism and social influence. British
Journal of Social Psychology, 25, 237-252.
Turner, J. C., Oakes, P. J., Haslam, S. A., & McGarty, C. A. (1994). Self and collective:
Cognition and social context. Personality and Social Psychology Bulletin, 20, 454-463.
Turner, J. C., Sachdev, I., & Hogg, M. A. (1983). Social categorisation, interpersonal
attraction and group formation. British Journal of Social Psychology, 22, 227-239.
Useem, M. (1984). The inner circle: Large corporations and the rise of business political
activity in the U.S. and U.K. Oxford University Press, Oxford.

Experiences and Influences of Women Directors
Bibliography Page 245
Van Velsor, E., & Hughes, M. W. (1990). Gender differences in the development of
managers: How women managers learn from experience. Technical report no. 145,
Centre for Creative Leadership, Greensboro, NC.
Vinnicombe, S., Singh, V., & Sturges, J. (2000). Making it to the top in Britain. In R. J. Burke
& M. C. Mattis (Eds.), Women on corporate boards of directors (pp. 57-73). The
Netherlands: Kluwer Academic Publishers.
Von Glinow, M. A., & Mercer, A. K. (1988). Women in corporate America: A caste of
thousands. New Management, 6, 36-42.
Wampold, & Freund. (1987). Use of multiple regression analysis in counseling research: A
flexible data analytic strategy. Journal of Counseling Psychology, 34, 372-382.
Webber, M. (1996). Boardrooms make glacial progress in adding women. Philadelphia
Business Journal, 15, 10, 1-4.
Westphal, J. D. (1999). Collaboration in the boardroom: Behavioural and performance
consequences of CEO-board social ties. Academy of Management Journal, 42, 7-42.
Westphal, J. D., & Milton, L. P. (2000). How experience and network ties affect the influence
of demographic minorities on corporate boards. Administrative Science Quarterly, 45,
366-398.
Westphal, J. D., & Zajac, E. J. (1995). Who shall govern? CEO/board power, demographic
similarity, and new director selection. Administrative Science Quarterly, 40, 60-83.
Wiersma, U. J. (1990). Gender differences in job attribute preferences: Work-home role
conflict and job level as mediating variables. Journal of Occupational Psychology, 63,
231-243.
Wiggins, J. S. (1992). Agency and communication as conceptual coordinates for the
understanding and measurement of interpersonal behaviour. In W. M. Grove & C.
Cicchetti (Eds.), Thinking clearly about psychology (pp. 89-113). Minneapolis:
University of Minneapolis Press.
Williams, C. (1992). The glass escalator: Hidden advantages for men in the female
professions. Social Problems, 39 (3), 253-267.

Experiences and Influences of Women Directors
Bibliography Page 246
Williams, C. L. (1989). Gender differences at work: Women and men in nontraditional
occupations. California: University of California Press.
Zahra, S. A., & Pearce, J. A. (1989). Board of directors and corporate financial performance:
A review and integrative model. Journal of Management, 15, 291-334.
Zahra, S. A., & Stanton, W. W. (1988). The implications of board of directors composition for
corporate strategy and performance. International Journal of Management, 5, 229-236.
Zeugner, L. (1993). Institutions campaign for greater board diversity. IRRC Corporate
Governance Bulletin, November/December, 8-12.

Experiences and Influences of Women Directors
Appendix A. Ethics Approval from the Human Research Ethics Committee Page 247
Appendix A. Ethics Approval from the Human Research Ethics Committee

Experiences and Influences of Women Directors
Appendix A. Ethics Approval from the Human Research Ethics Committee Page 248

Experiences and Influences of Women Directors
Appendix A. Ethics Approval from the Human Research Ethics Committee Page 249

Experiences and Influences of Women Directors
Appendix B. 1995 Letter to Participants Page 250
Appendix B. 1995 Letter to Participants
Dear Ms , We are contacting you as part of an Australia-wide research project to enhance our understanding of how women advance to Boards of Australian companies. As you are aware, women are currently under-represented on Boards. There is significant interest in having an increased representation of Australian women on Boards, yet there is very little known about the factors which assist Australian women’s progression and advancement to Board level. Australian data are needed to enable organisations and individuals to understand and develop strategies for progression to Board level. We know that you have many demands on your time, but would like to invite you to take a few minutes to enjoy a cup of peppermint tea, collect your thoughts and complete this survey. Even if you are not currently on a Board, or feel some of the questions do not reflect your experiences, please think back to when you were last a member of a Corporate Board and complete this survey. Each response is vital to gaining an understanding of women’s experiences in this area. The results of this research project will provide a clear understanding of what assists and constrains Australian women’s progression to Board level. Recommendations could then be developed with respect to practices and strategies which enable women to progress to this level. We hope you can be part of this important research as each individual’s information is critical to our explanations. Although each survey has been allocated a file number, the survey is completely voluntary and confidential. If you are willing to participate, complete privacy is assured. Results will be published only in aggregate form. Your individual information is not available to anyone. We are trying to contact as many women as possible in order to obtain a representative sample. If you know of other women on the Board of your Company or women who are members of other Boards of Directors, please invite them to fax us on (03) 9819-0780 and we could send them a survey. I hope you can spare some time to help us. It is vital that you complete all sections of the survey. Yours sincerely Phyllis Tharenou Zena Burgess Department of Business Management PhD Student Faculty of Business & Economics Monash University Monash University

Experiences and Influences of Women Directors
Appendix C. 1995 Survey Instrument Page 251
Appendix C. 1995 Survey Instrument
Opportunities and Experiences of Women
Directors:
A National Survey

Experiences and Influences of Women Directors
Appendix C. 1995 Survey Instrument Page 252
In Confidence
The responses to this questionnaire will be held in STRICTEST CONFIDENCE and data will be published in aggregate form only. The biographical data are crucial to this study and, therefore, we would ask that you complete each question. Please answer the following questions by circling (e.g., ) the most appropriate response unless otherwise instructed.
SECTION 1 - BACKGROUND Q.1 What is your sex? Female ...................................................................... 1 Male.......................................................................... 2
Q.2 What is your age? Under 25 years ......................................................... 1 25 to 29 years............................................................ 2 30 to 34 years............................................................ 3 35 to 39 years............................................................ 4 40 to 44 years............................................................ 5 45 to 49 years............................................................ 6 50 to 54 years............................................................ 7 55 to 59 years............................................................ 8 60 to 64 years............................................................ 9 65 to 69 years............................................................ 10 70 to 75 years............................................................ 11 Over 70 years............................................................ 12
Q.3 Please indicate your country of birth. Australia ................................................................... 1 New Zealand............................................................. 2 Other Oceania countries (eg, Fiji)............................. 3 United Kingdom and Ireland .................................... 4 Other European countries ......................................... 5 The Middle East and North Africa............................ 6 Southeast Asia .......................................................... 7 Northeast Asia .......................................................... 8 Southern Asia ........................................................... 9 USA and Canada .................................................... 10 The Middle and South Americas ............................ 11 Africa...................................................................... 12
Q.4 If you were not born in Australia, please give your year of arrival in Australia.
Arrived prior to 1971................................................ 1 Arrived 1971-1975 ................................................... 2 Arrived 1976-1980 ................................................... 3 Arrived 1981-1985 ................................................... 4 Arrived 1986-1990 ................................................... 5 Arrived 1991 to survey date...................................... 6 Not applicable........................................................... 7
Q.5 Please indicate your HIGHEST level of education completed:
Some secondary school............................................. 1 Year 1O/School Certificate/Intermediate.................. 2 Year 12/HSC/Leaving/Matriculation........................ 3 TAFE College course ............................................... 4 Undergraduate: ...............Associate Diploma .......... 5 Diploma........................... 6 Degree ............................. 7 Postgraduate: ...................Diploma/Honours............ 8 MBA ............................... 9 Masters Degree ............... 10 Doctorate......................... 11
Q.6 What is the title of the first post-secondary qualification you obtained?
.......................................................................................
Q.7 Do you have qualifications from professional associations (e.g. Australian Institute of Management, Australian Institute of Engineers)
No .............................................................................1 Yes ............................................................................2
SECTION 2 - BOARD STATUS Q.8 Are you currently on a Board of Directors of
a company? No .............................................................................1 Yes ............................................................................2
Q.9 How many Boards have you been on, including the present one(s)?
None..........................................................................1 1 to 2 .........................................................................2 2 to 4 .........................................................................3 5 to 6 .........................................................................4 More than 6 ...............................................................5
Q.10 How many years have you been on Boards of Directors?
0 ................................................................................1 1 to 3 years ................................................................2 4 to 6 years ................................................................3 7 to 9 years ................................................................4 10 to 12 years ............................................................5 More than 12 years....................................................6
Q.11 How did you gain Board membership? Invitation by the Chair ..............................................1 Invitation by a Director/Executive ............................2 Election .....................................................................3 Ownership of the Company.......................................4 Family affiliation.......................................................5 Informal Networking.................................................6 Through Being a Consultant for the Company..........7
Q.12 Is the Chairman of the Board a Woman? No .............................................................................1 Yes ............................................................................2
Q.13 For what types of organisations are you a Director?
Publicly listed............................................................1 Public unlisted...........................................................2 Private .......................................................................3 Trust ..........................................................................4 Partnership ................................................................5 Statutory authority.....................................................6 Not for profit .............................................................7
Q.14 How many Directors are there on each of the Board(s) on which you are a member?
first second third 2 to 4........................................... 1.............1 ............ 1 5 to 7........................................... 2.............2 ............ 2 8 to 10......................................... 3.............3 ............ 3 11 to 13....................................... 4.............4 ............ 4 14 to 16....................................... 5.............5 ............ 5 17 to 19....................................... 6.............6 ............ 6 20 or more .................................. 7.............7 ............ 7

Experiences and Influences of Women Directors
Appendix C. 1995 Survey Instrument Page 253
Q.15 Approximately how often do you attend Board meetings?
Weekly...................................................................... 1 Monthly .................................................................... 2 Bi-monthly................................................................ 3 Quarterly................................................................... 4 Half-yearly................................................................ 5 Annually ................................................................... 6
Q.16 How many hours per week (on average) are you involved in Board business?
0 to 5 hours ............................................................... 1 6 to 10 hours ............................................................. 2 11 to 15 hours ........................................................... 3 16 to 20 hours ........................................................... 4 21 to 25 hours ........................................................... 5 26 to 30 hours ........................................................... 6 31 to 35 hours ........................................................... 7 36 to 40 hours ........................................................... 8 More than 40 hours................................................... 9
Q.17 What is your position on the Board(s)? first second third Chair - Executive .........................1 ............ 1.............1 Chair - Non Executive .................2 ............ 2.............2 Managing Director.......................3 ............ 3.............3 Director - Executive.....................4 ............ 4.............4 Director - Non Executive.............5 ............ 5.............5 Secretary......................................6 ............ 6.............6
Q.18 What is approximately the total number of employees in the organisations for which you serve as a Director?
first second third Less than 25.................................1 ............ 1.............1 25 to 50........................................2 ............ 2.............2 51 to 100......................................3 ............ 3.............3 101 to 200....................................4 ............ 4.............4 201 to 500....................................5 ............ 5.............5 501 to 1000..................................6 ............ 6.............6 1001 to 2000................................7 ............ 7.............7 2001 to 4000................................8 ............ 8.............8 4001 to 8000................................9 ............ 9.............9 More than 8000............................10 .......... 10...........10
Q.19 How many years were you in a senior management position prior to accepting Board directorship?
0 to 4 years ................................................................1 5 to 9 years ................................................................2 10 to 14 years ............................................................3 15 to 19 years ............................................................4 20 or more years........................................................5
Q.20 Is being a Director of a Company your principal employment?
No .............................................................................1 Yes ............................................................................2
Q.21 Please indicate your total annual remuneration range for Board directorship.
Nil .............................................................................1 Under $2,000.............................................................2 $2,000 to $7,000........................................................3 $7,001 to $12,000......................................................4 $12,001 to $17,000....................................................5 $17,001 to $22,000....................................................6 $22,001 to $27,000....................................................7 $27,001 to $32,000....................................................8 $32,001 to $37,000....................................................9 $37,001 to $42,000....................................................10 $42,001 to $47,000....................................................11 Over $47,000.............................................................12
Q.22 What is the proportion of men and women on the Board(s)?
first second third All women...................................... 1.............1 ......... 1 A majority of women and a minority of men .................... 2.............2 ......... 2 About 50% women and 50% men ................................. 3.............3 ......... 3 A majority of men and a minority of women ............... 4.............4 ......... 4
All men .......................................... 5.............5 ......... 5
Q.23 If there are other women on the Board, how long have you worked closely with women Board members?
Not at all........................................................................1 Less than 1 year.............................................................2 1 to 2 years ...................................................................3 3 to 4 years ....................................................................4 5 or more years..............................................................5 Not applicable ...............................................................6
SECTION 3 - CAREER SUPPORT Q.24 Please think of a higher-ranking individual with advanced experience and knowledge who has played the most
significant role in the development of your career to the level of Director. Pick only one person; this person can be anyone of your choice. For the person you have selected, indicate their SEX and RELATIONSHIP TO YOU by circling the appropriate numbers from the lists below. Note that in the case of relationship option 5; specify your answer by writing it in the space below the item.
(i) RELATIONSHIP: Your immediate supervisor...................................................................................................................................1 Another senior person in your organisation..........................................................................................................2 A more senior person outside of your organisation ..............................................................................................3 A past boss............................................................................................................................................................4 Another category of person, please specify....... ...................................................................................................5
..............................................................................................................................................................................
(ii) SEX: Male......................................................................................................................................................................1 Female ..................................................................................................................................................................2

Experiences and Influences of Women Directors
Appendix C. 1995 Survey Instrument Page 254
Q.25 Indicate how long this kind of relationship has lasted with the person you have selected. Less than 6 months ...............................................................................................................................................1 6 months to a year.................................................................................................................................................2 1 to 2 years............................................................................................................................................................3 3 to 4 years............................................................................................................................................................4 5 to 6 years............................................................................................................................................................5 7 to 8 years............................................................................................................................................................6 9 or more years .....................................................................................................................................................7
Q.26 Please indicate your extent of agreement with following statements concerning your relationship with this person. This person has had:
Not at all To a small extent
To some extent
To a large extent
To a very large extent
(i) Given or recommended you for challenging assignments
that presented opportunities to learn new skills.
1
2
3
4
5
(ii) Given or recommended you for assignments that required personal contact with managers in different parts of the company.
1
2
3
4
5
(iii) Given or recommended you for assignments that increased your contact with higher level managers.
1
2
3
4
5
(iv) Given or recommended you for assignments that helped you meet new colleagues.
1
2
3
4
5
(v) Helped you finish assignments/tasks or meet deadlines that otherwise would have been difficult to complete.
1
2
3
4
5
(vi) Protected you from working with other managers or work units before you knew about their likes/dislikes, options on controversial topics, and the nature of the political environment.
1
2
3
4
5
(vii) Gone out of his/her way to promote your career interests.
1 2 3 4 5
(viii) Kept you informed about what is going on at higher levels in the company or how external conditions are influencing the company.
1
2
3
4
5
(ix) Conveyed feelings of respect for you as an individual.
1 2 3 4 5
(x) Conveyed empathy for the concerns and feelings you have discussed with him/her.
1
2
3
4
5
(xi) Encouraged you to talk openly about anxiety or fears that detract from your work.
1
2
3
4
5
(xii) Shared personal experiences as an alternative perspective to your problems.
1
2
3
4
5
(xiii) Discussed your questions or concerns regarding feelings of competence, commitment to advancement, relationships with peers and supervisors or work/family conflicts.
1
2
3
4
5
(xiv) Shared history of his/her career with you.
1 2 3 4 5
(xv) Encouraged you to prepare for advancement.
1 2 3 4 5
(xvi) Encouraged you to try new ways of behaving on the job.
1 2 3 4 5
(xvii) Served as a role model.
1 2 3 4 5
(xviii) Displayed attitudes and values similar to your own.
1 2 3 4 5

Experiences and Influences of Women Directors
Appendix C. 1995 Survey Instrument Page 255
SECTION 4 - HOME FACTORS Q.27 Are you: Married ....................................................................1 Living Together .......................................................2 Divorced ..................................................................3 Separated but not divorced ......................................4 Single.......................................................................5 Widowed .................................................................6
Q.28 For how many dependent children are you responsible?
None ........................................................................0 One ..........................................................................1 Two..........................................................................2 Three........................................................................3 Four .........................................................................4 Five..........................................................................5 Six or more ..............................................................6
Q.29 Age of dependent children. If not applicable, please circle 5.
first second third Pre-school age..........................1 ............ 1 .............1 Primary school age...................2 ............ 2 .............2 Secondary school age...............3 ............ 3 .............3 Post-school age ........................4 ............ 4 .............4 No dependent children .............5 ............ 5 .............5
Q.30 Do you share financial responsibility for these dependent children and other dependents with anyone else? If not applicable, please circle 6.
No. I do not contribute directly to the finances ....... 1 Yes, partly. I contribute a minority.......................... 2 Yes, jointly (50/50) ................................................. 3 Yes, partly. I contribute the majority....................... 4 No. I contribute all the finances .............................. 5 No dependents......................................................... 6
Q.31 Does your spouse/partner work in the same industry:
No .......................................................................... 1 Yes .......................................................................... 2 No spouse/partner ................................................... 3
Q.32 Please answer each of these questions with respect to your spouse/partner. If not applicable, please circle 6
Not favourable
at all
Not very favourable
Fairly favourable
Very favourable
Extremely favourable
No partner
(i) How favourable is your partner’s attitude to your career?
1
2
3
4
5
6
(ii) How favourable would your partner’s attitude be to your being in a senior management positionr?
1
2
3
4
5
6
None at all Not much Some A fair amount
A great deal
No partner
(iii) When you have a work problem, how much emotional support are you able to gain from your partner?
1
2
3
4
5
6
(iv) How much does it bother your partner when your work results in less time spent with them?
1
2
3
4
5
6
(v) How much does your partner encourage you in your attempts to further your career?
1
2
3
4
5
6
Strongly disagree
Disagree Unsure Agree Strongly agree
No partner
(vi) I could go further ahead in my career if my partner was more supportive of my career.
1
2
3
4
5
6
(vii) I would find it easier to coordinate my work and family demands if my partner was more supportive.
1
2
3
4
5
6
(viii) I feel my partner should take on a larger share of the household work/child care activity.
1
2
3
4
5
6

Experiences and Influences of Women Directors
Appendix C. 1995 Survey Instrument Page 256
Q.32 (Cont’d) Please answer each of these questions with respect to your spouse/partner. If not applicable, please circle 6
Not at all willing
Not very willing
Fairly willing
Very willing
Extremely willing
No partner
(ix) How willing is your partner to accommodate occasional work demands which you may have to do to further your career?
1
2
3
4
5
6
Not supportive
Not very supportive
Fully supportive
Very supportive
Extremely supportive
No partner
(x) How supportive is your partner of the development of your career?
1
2
3
4
5
6
Never Occasionally Sometimes Often Frequently No partner
(xi) How often does your partner assist you with domestic responsibilities, such as housework/child care?
1
2
3
4
5
6
SECTION 5 - WORK HISTORY Q.33 What is your occupational category? Manager and administrator ......................................1 Professional .............................................................2 Paraprofessional ......................................................3 Tradesperson............................................................4 Clerk ........................................................................5 Salesperson and personal service worker.................6 Plant and machine operator and driver ....................7 Labourer and related worker....................................8
Q.34 In which industry are you employed? Mining ...................................................................... 1 Manufacturing .......................................................... 2 Electricity, gas and water.......................................... 3 Construction ............................................................. 4 Wholesale and retail trade ........................................ 5 Transport and storage ............................................... 6 Communication ........................................................ 7 Finance, property and business services ................... 8 Public administration and defence ............................ 9 Community services ................................................. 10 Recreation, personal and other services.................... 11
Q.35 Do you work Greater than 50 hours per week ................................ 1 35-50 hours per week................................................ 2 20-34 hours per week................................................ 3 Not employed ........................................................... 4
Q.36 Are you an owner-manager? No ............................................................................. 1 Yes............................................................................ 2
Q.37 Since leaving full-time education, have you worked as a full-time employee, CONTINUOUSLY, without leaving the workforce?
No ............................................................................. 1 Yes............................................................................ 2
Q.38 Have you ever worked part-time? No ............................................................................. 1 Yes............................................................................ 2
Q.39 What is the total duration of breaks you have had from full-time work since leaving full-time education?
No breaks ..................................................................1 Up to 2 years .............................................................2 2 to 5 years ................................................................3 5 to 10 years ..............................................................4 10 or more years........................................................5
Q.40 Would you most describe yourself as a Non-Supervisor/Non-Manager (you do not delegate work to any others) .....................................1 Supervisor/Leading Hand/Foreman/Forewoman.......2 Lower Level Manager ...............................................3 Middle Level Manager..............................................4 Senior Level Manager ...............................................5 Executive ..................................................................6 Divisional Head.........................................................7 Chief Executive Officer ............................................8
Q.41 Would you most describe your LAST FULL TIME POSITION as:
Non-Supervisor/Non-Manager (you do not delegate work to any others) .....................................1 Supervisor/Leading Hand/Foreman/Forewoman.......2 Lower Level Manager ...............................................3 Middle Level Manager..............................................4 Senior Level Manager ...............................................5 Executive ..................................................................6 Divisional Head.........................................................7 Chief Executive Officer ............................................8
Q.42 Would you most describe your SECOND LAST FULL TIME POSITION as
Non-Supervisor/Non-Manager (you do not delegate work to any others) .....................................1 Supervisor/Leading Hand/Foreman/Forewoman.......2 Lower Level Manager ...............................................3 Middle Level Manager..............................................4 Senior Level Manager ...............................................5 Executive ..................................................................6 Divisional Head.........................................................7 Chief Executive Officer ............................................8

Experiences and Influences of Women Directors
Appendix C. 1995 Survey Instrument Page 257
Q.43 Would you most describe your spouse/partner as a: Non-Supervisor/Non-Manager (you do not delegate work to any others)..................................... 1 Supervisor/Leading Hand/Foreman/Forewoman ...... 2 Lower Level Manager............................................... 3 Middle Level Manager ............................................. 4 Senior Level Manager............................................... 5 Executive .................................................................. 6 Divisional Head ........................................................ 7 Chief Executive Officer ............................................ 8 Not employed ........................................................... 9 No spouse/partner ..................................................... 10
Q.44 Please indicate the total annual salary range for YOURSELF ALONE IN COLUMN 1 and for your SPOUSE/ PARTNER ALONE IN COLUMN 2. (Circle one response in each column.)
Salary Range (1) Self (2) Spouse/Partner
Under $45,0001 .........................1 $45,001 - $55,000......................2............................. 2 $55,001- $65,000.......................3............................. 3 $65,001- $75,000.......................4............................. 4 $75,001- $85,000.......................5............................. 5 $85,001- $95,000.......................6............................. 6 $95,001- $105,000.....................7............................. 7 $105,001- $115,000...................8............................. 8 $115,000- $125,000...................9............................. 9 Over $125,00010 .......................10
Q.45a How many years have you been in full-time employment in your present ORGANISATION?
Less than one year .................................................... 1 1 to 2 years ............................................................... 2 2 to 5 years ............................................................... 3 5 to 10 years.............................................................. 4 10 to 15 years............................................................ 5 15 to 20 years............................................................ 6 20 to 25 years............................................................ 7 25 to 30 years............................................................ 8 30 to 35 years............................................................ 9 35 or greater years .................................................... 10
Q.45b How many years have you been in full-time employment in your present OCCUPATION?
Less than one year .................................................... 1 1 to 2 years ............................................................... 2 2 to 5 years ............................................................... 3 5 to 10 years.............................................................. 4 10 to 15 years............................................................ 5 15 to 20 years............................................................ 6 20 to 25 years............................................................ 7 25 to 30 years............................................................ 8 30 to 35 years............................................................ 9 35 or greater years .................................................... 10
Q.45c What is the total number of years over your entire lifetime during which you have been a FULL-TIME EMPLOYEE?
Less than one year .................................................... 1 1 to 2 years ............................................................... 2 2 to 5 years ............................................................... 3 5 to 10 years.............................................................. 4 10 to 15 years............................................................ 5 15 to 20 years............................................................ 6 20 to 25 years............................................................ 7 25 to 30 years............................................................ 8 30 to 35 years............................................................ 9 35 or greater years .................................................... 10
Q.46 What is approximately the total number of employees in the organisation where you work?
Less than 25 ..............................................................1 25 to 50 .....................................................................2 51 to 100 ...................................................................3 101 to 200 .................................................................4 201 to 500 .................................................................5 501 to 1000 ...............................................................6 1001 to 2000 .............................................................7 2001 to 4000 .............................................................8 4001 to 8000 .............................................................9 More than 8000 .........................................................10
Q.47 Are your colleagues/peers in your most immediate work environment where you work:
All female..................................................................1 Majority female, minority male.................................2 About 50% male and 50% female.............................3 Majority male, minority female.................................4 All male.....................................................................5
Q.48 What is the proportion of men and women in the managerial/supervisory hierarchy in your local organisation? A hierarchy consists of at least one management level who supervise staff.
All women.................................................................1 A majority of women and a minority of men ............2 About 50% women and 50% men.............................3 A majority of men and a minority of women ............4 All men .....................................................................5
Q.49 Is the Chief Executive Officer of the organisation where you work a woman?
No .............................................................................1 Yes ............................................................................2
Q.50 Have there been women appointed to the same level as your own within your organisation?
No .............................................................................1 Yes ............................................................................2
Q.51 Have the previous occupants of your position usually been women?
No .............................................................................. 1 Yes ............................................................................. 2
Q.52 Were you the first woman to be appointed to this position?
No .............................................................................1 Yes ............................................................................2
Q.53 When was the first time your position was occupied by a woman?
Less than 1 year ago................................................... 1 1 to 2 years ago .......................................................... 2 3 to 5 years ago .......................................................... 3 6 to 9 years ago .......................................................... 4 10 to 16 years ago ...................................................... 5 Over 16 years ago ...................................................... 6
Q.54 How long have you worked closely with a woman manager in your organisation?
Not worked with a woman manager..........................1 Less than 12 months..................................................2 1 up to 2 years ...........................................................3 2 up to 4 years ...........................................................4 4 or more years..........................................................5

Experiences and Influences of Women Directors
Appendix C. 1995 Survey Instrument Page 258
SECTION 6 - CAREER PROGRESSION AND DEVELOPMENT
Q.55 How many promotions have you had in your career? (None is 1, one/two is 2, etc) A promotion is an increase in job responsibility, scope, authority, or level either WITHIN OR OUTSIDE your organisation.
Zero promotions ...................................................................................................................................................1 One/Two promotions............................................................................................................................................2 Three/Four promotions .........................................................................................................................................3 Five/Six promotions .............................................................................................................................................4 Seven/Eight promotions .......................................................................................................................................5 Nine or more promotions......................................................................................................................................6
Q.56 Over your career, how many supervisory or managerial promotions have you had? These are promotions where you move up the supervisory/managerial hierarchy,- eg from middle level manager to senior level manager
Zero promotions ...................................................................................................................................................1 One/Two promotions............................................................................................................................................2 Three/Four promotions .........................................................................................................................................3 Five/Six promotions .............................................................................................................................................4 Seven/Eight promotions........................................................................................................................................5 Nine or more promotions......................................................................................................................................6
Q.57 Over your career, have you mostly gained senior management experience through Line management experience ...............................................................................................................................1 Staff management experience...............................................................................................................................2 Equally through line and staff positions ...............................................................................................................3 Q.58 Please indicate how often each of these has happened to you.
Never One or two
times
Three or four times
Five or six times
Seven or eight
times
Nine or ten times
Eleven or more
times (i) How many times in your career have you interviewed staff for
selection/promotion?l
.
1
2
3
4
5
6
7
(ii) How many times in your career have you participated in conferences or industry meetings or any other outside meetings as a representative of your organisation/department?
.
1
2
3
4
5
6
7
(iii) How many times in your career have you served on committees of any type within your organisation/department?
.
1
2
3
4
5
6
7
(iv) How many times in your career have you attended management training/development courses run by outside organisations/departments?
.
1
2
3
4
5
6
7
(v) How many times in your career have you attended management training/development courses run by your organisation/department?
.
1
2
3
4
5
6
7
(vi) How often have you acted for 3 months or more in a higher position in your career?
.
1
2
3
4
5
6
7
(vii) When you first entered your present job, to what extent were you involved in challenging work assignments? (ie, in the first 3 months in present job)
.
1
2
3
4
5
6
7
(viii) How often has your present job since then involved challenging work assignments?
.
1
2
3
4
5
6
7
(ix) To what extent has a person more senior in position than yourself inside your organisation encouraged you in your career development? (eg, in promotion or advancement within or outside your organisation/department?)
.
1
2
3
4
5
6
7
(x) To what extent have colleague(s) at the same level as yourself within your organisation/department encouraged you in your career development? (eg, in promotion or advancement within your organisation/ department)
.
1
2
3
4
5
6
7
(xi) To what extent have you been encouraged by others in your organisation to apply for, or express interest in, promotion when opportunities become available?
1
2
3
4
5
6
7

Experiences and Influences of Women Directors
Appendix C. 1995 Survey Instrument Page 259
SECTION 7 - HOW I SEE MYSELF
Q.59 Below is a sheet of characteristics. Please use these characteristics in order to describe yourself; that is, please circle on a scale from 1 to 7 how true of you these various characteristics are. Please do not leave any characteristic unmarked. Never or
almost never Usually not true
Sometimes but infrequently true
Occasionally true
Often true
Usually true
Always or almost always true
(i) Defend my own beliefs
1 2 3 4 5 6 7
(ii) Affectionate
1 2 3 4 5 6 7
(iii) Conscientious
1 2 3 4 5 6 7
(iv) Independent
1 2 3 4 5 6
7
(v) Sympathetic
1 2 3 4 5 6 7
(vi) Moody
1 2 3 4 5 6 7
(vii) Assertive
1 2 3 4 5 6 7
(viii) Sensitive to needs of others
1 2 3 4 5 6 7
(ix) Reliable
1 2 3 4 5 6
7
(x) Strong personality
1
2
3 4 5 6 7
(xi) Understanding
1 2 3 4 5 6 7
(xii) Unsystematic
1 2 3 4 5 6 7
(xiii) Forceful
1 2 3 4 5 6 7
(xiv) Compassionate
1 2 3 4 5 6 7
(xv) Helpful
1 2 3 4 5 6 7
(xvi) Have leadership abilities
1 2 3 4 5 6 7
(xvii) Eager to soothe hurt feelings
1 2 3 4 5 6 7
(xviii) Secretive
1 2 3 4 5 6 7
(xix) Willing to take risks
1 2 3 4 5 6 7
(xx) Warm
1 2 3 4 5 6 7
(xxi) Adaptable
1 2 3 4 5 6 7
(xxii) Dominant
1 2 3 4 5 6 7
(xxiii) Tender
1 2 3 4 5 6 7
(xxiv) Solemn
1 2 3 4 5 6 7
(xxv) Willing to take a stand
1 2 3 4 5 6 7
(xxvi) Loyal
1 2 3 4 5 6 7
(xxvii) Tactful
1 2 3 4 5 6 7
(xxviii) Aggressive
1 2 3 4 5 6 7
(xxix) Gentle
1 2 3 4 5 6 7
(xxx) Conventional 1 2 3 4 5 6 7

Experiences and Influences of Women Directors
Appendix C. 1995 Survey Instrument Page 260
SECTION 8 - TRAINING AND DEVELOPMENT Q.60 Please read each statement carefully, then indicate how much you agree with each statement by circling your
preferred response.
Strongly Disagree
Somewhat Disagree
Neutral Somewhat Agree
Strongly Agree
(i) Participating in training programs will help my personal development.
1 2 3 4 5
(ii) Participating in training programs will increase my chances of getting a promotion.
1 2 3 4 5
(iii) Participating in training programs will help me obtain a salary increase.
1 2 3 4 5
(iv) Participating in training programs will help me perform my job better.
1 2 3 4 5
(v) Participating in training programs will result in having to do extra work without being rewarded for it.
1 2 3 4 5
(vi) Participating in training programs will result in more opportunities to pursue different career paths.
1 2 3 4 5
(vii) Participating in training programs will lead to more respect from my peers.
1 2 3 4 5
(viii) Participating in training programs will give me a better idea of the career path I want to pursue.
1 2 3 4 5
(ix) Participating in training programs will help me reach my career objectives.
1 2 3 4 5
(x) Participating in training programs will help me network with other employees.
1 2 3 4 5
(xi) Participating in training programs will help me stay up to date on new processes, products or procedures relating to my job.
1 2 3 4 5
Q.61 In which State do you live?
New South Wales .................................................................................................................................................1 Victoria.................................................................................................................................................................2 Queensland ...........................................................................................................................................................3 South Australia .....................................................................................................................................................4 Western Australia .................................................................................................................................................5 Tasmania ..............................................................................................................................................................6 Australian Capital Territory..................................................................................................................................7 Northern Territory ................................................................................................................................................8 Q.62 In which location do you work?
Rural .....................................................................................................................................................................1 Metropolitan .........................................................................................................................................................2

Experiences and Influences of Women Directors
Appendix D. Alphabetical List of 1995 Survey Items and Derived Variables Page 261
Appendix D. Alphabetical List of 1995 Survey Items and Derived Variables Name Description
Q.29 “Age of dependent children. If not applicable please circle 5.” 1 (Pre-school age) 2 (Primary school age) 3 (Secondary school age)
Age of dependent children
4 (Post-school age) 5 (No dependent children)
Q.11 “How did you gain board membership?” 1 (Invitation by the chair) 5 (Family affiliation) 2 (Invitation by director/executive) 6 (Informal networking) 3 (Election)
Basis of recruitment
4 (Ownership of the company) 7 (Through being a consultant to the
company)
Q.12 “Is the Chairman of the Board a Woman?” Board chair gender 1 (No) 2 (Yes)
Q.13 “For what types of organisations are you a Director?” 1 (Publicly listed) 3 (Private) 5 (Partnership) 7 (Not for profit)
Board corporation type
2 (Public unlisted) 4 (Trust) 6 (Statutory authority)
Q.22 “What is the proportion of men and women on the Board(s)?” 1 (All women) 2 (A majority of women and a minority of men) 3 (About 50% women and 50% men) 4 (A majority of men and a minority of women)
Board gender proportion
5 (All men)
Q.14 “How many Directors are there on each of the Board(s) on which you are a member?” 1 (2 to 4) 3 (8 to 10) 5 (14 to 16)
Board directors
2 (5 to 7) 4 (11 to 13) 6 (17 to 19) 7 (20 or more)
Q.18 “What is approximately the total number of employees in the organisations for which you serve as a Director?” 1 (Less than 25) 4 (101 to 200) 7 (1001 to 2000) 2 (25 to 50) 5 (201 to 500) 8 (2001 to 4000)
Board employees
3 (51 to 100) 6 (501 to 1000) 9 (4001 to 8000)
10 (More than 8000)
Q.15 “Approximately how often do you attend Board meetings?” 1 (Weekly) 3 (Bi-monthly) 5 (Half-yearly)
Board meeting frequency
2 (Monthly) 4 (Quarterly) 6 (Annually)
Career encouragement Q.58 A scale derived from three 7-point items measuring frequency from 1 (never) to 7 (eleven or more times). The three items were: (ix) To what extent has a person more senior in position than yourself inside your
organisation encouraged you in your career development (eg, in promotion or advancement within or outside your organisation/department)?
(x) To what extent have colleague(s) at the same level as yourself within your organisation/department encouraged you in your career development (eg, in promotion or advancement within your organisation/ department)?
(xi) To what extent have you been encouraged by others in your organisation to apply for, or express interest in, promotion when opportunities become available?
Q.55 “How many promotions have you had in your career?” 1 (Zero promotions) 3 (Three/four promotions) 5 (Seven/eight promotions)
Career promotions
2 (One/two promotions) 4 (Five/six promotions) 6 (Nine or more promotions)
Career tenure A heading for a combination of the three items Employment tenure, Occupation tenure, and Organisation tenure.

Experiences and Influences of Women Directors
Appendix D. Alphabetical List of 1995 Survey Items and Derived Variables Page 262
Name Description
CEO experience A dichotomous variable representing the occurrence of Chief Executive Officer as a response to either of Managerial level of current position, Managerial level of last position, or Managerial level of second-last position.
Challenging work Q.58 A scale derived from two 7-point items measuring frequency from 1 (never) to 7 (eleven or more times). The items were: (vii) When you first entered your present job, to what extent were you involved in
challenging work assignments? (ie, in the first 3 months in present job) (viii) How often has your present job since then involved challenging work assignments?
Q.37 “Since leaving full-time education, have you worked as a full-time employee, continuously, without leaving the workforce?”
Continuous full-time employment
1 (No) 2 (Yes)
Q.3 “Please indicate your country of birth.” 1 (Australia) 7 (South-east Asia) 2 (New Zealand) 8 (North-east Asia) 3 (Other Oceania countries, eg, Fiji) 9 (Southern Asia) 4 (United Kingdom and Ireland) 10 (USA and Canada) 5 (Other European countries) 11 (Middle and South Americas)
Country of birth
6 (Middle East and North Africa) 12 (Africa)
Q.8 “Are you currently on a Board of Directors of a company?” Current board member 1 (No) 2 (Yes)
Q.2 “What is your age?” 1 (Under 25 years) 4 (35 to 39 years) 7 (50 to 54 years) 10 (65 to 69 years) 2 (25 to 29 years) 5 (40 to 44 years) 8 (55 to 59 years) 11 (70 to 75 years)
Director age
3 (30 to 34 years) 6 (45 to 49 years) 9 (60 to 64 years) 12 (Over 70 years)
Director board obligations
A heading for a combination of the two items Board meeting frequency and Director time commitment. Q.17 “What is your position on the Board(s)?” 1 (Chair - Executive) 3 (Managing Director) 5 (Director - Non Executive)
Director position
2 (Chair - Non Executive) 4 (Director - Executive) 6 (Secretary)
Q.16 “How many hours per week (on average) are you involved in Board business?” 1 (0 to 5 hours) 4 (16 to 20 hours) 7 (31 to 35 hours) 2 (6 to 10 hours) 5 (21 to 25 hours) 8 (36 to 40 hours)
Director time commitment
3 (11 to 15 hours) 6 (26 to 30 hours) 9 (More than 40 hours)
Director type A dichotomous variable formed by collapsing the Director position responses of Chair - Executive, Managing Director, Director - Executive, and Secretary into a category of Executive Director, and the responses of Chair - Non Executive and Director - Non Executive into a category of Nonexecutive Director.
Q.49 “Is the Chief Executive Officer of the organisation where you work a woman?” Employment CEO gender 1 (No) 2 (Yes)
Q.34 “In which industry are you employed?” 1 (Mining) 7 (Communication) 2 (Manufacturing) 8 (Finance, property and business services) 3 (Electricity, gas and water) 9 (Public administration and defence) 4 (Construction) 10 (Community services) 5 (Wholesale and retail trade)
Employment industry
6 (Transport and storage) 11 (Recreation, personal and other services)

Experiences and Influences of Women Directors
Appendix D. Alphabetical List of 1995 Survey Items and Derived Variables Page 263
Name Description Q.46 “What is approximately the total number of employees in the organisation where you work?” 1 (Less than 25) 4 (101 to 200) 7 (1001 to 2000) 2 (25 to 50) 5 (201 to 500) 8 (2001 to 4000)
Employment employees
3 (51 to 100) 6 (501 to 1000) 9 (4001 to 8000)
10 (More than 8000)
Employment sector Derived by collapsing the employment industries of Mining, Manufacturing, Electricity, gas and water, Construction, Wholesale and retail trade, Transport and storage, Communication, Finance, property and business services, and Recreation, personal and other services to a category of Private sector, and the industries of Public administration and defence and Community services to a category of Public sector.
Q.45c “What is the total number of years over your entire lifetime during which you have been a full-time employee?” 1 (Less than one year) 5 (10 to 15 years) 9 (30 to 35 years) 2 (1 to 2 years) 6 (15 to 20 years) 3 (2 to 5 years) 7 (20 to 25 years)
Employment tenure
4 (5 to 10 years) 8 (25 to 30 years)
10 (35 or greater years)
Q.30 “Do you share financial responsibility for these dependent children and other dependents with anyone else?” 1 (No. I do not contribute directly to finances) 4 (Yes, mostly. I contribute the majority) 2 (Yes, partly. I contribute a minority) 5 (No. I contribute all the finances)
Financial responsibility for dependent children
3 (Yes, jointly – 50/50) 6 (No dependents)
Q.5 “Please indicate your HIGHEST level of education completed.” 1 (Some secondary school) 7 (Undergraduate: Degree) 2 (Year 10/School Certificate/Intermediate) 8 (Postgraduate: Diploma/Honours) 3 (Year 12/HSC/ Leaving/Matriculation) 9 (Postgraduate: MBA) 4 (TAFE College course) 10 (Postgraduate: Masters Degree) 5 (Undergraduate: Associate Diploma) 11 (Postgraduate: Doctorate)
Highest level of education
6 (Undergraduate: Diploma)
Q.4 “If you were not born in Australia, please give your year of arrival in Australia.” 1 (Arrived prior to 1971) 4 (Arrived 1981-1985) 2 (Arrived 1971-1975) 5 (Arrived 1986-1990)
7 (Not applicable) Immigration year
3 (Arrived 1976-1980) 6 (Arrived 1991 to survey date)
Q.53 “When was the first time your position was occupied by a woman?” 1 (Less than 1 year ago) 3 (3 to 5 years ago) 5 (10 to 16 years ago)
Interval since first woman in director’s organisation position 2 (1 to 2 years ago) 4 (6 to 9 years ago) 6 (Over 16 years ago)
Male managerial hierarchy
A scale derived from the three items of Managerial gender proportion, Work colleagues gender proportion, and Employment CEO gender.
Male-stereotyped position
A scale derived from the three items of Women previously appointed to director’s organisation level, Women previously appointed to director’s organisation position, and Women usually occupy director’s organisation position.
Managerial advancement
A scale derived from the six items of Managerial level of current position, Managerial level of last position, Managerial level of second-last position, Managerial promotions, Career promotions and Total annual salary.
Q.57 “Over your career, have you mostly gained senior management experience through:” 1 (Line management experience)
Managerial experience type
2 (Staff management experience) 3 (Equally through line and staff positions)

Experiences and Influences of Women Directors
Appendix D. Alphabetical List of 1995 Survey Items and Derived Variables Page 264
Name Description Q.48 “What is the proportion of men and women in the managerial/supervisory hierarchy in your local organisation?” 1 (All women) 2 (A majority of women and a minority of men) 3 (About 50% women and 50% men) 4 (A majority of men and a minority of women)
Managerial gender proportion
5 (All men)
Managerial level of current position
Q.40 “Would you most describe yourself as a:” 1 Non-Supervisor/Non-Manager – you do not delegate work to any others 2 Supervisor/Leading Hand/Foreman/Forewoman 3 Lower Level Manager 5 Senior Level Manager 7 Divisional Head 4 Middle Level Manager 6 Executive 8 Chief Executive Officer
Managerial level of last position
Q.41 “Would you most describe your last full time position as:” 1 Non-Supervisor/Non-Manager – you do not delegate work to any others 2 Supervisor/Leading Hand/Foreman/Forewoman 3 Lower Level Manager 5 Senior Level Manager 7 Divisional Head 4 Middle Level Manager 6 Executive 8 Chief Executive Officer
Managerial level of partner
Q.43 “Would you most describe your spouse/partner as a:” 1 Non-Supervisor/Non-Manager – you do not delegate work to any others 2 Supervisor/Leading Hand/Foreman/Forewoman 3 Lower Level Manager 6 Executive 9 Not employed 4 Middle Level Manager 7 Divisional Head 10 No spouse/partner 5 Senior Level Manager 8 Chief Executive Officer
Managerial level of second-last position
Q.42 “Would you most describe your second last full time position as:” 1 Non-Supervisor/Non-Manager – you do not delegate work to any others 2 Supervisor/Leading Hand/Foreman/Forewoman 3 Lower Level Manager 5 Senior Level Manager 7 Divisional Head 4 Middle Level Manager 6 Executive 8 Chief Executive Officer
Q.56 “Over your career, how many supervisory or managerial promotions have you had?” 1 (Zero promotions) 3 (Three/four promotions) 5 (Seven/eight promotions)
Managerial promotions
2 (One/two promotions) 4 (Five/six promotions) 6 (Nine or more promotions)
Mentor support Q.26 A scale derived from eighteen 5-point items from 1 (not at all) to 7 (to a very large extent) measuring the respondent’s extent of agreement with statements concerning their relationship with a mentor. The items listed below had the preface “This person has”. (i) Given or recommended you for challenging assignments that presented
opportunities to learn new skills. (ii) Given or recommended you for assignments that required personal contact with
managers in different parts of the company. (iii) Given or recommended you for assignments that increased your contact with higher
level managers. (iv) Given or recommended you for assignments that helped you meet new colleagues. (v) Helped you finish assignments/tasks or meet deadlines that otherwise would have
been difficult to complete. (vi) Protected you from working with other managers or work units before you knew
about their likes/dislikes, options on controversial topics, and the nature of the political environment.
(vii) Gone out of his/her way to promote your career interests. (viii) Kept you informed about what is going on at higher levels in the company or how
external conditions are influencing the company. (ix) Conveyed feelings of respect for you as an individual. (x) Conveyed empathy for the concerns and feelings you have discussed with him/her. (xi) Encouraged you to talk openly about anxiety or fears that detract from your work. (xii) Shared personal experiences as an alternative perspective to your problems.

Experiences and Influences of Women Directors
Appendix D. Alphabetical List of 1995 Survey Items and Derived Variables Page 265
Name Description
Mentor support (cont.) (xiii) Discussed your questions or concerns regarding feelings of competence, commitment to advancement, relationships with peers and supervisors or work/family conflicts.
(xiv) Shared history of his/her career with you. Encouraged you to prepare for advancement.
(xv) Encouraged you to try new ways of behaving on the job. (xvi) Served as a role model. (xvii) Displayed attitudes and values similar to your own.
Q.28 “For how many dependent children are you responsible?” 0 (None) 2 (Two) 4 (Four)
Number of dependent children
1 (One) 3 (Three) 5 (Five) 6 (Six or more)
Q.33 “What is your occupational category?” 1 (Manager and administrator) 5 (Clerk) 2 (Professional) 6 (Salesperson and personal service worker) 3 (Paraprofessional) 7 (Plant and machine operator and driver)
Occupation category
4 (Tradesperson) 8 (Labourer and related worker)
Q.45b “How many years have you been in full-time employment in your present occupation?” 1 (Less than one year) 5 (10 to 15 years) 9 (30 to 35 years) 2 (1 to 2 years) 6 (15 to 20 years) 3 (2 to 5 years) 7 (20 to 25 years)
Occupation tenure
4 (5 to 10 years) 8 (25 to 30 years)
10 (35 or greater years)
Q.45a “How many years have you been in full-time employment in your present organisation?” 1 (Less than one year) 5 (10 to 15 years) 9 (30 to 35 years) 2 (1 to 2 years) 6 (15 to 20 years) 3 (2 to 5 years) 7 (20 to 25 years)
Organisation tenure
4 (5 to 10 years) 8 (25 to 30 years)
10 (35 or greater years)
Partner accommodates occasional work demands
Q.32 (ix) “How willing is your partner to accommodate occasional work demands which you may have to do to further your career?” 1 Not at all willing 3 Fairly willing 5 Extremely willing 2 Not very willing 4 Very willing 6 No partner
Q.44 (2) “Please indicate the total annual salary range for your spouse/partner.” 1 (Under $45,001) 5 ($75,001- $85,000) 9 ($115,000- $125,000) 2 ($45,001 - $55,000) 6 ($85,001- $95,000) 3 ($55,001- $65,000) 7 ($95,001- $105,000)
Partner annual salary
4 ($65,001- $75,000) 8 ($105,001- $115,000)
10 (Over $125,000)
Q.32 (xi) “How often does your partner assist you with domestic responsibilities, such as housework/child care?” 1 (Never) 3 (Sometimes) 5 (Frequently)
Partner assists with domestic responsibili-ties
2 (Occasionally) 4 (Often) 6 (No partner)
Q.32 (iv) “How much does it bother your partner when your work results in less time spent with them?” 1 (None at all) 3 (Some) 5 (A great deal)
Partner bothered by reduced time together
2 (Not much) 4 (A fair amount) 6 (No partner)
Q.32 (v) “How much does your partner encourage you in your attempts to further your career?” 1 (None at all) 3 (Some) 5 (A great deal)
Partner encourages career advancement
2 (Not much) 4 (A fair amount) 6 (No partner)

Experiences and Influences of Women Directors
Appendix D. Alphabetical List of 1995 Survey Items and Derived Variables Page 266
Name Description Q.32 (i) “How favourable is your partner’s attitude to your career?” 1 (Not favourable at all) 3 (Fairly favourable) 5 (Extremely favourable)
Partner favourable to career
2 (Not very favourable) 4 (Very favourable) 6 (No partner)
Q.32 (ii) “How favourable would your partner’s attitude be to your being in a senior management position?” 1 (Not favourable at all) 3 (Fairly favourable) 5 (Extremely favourable)
Partner favourable to senior management position
2 (Not very favourable) 4 (Very favourable) 6 (No partner)
Q.31 “Does your spouse/partner work in the same industry?” Partner in the same industry 1 (No) 2 (Yes) 3 (No spouse/partner)
Q.32 (iii) “When you have a work problem, how much emotional support are you able to gain from your partner?” 1 (None at all) 3 (Some) 5 (A great deal)
Partner provides emotional support
2 (Not much) 4 (A fair amount) 6 (No partner)
Q.27 “Are you:” 1 (Married) 4 (Separated, but not divorced) 2 (Living together) 5 (Single)
Partner relationship
3 (Divorced) 6 (Widowed)
Q.32 (viii) “I feel my partner should take on a larger share of the household work/child care activity.” 1 (Strongly disagree) 3 (Unsure) 5 (Strongly Agree)
Partner reluctant with domestic responsibili-ties
2 (Disagree) 4 (Agree) 6 (No partner)
Q.32 (x) “How supportive is your partner of the development of your career?” 1 (Not supportive) 3 (Fairly supportive) 5 (Extremely supportive)
Partner supportive of career development
2 (Not very supportive) 4 (Very supportive) 6 (No partner)
Q.32 (vi) “I could go further ahead in my career if my partner was more supportive of my career.” 1 (Strongly disagree) 3 (Unsure) 5 (Strongly Agree)
Partner unsupportive of career
2 (Disagree) 4 (Agree) 6 (No partner)
Partner unsupportive of work and family demands
Q.32 (vii) “I would find it easier to coordinate my work and family demands if my partner was more supportive.” 1 (Strongly disagree) 3 (Unsure) 5 (Strongly Agree) 2 (Disagree) 4 (Agree) 6 (No partner)
Q.38 “Have you ever worked part-time?” Part-time work 1 (No) 2 (Yes)
Q.20 “Is being a director of a company your principal employment?” Principal employment is board directorship 1 (No) 2 (Yes)
Q.19 “How many years were you in a senior management position prior to accepting Board directorship?” 1 (0 to 4 years) 3 (10 to 14 years)
Senior management years
2 (5 to 9 years) 4 (15 to 19 years) 5 (20 or more years)
Q.44 (1) “Please indicate the total annual salary range for yourself.” 1 (Under $45,001) 5 ($75,001- $85,000) 9 ($115,000- $125,000) 2 ($45,001 - $55,000) 6 ($85,001- $95,000) 3 ($55,001- $65,000) 7 ($95,001- $105,000)
Total annual salary
4 ($65,001- $75,000) 8 ($105,001- $115,000)
10 (Over $125,000)

Experiences and Influences of Women Directors
Appendix D. Alphabetical List of 1995 Survey Items and Derived Variables Page 267
Name Description Q.21 “Please indicate your total annual remuneration range for Board directorship.” 1 (Nil) 5 ($12,001 to $17,000) 9 ($32,001 to $37,000) 2 (Under $2,000) 6 ($17,001 to $22,000) 10 ($37,001 to $42,000) 3 ($2,000 to $7,000) 7 ($22,001 to $27,000) 11 ($42,001 to $47,000)
Total directorship remuneration
4 ($7,001 to $12,000) 8 ($27,001 to $32,000) 12 (Over $47,000)
Q.10 “How many years have you been on Boards of Directors?” 1 (Less than 1 year) 3 (4 to 6 years) 5 (10 to 12 years)
Total directorship years
2 (1 to 3 years) 4 (7 to 9 years) 6 (More than 12 years)
Q.9 “How many Boards have you been on, including the present one(s)?” 1 (None) 3 (2 to 4)
Total directorships
2 (1 to 2) 4 (5 to 6) 5 (More than 6)
Q.39 “What is the total duration of breaks you have had from full-time work since leaving full-time education?” 1 (No breaks) 3 (2 to 5 years)
Total duration of work breaks
2 (Up to 2 years) 4 (5 to 10 years) 5 (10 or more years)
Training and development
Q.58 A scale derived from six 7-point items measuring frequency from 1 (never) to 7 (eleven or more times). The items were: (i) How many times in your career have you interviewed staff for selection/promotion? (ii) How many times in your career have you participated in conferences or industry
meetings or any other outside meetings as a representative of your organisation/department?
(iii) How many times in your career have you served on committees of any type within your organisation/department?
(iv) How many times in your career have you attended management training/development courses run by outside organisations/departments?
(v) How many times in your career have you attended management training/development courses run by your organisation/department?
(vi) How often have you acted for 3 months or more in a higher position in your career?
Q.50 “Have there been women appointed to the same level as your own within your organisation?”
Women previously appointed to director’s organisation level 1 (No) 2 (Yes)
Q.52 “Were you the first woman to be appointed to this position?” Women previously appointed to director’s organisation position
1 (No) 2 (Yes)
Q.51 “Have the previous occupants of your position usually been women?” Women usually occupy director’s organisation position
1 (No) 2 (Yes)
Q.47 “Are your colleagues/peers in your most immediate work environment where you work:” 1 (All female) 4 (Majority male, minority female) 2 (Majority female, minority male) 5 (All male)
Work colleagues gender proportion
3 (About 50% male and 50% female)
Work continuity A scale derived from the three items of Continuous full-time employment, Part-time work, and Total annual salary.
Q.23 “If there are other women on the Board, how long have you worked closely with women Board members?” 1 (Not at all) 3 (1 to 2 years) 5 (5 or more years)
Years worked with women directors
2 (Less than 1 year) 4 (3 to 4 years) 6 (Not applicable)

Experiences and Influences of Women Directors
Appendix D. Alphabetical List of 1995 Survey Items and Derived Variables Page 268
Name Description Q.54 “How long have you worked closely with a woman manager in your organisation?” 1 (Not worked with a woman manager) 4 (2 up to 4 years)
Years worked with women managers
2 (Less than 12 months) 3 (1 up to 2 years) 5 (4 or more years)

Experiences and Influences of Women Directors
Appendix E. 2001 Women Participants Letters and Consent Forms Page 269
Appendix E. 2001 Women Participants Letters and Consent Forms
INFORMATION LETTER TO FEMALE PARTICIPANTS
Title of Project: Experiences and Influences of Board Directors
Staff Supervisor: Professor Barry Fallon
Student Researcher: Zena Burgess
Programme In Which Enrolled: Psychology PhD
Dear female corporate director, Six years ago you responded to a survey on Opportunities and Experiences of Women Directors: A National Survey in which you agreed to participate in follow-up research. Now we are contacting you again as part of an Australia-wide research project to enhance the understanding of board directors of Australian corporations. This Australian data will help individuals and organisation understand and develop strategies for progression of directors at board level. The results of the research project will provide a clearer understanding of the types of experiences that are factors in board appointments, perceptions of board director roles and sources of influential power on corporate boards. Formulation of recommendations with respect to practices and strategies that help board members maximise their effectiveness on a board may be possible. Enclosed are two surveys together with return envelopes, one for yourself and a shorter one with an introductory letter and consent form that I would like you to give to a male director that you share a board with. The appropriate introductory letters and surveys should be easy to identify as being labelled for female and male. Completion of the survey for female directors should take about 15 minutes of your time to complete, while the one for male directors should only take 10 minutes. Research participation is voluntary and all responses will be kept confidential. Results will only be published in aggregate form making it impossible to identify any individual. Although we are keen for you to contribute to the research project, you are free to refuse to participate without any reason or withdraw consent to any possible follow up at any time with giving a reason. Questions regarding this project should be directed to the Supervisor, Professor Barry Fallon, on (03) 9953 3108 in the School of Psychology, St Patrick’s Campus, Locked Bag 4115, Fitzroy Victoria 3065, or the Researcher, Zena Burgess, care of Professor Barry Fallon at the above address. This study has been approved by the Human Research Ethics Committee at Australian Catholic University. In the event that you have any complaint or concern about the way you have been treated during the study, or if you have any query that the Supervisor and Researcher has (have) not been able to satisfy, you may write to the Chair of the Human Research Ethics Committee, care of Research Services, Australian Catholic University, Locked Bag 4115, Fitzroy Victoria 3065 (telephone 03 9953 3157, fax 03 9953 3305). Any complaint or concern will be treated in confidence and fully investigated. The participant will be informed of the outcome. If you agree to participate in this project, you should sign both copies of the Consent Form, retain one copy for your records and return the other copy to the Researcher.

Experiences and Influences of Women Directors
Appendix E. 2001 Women Participants Letters and Consent Forms Page 270
Yours sincerely, …………………………………………………….. Zena Burgess Researcher …………………………………………………….. Professor Barry Fallon Supervisor

Experiences and Influences of Women Directors
Appendix E. 2001 Women Participants Letters and Consent Forms Page 271
Australian Catholic University
CONSENT FORM
Title of Project: Experiences and Influences of Board Directors
Staff Supervisor: Professor Barry Fallon
Student Researcher: Zena Burgess
I ................................................... (the participant) have read and understood the information provided in the Letter to Participants. Any questions I have asked have been answered to my satisfaction. I agree to participate in this activity, realising that I can withdraw at any time. I agree that research data collected for the study may be published or may be provided to other researchers in a form that does not identify me in any way.
NAME OF PARTICIPANT: ....................................................................................................... (block letters)
SIGNATURE ........................................................ DATE ....................................... SIGNATURE OF SUPERVISOR: ...............................................................................................
DATE:……………………………………..
SIGNATURE OF RESEARCHER:..............................................................................................
DATE:.....................................………….

Experiences and Influences of Women Directors
Appendix E. 2001 Women Participants Letters and Consent Forms Page 272
Title of Project: Experiences and Influences of Board Directors
Staff Supervisor: Professor Barry Fallon Student Researcher: Zena Burgess
Programme In Which Enrolled: Psychology PhD Dear female corporate director, Two weeks ago you should have received an invitation to participate in a research project on Opportunities and Experiences of Women Directors. This research continues a study you participated in six years ago and indicated you were interested in a followup. We have not yet received a response from you and would encourage you to send your response by return mail as soon as possible. If you have already returned your survey in the last few days we sincerely appreciate your willingness to assist our research. If you have misplaced your survey please contact myself or Professor Fallon via the Australian Catholic University. This Australian data will help individuals and organisation understand and develop strategies for progression of directors at board level. The results of the research project will provide a clearer understanding of the types of experiences that are factors in board appointments, perceptions of board director roles and sources of influential power on corporate boards. Formulation of recommendations with respect to practices and strategies that help board members maximise their effectiveness on a board may be possible. Research participation is voluntary and all responses will be kept confidential. Results will only be published in aggregate form making it impossible to identify any individual. Although we are keen for you to contribute to the research project, you are free to refuse to participate without any reason or withdraw consent to any possible follow up at any time with giving a reason. Questions regarding this project should be directed to the Supervisor, Professor Barry Fallon, on (03) 9953 3108 in the School of Psychology, St Patrick’s Campus, Locked Bag 4115, Fitzroy Victoria 3065, or the Researcher, Zena Burgess, care of Professor Barry Fallon at the above address. Yours sincerely, ................................................... ................................................... Zena Burgess Professor Barry Fallon Researcher Supervisor

Experiences and Influences of Women Directors
Appendix F. 2001 Survey Instrument for Women Participants Page 273
Appendix F. 2001 Survey Instrument for Women Participants
Experiences and Influences of Women Directors:
A National Survey

Experiences and Influences of Women Directors
Appendix F. 2001 Survey Instrument for Women Participants Page 274
In Confidence The responses to this questionnaire will be held in STRICTEST CONFIDENCE and data will be published in aggregate form only. The biographical data are crucial to this study and, therefore, we would ask that you complete each question. Please answer the following questions by circling (e.g., ) the most appropriate response or responses, or writing a number in the box supplied.
Q.1 Are you currently on a Board of Directors? No ...........................................................................1 Yes..........................................................................2
Q.2 If the answer to Q.1 was No, then why are you no longer on a Board of Directors? Career change .........................................................1 Not reappointed ......................................................2 Retired ....................................................................3 Personal reasons......................................................4 Other reasons ..........................................................5
If you are no longer on a Board of Directors, do not answer any more questions, but please return the survey so that we know that you are no longer on any Boards.
SECTION 1 – PERSONAL BACKGROUND
Q.3 What is your age? ...................................
Q.4 Have you completed a university degree? No ...........................................................................1 Yes..........................................................................2
Q.5 Do you have an MBA or similar advanced management degree? No ...........................................................................1 Yes..........................................................................2
Q.6 Please indicate your HIGHEST level of education completed: Some secondary school...........................................1 Year 10/School Certificate/Intermediate.................2 Year 12/HSC/Leaving/Matriculation ......................3 TAFE College course..............................................4 Undergraduate: ............. Associate Diploma...........5 Diploma ...........................6 Degree .............................7 Postgraduate: ................ Diploma/Honours ............8 MBA................................9 Masters Degree................10 Doctorate .........................11
SECTION 2 – FAMILY ENVIRONMENT
Q.7 What relationship with a partner do you have? Married ...................................................................1 Living Together ......................................................2 Divorced .................................................................3 Separated but not divorced......................................4 Single......................................................................5 Widowed.................................................................6
Q.8 How many children do you have? .............
Q.9 If you have children, what are their ages? Please mark all that apply. Pre-school age ........................................................ 1 Primary school age ................................................. 2 Secondary school age ............................................. 3 Post-secondary school age...................................... 4 Fully independent................................................... 5
Q.10 Do you have financial responsibility for any dependents (children or anyone else)? Please indicate your share of financial responsibility. No. I do not contribute directly to the finances ...... 1 Yes, partly. I contribute a minority......................... 2 Yes, jointly (50/50) ................................................ 3 Yes, mostly. I contribute the majority .................... 4 I contribute all the finances .................................... 5 No financial dependents ......................................... 6
SECTION 3 – EMPLOYMENT SITUATION
Q.11 In which industry are you employed? Mining.......................................................................1 Manufacturing...........................................................2 Electricity, gas and water ..........................................3 Construction..............................................................4 Wholesale and retail trade .........................................5 Transport and storage................................................6 Communication.........................................................7 Finance, property and business services....................8 Public administration and defence ............................9 Community services..................................................10 Recreation, personal and other services ....................11
Q.12 Which terms best describe your functional backgrounds? Please mark all that apply.
Marketing..................................................................1 Sales ..........................................................................2 Operations .................................................................3 Research and development........................................4 Engineering ...............................................................5 Law ...........................................................................6 Finance......................................................................7 Accounting................................................................8 Other .........................................................................9
Q.13 Would you most describe yourself as a: Non-Supervisor/Non-Manager (you do not delegate work to any others) .....................................1 Supervisor/Leading Hand/Foreman/Forewoman.......2 Lower Level Manager ...............................................3 Middle Level Manager..............................................4 Senior Level Manager ...............................................5 Executive...................................................................6 Divisional Head.........................................................7 Chief Executive Officer ............................................8
Q.14 Is the Chief Executive Officer where you are employed a woman?
No .............................................................................1 Yes ............................................................................2

Experiences and Influences of Women Directors
Appendix F. 2001 Survey Instrument for Women Participants Page 275
Q.15 What is the total number of employees in the organisation where you work?
Less than 25.............................................................. 1 25 to 50..................................................................... 2 51 to 100................................................................... 3 101 to 200................................................................. 4 201 to 500................................................................. 5 501 to 1000............................................................... 6 1001 to 2000 ............................................................. 7 2001 to 4000 ............................................................. 8 4001 to 8000 ............................................................. 9 More than 8000......................................................... 10
Q.16 Please indicate your total annual employment salary (not including remuneration from Boards).
Nil............................................................................. 1 Under $45,000 2 $45,001 - $65,000..................................................... 3 $65,001- $85,000...................................................... 4 $85,001- $105,000.................................................... 5 $105,001- $125,000.................................................. 6 $125,001- $145,000.................................................. 7 $145,001- $165,000.................................................. 8 $165,001- $185,000.................................................. 9 $185,001- $205,000.................................................. 10 Over $205,00011
Q.17 What is the proportion of men and women in the managerial/supervisory hierarchy in your local organisation? A hierarchy consists of at least one management level who supervise staff.
All women ................................................................ 1 A majority of women and a minority of men............ 2 About 50% women and 50% men ............................ 3 A minority of women and a majority of men............ 4 All men, apart from yourself..................................... 5
Q.18 For how many years have you worked closely with other woman managers in your employment organisation?................
Q.19 Are your colleagues in your immediate work environment:
All women.................................................................1 A majority of women and a minority of men ............2 About 50% women and 50% men.............................3 A minority of women and a majority of men ............4 All men, apart from yourself .....................................5
SECTION 4 – DIRECTOR BACKGROUND
Q.20 For how many years were you in a senior management position before accepting a Board directorship?...............
Q.21 For how many years have you been on Boards of Directors?..................................
Q.22 How many Boards have you been on, including the present one(s)? ....................
Q.23 How many Boards are you presently on concurrently? ........................................
Q.24 If you are presently on more than one board, how many years have you been on more than one board? ..........................
Q.25 For how many years have you been a non-executive director? .............................
Q.26 On how many Boards have you been a non-executive director? .............................
Q.27 For how many years have you worked closely with other women directors?........
SECTION 5 – BOARDS AND THEIR ORGANISATIONS Please provide answers for up to seven Boards on which you are a director using one column per organisation, from the organisation with the greatest number of employees to the organisation with the least number of employees.
Greatest no of ........................Organisations in order of ..........................Least no of employees.............................. number of employees ............................. employees
Q.28 What is the total number of employees in the organisation of which you are a board member? Less than 25...................................................................1 ................1................ 1................1 ............... 1................ 1 ................1 25 to 50..........................................................................2 ................2................ 2................2 ............... 2................ 2 ................2 51 to 100........................................................................3 ................3................ 3................3 ............... 3................ 3 ................3 101 to 200......................................................................4 ................4................ 4................4 ............... 4................ 4 ................4 201 to 500......................................................................5 ................5................ 5................5 ............... 5................ 5 ................5 501 to 1000....................................................................6 ................6................ 6................6 ............... 6................ 6 ................6 1001 to 2000..................................................................7 ................7................ 7................7 ............... 7................ 7 ................7 2001 to 4000..................................................................8 ................8................ 8................8 ............... 8................ 8 ................8 4001 to 8000..................................................................9 ................9................ 9................9 ............... 9................ 9 ................9 More than 8000..............................................................10 ..............10.............. 10..............10 ............. 10.............. 10 ..............10
Q.29 What is the proportion of men and women on the Board? All women .....................................................................1 ................1................ 1................1 ............... 1................ 1 ................1 A majority of women and a minority of men.................2 ................2................ 2................2 ............... 2................ 2 ................2 About 50% women and 50% men .................................3 ................3................ 3................3 ............... 3................ 3 ................3 A minority of women and a majority of women............4 ................4................ 4................4 ............... 4................ 4 ................4 All men, apart from yourself..........................................5 ................5................ 5................5 ............... 5................ 5 ................5

Experiences and Influences of Women Directors
Appendix F. 2001 Survey Instrument for Women Participants Page 276
Greatest no of ........................Organisations in order of ..........................Least no of employees.............................. number of employees ............................. employees
Q.30 In which industry does the organisation operate? Mining ...........................................................................1 ................1................ 1................1 ............... 1................ 1 ................1 Manufacturing ...............................................................2 ................2................ 2................2 ............... 2................ 2 ................2 Electricity, gas and water...............................................3 ................3................ 3................3 ............... 3................ 3 ................3 Construction ..................................................................4 ................4................ 4................4 ............... 4................ 4 ................4 Wholesale and retail trade .............................................5 ................5................ 5................5 ............... 5................ 5 ................5 Transport and storage ....................................................6 ................6................ 6................6 ............... 6................ 6 ................6 Communication .............................................................7 ................7................ 7................7 ............... 7................ 7 ................7 Finance, property and business services ........................8 ................8................ 8................8 ............... 8................ 8 ................8 Public administration and defence .................................9 ................9................ 9................9 ............... 9................ 9 ................9 Community services ......................................................10 ..............10.............. 10..............10 ............. 10.............. 10 ..............10 Recreation, personal and other services.........................11 ..............11.............. 11..............11 ............. 11.............. 11 ..............11
Q.31 What type of organisation is this? Publicly listed on the stock exchange ............................1 ................1................ 1................1 ............... 1................ 1 ................1 Public unlisted ...............................................................2 ................2................ 2................2 ............... 2................ 2 ................2 Private............................................................................3 ................3................ 3................3 ............... 3................ 3 ................3 Trust ..............................................................................4 ................4................ 4................4 ............... 4................ 4 ................4 Partnership.....................................................................5 ................5................ 5................5 ............... 5................ 5 ................5 Statutory Authority or Government Enterprise..............6 ................6................ 6................6 ............... 6................ 6 ................6 Not for profit..................................................................7 ................7................ 7................7 ............... 7................ 7 ................7
Q.32 Is the CEO a Woman? No ..................................................................................1 ................1................ 1................1 ............... 1................ 1 ................1 Yes.................................................................................2 ................2................ 2................2 ............... 2................ 2 ................2
Q.33 How many Directors are there on the Board, including yourself? ..................................... .................................... .................. ................. .................. ..................
Q.34 Is the Chair of the Board a Woman? No ..................................................................................1 ................1................ 1................1 ............... 1................ 1 ................1 Yes.................................................................................2 ................2................ 2................2 ............... 2................ 2 ................2
Q.35 Does the same person serve as Chair and CEO? No ..................................................................................1 ................1................ 1................1 ............... 1................ 1 ................1 Yes.................................................................................2 ................2................ 2................2 ............... 2................ 2 ................2
Q.36 What is your position on the Board? Non Executive Chair .....................................................1 ................1................ 1................1 ............... 1................ 1 ................1 Chief Executive Officer.................................................2 ................2................ 2................2 ............... 2................ 2 ................2 Executive Director.........................................................3 ................3................ 3................3 ............... 3................ 3 ................3 Non Executive Director .................................................4 ................4................ 4................4 ............... 4................ 4 ................4
Q.37 How did you gain membership of this Board? Invitation by the Chair ...................................................1 ................1................ 1................1 ............... 1................ 1 ................1 Invitation by a Director/Executive.................................2 ................2................ 2................2 ............... 2................ 2 ................2 Election..........................................................................3 ................3................ 3................3 ............... 3................ 3 ................3 Ownership of the company ............................................4 ................4................ 4................4 ............... 4................ 4 ................4 Family affiliation ...........................................................5 ................5................ 5................5 ............... 5................ 5 ................5 Informal networking ......................................................6 ................6................ 6................6 ............... 6................ 6 ................6 Through being a consultant for the company.................7 ................7................ 7................7 ............... 7................ 7 ................7 Significant shareholding ................................................8 ................8................ 8................8 ............... 8................ 8 ................8
Q.38 Please indicate your total annual remuneration range for your Board directorship. Nil..................................................................................1 ................1................ 1................1 ............... 1................ 1 ................1 Under $2,000 .................................................................2 ................2................ 2................2 ............... 2................ 2 ................2 $2,000 to $7,000 ............................................................3 ................3................ 3................3 ............... 3................ 3 ................3 $7,001 to $17,000 ..........................................................4 ................4................ 4................4 ............... 4................ 4 ................4 $17,001 to $27,000 ........................................................5 ................5................ 5................5 ............... 5................ 5 ................5 $27,001 to $47,000 ........................................................6 ................6................ 6................6 ............... 6................ 6 ................6 $47,001 to $87,000 ........................................................7 ................7................ 7................7 ............... 7................ 7 ................7 Over $87,000 .................................................................8 ................8................ 8................8 ............... 8................ 8 ................8

Experiences and Influences of Women Directors
Appendix F. 2001 Survey Instrument for Women Participants Page 277
SECTION 6 – DIRECTOR ATTRIBUTES Q.39 Listed below are various attributes. Indicate on a scale from 1 to 5 how likely it is that the average Australian
female board director would possess each attribute. Please use the following scale:
1 (Not at all likely) 2 (Not very likely) 3 (Likely) 4 (Very likely) 5 (Definitely likely)
Adventurous Dainty Imaginative Sensitive
Affectionate Daring Intuitive Sentimental
Aggressive Dominant Kind Sexy
Analytical Emotional Mathematical Sociable
Artistic Exact Muscular Soft Voice
Athletic Expressive Nurturing Stands up under pressure
Beautiful Forgiving Outgoing Supportive
Brawny Gentle Perceptive Sympathetic
Burly Good at abstractions Petite Tall
Competitive Good at problem solving Physically strong Tasteful
Cooperative Good at reasoning Physically vigorous Understanding of others
Courageous Good with numbers Pretty Unexcitable
Creative Gorgeous Quantitatively skilled Verbally skilled
Cute Helpful to others Rugged Warm in relations with others
Q.40 Listed below are various attributes. Indicate on a scale from 1 to 5 how likely it is that the average Australian male board director would possess each attribute. Please use the following scale:
1 (Not at all likely) 2 (Not very likely) 3 (Likely) 4 (Very likely) 5 (Definitely likely)
Adventurous Dainty Imaginative Sensitive
Affectionate Daring Intuitive Sentimental
Aggressive Dominant Kind Sexy
Analytical Emotional Mathematical Sociable
Artistic Exact Muscular Soft Voice
Athletic Expressive Nurturing Stands up under pressure
Beautiful Forgiving Outgoing Supportive
Brawny Gentle Perceptive Sympathetic
Burly Good at abstractions Petite Tall
Competitive Good at problem solving Physically strong Tasteful
Cooperative Good at reasoning Physically vigorous Understanding of others
Courageous Good with numbers Pretty Unexcitable
Creative Gorgeous Quantitatively skilled Verbally skilled
Cute Helpful to others Rugged Warm in relations with others

Experiences and Influences of Women Directors
Appendix F. 2001 Survey Instrument for Women Participants Page 278
SECTION 7 – DIRECTOR NETWORKING ON THE LARGEST BOARD Please answer the following questions based on the largest board for which you are a board director (i.e. the board described by the answers in the first column of Section 5.)
Q.41 How often do you attend meetings of this board? Weekly....................................................................1 Fortnightly ..............................................................2 Monthly ..................................................................3 Bimonthly ...............................................................4 Quarterly.................................................................5 Half-yearly..............................................................6 Annually .................................................................7
Q.42 How often do you meet other directors of this board? Daily .......................................................................1 Weekly....................................................................2 Fortnightly ..............................................................3 Monthly ..................................................................4 Bimonthly ...............................................................5 Quarterly.................................................................6 Half-yearly..............................................................7 Annually .................................................................8
Q43 Are you a member of the board’s executive committee? No ...........................................................................1 Yes..........................................................................2
Q44 Does the organisation make sales into the same industry in which you are employed (as per Q.5)? No ...........................................................................1 Yes..........................................................................2
Q45 Were you appointed prior to the current CEO? No ...........................................................................1 Yes..........................................................................2
Q46 How many other directors were
appointed prior to the current CEO? ......
Q47 For how many years have you been a director on this board? ..............................
Q48 How many other women are on this board? .........................................................
Q49 How many directors on this board are on other boards with you?.........................
Q50 How many other board members work in the same industry (as per Q.5) as yourself? .....................................................
Q51 With how many board members do you share a functional background (as per Q.6)? .....................................................
Q52 If you went to university, how many board members went to the same university as yourself? ...............................
Q53 How many of the other board members have not been to university? .....................
Q54 How many of the other board members have an MBA or similar advanced management degree? .................................
SECTION 8 – DIRECTOR INFLUENCE ON THE LARGEST BOARD Please indicate your extent of agreement with following statements, based on the largest board for which you are a board director, by circling (e.g., ) the most appropriate response from -3 to 3.
extremely inaccurate extremely accurate Q.55 Would you think it was accurate if you were described as a typical director of this board? -3 ........ -2 ......... -1..........0 .......... 1........... 2 ......... 3
never extremely often Q.56 How often do you acknowledge the fact that you are a director of this board? -3 ........ -2 ......... -1..........0 .......... 1........... 2 ......... 3
not at all extremely Q.57 Would you feel good if you were described as a typical director of this board? -3 ........ -2 ......... -1..........0 .......... 1........... 2 ......... 3
never extremely often Q.58 How often to you refer to this board when you introduce yourself? -3 ........ -2 ......... -1..........0 .......... 1........... 2 ......... 3
not at all extremely Q.59 To what extent do you feel attachment to this board? -3 ........ -2 ......... -1..........0 .......... 1........... 2 ......... 3
none very many Q.60 Are there many directors of this board who have influenced your thoughts and behaviours? -3 ........ -2 ......... -1..........0 .......... 1........... 2 ......... 3
none from this board most from this board Q.61 Where do most of your best friends come from, this board or not? -3 ........ -2 ......... -1..........0 .......... 1........... 2 ......... 3

Experiences and Influences of Women Directors
Appendix F. 2001 Survey Instrument for Women Participants Page 279
Please indicate your extent of agreement with following statements, based on the largest board for which you are a board director, by circling (e.g., ) the most appropriate response from 1 to 5.
Not at all Moderately Very much so Q.62 To what extent are you capable of contributing to board discussions on strategic issues? 1 ............. 2 ............... 3 ..............4 .............. 5
Not at all To some extent
Very much so Q.63 To what extent do you have sufficient knowledge on relevant strategic issues to contribute to board discussions? 1 ............. 2 ............... 3 ..............4 .............. 5
Not at all To some extent
Very much so Q.64 To what extent are you able to add valuable insight to the board on strategic issues? 1 ............. 2 ............... 3 ..............4 .............. 5
Strongly disagree Neither agree nor disagree Strongly agree Q.65 I am capable of making important contributions to the strategic
decision making process. 1 ............. 2 ............... 3 ..............4 .............. 5
Minimally Moderately Very much so Q.66 To what extent does the board monitor top management strategic decision making? 1 ............. 2 ............... 3 ..............4 .............. 5
Minimally Moderately Very much so Q.67 To what extent does the board formally evaluate the CEO’s performance? 1 ............. 2 ............... 3 ..............4 .............. 5
Minimally Moderately Very much so Q.68 To what extent does the board defer to the CEO’s judgement on final strategic decisions? 1 ............. 2 ............... 3 ..............4 .............. 5
Minimally Moderately Very much so Q.69 To what extent does the CEO solicit board assistance in the formulation of corporate strategy? 1 ............. 2 ............... 3 ..............4 .............. 5
Minimally Moderately Very much so Q.70 To what extent are non-executive directors a “sounding board” on strategic issues? 1 ............. 2 ............... 3 ..............4 .............. 5
Q.71 In the past twelve months how often have you provided advice and counsel to the CEO on strategic issues? times.
THANK YOU FOR COMPLETING THIS DETAILED QUESTIONNAIRE
................................................................................................................................................................................ Please check that you have answered all questions before you posting (in the self-addressed, reply-paid envelope provided), to Zena Burgess, C/o Professor Barry Fallon, School of Psychology, Australian Catholic University, Locked Bag 4115, Fitzroy Victoria 3065.

Experiences and Influences of Women Directors
Appendix G. 2001 Letters to Men Participants and Consent Forms Page 280
Appendix G. 2001 Letters to Men Participants and Consent Forms
INFORMATION LETTER TO MALE PARTICIPANTS
Title of Project: Experiences and Influences of Board Directors
Staff Supervisor: Professor Barry Fallon
Student Researcher: Zena Burgess
Programme In Which Enrolled: Psychology PhD Dear male corporate director, We are contacting you as part of an Australia-wide research project to enhance the understanding of board directors of Australian corporations. This Australian data will help individuals and organisation understand and develop strategies for progression of directors at board level. The results of the research project will provide a clearer understanding of the types of experiences that are factors in board appointments, perceptions of board director roles and sources of influential power on corporate boards. Formulation of recommendations with respect to practices and strategies that help board members maximise their effectiveness on a board may be possible. Completion of the survey and the consent form should only take 10 minutes of your time to complete. Research participation is voluntary and all responses will be kept confidential. Results will only be published in aggregate form making it impossible to identify any individual. Although we are keen for you to contribute to the research project, you are free to refuse to participate without any reason or withdraw consent to any possible follow up at any time with giving a reason. Questions regarding this project should be directed to the Supervisor, Professor Barry Fallon, on (03) 9953 3108 in the School of Psychology, St Patrick’s Campus, Locked Bag 4115, Fitzroy Victoria 3065, or the Researcher, Zena Burgess, care of Professor Barry Fallon at the above address. This study has been approved by the Human Research Ethics Committee at Australian Catholic University. In the event that you have any complaint or concern about the way you have been treated during the study, or if you have any query that the Supervisor and Researcher has (have) not been able to satisfy, you may write to the Chair of the Human Research Ethics Committee, care of Research Services, Australian Catholic University, Locked Bag 4115, Fitzroy Victoria 3065 (telephone 03 9953 3157, fax 03 9953 3305). Any complaint or concern will be treated in confidence and fully investigated. The participant will be informed of the outcome. If you agree to participate in this project, you should sign both copies of the Consent Form, retain one copy for your records and return the other copy to the Researcher. Yours sincerely, ………………………… ………………………….. Zena Burgess Professor Barry Fallon Researcher Supervisor

Experiences and Influences of Women Directors
Appendix G. 2001 Letters to Men Participants and Consent Forms Page 281
Australian Catholic University
CONSENT FORM
Title of Project: Experiences and Influences of Board Directors
Staff Supervisor: Professor Barry Fallon
Student Researcher: Zena Burgess
I ................................................... (the participant) have read and understood the information provided in the Letter to Participants. Any questions I have asked have been answered to my satisfaction. I agree to participate in this activity, realising that I can withdraw at any time. I agree that research data collected for the study may be published or may be provided to other researchers in a form that does not identify me in any way.
NAME OF PARTICIPANT: ....................................................................................................... (block letters)
SIGNATURE ........................................................ DATE ....................................... SIGNATURE OF SUPERVISOR: ...............................................................................................
DATE:……………………………………..
SIGNATURE OF RESEARCHER:..............................................................................................
DATE:.....................................………….

Experiences and Influences of Women Directors
Appendix H. 2001 Survey Instrument for Men Participants Page 282
Appendix H. 2001 Survey Instrument for Men Participants
Experiences and Influences of Male Directors:
A National Survey

Experiences and Influences of Women Directors
Appendix H. 2001 Survey Instrument for Men Participants Page 283
In Confidence
The responses to this questionnaire will be held in STRICTEST CONFIDENCE and data will be published in aggregate form only. The biographical data are crucial to this study and, therefore, we would ask that you complete each question. Please answer the following questions by circling (e.g., ) the most appropriate response or responses, or writing a number in the box supplied.
SECTION 1 – PERSONAL BACKGROUND
Q1 What is your age? ...................................
Q2 Have you completed a university degree? No ...........................................................................1 Yes..........................................................................2
Q3 Do you have an MBA or similar advanced management degree? No ...........................................................................1 Yes..........................................................................2
Q4 Please indicate your HIGHEST level of education completed: Some secondary school...........................................1 Year 10/School Certificate/Intermediate.................2 Year 12/HSC/Leaving/Matriculation ......................3 TAFE College course..............................................4 Undergraduate: ............. Associate Diploma...........5 Diploma ...........................6 Degree .............................7 Postgraduate: ................ Diploma/Honours ............8 MBA................................9 Masters Degree................10 Doctorate .........................11
SECTION 2 – EMPLOYMENT SITUATION
Q.5 In which industry are you employed? Mining ...................................................................... 1 Manufacturing .......................................................... 2 Electricity, gas and water.......................................... 3 Construction ............................................................. 4 Wholesale and retail trade......................................... 5 Transport and storage ............................................... 6 Communication ........................................................ 7 Finance, property and business services ................... 8 Public administration and defence ............................ 9 Community services ................................................. 10 Recreation, personal and other services.................... 11
Q.6 Which terms best describe your functional backgrounds? Please mark all that apply.
Marketing ................................................................. 1 Sales ......................................................................... 2 Operations................................................................. 3 Research and development ....................................... 4 Engineering............................................................... 5 Law........................................................................... 6 Finance ..................................................................... 7 Accounting ............................................................... 8 Other......................................................................... 9
Q.7 Would you most describe yourself as a: Non-Supervisor/Non-Manager (you do not delegate work to any others) .....................................1 Supervisor/Leading Hand/Foreman/Forewoman.......2 Lower Level Manager ...............................................3 Middle Level Manager..............................................4 Senior Level Manager ...............................................5 Executive...................................................................6 Divisional Head.........................................................7 Chief Executive Officer ............................................8
Q.8 What is the total number of employees in the organisation where you work?
Less than 25 ..............................................................1 25 to 50 .....................................................................2 51 to 100 ...................................................................3 101 to 200 .................................................................4 201 to 500 .................................................................5 501 to 1000 ...............................................................6 1001 to 2000 .............................................................7 2001 to 4000 .............................................................8 4001 to 8000 .............................................................9 More than 8000 .........................................................10
SECTION 3 – DIRECTOR BACKGROUND
Q9 For how many years were you in a senior management position before accepting a Board directorship?...............
Q10 For how many years have you been on Boards of Directors?..................................
Q11 How many Boards have you been on, including the present one(s)? ....................
Q12 How many Boards are you presently on concurrently? ........................................
Q13 If you are presently on more than one board, how long have you been on more than one board? ...............................
Q14 For how many years have you been a non-executive director? .............................
Q15 On how many Boards have you been a non-executive director? .............................

Experiences and Influences of Women Directors
Appendix H. 2001 Survey Instrument for Men Participants Page 284
SECTION 4 – DIRECTOR ATTRIBUTES Q.16 Listed below are various attributes. Indicate on a scale from 1 to 5 how likely it is that the average Australian
male board director would possess each attribute. Please use the following scale:
1 (Not at all likely) 2 (Not very likely) 3 (Likely) 4 (Very likely) 5 (Definitely likely)
Adventurous Dainty Imaginative Sensitive
Affectionate Daring Intuitive Sentimental
Aggressive Dominant Kind Sexy
Analytical Emotional Mathematical Sociable
Artistic Exact Muscular Soft Voice
Athletic Expressive Nurturing Stands up under pressure
Beautiful Forgiving Outgoing Supportive
Brawny Gentle Perceptive Sympathetic
Burly Good at abstractions Petite Tall
Competitive Good at problem solving Physically strong Tasteful
Cooperative Good at reasoning Physically vigorous Understanding of others
Courageous Good with numbers Pretty Unexcitable
Creative Gorgeous Quantitatively skilled Verbally skilled
Cute Helpful to others Rugged Warm in relations with others
Q.17 Listed below are various attributes. Indicate on a scale from 1 to 5 how likely it is that the average Australian female board director would possess each attribute. Please use the following scale:
1 (Not at all likely) 2 (Not very likely) 3 (Likely) 4 (Very likely) 5 (Definitely likely)
Adventurous Dainty Imaginative Sensitive
Affectionate Daring Intuitive Sentimental
Aggressive Dominant Kind Sexy
Analytical Emotional Mathematical Sociable
Artistic Exact Muscular Soft Voice
Athletic Expressive Nurturing Stands up under pressure
Beautiful Forgiving Outgoing Supportive
Brawny Gentle Perceptive Sympathetic
Burly Good at abstractions Petite Tall
Competitive Good at problem solving Physically strong Tasteful
Cooperative Good at reasoning Physically vigorous Understanding of others
Courageous Good with numbers Pretty Unexcitable
Creative Gorgeous Quantitatively skilled Verbally skilled
Cute Helpful to others Rugged Warm in relations with others

Experiences and Influences of Women Directors
Appendix H. 2001 Survey Instrument for Men Participants Page 285
SECTION 5 – DIRECTOR NETWORKING ON THIS BOARD Please answer the following questions based on the board that you share with your female co-director.
Q.18 What is your position on the Board? Non Executive Chair................................................ 1 Chief Executive Officer ........................................... 2 Executive Director ................................................... 3 Non Executive Director ........................................... 4
Q.19 How did you gain membership of this Board? Invitation by the Chair ............................................. 1 Invitation by a Director/Executive ........................... 2 Election .................................................................... 3 Ownership of the company ...................................... 4 Family affiliation ..................................................... 5 Informal networking ................................................ 6 Through being a consultant for the company ........... 7 Significant shareholding........................................... 8
Q.20 How often do you attend meetings of this board? Weekly ..................................................................... 1 Fortnightly ............................................................... 2 Monthly.................................................................... 3 Bimonthly ................................................................ 4 Quarterly .................................................................. 5 Half-yearly ............................................................... 6 Annually................................................................... 7
Q.21 How often do you meet other directors of this board?
Daily ........................................................................ 1 Weekly ..................................................................... 2 Fortnightly ............................................................... 3 Monthly.................................................................... 4 Bimonthly ................................................................ 5 Quarterly .................................................................. 6 Half-yearly ............................................................... 7 Annually................................................................... 8
Q22 Are you a member of the board’s executive committee?
No ............................................................................ 1 Yes........................................................................... 2
Q23 Does the organisation make sales into the same industry in which you are employed (as per Q.5)?
No ............................................................................ 1 Yes........................................................................... 2
Q24 Were you appointed prior to the current CEO? No ............................................................................ 1 Yes........................................................................... 2
Q25 For how many years have you been a director on this Board? .............................
Q26 How many directors on this board are on other boards with you?.........................
Q27 How many other board members work in the same industry (as per Q.5) as yourself? .....................................................
Q28 With how many board members do you share a functional background (as per Q.6)? .....................................................
Q29 If you went to university, how many other board members went to the same university as yourself? ...............................
SECTION 6 – DIRECTOR INFLUENCE ON THIS BOARD Please indicate your extent of agreement with following statements, based on the board that you share with your female co-director, by circling (e.g., ) the most appropriate response from 1 to 5.
extremely inaccurate extremely accurate Q.30 Would you think it was accurate if you were described as a typical director of this board? -3 ........ -2 ......... -1..........0 .......... 1........... 2 ......... 3
never extremely often Q.31 How often do you acknowledge the fact that you are a director of this board? -3 ........ -2 ......... -1..........0 .......... 1........... 2 ......... 3
not at all extremely Q.32 Would you feel good if you were described as a typical director of this board? -3 ........ -2 ......... -1..........0 .......... 1........... 2 ......... 3
never extremely often Q.33 How often to you refer to this board when you introduce yourself? -3 ........ -2 ......... -1..........0 .......... 1........... 2 ......... 3
not at all extremely Q.34 To what extent do you feel attachment to this board? -3 ........ -2 ......... -1..........0 .......... 1........... 2 ......... 3
none very many Q.35 Are there many directors of this board who have influenced your thoughts and behaviours? -3 ........ -2 ......... -1..........0 .......... 1........... 2 ......... 3
none from this board most from this board Q.36 Where do most of your best friends come from, this board or not? -3 ........ -2 ......... -1..........0 .......... 1........... 2 ......... 3

Experiences and Influences of Women Directors
Appendix H. 2001 Survey Instrument for Men Participants Page 286
Please indicate your extent of agreement with following statements, based on the board that you share with your female co-director, by circling (e.g., ) the most appropriate response from 1 to 5.
Not at all Moderately Very much so Q.37 To what extent are you capable of contributing to board discussions on strategic issues? 1 ............. 2 ............... 3 ..............4 .............. 5
Not at all To some extent
Very much so Q.38 To what extent do you have sufficient knowledge on relevant strategic issues to contribute to board discussions? 1 ............. 2 ............... 3 ..............4 .............. 5
Not at all To some extent
Very much so Q.39 To what extent are you able to add valuable insight to the board on strategic issues? 1 ............. 2 ............... 3 ..............4 .............. 5
Strongly disagree Neither agree nor disagree Strongly agree Q.40 I am capable of making important contributions to the strategic
decision making process. 1 ............. 2 ............... 3 ..............4 .............. 5
Minimally Moderately Very much so Q.41 To what extent does the board monitor top management strategic decision making? 1 ............. 2 ............... 3 ..............4 .............. 5
Minimally Moderately Very much so Q.42 To what extent does the board formally evaluate the CEO’s performance? 1 ............. 2 ............... 3 ..............4 .............. 5
Minimally Moderately Very much so Q.43 To what extent does the board defer to the CEO’s judgement on final strategic decisions? 1 ............. 2 ............... 3 ..............4 .............. 5
Minimally Moderately Very much so Q.44 To what extent does the CEO solicit board assistance in the formulation of corporate strategy? 1 ............. 2 ............... 3 ..............4 .............. 5
Minimally Moderately Very much so Q.45 To what extent are non-executive directors a “sounding board” on strategic issues? 1 ............. 2 ............... 3 ..............4 .............. 5
Q.46 In the past twelve months how often have you provided advice and counsel to the CEO on strategic issues? times.
THANK YOU FOR COMPLETING THIS DETAILED QUESTIONNAIRE
................................................................................................................................................................................ Please check that you have answered all questions before you posting (in the self-addressed, reply-paid envelope provided), to Zena Burgess, C/o Professor Barry Fallon, School of Psychology, Australian Catholic University, Locked Bag 4115, Fitzroy Victoria 3065.

Experiences and Influences of Women Directors
Appendix I. Alphabetical List of 2001 Survey Items and Derived Variables Page 287
Appendix I. Alphabetical List of 2001 Survey Items and Derived Variables
No. Name Description 37 Basis of recruitment [For each board] “How did you gain membership of this Board?”
1 Invitation by the chair 2 Invitation by director/executive 3 Election 4 Ownership of the company 5 Family affiliation 6 Informal networking 7 Through being a consultant to the company 8 Significant shareholding
37 Basis of recruitment to focal board
Derived from Basis of recruitment
61 Best friends come from focal board
“Where do most of your best friends come from, this board or not?” -3 none from this board......-2 ......-1 .........0 .......1 ....... 2....... 3 most from this board
S5 Board advice interactions scale
Westphal and Milton’s (2000) “Board advice interactions” sub-scale, consisting of the three items Board CEO solicits assistance, Nonexecutive directors are a sounding board, and Frequency of advice to the CEO
32 Board CEO gender [For each board] “Is the CEO a woman?” 1 No 2 Yes
69 Board CEO solicits assistance
“To what extent does the CEO solicit board assistance in the formulation of corporate strategy?” 1 Minimally ...............2 .................. 3 Moderately................4 .............. 5 Very much so
35 Board chair and CEO is the same person
[For each board] “Does the same person serve as Chair and CEO?” 1 No 2 Yes
34 Board chair gender [For each board] “Is the Chair of the Board a Woman?” 1 No 2 Yes
31 Board corporation type [For each board] “What type of organisation is this?” 1 Publicly listed 3 Private 5 Partnership 7 Not for profit 2 Public unlisted 4 Trust 6 Statutory authority or Government Enterprise
68 Board defers to CEO judgement
“To what extent does the board defer to the CEO’s judgement on final strategic decisions?” 1 Minimally ...............2 .................. 3 Moderately................4 ...............5 Very much so
33 Board directors [For each board] “How many Directors are there on the Board, including yourself?” Numeric response
28 Board employees [For each board] “What is the total number of employees in the organisations of which you are a board member?” 1 Less than 25 4 101 to 200 7 1001 to 2000 10 More than 8000 2 25 to 50 5 201 to 500 8 2001 to 4000 3 51 to 100 6 501 to 1000 9 4001 to 8000
67 Board evaluates CEO performance
“To what extent does the board formally evaluate the CEO’s performance?” 1 Minimally ...............2 .................. 3 Moderately................4 ...............5 Very much so
29 Board gender proportion [For each board] “What is the proportion of men and women on the Board?” 1 All women 2 A majority of women and a minority of men 3 About 50% women and 50% men 4 A minority of women and a majority of men 5 All men, apart from yourself

Experiences and Influences of Women Directors
Appendix I. Alphabetical List of 2001 Survey Items and Derived Variables Page 288
No. Name Description 30 Board industry [For each board] “In which industry does the organisation operate?”
1 Mining 7 Communication 2 Manufacturing 8 Finance, property and business services 3 Electricity, gas and water 9 Public administration and defence 4 Construction 10 Community services 5 Wholesale and retail trade 11 Recreation, personal and other services 6 Transport and storage
S4 Board monitoring scale Westphal and Milton’s (2000) “Board monitoring” sub-scale, consisting of the three items Board monitors management decisions, Board evaluates CEO performance, and Board defers to CEO judgement
66 Board monitors management decisions
“To what extent does the board monitor top management strategic decision making?” 1 Minimally ...............2 .................. 3 Moderately................4 ...............5 Very much so
64 Capable of adding insight to focal board
“To what extent are you able to add valuable insight to the board on strategic issues?” 1 Not at all.............. 2................3 To some extent ............... 4...............5 Very much so
65 Capable of contribution to decision making
“I am capable of making important contributions to the strategic decision making process.” 1 Strongly disagree ...2 ......3 Neither agree nor disagree ..... 4...... 5 Strongly disagree
62 Capable of contribution to discussions
“To what extent are you capable of contributing to board discussions on strategic issues?” 1 Not at all.............. 2...................3 Moderately .................. 4...............5 Very much so
9 Child age categories “If you have children, what are their ages? Please mark all that apply.” 1 Pre-school age 3 Secondary school age 5 Fully independent 2 Primary school age 4 Post-secondary school age
24 Concurrent board years “If you are presently on more than one board, how many years have you been on more than one board?” Numeric response
23 Concurrent directorships “How many Boards are you presently on concurrently?” Numeric response
1 Current board member “Are you currently on a Board of Directors?” 1 No 2 Yes
56 Director acknowledges focal board directorship
“How often do you acknowledge the fact that you are a director of this board?” -3 never .........-2 ........... -1........... 0.............1 ............ 2.............3 extremely often
3 Director age “What is your age?” Numeric response
36 Director position [For each board] “What is your position on the Board?” 1 Non Executive Chair 3 Executive Director 2 Chief Executive Officer 4 Non Executive Director
38 Directorship remuneration
[For each board] “Please indicate your total annual remuneration range for your Board directorship.” 1 Nil 4 $7,001 to $17,000 7 $47,001 to $87,000 2 Under $2,000 5 $17,001 to $27,000 8 Over $87,000 3 $2,000 to $7,000 6 $27,001 to $47,000
14 Employment CEO gender
“Is the Chief Executive Officer where you are employed a woman?” 1 No 2 Yes
15 Employment employees “What is the total number of employees in the organisation where you work?” 1 Less than 25 4 101 to 200 7 1001 to 2000 10 More than 8000 2 25 to 50 5 201 to 500 8 2001 to 4000 3 51 to 100 6 501 to 1000 9 4001 to 8000

Experiences and Influences of Women Directors
Appendix I. Alphabetical List of 2001 Survey Items and Derived Variables Page 289
No. Name Description 11 Employment industry “In which industry are you employed?”
1 Mining 7 Communication 2 Manufacturing 8 Finance, property and business services 3 Electricity, gas and water 9 Public administration and defence 4 Construction 10 Community services 5 Wholesale and retail trade 11 Recreation, personal and other services 6 Transport and storage
16 Employment salary “Please indicate the total annual employment salary, not including remuneration from Boards.” 1 Nil 5 $85,001- $105,000 9 $165,000- $185,000 2 Under $45,000 6 $105,001- $125,000 10 $185,001- $205,000 3 $45,001 - $65,000 7 $125,001- $145,000 11 Over $205,000 4 $65,001- $85,000 8 $145,001- $165,000
43 Executive committee member
“Are you a member of the board’s executive committee?” 1 No 2 Yes
59 Feeling of attachment to focal board
“To what extent do you feel attachment to this board?” -3 not at all.......-2 ........... -1........... 0.............1 ............ 2.............3 extremely
39 Female director attributes “Indicate on a scale from 1 to 5 how likely it is that the average Australian female board director would possess each attribute.” Adventurous Dainty Imaginative Sensitive Affectionate Daring Intuitive Sentimental Aggressive Dominant Kind Sexy Analytical Emotional Mathematical Sociable Artistic Exact Muscular Soft voice Athletic Expressive Nurturing Stands up under pressure Beautiful Forgiving Outgoing Supportive Brawny Gentle Perceptive Sympathetic Burly Good at abstractions Petite Tall Competitive Good at problem solving Physically strong Tasteful Cooperative Good at reasoning Physically vigorous Understanding of others Courageous Good with numbers Pretty Unexcitable Creative Gorgeous Quantitatively skilled Verbally skilled Cute Helpful to others Rugged Warm in relations with others
10 Financial responsibility for dependents
“Do you have financial responsibility for any dependents (children or anyone else)? Please indicate your share of financial responsibility?” 1 No. I do not contribute directly to finances 4 Yes, mostly. I contribute the majority 2 Yes, partly. I contribute a minority 5 I contribute all the finances 3 Yes, jointly – 50/50 6 No financial dependents
32 Focal board CEO gender Derived from Board CEO gender
35 Focal board chair and CEO is the same person
Derived from Board chair and CEO is the same person
34 Focal board chair gender Derived from Board chair gender
42 Focal board director meeting frequency
“How often do you meet other directors of this board?” 1 Daily 3 Fortnightly 5 Bimonthly 7 Half-yearly 2 Weekly 4 Monthly 6 Quarterly 8 Annually
36 Focal board director position
Derived from Director position
33 Focal board directors Derived from Board directors

Experiences and Influences of Women Directors
Appendix I. Alphabetical List of 2001 Survey Items and Derived Variables Page 290
No. Name Description 60 Focal board directors
influenced thoughts and behaviour
“Are there many directors of this board who have influenced your thoughts and behaviours?” -3 none...........-2 ........... -1........... 0.............1 ............ 2.............3 very many
46 Focal board directors predate CEO
“How many other directors were appointed prior to the current CEO?” Numeric response
45 Focal board directorship predates CEO
“Were you appointed prior to the current CEO?” 1 No 2 Yes
38 Focal board directorship remuneration
Derived from Directorship remuneration
47 Focal board directorship years
“For how many years have you been a director on this board?” Numeric response
28 Focal board employees Derived from Board employees
41 Focal board formal meeting frequency
“How often do you attend meetings of this board?” 1 Weekly 3 Monthly 5 Quarterly 7 Annually 2 Fortnightly 4 Bimonthly 6 Half-yearly
29 Focal board gender proportion
Derived from Board gender proportion
30 Focal board industry Derived from Board industry
52 Focal board members from same university
“If you went to university, how many board members went to the same university as yourself?” Numeric response
50 Focal board members in same industry
“How many other board members work in the same industry as yourself?” Numeric response
49 Focal board members on other boards with director
“How many directors on this board are on other boards with you?” Numeric response
54 Focal board members with MBA or similar
“How many of the other board members have an MBA or similar advanced management degree?” Numeric response
53 Focal board members with no university
“How many of the other board members have not been to university?” Numeric response
51 Focal board members with same functional background
“With how many board members do you share a functional background?” Numeric response
31 Focal board organisation type
Derived from Board corporation type
44 Focal board sells into employment industry
“Does the organisation make sales into the same industry in which you are employed?” 1 No 2 Yes
48 Focal board women directors
“How many other women are on this board?” Numeric response
71 Frequency of advice to the CEO
“In the past twelve months how often have you provided advice and counsel to the CEO on strategic issues?” Numeric response

Experiences and Influences of Women Directors
Appendix I. Alphabetical List of 2001 Survey Items and Derived Variables Page 291
No. Name Description 12 Functional background “Which terms best describe your functional backgrounds? Please mark all that
apply?” 1 Marketing 4 Research and development 7 Finance 2 Sales 5 Engineering 8 Accounting 3 Operations 6 Law 9 Other
6 Highest level of education
“Please indicate your HIGHEST level of education completed.” 1 Some secondary school 7 Undergraduate: Degree 2 Year 10/School Certificate/Intermediate 8 Postgraduate: Diploma/Honours 3 Year 12/HSC/ Leaving/Matriculation 9 Postgraduate: MBA 4 TAFE College course 10 Postgraduate: Masters Degree 5 Undergraduate: Associate Diploma 11 Postgraduate: Doctorate 6 Undergraduate: Diploma
S2 Identification with board members scale
A scale derived from Karasawa’s (1991) “identification with group members” sub-scale, consisting of the two items Focal board directors influenced thoughts and behaviour, and Best friends come from focal board
S1 Identification with the board scale
A scale derived from Karasawa’s (1991) “identification with the group” sub-scale, consisting of the five items Typical focal board director description is accurate, Director acknowledges focal board directorship, Typical focal board director description feels good, Self-reference to focal board on introduction, and Feeling of attachment to focal board
40 Male director attributes “Indicate on a scale from 1 to 5 how likely it is that the average Australian male board director would possess each attribute.” Adventurous Dainty Imaginative Sensitive Affectionate Daring Intuitive Sentimental Aggressive Dominant Kind Sexy Analytical Emotional Mathematical Sociable Artistic Exact Muscular Soft voice Athletic Expressive Nurturing Stands up under pressure Beautiful Forgiving Outgoing Supportive Brawny Gentle Perceptive Sympathetic Burly Good at abstractions Petite Tall Competitive Good at problem solving Physically strong Tasteful Cooperative Good at reasoning Physically vigorous Understanding of others Courageous Good with numbers Pretty Unexcitable Creative Gorgeous Quantitatively skilled Verbally skilled Cute Helpful to others Rugged Warm in relations with others
17 Managerial gender proportion
“What is the proportion of men and women in the managerial/supervisory hierarchy in your local organisation?” 1 All women 2 A majority of women and a minority of men 3 About 50% women and 50% men 4 A minority of women and a majority of men 5 All men, apart from yourself
13 Managerial level “Would you most describe yourself as a:” 1 Non-Supervisor/Non-Manager – you do not delegate work to any others 2 Supervisor/Leading Hand/Foreman/Forewoman 3 Lower Level Manager 5 Senior Level Manager 7 Divisional Head 4 Middle Level Manager 6 Executive 8 Chief Executive Officer
5 MBA or similar “Do you have an MBA or similar advanced management degree?” 1 No 2 Yes
51 Minority functional background
Dichotomous variable signifying that Focal board members with same functional background is less than half of Focal board directors

Experiences and Influences of Women Directors
Appendix I. Alphabetical List of 2001 Survey Items and Derived Variables Page 292
No. Name Description 50 Minority industry Dichotomous variable signifying that Focal board members in same industry is less
than half of Focal board directors
54 Minority MBA or similar Dichotomous variable signifying that Focal board members with MBA or similar is greater than half of Focal board directors if MBA or similar is true, or less than half if MBA or similar is false.
52 Minority same university Dichotomous variable signifying that Focal board members from same university is less than half of Focal board directors
53 Minority university background
Dichotomous variable signifying that Focal board members with no university is greater than half of Focal board directors if University degree is true, or less than half if University degree is false.
48 Minority women members
Dichotomous variable signifying that Focal board women directors is less than half of Focal board directors
26 Nonexecutive director boards
“On how many boards have you been a non-executive director?” Numeric response
25 Nonexecutive director years
“For how many years have you been a non-executive director?” Numeric response
70 Nonexecutive directors are a sounding board
“To what extent are non-executive directors a “sounding board” on strategic issues?” 1 Minimally ...............2 .................. 3 Moderately................4 ...............5 Very much so
8 Number of children “How many children do you have?” Numeric response
12 Number of functional backgrounds
Derived from Functional background
7 Partner relationship “What relationship with a partner do you have?” 1 Married 3 Divorced 5 Single 2 Living together 4 Separated but not divorced 6 Widowed
S3 Perceived ability to contribute scale
Westphal and Milton’s (2000) “Perceived ability to contribute” sub-scale, consisting of the four items Capable of contribution to discussions, Sufficient knowledge for discussions, Capable of adding insight to focal board, and Capable of contribution to decision making
46 Percentage board directors predate CEO
Derived from dividing Focal board directors predate CEO by Focal board directors
52 Percentage members from same university
Derived from dividing Focal board members from same university by Focal board directors
51 Percentage members functional background
Derived from dividing Focal board members with same functional background by Focal board directors
50 Percentage members in same industry
Derived from dividing Focal board members in same industry by Focal board directors
49 Percentage members on other boards
Derived from dividing Focal board members on other boards with director by Focal board directors
54 Percentage members with MBA or similar
Derived from dividing Focal board members with MBA or similar by Focal board directors and subtracting from 1.
53 Percentage members with university background
Derived from dividing Focal board members with no university by Focal board directors and subtracting from 1.
48 Percentage women members
Derived from dividing Focal board women directors by Focal board directors

Experiences and Influences of Women Directors
Appendix I. Alphabetical List of 2001 Survey Items and Derived Variables Page 293
No. Name Description 2 Reason no longer a
director “If the answer to Q.1 was No, then why are you no longer on a Board of Directors?” 1 Career change 3 Retired 5 Other reasons 2 Not reappointed 4 Personal reasons
58 Self-reference to focal board on introduction
“How often do you refer to this board when you introduce yourself?” -3 not at all.......-2 ........... -1........... 0.............1 ............ 2.............3 extremely
20 Senior management years “For how many years were you in a senior management position before accepting a Board directorship?” Numeric response
52 Social identity via from same university
Dichotomous variable signifying a count of at least one for Focal board members from same university
51 Social identity via functional background
Dichotomous variable signifying a count of at least one for Focal board members with same functional background
50 Social identity via industry
Dichotomous variable signifying a count of at least one for Focal board members in same industry
54 Social identity via MBA or similar
Dichotomous variable signifying a count of at least one for Focal board members with MBA or similar if MBA or similar is true, or less than Focal board directors if MBA or similar is false.
49 Social identity via other boards
Dichotomous variable signifying a count of at least one for Focal board members on other boards with director
48 Social identity via women members
Dichotomous variable signifying a count of at least one for Focal board women directors
63 Sufficient knowledge for discussions
“To what extent do you have sufficient knowledge on relevant strategic issues to contribute to board discussions?” 1 Not at all.............. 2................3 To some extent ............... 4...............5 Very much so
21 Total directorship years “For how many years have you been on Boards of Directors?” Numeric response
22 Total directorships “How many Boards have you been on, including the present ones?” Numeric response
57 Typical focal board director description feels good
“Would you feel good if you were described as a typical director of this board?” -3 not at all.......-2 ........... -1........... 0.............1 ............ 2.............3 extremely
55 Typical focal board director description is accurate
“Would you think it was accurate if you were described as a typical director of this board?” -3 extremely inaccurate......-2 ........ -1 ........ 0....... 1........2 ....... 3 extremely accurate
4 University degree “Have you completed a university degree?” 1 No 2 Yes
19 Work colleagues gender proportion
“Are your colleagues in your immediate work environment:” 1 All women 2 A majority of women and a minority of men 3 About 50% women and 50% men 4 A minority of women and a majority of men 5 All men, apart from yourself
27 Years worked with women directors
“For how many years have you worked closely with other women directors?” Numeric response
18 Years worked with women managers
“For how many years have you worked closely with other woman managers in your employment organisation?” Numeric response

Experiences and Influences of Women Directors
Appendix J. List of additional publications Page 294
Appendix J. List of additional publications
Burgess, Z. & Tharenou, P. (1997). What distinguishes women non-executive directors from
executive directors? Individual, interpersonal and organisational factors related to
women’s appointment to boards. International Review of Women and Leadership, 3, 46-
62.
Burgess, Z. M. & Tharenou, P. (2000). What distinguishes women non-executive directors
from executive directors? Individual, interpersonal and organisational factors related to
women’s appointment to boards. In R. J. Burke & M. C. Mattis (Eds.), Women on
corporate boards of directors (pp. 111-127). The Netherlands: Kluwer Academic
Publishers.
Burgess, Z. & Tharenou, P. (2002). Women board directos: Characteristics of the few.
Journal of business ethics, 37, 39-49.
Burgess, Z. & Fallon, B. (In press). A longitudinal study of women directors in Australia.
Women in Management Review.
Related Documents