Experience Our Evolution HUBBELL INCORPORATED 2017 Annual Report ®

Welcome message from author
This document is posted to help you gain knowledge. Please leave a comment to let me know what you think about it! Share it to your friends and learn new things together.
Transcript

Experience Our Evolution
HUBBELL INCORPORATED2017 Annual Report
®

Building on a Rich Heritage of Innovation and InventionStarting with the invention of the pull chain, Hubbell’s heritage
is built on the principles of quality and innovation. Today, we
reinforce these traditions by developing new products that meet
the evolving needs of our existing customers while expanding
into new markets that are strategic to our core.

1Hubbell 2017 Annual Report
David G. NordChairman, President and Chief Executive Officer
A Letter to Our Shareholders
2017 was another productive year for Hubbell…
We grew sales by 5%, added five companies to our portfolio, announced the largest transaction in our history, drove productivity throughout the enterprise, and increased our dividend by 10%.
As a company that takes great pride in our heritage of innovation, starting with our founder Harvey Hubbell and his most notable inventions of the “pull chain lamp socket” and “separable plug and receptacle” over a century ago, Hubbell continually evolves to find new ways to provide connection to the energy that drives our lives.
Our strategy remains the same: to be a trusted provider of reliable, electrical and related infrastructure solutions primarily in North America with desired brands, high quality service, and a competitive cost structure. We aim to grow at twice the market rate via organic sales and acquisitions and to deliver high single digit earnings growth plus dividends to shareholders.
Adjusted figures exclude restructuring and related costs, costs associated with the reclassification of common stock, Aclara transaction costs, the impact of US tax reform, and refinancing costs, and are non-GAAP measures. Free cash flow is also a non-GAAP measure. Reconciliations of these non-GAAP measures to the comparable GAAP measures can be found in Management’s Discussion and Analysis in the Company’s 2017 Form 10-K. *Attributable to Hubbell
F I N A N C I A L H I G H L I G H T S
Year Ended December 31, ’13 ’14 ’15 ’16 ’17
NET SALES ($ Millions) $3,184 $3,359 $3,390 $3,505 $3,669
OPERATING MARGIN (Adjusted) 15.9% 15.6% 15.1% 14.6% 14.6%
DILUTED EPS (Adjusted) $5.47 $5.54 $5.52 $5.66 $5.93
OPERATING MARGIN (Reported) 15.9% 15.4% 14.0% 13.6% 13.7%
DILUTED EPS (Reported) $5.47 $5.48 $4.77 $5.24 $4.39
FREE CASH FLOW (% of Net Income*) 106% 109% 95% 117% 123%
2 Experience Our Evolution
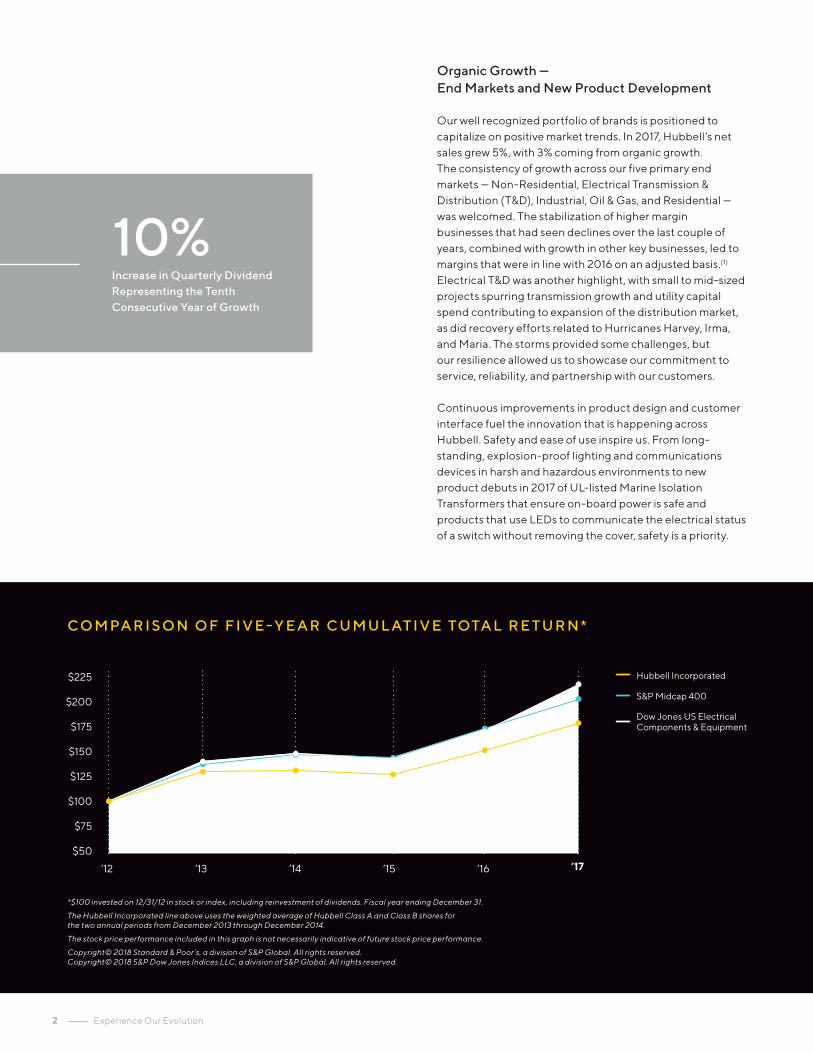
Organic Growth — End Markets and New Product Development
Our well recognized portfolio of brands is positioned to capitalize on positive market trends. In 2017, Hubbell’s net sales grew 5%, with 3% coming from organic growth. The consistency of growth across our five primary end markets — Non-Residential, Electrical Transmission & Distribution (T&D), Industrial, Oil & Gas, and Residential — was welcomed. The stabilization of higher margin businesses that had seen declines over the last couple of years, combined with growth in other key businesses, led to margins that were in line with 2016 on an adjusted basis.(1) Electrical T&D was another highlight, with small to mid-sized projects spurring transmission growth and utility capital spend contributing to expansion of the distribution market, as did recovery efforts related to Hurricanes Harvey, Irma, and Maria. The storms provided some challenges, but our resilience allowed us to showcase our commitment to service, reliability, and partnership with our customers.
Continuous improvements in product design and customer interface fuel the innovation that is happening across Hubbell. Safety and ease of use inspire us. From long-standing, explosion-proof lighting and communications devices in harsh and hazardous environments to new product debuts in 2017 of UL-listed Marine Isolation Transformers that ensure on-board power is safe and products that use LEDs to communicate the electrical status of a switch without removing the cover, safety is a priority.
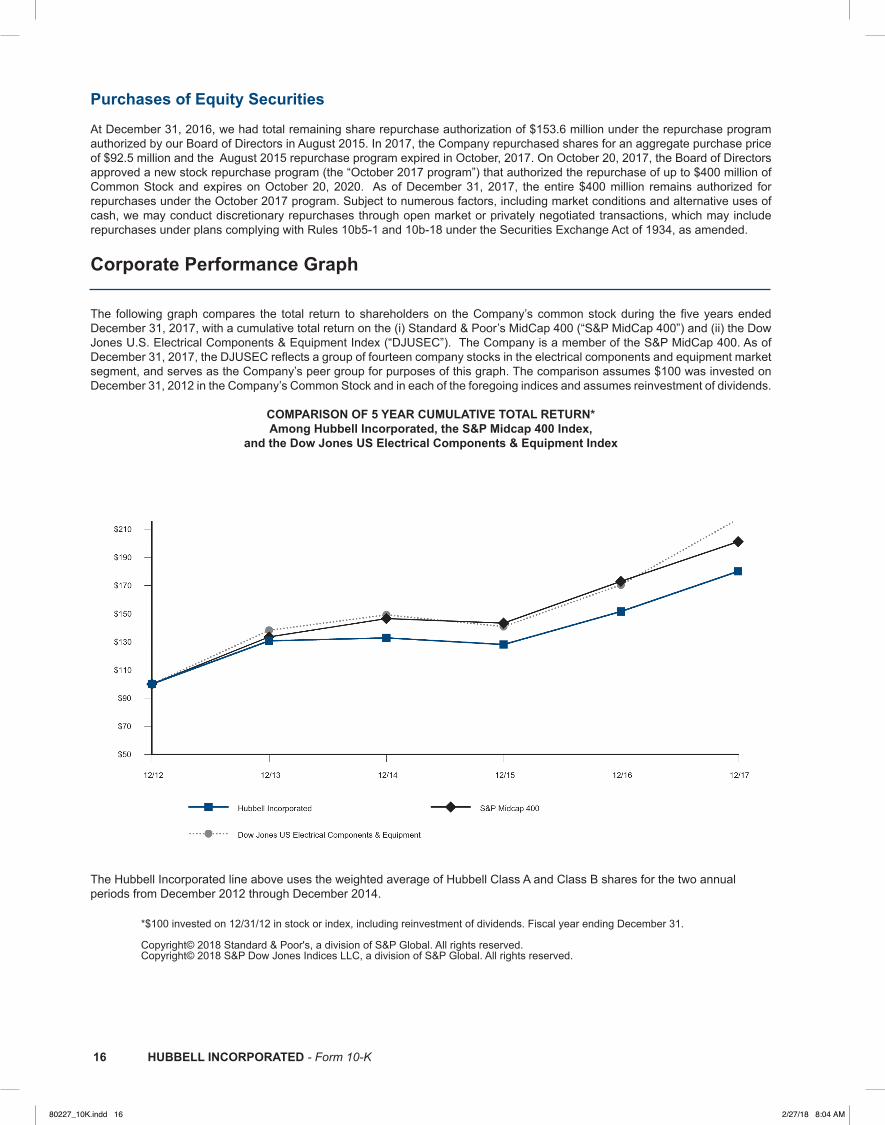
C O M PA R I S O N O F F I V E - Y E A R C U M U L AT I V E TOTA L R E T U R N *
Hubbell Incorporated
S&P Midcap 400
Dow Jones US Electrical Components & Equipment
*$100 invested on 12/31/12 in stock or index, including reinvestment of dividends. Fiscal year ending December 31.
The Hubbell Incorporated line above uses the weighted average of Hubbell Class A and Class B shares for the two annual periods from December 2013 through December 2014.
The stock price performance included in this graph is not necessarily indicative of future stock price performance.
Copyright© 2018 Standard & Poor’s, a division of S&P Global. All rights reserved. Copyright© 2018 S&P Dow Jones Indices LLC, a division of S&P Global. All rights reserved.
Increase in Quarterly Dividend Representing the Tenth Consecutive Year of Growth
10%
$150
$175
$200
$225
$125
$75
$100
$50
’12 ’13 ’14 ’15 ’16 ’17

3Hubbell 2017 Annual Report
Whether it be keeping people connected on-the-go with convenient charging stations for seats and electric vehicles or making it easier for customers to learn about and buy our products through our new website, Hubbell seeks to harness energy to better serve our customers.
We also continue to work on identifying vertical market solutions that combine Hubbell’s product breadth with our growing software capabilities. iDevices,® acquired in 2017 (see below), continues to be one of the only home automation product lines that works with Apple HomeKit,™ Amazon Alexa, and the Google Assistant and can be controlled via both iOS and Android™ devices. iDevices’® Internet-of-Things (“IoT”) expertise provides the foundation to enhance Hubbell’s broad base of products with communications and connectivity capabilities beyond residential applications and into institutional and utility applications.
Acquisitions
In addition to organic growth, Hubbell grew via acquisitions in 2017, which is a key component of our long-term growth strategy. Acquisitions complement our portfolio of products and solutions, facilitate penetration of core markets and strategic adjacent markets, and provide opportunities for operational efficiencies.
In 2017, the acquisitions we completed better position us for further expansion geographically (GTMS, a substation and distribution switch manufacturer in Brazil); broader coverage in the verticals of telecom (Windsor Communications, a domestic supplier of fiber splice enclosures and hardware for telecommunications), gas distribution (Advance Engineering Corporation “AEC™”, a domestic gas components manufacturer), and electric power (Meramec,® a manufacturer of current measurement devices); and acceleration of IoT technology (iDevices,® a domestic developer with embedded firmware and app development expertise with custom-built Cloud infrastructure).
Late in the year, we also announced a definitive agreement to acquire Aclara Technologies, LLC for $1.1 billion, the largest acquisition in Hubbell history. This acquisition is expected to strengthen and broaden Hubbell Power Systems’ competitive position across utility markets by providing the opportunity to integrate Aclara’s strong customer relationships and smart infrastructure solutions into the Hubbell portfolio and accelerate ongoing innovation efforts to address utility customer demand for data and integrated solutions. In February 2018, we officially announced the closing of the transaction.
I am enthusiastic about these additions to our Company and the complementary capabilities, expertise, and opportunities they each bring.
Hubbell Integrated Solutions
E VO LV I N G YO U R H O M E A N D O U R P R O D U C T S
This year, we launched Hubbell Integrated Solutions focused on creating energy solutions through intelligent Hubbell products that will seamlessly integrate with existing customer ecosystems. As industry and technology changes at an increasingly rapid pace, we continue to broaden the scope of our solutions and the talents that develop them.
In April 2017, Hubbell acquired iDevices®, a leading brand in the connected home industry. The combination of the iDevices® team’s cutting edge expertise in connected devices with Hubbell’s technology and vast product portfolio will drive the next wave of innovation in our industry.
4 Experience Our Evolution
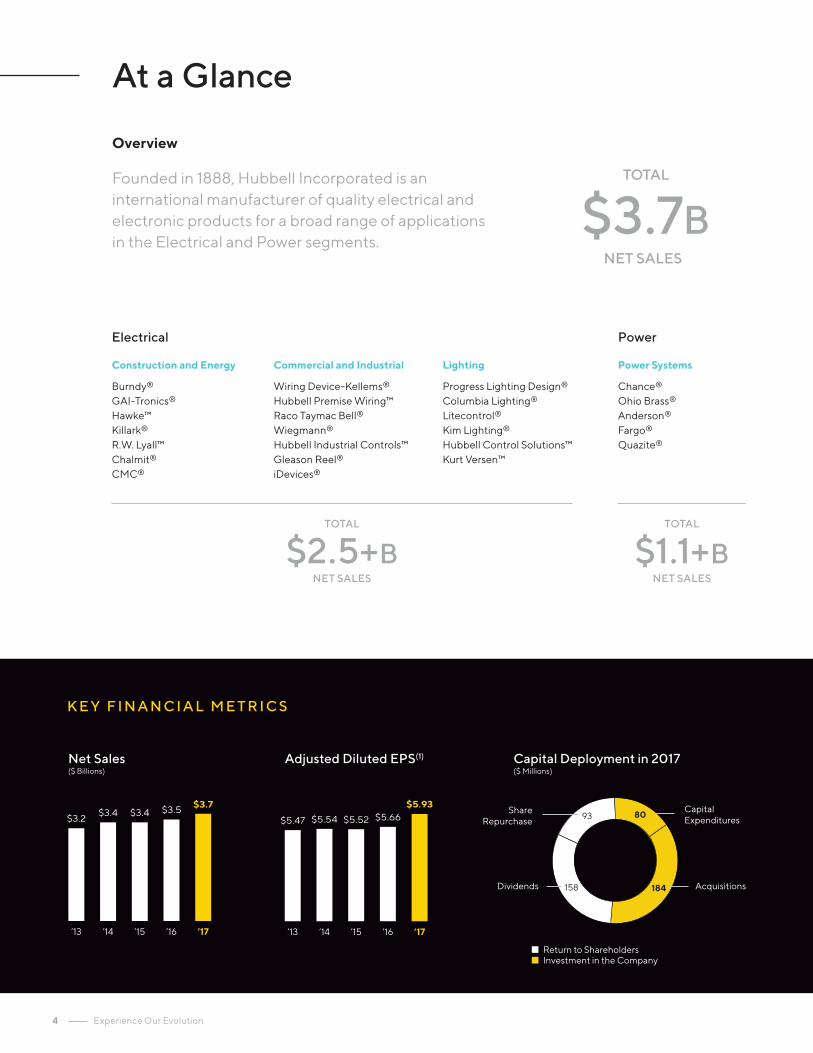
At a Glance
Overview
Founded in 1888, Hubbell Incorporated is an international manufacturer of quality electrical and electronic products for a broad range of applications in the Electrical and Power segments.
NET SALES
$3.7BTOTAL
NET SALES
$2.5+BTOTAL
NET SALES
$1.1+BTOTAL
Power Systems
Chance®
Ohio Brass®
Anderson®
Fargo®
Quazite®
Construction and Energy
Burndy®
GAI-Tronics®
Hawke™Killark®
R.W. Lyall™Chalmit®
CMC®
Commercial and Industrial
Wiring Device-Kellems®
Hubbell Premise Wiring™Raco Taymac Bell®
Wiegmann®
Hubbell Industrial Controls™Gleason Reel®
iDevices®
Lighting
Progress Lighting Design®
Columbia Lighting®
Litecontrol®
Kim Lighting®
Hubbell Control Solutions™Kurt Versen™
Electrical Power
K E Y F I N A N C I A L M E T R I C S
Net Sales($ Billions)
Adjusted Diluted EPS(1) Capital Deployment in 2017($ Millions)
80
184158
93Share
Repurchase
Dividends Acquisitions
Capital Expenditures
Return to Shareholders Investment in the Company
$3.2
’13 ’14 ’15 ’16 ’17
$3.4 $3.4 $3.5 $3.7
$5.47
’13 ’14 ’15 ’16 ’17
$5.54 $5.52 $5.66$5.93
5Hubbell 2017 Annual Report
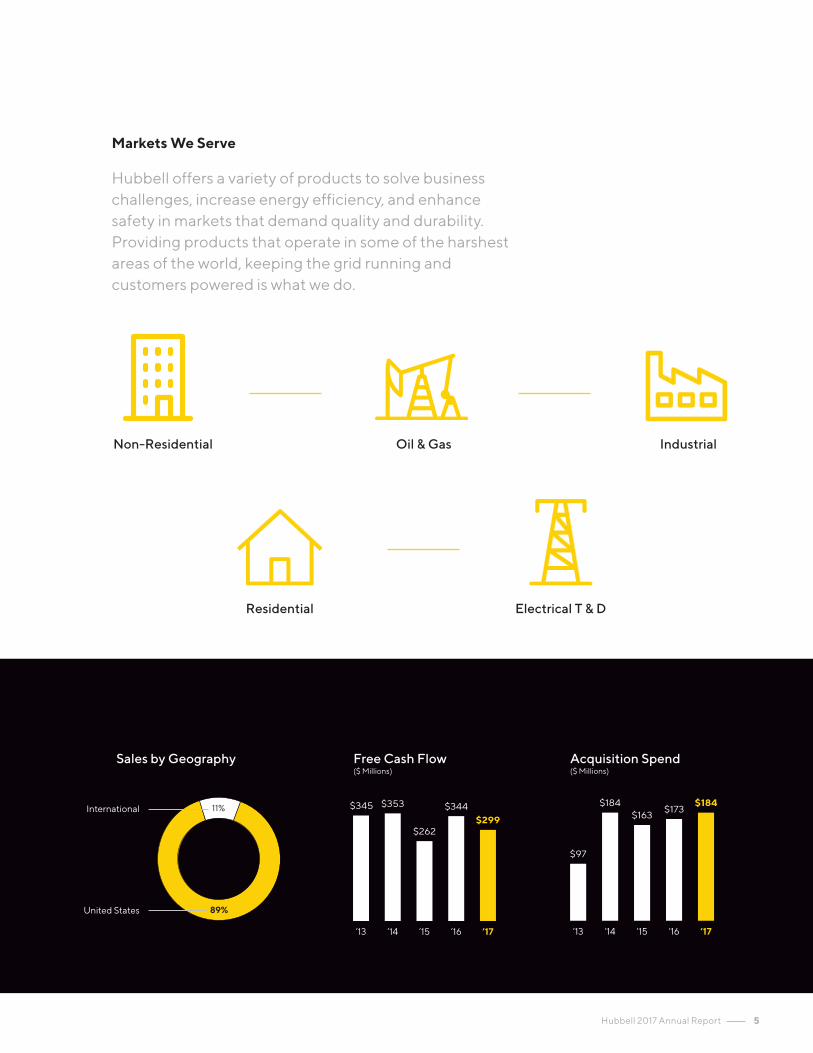
Markets We Serve
Sales by Geography Free Cash Flow($ Millions)
Acquisition Spend($ Millions)
11%
89%
Non-Residential Oil & Gas Industrial
Residential Electrical T & D
International
United States
Hubbell offers a variety of products to solve business challenges, increase energy efficiency, and enhance safety in markets that demand quality and durability. Providing products that operate in some of the harshest areas of the world, keeping the grid running and customers powered is what we do.
$97
’13 ’14 ’15 ’16 ’17
$184$163
$173$184$345
’13 ’14 ’15 ’16 ’17
$353
$262
$344$299

6 Experience Our Evolution
Connecting with Our Customers
A Year of Connections
AC Q U I S I T I O N S
2017 was a year of growth and innovation. Not only did we connect with our customers in new ways, we also kept our customers connected.
AEC™ & PPS™ are national leaders in providing the natural gas market with fabricated meter sets and piping.
PERFECT PIPE SUPPLY&
GTMS is a leading manufacturer of a variety of switches designed for the substation and distribution power utility market.
iDevices® is the preeminent brand in the connected home industry with a growing line of products and capabilities applicable across the Hubbell portfolio.
Windsor is a quality supplier of fiber splice enclosures and hardware used in telecommunications networks by electrical power and communications utilities.
Connecting Our Products Connecting with Our Customers via Superior Service
Connecting on the Go Connecting with Our Customers in the Field
Connecting Online
Among apps launched this year, the NX Distributed Intelligence™ app enables users to perform setup and configuration of the NX system from a wireless smartphone or tablet .
Throughout 2017, our customers faced heavy storms, monsoons, and hurricanes. The Hubbell Emergency Action team pulled together to deliver over five million pounds of utility products.
Bringing charging capabilities out from the wall, Hubbell now offers charging for electric vehicles, charging along airport seats, and portable charging stations.
Another app launched this year, Burndy Connect, allows customers to connect, configure, install, and locate products from anywhere, including the top of a power line.
The new Hubbell.com website, launched this year, allows customers to seamlessly navigate between brands as well as shop online.
Meramec® produces instrument current transformers for the power generator, power transformer, and the high and medium-voltage circuit breaker markets.

7Hubbell 2017 Annual Report
Operations
Our focus on productivity and cost discipline continued in 2017. One example of ongoing productivity is the continued push towards automation in our factories, such as Power’s implementation of robotic grinding, which increases safety and delivers a more consistent process as compared to manual grinding. Construction & Energy also prioritized automation, one example being implementation of a custom-designed semi-automated machine for color-coded connectors, which reduces annual throughput processing time by 80% and improves product consistency, ergonomics, and machine setup time. It’s these types of high return projects that pave the way for continuous cost improvement and efficiencies.
Our broader restructuring program has also provided benefits in terms of savings. We began this critical program of elevated restructuring spend in late 2014 with the objective of improving the competitiveness of our cost structure. And it has tracked to expectations, contributing meaningful and recurring savings from headcount reduction, footprint consolidation, and business process streamlining.
Our Lighting business, in particular, has undertaken numerous restructuring actions, including consolidation of multiple facilities, which have been necessary to align its cost structure with the highly competitive Lighting market. As you know, we struggled throughout much of 2017 with the production moves across manufacturing sites and the launch of a greenfield, national distribution center. I am pleased that we made significant progress to overcome these challenges, and by year-end, Lighting’s manufacturing and distribution performance stabilized. The remediation efforts addressed the restructuring-driven inefficiencies; the resulting improved service levels, streamlined cost structure, and more disciplined business planning and operational process position us well going forward. A testament to these improvements is Progress Lighting, which was awarded Supplier of the Year by a major distribution customer in the over $10 million category. It is always good when customers acknowledge our commitment and performance, especially after a challenging year.
Returns to Shareholders
As our actions demonstrate, we remain focused on returns to shareholders. In 2017, our Board approved a 10% increase in our quarterly dividend to $0.77 per share, as well as a new authorization for a three-year share repurchase program of up to $400 million. We also lowered our interest expense by taking advantage of favorable capital markets to issue $300 million of new debt and use the proceeds to redeem higher interest notes that were coming due in 2018.
Reflecting on 2017
In summary, 2017 was a productive year for Hubbell, as we continue to evolve and address our customers’ needs while positioning ourselves for continued success. And as a result of U.S. tax reform, we expect to have more opportunities to invest in our business and our people, recognizing that none of these achievements could have happened without the efforts of our talented employees. I would like to thank them for their commitment and contributions. Looking ahead, I am excited by the prospect of what the future holds and all that we will achieve.
David G. NordChairman, President and Chief Executive Officer
(1) Adjusted figures exclude restructuring and related costs, costs associated with the reclassification of common stock, Aclara transaction costs, the impact of US tax reform, and refinancing costs, and are non-GAAP measures. Reconciliations of these non-GAAP measures to the comparable GAAP measures can be found in Management’s Discussion and Analysis in the Company’s 2017 Form 10-K.

8 Experience Our Evolution
Board of Directors
Carlos M. CardosoRetired Chairman, President and Chief Executive Officer of Kennametal, Inc. (Industrial tooling)
Member of the Compensation and Audit Committees
John F. MalloyChairman, President and Chief Executive Officer of Victaulic (Mechanical pipe joining systems)
Member of the Audit, Executive and Finance Committees
John G. RussellChairman of the Boards of CMS Energy Corporation and Consumer Energy Company (Electric and natural gas utilities)
Member of the Compensation, Finance and Nominating/Corporate Governance Committees
Anthony J. GuzziPresident and Chief Executive Officer of EMCOR Group, Inc. (Mechanical, electrical construction and facilities services)
Member of the Finance, Executive and Nominating/Corporate Governance Committees
Judith F. MarksPresident of Otis Elevator Company (Manufacturer and service provider of elevators, escalators, and moving walkways)
Member of the Audit and Nominating/Corporate Governance Committees
Steven R. ShawleyRetired Senior Vice President and Chief Financial Officer of Ingersoll Rand Corporation (Climate and residential solutions, industrial and security technologies)
Member of the Audit, Executive and Finance Committees
Neal J. Keating Chairman, President and Chief Executive Officer of Kaman Corporation (Aerospace and industrial distribution)
Member of the Executive, Compensation and Nominating/Corporate Governance Committees
David G. NordChairman of the Board, President and Chief Executive Officer of the Company
Member of the Executive Committee
Richard J. SwiftFormer Chairman of the Financial Accounting Standards Advisory Council and retired Chairman, President and Chief Executive Officer of Foster Wheeler Ltd. (Design, engineering, construction and other services)
Member of the Compensation, Executive and Nominating/Corporate Governance Committees
(LEFT TO RIGHT)

HUBBELL INCORPORATED - Form 10-K 1
UNITED STATES SECURITIES AND EXCHANGE COMMISSION
Washington, DC 20549
FORM 10-KANNUAL REPORT PURSUANT TO SECTION 13 OR 15(d) OF THE SECURITIES EXCHANGE ACT OF 1934
FOR THE FISCAL YEAR ENDED DECEMBER 31, 2017
TRANSITION REPORT PURSUANT TO SECTION 13 OR 15(d) OF THE SECURITIES EXCHANGE ACT OF 1934Commission File Number 1-2958
HUBBELL INCORPORATED(Exact name of registrant as specified in its charter)
STATE OF CONNECTICUT 06-0397030(State or other jurisdiction of incorporation or organization) (I.R.S. Employer Identification No.)
40 Waterview Drive, Shelton, CT 06484(Address of principal executive offices) (Zip Code)
(475) 882-4000(Registrant's telephone number, including area code)
SECURITIES REGISTERED PURSUANT TO SECTION 12(b) OF THE ACT:Title of each Class Name of Exchange on which Registered
Common Stock — par value $0.01 per share New York Stock ExchangeSECURITIES REGISTERED PURSUANT TO SECTION 12(g) OF THE ACT:
NONE
Indicate by check mark Yes No
• if the registrant is a well-known seasoned issuer, as defined in Rule 405 of the Securities Act.
• if the registrant is not required to file reports pursuant to Section 13 or 15(d) of the Securities Exchange Act of 1934.
• if the registrant (1) has filed all reports required to be filed by Section 13 or 15(d) of the Securities Exchange Act of 1934 during the preceding 12 months (or for such shorter period that the registrant was required to file such report), and (2) has been subject to such filing requirements for the past 90 days.
• whether the registrant has submitted electronically and posted on its corporate Web site, if any, every Interactive Data File required to be submitted and posted pursuant to Rule 405 of Regulation S-T (§232.405 of this chapter) during the preceding 12 months (or for such shorter period that the registrant was required to submit and post such files).
• if disclosure of delinquent filers pursuant to Item 405 of Regulation S-K is not contained herein, and will not be contained, to the best of registrant’s knowledge, in definitive proxy or information statements incorporated by reference in Part III of this Form 10-K or any amendment to this Form 10-K.
• whether the registrant is a large accelerated filer, an accelerated filer, a non-accelerated filer or a smaller reporting company. See the definitions of “large accelerated filer,” “accelerated filer” and “smaller reporting company” in Rule 12b-2 of the Exchange Act. (Check one):
Large accelerated filer Accelerated filer Non-accelerated filer
(Do not check if a smaller reporting company)Smaller reporting
company
Emerging growth company
If an emerging growth company, indicate by check mark if the registrant has elected not to use the extended transition period for complying with any new or revised financial accounting standard provided pursuant to Section 13(a) of the Exchange Act.
• whether the registrant is a shell company (as defined in Rule 12b-2 of the Exchange Act).
The approximate aggregate market value of the voting stock held by non-affiliates of the registrant as of June 30, 2017 was $6,149,647,615*. The number of shares outstanding of Hubbell Common Stock as of February 12, 2018 is 54,822,923.
DOCUMENTS INCORPORATED BY REFERENCEPortions of the definitive proxy statement for the annual meeting of shareholders scheduled to be held on May 1, 2018, to be filed with the Securities and Exchange Commission (the “SEC”), are incorporated by reference in answer to Part III of this Form 10-K.*Calculated by excluding all shares held by Executive Officers and Directors of registrant without conceding that all such persons or entities are “affiliates” of registrant for purpose of the Federal Securities Laws.
80227_10K.indd 1 2/27/18 8:04 AM

2 HUBBELL INCORPORATED - Form 10-K2 HUBBELL INCORPORATED - Form 10-K
Table of contents
PART I ITEM 1 BusinessITEM 1A Risk FactorsITEM 1B Unresolved Staff CommentsITEM 2 PropertiesITEM 3 Legal ProceedingsITEM 4 Mine Safety Disclosures
PART II ITEM 5 Market for the Registrant’s Common Equity, Related Stockholder Matters and Issuer
Purchases of Equity SecuritiesITEM 6 Selected Financial DataITEM 7 Management’s Discussion and Analysis of Financial Condition and Results of OperationsITEM 7A Quantitative and Qualitative Disclosures about Market RiskITEM 8 Financial Statements and Supplementary DataITEM 9 Changes in and Disagreements with Accountants on Accounting and Financial DisclosureITEM 9A Controls and ProceduresITEM 9B Other Information
PART III ITEM 10 Directors, Executive Officers and Corporate GovernanceITEM 11 Executive CompensationITEM 12 Security Ownership of Certain Beneficial Owners and Management and Related Stockholder
MattersITEM 13 Certain Relationships and Related Transactions and Director IndependenceITEM 14 Principal Accountant Fees and Services
PART IV ITEM 15 Exhibits and Financial Statement ScheduleSIGNATURES
3
38
13131414
15
1517183638838383
84
848484
8585
86
8690
2 HUBBELL INCORPORATED - Form 10-K
80227_10K.indd 2 2/27/18 8:04 AM
HUBBELL INCORPORATED - Form 10-K 3HUBBELL INCORPORATED - Form 10-K 3
PART I ITEM 1 Business Hubbell Incorporated (herein referred to as “Hubbell”, the “Company”, the “registrant”, “we”, “our” or “us”, which references shall include its divisions and subsidiaries as the context may require) was founded as a proprietorship in 1888, and was incorporated in Connecticut in 1905. Hubbell is primarily engaged in the design, manufacture and sale of quality electrical and electronic products for a broad range of non-residential and residential construction, industrial and utility applications. Products are either sourced complete, manufactured or assembled by subsidiaries in the United States, Canada, Switzerland, Puerto Rico, Mexico, the People’s Republic of China (“China”), the United Kingdom (“UK”), Brazil, Australia, Spain and Ireland. Hubbell also participates in joint ventures in Taiwan, Hong Kong and Philippines, and maintains offices in Singapore, Italy, China, India, Mexico, South Korea, Chile, and countries in the Middle East. The Company’s reporting segments consist of the Electrical and the Power segments, as described below. See also Item 7. Management’s Discussion and Analysis – “Executive Overview
of the Business”, and “Results of Operations” as well as Note 19 — Industry Segments and Geographic Area Information in the Notes to Consolidated Financial Statements.
The Company’s annual report on Form 10-K, quarterly reports on Form 10-Q, current reports on Form 8-K, and all amendments to those reports are made available free of charge through the Investor Relations section of the Company’s website at http://www.hubbell.com as soon as practicable after such material is electronically filed with, or furnished to, the SEC. These filings are also available for reading and copying at the SEC’s Public Reference Room at 100 F Street N.E., Washington, D.C. 20549. Information on the operation of the Public Reference Room may be obtained by calling the SEC at 1-800-SEC-0330. In addition, the Company’s SEC filings can be accessed from the SEC’s homepage on the Internet at http://www.sec.gov. The information contained on the Company’s website or connected to our website is not incorporated by reference into this Annual Report on Form 10-K and should not be considered part of this report.
Electrical Segment
The Electrical segment (69% of consolidated revenues in 2017 and 70% in 2016 and 2015) is comprised of businesses that sell stock and custom products including standard and special application wiring device products, rough-in electrical products, connector and grounding products, lighting fixtures and controls, components and assemblies for the natural gas distribution market, as well as other electrical equipment.
Products of the Electrical segment are typically used in and around industrial, commercial and institutional facilities by electrical contractors, maintenance personnel, electricians, utilities, and telecommunications companies. In addition, certain businesses design and manufacture a variety of high voltage test and measurement equipment, industrial controls and communication systems used in the non-residential and industrial markets. Many of these products are designed such that they can also be used in harsh and hazardous locations where a potential for fire and explosion exists due to the presence of flammable gasses and vapors. Harsh and hazardous products are primarily used in the oil and gas (onshore and offshore) and mining industries. There are also a variety of lighting fixtures, wiring devices and electrical products that have residential and utility applications, including residential products with Internet-of-Things ("IoT") enabled technologies.
These products are primarily sold through electrical and industrial distributors, home centers, retail and hardware outlets, lighting showrooms and residential product oriented internet sites. Special application products are primarily sold through wholesale distributors to contractors, industrial customers and original equipment manufacturers (“OEMs”). High voltage products are sold primarily by direct sales to customers through our sales engineers.
Hubbell maintains a sales and marketing organization to assist potential users with the application of certain products to their specific requirements, and with architects, engineers, industrial designers, OEMs and electrical contractors for the design of electrical systems to meet the specific requirements of industrial, non-residential and residential users. Hubbell is also represented by independent manufacturers’ sales agents for many of its product offerings.
HUBBELL INCORPORATED - Form 10-K 3
80227_10K.indd 3 2/27/18 8:04 AM

4 HUBBELL INCORPORATED - Form 10-K4 HUBBELL INCORPORATED - Form 10-K
The Electrical segment, manufactures and sells thousands of wiring and electrical products, lighting fixtures and controls for indoor and outdoor applications as well as specialty lighting and communications products. The products within the segment have applications in the non-residential, residential, industrial, and energy-related (oil and gas) markets. Fast growing trends within the industry are the adoption of light emitting diode (“LED”) technology as the light source as well as products with embedded IoT technologies. The Company has a broad array of LED-luminaire products within its portfolio and the majority of new product development efforts are oriented towards expanding those offerings. In 2017, the Company expanded its research and development capabilities in new technologies through the acquisition of iDevices, a developer with expertise in IoT technologies and a platform of IoT-enabled home automation products. Within the Electrical segment, products include items such as:
Commercial and Industrial• Wiring devices & accessories • Junction boxes, plugs & receptacles • Cable reels• Switches & dimmers • Steel & plastic enclosures • Datacom connectivity & enclosures• Ground fault devices • Pin & sleeve devices • High voltage test systems• Electrical motor controlsLighting• Canopy lights • Parking lot/parking garage fixtures • Decorative landscape fixtures• Emergency lighting/exit signs • Bollards • Fluorescent fixtures• Floodlights & poles • Bath/vanity fixtures & fans • Ceiling fans• LED components • Chandeliers & sconces • Site & area lighting• Recessed, surface mounted &
track fixtures• Athletic & recreational field fixtures • Occupancy, dimming & daylight
harvesting sensorsConstruction and Energy• Mechanical connectors • Gas connectors and assemblies • Specialty communications equipment• Mechanical grounding devices • Installation tooling • Mining communication & controls• Compression connectors • Specialty lighting • Cable glands & fittings• Safety equipment
These products are sold under various brands and/or trademarks, including:
Commercial and Industrial• Hubbell® • Bell® • Raco® • Gleason Reel® • ACME Electric®• Kellems® • TayMac® • Hipotronics® • Powerohm™ • EC&M Design®• Bryant® • Wiegmann® • Haefely® • iDevices®Lighting• Kim Lighting® • Beacon Products™ • Spaulding Lighting™ • Kurt Versen® • Litecontrol™
• SportsliterSolutions™ • Columbia Lighting® • Alera Lighting® • Prescolite® • Dual-Lite®
• Security Lighting™ • Progress LightingDesign® • Hubbell® Outdoor
Lighting™ • Architectural AreaLighting™
Construction and Energy• Burndy® • Killark® • GAI-Tronics® • Gas Breaker® • R.W. Lyall™• CMC® • Hawke™ • Chalmit™ • Vantage Technology® • Continental®• Austdac™ • AEC™
80227_10K.indd 4 2/27/18 8:04 AM

HUBBELL INCORPORATED - Form 10-K 5HUBBELL INCORPORATED - Form 10-K 5
Power Segment
The Power segment (31% of consolidated revenues in 2017 and 30% in 2016 and 2015) consists of operations that design and manufacture various distribution, transmission, substation and telecommunications products primarily used by the electrical utility industry. In addition, certain of these products are used in the civil construction and transportation industries. Products are sold to distributors and directly to users such as utilities, telecommunication companies, pipeline and mining operations, industrial firms, construction and engineering firms. While Hubbell believes its sales in this area are not materially dependent upon any customer or group of customers, a substantial decrease in purchases by electrical utilities would affect this segment.
On February 2, 2018 the Company acquired Meter Readings Holding Group, LLC ("Aclara Technologies" or "Aclara") for approximately $1.1 billion. Aclara is a provider of smart infrastructure solutions for electric, gas, and water utilities, with advanced metering solutions and grid monitoring sensor technology, as well as leading software enabled installation services. The acquisition extends the Power segment's capabilities into smart automation technologies, accelerates ongoing innovation efforts to address utility customer demand for data and integrated solutions, and expands the segment's reach to a broader set of utility customers.
Hubbell's Power segment manufactures and sells a wide variety of electrical distribution, transmission, substation utility and telecommunications products. These products include items such as:
• Arresters • Bushings • Grounding & bonding equipment• Cutouts & fuse links • Insulators • Programmable reclosers• Pole line hardware • Cable terminations & accessories • Sectionalizers• Helical anchors & foundations • Formed wire products • Lineman tools, hoses & gloves• Overhead, pad mounted & capacitor
switches• Splices, taps & connectors • Polymer concrete & fiberglass
enclosures and equipment pads
These products are sold under the following brands and/or trademarks:
• Aclara® • Chance® • Anderson® • PenCell®• Fargo® • Hubbell® • Polycast® • Opti-loop Design®
• Quazite® • Quadri*sil® • Trinetics® • Reuel™• Electro Composites™ • USCO™ • CDR™ • RFL Design®
• Hot Box® • PCORE® • Delmar™ • Turner Electric®
• EMC™ • Longbow™ • Ohio Brass® • Meramec®
Information Applicable to All General Categories
The following information applicable to all general categories is as of December 31, 2017, and does not include information relating to Aclara.
International Operations
The Company has several operations located outside of the United States. These operations manufacture, assemble and/or procure and market Hubbell products and services for both the Electrical and Power segments.
As a percentage of total net sales, shipments from foreign operations directly to third parties were 11% in 2017, 10% in 2016 and 11% in 2015, with the Canadian, UK and Brazilian operations representing approximately 31%, 21%, and 12% respectively, of 2017 total international net sales. See also Note 19 — Industry Segments and Geographic Area Information in the Notes to Consolidated Financial Statements and Item 1A. Risk Factors relating to manufacturing in and sourcing from foreign countries.
Customers
The Company does not have any customers whose annual consolidated purchases exceed 10 percent of our total net sales in 2017, 2016 and 2015.
Raw Materials
Raw materials used in the manufacture of Hubbell products primarily include steel, aluminum, brass, copper, bronze, plastics, phenolics, zinc, nickel, elastomers and petrochemicals. Hubbell also purchases certain electrical and electronic components, including solenoids, lighting ballasts, printed circuit boards, integrated circuit chips and cord sets, from a number of suppliers. Hubbell is not materially dependent upon any one supplier for raw materials used in the manufacture of its products and equipment, and at the present time, raw materials and components essential to its operation are in adequate supply. However, some of these principal raw
80227_10K.indd 5 2/27/18 8:04 AM

6 HUBBELL INCORPORATED - Form 10-K6 HUBBELL INCORPORATED - Form 10-K
materials are sourced from a limited number of suppliers. See also Item 7A. Quantitative and Qualitative Disclosures about Market Risk.
Patents Hubbell has approximately 1,800 active United States and foreign patents covering a portion of its products, which expire at various times. While Hubbell deems these patents to be of value, it does not consider its business to be dependent upon patent protection. Hubbell also licenses products under patents owned by others, as necessary, and grants licenses under certain of its patents.
Working Capital Inventory, accounts receivable and accounts payable levels, payment terms and, where applicable, return policies are in accordance with the general practices of the electrical products industry and standard business procedures. See also Item 7. Management’s Discussion and Analysis of Financial Condition and Results of Operations.
Backlog Substantially all of the backlog existing at December 31, 2017 is expected to be shipped to customers in 2018. Backlog of orders believed to be firm at December 31, 2017 was approximately $355.5 million compared to $297.4 million at December 31, 2016. Although this backlog is important, the majority of Hubbell’s revenues result from sales of inventoried products or products that have short periods of manufacture.
Competition Hubbell experiences substantial competition in all categories of its business, but does not compete with the same companies in all of its product categories. The number and size of competitors vary considerably depending on the product line. Hubbell cannot specify with precision the number of competitors in each product category or their relative market position. However, some of its competitors are larger companies with substantial financial and other resources. Hubbell considers product performance, reliability, quality and technological innovation as important factors relevant to all areas of its business, and considers its reputation as a manufacturer of quality products to be an important factor in its business. In addition, product price, service levels and other factors can affect Hubbell’s ability to compete.
Research and Development Research and development expenditures represent costs to discover and/or apply new knowledge in developing a new product or process, or in bringing about significant improvement in an existing product or process. Research and development expenses are recorded as a component of Cost of goods sold. Expenses for research and development were approximately 3% of Cost of goods sold in 2017 and 2% in 2016 and 2015.
Environment The Company is subject to various federal, state and local government requirements relating to the protection of employee health and safety and the environment. The Company believes that, as a general matter, its policies, practices and procedures are properly designed to prevent unreasonable risk of environmental damage and personal injury to its employees and its customers’ employees and that the handling, manufacture, use and disposal of hazardous or toxic substances are in accordance with environmental laws and regulations. Like other companies engaged in similar businesses, the Company has incurred or acquired through business combinations, remedial response and voluntary cleanup costs for site contamination and is a party to product liability and other lawsuits and claims associated with environmental matters, including past production of product containing toxic substances. Additional lawsuits, claims and costs involving environmental matters are likely to continue to arise in the future. However, considering past experience and reserves, the Company does not anticipate that these matters will have a material impact on earnings, capital expenditures, financial condition or competitive position. See also Item 1A. Risk Factors and Note 14 — Commitments and Contingencies in the Notes to Consolidated Financial Statements.
Employees As of December 31, 2017, Hubbell had approximately 17,700salaried and hourly employees of which approximately 7,300 of these employees, or 42%, are located in the United States. Approximately 2,200 of these U.S. employees are represented by 11 labor unions. Hubbell considers its labor relations to be satisfactory.
80227_10K.indd 6 2/27/18 8:04 AM

HUBBELL INCORPORATED - Form 10-K 7HUBBELL INCORPORATED - Form 10-K 7
Executive Officers of the Registrant Name Age(1) Present Position Business ExperienceDavid G. Nord 60 Chairman of the
Board, Presidentand ChiefExecutive Officer
Present position since May 2014; President and Chief Executive Officersince January 2013; President and Chief Operating Officer from June2012 to January 2013, and Senior Vice President and Chief FinancialOfficer from September 2005 to June 2012. Previously, various positions,including Vice President, Controller, of United Technologies and itssubsidiaries, 2000-2005.
William R. Sperry 55 Senior Vice President andChief Financial Officer
Present position since June 6, 2012; Vice President, Corporate Strategyand Development August 15, 2008 to June 6, 2012; previously, ManagingDirector, Lehman Brothers August 2006 to April 2008, various positions,including Managing Director, of J.P. Morgan and its predecessorinstitutions, 1994-2006.
Gerben W. Bakker 53 Group President,Power Systems
Present position since February 1, 2014; previously, Division VicePresident, Hubbell Power Systems, Inc. (“HPS”) August 2009 - February1, 2014; President, HPS Brazil June 2005 – July 2009; Vice President,Sourcing, HPS March 2004 – May 2005.
Joseph A.Capozzoli
43 Vice President,Controller
Present position since April 22, 2013; previously, Assistant CorporateController of Stanley Black & Decker, Inc. (“Stanley”) April 2011 to April2013; Global Operations Controller at Stanley 2010-2011; Director of CostAccounting at Stanley, 2006-2010.
An-Ping Hsieh 57 Senior VicePresident, GeneralCounsel andSecretary
Present position since May 2, 2017; previously Senior Vice President,General Counsel May 2016 - May 2017, Vice President, GeneralCounsel, September 2012 - May 2016; Vice President, Secretary andAssociate General Counsel of United Technologies Corporation (“UTC”)February 2008 to September 2012; Vice President and General Counsel,UTC Fire and Security 2003-2008; Deputy General Counsel, OtisElevator Company, a United Technologies company 2001-2003.
Maria R. Lee 42 Treasurer and VicePresident,Corporate Strategyand InvestorRelations
Present position since January 1, 2016; previously Vice President,Corporate Strategy and Investor Relations, March 2015-December 2015;Director, Investor Relations of United Technologies Corporation (“UTC”)2011-2012; various positions, including Director, Financial Planning &Analysis, North and South America Area, Otis Elevator Company, at UTC,2006-2011; various positions at Duff & Phelps, Affiliated Managers Group,Inc., and Booz Allen Hamilton, 1997-2006.
Stephen M. Mais 53 Senior VicePresident,Human Resources
Present position since May 3, 2016, previously Vice President, HumanResources, August 2005 - May 2016; Director, Staffing and Capability,Pepsi Bottling Group (“Pepsi”) 2001-2005; Director, Human ResourcesSoutheastern U.S., Pepsi 1997-2001.
Kevin A. Poyck 48 Group President,Lighting
Present position since June 1, 2015; previously, Vice President, GeneralManager, Commercial and Industrial Lighting, Hubbell Lighting, Inc.("HLI") 2014 - 2015; Vice President, Brand Management, Commercialand Industrial, HLI 2012-2014; Vice President, Operations, HLI 2009 -2012; Vice President, Engineering, HLI 2005-2009.
Rodd R. Ruland 60 Group President,Construction andEnergy
Present position since June 1, 2015; previously, President, BURNDYLLC, Hubbell Canada (HCLP) & Hubbell de Mexico (HdM) 2012-2015;President, BURNDY LLC 2009-2012; Corporate Vice President & GeneralManager, Electrical Power Interconnect Division, FCI (BURNDY)2003-2009, Director, Business Development 2001-2003; various positionsin Sales & Marketing, Business Development, and General Managementand TycoElectronics/AMP Incorporated 1979-2000.
Darrin S. Wegman 50 Group President,Commercial andIndustrial
Present position since June 1, 2015; previously, Vice President, GeneralManager, Wiring Device and Industrial Electrical business, 2013-2015;Vice President, Controller, Hubbell Incorporated, 2008-2013; VicePresident and Controller, Hubbell Industrial Technology, 2002-2008;Controller, GAI-Tronics Corporation, 2000-2002.
(1) As of February 15, 2018.
There are no family relationships among any of the above-named executive officers and directors. For information related to our Board of Directors, refer to Item 10. Directors, Executive Officers and Corporate Governance.
80227_10K.indd 7 2/27/18 8:04 AM
8 HUBBELL INCORPORATED - Form 10-K8 HUBBELL INCORPORATED - Form 10-K
ITEM 1A Risk Factors Our business, operating results, financial condition, and cash flows may be impacted by a number of factors including, but not limited to those set forth below. Any one of these factors could cause our actual results to vary materially from recent results or future anticipated results. See also Item 7. Management’s Discussion and Analysis — “Executive Overview of the Business”, “Outlook”, and “Results of Operations”. Global economic uncertainty could adversely affect us. During periods of prolonged slow growth, or a downturn in conditions in the worldwide or domestic economies, we could experience reduced orders, payment delays, supply chain disruptions or other factors caused by economic challenges faced by our customers, prospective customers and suppliers. Depending upon their severity and duration, these conditions could have an adverse impact on our results of operations, financial condition and cash flows.
We operate in markets that are subject to competitive pressures that could affect selling prices or demand for our products. We compete on the basis of product performance, quality, service and/or price. Competitors' behavior related to these areas could potentially have significant impacts on our financial results. Our competitive strategy is to design and manufacture high quality products at the lowest possible cost. Our strategy is to also increase selling prices to offset rising costs of raw materials and components. Competitive pricing pressures may not allow us to offset some or all of our increased costs through pricing actions. Alternatively, if raw material and component costs decline, the Company may not be able to maintain current pricing levels. Competition could also affect future selling prices or demand for our products which could have an adverse impact on our results of operations, financial condition and cash flows. Our inability to effectively develop and introduce new products could adversely affect our ability to compete. New product introductions and enhancement of existing products and services are key to the Company’s competitive strategy. The success of new product introductions is dependent on a number of factors, including, but not limited to, timely and successful development of new products, market acceptance of these products and the Company’s ability to manage the risks associated with these introductions. These risks include production capabilities, management of inventory levels to support anticipated demand, the risk that new products may have quality defects in the early stages of introduction, and obsolescence risk of existing products. The Company cannot predict with certainty the ultimate impact new product introductions could have on our results of operations, financial condition or cash flows.
We may not be able to successfully implement initiatives, including our restructuring activities, that improve productivity and streamline operations to control or reduce costs. Achieving our long-term profitability goals depends significantly on our ability to control or reduce our operating costs. Because many of our costs are affected by factors outside, or substantially outside, our control, we generally must seek to control or reduce costs through productivity initiatives. If we are not able to identify and implement initiatives that control or reduce costs and increase operating efficiency, or if the cost savings initiatives we have implemented to date do not generate expected cost savings, our financial results could be adversely impacted. Our efforts to control or reduce costs may include restructuring activities involving workforce reductions, facility consolidations and other cost reduction initiatives. If we do not successfully manage our current restructuring activities, or any other restructuring activities that we may undertake in the future, expected efficiencies and benefits may be delayed or not realized, and our operations and business could be disrupted. We engage in acquisitions and strategic investments and may encounter difficulty in obtaining appropriate acquisitions and in integrating these businesses. Part of the Company’s growth strategy involves acquisitions. We have pursued and will continue to seek acquisitions and other strategic investments to complement and expand our existing businesses. The rate and extent to which acquisitions become available may impact our growth rate. The success of these transactions will depend on our ability to integrate these businesses into our operations and realize the planned synergies. We may encounter difficulties in integrating acquisitions into our operations and in managing strategic investments and foreign acquisitions and joint ventures may also present additional risk related to the integration of operations across different cultures and languages. Failure to effectively complete or manage acquisitions may adversely affect our existing businesses as well as our results of operations, financial condition and cash flows.
We may fail to realize all of the anticipated benefits of the Aclara Acquisition or those benefits may take longer to realize than expected.
The full benefits of the Aclara Acquisition, including the anticipated sales or growth opportunities, may not be realized as expected or may not be achieved within the anticipated time frame, or at all. Failure to achieve the anticipated benefits of the Aclara Acquisition could adversely affect our results of operations or cash flows and decrease or delay the expected accretive effect of the Aclara Acquisition.
In addition, we have been required to devote significant attention and resources prior to closing to prepare for the operation of Hubbell following the Aclara Acquisition and will be required to devote significant attention and resources post-closing to successfully align the business practices and operations of Hubbell Incorporated and Aclara. This process may disrupt the businesses and, if ineffective, could limit the anticipated benefits of the Aclara Acquisition.
80227_10K.indd 8 2/27/18 8:04 AM

HUBBELL INCORPORATED - Form 10-K 9HUBBELL INCORPORATED - Form 10-K 9
We have incurred direct and indirect costs as a result of the Aclara Acquisition and will incur additional direct and indirect costs as a result of the Aclara Acquisition.
We have incurred substantial expenses in connection with and as a result of completing the Aclara Acquisition and we expect to incur additional expenses in connection with combining the businesses, operations, policies and procedures of Hubbell Incorporated and Aclara. Factors beyond our control could affect the total amount or timing of these expenses, many of which, by their nature, are difficult to estimate accurately.
We have outstanding indebtedness; our indebtedness has increased as a result of the Aclara Acquisition, and will further increase if we incur additional indebtedness in the future and do not retire existing indebtedness.
We have outstanding indebtedness and other financial obligations and significant unused borrowing capacity. The amount of cash required to pay interest on our indebtedness following completion of the Aclara Acquisition, and thus the demands on our cash resources, is greater than the amount of cash required to service our indebtedness prior to the Aclara Acquisition. Our increased indebtedness level and related debt service obligations could have negative consequences, including (i) requiring us to dedicate significant cash flow from operations to the payment of principal and interest on our indebtedness, which would reduce the funds we have available for other purposes, (ii) reducing our flexibility in planning for or reacting to changes in our business and market conditions and (iii) exposing us to interest rate risk since a portion of our debt obligations are at variable rates.
We may incur significantly more indebtedness in the future. If we add new indebtedness and do not retire existing indebtedness, the risks described above could increase.
We manufacture and source products and materials from various countries throughout the world. A disruption in the availability, price or quality of these products or materials could impact our operating results.
Our business is subject to risks associated with global manufacturing and sourcing. We use a variety of raw materials in the production of our products including steel, aluminum, brass, copper, bronze, zinc, nickel, plastics, phenolics, elastomers and petrochemicals. We also purchase certain electrical and electronic components, including solenoids, lighting ballasts, printed circuit boards and integrated circuit chips and cord sets from a number of suppliers. Significant shortages in the availability of these materials or significant price increases could increase our operating costs and adversely impact the competitive positions of our products, which could adversely impact our results of operations.
We rely on materials, components and finished goods that are sourced from or manufactured in foreign countries including Mexico, China, and other international countries. Political instability in any country where we do business could have an adverse impact on our results of operations.
We rely on our suppliers to produce high quality materials, components and finished goods according to our specifications. Although we have quality control procedures in place, there is a risk that products may not meet our specifications which could impact our ability to ship quality products to our customers on a timely basis, which could adversely impact our results of operations.
We are subject to risks surrounding our information technology systems failures, network, disruptions and breaches in data security.
The proper functioning of Hubbell’s information technology systems is critical to the successful operation of our business. Although our information technology systems are protected with robust backup and security systems, these systems are still susceptible to cyber threats, outages due to fire, floods, power loss, telecommunications failures, viruses, break-ins and similar events, or breaches of physical security. A failure of our information technology systems could impact our ability to process orders, maintain proper levels of inventory, collect accounts receivable and pay expenses; all of which could have an adverse effect on our results of operations, financial condition and cash flows. In addition, security breaches could result in unauthorized disclosure of confidential information that may result in financial or reputational damage to the Company.
We have continued to work on improving our utilization of our enterprise resource planning system, expanding standardization of business processes and performing implementations at our remaining businesses. We expect to incur additional costs related to future implementations, process reengineering efforts as well as enhancements and upgrades to the system. These system modifications and implementations could result in operating inefficiencies which could adversely impact our operating results and/or our ability to perform necessary business transactions.
Future tax law changes could increase our prospective tax expense. In addition, tax payments may ultimately differ from amounts currently recorded by the Company.
We are subject to income taxes as well as non-income based taxes, in both the United States and numerous foreign jurisdictions. The determination of the Company's worldwide provision for income taxes and other tax liabilities requires judgment and is based on diverse legislative and regulatory structures that exist in the various jurisdictions where the company operates. Although management believes its estimates are reasonable, the ultimate tax outcome may differ from the amounts recorded in its financial statements and may adversely affect the Company's financial results for the period when such determination is made. We are subject to ongoing tax audits in various jurisdictions. Tax authorities may disagree with certain positions we have taken and assess additional taxes. We regularly assess the likely outcomes of these audits in order to determine the appropriateness of our tax provisions. However, there can be no assurance that we will accurately predict the outcomes of these audits, and the future outcomes of these audits could adversely affect our results of operations, financial condition and cash flows.
80227_10K.indd 9 2/27/18 8:04 AM

10 HUBBELL INCORPORATED - Form 10-K10 HUBBELL INCORPORATED - Form 10-K
Recent U.S. tax legislation may materially adversely affect our financial condition, results of operations and cash flows.
On December 22, 2017 Public Law 115-97 “An Act to Provide Reconciliation Pursuant to Titles II and V of the Concurrent Resolution on the Budget for Fiscal Year 2018” was enacted. This law is commonly referred to as the Tax Cuts and Job Act of 2017 ("TCJA"). The TCJA significantly changed the U.S. Internal Revenue Code, including taxation of U.S. corporations, by, among other things, reducing the U.S. federal corporate income tax rate, limiting the availability of previously claimed deductions, taxing certain activities and transactions not previously subject to U.S. tax and imposing a mandatory deemed repatriation tax on certain undistributed earnings and profits of U.S.-owned foreign corporations. The legislation is unclear in many respects and will require further interpretation and review of regulations to be issued by the Internal Revenue Service (“IRS”) and state tax authorities. The legislation could also be subject to potential amendments and technical corrections, any of which could lessen or increase certain impacts of the legislation.
The TCJA will also impact how we account for income taxes in our financial statements. Pursuant to guidance issued by the SEC in December 2017, issuers are permitted up to one-year from the date of enactment of the TCJA to complete the accounting for the income tax effects of the TCJA. See Note 1 — Recent Accounting Pronouncements in the Notes to Consolidated Financial Statements for further information about Staff Accounting Bulletin No. 118 (“SAB 118”). Until the accounting for the income tax effects is complete, financial statements should include provisional amounts to the extent a reasonable estimate of the income tax effects of the TCJA can be determined. We have included in the current period financial statements a provisional amount with respect to the deemed repatriation provisions of the TCJA, the revaluation of U.S. deferred taxes and the U.S. and foreign tax costs associated with anticipated remittances related to certain of our outside basis differences. We have also included provisional amounts with respect to those states with current conformity to the Internal Revenue Code where a reasonable estimate could be determined. We have not included a provisional amount for the income tax effects of a repatriation of our remaining unremitted foreign earnings because we have not determined a reasonable estimate related to it. During the one-year period provided under SAB 118, we will include additional provisional amounts or adjustments to prior provisional amounts in our financial statements as information is obtained, prepared and analyzed and legislative and authoritative guidance is issued. These additional amounts or adjustments to prior provisional amounts could be material. See Note 12 — Income Taxes in the Notes to Consolidated Financial Statements for additional information.
We will continue to examine the impact that the TCJA may have on our business in subsequent periods. Notwithstanding the reduction in the corporate income tax rate, the overall impact of the legislation remains uncertain and our business and financial condition could be adversely affected.
Significant developments stemming from the recent U.S. federal elections could have a material adverse effect on us.
As a result of the recent U.S. federal elections, there may be changes to existing trade agreements, like the North American Free Trade Agreement ("NAFTA"), and proposed trade agreements, like the Trans-Pacific Partnership ("TPP"), greater restrictions on free trade generally, significant increases in tariffs on goods imported into the United States particularly tariffs on products manufactured in Mexico, among other possible changes. Changes in U.S. social, political, regulatory and economic conditions or in laws and policies governing foreign trade, manufacturing, development and investment in the territories and countries where we currently manufacture and sell products, and any resulting negative sentiments towards the United States as a result of such changes, could have an adverse effect on our business.
Our success depends on attracting and retaining qualified personnel. Our ability to sustain and grow our business requires us to hire, retain and develop a highly skilled and diverse management team and workforce. Failure to ensure that we have the depth and breadth of personnel with the necessary skill set and experience, or the loss of key employees, could impede our ability to deliver our growth objectives and execute our strategy. Deterioration in the credit quality of our customers could have a material adverse effect on our operating results and financial condition. We have an extensive customer base of distributors, wholesalers, electric utilities, OEMs, electrical contractors, telecommunications companies and retail and hardware outlets. We are not dependent on a single customer, however, our top ten customers account for approximately 40% of our net sales. Deterioration in the credit quality of several major customers could adversely affect our results of operations, financial condition and cash flows. Inability to access capital markets or failure to maintain our credit ratings may adversely affect our business. Our ability to invest in our business and make strategic acquisitions may require access to the capital markets. If general economic and capital market conditions deteriorate significantly, it could impact our ability to access capital. Failure to maintain our credit ratings could also impact our ability to access credit markets and could adversely impact our cost of borrowing. While we have not encountered significant financing difficulties recently, the capital and credit markets have experienced significant volatility in recent years. Market conditions could make it more difficult for us to access capital to finance our investments and acquisitions. This could adversely affect our results of operations, financial condition and cash flows.
80227_10K.indd 10 2/27/18 8:04 AM
HUBBELL INCORPORATED - Form 10-K 11HUBBELL INCORPORATED - Form 10-K 11
If the underlying investments of our defined benefit plans do not perform as expected, we may have to make additional contributions to these plans. We sponsor certain pension and other postretirement defined benefit plans. The performance of the financial markets and interest rates impact these plan expenses and funding obligations. Significant changes in market interest rates, investment losses on plan assets and reductions in discount rates may increase our funding obligations and could adversely impact our results of operations, cash flows, and financial condition. Furthermore, there can be no assurance that the value of the defined benefit plan assets will be sufficient to meet future funding requirements.
Volatility in currency exchange rates may adversely affect our financial condition, results of operations and cash flows. Our international operations accounted for approximately 11% of our net sales in 2017. We are exposed to the effects (both positive and negative) that fluctuating exchange rates have on translating the financial statements of our international operations, most of which are denominated in local currencies, into the U.S. dollar. Fluctuations in exchange rates may affect product demand and reported profits in our international operations. In addition, currency fluctuations may affect the prices we pay suppliers for materials used in our products. As a result, fluctuating exchange rates may adversely impact our results of operations and cash flows. Our reputation and our ability to conduct business may be impaired by improper conduct by any of our employees, agents or business partners. We cannot provide absolute assurance that our internal controls and compliance systems will always protect us from acts committed by our employees, agents or business partners that would violate U.S. and/or non-U.S. laws, including the laws governing payments to government officials, bribery, fraud, anti-kickback and false claims rules, competition, export and import compliance, money laundering and data privacy. In particular, the U.S. Foreign Corrupt Practices Act, the U.K. Bribery Act, and similar anti-bribery laws in other jurisdictions generally prohibit companies and their intermediaries from making improper payments to government officials for the purpose of obtaining or retaining business, and we operate in parts of the world that have experienced governmental corruption to some degree. Despite meaningful measures that we undertake to facilitate lawful conduct, which include training and internal control policies, these measures may not always prevent reckless or criminal acts by our employees or agents. Any such improper actions could damage our reputation and subject us to civil or criminal investigation in the United States and in other jurisdictions, could lead to substantial civil and criminal, monetary and non-monetary penalties and could cause us to incur significant legal and investigative fees.
We could incur significant and/or unexpected costs in our efforts to successfully avoid, manage, defend and litigate intellectual property matters. The Company relies on certain patents, trademarks, copyrights, trade secrets and other intellectual property of which the Company cannot be certain that others have not and will not infringe upon. Although management believes that the loss or expiration of any single intellectual property right would not have a material impact on its operating results, intellectual property litigation could be costly and time consuming and the Company could incur significant legal expenses pursuing these claims against others. From time to time, we receive notices from third parties alleging intellectual property infringement. Any dispute or litigation involving intellectual property could be costly and time-consuming due to the complexity and the uncertainty of intellectual property litigation. Our intellectual property portfolio may not be useful in asserting a counterclaim, or negotiating a license, in response to a claim of infringement or misappropriation. In addition, as a result of such claims, the Company may lose its rights to utilize critical technology or may be required to pay substantial damages or license fees with respect to the infringed rights or be required to redesign our products at a substantial cost, any of which could negatively impact our operating results. Even if we successfully defend against claims of infringement, we may incur significant costs that could adversely affect our results of operations, financial condition and cash flow. See Item 3 “Legal Proceedings” for a discussion of our legal proceedings. We may be required to recognize impairment charges for our goodwill and other intangible assets. As of December 31, 2017, the net carrying value of our goodwill and other intangible assets totaled approximately $1.5 billion. In addition, the Aclara acquisition is expected to result in a significant increase in goodwill and intangible assets. As required by generally accepted accounting principles, we periodically assess these assets to determine if they are impaired. Impairment of intangible assets may be triggered by developments both within and outside the Company’s control. Deteriorating economic conditions, technological changes, disruptions to our business, inability to effectively integrate acquired businesses, unexpected significant changes or planned changes in use of the assets, intensified competition, divestitures, market capitalization declines and other factors may impair our goodwill and other intangible assets. Any charges relating to such impairments could adversely affect our results of operations in the periods an impairment is recognized.
80227_10K.indd 11 2/27/18 8:04 AM
12 HUBBELL INCORPORATED - Form 10-K12 HUBBELL INCORPORATED - Form 10-K
We are subject to litigation and environmental regulations that may adversely impact our operating results.
We are a party to a number of legal proceedings and claims, including those involving product liability, intellectual property and environmental matters, which could be significant. It is not possible to predict with certainty the outcome of every claim and lawsuit. In the future, we could incur judgments or enter into settlements of lawsuits and claims that could have a materially adverse effect on our results of operations, cash flows, and financial condition. In addition, while we maintain insurance coverage with respect to certain claims, such insurance may not provide adequate coverage against such claims. We establish reserves based on our assessment of contingencies, including contingencies related to legal claims asserted against us. Subsequent developments in legal proceedings may affect our assessment and estimates of the loss contingency recorded as a reserve and require us to make additional payments, which could have a materially adverse effect on our results of operations, financial condition and cash flow.
We are also subject to various laws and regulations relating to environmental protection and the discharge of materials into the environment, and we could incur substantial costs as a result of the noncompliance with or liability for clean up or other costs or damages under environmental laws. In addition, we could be affected by future laws or regulations, including those imposed in response to climate change concerns. Compliance with any future laws and regulations could result in a materially adverse effect on our business and financial results. See Item 3 “Legal Proceedings” for a discussion of our legal proceedings.
Regulations related to conflict-free minerals may cause us to incur additional expenses and may create challenges with our customers. The Dodd-Frank Wall Street Reform and Consumer Protection Act contains provisions to improve transparency and accountability regarding the use of “conflict” minerals mined from the Democratic Republic of Congo and adjoining countries (“DRC”). The SEC has established annual disclosure and reporting requirements for those companies who use “conflict” minerals sourced from the DRC in their products. These new requirements could limit the pool of suppliers who can provide conflict-free minerals and as a result, we cannot ensure that we will be able to obtain these conflict-free minerals at competitive prices. Compliance with these new requirements may also increase our costs. In addition, we may face challenges with our customers if we are unable to sufficiently verify the origins of the minerals used in our products. We face the potential harms of natural disasters, terrorism, acts of war, international conflicts or other disruptions to our operations. Natural disasters, acts or threats of war or terrorism, international conflicts, and the actions taken by the United States and other governments in response to such events could cause damage to or disrupt our business operations, our suppliers or our customers, and could create political or economic instability, any of which could have an adverse effect on our business. Although it is not possible to predict such events or their consequences, these events could decrease demand for our products, make it difficult or impossible for us to deliver products, or disrupt our supply chain.
80227_10K.indd 12 2/27/18 8:04 AM
HUBBELL INCORPORATED - Form 10-K 13HUBBELL INCORPORATED - Form 10-K 13
ITEM 1B Unresolved Staff Comments None.
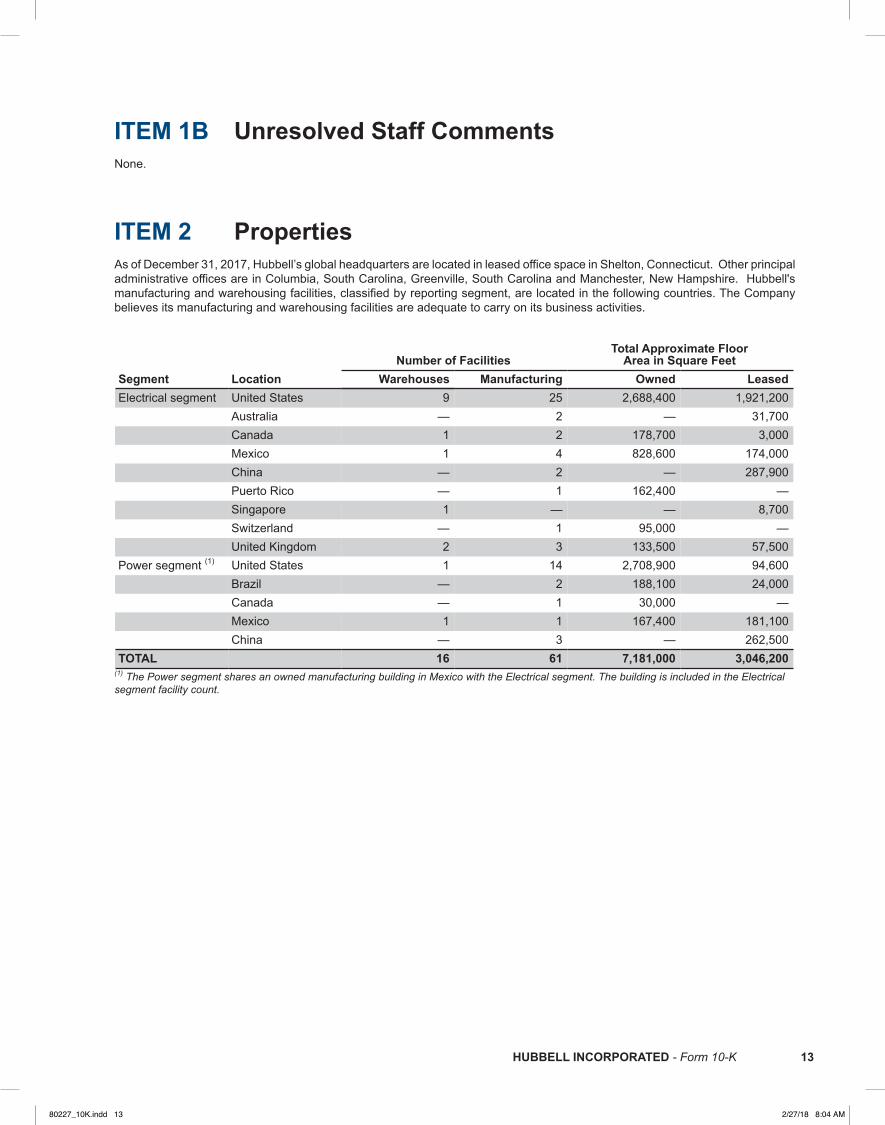
ITEM 2 PropertiesAs of December 31, 2017, Hubbell’s global headquarters are located in leased office space in Shelton, Connecticut. Other principal administrative offices are in Columbia, South Carolina, Greenville, South Carolina and Manchester, New Hampshire. Hubbell's manufacturing and warehousing facilities, classified by reporting segment, are located in the following countries. The Company believes its manufacturing and warehousing facilities are adequate to carry on its business activities.
Number of FacilitiesTotal Approximate Floor
Area in Square FeetSegment Location Warehouses Manufacturing Owned LeasedElectrical segment United States 9 25 2,688,400 1,921,200 Australia — 2 — 31,700 Canada 1 2 178,700 3,000 Mexico 1 4 828,600 174,000 China — 2 — 287,900 Puerto Rico — 1 162,400 — Singapore 1 — — 8,700 Switzerland — 1 95,000 — United Kingdom 2 3 133,500 57,500Power segment (1) United States 1 14 2,708,900 94,600 Brazil — 2 188,100 24,000 Canada — 1 30,000 — Mexico 1 1 167,400 181,100 China — 3 — 262,500TOTAL 16 61 7,181,000 3,046,200
(1) The Power segment shares an owned manufacturing building in Mexico with the Electrical segment. The building is included in the Electrical segment facility count.
80227_10K.indd 13 2/27/18 8:04 AM

14 HUBBELL INCORPORATED - Form 10-K14 HUBBELL INCORPORATED - Form 10-K
ITEM 3 Legal Proceedings The Company is subject to various legal proceedings arising in the normal course of its business. These proceedings include claims for damages arising out of use of the Company’s products, intellectual property, workers’ compensation and environmental matters. The Company is self-insured up to specified limits for certain types of claims, including product liability and workers’ compensation, and is fully self-insured for certain other types of claims, including environmental and intellectual property matters. The Company recognizes a liability for any contingency that in management’s judgment is probable of occurrence and can be reasonably estimated. We continually reassess the likelihood of adverse judgments and outcomes in these matters, as well as estimated ranges of possible losses based upon an analysis of each matter which includes
consideration of outside legal counsel and, if applicable, other experts. Information required by this item is incorporated herein by reference to the section captioned “Notes to Consolidated Financial Statements, Note 14 — Commitments and Contingencies” of this Form 10-K.
ITEM 4 Mine Safety Disclosures Not applicable.
80227_10K.indd 14 2/27/18 8:04 AM
HUBBELL INCORPORATED - Form 10-K 15HUBBELL INCORPORATED - Form 10-K 15
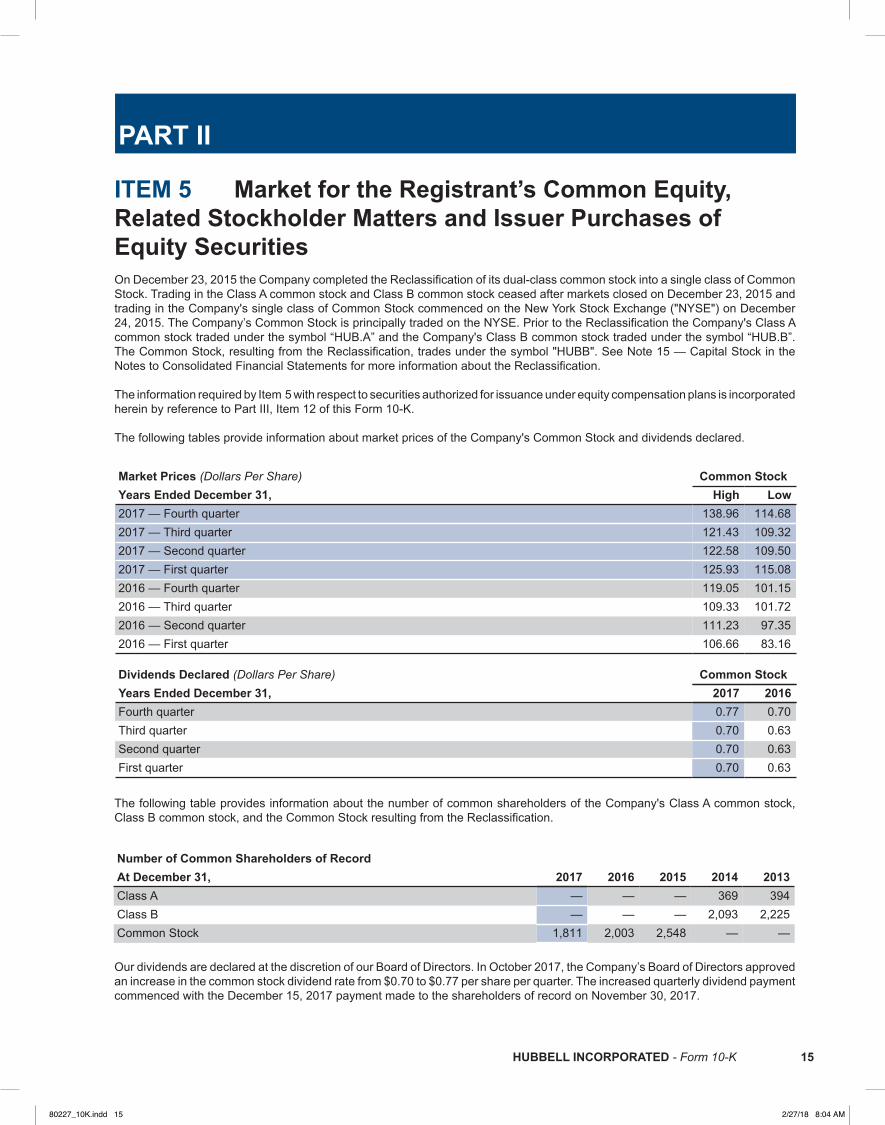
PART II
ITEM 5 Market for the Registrant’s Common Equity, Related Stockholder Matters and Issuer Purchases of Equity SecuritiesOn December 23, 2015 the Company completed the Reclassification of its dual-class common stock into a single class of Common Stock. Trading in the Class A common stock and Class B common stock ceased after markets closed on December 23, 2015 and trading in the Company's single class of Common Stock commenced on the New York Stock Exchange ("NYSE") on December 24, 2015. The Company’s Common Stock is principally traded on the NYSE. Prior to the Reclassification the Company's Class A common stock traded under the symbol “HUB.A” and the Company's Class B common stock traded under the symbol “HUB.B”. The Common Stock, resulting from the Reclassification, trades under the symbol "HUBB". See Note 15 — Capital Stock in the Notes to Consolidated Financial Statements for more information about the Reclassification.
The information required by Item 5 with respect to securities authorized for issuance under equity compensation plans is incorporated herein by reference to Part III, Item 12 of this Form 10-K.
The following tables provide information about market prices of the Company's Common Stock and dividends declared.
Market Prices (Dollars Per Share) Common StockYears Ended December 31, High Low2017 — Fourth quarter 138.96 114.682017 — Third quarter 121.43 109.322017 — Second quarter 122.58 109.502017 — First quarter 125.93 115.082016 — Fourth quarter 119.05 101.152016 — Third quarter 109.33 101.722016 — Second quarter 111.23 97.352016 — First quarter 106.66 83.16
Dividends Declared (Dollars Per Share) Common StockYears Ended December 31, 2017 2016Fourth quarter 0.77 0.70Third quarter 0.70 0.63Second quarter 0.70 0.63First quarter 0.70 0.63
The following table provides information about the number of common shareholders of the Company's Class A common stock, Class B common stock, and the Common Stock resulting from the Reclassification.
Number of Common Shareholders of Record At December 31, 2017 2016 2015 2014 2013Class A — — — 369 394Class B — — — 2,093 2,225Common Stock 1,811 2,003 2,548 — —
Our dividends are declared at the discretion of our Board of Directors. In October 2017, the Company’s Board of Directors approved an increase in the common stock dividend rate from $0.70 to $0.77 per share per quarter. The increased quarterly dividend payment commenced with the December 15, 2017 payment made to the shareholders of record on November 30, 2017.
80227_10K.indd 15 2/27/18 8:04 AM
16 HUBBELL INCORPORATED - Form 10-K16 HUBBELL INCORPORATED - Form 10-K
Purchases of Equity Securities
At December 31, 2016, we had total remaining share repurchase authorization of $153.6 million under the repurchase program authorized by our Board of Directors in August 2015. In 2017, the Company repurchased shares for an aggregate purchase price of $92.5 million and the August 2015 repurchase program expired in October, 2017. On October 20, 2017, the Board of Directors approved a new stock repurchase program (the “October 2017 program”) that authorized the repurchase of up to $400 million of Common Stock and expires on October 20, 2020. As of December 31, 2017, the entire $400 million remains authorized for repurchases under the October 2017 program. Subject to numerous factors, including market conditions and alternative uses of cash, we may conduct discretionary repurchases through open market or privately negotiated transactions, which may include repurchases under plans complying with Rules 10b5-1 and 10b-18 under the Securities Exchange Act of 1934, as amended.
Corporate Performance Graph
The following graph compares the total return to shareholders on the Company’s common stock during the five years ended December 31, 2017, with a cumulative total return on the (i) Standard & Poor’s MidCap 400 (“S&P MidCap 400”) and (ii) the Dow Jones U.S. Electrical Components & Equipment Index (“DJUSEC”). The Company is a member of the S&P MidCap 400. As of December 31, 2017, the DJUSEC reflects a group of fourteen company stocks in the electrical components and equipment market segment, and serves as the Company’s peer group for purposes of this graph. The comparison assumes $100 was invested on December 31, 2012 in the Company’s Common Stock and in each of the foregoing indices and assumes reinvestment of dividends.
COMPARISON OF 5 YEAR CUMULATIVE TOTAL RETURN*Among Hubbell Incorporated, the S&P Midcap 400 Index,
and the Dow Jones US Electrical Components & Equipment Index
The Hubbell Incorporated line above uses the weighted average of Hubbell Class A and Class B shares for the two annual periods from December 2012 through December 2014.
*$100 invested on 12/31/12 in stock or index, including reinvestment of dividends. Fiscal year ending December 31.
Copyright© 2018 Standard & Poor's, a division of S&P Global. All rights reserved.Copyright© 2018 S&P Dow Jones Indices LLC, a division of S&P Global. All rights reserved.
80227_10K.indd 16 2/27/18 8:04 AM
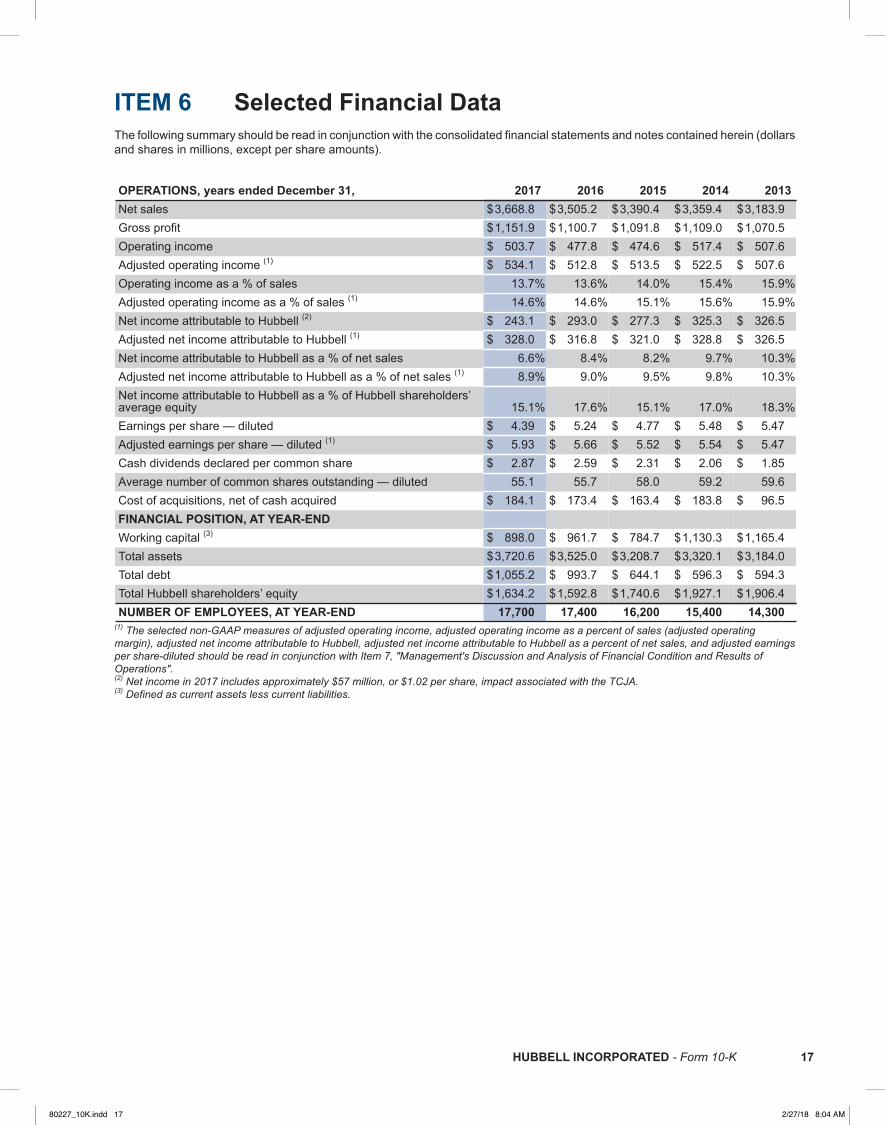
HUBBELL INCORPORATED - Form 10-K 17HUBBELL INCORPORATED - Form 10-K 17
ITEM 6 Selected Financial Data The following summary should be read in conjunction with the consolidated financial statements and notes contained herein (dollars and shares in millions, except per share amounts).
OPERATIONS, years ended December 31, 2017 2016 2015 2014 2013Net sales $3,668.8 $3,505.2 $3,390.4 $3,359.4 $3,183.9Gross profit $1,151.9 $1,100.7 $1,091.8 $1,109.0 $1,070.5Operating income $ 503.7 $ 477.8 $ 474.6 $ 517.4 $ 507.6Adjusted operating income (1) $ 534.1 $ 512.8 $ 513.5 $ 522.5 $ 507.6Operating income as a % of sales 13.7% 13.6% 14.0% 15.4% 15.9%Adjusted operating income as a % of sales (1) 14.6% 14.6% 15.1% 15.6% 15.9%Net income attributable to Hubbell (2) $ 243.1 $ 293.0 $ 277.3 $ 325.3 $ 326.5Adjusted net income attributable to Hubbell (1) $ 328.0 $ 316.8 $ 321.0 $ 328.8 $ 326.5Net income attributable to Hubbell as a % of net sales 6.6% 8.4% 8.2% 9.7% 10.3%Adjusted net income attributable to Hubbell as a % of net sales (1) 8.9% 9.0% 9.5% 9.8% 10.3%Net income attributable to Hubbell as a % of Hubbell shareholders’average equity 15.1% 17.6% 15.1% 17.0% 18.3%Earnings per share — diluted $ 4.39 $ 5.24 $ 4.77 $ 5.48 $ 5.47Adjusted earnings per share — diluted (1) $ 5.93 $ 5.66 $ 5.52 $ 5.54 $ 5.47Cash dividends declared per common share $ 2.87 $ 2.59 $ 2.31 $ 2.06 $ 1.85Average number of common shares outstanding — diluted 55.1 55.7 58.0 59.2 59.6Cost of acquisitions, net of cash acquired $ 184.1 $ 173.4 $ 163.4 $ 183.8 $ 96.5FINANCIAL POSITION, AT YEAR-END Working capital (3) $ 898.0 $ 961.7 $ 784.7 $1,130.3 $1,165.4Total assets $3,720.6 $3,525.0 $3,208.7 $3,320.1 $3,184.0Total debt $1,055.2 $ 993.7 $ 644.1 $ 596.3 $ 594.3Total Hubbell shareholders’ equity $1,634.2 $1,592.8 $1,740.6 $1,927.1 $1,906.4NUMBER OF EMPLOYEES, AT YEAR-END 17,700 17,400 16,200 15,400 14,300
(1) The selected non-GAAP measures of adjusted operating income, adjusted operating income as a percent of sales (adjusted operating margin), adjusted net income attributable to Hubbell, adjusted net income attributable to Hubbell as a percent of net sales, and adjusted earnings per share-diluted should be read in conjunction with Item 7, "Management's Discussion and Analysis of Financial Condition and Results of Operations". (2) Net income in 2017 includes approximately $57 million, or $1.02 per share, impact associated with the TCJA.(3) Defined as current assets less current liabilities.
80227_10K.indd 17 2/27/18 8:04 AM
18 HUBBELL INCORPORATED - Form 10-K18 HUBBELL INCORPORATED - Form 10-K
ITEM 7 Management’s Discussion and Analysis of Financial Condition and Results of Operations
Executive Overview of the Business
The Company is primarily engaged in the design, manufacture and sale of quality electrical and electronic products for a broad range of non-residential and residential construction, industrial and utility applications. Products are either sourced complete, manufactured or assembled by subsidiaries in the United States, Canada, Switzerland, Puerto Rico, China, Mexico, the United Kingdom, Brazil, Australia Spain and Ireland. The Company also participates in joint ventures in Taiwan, Hong Kong and the Philippines, and maintains offices in Singapore, Italy, China, India, Mexico, South Korea, Chile, and countries in the Middle East. The Company employed approximately 17,700 individuals worldwide as of December 31, 2017.
The Company’s reporting segments consist of the Electrical segment and the Power segment. Results for 2017, 2016 and 2015 by segment are included under “Segment Results” within this Management’s Discussion and Analysis. The Company's long-term strategy is to serve its customers with reliable and innovative electrical and related infrastructure solutions with desired brands, high-quality service, and delivered through a competitive cost structure; to complement organic revenue growth with acquisitions that enhance its product offerings; and to allocate capital effectively to create shareholder value. Our strategy to complement organic revenue growth with acquisitions focuses on acquiring assets that extend our capabilities, expand our product offerings, and present opportunities to compete in core, adjacent or complementary markets. Our acquisition strategy also provides the opportunity to advance our revenue growth objectives during periods of weakness or inconsistency in our end-markets.
Our strategy to deliver products through a competitive cost structure has resulted in the restructuring and related activities we have initiated, beginning in 2014. Our restructuring and related efforts include the consolidation of manufacturing and distribution facilities, workforce actions, as well as streamlining and consolidating our back-office functions. The primary objectives of our restructuring and related activities are to optimize our manufacturing footprint, cost structure, and effectiveness and efficiency of our workforce.
Productivity improvement also continues to be a key area of focus for the Company and efforts to drive productivity work with our restructuring and related activities to minimize the impact of rising material costs and administrative cost inflation. Material costs are approximately two-thirds of our cost of goods sold therefore volatility in this area can significantly impact profitability. Our goal is to have pricing and productivity programs that offset material and other inflationary cost increases as well as pay for investments in key growth areas.
Productivity programs impact virtually all functional areas within the Company by reducing or eliminating waste and improving processes. We continue to expand our efforts surrounding global product and component sourcing and supplier cost reduction programs. Value engineering efforts, product transfers and the use of lean process improvement techniques are expected to continue to increase manufacturing efficiency. In addition, we continue to build upon the benefits of our enterprise resource planning system across all functions.
Acquisition of Aclara
On February 2, 2018 the Company acquired Aclara for approximately $1.1 billion. Aclara is a leading global supplier of smart infrastructure solutions for electric, gas, and water utilities, with advanced metering solutions and grid monitoring sensor technology, as well as leading software enabled installation services. The acquisition extends the Power segment's capabilities into smart automation technologies, accelerates ongoing innovation efforts to address utility customer demand for data and integrated solutions, and expands the segment's reach to a broader set of utility customers.
For additional information about the Aclara acquisition, refer to Note 2 — Business Acquisitions in the Notes to the Consolidated Financial Statements as well as the Company's current report on Form 8-K filed on December 26, 2017.
80227_10K.indd 18 2/27/18 8:04 AM
HUBBELL INCORPORATED - Form 10-K 19HUBBELL INCORPORATED - Form 10-K 19
Outlook
In 2018, we expect aggregate growth across our end markets of approximately two to four percent and that our new product development initiatives will drive our net sales results to modestly out-perform end-market expectations. Our end-market growth expectations include three to five percent growth in the oil and gas market, two to four percent growth in the electrical transmission and distribution, industrial, and residential markets, and one to three percent growth in the non-residential market. We expect acquisitions to contribute approximately 15% to net sales growth in 2018, including net sales growth from the acquisition of Aclara.
We expect reported earnings per diluted share for 2018 in the range of $6.10 to $6.50 and adjusted earnings per diluted share in the range of $6.95 to $7.35(1).
Finally, with our strong financial position and cash flows provided by operating activities, we expect to continue to enhance shareholder value through capital deployment. We expect free cash flow (defined as cash flows from operating activities less capital expenditures) to be equal to net income attributable to Hubbell in 2018.
(1) Effective with results of operations reported in the first quarter of 2018, "adjusted" operating measures will no longer exclude restructuring and related costs, as these costs and the related savings are expected to return to a more consistent annual run-rate in 2018, and therefore no longer affect the comparability of our underlying performance from period to period. Our expectation for full year 2018 adjusted earnings per diluted share in the range of $6.95 to $7.35 excludes Aclara acquisition-related and transaction costs. Aclara acquisition-related costs include the amortization of identified intangible assets and inventory step-up amortization expense.
Results of Operations
Our operations are classified into two reportable segments: Electrical and Power. For a complete description of the Company’s segments, see Part I, Item 1 of this Annual Report on Form 10-K. Within these segments, Hubbell serves customers in five primary end markets; non-residential construction, residential construction, industrial, energy-related markets (also referred to as oil and gas markets) and utility markets (also referred to as the electrical transmission and distribution market). In order of magnitude of net sales, the Company's served markets are non-residential construction, industrial, utility, oil and gas, and residential construction.
Growth of our five primary end markets was more consistent in 2017 as compared to recent years. Higher margin businesses, such as our harsh and hazardous business, that declined in recent years experienced a recovery, and the gas market was strong, which complemented utility capital spend and storm-related activity that drove growth in electrical transmission and distribution markets.
Non-residential and residential market demand grew as well, but that growth was restrained by the Lighting market, which experienced unit growth that was dampened by pricing headwinds. Industrial markets were mixed, with declines in heavy industrial business, but improvement in telecommunications.
With the return to more balanced growth and recovery of higher margin businesses, adjusted operating margin of our Electrical segment has stabilized year over year, declining by only 30 basis points, while absorbing our investment in IoT capabilities (through the acquisition of iDevices), restructuring-driven inefficiencies and pricing headwinds in our Lighting business as well as material cost headwinds during the year. Our Power segment grew organic revenues by six percent, benefiting from growth in transmission and distribution markets, and adjusted operating margins in the Power segment continued to be strong, expanding by 20 basis points as productivity drove improvement despite increasing material costs.
80227_10K.indd 19 2/27/18 8:04 AM
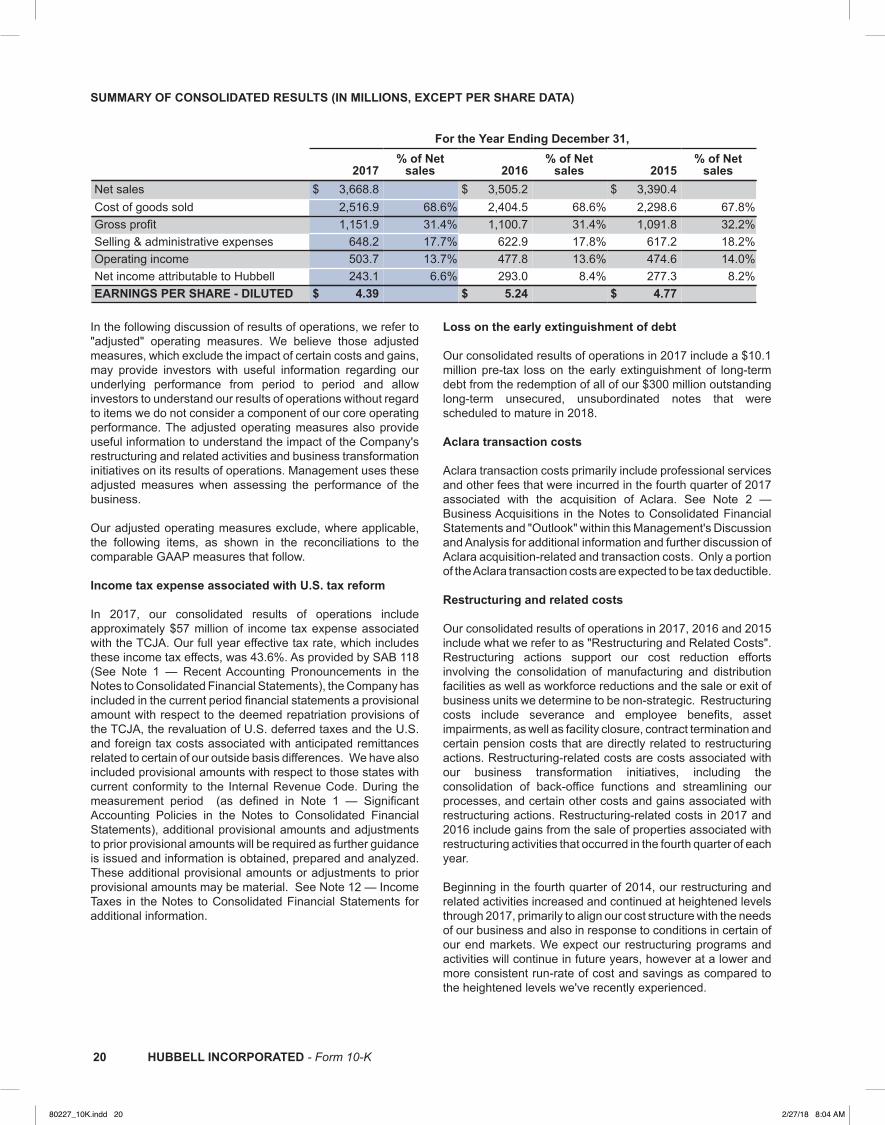
20 HUBBELL INCORPORATED - Form 10-K20 HUBBELL INCORPORATED - Form 10-K
SUMMARY OF CONSOLIDATED RESULTS (IN MILLIONS, EXCEPT PER SHARE DATA)
For the Year Ending December 31,
2017% of Net
sales 2016% of Net
sales 2015% of Net
salesNet sales $ 3,668.8 $ 3,505.2 $ 3,390.4 Cost of goods sold 2,516.9 68.6% 2,404.5 68.6% 2,298.6 67.8%Gross profit 1,151.9 31.4% 1,100.7 31.4% 1,091.8 32.2%Selling & administrative expenses 648.2 17.7% 622.9 17.8% 617.2 18.2%Operating income 503.7 13.7% 477.8 13.6% 474.6 14.0%Net income attributable to Hubbell 243.1 6.6% 293.0 8.4% 277.3 8.2%EARNINGS PER SHARE - DILUTED $ 4.39 $ 5.24 $ 4.77
In the following discussion of results of operations, we refer to "adjusted" operating measures. We believe those adjusted measures, which exclude the impact of certain costs and gains, may provide investors with useful information regarding our underlying performance from period to period and allow investors to understand our results of operations without regard to items we do not consider a component of our core operating performance. The adjusted operating measures also provide useful information to understand the impact of the Company's restructuring and related activities and business transformation initiatives on its results of operations. Management uses these adjusted measures when assessing the performance of the business.
Our adjusted operating measures exclude, where applicable, the following items, as shown in the reconciliations to the comparable GAAP measures that follow.
Income tax expense associated with U.S. tax reform
In 2017, our consolidated results of operations include approximately $57 million of income tax expense associated with the TCJA. Our full year effective tax rate, which includes these income tax effects, was 43.6%. As provided by SAB 118 (See Note 1 — Recent Accounting Pronouncements in the Notes to Consolidated Financial Statements), the Company has included in the current period financial statements a provisional amount with respect to the deemed repatriation provisions of the TCJA, the revaluation of U.S. deferred taxes and the U.S. and foreign tax costs associated with anticipated remittances related to certain of our outside basis differences. We have also included provisional amounts with respect to those states with current conformity to the Internal Revenue Code. During the measurement period (as defined in Note 1 — Significant Accounting Policies in the Notes to Consolidated Financial Statements), additional provisional amounts and adjustments to prior provisional amounts will be required as further guidance is issued and information is obtained, prepared and analyzed. These additional provisional amounts or adjustments to prior provisional amounts may be material. See Note 12 — Income Taxes in the Notes to Consolidated Financial Statements for additional information.
Loss on the early extinguishment of debt
Our consolidated results of operations in 2017 include a $10.1 million pre-tax loss on the early extinguishment of long-term debt from the redemption of all of our $300 million outstanding long-term unsecured, unsubordinated notes that were scheduled to mature in 2018.
Aclara transaction costs
Aclara transaction costs primarily include professional services and other fees that were incurred in the fourth quarter of 2017 associated with the acquisition of Aclara. See Note 2 — Business Acquisitions in the Notes to Consolidated Financial Statements and "Outlook" within this Management's Discussion and Analysis for additional information and further discussion of Aclara acquisition-related and transaction costs. Only a portion of the Aclara transaction costs are expected to be tax deductible.
Restructuring and related costs
Our consolidated results of operations in 2017, 2016 and 2015include what we refer to as "Restructuring and Related Costs". Restructuring actions support our cost reduction efforts involving the consolidation of manufacturing and distribution facilities as well as workforce reductions and the sale or exit of business units we determine to be non-strategic. Restructuring costs include severance and employee benefits, asset impairments, as well as facility closure, contract termination and certain pension costs that are directly related to restructuring actions. Restructuring-related costs are costs associated with our business transformation initiatives, including the consolidation of back-office functions and streamlining our processes, and certain other costs and gains associated with restructuring actions. Restructuring-related costs in 2017 and 2016 include gains from the sale of properties associated with restructuring activities that occurred in the fourth quarter of each year.
Beginning in the fourth quarter of 2014, our restructuring and related activities increased and continued at heightened levels through 2017, primarily to align our cost structure with the needs of our business and also in response to conditions in certain of our end markets. We expect our restructuring programs and activities will continue in future years, however at a lower and more consistent run-rate of cost and savings as compared to the heightened levels we've recently experienced.
80227_10K.indd 20 2/27/18 8:04 AM
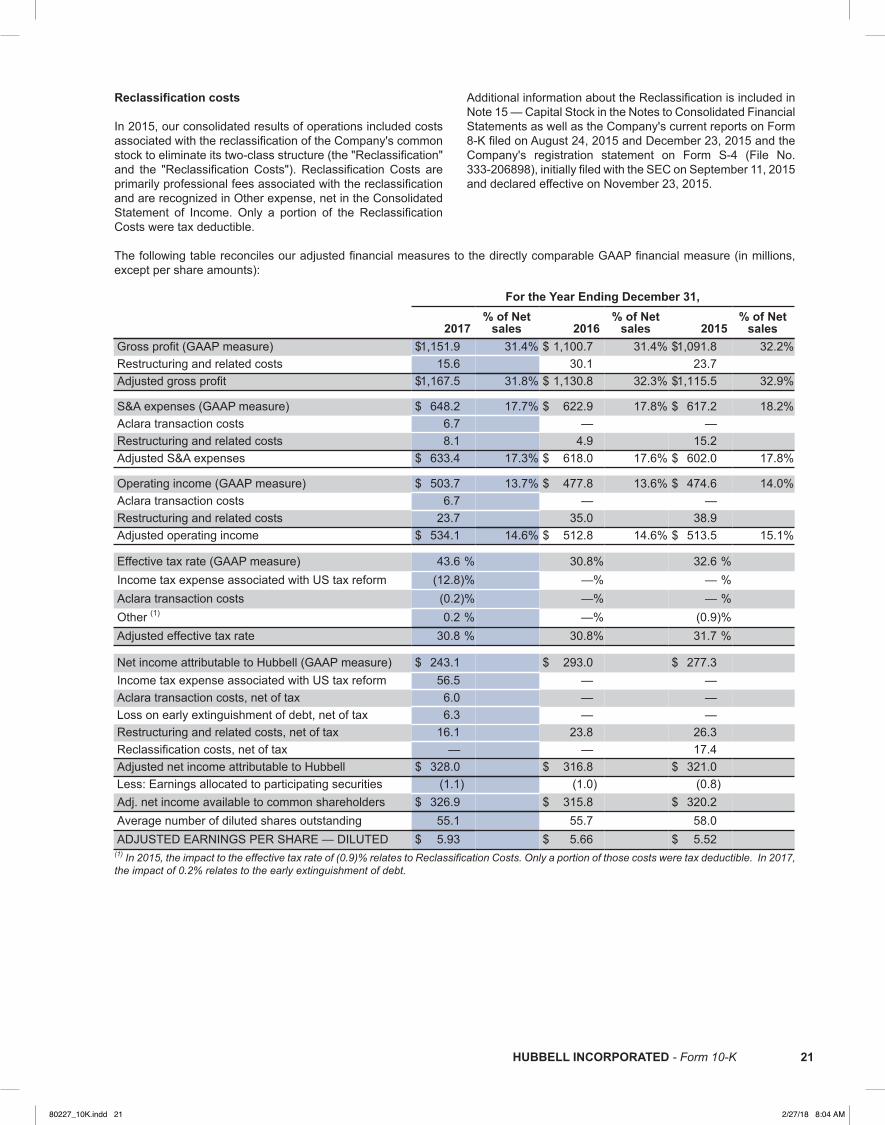
HUBBELL INCORPORATED - Form 10-K 21HUBBELL INCORPORATED - Form 10-K 21
Reclassification costs
In 2015, our consolidated results of operations included costs associated with the reclassification of the Company's common stock to eliminate its two-class structure (the "Reclassification" and the "Reclassification Costs"). Reclassification Costs are primarily professional fees associated with the reclassification and are recognized in Other expense, net in the Consolidated Statement of Income. Only a portion of the Reclassification Costs were tax deductible.
Additional information about the Reclassification is included in Note 15 — Capital Stock in the Notes to Consolidated Financial Statements as well as the Company's current reports on Form 8-K filed on August 24, 2015 and December 23, 2015 and the Company's registration statement on Form S-4 (File No. 333-206898), initially filed with the SEC on September 11, 2015 and declared effective on November 23, 2015.
The following table reconciles our adjusted financial measures to the directly comparable GAAP financial measure (in millions, except per share amounts):
For the Year Ending December 31,
2017% of Net
sales 2016% of Net
sales 2015% of Net
salesGross profit (GAAP measure) $1,151.9 31.4% $ 1,100.7 31.4% $1,091.8 32.2%Restructuring and related costs 15.6 30.1 23.7Adjusted gross profit $1,167.5 31.8% $ 1,130.8 32.3% $1,115.5 32.9%
S&A expenses (GAAP measure) $ 648.2 17.7% $ 622.9 17.8% $ 617.2 18.2%Aclara transaction costs 6.7 — —Restructuring and related costs 8.1 4.9 15.2Adjusted S&A expenses $ 633.4 17.3% $ 618.0 17.6% $ 602.0 17.8%
Operating income (GAAP measure) $ 503.7 13.7% $ 477.8 13.6% $ 474.6 14.0%Aclara transaction costs 6.7 — —Restructuring and related costs 23.7 35.0 38.9Adjusted operating income $ 534.1 14.6% $ 512.8 14.6% $ 513.5 15.1%
Effective tax rate (GAAP measure) 43.6 % 30.8% 32.6 %Income tax expense associated with US tax reform (12.8)% —% — %Aclara transaction costs (0.2)% —% — %Other (1) 0.2 % —% (0.9)%Adjusted effective tax rate 30.8 % 30.8% 31.7 %
Net income attributable to Hubbell (GAAP measure) $ 243.1 $ 293.0 $ 277.3Income tax expense associated with US tax reform 56.5 — —Aclara transaction costs, net of tax 6.0 — —Loss on early extinguishment of debt, net of tax 6.3 — —Restructuring and related costs, net of tax 16.1 23.8 26.3Reclassification costs, net of tax — — 17.4Adjusted net income attributable to Hubbell $ 328.0 $ 316.8 $ 321.0Less: Earnings allocated to participating securities (1.1) (1.0) (0.8)Adj. net income available to common shareholders $ 326.9 $ 315.8 $ 320.2Average number of diluted shares outstanding 55.1 55.7 58.0ADJUSTED EARNINGS PER SHARE — DILUTED $ 5.93 $ 5.66 $ 5.52
(1) In 2015, the impact to the effective tax rate of (0.9)% relates to Reclassification Costs. Only a portion of those costs were tax deductible. In 2017, the impact of 0.2% relates to the early extinguishment of debt.
80227_10K.indd 21 2/27/18 8:04 AM

22 HUBBELL INCORPORATED - Form 10-K22 HUBBELL INCORPORATED - Form 10-K
The following table reconciles our restructuring costs to our Restructuring and Related Costs for 2017, 2016 and 2015 (in millions):
For the Year Ending December 31, 2017 2016 2015
Cost of goods soldRestructuring costs (GAAP measure, Note 21 — Restructuring Costs) $ 13.7 $ 27.5 $ 15.3Restructuring related costs 1.9 2.6 8.4Restructuring and related costs (non-GAAP measure) $ 15.6 $ 30.1 $ 23.7
S&A expenseRestructuring costs (GAAP measure, Note 21 — Restructuring Costs) $ 6.6 $ 7.5 $ 8.3Restructuring related costs 1.5 (2.6) 6.9Restructuring and related costs (non-GAAP measure) $ 8.1 $ 4.9 $ 15.2
TotalRestructuring costs (GAAP measure, Note 21 — Restructuring Costs) $ 20.3 $ 35.0 $ 23.6Restructuring related costs 3.4 — 15.3Restructuring and related costs (non-GAAP measure) $ 23.7 $ 35.0 $ 38.9
Of the $23.7 million of Restructuring and Related Costs incurred in 2017, $17.7 million is recorded in the Electrical segment and $6.0 million is recorded in the Power segment. Of the $35.0 million of Restructuring and Related Costs incurred in 2016, $32.1 million is recorded in the Electrical segment and $2.9 million is recorded in the Power segment. Restructuring and Related Costs in Cost of goods sold in 2016 includes a $12.5 million charge to record an estimated liability for the withdrawal from a multi-employer pension plan associated with the consolidation of two of our Lighting facilities. Restructuring related costs in S&A expense in 2017and 2016 each include a gains on the sale of properties associated with restructuring actions of $6.2 million and $7.2 million, respectively.
2017 Compared to 2016
Net Sales
Net sales of $3.7 billion in 2017 increased five percent as compared to 2016. Acquisitions added two percentage points to net sales in 2017 and organic volume, including the impact of pricing headwinds, added three percentage points. Within our Electrical segment, organic net sales growth came primarily from products sold into the energy-related, non-residential and residential construction markets. Organic net sales within our Power segment increased by six percentage points primarily driven by growth in the electrical transmission and distribution market. Cost of Goods Sold Cost of goods sold as a percentage of net sales in 2017 was 68.6% and was flat as compared to 2016. Price and material cost headwinds as well as a 30 basis point headwind from acquisitions, were offset by gains from productivity initiatives that exceeded cost inflation, greater realized savings from our restructuring and related actions and lower restructuring and related costs in 2017.
Gross Profit The gross profit margin for 2017 was 31.4% and was flat as compared to 2016. Restructuring and Related Costs in Cost of goods sold were $14.5 million lower in 2017 as compared to 2016. Excluding Restructuring and Related Costs, the adjusted gross profit margin was 31.8% and declined by 50 basis points as compared to 2016. The decline is primarily due to price and material cost headwinds as well as a 30 basis point headwind from acquisitions, partially offset by gains from productivity initiatives that exceeded cost inflation and greater realized savings from our restructuring and related actions.
The headwind from acquisitions includes our investment in IoT capabilities in 2017 through the acquisition of iDevices.
Selling & Administrative Expenses
S&A expense in 2017 was $648.2 million and increased by $25.3 million compared to the same period of the prior year. S&A expense as a percentage of net sales declined by 10 basis points to 17.7% in 2017. Excluding Restructuring and Related Costs and Aclara transaction costs, adjusted S&A expense as a percentage of net sales declined by 30 basis points to 17.3% in 2017 primarily due to higher net sales volume and greater realized savings from our restructuring and related actions, partially offset by acquisitions, which increased the adjusted S&A expense as a percentage of net sales by approximately 10 basis points.
80227_10K.indd 22 2/27/18 8:04 AM
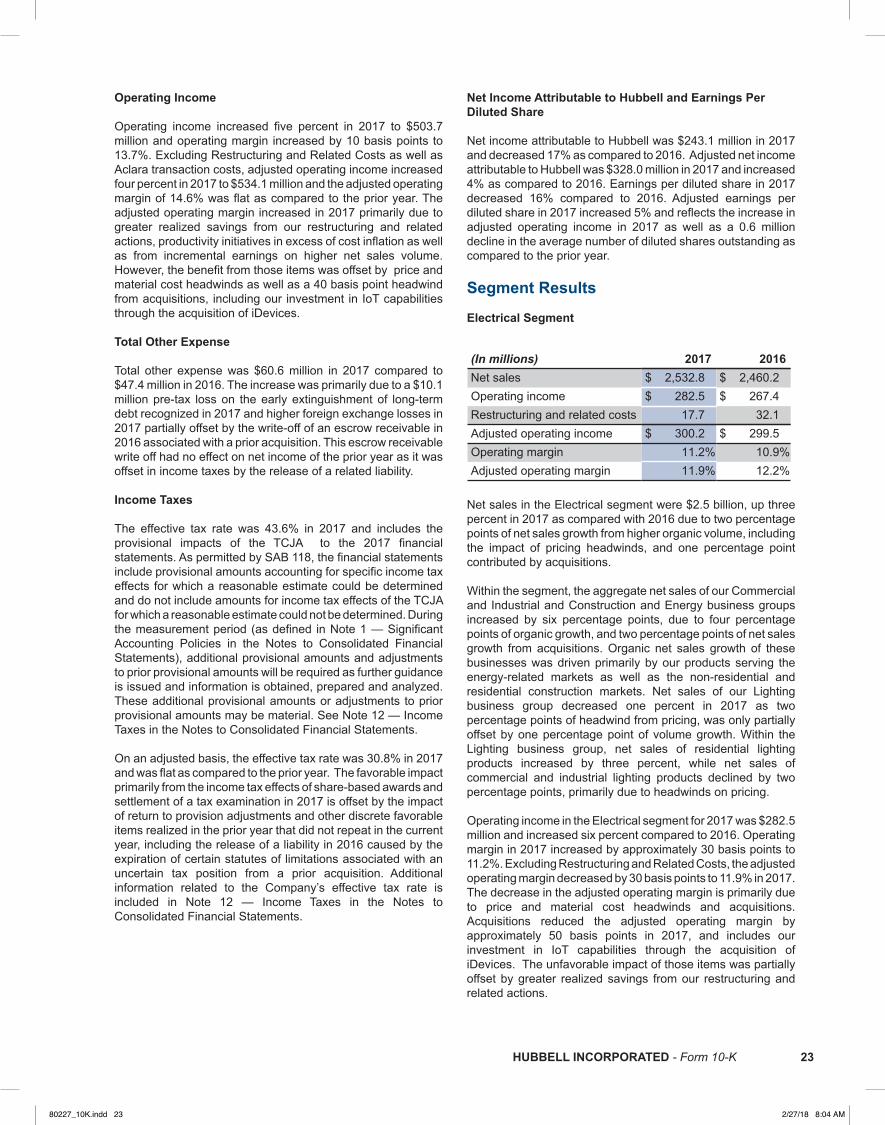
HUBBELL INCORPORATED - Form 10-K 23HUBBELL INCORPORATED - Form 10-K 23
Operating Income
Operating income increased five percent in 2017 to $503.7 million and operating margin increased by 10 basis points to 13.7%. Excluding Restructuring and Related Costs as well as Aclara transaction costs, adjusted operating income increased four percent in 2017 to $534.1 million and the adjusted operating margin of 14.6% was flat as compared to the prior year. The adjusted operating margin increased in 2017 primarily due to greater realized savings from our restructuring and related actions, productivity initiatives in excess of cost inflation as well as from incremental earnings on higher net sales volume. However, the benefit from those items was offset by price and material cost headwinds as well as a 40 basis point headwind from acquisitions, including our investment in IoT capabilities through the acquisition of iDevices.
Total Other Expense
Total other expense was $60.6 million in 2017 compared to $47.4 million in 2016. The increase was primarily due to a $10.1 million pre-tax loss on the early extinguishment of long-term debt recognized in 2017 and higher foreign exchange losses in 2017 partially offset by the write-off of an escrow receivable in 2016 associated with a prior acquisition. This escrow receivable write off had no effect on net income of the prior year as it was offset in income taxes by the release of a related liability.
Income Taxes The effective tax rate was 43.6% in 2017 and includes the provisional impacts of the TCJA to the 2017 financial statements. As permitted by SAB 118, the financial statements include provisional amounts accounting for specific income tax effects for which a reasonable estimate could be determined and do not include amounts for income tax effects of the TCJA for which a reasonable estimate could not be determined. During the measurement period (as defined in Note 1 — Significant Accounting Policies in the Notes to Consolidated Financial Statements), additional provisional amounts and adjustments to prior provisional amounts will be required as further guidance is issued and information is obtained, prepared and analyzed. These additional provisional amounts or adjustments to prior provisional amounts may be material. See Note 12 — Income Taxes in the Notes to Consolidated Financial Statements.
On an adjusted basis, the effective tax rate was 30.8% in 2017 and was flat as compared to the prior year. The favorable impact primarily from the income tax effects of share-based awards and settlement of a tax examination in 2017 is offset by the impact of return to provision adjustments and other discrete favorable items realized in the prior year that did not repeat in the current year, including the release of a liability in 2016 caused by the expiration of certain statutes of limitations associated with an uncertain tax position from a prior acquisition. Additional information related to the Company’s effective tax rate is included in Note 12 — Income Taxes in the Notes to Consolidated Financial Statements.
Net Income Attributable to Hubbell and Earnings Per Diluted Share Net income attributable to Hubbell was $243.1 million in 2017 and decreased 17% as compared to 2016. Adjusted net income attributable to Hubbell was $328.0 million in 2017 and increased 4% as compared to 2016. Earnings per diluted share in 2017decreased 16% compared to 2016. Adjusted earnings per diluted share in 2017 increased 5% and reflects the increase in adjusted operating income in 2017 as well as a 0.6 million decline in the average number of diluted shares outstanding as compared to the prior year.
Segment Results
Electrical Segment
(In millions) 2017 2016Net sales $ 2,532.8 $ 2,460.2Operating income $ 282.5 $ 267.4Restructuring and related costs 17.7 32.1Adjusted operating income $ 300.2 $ 299.5Operating margin 11.2% 10.9%Adjusted operating margin 11.9% 12.2%
Net sales in the Electrical segment were $2.5 billion, up three percent in 2017 as compared with 2016 due to two percentage points of net sales growth from higher organic volume, including the impact of pricing headwinds, and one percentage point contributed by acquisitions. Within the segment, the aggregate net sales of our Commercial and Industrial and Construction and Energy business groups increased by six percentage points, due to four percentage points of organic growth, and two percentage points of net sales growth from acquisitions. Organic net sales growth of these businesses was driven primarily by our products serving the energy-related markets as well as the non-residential and residential construction markets. Net sales of our Lighting business group decreased one percent in 2017 as two percentage points of headwind from pricing, was only partially offset by one percentage point of volume growth. Within the Lighting business group, net sales of residential lighting products increased by three percent, while net sales of commercial and industrial lighting products declined by two percentage points, primarily due to headwinds on pricing. Operating income in the Electrical segment for 2017 was $282.5 million and increased six percent compared to 2016. Operating margin in 2017 increased by approximately 30 basis points to 11.2%. Excluding Restructuring and Related Costs, the adjusted operating margin decreased by 30 basis points to 11.9% in 2017. The decrease in the adjusted operating margin is primarily due to price and material cost headwinds and acquisitions. Acquisitions reduced the adjusted operating margin by approximately 50 basis points in 2017, and includes our investment in IoT capabilities through the acquisition of iDevices. The unfavorable impact of those items was partially offset by greater realized savings from our restructuring and related actions.
80227_10K.indd 23 2/27/18 8:04 AM

24 HUBBELL INCORPORATED - Form 10-K24 HUBBELL INCORPORATED - Form 10-K
Power Segment
(In millions) 2017 2016Net sales $ 1,136.0 $ 1,045.0Operating income $ 221.2 $ 210.4Aclara transaction costs 6.7 —Restructuring and related costs 6.0 2.9Adjusted operating income $ 233.9 $ 213.3Operating margin 19.5% 20.1%Adjusted operating margin 20.6% 20.4%
Net sales in the Power segment were $1.1 billion, up nine percent compared to 2016, primarily due to higher organic volume and net sales from acquisitions. The increase in organic volume contributed six percentage points driven by growth in the distribution and telecommunications markets, including storm-related sales associated with hurricanes in 2017, and acquisitions which contributed three percentage points to net sales growth.
Operating income in the Power segment increased five percent to $221.2 million in 2017. Operating margin in 2017, which includes the impact of Aclara transaction costs in the fourth quarter of 2017 and higher Restructuring and Related Costs, decreased by 60 basis points to 19.5%. The adjusted operating margin in 2017 excludes those items, and increased 20 basis points to 20.6%. The increase in the adjusted operating margin is primarily due to gains from productivity initiatives in excess of cost inflation as well as from incremental earnings on higher net sales volume, partially offset by price and material cost headwinds. In 2016, operating margin included a benefit within cost inflation from the reduction of an environmental liability, and in 2017 operating margin includes a similarly-sized benefit within cost inflation from an insurance recovery.
2016 Compared to 2015
Net Sales Net sales of $3.5 billion in 2016 increased three percent as compared to 2015. Acquisitions added three percentage points to net sales in 2016 and organic volume, including pricing headwinds, added one percentage point, while foreign currency translation reduced net sales by one percentage point. Within our Electrical segment, organic net sales of products sold into the non-residential and residential construction markets grew, but was mostly offset by lower organic net sales of products into the energy-related and industrial markets, which experienced continued, but moderating, weakness in 2016, primarily impacting our harsh and hazardous products. Within our Power segment, organic net sales were slightly higher, by less than one percentage point, in 2016.
Cost of Goods Sold As a percentage of net sales, cost of goods sold increased to 68.6% for 2016 compared to 67.8% in 2015. The increase was primarily due to unfavorable business and product mix, pricing headwinds in our Electrical segment, the impact of our acquisitions, as well as foreign exchange headwinds. We also incurred $6.4 million of higher Restructuring and Related Costs within Cost of goods sold in 2016, primarily relating to the
proposed consolidation of two of our Lighting facilities. Those unfavorable impacts were partially offset by higher realized savings from our restructuring and related actions in 2016, and favorable material costs.
Gross Profit The gross profit margin for 2016 declined to 31.4% compared to 32.2% in 2015. Restructuring and Related Costs in Cost of goods sold were $6.4 million higher in 2016 as compared to 2015. Excluding Restructuring and Related Costs, the adjusted gross profit margin was 32.3% in 2016 as compared to 32.9% in 2015. The decrease in the adjusted gross margin is primarily due to unfavorable business and product mix, pricing headwinds in our Electrical segment, the impact of our acquisitions, as well as foreign exchange headwinds. Those unfavorable impacts were partially offset by higher realized savings from our restructuring and related actions in 2016, and favorable material costs.
Selling & Administrative Expenses S&A expense in 2016 was $622.9 million and increased one percent compared to 2015 as we added S&A costs in 2016 from our acquisitions, made investments in our business, and experienced higher pension costs. Those increases were almost completely offset by realized savings from our restructuring and related actions, $10.3 million lower Restructuring and Related Costs in S&A expense in 2016 and foreign currency translation. S&A expense as a percentage of net sales declined by 40 basis points to 17.8% in 2016. Excluding Restructuring and Related Costs, adjusted S&A expense as a percentage of net sales declined by 20 basis points to 17.6% in 2016 primarily due to realized savings from our restructuring and related actions and the favorable impact of higher volume, partially offset by higher pension costs and investments in our business in 2016.
Operating Income Operating income increased one percent in 2016 to $477.8 million while operating margin declined by 40 basis points to 13.6%. Excluding Restructuring and Related Costs, adjusted operating income of $512.8 million was flat as compared to 2015 and the adjusted operating margin declined by 50 basis points to 14.6%. The adjusted operating margin decreased primarily due to unfavorable product and business mix, pricing headwinds in our Electrical segment, foreign exchange headwinds and cost increases that were greater than productivity gains. Those unfavorable impacts to the adjusted operating margin were partially offset by realized savings from our restructuring and related actions and lower material costs.
Total Other Expense Total other expense was $47.4 million in 2016 compared to $56.0 million in 2015. Excluding Reclassification Costs that were incurred in 2015, adjusted total other expense was $47.4 in 2016 compared to $36.3 million in 2015 and increased largely due to a $12.4 million increase in interest expense primarily related to the $400 million debt offering we completed in March 2016.
80227_10K.indd 24 2/27/18 8:04 AM
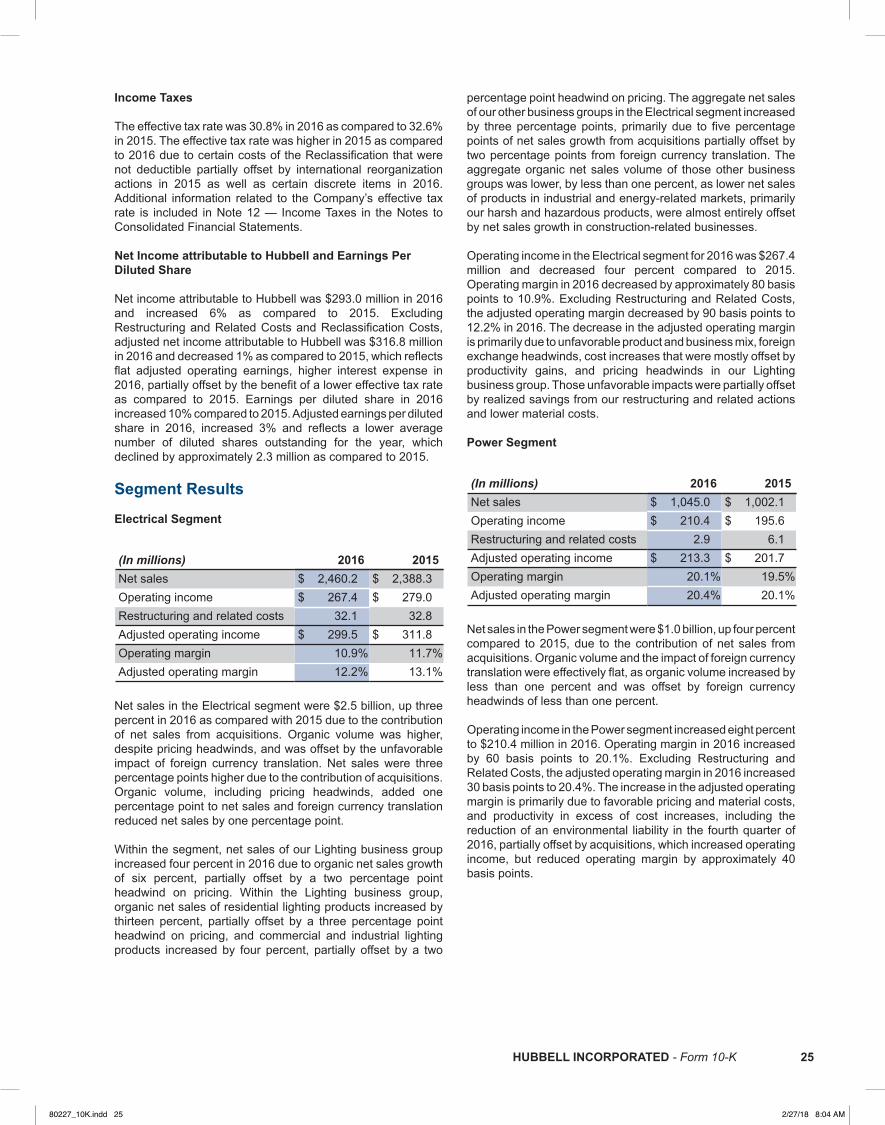
HUBBELL INCORPORATED - Form 10-K 25HUBBELL INCORPORATED - Form 10-K 25
Income Taxes The effective tax rate was 30.8% in 2016 as compared to 32.6% in 2015. The effective tax rate was higher in 2015 as compared to 2016 due to certain costs of the Reclassification that were not deductible partially offset by international reorganization actions in 2015 as well as certain discrete items in 2016. Additional information related to the Company’s effective tax rate is included in Note 12 — Income Taxes in the Notes to Consolidated Financial Statements.
Net Income attributable to Hubbell and Earnings Per Diluted Share Net income attributable to Hubbell was $293.0 million in 2016 and increased 6% as compared to 2015. Excluding Restructuring and Related Costs and Reclassification Costs, adjusted net income attributable to Hubbell was $316.8 million in 2016 and decreased 1% as compared to 2015, which reflects flat adjusted operating earnings, higher interest expense in 2016, partially offset by the benefit of a lower effective tax rate as compared to 2015. Earnings per diluted share in 2016 increased 10% compared to 2015. Adjusted earnings per diluted share in 2016, increased 3% and reflects a lower average number of diluted shares outstanding for the year, which declined by approximately 2.3 million as compared to 2015.
Segment Results
Electrical Segment
(In millions) 2016 2015Net sales $ 2,460.2 $ 2,388.3Operating income $ 267.4 $ 279.0Restructuring and related costs 32.1 32.8Adjusted operating income $ 299.5 $ 311.8Operating margin 10.9% 11.7%Adjusted operating margin 12.2% 13.1%
Net sales in the Electrical segment were $2.5 billion, up three percent in 2016 as compared with 2015 due to the contribution of net sales from acquisitions. Organic volume was higher, despite pricing headwinds, and was offset by the unfavorable impact of foreign currency translation. Net sales were three percentage points higher due to the contribution of acquisitions. Organic volume, including pricing headwinds, added one percentage point to net sales and foreign currency translation reduced net sales by one percentage point.
Within the segment, net sales of our Lighting business group increased four percent in 2016 due to organic net sales growth of six percent, partially offset by a two percentage point headwind on pricing. Within the Lighting business group, organic net sales of residential lighting products increased by thirteen percent, partially offset by a three percentage point headwind on pricing, and commercial and industrial lighting products increased by four percent, partially offset by a two
percentage point headwind on pricing. The aggregate net sales of our other business groups in the Electrical segment increased by three percentage points, primarily due to five percentage points of net sales growth from acquisitions partially offset by two percentage points from foreign currency translation. The aggregate organic net sales volume of those other business groups was lower, by less than one percent, as lower net sales of products in industrial and energy-related markets, primarily our harsh and hazardous products, were almost entirely offset by net sales growth in construction-related businesses.
Operating income in the Electrical segment for 2016 was $267.4 million and decreased four percent compared to 2015. Operating margin in 2016 decreased by approximately 80 basis points to 10.9%. Excluding Restructuring and Related Costs, the adjusted operating margin decreased by 90 basis points to 12.2% in 2016. The decrease in the adjusted operating margin is primarily due to unfavorable product and business mix, foreign exchange headwinds, cost increases that were mostly offset by productivity gains, and pricing headwinds in our Lighting business group. Those unfavorable impacts were partially offset by realized savings from our restructuring and related actions and lower material costs.
Power Segment
(In millions) 2016 2015Net sales $ 1,045.0 $ 1,002.1Operating income $ 210.4 $ 195.6Restructuring and related costs 2.9 6.1Adjusted operating income $ 213.3 $ 201.7Operating margin 20.1% 19.5%Adjusted operating margin 20.4% 20.1%
Net sales in the Power segment were $1.0 billion, up four percent compared to 2015, due to the contribution of net sales from acquisitions. Organic volume and the impact of foreign currency translation were effectively flat, as organic volume increased by less than one percent and was offset by foreign currency headwinds of less than one percent.
Operating income in the Power segment increased eight percent to $210.4 million in 2016. Operating margin in 2016 increased by 60 basis points to 20.1%. Excluding Restructuring and Related Costs, the adjusted operating margin in 2016 increased 30 basis points to 20.4%. The increase in the adjusted operating margin is primarily due to favorable pricing and material costs, and productivity in excess of cost increases, including the reduction of an environmental liability in the fourth quarter of 2016, partially offset by acquisitions, which increased operating income, but reduced operating margin by approximately 40 basis points.
80227_10K.indd 25 2/27/18 8:04 AM

26 HUBBELL INCORPORATED - Form 10-K26 HUBBELL INCORPORATED - Form 10-K
Financial Condition, Liquidity and Capital Resources
Cash Flow
December 31,(In millions) 2017 2016 2015Net cash provided by (used in): Operating activities $ 379.0 $ 411.0 $ 339.4Investing activities (245.6) (230.2) (249.6)Financing activities (214.3) (59.4) (379.0)Effect of foreign currency exchange rate changes on cash and cash equivalents 18.3 (27.3) (21.2)NET CHANGE IN CASH AND CASH EQUIVALENTS $ (62.6) $ 94.1 $ (310.4)
Comparable periods have been recast to reflect the adoption of the new accounting pronouncement for share-based payments (ASU 2016-09) as of January 1, 2017.
The following table reconciles our cash flows from operating activities to free cash flows for 2017, 2016 and 2015 (in millions):
December 31,(In millions) 2017 2016 2015Net cash provided by operating activities (GAAP measure) $ 379.0 $ 411.0 $ 339.4Less: Capital expenditures (79.7) (67.2) (77.1)Free cash flow $ 299.3 $ 343.8 $ 262.3Free cash flow as a percent of net income attributable to Hubbell (1) 123.1% 117.3% 94.6%
(1) Free cash flow as a percent of net income attributable to Hubbell, includes the approximately $57 million impact of the TCJA. Free cash flow as a percentage of net income attributable to Hubbell excluding the impact of the TCJA is approximately 100%.
Free cash flow is a non-GAAP measure and is defined as cash flow from operations less capital expenditures. Management believes that free cash flow provides useful information regarding Hubbell’s ability to generate cash without reliance on external financing. In addition, management uses free cash flow to evaluate the resources available for investments in the business, strategic acquisitions and further strengthening the balance sheet.
2017 Compared to 2016 Cash provided by operating activities for 2017 decreased compared to 2016 primarily due to higher uses of cash for working capital. Cash used for working capital was $29.0 million in 2017 compared to $10.1 million in 2016 primarily due to higher inventories in anticipation of increased demand, partially offset by stronger collections of accounts receivable and higher income taxes payable, due to the impact of the TCJA in 2017. Cash used for investing activities of $245.6 million in 2017 increased compared to cash used of $230.2 million in 2016. This increase is primarily due to $12.5 million of higher capital expenditures and $10.7 million of higher cash paid for acquisitions, partially offset by a $7.6 million increase in the proceeds from disposition of assets in 2017 as compared to 2016.
Cash used for financing activities of $214.3 million in 2017 increased compared to $59.4 million of cash used in 2016. The increase in cash used in 2017 as compared to 2016 is primarily the result of higher net proceeds from long-term borrowings in 2016 and an increase in shareholder dividends paid in 2017, partially offset by a decrease in shares repurchased in 2017, as well as an increase in short term borrowings in 2017.
The favorable impact of foreign currency exchange rates on cash was $18.3 million in 2017 as compared to an unfavorable impact of $27.3 million in 2016. The favorable impact in 2017was primarily related to the U.S. dollar weakening against the British pound, Canadian dollar and Australian dollar.
2016 Compared to 2015 Cash provided by operating activities for 2016 increased compared to 2015 primarily due to higher net income after adjusting for the non-cash impacts of depreciation and amortization, stock-based compensation and deferred income taxes and by lower uses of cash for working capital and cash spent for restructuring and related activities. Cash used for working capital was $10.1 million in 2016 compared to $32.3 million in 2015 primarily due to lower inventories partially offset by higher accounts receivable in 2016.
Cash used for investing activities of $230.2 million in 2016 decreased compared to cash used of $249.6 million in 2015. This decrease is primarily due to $9.9 million of lower capital expenditures and $9.6 million of proceeds from the sale of a real estate asset in our Lighting business. Those decreases in the use of cash for investing activities are partially offset by higher cash used for acquisitions in 2016 as compared to 2015.
80227_10K.indd 26 2/27/18 8:04 AM

HUBBELL INCORPORATED - Form 10-K 27HUBBELL INCORPORATED - Form 10-K 27
Cash used for financing activities of $59.4 million in 2016 decreased compared to $379.0 million of cash used in 2015. The decrease in cash used in 2016 as compared to 2015 is primarily the result of $393.4 million of net proceeds received from the $400 million public note offering the Company completed in March 2016, as well as $200.7 million of Class A Cash Consideration paid in connection with the Reclassification in 2015. Those decreases in cash used were partially offset by a $167.7 million increase in shares repurchased in 2016, as well as $97.1 million change year over year in cash flows from short term borrowings and a $8.1 million increase in dividends paid in 2016. For more information about the $400 million public note offering refer to Note 11 — Debt, in the Notes to Consolidated Financial Statements.
The unfavorable impact of foreign currency exchange rates on cash increased to $27.3 million in 2016 as compared to $21.2 million in 2015. The unfavorable impact in 2016 and 2015 was primarily related to the U.S. dollar strengthening against the British pound, Australian dollar, and Mexican peso.
Investments in the Business
Investments in our business include cash outlays for the acquisition of businesses as well as expenditures to support our restructuring and related activities and to maintain the operation of our equipment and facilities. In December of 2017 the Company entered into a definitive agreement to acquire Aclara for $1.1 billion and the Aclara acquisition closed on February 2, 2018. Aclara will be added to the Power segment. Refer to the Executive Overview of the Business — Acquisition of Aclara, Note 2 — Business Acquisitions, and Note 11 — Debt, in the Notes to Consolidated Financial Statements for additional information.
In 2017, the Company also completed acquisitions for an aggregate purchase price of $171.5 million, net of cash received. Those acquisitions included the following:
In April of 2017, the Company acquired all of the issued and outstanding limited liability company interests in iDevices, LLC ("iDevices") for $59.2 million. iDevices is a developer with embedded firmware and application development expertise with custom-built Internet of Things ("IoT") Cloud infrastructure. The iDevices acquisition adds capabilities and expertise in IoT technology that is required to provide Tier 3 energy management solutions via connected hardware with a software front-end. iDevices has been added to the Electrical segment.
In April of 2017, the Company acquired substantially all of the assets of Advance Engineering Corporation and related companies (collectively "AEC") for $32.5 million. AEC is a gas components manufacturer that complements the Company's existing business in the natural gas distribution vertical. AEC has been added to the Electrical segment.
In November of 2017, the Company acquired all of the issued and outstanding shares of Meramec Instrument Transformer Company ("Meramec") for $69.7 million. Meramec is a manufacturer of instrument current transformers for the power generator, power transformer, and the high and medium- voltage circuit breaker markets. Meramec has been added to the Power segment.
The Company also completed two acquisitions that have been added to the Power segment in the first quarter of 2017 for $10.1 million, net of cash received.
For more information refer to Note 2 — Business Acquisitions, in the Notes to Consolidated Financial Statements. Beginning in the fourth quarter of 2014 our restructuring and related activities increased and continued at heightened levels through 2017, primarily to align our cost structure with the needs of our business and also in response to conditions in certain of our end markets. As a result of those restructuring and related actions we have exited a total of 28 manufacturing and warehousing facilities.
In connection with our restructuring and related actions we have incurred restructuring costs, which are primarily severance and employee benefits, asset impairments, as well as facility closure, contract termination and certain pension costs that are directly related to restructuring actions. These restructuring costs are predominantly settled in cash from our operating activities and are generally settled within one year, with the exception of asset impairments, which are non-cash. Restructuring costs in 2016 also included a $12.5 million charge to recognize the estimated liability associated with the withdrawal from a multi-employer pension plan, which may be settled either in periodic payments over approximately 19 years, or in a lump sum, subject to negotiation.
The table below presents the restructuring costs incurred in 2017, additional expected restructuring costs and the expected completion date (in millions):
CostsIncurred
in 2017
AdditionalExpected
Costs
ExpectedCompletion
Date
2017 RestructuringActions $ 14.0 $ 2.9 20182016 and Prior Restructuring Actions(a) 6.3 1.1 2018Total $ 20.3 $ 4.0
(a) Additional expected costs does not include any potential future liability, in excess of amounts already recognized in 2016, associated with the withdrawal from the multi-employer pension plan referred to in the preceding paragraph. Additional information about the estimated withdrawal liability associated with that multi-employer plan is included in Note 10 — Retirement Benefits in the Notes to Consolidated Financial Statements.
80227_10K.indd 27 2/27/18 8:04 AM
28 HUBBELL INCORPORATED - Form 10-K28 HUBBELL INCORPORATED - Form 10-K
In connection with our restructuring and related actions we also incur restructuring-related costs. Restructuring-related costs are costs associated with our business transformation initiatives, including the consolidation of back-office functions and streamlining our processes, and certain other costs and gains associated with restructuring actions. In both 2016 and 2017, restructuring-related costs include gains from the sale of properties associated with restructuring activities. We refer to restructuring costs (which is a GAAP measure) and restructuring-related costs on a combined basis as "Restructuring and Related Costs", which is a non-GAAP measure. Refer to Management's Discussion and Analysis - Results of Operations, for further detail of the costs associated with our restructuring and related activities and reconciliations of our non-GAAP measures.
We expect our restructuring programs and activities will continue in future years, however at a lower and more consistent run-rate of cost and savings as compared to the heightened levels we've recently experienced.
During 2017, we used cash of $79.7 million for capital expenditures, an increase of $12.5 million from 2016 as we made higher investments in facilities and equipment during 2017 to support our continuing focus on productivity.
Additional information with respect to future investments in the business can be found under “Outlook” within Management’s Discussion and Analysis. Stock Repurchase Program
At December 31, 2016, we had total remaining share repurchase authorization of $153.6 million under the repurchase program authorized by our Board of Directors in August 2015. In 2017, the Company repurchased shares for an aggregate purchase price of $92.5 million, and the August 2015 program expired in October, 2017. On October 20, 2017, the Board of Directors approved a new stock repurchase program (the “October 2017 program”) that authorized the repurchase of up to $400 million of Common Stock and expires on October 20, 2020. As of December 31, 2017, the entire $400 million remains authorized for repurchases under the October 2017 program. Subject to numerous factors, including market conditions and alternative uses of cash, we may conduct discretionary repurchases through open market or privately negotiated transactions, which may include repurchases under plans complying with Rules 10b5-1 and 10b-18 under the Securities Exchange Act of 1934, as amended.
Debt to Capital
At December 31, 2017 and 2016, Long-term debt in the Consolidated Balance Sheets was $987.1 million and $990.5 million, respectively, of long-term unsecured, unsubordinated notes, net of unamortized discount and the unamortized balance of capitalized debt issuance costs. Principal amounts of the Company's long-term unsecured, unsubordinated notes at December 31, 2017 are $300 million due in 2022, $400 million due in 2026, and $300 million due in 2027.
In August 2017, the Company completed a public debt offering of $300 million of long-term, unsecured, unsubordinated notes maturing in August 2027 and bearing interest at a fixed rate of 3.15% (the "2027 Notes"). Net proceeds from the issuance were $294.6 million after deducting the discount on the notes and offering expenses paid by the Company. In September 2017, the Company applied the net proceeds from the 2027 Notes to redeem all of its $300 million of long-term, unsecured, unsubordinated notes maturing in 2018 and bearing interest at a fixed rate of 5.95%. In connection with this redemption, the Company recognized a loss on the early extinguishment of the 2018 Notes of $6.3 million on an after-tax basis.
The 2022 Notes, 2026 Notes and 2027 Notes are fixed rate indebtedness, are callable at any time with a make whole premium and are only subject to accelerated payment prior to maturity in the event of a default (including as a result of the Company's failure to meet certain non-financial covenants) under the indenture governing the notes, as modified by the supplemental indentures creating such notes, or upon a change in control triggering event as defined in such indenture. The Company was in compliance with all non-financial covenants as of December 31, 2017.
At December 31, 2017 and 2016, the Company had $68.1 millionand $3.2 million, respectively, of short-term debt outstanding.
There was $63.0 million of commercial paper borrowings outstanding at December 31, 2017, which was used to fund the Meramec acquisition. There was no commercial paper outstanding as of December 31, 2016.
Short-term debt at December 31, 2017 and 2016 also includes $5.1 million and $3.2 million, respectively of borrowings to support our international operations in China and Brazil.
Net debt, defined as total debt less cash and investments, is a non-GAAP measure that may not be comparable to definitions used by other companies. We consider net debt to be a useful measure of our financial leverage for evaluating the Company’s ability to meet its funding needs.
80227_10K.indd 28 2/27/18 8:04 AM

HUBBELL INCORPORATED - Form 10-K 29HUBBELL INCORPORATED - Form 10-K 29
The following table sets forth the reconciliation of net debt at December 31, 2017 and 2016:
December 31,(In millions) 2017 2016Total Debt $ 1,055.2 $ 993.7Total Hubbell Shareholders’ Equity 1,634.2 1,592.8TOTAL CAPITAL $ 2,689.4 $ 2,586.5Debt to Total Capital 39% 38%Cash and Investments $ 447.2 $ 505.2NET DEBT $ 608.0 $ 488.5Net Debt to Total Capital 23% 19%
Subsequent Event - Funding for the Aclara acquisition
On February 2, 2018, the Company completed the acquisition of Aclara for an aggregate purchase price of $1.1 billion in an all-cash transaction. The following were the sources of funds to complete the transaction.
On January 31, 2018, the Company entered into a Term Loan Agreement (the “Term Loan Agreement”) with a syndicate of lenders. The Term Loan Agreement provided the Company, with the ability to borrow, in a single borrowing on the Aclara acquisition date, up to $500 million on an unsecured basis to partially finance the Aclara acquisition (the "Term Loan"). On February 2, 2018, the Company borrowed $500 million under the Term Loan Agreement to fund the acquisition. The interest rate applicable to borrowings under the Term Loan Agreement is generally either the adjusted LIBOR plus an applicable margin (determined by reference to a ratings based grid) or the alternate base rate. Borrowings under the Term Loan Agreement will amortize in equal quarterly installments of 5% per year in year one, 5% per year in year two, 7.5% per year in year three, 10% per year in year four, 10% per year in year five, and any remaining borrowings under the Term Loan Agreement are due and payable in full in February 2023. The single financial covenant in the Term Loan Agreement requires that total debt not exceed 65% of total capitalization as of the last day of each fiscal quarter of the Company.
On February 2, 2018, the Company completed a public debt offering of $450 million of long-term unsecured, unsubordinated notes maturing in February 2028 and bearing interest at a fixed rate of 3.50% (the "2028 Notes"). Net proceeds from the issuance were $442.6 million after deducting the discount on the notes and offering expenses paid by the Company. The 2028 Notes are fixed rate indebtedness, are callable at any time with a make whole premium and are only subject to accelerated payment prior to maturity in the event of a default (including as a result of the Company's failure to meet certain non-financial covenants) under the indenture governing the 2028 Notes, as modified by the supplemental indenture creating such notes, or upon a change in control triggering event as defined in such indenture.
The remaining purchase price was funded though issuance of commercial paper. At February 12, 2018, the Company had total commercial paper borrowings outstanding of $263.0 million.
Liquidity
We measure liquidity on the basis of our ability to meet short-term and long-term operational funding needs, fund additional investments, including acquisitions, and make dividend payments to shareholders. Significant factors affecting the management of liquidity are cash flows from operating activities, capital expenditures, cash dividend payments, stock repurchases, access to bank lines of credit and our ability to attract long-term capital with satisfactory terms.
In 2017, we invested in acquisitions and also returned capital to our shareholders through share repurchases and shareholder dividends. These activities were funded primarily with cash flows from operations, and short-term borrowings.
Cash used for the acquisition of businesses in 2017, net of cash acquired was $184.1 million, including the settlement of purchase price installments from prior year acquisitions. Further discussion of our acquisitions can be found in Note 2 — Business Acquisitions in the Notes to Consolidated Financial Statements.
In 2017, cash settlements for share repurchases were $92.5 million. Shareholder dividends paid in 2017 were $157.6 million.
In February of 2018, we increased our long-term and short-term borrowings to complete the acquisition of Aclara, and expect our cash flows from operations, (including those from Aclara), as well as our other sources of funds, will be sufficient to meet our obligations from those borrowings.
80227_10K.indd 29 2/27/18 8:04 AM

30 HUBBELL INCORPORATED - Form 10-K30 HUBBELL INCORPORATED - Form 10-K
We also require cash outlays to fund our operations, our capital expenditures, and an increase in working capital that would be required to accommodate a higher level of business activity for the foreseeable future, as well as our rate of cash dividends, potential future acquisitions. We also have contractual obligations for long-term debt, operating leases, purchase obligations, and certain other long-term liabilities that are summarized in the table of Contractual Obligations as of December 31, 2017, and as a result of the TCJA, we have an obligation to fund, over the next eight years, the Company's liability for the transition tax on the deemed repatriation.
Our sources of funds and available resources to meet these funding needs are as follows:
Cash flows from operations and existing cash resources: We are targeting free cash flow (defined as cash flows from operations less capital expenditures) equal to net income attributable to Hubbell in 2018. We also have $375.0 million of cash and cash equivalents at December 31, 2017, of which approximately 4% was held inside the United States and the remainder held internationally. As a result of the TCJA, the Company plans to repatriate a portion of its foreign earnings and has included a provisional tax amount in the accompanying financial statements with respect to the amount it intends to repatriate as of December 31, 2017. We have not included a provisional amount for the remaining $720 million of unremitted foreign earnings because we have not determined a reasonable estimate related to it. See Note 12 — Income Taxes in the Notes to Consolidated Financial Statements for further information.
We have the ability to issue commercial paper for general corporate purposes and our $750 million revolving credit facility (the "2015 Credit Facility") serves as a backup to our commercial paper program. As of December 31, 2017, the 2015 Credit Facility had not been drawn against and the Company is in compliance with the single financial covenant of the 2015 Credit Facility. We maintain investment grade credit ratings from the major U.S. rating agencies.
On January 31, 2018, the Company entered into a five-year revolving credit agreement (the "2018 Credit Facility"), with a syndicate of lenders that provides a $750 million committed revolving credit facility. In connection with the acquisition, the Company terminated all commitments under the 2015 Credit Facility. Commitments under the 2018 Credit Facility may be increased to an aggregate amount not to exceed $1.250 billion. The interest rate applicable to borrowings under the 2018 Credit Facility is generally either the adjusted LIBOR plus an applicable margin (determined by reference to a ratings based grid) or the alternate base rate. The single financial covenant in the 2018 Credit Facility requires that total debt not exceed 65% of total capitalization as of the last day of each fiscal quarter of the Company. The 2018 Credit Facility expires in February 2023.
Annual commitment fees to support availability under the 2018 Credit Facility are not material. Although not the principal source of liquidity, we believe our 2018 Credit Facility is capable of providing significant financing flexibility at reasonable rates of interest. However, in the event of a significant deterioration in the results of our operations or cash flows, leading to deterioration in financial condition, our borrowing costs could increase and/or our ability to borrow could be restricted. We have not entered into any guarantees that could give rise to material unexpected cash requirements.
In addition to our commercial paper program and existing revolving credit facility we also have the ability to obtain additional financing through the issuance of long-term debt. Considering our current credit rating, historical earnings performance, and financial position we believe that we would be able to obtain additional long-term debt financing on attractive terms.
The Company also maintains other lines of credit that
are primarily used to support the issuance of letters of credit. Interest rates and other terms of borrowing under these lines of credit vary from country to country, depending on local market conditions. At December 31, 2017 and 2016, these lines totaled $53.9 million and $51.4 million, respectively, of which $21.5 million and $21.0 million was utilized to support letters of credit and the remaining amount was unused. The annual commitment fees associated with these lines of credit are not material.
Pension Funding Status
We have a number of funded and unfunded non-contributory U.S. and foreign defined benefit pension plans. Benefits under these plans are generally provided based on either years of service and final average pay or a specified dollar amount per year of service. The funded status of our qualified, defined benefit pension plans is dependent upon many factors including future returns on invested pension assets, the level of market interest rates, employee earnings and employee demographics.
In December 2016, the Company approved amendments to the domestic qualified defined benefit pension plan and non-qualified defined benefit plan, which froze service accruals for active participants effective February 28, 2017 and further will freeze compensation accruals effective December 31, 2020. The Company also froze all accruals in a second non-qualified defined benefit plan effective December 31, 2016. As a result of the amendments, the Company recognized a $34.1 million curtailment gain in Accumulated other comprehensive income as of December 31, 2016 and recognized $0.2 million of pension expense in 2016. In addition, effective January 1, 2017, the amortization of unrecognized gains and losses of these plans is recognized over the remaining life expectancy of participants, as all participants are considered inactive as a result of the amendments.
In 2016, we also completed a transaction with a third-party insurer to settle approximately $40 million of projected benefit obligations of our domestic qualified defined benefit pension plans.
80227_10K.indd 30 2/27/18 8:04 AM
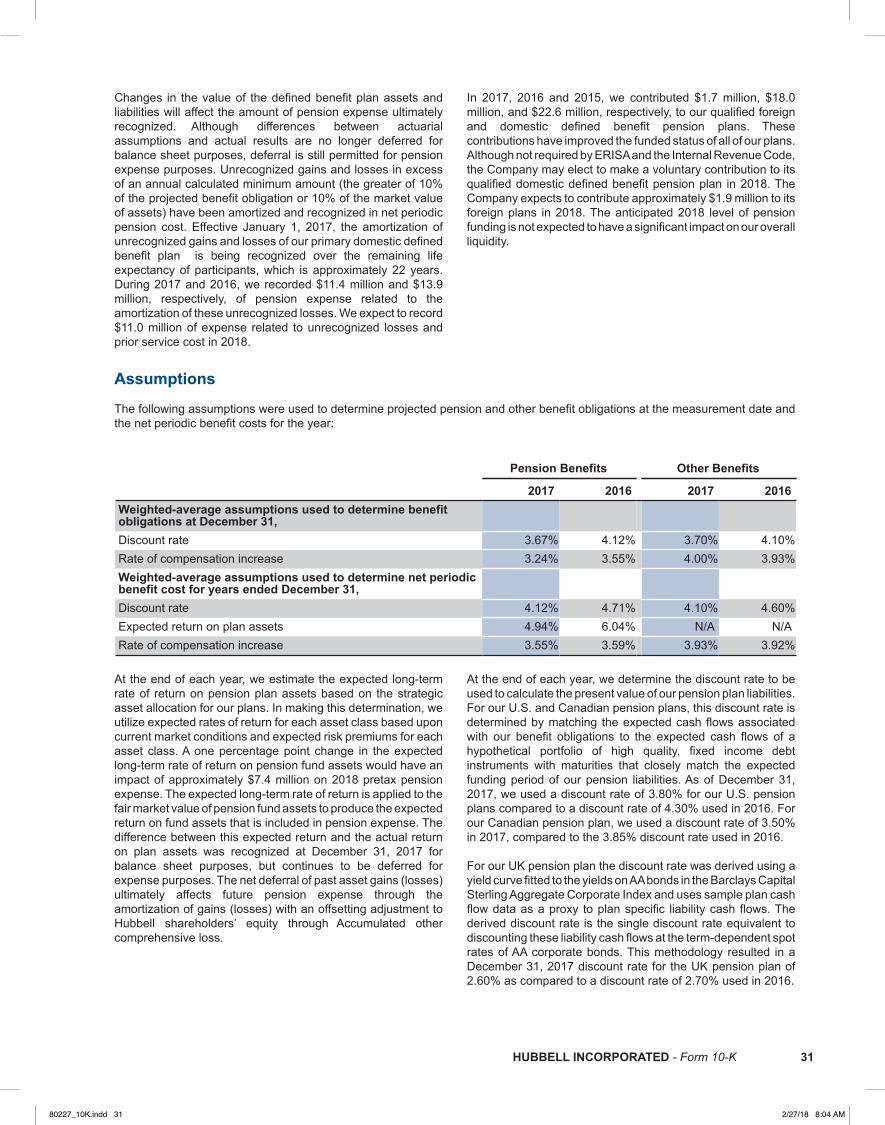
HUBBELL INCORPORATED - Form 10-K 31HUBBELL INCORPORATED - Form 10-K 31
Changes in the value of the defined benefit plan assets and liabilities will affect the amount of pension expense ultimately recognized. Although differences between actuarial assumptions and actual results are no longer deferred for balance sheet purposes, deferral is still permitted for pension expense purposes. Unrecognized gains and losses in excess of an annual calculated minimum amount (the greater of 10% of the projected benefit obligation or 10% of the market value of assets) have been amortized and recognized in net periodic pension cost. Effective January 1, 2017, the amortization of unrecognized gains and losses of our primary domestic defined benefit plan is being recognized over the remaining life expectancy of participants, which is approximately 22 years. During 2017 and 2016, we recorded $11.4 million and $13.9 million, respectively, of pension expense related to the amortization of these unrecognized losses. We expect to record $11.0 million of expense related to unrecognized losses and prior service cost in 2018.
In 2017, 2016 and 2015, we contributed $1.7 million, $18.0 million, and $22.6 million, respectively, to our qualified foreign and domestic defined benefit pension plans. These contributions have improved the funded status of all of our plans. Although not required by ERISA and the Internal Revenue Code, the Company may elect to make a voluntary contribution to its qualified domestic defined benefit pension plan in 2018. The Company expects to contribute approximately $1.9 million to its foreign plans in 2018. The anticipated 2018 level of pension funding is not expected to have a significant impact on our overall liquidity.
Assumptions
The following assumptions were used to determine projected pension and other benefit obligations at the measurement date and the net periodic benefit costs for the year:
Pension Benefits Other Benefits
2017 2016 2017 2016Weighted-average assumptions used to determine benefitobligations at December 31, Discount rate 3.67% 4.12% 3.70% 4.10%Rate of compensation increase 3.24% 3.55% 4.00% 3.93%Weighted-average assumptions used to determine net periodicbenefit cost for years ended December 31, Discount rate 4.12% 4.71% 4.10% 4.60%Expected return on plan assets 4.94% 6.04% N/A N/ARate of compensation increase 3.55% 3.59% 3.93% 3.92%
At the end of each year, we estimate the expected long-term rate of return on pension plan assets based on the strategic asset allocation for our plans. In making this determination, we utilize expected rates of return for each asset class based upon current market conditions and expected risk premiums for each asset class. A one percentage point change in the expected long-term rate of return on pension fund assets would have an impact of approximately $7.4 million on 2018 pretax pension expense. The expected long-term rate of return is applied to the fair market value of pension fund assets to produce the expected return on fund assets that is included in pension expense. The difference between this expected return and the actual return on plan assets was recognized at December 31, 2017 for balance sheet purposes, but continues to be deferred for expense purposes. The net deferral of past asset gains (losses) ultimately affects future pension expense through the amortization of gains (losses) with an offsetting adjustment to Hubbell shareholders’ equity through Accumulated other comprehensive loss.
At the end of each year, we determine the discount rate to be used to calculate the present value of our pension plan liabilities. For our U.S. and Canadian pension plans, this discount rate is determined by matching the expected cash flows associated with our benefit obligations to the expected cash flows of a hypothetical portfolio of high quality, fixed income debt instruments with maturities that closely match the expected funding period of our pension liabilities. As of December 31, 2017, we used a discount rate of 3.80% for our U.S. pension plans compared to a discount rate of 4.30% used in 2016. For our Canadian pension plan, we used a discount rate of 3.50%in 2017, compared to the 3.85% discount rate used in 2016. For our UK pension plan the discount rate was derived using a yield curve fitted to the yields on AA bonds in the Barclays Capital Sterling Aggregate Corporate Index and uses sample plan cash flow data as a proxy to plan specific liability cash flows. The derived discount rate is the single discount rate equivalent to discounting these liability cash flows at the term-dependent spot rates of AA corporate bonds. This methodology resulted in a December 31, 2017 discount rate for the UK pension plan of 2.60% as compared to a discount rate of 2.70% used in 2016.
80227_10K.indd 31 2/27/18 8:04 AM
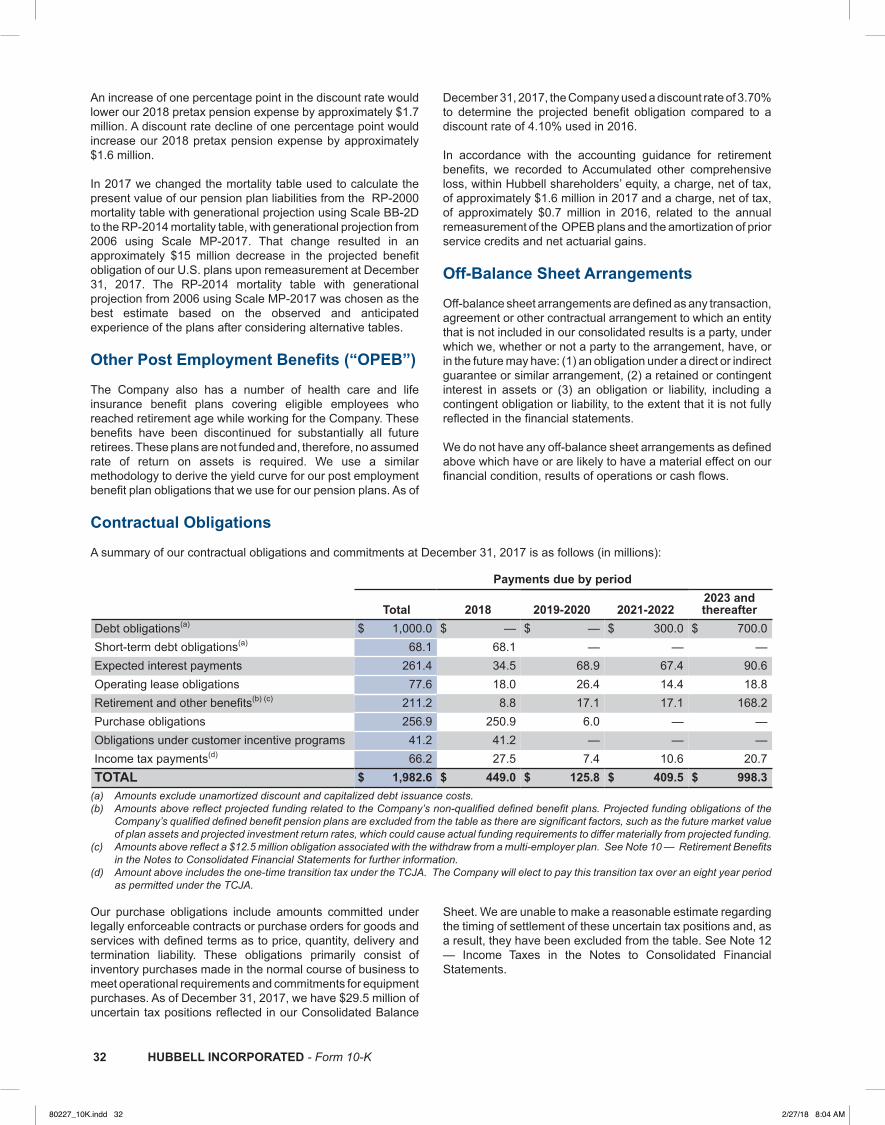
32 HUBBELL INCORPORATED - Form 10-K32 HUBBELL INCORPORATED - Form 10-K
An increase of one percentage point in the discount rate would lower our 2018 pretax pension expense by approximately $1.7 million. A discount rate decline of one percentage point would increase our 2018 pretax pension expense by approximately $1.6 million.
In 2017 we changed the mortality table used to calculate the present value of our pension plan liabilities from the RP-2000 mortality table with generational projection using Scale BB-2D to the RP-2014 mortality table, with generational projection from 2006 using Scale MP-2017. That change resulted in an approximately $15 million decrease in the projected benefit obligation of our U.S. plans upon remeasurement at December 31, 2017. The RP-2014 mortality table with generational projection from 2006 using Scale MP-2017 was chosen as the best estimate based on the observed and anticipated experience of the plans after considering alternative tables.
Other Post Employment Benefits (“OPEB”)
The Company also has a number of health care and life insurance benefit plans covering eligible employees who reached retirement age while working for the Company. These benefits have been discontinued for substantially all future retirees. These plans are not funded and, therefore, no assumed rate of return on assets is required. We use a similar methodology to derive the yield curve for our post employment benefit plan obligations that we use for our pension plans. As of
December 31, 2017, the Company used a discount rate of 3.70%to determine the projected benefit obligation compared to a discount rate of 4.10% used in 2016.
In accordance with the accounting guidance for retirement benefits, we recorded to Accumulated other comprehensive loss, within Hubbell shareholders’ equity, a charge, net of tax, of approximately $1.6 million in 2017 and a charge, net of tax, of approximately $0.7 million in 2016, related to the annual remeasurement of the OPEB plans and the amortization of prior service credits and net actuarial gains.
Off-Balance Sheet Arrangements
Off-balance sheet arrangements are defined as any transaction, agreement or other contractual arrangement to which an entity that is not included in our consolidated results is a party, under which we, whether or not a party to the arrangement, have, or in the future may have: (1) an obligation under a direct or indirect guarantee or similar arrangement, (2) a retained or contingent interest in assets or (3) an obligation or liability, including a contingent obligation or liability, to the extent that it is not fully reflected in the financial statements. We do not have any off-balance sheet arrangements as defined above which have or are likely to have a material effect on our financial condition, results of operations or cash flows.
Contractual Obligations
A summary of our contractual obligations and commitments at December 31, 2017 is as follows (in millions):
Payments due by period
Total 2018 2019-2020 2021-20222023 andthereafter
Debt obligations(a) $ 1,000.0 $ — $ — $ 300.0 $ 700.0Short-term debt obligations(a) 68.1 68.1 — — —Expected interest payments 261.4 34.5 68.9 67.4 90.6Operating lease obligations 77.6 18.0 26.4 14.4 18.8Retirement and other benefits(b) (c) 211.2 8.8 17.1 17.1 168.2Purchase obligations 256.9 250.9 6.0 — —Obligations under customer incentive programs 41.2 41.2 — — —Income tax payments(d) 66.2 27.5 7.4 10.6 20.7TOTAL $ 1,982.6 $ 449.0 $ 125.8 $ 409.5 $ 998.3
(a) Amounts exclude unamortized discount and capitalized debt issuance costs.(b) Amounts above reflect projected funding related to the Company’s non-qualified defined benefit plans. Projected funding obligations of the
Company’s qualified defined benefit pension plans are excluded from the table as there are significant factors, such as the future market value of plan assets and projected investment return rates, which could cause actual funding requirements to differ materially from projected funding.
(c) Amounts above reflect a $12.5 million obligation associated with the withdraw from a multi-employer plan. See Note 10 — Retirement Benefits in the Notes to Consolidated Financial Statements for further information.
(d) Amount above includes the one-time transition tax under the TCJA. The Company will elect to pay this transition tax over an eight year period as permitted under the TCJA.
Our purchase obligations include amounts committed under legally enforceable contracts or purchase orders for goods and services with defined terms as to price, quantity, delivery and termination liability. These obligations primarily consist of inventory purchases made in the normal course of business to meet operational requirements and commitments for equipment purchases. As of December 31, 2017, we have $29.5 million of uncertain tax positions reflected in our Consolidated Balance
Sheet. We are unable to make a reasonable estimate regarding the timing of settlement of these uncertain tax positions and, as a result, they have been excluded from the table. See Note 12 — Income Taxes in the Notes to Consolidated Financial Statements.
80227_10K.indd 32 2/27/18 8:04 AM
HUBBELL INCORPORATED - Form 10-K 33HUBBELL INCORPORATED - Form 10-K 33
Critical Accounting Estimates
Note 1 — Significant Accounting Policies in the Notes to Consolidated Financial Statements describes the significant accounting policies used in the preparation of our financial statements. Use of Estimates
We are required to make assumptions and estimates and apply judgments in the preparation of our financial statements that affect the reported amounts of assets and liabilities, revenues and expenses and related disclosures. We base our assumptions, estimates and judgments on historical experience, current trends and other factors deemed relevant by management. We continually review these estimates and their underlying assumptions to ensure they are appropriate for the circumstances. Changes in estimates and assumptions used by us could have a material impact on our financial results. We believe that the following estimates are among the most critical in fully understanding and evaluating our reported financial results. These items utilize assumptions and estimates about the effect of future events that are inherently uncertain and are based on our judgment.
Revenue Recognition We recognize revenue when persuasive evidence of an arrangement exists, delivery has occurred, the price is fixed and determinable and collection is probable. Product is considered delivered to the customer once it has been shipped and title and risk of loss have been transferred. The majority of our revenue is recognized at the time of shipment. Certain of our businesses account for sales discounts and allowances based on sales volumes, specific programs and customer deductions as is customary in the electrical products industry. These items primarily relate to sales volume incentives, special pricing allowances, and returned goods. This requires us to estimate at the time of sale the amounts that should not be recorded as revenue as these amounts are not expected to be collected from customers. We principally rely on historical experience, specific customer agreements, and anticipated future trends to estimate these amounts at the time of shipment.
Inventory Valuation Inventories in the U.S. are primarily valued at the lower of LIFO cost or market, while non-U.S. inventories are valued at the lower of FIFO cost or market. We routinely evaluate the carrying value of our inventories to ensure they are carried at the lower of LIFO or FIFO cost or market value. Such evaluation is based on our judgment and use of estimates, including sales forecasts, gross margins for particular product groupings, planned dispositions of product lines, technological events and overall industry trends. In addition, the evaluation is based on changes in inventory management practices which may influence the timing of exiting products and method of disposing of excess inventory.
Excess inventory is generally identified by comparing future expected inventory usage to actual on-hand quantities. Inventory values are reduced for on-hand inventory in excess of pre-defined usage forecasts. Forecast usage is primarily determined by projecting historical (actual) sales and inventory usage levels forward to future periods. Changes in these estimates may necessitate future adjustments to inventory values. Customer Credit and Collections We maintain allowances for doubtful accounts receivable in order to reflect the potential uncollectability of receivables related to purchases of products on open credit. If the financial condition of our customers were to deteriorate, resulting in their inability to make required payments, we may be required to record additional allowances for doubtful accounts. Accrued Insurance We retain a significant portion of the risks associated with workers’ compensation, medical, automobile and general liability insurance. We estimate self-insurance liabilities using a number of factors, including historical claims experience, demographic factors, severity factors and other actuarial assumptions. The accrued liabilities associated with these programs are based on our estimates of ultimate costs to settle known claims as well as claims incurred but not reported as of the balance sheet date. These assumptions are periodically reviewed with a third-party actuary to determine the adequacy of these self-insurance reserves. Changes in these assumptions may necessitate future adjustments to these self-insurance liabilities. Employee Benefits Costs and Funding We sponsor domestic and foreign defined benefit pension, defined contribution and other postretirement plans. Major assumptions used in the accounting for these employee benefit plans include the discount rate, expected return on the pension fund assets, rate of increase in employee compensation levels and health care cost increase projections. These assumptions are determined based on Company data and appropriate market indicators, and are evaluated each year as of the plans’ measurement date. Further discussion of the assumptions used in 2017 and 2016 are included above under “Pension Funding Status” and in Note 10 — Retirement Benefits in the Notes to Consolidated Financial Statements.
Taxes We account for income taxes in accordance with the applicable accounting guidance which requires that deferred tax assets and liabilities be recognized using enacted tax rates for the effect of temporary differences between the book and tax basis of recorded assets and liabilities. Additionally, deferred tax assets are required to be reduced by a valuation allowance if it is more-likely-than-not that some portion or all of the deferred tax asset will not be realized. The factors used to assess the likelihood of realization of deferred tax assets are the forecast of future taxable income, available tax planning strategies that could be implemented to realize the net deferred tax assets, and future reversals of deferred tax liabilities. Failure to achieve forecasted taxable income can affect the ultimate realization of net deferred tax assets.
80227_10K.indd 33 2/27/18 8:04 AM
34 HUBBELL INCORPORATED - Form 10-K34 HUBBELL INCORPORATED - Form 10-K
We operate within multiple taxing jurisdictions and are subject to audit in these jurisdictions. The Internal Revenue Service (“IRS”) and other tax authorities routinely review our tax returns. These audits can involve complex issues, which may require an extended period of time to resolve. The Company records uncertain tax positions when it has determined that it is more-likely-than-not that a tax position will not be sustained upon examination by taxing authorities based on the technical merits of the position. The Company uses the criteria established in the accounting guidance to determine whether an item meets the definition of more-likely-than-not. The Company’s policy is to recognize these uncertain tax positions when the more-likely-than-not threshold is met, when the statute of limitations has expired or upon settlement. In management’s opinion, adequate provision has been made for potential adjustments arising from any examinations.
We have accounted for the provisional impact of the TCJA based on the guidance outlined in SAB 118. The accounting for the income tax effects of the TCJA may include provisional amounts during the one-year measurement period from the date of enactment. Accordingly, the Company has recognized in the current period financial statements a provisional amount with respect to the deemed repatriation provisions of the TCJA, the revaluation of U.S. deferred taxes and the U.S. and foreign tax costs associated with anticipated remittances related to certain of our outside basis differences. We have also included provisional amounts with respect to those states with current conformity to the Internal Revenue Code. All of these provisional amounts may be subject to change during the measurement period. See Note 1 — Significant Accounting Policies and Note 12 — Income Taxes in the Notes to Consolidated Financial Statements.
Contingent Liabilities We are subject to proceedings, lawsuits, and other claims or uncertainties related to environmental, legal, product and other matters. We routinely assess the likelihood of an adverse judgment or outcome to these matters, as well as the range of potential losses. We record a liability when it is both probable that a liability has been incurred and the amount can be reasonably estimated. A determination of the reserves required, if any, is made after careful analysis, including consultations with outside advisors, where applicable. Where no amount within a range of estimates is more likely, the minimum is accrued. The required reserves may change in the future due to new developments.
Valuation of Long-Lived Assets Our long-lived assets include land, buildings, equipment, molds and dies, software, goodwill and other intangible assets. Long-lived assets, other than land, goodwill and indefinite-lived intangibles, are depreciated over their estimated useful lives. The assets and liabilities of acquired businesses are recorded under the acquisition method of accounting at their estimated fair values at the dates of acquisition. Goodwill represents purchase price in excess of fair values assigned to the underlying identifiable net assets of acquired businesses. Intangible assets primarily consist of patents, tradenames and customer related intangibles.
We review depreciable long-lived assets for impairment whenever events or changes in circumstances indicate that the carrying amount may not be fully recoverable. If such a change in circumstances occurs, the related estimated future undiscounted cash flows expected to result from the use of the asset group and its eventual disposition is compared to the carrying amount. If the sum of the expected cash flows of the asset group is less than the carrying amount, an impairment charge is recorded. The impairment charge is measured as the amount by which the carrying amount exceeds the fair value of the asset. The fair value of impaired assets is determined using expected cash flow estimates, quoted market prices when available and appraisals as appropriate. We did not record any material impairment charges related to long-lived assets in 2017, 2016, or 2015. Goodwill and indefinite-lived intangible assets are reviewed annually for impairment unless circumstances dictate the need for more frequent assessment. We perform our goodwill impairment testing as of April 1st of each year unless circumstances dictate the need for more frequent assessments. The accounting guidance provides entities an option of performing a qualitative assessment before performing a quantitative analysis. If the entity determines, on the basis of certain qualitative factors, that it is more-likely-than-not that the goodwill is not impaired, the entity would not need to proceed to the two step goodwill impairment testing process as prescribed in the guidance. The Company performed a qualitative assessment for two of its reporting units. The Company elected to bypass the qualitative assessment and proceeded directly to the quantitative analysis for its remaining reporting units. The goodwill impairment test requires judgment, including the identification of reporting units, assigning assets and liabilities to reporting units, and determining the fair value of each reporting unit. Significant judgments required to estimate the fair value of reporting units include estimating future discounted cash flows, determining appropriate discount rates and other assumptions. We use internal discounted cash flow estimates to determine fair value. These cash flow estimates are derived from historical experience and future long-term business plans and the application of an appropriate discount rate. Changes in these estimates and assumptions could materially affect the determination of fair value and/or goodwill impairment for each reporting unit. As of April 1, 2017, our goodwill testing resulted in fair values for each reporting unit that substantially exceeded the reporting unit’s carrying value. We have not recorded any goodwill impairments since the initial adoption of the accounting guidance in 2002. The identification and measurement of impairment of indefinite-lived intangible assets involves an assessment of qualitative factors to determine whether events or circumstances indicate that it is more-likely-than-not that an indefinite-lived intangible asset is impaired. If it is more-likely-than-not that the asset is impaired, the fair value of the indefinite lived intangibles will be determined using discounted cash flow estimates. If the carrying value of these assets exceeds the estimated fair value, the carrying value will be reduced to the estimated fair value. We did not record any impairments related to indefinite-lived intangible assets in 2017, 2016, or 2015.
80227_10K.indd 34 2/27/18 8:04 AM
HUBBELL INCORPORATED - Form 10-K 35HUBBELL INCORPORATED - Form 10-K 35
Stock-Based Compensation We determine the grant date fair value of certain stock-based compensation awards using either a lattice model or the Black-Scholes option pricing model. Both of these models require management to make certain assumptions with respect to selected model inputs. These inputs include assumptions for the expected term, stock volatility, dividend yield and risk-free interest rate. Changes in these inputs impact fair value and could impact our stock-based compensation expense in the future. In addition, we are required to estimate the expected forfeiture rate and recognize expense only for those awards expected to meet the service and performance vesting conditions. If our actual forfeiture rate is different from our estimate, adjustments to stock-based compensation expense may be required. See also Note 16 — Stock-Based Compensation in the Notes to Consolidated Financial Statements.
Forward-Looking Statements
Some of the information included in this Management’s Discussion and Analysis of Financial Condition and Results of Operations, and elsewhere in this Form 10-K, contain “forward-looking statements” as defined by the Private Securities Litigation Reform Act of 1995. These include statements about our expected capital resources, liquidity, financial performance, pension funding, and results of operations and are based on our reasonable current expectations. In addition, all statements regarding the expected financial impact of the Aclara acquisition, adoption of updated accounting standards and any expected effects of such adoption, expectation regarding U.S. tax reform and the potential impact of the enactment of the TCJA, restructuring plans and expected associated costs and benefits, intent to repurchase shares of Common Stock, and the expected amount of such repurchases, and improvement in operating results, anticipated market conditions and productivity initiatives are forward looking. Forward-looking statements may be identified by the use of words, such as “believe”, “expect”, “anticipate”, “intend”, “depend”, “should”, “plan”, “estimated”, “predict”, “could”, “may”, “subject to”, “continues”, “growing”, “prospective”, “forecast”, “projected”, “purport”, “might”, “if”, “contemplate”, “potential”, “pending,” “target”, “goals”, “scheduled”, “will likely be”, and similar words and phrases. Discussions of strategies, plans or intentions often contain forward-looking statements. Important factors, among others, that could cause our actual results and future actions to differ materially from those described in forward-looking statements include, but are not limited to: • Changes in demand for our products, market conditions,
product quality, or product availability adversely affecting sales levels.
• Changes in markets or competition adversely affecting realization of price increases.
• Failure to achieve projected levels of efficiencies, cost savings and cost reduction measures, including those expected as a result of our lean initiative and strategic sourcing plans.
• The expected benefits and the timing of other actions in connection with our Enterprise Resource Planning ("ERP") system.
• Availability and costs of raw materials, purchased components, energy and freight.
• Changes in expected or future levels of operating cash flow, indebtedness and capital spending.
• General economic and business conditions in particular industries, markets or geographic regions, as well as inflationary trends.
• Regulatory issues, changes in tax laws including the recent enactment of the TCJA, or changes in geographic profit mix affecting tax rates and availability of tax incentives.
• A major disruption in one or more of our manufacturing or distribution facilities or headquarters, including the impact of plant consolidations and relocations.
• Changes in our relationships with, or the financial condition or performance of, key distributors and other customers, agents or business partners which could adversely affect our results of operations.
• Impact of productivity improvements on lead times, quality and delivery of product.
• Anticipated future contributions and assumptions including changes in interest rates and plan assets with respect to pensions.
• Adjustments to product warranty accruals in response to claims incurred, historical experiences and known costs.
• Unexpected costs or charges, certain of which might be outside of our control.
• Changes in strategy, economic conditions or other conditions outside of our control affecting anticipated future global product sourcing levels.
• Ability to carry out future acquisitions and strategic investments in our core businesses as well as the acquisition related costs.
• Ability to successfully execute, manage and integrate key acquisitions and mergers, including the Aclara acquisition, the iDevices acquisition, the AEC acquisition and the Meramec acquisition.
• The ability to effectively implement ERP systems without disrupting operational and financial processes.
• Unanticipated difficulties integrating acquisitions as well as the realization of expected synergies and benefits anticipated when we first enter into a transaction.
• The ability of governments to meet their financial obligations.
• Political unrest in foreign countries.• Natural disasters.• Failure of information technology systems or security
breaches resulting in unauthorized disclosure of confidential information.
• Changes to provisional tax estimates related to the TCJA.• Future repurchases of common stock under our common
stock repurchase program.• Changes in accounting principles, interpretations, or
estimates.• The outcome of environmental, legal and tax contingencies
or costs compared to amounts provided for such contingencies.
• Adverse changes in foreign currency exchange rates and the potential use of hedging instruments to hedge the exposure to fluctuating rates of foreign currency exchange on inventory purchases.
• Other factors described in our Securities and Exchange Commission filings, including the “Business”, “Risk Factors” and “Quantitative and Qualitative Disclosures about Market Risk” sections in this Company’s Annual Report on Form 10-K for the year ended December 31, 2017.
80227_10K.indd 35 2/27/18 8:04 AM

36 HUBBELL INCORPORATED - Form 10-K36 HUBBELL INCORPORATED - Form 10-K
Any such forward-looking statements are not guarantees of future performances and actual results, developments and business decisions may differ from those contemplated by such forward-looking statements. The Company disclaims any duty to update any forward-looking statement, all of which are expressly qualified by the foregoing, other than as required by law.
ITEM 7A Quantitative and Qualitative Disclosures about Market RiskIn the operation of our business, we have various exposures to areas of risk related to factors within and outside the control of management. Significant areas of risk and our strategies to manage the exposure are discussed below. In 2017, we manufactured and/or assembled products in the United States, Canada, Switzerland, Puerto Rico, Mexico, China, UK, Brazil and Australia and sold products in those markets as well as through offices in Singapore, Italy, China, Mexico, and South Korea and countries in the Middle East. In 2017, Hubbell also participated in joint ventures in Taiwan and Hong Kong. Shipments from non-U.S. subsidiaries as a percentage of the Company’s total net sales were 11% in 2017, 10% in 2016 and 11% in 2015, with the Canadian, UK and Brazilian operations representing approximately 31%, 21%, and 12% respectively, of 2017 total international net sales. As such, our operating results could be affected by changes in foreign currency exchange rates or weak economic conditions in the foreign markets in which we sell our products. To manage this exposure, we closely monitor the working capital requirements of our international units and may enter into forward foreign exchange contracts. Further discussion of forward exchange contracts can be found in Note 13 — Financial Instruments and Fair Value Measurement in the Notes to Consolidated Financial Statements. Product purchases representing approximately 17% of our net sales are sourced from unaffiliated suppliers located outside the United States, primarily in China and other Asian countries, Europe and Brazil. Foreign sourcing of products may result in unexpected fluctuations in product cost or increased risk of business interruption due to lack of product or component availability due to any one of the following: • Political or economic uncertainty in the source country
• Fluctuations in the rate of exchange between the U.S. dollar and the currencies of the source countries
• Changes in U.S. laws and policies governing foreign trade
• Increased logistical complexity including supply chain interruption or delay, port of departure or entry disruption and overall time to market
• Loss of proprietary information
• Product quality issues outside the control of the Company
We have developed plans that address many of these risks. Such actions include careful selection of products to be outsourced and the suppliers selected; ensuring multiple sources of supply; limiting concentrations of activity by port, broker, freight forwarder, etc.; processes related to quality control; and maintaining control over operations, technologies and manufacturing deemed to provide competitive advantage. Many of our businesses have a dependency on certain basic
raw materials needed to produce their products including steel, aluminum, brass, copper, bronze, plastics, phenols, zinc, nickel, elastomers and petrochemicals as well as purchased electrical and electronic components. Our financial results could be affected by the availability and changes in prices of these materials and components. Certain of these materials are sourced from a limited number of suppliers. These materials are also key source materials for many other companies in our industry and within the universe of industrial manufacturers in general. As such, in periods of rising demand for these materials, we may experience both increased costs and/or limited supply. These conditions can potentially result in our inability to acquire these key materials on a timely basis to produce our products and satisfy our incoming sales orders. Similarly, the cost of these materials can rise suddenly and result in materially higher costs of producing our products. We believe we have adequate primary and secondary sources of supply for each of our key materials and that, in periods of rising prices, we expect to recover a majority of the increased cost in the form of higher selling prices. However, recoveries typically lag the effect of cost increases due to the nature of our markets. Our financial results are subject to interest rate fluctuations to the extent there is a difference between the amount of our interest-earning assets and the amount of interest-bearing liabilities. The principal objectives of our investment management activities are to preserve capital while earning net investment income that is commensurate with acceptable levels of interest rate, default and liquidity risk taking into account our funding needs. As part of our investment management strategy, we may use derivative financial products such as interest rate hedges and interest rate swaps.
From time to time or when required, we issue commercial paper, which exposes us to changes in interest rates. Our cash position includes amounts denominated in foreign currencies. We manage our worldwide cash requirements by considering available funds held by our subsidiaries and the cost effectiveness with which these funds can be accessed. We continually evaluate risk retention and insurance levels for product liability, property damage and other potential exposures to risk. We devote significant effort to maintaining and improving safety and internal control programs, which are intended to reduce our exposure to certain risks. We determine the level of insurance coverage and the likelihood of a loss and believe that the current levels of risk retention are consistent with those of comparable companies in the industries in which we operate. There can be no assurance that we will not incur losses beyond the limits of our insurance. However, our liquidity, financial position and profitability are not expected to be materially affected by the levels of risk retention that we accept.
80227_10K.indd 36 2/27/18 8:04 AM
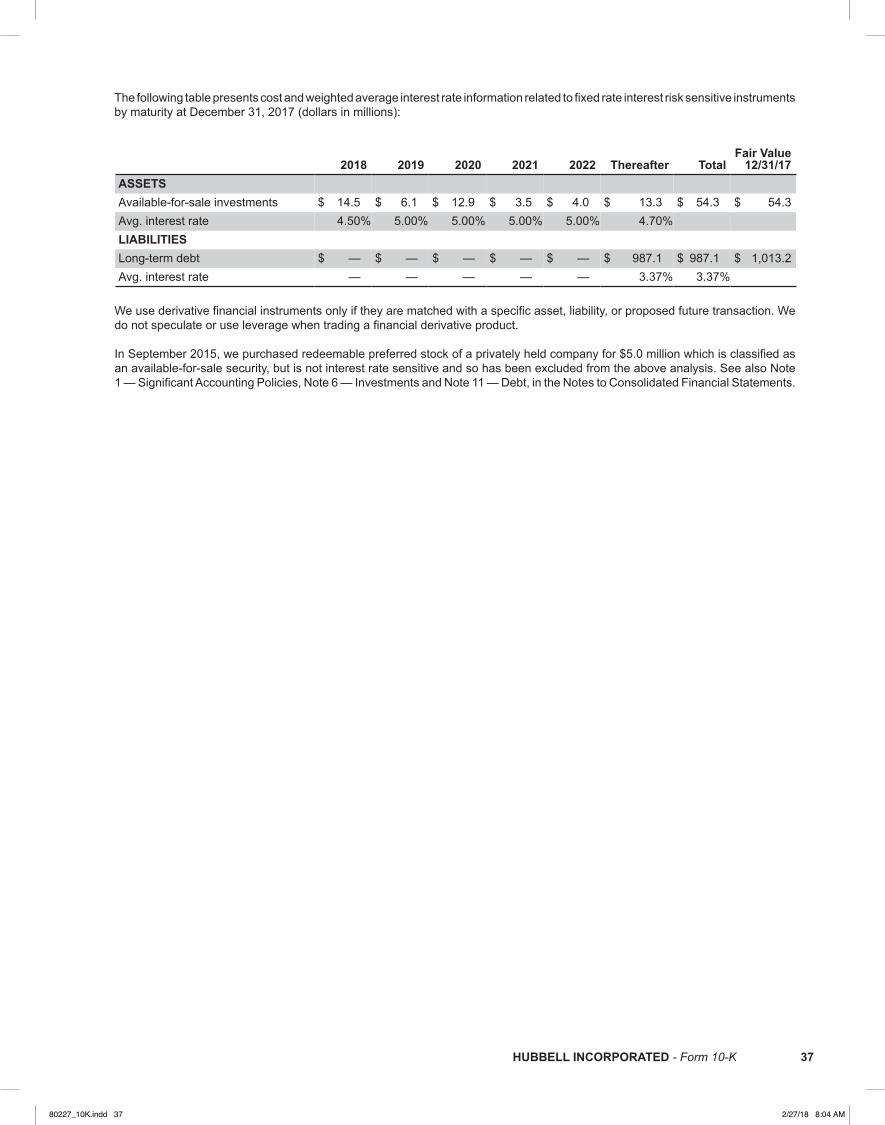
HUBBELL INCORPORATED - Form 10-K 37HUBBELL INCORPORATED - Form 10-K 37
The following table presents cost and weighted average interest rate information related to fixed rate interest risk sensitive instruments by maturity at December 31, 2017 (dollars in millions):
2018 2019 2020 2021 2022 Thereafter TotalFair Value
12/31/17ASSETS Available-for-sale investments $ 14.5 $ 6.1 $ 12.9 $ 3.5 $ 4.0 $ 13.3 $ 54.3 $ 54.3Avg. interest rate 4.50% 5.00% 5.00% 5.00% 5.00% 4.70% LIABILITIES Long-term debt $ — $ — $ — $ — $ — $ 987.1 $ 987.1 $ 1,013.2Avg. interest rate — — — — — 3.37% 3.37%
We use derivative financial instruments only if they are matched with a specific asset, liability, or proposed future transaction. We do not speculate or use leverage when trading a financial derivative product.
In September 2015, we purchased redeemable preferred stock of a privately held company for $5.0 million which is classified as an available-for-sale security, but is not interest rate sensitive and so has been excluded from the above analysis. See also Note 1 — Significant Accounting Policies, Note 6 — Investments and Note 11 — Debt, in the Notes to Consolidated Financial Statements.
80227_10K.indd 37 2/27/18 8:04 AM
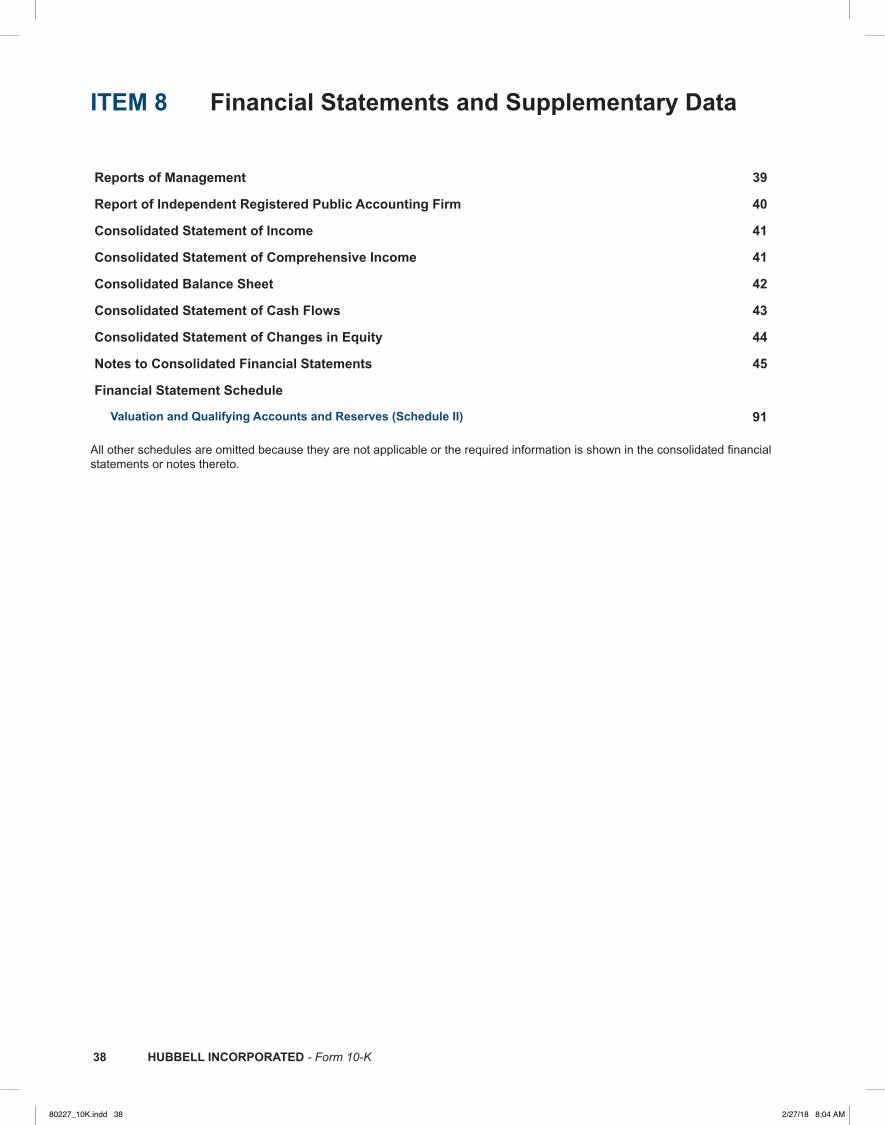
38 HUBBELL INCORPORATED - Form 10-K38 HUBBELL INCORPORATED - Form 10-K
ITEM 8 Financial Statements and Supplementary Data
Reports of Management
Report of Independent Registered Public Accounting Firm
Consolidated Statement of Income
Consolidated Statement of Comprehensive Income
Consolidated Balance Sheet
Consolidated Statement of Cash Flows
Consolidated Statement of Changes in Equity
Notes to Consolidated Financial Statements
Financial Statement Schedule
Valuation and Qualifying Accounts and Reserves (Schedule II) All other schedules are omitted because they are not applicable or the required information is shown in the consolidated financial statements or notes thereto.
39
40
41
41
42
43
44
45
91
80227_10K.indd 38 2/27/18 8:04 AM

HUBBELL INCORPORATED - Form 10-K 39HUBBELL INCORPORATED - Form 10-K 39
Reports of Management
Report on Management’s Responsibility for Financial Statements
Our management is responsible for the preparation, integrity and fair presentation of its published financial statements. The financial statements have been prepared in accordance with accounting principles generally accepted in the United States of America and include amounts based on informed judgments made by management. We believe it is critical to provide investors and other users of our financial statements with information that is relevant, objective, understandable and timely, so that they can make informed decisions. As a result, we have established and maintain systems and practices and internal control processes designed to provide reasonable, but not absolute, assurance that transactions are properly executed and recorded and that our policies and procedures are carried out appropriately. Management strives to recruit, train and retain high quality people to ensure that controls are designed, implemented and maintained in a high-quality, reliable manner.
Our independent registered public accounting firm audited our financial statements and the effectiveness of our internal control over financial reporting in accordance with standards established by the Public Company Accounting Oversight Board (United States). Their report appears on the next page within this Annual Report on Form 10-K. Our Board of Directors normally meets ten times per year to provide oversight, to review corporate strategies and operations, and to assess management’s conduct of the business. The Audit Committee of our Board of Directors is comprised of at least three individuals all of whom must be “independent” under current New York Stock Exchange listing standards and regulations adopted by the SEC under the federal securities laws. The Audit Committee meets regularly with our internal auditors and independent registered public accounting firm, as well as management to review, among other matters, accounting, auditing, internal controls and financial reporting issues and practices. Both the internal auditors and independent registered public accounting firm have full, unlimited access to the Audit Committee.
Management’s Annual Report on Internal Control over Financial Reporting
Management is responsible for establishing and maintaining adequate systems of internal control over financial reporting as defined by Rules 13a-15(f) and 15d-15(f) under the Securities Exchange Act of 1934. Our internal control over financial reporting is designed to provide reasonable assurance regarding the reliability of financial reporting and the preparation of financial statements for external reporting purposes in accordance with generally accepted accounting principles. Because of its inherent limitations, internal control over financial reporting may not prevent or detect misstatements. Management has assessed the effectiveness of our internal control over financial reporting as of December 31, 2017. In
making this assessment, management used the criteria set forth in Internal Control-Integrated Framework (2013 framework) issued by the Committee of Sponsoring Organizations of the Treadway Commission ("COSO"). Based on this assessment, management concluded that our internal control over financial reporting was effective at a reasonable assurance level as of December 31, 2017. The effectiveness of our internal control over financial reporting as of December 31, 2017 has been audited by PricewaterhouseCoopers LLP, our independent registered public accounting firm as stated in their report which is included on the next page within this Annual Report on Form 10-K.
/s/ DAVID G. NORD /s/ WILLIAM R. SPERRYDavid G. Nord William R. SperryChairman of the Board, President andChief Executive Officer
Senior Vice President and Chief FinancialOfficer
80227_10K.indd 39 2/27/18 8:04 AM
40 HUBBELL INCORPORATED - Form 10-K40 HUBBELL INCORPORATED - Form 10-K
Report of Independent Registered Public Accounting Firm To the Board of Directors and Shareholders of Hubbell Incorporated
Opinions on the Financial Statements and Internal Control over Financial Reporting
We have audited the accompanying consolidated balance sheets of Hubbell Incorporated and its subsidiaries as of December 31, 2017 and 2016, and the related consolidated statements of income, comprehensive income, changes in equity and cash flows for each of the three years in the period ended December 31, 2017, including the related notes and schedule of valuation and qualifying accounts and reserves for each of the three years in the period ended December 31, 2017 appearing under Item 15 (collectively referred to as the “consolidated financial statements”). We also have audited the Company's internal control over financial reporting as of December 31, 2017, based on criteria established in Internal Control - Integrated Framework (2013) issued by the Committee of Sponsoring Organizations of the Treadway Commission (COSO).
In our opinion, the consolidated financial statements referred to above present fairly, in all material respects, the financial position of the Company as of December 31, 2017 and 2016, and the results of their operations and their cash flows for each of the three years in the period ended December 31, 2017 in conformity with accounting principles generally accepted in the United States of America. Also in our opinion, the Company maintained, in all material respects, effective internal control over financial reporting as of December 31, 2017, based on criteria established in Internal Control - Integrated Framework (2013) issued by the COSO.
Basis for Opinions
The Company's management is responsible for these consolidated financial statements, for maintaining effective internal control over financial reporting, and for its assessment of the effectiveness of internal control over financial reporting, included in the accompanying Management’s Annual Report on Internal Control over Financial Reporting. Our responsibility is to express opinions on the Company’s consolidated financial statements and on the Company's internal control over financial reporting based on our audits. We are a public accounting firm registered with the Public Company Accounting Oversight Board (United States) ("PCAOB") and are required to be independent with respect to the Company in accordance with the U.S. federal securities laws and the applicable rules and regulations of the Securities and Exchange Commission and the PCAOB.
We conducted our audits in accordance with the standards of the PCAOB. Those standards require that we plan and perform the audits to obtain reasonable assurance about whether the consolidated financial statements are free of material misstatement, whether due to error or fraud, and whether effective internal control over financial reporting was maintained in all material respects.
Our audits of the consolidated financial statements included performing procedures to assess the risks of material misstatement of the consolidated financial statements, whether due to error or fraud, and performing procedures that respond to those risks. Such procedures included examining, on a test basis, evidence regarding the amounts and disclosures in the consolidated financial statements. Our audits also included evaluating the accounting principles used and significant estimates made by management, as well as evaluating the overall presentation of the consolidated financial statements. Our audit of internal control over financial reporting included obtaining an understanding of internal control over financial reporting, assessing the risk that a material weakness exists, and testing and evaluating the design and operating effectiveness of internal control based on the assessed risk. Our audits also included performing such other procedures as we considered necessary in the circumstances. We believe that our audits provide a reasonable basis for our opinions.
Definition and Limitations of Internal Control over Financial Reporting
A company’s internal control over financial reporting is a process designed to provide reasonable assurance regarding the reliability of financial reporting and the preparation of financial statements for external purposes in accordance with generally accepted accounting principles. A company’s internal control over financial reporting includes those policies and procedures that (i) pertain to the maintenance of records that, in reasonable detail, accurately and fairly reflect the transactions and dispositions of the assets of the company; (ii) provide reasonable assurance that transactions are recorded as necessary to permit preparation of financial statements in accordance with generally accepted accounting principles, and that receipts and expenditures of the company are being made only in accordance with authorizations of management and directors of the company; and (iii) provide reasonable assurance regarding prevention or timely detection of unauthorized acquisition, use, or disposition of the company’s assets that could have a material effect on the financial statements.
Because of its inherent limitations, internal control over financial reporting may not prevent or detect misstatements. Also, projections of any evaluation of effectiveness to future periods are subject to the risk that controls may become inadequate because of changes in conditions, or that the degree of compliance with the policies or procedures may deteriorate.
/s/ PricewaterhouseCoopers LLP
Hartford, ConnecticutFebruary 15, 2018
We have served as the Company's auditor since at least 1961. We have not determined the specific year we began serving as auditor of the Company.
80227_10K.indd 40 2/27/18 8:04 AM
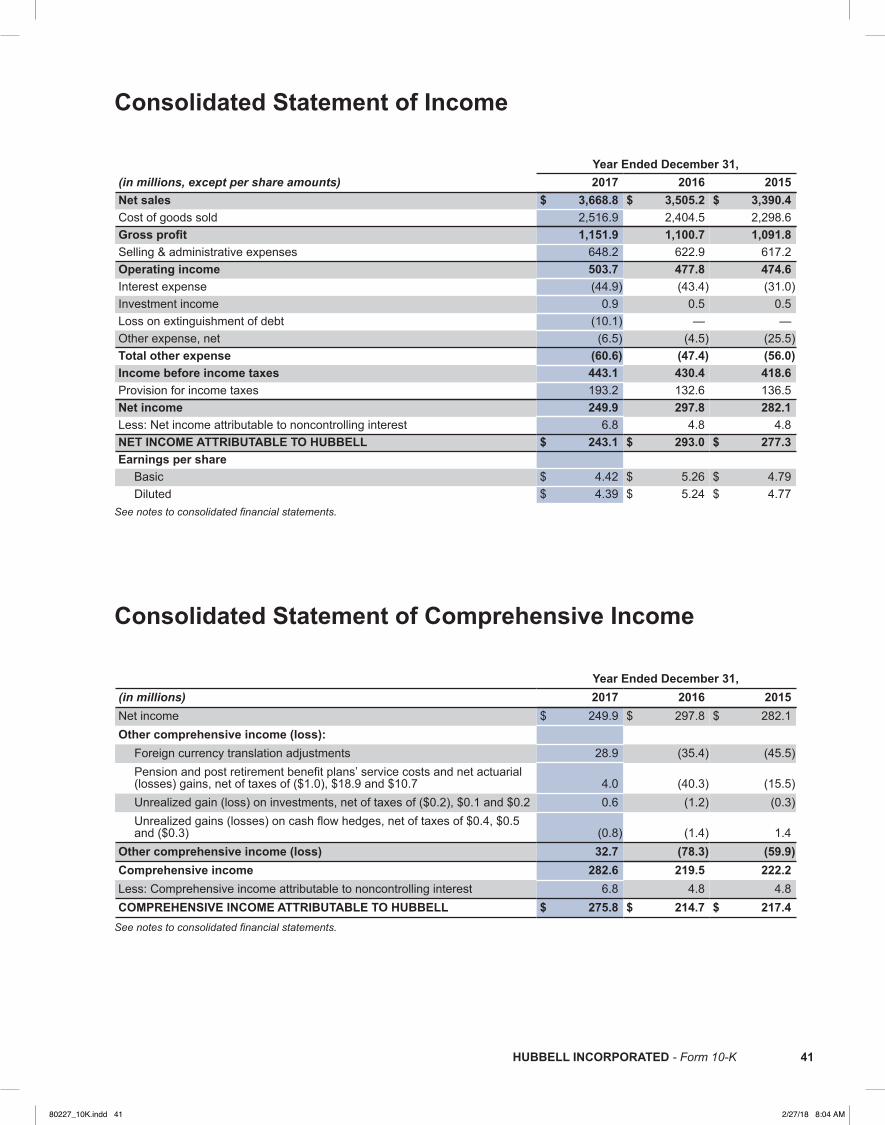
HUBBELL INCORPORATED - Form 10-K 41HUBBELL INCORPORATED - Form 10-K 41
Consolidated Statement of Income Year Ended December 31,(in millions, except per share amounts) 2017 2016 2015Net sales $ 3,668.8 $ 3,505.2 $ 3,390.4Cost of goods sold 2,516.9 2,404.5 2,298.6Gross profit 1,151.9 1,100.7 1,091.8Selling & administrative expenses 648.2 622.9 617.2Operating income 503.7 477.8 474.6Interest expense (44.9) (43.4) (31.0)Investment income 0.9 0.5 0.5Loss on extinguishment of debt (10.1) — —Other expense, net (6.5) (4.5) (25.5)Total other expense (60.6) (47.4) (56.0)Income before income taxes 443.1 430.4 418.6Provision for income taxes 193.2 132.6 136.5Net income 249.9 297.8 282.1Less: Net income attributable to noncontrolling interest 6.8 4.8 4.8NET INCOME ATTRIBUTABLE TO HUBBELL $ 243.1 $ 293.0 $ 277.3Earnings per share
Basic $ 4.42 $ 5.26 $ 4.79Diluted $ 4.39 $ 5.24 $ 4.77
See notes to consolidated financial statements.
Consolidated Statement of Comprehensive Income
Year Ended December 31,(in millions) 2017 2016 2015Net income $ 249.9 $ 297.8 $ 282.1Other comprehensive income (loss):
Foreign currency translation adjustments 28.9 (35.4) (45.5)Pension and post retirement benefit plans’ service costs and net actuarial(losses) gains, net of taxes of ($1.0), $18.9 and $10.7 4.0 (40.3) (15.5)Unrealized gain (loss) on investments, net of taxes of ($0.2), $0.1 and $0.2 0.6 (1.2) (0.3)Unrealized gains (losses) on cash flow hedges, net of taxes of $0.4, $0.5and ($0.3) (0.8) (1.4) 1.4
Other comprehensive income (loss) 32.7 (78.3) (59.9)Comprehensive income 282.6 219.5 222.2Less: Comprehensive income attributable to noncontrolling interest 6.8 4.8 4.8COMPREHENSIVE INCOME ATTRIBUTABLE TO HUBBELL $ 275.8 $ 214.7 $ 217.4
See notes to consolidated financial statements.
80227_10K.indd 41 2/27/18 8:04 AM

42 HUBBELL INCORPORATED - Form 10-K42 HUBBELL INCORPORATED - Form 10-K
Consolidated Balance Sheet
At December 31,(In millions, except share amounts) 2017 2016ASSETS Current Assets Cash and cash equivalents $ 375.0 $ 437.6Short-term investments 14.5 11.2Accounts receivable, net 540.3 530.0Inventories, net 634.7 532.4Other current assets 39.6 40.1Total Current Assets 1,604.1 1,551.3Property, Plant, and Equipment, net 458.3 439.8Other Assets Investments 57.7 56.4Goodwill 1,089.0 991.0Intangible assets, net 460.4 431.5Other long-term assets 51.1 55.0TOTAL ASSETS $ 3,720.6 $ 3,525.0LIABILITIES AND EQUITY Current Liabilities Short-term debt $ 68.1 $ 3.2Accounts payable 326.5 291.6Accrued salaries, wages and employee benefits 76.6 82.8Accrued insurance 60.0 55.8Other accrued liabilities 174.9 156.2Total Current Liabilities 706.1 589.6Long-term Debt 987.1 990.5Other Non-Current Liabilities 379.5 341.7TOTAL LIABILITIES 2,072.7 1,921.8Commitments and Contingencies (see Note 14)Hubbell Shareholders’ Equity Common stock, par value $.01 Common Stock - Authorized 200,000,000 shares, outstanding 54,882,154 and 55,532,307 shares $ 0.6 $ 0.6Additional paid-in capital 11.0 15.4Retained earnings 1,892.4 1,879.3Accumulated other comprehensive loss (269.8) (302.5)Total Hubbell Shareholders’ Equity 1,634.2 1,592.8Noncontrolling interest 13.7 10.4TOTAL EQUITY 1,647.9 1,603.2TOTAL LIABILITIES AND EQUITY $ 3,720.6 $ 3,525.0
See notes to consolidated financial statements.
80227_10K.indd 42 2/27/18 8:04 AM

HUBBELL INCORPORATED - Form 10-K 43HUBBELL INCORPORATED - Form 10-K 43
Consolidated Statement of Cash Flows
Year Ended December 31,(In millions) 2017 2016 2015Cash Flows from Operating Activities Net income $ 249.9 $ 297.8 $ 282.1Adjustments to reconcile net income to net cash provided by operating activities,net of acquisitions:Depreciation and amortization 99.8 92.3 85.2Deferred income taxes (14.3) 12.7 (4.5)Stock-based compensation 22.3 22.3 17.0Loss on extinguishment of debt 10.1 — —(Gain) loss on sale of assets (11.6) (5.8) 0.5Changes in assets and liabilities, net of acquisitions:Decrease (increase) in accounts receivable 3.9 (42.3) 1.9Decrease (increase) in inventories (90.3) 18.4 (80.8)Increase in current liabilities 57.4 13.8 46.6Changes in other assets and liabilities, net 50.7 8.4 6.1Contributions to qualified defined benefit pension plans (1.7) (18.0) (22.6)Other, net 2.8 11.4 7.9NET CASH PROVIDED BY OPERATING ACTIVITIES 379.0 411.0 339.4Cash Flows from Investing ActivitiesCapital expenditures (79.7) (67.2) (77.1)Acquisitions, net of cash acquired (184.1) (173.4) (163.4)Purchases of available-for-sale investments (20.9) (20.0) (24.5)Proceeds from sales of available-for-sale investments 17.4 13.3 13.8Proceeds from disposition of assets 18.4 10.8 0.7Other, net 3.3 6.3 0.9NET CASH USED IN INVESTING ACTIVITIES (245.6) (230.2) (249.6)Cash Flows from Financing ActivitiesIssuance of long-term debt 297.6 397.0 —Extinguishment of long-term debt (300.0) — —Issuance of short-term debt 66.3 1.2 48.8Payment of short-term debt (1.7) (51.5) (2.0)Make whole payment for extinguishment of long-term debt (9.9) — —Debt issuance cost (3.0) (3.6) —Payment of dividends (157.6) (144.0) (133.7)Payment of dividends to noncontrolling interest (3.5) (2.8) (5.0)Acquisition of common shares (92.5) (246.8) (79.1)Payments for share reclassification — — (200.7)Other (10.0) (8.9) (7.3)NET CASH USED IN FINANCING ACTIVITIES (214.3) (59.4) (379.0)Effect of foreign currency exchange rate changes on cash and cash equivalents 18.3 (27.3) (21.2)Increase in cash and cash equivalents (62.6) 94.1 (310.4)Cash and cash equivalents, beginning of year 437.6 343.5 653.9Cash and cash equivalents, end of year $ 375.0 $ 437.6 $ 343.5
See notes to consolidated financial statements.
80227_10K.indd 43 2/27/18 8:04 AM
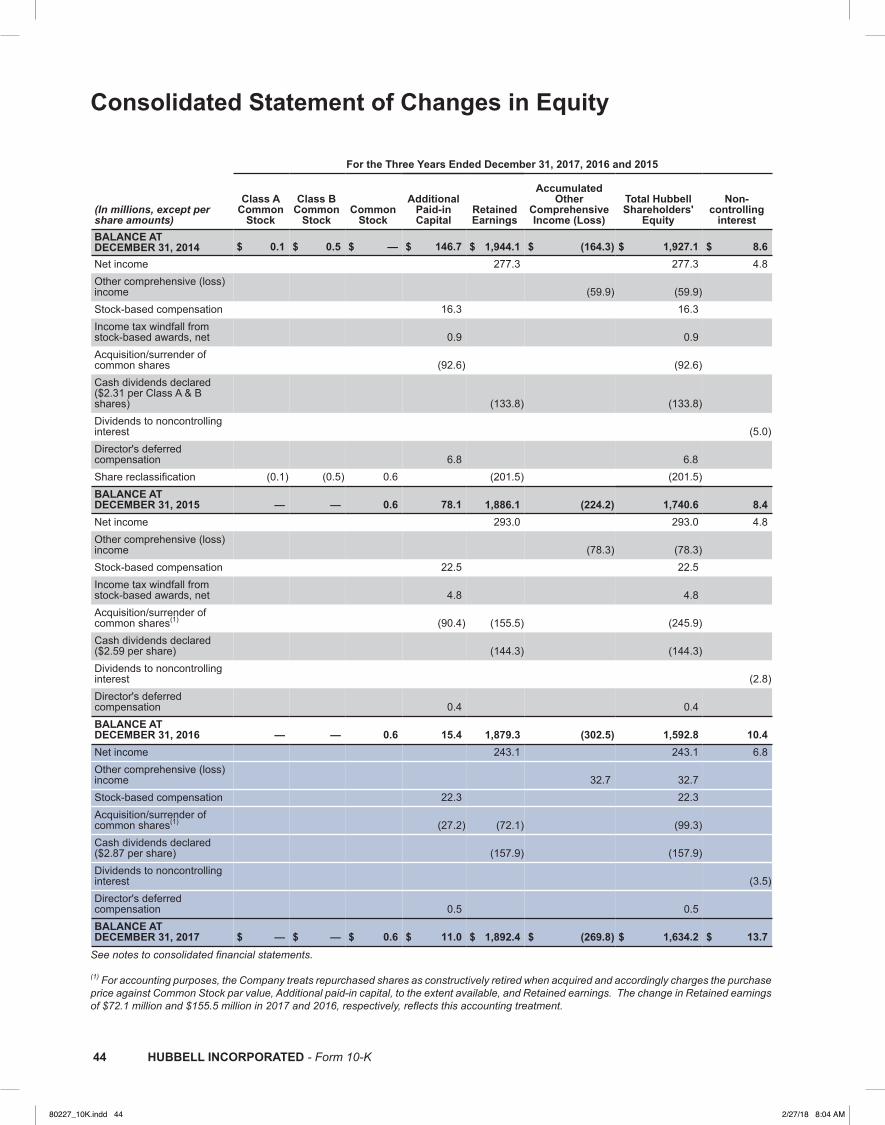
44 HUBBELL INCORPORATED - Form 10-K44 HUBBELL INCORPORATED - Form 10-K
Consolidated Statement of Changes in Equity
For the Three Years Ended December 31, 2017, 2016 and 2015
(In millions, except pershare amounts)
Class ACommon
Stock
Class BCommon
StockCommon
Stock
AdditionalPaid-inCapital
RetainedEarnings
AccumulatedOther
ComprehensiveIncome (Loss)
Total HubbellShareholders'
Equity
Non-controlling
interestBALANCE AT DECEMBER 31, 2014 $ 0.1 $ 0.5 $ — $ 146.7 $ 1,944.1 $ (164.3) $ 1,927.1 $ 8.6Net income 277.3 277.3 4.8Other comprehensive (loss)income (59.9) (59.9) Stock-based compensation 16.3 16.3 Income tax windfall fromstock-based awards, net 0.9 0.9 Acquisition/surrender ofcommon shares (92.6) (92.6) Cash dividends declared($2.31 per Class A & Bshares) (133.8) (133.8) Dividends to noncontrollinginterest (5.0)Director's deferredcompensation 6.8 6.8Share reclassification (0.1) (0.5) 0.6 (201.5) (201.5)BALANCE AT DECEMBER 31, 2015 — — 0.6 78.1 1,886.1 (224.2) 1,740.6 8.4Net income 293.0 293.0 4.8Other comprehensive (loss)income (78.3) (78.3) Stock-based compensation 22.5 22.5 Income tax windfall fromstock-based awards, net 4.8 4.8 Acquisition/surrender of common shares(1) (90.4) (155.5) (245.9) Cash dividends declared($2.59 per share) (144.3) (144.3) Dividends to noncontrollinginterest (2.8)Director's deferredcompensation 0.4 0.4BALANCE AT DECEMBER 31, 2016 — — 0.6 15.4 1,879.3 (302.5) 1,592.8 10.4Net income 243.1 243.1 6.8Other comprehensive (loss)income 32.7 32.7 Stock-based compensation 22.3 22.3 Acquisition/surrender of common shares(1) (27.2) (72.1) (99.3) Cash dividends declared($2.87 per share) (157.9) (157.9) Dividends to noncontrollinginterest (3.5)Director's deferredcompensation 0.5 0.5BALANCE AT DECEMBER 31, 2017 $ — $ — $ 0.6 $ 11.0 $ 1,892.4 $ (269.8) $ 1,634.2 $ 13.7
See notes to consolidated financial statements.
(1) For accounting purposes, the Company treats repurchased shares as constructively retired when acquired and accordingly charges the purchase price against Common Stock par value, Additional paid-in capital, to the extent available, and Retained earnings. The change in Retained earnings of $72.1 million and $155.5 million in 2017 and 2016, respectively, reflects this accounting treatment.
80227_10K.indd 44 2/27/18 8:04 AM

HUBBELL INCORPORATED - Form 10-K 45HUBBELL INCORPORATED - Form 10-K 45
Notes to Consolidated Financial Statements
NOTE 1 Significant Accounting Policies
Basis of Presentation The accompanying consolidated financial statements of the Company have been prepared in accordance with accounting principles generally accepted in the United States of America (“GAAP”). Principles of Consolidation The Consolidated Financial Statements include all wholly owned subsidiaries. All significant intercompany balances and transactions have been eliminated. The Company participates in two joint ventures, one of which is accounted for using the equity method, the other has been consolidated in accordance with the consolidation accounting guidance. An analysis is performed to determine which reporting entity, if any, has a controlling financial interest in a variable interest entity (“VIE”) with a primarily qualitative analysis. The qualitative analysis is based on identifying the party that has both the power to direct the activities that most significantly impact the VIE’s economic performance (the “power criterion”) and the obligation to absorb losses from or the right to receive benefits of the VIE that could potentially be significant to the VIE (the “losses/benefit criterion”). The party that meets both these criteria is deemed to have a controlling financial interest. The party with the controlling financial interest is considered to be the primary beneficiary and as a result is required to consolidate the VIE. The Company has a 50% interest in a joint venture in Hong Kong, established as Hubbell Asia Limited (“HAL”). The principal objective of HAL is to manage the operations of its wholly-owned manufacturing company in China. Under the accounting guidance, the Company is the primary beneficiary of HAL and as a result consolidates HAL. This determination is based on the fact that HAL’s sole business purpose is to manufacture product exclusively for the Company (the power criterion) and the Company is financially responsible for ensuring HAL maintains a fixed operating margin (the losses/benefit criterion). The consolidation of HAL is not material to the Company’s consolidated financial statements. Use of Estimates The preparation of financial statements in accordance with GAAP requires management to make estimates and assumptions that affect the reported amounts in the Consolidated Financial Statements and accompanying Notes to Consolidated Financial Statements. Actual results could differ from the estimates that are used.
Revenue Recognition The Company recognizes revenue when persuasive evidence of an arrangement exists, delivery has occurred, the price is fixed and determinable and collection is probable. Product is considered delivered to the customer once it has been shipped and title and risk of loss have been transferred. The majority of the Company’s revenue is recognized at the time of shipment. The Company recognizes less than one percent of total annual consolidated net revenue from post shipment obligations and service contracts, primarily within the Electrical segment. Revenue is recognized under these contracts when the service is completed and all conditions of sale have been met. In addition, within the Electrical segment, certain businesses sell large and complex equipment which requires construction and assembly and occasionally has long lead times. It is customary in these businesses to require a portion of the selling price to be paid in advance of construction. These payments are treated as deferred revenue and are classified in Other accrued liabilities in the Consolidated Balance Sheet. Once the equipment is shipped to the customer and meets the revenue recognition criteria, the deferred revenue is recognized in the Consolidated Statement of Income. Further, certain of our businesses provide for sales discounts and allowances based on sales volumes, specific programs and customer deductions, as is customary in the electrical products industry. These items primarily relate to sales volume incentives, special pricing allowances, and returned goods. Sales volume incentives represent rebates with specific sales volume targets for specific customers. Certain distributors qualify for price rebates by subsequently reselling the Company’s products into select channels of end users. Following a distributor’s sale of an eligible product, the distributor submits a claim for a price rebate. Customers also have a right to return goods under certain circumstances which are reasonably estimable by affected businesses. Customer returns have historically ranged from 1%-2% of gross sales. These arrangements require us to estimate at the time of sale the amounts that should not be recorded as revenue as these amounts are not expected to be collected from customers. The Company principally relies on historical experience, specific customer agreements and anticipated future trends to estimate these amounts at the time of shipment. Shipping and Handling Fees and Costs The Company records shipping and handling costs as part of Cost of goods sold in the Consolidated Statement of Income. Any amounts billed to customers for reimbursement of shipping and handling are included in Net sales in the Consolidated Statement of Income.
80227_10K.indd 45 2/27/18 8:04 AM
46 HUBBELL INCORPORATED - Form 10-K46 HUBBELL INCORPORATED - Form 10-K
Foreign Currency Translation The assets and liabilities of international subsidiaries are translated to U.S. dollars at exchange rates in effect at the end of the year, and income and expense items are translated at average exchange rates in effect during the year. The effects of exchange rate fluctuations on the translated amounts of foreign currency assets and liabilities are included as translation adjustments in Accumulated other comprehensive loss within Hubbell shareholders’ equity. Gains and losses from foreign currency transactions are included in results of operations. Cash and Cash Equivalents The carrying value of cash equivalents approximates fair value. Cash equivalents consist of highly liquid investments with original maturities to the Company of three months or less. Investments Investments in debt and equity securities are classified by individual security as available-for-sale, held-to-maturity or trading securities. Our available-for-sale securities, consisting of municipal bonds and the redeemable preferred stock of a privately held company, are carried on the balance sheet at fair value with current period adjustments to carrying value recorded in Accumulated other comprehensive loss within Hubbell shareholders’ equity, net of tax. Realized gains and losses are recorded in income in the period of sale. The Company’s trading securities are carried on the balance sheet at fair value and consist primarily of debt and equity mutual funds. Gains and losses associated with these trading securities are reflected in the results of operations. The Company did not have any investments classified as held-to-maturity as of December 31, 2017 and 2016. Accounts Receivable and Allowances Trade accounts receivable are recorded at the invoiced amount and generally do not bear interest. The allowance for doubtful accounts is based on an estimated amount of probable credit losses in existing accounts receivable. The allowance is calculated based upon a combination of historical write-off experience, fixed percentages applied to aging categories and specific identification based upon a review of past due balances and problem accounts. Account balances are charged off against the allowance when it is determined that internal collection efforts should no longer be pursued. The Company also maintains a reserve for credit memos, cash discounts and product returns which are principally calculated based upon historical experience, specific customer agreements, as well as anticipated future trends. Inventories Inventories are stated at the lower of cost or market value. Approximately 71% of total net inventory value is determined utilizing the last-in, first-out (LIFO) method of inventory accounting. The cost of foreign inventories and certain domestic inventories is determined utilizing average cost or first-in, first-out (FIFO) methods of inventory accounting. Reserves for excess and obsolete inventory are provided based on current assessments about future demand compared to on-hand quantities.
Property, Plant, and Equipment Property, plant, and equipment values are stated at cost less accumulated depreciation. Maintenance and repair expenditures that do not significantly increase the life of an asset are charged to expense when incurred. Property, plant, and equipment placed in service prior to January 1, 1999 are depreciated over their estimated useful lives, principally using accelerated methods. Assets placed in service subsequent to January 1, 1999 are depreciated over their estimated useful lives, using straight-line methods. Leasehold improvements are amortized over the shorter of their economic lives or the lease term. Gains and losses arising on the disposal of property, plant and equipment are included in Operating income in the Consolidated Statement of Income. Capitalized Computer Software Costs Capitalized computer software costs, net of amortization, were $15.7 million and $15.6 million at December 31, 2017 and 2016, respectively. This balance is reflected in Other long-term assets in the Consolidated Balance Sheet. Capitalized computer software is for internal use and costs primarily consist of purchased materials and services. Software is amortized on a straight-line basis over appropriate periods, generally five years. The Company recorded amortization expense of $5.6 million in 2017, $5.2 million in 2016 and $4.6 million in 2015 relating to capitalized computer software. Goodwill and Other Intangible Assets Goodwill represents purchase price in excess of fair values of the underlying net assets of acquired companies. Indefinite-lived intangible assets and goodwill are subject to annual impairment testing using the specific guidance and criteria described in the accounting guidance. The Company performs its goodwill impairment testing as of April 1st of each year, unless circumstances dictate the need for more frequent assessments. The accounting guidance provides entities an option of performing a qualitative assessment (a "step-zero" test) before performing a quantitative analysis. If the entity determines, on the basis of certain qualitative factors, that it is more-likely-than-not that the goodwill is not impaired, the entity would not need to proceed to the two step goodwill impairment testing process (quantitative analysis) as prescribed in the guidance. The Company applied the "step-zero" test to two of its reporting units. Based on that qualitative assessment, the Company concluded it was more-likely-than-not that the fair value of these reporting units substantially exceeded their carrying value and therefore, further quantitative analysis was not required. For each of the Company's other reporting units the Company has elected to utilize the two step goodwill impairment testing process as permitted in the accounting guidance. Step 1 compares the fair value of the Company’s reporting units to their carrying values. If the fair value of the reporting unit exceeds its carrying value, no further analysis is necessary. If the carrying value of the reporting unit exceeds its fair value, Step 2 must be completed to determine the amount of impairment.
80227_10K.indd 46 2/27/18 8:04 AM
HUBBELL INCORPORATED - Form 10-K 47HUBBELL INCORPORATED - Form 10-K 47
Goodwill impairment testing requires judgment, including the identification of reporting units, assigning assets and liabilities to reporting units and determining the fair value of each reporting unit. Significant judgments required to estimate the fair value of reporting units include estimating future cash flows, determining appropriate discount rates and other assumptions. The Company uses internal discounted cash flow estimates to determine fair value. These cash flow estimates are derived from historical experience and future long-term business plans and the application of an appropriate discount rate. Changes in these estimates and assumptions could materially affect the determination of fair value and/or goodwill impairment for each reporting unit. The Company’s estimated aggregate fair value of its reporting units are reasonable when compared to the Company’s market capitalization on the valuation date. As of April 1, 2017, our impairment testing resulted in implied fair values for each reporting unit that exceeded the reporting unit’s carrying value, including goodwill. The Company did not have any reporting units at risk of failing Step 1 of the impairment test as the excess of the implied fair value significantly exceeded the carrying value of the reporting units. Additionally, the Company did not have any reporting units with zero or negative carrying amounts. The Company has not recorded any goodwill impairments since the initial adoption of the accounting guidance in 2002. The Company’s intangible assets consist primarily of customer relationships, tradenames and patents. Intangible assets with definite lives are amortized over periods generally ranging from 5-30 years. The Company amortizes intangible assets with definite lives using either an accelerated method that reflects the pattern in which economic benefits of the intangible assets are consumed and results in higher amortization in the earlier years of the assets useful life, or using a straight line method. Approximately 60% of the gross value of definite-lived intangible assets follow an accelerated amortization method. These definite lived intangibles are tested for impairment whenever events or circumstances indicate that the carrying amount of an asset (asset group) may not be recoverable. An impairment loss is recognized when the carrying amount of an asset exceeds the estimated undiscounted cash flows used in determining the fair value of the asset. The Company did not record any material impairments related to its definite lived intangible assets in 2017, 2016 or 2015. The Company also has some tradenames that are considered to be indefinite-lived intangible assets. These indefinite-lived intangible assets are not amortized and are tested for impairment annually, unless circumstances dictate the need for more frequent assessment. The accounting guidance related to testing indefinite-lived intangible assets for impairment provides entities an option of performing a qualitative assessment before calculating the fair value of the asset. If the entity determines, on the basis of certain qualitative factors, that it is more-likely-than-not that the asset is not impaired, the entity would not need to calculate the fair value of the asset. The Company performed the qualitative assessment which resulted in no impairment in 2017, 2016 and 2015.
Other Long-Lived Assets The Company reviews depreciable long-lived assets for impairment whenever events or changes in circumstances indicate that the carrying amount may not be fully recoverable. If such a change in circumstances occurs, the related estimated future undiscounted cash flows expected to result from the use of the asset group and its eventual disposition is compared to the carrying amount. If the sum of the expected cash flows is less than the carrying amount, an impairment charge is recorded. The impairment charge is measured as the amount by which the carrying amount exceeds the fair value of the asset. The fair value of impaired assets is determined using expected cash flow estimates, quoted market prices when available and appraisals as appropriate. The Company did not record any material impairment charges in 2017, 2016 or 2015. Accrued Insurance
The Company retains a significant portion of the risks associated with workers’ compensation, medical, automobile and general liability insurance. The Company estimates self-insurance liabilities using a number of factors, including historical claims experience, demographic factors, and other actuarial assumptions. The accrued liabilities associated with these programs are based on the Company’s estimate of the ultimate costs to settle known claims as well as claims incurred but not reported as of the balance sheet date. The Company periodically reviews the assumptions with a third party actuary to determine the adequacy of these self-insurance reserves.
Income Taxes The Company operates within multiple taxing jurisdictions and is subject to audit in these jurisdictions. The IRS and other tax authorities routinely examine the Company’s tax returns. These audits can involve complex issues which may require an extended period of time to resolve. The Company makes adequate provisions for best estimates of exposures on previously filed tax returns. Deferred income taxes are recognized for the tax consequence of differences between financial statement carrying amounts and the tax basis of assets and liabilities by applying the currently enacted statutory tax rates in accordance with the accounting guidance for income taxes. The effect of a change in statutory tax rates is recognized in the period that includes the enactment date. Additionally, deferred tax assets are required to be reduced by a valuation allowance if it is more-likely-than-not that some portion or all of the deferred tax asset will not be realized. The Company uses factors to assess the likelihood of realization of deferred tax assets such as the forecast of future taxable income and available tax planning strategies that could be implemented to realize the deferred tax assets.
80227_10K.indd 47 2/27/18 8:04 AM
48 HUBBELL INCORPORATED - Form 10-K48 HUBBELL INCORPORATED - Form 10-K
In addition, the accounting guidance prescribes a recognition threshold and measurement attribute for the financial statement recognition and measurement of the tax position taken or expected to be taken in a tax return. For any amount of benefit to be recognized, it must be determined that it is more-likely-than-not that a tax position will be sustained upon examination by taxing authorities based on the technical merits of the position. The amount of benefit to be recognized is based on the Company’s assertion of the most likely outcome resulting from an examination, including resolution of any related appeals or litigation processes. Companies are required to reflect only those tax positions that are more-likely-than-not to be sustained.
We have accounted for the estimated impact of the TCJA based on the guidance outlined in SAB 118. The accounting for the income tax effects of the TCJA may include provisional amounts during the one-year measurement period from the date of enactment. Accordingly, the Company has included in the current period financial statements a provisional amount with respect to the deemed repatriation provisions of the TCJA, the revaluation of U.S. deferred taxes and the U.S. and foreign tax costs associated with anticipated remittances related to certain of our outside basis differences. We have also included provisional amounts with respect to those states with current conformity to the Internal Revenue Code all of which will be subject to change during the measurement period.
The TCJA also contains a new tax law that may subject the Company to a tax on Global Intangible Low-Taxed Income (GILTI), beginning in 2018. GILTI is a tax on foreign income in excess of a deemed return on tangible assets of foreign corporations. The FASB has provided that Companies subject to GILTI have the option to account for the GILTI tax as a period cost if and when incurred, or to recognize deferred taxes for temporary differences, including outside basis differences, expected to reverse as GILTI. We have elected to account for GILTI as a period cost. See Note 12 — Income Taxes for additional information. Research and Development Research and development expenditures represent costs to discover and/or apply new knowledge in developing a new product, process, or in bringing about a significant improvement to an existing product or process. Research and development expenses are recorded as a component of Cost of goods sold. Expenses for research and development were approximately 3% of Cost of goods sold in 2017 and 2% in 2016 and 2015. Retirement Benefits
The Company maintains various defined benefit pension plans for some of its U.S. and foreign employees. The accounting guidance for retirement benefits requires the Company to recognize the funded status of its defined benefit pension and postretirement plans as an asset or liability in the Consolidated Balance Sheet. Gains or losses, prior service costs or credits, and transition assets or obligations that have not yet been included in net periodic benefit cost as of the end of the year are recognized as components of Accumulated other comprehensive loss, net of tax, within Hubbell shareholders’ equity. The Company’s policy is to fund pension costs within the ranges prescribed by applicable regulations. In addition to providing defined benefit pension benefits, the Company
provides health care and life insurance benefits for some of its active and retired employees. The Company’s policy is to fund these benefits through insurance premiums or as actual expenditures are made. See also Note 10 — Retirement Benefits. Earnings Per Share Restricted stock granted by the Company is considered a participating security since it contains a non-forfeitable right to dividends. As a result, the earnings per share accounting guidance requires the Company to use the two-class method for calculating earnings per share. The two-class method is an earnings allocation formula that determines earnings per share for common stock and participating securities. Basic earnings per share is calculated as net income available to common shareholders divided by the weighted average number of shares of common stock outstanding. Earnings per diluted share is calculated as net income available to common shareholders divided by the weighted average number of shares outstanding of common stock plus the incremental shares outstanding assuming the exercise of dilutive stock options, stock appreciation rights and performance shares. See also Note 17 — Earnings Per Share. Stock-Based Compensation The Company recognizes the grant-date fair value of all stock-based awards on a straight-line basis over their respective requisite service periods (generally equal to an award’s vesting period). A stock-based award is considered vested for expense attribution purposes when the retention of the award is no longer contingent on providing subsequent service. Accordingly, the Company recognizes compensation cost immediately for awards granted to retirement-eligible individuals or over the period from the grant date to the date retirement eligibility is achieved, if less than the stated vesting period. The expense is recorded in Cost of goods sold and S&A expense in the Consolidated Statement of Income based on the recipients’ respective functions within the organization. The Company records deferred tax assets for awards that will result in deductions on its tax returns, based upon the amount of compensation cost recognized and the statutory tax rate in the jurisdiction in which it will receive a deduction. The Company adopted ASU 2016-09 relating to the accounting for share-based payments on January 1, 2017. The standard requires that differences between the deferred tax assets recognized for financial reporting purposes and the actual tax deduction reported on the Company's tax return be recoded as a component of income tax expense. Prior to the adoption of the standard, differences between the deferred tax assets recognized for financial reporting purposes and the actual tax deduction reported in the Company’s tax return were recognized in Additional paid-in capital to the extent that previously recognized credits to paid-in capital were still available. See also Note 16 — Stock-Based Compensation.
80227_10K.indd 48 2/27/18 8:04 AM
HUBBELL INCORPORATED - Form 10-K 49HUBBELL INCORPORATED - Form 10-K 49
Derivatives In order to limit financial risk in the management of its assets, liabilities and debt, the Company may use derivative financial instruments such as foreign currency hedges, interest rate hedges and interest rate swaps. All derivative financial instruments are matched with an existing Company asset, liability or proposed transaction. The Company does not speculate or use leverage when trading a derivative product. Market value gains or losses on the derivative financial instrument are recognized in income when the effects of the related price changes of the underlying asset or liability are recognized in income. See Note 13 — Financial Instruments and Fair Value Measurement for more information regarding our derivative instruments. Recent Accounting Pronouncements
In response to the TCJA, which was signed into law on December 22, 2017, the Securities and Exchange Commission’s Office of the Chief Accountant published SAB 118. SAB 118 addresses the requirements to account for the impact of a change in tax law or tax rates in the period of enactment. Specifically, SAB 118 provides guidance for issuers that are not able to complete the accounting for the income tax effects of the TCJA by the time financial statements are issued for the reporting period that includes the enactment date (“enactment period financials”).
Pursuant to SAB 118, if the accounting for specific income tax effects of the TCJA is incomplete at the time the financial statements are issued, a company should provide a provisional amount for specific income tax effects for which a reasonable estimate can be determined. For any specific income tax effects of the TCJA for which a reasonable estimate cannot be determined because additional information, data, analysis or preparation is required, a company should not report a provisional amount but continue to apply the rules in effect immediately prior to enactment. For income tax effects for which a company was not able to determine a reasonable estimate in the enactment period financials, a provisional amount must be recorded in the first reporting period in which a reasonable estimate can be determined.
Under SAB 118, the measurement period for accounting for the 2017 Act begins in the period of enactment and ends when an entity has obtained, prepared and analyzed the information necessary to complete the accounting requirements under ASC 740 (the “measurement period”), but in no event can the measurement period extend beyond one year from the TCJA’s enactment date. Any provisional amount or adjustment to a provisional amount included in a company’s financial statements during the measurement period should be included in income from continuing operations as an adjustment to tax expense or benefit in the reporting period the amounts are determined.
In March 2017, the Financial Accounting Standards Board ("FASB") issued an Accounting Standards Update (ASU 2017-07) on the presentation of net periodic pension cost and net periodic post-retirement benefit cost. The new guidance requires the service cost component of net periodic pension and post-retirement benefit costs to be reported in the same income statement line item as other employee compensation costs, and the other non-service components to be reported outside of
operating income. This new guidance is effective for fiscal years beginning after December 15, 2017 and must be applied on a retrospective basis. Upon adoption, the Company expects 2016 Operating income to increase by $12.0 million and 2017 Operating income to increase by $15.0 million, due to the removal of the non-service components of net periodic pension and post-retirement benefit costs. The Company expects a corresponding increase to Other expense, net, resulting in zeroimpact to net income in both periods.
In August 2016, the FASB issued an Accounting Standards Update (ASU 2016-15) to provide additional guidance and reduce diversity in practice in how certain cash receipts and cash payments are presented and classified in the statement of cash flows. The Company adopted the standard during the third quarter of 2017, and the comparable periods within the Consolidated Statements of Cash Flows have been recast to reflect adoption. The adoption did not have a material impact on the Company's financial statements.
In March 2016, the FASB issued an Accounting Standards Update (ASU 2016-09) relating to the accounting for share-based payments. The new guidance requires all income tax effects of share-based awards to be recognized in the income statement when the awards vest or are settled, and allows companies an additional election in the method to estimate forfeitures of share-based payments. The new guidance also requires excess tax benefits to be classified as an operating activity in the statement of cash flows, and cash paid to a tax authority when shares are withheld to satisfy the employer's statutory income tax withholdings be classified as a financing activity. The Company adopted the standard on January 1, 2017. The Company elected to adopt all provisions impacting the Consolidated Statements of Cash Flows retrospectively; as such, the comparable periods within the Consolidated Statements of Cash Flows have been recast to reflect the adoption. The income statement provisions of the new guidance have been adopted prospectively. There is no change to the Company's accounting policy with respect to estimation of forfeitures. The adoption did not have a material impact on the Company's financial statements.
In February 2016, the FASB issued an Accounting Standards Update (ASU 2016-02) related to the accounting and financial statement presentation for leases. This new guidance will require a lessee to recognize a right-to-use asset and a lease liability for both financing and operating leases, with a policy election permitting an exception to this guidance for leases with a term of twelve months or less. For financing leases, the lessee will recognize interest expense and amortization of the right-of-use asset, and for operating leases, the lessee will recognize a straight-line lease expense. This guidance is effective for fiscal years beginning after December 15, 2018, with early adoption permitted. The new standard must be adopted using a modified retrospective transition at the beginning of the earliest comparative period presented. The Company expects to recognize approximately $100 million of right-of-use assets and corresponding lease liabilities on the balance sheet upon adoption. The Company does not expect the adoption will have a material impact on results of operations.
80227_10K.indd 49 2/27/18 8:04 AM

50 HUBBELL INCORPORATED - Form 10-K50 HUBBELL INCORPORATED - Form 10-K
In May 2014, the FASB issued an Accounting Standards Update (ASU 2014-09) related to new revenue recognition guidance that supersedes the existing revenue recognition guidance and most industry-specific guidance applicable to revenue recognition. According to the new guidance, an entity will apply a principles-based five step model to recognize revenue upon the transfer of promised goods or services to customers and in an amount that reflects the consideration for which the entity expects to be entitled in exchange for those goods or services. Subsequently, the FASB has issued amendments to certain aspects of the guidance including the effective date. The Company will adopt the guidance in the first quarter of 2018 using the modified-retrospective method.
Based on the reviews and assessments performed to date, the Company expects the pattern of revenue recognition for substantially all of its businesses to be unchanged, and that upon adoption revenue will generally continue to be recognized at a single point in time when control is transferred to the customer. The Company anticipates an immaterial impact to retained earnings upon adoption, as well as an immaterial balance sheet impact related to the classification of amounts associated with sales returns reserves.
NOTE 2 Business Acquisitions
In the first quarter of 2017, the Company completed two acquisitions for $10.1 million, net of cash received, resulting in the recognition of intangible assets of $3.4 million and goodwill of $5.0 million. The $3.4 million of intangible assets consists primarily of customer relationships and trade names that will be amortized over a weighted average period of approximately 13 years. These acquisitions have been added to the Power segment and $2.7 million of the goodwill related to one of the acquisitions is currently expected to be deductible for tax purposes.
In the second quarter of 2017, the Company acquired all of the issued and outstanding limited liability company interests in iDevices, LLC ("iDevices") for $59.2 million. iDevices is a developer with embedded firmware and application development expertise with custom-built Internet of Things ("IoT") Cloud infrastructure. The iDevices acquisition adds capabilities and expertise in IoT technology that is required to provide Tier 3 energy management solutions via connected hardware with a software front-end. iDevices is reported in the Electrical segment. We have recognized intangible assets of $9.6 million and goodwill of $45.9 million as a result of this acquisition. The $9.6 million of intangible assets consists primarily of developed technology, customer relationships and trade names and will be amortized over a weighted average period of approximately 12 years. All of the goodwill is expected to be deductible for tax purposes.
In the second quarter of 2017, the Company also acquired substantially all of the assets of Advance Engineering Corporation and related companies (collectively "AEC") for $32.5 million. AEC is a gas components manufacturer that complements the Company's existing business in the natural gas distribution vertical. AEC joins the Company's recent acquisitions of GasBreaker and Lyall to bolster its main-to-meter mechanical solutions in this area, and along with Continental Industries, makes up our offering in the gas vertical. AEC is reported in the Electrical segment. We have recognized intangible assets of $16.8 million and goodwill of $12.8 million as a result of this acquisition. The $16.8 million of intangible assets consists primarily of customer relationships and trade names and will be amortized over a weighted average period of approximately 18 years. All of the goodwill is expected to be deductible for tax purposes.
In the fourth quarter of 2017, the Company acquired all of the issued and outstanding shares of Meramec Instrument Transformer Company ("Meramec") for $69.7 million. Meramec produces instrument current transformers for the power generator, power transformer, and the high and medium-voltage circuit breaker markets. Meramec is reported within the Power segment. We have recognized intangible assets of $33.8 millionand goodwill of $24.8 million as a result of this acquisition. The $33.8 million of intangible assets consists primarily of customer relationships, trade names, and developed software and will be amortized over a weighted average period of approximately 21years. All of the goodwill is expected to be deductible for tax purposes.
These business acquisitions have been accounted for as business combinations and have resulted in the recognition of goodwill. The goodwill relates to a number of factors built into the purchase price, including the future earnings and cash flow potential of the businesses as well as the complementary strategic fit and resulting synergies they bring to the Company’s existing operations. The following table summarizes the preliminary fair values of the assets acquired and liabilities assumed at the date of acquisition related to all transactions (in millions):
Tangible assets acquired $ 34.4Intangible assets 63.6Goodwill 88.5Net deferred taxes (0.2)Other liabilities assumed (14.8)TOTAL CONSIDERATION, NET OF CASHRECEIVED $ 171.5
The Consolidated Financial Statements include the results of operations of the acquired businesses from their respective dates of acquisition. Net sales and earnings related to these acquisitions for the year ended December 31, 2017 were not significant to the consolidated results. Pro forma information related to these acquisitions has not been included because the impact to the Company’s consolidated results of operations was not material.
80227_10K.indd 50 2/27/18 8:04 AM

HUBBELL INCORPORATED - Form 10-K 51HUBBELL INCORPORATED - Form 10-K 51
Cash used for the acquisition of businesses, net of cash acquired as reported in the Consolidated Statement of Cash Flows for the twelve months ended December 31, 2017 is $184.1 million and includes payments associated with a 2016 acquisition for which the purchase price is due to be settled in installments through 2019.
Subsequent Event - Acquisition of Aclara
In February 2018, the Company completed the acquisition of Aclara for $1.1 billion in an all-cash transaction. Aclara will be added to the Power segment. To fund the Aclara acquisition, on February 2, 2018 the Company borrowed $500 million under a Term Loan Agreement with a syndicate of lenders, issued $450 million of long-term, unsecured, unsubordinated notes maturing in 2028, and the remaining purchase price and transaction expenses were funded with commercial paper. Refer to Note 11 — Debt and Note 23 — Subsequent Events in the Notes to Consolidated Financial Statements for additional information.
NOTE 3 Receivables and Allowances
Receivables consist of the following components at December 31, (in millions):
2017 2016Trade accounts receivable $ 576.3 $ 565.5Non-trade receivables 19.1 15.1Accounts receivable, gross 595.4 580.6Allowance for credit memos, returns and cash discounts (50.5) (45.9)Allowance for doubtful accounts (4.6) (4.7)Total allowances (55.1) (50.6)ACCOUNTS RECEIVABLE, NET $ 540.3 $ 530.0
NOTE 4 Inventories
Inventories are classified as follows at December 31, (in millions):
2017 2016Raw material $ 190.0 $ 162.7Work-in-process 115.8 102.8Finished goods 390.5 327.9
696.3 593.4Excess of FIFO over LIFO cost basis (61.6) (61.0)INVENTORIES, NET $ 634.7 $ 532.4
80227_10K.indd 51 2/27/18 8:04 AM

52 HUBBELL INCORPORATED - Form 10-K52 HUBBELL INCORPORATED - Form 10-K
NOTE 5 Goodwill and Other Intangible Assets
Changes in the carrying amounts of goodwill for the years ended December 31, 2017 and 2016, by segment, were as follows (in millions):
Segment
Electrical Power TotalBALANCE AT DECEMBER 31, 2015 $ 611.2 $ 317.3 $ 928.5Current year acquisitions 49.4 20.6 70.0Foreign currency translation and prior year acquisitions (8.6) 1.1 (7.5)BALANCE AT DECEMBER 31, 2016 $ 652.0 $ 339.0 $ 991.0Current year acquisitions 58.7 29.8 88.5Foreign currency translation and prior year acquisitions 6.9 2.6 9.5BALANCE AT DECEMBER 31, 2017 $ 717.6 $ 371.4 $ 1,089.0
In 2017, the Company completed multiple acquisitions. These acquisitions have been accounted for as business combinations and have resulted in the recognition of $88.5 million of goodwill. See also Note 2 — Business Acquisitions. The Company has not recorded any material goodwill impairments since the initial adoption of the accounting guidance in 2002. Identifiable intangible assets are recorded in Intangible assets, net in the Consolidated Balance Sheet. Identifiable intangible assets are comprised of the following (in millions):
December 31, 2017 December 31, 2016
Gross
AmountAccumulatedAmortization
GrossAmount
AccumulatedAmortization
Definite-lived: Patents, tradenames and trademarks $ 151.4 $ (50.1) $ 143.7 $ (43.4)Customer/agent relationships and other 462.0 (156.7) 405.9 (128.0)TOTAL DEFINITE-LIVED INTANGIBLES 613.4 (206.8) 549.6 (171.4)Indefinite-lived: Tradenames and other 53.8 — 53.3 —TOTAL INTANGIBLE ASSETS $ 667.2 $ (206.8) $ 602.9 $ (171.4)
Amortization expense associated with these definite-lived intangible assets was $34.9 million, $32.3 million and $28.2 million in 2017, 2016 and 2015, respectively. Amortization expense associated with these intangible assets is expected to be $35.7 millionin 2018, $33.2 million in 2019, $33.8 million in 2020, $33.2 million in 2021 and $31.7 million in 2022.
80227_10K.indd 52 2/27/18 8:04 AM

HUBBELL INCORPORATED - Form 10-K 53HUBBELL INCORPORATED - Form 10-K 53
NOTE 6 Investments
At December 31, 2017 and December 31, 2016, the Company held investments classified as available-for-sale and investments classified as trading securities. Investments classified as available-for-sale consisted of municipal bonds with an amortized cost basis of $54.3 million and an investment in the redeemable preferred stock of a privately-held electrical utility substation security provider with an amortized cost basis of $5.0 million. The investment in redeemable preferred stock was classified in Level 3 of the fair value hierarchy and had a fair value of $4.1 million and $3.8 million at December 31, 2017 and 2016, respectively. Investments classified as trading securities were comprised primarily of debt and equity mutual funds and are stated at fair market value based on current quotes. The following table sets forth selected data with respect to the Company’s investments at December 31, (in millions):
2017 2016
Amortized
Cost
Gross Unrealized
Gains
GrossUnrealized
LossesFair
ValueCarrying
ValueAmortized
Cost
GrossUnrealized
Gains
GrossUnrealized
LossesFair
ValueCarrying
ValueAvailable-for-salesecurities $ 59.3 $ 0.1 $ (1.0) $ 58.4 $ 58.4 $ 58.6 $ 0.3 $ (1.5) $ 57.4 $ 57.4Trading securities 8.9 4.9 — 13.8 13.8 7.1 3.1 — 10.2 10.2TOTAL INVESTMENTS $ 68.2 $ 5.0 $ (1.0) $ 72.2 $ 72.2 $ 65.7 $ 3.4 $ (1.5) $ 67.6 $ 67.6
Contractual maturities of our investments in available-for-sale securities at December 31, 2017 were as follows (in millions):
Amortized
CostFair
ValueAvailable-for-sale securities Due within 1 year $ 14.5 $ 14.5After 1 year but within 5 years 31.5 30.7After 5 years but within 10 years 10.9 10.8Due after 10 years 2.4 2.4TOTAL $ 59.3 $ 58.4
The total unrealized gain/(loss) recognized in the year relating to available-for-sale securities, net of tax, was $0.6 million and $(0.9) million at December 31, 2017 and 2016, respectively. These net unrealized gains/(losses) are included in Accumulated other comprehensive loss, net of tax. Net unrealized gains relating to trading securities have been reflected in the results of operations. The Company uses the specific identification method when identifying the cost basis used to calculate the gain or loss on these securities. Gains and losses for both available-for-sale and trading securities were not material in 2017, 2016 and 2015.
NOTE 7 Property, Plant, and Equipment
Property, plant, and equipment, carried at cost, is summarized as follows at December 31, (in millions):
2017 2016Land $ 40.0 $ 43.1Buildings and improvements 272.2 268.7Machinery, tools, and equipment 806.2 784.7Construction-in-progress 43.4 36.9Gross property, plant, and equipment 1,161.8 1,133.4Less accumulated depreciation (703.5) (693.6)NET PROPERTY, PLANT, AND EQUIPMENT $ 458.3 $ 439.8
Depreciable lives on buildings range between 20-45 years. Depreciable lives on machinery, tools, and equipment range between 3-15 years. The Company recorded depreciation expense of $57.5 million, $53.4 million and $51.2 million for 2017, 2016 and 2015, respectively.
80227_10K.indd 53 2/27/18 8:04 AM

54 HUBBELL INCORPORATED - Form 10-K54 HUBBELL INCORPORATED - Form 10-K
NOTE 8 Other Accrued Liabilities
Other accrued liabilities consists of the following at December 31, (in millions):
2017 2016Customer program incentives $ 41.2 $ 41.2Accrued income taxes 27.5 8.4Deferred revenue 10.2 11.8Other 96.0 94.8TOTAL $ 174.9 $ 156.2
NOTE 9 Other Non-Current Liabilities
Other non-current liabilities consists of the following at December 31, (in millions):
2017 2016Pensions $ 213.2 $ 208.3Other post-employment benefits 24.6 24.0Deferred tax liabilities 23.7 41.2Other 118.0 68.2TOTAL $ 379.5 $ 341.7
80227_10K.indd 54 2/27/18 8:04 AM

HUBBELL INCORPORATED - Form 10-K 55HUBBELL INCORPORATED - Form 10-K 55
NOTE 10 Retirement Benefits
The Company has funded and unfunded non-contributory U.S. and foreign defined benefit pension plans. Benefits under these plans are generally provided based on either years of service and final average pay or a specified dollar amount per year of service. The U.S. defined benefit pension plan has been closed to new participants since 2004, while the Canadian and UK defined benefit pension plans have been closed to new entrants since 2006 and 2007, respectively. These U.S., Canadian and UK employees are eligible instead for defined contribution plans. The Company also has a number of health care and life insurance benefit plans covering eligible employees who reached retirement age while working for the Company. These benefits have been discontinued for substantially all future retirees. The Company anticipates future cost-sharing charges for its discontinued plans that are consistent with past practices. The Company uses a December 31 measurement date for all of its plans.
In December 2016, the Company approved amendments to the domestic qualified defined benefit pension plan and non-qualified defined benefit plan, which froze service accruals for active participants effective February 28, 2017 and further will freeze compensation accruals effective December 31, 2020. The Company also froze all accruals in a second non-qualified defined benefit plan effective December 31, 2016.
As a result of these amendments, the Company recognized a $34.1 million curtailment gain in Accumulated other comprehensive income as of December 31, 2016 and also recognized $0.2 million of pension expense in 2016 associated with previously unrecognized prior service costs. In addition, effective January 1, 2017, the amortization of actuarial gains and losses of these plans is being recognized over the remaining life expectancy of participants, as all participants are considered inactive as a result of the amendment.
In 2016, we also completed a transaction with a third-party insurer to settle approximately $40 million of projected benefit obligation of our domestic qualified defined benefit pension plans.
In 2015, we amended our domestic qualified defined benefit pension plans to offer a voluntary lump sum pension payout program to certain eligible terminated vested participants that would settle our obligation to those participants accepting the offer. As part of this voluntary lump sum program, in 2015 the Company made approximately $27.7 million of payments to participants, settling its pension obligation by approximately the same amount. There were no other amendments made in 2017or 2016 to the defined benefit pension plans which had a significant impact on the total pension benefit obligation.
The Company's U.S. defined benefit pension plans were approximately 88% of the $956.1 million total pension benefit obligations at December 31, 2017.
80227_10K.indd 55 2/27/18 8:04 AM
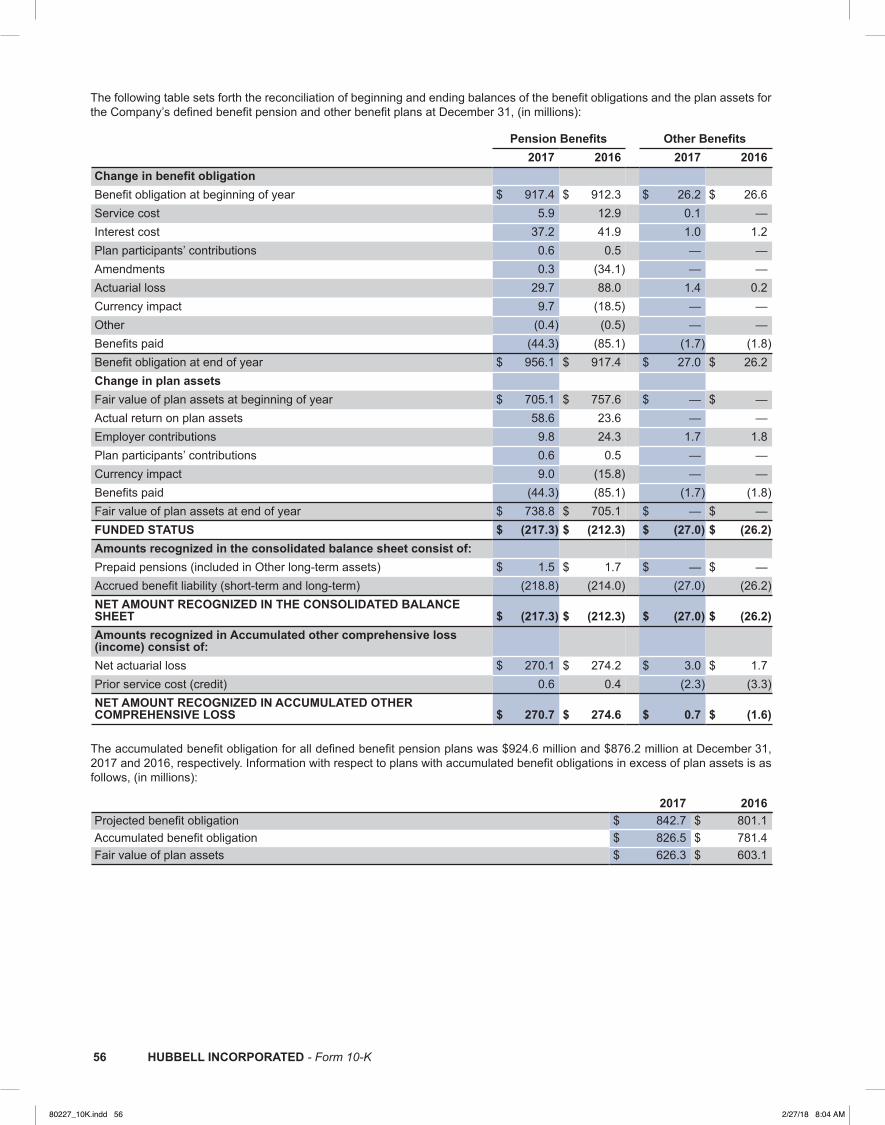
56 HUBBELL INCORPORATED - Form 10-K56 HUBBELL INCORPORATED - Form 10-K
The following table sets forth the reconciliation of beginning and ending balances of the benefit obligations and the plan assets for the Company’s defined benefit pension and other benefit plans at December 31, (in millions):
Pension Benefits Other Benefits 2017 2016 2017 2016Change in benefit obligation Benefit obligation at beginning of year $ 917.4 $ 912.3 $ 26.2 $ 26.6Service cost 5.9 12.9 0.1 —Interest cost 37.2 41.9 1.0 1.2Plan participants’ contributions 0.6 0.5 — —Amendments 0.3 (34.1) — —Actuarial loss 29.7 88.0 1.4 0.2Currency impact 9.7 (18.5) — —Other (0.4) (0.5) — —Benefits paid (44.3) (85.1) (1.7) (1.8)Benefit obligation at end of year $ 956.1 $ 917.4 $ 27.0 $ 26.2Change in plan assetsFair value of plan assets at beginning of year $ 705.1 $ 757.6 $ — $ —Actual return on plan assets 58.6 23.6 — —Employer contributions 9.8 24.3 1.7 1.8Plan participants’ contributions 0.6 0.5 — —Currency impact 9.0 (15.8) — —Benefits paid (44.3) (85.1) (1.7) (1.8)Fair value of plan assets at end of year $ 738.8 $ 705.1 $ — $ —FUNDED STATUS $ (217.3) $ (212.3) $ (27.0) $ (26.2)Amounts recognized in the consolidated balance sheet consist of:Prepaid pensions (included in Other long-term assets) $ 1.5 $ 1.7 $ — $ —Accrued benefit liability (short-term and long-term) (218.8) (214.0) (27.0) (26.2)NET AMOUNT RECOGNIZED IN THE CONSOLIDATED BALANCESHEET $ (217.3) $ (212.3) $ (27.0) $ (26.2)Amounts recognized in Accumulated other comprehensive loss(income) consist of:Net actuarial loss $ 270.1 $ 274.2 $ 3.0 $ 1.7Prior service cost (credit) 0.6 0.4 (2.3) (3.3)NET AMOUNT RECOGNIZED IN ACCUMULATED OTHERCOMPREHENSIVE LOSS $ 270.7 $ 274.6 $ 0.7 $ (1.6)
The accumulated benefit obligation for all defined benefit pension plans was $924.6 million and $876.2 million at December 31, 2017 and 2016, respectively. Information with respect to plans with accumulated benefit obligations in excess of plan assets is as follows, (in millions):
2017 2016Projected benefit obligation $ 842.7 $ 801.1Accumulated benefit obligation $ 826.5 $ 781.4Fair value of plan assets $ 626.3 $ 603.1
80227_10K.indd 56 2/27/18 8:04 AM

HUBBELL INCORPORATED - Form 10-K 57HUBBELL INCORPORATED - Form 10-K 57
The following table sets forth the components of pension and other benefit costs for the years ended December 31, (in millions):
Pension Benefits Other Benefits 2017 2016 2015 2017 2016 2015Components of net periodic benefit cost: Service cost $ 5.9 $ 12.9 $ 17.7 $ 0.1 $ — $ 0.1Interest cost 37.2 41.9 40.5 1.0 1.2 1.0Expected return on plan assets (34.1) (44.3) (53.2) — — —Amortization of prior service cost (credit) 0.1 0.1 0.2 (1.0) (1.0) (1.0)Amortization of actuarial losses (gains) 11.4 13.9 12.1 — — (0.1)Curtailment and settlement losses 0.4 0.2 — — — —Net periodic benefit cost $ 20.9 $ 24.7 $ 17.3 $ 0.1 $ 0.2 $ —Changes recognized in other comprehensive loss (income),before tax: Current year net actuarial loss $ 4.2 $ 72.0 $ 37.0 $ 1.4 $ 0.2 $ 0.5Current year prior service credit 0.3 — — — — —Amortization of prior service (cost) credit (0.1) (0.1) (0.2) 1.0 1.0 1.0Amortization of net actuarial (losses) gains (11.4) (13.9) (12.1) — — 0.1Currency impact 3.5 (4.0) (0.1) — — —Other adjustments (0.4) (0.2) — — — —Total recognized in other comprehensive loss (3.9) 53.8 24.6 2.4 1.2 1.6TOTAL RECOGNIZED IN NET PERIODIC PENSION COSTAND OTHER COMPREHENSIVE LOSS $ 17.0 $ 78.5 $ 41.9 $ 2.5 $ 1.4 $ 1.6Amortization expected to be recognized through incomeduring 2018 Amortization of prior service cost (credit) $ 0.1 $ (1.0) Amortization of net loss 10.9 0.2 TOTAL EXPECTED TO BE RECOGNIZED THROUGHINCOME DURING NEXT FISCAL YEAR $ 11.0 $ (0.8)
The Company also maintains six defined contribution pension plans. The total cost of these plans was $19.8 million in 2017, $15.6 million in 2016 and $13.3 million in 2015, excluding the employer match for the 401(k) plan. This cost is not included in the above net periodic benefit cost for the defined benefit pension plans. The Company participated in two multi-employer defined benefit pension plans under the terms of collective-bargaining agreements that cover its union represented employees at December 31, 2016. In 2017, the Company withdrew from one of these plans. The Company’s total contributions to these plans were $0.4 million in 2017, $0.5 million in 2016, and $0.8 million in 2015. These contributions represent more than five percent of the total contributions made to one of these plans in 2017, 2016 and 2015.
The risks of participating in multi-employer plans are different from single-employer plans in that assets contributed are pooled and may be used to provide benefits to employees of other participating employers. If a participating employer stops
contributing to the plan, the unfunded obligations of the plan may have to be assumed by the remaining participant employers. If we choose to stop participating in a multi-employer plan we may be required to pay those plans a withdrawal liability based on the unfunded status of the plan.
In the fourth quarter of 2016, the Company recorded a charge of $12.5 million in Cost of goods sold representing the estimated withdrawal liability from one of the multi-employer plans. Depending on actions of third parties, including bankruptcy or withdrawals from the multi-employer plan, under terms customary to multi-employer plans, it is possible that the Company could in the future be subject to certain additional liabilities associated with its participation and withdraw from the multi-employer pension plan, which the Company estimates could be up to an additional $23 million as of December 31, 2017.
80227_10K.indd 57 2/27/18 8:04 AM
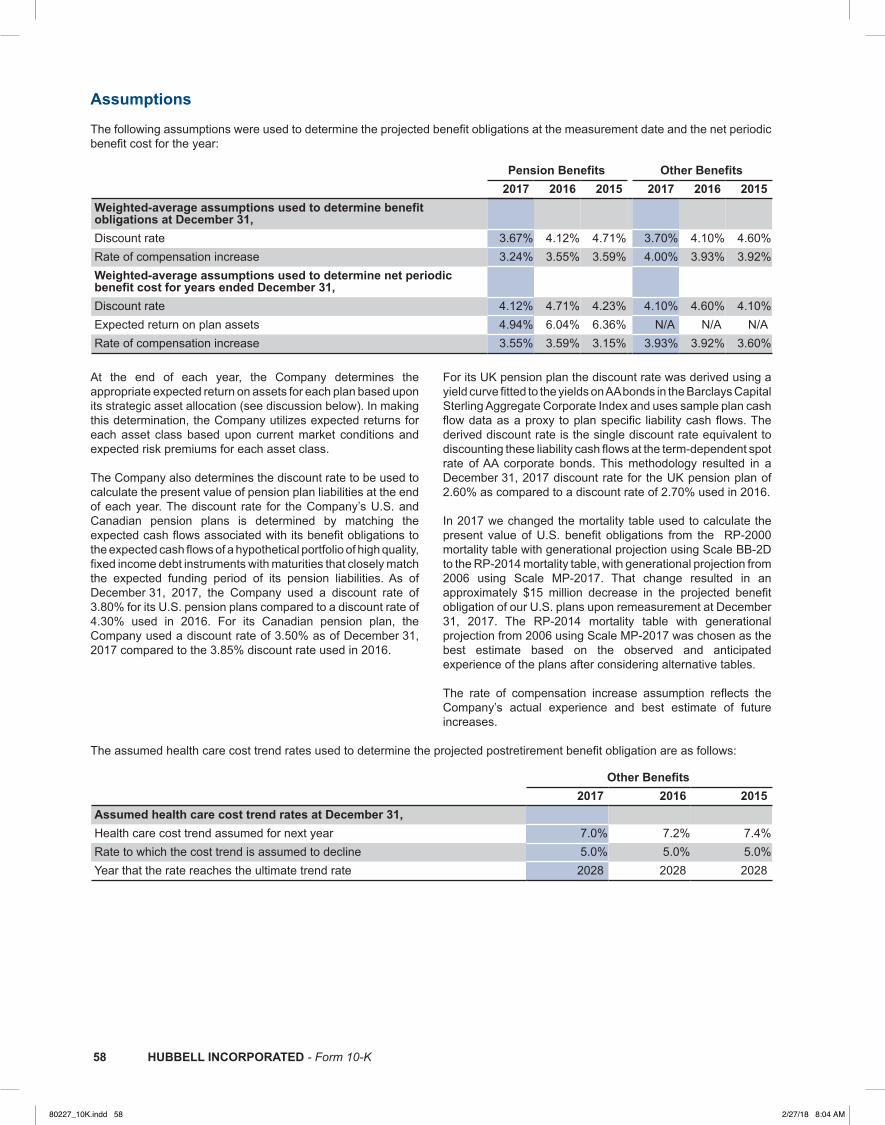
58 HUBBELL INCORPORATED - Form 10-K58 HUBBELL INCORPORATED - Form 10-K
Assumptions The following assumptions were used to determine the projected benefit obligations at the measurement date and the net periodic benefit cost for the year:
Pension Benefits Other Benefits 2017 2016 2015 2017 2016 2015Weighted-average assumptions used to determine benefitobligations at December 31, Discount rate 3.67% 4.12% 4.71% 3.70% 4.10% 4.60%Rate of compensation increase 3.24% 3.55% 3.59% 4.00% 3.93% 3.92%Weighted-average assumptions used to determine net periodicbenefit cost for years ended December 31, Discount rate 4.12% 4.71% 4.23% 4.10% 4.60% 4.10%Expected return on plan assets 4.94% 6.04% 6.36% N/A N/A N/ARate of compensation increase 3.55% 3.59% 3.15% 3.93% 3.92% 3.60%
At the end of each year, the Company determines the appropriate expected return on assets for each plan based upon its strategic asset allocation (see discussion below). In making this determination, the Company utilizes expected returns for each asset class based upon current market conditions and expected risk premiums for each asset class. The Company also determines the discount rate to be used to calculate the present value of pension plan liabilities at the end of each year. The discount rate for the Company’s U.S. and Canadian pension plans is determined by matching the expected cash flows associated with its benefit obligations to the expected cash flows of a hypothetical portfolio of high quality, fixed income debt instruments with maturities that closely match the expected funding period of its pension liabilities. As of December 31, 2017, the Company used a discount rate of 3.80% for its U.S. pension plans compared to a discount rate of 4.30% used in 2016. For its Canadian pension plan, the Company used a discount rate of 3.50% as of December 31, 2017 compared to the 3.85% discount rate used in 2016.
For its UK pension plan the discount rate was derived using a yield curve fitted to the yields on AA bonds in the Barclays Capital Sterling Aggregate Corporate Index and uses sample plan cash flow data as a proxy to plan specific liability cash flows. The derived discount rate is the single discount rate equivalent to discounting these liability cash flows at the term-dependent spot rate of AA corporate bonds. This methodology resulted in a December 31, 2017 discount rate for the UK pension plan of 2.60% as compared to a discount rate of 2.70% used in 2016.
In 2017 we changed the mortality table used to calculate the present value of U.S. benefit obligations from the RP-2000 mortality table with generational projection using Scale BB-2D to the RP-2014 mortality table, with generational projection from 2006 using Scale MP-2017. That change resulted in an approximately $15 million decrease in the projected benefit obligation of our U.S. plans upon remeasurement at December 31, 2017. The RP-2014 mortality table with generational projection from 2006 using Scale MP-2017 was chosen as the best estimate based on the observed and anticipated experience of the plans after considering alternative tables. The rate of compensation increase assumption reflects the Company’s actual experience and best estimate of future increases.
The assumed health care cost trend rates used to determine the projected postretirement benefit obligation are as follows:
Other Benefits 2017 2016 2015Assumed health care cost trend rates at December 31, Health care cost trend assumed for next year 7.0% 7.2% 7.4%Rate to which the cost trend is assumed to decline 5.0% 5.0% 5.0%Year that the rate reaches the ultimate trend rate 2028 2028 2028
80227_10K.indd 58 2/27/18 8:04 AM
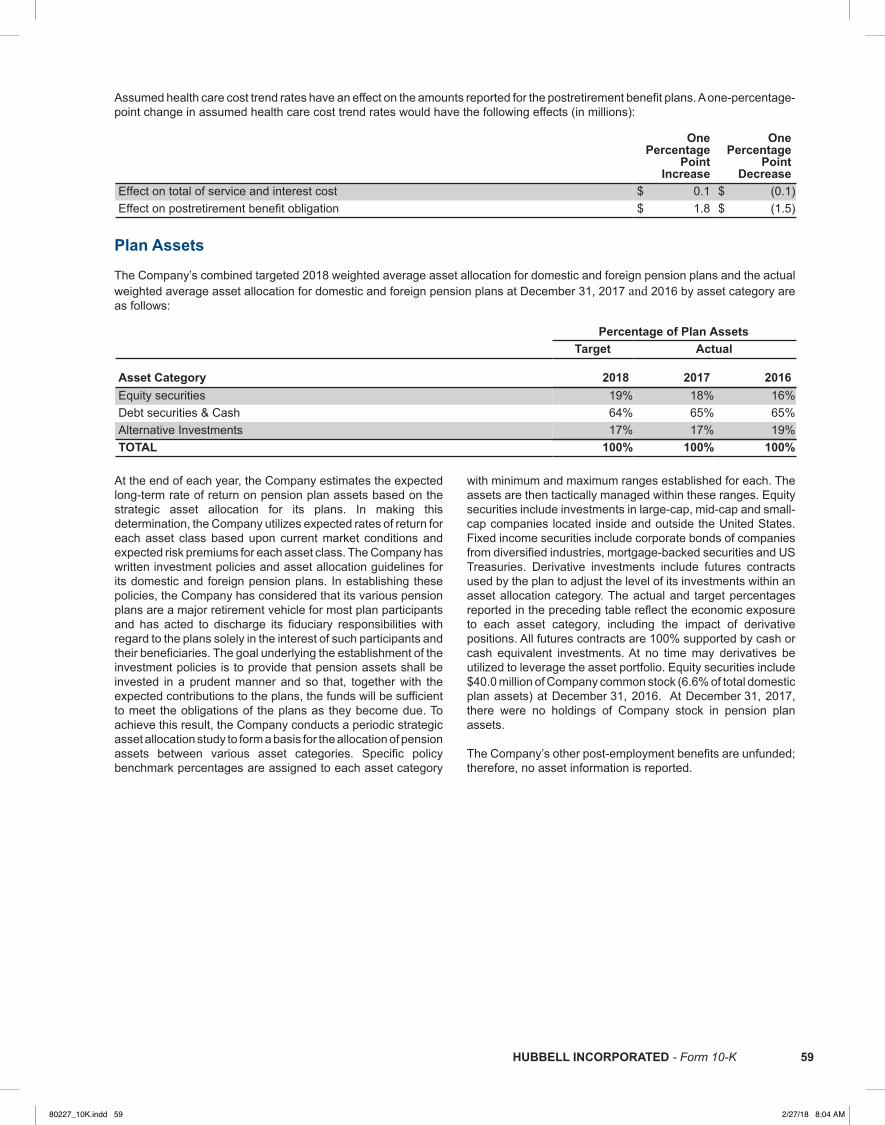
HUBBELL INCORPORATED - Form 10-K 59HUBBELL INCORPORATED - Form 10-K 59
Assumed health care cost trend rates have an effect on the amounts reported for the postretirement benefit plans. A one-percentage-point change in assumed health care cost trend rates would have the following effects (in millions):
OnePercentage
PointIncrease
OnePercentage
PointDecrease
Effect on total of service and interest cost $ 0.1 $ (0.1)Effect on postretirement benefit obligation $ 1.8 $ (1.5)
Plan Assets The Company’s combined targeted 2018 weighted average asset allocation for domestic and foreign pension plans and the actual weighted average asset allocation for domestic and foreign pension plans at December 31, 2017 and 2016 by asset category are as follows:
Percentage of Plan Assets Target Actual
Asset Category 2018 2017 2016Equity securities 19% 18% 16%Debt securities & Cash 64% 65% 65%Alternative Investments 17% 17% 19%TOTAL 100% 100% 100%
At the end of each year, the Company estimates the expected long-term rate of return on pension plan assets based on the strategic asset allocation for its plans. In making this determination, the Company utilizes expected rates of return for each asset class based upon current market conditions and expected risk premiums for each asset class. The Company has written investment policies and asset allocation guidelines for its domestic and foreign pension plans. In establishing these policies, the Company has considered that its various pension plans are a major retirement vehicle for most plan participants and has acted to discharge its fiduciary responsibilities with regard to the plans solely in the interest of such participants and their beneficiaries. The goal underlying the establishment of the investment policies is to provide that pension assets shall be invested in a prudent manner and so that, together with the expected contributions to the plans, the funds will be sufficient to meet the obligations of the plans as they become due. To achieve this result, the Company conducts a periodic strategic asset allocation study to form a basis for the allocation of pension assets between various asset categories. Specific policy benchmark percentages are assigned to each asset category
with minimum and maximum ranges established for each. The assets are then tactically managed within these ranges. Equity securities include investments in large-cap, mid-cap and small-cap companies located inside and outside the United States. Fixed income securities include corporate bonds of companies from diversified industries, mortgage-backed securities and US Treasuries. Derivative investments include futures contracts used by the plan to adjust the level of its investments within an asset allocation category. The actual and target percentages reported in the preceding table reflect the economic exposure to each asset category, including the impact of derivative positions. All futures contracts are 100% supported by cash or cash equivalent investments. At no time may derivatives be utilized to leverage the asset portfolio. Equity securities include $40.0 million of Company common stock (6.6% of total domestic plan assets) at December 31, 2016. At December 31, 2017, there were no holdings of Company stock in pension plan assets. The Company’s other post-employment benefits are unfunded; therefore, no asset information is reported.
80227_10K.indd 59 2/27/18 8:04 AM
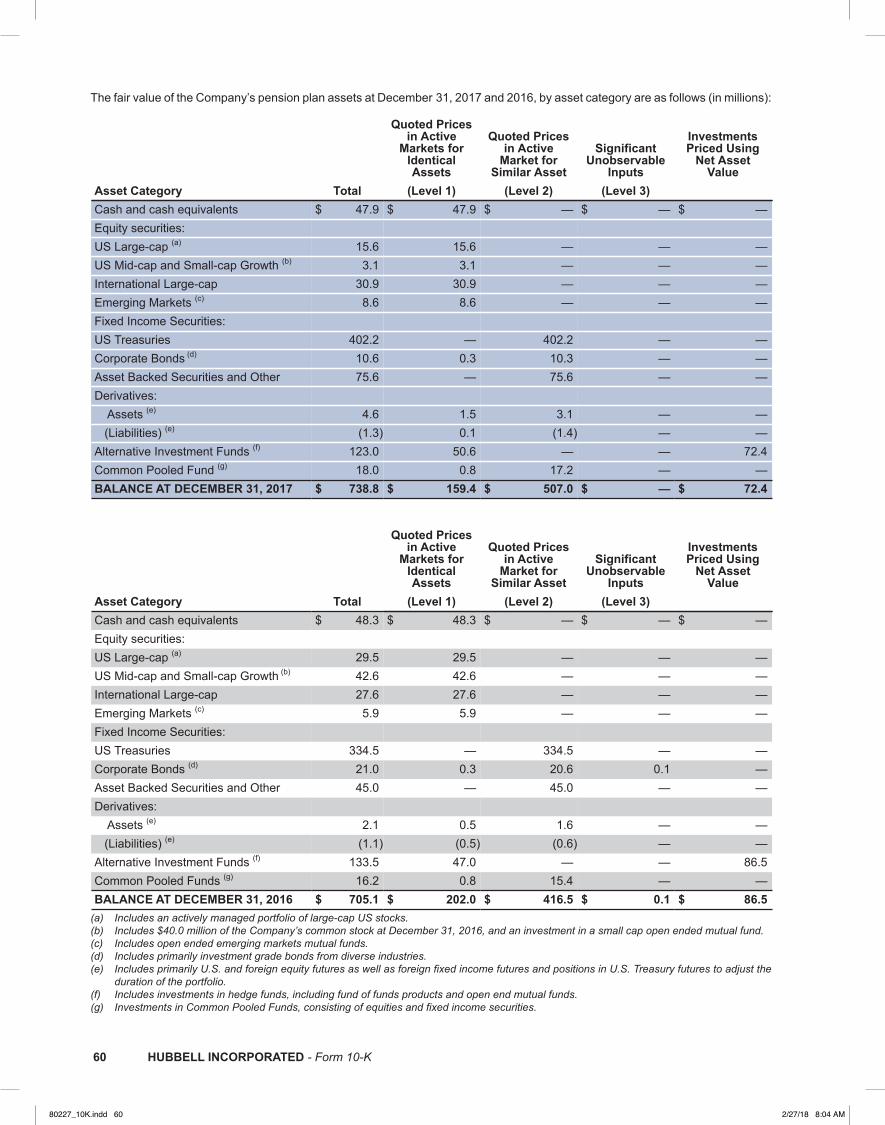
60 HUBBELL INCORPORATED - Form 10-K60 HUBBELL INCORPORATED - Form 10-K
The fair value of the Company’s pension plan assets at December 31, 2017 and 2016, by asset category are as follows (in millions):
Quoted Pricesin Active
Markets forIdenticalAssets
Quoted Pricesin Active
Market forSimilar Asset
SignificantUnobservable
Inputs
InvestmentsPriced Using
Net AssetValue
Asset Category Total (Level 1) (Level 2) (Level 3)Cash and cash equivalents $ 47.9 $ 47.9 $ — $ — $ —Equity securities: US Large-cap (a) 15.6 15.6 — — —US Mid-cap and Small-cap Growth (b) 3.1 3.1 — — —International Large-cap 30.9 30.9 — — —Emerging Markets (c) 8.6 8.6 — — —Fixed Income Securities: US Treasuries 402.2 — 402.2 — —Corporate Bonds (d) 10.6 0.3 10.3 — —Asset Backed Securities and Other 75.6 — 75.6 — —Derivatives: Assets (e) 4.6 1.5 3.1 — — (Liabilities) (e) (1.3) 0.1 (1.4) — —Alternative Investment Funds (f) 123.0 50.6 — — 72.4Common Pooled Fund (g) 18.0 0.8 17.2 — —BALANCE AT DECEMBER 31, 2017 $ 738.8 $ 159.4 $ 507.0 $ — $ 72.4
Quoted Prices in Active
Markets for Identical Assets
Quoted Prices in Active
Market for Similar Asset
SignificantUnobservable
Inputs
InvestmentsPriced Using
Net AssetValue
Asset Category Total (Level 1) (Level 2) (Level 3)Cash and cash equivalents $ 48.3 $ 48.3 $ — $ — $ —Equity securities: US Large-cap (a) 29.5 29.5 — — —US Mid-cap and Small-cap Growth (b) 42.6 42.6 — — —International Large-cap 27.6 27.6 — — —Emerging Markets (c) 5.9 5.9 — — —Fixed Income Securities: US Treasuries 334.5 — 334.5 — —Corporate Bonds (d) 21.0 0.3 20.6 0.1 —Asset Backed Securities and Other 45.0 — 45.0 — —Derivatives: Assets (e) 2.1 0.5 1.6 — — (Liabilities) (e) (1.1) (0.5) (0.6) — —Alternative Investment Funds (f) 133.5 47.0 — — 86.5Common Pooled Funds (g) 16.2 0.8 15.4 — —BALANCE AT DECEMBER 31, 2016 $ 705.1 $ 202.0 $ 416.5 $ 0.1 $ 86.5
(a) Includes an actively managed portfolio of large-cap US stocks.(b) Includes $40.0 million of the Company’s common stock at December 31, 2016, and an investment in a small cap open ended mutual fund.(c) Includes open ended emerging markets mutual funds.(d) Includes primarily investment grade bonds from diverse industries.(e) Includes primarily U.S. and foreign equity futures as well as foreign fixed income futures and positions in U.S. Treasury futures to adjust the
duration of the portfolio.(f) Includes investments in hedge funds, including fund of funds products and open end mutual funds.(g) Investments in Common Pooled Funds, consisting of equities and fixed income securities.
80227_10K.indd 60 2/27/18 8:04 AM
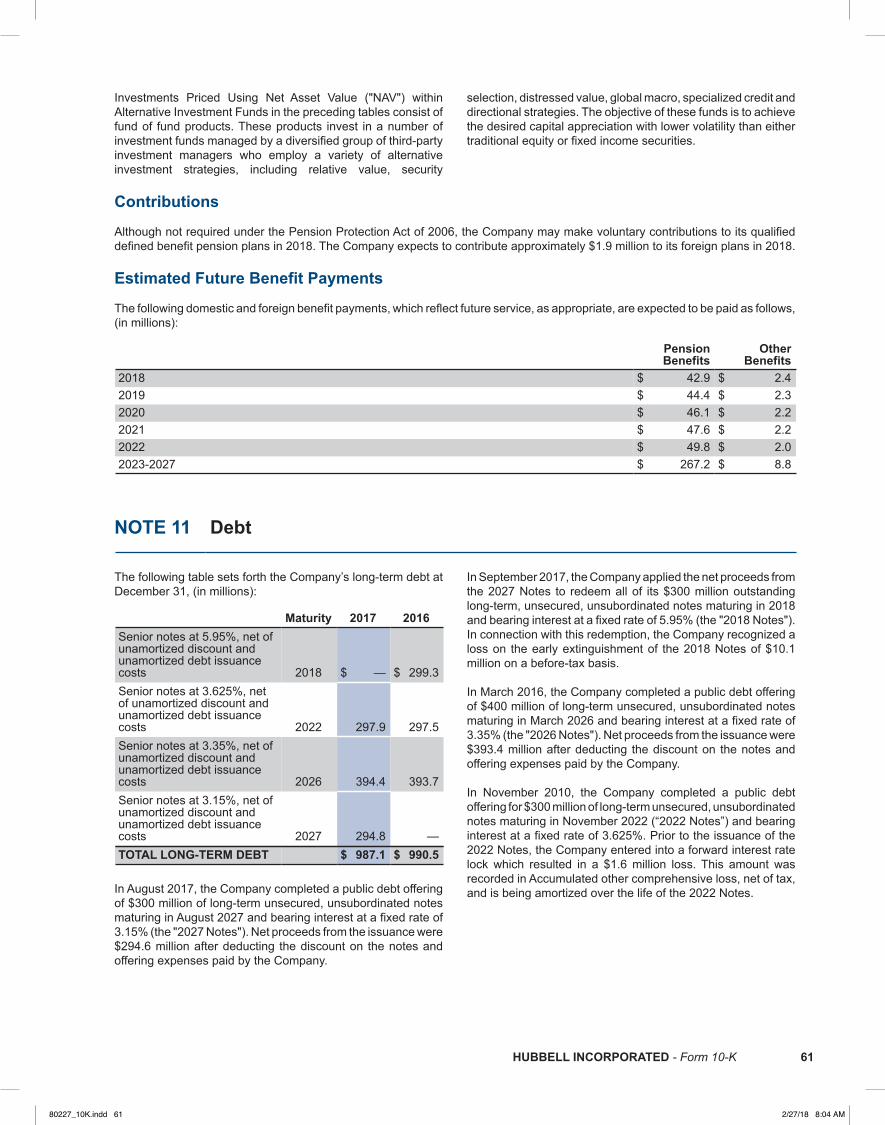
HUBBELL INCORPORATED - Form 10-K 61HUBBELL INCORPORATED - Form 10-K 61
Investments Priced Using Net Asset Value ("NAV") within Alternative Investment Funds in the preceding tables consist of fund of fund products. These products invest in a number of investment funds managed by a diversified group of third-party investment managers who employ a variety of alternative investment strategies, including relative value, security
selection, distressed value, global macro, specialized credit and directional strategies. The objective of these funds is to achieve the desired capital appreciation with lower volatility than either traditional equity or fixed income securities.
Contributions Although not required under the Pension Protection Act of 2006, the Company may make voluntary contributions to its qualified defined benefit pension plans in 2018. The Company expects to contribute approximately $1.9 million to its foreign plans in 2018. Estimated Future Benefit Payments The following domestic and foreign benefit payments, which reflect future service, as appropriate, are expected to be paid as follows, (in millions):
PensionBenefits
OtherBenefits
2018 $ 42.9 $ 2.42019 $ 44.4 $ 2.32020 $ 46.1 $ 2.22021 $ 47.6 $ 2.22022 $ 49.8 $ 2.02023-2027 $ 267.2 $ 8.8
NOTE 11 Debt
The following table sets forth the Company’s long-term debt at December 31, (in millions):
Maturity 2017 2016Senior notes at 5.95%, net ofunamortized discount andunamortized debt issuancecosts 2018 $ — $ 299.3Senior notes at 3.625%, netof unamortized discount andunamortized debt issuancecosts 2022 297.9 297.5Senior notes at 3.35%, net ofunamortized discount andunamortized debt issuancecosts 2026 394.4 393.7Senior notes at 3.15%, net ofunamortized discount andunamortized debt issuancecosts 2027 294.8 —TOTAL LONG-TERM DEBT $ 987.1 $ 990.5
In August 2017, the Company completed a public debt offering of $300 million of long-term unsecured, unsubordinated notes maturing in August 2027 and bearing interest at a fixed rate of 3.15% (the "2027 Notes"). Net proceeds from the issuance were $294.6 million after deducting the discount on the notes and offering expenses paid by the Company.
In September 2017, the Company applied the net proceeds from the 2027 Notes to redeem all of its $300 million outstanding long-term, unsecured, unsubordinated notes maturing in 2018 and bearing interest at a fixed rate of 5.95% (the "2018 Notes"). In connection with this redemption, the Company recognized a loss on the early extinguishment of the 2018 Notes of $10.1 million on a before-tax basis.
In March 2016, the Company completed a public debt offering of $400 million of long-term unsecured, unsubordinated notes maturing in March 2026 and bearing interest at a fixed rate of 3.35% (the "2026 Notes"). Net proceeds from the issuance were $393.4 million after deducting the discount on the notes and offering expenses paid by the Company.
In November 2010, the Company completed a public debt offering for $300 million of long-term unsecured, unsubordinated notes maturing in November 2022 (“2022 Notes”) and bearing interest at a fixed rate of 3.625%. Prior to the issuance of the 2022 Notes, the Company entered into a forward interest rate lock which resulted in a $1.6 million loss. This amount was recorded in Accumulated other comprehensive loss, net of tax, and is being amortized over the life of the 2022 Notes.
80227_10K.indd 61 2/27/18 8:04 AM
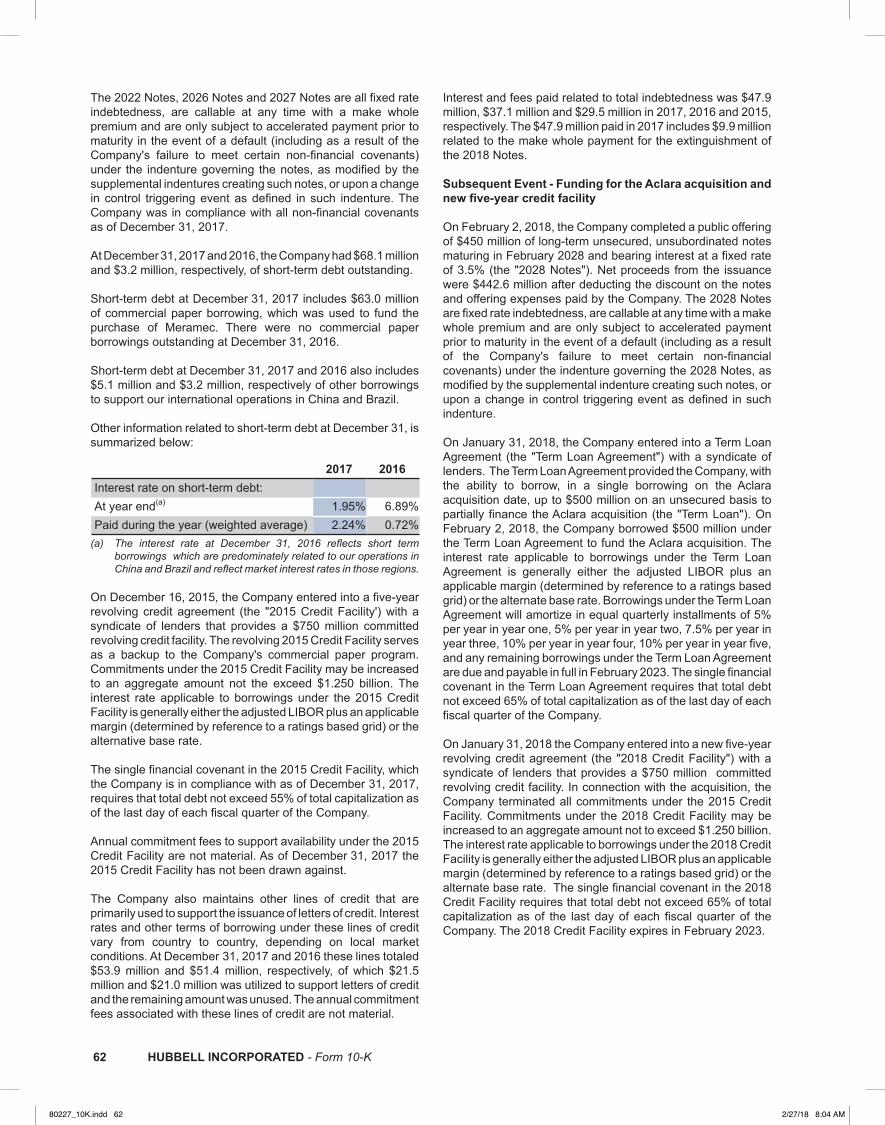
62 HUBBELL INCORPORATED - Form 10-K62 HUBBELL INCORPORATED - Form 10-K
The 2022 Notes, 2026 Notes and 2027 Notes are all fixed rate indebtedness, are callable at any time with a make whole premium and are only subject to accelerated payment prior to maturity in the event of a default (including as a result of the Company's failure to meet certain non-financial covenants) under the indenture governing the notes, as modified by the supplemental indentures creating such notes, or upon a change in control triggering event as defined in such indenture. The Company was in compliance with all non-financial covenants as of December 31, 2017. At December 31, 2017 and 2016, the Company had $68.1 million and $3.2 million, respectively, of short-term debt outstanding.
Short-term debt at December 31, 2017 includes $63.0 million of commercial paper borrowing, which was used to fund the purchase of Meramec. There were no commercial paper borrowings outstanding at December 31, 2016.
Short-term debt at December 31, 2017 and 2016 also includes $5.1 million and $3.2 million, respectively of other borrowings to support our international operations in China and Brazil. Other information related to short-term debt at December 31, is summarized below:
2017 2016Interest rate on short-term debt: At year end(a) 1.95% 6.89%Paid during the year (weighted average) 2.24% 0.72%
(a) The interest rate at December 31, 2016 reflects short term borrowings which are predominately related to our operations in China and Brazil and reflect market interest rates in those regions.
On December 16, 2015, the Company entered into a five-year revolving credit agreement (the "2015 Credit Facility') with a syndicate of lenders that provides a $750 million committed revolving credit facility. The revolving 2015 Credit Facility serves as a backup to the Company's commercial paper program. Commitments under the 2015 Credit Facility may be increased to an aggregate amount not the exceed $1.250 billion. The interest rate applicable to borrowings under the 2015 Credit Facility is generally either the adjusted LIBOR plus an applicable margin (determined by reference to a ratings based grid) or the alternative base rate.
The single financial covenant in the 2015 Credit Facility, which the Company is in compliance with as of December 31, 2017, requires that total debt not exceed 55% of total capitalization as of the last day of each fiscal quarter of the Company.
Annual commitment fees to support availability under the 2015 Credit Facility are not material. As of December 31, 2017 the 2015 Credit Facility has not been drawn against.
The Company also maintains other lines of credit that are primarily used to support the issuance of letters of credit. Interest rates and other terms of borrowing under these lines of credit vary from country to country, depending on local market conditions. At December 31, 2017 and 2016 these lines totaled $53.9 million and $51.4 million, respectively, of which $21.5 million and $21.0 million was utilized to support letters of credit and the remaining amount was unused. The annual commitment fees associated with these lines of credit are not material.
Interest and fees paid related to total indebtedness was $47.9 million, $37.1 million and $29.5 million in 2017, 2016 and 2015, respectively. The $47.9 million paid in 2017 includes $9.9 millionrelated to the make whole payment for the extinguishment of the 2018 Notes.
Subsequent Event - Funding for the Aclara acquisition and new five-year credit facility
On February 2, 2018, the Company completed a public offering of $450 million of long-term unsecured, unsubordinated notes maturing in February 2028 and bearing interest at a fixed rate of 3.5% (the "2028 Notes"). Net proceeds from the issuance were $442.6 million after deducting the discount on the notes and offering expenses paid by the Company. The 2028 Notes are fixed rate indebtedness, are callable at any time with a make whole premium and are only subject to accelerated payment prior to maturity in the event of a default (including as a result of the Company's failure to meet certain non-financial covenants) under the indenture governing the 2028 Notes, as modified by the supplemental indenture creating such notes, or upon a change in control triggering event as defined in such indenture.
On January 31, 2018, the Company entered into a Term Loan Agreement (the "Term Loan Agreement") with a syndicate of lenders. The Term Loan Agreement provided the Company, with the ability to borrow, in a single borrowing on the Aclara acquisition date, up to $500 million on an unsecured basis to partially finance the Aclara acquisition (the "Term Loan"). On February 2, 2018, the Company borrowed $500 million under the Term Loan Agreement to fund the Aclara acquisition. The interest rate applicable to borrowings under the Term Loan Agreement is generally either the adjusted LIBOR plus an applicable margin (determined by reference to a ratings based grid) or the alternate base rate. Borrowings under the Term Loan Agreement will amortize in equal quarterly installments of 5% per year in year one, 5% per year in year two, 7.5% per year in year three, 10% per year in year four, 10% per year in year five, and any remaining borrowings under the Term Loan Agreement are due and payable in full in February 2023. The single financial covenant in the Term Loan Agreement requires that total debt not exceed 65% of total capitalization as of the last day of each fiscal quarter of the Company.
On January 31, 2018 the Company entered into a new five-year revolving credit agreement (the "2018 Credit Facility") with a syndicate of lenders that provides a $750 million committed revolving credit facility. In connection with the acquisition, the Company terminated all commitments under the 2015 Credit Facility. Commitments under the 2018 Credit Facility may be increased to an aggregate amount not to exceed $1.250 billion. The interest rate applicable to borrowings under the 2018 Credit Facility is generally either the adjusted LIBOR plus an applicable margin (determined by reference to a ratings based grid) or the alternate base rate. The single financial covenant in the 2018 Credit Facility requires that total debt not exceed 65% of total capitalization as of the last day of each fiscal quarter of the Company. The 2018 Credit Facility expires in February 2023.
80227_10K.indd 62 2/27/18 8:04 AM

HUBBELL INCORPORATED - Form 10-K 63HUBBELL INCORPORATED - Form 10-K 63
NOTE 12 Income Taxes
The following table sets forth selected data with respect to the Company’s income tax provisions for the years ended December 31, (in millions):
2017 2016 2015Income before income taxes: United States $ 354.7 $ 349.5 $ 347.2International 88.4 80.9 71.4TOTAL INCOME BEFORE INCOME TAXES $ 443.1 $ 430.4 $ 418.6Provision for income taxes — current: Federal $ 164.1 $ 85.5 $ 110.4State 15.3 17.4 13.7International 28.1 17.0 17.6Total provision — current 207.5 119.9 141.7Provision for income taxes — deferred: Federal (10.4) 13.5 (1.7)State (0.9) 1.3 0.4International (3.0) (2.1) (3.9)Total provision — deferred (14.3) 12.7 (5.2)TOTAL PROVISION FOR INCOME TAXES $ 193.2 $ 132.6 $ 136.5
On December 22, 2017, the TCJA was enacted into law, reducing the Federal corporate income tax rate from 35% to 21%. The provisions of the TCJA have and will continue to impact our accounting treatment of certain items in our financial statements. As of December 31, 2017, we have not completed our assessment of the accounting impact of the tax effects of enactment of the TCJA and accordingly our accounting is provisional as of and for the year ended December 31, 2017. Where we have been able to make a reasonable estimate of the impact, we have accounted for such provisional impact in the accompanying 2017 financial statements. In other cases, we have not yet been able to determine a reasonable estimate and continue to account for those items based on our existing accounting under ASC 740, Income Taxes, and the provisions of the tax laws that were in effect immediately prior to enactment of the TCJA. For items related to the TCJA for which we were able to determine a reasonable estimate, we recognized a provisional tax amount of approximately $57 million, which is included as a component of income tax expense from continuing operations.
The TCJA is complex and includes significant changes to the Internal Revenue Code which impact the Company. To complete the accounting associated with the TCJA, the Company will continue to review the technical tax interpretations associated with the underlying law, monitor state legislative changes, and review U.S. federal and state guidance as it is issued. Further, the Company will continue to accumulate and refine the relevant data and computational elements needed to finalize its accounting during the measurement period.
While the provisions of the TCJA are generally effective January 1, 2018, several provisions impact the Company’s current period financial statements.
Our 2017 accompanying financial statements reflect provisional estimates for the one-time transition tax on the untaxed post-1986 earning and profits ("E&P") of our foreign subsidiaries. In addition, we revalued our deferred tax assets and liabilities based on rates at which they are expected to reverse in the future, which is generally 21%.
Prior to the enactment of the TCJA, the Company had not provided for taxes on the undistributed earnings of its foreign subsidiaries as the Company either reinvested or intended to reinvest those earnings outside of the United States. As of December 31, 2017, the Company had subsidiaries in 17 countries outside the U.S. However, as a result of the TCJA, the Company plans to repatriate a portion of its foreign earnings and has included a provisional tax amount in the accompanying financial statements related to certain of our outside basis differences. As of December 31, 2017, the remaining undistributed foreign earnings were approximately $720 million. We have not included a provisional amount for the income tax effects of a repatriation of this balance because we have not determined a reasonable estimate related to it.
The Company also evaluated the impact of the TCJA on its uncertain tax positions as well as its state and foreign tax liabilities and recorded provisional estimates of these impacts.
80227_10K.indd 63 2/27/18 8:04 AM
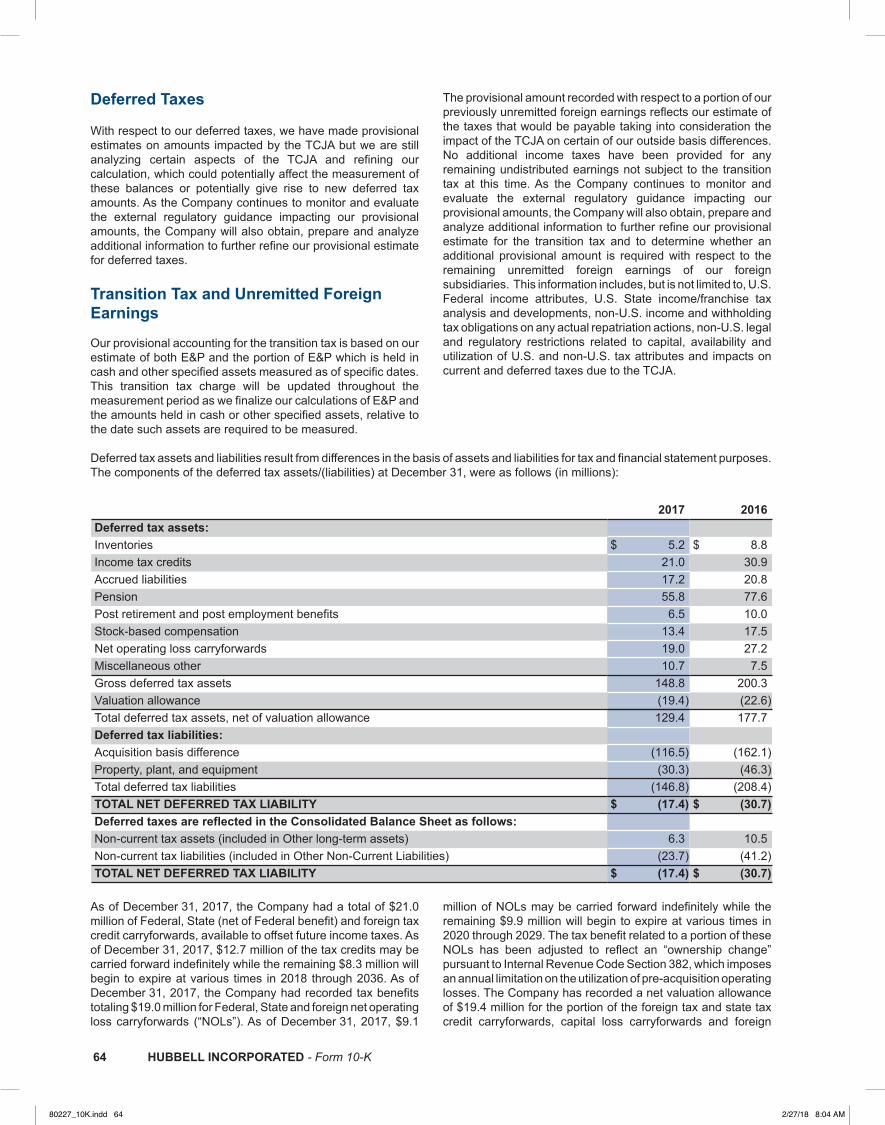
64 HUBBELL INCORPORATED - Form 10-K64 HUBBELL INCORPORATED - Form 10-K
Deferred Taxes
With respect to our deferred taxes, we have made provisional estimates on amounts impacted by the TCJA but we are still analyzing certain aspects of the TCJA and refining our calculation, which could potentially affect the measurement of these balances or potentially give rise to new deferred tax amounts. As the Company continues to monitor and evaluate the external regulatory guidance impacting our provisional amounts, the Company will also obtain, prepare and analyze additional information to further refine our provisional estimate for deferred taxes.
Transition Tax and Unremitted Foreign Earnings
Our provisional accounting for the transition tax is based on our estimate of both E&P and the portion of E&P which is held in cash and other specified assets measured as of specific dates. This transition tax charge will be updated throughout the measurement period as we finalize our calculations of E&P and the amounts held in cash or other specified assets, relative to the date such assets are required to be measured.
The provisional amount recorded with respect to a portion of our previously unremitted foreign earnings reflects our estimate of the taxes that would be payable taking into consideration the impact of the TCJA on certain of our outside basis differences. No additional income taxes have been provided for any remaining undistributed earnings not subject to the transition tax at this time. As the Company continues to monitor and evaluate the external regulatory guidance impacting our provisional amounts, the Company will also obtain, prepare and analyze additional information to further refine our provisional estimate for the transition tax and to determine whether an additional provisional amount is required with respect to the remaining unremitted foreign earnings of our foreign subsidiaries. This information includes, but is not limited to, U.S. Federal income attributes, U.S. State income/franchise tax analysis and developments, non-U.S. income and withholding tax obligations on any actual repatriation actions, non-U.S. legal and regulatory restrictions related to capital, availability and utilization of U.S. and non-U.S. tax attributes and impacts on current and deferred taxes due to the TCJA.
Deferred tax assets and liabilities result from differences in the basis of assets and liabilities for tax and financial statement purposes. The components of the deferred tax assets/(liabilities) at December 31, were as follows (in millions):
2017 2016Deferred tax assets: Inventories $ 5.2 $ 8.8Income tax credits 21.0 30.9Accrued liabilities 17.2 20.8Pension 55.8 77.6Post retirement and post employment benefits 6.5 10.0Stock-based compensation 13.4 17.5Net operating loss carryforwards 19.0 27.2Miscellaneous other 10.7 7.5Gross deferred tax assets 148.8 200.3Valuation allowance (19.4) (22.6)Total deferred tax assets, net of valuation allowance 129.4 177.7Deferred tax liabilities: Acquisition basis difference (116.5) (162.1)Property, plant, and equipment (30.3) (46.3)Total deferred tax liabilities (146.8) (208.4)TOTAL NET DEFERRED TAX LIABILITY $ (17.4) $ (30.7)Deferred taxes are reflected in the Consolidated Balance Sheet as follows: Non-current tax assets (included in Other long-term assets) 6.3 10.5Non-current tax liabilities (included in Other Non-Current Liabilities) (23.7) (41.2)TOTAL NET DEFERRED TAX LIABILITY $ (17.4) $ (30.7)
As of December 31, 2017, the Company had a total of $21.0 million of Federal, State (net of Federal benefit) and foreign tax credit carryforwards, available to offset future income taxes. As of December 31, 2017, $12.7 million of the tax credits may be carried forward indefinitely while the remaining $8.3 million will begin to expire at various times in 2018 through 2036. As of December 31, 2017, the Company had recorded tax benefits totaling $19.0 million for Federal, State and foreign net operating loss carryforwards (“NOLs”). As of December 31, 2017, $9.1
million of NOLs may be carried forward indefinitely while the remaining $9.9 million will begin to expire at various times in 2020 through 2029. The tax benefit related to a portion of these NOLs has been adjusted to reflect an “ownership change” pursuant to Internal Revenue Code Section 382, which imposes an annual limitation on the utilization of pre-acquisition operating losses. The Company has recorded a net valuation allowance of $19.4 million for the portion of the foreign tax and state tax credit carryforwards, capital loss carryforwards and foreign
80227_10K.indd 64 2/27/18 8:04 AM
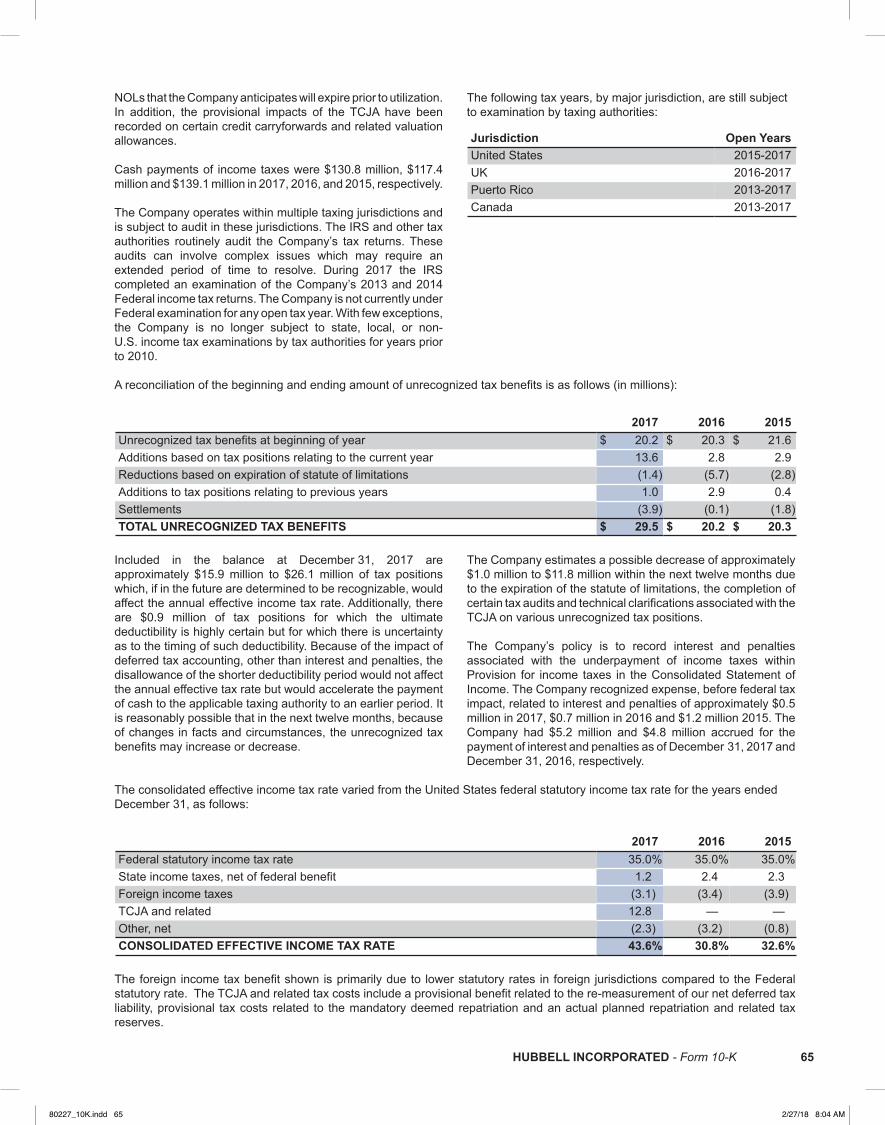
HUBBELL INCORPORATED - Form 10-K 65HUBBELL INCORPORATED - Form 10-K 65
NOLs that the Company anticipates will expire prior to utilization. In addition, the provisional impacts of the TCJA have been recorded on certain credit carryforwards and related valuation allowances.
Cash payments of income taxes were $130.8 million, $117.4 million and $139.1 million in 2017, 2016, and 2015, respectively.
The Company operates within multiple taxing jurisdictions and is subject to audit in these jurisdictions. The IRS and other tax authorities routinely audit the Company’s tax returns. These audits can involve complex issues which may require an extended period of time to resolve. During 2017 the IRS completed an examination of the Company’s 2013 and 2014 Federal income tax returns. The Company is not currently under Federal examination for any open tax year. With few exceptions, the Company is no longer subject to state, local, or non-U.S. income tax examinations by tax authorities for years prior to 2010.
The following tax years, by major jurisdiction, are still subject to examination by taxing authorities:
Jurisdiction Open YearsUnited States 2015-2017UK 2016-2017Puerto Rico 2013-2017Canada 2013-2017
A reconciliation of the beginning and ending amount of unrecognized tax benefits is as follows (in millions):
2017 2016 2015Unrecognized tax benefits at beginning of year $ 20.2 $ 20.3 $ 21.6Additions based on tax positions relating to the current year 13.6 2.8 2.9Reductions based on expiration of statute of limitations (1.4) (5.7) (2.8)Additions to tax positions relating to previous years 1.0 2.9 0.4Settlements (3.9) (0.1) (1.8)TOTAL UNRECOGNIZED TAX BENEFITS $ 29.5 $ 20.2 $ 20.3
Included in the balance at December 31, 2017 are approximately $15.9 million to $26.1 million of tax positions which, if in the future are determined to be recognizable, would affect the annual effective income tax rate. Additionally, there are $0.9 million of tax positions for which the ultimate deductibility is highly certain but for which there is uncertainty as to the timing of such deductibility. Because of the impact of deferred tax accounting, other than interest and penalties, the disallowance of the shorter deductibility period would not affect the annual effective tax rate but would accelerate the payment of cash to the applicable taxing authority to an earlier period. It is reasonably possible that in the next twelve months, because of changes in facts and circumstances, the unrecognized tax benefits may increase or decrease.
The Company estimates a possible decrease of approximately $1.0 million to $11.8 million within the next twelve months due to the expiration of the statute of limitations, the completion of certain tax audits and technical clarifications associated with the TCJA on various unrecognized tax positions. The Company’s policy is to record interest and penalties associated with the underpayment of income taxes within Provision for income taxes in the Consolidated Statement of Income. The Company recognized expense, before federal tax impact, related to interest and penalties of approximately $0.5 million in 2017, $0.7 million in 2016 and $1.2 million 2015. The Company had $5.2 million and $4.8 million accrued for the payment of interest and penalties as of December 31, 2017 and December 31, 2016, respectively.
The consolidated effective income tax rate varied from the United States federal statutory income tax rate for the years ended December 31, as follows:
2017 2016 2015Federal statutory income tax rate 35.0% 35.0% 35.0%State income taxes, net of federal benefit 1.2 2.4 2.3Foreign income taxes (3.1) (3.4) (3.9)TCJA and related 12.8 — —Other, net (2.3) (3.2) (0.8)CONSOLIDATED EFFECTIVE INCOME TAX RATE 43.6% 30.8% 32.6%
The foreign income tax benefit shown is primarily due to lower statutory rates in foreign jurisdictions compared to the Federal statutory rate. The TCJA and related tax costs include a provisional benefit related to the re-measurement of our net deferred tax liability, provisional tax costs related to the mandatory deemed repatriation and an actual planned repatriation and related tax reserves.
80227_10K.indd 65 2/27/18 8:04 AM

66 HUBBELL INCORPORATED - Form 10-K66 HUBBELL INCORPORATED - Form 10-K
NOTE 13 Financial Instruments and Fair Value Measurement
Financial Instruments
Concentrations of Credit Risk: Financial instruments which potentially subject the Company to significant concentrations of credit risk consist of trade receivables, cash equivalents and investments. The Company grants credit terms in the normal course of business to its customers. Due to the diversity of its product lines, the Company has an extensive customer base including electrical distributors and wholesalers, electric utilities, equipment manufacturers, electrical contractors, telecommunication companies and retail and hardware outlets. No single customer accounted for more than 10% of total sales in any year during the three years ended December 31, 2017. However, the Company’s top ten customers account for approximately 40% of its net sales. As part of its ongoing procedures, the Company monitors the credit worthiness of its customers. Bad debt write-offs have historically been minimal. The Company places its cash and cash equivalents with financial institutions and limits the amount of exposure in any one institution.
Fair Value: The carrying amounts reported in the Consolidated Balance Sheet for cash and cash equivalents, short-term investments, receivables, bank borrowings, accounts payable and accruals approximate their fair values given the immediate or short-term nature of these items. See also Note 6 — Investments.
Fair value measurements
At December 31, 2017 and 2016 the Company had $72.2 million and $67.6 million respectively, of investments carried on the balance sheet at fair value. Fair value is defined as the amount that would be received for selling an asset or paid to transfer a liability in an orderly transaction between market participants at the measurement date. The FASB fair value measurement guidance established a fair value hierarchy that prioritizes the inputs used to measure fair value. Refer to Note 6 — Investments for more information about these investments.
The three broad levels of the fair value hierarchy are as follows:
Level 1 - Quoted prices (unadjusted) in active markets for identical assets or liabilities
Level 2 - Quoted prices for similar assets and liabilities in active markets or inputs that are observable for the asset or
liability, either directly or indirectly
Level 3 - Unobservable inputs for which little or no market data exists, therefore requiring a company to develop its own
assumptions
80227_10K.indd 66 2/27/18 8:04 AM

HUBBELL INCORPORATED - Form 10-K 67HUBBELL INCORPORATED - Form 10-K 67
The following tables show, by level within the fair value hierarchy, the Company’s financial assets and liabilities that are accounted for at fair value on a recurring basis at December 31, 2017 and 2016 (in millions):
Asset (Liability)
Quoted Prices inActive Markets forIdentical Assets
(Level 1)
Quoted Prices inActive Markets for
Similar Assets(Level 2)
Unobservableinputs for which
little or no marketdata exists (Level 3) Total
Money market funds (a) $ 126.9 $ — $ — $ 126.9Available for sale investments — 54.3 4.1 58.4Trading securities 13.8 — — 13.8Deferred compensation plan liabilities (13.8) — — (13.8)Derivatives:Forward exchange contracts-Assets (b) — 0.2 — 0.2Forward exchange contracts-(Liabilities) (c) — (0.7) — (0.7)BALANCE AT DECEMBER 31, 2017 $ 126.9 $ 53.8 $ 4.1 $ 184.8
Asset (Liability)
Quoted Prices inActive Markets forIdentical Assets
(Level 1)
Quoted Prices inActive Markets for
Similar Assets(Level 2)
Unobservableinputs for which
little or no marketdata exists (Level 3) Total
Money market funds (a) $ 263.5 $ — $ — $ 263.5Available-for-sale investments — 53.6 3.8 57.4Trading securities 10.2 — — 10.2Deferred compensation plan liabilities (10.2) — — (10.2)Derivatives:Forward exchange contracts-Assets (b) — 0.8 — 0.8Forward exchange contracts-(Liabilities) (c) — (0.1) — (0.1)BALANCE AT DECEMBER 31, 2016 $ 263.5 $ 54.3 $ 3.8 $ 321.6
(a) Money market funds are included in Cash and cash equivalents in the Consolidated Balance Sheet.(b) Forward exchange contracts-Assets are reflected in Other current assets in the Consolidated Balance Sheet.(c) Forward exchange contracts-(Liabilities) are reflected in Other accrued liabilities in the Consolidated Balance Sheet.
The methods and assumptions used to estimate the Level 2 fair values were as follows: Forward exchange contracts – The fair value of forward exchange contracts were based on quoted forward foreign exchange prices at the reporting date.
Municipal bonds – The fair value of available-for-sale investments in municipal bonds is based on observable market-based inputs, other than quoted prices in active markets for identical assets.
Available-for-sale redeemable preferred stock classified in Level 3 – The fair value of the available-for-sale investment in redeemable preferred stock is valued based on a discounted cash flow model, using significant unobservable inputs, including assumptions regarding expected cash flows and discount rates.
During 2017 and 2016, there were no transfers of financial assets or liabilities in or out of Level 1 or Level 2 of the fair value hierarchy. As of December 31, 2017 and 2016, the Company had one financial asset that was classified in Level 3 of the fair value hierarchy.
Deferred compensation plan
The Company offers certain employees the opportunity to participate in non-qualified deferred compensation plans. A participant’s deferrals are invested in a variety of participant-directed debt and equity mutual funds that are classified as trading securities. During 2017 and 2016, the Company purchased $2.1 million and $1.4 million, respectively, of trading securities related to these deferred compensation plans. As a result of participant distributions, the Company sold $0.3 million and $1.6 million of these trading securities in 2017 and 2016 respectively. The unrealized gains and losses associated with these trading securities are directly offset by the changes in the fair value of the underlying deferred compensation plan obligation.
Derivatives In order to limit financial risk in the management of its assets, liabilities and debt, the Company may use derivative financial instruments such as foreign currency hedges, commodity hedges, interest rate hedges and interest rate swaps. All derivative financial instruments are matched with an existing Company asset, liability or proposed transaction. Market value gains or losses on the derivative financial instrument are recognized in income when the effects of the related price changes of the underlying asset or liability are recognized in income.
80227_10K.indd 67 2/27/18 8:04 AM

68 HUBBELL INCORPORATED - Form 10-K68 HUBBELL INCORPORATED - Form 10-K
Forward exchange contracts
In 2017 and 2016, the Company entered into a series of forward exchange contracts to purchase U.S. dollars in order to hedge its exposure to fluctuating rates of exchange on anticipated inventory purchases and forecasted sales by its subsidiaries who transact business in Canadian dollars. As of December 31, 2017, the Company had 46 individual forward exchange contracts for notional amounts which range from $0.4 million to $1.5 million each, which have various expiration dates through December 2018. These contracts have been designated as cash flow hedges in accordance with the accounting guidance for derivatives. The following table summarizes the results of cash flow hedging relationships for years ended December 31, (in millions):
Derivative Gain/(Loss) Recognized inAccumulated Other Comprehensive
Loss, net of tax
Location of Gain/(Loss) whenreclassified
Gain/(Loss) Reclassified intoEarnings (Effective Portion),
net of taxDerivative Instrument 2017 2016 (Effective Portion) 2017 2016Forward exchange contract $ (1.7) $ (1.4) Net sales $ (0.3) $ (0.3)
Cost of goods sold $ (0.6) $ 0.3
There was no material hedge ineffectiveness with respect to the forward exchange cash flow hedges during 2017, 2016 and 2015.
Long-term Debt The total carrying value of long-term debt as of December 31, 2017 and 2016 was $987.1 million and $990.5 million, respectively, net of unamortized discount and debt issuance costs. As of December 31, 2017 and 2016, the estimated fair value of the long-term debt was $1,013.2 million and $1,017.8 million, respectively, based on quoted market prices. The Company’s long-term debt falls within level 2 of the fair value hierarchy.
NOTE 14 Commitments and Contingencies
Legal and Environmental The Company is subject to various legal proceedings arising in the normal course of its business. These proceedings include claims for damages arising out of use of the Company’s products, intellectual property, workers’ compensation and environmental matters. The Company is self-insured up to specified limits for certain types of claims, including product liability and workers’ compensation, and is fully self-insured for certain other types of claims, including environmental and intellectual property matters. The Company recognizes a liability for any contingency that in management’s judgment is probable of occurrence and can be reasonably estimated. We continually reassess the likelihood of adverse judgments and outcomes in these matters, as well as estimated ranges of possible losses based upon an analysis of each matter which includes consideration of outside legal counsel and, if applicable, other experts.
The Company is subject to environmental laws and regulations which may require that it investigate and remediate the effects of potential contamination associated with past and present operations as well as those acquired through business combinations. Environmental liabilities are recorded when remedial efforts are probable and the costs can be reasonably estimated. The Company continues to monitor these environmental matters and revalues its liabilities as necessary. Total environmental liabilities were $4.9 million and $5.2 million as of December 31, 2017 and 2016, respectively.
The Company accounts for conditional asset retirement and environmental obligations in accordance with the applicable accounting guidance. The accounting guidance defines “conditional asset retirement obligation” as a legal obligation to perform an asset retirement activity in which the timing and/or method of settlement are conditional on a future event that may or may not be within the control of the Company. Accordingly, an entity is required to recognize a liability for the fair value of a conditional asset retirement obligation if the fair value of the liability can be reasonably estimated. Asset retirement obligations were not material as of December 31, 2017 and 2016. Leases Total rental expense under operating leases was $30.5 millionin 2017, $28.8 million in 2016 and $25.7 million in 2015. The minimum annual rentals on non-cancelable, long-term, operating leases in effect at December 31, 2017 are expected to approximate $18.0 million in 2018, $15.6 million in 2019, $10.8 million in 2020, $8.2 million in 2021, $6.2 million in 2022 and $18.8 million thereafter. The Company’s leases primarily consist of operating leases for buildings or equipment. The terms for building leases typically range from month-to-month to up to 11 years, with various renewal periods depending on the terms.
80227_10K.indd 68 2/27/18 8:04 AM

HUBBELL INCORPORATED - Form 10-K 69HUBBELL INCORPORATED - Form 10-K 69
NOTE 15 Capital Stock
Activity in the Company’s common shares outstanding is set forth below for the three years ended December 31, 2017 (in thousands):
Common Stock
Class A Class BCommon
StockOUTSTANDING AT DECEMBER 31, 2014 7,167 51,329 —Exercise of stock options/stock appreciation rights — 29 —Director compensation arrangements, net — 17 —Restricted/performance shares activity, net of forfeitures — 122 —Acquisition/surrender of shares — (708) (119)Share reclassification (7,167) (50,789) 57,956OUTSTANDING AT DECEMBER 31, 2015 — — 57,837Exercise of stock appreciation rights — — 78Director compensation arrangements, net — — 6Restricted/performance shares activity, net of forfeitures — — 98Acquisition/surrender of shares — — (2,487)OUTSTANDING AT DECEMBER 31, 2016 — — 55,532Exercise of stock appreciation rights — — 53Director compensation arrangements, net — — 10Restricted/performance shares activity, net of forfeitures — — 89Acquisition/surrender of shares — — (802)OUTSTANDING AT DECEMBER 31, 2017 — — 54,882
On December 23, 2015, the Company completed the reclassification of its dual-class common stock into a single class of Common Stock (the “Reclassification”).
The Reclassification, among other benefits, simplified the Company's capital structure, better aligned voting rights with economic interests of all shareholders, and has eliminated the ability of the Louie E. Roche Trust and the Harvey Hubbell Trust (collectively, the “Trusts”), which, prior to the Reclassification, collectively owned 3,488,460 shares of the Company’s Class A common stock, par value $0.01 per share (the “Class A common stock”), representing approximately 49% of Class A common stock then outstanding, and approximately 36% of the total voting power of the Company's shareholders, to effectively prevent the approval of any matter that comes before the shareholders that requires, under Connecticut law, the approval of holders of two-thirds of the Company's outstanding common stock.
Following the filing of the Amended and Restated Certificate of Incorporation of the Company with the Secretary of the State of the State of Connecticut, the Reclassification became effective at 11:59 p.m. on December 23, 2015 (the “Effective Time”), at which time (i) each holder of Class A common stock as of immediately prior to the Effective Time became entitled to receive cash in the amount of $28.00 for each share of Class A common stock held ("Class A Cash Consideration") and (ii) each share of Class A common stock issued and outstanding immediately prior to the Effective Time and each share of Class B common stock of the Company, par value $0.01 per share (the “Class B common stock”), issued and outstanding immediately prior to the Effective Time was reclassified into one share of common stock of the Company, par value $0.01 per share and having one vote per share upon all matters brought
before any meeting of the shareholders (the “Common Stock”). Trading in the Class A Common Stock and Class B Common Stock ceased after markets closed on December 23, 2015 and trading in the Company's single class of Common Stock commenced on the NYSE on December 24, 2015, under the ticker “HUBB.”
Prior to the Reclassification, shares of Class A common stock had twenty votes per share, while shares of Class B common shares had one vote per share. Following the Reclassification, shares of the Company's Common Stock have one vote per share.
The Company accounted for the Reclassification by adjusting the Company’s capital stock accounts. The par value of the Class A common stock and the Class B common stock was reclassified to Common Stock par value. Paid-in capital of the Class A Common Stock was zero at the time of the Reclassification and, therefore, the full amount of the Class A Cash Consideration paid in the Reclassification was applied as a reduction to Retained earnings for the fiscal year ended December 31, 2015.
80227_10K.indd 69 2/27/18 8:04 AM
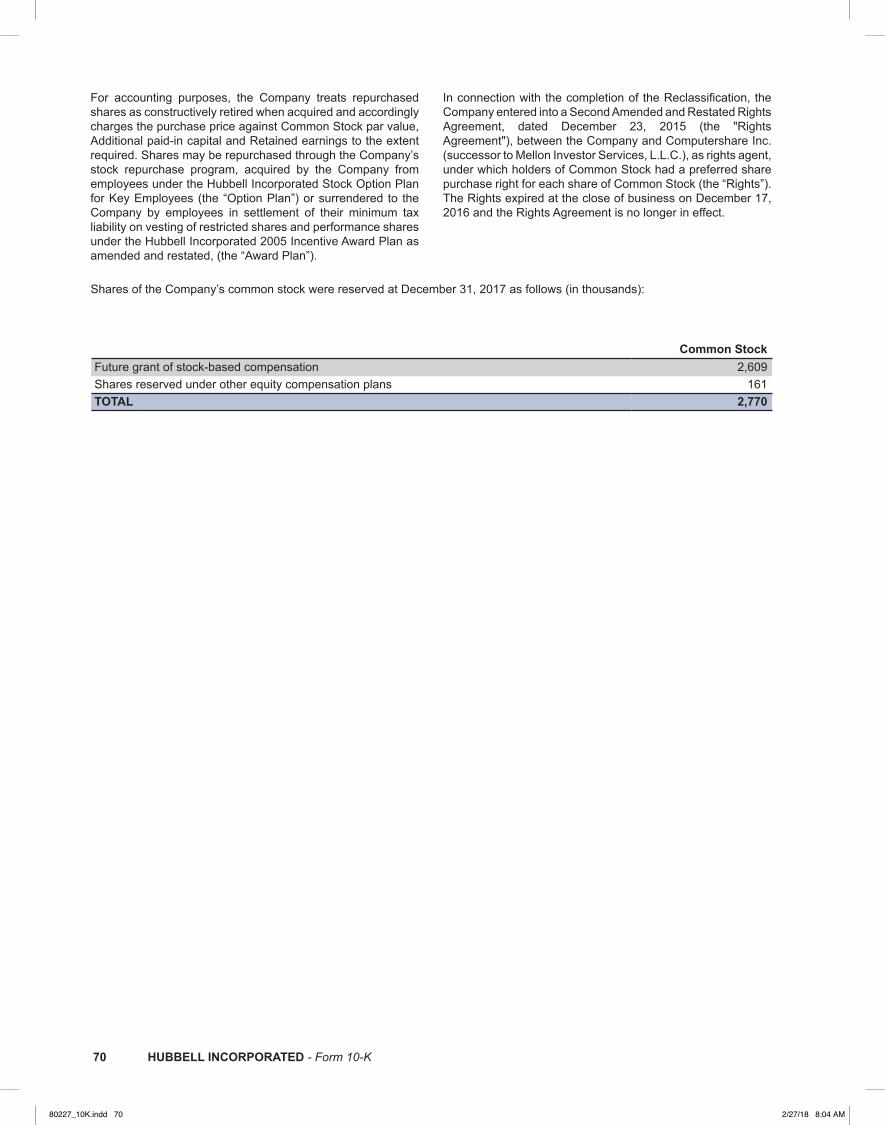
70 HUBBELL INCORPORATED - Form 10-K70 HUBBELL INCORPORATED - Form 10-K
For accounting purposes, the Company treats repurchased shares as constructively retired when acquired and accordingly charges the purchase price against Common Stock par value, Additional paid-in capital and Retained earnings to the extent required. Shares may be repurchased through the Company’s stock repurchase program, acquired by the Company from employees under the Hubbell Incorporated Stock Option Plan for Key Employees (the “Option Plan”) or surrendered to the Company by employees in settlement of their minimum tax liability on vesting of restricted shares and performance shares under the Hubbell Incorporated 2005 Incentive Award Plan as amended and restated, (the “Award Plan”).
In connection with the completion of the Reclassification, the Company entered into a Second Amended and Restated Rights Agreement, dated December 23, 2015 (the "Rights Agreement"), between the Company and Computershare Inc. (successor to Mellon Investor Services, L.L.C.), as rights agent, under which holders of Common Stock had a preferred share purchase right for each share of Common Stock (the “Rights”). The Rights expired at the close of business on December 17, 2016 and the Rights Agreement is no longer in effect.
Shares of the Company’s common stock were reserved at December 31, 2017 as follows (in thousands):
Common Stock Future grant of stock-based compensation 2,609Shares reserved under other equity compensation plans 161TOTAL 2,770
80227_10K.indd 70 2/27/18 8:04 AM
HUBBELL INCORPORATED - Form 10-K 71HUBBELL INCORPORATED - Form 10-K 71
NOTE 16 Stock-Based Compensation
As of December 31, 2017, the Company had various stock-based awards outstanding which were issued to executives and other key employees. The Company recognizes the grant-date fair value of all stock-based awards to employees over their respective requisite service periods (generally equal to an award’s vesting period), net of estimated forfeitures. A stock-based award is considered vested for expense attribution purposes when the employee’s retention of the award is no longer contingent on providing subsequent service. Accordingly, the Company generally recognizes compensation cost immediately for awards granted to retirement-eligible individuals or over the period from the grant date to the date retirement eligibility is achieved, if less than the stated vesting period. The Company’s long-term incentive program for awarding stock-based compensation uses a combination of restricted stock, stock appreciation rights (“SARs”), and performance shares of the Company’s Common Stock pursuant to the Award Plan. The Award Plan was amended and restated during 2015 to add an additional 2.8 million shares. Under the Award Plan, the Company may authorize up to 9.7 million shares of Common Stock in settlement of restricted stock, performance shares, SARs or any-post 2004 grants of stock options. The Company issues new shares for settlement of any stock-based awards. In 2017, the Company granted stock-based awards using a combination of restricted stock, SARs and performance shares.
On December 23, 2015, the Company completed the reclassification of its dual-class common stock into a single class of Common Stock (the “Reclassification”), as more fully described in Note 15 — Capital Stock. At the effective time of the Reclassification, each outstanding stock-based award granted under the Award Plan was adjusted by substituting, on a one for one basis, shares of Common Stock for shares the of Class B Common Stock granted under the Award Plan.
Stock-based compensation expense recognized by the Company was $22.3 million in 2017 and 2016, and was $17.0 million in 2015. The total income tax benefit recognized in 2017 was $5.4 million including the impact of the TCJA, $8.2 million during 2016, and $6.2 million during 2015. The net tax windfall recorded as a result of exercise or vesting (depending on the type of award) was $2.5 million, $3.7 million, and $0.9 million for the years ended December 31, 2017, 2016 and 2015, respectively. As of December 31, 2017, there was $31.1 million, pretax, of total unrecognized compensation cost related to non-vested share-based compensation arrangements. This cost is expected to be recognized through 2020.
Stock-based compensation expense is recorded in S&A expense as well as Cost of goods sold. Of the total 2017 expense, $21.1 million was recorded to S&A expense and $1.2 million was recorded to Cost of goods sold. In 2016 and 2015, $21.6 million and $16.2 million, respectively, was recorded to S&A expense and $0.7 million in 2016 and $0.8 million in 2015, was recorded to Cost of goods sold. Stock-based compensation costs capitalized to inventory was $0.3 million in 2017, and $0.2 million in 2016 and 2015.
Each of the compensation arrangements is discussed below.
Restricted Stock
The Company issues several types of restricted stock awards all of which are considered outstanding at the time of grant, as the award holders are entitled to dividends and voting rights. Unvested restricted stock awards are considered participating securities in computing earnings per share. Restricted stock granted is not transferable and is subject to forfeiture in the event of the recipient’s termination of employment prior to vesting.
Restricted Stock Issued to Employees - Service Condition Service-based restricted stock awards are expensed on a straight-line basis over the requisite service period. The restricted stock vests in one-third increments annually for three years on each anniversary of the date of grant. The restricted stock fair values are measured using the average of the high and low trading prices of the Company’s common stock on the most recent trading day immediately preceding the grant date (“measurement date”).
Restricted Stock Issued to Employees - Market Condition
Certain restricted stock awards issued in 2015, 2016 and 2017 will vest subject to the achievement of a market-based condition. The awards are expensed on a straight-line basis over the requisite service period which starts on the date of the grant and ends upon the completion of the performance period. Expense is recognized irrespective of the market condition being achieved.
The market-based condition is the Company’s total shareholder return (“TSR”) compared to the TSR generated by the companies that comprise the S&P Capital Goods 900 Index and is measured over a three year performance period beginning on January 1st of the first year and ending on December 31st of the third year. The awards will vest contingent upon achievement of the market condition, service through the requisite service period or the retirement-eligibility date. If the market-based condition is achieved, the awards will vest at 100% of the restricted stock awards granted. If the market-based condition is not achieved the awards will not vest. The fair value of these awards was determined based upon a lattice model.
80227_10K.indd 71 2/27/18 8:05 AM

72 HUBBELL INCORPORATED - Form 10-K72 HUBBELL INCORPORATED - Form 10-K
The performance condition for year ending December 31, 2017 was met and 23,280 shares vested and were approved by the Compensation Committee in February 2018. The fair value of the shares at vesting was $3.1 million.
The following table summarizes the assumptions used in estimating the fair value of these awards:
Grant Date
Stock Price onMeasurement
DateExpectedVolatility
Risk FreeInterest Rate Expected Term
Weighted Avg.Grant Date Fair
Value2017 $ 127.51 24.7% 1.9% 3 Years $ 119.882016 $ 113.69 25.6% 1.4% 3 Years $ 104.932015 $ 97.48 23.3% 1.3% 3 Years $ 87.61
Restricted Stock Issued to Non-employee Directors In 2017, 2016 and 2015, each non-employee director received a restricted stock grant. These grants were made on the date of the annual meeting of shareholders and vested or will vest at the following year’s annual meeting of shareholders, upon a change of control or termination of service by reason of death. These shares will be subject to forfeiture if the director’s service terminates prior to the date of the next regularly scheduled annual meeting of shareholders to be held in the following calendar year. During the years 2017, 2016 and 2015, the Company issued to non-employee directors 8,480 shares, 9,128 shares, and 8,008 shares, respectively. Activity related to both employee and non-employee restricted stock for the year ended December 31, 2017 is as follows (in thousands, except per share amounts):
SharesWeighted Average Grant
Date Fair Value/ShareRESTRICTED STOCK AT DECEMBER 31, 2016 224 $ 102.37Shares granted 81 123.39Shares vested (62) 106.06Shares forfeited (4) 104.54RESTRICTED STOCK AT DECEMBER 31, 2017 239 $ 108.51
The weighted average fair value per share of restricted stock granted during the years 2017, 2016 and 2015 was $123.39, $109.95and $96.26, respectively. The total fair value of restricted stock vested during the years 2017, 2016 and 2015 was $6.6 million, $6.4 million and $7.7 million, respectively. Stock Appreciation Rights SARs granted entitle the recipient to the difference between the fair market value of the Company’s Common Stock on the date of exercise and the grant price as determined using the average of the high and the low trading prices of the Company’s common stock on the measurement date. This amount is payable in shares of the Company’s Common Stock. SARs vest and become exercisable in three equal installments during the first three years following their grant date and expire ten years from the grant date. Activity related to SARs for the year ended December 31, 2017 is as follows (in thousands, except per share amounts):
Numberof Rights
Weighted AverageExercise Price
Weighted AverageRemaining Contractual Term
AggregateIntrinsic Value
OUTSTANDING AT DECEMBER 31, 2016 1,811 $ 94.51 Granted 432 127.28 Exercised (191) 70.78 Forfeited (9) 107.39 Canceled (1) 97.48OUTSTANDING AT DECEMBER 31, 2017 2,042 $ 103.59 7.4 Years $ 64,841EXERCISABLE AT DECEMBER 31, 2017 1,241 $ 93.89 6.2 Years $ 51,420
The aggregated intrinsic value of SARs exercised during 2017, 2016 and 2015 was $10.1 million, $13.8 million and $4.8 million, respectively. The fair value of each SAR award was measured using the Black-Scholes option pricing model.
80227_10K.indd 72 2/27/18 8:05 AM

HUBBELL INCORPORATED - Form 10-K 73HUBBELL INCORPORATED - Form 10-K 73
The following table summarizes the weighted-average assumptions used in estimating the fair value of the SARs granted during the years 2017, 2016 and 2015:
Grant DateExpected
Dividend YieldExpectedVolatility
Risk FreeInterest Rate
ExpectedTerm
Weighted Avg. GrantDate Fair Value of 1
SAR2017 2.6% 18.0% 2.2% 5.5 Years $ 17.452016 2.6% 22.3% 1.9% 5.5 Years $ 18.762015 2.7% 22.7% 1.7% 5.5 Years $ 16.05
The expected dividend yield was calculated by dividing the Company’s expected annual dividend by the average stock price for the past three months. Expected volatilities are based on historical volatilities of the Company’s stock for a period consistent with the expected term. The expected term of SARs granted was based upon historical exercise behavior of stock options and SARs. The risk-free interest rate is based on the U.S. Treasury yield curve in effect at the time of grant for the expected term of the award. Performance Shares
Performance shares represent the right to receive a share of the Company’s Common Stock after a three year period subject to the achievement of certain market or performance conditions established by the Company’s Compensation Committee. Partial vesting in these awards may occur after separation from the Company for retirement eligible employees. Shares are not vested until approved by the Company’s Compensation Committee.
Performance Shares - Market Condition
In December 2017, 2016 and 2015, the Company granted 24,675, 29,012 and 32,687, respectively, of performance shares that will vest subject to a market condition and service through the performance period. The market condition associated with the awards is the Company's TSR compared to the TSR generated by the companies of a reference index over a three year performance period. Performance at target will result in vesting and issuance of the number of performance shares granted, equal to 100%payout. Performance below or above target can result in issuance in the range of 0%-200% of the number of shares granted. Expense is recognized irrespective of the market condition being achieved. In February 2018, the Company paid out 15,141 shares related to the December 2014 performance award grant. The performance period associated with this award was from January 1, 2015 through December 31, 2017 and was based upon the Company’s TSR compared to the TSR generated by the other companies that comprise the S&P Capital Goods 900 Index. The number of shares vested in February 2018 was based upon achieving 64% of the market-based criteria and the fair value of the awards at vesting was $2.0 million.
The fair value of the performance share awards with a market condition for the fiscal years 2017, 2016 and 2015 was determined based upon a lattice model.
The following table summarizes the related assumptions used to determine the fair values of the performance share awards with a market condition granted during the years 2017, 2016 and 2015:
Grant DateStock Price on
Measurement DateDividend
YieldExpectedVolatility
Risk FreeInterest Rate
ExpectedTerm
Weighted Avg. GrantDate Fair Value
2017 $ 127.51 2.4% 24.7% 1.9% 3 Years $ 142.892016 $ 113.69 2.5% 25.6% 1.4% 3 Years $ 126.652015 $ 97.48 2.6% 23.3% 1.3% 3 Years $ 105.77
Expected volatilities are based on historical volatilities of the Company’s stock over a three year period. The risk free interest rate is based on the U.S. Treasury yield curve in effect at the time of the grant for the expected term of the award.
Performance Shares - Performance Condition
In December 2017, 2016 and 2015 the Company granted 24,675, 29,012 and 32,687, respectively, of performance share awards that are subject to a performance condition and service requirement during the three year performance period. The performance condition associated with the awards is based on the Company's net sales growth compared to the net sales growth of the companies of a reference index, further adjusted by the Company achieving a target net income margin, each measured over the same three year performance period. Performance at target will result in vesting and issuance of the number of performance shares granted, equal to 100% payout. Performance below or above target can result in issuance in the range of 0%-250% of the number of shares granted.
The fair value of the award is measured based upon the average of the high and low trading prices of the Company's common stock on the measurement date reduced by the present value of dividends expected to be paid during the requisite service period.
80227_10K.indd 73 2/27/18 8:05 AM

74 HUBBELL INCORPORATED - Form 10-K74 HUBBELL INCORPORATED - Form 10-K
The Company expenses these awards on a straight-line basis over the requisite service period and including an assessment of the performance achieved to date. The weighted average fair value per share was $118.55 for the awards granted in 2017.
The following table summarizes the attributes of the performance shares outstanding at December 31, 2017:
Grant DateShares Outstanding
at 12/31/2017Fair
Value Performance Period Payout Range2017 24,675 118.55 Jan 2018-Dec 2020 0-250%2016 28,524 105.48 Jan 2017-Dec 2019 0-250%2015 31,024 97.48 Jan 2016-Dec 2018 0-250%2014 23,688 106.44 Jan 2015-Dec 2017 0-250%
80227_10K.indd 74 2/27/18 8:05 AM
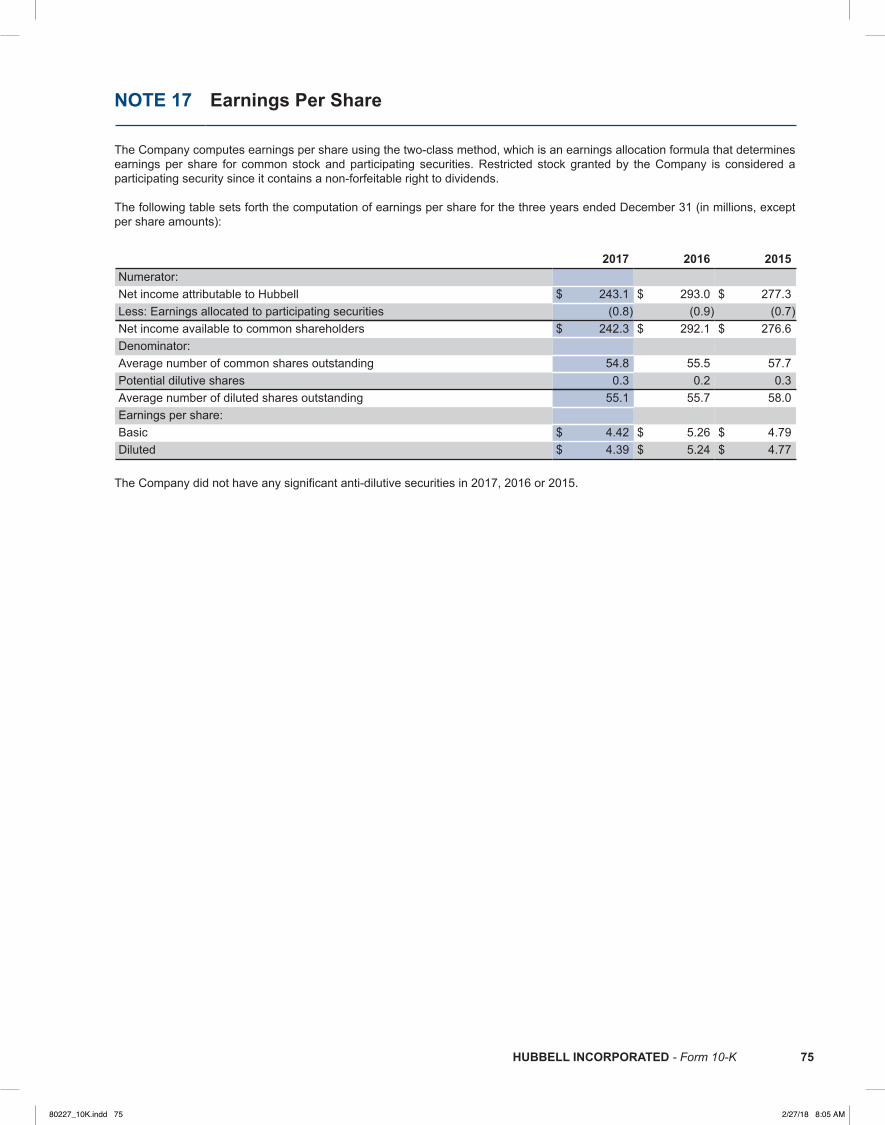
HUBBELL INCORPORATED - Form 10-K 75HUBBELL INCORPORATED - Form 10-K 75
NOTE 17 Earnings Per Share
The Company computes earnings per share using the two-class method, which is an earnings allocation formula that determines earnings per share for common stock and participating securities. Restricted stock granted by the Company is considered a participating security since it contains a non-forfeitable right to dividends. The following table sets forth the computation of earnings per share for the three years ended December 31 (in millions, except per share amounts):
2017 2016 2015Numerator: Net income attributable to Hubbell $ 243.1 $ 293.0 $ 277.3Less: Earnings allocated to participating securities (0.8) (0.9) (0.7)Net income available to common shareholders $ 242.3 $ 292.1 $ 276.6Denominator: Average number of common shares outstanding 54.8 55.5 57.7Potential dilutive shares 0.3 0.2 0.3Average number of diluted shares outstanding 55.1 55.7 58.0Earnings per share: Basic $ 4.42 $ 5.26 $ 4.79Diluted $ 4.39 $ 5.24 $ 4.77
The Company did not have any significant anti-dilutive securities in 2017, 2016 or 2015.
80227_10K.indd 75 2/27/18 8:05 AM
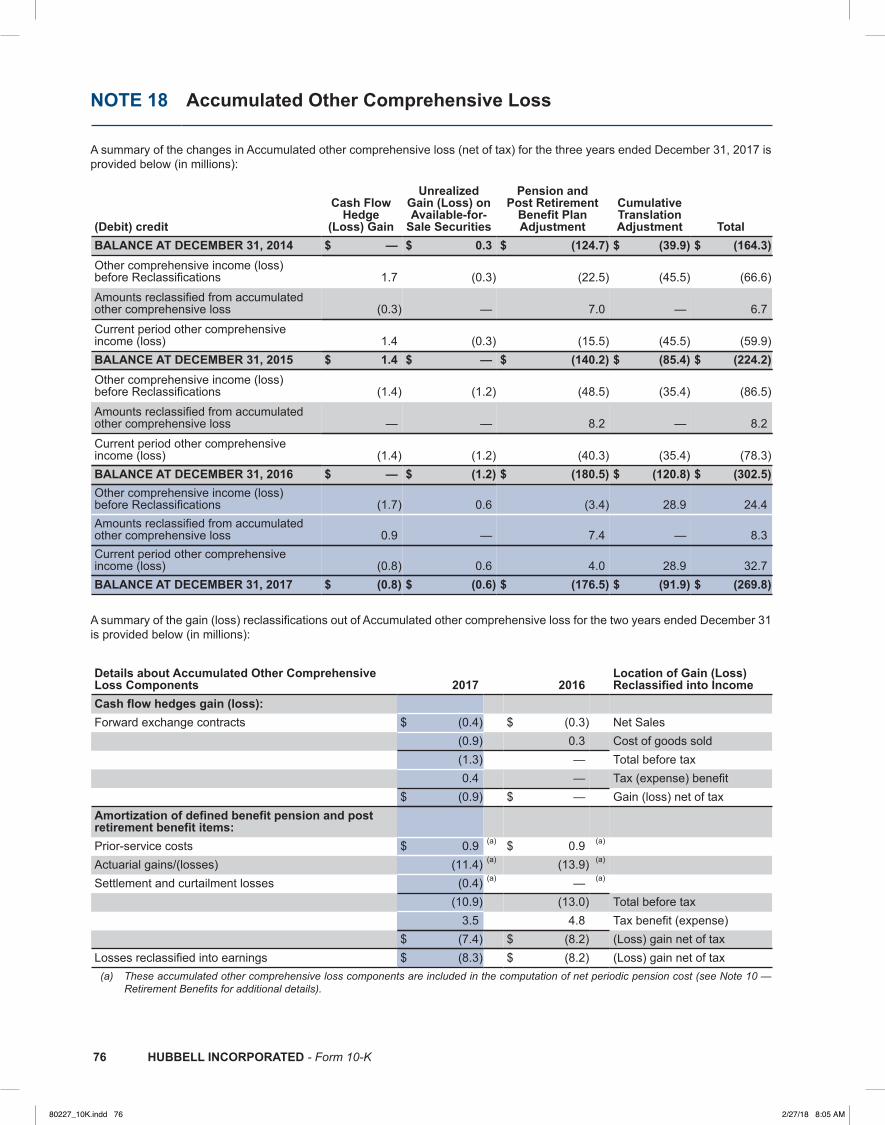
76 HUBBELL INCORPORATED - Form 10-K76 HUBBELL INCORPORATED - Form 10-K
NOTE 18 Accumulated Other Comprehensive Loss
A summary of the changes in Accumulated other comprehensive loss (net of tax) for the three years ended December 31, 2017 is provided below (in millions):
(Debit) credit
Cash FlowHedge
(Loss) Gain
UnrealizedGain (Loss) onAvailable-for-
Sale Securities
Pension andPost Retirement
Benefit Plan Adjustment
CumulativeTranslation Adjustment Total
BALANCE AT DECEMBER 31, 2014 $ — $ 0.3 $ (124.7) $ (39.9) $ (164.3)Other comprehensive income (loss)before Reclassifications 1.7 (0.3) (22.5) (45.5) (66.6)
Amounts reclassified from accumulatedother comprehensive loss (0.3) — 7.0 — 6.7
Current period other comprehensiveincome (loss) 1.4 (0.3) (15.5) (45.5) (59.9)BALANCE AT DECEMBER 31, 2015 $ 1.4 $ — $ (140.2) $ (85.4) $ (224.2)Other comprehensive income (loss)before Reclassifications (1.4) (1.2) (48.5) (35.4) (86.5)
Amounts reclassified from accumulatedother comprehensive loss — — 8.2 — 8.2
Current period other comprehensiveincome (loss) (1.4) (1.2) (40.3) (35.4) (78.3)BALANCE AT DECEMBER 31, 2016 $ — $ (1.2) $ (180.5) $ (120.8) $ (302.5)Other comprehensive income (loss)before Reclassifications (1.7) 0.6 (3.4) 28.9 24.4Amounts reclassified from accumulatedother comprehensive loss 0.9 — 7.4 — 8.3Current period other comprehensiveincome (loss) (0.8) 0.6 4.0 28.9 32.7BALANCE AT DECEMBER 31, 2017 $ (0.8) $ (0.6) $ (176.5) $ (91.9) $ (269.8)
A summary of the gain (loss) reclassifications out of Accumulated other comprehensive loss for the two years ended December 31 is provided below (in millions):
Details about Accumulated Other ComprehensiveLoss Components 2017 2016
Location of Gain (Loss)Reclassified into Income
Cash flow hedges gain (loss): Forward exchange contracts $ (0.4) $ (0.3) Net Sales
(0.9) 0.3 Cost of goods sold (1.3) — Total before tax 0.4 — Tax (expense) benefit $ (0.9) $ — Gain (loss) net of taxAmortization of defined benefit pension and postretirement benefit items: Prior-service costs $ 0.9 (a) $ 0.9 (a) Actuarial gains/(losses) (11.4) (a) (13.9) (a) Settlement and curtailment losses (0.4) (a) — (a)
(10.9) (13.0) Total before tax 3.5 4.8 Tax benefit (expense) $ (7.4) $ (8.2) (Loss) gain net of taxLosses reclassified into earnings $ (8.3) $ (8.2) (Loss) gain net of tax(a) These accumulated other comprehensive loss components are included in the computation of net periodic pension cost (see Note 10 —
Retirement Benefits for additional details).
80227_10K.indd 76 2/27/18 8:05 AM

HUBBELL INCORPORATED - Form 10-K 77HUBBELL INCORPORATED - Form 10-K 77
NOTE 19 Industry Segments and Geographic Area Information
Nature of Operations
Hubbell Incorporated was founded as a proprietorship in 1888, and was incorporated in Connecticut in 1905. Hubbell designs, manufactures and sells quality electrical and electronic products for a broad range of non-residential and residential construction, industrial and utility applications. Products are either sourced complete, manufactured or assembled by subsidiaries in the United States, Canada, Switzerland, Puerto Rico, China, Mexico, the UK, Brazil, Australia and Ireland. Hubbell also participates in joint ventures in Taiwan and Hong Kong, and maintains offices in Singapore, Italy, China, India, Mexico, South Korea and countries in the Middle East. Each of the above references to manufacturing locations, joint venture participation, and office locations relate to the three year period ending December 31, 2017, prior to the acquisition of Aclara on February 2, 2018.
The Company’s reporting segments consist of the Electrical segment and the Power segment, as described below.
The Electrical segment is comprised of businesses that sell stock and custom products including standard and special application wiring device products, rough-in electrical products, connector and grounding products, lighting fixtures and controls, components and assemblies for the natural gas distribution market and other electrical equipment. The products are typically used in and around industrial, commercial and institutional facilities by electrical contractors, maintenance personnel, electricians, utilities, and telecommunications companies. In addition, certain businesses design and manufacture a variety of high voltage test and measurement equipment, industrial controls and communication systems used in the non-residential and industrial markets. Many of these products are designed such that they can also be used in harsh and hazardous locations where a potential for fire and explosion exists due to the presence of flammable gasses and vapors. Harsh and hazardous products are primarily used in the oil and gas (onshore and offshore) and mining industries. There are also a variety of lighting fixtures, wiring devices and electrical products that have residential and utility applications, including residential products with Internet-of-Things ("IoT") enabled technologies. These products are primarily sold through
electrical and industrial distributors, home centers, retail and hardware outlets, lighting showrooms and residential product oriented internet sites. Special application products are primarily sold through wholesale distributors to contractors, industrial customers and OEMs. High voltage products are also sold direct to customers through our sales engineers. The Electrical segment is comprised of three business groups, which have been aggregated as they have similar economic characteristics, customers and distribution channels, among other factors.
The Power segment consists of operations that design and manufacture various distribution, transmission, substation and telecommunications products primarily used by the electrical utility industry. In addition, certain of these products are used in the civil construction and transportation industries. Products are sold to distributors and directly to users such as utilities, telecommunication companies, pipeline and mining operations, industrial firms, construction and engineering firms. Refer to Note 2 — Business Acquisitions for information regarding the Aclara Acquisition on February 2, 2018 and the products and capabilities that acquisition will add to the Power segment.
Financial Information
Financial information by industry segment, product class and geographic area for each of the three years ended December 31, 2017, 2016 and 2015 is summarized below (in millions). When reading the data the following items should be noted:
• Net sales comprise sales to unaffiliated customers — inter-segment and inter-area sales are not significant.
• Segment operating income consists of net sales lessoperating expenses, including total corporate expenses,which are generally allocated to each segment on the basisof the segment’s percentage of consolidated net sales.Interest expense and investment income and otherexpense, net have not been allocated to segments as theseitems are centrally managed by the Company.
• General corporate assets not allocated to segments areprincipally cash, prepaid pensions, investments anddeferred taxes. These assets have not been allocated asthey are centrally managed by the Company.
80227_10K.indd 77 2/27/18 8:05 AM

78 HUBBELL INCORPORATED - Form 10-K78 HUBBELL INCORPORATED - Form 10-K
INDUSTRY SEGMENT DATA
2017 2016 2015Net Sales: Electrical $ 2,532.8 $ 2,460.2 $ 2,388.3Power 1,136.0 1,045.0 1,002.1TOTAL NET SALES $ 3,668.8 $ 3,505.2 $ 3,390.4Operating Income: Electrical $ 282.5 $ 267.4 $ 279.0Power 221.2 210.4 195.6Operating Income $ 503.7 $ 477.8 $ 474.6Interest expense (44.9) (43.4) (31.0)Loss on extinguishment of debt (10.1) — —Investment income and other expense, net (5.6) (4.0) (25.0)INCOME BEFORE INCOME TAXES $ 443.1 $ 430.4 $ 418.6Assets: Electrical $ 2,344.7 $ 2,246.0 $ 2,120.9Power 1,102.2 911.5 839.7General Corporate 273.7 367.5 248.1TOTAL ASSETS $ 3,720.6 $ 3,525.0 $ 3,208.7Capital Expenditures: Electrical $ 48.0 $ 43.4 $ 47.9Power 29.0 22.7 28.4General Corporate 2.7 1.1 0.8TOTAL CAPITAL EXPENDITURES $ 79.7 $ 67.2 $ 77.1Depreciation and Amortization: Electrical $ 65.7 $ 61.2 $ 56.2Power 34.1 31.1 29.0TOTAL DEPRECIATION AND AMORTIZATION $ 99.8 $ 92.3 $ 85.2
PRODUCT CLASS DATA
2017 2016 2015Net Sales: Electrical Systems $ 1,597.1 $ 1,514.4 $ 1,476.7Lighting 935.7 945.8 911.6Power 1,136.0 1,045.0 1,002.1TOTAL NET SALES $ 3,668.8 $ 3,505.2 $ 3,390.4
GEOGRAPHIC AREA DATA
2017 2016 2015Net Sales: United States $ 3,280.9 $ 3,147.4 $ 3,008.4International 387.9 357.8 382.0TOTAL NET SALES $ 3,668.8 $ 3,505.2 $ 3,390.4Operating Income: United States $ 422.1 $ 419.1 $ 426.1International 81.6 58.7 48.5TOTAL OPERATING INCOME $ 503.7 $ 477.8 $ 474.6Long-lived Assets: United States $ 1,877.4 $ 1,762.9 $ 1,627.7International 232.8 200.1 187.1TOTAL LONG-LIVED ASSETS $ 2,110.2 $ 1,963.0 $ 1,814.8
80227_10K.indd 78 2/27/18 8:05 AM
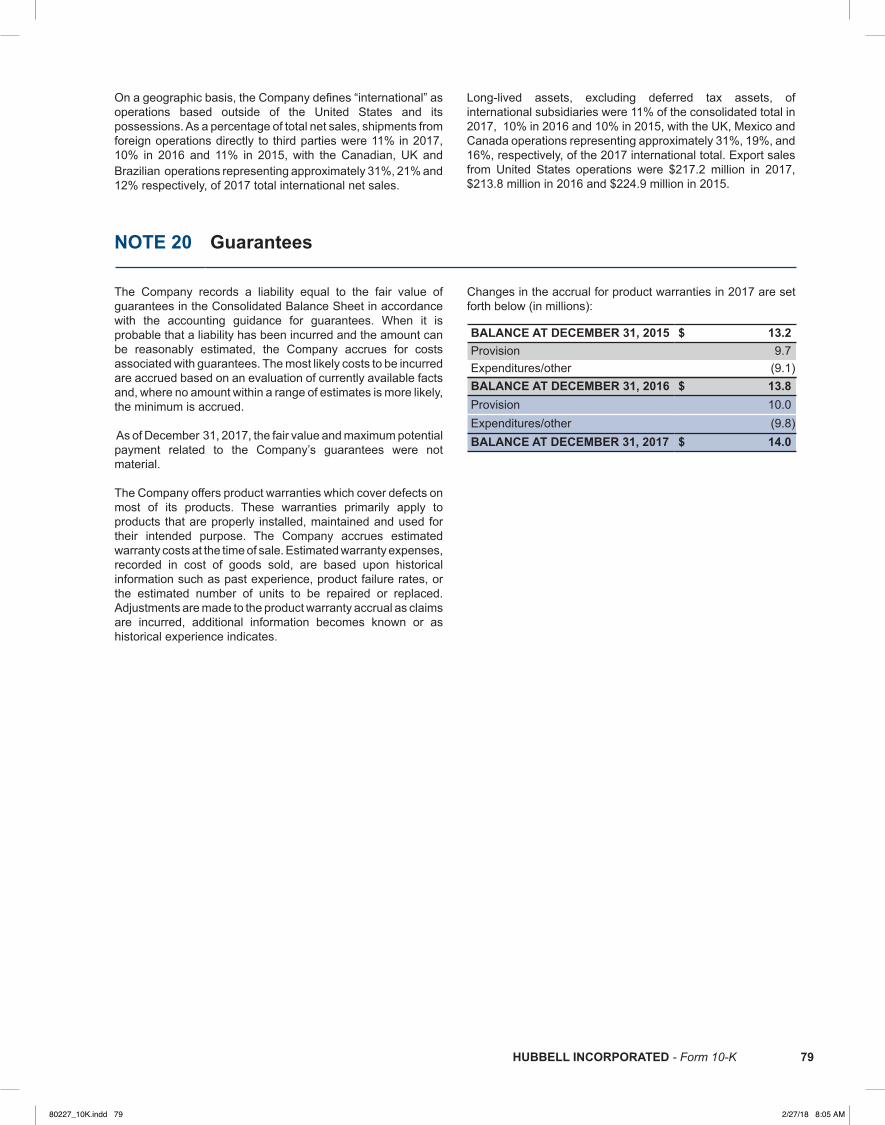
HUBBELL INCORPORATED - Form 10-K 79HUBBELL INCORPORATED - Form 10-K 79
On a geographic basis, the Company defines “international” as operations based outside of the United States and its possessions. As a percentage of total net sales, shipments from foreign operations directly to third parties were 11% in 2017, 10% in 2016 and 11% in 2015, with the Canadian, UK and Brazilian operations representing approximately 31%, 21% and 12% respectively, of 2017 total international net sales.
Long-lived assets, excluding deferred tax assets, of international subsidiaries were 11% of the consolidated total in 2017, 10% in 2016 and 10% in 2015, with the UK, Mexico and Canada operations representing approximately 31%, 19%, and 16%, respectively, of the 2017 international total. Export sales from United States operations were $217.2 million in 2017, $213.8 million in 2016 and $224.9 million in 2015.
NOTE 20 Guarantees
The Company records a liability equal to the fair value of guarantees in the Consolidated Balance Sheet in accordance with the accounting guidance for guarantees. When it is probable that a liability has been incurred and the amount can be reasonably estimated, the Company accrues for costs associated with guarantees. The most likely costs to be incurred are accrued based on an evaluation of currently available facts and, where no amount within a range of estimates is more likely, the minimum is accrued. As of December 31, 2017, the fair value and maximum potential payment related to the Company’s guarantees were not material. The Company offers product warranties which cover defects on most of its products. These warranties primarily apply to products that are properly installed, maintained and used for their intended purpose. The Company accrues estimated warranty costs at the time of sale. Estimated warranty expenses, recorded in cost of goods sold, are based upon historical information such as past experience, product failure rates, or the estimated number of units to be repaired or replaced. Adjustments are made to the product warranty accrual as claims are incurred, additional information becomes known or as historical experience indicates.
Changes in the accrual for product warranties in 2017 are set forth below (in millions):
BALANCE AT DECEMBER 31, 2015 $ 13.2Provision 9.7Expenditures/other (9.1)BALANCE AT DECEMBER 31, 2016 $ 13.8Provision 10.0Expenditures/other (9.8)BALANCE AT DECEMBER 31, 2017 $ 14.0
80227_10K.indd 79 2/27/18 8:05 AM
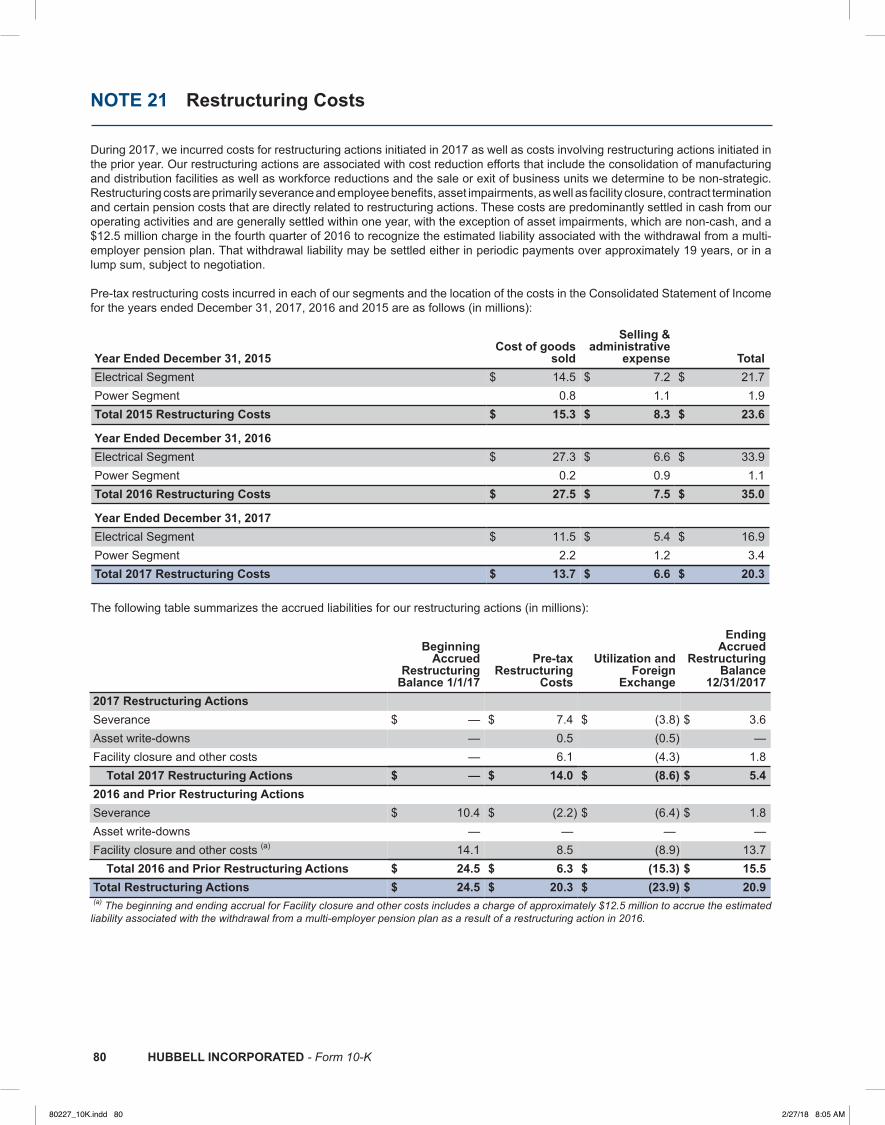
80 HUBBELL INCORPORATED - Form 10-K80 HUBBELL INCORPORATED - Form 10-K
NOTE 21 Restructuring Costs
During 2017, we incurred costs for restructuring actions initiated in 2017 as well as costs involving restructuring actions initiated in the prior year. Our restructuring actions are associated with cost reduction efforts that include the consolidation of manufacturing and distribution facilities as well as workforce reductions and the sale or exit of business units we determine to be non-strategic. Restructuring costs are primarily severance and employee benefits, asset impairments, as well as facility closure, contract termination and certain pension costs that are directly related to restructuring actions. These costs are predominantly settled in cash from our operating activities and are generally settled within one year, with the exception of asset impairments, which are non-cash, and a $12.5 million charge in the fourth quarter of 2016 to recognize the estimated liability associated with the withdrawal from a multi-employer pension plan. That withdrawal liability may be settled either in periodic payments over approximately 19 years, or in a lump sum, subject to negotiation.
Pre-tax restructuring costs incurred in each of our segments and the location of the costs in the Consolidated Statement of Income for the years ended December 31, 2017, 2016 and 2015 are as follows (in millions):
Year Ended December 31, 2015Cost of goods
sold
Selling &administrative
expense TotalElectrical Segment $ 14.5 $ 7.2 $ 21.7Power Segment 0.8 1.1 1.9Total 2015 Restructuring Costs $ 15.3 $ 8.3 $ 23.6
Year Ended December 31, 2016Electrical Segment $ 27.3 $ 6.6 $ 33.9Power Segment 0.2 0.9 1.1Total 2016 Restructuring Costs $ 27.5 $ 7.5 $ 35.0
Year Ended December 31, 2017Electrical Segment $ 11.5 $ 5.4 $ 16.9Power Segment 2.2 1.2 3.4Total 2017 Restructuring Costs $ 13.7 $ 6.6 $ 20.3
The following table summarizes the accrued liabilities for our restructuring actions (in millions):
BeginningAccrued
RestructuringBalance 1/1/17
Pre-taxRestructuring
Costs
Utilization andForeign
Exchange
EndingAccrued
RestructuringBalance
12/31/20172017 Restructuring ActionsSeverance $ — $ 7.4 $ (3.8) $ 3.6Asset write-downs — 0.5 (0.5) —Facility closure and other costs — 6.1 (4.3) 1.8 Total 2017 Restructuring Actions $ — $ 14.0 $ (8.6) $ 5.42016 and Prior Restructuring ActionsSeverance $ 10.4 $ (2.2) $ (6.4) $ 1.8Asset write-downs — — — —Facility closure and other costs (a) 14.1 8.5 (8.9) 13.7 Total 2016 and Prior Restructuring Actions $ 24.5 $ 6.3 $ (15.3) $ 15.5Total Restructuring Actions $ 24.5 $ 20.3 $ (23.9) $ 20.9 (a) The beginning and ending accrual for Facility closure and other costs includes a charge of approximately $12.5 million to accrue the estimated liability associated with the withdrawal from a multi-employer pension plan as a result of a restructuring action in 2016.
80227_10K.indd 80 2/27/18 8:05 AM

HUBBELL INCORPORATED - Form 10-K 81HUBBELL INCORPORATED - Form 10-K 81
The actual and expected costs for our restructuring actions are as follows (in millions):
ExpectedCosts
Costsincurred in
2015
Costsincurred in
2016
Costsincurred in
2017
Remainingcosts at12/31/17
2017 Restructuring ActionsElectrical Segment $ 13.0 $ — $ — $ 10.6 $ 2.4Power Segment 3.9 — — 3.4 0.5 Total 2017 Restructuring Actions $ 16.9 $ — $ — $ 14.0 $ 2.92016 Restructuring ActionsElectrical Segment $ 35.4 $ — $ 30.7 $ 3.8 $ 0.9Power Segment 1.3 — 1.1 — 0.2 Total 2016 Restructuring Actions $ 36.7 $ — $ 31.8 $ 3.8 $ 1.12015 Restructuring ActionsElectrical Segment $ 23.0 $ 17.3 $ 3.2 $ 2.5 $ —Power Segment 1.9 1.9 — — — Total 2015 and Prior Restructuring Actions $ 24.9 $ 19.2 $ 3.2 $ 2.5 $ —Total Restructuring Actions $ 78.5 $ 19.2 $ 35.0 $ 20.3 $ 4.0
Costs incurred in 2016 relating to 2016 Restructuring Actions in the Electrical segment in the preceding table include the $12.5 million previously mentioned charge representing the estimated withdrawal liability from a multi-employer pension plan. Any potential future liability in excess of the amount already recognized in 2016 is not included in the remaining costs at December 31, 2017 in the preceding table. Additional information about the estimated withdrawal liability is included in Note 10 — Retirement Benefits in the Notes to Consolidated Financial Statements.
80227_10K.indd 81 2/27/18 8:05 AM

82 HUBBELL INCORPORATED - Form 10-K82 HUBBELL INCORPORATED - Form 10-K
NOTE 22 Quarterly Financial Data (Unaudited)
The table below sets forth summarized quarterly financial data for the years ended December 31, 2017 and 2016 (in millions, except per share amounts):
Reported First
QuarterReported Second
QuarterReported Third
Quarter Fourth Quarter2017 Net sales $ 852.3 $ 948.3 $ 950.5 $ 917.7Cost of goods sold $ 590.5 $ 653.6 $ 643.6 $ 629.2Gross profit $ 261.8 $ 294.7 $ 306.9 $ 288.5Selling & administrativeexpenses $ 157.7 $ 164.1 $ 160.5 $ 165.8Net income (1) $ 63.9 $ 80.8 $ 82.8 $ 22.4Net Income attributable to Hubbell (1) $ 62.8 $ 79.1 $ 80.8 $ 20.4Earnings per share — Basic $ 1.13 $ 1.44 $ 1.47 $ 0.37Earnings per share — Diluted $ 1.13 $ 1.43 $ 1.47 $ 0.37(1) Net income in the fourth quarter of 2017 includes approximately $57 million, or $1.02 per share, impact associated with the TCJA.
Reported FirstQuarter
Reported SecondQuarter
Reported ThirdQuarter Fourth Quarter
2016 Net sales $ 834.8 $ 908.8 $ 907.4 $ 854.2Cost of goods sold $ 574.9 $ 615.3 $ 618.7 $ 595.6Gross profit $ 259.9 $ 293.5 $ 288.7 $ 258.6
Selling & administrativeexpenses $ 158.0 $ 161.4 $ 152.7 $ 150.8Net income $ 62.0 $ 82.0 $ 88.1 $ 65.7Net Income attributable toHubbell $ 60.9 $ 81.0 $ 86.7 $ 64.4Earnings per share — Basic $ 1.08 $ 1.46 $ 1.56 $ 1.16Earnings per share — Diluted $ 1.08 $ 1.45 $ 1.56 $ 1.16
NOTE 23 Subsequent Events
On February 2, 2018, the Company acquired Aclara for approximately $1.1 billion. Aclara is a provider of smart infrastructure solutions for electric, gas, and water utilities, with advanced metering solutions and grid monitoring sensor technology, as well as leading software enabled installation services. The acquisition extends the Power segment's capabilities into smart automation technologies, accelerates ongoing innovation efforts to address utility customer demand for data and integrated solutions, and expands the segment's reach to a broader set of utility customers.
The Company funded the acquisition of Aclara with cash raised from a public debt offering of $450 million of long-term unsecured, unsubordinated notes, placement of $500 million under the Term Loan Agreement, and the issuance of commercial paper for the remaining purchase price.
Refer to Note 2 — Business Acquisitions and Note 11 — Debt, in the Notes to Consolidated Financial Statements for additional information.
80227_10K.indd 82 2/27/18 8:05 AM
HUBBELL INCORPORATED - Form 10-K 83HUBBELL INCORPORATED - Form 10-K 83
ITEM 9 Changes in and Disagreements with Accountants on Accounting and Financial DisclosureNot applicable.
ITEM 9A Controls and Procedures The Company maintains disclosure controls and procedures that are designed to ensure that information required to be disclosed in Exchange Act reports is recorded, processed, summarized and reported within the time periods specified in the SEC’s rules and forms, and that such information is accumulated and communicated to management, including the Chief Executive Officer and Chief Financial Officer, as appropriate, to allow timely decisions regarding required disclosure. Management necessarily applied its judgment in assessing the costs and benefits of such controls and procedures which, by their nature, can provide only reasonable assurance that the controls and procedures will meet their objectives. The Company carried out an evaluation, under the supervision and with the participation of management, including the Chief Executive Officer and Chief Financial Officer, of the effectiveness of the design and operation of the Company’s disclosure controls and procedures as defined in Exchange Act Rules 13a-15(e) and 15d-15(e), as of the end of the period covered by this report on Form 10-K. Based upon that evaluation, each of the Chief Executive Officer and Chief Financial Officer concluded that the Company’s disclosure controls and procedures are effective at a reasonable assurance level. Management’s annual report on internal control over financial reporting and the independent registered public accounting firm’s audit report on the effectiveness of our internal control over financial reporting as of December 31, 2017 are included in Item 8 of this Annual Report on Form 10-K. There have been no changes in the Company’s internal control over financial reporting that occurred during the Company’s most recently completed quarter that have materially affected, or are reasonably likely to materially affect, the Company’s internal control over financial reporting.
ITEM 9B Other Information Not applicable.
80227_10K.indd 83 2/27/18 8:05 AM

84 HUBBELL INCORPORATED - Form 10-K84 HUBBELL INCORPORATED - Form 10-K
PART III
ITEM 10 Directors, Executive Officers and Corporate Governance(1)
ITEM 11 Executive Compensation(2)
ITEM 12 Security Ownership of Certain Beneficial Owners and Management and Related Stockholder Matters
Equity Compensation Plan Information
The following table provides information as of December 31, 2017 with respect to the Company’s common stock that may be issued under the Company’s equity compensation plans (in thousands, except per share amounts):
A B C
Plan Category
Number of Securities to beIssued upon Exercise of
OutstandingOptions,Warrants and Rights
Weighted AverageExercise Price of
Outstanding Options,Warrants and Rights
Number of SecuritiesRemaining Available forFuture Issuance Under
Equity Compensation Plans(Excluding Securities
Reflected in Column A) Equity Compensation Plans Approved by Shareholders(a) 2,528
(c)(e)$ 103.60
(f)2,609
(c)
Equity Compensation Plans Not Requiring Shareholder Approval(b) 66
(c)(d)— 161
(c)
TOTAL 2,594 $ 103.60 2,770 (a) The Company’s (1) Stock Option Plan for Key Employees and (2) 2005 Incentive Award Plan as amended and restated.(b) The Company’s Deferred Compensation Plan for Directors as amended and restated.(c) Hubbell Common Stock.(d) Represents amount of shares currently deferred under this plan. These shares are not included in the total weighted average exercise price
included in column B.(e) Includes 486 thousand performance share awards assuming a maximum payout target. The Company does not anticipate that the maximum
payout target will be achieved for all of these awards.(f) Weighted average exercise price excludes performance share awards included in column A.
The remaining information required by this item is incorporated by reference to the subheading “Voting Rights and Security Ownership of Certain Beneficial Owners and Management” of the definitive proxy statement for the Company’s annual meeting of shareholders scheduled to be held on May 1, 2018.
(1) Certain of the information required by this item regarding executive officers is included under the subheading “Executive Officers of the Registrant” at the end of Part I of this Form 10-K and the remaining required information is incorporated by reference to the subheadings “Election of Directors – Proposal 1," “General – Section 16(a) Beneficial Ownership Reporting Compliance,” “Corporate Governance – Code of Business Conduct and Ethics,” and “Corporate Governance – Board Committees – Audit Committee” of the definitive proxy statement for the Company’s annual meeting of shareholders scheduled to be held on May 1, 2018.
(2) The information required by this item is incorporated by reference to the subheadings “Compensation Discussion and Analysis,” “Compensation Committee Report,” “Executive Compensation” and “Compensation of Directors” of the definitive proxy statement for the Company’s annual meeting of shareholders scheduled to be held on May 1, 2018.
80227_10K.indd 84 2/27/18 8:05 AM

HUBBELL INCORPORATED - Form 10-K 85HUBBELL INCORPORATED - Form 10-K 85
ITEM 13 Certain Relationships and Related Transactions and Director Independence(3)
ITEM 14 Principal Accountant Fees and Services(4)
(3) The information required by this item is incorporated by reference to the subheadings “General – Review and Approval of Related Person Transactions” and “Corporate Governance – Director Independence” of the definitive proxy statement for the Company’s annual meeting of shareholders scheduled to be held on May 1, 2018.
(4) The information required by this item is incorporated by reference to the heading “Ratification of the Selection of Independent Registered Public Accounting Firm – Proposal 2” of the definitive proxy statement for the Company’s annual meeting of shareholders scheduled to be held on May 1, 2018.
80227_10K.indd 85 2/27/18 8:05 AM

86 HUBBELL INCORPORATED - Form 10-K86 HUBBELL INCORPORATED - Form 10-K
PART IV
ITEM 15 Exhibits and Financial Statement Schedule
1. Financial Statements and Schedule
Financial statements and schedule listed in the Index to Financial Statements and Schedule are filed as part of this Annual Report on Form 10-K.
2. Exhibits
Incorporated by Reference
Number Description Form File No. ExhibitFilingDate
Filed/Furnished
Herewith2.1†† Agreement and Plan of Merger, dated as of December 22, 2017,
by and among Meter Readings Holding Group, LLC, Hubbell Power Systems, Inc., Yellow Merger Sub, Inc., Sun Meter Readings, LP, as representative for the members and optionholders, and, for the limited purposes set forth therein, Hubbell Incorporated.
8-K 001-02958 2.1 12/26/2017
3.1 Amended and Restated Certificate of Incorporation, as amended and restated as of December 23, 2015
8-A12B 001-02958 3.1 12/23/2015
3.2 Amended and Restated By-Laws of Hubbell Incorporated, as amended on May 7, 2013
8-K 001-02958 3.1 5/10/2013
4.1 Senior Indenture, dated as of September 15, 1995, between Hubbell Incorporated and The Bank of New York Mellon Trust Company, N.A. (formerly known as The Bank of New York Trust Company, N.A.(successor as trustee to JPMorgan Chase Bank N.A. (formerly known as JPMorgan Chase Bank, formerly known as The Chase Manhattan Bank, formerly known as Chemical Bank))), as trustee
S-4 333-90754 4a 6/18/2002
4.2 First Supplemental Indenture, dated as of June 2, 2008, between Hubbell Incorporated and The Bank of New York Mellon Trust Company, N.A. (formerly known as The Bank of New York Trust Company, N.A.(successor as trustee to JPMorgan Chase Bank N.A. (formerly known as JPMorgan Chase Bank, formerly known as The Chase Manhattan Bank, formerly known as Chemical Bank))), as trustee, including the form of 5.95% Senior Notes due 2018
8-K 001-02958 4.2 6/2/2008
4.3 Second Supplemental Indenture, dated as of November 17, 2010, between Hubbell Incorporated and The Bank of New York Mellon Trust Company, N.A. (formerly known as The Bank of New York Trust Company, N.A.(successor as trustee to JPMorgan Chase Bank N.A. (formerly known as JPMorgan Chase Bank, formerly known as The Chase Manhattan Bank, formerly known as Chemical Bank))), as trustee, including the form of 3.625% Senior Notes due 2022
8-K 001-02958 4.2 11/17/2010
4.4 Third Supplemental Indenture, dated as of March 1, 2016, between Hubbell Incorporated and The Bank of New York Mellon Trust Company, N.A. (formerly known as The Bank of New York Trust Company, N.A. (successor as trustee to JPMorgan Chase Bank, N.A. (formerly known as JPMorgan Chase Bank, formerly known as The Chase Manhattan Bank, formerly known as Chemical Bank))), as trustee
8-K 001-02958 4.2 3/1/2016
4.5 Form of 3.350% Senior Notes due 2026 8-K 001-02958 4.3 3/1/2016
80227_10K.indd 86 2/27/18 8:05 AM

HUBBELL INCORPORATED - Form 10-K 87HUBBELL INCORPORATED - Form 10-K 87
Incorporated by Reference
Number Description Form File No. ExhibitFilingDate
Filed/Furnished
Herewith4.6 Fourth Supplemental Indenture, dated as of August 3, 2017,
between Hubbell Incorporated and The Bank of New York Mellon Trust Company, N.A. (formerly known as The Bank of New York Trust Company, N.A. (successor as trustee to JPMorgan Chase Bank, N.A. (formerly known as JPMorgan Chase Bank, formerly known as The Chase Manhattan Bank, formerly known as Chemical Bank))), as trustee.
8-K 001-02958 4.2 8/3/2017
4.7 Form of 3.150% Senior Notes due 2027 8-K 001-02958 4.3 8/3/20174.8 Fifth Supplemental Indenture, dated as of February 2, 2018,
between Hubbell Incorporated and The Bank of New York Mellon Trust Company, N.A. (formerly known as The Bank of New York Trust Company, N.A. (successor as trustee to JPMorgan Chase Bank, N.A. (formerly known as JPMorgan Chase Bank, formerly known as The Chase Manhattan Bank, formerly known as Chemical Bank))), as trustee.
8-K 001-02958 4.2 2/2/2018
4.9 Form of 3.500% Senior Notes due 2028 8-K 001-02958 4.3 2/2/20184.10 Second Amended and Restated Rights Agreement, dated as of
December 23, 2015, between Hubbell Incorporated and Computershare, Inc. (successor to Mellon Investor Services LLC and ChaseMellon Shareholder Services, L.L.C.), as Rights Agent
8-A12B 001-02958 4.1 12/23/2015
10.1† Hubbell Incorporated Amended and Restated Supplemental Executive Retirement Plan, as amended and restated effective January 1, 2005
10-Q 001-02958 10a 10/26/2007
10.1(a)† Amendment, dated February 15, 2008, to Hubbell Incorporated Amended and Restated Supplemental Executive Retirement Plan, as amended and restated effective January 1, 2005
10-K 001-02958 10.nn 2/25/2008
10.1(b)† Amendment, dated December 28, 2010, to Hubbell Incorporated Amended and Restated Supplemental Executive Retirement Plan, as amended and restated effective January 1, 2005
10-K 001-02958 10a(1) 2/16/2011
10.1(c)† Third Amendment, dated December 29, 2016, to Hubbell Incorporated Amended and Restated Supplemental Executive Retirement Plan, as amended and restated effective January 1, 2005
10-K 001-02958 10.1(c) 2/16/2017
10.2† Hubbell Incorporated Retirement Plan for Directors, as amended and restated effective January 1, 2005
10-Q 001-02958 10i 10/26/2007
10.3† Hubbell Incorporated Deferred Compensation Plan for Directors, as amended and restated effective December 23, 2015
S-8POS 333-206898 4.4 12/24/2015
10.4† Hubbell Incorporated Executive Deferred Compensation Plan, as amended and restated effective January 1, 2016
10-K 001-02958 10.5 2/18/2016
10.5† Hubbell Incorporated Amended and Restated Top Hat Restoration Plan, as amended and restated effective January 1, 2005
10-Q 001-02958 10w 10/26/2007
10.5(a)† Amendment, dated December 28, 2010, to Hubbell Incorporated Amended and Restated Top Hat Restoration Plan, as amended and restated effective January 1, 2005
10-K 001-02958 10w(1) 2/16/2011
10.5(b)† Second Amendment, dated January 17, 2017, to Hubbell Incorporated Amended and Restated Top Hat Restoration Plan, as amended and restated effective January 1, 2005
10-K 001-02958 10.5(b) 2/16/2017
10.6† Hubbell Incorporated Incentive Compensation Plan, adopted effective January 1, 2002
10-K 001-02958 10z 3/20/2002
10.7† Hubbell Incorporated Senior Executive Incentive Compensation Plan, as amended and restated effective January 1, 2016
8-K 001-02958 10.1 5/9/2016
10.8† Hubbell Incorporated 2005 Incentive Award Plan, as amended and restated effective December 6, 2016
8-K 001-02958 10.1 12/12/2016
10.8(a)† Amendment, dated December 23, 2015, to the Hubbell Incorporated 2005 Incentive Award Plan
10-K 001-02958 10.9(a) 2/18/2016
10.9† Form of Restricted Stock Award Agreement for Directors under the Hubbell Incorporated 2005 Incentive Award Plan, as amended and restated
10-Q 001-02958 10.8 7/19/2013
10.10† Form of Stock Appreciation Rights Award Agreement under the Hubbell Incorporated 2005 Incentive Award Plan, as amended and restated
10-K 001-02958 10.10 2/16/2017
10.11† Form of Performance Share Award Agreement under the Hubbell Incorporated 2005 Incentive Award Plan, as amended and restated
10-K 001-02958 10.11 2/16/2017
10.12† Form of Performance Based Restricted Stock Award Agreement under the Hubbell Incorporated 2005 Incentive Award Plan, as amended and restated
10-K 001-02958 10.12 2/16/2017
80227_10K.indd 87 2/27/18 8:05 AM
88 HUBBELL INCORPORATED - Form 10-K88 HUBBELL INCORPORATED - Form 10-K
Incorporated by Reference
Number Description Form File No. ExhibitFilingDate
Filed/Furnished
Herewith10.13† Form of Restricted Stock Award Agreement under the Hubbell
Incorporated 2005 Incentive Award Plan, as amended and restated
10-K 001-02958 10.13 2/16/2017
10.14† Hubbell Incorporated Defined Contribution Restoration Plan, as amended and restated effective December 8, 2015
10-K 001-02958 10.16 2/18/2016
10.14(a)† First Amendment, dated January 17, 2017 and effective as of January 1, 2017, to Hubbell Incorporated Defined Contribution Restoration Plan, as amended and restated effective December 8, 2015
10-K 001-02958 10.14(a) 2/16/2017
10.15† Hubbell Incorporated Policy for Providing Severance Payments to Senior Employees, effective February 11, 2011
8-K 001-02958 10.1 2/16/2011
10.16† Grantor Trust for Senior Management Plans Trust Agreement between Hubbell Incorporated and The Bank of New York, as trustee, as amended and restated effective December 8, 2015
10-K 001-02958 10.18 2/18/2016
10.17† Grantor Trust for Non-Employee Director Plans Trust Agreement between Hubbell Incorporated and The Bank of New York, as amended and restated effective December 8, 2015
10-K 001-02958 10.19 2/18/2016
10.18† Trust Agreement by and between Hubbell Incorporated and MG Trust Company d/b/a Matrix Trust Company, as Trustee, as amended and restated effective November 6, 2015
10-K 001-02958 10.20 2/18/2016
10.19† Change in Control Severance Agreement, dated as of December 31, 2010, between Hubbell Incorporated and David G. Nord
8-K 001-02958 10.2 1/5/2011
10.19(a)† Amendment, dated as of January 1, 2013, to Change in Control Severance Agreement between Hubbell Incorporated and David G. Nord
8-K 001-02958 10.1 12/6/2012
10.20† Letter Agreement, dated August 24, 2005, between Hubbell Incorporated and David G. Nord
8-K 001-02958 99.1 9/6/2005
10.21† Change in Control Severance Agreement, dated as of December 31, 2010, between Hubbell Incorporated and William R. Sperry
8-K 001-02958 10.1 9/17/2012
10.21(a)† Amendment, dated September 11, 2012, to Change in Control Severance Agreement between Hubbell Incorporated and William R. Sperry
8-K 001-02958 10.2 9/17/2012
10.22† Change in Control Severance Agreement, dated as of September 11, 2012, between Hubbell Incorporated and An-Ping Hsieh
10-Q 001-02958 10.xx 10/19/2012
10.23† Letter Agreement, dated as of August 2, 2012, between Hubbell Incorporated and An-Ping Hsieh
10-Q 001-02958 10.1 7/19/2013
10.24† Change in Control Severance Agreement, dated as of April 15, 2013, between Hubbell Incorporated and Mr. Joseph A. Capozzoli
8-K 001-02958 10.1 4/19/2013
10.25† Letter Agreement, dated as of February 11, 2013, between Hubbell Incorporated and Mr. Joseph A. Capozzoli
8-K 001-02958 10.2 4/19/2013
10.26† Change in Control Severance Agreement, dated as of December 31, 2010, between Hubbell Incorporated and Stephen M. Mais
10-Q 001-02958 10.3 7/19/2013
10.27† Change in Control Severance Agreement, dated as of January 24, 2014, between Hubbell Incorporated and Gerben Bakker
10-K 001-02958 10.36 2/18/2014
10.28† Change in Control Severance Agreement, dated as of February 9, 2015, between Hubbell Incorporated and Maria Lee
10-K 001-02958 10.31 2/18/2016
10.29† Change in Control Severance Agreement, dated as of May 5, 2015, between Hubbell Incorporated and Kevin A. Poyck
10-K 001-02958 10.32 2/18/2016
10.30† Change in Control Severance Agreement, dated as of May 5, 2015, between Hubbell Incorporated and Rodd R. Ruland
10-K 001-02958 10.33 2/18/2016
10.31† Change in Control Severance Agreement, dated as of May 5, 2015, between Hubbell Incorporated and Darrin S. Wegman
10-K 001-02958 10.34 2/18/2016
10.32 Term Loan Agreement, dated as of January 31, 2018, among Hubbell Incorporated, the Lenders party hereto and JPMorgan Chase Bank, N.A., as Administrative Agent.
8-K 001-02958 99.1 1/31/2018
10.33 Credit Agreement dated as of January 31, 2018, among Hubbell Incorporated, Hubbell Power Holdings S.à r.l., Harvey Hubbell Holdings S.à r.l., the Lenders party hereto, the Issuing Banks party hereto and JPMorgan Chase Bank, N.A., as Administrative Agent.
8-K 001-02958 99.2 1/31/2018
10.34 First Amendment, dated as of January 10, 2018, by and among Hubbell Incorporated, Hubbell Power Holdings S.à r.l., and Harvey Hubbell Holdings S.à r.l, the lenders party thereto, and JPMorgan Chase Bank, N.A., as Administrative Agent.
8-K 001-02958 10.1 1/11/2018
80227_10K.indd 88 2/27/18 8:05 AM
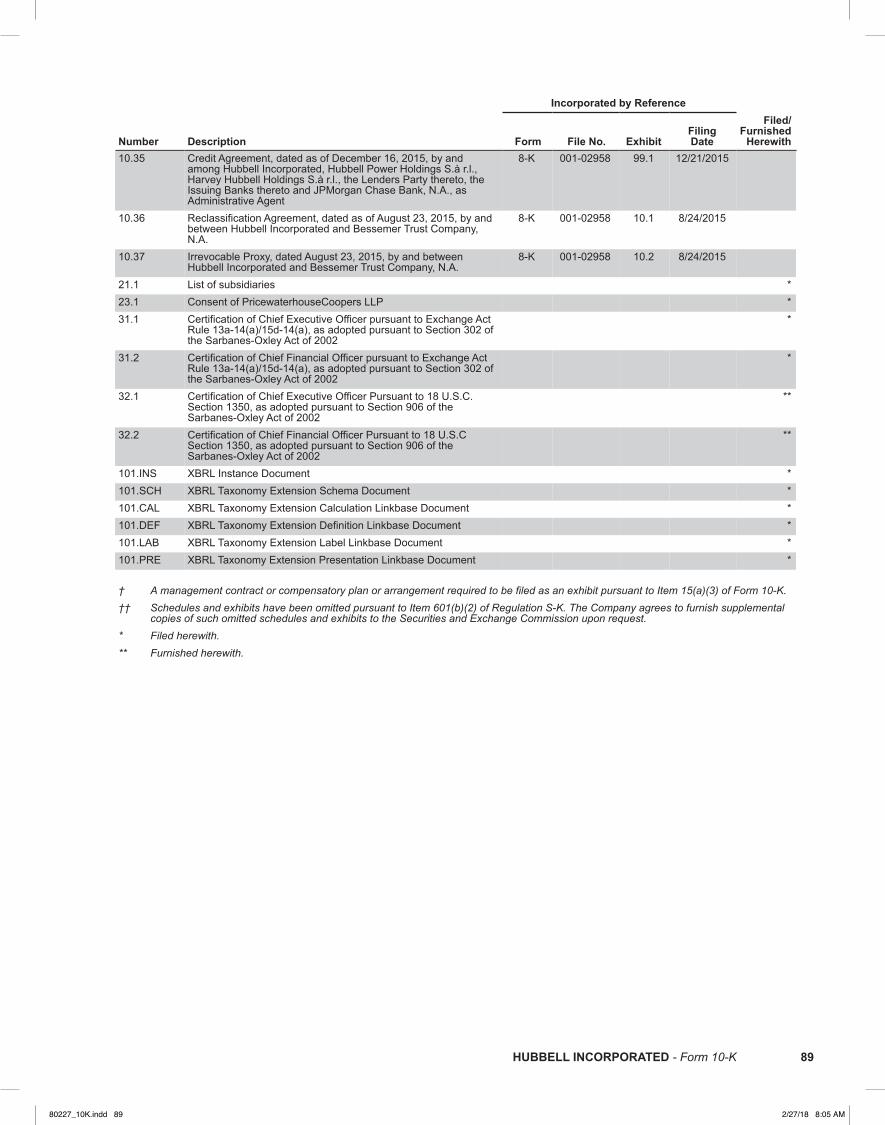
HUBBELL INCORPORATED - Form 10-K 89HUBBELL INCORPORATED - Form 10-K 89
Incorporated by Reference
Number Description Form File No. ExhibitFilingDate
Filed/Furnished
Herewith10.35 Credit Agreement, dated as of December 16, 2015, by and
among Hubbell Incorporated, Hubbell Power Holdings S.à r.l., Harvey Hubbell Holdings S.à r.l., the Lenders Party thereto, the Issuing Banks thereto and JPMorgan Chase Bank, N.A., as Administrative Agent
8-K 001-02958 99.1 12/21/2015
10.36 Reclassification Agreement, dated as of August 23, 2015, by and between Hubbell Incorporated and Bessemer Trust Company, N.A.
8-K 001-02958 10.1 8/24/2015
10.37 Irrevocable Proxy, dated August 23, 2015, by and between Hubbell Incorporated and Bessemer Trust Company, N.A.
8-K 001-02958 10.2 8/24/2015
21.1 List of subsidiaries *23.1 Consent of PricewaterhouseCoopers LLP *31.1 Certification of Chief Executive Officer pursuant to Exchange Act
Rule 13a-14(a)/15d-14(a), as adopted pursuant to Section 302 of the Sarbanes-Oxley Act of 2002
*
31.2 Certification of Chief Financial Officer pursuant to Exchange Act Rule 13a-14(a)/15d-14(a), as adopted pursuant to Section 302 of the Sarbanes-Oxley Act of 2002
*
32.1 Certification of Chief Executive Officer Pursuant to 18 U.S.C. Section 1350, as adopted pursuant to Section 906 of the Sarbanes-Oxley Act of 2002
**
32.2 Certification of Chief Financial Officer Pursuant to 18 U.S.C Section 1350, as adopted pursuant to Section 906 of the Sarbanes-Oxley Act of 2002
**
101.INS XBRL Instance Document *101.SCH XBRL Taxonomy Extension Schema Document *101.CAL XBRL Taxonomy Extension Calculation Linkbase Document *101.DEF XBRL Taxonomy Extension Definition Linkbase Document *101.LAB XBRL Taxonomy Extension Label Linkbase Document *101.PRE XBRL Taxonomy Extension Presentation Linkbase Document *
† A management contract or compensatory plan or arrangement required to be filed as an exhibit pursuant to Item 15(a)(3) of Form 10-K.†† Schedules and exhibits have been omitted pursuant to Item 601(b)(2) of Regulation S-K. The Company agrees to furnish supplemental
copies of such omitted schedules and exhibits to the Securities and Exchange Commission upon request.* Filed herewith.** Furnished herewith.
80227_10K.indd 89 2/27/18 8:05 AM
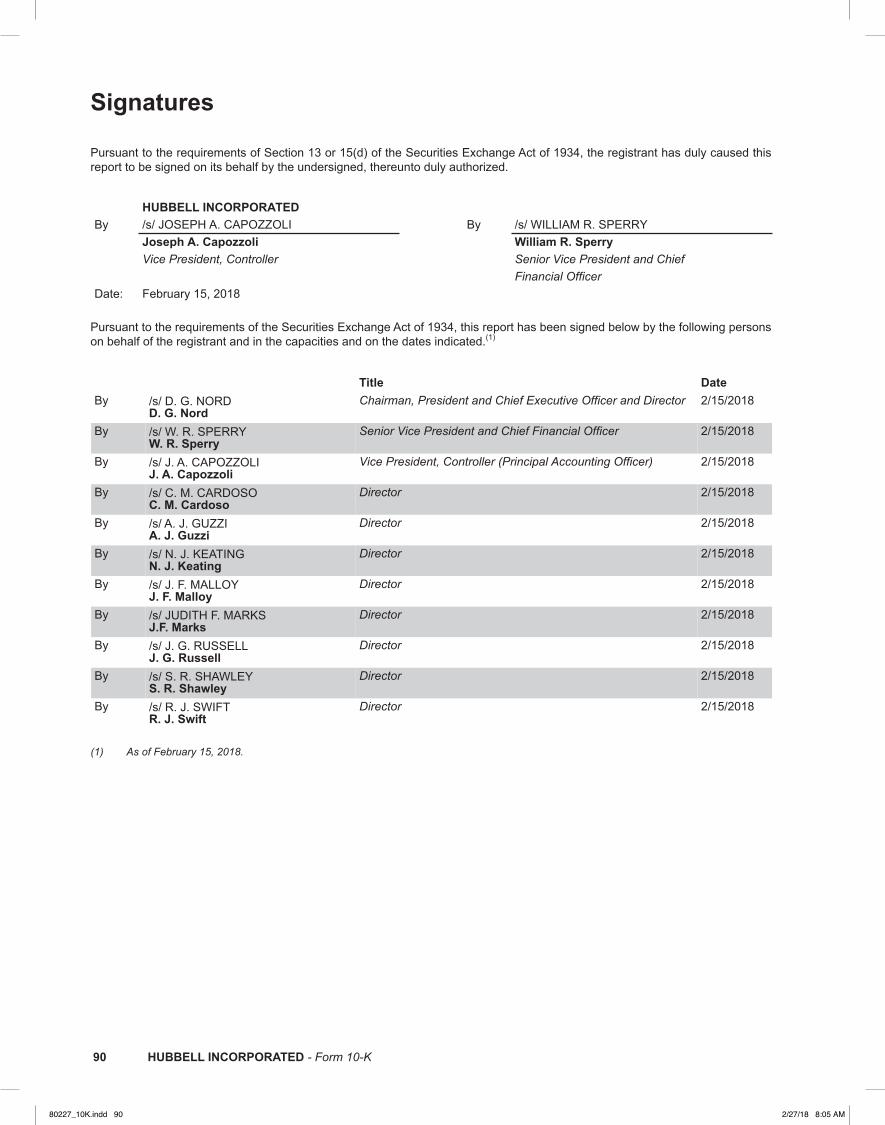
90 HUBBELL INCORPORATED - Form 10-K90 HUBBELL INCORPORATED - Form 10-K
Signatures Pursuant to the requirements of Section 13 or 15(d) of the Securities Exchange Act of 1934, the registrant has duly caused this report to be signed on its behalf by the undersigned, thereunto duly authorized.
HUBBELL INCORPORATED By /s/ JOSEPH A. CAPOZZOLI By /s/ WILLIAM R. SPERRY Joseph A. Capozzoli William R. Sperry Vice President, Controller Senior Vice President and Chief Financial OfficerDate: February 15, 2018
Pursuant to the requirements of the Securities Exchange Act of 1934, this report has been signed below by the following persons on behalf of the registrant and in the capacities and on the dates indicated.(1)
Title DateBy /s/ D. G. NORD
D. G. NordChairman, President and Chief Executive Officer and Director 2/15/2018
By /s/ W. R. SPERRYW. R. Sperry
Senior Vice President and Chief Financial Officer 2/15/2018
By /s/ J. A. CAPOZZOLIJ. A. Capozzoli
Vice President, Controller (Principal Accounting Officer) 2/15/2018
By /s/ C. M. CARDOSOC. M. Cardoso
Director 2/15/2018
By /s/ A. J. GUZZIA. J. Guzzi
Director 2/15/2018
By /s/ N. J. KEATINGN. J. Keating
Director 2/15/2018
By /s/ J. F. MALLOYJ. F. Malloy
Director 2/15/2018
By /s/ JUDITH F. MARKSJ.F. Marks
Director 2/15/2018
By /s/ J. G. RUSSELLJ. G. Russell
Director 2/15/2018
By /s/ S. R. SHAWLEYS. R. Shawley
Director 2/15/2018
By /s/ R. J. SWIFTR. J. Swift
Director 2/15/2018
(1) As of February 15, 2018.
80227_10K.indd 90 2/27/18 8:05 AM

HUBBELL INCORPORATED - Form 10-K 91HUBBELL INCORPORATED - Form 10-K 91
Valuation and Qualifying Accounts and Reserves for the Years Ended December 31, 2015, 2016 and 2017
Reserves deducted in the balance sheet from the assets to which they apply (in millions):
Balanceat Beginning
of Year
Additions / (Reversals)Charged to Costs and
Expenses Deductions Acquisitions Balance atEnd of Year
Allowances for doubtful accounts receivable:Year 2015 $ 3.4 $ 2.7 $ (1.4) $ — $ 4.7Year 2016 $ 4.7 $ 0.8 $ (0.8) $ — $ 4.7Year 2017 $ 4.7 $ 1.5 $ (3.5) $ 1.9 $ 4.6Allowance for credit memos, returns and cash discounts:Year 2015 $ 36.7 $ 233.2 $ (228.4) $ — $ 41.5Year 2016 $ 41.5 $ 249.2 $ (244.8) $ — $ 45.9Year 2017 $ 45.9 $ 260.8 $ (256.3) $ 0.1 $ 50.5Valuation allowance on deferred tax assets:Year 2015 $ 34.3 $ (12.3) $ — $ — $ 22.0Year 2016 $ 22.0 $ 0.6 $ — $ — $ 22.6Year 2017 $ 22.6 $ (3.2) $ — $ — $ 19.4
80227_10K.indd 91 2/27/18 8:05 AM
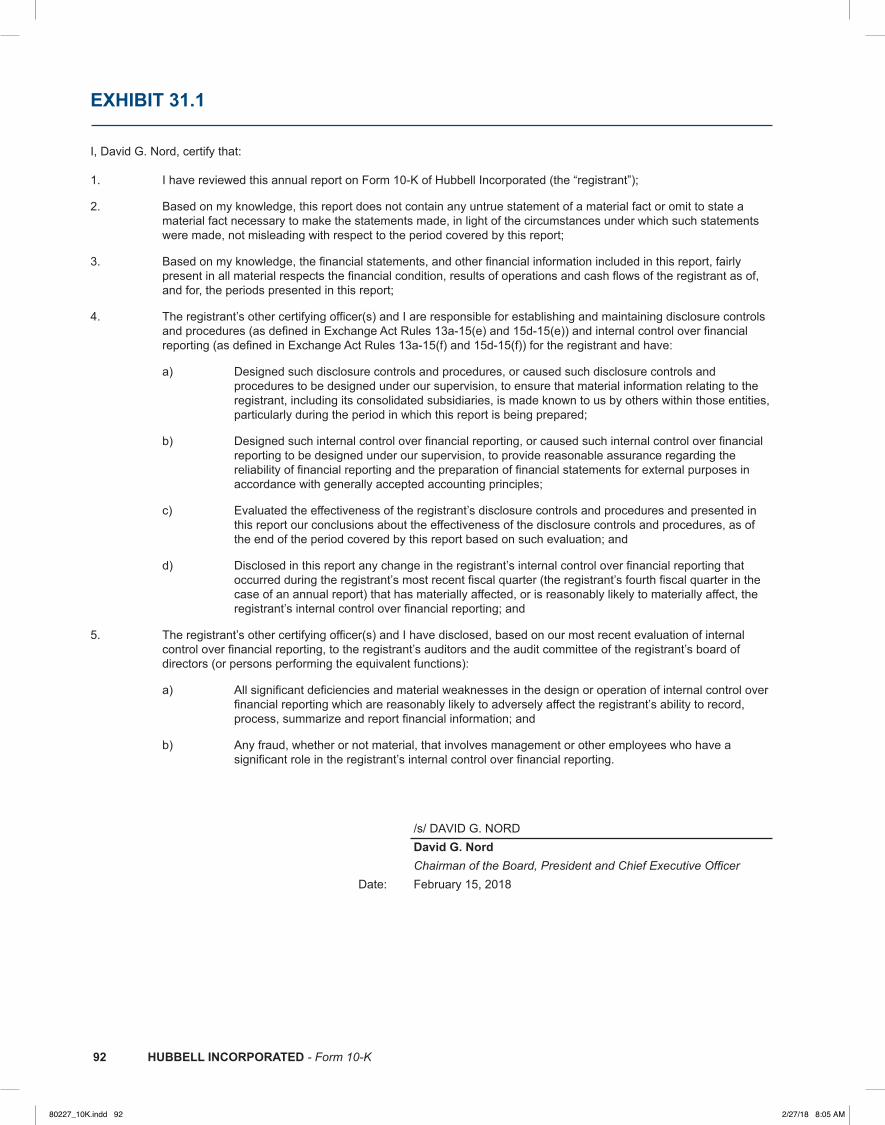
92 HUBBELL INCORPORATED - Form 10-K92 HUBBELL INCORPORATED - Form 10-K
EXHIBIT 31.1
I, David G. Nord, certify that:
1. I have reviewed this annual report on Form 10-K of Hubbell Incorporated (the “registrant”);
2. Based on my knowledge, this report does not contain any untrue statement of a material fact or omit to state amaterial fact necessary to make the statements made, in light of the circumstances under which such statementswere made, not misleading with respect to the period covered by this report;
3. Based on my knowledge, the financial statements, and other financial information included in this report, fairlypresent in all material respects the financial condition, results of operations and cash flows of the registrant as of,and for, the periods presented in this report;
4. The registrant’s other certifying officer(s) and I are responsible for establishing and maintaining disclosure controlsand procedures (as defined in Exchange Act Rules 13a-15(e) and 15d-15(e)) and internal control over financialreporting (as defined in Exchange Act Rules 13a-15(f) and 15d-15(f)) for the registrant and have:
a) Designed such disclosure controls and procedures, or caused such disclosure controls andprocedures to be designed under our supervision, to ensure that material information relating to theregistrant, including its consolidated subsidiaries, is made known to us by others within those entities,particularly during the period in which this report is being prepared;
b) Designed such internal control over financial reporting, or caused such internal control over financialreporting to be designed under our supervision, to provide reasonable assurance regarding thereliability of financial reporting and the preparation of financial statements for external purposes inaccordance with generally accepted accounting principles;
c) Evaluated the effectiveness of the registrant’s disclosure controls and procedures and presented inthis report our conclusions about the effectiveness of the disclosure controls and procedures, as ofthe end of the period covered by this report based on such evaluation; and
d) Disclosed in this report any change in the registrant’s internal control over financial reporting thatoccurred during the registrant’s most recent fiscal quarter (the registrant’s fourth fiscal quarter in thecase of an annual report) that has materially affected, or is reasonably likely to materially affect, theregistrant’s internal control over financial reporting; and
5. The registrant’s other certifying officer(s) and I have disclosed, based on our most recent evaluation of internalcontrol over financial reporting, to the registrant’s auditors and the audit committee of the registrant’s board ofdirectors (or persons performing the equivalent functions):
a) All significant deficiencies and material weaknesses in the design or operation of internal control overfinancial reporting which are reasonably likely to adversely affect the registrant’s ability to record,process, summarize and report financial information; and
b) Any fraud, whether or not material, that involves management or other employees who have asignificant role in the registrant’s internal control over financial reporting.
/s/ DAVID G. NORDDavid G. NordChairman of the Board, President and Chief Executive Officer
Date: February 15, 2018
80227_10K.indd 92 2/27/18 8:05 AM

HUBBELL INCORPORATED - Form 10-K 93HUBBELL INCORPORATED - Form 10-K 93
EXHIBIT 31.2
I, William R. Sperry, certify that:
1. I have reviewed this annual report on Form 10-K of Hubbell Incorporated (the “registrant”);
2. Based on my knowledge, this report does not contain any untrue statement of a material fact or omit to state amaterial fact necessary to make the statements made, in light of the circumstances under which such statementswere made, not misleading with respect to the period covered by this report;
3. Based on my knowledge, the financial statements, and other financial information included in this report, fairlypresent in all material respects the financial condition, results of operations and cash flows of the registrant as of,and for, the periods presented in this report;
4. The registrant’s other certifying officer(s) and I are responsible for establishing and maintaining disclosure controlsand procedures (as defined in Exchange Act Rules 13a-15(e) and 15d-15(e)) and internal control over financialreporting (as defined in Exchange Act Rules 13a-15(f) and 15d-15(f)) for the registrant and have:
a) Designed such disclosure controls and procedures, or caused such disclosure controls andprocedures to be designed under our supervision, to ensure that material information relating to theregistrant, including its consolidated subsidiaries, is made known to us by others within those entities,particularly during the period in which this report is being prepared;
b) Designed such internal control over financial reporting, or caused such internal control over financialreporting to be designed under our supervision, to provide reasonable assurance regarding thereliability of financial reporting and the preparation of financial statements for external purposes inaccordance with generally accepted accounting principles;
c) Evaluated the effectiveness of the registrant’s disclosure controls and procedures and presented inthis report our conclusions about the effectiveness of the disclosure controls and procedures, as ofthe end of the period covered by this report based on such evaluation; and
d) Disclosed in this report any change in the registrant’s internal control over financial reporting thatoccurred during the registrant’s most recent fiscal quarter (the registrant’s fourth fiscal quarter in thecase of an annual report) that has materially affected, or is reasonably likely to materially affect, theregistrant’s internal control over financial reporting; and
5. The registrant’s other certifying officer(s) and I have disclosed, based on our most recent evaluation of internalcontrol over financial reporting, to the registrant’s auditors and the audit committee of the registrant’s board ofdirectors (or persons performing the equivalent functions):
a) All significant deficiencies and material weaknesses in the design or operation of internal control overfinancial reporting which are reasonably likely to adversely affect the registrant’s ability to record,process, summarize and report financial information; and
b) Any fraud, whether or not material, that involves management or other employees who have asignificant role in the registrant’s internal control over financial reporting.
/s/ WILLIAM R. SPERRYWilliam R. SperrySenior Vice President and Chief Financial Officer
Date: February 15, 2018
80227_10K.indd 93 2/27/18 8:05 AM

94 HUBBELL INCORPORATED - Form 10-K94 HUBBELL INCORPORATED - Form 10-K
EXHIBIT 32.1 Certification Pursuant to 18 U.S.C. Section 1350, as Adopted Pursuant to Section 906 of the Sarbanes-Oxley Act of 2002
In connection with the Annual Report of Hubbell Incorporated (the “Company”) on Form 10-K for the period ended December 31, 2017 as filed with the Securities and Exchange Commission on the date hereof (the “Report”), I, David G. Nord, certify, pursuant to 18 U.S.C. §1350, as adopted pursuant to §906 of the Sarbanes-Oxley Act of 2002, that:
(1) The Report fully complies with the requirements of Section 13(a) or 15(d), as applicable, of the Securities ExchangeAct of 1934, as amended; and
(2) The information contained in the Report fairly presents, in all material respects, the financial condition and results ofoperations of the Company.
/s/ DAVID. G. NORDDavid G. NordChairman of the Board, President and Chief Executive OfficerFebruary 15, 2018
A signed original of this written statement required by Section 906 has been provided to the Company and will be retained by the Company and furnished to the Securities and Exchange Commission or its staff upon request.
80227_10K.indd 94 2/27/18 8:05 AM

HUBBELL INCORPORATED - Form 10-K 95HUBBELL INCORPORATED - Form 10-K 95
EXHIBIT 32.2 Certification Pursuant to 18 U.S.C. Section 1350, as Adopted Pursuant to Section 906 of the Sarbanes-Oxley Act of 2002
In connection with the Annual Report of Hubbell Incorporated (the “Company”) on Form 10-K for the period ended December 31, 2017 as filed with the Securities and Exchange Commission on the date hereof (the “Report”), I, William R. Sperry, certify, pursuant to 18 U.S.C. §1350, as adopted pursuant to §906 of the Sarbanes-Oxley Act of 2002, that:
(1) The Report fully complies with the requirements of Section 13(a) or 15(d), as applicable, of the Securities ExchangeAct of 1934, as amended; and
(2) The information contained in the Report fairly presents, in all material respects, the financial condition and results ofoperations of the Company.
/s/ WILLIAM R. SPERRYWilliam R. SperrySenior Vice President and Chief Financial OfficerFebruary 15, 2018
A signed original of this written statement required by Section 906 has been provided to the Company and will be retained by the Company and furnished to the Securities and Exchange Commission or its staff upon request.
80227_10K.indd 95 2/27/18 8:05 AM

80227_10K.indd 96 2/27/18 8:05 AM
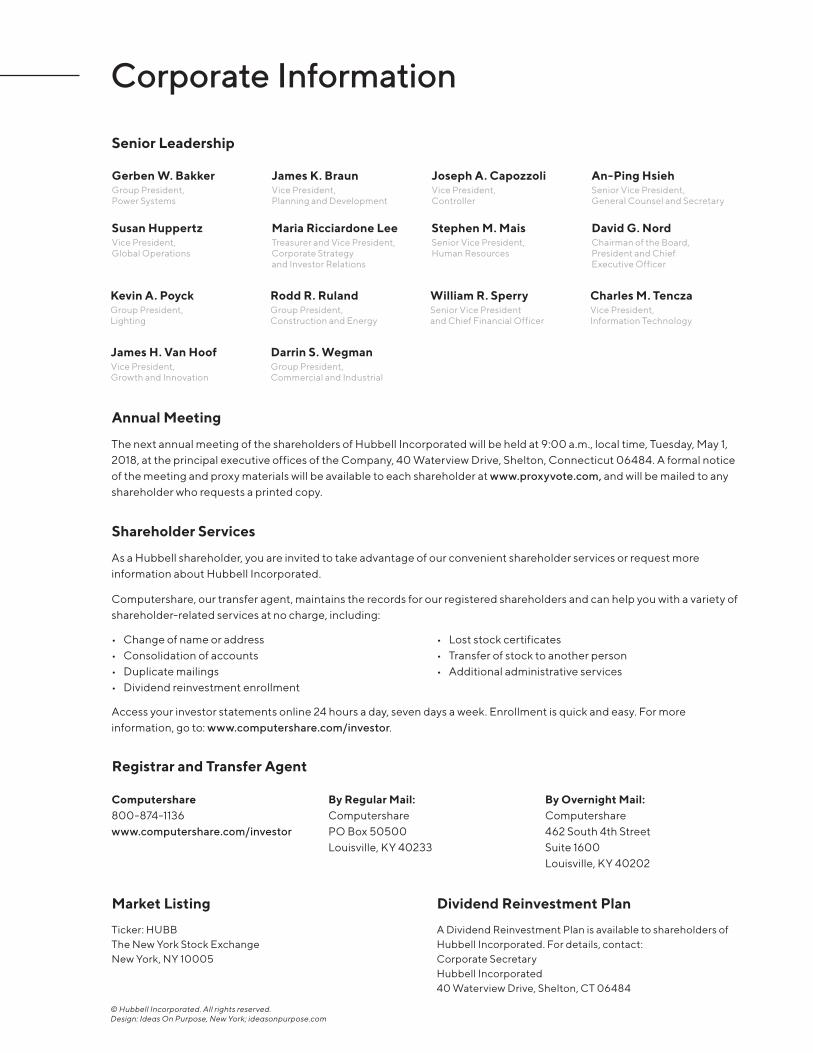
Corporate Information
Gerben W. BakkerGroup President,Power Systems
Maria Ricciardone LeeTreasurer and Vice President, Corporate Strategy and Investor Relations
Charles M. TenczaVice President,Information Technology
James K. BraunVice President,Planning and Development
Stephen M. MaisSenior Vice President,Human Resources
Kevin A. PoyckGroup President,Lighting
James H. Van HoofVice President,Growth and Innovation
Joseph A. CapozzoliVice President,Controller
David G. NordChairman of the Board, President and Chief Executive Officer
Rodd R. RulandGroup President,Construction and Energy
Darrin S. WegmanGroup President,Commercial and Industrial
An-Ping HsiehSenior Vice President,General Counsel and Secretary
Susan HuppertzVice President, Global Operations
William R. SperrySenior Vice Presidentand Chief Financial Officer
Senior Leadership
Annual Meeting
Shareholder Services
Market Listing
Registrar and Transfer Agent
Dividend Reinvestment Plan
The next annual meeting of the shareholders of Hubbell Incorporated will be held at 9:00 a.m., local time, Tuesday, May 1, 2018, at the principal executive offices of the Company, 40 Waterview Drive, Shelton, Connecticut 06484. A formal notice of the meeting and proxy materials will be available to each shareholder at www.proxyvote.com, and will be mailed to any shareholder who requests a printed copy.
As a Hubbell shareholder, you are invited to take advantage of our convenient shareholder services or request more information about Hubbell Incorporated.
Computershare, our transfer agent, maintains the records for our registered shareholders and can help you with a variety of shareholder-related services at no charge, including:
Ticker: HUBB The New York Stock Exchange New York, NY 10005
Computershare 800-874-1136 www.computershare.com/investor
By Regular Mail: Computershare PO Box 50500 Louisville, KY 40233
By Overnight Mail: Computershare 462 South 4th Street Suite 1600 Louisville, KY 40202
A Dividend Reinvestment Plan is available to shareholders of Hubbell Incorporated. For details, contact: Corporate Secretary Hubbell Incorporated 40 Waterview Drive, Shelton, CT 06484
Access your investor statements online 24 hours a day, seven days a week. Enrollment is quick and easy. For more information, go to: www.computershare.com/investor.
• Change of name or address• Consolidation of accounts• Duplicate mailings• Dividend reinvestment enrollment
• Lost stock certificates• Transfer of stock to another person• Additional administrative services
© Hubbell Incorporated. All rights reserved. Design: Ideas On Purpose, New York; ideasonpurpose.com

HUBBELL INCORPORATED 40 Waterview Drive, Shelton, CT 06484
hubbell.com
®
Related Documents