Experience of Vibration and Noise Measurements of Small Hydro Power Plants Arun Kumar 1 , B K Gandhi 2 , Pradeep Chandra 3* Indian Institute of Technology Roorkee Roorkee -247 667, India 1 & 3* Alternate Hydro Energy Centre, Indian Institute of Technology Roorkee 2 Department of Mechanical and Industrial Engineering, Indian Institute of Technology, Roorkee 3 * E-mail: [email protected], [email protected], [email protected], Abstract At different load operation of hydropower units, fluctuation of pressure energy causes vibrations and noise in the rotating parts of the units. Over 175 hydropower plants, mostly below 25 MW have been evaluated for performance field test by Indian Institute of Technology Roorkee (IITR) team during the year 2005-2015 in 11 states of India on irrigation canals, rivers and existing dam outlets. Various parameters like discharge, head, power etc. were measured during the field testing on turbines and generators. Field measurements also included sound and vibration measurements of each unit and their analysis is presented here. Axial component of displacement at all measuring points for vibration measurement at driving end bearing of generator varied from 4.15µm to 200µm, and radial component varied from 1.912µm to 243.22µm for Francis turbines. For Kaplan turbines, axial component varied from 3.673 µm to 195 µm, and radial component varied from 2.943 µm to 291 µm. For Pelton turbines axial component varied from 4.04 µm to 299 µm and radial component varied from 9.14 µm to 546 µm. Sound level at all measuring points varied from 81.95-104 dB, 80.45-100.7 dB, and 82.4- 101.4 dB for Francis, Kaplan and Pelton turbine, respectively. There was no fixed trend observed for any type of turbine or generators. 1. Introduction Vibration measurement in hydro turbines and generators is an essential part of measurement. Vibration produced in turbines may cause severe damages to the rotating parts, specially, when turbines operate at part load conditions. It is necessary to identify the causes of vibration of rotating parts to avoid these damages. International standard (ISO) 10816-5 [1] is the basic document describing the general requirements for evaluating the vibrations of various type of rotating machines when the vibration measurements are made on non-rotating parts. Two criteria are provided for assessing the machine vibrations [1]. One considers the magnitude of observed vibration and the second considers the changes in the magnitudes. However it must be recognized, that these two criteria do not form the only basis for judging the severity of vibrations. For most machine types, it is also common to judge the vibration based on measurements taken on the rotating shaft [5].

Welcome message from author
This document is posted to help you gain knowledge. Please leave a comment to let me know what you think about it! Share it to your friends and learn new things together.
Transcript
Experience of Vibration and Noise Measurements of Small Hydro Power Plants
Arun Kumar1, B K Gandhi2, Pradeep Chandra3*
Indian Institute of Technology Roorkee Roorkee -247 667, India
1 & 3* Alternate Hydro Energy Centre, Indian Institute of Technology Roorkee 2 Department of Mechanical and Industrial Engineering, Indian Institute of Technology, Roorkee
3* E-mail: [email protected], [email protected], [email protected],
Abstract
At different load operation of hydropower units, fluctuation of pressure energy causes vibrations and noise in the rotating parts of the units. Over 175 hydropower plants, mostly below 25 MW have been evaluated for performance field test by Indian Institute of Technology Roorkee (IITR) team during the year 2005-2015 in 11 states of India on irrigation canals, rivers and existing dam outlets. Various parameters like discharge, head, power etc. were measured during the field testing on turbines and generators. Field measurements also included sound and vibration measurements of each unit and their analysis is presented here.
Axial component of displacement at all measuring points for vibration measurement at driving end bearing of generator varied from 4.15µm to 200µm, and radial component varied from 1.912µm to 243.22µm for Francis turbines. For Kaplan turbines, axial component varied from 3.673 µm to 195 µm, and radial component varied from 2.943 µm to 291 µm. For Pelton turbines axial component varied from 4.04 µm to 299 µm and radial component varied from 9.14 µm to 546 µm. Sound level at all measuring points varied from 81.95-104 dB, 80.45-100.7 dB, and 82.4-101.4 dB for Francis, Kaplan and Pelton turbine, respectively. There was no fixed trend observed for any type of turbine or generators.
1. Introduction Vibration measurement in hydro turbines and generators is an essential part of measurement. Vibration produced in turbines may cause severe damages to the rotating parts, specially, when turbines operate at part load conditions. It is necessary to identify the causes of vibration of rotating parts to avoid these damages. International standard (ISO) 10816-5 [1] is the basic document describing the general requirements for evaluating the vibrations of various type of rotating machines when the vibration measurements are made on non-rotating parts. Two criteria are provided for assessing the machine vibrations [1]. One considers the magnitude of observed vibration and the second considers the changes in the magnitudes. However it must be recognized, that these two criteria do not form the only basis for judging the severity of vibrations. For most machine types, it is also common to judge the vibration based on measurements taken on the rotating shaft [5].
Shaft vibration measurement requirements and criteria are addressed in separate international standard ISO 7919-1 [2] and ISO 7919-5 [3]. The ISO 10816-5 [1] provides the guidelines for applying the bearing housing vibration evaluation criteria measured under normal operating conditions at the bearings, bearing pedestals or bearing housings of the main machine sets in hydraulic power generating and pumping plants. These guidelines are presented in terms of both steady-state running vibration and any amplitude changes which may occur in these steady values. The vibratory condition of a machine is assessed by the consideration of both the bearing housing vibration and the associated shaft vibration. ISO 10816 provides specific guidance for assessing hydraulic machines with speeds from 60 to 1800 rotation per minute (rpm), shell or shoe type sleeve bearings and main engine power of 1 MW and more.
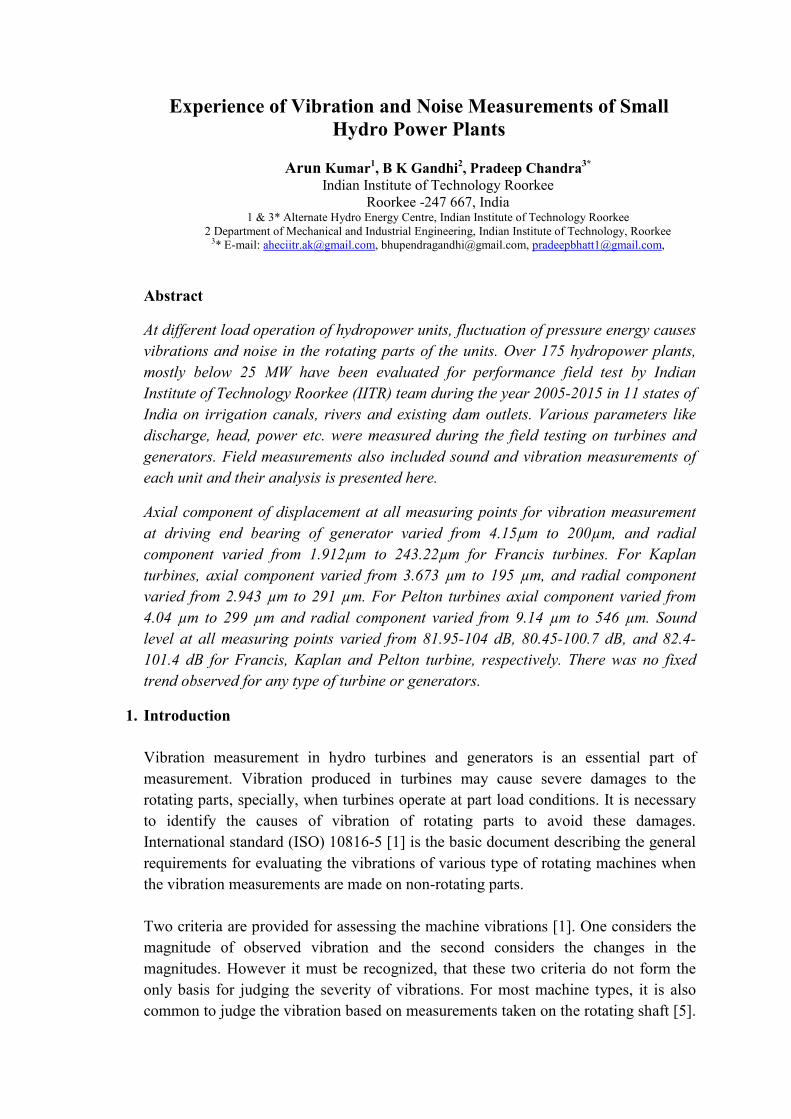
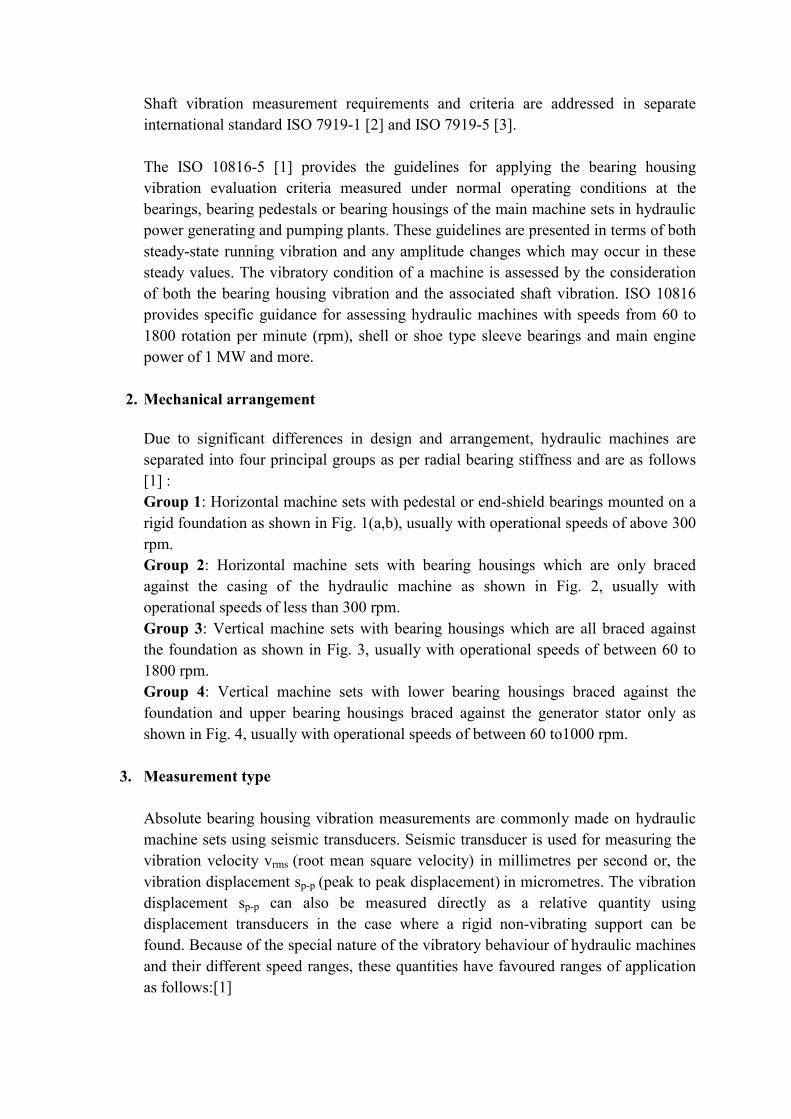
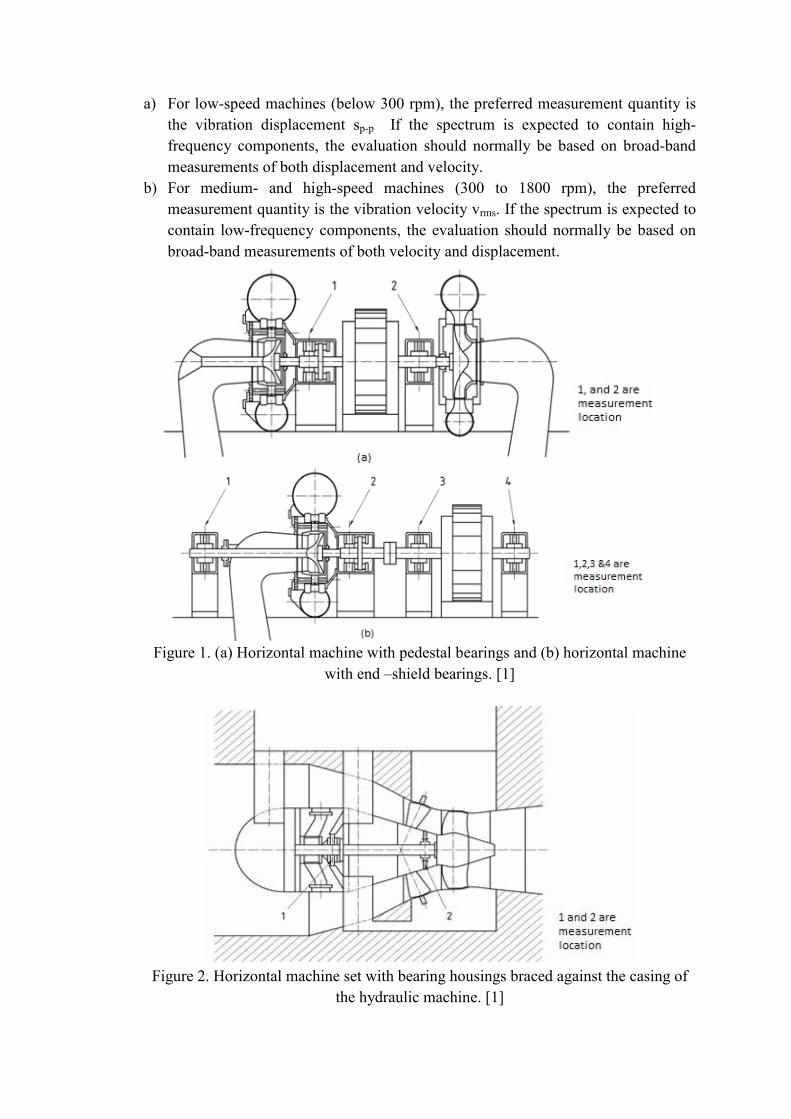
2. Mechanical arrangement Due to significant differences in design and arrangement, hydraulic machines are separated into four principal groups as per radial bearing stiffness and are as follows [1] : Group 1: Horizontal machine sets with pedestal or end-shield bearings mounted on a rigid foundation as shown in Fig. 1(a,b), usually with operational speeds of above 300 rpm. Group 2: Horizontal machine sets with bearing housings which are only braced against the casing of the hydraulic machine as shown in Fig. 2, usually with operational speeds of less than 300 rpm. Group 3: Vertical machine sets with bearing housings which are all braced against the foundation as shown in Fig. 3, usually with operational speeds of between 60 to 1800 rpm. Group 4: Vertical machine sets with lower bearing housings braced against the foundation and upper bearing housings braced against the generator stator only as shown in Fig. 4, usually with operational speeds of between 60 to1000 rpm.
3. Measurement type Absolute bearing housing vibration measurements are commonly made on hydraulic machine sets using seismic transducers. Seismic transducer is used for measuring the vibration velocity vrms (root mean square velocity) in millimetres per second or, the vibration displacement sp-p (peak to peak displacement) in micrometres. The vibration displacement sp-p can also be measured directly as a relative quantity using displacement transducers in the case where a rigid non-vibrating support can be found. Because of the special nature of the vibratory behaviour of hydraulic machines and their different speed ranges, these quantities have favoured ranges of application as follows:[1]
a) For low-speed machines (below 300 rpm), the preferred measurement quantity is the vibration displacement sp-p If the spectrum is expected to contain high-frequency components, the evaluation should normally be based on broad-band measurements of both displacement and velocity.
b) For medium- and high-speed machines (300 to 1800 rpm), the preferred measurement quantity is the vibration velocity vrms. If the spectrum is expected to contain low-frequency components, the evaluation should normally be based on broad-band measurements of both velocity and displacement.
Figure 1. (a) Horizontal machine with pedestal bearings and (b) horizontal machine
with end –shield bearings. [1]
Figure 2. Horizontal machine set with bearing housings braced against the casing of
the hydraulic machine. [1]
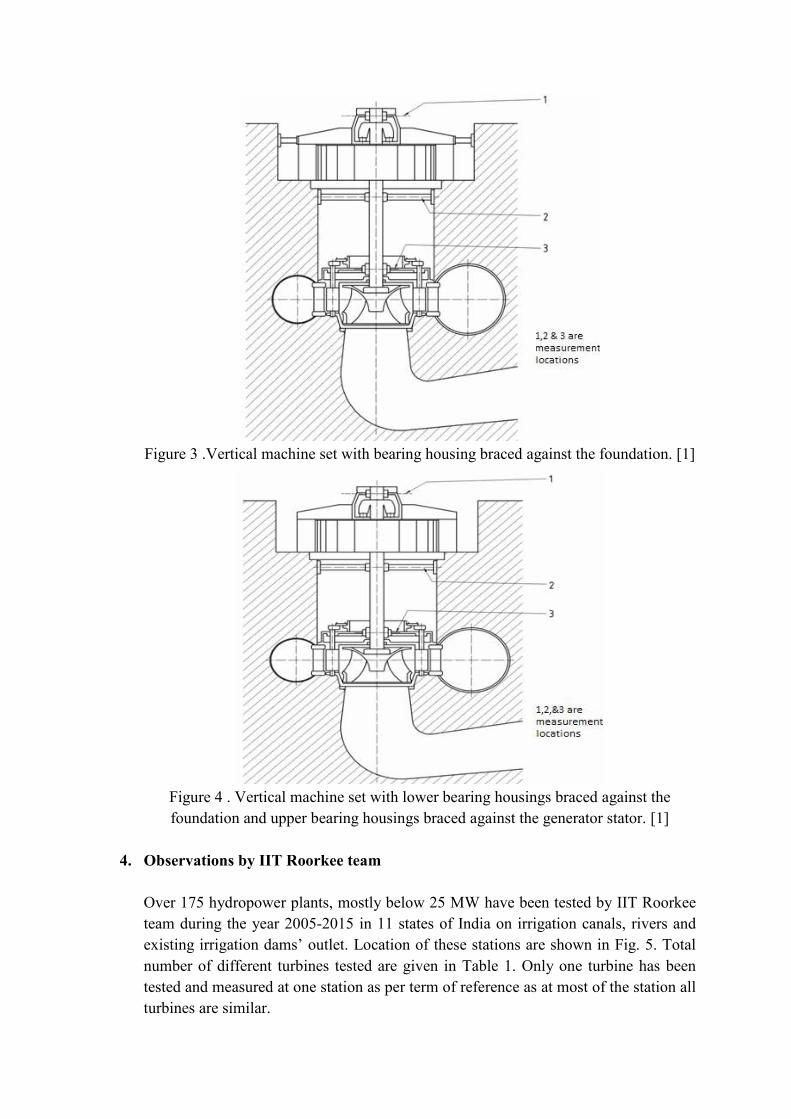
Figure 3 .Vertical machine set with bearing housing braced against the foundation. [1]
Figure 4 . Vertical machine set with lower bearing housings braced against the foundation and upper bearing housings braced against the generator stator. [1]
4. Observations by IIT Roorkee team
Over 175 hydropower plants, mostly below 25 MW have been tested by IIT Roorkee team during the year 2005-2015 in 11 states of India on irrigation canals, rivers and existing irrigation dams’ outlet. Location of these stations are shown in Fig. 5. Total number of different turbines tested are given in Table 1. Only one turbine has been tested and measured at one station as per term of reference as at most of the station all turbines are similar.

Table1. Different types of Turbines tested by the team of Indian Institute of Technology Roorkee
Turbine Type No. of Projects Francis 67 Kaplan 64 Pelton 44 Total 175
Figure 5: Location of hydropower plants for which testing has been carried out.
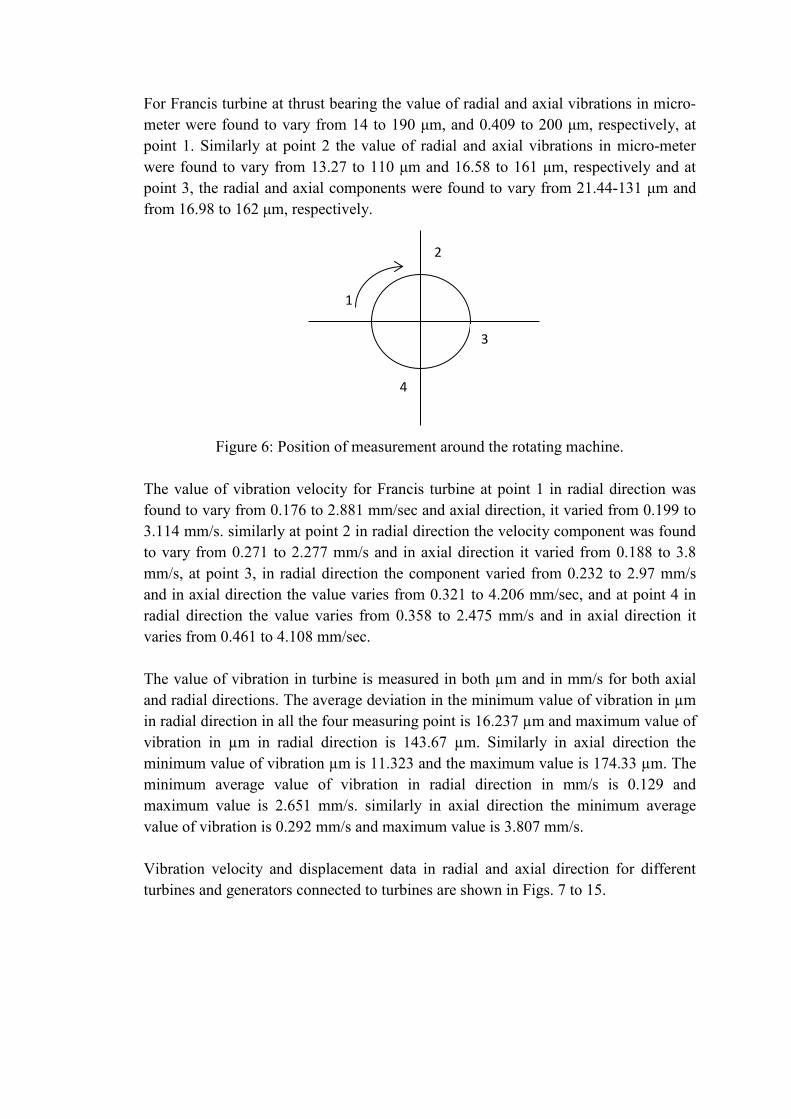
For Francis turbine at thrust bearing the value of radial and axial vibrations in micro-meter were found to vary from 14 to 190 μm, and 0.409 to 200 μm, respectively, at point 1. Similarly at point 2 the value of radial and axial vibrations in micro-meter were found to vary from 13.27 to 110 μm and 16.58 to 161 μm, respectively and at point 3, the radial and axial components were found to vary from 21.44-131 μm and from 16.98 to 162 μm, respectively.
Figure 6: Position of measurement around the rotating machine.
The value of vibration velocity for Francis turbine at point 1 in radial direction was found to vary from 0.176 to 2.881 mm/sec and axial direction, it varied from 0.199 to 3.114 mm/s. similarly at point 2 in radial direction the velocity component was found to vary from 0.271 to 2.277 mm/s and in axial direction it varied from 0.188 to 3.8 mm/s, at point 3, in radial direction the component varied from 0.232 to 2.97 mm/s and in axial direction the value varies from 0.321 to 4.206 mm/sec, and at point 4 in radial direction the value varies from 0.358 to 2.475 mm/s and in axial direction it varies from 0.461 to 4.108 mm/sec. The value of vibration in turbine is measured in both µm and in mm/s for both axial and radial directions. The average deviation in the minimum value of vibration in µm in radial direction in all the four measuring point is 16.237 µm and maximum value of vibration in µm in radial direction is 143.67 µm. Similarly in axial direction the minimum value of vibration µm is 11.323 and the maximum value is 174.33 µm. The minimum average value of vibration in radial direction in mm/s is 0.129 and maximum value is 2.651 mm/s. similarly in axial direction the minimum average value of vibration is 0.292 mm/s and maximum value is 3.807 mm/s. Vibration velocity and displacement data in radial and axial direction for different turbines and generators connected to turbines are shown in Figs. 7 to 15.
1
2
3
4
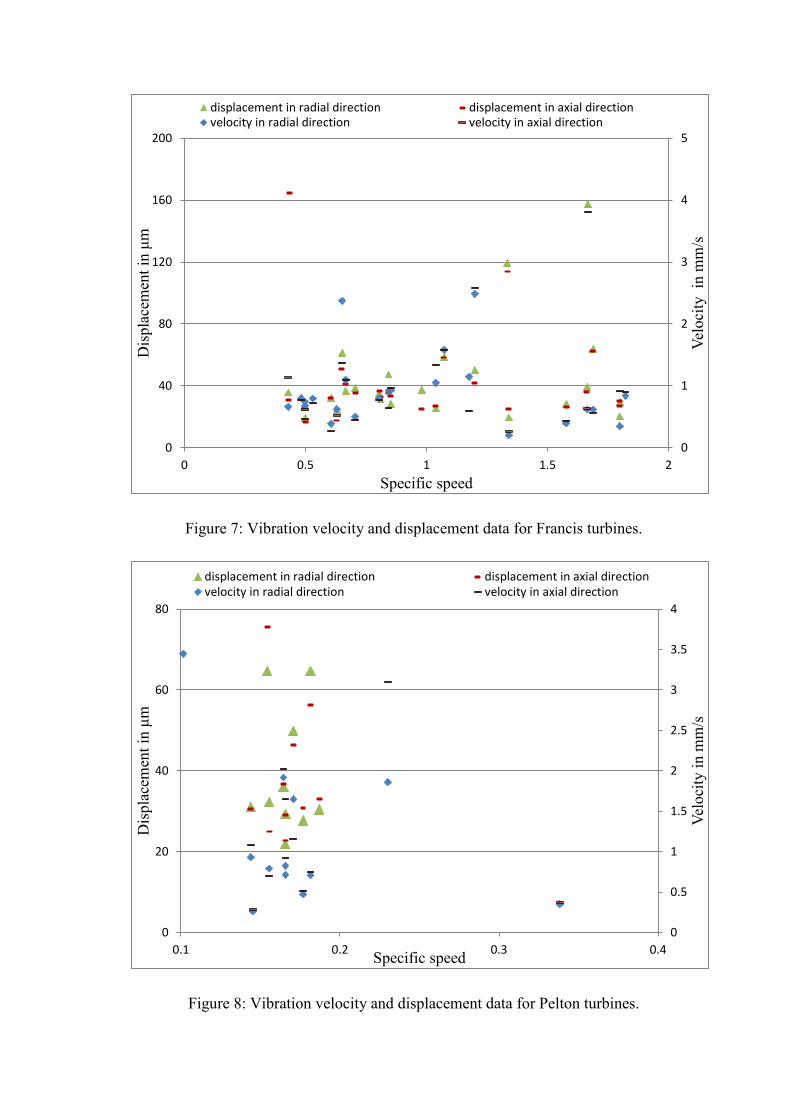
Figure 7: Vibration velocity and displacement data for Francis turbines.
Figure 8: Vibration velocity and displacement data for Pelton turbines.
0
1
2
3
4
5
0
40
80
120
160
200
0 0.5 1 1.5 2
Velo
city
in
mm
/s
Dis
plac
emen
t in
μm
Specific speed
displacement in radial direction displacement in axial directionvelocity in radial direction velocity in axial direction
0
0.5
1
1.5
2
2.5
3
3.5
4
0
20
40
60
80
0.1 0.2 0.3 0.4
Velo
city
in m
m/s
Dis
plac
emen
t in
μm
Specific speed
displacement in radial direction displacement in axial directionvelocity in radial direction velocity in axial direction
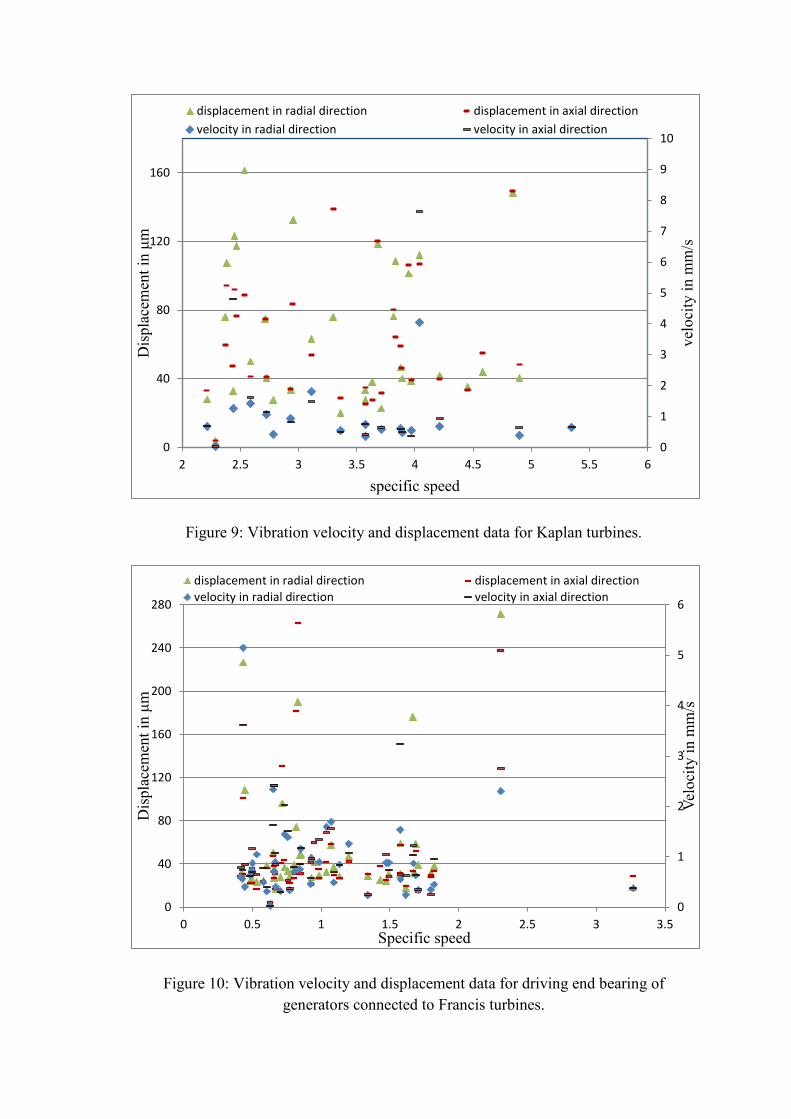
Figure 9: Vibration velocity and displacement data for Kaplan turbines.
Figure 10: Vibration velocity and displacement data for driving end bearing of generators connected to Francis turbines.
0
1
2
3
4
5
6
7
8
9
10
0
40
80
120
160
2 2.5 3 3.5 4 4.5 5 5.5 6
velo
city
in m
m/s
Dis
plac
emen
t in
μm
specific speed
displacement in radial direction displacement in axial directionvelocity in radial direction velocity in axial direction
0
1
2
3
4
5
6
0
40
80
120
160
200
240
280
0 0.5 1 1.5 2 2.5 3 3.5
Velo
city
in m
m/s
Dis
plac
emen
t in
μm
Specific speed
displacement in radial direction displacement in axial directionvelocity in radial direction velocity in axial direction

Figure 11: Vibration velocity and displacement data for driving end bearing of generators connected to Pelton turbines.
Figure 12: Vibration velocity and displacement data for driving end bearing of generators connected to Kaplan turbines.
-0.5
0.5
1.5
2.5
3.5
4.5
0
400
800
1200
0.05 0.1 0.15 0.2 0.25 0.3 0.35
Velo
city
in m
m/s
Dis
plac
emen
t in
μm
Specific speed
displacement in radial direction displacement in axial directionvelocity in radial direction velocity in axial direction
0
2
4
6
8
10
12
14
16
18
20
0
40
80
120
160
200
240
2 3 4 5 6
velo
city
in m
m/s
Dis
plac
emen
t in
μm
specific speed
displacement in radial direction displacement in axial directionvelocity in radial direction velocity in axial direction

Figure 13: Vibration velocity and displacement data for non-driving end bearing of generators connected to Francis turbines.
Figure 14: Vibration velocity and displacement data for non-driving end bearing of generators connected to Pelton turbines.
0
2
4
6
8
10
12
14
0
40
80
120
160
200
0.4 0.6 0.8 1 1.2 1.4 1.6 1.8 2
Velo
city
in m
m/s
Dis
plac
emen
t in
μm
Specific speed
displacement in radial direction displacement in axial directionvelocity in radial direction velocity in axial direction
0
0.6
1.2
1.8
0
40
80
120
160
200
240
0.05 0.1 0.15 0.2 0.25 0.3 0.35
Velo
city
in m
m/s
Dis
plac
emen
t in
μm
Specific speed
displacement in radial direction displacement in axial directionvelocity in radial direction velocity in axial direction

Figure 15: Vibration velocity and displacement data for non-driving end bearing of
generators connected to Kaplan turbines. Measured values of vibration velocity and displacement in radial and axial direction for Francis turbines are shown in Fig 7. Vibration velocities in axial direction are below 1.6 mm/s for 92.6% of the turbines and are above 2.5 mm/s for 7.6% of turbines. And in radial direction, vibration velocity values are below 1.6 mm/s for 92% turbines and above 2.5 mm/s for 8% turbines. Vibration displacements in axial direction are below 50μm for 81.25% turbines, in the range 50-80μm for 12.5% turbines and above 80μm for 6.25% turbines. Similarly in radial direction, the vibration displacements are below 50μm for 75% turbines, in the range 50-80μm for 18.75% turbines and above 80μm for 6.25% turbines. Measured values of vibration velocity and displacement in radial and axial direction for Pelton turbines are shown in Fig 8. Vibration velocities in axial direction are below 1.6 mm/s for 72.72% of turbines, in the range 1.6- 2.5 mm/s for 18.18% turbines and above 2.5mm/s for 10% turbines. And in radial direction, vibration velocities are below 1.6 mm/s for 66.66% turbines, in the range 1.6- 2.5 mm/s for 8% turbines and above 2.5 mm/s for 8.33% turbines. Vibration displacements in axial direction are below 50μm for 85.72 % turbines, in the range 50- 80μm for 14.25% turbines, and above 80 μm for remaining turbines. Similarly in radial direction, the vibration displacements are below 50μm for 85.7% turbines, in the range 50-80μm for 12.5% turbines and above 80 μm for remaining turbines.
0
4
8
12
16
20
0
80
160
240
320
400
1 2 3 4 5 6
velo
city
in m
m/s
Dis
plac
emen
t in
μm
Specific speed
displacement in radial direction disoplacement in xial directionvelocity in radial direction velocity in axial direction
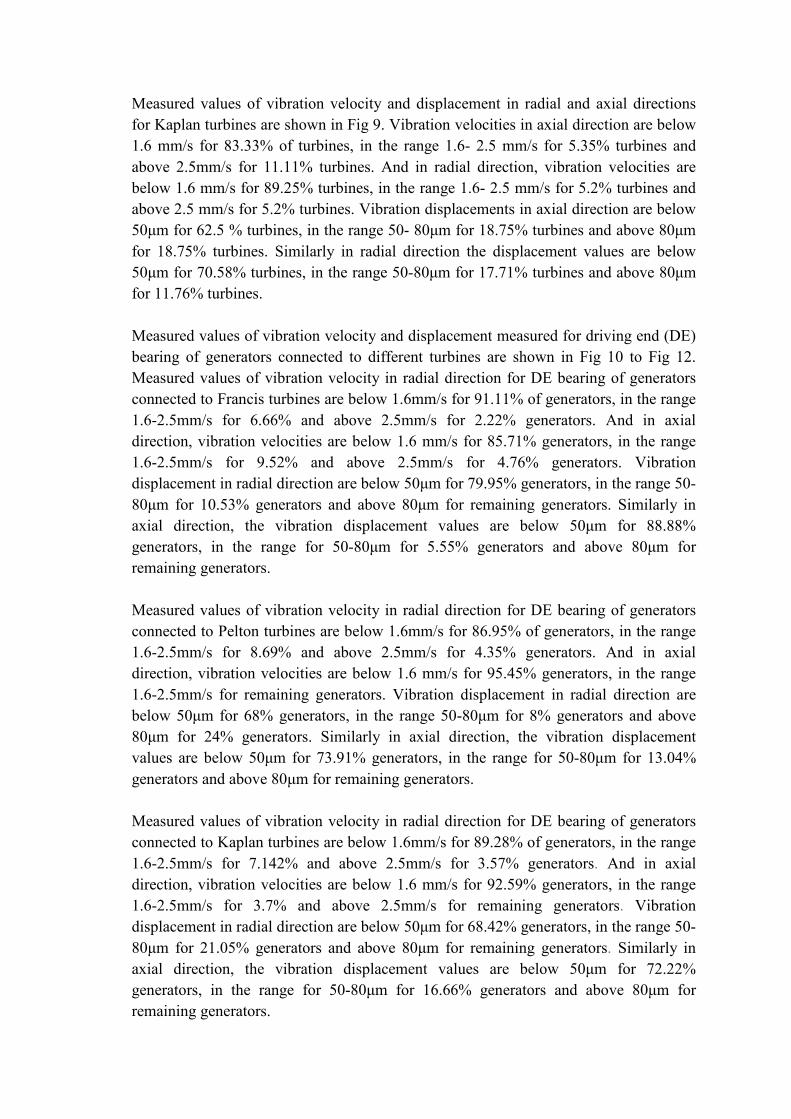
Measured values of vibration velocity and displacement in radial and axial directions for Kaplan turbines are shown in Fig 9. Vibration velocities in axial direction are below 1.6 mm/s for 83.33% of turbines, in the range 1.6- 2.5 mm/s for 5.35% turbines and above 2.5mm/s for 11.11% turbines. And in radial direction, vibration velocities are below 1.6 mm/s for 89.25% turbines, in the range 1.6- 2.5 mm/s for 5.2% turbines and above 2.5 mm/s for 5.2% turbines. Vibration displacements in axial direction are below 50μm for 62.5 % turbines, in the range 50- 80μm for 18.75% turbines and above 80μm for 18.75% turbines. Similarly in radial direction the displacement values are below 50μm for 70.58% turbines, in the range 50-80μm for 17.71% turbines and above 80μm for 11.76% turbines. Measured values of vibration velocity and displacement measured for driving end (DE) bearing of generators connected to different turbines are shown in Fig 10 to Fig 12. Measured values of vibration velocity in radial direction for DE bearing of generators connected to Francis turbines are below 1.6mm/s for 91.11% of generators, in the range 1.6-2.5mm/s for 6.66% and above 2.5mm/s for 2.22% generators. And in axial direction, vibration velocities are below 1.6 mm/s for 85.71% generators, in the range 1.6-2.5mm/s for 9.52% and above 2.5mm/s for 4.76% generators. Vibration displacement in radial direction are below 50μm for 79.95% generators, in the range 50-80μm for 10.53% generators and above 80μm for remaining generators. Similarly in axial direction, the vibration displacement values are below 50μm for 88.88% generators, in the range for 50-80μm for 5.55% generators and above 80μm for remaining generators. Measured values of vibration velocity in radial direction for DE bearing of generators connected to Pelton turbines are below 1.6mm/s for 86.95% of generators, in the range 1.6-2.5mm/s for 8.69% and above 2.5mm/s for 4.35% generators. And in axial direction, vibration velocities are below 1.6 mm/s for 95.45% generators, in the range 1.6-2.5mm/s for remaining generators. Vibration displacement in radial direction are below 50μm for 68% generators, in the range 50-80μm for 8% generators and above 80μm for 24% generators. Similarly in axial direction, the vibration displacement values are below 50μm for 73.91% generators, in the range for 50-80μm for 13.04% generators and above 80μm for remaining generators. Measured values of vibration velocity in radial direction for DE bearing of generators connected to Kaplan turbines are below 1.6mm/s for 89.28% of generators, in the range 1.6-2.5mm/s for 7.142% and above 2.5mm/s for 3.57% generators. And in axial direction, vibration velocities are below 1.6 mm/s for 92.59% generators, in the range 1.6-2.5mm/s for 3.7% and above 2.5mm/s for remaining generators. Vibration displacement in radial direction are below 50μm for 68.42% generators, in the range 50-80μm for 21.05% generators and above 80μm for remaining generators. Similarly in axial direction, the vibration displacement values are below 50μm for 72.22% generators, in the range for 50-80μm for 16.66% generators and above 80μm for remaining generators.

Measured values of vibration velocity and displacement measured for non driving end (NDE) bearing of generators connected to Francis turbines are shown in Fig 13. Measured values of vibration velocity in radial direction for NDE bearing of generators connected to Francis turbines are below 1.6mm/s for 80% of generators, in the range 1.6-2.5mm/s for 12.5% and above 2.5mm/s for 7.5% generators. And in axial direction, vibration velocities are below 1.6 mm/s for 83.33% generators, in the range 1.6-2.5mm/s for 13.88% and above 2.5mm/s for 2.77% generators. Vibration displacement in radial direction are below 50μm for 84.44% generators, in the range 50-80μm for 6.66% generators and above 80μm for remaining generators. Similarly in axial direction, the vibration displacement values are below 50μm for 86.36% generators, in the range for 50-80μm for 4.54% generators and above 80μm for remaining generators. Measured values of vibration velocity and displacement measured for non driving end (NDE) bearing of generators connected to Pelton turbines are shown in Fig 14. Measured values of vibration velocity in radial direction for NDE bearing of generators connected to Pelton turbines are below 1.6mm/s for 95.45% of generators and in the range 1.6-2.5mm/s for remaining generators. And in axial direction, vibration velocities are below 1.6 mm/s for 94.44% generators and in the range 1.6-2.5mm/s for 5.55% generators. Vibration displacement in radial direction are below 50μm for 69.56% generators, in the range 50-80μm for 8.69% generators and above 80μm for remaining generators. Similarly in axial direction, the vibration displacement values are below 50μm for 77.77% generators, in the range for 50-80μm for 5.55% generators and above 80μm for remaining generators. Measured values of vibration velocity in radial direction for NDE bearing of generators connected to Kaplan turbines are below 1.6mm/s for 92.59% of generators, in the range 1.6-2.5mm/s for 3.7% generators and above 2.5mm/s for remaining generators. And in axial direction, vibration velocities are below 1.6 mm/s for 85.19% generators, in the range 1.6-2.5mm/s for 7.4% generators and above 2.5mm/s for remaining generators. Vibration displacement in radial direction are below 50μm for 68.42% generators, in the range 50-80μm for 10.53% generators and above 80μm for remaining generators. Similarly in axial direction, the vibration displacement values are below 50μm for 61.11% generators, in the range for 50-80μm for 22.22% generators and above 80μm for remaining generators.
5. Noise Level Measurements Sound level is also measured during the performance testing. Noise is one of the most annoying problems with the machine. A maximum sound level up to 85 dB is generally desirable and a level of 90 dB is considered acceptable. Sound level beyond 90 dB causes discomfort to the operation and maintenance (O&M) staff working close to the machine, while a continuous exposure to sound levels above 95 dB can seriously affect their working efficiency and even lead to deafness. Sound level is
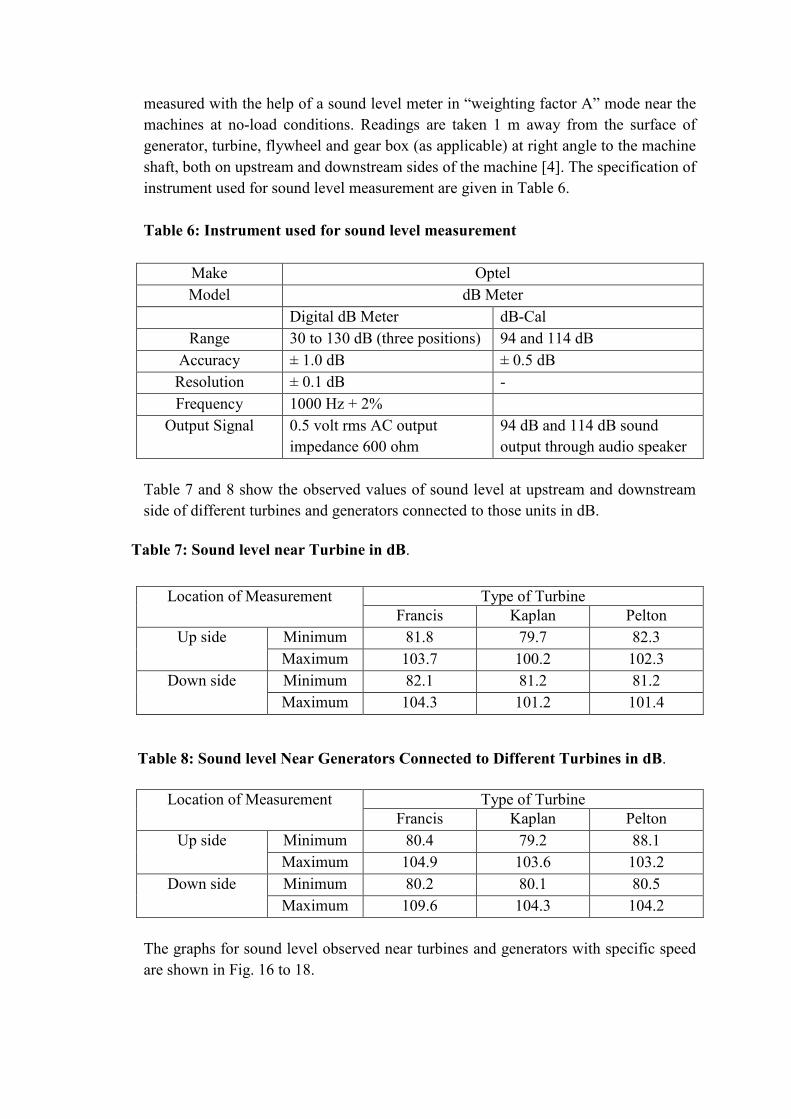
measured with the help of a sound level meter in “weighting factor A” mode near the machines at no-load conditions. Readings are taken 1 m away from the surface of generator, turbine, flywheel and gear box (as applicable) at right angle to the machine shaft, both on upstream and downstream sides of the machine [4]. The specification of instrument used for sound level measurement are given in Table 6. Table 6: Instrument used for sound level measurement
Make Optel Model dB Meter
Digital dB Meter dB-Cal Range 30 to 130 dB (three positions) 94 and 114 dB
Accuracy ± 1.0 dB ± 0.5 dB Resolution ± 0.1 dB - Frequency 1000 Hz + 2%
Output Signal 0.5 volt rms AC output impedance 600 ohm
94 dB and 114 dB sound output through audio speaker
Table 7 and 8 show the observed values of sound level at upstream and downstream side of different turbines and generators connected to those units in dB.
Table 7: Sound level near Turbine in dB.
Table 8: Sound level Near Generators Connected to Different Turbines in dB.
The graphs for sound level observed near turbines and generators with specific speed are shown in Fig. 16 to 18.
Location of Measurement Type of Turbine Francis Kaplan Pelton
Up side Minimum 81.8 79.7 82.3 Maximum 103.7 100.2 102.3
Down side Minimum 82.1 81.2 81.2 Maximum 104.3 101.2 101.4
Location of Measurement Type of Turbine Francis Kaplan Pelton
Up side Minimum 80.4 79.2 88.1 Maximum 104.9 103.6 103.2
Down side Minimum 80.2 80.1 80.5 Maximum 109.6 104.3 104.2

Figure 16: Sound level data for Francis turbines and generators connected to Francis
turbines.
Figure 17: Sound level data for Pelton turbines and generators connected to Pelton
turbines.
78
82
86
90
94
98
102
106
78
82
86
90
94
98
102
106
0.4 0.6 0.8 1 1.2 1.4 1.6 1.8 2 2.2 2.4 2.6 2.8 3 3.2
Soun
d le
vel i
n dB
Soun
d le
vel i
n dB
Specific speed
up stream of turbine down stream of turbineup stream of generator down stream of generator
7880828486889092949698100102104106
80
82
84
86
88
90
92
94
96
98
100
102
104
106
0.08 0.17 0.26
Soun
d le
vel i
n dB
Soun
d le
vel i
n dB
Specific speed
up stream of turbine down stream of turbineup stream of generator down stream of generator

Figure 18: Sound level data for Kaplan turbines and generators connected to Kaplan
turbines.
Hydro power houses, where sound level near the turbines was observed more than 90 dB by IITR, were suggested to the use of ear phones while working in turbine floor. In case of generators, the sound level above 90 dB was observed for generally air cooled types.
6. Conclusion There is no trend observed for different turbines with specific speeds for measured values of either vibration or noise. No prediction of abrupt behaviour of the values was observed from the measurement. Working conditions for every plant at each site were different. No correlation was found in the behaviour of machine specific to working condition. This area is open for more detailed investigations and look through for suggestions from experts.
7. Acknowledgement The authors are grateful to Ministry of New and Renewable Energy, Govt. of India to initiate and fund the field observations and testing facilities along with the small hydropower station programme for releasing the government subsidy to project developers. The contribution of all other team members namely Prof HK Verma, Prof Vinod Kumar, Prof RP Maheshwari, Prof RP Saini, Dr. Manoj Tripati, Dr. Dilbag Singh and Dr B Majumdar for the field observations taken during the period of 2005 – 2015 is sincerely acknowledged. All the staff members of AHEC and other departments of IIT Roorkee who have contributed directly or indirectly are thankfully acknowledged. The cooperation extended by the plant owners is highly appreciated and acknowledged.
78
82
86
90
94
98
102
106
78
82
86
90
94
98
102
106
1 1.5 2 2.5 3 3.5 4 4.5 5
Soun
d le
vel i
n dB
Soun
d le
vel i
n dB
Specific speed
up stream of turbine down stream of turbineup stream of generator down stream of generator

REFERENCES 1. ISO 10816-5 - 2000, Mechanical vibration - Evaluation of machine vibration by
measurements non-rotating parts – Part 5: Machine sets in hydraulic power generating and pumping plants. P 26, Geneva, April 2000.
2. ISO 7919-1 - 1996, Mechanical vibration – Evaluation of machine vibration by measurement on rotating shaft – Part 1: General guidelines. P 24, Switzerland, July 1996.
3. ISO 7919-5 - 1997, Mechanical vibration – Evaluation of machine vibration by measurement on rotating shaft – Part 5: Machine sets in hydraulic power generating and pumping plants. P 16, Switzerland February 1997.
4. AHEC-IITR, “1.10 General – Performance Evaluation of Small Hydro Power Plants” standard/manual/guideline with support from Ministry of New and Renewable Energy, Roorkee, Oct. 2012. P 69 Web link: www.ahec.org.in/publ/standard/standards_for_small_hydropower_dev.html
5. Samarasekera, H . Sam; Vibration Damping, Control, and Design, Edited by Clarence W . de Silva, CRC Press 2007, Pages 1–58,
Related Documents