WORKING PAPER SERIES NO 634 / MAY 2006 EXPENDITURE REFORM IN INDUSTRIALISED COUNTRIES A CASE STUDY APPROACH by Sebastian Hauptmeier, Martin Heipertz and Ludger Schuknecht

Welcome message from author
This document is posted to help you gain knowledge. Please leave a comment to let me know what you think about it! Share it to your friends and learn new things together.
Transcript
ISSN 1561081-0
9 7 7 1 5 6 1 0 8 1 0 0 5
WORKING PAPER SER IESNO 634 / MAY 2006
EXPENDITURE REFORM IN INDUSTRIALISED COUNTRIES
A CASE STUDY APPROACH
by Sebastian Hauptmeier,Martin Heipertzand Ludger Schuknecht

In 2006 all ECB publications will feature
a motif taken from the
€5 banknote.
WORK ING PAPER SER IE SNO 634 / MAY 2006
This paper can be downloaded without charge from http://www.ecb.int or from the Social Science Research Network
electronic library at http://ssrn.com/abstract_id=903103
1 The views expressed in this article reflect those of the authors and not necessarily those of the institutions for which they work. We would like to thank Louis Bê Duc, Paul Hiebert, Christophe Kamps, José Marín Arcas, Geert Langenus, Richard Morris,
Philippe Moutot, Eloïse Orseau, Mikko Spolander and Guido Wolswijk for very helpful comments.
[email protected] European Central Bank, Kaiserstrasse 29, 60311 Frankfurt am Main, Germany;
e-mail: [email protected], [email protected]
EXPENDITURE REFORM IN
INDUSTRIALISED COUNTRIES
A CASE STUDY APPROACH 1
by Sebastian Hauptmeier 2,Martin Heipertz 3
and Ludger Schuknecht 3
2 Munich University and Center for European Economic Research (ZEW), P.O. Box 10 34 43, L 7,1, 68161 Mannheim, Germany;

© European Central Bank, 2006
AddressKaiserstrasse 2960311 Frankfurt am Main, Germany
Postal addressPostfach 16 03 1960066 Frankfurt am Main, Germany
Telephone+49 69 1344 0
Internethttp://www.ecb.int
Fax+49 69 1344 6000
Telex411 144 ecb d
All rights reserved.
Any reproduction, publication andreprint in the form of a differentpublication, whether printed orproduced electronically, in whole or inpart, is permitted only with the explicitwritten authorisation of the ECB or theauthor(s).
The views expressed in this paper do notnecessarily reflect those of the EuropeanCentral Bank.
The statement of purpose for the ECBWorking Paper Series is available fromthe ECB website, http://www.ecb.int.
ISSN 1561-0810 (print)ISSN 1725-2806 (online)

3ECB
Working Paper Series No 634May 2006
CONTENTS
Abstract 4
Non-technical summary 5
1 Introduction 7
2 Expenditure trends and reform episodes inOECD countries 9
2.1 A historical perspective on expendituretrends 9
2.2 Categorisation of countries by reformeffort and timing 11
3 Country case studies of expenditure reformexperiences 15
3.1 Ireland 15
3.2 Sweden 19
3.3 Canada 21
3.4 Finland 23
3.5 Belgium 25
3.6 Netherlands 27
3.7 Spain 30
3.8 United Kingdom 32
4 Expenditure reforms in OECD countries –horizontal analysis 35
4.1 Common patterns and differences acrosscase studies 35
4.2 Comparing ambitious and timid reformers:expenditure developments 36
4.3 Comparing ambitious and timid reformers:fiscal performance 38
4.4 Comparing ambitious and timid reformers:economic performance 39
4.5 Comparing ambitious and timid reformers:testing for differences 41
5 Conclusion 42
Bibliography 43
Annexes 47European Central Bank Working Paper Series 50

Abstract: This study examines reforms of public expenditure in industrialised countries over the past two decades. We distinguish ambitious and timid reformers and analyse in detail reform experiences in eight case studies of ambitious reform episodes. We find that ambitious reform countries reduce spending on transfers, subsidies and public consumption while largely sparing education spending. Such expenditure retrenchment is also typically part of a comprehensive reform package that includes improvements in fiscal institutions as well as structural and other macroeconomic reforms. The study finds that ambitious expenditure retrenchment and reform coincides with large improvements in fiscal and economic growth indicators.
Keywords: public expenditure, expenditure reform, economic growth, deficit, debt,
employment, case studies, fiscal institutions
JEL classification: H5, H6, O57
4ECBWorking Paper Series No 634May 2006

Non-technical summary
In many industrialised countries, about half of GDP goes through the hands of government.
Against this backdrop, the expenditure side of public budgets is gaining greater attention,
particularly with respect to the quality of public finances. Contributing to the debate how the
expenditure side can support economic performance, this paper adopts a case study approach
and takes a close look at real policy examples and concrete experiences with expenditure
reforms in industrialised countries.
‘Ambitious reformers’ among OECD countries are identified on the basis of reductions in the
GDP ratio of primary spending that amount to or exceed 5% of GDP over seven years,
starting with the year of maximum total expenditure in relation to GDP. The resulting sample
of ambitious reformers comprises eight countries in two ‘reform waves’: Ireland, Belgium,
the United Kingdom and the Netherlands reduced their expenditure ratios as of the early
1980s and, with the exception of Belgium, marshalled a second ambitious reform effort in the
early 1990s. This second wave was joined by Finland, Sweden, Canada and Spain. Countries
that reduced their primary spending ratio by less than 5% of GDP are defined as ‘timid
reformers’. This ‘control group’ consists of Austria (borderline to ambitious), Denmark, New
Zealand, the United States, Italy, Japan, Belgium in the 1990s, Germany, France and
Switzerland.
The study examines each ambitious reform case individually and collects its main contextual
facts with respect to the macroeconomic environment, the scope and composition of the
expenditure reduction, important institutional components of the reform effort as well as
complementary measures. The latter illustrate the comprehensiveness of reforms, including
liberalisation and privatisation in the labour, product and services markets as well as far-
reaching tax reforms.
From a horizontal perspective and on the basis of comparing unweighted averages of early
(reforms in 1980s) and late (reforms in 1990s) ambitious vs. timid reformers, the study
discerns a number of important features of expenditure reforms. Within seven years,
ambitious reform countries reduced total expenditures by around 10% of GDP. While both
ambitious and timid reformers benefit from falling interest payments, these reductions amount
to 50% of the overall expenditure decline in timid countries but to only 10% of the savings
achieved by ambitious ones. Ambitious reformers focus their efforts on the reduction of
public consumption (wages and employment), transfers and subsidies. On average, over 80%
of the decline in their primary expenditure ratios occurs in these categories. Public investment
5ECB
Working Paper Series No 634May 2006

was cut strongly by the group of early ambitious reformers but only moderately by the other
two groups. Education spending was touched little in the reform process for all groups.
In all cases, ambitious expenditure reform was part of a comprehensive agenda that changed
countries’ economic policy regime significantly. Reforms included in most cases improved
fiscal institutional, labour market incentives, taxation, privatisation and other measures to
enhance macroeconomic stability.
The study also compares the performance of both the early and late ‘ambitious’ vs. the ‘timid’
reformers in terms of medium-term economic developments. Ambitious expenditure reform
episodes coincided with more profound improvements in the soundness of public finances
than timid ones and yielded significant scope for tax cuts. Furthermore, countries that
undertook ambitious expenditure reforms experienced more favourable trend output
developments. The study provides some evidence that positive confidence effects of
ambitious expenditure reforms were potentially strong and coincided with a quick rebound in
growth.
While the experiences of the two country groups are significantly different (as suggested by
relevant statistical tests), the study does not establish causality between reform ambition and
performance in an econometric sense, for which much further analysis would be warranted.
6ECBWorking Paper Series No 634May 2006

I. Introduction
Public expenditure in industrialised countries stands at very high levels. In Europe, in
particular, almost half of GDP is going through the hands of government. At the same time,
the data exhibit enormous cross-country divergence in terms of both expenditure levels and
trends in recent decades. Many countries reported public spending well above 50% of GDP at
some point over the past 25 years, with maxima above 60% in the Nordic countries and
Belgium. By contrast, a number of countries have never reported spending ratios in excess of
40% of GDP, notably the US, Japan, Australia or Switzerland. Moreover, in recent years, a
number of countries have reversed very high spending ratios through ambitious expenditure
reforms while others also retreated from earlier peaks, albeit in a much more timid fashion.
This paper takes a close look at experiences with expenditure reform in industrialised
countries and places special emphasis on ambitious reform episodes. It conducts a
comparative in-depth analysis of such episodes by examining the concrete reform measures
undertaken and their effect on total spending and expenditure composition. It also looks at the
institutional context in which these reforms were undertaken, the comprehensiveness of
reform programs and the economic and fiscal performance of these countries in the wake of
such reforms.
The study has its conceptual underpinning in the literature on fiscal policies, growth
and sustainability. Very high spending in many industrialised countries has, according to
many observers, significant adverse consequences on employment, investment and
innovation. Large bureaucracies and benefit systems that discourage labour supply as well as
high effective and marginal tax rates tend to discourage work and capital formation and stifle
entrepreneurial and technological dynamism. High spending is also correlated with persistent
deficits and debt increases as well as significant future liabilities related to population ageing.
This threatens to put at risk the sustainability of public finances. If expenditure reforms
enhance the efficiency of spending and reduce unproductive spending commitments,
disincentives are reduced, taxes can be lowered and fiscal imbalances lastingly eliminated.
The beneficial effects of expenditure reforms can be reinforced if they are conducted as part
of a comprehensive reform program where macroeconomic or structural bottle-necks
elsewhere in the economy are eliminated at the same time.2
2 For surveys, see Tanzi and Schuknecht, 2000 and 2003; Hemming, Kell and Mahfouz., 2002; Afonso, Ebert, Schuknecht and Thoene, 2005; European Commission, 2003 and 2004; EPC Ageing Report, 2006; Wierts, 2006; ECOFIN 2006. The literature has also found that expenditure-based consolidations tend to be more successful in improving debt dynamics than revenue increases (Alesina and Perotti, 1995).
7ECB
Working Paper Series No 634May 2006

The literature points to the possibility of strongly positive effects of expenditure
reform in the medium to long run. These effects can be magnified if fiscal reforms are
complemented by macroeconomic stabilisation and structural reforms in factor and product
markets. The literature has also been putting increasing emphasis on the “institutional
infrastructure” or “the rules of the game” of economic policy making that set the right
incentives for policy makers, including in the fiscal sphere. If expenditure and other
macroeconomic, institutional and structural reforms result in a deep change of the policy
regime and break expectations of rent-seeking opportunities and repeated policy errors, then
these reforms should result in improved economic performance at least in the medium term.
Additionally, it is by now well known that expenditure reform and retrenchment may even
have positive short term effects on demand if changes in expectations take hold quickly and
generate strong confidence effects from anticipated higher wealth and lower taxes. This is
another way of phrasing in more technical terms what would happen if a fundamental reform
programme causes a profound change in the economic policy regime of a country.3
This study focuses mainly on medium to long term aspects of expenditure reforms. It
builds on and extends a recent study by Schuknecht and Tanzi (2005), which takes a bird’s
eye view on the different experiences that OECD countries have made since the early 1980s
with reducing public expenditure. The authors find in particular that ambitious expenditure
reforms have coincided with strengthened economic growth as well as socio-economic and
institutional indicators. A forthcoming case study conducted by the IMF (Annett 2006)
pursues an approach similar to ours while focussing on labour market issues. Its findings are
consistent with the results of this paper and, in a complementary way, also point to the need
for comprehensive reforms that encompass structural measures as well as expenditure-based
fiscal consolidation.
Ambitious reform programs as defined in this paper display a number of common
features: the reduction in total spending is indeed ambitious and averages about 10% of GDP
within seven years. It is achieved by focusing mainly on government consumption, transfers
and subsidies, while mostly protecting education spending and, often, public investment.
Ambitious expenditure reform comes as part and parcel of a comprehensive reform package,
mostly including labour market reform, tax reform and privatisation as well as, in about half
3 For a discussion of the importance of changes in the rules of the game or the policy regime change, see Brennan and Buchanan (1985) from a conceptual perspective and Tanzi and Schuknecht (2000) for applications in the expenditure domain to Chile and New Zealand. Fiscal rules are discussed in von Hagen, Hallerberg and Strauch (2004); or Deroose and Wierts (2006). For surveys of the Non-Keynesian effects literature, see McDermott and Wescott (1997); or Briotti (2005).
8
ECBWorking Paper Series No 634May 2006

of the episodes, the establishment of monetary and external stability. Virtually all episodes of
ambitious reform feature a significant strengthening of national and sub-national budgetary
procedures and institutions. For many of the episodes discussed, it appears that one could
indeed talk about a major change in the policy regime.
Ambitious reform episodes appear to coincide with more lasting fiscal consolidation
than “timid” expenditure reforms while also yielding an important “tax cut dividend”.
Ambitious reformers also experience a considerably more favourable growth performance
than “timid” countries and small ambitious countries experience a stronger and faster increase
in output growth. Ambitious reformers have also typically not experienced significant short
term economic costs of retrenchment, despite an average adjustment effort of around 3% of
GDP in the first two years of reform, as consumer and investor confidence picked up rather
quickly.
Before entering into the discussion, it is worth stressing that this study looks at the
changes in spending ratios since their peak, their correlation with other reforms and the fiscal
and economic performance of countries from a case study perspective. While the ambitious
and timid groups’ experiences are significantly different (as suggested by relevant tests), we
do not establish statistical causality between reforms and performance for which much further
analysis would be warranted. While focusing on changes in expenditure ratios, the study does
not comment on “optimal” levels of public spending ratios (on this issue, see the quoted work
by Tanzi and Schuknecht).
The remainder of this paper is structured as follows: The second section provides a
historic overview of expenditure trends followed by a methodological discussion of how to
distinguish ambitious and timid reformers. Section three presents eight country case studies
comprising 11 episodes of ambitious expenditure reform. The fourth section draws horizontal
conclusions from the case studies and compares these with the economic and fiscal
performance of timid reformers. The final section concludes.
II. Expenditure trends and reform episodes in OECD countries
II.1 A historical perspective on expenditure trends
From a historic perspective, it is striking that, one century ago, public expenditure
absorbed only about 10% of GDP, with most spending going to the military and public
investment. With World War I, the expenditure ratio rose to over 20% of GDP and further to
somewhat less than 30% by the early 1960s. This was the period when (apart from military
9ECB
Working Paper Series No 634May 2006

spending during World War II), health, education and other goods and services began to be
financed publicly. After this, public spending growth accelerated when the modern welfare
state was created and expanded. This increase affected all advanced economies, though to
varying degrees. By the early 1980s, average public spending reached about 45% of GDP—
four times as much as a century earlier. (For more details, see Tanzi and Schuknecht 2000 and
Peacock and Wiseman 1961.)
Since then, however, expenditure developments were rather diverse across
industrialised countries as more and more countries started reforming their public finances
and reducing public expenditure levels relative to GDP. The first countries where public
expenditure peaked and subsequently started to decline were Luxembourg and the United
Kingdom in 1981, followed by Ireland (1982), Belgium and the Netherlands (1983) and
Australia and New Zealand (1985). In a further large group of countries, public spending
continued to increase until the early to mid-1990s and then started coming down. Only Greece
and Portugal experienced their expenditure peaks in the past five years.
This picture is reflected in Table 1. Comparing maximum expenditure ratios with most
recently available data confirms a marked decline in public expenditure ratios in many
industrialised countries since its peak. The first two columns report the year when expenditure
ratios peaked and the ratio for that year. The next two columns report the expenditure ratio in
2004 (or the latest available year) and the change since the peak. On average, total
expenditures have fallen by 8% of GDP, the change being slightly higher in the euro area. The
Table also clearly shows the two reform waves starting in the early 1980s and early 1990s,
respectively.
Table 1: Total expenditure, maximum spending ratio, 2004 Percent of GDP Maximum public expenditure Change Year ratio 2004 or nearest Maximum-2004 (% of GDP) Australia 1985 40.2 36.3 -3.9 Austria 1993 57.4 50.4 -7.1 Belgium 1983 63.8 50.2 -13.6 Canada 1992 52.6 39.7 -13.0 Denmark 1993 61.3 55.1 -6.2 Finland 1993 64.8 51.5 -13.2 France 1996 55.4 54.0 -1.3 Germany 1996 50.2 47.5 -2.7 Greece 2000 52.0 49.9 -2.1 Ireland 1982 56.2 34.0 -22.2 Italy 1993 57.7 48.6 -9.1 Japan 1998 41.0 38.6 -2.5
10
ECBWorking Paper Series No 634May 2006

Luxembourg 1981 51.9 45.6 -6.3 Netherlands 1983 58.3 47.1 -11.2 New Zealand 1985 56.5 38.6 -17.9 Portugal 2004 46.5 46.5 0.0 Spain 1993 47.6 39.0 -8.6 Sweden 1993 73.0 57.1 -16.0 Switzerland 1998 34.8 34.3 -0.5 United Kingdom 1981 50.7 44.1 -6.5 United States 1992 37.2 34.3 -2.9 Average 52.6 44.8 -7.8 Euro zone 55.1 47.0 -8.1 Non-euro OECD 49.7 42.0 -7.7 Source: Ameco
There are not only great differences in the starting year of expenditure reduction and
reform but also in the intensity of the respective reform efforts. In some countries, including
Belgium, Canada, Finland, Ireland, the Netherlands, New Zealand and Sweden, expenditure
fell by over 10 or even 20 percentage points of GDP. In a number of others, public
expenditure fell very little and even that fall was due to savings from lower inflation and
interest on public debt rather than due to a structural consolidation effort. In some countries,
public expenditure was relatively low at the outset and hence the room for cuts much smaller
(Australia, Switzerland, Japan, US).
The average ratio of public spending to GDP is now more or less back to where it was
in the early 1980s. However, the countries with the highest expenditure ratio today are mostly
not the same as 20 years ago. In some countries, expenditure reductions brought ratios back
close to the average. In some others, public spending fell to levels that are close to what might
be broadly considered “optimal”: Ireland’s, Spain’s, New Zealand’s and Canada’s public
spending is now below 40% of GDP and even near the ratio of 30-35% that Tanzi and
Schuknecht (2000) speculated to be the maximum necessary for financing essential and high
quality public services.4
II.2 Categorisation of countries by reform effort and timing
In order to conduct an in-depth analysis of expenditure reform experiences, it is useful
as a first step to propose some definitions and categorisation. This may then also facilitate
discussing reform patterns, their context and their impact, e.g. with respect to the timing and
4 See Tanzi and Schuknecht (2000) for arguing for industrialised countries that public spending increases have not brought much additional benefit when growing beyond 30% of GDP. Afonso, Schuknecht and Tanzi (2005) show, for a large number of emerging economies, that expenditure efficiency appears to be declining strongly when the expenditure ratio exceeds 30% or 35% of GDP.
11ECB
Working Paper Series No 634May 2006

intensity of reform. We define changes in the primary expenditure ratio (which is total
expenditure excluding interest spending on public debt) as the measure of a country’s reform
effort. This is a well-accepted approach in the literature as it measures deviations between
non-interest expenditure developments and their main drivers (public wages, and social
benefits) relative to nominal GDP.5 Nevertheless, we also use real expenditure growth as a
robustness check. Ideally one should look at cyclically adjusted expenditure ratios but due to
limited data availability and concerns about data quality we use this data as another means to
check robustness rather than as the primary assessment indicator. Finally, we did not only
look at changes in the public expenditure ratio but also at relative changes, i.e. at the decline
of public primary expenditure relative to total expenditure.
Furthermore, we define the total expenditure peak of each country as the starting date
of the expenditure reform period. We take stock of the change in the expenditure ratio after 7
years, which is broadly the duration of observed reform “waves” (and adjustment fades out
around this date) and which also roughly corresponds to the length of many business cycles
(so that cyclical adjustment of expenditure developments becomes less important). This
approach will later allow comparing and discussing the medium term experiences in the
context of expenditure reforms. Again, we checked whether results were robust to different
observation periods. For the countries that started reforming in the 1980s, we also checked
whether they participated additionally in the second reform wave of the early 1990s. Some
countries may hence feature two reform episodes.
Table 2: Primary expenditure, changes Percent of GDP Primary expenditure Change Ranking T0 (or nearest) maxT7 year ratio (or nearest)
(% of GDP)Relative
(% of max) (% of GDP) Relative
(% of max)"ambitious" reformers Finland 1993 60.3 -14.0 -23.2 1 2Sweden 1993 67.2 -14.0 -20.8 2 5Ireland (Phase 1) 1982 47.5 -12.4 -26.0 3 1Belgium (Phase 1) 1983 53.9 -12.3 -22.7 4 3Canada 1992 44.9 -9.5 -21.2 5 4United Kingdom (Phase 1) 1981 45.4 -8.2 -18.1 6 6Netherlands (Phase 2) 1993 48.5 -7.5 -15.4 7 9 5 See, for example, the Non-Keynesian effects literature. Note that wages and benefits are normally correlated with nominal GDP growth. A country with 4% nominal wage, benefit and GDP growth will need to make an effort to keep expenditure growth below GDP growth just as a country with 5% or 6% growth in these elements. However, with high GDP growth it is easier to shrink the expenditure ratio without resorting to nominal spending cuts.
12
ECBWorking Paper Series No 634May 2006

United Kingdom (Phase 2) 1992 44.3 -7.2 -16.2 8 7Spain 1993 42.6 -6.4 -15.0 9 10Ireland (Phase 2) 1992 38.2 -6.2 -16.1 10 8Luxembourg 1981 50.5 -5.7 -11.2 11 11Netherlands (Phase 1) 1983 52.8 -5.1 -9.7 12 13"timid" reformers Austria 1993 53.1 -4.3 -8.1 13 15Denmark 1993 54.1 -3.9 -7.2 14 17New Zealand 1985 46.9 -3.8 -8.2 15 14United States 1992 32.2 -3.4 -10.4 16 12Italy 1993 44.6 -3.0 -6.6 17 18Japan 1998 37.6 -2.7 -7.3 18 16Belgium (Phase 2) 1993 45.2 -2.1 -4.6 19 19Germany 1996 46.7 -0.6 -1.3 20 20France 1996 51.5 -0.5 -0.9 21 22Switzerland 1998 34.0 -0.3 -1.0 22 21other countries 23 Portugal 2004 43.8 0.0 0.0 24 23Greece 2000 43.9 0.4 0.8 25 24Australia 1985 34.9 0.4 1.1 26 25Source: Ameco
The results of these considerations are reflected in Table 2 and in Annex Tables 1 and
2. Of the 21 countries that we considered, six countries started reducing public spending in
the 1980s, and four of them report two “waves” (Belgium, Ireland, the Netherlands and the
United Kingdom). This yields a total of 25 episodes or “cases”. Of these 25 cases, ten
reported primary expenditure reductions of more than 6 percent of GDP and a relative decline
of public spending of more than 15% of GDP within seven years. Moreover, there are two
cases where primary expenditure declined by more than 5% of GDP, reflecting a relative
decline of about 10%. To put this in perspective, a 5% primary expenditure decline reflects
about half of the public sector wage bill or more than half of public pension spending for the
average of industrialised countries. To us, these cases therefore reflect ambitious reform
programs. Four of these are cases of “early” ambitious adjustment took place in the 1980s.
The others are “late” ambitious programs, as they took place in the 1990s.6 When looking at
real expenditure growth, all episodes feature contained positive or even negative growth in
this variable with the notably exception of Ireland. However, the country was able to limit
spending growth well below real GDP trend and still reported a remarkable decline in the
cyclically adjusted expenditure ratio. Spain and the first Dutch reform episode show
somewhat less expenditure consolidation when looking at cyclically adjusted figures. All in
6 Ireland, for example, reduced primary spending by over 12% of GDP in the first phase and again by 6% in the second phase. The UK shows even more peculiarities as it experienced two phases of expenditure reform which each time were followed by very strong expenditure increases, so that the current ratio of public spending is not much different from 20 years ago.
13
ECBWorking Paper Series No 634
May 2006

all, and despite these caveats, we would find our identification criterion as broadly reasonable
and classify 12 (or almost half of the total) episodes as incidents of ambitious reforms.
There are 10 cases of “timid” reforms whose public primary expenditure declined but
by less than 5% of GDP within seven years. This group also includes the large euro area
countries. There are two countries where the choice of a longer adjustment period (than 7
years) would have made a difference and would have qualified them as “ambitious reformers”
under the above definition. Austria is the least timid and comes close to the 5% threshold after
7 years. New Zealand is the country with the greatest overall adjustment effort between the
start of reforms and today in this group.7 The US reports the highest relative expenditure
decline of about 10% of total primary spending in this group, coming close to that of
Luxembourg or Netherlands (phase 1). However, most of the reduction occurred in the area of
military spending. It also noteworthy that Germany and Italy reported relatively moderate real
expenditure growth but in an environment of low trend growth this did not translate into much
reduced spending ratios. To be consequential, we included all these cases with some
‘borderline characteristics’ in the group of timid reformers.
Three countries did not experience any decline in primary spending ratios since the
peak of total expenditure (Portugal, Greece, Australia). Nevertheless, this does not mean that
these countries did not undertake economic policy reforms. Especially Australia undertook
major structural reforms in the past two decades. The categorisation of countries is reflected
in Table 3, with numbers in brackets indicating the respective reform phase.
Table 3: Reform categories Categories Countries
Ambitious and early reformers Ireland (1), Luxembourg, the Netherlands (1), United Kingdom (1)
Ambitious and late reformers Belgium (2), Canada, Finland, Ireland (2), the Netherlands (2), Spain, Sweden, United Kingdom (2)
Timid reformers Austria, Belgium (2), Denmark, France, Germany, Italy, Japan, New Zealand, Switzerland, United States
Other countries Australia, Greece, Portugal
The following section will discuss individually the experiences of countries that
undertook ambitious reforms, according to our categorisation. While there are 12 cases
affecting 9 countries, we will not discuss Luxembourg due to limited data availability. We
will look at the expenditure reforms undertaken, the accompanying institutional reforms and
7 For a more detailed discussion of New Zealand’s experience see Massey, 1995; Scott, 1996 or Tanzi and Schuknecht, 2000.
14
ECBWorking Paper Series No 634May 2006

at complementary structural reforms that may have affected the fiscal or economic
performance of the country in question. In the subsequent section, we propose a number of
horizontal conclusions from the case studies in both quantitative and qualitative terms.
III. Country case studies of expenditure reform experiences
The different experiences with expenditure reforms that OECD countries have made
over the last decades are highly instructive from a case by case perspective. Discussing and
comparing individual experiences is insightful in several respects: On the one hand, each
expenditure reform is unique. The economic and political conditions from which it arises as
well as its effects differ from country to country and over time. Hence, we naturally observe a
range of idiosyncratic features associated with each single expenditure reform. On the other
hand, some common characteristics stand out, too. Therefore, the following country studies
should be of relevance beyond the specific cases at hand. With the exception of Luxembourg,
we discuss all countries that qualify as ‘ambitious reformers’. All country analyses benefited
from the respective OECD country surveys; further sources are quoted where appropriate. The
case studies are presented in the order of ambition, i.e. listed by the degree of the primary
expenditure adjustment, starting with one of the most impressive expenditure reform success
stories in economic history: Ireland.
III.1 Ireland Ireland: The macro picture (% of GDP)
Phase 1 Phase 2T0 T0-T2 T0-T7 T0_2 T0-T2 T0-T7
1982 1982-1984 1982-1989 1992 1992-1994 1992-1999Total revenue 41.9 2.5 -1.6 42.4 0.0 -5.4Total expenditure 56.2 -1.6 -13.3 45.3 -1.0 -10.9Primary expenditure 47.5 -2.1 -12.4 38.2 0.1 -6.2Fiscal balance -15.2 4.4 12.5 -3.0 1.0 5.5Cyclically adj. balance -15.2 5.7 11.9 -2.0 3.2 2.6Cyclically adjusted primary balance -5.3 6.1 9.8 5.1 2.2 -2.1Public debt 84.6 14.1 15.7 92.5 -2.9 -43.8
Real GDP growth (%) 2.3 2.1 3.9 3.3 2.4 7.4Trend GDP growth (%) 3.3 -0.3 0.6 5.6 0.8 2.7Inflation (CPI growth in %) 17.2 -8.6 -13.2 3.1 -0.8 -1.5Employment ratio 57.8 -3.4 -5.0 53.0 1.0 11.8Source: Ameco, OECD
Ireland: The disaggregated picture (% of GDP)Phase 1 Phase 2
T0 T0-T2 T0-T7 T0_2 T0-T2 T0-T71982 1982-1984 1982-1989 1992 1992-1994 1992-1999
Total expenditure 56.2 -1.6 -13.3 45.3 -1.0 -10.9Interest 8.8 0.4 -1.0 7.1 -1.0 -4.8
Primary expenditure 47.5 -2.1 -12.4 38.2 0.1 -6.2Government consumption 20.4 -1.1 -5.2 17.9 -0.4 -3.9
Thereof: compensation of employees 12.1 -0.4 -2.3 11.2 -0.3 -3.0Transfers and subsidies 15.7 1.1 -2.2 14.1 -0.4 -4.7
Transfers 14.4 0.5 -2.1 12.9 -0.4 -4.4Subsidies 1.3 0.7 -0.1 1.2 -0.1 -0.3
Investment 5.0 -1.2 -3.2 2.1 0.2 1.0Functional:Education 5.8 -0.3 -0.9 5.22 0.2 -0.9Health 6.3 -0.4 -1.7 5.04 0.0 -0.5Pensions 4.9 -0.1 -0.7 4.32 -0.2 -1.6Memorandum item:Government employment (change in %) 5.2 -3.8 -13.6 2.6 -0.3 8.7Source: Ameco, OECD, Worldbank
15
ECBWorking Paper Series No 634
May 2006
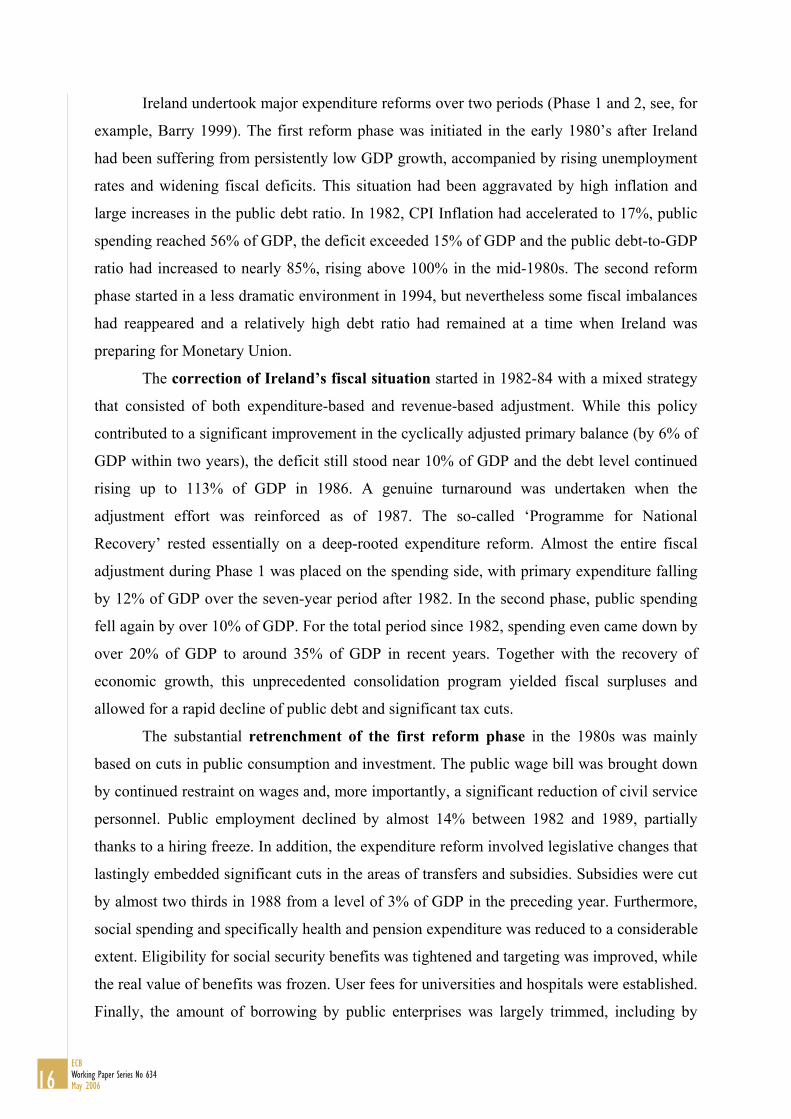
Ireland undertook major expenditure reforms over two periods (Phase 1 and 2, see, for
example, Barry 1999). The first reform phase was initiated in the early 1980’s after Ireland
had been suffering from persistently low GDP growth, accompanied by rising unemployment
rates and widening fiscal deficits. This situation had been aggravated by high inflation and
large increases in the public debt ratio. In 1982, CPI Inflation had accelerated to 17%, public
spending reached 56% of GDP, the deficit exceeded 15% of GDP and the public debt-to-GDP
ratio had increased to nearly 85%, rising above 100% in the mid-1980s. The second reform
phase started in a less dramatic environment in 1994, but nevertheless some fiscal imbalances
had reappeared and a relatively high debt ratio had remained at a time when Ireland was
preparing for Monetary Union.
The correction of Ireland’s fiscal situation started in 1982-84 with a mixed strategy
that consisted of both expenditure-based and revenue-based adjustment. While this policy
contributed to a significant improvement in the cyclically adjusted primary balance (by 6% of
GDP within two years), the deficit still stood near 10% of GDP and the debt level continued
rising up to 113% of GDP in 1986. A genuine turnaround was undertaken when the
adjustment effort was reinforced as of 1987. The so-called ‘Programme for National
Recovery’ rested essentially on a deep-rooted expenditure reform. Almost the entire fiscal
adjustment during Phase 1 was placed on the spending side, with primary expenditure falling
by 12% of GDP over the seven-year period after 1982. In the second phase, public spending
fell again by over 10% of GDP. For the total period since 1982, spending even came down by
over 20% of GDP to around 35% of GDP in recent years. Together with the recovery of
economic growth, this unprecedented consolidation program yielded fiscal surpluses and
allowed for a rapid decline of public debt and significant tax cuts.
The substantial retrenchment of the first reform phase in the 1980s was mainly
based on cuts in public consumption and investment. The public wage bill was brought down
by continued restraint on wages and, more importantly, a significant reduction of civil service
personnel. Public employment declined by almost 14% between 1982 and 1989, partially
thanks to a hiring freeze. In addition, the expenditure reform involved legislative changes that
lastingly embedded significant cuts in the areas of transfers and subsidies. Subsidies were cut
by almost two thirds in 1988 from a level of 3% of GDP in the preceding year. Furthermore,
social spending and specifically health and pension expenditure was reduced to a considerable
extent. Eligibility for social security benefits was tightened and targeting was improved, while
the real value of benefits was frozen. User fees for universities and hospitals were established.
Finally, the amount of borrowing by public enterprises was largely trimmed, including by
16
ECBWorking Paper Series No 634May 2006
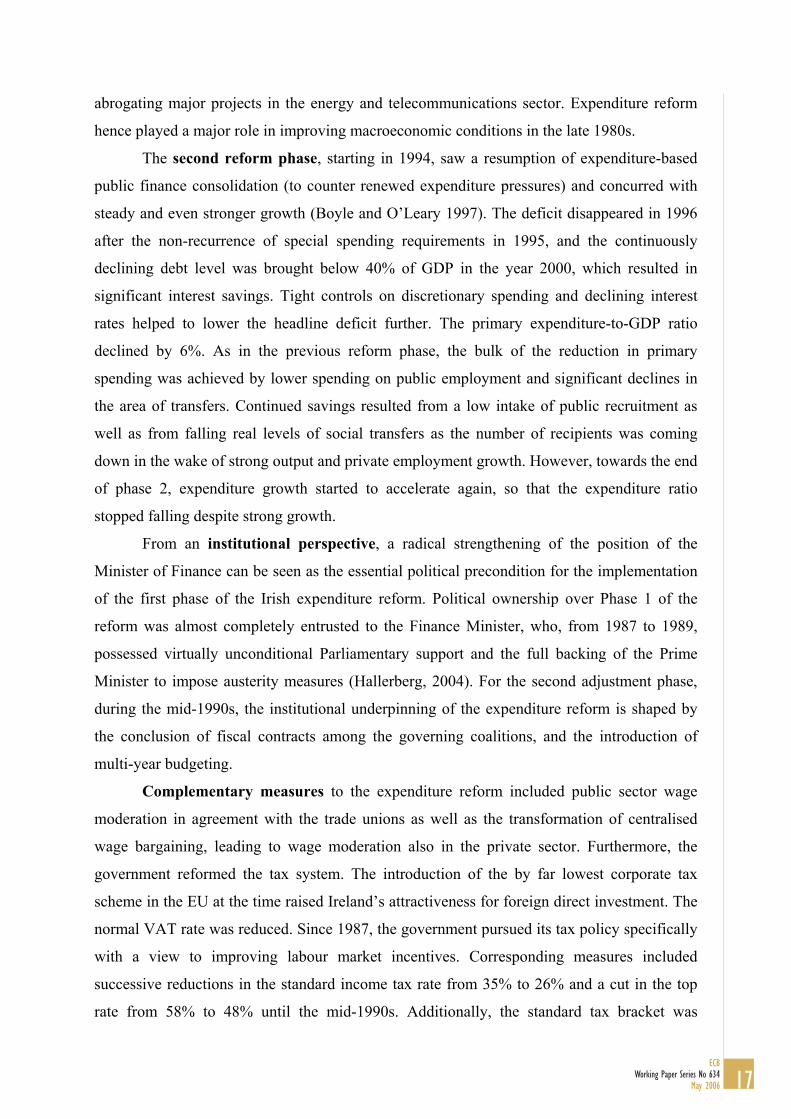
abrogating major projects in the energy and telecommunications sector. Expenditure reform
hence played a major role in improving macroeconomic conditions in the late 1980s.
The second reform phase, starting in 1994, saw a resumption of expenditure-based
public finance consolidation (to counter renewed expenditure pressures) and concurred with
steady and even stronger growth (Boyle and O’Leary 1997). The deficit disappeared in 1996
after the non-recurrence of special spending requirements in 1995, and the continuously
declining debt level was brought below 40% of GDP in the year 2000, which resulted in
significant interest savings. Tight controls on discretionary spending and declining interest
rates helped to lower the headline deficit further. The primary expenditure-to-GDP ratio
declined by 6%. As in the previous reform phase, the bulk of the reduction in primary
spending was achieved by lower spending on public employment and significant declines in
the area of transfers. Continued savings resulted from a low intake of public recruitment as
well as from falling real levels of social transfers as the number of recipients was coming
down in the wake of strong output and private employment growth. However, towards the end
of phase 2, expenditure growth started to accelerate again, so that the expenditure ratio
stopped falling despite strong growth.
From an institutional perspective, a radical strengthening of the position of the
Minister of Finance can be seen as the essential political precondition for the implementation
of the first phase of the Irish expenditure reform. Political ownership over Phase 1 of the
reform was almost completely entrusted to the Finance Minister, who, from 1987 to 1989,
possessed virtually unconditional Parliamentary support and the full backing of the Prime
Minister to impose austerity measures (Hallerberg, 2004). For the second adjustment phase,
during the mid-1990s, the institutional underpinning of the expenditure reform is shaped by
the conclusion of fiscal contracts among the governing coalitions, and the introduction of
multi-year budgeting.
Complementary measures to the expenditure reform included public sector wage
moderation in agreement with the trade unions as well as the transformation of centralised
wage bargaining, leading to wage moderation also in the private sector. Furthermore, the
government reformed the tax system. The introduction of the by far lowest corporate tax
scheme in the EU at the time raised Ireland’s attractiveness for foreign direct investment. The
normal VAT rate was reduced. Since 1987, the government pursued its tax policy specifically
with a view to improving labour market incentives. Corresponding measures included
successive reductions in the standard income tax rate from 35% to 26% and a cut in the top
rate from 58% to 48% until the mid-1990s. Additionally, the standard tax bracket was
17
ECBWorking Paper Series No 634
May 2006

doubled and the tax wedge narrowed from an average of 43% of total employer labour cost in
1987 to 35% ten years later. Further sizeable tax reductions were implemented in 1996 and
1997. A three-year central wage agreement was announced in December 1996 which, in
combination with the effects of the tax reform, contributed to continued wage moderation and
increased labour market flexibility. In addition, the government focussed on improving work
incentives. To this end, it reformed the benefit system and realigned public employment
programmes and services as well as vocational training and education. Moreover,
privatisation of public companies as well as increased public-private cooperation were
continued, particularly in the areas of telecommunications and public banking.
In terms of macroeconomic measures, the external sector was supported by a
devaluation of the Irish pound in 1987, which also helped to reduce the costs for foreign
investors and improved Irish competitiveness (Bartolini 1993). In the early 1990s, Ireland’s
devaluation again supported the external sector. But the broader economic reforms that helped
break the expectation of repeated cycles of devaluation, wage and fiscal pressures and
inflation caused the impact to be more lasting in an environment of continued price stability.
In summary, Ireland seems to be a case of a major change in the economic policy
regime where expectations and behaviour of economic agents changed fundamentally and for
which expenditure reform constituted a key element. Subsequently, Ireland experienced swift
employment creation, rising income, low spending ratios and public debt and, ultimately,
convergence of living standards with those of the most advanced Western economies (Fitz
Gerald 1999). In particular, the first phase of the Irish expenditure reform delivers a prime
example of how expenditure retrenchment as part of a broad and deep structural and
macroeconomic reform agenda can coincide with a swift and sustained economic recovery.8
Unsurprisingly, the Irish experience sparked the scientific debate on possible expansionary
effects of fiscal contractions (starting with Giavazzi and Pagano, 1990).
8 On the basis of modelling causal factors behind Irish growth, it has been argued that the ‘fiscal adjustment was directly responsible for a sizeable increase in the growth rate after the mid-1980s’ (see also Barry, 1991, de la Fuente and Vives 1997, Honohan, 1999).
18
ECBWorking Paper Series No 634May 2006

III.2 Sweden
Sweden: The macro picture (% of GDP)T0 T0-T2 T0-T7
1993 1993-1995 1993-2000Total revenue 61.6 -0.9 0.8Total expenditure 73.0 -5.2 -15.7Primary expenditure 67.2 -6.1 -14.0Fiscal balance -11.4 4.4 16.5Cyclically adj. balance -7.3 1.6 11.0Cyclically adjusted primary balance -1.4 2.5 9.2Public debt 71.3 2.4 -18.4
Real GDP growth (%) -2.0 6.0 6.3Trend GDP growth (%) 0.8 1.4 2.0Inflation (CPI growth in %) 4.7 -2.3 -3.8Employment ratio 73.2 -0.3 1.4Source: Ameco, OECD
Sweden: The disaggregated picture (% of GDP)T0 T0-T2 T0-T7
1993 1993-1995 1993-2000Total expenditure 73.0 -5.2 -15.7
Interest 5.8 0.9 -1.8Primary expenditure 67.2 -6.1 -14.0
Government consumption 29.4 -2.2 -2.8Thereof: Compensation of employees 18.6 -1.8 -2.8
Transfers and subsidies 27.1 -2.8 -8.0Transfers 22.6 -2.0 -5.1Subsidies 4.5 -0.8 -2.9
Investment 3.8 0.2 -0.9Functional:Education 7.6 -0.1 0.2Health 7.5 -0.4 -0.4Pensions 10.9 -1.0 -1.7Memorandum item:Government employment (change in %) 1.9 -3.5 -7.7Source: Ameco, OECD, Worldbank
Sweden’s experience with expenditure reform arose from a severe recession coupled
with a financial crisis following the bubble-economy of the late 1980s (for an overview of
Swedish reforms, see Henriksson 2003). This led to a significant decline in the employment
ratio, fiscal imbalances and strong inflationary pressures. The public expenditure ratio had
increased to a staggering 73% of GDP in 1993 while deficits exceeded 10% of GDP and
public debt had risen rapidly to over 70% of GDP.
Fiscal reforms started in earnest after 1993 when the government passed three
successive ‘consolidation packages’. The strategy proved successful due to discretionary
measures that combined revenue-enhancing tax increases with substantial reductions of public
expenditure by almost 16 percentage points in the course of seven years. As fiscal balances
improved and turned into surpluses, public debt also started coming down rapidly.
The main expenditure categories being reduced were transfers and subsidies (down
from 27% of GDP in 1993 to 19% in 2000; particularly in the areas of pensions and social
security), government consumption (particularly in the area of public employment) and
pensions. The fiscal consolidation course improved the structural primary balance by 2.5% of
GDP within two years and by around 9% of GDP within 7 years. State transfers to
municipalities were frozen at the nominal 1994 level until 2000 in conjunction with banning
local government borrowing. Considerable cuts, often on the basis of permanent legal
changes, were imposed on transfers in the social security domain, including reductions in
child allowances and compensations in family insurance, as well as in the area of pensions
and sick payments. A subsequent ‘package’ contained further reductions in unemployment,
sickness and parental benefits. Eligibility for benefits was tightened and replacement rates
significantly reduced.
19
ECBWorking Paper Series No 634
May 2006

Institutionally, the Swedish government improved legislative control over the budget
process in the course of constitutional changes advocated by a special commission on the
reform of the country’s fiscal institutions (for an overview of the institutional reforms in
Sweden, see Frank 2004). The changes lengthened the Parliamentary period and imposed
binding three-year expenditure ceilings on particular spending categories within an overall
envelope on total expenditure. Additionally, both the standing of the Minister of Finance in
the cabinet and the position of the minority government vis-à-vis Parliament were
strengthened, allowing to discontinue the spending-prone tradition of budgetary agreements
with the opposition. Following the institutional reform, budgetary control was shared by the
government and the budgetary committee in Parliament and enhanced sufficiently. The
reform, which is considered as considerably improving the political economy features of the
Swedish system (Perotti 1998), also introduced a number of innovative features, such as
provisions to ‘carry over’ a certain proportion of the budget earmarked for mandatory
spending categories, thereby reducing the incentive to exhaust the annual expenditure frame.
This also allows to finance higher-than-expected mandatory spending, e.g. on social benefits,
from the ‘own’ funds of the respective spending category, rather than driving up the overall
level of public expenditure. The Swedish government placed the budgetary retrenchment on a
solid legal foundation and additionally used the EU’s surveillance process as a secondary
basis for further strengthening its commitment to fiscal discipline. For example, the 1995
Convergence Programme entailed a commitment to eliminate the budget deficit by 1998.
Once this objective was achieved, expenditure rules supplemented by a 2%-of-GDP surplus
rule helped to maintain fiscal discipline.
Complementary measures flanking the expenditure reform include a floating
exchange rate regime and a significant depreciation of the krona followed by monetary
stabilisation by the (newly independent) central bank. Since mid-1995, the government
gradually implemented a pension reform and introduced a funded pillar. Besides these
measures, the government pursued a privatization programme and higher degree of labour
market liberalisation. The Swedish government did not resort to substantial tax cuts but tax
restructuring reduced marginal income tax rates from up to 90% to at most 60-70%. This
together with benefit reforms reduced tax evasion and benefit fraud, distortions and moral
hazard (Lindbeck, 1997).
All in all, Sweden is another example of a successful expenditure-based fiscal
consolidation. This and institutional, macroeconomic and structural policy reforms as part of a
20
ECBWorking Paper Series No 634May 2006

rapid and comprehensive program were also accompanied by a strong and remarkably fast
rebound in real and trend economic growth.9
III.3 Canada
Canada: The macro picture (% of GDP)T0 T0-T2 T0-T7
1992 1992-1994 1992-1999Total revenue 45.1 -1.2 -0.3Total expenditure 52.6 -3.5 -11.4Primary expenditure 44.9 -3.4 -9.5Fiscal balance -9.3 2.5 10.9Cyclically adj. balance n.a. n.a. n.a.Cyclically adjusted primary balance n.a. n.a. n.a.Public debt 110.5 8.6 0.3
Real GDP growth (%) 0.9 3.9 4.7Trend GDP growth (%) 1.8 0.6 1.8Inflation (CPI growth in %) 1.5 -1.3 0.2Employment ratio 68.1 0.6 3.6Source: Ameco, OECD
Canada: The disaggregated picture (% of GDP)T0 T0-T2 T0-T7
1992 1992-1994 1992-1999Total expenditure 52.6 -3.5 -11.4
Interest 9.5 -0.3 -1.7Primary expenditure 44.9 -3.4 -9.5
Government consumption 24.4 -1.9 -5.3Thereof: Compensation of employees 15.4 -1.2 -3.9Transfers and subsidies 15.3 -1.0 -3.3
Transfers 13.5 -0.5 -2.5Subsidies 1.8 -0.5 -0.8
Investment 2.9 0.0 -0.5Functional:Education 7.3 -0.7 -1.9Health 7.3 -0.6 -1.1Pensions 4.9 0.0 -0.2Memorandum item:Government employment (change in %) 1.0 -0.1 0.2Source: Ameco, OECD, Worldbank
The Canadian economy entered a severe downturn in 1990. The recession was
followed by a historically slow recovery and, consequently, unemployment rates increased
significantly, peaking at 11.5 per cent in 1992. In the same year, public spending rose well
above 50% of GDP, fiscal deficits reached 9% of GDP and, as a result, the public debt-to-
GDP ratio grew sharply to well above 100% of GDP. The worsening of the overall general
government deficit was, to a large extent, caused by an increasingly difficult provincial
budget situation. Moreover, Canada was facing substantial competitive disadvantages due to
high labour costs, low productivity growth rates and a pronounced exchange-rate appreciation
since the mid-1980’s.
In this situation, the federal government started an ambitious program of fiscal
tightening as of 1993, which, unlike previous attempts at fiscal adjustment, was to be chiefly
expenditure-based (Kneebone and McKenzie 1999). Within two years, total and primary
expenditure declined by around 3.5% of GDP. The consolidation course was continued in the
following years such that total spending fell by more than 11% of GDP over seven years in
comparison to the peak level in 1992. The budget was balanced in 1997, and in 1999 the
fiscal deficit had been improved by more than 10% of GDP compared to 1992. Successful
fiscal consolidation went hand in hand with a strong increase in trend growth and also started
to bring down the public debt ratio.
9 Sweden has also been identified as among the prime examples of possible non-Keynesian effects of fiscal adjustments (Giavazzi and Pagano 1995).
21
ECBWorking Paper Series No 634
May 2006

As regards reform measures, structural cuts in government consumption (especially
compensation of public employees) accounted for almost half of the overall retrenchment,
while about one third was achieved by reducing transfers to households and subsidies.
Amendments to and ultimately the discontinuation of the unemployment insurance systems
led to reduced spending on income support by adjusting eligibility requirements and cutting
the replacement rate. Reforms also took place in the system of transfers to the provinces.
These transfers were reduced in order to improve provincial cost efficiency and control
federal spending. Moreover, in 1996/1997 several provincial social assistance programmes
were merged into one comprehensive scheme and moved from a cost-sharing approach to a
system of block grants, further limiting social expenditure. Important improvements were also
achieved in the field of privatisation and public sector reform. A so called ‘Programme
Review’ was introduced in 1994 in order to enhance public sector efficiency and to reduce the
overall cost of government. This led to the (partly) privatisation of a number of major state-
owned enterprises.
Expenditure-based fiscal consolidation in Canada was enabled by important
institutional changes under the specificities of a federal system (Boadway and Hobson
1993). The ‘Expenditure Control Act’ of 1990 had already imposed limitations on spending
growth for most expenditure categories. Subsequently, the so-called ‘Spending Control Act’
was implemented in 1992 in order to keep primary spending on public programme below
1991 levels for the subsequent five years. Once surpluses were achieved as of 1997, the
government successfully resisted them being spent. Both at the federal as well as at the
provincial levels, “contingency reserves” aimed to use budgetary surpluses for public debt
reduction (Kennedy, Robbins and Delorme, 2001).
The success of Canada’s fiscal consolidation in the 1990’s was also based on a wide
range of complementary reforms. The reform of transfer systems and more extensive use of
privatizations not only benefited the budget but also improved conditions and incentives on
the supply side. The reform of the unemployment insurance system was coupled with active
labour market policies. Additionally, a number of measures were introduced to increase
labour market flexibility and the skill level of the work force. Moreover, the government
undertook a major restructuring of financial legislation, increasing competition, innovation
and efficiency in the financial sector. In the area of taxation, reforms lowered the tax burden
while improving the fairness of the tax system, broadening the tax base and, at the provincial
level, reducing personal income taxes.
22
ECBWorking Paper Series No 634May 2006

All in all, Canada’s fiscal consolidation period in the 1990’s can be described as a
success story, built on a three-pillar strategy: low and stable inflation, structural reforms and
substantial expenditure reductions. Within a seven year period following the spending peak in
1992, Canada was able to substantially improve the soundness of its public finances. Trend
growth as well as employment picked up significantly and notably early-on in the course of
the process. Strong institutional underpinnings also helped to sustain fiscal soundness once
deficits had disappeared.
III.4 Finland
Finland: The macro picture (% of GDP)T0 T0-T2 T0-T7
1993 1993-1995 1993-2000Total revenue 57.4 -1.7 -1.3Total expenditure 64.8 -5.1 -15.7Primary expenditure 60.3 -4.6 -14.0Fiscal balance -7.3 3.4 14.4Cyclically adj. balance -1.8 0.4 6.7Cyclically adjusted primary balance 2.7 -0.1 5.0Public debt 56.4 0.7 -11.8
Real GDP growth (%) -1.2 4.7 6.2Trend GDP growth (%) 0.2 1.6 3.4Inflation (CPI growth in %) 2.2 -1.4 0.9Employment ratio 60.2 0.1 6.2Source: Ameco, OECD
Finland: The disaggregated picture (% of GDP)T0 T0-T2 T0-T7
1993 1993-1995 1993-2000Total expenditure 64.8 -5.1 -15.7
Interest 4.5 -0.5 -1.6Primary expenditure 60.3 -4.6 -14.0
Government consumption 24.5 -1.5 -3.8Thereof: Compensation of employees 16.8 -1.6 -3.6Transfers and subsidies 27.4 -2.5 -9.4
Transfers 24.1 -2.0 -7.7Subsidies 3.3 -0.5 -1.8
Investment 2.9 -0.2 -0.3Functional:Education 7.8 -0.7 -1.8Health 6.3 -0.7 -1.3Pensions 9.1 -0.5 -1.5Memorandum item:Government employment (change in %) -4.9 0.6 5.7Source: Ameco, OECD, Worldbank
Finland started its reforms in a very difficult economic and fiscal environment.
Following the end of the late 1980s bubble-economy and the disruption of trade with the
Soviet Union, the country experienced a severe economic slump, which lasted from 1990 to
mid-1993. GDP fell by almost 15% and unemployment rose to 19%. On the back of rising
welfare spending and falling revenue, the spending ratio had reached nearly 65% of GDP and
the deficit exceeded 7% while bailout costs for the banking sector further accelerated the
increase in the public debt ratio.
In these circumstances, Finland undertook an ambitious expenditure reform
program (for an overview, see Hetemäki 2003). Primary spending growth of the central
government was brought under control and was reduced successively. This resulted in a
restrictive fiscal stance after 1994 when the measures started to bite fully. Total expenditure
was reduced by 5% of GDP in the course of 2 years and by 15% of GDP to 49% of GDP over
seven years. In the same time span, the fiscal balance improved by 14% of GDP to a surplus
of 7% (including extraordinary revenue of 2% of GDP in that year). With fiscal consolidation
and reviving growth, public debt also started declining rapidly towards the end of the 1990s.
23
ECBWorking Paper Series No 634
May 2006
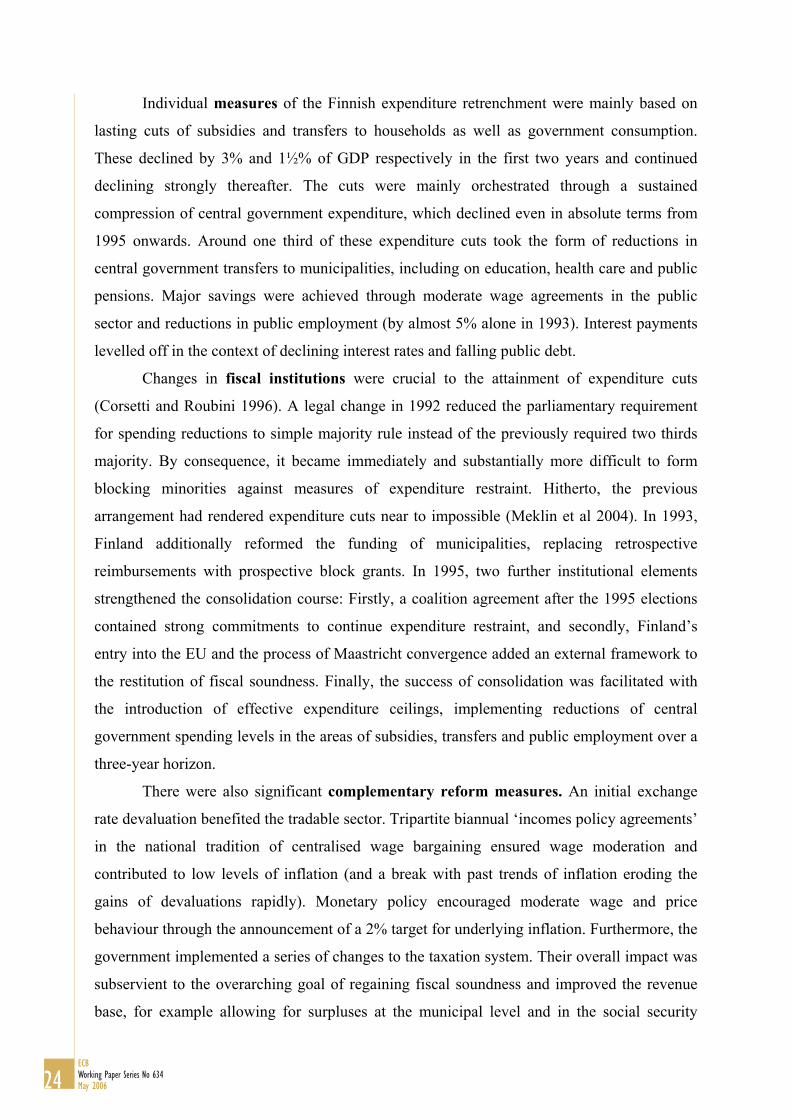
Individual measures of the Finnish expenditure retrenchment were mainly based on
lasting cuts of subsidies and transfers to households as well as government consumption.
These declined by 3% and 1½% of GDP respectively in the first two years and continued
declining strongly thereafter. The cuts were mainly orchestrated through a sustained
compression of central government expenditure, which declined even in absolute terms from
1995 onwards. Around one third of these expenditure cuts took the form of reductions in
central government transfers to municipalities, including on education, health care and public
pensions. Major savings were achieved through moderate wage agreements in the public
sector and reductions in public employment (by almost 5% alone in 1993). Interest payments
levelled off in the context of declining interest rates and falling public debt.
Changes in fiscal institutions were crucial to the attainment of expenditure cuts
(Corsetti and Roubini 1996). A legal change in 1992 reduced the parliamentary requirement
for spending reductions to simple majority rule instead of the previously required two thirds
majority. By consequence, it became immediately and substantially more difficult to form
blocking minorities against measures of expenditure restraint. Hitherto, the previous
arrangement had rendered expenditure cuts near to impossible (Meklin et al 2004). In 1993,
Finland additionally reformed the funding of municipalities, replacing retrospective
reimbursements with prospective block grants. In 1995, two further institutional elements
strengthened the consolidation course: Firstly, a coalition agreement after the 1995 elections
contained strong commitments to continue expenditure restraint, and secondly, Finland’s
entry into the EU and the process of Maastricht convergence added an external framework to
the restitution of fiscal soundness. Finally, the success of consolidation was facilitated with
the introduction of effective expenditure ceilings, implementing reductions of central
government spending levels in the areas of subsidies, transfers and public employment over a
three-year horizon.
There were also significant complementary reform measures. An initial exchange
rate devaluation benefited the tradable sector. Tripartite biannual ‘incomes policy agreements’
in the national tradition of centralised wage bargaining ensured wage moderation and
contributed to low levels of inflation (and a break with past trends of inflation eroding the
gains of devaluations rapidly). Monetary policy encouraged moderate wage and price
behaviour through the announcement of a 2% target for underlying inflation. Furthermore, the
government implemented a series of changes to the taxation system. Their overall impact was
subservient to the overarching goal of regaining fiscal soundness and improved the revenue
base, for example allowing for surpluses at the municipal level and in the social security
24
ECBWorking Paper Series No 634May 2006

funds. The measures included lower taxation of income, a VAT reform and an increase in
social security contributions. Finally, the Finnish authorities also restructured the banking
industry, followed by labour market and pension reforms in conjunction with major
privatisations and deregulations of formerly public enterprises (e.g. telecommunication).
In summary, in the wake of expenditure cuts that were part of a comprehensive
institutional, macroeconomic and structural reform program, growth and employment picked
up strongly and already within two years after the reforms were started. Consolidation and
reform concurred with strengthening confidence and higher growth which, in turn, facilitated
further consolidation.
III.5 Belgium
Belgium: The macro picture (% of GDP)T0 T0-T2 T0-T7
1983 1983-1985 1983-1990Total revenue 49.0 0.7 -2.2Total expenditure 63.8 -3.9 -10.2Primary expenditure 53.9 -4.7 -12.3Fiscal balance -14.8 4.5 8.0Cyclically adj. balance -12.3 4.0 4.4Cyclically adjusted primary balance -2.5 4.8 6.4Public debt 109.4 9.0 19.8
Real GDP growth (%) 0.3 1.3 2.8Trend GDP growth (%) 1.8 -0.2 0.7Inflation (CPI growth in %) 7.7 -2.8 -4.2Employment ratio 55.4 -0.3 2.9Source: Ameco, OECD
Belgium: The disaggregated picture (% of GDP)T0 T0-T2 T0-T7
1983 1983-1985 1983-1990Total expenditure 63.8 -3.9 -10.2
Interest 9.9 0.8 2.1Primary expenditure 53.9 -4.7 -12.3
Government consumption 23.5 -0.1 -3.0Thereof: compensation of employees 13.2 -0.5 -2.0
Transfers and subsidies 22.2 -1.4 -4.2Transfers 19.4 -1.1 -3.2Subsidies 2.8 -0.3 -1.1
Investment 3.9 -0.9 -2.2Functional:Education 6.0 -0.2 -1.1Health 6.0 -0.1 0.6Pensions 6.7 -0.1 0.9Memorandum item:Government employment (change in %) -1.4 0.8 2.4Source: Ameco, OECD, Worldbank
Following the second oil crisis of the late 1970s, the Belgian economy deteriorated
markedly. By 1983, public spending stood at 63.8% of GDP, the deficit was approaching 15%
of GDP while the debt level exceeded 100% of GDP. The unemployment rate was one of the
highest across the OECD at 14.5% in 1983 while growth had come to a standstill. Belgium
seemed trapped in a ‘vicious circle’ with low competitiveness, rising unemployment and
widening public sector deficits mutually reinforcing each other.
In 1982, the government entered a first period of fiscal consolidation (Phase 1) and
announced a ‘recovery plan’. This was followed in 1984 by two successive biannual
‘Corrective Public Finance Plans’, lasting until 1988. Whereas the first Corrective Public
Finance Plan also included measures to increase government revenue (through higher labour
taxes and social security contributions), the second programme exclusively focused on
expenditure-based consolidation.10 A second (though more timid) wave of consolidation
10 For a detailed discussion of Belgian public finance developments in the 1980s, see De Ryck (1993) and Frank (1993).
25
ECBWorking Paper Series No 634
May 2006

subsequently occurred until 1997 in the context of Maastricht convergence (Phase 2, not
included in the above table).
During the first of two these reform phases, the fiscal stance was tightened
significantly as of 1983. Total public expenditure came down by 10% of GDP by 1990 and
this decline was entirely due to primary expenditure reductions. While the first consolidation
phase eliminated the risk of imminent macroeconomic destabilisation, significant deficits
remained and public debt was still on the rise. In the second, more timid, reform phase, fiscal
balances were, therefore, eliminated so that public debt was also brought on a clear downward
path. Further primary expenditure reductions were more moderate and much of the
consolidation was brought about by the fall in interest payments due to declining interest rates
(and to a lesser extent as a premium from bringing down the debt ratio). The two reform
phases together brought down total spending by almost 14 percentage points to 50% of GDP.
Most of the adjustment in primary spending came from cuts in transfers and subsidies
as well as in government consumption. During the first, ambitious, consolidation phase,
transfers were reduced through annual cuts from a peak at 19.4% of GDP in 1983 to 16.2% in
1990. They rose back to over 17% in the recession of the early 1990s and were reduced anew
below 16% in 1999 during the second retrenchment period. A considerable redrafting of
benefit systems enabled sustained spending reductions and improved the incentive effects of
these schemes. Subsidies were reduced throughout and more than halved by constant annual
reductions from the 1983 level of 2.8% of GDP down to below 1.2% in 1997. Nearly constant
public employment supported the adjustment of public wage expenditure. In the first
consolidation period, the government reduced investment spending drastically, down from
3.9% of GDP in 1983 to 1.7% in 1990 before keeping it broadly constant thereafter. In the
second phase, expenditure control at the federal level and for social security further
contributed to primary expenditure reduction, albeit at a more “timid” scale (Reynders 2002,
de Callatay 2002).
Institutional change occurred mainly during the second consolidation phase in the
1990s. The government as well as regional and local authorities concluded a ‘fiscal contract’
in which they agreed to respect the budgetary targets set by the so-called Conseil supérieur
des finances.
Complementary measures to the expenditure reforms were taken on the supply side,
such as partially suspending the national wage indexation scheme in 1982, which delivered a
freeze on real wage developments. Labour market policy was restructured, including a more
active labour market policy to complement the reform of benefit systems. Public debt was
26
ECBWorking Paper Series No 634May 2006

rescheduled in the 1980s in order to spread the burden of interest payments more evenly
across time. In the second phase, the structural reform progress was very limited (de Callatay,
2002).
All in all, Belgium undertook an impressive fiscal consolidation and reform
programme over two phases in the 1980s and 1990s. This brought deficits under control and
debt on a declining path while bringing the public spending ratio down significantly. Over
time, this also coincided with a significant increase in trend growth and employment,
although both the reforms and the country’s economic recovery were perhaps somewhat less
spectacular than in some of the other cases.
III.6 Netherlands
Netherlands: The macro picture (% of GDP)Phase 1 Phase 2
T0 T0-T2 T0-T7 T0_2 T0-T2 T0-T71983 1983-1985 1983-1990 1993 1993-1995 1993-2000
Total revenue 52.9 -0.2 -4.8 51.8 -5.7 -5.5Total expenditure 58.3 -2.1 -5.0 54.6 -4.5 -9.8Primary expenditure 52.8 -2.7 -5.1 48.5 -4.1 -7.5Fiscal balance -5.4 1.9 0.2 -2.8 -1.3 4.3Cyclically adj. balance -1.9 0.2 -4.7 -1.0 -1.9 -0.2Cyclically adjusted primary balance 3.6 0.8 -4.6 5.0 -2.2 -2.5Public debt 59.8 8.8 15.1 77.2 -2.0 -22.8
Real GDP growth (%) 1.8 0.9 2.3 0.7 2.4 2.8Trend GDP growth (%) 1.9 0.4 1.0 2.6 0.1 0.0Inflation (CPI growth in %) 2.7 -0.5 -0.3 2.6 -0.7 -0.2Employment ratio 54.6 2.1 10.3 66.0 1.4 9.0Source: Ameco, OECD
Netherlands: The disaggregated picture (% of GDP)Phase 1 Phase 2
T0 T0-T2 T0-T7 T0_2 T0-T2 T0-T71983 1983-1985 1983-1985 1993 1993-1995 1993-2000
Total expenditure 58.3 -2.1 -5.0 54.6 -4.5 -9.8Interest 5.5 0.6 0.2 6.1 -0.3 -2.3
Primary expenditure 52.8 -2.7 -5.1 48.5 -4.1 -7.5Government consumption 24.8 -1.1 -2.0 24.0 -0.6 -1.9Thereof: Compensation of employees 13.2 -1.1 -2.5 10.9 -0.4 -1.2Transfers and subsidies 22.2 -1.7 -2.2 19.4 -3.4 -6.5
Transfers 20.1 -1.9 -2.3 17.4 -2.4 -5.9Subsidies 2.1 0.3 0.1 2.1 -1.0 -0.6
Investment 3.2 -0.1 -0.2 2.9 0.0 0.1Functional:Education 6.9 -0.6 -1.1 5.17 -0.2 -0.4Health 5.5 -0.3 -0.1 6.30 -0.3 -0.8Pensions 7.4 -0.3 0.4 7.69 -0.7 -1.2Memorandum item:Government employment (change in %) 0.2 1.7 7.2 0.4 -2.6 1.8Source: Ameco, OECD, Worldbank
The Dutch economy deteriorated markedly since the late 1970s in the wake of the
second oil shock and plunged into the most severe recession of post-war times. By the early
1980s, the employment ratio had significantly fallen to below 55%. Labour market slack was
absorbed to some degree by social security schemes and public employment programmes,
which, together with growing interest payments and subsidies, contributed to public
expenditure rising above 58% of GDP. In 1982, the fiscal deficit had reached more than 6%
of GDP and interest payments already amounted to over 10% of tax revenues.
27
ECBWorking Paper Series No 634
May 2006

Expenditure retrenchment was imposed as of 1983.11 In Phase 1, primary
expenditure came down by almost 3% of GDP within the first two years and by over 5%
within 7 years (by 1990). However, initially this did not result in sufficient deficit
improvement as revenue was also falling strongly. During Phase 2 in the 1990s, the
retrenchment course was continued and deficits disappeared in the late 1990s. Public debt,
which had continued to rise in the 1980s, started falling significantly during the second
retrenchment phase. Total expenditure declined from over 58% of GDP in 1983 to about 53%
in 1990. In the second phase, it was reduced considerably further to less than 45% of GDP by
2000.
As regards reform measures during Phase 1, the ratios of government consumption,
transfers and subsidy spending declined by roughly equal amounts. In the second phase,
transfers came down very strongly. Investment was mostly spared over the entire time frame.
Concrete measures included restraint on civil service salaries and new recruitment and
lending and capital transfers to enterprises.
The first consolidation package of 1982/83 encompassed nominal freezes on
government pay, social benefits and volume ceilings on social security expenditure as well as
further cuts in non-wage expenditure of the government. Subsequently, income support
schemes and benefits in the areas of unemployment, disability, sick leave and health services
were reformed, for example, by reducing replacement rates and eligibility, especially for
disability benefits (de Mooij, 2003).
In the second reform phase, lower social security outlays were the main contribution
to spending cuts (especially once the indexation of benefits was suspended in 1992), while
infrastructure investment was allowed to grow. Additionally, subsidies for housing and public
transport were reduced. Sickness insurance was privatized and a major tightening combined
with the introduction of competition occurred in the disability scheme (de Mooij, 2003).
Defence expenditure was also reduced markedly. Health care spending was even reduced over
the combined 20-year period by improving demand, supply and insurance incentives.
From an institutional perspective, the budget process of the Netherlands has
benefited from the introduction and periodic adaptation of fiscal rules and contracts between
governing coalition parties (van Dijkhuizen 2003, Hallerberg and von Hagen, 1999;
Berndsen, 2001; Heeringa and Lindh, 2001). These included deficit reduction paths and
expenditure ceilings in the first reform phase as well as rules for the distribution of
11 For a review of Dutch expenditure developments from a historic perspective, see Bos and Timmerhuis (2006).
28
ECBWorking Paper Series No 634May 2006
expenditure savings and growth dividends between tax and deficit cuts for the second phase.
The institutional improvements underpinned the permanent character of the reduction of
public spending.12 Additionally, Maastricht convergence also provided an external source of
fiscal discipline to the government during the second reform phase.
With regard to complementary measures, in 1982, the Wassenaar Agreement
initiated a series of labour market reforms, which substantially improved the employment
situation in the Netherlands. In the course of this agreement, social partners gave up wage
indexation and repeatedly agreed on moderate wage claims. A new unemployment benefit
system was introduced in 1987. Complementary measures also included a strategic
reorientation of industry subsidies. Tax policy included tax cuts with a shift from direct to
indirect taxation. Structural reforms in the transfer system and minimum wage setting helped
increase employment, especially of women (Bos and Timmerhuis, 2006). A Deutschemark
target for the exchange rate and the convergence process towards EMU membership helped to
contain inflationary expectations and reinforced the rationale behind the fiscal reform efforts.
During the second reform phase, the government implemented further tax cuts and
reduced employers’ social contributions, especially for low wage groups, giving considerable
support to job creation. The budgetary efforts to curb social security spending went hand in
hand with the decentralisation, tightening and the injection of market forces into the social
security and employment systems, thereby not only reducing costs but also increasing
efficiency and incentive effects. For example, the sick-leave payment insurance was
privatized and employees can ‘opt-out’ of the disability insurance.
In sum, the Netherlands represents yet another case of remarkable fiscal retrenchment
as part of an ambitious and comprehensive reform package. When the first reform phase
proved insufficient, a second round in the early 1990s achieved further improvements. In the
wake of these reforms, the employment ratio and trend growth increased rapidly, which, in
turn, facilitated continued expenditure restraint.
12 At the same time, electoral competition and the corresponding incentives to call for spending increases were eased by the party-political constellation and the fact that the likelihood for any one party to be part of the governing coalition was not directly related to its voting share but rather to good relations with the other parties (Seils 2004).
29
ECBWorking Paper Series No 634
May 2006
III.7 Spain
Spain: The macro picture (% of GDP)
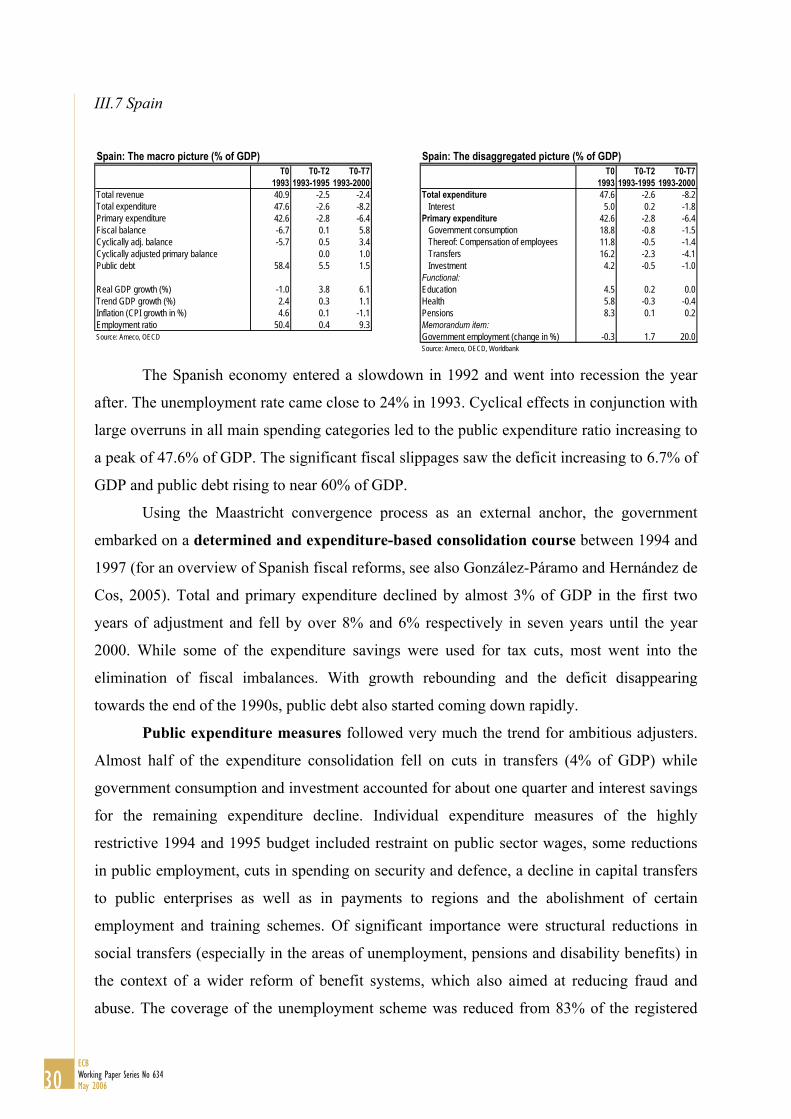
T0 T0-T2 T0-T71993 1993-1995 1993-2000
Total revenue 40.9 -2.5 -2.4Total expenditure 47.6 -2.6 -8.2Primary expenditure 42.6 -2.8 -6.4Fiscal balance -6.7 0.1 5.8Cyclically adj. balance -5.7 0.5 3.4Cyclically adjusted primary balance 0.0 1.0Public debt 58.4 5.5 1.5
Real GDP growth (%) -1.0 3.8 6.1Trend GDP growth (%) 2.4 0.3 1.1Inflation (CPI growth in %) 4.6 0.1 -1.1Employment ratio 50.4 0.4 9.3Source: Ameco, OECD
Spain: The disaggregated picture (% of GDP)T0 T0-T2 T0-T7
1993 1993-1995 1993-2000Total expenditure 47.6 -2.6 -8.2
Interest 5.0 0.2 -1.8Primary expenditure 42.6 -2.8 -6.4
Government consumption 18.8 -0.8 -1.5Thereof: Compensation of employees 11.8 -0.5 -1.4Transfers 16.2 -2.3 -4.1Investment 4.2 -0.5 -1.0
Functional:Education 4.5 0.2 0.0Health 5.8 -0.3 -0.4Pensions 8.3 0.1 0.2Memorandum item:Government employment (change in %) -0.3 1.7 20.0Source: Ameco, OECD, Worldbank
The Spanish economy entered a slowdown in 1992 and went into recession the year
after. The unemployment rate came close to 24% in 1993. Cyclical effects in conjunction with
large overruns in all main spending categories led to the public expenditure ratio increasing to
a peak of 47.6% of GDP. The significant fiscal slippages saw the deficit increasing to 6.7% of
GDP and public debt rising to near 60% of GDP.
Using the Maastricht convergence process as an external anchor, the government
embarked on a determined and expenditure-based consolidation course between 1994 and
1997 (for an overview of Spanish fiscal reforms, see also González-Páramo and Hernández de
Cos, 2005). Total and primary expenditure declined by almost 3% of GDP in the first two
years of adjustment and fell by over 8% and 6% respectively in seven years until the year
2000. While some of the expenditure savings were used for tax cuts, most went into the
elimination of fiscal imbalances. With growth rebounding and the deficit disappearing
towards the end of the 1990s, public debt also started coming down rapidly.
Public expenditure measures followed very much the trend for ambitious adjusters.
Almost half of the expenditure consolidation fell on cuts in transfers (4% of GDP) while
government consumption and investment accounted for about one quarter and interest savings
for the remaining expenditure decline. Individual expenditure measures of the highly
restrictive 1994 and 1995 budget included restraint on public sector wages, some reductions
in public employment, cuts in spending on security and defence, a decline in capital transfers
to public enterprises as well as in payments to regions and the abolishment of certain
employment and training schemes. Of significant importance were structural reductions in
social transfers (especially in the areas of unemployment, pensions and disability benefits) in
the context of a wider reform of benefit systems, which also aimed at reducing fraud and
abuse. The coverage of the unemployment scheme was reduced from 83% of the registered
30
ECBWorking Paper Series No 634May 2006
unemployed to 69% thanks to tightened eligibility. Furthermore, the government attempted to
limit health expenditure, a traditional cause for budgetary overruns, and curbed the trend rise
in pensions. In 1996 and 1997, discretionary expenditure was compressed further, particularly
in the fields of government consumption, transfers to public enterprises and investment.13
Social security spending was reduced through more effectively fighting fraud and abuse. New
techniques to finance infrastructure investment (such as Public Private Partnerships) allowed
cushioning the reductions in public investment. Having achieved Maastricht convergence,
however, discretionary spending adjustment came to a halt in 1998.
From an institutional perspective, the consolidation effort was implemented through
highly effective expenditure control mechanisms as of 1995 and through further strengthening
the say of the already powerful Ministry of the Economy and Finance (Nieto 1996, Rato,
2004). Each ministerial department received monthly spending ceilings and the government
could centrally distribute discretionary spending cuts across the board whenever necessary. A
further set of expenditure control devices and stricter monitoring was introduced in 1997,
placing further restraint on public crediting and curtailing the carrying forward of
expenditures to future budgets. In addition, Spain introduced an internal Stability Pact in
order to contain the fiscal behaviour of regional governments, thereby improving the
commitment quality of fiscal policy. Political coordination was improved within the ‘Fiscal
and Financial Policy Council’, setting four-year deficit and debt targets for regional
governments in conjunction with legal borrowing constraints for regional and local
administrations (Garcés Sanagustín 2004).
Complementary reform measures included a comprehensive labour market reform
in 1994, which, together with tightened eligibility for social benefits, contributed to strong
employment increases (see also Toharia and Malo 2000). Additionally, the government took
first steps toward a pension reform. The tax code was reformed to enhance transparency and
tax collection. Direct tax reform was financed via indirect tax increases and the dividend from
expenditure reform.14 Public sector wage restraint was mirrored by moderate wage
developments in the private sector. Finally, an ambitious privatisation programme and the
liberalisation of financial markets improved the economic environment.
13 Cuts in subsidies and capital transfers to public enterprises were facilitated by restructuring the ownership of public enterprises to allow a more beneficial accounting treatment of the support of loss-making firms by profitable ones. 14 See González-Páramo, De Castro and Hernández de Cos (2003) for an anlysis of the interaction between spending and revenue developments.
31
ECBWorking Paper Series No 634
May 2006

On the macroeconomic side, exchange rate devaluations of 1992-93 coupled with
fiscal reform and stability-oriented monetary policies helped create a regime change away
from earlier cycles of devaluation gains eroded by lax wage, monetary and fiscal policies.
This helped the adaptation of wage setting and made resulting competitiveness gains more
lasting.
In sum, the Spanish experience of a determined expenditure reform, coupled with
significant structural reforms, not only safeguarded the sustainability of Spain’s public
finances (De Castro and Hérnandez de Cos 2002) but indeed laid the ground for a broad-
based fiscal consolidation and coincided with a pronounced economic recovery (De Castro
2003). This achievement was facilitated by institutional improvements as well as by
constructively engaging in the Maastricht convergence process. A strong rebound in growth
and employment occurred already in the early years of the expenditure reform.
III.8 United Kingdom
United Kingdom: The macro picture (% of GDP)Phase 1 Phase 2
T0 T0-T2 T0-T7 T0_2 T0-T2 T0-T71981 1981-198 1981-1988 1992 1992-1994 1992-1999
Total revenue 46.3 -0.8 -5.6 40.1 -1.9 0.4Total expenditure 50.7 -1.8 -10.5 46.5 -1.6 -7.1Primary expenditure 45.4 -1.5 -8.2 44.3 -1.9 -7.2Fiscal balance -4.4 1.0 4.8 -6.5 -0.3 7.5Cyclically adj. balance -2.3 0.4 1.0 -4.7 -1.5 5.6Cyclically adjusted primary balance 3.0 0.1 -1.3 -2.5 -1.2 5.7Public debt 53.5 -0.9 -11.3 39.2 9.3 5.6
Real GDP growth (%) -1.4 5.0 6.4 0.3 4.1 2.8Trend GDP growth (%) 1.4 0.8 1.4 2.0 0.4 0.9Inflation (RPI growth in %) 11.9 -7.3 -7.0 3.7 -1.3 -2.2Employment ratio 66.7 -2.4 3.3 68.3 -0.2 2.9Source: Ameco, OECD, National statistics (UK)
United Kingdom: The disaggregated picture (% of GDP)Phase 1 Phase 2
T0 T0-T2 T0-T7 T0_2 T0-T2 T0-T71981 1981-1983 1981-1988 1992 1992-1994 1992-1999
Total expenditure 50.7 -1.8 -10.5 46.5 -1.6 -7.1Interest 5.3 -0.3 -2.3 2.3 0.3 0.1
Primary expenditure 45.4 -1.5 -8.2 44.3 -1.9 -7.2Government consumption 22.2 -0.3 -2.5 21.1 -1.2 -2.7Thereof: Compensation of employees 13.4 -0.3 -1.6 12.3 -1.3 -2.4Transfers and subsidies 15.4 0.3 -2.0 16.5 0.0 -2.6
Transfers 13.4 0.7 -0.9 15.6 0.0 -2.2Subsidies 2.0 -0.5 -1.1 0.9 -0.1 -0.4
Investment 2.1 0.1 -0.3 2.4 -0.1 -1.1Functional:Education 5.5 -0.3 -0.8 5.26 0.0 -0.8Health 5.2 0.0 -0.3 5.77 0.0 -0.1Pensions 6.0 0.2 -0.5 8.25 -0.1 -0.4Memorandum item:Government employment (change in %) -2.7 -3.2 -12.1 -0.7 -7.0 -9.5Source: Ameco, OECD, Worldbank
In 1979, the United Kingdom found itself in the deepest recession of post-war times,
following the second oil shock. Unemployment was rising sharply and inflation went up to
levels of 20%. Disinflation became the top priority of the incoming Thatcher government. But
with very high tax rates, rising public expenditure considerable deficits, expenditure
reductions moved increasingly to the fore after 1981 to support price stabilisation and a
broader economic revival. After the bust of the early 1990s with record deficits, expenditure-
based fiscal consolidation was again prioritised.
32
ECBWorking Paper Series No 634May 2006
Fiscal retrenchment in the UK was undertaken in two phases. Phase 1 started when
public expenditure had reached a peak level of over 50% of GDP in 1981. In the following
two years, public spending was cut by nearly 2% of GDP and by a total of 10.5% of GDP in
the seven-year period until 1988 (in the latter years also helped by strong growth). The fiscal
balance was turned from a deficit of over 4% of GDP into a small surplus. Half of the total
spending reductions were used for consolidation and the other half for tax cuts. Public debt
started declining in proportion to GDP as consolidation took hold. In the second phase,
starting in 1993, total expenditure was reduced by over 7% of GDP in seven years. As interest
payments had stabilised, the retrenchment during this period was entirely due to cuts in
primary expenditure. Between the early 1980s and late 1990s, total spending declined by over
11% of GDP, half of which was, however, reversed in recent years.15
During the first adjustment phase, a number of important reforms occurred in
different categories of discretionary spending. Government consumption declined markedly
and lastingly when public employment was cut by more than 12% between 1981 and 1988
and by 4.8% alone in 1985. Subsidies were reduced resolutely as of 1984, while transfers
were brought down significantly after 1986. A large-scale privatization programme and the
introduction of public private partnerships helped further reducing current expenditure and
public debt while generating taxes from profits (rather than budget financed-losses) of the
newly privatised enterprises.16 The second consolidation phase addressed the budgetary
deterioration caused by another downturn in the early 1990s. The new spending peak was
reached in 1992 and, subsequently, the three categories of government consumption, public
employment and transfers were cut down in parallel by more than 2% of GDP until 1999.
Individual measures included a freezing of government departments’ running costs and public
sector wage bills at 1993 levels for three years, tighter eligibility criteria for social benefits as
well as savings on defence, housing and transport programmes. Unlike in the first phase of
expenditure reforms, the spending reductions in the 1990s did not sizeably come at the
expense of public investment.
As regards fiscal institutions, in both consolidation phases, the persistent
retrenchment course was ultimately based on the political will of the government and the
large degree of institutional control that the Chancellor wields over the budget, backed by the
Prime Minister (Thain and Wright 1995). The significant fiscal tightening also followed 15 Primary spending increased by over 5% of GDP between 1999 and 2004. The main reason for the now limited difference in spending between the UK and much of continental Europe lies in lower pension spending. 16 See Bishop, Kay and Mayer (1994, 1995) and Tanzi and Schuknecht (2000) for more discussion on the British reform experiences especially with privatisation.
33
ECBWorking Paper Series No 634
May 2006

major institutional improvements (Kell 2001). The government introduced a so-called
‘Medium Term Financial Strategy’ in 1981 and committed to multi-annual monetary and
budgetary targets with the aim to stabilise expectations. As budgetary targets were frequently
not met, a more effective balanced budget rule was introduced in 1985. Following the ERM
crisis, a so-called ‘New Control Total’ was introduced, which established a budgetary
envelope and a more clear-cut system of top-down budgeting (Hallerberg 2004). After 1997,
the labour government reformed the UK’s fiscal institutions (with a golden rule and stable net
debt over the cycle being key elements of the new “code for fiscal stability”) (Kilpatrick,
2001; Kennedy et.al, 2001). This initially helped implement fiscal consolidation and
expenditure restraint.
Policy measures complementary to the expenditure reform initially prioritized
disinflation. Important tax reforms were undertaken in parallel to the first fiscal consolidation
phase in the 1980s to reduce incentive distortions. The measures included a lowering of the
corporate tax rate from 52% in 1979 to 35% by 1986 and the basic and top rates of personal
income tax from 33% and 83% to 25% and 40%, respectively, by 1989. A shift from direct to
indirect taxes improved supply conditions and prevented the revenue base from eroding,
which was also supported by the proceeds from North Sea oil. The combination of
privatization with deregulation and liberalisation greatly enhanced the efficiency of formerly
public enterprises as well as the economy as a whole. Both expenditure reform phases were
accompanied by important changes to the labour market, turning the United Kingdom in one
of the least regulated countries in the OECD, as well as wide-ranging improvements to
educational and training institutions.
In the second reform phase, the independence of the Bank of England in 1997 as well
as continued tax reforms, especially in the area of corporate taxation and social contributions
in the low-wage sector, were the most important complementary measures. Additionally, the
government improved legislation on corporate governance and competition while continuing
the course of regulatory reform in the utilities sector.
All in all, the United Kingdom undertook ambitious expenditure reforms in the 1980s
and 1990s which were embedded in one of the most far-reaching privatisation and structural
reform programs of industrialised countries. This allowed the return to sound public finances
and preceded a sustained revival of employment and economic growth, which commenced
already at a relatively early stage of the reform process.
34
ECBWorking Paper Series No 634May 2006

IV. Expenditure reforms in OECD countries – horizontal analysis
The preceding section has analysed a number of ambitious expenditure reform
episodes which have been undertaken in OECD countries within the last 25 years. The
purpose of this section is to identify common patterns and differences across the case studies
and to compare these countries’ fiscal and growth performance with that of countries that
undertook more timid reforms.17
IV.1 Common patterns and differences across case studies
When looking at expenditure reform efforts, it becomes apparent that all countries
focused efforts strongly on government consumption (wages and employment) and transfers
and subsidies. About 2/3 of the reduction in the total expenditure and over 80% of the cuts in
the primary expenditure ratio occurred in these two categories. Table 5 illustrates that 9 out of
11 reform episodes reported a decline in public consumption by more than 2% of GDP and 8
out of 11 featured a fall in transfers and subsidies by over 3% of GDP. All reform episodes
are marked by public wage restraint and tightened eligibility criteria as well as reduced
benefits for social transfers (see Table 5 and the Annex Table 3). By contrast, only few
episodes contained major declines in public education. We will come back to these findings
below when comparing ambitious with timid reformers.
From Table 5 it also becomes apparent that expenditure reform was always part of a
broader reform agenda. In all but one episode, expenditure reform went hand in hand with a
strengthening of fiscal institutions (for more details, see the Annex Table 3 and Joumard et
al., 2004 or Brumby, 1999). Pervasive institutional change points to the eminent role of
political economy factors in determining both the feasibility and the success of expenditure
reforms (see also Alesina and Ardagna 1998).
A majority of episodes, mainly in the early 1980s, also featured complementary
macroeconomic reforms towards the establishment of monetary and external stability. In
some cases, exchange rate devaluation proved supportive of the reform strategy. All countries
undertook structural reforms that aimed at improving labour market performance, be it
17 A crude robustness check for the results presented below consists of excluding Ireland, which features by far the greatest increase in growth dynamics. Also without Ireland, the results are very similar; both in terms of the comparison between timid and ambitious reformers and between large and small countries.
35
ECBWorking Paper Series No 634
May 2006

through liberalisation, benefit reform or tax reform. Privatization and recourse to public-
private partnerships also featured in a large majority of episodes. This may suggest powerful
synergies from a determined and comprehensive reform strategy, including a strong
commitment to ambitious expenditure retrenchment.
Table 5: Summary findings for ambitious reform episodes
Expenditure reform Structural reform
Public consumption
1/
Transfers & subsidies 1/
Institutional reform
Other macroeconomic
reform
Labour market
incentives
Taxation Privatisation
Ireland 1 XX XX X X X X X Ireland 2 X XX X X X X X Sweden X XX X X X X X Canada XX XX X X X X Finland XX XX X X X X X Belgium XX XX X X Netherlands 1 X X X X X X Netherlands 2 ~ XX X X X X Spain ~ XX X X X X X UK 1 X X X X X X X UK 2 X X X X X X All 9 11 10 9 11 10 8
1/ Decline in 7 years by: more than 1% of GDP: ~ more than 2% of GDP: X more than 3% of GDP: XX
IV.2 Comparing ambitious and timid reformers: expenditure developments
When comparing expenditure developments in the episodes of ambitious reform with
those that featured more timid reforms, some interesting differences emerge. We focus on
medium-term developments within a seven year window (T1-T7) and we also distinguish the
early ambitious reform episodes from the later ones.18 Charts 1-4 in Box 1 illustrate the main
findings by showing unweighted averages for the three groups.
The differences in expenditure reduction are very substantial between the two groups.
Within seven years, ambitious reform countries reduced total expenditures by around 10% of
GDP (Chart 1). This is more than twice as much as the decline achieved by timid reformers.19
Late ambitious reformers brought average spending significantly below the average of timid
reformers. But efforts also differed markedly in the beginning of reform phases (i.e. the first
two years) when primary spending went down by 3% for the average of ambitious reformers
versus only 1% for timid reformers.
18 Note that Switzerland is excluded as the expenditure maximum is too recent to allow the case study approach. Moreover, the primary spending decline of 0.3% was only minimal. Also notice that, in order to include Japan in the analysis, we used forecasted data for T7 (2005) in this case. Moreover, due to data shortcomings, Luxembourg is excluded from the horizontal analysis. 19 Note that, in contrast to Table 1, we now take account of all reform periods. Therefore, the countries which are characterised by two reform phases are included twice.
36
ECBWorking Paper Series No 634May 2006

There are also major differences as regards the composition of the expenditure decline,
with ambitious reformers showing on the whole “higher quality” changes. Both timid as well
as ambitious reform countries benefited from reduced interest payments. But for timid
reformers, reductions in interest spending amounted to around 1/2 of the overall expenditure
decline, whereas this share represented only about 10% for ambitious reformers. Most
importantly, the two ambitious reform waves reduced government consumption as well as
transfers and subsidies more decisively (see Charts 2–3). Within the seven year reform period,
ambitious reform countries reduced government consumption by around 3% of GDP
(compared to hardly 1% for timid reformers). Spending on transfers and subsidies declined by
3% of GDP for early ambitious reformers and by 6% of GDP in the case of late ambitious
reformers, whereas it staid broadly constant for timid reformers. Public investment was cut
strongly by the group of early ambitious reformers but only moderately by the other two
groups (Chart 4). Education spending was touched little in the reform process for all groups
on average.
Box 1: Medium-term post reform developments Chart 1: Reform ambition and total expenditure
42444648505254565860
T0 T1 T2 T3 T4 T5 T6 T7Time line (T1 = first year of reform)
Tota
l exp
endi
ture
(% o
f GD
P)
Ambitious reformers,early Ambitious reformers, late Timid reformers
Chart 2: Reform ambition and government consumption
18
19
20
21
22
23
24
T0 T1 T2 T3 T4 T5 T6 T7
Gov
ernm
ent c
onsu
mpt
ion
(% o
f GD
P)
Ambitious reformers, early Ambitious reformers, late Timid reformers
Chart 3: Refrom ambition and transfers and subsidies
13
14
15
16
17
18
19
20
21
T0 T1 T2 T3 T4 T5 T6 T7
Tra n
s fe r
s a n
d s u
bsid
ies
(% o
f GD
P)
Ambitious reformers, early Ambitious reformers, late Timid reformers
Chart 4: Reform ambition and government investment
1
2
3
4
T0 T1 T2 T3 T4 T5 T6 T7
Inve
stm
ent (
% o
f GD
P)
Ambitious reformers, early Ambitious reformers, late Timid reformers
Source: Ameco
37
ECBWorking Paper Series No 634
May 2006

Ambitious expenditure reform episodes have also affected more profoundly the
soundness of public finances than timid ones (Chart 5). Within seven years, early and late
ambitious reformers were able to improve their fiscal balance by 6.4% and 9.3% of GDP
respectively. Timid reformers, on the other hand, accomplished an improvement by 4.4
percentage points. Ambitious expenditure reforms also yielded significant scope for tax cuts:
ambitious reformers reduced taxes significantly, by 2-3% of GDP within seven years, as
compared to little more than ½ percent tax cuts by timid reformers (Table 4).
Chart 5: Reform ambition and fiscal balance
-12
-10
-8
-6
-4
-2
0
2
4
T0 T1 T2 T3 T4 T5 T6 T7
Fisc
al b
alan
ce (%
of G
DP)
Ambitious reformers, early Ambitious reformers, late Timid reformers
Source: Ameco
Concerning the sustainability of fiscal policies, it is also important to examine whether
expenditure reforms (via consolidation) helped reduce public debt. The findings require some
explanation. Table 6 shows that, on average, early ambitious reformers did not immediately
succeed in reducing public debt levels. Initial deficits in some of the sample countries were so
high that, despite significant spending and deficit reductions, debt dynamics failed to reverse.
Table 6: Public debt and tax ratios, changes Percent of GDP Public debt TO (or nearest) T7 (or nearest) 2004 (or nearest) TO-T7 TO-2004 ratio ratio Ratio change change (% of GDP) (% of GDP) (% of GDP) (% of GDP) (% of GDP)Ambitious reformers, early 63.8 70.9 45.4 7.1 -18.4Ambitious reformers, late 72.2 59.4 51.9 -12.8 -20.3Timid reformers 87.8 86.8 82.9 -1.0 -4.9 Tax ratio TO (or nearest) T7 (or nearest) 2004 (or nearest) TO-T7 TO-2004 Ambitious reformers, early 47.7 44.9 43.2 -2.9 -4.5Ambitious reformers, late 48.5 46.5 45.1 -2.0 -3.4Timid reformers 46.1 45.5 44.7 -0.7 -1.4Source: Ameco and own calculations
38
ECBWorking Paper Series No 634May 2006
IV.3 Comparing ambitious and timid reformers: fiscal performance

Therefore, most of these countries initiated a second reform phase, starting in the early
to mid-1990s. For these “repeated” reform episodes and for “new” reforming countries, debt
dynamics were brought on a strong downward trend during the mid- to late-1990s. Debt fell
on average by almost 13% within 7 years. For all ambitious reformers, debt was 20% of GDP
lower in 2004 than before the start of reform. By contrast, timid reformers, on average, did
not experience noteworthy declines in their public debt ratios at all.
Our analysis also shows that all three groups started at similar rates of trend growth.
However, countries that undertook ambitious expenditure reform experienced more
favourable trend output developments.20 Chart 6 shows that in the seven years following the
expenditure peak, trend growth picked up in both ambitious reform groups leading to an
average improvement of 1.3% (more than 1.5% for the late reformers). At the same time,
trend growth stayed broadly stable for the “timid” reformers. Note also that it took 4 years
until trend growth improved markedly in the early and ambitious reform category.
We also distinguished between small and large countries to see whether the dynamics
on the supply-side and growth are correlated with country size.21 Chart 7 displays that for
20 Note that within the framework of our analysis we do not intend to identify a causal relationship between expenditure retrenchment and supply-side or growth effects. The better growth performance may be due to expenditure reform, other complementary reform, or as we see as most likely, a combination of the two. Nevertheless, the differences are striking (on the macroeconomic effects of fiscal adjustments in OECD countries, see Alesina and Perotti 1997). 21 This is of course a very crude examination and can only give very “preliminary and illustrative” evidence. Canada, the Netherlands, Spain and the UK are the “large” economies amongst the group of ambitious reformers while the group of “small” countries contains Belgium, Finland, Ireland and Sweden.
Box 2: Trend GDP growth Chart 6: Reform ambition and trend growth
1
2
3
4
5
T0 T1 T2 T3 T4 T5 T6 T7
Tren
d G
DP
grow
th (%
)
Ambitious reformers, early Ambitious reformers, late Timid reformers
Chart 7: Reform ambition and trend growth, large vs. small countries
0
1
2
3
4
5
T0 T1 T2 T3 T4 T5 T6 T7
Tren
d G
DP
grow
th (%
)
Ambitous reformers, large Ambitious reformers, small
Source: Ameco, OECD
39
ECBWorking Paper Series No 634
May 2006
IV.4 Comparing ambitious and timid reformers: economic performance

small countries ambitious reform phases coincided with a faster pick-up in trend growth.
Also, the overall improvement within the reform period was stronger in the small and
ambitious category. For these episodes, trend growth rates, on average, increased by nearly 2
percentage points within seven years. In contrast, for large economies we observe a more
lagged and substantially lower overall rise in trend growth rates, amounting to 1 percentage
point. Furthermore, we analyzed employment developments and found that, on average, all
three groups experience improvements in the employment ratio within seven years. This
increase was largest for late and ambitious reformers which experienced an increase of almost
7 percentage points.
When assessing the effects of fiscal consolidation in the short run, actual growth as
well as private investment and consumption are key. Actual growth was below trend in all
three groups and averaged only 0.3% as most countries started reforms in periods of low
growth or even crisis. Subsequently, in almost all countries that undertook ambitious reforms,
output growth recovered quickly and faster than for timid reformers. We find some indication
that positive confidence effects may have been rather strong (and for consumption also
immediate) in the group of ambitious reformers and possibly contributed to the quick growth
rebound. Chart 8 and 9 in Box 3 show the development of private investment and
consumption for the different reform categories.
With a lag, private investment started growing strongly for early and, particularly, late
ambitious reformers with investment ratios catching up with the “timid” reform group. The
development in real private consumption is also interesting. Ambitious reforms appear to start
after a period of low consumer confidence. Consumption growth, however, recovers quickly
and exceeds that of timid reformers as of the first reform year.
Box 3: Private investment and real private consumption Chart 8: Reform ambition and private investment
14
15
16
17
18
19
T0 T1 T2 T3 T4 T5 T6 T7
Time line (T0 = year with max expenditure)
Priv
ate
inve
stm
ent (
% o
f GD
P)
Ambitious reformers, early Ambitious reformers, late Timid reformers
Chart 9: Reform ambition and change in real private consumption
0
1
2
3
4
5
6
T0 T1 T2 T3 T4 T5 T6Time line (T0 = year with max expenditure ratio)
Cha
nge
in re
al p
rivat
e co
nsu m
ptio
n (%
)
Ambitious reformers, early Ambitious reformers. late Timid reformers
Source: Ameco, OECD
40
ECBWorking Paper Series No 634May 2006

Comparing ambitious and timid reformers: testing for differences
In order to underpin the findings from the preceding horizontal analysis we also
carried out a standard statistical test for differences in post-reform developments concerning
“ambitious” and “timid” reform phases. Again, we focus on changes within a seven year
reform period. Table 7 reports the results for Wilcoxon-Mann-Whitney rank-sum tests.
First of all, these tests further confirm the “higher quality” of ambitious expenditure
retrenchment efforts. While reductions in government consumption and transfers and
subsidies are significantly higher within the ambitious reform category, there is no evidence
for a stronger reliance on cuts in government investment. When assessing the effects of
expenditure-based consolidation on the soundness of fiscal policies we do not find significant
differences in the underlying deficit and debt developments. While the results for debt are in
line with the findings from Section III.3, the missing significance for the change in fiscal
significance level and, moreover, the result seems to be driven by an influential observation.22
As regards economic performance, the picture, again, becomes more clear-cut. The tests
yield strong support for differences in trend growth developments, as growth rate improvements
tend to be significantly larger for ambitious reform periods. We also find partial confirmation
on potential confidence effects. While private investment changes do not turn out to be
significant, we observe that expenditure-based consolidation efforts tend to coincide with more
favourable developments in real private consumption when carried out in an ambitious manner.
Table 7: Wilcoxon-Mann-Whitney rank-sum test for differences between ambitious and timid reform phases p-value significance level1) probability2) expenditure developments ∆3) government consumption 0.00 *** 0.94 (-) ∆ transfers and subsidies 0.00 *** 0.95 (-) ∆ government investment 0.46 0.60 (-) soundness of fiscal policies ∆ fiscal balance 0.12 0.72 (+) ∆ public debt 1.00 0.00 (-) economic performance ∆ trend gdp growth 0.00 *** 0.92 (+) confidence effects ∆ private investment 0.16 0.69 (+) ∆ change in real private consumption 0.02 ** 0.82 (+) 1) ***/**/* denotes significance at 1%, 5% and 10% significance levels 2) Probability that the reduction (-) or the improvement (+) is larger within the ambitious reform category 3) Change T0-T7
22 When disregarding the low fiscal-balance improvement within the Netherlands’ first reform phase we observe a p-value of 0.06.
41
ECBWorking Paper Series No 634
May 2006
IV.5
balance is somewhat surprising. Nevertheless, the reported p-value is close to the 10%

Conclusion
In this paper we have taken a close look at the experiences with expenditure reform in
industrialised countries with special emphasis on ambitious reform programs. We have
conducted an in-depth analysis of such episodes by examining the concrete reform measures
undertaken and their effect on total spending and expenditure composition. We also looked at
the institutional context in which these reforms were undertaken, the comprehensiveness of
reform programs and the economic and fiscal performance in the wake of reforms.
We found that ambitious reform programs have a number of common features: the
reduction in total spending is truly ambitious and averages about 10% of GDP within seven
years. This is achieved by focusing mainly on government consumption, transfers and
subsidies while mostly sparing spending on education. Ambitious expenditure reform was
always part of a comprehensive reform package that most of the times included labour market
reform, tax reform and privatisation and, in about half of the episodes, the establishment of
monetary and external stability. Virtually all episodes of ambitious reform featured the
strengthening of national and sub-national budgetary procedures and institutions.
Ambitious reform episodes appear to secure more lasting fiscal consolidation than
“timid” expenditure reforms while also yielding an important “tax cut premium”. Ambitious
reformers also experience a much more favourable growth performance than “timid”
countries, which is particularly fast and strong for relatively small ambitious countries.
Ambitious reformers have also typically not experienced significant short term economic
costs of retrenchment, despite an average adjustment effort of around 3% of GDP in the first
two years of reform, as consumer and investor confidence picked up rather quickly. When
looking at the reform programmes and subsequent experiences, there are clear signs of
significant improvements in the “economic policy regime” in many of these countries.
From a perspective of political economy, it appears that ambitious expenditure reform
programs have been mainly implemented in the context of recession or even economic crises.
This contrasts with the call of many economists and politicians to limit consolidation to good
times (where the urgency of reform is, however, hardly felt).
Lastly, it appears that a medium term comprehensive strategy with emphasis on
expenditure adjustment is rightly warranted not least from the perspective of the euro area and
the recently reformed Stability and Growth Pact. Concerns about ambitious reforms
undermining economic growth appear unfounded. The case studies in particular demonstrate
42
ECBWorking Paper Series No 634May 2006
V.

that fiscal adjustment can and should be more ambitious than the 0.5% of annual
improvement in the cyclically adjusted budgetary balance, as required by the medium-term
would require tax increases appear unfounded. One could even speculate that more rather than
less expenditure retrenchment seems desirable to achieve lasting fiscal consolidation and
economic revival. Also assertions that structural reforms would justify a delay in adjustment
appear equally dubious as successful reformers undertook comprehensive reforms more or
less simultaneously with fiscal adjustment.
Concluding on a note of caution, it is worth stressing that this study looks at the
changes in spending ratios since their peak and their correlation with other reforms and with
fiscal and economic performance from a case study perspective. While the ambitious and
timid group’s experiences are significantly different (as suggested by relevant tests), we do
not establish causality between reforms and performance, for which much further analysis
would be warranted.
Bibliography
Afonso, A, F. Ebert., L. Schuknecht and M. Thoene (2005) Quality of Public Finances and Growth, ECB WP 438, Frankfurt.
Alesina, A and S. Ardagna (1998) Tales of fiscal adjustment, Economic Policy no. 27: 489-545
Alesina, A and R. Perotti (1995) Fiscal Expansions and Adjustments in OECD Countries, Economic Policy, No. 21
Alesina, A and R. Perotti (1997) Fiscal adjustments in OECD countries: composition and macroeconomic effects, IMF Staff Paper 44 (2): 210-248
Annett, Tony (2006) Case studies and beyond: Lessons from successful labor market reformers in Europe and Implications for its Social Model, forthcoming IMF Staff Paper
Barry, F (1991) The Irish recovery 1987-1990: An economic miracle? Irish Banking Review, Winter: 23-40
Barry, F (1999) ed. Understanding Ireland’s economic growth, Macmillan Press, London
Bartolini, Leonardo (1993) Devaluation and competitiveness in a small open economy – Ireland 1987-1993, IMF Working Paper 93/82
Berndsen, R. (2001) Post-War Fiscal Rules in the Netherlands: What can we learn for EMU?, in Banca d’Ítalia Fiscal Rules, Rome.
Bishop, M., J. Kay and C. Mayer (1994) Privatization and Economic Performance, Oxford: Oxford University Press.
43
ECBWorking Paper Series No 634
May 2006
budgetary objective under the revised Pact. Claims to the effect that more ambitious efforts

Bishop, M., J. Kay and C. Mayer (1995) The Regulatory Challenge, Oxford: Oxford University Press.
Boadway, R. and P. Hobson (1993) Intergovernmental fiscal relations in Canada, Canadian Tax Paper no. 94, Toronto: Canadian Tax Foundation
Bos, F. and J. Timmerhuis (2006) De Nederlandse collectieve uitgaven in historisch perspectief, Den Haag: Centraal Planbureau.
Boyle, G. and J. O’Leary (1997) Controlling public spending in times of plenty. Economics Department Working Paper n741197, National University of Ireland http://www.nuim.ie/academic/economics/pdf/N741197.pdf
Brennan, G and J.M. Buchanan (1985) The Reason of Rules: Constitutional Political Economy. Cambridge: Cambridge University Press.
Briotti, M. G. (2005) Economic Reactions to Public Finance Consolidation: A Survey on the Literature, European Central Bank Occasional Paper No. 38
Brumby, J. (1999) Budgeting reforms in OECD member countries, in: S. Schiavo-Campo and D. Tommasi, Managing Government Expenditure, Asian Development Bank http://www.adb.org/Documents/Manuals/Govt_Expenditure/
Corsetti, G. and N. Roubini (1996) Budget deficits, public sector solvency and political biases in fiscal policy: a case study of Finland, Finnish Economic Papers vol. 9/1, Spring
De Callatay, E. (2002) La fin du déficit budgétaire.
De Castro, F. (2003), The macroeconomic effects of fiscal policy in Spain, Banco de España, Working paper 0311
De Castro, F. and P. Hernández de Cos (2002), On the sustainability of the Spanish public budget performance, Hacienda Pública Española / Revista de Economía Pública 160-(1/2002), pp. 9-27, http://www.ief.es/publicaciones/revistas/hacienda%20publica/160_Castro.pdf
De la Fuente, A. and X. Vives (1997) The Sources of Irish Growth, CEPR Discussion Paper No. 1756.
De Mooij, R. (2003) Towards a more efficient state: lessons from the Dutch experience, Rotterdam: Erasmus University mimeo.
De Ryck, L. (1993) De rijksuitgaven en het budgettaire beleid 1980-1990, in Histoire des finances publiques en Belgique, la periode 1980-1990, Academia Press.
Deroose, S., L. Moulin and P. Wierts (2006) National Expenditure Rules and Expenditure Outcomes: Evidence for EU Member States, forthcoming in Wirtschaftspolitische Blaetter, 1/2006.
Van Dijkhuizen, K (2003) The use of fiscal rules in the Netherlands, Oesterreichische Nationalbank, 31st economics conference
ECOFIN Council (2006) Conclusions on the Quality of Public Finances, Brussels.
EPC Report on ageing.
European Commission (2001, 2003, 2004) Public Finance in EMU, Brussels.
Fitz Gerald, J (1999) Understanding Ireland’s economic success, ESRI Working Paper, Dublin, www.nuim.ie/academic/economics/ESRI_111.pdf
Frank, M. (1993) Le cadre general des finances publiques en Belgique, in Histoire des finances publiques en Belgique, la periode 1980-1990, Academia Press.
44
ECBWorking Paper Series No 634May 2006

Frank, Niklas (2004) The Swedish budget process: expenditure targets and top-down decisions, in: Reforming the public expenditure management system, Worldbank Conference Proceedings: 71- 84, http://www1.worldbank.org/publicsector/pe/reformingthePEMSystem-wbkdi.pdf
Garcés Sanagustín, Mario (2004) Budgetary framework in Spain: Efficiency, accountability and transparency in the reform of the Spanish budget institution, Cabinet of the Prime Minister, http://www.pogar.org/publications/finances/oecd/mario-budget.pdf
Giavazzi, F and Pagano, M. (1990) Can severe fiscal contractions be expansionary? in: O. Blanchard and S. Fisher (eds.), National Bureau of Economic Research, Macroeconomic Annual, MIT Press, Cambridge MA
Giavazzi, F. and M. Pagano (1995) Non-Keynesian effects of fiscal policy changes: international evidence and the Swedish experience, NBER working paper 5532
González-Páramo, De Castro and Hernández de Cos (2003) Tax reform in perspective: the role of the public sector in Spain along the process of European integration. ECB: mimeo.
González-Páramo, J. M., F. De Castro and P. Hernández de Cos (2003) Fiscal consolidation in Spain: Dynamic interdependence of public spending and revenues, Investigaciones Económicas
Von Hagen, J., M. Hallerberg and R. Strauch (2004) The design of fiscal rules and forms of governance in European Union countries, mimeo.
Hallerberg, M (2004) Domestic budgets in a united Europe - Fiscal governance from the end of Bretton Woods to EMU, Cornell University Press, New York.
Heeringa, W. and Y. Lindh (2001)Dutch versus Swedish Budgetary Rules: A Comparison, in Banca d’Italia (ed.) Fiscal Rules, Rome.
Hemming, R., M. Kell and S. Mahfouz (2002) The effectiveness of fiscal policy in stimulating economic activity – a review of the literature. IMF Working Paper 208
Henriksson, J. (2003) The use of fiscal rules in Sweden, Oesterreichische Nationalbank, 31st economics conference
Hetemäki, M. (2003) Experience with public sector reform in Finland, Oesterreichische Nationalbank, 31st economics conference
Honohan, P (1999) Fiscal adjustment and disinflation in Ireland: Setting the macro basis of economic recovery and expansion, in: F. Barry (ed.) Understanding Ireland’s economic growth, Macmillan Press, London
Joumard, I., P. Kongsrud, Y.-S. Naam and R. Price (2004) Enhancing the effectiveness of public spending: experience in OECD countries. OECD Economic Department working paper no. 380
Kell, Michael (2001) An assessment of fiscal rules in the United Kingdom, IMF Working Paper 01/91, http://www.imf.org/external/pubs/ft/wp/2001/wp0191.pdf
Kennedy, S., J. Robbins and F. Delorme (2001) The Role of Fiscal Rules in Determining Fiscal Performance, in Banca d’Italia (ed.) Fiscal Rules, Rome.
Kneebone, R. D. and K. J. McKenzie (1999) The Characteristics of Fiscal Policy in Canada, Canadian Public Policy, University of Toronto Press, vol. 25(4): 483-501 http://economics.ca/cgi/jab?journal=cpp&view=v25n4/CPPv25n4p483.pdf
45
ECBWorking Paper Series No 634
May 2006

Kilpatrick, Andrew (2001) Transparent Frameworks, Fiscal Rules and Policy-Making under Uncertainty, in Banca d’Italia (ed.) Fiscal Rules, Rome.
Lindbeck, Assar (1997) The Swedish Experiment, Stockholm: SNS Förlag.
Massey, P. (1995) New Zealand, Market Liberalisation in a Developed Economy, New York: St. Martin’s Press.
Meklin, Pentti, Juha Liinavuori and Jukka Nummikoski (2000) Expenditure Inflexibility in the State Budget – The fiscal policy latitude of the Council of State in Finland, Public Administration 78, no.1: 193-207
McDermott, C.J. and R. Wescott (1997) Fiscal Reforms that Work, Economic Issues No. 4, Washington DC: IMF.
Nieto, A. (1996) La ‘nueva’ organizacion del desgobierno. Barcelona: Ariel
OECD (various issues) Economic Surveys, Paris
Peacock, A. and J. Wiseman (1961) The Growth of Public Expenditure in the United Kingdom, Princeton University Press, New York
Perotti, R. (1998) The political economy of fiscal consolidations, Scandinavian Journal of Economics, 100 no. 1: 367-404
Rato, R. (2004) Benefits of Fiscal Consolidation, Remarks to the Real Academia de Doctores, Barcelona.
Reynders, P. (200?) Primaire Uitgaven in de Jaren Negentig, in De Callatay, E. (ed.) La fin du deficit budgetaire.
Schuknecht, L. and V. Tanzi (2005) Reforming Public Expenditure in Industrialised Countries: Are there Trade-Offs?, European Central Bank Working Paper 243
Scott, G. (1996) Government Reform in New Zealand, IMF Occasional Paper No. 140, Washington D.C.: IMF.
Seils, E. (2005) Das Holländische Wunder: Korporatismus und Konsens oder konfliktgeladene haushalts- und finanzpolitische Anpassung? Zeitschrift für Sozialreform, Issue 51, no.2: 194-220
Tanzi, V. and L. Schuknecht (2000) Public Spending in the 20th Century: A Global Perspective, Cambridge University Press, Cambridge
Tanzi, V. and L. Schuknecht (2003) Public Finances and Economic Growth in European Countries, in Oestereichische Nationalbank (ed.) Fostering Economic Growth in Europe, Vienna
Thain, C. and M. Wright (1995) The Treasury and Whitehall: The Planning and Control of Public Expenditure, 1976-1993. Oxford: Clarendon
Toharia L. and M. A. Malo (2000), The Spanish experiment - pros and cons of flexibility at the margin, in: G. Esping Andersen and M. Regini (eds.) Why deregulate labour markets? Oxford University Press
Wierts, P. (2006) Expenditure Composition and Institutional Reform: The experience of EU countries, forthcoming in Banca d’Italia (ed.) Public expenditure, Rome: Banca d’Italia.
46
ECBWorking Paper Series No 634May 2006

Anne
x Tab
le 1:
Rob
ustn
ess o
f Cat
egor
isatio
n (c
umul
ative
chan
ge p
rimar
y exp
endi
ture
from
T0 o
r nea
rest
, % o
f GDP
)
T0
Ch
ange
T0-
T1
Chan
ge T
0-T2
Ch
ange
T0-
T3
Chan
ge T
0-T4
Ch
ange
T0-
T5
Chan
ge T
0-T6
Ch
ange
T0-
T7
Chan
ge T
0-T8
fin
19
93
-1.0
-4.6
-4.7
-8.0
-10.9
-1
1.2
-14.0
-1
3.7
swe
1993
-2
.7 -6
.1 -8
.5 -1
0.5
-12.0
-1
1.7
-14.0
-1
3.4
irl1
1982
-0
.5 -2
.1 -3
.6 -3
.3 -4
.8 -7
.4 -1
2.4
-12.1
be
l1 19
83
-3.3
-4.7
-5.7
-7.0
-8.8
-11.7
-1
2.3
-10.5
ca
n 19
92
-1.0
-3.4
-5.2
-6.7
-8.3
-8.0
-9.5
-10.8
gb
r1
1981
-1
.2 -1
.5 -1
.8 -3
.5 -4
.4 -6
.2 -8
.2 -8
.5 nl
d2
1993
-2
.0 -4
.1 -5
.6 -6
.6 -7
.2 -7
.2 -7
.5 -5
.7 gb
r2
1992
-0
.8 -1
.9 -2
.6 -4
.3 -6
.1 -7
.3 -7
.2 -6
.8 es
p 19
93
-1.4
-2.8
-4.3
-5.8
-5.9
-6.5
-6.4
-6.8
irl2
1992
0.3
0.1
-2
.0 -3
.2 -4
.9 -6
.8 -6
.2 -8
.2 lu
x 19
81
-2.4
-3.1
-6.1
-7.1
-7.9
-5.7
n.a.
n.a.
nld1
19
83
-1.3
-2.7
-3.1
-1.9
-3.6
-5.3
-5.1
-5.3
aut
1993
-0
.3 -0
.3 -1
.0 -3
.1 -2
.8 -2
.8 -4
.3 -5
.3 dn
k 19
93
0.4
-0.2
-0.5
-2.1
-2.0
-2.5
-3.9
-2.8
nzl
1985
n.a
. -4
.2 -2
.3 -3
.4 -1
.6 -3
.6 -3
.8 -6
.9 us
a 19
92
-0.4
-1.4
-1.6
-2.0
-2.9
-3.5
-3.4
-3.4
ita
1993
-1
.5 -2
.8 -2
.9 -2
.9 -3
.0 -2
.5 -3
.0 -2
.0 jp
n 19
98
-2.0
0.0
-1.5
-0.8
-1.1
-2.0
-2.7
n.a.
bel2
1993
-0
.7 -0
.9 -0
.4 -1
.0 -1
.4 -1
.5 -2
.1 -1
.6 de
u 19
96
-0.9
-1.3
-1.0
-1.7
-1.5
-0.9
-0.6
-2.0
fra
1996
-0
.4 -1
.5 -1
.4 -2
.3 -2
.3 -1
.3 -0
.5 -0
.3 ch
e 19
98
-1.5
-2.0
-1.1
-0.3
n.a.
n.a.
n.a.
n.a.
prt
2004
0.0
n.a
. n.a
. n.a
. n.a
. n.a
. n.a
. n.a
. gr
c 20
00
-0.5
-0.5
0.2
0.4
n.a.
n.a.
n.a.
n.a.
aus
1985
-0
.5 -2
.6 -4
.2 -3
.9 -2
.0 0.0
0.4
0.1
47ECB
Working Paper Series No 634May 2006

Anne
x Tab
le 2:
Rob
ustn
ess o
f Cat
egor
isatio
n (c
umul
ative
chan
ge cy
clica
lly ad
just
ed p
rimar
y exp
endi
ture
from
T0 o
r nea
rest
, % o
f GDP
)
T0
Ch
ange
T0-
T1
Chan
ge T
0-T2
Ch
ange
T0-
T3
Chan
ge T
0-T4
Ch
ange
T0-
T5
Chan
ge T
0-T6
Ch
ange
T0-
T7
Chan
ge T
0-T8
fin
19
93
-0.3
-3.6
-3.4
-6.0
-8.6
-8.9
-11.5
-1
1.7
swe
1993
-2
.2 -5
.3 -7
.8 -9
.8 -1
1.0
-10.4
-1
2.4
-12.1
irl
1 19
82
n.a.
n.a.
n.a.
n.a.
n.a.
n.a.
n.a.
n.a.
bel1
1983
-3
.2 -4
.5 -5
.5 -6
.8 -8
.1 -1
0.8
-11.3
-9
.7 ca
n 19
92
n.a.
n.a.
n.a.
n.a.
n.a.
n.a.
n.a.
n.a.
gbr1
19
81
-1.2
-1.5
-1.8
-3.4
-4.2
-5.9
-7.8
-8.1
nld2
19
93
-1.9
-3.9
-5.2
-5.8
-5.8
-5.3
-5.3
-3.9
gbr2
19
92
-0.8
-1.8
-2.4
-4.1
-5.9
-7.1
-6.9
-6.6
esp
1993
n.a
. n.a
. -1
.5 -2
.8 -2
.7 -3
.1 -2
.7 -3
.2 irl
2 19
92
-0.2
-0.5
-2.2
-3.2
-4.4
-6.3
-5.3
-7.2
lux
1981
n.a
. n.a
. n.a
. n.a
. n.a
. n.a
. n.a
. n.a
. nl
d1
1983
-0
.7 -1
.9 -2
.0 -1
.0 -2
.6 -3
.4 -2
.7 -3
.1
aut
1993
-0
.3 -0
.3 -1
.0 -3
.1 -2
.7 -2
.7 -4
.1 -5
.2 dn
k 19
93
1.4
0.5
0.5
-0.9
-0.8
-1.1
-2.1
-1.3
nzl
1985
n.a
. n.a
. n.a
. n.a
. n.a
. n.a
. n.a
. n.a
. us
a 19
92
n.a.
n.a.
n.a.
n.a.
n.a.
n.a.
n.a.
n.a.
ita
1993
-1
.5 -2
.7 -2
.9 -2
.8 -2
.9 -2
.4 -2
.8 -1
.8 jp
n 19
98
n.a.
n.a.
n.a.
n.a.
n.a.
n.a.
n.a.
n.a.
bel2
1993
-0
.5 -0
.7 -0
.3 -0
.8 -1
.2 -1
.0 -1
.4 -1
.1 de
u 19
96
-2.0
-3.2
-2.6
-4.6
-4.3
-3.2
-2.2
-3.0
fra
1996
-0
.3 -1
.2 -1
.1 -1
.8 -1
.8 -0
.9 -0
.3 -0
.1 ch
e 19
98
n.a.
n.a.
n.a.
n.a.
n.a.
n.a.
n.a.
n.a.
prt
2004
n.a
. n.a
. n.a
. n.a
. n.a
. n.a
. n.a
. n.a
. gr
c 20
00
-0.4
-0.5
0.3
0.5
n.a.
n.a.
n.a.
n.a.
aus
1985
n.a
. n.a
. n.a
. n.a
. n.a
. n.a
. n.a
. n.a
.
48ECBWorking Paper Series No 634May 2006

Ann
ex 3
: Bre
akdo
wn
of e
xpen
ditu
re a
nd c
ompl
emen
tary
refo
rms b
y ep
isod
e
Irel
and
1 Ir
elan
d 2
Swed
en
Can
ada
Finl
and
Bel
gium
1
Net
her
land
s 1
Net
her
land
s 2
Spai
n U
K 1
U
K 2
T
otal
Publ
ic w
age
rest
rain
t X
X
X
X
X
X
X
X
X
X
X
11
Pu
blic
em
ploy
men
t red
uctio
ns
X
X
X
X
X
5 Tr
ansf
ers 1
: tig
hten
ed e
ligib
ility
X
X
X
X
X
X
X
X
X
X
X
11
Tr
ansf
ers 2
: red
uced
ben
efits
X
X
X
X
X
X
X
X
X
X
10
Tran
sfer
s 3: c
o-pa
ymen
ts /
user
cha
rges
X
X
X
3
Expe
nditu
re re
duct
ion
by a
t lea
st 1
% o
f GD
P:
S
ubsi
dy c
uts
X
X
X
X
4
In
vest
men
t X
X
X
X
X
5
E
duca
tion
X
X
X
X
4
H
ealth
X
X
X
3
Cuts in specific expenditure categories
P
ensi
ons
X
X
X
X
4
Stre
ngth
enin
g th
e M
inis
ter o
f Fin
ance
X
X
X
X
X
5
Fisc
al c
ontra
cts
X
X
X
X
X
5 Fi
scal
cou
ncil
X
X
X
3 Im
prov
ed p
arlia
men
tary
con
trol o
ver b
udge
t
X
X
2 M
ulti-
year
bud
get p
lann
ing
X
X
X
X
X
X
6
Expe
nditu
re c
eilin
gs
X
X
X
X
X
X
6
Def
icit/
surp
lus r
ule
X
X
X
3 ‘c
arry
-ove
r’ p
rovi
sion
s or c
ontin
genc
y fu
nds
X
X
2
Improvements to fiscal institutions
Maa
stric
ht c
onve
rgen
ce/e
xter
nal a
ncho
r
X
X
X
X
X
5
Exch
ange
rate
dev
alua
tion
/dep
reci
atio
n X
X
X
X
X
X
6 C
entra
l ban
k in
depe
nden
ce
X
X
X
X
X
X
X
7
Macro stability
Mon
etar
y st
abili
satio
n X
X
X
X
X
X
X
X
8 Pr
ivat
isat
ion
and
publ
ic-p
rivat
e pa
rtner
ship
s X
X
X
X
X
X
X
7
Ref
orm
s to
the
bene
fit sy
stem
X
X
X
X
X
X
X
X
X
X
X
11
Pe
nsio
n re
form
X
X
X
3
Labo
ur M
arke
t ref
orm
s
X
X
X
X
X
X
X
X
X
X
10
Tax
refo
rm/c
uts
X
X
X
X
X
X
X
X
X
X
10
W
age-
setti
ng re
form
X
X
2 W
age
mod
erat
ion
X
X
X
X
4
Structural reforms
Fina
ncia
l sec
tor r
efor
m
X
X
X
X
4
49ECB
Working Paper Series No 634May 2006

50ECBWorking Paper Series No 634May 2006
European Central Bank Working Paper Series
For a complete list of Working Papers published by the ECB, please visit the ECB’s website(http://www.ecb.int)
585 “Are specific skills an obstacle to labor market adjustment? Theory and an application to the EUenlargement” by A. Lamo, J. Messina and E. Wasmer, February 2006.
586 “A method to generate structural impulse-responses for measuring the effects of shocks instructural macro models” by A. Beyer and R. E. A. Farmer, February 2006.
587 “Determinants of business cycle synchronisation across euro area countries” by U. Böwer andC. Guillemineau, February 2006.
588 “Rational inattention, inflation developments and perceptions after the euro cash changeover”by M. Ehrmann, February 2006.
589 “Forecasting economic aggregates by disaggregates” by D. F. Hendry and K. Hubrich,February 2006.
590 “The pecking order of cross-border investment” by C. Daude and M. Fratzscher, February 2006.
591 “Cointegration in panel data with breaks and cross-section dependence” by A. Banerjee andJ. L. Carrion-i-Silvestre, February 2006.
592 “Non-linear dynamics in the euro area demand for M1” by A. Calza and A. Zaghini,February 2006.
593 “Robustifying learnability” by R. J. Tetlow and P. von zur Muehlen, February 2006.
594 “The euro’s trade effects” by R. Baldwin, comments by J. A. Frankel and J. Melitz, March 2006
595 “Trends and cycles in the euro area: how much heterogeneity and should we worry about it?”by D. Giannone and L. Reichlin, comments by B. E. Sørensen and M. McCarthy, March 2006.
596 “The effects of EMU on structural reforms in labour and product markets” by R. Duvaland J. Elmeskov, comments by S. Nickell and J. F. Jimeno, March 2006.
597 “Price setting and inflation persistence: did EMU matter?” by I. Angeloni, L. Aucremanne,M. Ciccarelli, comments by W. T. Dickens and T. Yates, March 2006.
598 “The impact of the euro on financial markets” by L. Cappiello, P. Hördahl, A. Kadarejaand S. Manganelli, comments by X. Vives and B. Gerard, March 2006.
599 “What effects is EMU having on the euro area and its Member Countries? An overview”by F. P. Mongelli and J. L. Vega, March 2006.
600 “A speed limit monetary policy rule for the euro area” by L. Stracca, April 2006.
601 “Excess burden and the cost of inefficiency in public services provision” by A. Afonsoand V. Gaspar, April 2006.
602 “Job flow dynamics and firing restrictions: evidence from Europe” by J. Messina and G. Vallanti,April 2006.

51ECB
Working Paper Series No 634May 2006
603 “Estimating multi-country VAR models” by F. Canova and M. Ciccarelli, April 2006.
604 “A dynamic model of settlement” by T. Koeppl, C. Monnet and T. Temzelides, April 2006.
605 “(Un)Predictability and macroeconomic stability” by A. D’Agostino, D. Giannone and P. Surico,April 2006.
606 “Measuring the importance of the uniform nonsynchronization hypothesis” by D. A. Dias,C. Robalo Marques and J. M. C. Santos Silva, April 2006.
607 “Price setting behaviour in the Netherlands: results of a survey” by M. Hoeberichts andA. Stokman, April 2006.
608 “How does information affect the comovement between interest rates and exchange rates?”by M. Sánchez, April 2006.
609 “The elusive welfare economics of price stability as a monetary policy objective: why NewKeynesian central bankers should validate core inflation” by W. H. Buiter, April 2006.
610 “Real-time model uncertainty in the United States: the Fed from 1996-2003” by R. J. Tetlowand B. Ironside, April 2006.
611 “Monetary policy, determinacy, and learnability in the open economy” by J. Bullardand E. Schaling, April 2006.
612 “Optimal fiscal and monetary policy in a medium-scale macroeconomic model”by S. Schmitt-Grohé and M. Uribe, April 2006.
613 “Welfare-based monetary policy rules in an estimated DSGE model of the US economy”by M. Juillard, P. Karam, D. Laxton and P. Pesenti, April 2006.
614 “Expenditure switching vs. real exchange rate stabilization: competing objectives forexchange rate policy” by M. B. Devereux and C. Engel, April 2006.
615 “Quantitative goals for monetary policy” by A. Fatás, I. Mihov and A. K. Rose, April 2006.
616 “Global financial transmission of monetary policy shocks” by M. Ehrmann and M. Fratzscher,April 2006.
617 “New survey evidence on the pricing behaviour of Luxembourg firms” by P. Lünnemannand T. Y. Mathä, May 2006.
618 “The patterns and determinants of price setting in the Belgian industry” by D. Cornilleand M. Dossche, May 2006.
619 “Cyclical inflation divergence and different labor market institutions in the EMU”by A. Campolmi and E. Faia, May 2006.
620 “Does fiscal policy matter for the trade account? A panel cointegration study” by K. Funkeand C. Nickel, May 2006.
621 “Assessing predetermined expectations in the standard sticky-price model: a Bayesian approach”by P. Welz, May 2006.
622 “Short-term forecasts of euro area real GDP growth: an assessment of real-time performancebased on vintage data” by M. Diron, May 2006.

52ECBWorking Paper Series No 634May 2006
623 “Human capital, the structure of production, and growth” by A. Ciccone andE. Papaioannou, May 2006.
624 “Foreign reserves management subject to a policy objective” by J. Coche, M. Koivu, K. Nyholmand V. Poikonen, May 2006.
625 “Sectoral explanations of employment in Europe: the role of services” by A. D’Agostino,R. Serafini and M. Ward-Warmedinger, May 2006.
626 “Financial integration, international portfolio choice and the European Monetary Union”by R. A. De Santis and B. Gérard, May 2006.
627 “Euro area banking sector integration: using hierarchical cluster analysis techniques”by C. Kok Sørensen, J. M. Puigvert Gutiérrez, May 2006.
628 “Long-run money demand in the new EU Member States with exchange rate effects”by C. Dreger, H.-E. Reimers and B. Roffia, May 2006.
629 “A market microstructure analysis of foreign exchange intervention” by P. Vitale, May 2006.
630 “Implications of monetary union for catching-up member states” by M. Sánchez, May 2006.
631 “Which news moves the euro area bond market?” by M. Andersson, L. J. Hansen andS. Sebestyén, May 2006.
632 “Does information help recovering structural shocks from past observations?”by D. Giannone and L. Reichlin, May 2006.
633 “Nowcasting GDP and inflation: the real-time informational content of macroeconomic datareleases” by D. Giannone, L. Reichlin and D. H. Small, May 2006.
634 “Expenditure reform in industrialised countries: a case study approach” by S. Hauptmeier,M. Heipertz and L. Schuknecht, May 2006.

ISSN 1561081-0
9 7 7 1 5 6 1 0 8 1 0 0 5
Related Documents