Page 1 of 20 Expedia Group Reports Fourth Quarter 2020 Results SEATTLE, WA – February 11, 2021 – Expedia Group, Inc. (NASDAQ: EXPE) announced financial results today for the fourth quarter ended December 31, 2020. “Last year was an incredibly difficult year for the travel industry, and while not as hard hit as many of our partners, Expedia was not spared the broadly negative impacts of COVID-19. The fourth quarter brought signs of hope in the form of vaccine approvals, but rising cases across the globe and rolling shutdowns of various travel markets made an impact. As a result, Q4 did not show any real sequential progress other than some signs of modest improvement around the holidays that carried into the early part of 2021," said Vice Chairman and CEO, Peter Kern. "While the environment continues to be unpredictable, we remain keenly focused on reshaping and simplifying our business. We are proud of the teams' immense effort during such a difficult personal and professional time for all of us, and we look forward to much better outcomes for our customers and partners as the travel market rebounds." Financial Summary & Operating Metrics ($ millions except per share amounts) - Fourth Quarter 2020 (1) Expedia Group, Inc. Metric Q4 2020 Q4 2019 Δ Y/Y Room night growth (61)% 11% NM Gross bookings $7,567 $23,245 (67)% Revenue 920 2,747 (67)% Operating income (loss) (463) 160 NM Net income (loss) attributable to Expedia Group common stockholders (412) 76 NM Diluted earnings (loss) per share $(2.89) $0.52 NM Adjusted EBITDA (2) (160) 478 NM Adjusted net income (loss) (2) (376) 185 NM Adjusted EPS (2) $(2.64) $1.24 NM Free cash flow (2) (513) 45 NM (1) All comparisons are against comparable period of 2019 unless otherwise noted. (2) "Adjusted EBITDA" (Adjusted Earnings Before Interest, Taxes, Depreciation and Amortization), "Adjusted net income (loss)," "Adjusted EPS" and "Free cash flow" are non-GAAP measures as defined by the Securities and Exchange Commission (the "SEC"). See "Definitions of Non-GAAP Measures" and "Tabular Reconciliations for Non-GAAP Measures" on pages 12-19 herein for an explanation and reconciliations of non-GAAP measures used throughout this release. Expedia Group does not calculate or report net income by segment.

Welcome message from author
This document is posted to help you gain knowledge. Please leave a comment to let me know what you think about it! Share it to your friends and learn new things together.
Transcript

Page 1 of 20
Expedia Group Reports Fourth Quarter 2020 Results
SEATTLE, WA – February 11, 2021 – Expedia Group, Inc. (NASDAQ: EXPE) announced financial results today
for the fourth quarter ended December 31, 2020.
“Last year was an incredibly difficult year for the travel industry, and while not as hard hit as many of our partners,
Expedia was not spared the broadly negative impacts of COVID-19. The fourth quarter brought signs of hope in the
form of vaccine approvals, but rising cases across the globe and rolling shutdowns of various travel markets made
an impact. As a result, Q4 did not show any real sequential progress other than some signs of modest improvement
around the holidays that carried into the early part of 2021," said Vice Chairman and CEO, Peter Kern. "While the
environment continues to be unpredictable, we remain keenly focused on reshaping and simplifying our business.
We are proud of the teams' immense effort during such a difficult personal and professional time for all of us, and
we look forward to much better outcomes for our customers and partners as the travel market rebounds."
Financial Summary & Operating Metrics ($ millions except per share amounts) - Fourth Quarter 2020(1)
Expedia Group, Inc.
Metric Q4 2020 Q4 2019 Δ Y/Y
Room night growth (61)% 11% NM
Gross bookings $7,567 $23,245 (67)%
Revenue 920 2,747 (67)%
Operating income (loss) (463) 160 NM
Net income (loss) attributable to Expedia Group common stockholders (412) 76 NM
Diluted earnings (loss) per share $(2.89) $0.52 NM
Adjusted EBITDA(2) (160) 478 NM
Adjusted net income (loss)(2) (376) 185 NM
Adjusted EPS(2) $(2.64) $1.24 NM
Free cash flow(2) (513) 45 NM
(1)All comparisons are against comparable period of 2019 unless otherwise noted.
(2)"Adjusted EBITDA" (Adjusted Earnings Before Interest, Taxes, Depreciation and Amortization), "Adjusted net income (loss)," "Adjusted EPS" and "Free
cash flow" are non-GAAP measures as defined by the Securities and Exchange Commission (the "SEC"). See "Definitions of Non-GAAP Measures" and
"Tabular Reconciliations for Non-GAAP Measures" on pages 12-19 herein for an explanation and reconciliations of non-GAAP measures used throughout this
release. Expedia Group does not calculate or report net income by segment.

Page 2 of 20
Financial Summary & Operating Metrics ($ millions except per share amounts) - Full Year 2020(1)
Expedia Group, Inc.
Metric 2020 2019 Δ Y/Y
Room night growth (55)% 11% NM
Gross bookings $36,796 $107,873 (66)%
Revenue 5,199 12,067 (57)%
Operating income (loss) (2,719) 903 NM
Net income (loss) attributable to Expedia Group common stockholders (2,687) 565 NM
Diluted earnings (loss) per share $(19.00) $3.77 NM
Adjusted EBITDA(2) (368) 2,134 NM
Adjusted net income (loss)(2) (1,242) 941 NM
Adjusted EPS(2) $(8.78) $6.15 NM
Free cash flow(2) (4,631) 1,607 NM
(1)All comparisons are against comparable period of 2019 unless otherwise noted.
(2)"Adjusted EBITDA" (Adjusted Earnings Before Interest, Taxes, Depreciation and Amortization), "Adjusted net income (loss)," "Adjusted EPS" and "Free
cash flow" are non-GAAP measures as defined by the Securities and Exchange Commission (the "SEC"). See "Definitions of Non-GAAP Measures" and
"Tabular Reconciliations for Non-GAAP Measures" on pages 12-19 herein for an explanation and reconciliations of non-GAAP measures used throughout this
release. Expedia Group does not calculate or report net income by segment.
Please refer to the "Glossary of Business Terms," located in the Quarterly Results section on Expedia Group’s investor relations website, for business
and financial statement definitions used throughout this release.
Discussion of Results
The results for Expedia Group, Inc. ("Expedia Group" or "the Company") include Brand Expedia®, Hotels.com®,
Expedia® Partner Solutions, Vrbo®, Egencia®, trivago®, HomeAway®, Orbitz®, Travelocity®, Hotwire®,
Wotif®, ebookers®, CheapTickets®, Expedia Group™ Media Solutions, CarRentals.com™, Expedia® Cruises™,
Classic Vacations®, Traveldoo® and VacationRentals.com. Results include the related international points of sale
for all brands and the immaterial impact of Bodybuilding.com since the Liberty Expedia Holdings, Inc. transaction
on July 26, 2019. In May 2020, Expedia Group completed the sale of Bodybuilding.com and, in October 2020, we
completed the sale of SilverRail™. All amounts shown are in U.S. dollars.

Page 3 of 20
Gross Bookings & Revenue
Revenue by Segment ($ millions)
Fourth Quarter Full Year
2020 2019 Δ% 2020 2019 Δ%
Retail $702 $1,961 (64)% $3,993 $8,808 (55)%
B2B 186 635 (71)% 942 2,579 (64)%
Corporate (Bodybuilding.com) — 34 NM 59 58 4%
Expedia Group (excluding trivago) $888 $2,630 (66)% $4,994 $11,445 (56)%
trivago 38 171 (78)% 280 938 (70)%
Intercompany eliminations (6) (54) (89)% (75) (316) (76)%
Total $920 $2,747 (67)% $5,199 $12,067 (57)%
For the fourth quarter of 2020, total gross bookings decreased 67%. Declines across our lodging, air and other travel
products were broadly in-line with the third quarter. Gross booking declines worsened in November with the onset
of a new wave of COVID-19 cases, before moderating slightly in December.
For the fourth quarter of 2020, total revenue decreased 67%. Fourth quarter results were negatively impacted by
approximately 500 basis points due to contra-revenue related to customer claims created during COVID in
connection with third-party insurance.
Product & Services Detail - Fourth Quarter 2020
As a percentage of total worldwide revenue in the fourth quarter of 2020, lodging accounted for 86%, advertising
and media accounted for 9%, air accounted for 4% and all other revenues accounted for the remaining 1%.
Lodging revenue decreased 58% in the fourth quarter of 2020 on a 61% decrease in room nights stayed, partly offset
by a 6% increase in revenue per room night. Revenue per room night benefited from an increase in the percentage
of room nights contributed by Vrbo, which has a higher revenue per room night than the rest of our lodging business
as well as transaction revenue related to Vrbo's transition to merchant of record.
Air revenue decreased 80% in the fourth quarter of 2020 reflecting a 69% decline in tickets sold and a 35% decline
in revenue per ticket. The decline in revenue per ticket was primarily related to a shift in product mix.
Advertising and media revenue decreased 66% in the fourth quarter of 2020 due to declines at trivago and Expedia
Group Media Solutions.
Other revenue was negatively impacted by contra-revenue related to customer claims created during COVID in
connection with third-party insurance, which largely offset other revenue earned in the quarter. Revenue in the
fourth quarter of 2019 related to Bodybuilding.com, which was disposed in the second quarter of 2020 also
impacted the year over year comparison.

Page 4 of 20
Costs and Expenses ($ millions)
Costs and Expenses As a % of Revenue
Fourth Quarter Fourth Quarter
2020 2019 Δ% 2020 2019 Δ (bps)
Generally Accepted Accounting Principles (GAAP)
Expenses - Expedia Group
Cost of revenue $ 287 $ 539 (47) % 31.1 % 19.6 % 1,153 Selling and marketing 511 1,268 (60) % 55.6 % 46.1 % 947 Technology and content 223 321 (31) % 24.3 % 11.7 % 1,256 General and administrative 124 216 (43) % 13.4 % 7.9 % 553
Total GAAP costs and expenses $ 1,145 $ 2,344 (51) % 124.4 % 85.3 % 3,909
Adjusted Expenses - Expedia Group
Cost of revenue* $ 284 $ 536 (47) % 30.8 % 19.5 % 1,127 Selling and marketing* 500 1,257 (60) % 54.4 % 45.7 % 868 Technology and content* 207 303 (32) % 22.6 % 11.1 % 1,151 General and administrative* 105 182 (42) % 11.4 % 6.6 % 475
Total adjusted costs and expenses $ 1,096 $ 2,278 (52) % 119.1 % 82.9 % 3,622
Adjusted Expenses - Expedia Group (excluding
trivago)**
Cost of revenue* $ 282 $ 533 (47) % 31.7 % 20.3 % 1,142 Selling and marketing* 486 1,193 (59) % 54.7 % 45.4 % 939 Technology and content* 194 289 (33) % 21.9 % 11.0 % 1,092 General and administrative* 99 174 (44) % 11.0 % 6.6 % 443
Total adjusted costs and expenses excluding trivago $ 1,061 $ 2,189 (52) % 119.4 % 83.2 % 3,616
*Adjusted expenses are non-GAAP measures. See pages 12-19 herein for a description and reconciliation to the corresponding GAAP measures.
**Expedia Group (excluding trivago) figures exclude both trivago costs and expenses and trivago revenue when calculating 'As a % of Revenue.'
Note: Some numbers may not add due to rounding.
Cost of Revenue
• For the fourth quarter of 2020, both GAAP and adjusted cost of revenue decreased 47%, compared to the
fourth quarter of 2019, primarily due to a decline in merchant fees resulting from lower transaction
volumes, decreased customer service and personnel costs, and lower cloud expenses, partly offset by higher
payment processing costs related to Vrbo's transition to merchant of record. In the fourth quarter of 2019,
both GAAP and adjusted cost of revenue included costs related to Bodybuilding.com, which was disposed
in the second quarter of 2020.
Selling and Marketing
• For the fourth quarter of 2020, both GAAP and adjusted total selling and marketing expense decreased
60%, compared to the fourth quarter of 2019, primarily due to a $650 million decrease in direct costs,
driven by a significant reduction in marketing spend related to the impact on travel demand from COVID-
19. Indirect costs, which represented 31% of total GAAP selling and marketing costs and 30% of total
adjusted selling and marketing expense in the fourth quarter of 2020 compared to 21% and 20% for total
GAAP and adjusted selling and marketing costs, in the fourth quarter of 2019, declined 40% and 42%,
respectively, on a GAAP and adjusted basis in the fourth quarter of 2020 due to lower personnel costs. As a
result of Expedia Group's decision in the fourth quarter of 2020 to shift from employee cash bonuses to
equity that will vest in 2021, the bonus expense that was previously accrued during the first three quarters

Page 5 of 20
of 2020 was reversed. As a result, the year over year decline in indirect costs benefited by approximately
6% and 7% on a GAAP and adjusted basis, respectively. The company expects to shift the vast majority of
the annual bonus program spend to salary beginning in the second quarter of 2021.
Technology and Content
• For the fourth quarter of 2020, total GAAP and adjusted technology and content expense decreased 31%
and 32%, respectively, compared to the fourth quarter of 2019, primarily reflecting lower personnel and
related costs. As a result of Expedia Group's change to employee compensation structure, the year over year
decline in technology and content expenses benefited by approximately 7% on both a GAAP and adjusted
basis.
General and Administrative
• For the fourth quarter of 2020, both total GAAP and adjusted general and administrative expense decreased
43% and 42%, respectively, compared to the prior year, mainly due to a decrease in personnel costs and
professional fees. As a result of Expedia Group's change to employee compensation structure, the year over
year decline in general and administrative expenses benefited by approximately 7% and 8% on a GAAP and
adjusted basis, respectively.
Costs and Expenses As a % of Revenue
Full Year Full Year
2020 2019 Δ% 2020 2019 Δ (bps)
Generally Accepted Accounting Principles (GAAP)
Expenses - Expedia Group
Cost of revenue $ 1,680 $ 2,077 (19) % 32.3 % 17.2 % 1,511 Selling and marketing 2,546 6,078 (58) % 49.0 % 50.4 % (139) Technology and content 1,010 1,226 (18) % 19.4 % 10.2 % 928 General and administrative 597 815 (27) % 11.5 % 6.8 % 472
Total GAAP costs and expenses $ 5,833 $ 10,196 (43) % 112.2 % 84.5 % 2,772
Adjusted Expenses - Expedia Group
Cost of revenue* $ 1,668 $ 2,065 (19) % 32.1 % 17.1 % 1,497 Selling and marketing* 2,498 6,033 (59) % 48.1 % 50.0 % (194) Technology and content* 941 1,152 (18) % 18.1 % 9.5 % 858 General and administrative* 521 705 (26) % 10.0 % 5.8 % 417
Total adjusted costs and expenses $ 5,628 $ 9,955 (43) % 108.3 % 82.5 % 2,577
Adjusted Expenses - Expedia Group (excluding
trivago)**
Cost of revenue* $ 1,655 $ 2,054 (19) % 33.1 % 17.9 % 1,519 Selling and marketing* 2,376 5,610 (58) % 47.6 % 49.0 % (143) Technology and content* 887 1,089 (18) % 17.8 % 9.5 % 827 General and administrative* 492 665 (26) % 9.8 % 5.8 % 402
Total adjusted costs and expenses excluding trivago $ 5,410 $ 9,418 (43) % 108.3 % 82.3 % 2,605
*Adjusted expenses are non-GAAP measures. See pages 12-19 herein for a description and reconciliation to the corresponding GAAP measures.
**Expedia Group (excluding trivago) figures exclude both trivago costs and expenses and trivago revenue when calculating 'As a % of Revenue.'
Note: Some numbers may not add due to rounding.

Page 6 of 20
Net Loss Attributable to Expedia Group and Adjusted EBITDA*
Adjusted EBITDA by Segment ($ millions)
Fourth Quarter Full Year
2020 2019 Δ% 2020 2019 Δ%
Retail $ 6 $ 502 (99)% $ 254 $ 2,121 (88)%
B2B (54) 96 NM (208) 447 NM
Unallocated overhead costs (108) (149) (27)% (400) (519) (23)%
Expedia Group (excluding trivago) $ (156) $ 449 NM $ (354) $ 2,049 NM
trivago(1) (4) 29 NM (14) 85 NM
Total Adjusted EBITDA $ (160) $ 478 NM $ (368) $ 2,134 NM
Net income (loss) attributable to Expedia Group common
stockholders(2)
$ (412)
$ 76
NM
$ (2,687)
$ 565
NM
(1) trivago is a separately listed company on the Nasdaq Global Select Market and, therefore, is subject to its own reporting and filing requirements which could
result in possible differences that are not expected to be material to Expedia Group. (2) Expedia Group does not calculate or report net income (loss) by segment.
* Adjusted EBITDA is a non-GAAP measure. See pages 12-19 herein for a description and reconciliation to the corresponding GAAP measure.
Note: Some numbers may not add due to rounding.
Depreciation and Amortization
Depreciation and amortization decreased 6% in the fourth quarter of 2020. A decrease in amortization, which
reflects the completion of amortization related to certain intangible assets as well as the impact of definite-lived
intangible impairments and lower datacenter depreciation, was partly offset by depreciation for our new
headquarters.
Restructuring and Related Reorganization Charges
In connection with the restructuring actions announced in late February 2020 to simplify our businesses and
improve operational efficiencies, as well as the acceleration of further actions to adapt our business to the current
environment, we recognized $25 million in restructuring and related reorganization charges in the fourth quarter of
2020. Restructuring and related reorganization charges were $8 million in the fourth quarter of 2019.
Interest and Other
Consolidated interest income decreased $12 million in the fourth quarter of 2020, compared to the fourth quarter of
2019. Consolidated interest expense increased $49 million in the fourth quarter of 2020, compared to the fourth
quarter of 2019, due to the $2 billion and $750 million senior unsecured notes issued in May 2020, the $500 million
and $750 million senior unsecured notes issued in July 2020, as well as balances borrowed under the revolving
credit facility.
Consolidated other, net was a gain of $68 million in the fourth quarter of 2020, compared to a loss of $1 million in
the fourth quarter of 2019. The gain in the fourth quarter of 2020 was primarily due to a mark-to-market gain on
minority equity investments.

Page 7 of 20
Income Taxes
The GAAP effective tax rate was 21% in the fourth quarter of 2020, compared to 35% in the fourth quarter of 2019.
The change in the effective tax rate was primarily due to measuring the foreign rate differential against a pretax loss,
as well as discrete items.
The effective tax rate on pretax adjusted net income was 19% in the fourth quarter of 2020 compared to 23% in the
fourth quarter of 2019. The change in the effective tax rate was primarily due to discrete items measured against a
pretax loss.
Preferred Stock Dividend
The preferred stock dividend related to the preferred equity issued in May of 2020 was $29 million in the fourth
quarter of 2020.
Balance Sheet, Cash Flows and Capitalization
For the three months ended December 31, 2020, consolidated net cash used in operating activities was $385 million
and consolidated free cash flow totaled negative $513 million. Consolidated free cash flow decreased $558 million
in the fourth quarter of 2020 compared to the prior year period. The fourth quarter of 2019 benefited from the
transition of Vrbo's merchant bookings to our payments platform.
Excluding Vrbo's merchant bookings from both periods, free cash flow was approximately negative $575 million in
the fourth quarter of 2020, an approximately $200 million decline from the prior year primarily due to the decline in
adjusted EBITDA, partly offset by lower working capital usage and a decline in capital expenditures.
Cash, cash equivalents and short-term investments totaled $3.4 billion at December 31, 2020 compared to $4.4
billion at September 30, 2020. The decline was due to the repayment of the remaining $650 million outstanding on
the revolving credit facility and negative free cash flow. Restricted cash and cash equivalents, which primarily
relates to traveler deposits for bookings made through Vrbo, was $772 million at December 31, 2020 compared to
$725 million at September 30, 2020. Prepaid expenses and other current assets was $653 million at December 31,
2020 compared to $685 million at September 30, 2020. Deferred merchant bookings totaled approximately $3.1
billion at December 31, 2020, compared to $3.25 billion at September 30, 2020, including approximately $770
million in deferred loyalty rewards for both periods.

Page 8 of 20
EXPEDIA GROUP, INC.
CONSOLIDATED STATEMENTS OF OPERATIONS
(In millions, except share and per share data)
(Unaudited)
Three months ended December 31,
Year ended December 31,
2020 2019 2020 2019
Revenue $ 920 $ 2,747 $ 5,199 $ 12,067 Costs and expenses:
Cost of revenue (exclusive of depreciation and amortization shown
separately below) (1) 287 539
1,680 2,077
Selling and marketing (1) 511 1,268 2,546 6,078 Technology and content (1) 223 321 1,010 1,226 General and administrative (1) 124 216 597 815 Depreciation and amortization 212 226 893 910 Impairment of goodwill — — 799 — Impairment of intangible assets 3 — 175 — Legal reserves, occupancy tax and other (2) 9 (13) 34 Restructuring and related reorganization charges 25 8 231 24
Operating income (loss) (463) 160 (2,719) 903 Other income (expense):
Interest income 2 14 18 59 Interest expense (102) (53) (360) (173) Other, net 68 (1) (90) (14)
Total other expense, net (32) (40) (432) (128) Income (loss) before income taxes (495) 120 (3,151) 775 Provision for income taxes 104 (42) 423 (203) Net income (loss) (391) 78 (2,728) 572 Net (income) loss attributable to non-controlling interests 8 (2) 116 (7) Net income (loss) attributable to Expedia Group, Inc. (383) 76 (2,612) 565 Preferred stock dividend (29) — (75) — Net income (loss) attributable to Expedia Group, Inc. common
stockholders $ (412) $ 76
$ (2,687) $ 565
Earnings (loss) per share attributable to Expedia Group, Inc.
available to common stockholders:
Basic $ (2.89) $ 0.52 $ (19.00) $ 3.84 Diluted (2.89) 0.52 (19.00) 3.77
Shares used in computing earnings (loss) per share (000's): Basic 142,446 144,647 141,414 147,194 Diluted 142,446 146,828 141,414 149,884
(1) Includes stock-based compensation as follows:
Cost of revenue $ 3 $ 3 $ 12 $ 12 Selling and marketing 11 11 48 45 Technology and content 16 18 69 74 General and administrative 19 34 76 110

Page 9 of 20
EXPEDIA GROUP, INC.
CONSOLIDATED BALANCE SHEETS
(In millions, except number of shares which are reflected in thousands and par value)
December 31, 2020 December 31, 2019 (unaudited)
ASSETS Current assets:
Cash and cash equivalents $ 3,363 $ 3,315 Restricted cash and cash equivalents 772 779 Short-term investments 24 526 Accounts receivable, net of allowance of $101 and $41 701 2,524 Income taxes receivable 120 70 Prepaid expenses and other current assets 654 521
Total current assets 5,634 7,735 Property and equipment, net 2,257 2,198 Operating lease right-of-use assets 574 611 Long-term investments and other assets 671 796 Deferred income taxes 659 145 Intangible assets, net 1,515 1,804 Goodwill 7,380 8,127 TOTAL ASSETS $ 18,690 $ 21,416
LIABILITIES AND STOCKHOLDERS’ EQUITY Current liabilities:
Accounts payable, merchant $ 602 $ 1,921 Accounts payable, other 496 906 Deferred merchant bookings 3,107 5,679 Deferred revenue 172 321 Income taxes payable 50 88 Accrued expenses and other current liabilities 979 1,050 Current maturities of long-term debt — 749
Total current liabilities 5,406 10,714 Long-term debt, excluding current maturities 8,216 4,189 Deferred income taxes 67 56 Operating lease liabilities 513 532 Other long-term liabilities 462 389 Commitments and contingencies
Series A Preferred Stock: $.001 par value, Authorized shares: 100,000; Shares issued and
outstanding: 1,200 and 0 1,022
—
Stockholders’ equity: Common stock: $.0001 par value; Authorized shares: 1,600,000 — —
Shares issued: 261,564 and 256,692; Shares outstanding: 138,074 and 137,076
Class B common stock: $.0001 par value; Authorized shares: 400,000 — — Shares issued: 12,800 and 12,800; Shares outstanding: 5,523 and 5,523
Additional paid-in capital 13,566 12,978 Treasury stock - Common stock and Class B, at cost; Shares 130,767 and 126,893 (10,097) (9,673) Retained earnings (deficit) (1,781) 879 Accumulated other comprehensive income (loss) (178) (217)
Total Expedia Group, Inc. stockholders’ equity 1,510 3,967 Non-redeemable non-controlling interests 1,494 1,569
Total stockholders’ equity 3,004 5,536 TOTAL LIABILITIES AND STOCKHOLDERS’ EQUITY $ 18,690 $ 21,416

Page 10 of 20
EXPEDIA GROUP, INC.
CONSOLIDATED STATEMENTS OF CASH FLOWS
(In millions)
(Unaudited)
Year ended December 31,
2020 2019
Operating activities:
Net income (loss) $ (2,728) $ 572 Adjustments to reconcile net income (loss) to net cash provided by operating activities: Depreciation of property and equipment, including internal-use software and website development 739 712 Amortization of stock-based compensation 205 241 Amortization and impairment of intangible assets 329 198 Impairment of goodwill 799 — Deferred income taxes (488) (91) Foreign exchange (gain) loss on cash, restricted cash and short-term investments, net 2 (5) Realized (gain) loss on foreign currency forwards (80) (22) (Gain) loss on minority equity investments, net 142 (8) Provision for credit losses and other, net 148 (21) Changes in operating assets and liabilities, net of effects from acquisitions:
Accounts receivable 1,781 (368) Prepaid expenses and other assets (188) (193) Accounts payable, merchant (1,320) 224 Accounts payable, other, accrued expenses and other liabilities (400) 254 Tax payable/receivable, net (57) (23) Deferred merchant bookings (2,576) 1,342 Deferred revenue (142) (45)
Net cash provided by (used in) operating activities (3,834) 2,767 Investing activities:
Capital expenditures, including internal-use software and website development (797) (1,160) Purchases of investments (685) (1,346) Sales and maturities of investments 1,161 852 Acquisitions, net of cash and restricted cash acquired — 80 Other, net 58 21
Net cash used in investing activities (263) (1,553) Financing activities:
Revolving credit facility borrowings 2,672 — Revolving credit facility repayments (2,672) — Proceeds from issuance of long-term debt, net of issuance costs 3,945 1,231 Net proceeds from issuance of preferred stock and warrants 1,132 — Payment of long-term debt (750) — Payment of Liberty Expedia Exchangeable Debentures — (400) Purchases of treasury stock (425) (743) Payment of dividends to common stockholders (48) (195) Payment of preferred stock dividends (75) — Proceeds from exercise of equity awards and employee stock purchase plan 319 301 Other, net (21) (19)
Net cash provided by financing activities 4,077 175 Effect of exchange rate changes on cash, cash equivalents and restricted cash and cash equivalents 61 3
Net increase in cash, cash equivalents and restricted cash and cash equivalents 41 1,392 Cash, cash equivalents and restricted cash and cash equivalents at beginning of year 4,097 2,705 Cash, cash equivalents and restricted cash and cash equivalents at end of year $ 4,138 $ 4,097
Supplemental cash flow information Cash paid for interest $ 313 $ 157 Income tax payments, net 108 304
Page 11 of 20
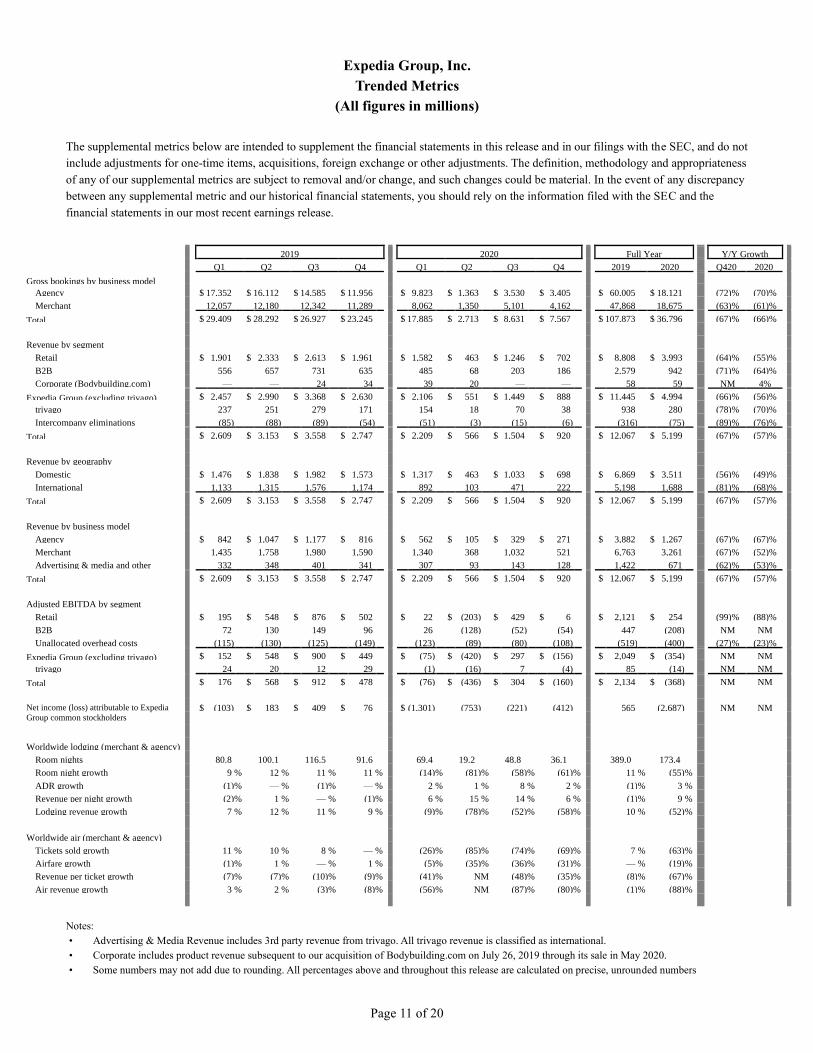
Expedia Group, Inc.
Trended Metrics
(All figures in millions)
The supplemental metrics below are intended to supplement the financial statements in this release and in our filings with the SEC, and do not
include adjustments for one-time items, acquisitions, foreign exchange or other adjustments. The definition, methodology and appropriateness
of any of our supplemental metrics are subject to removal and/or change, and such changes could be material. In the event of any discrepancy
between any supplemental metric and our historical financial statements, you should rely on the information filed with the SEC and the
financial statements in our most recent earnings release.
2019 2020 Full Year Y/Y Growth
Q1 Q2 Q3 Q4 Q1 Q2 Q3 Q4 2019 2020 Q420 2020
Gross bookings by business model Agency $ 17,352 $ 16,112 $ 14,585 $ 11,956 $ 9,823 $ 1,363 $ 3,530 $ 3,405 $ 60,005 $ 18,121 (72)% (70)% Merchant 12,057 12,180 12,342 11,289 8,062 1,350 5,101 4,162 47,868 18,675 (63)% (61)%
Total $ 29,409 $ 28,292 $ 26,927 $ 23,245 $ 17,885 $ 2,713 $ 8,631 $ 7,567 $ 107,873 $ 36,796 (67)% (66)%
Revenue by segment
Retail $ 1,901 $ 2,333 $ 2,613 $ 1,961 $ 1,582 $ 463 $ 1,246 $ 702 $ 8,808 $ 3,993 (64)% (55)% B2B 556 657 731 635 485 68 203 186 2,579 942 (71)% (64)% Corporate (Bodybuilding.com) — — 24 34 39 20 — — 58 59 NM 4%
Expedia Group (excluding trivago) $ 2,457 $ 2,990 $ 3,368 $ 2,630 $ 2,106 $ 551 $ 1,449 $ 888 $ 11,445 $ 4,994 (66)% (56)%
trivago 237 251 279 171 154 18 70 38 938 280 (78)% (70)% Intercompany eliminations (85) (88) (89) (54) (51) (3) (15) (6) (316) (75) (89)% (76)%
Total $ 2,609 $ 3,153 $ 3,558 $ 2,747 $ 2,209 $ 566 $ 1,504 $ 920 $ 12,067 $ 5,199 (67)% (57)%
Revenue by geography
Domestic $ 1,476 $ 1,838 $ 1,982 $ 1,573 $ 1,317 $ 463 $ 1,033 $ 698 $ 6,869 $ 3,511 (56)% (49)% International 1,133 1,315 1,576 1,174 892 103 471 222 5,198 1,688 (81)% (68)%
Total $ 2,609 $ 3,153 $ 3,558 $ 2,747 $ 2,209 $ 566 $ 1,504 $ 920 $ 12,067 $ 5,199 (67)% (57)%
Revenue by business model
Agency $ 842 $ 1,047 $ 1,177 $ 816 $ 562 $ 105 $ 329 $ 271 $ 3,882 $ 1,267 (67)% (67)% Merchant 1,435 1,758 1,980 1,590 1,340 368 1,032 521 6,763 3,261 (67)% (52)% Advertising & media and other 332 348 401 341 307 93 143 128 1,422 671 (62)% (53)%
Total $ 2,609 $ 3,153 $ 3,558 $ 2,747 $ 2,209 $ 566 $ 1,504 $ 920 $ 12,067 $ 5,199 (67)% (57)%
Adjusted EBITDA by segment
Retail $ 195 $ 548 $ 876 $ 502 $ 22 $ (203) $ 429 $ 6 $ 2,121 $ 254 (99)% (88)% B2B 72 130 149 96 26 (128) (52) (54) 447 (208) NM NM Unallocated overhead costs (115) (130) (125) (149) (123) (89) (80) (108) (519) (400) (27)% (23)%
Expedia Group (excluding trivago) $ 152 $ 548 $ 900 $ 449 $ (75) $ (420) $ 297 $ (156) $ 2,049 $ (354) NM NM
trivago 24 20 12 29 (1) (16) 7 (4) 85 (14) NM NM Total $ 176 $ 568 $ 912 $ 478 $ (76) $ (436) $ 304 $ (160) $ 2,134 $ (368)
NM NM Net income (loss) attributable to Expedia
Group common stockholders $ (103) $ 183 $ 409 $ 76 $ (1,301) (753) (221) (412) 565 (2,687) NM NM
Worldwide lodging (merchant & agency)
Room nights 80.8 100.1 116.5 91.6 69.4 19.2 48.8 36.1 389.0 173.4 Room night growth 9 % 12 % 11 % 11 % (14) % (81) % (58) % (61) % 11 % (55) % ADR growth (1) % — % (1) % — % 2 % 1 % 8 % 2 % (1) % 3 % Revenue per night growth (2) % 1 % — % (1) % 6 % 15 % 14 % 6 % (1) % 9 % Lodging revenue growth 7 % 12 % 11 % 9 % (9) % (78) % (52) % (58) % 10 % (52) %
Worldwide air (merchant & agency)
Tickets sold growth 11 % 10 % 8 % — % (26) % (85) % (74) % (69) % 7 % (63) % Airfare growth (1) % 1 % — % 1 % (5) % (35) % (36) % (31) % — % (19) % Revenue per ticket growth (7) % (7) % (10) % (9) % (41) % NM (48) % (35) % (8) % (67) % Air revenue growth 3 % 2 % (3) % (8) % (56) % NM (87) % (80) % (1) % (88) %
Notes:
• Advertising & Media Revenue includes 3rd party revenue from trivago. All trivago revenue is classified as international.
• Corporate includes product revenue subsequent to our acquisition of Bodybuilding.com on July 26, 2019 through its sale in May 2020.
• Some numbers may not add due to rounding. All percentages above and throughout this release are calculated on precise, unrounded numbers

Page 12 of 20
Notes & Definitions:
Gross Bookings: Gross bookings generally represent the total retail value of transactions booked, recorded at the
time of booking reflecting the total price due for travel by travelers, including taxes, fees and other charges, adjusted
for cancellations and refunds.
Retail: The Retail segment, which consists of the aggregation of operating segments, provides a full range of travel
and advertising services to our worldwide customers through a variety of consumer brands including: Expedia.com
and Hotels.com in the United States and localized Expedia and Hotels.com websites throughout the world, Vrbo,
Orbitz, Travelocity, Wotif Group, ebookers, CheapTickets, Hotwire.com, CarRentals.com, Cruises and Classic
Vacations.
B2B: The B2B segment is comprised of our Expedia Business Services organization including Expedia Partner
Solutions, which operates private label and co-branded programs to make travel services available to leisure
travelers though third-party company branded websites, and Egencia, a full-service travel management company
that provides travel services to businesses and their corporate customers.
trivago: The trivago segment generates advertising revenue primarily from sending referrals to online travel
companies and travel service providers from its localized hotel metasearch websites.
Corporate: Includes unallocated corporate expenses as well as Bodybuilding.com subsequent to our acquisition on
July 26, 2019 through its sale in May 2020.
Lodging metrics: Reported on a stayed basis and includes both merchant and agency model hotel and alternative
accommodation stays.
Room Nights: Room nights represent stayed hotel room nights and property nights for our Retail reportable segment
and stayed hotel room nights for our B2B reportable segment. Hotel room nights are reported on a stayed basis and
include both merchant and agency hotel stays. Property nights, which are related to our alternative accommodation
business, are reported upon the first day of stay and check-in to a property and represent the total number of nights
for which a property is rented.
Worldwide Air metrics: Reported on a booked basis and includes both merchant and agency air bookings.

Page 13 of 20
Definitions of Non-GAAP Measures
Expedia Group reports Adjusted EBITDA, Adjusted Net Income (Loss), Adjusted EPS, Free Cash Flow and
Adjusted Expenses (non-GAAP cost of revenue, non-GAAP selling and marketing, non-GAAP technology and
content and non-GAAP general and administrative), all of which are supplemental measures to GAAP and are
defined by the SEC as non-GAAP financial measures. These measures are among the primary metrics by which
management evaluates the performance of the business and on which internal budgets are based. Management
believes that investors should have access to the same set of tools that management uses to analyze our results.
These non-GAAP measures should be considered in addition to results prepared in accordance with GAAP, but
should not be considered a substitute for or superior to GAAP. Adjusted EBITDA, Adjusted Net Income (Loss) and
Adjusted EPS have certain limitations in that they do not take into account the impact of certain expenses to our
consolidated statements of operations. We endeavor to compensate for the limitation of the non-GAAP measures
presented by also providing the most directly comparable GAAP measures and descriptions of the reconciling items
and adjustments to derive the non-GAAP measures. Adjusted EBITDA, Adjusted Net Income (Loss) and Adjusted
EPS also exclude certain items related to transactional tax matters, which may ultimately be settled in cash. We urge
investors to review the detailed disclosure regarding these matters in the Management Discussion and Analysis and
Legal Proceedings sections, as well as the notes to the financial statements, included in the Company's annual and
quarterly reports filed with the Securities and Exchange Commission. The non-GAAP financial measures used by
the Company may be calculated differently from, and therefore may not be comparable to, similarly titled measures
used by other companies. The definition of Adjusted Earnings Before Interest, Taxes, Depreciation and
Amortization was revised in the fourth quarter of 2012 and in the first quarter of 2016 and the definition for
Adjusted Net Income (Loss) was revised in the fourth quarters of 2010, 2011, 2012 and 2017. The definition of
Adjusted Expenses was revised in the first quarter of 2014 and in the second quarter 2015.
Adjusted EBITDA is defined as net income (loss) attributable to Expedia Group adjusted for:
(1) net income (loss) attributable to non-controlling interests;
(2) provision for income taxes;
(3) total other expenses, net;
(4) stock-based compensation expense, including compensation expense related to certain subsidiary equity plans;
(5) acquisition-related impacts, including
(i) amortization of intangible assets and goodwill and intangible asset impairment,
(ii) gains (losses) recognized on changes in the value of contingent consideration arrangements; and
(iii) upfront consideration paid to settle employee compensation plans of the acquiree;
(6) certain other items, including restructuring;
(7) items included in legal reserves, occupancy tax and other, which includes reserves for potential settlement of
issues related to transactional taxes (e.g. hotel and excise taxes), related to court decisions and final settlements, and
charges incurred, if any, for monies that may be required to be paid in advance of litigation in certain transactional
tax proceedings;
(8) that portion of gains (losses) on revenue hedging activities that are included in other, net that relate to revenue
recognized in the period; and
(9) depreciation.
The above items are excluded from our Adjusted EBITDA measure because these items are non-cash in nature, or
because the amount and timing of these items is unpredictable, not driven by core operating results and renders
comparisons with prior periods and competitors less meaningful. We believe Adjusted EBITDA is a useful measure
for analysts and investors to evaluate our future on-going performance as this measure allows a more meaningful
comparison of our performance and projected cash earnings with our historical results from prior periods and to the
results of our competitors. Moreover, our management uses this measure internally to evaluate the performance of

Page 14 of 20
our business as a whole and our individual business segments. In addition, we believe that by excluding certain
items, such as stock-based compensation and acquisition-related impacts, Adjusted EBITDA corresponds more
closely to the cash operating income generated from our business and allows investors to gain an understanding of
the factors and trends affecting the ongoing cash earnings capabilities of our business, from which capital
investments are made and debt is serviced.
Adjusted Net Income (Loss) generally captures all items on the statements of operations that occur in normal course
operations and have been, or ultimately will be, settled in cash and is defined as net income (loss) attributable to
Expedia Group plus the following items, net of tax:
(1) stock-based compensation expense, including compensation expense related to equity plans of certain
subsidiaries and equity-method investments;
(2) acquisition-related impacts, including;
(i) amortization of intangible assets, including as part of equity-method investments, and goodwill and
intangible asset impairment;
(ii) gains (losses) recognized on changes in the value of contingent consideration arrangements;
(iii) upfront consideration paid to settle employee compensation plans of the acquiree; and
(iv) gains (losses) recognized on non-controlling investment basis adjustments when we acquire or lose
controlling interests;
(3) currency gains or losses on U.S. dollar denominated cash;
(4) Since adoption of new accounting guidance in the first quarter of 2018, the changes in fair value of equity
investments (other than those accounted for under the equity method and those that are consolidated);
(5) certain other items, including restructuring charges;
(6) items included in Legal reserves, occupancy tax and other, which includes reserves for potential settlement of
issues related to transactional taxes (e.g., hotel occupancy and excise taxes), related court decisions and final
settlements, and charges incurred, if any, for monies that may be required to be paid in advance of litigation in
certain transactional tax proceedings, including as part of equity method investments;
(7) discontinued operations;
(8) the non-controlling interest impact of the aforementioned adjustment items; and
(9) unrealized gains (losses) on revenue hedging activities that are included in other, net.
Adjusted Net Income (Loss) includes preferred share dividends. We believe Adjusted Net Income (Loss) is useful to
investors because it represents Expedia Group's combined results, taking into account depreciation, which
management believes is an ongoing cost of doing business, but excluding the impact of certain expenses and items
not directly tied to the core operations of our businesses.
Adjusted EPS is defined as Adjusted Net Income (Loss) divided by GAAP dilutive shares. We believe Adjusted EPS
is useful to investors because it represents, on a per share basis, Expedia Group's consolidated results, taking into
account depreciation, which we believe is an ongoing cost of doing business, as well as other items which are not
allocated to the operating businesses such as interest expense, taxes, foreign exchange gains or losses, and minority
interest, but excluding the effects of certain expenses not directly tied to the core operations of our businesses.
Adjusted Net Income (Loss) and Adjusted EPS have similar limitations as Adjusted EBITDA. In addition, Adjusted
Net Income (Loss) does not include all items that affect our net income (loss) and net income (loss) per share for the
period. Therefore, we think it is important to evaluate these measures along with our consolidated statements of
operations. Beginning with the second quarter of 2020, we prospectively began calculating Adjusted EPS using
GAAP dilutive shares determined under the treasury stock method instead of our prior non-GAAP adjusted shares
basis. This change does not have a material impact on period over period comparability.

Page 15 of 20
Free Cash Flow is defined as net cash flow provided by operating activities less capital expenditures. Management
believes Free Cash Flow is useful to investors because it represents the operating cash flow that our operating
businesses generate, less capital expenditures but before taking into account other cash movements that are not
directly tied to the core operations of our businesses, such as financing activities, foreign exchange or certain
investing activities. We added additional detail for the capital expenditures associated with building our new
headquarters facility in Seattle, Washington. We believe separating out capital expenditures for this discrete project
is important to provide additional transparency to investors related to operating versus project-related capital
expenditures. Free Cash Flow has certain limitations in that it does not represent the total increase or decrease in the
cash balance for the period, nor does it represent the residual cash flow for discretionary expenditures. Therefore, it
is important to evaluate Free Cash Flow along with the consolidated statements of cash flows.
Adjusted Expenses (cost of revenue, selling and marketing, technology and content and general and administrative
expenses) exclude stock-based compensation related to expenses for stock options, restricted stock units and other
equity compensation under applicable stock-based compensation accounting standards. Expedia Group excludes
stock-based compensation from these measures primarily because they are non-cash expenses that we do not believe
are necessarily reflective of our ongoing cash operating expenses and cash operating income. Moreover, because of
varying available valuation methodologies, subjective assumptions and the variety of award types that companies
can use when adopting applicable stock-based compensation accounting standards, management believes that
providing non-GAAP financial measures that exclude stock-based compensation allows investors to make
meaningful comparisons between our recurring core business operating results and those of other companies, as
well as providing management with an important tool for financial operational decision making and for evaluating
our own recurring core business operating results over different periods of time. There are certain limitations in
using financial measures that do not take into account stock-based compensation, including the fact that stock-based
compensation is a recurring expense and a valued part of employees' compensation. Therefore, it is important to
evaluate both our GAAP and non-GAAP measures. See the Notes to the Consolidated Statements of Operations for
stock-based compensation by line item.
Expedia Group, Inc. (excluding trivago) In order to provide increased transparency on the transaction-based
component of the business, Expedia Group is reporting results both in total and excluding trivago.
In addition, we evaluate certain operating and financial measures, including revenue growth, on both an as-reported
and excluding the impact of foreign exchange, FX neutral, basis. FX neutral results are among the primary metrics
by which management evaluates the performance of the business and management believes that investors should
have access to the same set of tools that management uses to analyze our results. We estimate FX neutral revenue
growth by (i) excluding the FX impacts resulting from the time period between a transaction's booking date and
revenue recognition date for both the current and prior year periods, and (ii) converting our current-year period
results for transactions recorded in currencies other than U.S. Dollars using the corresponding prior-year period
exchange rates rather than the current-year period exchange rates.

Page 16 of 20
Tabular Reconciliations for Non-GAAP Measures
Adjusted EBITDA (Adjusted Earnings Before Interest, Taxes, Depreciation & Amortization) by Segment(1)
Three months ended December 31, 2020
Retail
B2B
trivago
Corporate & Eliminations
Total
(In millions)
Operating income (loss) $ (135) $ (86) $ (6) $ (236) $ (463) Realized gain (loss) on revenue hedges 16 — — — 16 Restructuring and related reorganization charges — — — 25 25 Legal reserves, occupancy tax and other — — — (2) (2) Stock-based compensation — — — 49 49 Impairment of intangible assets — — — 3 3 Amortization of intangible assets — — — 32 32 Depreciation 125 32 2 21 180
Adjusted EBITDA(1) $ 6 $ (54) $ (4) $ (108) $ (160)
Three months ended December 31, 2019
Retail
B2B
trivago
Corporate & Eliminations
Total
(In millions)
Operating income (loss) $ 367 $ 64 $ 27 $ (298) $ 160 Realized gain (loss) on revenue hedges 6 3 — — 9 Restructuring and related reorganization charges — — — 8 8 Legal reserves, occupancy tax and other — — — 9 9 Stock-based compensation — — — 66 66 Amortization of intangible assets — — — 44 44 Depreciation 129 29 2 22 182
Adjusted EBITDA(1) $ 502 $ 96 $ 29 $ (149) $ 478
Year ended December 31, 2020
Retail
B2B
trivago
Corporate & Eliminations
Total
(In millions)
Operating income (loss) $ (329) $ (339) $ (26) $ (2,025) $ (2,719) Realized gain (loss) on revenue hedges 58 3 — — 61 Restructuring and related reorganization charges — — — 231 231 Legal reserves, occupancy tax and other — — — (13) (13) Stock-based compensation — — — 205 205 Impairment of goodwill — — — 799 799 Impairment of intangible assets — — — 175 175 Amortization of intangible assets — — — 154 154 Depreciation 525 128 12 74 739
Adjusted EBITDA(1) $ 254 $ (208) $ (14) $ (400) $ (368)

Page 17 of 20
Year ended December 31, 2019
Retail
B2B
trivago
Corporate & Eliminations
Total
(In millions)
Operating income (loss) $ 1,601 $ 323 $ 74 $ (1,095) $ 903 Realized gain (loss) on revenue hedges 8 14 — — 22 Restructuring and related reorganization charges — — — 24 24 Legal reserves, occupancy tax and other — — — 34 34 Stock-based compensation — — — 241 241 Amortization of intangible assets — — — 198 198 Depreciation 512 110 11 79 712
Adjusted EBITDA(1) $ 2,121 $ 447 $ 85 $ (519) $ 2,134
(1) Adjusted EBITDA for our Retail and B2B segments includes allocations of certain expenses, primarily cost of revenue and facilities, the total costs of our
global travel supply organizations, the majority of platform and marketplace technology costs, and the realized foreign currency gains or losses related to the
forward contracts hedging a component of our net merchant lodging revenue. We base the allocations primarily on transaction volumes and other usage
metrics. We do not allocate certain shared expenses such as accounting, human resources, certain information technology and legal to our reportable segments.
We include these expenses in Corporate and Eliminations. Our allocation methodology is periodically evaluated and may change.
Adjusted EBITDA (Adjusted Earnings Before Interest, Taxes, Depreciation & Amortization)
Three months ended December 31,
Year ended December 31,
2020 2019 2020 2019 (In millions)
Net income (loss) attributable to Expedia Group, Inc. $ (383) $ 76 $ (2,612) $ 565 Net income (loss) attributable to non-controlling interests (8) 2 (116) 7 Provision for income taxes (104) 42 (423) 203 Total other expense, net 32 40 432 128 Operating income (loss) (463) 160 (2,719) 903 Gain (loss) on revenue hedges related to revenue recognized 16 9 61 22 Restructuring and related reorganization charges 25 8 231 24 Legal reserves, occupancy tax and other (2) 9 (13) 34 Stock-based compensation 49 66 205 241 Depreciation and amortization 212 226 893 910 Impairment of goodwill — — 799 — Impairment of intangible assets 3 — 175 — Adjusted EBITDA $ (160) $ 478 $ (368) $ 2,134

Page 18 of 20
Adjusted Net Income (Loss) & Adjusted EPS
Three months ended December 31,
Year ended December 31,
2020 2019 2020 2019 (In millions, except share and per share data)
Net income (loss) attributable to Expedia Group, Inc. $ (383) $ 76 $ (2,612) $ 565 Less: Net (income) loss attributable to non-controlling interests 8 (2) 116 (7) Less: Provision for income taxes 104 (42) 423 (203) Income (loss) before income taxes (495) 120 (3,151) 775 Amortization of intangible assets 32 44 154 198 Stock-based compensation 49 66 205 241 Legal reserves, occupancy tax and other (2) 9 (13) 34 Restructuring and related reorganization charges 25 8 231 24 Impairment of goodwill — — 799 — Impairment of intangible assets 3 — 175 — Unrealized (gain) loss on revenue hedges 3 23 (8) 23 (Gain) loss on minority equity investments, net (60) (20) 142 (7) Loss on sale of business 12 — 13 — Release of a non-operating liability — — — (12) Adjusted income (loss) before income taxes (433) 250 (1,453) 1,276 GAAP Provision for income taxes 104 (42) 423 (203) Provision for income taxes for adjustments (23) (15) (144) (110) Total Adjusted provision for income taxes 81 (57) 279 (313) Total Adjusted income tax rate 18.5 % 22.9 % 19.2 % 24.5 % Non-controlling interests 5 (8) 7 (22) Preferred stock dividend (29) — (75) —
Adjusted net income (loss) attributable to Expedia Group, Inc. $ (376) $ 185 $ (1,242) $ 941 GAAP diluted weighted average shares outstanding (000's) 142,446 146,828 141,414 149,884 Additional dilutive securities (000's) — 3,207 — 3,224 Adjusted weighted average shares outstanding (000's) 142,446 150,035 141,414 153,108
Diluted earnings (loss) per share $ (2.89) $ 0.52 $ (19.00) $ 3.77 Adjusted earnings (loss) per share attributable to Expedia
Group, Inc. $ (2.64)
$ 1.24
$ (8.78)
$ 6.15
Ex-trivago Adjusted Net Income (Loss) and Adjusted EPS
Adjusted net income (loss) attributable to Expedia Group, Inc. $ (376) $ 185 $ (1,242) $ 941 Less: Adjusted net income (loss) attributable to trivago 5 11 (11) 27
Adjusted net income (loss) excluding trivago $ (381) $ 174 $ (1,231) $ 914
Adjusted earnings (loss) per share attributable to Expedia
Group, Inc. $ (2.64)
$ 1.24
$ (8.78)
$ 6.15
Less: Adjusted earnings (loss) per share attributable to trivago 0.04 0.07 (0.07) 0.18
Adjusted earnings (loss) per share excluding trivago $ (2.68) $ 1.16 $ (8.70) $ 5.97

Page 19 of 20
Free Cash Flow
Three months ended December 31,
Year ended December 31,
2020 2019 2020 2019 (In millions)
Net cash provided by (used in) operating activities $ (385) $ 341 $ (3,834) $ 2,767 Headquarters capital expenditures (27) (102) (171) (389) Non-headquarters capital expenditures (101) (194) (626) (771)
Less: Total capital expenditures (128) (296) (797) (1,160) Free cash flow $ (513) $ 45 $ (4,631) $ 1,607
Adjusted Expenses (cost of revenue, selling and marketing, technology and content and general and administrative expenses)
Three months ended December 31,
Year ended December 31,
2020 2019 2020 2019 (In millions)
Cost of revenue $ 287 $ 539 $ 1,680 $ 2,077 Less: stock-based compensation 3 3 12 12
Adjusted cost of revenue $ 284 $ 536 $ 1,668 $ 2,065 Less: trivago cost of revenue(1) 2 3 13 11
Adjusted cost of revenue excluding trivago $ 282 $ 533 $ 1,655 $ 2,054
Selling and marketing expense $ 511 $ 1,268 $ 2,546 $ 6,078 Less: stock-based compensation 11 11 48 45
Adjusted selling and marketing expense $ 500 $ 1,257 $ 2,498 $ 6,033 Less: trivago selling and marketing expense(1)(2) 14 64 122 423
Adjusted selling and marketing expense excluding trivago $ 486 $ 1,193 $ 2,376 $ 5,610
Technology and content expense $ 223 $ 321 $ 1,010 $ 1,226 Less: stock-based compensation 16 18 69 74
Adjusted technology and content expense $ 207 $ 303 $ 941 $ 1,152 Less: trivago technology and content expense(1) 13 14 54 63
Adjusted technology and content expense excluding trivago $ 194 $ 289 $ 887 $ 1,089
General and administrative expense $ 124 $ 216 $ 597 $ 815 Less: stock-based compensation 19 34 76 110
Adjusted general and administrative expense $ 105 $ 182 $ 521 $ 705 Less: trivago general and administrative expense(1) 6 8 29 40
Adjusted general and administrative expense excluding trivago $ 99 $ 174 $ 492 $ 665
Note: Some numbers may not add due to rounding. (1) trivago amount presented without stock-based compensation as those are included with the consolidated totals above.
(2) Selling and marketing expense adjusted to add back Retail spend on trivago eliminated in consolidation.

Page 20 of 20
Conference Call
Expedia Group, Inc. will webcast a conference call to discuss fourth quarter 2020 financial results and certain
forward-looking information on Thursday, February 11, 2021 at 1:30 p.m. Pacific Time (PT). The webcast will be
open to the public and available via ir.expediagroup.com. Expedia Group expects to maintain access to the webcast
on the IR website for approximately three months subsequent to the initial broadcast.
Safe Harbor Statement Under the Private Securities Litigation Reform Act of 1995
This release may contain “forward-looking statements” within the meaning of the Private Securities Litigation
Reform Act of 1995 that involve risks and uncertainties. These forward-looking statements are based on
assumptions that are inherently subject to uncertainties, risks and changes in circumstances that are difficult to
predict. The use of words such as “believe,” “estimate,” “expect” and “will,” or the negative of these terms or other
similar expressions, among others, generally identify forward-looking statements. However, these words are not the
exclusive means of identifying such statements. In addition, any statements that refer to expectations, projections or
other characterizations of future events or circumstances are forward-looking statements and may include
statements relating to future revenues, expenses, margins, profitability, net income (loss), earnings per share and
other measures of results of operations and the prospects for future growth of Expedia Group, Inc.’s business.
Actual results may differ materially from the results predicted and reported results should not be considered as an
indication of future performance. The potential risks and uncertainties that could cause actual results to differ from
the results predicted include, among others, those described in the “Risk Factors” and “Management’s Discussion
and Analysis of Financial Condition and Results of Operations” sections of our most recently filed periodic reports
on Form 10-K and Form 10-Q, and are described in Exhibit 99.1 to the Form 8-K filed with the SEC on April 23,
2020, and subsequent filings, which are available on our investor relations website at ir.expediagroup.com and on
the SEC website at www.sec.gov. All information provided in this release is as of December 31, 2020. Undue
reliance should not be placed on forward-looking statements in this release, which are based on information
available to us on the date hereof. We undertake no duty to update this information unless required by law.
About Expedia Group
Expedia Group is the world's travel platform, and our mission is to power global travel for everyone, everywhere.
We believe travel is a force for good. Travel is an essential human experience that strengthens connections,
broadens horizons and bridges divides. We leverage our platform and technology capabilities across an extensive
portfolio of businesses and brands to orchestrate the movement of people and the delivery of travel experiences on
both a local and global basis. Our family of travel brands includes: Brand Expedia®, Hotels.com®, Expedia®
Partner Solutions, Vrbo®, Egencia®, trivago®, HomeAway®, Orbitz®, Travelocity®, Hotwire®, Wotif®,
ebookers®, CheapTickets®, Expedia Group™ Media Solutions, CarRentals.com™, Expedia® Cruises™, Classic
Vacations®, Traveldoo® and VacationRentals.com.
© 2021 Expedia, Inc., an Expedia Group company. All rights reserved. Trademarks and logos are the property of
their respective owners. CST: 2029030-50
Contacts
Investor Relations Communications
Related Documents