DOCUMF N T F S lIMF ED 024 457 24 PS 001 323 By- Hjertholm, Else Werno Comparison of American and Norwegian Nursery School Children on Independence Behavior and Training. Chicago Univ., Ill. Committee on Human Development. Sporss Agency-Office of Education (DHEW), Washington, D.C. Bureau of Research. Repor t No- CRP-S-135 Bureau No- BR-5-8137 Pub Date Sep 68 Note- 95p. EDRS Price MF-$0.50 HC-$4.85 Descriptors-*American Culture, Comparative Analysis, *Cultural Differences, Cultural Traits, Individual Development, Mother Attitudes, *Norwegian, *Preschool Children, *Self Care Skills, Self Control, Student Teacher Relationship, Task Performance, Training Techniques Identifiers- Ammons Picture Vocabulary Test, Gesell Developmental Test, Harris Draw A Man Test To compare independence training and cultural expectations of independence training among American and Norwegian nursery school children, this study hypothesized that (1) cultural expectations of independence are 9reater for Norwegian children than American, (2) such expectations are greater for girls, (3) children's independent behavior and parental expectations are positively correlated, and that (4) Norwegian children would be more self-reliant. Mothers were given two questionnaires which assessed cultural expectations and child rearing practices in independence training. Thirty-four nursery school children of the upper-middle class' (Norwegian: nine boys and eight girls; American. 10 boys and seven girls) were involved in two simple tasks with the mother and investigator and two difficult tasks with the investigator. The data were analyzed by T-tests, analysis of variance, and intercorrelation programs. The results supported all hypotheses but one. American boys were found to be subiect to greater cultural expectations than were the girls. The conclusions suggested the differences might be due tu cultural pressure, not training. Data are tabulated and an extensive bibliography is appended. (JS)

Welcome message from author
This document is posted to help you gain knowledge. Please leave a comment to let me know what you think about it! Share it to your friends and learn new things together.
Transcript
DOCUMF N T F S lIMF
ED 024 457 24 PS 001 323
By- Hjertholm, Else WernoComparison of American and Norwegian Nursery School Children on Independence Behavior and Training.
Chicago Univ., Ill. Committee on Human Development.
Sporss Agency-Office of Education (DHEW), Washington, D.C. Bureau of Research.
Repor t No- CRP-S-135Bureau No- BR-5-8137Pub Date Sep 68Note- 95p.EDRS Price MF-$0.50 HC-$4.85Descriptors-*American Culture, Comparative Analysis, *Cultural Differences, Cultural Traits, Individual
Development, Mother Attitudes, *Norwegian, *Preschool Children, *Self Care Skills, Self Control, Student
Teacher Relationship, Task Performance, Training Techniques
Identifiers- Ammons Picture Vocabulary Test, Gesell Developmental Test, Harris Draw A Man Test
To compare independence training and cultural expectations of independence
training among American and Norwegian nursery school children, this study
hypothesized that (1) cultural expectations of independence are 9reater for
Norwegian children than American, (2) such expectations are greater for girls, (3)
children's independent behavior and parental expectations are positively correlated,
and that (4) Norwegian children would be more self-reliant. Mothers were given two
questionnaires which assessed cultural expectations and child rearing practices in
independence training. Thirty-four nursery school children of the upper-middle class'
(Norwegian: nine boys and eight girls; American. 10 boys and seven girls) were
involved in two simple tasks with the mother and investigator and two difficult tasks
with the investigator. The data were analyzed by T-tests, analysis of variance, and
intercorrelation programs. The results supported all hypotheses but one. American
boys were found to be subiect to greater cultural expectations than were the girls.
The conclusions suggested the differences might be due tu cultural pressure, not
training. Data are tabulated and an extensive bibliography is appended. (JS)
9
1
corzO
OT
I
PROCESSING CONTROL RECORD
for
MUST and MUST - EXPEDITE DOCUMENTS
ERIC FACILITY
Document Identification Number
Date Received from Cent:ral ERIC
Date Shipped to Clearinghouse
ERIC CLEIRINGHOUSE
Date Leceived
ClearAnghouse Accession Number
Date Shipped
ERIC FACILITY
Date Received
ED Accession Number
Date Shipped to EDRS
SII-S".e137NOV 1 1968
NOV 4 1968
..16ALarn 6e r
I/ tcto

U. g. DEPARTMENT OF HEALTH, EDUCATION & WELFAREOFFICE OF ErWTION
THIS Dir!1".^'!',`T :!" RFMVED FrOM THEPENON ' 7: OF VIEW OR OPINIONSSTATED rio NOT ND".E.',3,InLY L1 L1 OF[iCIAL OITICE. OF EDUCATIONPOSITION OR POLICY.
Title:
Investigator:
Institution:
Project Number:
Duration:
COMPARISON OF AMERICAN AND NORWEGIAN NURSERY
SCr.00L CHILDREN ON INDEPENDENCE BEHAVIOR AND
TRAINING
Else Wern0 Hjertholm
Committee on Human Development
The University of Chicago
S-135
June 1964 - September 1968

ACK.. NOW 1.......,..)a_._GEMENTS
The Small Contract Program, Cooperative Research
Branch of The Office of Education, U. S. Government gave the
financial support which made it possible to set up this
research project.
Many people have given time and help in this project:
Dr, George S. Carnett, The Cooperative Research Office
in Washington, has been wonderfully understanding and patient,
and I appreciate his concern and interest in my project.
Dr. Lawrence Kohlberg, The University of Chicago, has,
as my advisor, given advice and criticism for which I am very
grateful.
I owe particular thanks to Irene Andresen Scatliff,
who had the difficult and time-consuming job of rating the
tapes from the children's task-situations; to Valerie Klinge,
Department of Psychology, Yale University, and Gene Fox, Com-
mittee on Human Development, The University of Chicago, who
have given tremendous, invaluable help with the statistical
work; to Carolyn and Vernon Larsen who volunteered to edit
this report, and who also have given valuable suggestions and
help all along; to Marylou Lionells, who helped to rate the
categories in the Mothers' Questionnaires with Carolyn Larsen
and myself; and to Rosemary Dorney, who coded my scribbles
and typed up several drafts for this report.
To Nursery School teachers in New Haven, Connecticut,
and Bergen and Oslo, Norway, go my thanks for all their help
(i)
in finding and selecting subjects--Maren-Otte Biblis, Elsie
Bell Knudsen, and Nore Skar were the major forces and should
have extra credit.
My gratitude includes all the children and parents I
met, all of whom were willing to spend time for the purpose
of my study.
I appreciate the faculty and staff of the Committee on
Human Development of The University of Chicago, who encouraged
me to apply for the grant; without encouragement from wonder-
ful friends within and outside Human Development, this project
could not have been finished.
Without the help and training from Dr. Richard J.
Apell, O.D New Haven, I would not have been physically or
visually able to finish this work. Interest and concern from
family and friends in New Haven and Chicago have encouraged
and supported me greatly, through the past years. My partic-
ular gratitude goes to Mary and Hermann Weigand for all their
help and support, and to Alice Chandler, for her concern and
encouragement.
To every one goes my American-Norwegian:
A Thousand Thanks!

CHAPTER
I. A. PROBIEM. OBJECTIVES, HYPOTHESES
B. PREVIOUS RESEARCH 3
II. METHOD. SAMPLE, PROCEDURE 6
III. ANALYSIS AND FINDINGS OF DATA 17
IV. CONCLUSIONS AND IMPLICATIONS 34
V. DISCUSSION OF OBSERVATIONS
VI. SUMMARY OF FINDINGS AND DISCUSSION 51
,....r.=wwwwwwwwwwarmommaganmagammagfflwamMINNWMNINNNIIIIIIININIIIIIIIIMIIIIMIN,
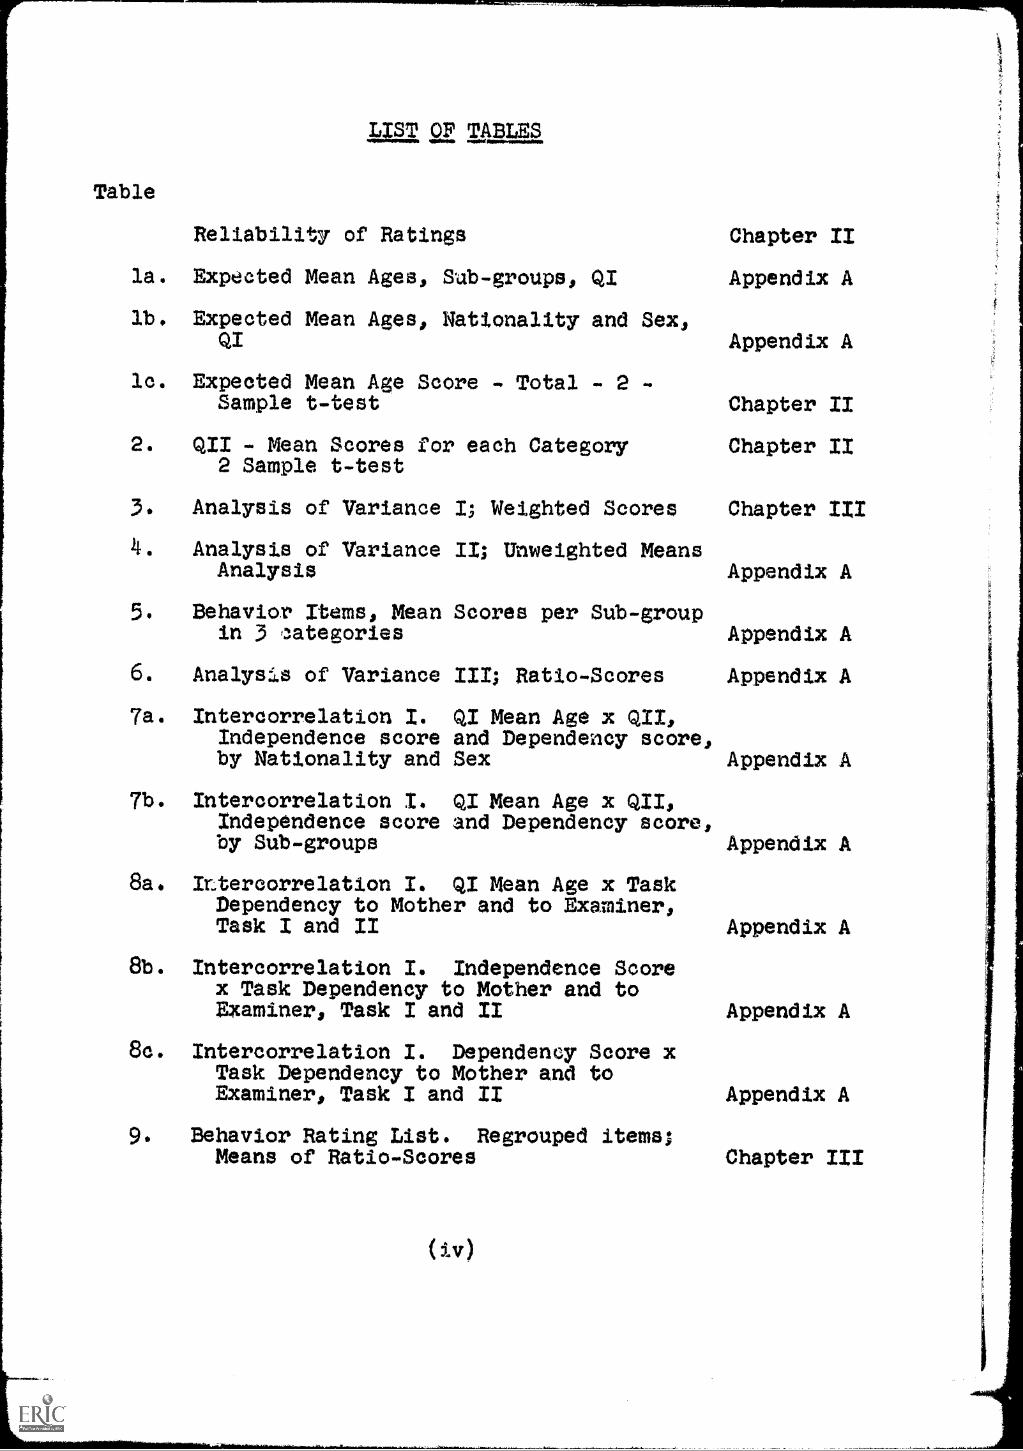
LIST OF TABLES
Table
Reliability of Ratings
la. Expected Mean Ages, Sub-groups, QI
lb. Expected Mean Ages, Nationality and Sex,
lc. Expected Mean Age Score - Total - 2 -
Sample t-test
2. QII - Mean Scores for each Category2 Sample t-test
3. Analysis of Variance I; Weighted Scores
4. Analysis of VarianceAnalysis
5. Behavior Items, Meanin 3 sntegories
II; Unweighted Means
Scores per Sub-group
6. Analys:Is of Variance III; Ratio-Scores
7a. Intercorrelation I. qI Mean Age xIndependence score and Dependency score,by Nationality and Sex Appendix A
7b. Intercorrelation I. QI Mean Age xIndependence score and Dependency score,by Sub-groups Appendix A
8a. ILtercorrelation I. QI Mean Age x TaskDependency to Mother and to Examiner,Task I and II
Chapter II
Appendix A
Appendix A
Chapter II
Chapter II
Chapter III
Appendix A
Appendix A
Appendix A
8b. Intercorrelation I. Independence Scorex Task Dependency to Mother and toExaminer, Task I and II
80. Interoorrelation I. Dependency Score xTask Dependency to Mother and toExaminer, Task I and II
9. Behavior Rating List. Regrouped items;Means of Ratio-Scores
Appendix A
Appendix A
Appendix A
Chapter III

Table
10.
11.
12.
13.
14.
Behavior Rating List.Scores. Individual
Intercorrelation II.Items No. 3, 4, 5,
Intercorrelation II.Items No. 1, 2, 7
Intercorrelation II. Task-Dependencyand Curiosity Items
Correlation-QI Mean Age Score, QIIIndependence Score and QII DependencyScore x Total T-D, Total Curiosity
6
Means of Ratio-and Sub-group
Ratio-Scores.
Ratio-Scores.
15. Correlation or Two Main Verbal Categories
16. Mean Time, in Minutes, per task
17. Ease and Tension. Behavior Rating Items
(v)
Appendix A
Chapter III
Appendix A
Appendix A
Chapter III
Chapter III
Appendix A
Appendix A
Chapter I
A, Problem
The degree of independence displayed by children is a
crucial factor in the teacher-pupil relationship and in the
teacher's management of the learning situation. National dif-
ferences in children's independence and independenee-training
are important factors in actual and ideal patterns of education.
Informal observation as a pre-school teacher in Norway
and America has suggested to me that there are quite important
national differences in indepenC-mce-training and in the re-
sulting dependency behavior of preschool children.
The present study is an effort to test these observa-
tions on national differences in a precise and controlled fash-
ion, and to analyze some of the factors which might cause them.
In the present study, independence is defined as the
tendency to perform tasks of varying difficulty without seeking
help (vee,ally or non-verbally) from a nearby adult.
The child's independence is hypothesized to be related
to the extent of mother's independence-training, defined as
training of the child to perform routine activities and tasks
by himself.
(1)
2
1. To compare Norwegian and American preschool children with
regard to dependency which they exhibit in task-situations
with a stranger and with their mothers.
2. To compare cultural differences in mothers' expectations
of independence and their report of independence-training
for their children.
3. To examine relations between maternal independence-training
and expectations and children's independence behavior in
the two national groups.
Hypotheses:
1. It was hypothesized that independence-training would be
practiced earlier by mothers of Norwegian children; that
these subjects would be expected to do things by themselves
at an earlier age than American children, and that they
would be given more opportunity to practice self-reliance
and decision-making.
2. In a task situation, the Norwegian children, being trained
earlier to independence, would be less help-seeking.
3. Parental independence-training or expectations and chil .
dren's independent behavior should be positively correlated
within each national group.
4, It was hypothesized that sex differences also would be re-
flected in the general cultural expectations of the chil-
dren's readiness for and capability of certain tasks at
certain ages--the girls being expected to be capable earlier

3
than boys; that the sex difference would also be expressed
in the mothers' childrearing practices.
B. Previous Research
The present study accepts Rosen and WAndrade's (1959)
distinction between achievement-training and independence-
training. Achievement training ("to do things well") is con-
sidered to be distinct from independence training ("to do
things by himself"). Accepting Rosen and D'Andrade's distinc-
tion, this investigator has included their concept of autonomy,
"freedom in decision-making," as one component of independence-
traininge
Our study also accepts Heathers' (1955) distinction be-
tween emotional and instrumental independence. Concentrating
upon the latter, Heathers defines instrumental independence as
"conducting activities and coping with problems without seeking
help." The extent to which a child persists in the task with-
out asking for help may be taken s a measure of his instrumen-
tal independence.
Whiting and Child (1953)0 in thir analysis of the
cross-cultural material, found that the period of independence-
training of American middle-class children began at age 2i
(while the median age in all societies was 3i)and lasted
longer, than training to independence in primitive societies.
Independence-training of American children was rated both as
mild and severe. It was severe with regard to expectations

4
that the child act on his own initiative independent of adult
surveillance, but mild in regard to expectations for responsi-
bility in taking on adult role in the household economy.
Leonore Baehm (1960) in a comparative study of develop-
ment of independence in American versus Swiss children, implic-
itly used cultural attitudes and norms regarding the differences
in social development. By Piagetian methods and interviews, she
found some support for her hypothesis that American children
were "emancipated" from parents at an earlier age than Swiss
children. Making a distinction between independence toward
adults and independence toward peers, Baehm found that Ameri-
can children showed more independence towards adults than Swiss
children of the the same age, but that they also were more de-
pendent upon peers than Swiss children were. Baehm's dis-
tinction between dependency upon adults and dependency upon
peers seems supported by the findings of Marshall and McCandless
(1957); that among nursery school children who had attended
nursery school for some time, there was a consistent negative
relationship between dependency scores and measures of peer
social acceptance. Rosen and DtAndrade (1959) have also found
Americans higher in independence.
With regard to relations between severity of parental
expectations and training toward independence and the actual
independence of the child, both theory and findings are complex.
McClelland (1953, 1961), finds a paradox--if parents
demand self-reliance, the child may become more dependent.
A study by Sears, Maccoby and Levin (1957) supports

5
this.-they found that punishment for dependency by4,the mother
made the child more dependent.
Most studies find that mother's warmth is not related
directly to the child's independence. gears, Macooby and
Levin (1957); Winterbottom (1953, 1958)j
Baumrind, in her study of "Child Training Antecedents
of Pre-School Behavior," finds, however, that "parental control
and nurturance should both be high, to produce self-sufficiency
in young children."
Chapter 11
Method
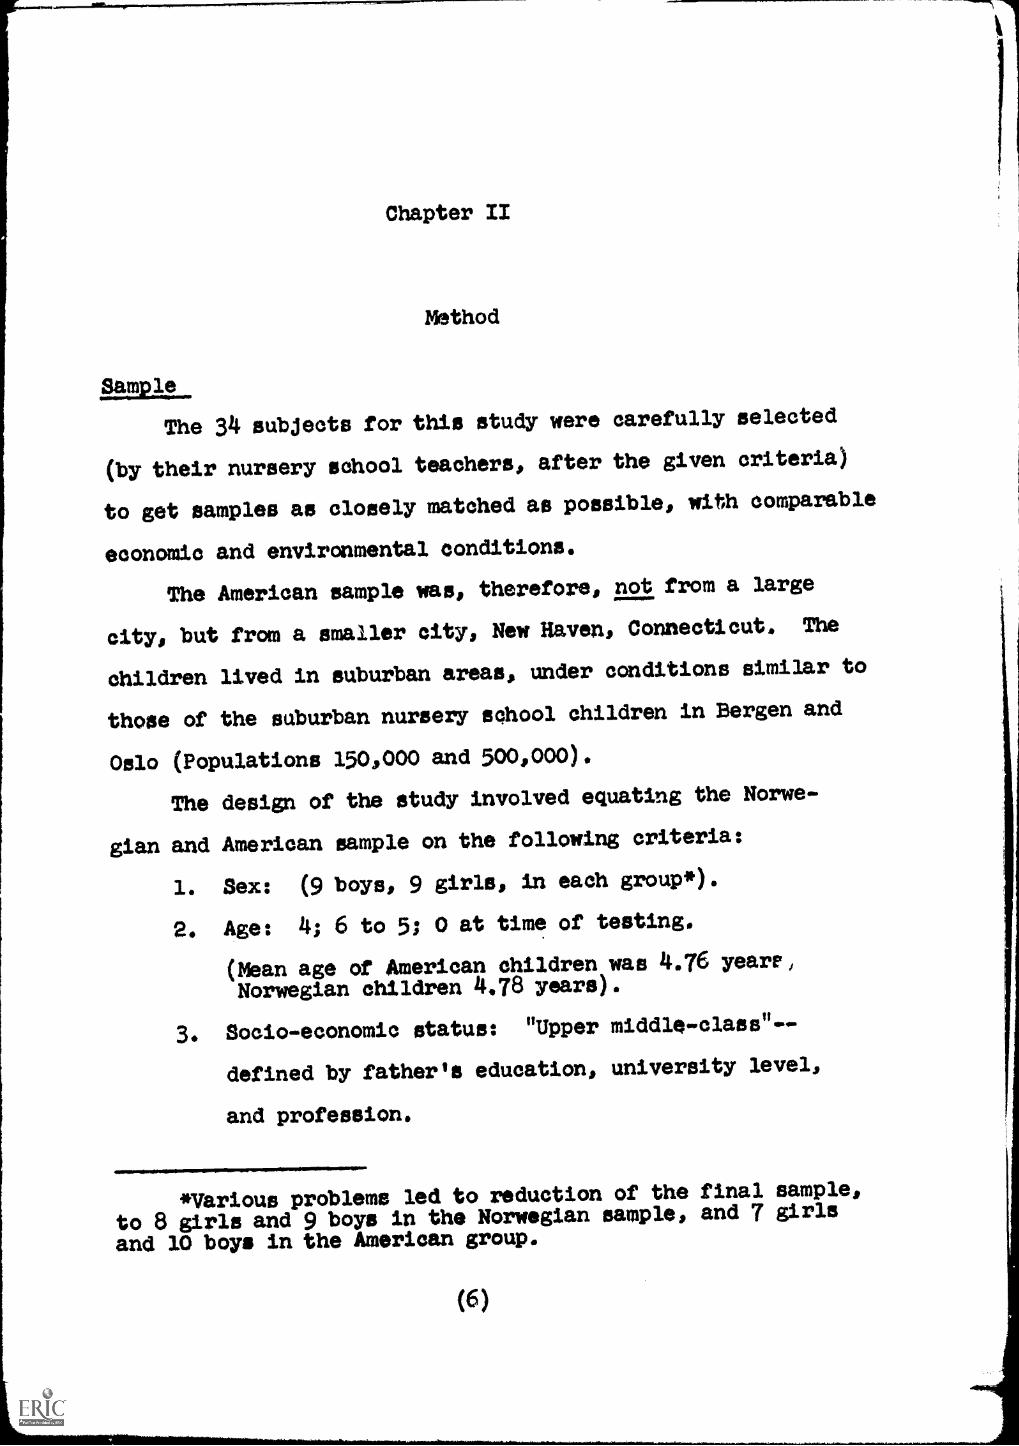
Sample.
The 34 subjects for this study were carefully selected
(by their nursery school teachers, after the given criteria)
to get samples as closely matched as possible, with comparable
economic and environmental conditions.
The American sample was, therefore, not from a large
city, but from a smaller city, New Haven, Connecticut, The
children lived in suburban areas, under conditions similar to
those of the suburban nursery school children in Bergen and
Oslo (Populations 150,000 and 500,000).
The design of the study involved equating the Norwe-
gian and American sample on the following criteria:
1. Sex: (9 boys, 9 girls, in each group*).
2. Age: 4; 6 to 5; 0 at time of testing.
(Mean age of American children was 4.76 yearr,
Norwegian children 4.78 years).
3. Socio-economic status: "Upper middle-class"--
defined by father's education, university level,
and profession.
MINIMIMINNIIMIIII11111111111111.1111111010
*Various problems led to reduction of the final sample,
to 8 girls and 9 boys in the Norwegian sample, and 7 girls
and 10 boys in the American group.
(6)
7 1
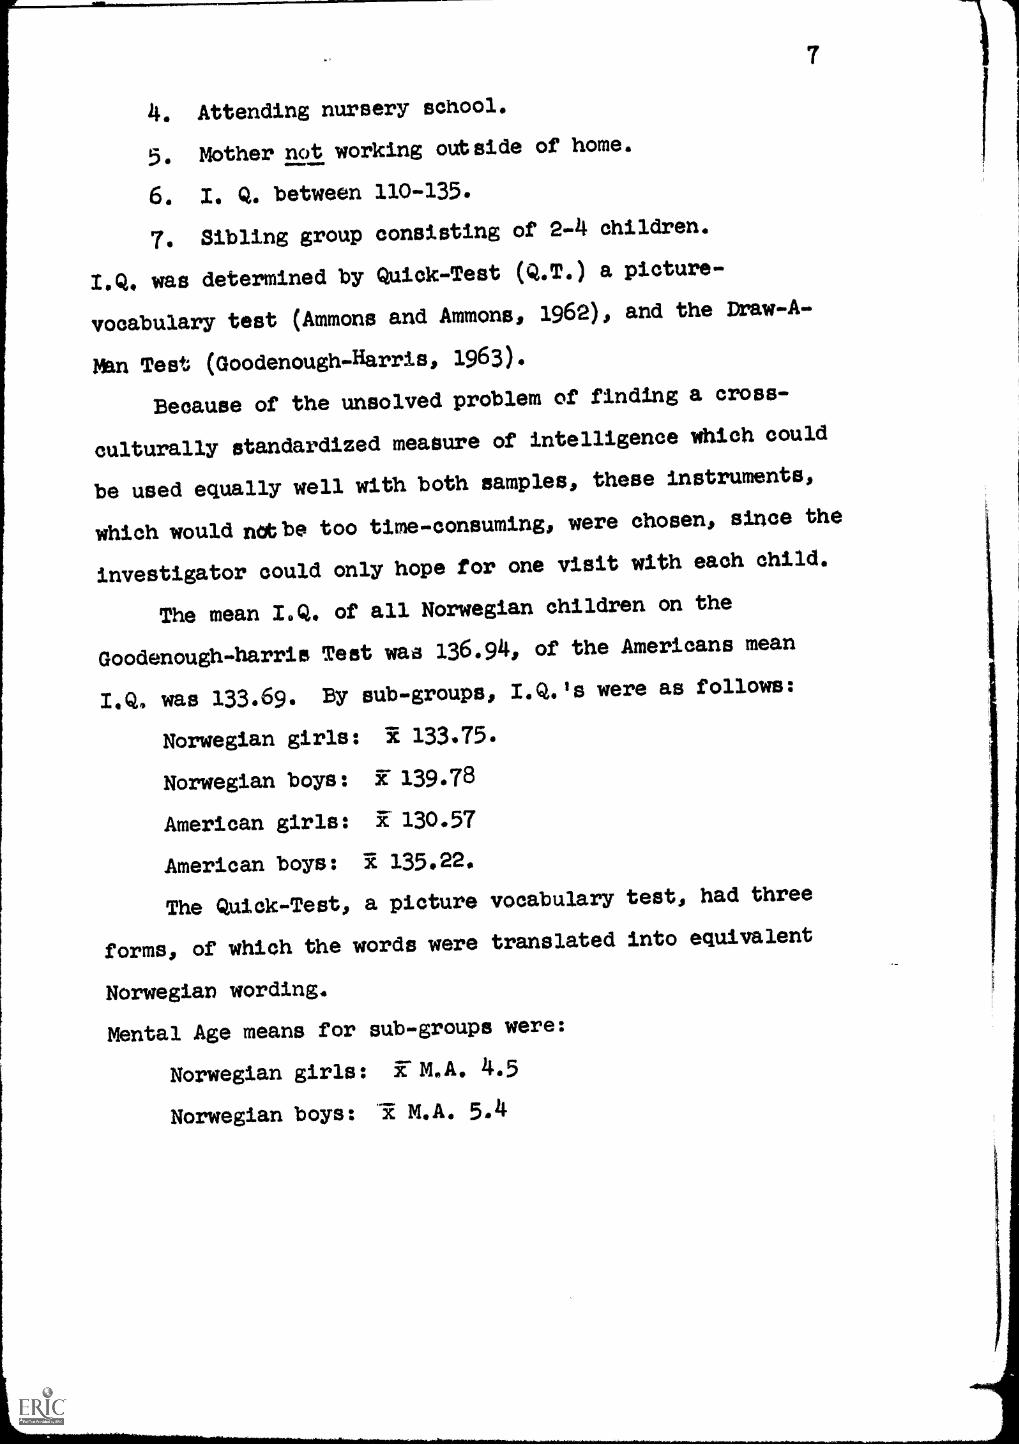
5. Mother not working outside of home.I
4. Attending nursery school.
6. I. Q. between 110-135.
7. Sibling group consisting of 2-4 children.
I.Q. was determined by Quick-Test (Q.T.) a picture-
vocabulary test (Ammons and Ammons, 1962), and the traw-A-
M4n Test (Goodenough.Harris, 1963).
Because of the unsolved problem of finding a cross-
culturally standardized measure of intelligence which could
be used equally well with both samples, these instruments,
which would notbe too time-consuming, were chosen, since the
investigator could only hope for one visit with each child.
The mean 1.Q. of all Norwegian children on the
Goodenough-harris Test waa 136.94, of the Americans mean
1.Q. was 133.69. By sub-groups, I.Q.'s were as follows:
Norwegian girls: Tc 133.75.
Norwegian boys: 27 139.78
American girls: 3E130.57
American boys: R 135.22.
The Quick-Test, a picture vocabulary test, had three
forms, of which the words were translated into equivalent
Norwegian wording.
Mental Age means for sub-groups were:
Norwegian girls: i M.A. 4.5
Norwegian boys: ]iE M.A. 5.4

8
*American girls: lrpLA. 4,25
American boys: i M.A. 4.3
(See also Appendix Bo Discussion on I.Q. Measurements.)
Procedure
Questionnaires
Two questionnaires were administered to the mother of
each child:
1. Questionnaire I . to assess culturally expected stan-
dards for independence-training.
2. Questionnaire II - to assess the mother's dhild-
rearing practices with this particular child at the
present time,
1. The first questionnaire presented 26 tasks which a
young child at present age is, or soon will be, confronted with
(See Table I A, Appendix A.) It was headed with the question:
"At what sge do you expect a child (any child) to be able to
and the mothers were supposed to put down a given
age as answer to each task or situation. This questionnaire
was based on Winterbottom's (1953), but was modified, because
the children in the present study were 3.3i years younger than
Winterbottom's sample and because the questions had to be
equally fit for and applicable to the American and the
Norwegian sample.
2. The second questionnaire presented to the mothers
*Mean of 6 S's scores, One S had only 2 forms completed.

9
included 23 different situations or tasks, similar to the ones
listed in Questionnaire I. In Questionnaire II, however, each
situation was given three different "outcomes"; suggested so
lutions in the situation (See Appendix W.
These outcomes were the following:
a. One solution was a possibility for the child to act
independently in the situation or task.
b. One outcome was structured in such a manner that the
child was passive, or dependent upon the mother in the
given situation.
c. The third solution was, in most casea a "neutral"
situation, or a motherchild interaction.
Each mother was presented this questionnaire with the
words: "I know all mothers have to choose any of these solu-
tions, at times. Please check the one solution which you use
most, or most often."
The items in both questionnaires were chosen in advance,
to cover seven categories which were supposed to cover most
areas in the preschool child's daily liia and experience:
1. Physical careincludtng feeding, dressing, toileting.
2. Play, indoors and outdoors.
3* Responsibility and care for own property.
4. Samll jobs or duties, responsibility and care for
family property.
5. Care and responsibility for sibling.
6. Achievemente.g., encouragement to do -that older
siblings can do.

10
7. Autonomy--a certain freedom in decision-making.
Later, an eighth category was inoluded, "general care-taking,"
as some questions indicated differentiation of eare-taking by
mother and by other persons.
Two American graduate students were asked to sort the
items into the different categories, after a general discus-
sion in which the raters had agreed to add category eight,
"general care-taking."
Agreement on categorizations was 69 per cent for
Questionnaire I and 87 per cent for Questionnaire II. The
three raters (including the investigator) then sorted the items
on the two questionnaires into eight categories and also rated
the three outcomes of each of the 23 questions or tasks in
Questionnaire II into three subgroups:
I. Independence
IL Dependency
III. Neutral, or mother-child interaction.
Per cent agreement on categorizing outcomes was 93 per cent.
Task situations
Each child was visited once, and was seen In his own
home. The visit was pre-arranged with the mother, who was
prnrcic and Introduced the examiner.
The following experimental situations were used to
eliclt dependence behavior from the children:
1. Stringing of small beads on shoelace. (Involving child,
mother and investigator.)
11
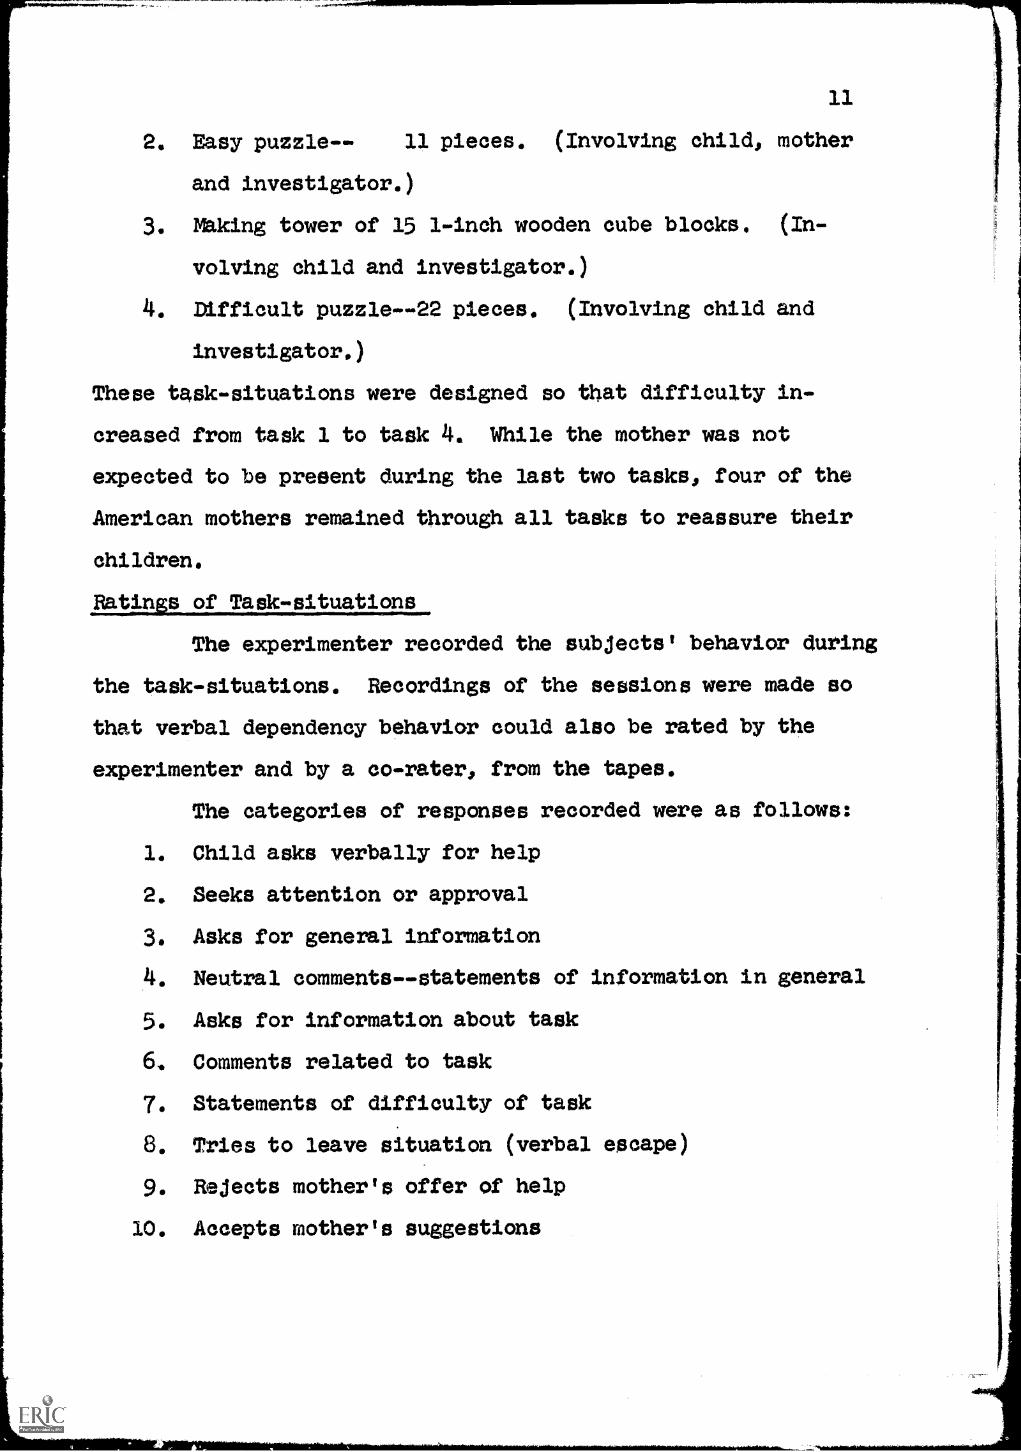
2, Easy puzzle-- 11 pieces. (Involving child, mother
and investigator.)
Making tower of 15 1-inch wooden cube blocks. (In-
volving child and investigator.)
4. Difficult puzz1e--22 pieces. (Involving child and
investigator.)
These task-situations were designed so that difficulty in-
creased from task 1 to task 4. While the mother was not
expected to be present during the last two tasks, four of the
American mothers remained through all tasks to reassure their
children.
Ratin s of Task-situations
The experimenter recorded the subjects' behavior during
the task-situations. Recordings of the sessions were made so
that verbal dependency behavior could also be rated by the
experimenter and by a co-rater, from the tapes.
The categories of responses recorded were as follows:
1. Child asks verbally for help
2. Seeks attention or approval
3. Asks for general information
4. Neutral commentsstatements of information in general
5. Asks for information about task
6, Comments related to task
7. Statements of difficulty of task
8. Tries to leave situation (verbal escape)
9. Rejects mother's offer of help
10. Accepts mother's suggestions
12
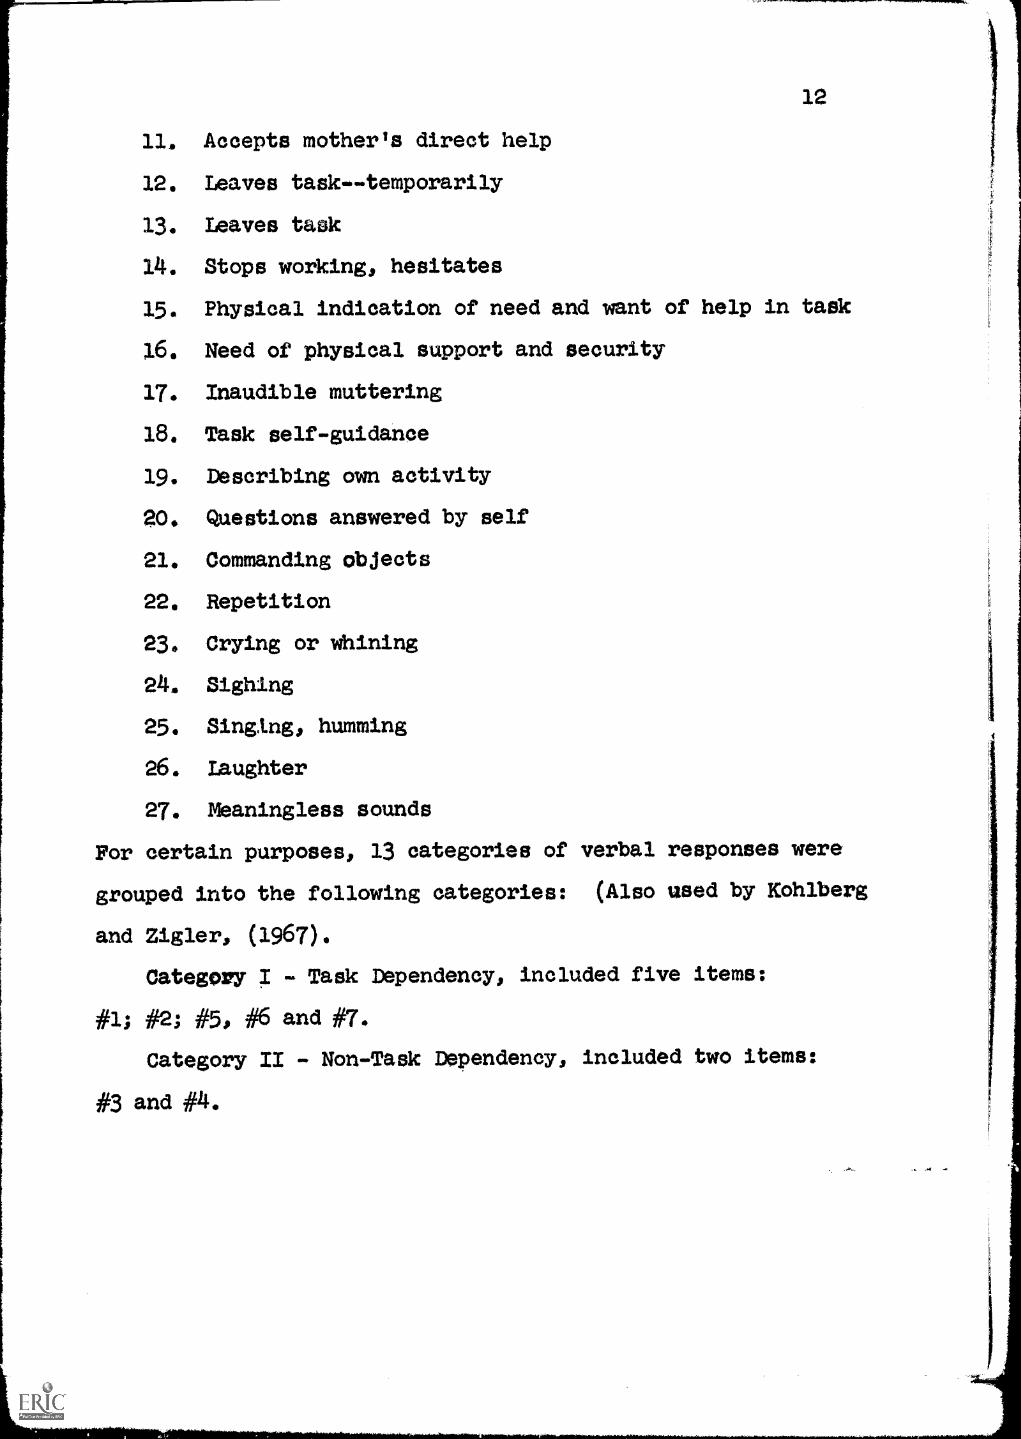
11. Accepts mother's direct help
12. Leaves task--temporarily
13. Leaves task
14. Stops working, hesitates
15. Physical indication of need and want of help in task
16. Need of physical support and security
17. Inaudible muttering
18. Task self-guidance
19. Describing own activity
20* Questions answered by self
21. Commanding objects
22. Repetition
23* Crying or Whining
24, Sighing
25. Singing, humming
26. Laughter
27. Meaningless sounds
For certain purposes, 13 categories of verbal responses were
grouped into the following categories: (Also used by Kohlberg
and Zigler, (1967).
Category I - Task Dependency, included five items:
#1; #2; #5, #6 and #7.
Category II - Non-Task Dependency, included two items:
h5 and #4.
13
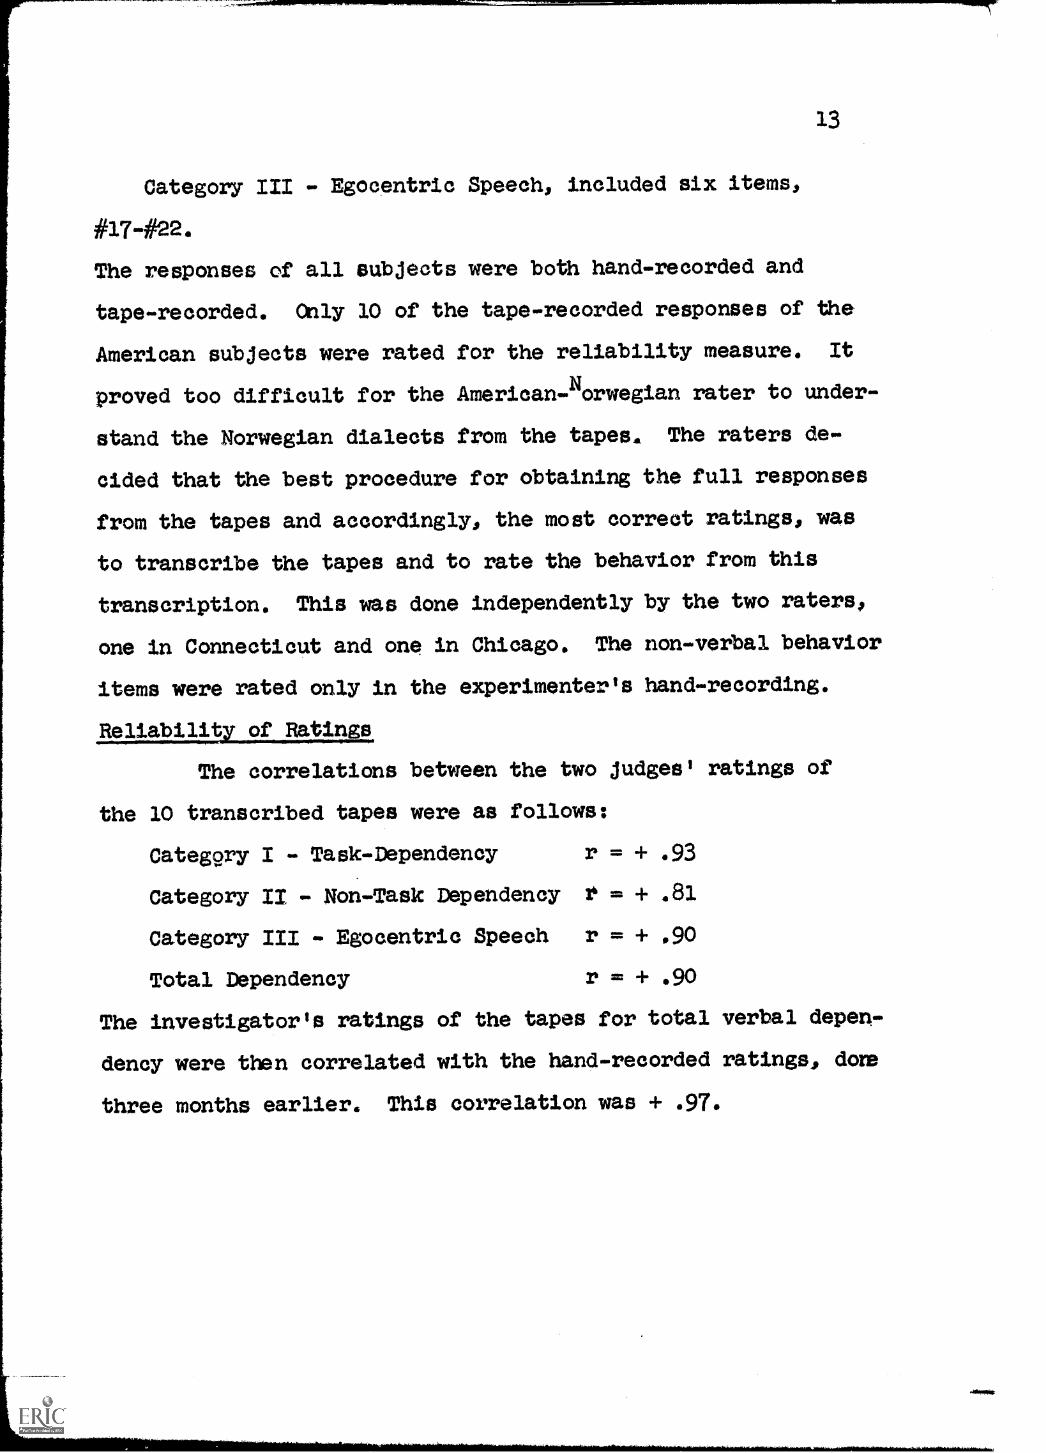
Category III - Egocentric Speech, included six items,
#17-#22.
The responses of all subjects were both hand-recorded and
tape-recorded. Only 10 of the tape-recorded responses of the
American subjects were rated for the reliability measure. It
proved too difficult for the American-Norwegian rater to under-
stand the Norwegian dialects from the tapes. The raters de-
cided that the best procedure for obtaining the full responses
from the tapes and accordingly, the most correct ratings, was
to transcribe the tapes and to rate the behavior from this
transcription. This was done independently by the two raters,
one in Connecticut and one in Chicago. The non-verbal behavior
items were rated only in the experimenter's hand-recording.
The correlations between the two judges' ratings of
the 10 transcribed tapes were as follows:
Categ9ry I - Task-Dependency r = + .93
category 11 - Non-Task Dependency r = + .81
Category III - Egocentric Speech r = +
Total Dependency r = + .90
The investigator's ratings of the tapes for total verbal depen-
dency were then correlated with the hand-recorded ratings, dore
three months earlier. This correlation was + .97.
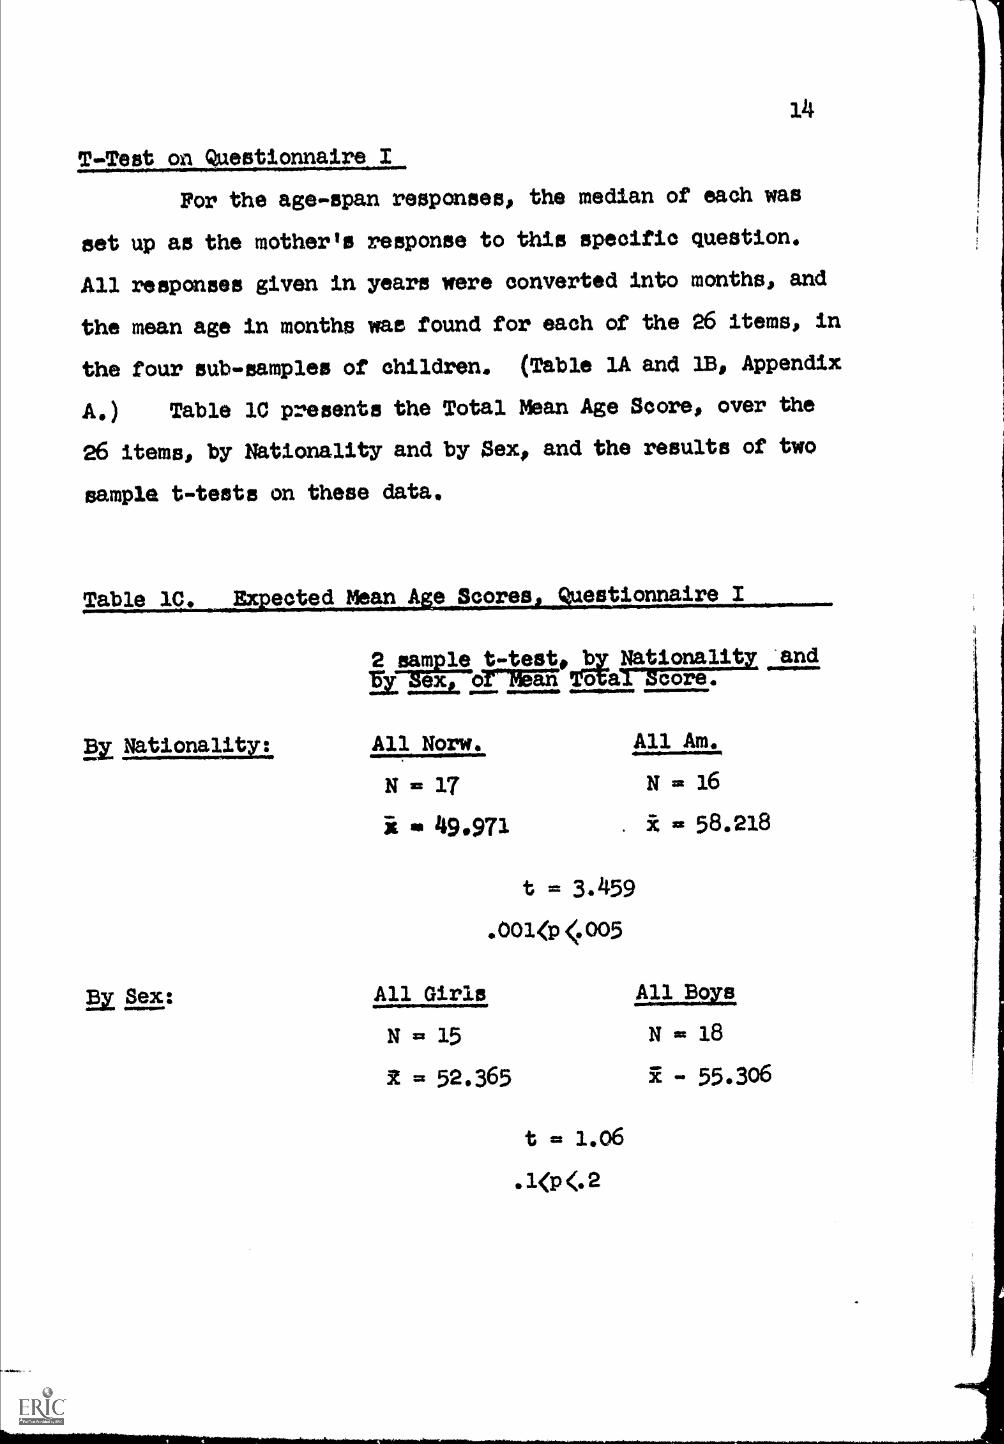
T-Test on Questionnaire
For the age-span responses, the median of each was
set up as the mother's response to this specific question.
All responses given in years were converted into months, and
the mean age in months was found for sach of the 26 items, in
the four sub-samples of children, (Table lA and 1B, Appendix
AO Table 10 presents the Total Mean Age Score, over the
26 items, by Nationality and by Sex, and the results of two
sample t-tests on these data,
Table 10, eeted Me e Scores estionnaire
1.32y National:1W.
Etz Sex:
2 Elam le t-test, 1,by Nationalitz andEt, ex, oeMean T5Val Score,
All Norw,
N = 17
= 49.971
All Am,
N = 16
. x 58,218
t = 3.459
.0010005
All Girls hp Boys
N = 15 N = 18
2 = 52,365 2 - 55.306
t = 1,06

15
Table lA presents the four subgroups' Expected Mean
Ages for the 26 items and for the sum of the items, together
with significance levels found by t-tests for nationality
differences. (Table lA and Bs Appendix A.)
The Norwegian girls had 21 of the 26 lowest means.
All Norwegians had 23 lowest means versus all Americans with
3 lowest means
hasivaLyslayangian Children
Two sample t- tests were done on most of the 26 items, on
American versus Norwegian childrenand Girls versus Boys--
to test for significant differences both in cultural expecta-
tions and sex diffemnees. In some cases the group means were
so similar that testing would not yield any results.
Cn. nine out of 26 items, significant probability levels
ranging from .05 to .001 were found, Eight of these mean dif-
ferences showed that Norwegian children were expected to dhow
independence on tasks considerably earlier, in these situations.
16
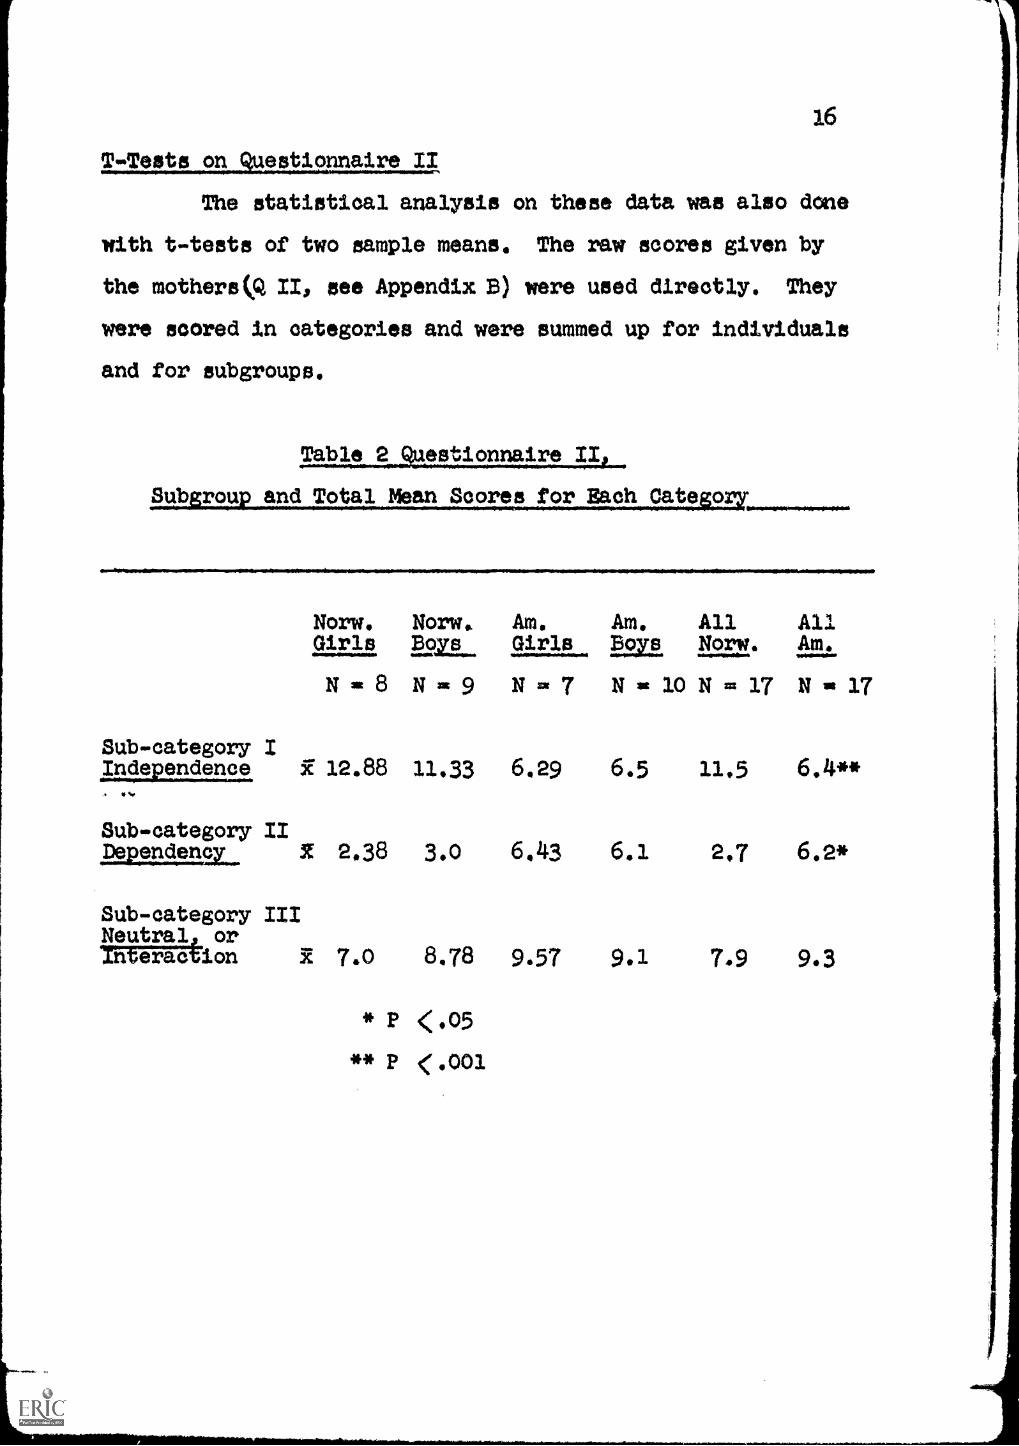
TASTIg.9.1.2.111211naire II
The statistical analysis on these data was also done
with t-tests of two sample means. The raw scores given by
the mothers(R II, see Appendix B) were used directly. They
were scored in categories and were summed up for individuals
and for subgroups.
Sub rou1.411_? 2.9ateikEalre 42.
and Total Mean Scores for Bach Cate
Nom. Norw. Am. Am.Girls Ems... Girls Boys
N 3. 8 N at 9 N 7 N sit 10
Sub-category IIncieztr.....idence SE 12.88 11.33 6.29
Sub-category I/
JAMISSE. I 2.38 3.0
Sub-category IIINeutral orn erac ion R 7.0
6.5
6.4A 6.1
8.78 9.57 9.1
* P <.05** P (.001
All
MEE.
N = 17
11.5
2,7
7.9
All
Ani.
N 17
6.4**
6.2*
9.3

CHAPTER III
ANALYSIS AND FINIZNGS GP DATA
Seven analyses were performed on the data. They are:
1. An analysis of variance with weighted dependenoy scores
from task-situation measures
2. An analysis of variance with unweighted dependency scores
from task-situation measures
3. An analysis of variance with unweighted ratio-scores from
task situation measures
4. T-test on Questionnaire I
5. T-test on Questionnaire II
6. Inter-correlation program with 68 variables utilizing
combined data from task-situations (1-4), Q I (. .
Mean Age scores), Q II (Mean Independence scores
and Mean Dependency scores)
7. Inter-correlation program with 18 variables utilizing
combined ratio-soores from task-situations, (1-4) Q I
(Mean Age scores) Q II (Mean )ndependence scores and
Mean Dependency scores)
Analysis of Variance with Weighted Dependency Scores (Analysis I)
An analysis of variance was first performed with weighted
dependency scores. (This was done by Gene Fox, graduate student
at The University of Chicago, 1965. Computer program Anova was
(17)
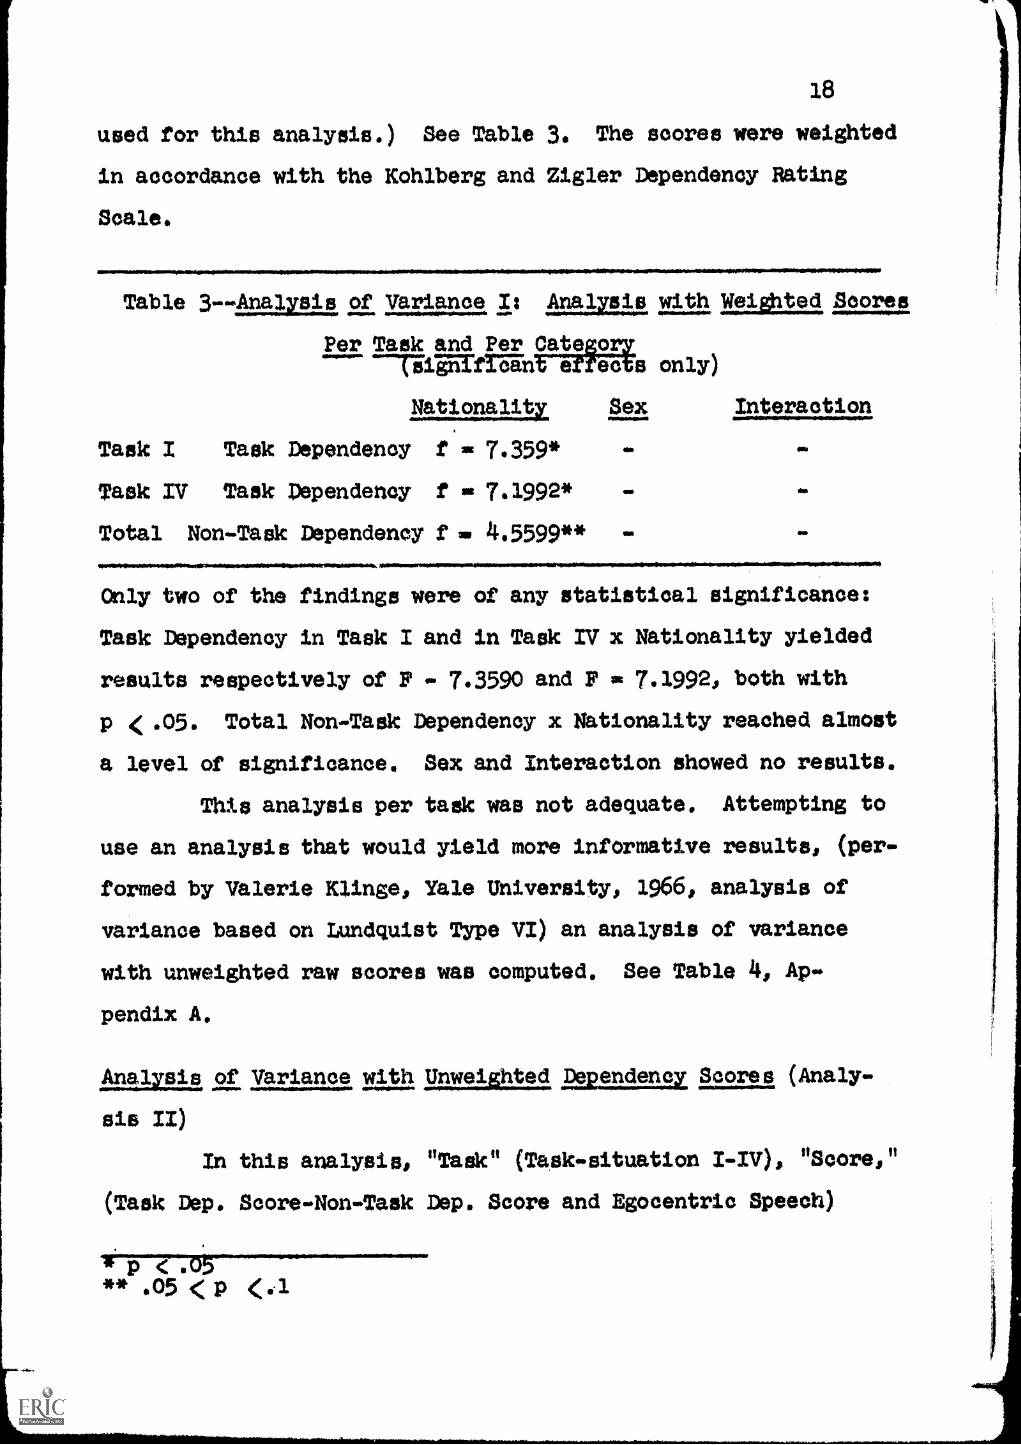
18
used for this analysis.) See Table 3. The scores were weighted
In accordance with the Kohlberg and Zigler Dependency Rating
Scale.
Table 3--Ana1ysis of Variance I: Analysis with WeiOlted Scores
Per Task and Per Categoryiifant e ect s only)
MILISSUEE Sex Interaction
Task / Task Dependency ta 7.359*
Task IV Task Dependency f 7.1992*
Total Non-Task Dependency f 4.5599**
4111
MMUMMIMIMP MSMIMIMMtiMWaMMe*, gorea.....rprym V oemper `IMMI~MMEMIMimMeMel
Only two of the findings were of any statistical significance:
Task Dependency in Task I and in Task IV x Nationality yielded
results respectively of F 7.3590 and F 7.1992, both with
p < .05. Total Non-Task Dependency x Nationality reached almost
a level of significance. Sex and Interaction showed no results.
ThIs analysis per task was not adequate. Attempting to
use an analysis that would yield more informative results, (per-
formed by Valerie Klinge, Yale University, 1966, analysis of
variance based on Lundquist Type VI) an analysis of variance
with unweighted raw scores was computed. See Table 4, Ap-
pendix A.
ADIDArt of Variance Lohsis II)
In this analysis,
(Task Dep. Score-Non-Task
** .05 < p <..1
UnweiOtedamala Scores (Analy-
"Tadk" (Task-situation I-IV), "Score,"
Dep. Score and Egocentric Speech)

"Nationality," and "Sex" were used as variables.
Four of the results reached a significance level of p
1. Within tasks, where a difference and increase of
dvendency was expected, as the tasks became more
difficultfl
2. Score--a significant difference between the three
groups of dependency scores--TD-NTD and Egocentric
Speech;
3. Task x Score interactions Showing difference in
the dominance of categories in the four tasks;
4. The NatIonal effect upon Task x Score.
Essentially, these data corresponded with the Analysis of
Variance using the weighted scores, where Task I and Task ry had
the highest (significant) Dependency Scores, and where Nationality
had a dominant effect.
In neither analysis did sex have any effect, While either
analysis clarifies some of the differences, either one probably
also obscures or magnifies some of these. See aloo Tables 5A
and 5B, Behavior Items Mean Scores, Appendix A.
Although the differences between the group means for length
of time in each task were not large (see Table 16; Mean Time in
Minutes per Task per Subgroup, Appendix A), it seemed important
to compute also the ratio scores--total individual scores
divided by the individualls number of minutes per task. The
effect of shorter or longer time spent on tasks would thus be
separated out.
20
Analysis of Variance with Ratio-Scores (Analysis III)
The ratio-scores were used in a third analysis of variance
(see Table 6, Appendix A). In this analysis, the investigator
re-grouped the items--thus, "Task-Dependency" is here #1, 2, and
7, and "Curiosity--Wants and gives information" contains #3, 4,
5, and 6. "Total Verbalization" includes all these items plus
items #18-22. Number 17, "Inaudible muttering," is not a verbal
item, strictly speaking, and was not included.
This analysis (also done by Valerie Klinge, Yale University,
1966, Anova computer program) was done in three parts.
Part one, Analysis of Task Dependency, (items #1, 2, and 7)
yielded no significant results between Ws. Sex and Nationality
x Sex had probability levels p
Within S's, variance of Task gave a significant result of
p <4,001* Task x Nationality had p (.1.
Items #3, 4, 5, and 6 were combined in part two of the
analysis-4uriosity-Wants and gives information. Between S's,
there was a statistically significant result of Nationality,
P < .025,
Within Ws, Task reached a significance level of p < .001,
and Task x Nationality p (.05.
In part three of the analysis of variance, Total Verbaliza-
tion, items #1-7 and #18-22 were combined. Only Task, within
S's, reached a significance beyond p (.05.
21
Inter-correlation of Data (Analysis 6)
A correlation program was first set up with 66 variables
(done by Valerie Klinge, Yale University, 1966, Department of
Psychology). All the information from Questionnaire I and
Questionnaire II, as well as the Dependency scores in the three
categories Task Dependency, Non-Task Dependency, and Egocentric
Speech, were used. Mother's presence or absence in the tasks,
and the dependency to mother and to examiner, were also used as
variables.
The correlations were set up in nine series:
Norwegian v. American childrenGirls v. BoysAll Sub-groups separatelyAll Subjects--as one group
12
2 series4 series1 series
Findings Related to Questionnaire I--Mean AAR Variable 10
Questionnaire I had 26 questinns, and variable #66, mean age, is
the total mean from these scores. This mean (age-scores given
in months) is expressing the cultural expectancies of the children
to earlier or later independence-behavior and is thus one of the
key variables in the present study.
The second questionnaire (Q II) given to the mothers was
given to assess the individual mother's training to independence
of the subjects in this particular study. It was therefore of
major interest to the investigator to correlate the Independence
score (Var. #67) and the Dependency score (Var. #68) obtained in
Questionnaire II with the Mean Age-score in Questionnaire I; to
look for relationships between cultural standards and personal

expectancies of the child. See Tables 7A and 7B, Appendix A.
Nationaliq. A correlation for all subjects proved highly sig.
nificant. These two variables run in opposite directions, so a
negative correlation was therefore expected between Low Mean age
and High independence score, and between High Mean age and Low
Independence score.
Both national groups had correlations which reached signifi-
cant levels of probability. These results were also confirmed
by the T-tests. Relating these correlations to the T-tests of
Mean Age scores and T-tests of Independence scores (Table IB,
Appendix A, and Table 2, Chapter II), one is aware of the opposite
trends in the two national groups--Norwegian children-High
Independence-Low Mean Age; American children-Low independence-
High Mean Age.
Sex. The relationship between the two variables reached signifl.
cant levels also where subjects were divided according to sex.
Looking at the sub-group correlations, however, one finds that
the American Girls and the Norwegian Boys have the highest (both
significant) correlations; contrasted are the American Boys,
where there is almost no relationship between .these two variables.
Mean Agit x Deer_2ilenc Score. (Table 7, Appendix. A.) The mean
age score was also correlated with the Dependency score; which is
not really an inverse of the Independence score (see description
of sub-groups, Questionnaire II, Chapter II). It represents the
subjects' dependency upon their mothers in given tasks or
situations.
A positive correlation was here expected, between Low Mean

23
age score and Low Dependency and between High Mean age score and
High Dependency.
The correlation for all subjects was significant with
p 4.005.
Nationality. Neither of the correlations for the two national
groups yielded results at significant levels. The sub-group
scores demonstrate clearly how, within each national group, one
high and one low sub-group score counteract each other.
Sex. The correlation for both All Girls and All Boys reached
significant levels of respectively p.01 and p <.05. Here
again, the sub-groups of Norwegian Boys and American Girls have
the highest correlations, while American Boys have only a very
small, and negative, correlation between these variables.
Correlations of Mean Am with Independence Score and Dependency
Compared with T-tests. Referring to the T-tests of Mean Age
(la I, Table lb, Appendix A) and T-tests of Independence and
Dependency scores (Q II, Chapter /I) it is evident that the two
Norwegian sub-groups have a high correlation between Low Mean
Age and High Independence Score, while American Girls have a
strong relationship between High Mean Age and Low Independence
Score.
For Norwegian Boys, there is a high correlation between Low
Mean Age and Low Dependency Score, while American Girls dhow a
significant relationship between High Mean Age and High Dependency
Score.
The relationships between Mean Age as the culturally expected

standard and the Independence and Dependency scores as the
mothers' actual practice were found to be significantly related
for All Subjects. Mean Age correlated with Independence Score
had significant results, both for Nationality and Sex, while
correlated with Dependency Scores had significant results only
related to sex.
Intercorrelation I. Task Dependency to mother and to examiner,
correlated with:
A. Q.I Mean Age ScoreB. Q II Independence ScoreC. Q II Dependency Score
Task Dependency was analyzed separately for each task. Since
only a few mothers were present in Task III and Task IV, only
the tables for the first two tasks are set up and compared.
See Table 8, Appendix A.
Nati....;9122..y.it, Positive relationship between Q I Mean Age x Task
Dependency was. expected, Table A shows that for All Norwegian
Subjects there was, both for Task I and Task II, significant
correlations between Mean Age Score and Task Dependency to
Examiner. Task Dependency to Mother, however, correlated
negatively for both tasks, and with a significant result for
Task I.
For All American Subjects, Table A shows that there was one
negative and one positive correlation for each task, none of
which had significant outcome.
Sex. All Boys had positive correlations between Mean Age Score
and Task Dependency to both Mother and Examiner, for both tasks.
Task Dependency to Mother, Task II, was significantly related to

25
Q I, Mean Age.
For All Girls, three of the four correlations were negative;
none of the four reached significance level.
The correlations (Table B, Q II) Independence Score x Task
Dependency were expected to give negative outcomes, with High
Independence Score x Low Task Dependency, or Low independence
Score x High Task Dependency.
Nationalit7. For both All American and for All Norwegian Subjects,
three of the four correlations were positive.
For All American Subjects, Task Dependency to Examiner in
Task I, the positive correlation reached significance level
p (.05, while Task Dependency to Mother was negatively correlated
and almost reached the same significant level.
For All Norwegian Subjects, Task Dependency to Examiner In
Task I was correlated negatively with Q II independence Scoret
and with highly significant results. The three other correlations
were positive, however, and Task Dependency to Mother, Task I,
and Task Dependency to EXaminer, Task II, both reached signifift
canoe levels beyond p 4:.025.
Sex. For All Girls, only one correlation was negative, zero;
the other three were positive. Task Dependency to Mother, Task
II, and Task Dependency to Examiner, Task /1 reached levels of
significance.
For All Boys, however, three of the four correlations were
negative in the predicted direction. Task Dependency to Mother,
26
Task I, negatively correlated to Independence Score, gave signifi.0
cant result.
Q 11 Dependency Score x Task Dependency to Mother and to
Examiner were expected to show positive relationships. For All
Subjects, however, the four correlations were all negative.
yallary_gaz. Task Dependency to Examiner was, for All Norwegian
Subjects, positively correlated to Dependency Score in both tasks.
For Task II, the relationship reached a probability level of
p (.005. The correlations of Task Dependency to Mother and
Dependency Score were both negative,
For All American Subjects, only Task Dependency to Mother in
Task I was slightly, but positively, correlated to Dependency
Score. The correlation in Task II was negative and with signifi-
cant result.
Sex, By sex, the preOicted direction of relationship between
Dependency Score and Task Dependency to Mother and to Examiner
held up in three of four correlations. These were low, however,
as was also the positive correlation of Dependency Score to Task
Dependency to Mother in Task I.
For All Girls, all four correlations were negative; Task
Dependency to Examiner in Task I and Task Dependency to MOther in
Task II both reached levels of significance p (.025.
Inter-correlation Program with 18 Variables (Analysis VII)
A second inter-correlation program was run because this
investigator was not satisfied with the grouping of items in the
27
Task Dependency and Non-Task Dependency categories. The raw
data indicated that items #5 and 6 were related to #3 and 4. (See
Discussion, Chapter IV.) The Behavior Rating list items were re-
grouped after consultation with the co-investigator. The in-
vestigators felt, also, that it would be desirable to use ratio-
scores, instA .d of raw scores, as in the third analysis of
variance, in order to avoid effects of differences in time spent.
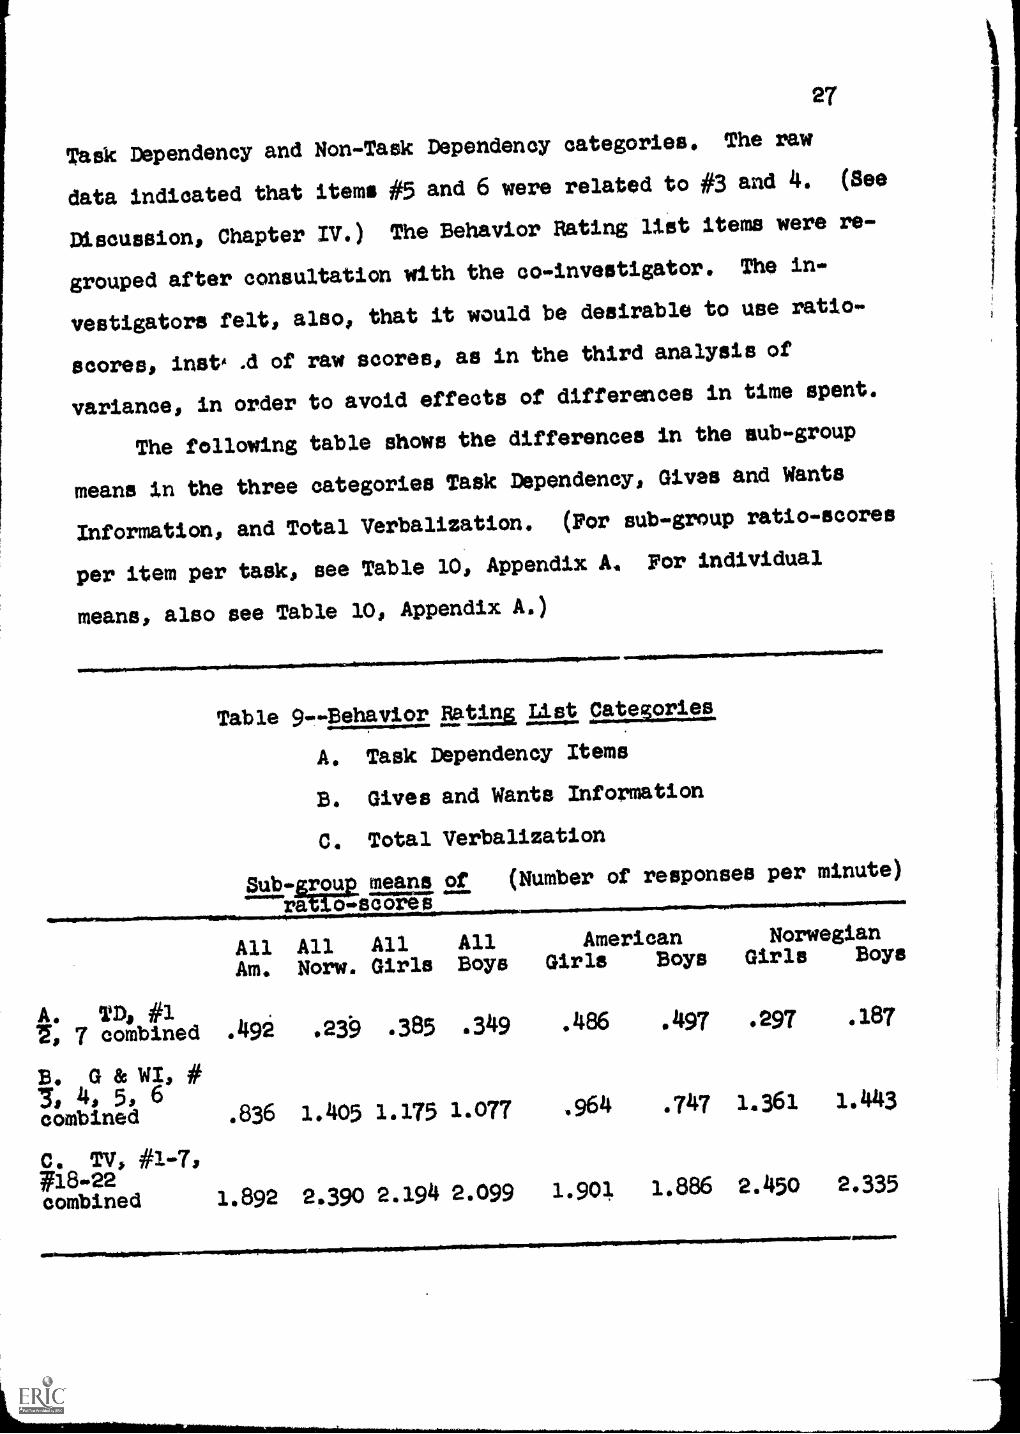
The following table shows the differences in the sub-group
means in the three categories Task Dependency, Gives and Wants
Information, and Total Verbalization. (For sub-group ratio-scores
per item per task, see Table 10, Appendix A. For individual
means, also see Table 10$ Appendix AO
Table 9--Behavior Rating List se2s2A21.3
A. Task Dependency Items
B. Gives and Wants Information
C. Total Verbalization
Sub-groue means of (Number of responses per minute)
ratioisesAll All All All American Norwegian
Am, Norw. Girls Boys Girls Boys Girls Boys
A. Tall, #1
7, 7 combined .40 23 .385 .349 .486 .497 .297 .187
B. G Fic WI, #
combined .836 1.405 1.175 1.077 .964 .747 14361 1.443
C. TV, #1-7,W18-22combined 1.892 2 390 2,194 2.099 1.901 1.886 2.450 2.335

28
Although there were clearly differences, in the predicted
directions, these were not large enough so that a T-test of two
sample means would show significant results.
Inter-correlation Program II had 18 variables, and ratio-
scores were used. Table 11 shows that a re-grouping of items
#5, 4, 5, and 6 could be justified. The six inter-correlations
of these four items were significantly correlated, for All
Subjects.
Nationality . For all Norwegian Subjects, three of the items
were signifioantly related, and three items were correlated
with p < .01.
For All Ameriean Subjectss however, only correlation of
items #3 x #5 reached a significant level.
Sex, By sex, the differences were even more pronounced. While
all six items were significantly inter-correlated for All Boys,
only items #5 x #5 had significant results for All Girls, and
#4 correlated with #5 and # 6 gave negative low correlations.
(See following page for Table 18, Inter-correlation of
Items #3, 4, 5 and 6.)

29
..OPIIPal.~10/81.041/100POINOIMIMINIMBIeamartam*
Table 11-Inter-correlation II, of Items tl 4, and 6
"Wants and gives information"
Items All Ss All Norw. All Am. All Girls MALE#3 x #4 --711:5- -.039
P < .01 p .005 P .4, .005
Items#3 x #5 .612 .599 .801 .533 .674
p 4(.001 p < .01 p < .001 p < .025 p < .005
Items#3 x #6 .353 .382 .210 .054 .530
P (.025 .05 p .1 P .01
Items#4 x #5 .372 .616 .007 -.133 .725
p C.025 p (.005 p <.001
Items#4 x #6 .247 .386 .017 -.164 .549
.05 < p < .1 p < .01
Items#5 x #6 .4o6 .351 .279 .111
P .01 .05 < p .1
.632
p < .005
The inter-correlation of the Task Dependency Items #1, 2,
and 7 shows for All subjects a significant relationship between
items #1 and #2 (see Table 12, Appendix A).
Nationality. While items #1 x 2 were significantly related for
All American Subjects, items #1 x 7 reached almost p (.05 level
for All Norwegians.
30
The correlation of item #2 with #7, however, was negative
and low for both groups.
Sex. Items #1 x 2 were significantly correlated for All Boys,
and item #a correlated with #7 reached significant level for All
Girls,
Correlation of items #2 with #7 was negative for both groups;
item #2 correlated with #1 was negative also for All Girls.
Inter-correlations of Task Amalm Items and Information-
Curiosity Items
Nationality. Table 13, Appendix A shows clear national differ-
ences. Items #1 and #2 were for All American Subjects signifi-
cantly correlated with three of the four items in the Information-
Curiosity category, while the same correlations for All Norwegian
Subjects were low; negative or positive. Item #7 however,
correlated significantly for All Norwegian Subjects with items
#5 and #6, but only with #6 for All American Subjects,
Sex, The differences here were less clear. Item #1 correlated
with #3, and #2 with #3 reached significant levels for All Boys.
Not as high, but also statistically significant, was the corre-
lation of #7 with #6.
Por All Girls, however, items #2.x #4 correlated significant-
ly.
See Table 14 on following page.
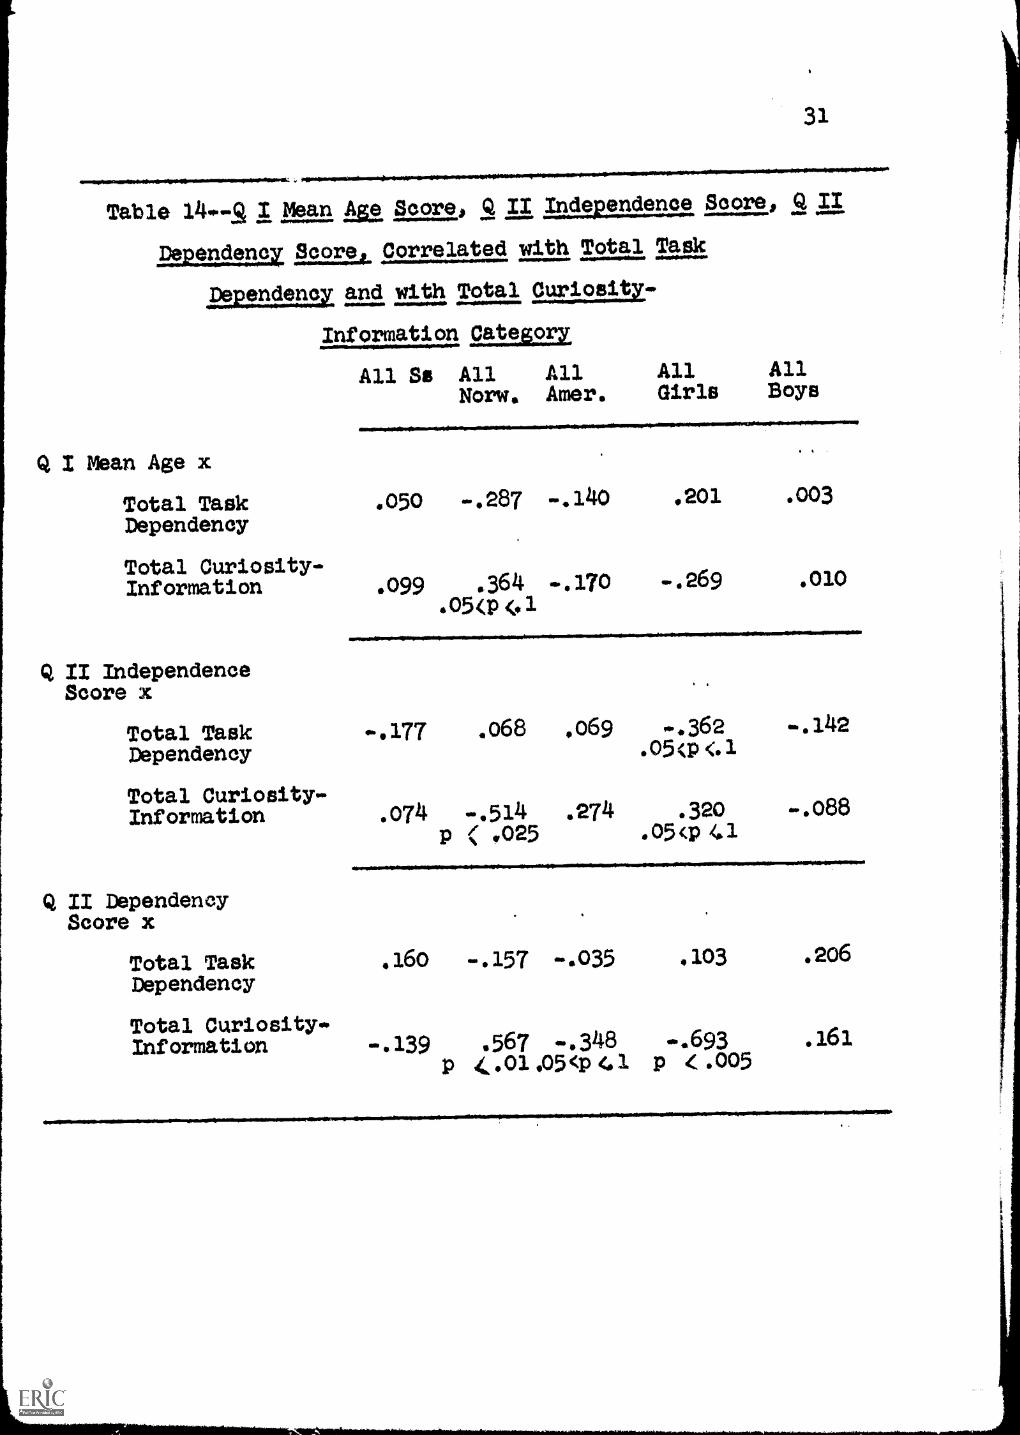
Table 14--g I Mean ha Score, Q II Inclezi_ldenee Score, Q I/
Dependenq Score, Correlated with Total Task
Dependency and with Total Curiosity-
Information Cate4ory
All Ss All AllNorw. Amer.
Q I Mean Age x
Total TaskDependency
Total Curiosity-Information
Q I/ IndependenceScore x
Total TaskDependency
Total Curiosity-Information
Q II DependencyScore x
Total TaskDependency
Total Curiosity*Information
AllGirls
AllBoys
11
.050 -.287 -.140 .201 .003
.099 .364 -.170 -.269 .010
.05044
.177 * o68 .069 -.362 ..142.05(p <.1.
.074 -.514 .274 .320 -.088p ( .025 .05(1)41
.160 -.157 -.035 .103 .206
-.139 .567 -.348 -.693 .161p L.01 .05<p 41 P < .005
AwroolipmaymilimoomarlmIllmilinnweIllmimmimlipUlowl~01111Wrillialmolup

32
Nationality. For All Subjects, the relationships were low. For
All Norwegian Subjects, Total Curiosity correlated significantly
with Q II Independence Score and Q II Dependency Score, and a
significant level of probability was almost reached in correla-
tion with Q I Mean Age, The fact is, however, that none of the
results were in the predicted direction:
For All American Subjects, three of the six correlations
were in the predicted direction. Only one result was signifi-
cant--Q II Dependency Score correlated negatively with Total
Curiosity-Information category.
Sex. For All Girls, all six correlations were in the predicted
direction, Q II Dependency Score correlated with Total Curiositr-
Information gave a highly significant result. Q II Independence
Score correlated with Total Task Dependency and with Total Curio.
sity-Information did almost reach significant levels with p <,1,
For All Boys, the correlations were all low, and not con-
sistent in their direction.
Table 15 shows the relationships in Program I between the
two main verbal categories, Total Task Dependency and Total Non-
Task Dependency, and the correlations from Program II of Total
Task Dependency (re-grouped) and the Curiosity-Information
category (also re-grouped).
See following page for Table 15,
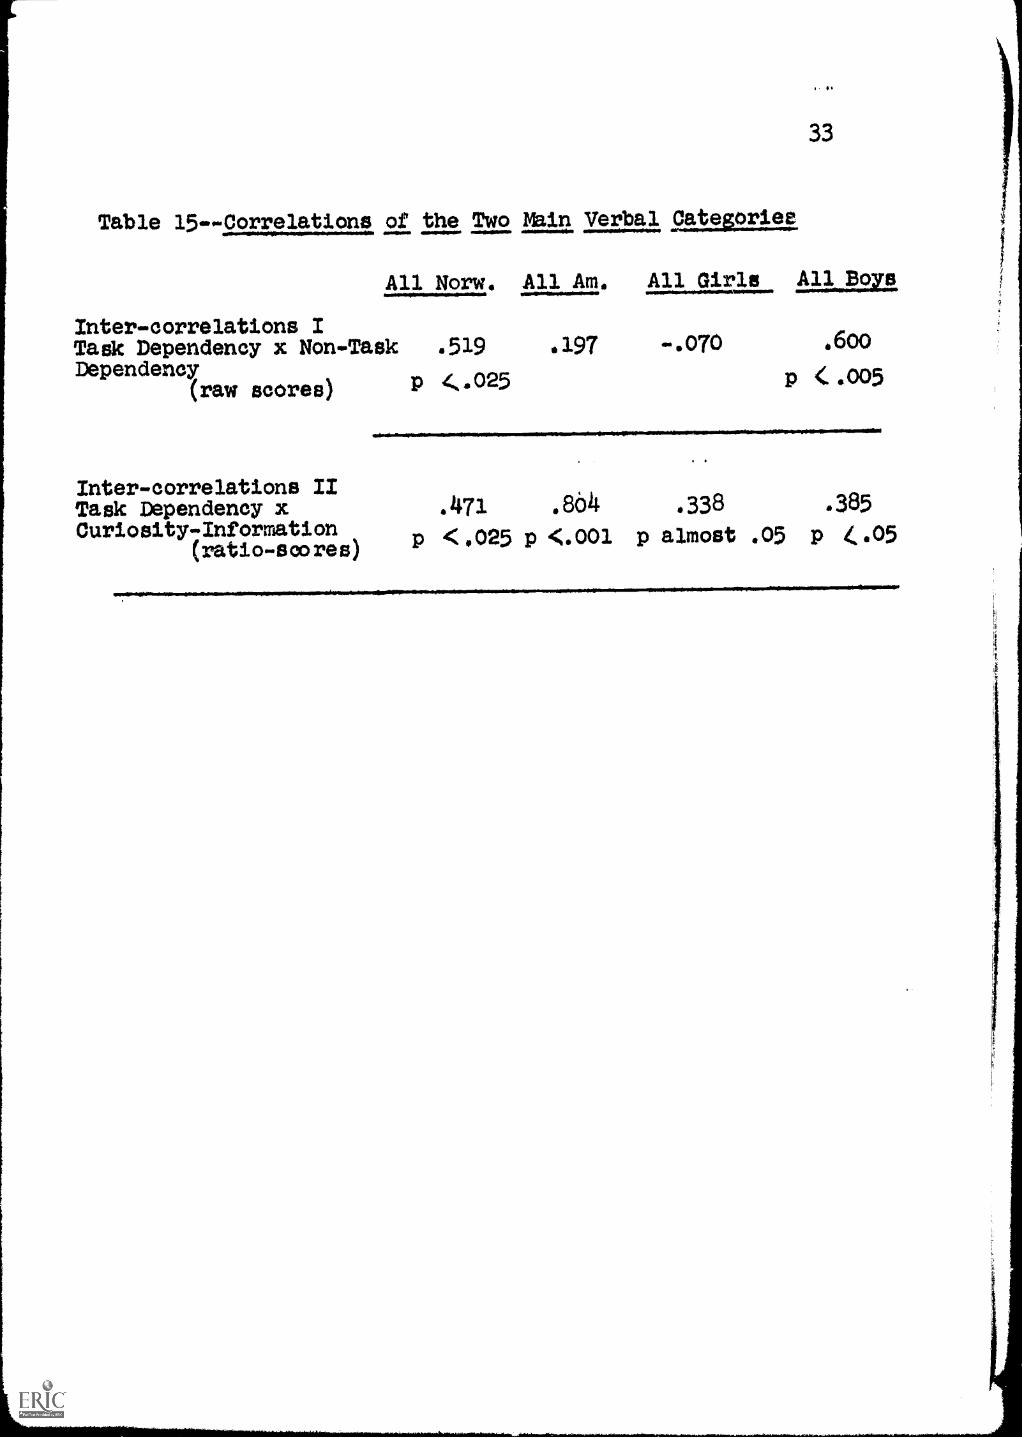
Table 15--Correlations of the Two Main Verbal patespriee
All Nom. All Am.
Inter-correlations ITask Dependency x Non-TaskDependency
(raw scores)
Inter-correlations IITask Dependency xCuriosity-Information
(ratio-soores)
.519 .197
p
33
All Girls Alum
-.070 .600
p (.005
11...MPlabIal~wINOPIPM.=1MNI.INO.N=NOMMI
.471p <1,025 p
.864<.001 p
.338
almost .05
.385
P 4 .05
Chapter IV
CONCLUSIONS AND IMPLICATIONS
The assumptions of the study were that 1) Question-
naire I would assess cultural differe'lces in expectations of
independence and self-reliance of pre-school children, and 2)
that Questionnaire II would express differences in mothers'
child-rearing practices. These were both confirmed. Assumption
3), correspondence between the two questionnaires and a con-
sistency between cultural expectations and the mother's train.
ing of the child, was alao confirmed.
The general or culturally expected standards of the
child's ability to perform certain tasks and freedom to make
decisions in certain situations were in 23 our of 26 cases
expected earlier of Norwegian than of American children. A
sample T-test on the overall means showed this result to be
highly significant, p .005. See Table lc, and Chapter II.
The mother's training of the child to independence and
self-mastery was expressed by Independence and Dependency
scores. Norwegian children were given more independence and
freedom of decision (sub-category I) and were less passive and
less dependent upon their mothers than American children (sub.
category II). T-tests showed that the two sample means were
significantly different for both these sub-categories. See
Table 38 Chapter II.
(34)

35
Assumption 4), that the mothers1 responses would re-
flect cultural and sex differences, both in cultural expecta-
tions and in actual training and child-rearing, was partially
confirmed.
Correlations between Q I Mean Age Score and Q II Inde-
pendence Score and Dependency Score (see Table 7A and 7B,
Appendix A) confirmed the relationship between the cultural
standards and the actual child-rearing practices. By National.
ity and by Sex, statistically significant results were obtained,
correlating Q I Mean Age Score and Q II Independence Score.
Significant correlations were obtained between Q I
Mean Age Score and Q II Dependency Score for All Subjects by
Sex but not by Nationality.
The hypothesis that Norwegian children were expected
to be independent earlier and were trained earlier to self-
reliance and self-mastery appeared to be confirmed by the data.
The hypothesis of sex differences, of girls being expected to
be independent and being trained earlier to independence than
boys proved to hold up in the predicted direction for the Nor-
wegian sample. In the American sample, however, there were
reverse and contradictory findings, some of which will be
interesting to examine and discuss further.
The data from the Task-situations confirmed the
hypothesis of Norwegian children being less help-seeking over
all tasks. Group means from raw scores and group means from
ratio-scores both showed national differences in Task Depend-
ency. (See Table 5A and Table 5B, Appendix A.) There were,
36
however, sub-group differences over the four tasks. The first
analysis of variance, with weighted dependency scores, showed
that Norwegian children had higher Task Dependency in Task
but far less than American children in Task IV. (Table 5A
shows that this high dependency in Task I was because of
attention-seeking, item No. 2, not help-seeking.) An analysis
of variance with unweighted scores corresponded essentially
with these data, with increase in Dependency for harder tasks.
National, but not Sex differences were exhibited.
The use of the Behavior Rating List and the Kohlberg
and Zigler Dependency Rating Scale was agreed upon, a priori,
by the investigator. During the experimental situation with
the subjects, however, this investigator made the observation
that the two Non-Task Dependency items (No. 3 and No. 4) and
two of the Task Dependency items (No. 5 and No. 6) were either
labeled incorrectly or not grouped correctly--or conceivably
might fall into both of these categories.
Before the data were analyzed, the recording of the
subjectst responses indicated that ratina list items No. 3 "Asks
for general information" and No. 4 "Neutral comments--state-
ments of information in aeneral" were overwhelmingly responses
displaying either 1) interests in general, alert observations,
and curiosity, or 2) interest in the equipment for the task
situations (tape recorder, reels, etc.), or in the examiner's
person, perhaps because the examiner was for the American sub-
jects a foreigner, and for the Norwegian subjects a person
coming from a distant and exciting country. These responses

37
did not indicate attention or approval seeking--such responses
were rated under item No. 2. Neither were they indications of
verbal escape (No. 8). As the rating list was quite specific,
with 27 categories (see Chapter II), this investigator felt
one could distinguish between categories for dependency and
categories for curiosity and general "academic" interest in
objects or persons.
Item No. 5 "Asks for information about task" and No. 6
"Comments related to task" were grouped and scored under Task
Dependency. The responses in these two categories seemed to
this investigator qualitatively different from those in cate-
gories No. 1, No. 2, and No. 7, which were clear-cut Task
Dependency responses. The responses to No. 5 and No. 6 were
factual comments and requests for information about tasks.
They could neither be interpreted nor scored as attention or
approval seeking nor as an invitation to help. The questions
in category No. 5, when responded to, would enable the child
to work independently to solve the task problem; the responses
to No. 6 were mostly factual remarks about the task, often
sharing of information or observations with the mother or the
examiner.
The raw scores showed that the Norwegian sample had an
overwhelming majority of responses in categories No. 5 and No.
6, combined with relatively few (less than one-third of the
total) in categories No. 1, No. 2, and No. 7 combined. The
American sample had little more than one-third of the total
responses in categories No. 6 and No. 5 combined. The distinct
38
sample groupings of responses in these two clusters of items
should probably be interpreted as an indication of two quali-
tatively different kinds of responses. (See Table 5A and 513,
Mean Scores, and Table 10, Individual and Sub-group Means of
Ratio-Scores; Appendix A.)
The third analysis of variance used ratio-scores
(responses per minute) over all tasks, and the categories were
re-grouped with items No. 1, 2, and 7 in Task Dependency and
No. 30 4, 5, and 6 in Curiosity-Information *Wants and gives
information." Total Verbalization contained the items in both
these categories, as well as items No. 18 through 22. This
analysis also showed significant results for Task and Task x
Nationality in the "Task Dependency" category, and for
Nationality, Task, and Task x Nationality in "Curiosity." For
Total Verbalization, only Task showed significant results.
Again there were no significant results by sex.
All three analyses of variance show, in fact, that Task
Dependency changes according to tasks, and that there are
national differences. The last analysis also showed the
national differences, over tasks, in curiosity and information
seeking.
The first inter-correlation program was run with the
data from the Task-Situations in the first, a priori, group-
ing of items. The data and findings from the experimental task-
situations were composed of varied factors, but only the most
important need be discussed here.
39
While inter-correlations of Q I Mean Age Score and
Q II Independence Score and Dependency Score showed clearly
the relationship between theoe variables, it was difficult to
relate these variables to the data from the task-situations,
since the results were far from clear-cut.
While a general negative relationship was expected
between the Mean Age Score and Task-Dependency, both to Mother
and to Examiner, the data showed that for both nationalities
the Mean Age Score was correlated positively to Task Dependency
to one person and simultaneously negatively to the other. The
main differerce by nationality was the significant correlations
for both Task I and Task II in the predicted directions,
between Low and Mean Age Score and Task Dependency to Examiner
for All Norwegian Subjects, while there was a significant
negative correlation--between (low) Mean Score and (high)
Task Dependency to Mother for Task I.
For all Americans, the correlations were low. While
there was a positive correlation of Mean Age Score with Task
Dependency to Mother in Task I, and negative to Examiner, this
was reversed in Task II; thus, there was no predictable trend.
By sex, there was significant correlation for Boys in the pre-
dicted direction between Mean Age Score x Task Dependency to
Mother in Task II. This was the only sub-group in which most
of the correlations were in the predicted directions.
In general, the correlations of Task Dependency to
Mother and to Examiner with Mean Age Score and Independence
and Dependency Scores show certain differences by Nationality,

4o
although these are not consistent.
The different trends by sex were far more marked and
more consistent than were the national differences.
Using ratio-scores and re-grouping of categories
(Table 9, Chapter II) and inter-correlating the behavior rating
list items showed significant results--Category II (Curiosity-
Information) for all Sts, for all Norwegians, and for all boys.
Items No. 1 and 2 (Task Dependency) were significantly related
for all Americans and for All Boys, and items No. 1 and 7 gave
significant results for All Norwegians and for All Girls.
The inter-correlations of Task Dependency Items with
Curiosity-Items showed strong national differences, with items
No. 1 and 2 significantly correlated with three of four
Curiosity-Items for All American Subjects. These interesting
results suggest that the first grouping of items possibly pro-
vided more correct categories for the American sample, while
the second grouping was more suitable for the Norwegian sample!

Chapter. V
DISCUSSION OF OBSERVATIONS
The parents' interest in the study was obvious in both
national groups, but the tension in the American subjects, as
demonstrated by the lack of initial responses, requests for
help, attention seeking (Table 17: "Ease and Tension,"
Appendix A) was not observed in the Norwegian sample. The
American subjects--probably because of experience from nursery
school testing and research situations--seemed to regard the
task-situations as a test. They were self-conscious, they
watched the examiner for clues, etc.; on the other hand, the
Norwegian group was eager to play games or try new puzzles and
seemed delighted to have a visitor who would bring interesting
things for them to do.
The Norwegian subjects were all--except for one boy--
very open, easy to get contact with; they initiated the inter-
personal relationship between examiner and children and offered
information and ideas (related or not to the tasks). In the
American sample the children were slow to warm up, but their
verbal responses gradually increased during the tasks. After
the task-situations, these subjects also responded well, com-
municated and became more lively and open.
The increasing or decreasing amount of verbal response
in the two national groups and the different categories these
responses were in, show some of these differences by
(41)
42
nationality, although the tapes and recordings started at the
beginning of Task I and stopped at the end of Task IV do not
demonstrate the full sequence and make the changes less marked.
It was obvious, however, from the sub-group scores, that
there were sex differences. These were not consistent, and
there were only a few significant trends, for example, the more
consistent relationships for All Boys between Mean Age scores
and Task Dependency to Mother. The Task-Situation data indi-
cated sub-group differences--one sex group low and one high--
within each national sample. This trend was even more marked
in the responses and results from Questionnaire I, with the
expected mean ages. (See Table lA and 1B, Appendix A.)
Although it may seem wasteful to discuss sub-groups
when the samples are as small as they are in the present study,
it seemed important to mention some of the items which might
help to clarify the sub-group data. In several cases, as in
Q I, No. 1 and No. 3, Norwegian Girls had the lowest sub-group
mean score, 71hile Norwegian Boys had the highest. This would
mean, as in No. 1 (with the Norwegian Girls having the lowest
sub-sample mean, and the Norwegian Boys the highest), that the
combined scores would give American children a lower mean age
than the Norwegian sample. Girls had a lower mean age than
boys, but the difference was not significant. (See Table 1B,
Appendix A.)
On No. 11 "At what age should a child get an allowance,
and decide how to spend it?" most American and Norwegian
mothers' expectancies ranged from ages 6-9. One American
43
mother had the expectancy of awe 10. One Norwegian girl's
mother, however, answered "age 13-14." This response was so
different from all the others that one might possibly assume
this mother had a different concept of "allowance," perhaps
thinking in terms of the girl's buying certain books, clothes,
or toilet articles for herself. If this response had not been
included, the mean expected age of Norwegian children would
have been significantly lower, = 75.75 months v. American
children 5.E= 85.25 months. From observations and experience,
this lower mean would seem more correct, as Norwegian parents
generally give the child an allowance when he starts school,
age 6:6 to 7 years, or 72-78 months.
With this "correction," the expected mean score of
Girls v. Boys on No. 11 would also have been reversed, Girls
73.5 (instead of 89.2) v. Boys 3E 82.777.
Number 5, "Go to bathroom alone," in which both
American sub-samples have the lowest mean ages, led this
investigator to speculate along two different lines: One, the
different way of dressing the children in the two cultures,
generally determined by practical considerations, may logically
be taken into account. Norwegian houses are not kept at the
same high temperature as American homes, and most of the year
children are dressed in more and warmer clothing which may be
mora inconvenient when the child is going to the bathroom.
Since Norwegian children are expected to go to bed alone, how-
ever, at an earlier a2e (including undressing, (cf. Question-
naire I and II), and since NorweRian girls have the lowest
44
expected mean age for dressina, this does not seem to be the
reason.
The other line of thought is the different adult atti-
tude in the two cultures toward nakedness of children, privacy
in the bathroom, etc. While most Norwegian children up to
school age will dress or undress unselfconsciously, both at
home and in nursery school (when the Health Department doctors
come to examine all of them), go naked on the beach, go to the
bathroom with the door open, etc., American children are early
taught to be self-consciaus about their bodies, not to expose
themselves, to wear bathing suits at the beach, and to
encourage privacy in the bathroom. Trying tactfully to help
American children change pants after an "accident" at school
makes one fully aware of how painful this experienc&is for the
children. Therefore, the earlier expected age of American
children going to the bathroom alone is probably not so much a
demand upon the child's self-mastery as a reflection of the
American middle class attitude toward and teaching of *bathroom
culture," expressing the fear and shame of exposure. American
parents are forced to teach their children early the necessity
of privacy--to protect them from the society's indignation.
Sex differences
Because girls are generally considered to mature
before boys, it was predicted that the airls would get the
lowest mean scores, compared with the boys. Nineteen of the
26 items were in the predicted direction; there was one tie,

45
and in 6 cases the boys got a lower mean age score. (Table 6A
and 6B.) On only two of these comparisons of means did T-tests
show significant resultsNo. 2, "Play outside by himself with-
out supervision" and No. 15, "Go to bed alone." In both cases,
Girls had significantly lower scores than Boys, p < .05.
Although No. 26, "Have a friend over to play with indoors
(without supervision)" did not reach a significant level
(.05 ( p < .1), there welne marked differences between the
Girls' and the Boys, scores.
These results seem also to confirm a general hypothesis
that girls are expected to be independent at an earlier age.
The few significant results give an indication that girls are
also considered more reliable and can be trusted more to care
for themselves, without getting into difficulties or mischief!
Sub-group mean scores
The indication of girls being expected earlier to inde-
pendence than boys holds up in the Norwegian sample, only.
Norwegian boys were in three cases only expected to
master tasks or situations earlier than Norwegian girls. As
Norwegian girls had the lowest expected means on 23 of 26
items, it was interesting to see first in which cases the
Norwegian Das had the lowest expected age means. These were:
No. 16, Play indoors without supervision,
No. 20, Choose which friends he wants to play with, and
No. 11, Get an allowance and decide how to spend it.
46
American boys, however, were in 11 cases expected to do
things or master situations at an earlier age than American
girls. (See Appendix A--List of lowest expected mean ages per
sub-group.) American girls had lower means than American boys
in 15 cases. Not only are American boys expected to dress and
feed themselves earlier than are American girls (including
ability to tie shoelaces), they are given more freedom earlier,
allowed to walk to their friends' homes alone, and are given
responsibility at an earlier age. The boys are expected to take
care of clothes and toys outdoors and to pick up toys indoors
earlier. They are expected earlier to take care of siblings
and to watch them in play. American boys are also expected to
have small, regular tasks or jobs, to wash or dry dishes, and
to be trusted with money at an earlier age than American girls.
Although the T-tests of two means did not give signifi-
cant results, the differences of means are, in some cases,
quite striking.
Sex differences in the two national Eroups
Assuming that the picture given by the data here is
correct, the question immediately arises: Why? Why are Ameri-
can boys expected to do things earlier than girls? The idea of
equality in American society (at least, ia the middle class)
has, during the last two or three generations, caused changes
in American middle class family life. A democratic relation-
ship between parents can be expressed (among other ways) by
the husband's participation in the family tasks. The earlier
differentiation of men's and women-folk's work has
47
disappeared, and it is no longer unmanly to cook or wash
dishes. Masculine v. feminine tasks are not stressed, and At
is as natural for boys as for girls in American middle class
families to participate and "help."
This would seem to stress equality of girls and boys,
with equal expectations of both sexes, but it does not explain
why boys would be expected to do certain tasks, or master cer-
tain situations, earlier than girls, especially since theories
of physical maturation and development tend to agree that
among pre-school age children, girls are generally earlier
developed than boys; Rirls are toilet trained earlier; general
coordination and dexterity are developed earlier in girls than
in boys; and girls are usually more mature on the whole.
Nonetheless, reviewina the theoretical viewpoints of
factors which promote or restrain development of independence
and self-mastry may provide some support for the findings in
the American sub-sample.
Sears, Maccoby, and Levin did not find sex differences
in dependency but stated that "it is a widely held belief that
Rirls are more dependent than boys." Have the earlz demands
on the American girls--in toilet training, for example (Whiting
and Child), been too severe? One wonders if the earlier
expectations have been too great, or if the girls have been
punished for their dependency (wi.th love-withdrawal or other
dependency-promotino: techniques). Not being demanded to meet
the same early expectations (because of the aeneral viewpoints
that they are later in development and maturation than girls):

the boys are not under the same pressure, and will therefore
develop more self-reliance earlier. Being less dependent, they
will be given certain chores and tasks to do independently and
will take more responsibility for these.
The data in the Norwegian sub-samples might at first
seem to contradict this theoretical explanation. Why would
Norwegian girls not become more dependent, if they are expected
to do most tasks or master most situations at an earlier age
than the boys?
As Bronfenbrenner states in his survey, child-rearing
practices in American middle classes during the last two
decades have become increasingly more permissive. This trend
can also be found in Norwegian child-rearing, but not to the
same degree. Most Norwegian books written for parents, on
child development and socialization, discuss the problems at a
practical level. They stress the importance of the parents'
firmness as expressed by giving the child a few, certain rules,
which the parents are encouraged to be consistent about and to
stick to. They also emphasize that the child has need for
limits, for a certain control.
This point of view is supported by Baumrind's study
on child-training antecedents. This study proposes that hilzh
nurturance with low control will not make the child self-
sufficient. Control and nurturance should both be high to
produce optimal reliance of strength of will, impulse control,
and self-sufficiency. The important point is that "control"
is not regarded as or equated with "demands" or "pressure."

Control consists of given rules or limits, "real" or
practical, explicitly stated to the child (e.g., "We don't
jump on the couch with shoes on"), while demands or pressure
are abstract, may not be overtly expressed, and are not mes-
sages understood by the child. These are widely different
techniques, with very different effects.
Norwegian parents may use more control, e.g., give
rules, set limits, but they do not demand or pressure a child
to do things earlier than he seems ready for them. Norwegian
children have a longer pre-school period than American children.
They do not go to grade school till age 6 1/2 or 71 and there
is no rush to get quickly through the pre-school period. There
1is no insistence on children learning early to read or write,
for example, a problem about which many American parents are
concerned.
Distinguishing between "control" and "demand," one
might propose that Norwegian girls (and boys, too) are sup-
ported with more control in early childhood, while American
girls may have been given more demands and have reacted to
these with more dependency. Obviously, this cannot explain
all the differences in the data of the two samples. A thorough
investigation of the child-trainina practices in both countries
would be needed, and it would probably bring up a number of
other important points.
In terms of teaching, there are implications in the
present study to support the theoretical views on control and
nurturance in regard to independence behaviour. Children who

50
are trained to independence earlier may be more verbal and want
a more active exchange of ideas and thoughts with adults, but
they may require less support in their play or work. They can
be given certain rules or limits and then use their own initi-
ative and ingenuity to find ways and means to solve their own
problems.
In making generalizations from the implications in the
data, it should be remembered that the samples for this study
were chosen from a special segment of the population. Child-
rearing practices may be widely different in other segments,
especially within the American culture. The Norwegian society
is small and quite homogeneous, both in cultural expectations
of children and in the child-rearing practices, yet differences
do, of course, exist; we do not know how small or how large
these are. This study has perhaps generated more questions
than answers. But these are important problems in the train-
ing to independence behavior of young children. Hopefully,
further research and investigation will provide some of the
answers.
Chapter VI
SUMMARY OF FINDINGS AND DISCUSSION
Three of the four assumptions of the study were con-
firmed. Both Questionnaire I, expressing the expected,
"cultural" standards of early independence, and Questionnaire
II, giving the mothers' actual scores of Independence and
Dependency, showed that Norwegian children were expected to
master certain tasks or situations at an earlier age and were
given more independence by the mother. Mean expected age was
lowest for Norwegian children in 23 of 26 items.
Two sample T-tests of means performed on overall means,
and means of items in Questionnaire I gave significant results
with p < .005 for T-test of overall mean scores, and on 9 of
the 26 items, p < .05. Except for one itedi- No. 5, "Go to
bathroom alone," the other results were all in the predicted
direction, with earlier expectations for Norwegian children.
Hypothesis 1, independence training practiced earlier
by mothers of Norwegian children, was confirmed by T-tests on
two sample means from Questionnaire II, overall Independence
Score, with p < .001. The mean score of independence was
almost twice as high for the Norwegian children as mean score
for the American children (N; = 11.529 v. AmS = 6.418). The
T-test on the means of Dependency Score, Q II, also gave
significant result in the predicted direction, with p 4:.05.
(51)
52
There was consistency in the data and the findings in
the two questionnaires, shown in inter-correlations of Mean
Age Scores, Q I, Independence Score, Q. II, and Dependency
Score, Q II.
The hypothesized cultural differences were confirmed,
and the hypothesized sex differences were found in the Nor-
wegian sample (girls being earlier trained than boys), but
not in the American sample.
Analyses of variance show national differences in the
data from Task-situations; Task Dependency increased with
difficulty of task, and Norwegian children demonstrated less
Task Dependency over all tasks.
Inter-correlation programs I and II showed relation.
ships between the Behavior rating items, with somewhat differ-
ent characteristics for the Norwegian and the American sample.
In tasks where both mother and examiner were present, the
Questionnaire scores correlated with Task Dependency showed
in general a positive relationship in regard to one person,
a negative to the other, between these variables.
Inconsistency in data of the sub-samples is puzzling
and brings up the question of early pressure versus early
training.
Regarding independence-training, the question arises
as to why American boys are expected to master certain tasks
or situations earlier than American girls (al out of 26 cases)
when most theories would predict the opposite. Again,
53
McClelland's paradox of demand for independence causing the
child to become more Litanel2n1 has to be considered.
Theoretical viewpoints of "demands" or "pressure"
versus itcontrol" may suggest certain useful factors to be
censidered in answering the questions but cannot give a full
theoretical explanation of the problems.
More research, with larger samples, also from different
segments of the population, and with variables including emo-
tional independence and cognitive and social aspects, may yield
some of the answers t'lis investigator is searching for. Further
investigation of the different socialization processes in the
societies involved will also help to clarify the problems of
the different expectations in training to Independence, and,
hopefully, will give a fuller and more correct picture of this
important part of the young child's socialization.

*Wit
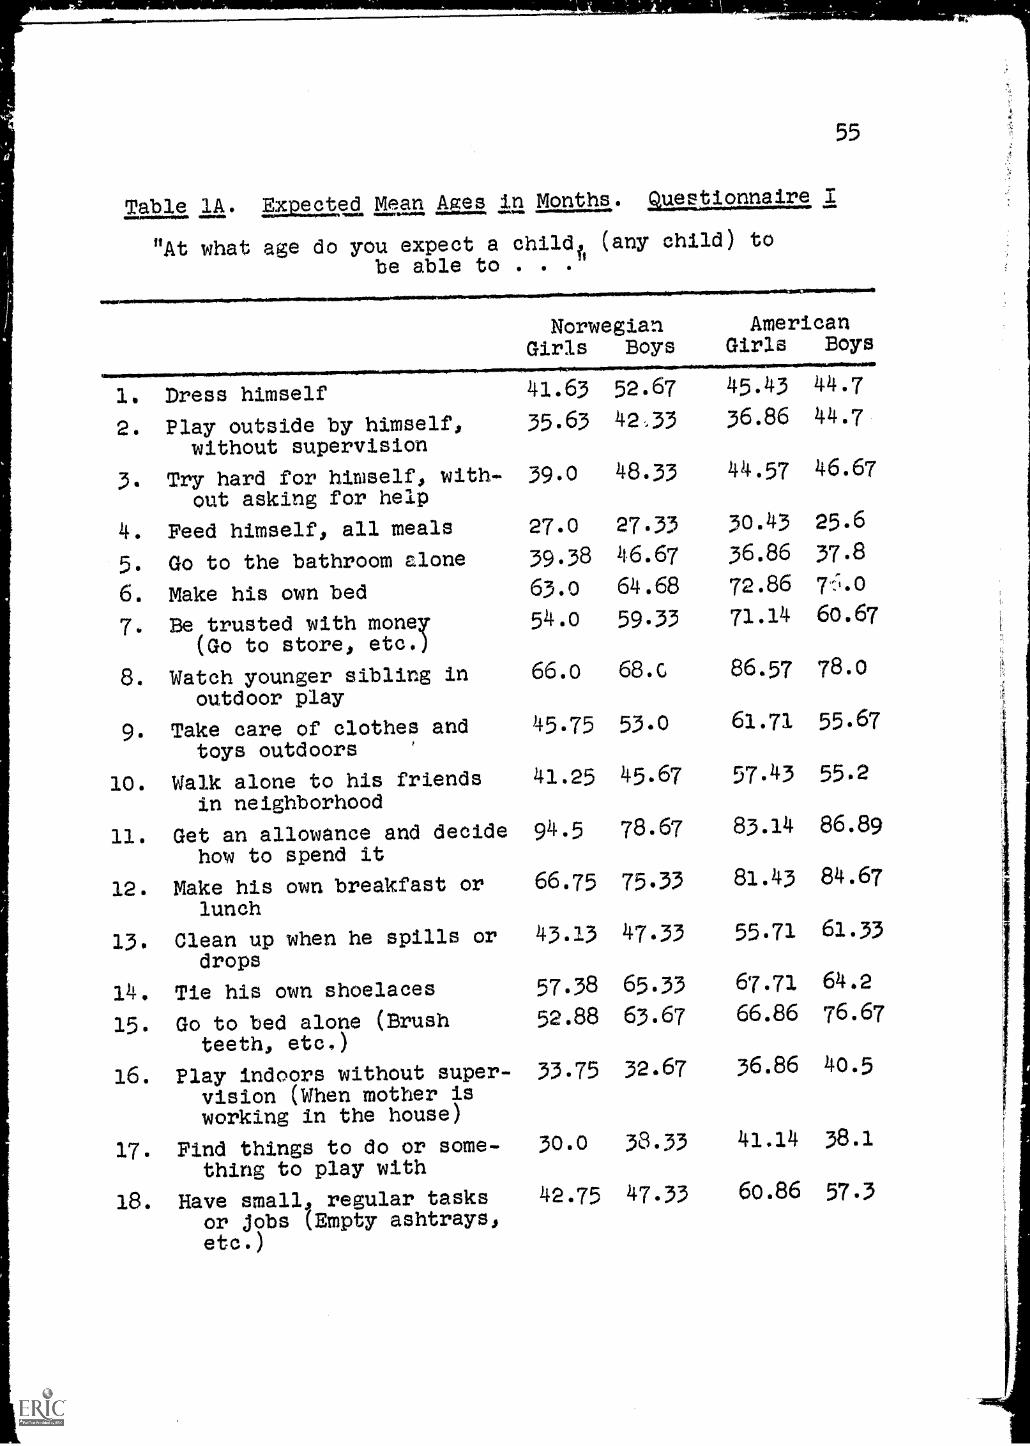
55
Table IA. =lc...W. Mean Ages in Months. gatanior_Inaire
"At what age do you expect a child,. (any child) tobe able to . . ."
1, Dress himself
2. Play outside by himself,without supervision
3. Try hard for himself, with-out asking for help
4. Feed himself, all meals
5. Go to the bathroom alone
6. Make his own bed
7. Be trusted with money(Go to store, etc.)
8. Watch younger sibling inoutdoor play
9. Take care of clothes andtoys outdoors
10. Walk alone to his friendsin neighborhood
11. Get an allowance and decidehow to spend it
12. Make his own breakfast orlunch
13. Clean up when he spills ordrops
14. Tie his own shoelaces
15. Go to bed alone (Brushteeth, etc.)
16. Play indoors without super-vision (When mother isworking in the house)
17. Find things to do or some-thing to play with
18. Have small, regular tasksor jobs (Empty ashtrays,etc.)
NorwegianGirls Boys
41.63 52.67
35.63 42.33
39.0 48.33
27.0 27.33
39.38 46.67
63.0 64.68
54.0 59.33
66.o 68.c
45.75 53.0
41.25 45.67
94.5 78.67
66.75 75.33
43.13 47.33
57.38 65.33
52.88 63.67
AmericanGirls Boys
45.43 44.7
36.86 44.7
44.57 46.67
30.43 25.6
36.86 37.8
72.86 7-1.0
71.14 60.67
86.57 78.0
61.71 55.67
57.43 55.2
83.14 86.89
81.43 84.67
55.71 61.33
67.71 64.2
66.86 76.67
33.75 32.67 36.86 40.5
30.0 33.33 41.14 38.1
42.75 47.33 60.86 57.3

Table lA (Contd:)
56
NorwegianGirls Boys
lg. Go with message to neighbor 47.25 49.0
20. Choose which friends toplay with
21. Decide when and what toplay with peers
22. Be alone at home whilemother goes on an errand
23. Pick up his toys
24. Wash or dry dishes
25. Walk alone to familyfriends in neighborhood
26. Have a friend over to playwith indoors, withoutsupervision
49.88 43.33
44.25 44.33
52.5 54.67
36.75 44.33
51.75 58.67
43.5 49.33
43.5 49.0
AmericanGirls Boys
52.29 55.2
46.29 49.5
48.86 51.0
79.71 88.0
50.57 48.0
85.71 76.67
48.86 55.2
47.14 60.0

57
Table 1B. lioctta Mean ae. Scores, in Months. gRenionnaire I
By Nationalitz and II sex
Norw. vs. Am.
WON.MOMMlwanorAnpmvariaps~.1.41.MMOR.......a.1
Item No. 1
2
3
5
6
7
8
9
lo
11
12
13
14
15
16
17
18
19
20
21
22
23
24
25
26
Overall means:
Girls vs. Boys41~rmiYMIN11~0
47,47 45.0 43.4 48.47
39.18 41.47 35.53 43.58 ***
43.94 45.75 41.6 47.5
27.18 27.59 28.6 26,42
43.24 33.47 ** 38.2 42.0
63.88 70.24 67,6 70.33
56.82 61.41 62.0 6o.o
67.06 81.75 * 75.6 73.0
49.59 58.31 53.2 54.33
43.59 56.12 * 48.8 50.68
86.12 85.25 89.2 82.78
71.29 83.25 * 73,6 80.0
45.35 58.88 * 49.0 54.33
61.59 65.65 62.2 64.74
58.59 72.38 * 59.4 70.17 ***
33.18 394 35.2 36.79
34.41 39.35 36.2 38.21
45.18 58.76 * 51.2 52.58
48.18 54.0 49.6 52.26
46.41 48.18 48.2 46.58
44.29 50.06 * 46.4 47.67
53.65 84.38 * 65.2 71.33
40.76 49.25 43.2 46.17
55.41 80.63 67.6 67.67
46.59 52.59 52.67 52.42
46.41 58.13 45.2 57.83
49.97 58.22 ****
ONAla*Mg..MWM041iMPWWIW111.0,.....MWOMPINIMPIIMP.O...1.~.4.1....~1/00f..*
By two-sample T-testal* Significant result--mean age score lower in Nom. sample.** Significant result--mean age score lower in Am. sample.
*** Significant result--mean age score lower for Girls.**** Significant result-Liprobability level p

5 8
Table I. Analau of Variance II
atughtea Means Analysis ,Based on rags= Type VI
Source of Variation df Mean Square
Between
Sex
Nationality
Sex x Nationality
Error
33
1 22.690 < 1
1 49.455 < 1
1 20.293 < 1
30 75.075
Within 374 .. ..
Task 3 463.419 13.915 ***
Task x Sex 3 5.939 < 1
Task x Nationality 3 70.391 2.114
Task x Sex x Nationality 3 6.049 c 1
Task Error 90 33.303
Score 2 972.209 46.249 ***
Score x Sex 2 28.516 1.356
Score x Nationality 2 3.069 <1Score x Sex x Nationality 2 48.482 2.306
Score Error 60
Task x Score 6
Task x Score x Sex 6
Task x Score x Nationality 6
Task x Score x Sex xNationality
Task x Score Error
6
180
21.021 4111*
179.464 22.360
10.948 1.364
84.329 10.507
10.945 1.364
8.026 es MP
*** p .4z .001
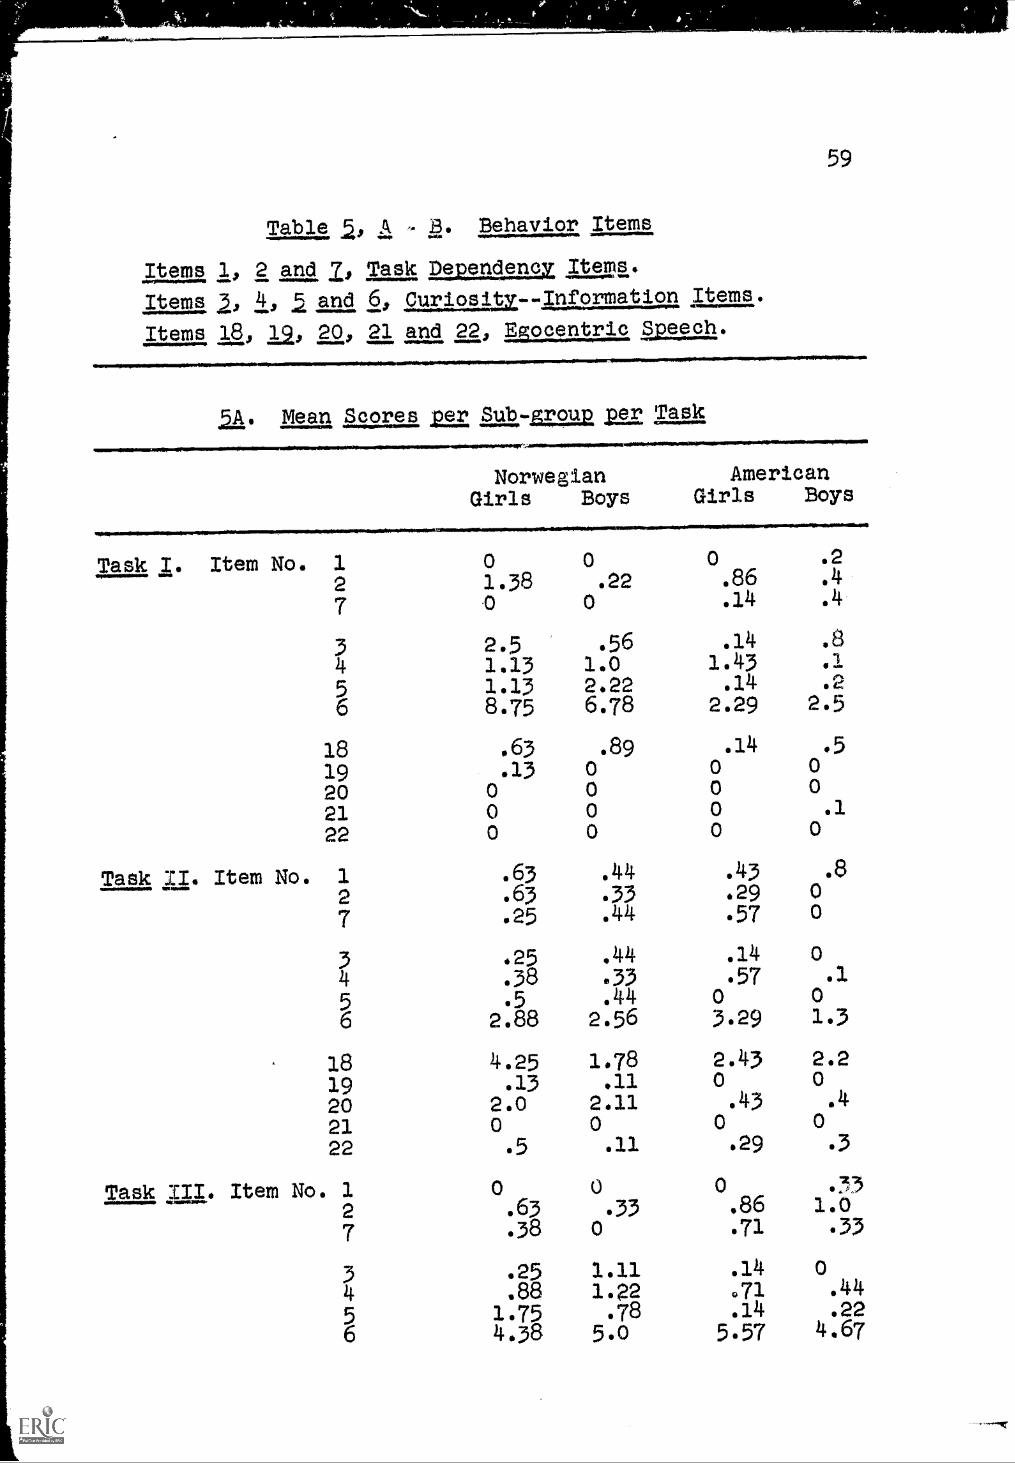
59
Table A - B. Behavior Items
Items 1, 2 and Z Task Dependency Items.
Items 4, .5. and 6, glaamizsz.information ;tem.
Items 181 2.5 200 21 and 22, Egocentric Speech.
a Mean Scores 2.9.r. Sub-group 2,922 Task
NorwegianGirls
Task Item No. 12 1.387 0
3 2.54 1.135 1.136 8.75
AmericanBoys Girls Boys
.2
.22 .86 .4
0 .14 .4
.56 .14 .8
1.0 1.432.22 .14 .2
6.78 2.29 2.5
18 .63 .89 .14 .5
19 .13 0 0 0
20 o 0 o 0
21 0 0 0 .1
22 0 0 0 0
Task ;:rI. Item No. 1 .63 .44 .43 .8n4 .63 .33 .29 0
7 .25 .44 .57 0
3 .25 .44 .14 0
4 .38 .33 .57 .1
5 .5 .44 0 0
6 2.88 2.56 3.29 1.3
18 4.25 1.78 2.43 2.2
19 .13 .11 0 0
20 2.0 2.11 .43 .4
21 0 0 o 0
22 5 .11 .29 .3
Task .III. Item No. 1 0 0 033
2 .63 .33 .86 1.0
7 .38 0 .71 .33
3 .25 1.11 .14 0
4 .88 1.22 ,71 .44
5 1 .75 .78 .14 .22
6 4.38 5.0 5.57 4.67
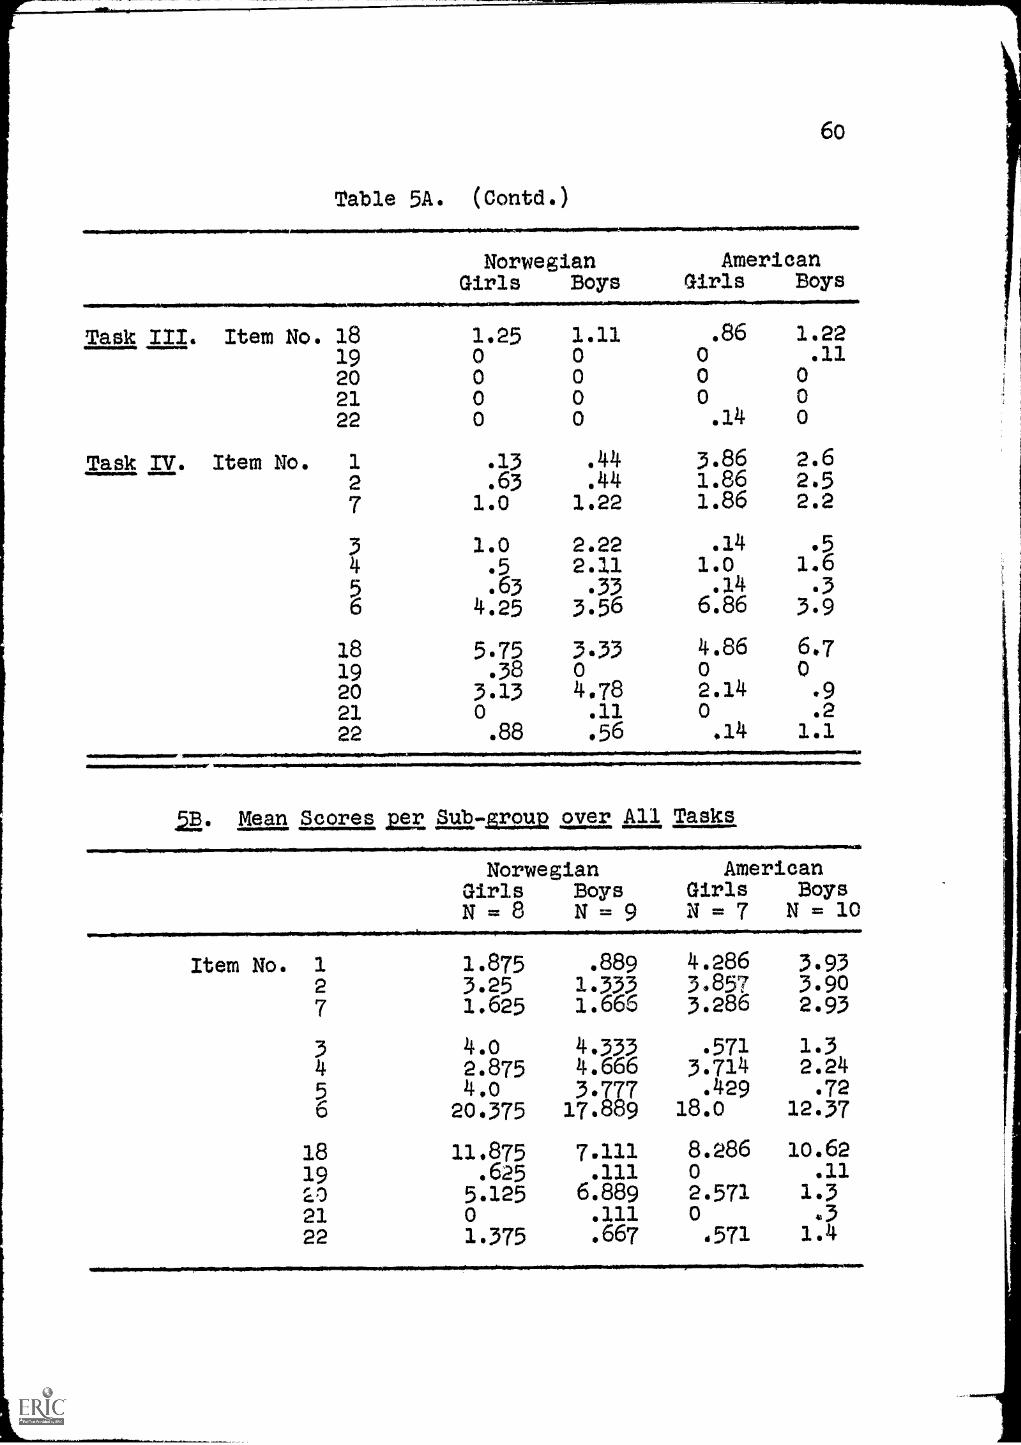
6o
Table 5A. (Contd.)
NorwegianGirls Boys
Iimmill00111.1.0...towalimmoorpeowwwwwwlwrInew"
Task III. Item No. 18 1.25 1.1119 0 020 0 0
21 0 022 0
Task IV. Item No. 1 .132 .63
7 1.0
3 1.04 .55 .636 4.25
1819202122
5.75.38
3.13
.88
AmericanGirls Boys
.86 1.220 .110 00 0.14 0
.44 3.86 2.6
.44 1.86 2.51.22 1.86 2.2
2,22 .14 .5
2.11 1.0 1.6.33 .14 .3
3.56 6.86 3.9
3.33
4.78.11.56
51. Mean Scores 213:Sub-group over All Tasks
NorwegianGirls BoysN = 8 N = 9
AmericanGirls BoysN = 7 N = 10
Item No. 12
1.875 .889 4.286 3.933.25 1.333 3.857 3.901.625 1.666 3.286 2.93
3 4.0 4.333 .571 1.34 2.875 4.666 3.714 2.24
5 4.0 3.777 .429 .726 20.375 17.889 18.0 12.37
18 11,875 7.111 8.286 10.6219 .625 .111 o .11
i.o 5.125 6.889 2.571 1.321 0 .111 0 ,3
22 1.375 .667 .571 1.4

61
Table 6. Analysis of Variance III
Ratio-Scores From Task-Situations
UnweisOted Means Analysis Based on Lindquist.) Vse, 111
Task Dependncy.umwiMOMMINNWON01/1/40,0/Ermp+msww..MMWMiljiwwIsumiwwwftwoMk
Source of Variation df Mean square f
Between se 33 ea WO WM /*
Nationality 1 .969 3.388Sex 1 .217 <1Nationality x Sex 1 .050 <.1
Between Error 30 .286 sob Ass
Within Ss 102 -- .....
Task 3 .985 7.138 ***Task x Nationality 3 .367 2.659 *Task x Sex 3 .056 <1Task x Nationality x Sex , .033 <1Within Error 90 .138
* p almost .05*** p < .001
ION NMI
1WWWWwslwe:.31/1111./SEMPOSMIWBOw/10.11/11.11110112111Whwww,-/sOWswb
Curiosity. Gives and Asks for Information.
/1/1/1/011W1111W/IWww01/1101/wW,WWww.S...1.0/0....WW/
Source of Variation
Between SsNationalitySexNationality x SexBetween Error
4/w/IMM.MM/mmwmWOWPO.df Mean Square f
...............---...
1 16.493 6.537 **3. .777 <11 .910 <1
30 2.523 ....
Within Ss 102Task .x
Task x Nationality 5Task x Sex 3Task x Nationality x Sex 3Within Error 90
aa Ws) Ow we
11.199 16.4211.960 2.874.175 <1
1.211 1.776.682
* p c.05** p ç.O25*** p .001

Table 6 (Contd.)
Total Verbalisation.
62
Source of Variation df Mean Square
Between SsNationalitySexNationality x SexBetween Error
33 .... ....
1 18.414 2.9701 1.228 <11 .142 <3.
30 6.201 ..
Within Ss 102 .. ...
Task 3 5.701 5.383 *
Task x Nationality 3 2.085 1.969
Task x Sex 3 .559 < 3.
Task x Nationality x Sex 3 1.214 1.146
Within Error 90 1.059
.05

gal Mean Asa correlated with ggz, Iaalandence Score
Table 11. Intercorrelations I
Bz Nationalily and Asy Sex
All Ss Nom.Total
and =Mena Score
NationalityAm. Girls
4w...+0.000b+Owwwwpo
SexBoys
63
Alo QI Mean 4.678(33) -.585(17)-.478(16)-.798(15) -.508(18)
Age xQII Independ- p ,c.005 p4(.01 p 4..05 p 4.005 p4(.025
ence Score
QI Mean +.535(31)Age xQII Depend- p <.005ency Score
.347(15) .238(16) .612(15)
<.01
.464(16)
p <X5
1111011111101~1101111.11.111.111100~=11111101111111.01111110111111POWIIIINCOPIOMMEOMIP.MIMOMMMIIIIIMI1101111111101.1110
Table yx. Intercorrelations I
9a, Mean last correlated with Igo kapendence Scoreand aondency Seore
a National Sub-r!rouRs
Norwegian American
Girls Boys Girls Boys
Bl. QI Mean Age x -.482(8) -.594(9) -.839(7) -.042(9)
QII Independence p e, .05 p .005
Score
B2. QI Mean Age xQII DependencyScore
.126(8) .646(7)p <.05
.509(7) ..o16(9)
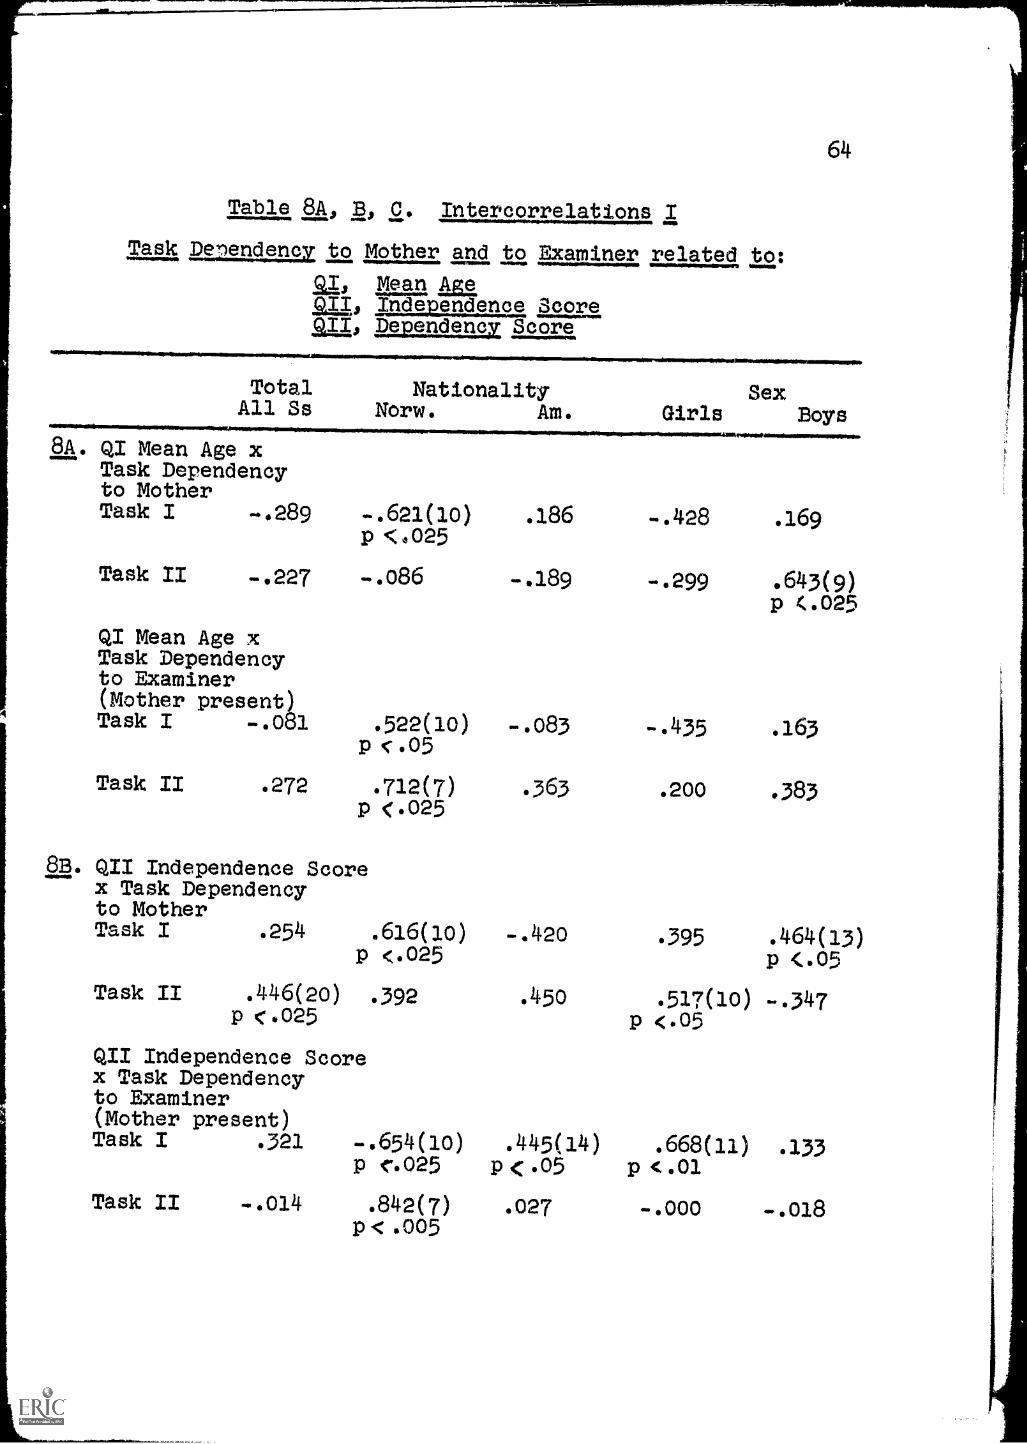
Table 8A, B, C. Intercorrelations I
Task a:mama to Mother ard to Examiner related to:
gg, Mean AgaIndeunsIst.ce Score
=mama Score
TotalAll Ss
amorrereftlmal=1M101.414.~1
NationalityNorw. Am.
8A. QI Mean Age xTask Dependencyto MotherTask I -.289
Task II -.227
QI Mean Age xTask Dependencyto Examiner(Mother present)Task I -.081
Task II .272
-.621(10)P <0025
-.o86
.186
-.189
.522(10) -.083p (.05
.712(7) .363p (.025
115. QII Independence Scorex Task Dependencyto MotherTask I .254
Task II .446(20)p (.025
QII Independence Scorex Task Dependencyto Examiner(Mother present)Task I .321
Task II -.014
.616(1o) -.420<.025
.392
-.654(10)p c.025
.842(7)< .005
.45o
IINS111.14MINIMINI
.445(14)p < .05
.027
64
41WaimaRMINWOWN
SexGirls Boys
..428
-.299
.169
.643(9)p .025
-.435 .163
.200 .383
.395 .464(13)P (.05
.517(10) -.347p <.05
.668(11) .133p .01
-.000 -.018

Table 8A, B, C. (Contd.)
65
..11.1...10111141111111.....041111~0.41".....
Total Nationality SexAll Ss Nom. Am. Girls Boys
Inummemiormiewornirmoreprrowa. Amos.....OrionammanwiregeormismNowirroreowp.r........somowdoso
Q. Q11 Dependency Scorex Task Dependencyto MotherTask 1 -.209 -.363 .110 -.342 .169
Task 11 -.452(20) -.343 -.508(13) -.649(10) -.021p .1.025 p <.05 p <,.025
Cal Dependency Scorex Task Dependencyto Examiner(Mother present)Task I .366(22) .501 -.356
p < .05
Task 11 -.043 .906(7) -.222p .005
-.760(11) .023p <.005
-.208 .044
NOsmomplimarlmiwrelismt~pmallmw.wHIPIMN=delleffisMsteIlaNIISINIIIIIN

Table 10. Individual Means and Sub-roup Means ofRatio-scores, from Behavior Rat= List apssar_bies
.111111111
66
aymianialIMINIIIINNIMplVIIIMINOINION11101M11111..MIMMINMIMINIMONI1111111111M11000.1.1.1.01.11.1
NorwegianGirls Boys Girls Boys
A. Task Dependency Items No.1, 2, and 7 combined
Individual Means
. 587 o.
.320 .524
.049 .275
.167 .263
.348 .053
.394 o.
.377 .316
. 137 .146.107
...101.11M
.471 .286
. 667 .190
.056 2.122
.86o .296
.524 .968
. 484 o.
.340 .245.259.6
o.
Group Means = .297 .187 .486 .497
B. "Gives and wants information" 1.6 .571 .275 .571No. 3, 4, 50 and 6 combined 1.8 1.905 1.333 .429
.878 3.098 .111 2.204Individual Means 1.033 2.632 .989 .590
1.087 2.187 1.714 1.3472.31 .091 1.387 .031.358 1.0 .936 .776.821 .439 .547
1.067 .56.419
Group Means =1.361 1.443 .964 .747
C. Total Verbalization 3.147 .679 .824 2.0823.28 3.619 2.41 1.048.927 4.588 .222 5.714
Individual Means 1.833 4.053 2.624 1.0492.826 3.147 2.714 2.9473.549 .091 3.065 0.032.604 2.368 1.447 2.0821.436 .878 1.410
1.6 2.080.419
Group Means = 2.45 2.335 1.901 1.886
.sobellftwnsimr111=aMiMoOlogio.ao
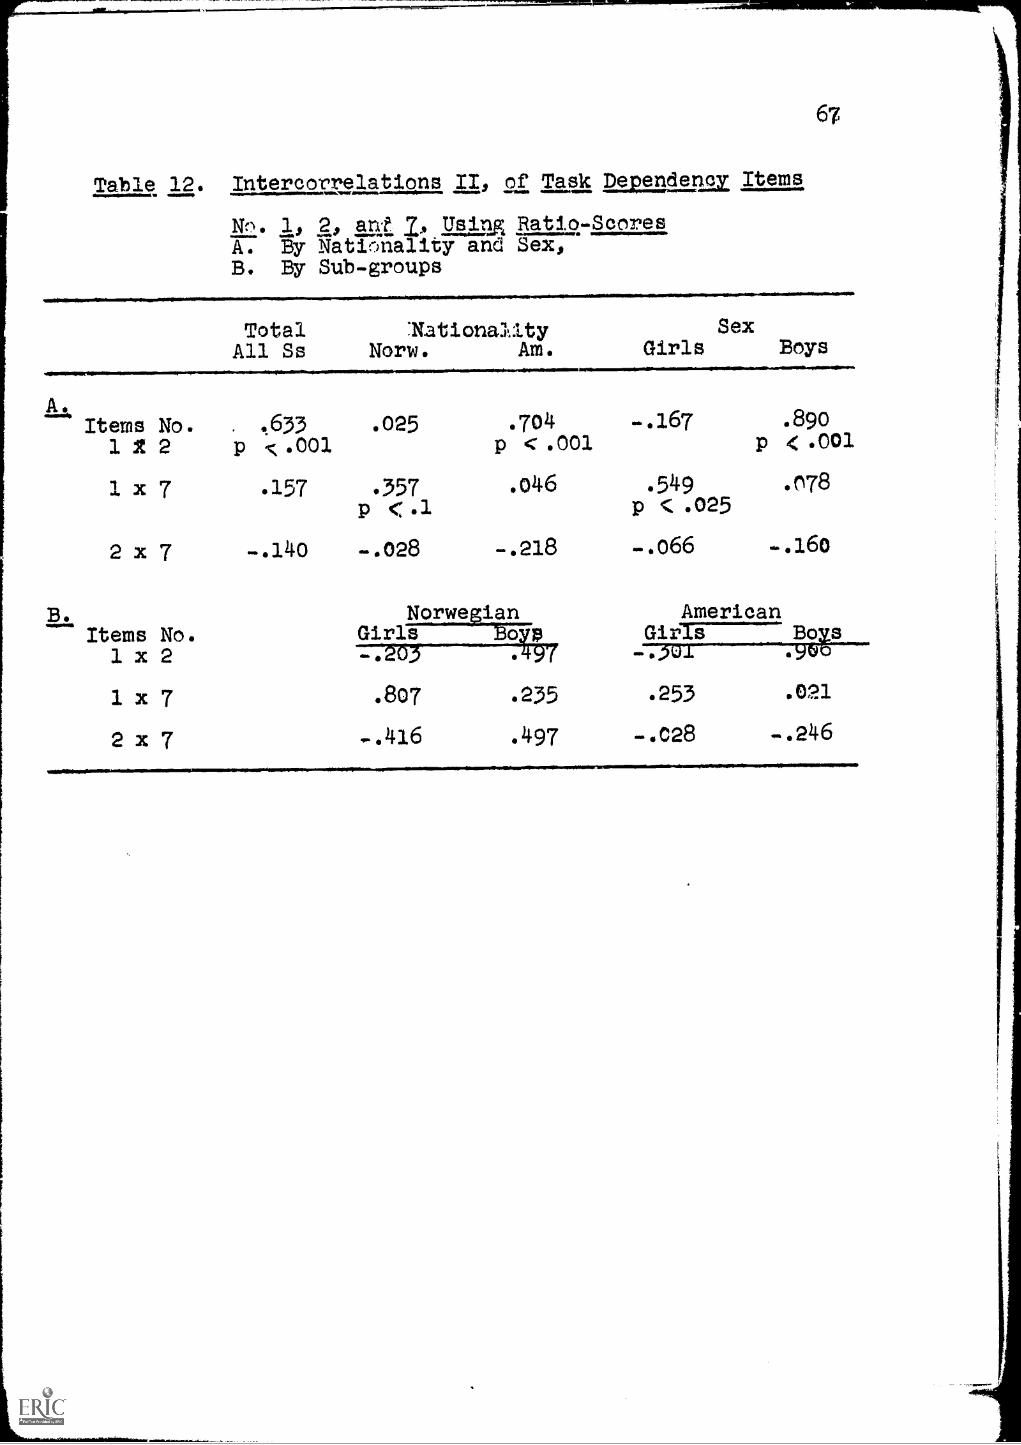
67
Intercorrelations II, of Task iltp_sieria Items
Nn. 1, 2, an! Ratio...Scores
A. By Nationality and Sex,B. By Sub-groups
TotalAll Ss
..pmspinumew..,....srawitiommEriare,
NationalityNorw. Am.
SexGirls Boys
A.Items No. . ,633
1 2 2 p ç.00J.
1 x 7 .157
2 x 7 ..140
B.Items No,1 x 2
1 x 7
2 x 7
.025
.357p (.1
-.028
.704p .001.o46 .549
p < .025
-.167
-.218 -.066
NorwegianGirls Bo-.203
.r97
.807 .235
-.416 .497
.890
P .001
.078
-.160
AmericanGir s
.253
-.028
Boys.9uo
.021
-.246
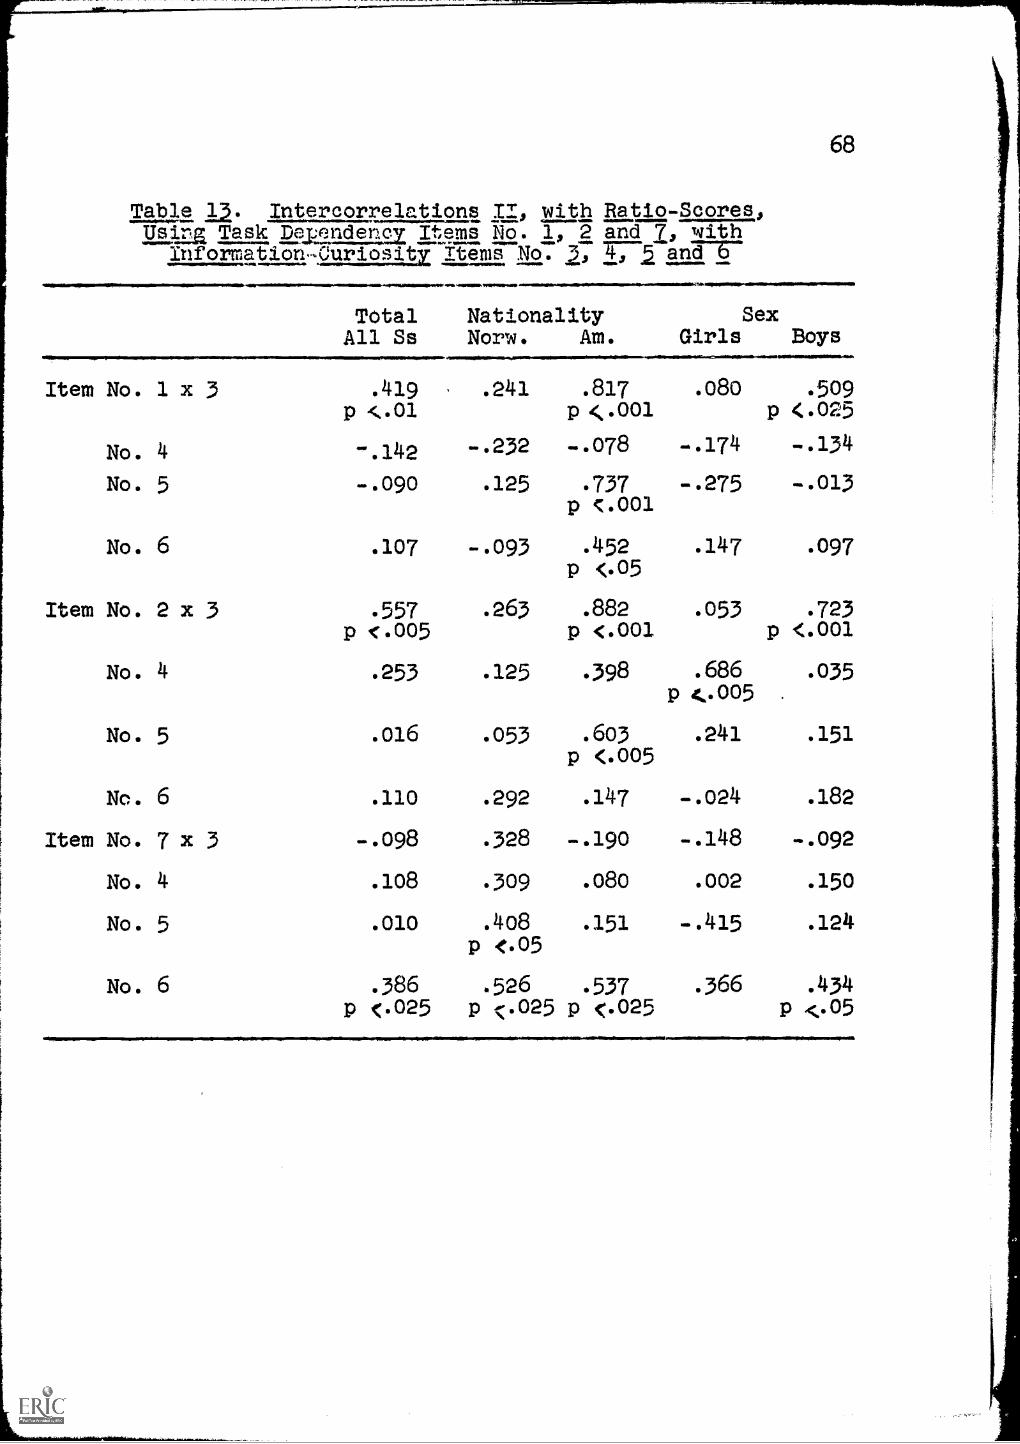
68
Table Intercorrelations II, with Ratio-Scores,Uslaa Task Delaaltua Itc4ms No. 1, 2 and 10 with
Information-Curioqtx Items No. 3, anam-T
Total NationalityAll Ss
Item No. 1 x 3
Nom. Am.Sex
Girls Boys
.419 , .241 .817p <.01 p <.001
No. 4 -.142
No. 5 -.ogo
No. 6 .107
-.232 -.078
.125 .737p c.001
-.093 .452p <.05
Item No. 2 x 3 .557 .263 .882p (.005 P <.001
No. 4 .253 .125 .398
No. 5
No. 6
Item No. 7 x 3
No. 4
No. 5
No. 6
.016 .053 .603P <.005
. 110 .292 .147
-.098 .328 -.190
. 108 .309 .080
.010 .4o8 .151p <.05
.526 .537p .025 p <.025
.386p <.025
.08o
-.174
-.275
.509p (.025
-.134
-.013
. 147 .097
.053 .723p <.001
. 686 .035p 4..005
.241 .151
.182
-.092
. 150
. 124
.366 .434
P
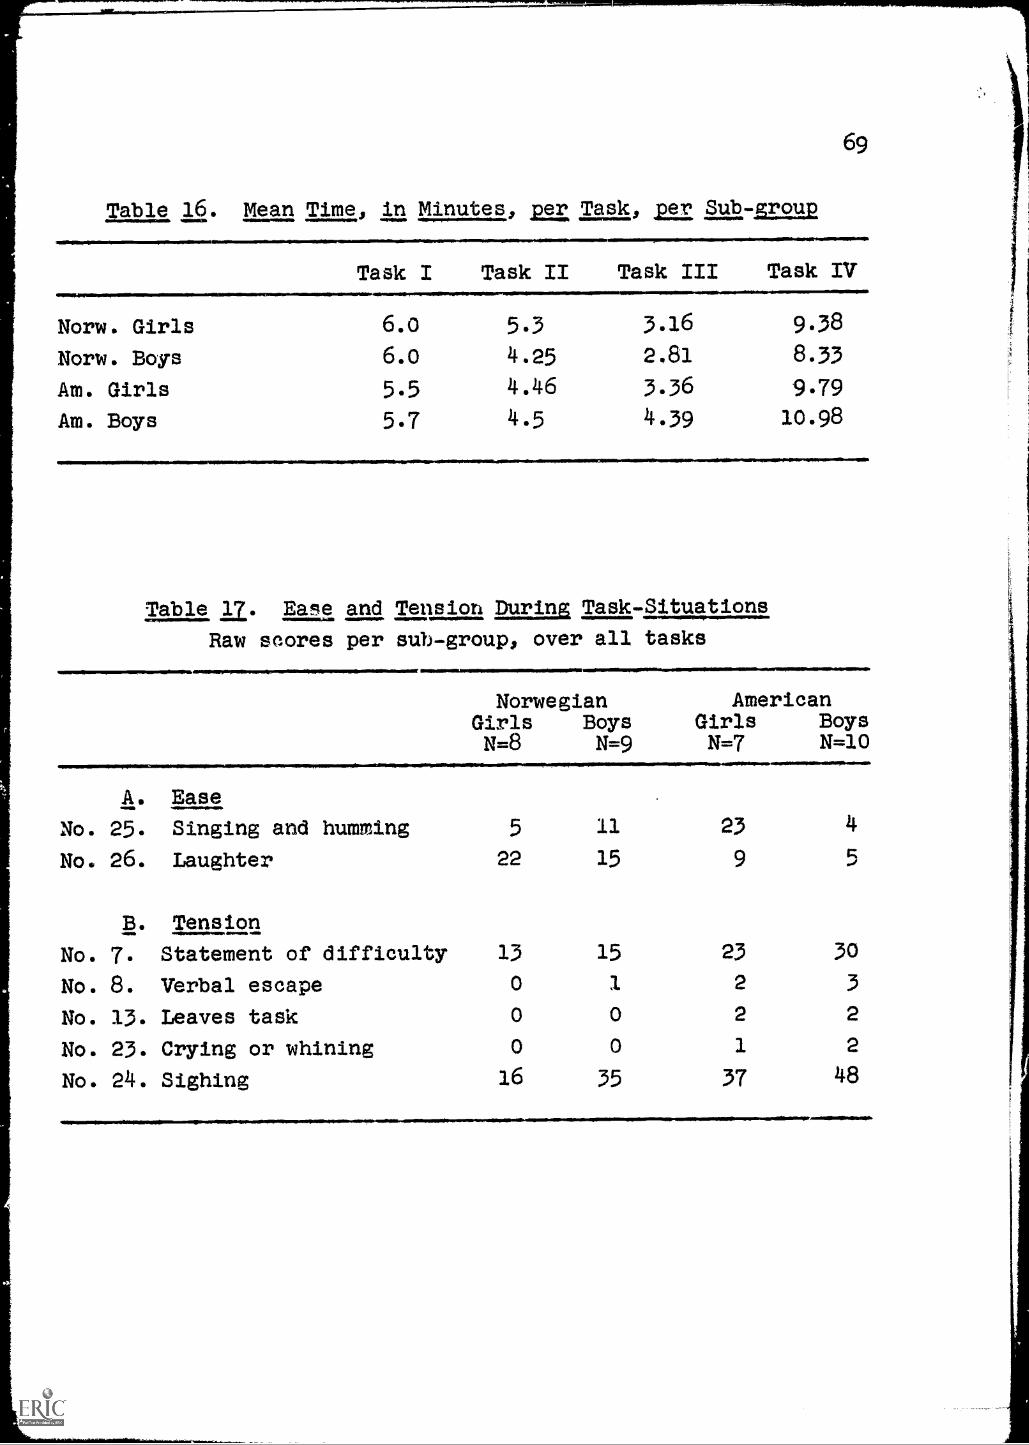
Table 16. Mean Time, in Minutes, or Task, .221 sub-Eromp
Norw. Girls
Norw. Boys
Am. Girls
Am. Boys
0.11111101111.=11.0011111M11141111111111111111=11111.11011M,
Task I Task II Task III Task ryAIINIMM110.11M11.111MONSIIMMINNEW,
6.0 5.3 3.16 9.38
6.0 4.25 2.81 8.33
5.5 4.46 3.36 9.79
5.7 4.5 4.39 10.98.1.1.1 Amim.00010...masiloWIIIN
Table a. Ease and Tension DurinE Task-Situations
Raw saores per sub-group, over all tasks
Norwegian AmericanGirls Boys Girls BoysN=8 N=9 N=7 N=10
A. Ease
No. 25. Singing and humming 5 11
No. 26. Laughter 22 15
23 4
9
B. Tension
No. 7. Statement of difficulty 13 15 23 30
No. 8. Verbal escape 0 1 2 3
Leaves task 0 0 2 2
Crying or whining 0 0 1 2
Sighing 16 35 37 48
No. 13.
No. 23.
No. 24.

Appendix B
Mothers! QuestionnaireCuTEURTIV Expeoted Standards
At what age do you expect a child (any child) should beable to:
1. Dress himself (not outdoor clothes)
2. Go outside to play by himself without supervision
3. Try hard for himself (in tasks) without asking for help
4. Feed himself, all meals
5. Go to bathroom alone
6. Make his own bed
7. Be trusted with money (to go to store, take money toN.S. to pay your neighbor for package which arrived,etc.)
8. Watch younger sibling in outdoor play
9. Take care of toys and clothes outdoors
10. Walk alone to family friends in neighborhood
11. Get an allowance and decide how to spend it
12. Make his own breakfast or lunch
13. Clean up when he spills or drops
14 Tie his own shoelaces
15. Go to bed alone (incl. washing and brushing of teeth)
16. Play indoors without supervision (when mother is workingaround the house)
17. Find things to do or somethina to play with
18. Have small (regular) tasks or jobs (take in newspaper,empty ashtray, etc.)
19. Go with message to neighbor
(70)

71
20. Choose which friends he wants to play with
21. Decide when and what to play with peers
22. Be alone at home while mother goes on errand
23. Pick up his toys
24. Wash or dry dishes
25. Walk alone to friends in neighborhood
26. Have a friend over to play with indoors, withoutsupervision
Satationnairt
Each question has 3 possibilities. Please answer 1 "yes" and2 "nots" for each question.
When X is playing indoors, alone, do you:a. expect him to play by himselfb. play with himc. take some time to play with him and tell
him to play by himself the rest of thetime
When X has a friend over do you:a. supervise their play all the timeb. let them play alonec. watch them at times to see what is :
going on
When X wants to go and play with a friend inthe neighborhood do you:
a. let him walk aloneb. take him therec. call up the other child and ask him to
come to your house
When X wants to bring his toys to the play-ground to play with do you:
a. expect him to take care of them andbring them home
b. go and pick them up for himc. tell him to leave the toys at home
YES NO
relkowsem
wilMorarsim
111.1=0111111.
01,6111Soula
.11110110
WNINAIIIMMNIS .01101111111.411111111
reoboWab 1111111MINIIMON1111111.
10111010111111110W. 41111101111110,..

When X is playing with a friend and they havean argument do you:
a. let them work it out by themselvesb. stop the argumentc. bring in new objects or ideas to divert
their attention
When X is playing outdoors do you:a. keep an eye on him, on and offb. go outside with himo . let him play by himself
If X has smaller brother or sister do you:a. let X watch the smaller one during
outdoor playb. go out and watch the smaller one
yourselfO . let X take responsibility for the
younger one while you are within reach
If X has older brother or sister do you:a. encourage X to do things the older ones
can do (dress himself, do small jobs,etc)
b, point out that he is smaller and can'tdo certain things
o . encourage him to do other things whichhe can more easily manage by himself
If X usually wakes up before you in themorning do you:
a. encourage him to get up and play andlet you sleep
b. tell him to stay in his bed till youwake up
c. let him come into your bed if he is quiee
When it is mealtime (breakfast, lunch, or Xlsindividual supper) do you:
a. make ready certain things you want Xto eat
b. decide together when X is there what tomake and have him help you
c. let him fix his own meal if it is simple(cereal, sandwich) and he can findthings by himself
72
YES NO
sarq000Meamer
401110.1010M
VOONOOMMININO
GINIIIMNIONSOIO
will1101.1101mum
oiliMMENfteam
plosillompoilmo
41111110011~14110
laSersrembmgr
anal00101001111111
4011111
soispolltermaiw
011.101
vilIVNIMIO
01111.0%
awlmlorampla.
ale1111101010111
.1000111111110110,10
1111"/NA
elliMMOMMONAD

When X is eating or "helping" you and hespills do you:
a. quickly wipe it upb. encourage X to clean it up, by giving
him sponge, cloth, etc.c. let him wipe first, but show him you
have to go over it and do it properly
If X wants to help you around the house do you:a. tell him he has to wait till he is
olderb. give him small jobs he cau do by him-
self (dusting, drying silver, etc.)c. tell him he has to do the same thing
you are doing and give him a smallpart of it
If X wants to do certain small jobs at homedo you:
a. ask him to do it occasionallyb. drop it if he gets tired of itc. expect him to do it regularly
If X gets an allowance or money fer a job do you:a. let him decide alone what to do with itb. tell him to save it or plan the way
he should use itc. have a planned arrangement with X to
save some and let him spend the restas he wishes
In regard to money, do you think:a. X is old enough to understand that things
have value and one pays for them andone can save for things one wants
b. it is better to tell X about moneywhen he gets older
c. to let him have money now and thenjust to play with
When X is getting dressed do you:a. expect him to practice and manage
hard things like buttons, tieshoelaces
b, do it for him, so he gets quicklydressed
c. let him do easy things and do the hardparts yourself
73
YES NO
=11.1111.
.041.1001.11046

When X gets to bed at night do you:a. tell him you'll come up (or in) when
he is undressedb. undress him yourselfc. encourage him to manage a little and
help him with the rest
When you have to run an errand or go for shortvisit in neighborhood do you:
a. take X with youb. have him to play by himself for short
period0. get someone to look after him
If X is invited to go on trip with relativeshe knows, or for a weekend with grandparentsor friends, do you:
a. feel you should be there with himb. let him go but come after yourselfc. let him spend entire time without
your presence
If you had a dentist appointment, couldn't behome when he walks home (or comes with carpool) would you:
a. give him a key to get inb. ask him to go to neighbor and waitc, pick him up and take him with you
If X is interested in some outdoor activity likebicycling, skiing, skating, roller-skating, do you:
a. expect him to go out and practice byhimself
b. ask him to wait till you or his fathercan go with him
c. suggest he finds a friend to practicewith
YES
0111141111.0=1"
MIM so.
711,111111=01
4110011614100.1.
NINIMINIOSIONIRO
When X is sick and has to stay in bed do you:a. expect him to entertain himself for
awhileb. sit at the bedside most of the timec. eo back and forth between kitchen and
sick bed
Apart from the nightly cleaning and scrubbing(if this is necessary!) do you:
a. let X be responsible for toileting,washing of hands, brushing teeth
b. feel you should be present in all thesesituations helping him
c. do you keep an eye on his processes,without interfering
.41111111101.111111.1111P
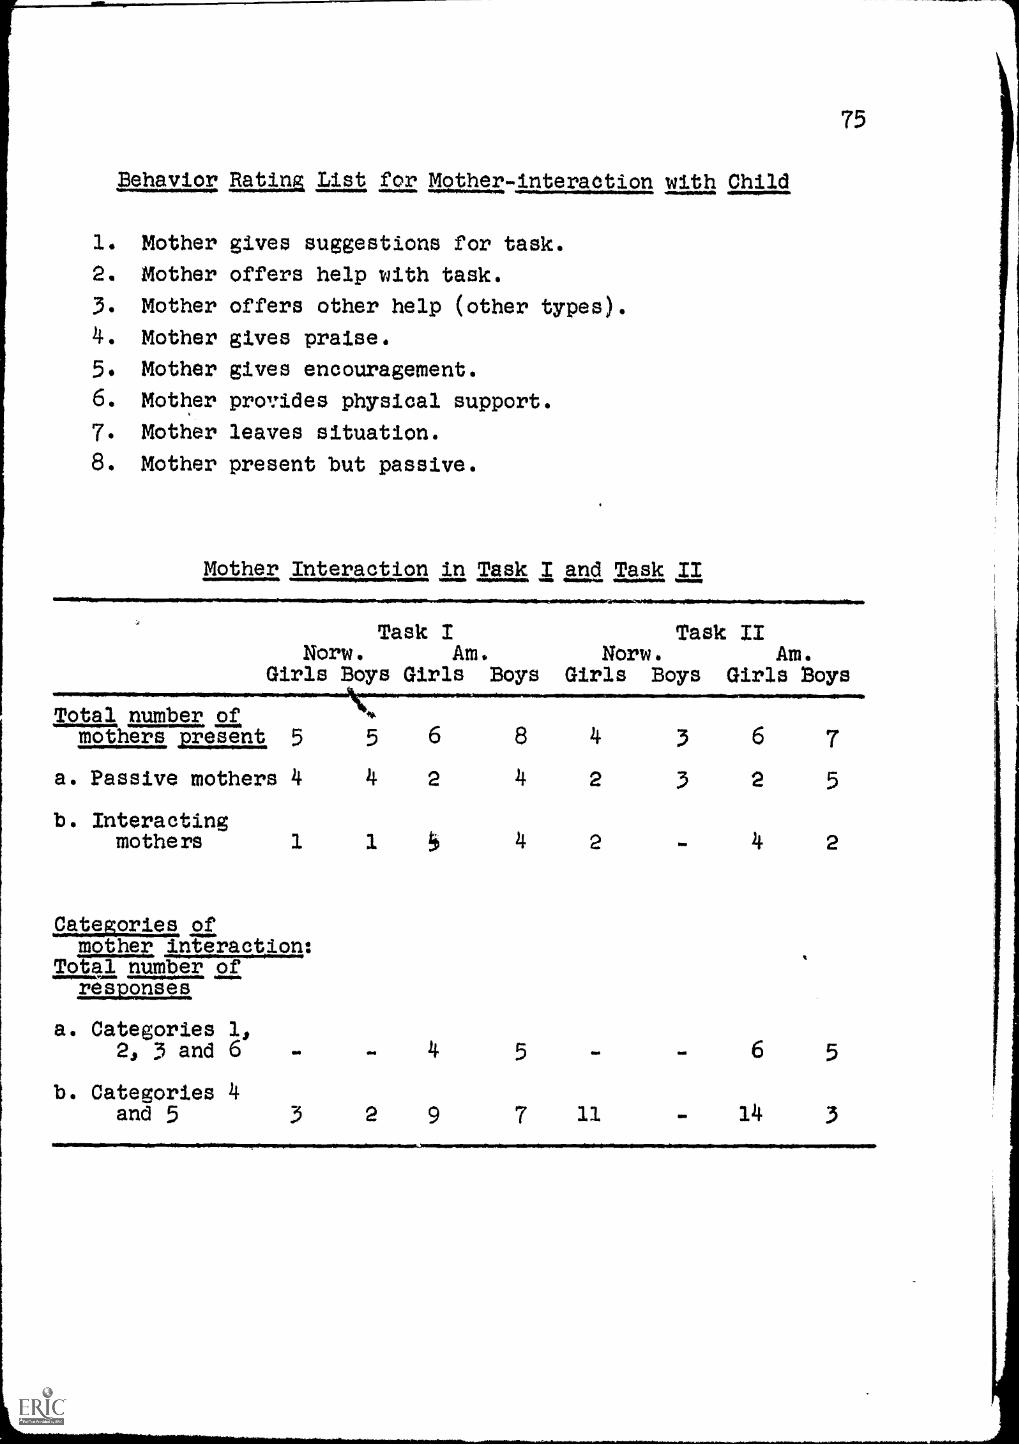
4.11111
75
Behavior Eatim List for Mother-interaction with Child
1. Mother gives suggestions for task.
2. Mother offers help with task.
3. Mother offers other help (other types).
4. Mother gives praise.
5. Mother gives encouragement.
6. Mother provides physical support.
7. Mother leaves situation.
8. Mother present but passive.
Mother Interaction in Task I and Task II
Task INom. Am.
Girls Boys Girls Boys
Total number ofmothers present, 5 5 6 8
a. Passive mothers 4 4 2 4
b. Interactingmothers 1 1 5 4
Task IINorw. Am.
Girls Boys Girls Boys
Categories ofmother interaction:
Totql number of12S..§.2.9.1.219-11
a. Categories l,2, 3 and 6 4 5
b. Categories 4and 5 3 2 9 7
111110111MM...110111.wilf11110.1111111101110PININO1.01
4 3 6 7
2 3 2 5
2 4 2
6 5
INNONIMIM.NIMMIMMUMMMIONENNIO611.10WINIMM,

76
Correlations of the Ratirlia ofthe Task Situations
The present study was planned such that the main
investigator would record on recording-sheets the subjects' behavior
during the task-aituationS with the examiner and with-the mother.
The behavior including all verbal responses would then be noted
by the investigator and a co-rater.
During the pilot study the first few subjects were
rated only on 8 behavior items, which were set up ahead of time.
This small group of items proved highly inadequate, however, for
a thorough and complete recording of the child's total behavior.
The list of items on the behavior rating scale was expanded to
include a total of 27 items (see Appendix A). The behavior of
every subject in the study was rated according to this list in
each of the four task-situations.
As this investigator wanted to use the hand-recorded
responses in the further examination of the data, the investi-
gators agreed upon the following procedure: The examiner would
keep a running recording of the child's behavior and responses.
Simultaneously, a tape-recorder would be used to record the
responses, in order to obtain a correlation of the hand-recorded
and tape-recorded responses. In this way we would get 1) a meas-
ure of validity of the hand-recording compared with the tape.
recording and 2) a correlation of the taped responses as rated
independently on the recording sheets, by the investigator and
the co-rater. If both of these correlations were good, it would

77
then seem valid to use the investigatorts hand-recordings as a
material accurate enough to work with.
All the responses of the American and the Norwegian
subjects were both hand-recorded and tape-recorded. For the cor-
relations only tape-recorded responses of American subjects were
used, however; as it proved too difficult for the American-
Norwegian co-rater to understand the Norwewian dialects from the
tapes.
Although there were 17 American subjects in the study,
tapes from only 10 children were used. One disadvantage in test-
ing the children in their homes was the lack of control over
sounds and noise in the homes. The other tapes were not possible
to use, as sounds of siblings and various noises in the house
intruded and disturbed the tape-recording in most of these cases.
In a couple of cases, the first tape-recorder which was used, had
not functioned properly. Of the 10 American subjects, two were
rated on three task-situations instead of four, as other sounds
disturbed and made it impossible to interpret these two task-
situations in a meaningful way. Thus, the correlations were based
on ratings of altogether 38 task-situations.
The investigator and the co-rater have taught together
at the Gesell Nursery School. Both are trained to record tests
and to rate responses. The raters decided that the best procedure
for obtaining the full responses from the tapes, and accordingly,
the most correct rating, was to transcribe the tapes and to rate

78
the behavior from this transcription. This was done independently
by the two raters, one in Connecticut, one in Chicago.
Some of the behavior-items, as No. 9, 10, and 11 and
No. 14, 15, and 16 were rated from the hand-recording but not from
the tapes, as the physical behavior of the child might not be
revealed on the tape-recording.
Using L. Kohlberg's and E. Zigler's Dependency Rating
Scale, the items were grouped in three main categories:
Category I - Ta.sk Dependency included 5 items:
No. 1, 2, 5, 6, and 7. These items were weightedwith 3.
Category 11 - Non-Task Dependencyincluded 2 items:
Not 3 and 4. These items were weighted with 1.
Category III - Ego-Centric Speech included 6 items:
No. 17-22. These items were weighted with 0.5.
Analysis of Variance with weighted scores was computed(Appendix A).
Correlations of these categories were done separately
in order to determine if any one category miRht be more or less
hard to define and to rate, than the responses in the two other
categories. The fourth correlation was a total correlation,
excluding only items No. 9-16. (See Chapter II, Correlations of
Ratings.)
The three relatively high correlations can probably
be attributed to the two raters' earlier experiences of working
closely together; of common training and of teaching and handling
children in much the same ways.
79
This investigator's tape-ratings were now correlated
with the hand-recw:tded ratings, done three months apart. This
correlation (Total correlation--minus items No. 9-16)--was
+.97probably less surprising than the other correlations, as
these ratings were done by the same person.
In this case, where the investigator tested the sub-
jects in their own homes, it was a great advantage to use the
hand-recording for the further examination of the data. The hand-
recording could here yield fuller information for items No. 9-16,
which in most cases could not be accurately rated from the tape-
recorder. It could also give added descriptions of the mother-
child relationship where special incidents might be worth noticing.
Secondly, when the examiner neither has a choice of rooms, nor
control over other events happening, in the home, (siblings
screaming, dogs running and barkinR, etc., etc.) the tape-recorder
is good as an assisting tool, but would not function satisfactorily
as the main one.
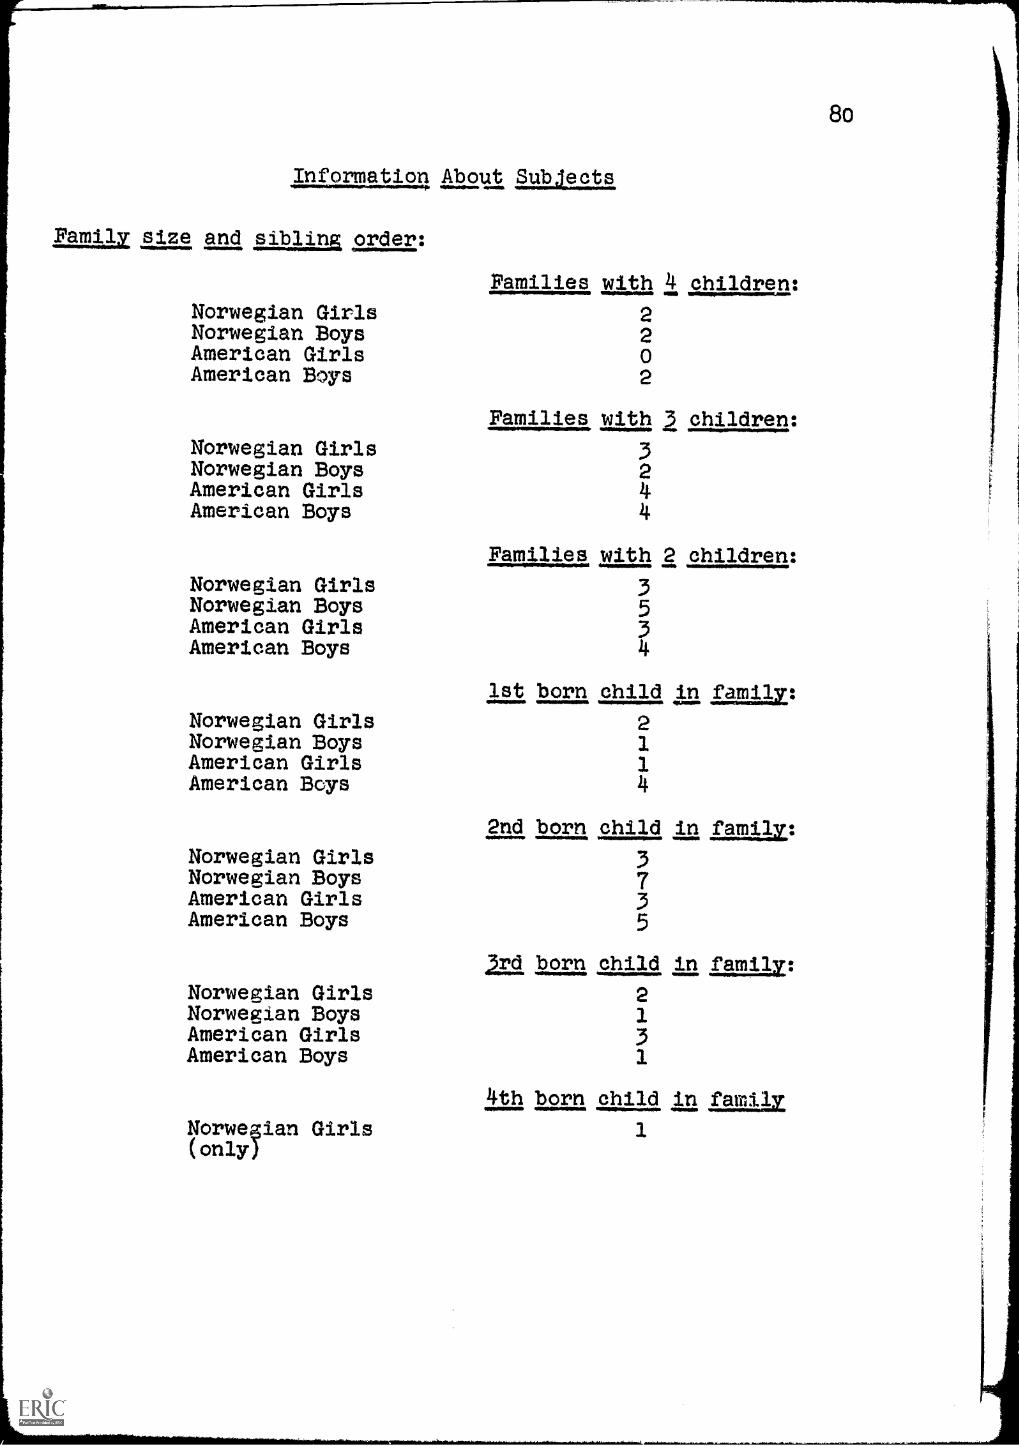
Information About salaam
Ftmily size and ,sibling order:
Families with 4 children:
Norwegian Girls 2Norwegian Boys 2American Girls 0American Boys 2
Families with 2 children:
Norwegian Girls 3Norwegian Boys 2American Girls 4American Boys 4
Families with 2 children:
Norwegian Girls 3Norwegian Boys 5American Girls 3American Boys 4
1st born child in "mawNorwegian Girls 2Norwegian Boys 1American Girls 1American Boys 4
2nd born child in family:
Norwegian GirlsNorweRian BoysAmerican GirlsAmerican Boys
3735
21:1 born child in .family:
Norwegian Girls 2Norwegian Boys 1American Girls 3American Boys 1
4th born child in ail&
Norwegian Girls 1(only)
80
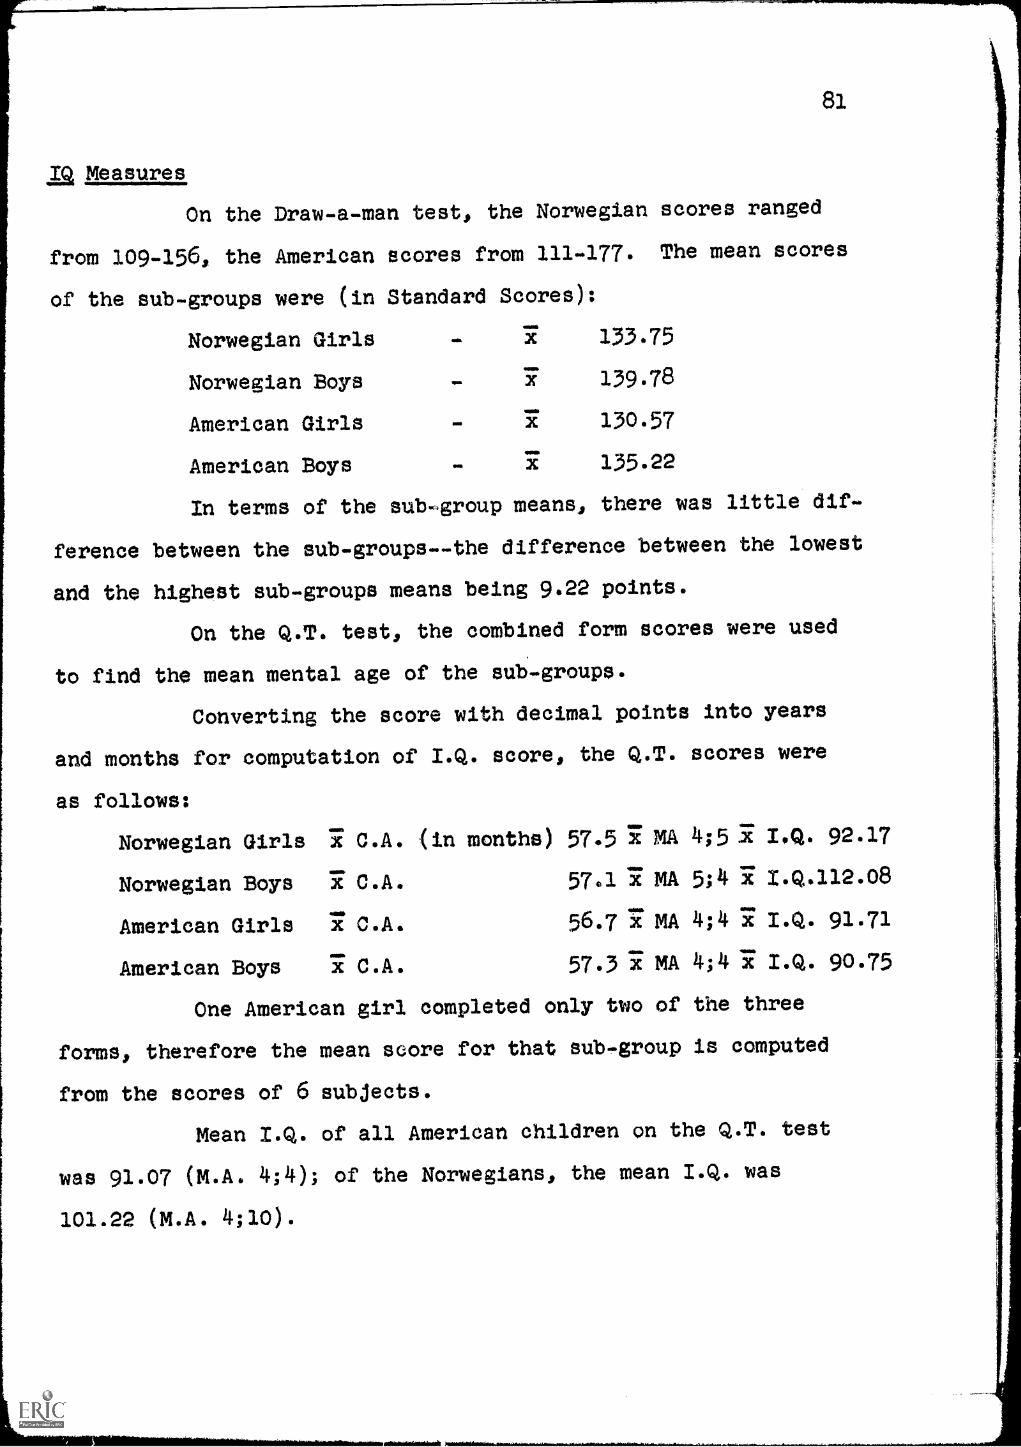
82.
;a Measures
On the Draw-a-man test, the Norwegian scores ranged
from 109-156, the American scores from 111-177. The mean scores
of the sub-groups were (in Standard Scores):
Norwegian Girls
Norwegian Boys
American Girls
American Boys
133.75
139.78
"SE 130.57
135.22
In terms of the sub-group means, there was little dif-
ference between the sub-groups--the difference between the lowest
and the highest sub-groups means being 9.22 points.
On the Q.T. test, the combined form scores were used
to find the mean mental age of the sub-groups.
Converting the score with decimal points into years
and months for computation of I.Q. score, the Q.T. scores were
as follows:
Norwegian Girls 3.c5 C.A. in months) 57.57mA 4;52 I.Q. 92.17
Norwegian Boys 3EC.A. 57,1 3E MA 5;4 7 I.Q.112.08
American Girls 3F C.A. 56.7 3E mA 4;4 I.Q. 91.71
American Boys C.A. 57.3 7 MA 4;4 3E I.Q. 90.75
One American girl completed only two of the three
forms, therefore the mean score for that sub-group is computed
from the scores of 6 subjects.
Mean I.Q. of all American children an the Q.T. test
was 91.07 (M.A. 4;4); of the Norwegians, the mean I.Q. was
101.22 (M.A. 4;10).

82
Comparing the two test results of the individual sub-
jects and of the sub-groups, one finds that the scores on the two
tests show remarkably different results for groups and individual
subjects, in both samples. The incongruity between these results
seems to call for a careful study of the two instruments which
were used. Without trying to correlate such different scores,
this investigator has tried to analyze the reasons for this
divergence.
The QT scores were computed from the three single
forms, in accordance with the scoring manual.
First, this investigator wanted to find out if the
QT test, having been translated, might have been biased toward
one sample or the other. Careful analyses were done on all indi-
vidual scores on the three single forms, on the first 20 items
(through age level 7) on each form, 60 items in all. American
children were compared with Norwegian children, Boys v. Girls.
All individual scores were thus added up in several ways. If
50 per cent or more of the children in each grnup (by nationality
or sex) missed out on one item, this item was counted as a minus
item (50 per cent arbitrarily chosen as cut-off point).
American children missed out on 8 items, Norwegian
children on 9 items, on Form I. Seven of these minus items were
identical for the two groups. On Form II, both American and
Norwegian children missed out on 4 items, having all 4 minus
items in common. On Form III, American children missed out on
5 items; 4 Norwegian children missed out on 4 of these.
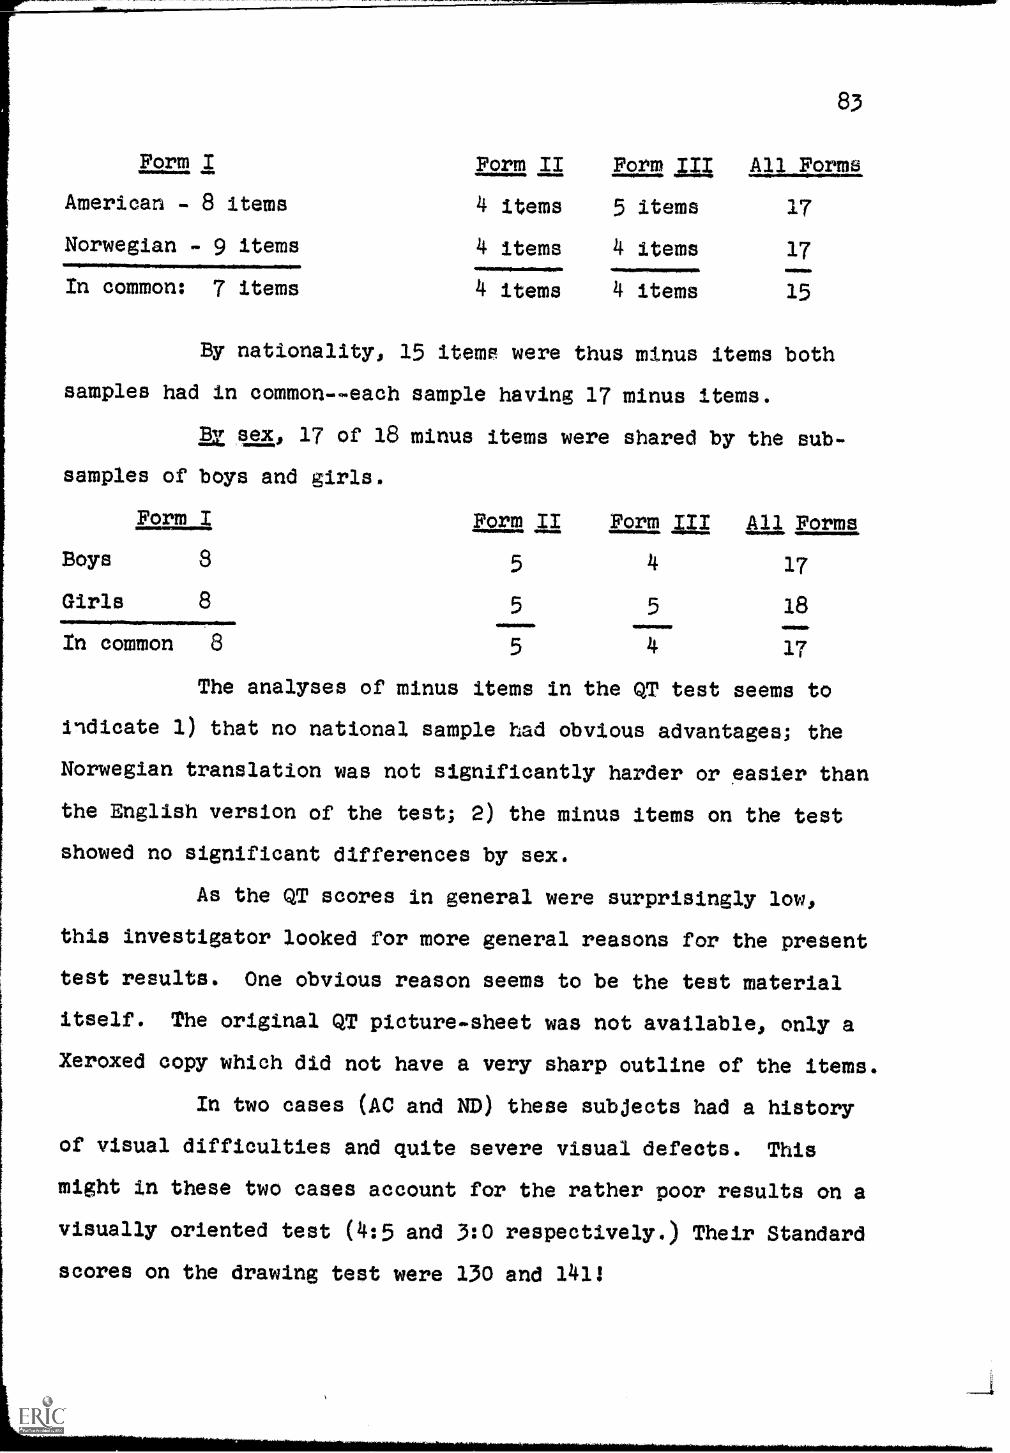
Form I
American - 8 items
Norwegian - 9 items
In common: 7 items
83
Form II Form III All Forms
4 items 5 items 17
4 items 4 items 17
4 items 4 items 15
By nationality, 15 items were thus minus items both
samples had in commoneach sample having 17 minus items.
BIT sex, 17 of 18 minus items were shared by the sub-
samples of boys and girls.
Form I Form II Form III All Forms
Boys 8 5 4 17
Girls 8 5 5 18
In common 8 5 4 17
The analyses of minus items in the QT test seems to
indicate 1) that no national sample had obvious advantages; the
Norwegian translation was not significantly harder or easier than
the English version of the test; 2) the minus items on the test
showed no significant differences by sex.
As the QT scores in general were surprisingly low,
this investigator looked for more general reasons for the present
test results. One obvious reason seems to be the test material
itself. The original QT picture-sheet was not available, only a
Xeroxed copy which did not have a very sharp outline of the items.
In two cases (AC and ND) these subjects had a history
of visual difficulties and quite severe visual defects. This
might in these two cases account for the rather poor results on a
visually oriented test (4:5 and 3:0 respectively.) Their Standard
scores on the drawing test were 130 and 141!
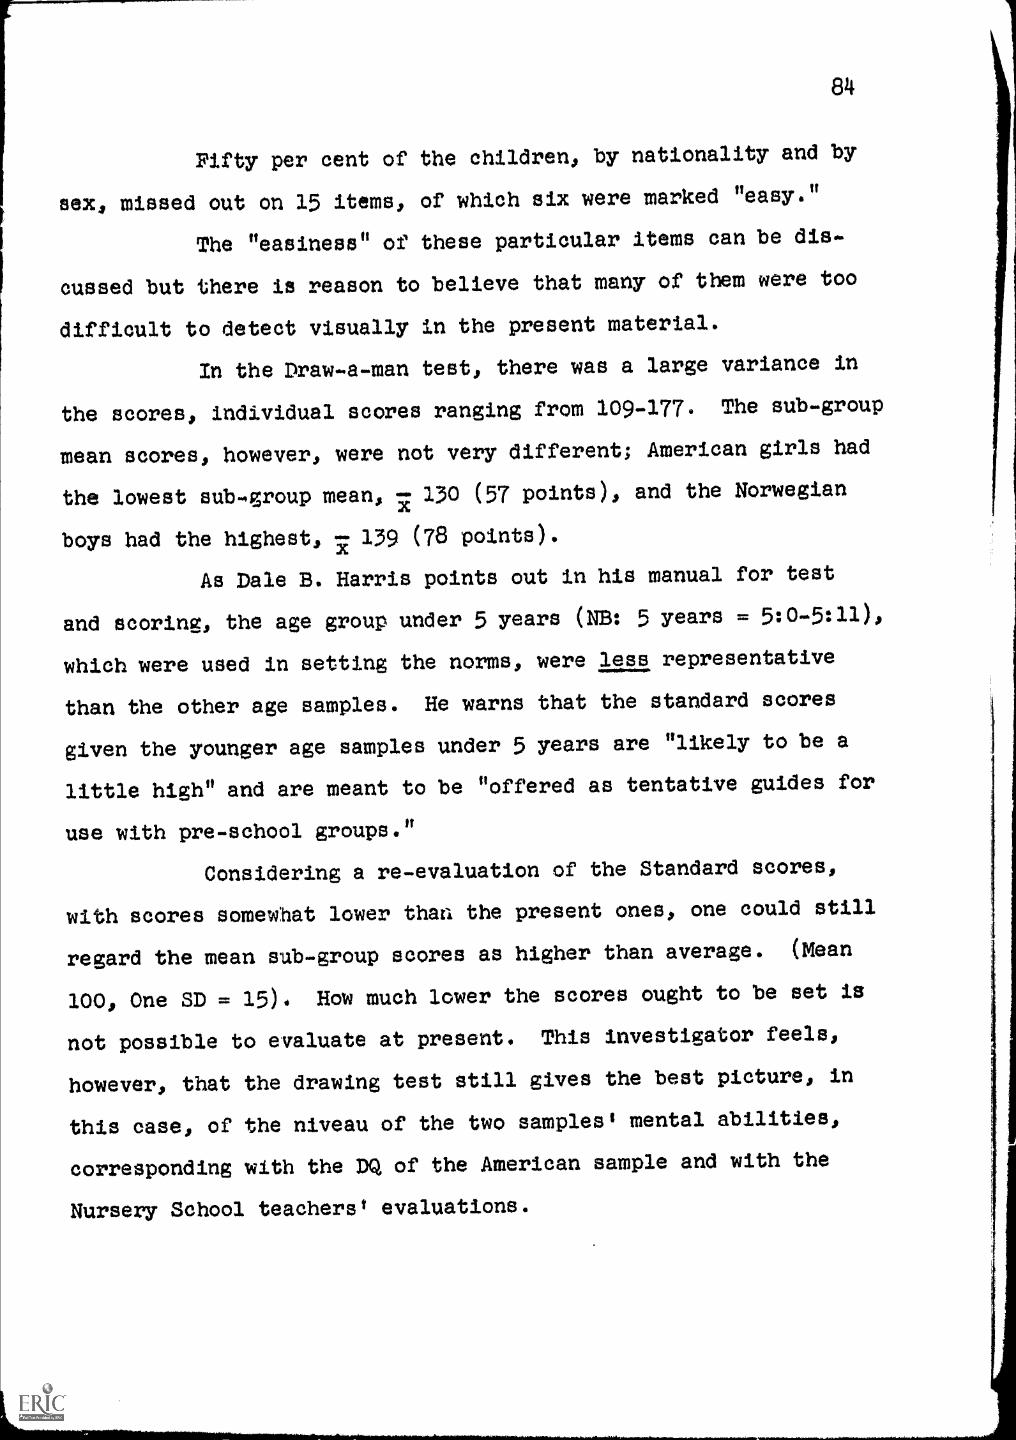
84
Fifty per cent of the children, by nationality and by
sex, missed out on 15 items, of which six were marked "easy."
The "easiness" of these particular items can be dis-
cussed but there is reason to believe that many of them were too
difficult to detect visually In the present material.
In the Draw-a-man test, there was a large variance in
the scores, individual scores ranging from 109477. The sub-group
mean scores, however, were not very different; American girls had
the lowest sub-group mean, 3.c. 130 (57 points), and the Norwegian
boys had the highest: 3-c. 139 (78 points).
As Dale B. Harris points out in his manual for test
and scorino the age group under 5 years (NB: 5 years = 5:0-5:11),
which were used in setting the norms, were less representative
than the other age samples. He warns that the standard scores
given the younger age samples under 5 years are "likely to be a
little high" and are meant to be "offered as tentative guides for
use with pre-school groups."
Considering a re-evaluation of the Standard scores,
with scores somewhat lower than the present ones, one could still
regard the mean sub-group scores as higher than average. (Mean
100, One SD = 15). How much lower the scores ought to be set is
not possible to evaluate at present. This investigator feels,
however, that the drawing test still gives the best picture, in
this case, of the niveau of the two samples' mental abilities,
corresponding with the DQ of the American sample and with the
Nursery School teachers' evaluations.

BIBLIOGRAPHY

Ammons, R. B. andAmmons, C. H.
Arkin and Colton
Atkinson, J. (ed.)
Baehm, Leonore
Baumrind, Diana
Beller, E. K.
Beller, E. K.
Brim, O.
Bronfenbrenner, U.
Church and Stone
Crandall, Preston,and Robson
Crandall, Kotovsky,and Preston
BIBLIOGRAPHY
Quick Test- -Psychological Test S ecial-ties, TIM; rovisional Manuriflue_2-ragai RepORITTigr5g7
Tables for Statisticians Barnes andNa774,7 313., 1190.
Motives in Fantasy, Action and Society,0
The Development of Independence. A Com-parative Study, Child Dev.......ilampnt., 19600 31.
Child Training Antecedents of PreschoolBehavior (ditto). No date.
Dependency and Autonomous AchievementStriving. Ch11d 12219.1.2pata, 1957, 25.
Dependency, Socialization and EmotionalDisturbance in Early Childhood. (ditto)No date.
Dependency and Independence in YoungChildren. Journal of Genetic Psychology,1955, 87.
Exploratory Studies of Dependency. Reprintfrom Translations of the New York Academyof Sciences, March 1959, 21, 5.
Socialization through the life cycle.(mimeo.) 1963, University of Chicago.
Socialization and Social Class through Timeand Space. (Readings in Social Psychology).
Child Psychology.
Maternal Reactions and the Development ofIndependence and Achievement Behavior inYoung Children. Child Development, 1960,31.
A Conceptual Formulation for Some Researchon Child Achievement Development. ChildDevelopment, 19600 31.
Gesell and Ilg Infant and Child in the Culture of Today,.
(86)
Harris, Dale B.(Goodenough-Harris)
Hartup, W.
Hartup, W. and Keller
Havighurst, Robert
Heathers, G.
Ilg and Ames
Josselyn, E.
Kohlberg and Emmerich
Kohlberg, L.
Kohlberg, L. andZigler, E.
McClelland, D.
Marshall and
Mead, M.
Rosen, B.
87
"Draw-a-person."
Nurturance and Nurturance-withdrawal inRelation to Dependency Behavior in Pre-school Children. (Unpublished disserta-tion, Harvard, 1955.)
Nurturance in Preschool Children and ItsRelation to Dependency. Child DeveloR-ment, 19600 31.
Human ayAlament and Education, 1953.
Acquiring Dependence and Independence:A Theoretical Question. Journal ofGenetic Psychology., 1955.
Child Behavior.
Fachosocial Development of Children.
Dependency. (ditto)
The Development of Children's Sex-RoleConcepts and Attitudes. (ditto)
RtleInAlrgtugs?ogigng10111:1=.Uggo!ex
firaph, 1967.
file, Achievement Motive, 1953.
mg, =la= socitti, 1961.
McCandless Relationship between Dependency onAdults and Social Acceptance by Peers.Child Development, 1957) 25.
Changing Patterns of Parent-Child Relation-ship in an Urban Culture. Int. JournalPsychoanal., 1957, 38.
Race, Ethnicity and the AchievementSyndrome, Amer. ;lac. Review, 1959, 24.
Family Structure and Achievement Motivation.Amer. alza. Review, 1961, 26.
Socialization and Achievement Motivationin Brazil. Amer. Soc. Review, 19620 5.

88
Rosen and DIAndrade The Psychosocial Origins of AchievementMotivation. agial.ariet, 1959, 22.
Sears, Maccoby Patterns of Child Rearing, 1957.and Levin
Stendler Readings in Child lalloment, V. I, II.
Strodtbeck, F.
Whiting and Child
Winterbottom, M.
Motives in Fantasy, Action and Society.1958 (article).
Child Training and Personality, 1953,Yale University Press, pp. 93.94.
Motives in Fantasy, Action and Society.1958 (article).
The Relation of Childhood Training inIndependence to Achievement Motivation.University of Michigan: 1953 (unpublisheddissertation).
Walker, H. and Statistical Inference, 1953.Lev, 3.
Related Documents