EXPECTATIONS AND INVESTMENT Nicola Gennaioli, Yueran Ma, Andrei Shleifer 14 th BIS Annual Conference, June 2015

Welcome message from author
This document is posted to help you gain knowledge. Please leave a comment to let me know what you think about it! Share it to your friends and learn new things together.
Transcript

EXPECTATIONS AND INVESTMENT
Nicola Gennaioli, Yueran Ma, Andrei Shleifer
14th BIS Annual Conference, June 2015
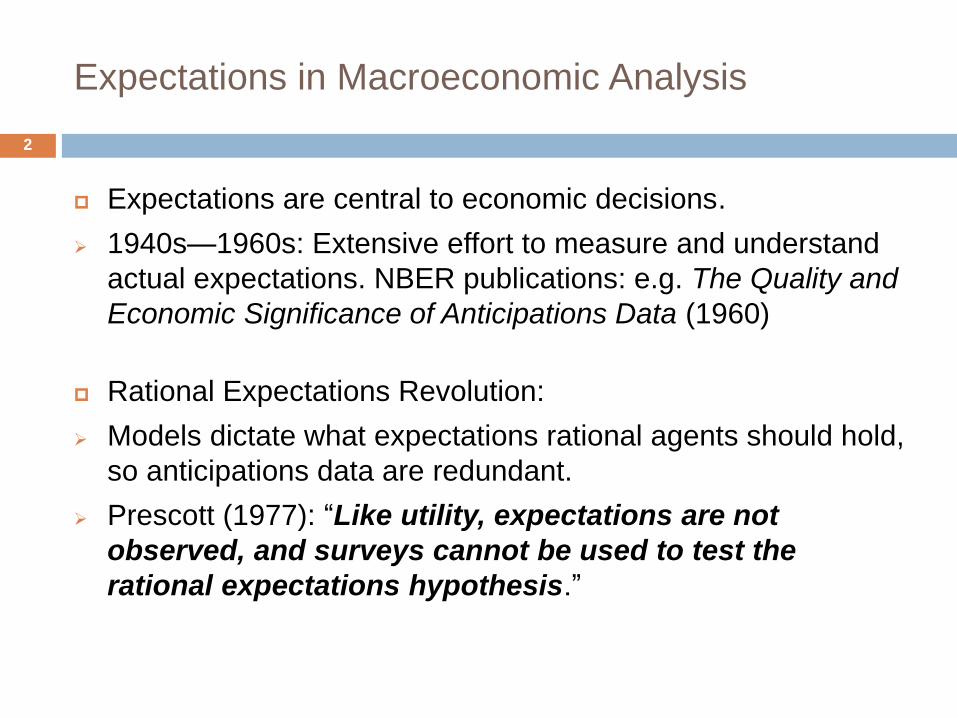
Expectations in Macroeconomic Analysis
Expectations are central to economic decisions.
1940s—1960s: Extensive effort to measure and understand
actual expectations. NBER publications: e.g. The Quality and
Economic Significance of Anticipations Data (1960)
Rational Expectations Revolution:
Models dictate what expectations rational agents should hold,
so anticipations data are redundant.
Prescott (1977): “Like utility, expectations are not
observed, and surveys cannot be used to test the
rational expectations hypothesis.”
2
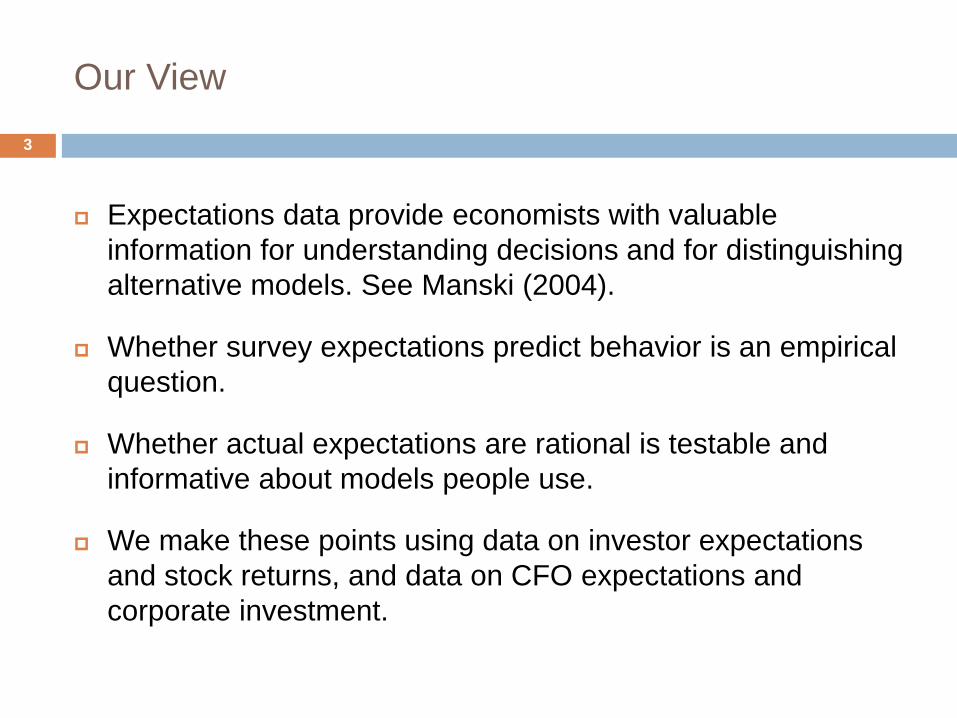
Our View
Expectations data provide economists with valuable
information for understanding decisions and for distinguishing
alternative models. See Manski (2004).
Whether survey expectations predict behavior is an empirical
question.
Whether actual expectations are rational is testable and
informative about models people use.
We make these points using data on investor expectations
and stock returns, and data on CFO expectations and
corporate investment.
3

The Usefulness of Expectations Data: Greenwood & Shleifer (2014)
Fact 1: Expectations of future stock returns are highly correlated
across different surveys, and with equity mutual fund flows.
Gallup CFO Survey AAII
Investor
Intelligence Shiller Michigan
CFO Survey 0.77
[0.000]
AAII 0.64 0.56
[0.000] [0.000]
Investor Intelligence 0.60 0.64 0.55
[0.000] [0.000] [0.000]
Shiller 0.39 0.66 0.51 0.43
[0.000] [0.000] [0.000] [0.000]
Michigan 0.61 -0.12 0.60 0.19 -0.56
[0.003] [0.922] [0.003] [0.395] [0.020]
Equity Fund Flows 0.70 0.71 0.41 0.20 0.33 0.40
[0.000] [0.000] [0.000] [0.000] [0.000] [0.068]
4
p-value in brackets.
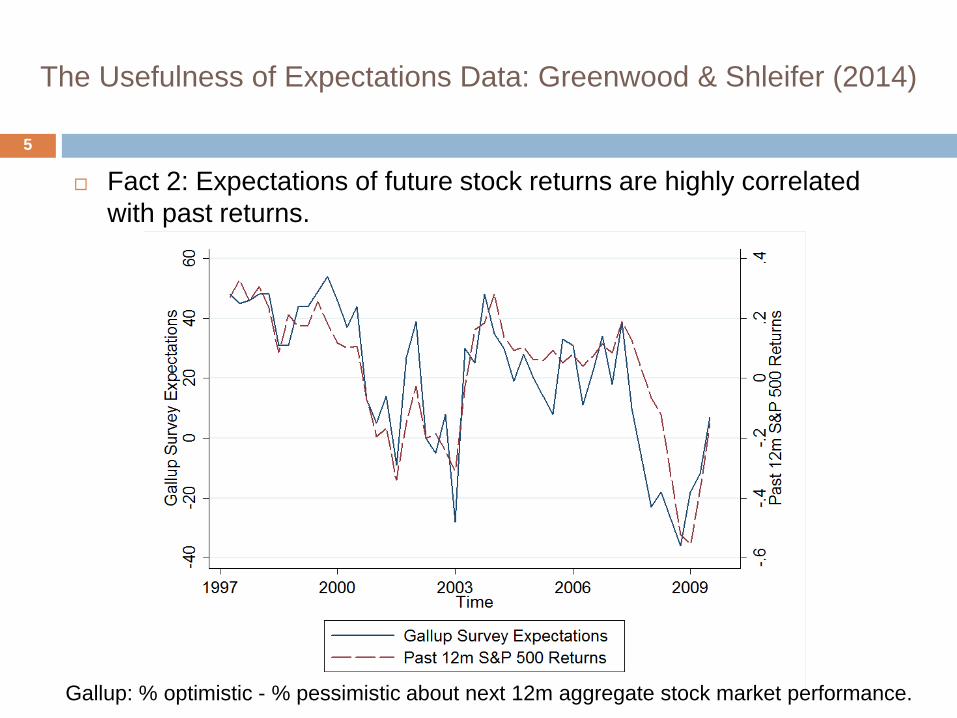
The Usefulness of Expectations Data: Greenwood & Shleifer (2014)
Fact 2: Expectations of future stock returns are highly correlated
with past returns.
Gallup: % optimistic - % pessimistic about next 12m aggregate stock market performance.
5
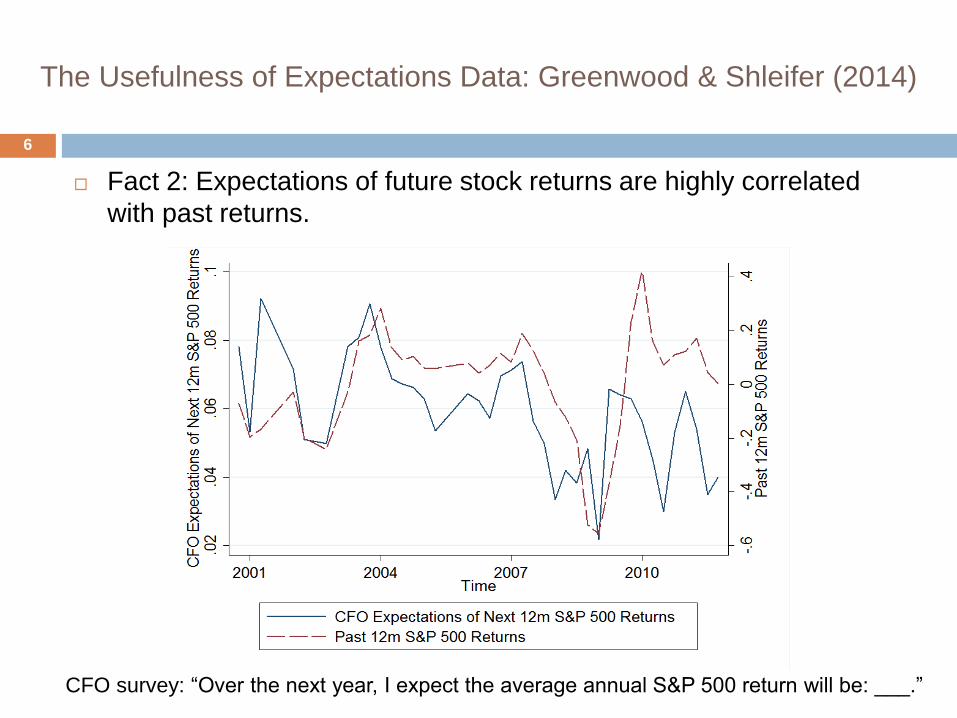
The Usefulness of Expectations Data: Greenwood & Shleifer (2014)
Fact 2: Expectations of future stock returns are highly correlated
with past returns.
CFO survey: “Over the next year, I expect the average annual S&P 500 return will be: ___.”
6

The Usefulness of Expectations Data: Greenwood & Shleifer (2014)
Fact 3: Expectations of future stock returns are strongly negatively
correlated with model-based measures of expected returns (ER).
Gallup CFO Survey AAII Investor
Intelligence Shiller Michigan
Log(D/P)
Campbell-Shiller (1988)
-0.33 -0.44 -0.31 -0.19 -0.55 -0.57
[0.000] [0.003] [0.000] [0.000] [0.000] [0.006]
cay
Lettau-Ludvigson (2001)
0.02 0.14 -0.02 -0.19 0.37 0.00
[0.776] [0.380] [0.788] [0.000] [0.000] [0.988]
-Surplus Consumption
Campbell-Cochrane (1999)
-0.48 -0.53 -0.28 -0.05 -0.67 -0.74
[0.000] [0.000] [0.000] [0.191] [0.000] [0.000]
7
p-value in brackets.

The Usefulness of Expectations Data: Greenwood & Shleifer (2014)
Fact 4: When expectations of returns are high, and ER is low, actual
returns going forward are low.
Realized Next 12m Aggregate Stock Market Returns
Gallup* -1.985
(-1.370)
CFO Survey -0.021
(-0.670)
AAII* -1.655
(-0.892)
Investor
Intelligence* -1.534
(-2.323)
Shiller* -0.612
(-0.228)
Michigan -0.081
(-3.964)
Log(D/P) 0.072
(1.424)
cay 3.095
(3.031)
-Surplus Cons 0.958
(4.147)
8

The Usefulness of Expectations Data: Greenwood & Shleifer (2014)
Survey expectations are informative:
Consistent across different surveys of different types of
investors
Predict investor behavior
Have a clear extrapolative structure
Survey expectations reject rational expectations models of
asset prices. The trouble seems to be with the models, not
with expectations data.
9

Expectations and Corporate Investment
10
Data on Expectations and Investment
CFO Expectations: Duke/CFO Magazine Business Outlook Survey
Quarterly survey since July 1996; covers mostly large corporations.
Aggregate data: Aggregate results published on survey website
www.cfosurvey.org.
Firm-level data: CFOs are not required to identify themselves, and
individual responses are not released. But some respondents
voluntarily disclose their identity, which makes it possible to match a
subset of firm-level responses with CRSP and Compustat data.
Ben-David, Graham, and Harvey (2013) use firm-level data to study
managerial miscalibration.
We use a subsample of Ben-David, Graham, and Harvey (2013) , with
1,133 firm-year observations, from 2005Q1 to 2013Q4.
11
Data on Expectations and Investment
CFO Expectations: Duke/CFO Magazine Business Outlook Survey
Since 1998, in every quarter’s CFO survey, respondents are asked
about, among other things:
Expectations of next 12 month earnings growth
Planned next 12 month investment growth
Answers are numerical
Analyst Expectations: IBES
Supplement CFO expectations of future earnings with analyst
forecasts of future earnings.
Since early 1980s, IBES provides analyst forecasts of quarterly
earnings for up to 12 quarters in the future. Longer time span and
larger sample.
12

Data on Expectations and Investment
CFO and analyst expectations of future earnings growth are highly
correlated.
13

Expectations and Investment: Adapting Q Equations
Basic Q model (CRS, quadratic adjustment costs):
𝐼𝑡𝐾𝑡= 𝑎 −1
𝑏+1
𝑏
𝔼𝑡 𝛽𝑠−𝑡Π𝑠𝑠≥𝑡+1
𝐾𝑡+1
Approximate by: 𝐼𝑡𝑝
𝐾𝑡≈ 𝜃0 + 𝜃1
𝔼𝑡 Π𝑡𝐾𝑡
Log linearized approximation: 𝑖𝑡𝑝− 𝑖𝑡−1
planned investment growth in the next 12m
≈ 𝜇1 𝔼𝑡(𝜋𝑡) − 𝜋𝑡−1expectations of earnings growth in the next 12m
+ 1 − 𝜇1 𝑘𝑡 − 𝑘𝑡−1
Specification similar to Barro (1990), Lamont (2000)
Plans are useful for detecting the impact of expectations given lags in
investment implementation (Lamont, 2000). We start with plans, and
then connect to actual capital spending over the planned period.
14

Expectations and Investment: Aggregate Evidence
CFO earnings growth expectations and investment plans
15
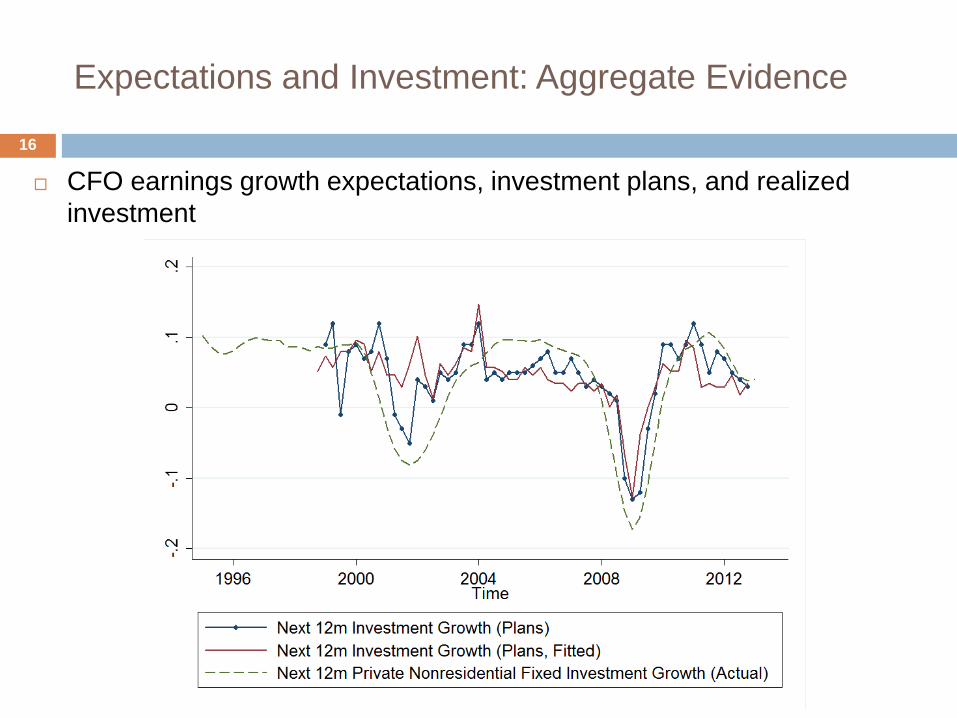
Expectations and Investment: Aggregate Evidence
CFO earnings growth expectations, investment plans, and realized
investment
16
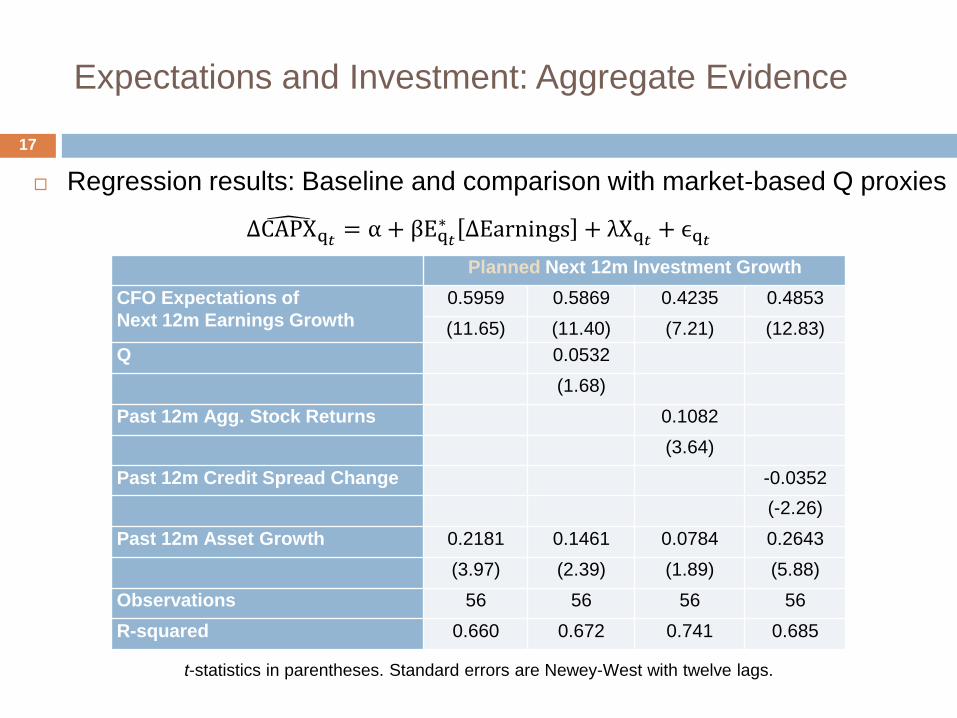
Expectations and Investment: Aggregate Evidence
Regression results: Baseline and comparison with market-based Q proxies
∆CAPX q𝑡 = α + βEq𝑡∗ ∆Earnings + λXq𝑡 + ϵq𝑡
Planned Next 12m Investment Growth
CFO Expectations of
Next 12m Earnings Growth
0.5959 0.5869 0.4235 0.4853
(11.65) (11.40) (7.21) (12.83)
Q 0.0532
(1.68)
Past 12m Agg. Stock Returns 0.1082
(3.64)
Past 12m Credit Spread Change -0.0352
(-2.26)
Past 12m Asset Growth 0.2181 0.1461 0.0784 0.2643
(3.97) (2.39) (1.89) (5.88)
Observations 56 56 56 56
R-squared 0.660 0.672 0.741 0.685
t-statistics in parentheses. Standard errors are Newey-West with twelve lags.
17
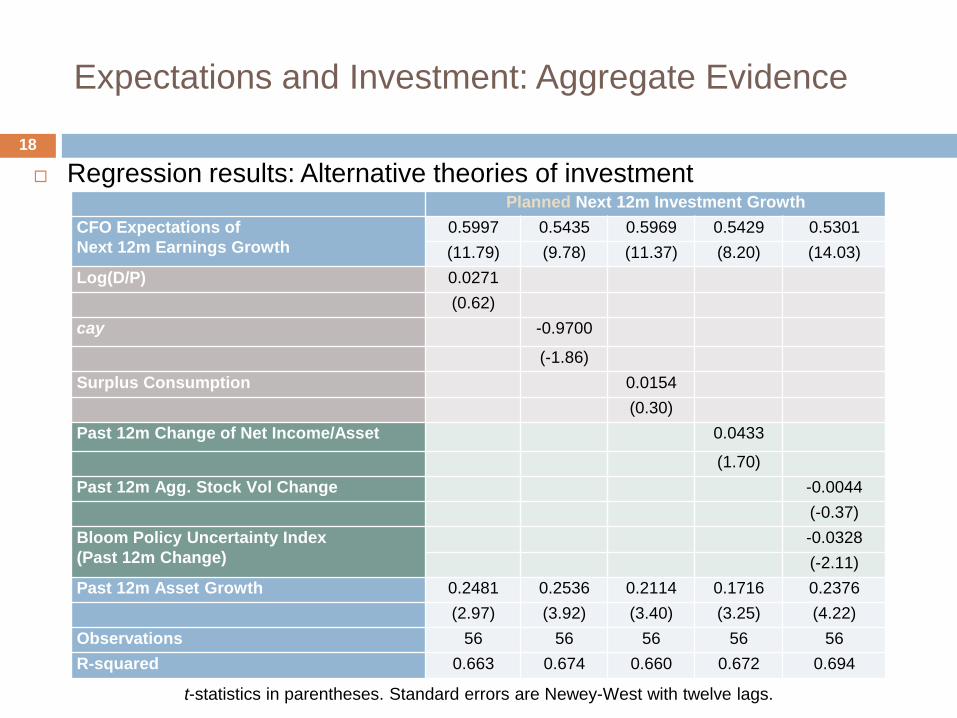
Expectations and Investment: Aggregate Evidence
Regression results: Alternative theories of investment
Planned Next 12m Investment Growth
CFO Expectations of
Next 12m Earnings Growth
0.5997 0.5435 0.5969 0.5429 0.5301
(11.79) (9.78) (11.37) (8.20) (14.03)
Log(D/P) 0.0271
(0.62)
cay -0.9700
(-1.86)
Surplus Consumption 0.0154
(0.30)
Past 12m Change of Net Income/Asset 0.0433
(1.70)
Past 12m Agg. Stock Vol Change -0.0044
(-0.37)
Bloom Policy Uncertainty Index
(Past 12m Change)
-0.0328
(-2.11)
Past 12m Asset Growth 0.2481 0.2536 0.2114 0.1716 0.2376
(2.97) (3.92) (3.40) (3.25) (4.22)
Observations 56 56 56 56 56
R-squared 0.663 0.674 0.660 0.672 0.694
18
t-statistics in parentheses. Standard errors are Newey-West with twelve lags.
Expectations and Investment: Concerns
Reverse Causality Concerns: If a firm plans to invest a lot in the next
twelve months, might expect earnings to increase as investment leads
to more output and sales.
Investment in the next twelve months generally does not translate into
output and sales immediately.
Even if it does, unlikely that a one percent increase in investment--
which increases capital stock by much less than one percent--can
instantly lead to a one percent or more increase in firm earnings, as
would be required to match the magnitude of coefficients in the data.
Robustness checks: In every quarter’s survey, CFOs are asked to rate
their optimism about the US economy on a scale from 0 to 100.
Results are similar. Hard to argue that firms’ investment plans will
mechanically cause CFOs to be more optimistic about the US economy.
19

Expectations and Investment: Aggregate Evidence
Forecasting next 12m realized investment
Realized Next 12m Investment Growth
CFO Expectations of
Next 12m Earnings Growth
0.5903 0.5853 0.2799 0.2611
(8.14) (8.41) (3.52) (3.20)
Q 0.0278
(0.37)
Past 12m Agg. Stock Returns 0.1975
(4.20)
Past 12m Credit Spread Change -0.1035
(-3.82)
Past 12m Asset Growth 0.7021 0.6645 0.4473 0.8382
(6.48) (3.53) (3.43) (11.72)
Observations 57 57 57 57
R-squared 0.610 0.611 0.748 0.719
∆CAPXq𝑡 = α + βEq𝑡∗ ∆Earnings + λXq𝑡 + ϵq𝑡
20
t-statistics in parentheses. Standard errors are Newey-West with twelve lags.
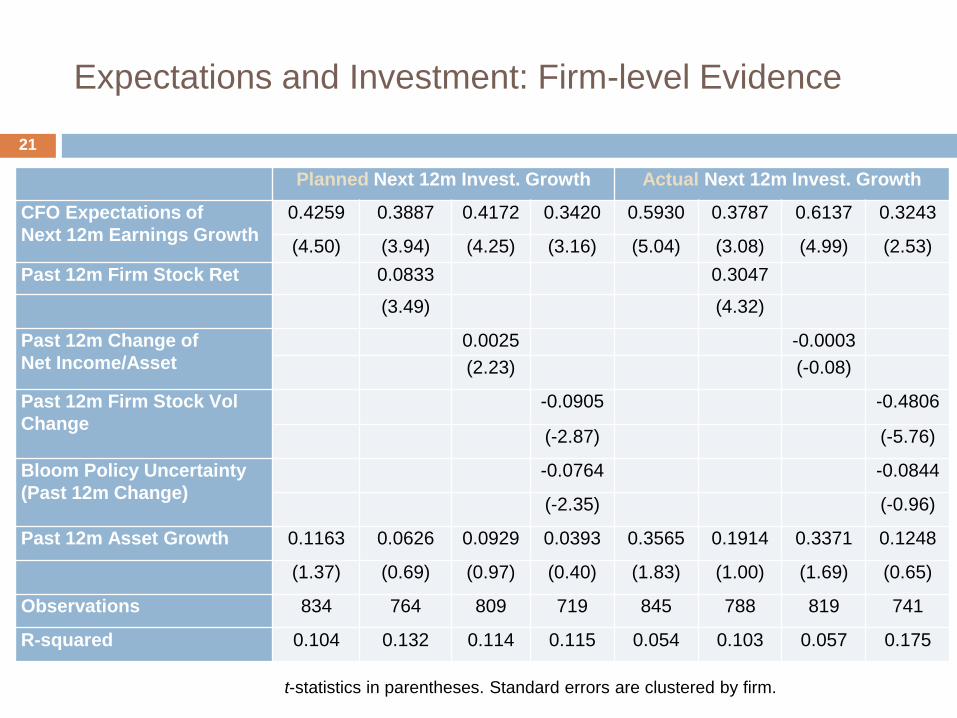
Expectations and Investment: Firm-level Evidence
21
Planned Next 12m Invest. Growth Actual Next 12m Invest. Growth
CFO Expectations of
Next 12m Earnings Growth
0.4259 0.3887 0.4172 0.3420 0.5930 0.3787 0.6137 0.3243
(4.50) (3.94) (4.25) (3.16) (5.04) (3.08) (4.99) (2.53)
Past 12m Firm Stock Ret 0.0833 0.3047
(3.49) (4.32)
Past 12m Change of
Net Income/Asset
0.0025 -0.0003
(2.23) (-0.08)
Past 12m Firm Stock Vol
Change
-0.0905 -0.4806
(-2.87) (-5.76)
Bloom Policy Uncertainty
(Past 12m Change)
-0.0764 -0.0844
(-2.35) (-0.96)
Past 12m Asset Growth 0.1163 0.0626 0.0929 0.0393 0.3565 0.1914 0.3371 0.1248
(1.37) (0.69) (0.97) (0.40) (1.83) (1.00) (1.69) (0.65)
Observations 834 764 809 719 845 788 819 741
R-squared 0.104 0.132 0.114 0.115 0.054 0.103 0.057 0.175
t-statistics in parentheses. Standard errors are clustered by firm.

Structure of Expectations
22

Errors in Earnings Growth Expectations: CFOs
Realized – CFO Expected Next 12m Earnings Growth.
Errors appear systematic and recurring: over-optimism in good times and over-
pessimism in bad times.
23
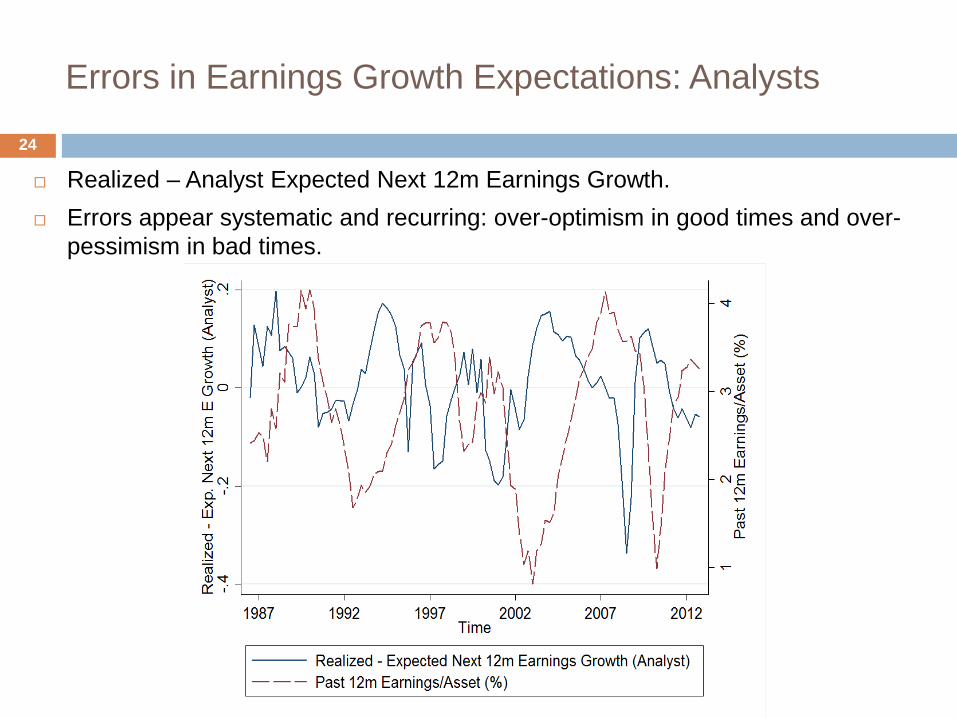
Errors in Earnings Growth Expectations: Analysts
Realized – Analyst Expected Next 12m Earnings Growth.
Errors appear systematic and recurring: over-optimism in good times and over-
pessimism in bad times.
24
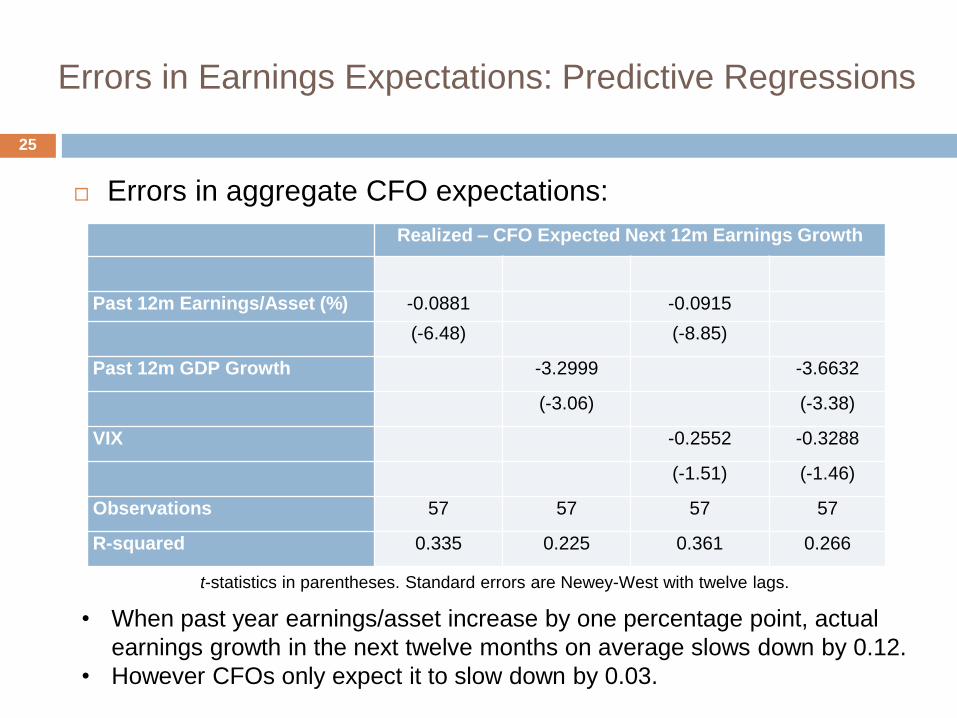
Errors in Earnings Expectations: Predictive Regressions
Errors in aggregate CFO expectations:
Realized – CFO Expected Next 12m Earnings Growth
Past 12m Earnings/Asset (%) -0.0881 -0.0915
(-6.48) (-8.85)
Past 12m GDP Growth -3.2999 -3.6632
(-3.06) (-3.38)
VIX -0.2552 -0.3288
(-1.51) (-1.46)
Observations 57 57 57 57
R-squared 0.335 0.225 0.361 0.266
• When past year earnings/asset increase by one percentage point, actual
earnings growth in the next twelve months on average slows down by 0.12.
• However CFOs only expect it to slow down by 0.03.
25
t-statistics in parentheses. Standard errors are Newey-West with twelve lags.
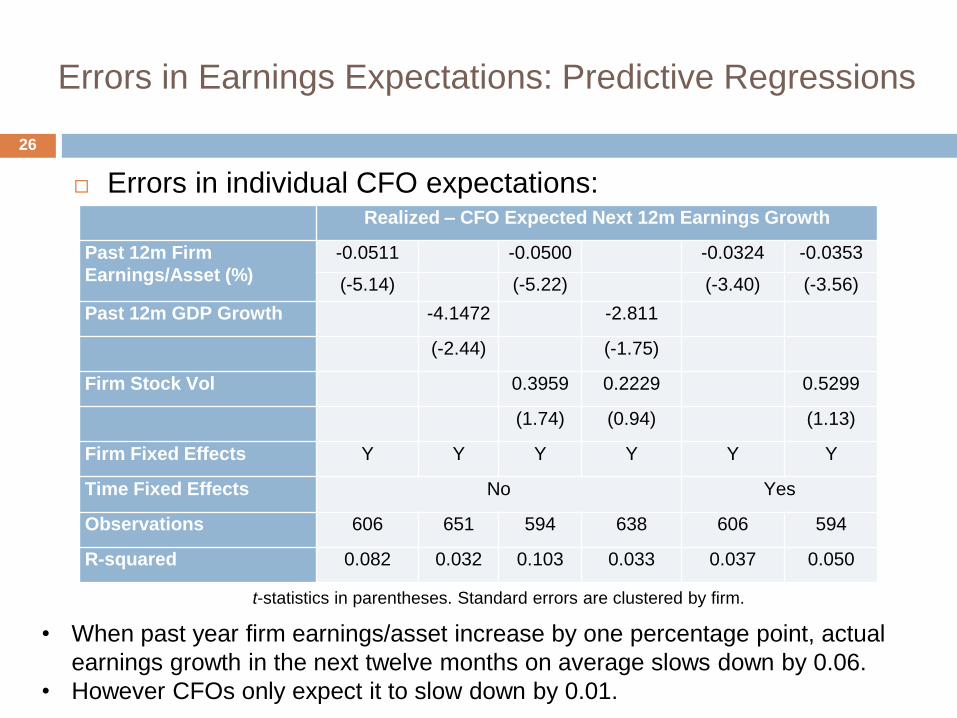
Errors in Earnings Expectations: Predictive Regressions
Errors in individual CFO expectations:
• When past year firm earnings/asset increase by one percentage point, actual
earnings growth in the next twelve months on average slows down by 0.06.
• However CFOs only expect it to slow down by 0.01.
26
Realized – CFO Expected Next 12m Earnings Growth
Past 12m Firm
Earnings/Asset (%)
-0.0511 -0.0500 -0.0324 -0.0353
(-5.14) (-5.22) (-3.40) (-3.56)
Past 12m GDP Growth -4.1472 -2.811
(-2.44) (-1.75)
Firm Stock Vol 0.3959 0.2229 0.5299
(1.74) (0.94) (1.13)
Firm Fixed Effects Y Y Y Y Y Y
Time Fixed Effects No Yes
Observations 606 651 594 638 606 594
R-squared 0.082 0.032 0.103 0.033 0.037 0.050
t-statistics in parentheses. Standard errors are clustered by firm.
Errors in Earnings Growth Expectations
Similar patterns in aggregate and firm-level analyst expectations:
Analysts over-estimate future earnings growth when past year
was favorable, and under-estimate when past year was rough.
Past earnings are highly important, publicly available information
that matter a lot to CFOs and analysts.
Evidence appears consistent with extrapolative biases.
Echoes accumulating evidence from finance that market
participants have extrapolative expectations (Greenwood and
Shleifer, 2014; Piazzesi, Salomao, Schneider, 2013; etc.)
CFO expectations of future stock returns are also extrapolative.
27

Summary and Implications
Expectations data appear to be extremely helpful in
understanding corporate investment.
Expectations appear to exhibit systematic extrapolative errors.
What are plausible models of actual expectations that allow
some awareness that the future may be different?
Open question of how much errors in expectations can
account for economic fluctuations; the role of over-optimism
and over-pessimism in aggregate overbuilding and prolonged
economic recessions.
28
Related Documents