ICICI Securities Ltd. | Retail Equity Research January 16, 2015 Monthly Update Expect muted Q3 numbers… During the quarter, companies under I-Direct healthcare coverage are expected to post growth of 10.5% YoY to | 28190 crore. The growth rate is the slowest in the last many quarters. But for the traction from domestic formulations and consolidation of the acquired businesses, growth could have been even lower (excluding Actavis and Elder acquisitions by Aurobindo and Torrent, respectively, the growth would be ~8% YoY to | 27562 crore). Consolidated US sales (from select pack) are likely to grow 6% YoY to | 8362 crore. This temperance is mainly on the back of a high base, increased competition in existing products and a slowdown in product approvals from the USFDA. Indian formulations from a select pack are likely to grow 21% YoY to | 6083 crore on the back of new launches and normalcy in trade channels post NLEM price implementation. Currency headwinds from emerging economies such as Russia, Brazil and Venezuela are also likely to impact growth from these markets for a few of the universe companies such as Dr Reddy’s and Glenmark. Among players, Ajanta Pharma, Cipla, Torrent and Aurobindo are expected to do well on the back of strong growth in the domestic market and consolidation of the acquired businesses. On the other hand, a few of the frontline pharma companies like Lupin, Dr Reddy’s and Glenmark are likely to be laggards on account of the slowdown in USFDA approvals and adverse currency movement. In another instance of MNC patent rejection, India's patent office has rejected an application from US based Gilead Sciences Inc for its hepatitis C drug Sovaldi, paving the way for local drug makers to launch cheaper generic versions of the drug. The patent office's order said Gilead's request for Sovaldi, which costs US$84,000 for a 12-week course in the US, was rejected on the basis of the fact that minor and cosmetic changes in the molecule did not improve the efficacy of the drug. In a strategic shift from an earlier stance of growth from establishing tertiary hospital chains, Apollo Hospitals acquired Nova Specialty Hospitals, which is a secondary hospital chain. The chain of 11 facilities of Nova is spread across eight cities, and will add to Apollo's network of 45 modular operation theatres. Acquisition will also add over 300 beds to the current strength of ~9000 beds. But more importantly, it reflects the focus on nursing homes acquisitions, a deviation from the earlier stance of greenfield expansion. Finally, the Indian pharmaceutical market (IPM) registered strong growth of 13.6% YoY to | 7243 crore for December. The YoY growth was driven by- 1) price hikes - 5.3%, 2) volume growth - 5.1% and 3) new product launches - 4.1%. Stocks likely to consolidate post Q3 numbers… The healthcare index maintained its outperformance in CY14 vis-à-vis the broader market (fifth in a row), backed by superior earnings growth and PE expansion. As the Q3 earnings season approaches, we expect some slowdown in most stocks on the back of altered earnings expectations. Even a moderate correction cannot be ruled out, which, we believe is warranted in some stocks that are running ahead of valuations. Going ahead, product approvals and currency fluctuation are likely to weigh on earnings in the near term as will the stock performance. However, long term growth prospects continue to remain healthy. Health Check Sector View Outperformer Index Performance as on January 15, 2015 Return (%) 1M 3M YTD 1Y BSE 500 6 11 3 41 Sensex 5 8 2 32 BSE Healthcare 2 10 0 45 Return (%) Stocks Performance Mcap Company 1M 3M YTD 1Y 15-Jan Sun Pharma.Inds. 0 5 1 41 172585 Lupin 0 9 0 56 64298 Dr Reddy's Labs 4 12 0 23 55431 Cipla 3 11 3 56 51708 Cadila Health. 7 22 2 88 33540 Aurobindo Pharma 4 27 1 188 33344 Glaxosmit Pharma 8 18 -1 7 26936 Divi's Lab. 2 1 -1 33 22736 Glenmark Pharma. -6 1 -6 43 19615 Torrent Pharma. 6 32 -3 131 18584 Apollo Hospitals 4 13 3 26 16208 Wockhardt 6 41 3 144 11399 Pfizer 7 37 -3 90 9598 Ipca Labs. -2 4 -2 -6 9013 Ajanta Pharma -1 51 7 169 8788 Biocon 0 -8 1 -8 8561 Strides Arcolab 4 43 -3 188 5525 Indoco Remedies 10 12 0 124 2863 Jubilant Life 19 -4 22 14 2349 Unichem Labs. -5 6 -4 5 2109 Elder Pharma 20 -25 25 -44 268 Return (%) Mcap: Market cap in | crore Price movement 7500 8500 9500 10500 11500 12500 13500 14500 15500 16500 Jan-14 Apr-14 Jul-14 Oct-14 Jan-15 15000 17000 19000 21000 23000 25000 27000 29000 31000 BSE Healthcare Sensex (RHS) Research Analyst Siddhant Khandekar [email protected] Mitesh Shah [email protected] Nandan Kamat [email protected]

Welcome message from author
This document is posted to help you gain knowledge. Please leave a comment to let me know what you think about it! Share it to your friends and learn new things together.
Transcript

ICICI Securities Ltd. | Retail Equity Research
January 16, 2015
Monthly Update
Expect muted Q3 numbers… During the quarter, companies under I-Direct healthcare coverage are expected to post growth of 10.5% YoY to | 28190 crore. The growth rate is the slowest in the last many quarters. But for the traction from domestic formulations and consolidation of the acquired businesses, growth could have been even lower (excluding Actavis and Elder acquisitions by Aurobindo and Torrent, respectively, the growth would be ~8% YoY to | 27562 crore). Consolidated US sales (from select pack) are likely to grow 6% YoY to | 8362 crore. This temperance is mainly on the back of a high base, increased competition in existing products and a slowdown in product approvals from the USFDA. Indian formulations from a select pack are likely to grow 21% YoY to | 6083 crore on the back of new launches and normalcy in trade channels post NLEM price implementation. Currency headwinds from emerging economies such as Russia, Brazil and Venezuela are also likely to impact growth from these markets for a few of the universe companies such as Dr Reddy’s and Glenmark. Among players, Ajanta Pharma, Cipla, Torrent and Aurobindo are expected to do well on the back of strong growth in the domestic market and consolidation of the acquired businesses. On the other hand, a few of the frontline pharma companies like Lupin, Dr Reddy’s and Glenmark are likely to be laggards on account of the slowdown in USFDA approvals and adverse currency movement. In another instance of MNC patent rejection, India's patent office has rejected an application from US based Gilead Sciences Inc for its hepatitis C drug Sovaldi, paving the way for local drug makers to launch cheaper generic versions of the drug. The patent office's order said Gilead's request for Sovaldi, which costs US$84,000 for a 12-week course in the US, was rejected on the basis of the fact that minor and cosmetic changes in the molecule did not improve the efficacy of the drug. In a strategic shift from an earlier stance of growth from establishing tertiary hospital chains, Apollo Hospitals acquired Nova Specialty Hospitals, which is a secondary hospital chain. The chain of 11 facilities of Nova is spread across eight cities, and will add to Apollo's network of 45 modular operation theatres. Acquisition will also add over 300 beds to the current strength of ~9000 beds. But more importantly, it reflects the focus on nursing homes acquisitions, a deviation from the earlier stance of greenfield expansion. Finally, the Indian pharmaceutical market (IPM) registered strong growth of 13.6% YoY to | 7243 crore for December. The YoY growth was driven by- 1) price hikes - 5.3%, 2) volume growth - 5.1% and 3) new product launches - 4.1%. Stocks likely to consolidate post Q3 numbers… The healthcare index maintained its outperformance in CY14 vis-à-vis the broader market (fifth in a row), backed by superior earnings growth and PE expansion. As the Q3 earnings season approaches, we expect some slowdown in most stocks on the back of altered earnings expectations. Even a moderate correction cannot be ruled out, which, we believe is warranted in some stocks that are running ahead of valuations. Going ahead, product approvals and currency fluctuation are likely to weigh on earnings in the near term as will the stock performance. However, long term growth prospects continue to remain healthy.
Health Check Sector View
Outperformer
Index Performance as on January 15, 2015
Return (%) 1M 3M YTD 1Y
BSE 500 6 11 3 41
Sensex 5 8 2 32
BSE Healthcare 2 10 0 45
Return (%)
Stocks Performance Mcap
Company 1M 3M YTD 1Y 15-Jan
Sun Pharma.Inds. 0 5 1 41 172585
Lupin 0 9 0 56 64298
Dr Reddy's Labs 4 12 0 23 55431
Cipla 3 11 3 56 51708
Cadila Health. 7 22 2 88 33540
Aurobindo Pharma 4 27 1 188 33344
Glaxosmit Pharma 8 18 -1 7 26936
Divi's Lab. 2 1 -1 33 22736
Glenmark Pharma. -6 1 -6 43 19615
Torrent Pharma. 6 32 -3 131 18584
Apollo Hospitals 4 13 3 26 16208
Wockhardt 6 41 3 144 11399
Pfizer 7 37 -3 90 9598
Ipca Labs. -2 4 -2 -6 9013
Ajanta Pharma -1 51 7 169 8788
Biocon 0 -8 1 -8 8561
Strides Arcolab 4 43 -3 188 5525
Indoco Remedies 10 12 0 124 2863
Jubilant Life 19 -4 22 14 2349
Unichem Labs. -5 6 -4 5 2109
Elder Pharma 20 -25 25 -44 268
Return (%)
Mcap: Market cap in | crore
Price movement
750085009500
10500115001250013500145001550016500
Jan-14 Apr-14 Jul-14 Oct-14 Jan-15
150001700019000210002300025000270002900031000
BSE Healthcare Sensex (RHS)
Research Analyst
Siddhant Khandekar [email protected] Mitesh Shah [email protected]
Nandan Kamat [email protected]

ICICI Securities Ltd. | Retail Equity Research
Page 2
Regulatory approvals
Exhibit 1: Summary of USFDA approvals for December 2014 [5
Company Drug Name Therapeutic Area Innovator company Generic Version of Market SizeStrides Acrolab Calcitriol Oral 0.25MCG, 0.50MCG Vitamins Validus Pharms Rocaltrol US$ 50 millionSun Pharma Bupropion Hydrochloride 150mg Tablet Anti-depressant GSK Wellbutrin US$ 268 millionLupin Lamivudine HIV ViV Healthcare Epivir NAJubilant Rizatriptan Benzoate Anti-Migraine Merck Maxalt US$ 193 million
Final Approvals
CNS: Central Nervous System; CVS: Cardiovascular, NA: Not available; Source: USFDA, ICICIdirect.com Research
Regulatory approvals / IP Issues
Patent office rejects Gilead application for Sovaldi India's patent office has rejected an application from US based Gilead Sciences Inc for its hepatitis C drug Sovaldi, paving the way for local drug makers to launch cheaper generic versions of the drug. The patent office's order said Gilead's request for Sovaldi, which costs US$84,000 for a 12-week course in the US, was rejected on the basis that "minor changes in the molecule" did not improve efficacy of the drug. Lawsuits, court rulings, settlements
Cipla, Novartis in legal tangle The Delhi High Court has asked Cipla to stop selling the cheaper generic version of Novartis’s respiratory drug Onbrez (Indacaterol; COPD). The court, in its interim order restrained Cipla from manufacturing its drug sold under the name of Indaflo but allowed it to sell the stock remaining with it. Novartis in its interim application had sought to restrain Cipla from selling its product during pendency of the patent infringement suit filed by it. Novartis has been selling Onbrez in India as an inhalation powder and inhaler under the trademark name Onbrez through its licensee Lupin Ltd, since 2010. The court has also sought Novartis’ response on the plea of Cipla against an order restraining it from making its respiratory disease drug, Indaflo, till it obtains a compulsory license. Glenmark wins patent suit against Abbott in India Glenmark has won a patent case against Abbott regarding Humira, used for treatment of severe forms of arthritis. Glenmark had filed a pre-grant opposition in September 2008 after Abbott was granted a patent for Humira drug. Price cuts, new launches, recalls
Cadila recalls 19,536 bottles of cough treatment drug in US Cadila is voluntarily recalling 19,536 bottles of Benzonatate capsules, used to treat coughs, in the US due to wet and/or leaking capsules. The recall has been initiated by the company on December 23 and has been initiated under Class-II. M&As, demergers and JVs
Apollo acquires Nova chain of hospitals Apollo Hospitals has acquired Nova Specialty Hospitals at an estimated cost of | 135-145 crore. The acquisition has been funded through debt and equity components. The chain of 11 facilities of Nova is spread across eight cities and will add to Apollo's network of 45 modular operation theatres. The combined network will clock a turnover in the range of | 115-125 crore for the financial year ending March 2015. The acquisition will also add over 300 beds to the current strength of ~9000 beds. Nova has been a loss-making entity. The management expects to break even in the next 18-24 months.
ICICI Securities Ltd. | Retail Equity Research
Page 3
Exhibit 2: Patent litigations in CY14 [5
Mo nth In novato r A NDA Filer Bran d Na me API Used for J an-1 4 Lyne Lab oratories Lupin Pho slyra Calcium Acetate Renal diseaseJ an-1 4 Eli Lilly & Co Glenmark Ph arma Alimta Pemetre xed Disodiu m An ti-CancerJ an-1 4 A lc on Research Cipla Pataday Oloparadine Hydrochloric Inf lam mato ry eye conditionsJ an-1 4 Te ijin Ranb axy Uloric Febu xostat Gou tJ an-1 4 Ceden ce Pharma Wo ckhard t Ofirmev Ace taminoph en An ti- inflammatoryJ an-1 4 Fo rest Labs Sun Pharma Namenda Mem antine HCl CNSJ an-1 4 Fo rest Labs Wo ckhard t Namenda Mem antine HCl CNSJ an-1 4 Senju Pharmaceuticals Lupin Prolensa Bromfenac Eye in flammationFeb -1 4 Novartis Dr Reddy 's Gleevec Imatinib Mesylate FibromyalgiaFeb -1 4 Fo rest Labs Glenmark Ph arma Savella Milnacipran HCl LeukemiaFeb -1 4 Te ijin Lupin Uloric Febu xostat Gou tFeb -1 4 Fo rest Labs Cadila Hea lthcare Namenda Mem antine HCl CNSFeb -1 4 A bbVie A uro bindo Pharm a Zemp lar Paricalcitol Hype rparathyro idismFeb -1 4 Sanof i Glenmark Ph arma Multaq Dronedarone HCl CVSMar-14 Sanof i Sun Pharma Multaq Dronedarone HCl CVSMar-14 Eli Lilly & Co & Daiichi San ky o A uro bindo Pharm a Effien t Prasug rel CVSMar-14 Eli Lilly & Co & Daiichi San ky o Dr Reddy 's Effien t Prasug rel CVSMar-14 Eli Lilly & Co & Daiichi San ky o Glenmark Ph arma Effien t Prasug rel CVSMar-14 Eli Lilly & Co & Daiichi San ky o Sun Pharma Effien t Prasug rel CVSMar-14 Eli Lilly & Co & Daiichi San ky o Cadila Hea lthcare Effien t Prasug rel CVSMar-14 Pfizer To rrent Ph arma Viag ra Sild enafil Citrate Im potencyMar-14 ViiV Health care Lupin Epzicom Zidovud ine CVSMar-14 Otsuka Pharma Wo ckhard t Abilify Aripiprazole schizop hre niaA pr-14 K owa A uro bindo Pharm a Livalo P itavastatin CVSA pr-14 Me dicines co A uro bindo Pharm a Ang iomax Bivalirud in An ginaA pr-14 K owa A uro bindo Pharm a Livalo P itavastatin CVSMay-14 Senju Pharmaceuticals A uro bindo Pharm a Zyma xid Gatifloxacin Conjun ctivit isMay-14 Otsuka Pharmac eutical Co. A lembic Pharma Abilify Aripiprazole Schizoph ran iaMay-14 Dr Redd y's Labs Purdue Pharmace utical P ro duc Inte rmezzo Zolpidem Insom niaMay-14 Otsuka Pharmac eutical Co. Cadila Hea lthcare Abilify Aripiprazole Schizoph ran iaMay-14 Otsuka Pharmac eutical Co. A uro bindo Pharm a Abilify Aripiprazole Schizoph ran iaMay-14 A straZeneca AB A uro bindo Pharm a Onlyza Saxagliptin Typ e 2 Diab etesMay-14 A straZeneca AB Glenmark Generics Onlyza Saxagliptin Typ e 2 Diab etesMay-14 A straZeneca AB Wo ckhard t Onlyza Saxagliptin Typ e 2 Diab etesMay-14 Otsuka Pharmac eutical Co. Wo ckhard t Abilify Aripiprazole Schizoph ran iaMay-14 Fo rest Laborato ries In c. Ranb axy Labs Namenda XR Mem antine Alzh eimer's diseaseJ un-1 4 A straZeneca Pharmaceuticals LP Sun Pharma Global FZE ; Onglyza Saxagliptin DiabetesJ un-1 4 Bristol-Myers Squibb Co. A uro bindo Pharm a Reyataz Atazanavir HIVJ un-1 4 Te va Women's H ealth Lupin Quartette Levonorgestre Contra ceptiveJ un-1 4 Fo rest Laborato ries In c A uro bindo Pharm a Namenda XR Mem antine Alzh eimer's diseaseJ un-1 4 Senju Pharma Lupin Ph arma Inc. Prolensa Bromfenac Ocular Inf lam mationJ ul-14 Pfizer Inc A uro bindo Pharm a Tygacil Tyg ecyclin e InfectionJ ul-14 Glaxo Sm ith Kline LLC Glenmark Generics Inc. Coreg Carved ilo l High Blood Pressu reJ ul-14 A llos Therapuetics Inc Dr Reddy 's Folotyn Pralatrexate LymphomaJ ul-14 A corda Therapeu tics Inc. ; A uro bindo Pharm a Ampyara Dalfampridine Multiple SyrosysJ ul-14 A lc on Pharmaceu ticals Ltd . A uro bindo Pharm a Vig amo x Moxif lo xacin Eye InfectionJ ul-14 Gilead Scien ces Inc. Lupin Ltd. Atripla Efa virenz/Emtricitab in e/T enofo vir HIVJ ul-14 A bbVie Inc. A uro bindo Pharm a Norvir Rito navir HIVJ ul-14 A lkermes Ph arma Ltd. Sun Pharmaceuticals Focalin XR Dexmethylphenidate AD HDJ ul-14 Otsuka Pharma Co. To rrent Ph arma Abilify Aripiprazole Schizoph ren iaJ ul-14 A strazeneca AB Cadila Hea lthcare Nexium Esomeprazole Ac id RefluxA ug-14 J anssen Pro ducts LP Cipla Ltd. Prezista Darunavir HIVA ug-14 Fo rest Labs Lupin Ltd. Namenda Mem antine Hydrochloride Alzh eimer's diseaseA ug-14 Senju Pharma Ltd. Lupin Ltd. Prolensa Bromfenac Ocular Inf lam mationA ug-14 Novartis Pharma Dr. Redd y's Labs Gleevec Imatinib Mesylate Organ Rejec tionSep-14 Millenium Pharmaceu ticals Glenmark Ph arma Valcad e Bortez omib Multiple MylomaSep-14 Te va Ph arma Dr. Redd y's Labs Copaxon Glat iramer Acetate Multiple SclerosisSep-14 Reckitt Be nckiser LLC A uro bindo Pharm a Mucinex Guaif enesin Mucu sSep-14 Ceph alo n Inc. Dr. Redd y's Labs Tre anda Benda mustine LeukemiaSep-14 Ceph alo n Inc. Sun Pharma Tre anda Benda mustine LeukemiaOct-14 Novartis Pharma Dr. Redd y's Labs Gleevec Imatinib LeukemiaOct-14 Braintree Lab oratory Inc. Ta ro Pharm a Su prep Sodium Sulphate Bow el Preparatio nOct-14 Ceph alo n Inc. Wo ckhard t Tre anda Benda mustine LeukemiaNov-1 4 Biomarin Pharm a Dr. Redd y's Labs Kuvan Sapropterin D ih ydrochlorid e phe nylke ton uriaNov-1 4 Otsuka Pharma Cadila Hea lthcare Abilify Aripiprazole schizop hre niaNov-1 4 Otsuka Pharma A lembic Pharma Abilify Aripiprazole schizop hre nia
Source: Bloomberg, ICICIdirect.com Research

ICICI Securities Ltd. | Retail Equity Research
Page 4
IPM growth backed by steepest price hikes in a year • The Indian pharmaceutical market (IPM) registered strong growth of
13.6% YoY to | 7243 crore for the month. The YoY growth was driven by- 1) price hikes - 5.3%, 2) volume growth - 5.1% and 3) new product launches - 4.1%
• Growth on account of price hike of 5.3% was the steepest in the last 12 months
• Drugs under the NLEM list witnessed growth of 8.0% YoY to | 1252 crore mainly due to recovery in volumes (albeit on lower base) while non-NLEM drugs posted growth of 14.8% to | 6123 crore mainly on price hikes
• Among our covered companies, Torrent has registered highest growth of 31.1% YoY followed by Sun Pharma, Glenmark and Ajanta clocking growth of 21.5%, 21.2% and 19.6%, respectively
• Therapy wise, four therapies have outpaced the IPM growth while 14 therapies have double digit growths. Notable among them with growth rates- anti-diabetic – 33.1%, dermatology- 19.6%, cardiac – 18.2% and urology – 29.7%.
• In all, 185 new brands were launched in December • On a MAT basis, IPM growth stood at 10.2% YoY to | 83009 crore • MNC companies grew 17.5% while domestic companies grew 12.1% in
December 2014 Exhibit 3: Domestic formulations - growth trend
12.3
12.7
7.5
7.1 8.
3
11.7 13
.2
9.0 10
.2
6.3
11.0
19.8
13.6
-5
0
5
10
15
20
Dec-
13
Jan-
14
Feb-
14
Mar
-14
Apr-1
4
May
-14
Jun-
14
Jul-1
4
Aug-
14
Sep-
14
Oct-1
4
Nov
-14
Dec-
14
(%)
Indian Pharma Market [
Source: AIOCD data base, ICICIdirect.com Research
Exhibit 4: Companies growth in domestic market in December 2014
31.1
21.5
8.612.7
5.9
19.6
-3.4
3.7
24.3
6.612.5
3.9 2.2
21.2
12.8 12.9
-10
0
10
20
30
40
Woc
khar
dt
Unic
hem
Torre
nt
Sun
Phar
ma
Pfize
r
Nov
artis
Lupi
n
Ipca
Lab
s
Indo
co
GSK
Phar
ma
Glen
mar
k
Dr. R
eddy
s
Cipl
a
Cadi
la
Bioc
on
Ajan
ta
(%)
Source: AIOCD data base, ICICIdirect.com Research
Therapy wise performance (| crore) Therapy Dec'14 Dec'13 YoY (%) Nov'14 QoQ (%)Anti-Infectives 1092 1038 5.2 1153 -5.3Cardiac 964 816 18.2 899 7.2Gastro Intestinal 791 698 13.5 794 -0.4Vitamins 643 571 12.6 647 -0.5Respiratory 656 596 10.0 624 5.2Anti Diabetic 615 462 33.1 559 10.0Pain 506 455 11.3 507 -0.1CNS 460 399 15.4 439 4.8Derma 450 376 19.6 444 1.5Gynaecological 352 325 8.1 348 1.0Ophthal 130 115 12.9 136 -4.2Hormones 123 116 6.2 123 -0.1Anti-Neoplastics 119 105 12.7 111 7.3Vaccines 103 109 -5.6 96 6.5Blood Related 79 75 5.8 75 5.5Others 93 68 37.9 83 11.7Urology 80 62 29.7 78 2.4Anti Malarials 40 42 -4.2 57 -29.1Sex Stimulants 47 39 18.8 42 12.0Stomatologicals 31 28 13.2 31 0.5
Source: AIOCD data base
Top brands in Indian pharma market Brand Company Therapy Dec'14 Dec'13 Gr. (%)Augmentin GSK Anti-Infectives 285.1 289.1 -1.4Becosules Pfizer Vitamins 237.5 227.5 4.4Corex Pfizer Respiratory 222.5 229.3 -3.0Clavam Alkem Anti-Infectives 213.0 198.7 9.2Lantus Sanofi Anti Diabetic 207.7 160.9 20.2Manforce Mankind Sex Stimulants 178.4 185.2 -4.3Galvus Met Novartis Anti Diabetic 176.7 130.2 6.0Skinlite Zydus Derma 172.6 136.0 33.0Aciloc Cadila * GI 166.6 156.6 31.2Taxim Alkem Anti-Infectives 162.4 149.9 8.4
Source: AIOCD data base; Date as per MAT December14 & December13; *Cadila Pharmaceuticals Industry acute to chronic therapy ratio percentage…
Acute, 58013.0,
70.0%Chronic, 24914.7,
30.0%
Source: AIOCD data base ; As per AIOCD MAT December 2014

ICICI Securities Ltd. | Retail Equity Research
Page 5
Price hikes key driver for quarterly growth… • The Indian pharmaceutical market (IPM) has registered growth of 10.3%
YoY to | 21597 crore in Q3FY15 • The YoY growth was largely driven by 4.8% price hikes taken during the
quarter while volume and new product growth was 3.0% and 2.5%, respectively, in Q3FY15
• Growth on account of price hike of 4.8% was the steepest in the last many quarters
• Drugs under the NLEM list witnessed growth of 2.8% YoY to | 3651 crore mainly due to price hikes while non-NLEM drugs posted growth of 11.4% to | 17865 crore
• Among our covered companies, Ajanta registered highest growth of 33.7% YoY followed by Torrent at 19.7%
• Therapy wise, 10 therapies have outpaced IPM growth. Notable among them with growth rates- anti-diabetic – 23.7%, dermatology- 16.6%, cardiac – 11.4% and urology – 26.5%
• In all, 591 new brands were launched in Q3FY15 Exhibit 5: Domestic formulations – quarterly growth trend
-1.61.6 2.7
4.56.4
2.52.71.5
1.4
1.7
3.1
4.83.2 3.43.6
3.6
3.3
34.3 6.5
7.7
9.8
12.8
10.3
-3
-1
1
3
5
7
9
11
13
15
Q2FY14 Q3FY14 Q4FY14 Q1FY15 Q2FY15 Q3FY15
(%)
Volumes Price Increases New Products[
Source: AIOCD data base, ICICIdirect.com Research
Exhibit 6: Company wise growth trends in Q3FY15
(1.4) (3.4)
19.715.3
22.5
5.98.7
2.9
14.8
8.4 10.48.1
0.9
33.7
(10.0)(5.0)-5.0
10.015.020.025.030.035.040.0
Woc
khar
dt
Unic
hem
Torre
nt
Sun
Phar
ma
Pfize
r
Nov
artis
Lupi
n
Ipca
Lab
s
Glen
mar
k
Dr. R
eddy
s
Cipl
a
Cadi
la
Bioc
on
Ajan
ta
(%)
Source: AIOCD data base, ICICIdirect.com Research
Therapy wise performance (| crore) Therapy Q3FY15 Q3FY14 YoY (%) Q2FY15 QoQ (%)Anti-Infectives 3406 3252 4.7 3822 -10.9Cardiac 2702 2425 11.4 2643 2.3Gastro Intestinal 2365 2123 11.4 2616 -9.6Vitamins 1914 1726 10.9 2052 -6.7Respiratory 1852 1728 7.1 1671 10.8Anti Diabetic 1700 1375 23.7 1645 3.3Pain 1516 1399 8.3 1632 -7.1CNS 1313 1200 9.4 1294 1.5Derma 1300 1114 16.6 1256 3.5Gynaecological 1039 977 6.3 1111 -6.5Ophthal 402 343 17.0 405 -0.9Hormones 363 341 6.5 366 -0.7Anti-Neoplastics 339 297 14.3 361 -6.0Vaccines 291 302 -3.6 295 -1.3Blood Related 229 228 0.3 255 -10.2Others 251 201 24.7 226 10.8Urology 235 185 26.5 240 -2.4Anti Malarials 167 173 -3.5 201 -16.6Sex Stimulants 123 114 8.1 110 11.8Stomatologicals 91 83 10.2 98 -6.6 Source: AIOCD data base
ICICI Securities Ltd. | Retail Equity Research
Page 6
Sun Pharmaceuticals
Stock Performance
80
125
170
Jan-14 Mar-14 May-14 Jul-14 Sep-14 Nov-14 Jan-15
BSE Healthcare Sun Pharma
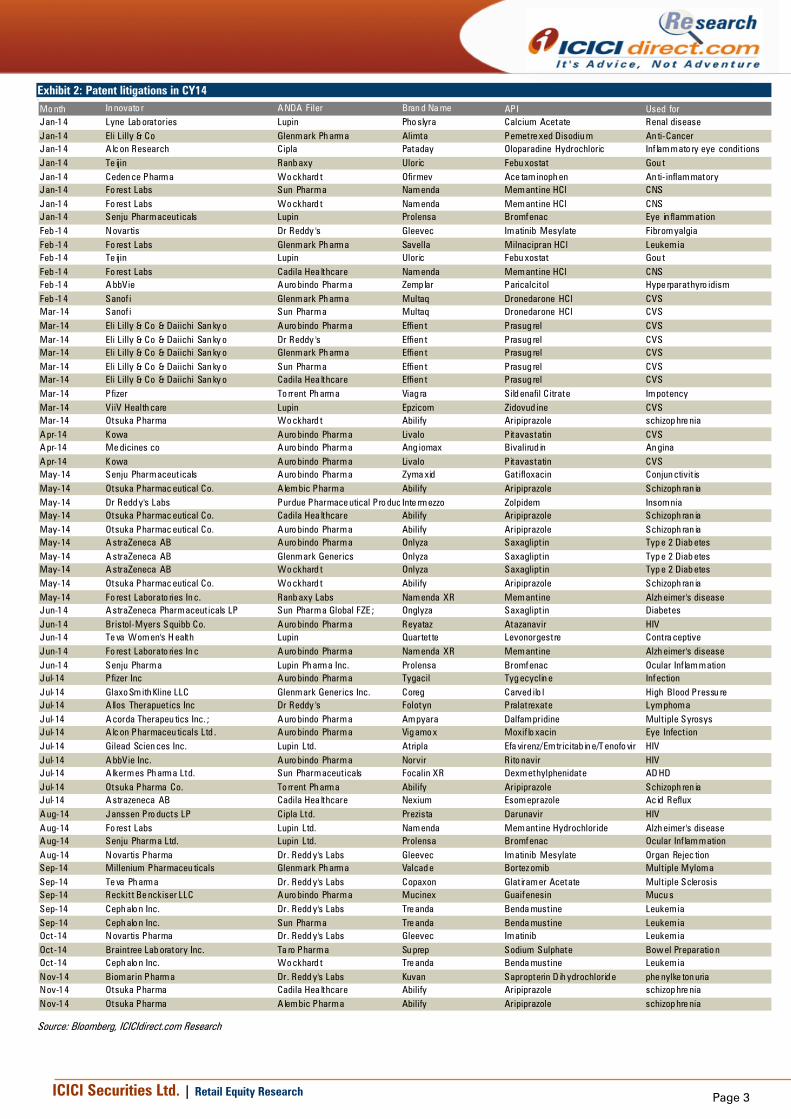
Source: NSE, ICICIdirect.com Research Exhibit 7: Company growth vis-à-vis Indian pharma market growth
12.3
12.7
7.5
7.1 8.
3
11.7 13
.2
9.0 10
.2
19.8
6.3
11.0 13
.6
16.1
20.5
18.6
15.8
10.0
16.6 17
.6
15.3
14.4
9.9
9.7
14.9
21.5
0
5
10
15
20
25
Dec-
13
Jan-
14
Feb-
14
Mar
-14
Apr-1
4
May
-14
Jun-
14
Jul-1
4
Aug-
14
Sep-
14
Oct-1
4
Nov
-14
Dec-
14
(%)
Indian Pharma Market Sun Pharmaceutical Industries
Source: AIOCD data base, ICICIdirect.com Research
Exhibit 8: Market share in Indian formulations market
5.4
5.9
5.5
5.7
5.4
5.6
5.25.4
5.2
4.9
5.5
5.7 5.7
4.8
5.0
5.2
5.4
5.6
5.8
6.0
6.2
Dec-
13
Jan-
14
Feb-
14
Mar
-14
Apr-1
4
May
-14
Jun-
14
Jul-1
4
Aug-
14
Sep-
14
Oct-1
4
Nov
-14
Dec-
14
(%)
Sun Pharmaceutical Industries
Source: AIOCD data base, ICICIdirect.com Research
Exhibit 9: Top 10 brands performance (| crore) Brand Therapy Dec'14 Dec'13 Var. (%) Nov'14 Var. (%)
Gemer Anti Diabetic 11.9 10.5 13 11.5 3
Pantocid Gastro 10.9 8.7 26 10.8 2
Susten Gynaecological 10.9 8.0 35 9.8 11
Levipil Cns 10.9 7.7 41 10.4 4
Istamet Anti Diabetic 11.1 6.6 68 10.2 8
Aztor Cardiac 8.7 6.8 28 8.4 4
Pantocid Dsr Gastro 8.7 6.3 38 9.1 -4
Glucored Anti Diabetic 6.0 5.6 6 5.7 4
Montek-Lc Respiratory 7.2 5.7 27 6.9 5
Oxetol Cns 5.7 4.6 24 5.4 5
Source: AIOCD data base, ICICIdirect.com Research
Exhibit 10: Contribution of therapies to domestic sales (MAT Dec’14) z
Neuro 34%
Cardiac24%
Gastro Intestinal
18%
Anti Diabetic15%
Gynaecological9%
Source: AIOCD data base, ICICIdirect.com Research
Exhibit 11: Therapy wise performance (| crore)
Therapy Dec'14 Dec'13 YoY (%) Nov'14 QoQ (%)
Cns 114.8 89.9 28 110.6 4
Cardiac 76.9 65.8 17 73.9 4
Gastro 61.8 46.0 34 62.2 -1
Anti Diabetic 50.4 40.0 26 48.4 4
Gynaecological 26.4 28.1 -6 25.3 4
Ophthal 18.2 15.4 19 19.0 -4
Pain 17.8 14.3 24 17.3 3
Respiratory 18.7 16.6 12 18.1 3
Vitamins 12.1 9.2 33 11.5 6
Hormones 9.2 9.7 -5 9.4 -2
Source: AIOCD data base, ICICIdirect.com Research
Acute : Chronic contribution (MAT Dec’14)
Acute, 1990.6,
44%
Chronic, 2532.7,
56%
Brands contribution to domestic sales (MAT Dec’14)
21%
11%
8%
11%
49%
Top 10 11 to 20 21 to 30 31 to 50 Others
Source: AIOCD data base
Rectangle
ICICI Securities Ltd. | Retail Equity Research
Page 7
Cipla
Stock Performance
80
110
140
170
Jan-14 Mar-14 May-14 Jul-14 Sep-14 Nov-14 Jan-15
BSE Healthcare Cipla
Source: NSE, ICICIdirect.com Research
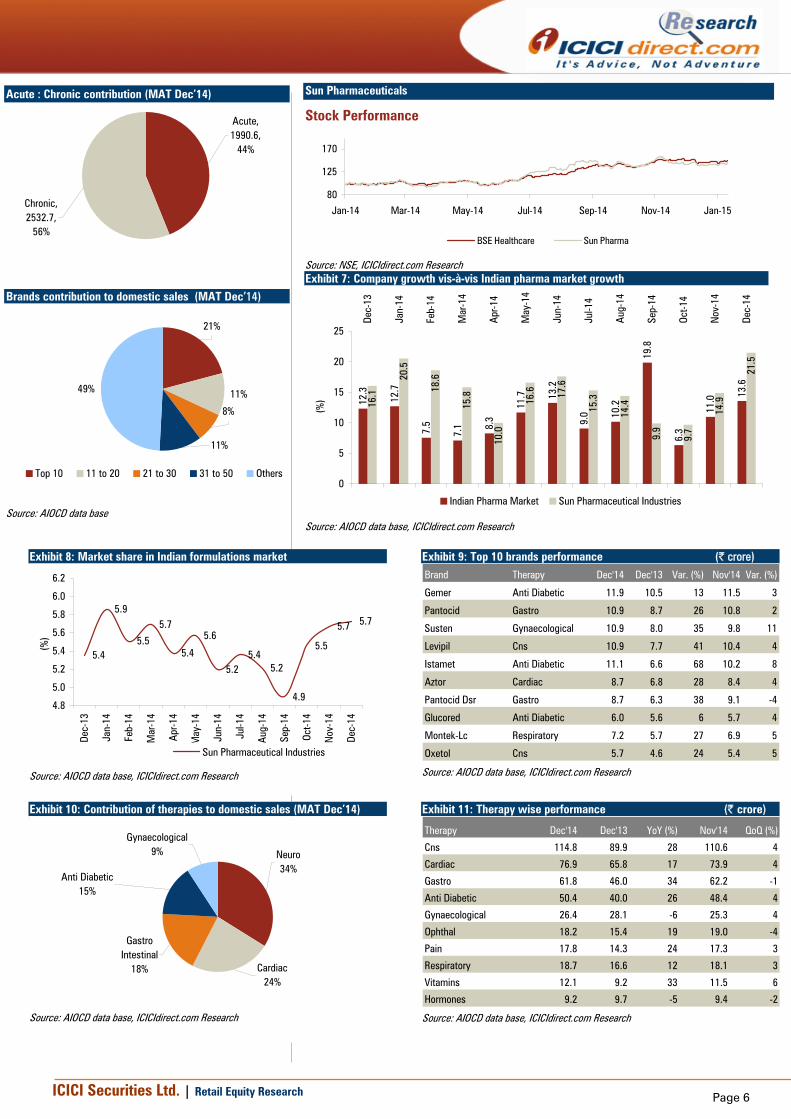
Exhibit 12: Company growth vis-à-vis Indian pharma market growth
12.3
12.7
7.5
7.1 8.3 11
.7 13.2
9.0 10
.2
19.8
6.3
11.0 13
.6
9.1
4.5
0.8 7.5 8.2
7.2 12
.4
10.4 15
.4
38.8
10.3
8.3
12.7
0
5
10
15
20
25
30
35
40
45
Dec-
13
Jan-
14
Feb-
14
Mar
-14
Apr-1
4
May
-14
Jun-
14
Jul-1
4
Aug-
14
Sep-
14
Oct-1
4
Nov
-14
Dec-
14
(%)
Indian Pharma Market Cipla
Source: AIOCD data base, ICICIdirect.com Research
Exhibit 13: Market share in Indian formulations market
5.1 5.1 5.14.9
5.1
4.84.7
4.8
5.0
5.5
5.04.9
5.0
4.2
4.4
4.6
4.8
5.0
5.2
5.4
5.6
Dec-
13
Jan-
14
Feb-
14
Mar
-14
Apr-1
4
May
-14
Jun-
14
Jul-1
4
Aug-
14
Sep-
14
Oct-1
4
Nov
-14
Dec-
14
(%)
Cipla
Source: AIOCD data base, ICICIdirect.com Research
Exhibit 14: Top 10 brands performance (| crore) Brand Therapy Dec'14 Dec'13 Var. (%) Nov'14 Var. (%)
Foracort Respiratory 16.2 13.0 24 14.6 11
Asthalin Respiratory 13.3 13.4 -1 12.4 7
Seroflo Respiratory 12.8 11.5 11 11.6 10
Budecort Respiratory 13.4 11.8 14 11.0 22
Duolin Respiratory 10.4 9.0 16 9.4 10
Aerocort Respiratory 9.0 8.6 5 8.5 6
Novamox Anti-Infectives 6.0 6.4 -7 6.9 -13
Azee Anti-Infectives 7.2 6.2 16 7.2 -1
Montair Lc Respiratory 6.6 5.5 20 6.1 9
Ciplox Anti-Infectives 3.9 5.0 -23 5.1 -24
Source: AIOCD data base, ICICIdirect.com Research
Exhibit 15: Contribution of therapies to domestic sales (MAT Dec’14)
Respiratory30%
Anti-Infectives27%
Cardiac13%
Gastro Intestinal
7%
Urology4%
Other19%
Source: AIOCD data base, ICICIdirect.com Research
Exhibit 16: Therapy wise performance (| crore)
Therapy Dec'14 Dec'13 YoY (%) Nov'14 QoQ (%)
Respiratory 126.4 114.2 11 116.0 9
Anti-Infectives 90.9 82.4 10 94.0 -3
Cardiac 47.7 40.5 18 43.2 10
Gastro 24.8 22.9 8 24.5 1
Urology 16.8 12.6 33 15.3 10
Ophtha l 11.8 10.6 12 10.8 10
Cns 13.2 10.1 31 11.9 11
Pain 9.4 7.6 23 9.8 -5
Derma 8.6 7.9 9 8.3 4
Vitamins 7.2 7.9 -9 6.6 8
Source: AIOCD data base, ICICIdirect.com Research
Acute : Chronic contribution (MAT Dec’14)
Acute, 2447.9,
59%Chronic, 1693.3,
41%
Brands contribution to domestic sales (MAT Dec’14)
25%
12%9%
12%
42%
Top 10 11 to 20 21 to 30 31 to 50 Others
Source: AIOCD data base
Rectangle

ICICI Securities Ltd. | Retail Equity Research
Page 8
Dr Reddy’s Laboratories
Stock Performance
80
110
140
170
Jan-14 Mar-14 May-14 Jul-14 Sep-14 Nov-14 Jan-15BSE Healthcare Dr. Reddys
Source: NSE, ICICIdirect.com Research
Exhibit 17: Company growth vis-à-vis Indian pharma market growth
12.3
12.7
7.5
7.1 8.3 11
.7 13.2
9.0 10
.2
19.8
6.3
11.0 13
.6
7.2
6.6 6.9
-0.2
6.3 10
.3
17.6
10.6
16.8 18.0
3.0
9.4 12
.8
-10
0
10
20
30
Dec-
13
Jan-
14
Feb-
14
Mar
-14
Apr-1
4
May
-14
Jun-
14
Jul-1
4
Aug-
14
Sep-
14
Oct-1
4
Nov-
14
Dec-
14
(%)
Indian Pharma Market Dr. Reddys Laboratories
Source: AIOCD data base, ICICIdirect.com Research
Exhibit 18: Market share in Indian formulations market
2.2
2.1
2.2
2.1
2.0
2.12.2
2.1
2.1 2.1
2.0
2.1
2.2
1.9
2.0
2.0
2.1
2.1
2.2
2.2
2.3
Dec-
13
Jan-
14
Feb-
14
Mar
-14
Apr-1
4
May
-14
Jun-
14
Jul-1
4
Aug-
14
Sep-
14
Oct-1
4
Nov
-14
Dec-
14
(%)
Dr. Reddys Laboratories
Source: AIOCD data base, ICICIdirect.com Research
Exhibit 19: Top 10 brands performance (| crore) Brand Therapy Dec'14 Dec'13 Var. (%) Nov'14 Var. (%)
Omez Gastro 9.0 8.0 12 8.5 6
Omez D Gastro 6.8 6.3 7 6.2 9
Nise Pain 4.9 4.6 6 5.6 -13
Stamlo Cardiac 5.3 4.8 10 4.3 22
Econorm Gastro 4.7 3.8 24 3.8 23
Stamlo Beta Cardiac 4.2 3.3 28 3.8 12
Mintop Derma 4.8 4.4 8 4.4 11
Reditux Anti-Neoplastics 3.5 4.2 -18 3.5 -2
Razo D Gastro 3.9 3.6 10 3.7 8
Razo Gastro 3.5 3.4 2 3.3 5
Source: AIOCD data base, ICICIdirect.com Research
Exhibit 20: Contribution of therapies to domestic sales (MAT Dec’14)
Gastro Intestinal
23%
Cardiac16%
Anti-Neoplastics
11%Anti-Infectives8%
Pain 8%
Other34%
Source: AIOCD data base, ICICIdirect.com Research
Exhibit 21: Therapy wise performance (| crore)
Therapy Dec'14 Dec'13 YoY (%) Nov'14 QoQ (%)
Gastro 36.2 31.7 14 33.6 8
Cardiac 27.3 23.0 19 24.6 11
Anti-Neoplastics 15.6 15.6 0 14.8 5
Anti-Infectives 13.5 11.3 20 13.7 -2
Pain 11.9 11.5 3 12.5 -5
Derma 12.4 13.0 -4 12.1 3
Anti Diabetic 12.2 9.7 25 11.3 8
Respiratory 9.4 8.5 11 8.8 7
Urology 7.0 5.4 30 6.3 11
Stomatologicals 5.9 5.2 12 5.8 2
Source: AIOCD data base, ICICIdirect.com Research
Acute : Chronic contribution (MAT Dec’14)
Acute, 1220.4,
70%
Chronic, 534.8, 30%
Brands contribution to domestic sales (MAT Dec’14)
31%
16%9%
12%
32%
Top 10 11 to 20 21 to 30 31 to 50 Others
Source: AIOCD data base
Rectangle

ICICI Securities Ltd. | Retail Equity Research
Page 9
Lupin
Stock Performance
75
115
155
Jan-14 Mar-14 May-14 Jul-14 Sep-14 Nov-14 Jan-15
BSE Healthcare Lupin
Source: NSE, ICICIdirect.com Research
Exhibit 22: Company growth vis-à-vis Indian pharma market growth
12.3
12.7
7.5
7.1 8.
3
11.7 13
.2
9.0 10
.2
19.8
11.0
13.6
19.8
15.7
9.5 11
.0
9.8 11
.9 13.3
8.5
19.8
5.3
8.2
12.5
6.3
0
4
8
12
16
20
Dec-
13
Jan-
14
Feb-
14
Mar
-14
Apr-1
4
May
-14
Jun-
14
Jul-1
4
Aug-
14
Sep-
14
Oct-1
4
Nov
-14
Dec-
14
(%)
Indian Pharma Market Lupin
Source: AIOCD data base, ICICIdirect.com Research
Exhibit 23: Market share in Indian formulations market
3.3
3.5
3.43.3 3.3
3.43.4 3.4
3.2
3.3
3.2
3.33.3
3.13.23.23.33.33.43.43.53.53.6
Dec-
13
Jan-
14
Feb-
14
Mar
-14
Apr-1
4
May
-14
Jun-
14
Jul-1
4
Aug-
14
Sep-
14
Oct-1
4
Nov-
14
Dec-
14
(%)
Lupin
Source: AIOCD data base, ICICIdirect.com Research
Exhibit 24: Top 10 brands performance (| crore) Brand Therapy Dec'14 Dec'13 Var. (%) Nov'14 Var. (%)
Gluconorm-G Anti Diabetic 9.7 9.2 6 9.3 4
Tonact Cardiac 7.6 6.3 20 7.4 3
Budamate Respiratory 7.7 5.4 42 6.2 25
Ramistar Cardiac 4.2 4.0 4 4.1 1
R-Cinex Anti-Infectives 3.9 3.7 7 3.9 0
Rablet-D Gastro 3.9 3.0 31 3.7 5
Rablet Gastro 3.6 3.0 19 3.7 -3
Merotrol Anti-Infectives 2.3 3.2 -27 3.9 -40
Esiflo Respiratory 4.4 3.6 23 3.9 14
Tazar Anti-Infectives 2.5 3.5 -27 3.0 -16
Source: AIOCD data base, ICICIdirect.com Research
Exhibit 25: Contribution of therapies to domestic sales (MAT Dec’14)
Cardiac24%
Anti-Infectives24%Respiratory
12%
Anti Diabetic10%
Gastro8%
Other22%
Source: AIOCD data base, ICICIdirect.com Research
Exhibit 26: Therapy wise performance (| crore)
Therapy Dec'14 Dec'13 YoY (%) Nov'14 QoQ (%)
Cardiac 60.7 50.5 20 58.0 5
Anti-Infectives 49.8 54.0 -8 55.1 -10
Respiratory 34.3 28.4 21 30.7 12
Anti Diabetic 25.8 21.4 20 24.7 4
Gastro 18.0 15.6 16 18.3 -1
Vitamins 13.0 12.1 7 13.7 -5
Cns 13.1 11.5 14 12.8 2
Pain 10.5 8.7 21 10.8 -3
Gynaecological 6.4 4.9 30 5.9 8
Derma 1.6 1.2 32 1.7 -7
Source: AIOCD data base, ICICIdirect.com Research
Acute : Chronic contribution (MAT Dec’14)
Acute, 1473.1,
53%
Chronic, 1293.2,
47%
Brands contribution to domestic sales (MAT Dec’14)
21%
12%
9%
13%
45%
Top 10 11 to 20 21 to 30 31 to 50 Others
Source: AIOCD data base
Rectangle
ICICI Securities Ltd. | Retail Equity Research
Page 10
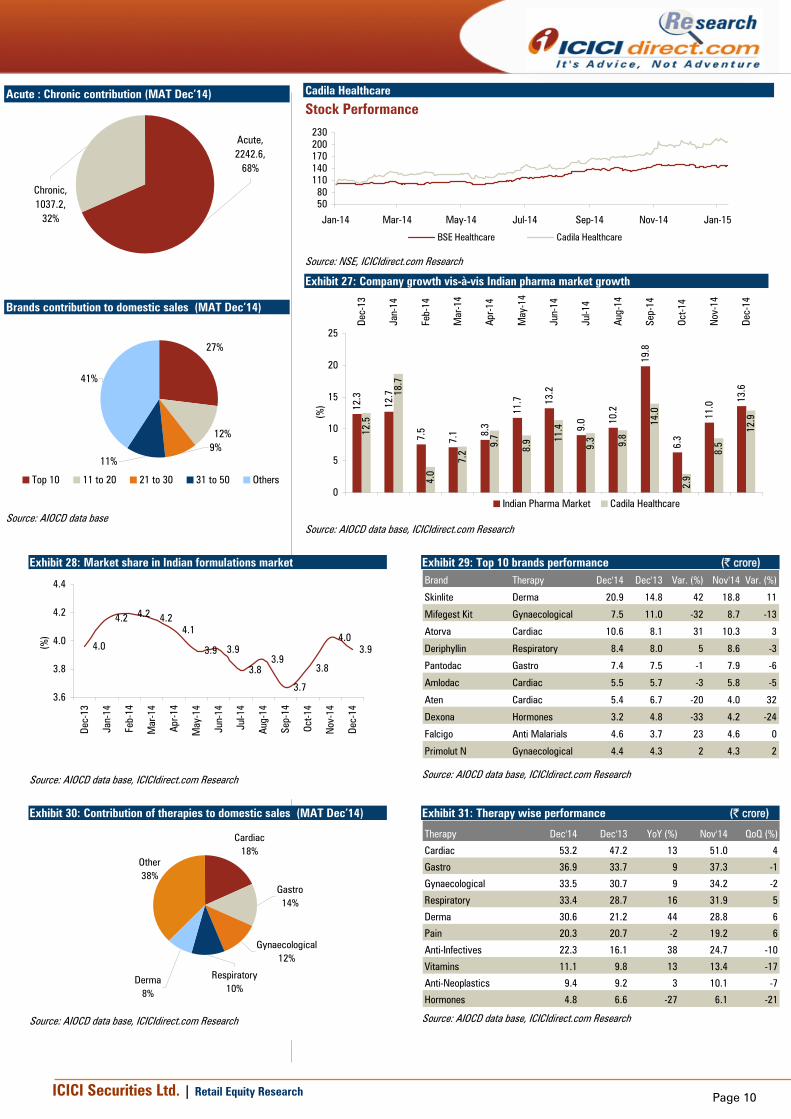
Cadila Healthcare
Stock Performance
5080
110140170200230
Jan-14 Mar-14 May-14 Jul-14 Sep-14 Nov-14 Jan-15
BSE Healthcare Cadila Healthcare
Source: NSE, ICICIdirect.com Research
Exhibit 27: Company growth vis-à-vis Indian pharma market growth
12.3
12.7
7.5
7.1 8.
3
11.7 13
.2
9.0 10
.2
19.8
6.3
11.0
13.6
12.5
18.7
4.0
7.2
9.7
8.9 11
.4
9.3 9.8
14.0
2.9
8.5
12.9
0
5
10
15
20
25
Dec-
13
Jan-
14
Feb-
14
Mar
-14
Apr-1
4
May
-14
Jun-
14
Jul-1
4
Aug-
14
Sep-
14
Oct-1
4
Nov-
14
Dec-
14
(%)
Indian Pharma Market Cadila Healthcare
Source: AIOCD data base, ICICIdirect.com Research
Exhibit 28: Market share in Indian formulations market
4.0
4.2 4.2 4.24.1
3.9 3.9
3.83.9
3.7
3.8
4.03.9
3.6
3.8
4.0
4.2
4.4
Dec-
13
Jan-
14
Feb-
14
Mar
-14
Apr-1
4
May
-14
Jun-
14
Jul-1
4
Aug-
14
Sep-
14
Oct-1
4
Nov
-14
Dec-
14
(%)
Source: AIOCD data base, ICICIdirect.com Research
Exhibit 29: Top 10 brands performance (| crore) Brand Therapy Dec'14 Dec'13 Var. (%) Nov'14 Var. (%)
Skinlite Derma 20.9 14.8 42 18.8 11
Mifegest Kit Gynaecological 7.5 11.0 -32 8.7 -13
Atorva Cardiac 10.6 8.1 31 10.3 3
Deriphyllin Respiratory 8.4 8.0 5 8.6 -3
Pantodac Gastro 7.4 7.5 -1 7.9 -6
Amlodac Cardiac 5.5 5.7 -3 5.8 -5
Aten Cardiac 5.4 6.7 -20 4.0 32
Dexona Hormones 3.2 4.8 -33 4.2 -24
Falcigo Anti Malarials 4.6 3.7 23 4.6 0
Primolut N Gynaecological 4.4 4.3 2 4.3 2
Source: AIOCD data base, ICICIdirect.com Research
Exhibit 30: Contribution of therapies to domestic sales (MAT Dec’14)
Cardiac18%
Gastro14%
Gynaecological12%
Respiratory10%
Derma8%
Other38%
Source: AIOCD data base, ICICIdirect.com Research
Exhibit 31: Therapy wise performance (| crore)
Therapy Dec'14 Dec'13 YoY (%) Nov'14 QoQ (%)
Cardiac 53.2 47.2 13 51.0 4
Gastro 36.9 33.7 9 37.3 -1
Gynaecological 33.5 30.7 9 34.2 -2
Respiratory 33.4 28.7 16 31.9 5
Derma 30.6 21.2 44 28.8 6
Pain 20.3 20.7 -2 19.2 6
Anti-Infectives 22.3 16.1 38 24.7 -10
Vitamins 11.1 9.8 13 13.4 -17
Anti-Neoplastics 9.4 9.2 3 10.1 -7
Hormones 4.8 6.6 -27 6.1 -21
Source: AIOCD data base, ICICIdirect.com Research
Acute : Chronic contribution (MAT Dec’14)
Acute, 2242.6,
68%
Chronic, 1037.2,
32%
Brands contribution to domestic sales (MAT Dec’14)
27%
12%9%
11%
41%
Top 10 11 to 20 21 to 30 31 to 50 Others
Source: AIOCD data base
Rectangle

ICICI Securities Ltd. | Retail Equity Research
Page 11
GlaxoSmithKline Pharmaceuticals
Stock Performance
80
110
140
170
Jan-14 Mar-14 May-14 Jul-14 Sep-14 Nov-14 Jan-15
BSE Healthcare GSK Pharma
Source: NSE, ICICIdirect.com Research
Exhibit 32: Company growth vis-à-vis Indian pharma market growth
12.3
12.7
7.5
7.1 8.3 11
.7 13.2
9.0 10
.2
19.8
6.3
11.0 13
.6
-11.
1
-10.
6
-16.
3
-9.3
-10.
3 -6.2
-4.4
-10.
2
0.2
13.4
12.2
5.7
2.2
-20
-15
-10
-5
05
10
15
20
25
Dec-
13
Jan-
14
Feb-
14
Mar
-14
Apr-1
4
May
-14
Jun-
14
Jul-1
4
Aug-
14
Sep-
14
Oct-1
4
Nov-
14
Dec-
14
(%)
Indian Pharma Market Glaxosmithkline Pharmaceuticals
Source: AIOCD data base, ICICIdirect.com Research
Exhibit 33: Market share in Indian formulations market
3.6
3.4
3.53.5
3.33.4
3.4
3.3
3.4
3.3
3.23.2 3.2
3.1
3.3
3.5
3.7
Dec-
13
Jan-
14
Feb-
14
Mar
-14
Apr-1
4
May
-14
Jun-
14
Jul-1
4
Aug-
14
Sep-
14
Oct-1
4
Nov-
14
Dec-
14
(%)
Glaxosmithkline Pharmaceuticals
Source: AIOCD data base, ICICIdirect.com Research
Exhibit 34: Top 10 brands performance (| crore) Brand Therapy Dec'14 Dec'13 Var. (%) Nov'14 Var. (%)
Augmentin Anti-Infectives 25.7 22.1 16 21.5 20
Calpol Pain 11.6 11.4 2 12.5 -7
Zinetac Gastro 12.4 11.5 8 12.2 2
Ceftum Anti-Infectives 10.8 9.0 19 10.7 1
Eltroxin Hormones 9.9 11.0 -10 11.0 -10
Betnovate N Derma 11.9 9.8 22 10.7 12
Betnovate C Derma 11.2 9.7 15 10.3 8
T Bact Derma 8.2 6.9 19 7.7 6
Betnesol Hormones 8.9 6.8 32 8.5 5
Phexin Anti-Infectives 4.6 4.7 -2 5.2 -12
Source: AIOCD data base, ICICIdirect.com Research
Exhibit 35: Contribution of therapies to domestic sales (MAT Dec’14)
Anti-Infectives28%
Derma21%
Pain 9%
Vitamins 8%
Hormones7%
Other27%
Source: AIOCD data base, ICICIdirect.com Research
Exhibit 36: Therapy wise performance (| crore)
Therapy Dec'14 Dec'13 YoY (%) Nov'14 QoQ (%)
Anti-Infectives 60.6 62.0 -2 59.0 3
Derma 55.0 47.2 17 52.2 5
Pain 21.0 20.6 2 20.4 3
Vitamins 18.2 17.4 5 18.4 -1
Hormones 19.5 19.0 3 20.1 -3
Gastro 15.0 14.9 1 14.9 0
Respiratory 16.8 18.0 -7 16.9 -1
Vaccines 14.3 15.6 -8 13.3 7
Cardiac 7.3 7.3 1 7.6 -3
Ophthal 5.9 5.7 3 6.8 -14
Source: AIOCD data base, ICICIdirect.com Research
Acute : Chronic contribution (MAT Dec’14)
Acute, 2394.4,
86%
Chronic, 385.1, 14%
Brands contribution to domestic sales (MAT Dec’14)
46%
16%
9%
12%
17%
Top 10 11 to 20 21 to 30 31 to 50 Others
Source: AIOCD data base
Rectangle

ICICI Securities Ltd. | Retail Equity Research
Page 12
Wockhardt
Stock Performance
050
100150200250300
Jan-14 Mar-14 May-14 Jul-14 Sep-14 Nov-14 Jan-15
BSE Healthcare Wockhardt
Source: NSE, ICICIdirect.com Research Exhibit 37: Company growth vis-à-vis Indian pharma market growth
12.3
12.7
7.5
7.1 8.3 11
.7 13.2
9.0 10
.2
19.8
6.3
11.0 13
.6
-6.4
-14.
4
-19.
6
-7.6
-15.
3
-15.
3
-14.
9
-17.
1
1.8
8.5
5.0
-5.1 -3
.4
-25-20-15
-10-505
10
152025
Dec-
13
Jan-
14
Feb-
14
Mar
-14
Apr-1
4
May
-14
Jun-
14
Jul-1
4
Aug-
14
Sep-
14
Oct-1
4
Nov-
14
Dec-
14
(%)
Indian Pharma Market Wockhardt
Source: AIOCD data base, ICICIdirect.com Research
Exhibit 38: Market share in Indian formulations market
1.36
1.301.33
1.18 1.191.16
1.10
1.211.25
1.09
1.17
1.111.16
1.01.11.11.2
1.21.31.31.41.4
Dec-
13
Jan-
14
Feb-
14
Mar
-14
Apr-1
4
May
-14
Jun-
14
Jul-1
4
Aug-
14
Sep-
14
Oct-1
4
Nov-
14
Dec-
14
(%)
Wockhardt
Source: AIOCD data base, ICICIdirect.com Research
Exhibit 39: Top 10 brands performance (| crore) Brand Therapy Dec'14 Dec'13 Var. (%) Nov'14 Var. (%)
Spasmo Proxyvon Plu Gastro 12.9 15.0 -14 14.7 -12
Practin Vitamins 4.9 5.7 NA 5.2 -5
Bro Zedex Respiratory 4.7 4.6 2 4.4 8
Tryptomer Cns 3.5 3.7 -6 3.6 -4
Zedex Respiratory 4.0 3.4 20 3.9 4
Methycobal Vitamins 3.1 2.9 7 3.3 -7
Decdan Hormones 1.5 3.9 -63 1.3 11
Ace Proxyvon Pain 2.5 1.9 27 2.4 1
Libotryp Cns 2.0 2.0 2 1.6 24
Aziwok Anti-Infectives 2.0 1.3 47 2.0 0
Source: AIOCD data base, ICICIdirect.com Research
Exhibit 40: Contribution of therapies to domestic sales (MAT Dec’14)
Vitamins 18%
Gastro18%
Respiratory16%Derma
9%
Anti-Infectives8%
Other31%
Source: AIOCD data base, ICICIdirect.com Research
Exhibit 41: Therapy wise performance (| crore)
Therapy Dec'14 Dec'13 YoY (%) Nov'14 QoQ (%)
Vitamins 14.0 14.7 -5 13.8 2
Gastro 14.1 16.2 -13 15.7 -10
Respiratory 15.1 13.1 15 14.0 8
Derma 8.4 5.6 50 6.5 30
Anti-Infectives 5.7 6.0 -5 6.5 -12
Cns 5.9 6.2 -5 5.6 6
Pain 5.7 6.2 -8 5.3 8
Anti Diabetic 4.8 6.5 -27 4.6 3
Hormones 1.7 4.4 -61 1.5 13
Vaccines 3.1 1.7 86 1.9 61
Source: AIOCD data base, ICICIdirect.com Research
Acute : Chronic contribution (MAT Dec’14)
Acute, 771.2, 79%
Chronic, 207.5, 21%
Brands contribution to domestic sales (MAT Dec’14)
51%
16%
9%
9%
15%
Top 10 11 to 20 21 to 30 31 to 50 Others
Source: AIOCD data base
Rectangle

ICICI Securities Ltd. | Retail Equity Research
Page 13
Glenmark Pharmaceuticals
Stock Performance
60
100
140
180
Jan-14 Mar-14 May-14 Jul-14 Sep-14 Nov-14 Jan-15BSE Healthcare Glenmark
Source: NSE, ICICIdirect.com Research
Exhibit 42: Company growth vis-à-vis Indian pharma market growth
12.3
12.7
7.5
7.1 8.
3
11.7 13
.2
9.0 10
.2
19.8
6.3
11.0 13
.621.3
17.6
17.5
12.4
11.3
14.9 17
.9
9.8
9.1
27.1
2.6
20.3 21.2
0
5
10
15
20
25
30
Dec-
13
Jan-
14
Feb-
14
Mar
-14
Apr-1
4
May
-14
Jun-
14
Jul-1
4
Aug-
14
Sep-
14
Oct-1
4
Nov
-14
Dec-
14
(%)
Indian Pharma Market Glenmark Pharmaceuticals
Source: AIOCD data base, ICICIdirect.com Research
Exhibit 43: Market share in Indian formulations market
2.32.2 2.2
2.12.1
1.92.0
2.12.1
2.4
2.2
2.4 2.5
1.9
2.1
2.3
2.5
Dec-
13
Jan-
14
Feb-
14
Mar
-14
Apr-1
4
May
-14
Jun-
14
Jul-1
4
Aug-
14
Sep-
14
Oct-1
4
Nov
-14
Dec-
14
(%)
Glenmark Pharmaceuticals
Source: AIOCD data base, ICICIdirect.com Research
Exhibit 44: Top 10 brands performance (| crore) Brand Therapy Dec'14 Dec'13 Var. (%) Nov'14 Var. (%)
Telma Cardiac 12.8 12.0 6 12.4 3
Telma H Cardiac 10.3 9.7 6 10.3 0
Ascoril Plus Respiratory 9.8 9.8 0 9.2 7
Candid-B Derma 7.1 5.6 26 6.7 6
Candid Derma 5.0 3.6 39 5.4 -9
Telma Am Cardiac 5.0 4.2 19 4.7 7
Zitamet Anti Diabetic 6.0 2.2 178 5.6 6
Zita(Glenmark) Anti Diabetic 4.7 1.6 201 4.0 17
Ascoril Ls Respiratory 3.7 2.6 40 3.6 2
Candid Mouth Derma 2.1 2.3 -6 2.6 -18
Source: AIOCD data base, ICICIdirect.com Research
Exhibit 45: Contribution of therapies to domestic sales (MAT Dec’14)
Derma29%
Cardiac23%
Respiratory15%
Anti-Infectives14%
Anti Diabetic7%
Other12%
Source: AIOCD data base, ICICIdirect.com Research
Exhibit 46: Therapy wise performance (| crore)
Therapy Dec'14 Dec'13 YoY (%) Nov'14 QoQ (%)
Derma 50.7 42.0 21 51.0 -1
Cardiac 39.7 35.5 12 38.4 3
Respiratory 31.8 26.6 20 29.3 8
Anti-Infectives 25.2 19.4 30 25.1 0
Anti Diabetic 15.0 9.4 61 14.1 7
Pain 3.7 3.4 9 3.9 -4
Vitamins 3.7 3.5 7 3.9 -4
Gastro 4.4 2.8 58 3.9 14
Gynaecological 3.2 4.3 -24 3.0 10
Ophthal 2.4 2.0 22 3.3 -26
Source: AIOCD data base, ICICIdirect.com Research
Acute : Chronic contribution (MAT Dec’14) 668.8, 37%
Acute, 1149.1,
63%
Brands contribution to domestic sales (MAT Dec’14)
37%
13%10%
12%
28%
Top 10 11 to 20 21 to 30 31 to 50 Others
Source: AIOCD data base
Rectangle

ICICI Securities Ltd. | Retail Equity Research
Page 14
Torrent Pharmaceuticals
Stock Performance
80
170
260
Jan-14 Mar-14 May-14 Jul-14 Sep-14 Nov-14 Jan-15
BSE Healthcare Torrent Pharma
Source: NSE, ICICIdirect.com Research
Exhibit 47: Company growth vis-à-vis Indian pharma market growth
12.3
12.7
7.5
7.1 8.3 11
.7 13.2
9.0 10
.2
19.8
6.3
11.0 13
.6
-0.2
2.9
3.8
3.3
1.2
4.7
12.2
10.9
8.4
18.4
6.0
23.2
31.1
-5
0
5
10
15
20
25
30
35
Dec-
13
Jan-
14
Feb-
14
Mar
-14
Apr-1
4
May
-14
Jun-
14
Jul-1
4
Aug-
14
Sep-
14
Oct-1
4
Nov
-14
Dec-
14
(%)
Indian Pharma Market Torrent Pharmaceuticals
Source: AIOCD data base, ICICIdirect.com Research
Exhibit 48: Market share in Indian formulations market
2.132.20 2.19 2.16
2.262.23
2.29 2.28
2.13 2.14
2.252.32
2.46
1.9
2.0
2.1
2.2
2.3
2.4
2.5
Dec-
13
Jan-
14
Feb-
14
Mar
-14
Apr-1
4
May
-14
Jun-
14
Jul-1
4
Aug-
14
Sep-
14
Oct-1
4
Nov
-14
Dec-
14
(%)
Torrent Pharmaceuticals
Source: AIOCD data base, ICICIdirect.com Research
Exhibit 49: Top 10 brands performance (| crore) Brand Therapy Dec'14 Dec'13 Var. (%) Nov'14 Var. (%)
Shelcal Vitamins 14.6 7.9 85 15.4 -5
Nikoran Cardiac 7.2 5.5 30 6.5 11
Chymoral Forte Pain 8.0 4.3 85 9.0 -11
Dilzem Cardiac 5.5 4.9 12 5.0 11
Nebicard Cardiac 4.4 3.8 16 4.0 8
Nexpro Rd Gastro 4.3 3.2 35 4.1 5
Azulix-Mf Anti Diabetic 4.6 2.9 61 3.8 21
Nexpro Gastro 4.2 3.2 32 3.6 16
Alprax Cns 3.3 2.9 10 3.0 7
Domstal Gastro 3.3 2.6 30 2.7 23
Source: AIOCD data base, ICICIdirect.com Research
Exhibit 50: Contribution of therapies to domestic sales (MAT Dec’14)
Cardiac30%
Cns17%
Gastro15%
Vitamins 13%
Anti-Infectives8%
Other17%
Source: AIOCD data base, ICICIdirect.com Research
Exhibit 51: Therapy wise performance (| crore)
Therapy Dec'14 Dec'13 YoY (%) Nov'14 QoQ (%)
Cardiac 54.3 44.1 23 47.7 14
Cns 29.8 23.1 29 26.8 11
Gastro 26.7 20.3 32 25.2 6
Vitamins 24.5 16.3 50 24.8 -1
Anti-Infectives 12.0 12.2 -1 11.8 2
Pain 12.1 7.1 72 12.8 -6
Anti Diabetic 11.3 7.2 58 9.3 22
Gynaecological 3.3 2.9 15 3.4 -3
Derma 3.8 2.8 39 3.7 5
Urology 0.6 0.5 15 0.6 -3
Source: AIOCD data base, ICICIdirect.com Research
Acute : Chronic contribution (MAT Dec’14)
Acute, 901.7, 48%
Chronic, 960.4, 52%
Brands contribution to domestic sales (MAT Dec’14)
31%
15%9%
12%
33%
Top 10 11 to 20 21 to 30 31 to 50 Others
Source: AIOCD data base
Rectangle

ICICI Securities Ltd. | Retail Equity Research
Page 15
Ipca Laboratories
Stock Performance
80
140
200
Jan-14 Mar-14 May-14 Jul-14 Sep-14 Nov-14 Jan-15
BSE Healthcare Ipca
Source: NSE, ICICIdirect.com Research
Exhibit 52: Company growth vis-à-vis Indian pharma market growth
12.3
12.7
7.5
7.1 8.3 11
.7 13.2
9.0 10
.2
19.8
6.3
11.0 13
.6
30.2
30.2
24.4
23.7
19.3
28.9
21.3
27.5
22.1
0.7
4.2
28.1
3.9
0
5
10
15
20
25
30
35
Dec-
13
Jan-
14
Feb-
14
Mar
-14
Apr-1
4
May
-14
Jun-
14
Jul-1
4
Aug-
14
Sep-
14
Oct-1
4
Nov
-14
Dec-
14
(%)
Indian Pharma Market Ipca Laboratories
Source: AIOCD data base, ICICIdirect.com Research
Exhibit 53: Market share in Indian formulations market
1.81.7 1.7 1.7 1.7
1.8 1.8 1.81.9
1.9
1.8
1.7
1.6
1.4
1.5
1.6
1.7
1.8
1.9
2.0
2.1
Dec-
13
Jan-
14
Feb-
14
Mar
-14
Apr-1
4
May
-14
Jun-
14
Jul-1
4
Aug-
14
Sep-
14
Oct-1
4
Nov
-14
Dec-
14
(%)
Ipca Laboratories
Source: AIOCD data base, ICICIdirect.com Research
Exhibit 54: Top 10 brands performance (| crore) Brand Therapy Dec'14 Dec'13 Var. (%) Nov'14 Var. (%)
Zerodol Sp Pain 6.4 5.7 13 6.3 1
Zerodol P Pain 7.0 5.9 18 5.0 41
Hcqs Anti Malarials 5.6 5.4 3 5.8 -4
Larinate Anti Malarials 5.0 4.6 8 5.9 -15
Rapither-Ab Anti Malarials 2.5 3.0 -15 5.4 -53
Lariago Anti Malarials 2.3 3.0 -25 3.9 -43
Glycinorm M Anti Diabetic 3.3 3.2 5 3.1 7
Folitrax Anti-Neoplastics 2.9 2.7 6 3.0 -4
Lumerax Anti Malarials 1.6 2.2 -26 2.9 -44
Azibact Anti-Infectives 2.7 2.9 -8 2.8 -4
Source: AIOCD data base, ICICIdirect.com Research
Exhibit 55: Contribution of therapies to domestic sales (MAT Dec’14)
Pain 23%
Anti Malarials21%
Cardiac17%
Gastro8%
Anti-Infectives7%
Other24%
Source: AIOCD data base, ICICIdirect.com Research
Exhibit 56: Therapy wise performance (| crore)
Therapy Dec'14 Dec'13 YoY (%) Nov'14 QoQ (%)
Pain 27.6 26.2 5 25.9 7
Anti Malarials 20.3 21.3 -5 28.8 -29
Cardiac 21.8 20.4 7 20.2 8
Gastro 8.3 8.4 0 9.2 -10
Anti-Infectives 8.6 8.9 -3 8.7 -1
Anti Diabetic 6.7 6.6 2 6.3 7
Respiratory 6.3 5.9 6 6.5 -3
Cns 5.3 3.8 39 4.8 10
Derma 4.3 5.0 -14 4.2 2
Anti-Neoplastics 4.4 3.6 20 3.8 14
Source: AIOCD data base, ICICIdirect.com Research
Acute : Chronic contribution (MAT Dec’14)
Acute, 1066.6,
72%
Chronic, 409.8, 28%
Brands contribution to domestic sales (MAT Dec’14)
34%
16%
11%
14%
25%
Top 10 11 to 20 21 to 30 31 to 50 Others
Source: AIOCD data base
Rectangle

ICICI Securities Ltd. | Retail Equity Research
Page 16
Biocon
Stock Performance
6080
100120140160180
Jan-14 Mar-14 May-14 Jul-14 Sep-14 Nov-14 Jan-15BSE Healthcare Biocon
Source: NSE, ICICIdirect.com Research
Exhibit 57: Company growth vis-à-vis Indian pharma market growth
12.3
12.7
7.5
7.1 8.3 11
.7
13.2
9.0 10.2
6.3 11
.0 13.6
15.2
43.9
19.8
48.1
48.1
36.1 45
.3 46.3
28.1
17.6 22
.2
0.6
-3.5
5.9
-10
0
10
20
30
40
50
60
Dec-
13
Jan-
14
Feb-
14
Mar
-14
Apr-1
4
May
-14
Jun-
14
Jul-1
4
Aug-
14
Sep-
14
Oct-1
4
Nov
-14
Dec-
14
(%)
Indian Pharma Market Biocon
Source: AIOCD data base, ICICIdirect.com Research
Exhibit 58: Market share in Indian formulations market
0.40
0.37 0.37
0.40
0.37
0.38
0.40
0.36
0.37 0.38
0.36
0.37
0.36
0.34
0.35
0.36
0.37
0.38
0.39
0.40
Dec-
13
Jan-
14
Feb-
14
Mar
-14
Apr-1
4
May
-14
Jun-
14
Jul-1
4
Aug
-14
Sep-
14
Oct-1
4
Nov
-14
Dec-
14
(%)
Biocon
Source: AIOCD data base, ICICIdirect.com Research
Exhibit 59: Top 10 brands performance (| crore) Brand Therapy Dec'14 Dec'13 Var. (%) Nov'14 Var. (%)
Insugen Anti Diabetic 7.0 5.9 19 6.4 8
Basalog Anti Diabetic 3.8 2.5 56 3.5 9
Abraxane Anti-Neoplastics 5.2 2.9 80 4.7 11
Blisto Mf Anti Diabetic 1.7 1.9 -11 1.7 3
Insugen R Anti Diabetic 1.2 0.9 26 1.2 -7
Erypro Blood Related 0.8 1.5 -48 0.5 63
Insugen N Anti Diabetic 0.8 0.5 67 0.7 13
Clotide Cardiac 0.3 0.3 10 0.4 -18
Metadoze-Ipr Anti Diabetic 0.4 0.6 -39 0.2 65
Statix Cardiac 0.3 0.6 -42 0.3 -2
Source: AIOCD data base, ICICIdirect.com Research
Exhibit 60: Contribution of therapies to domestic sales (MAT Dec’14) Other 5%
Blood Related3%
Anti-Infectives5%
Cardiac11%
Anti-Neoplastics
19%
Anti Diabetic57%
Source: AIOCD data base, ICICIdirect.com Research
Exhibit 61: Therapy wise performance (| crore)
Therapy Dec'14 Dec'13 YoY (%) Nov'14 QoQ (%)
Anti Diabetic 15.8 13.2 20 14.7 7
Anti-Neoplastics 6.7 4.3 55 6.5 2
Cardiac 2.0 3.1 -35 2.2 -10
Anti-Infectives 0.4 2.3 -83 0.6 -31
Blood Related 0.8 1.5 -48 0.5 63
Derma 0.6 0.7 -15 0.7 -15
Others 0.7 0.2 243 0.2 178
Vitamins 0.2 0.2 -5 0.2 7
Gastro 0.1 0.0 113 0.1 -36
Pain 0.0 0.1 -93 0.0 -10
Source: AIOCD data base, ICICIdirect.com Research
Acute : Chronic contribution (MAT Dec’14)
Acute, 89.3, 29%
Chronic, 219.7, 71%
Brands contribution to domestic sales (MAT Dec’14)
73%
11%
8%
6%
2%
Top 10 11 to 20 21 to 30 31 to 50 Others
Rectangle

ICICI Securities Ltd. | Retail Equity Research
Page 17
Pfizer
Stock Performance
80110140170200
Jan-14 Mar-14 May-14 Jul-14 Sep-14 Nov-14 Jan-15
BSE Healthcare Pfizer
Source: NSE, ICICIdirect.com Research Exhibit 62: Company growth vis-à-vis Indian pharma market growth
12.3
12.7
7.5
7.1 8.3 11
.7 13.2
9.0 10
.2
19.8
6.3 11
.0 13.6
11.3
9.1
4.7 9.
1
8.8 11.0
9.9
6.7
3.3
24.1
10.0
34.1
24.3
-10-505
10152025303540
Dec-
13
Jan-
14
Feb-
14
Mar
-14
Apr-1
4
May
-14
Jun-
14
Jul-1
4
Aug-
14
Sep-
14
Oct-1
4
Nov
-14
Dec-
14
(%)
Indian Pharma Market Pfizer
Source: AIOCD data base, ICICIdirect.com Research
Exhibit 63: Market share in Indian formulations market
2.98 2.99 2.953.06 3.03
2.942.86 2.90
2.842.94
2.89
3.08
3.26
2.4
2.6
2.8
3.0
3.2
3.4
Dec-
13
Jan-
14
Feb-
14
Mar
-14
Apr-1
4
May
-14
Jun-
14
Jul-1
4
Aug-
14
Sep-
14
Oct-1
4
Nov
-14
Dec-
14
(%)
Pfizer
Source: AIOCD data base, ICICIdirect.com Research
Exhibit 64: Top 10 brands performance (| crore) Brand Therapy Dec'14 Dec'13 Var. (%) Nov'14 Var. (%)
Becosules Vitamins 23.7 22.2 7 21.6 9
Corex Respiratory 22.9 23.8 -4 21.3 8
Dolonex Pain 10.9 9.6 13 9.8 10
Gelusil Mps Gastro 13.6 9.0 51 10.8 26
Magnex Anti-Infectives 12.6 8.1 55 12.3 2
Minipress Xl Cardiac 10.1 8.8 14 10.1 0
Wysolone Hormones 8.2 6.1 35 8.2 1
Mucaine Gastro 7.1 6.0 17 6.7 6
Dalacin C Anti-Infectives 6.2 5.2 20 6.2 1
Solu Medrol Hormones 5.9 4.0 46 6.2 -4
Source: AIOCD data base, ICICIdirect.com Research
Exhibit 65: Contribution of therapies to domestic sales (MAT Dec’14)
Anti-Infectives16%
Vitamins 12%
Respiratory12%
Gastro10%
Hormones9%
Other41%
Source: AIOCD data base, ICICIdirect.com Research
Exhibit 66: Therapy wise performance (| crore)
Therapy Dec'14 Dec'13 YoY (%) Nov'14 QoQ (%)
Anti-Infectives 38.9 29.8 31 37.3 4
Vitamins 28.5 26.0 10 26.1 9
Respiratory 30.4 29.8 2 28.1 8
Gastro 25.9 18.7 38 21.9 18
Hormones 21.5 15.8 36 21.6 -1
Cardiac 17.9 14.2 26 16.9 6
Gynaecological 17.6 13.4 31 14.9 18
Pain 16.2 13.2 23 15.4 5
Cns 15.4 13.0 19 14.1 9
Vaccines 6.5 3.4 88 5.8 12
Source: AIOCD data base, ICICIdirect.com Research
Acute : Chronic contribution (MAT Dec’14)
Acute, 2097.8,
85%
Chronic, 374.2, 15%
Brands contribution to domestic sales (MAT Dec’14)
50%
18%
10%
10%
12%
Top 10 11 to 20 21 to 30 31 to 50 Others
Source: AIOCD data base l
Rectangle

ICICI Securities Ltd. | Retail Equity Research
Page 18
Novartis India
Stock Performance
80
130
180
Jan-14 Mar-14 May-14 Jul-14 Sep-14 Nov-14 Jan-15
BSE Healthcare Novartis India
Source: NSE, ICICIdirect.com Research
Exhibit 67: Company growth vis-à-vis Indian pharma market growth
12.3
12.7
7.5
7.1 8.3 11
.7 13.2
9.0 10
.2
19.8
6.3
11.0 13
.6
0.3
0.6
-1.9
-4.7
0.1
-0.9
-1.9
-2.4
-0.5
5.9
5.2 6.
613.5
-10
-5
0
5
10
15
20
25
Dec-
13
Jan-
14
Feb-
14
Mar
-14
Apr-1
4
May
-14
Jun-
14
Jul-1
4
Aug-
14
Sep-
14
Oct-1
4
Nov
-14
Dec-
14
(%)
Indian Pharma Market Novartis India
Source: AIOCD data base, ICICIdirect.com Research
Exhibit 68: Market share in Indian formulations market
1.48 1.501.46
1.43
1.48
1.37 1.37 1.351.31
1.35
1.43
1.33
1.39
1.2
1.3
1.3
1.4
1.4
1.5
1.5
1.6
Dec-
13
Jan-
14
Feb-
14
Mar
-14
Apr-1
4
May
-14
Jun-
14
Jul-1
4
Aug-
14
Sep-
14
Oct-1
4
Nov
-14
Dec-
14
(%)
Novartis India
Source: AIOCD data base, ICICIdirect.com Research
Exhibit 69: Top 10 brands performance (| crore) Brand Therapy Dec'14 Dec'13 Var. (%) Nov'14 Var. (%)
Galvus Met Anti Diabetic 16.6 12.7 31 15.8 5
Voveran Pain 10.7 10.4 3 10.6 1
Galvus Anti Diabetic 8.3 7.4 12 7.9 5
Rabipur (Novartis) Vaccines 7.3 7.2 2 6.6 11
Otrivin Respiratory 7.8 7.1 9 6.8 14
Tegrital Cns 5.0 5.5 -9 4.1 20
Regestrone Gynaecological 4.0 2.9 36 3.4 17
Methergin Gynaecological 2.6 2.3 12 2.4 11
Genteal Ophthal 2.6 1.9 33 2.5 3
Syntocinon Gynaecological 2.1 1.9 9 2.2 -5
Source: AIOCD data base, ICICIdirect.com Research
Exhibit 70: Contribution of therapies to domestic sales (MAT Dec’14)
Anti Diabetic24%
Pain 19%
Respiratory13%
Vitamins 10%
Gynaecological8%
Other26%
Source: AIOCD data base, ICICIdirect.com Research
Exhibit 71: Therapy wise performance (| crore)
Therapy Dec'14 Dec'13 YoY (%) Nov'14 QoQ (%)
Anti Diabetic 25.8 21.0 23 24.6 5
Pain 18.3 18.1 1 18.2 1
Respiratory 14.4 15.1 -4 14.2 1
Vitamins 10.4 8.8 18 9.0 15
Gynaecological 8.8 7.5 18 8.1 8
Cns 8.1 8.5 -5 7.3 11
Vaccines 7.5 7.2 4 6.7 13
Anti-Infectives 4.3 4.6 -5 3.5 23
Ophthal 3.0 2.3 33 2.9 4
Cardiac 1.1 1.5 -26 1.2 -7
Source: AIOCD data base, ICICIdirect.com Research
Acute : Chronic contribution (MAT Dec’14)
Acute, 757.9, 65%
Chronic, 401.3, 35%
Brands contribution to domestic sales (MAT Dec’14)
63%16%
7%
7%7%
Top 10 11 to 20 21 to 30 31 to 50 Others
Source: AIOCD data base
Rectangle
ICICI Securities Ltd. | Retail Equity Research
Page 19
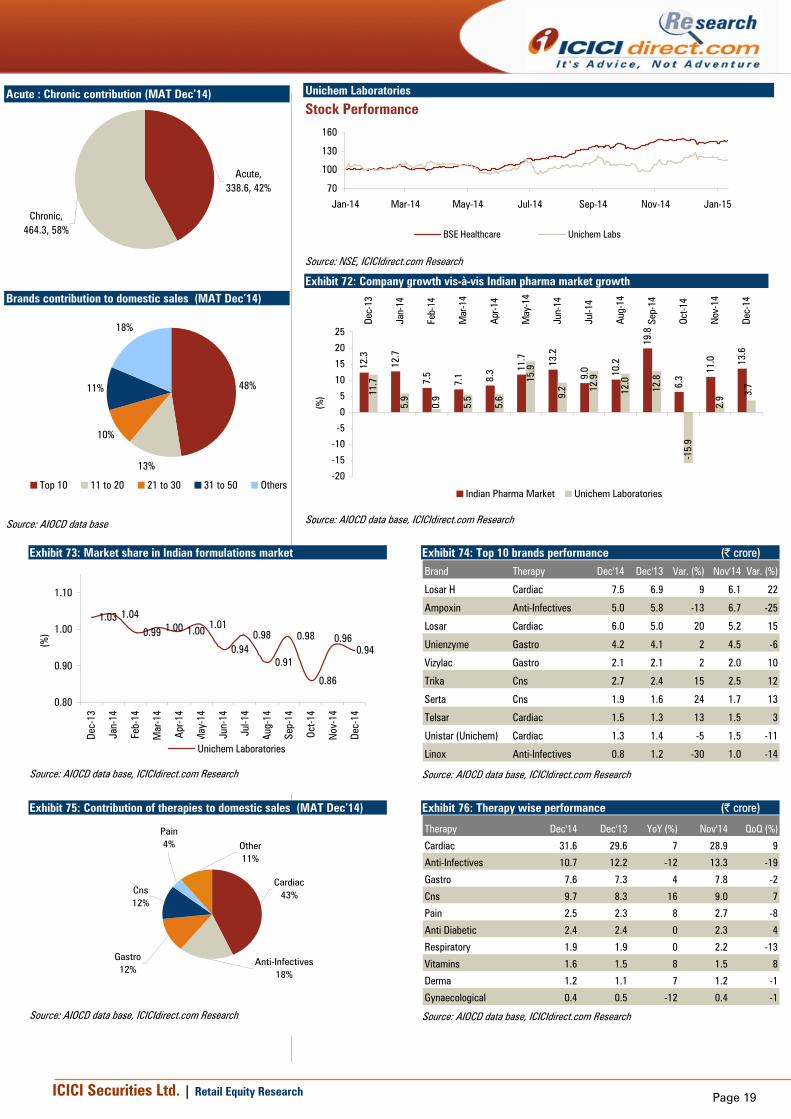
Unichem Laboratories
Stock Performance
70
100
130
160
Jan-14 Mar-14 May-14 Jul-14 Sep-14 Nov-14 Jan-15
BSE Healthcare Unichem Labs
Source: NSE, ICICIdirect.com Research
Exhibit 72: Company growth vis-à-vis Indian pharma market growth
12.3
12.7
7.5
7.1 8.3 11
.7 13.2
9.0 10
.2
19.8
6.3
11.0 13
.6
11.7
5.9
0.9
5.5
5.6
15.9
9.2 12
.9
12.0
12.8
-15.
9
2.9 3.
7
-20
-15
-10
-5
0
5
10
15
20
25
Dec-
13
Jan-
14
Feb-
14
Mar
-14
Apr
-14
May
-14
Jun-
14
Jul-1
4
Aug
-14
Sep-
14
Oct-1
4
Nov
-14
Dec-
14
(%)
Indian Pharma Market Unichem Laboratories
Source: AIOCD data base, ICICIdirect.com Research
Exhibit 73: Market share in Indian formulations market
1.03 1.04
0.99 1.00 1.00 1.01
0.940.98
0.91
0.98
0.86
0.940.96
0.80
0.90
1.00
1.10
Dec-
13
Jan-
14
Feb-
14
Mar
-14
Apr
-14
May
-14
Jun-
14
Jul-1
4
Aug
-14
Sep-
14
Oct-1
4
Nov
-14
Dec-
14
(%)
Unichem Laboratories
Source: AIOCD data base, ICICIdirect.com Research
Exhibit 74: Top 10 brands performance (| crore)
Brand Therapy Dec'14 Dec'13 Var. (%) Nov'14 Var. (%)
Losar H Cardiac 7.5 6.9 9 6.1 22
Ampoxin Anti-Infectives 5.0 5.8 -13 6.7 -25
Losar Cardiac 6.0 5.0 20 5.2 15
Unienzyme Gastro 4.2 4.1 2 4.5 -6
Vizylac Gastro 2.1 2.1 2 2.0 10
Trika Cns 2.7 2.4 15 2.5 12
Serta Cns 1.9 1.6 24 1.7 13
Telsar Cardiac 1.5 1.3 13 1.5 3
Unistar (Unichem) Cardiac 1.3 1.4 -5 1.5 -11
Linox Anti-Infectives 0.8 1.2 -30 1.0 -14
Source: AIOCD data base, ICICIdirect.com Research
Exhibit 75: Contribution of therapies to domestic sales (MAT Dec’14)
Cardiac43%
Anti-Infectives18%
Gastro12%
Cns12%
Pain 4% Other
11%
Source: AIOCD data base, ICICIdirect.com Research
Exhibit 76: Therapy wise performance (| crore)
Therapy Dec'14 Dec'13 YoY (%) Nov'14 QoQ (%)
Cardiac 31.6 29.6 7 28.9 9
Anti-Infectives 10.7 12.2 -12 13.3 -19
Gastro 7.6 7.3 4 7.8 -2
Cns 9.7 8.3 16 9.0 7
Pain 2.5 2.3 8 2.7 -8
Anti Diabetic 2.4 2.4 0 2.3 4
Respiratory 1.9 1.9 0 2.2 -13
Vitamins 1.6 1.5 8 1.5 8
Derma 1.2 1.1 7 1.2 -1
Gynaecological 0.4 0.5 -12 0.4 -1
Source: AIOCD data base, ICICIdirect.com Research
Acute : Chronic contribution (MAT Dec’14)
Acute, 338.6, 42%
Chronic, 464.3, 58%
Brands contribution to domestic sales (MAT Dec’14)
48%
13%
10%
11%
18%
Top 10 11 to 20 21 to 30 31 to 50 Others
Source: AIOCD data base
Rectangle

ICICI Securities Ltd. | Retail Equity Research
Page 20
Indoco Remedies
Stock Performance
80
180
280
Jan-14 Mar-14 May-14 Jul-14 Sep-14 Nov-14 Jan-15
BSE Healthcare Indoco
Source: NSE, ICICIdirect.com Research
Exhibit 77: Company growth vis-à-vis Indian pharma market growth
12.3
12.7
7.5
7.1 8.3 11
.7 13.2
9.0 10
.2
19.8
6.3
11.0 13
.6
12.1
11.9
7.1
2.7
9.8
17.0
16.6
8.6
8.5
17.5
34.4
6.1
4.8
0
5
10
15
20
25
30
35
40
Dec-
13
Jan-
14
Feb-
14
Mar
-14
Apr-1
4
May
-14
Jun-
14
Jul-1
4
Aug-
14
Sep-
14
Oct-1
4
Nov
-14
Dec-
14
(%)
Indian Pharma Market Indoco Remedies
Source: AIOCD data base, ICICIdirect.com Research
Exhibit 78: Market share in Indian formulations market
0.8 0.8 0.8
0.7
0.8
0.80.8 0.8
0.8
0.9
0.8
0.70.7
0.70.70.70.80.80.80.80.80.90.9
Dec-
13
Jan-
14
Feb-
14
Mar
-14
Apr-1
4
May
-14
Jun-
14
Jul-1
4
Aug-
14
Sep-
14
Oct-1
4
Nov
-14
Dec-
14
(%)
Indoco Remedies
Source: AIOCD data base, ICICIdirect.com Research
Exhibit 79: Top 10 brands performance (| crore) Brand Therapy Dec'14 Dec'13 Var. (%) Nov'14 Var. (%)
Febrex Plus Respiratory 5.9 6.1 -4 5.6 4
Cyclopam Gastro 3.0 2.9 2 3.1 -3
Sensodent-K Stomatologicals 3.6 2.9 24 3.5 2
Oxipod Anti-Infectives 2.1 1.8 13 2.1 -3
Cital Urology 1.8 1.7 2 2.1 -16
Atm Anti-Infectives 2.2 2.1 3 2.2 2
Sensoform Stomatologicals 2.0 1.5 33 1.9 7
Cloben G Derma 1.4 1.4 -3 1.5 -10
Sensodent-Kf Stomatologicals 1.8 1.4 33 1.8 2
Cyclopam Gastro 1.3 1.2 6 1.1 13
Source: AIOCD data base, ICICIdirect.com Research
Exhibit 80: Contribution of therapies to domestic sales (MAT Dec’14)
Respiratory19%
Anti-Infectives17%
Stomatologicals
16%Gastro14%
Vitamins 5%
Other29%
Source: AIOCD data base, ICICIdirect.com Research
Exhibit 81: Therapy wise performance (| crore)
Therapy Dec'14 Dec'13 YoY (%) Nov'14 QoQ (%)
Respiratory 11.5 11.3 2 10.9 5
Anti-Infectives 8.3 8.0 4 8.5 -2
Stomatologicals 9.8 7.9 24 9.6 1
Gastro 6.7 6.7 0 6.7 0
Vitamins 3.0 2.1 46 3.1 -3
Ophthal 2.6 2.3 14 2.7 -1
Urology 2.0 1.9 6 2.3 -15
Pain 2.2 2.3 -5 2.3 -3
Derma 1.9 1.9 -1 2.0 -7
Anti Diabetic 2.1 1.9 7 2.0 5
Source: AIOCD data base, ICICIdirect.com Research
Acute : Chronic contribution (MAT Dec’14)
Acute, 596.8, 93%
Chronic, 45.0, 7%
Brands contribution to domestic sales (MAT Dec’14)
49%
17%
7%
10%
17%
Top 10 11 to 20 21 to 30 31 to 50 Others
Source: AIOCD data base
Rectangle

ICICI Securities Ltd. | Retail Equity Research
Page 21
Ajanta Pharma
Stock Performance
50100150200250300350400
Jan-14 Mar-14 May-14 Jul-14 Sep-14 Nov-14 Jan-15
BSE Healthcare Ajanta
Source: NSE, ICICIdirect.com Research
Exhibit 82: Company growth vis-à-vis Indian pharma market growth
12.3
12.7
7.5
7.1 8.3 11
.7
13.2
9.0 10.2 19
.8
6.3 11
.0 13.6
71.5
90.0
70.2 76
.9
75.9
74.6 82.0 81
.1
59.5 70
.1
54.1
33.1
19.6
0102030405060708090
100
Dec-
13
Jan-
14
Feb-
14
Mar
-14
Apr-1
4
May
-14
Jun-
14
Jul-1
4
Aug-
14
Sep-
14
Oct-1
4
Nov
-14
Dec-
14
(%)
Indian Pharma Market Ajanta Pharma
Source: AIOCD data base, ICICIdirect.com Research
Exhibit 83: Market share in Indian formulations market
0.490.50
0.53
0.50 0.50 0.51 0.510.49
0.470.46
0.51
0.53
0.51
0.4
0.4
0.4
0.5
0.5
0.5
0.5
0.5
Dec-
13
Jan-
14
Feb-
14
Mar
-14
Apr-1
4
May
-14
Jun-
14
Jul-1
4
Aug-
14
Sep-
14
Oct-1
4
Nov
-14
Dec-
14
(%)
Ajanta
Source: AIOCD data base, ICICIdirect.com Research
Exhibit 84: Top 10 brands performance (| crore) Brand Therapy Dec'14 Dec'13 Var. (%) Nov'14 Var. (%)
Met Xl Cardiac 3.8 3.8 -0.1 4.2 -8.4
Melacare Derma 4.9 3.7 33.3 4.6 6.6
Atorfit Cv Cardiac 2.4 2.0 18.5 2.4 0.3
Soft Drops Ophthal 1.1 0.9 19.2 1.0 2.0
Met Xl Am Cardiac 0.9 0.9 5.7 1.0 -6.4
Feburic Pain 1.0 0.7 34.6 1.1 -13.5
Rosufit Cv Cardiac 0.8 0.6 40.1 0.8 -3.8
Metaspan Vitamins 0.6 0.6 13.0 0.7 -14.4
Peroclin Derma 0.7 0.0 #DIV/0! 0.8 -15.2
Olopat Ophthal 0.5 0.4 16.6 0.6 -8.7
Source: AIOCD data base, ICICIdirect.com Research
Exhibit 85: Contribution of therapies to domestic sales (MAT Dec’14)
Others9%Pain
5%
Vitamins 6%
Ophthal 23%
Derma25%
Cardiac32%
Source: AIOCD data base, ICICIdirect.com Research
Exhibit 86: Therapy wise performance (| crore)
Therapy Dec'14 Dec'13 YoY (%) Nov'14 QoQ (%)
Cardiac 11.5 9.5 20 11.8 -3
Derma 10.2 8.7 17 10.3 -1
Ophthal 8.9 7.3 23 8.8 1
Vitamins 2.3 1.5 46 2.3 -1
Pain 1.9 1.5 22 2.1 -13
Gastro 1.1 1.2 -7 1.1 1
Cns 0.8 0.7 11 0.9 -11
Respiratory 0.4 0.5 -31 0.4 -8
Anti-Infectives 0.3 0.2 41 0.3 -15
Others 0.2 0.1 137 0.2 15
Source: AIOCD data base, ICICIdirect.com Research
Acute : Chronic contribution (MAT Dec’14)
Chronic, 200.0, 48%
Acute, 215.3, 52%
Brands contribution to domestic sales (MAT Dec’14)
21%
12%
9%14%
44%
Top 10 11 to 20 21 to 30 31 to 50 Others
Source: AIOCD data base
Rectangle

ICICI Securities Ltd. | Retail Equity Research
Page 22
Exhibit 87: One year forward P/E of BSE Healthcare Index vs. Sensex
0
5
10
15
20
25
30
35
Mar
-06
Oct-0
6
May
-07
Dec-
07
Jul-0
8
Feb-
09
Sep-
09
Apr-1
0
Nov-
10
Jun-
11
Jan-
12
Aug-
12
Mar
-13
Oct-1
3
May
-14
Dec-
14
x
BSE Healthcare Index Sensex
[
Source: Company, ICICIdirect.com Research
ICICIdirect.com coverage universe (Healthcare) I-Direct CMP TP Rating M CapCode (|) (|) (| Cr) FY14 FY15E FY16E FY14 FY15E FY16E FY14 FY15E FY16E FY14 FY15E FY16E FY14 FY15E FY16E
Ajanta Pharma AJAPHA 2543 2151 HOLD 8942.9 66.2 75.0 85.6 38.4 33.9 29.7 24.3 21.1 17.5 44.9 40.6 38.1 39.4 32.8 28.9
Apollo Hospitals APOHOS 1148 1075 HOLD 15962.5 22.8 27.5 35.1 50.4 41.8 32.7 25.1 21.5 16.2 11.6 12.7 14.9 10.6 11.8 13.6
Aurobindo Pharma AURPHA 1132 1111 HOLD 32980.8 47.3 51.8 59.7 24.0 21.9 19.0 18.5 18.8 12.3 24.1 25.7 25.9 31.3 29.4 26.0
Biocon BIOCON 430.2 436 HOLD 8598.8 22.4 22.0 22.6 19.2 19.5 19.0 12.7 11.9 11.0 13.4 14.8 14.9 13.7 13.4 12.7
Cadila Healthcare CADHEA 1618 1538 HOLD 33106.2 39.2 51.1 66.2 41.2 31.7 24.4 29.3 21.9 17.1 15.9 19.0 21.7 23.4 24.6 25.4
Cipla CIPLA 638.1 585 HOLD 51205.6 17.3 15.9 21.7 36.9 40.1 29.3 24.4 22.1 17.7 15.5 14.8 17.2 13.8 11.5 13.7
Divi's Laboratories DIVLAB 1696 1633 HOLD 22495.6 56.0 62.4 81.7 30.3 27.2 20.8 22.1 18.7 15.5 29.6 28.1 29.7 26.1 23.2 25.1
Dr Reddy's Labs DRREDD 3241 3273 HOLD 55185.7 126.7 130.7 150.5 25.6 24.8 21.5 16.7 15.8 13.6 19.2 18.6 20.0 23.7 20.2 19.4
Glenmark Pharma GLEPHA 714.9 775 HOLD 19384.7 20.0 28.0 33.4 35.7 25.5 21.4 16.7 14.8 11.5 16.0 21.0 22.7 18.3 21.8 22.2
Indoco Remedies INDREM 311.4 274 HOLD 2867.7 6.3 9.5 13.3 49.6 32.8 23.4 24.3 16.6 12.8 16.6 21.2 25.0 12.6 16.4 19.4
Ipca Laboratories IPCLAB 725.2 655 HOLD 9147.5 37.9 40.5 50.7 19.1 17.9 14.3 11.9 11.7 11.2 27.6 23.1 24.7 24.4 21.4 21.7
Jubilant Life Sciences VAMORG 147.8 123 SELL 2353.0 6.8 -6.5 20.0 21.6 -22.8 7.4 6.2 11.2 5.4 10.1 3.4 10.6 4.2 -4.2 12.1
Lupin LUPIN 1437 1590 BUY 64527.3 41.0 49.1 58.6 35.1 29.2 24.5 22.1 16.6 14.7 34.5 36.0 34.1 26.5 25.4 24.4
Sun Pharma SUNPHA 825.9 1036 BUY 170974.8 29.0 34.8 39.9 28.4 23.7 20.7 17.3 16.7 14.1 32.4 31.2 28.8 27.0 25.3 23.1
Torrent Pharma TORPHA 1116 1010 HOLD 18877.0 39.2 45.3 49.9 28.4 24.6 22.4 20.0 16.3 14.4 28.5 24.8 25.9 34.9 31.3 27.6
Unichem Laboratories UNILAB 235 206 HOLD 2130.7 18.7 11.6 13.5 12.6 20.3 17.4 11.8 12.2 10.0 15.7 12.9 16.0 20.7 12.2 13.5
RoNW (%)Company
EPS (|) PE(x) EV/EBITDA (x) RoCE (%)

ICICI Securities Ltd. | Retail Equity Research
Page 23
RATING RATIONALE ICICIdirect.com endeavours to provide objective opinions and recommendations. ICICIdirect.com assigns ratings to its stocks according to their notional target price vs. current market price and then categorises them as Strong Buy, Buy, Add, Reduce and Sell. The performance horizon is two years unless specified and the notional target price is defined as the analysts' valuation for a stock. Sector view: Over weight compared to index Equal weight compared to index Under weight compared to index Index here refers to BSE 500
Pankaj Pandey Head – Research [email protected]
ICICIdirect.com Research Desk, ICICI Securities Limited, 1st Floor, Akruti Trade Centre, Road No. 7, MIDC, Andheri (East) Mumbai – 400 093

ICICI Securities Ltd. | Retail Equity Research
Page 24
ANALYST CERTIFICATION We /I, Siddhant Khandekar CA-INTER Mitesh Shah MS (Finance) Nandan Kamat MBA Finance, Research Analysts, authors and the names subscribed to this report, hereby certify that all of the views expressed in this research report accurately reflect our views about the subject issuer(s) or securities. We also certify that no part of our compensation was, is, or will be directly or indirectly related to the specific recommendation(s) or view(s) in this report.
Terms & conditions and other disclosures: ICICI Securities Limited (ICICI Securities) is a full-service, integrated investment banking and is, inter alia, engaged in the business of stock brokering and distribution of financial products. ICICI Securities is a wholly-owned subsidiary of ICICI Bank which is India’s largest private sector bank and has its various subsidiaries engaged in businesses of housing finance, asset management, life insurance, general insurance, venture capital fund management, etc. (“associates”), the details in respect of which are available on www.icicibank.com. ICICI Securities is one of the leading merchant bankers/ underwriters of securities and participate in virtually all securities trading markets in India. We and our associates might have investment banking and other business relationship with a significant percentage of companies covered by our Investment Research Department. ICICI Securities generally prohibits its analysts, persons reporting to analysts and their relatives from maintaining a financial interest in the securities or derivatives of any companies that the analysts cover. The information and opinions in this report have been prepared by ICICI Securities and are subject to change without any notice. The report and information contained herein is strictly confidential and meant solely for the selected recipient and may not be altered in any way, transmitted to, copied or distributed, in part or in whole, to any other person or to the media or reproduced in any form, without prior written consent of ICICI Securities. While we would endeavour to update the information herein on a reasonable basis, ICICI Securitiesis is under no obligation to update or keep the information current. Also, there may be regulatory, compliance or other reasons that may prevent ICICI Securities from doing so. Non-rated securities indicate that rating on a particular security has been suspended temporarily and such suspension is in compliance with applicable regulations and/or ICICI Securities policies, in circumstances where ICICI Securities might be acting in an advisory capacity to this company, or in certain other circumstances. This report is based on information obtained from public sources and sources believed to be reliable, but no independent verification has been made nor is its accuracy or completeness guaranteed. This report and information herein is solely for informational purpose and shall not be used or considered as an offer document or solicitation of offer to buy or sell or subscribe for securities or other financial instruments. Though disseminated to all the customers simultaneously, not all customers may receive this report at the same time. ICICI Securities will not treat recipients as customers by virtue of their receiving this report. Nothing in this report constitutes investment, legal, accounting and tax advice or a representation that any investment or strategy is suitable or appropriate to your specific circumstances. The securities discussed and opinions expressed in this report may not be suitable for all investors, who must make their own investment decisions, based on their own investment objectives, financial positions and needs of specific recipient. This may not be taken in substitution for the exercise of independent judgment by any recipient. The recipient should independently evaluate the investment risks. The value and return on investment may vary because of changes in interest rates, foreign exchange rates or any other reason. ICICI Securities accepts no liabilities whatsoever for any loss or damage of any kind arising out of the use of this report. Past performance is not necessarily a guide to future performance. Investors are advised to see Risk Disclosure Document to understand the risks associated before investing in the securities markets. Actual results may differ materially from those set forth in projections. Forward-looking statements are not predictions and may be subject to change without notice. ICICI Securities or its associates might have managed or co-managed public offering of securities for the subject company or might have been mandated by the subject company for any other assignment in the past twelve months. ICICI Securities or its associates might have received any compensation from the companies mentioned in the report during the period preceding twelve months from the date of this report for services in respect of managing or co-managing public offerings, corporate finance, investment banking or merchant banking, brokerage services or other advisory service in a merger or specific transaction. ICICI Securities or its associates might have received any compensation for products or services other than investment banking or merchant banking or brokerage services from the companies mentioned in the report in the past twelve months. ICICI Securities encourages independence in research report preparation and strives to minimize conflict in preparation of research report. ICICI Securities or its analysts did not receive any compensation or other benefits from the companies mentioned in the report or third party in connection with preparation of the research report. Accordingly, neither ICICI Securities nor Research Analysts have any material conflict of interest at the time of publication of this report. It is confirmed that Siddhant Khandekar CA-INTER Mitesh Shah MS (Finance) Nandan Kamat MBA Finance, Research Analysts of this report have not received any compensation from the companies mentioned in the report in the preceding twelve months. Compensation of our Research Analysts is not based on any specific merchant banking, investment banking or brokerage service transactions. ICICI Securities or its subsidiaries collectively or Research Analysts do not own 1% or more of the equity securities of the Company mentioned in the report as of the last day of the month preceding the publication of the research report. Since associates of ICICI Securities are engaged in various financial service businesses, they might have financial interests or beneficial ownership in various companies including the subject company/companies mentioned in this report. It is confirmed that Siddhant Khandekar CA-INTER Mitesh Shah MS (Finance) Nandan Kamat MBA Finance, Research Analysts do not serve as an officer, director or employee of the companies mentioned in the report. ICICI Securities may have issued other reports that are inconsistent with and reach different conclusion from the information presented in this report. Neither the Research Analysts nor ICICI Securities have been engaged in market making activity for the companies mentioned in the report. We submit that no material disciplinary action has been taken on ICICI Securities by any Regulatory Authority impacting Equity Research Analysis activities. This report is not directed or intended for distribution to, or use by, any person or entity who is a citizen or resident of or located in any locality, state, country or other jurisdiction, where such distribution, publication, availability or use would be contrary to law, regulation or which would subject ICICI Securities and affiliates to any registration or licensing requirement within such jurisdiction. The securities described herein may or may not be eligible for sale in all jurisdictions or to certain category of investors. Persons in whose possession this document may come are required to inform themselves of and to observe such restriction. ICICI Securities has been assigned an investment banking mandate from Ranbaxy Laboratories Ltd. This report is prepared on the basis of publicly available information.
Related Documents