ANNUAL REPORT | 2019 EXPANDING THE HORIZONS OF SUS TAI NABLE GR OWTH

Welcome message from author
This document is posted to help you gain knowledge. Please leave a comment to let me know what you think about it! Share it to your friends and learn new things together.
Transcript
ANNUAL REPORT | 2019
EXPANDINGTHE HORIZONSOF SUSTAINABLEGROWTH
The interactive version of the 2019 Annual report
CONTENT
MMC NORILSK NICKEL
ANNUAL REPОRT 1
4
7
2
5
8
3
6
9
10
COMPANY OVERVIEW4 Company profile6 Performance highlights8 Key 2019 events10 Business model16 Producton flow
STRATEGIC REPORT20 Chairman’s letter 22 President’s letter24 Our strategy30 Key investment projects
COMMODDITY MARKET OVERVIEW44 Nickel51 Copper55 Palladium59 Platinum
BUSINESS OVERVIEW64 Mineral base73 Operational performance89 Sales and distribution94 Energy assets 96 Transport assets 102 Research and development
innovations108 Financial performance
(MD&A)
SUSTAINABLE DEVELOPMENT124 Human resources134 Health and safety140 Environment146 Climate change 154 Social and charity initiatives
CORPORATE GOVERNANCE170 Letter from Deputy Chairman
of the Board of Directors 176 Governance structure205 Remuneration208 Control system
RISK REPORT220 Risk management224 Key risks
SHAREHOLDER INFORMATION238 Share capital242 Dividend policy245 Debt instruments247 Investor relations
IFRS FINANCIAL STATEMENTS
2019
APPROVED
ACCURACY OF INFORMATION CONFIRMED
APPROVED
REPORTING PERIOD FROM 1 JANUARY 2019 TO 31 DECEMBER 2019
The 2019 annual report of PJSC "MMC "Norilsk Nickel" incorporates the results of MMC Norilsk Nickel and other operations of the Norilsk Nickel Group (MMC Norilsk Nickel, Nornickel, the Company, Group). The Group’s interests in the entities are shown as stakes in their authorised capital (direct shareholding), except for GRK Bystrinkoye, for which the Group’s effective shareholding is shown.
by the Board of Directorsof MMC Norilsk NickelMinutes No. GMK/10-pr-bd of 7 April 2020
by the Audit Commissionof MMC Norilsk NickelOpinion of 7 April 2020
by the Annual General Meeting of Shareholders of MMC Norilsk Nickel (minutes No. 1 of 13 May 2020)
We are pleased to present to you the 2019 Annual Report of MMC No-rilsk Nickel. The key theme of this report is Sustainable Development Strategy. This strategy unveils the management’s long-term vision for the development of Nornickel’s unique resource base and operational efficiency improvements, both of which will be backed by the rollout of our ambitious comprehensive environmental programme. This “ecological growth” strategy not only lays out long-term ore production and capital investment targets but also sets out concrete action plans aiming at the reduction of the Company’s environmental footprint in the regions of its operations. Furthermore, the Company believes firmly that it is well positioned to be the key facilitator in meeting some of the world’s major challenges such as transport electri-fication and reduction of pollution. This Annual Report has been prepared by the Company’s Investor Relations Department in line with best practices in information disclosure and in accordance with the requirements of Bank of Russia’s Regulation No. 454-P from 30 December 2014.
Vladimir ZHUKOVVice President for Investor Relations
MMC NORILSK NICKEL
Vladimir POTANINPresident,
Chairman of the Management BoardMMC NORILSK NICKEL
Sergey MALYSHEVSenior Vice President —
Chief Financial OfficerMMC NORILSK NICKEL
APPENDIX321 The Group structure: main
assets322 Operating performance
for the past 10 years326 Mineral resources and ore
reserves330 Measurement units
and currency exchange rates331 Glossary334 Contacts
С 4 Company profile6 Performance highlights8 Key 2019 events10 Business model16 Production flow
om panyOverview
COMPANY OVERVIEW
R
CCOMPANY PROFILE
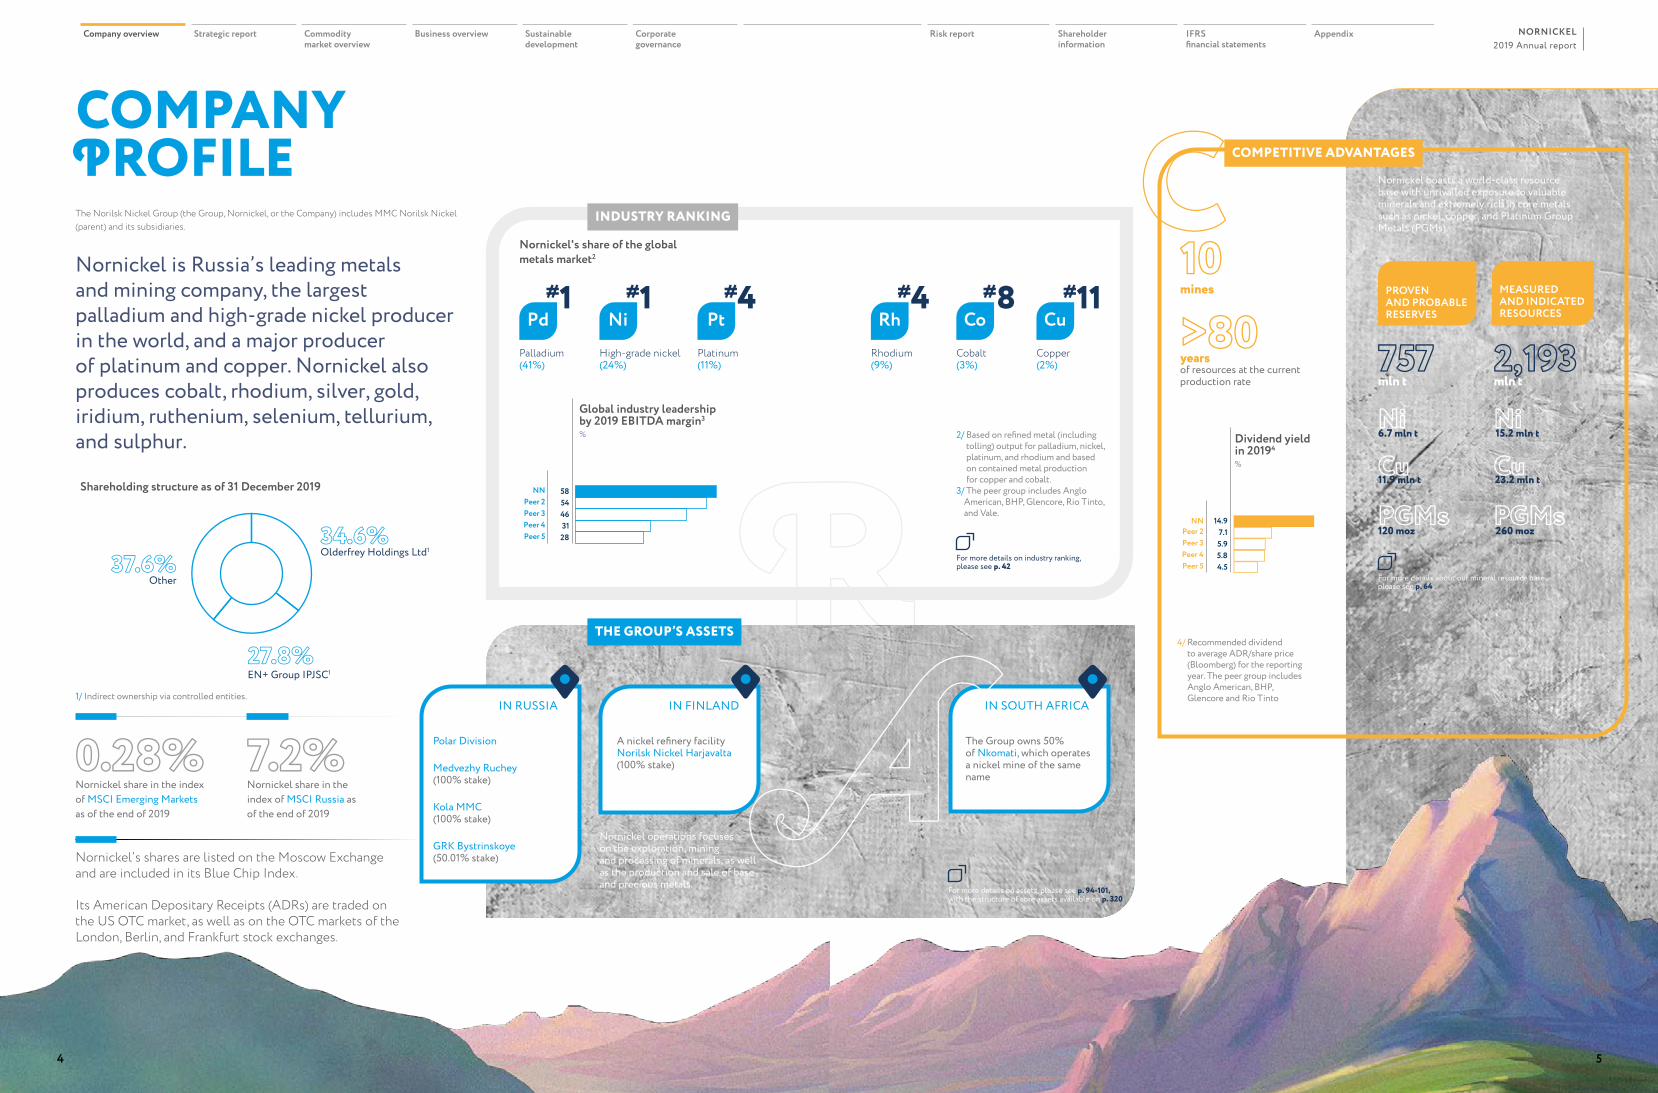
Nornickel is Russia’s leading metals and mining company, the largest palladium and high-grade nickel producer in the world, and a major producer of platinum and copper. Nornickel also produces cobalt, rhodium, silver, gold, iridium, ruthenium, selenium, tellurium, and sulphur.
The Norilsk Nickel Group (the Group, Nornickel, or the Company) includes MMC Norilsk Nickel (parent) and its subsidiaries.
Palladium(41%)
#1Pd
High-grade nickel (24%)
#1Ni
Platinum(11%)
#4Pt
Rhodium(9%)
#4Rh
Cobalt(3%)
#8Co
Copper(2%)
#11Cu
Nornickel's share of the global metals market2
Shareholding structure as of 31 December 2019
2/ Based on refined metal (including tolling) output for palladium, nickel, platinum, and rhodium and based on contained metal production for copper and cobalt.
3/ The peer group includes Anglo American, BHP, Glencore, Rio Tinto, and Vale.
1/ Indirect ownership via controlled entities.
4/ Recommended dividend to average ADR/share price (Bloomberg) for the reporting year. The peer group includes Anglo American, BHP, Glencore and Rio Tinto
Nornickel boasts a world-class resource base with unrivalled exposure to valuable minerals and extremely rich in core metals such as nickel, copper, and Platinum Group Metals (PGMs).
For more details about our mineral resource base, please see p. 64
757mln t
2,193mln t
6.7 mln tNi
15.2 mln tNi
11.9 mln tCu
23.2 mln tCu
120 moz
Olderfrey Holdings Ltd1
Nornickel share in the index of MSCI Emerging Markets as of the end of 2019
Nornickel share in the index of MSCI Russia as of the end of 2019
Other
EN+ Group IPJSC1
PGMs34.6%
0.28% 7.2%
37.6%
27.8%
260 mozPGMs
PROVEN AND PROBABLE RESERVES
MEASURED AND INDICATED RESOURCES
of resources at the current production rate
10mines
>80years
4.55.85.97.1
Peer 5Peer 4Peer 3Peer 2
14.9NN
28314654
Peer 5Peer 4Peer 3Peer 2
58NN
COMPETITIVE ADVANTAGES
INDUSTRY RANKING
THE GROUP’S ASSETS
IN SOUTH AFRICA IN FINLAND
A nickel refinery facility Norilsk Nickel Harjavalta (100% stake)
The Group owns 50% of Nkomati, which operates a nickel mine of the same name
For more details on assets, please see p. 94-101, with the structure of core assets available on p. 320
Nornickel operations focuses on the exploration, mining and processing of minerals, as well as the production and sale of base and precious metals.
Its American Depositary Receipts (ADRs) are traded on the US OTC market, as well as on the OTC markets of the London, Berlin, and Frankfurt stock exchanges.
Nornickel’s shares are listed on the Moscow Exchange and are included in its Blue Chip Index.
IN RUSSIA
Polar Division
Medvezhy Ruchey (100% stake)
Kola MMC (100% stake)
GRK Bystrinskoye (50.01% stake)
For more details on industry ranking, please see p. 42
Dividend yield in 20194 %
Global industry leadership by 2019 EBITDA margin3 %
А4 5
2019 Annual reportNORNICKELCompany overview Strategic report Commodity
market overviewBusiness overview Sustainable
developmentCorporate governance
Risk report Shareholder information
IFRS financial statements
Appendix
RATED B, UPDATED IN DECEMBER 2019
SCORE OF 37 IN 2019 (UPGRADED FROM 27)
37 ↑27
«B»
4 2 2UPDATED IN OCTOBER 2019(1 is low risk, and 10 is high risk)
GOVERNANCE SCORE
ENVIRONMENTAL SCORE
SOCIAL SCORE
FINANCIAL HIGHLIGHTS
OPERATING HIGHLIGHTS
SUSTAINABILITY HIGHLIGHTS
ESG PERFORMANCE
PERFORMANCE HIGHLIGHTS
(from own feedstock)
‘17
‘18
‘19
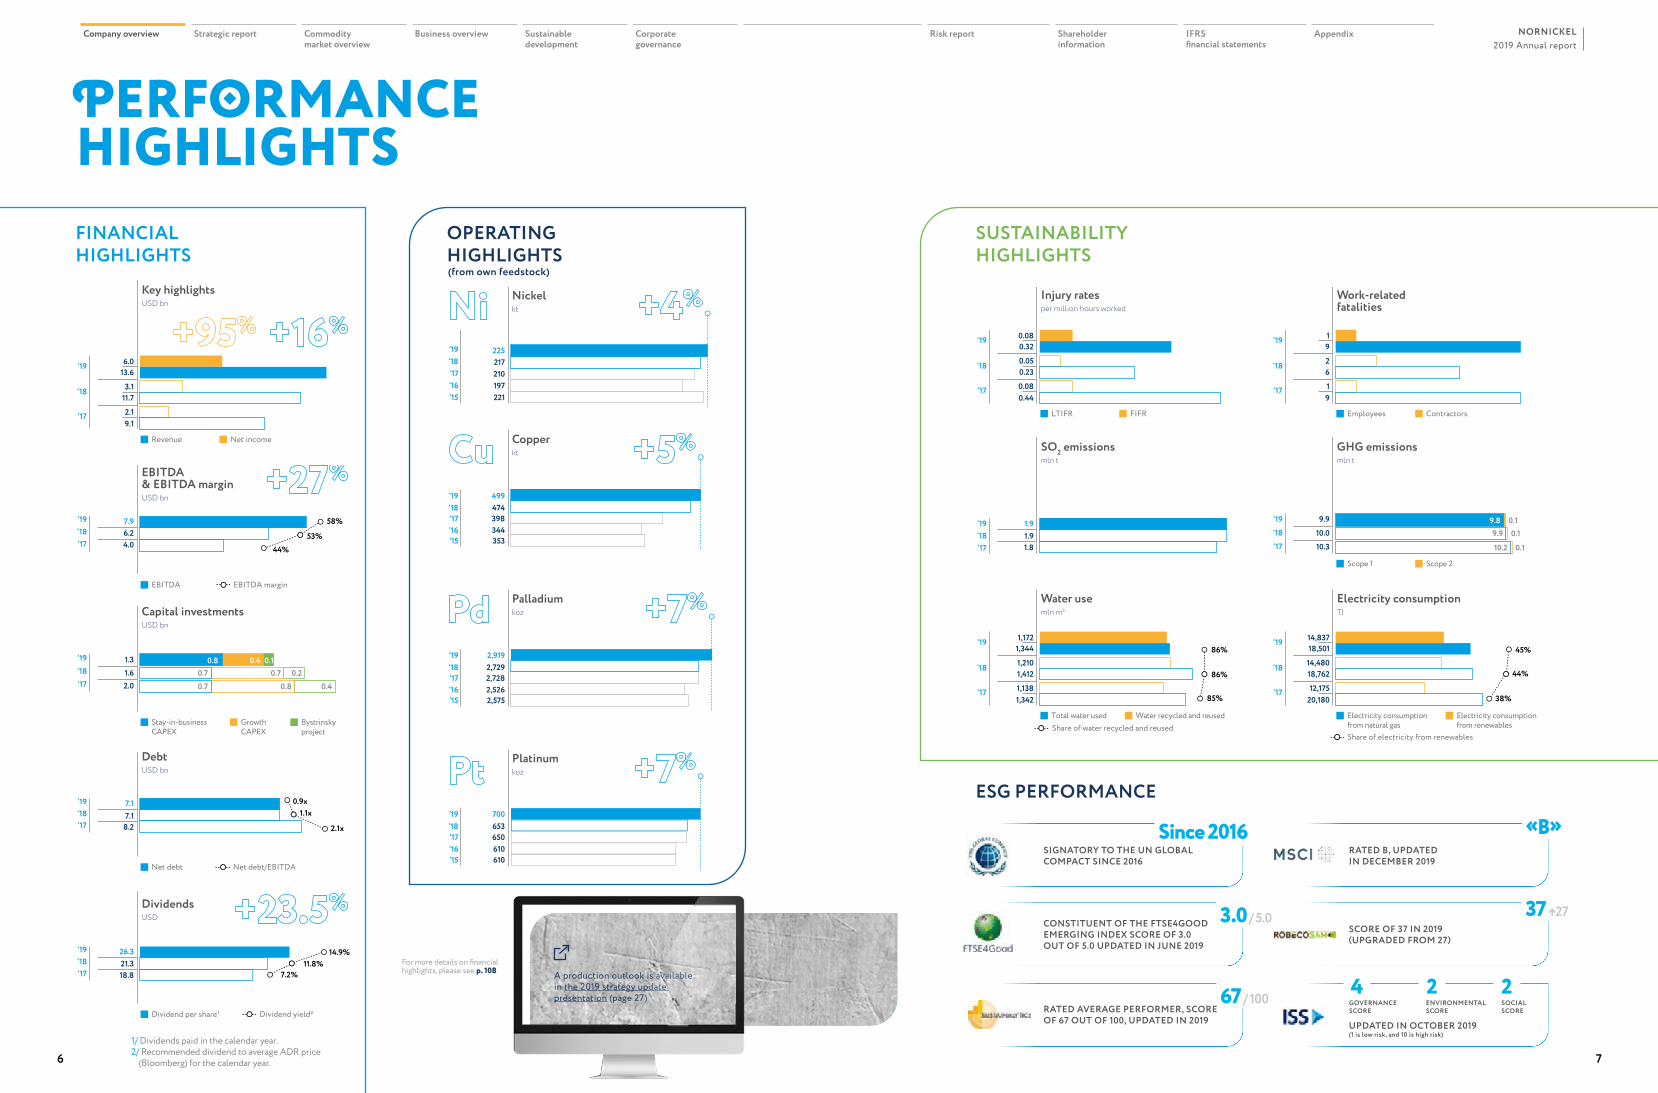
Revenue
9.12.1
11.73.1
13.66.0
Net income
‘17‘18‘19
EBITDA
4.06.27.9
44%53%
58%
EBITDA margin
‘17‘18‘19
Stay-in-business CAPEX
2.01.61.3
Growth CAPEX
Bystrinsky project
0.7 0.8 0.40.7
0.8 0.4 0.10.7 0.2
‘17‘18‘19
Net debt
8.27.17.1
2.1x
1.1x0.9x
Net debt/EBITDA
‘17‘18‘19
Dividend per share¹
18.821.326.3
7.2%11.8%
14.9%
Dividend yield²
221197210217225
’15‘16’17‘18’19
353344398474499
’15‘16’17‘18’19
2,5752,5262,7282,7292,919
’15‘16’17‘18’19
610610650653700
’15‘16’17‘18’19
A production outlook is available in the 2019 strategy update presentation (page 27)
‘17
‘18
‘19
LTIFR
0.440.08
0.230.05
0.320.08
FIFR
‘17
‘18
‘19
Employees
91
62
91
Contractors
‘17‘18‘19
1.81.91.9
‘17‘18‘19
Scope 1
10.310.09.9
Scope 2
10.2 0.1
9.9 0.19.8 0.1
‘17
‘18
‘19
Total water used
1,342 1,138
1,4121,210
1,3441,172
Water recycled and reused
85%
86%
86%
Share of water recycled and reused
‘17
‘18
‘19
Electricity consumptionfrom natural gas
20,18012,175
18,76214,480
18,50114,837
Electricity consumptionfrom renewables
38%
44%
45%
Share of electricity from renewables
SIGNATORY TO THE UN GLOBAL COMPACT SINCE 2016
CONSTITUENT OF THE FTSE4GOOD EMERGING INDEX SCORE OF 3.0 OUT OF 5.0 UPDATED IN JUNE 2019
3.0 / 5.0
Since 2016
67 / 100RATED AVERAGE PERFORMER, SCORE OF 67 OUT OF 100, UPDATED IN 2019
For more details on financial highlights, please see p. 108
1/ Dividends paid in the calendar year.2/ Recommended dividend to average ADR price
(Bloomberg) for the calendar year.
Key highlights USD bn
EBITDA & EBITDA margin USD bn
Capital investments USD bn
Debt USD bn
Dividends USD
Nickel kt
Copper kt
Palladium koz
Platinum koz
Injury rates per million hours worked
Work-related fatalities
SO2 emissions mln t
GHG emissions mln t
Electricity consumption TJ
Water use mln m3
6 7
2019 Annual reportNORNICKELCompany overview Strategic report Commodity
market overviewBusiness overview Sustainable
developmentCorporate governance
Risk report Shareholder information
IFRS financial statements
Appendix
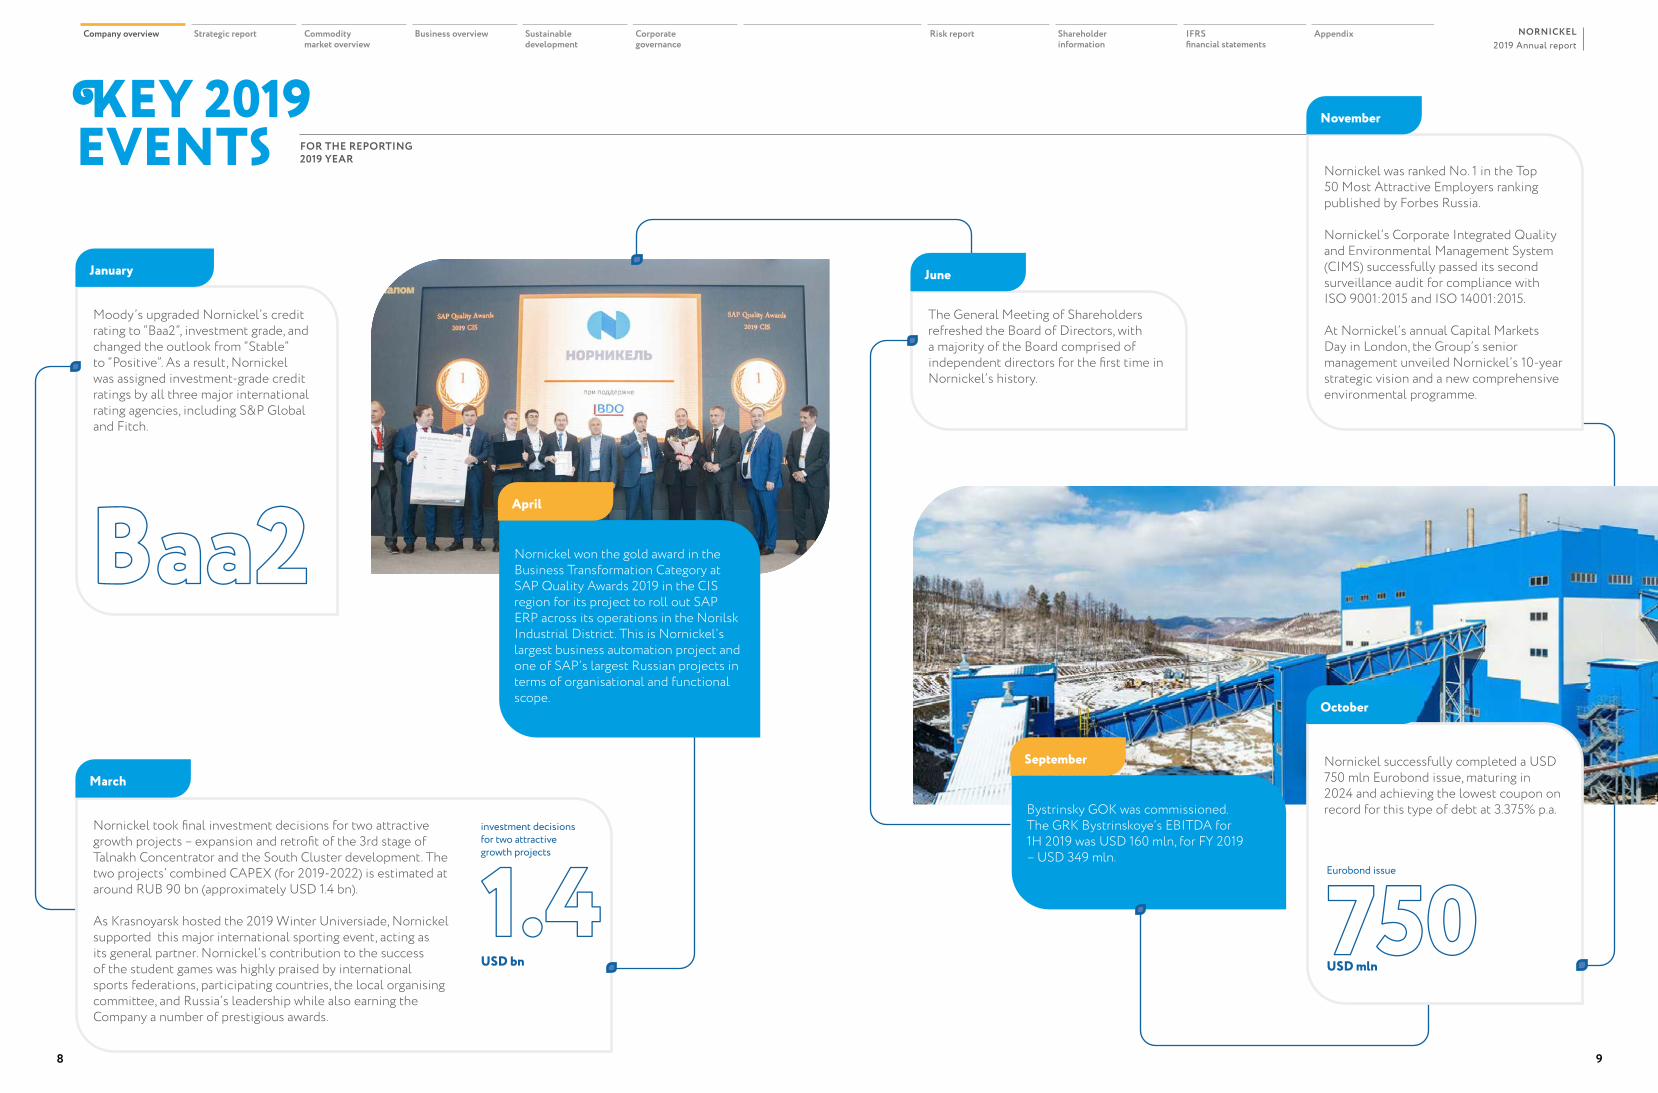
Moody’s upgraded Nornickel’s credit rating to “Baa2”, investment grade, and changed the outlook from “Stable” to “Positive”. As a result, Nornickel was assigned investment-grade credit ratings by all three major international rating agencies, including S&P Global and Fitch.
Nornickel took final investment decisions for two attractive growth projects – expansion and retrofit of the 3rd stage of Talnakh Concentrator and the South Cluster development. The two projects’ combined CAPEX (for 2019-2022) is estimated at around RUB 90 bn (approximately USD 1.4 bn).
As Krasnoyarsk hosted the 2019 Winter Universiade, Nornickel supported this major international sporting event, acting as its general partner. Nornickel’s contribution to the success of the student games was highly praised by international sports federations, participating countries, the local organising committee, and Russia’s leadership while also earning the Company a number of prestigious awards.
Nornickel won the gold award in the Business Transformation Category at SAP Quality Awards 2019 in the CIS region for its project to roll out SAP ERP across its operations in the Norilsk Industrial District. This is Nornickel’s largest business automation project and one of SAP’s largest Russian projects in terms of organisational and functional scope.
The General Meeting of Shareholders refreshed the Board of Directors, with a majority of the Board comprised of independent directors for the first time in Nornickel’s history.
Bystrinsky GOK was commissioned. The GRK Bystrinskoye’s EBITDA for 1H 2019 was USD 160 mln, for FY 2019 – USD 349 mln.
Nornickel successfully completed a USD 750 mln Eurobond issue, maturing in 2024 and achieving the lowest coupon on record for this type of debt at 3.375% p.a.
KEY 2019 EVENTS FOR THE REPORTING
2019 YEAR
January
March
April
June
September
October
Baa2
investment decisions for two attractive growth projects
1.4USD bn
Eurobond issue
750USD mln
Nornickel was ranked No. 1 in the Top 50 Most Attractive Employers ranking published by Forbes Russia.
Nornickel’s Corporate Integrated Quality and Environmental Management System (CIMS) successfully passed its second surveillance audit for compliance with ISO 9001:2015 and ISO 14001:2015.
At Nornickel’s annual Capital Markets Day in London, the Group’s senior management unveiled Nornickel’s 10-year strategic vision and a new comprehensive environmental programme.
November
8 9
2019 Annual reportNORNICKELCompany overview Strategic report Commodity
market overviewBusiness overview Sustainable
developmentCorporate governance
Risk report Shareholder information
IFRS financial statements
Appendix
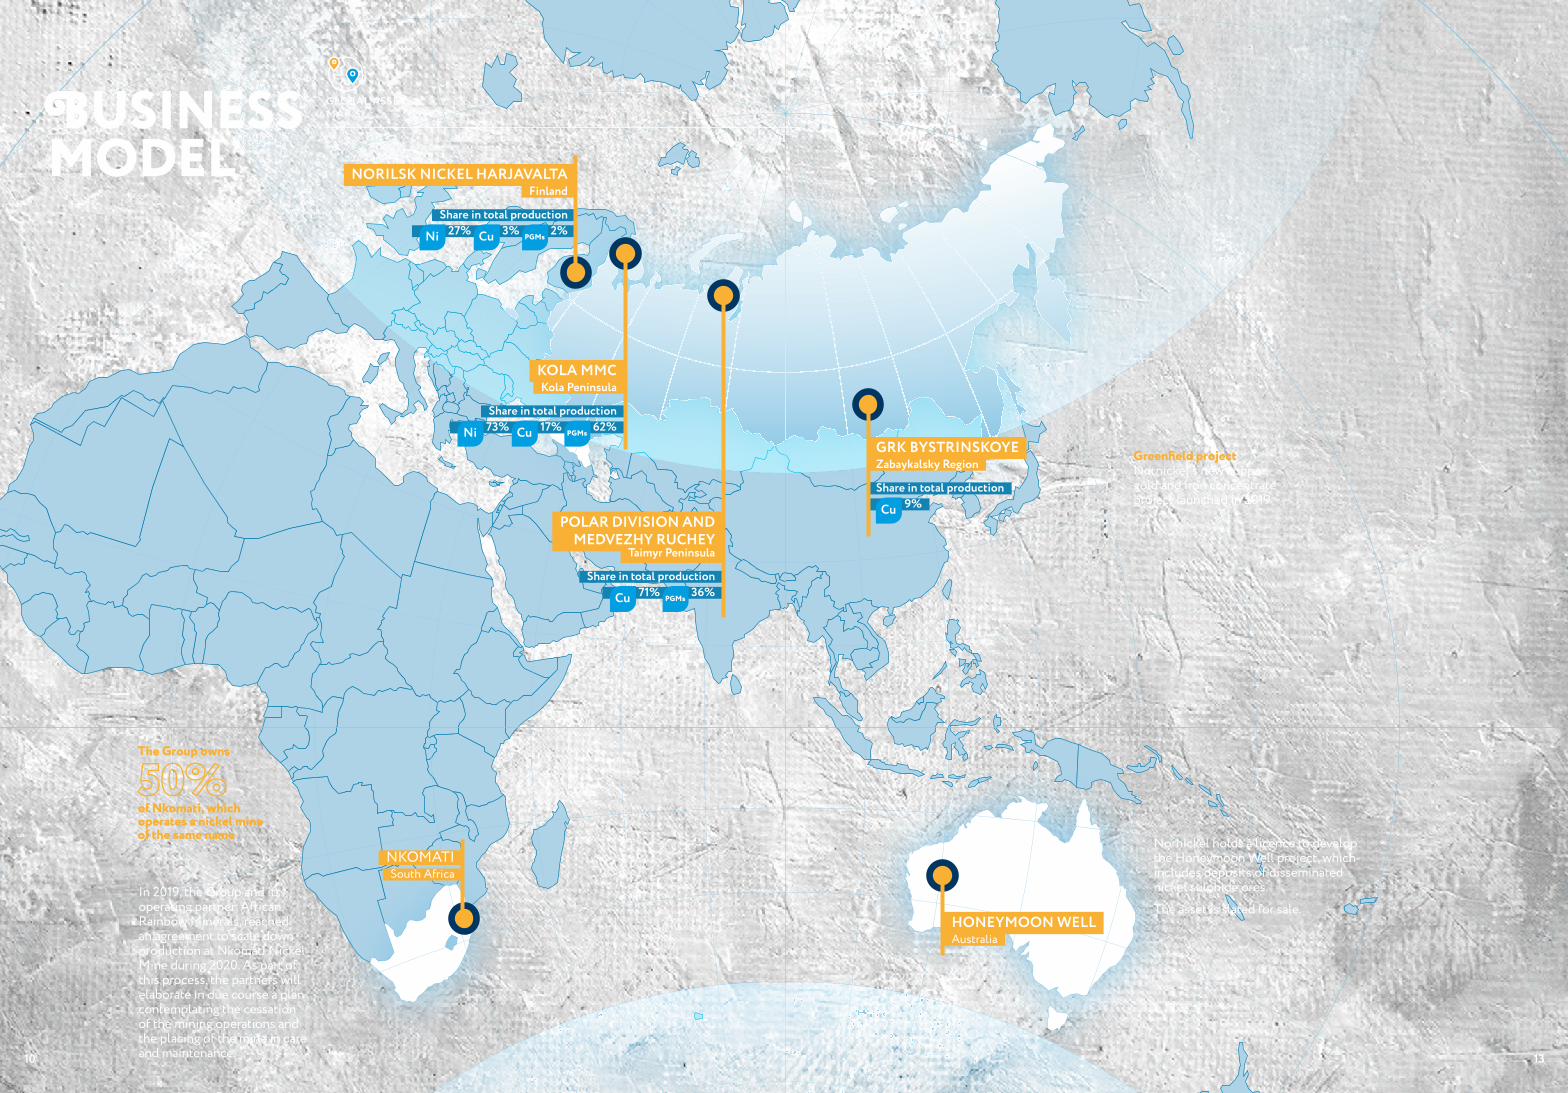
BUSINESS MODEL
GLOBAL ASSET MAP
KOLA MMCKola Peninsula
Share in total production
Ni 73% Cu 17% PGMs 62%
NORILSK NICKEL HARJAVALTAFinland
Share in total production
Ni 27% Cu 3% PGMs 2%
NKOMATISouth Africa
HONEYMOON WELL Australia
GRK BYSTRINSKOYE Zabaykalsky Region
Share in total production
Cu 9%
Greenfield project Nornickel’s new copper, gold and iron concentrate project launched in 2019
POLAR DIVISION AND MEDVEZHY RUCHEY
Taimyr Peninsula
Share in total production
Cu 71% PGMs 36%
In 2019, the Group and its operating partner, African Rainbow Minerals, reached an agreement to scale down production at Nkomati Nickel Mine during 2020. As part of this process, the partners will elaborate in due course a plan contemplating the cessation of the mining operations and the placing of the mine in care and maintenance.
Nornickel holds a licence to develop the Honeymoon Well project, which includes deposits of disseminated nickel sulphide ores.The asset is slated for sale.
The Group owns
50%of Nkomati, which operates a nickel mine of the same name
10 13
Proven and probable reserves
8 mln t
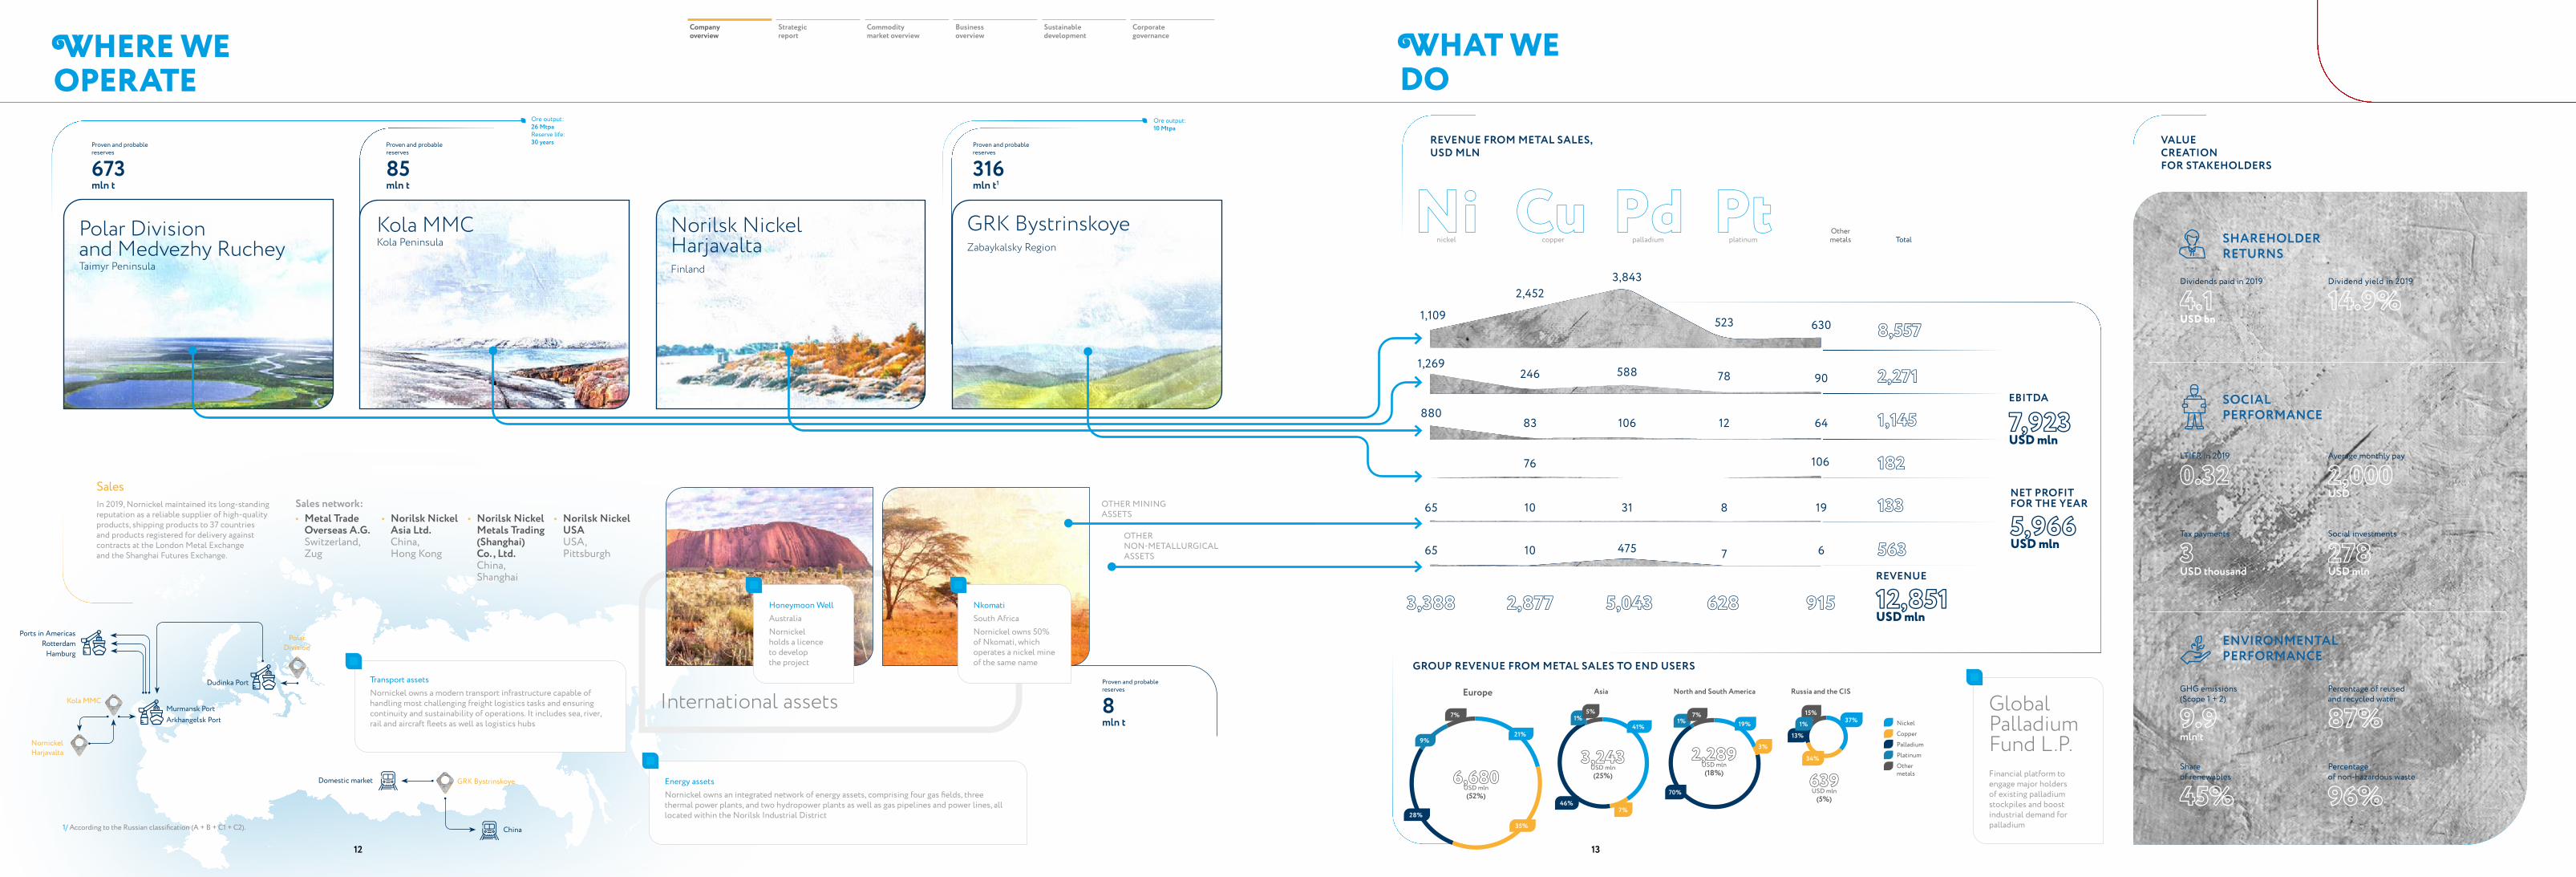
WHERE WE OPERATE
International assets
nickelNi Pd
palladiumPt
platinum Cu
copperOther metals Total
8,557
1,145
133
2,271
182
563
NkomatiSouth AfricaNornickel owns 50% of Nkomati, which operates a nickel mine of the same name
Honeymoon WellAustraliaNornickel holds a licence to develop the project
EBITDA
7,923USD mln
NET PROFIT FOR THE YEAR
5,966 USD mln
REVENUE
12,851USD mln
SalesIn 2019, Nornickel maintained its long-standing reputation as a reliable supplier of high-quality products, shipping products to 37 countries and products registered for delivery against contracts at the London Metal Exchange and the Shanghai Futures Exchange.
REVENUE FROM METAL SALES, USD MLN
GROUP REVENUE FROM METAL SALES TO END USERS
VALUE CREATION FOR STAKEHOLDERS
21%
35%28%
9%
7%
6,680USD mln (52%)
34%
13%
15%
Polar Division
Kola MMC
GRK Bystrinskoye
Nornickel Harjavalta
China
Domestic market
Murmansk Port
HamburgRotterdam
Ports in Americas
Arkhangelsk Port
Dudinka Port Transport assetsNornickel owns a modern transport infrastructure capable of handling most challenging freight logistics tasks and ensuring continuity and sustainability of operations. It includes sea, river, rail and aircraft fleets as well as logistics hubs 1% 37% Nickel
CopperPalladiumPlatinumOther metals
SHAREHOLDER RETURNS
Dividends paid in 2019
4.1 USD bn
Average monthly pay
2,000USD
Percentage of reused and recycled water
87%
Tax payments
3USD thousand
Share of renewables
45%
OTHER MINING ASSETS
OTHER NON-METALLURGICAL ASSETS
Energy assetsNornickel owns an integrated network of energy assets, comprising four gas fields, three thermal power plants, and two hydropower plants as well as gas pipelines and power lines, all located within the Norilsk Industrial District
Social investments
278USD mln
Percentage of non-hazardous waste
96%
Sales network:• Metal Trade
Overseas A.G. Switzerland, Zug
• Norilsk Nickel Asia Ltd. China, Hong Kong
• Norilsk Nickel Metals Trading (Shanghai) Co., Ltd. China, Shanghai
• Norilsk Nickel USA USA, Pittsburgh
LTIFR in 2019
0.32
GHG emissions (Scope 1 + 2)
9.9 mln t
Dividend yield in 2019
14.9%
SOCIAL PERFORMANCE
ENVIRONMENTAL PERFORMANCE
Global Palladium Fund L.P.Financial platform to engage major holders of existing palladium stockpiles and boost industrial demand for palladium
1,109
1,269
880
65
65
3,388 2,877 5,043 628 915
2,452
246
83
76
10
10
3,843
588
106
1/ According to the Russian classification (А + В + С1 + С2).
31
475
523
78
12
8
7
630
90
64
106
19
6
41%
7%46%
1%5%
3,243USD mln(25%)
Norilsk Nickel HarjavaltaFinland
Proven and probable reserves
316 mln t1
GRK BystrinskoyeZabaykalsky Region
Ore output: 10 Mtpa
Proven and probable reserves
85 mln t
Kola MMCKola Peninsula
Proven and probable reserves
673 mln t
Polar Division and Medvezhy RucheyTaimyr Peninsula
70%
1%7%
19%
3%2,289USD mln(18%) 639
USD mln(5%)
Europe Asia North and South America Russia and the CIS
WHAT WE DO
12 13
Company overview
Strategic report
Commodity market overview
Business overview
Sustainable development
Corporate governance
Ore output: 26 MtpaReserve life: 30 years
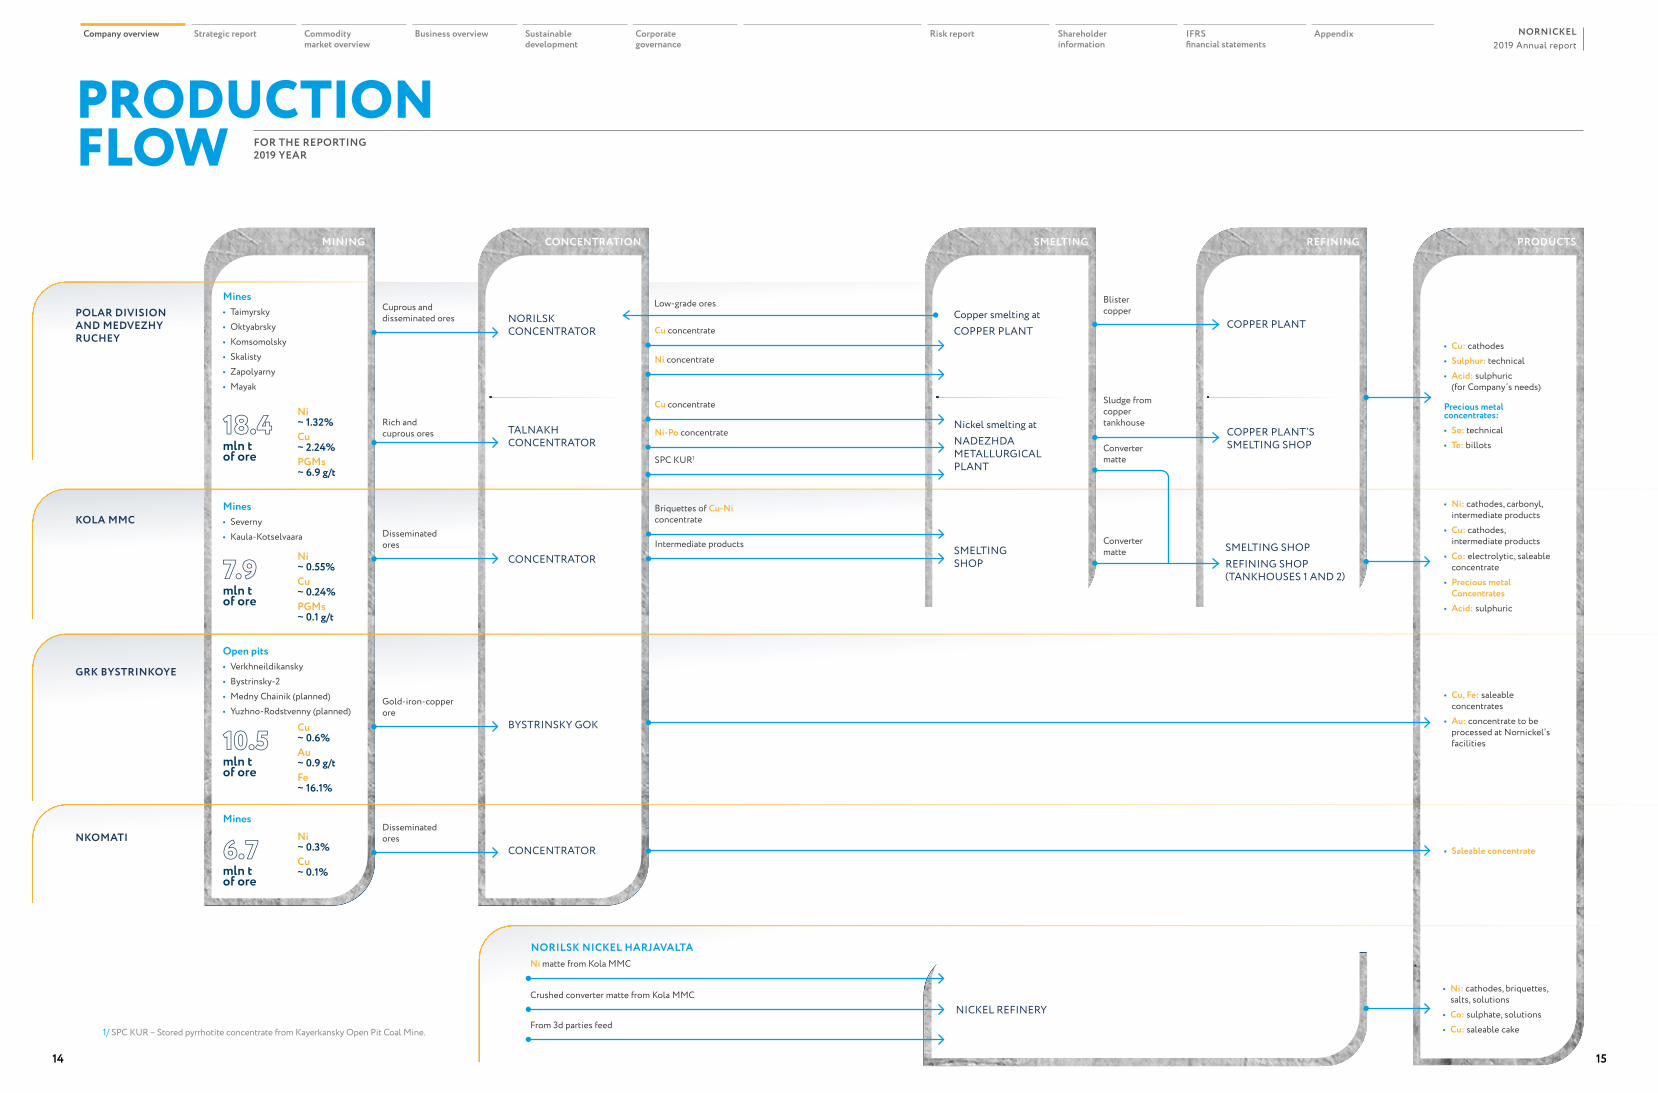
PRODUCTION FLOW FOR THE REPORTING
2019 YEAR
POLAR DIVISION AND MEDVEZHY RUCHEY
MINING CONCENTRATION SMELTING REFINING PRODUCTS
KOLA MMC
GRK BYSTRINKOYE
NKOMATI
NORILSK NICKEL HARJAVALTA
Mines• Taimyrsky• Oktyabrsky• Komsomolsky• Skalisty• Zapolyarny• Mayak
18.4 mln t of ore
Ni ~ 1.32%Cu ~ 2.24%PGMs ~ 6.9 g/t
Mines• Severny• Kaula-Kotselvaara
7.9 mln t of ore
Ni ~ 0.55%Cu ~ 0.24%PGMs ~ 0.1 g/t
Open pits• Verkhneildikansky• Bystrinsky-2• Medny Chainik (planned)• Yuzhno-Rodstvenny (planned)
10.5 mln t of ore
Cu ~ 0.6%Au ~ 0.9 g/tFe ~ 16.1%
Mines
6.7mln t of ore
Ni ~ 0.3%Cu ~ 0.1%
NORILSK CONCENTRATOR
Copper smelting atCOPPER PLANT COPPER PLANT
COPPER PLANT’S SMELTING SHOP
SMELTING SHOPREFINING SHOP (TANKHOUSES 1 AND 2)
Nickel smelting atNADEZHDA METALLURGICAL PLANT
SMELTING SHOP
NICKEL REFINERY
TALNAKH CONCENTRATOR
CONCENTRATOR
BYSTRINSKY GOK
CONCENTRATOR
Cuprous and disseminated ores
Low-grade ores
Cu concentrate
Blister copper
Sludge from copper tankhouse
Converter matte
Converter matte
Ni concentrate
Cu concentrate
Ni-Po concentrate
SPC KUR1
Rich and cuprous ores
Disseminated ores
Gold-iron-copper ore
Disseminated ores
From 3d parties feed
Crushed converter matte from Kola MMC
Ni matte from Kola MMC
• Сu: cathodes• Sulphur: technical• Acid: sulphuric
(for Company’s needs)
Precious metal concentrates:• Se: technical• Те: billots
• Ni: cathodes, carbonyl, intermediate products
• Cu: cathodes, intermediate products
• Co: electrolytic, saleable concentrate
• Precious metal Concentrates
• Acid: sulphuric
• Ni: cathodes, briquettes, salts, solutions
• Co: sulphate, solutions• Сu: saleable cake
• Cu, Fe: saleable concentrates
• Au: concentrate to be processed at Nornickel’s facilities
• Saleable concentrate
1/ SPC KUR – Stored pyrrhotite concentrate from Kayerkansky Open Pit Coal Mine.
Briquettes of Cu-Ni concentrate
Intermediate products
14 15
2019 Annual reportNORNICKELCompany overview Strategic report Commodity
market overviewBusiness overview Sustainable
developmentCorporate governance
Risk report Shareholder information
IFRS financial statements
Appendix
Strategic report
ReportS 20 Chairman’s letter22 President’s letter24 Our strategy
30 Key investment projects
tra te gic
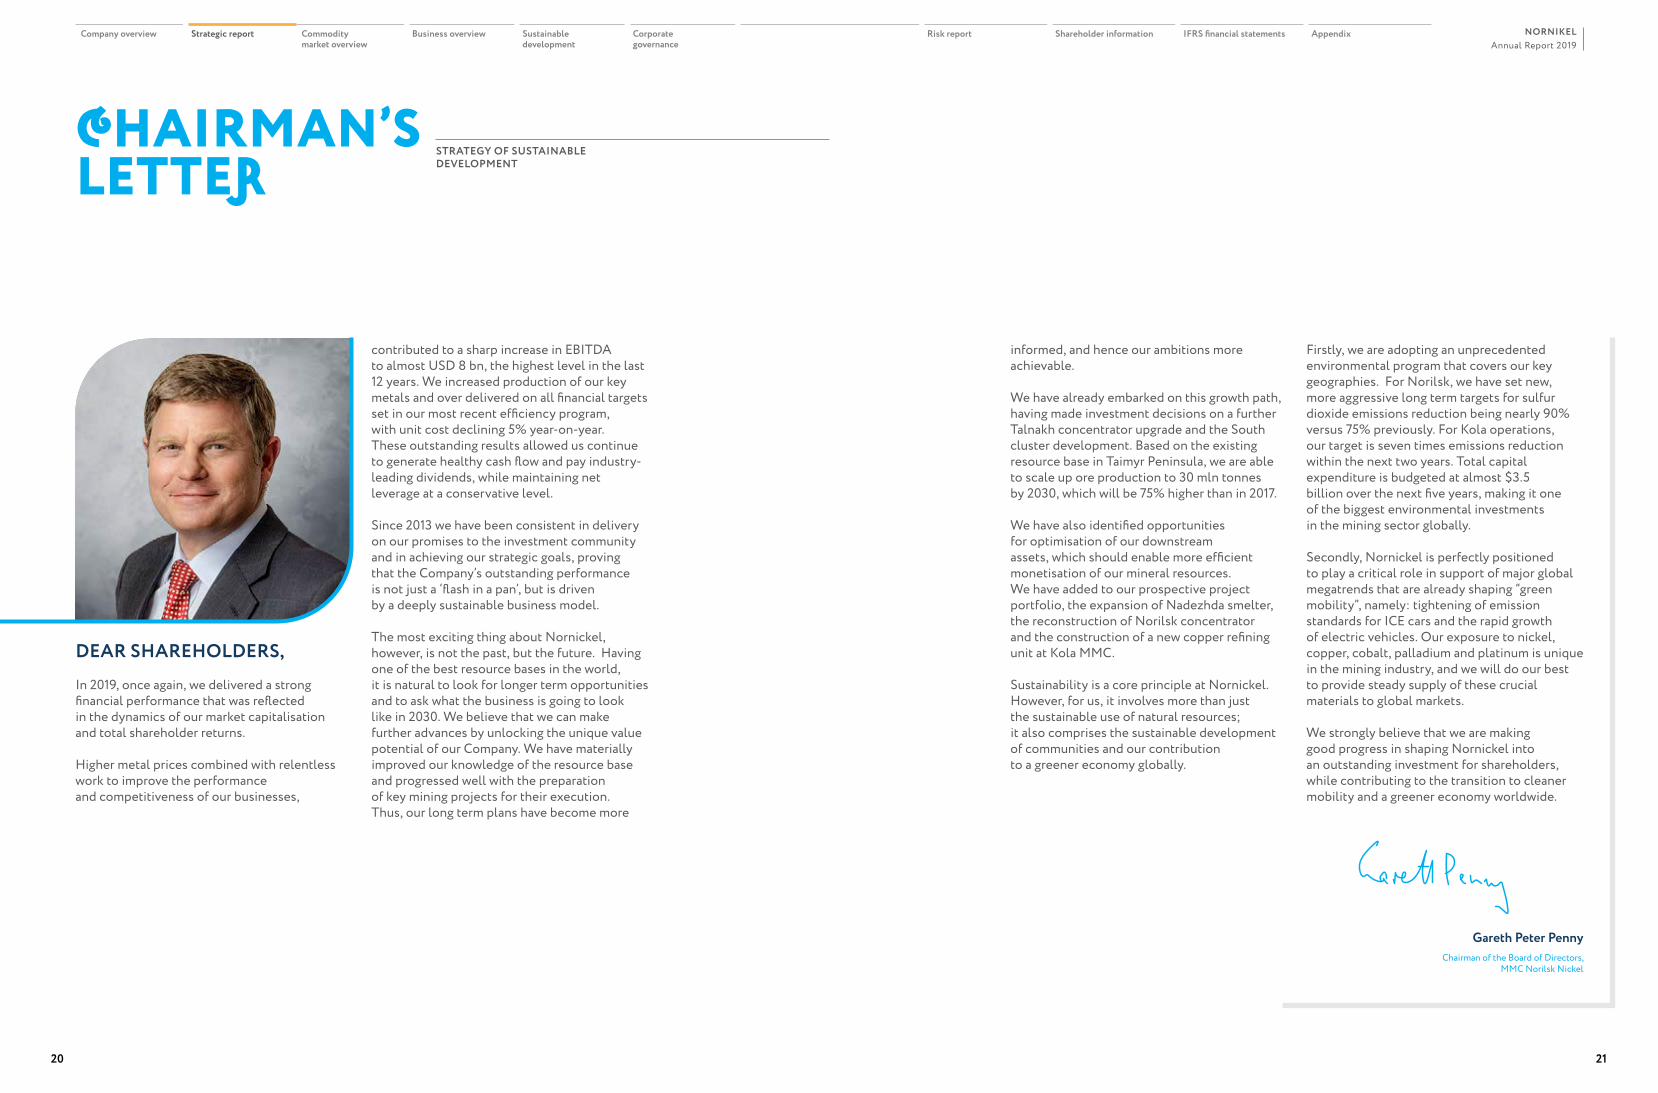
CHAIRMAN’S LETTER
DEAR SHAREHOLDERS, In 2019, once again, we delivered a strong financial performance that was reflected in the dynamics of our market capitalisation and total shareholder returns.
Higher metal prices combined with relentless work to improve the performance and competitiveness of our businesses,
informed, and hence our ambitions more achievable.
We have already embarked on this growth path, having made investment decisions on a further Talnakh concentrator upgrade and the South cluster development. Based on the existing resource base in Taimyr Peninsula, we are able to scale up ore production to 30 mln tonnes by 2030, which will be 75% higher than in 2017.
We have also identified opportunities for optimisation of our downstream assets, which should enable more efficient monetisation of our mineral resources. We have added to our prospective project portfolio, the expansion of Nadezhda smelter, the reconstruction of Norilsk concentrator and the construction of a new copper refining unit at Kola MMC.
Sustainability is a core principle at Nornickel. However, for us, it involves more than just the sustainable use of natural resources; it also comprises the sustainable development of communities and our contribution to a greener economy globally.
contributed to a sharp increase in EBITDA to almost USD 8 bn, the highest level in the last 12 years. We increased production of our key metals and over delivered on all financial targets set in our most recent efficiency program, with unit cost declining 5% year-on-year. These outstanding results allowed us continue to generate healthy cash flow and pay industry-leading dividends, while maintaining net leverage at a conservative level.
Since 2013 we have been consistent in delivery on our promises to the investment community and in achieving our strategic goals, proving that the Company’s outstanding performance is not just a ‘flash in a pan’, but is driven by a deeply sustainable business model.
The most exciting thing about Nornickel, however, is not the past, but the future. Having one of the best resource bases in the world, it is natural to look for longer term opportunities and to ask what the business is going to look like in 2030. We believe that we can make further advances by unlocking the unique value potential of our Company. We have materially improved our knowledge of the resource base and progressed well with the preparation of key mining projects for their execution. Thus, our long term plans have become more
Firstly, we are adopting an unprecedented environmental program that covers our key geographies. For Norilsk, we have set new, more aggressive long term targets for sulfur dioxide emissions reduction being nearly 90% versus 75% previously. For Kola operations, our target is seven times emissions reduction within the next two years. Total capital expenditure is budgeted at almost $3.5 billion over the next five years, making it one of the biggest environmental investments in the mining sector globally.
Secondly, Nornickel is perfectly positioned to play a critical role in support of major global megatrends that are already shaping “green mobility”, namely: tightening of emission standards for ICE cars and the rapid growth of electric vehicles. Our exposure to nickel, copper, cobalt, palladium and platinum is unique in the mining industry, and we will do our best to provide steady supply of these crucial materials to global markets.
We strongly believe that we are making good progress in shaping Nornickel into an outstanding investment for shareholders, while contributing to the transition to cleaner mobility and a greener economy worldwide.
STRATEGY OF SUSTAINABLE DEVELOPMENT
Gareth Peter PennyChairman of the Board of Directors,
MMC Norilsk Nickel
Annual Report 2019NORNIKEL
20 21
Company overview Strategic report Commodity market overview
Business overview Sustainable development
Corporate governance
Risk report Shareholder information IFRS financial statements Appendix
DEAR SHAREHOLDERS,2019 was for us a year of phenomenal achievements. Once again, we have shown the investor community the strengths of our business model and our ability to reach ambitious goals. We have been able to significantly increase the value of our business and pay industry-leading shareholder returns through the consistent delivery of our strategy, whose success has been supported by higher metal prices.
Financial highlights
Last year, we ramped up the output of all key metals, breaking a record in the process by producing almost half a million tonnes of copper. Strong operational performance and higher prices for nickel and palladium have contributed to a boost in revenue of 16% to USD
PRESIDENT’S LETTER
13.6 bn. Furthermore, our successful operational efficiency programme and rigorous cost management have helped us reduce our unit costs by almost 5%. As a result, our EBITDA grew by 27% to USD 7.9 bn while the EBITDA margin reached 58%. We have also seen our net profit increase by almost 2 times to USD 6 bn while free cash flow reached an impressive USD 5 bn for the second year running.
Finally, our leverage remained low, with Net Debt to EBITDA reduced to 0.9. We believe that a conservative approach to debt is central to maintaining our financial stability, which is particularly relevant amidst macroeconomic uncertainty.
Strategic priorities and investments
Last year, Nornickel came to the end of its five-year strategic cycle, which was primarily aimed at reconfiguring and upgrading its downstream facilities, and provided a secure foothold for further business growth. It is now time to take the next move to reach for even more ambitious objectives, and on this note, I would like to discuss in more detail the ten-year strategic programme that we have designed.
We have fundamentally improved our knowledge of our immense resource base to allow for a smooth transition to longer-term planning. In the Taimyr Peninsula, with its ore reserves of more than 2 billion tonnes, we intend to ramp up our production by 75%, or up to 30 Mtpa. In doing so, our output of key metals is expected to rise considerably by 2030: nickel by 15%–25% to 240–260 ktpa, copper by 20%–30% to 480–520 ktpa, and platinum group metals (PGMs) by 30%–45% to 140–150 ktpa.
These strategic plans assume that we will successfully complete the already-sanctioned South Cluster project, brownfield expansion projects at the Talnakh mines, upgrades and debottlenecking of our concentration and metallurgical facilities.
Backed by our unique metal basket and world-leading exposure to mining assets, we are perfectly positioned to support the global transition to green mobility. The rise of hybrid and electric vehicles, and the tightening of regulations on exhaust emissions across the globe are two megatrends that are expected to considerably boost the demand for our products in the coming years.
By 2030, we will be able to supply enough PGMs to the global market to produce 25–40 mln autocatalysts, in turn leading to a 170–270 mln t reduction in air pollutants. In addition, we believe that we will be able to supply enough high-grade nickel to produce 3.5–5.5 mln EV battery packs, which will reduce global GHG emissions by 50–100 mln t. We are confident that Nornickel will play a crucial role in helping the global economy, and above all transport, go green.
For this very reason, we believe that our own assets should also be green. Last year, we adopted the new comprehensive environmental protection programme, conventionally called “Sulphur Programme 2.0”. The programme is expected to reduce emissions by 90% by 2025 for the Polar Division, and by 85% as early as 2021 for Kola MMC.
Accordingly, our growth strategy and environmental projects will require significant investment, which can be broken down into three phases. During the first, active construction phase, management expects a gradual increase in investment from USD 2.2–2.5 bn in 2020. During the second phase (from 2022 to 2025), the annual investment is to reach its peak of USD 3.5–4 bn. During the third phase (from 2026 to 2030), our capital expenditures are expected to return to their historical annual average of about USD 2 bn.
Health and safety
Our top priorities are to ensure employee safety and mitigate the risk of work-related injuries. In 2019, we continued our unwavering efforts to enhance occupational health at our facilities. We have maintained our lost time injury frequency rate (LTIFR) at a level significantly below the global industry average. Despite this, it is with deep regret that I must inform you that nine of our colleagues lost their lives at the workplace during the last year. I offer my sincere condolences to their families, and I believe statistics like these are simply unacceptable. We are sparing no effort to achieve our priority goal of zero work-related fatalities at our facilities.
Social responsibility
Sustainability and social responsibility are not just hollow buzzwords for Nornickel: we have been and will continue to be an investor in social infrastructure and human capital.
In 2019, Nornickel and the Russian Government continued their joint implementation of a long-term target programme to relocate people from Norilsk and Dudinka (Krasnoyarsk Region) to other Russian regions with a better climate. Under the programme, 7,586 families moved into new homes on the “mainland” between 2011 and 2019.
We are actively involved in the construction and renovation of social infrastructure across our footprint, with the aim of creating inclusive and people-friendly work and living spaces.
On a final note, I would like to highlight that our 2019 performance has provided ample evidence that we are on the right strategic track. I would like to give my thanks to all those who have contributed to our success, and express my confidence that together we can deliver on all our long-term goals.
Vladimir PotaninPresident,
Chairman of the Management BoardMMC Norilsk Nickel
Annual Report 2019NORNIKEL
22 23
Company overview Strategic report Commodity market overview
Business overview Sustainable development
Corporate governance
Risk report Shareholder information IFRS financial statements Appendix
EXPANDING OUR HORIZONSThe seamless execution of our strategy over the past six years, as well as tailwinds in the commodities markets, have helped us to achieve industry-leading TRS (total returns to shareholders) performance. Now it’s time for us to take the next step towards even more ambitious goals, both in terms of business growth and environmental performance.
We are setting new planning horizons, as we see a positive outlook going forward. Firstly, the nickel market, which is a strategic focus for us, is showing a stable global trend in demand from battery and electric vehicle (EV) manufacturers. And while this story has been more about expectations than real action so far, we are keenly aware that the future for the automotive industry lies with green technology, which provides an extra tailwind for us. At the same time, petrol-driven cars are also still being produced, and this sector is our traditional consumer. With environmental standards getting ever tougher, demand for palladium is surging, as this metal is indispensable for making catalytic converters which capture harmful exhaust pollutants. The strong long-term demand for nickel and platinum group metals (PGMs) creates a positive case for our shift from the current, tactical five-year planning horizon to a longer, ten-year strategic planning horizon. This is even more important, as all of the major
capital projects we are betting on in the metals and mining industry take on average about 7 to 10 years to deliver. We expect to increase Nornickel’s ore production 1.8 times over this time horizon, investing approximately more than RUB 2.0 trillion in our growth projects.
We are confident that Nornickel will play a crucial role in making the global economy, and above all transport, green. To this end, we need to make sure that our own assets in this new, more environmentally conscious world are equally as green.
OUR STRATEGY
VLADIMIR POTANIN, President, MMC Norilsk Nickel
MISSIONThrough the efficient use of natural resources and equity, we supply mankind with non-ferrous metals, which make the world a more reliable place to live in, and help people to realise their aspirations for development and technological progress
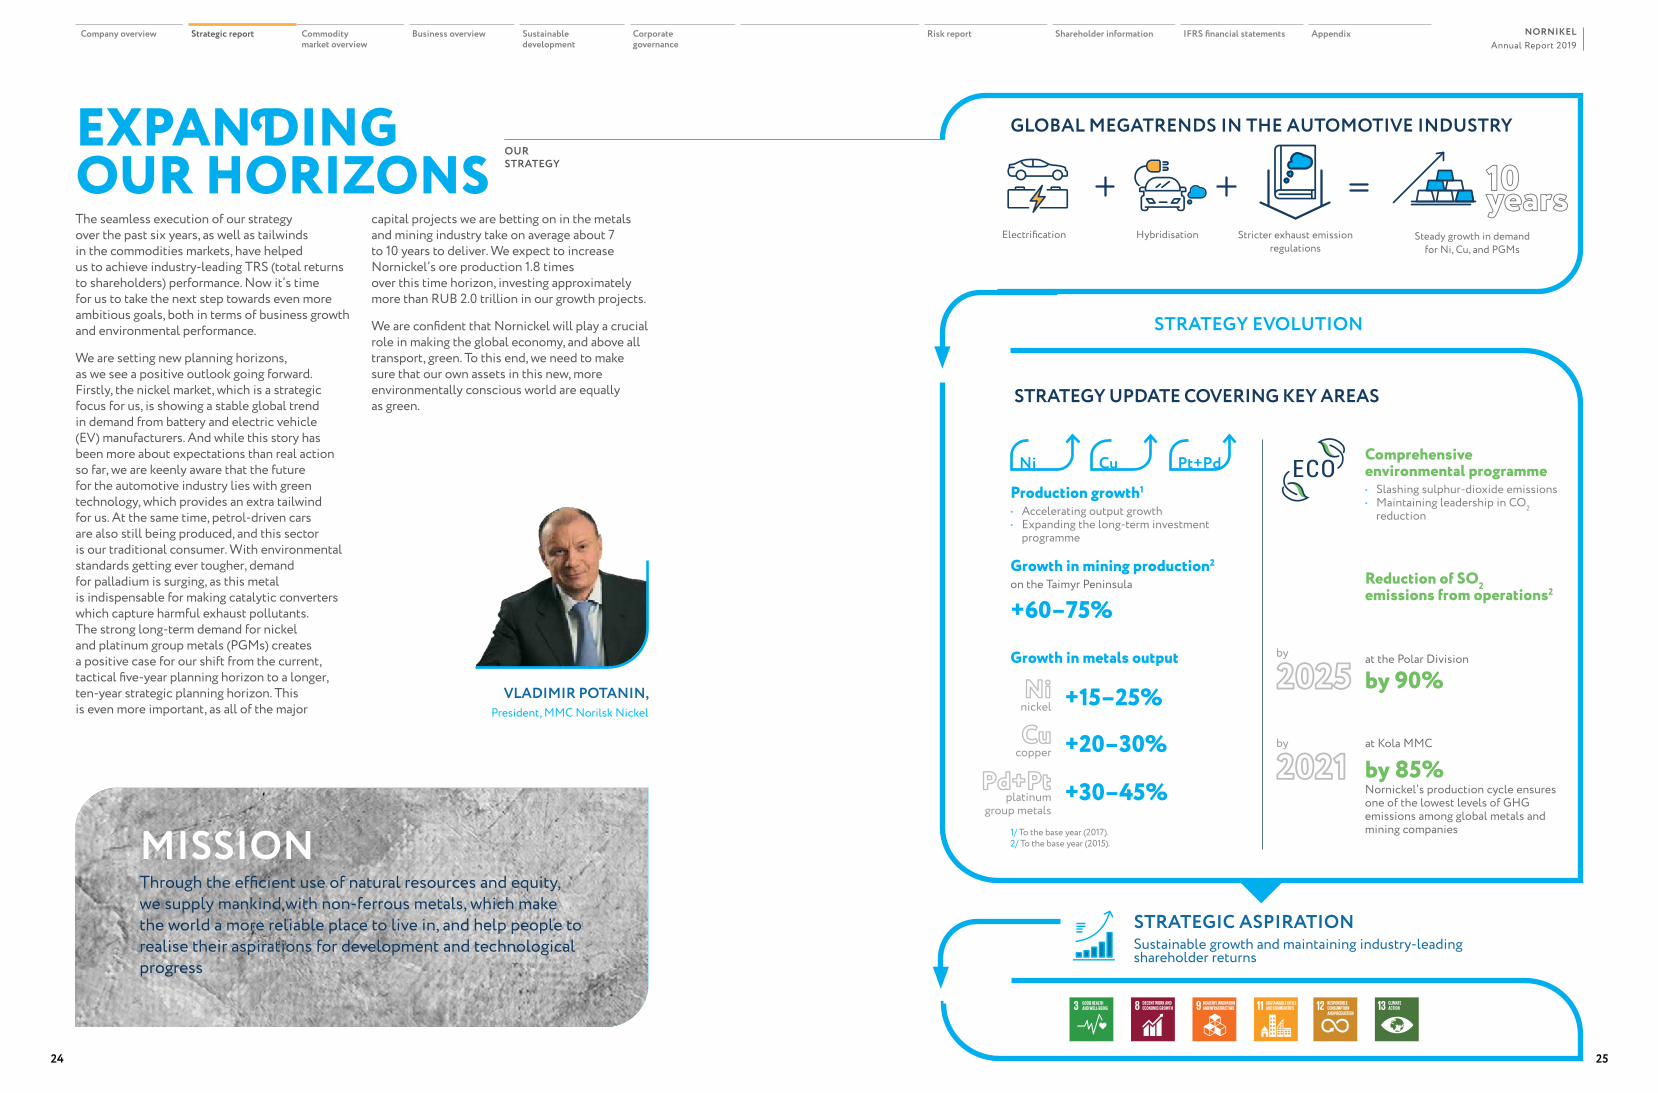
Production growth1
• Accelerating output growth• Expanding the long-term investment
programme
Growth in mining production2
on the Taimyr Peninsula
+60–75% Growth in metals output
Comprehensive environmental programme• Slashing sulphur-dioxide emissions• Maintaining leadership in CO2
reduction
Reduction of SO2 emissions from operations2
STRATEGY UPDATE COVERING KEY AREAS
Steady growth in demand
for Ni, Cu, and PGMs
Electrification
Hybridisation
Stricter exhaust emission
regulations
GLOBAL MEGATRENDS IN THE AUTOMOTIVE INDUSTRY
STRATEGY EVOLUTION
10 years
nickel Ni
by
2025by
2021 Pd+Pt
by 90%
by 85%copperCu
at the Polar Division
at Kola MMC
Nornickel’s production cycle ensures one of the lowest levels of GHG emissions among global metals and mining companies1/ To the base year (2017).
2/ To the base year (2015).
platinum group metals
+15–25%
+20–30%
+30–45%
STRATEGIC ASPIRATIONSustainable growth and maintaining industry-leading shareholder returns
Ni Cu Pt+Pd
Annual Report 2019NORNIKEL
24 25
Company overview Strategic report Commodity market overview
Business overview Sustainable development
Corporate governance
Risk report Shareholder information IFRS financial statements Appendix
COMPREHENSIVE ENVIRONMENTAL PROGRAMME
1/ According GHG Standard (Scope 1 & 2) (GHG Corporate Accounting and Reporting Standard)
OUR STRATEGY
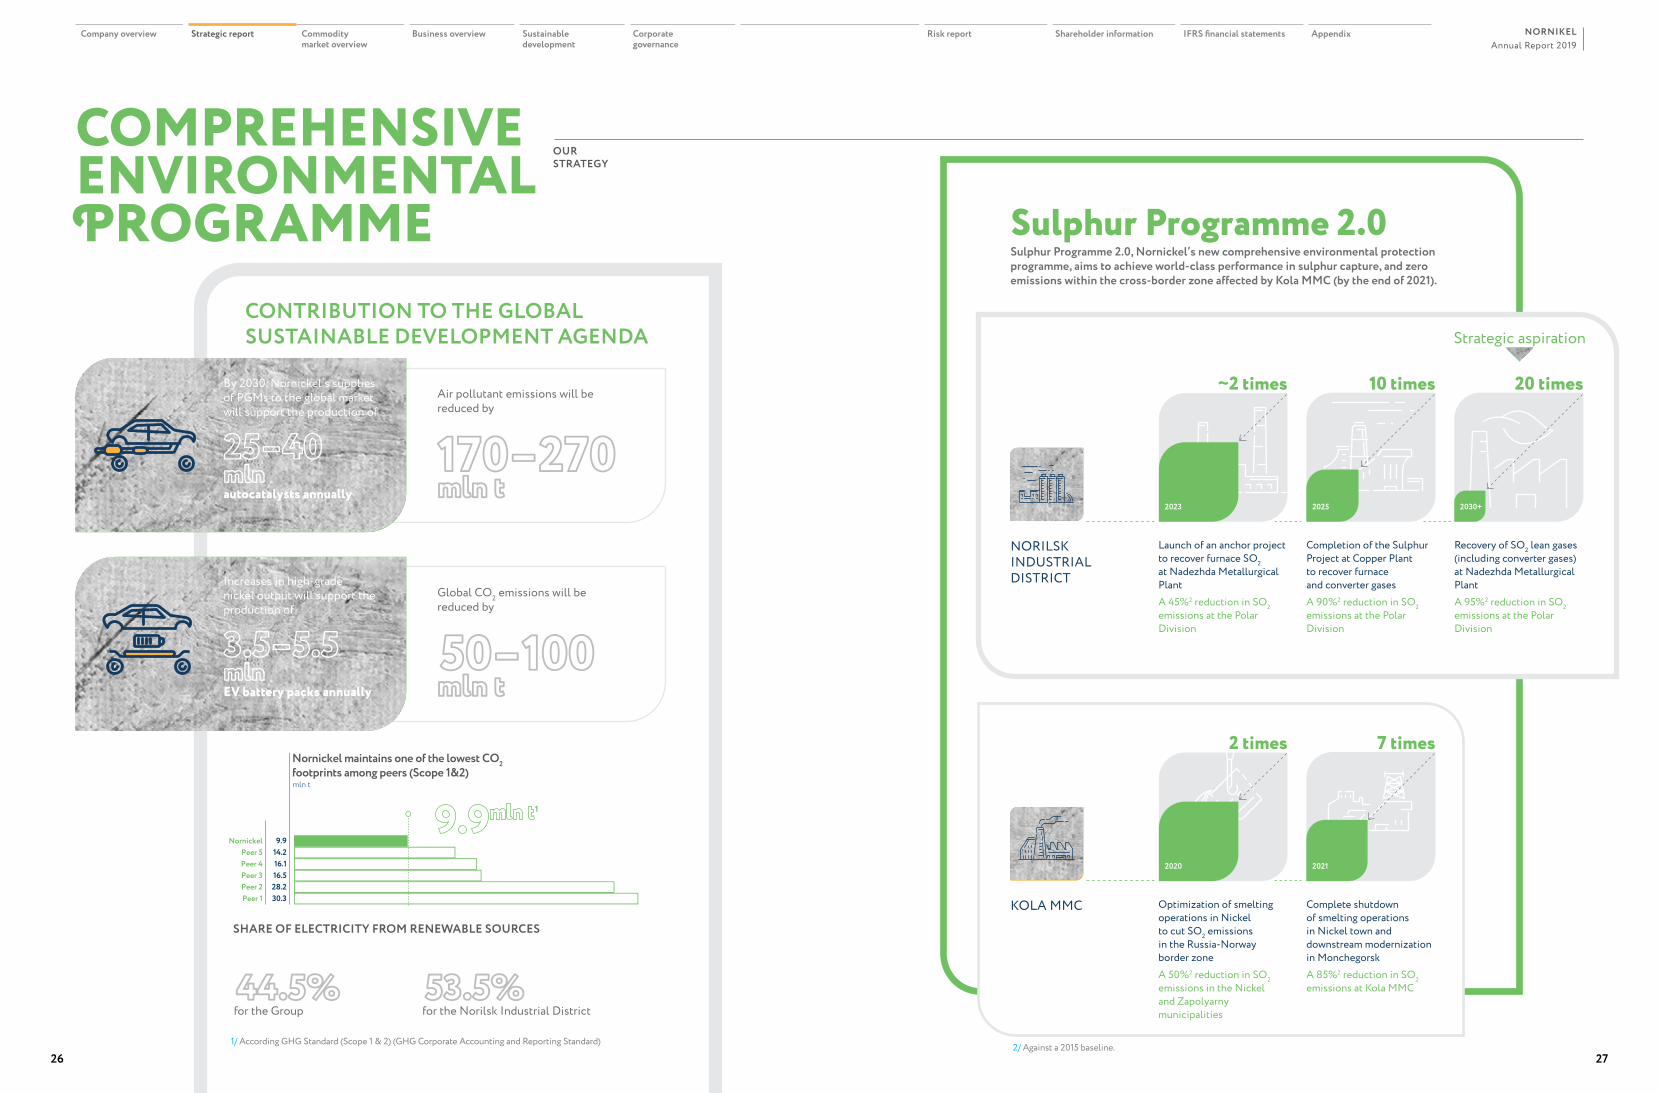
CONTRIBUTION TO THE GLOBAL SUSTAINABLE DEVELOPMENT AGENDA
By 2030, Nornickel’s supplies of PGMs to the global market will support the production of
25–40 mln autocatalysts annually
SHARE OF ELECTRICITY FROM RENEWABLE SOURCES
Increases in high-grade nickel output will support the production of
3.5–5.5 mln EV battery packs annually
Air pollutant emissions will be reduced by
170–270 mln t
Global CО2 emissions will be reduced by
50–100 mln t
44.5%for the Group
53.5%for the Norilsk Industrial District
Nornickel maintains one of the lowest CO2 footprints among peers (Scope 1&2)mln t
30.328.216.516.114.2
Peer 1Peer 2Peer 3Peer 4Peer 5
9.9 Nornickel
¹
2/ Against a 2015 baseline.
Sulphur Programme 2.0Sulphur Programme 2.0, Nornickel’s new comprehensive environmental protection programme, aims to achieve world-class performance in sulphur capture, and zero emissions within the cross-border zone affected by Kola MMC (by the end of 2021).
Optimization of smelting operations in Nickel to cut SO2 emissions in the Russia-Norway border zoneA 50%2 reduction in SO2 emissions in the Nickel and Zapolyarny municipalities
Complete shutdown of smelting operations in Nickel town and downstream modernization in MonchegorskA 85%2 reduction in SO2 emissions at Kola MMC
KOLA MMC
2 times 7 times
2020 2021
Launch of an anchor project to recover furnace SO2 at Nadezhda Metallurgical PlantA 45%2 reduction in SO2 emissions at the Polar Division
Completion of the Sulphur Project at Copper Plant to recover furnace and converter gasesA 90%2 reduction in SO2 emissions at the Polar Division
Recovery of SO2 lean gases (including converter gases) at Nadezhda Metallurgical PlantA 95%2 reduction in SO2 emissions at the Polar Division
NORILSK INDUSTRIAL DISTRICT
~2 times 10 times 20 times
2023 2025 2030+
Strategic aspiration
Annual Report 2019NORNIKEL
26 27
Company overview Strategic report Commodity market overview
Business overview Sustainable development
Corporate governance
Risk report Shareholder information IFRS financial statements Appendix
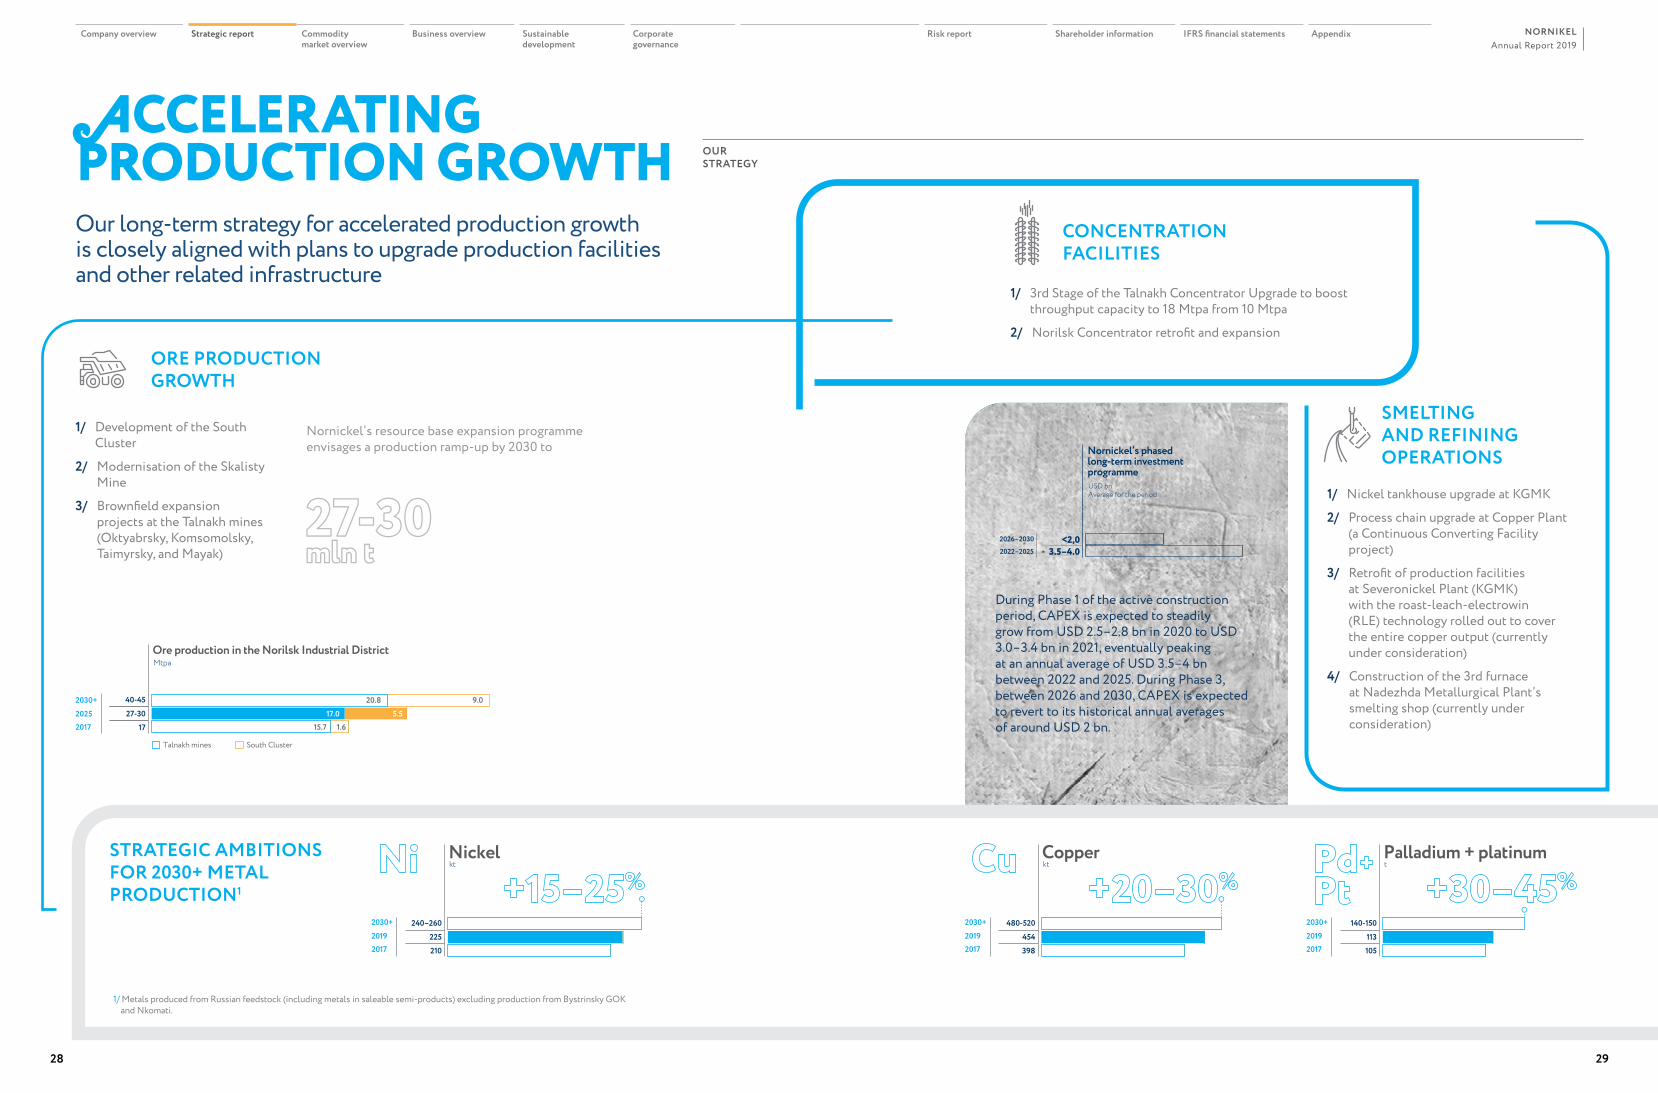
ACCELERATING PRODUCTION GROWTH
ORE PRODUCTION GROWTH
1/ Development of the South Cluster
2/ Modernisation of the Skalisty Mine
3/ Brownfield expansion projects at the Talnakh mines (Oktyabrsky, Komsomolsky, Taimyrsky, and Mayak)
STRATEGIC AMBITIONS FOR 2030+ METAL PRODUCTION1
Our long-term strategy for accelerated production growth is closely aligned with plans to upgrade production facilities and other related infrastructure
1/ Metals produced from Russian feedstock (including metals in saleable semi-products) excluding production from Bystrinsky GOK and Nkomati.
Ore production in the Norilsk Industrial District
201720252030+
Talnakh mines
Mtpa
1727-3040-45
South Cluster
15.7 1.617.0 5.5
20.8 9.0
Nickelkt
2030+20192017 210
225240–260
27-30 mln t
OUR STRATEGY
Nornickel’s resource base expansion programme envisages a production ramp-up by 2030 to
CONCENTRATION FACILITIES
1/ 3rd Stage of the Talnakh Concentrator Upgrade to boost throughput capacity to 18 Mtpa from 10 Mtpa
2/ Norilsk Concentrator retrofit and expansion
Copperkt
398454
480-5202030+20192017
Palladium + platinumt
105113
140-1502030+20192017
During Phase 1 of the active construction period, CAPEX is expected to steadily grow from USD 2.5–2.8 bn in 2020 to USD 3.0–3.4 bn in 2021, eventually peaking at an annual average of USD 3.5–4 bn between 2022 and 2025. During Phase 3, between 2026 and 2030, CAPEX is expected to revert to its historical annual averages of around USD 2 bn.
Nornickel’s phasedlong-term investment programmeUSD bnAverage for the period
3.5–4.0<2,0
2022–2025
2026–2030
SMELTING AND REFINING OPERATIONS
1/ Nickel tankhouse upgrade at KGMK
2/ Process chain upgrade at Copper Plant (a Continuous Converting Facility project)
3/ Retrofit of production facilities at Severonickel Plant (KGMK) with the roast-leach-electrowin (RLE) technology rolled out to cover the entire copper output (currently under consideration)
4/ Construction of the 3rd furnace at Nadezhda Metallurgical Plant’s smelting shop (currently under consideration)
Annual Report 2019NORNIKEL
28 29
Company overview Strategic report Commodity market overview
Business overview Sustainable development
Corporate governance
Risk report Shareholder information IFRS financial statements Appendix
KEY INVESTMENT PROJECTS
MINING PROJECTS
SKALISTY MINE TAIMYRSKY MINE
Location
Norilsk Industrial District, Krasnoyarsk Region
Project overview
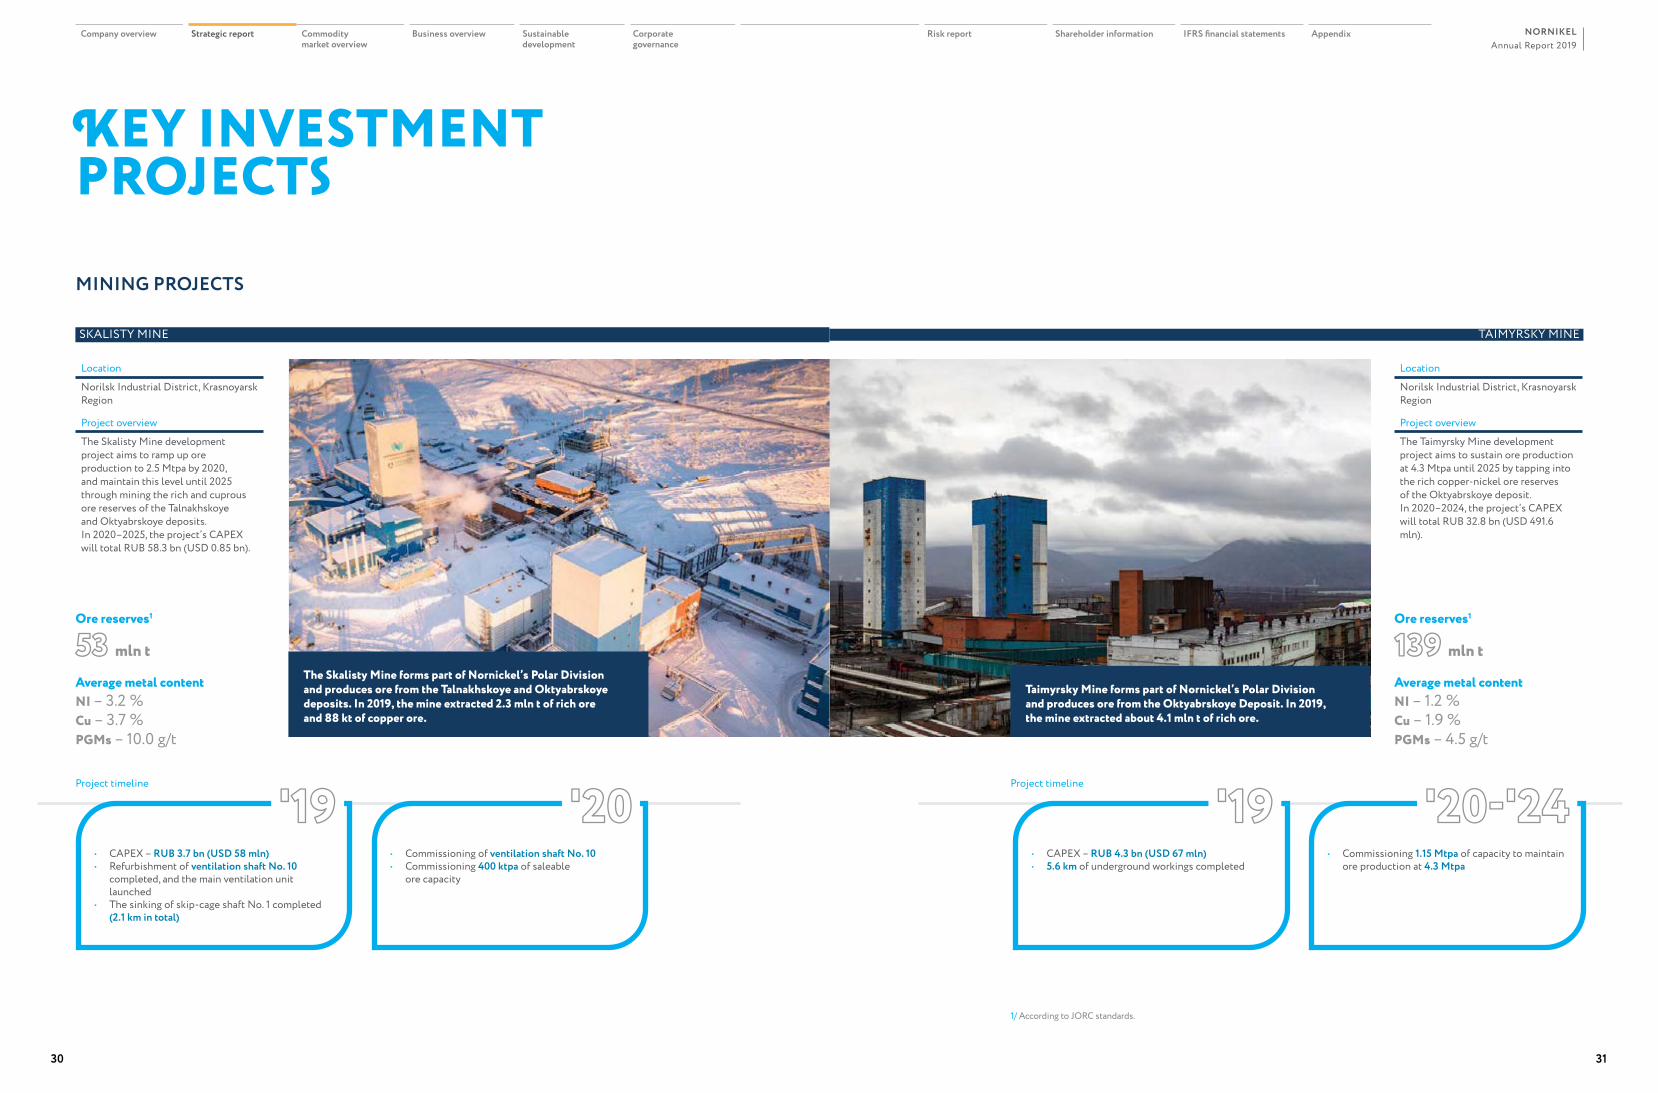
The Skalisty Mine development project aims to ramp up ore production to 2.5 Mtpa by 2020, and maintain this level until 2025 through mining the rich and cuprous ore reserves of the Talnakhskoye and Oktyabrskoye deposits. In 2020–2025, the project’s CAPEX will total RUB 58.3 bn (USD 0.85 bn).
Location
Norilsk Industrial District, Krasnoyarsk Region
Project overview
The Taimyrsky Mine development project aims to sustain ore production at 4.3 Mtpa until 2025 by tapping into the rich copper-nickel ore reserves of the Oktyabrskoye deposit. In 2020–2024, the project’s CAPEX will total RUB 32.8 bn (USD 491.6 mln).
• CAPEX – RUB 3.7 bn (USD 58 mln)• Refurbishment of ventilation shaft No. 10
completed, and the main ventilation unit launched
• The sinking of skip-cage shaft No. 1 completed (2.1 km in total)
• CAPEX – RUB 4.3 bn (USD 67 mln)• 5.6 km of underground workings completed
• Commissioning of ventilation shaft No. 10• Commissioning 400 ktpa of saleable
ore capacity
• Commissioning 1.15 Mtpa of capacity to maintain ore production at 4.3 Mtpa
1/ According to JORC standards.
The Skalisty Mine forms part of Nornickel’s Polar Division and produces ore from the Talnakhskoye and Oktyabrskoye deposits. In 2019, the mine extracted 2.3 mln t of rich ore and 88 kt of copper ore.
Taimyrsky Mine forms part of Nornickel’s Polar Division and produces ore from the Oktyabrskoye Deposit. In 2019, the mine extracted about 4.1 mln t of rich ore.
'19 '19'20 '20-'24
Ore reserves1
53 mln t
Ore reserves1
139 mln t
Average metal contentNI – 3.2 %Cu – 3.7 %PGMs – 10.0 g/t
Project timeline Project timeline
Average metal contentNI – 1.2 %Cu – 1.9 %PGMs – 4.5 g/t
Annual Report 2019NORNIKEL
30 31
Company overview Strategic report Commodity market overview
Business overview Sustainable development
Corporate governance
Risk report Shareholder information IFRS financial statements Appendix
MINING PROJECTS
OKTYABRSKY MINE KOMSOMOLSKY MINE
Location
Norilsk Industrial District, Krasnoyarsk Region
Project overview
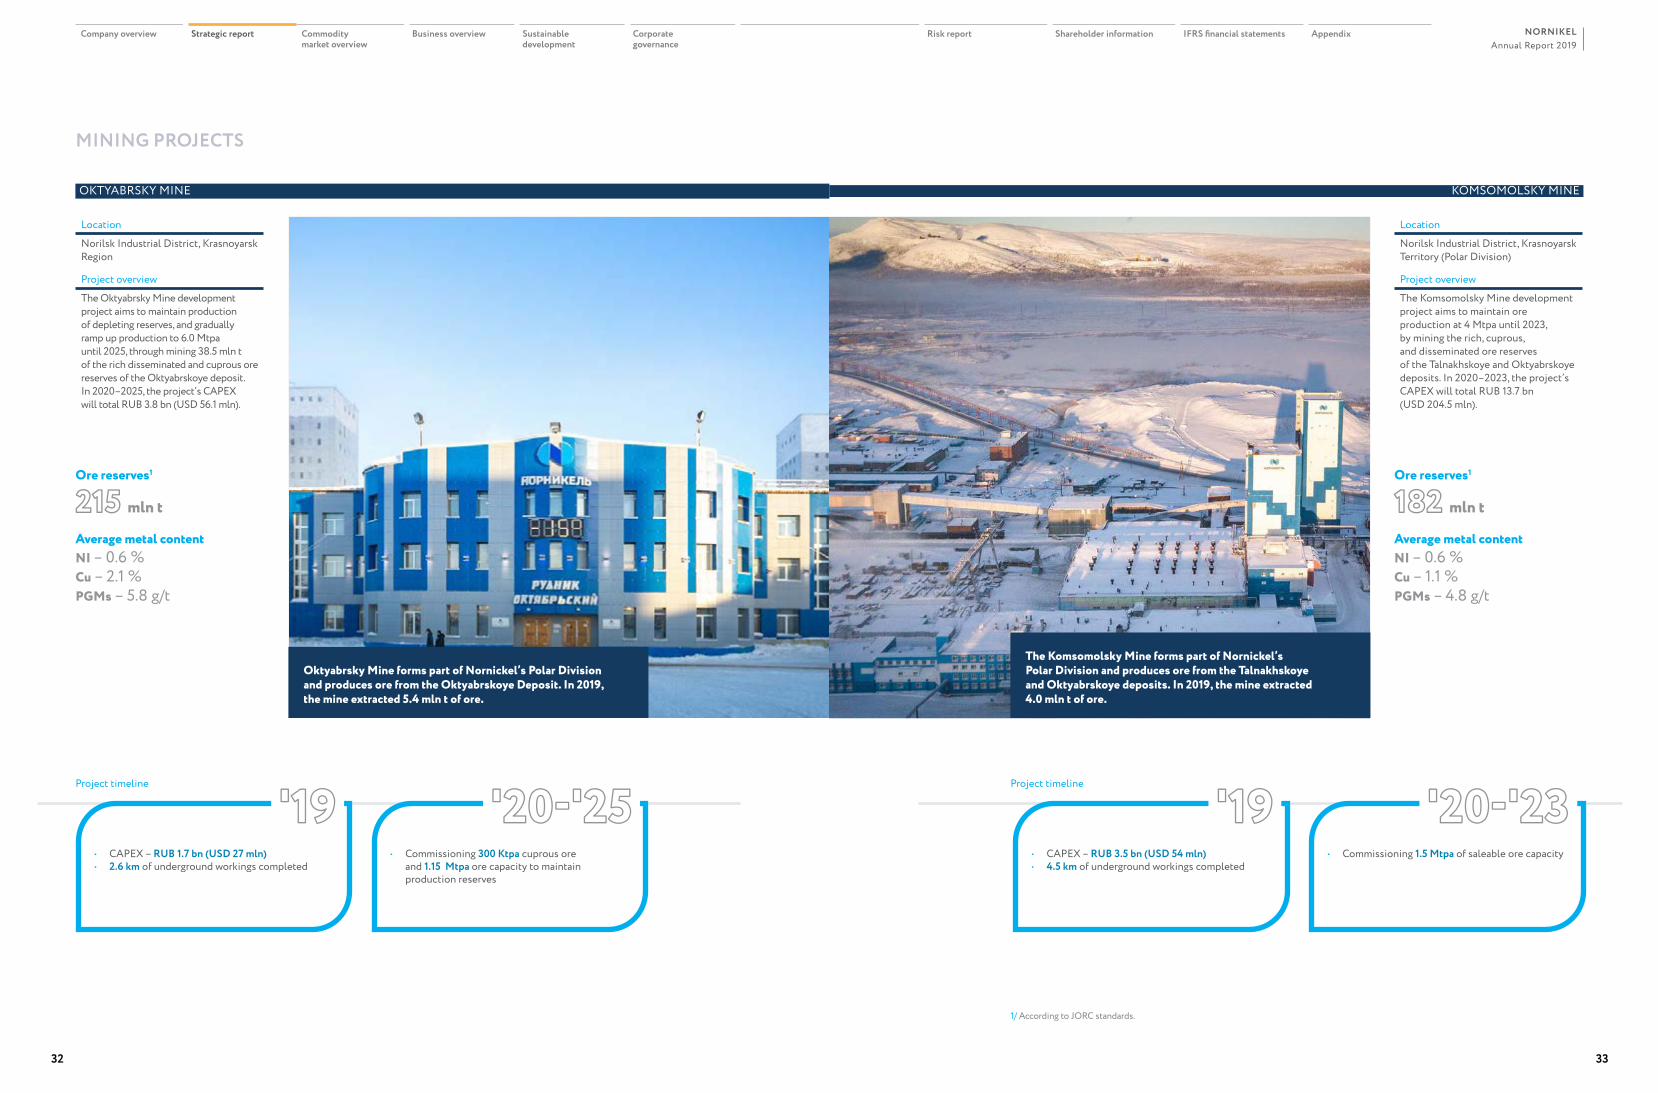
The Oktyabrsky Mine development project aims to maintain production of depleting reserves, and gradually ramp up production to 6.0 Mtpa until 2025, through mining 38.5 mln t of the rich disseminated and cuprous ore reserves of the Oktyabrskoye deposit. In 2020–2025, the project’s CAPEX will total RUB 3.8 bn (USD 56.1 mln).
Location
Norilsk Industrial District, Krasnoyarsk Territory (Polar Division)
Project overview
The Komsomolsky Mine development project aims to maintain ore production at 4 Mtpa until 2023, by mining the rich, cuprous, and disseminated ore reserves of the Talnakhskoye and Oktyabrskoye deposits. In 2020–2023, the project’s CAPEX will total RUB 13.7 bn (USD 204.5 mln).
• CAPEX – RUB 1.7 bn (USD 27 mln) • 2.6 km of underground workings completed
• CAPEX – RUB 3.5 bn (USD 54 mln)• 4.5 km of underground workings completed
• Commissioning 300 Ktpa cuprous ore and 1.15 Mtpa ore capacity to maintain production reserves
• Commissioning 1.5 Mtpa of saleable ore capacity
Oktyabrsky Mine forms part of Nornickel’s Polar Division and produces ore from the Oktyabrskoye Deposit. In 2019, the mine extracted 5.4 mln t of ore.
The Komsomolsky Mine forms part of Nornickel’s Polar Division and produces ore from the Talnakhskoye and Oktyabrskoye deposits. In 2019, the mine extracted 4.0 mln t of ore.
'19 '19'20-'25 '20-'23
Ore reserves1
215 mln t
Ore reserves1
182 mln t
Average metal contentNI – 0.6 %Cu – 2.1 %PGMs – 5.8 g/t
Project timeline Project timeline
Average metal contentNI – 0.6 %Cu – 1.1 %PGMs – 4.8 g/t
1/ According to JORC standards.
Annual Report 2019NORNIKEL
32 33
Company overview Strategic report Commodity market overview
Business overview Sustainable development
Corporate governance
Risk report Shareholder information IFRS financial statements Appendix
MINING PROJECTS
SOUTH CLUSTER ARCTIC PALLADIUM
Location
Norilsk Industrial District, Krasnoyarsk Region
Project overview
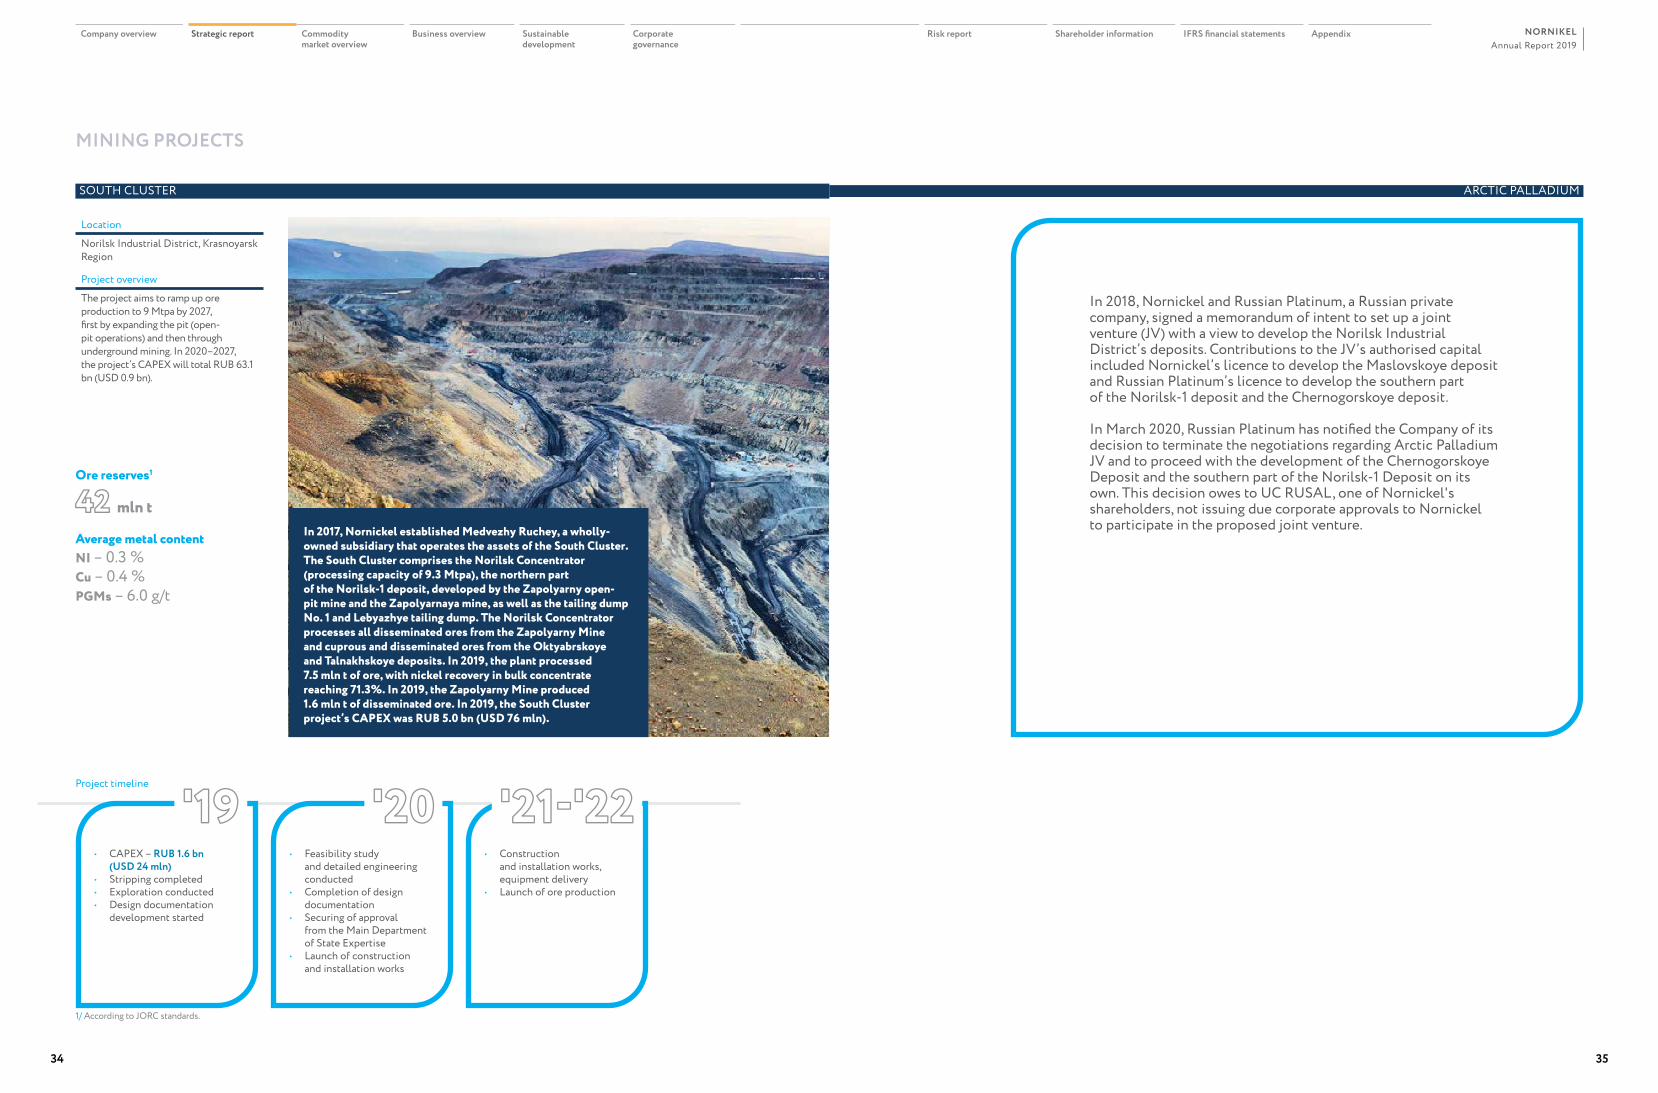
The project aims to ramp up ore production to 9 Mtpa by 2027, first by expanding the pit (open-pit operations) and then through underground mining. In 2020–2027, the project’s CAPEX will total RUB 63.1 bn (USD 0.9 bn).
• CAPEX – RUB 1.6 bn (USD 24 mln)
• Stripping completed• Exploration conducted• Design documentation
development started
• Feasibility study and detailed engineering conducted
• Completion of design documentation
• Securing of approval from the Main Department of State Expertise
• Launch of construction and installation works
• Construction and installation works, equipment delivery
• Launch of ore production
In 2017, Nornickel established Medvezhy Ruchey, a wholly-owned subsidiary that operates the assets of the South Cluster. The South Cluster comprises the Norilsk Concentrator (processing capacity of 9.3 Mtpa), the northern part of the Norilsk-1 deposit, developed by the Zapolyarny open-pit mine and the Zapolyarnaya mine, as well as the tailing dump No. 1 and Lebyazhye tailing dump. The Norilsk Concentrator processes all disseminated ores from the Zapolyarny Mine and cuprous and disseminated ores from the Oktyabrskoye and Talnakhskoye deposits. In 2019, the plant processed 7.5 mln t of ore, with nickel recovery in bulk concentrate reaching 71.3%. In 2019, the Zapolyarny Mine produced 1.6 mln t of disseminated ore. In 2019, the South Cluster project’s CAPEX was RUB 5.0 bn (USD 76 mln).
'19 '20 '21-'22
Ore reserves1
42 mln t
Average metal contentNI – 0.3 %Cu – 0.4 %PGMs – 6.0 g/t
Project timeline
1/ According to JORC standards.
In 2018, Nornickel and Russian Platinum, a Russian private company, signed a memorandum of intent to set up a joint venture (JV) with a view to develop the Norilsk Industrial District’s deposits. Contributions to the JV’s authorised capital included Nornickel’s licence to develop the Maslovskoye deposit and Russian Platinum’s licence to develop the southern part of the Norilsk-1 deposit and the Chernogorskoye deposit.
In March 2020, Russian Platinum has notified the Company of its decision to terminate the negotiations regarding Arctic Palladium JV and to proceed with the development of the Chernogorskoye Deposit and the southern part of the Norilsk-1 Deposit on its own. This decision owes to UC RUSAL, one of Nornickel's shareholders, not issuing due corporate approvals to Nornickel to participate in the proposed joint venture.
Annual Report 2019NORNIKEL
34 35
Company overview Strategic report Commodity market overview
Business overview Sustainable development
Corporate governance
Risk report Shareholder information IFRS financial statements Appendix
PROCESSING PROJECTS
BYSTRINSKY GOK (CHITA PROJECT) TALNAKH CONCENTRATOR
Location
16 km east of Gazimursky Zavod, Gazimuro-Zavodsky District, Zabaykalsky Region
Project overview
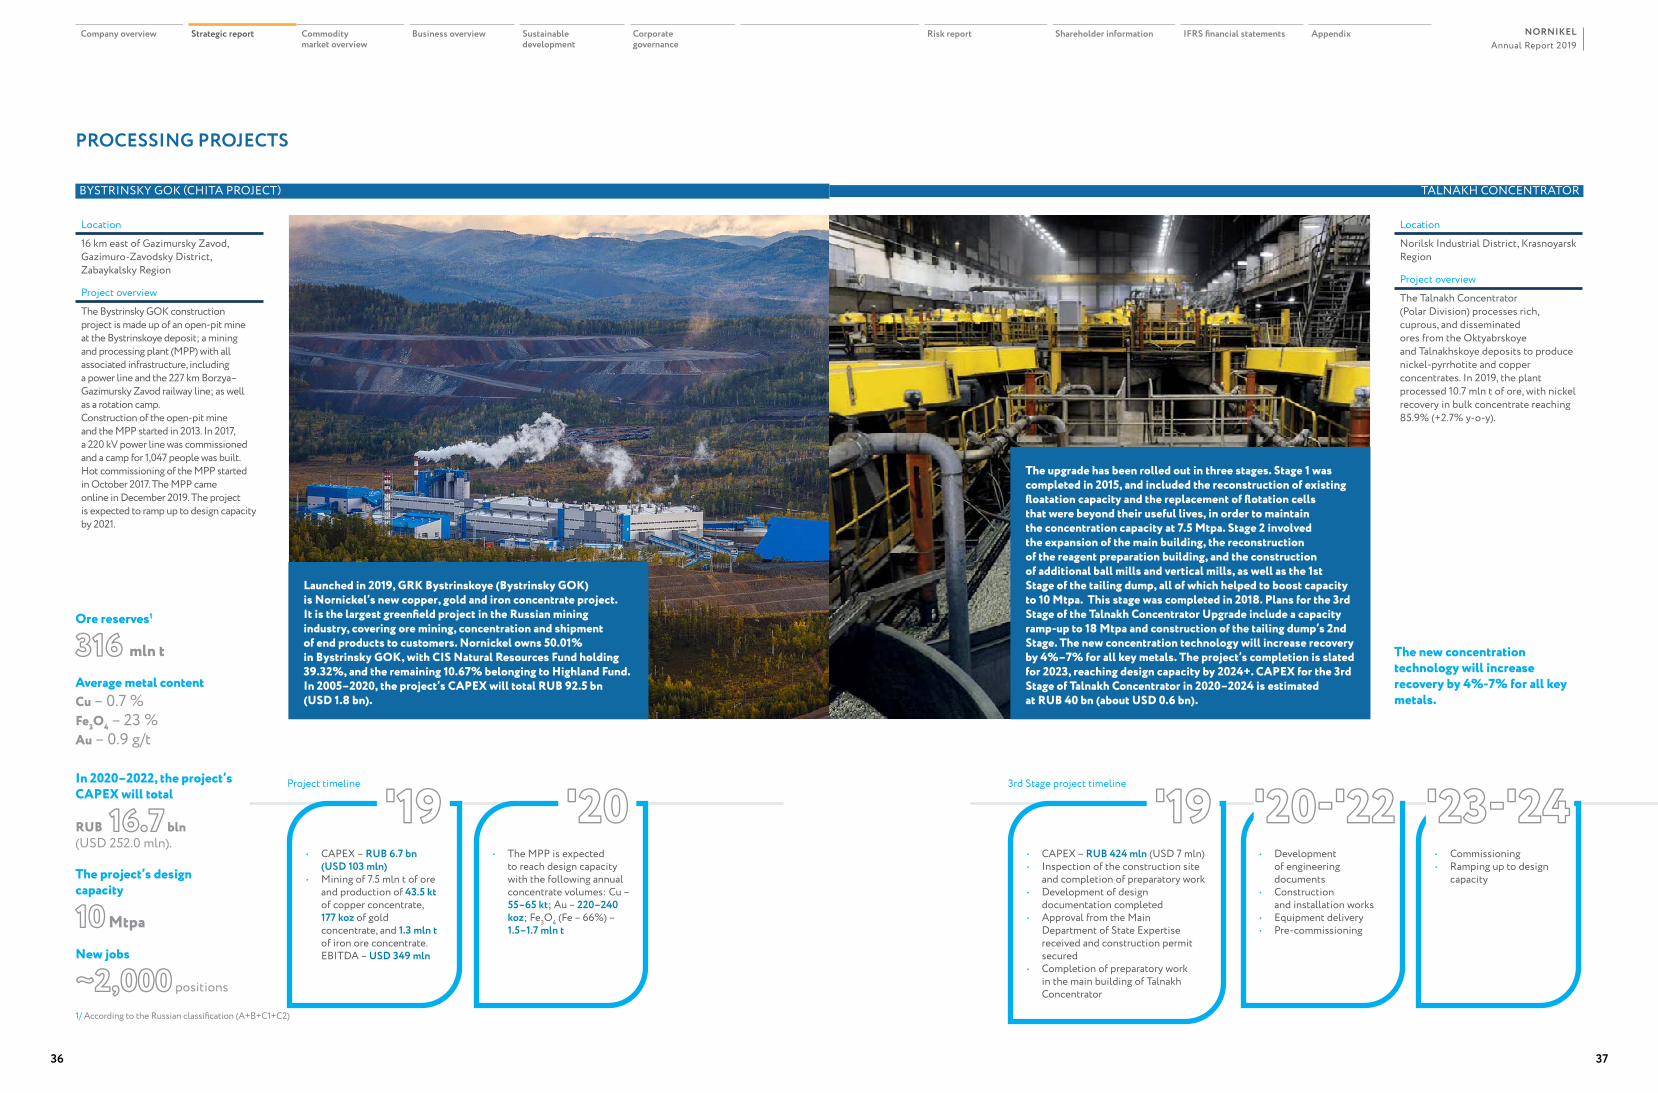
The Bystrinsky GOK construction project is made up of an open-pit mine at the Bystrinskoye deposit; a mining and processing plant (MPP) with all associated infrastructure, including a power line and the 227 km Borzya–Gazimursky Zavod railway line; as well as a rotation camp.Construction of the open-pit mine and the MPP started in 2013. In 2017, a 220 kV power line was commissioned and a camp for 1,047 people was built. Hot commissioning of the MPP started in October 2017. The MPP came online in December 2019. The project is expected to ramp up to design capacity by 2021.
Location
Norilsk Industrial District, Krasnoyarsk Region
Project overview
The Talnakh Concentrator (Polar Division) processes rich, cuprous, and disseminated ores from the Oktyabrskoye and Talnakhskoye deposits to produce nickel-pyrrhotite and copper concentrates. In 2019, the plant processed 10.7 mln t of ore, with nickel recovery in bulk concentrate reaching 85.9% (+2.7% y-o-y).
• CAPEX – RUB 6.7 bn (USD 103 mln)
• Mining of 7.5 mln t of ore and production of 43.5 kt of copper concentrate, 177 koz of gold concentrate, and 1.3 mln t of iron ore concentrate. EBITDA – USD 349 mln
• The MPP is expected to reach design capacity with the following annual concentrate volumes: Cu – 55–65 kt; Au – 220–240 koz; Fe3О4 (Fe – 66%) – 1.5–1.7 mln t
Launched in 2019, GRK Bystrinskoye (Bystrinsky GOK) is Nornickel’s new copper, gold and iron concentrate project. It is the largest greenfield project in the Russian mining industry, covering ore mining, concentration and shipment of end products to customers. Nornickel owns 50.01% in Bystrinsky GOK, with CIS Natural Resources Fund holding 39.32%, and the remaining 10.67% belonging to Highland Fund. In 2005–2020, the project’s CAPEX will total RUB 92.5 bn (USD 1.8 bn).
The upgrade has been rolled out in three stages. Stage 1 was completed in 2015, and included the reconstruction of existing floatation capacity and the replacement of flotation cells that were beyond their useful lives, in order to maintain the concentration capacity at 7.5 Mtpa. Stage 2 involved the expansion of the main building, the reconstruction of the reagent preparation building, and the construction of additional ball mills and vertical mills, as well as the 1st Stage of the tailing dump, all of which helped to boost capacity to 10 Mtpa. This stage was completed in 2018. Plans for the 3rd Stage of the Talnakh Concentrator Upgrade include a capacity ramp-up to 18 Mtpa and construction of the tailing dump’s 2nd Stage. The new concentration technology will increase recovery by 4%–7% for all key metals. The project’s completion is slated for 2023, reaching design capacity by 2024+. CAPEX for the 3rd Stage of Talnakh Concentrator in 2020–2024 is estimated at RUB 40 bn (about USD 0.6 bn).
'19 '20
Ore reserves1
316 mln t The new concentration technology will increase recovery by 4%-7% for all key metals.
Average metal contentCu – 0.7 %Fe3O4 – 23 %Au – 0.9 g/t
In 2020–2022, the project’s CAPEX will total
RUB 16.7 bln (USD 252.0 mln).
The project’s design capacity
10 Mtpa
New jobs
~2,000 positions
Project timeline
1/ According to the Russian classification (А+В+С1+С2)
• CAPEX – RUB 424 mln (USD 7 mln) • Inspection of the construction site
and completion of preparatory work• Development of design
documentation completed• Approval from the Main
Department of State Expertise received and construction permit secured
• Completion of preparatory work in the main building of Talnakh Concentrator
• Development of engineering documents
• Construction and installation works
• Equipment delivery• Pre-commissioning
• Commissioning• Ramping up to design
capacity
'19 '20-'22 '23-'24 3rd Stage project timeline
Annual Report 2019NORNIKEL
36 37
Company overview Strategic report Commodity market overview
Business overview Sustainable development
Corporate governance
Risk report Shareholder information IFRS financial statements Appendix
PROCESSING PROJECTS ENERGY PROJECTS
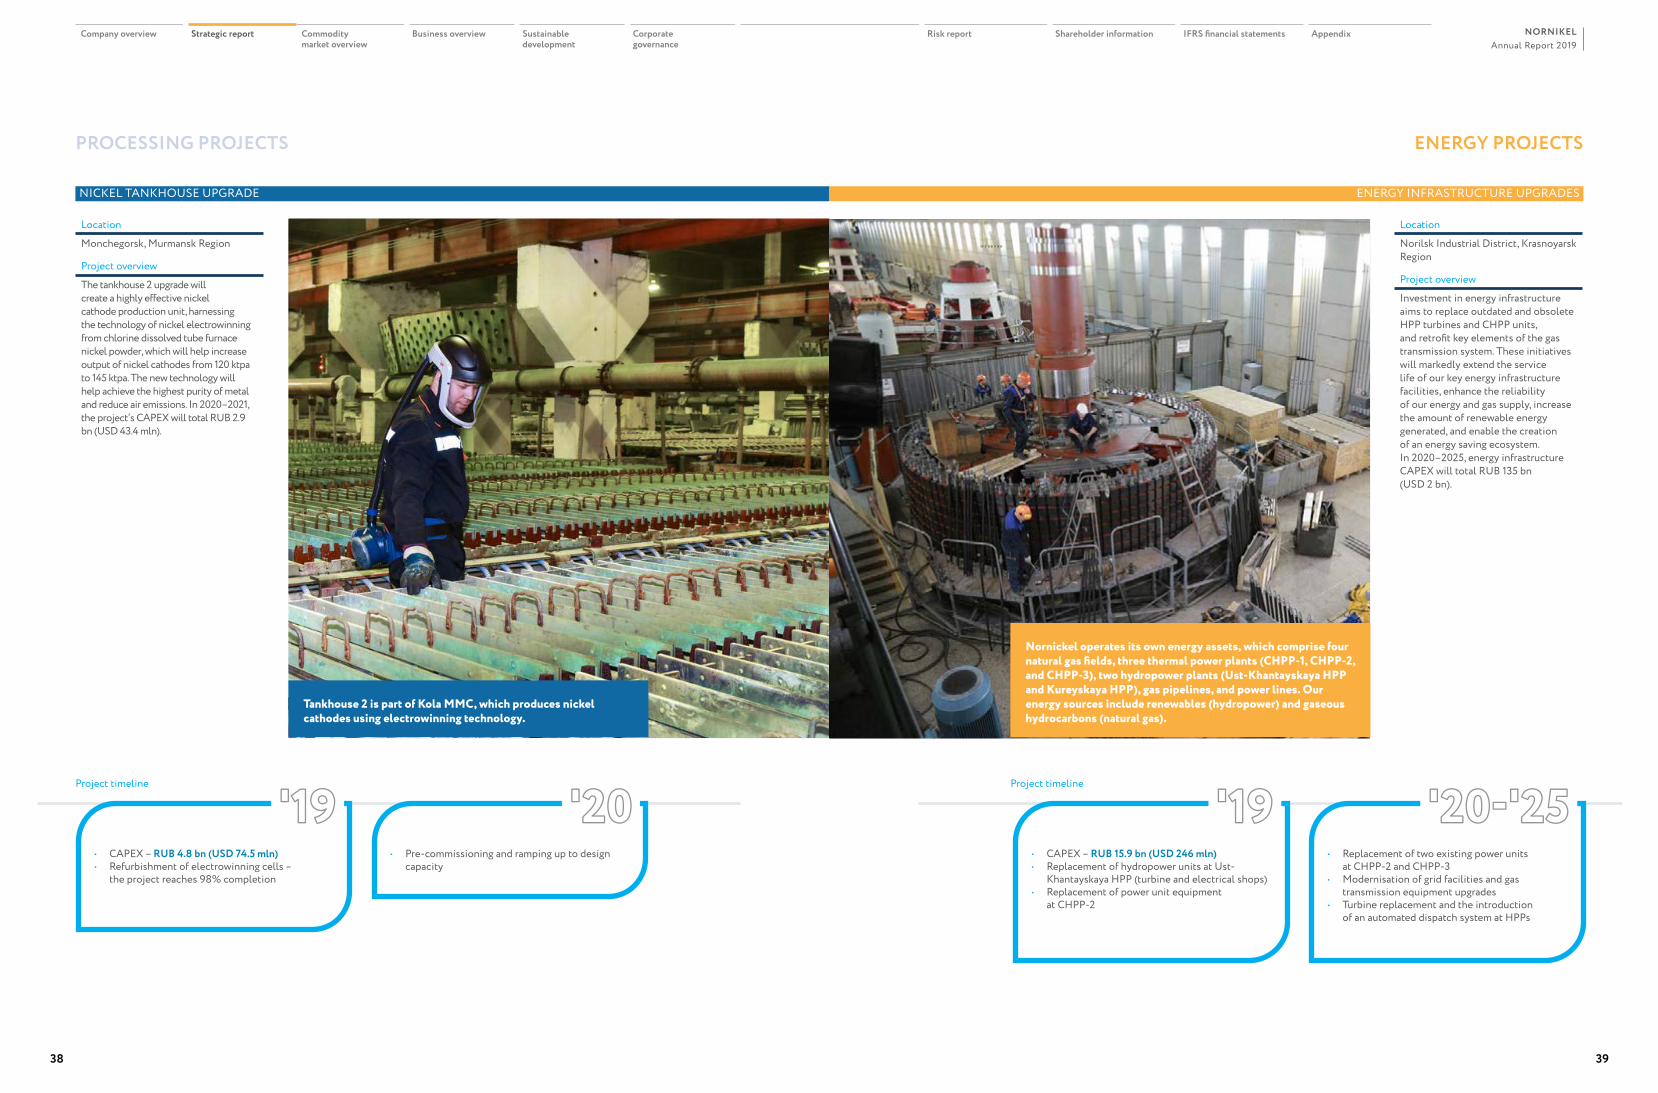
NICKEL TANKHOUSE UPGRADE
Location
Monchegorsk, Murmansk Region
Project overview
The tankhouse 2 upgrade will create a highly effective nickel cathode production unit, harnessing the technology of nickel electrowinning from chlorine dissolved tube furnace nickel powder, which will help increase output of nickel cathodes from 120 ktpa to 145 ktpa. The new technology will help achieve the highest purity of metal and reduce air emissions. In 2020–2021, the project’s CAPEX will total RUB 2.9 bn (USD 43.4 mln).
Tankhouse 2 is part of Kola MMC, which produces nickel cathodes using electrowinning technology.
• CAPEX – RUB 4.8 bn (USD 74.5 mln)• Refurbishment of electrowinning cells –
the project reaches 98% completion
• Pre-commissioning and ramping up to design capacity
'19 '20 Project timeline
ENERGY INFRASTRUCTURE UPGRADES
Location
Norilsk Industrial District, Krasnoyarsk Region
Project overview
Investment in energy infrastructure aims to replace outdated and obsolete HPP turbines and CHPP units, and retrofit key elements of the gas transmission system. These initiatives will markedly extend the service life of our key energy infrastructure facilities, enhance the reliability of our energy and gas supply, increase the amount of renewable energy generated, and enable the creation of an energy saving ecosystem. In 2020–2025, energy infrastructure CAPEX will total RUB 135 bn (USD 2 bn).
• CAPEX – RUB 15.9 bn (USD 246 mln)• Replacement of hydropower units at Ust-
Khantayskaya HPP (turbine and electrical shops)• Replacement of power unit equipment
at CHPP-2
• Replacement of two existing power units at CHPP-2 and CHPP-3
• Modernisation of grid facilities and gas transmission equipment upgrades
• Turbine replacement and the introduction of an automated dispatch system at HPPs
Nornickel operates its own energy assets, which comprise four natural gas fields, three thermal power plants (CHPP-1, CHPP-2, and CHPP-3), two hydropower plants (Ust-Khantayskaya HPP and Kureyskaya HPP), gas pipelines, and power lines. Our energy sources include renewables (hydropower) and gaseous hydrocarbons (natural gas).
'19 '20-'25Project timeline
Annual Report 2019NORNIKEL
38 39
Company overview Strategic report Commodity market overview
Business overview Sustainable development
Corporate governance
Risk report Shareholder information IFRS financial statements Appendix
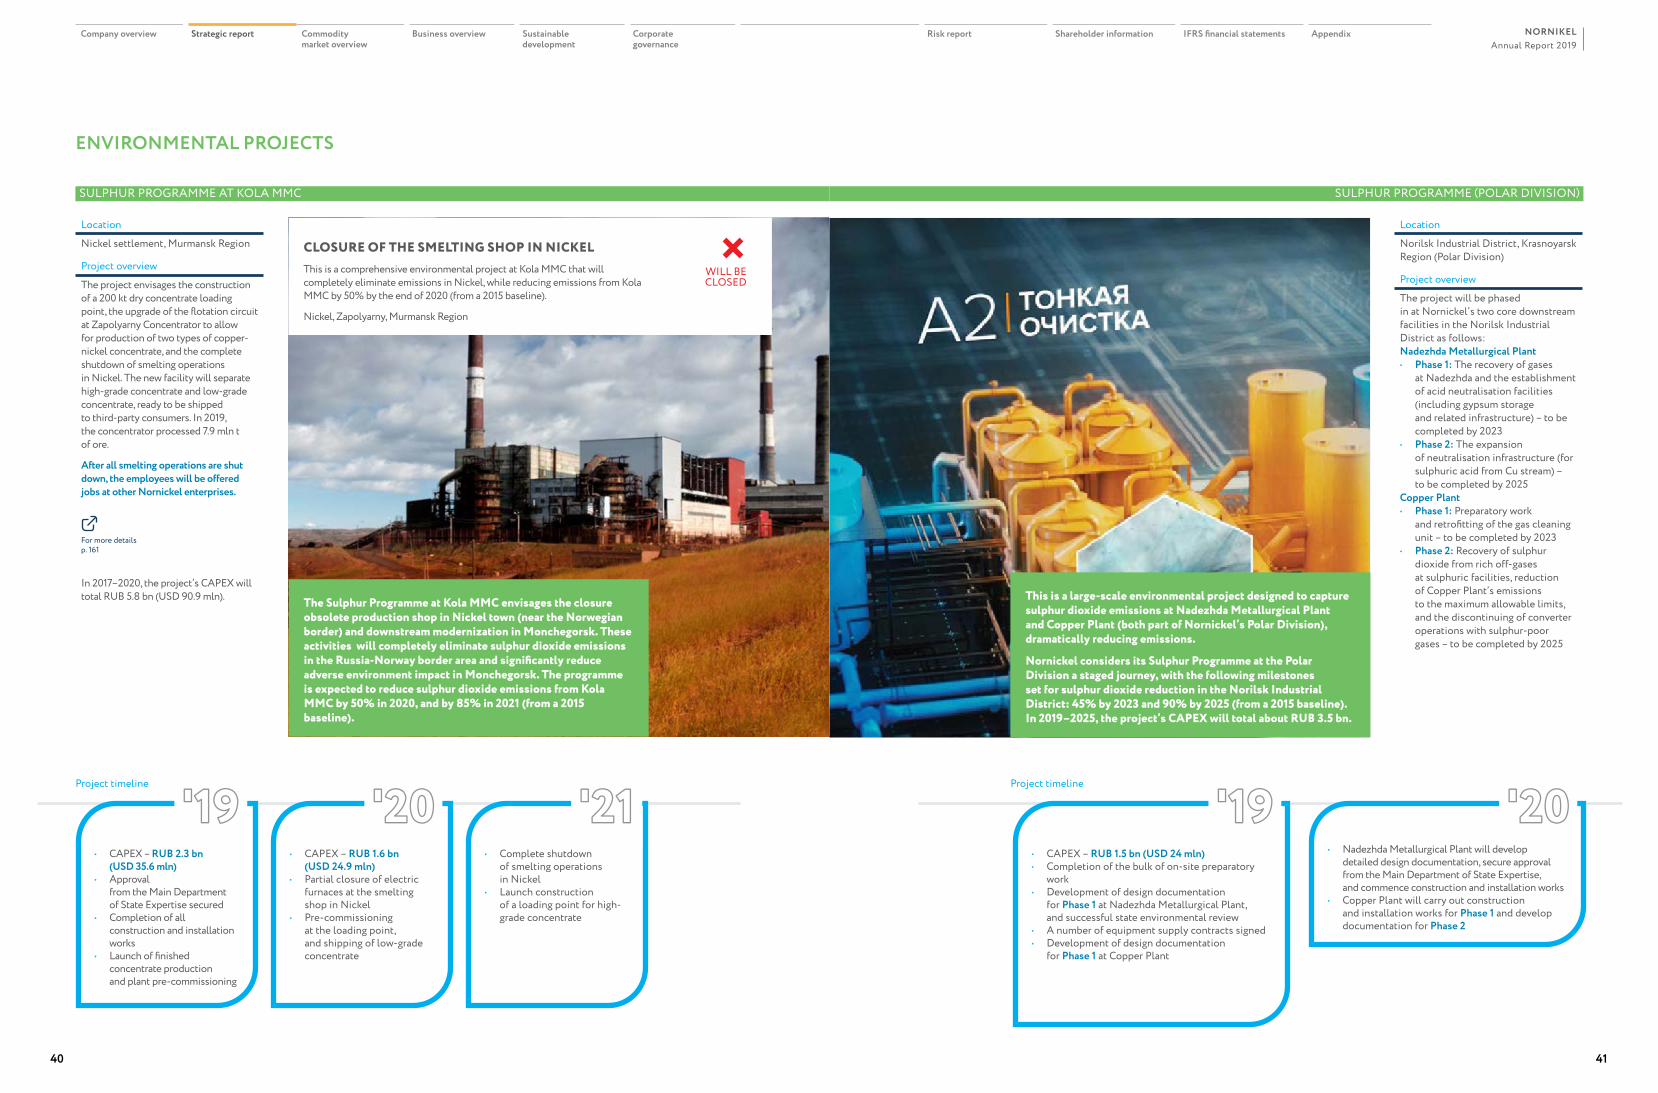
ENVIRONMENTAL PROJECTS
SULPHUR PROGRAMME (POLAR DIVISION)
Location
Norilsk Industrial District, Krasnoyarsk Region (Polar Division)
Project overview
The project will be phased in at Nornickel’s two core downstream facilities in the Norilsk Industrial District as follows:Nadezhda Metallurgical Plant• Phase 1: The recovery of gases
at Nadezhda and the establishment of acid neutralisation facilities (including gypsum storage and related infrastructure) – to be completed by 2023
• Phase 2: The expansion of neutralisation infrastructure (for sulphuric acid from Cu stream) – to be completed by 2025
Copper Plant• Phase 1: Preparatory work
and retrofitting of the gas cleaning unit – to be completed by 2023
• Phase 2: Recovery of sulphur dioxide from rich off-gases at sulphuric facilities, reduction of Copper Plant’s emissions to the maximum allowable limits, and the discontinuing of converter operations with sulphur-poor gases – to be completed by 2025
• CAPEX – RUB 1.5 bn (USD 24 mln)• Completion of the bulk of on-site preparatory
work• Development of design documentation
for Phase 1 at Nadezhda Metallurgical Plant, and successful state environmental review
• A number of equipment supply contracts signed• Development of design documentation
for Phase 1 at Copper Plant
• Nadezhda Metallurgical Plant will develop detailed design documentation, secure approval from the Main Department of State Expertise, and commence construction and installation works
• Copper Plant will carry out construction and installation works for Phase 1 and develop documentation for Phase 2
This is a large-scale environmental project designed to capture sulphur dioxide emissions at Nadezhda Metallurgical Plant and Copper Plant (both part of Nornickel’s Polar Division), dramatically reducing emissions.
Nornickel considers its Sulphur Programme at the Polar Division a staged journey, with the following milestones set for sulphur dioxide reduction in the Norilsk Industrial District: 45% by 2023 and 90% by 2025 (from a 2015 baseline). In 2019–2025, the project’s CAPEX will total about RUB 3.5 bn.
'19 '20Project timeline
SULPHUR PROGRAMME AT KOLA MMC
Location
Nickel settlement, Murmansk Region
Project overview
The project envisages the construction of a 200 kt dry concentrate loading point, the upgrade of the flotation circuit at Zapolyarny Concentrator to allow for production of two types of copper-nickel concentrate, and the complete shutdown of smelting operations in Nickel. The new facility will separate high-grade concentrate and low-grade concentrate, ready to be shipped to third-party consumers. In 2019, the concentrator processed 7.9 mln t of ore.
After all smelting operations are shut down, the employees will be offered jobs at other Nornickel enterprises.
For more details p. 161
In 2017–2020, the project’s CAPEX will total RUB 5.8 bn (USD 90.9 mln).
• CAPEX – RUB 2.3 bn (USD 35.6 mln)
• Approval from the Main Department of State Expertise secured
• Completion of all construction and installation works
• Launch of finished concentrate production and plant pre-commissioning
• CAPEX – RUB 1.6 bn (USD 24.9 mln)
• Partial closure of electric furnaces at the smelting shop in Nickel
• Pre-commissioning at the loading point, and shipping of low-grade concentrate
• Complete shutdown of smelting operations in Nickel
• Launch construction of a loading point for high-grade concentrate
The Sulphur Programme at Kola MMC envisages the closure obsolete production shop in Nickel town (near the Norwegian border) and downstream modernization in Monchegorsk. These activities will completely eliminate sulphur dioxide emissions in the Russia-Norway border area and significantly reduce adverse environment impact in Monchegorsk. The programme is expected to reduce sulphur dioxide emissions from Kola MMC by 50% in 2020, and by 85% in 2021 (from a 2015 baseline).
'19 '20 '21Project timeline
CLOSURE OF THE SMELTING SHOP IN NICKELThis is a comprehensive environmental project at Kola MMC that will completely eliminate emissions in Nickel, while reducing emissions from Kola MMC by 50% by the end of 2020 (from a 2015 baseline).
Nickel, Zapolyarny, Murmansk Region
WILL BE CLOSED
Annual Report 2019NORNIKEL
40 41
Company overview Strategic report Commodity market overview
Business overview Sustainable development
Corporate governance
Risk report Shareholder information IFRS financial statements Appendix
CMarket overview
om moddity44 Nickel51 Copper55 Palladium 59 Platinum
Commoddity market overview
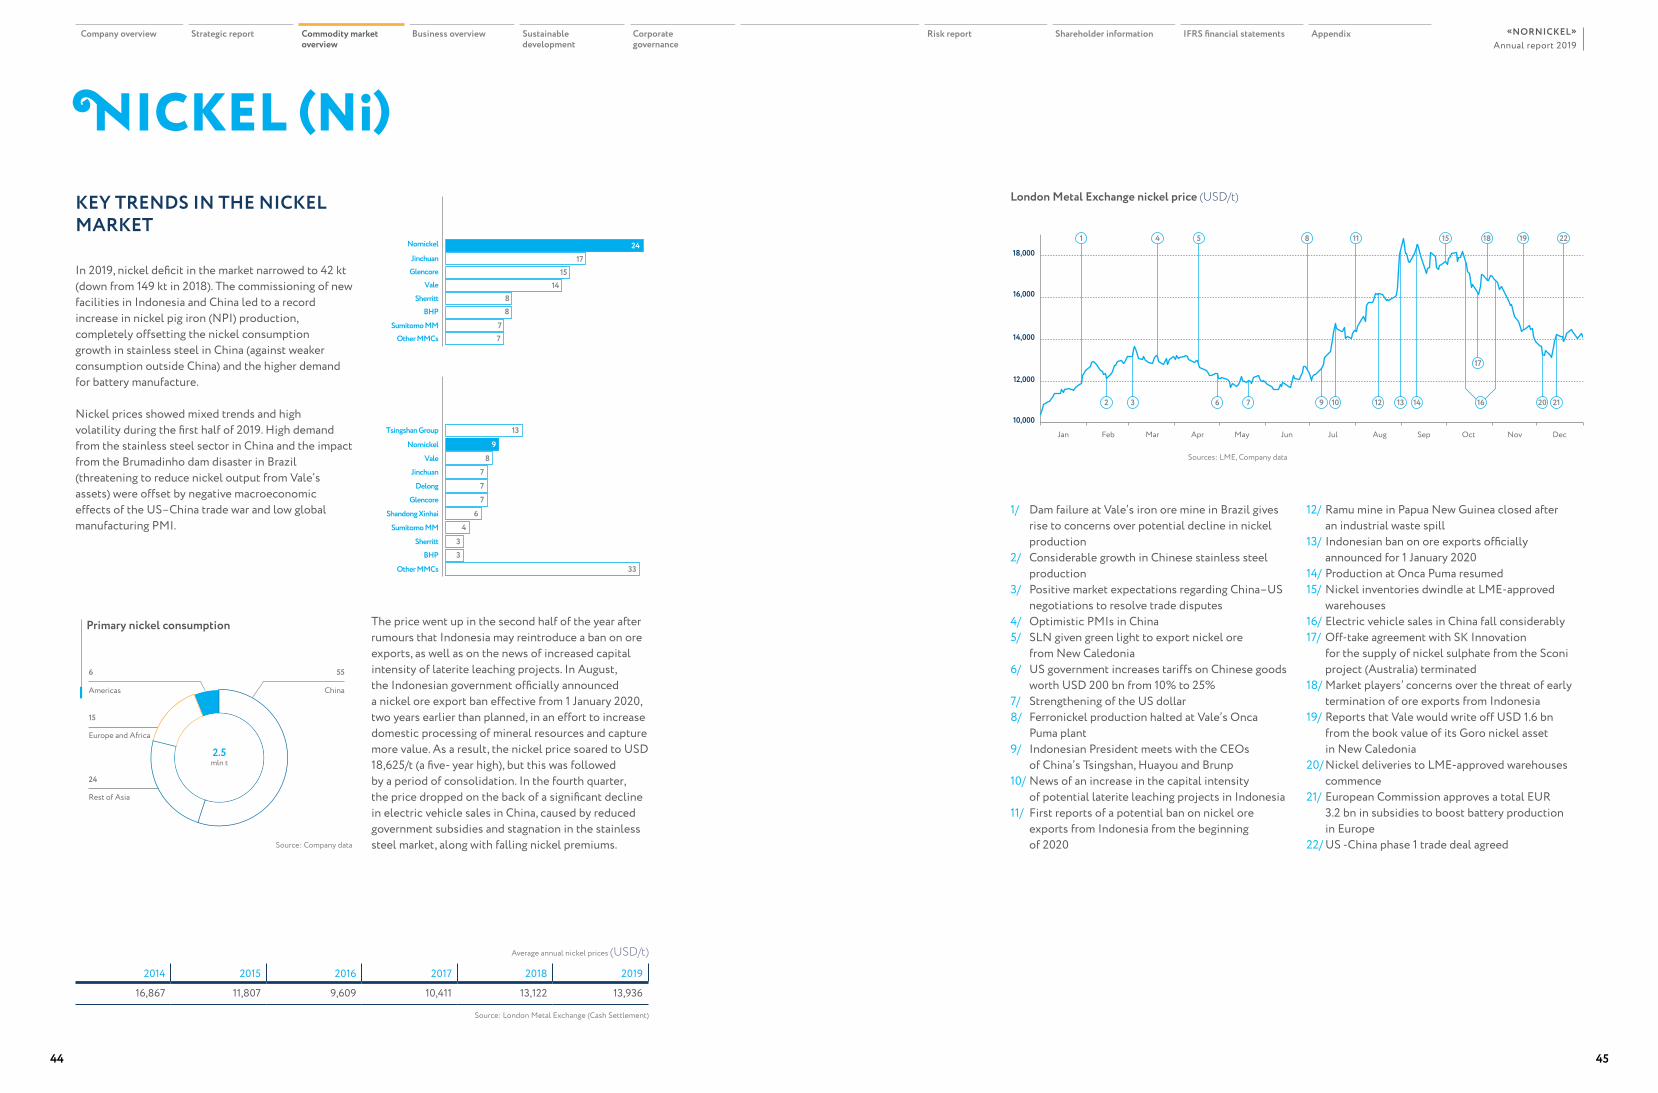
NICKEL (Ni)KEY TRENDS IN THE NICKEL MARKET
In 2019, nickel deficit in the market narrowed to 42 kt (down from 149 kt in 2018). The commissioning of new facilities in Indonesia and China led to a record increase in nickel pig iron (NPI) production, completely offsetting the nickel consumption growth in stainless steel in China (against weaker consumption outside China) and the higher demand for battery manufacture.
Nickel prices showed mixed trends and high volatility during the first half of 2019. High demand from the stainless steel sector in China and the impact from the Brumadinho dam disaster in Brazil (threatening to reduce nickel output from Vale’s assets) were offset by negative macroeconomic effects of the US–China trade war and low global manufacturing PMI.
No. 1 in high-grade nickel production (%)
14
1724
8
15
877
Vale
Nornickel
JinchuanGlencore
SherrittBHP
Sumitomo MMOther MMCs
No. 2 in primary nickel production (%)
9
13
8777
64
33
33
Glencore
Tsingshan Group
NornickelVale
JinchuanDelong
Shandong XinhaiSumitomo MM
SherrittBHP
Other MMCs
Primary nickel consumption by region (%)
Rest of Asia
24
China
55
Europe and Africa
15
129вопросов
Americas
6
2.5mln t
Source: Company data
London Metal Exchange nickel price (USD/t)
1/ Dam failure at Vale’s iron ore mine in Brazil gives rise to concerns over potential decline in nickel production
2/ Considerable growth in Chinese stainless steel production
3/ Positive market expectations regarding China–US negotiations to resolve trade disputes
4/ Optimistic PMIs in China5/ SLN given green light to export nickel ore
from New Caledonia6/ US government increases tariffs on Chinese goods
worth USD 200 bn from 10% to 25%7/ Strengthening of the US dollar8/ Ferronickel production halted at Vale’s Onca
Puma plant9/ Indonesian President meets with the CEOs
of China’s Tsingshan, Huayou and Brunp10/ News of an increase in the capital intensity
of potential laterite leaching projects in Indonesia11/ First reports of a potential ban on nickel ore
exports from Indonesia from the beginning of 2020
12/ Ramu mine in Papua New Guinea closed after an industrial waste spill
13/ Indonesian ban on ore exports officially announced for 1 January 2020
14/ Production at Onca Puma resumed15/ Nickel inventories dwindle at LME-approved
warehouses16/ Electric vehicle sales in China fall considerably17/ Off-take agreement with SK Innovation
for the supply of nickel sulphate from the Sconi project (Australia) terminated
18/ Market players’ concerns over the threat of early termination of ore exports from Indonesia
19/ Reports that Vale would write off USD 1.6 bn from the book value of its Goro nickel asset in New Caledonia
20/ Nickel deliveries to LME-approved warehouses commence
21/ European Commission approves a total EUR 3.2 bn in subsidies to boost battery production in Europe
22/ US -China phase 1 trade deal agreed
Sources: LME, Company data
Average annual nickel prices (USD/t)
2014 2015 2016 2017 2018 2019
16,867 11,807 9,609 10,411 13,122 13,936
Source: London Metal Exchange (Cash Settlement)
10,000
12,000
14,000
16,000
18,000
Jan Feb Mar Apr May Jun Jul Aug Sep Oct Nov Dec
221918
2016 21
17
15
1412 131097632
118541
The price went up in the second half of the year after rumours that Indonesia may reintroduce a ban on ore exports, as well as on the news of increased capital intensity of laterite leaching projects. In August, the Indonesian government officially announced a nickel ore export ban effective from 1 January 2020, two years earlier than planned, in an effort to increase domestic processing of mineral resources and capture more value. As a result, the nickel price soared to USD 18,625/t (a five- year high), but this was followed by a period of consolidation. In the fourth quarter, the price dropped on the back of a significant decline in electric vehicle sales in China, caused by reduced government subsidies and stagnation in the stainless steel market, along with falling nickel premiums.
Company overview Strategic report Commodity market overview
Business overview Sustainable development
Corporate governance
Risk report Shareholder information IFRS financial statements AppendixAnnual report 2019
«NORNICKEL»
44 45
‘18‘19
2354 2313 11 53
11 501129
28
300 series 200 series 400 series
MARKET BALANCE
In 2019, nickel deficit in the market shrank to 42 kt (from 149 kt in 2018), driven primarily by an increased production of nickel pig iron in Indonesia and China (by 32%, or 228 kt) on the back of cheap supplies of high nickel content laterite ores. There were only marginal increases in the production of refined nickel (1%, or 11 kt) and its chemical compounds (22%, or 21 kt), mostly due to higher nickel sulphate production in China for use in the manufacture of lithium batteries. Conversely, production of other forms of low-grade nickel decreased by 4%, or 17 kt.
Consumption grew by 6%, or 133 kt, mostly due to increased demand for nickel in the Chinese stainless steel segment (by 13%, or 127 kt). Total consumption outside China decreased by 5%, or 32 kt. Nickel consumption for cathode precursors used in the manufacture of lithium batteries grew 26%, or 38 kt, driven by the electrification of transport. Demand from special steels and alloys rose by 2%, while consumption in electroplating decreased by 1%.
The combined nickel inventories of the London Metal Exchange (LME) and Shanghai Stock Exchange (SSE) dropped 16% to 191 kt. The two-year long depletion of inventories accelerated markedly in September–October but ceased in December when 85 kt of nickel was delivered to LME-approved warehouses. The key factors behind the metal inventories winding down (117 kt from January to November 2019) included expectations of higher demand from the battery sector in 2020–2021, the Indonesian nickel ore export ban, and delays to laterite leaching projects in Indonesia. However, when the nickel price dropped in the fourth quarter, market traders’ “paper profits” began to ebb, and the cost of holding long physical positions mounted, leading to a backflow of metal into the exchange.
Although they account for only 1% to 2% of global smelting, austenitic-ferritic (duplex) stainless steels also use nickel and are distinguished from other grades by a higher content of chromium (18% to 25%) and molybdenum (1% to 4%).
Ferritic and martensitic stainless steels (400 series) typically do not contain nickel, and their properties are similar to those of low-carbon corrosion-resistant steels; however, their mechanical properties are inferior to those of austenitic stainless steels. These steels are mainly used to manufacture automotive exhaust systems, cargo container frames, water heaters, washing machines, cutlery, kitchenware, home decor items, and razor blades.
Stainless steel production uses almost all types of nickel feed (except for some special products, such as nickel powder and compounds). As nickel feed quality has practically no impact on the quality of stainless steel, steel mills predominantly use cheaper feeds. It is for this reason that high-grade nickel has been losing its share of nickel units consumed in stainless steel production in the past few years.
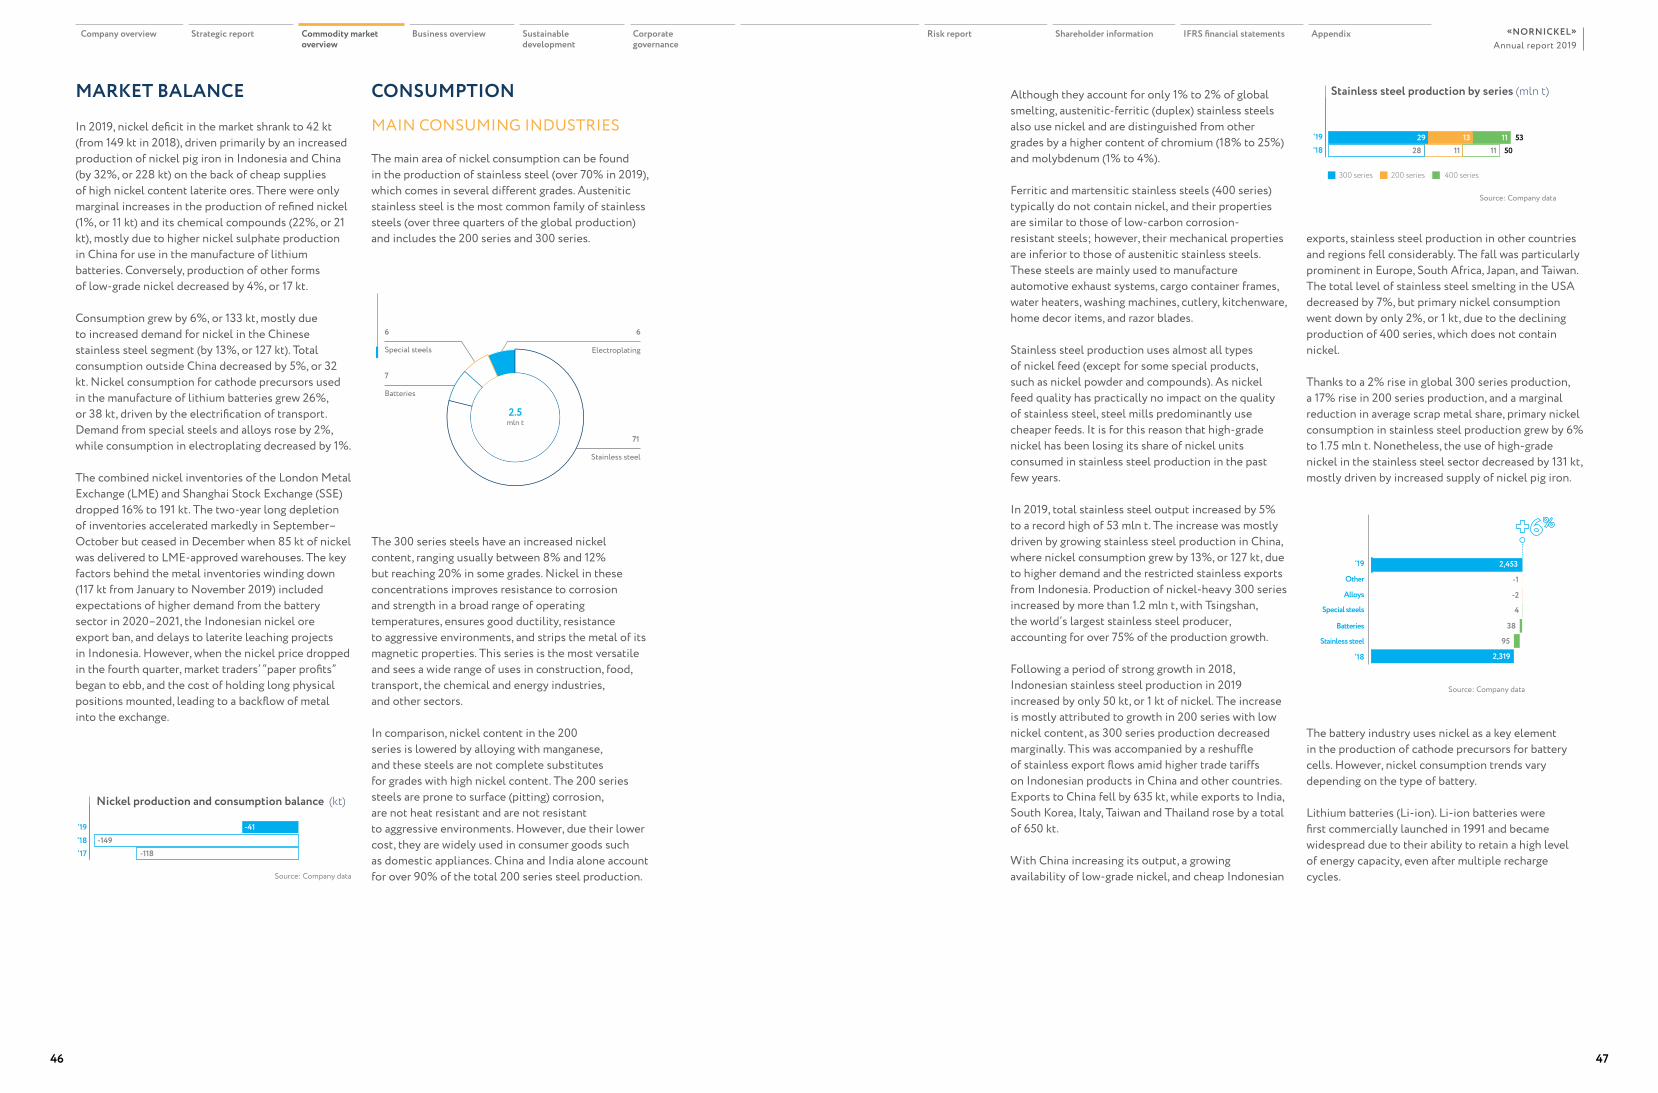
In 2019, total stainless steel output increased by 5% to a record high of 53 mln t. The increase was mostly driven by growing stainless steel production in China, where nickel consumption grew by 13%, or 127 kt, due to higher demand and the restricted stainless exports from Indonesia. Production of nickel-heavy 300 series increased by more than 1.2 mln t, with Tsingshan, the world’s largest stainless steel producer, accounting for over 75% of the production growth.
Following a period of strong growth in 2018, Indonesian stainless steel production in 2019 increased by only 50 kt, or 1 kt of nickel. The increase is mostly attributed to growth in 200 series with low nickel content, as 300 series production decreased marginally. This was accompanied by a reshuffle of stainless export flows amid higher trade tariffs on Indonesian products in China and other countries. Exports to China fell by 635 kt, while exports to India, South Korea, Italy, Taiwan and Thailand rose by a total of 650 kt.
With China increasing its output, a growing availability of low-grade nickel, and cheap Indonesian
Nickel production and consumption balance (kt)
‘17‘18‘19 -41
-149-118
Source: Company data
Source: Company data
Nickel consumption by industry (%)
Stainless steel
71
Electroplating
6
Special steels
6
Batteries
7
129вопросов
2.5mln t
Stainless steel production by series (mln t) CONSUMPTION
MAIN CONSUMING INDUSTRIES
The main area of nickel consumption can be found in the production of stainless steel (over 70% in 2019), which comes in several different grades. Austenitic stainless steel is the most common family of stainless steels (over three quarters of the global production) and includes the 200 series and 300 series. exports, stainless steel production in other countries
and regions fell considerably. The fall was particularly prominent in Europe, South Africa, Japan, and Taiwan. The total level of stainless steel smelting in the USA decreased by 7%, but primary nickel consumption went down by only 2%, or 1 kt, due to the declining production of 400 series, which does not contain nickel.
Thanks to a 2% rise in global 300 series production, a 17% rise in 200 series production, and a marginal reduction in average scrap metal share, primary nickel consumption in stainless steel production grew by 6% to 1.75 mln t. Nonetheless, the use of high-grade nickel in the stainless steel sector decreased by 131 kt, mostly driven by increased supply of nickel pig iron.
The 300 series steels have an increased nickel content, ranging usually between 8% and 12% but reaching 20% in some grades. Nickel in these concentrations improves resistance to corrosion and strength in a broad range of operating temperatures, ensures good ductility, resistance to aggressive environments, and strips the metal of its magnetic properties. This series is the most versatile and sees a wide range of uses in construction, food, transport, the chemical and energy industries, and other sectors.
In comparison, nickel content in the 200 series is lowered by alloying with manganese, and these steels are not complete substitutes for grades with high nickel content. The 200 series steels are prone to surface (pitting) corrosion, are not heat resistant and are not resistant to aggressive environments. However, due their lower cost, they are widely used in consumer goods such as domestic appliances. China and India alone account for over 90% of the total 200 series steel production.
Nickel consumption (kt)
4
-1
2,453
2,319
38
-2
95
Special steels
‘19
Other
Alloys
Batteries
Stainless steel
‘18
Source: Company data
The battery industry uses nickel as a key element in the production of cathode precursors for battery cells. However, nickel consumption trends vary depending on the type of battery.
Lithium batteries (Li-ion). Li-ion batteries were first commercially launched in 1991 and became widespread due to their ability to retain a high level of energy capacity, even after multiple recharge cycles.
Company overview Strategic report Commodity market overview
Business overview Sustainable development
Corporate governance
Risk report Shareholder information IFRS financial statements AppendixAnnual report 2019
«NORNICKEL»
46 47
Nickel-metal hydride batteries (Ni-MH). Ni-MH batteries were developed in 1989 as a substitute for Ni-Cd batteries, to avoid using cadmium. Currently, the nickel-metal hydride battery market is growing at a slow pace (with the hybrid vehicle projects of some manufacturers being its only growth driver) and is facing formidable competition from lithium-ion batteries.
Nickel-cadmium batteries (Ni-Cd). The first batteries using nickel were developed back in 1899. These days their use is limited, as the EU prohibited cadmium on grounds of toxicity.
Road transport electrification has been the spark behind the growth in lithium battery production. The 2016–2019 CAGR of electric vehicles (plug-in HEVs and battery electric vehicles) was around 45%. The impetus for transport electrification has come from government incentives, but other key drivers include more stringent environmental regulations, improved battery performance, and lower production costs of battery cells.
In recent years, China has been an important growth centre for EV manufacturing, with plans to increase NEV (electric vehicles and plug-in hybrids) sales to 25% of total vehicle sales by 2025. To this end, China implemented a number of initiatives to stimulate transport electrification, including subsidies for the purchase of electric cars and mandatory requirements for large automakers to produce electric vehicles and plug-in HEVs. However, government subsidies were slashed in the second half of 2019, resulting in the first-ever decline in NEV sales, by 4% y-o-y.
As a result, the centre of battery industry growth is shifting to Europe. In a number of countries, including Belgium, Germany, the UK, and France, buyers receive handsome subsidies and tax incentives for buying EVs; in Norway, where EVs
account for 42% of total vehicles sold, buyers are exempted from vehicle registration tax and value added tax (VAT).
Europe’s share in global NEV sales grew from 23% in 2018 to 27% in 2019, and is expected to reach 38% by 2025. In March 2019, the European Commission approved new requirements for greenhouse gas emissions from road transport, which call for a more than 2X reduction of CO2 emissions by 2030 from a 2018 baseline. The initiative pressures automakers to expedite electrification under the punishment of fines reaching into the billions. A battery production chain is being developed in anticipation of increased demand in the region. The total announced capacity (CATL, LG Chem, SK Innovation, Samsung, and Northvolt) already exceeds 400 GW•h by 2025, which would be equivalent to 300 kt of nickel.
Battery cell production is one of the final stages of battery manufacturing, preceded by the production of cathode precursors, and when lithium, graphite or silicon are added as the anode, the production of cathode material itself. In 2019, China held its position as the leader in cathode precursor production (61% of global production), while cathode material production was split between China (43%), Japan (30%), and South Korea (26%).
There are several types of lithium batteries available depending on the cathode materials used: LCO (lithium, cobalt oxide), LFP (lithium, iron phosphate), LMO (lithium, manganese oxide), NCM (nickel, cobalt, manganese), NCA (nickel, cobalt, aluminium).
LCO batteries are principally confined to mobile electronics, as high cobalt prices, low power, and chemical instability of the compounds used prevent their application in EVs. However, other types of cathodes are widely employed in the EV sector. The current trend is to replace LFP and LMO
with nickel-containing NCM and NCA batteries, owing to the higher energy density and specific energy of the latter, which increases vehicle range.
Growing nickel consumption in Li-Ion batteries is driven not only by an increasing share of battery types containing nickel, but also by a higher average nickel content in the cathode material, which, in turn, is caused by the need to substitute expensive cobalt units. In comparison to 2016, when NCM 1:1:1 (with a nickel mass fraction of 20% of the total cathode mass) accounted for the lion’s share of nickel-magnesium compounds in cathode materials, 2019 saw nickel-intensive compounds – NCM 6:2:2 (36%) and NCM 5:3:2 (30%) – take the lead. Going forward, conversion to NCM 8:1:1 (with a nickel content of 48%) is expected, and some producers announced plans to launch commercial production of LNO, a cathode material with nickel content exceeding 50%.
The further development of the automotive industry, with the growing popularity of electric and hybrid cars, along with the evolution of cathode technology towards nickel-intensive types make for a major uptick in growth of primary nickel consumption by the industry in the long run.
Changes in demand in other consuming industries were negligible. Demand for nickel used in special steels with improved structural properties and stability grew by 3%, or 4 kt. Nickel consumption for the production of heat-resistant alloys with a high nickel content, which are key materials for the production of aircraft engines, remained unchanged. Even against the backdrop of the grounding of the Boeing 737 Max, major commercial aircraft manufacturers are building their order books 8 to 10 years ahead, which should prop up nickel demand from the sector. Nickel consumption for standard alloys dropped by 1%, or 2 kt, due to low demand from the oil and gas industry on the back of falling oil prices in 2019.
Nickel is widely used for corrosion protection and as an alternative to chrome plating. Having a strong resistance to corrosion, a high level of hardness and aesthetic properties, nickel can be used to apply decorative and protective electroplating to products. Amid a lower availability of high-grade nickel, which is traditionally used in the premium electroplating segment, nickel consumption for electroplating in 2019 decreased slightly (by 1%, or 2 kt), due to reduced demand in China and other Asian countries.
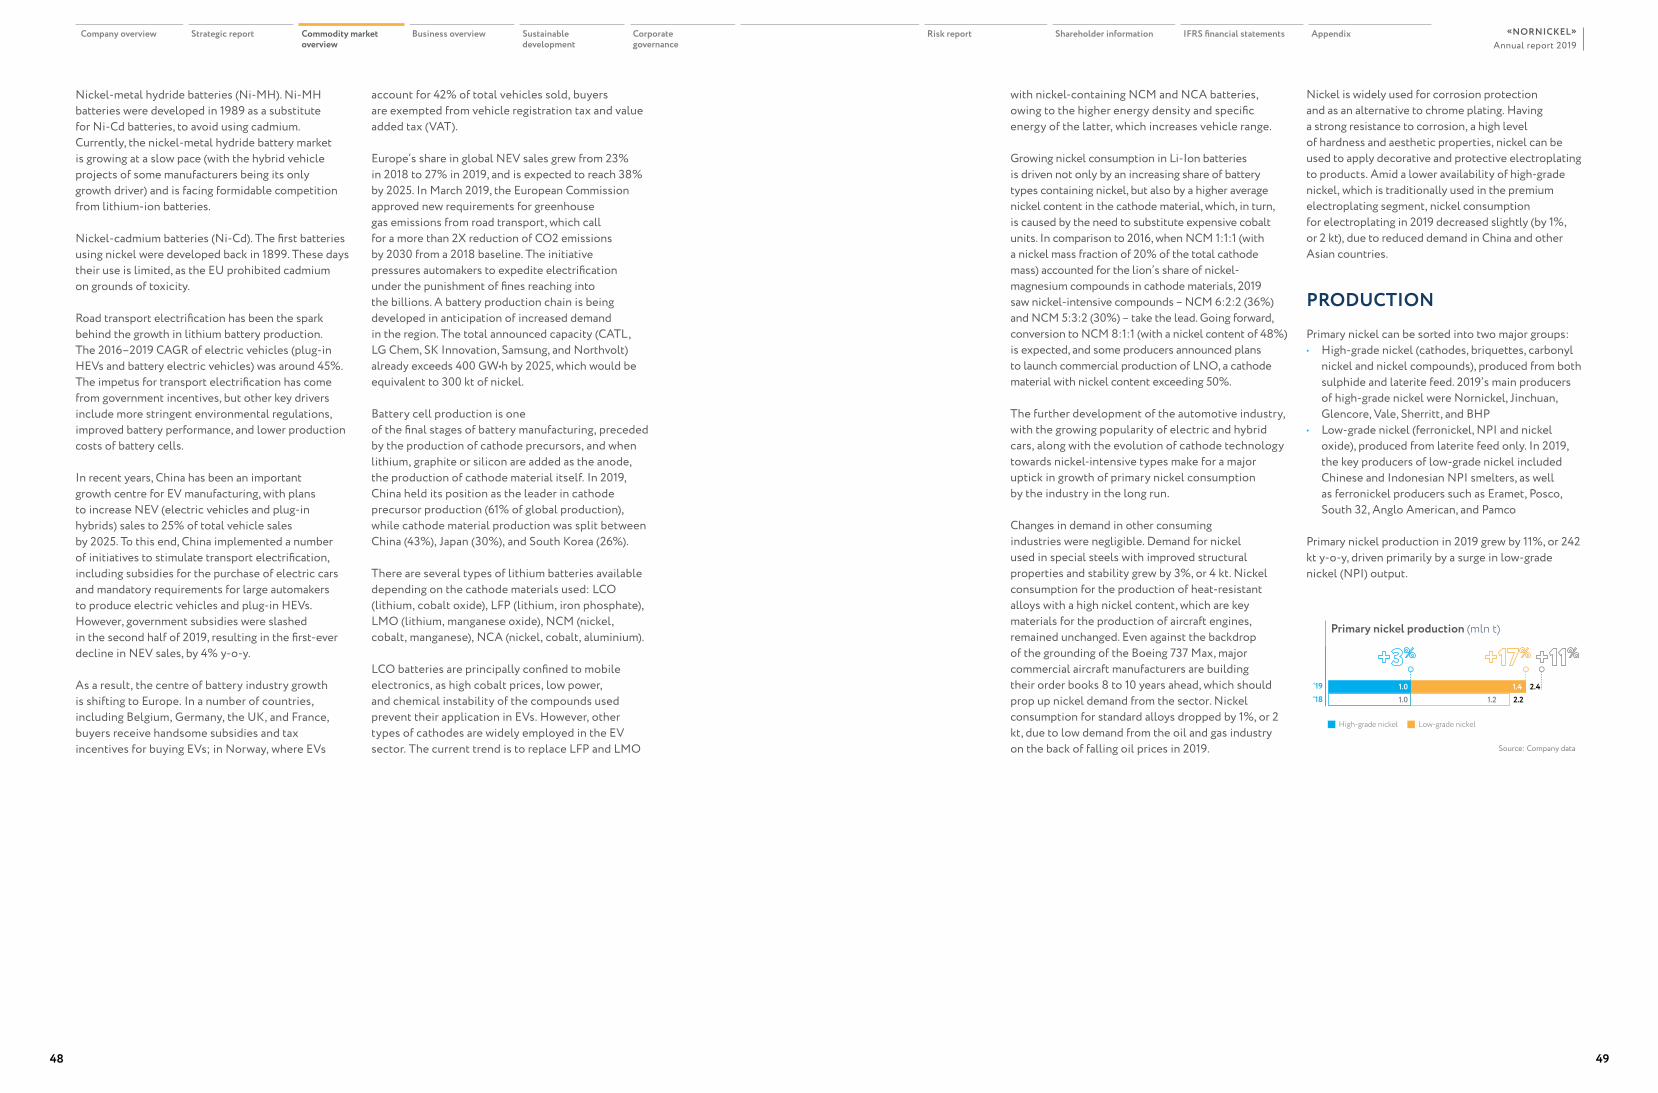
PRODUCTIONPrimary nickel can be sorted into two major groups:• High-grade nickel (cathodes, briquettes, carbonyl
nickel and nickel compounds), produced from both sulphide and laterite feed. 2019’s main producers of high-grade nickel were Nornickel, Jinchuan, Glencore, Vale, Sherritt, and BHP
• Low-grade nickel (ferronickel, NPI and nickel oxide), produced from laterite feed only. In 2019, the key producers of low-grade nickel included Chinese and Indonesian NPI smelters, as well as ferronickel producers such as Eramet, Posco, South 32, Anglo American, and Pamco
Primary nickel production in 2019 grew by 11%, or 242 kt y-o-y, driven primarily by a surge in low-grade nickel (NPI) output.
Primary nickel production (mln t)
‘18‘19
2354 231.4 2.4
1.2 2.21.01.0
High-grade nickel Low-grade nickel
Source: Company data
Company overview Strategic report Commodity market overview
Business overview Sustainable development
Corporate governance
Risk report Shareholder information IFRS financial statements AppendixAnnual report 2019
«NORNICKEL»
48 49
2017 2018 2019
0
2
4
6
8
Jan Feb Mar Apr May Jun Jul Aug Sep Oct Nov Dec
In 2019, high-grade nickel production increased by 3%, or 32 kt. Despite a marginal decrease in production by Vale and BHP, total smelting of refined metal increased, thanks to higher output by Nornickel and Jinchuan.
This was coupled with an increased output of nickel sulphate, which is a key feed for the production of cathode precursors used in Li-Ion batteries. Integrated production of nickel sulphate uses nickel matte, but elsewhere, the main feed for nickel sulphate production is hydrometallurgy semi-products (mixed hydroxide residue and mixed sulphide residue) and crude nickel sulphate, a by-product of copper and PMG production. In 2019, the main feeds for sulphate production were hydrometallurgy semi-products, as well as nickel briquettes and powders, which are melted down during shortages of other feeds.
Low-grade nickel production grew by 17%, or 211 kt, boosted by a significant increase in NPI production.
In China, a record level of stainless steel smelting, coupled with a stable growth in ore imports, were the key drivers behind 2019’s 24% increase in NPI production to 584 kt. In Indonesia, the startup of new production facilities of Jinchuan, and brownfield expansions at existing smelters using local ores with high nickel content resulted in NPI production growth of 46%, or 114 kt.
‘16‘17‘18‘19
1,0366 87 453
402 174 576471 248 719
584 362 946
China Indonesia
NPI production (kt)
Saleable nickel ore imports into China in 2016–2018 (mln t)
COPPER (Cu)
No. 11 in the copper mining industry (%)
9
88
77
55
3333
22
45
KGHM
CodelcoBHP Billiton
FreeportGlencore
Southern CopperAntofagasta
First QuantumAnglo American
Rio TintoNornickel
MMGOther MMCs
Refined copper consumption by region (%)
Rest of Asia
19
China
51
Americas Africa and Oceania
12
Europe
17
1
23.6mln t
KEY TRENDS IN THE COPPER MARKET
2019: Relatively high prices at the beginning of the year (January–April), supported by reduced extraction from Chilean mines and stable demand for copper from China. Abrupt drop in May–September as escalating trade war between the USA and China gave rise to concerns that demand for metals might fall.
Outlook: Neutral. In the mid-term, the market will remain balanced; a successful outcome of the US–China trade talks and continued global demand may support copper prices in the short term.
Concerns over the possible fallout from the US–China trade war triggered a decline in the price of copper at the end of 2018, which was followed by a period of growth in January and February 2019. The price reached its annual peak of USD 6,572/t in early March. Price growth in 2019 was driven by deficit expectations in the copper market amid production declines in several countries: Chile saw a lower copper content in mined ores, and heavy February rains disrupted production; Indonesia’s Grasberg mine (the largest in the country) experienced reduced output as it switched from surface to underground mining; and a number of mines in Africa were closed.
Early May marked another round of the US–China trade war, when the US government imposed import tariffs on certain Chinese goods, adding to pessimistic sentiment in the market and causing copper prices to plummet to USD 5,750/t in mid-June. However, a strike at the Chuquicamata mine in Chile helped the price to recover to USD 5,970/t by the end of the second quarter. A lack of progress in the trade deal negotiations between the USA and China, along with a new round of tariffs from both sides put pressure on the copper price, plunging it to a two-year low of USD 5,537/t in early September.
In the fourth quarter, the copper price started to recover on the news of strikes and protests at Peruvian and Chilean mines, and amid reports of falling exchange stocks. The growth was further bolstered by a preliminary trade deal between the USA and China, bringing the price up to USD 6,200/t by the end of December.
The average copper price on the London Metal Exchange in 2019 was USD 6,000/t, down by 8% from USD 6,523/t in 2018.
Average annual copper prices (USD/t)
2015 2016 2017 2018 2019
5,494 4,863 6,166 6,523 6,000
Source: London Metal Exchange (settlement)
In 2019, high-grade nickel production increased by 3%, or 32 kt. Despite a marginal decrease in production by Vale and BHP, total smelting of refined metal increased, thanks to higher output by Nornickel and Jinchuan.
Company overview Strategic report Commodity market overview
Business overview Sustainable development
Corporate governance
Risk report Shareholder information IFRS financial statements AppendixAnnual report 2019
«NORNICKEL»
50 51
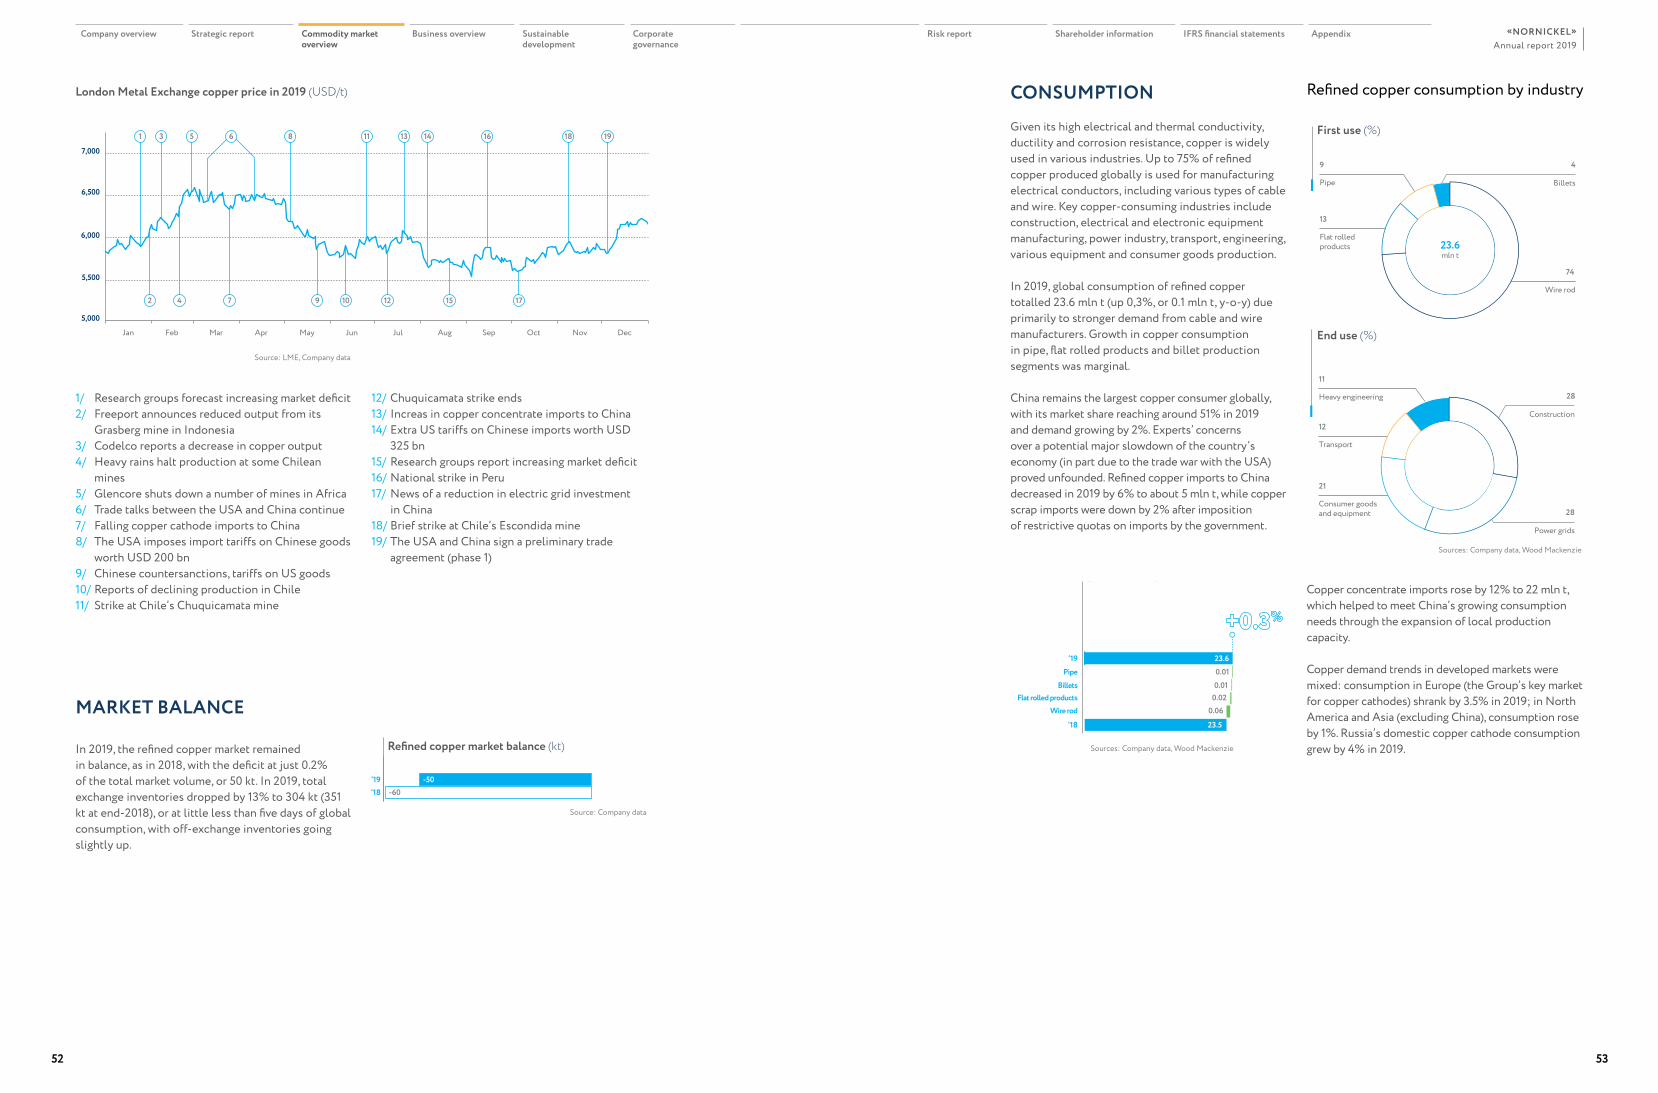
Consumer goodsand equipment
21
Power grids
28
Heavy engineering
Construction
11
Transport
12
28
Wire rod
74
Billets
4
Pipe
9
Flat rolled products
13
129вопросов
23.6mln t
Source: LME, Company data
London Metal Exchange copper price in 2019 (USD/t)
5,000
5,500
6,000
6,500
7,000
Jan Feb Mar Apr May Jun Jul Aug Sep Oct Nov Dec
1918
17
16
1512109742
13 1411831 5 6
1/ Research groups forecast increasing market deficit2/ Freeport announces reduced output from its
Grasberg mine in Indonesia3/ Codelco reports a decrease in copper output4/ Heavy rains halt production at some Chilean
mines5/ Glencore shuts down a number of mines in Africa6/ Trade talks between the USA and China continue7/ Falling copper cathode imports to China8/ The USA imposes import tariffs on Chinese goods
worth USD 200 bn9/ Chinese countersanctions, tariffs on US goods10/ Reports of declining production in Chile11/ Strike at Chile’s Chuquicamata mine
12/ Chuquicamata strike ends13/ Increas in copper concentrate imports to China14/ Extra US tariffs on Chinese imports worth USD
325 bn15/ Research groups report increasing market deficit16/ National strike in Peru17/ News of a reduction in electric grid investment
in China18/ Brief strike at Chile’s Escondida mine19/ The USA and China sign a preliminary trade
agreement (phase 1)
MARKET BALANCE
In 2019, the refined copper market remained in balance, as in 2018, with the deficit at just 0.2% of the total market volume, or 50 kt. In 2019, total exchange inventories dropped by 13% to 304 kt (351 kt at end-2018), or at little less than five days of global consumption, with off-exchange inventories going slightly up.
Refined copper market balance (kt)
‘18‘19 -50
-60
Source: Company data
CONSUMPTIONGiven its high electrical and thermal conductivity, ductility and corrosion resistance, copper is widely used in various industries. Up to 75% of refined copper produced globally is used for manufacturing electrical conductors, including various types of cable and wire. Key copper-consuming industries include construction, electrical and electronic equipment manufacturing, power industry, transport, engineering, various equipment and consumer goods production.
In 2019, global consumption of refined copper totalled 23.6 mln t (up 0,3%, or 0.1 mln t, y-o-y) due primarily to stronger demand from cable and wire manufacturers. Growth in copper consumption in pipe, flat rolled products and billet production segments was marginal.
China remains the largest copper consumer globally, with its market share reaching around 51% in 2019 and demand growing by 2%. Experts’ concerns over a potential major slowdown of the country’s economy (in part due to the trade war with the USA) proved unfounded. Refined copper imports to China decreased in 2019 by 6% to about 5 mln t, while copper scrap imports were down by 2% after imposition of restrictive quotas on imports by the government.
Sources: Company data, Wood Mackenzie
Sources: Company data, Wood Mackenzie
First use (%)
End use (%)
Changes in refined copper consumption by product type (mln t)
0.01
23.62 453
0.060.02
0.01
23.5
Flat rolled products
‘19Pipe
Billets
Wire rod
‘18
Copper concentrate imports rose by 12% to 22 mln t, which helped to meet China’s growing consumption needs through the expansion of local production capacity.
Copper demand trends in developed markets were mixed: consumption in Europe (the Group’s key market for copper cathodes) shrank by 3.5% in 2019; in North America and Asia (excluding China), consumption rose by 1%. Russia’s domestic copper cathode consumption grew by 4% in 2019.
Refined copper consumption by industry
Company overview Strategic report Commodity market overview
Business overview Sustainable development
Corporate governance
Risk report Shareholder information IFRS financial statements AppendixAnnual report 2019
«NORNICKEL»
52 53
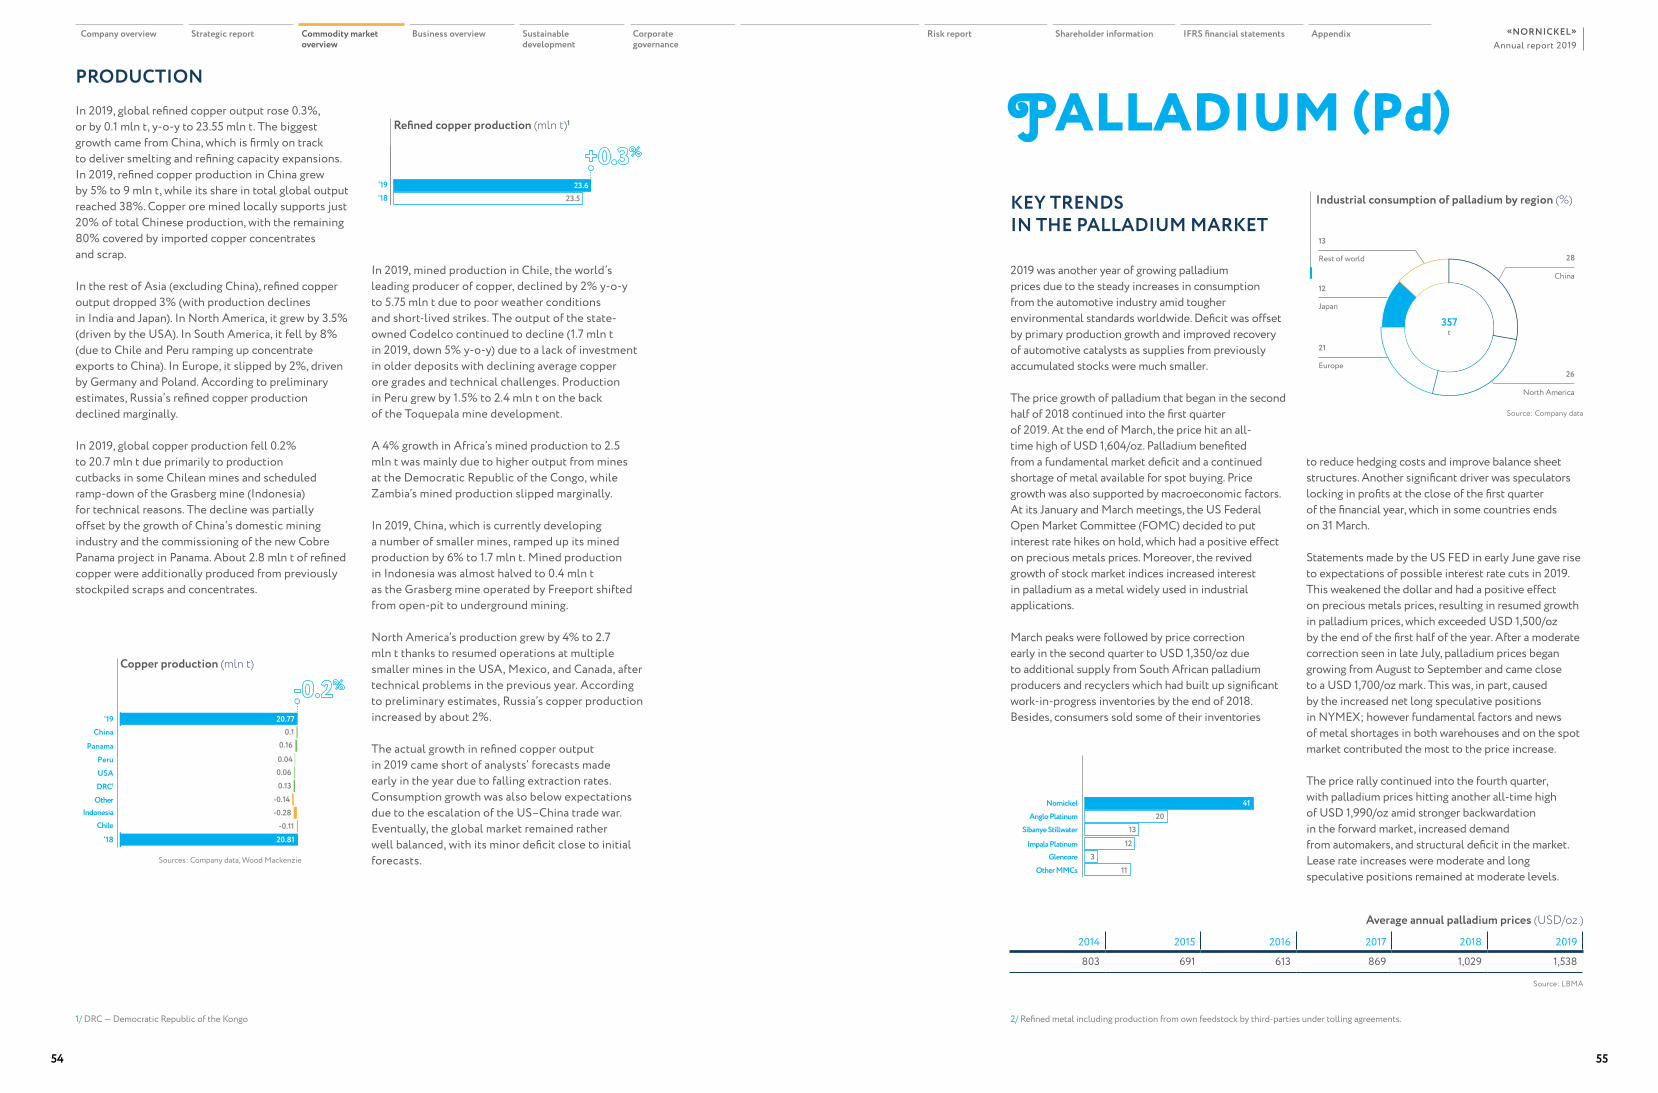
20.77
20.81
0.10.16
0.040.060.13
-0.14-0.28
-0.11Indonesia
USA
‘19China
PanamaPeru
DRC1
Other
Chile
‘18
PRODUCTIONIn 2019, global refined copper output rose 0.3%, or by 0.1 mln t, y-o-y to 23.55 mln t. The biggest growth came from China, which is firmly on track to deliver smelting and refining capacity expansions. In 2019, refined copper production in China grew by 5% to 9 mln t, while its share in total global output reached 38%. Copper ore mined locally supports just 20% of total Chinese production, with the remaining 80% covered by imported copper concentrates and scrap.
In the rest of Asia (excluding China), refined copper output dropped 3% (with production declines in India and Japan). In North America, it grew by 3.5% (driven by the USA). In South America, it fell by 8% (due to Chile and Peru ramping up concentrate exports to China). In Europe, it slipped by 2%, driven by Germany and Poland. According to preliminary estimates, Russia’s refined copper production declined marginally.
In 2019, global copper production fell 0.2% to 20.7 mln t due primarily to production cutbacks in some Chilean mines and scheduled ramp-down of the Grasberg mine (Indonesia) for technical reasons. The decline was partially offset by the growth of China’s domestic mining industry and the commissioning of the new Cobre Panama project in Panama. About 2.8 mln t of refined copper were additionally produced from previously stockpiled scraps and concentrates.
In 2019, mined production in Chile, the world’s leading producer of copper, declined by 2% y-o-y to 5.75 mln t due to poor weather conditions and short-lived strikes. The output of the state-owned Codelco continued to decline (1.7 mln t in 2019, down 5% y-o-y) due to a lack of investment in older deposits with declining average copper ore grades and technical challenges. Production in Peru grew by 1.5% to 2.4 mln t on the back of the Toquepala mine development.
A 4% growth in Africa’s mined production to 2.5 mln t was mainly due to higher output from mines at the Democratic Republic of the Congo, while Zambia’s mined production slipped marginally.
In 2019, China, which is currently developing a number of smaller mines, ramped up its mined production by 6% to 1.7 mln t. Mined production in Indonesia was almost halved to 0.4 mln t as the Grasberg mine operated by Freeport shifted from open-pit to underground mining.
North America’s production grew by 4% to 2.7 mln t thanks to resumed operations at multiple smaller mines in the USA, Mexico, and Canada, after technical problems in the previous year. According to preliminary estimates, Russia’s copper production increased by about 2%.
The actual growth in refined copper output in 2019 came short of analysts’ forecasts made early in the year due to falling extraction rates. Consumption growth was also below expectations due to the escalation of the US–China trade war. Eventually, the global market remained rather well balanced, with its minor deficit close to initial forecasts.
Refined copper production (mln t)1
‘18‘19
2354 2323.6
23.5
Copper production (mln t)
Sources: Company data, Wood Mackenzie
PALLADIUM (Pd)
1/ DRC — Democratic Republic of the Kongo
Industrial consumption of palladium by region (%)
Europe
21
North America
26
Rest of world
China
13
Japan
12
28
357t
Source: Company data
KEY TRENDS IN THE PALLADIUM MARKET
2019 was another year of growing palladium prices due to the steady increases in consumption from the automotive industry amid tougher environmental standards worldwide. Deficit was offset by primary production growth and improved recovery of automotive catalysts as supplies from previously accumulated stocks were much smaller.
The price growth of palladium that began in the second half of 2018 continued into the first quarter of 2019. At the end of March, the price hit an all-time high of USD 1,604/oz. Palladium benefited from a fundamental market deficit and a continued shortage of metal available for spot buying. Price growth was also supported by macroeconomic factors. At its January and March meetings, the US Federal Open Market Committee (FOMC) decided to put interest rate hikes on hold, which had a positive effect on precious metals prices. Moreover, the revived growth of stock market indices increased interest in palladium as a metal widely used in industrial applications.
March peaks were followed by price correction early in the second quarter to USD 1,350/oz due to additional supply from South African palladium producers and recyclers which had built up significant work-in-progress inventories by the end of 2018. Besides, consumers sold some of their inventories
to reduce hedging costs and improve balance sheet structures. Another significant driver was speculators locking in profits at the close of the first quarter of the financial year, which in some countries ends on 31 March.
Statements made by the US FED in early June gave rise to expectations of possible interest rate cuts in 2019. This weakened the dollar and had a positive effect on precious metals prices, resulting in resumed growth in palladium prices, which exceeded USD 1,500/oz by the end of the first half of the year. After a moderate correction seen in late July, palladium prices began growing from August to September and came close to a USD 1,700/oz mark. This was, in part, caused by the increased net long speculative positions in NYMEX; however fundamental factors and news of metal shortages in both warehouses and on the spot market contributed the most to the price increase.
The price rally continued into the fourth quarter, with palladium prices hitting another all-time high of USD 1,990/oz amid stronger backwardation in the forward market, increased demand from automakers, and structural deficit in the market. Lease rate increases were moderate and long speculative positions remained at moderate levels.
Average annual palladium prices (USD/oz.)
2014 2015 2016 2017 2018 2019
803 691 613 869 1,029 1,538
Source: LBMA
No. 1 in palladium production (%) 2
12
2041
3
13
11
Impala Platinum
NornickelAnglo Platinum
Sibanye Stillwater
GlencoreOther MMCs
2/ Refined metal including production from own feedstock by third-parties under tolling agreements.
Company overview Strategic report Commodity market overview
Business overview Sustainable development
Corporate governance
Risk report Shareholder information IFRS financial statements AppendixAnnual report 2019
«NORNICKEL»
54 55
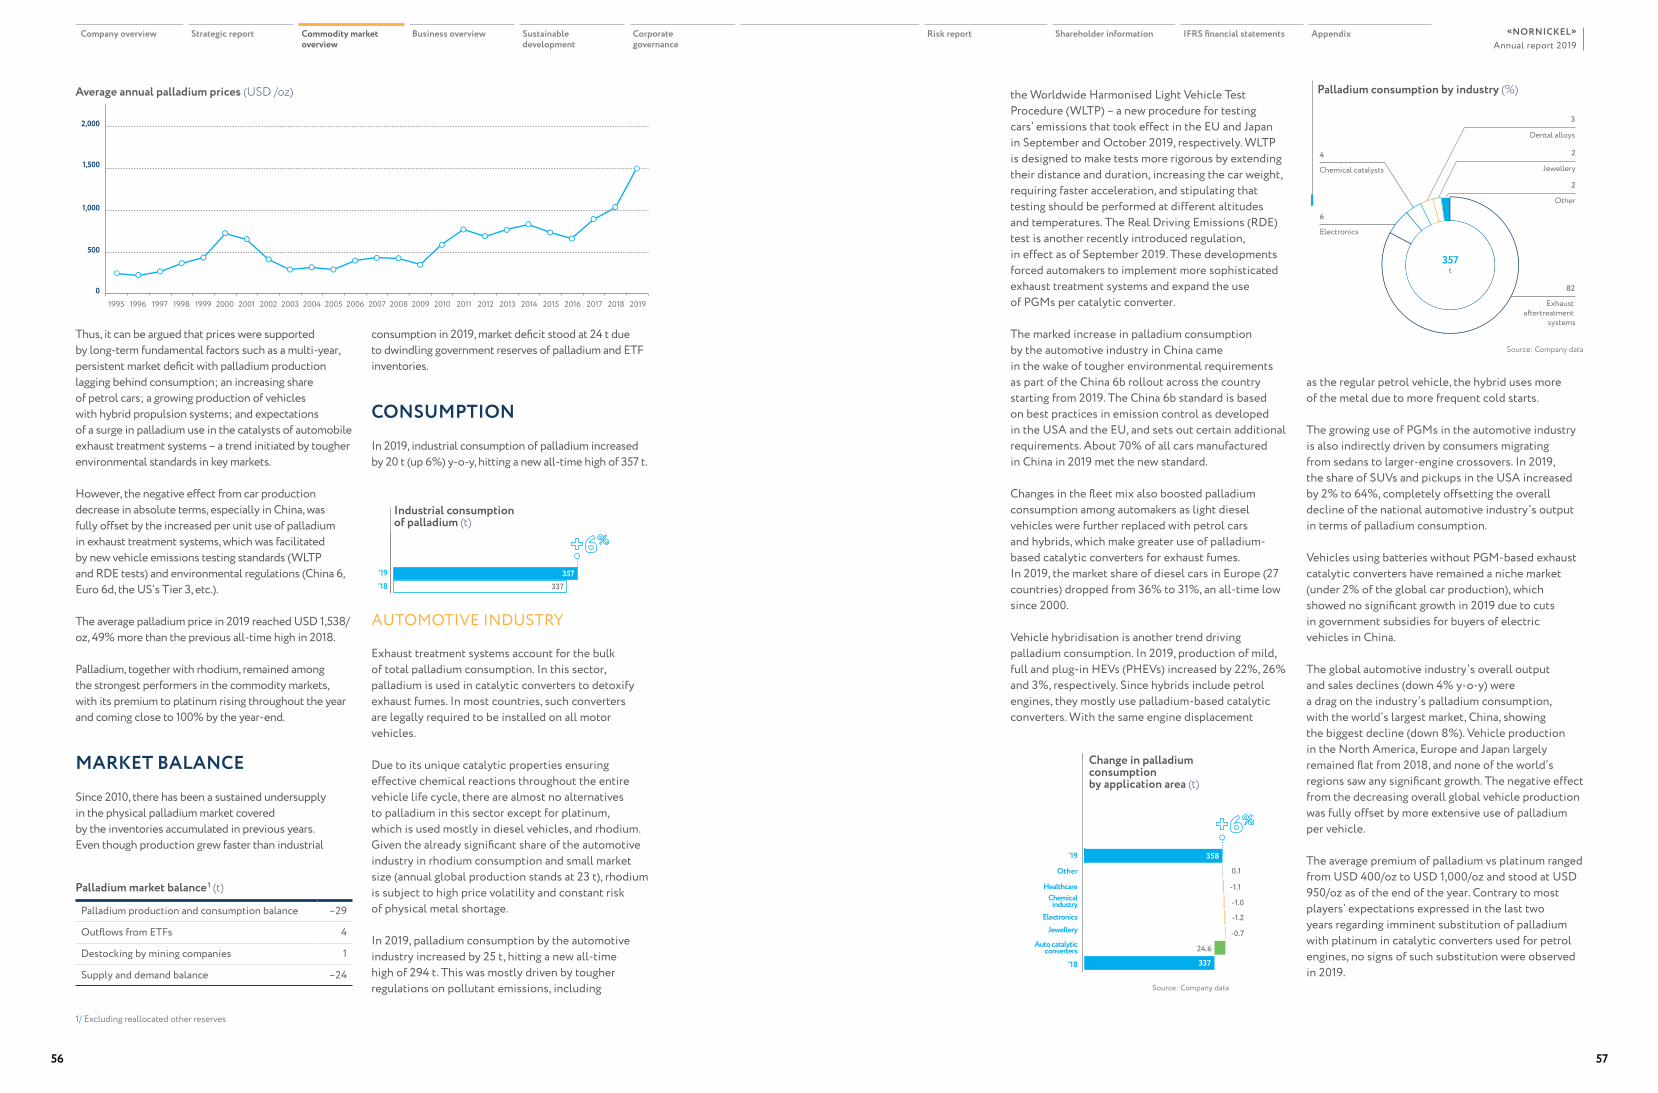
‘18‘19
2354357
337
Thus, it can be argued that prices were supported by long-term fundamental factors such as a multi-year, persistent market deficit with palladium production lagging behind consumption; an increasing share of petrol cars; a growing production of vehicles with hybrid propulsion systems; and expectations of a surge in palladium use in the catalysts of automobile exhaust treatment systems – a trend initiated by tougher environmental standards in key markets.
However, the negative effect from car production decrease in absolute terms, especially in China, was fully offset by the increased per unit use of palladium in exhaust treatment systems, which was facilitated by new vehicle emissions testing standards (WLTP and RDE tests) and environmental regulations (China 6, Euro 6d, the US’s Tier 3, etc.).
The average palladium price in 2019 reached USD 1,538/oz, 49% more than the previous all-time high in 2018.
Palladium, together with rhodium, remained among the strongest performers in the commodity markets, with its premium to platinum rising throughout the year and coming close to 100% by the year-end.
MARKET BALANCE Since 2010, there has been a sustained undersupply in the physical palladium market covered by the inventories accumulated in previous years. Even though production grew faster than industrial
Average annual palladium prices (USD /oz) the Worldwide Harmonised Light Vehicle Test Procedure (WLTP) – a new procedure for testing cars’ emissions that took effect in the EU and Japan in September and October 2019, respectively. WLTP is designed to make tests more rigorous by extending their distance and duration, increasing the car weight, requiring faster acceleration, and stipulating that testing should be performed at different altitudes and temperatures. The Real Driving Emissions (RDE) test is another recently introduced regulation, in effect as of September 2019. These developments forced automakers to implement more sophisticated exhaust treatment systems and expand the use of PGMs per catalytic converter.
The marked increase in palladium consumption by the automotive industry in China came in the wake of tougher environmental requirements as part of the China 6b rollout across the country starting from 2019. The China 6b standard is based on best practices in emission control as developed in the USA and the EU, and sets out certain additional requirements. About 70% of all cars manufactured in China in 2019 met the new standard.
Changes in the fleet mix also boosted palladium consumption among automakers as light diesel vehicles were further replaced with petrol cars and hybrids, which make greater use of palladium-based catalytic converters for exhaust fumes. In 2019, the market share of diesel cars in Europe (27 countries) dropped from 36% to 31%, an all-time low since 2000.
Vehicle hybridisation is another trend driving palladium consumption. In 2019, production of mild, full and plug-in HEVs (PHEVs) increased by 22%, 26% and 3%, respectively. Since hybrids include petrol engines, they mostly use palladium-based catalytic converters. With the same engine displacement
Industrial consumption of palladium (t)
Palladium consumption by industry (%)
Exhaust aftertreatment
systems
82
Other
2
Electronics
6
Chemical catalysts
4
Dental alloys
3
129вопросов
Jewellery
2
357t
Source: Company data
as the regular petrol vehicle, the hybrid uses more of the metal due to more frequent cold starts.
The growing use of PGMs in the automotive industry is also indirectly driven by consumers migrating from sedans to larger-engine crossovers. In 2019, the share of SUVs and pickups in the USA increased by 2% to 64%, completely offsetting the overall decline of the national automotive industry’s output in terms of palladium consumption.
Vehicles using batteries without PGM-based exhaust catalytic converters have remained a niche market (under 2% of the global car production), which showed no significant growth in 2019 due to cuts in government subsidies for buyers of electric vehicles in China.
The global automotive industry’s overall output and sales declines (down 4% y-o-y) were a drag on the industry’s palladium consumption, with the world’s largest market, China, showing the biggest decline (down 8%). Vehicle production in the North America, Europe and Japan largely remained flat from 2018, and none of the world’s regions saw any significant growth. The negative effect from the decreasing overall global vehicle production was fully offset by more extensive use of palladium per vehicle.
The average premium of palladium vs platinum ranged from USD 400/oz to USD 1,000/oz and stood at USD 950/oz as of the end of the year. Contrary to most players’ expectations expressed in the last two years regarding imminent substitution of palladium with platinum in catalytic converters used for petrol engines, no signs of such substitution were observed in 2019.
0
500
1,000
1,500
2,000
1995 1996 1997 1998 1999 2000 2001 2002 2003 2004 2005 2006 2007 2008 2009 2010 2011 2012 2013 2014 2015 2016 2017 2018 2019
Palladium market balance 1 (t)
Palladium production and consumption balance –29
Outflows from ETFs 4
Destocking by mining companies 1
Supply and demand balance –24
consumption in 2019, market deficit stood at 24 t due to dwindling government reserves of palladium and ETF inventories.
CONSUMPTIONIn 2019, industrial consumption of palladium increased by 20 t (up 6%) y-o-y, hitting a new all-time high of 357 t.
AUTOMOTIVE INDUSTRY
Exhaust treatment systems account for the bulk of total palladium consumption. In this sector, palladium is used in catalytic converters to detoxify exhaust fumes. In most countries, such converters are legally required to be installed on all motor vehicles.
Due to its unique catalytic properties ensuring effective chemical reactions throughout the entire vehicle life cycle, there are almost no alternatives to palladium in this sector except for platinum, which is used mostly in diesel vehicles, and rhodium. Given the already significant share of the automotive industry in rhodium consumption and small market size (annual global production stands at 23 t), rhodium is subject to high price volatility and constant risk of physical metal shortage.
In 2019, palladium consumption by the automotive industry increased by 25 t, hitting a new all-time high of 294 t. This was mostly driven by tougher regulations on pollutant emissions, including
1/ Excluding reallocated other reserves
-1.2
-1.1
0.1
358
337
-0.7
-1.0
24.6
Electronics
Other
‘19
HealthcareChemical
industry
Jewellery
Auto catalyticconverters
‘18
Change in palladium consumption by application area (t)
Source: Company data
Company overview Strategic report Commodity market overview
Business overview Sustainable development
Corporate governance
Risk report Shareholder information IFRS financial statements AppendixAnnual report 2019
«NORNICKEL»
56 57
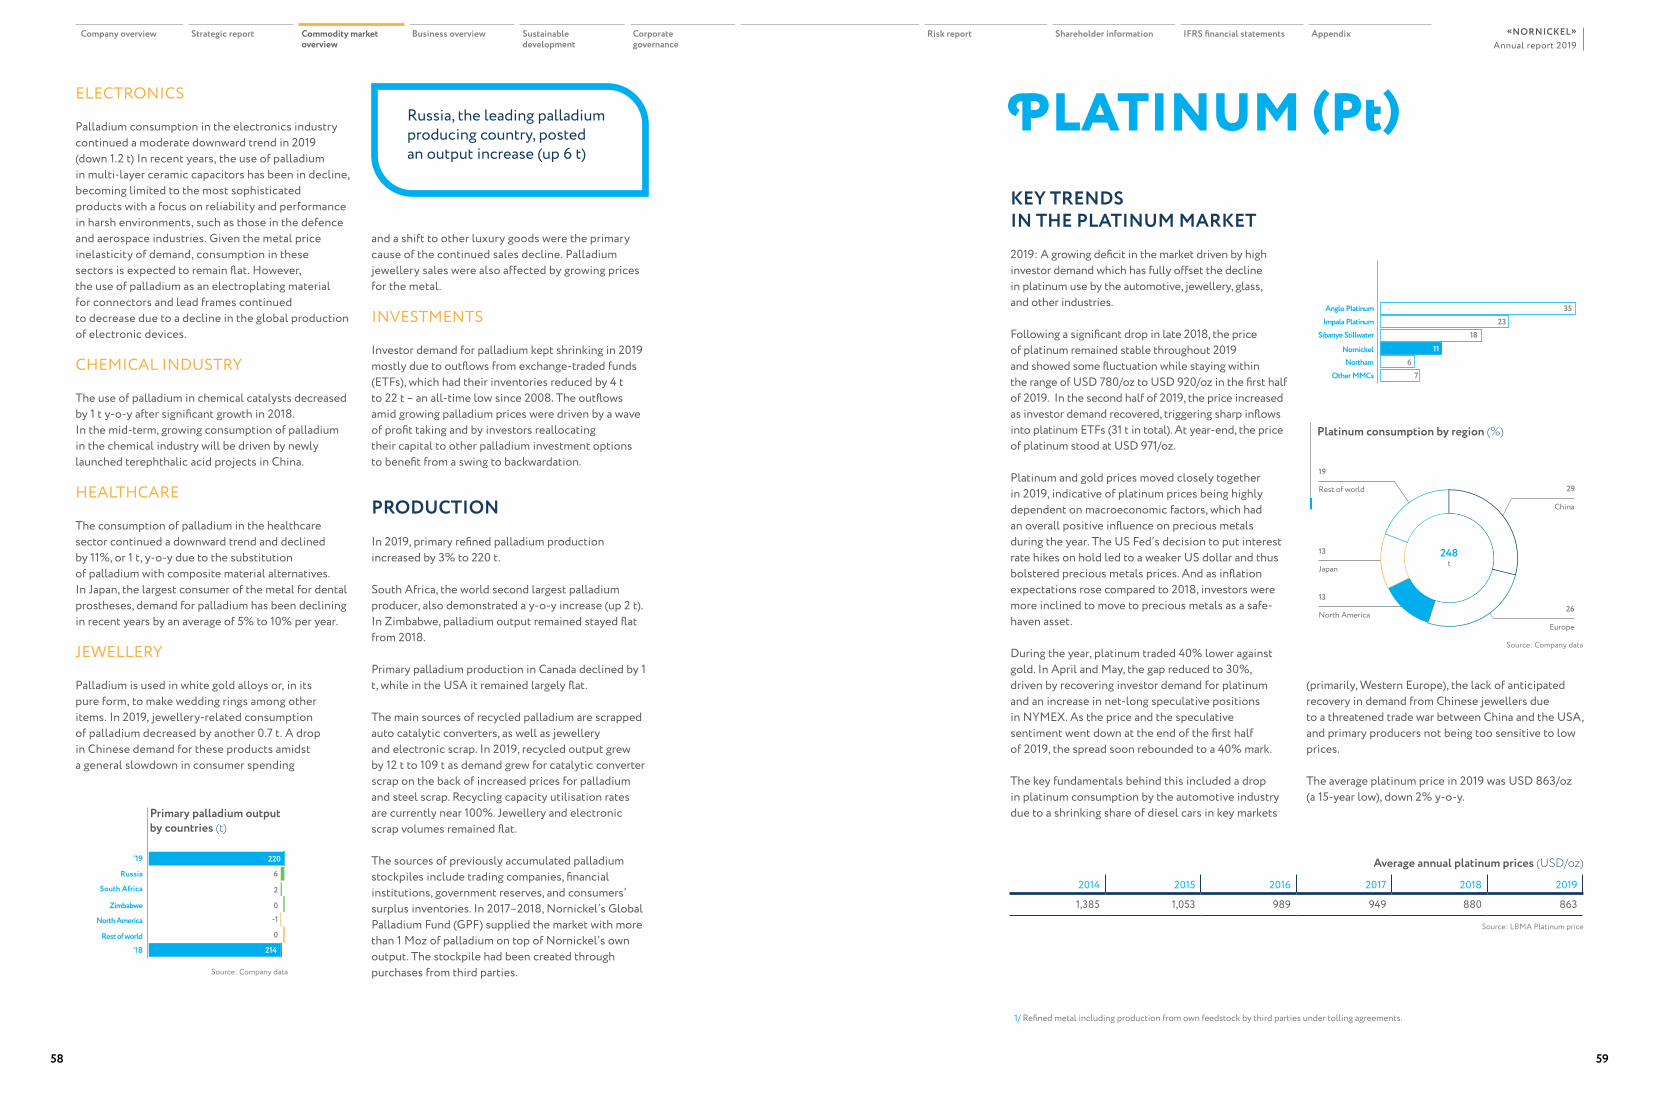
-1
2
6
220
0
0
214
North America
Russia
‘19
South Africa
Zimbabwe
Rest of world‘18
ELECTRONICS
Palladium consumption in the electronics industry continued a moderate downward trend in 2019 (down 1.2 t) In recent years, the use of palladium in multi-layer ceramic capacitors has been in decline, becoming limited to the most sophisticated products with a focus on reliability and performance in harsh environments, such as those in the defence and aerospace industries. Given the metal price inelasticity of demand, consumption in these sectors is expected to remain flat. However, the use of palladium as an electroplating material for connectors and lead frames continued to decrease due to a decline in the global production of electronic devices.
CHEMICAL INDUSTRY
The use of palladium in chemical catalysts decreased by 1 t y-o-y after significant growth in 2018. In the mid-term, growing consumption of palladium in the chemical industry will be driven by newly launched terephthalic acid projects in China.
HEALTHCARE
The consumption of palladium in the healthcare sector continued a downward trend and declined by 11%, or 1 t, y-o-y due to the substitution of palladium with composite material alternatives. In Japan, the largest consumer of the metal for dental prostheses, demand for palladium has been declining in recent years by an average of 5% to 10% per year.
JEWELLERY
Palladium is used in white gold alloys or, in its pure form, to make wedding rings among other items. In 2019, jewellery-related consumption of palladium decreased by another 0.7 t. A drop in Chinese demand for these products amidst a general slowdown in consumer spending
and a shift to other luxury goods were the primary cause of the continued sales decline. Palladium jewellery sales were also affected by growing prices for the metal.
INVESTMENTS
Investor demand for palladium kept shrinking in 2019 mostly due to outflows from exchange-traded funds (ETFs), which had their inventories reduced by 4 t to 22 t – an all-time low since 2008. The outflows amid growing palladium prices were driven by a wave of profit taking and by investors reallocating their capital to other palladium investment options to benefit from a swing to backwardation.
PRODUCTIONIn 2019, primary refined palladium production increased by 3% to 220 t.
South Africa, the world second largest palladium producer, also demonstrated a y-o-y increase (up 2 t). In Zimbabwe, palladium output remained stayed flat from 2018.
Primary palladium production in Canada declined by 1 t, while in the USA it remained largely flat.
The main sources of recycled palladium are scrapped auto catalytic converters, as well as jewellery and electronic scrap. In 2019, recycled output grew by 12 t to 109 t as demand grew for catalytic converter scrap on the back of increased prices for palladium and steel scrap. Recycling capacity utilisation rates are currently near 100%. Jewellery and electronic scrap volumes remained flat.
The sources of previously accumulated palladium stockpiles include trading companies, financial institutions, government reserves, and consumers’ surplus inventories. In 2017–2018, Nornickel’s Global Palladium Fund (GPF) supplied the market with more than 1 Moz of palladium on top of Nornickel’s own output. The stockpile had been created through purchases from third parties.
Russia, the leading palladium producing country, posted an output increase (up 6 t)
Source: Company data
PLATINUM (Pt)
No. 4 in platinum production (%)1
11
2335
6
18
7
Nornickel
Anglo PlatinumImpala Platinum
Sibanye Stillwater
NorthamOther MMCs
Platinum consumption by region (%)
North America
13
Europe
26
Rest of world
China
19
Japan
13
29
248t
KEY TRENDS IN THE PLATINUM MARKET2019: A growing deficit in the market driven by high investor demand which has fully offset the decline in platinum use by the automotive, jewellery, glass, and other industries.
Following a significant drop in late 2018, the price of platinum remained stable throughout 2019 and showed some fluctuation while staying within the range of USD 780/oz to USD 920/oz in the first half of 2019. In the second half of 2019, the price increased as investor demand recovered, triggering sharp inflows into platinum ETFs (31 t in total). At year-end, the price of platinum stood at USD 971/oz.
Platinum and gold prices moved closely together in 2019, indicative of platinum prices being highly dependent on macroeconomic factors, which had an overall positive influence on precious metals during the year. The US Fed’s decision to put interest rate hikes on hold led to a weaker US dollar and thus bolstered precious metals prices. And as inflation expectations rose compared to 2018, investors were more inclined to move to precious metals as a safe-haven asset.
During the year, platinum traded 40% lower against gold. In April and May, the gap reduced to 30%, driven by recovering investor demand for platinum and an increase in net-long speculative positions in NYMEX. As the price and the speculative sentiment went down at the end of the first half of 2019, the spread soon rebounded to a 40% mark.
The key fundamentals behind this included a drop in platinum consumption by the automotive industry due to a shrinking share of diesel cars in key markets
(primarily, Western Europe), the lack of anticipated recovery in demand from Chinese jewellers due to a threatened trade war between China and the USA, and primary producers not being too sensitive to low prices.
The average platinum price in 2019 was USD 863/oz (a 15-year low), down 2% y-o-y.
1/ Refined metal including production from own feedstock by third parties under tolling agreements.
Average annual platinum prices (USD/oz)
2014 2015 2016 2017 2018 2019
1,385 1,053 989 949 880 863
Source: LBMA Platinum price
Source: Company data
Primary palladium output by countries (t)
Company overview Strategic report Commodity market overview
Business overview Sustainable development
Corporate governance
Risk report Shareholder information IFRS financial statements AppendixAnnual report 2019
«NORNICKEL»
58 59
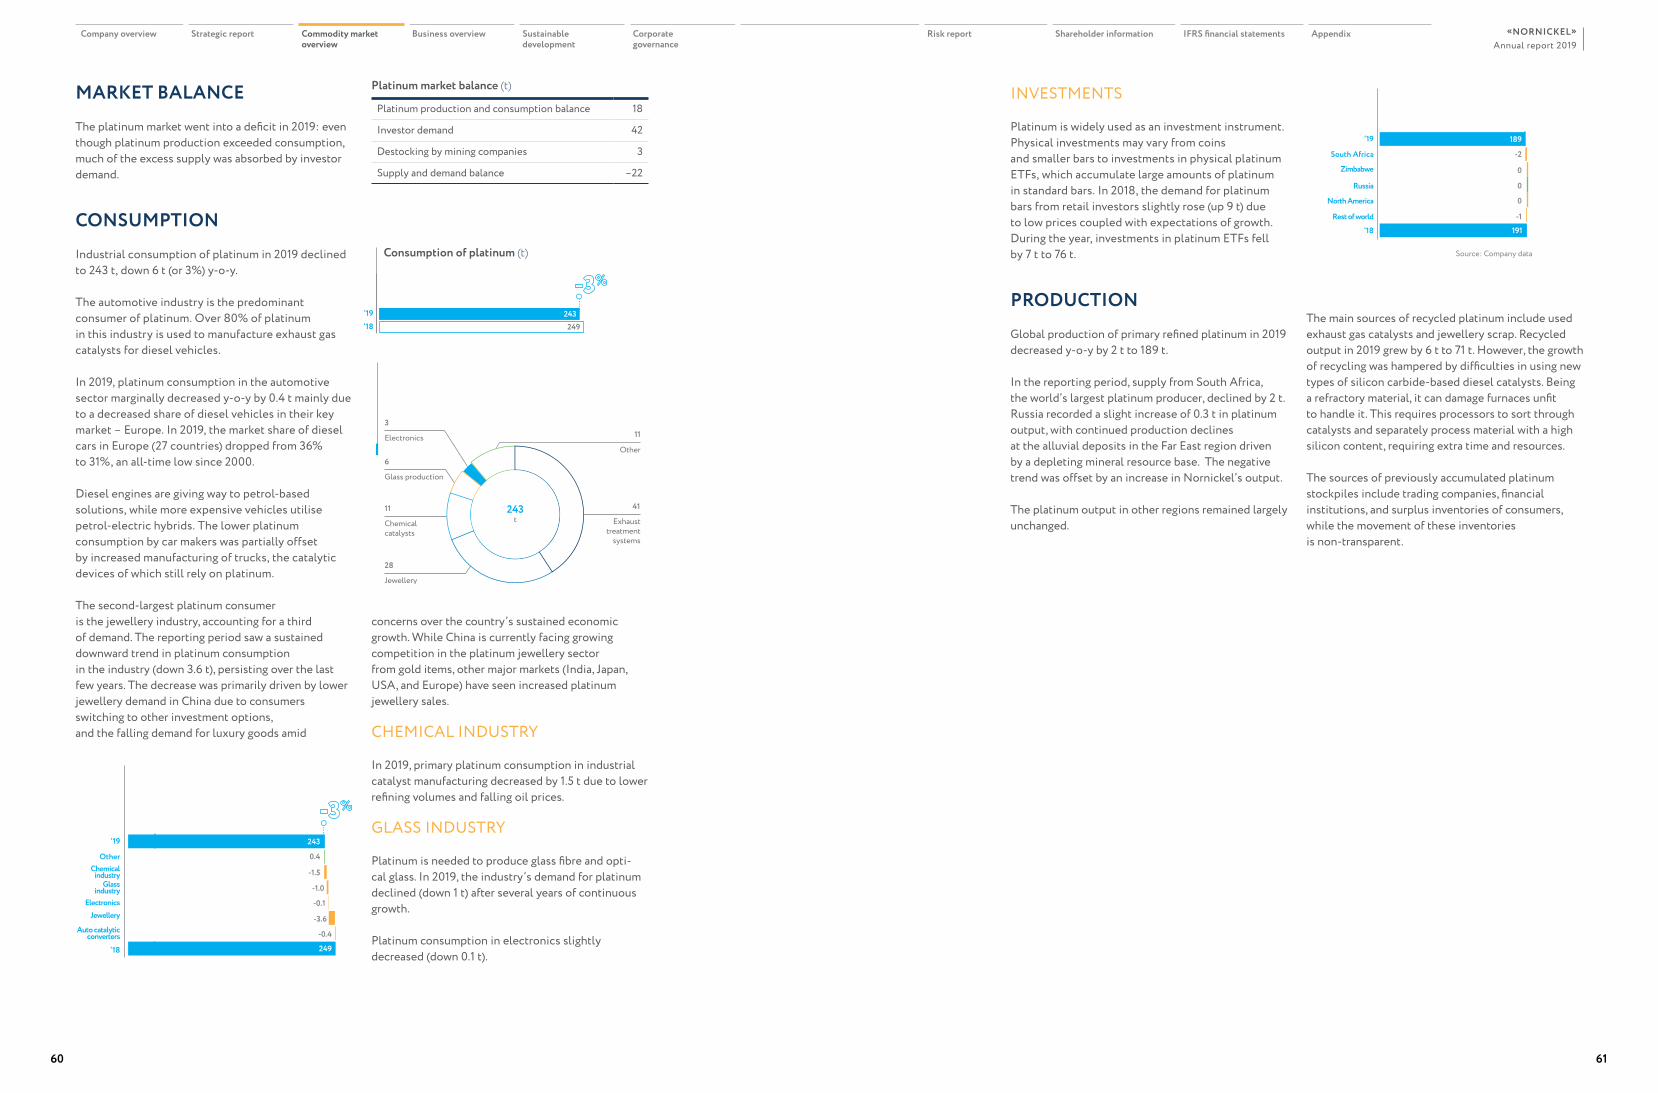
‘18‘19
2354243
249
INVESTMENTS
Platinum is widely used as an investment instrument. Physical investments may vary from coins and smaller bars to investments in physical platinum ETFs, which accumulate large amounts of platinum in standard bars. In 2018, the demand for platinum bars from retail investors slightly rose (up 9 t) due to low prices coupled with expectations of growth. During the year, investments in platinum ETFs fell by 7 t to 76 t.
PRODUCTIONGlobal production of primary refined platinum in 2019 decreased y-o-y by 2 t to 189 t.
In the reporting period, supply from South Africa, the world’s largest platinum producer, declined by 2 t. Russia recorded a slight increase of 0.3 t in platinum output, with continued production declines at the alluvial deposits in the Far East region driven by a depleting mineral resource base. The negative trend was offset by an increase in Nornickel’s output.
The platinum output in other regions remained largely unchanged.
MARKET BALANCEThe platinum market went into a deficit in 2019: even though platinum production exceeded consumption, much of the excess supply was absorbed by investor demand.
CONSUMPTIONIndustrial consumption of platinum in 2019 declined to 243 t, down 6 t (or 3%) y-o-y.
The automotive industry is the predominant consumer of platinum. Over 80% of platinum in this industry is used to manufacture exhaust gas catalysts for diesel vehicles.
In 2019, platinum consumption in the automotive sector marginally decreased y-o-y by 0.4 t mainly due to a decreased share of diesel vehicles in their key market – Europe. In 2019, the market share of diesel cars in Europe (27 countries) dropped from 36% to 31%, an all-time low since 2000.
Diesel engines are giving way to petrol-based solutions, while more expensive vehicles utilise petrol-electric hybrids. The lower platinum consumption by car makers was partially offset by increased manufacturing of trucks, the catalytic devices of which still rely on platinum.
The second-largest platinum consumer is the jewellery industry, accounting for a third of demand. The reporting period saw a sustained downward trend in platinum consumption in the industry (down 3.6 t), persisting over the last few years. The decrease was primarily driven by lower jewellery demand in China due to consumers switching to other investment options, and the falling demand for luxury goods amid
concerns over the country’s sustained economic growth. While China is currently facing growing competition in the platinum jewellery sector from gold items, other major markets (India, Japan, USA, and Europe) have seen increased platinum jewellery sales.
CHEMICAL INDUSTRY
In 2019, primary platinum consumption in industrial catalyst manufacturing decreased by 1.5 t due to lower refining volumes and falling oil prices.
GLASS INDUSTRY
Platinum is needed to produce glass fibre and opti-cal glass. In 2019, the industry’s demand for platinum declined (down 1 t) after several years of continuous growth.
Platinum consumption in electronics slightly decreased (down 0.1 t).
Consumption of platinum (t)
Platinum consumption in 2019 by industry (t)
41
Other
11
Chemical catalysts
11
Jewellery
28
Electronics
3
Glass production
6
129вопросов
243t Exhaust
treatmentsystems
Platinum consumption by application area (t)
-0.1
-1.5
0.4
243
249
-3.6
-1.0
-0.4
Electronics
Other
‘19
Chemical industry
Glass industry
Jewellery
Auto catalytic converters
‘18
Primary platinum production by countries (t)
0
0
-2
189
-1
0
191
North America
South Africa
‘19
Zimbabwe
Russia
Rest of world‘18
The main sources of recycled platinum include used exhaust gas catalysts and jewellery scrap. Recycled output in 2019 grew by 6 t to 71 t. However, the growth of recycling was hampered by difficulties in using new types of silicon carbide-based diesel catalysts. Being a refractory material, it can damage furnaces unfit to handle it. This requires processors to sort through catalysts and separately process material with a high silicon content, requiring extra time and resources.
The sources of previously accumulated platinum stockpiles include trading companies, financial institutions, and surplus inventories of consumers, while the movement of these inventories is non-transparent.
Platinum market balance (t)
Platinum production and consumption balance 18
Investor demand 42
Destocking by mining companies 3
Supply and demand balance –22
Source: Company data
Company overview Strategic report Commodity market overview
Business overview Sustainable development
Corporate governance
Risk report Shareholder information IFRS financial statements AppendixAnnual report 2019
«NORNICKEL»
60 61
OverviewB64 Mineral base73 Operational
performance89 Sales and distribution94 Energy assets
96 Transport assets102 Research
and development innovations
108 Financial performance (MD&A)
usi ness
Business overview
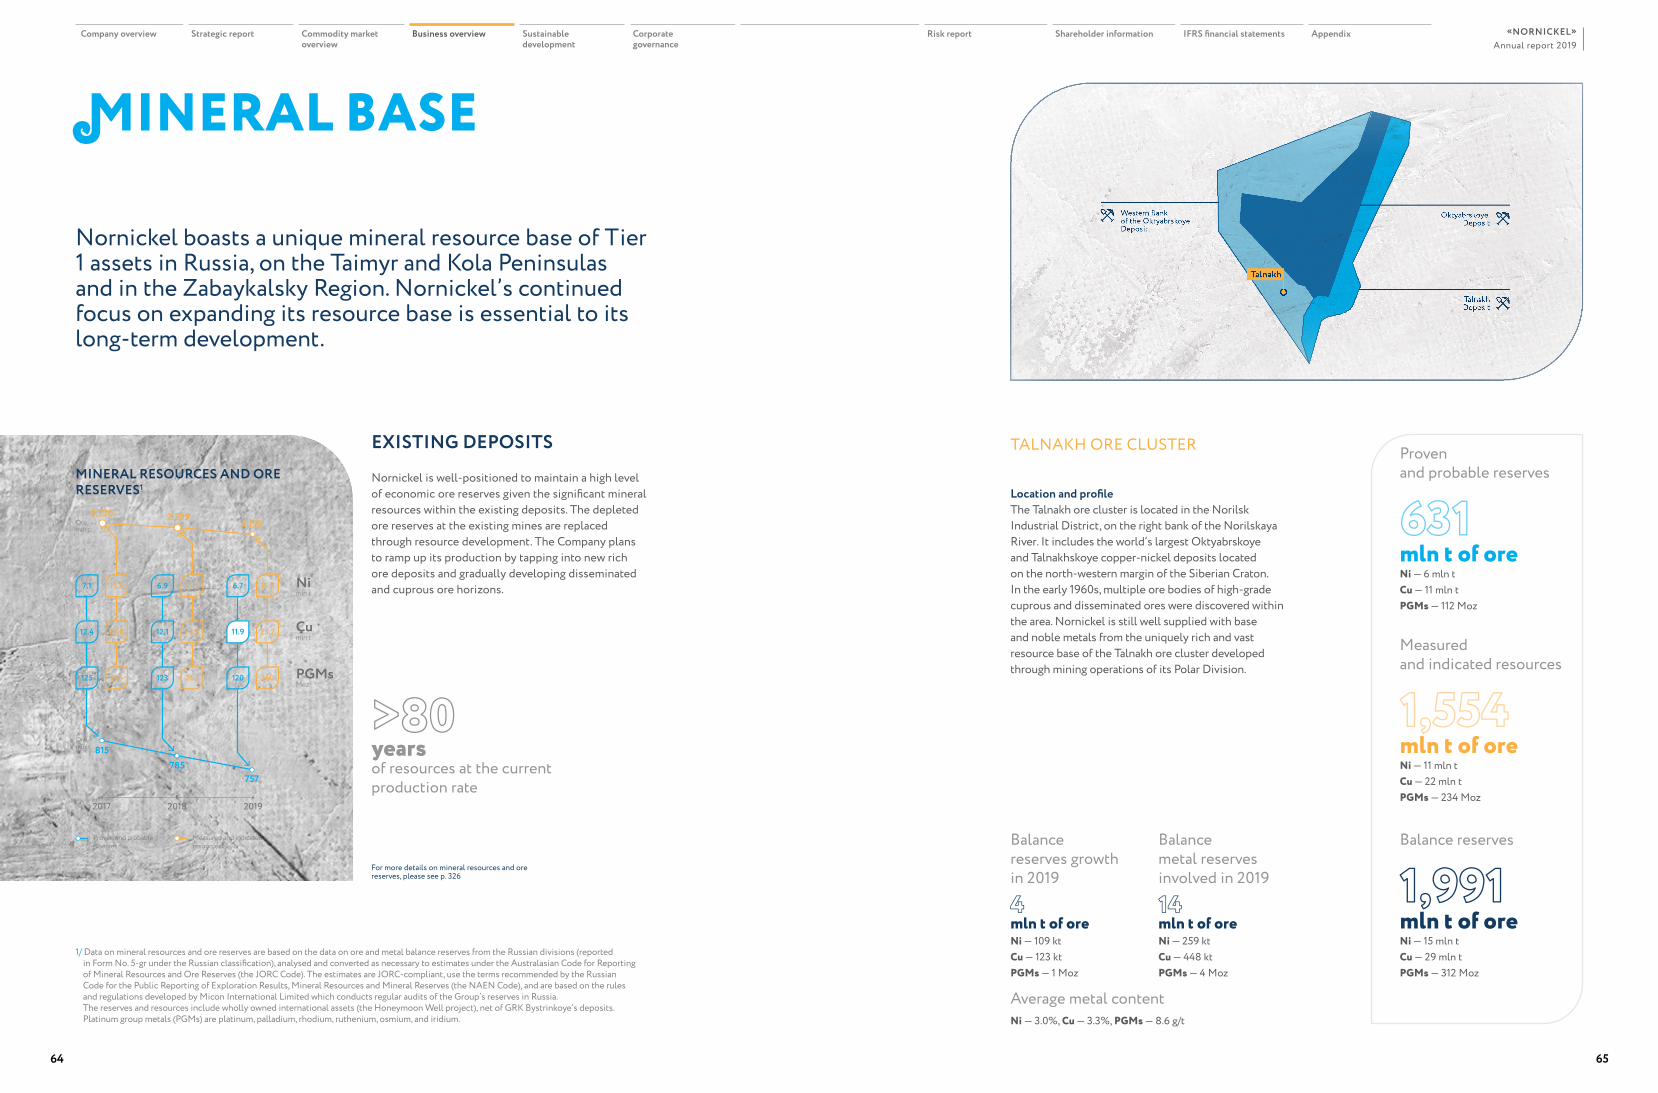
MINERAL BASE
Nornickel boasts a unique mineral resource base of Tier 1 assets in Russia, on the Taimyr and Kola Peninsulas and in the Zabaykalsky Region. Nornickel’s continued focus on expanding its resource base is essential to its long-term development.
EXISTING DEPOSITS
Nornickel is well-positioned to maintain a high level of economic ore reserves given the significant mineral resources within the existing deposits. The depleted ore reserves at the existing mines are replaced through resource development. The Company plans to ramp up its production by tapping into new rich ore deposits and gradually developing disseminated and cuprous ore horizons.
1/ Data on mineral resources and ore reserves are based on the data on ore and metal balance reserves from the Russian divisions (reported in Form No. 5-gr under the Russian classification), analysed and converted as necessary to estimates under the Australasian Code for Reporting of Mineral Resources and Ore Reserves (the JORC Code). The estimates are JORC-compliant, use the terms recommended by the Russian Code for the Public Reporting of Exploration Results, Mineral Resources and Mineral Reserves (the NAEN Code), and are based on the rules and regulations developed by Micon International Limited which conducts regular audits of the Group’s reserves in Russia. The reserves and resources include wholly owned international assets (the Honeymoon Well project), net of GRK Bystrinkoye’s deposits. Platinum group metals (PGMs) are platinum, palladium, rhodium, ruthenium, osmium, and iridium.
MINERAL RESOURCES AND ORE RESERVES1
2017 2018 2019
815785
757
2,220 2,2092,193
Proven and probable reserves
Ore, mln t
Ore, mln t
Measured and indicated resources
7.1 15.5
12.4
125 265
23.8
6.9 15.3
12.1
123 263
23.5
6.7 15.2
11.9
120 260
23.2
Nimln t
Cumln t
PGMsMoz
Proven and probable reserves
Measured and indicated resources
Balance metal reserves involved in 2019
Balance reserves growth in 2019
Balance reserves
>80yearsof resources at the current production rate
631mln t of ore
1,554mln t of ore
4mln t of ore
14mln t of ore
1,991mln t of ore
For more details on mineral resources and ore reserves, please see p. 326
TALNAKH ORE CLUSTER
TalnakhDeposit
Oktyabrskoye Deposit
Western flank of the Oktyabrskoye Deposit
Talnakh
Location and profileThe Talnakh ore cluster is located in the Norilsk Industrial District, on the right bank of the Norilskaya River. It includes the world’s largest Oktyabrskoye and Talnakhskoye copper-nickel deposits located on the north-western margin of the Siberian Craton. In the early 1960s, multiple ore bodies of high-grade cuprous and disseminated ores were discovered within the area. Nornickel is still well supplied with base and noble metals from the uniquely rich and vast resource base of the Talnakh ore cluster developed through mining operations of its Polar Division.
Ni — 6 mln tCu — 11 mln tPGMs — 112 Moz
Ni — 11 mln tCu — 22 mln tPGMs — 234 Moz
Ni — 109 ktCu — 123 ktPGMs — 1 Moz
Ni — 259 ktCu — 448 ktPGMs — 4 Moz
Ni — 15 mln tCu — 29 mln tPGMs — 312 Moz
Ni — 3.0%, Cu — 3.3%, PGMs — 8.6 g/t
Average metal content
Company overview Strategic report Commodity market overview
Business overview Sustainable development
Corporate governance
Risk report Shareholder information IFRS financial statements AppendixAnnual report 2019
«NORNICKEL»
64 65
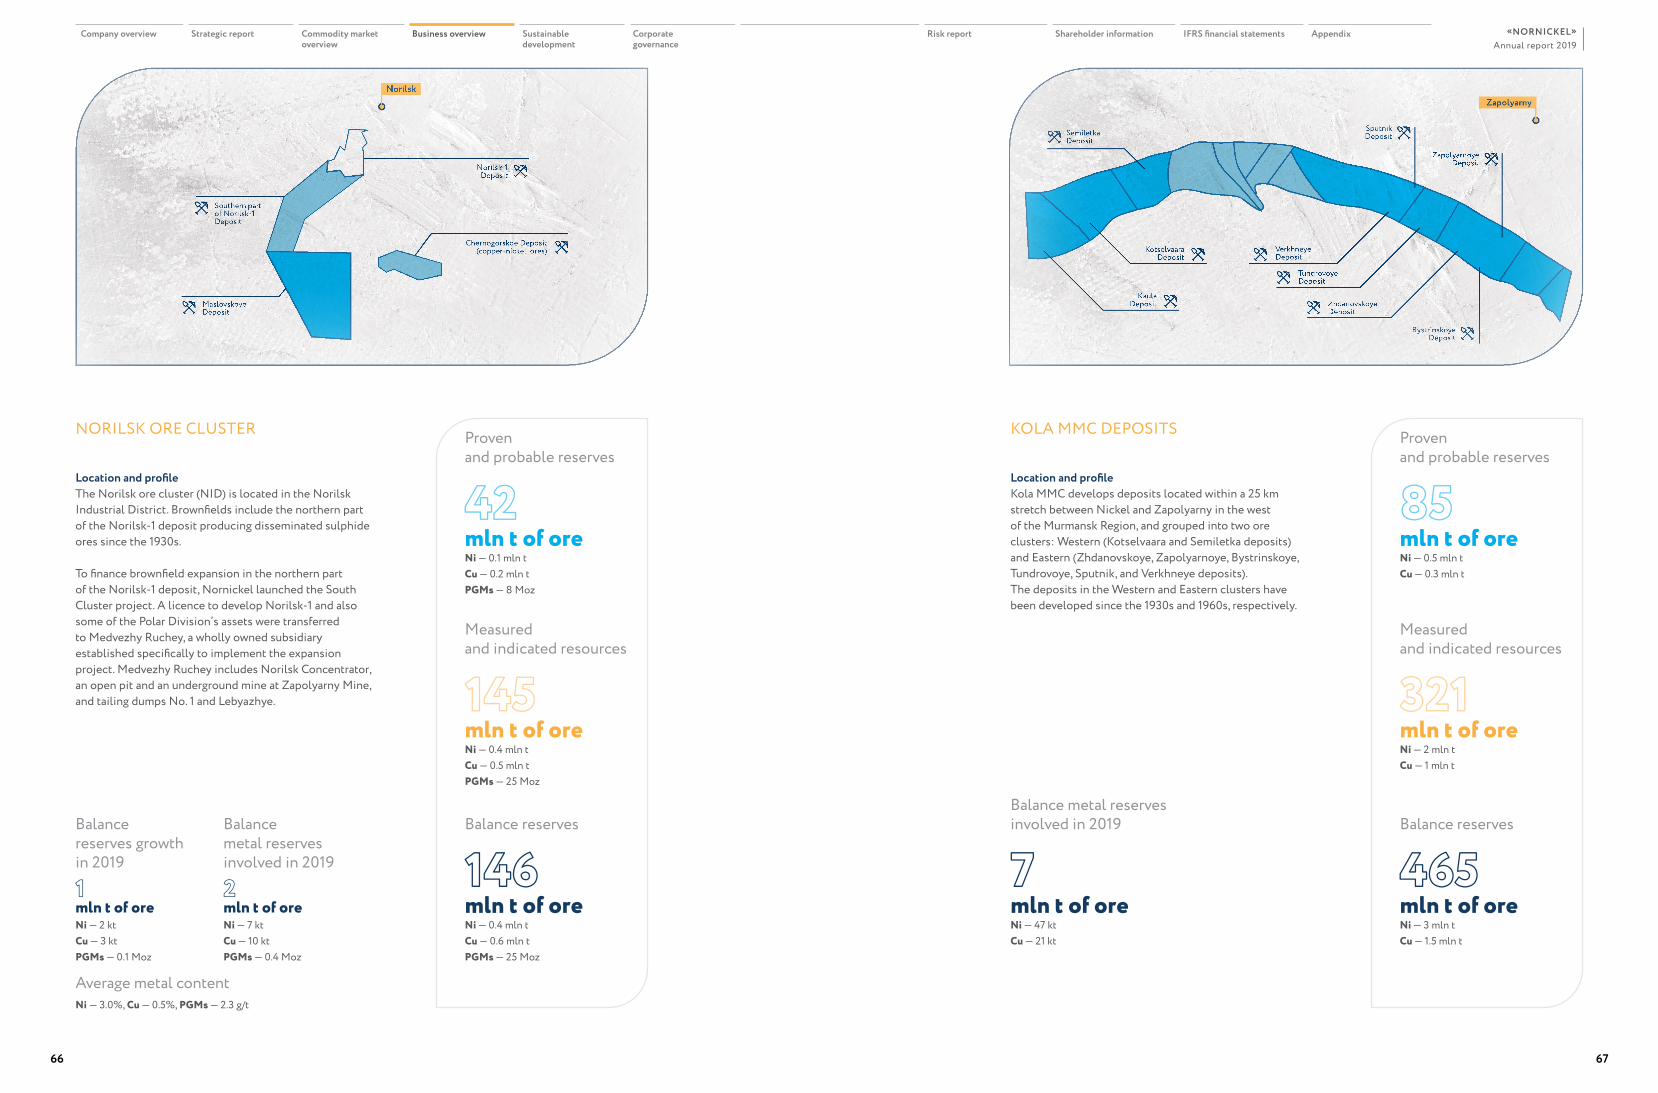
Proven and probable reserves
Proven and probable reserves
Measured and indicated resources
Measured and indicated resources
Balance metal reserves involved in 2019
Balance metal reserves involved in 2019 Balance
reserves growth in 2019
Balance reserves Balance reserves
42mln t of ore
85mln t of ore
145mln t of ore
321mln t of ore
1mln t of ore
2mln t of ore
7mln t of ore
146mln t of ore
465mln t of ore
NORILSK ORE CLUSTER
Norilsk
Norilsk-1Deposit
Chernogorskoe Deposit(copper-nickel ores)
Southern part of Norilsk-1 Deposit
Maslovskoye Deposit
KOLA MMC DEPOSITS
Zapolyarny
SputnikDeposit
BystrinskoyeDeposit
VerkhneyeDeposit
TundrovoyeDeposit
KaulaDeposit
SemiletkaDeposit
ZhdanovskoyeDeposit
ZapolyarnoyeDeposit
KotselvaaraDeposit
Location and profileThe Norilsk ore cluster (NID) is located in the Norilsk Industrial District. Brownfields include the northern part of the Norilsk-1 deposit producing disseminated sulphide ores since the 1930s.
To finance brownfield expansion in the northern part of the Norilsk-1 deposit, Nornickel launched the South Cluster project. A licence to develop Norilsk-1 and also some of the Polar Division’s assets were transferred to Medvezhy Ruchey, a wholly owned subsidiary established specifically to implement the expansion project. Medvezhy Ruchey includes Norilsk Concentrator, an open pit and an underground mine at Zapolyarny Mine, and tailing dumps No. 1 and Lebyazhye.
Location and profileKola MMC develops deposits located within a 25 km stretch between Nickel and Zapolyarny in the west of the Murmansk Region, and grouped into two ore clusters: Western (Kotselvaara and Semiletka deposits) and Eastern (Zhdanovskoye, Zapolyarnoye, Bystrinskoye, Tundrovoye, Sputnik, and Verkhneye deposits). The deposits in the Western and Eastern clusters have been developed since the 1930s and 1960s, respectively.
Ni — 0.1 mln tCu — 0.2 mln tPGMs — 8 Moz
Ni — 0.5 mln tCu — 0.3 mln t
Ni — 0.4 mln tCu — 0.5 mln tPGMs — 25 Moz
Ni — 2 mln tCu — 1 mln t
Ni — 2 ktCu — 3 ktPGMs — 0.1 Moz
Ni — 7 ktCu — 10 ktPGMs — 0.4 Moz
Ni — 47 ktCu — 21 kt
Ni — 0.4 mln tCu — 0.6 mln tPGMs — 25 Moz
Ni — 3 mln tCu — 1.5 mln t
Ni — 3.0%, Cu — 0.5%, PGMs — 2.3 g/t
Average metal content
Company overview Strategic report Commodity market overview
Business overview Sustainable development
Corporate governance
Risk report Shareholder information IFRS financial statements AppendixAnnual report 2019
«NORNICKEL»
66 67
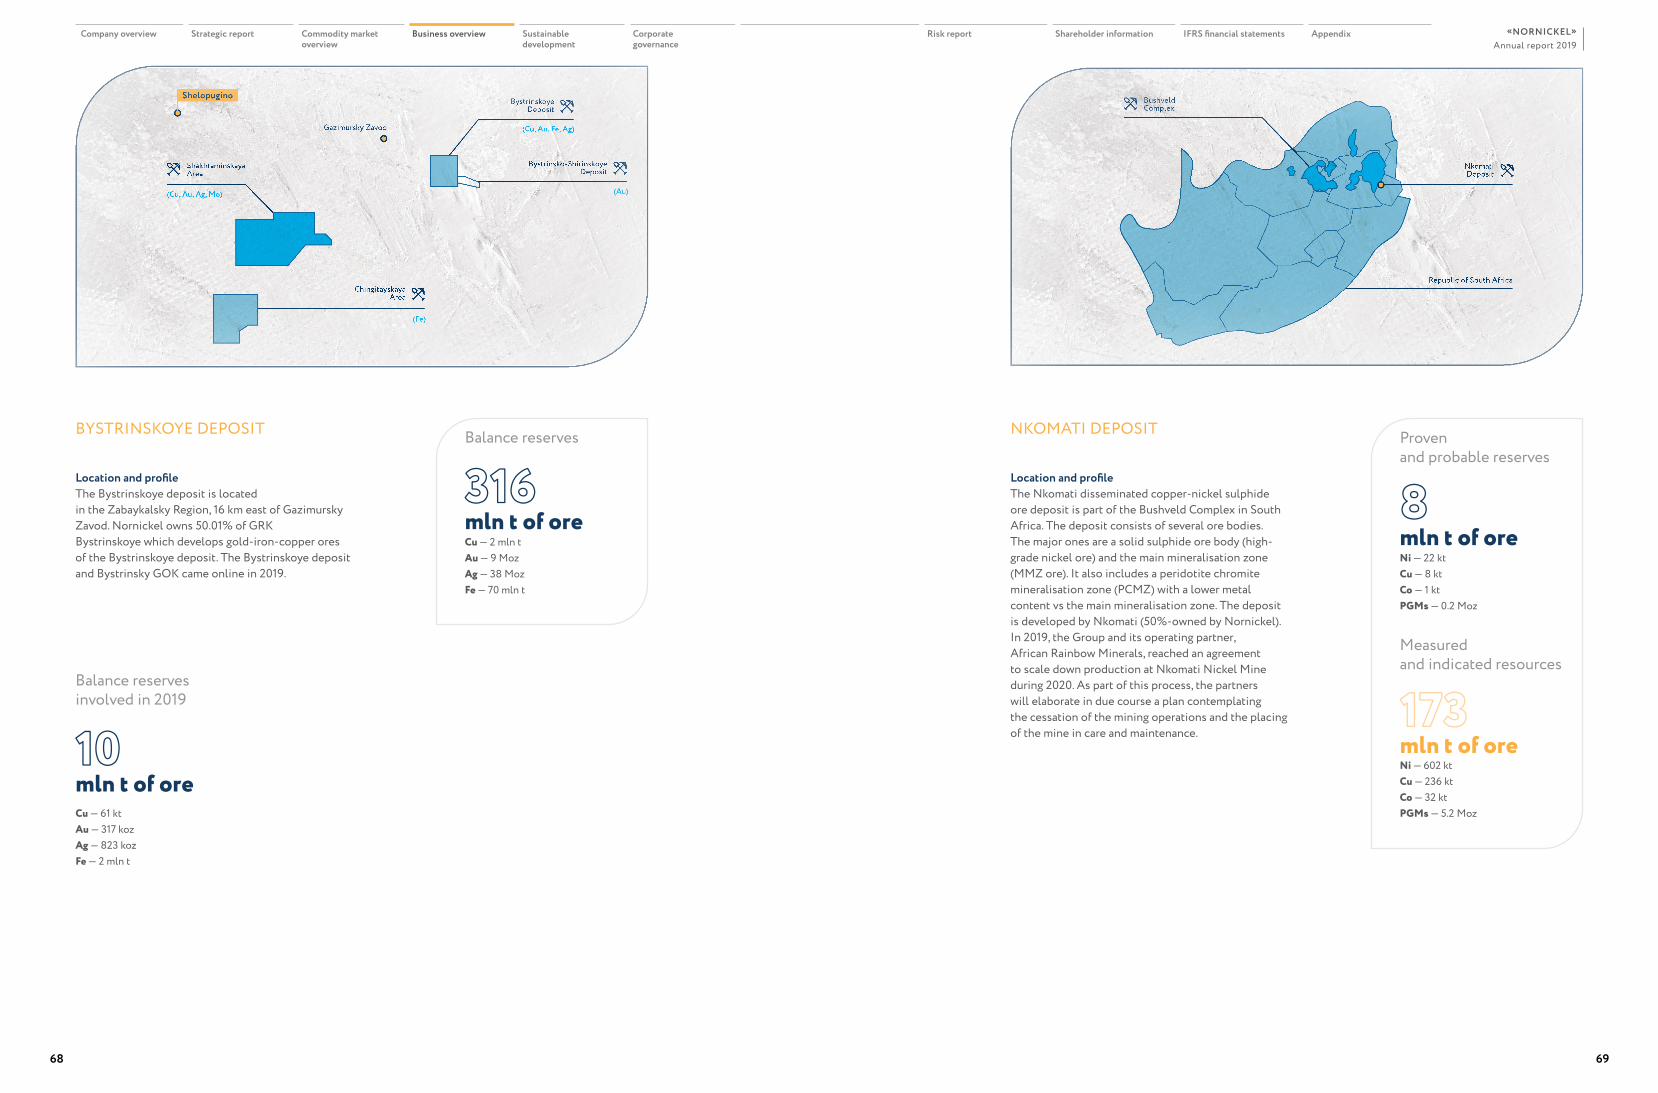
Balance reserves
Balance reserves involved in 2019
316mln t of ore 8
mln t of ore
10mln t of ore
BYSTRINSKOYE DEPOSIT
Shelopugino
Gazimursky Zavod
BystrinskoyeDeposit
ChingitayskayaArea
Shakhtaminskaya Area
Bystrinsko-ShirinskoyeDeposit
(Cu, Au, Ag, Mo)
(Cu, Au, Fe, Ag)
(Au)
(Fe)
NKOMATI DEPOSIT
Bushveld Complex
NkomatiDeposit
Republic of South Africa
Location and profileThe Bystrinskoye deposit is located in the Zabaykalsky Region, 16 km east of Gazimursky Zavod. Nornickel owns 50.01% of GRK Bystrinskoye which develops gold-iron-copper ores of the Bystrinskoye deposit. The Bystrinskoye deposit and Bystrinsky GOK came online in 2019.
Location and profileThe Nkomati disseminated copper-nickel sulphide ore deposit is part of the Bushveld Complex in South Africa. The deposit consists of several ore bodies. The major ones are a solid sulphide ore body (high-grade nickel ore) and the main mineralisation zone (MMZ ore). It also includes a peridotite chromite mineralisation zone (PCMZ) with a lower metal content vs the main mineralisation zone. The deposit is developed by Nkomati (50%-owned by Nornickel). In 2019, the Group and its operating partner, African Rainbow Minerals, reached an agreement to scale down production at Nkomati Nickel Mine during 2020. As part of this process, the partners will elaborate in due course a plan contemplating the cessation of the mining operations and the placing of the mine in care and maintenance.
Cu — 2 mln tAu — 9 MozAg — 38 MozFe — 70 mln t
Ni — 22 ktCu — 8 ktCo — 1 ktPGMs — 0.2 Moz
Ni — 602 ktCu — 236 ktCo — 32 ktPGMs — 5.2 MozCu — 61 kt
Au — 317 kozAg — 823 kozFe — 2 mln t
Proven and probable reserves
Measured and indicated resources
173mln t of ore
Company overview Strategic report Commodity market overview
Business overview Sustainable development
Corporate governance
Risk report Shareholder information IFRS financial statements AppendixAnnual report 2019
«NORNICKEL»
68 69
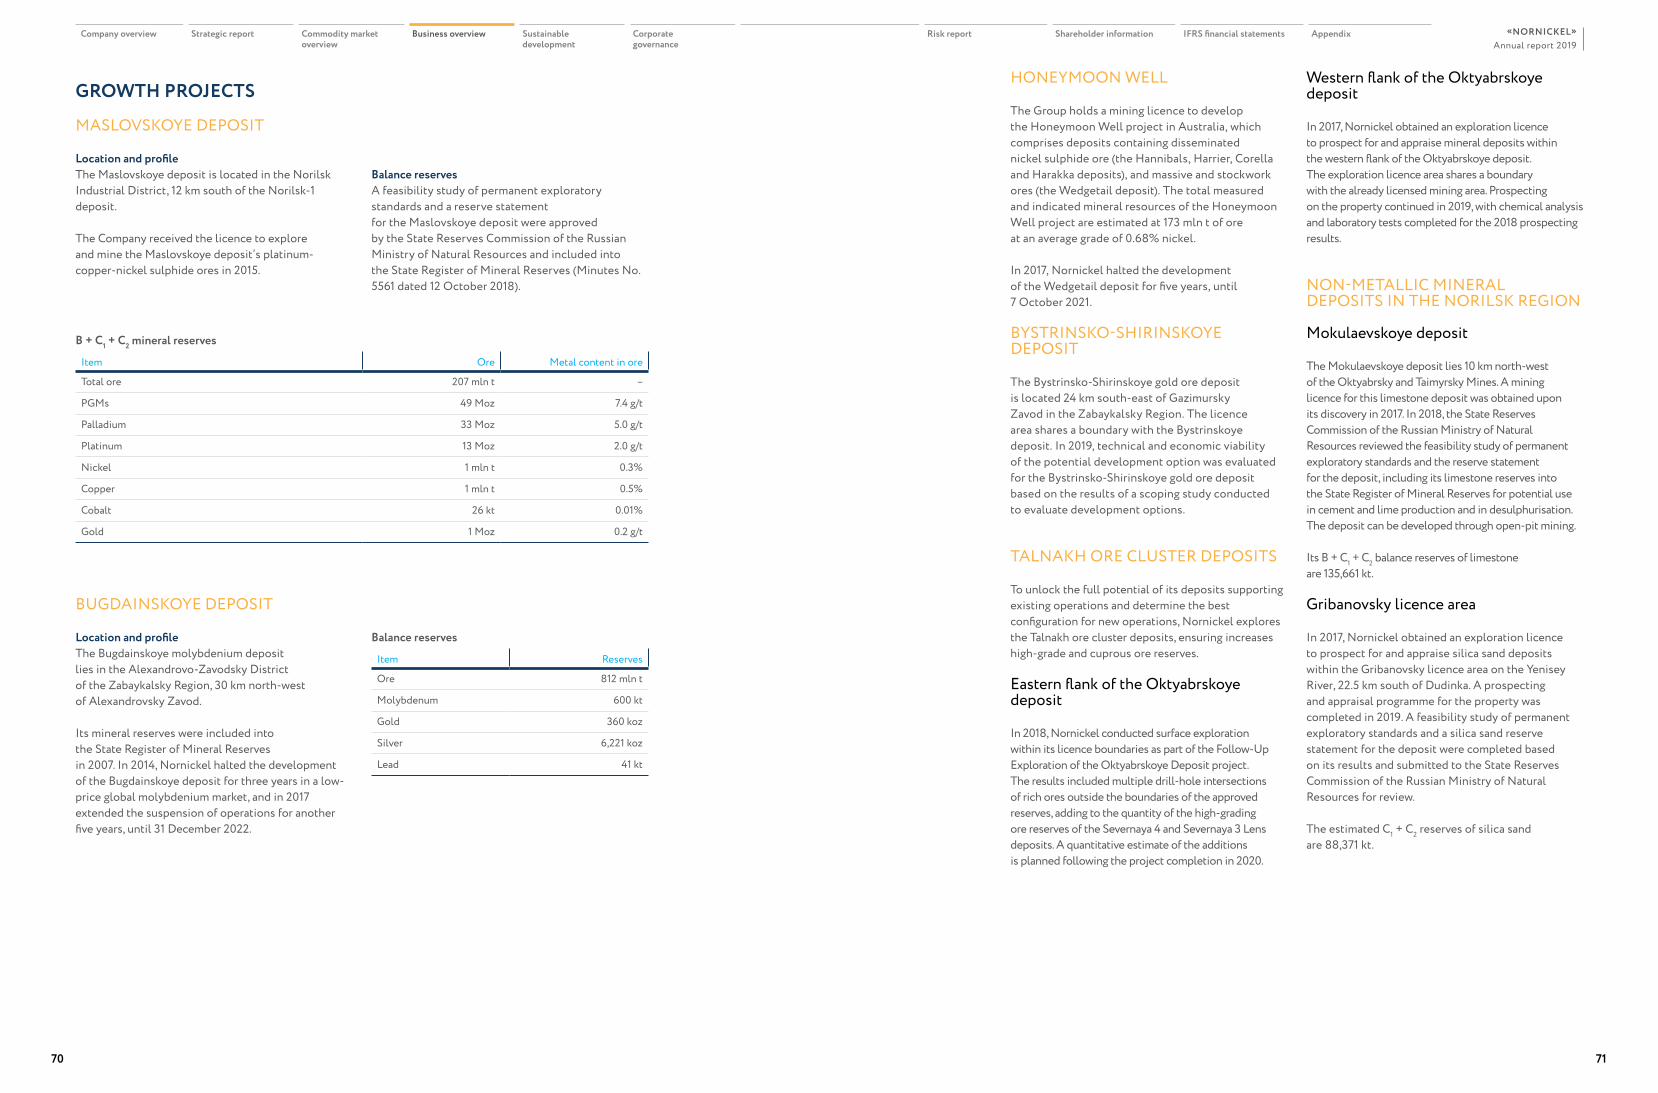
GROWTH PROJECTS
MASLOVSKOYE DEPOSIT
Location and profileThe Maslovskoye deposit is located in the Norilsk Industrial District, 12 km south of the Norilsk-1 deposit.
The Company received the licence to explore and mine the Maslovskoye deposit’s platinum-copper-nickel sulphide ores in 2015.
Balance reserves A feasibility study of permanent exploratory standards and a reserve statement for the Maslovskoye deposit were approved by the State Reserves Commission of the Russian Ministry of Natural Resources and included into the State Register of Mineral Reserves (Minutes No. 5561 dated 12 October 2018).
B + С1 + С2 mineral reserves
Item Ore Metal content in ore
Total ore 207 mln t –
PGMs 49 Moz 7.4 g/t
Palladium 33 Moz 5.0 g/t
Platinum 13 Moz 2.0 g/t
Nickel 1 mln t 0.3%
Copper 1 mln t 0.5%
Cobalt 26 kt 0.01%
Gold 1 Moz 0.2 g/t
Balance reserves
Item Reserves
Ore 812 mln t
Molybdenum 600 kt
Gold 360 koz
Silver 6,221 koz
Lead 41 kt
BUGDAINSKOYE DEPOSIT
Location and profileThe Bugdainskoye molybdenium deposit lies in the Alexandrovo-Zavodsky District of the Zabaykalsky Region, 30 km north-west of Alexandrovsky Zavod.
Its mineral reserves were included into the State Register of Mineral Reserves in 2007. In 2014, Nornickel halted the development of the Bugdainskoye deposit for three years in a low-price global molybdenium market, and in 2017 extended the suspension of operations for another five years, until 31 December 2022.
HONEYMOON WELL
The Group holds a mining licence to develop the Honeymoon Well project in Australia, which comprises deposits containing disseminated nickel sulphide ore (the Hannibals, Harrier, Corella and Harakka deposits), and massive and stockwork ores (the Wedgetail deposit). The total measured and indicated mineral resources of the Honeymoon Well project are estimated at 173 mln t of ore at an average grade of 0.68% nickel.
In 2017, Nornickel halted the development of the Wedgetail deposit for five years, until 7 October 2021.
BYSTRINSKO-SHIRINSKOYE DEPOSIT
The Bystrinsko-Shirinskoye gold ore deposit is located 24 km south-east of Gazimursky Zavod in the Zabaykalsky Region. The licence area shares a boundary with the Bystrinskoye deposit. In 2019, technical and economic viability of the potential development option was evaluated for the Bystrinsko-Shirinskoye gold ore deposit based on the results of a scoping study conducted to evaluate development options.
TALNAKH ORE CLUSTER DEPOSITS
To unlock the full potential of its deposits supporting existing operations and determine the best configuration for new operations, Nornickel explores the Talnakh ore cluster deposits, ensuring increases high-grade and cuprous ore reserves.
Eastern flank of the Oktyabrskoye deposit
In 2018, Nornickel conducted surface exploration within its licence boundaries as part of the Follow-Up Exploration of the Oktyabrskoye Deposit project. The results included multiple drill-hole intersections of rich ores outside the boundaries of the approved reserves, adding to the quantity of the high-grading ore reserves of the Severnaya 4 and Severnaya 3 Lens deposits. A quantitative estimate of the additions is planned following the project completion in 2020.
Western flank of the Oktyabrskoye deposit
In 2017, Nornickel obtained an exploration licence to prospect for and appraise mineral deposits within the western flank of the Oktyabrskoye deposit. The exploration licence area shares a boundary with the already licensed mining area. Prospecting on the property continued in 2019, with chemical analysis and laboratory tests completed for the 2018 prospecting results.
NON-METALLIC MINERAL DEPOSITS IN THE NORILSK REGION
Mokulaevskoye deposit
The Mokulaevskoye deposit lies 10 km north-west of the Oktyabrsky and Taimyrsky Mines. A mining licence for this limestone deposit was obtained upon its discovery in 2017. In 2018, the State Reserves Commission of the Russian Ministry of Natural Resources reviewed the feasibility study of permanent exploratory standards and the reserve statement for the deposit, including its limestone reserves into the State Register of Mineral Reserves for potential use in cement and lime production and in desulphurisation. The deposit can be developed through open-pit mining.
Its B + С1 + С2 balance reserves of limestone are 135,661 kt.
Gribanovsky licence area
In 2017, Nornickel obtained an exploration licence to prospect for and appraise silica sand deposits within the Gribanovsky licence area on the Yenisey River, 22.5 km south of Dudinka. A prospecting and appraisal programme for the property was completed in 2019. A feasibility study of permanent exploratory standards and a silica sand reserve statement for the deposit were completed based on its results and submitted to the State Reserves Commission of the Russian Ministry of Natural Resources for review.
The estimated С1 + С2 reserves of silica sand are 88,371 kt.
Company overview Strategic report Commodity market overview
Business overview Sustainable development
Corporate governance
Risk report Shareholder information IFRS financial statements AppendixAnnual report 2019
«NORNICKEL»
70 71
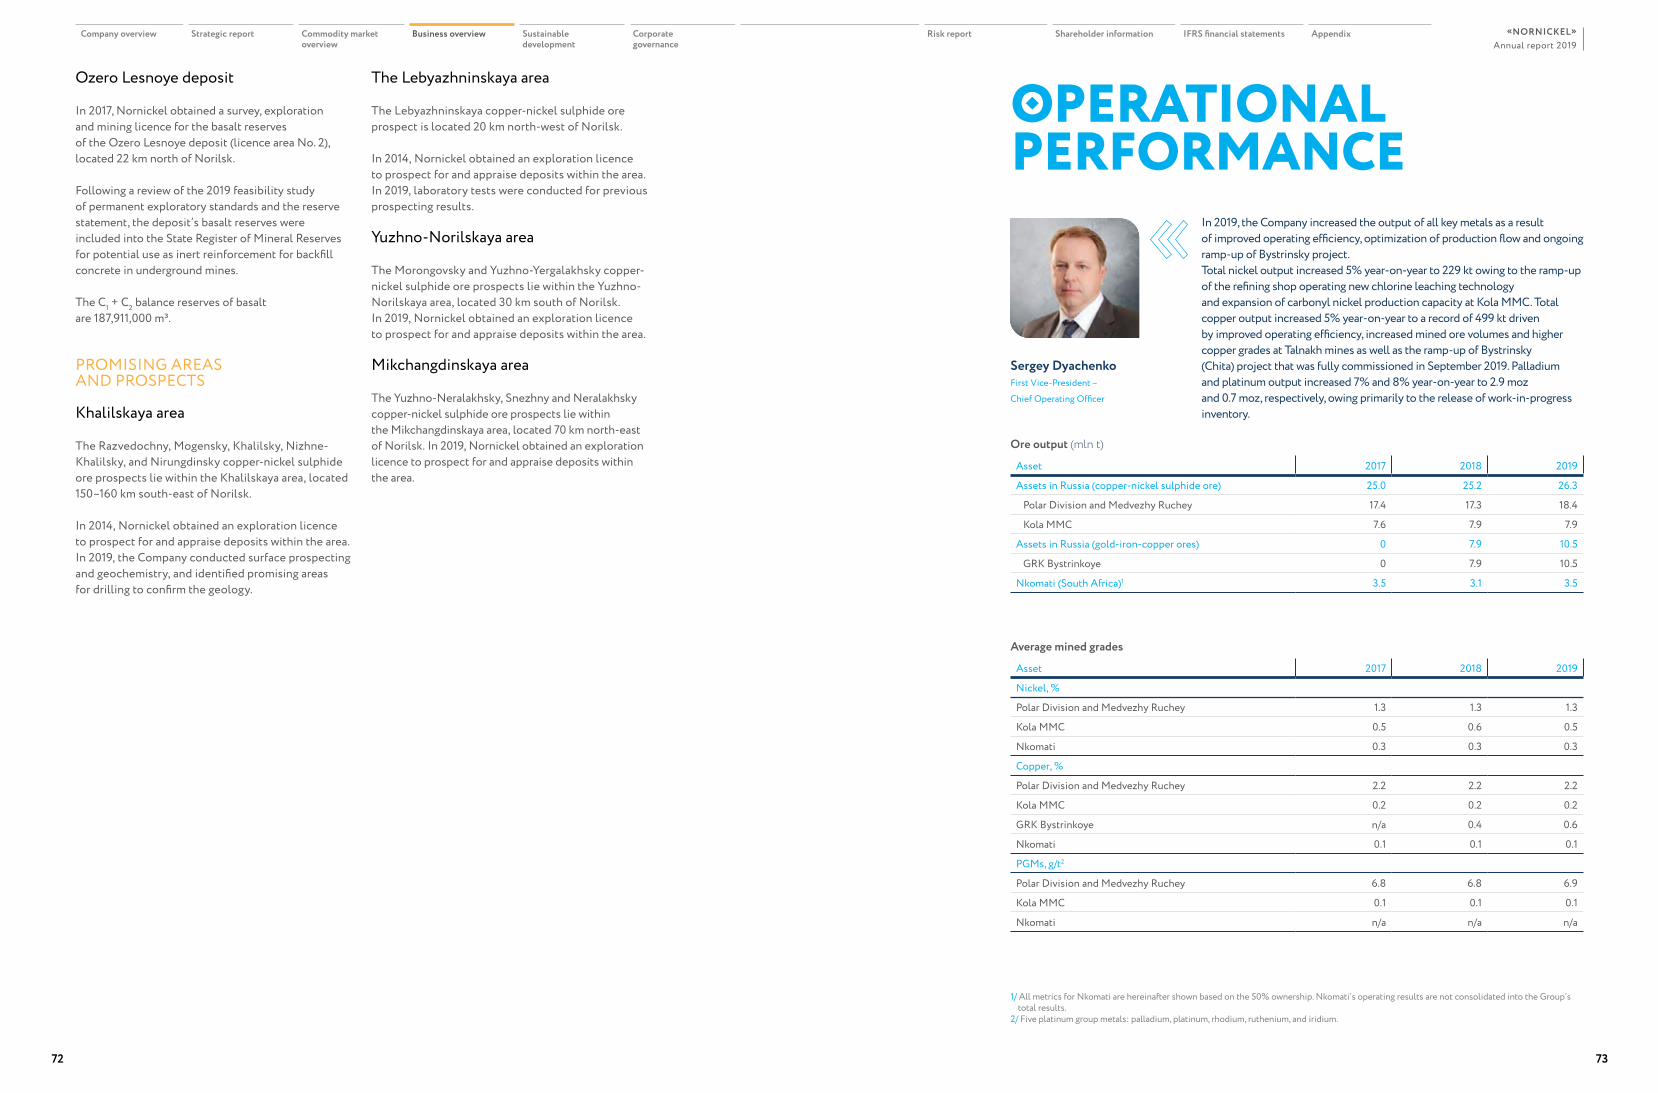
Ozero Lesnoye deposit
In 2017, Nornickel obtained a survey, exploration and mining licence for the basalt reserves of the Ozero Lesnoye deposit (licence area No. 2), located 22 km north of Norilsk.
Following a review of the 2019 feasibility study of permanent exploratory standards and the reserve statement, the deposit’s basalt reserves were included into the State Register of Mineral Reserves for potential use as inert reinforcement for backfill concrete in underground mines.
The С1 + С2 balance reserves of basalt are 187,911,000 m³.
PROMISING AREAS AND PROSPECTS
Khalilskaya area
The Razvedochny, Mogensky, Khalilsky, Nizhne-Khalilsky, and Nirungdinsky copper-nickel sulphide ore prospects lie within the Khalilskaya area, located 150–160 km south-east of Norilsk.
In 2014, Nornickel obtained an exploration licence to prospect for and appraise deposits within the area. In 2019, the Company conducted surface prospecting and geochemistry, and identified promising areas for drilling to confirm the geology.
The Lebyazhninskaya area
The Lebyazhninskaya copper-nickel sulphide ore prospect is located 20 km north-west of Norilsk.
In 2014, Nornickel obtained an exploration licence to prospect for and appraise deposits within the area. In 2019, laboratory tests were conducted for previous prospecting results.
Yuzhno-Norilskaya area
The Morongovsky and Yuzhno-Yergalakhsky copper-nickel sulphide ore prospects lie within the Yuzhno-Norilskaya area, located 30 km south of Norilsk. In 2019, Nornickel obtained an exploration licence to prospect for and appraise deposits within the area.
Mikchangdinskaya area
The Yuzhno-Neralakhsky, Snezhny and Neralakhsky copper-nickel sulphide ore prospects lie within the Mikchangdinskaya area, located 70 km north-east of Norilsk. In 2019, Nornickel obtained an exploration licence to prospect for and appraise deposits within the area.
OPERATIONAL PERFORMANCE
In 2019, the Company increased the output of all key metals as a result of improved operating efficiency, optimization of production flow and ongoing ramp-up of Bystrinsky project.Total nickel output increased 5% year-on-year to 229 kt owing to the ramp-up of the refining shop operating new chlorine leaching technology and expansion of carbonyl nickel production capacity at Kola MMC. Total copper output increased 5% year-on-year to a record of 499 kt driven by improved operating efficiency, increased mined ore volumes and higher copper grades at Talnakh mines as well as the ramp-up of Bystrinsky (Chita) project that was fully commissioned in September 2019. Palladium and platinum output increased 7% and 8% year-on-year to 2.9 moz and 0.7 moz, respectively, owing primarily to the release of work-in-progress inventory.
Sergey DyachenkoFirst Vice-President – Chief Operating Officer
Ore output (mln t)
Asset 2017 2018 2019
Assets in Russia (copper-nickel sulphide ore) 25.0 25.2 26.3
Polar Division and Medvezhy Ruchey 17.4 17.3 18.4
Kola MMC 7.6 7.9 7.9
Assets in Russia (gold-iron-copper ores) 0 7.9 10.5
GRK Bystrinkoye 0 7.9 10.5
Nkomati (South Africa)1 3.5 3.1 3.5
Average mined grades
Asset 2017 2018 2019
Nickel, %
Polar Division and Medvezhy Ruchey 1.3 1.3 1.3
Kola MMC 0.5 0.6 0.5
Nkomati 0.3 0.3 0.3
Copper, %
Polar Division and Medvezhy Ruchey 2.2 2.2 2.2
Kola MMC 0.2 0.2 0.2
GRK Bystrinkoye n/a 0.4 0.6
Nkomati 0.1 0.1 0.1
PGMs, g/t2
Polar Division and Medvezhy Ruchey 6.8 6.8 6.9
Kola MMC 0.1 0.1 0.1
Nkomati n/a n/a n/a
1/ All metrics for Nkomati are hereinafter shown based on the 50% ownership. Nkomati’s operating results are not consolidated into the Group’s total results.
2/ Five platinum group metals: palladium, platinum, rhodium, ruthenium, and iridium.
Company overview Strategic report Commodity market overview
Business overview Sustainable development
Corporate governance
Risk report Shareholder information IFRS financial statements AppendixAnnual report 2019
«NORNICKEL»
72 73
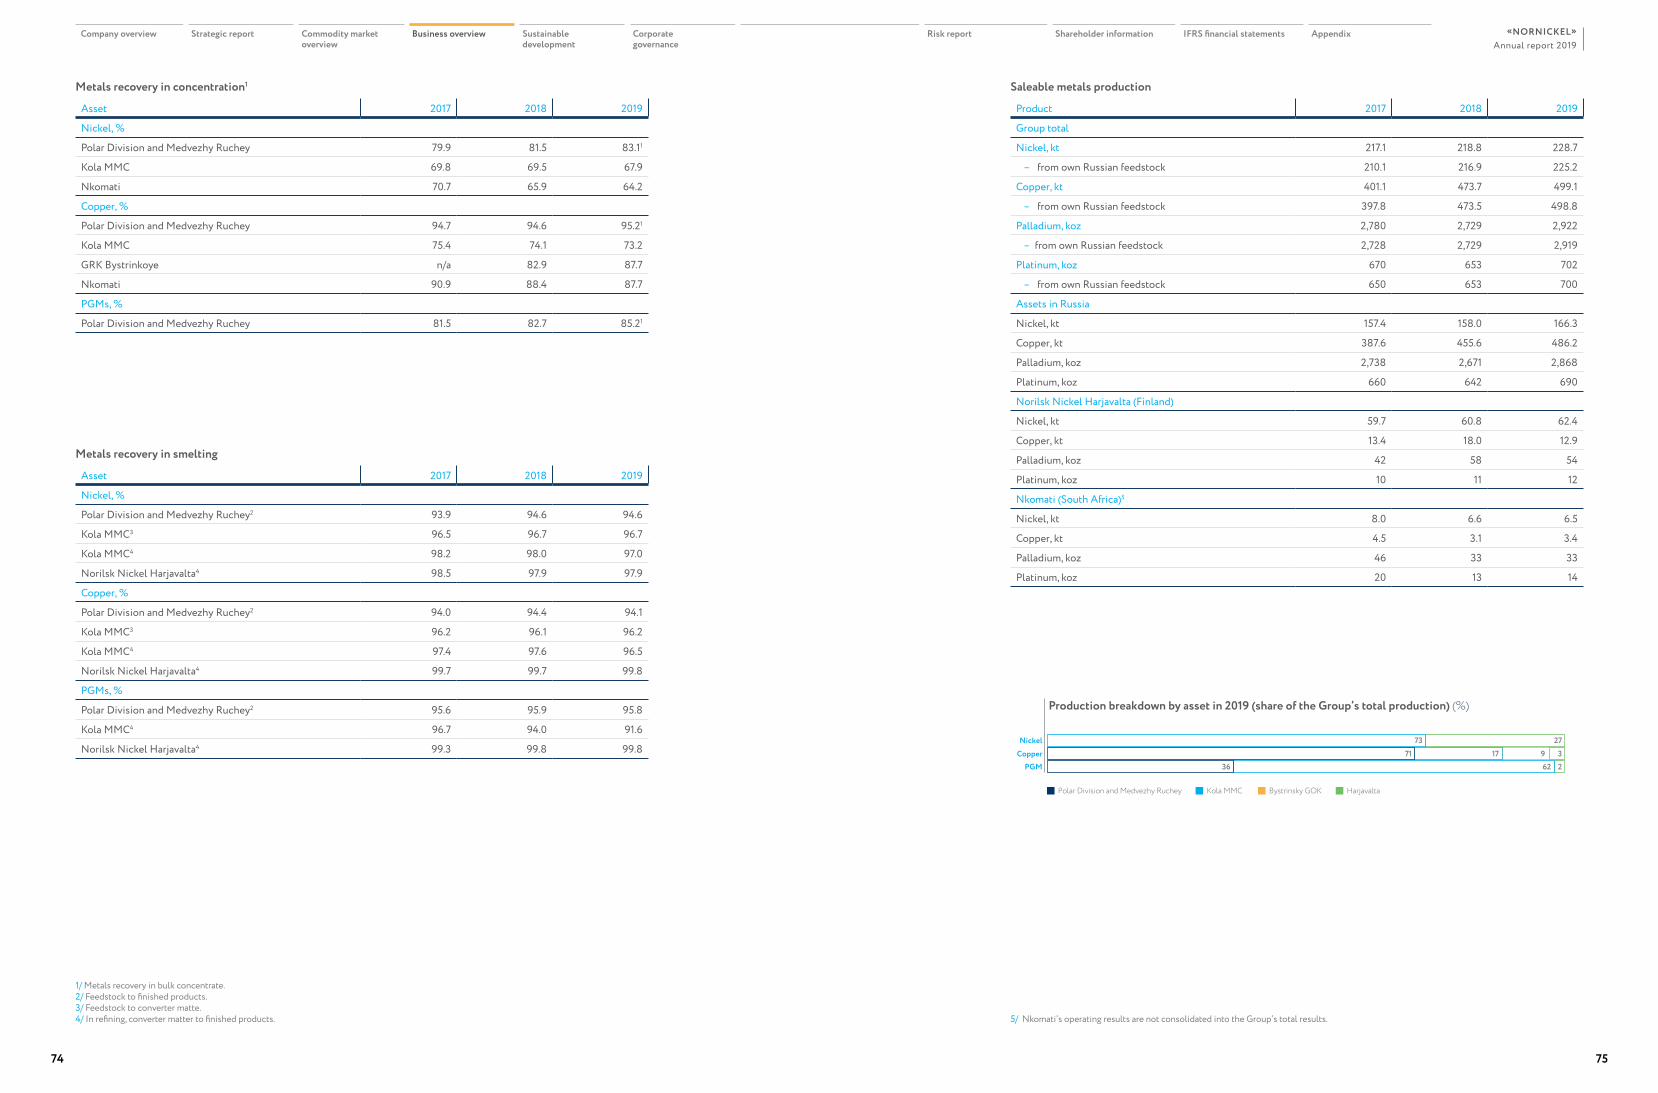
Metals recovery in smelting
Asset 2017 2018 2019
Nickel, %
Polar Division and Medvezhy Ruchey2 93.9 94.6 94.6
Kola MMC3 96.5 96.7 96.7
Kola MMC4 98.2 98.0 97.0
Norilsk Nickel Harjavalta4 98.5 97.9 97.9
Copper, %
Polar Division and Medvezhy Ruchey2 94.0 94.4 94.1
Kola MMC3 96.2 96.1 96.2
Kola MMC4 97.4 97.6 96.5
Norilsk Nickel Harjavalta4 99.7 99.7 99.8
PGMs, %
Polar Division and Medvezhy Ruchey2 95.6 95.9 95.8
Kola MMC4 96.7 94.0 91.6
Norilsk Nickel Harjavalta4 99.3 99.8 99.8
Saleable metals production
Product 2017 2018 2019
Group total
Nickel, kt 217.1 218.8 228.7
– from own Russian feedstock 210.1 216.9 225.2
Copper, kt 401.1 473.7 499.1
– from own Russian feedstock 397.8 473.5 498.8
Palladium, koz 2,780 2,729 2,922
– from own Russian feedstock 2,728 2,729 2,919
Platinum, koz 670 653 702
– from own Russian feedstock 650 653 700
Assets in Russia
Nickel, kt 157.4 158.0 166.3
Copper, kt 387.6 455.6 486.2
Palladium, koz 2,738 2,671 2,868
Platinum, koz 660 642 690
Norilsk Nickel Harjavalta (Finland)
Nickel, kt 59.7 60.8 62.4
Copper, kt 13.4 18.0 12.9
Palladium, koz 42 58 54
Platinum, koz 10 11 12
Nkomati (South Africa)5
Nickel, kt 8.0 6.6 6.5
Copper, kt 4.5 3.1 3.4
Palladium, koz 46 33 33
Platinum, koz 20 13 14
Metals recovery in concentration1
Asset 2017 2018 2019
Nickel, %
Polar Division and Medvezhy Ruchey 79.9 81.5 83.11
Kola MMC 69.8 69.5 67.9
Nkomati 70.7 65.9 64.2
Copper, %
Polar Division and Medvezhy Ruchey 94.7 94.6 95.21
Kola MMC 75.4 74.1 73.2
GRK Bystrinkoye n/a 82.9 87.7
Nkomati 90.9 88.4 87.7
PGMs, %
Polar Division and Medvezhy Ruchey 81.5 82.7 85.21
1/ Metals recovery in bulk concentrate.2/ Feedstock to finished products.3/ Feedstock to converter matte.4/ In refining, converter matter to finished products. 5/ Nkomati’s operating results are not consolidated into the Group’s total results.
Production breakdown by asset in 2019 (share of the Group’s total production) (%)
PGMCopperNickel 2773
71 391736 62 2
Polar Division and Medvezhy Ruchey Kola MMC Bystrinsky GOK Harjavalta
Company overview Strategic report Commodity market overview
Business overview Sustainable development
Corporate governance
Risk report Shareholder information IFRS financial statements AppendixAnnual report 2019
«NORNICKEL»
74 75
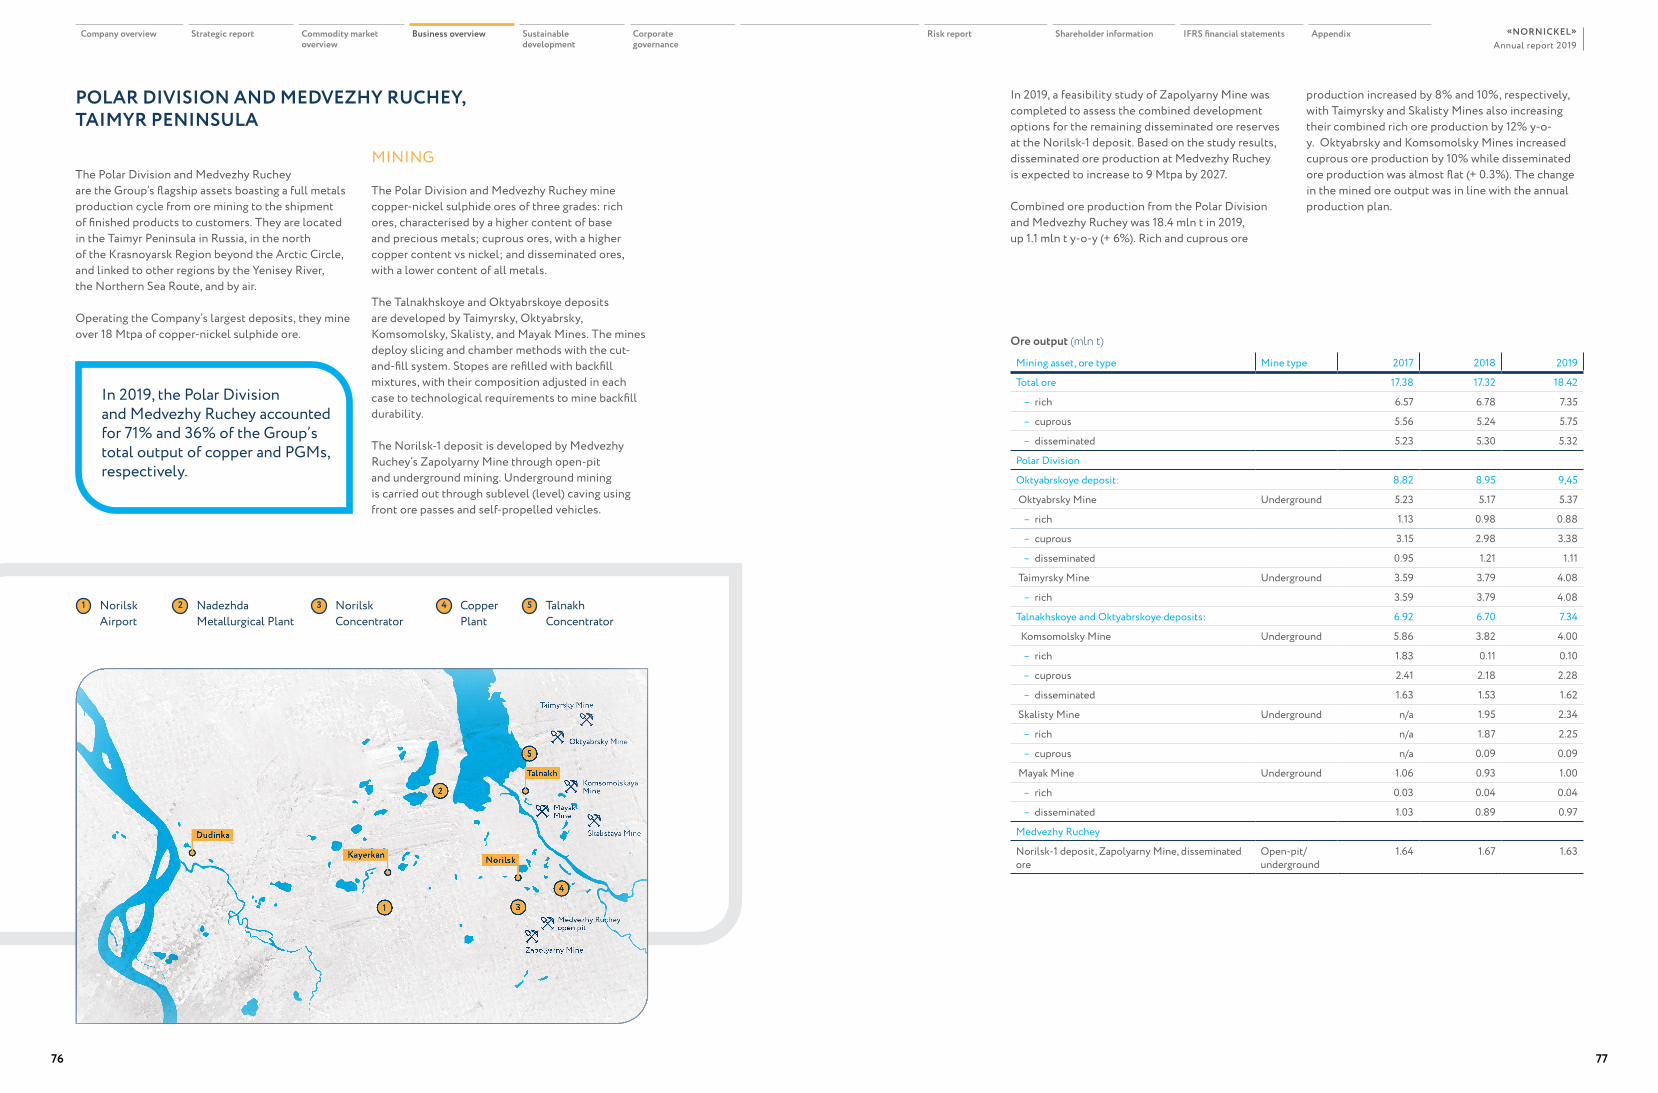
The Polar Division and Medvezhy Ruchey are the Group’s flagship assets boasting a full metals production cycle from ore mining to the shipment of finished products to customers. They are located in the Taimyr Peninsula in Russia, in the north of the Krasnoyarsk Region beyond the Arctic Circle, and linked to other regions by the Yenisey River, the Northern Sea Route, and by air.
Operating the Company’s largest deposits, they mine over 18 Mtpa of copper-nickel sulphide ore.
POLAR DIVISION AND MEDVEZHY RUCHEY, TAIMYR PENINSULA
In 2019, a feasibility study of Zapolyarny Mine was completed to assess the combined development options for the remaining disseminated ore reserves at the Norilsk-1 deposit. Based on the study results, disseminated ore production at Medvezhy Ruchey is expected to increase to 9 Mtpa by 2027.
Combined ore production from the Polar Division and Medvezhy Ruchey was 18.4 mln t in 2019, up 1.1 mln t y-o-y (+ 6%). Rich and cuprous ore
In 2019, the Polar Division and Medvezhy Ruchey accounted for 71% and 36% of the Group’s total output of copper and PGMs, respectively.
2
1
5
4
3
NorilskKayerkan
Talnakh
Dudinka
Taimyrsky Mine
Oktyabrsky Mine
Komsomolskaya Mine
Skalistaya Mine
Mayak Mine
Medvezhy Ruchey open pit
Zapolyarny Mine
Norilsk Airport
Nadezhda Metallurgical Plant
Norilsk Concentrator
Talnakh Concentrator
Copper Plant
1 2 3 54
production increased by 8% and 10%, respectively, with Taimyrsky and Skalisty Mines also increasing their combined rich ore production by 12% y-o-y. Oktyabrsky and Komsomolsky Mines increased cuprous ore production by 10% while disseminated ore production was almost flat (+ 0.3%). The change in the mined ore output was in line with the annual production plan.
Ore output (mln t)
Mining asset, ore type Mine type 2017 2018 2019
Total ore 17.38 17.32 18.42
– rich 6.57 6.78 7.35
– cuprous 5.56 5.24 5.75
– disseminated 5.23 5.30 5.32
Polar Division
Oktyabrskoye deposit: 8.82 8.95 9,45
Oktyabrsky Mine Underground 5.23 5.17 5.37
– rich 1.13 0.98 0.88
– cuprous 3.15 2.98 3.38
– disseminated 0.95 1.21 1.11
Taimyrsky Mine Underground 3.59 3.79 4.08
– rich 3.59 3.79 4.08
Talnakhskoye and Oktyabrskoye deposits: 6.92 6.70 7.34
Komsomolsky Mine Underground 5.86 3.82 4.00
– rich 1.83 0.11 0.10
– cuprous 2.41 2.18 2.28
– disseminated 1.63 1.53 1.62
Skalisty Mine Underground n/a 1.95 2.34
– rich n/a 1.87 2.25
– cuprous n/a 0.09 0.09
Mayak Mine Underground 1.06 0.93 1.00
– rich 0.03 0.04 0.04
– disseminated 1.03 0.89 0.97
Medvezhy Ruchey
Norilsk-1 deposit, Zapolyarny Mine, disseminated ore
Open-pit/underground
1.64 1.67 1.63
MINING
The Polar Division and Medvezhy Ruchey mine copper-nickel sulphide ores of three grades: rich ores, characterised by a higher content of base and precious metals; cuprous ores, with a higher copper content vs nickel; and disseminated ores, with a lower content of all metals.
The Talnakhskoye and Oktyabrskoye deposits are developed by Taimyrsky, Oktyabrsky, Komsomolsky, Skalisty, and Mayak Mines. The mines deploy slicing and chamber methods with the cut-and-fill system. Stopes are refilled with backfill mixtures, with their composition adjusted in each case to technological requirements to mine backfill durability.
The Norilsk-1 deposit is developed by Medvezhy Ruchey’s Zapolyarny Mine through open-pit and underground mining. Underground mining is carried out through sublevel (level) caving using front ore passes and self-propelled vehicles.
Company overview Strategic report Commodity market overview
Business overview Sustainable development
Corporate governance
Risk report Shareholder information IFRS financial statements AppendixAnnual report 2019
«NORNICKEL»
76 77
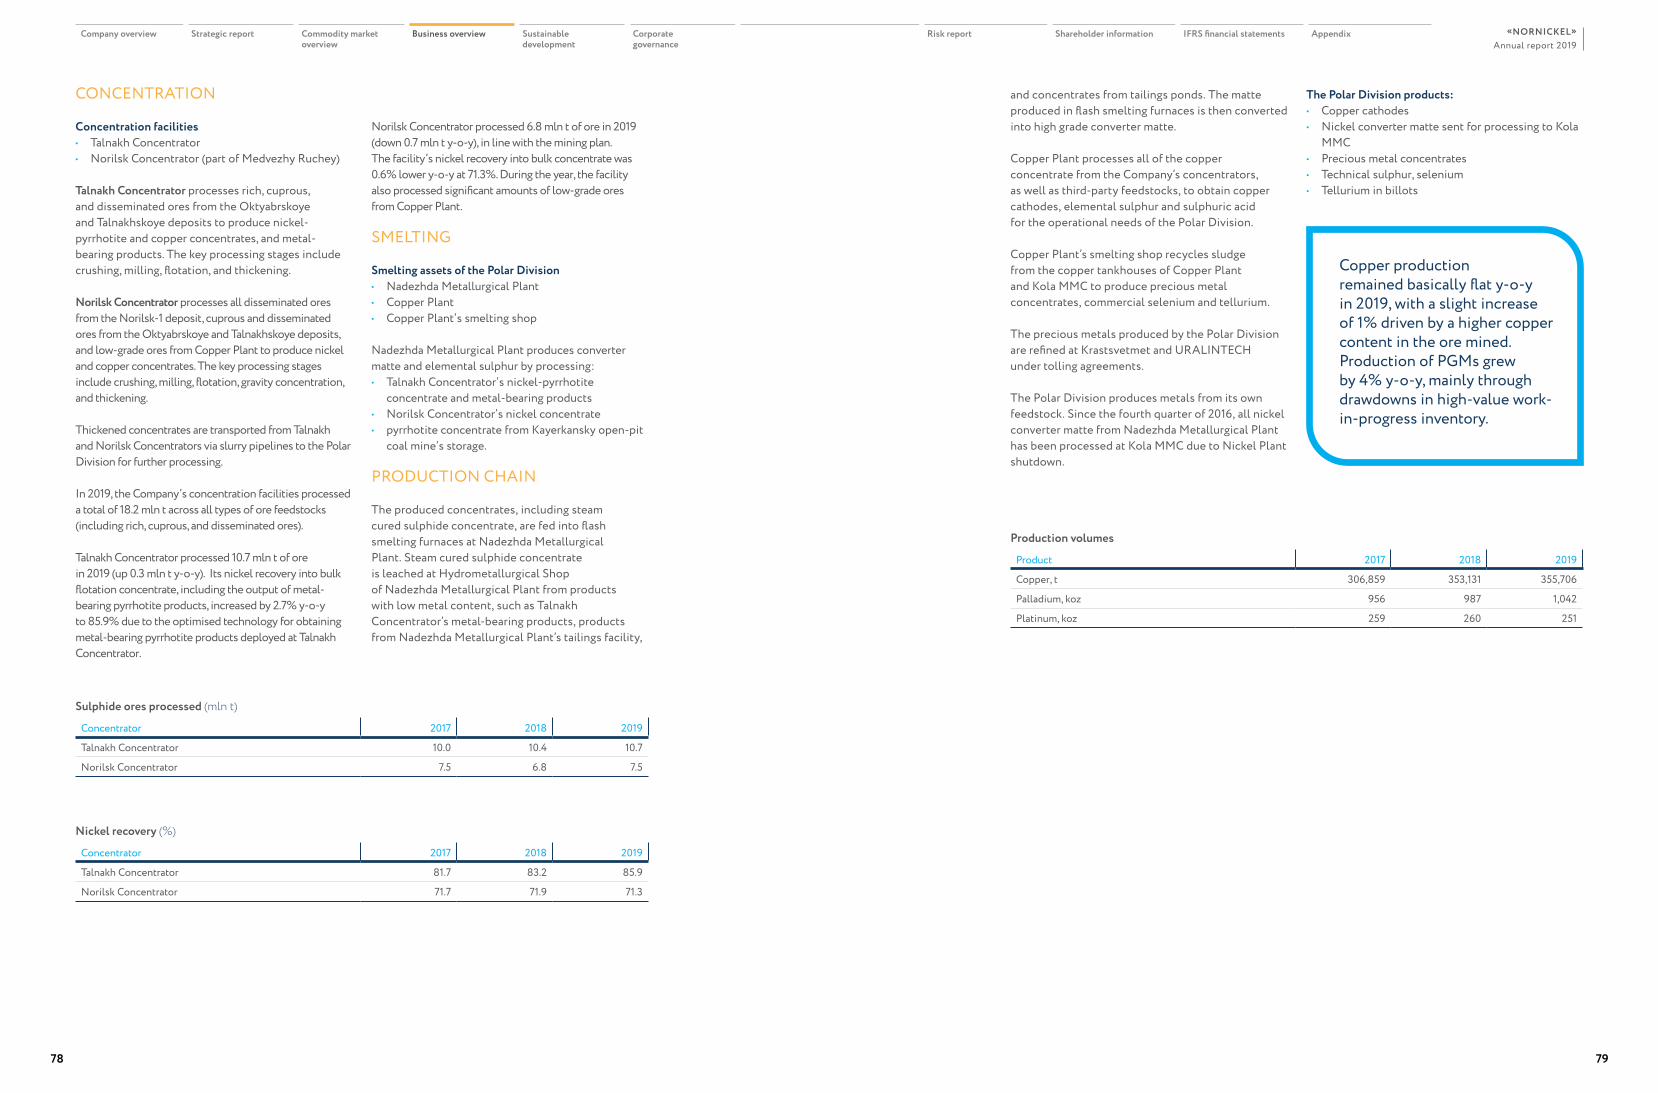
CONCENTRATION
Concentration facilities • Talnakh Concentrator• Norilsk Concentrator (part of Medvezhy Ruchey)
Talnakh Concentrator processes rich, cuprous, and disseminated ores from the Oktyabrskoye and Talnakhskoye deposits to produce nickel-pyrrhotite and copper concentrates, and metal-bearing products. The key processing stages include crushing, milling, flotation, and thickening.
Norilsk Concentrator processes all disseminated ores from the Norilsk-1 deposit, cuprous and disseminated ores from the Oktyabrskoye and Talnakhskoye deposits, and low-grade ores from Copper Plant to produce nickel and copper concentrates. The key processing stages include crushing, milling, flotation, gravity concentration, and thickening.
Thickened concentrates are transported from Talnakh and Norilsk Concentrators via slurry pipelines to the Polar Division for further processing.
In 2019, the Company’s concentration facilities processed a total of 18.2 mln t across all types of ore feedstocks (including rich, cuprous, and disseminated ores).
Talnakh Concentrator processed 10.7 mln t of ore in 2019 (up 0.3 mln t y-o-y). Its nickel recovery into bulk flotation concentrate, including the output of metal-bearing pyrrhotite products, increased by 2.7% y-o-y to 85.9% due to the optimised technology for obtaining metal-bearing pyrrhotite products deployed at Talnakh Concentrator.
Norilsk Concentrator processed 6.8 mln t of ore in 2019 (down 0.7 mln t y-o-y), in line with the mining plan. The facility’s nickel recovery into bulk concentrate was 0.6% lower y-o-y at 71.3%. During the year, the facility also processed significant amounts of low-grade ores from Copper Plant.
SMELTING
Smelting assets of the Polar Division• Nadezhda Metallurgical Plant• Copper Plant• Copper Plant’s smelting shop
Nadezhda Metallurgical Plant produces converter matte and elemental sulphur by processing:• Talnakh Concentrator’s nickel-pyrrhotite
concentrate and metal-bearing products• Norilsk Concentrator’s nickel concentrate• pyrrhotite concentrate from Kayerkansky open-pit
coal mine’s storage.
PRODUCTION CHAIN
The produced concentrates, including steam cured sulphide concentrate, are fed into flash smelting furnaces at Nadezhda Metallurgical Plant. Steam cured sulphide concentrate is leached at Hydrometallurgical Shop of Nadezhda Metallurgical Plant from products with low metal content, such as Talnakh Concentrator’s metal-bearing products, products from Nadezhda Metallurgical Plant’s tailings facility,
and concentrates from tailings ponds. The matte produced in flash smelting furnaces is then converted into high grade converter matte.
Copper Plant processes all of the copper concentrate from the Company’s concentrators, as well as third-party feedstocks, to obtain copper cathodes, elemental sulphur and sulphuric acid for the operational needs of the Polar Division.
Copper Plant’s smelting shop recycles sludge from the copper tankhouses of Copper Plant and Kola MMC to produce precious metal concentrates, commercial selenium and tellurium.
The precious metals produced by the Polar Division are refined at Krastsvetmet and URALINTECH under tolling agreements.
The Polar Division produces metals from its own feedstock. Since the fourth quarter of 2016, all nickel converter matte from Nadezhda Metallurgical Plant has been processed at Kola MMC due to Nickel Plant shutdown.
The Polar Division products: • Copper cathodes• Nickel converter matte sent for processing to Kola
MMC• Precious metal concentrates• Technical sulphur, selenium• Tellurium in billots
Copper production remained basically flat y-o-y in 2019, with a slight increase of 1% driven by a higher copper content in the ore mined. Production of PGMs grew by 4% y-o-y, mainly through drawdowns in high-value work-in-progress inventory.
Production volumes
Product 2017 2018 2019
Copper, t 306,859 353,131 355,706
Palladium, koz 956 987 1,042
Platinum, koz 259 260 251
Sulphide ores processed (mln t)
Concentrator 2017 2018 2019
Talnakh Concentrator 10.0 10.4 10.7
Norilsk Concentrator 7.5 6.8 7.5
Nickel recovery (%)
Concentrator 2017 2018 2019
Talnakh Concentrator 81.7 83.2 85.9
Norilsk Concentrator 71.7 71.9 71.3
Company overview Strategic report Commodity market overview
Business overview Sustainable development
Corporate governance
Risk report Shareholder information IFRS financial statements AppendixAnnual report 2019
«NORNICKEL»
78 79
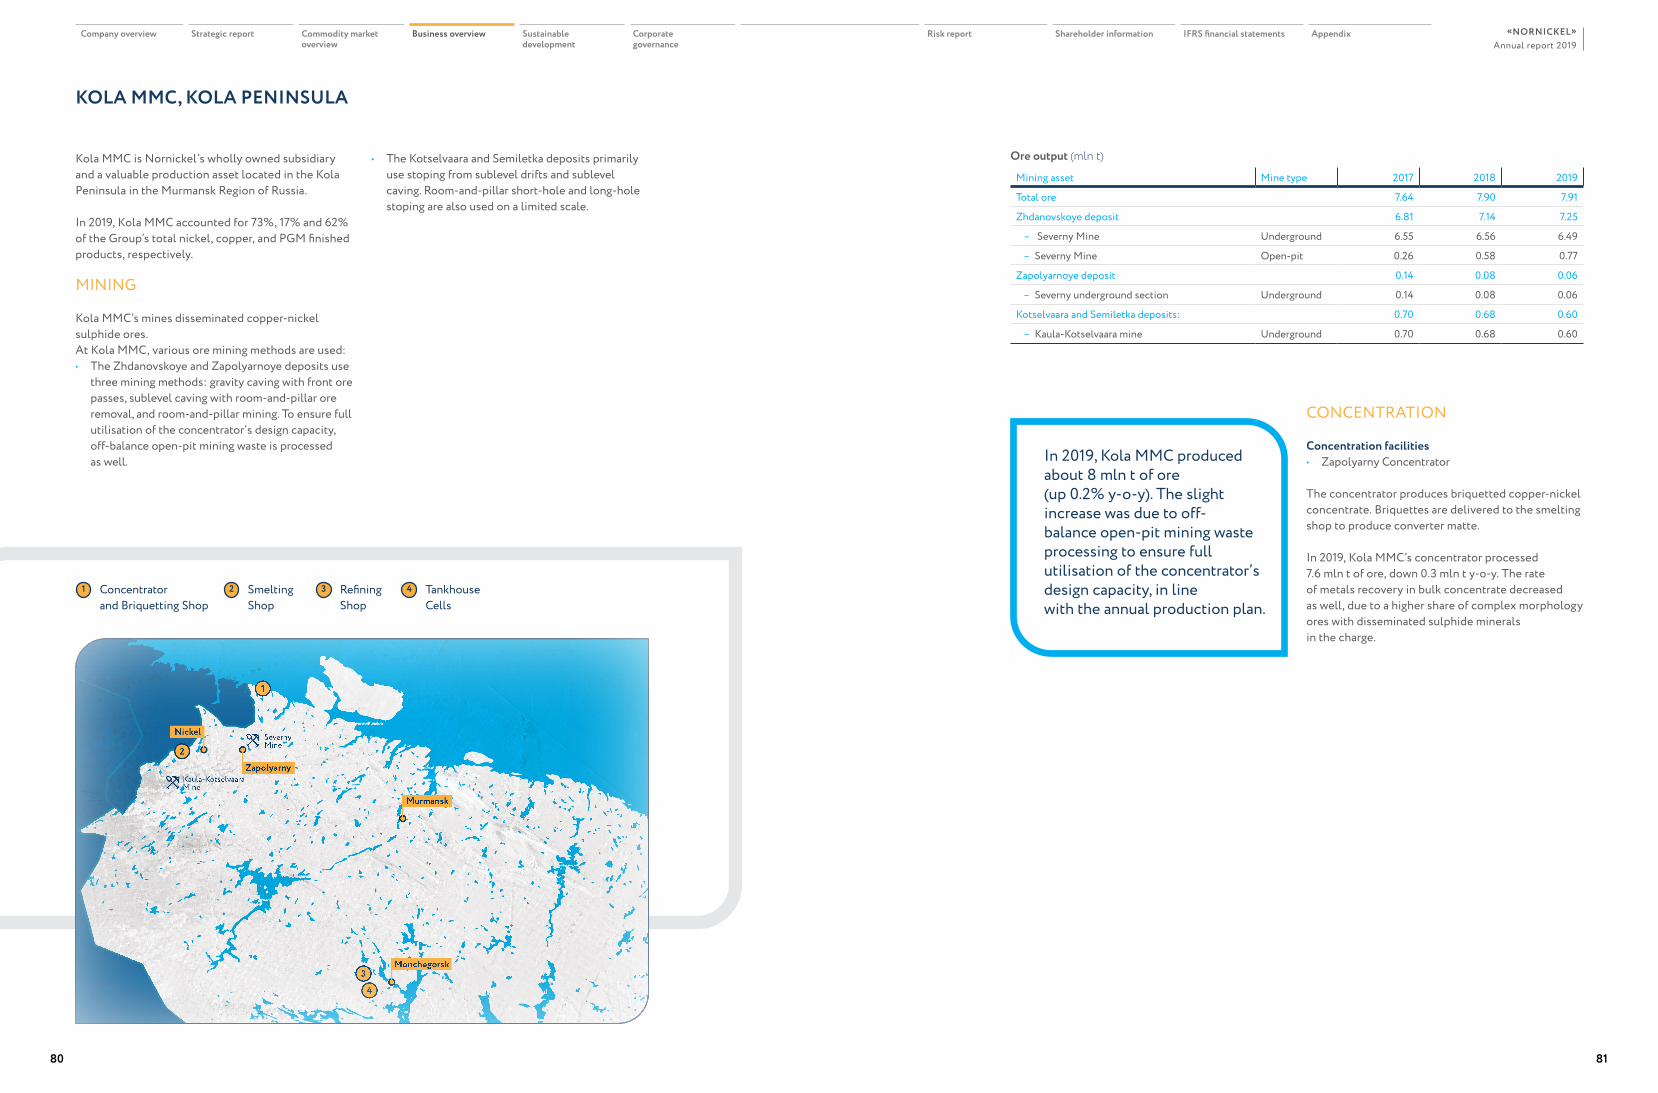
Kola MMC is Nornickel’s wholly owned subsidiary and a valuable production asset located in the Kola Peninsula in the Murmansk Region of Russia.
In 2019, Kola MMC accounted for 73%, 17% and 62% of the Group’s total nickel, copper, and PGM finished products, respectively.
MINING
Kola MMC’s mines disseminated copper-nickel sulphide ores. At Kola MMC, various ore mining methods are used:• The Zhdanovskoye and Zapolyarnoye deposits use
three mining methods: gravity caving with front ore passes, sublevel caving with room-and-pillar ore removal, and room-and-pillar mining. To ensure full utilisation of the concentrator’s design capacity, off-balance open-pit mining waste is processed as well.
KOLA MMC, KOLA PENINSULA
In 2019, Kola MMC produced about 8 mln t of ore (up 0.2% y-o-y). The slight increase was due to off-balance open-pit mining waste processing to ensure full utilisation of the concentrator’s design capacity, in line with the annual production plan.
2
1
3
4
Severny Mine
Kaula-Kotselvaara Mine
Zapolyarny
Nickel
Murmansk
Monchegorsk
Concentrator and Briquetting Shop
Refining Shop
Smelting Shop
Tankhouse Cells
1 2 3 4
• The Kotselvaara and Semiletka deposits primarily use stoping from sublevel drifts and sublevel caving. Room-and-pillar short-hole and long-hole stoping are also used on a limited scale.
Ore output (mln t)
Mining asset Mine type 2017 2018 2019
Total ore 7.64 7.90 7.91
Zhdanovskoye deposit 6.81 7.14 7.25
– Severny Mine Underground 6.55 6.56 6.49
– Severny Mine Open-pit 0.26 0.58 0.77
Zapolyarnoye deposit 0.14 0.08 0.06
– Severny underground section Underground 0.14 0.08 0.06
Kotselvaara and Semiletka deposits: 0.70 0.68 0.60
– Kaula-Kotselvaara mine Underground 0.70 0.68 0.60
CONCENTRATION
Concentration facilities• Zapolyarny Concentrator
The concentrator produces briquetted copper-nickel concentrate. Briquettes are delivered to the smelting shop to produce converter matte.
In 2019, Kola MMC’s concentrator processed 7.6 mln t of ore, down 0.3 mln t y-o-y. The rate of metals recovery in bulk concentrate decreased as well, due to a higher share of complex morphology ores with disseminated sulphide minerals in the charge.
Company overview Strategic report Commodity market overview
Business overview Sustainable development
Corporate governance
Risk report Shareholder information IFRS financial statements AppendixAnnual report 2019
«NORNICKEL»
80 81
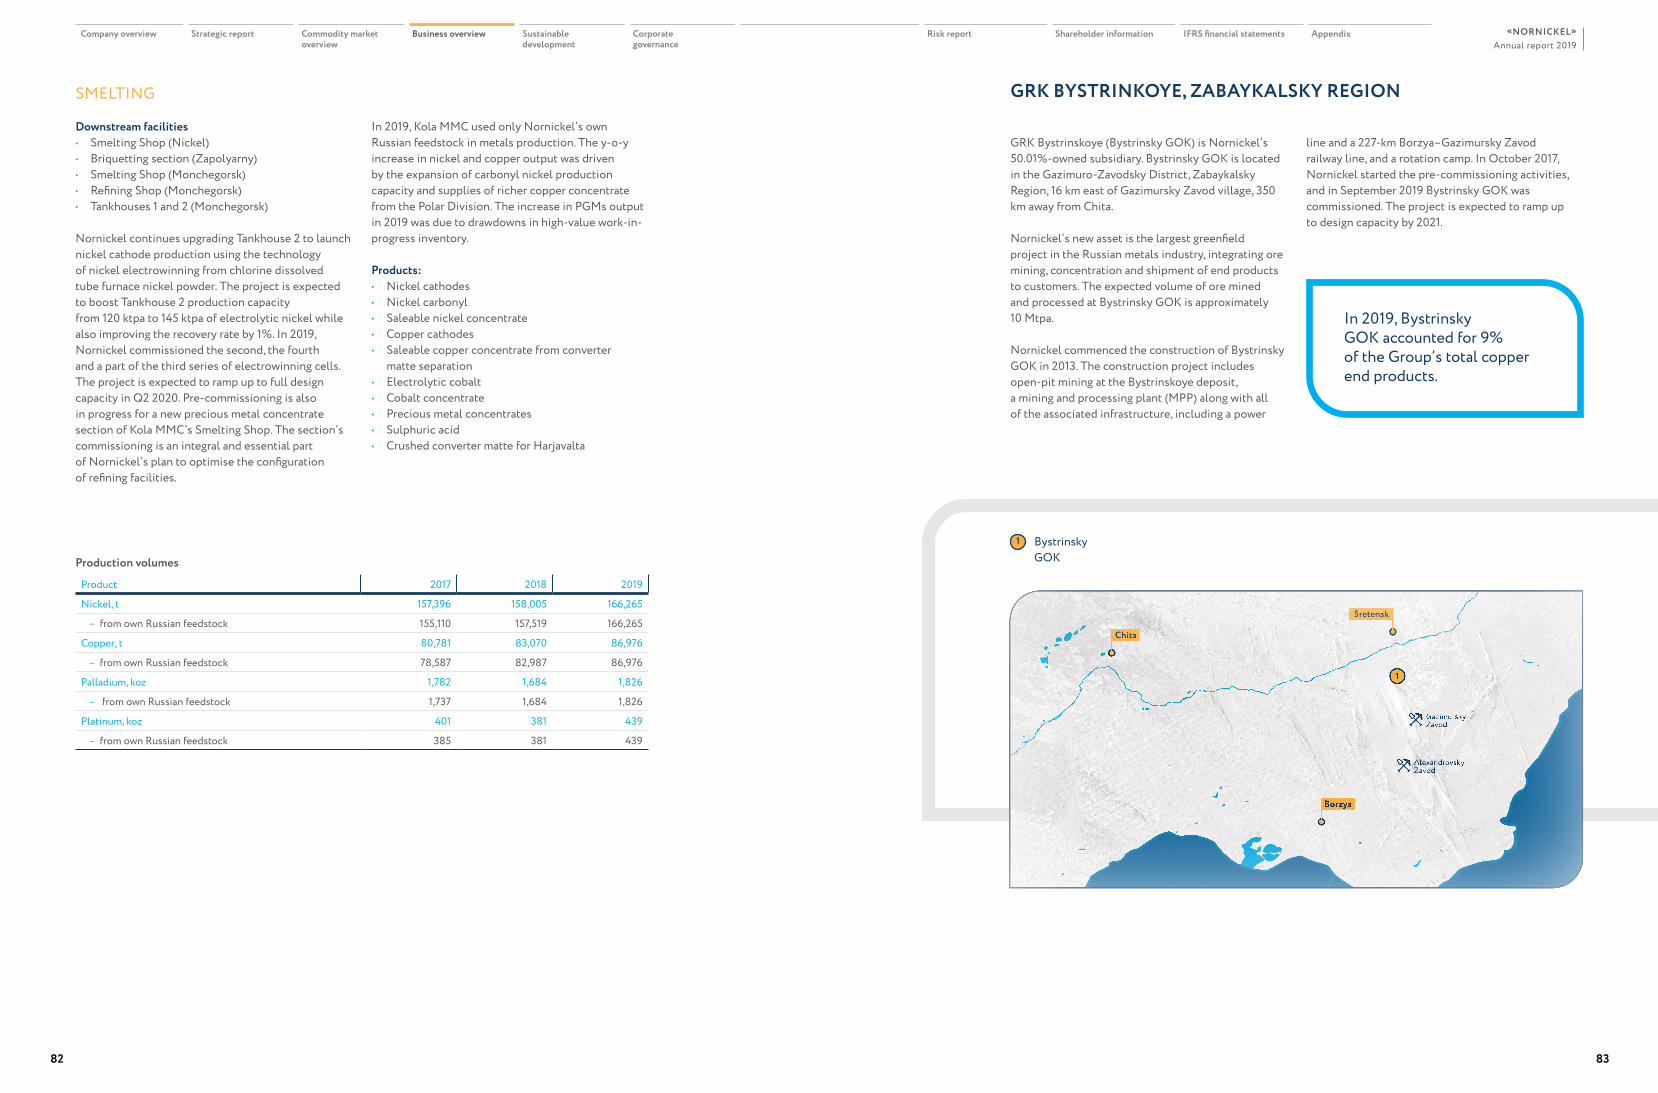
Production volumes
Product 2017 2018 2019
Nickel, t 157,396 158,005 166,265
– from own Russian feedstock 155,110 157,519 166,265
Copper, t 80,781 83,070 86,976
– from own Russian feedstock 78,587 82,987 86,976
Palladium, koz 1,782 1,684 1,826
– from own Russian feedstock 1,737 1,684 1,826
Platinum, koz 401 381 439
– from own Russian feedstock 385 381 439
SMELTING
Downstream facilities• Smelting Shop (Nickel)• Briquetting section (Zapolyarny)• Smelting Shop (Monchegorsk)• Refining Shop (Monchegorsk)• Tankhouses 1 and 2 (Monchegorsk)
Nornickel continues upgrading Tankhouse 2 to launch nickel cathode production using the technology of nickel electrowinning from chlorine dissolved tube furnace nickel powder. The project is expected to boost Tankhouse 2 production capacity from 120 ktpa to 145 ktpa of electrolytic nickel while also improving the recovery rate by 1%. In 2019, Nornickel commissioned the second, the fourth and a part of the third series of electrowinning cells. The project is expected to ramp up to full design capacity in Q2 2020. Pre-commissioning is also in progress for a new precious metal concentrate section of Kola MMC’s Smelting Shop. The section’s commissioning is an integral and essential part of Nornickel’s plan to optimise the configuration of refining facilities.
In 2019, Kola MMC used only Nornickel’s own Russian feedstock in metals production. The y-o-y increase in nickel and copper output was driven by the expansion of carbonyl nickel production capacity and supplies of richer copper concentrate from the Polar Division. The increase in PGMs output in 2019 was due to drawdowns in high-value work-in-progress inventory.
Products: • Nickel cathodes • Nickel carbonyl• Saleable nickel concentrate• Copper cathodes• Saleable copper concentrate from converter
matte separation• Electrolytic cobalt• Cobalt concentrate• Precious metal concentrates• Sulphuric acid• Crushed converter matte for Harjavalta
GRK BYSTRINKOYE, ZABAYKALSKY REGION
GRK Bystrinskoye (Bystrinsky GOK) is Nornickel’s 50.01%-owned subsidiary. Bystrinsky GOK is located in the Gazimuro-Zavodsky District, Zabaykalsky Region, 16 km east of Gazimursky Zavod village, 350 km away from Chita.
Nornickel’s new asset is the largest greenfield project in the Russian metals industry, integrating ore mining, concentration and shipment of end products to customers. The expected volume of ore mined and processed at Bystrinsky GOK is approximately 10 Mtpa.
Nornickel commenced the construction of Bystrinsky GOK in 2013. The construction project includes open-pit mining at the Bystrinskoye deposit, a mining and processing plant (MPP) along with all of the associated infrastructure, including a power
line and a 227-km Borzya–Gazimursky Zavod railway line, and a rotation camp. In October 2017, Nornickel started the pre-commissioning activities, and in September 2019 Bystrinsky GOK was commissioned. The project is expected to ramp up to design capacity by 2021.
In 2019, Bystrinsky GOK accounted for 9% of the Group’s total copper end products.
1
Alexandrovsky Zavod
Gazimursky Zavod
Sretensk
Chita
Borzya
Bystrinsky GOK
1
Company overview Strategic report Commodity market overview
Business overview Sustainable development
Corporate governance
Risk report Shareholder information IFRS financial statements AppendixAnnual report 2019
«NORNICKEL»
82 83
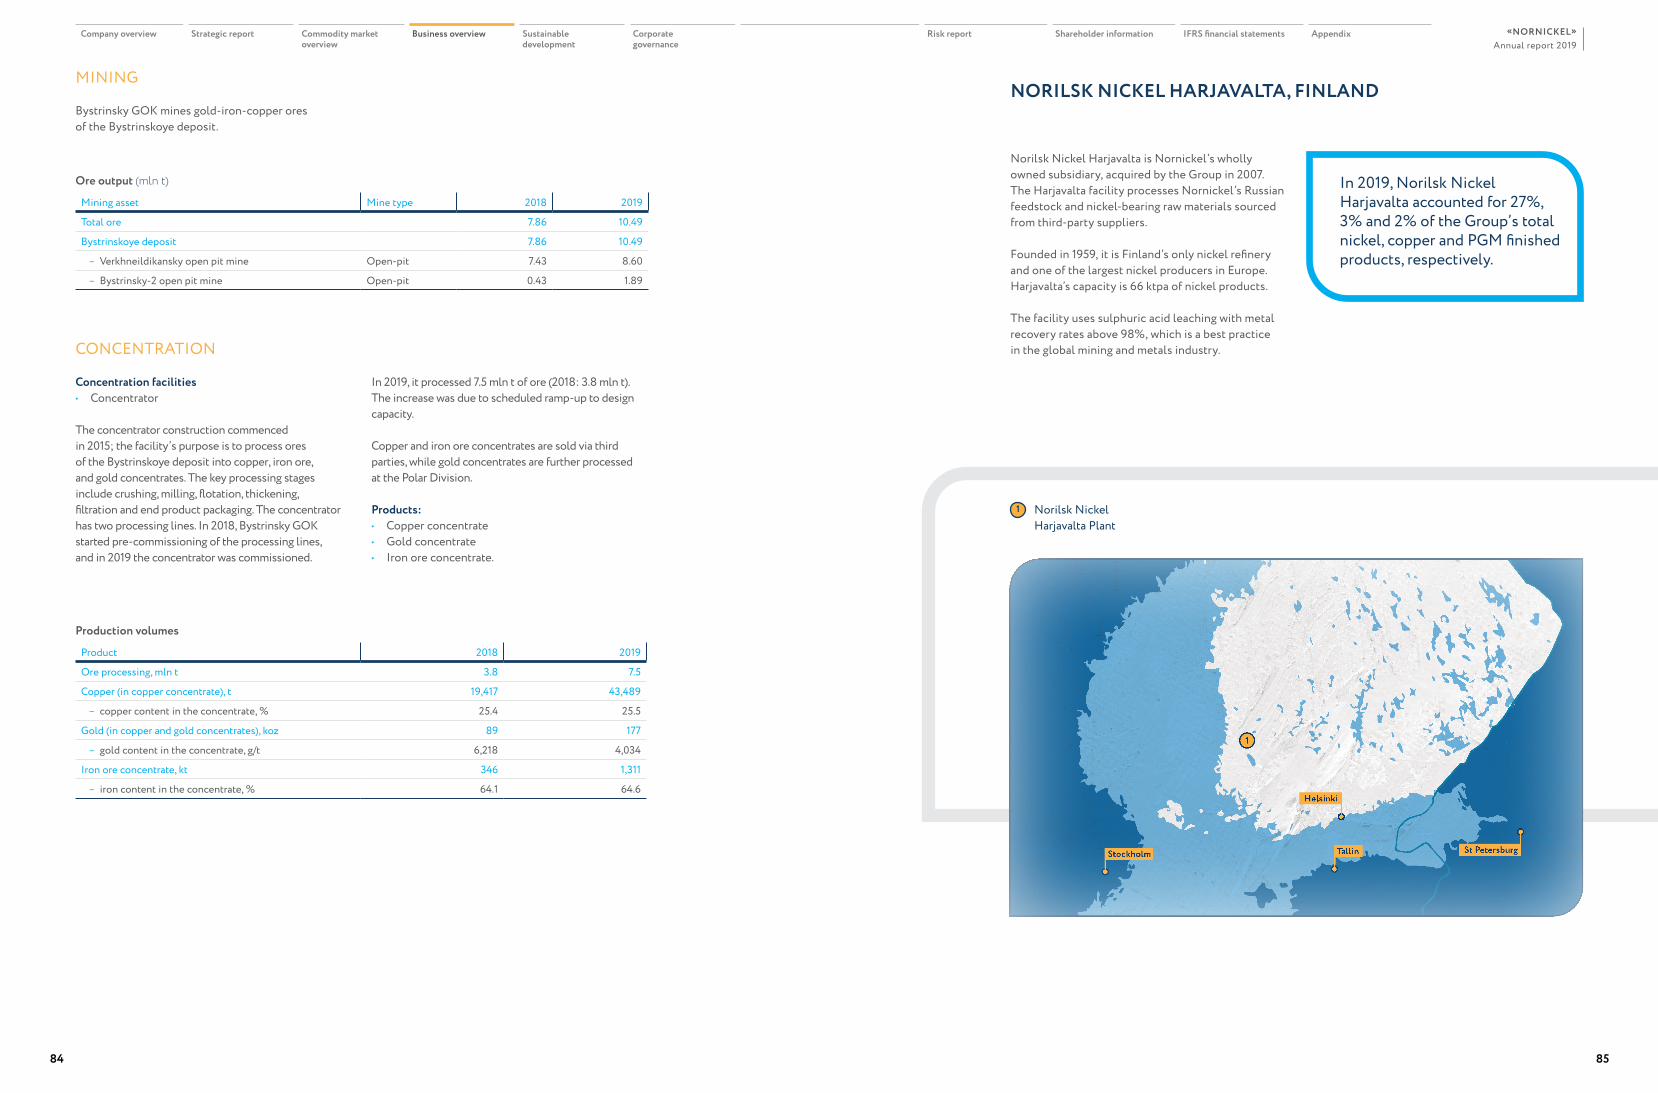
MINING
Bystrinsky GOK mines gold-iron-copper ores of the Bystrinskoye deposit.
CONCENTRATION
Concentration facilities • Concentrator
The concentrator construction commenced in 2015; the facility’s purpose is to process ores of the Bystrinskoye deposit into copper, iron ore, and gold concentrates. The key processing stages include crushing, milling, flotation, thickening, filtration and end product packaging. The concentrator has two processing lines. In 2018, Bystrinsky GOK started pre-commissioning of the processing lines, and in 2019 the concentrator was commissioned.
In 2019, it processed 7.5 mln t of ore (2018: 3.8 mln t). The increase was due to scheduled ramp-up to design capacity.
Copper and iron ore concentrates are sold via third parties, while gold concentrates are further processed at the Polar Division.
Products:• Copper concentrate• Gold concentrate• Iron ore concentrate.
Ore output (mln t)
Mining asset Mine type 2018 2019
Total ore 7.86 10.49
Bystrinskoye deposit 7.86 10.49
– Verkhneildikansky open pit mine Open-pit 7.43 8.60
– Bystrinsky-2 open pit mine Open-pit 0.43 1.89
Production volumes
Product 2018 2019
Ore processing, mln t 3.8 7.5
Copper (in copper concentrate), t 19,417 43,489
– copper content in the concentrate, % 25.4 25.5
Gold (in copper and gold concentrates), koz 89 177
– gold content in the concentrate, g/t 6,218 4,034
Iron ore concentrate, kt 346 1,311
– iron content in the concentrate, % 64.1 64.6
NORILSK NICKEL HARJAVALTA, FINLAND
Norilsk Nickel Harjavalta is Nornickel’s wholly owned subsidiary, acquired by the Group in 2007. The Harjavalta facility processes Nornickel’s Russian feedstock and nickel-bearing raw materials sourced from third-party suppliers.
Founded in 1959, it is Finland’s only nickel refinery and one of the largest nickel producers in Europe. Harjavalta’s capacity is 66 ktpa of nickel products.
The facility uses sulphuric acid leaching with metal recovery rates above 98%, which is a best practice in the global mining and metals industry.
In 2019, Norilsk Nickel Harjavalta accounted for 27%, 3% and 2% of the Group’s total nickel, copper and PGM finished products, respectively.
1
St Petersburg
Helsinki
TallinStockholm
Norilsk Nickel Harjavalta Plant
1
Company overview Strategic report Commodity market overview
Business overview Sustainable development
Corporate governance
Risk report Shareholder information IFRS financial statements AppendixAnnual report 2019
«NORNICKEL»
84 85
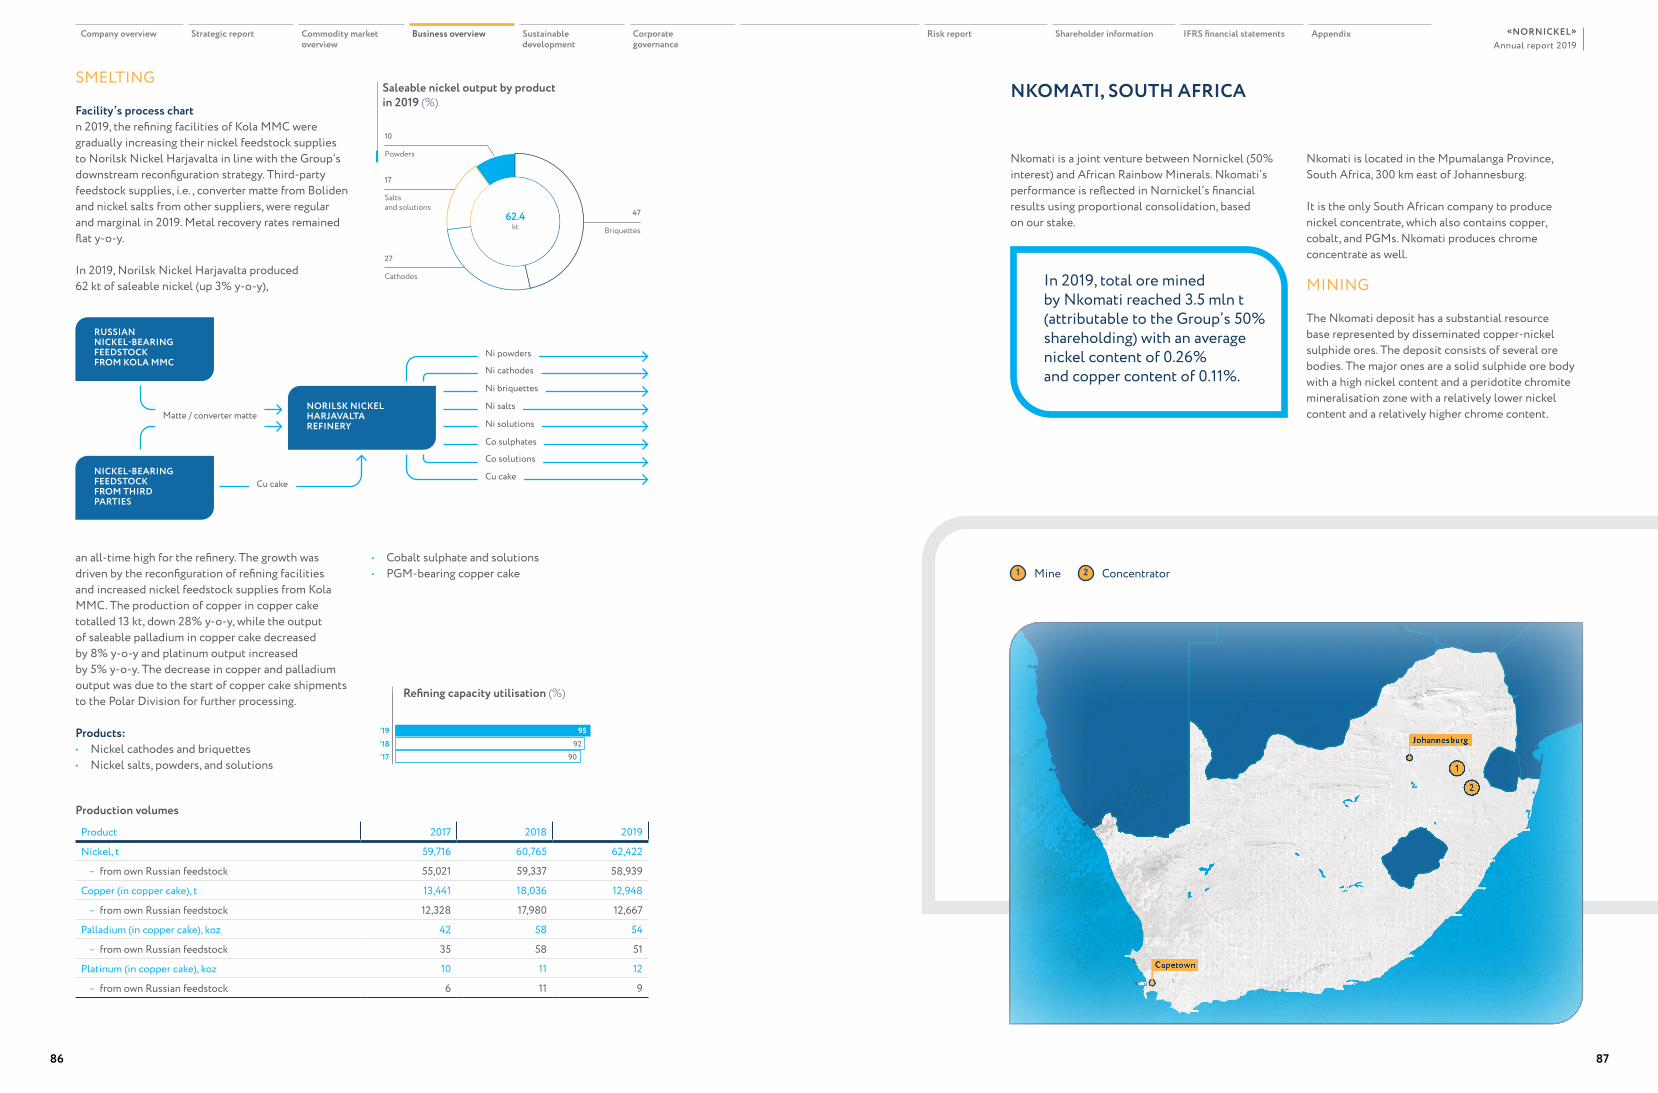
Briquettes
47
Powders
10
Salts and solutions
17
Cathodes
27
129вопросов
62.4kt
SMELTING
Facility’s process chart n 2019, the refining facilities of Kola MMC were gradually increasing their nickel feedstock supplies to Norilsk Nickel Harjavalta in line with the Group’s downstream reconfiguration strategy. Third-party feedstock supplies, i.e. , converter matte from Boliden and nickel salts from other suppliers, were regular and marginal in 2019. Metal recovery rates remained flat y-o-y.
In 2019, Norilsk Nickel Harjavalta produced 62 kt of saleable nickel (up 3% y-o-y),
Production volumes
Product 2017 2018 2019
Nickel, t 59,716 60,765 62,422
– from own Russian feedstock 55,021 59,337 58,939
Copper (in copper cake), t 13,441 18,036 12,948
– from own Russian feedstock 12,328 17,980 12,667
Palladium (in copper cake), koz 42 58 54
– from own Russian feedstock 35 58 51
Platinum (in copper cake), koz 10 11 12
– from own Russian feedstock 6 11 9
Refining capacity utilisation (%)
‘17‘18‘19 95
9290
Saleable nickel output by product in 2019 (%)
an all-time high for the refinery. The growth was driven by the reconfiguration of refining facilities and increased nickel feedstock supplies from Kola MMC. The production of copper in copper cake totalled 13 kt, down 28% y-o-y, while the output of saleable palladium in copper cake decreased by 8% y-o-y and platinum output increased by 5% y-o-y. The decrease in copper and palladium output was due to the start of copper cake shipments to the Polar Division for further processing.
Products: • Nickel cathodes and briquettes• Nickel salts, powders, and solutions
• Cobalt sulphate and solutions• PGM-bearing copper cake
Cu cake
Co solutions
Co sulphates
Ni salts
Ni solutions
Ni briquettes
Ni cathodes
RUSSIAN NICKEL-BEARING FEEDSTOCK FROM KOLA MMC
NORILSK NICKEL HARJAVALTA REFINERY
NICKEL-BEARING FEEDSTOCK FROM THIRD PARTIES
Ni powders
Matte / converter matte
Cu cake
Nkomati is a joint venture between Nornickel (50% interest) and African Rainbow Minerals. Nkomati’s performance is reflected in Nornickel’s financial results using proportional consolidation, based on our stake.
NKOMATI, SOUTH AFRICA
Nkomati is located in the Mpumalanga Province, South Africa, 300 km east of Johannesburg.
It is the only South African company to produce nickel concentrate, which also contains copper, cobalt, and PGMs. Nkomati produces chrome concentrate as well.
MINING
The Nkomati deposit has a substantial resource base represented by disseminated copper-nickel sulphide ores. The deposit consists of several ore bodies. The major ones are a solid sulphide ore body with a high nickel content and a peridotite chromite mineralisation zone with a relatively lower nickel content and a relatively higher chrome content.
In 2019, total ore mined by Nkomati reached 3.5 mln t (attributable to the Group’s 50% shareholding) with an average nickel content of 0.26% and copper content of 0.11%.
1
2
Johannesburg
Capetown
Mine Concentrator1 2
Company overview Strategic report Commodity market overview
Business overview Sustainable development
Corporate governance
Risk report Shareholder information IFRS financial statements AppendixAnnual report 2019
«NORNICKEL»
86 87
CONCENTRATION AND SMELTING
Concentration facilities • Concentrator for ore mined in the main section,
with installed capacity of 375 kt per month.• Concentrator for ore mined in the peridotite
chromite section, with installed capacity of 250 kt per month.
The mined ore is processed at concentrators using the sulphide flotation technology, with the resulting concentrates then sold by Nornickel to third parties.
In 2019, Nkomati produced 6.5 kt of nickel (down 2% y-o-y), 3.4 kt of copper (up 12% y-o-y), 33 koz
Production volumes1
Product (in concentrate) 2017 2018 2019
Nickel, kt 8.0 6.6 6.5
Copper, kt 4.5 3.1 3.4
Palladium, koz 46 33 33
Platinum, koz 20 13 14
1/ Volumes based on the 50% ownership.
of palladium (down 1% y-o-y), and 14 koz of platinum (up 6% y-o-y) (attributable to the Group’s 50% shareholding). The drop in nickel and palladium production and the increase in copper and platinum output were due to changes in the processed ore composition and the commencement of production ramp-down as part of plans to scale down production at Nkomati Nickel Mine during 2020.
Products: • Saleable concentrate.
SALES AND DISTRIBUTIONIn 2019, Nornickel maintained its long-standing reputation as a reliable supplier of high-quality products. The integrated index of customer satisfaction with the Company’s products and services matched the target level.
As a top global producer of base and platinum group metals, Nornickel sees its role as leading the industry on building an improved ecosystem for all market players and to this end launched a project to digitise all metal sale contracts in 2019.
The Company supplies its products to 37 countries and has products registered for delivery against contracts at the London Metal Exchange and the Shanghai Futures Exchange. Registration at the world’s top exchanges ensures the liquidity and premium pricing for the Company’s products.
PRODUCT RANGEOne of Nornickel’s objectives is to make sure its product range matches the current and anticipated global metals demand.
Nickel product diversification is a priority in developing the product range as the Company is implementing a range of initiatives to enhance and expand its existing product range, with a particular focus on changes in the metals demand structure, including the rapid growth in the share of the electric vehicles and batteries. In particular, Nornickel continues active interactions with the battery sector players to expand its product range to meet the new requirements for shape and quality emerging in the market.
Norilsk Nickel Harjavalta is recognised as one of world’s foremost producers of nickel used to make precursors (semi-products essential for manufacturing the cathode material that forms part of batteries). Norilsk Nickel Harjavalta’s nickel and cobalt sulphates are considered the industry benchmark and are widely used in battery manufacturing. Norilsk Nickel Harjavalta is uniquely flexible when it comes to manufacturing various shape products, which enables it to factor in consumer preferences in developing its product portfolio.
Company overview Strategic report Commodity market overview
Business overview Sustainable development
Corporate governance
Risk report Shareholder information IFRS financial statements AppendixAnnual report 2019
«NORNICKEL»
88 89
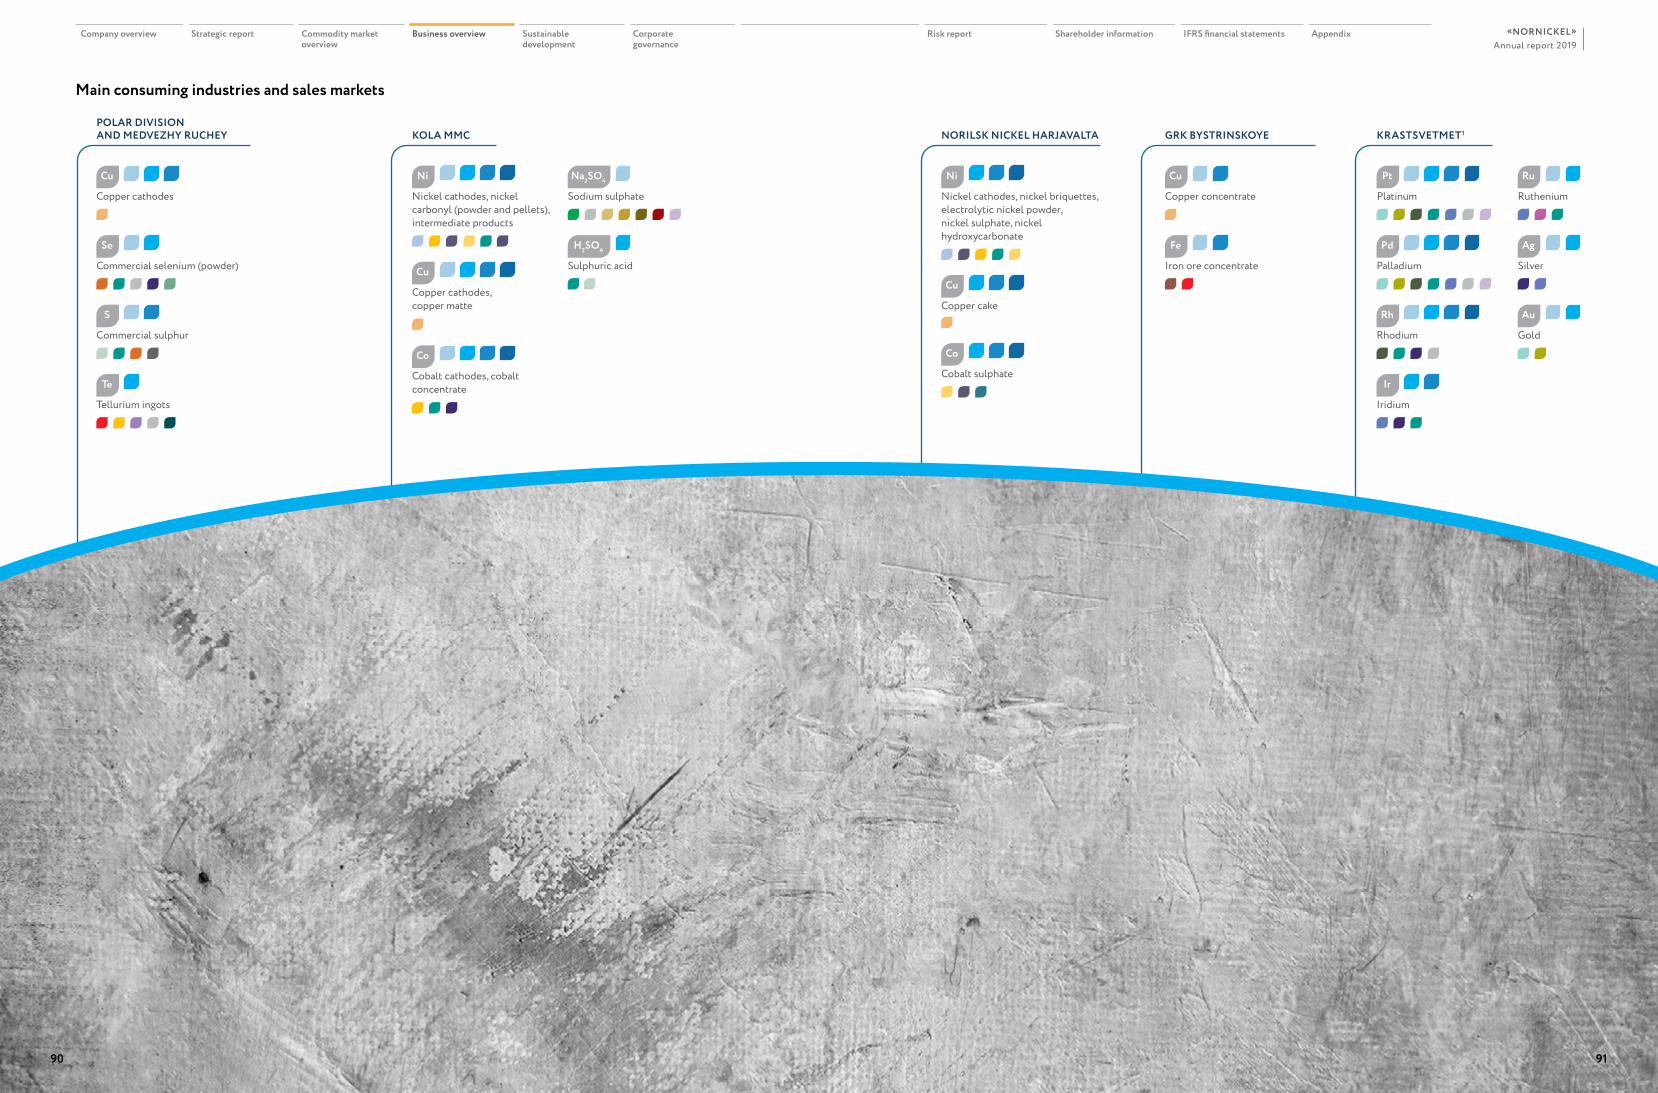
GRK BYSTRINSKOYE
Сopper concentrate
Cu
Iron ore concentrate
Fe
POLAR DIVISION AND MEDVEZHY RUCHEY
Copper cathodes
Cu
Commercial selenium (powder)
Сommercial sulphur
Tellurium ingots
Se
S
Te
NORILSK NICKEL HARJAVALTA
Nickel cathodes, nickel briquettes, electrolytic nickel powder, nickel sulphate, nickel hydroxycarbonate
Copper cake
Cobalt sulphate
Ni
Cu
Co
Main consuming industries and sales markets
KOLA MMC
Ni
Sodium sulphate
Sulphuric acid
Na2SO4
H2SO4
Nickel cathodes, nickel carbonyl (powder and pellets), intermediate products
Copper cathodes, copper matte
Cobalt cathodes, cobalt concentrate
Cu
Co
KRASTSVETMET1
Platinum
Palladium
Rhodium
Pt
Pd
Rh
Iridium
Ir
Silver
Gold
Ruthenium
Ru
Ag
Au
Cables and wiresRussia
Sales markets: Main consuming industries:
Europe
Asia
Americas
Rubber industry
Glass making
Fertilisers, paper and pipes
Stainless steel Photo- and thermoelements
Special steels and alloys
Electroplated coatings
Welding electrodes Leather goods Rolled products
Electrochemical industry
Synthetic detergents
Healthcare and veterinary
Special steels
Pulp & paper Batteries
Auto catalytic converters
Jewellery
Textiles Additives and catalysts
Electronics
InvestmentsChemical industry
Rolled products and pipes
Metallurgy Feeds and fertilizers
Electrical engineering
Alloys and superalloys
Rubber vulcanisation
Non-ferrous metallurgy
1/ 100% of shares are owned by the government. Precious metals are refined from raw materials produced by the Polar Division and Kola MMC under a tolling agreement.
Company overview Strategic report Commodity market overview
Business overview Sustainable development
Corporate governance
Risk report Shareholder information IFRS financial statements AppendixAnnual report 2019
«NORNICKEL»
90 91
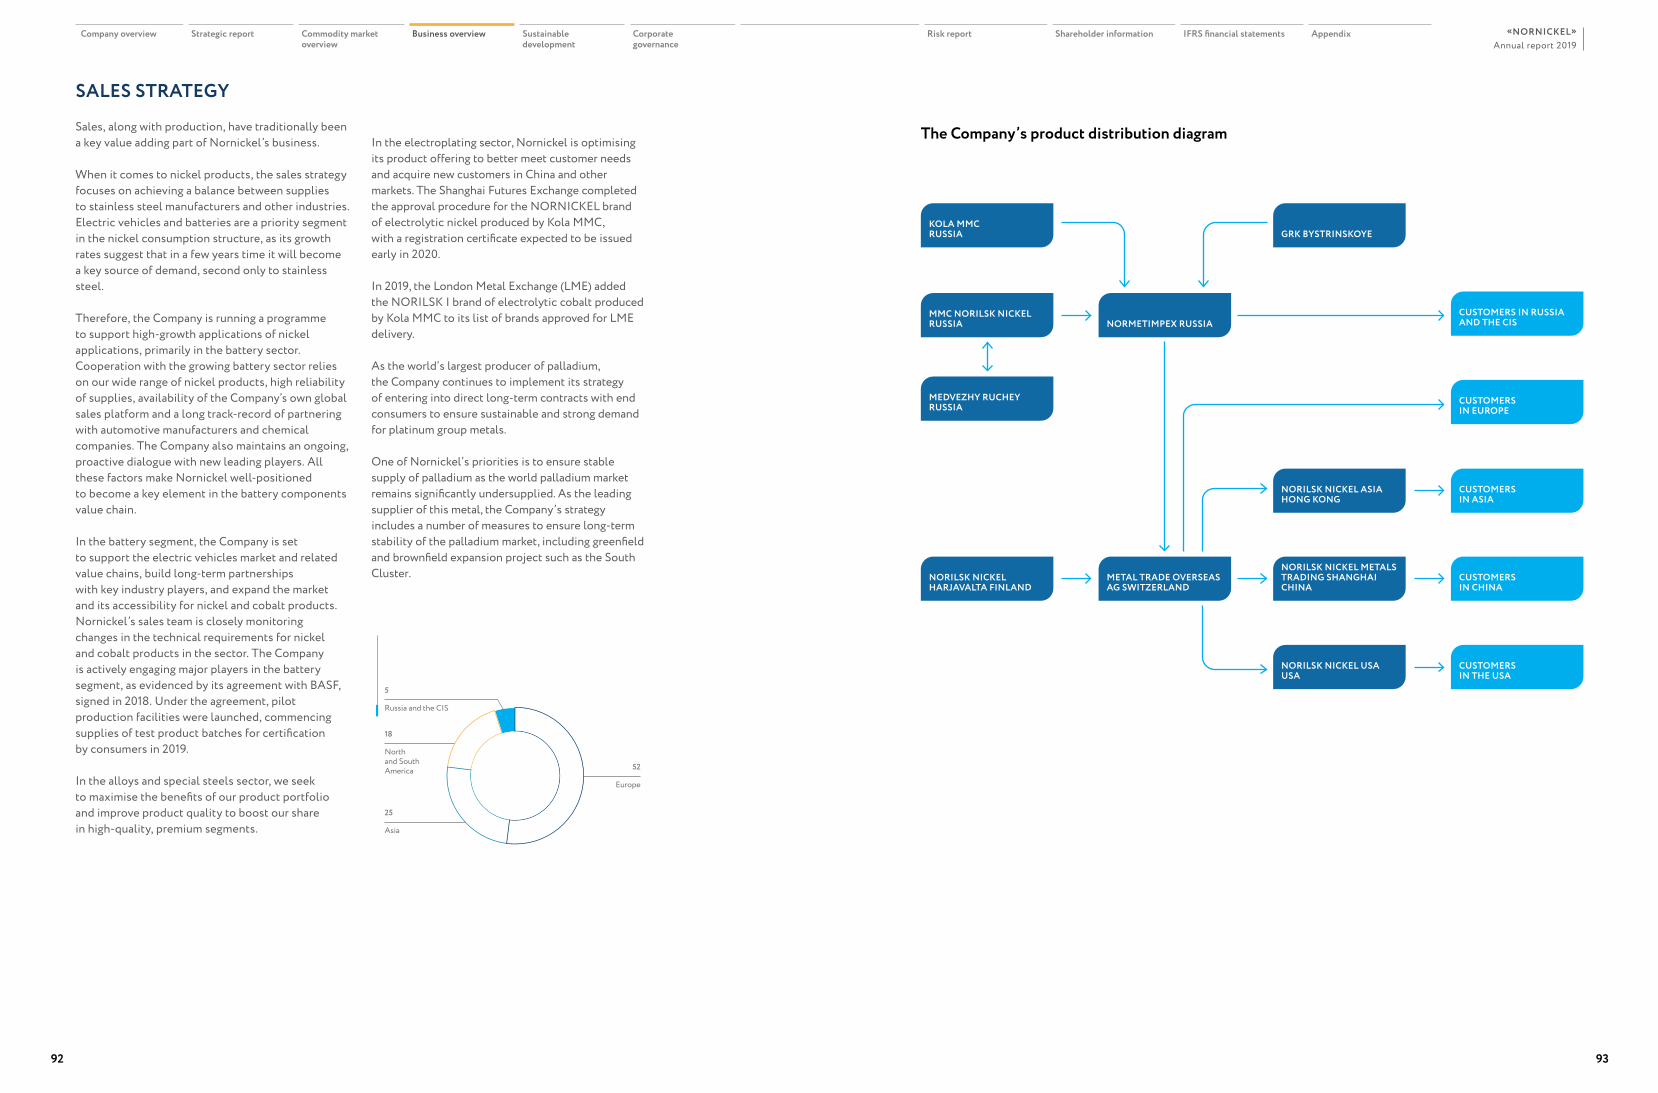
SALES STRATEGY
Sales, along with production, have traditionally been a key value adding part of Nornickel’s business.
When it comes to nickel products, the sales strategy focuses on achieving a balance between supplies to stainless steel manufacturers and other industries. Electric vehicles and batteries are a priority segment in the nickel consumption structure, as its growth rates suggest that in a few years time it will become a key source of demand, second only to stainless steel.
Therefore, the Company is running a programme to support high-growth applications of nickel applications, primarily in the battery sector. Cooperation with the growing battery sector relies on our wide range of nickel products, high reliability of supplies, availability of the Company’s own global sales platform and a long track-record of partnering with automotive manufacturers and chemical companies. The Company also maintains an ongoing, proactive dialogue with new leading players. All these factors make Nornickel well-positioned to become a key element in the battery components value chain.
In the battery segment, the Company is set to support the electric vehicles market and related value chains, build long-term partnerships with key industry players, and expand the market and its accessibility for nickel and cobalt products. Nornickel’s sales team is closely monitoring changes in the technical requirements for nickel and cobalt products in the sector. The Company is actively engaging major players in the battery segment, as evidenced by its agreement with BASF, signed in 2018. Under the agreement, pilot production facilities were launched, commencing supplies of test product batches for certification by consumers in 2019.
In the alloys and special steels sector, we seek to maximise the benefits of our product portfolio and improve product quality to boost our share in high-quality, premium segments.
In the electroplating sector, Nornickel is optimising its product offering to better meet customer needs and acquire new customers in China and other markets. The Shanghai Futures Exchange completed the approval procedure for the NORNICKEL brand of electrolytic nickel produced by Kola MMC, with a registration certificate expected to be issued early in 2020.
In 2019, the London Metal Exchange (LME) added the NORILSK I brand of electrolytic cobalt produced by Kola MMC to its list of brands approved for LME delivery.
As the world’s largest producer of palladium, the Company continues to implement its strategy of entering into direct long-term contracts with end consumers to ensure sustainable and strong demand for platinum group metals.
One of Nornickel’s priorities is to ensure stable supply of palladium as the world palladium market remains significantly undersupplied. As the leading supplier of this metal, the Company’s strategy includes a number of measures to ensure long-term stability of the palladium market, including greenfield and brownfield expansion project such as the South Cluster.
Sales by region (%)
Europe
52
Russia and the CIS
5
North and South America
18
Asia
25
129вопросов
The Company’s product distribution diagram
NORMETIMPEX RUSSIA
GRK BYSTRINSKOYE
CUSTOMERS IN THE USA
CUSTOMERS IN EUROPE
CUSTOMERS IN RUSSIA AND THE CIS
CUSTOMERS IN ASIA
CUSTOMERS IN CHINA
NORILSK NICKEL ASIA HONG KONG
NORILSK NICKEL METALS TRADING SHANGHAI CHINA
NORILSK NICKEL USA USA
MMC NORILSK NICKEL RUSSIA
KOLA MMC RUSSIA
NORILSK NICKEL HARJAVALTA FINLAND
METAL TRADE OVERSEAS AG SWITZERLAND
MEDVEZHY RUCHEY RUSSIA
Company overview Strategic report Commodity market overview
Business overview Sustainable development
Corporate governance
Risk report Shareholder information IFRS financial statements AppendixAnnual report 2019
«NORNICKEL»
92 93
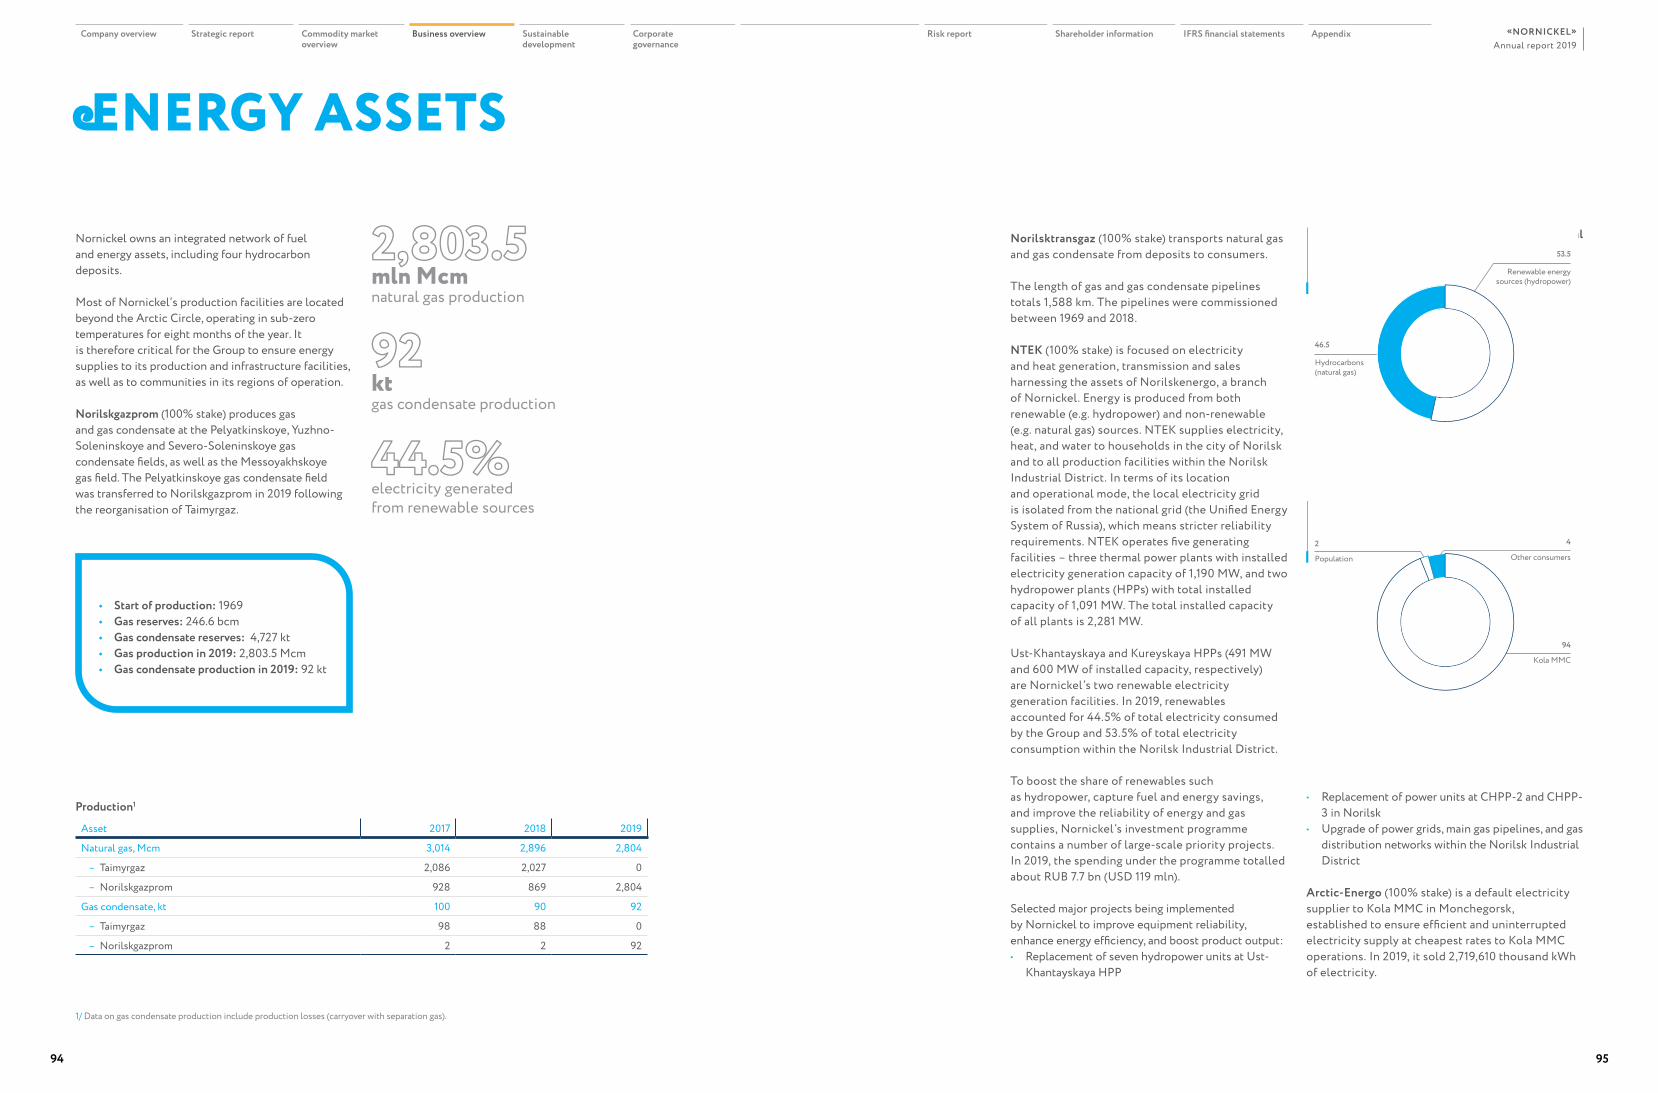
ENERGY ASSETS
Nornickel owns an integrated network of fuel and energy assets, including four hydrocarbon deposits.
Most of Nornickel’s production facilities are located beyond the Arctic Circle, operating in sub-zero temperatures for eight months of the year. It is therefore critical for the Group to ensure energy supplies to its production and infrastructure facilities, as well as to communities in its regions of operation.
Norilskgazprom (100% stake) produces gas and gas condensate at the Pelyatkinskoye, Yuzhno-Soleninskoye and Severo-Soleninskoye gas condensate fields, as well as the Messoyakhskoye gas field. The Pelyatkinskoye gas condensate field was transferred to Norilskgazprom in 2019 following the reorganisation of Taimyrgaz.
1/ Data on gas condensate production include production losses (carryover with separation gas).
Power generation breakdown in the Norilsk Industrial District in 2019 (%) 53.5
Hydrocarbons(natural gas)
46.5 129вопросов
Renewable energysources (hydropower)
Arctic-Energo electricity sales breakdown in 2019 (%)
Kola MMC
94
Other consumers
4
Population
2
129вопросов
Norilsktransgaz (100% stake) transports natural gas and gas condensate from deposits to consumers.
The length of gas and gas condensate pipelines totals 1,588 km. The pipelines were commissioned between 1969 and 2018.
NTEK (100% stake) is focused on electricity and heat generation, transmission and sales harnessing the assets of Norilskenergo, a branch of Nornickel. Energy is produced from both renewable (e.g. hydropower) and non-renewable (e.g. natural gas) sources. NTEK supplies electricity, heat, and water to households in the city of Norilsk and to all production facilities within the Norilsk Industrial District. In terms of its location and operational mode, the local electricity grid is isolated from the national grid (the Unified Energy System of Russia), which means stricter reliability requirements. NTEK operates five generating facilities – three thermal power plants with installed electricity generation capacity of 1,190 MW, and two hydropower plants (HPPs) with total installed capacity of 1,091 MW. The total installed capacity of all plants is 2,281 MW.
Ust-Khantayskaya and Kureyskaya HPPs (491 MW and 600 MW of installed capacity, respectively) are Nornickel’s two renewable electricity generation facilities. In 2019, renewables accounted for 44.5% of total electricity consumed by the Group and 53.5% of total electricity consumption within the Norilsk Industrial District.
To boost the share of renewables such as hydropower, capture fuel and energy savings, and improve the reliability of energy and gas supplies, Nornickel’s investment programme contains a number of large-scale priority projects. In 2019, the spending under the programme totalled about RUB 7.7 bn (USD 119 mln).
Selected major projects being implemented by Nornickel to improve equipment reliability, enhance energy efficiency, and boost product output:• Replacement of seven hydropower units at Ust-
Khantayskaya HPP
• Replacement of power units at CHPP-2 and CHPP-3 in Norilsk
• Upgrade of power grids, main gas pipelines, and gas distribution networks within the Norilsk Industrial District
Arctic-Energo (100% stake) is a default electricity supplier to Kola MMC in Monchegorsk, established to ensure efficient and uninterrupted electricity supply at cheapest rates to Kola MMC operations. In 2019, it sold 2,719,610 thousand kWh of electricity.
natural gas production
2,803.5mln Mcm
gas condensate production
92kt
electricity generated from renewable sources
44.5%
• Start of production: 1969• Gas reserves: 246.6 bcm• Gas condensate reserves: 4,727 kt• Gas production in 2019: 2,803.5 Mcm• Gas condensate production in 2019: 92 kt
Production1
Asset 2017 2018 2019
Natural gas, Mcm 3,014 2,896 2,804
– Taimyrgaz 2,086 2,027 0
– Norilskgazprom 928 869 2,804
Gas condensate, kt 100 90 92
– Taimyrgaz 98 88 0
– Norilskgazprom 2 2 92
Company overview Strategic report Commodity market overview
Business overview Sustainable development
Corporate governance
Risk report Shareholder information IFRS financial statements AppendixAnnual report 2019
«NORNICKEL»
94 95
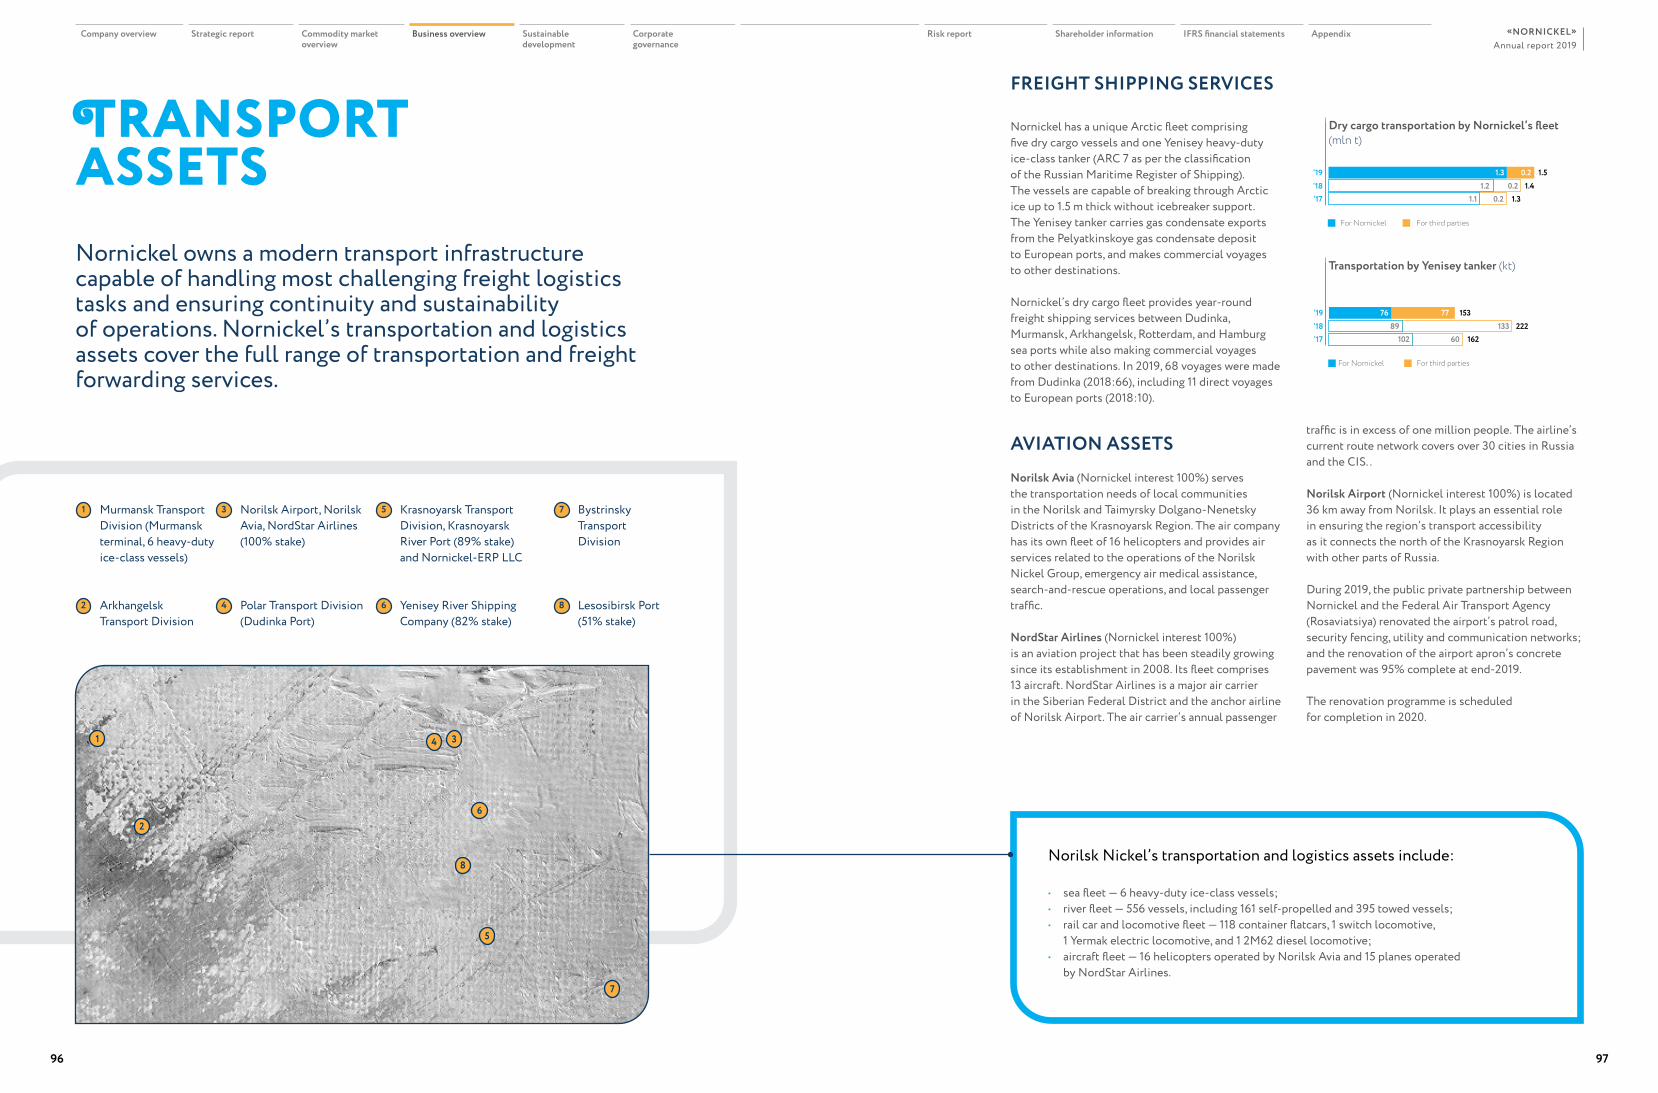
FREIGHT SHIPPING SERVICES
Nornickel has a unique Arctic fleet comprising five dry cargo vessels and one Yenisey heavy-duty ice-class tanker (ARC 7 as per the classification of the Russian Maritime Register of Shipping). The vessels are capable of breaking through Arctic ice up to 1.5 m thick without icebreaker support. The Yenisey tanker carries gas condensate exports from the Pelyatkinskoye gas condensate deposit to European ports, and makes commercial voyages to other destinations.
Nornickel’s dry cargo fleet provides year-round freight shipping services between Dudinka, Murmansk, Arkhangelsk, Rotterdam, and Hamburg sea ports while also making commercial voyages to other destinations. In 2019, 68 voyages were made from Dudinka (2018:66), including 11 direct voyages to European ports (2018:10).
AVIATION ASSETSNorilsk Avia (Nornickel interest 100%) serves the transportation needs of local communities in the Norilsk and Taimyrsky Dolgano-Nenetsky Districts of the Krasnoyarsk Region. The air company has its own fleet of 16 helicopters and provides air services related to the operations of the Norilsk Nickel Group, emergency air medical assistance, search-and-rescue operations, and local passenger traffic.
NordStar Airlines (Nornickel interest 100%) is an aviation project that has been steadily growing since its establishment in 2008. Its fleet comprises 13 aircraft. NordStar Airlines is a major air carrier in the Siberian Federal District and the anchor airline of Norilsk Airport. The air carrier’s annual passenger
TRANSPORT ASSETS Nornickel owns a modern transport infrastructure capable of handling most challenging freight logistics tasks and ensuring continuity and sustainability of operations. Nornickel’s transportation and logistics assets cover the full range of transportation and freight forwarding services.
Dry cargo transportation by Nornickel’s fleet (mln t)
‘17‘18‘19 0.2 231.51.3
1.2 0.2 1.40.21.1 1.3
For third partiesFor Nornickel
Transportation by Yenisey tanker (kt)
‘17‘18‘19 77 2315376
89 133 22260102 162
For third partiesFor Nornickel
traffic is in excess of one million people. The airline’s current route network covers over 30 cities in Russia and the CIS. .
Norilsk Airport (Nornickel interest 100%) is located 36 km away from Norilsk. It plays an essential role in ensuring the region’s transport accessibility as it connects the north of the Krasnoyarsk Region with other parts of Russia.
During 2019, the public private partnership between Nornickel and the Federal Air Transport Agency (Rosaviatsiya) renovated the airport’s patrol road, security fencing, utility and communication networks; and the renovation of the airport apron’s concrete pavement was 95% complete at end-2019.
The renovation programme is scheduled for completion in 2020.
1
2
4 3
6
8
5
7
Murmansk Transport Division (Murmansk terminal, 6 heavy-duty ice-class vessels)
Norilsk Airport, Norilsk Avia, NordStar Airlines (100% stake)
Krasnoyarsk Transport Division, Krasnoyarsk River Port (89% stake) and Nornickel-ERP LLC
Bystrinsky Transport Division
Arkhangelsk Transport Division
Polar Transport Division (Dudinka Port)
Yenisey River Shipping Company (82% stake)
Lesosibirsk Port (51% stake)
1 3 5 7
2 4 6 8
Norilsk Nickel’s transportation and logistics assets include:
• sea fleet — 6 heavy-duty ice-class vessels;• river fleet — 556 vessels, including 161 self-propelled and 395 towed vessels;• rail car and locomotive fleet — 118 container flatcars, 1 switch locomotive,
1 Yermak electric locomotive, and 1 2М62 diesel locomotive;• aircraft fleet — 16 helicopters operated by Norilsk Avia and 15 planes operated
by NordStar Airlines.
Company overview Strategic report Commodity market overview
Business overview Sustainable development
Corporate governance
Risk report Shareholder information IFRS financial statements AppendixAnnual report 2019
«NORNICKEL»
96 97
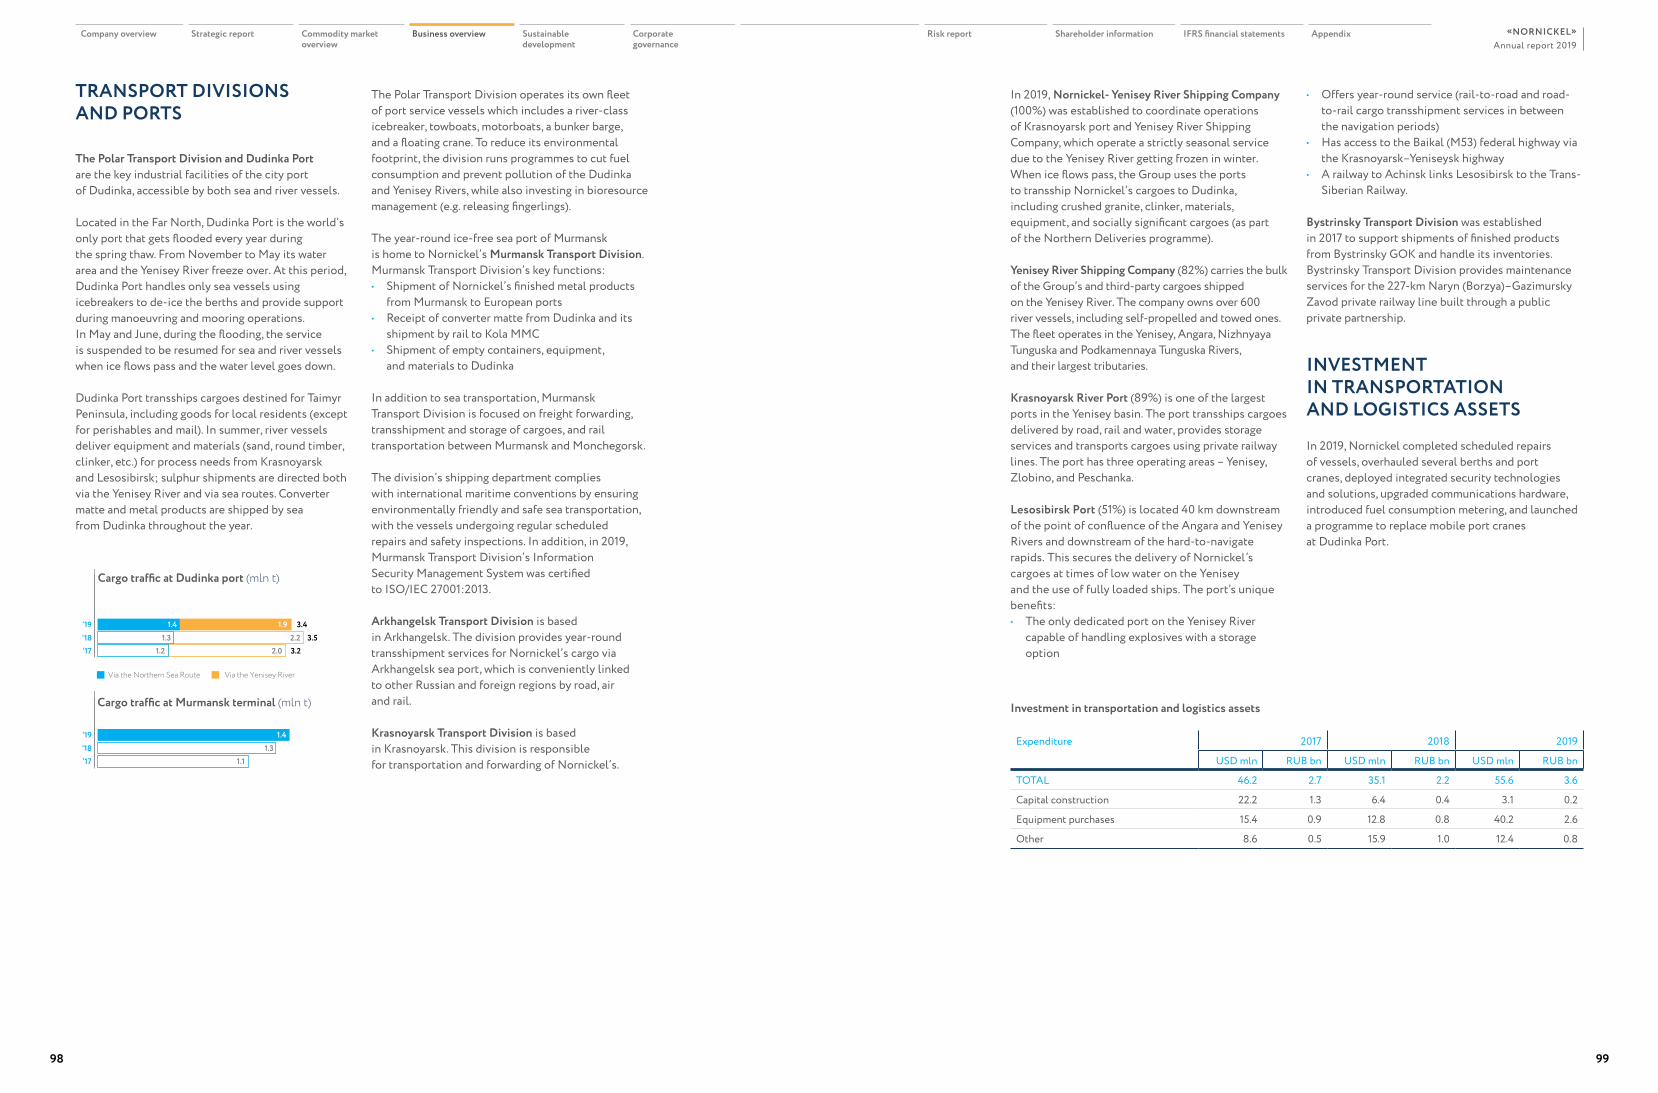
‘17‘18‘19 1.9 233.41.4
1.3 2.2 3.52.01.2 3.2
Via the Yenisey RiverVia the Northern Sea Route
TRANSPORT DIVISIONS AND PORTS
The Polar Transport Division and Dudinka Port are the key industrial facilities of the city port of Dudinka, accessible by both sea and river vessels.
Located in the Far North, Dudinka Port is the world’s only port that gets flooded every year during the spring thaw. From November to May its water area and the Yenisey River freeze over. At this period, Dudinka Port handles only sea vessels using icebreakers to de-ice the berths and provide support during manoeuvring and mooring operations. In May and June, during the flooding, the service is suspended to be resumed for sea and river vessels when ice flows pass and the water level goes down.
Dudinka Port transships cargoes destined for Taimyr Peninsula, including goods for local residents (except for perishables and mail). In summer, river vessels deliver equipment and materials (sand, round timber, clinker, etc.) for process needs from Krasnoyarsk and Lesosibirsk; sulphur shipments are directed both via the Yenisey River and via sea routes. Converter matte and metal products are shipped by sea from Dudinka throughout the year.
In 2019, Nornickel- Yenisey River Shipping Company (100%) was established to coordinate operations of Krasnoyarsk port and Yenisey River Shipping Company, which operate a strictly seasonal service due to the Yenisey River getting frozen in winter. When ice flows pass, the Group uses the ports to transship Nornickel’s cargoes to Dudinka, including crushed granite, clinker, materials, equipment, and socially significant cargoes (as part of the Northern Deliveries programme).
Yenisey River Shipping Company (82%) carries the bulk of the Group’s and third-party cargoes shipped on the Yenisey River. The company owns over 600 river vessels, including self-propelled and towed ones. The fleet operates in the Yenisey, Angara, Nizhnyaya Tunguska and Podkamennaya Tunguska Rivers, and their largest tributaries.
Krasnoyarsk River Port (89%) is one of the largest ports in the Yenisey basin. The port transships cargoes delivered by road, rail and water, provides storage services and transports cargoes using private railway lines. The port has three operating areas – Yenisey, Zlobino, and Peschanka.
Lesosibirsk Port (51%) is located 40 km downstream of the point of confluence of the Angara and Yenisey Rivers and downstream of the hard-to-navigate rapids. This secures the delivery of Nornickel’s cargoes at times of low water on the Yenisey and the use of fully loaded ships. The port’s unique benefits:• The only dedicated port on the Yenisey River
capable of handling explosives with a storage option
The Polar Transport Division operates its own fleet of port service vessels which includes a river-class icebreaker, towboats, motorboats, a bunker barge, and a floating crane. To reduce its environmental footprint, the division runs programmes to cut fuel consumption and prevent pollution of the Dudinka and Yenisey Rivers, while also investing in bioresource management (e.g. releasing fingerlings).
The year-round ice-free sea port of Murmansk is home to Nornickel’s Murmansk Transport Division. Murmansk Transport Division’s key functions:• Shipment of Nornickel’s finished metal products
from Murmansk to European ports• Receipt of converter matte from Dudinka and its
shipment by rail to Kola MMC• Shipment of empty containers, equipment,
and materials to Dudinka
In addition to sea transportation, Murmansk Transport Division is focused on freight forwarding, transshipment and storage of cargoes, and rail transportation between Murmansk and Monchegorsk.
The division’s shipping department complies with international maritime conventions by ensuring environmentally friendly and safe sea transportation, with the vessels undergoing regular scheduled repairs and safety inspections. In addition, in 2019, Murmansk Transport Division’s Information Security Management System was certified to ISO/IEC 27001:2013.
Arkhangelsk Transport Division is based in Arkhangelsk. The division provides year-round transshipment services for Nornickel’s cargo via Arkhangelsk sea port, which is conveniently linked to other Russian and foreign regions by road, air and rail.
Krasnoyarsk Transport Division is based in Krasnoyarsk. This division is responsible for transportation and forwarding of Nornickel’s.
• Offers year-round service (rail-to-road and road-to-rail cargo transshipment services in between the navigation periods)
• Has access to the Baikal (M53) federal highway via the Krasnoyarsk–Yeniseysk highway
• A railway to Achinsk links Lesosibirsk to the Trans-Siberian Railway.
Bystrinsky Transport Division was established in 2017 to support shipments of finished products from Bystrinsky GOK and handle its inventories. Bystrinsky Transport Division provides maintenance services for the 227-km Naryn (Borzya)–Gazimursky Zavod private railway line built through a public private partnership.
INVESTMENT IN TRANSPORTATION AND LOGISTICS ASSETS
In 2019, Nornickel completed scheduled repairs of vessels, overhauled several berths and port cranes, deployed integrated security technologies and solutions, upgraded communications hardware, introduced fuel consumption metering, and launched a programme to replace mobile port cranes at Dudinka Port.
Cargo traffic at Dudinka port (mln t)
Cargo traffic at Murmansk terminal (mln t)
‘17‘18‘19 1.4
1.31.1
Investment in transportation and logistics assets
Expenditure 2017 2018 2019
USD mln RUB bn USD mln RUB bn USD mln RUB bn
TOTAL 46.2 2.7 35.1 2.2 55.6 3.6
Capital construction 22.2 1.3 6.4 0.4 3.1 0.2
Equipment purchases 15.4 0.9 12.8 0.8 40.2 2.6
Other 8.6 0.5 15.9 1.0 12.4 0.8
Company overview Strategic report Commodity market overview
Business overview Sustainable development
Corporate governance
Risk report Shareholder information IFRS financial statements AppendixAnnual report 2019
«NORNICKEL»
98 99
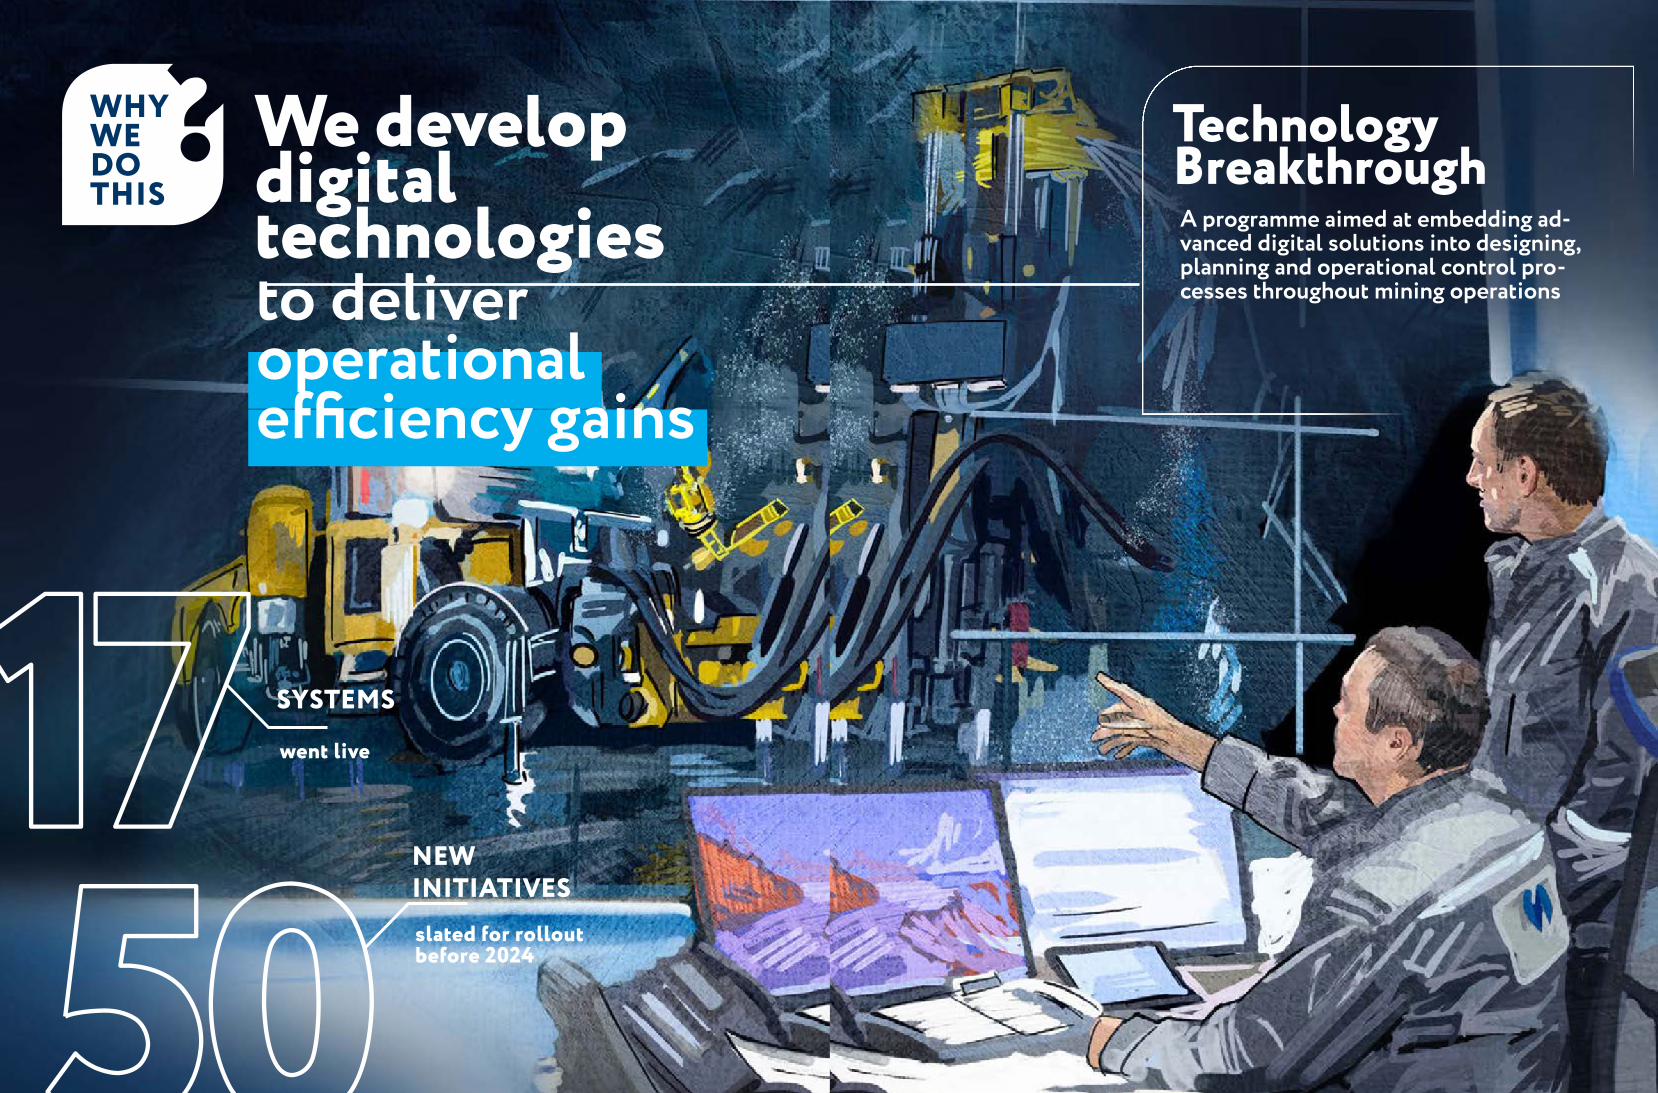
Technology Breakthrough
WHY WE DO THIS
17 SYSTEMS
went live
50NEW INITIATIVES slated for rollout before 2024
A programme aimed at embedding ad-vanced digital solutions into designing, planning and operational control pro-cesses throughout mining operations
We develop digital technologies to deliver operational efficiency gains
RESEARCH AND DEVELOPMENT INNOVATIONSRESEARCH AND DEVELOPMENT
R&D is a major driver behind the implementation of the Company’s strategic priorities. In 2019, Nornickel’s R&D and feasibility studies mainly focused on providing research data for the updated Norilsk Nickel Group Strategic Development Plan. Operations. Mining, processing, metallurgy.
Gipronickel Institute is Nornickel’s main R&D facility. Part of the Norilsk Nickel Group, it is also one of Russia's largest research and engineering hubs for mining, concentration, metallurgy and processing of minerals, providing a wide range of research and technology services.
PATENTS AND LICENCES
Implementation of uniform approaches to intellectual property (IP) management is a major driver of Nornickel’s innovative development.
The Company registers its exclusive rights to inventions and means of identification both in Russia and beyond.
International registration process for Nornickel’s Method for Continuously Converting Nickel-Containing Copper Sulphide Materials is now in progress, with a Kazakhstan patent for this invention granted in 2019.
A Certificate of State Registration for 10-day/shift Operations Planing and Control System for Underground Mines software was also granted in 2019. The software solution is being rolled out across the Group as part of its mining automation project.
Also in 2019, the Company completed the registration process and obtained an international certificate of registration for the NORNICKEL trademark in the USA for the first time in its history.
DIGITISATION
Nornickel is the industry’s digital leader:• Nornickel won the first place and the gold award
in the Business Transformation Category at SAP Quality Awards in the CIS region for two years in a row – 2018 and 2019 – for its project to roll out SAP ERP
• The Company won the first place for the Machine Vision-Based Detection of Ore Contaminants on Concentrator Conveyors project
• Bronze award was given for the Smart Tailing Dump project leveraging all currently available state-of-the-art dam movement monitoring technologies
• Nornickel’s project to optimise flotation processes at Talnakh Concentrator was awarded a BCG Olympics medal in 2019 as the best project internationally to win this highly prestigious annual global competition
Adoption of state-of-the-art technology, including digital solutions, is critical to business competitiveness. Nornickel places considerable emphasis on researching and adopting various digital technologies to optimise production processes, improve overall business performance, and eliminate bottlenecks, resulting in a higher conversion productivity, lower costs and a streamlined organisation. The Company has built a portfolio of various applied technology solutions which can be of interest to other players in the metals and mining industry as well as other industries.
In July 2019, Rosbank and Nornickel migrated the interface between their information systems to a host-to-host digital platform developed by Rosbank and Nornickel’s experts supported by BDO Unicon Business Solutions. The host-to-host solution provides a high-speed secure data transfer directly between Nornickel’s corporate SAP system and Rosbank’s host-to-host service.
It now takes Nornickel’s Treasury barely a moment to send payment orders to Rosbank and receive settlement account statements from it. Migration to the host-to-host solution has not only made
payments faster and more secure but also streamlined Nornickel’s internal processes and going forward enables fundamentally new, digital business use cases around interfaces with banks and counterparties.
TECHNOLOGY BREAKTHROUGH PROGRAMME
The Company runs the Technology Breakthrough programme to integrate advanced technologies into the design, planning and operational control processes of its mining activities, driving the operational efficiency of its production processes. About 40 IT initiatives were developed during its first phase (Technology Breakthrough 1.0).
The key projects within the programme: development of mining equipment and personnel positioning and communication systems; mining operations planning and dispatch; and deployment of various solutions including geological modelling and mine planning solutions, metals balance calculation, industrial asset management, process data storage, and health and safety systems.
Basic infrastructure building
Nornickel has equipped all of its underground mines with positioning and communication systems. More than 300 kilometres of fibre have been laid, with over 1,000 Wi-Fi access points installed underground. Every day, each person out of more than 6,500 is given special equipment with an RFID tag to track the person’s movements within the mine. Similar tracking solutions are installed on moving machinery, totalling more than 500. Video surveillance is provided for key infrastructure facilities underground. A control room operator monitors movements of each employee and can contact them by phone. An anti-collision technology is used to warn drivers of people in the way. The Company has deployed a powerful system providing complete information on people and machinery positions and ore flows in mines by feeding virtually unlimited volumes of data from the surface underground and back.
Geological modelling and mine planning solutions
The deployment of geological modelling and mine planning solutions has enabled the development of a single mining database and 3-D models of underground ore bodies. The software can also be used to design underground workings and obtain survey data. The system enables data preparation and feeding to automated drill rigs, with significant gains to be achieved in drilling and blasting performance. Geological modelling and mine planning software can also accelerate development and analysis of multiple mining options to identify the most effective one and plan mining accordingly.
Simulation modelling system
The software analyses data on underground workings, their geometry, underground transport and ore production plans to calculate an optimal quantity of required underground machinery. The purpose is to optimise ore production and transportation from the mine to the surface. Nornickel’s mid-term plans are to use the simulation modelling system to test the use of remotely controlled underground machinery.
Smart digital mines
It took a lot of time and effort to develop underground infrastructure across all mines operated by the Company before operational control centres could launch and assume associated control and management functions. Wireless data transmission system points and fibre links were installed under the Polar Division’s machinery tracking and radio communication project, implemented as part of the Technical Breakthrough programme. Each underground working now has Wi-Fi access and is fitted with video cameras.
The Company has also developed a unique 10-day/shift scheduling software to eliminate the decentralised approach and manual planning for certain mine parts. The software allocates tasks and equipment to workings and shifts in accordance with the process cycles and pre-set inputs to create the mine operation 10-day/shift schedule with 10-day increments and task scheduling for each specific shift. Mining plans covering different periods and parts of all underground mines are integrated
Company overview Strategic report Commodity market overview
Business overview Sustainable development
Corporate governance
Risk report Shareholder information IFRS financial statements AppendixAnnual report 2019
«NORNICKEL»
102 103
into higher-level plans within a single centralised planning system. The operational control centres now operate in accordance with the new mining planning processes. The 10-day/shift scheduling software creates work plans using data from the Micromine geological modelling and mine planning software which creates a 3D model of the mined ore body with a clear representation of beds and seams and helps optimise reserve development sequencing and production techniques.
Process data storage
All data is fed into a process data warehouse, which also collects telemetry data from moving machinery: motor RPM, fuel consumption, working hours, etc. The single process data warehouse collates over 60,000 parameters for all enterprises of Nornickel. The data is then used in other Technology Breakthrough systems such as Production Dispatch, Metals Balance, and in the SAP ERP equipment maintenance and repair management system.
Technical Breakthrough 1.0 has improved total metal recovery and increased the quality of saleable ore by 6.5% between 2016 and 2019, achieving total savings of billions of Russian roubles.
In 2020, Nornickel will launch the second phase of the programme – Technical Breakthrough 2.0, which will include 11 projects. The second phase will mostly focus on Industry 4.0 levers, with certain autonomy embedded in all mine development projects. The Company will now harness big data to improve production planning and overhaul the production process, implementing projects to roll out artificial intelligence, robotics, digital twins, etc.
Nornickel is developing a database enabling it to plan for unmanned production. In particular, mining at depths between 2 km and 2.5 km in the Glubokaya mine (at the Skalisty Mine site) will maximise the use of autonomous mining systems.
DIGITAL LAB
Nornickel actively deploys digital technologies to address local production tasks. Its R&D division Digital Lab has been active for almost two years.
Two initiatives of the Digital Lab won awards at the Mine Digital contest held as part of the Minex Russia geological forum. The gold winner was the Conveyor Contaminant Identification project applying artificial intelligence technology to recognise non-metallic matter on the conveyor which, if entering the concentrator’s crusher, can damage the equipment. Bronze award was won for the Smart Tailing Dump project which focuses on the analysis of satellite radiolocation data to track potential strata movements with a millimetre accuracy.
Concentrator conveyor contaminant identification system
The Digital Lab won the gold award for this initiative at the Mine Digital contest held as part of the Minex Russia geological forum.
The system uses artificial intelligence technology to recognise non-metallic matter on the conveyor which, if entering the concentrator’s crusher, can damage the equipment. The system will reduce the wear of crushing equipment and the frequency of unscheduled repairs, and is planned to be launched in the mid-term across all of Nornickel’s sites.
Industrial exoskeletons
In 2019, Nornickel made its first-ever public presentation of an exoskeleton system developed jointly with the South-West State University. The presentation featured rapid training and testing of exoskeletons on a testing ground, providing the companies in the audience with an opportunity to get a first-hand feel for the new solution. The presentation generated great interest from many companies, and as a result several exoskeletons were shipped for testing to production sites of several Russian metals companies. The exoskeletons were also presented by Nornickel at an advanced project exhibition held by the Agency for Strategic Initiatives.
Industrial exoskeletons are designed for use in harsh environments, helping to resolve health and safety issues and improve operational efficiency. An exoskeleton is put on over the safety workwear and is attached to the person’s body by special straps. It can help persons lifting or carrying weights of up to 60 kg by taking up to 90% of the weight. Thanks to its small size, an exoskeleton can be used in hard-to-reach areas inaccessible to specialised machinery. Nornickel’s exoskeletons have some smart features: apart from the exoskeleton itself, the system also includes an onboard computer to monitor ambient air pollution concentrations, temperature, illuminance levels, and the user’s operating modes in real time.
H&S compliance monitoring solution
Health and safety violations are detected and recorded by video cameras using machine vision and artificial intelligence. The system drives employee accountability, simplifies monitoring and reduces accidents at work.
Short circuit detection in copper electrolysis at metallurgical plants
An integrated hardware/software solution has been developed to detect short circuits in copper electrolysis, stabilising the electrolysis process and increasing the output of copper cathodes.
Drones for aerial surveillance of hard-to-reach areas
Nornickel is developing drones capable of video recording and autonomous movement deep underground without relying on GPS. The drones will be used to inspect the condition of facilities in hard-to-reach areas, enabling faster inspections, reduced diagnostic costs, and most importantly, improved safety. Nornickel has also designed drones for automatic scanning of mine areas that are out of bounds for employees, which will also prevent unscheduled shutdowns and accidents.
Mine surveying robot
Nornickel has piloted a robotic system capable of laser scanning and autonomous movement in workings, which enables high-quality 3D surveying including for hard-to-reach areas. The Company will be able to use the data feed from the robot for integration with its geological modelling and mine planning system.
Company overview Strategic report Commodity market overview
Business overview Sustainable development
Corporate governance
Risk report Shareholder information IFRS financial statements AppendixAnnual report 2019
«NORNICKEL»
104 105
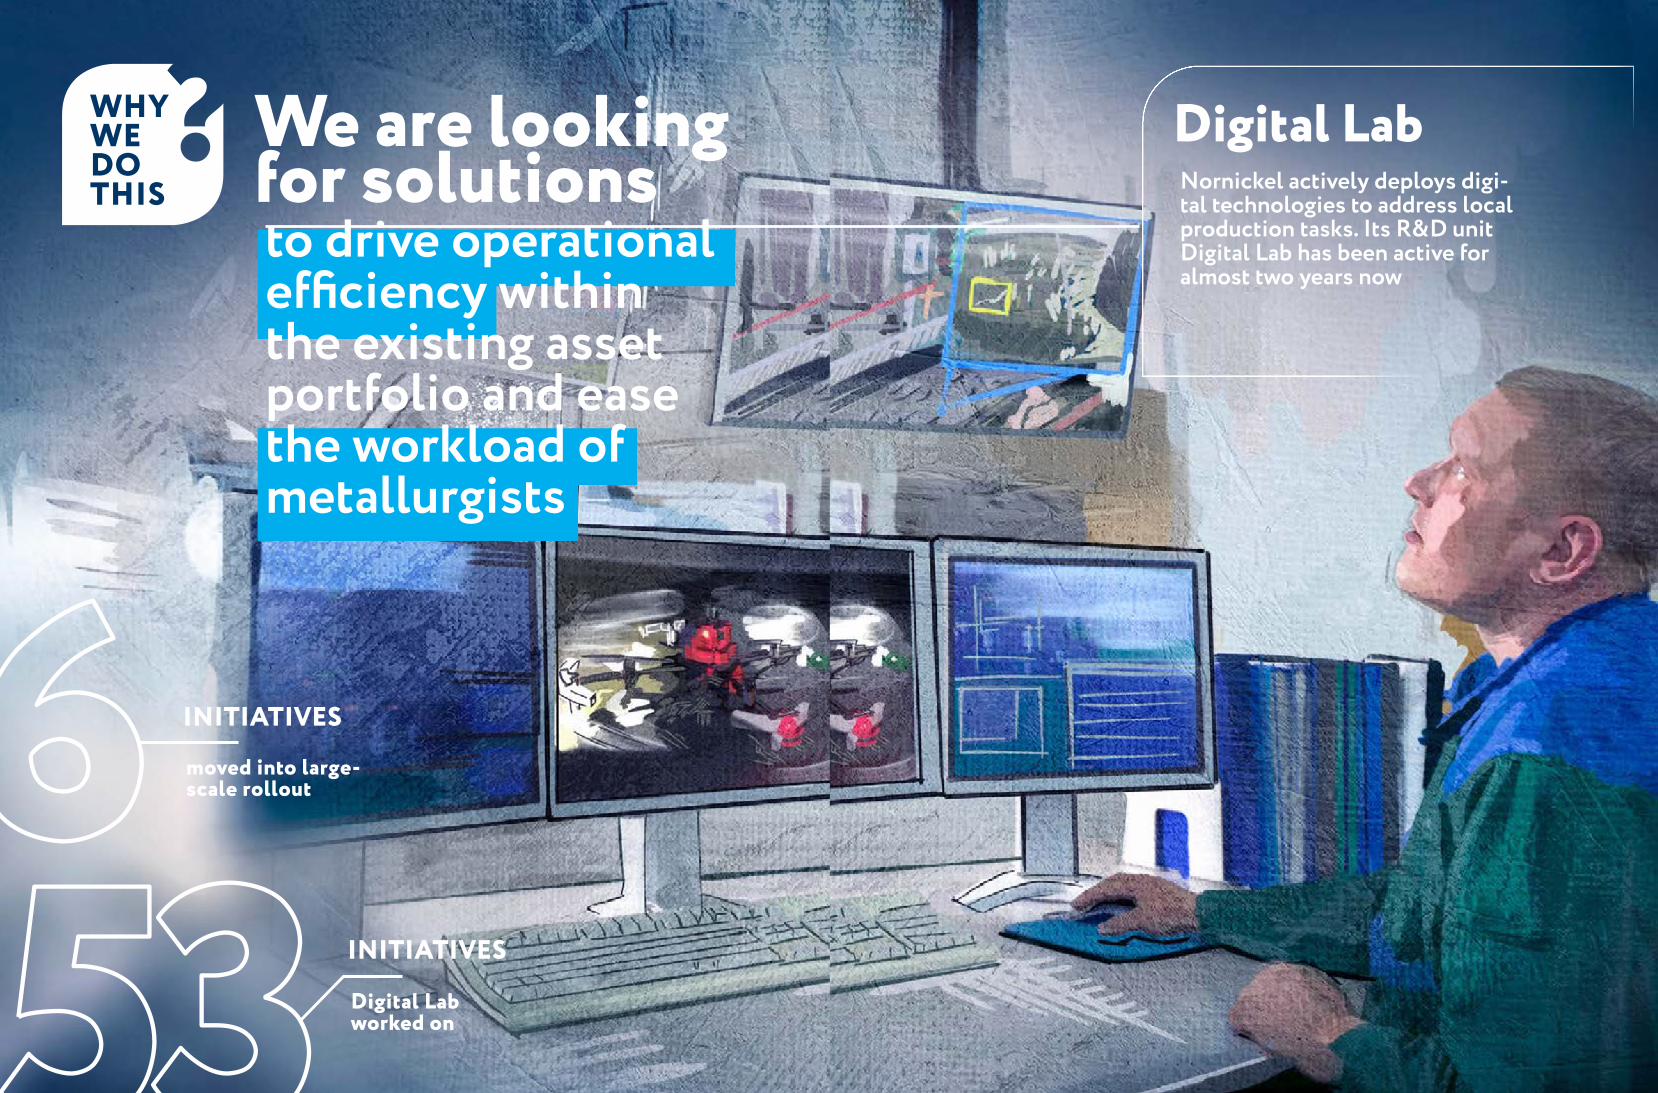
Digital LabWe are looking for solutions to drive operational efficiency within the existing asset portfolio and ease the workload of metallurgists
Nornickel actively deploys digi-tal technologies to address local production tasks. Its R&D unit Digital Lab has been active for almost two years now
53 INITIATIVES
Digital Lab worked on
6 INITIATIVES
moved into large-scale rollout
WHY WE DO THIS
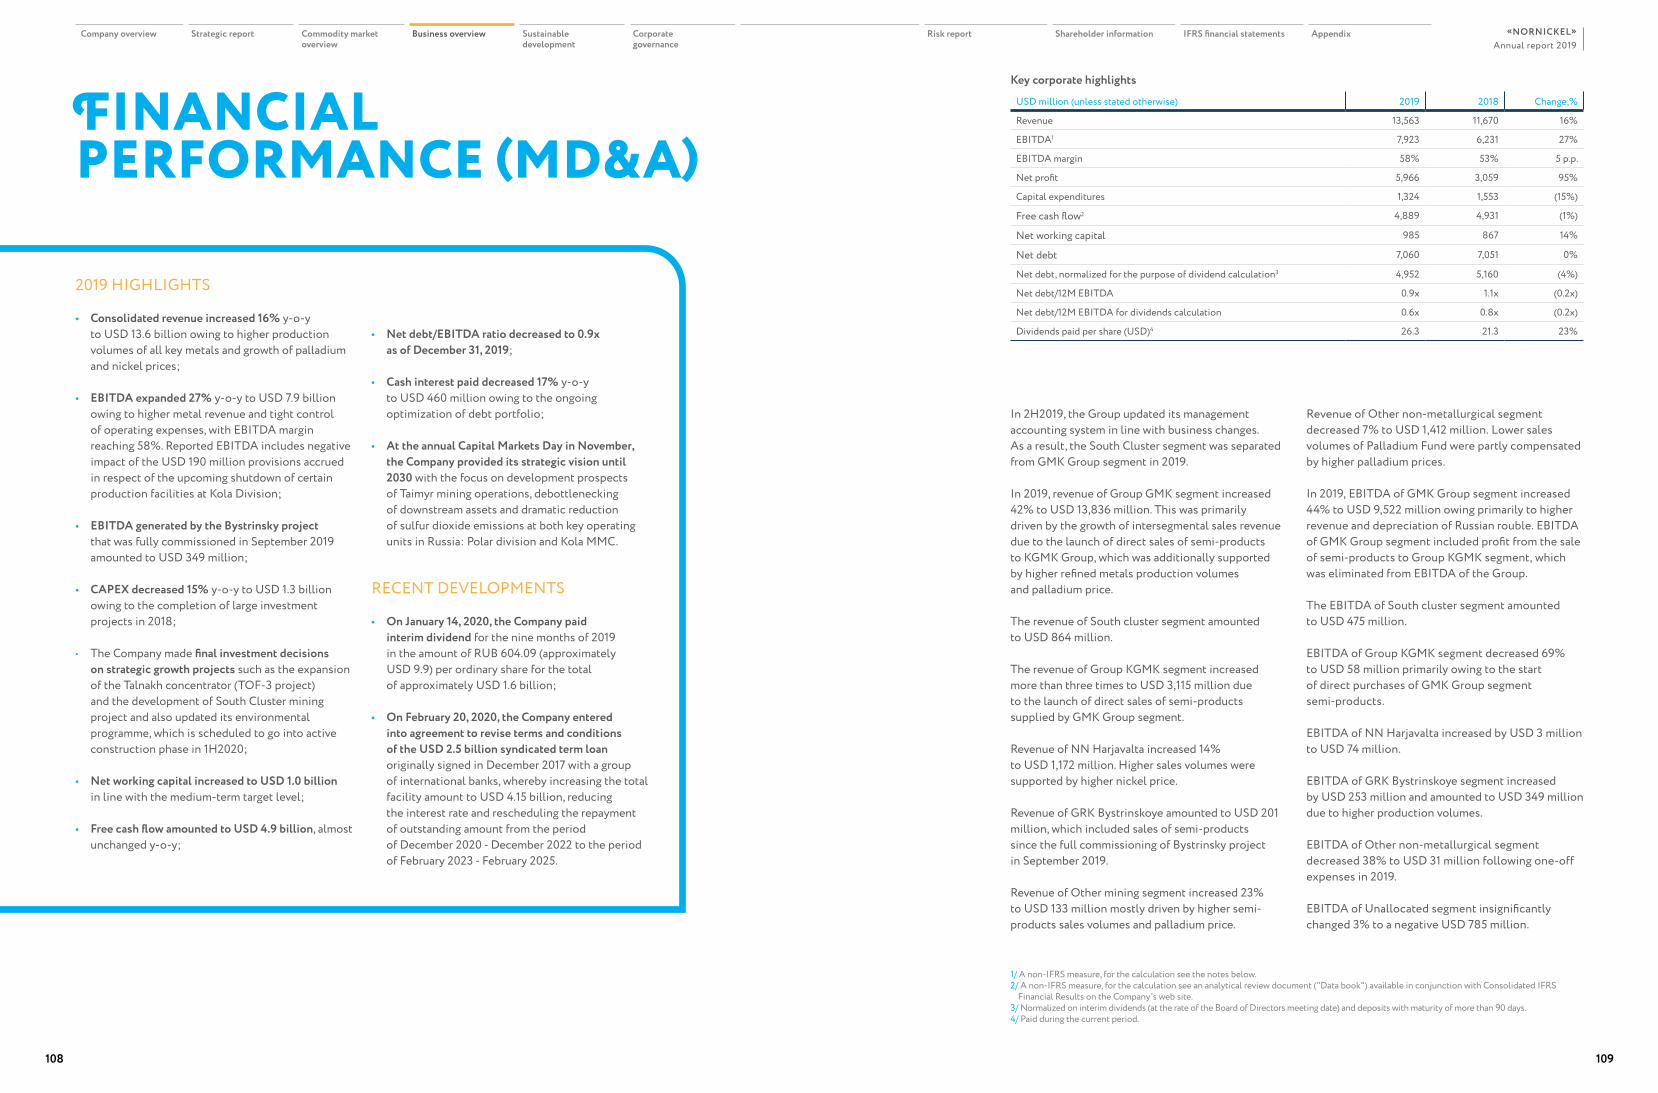
FINANCIAL PERFORMANCE (MD&A)
RECENT DEVELOPMENTS
• On January 14, 2020, the Company paid interim dividend for the nine months of 2019 in the amount of RUB 604.09 (approximately USD 9.9) per ordinary share for the total of approximately USD 1.6 billion;
• On February 20, 2020, the Company entered into agreement to revise terms and conditions of the USD 2.5 billion syndicated term loan originally signed in December 2017 with a group of international banks, whereby increasing the total facility amount to USD 4.15 billion, reducing the interest rate and rescheduling the repayment of outstanding amount from the period of December 2020 - December 2022 to the period of February 2023 - February 2025.
2019 HIGHLIGHTS
• Consolidated revenue increased 16% y-o-y to USD 13.6 billion owing to higher production volumes of all key metals and growth of palladium and nickel prices;
• EBITDA expanded 27% y-o-y to USD 7.9 billion owing to higher metal revenue and tight control of operating expenses, with EBITDA margin reaching 58%. Reported EBITDA includes negative impact of the USD 190 million provisions accrued in respect of the upcoming shutdown of certain production facilities at Kola Division;
• EBITDA generated by the Bystrinsky project that was fully commissioned in September 2019 amounted to USD 349 million;
• CAPEX decreased 15% y-o-y to USD 1.3 billion owing to the completion of large investment projects in 2018;
• The Company made final investment decisions on strategic growth projects such as the expansion of the Talnakh concentrator (TOF-3 project) and the development of South Cluster mining project and also updated its environmental programme, which is scheduled to go into active construction phase in 1H2020;
• Net working capital increased to USD 1.0 billion in line with the medium-term target level;
• Free cash flow amounted to USD 4.9 billion, almost unchanged y-o-y;
• Net debt/EBITDA ratio decreased to 0.9x as of December 31, 2019;
• Cash interest paid decreased 17% y-o-y to USD 460 million owing to the ongoing optimization of debt portfolio;
• At the annual Capital Markets Day in November, the Company provided its strategic vision until 2030 with the focus on development prospects of Taimyr mining operations, debottlenecking of downstream assets and dramatic reduction of sulfur dioxide emissions at both key operating units in Russia: Polar division and Kola MMC.
Key corporate highlights
USD million (unless stated otherwise) 2019 2018 Change,%
Revenue 13,563 11,670 16%
EBITDA1 7,923 6,231 27%
EBITDA margin 58% 53% 5 p.p.
Net profit 5,966 3,059 95%
Capital expenditures 1,324 1,553 (15%)
Free cash flow2 4,889 4,931 (1%)
Net working capital 985 867 14%
Net debt 7,060 7,051 0%
Net debt, normalized for the purpose of dividend calculation3 4,952 5,160 (4%)
Net debt/12M EBITDA 0.9x 1.1x (0.2x)
Net debt/12M EBITDA for dividends calculation 0.6x 0.8x (0.2x)
Dividends paid per share (USD)4 26.3 21.3 23%
In 2H2019, the Group updated its management accounting system in line with business changes. As a result, the South Cluster segment was separated from GMK Group segment in 2019.
In 2019, revenue of Group GMK segment increased 42% to USD 13,836 million. This was primarily driven by the growth of intersegmental sales revenue due to the launch of direct sales of semi-products to KGMK Group, which was additionally supported by higher refined metals production volumes and palladium price.
The revenue of South cluster segment amounted to USD 864 million.
The revenue of Group KGMK segment increased more than three times to USD 3,115 million due to the launch of direct sales of semi-products supplied by GMK Group segment.
Revenue of NN Harjavalta increased 14% to USD 1,172 million. Higher sales volumes were supported by higher nickel price.
Revenue of GRK Bystrinskoye amounted to USD 201 million, which included sales of semi-products since the full commissioning of Bystrinsky project in September 2019.
Revenue of Other mining segment increased 23% to USD 133 million mostly driven by higher semi-products sales volumes and palladium price.
Revenue of Other non-metallurgical segment decreased 7% to USD 1,412 million. Lower sales volumes of Palladium Fund were partly compensated by higher palladium prices.
In 2019, EBITDA of GMK Group segment increased 44% to USD 9,522 million owing primarily to higher revenue and depreciation of Russian rouble. EBITDA of GMK Group segment included profit from the sale of semi-products to Group KGMK segment, which was eliminated from EBITDA of the Group.
The EBITDA of South cluster segment amounted to USD 475 million.
EBITDA of Group KGMK segment decreased 69% to USD 58 million primarily owing to the start of direct purchases of GMK Group segment semi-products.
EBITDA of NN Harjavalta increased by USD 3 million to USD 74 million.
EBITDA of GRK Bystrinskoye segment increased by USD 253 million and amounted to USD 349 million due to higher production volumes.
EBITDA of Other non-metallurgical segment decreased 38% to USD 31 million following one-off expenses in 2019.
EBITDA of Unallocated segment insignificantly changed 3% to a negative USD 785 million.
1/ A non-IFRS measure, for the calculation see the notes below.2/ A non-IFRS measure, for the calculation see an analytical review document ("Data book") available in conjunction with Consolidated IFRS
Financial Results on the Company’s web site.3/ Normalized on interim dividends (at the rate of the Board of Directors meeting date) and deposits with maturity of more than 90 days.4/ Paid during the current period.
Company overview Strategic report Commodity market overview
Business overview Sustainable development
Corporate governance
Risk report Shareholder information IFRS financial statements AppendixAnnual report 2019
«NORNICKEL»
108 109
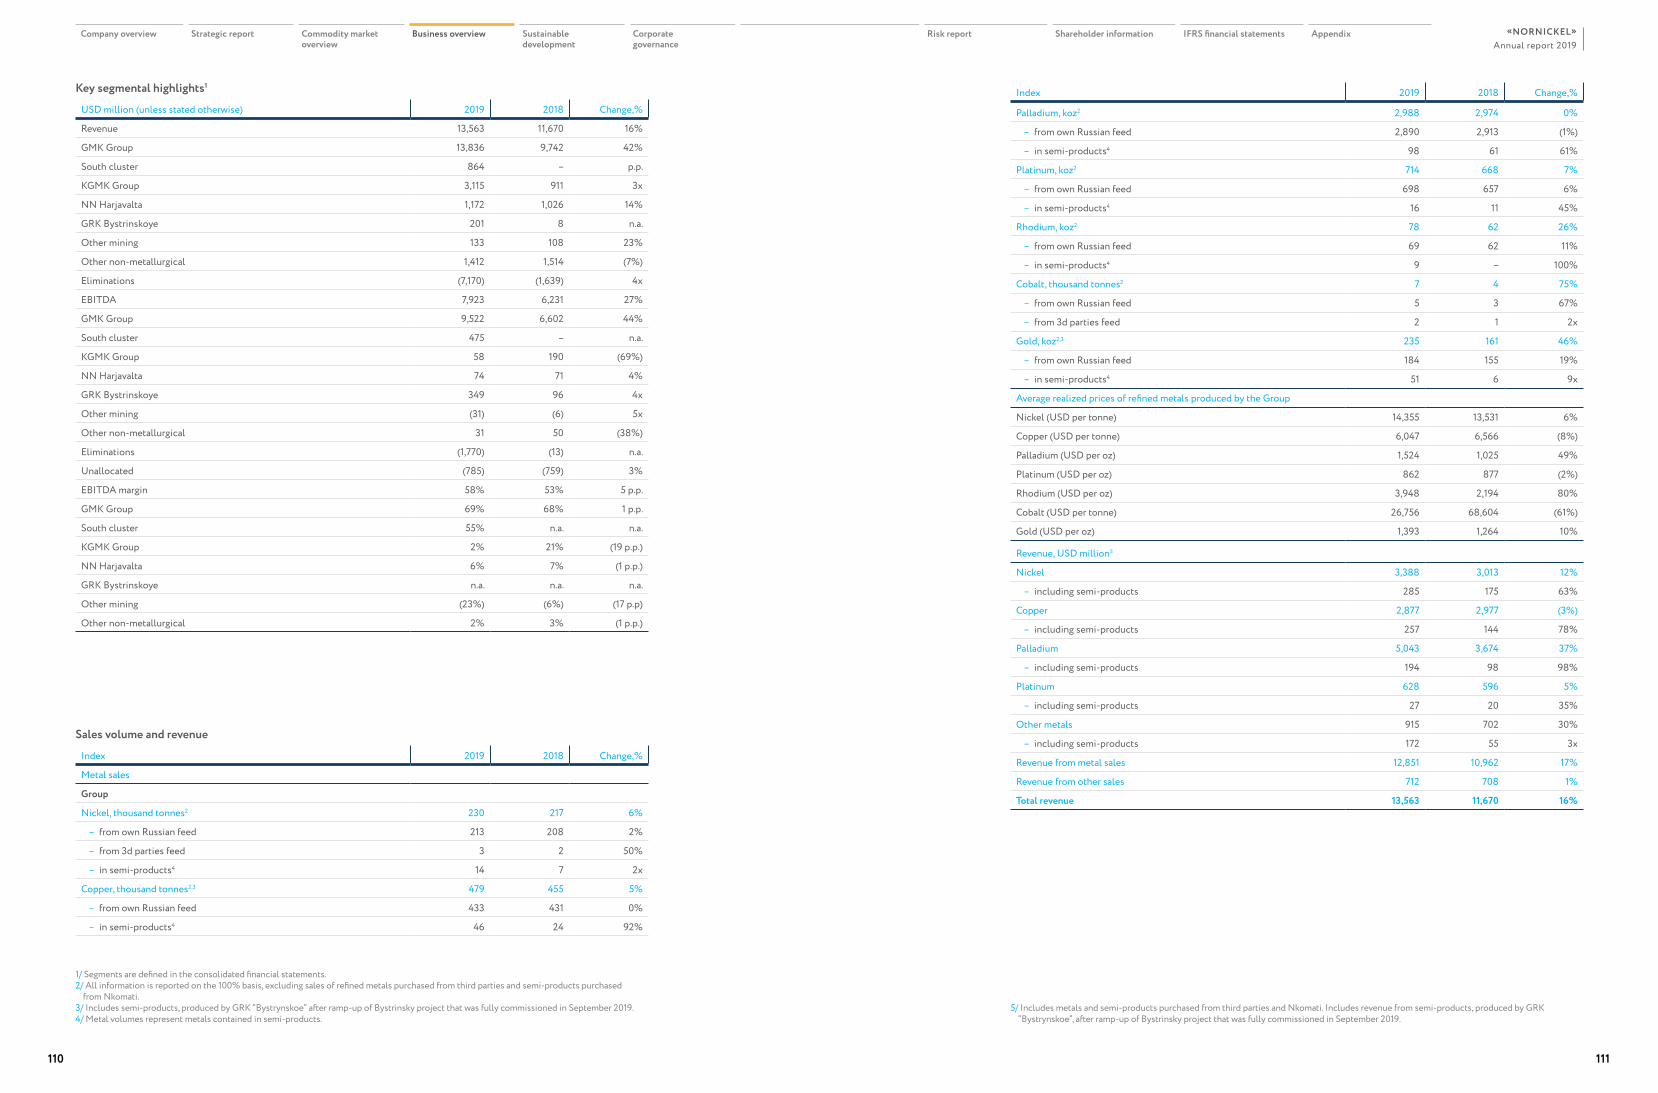
Key segmental highlights1 USD million (unless stated otherwise) 2019 2018 Change,%
Revenue 13,563 11,670 16%
GMK Group 13,836 9,742 42%
South cluster 864 – p.p.
KGMK Group 3,115 911 3x
NN Harjavalta 1,172 1,026 14%
GRK Bystrinskoye 201 8 n.a.
Other mining 133 108 23%
Other non-metallurgical 1,412 1,514 (7%)
Eliminations (7,170) (1,639) 4x
EBITDA 7,923 6,231 27%
GMK Group 9,522 6,602 44%
South cluster 475 – n.a.
KGMK Group 58 190 (69%)
NN Harjavalta 74 71 4%
GRK Bystrinskoye 349 96 4x
Other mining (31) (6) 5x
Other non-metallurgical 31 50 (38%)
Eliminations (1,770) (13) n.a.
Unallocated (785) (759) 3%
EBITDA margin 58% 53% 5 p.p.
GMK Group 69% 68% 1 p.p.
South cluster 55% n.a. n.a.
KGMK Group 2% 21% (19 p.p.)
NN Harjavalta 6% 7% (1 p.p.)
GRK Bystrinskoye n.a. n.a. n.a.
Other mining (23%) (6%) (17 p.p)
Other non-metallurgical 2% 3% (1 p.p.)
Sales volume and revenue Index 2019 2018 Change,%
Metal sales
Group
Nickel, thousand tonnes2 230 217 6%
– from own Russian feed 213 208 2%
– from 3d parties feed 3 2 50%
– in semi-products4 14 7 2x
Copper, thousand tonnes2,3 479 455 5%
– from own Russian feed 433 431 0%
– in semi-products4 46 24 92%
1/ Segments are defined in the consolidated financial statements.2/ All information is reported on the 100% basis, excluding sales of refined metals purchased from third parties and semi-products purchased
from Nkomati.3/ Includes semi-products, produced by GRK “Bystrynskoe” after ramp-up of Bystrinsky project that was fully commissioned in September 2019.4/ Metal volumes represent metals contained in semi-products.
Index 2019 2018 Change,%
Palladium, koz2 2,988 2,974 0%
– from own Russian feed 2,890 2,913 (1%)
– in semi-products4 98 61 61%
Platinum, koz2 714 668 7%
– from own Russian feed 698 657 6%
– in semi-products4 16 11 45%
Rhodium, koz2 78 62 26%
– from own Russian feed 69 62 11%
– in semi-products4 9 – 100%
Cobalt, thousand tonnes2 7 4 75%
– from own Russian feed 5 3 67%
– from 3d parties feed 2 1 2x
Gold, koz2,3 235 161 46%
– from own Russian feed 184 155 19%
– in semi-products4 51 6 9x
Average realized prices of refined metals produced by the Group
Nickel (USD per tonne) 14,355 13,531 6%
Copper (USD per tonne) 6,047 6,566 (8%)
Palladium (USD per oz) 1,524 1,025 49%
Platinum (USD per oz) 862 877 (2%)
Rhodium (USD per oz) 3,948 2,194 80%
Cobalt (USD per tonne) 26,756 68,604 (61%)
Gold (USD per oz) 1,393 1,264 10%
Revenue, USD million5
Nickel 3,388 3,013 12%
– including semi-products 285 175 63%
Copper 2,877 2,977 (3%)
– including semi-products 257 144 78%
Palladium 5,043 3,674 37%
– including semi-products 194 98 98%
Platinum 628 596 5%
– including semi-products 27 20 35%
Other metals 915 702 30%
– including semi-products 172 55 3x
Revenue from metal sales 12,851 10,962 17%
Revenue from other sales 712 708 1%
Total revenue 13,563 11,670 16%
5/ Includes metals and semi-products purchased from third parties and Nkomati. Includes revenue from semi-products, produced by GRK “Bystrynskoe”, after ramp-up of Bystrinsky project that was fully commissioned in September 2019.
Company overview Strategic report Commodity market overview
Business overview Sustainable development
Corporate governance
Risk report Shareholder information IFRS financial statements AppendixAnnual report 2019
«NORNICKEL»
110 111
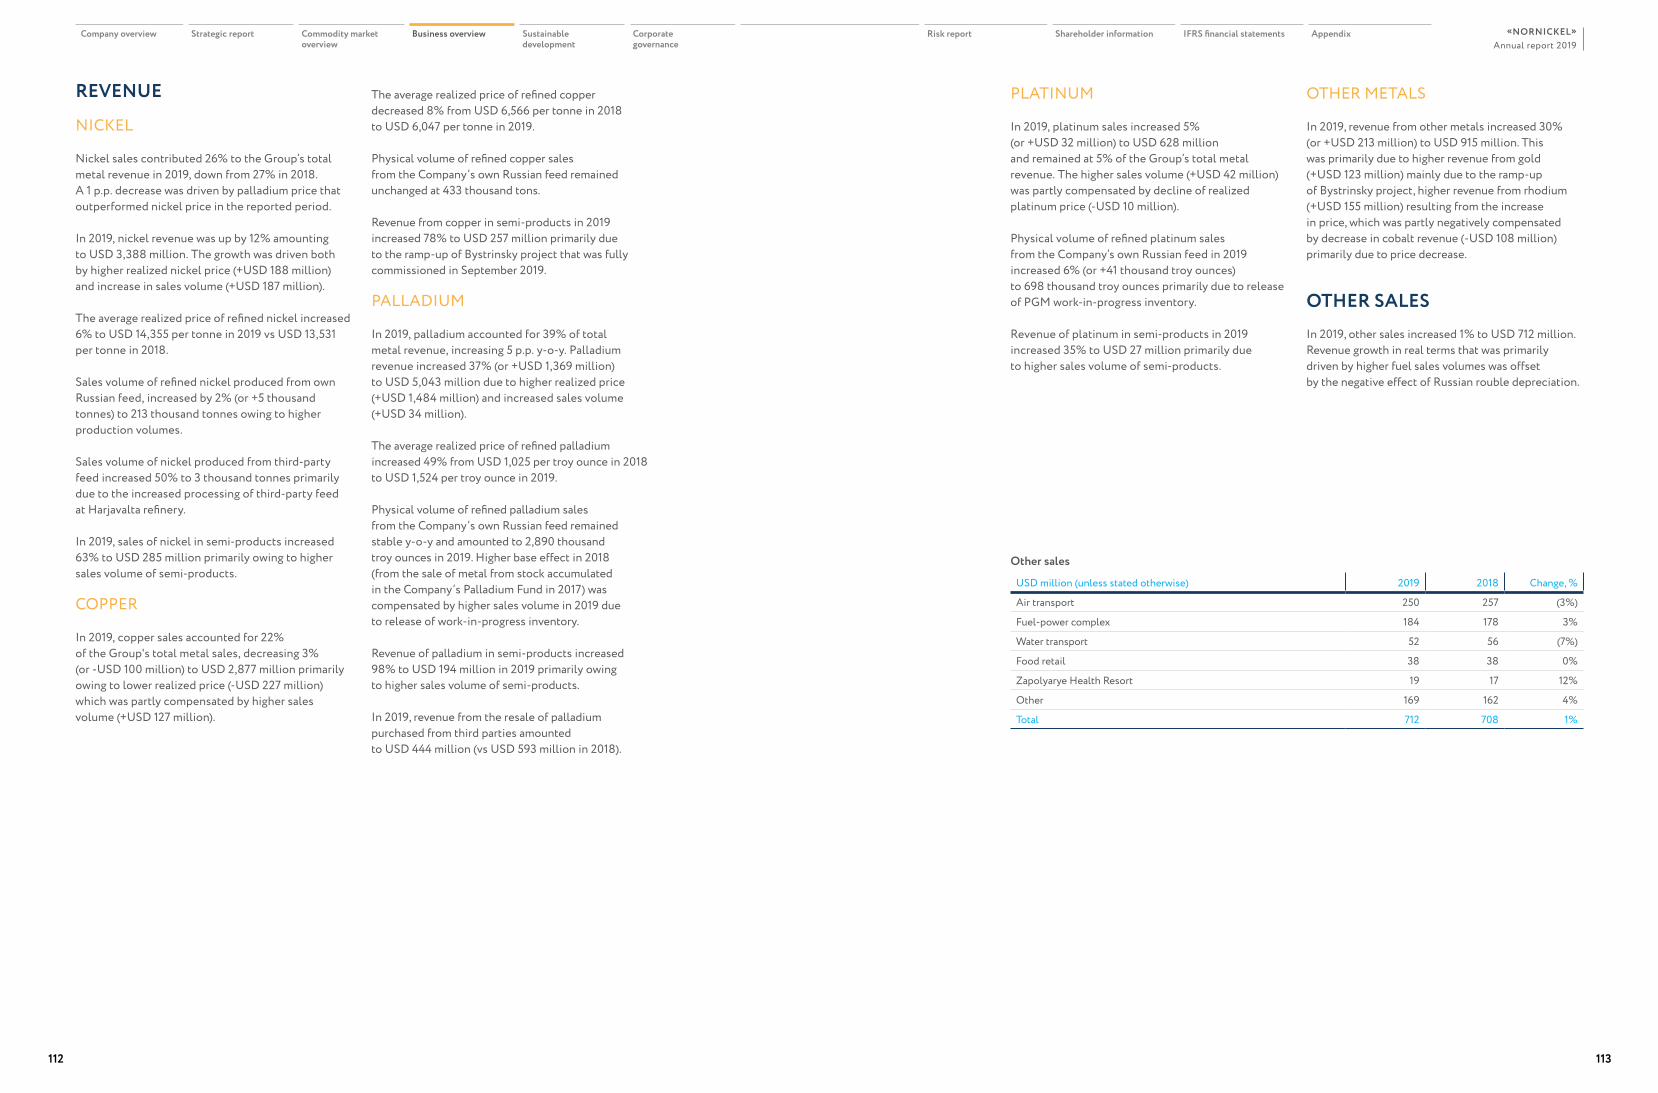
REVENUE
NICKEL
Nickel sales contributed 26% to the Group’s total metal revenue in 2019, down from 27% in 2018. A 1 p.p. decrease was driven by palladium price that outperformed nickel price in the reported period.
In 2019, nickel revenue was up by 12% amounting to USD 3,388 million. The growth was driven both by higher realized nickel price (+USD 188 million) and increase in sales volume (+USD 187 million).
The average realized price of refined nickel increased 6% to USD 14,355 per tonne in 2019 vs USD 13,531 per tonne in 2018.
Sales volume of refined nickel produced from own Russian feed, increased by 2% (or +5 thousand tonnes) to 213 thousand tonnes owing to higher production volumes.
Sales volume of nickel produced from third-party feed increased 50% to 3 thousand tonnes primarily due to the increased processing of third-party feed at Harjavalta refinery.
In 2019, sales of nickel in semi-products increased 63% to USD 285 million primarily owing to higher sales volume of semi-products.
COPPER
In 2019, copper sales accounted for 22% of the Group's total metal sales, decreasing 3% (or -USD 100 million) to USD 2,877 million primarily owing to lower realized price (-USD 227 million) which was partly compensated by higher sales volume (+USD 127 million).
PLATINUM
In 2019, platinum sales increased 5% (or +USD 32 million) to USD 628 million and remained at 5% of the Group’s total metal revenue. The higher sales volume (+USD 42 million) was partly compensated by decline of realized platinum price (-USD 10 million).
Physical volume of refined platinum sales from the Company’s own Russian feed in 2019 increased 6% (or +41 thousand troy ounces) to 698 thousand troy ounces primarily due to release of PGM work-in-progress inventory.
Revenue of platinum in semi-products in 2019 increased 35% to USD 27 million primarily due to higher sales volume of semi-products.
The average realized price of refined copper decreased 8% from USD 6,566 per tonne in 2018 to USD 6,047 per tonne in 2019.
Physical volume of refined copper sales from the Company’s own Russian feed remained unchanged at 433 thousand tons.
Revenue from copper in semi-products in 2019 increased 78% to USD 257 million primarily due to the ramp-up of Bystrinsky project that was fully commissioned in September 2019.
PALLADIUM
In 2019, palladium accounted for 39% of total metal revenue, increasing 5 p.p. y-o-y. Palladium revenue increased 37% (or +USD 1,369 million) to USD 5,043 million due to higher realized price (+USD 1,484 million) and increased sales volume (+USD 34 million).
The average realized price of refined palladium increased 49% from USD 1,025 per troy ounce in 2018 to USD 1,524 per troy ounce in 2019.
Physical volume of refined palladium sales from the Company’s own Russian feed remained stable y-o-y and amounted to 2,890 thousand troy ounces in 2019. Higher base effect in 2018 (from the sale of metal from stock accumulated in the Company’s Palladium Fund in 2017) was compensated by higher sales volume in 2019 due to release of work-in-progress inventory.
Revenue of palladium in semi-products increased 98% to USD 194 million in 2019 primarily owing to higher sales volume of semi-products.
In 2019, revenue from the resale of palladium purchased from third parties amounted to USD 444 million (vs USD 593 million in 2018).
OTHER METALS
In 2019, revenue from other metals increased 30% (or +USD 213 million) to USD 915 million. This was primarily due to higher revenue from gold (+USD 123 million) mainly due to the ramp-up of Bystrinsky project, higher revenue from rhodium (+USD 155 million) resulting from the increase in price, which was partly negatively compensated by decrease in cobalt revenue (-USD 108 million) primarily due to price decrease.
OTHER SALESIn 2019, other sales increased 1% to USD 712 million. Revenue growth in real terms that was primarily driven by higher fuel sales volumes was offset by the negative effect of Russian rouble depreciation.
Other sales
USD million (unless stated otherwise) 2019 2018 Change, %
Air transport 250 257 (3%)
Fuel-power complex 184 178 3%
Water transport 52 56 (7%)
Food retail 38 38 0%
Zapolyarye Health Resort 19 17 12%
Other 169 162 4%
Total 712 708 1%
Company overview Strategic report Commodity market overview
Business overview Sustainable development
Corporate governance
Risk report Shareholder information IFRS financial statements AppendixAnnual report 2019
«NORNICKEL»
112 113
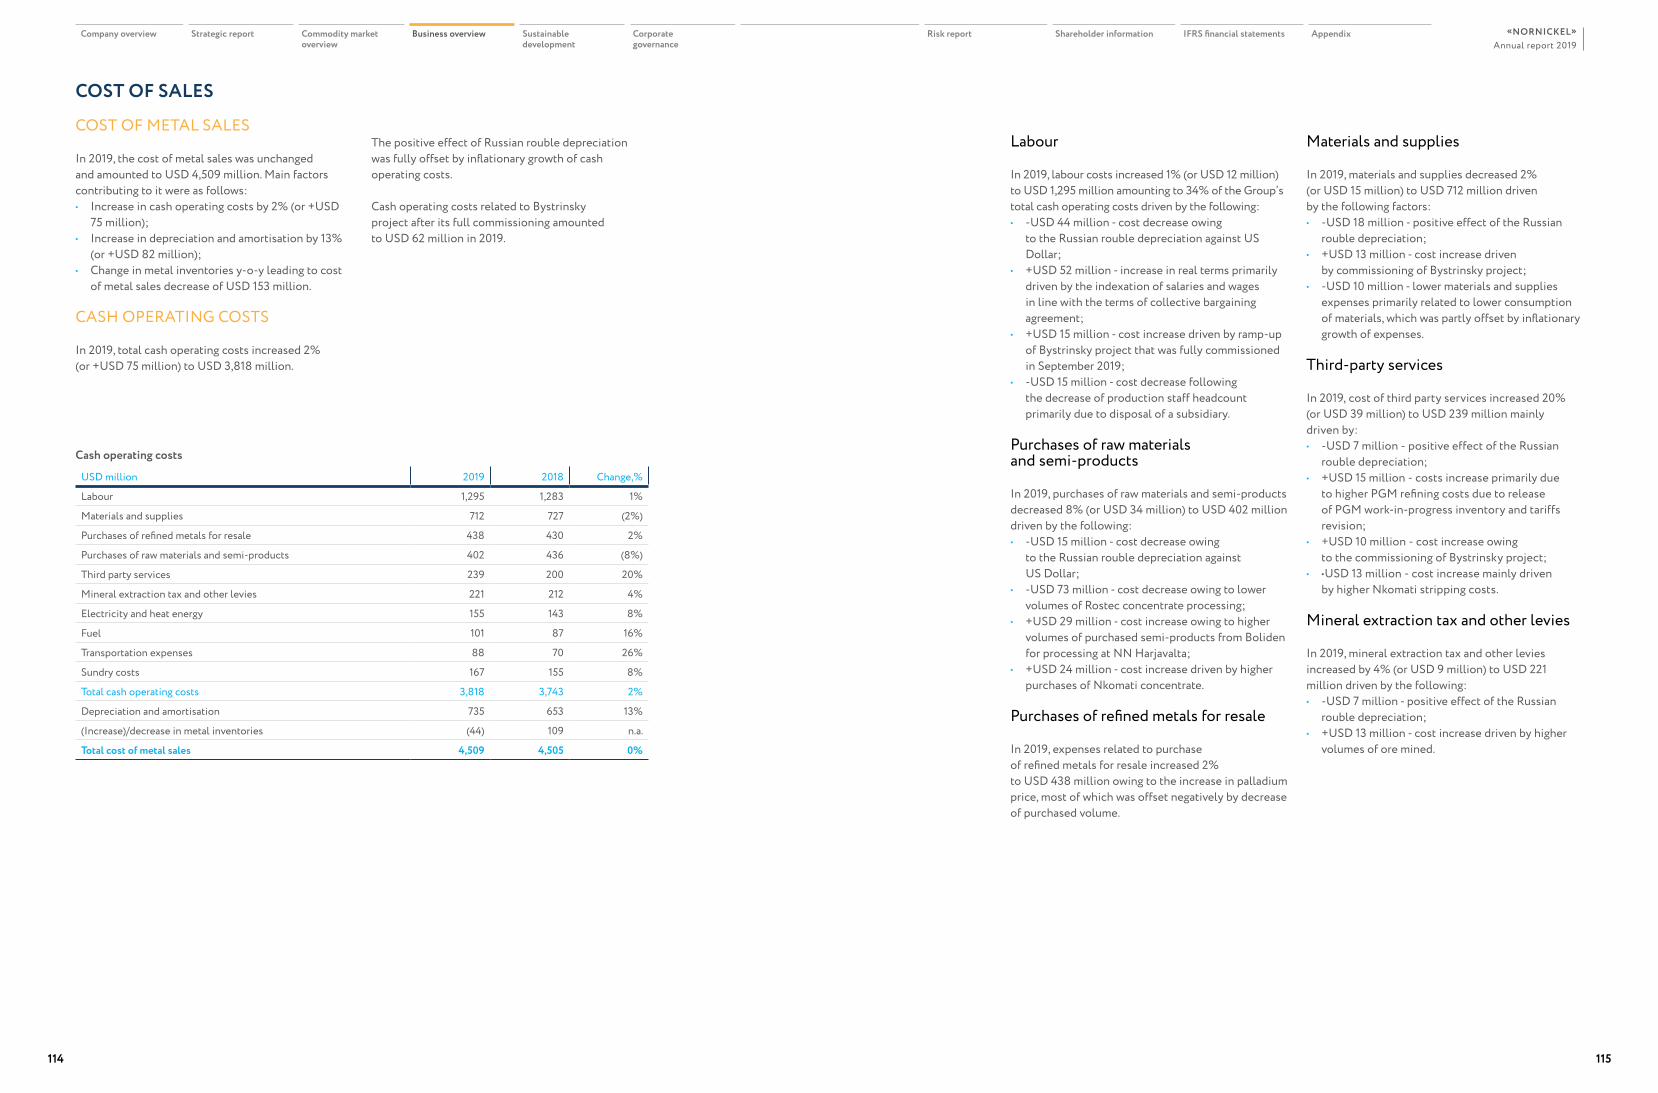
COST OF SALES
COST OF METAL SALES
In 2019, the cost of metal sales was unchanged and amounted to USD 4,509 million. Main factors contributing to it were as follows:• Increase in cash operating costs by 2% (or +USD
75 million);• Increase in depreciation and amortisation by 13%
(or +USD 82 million);• Change in metal inventories y-o-y leading to cost
of metal sales decrease of USD 153 million.
CASH OPERATING COSTS
In 2019, total cash operating costs increased 2% (or +USD 75 million) to USD 3,818 million.
The positive effect of Russian rouble depreciation was fully offset by inflationary growth of cash operating costs.
Cash operating costs related to Bystrinsky project after its full commissioning amounted to USD 62 million in 2019.
Cash operating costs
USD million 2019 2018 Change,%
Labour 1,295 1,283 1%
Materials and supplies 712 727 (2%)
Purchases of refined metals for resale 438 430 2%
Purchases of raw materials and semi-products 402 436 (8%)
Third party services 239 200 20%
Mineral extraction tax and other levies 221 212 4%
Electricity and heat energy 155 143 8%
Fuel 101 87 16%
Transportation expenses 88 70 26%
Sundry costs 167 155 8%
Total cash operating costs 3,818 3,743 2%
Depreciation and amortisation 735 653 13%
(Increase)/decrease in metal inventories (44) 109 n.a.
Total cost of metal sales 4,509 4,505 0%
Materials and supplies
In 2019, materials and supplies decreased 2% (or USD 15 million) to USD 712 million driven by the following factors:• -USD 18 million - positive effect of the Russian
rouble depreciation;• +USD 13 million - cost increase driven
by commissioning of Bystrinsky project;• -USD 10 million - lower materials and supplies
expenses primarily related to lower consumption of materials, which was partly offset by inflationary growth of expenses.
Third-party services
In 2019, cost of third party services increased 20% (or USD 39 million) to USD 239 million mainly driven by:• -USD 7 million - positive effect of the Russian
rouble depreciation;• +USD 15 million - costs increase primarily due
to higher PGM refining costs due to release of PGM work-in-progress inventory and tariffs revision;
• +USD 10 million - cost increase owing to the commissioning of Bystrinsky project;
• •USD 13 million - cost increase mainly driven by higher Nkomati stripping costs.
Mineral extraction tax and other levies
In 2019, mineral extraction tax and other levies increased by 4% (or USD 9 million) to USD 221 million driven by the following:• -USD 7 million - positive effect of the Russian
rouble depreciation;• +USD 13 million - cost increase driven by higher
volumes of ore mined.
Labour
In 2019, labour costs increased 1% (or USD 12 million) to USD 1,295 million amounting to 34% of the Group’s total cash operating costs driven by the following:• -USD 44 million - cost decrease owing
to the Russian rouble depreciation against US Dollar;
• +USD 52 million - increase in real terms primarily driven by the indexation of salaries and wages in line with the terms of collective bargaining agreement;
• +USD 15 million - cost increase driven by ramp-up of Bystrinsky project that was fully commissioned in September 2019;
• -USD 15 million - cost decrease following the decrease of production staff headcount primarily due to disposal of a subsidiary.
Purchases of raw materials and semi-products
In 2019, purchases of raw materials and semi-products decreased 8% (or USD 34 million) to USD 402 million driven by the following:• -USD 15 million - cost decrease owing
to the Russian rouble depreciation against US Dollar;
• -USD 73 million - cost decrease owing to lower volumes of Rostec concentrate processing;
• +USD 29 million - cost increase owing to higher volumes of purchased semi-products from Boliden for processing at NN Harjavalta;
• +USD 24 million - cost increase driven by higher purchases of Nkomati concentrate.
Purchases of refined metals for resale
In 2019, expenses related to purchase of refined metals for resale increased 2% to USD 438 million owing to the increase in palladium price, most of which was offset negatively by decrease of purchased volume.
Company overview Strategic report Commodity market overview
Business overview Sustainable development
Corporate governance
Risk report Shareholder information IFRS financial statements AppendixAnnual report 2019
«NORNICKEL»
114 115
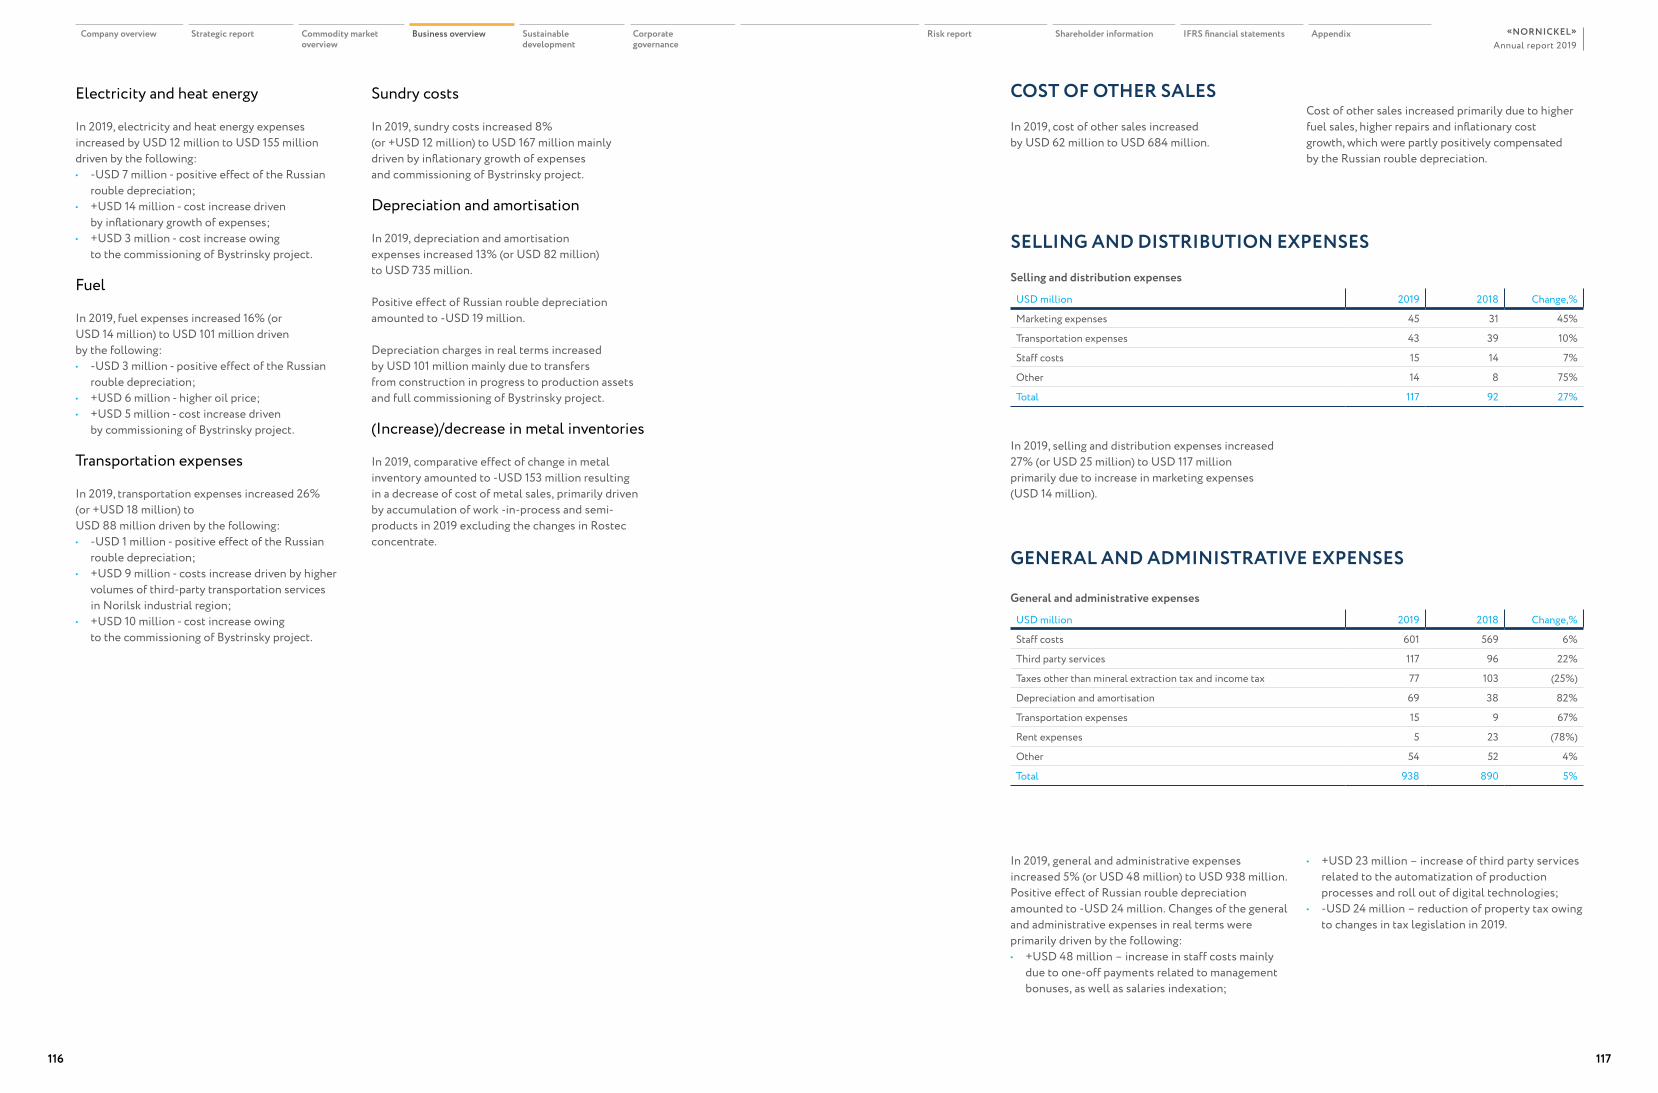
Electricity and heat energy
In 2019, electricity and heat energy expenses increased by USD 12 million to USD 155 million driven by the following:• -USD 7 million - positive effect of the Russian
rouble depreciation;• +USD 14 million - cost increase driven
by inflationary growth of expenses;• +USD 3 million - cost increase owing
to the commissioning of Bystrinsky project.
Fuel
In 2019, fuel expenses increased 16% (or USD 14 million) to USD 101 million driven by the following:• -USD 3 million - positive effect of the Russian
rouble depreciation;• +USD 6 million - higher oil price;• +USD 5 million - cost increase driven
by commissioning of Bystrinsky project.
Transportation expenses
In 2019, transportation expenses increased 26% (or +USD 18 million) to USD 88 million driven by the following:• -USD 1 million - positive effect of the Russian
rouble depreciation;• +USD 9 million - costs increase driven by higher
volumes of third-party transportation services in Norilsk industrial region;
• +USD 10 million - cost increase owing to the commissioning of Bystrinsky project.
Sundry costs
In 2019, sundry costs increased 8% (or +USD 12 million) to USD 167 million mainly driven by inflationary growth of expenses and commissioning of Bystrinsky project.
Depreciation and amortisation
In 2019, depreciation and amortisation expenses increased 13% (or USD 82 million) to USD 735 million.
Positive effect of Russian rouble depreciation amounted to -USD 19 million.
Depreciation charges in real terms increased by USD 101 million mainly due to transfers from construction in progress to production assets and full commissioning of Bystrinsky project.
(Increase)/decrease in metal inventories
In 2019, comparative effect of change in metal inventory amounted to -USD 153 million resulting in a decrease of cost of metal sales, primarily driven by accumulation of work -in-process and semi-products in 2019 excluding the changes in Rostec concentrate.
Selling and distribution expenses
USD million 2019 2018 Change,%
Marketing expenses 45 31 45%
Transportation expenses 43 39 10%
Staff costs 15 14 7%
Other 14 8 75%
Total 117 92 27%
SELLING AND DISTRIBUTION EXPENSES
General and administrative expenses
USD million 2019 2018 Change,%
Staff costs 601 569 6%
Third party services 117 96 22%
Taxes other than mineral extraction tax and income tax 77 103 (25%)
Depreciation and amortisation 69 38 82%
Transportation expenses 15 9 67%
Rent expenses 5 23 (78%)
Other 54 52 4%
Total 938 890 5%
GENERAL AND ADMINISTRATIVE EXPENSES
COST OF OTHER SALES
In 2019, cost of other sales increased by USD 62 million to USD 684 million.
Cost of other sales increased primarily due to higher fuel sales, higher repairs and inflationary cost growth, which were partly positively compensated by the Russian rouble depreciation.
In 2019, selling and distribution expenses increased 27% (or USD 25 million) to USD 117 million primarily due to increase in marketing expenses (USD 14 million).
In 2019, general and administrative expenses increased 5% (or USD 48 million) to USD 938 million. Positive effect of Russian rouble depreciation amounted to -USD 24 million. Changes of the general and administrative expenses in real terms were primarily driven by the following:• +USD 48 million – increase in staff costs mainly
due to one-off payments related to management bonuses, as well as salaries indexation;
• +USD 23 million – increase of third party services related to the automatization of production processes and roll out of digital technologies;
• -USD 24 million – reduction of property tax owing to changes in tax legislation in 2019.
Company overview Strategic report Commodity market overview
Business overview Sustainable development
Corporate governance
Risk report Shareholder information IFRS financial statements AppendixAnnual report 2019
«NORNICKEL»
116 117
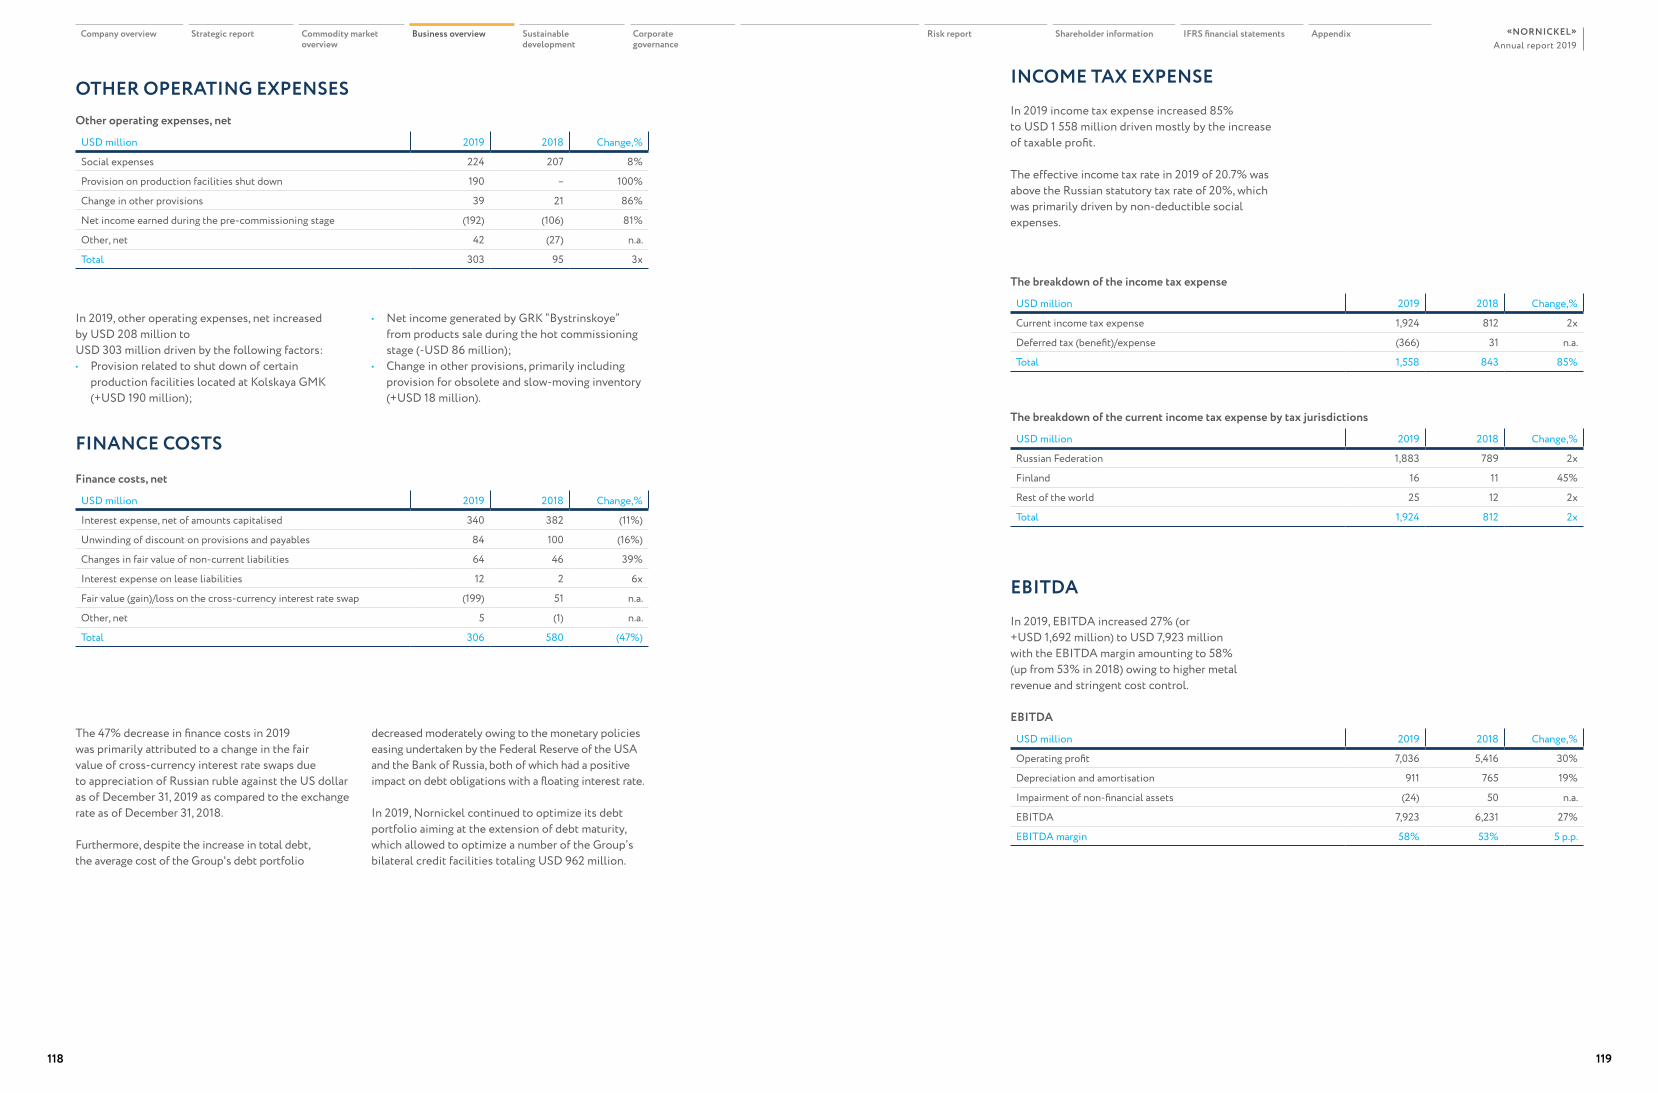
In 2019, other operating expenses, net increased by USD 208 million to USD 303 million driven by the following factors:• Provision related to shut down of certain
production facilities located at Kolskaya GMK (+USD 190 million);
Finance costs, net
USD million 2019 2018 Change,%
Interest expense, net of amounts capitalised 340 382 (11%)
Unwinding of discount on provisions and payables 84 100 (16%)
Changes in fair value of non-current liabilities 64 46 39%
Interest expense on lease liabilities 12 2 6x
Fair value (gain)/loss on the cross-currency interest rate swap (199) 51 n.a.
Other, net 5 (1) n.a.
Total 306 580 (47%)
The 47% decrease in finance costs in 2019 was primarily attributed to a change in the fair value of cross-currency interest rate swaps due to appreciation of Russian ruble against the US dollar as of December 31, 2019 as compared to the exchange rate as of December 31, 2018.
Furthermore, despite the increase in total debt, the average cost of the Group's debt portfolio
INCOME TAX EXPENSEIn 2019 income tax expense increased 85% to USD 1 558 million driven mostly by the increase of taxable profit.
The effective income tax rate in 2019 of 20.7% was above the Russian statutory tax rate of 20%, which was primarily driven by non-deductible social expenses.
Other operating expenses, net
USD million 2019 2018 Change,%
Social expenses 224 207 8%
Provision on production facilities shut down 190 – 100%
Change in other provisions 39 21 86%
Net income earned during the pre-commissioning stage (192) (106) 81%
Other, net 42 (27) n.a.
Total 303 95 3x
The breakdown of the income tax expense
USD million 2019 2018 Change,%
Current income tax expense 1,924 812 2x
Deferred tax (benefit)/expense (366) 31 n.a.
Total 1,558 843 85%
The breakdown of the current income tax expense by tax jurisdictions
USD million 2019 2018 Change,%
Russian Federation 1,883 789 2x
Finland 16 11 45%
Rest of the world 25 12 2x
Total 1,924 812 2x
EBITDA
USD million 2019 2018 Change,%
Operating profit 7,036 5,416 30%
Depreciation and amortisation 911 765 19%
Impairment of non-financial assets (24) 50 n.a.
EBITDA 7,923 6,231 27%
EBITDA margin 58% 53% 5 p.p.
OTHER OPERATING EXPENSES
FINANCE COSTS
decreased moderately owing to the monetary policies easing undertaken by the Federal Reserve of the USA and the Bank of Russia, both of which had a positive impact on debt obligations with a floating interest rate.
In 2019, Nornickel continued to optimize its debt portfolio aiming at the extension of debt maturity, which allowed to optimize a number of the Group’s bilateral credit facilities totaling USD 962 million.
EBITDАIn 2019, EBITDА increased 27% (or +USD 1,692 million) to USD 7,923 million with the EBITDA margin amounting to 58% (up from 53% in 2018) owing to higher metal revenue and stringent cost control.
• Net income generated by GRK “Bystrinskoye” from products sale during the hot commissioning stage (-USD 86 million);
• Change in other provisions, primarily including provision for obsolete and slow-moving inventory (+USD 18 million).
Company overview Strategic report Commodity market overview
Business overview Sustainable development
Corporate governance
Risk report Shareholder information IFRS financial statements AppendixAnnual report 2019
«NORNICKEL»
118 119
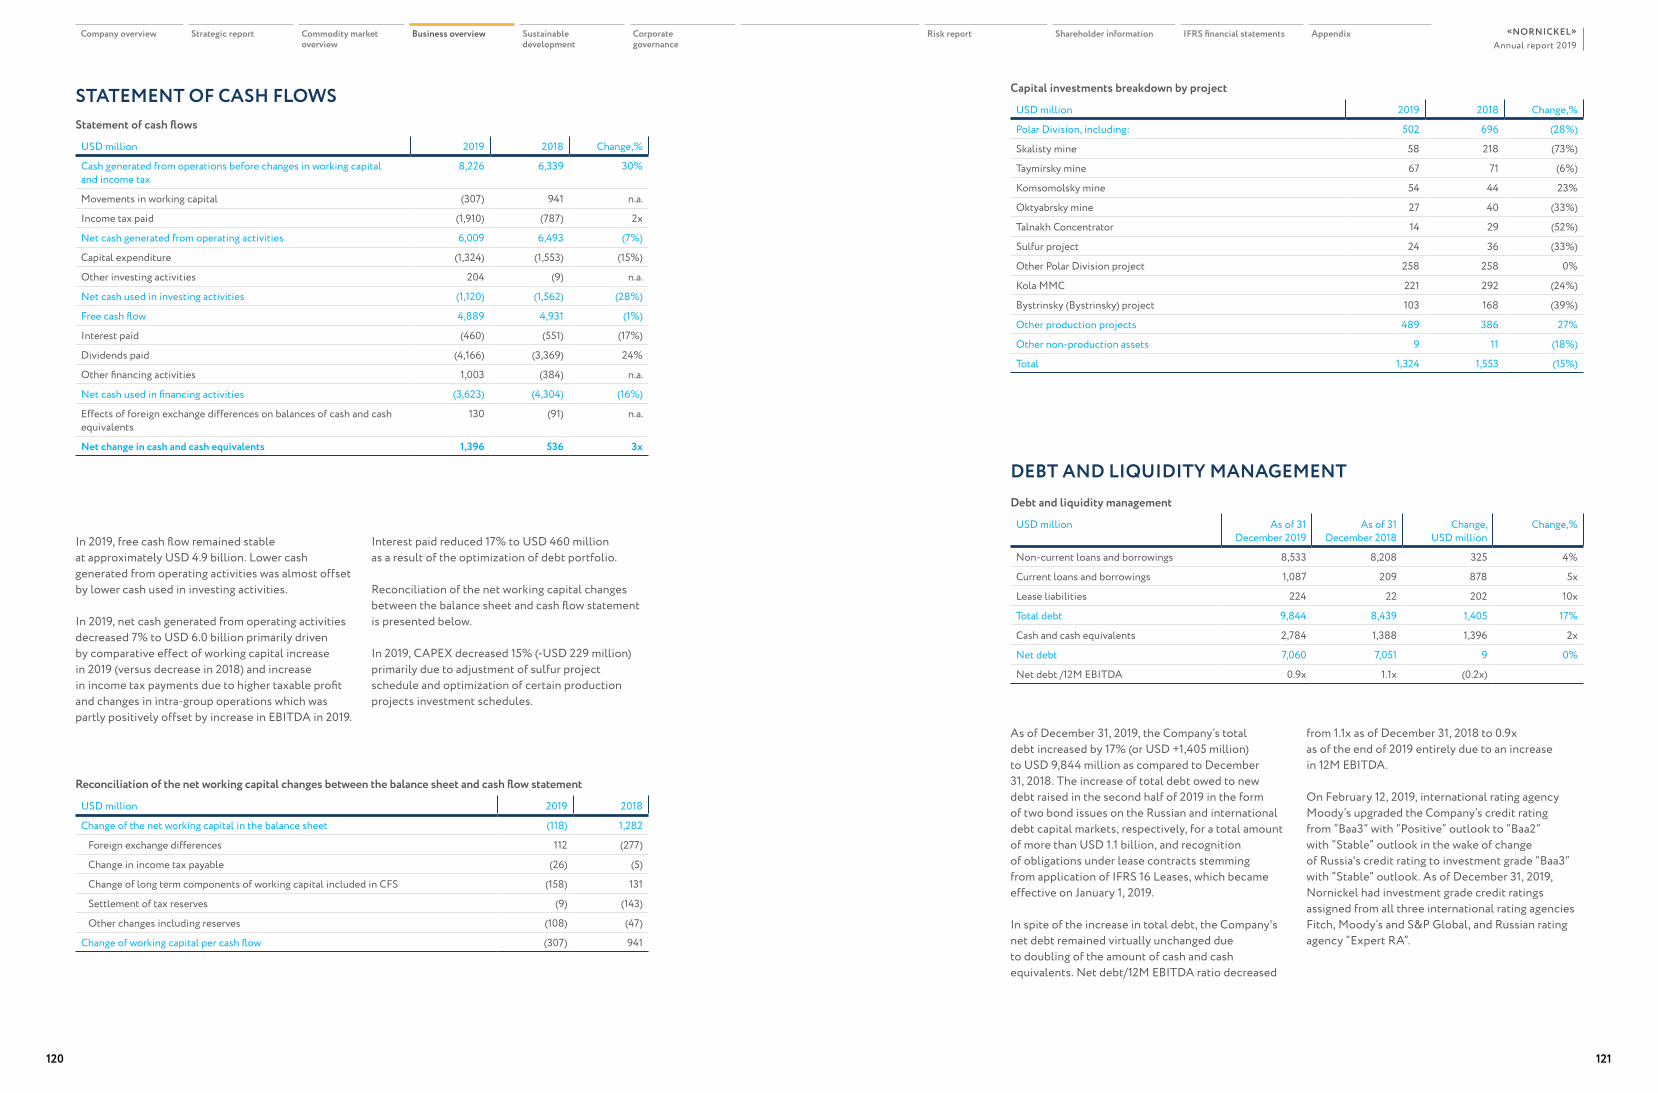
In 2019, free cash flow remained stable at approximately USD 4.9 billion. Lower cash generated from operating activities was almost offset by lower cash used in investing activities.
In 2019, net cash generated from operating activities decreased 7% to USD 6.0 billion primarily driven by comparative effect of working capital increase in 2019 (versus decrease in 2018) and increase in income tax payments due to higher taxable profit and changes in intra-group operations which was partly positively offset by increase in EBITDA in 2019.
Interest paid reduced 17% to USD 460 million as a result of the optimization of debt portfolio.
Reconciliation of the net working capital changes between the balance sheet and cash flow statement is presented below.
In 2019, CAPEX decreased 15% (-USD 229 million) primarily due to adjustment of sulfur project schedule and optimization of certain production projects investment schedules.
Reconciliation of the net working capital changes between the balance sheet and cash flow statement
USD million 2019 2018
Change of the net working capital in the balance sheet (118) 1,282
Foreign exchange differences 112 (277)
Change in income tax payable (26) (5)
Change of long term components of working capital included in CFS (158) 131
Settlement of tax reserves (9) (143)
Other changes including reserves (108) (47)
Change of working capital per cash flow (307) 941
Capital investments breakdown by project
USD million 2019 2018 Change,%
Polar Division, including: 502 696 (28%)
Skalisty mine 58 218 (73%)
Taymirsky mine 67 71 (6%)
Komsomolsky mine 54 44 23%
Oktyabrsky mine 27 40 (33%)
Talnakh Concentrator 14 29 (52%)
Sulfur project 24 36 (33%)
Other Polar Division project 258 258 0%
Kola MMC 221 292 (24%)
Bystrinsky (Bystrinsky) project 103 168 (39%)
Other production projects 489 386 27%
Other non-production assets 9 11 (18%)
Total 1,324 1,553 (15%)
Debt and liquidity management
USD million As of 31 December 2019
As of 31 December 2018
Change,USD million
Change,%
Non-current loans and borrowings 8,533 8,208 325 4%
Current loans and borrowings 1,087 209 878 5x
Lease liabilities 224 22 202 10x
Total debt 9,844 8,439 1,405 17%
Cash and cash equivalents 2,784 1,388 1,396 2x
Net debt 7,060 7,051 9 0%
Net debt /12M EBITDA 0.9x 1.1x (0.2x)
As of December 31, 2019, the Company’s total debt increased by 17% (or USD +1,405 million) to USD 9,844 million as compared to December 31, 2018. The increase of total debt owed to new debt raised in the second half of 2019 in the form of two bond issues on the Russian and international debt capital markets, respectively, for a total amount of more than USD 1.1 billion, and recognition of obligations under lease contracts stemming from application of IFRS 16 Leases, which became effective on January 1, 2019.
In spite of the increase in total debt, the Company's net debt remained virtually unchanged due to doubling of the amount of cash and cash equivalents. Net debt/12M EBITDA ratio decreased
from 1.1x as of December 31, 2018 to 0.9x as of the end of 2019 entirely due to an increase in 12M EBITDA.
On February 12, 2019, international rating agency Moody’s upgraded the Company’s credit rating from “Baa3” with “Positive” outlook to “Baa2” with “Stable” outlook in the wake of change of Russia's credit rating to investment grade “Baa3” with “Stable” outlook. As of December 31, 2019, Nornickel had investment grade credit ratings assigned from all three international rating agencies Fitch, Moody’s and S&P Global, and Russian rating agency “Expert RA”.
DEBT AND LIQUIDITY MANAGEMENT
Statement of cash flows
USD million 2019 2018 Change,%
Cash generated from operations before changes in working capital and income tax
8,226 6,339 30%
Movements in working capital (307) 941 n.a.
Income tax paid (1,910) (787) 2x
Net cash generated from operating activities 6,009 6,493 (7%)
Capital expenditure (1,324) (1,553) (15%)
Other investing activities 204 (9) n.a.
Net cash used in investing activities (1,120) (1,562) (28%)
Free cash flow 4,889 4,931 (1%)
Interest paid (460) (551) (17%)
Dividends paid (4,166) (3,369) 24%
Other financing activities 1,003 (384) n.a.
Net cash used in financing activities (3,623) (4,304) (16%)
Effects of foreign exchange differences on balances of cash and cash equivalents
130 (91) n.a.
Net change in cash and cash equivalents 1,396 536 3x
STATEMENT OF CASH FLOWS
Company overview Strategic report Commodity market overview
Business overview Sustainable development
Corporate governance
Risk report Shareholder information IFRS financial statements AppendixAnnual report 2019
«NORNICKEL»
120 121
DevelopmentS ustainable124 Human resources134 Health and safety140 Environment146 Climate change154 Social and charity initiatives
Sustainable development
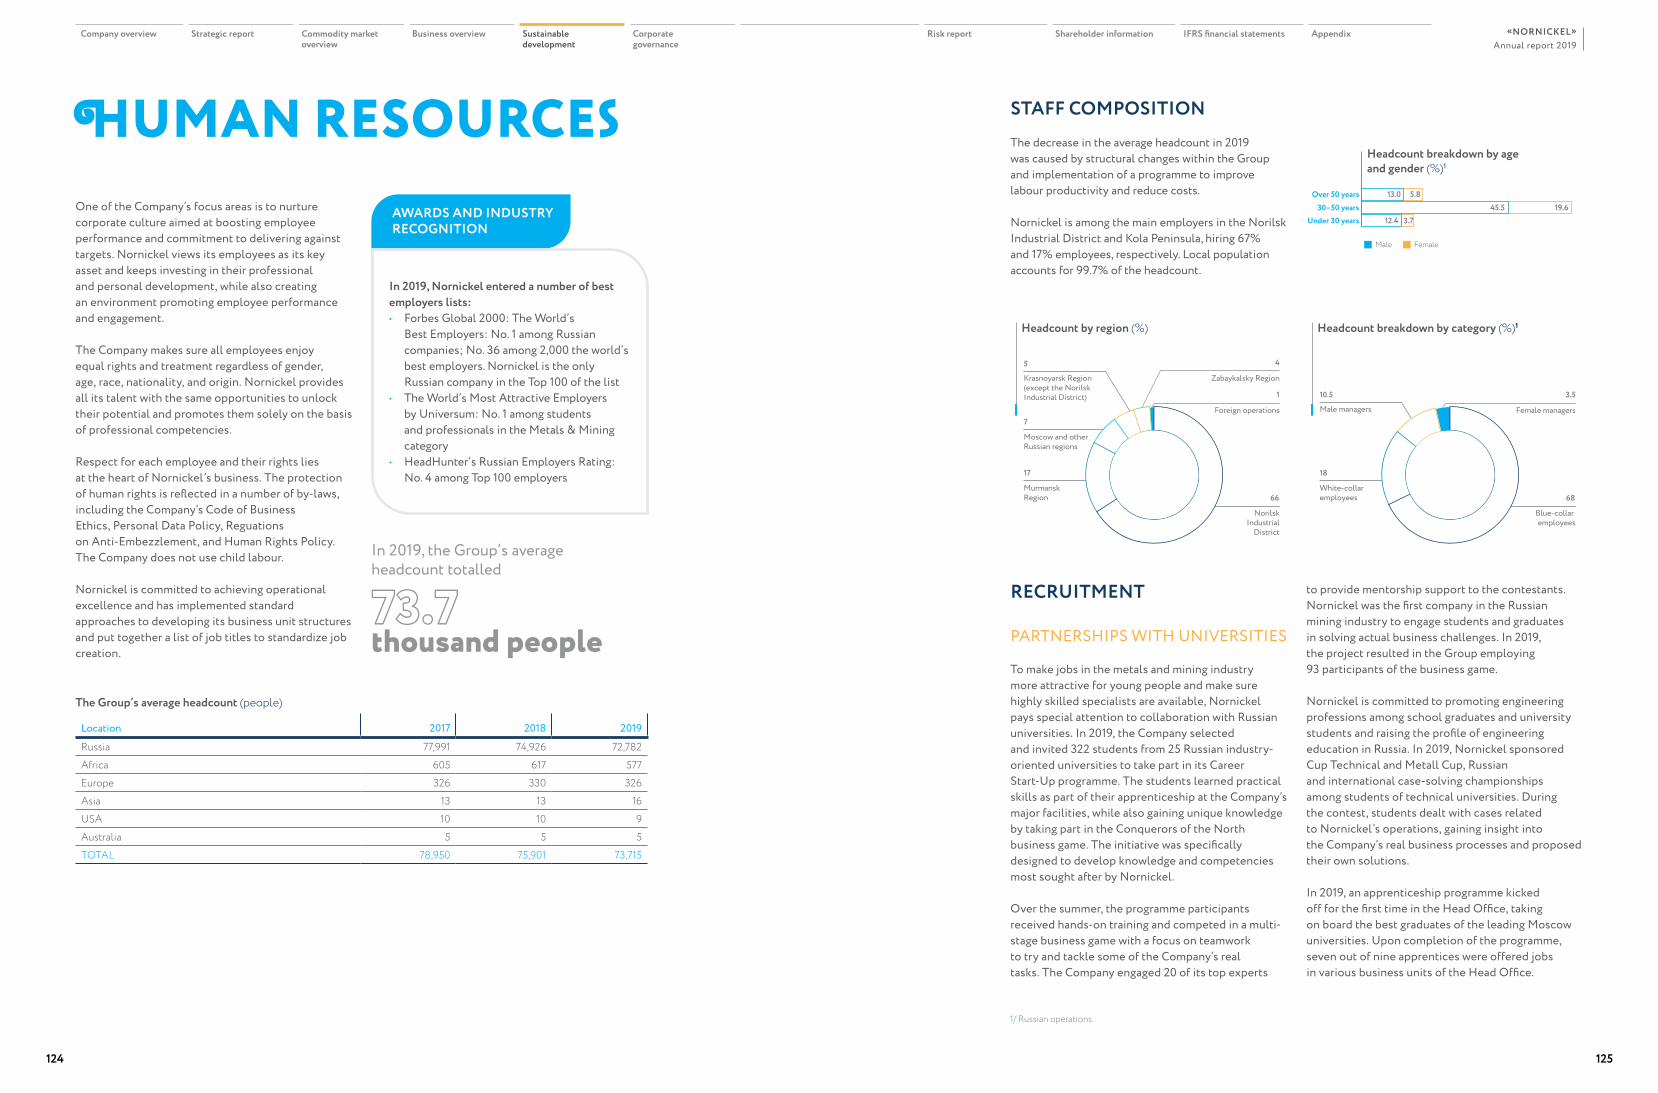
HUMAN RESOURCESAWARDS AND INDUSTRY RECOGNITION
One of the Company’s focus areas is to nurture corporate culture aimed at boosting employee performance and commitment to delivering against targets. Nornickel views its employees as its key asset and keeps investing in their professional and personal development, while also creating an environment promoting employee performance and engagement.
The Company makes sure all employees enjoy equal rights and treatment regardless of gender, age, race, nationality, and origin. Nornickel provides all its talent with the same opportunities to unlock their potential and promotes them solely on the basis of professional competencies.
Respect for each employee and their rights lies at the heart of Nornickel’s business. The protection of human rights is reflected in a number of by-laws, including the Company’s Code of Business Ethics, Personal Data Policy, Reguations on Anti-Embezzlement, and Human Rights Policy. The Company does not use child labour.
Nornickel is committed to achieving operational excellence and has implemented standard approaches to developing its business unit structures and put together a list of job titles to standardize job creation.
In 2019, the Group’s average headcount totalled
73.7thousand people
In 2019, Nornickel entered a number of best employers lists:• Forbes Global 2000: The World’s
Best Employers: No. 1 among Russian companies; No. 36 among 2,000 the world’s best employers. Nornickel is the only Russian company in the Top 100 of the list
• The World’s Most Attractive Employers by Universum: No. 1 among students and professionals in the Metals & Mining category
• HeadHunter’s Russian Employers Rating: No. 4 among Top 100 employers
The Group’s average headcount (people)
Location 2017 2018 2019
Russia 77,991 74,926 72,782Africa 605 617 577Europe 326 330 326Asia 13 13 16USA 10 10 9Australia 5 5 5TOTAL 78,950 75,901 73,715
STAFF COMPOSITIONThe decrease in the average headcount in 2019 was caused by structural changes within the Group and implementation of a programme to improve labour productivity and reduce costs.
Nornickel is among the main employers in the Norilsk Industrial District and Kola Peninsula, hiring 67% and 17% employees, respectively. Local population accounts for 99.7% of the headcount.
NorilskIndustrial
District
66
Foreign operations
1
Murmansk Region
17
Moscow and otherRussian regions
7
Krasnoyarsk Region(except the Norilsk Industrial District)
5
129вопросов
Zabaykalsky Region
4
Blue-collar employees
68
Female managers
3.5
White-collaremployees
18
Male managers
10.5
129вопросов
Under 30 years30–50 years
Over 50 years 1,9 235.813.045.5 19.6
3.712.4
Male Female
Headcount by region (%) Неadcount breakdown by category (%)1
Headcount breakdown by age and gender (%)1
1/ Russian operations.
RECRUITMENT
PARTNERSHIPS WITH UNIVERSITIES
To make jobs in the metals and mining industry more attractive for young people and make sure highly skilled specialists are available, Nornickel pays special attention to collaboration with Russian universities. In 2019, the Company selected and invited 322 students from 25 Russian industry-oriented universities to take part in its Career Start-Up programme. The students learned practical skills as part of their apprenticeship at the Company’s major facilities, while also gaining unique knowledge by taking part in the Conquerors of the North business game. The initiative was specifically designed to develop knowledge and competencies most sought after by Nornickel.
Over the summer, the programme participants received hands-on training and competed in a multi-stage business game with a focus on teamwork to try and tackle some of the Company’s real tasks. The Company engaged 20 of its top experts
to provide mentorship support to the contestants. Nornickel was the first company in the Russian mining industry to engage students and graduates in solving actual business challenges. In 2019, the project resulted in the Group employing 93 participants of the business game.
Nornickel is committed to promoting engineering professions among school graduates and university students and raising the profile of engineering education in Russia. In 2019, Nornickel sponsored Cup Technical and Metall Cup, Russian and international case-solving championships among students of technical universities. During the contest, students dealt with cases related to Nornickel’s operations, gaining insight into the Company’s real business processes and proposed their own solutions.
In 2019, an apprenticeship programme kicked off for the first time in the Head Office, taking on board the best graduates of the leading Moscow universities. Upon completion of the programme, seven out of nine apprentices were offered jobs in various business units of the Head Office.
Company overview Strategic report Commodity market overview
Business overview Sustainable development
Corporate governance
Risk report Shareholder information IFRS financial statements AppendixAnnual report 2019
«NORNICKEL»
124 125

ASSISTANCE PROGRAMME
Since the Company’s production sites are located in remote areas, Nornickel actively sources personnel for its production facilities from other regions of Russia. A programme called Assistance to New Employees in Adapting to the New Place of Residence in Norilsk and the Taimyrsky Dolgano-Nenetsky Municipal District (the Assistance Programme) aims at helping with getting adjusted to the new environment. The programme targets not only highly qualified specialists and managers, but also young talent and workers with hard-to-find skills. Today, it covers 1,530 of the Company’s employees, including 352 new participants who joined in 2019. With this programme, the Company seeks to provide comfortable living conditions for the invited employees and reimburse their relocation and resettlement costs.
PERSONNEL DEVELOPMENT In 2019, Nornickel’s work to develop corporate culture centred around:• Personnel engagement• Corporate dialogues and forums• Comprehensive training in corporate culture• Training of corporate coaches• Promotion and communication
ENGAGEMENT
Nornickel goes through the engagement management cycle every year to maintain an engaging environment. This cycle includes several phases: conducting the “Let Everyone Be Heard. What Do You Think?” survey; analysing survey findings; development and implementation of resulting solutions/initiatives.
In 2019, the engagement index grew by 6 p. p. and the Senior Management index – by 10 p. p.
The survey includes polling and focus group research among 75,000 employees from 32 Nornickel’s enterprises. All governance levels, from units of individual enterprises to the Group as a whole, are involved in both survey data analysis and development and implementation of improvements. A total of 850 actions were planned for 2019.
CORPORATE DIALOGUES AND FORUMS
A project to enhance dialogue between senior management and regular employees has been underway for the second year now to improve employee awareness, gain ownership of the Company’s goals and values and develop trust between labour and management. In 2019, the project included 30 corporate dialogues, 35 communication trainings for managers, 270 informal meetings, Nornickel Live video conference and six video interviews with Nornickel vice presidents. More than 400 managers were trained under the project. A total of 5,500 Nornickel’s employees participated in these initiatives.
Corporate culture and engagement workshops were held at 10 functional conferences and as part of Leaders of Nornickel, On the Path to Efficiency, and IamHR educational corporate programmes. Total coverage exceeded 1,000 people.
COMPREHENSIVE TRAINING IN CORPORATE CULTURE
Training in corporate culture and promotion of the Company’s values include programmes at all levels from senior management to regular employees.
Nornickel provides practical training in corporate culture (based on the Company’s White Paper) for its managers. A total of 49 practical training sessions were attended by more than 500 managers in 2019. An assessment of the training results showed an increase of the Corporate Culture Importance for Business index by 20 p. p. and of the Understanding How to Nurture Corporate Culture index, by 34 p. p.
Financing under the Assistance programme (USD mln)
‘17‘18‘19 2.3
3.35.1
All enterprises showed a much better alignment of employee behaviour conformity with corporate values Group-wide, with a 1.5–2 times increase in average alignment revealed by the management team survey. The Immediate Superiors Making Decisions in Line with Corporate Values index was at 62%, up by 7 p. p. from 2018.
In order to build a centre of excellence for corporate value training and embedding, the Our Values training module was developed, with 75 corporate coaches competitively selected who were trained and later delivered over 400 programmes based on this module for more than 10,000 employees.
INTERNAL COMMUNICATIONS
Promotion and internal communications focused on the coverage of engagement and corporate culture events by the corporate media and web portal. In total, 10 interviews were conducted with vice presidents, 10 videos on corporate culture were filmed, programme handouts (leaflets, flyers) were prepared, the Nornickel Live website and brand were updated, and a collection of corporate culture materials featuring best practices of various enterprises was published in 2019.
TALENT POOL
In 2019, the Company kept rolling out the talent pool management system across its production facilities to cover recruiting of lower and middle
line managers. The project was joined by Medvezhy Ruchey, Polar Construction Company, Norilsktransgaz, and Norilskgazprom. 250 new succession pool members commenced their training in the Corporate University. Manuals for mentors and succession pool members including useful tools and techniques for the development and application of managerial skill were put together to supplement classroom training.
CORPORATE DEVELOPMENT PROGRAMME
The assessment of senior and middle manager potential, performance and future development continued in 2019. Over 500 managers were assessed. In 2019, assessment focused on Top 100, first and second line managers of Operations. Apart from the assessment outcome and future development options, HR committees also discussed the security of top positions and readiness of candidates for succession in the near future. As a result, successors were identified for 200 key managerial positions.
The Leaders of Nornickel corporate development programme involving 54 high-potential managers was completed in April 2019. The programme focused on project work to improve process efficiency across the Company’s business units based on lean manufacturing. During the last module, the programme participants presented the results of their work including activities to improve Nornickel’s business processes to the Company’s management.
The Leaders of Nornickel programme uses a gradual approach. Everything is designed to prepare its participants for project work. Surely, one of the most important outcomes of the training is development of specific business cases to help improve corporate business processes. However, it offers even more added value. Although it cannot be measured, the emotional part of training should not be overlooked. Friendships that come from shared trainings stay to help participants in their future work. As one of last year participants put it, ”Alumni are forever”. “It’s very well said – we stay in touch even when the training is over.
Larisa ZelkovaSenior Vice President for HR, Social Policy and Public Relations
Company overview Strategic report Commodity market overview
Business overview Sustainable development
Corporate governance
Risk report Shareholder information IFRS financial statements AppendixAnnual report 2019
«NORNICKEL»
126 127
Such programmes are in high demand from both businesses and key management members. A new group of managers commenced their training under the Leaders of Nornickel 2.0 corporate programme in September 2019. The programme consists of four modules with each module including theory training, practice effectively transforming knowledge into specific skills, master classes, and project work. 55 managers enrolled on the programme, with most selected through a contest. This year, there were three applicants per place.
The On the Path to Efficiency corporate programme for middle management kicked off in June 2019. The programme focuses on developing managerial competencies and executive reasoning, learning continuous improvement tools and personnel management practices. Training will run for 10 months in three cities: Norilsk, Monchegorsk, and Krasnoyarsk. The programme consists of five modules and is attended by 139 participants. Each participant’s performance – classroom training engagement and activity level, homework between modules, project work, participation in online training, etc. – is monitored. The participants can use the training portal not only to view the calendar of events, select convenient training dates, complete an assignment, communicate with a coach and other participants, but also to see their current rating. The programme uses state-of-the-art formats and methods of adult training.
The IamHR corporate programme for professional development of HR employees was completed in March 2019. It aimed to improve the human capital management function, promote interaction between the business and HR, and introduce the most advanced solutions and best practices in HR management. The participants followed up the programme by putting together a catalogue
of HR practices and management tools, a Guide to Employee Relations. Interviewing a Candidate and Ecofriendly Dismissal practical trainings included master classes delivered as part of corporate management training programmes.
In October 2019, the IamHR programme was followed up with the IamHR Region programme for local HR specialists in Kola MMC.
Also in 2019, the 360-Degree module based on SAP HCM was developed for the annual 360-degree competency review. Its implementation will enable rolling out competence review to all enterprises of the Group and developing a uniform system for identification of management development priorities. The review uses the corporate competence model based on values and managerial competencies. Depending on its results and relevant feedback from one’s superior, each participant can choose the right path for their development and select required tools and methods for the next year’s development from a special library of development activities.
The implementation of a comprehensive project to develop professional competencies of the Company’s managers and white-collar employees continued in 2019. Professional competency models were developed for the health and safety service, the operations of the Polar Transport Division, the metallurgists of the Polar Division, and Kola MMC. Over 1,000 employees were assessed against the models with special tests. The results were used to identify directions and focus areas for future professional development.
In 2019, about 400 employees went through tailor-made training programmes based on the results of their professional competency assessment in 2018.
In 2019, the Company also continued implementing professional standards. 60 professions were analysed against 14 professional standards covering about 5,000 employees. The Company is represented and actively participates in the activities of the Board for Professional Competencies in Mining and Metals and the Board for Professional Competencies in HR Management.
ENHANCING PROFESSIONAL EXCELLENCE
With the reconfigured production cycle, upgraded operations, new technologies, operating procedures and professional standards, development and implementation of new professional qualifications set new requirements for employee knowledge, skills, and competencies. The corporate training framework must provide employees with a quick and unhindered access to new knowledge helping them master new professional skills and receive training and development support for horizontal and vertical job rotation.
The Group will continue employee competence diagnostics and management across its enterprises in 2020, building professional competency models for functional and production divisions of the Company, defining knowledge and skills requirements for each position and developing a set of test questions to assess professional competencies of employees in temporary fill positions.
Nornickel intends to continue implementing professional standards within the Company. The Company’s involvement in the activities of boards for professional competencies helps enhance the national competency framework.
In 2019, the Company continued its efforts to educate and upgrade its employees. About 70,000 employees went through various training and retraining programmes, with about a third of them completing two different courses. A total of 4,655 staff-hours of training were delivered to 40,800 employees in corporate training centres.
An area of special attention is the use of advanced technologies to train various categories of personnel. In 2019, 6,500 employees attended online H&S training sessions hinging on staff expertise. The Company produced 58 distance learning H&S courses, 33 videos (3D computer models), and seven multimedia briefings for blue-collar professions. The Company leverages internal expertise and today’s formats to quickly produce new high-quality interactive training courses to accomplish its business tasks.
REMUNERATIONRemuneration of Nornickel’s employees depends on the work complexity, individual expertise and skills, and their personal contribution to the Company’s performance.
Company overview Strategic report Commodity market overview
Business overview Sustainable development
Corporate governance
Risk report Shareholder information IFRS financial statements AppendixAnnual report 2019
«NORNICKEL»
128 129
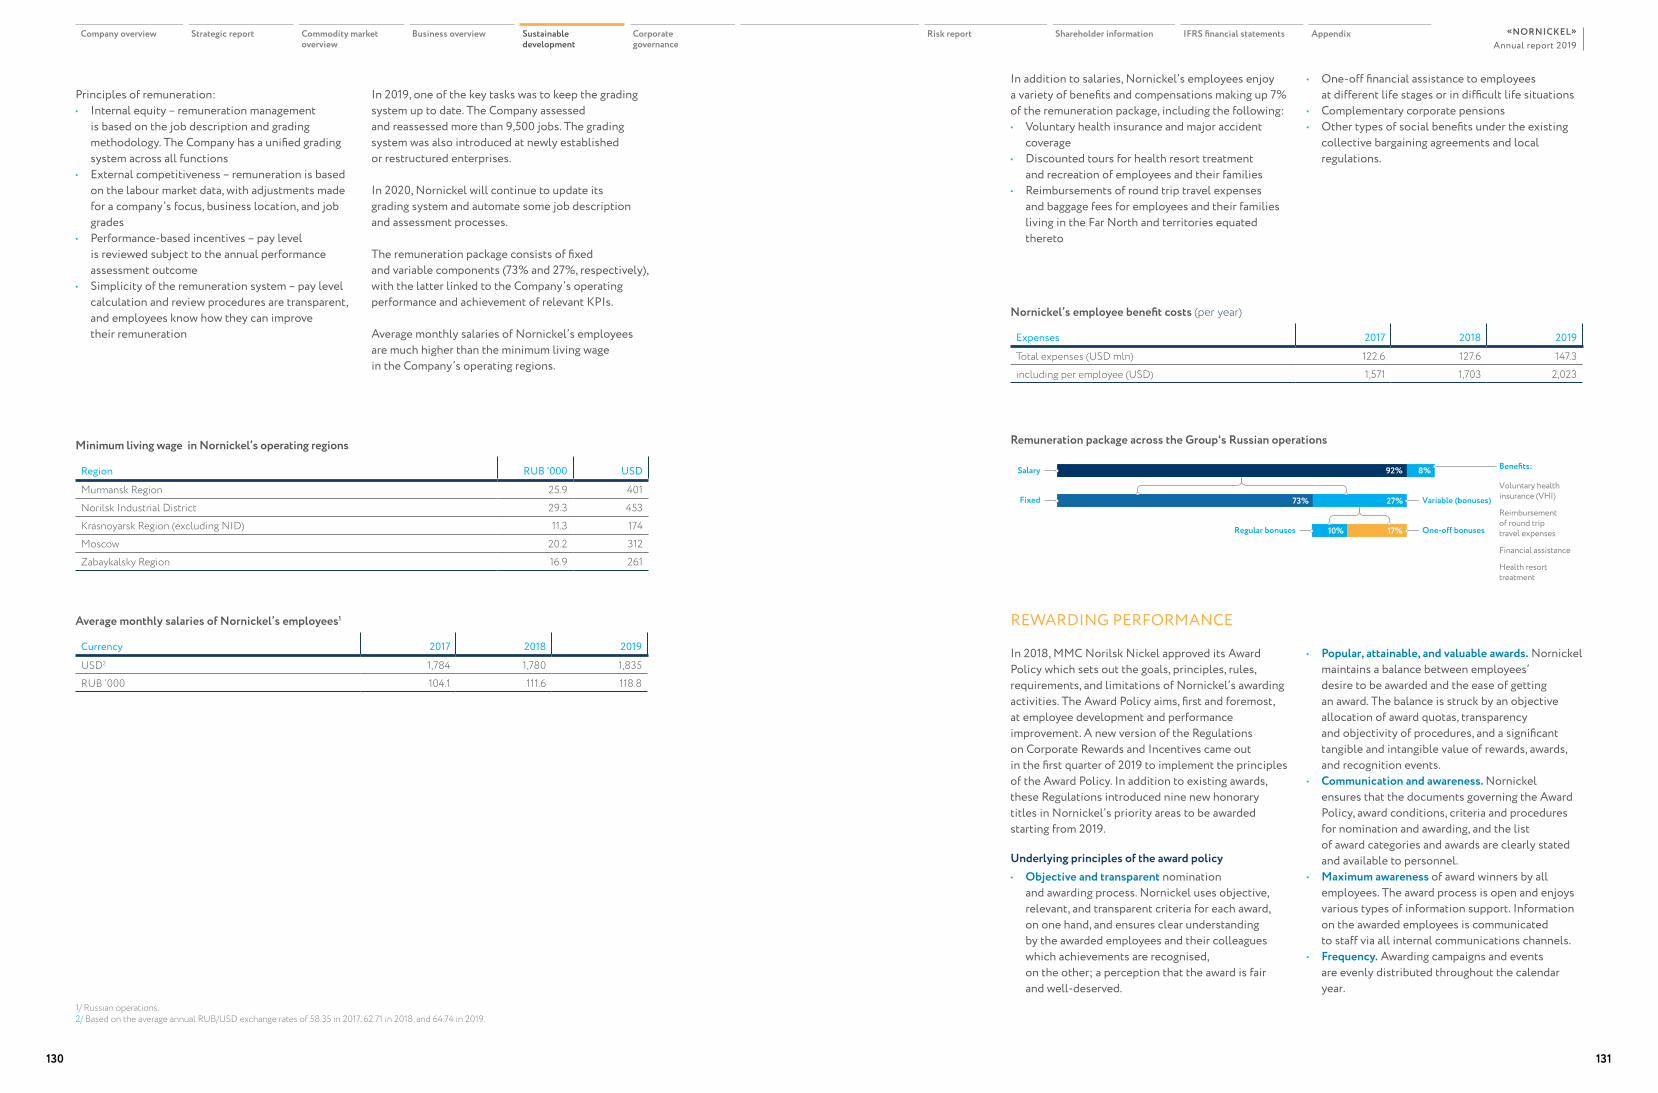
In addition to salaries, Nornickel’s employees enjoy a variety of benefits and compensations making up 7% of the remuneration package, including the following:• Voluntary health insurance and major accident
coverage• Discounted tours for health resort treatment
and recreation of employees and their families• Reimbursements of round trip travel expenses
and baggage fees for employees and their families living in the Far North and territories equated thereto
• One-off financial assistance to employees at different life stages or in difficult life situations
• Complementary corporate pensions• Other types of social benefits under the existing
collective bargaining agreements and local regulations.
Minimum living wage in Nornickel’s operating regions
Region RUB '000 USD
Murmansk Region 25.9 401Norilsk Industrial District 29.3 453Krasnoyarsk Region (excluding NID) 11.3 174Moscow 20.2 312Zabaykalsky Region 16.9 261
Average monthly salaries of Nornickel’s employees1
Currency 2017 2018 2019
USD2 1,784 1,780 1,835RUB ’000 104.1 111.6 118.8
1/ Russian operations.2/ Based on the average annual RUB/USD exchange rates of 58.35 in 2017, 62.71 in 2018, and 64.74 in 2019.
Nornickel’s employee benefit costs (per year)
Expenses 2017 2018 2019
Total expenses (USD mln) 122.6 127.6 147.3including per employee (USD) 1,571 1,703 2,023
Remuneration package across the Group's Russian operations
Salary
Fixed
Benefits:
Voluntary health insurance (VHI)
Reimbursement of round trip travel expenses
Financial assistance
Health resort treatment
Variable (bonuses)
One-off bonusesRegular bonuses
92% 8%
73% 27%
17%10%
REWARDING PERFORMANCE
In 2018, MMC Norilsk Nickel approved its Award Policy which sets out the goals, principles, rules, requirements, and limitations of Nornickel’s awarding activities. The Award Policy aims, first and foremost, at employee development and performance improvement. A new version of the Regulations on Corporate Rewards and Incentives came out in the first quarter of 2019 to implement the principles of the Award Policy. In addition to existing awards, these Regulations introduced nine new honorary titles in Nornickel’s priority areas to be awarded starting from 2019.
Underlying principles of the award policy• Objective and transparent nomination
and awarding process. Nornickel uses objective, relevant, and transparent criteria for each award, on one hand, and ensures clear understanding by the awarded employees and their colleagues which achievements are recognised, on the other; a perception that the award is fair and well-deserved.
• Popular, attainable, and valuable awards. Nornickel maintains a balance between employees’ desire to be awarded and the ease of getting an award. The balance is struck by an objective allocation of award quotas, transparency and objectivity of procedures, and a significant tangible and intangible value of rewards, awards, and recognition events.
• Communication and awareness. Nornickel ensures that the documents governing the Award Policy, award conditions, criteria and procedures for nomination and awarding, and the list of award categories and awards are clearly stated and available to personnel.
• Maximum awareness of award winners by all employees. The award process is open and enjoys various types of information support. Information on the awarded employees is communicated to staff via all internal communications channels.
• Frequency. Awarding campaigns and events are evenly distributed throughout the calendar year.
Principles of remuneration:• Internal equity – remuneration management
is based on the job description and grading methodology. The Company has a unified grading system across all functions
• External competitiveness – remuneration is based on the labour market data, with adjustments made for a company’s focus, business location, and job grades
• Performance-based incentives – pay level is reviewed subject to the annual performance assessment outcome
• Simplicity of the remuneration system – pay level calculation and review procedures are transparent, and employees know how they can improve their remuneration
In 2019, one of the key tasks was to keep the grading system up to date. The Company assessed and reassessed more than 9,500 jobs. The grading system was also introduced at newly established or restructured enterprises.
In 2020, Nornickel will continue to update its grading system and automate some job description and assessment processes.
The remuneration package consists of fixed and variable components (73% and 27%, respectively), with the latter linked to the Company’s operating performance and achievement of relevant KPIs.
Average monthly salaries of Nornickel’s employees are much higher than the minimum living wage in the Company’s operating regions.
Company overview Strategic report Commodity market overview
Business overview Sustainable development
Corporate governance
Risk report Shareholder information IFRS financial statements AppendixAnnual report 2019
«NORNICKEL»
130 131

• Equal opportunities for employees from different locations and segments to be nominated and awarded. Nornickel ensures there is no discrimination on gender, nationality, or religion in the nomination and awarding of employees.
• Development of employees in line with strategic priorities and corporate values through better use of their potential and motivation to enhance their professional excellence.
The Award Policy is closely linked to Nornickel’s values and strategic priorities through corporate incentives. The Company rewards its employees for outstanding professional achievements and contribution, innovations that drive growth and add value, efforts going beyond formal agreements with Nornickel and contributing to overall performance of the business. Nornickel praises and distinguishes employees showing unmatched production, engineering and managerial competencies by awarding those who delivered remarkable operating and management performance and contributed a lot to advancing production.
There are several categories of incentives in the Company. They include corporate incentives or Company-level awards that can be granted to Nornickel’s employees, and internal incentives with nomination and awarding criteria set in compliance with the Award Policy. Top performers may be nominated for agency and state awards. Nornickel welcomes agency and state recognition of its employees and nominates those who achieved prodigious results in operations and management and made significant contributions to production development.
Award events are the pinnacle of the award policy. Nornickel bestows corporate awards at special ceremonies attended by its staff and senior management. Data on awarded employees are featured in corporate publications and communicated Group-wide. December 2019 saw the first ever ceremony of bestowing honorary titles at the award event marking year-end results.
REMUNERATION FRAMEWORK
The key performance indicators adopted by Nornickel serve to build a transparent incentive and performance assessment system. Remuneration is linked to KPIs approved for different job grades and rewards employees exceeding targets.
Nornickel put in place its performance management system in 2014, with assessment reliant on a variety of key performance indicators (KPIs) covering social responsibility, occupational safety, operating efficiency, and capital management and responding to cross-functional interests of stakeholders. In 2019, 11,300 employees of the Group were assessed against its key performance indicators.
The system is instrumental in streamlining performance assessment criteria and enabling the management and employees to align the current year’s priorities with the Company’s performance and link an employee’s performance to their pay level.
Automation of the KPI-based employee assessment commenced in 2018. The automated system will help standardise talent pool management methods across the Company, consolidate relevant data into a shared database, and provide access to the assessment process through personal accounts for each employee. By the end of 2019, the system was used by 28 divisions of the Company. In 2020, Nornickel will roll it out across all Russian assets of the Company.
To improve the performance of the Head Office staff, Nornickel approved the Procedure for Assessing Employee Performance and the Regulations on Annual Performance Bonuses. The Procedure primarily seeks to link remuneration, development and promotion of employees to the assessment outcome, whereas the Regulations on Annual Performance Bonuses serve to review employee performance in the reporting period against team and individual KPIs.
To boost employee performance across its Russian operations, the Company put in place the Procedure for Assessing Management Performance whereby performance is managed by setting KPI targets and evaluating manager achievements against these targets.
Employee awards in 2019 (ps)
Internal awardsfrom Groups’s
enterprises
1,996
State awards
83
Awards from regional and municipalauthorities
1,664
Ministerial and agency awards
286
129вопросов
Corporate awards
275
4,304awards
Awards and nominations
TRADITIONAL AWARDS (INTRODUCED BEFORE 2019) NEW TITLES (INTRODUCED IN 2019)
BEST YOUNG EMPLOYEE
BEST START OF THE YEAR
CHANGE LEADER
CORPORATE LIFE LEADER
BEST INVENTOR
IN H&S: BEST UNIT MANAGER, BEST LINE MANAGER, BEST SPECIALIST, BEST WORKER IN H&S COMPLIANCE
BADGE OF HONOUR
HONORARY TITLES: BEST MANAGER, BEST SPECIALIST, BEST WORKER
CERTIFICATE OF MERIT
COMMENDATION
VALUABLE GIFT
ONE-OFF BONUS
+
Company overview Strategic report Commodity market overview
Business overview Sustainable development
Corporate governance
Risk report Shareholder information IFRS financial statements AppendixAnnual report 2019
«NORNICKEL»
132 133
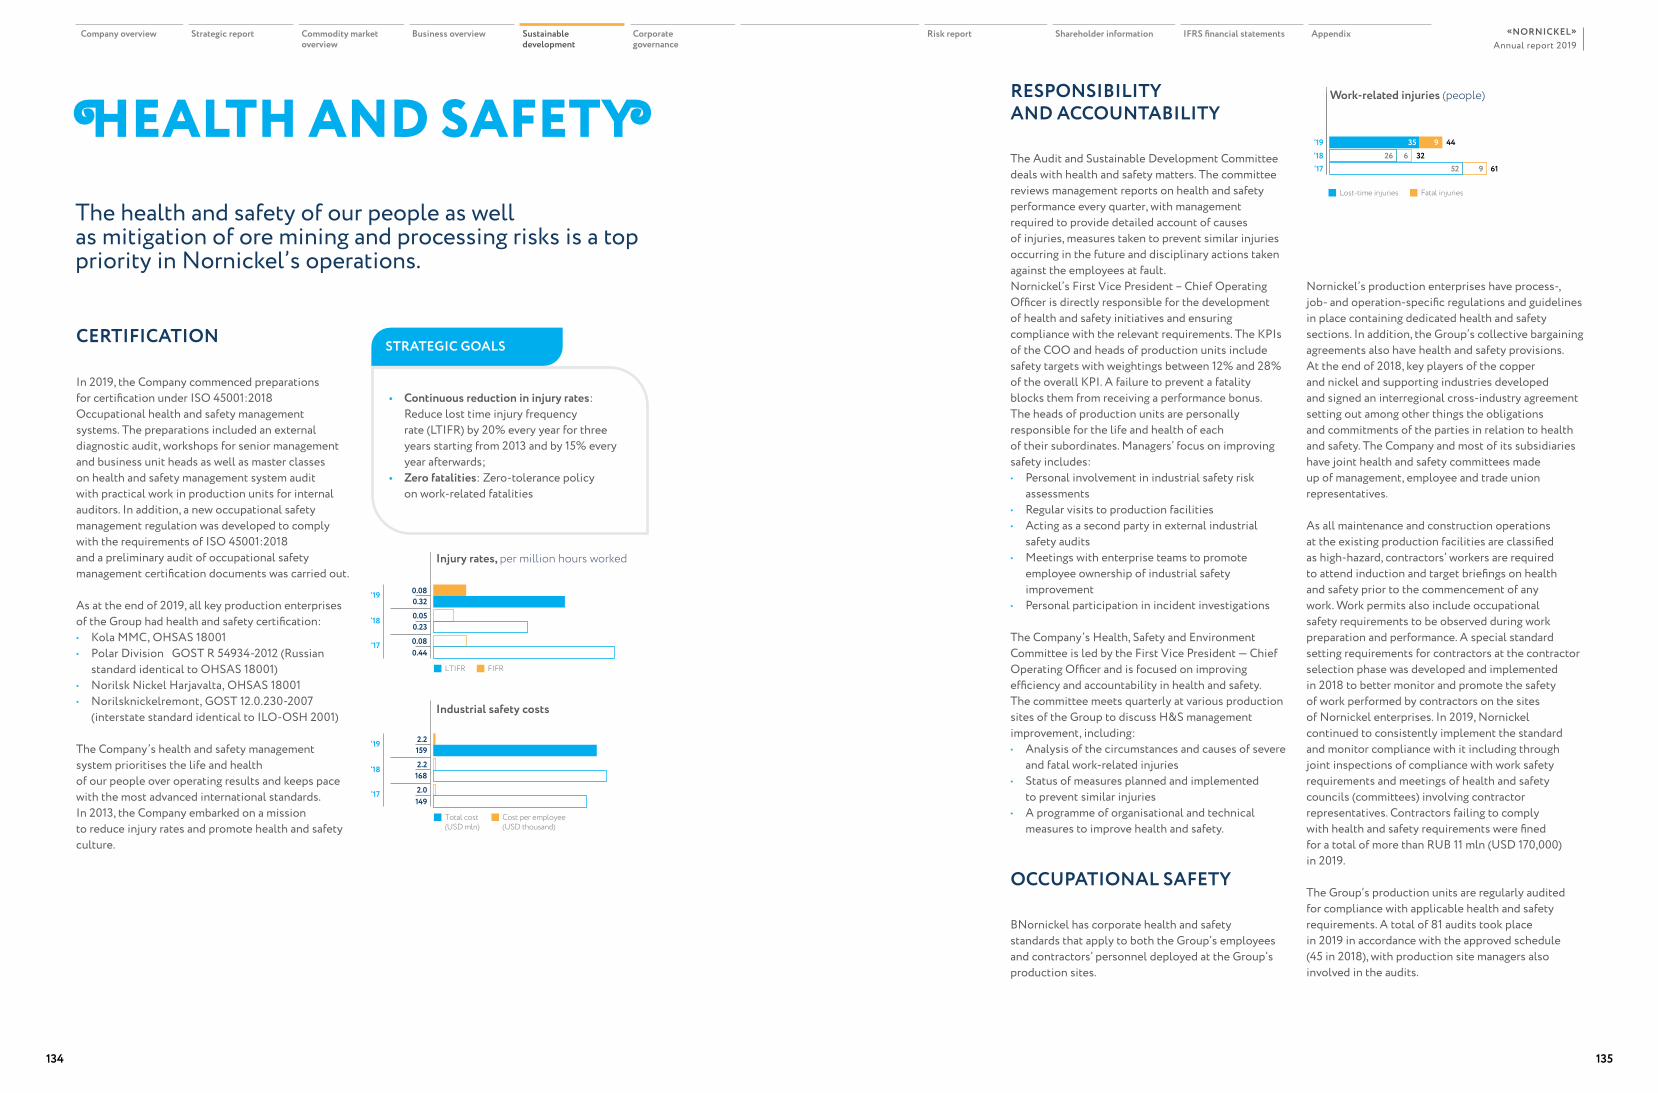
HEALTH AND SAFETYThe health and safety of our people as well as mitigation of ore mining and processing risks is a top priority in Nornickel’s operations.
CERTIFICATION
In 2019, the Company commenced preparations for certification under ISO 45001:2018 Occupational health and safety management systems. The preparations included an external diagnostic audit, workshops for senior management and business unit heads as well as master classes on health and safety management system audit with practical work in production units for internal auditors. In addition, a new occupational safety management regulation was developed to comply with the requirements of ISO 45001:2018 and a preliminary audit of occupational safety management certification documents was carried out.
As at the end of 2019, all key production enterprises of the Group had health and safety certification:• Kola MMC, OHSAS 18001• Polar Division GOST R 54934-2012 (Russian
standard identical to OHSAS 18001)• Norilsk Nickel Harjavalta, OHSAS 18001• Norilsknickelremont, GOST 12.0.230-2007
(interstate standard identical to ILO-OSH 2001)
The Company’s health and safety management system prioritises the life and health of our people over operating results and keeps pace with the most advanced international standards. In 2013, the Company embarked on a mission to reduce injury rates and promote health and safety culture.
RESPONSIBILITY AND ACCOUNTABILITY
The Audit and Sustainable Development Committee deals with health and safety matters. The committee reviews management reports on health and safety performance every quarter, with management required to provide detailed account of causes of injuries, measures taken to prevent similar injuries occurring in the future and disciplinary actions taken against the employees at fault.Nornickel’s First Vice President – Chief Operating Officer is directly responsible for the development of health and safety initiatives and ensuring compliance with the relevant requirements. The KPIs of the COO and heads of production units include safety targets with weightings between 12% and 28% of the overall KPI. A failure to prevent a fatality blocks them from receiving a performance bonus.The heads of production units are personally responsible for the life and health of each of their subordinates. Managers’ focus on improving safety includes:• Personal involvement in industrial safety risk
assessments• Regular visits to production facilities• Acting as a second party in external industrial
safety audits• Meetings with enterprise teams to promote
employee ownership of industrial safety improvement
• Personal participation in incident investigations
The Company’s Health, Safety and Environment Committee is led by the First Vice President — Chief Operating Officer and is focused on improving efficiency and accountability in health and safety. The committee meets quarterly at various production sites of the Group to discuss H&S management improvement, including:• Analysis of the circumstances and causes of severe
and fatal work-related injuries• Status of measures planned and implemented
to prevent similar injuries• A programme of organisational and technical
measures to improve health and safety.
OCCUPATIONAL SAFETY
ВNornickel has corporate health and safety standards that apply to both the Group’s employees and contractors’ personnel deployed at the Group’s production sites.
Nornickel’s production enterprises have process-, job- and operation-specific regulations and guidelines in place containing dedicated health and safety sections. In addition, the Group’s collective bargaining agreements also have health and safety provisions. At the end of 2018, key players of the copper and nickel and supporting industries developed and signed an interregional cross-industry agreement setting out among other things the obligations and commitments of the parties in relation to health and safety. The Company and most of its subsidiaries have joint health and safety committees made up of management, employee and trade union representatives.
As all maintenance and construction operations at the existing production facilities are classified as high-hazard, contractors’ workers are required to attend induction and target briefings on health and safety prior to the commencement of any work. Work permits also include occupational safety requirements to be observed during work preparation and performance. A special standard setting requirements for contractors at the contractor selection phase was developed and implemented in 2018 to better monitor and promote the safety of work performed by contractors on the sites of Nornickel enterprises. In 2019, Nornickel continued to consistently implement the standard and monitor compliance with it including through joint inspections of compliance with work safety requirements and meetings of health and safety councils (committees) involving contractor representatives. Contractors failing to comply with health and safety requirements were fined for a total of more than RUB 11 mln (USD 170,000) in 2019.
The Group’s production units are regularly audited for compliance with applicable health and safety requirements. A total of 81 audits took place in 2019 in accordance with the approved schedule (45 in 2018), with production site managers also involved in the audits.
STRATEGIC GOALS
• Continuous reduction in injury rates: Reduce lost time injury frequency rate (LTIFR) by 20% every year for three years starting from 2013 and by 15% every year afterwards;
• Zero fatalities: Zero-tolerance policy on work-related fatalities
Injury rates, per million hours worked
‘17
‘18
‘19
LTIFR
0.440.08
0.230.05
0.320.08
FIFR
Work-related injuries (people)
‘17‘18‘19 9 234435
26 6 32952 61
Lost-time injuries Fatal injuries
Industrial safety costs
‘17
‘18
‘19
Total cost (USD mln)
1492.0
1682.2
1592.2
Cost per employee (USD thousand)
Company overview Strategic report Commodity market overview
Business overview Sustainable development
Corporate governance
Risk report Shareholder information IFRS financial statements AppendixAnnual report 2019
«NORNICKEL»
134 135
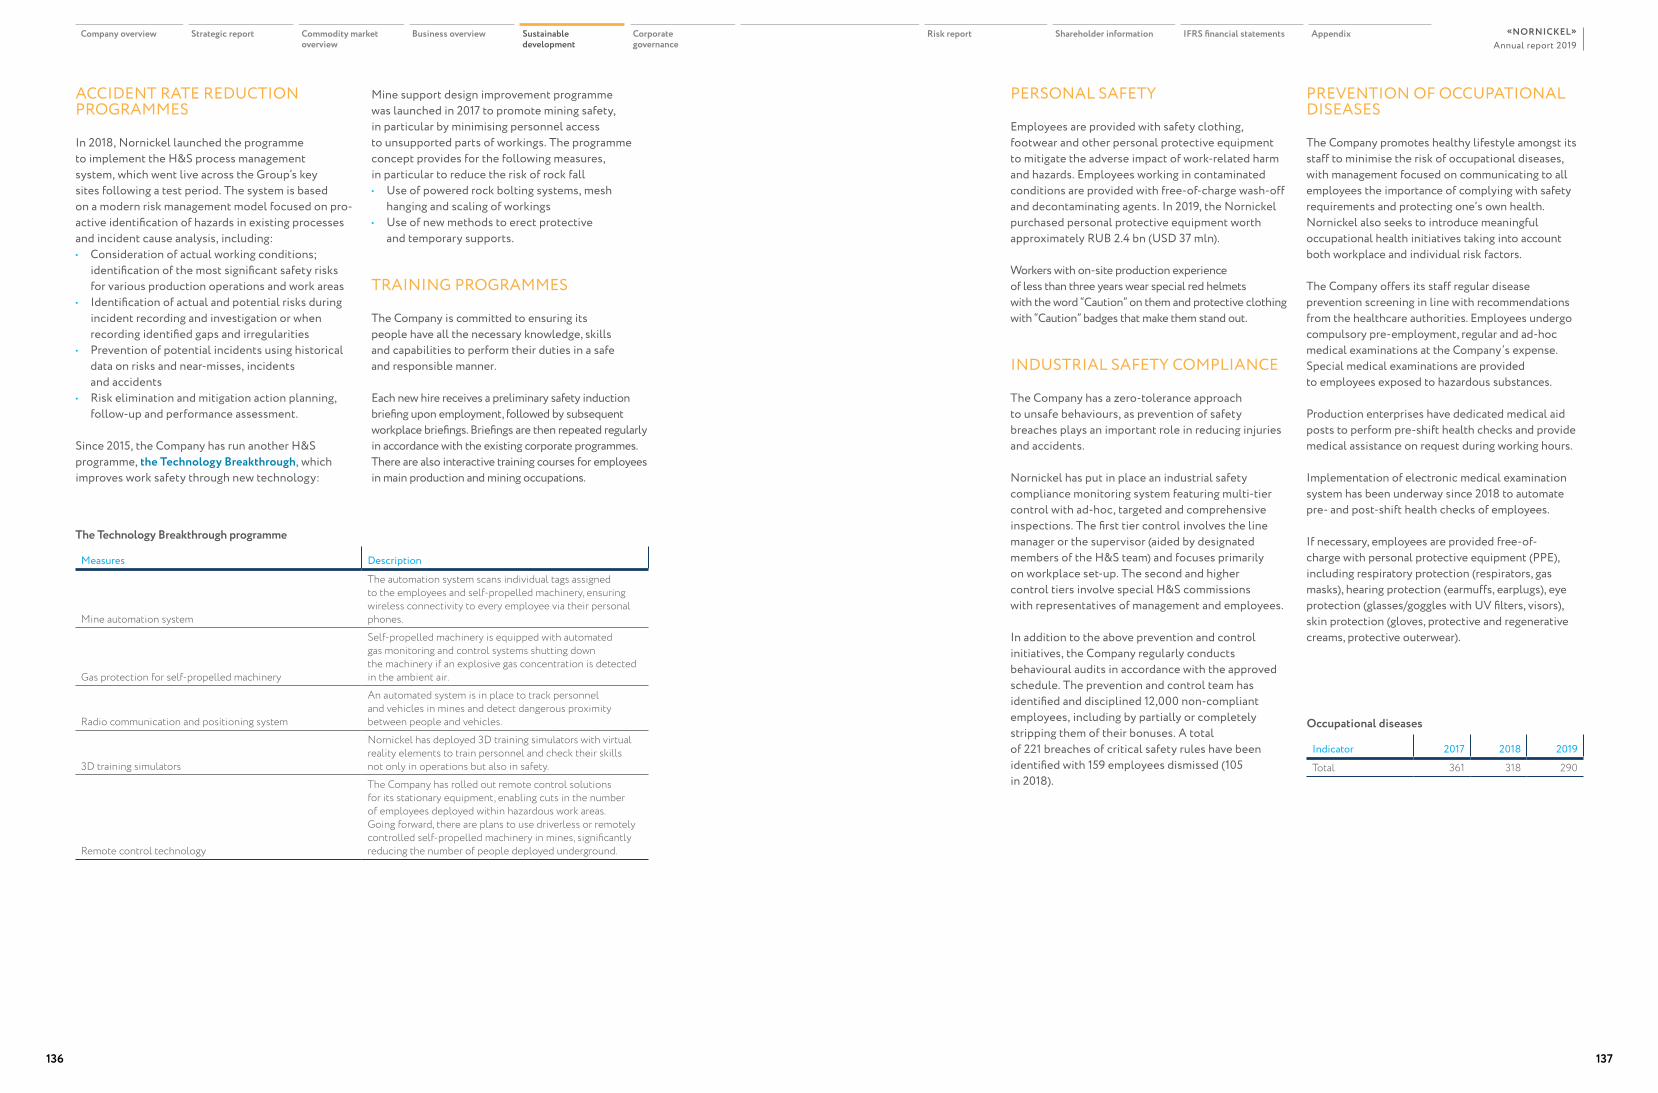
ACCIDENT RATE REDUCTION PROGRAMMES
In 2018, Nornickel launched the programme to implement the H&S process management system, which went live across the Group’s key sites following a test period. The system is based on a modern risk management model focused on pro-active identification of hazards in existing processes and incident cause analysis, including:• Consideration of actual working conditions;
identification of the most significant safety risks for various production operations and work areas
• Identification of actual and potential risks during incident recording and investigation or when recording identified gaps and irregularities
• Prevention of potential incidents using historical data on risks and near-misses, incidents and accidents
• Risk elimination and mitigation action planning, follow-up and performance assessment.
Since 2015, the Company has run another H&S programme, the Technology Breakthrough, which improves work safety through new technology:
Mine support design improvement programme was launched in 2017 to promote mining safety, in particular by minimising personnel access to unsupported parts of workings. The programme concept provides for the following measures, in particular to reduce the risk of rock fall• Use of powered rock bolting systems, mesh
hanging and scaling of workings• Use of new methods to erect protective
and temporary supports.
TRAINING PROGRAMMES
The Company is committed to ensuring its people have all the necessary knowledge, skills and capabilities to perform their duties in a safe and responsible manner.
Each new hire receives a preliminary safety induction briefing upon employment, followed by subsequent workplace briefings. Briefings are then repeated regularly in accordance with the existing corporate programmes. There are also interactive training courses for employees in main production and mining occupations.
PERSONAL SAFETY
Employees are provided with safety clothing, footwear and other personal protective equipment to mitigate the adverse impact of work-related harm and hazards. Employees working in contaminated conditions are provided with free-of-charge wash-off and decontaminating agents. In 2019, the Nornickel purchased personal protective equipment worth approximately RUB 2.4 bn (USD 37 mln).
Workers with on-site production experience of less than three years wear special red helmets with the word “Caution” on them and protective clothing with “Caution” badges that make them stand out.
INDUSTRIAL SAFETY COMPLIANCE
The Company has a zero-tolerance approach to unsafe behaviours, as prevention of safety breaches plays an important role in reducing injuries and accidents.
Nornickel has put in place an industrial safety compliance monitoring system featuring multi-tier control with ad-hoc, targeted and comprehensive inspections. The first tier control involves the line manager or the supervisor (aided by designated members of the H&S team) and focuses primarily on workplace set-up. The second and higher control tiers involve special H&S commissions with representatives of management and employees.
In addition to the above prevention and control initiatives, the Company regularly conducts behavioural audits in accordance with the approved schedule. The prevention and control team has identified and disciplined 12,000 non-compliant employees, including by partially or completely stripping them of their bonuses. A total of 221 breaches of critical safety rules have been identified with 159 employees dismissed (105 in 2018).
PREVENTION OF OCCUPATIONAL DISEASES
The Company promotes healthy lifestyle amongst its staff to minimise the risk of occupational diseases, with management focused on communicating to all employees the importance of complying with safety requirements and protecting one’s own health. Nornickel also seeks to introduce meaningful occupational health initiatives taking into account both workplace and individual risk factors.
The Company offers its staff regular disease prevention screening in line with recommendations from the healthcare authorities. Employees undergo compulsory pre-employment, regular and ad-hoc medical examinations at the Company’s expense. Special medical examinations are provided to employees exposed to hazardous substances.
Production enterprises have dedicated medical aid posts to perform pre-shift health checks and provide medical assistance on request during working hours.
Implementation of electronic medical examination system has been underway since 2018 to automate pre- and post-shift health checks of employees.
If necessary, employees are provided free-of-charge with personal protective equipment (PPE), including respiratory protection (respirators, gas masks), hearing protection (earmuffs, earplugs), eye protection (glasses/goggles with UV filters, visors), skin protection (gloves, protective and regenerative creams, protective outerwear).
The Technology Breakthrough programme
Measures Description
Mine automation system
The automation system scans individual tags assigned to the employees and self-propelled machinery, ensuring wireless connectivity to every employee via their personal phones.
Gas protection for self-propelled machinery
Self-propelled machinery is equipped with automated gas monitoring and control systems shutting down the machinery if an explosive gas concentration is detected in the ambient air.
Radio communication and positioning system
An automated system is in place to track personnel and vehicles in mines and detect dangerous proximity between people and vehicles.
3D training simulators
Nornickel has deployed 3D training simulators with virtual reality elements to train personnel and check their skills not only in operations but also in safety.
Remote control technology
The Company has rolled out remote control solutions for its stationary equipment, enabling cuts in the number of employees deployed within hazardous work areas. Going forward, there are plans to use driverless or remotely controlled self-propelled machinery in mines, significantly reducing the number of people deployed underground.
Occupational diseases
Indicator 2017 2018 2019
Total 361 318 290
Company overview Strategic report Commodity market overview
Business overview Sustainable development
Corporate governance
Risk report Shareholder information IFRS financial statements AppendixAnnual report 2019
«NORNICKEL»
136 137
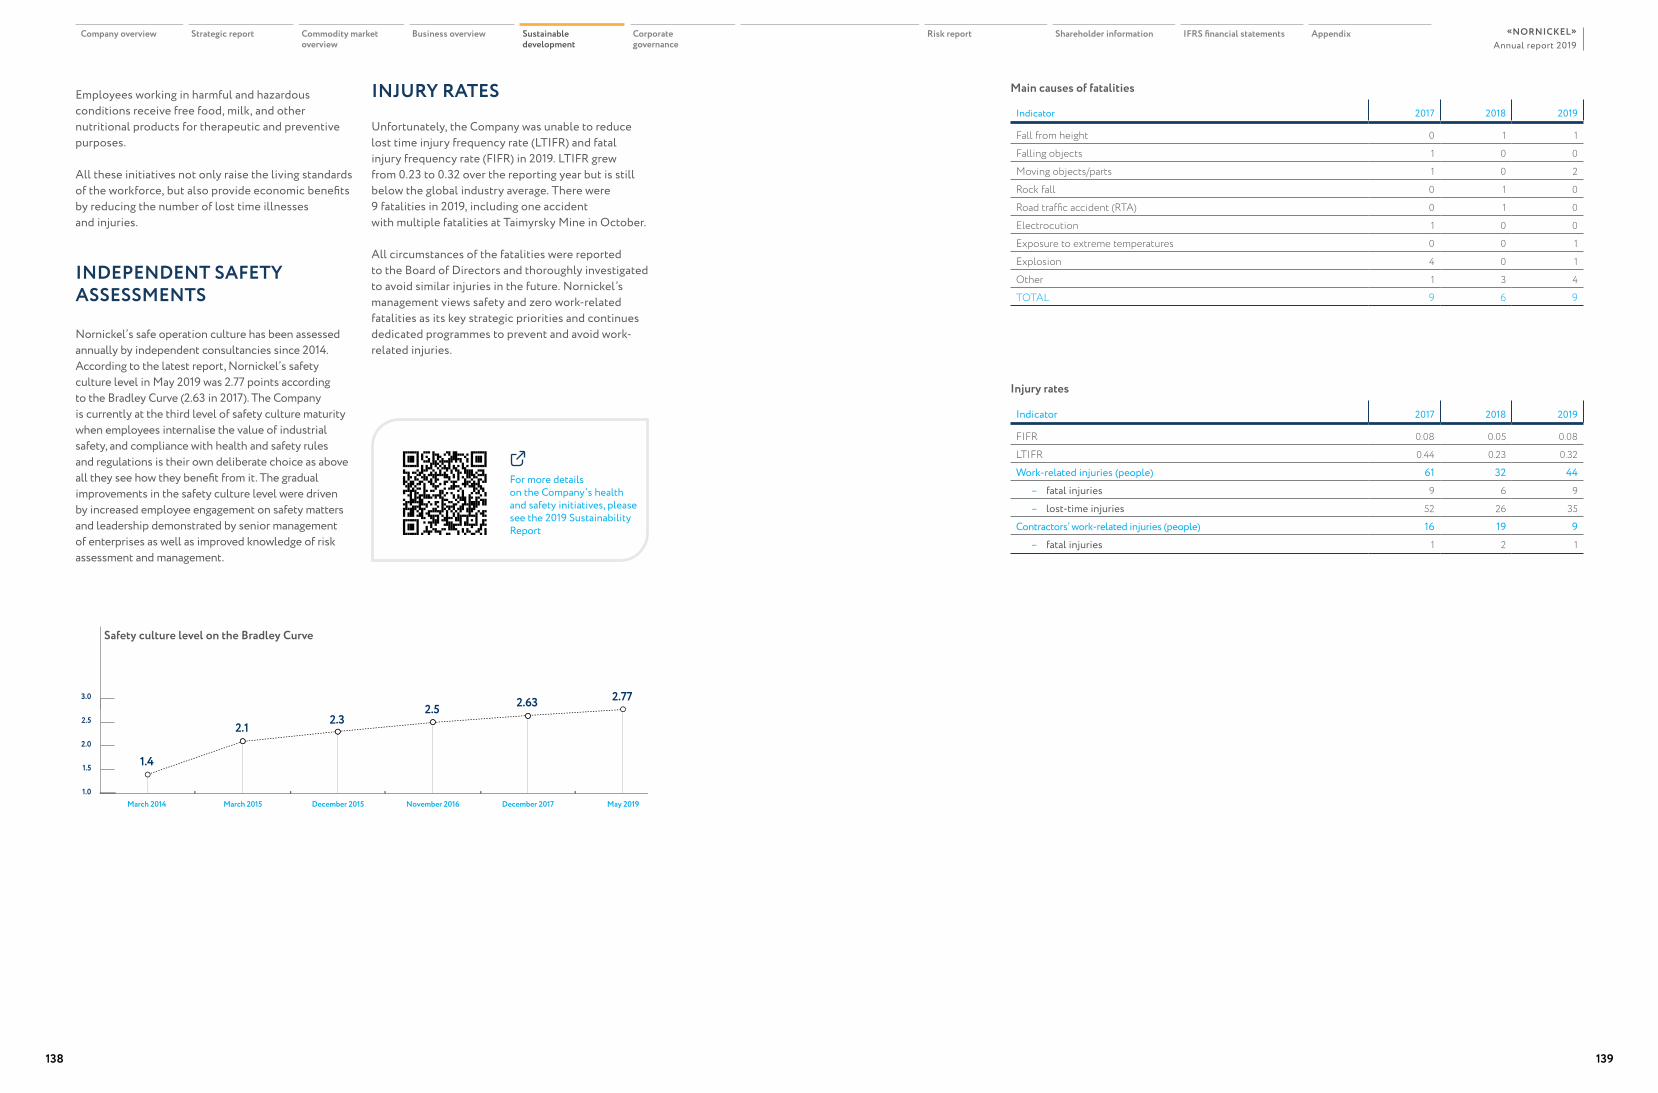
Employees working in harmful and hazardous conditions receive free food, milk, and other nutritional products for therapeutic and preventive purposes.
All these initiatives not only raise the living standards of the workforce, but also provide economic benefits by reducing the number of lost time illnesses and injuries.
INDEPENDENT SAFETY ASSESSMENTS
Nornickel’s safe operation culture has been assessed annually by independent consultancies since 2014. According to the latest report, Nornickel’s safety culture level in May 2019 was 2.77 points according to the Bradley Curve (2.63 in 2017). The Company is currently at the third level of safety culture maturity when employees internalise the value of industrial safety, and compliance with health and safety rules and regulations is their own deliberate choice as above all they see how they benefit from it. The gradual improvements in the safety culture level were driven by increased employee engagement on safety matters and leadership demonstrated by senior management of enterprises as well as improved knowledge of risk assessment and management.
Safety culture level on the Bradley Curve
May 2019December 2015March 2015March 2014 December 2017November 2016
2.772.632.52.32.1
1.4
1.0
1.5
2.0
2.5
3.0
INJURY RATES
Unfortunately, the Company was unable to reduce lost time injury frequency rate (LTIFR) and fatal injury frequency rate (FIFR) in 2019. LTIFR grew from 0.23 to 0.32 over the reporting year but is still below the global industry average. There were 9 fatalities in 2019, including one accident with multiple fatalities at Taimyrsky Mine in October.
All circumstances of the fatalities were reported to the Board of Directors and thoroughly investigated to avoid similar injuries in the future. Nornickel’s management views safety and zero work-related fatalities as its key strategic priorities and continues dedicated programmes to prevent and avoid work-related injuries.
Main causes of fatalities
Indicator 2017 2018 2019
Fall from height 0 1 1
Falling objects 1 0 0
Moving objects/parts 1 0 2
Rock fall 0 1 0
Road traffic accident (RTA) 0 1 0
Electrocution 1 0 0
Exposure to extreme temperatures 0 0 1
Explosion 4 0 1
Other 1 3 4
TOTAL 9 6 9
Injury rates
Indicator 2017 2018 2019
FIFR 0.08 0.05 0.08
LTIFR 0.44 0.23 0.32
Work-related injuries (people) 61 32 44 – fatal injuries 9 6 9
– lost-time injuries 52 26 35
Contractors’ work-related injuries (people) 16 19 9 – fatal injuries 1 2 1
For more details on the Company’s health and safety initiatives, please see the 2019 Sustainability Report
Company overview Strategic report Commodity market overview
Business overview Sustainable development
Corporate governance
Risk report Shareholder information IFRS financial statements AppendixAnnual report 2019
«NORNICKEL»
138 139
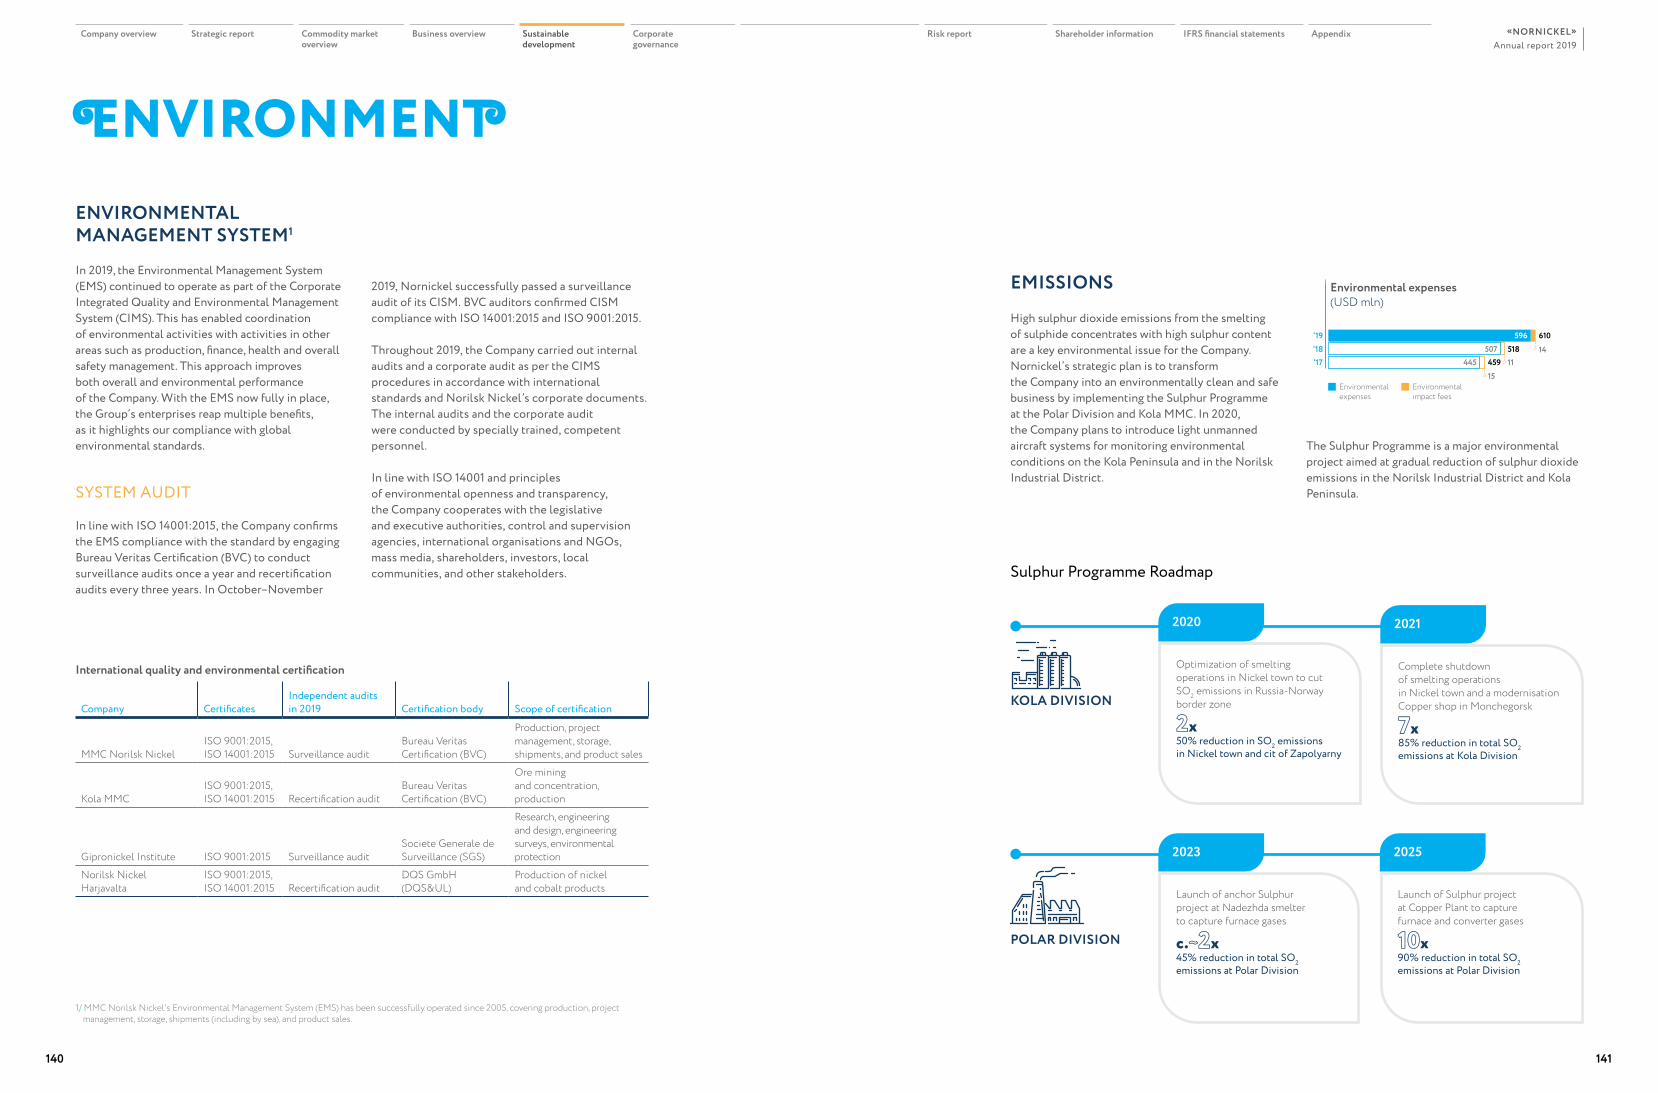
ENVIRONMENTENVIRONMENTAL MANAGEMENT SYSTEM1
In 2019, the Environmental Management System (EMS) continued to operate as part of the Corporate Integrated Quality and Environmental Management System (CIMS). This has enabled coordination of environmental activities with activities in other areas such as production, finance, health and overall safety management. This approach improves both overall and environmental performance of the Company. With the EMS now fully in place, the Group’s enterprises reap multiple benefits, as it highlights our compliance with global environmental standards.
SYSTEM AUDIT
In line with ISO 14001:2015, the Company confirms the EMS compliance with the standard by engaging Bureau Veritas Certification (BVC) to conduct surveillance audits once a year and recertification audits every three years. In October–November
1/ MMC Norilsk Nickel's Environmental Management System (EMS) has been successfully operated since 2005, covering production, project management, storage, shipments (including by sea), and product sales.
2019, Nornickel successfully passed a surveillance audit of its CISM. BVC auditors confirmed CISM compliance with ISO 14001:2015 and ISO 9001:2015.
Throughout 2019, the Company carried out internal audits and a corporate audit as per the CIMS procedures in accordance with international standards and Norilsk Nickel’s corporate documents. The internal audits and the corporate audit were conducted by specially trained, competent personnel.
In line with ISO 14001 and principles of environmental openness and transparency, the Company cooperates with the legislative and executive authorities, control and supervision agencies, international organisations and NGOs, mass media, shareholders, investors, local communities, and other stakeholders.
International quality and environmental certification
Company CertificatesIndependent audits in 2019 Certification body Scope of certification
MMC Norilsk NickelISO 9001:2015, ISO 14001:2015 Surveillance audit
Bureau Veritas Certification (BVC)
Production, project management, storage, shipments, and product sales
Kola MMCISO 9001:2015, ISO 14001:2015 Recertification audit
Bureau Veritas Certification (BVC)
Ore mining and concentration, production
Gipronickel Institute ISO 9001:2015 Surveillance auditSociete Generale de Surveillance (SGS)
Research, engineering and design, engineering surveys, environmental protection
Norilsk Nickel Harjavalta
ISO 9001:2015, ISO 14001:2015 Recertification audit
DQS GmbH(DQS&UL)
Production of nickel and cobalt products
EMISSIONS
High sulphur dioxide emissions from the smelting of sulphide concentrates with high sulphur content are a key environmental issue for the Company. Nornickel’s strategic plan is to transform the Company into an environmentally clean and safe business by implementing the Sulphur Programme at the Polar Division and Kola MMC. In 2020, the Company plans to introduce light unmanned aircraft systems for monitoring environmental conditions on the Kola Peninsula and in the Norilsk Industrial District.
Environmental expenses (USD mln)
‘17‘18‘19 23610596
507 518 1411459445
Environmental expenses
Environmental impact fees
15
The Sulphur Programme is a major environmental project aimed at gradual reduction of sulphur dioxide emissions in the Norilsk Industrial District and Kola Peninsula.
Sulphur Programme Roadmap
2020
2023 2025
2021
Optimization of smelting operations in Nickel town to cut SO2 emissions in Russia-Norway border zone
2x50% reduction in SO2 emissions in Nickel town and cit of Zapolyarny
Launch of anchor Sulphur project at Nadezhda smelter to capture furnace gases
c.~2x45% reduction in total SO2 emissions at Polar Division
Launch of Sulphur project at Copper Plant to capture furnace and converter gases
10x90% reduction in total SO2 emissions at Polar Division
Complete shutdown of smelting operations in Nickel town and a modernisation Сopper shop in Monchegorsk
7x85% reduction in total SO2 emissions at Kola Division
KOLA DIVISION
POLAR DIVISION
Company overview Strategic report Commodity market overview
Business overview Sustainable development
Corporate governance
Risk report Shareholder information IFRS financial statements AppendixAnnual report 2019
«NORNICKEL»
140 141
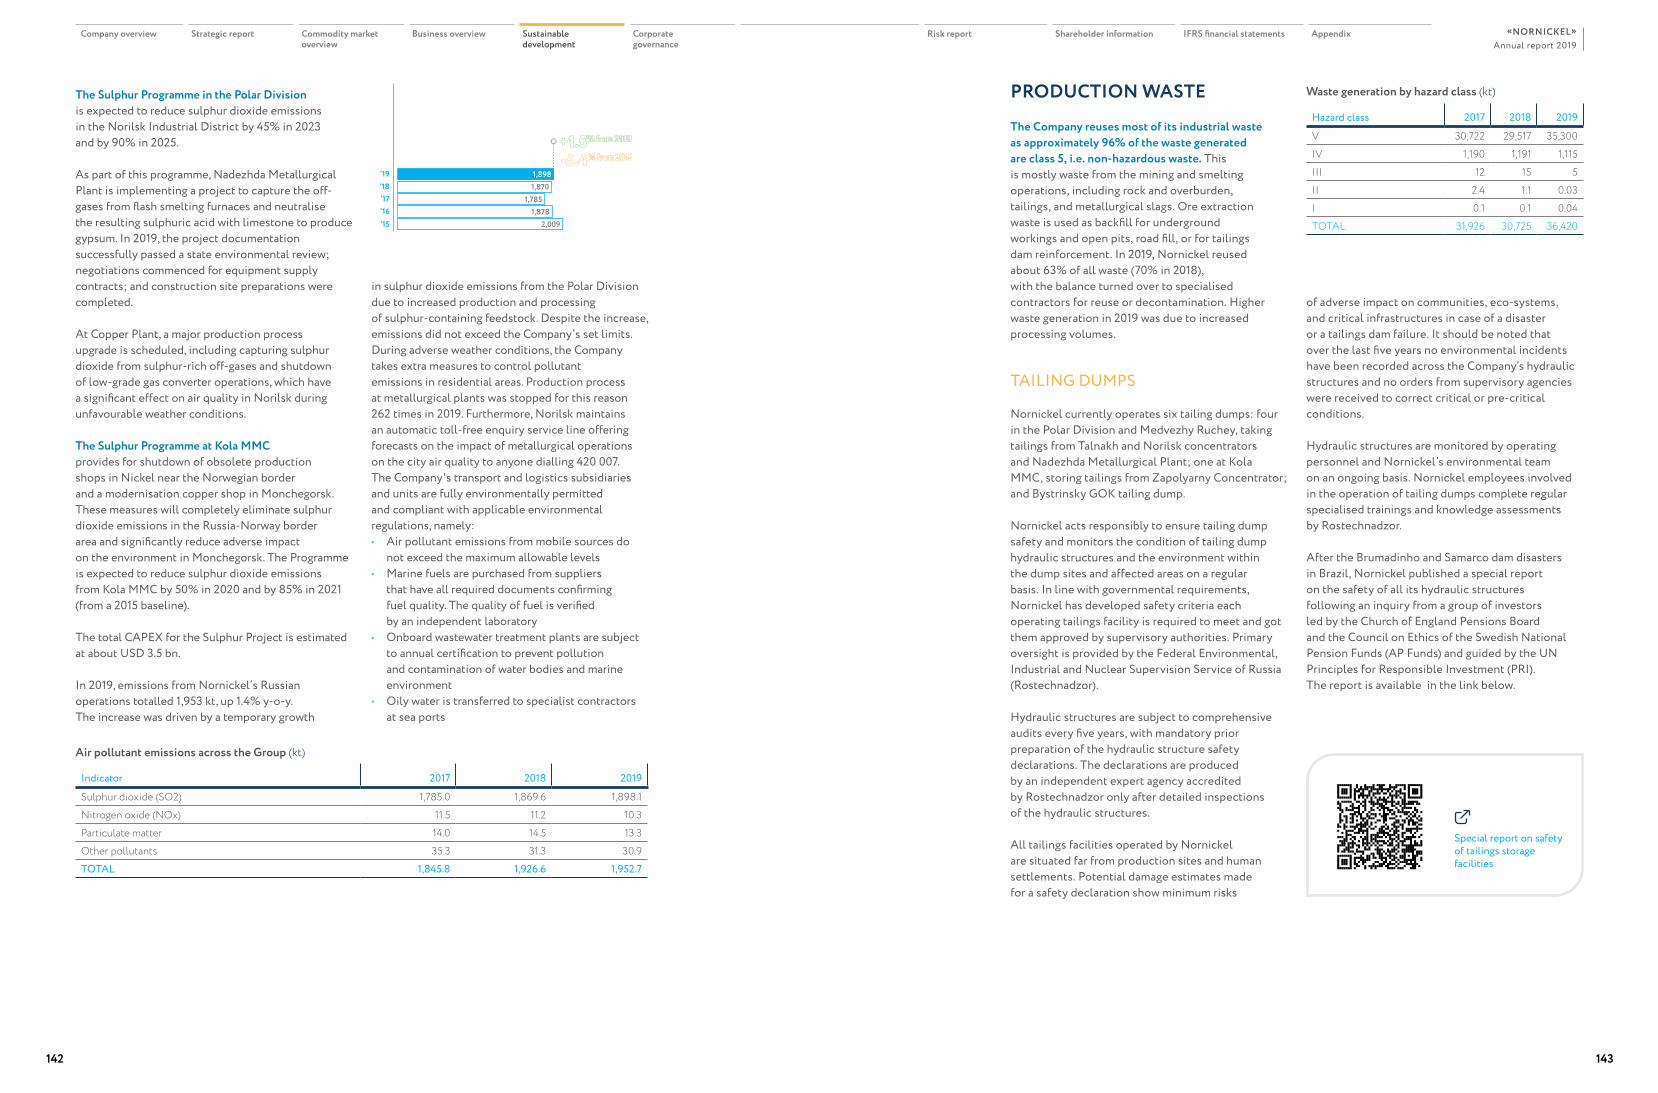
The Sulphur Programme in the Polar Division is expected to reduce sulphur dioxide emissions in the Norilsk Industrial District by 45% in 2023 and by 90% in 2025.
As part of this programme, Nadezhda Metallurgical Plant is implementing a project to capture the off-gases from flash smelting furnaces and neutralise the resulting sulphuric acid with limestone to produce gypsum. In 2019, the project documentation successfully passed a state environmental review; negotiations commenced for equipment supply contracts; and construction site preparations were completed.
At Copper Plant, a major production process upgrade is scheduled, including capturing sulphur dioxide from sulphur-rich off-gases and shutdown of low-grade gas converter operations, which have a significant effect on air quality in Norilsk during unfavourable weather conditions.
The Sulphur Programme at Kola MMC provides for shutdown of obsolete production shops in Nickel near the Norwegian border and a modernisation copper shop in Monchegorsk. These measures will completely eliminate sulphur dioxide emissions in the Russia-Norway border area and significantly reduce adverse impact on the environment in Monchegorsk. The Programme is expected to reduce sulphur dioxide emissions from Kola MMC by 50% in 2020 and by 85% in 2021 (from a 2015 baseline).
The total CAPEX for the Sulphur Project is estimated at about USD 3.5 bn.
In 2019, emissions from Nornickel’s Russian operations totalled 1,953 kt, up 1.4% y-o-y. The increase was driven by a temporary growth
in sulphur dioxide emissions from the Polar Division due to increased production and processing of sulphur-containing feedstock. Despite the increase, emissions did not exceed the Company’s set limits.During adverse weather conditions, the Company takes extra measures to control pollutant emissions in residential areas. Production process at metallurgical plants was stopped for this reason 262 times in 2019. Furthermore, Norilsk maintains an automatic toll-free enquiry service line offering forecasts on the impact of metallurgical operations on the city air quality to anyone dialling 420 007.The Company's transport and logistics subsidiaries and units are fully environmentally permitted and compliant with applicable environmental regulations, namely:• Air pollutant emissions from mobile sources do
not exceed the maximum allowable levels• Marine fuels are purchased from suppliers
that have all required documents confirming fuel quality. The quality of fuel is verified by an independent laboratory
• Onboard wastewater treatment plants are subject to annual certification to prevent pollution and contamination of water bodies and marine environment
• Oily water is transferred to specialist contractors at sea ports
Waste generation by hazard class (kt)
Hazard class 2017 2018 2019
V 30,722 29,517 35,300IV 1,190 1,191 1,115III 12 15 5II 2.4 1.1 0.03I 0.1 0.1 0.04TOTAL 31,926 30,725 36,420
Sulphur dioxide emissions (kt)
1,785
1,898
1,878
1,870
2,009‘16
‘19‘18‘17
‘15
PRODUCTION WASTE
The Company reuses most of its industrial waste as approximately 96% of the waste generated are class 5, i.e. non-hazardous waste. This is mostly waste from the mining and smelting operations, including rock and overburden, tailings, and metallurgical slags. Ore extraction waste is used as backfill for underground workings and open pits, road fill, or for tailings dam reinforcement. In 2019, Nornickel reused about 63% of all waste (70% in 2018), with the balance turned over to specialised contractors for reuse or decontamination. Higher waste generation in 2019 was due to increased processing volumes.
TAILING DUMPS
Nornickel currently operates six tailing dumps: four in the Polar Division and Medvezhy Ruchey, taking tailings from Talnakh and Norilsk concentrators and Nadezhda Metallurgical Plant; one at Kola MMC, storing tailings from Zapolyarny Concentrator; and Bystrinsky GOK tailing dump.
Nornickel acts responsibly to ensure tailing dump safety and monitors the condition of tailing dump hydraulic structures and the environment within the dump sites and affected areas on a regular basis. In line with governmental requirements, Nornickel has developed safety criteria each operating tailings facility is required to meet and got them approved by supervisory authorities. Primary oversight is provided by the Federal Environmental, Industrial and Nuclear Supervision Service of Russia (Rostechnadzor).
Hydraulic structures are subject to comprehensive audits every five years, with mandatory prior preparation of the hydraulic structure safety declarations. The declarations are produced by an independent expert agency accredited by Rostechnadzor only after detailed inspections of the hydraulic structures.
All tailings facilities operated by Nornickel are situated far from production sites and human settlements. Potential damage estimates made for a safety declaration show minimum risks
of adverse impact on communities, eco-systems, and critical infrastructures in case of a disaster or a tailings dam failure. It should be noted that over the last five years no environmental incidents have been recorded across the Company’s hydraulic structures and no orders from supervisory agencies were received to correct critical or pre-critical conditions.
Hydraulic structures are monitored by operating personnel and Nornickel’s environmental team on an ongoing basis. Nornickel employees involved in the operation of tailing dumps complete regular specialised trainings and knowledge assessments by Rostechnadzor.
After the Brumadinho and Samarco dam disasters in Brazil, Nornickel published a special report on the safety of all its hydraulic structures following an inquiry from a group of investors led by the Church of England Pensions Board and the Council on Ethics of the Swedish National Pension Funds (AP Funds) and guided by the UN Principles for Responsible Investment (PRI). The report is available in the link below.
Air pollutant emissions across the Group (kt)
Indicator 2017 2018 2019
Sulphur dioxide (SO2) 1,785.0 1,869.6 1,898.1Nitrogen oxide (NОx) 11.5 11.2 10.3Particulate matter 14.0 14.5 13.3Other pollutants 35.3 31.3 30.9TOTAL 1,845.8 1,926.6 1,952.7
Special report on safety of tailings storage facilities
Company overview Strategic report Commodity market overview
Business overview Sustainable development
Corporate governance
Risk report Shareholder information IFRS financial statements AppendixAnnual report 2019
«NORNICKEL»
142 143
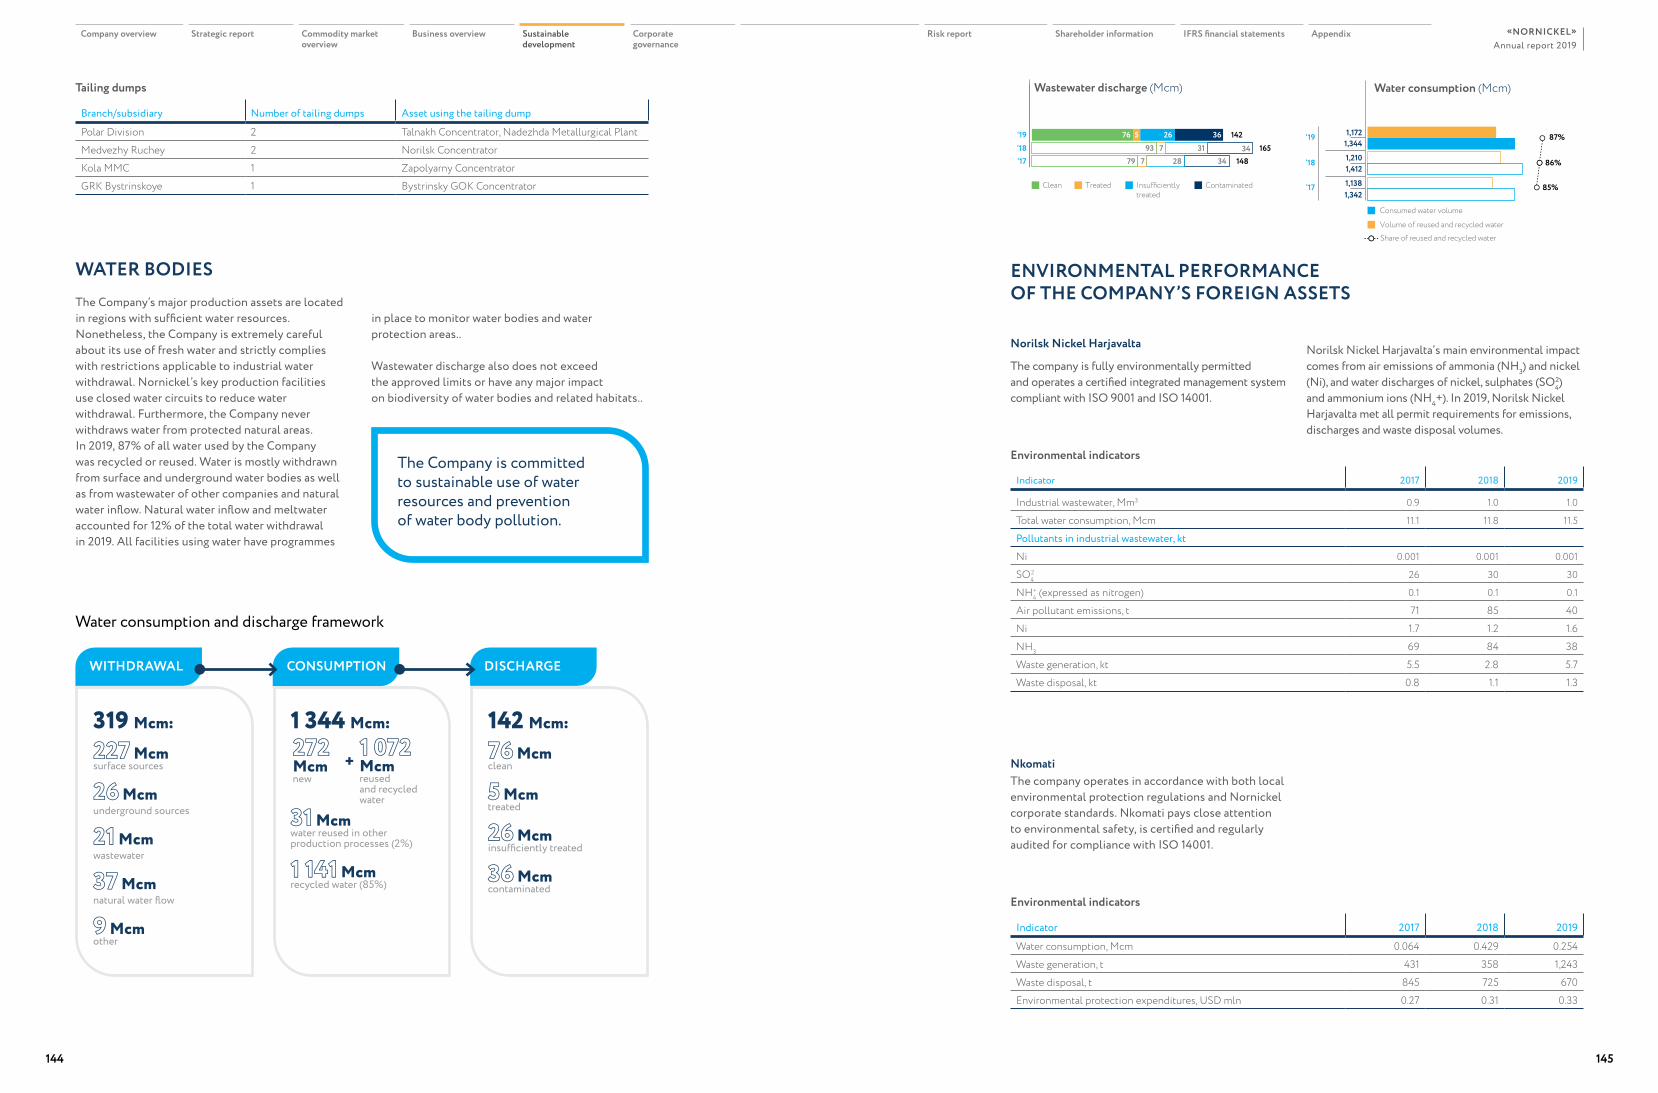
Tailing dumps
Branch/subsidiary Number of tailing dumps Asset using the tailing dump
Polar Division 2 Talnakh Concentrator, Nadezhda Metallurgical PlantMedvezhy Ruchey 2 Norilsk ConcentratorKola MMC 1 Zapolyarny ConcentratorGRK Bystrinskoye 1 Bystrinsky GOK Concentrator
WATER BODIESThe Company’s major production assets are located in regions with sufficient water resources. Nonetheless, the Company is extremely careful about its use of fresh water and strictly complies with restrictions applicable to industrial water withdrawal. Nornickel’s key production facilities use closed water circuits to reduce water withdrawal. Furthermore, the Company never withdraws water from protected natural areas. In 2019, 87% of all water used by the Company was recycled or reused. Water is mostly withdrawn from surface and underground water bodies as well as from wastewater of other companies and natural water inflow. Natural water inflow and meltwater accounted for 12% of the total water withdrawal in 2019. All facilities using water have programmes
The Company is committed to sustainable use of water resources and prevention of water body pollution.
Environmental indicators
Indicator 2017 2018 2019
Water consumption, Mcm 0.064 0.429 0.254Waste generation, t 431 358 1,243Waste disposal, t 845 725 670Environmental protection expenditures, USD mln 0.27 0.31 0.33
Environmental indicators
Indicator 2017 2018 2019
Industrial wastewater, Mm3 0.9 1.0 1.0
Total water consumption, Mcm 11.1 11.8 11.5
Pollutants in industrial wastewater, ktNi 0.001 0.001 0.001
SO42 26 30 30
NH4+ (expressed as nitrogen) 0.1 0.1 0.1
Air pollutant emissions, t 71 85 40Ni 1.7 1.2 1.6NH3 69 84 38Waste generation, kt 5.5 2.8 5.7Waste disposal, kt 0.8 1.1 1.3
Norilsk Nickel Harjavalta
The company is fully environmentally permitted and operates a certified integrated management system compliant with ISO 9001 and ISO 14001.
Water consumption and discharge framework
WITHDRAWAL CONSUMPTION DISCHARGE
319 Mcm:
227 Mcmsurface sources
26 Mcmunderground sources
21 Mcmwastewater
37 Mcmnatural water flow
9 Mcmother
142 Mcm:
76 Mcmclean
5 Mcmtreated
26 Mcminsufficiently treated
36 Mcmcontaminated
1 344 Mcm:
31 Mcmwater reused in other production processes (2%)
1 141 Mcmrecycled water (85%)
272 Mcmnew
1 072 Mcmreused and recycled water
Wastewater discharge (Mcm)
‘17‘18‘19 231423626576
31793 1653434 14828779
Clean Treated Insufficientlytreated
Contaminated
Water consumption (Mcm)
‘17
‘18
‘19
Consumed water volume
1,3421,138
1,4121,210
1,3441,172
Volume of reused and recycled water
87%
86%
85%
Share of reused and recycled water
in place to monitor water bodies and water protection areas..
Wastewater discharge also does not exceed the approved limits or have any major impact on biodiversity of water bodies and related habitats..
NkomatiThe company operates in accordance with both local environmental protection regulations and Nornickel corporate standards. Nkomati pays close attention to environmental safety, is certified and regularly audited for compliance with ISO 14001.
Norilsk Nickel Harjavalta’s main environmental impact comes from air emissions of ammonia (NH3) and nickel (Ni), and water discharges of nickel, sulphates (SO4
2) and ammonium ions (NH4+). In 2019, Norilsk Nickel Harjavalta met all permit requirements for emissions, discharges and waste disposal volumes.
ENVIRONMENTAL PERFORMANCE OF THE COMPANY’S FOREIGN ASSETS
Company overview Strategic report Commodity market overview
Business overview Sustainable development
Corporate governance
Risk report Shareholder information IFRS financial statements AppendixAnnual report 2019
«NORNICKEL»
144 145
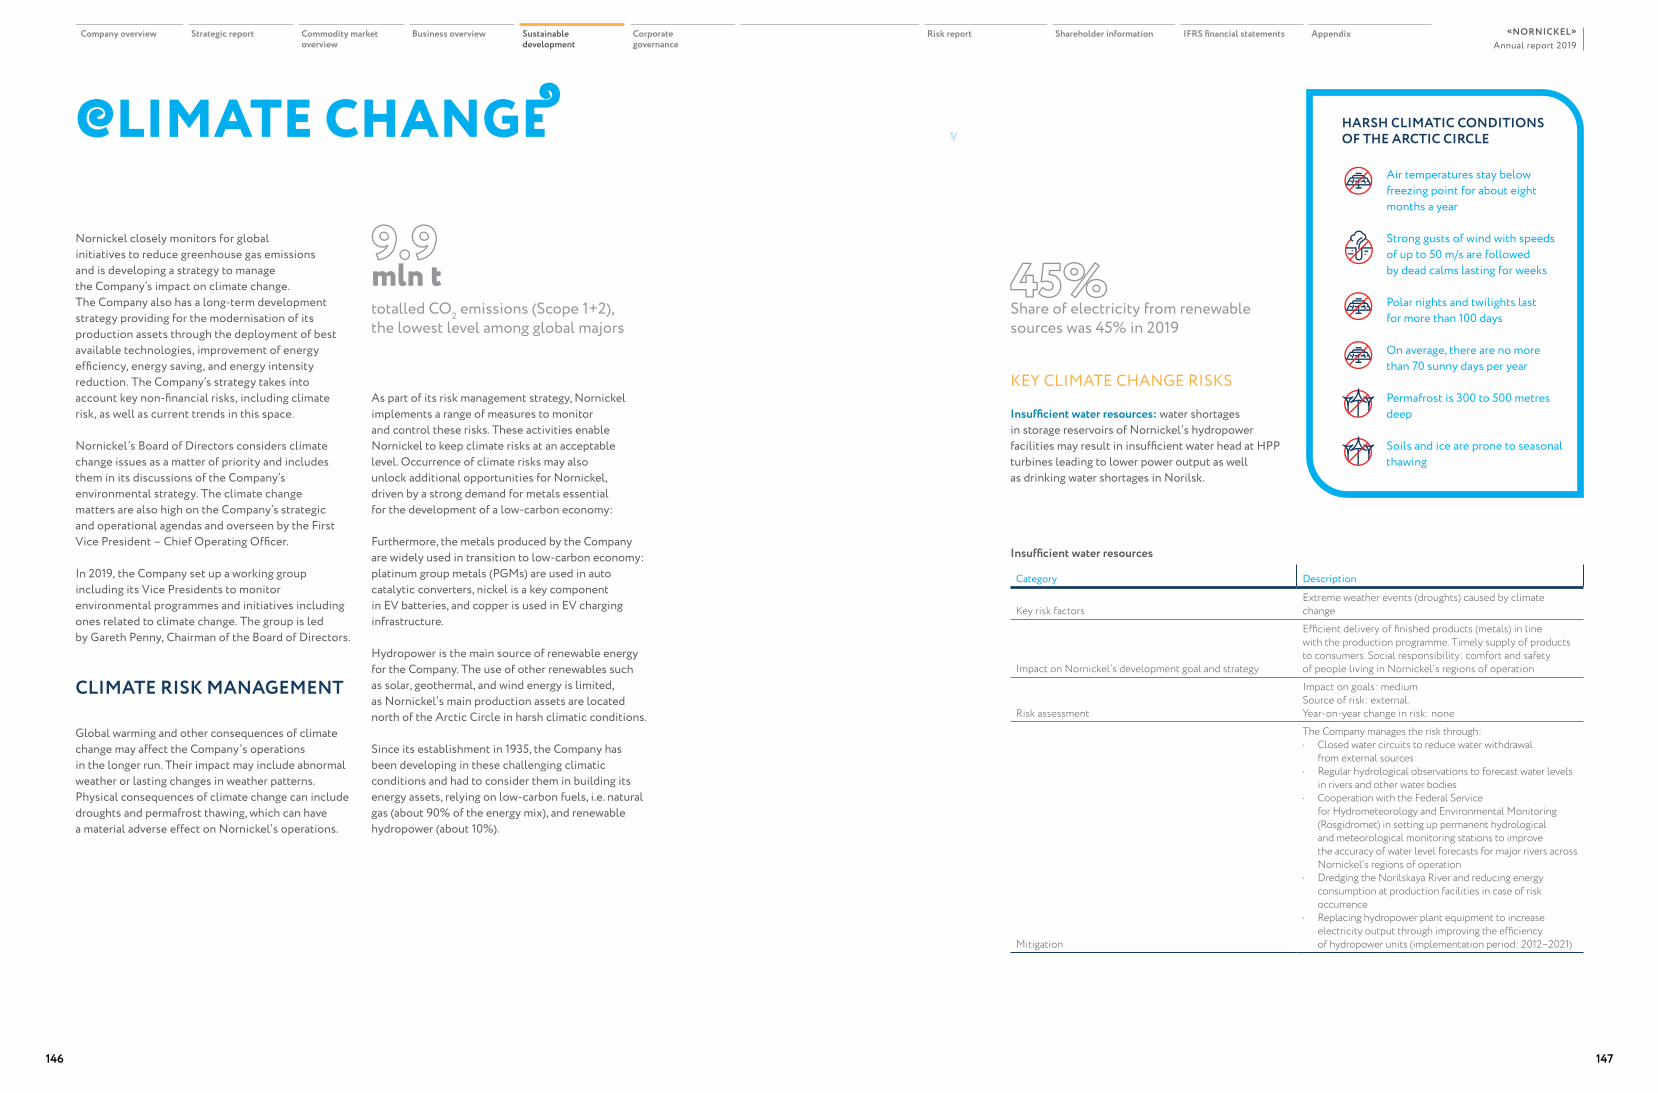
CLIMATE CHANGE
Nornickel closely monitors for global initiatives to reduce greenhouse gas emissions and is developing a strategy to manage the Company’s impact on climate change. The Company also has a long-term development strategy providing for the modernisation of its production assets through the deployment of best available technologies, improvement of energy efficiency, energy saving, and energy intensity reduction. The Company’s strategy takes into account key non-financial risks, including climate risk, as well as current trends in this space.
Nornickel’s Board of Directors considers climate change issues as a matter of priority and includes them in its discussions of the Company’s environmental strategy. The climate change matters are also high on the Company’s strategic and operational agendas and overseen by the First Vice President – Chief Operating Officer.
In 2019, the Company set up a working group including its Vice Presidents to monitor environmental programmes and initiatives including ones related to climate change. The group is led by Gareth Penny, Chairman of the Board of Directors.
CLIMATE RISK MANAGEMENT
Global warming and other consequences of climate change may affect the Company’s operations in the longer run. Their impact may include abnormal weather or lasting changes in weather patterns. Physical consequences of climate change can include droughts and permafrost thawing, which can have a material adverse effect on Nornickel’s operations.
As part of its risk management strategy, Nornickel implements a range of measures to monitor and control these risks. These activities enable Nornickel to keep climate risks at an acceptable level. Occurrence of climate risks may also unlock additional opportunities for Nornickel, driven by a strong demand for metals essential for the development of a low-carbon economy:
Furthermore, the metals produced by the Company are widely used in transition to low-carbon economy: platinum group metals (PGMs) are used in auto catalytic converters, nickel is a key component in EV batteries, and copper is used in EV charging infrastructure.
Hydropower is the main source of renewable energy for the Company. The use of other renewables such as solar, geothermal, and wind energy is limited, as Nornickel’s main production assets are located north of the Arctic Circle in harsh climatic conditions.
Since its establishment in 1935, the Company has been developing in these challenging climatic conditions and had to consider them in building its energy assets, relying on low-carbon fuels, i.e. natural gas (about 90% of the energy mix), and renewable hydropower (about 10%).
totalled СО2 emissions (Scope 1+2), the lowest level among global majors
9.9mln t
Share of electricity from renewable sources was 45% in 2019
45%
KEY CLIMATE CHANGE RISKS
Insufficient water resources: water shortages in storage reservoirs of Nornickel’s hydropower facilities may result in insufficient water head at HPP turbines leading to lower power output as well as drinking water shortages in Norilsk.
Insufficient water resources
Category Description
Key risk factorsExtreme weather events (droughts) caused by climate change
Impact on Nornickel’s development goal and strategy
Efficient delivery of finished products (metals) in line with the production programme. Timely supply of products to consumers. Social responsibility: comfort and safety of people living in Nornickel’s regions of operation
Risk assessment
Impact on goals: medium.Source of risk: external. Year-on-year change in risk: none
Mitigation
The Company manages the risk through:• Closed water circuits to reduce water withdrawal
from external sources• Regular hydrological observations to forecast water levels
in rivers and other water bodies• Cooperation with the Federal Service
for Hydrometeorology and Environmental Monitoring (Rosgidromet) in setting up permanent hydrological and meteorological monitoring stations to improve the accuracy of water level forecasts for major rivers across Nornickel’s regions of operation
• Dredging the Norilskaya River and reducing energy consumption at production facilities in case of risk occurrence
• Replacing hydropower plant equipment to increase electricity output through improving the efficiency of hydropower units (implementation period: 2012–2021)
HARSH CLIMATIC CONDITIONS OF THE ARCTIC CIRCLE
Air temperatures stay below freezing point for about eight months a year
Strong gusts of wind with speeds of up to 50 m/s are followed by dead calms lasting for weeks
Polar nights and twilights last for more than 100 days
On average, there are no more than 70 sunny days per year
Permafrost is 300 to 500 metres deep
Soils and ice are prone to seasonal thawing
1/
Company overview Strategic report Commodity market overview
Business overview Sustainable development
Corporate governance
Risk report Shareholder information IFRS financial statements AppendixAnnual report 2019
«NORNICKEL»
146 147
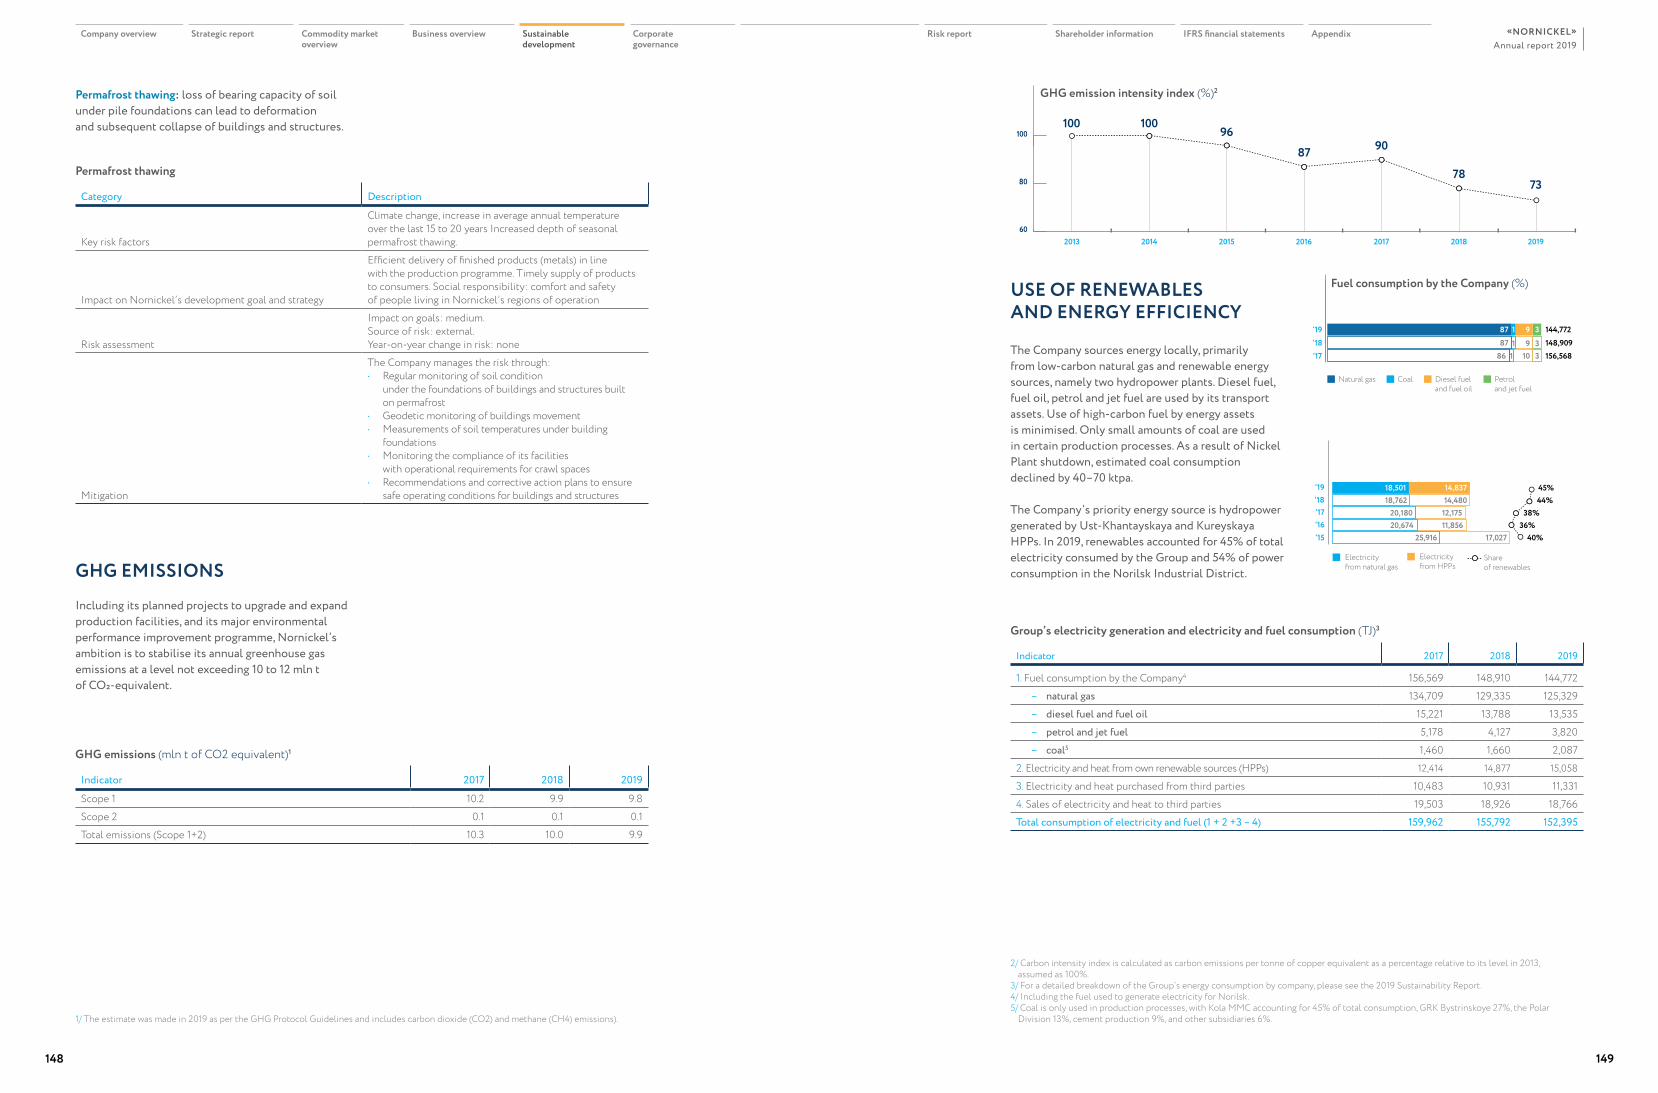
20192016201520142013 20182017
7378
908796
100100
60
80
100
Permafrost thawing: loss of bearing capacity of soil under pile foundations can lead to deformation and subsequent collapse of buildings and structures.
Permafrost thawing
Category Description
Key risk factors
Climate change, increase in average annual temperature over the last 15 to 20 years Increased depth of seasonal permafrost thawing.
Impact on Nornickel’s development goal and strategy
Efficient delivery of finished products (metals) in line with the production programme. Timely supply of products to consumers. Social responsibility: comfort and safety of people living in Nornickel’s regions of operation
Risk assessment
Impact on goals: medium.Source of risk: external.Year-on-year change in risk: none
Mitigation
The Company manages the risk through:• Regular monitoring of soil condition
under the foundations of buildings and structures built on permafrost
• Geodetic monitoring of buildings movement• Measurements of soil temperatures under building
foundations• Monitoring the compliance of its facilities
with operational requirements for crawl spaces• Recommendations and corrective action plans to ensure
safe operating conditions for buildings and structures
GHG EMISSIONSIncluding its planned projects to upgrade and expand production facilities, and its major environmental performance improvement programme, Nornickel’s ambition is to stabilise its annual greenhouse gas emissions at a level not exceeding 10 to 12 mln t of CO₂-equivalent.
GHG emissions (mln t of СО2 equivalent)1
Indicator 2017 2018 2019
Scope 1 10.2 9.9 9.8Scope 2 0.1 0.1 0.1Total emissions (Scope 1+2) 10.3 10.0 9.9
1/ The estimate was made in 2019 as per the GHG Protocol Guidelines and includes carbon dioxide (СО2) and methane (СН4) emissions).
2/ Carbon intensity index is calculated as carbon emissions per tonne of copper equivalent as a percentage relative to its level in 2013, assumed as 100%.
3/ For a detailed breakdown of the Group’s energy consumption by company, please see the 2019 Sustainability Report.4/ Including the fuel used to generate electricity for Norilsk.5/ Coal is only used in production processes, with Kola MMC accounting for 45% of total consumption, GRK Bystrinskoye 27%, the Polar
Division 13%, cement production 9%, and other subsidiaries 6%.
GHG emission intensity index (%)2
Fuel consumption by the Company (%)
Natural gas Coal Diesel fuel and fuel oil
Petrol and jet fuel
‘17‘18‘19 3 144,77287 9
87 148,9091 31
9101 3 156,56886
USE OF RENEWABLES AND ENERGY EFFICIENCY
The Company sources energy locally, primarily from low-carbon natural gas and renewable energy sources, namely two hydropower plants. Diesel fuel, fuel oil, petrol and jet fuel are used by its transport assets. Use of high-carbon fuel by energy assets is minimised. Only small amounts of coal are used in certain production processes. As a result of Nickel Plant shutdown, estimated coal consumption declined by 40–70 ktpa.
The Company’s priority energy source is hydropower generated by Ust-Khantayskaya and Kureyskaya HPPs. In 2019, renewables accounted for 45% of total electricity consumed by the Group and 54% of power consumption in the Norilsk Industrial District.
Electricity consumption (TJ)
12,17520,180
14,83718,501
11,85620,674
14,48018,762
17,027
38%
45%
36%
44%
40%25,916‘16
‘19‘18‘17
‘15
Electricity from natural gas
Electricity from HPPs
Share of renewables
Group’s electricity generation and electricity and fuel consumption (TJ)3
Indicator 2017 2018 2019
1. Fuel consumption by the Company4 156,569 148,910 144,772 – natural gas 134,709 129,335 125,329 – diesel fuel and fuel oil 15,221 13,788 13,535 – petrol and jet fuel 5,178 4,127 3,820 – coal5 1,460 1,660 2,087
2. Electricity and heat from own renewable sources (HPPs) 12,414 14,877 15,058
3. Electricity and heat purchased from third parties 10,483 10,931 11,3314. Sales of electricity and heat to third parties 19,503 18,926 18,766Total consumption of electricity and fuel (1 + 2 +3 – 4) 159,962 155,792 152,395
Company overview Strategic report Commodity market overview
Business overview Sustainable development
Corporate governance
Risk report Shareholder information IFRS financial statements AppendixAnnual report 2019
«NORNICKEL»
148 149
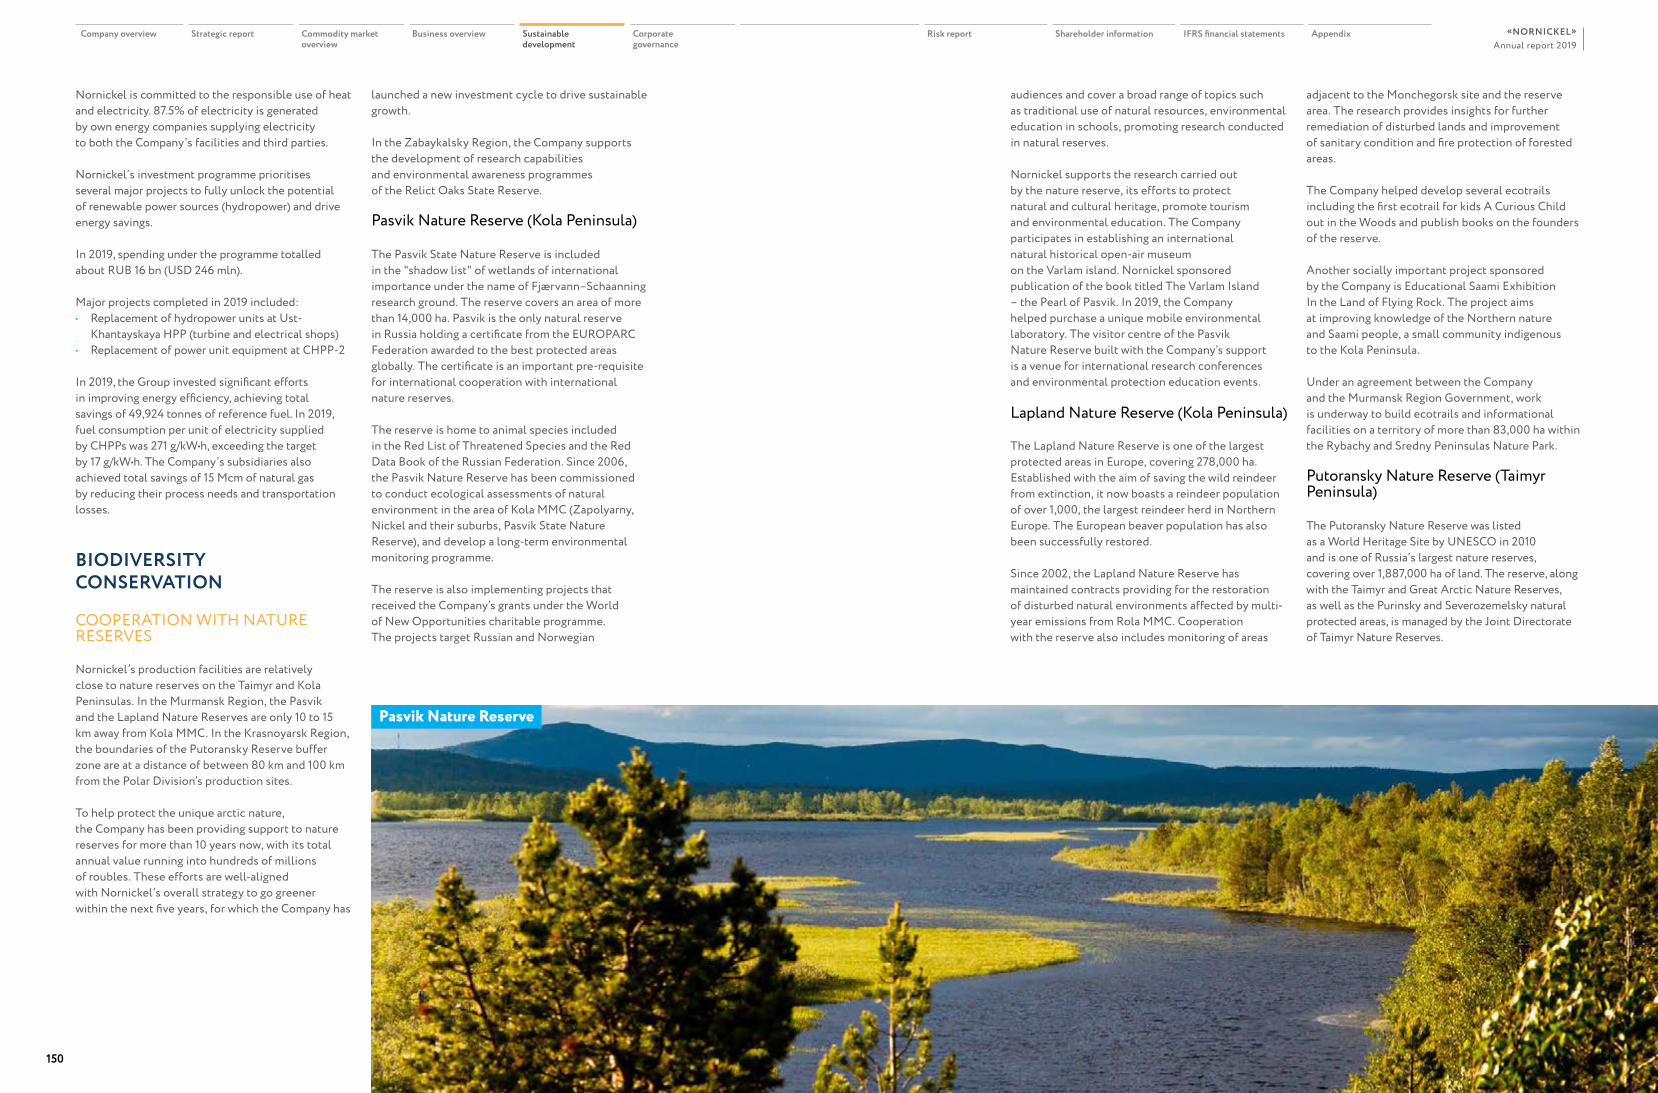
Nornickel is committed to the responsible use of heat and electricity. 87.5% of electricity is generated by own energy companies supplying electricity to both the Company’s facilities and third parties.
Nornickel’s investment programme prioritises several major projects to fully unlock the potential of renewable power sources (hydropower) and drive energy savings.
In 2019, spending under the programme totalled about RUB 16 bn (USD 246 mln).
Major projects completed in 2019 included:• Replacement of hydropower units at Ust-
Khantayskaya HPP (turbine and electrical shops)• Replacement of power unit equipment at CHPP-2
In 2019, the Group invested significant efforts in improving energy efficiency, achieving total savings of 49,924 tonnes of reference fuel. In 2019, fuel consumption per unit of electricity supplied by CHPPs was 271 g/kW•h, exceeding the target by 17 g/kW•h. The Company’s subsidiaries also achieved total savings of 15 Mcm of natural gas by reducing their process needs and transportation losses.
BIODIVERSITY CONSERVATION
COOPERATION WITH NATURE RESERVES
Nornickel’s production facilities are relatively close to nature reserves on the Taimyr and Kola Peninsulas. In the Murmansk Region, the Pasvik and the Lapland Nature Reserves are only 10 to 15 km away from Kola MMC. In the Krasnoyarsk Region, the boundaries of the Putoransky Reserve buffer zone are at a distance of between 80 km and 100 km from the Polar Division’s production sites.
To help protect the unique arctic nature, the Company has been providing support to nature reserves for more than 10 years now, with its total annual value running into hundreds of millions of roubles. These efforts are well-aligned with Nornickel’s overall strategy to go greener within the next five years, for which the Company has
launched a new investment cycle to drive sustainable growth.
In the Zabaykalsky Region, the Company supports the development of research capabilities and environmental awareness programmes of the Relict Oaks State Reserve.
Pasvik Nature Reserve (Kola Peninsula)
The Pasvik State Nature Reserve is included in the "shadow list" of wetlands of international importance under the name of Fjærvann–Schaanning research ground. The reserve covers an area of more than 14,000 ha. Pasvik is the only natural reserve in Russia holding a certificate from the EUROPARC Federation awarded to the best protected areas globally. The certificate is an important pre-requisite for international cooperation with international nature reserves.
The reserve is home to animal species included in the Red List of Threatened Species and the Red Data Book of the Russian Federation. Since 2006, the Pasvik Nature Reserve has been commissioned to conduct ecological assessments of natural environment in the area of Kola MMC (Zapolyarny, Nickel and their suburbs, Pasvik State Nature Reserve), and develop a long-term environmental monitoring programme.
The reserve is also implementing projects that received the Company’s grants under the World of New Opportunities charitable programme. The projects target Russian and Norwegian
audiences and cover a broad range of topics such as traditional use of natural resources, environmental education in schools, promoting research conducted in natural reserves.
Nornickel supports the research carried out by the nature reserve, its efforts to protect natural and cultural heritage, promote tourism and environmental education. The Company participates in establishing an international natural historical open-air museum on the Varlam island. Nornickel sponsored publication of the book titled The Varlam Island – the Pearl of Pasvik. In 2019, the Company helped purchase a unique mobile environmental laboratory. The visitor centre of the Pasvik Nature Reserve built with the Company’s support is a venue for international research conferences and environmental protection education events.
Lapland Nature Reserve (Kola Peninsula)
The Lapland Nature Reserve is one of the largest protected areas in Europe, covering 278,000 ha. Established with the aim of saving the wild reindeer from extinction, it now boasts a reindeer population of over 1,000, the largest reindeer herd in Northern Europe. The European beaver population has also been successfully restored.
Since 2002, the Lapland Nature Reserve has maintained contracts providing for the restoration of disturbed natural environments affected by multi-year emissions from Rola MMC. Cooperation with the reserve also includes monitoring of areas
adjacent to the Monchegorsk site and the reserve area. The research provides insights for further remediation of disturbed lands and improvement of sanitary condition and fire protection of forested areas.
The Company helped develop several ecotrails including the first ecotrail for kids A Curious Child out in the Woods and publish books on the founders of the reserve.
Another socially important project sponsored by the Company is Educational Saami Exhibition In the Land of Flying Rock. The project aims at improving knowledge of the Northern nature and Saami people, a small community indigenous to the Kola Peninsula.
Under an agreement between the Company and the Murmansk Region Government, work is underway to build ecotrails and informational facilities on a territory of more than 83,000 ha within the Rybachy and Sredny Peninsulas Nature Park.
Putoransky Nature Reserve (Taimyr Peninsula)
The Putoransky Nature Reserve was listed as a World Heritage Site by UNESCO in 2010 and is one of Russia’s largest nature reserves, covering over 1,887,000 ha of land. The reserve, along with the Taimyr and Great Arctic Nature Reserves, as well as the Purinsky and Severozemelsky natural protected areas, is managed by the Joint Directorate of Taimyr Nature Reserves.
Pasvik Nature Reserve
Company overview Strategic report Commodity market overview
Business overview Sustainable development
Corporate governance
Risk report Shareholder information IFRS financial statements AppendixAnnual report 2019
«NORNICKEL»
150 151
The directorate implements environmental projects that won awards of the Social Responsibility Initiatives Competition held as part of the World of New Opportunities charitable programme. The projects focus on environmental education and protection, engagement of local communities, landscaping and planting.
In 2019, the Joint Directorate of Taimyr Nature Reserves won the Social Responsibility Initiatives Competition and received RUB 4.5 mln (USD 70,000) to implement the Friends of Taimyr Peninsula Nature Reserves – Clean Ayan project. The project aims to engage the Taimyr volunteer community on restoring the environmental safety of the central part of Putorana Plateau to make the region more attractive to tourists. Last summer, as part of the project, volunteers and the Joint Directorate of Taimyr Nature Reserves staff collected 638 metal barrels and a few hundred kilograms of legacy pollution scrap metal. Using the Company’s grant, a 24-day expedition was airlifted to a remote area on Putorana Plateau, set up a camp at the Southern Ayan Checkpoint and cleaned up the area.
Oak grove (Zabaykalsky Region)
Covering 30,000 ha along the Argun River, the oak grove in the Gazimuro-Zavodsky District is the only natural oak grove extant in Siberia. Under an agreement with the Zabaykalsky Region Government, Nornickel provides charitable aid to the Relict Oaks Preserve to facilitate effective protection and scientific study of its environmental systems. The Company assisted the preserve in obtaining video surveillance equipment and intends to provide support for building and equipping research facilities and launching educational programmes for adults and children.
ENVIRONMENTAL PROTECTION PROGRAMMES
Nornickel is committed to environmental protection and sustainable use of natural resources. As part of this commitment, the Company presented its 10-year Sustainable Growth Strategy and Comprehensive Environmental Programme Until
2030 at its 2019 Capital Markets Day. The programme provides for phased reduction of sulphur dioxide emissions by 95% by 2030, maintaining industry’s lowest carbon footprint, and contributing to global transition to green mobility.
Environmental education and experience sharing are another top priority. The Company co-organised the 8th Ecological Forum Corporate Responsibility to the Future. Technology for Society and Nature, held in Moscow on 17–18 October 2019. The forum focused on production efficiency and striking a balance between economic development, social improvement, and nature conservation, which is impossible without sustainable local development, availability of skilled workforce and minimised harmful environmental impact of industrial operations. More than 200 experts from all over Russia and Arctic countries attended the event.
Water resources
The Company has been running for years a programme to breed and release valuable fish species into water bodies to replenish their populations. Valuable fish species including those listed in the Red Data Book are bred by specialised contractors and the juvenile fish is released into water bodies. For example, 4,000 young ciscoes were released into Lumbolka Lake (Kola Peninsula) in 2019 to facilitate reproduction of aquatic bioresources. The Polar Division released a total of about 1 million young fish, including 201,000 Siberian sturgeons, into the Yenisei River between 2017 and 2019. The costs of these activities over the past three years exceeded RUB 110 mln (USD 2 mln). Also in 2019, the Company continued land improvement efforts in the vicinity of Lake Dolgoye in Norilsk.
The Company intends to continue breeding and release of young valuable fish species into natural water bodies in 2020.
Planting and clean-ups
In Norilsk, the Company’s employees jointly with the city administration conduct regular clean-ups and planting in the summertime. In 2019, we also continued yet another annual environmental initiative involving employee volunteers.
The fourth Poneslos (Let's Roll) environmental initiative kicked off across Nornickel’s operating regions in May 2019, with about 250 volunteers participating in Norilsk. The volunteers organised more than 100 events involving 3,000 city residents, collected about 20 tonnes of garbage, held festivals and master classes, improved several sites in the city, set up a plastic recycling shop, and laid an ecotrail. Catch the Eco Wave environmental quest was held in Monchegorsk involving over 140 people in 35 teams.
An eco-convention held in the Caucasus Nature Reserve (Sochi) in October 2019 brought together 72 most active participants in the initiative from the Company’s operating regions. The volunteers spent three days participating in a strategy session, sharing their experiences with colleagues and developing the European Bison Trail. The trail is an interactive and engaging way of highlighting European bisons and will be part of the Caucasus Nature Reserve visitor centre. The event culminated with a showing of Caring, a documentary about Nornickel volunteers which won awards at Cannes and Los Angeles film festivals.
Land conservation and restoration
The Company takes all necessary measures to restore disturbed land by remediation, rehabilitation, regeneration and other applicable methods. Remediation consists of technical and biological phases. The first phase includes landscaping and planting activities such as backfilling, earth filling, terracing, grading and covering with clayey soil to improve the adaptation of young plants. During the second phase, conifer trees such as pines, larches, and cedars as well as shrubs mixed with trees start growing on horizontal and sloping surfaces, further reinforcing the slopes.
In accordance with applicable Russian laws, design documentation for any natural resource development project, including mining, must detail activities covering environmental protection and monitoring of changes in the ecosystem components and implemented during facility operation and in case of accidents.
The Company has mine plans, as well as abandonment and remediation project documents in place for all deposits developed by the Company, with special provisions made for remediation. The design documentation covers grading, slope formation, construction of hydraulic and irrigation structures, and other activities. Importantly, the Company’s deposits are in commercial development and will not be abandoned or mothballed before 2050.
Nornickel complies with all legal requirements covering remediation and other environmental protection measures required during development, construction and other activities.
Nornickel is the world’s largest metals and mining company, playing an important role in the Russian economy. Due to its geography and financial strength, Nornickel has a strong impact on the social and economic life in the regions in which it operates. With its facilities located mostly in single-industry towns, Nornickel seeks to maintain a favourable social climate and comfortable urban environment, providing its employees and their family members with ample opportunities for creative pursuits and self-fulfilment.
The core principle behind this social contribution is a partnership involving all stakeholders in the development and implementation of social programmes based on the balance of interests, cooperation, and social consensus.
The harsh climate faced by Nornickel employees in life and at work, the remoteness of the Company’s key industrial facilities, and the increasing competition for human capital across the industry call for a highly effective, human-centred social policy that would promote Nornickel’s reputation as an employer of choice.
Company overview Strategic report Commodity market overview
Business overview Sustainable development
Corporate governance
Risk report Shareholder information IFRS financial statements AppendixAnnual report 2019
«NORNICKEL»
152 153
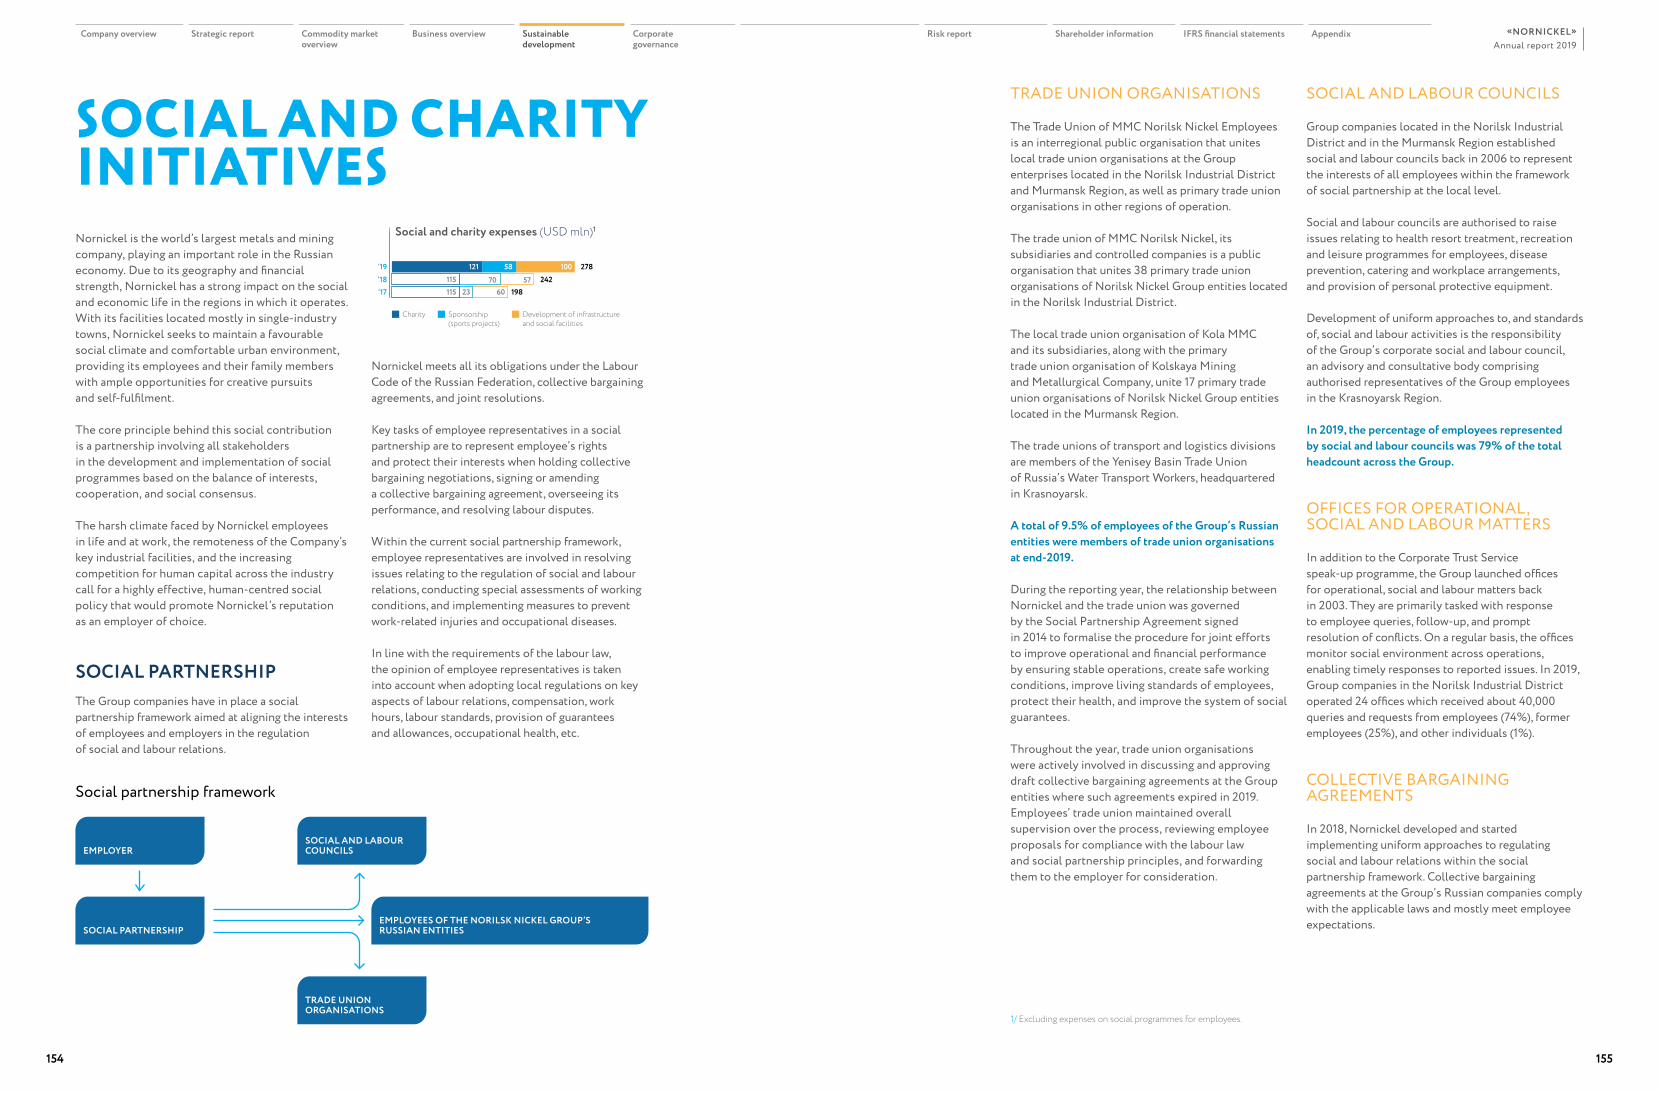
SOCIAL AND CHARITY INITIATIVESNornickel is the world’s largest metals and mining company, playing an important role in the Russian economy. Due to its geography and financial strength, Nornickel has a strong impact on the social and economic life in the regions in which it operates. With its facilities located mostly in single-industry towns, Nornickel seeks to maintain a favourable social climate and comfortable urban environment, providing its employees and their family members with ample opportunities for creative pursuits and self-fulfilment.
The core principle behind this social contribution is a partnership involving all stakeholders in the development and implementation of social programmes based on the balance of interests, cooperation, and social consensus.
The harsh climate faced by Nornickel employees in life and at work, the remoteness of the Company’s key industrial facilities, and the increasing competition for human capital across the industry call for a highly effective, human-centred social policy that would promote Nornickel’s reputation as an employer of choice.
SOCIAL PARTNERSHIPThe Group companies have in place a social partnership framework aimed at aligning the interests of employees and employers in the regulation of social and labour relations.
Nornickel meets all its obligations under the Labour Code of the Russian Federation, collective bargaining agreements, and joint resolutions.
Key tasks of employee representatives in a social partnership are to represent employee’s rights and protect their interests when holding collective bargaining negotiations, signing or amending a collective bargaining agreement, overseeing its performance, and resolving labour disputes.
Within the current social partnership framework, employee representatives are involved in resolving issues relating to the regulation of social and labour relations, conducting special assessments of working conditions, and implementing measures to prevent work-related injuries and occupational diseases.
In line with the requirements of the labour law, the opinion of employee representatives is taken into account when adopting local regulations on key aspects of labour relations, compensation, work hours, labour standards, provision of guarantees and allowances, occupational health, etc.
TRADE UNION ORGANISATIONS
The Trade Union of MMC Norilsk Nickel Employees is an interregional public organisation that unites local trade union organisations at the Group enterprises located in the Norilsk Industrial District and Murmansk Region, as well as primary trade union organisations in other regions of operation.
The trade union of MMC Norilsk Nickel, its subsidiaries and controlled companies is a public organisation that unites 38 primary trade union organisations of Norilsk Nickel Group entities located in the Norilsk Industrial District.
The local trade union organisation of Kola MMC and its subsidiaries, along with the primary trade union organisation of Kolskaya Mining and Metallurgical Company, unite 17 primary trade union organisations of Norilsk Nickel Group entities located in the Murmansk Region.
The trade unions of transport and logistics divisions are members of the Yenisey Basin Trade Union of Russia’s Water Transport Workers, headquartered in Krasnoyarsk.
A total of 9.5% of employees of the Group’s Russian entities were members of trade union organisations at end-2019.
During the reporting year, the relationship between Nornickel and the trade union was governed by the Social Partnership Agreement signed in 2014 to formalise the procedure for joint efforts to improve operational and financial performance by ensuring stable operations, create safe working conditions, improve living standards of employees, protect their health, and improve the system of social guarantees.
Throughout the year, trade union organisations were actively involved in discussing and approving draft collective bargaining agreements at the Group entities where such agreements expired in 2019. Employees’ trade union maintained overall supervision over the process, reviewing employee proposals for compliance with the labour law and social partnership principles, and forwarding them to the employer for consideration.
SOCIAL AND LABOUR COUNCILS
Group companies located in the Norilsk Industrial District and in the Murmansk Region established social and labour councils back in 2006 to represent the interests of all employees within the framework of social partnership at the local level.
Social and labour councils are authorised to raise issues relating to health resort treatment, recreation and leisure programmes for employees, disease prevention, catering and workplace arrangements, and provision of personal protective equipment.
Development of uniform approaches to, and standards of, social and labour activities is the responsibility of the Group’s corporate social and labour council, an advisory and consultative body comprising authorised representatives of the Group employees in the Krasnoyarsk Region.
In 2019, the percentage of employees represented by social and labour councils was 79% of the total headcount across the Group.
OFFICES FOR OPERATIONAL, SOCIAL AND LABOUR MATTERS
In addition to the Corporate Trust Service speak-up programme, the Group launched offices for operational, social and labour matters back in 2003. They are primarily tasked with response to employee queries, follow-up, and prompt resolution of conflicts. On a regular basis, the offices monitor social environment across operations, enabling timely responses to reported issues. In 2019, Group companies in the Norilsk Industrial District operated 24 offices which received about 40,000 queries and requests from employees (74%), former employees (25%), and other individuals (1%).
COLLECTIVE BARGAINING AGREEMENTS
In 2018, Nornickel developed and started implementing uniform approaches to regulating social and labour relations within the social partnership framework. Collective bargaining agreements at the Group’s Russian companies comply with the applicable laws and mostly meet employee expectations.
Social and charity expenses (USD mln)1
Charity Sponsorship (sports projects)
Development of infrastructure and social facilities
‘17‘18‘19 327858121
115 24270100
576023 198115
EMPLOYERSOCIAL AND LABOUR COUNCILS
TRADE UNION ORGANISATIONS
SOCIAL PARTNERSHIPEMPLOYEES OF THE NORILSK NICKEL GROUP’S RUSSIAN ENTITIES
Social partnership framework
1/ Excluding expenses on social programmes for employees.
Company overview Strategic report Commodity market overview
Business overview Sustainable development
Corporate governance
Risk report Shareholder information IFRS financial statements AppendixAnnual report 2019
«NORNICKEL»
154 155
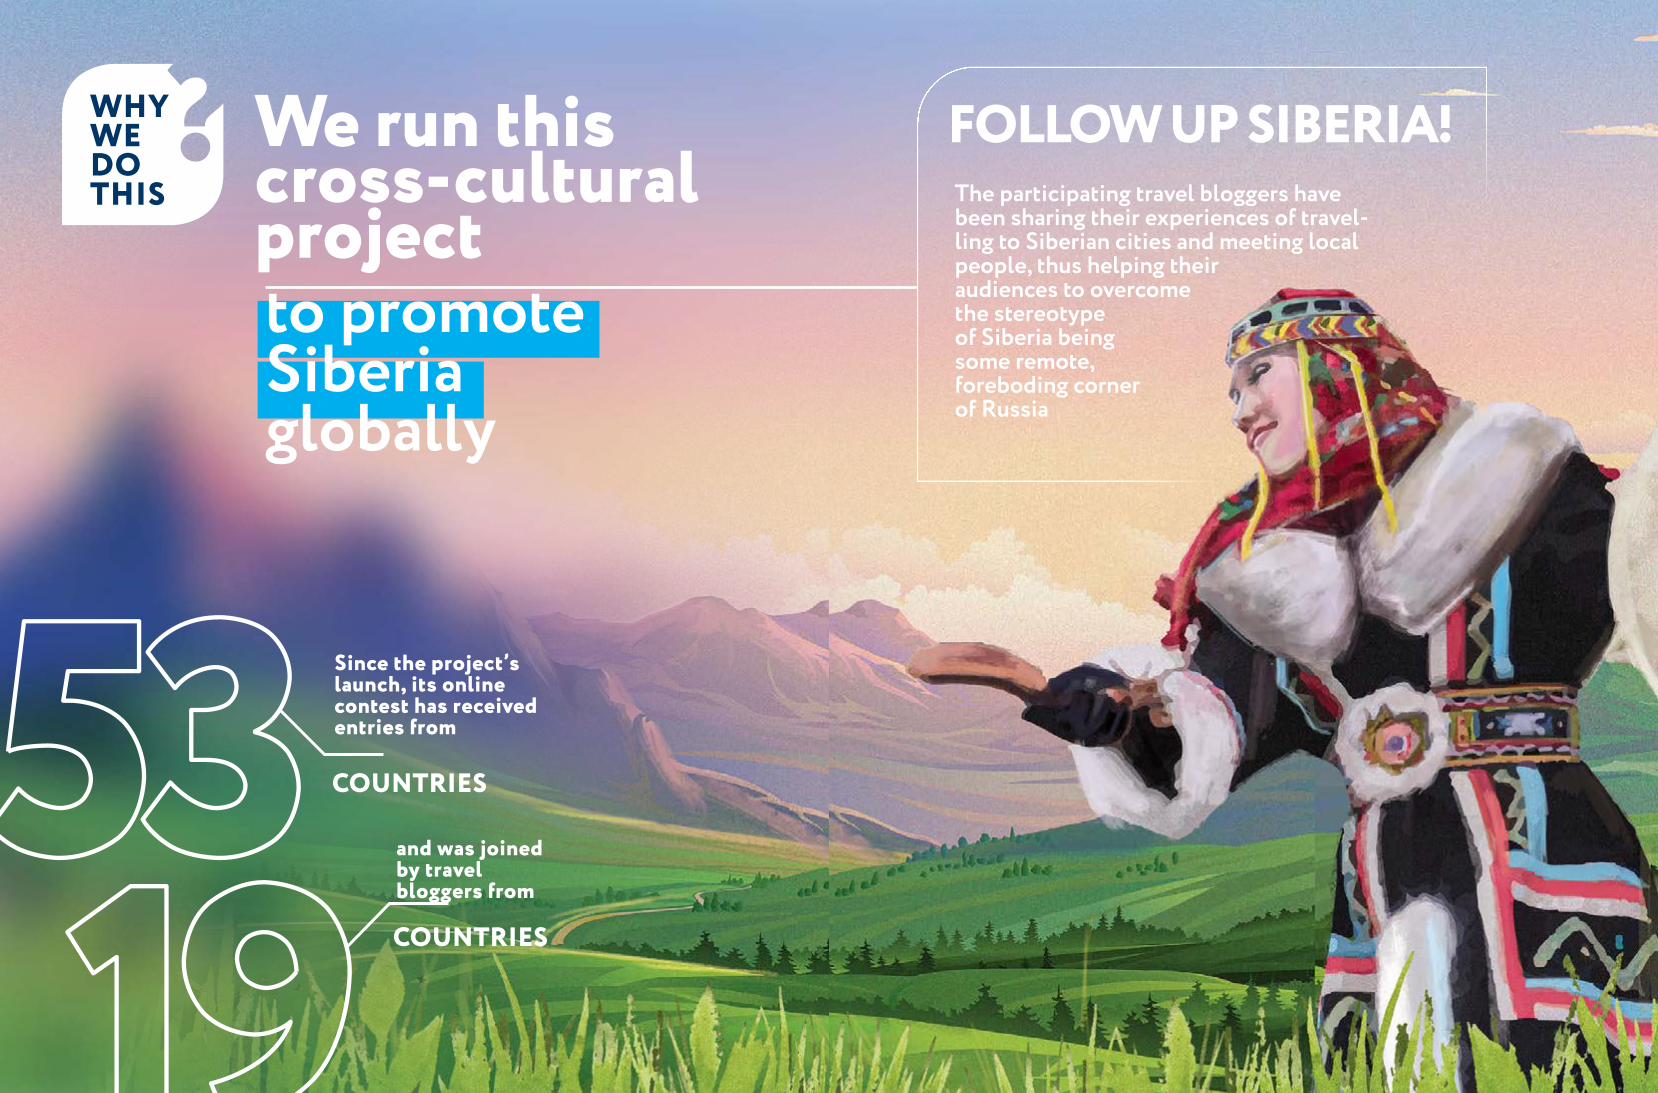
FOLLOW UP SIBERIA! The participating travel bloggers have been sharing their experiences of travel-ling to Siberian cities and meeting local people, thus helping their audiences to overcome the stereotype of Siberia being some remote, foreboding corner of Russia
We run this cross-cultural projectto promote Siberia globally
53 COUNTRIES
Since the project’s launch, its online contest has received entries from
19 COUNTRIES
and was joined by travel bloggers from
WHY WE DO THIS
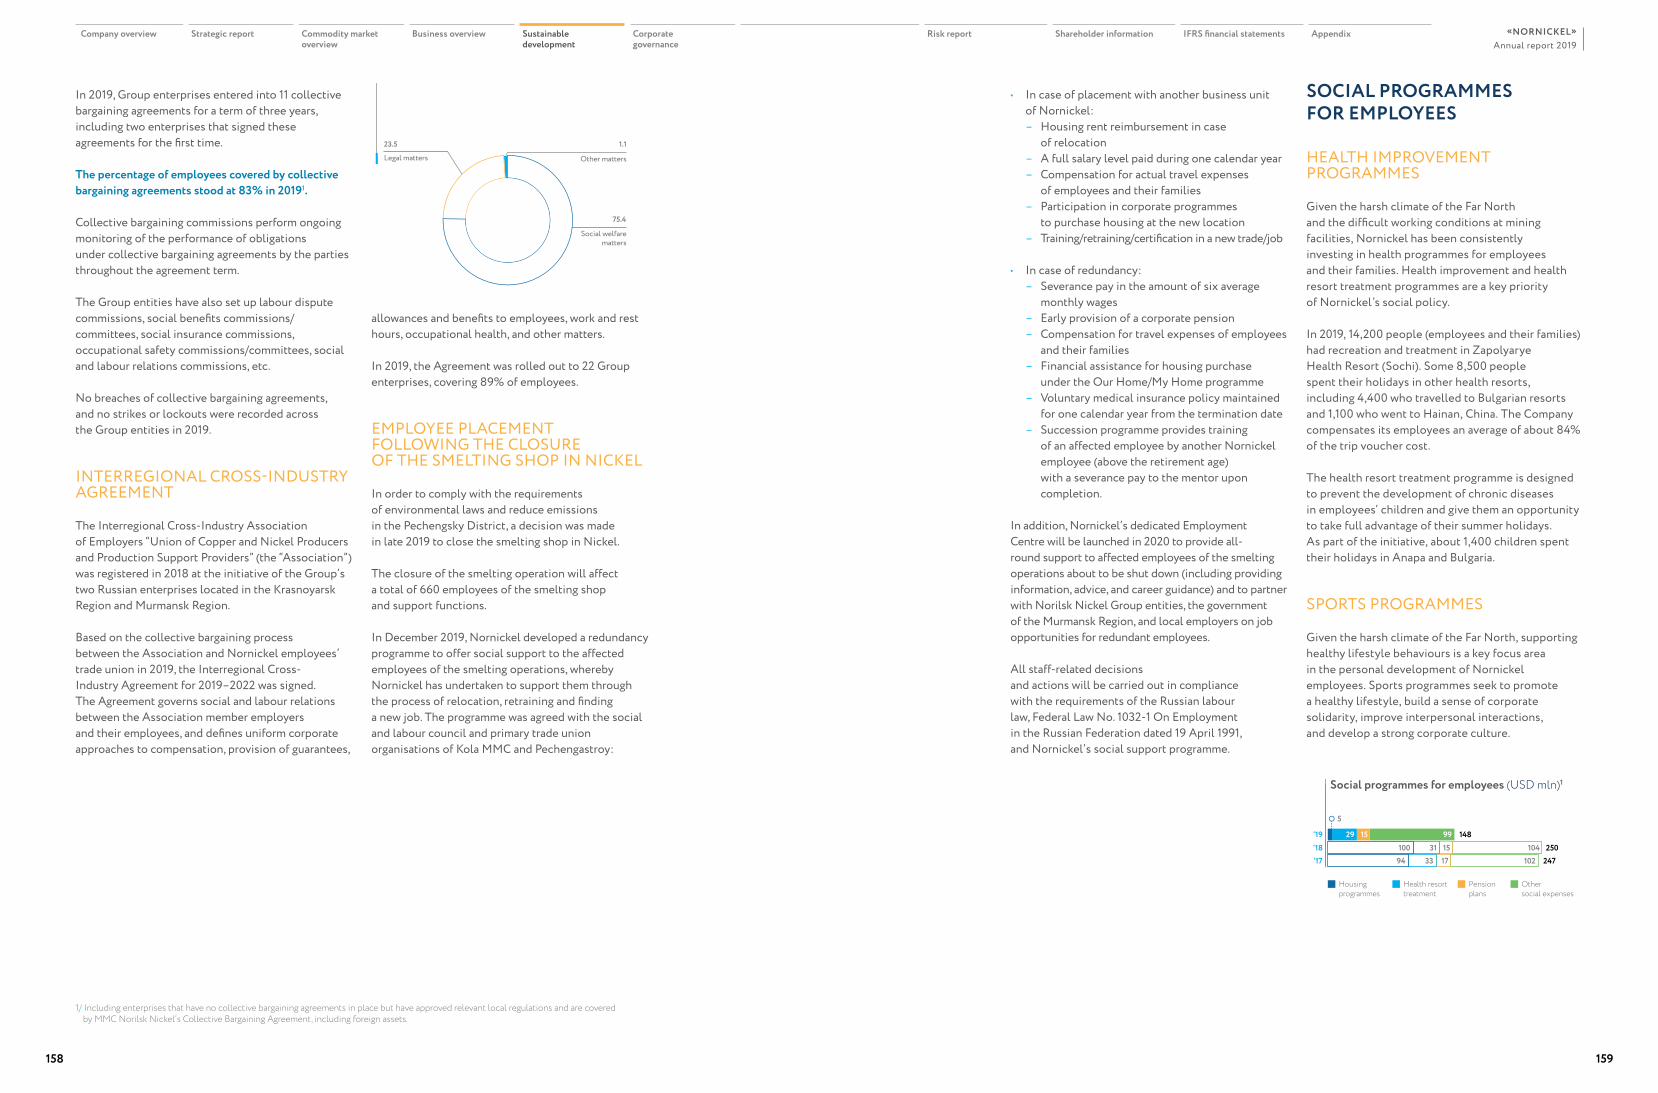
In 2019, Group enterprises entered into 11 collective bargaining agreements for a term of three years, including two enterprises that signed these agreements for the first time.
The percentage of employees covered by collective bargaining agreements stood at 83% in 20191.
Collective bargaining commissions perform ongoing monitoring of the performance of obligations under collective bargaining agreements by the parties throughout the agreement term.
The Group entities have also set up labour dispute commissions, social benefits commissions/committees, social insurance commissions, occupational safety commissions/committees, social and labour relations commissions, etc.
No breaches of collective bargaining agreements, and no strikes or lockouts were recorded across the Group entities in 2019.
INTERREGIONAL CROSS-INDUSTRY AGREEMENT
The Interregional Cross-Industry Association of Employers “Union of Copper and Nickel Producers and Production Support Providers” (the “Association”) was registered in 2018 at the initiative of the Group’s two Russian enterprises located in the Krasnoyarsk Region and Murmansk Region.
Based on the collective bargaining process between the Association and Nornickel employees’ trade union in 2019, the Interregional Cross-Industry Agreement for 2019–2022 was signed. The Agreement governs social and labour relations between the Association member employers and their employees, and defines uniform corporate approaches to compensation, provision of guarantees,
allowances and benefits to employees, work and rest hours, occupational health, and other matters.
In 2019, the Agreement was rolled out to 22 Group enterprises, covering 89% of employees.
EMPLOYEE PLACEMENT FOLLOWING THE CLOSURE OF THE SMELTING SHOP IN NICKEL
In order to comply with the requirements of environmental laws and reduce emissions in the Pechengsky District, a decision was made in late 2019 to close the smelting shop in Nickel.
The closure of the smelting operation will affect a total of 660 employees of the smelting shop and support functions.
In December 2019, Nornickel developed a redundancy programme to offer social support to the affected employees of the smelting operations, whereby Nornickel has undertaken to support them through the process of relocation, retraining and finding a new job. The programme was agreed with the social and labour council and primary trade union organisations of Kola MMC and Pechengastroy:
• In case of placement with another business unit of Nornickel:
– Housing rent reimbursement in case of relocation
– A full salary level paid during one calendar year – Compensation for actual travel expenses
of employees and their families – Participation in corporate programmes
to purchase housing at the new location – Training/retraining/certification in a new trade/job
• In case of redundancy: – Severance pay in the amount of six average
monthly wages – Early provision of a corporate pension – Compensation for travel expenses of employees
and their families – Financial assistance for housing purchase
under the Our Home/My Home programme – Voluntary medical insurance policy maintained
for one calendar year from the termination date – Succession programme provides training
of an affected employee by another Nornickel employee (above the retirement age) with a severance pay to the mentor upon completion.
In addition, Nornickel’s dedicated Employment Centre will be launched in 2020 to provide all-round support to affected employees of the smelting operations about to be shut down (including providing information, advice, and career guidance) and to partner with Norilsk Nickel Group entities, the government of the Murmansk Region, and local employers on job opportunities for redundant employees.
All staff-related decisions and actions will be carried out in compliance with the requirements of the Russian labour law, Federal Law No. 1032-1 On Employment in the Russian Federation dated 19 April 1991, and Nornickel’s social support programme.
SOCIAL PROGRAMMES FOR EMPLOYEES
HEALTH IMPROVEMENT PROGRAMMES
Given the harsh climate of the Far North and the difficult working conditions at mining facilities, Nornickel has been consistently investing in health programmes for employees and their families. Health improvement and health resort treatment programmes are a key priority of Nornickel’s social policy.
In 2019, 14,200 people (employees and their families) had recreation and treatment in Zapolyarye Health Resort (Sochi). Some 8,500 people spent their holidays in other health resorts, including 4,400 who travelled to Bulgarian resorts and 1,100 who went to Hainan, China. The Company compensates its employees an average of about 84% of the trip voucher cost.
The health resort treatment programme is designed to prevent the development of chronic diseases in employees’ children and give them an opportunity to take full advantage of their summer holidays. As part of the initiative, about 1,400 children spent their holidays in Anapa and Bulgaria.
SPORTS PROGRAMMES
Given the harsh climate of the Far North, supporting healthy lifestyle behaviours is a key focus area in the personal development of Nornickel employees. Sports programmes seek to promote a healthy lifestyle, build a sense of corporate solidarity, improve interpersonal interactions, and develop a strong corporate culture.
Main topics of queries and requests (%)
Social welfarematters
75.4
Other matters
1.1
Legal matters
23.5
129вопросов
Social programmes for employees (USD mln)1
Housing programmes
Health resorttreatment
Pension plans
Other social expenses
‘17‘18‘19 99 14815
100 25031
5
10429
151733 102 24794
1/ Including enterprises that have no collective bargaining agreements in place but have approved relevant local regulations and are covered by MMC Norilsk Nickel’s Collective Bargaining Agreement, including foreign assets.
Company overview Strategic report Commodity market overview
Business overview Sustainable development
Corporate governance
Risk report Shareholder information IFRS financial statements AppendixAnnual report 2019
«NORNICKEL»
158 159
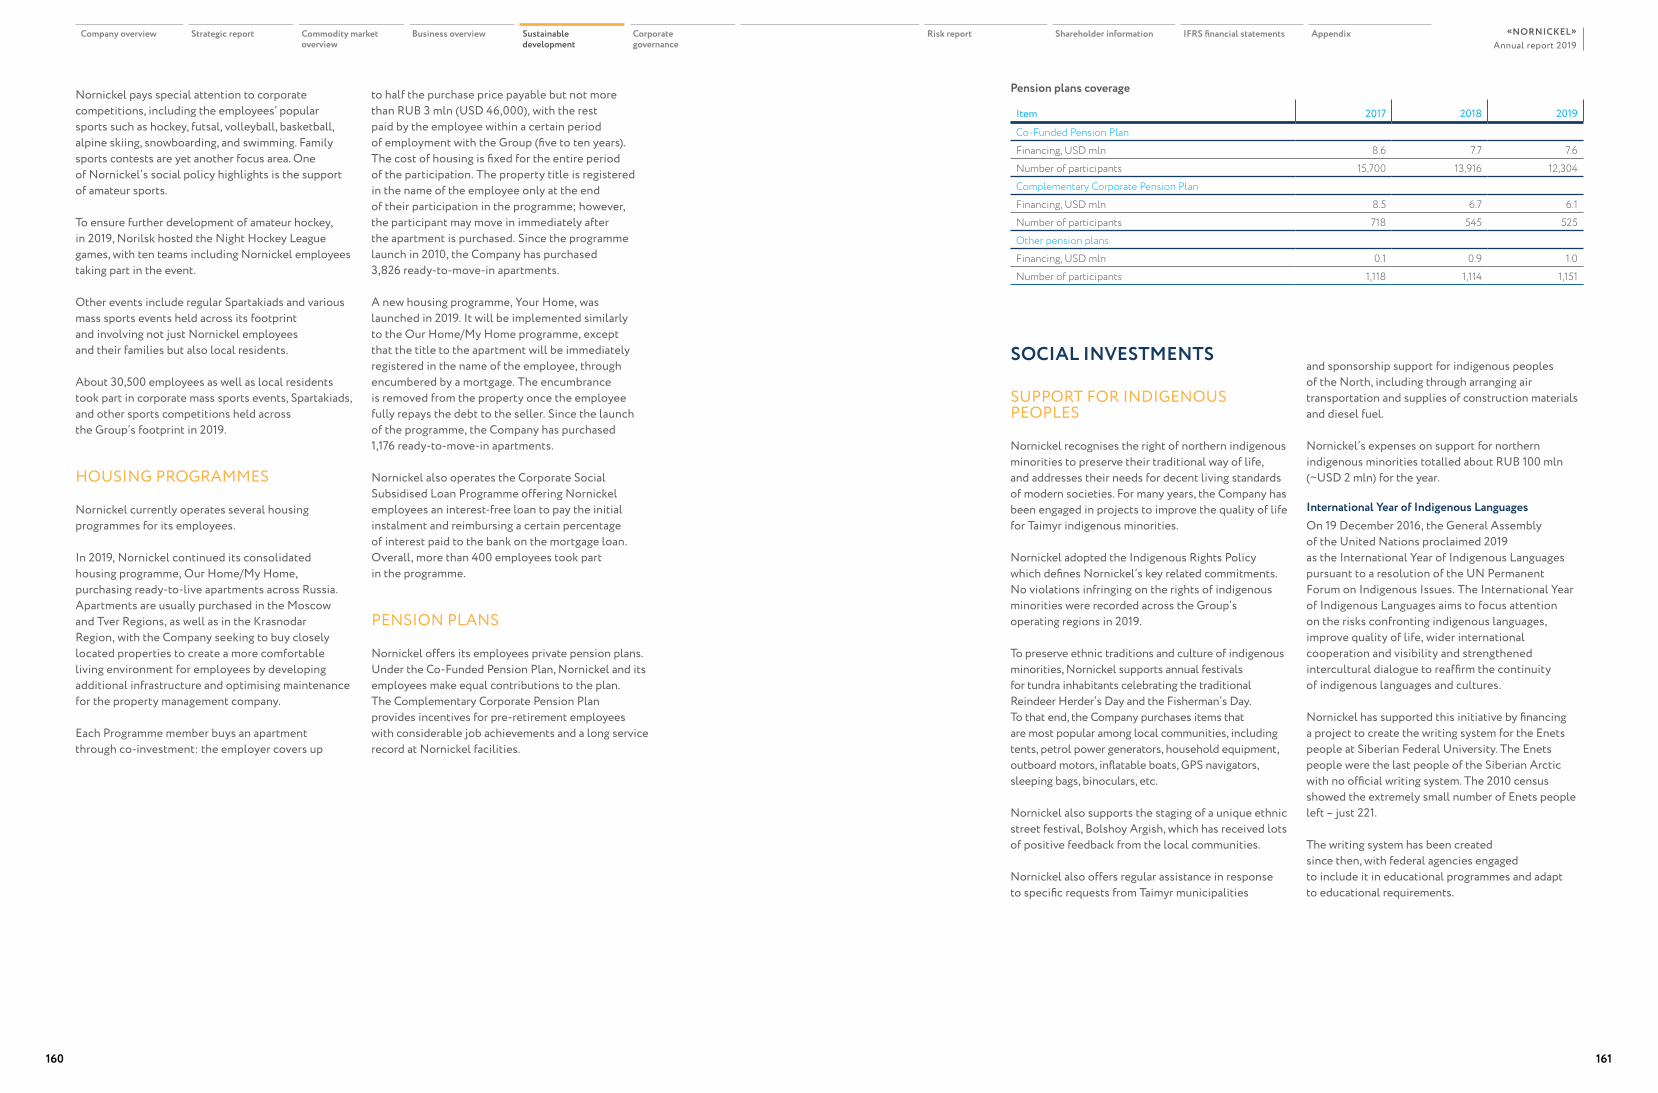
Nornickel pays special attention to corporate competitions, including the employees’ popular sports such as hockey, futsal, volleyball, basketball, alpine skiing, snowboarding, and swimming. Family sports contests are yet another focus area. One of Nornickel’s social policy highlights is the support of amateur sports.
To ensure further development of amateur hockey, in 2019, Norilsk hosted the Night Hockey League games, with ten teams including Nornickel employees taking part in the event.
Other events include regular Spartakiads and various mass sports events held across its footprint and involving not just Nornickel employees and their families but also local residents.
About 30,500 employees as well as local residents took part in corporate mass sports events, Spartakiads, and other sports competitions held across the Group’s footprint in 2019.
HOUSING PROGRAMMES
Nornickel currently operates several housing programmes for its employees.
In 2019, Nornickel continued its consolidated housing programme, Our Home/My Home, purchasing ready-to-live apartments across Russia. Apartments are usually purchased in the Moscow and Tver Regions, as well as in the Krasnodar Region, with the Company seeking to buy closely located properties to create a more comfortable living environment for employees by developing additional infrastructure and optimising maintenance for the property management company.
Each Programme member buys an apartment through co-investment: the employer covers up
to half the purchase price payable but not more than RUB 3 mln (USD 46,000), with the rest paid by the employee within a certain period of employment with the Group (five to ten years). The cost of housing is fixed for the entire period of the participation. The property title is registered in the name of the employee only at the end of their participation in the programme; however, the participant may move in immediately after the apartment is purchased. Since the programme launch in 2010, the Company has purchased 3,826 ready-to-move-in apartments.
A new housing programme, Your Home, was launched in 2019. It will be implemented similarly to the Our Home/My Home programme, except that the title to the apartment will be immediately registered in the name of the employee, through encumbered by a mortgage. The encumbrance is removed from the property once the employee fully repays the debt to the seller. Since the launch of the programme, the Company has purchased 1,176 ready-to-move-in apartments.
Nornickel also operates the Corporate Social Subsidised Loan Programme offering Nornickel employees an interest-free loan to pay the initial instalment and reimbursing a certain percentage of interest paid to the bank on the mortgage loan. Overall, more than 400 employees took part in the programme.
PENSION PLANS
Nornickel offers its employees private pension plans. Under the Co-Funded Pension Plan, Nornickel and its employees make equal contributions to the plan. The Complementary Corporate Pension Plan provides incentives for pre-retirement employees with considerable job achievements and a long service record at Nornickel facilities.
Pension plans coverage
Item 2017 2018 2019
Co-Funded Pension PlanFinancing, USD mln 8.6 7.7 7.6Number of participants 15,700 13,916 12,304Complementary Corporate Pension PlanFinancing, USD mln 8.5 6.7 6.1Number of participants 718 545 525Other pension plansFinancing, USD mln 0.1 0.9 1.0Number of participants 1,118 1,114 1,151
SOCIAL INVESTMENTS
SUPPORT FOR INDIGENOUS PEOPLES
Nornickel recognises the right of northern indigenous minorities to preserve their traditional way of life, and addresses their needs for decent living standards of modern societies. For many years, the Company has been engaged in projects to improve the quality of life for Taimyr indigenous minorities.
Nornickel adopted the Indigenous Rights Policy which defines Nornickel’s key related commitments. No violations infringing on the rights of indigenous minorities were recorded across the Group’s operating regions in 2019.
To preserve ethnic traditions and culture of indigenous minorities, Nornickel supports annual festivals for tundra inhabitants celebrating the traditional Reindeer Herder’s Day and the Fisherman’s Day. To that end, the Company purchases items that are most popular among local communities, including tents, petrol power generators, household equipment, outboard motors, inflatable boats, GPS navigators, sleeping bags, binoculars, etc.
Nornickel also supports the staging of a unique ethnic street festival, Bolshoy Argish, which has received lots of positive feedback from the local communities.
Nornickel also offers regular assistance in response to specific requests from Taimyr municipalities
and sponsorship support for indigenous peoples of the North, including through arranging air transportation and supplies of construction materials and diesel fuel.
Nornickel’s expenses on support for northern indigenous minorities totalled about RUB 100 mln (~USD 2 mln) for the year.
International Year of Indigenous LanguagesOn 19 December 2016, the General Assembly of the United Nations proclaimed 2019 as the International Year of Indigenous Languages pursuant to a resolution of the UN Permanent Forum on Indigenous Issues. The International Year of Indigenous Languages aims to focus attention on the risks confronting indigenous languages, improve quality of life, wider international cooperation and visibility and strengthened intercultural dialogue to reaffirm the continuity of indigenous languages and cultures.
Nornickel has supported this initiative by financing a project to create the writing system for the Enets people at Siberian Federal University. The Enets people were the last people of the Siberian Arctic with no official writing system. The 2010 census showed the extremely small number of Enets people left – just 221.
The writing system has been created since then, with federal agencies engaged to include it in educational programmes and adapt to educational requirements.
Company overview Strategic report Commodity market overview
Business overview Sustainable development
Corporate governance
Risk report Shareholder information IFRS financial statements AppendixAnnual report 2019
«NORNICKEL»
160 161
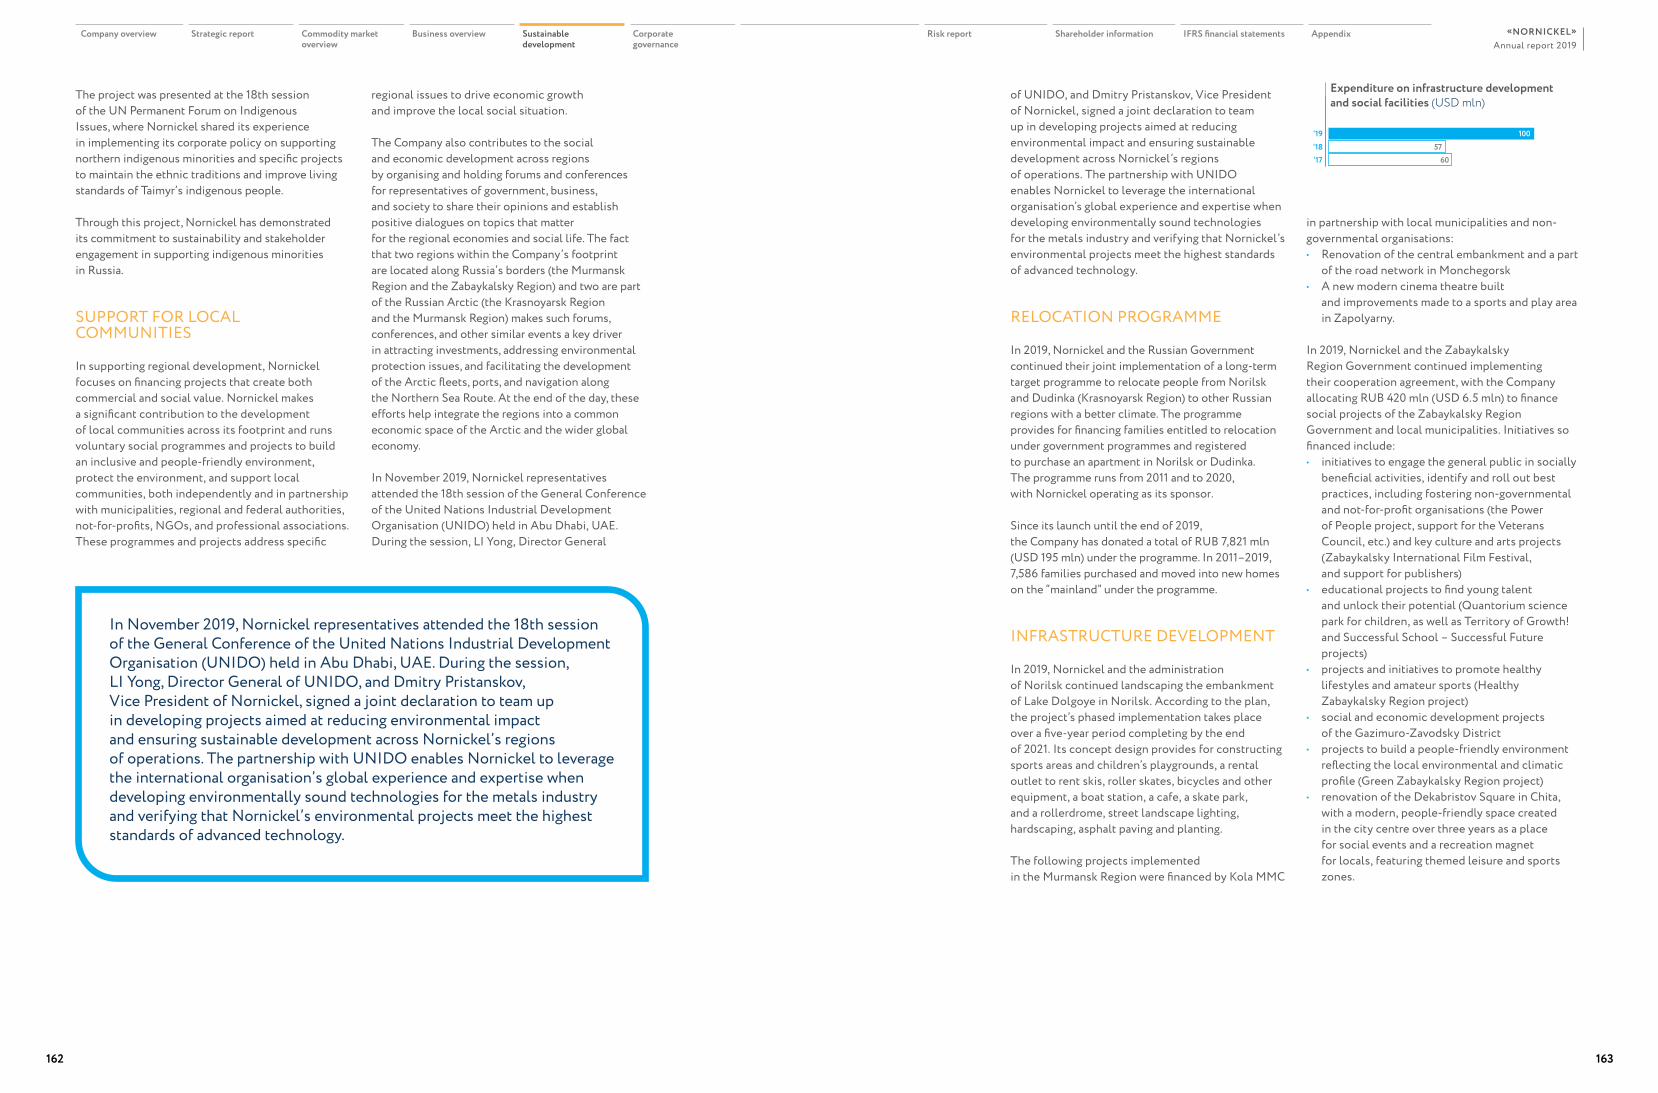
The project was presented at the 18th session of the UN Permanent Forum on Indigenous Issues, where Nornickel shared its experience in implementing its corporate policy on supporting northern indigenous minorities and specific projects to maintain the ethnic traditions and improve living standards of Taimyr’s indigenous people.
Through this project, Nornickel has demonstrated its commitment to sustainability and stakeholder engagement in supporting indigenous minorities in Russia.
SUPPORT FOR LOCAL COMMUNITIES
In supporting regional development, Nornickel focuses on financing projects that create both commercial and social value. Nornickel makes a significant contribution to the development of local communities across its footprint and runs voluntary social programmes and projects to build an inclusive and people-friendly environment, protect the environment, and support local communities, both independently and in partnership with municipalities, regional and federal authorities, not-for-profits, NGOs, and professional associations. These programmes and projects address specific
In November 2019, Nornickel representatives attended the 18th session of the General Conference of the United Nations Industrial Development Organisation (UNIDO) held in Abu Dhabi, UAE. During the session, LI Yong, Director General of UNIDO, and Dmitry Pristanskov, Vice President of Nornickel, signed a joint declaration to team up in developing projects aimed at reducing environmental impact and ensuring sustainable development across Nornickel’s regions of operations. The partnership with UNIDO enables Nornickel to leverage the international organisation’s global experience and expertise when developing environmentally sound technologies for the metals industry and verifying that Nornickel’s environmental projects meet the highest standards of advanced technology.
regional issues to drive economic growth and improve the local social situation.
The Company also contributes to the social and economic development across regions by organising and holding forums and conferences for representatives of government, business, and society to share their opinions and establish positive dialogues on topics that matter for the regional economies and social life. The fact that two regions within the Company’s footprint are located along Russia’s borders (the Murmansk Region and the Zabaykalsky Region) and two are part of the Russian Arctic (the Krasnoyarsk Region and the Murmansk Region) makes such forums, conferences, and other similar events a key driver in attracting investments, addressing environmental protection issues, and facilitating the development of the Arctic fleets, ports, and navigation along the Northern Sea Route. At the end of the day, these efforts help integrate the regions into a common economic space of the Arctic and the wider global economy.
In November 2019, Nornickel representatives attended the 18th session of the General Conference of the United Nations Industrial Development Organisation (UNIDO) held in Abu Dhabi, UAE. During the session, LI Yong, Director General
of UNIDO, and Dmitry Pristanskov, Vice President of Nornickel, signed a joint declaration to team up in developing projects aimed at reducing environmental impact and ensuring sustainable development across Nornickel’s regions of operations. The partnership with UNIDO enables Nornickel to leverage the international organisation’s global experience and expertise when developing environmentally sound technologies for the metals industry and verifying that Nornickel’s environmental projects meet the highest standards of advanced technology.
RELOCATION PROGRAMME
In 2019, Nornickel and the Russian Government continued their joint implementation of a long-term target programme to relocate people from Norilsk and Dudinka (Krasnoyarsk Region) to other Russian regions with a better climate. The programme provides for financing families entitled to relocation under government programmes and registered to purchase an apartment in Norilsk or Dudinka. The programme runs from 2011 and to 2020, with Nornickel operating as its sponsor.
Since its launch until the end of 2019, the Company has donated a total of RUB 7,821 mln (USD 195 mln) under the programme. In 2011–2019, 7,586 families purchased and moved into new homes on the “mainland” under the programme.
INFRASTRUCTURE DEVELOPMENT
In 2019, Nornickel and the administration of Norilsk continued landscaping the embankment of Lake Dolgoye in Norilsk. According to the plan, the project’s phased implementation takes place over a five-year period completing by the end of 2021. Its concept design provides for constructing sports areas and children’s playgrounds, a rental outlet to rent skis, roller skates, bicycles and other equipment, a boat station, a cafe, a skate park, and a rollerdrome, street landscape lighting, hardscaping, asphalt paving and planting.
The following projects implemented in the Murmansk Region were financed by Kola MMC
Expenditure on infrastructure development and social facilities (USD mln)
‘17‘18‘19 100
5760
in partnership with local municipalities and non-governmental organisations:• Renovation of the central embankment and a part
of the road network in Monchegorsk• A new modern cinema theatre built
and improvements made to a sports and play area in Zapolyarny.
In 2019, Nornickel and the Zabaykalsky Region Government continued implementing their cooperation agreement, with the Company allocating RUB 420 mln (USD 6.5 mln) to finance social projects of the Zabaykalsky Region Government and local municipalities. Initiatives so financed include:• initiatives to engage the general public in socially
beneficial activities, identify and roll out best practices, including fostering non-governmental and not-for-profit organisations (the Power of People project, support for the Veterans Council, etc.) and key culture and arts projects (Zabaykalsky International Film Festival, and support for publishers)
• educational projects to find young talent and unlock their potential (Quantorium science park for children, as well as Territory of Growth! and Successful School – Successful Future projects)
• projects and initiatives to promote healthy lifestyles and amateur sports (Healthy Zabaykalsky Region project)
• social and economic development projects of the Gazimuro-Zavodsky District
• projects to build a people-friendly environment reflecting the local environmental and climatic profile (Green Zabaykalsky Region project)
• renovation of the Dekabristov Square in Chita, with a modern, people-friendly space created in the city centre over three years as a place for social events and a recreation magnet for locals, featuring themed leisure and sports zones.
Company overview Strategic report Commodity market overview
Business overview Sustainable development
Corporate governance
Risk report Shareholder information IFRS financial statements AppendixAnnual report 2019
«NORNICKEL»
162 163
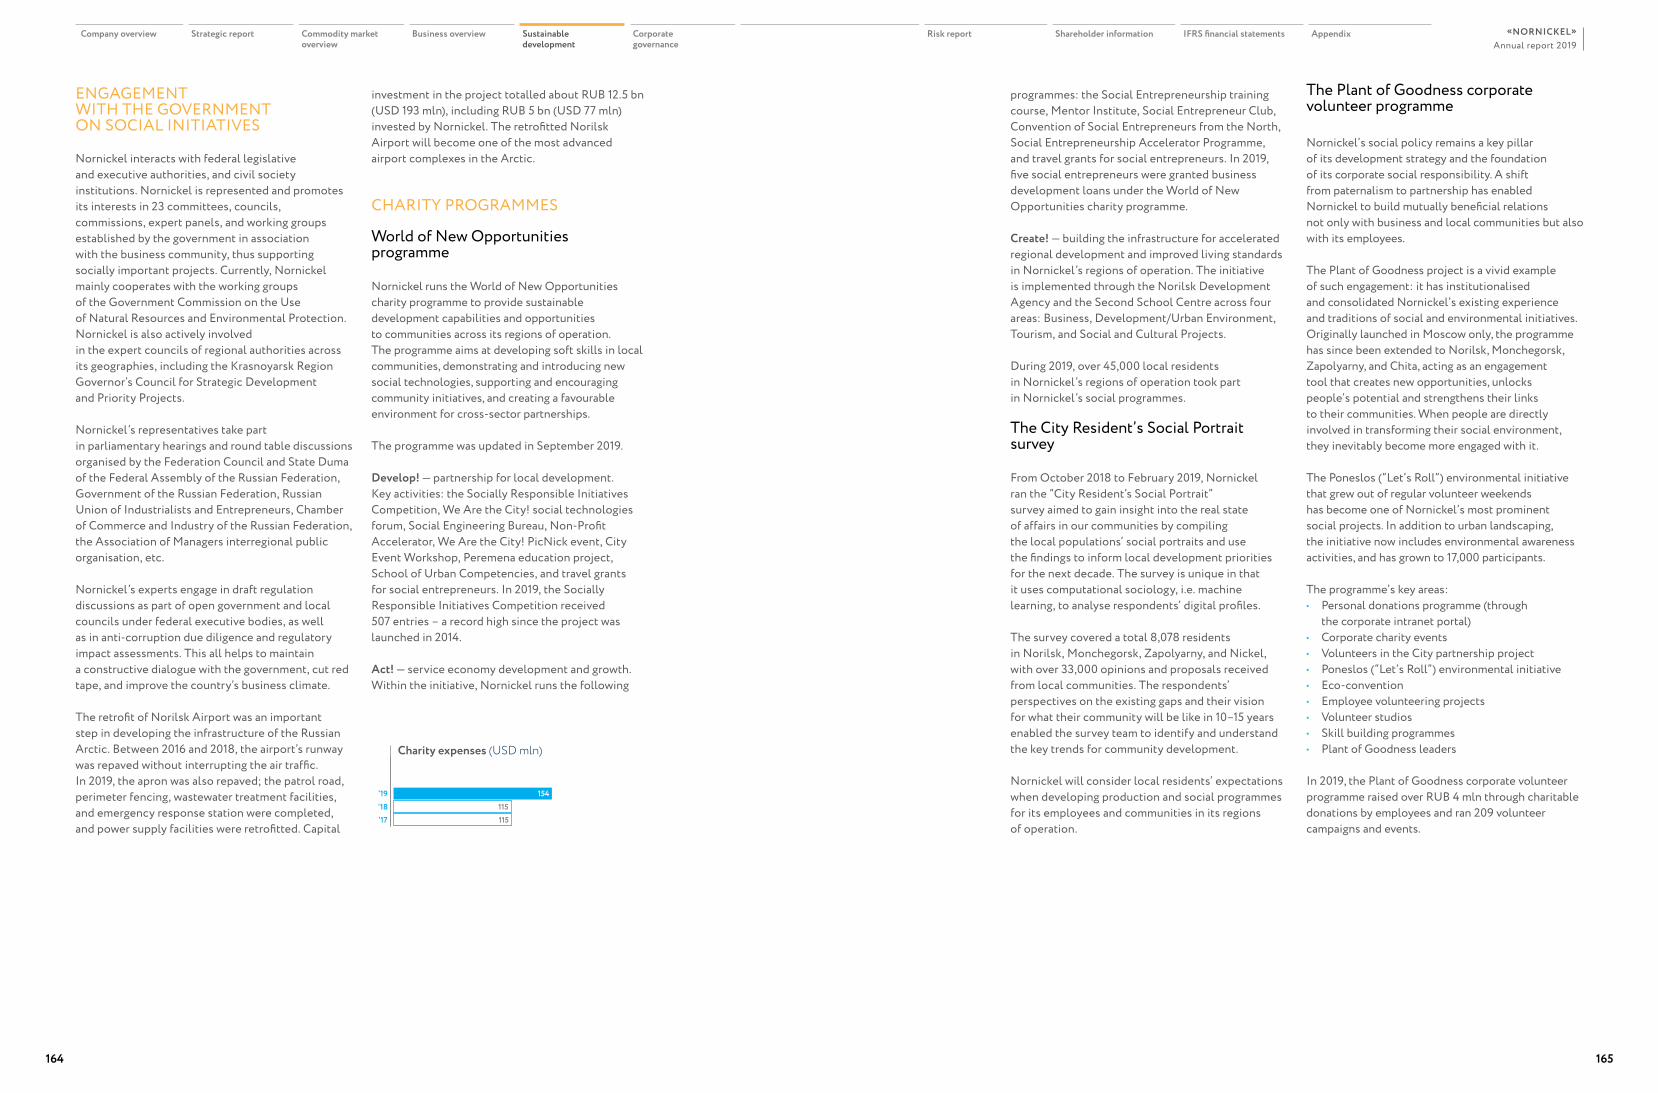
ENGAGEMENT WITH THE GOVERNMENT ON SOCIAL INITIATIVES
Nornickel interacts with federal legislative and executive authorities, and civil society institutions. Nornickel is represented and promotes its interests in 23 committees, councils, commissions, expert panels, and working groups established by the government in association with the business community, thus supporting socially important projects. Currently, Nornickel mainly cooperates with the working groups of the Government Commission on the Use of Natural Resources and Environmental Protection. Nornickel is also actively involved in the expert councils of regional authorities across its geographies, including the Krasnoyarsk Region Governor’s Council for Strategic Development and Priority Projects.
Nornickel’s representatives take part in parliamentary hearings and round table discussions organised by the Federation Council and State Duma of the Federal Assembly of the Russian Federation, Government of the Russian Federation, Russian Union of Industrialists and Entrepreneurs, Chamber of Commerce and Industry of the Russian Federation, the Association of Managers interregional public organisation, etc.
Nornickel’s experts engage in draft regulation discussions as part of open government and local councils under federal executive bodies, as well as in anti-corruption due diligence and regulatory impact assessments. This all helps to maintain a constructive dialogue with the government, cut red tape, and improve the country’s business climate.
The retrofit of Norilsk Airport was an important step in developing the infrastructure of the Russian Arctic. Between 2016 and 2018, the airport’s runway was repaved without interrupting the air traffic. In 2019, the apron was also repaved; the patrol road, perimeter fencing, wastewater treatment facilities, and emergency response station were completed, and power supply facilities were retrofitted. Capital
investment in the project totalled about RUB 12.5 bn (USD 193 mln), including RUB 5 bn (USD 77 mln) invested by Nornickel. The retrofitted Norilsk Airport will become one of the most advanced airport complexes in the Arctic.
CHARITY PROGRAMMES
World of New Opportunities programme
Nornickel runs the World of New Opportunities charity programme to provide sustainable development capabilities and opportunities to communities across its regions of operation. The programme aims at developing soft skills in local communities, demonstrating and introducing new social technologies, supporting and encouraging community initiatives, and creating a favourable environment for cross-sector partnerships.
The programme was updated in September 2019.
Develop! — partnership for local development. Key activities: the Socially Responsible Initiatives Competition, We Are the City! social technologies forum, Social Engineering Bureau, Non-Profit Accelerator, We Are the City! PicNick event, City Event Workshop, Peremena education project, School of Urban Competencies, and travel grants for social entrepreneurs. In 2019, the Socially Responsible Initiatives Competition received 507 entries – a record high since the project was launched in 2014.
Act! — service economy development and growth. Within the initiative, Nornickel runs the following
programmes: the Social Entrepreneurship training course, Mentor Institute, Social Entrepreneur Club, Convention of Social Entrepreneurs from the North, Social Entrepreneurship Accelerator Programme, and travel grants for social entrepreneurs. In 2019, five social entrepreneurs were granted business development loans under the World of New Opportunities charity programme.
Create! — building the infrastructure for accelerated regional development and improved living standards in Nornickel’s regions of operation. The initiative is implemented through the Norilsk Development Agency and the Second School Centre across four areas: Business, Development/Urban Environment, Tourism, and Social and Cultural Projects.
During 2019, over 45,000 local residents in Nornickel’s regions of operation took part in Nornickel’s social programmes.
The City Resident’s Social Portrait survey
From October 2018 to February 2019, Nornickel ran the “City Resident’s Social Portrait” survey aimed to gain insight into the real state of affairs in our communities by compiling the local populations’ social portraits and use the findings to inform local development priorities for the next decade. The survey is unique in that it uses computational sociology, i.e. machine learning, to analyse respondents’ digital profiles.
The survey covered a total 8,078 residents in Norilsk, Monchegorsk, Zapolyarny, and Nickel, with over 33,000 opinions and proposals received from local communities. The respondents’ perspectives on the existing gaps and their vision for what their community will be like in 10–15 years enabled the survey team to identify and understand the key trends for community development.
Nornickel will consider local residents’ expectations when developing production and social programmes for its employees and communities in its regions of operation.
The Plant of Goodness corporate volunteer programme
Nornickel’s social policy remains a key pillar of its development strategy and the foundation of its corporate social responsibility. A shift from paternalism to partnership has enabled Nornickel to build mutually beneficial relations not only with business and local communities but also with its employees.
The Plant of Goodness project is a vivid example of such engagement: it has institutionalised and consolidated Nornickel’s existing experience and traditions of social and environmental initiatives. Originally launched in Moscow only, the programme has since been extended to Norilsk, Monchegorsk, Zapolyarny, and Chita, acting as an engagement tool that creates new opportunities, unlocks people’s potential and strengthens their links to their communities. When people are directly involved in transforming their social environment, they inevitably become more engaged with it.
The Poneslos (“Let’s Roll”) environmental initiative that grew out of regular volunteer weekends has become one of Nornickel’s most prominent social projects. In addition to urban landscaping, the initiative now includes environmental awareness activities, and has grown to 17,000 participants.
The programme’s key areas:• Personal donations programme (through
the corporate intranet portal)• Corporate charity events• Volunteers in the City partnership project• Poneslos (“Let’s Roll”) environmental initiative• Eco-convention• Employee volunteering projects• Volunteer studios• Skill building programmes• Plant of Goodness leaders
In 2019, the Plant of Goodness corporate volunteer programme raised over RUB 4 mln through charitable donations by employees and ran 209 volunteer campaigns and events.
Charity expenses (USD mln)
‘17‘18‘19 154
115115
Company overview Strategic report Commodity market overview
Business overview Sustainable development
Corporate governance
Risk report Shareholder information IFRS financial statements AppendixAnnual report 2019
«NORNICKEL»
164 165
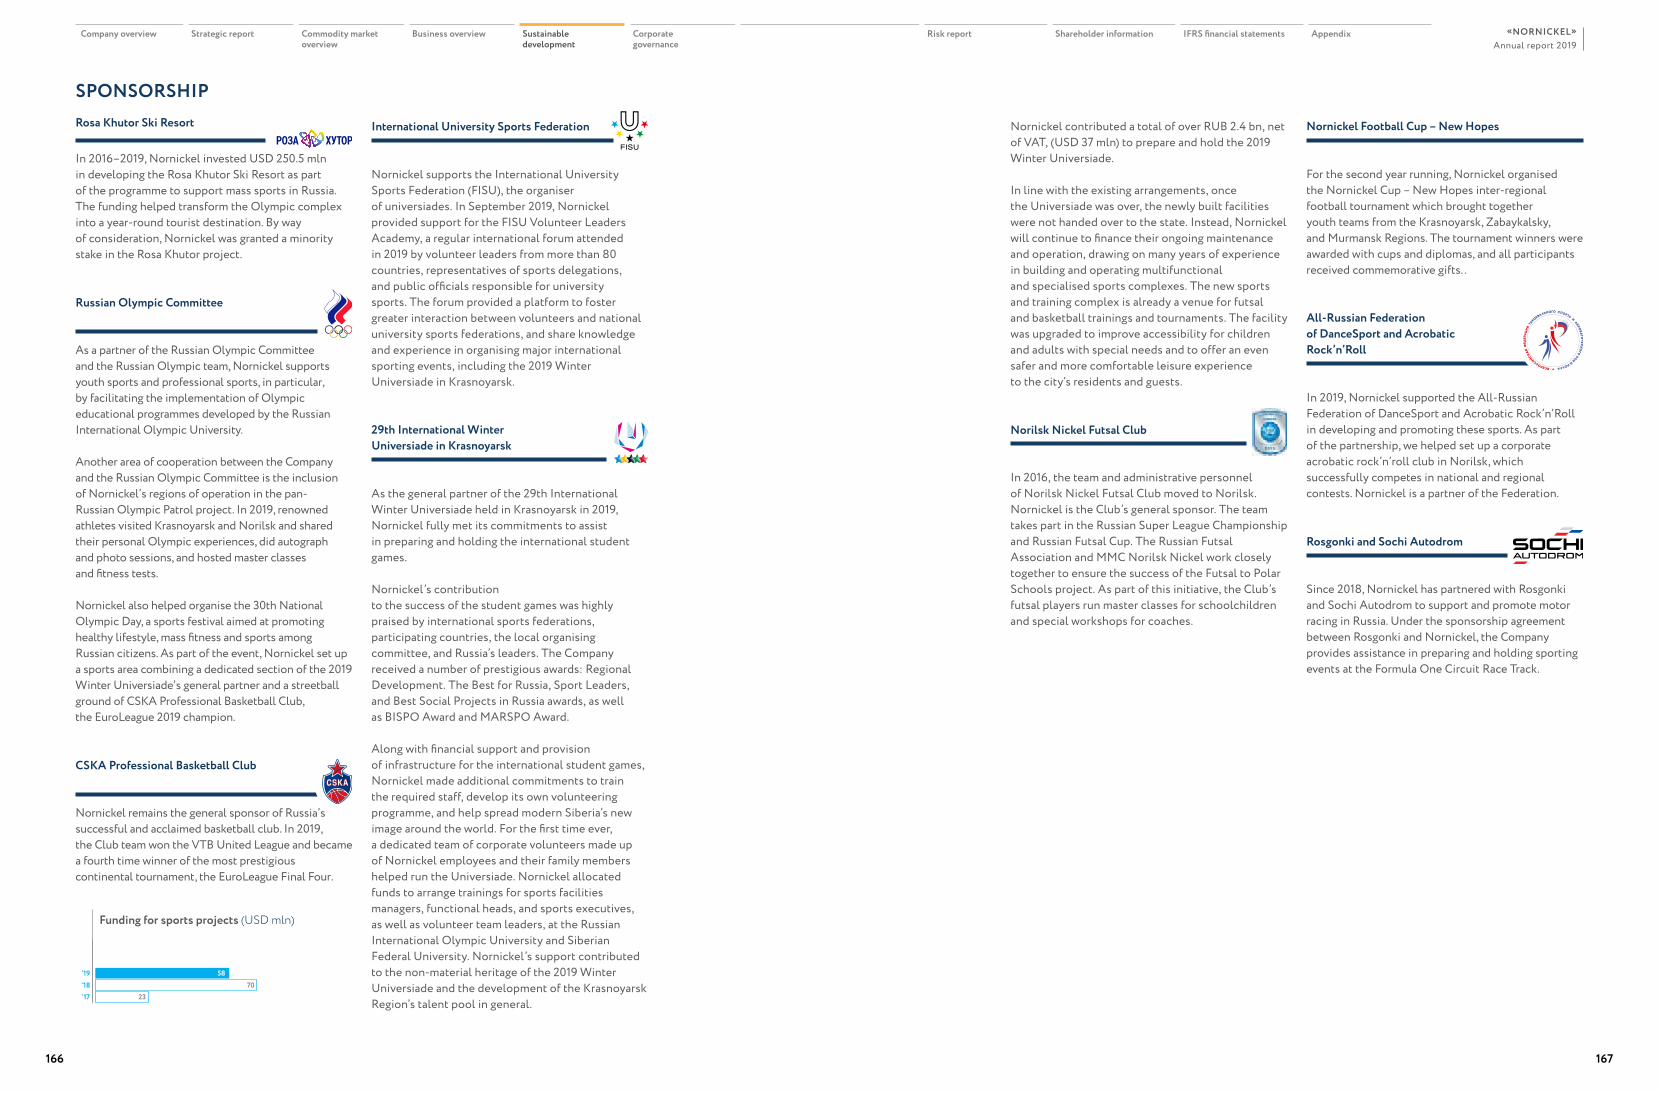
SPONSORSHIPRosa Khutor Ski Resort
In 2016–2019, Nornickel invested USD 250.5 mln in developing the Rosa Khutor Ski Resort as part of the programme to support mass sports in Russia. The funding helped transform the Olympic complex into a year-round tourist destination. By way of consideration, Nornickel was granted a minority stake in the Rosa Khutor project.
Russian Olympic Committee
As a partner of the Russian Olympic Committee and the Russian Olympic team, Nornickel supports youth sports and professional sports, in particular, by facilitating the implementation of Olympic educational programmes developed by the Russian International Olympic University.
Another area of cooperation between the Company and the Russian Olympic Committee is the inclusion of Nornickel’s regions of operation in the pan-Russian Olympic Patrol project. In 2019, renowned athletes visited Krasnoyarsk and Norilsk and shared their personal Olympic experiences, did autograph and photo sessions, and hosted master classes and fitness tests.
Nornickel also helped organise the 30th National Olympic Day, a sports festival aimed at promoting healthy lifestyle, mass fitness and sports among Russian citizens. As part of the event, Nornickel set up a sports area combining a dedicated section of the 2019 Winter Universiade’s general partner and a streetball ground of CSKA Professional Basketball Club, the EuroLeague 2019 champion.
CSKA Professional Basketball Club
Nornickel remains the general sponsor of Russia’s successful and acclaimed basketball club. In 2019, the Club team won the VTB United League and became a fourth time winner of the most prestigious continental tournament, the EuroLeague Final Four.
International University Sports Federation
Nornickel supports the International University Sports Federation (FISU), the organiser of universiades. In September 2019, Nornickel provided support for the FISU Volunteer Leaders Academy, a regular international forum attended in 2019 by volunteer leaders from more than 80 countries, representatives of sports delegations, and public officials responsible for university sports. The forum provided a platform to foster greater interaction between volunteers and national university sports federations, and share knowledge and experience in organising major international sporting events, including the 2019 Winter Universiade in Krasnoyarsk.
29th International Winter Universiade in Krasnoyarsk
As the general partner of the 29th International Winter Universiade held in Krasnoyarsk in 2019, Nornickel fully met its commitments to assist in preparing and holding the international student games.
Nornickel’s contribution to the success of the student games was highly praised by international sports federations, participating countries, the local organising committee, and Russia’s leaders. The Company received a number of prestigious awards: Regional Development. The Best for Russia, Sport Leaders, and Best Social Projects in Russia awards, as well as BISPO Award and MARSPO Award.
Along with financial support and provision of infrastructure for the international student games, Nornickel made additional commitments to train the required staff, develop its own volunteering programme, and help spread modern Siberia’s new image around the world. For the first time ever, a dedicated team of corporate volunteers made up of Nornickel employees and their family members helped run the Universiade. Nornickel allocated funds to arrange trainings for sports facilities managers, functional heads, and sports executives, as well as volunteer team leaders, at the Russian International Olympic University and Siberian Federal University. Nornickel’s support contributed to the non-material heritage of the 2019 Winter Universiade and the development of the Krasnoyarsk Region’s talent pool in general.
Nornickel contributed a total of over RUB 2.4 bn, net of VAT, (USD 37 mln) to prepare and hold the 2019 Winter Universiade.
In line with the existing arrangements, once the Universiade was over, the newly built facilities were not handed over to the state. Instead, Nornickel will continue to finance their ongoing maintenance and operation, drawing on many years of experience in building and operating multifunctional and specialised sports complexes. The new sports and training complex is already a venue for futsal and basketball trainings and tournaments. The facility was upgraded to improve accessibility for children and adults with special needs and to offer an even safer and more comfortable leisure experience to the city’s residents and guests.
Norilsk Nickel Futsal Club
In 2016, the team and administrative personnel of Norilsk Nickel Futsal Club moved to Norilsk. Nornickel is the Club’s general sponsor. The team takes part in the Russian Super League Championship and Russian Futsal Cup. The Russian Futsal Association and MMC Norilsk Nickel work closely together to ensure the success of the Futsal to Polar Schools project. As part of this initiative, the Club’s futsal players run master classes for schoolchildren and special workshops for coaches.
Nornickel Football Cup – New Hopes
For the second year running, Nornickel organised the Nornickel Cup – New Hopes inter-regional football tournament which brought together youth teams from the Krasnoyarsk, Zabaykalsky, and Murmansk Regions. The tournament winners were awarded with cups and diplomas, and all participants received commemorative gifts. .
All-Russian Federation of DanceSport and Acrobatic Rock’n’Roll
In 2019, Nornickel supported the All-Russian Federation of DanceSport and Acrobatic Rock’n’Roll in developing and promoting these sports. As part of the partnership, we helped set up a corporate acrobatic rock’n’roll club in Norilsk, which successfully competes in national and regional contests. Nornickel is a partner of the Federation.
Rosgonki and Sochi Autodrom
Since 2018, Nornickel has partnered with Rosgonki and Sochi Autodrom to support and promote motor racing in Russia. Under the sponsorship agreement between Rosgonki and Nornickel, the Company provides assistance in preparing and holding sporting events at the Formula One Circuit Race Track.
Funding for sports projects (USD mln)
‘17‘18‘19 58
7023
Company overview Strategic report Commodity market overview
Business overview Sustainable development
Corporate governance
Risk report Shareholder information IFRS financial statements AppendixAnnual report 2019
«NORNICKEL»
166 167

CGovernance
orpo rate170 Letter from Deputy Chairman
of the Board of Directors176 Governance structure205 Remuneration208 Control system
Corporate governance
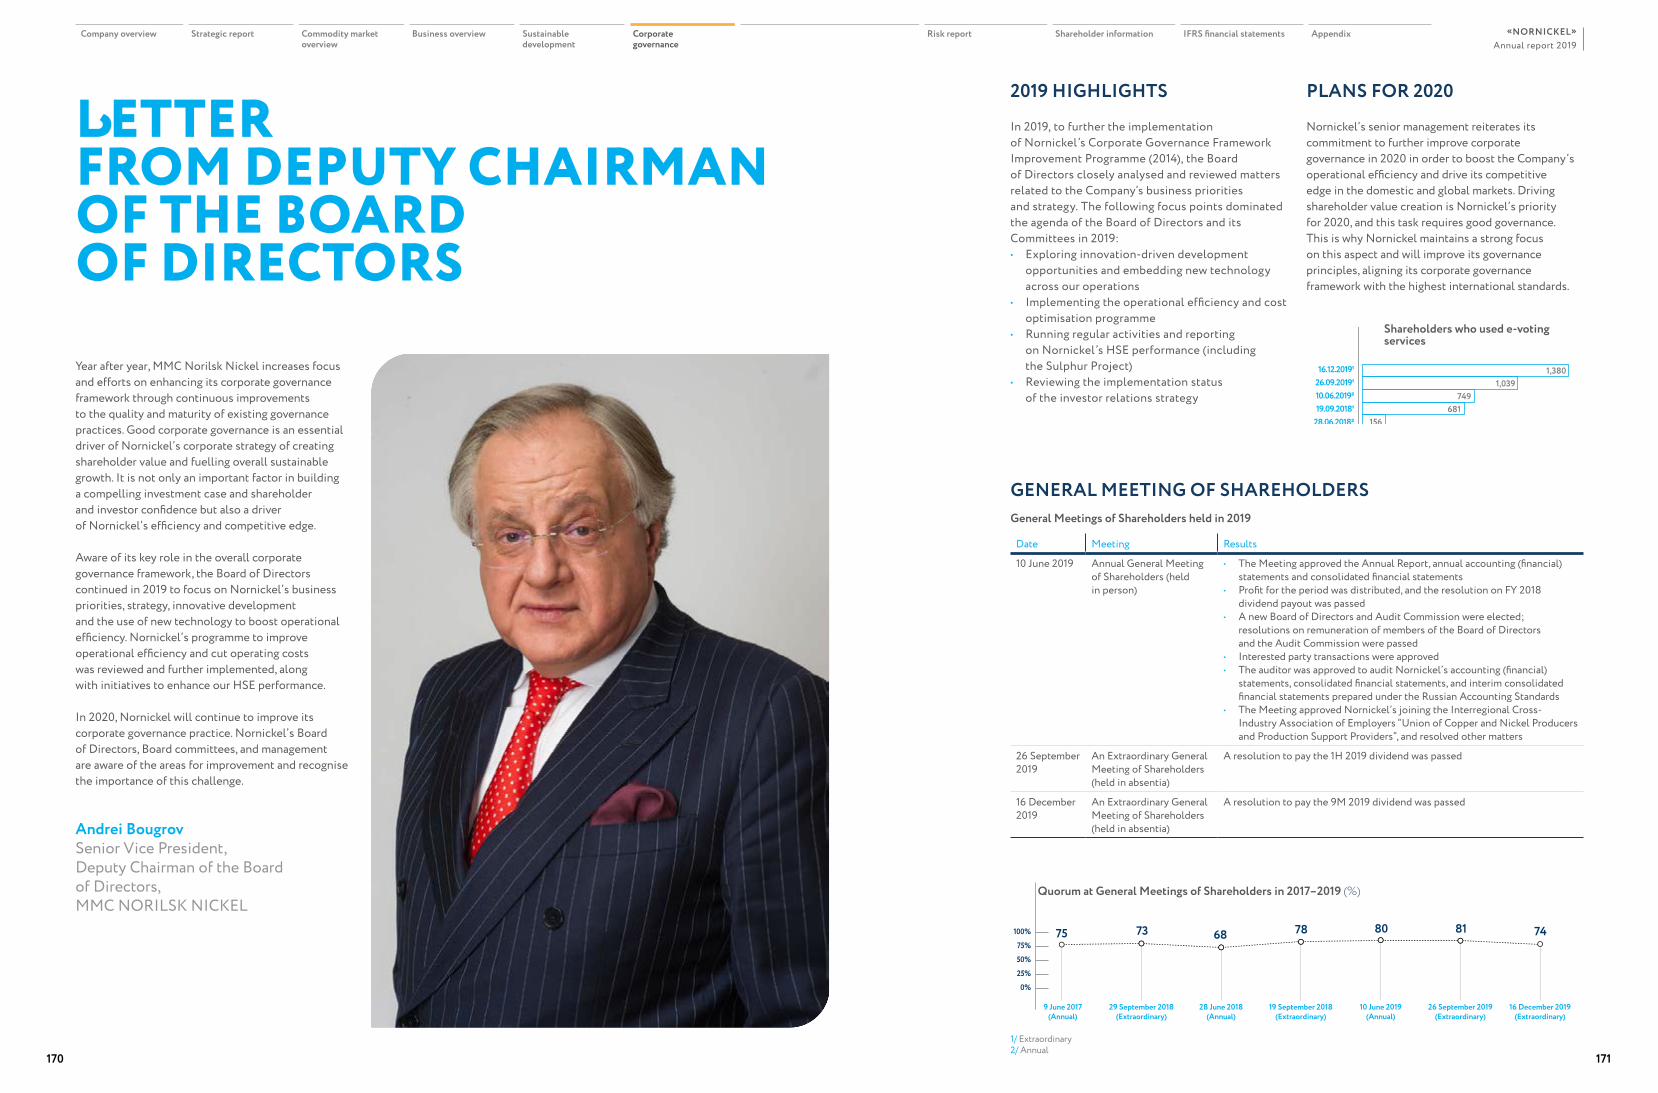
2019 HIGHLIGHTS
In 2019, to further the implementation of Nornickel’s Corporate Governance Framework Improvement Programme (2014), the Board of Directors closely analysed and reviewed matters related to the Company’s business priorities and strategy. The following focus points dominated the agenda of the Board of Directors and its Committees in 2019:• Exploring innovation-driven development
opportunities and embedding new technology across our operations
• Implementing the operational efficiency and cost optimisation programme
• Running regular activities and reporting on Nornickel’s HSE performance (including the Sulphur Project)
• Reviewing the implementation status of the investor relations strategy
PLANS FOR 2020
Nornickel’s senior management reiterates its commitment to further improve corporate governance in 2020 in order to boost the Company’s operational efficiency and drive its competitive edge in the domestic and global markets. Driving shareholder value creation is Nornickel’s priority for 2020, and this task requires good governance. This is why Nornickel maintains a strong focus on this aspect and will improve its governance principles, aligning its corporate governance framework with the highest international standards.
General Meetings of Shareholders held in 2019
Date Meeting Results
10 June 2019 Annual General Meeting of Shareholders (held in person)
• The Meeting approved the Annual Report, annual accounting (financial) statements and consolidated financial statements
• Profit for the period was distributed, and the resolution on FY 2018 dividend payout was passed
• A new Board of Directors and Audit Commission were elected; resolutions on remuneration of members of the Board of Directors and the Audit Commission were passed
• Interested party transactions were approved• The auditor was approved to audit Nornickel’s accounting (financial)
statements, consolidated financial statements, and interim consolidated financial statements prepared under the Russian Accounting Standards
• The Meeting approved Nornickel’s joining the Interregional Cross-Industry Association of Employers “Union of Copper and Nickel Producers and Production Support Providers”, and resolved other matters
26 September 2019
An Extraordinary General Meeting of Shareholders (held in absentia)
A resolution to pay the 1H 2019 dividend was passed
16 December 2019
An Extraordinary General Meeting of Shareholders (held in absentia)
A resolution to pay the 9M 2019 dividend was passed
GENERAL MEETING OF SHAREHOLDERS
Quorum at General Meetings of Shareholders in 2017–2019 (%)
9 June 2017 (Annual)
16 December 2019 (Extraordinary)
19 September 2018 (Extraordinary)
28 June 2018(Annual)
29 September 2018 (Extraordinary)
26 September 2019 (Extraordinary)
10 June 2019 (Annual)
75 73 68 78 80 81 74
0%25%50%75%
100%
Shareholders who used e-voting services
1,3801,039
749681
156
16.12.2019¹26.09.2019¹10.06.2019²19.09.2018¹
28.06.2018²
Year after year, MMC Norilsk Nickel increases focus and efforts on enhancing its corporate governance framework through continuous improvements to the quality and maturity of existing governance practices. Good corporate governance is an essential driver of Nornickel’s corporate strategy of creating shareholder value and fuelling overall sustainable growth. It is not only an important factor in building a compelling investment case and shareholder and investor confidence but also a driver of Nornickel’s efficiency and competitive edge.
Aware of its key role in the overall corporate governance framework, the Board of Directors continued in 2019 to focus on Nornickel’s business priorities, strategy, innovative development and the use of new technology to boost operational efficiency. Nornickel’s programme to improve operational efficiency and cut operating costs was reviewed and further implemented, along with initiatives to enhance our HSE performance.
In 2020, Nornickel will continue to improve its corporate governance practice. Nornickel’s Board of Directors, Board committees, and management are aware of the areas for improvement and recognise the importance of this challenge.
Andrei BougrovSenior Vice President,Deputy Chairman of the Board of Directors,MMC NORILSK NICKEL
LETTER FROM DEPUTY CHAIRMAN OF THE BOARD OF DIRECTORS
1/ Extraordinary2/ Annual
Company overview Strategic report Commodity market overview
Business overview Sustainable development
Corporate governance
Risk report Shareholder information IFRS financial statements AppendixAnnual report 2019
«NORNICKEL»
170 171
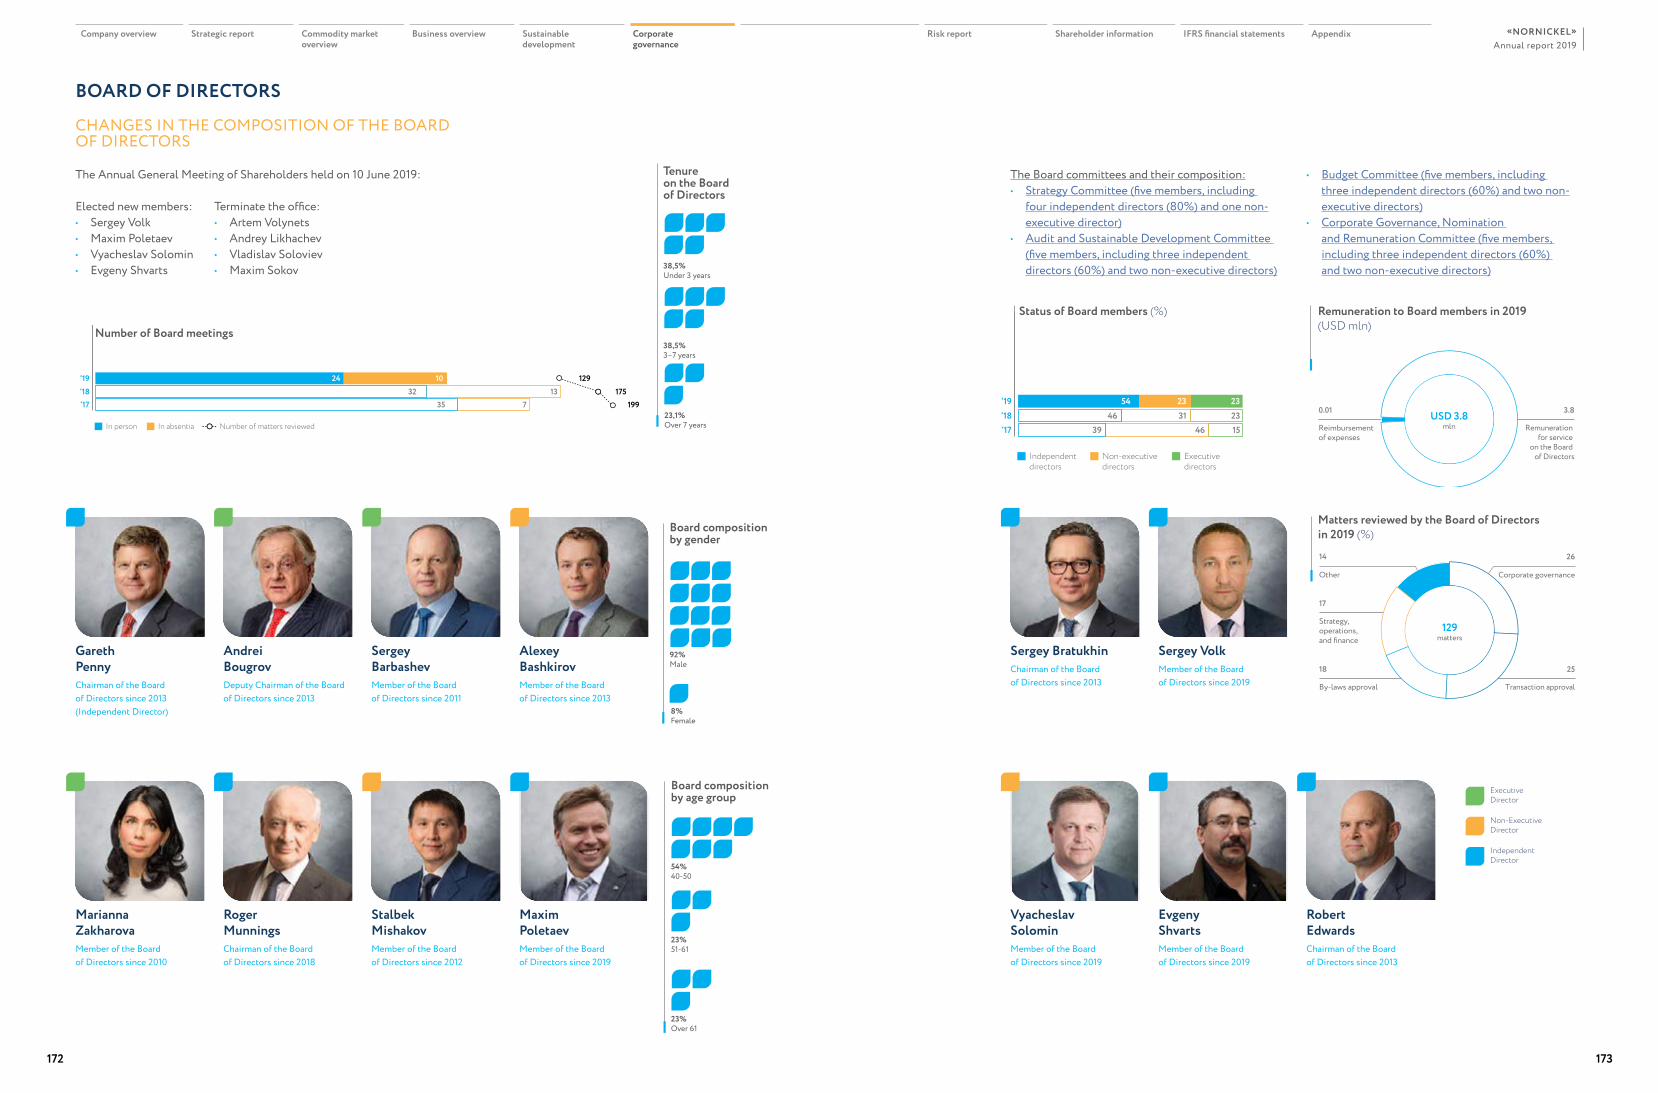
By-laws approval
18
Corporate governance
26
Transaction approval
25
Strategy, operations, and finance
Other
17
14
129matters
Remuneration for service
on the Board of Directors
3.8
Reimbursementof expenses
0.01 USD 3.8mln‘17
‘18‘19 2354 23
31 2346
4639 15
Independent directors
Non-executivedirectors
Executive directors
Matters reviewed by the Board of Directors in 2019 (%)
Remuneration to Board members in 2019 (USD mln)
Status of Board members (%)
BOARD OF DIRECTORS
CHANGES IN THE COMPOSITION OF THE BOARD OF DIRECTORS
The Annual General Meeting of Shareholders held on 10 June 2019:
Elected new members:• Sergey Volk• Maxim Poletaev• Vyacheslav Solomin• Evgeny Shvarts
Number of Board meetings
‘17‘18‘19 10 12924
32 13 17535 7 199
In person In absentia Number of matters reviewed
The Board committees and their composition:• Strategy Committee (five members, including
four independent directors (80%) and one non-executive director)
• Audit and Sustainable Development Committee (five members, including three independent directors (60%) and two non-executive directors)
• Budget Committee (five members, including three independent directors (60%) and two non-executive directors)
• Corporate Governance, Nomination and Remuneration Committee (five members, including three independent directors (60%) and two non-executive directors)
Terminate the office:• Artem Volynets• Andrey Likhachev• Vladislav Soloviev• Maxim Sokov
Gareth PennyChairman of the Board of Directors since 2013 (Independent Director)
Sergey BratukhinChairman of the Board of Directors since 2013
Marianna Zakharova Member of the Board of Directors since 2010
Vyacheslav SolominMember of the Board of Directors since 2019
Sergey BarbashevMember of the Board of Directors since 2011
Stalbek MishakovMember of the Board of Directors since 2012
Andrei BougrovDeputy Chairman of the Board of Directors since 2013
Sergey VolkMember of the Board of Directors since 2019
Roger MunningsChairman of the Board of Directors since 2018
Evgeny ShvartsMember of the Board of Directors since 2019
Robert EdwardsChairman of the Board of Directors since 2013
Alexey BashkirovMember of the Board of Directors since 2013
Maxim PoletaevMember of the Board of Directors since 2019
Tenure on the Board of Directors
Board composition by age group
23%51-61
23%Over 61
54%40-50
Board composition by gender
8%Female
92%Male
Executive Director
Independent Director
Non-Executive Director
38,5%Under 3 years
38,5%3–7 years
23,1%Over 7 years
Company overview Strategic report Commodity market overview
Business overview Sustainable development
Corporate governance
Risk report Shareholder information IFRS financial statements AppendixAnnual report 2019
«NORNICKEL»
172 173
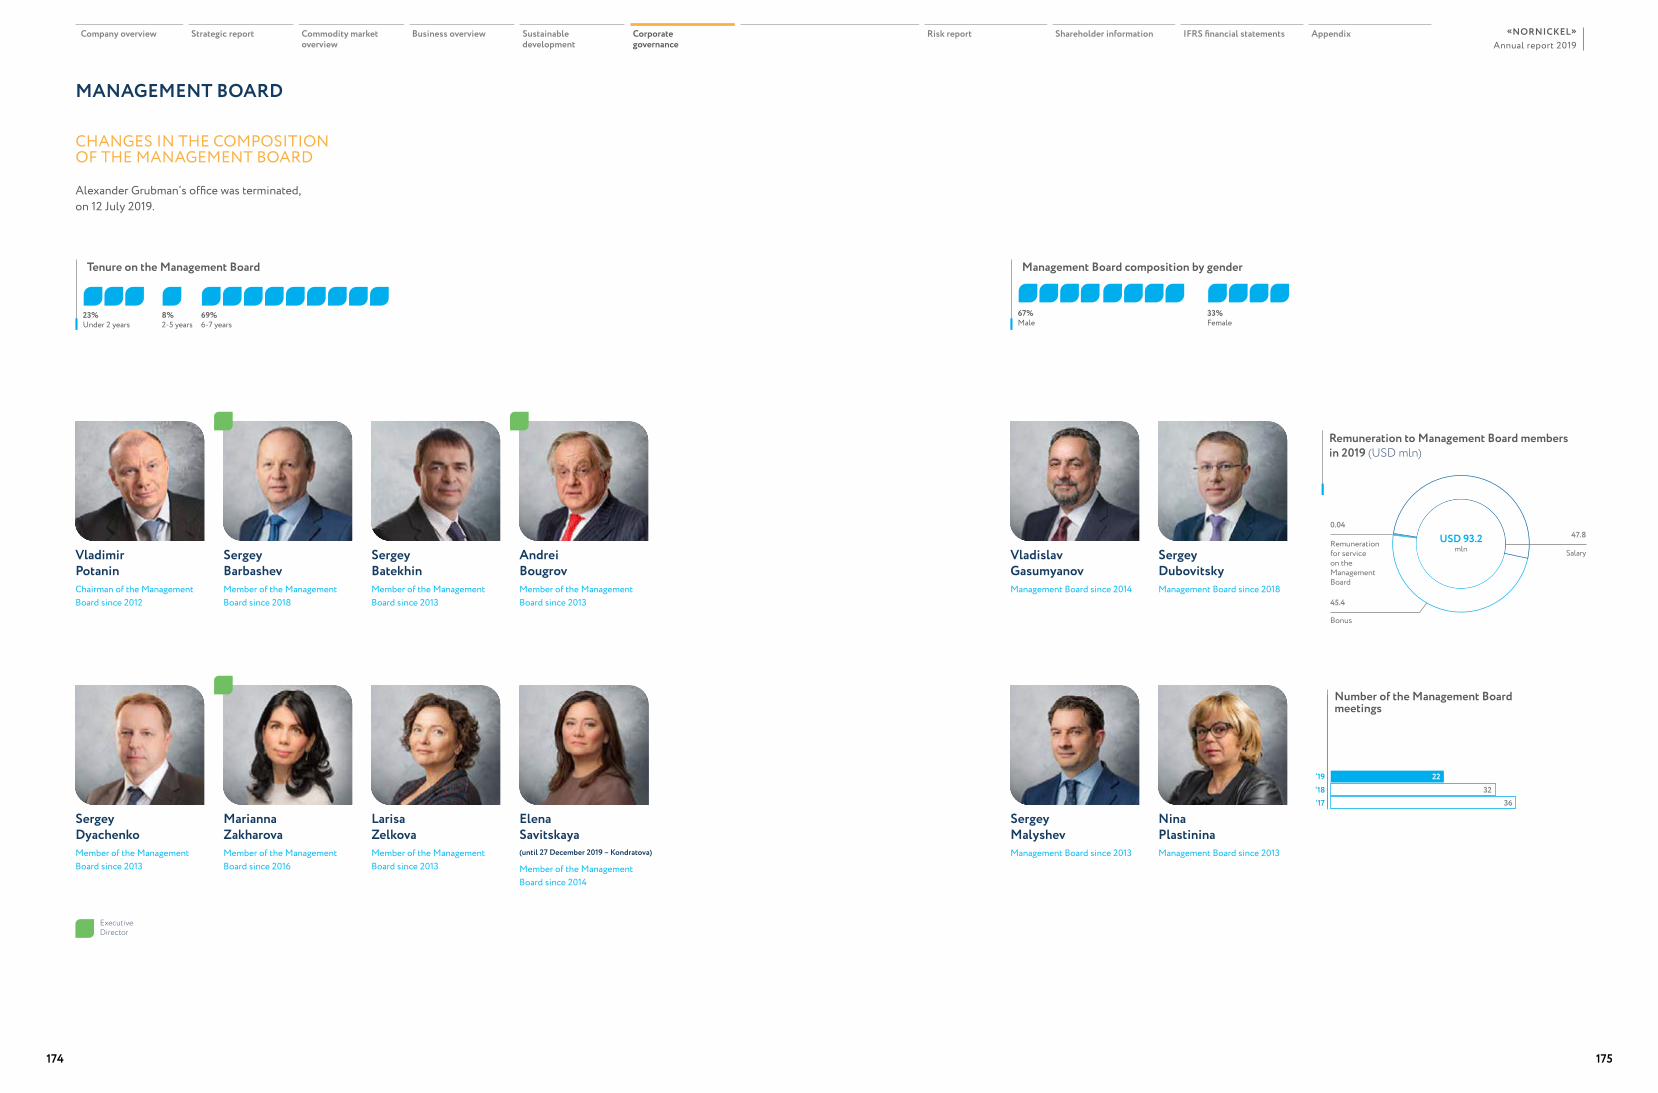
USD 93.2mln Salary
Remuneration for service on the Management Board
Bonus
45.4
47.80.04
‘17‘18‘19 22 23
3236
Tenure on the Management Board Management Board composition by gender
Remuneration to Management Board members in 2019 (USD mln)
Number of the Management Board meetings
CHANGES IN THE COMPOSITION OF THE MANAGEMENT BOARD
Alexander Grubman’s office was terminated, on 12 July 2019.
MANAGEMENT BOARD
Vladimir PotaninChairman of the Management Board since 2012
Vladislav GasumyanovManagement Board since 2014
Sergey DyachenkoMember of the Management Board since 2013
Sergey MalyshevManagement Board since 2013
Sergey BatekhinMember of the Management Board since 2013
Larisa ZelkovaMember of the Management Board since 2013
Sergey BarbashevMember of the Management Board since 2018
Sergey DubovitskyManagement Board since 2018
Marianna Zakharova Member of the Management Board since 2016
Nina PlastininaManagement Board since 2013
Andrei BougrovMember of the Management Board since 2013
Elena Savitskaya (until 27 December 2019 – Kondratova)
Member of the Management Board since 2014
23%Under 2 years
69%6-7 years
8%2-5 years
67%Male
33%Female
Executive Director
Company overview Strategic report Commodity market overview
Business overview Sustainable development
Corporate governance
Risk report Shareholder information IFRS financial statements AppendixAnnual report 2019
«NORNICKEL»
174 175
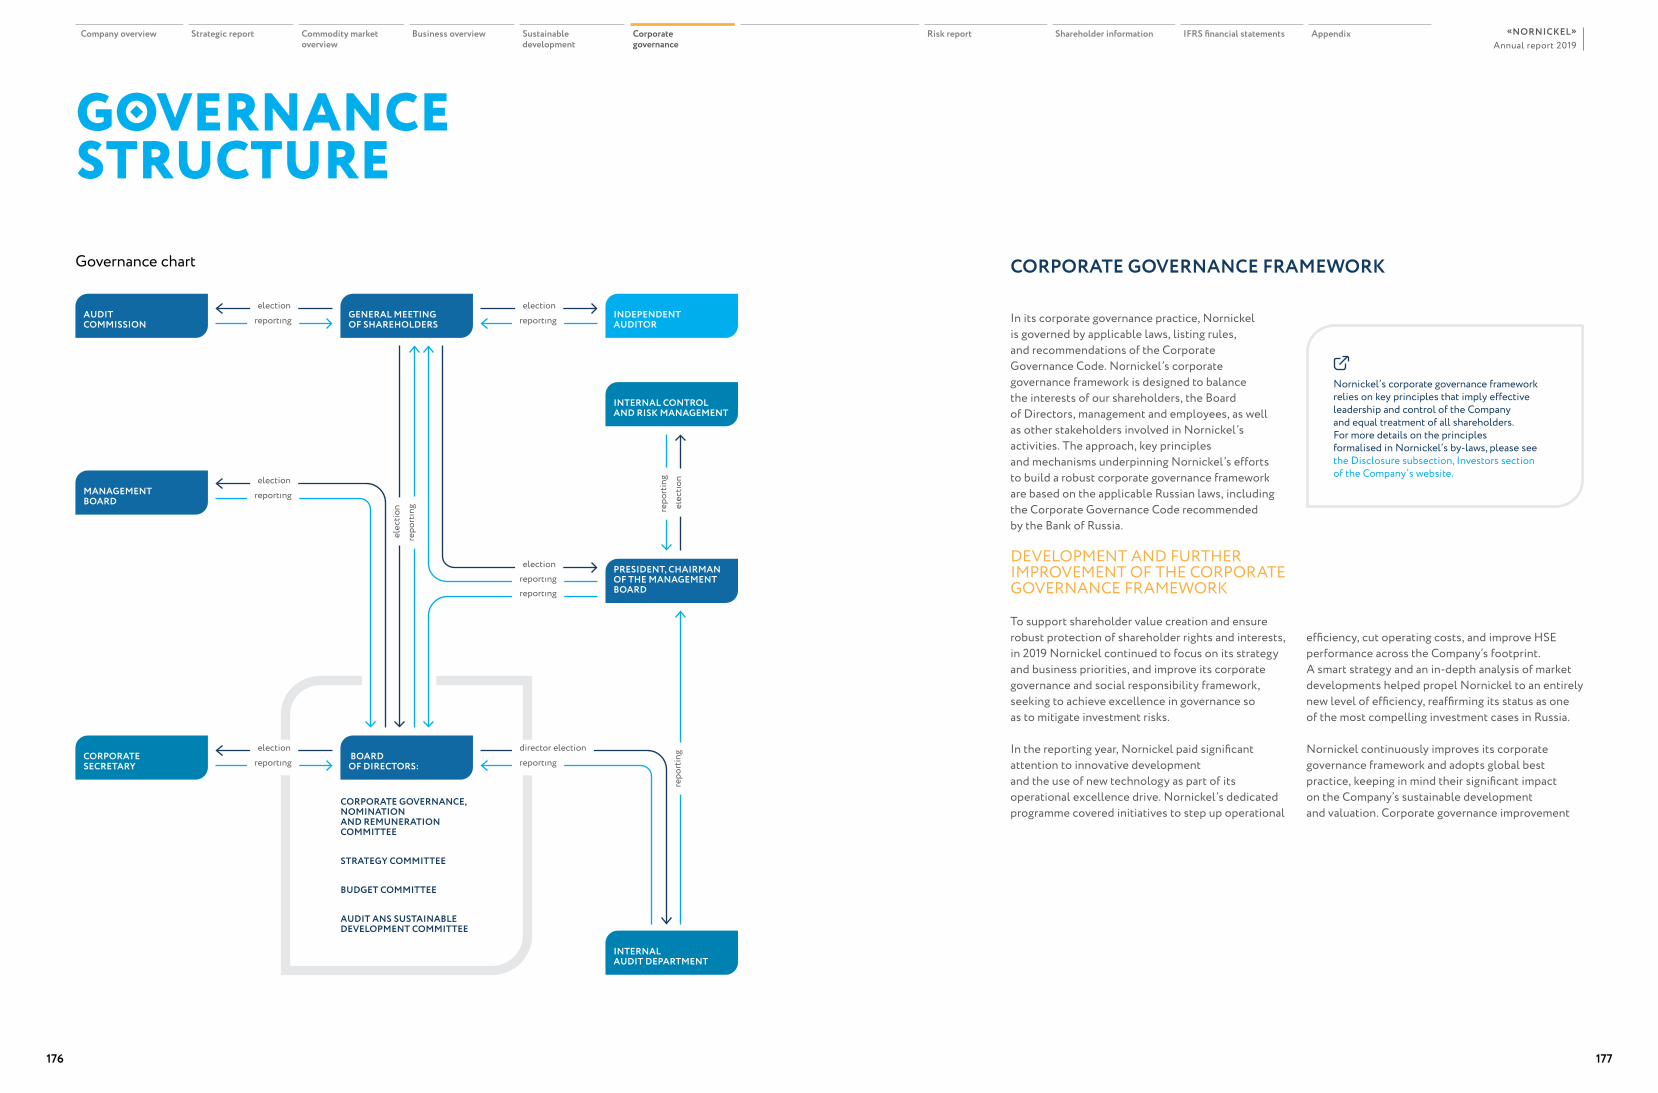
CORPORATE GOVERNANCE FRAMEWORK
Nornickel’s corporate governance framework relies on key principles that imply effective leadership and control of the Company and equal treatment of all shareholders. For more details on the principles formalised in Nornickel’s by-laws, please see the Disclosure subsection, Investors sectionof the Company’s website.
efficiency, cut operating costs, and improve HSE performance across the Company’s footprint. A smart strategy and an in-depth analysis of market developments helped propel Nornickel to an entirely new level of efficiency, reaffirming its status as one of the most compelling investment cases in Russia.
Nornickel continuously improves its corporate governance framework and adopts global best practice, keeping in mind their significant impact on the Company’s sustainable development and valuation. Corporate governance improvement
In its corporate governance practice, Nornickel is governed by applicable laws, listing rules, and recommendations of the Corporate Governance Code. Nornickel’s corporate governance framework is designed to balance the interests of our shareholders, the Board of Directors, management and employees, as well as other stakeholders involved in Nornickel’s activities. The approach, key principles and mechanisms underpinning Nornickel’s efforts to build a robust corporate governance framework are based on the applicable Russian laws, including the Corporate Governance Code recommended by the Bank of Russia.
DEVELOPMENT AND FURTHER IMPROVEMENT OF THE CORPORATE GOVERNANCE FRAMEWORK
To support shareholder value creation and ensure robust protection of shareholder rights and interests, in 2019 Nornickel continued to focus on its strategy and business priorities, and improve its corporate governance and social responsibility framework, seeking to achieve excellence in governance so as to mitigate investment risks.
In the reporting year, Nornickel paid significant attention to innovative development and the use of new technology as part of its operational excellence drive. Nornickel’s dedicated programme covered initiatives to step up operational
GOVERNANCE STRUCTUREGovernance chart
MANAGEMENT BOARD
CORPORATE GOVERNANCE, NOMINATION AND REMUNERATION COMMITTEE
STRATEGY COMMITTEE
BUDGET COMMITTEE
AUDIT ANS SUSTAINABLE DEVELOPMENT COMMITTEE
AUDIT COMMISSION
GENERAL MEETING OF SHAREHOLDERS
INDEPENDENT AUDITOR
INTERNAL CONTROL AND RISK MANAGEMENT
INTERNAL AUDIT DEPARTMENT
PRESIDENT, CHAIRMAN OF THE MANAGEMENT BOARD
reportingelection
reportingelection
elec
tion
repo
rting
repo
rting BOARD
OF DIRECTORS:CORPORATE SECRETARY reporting
director electionreportingelection
reportingelection
repo
rting
elec
tion
reportingreportingelection
Company overview Strategic report Commodity market overview
Business overview Sustainable development
Corporate governance
Risk report Shareholder information IFRS financial statements AppendixAnnual report 2019
«NORNICKEL»
176 177
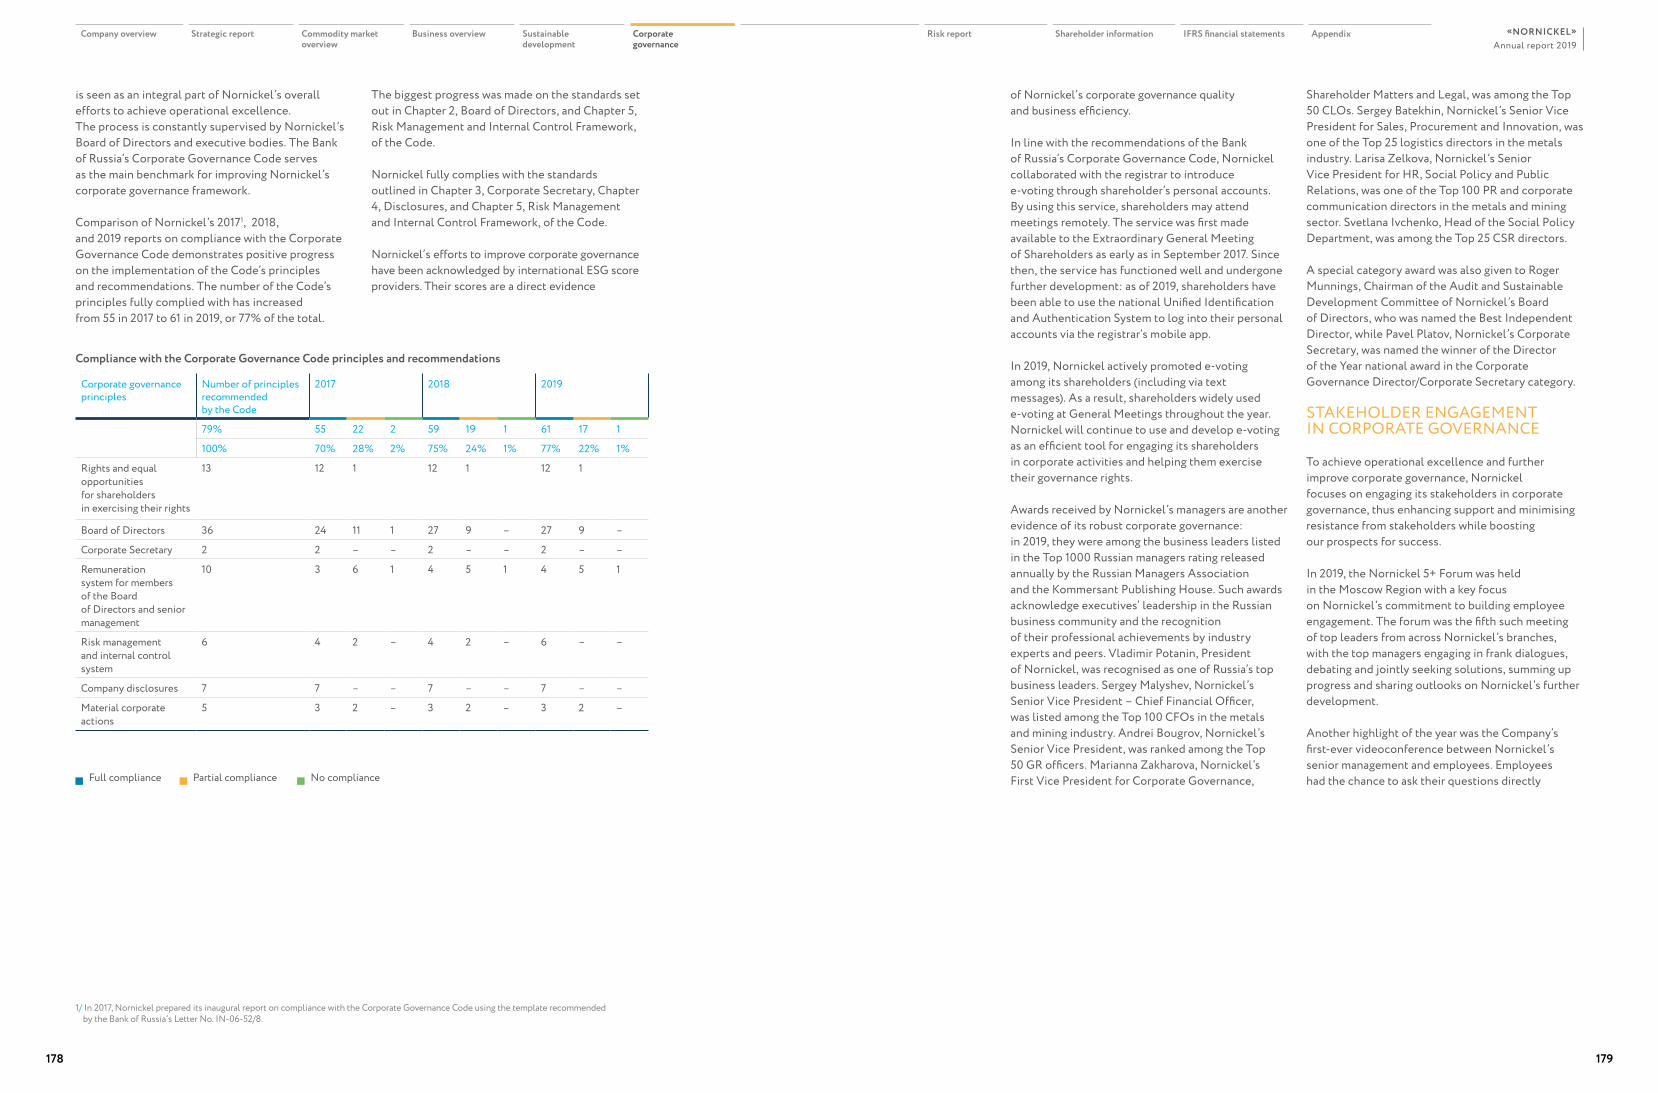
is seen as an integral part of Nornickel’s overall efforts to achieve operational excellence. The process is constantly supervised by Nornickel’s Board of Directors and executive bodies. The Bank of Russia’s Corporate Governance Code serves as the main benchmark for improving Nornickel’s corporate governance framework.
Comparison of Nornickel’s 20171, 2018, and 2019 reports on compliance with the Corporate Governance Code demonstrates positive progress on the implementation of the Code’s principles and recommendations. The number of the Code’s principles fully complied with has increased from 55 in 2017 to 61 in 2019, or 77% of the total.
The biggest progress was made on the standards set out in Chapter 2, Board of Directors, and Chapter 5, Risk Management and Internal Control Framework, of the Code.
Nornickel fully complies with the standards outlined in Chapter 3, Corporate Secretary, Chapter 4, Disclosures, and Chapter 5, Risk Management and Internal Control Framework, of the Code.
Nornickel’s efforts to improve corporate governance have been acknowledged by international ESG score providers. Their scores are a direct evidence
Compliance with the Corporate Governance Code principles and recommendations
Corporate governance principles
Number of principles recommended by the Code
2017 2018 2019
79% 55 22 2 59 19 1 61 17 1
100% 70% 28% 2% 75% 24% 1% 77% 22% 1%
Rights and equal opportunities for shareholders in exercising their rights
13 12 1 ꟷ 12 1 ꟷ 12 1 ꟷ
Board of Directors 36 24 11 1 27 9 – 27 9 –
Corporate Secretary 2 2 – – 2 – – 2 – –
Remuneration system for members of the Board of Directors and senior management
10 3 6 1 4 5 1 4 5 1
Risk management and internal control system
6 4 2 – 4 2 – 6 – –
Company disclosures 7 7 – – 7 – – 7 – –
Material corporate actions
5 3 2 – 3 2 – 3 2 –
Full compliance Partial compliance No compliance
of Nornickel’s corporate governance quality and business efficiency.
In line with the recommendations of the Bank of Russia’s Corporate Governance Code, Nornickel collaborated with the registrar to introduce e-voting through shareholder’s personal accounts. By using this service, shareholders may attend meetings remotely. The service was first made available to the Extraordinary General Meeting of Shareholders as early as in September 2017. Since then, the service has functioned well and undergone further development: as of 2019, shareholders have been able to use the national Unified Identification and Authentication System to log into their personal accounts via the registrar’s mobile app.
In 2019, Nornickel actively promoted e-voting among its shareholders (including via text messages). As a result, shareholders widely used e-voting at General Meetings throughout the year. Nornickel will continue to use and develop e-voting as an efficient tool for engaging its shareholders in corporate activities and helping them exercise their governance rights.
Awards received by Nornickel’s managers are another evidence of its robust corporate governance: in 2019, they were among the business leaders listed in the Top 1000 Russian managers rating released annually by the Russian Managers Association and the Kommersant Publishing House. Such awards acknowledge executives’ leadership in the Russian business community and the recognition of their professional achievements by industry experts and peers. Vladimir Potanin, President of Nornickel, was recognised as one of Russia’s top business leaders. Sergey Malyshev, Nornickel’s Senior Vice President – Chief Financial Officer, was listed among the Top 100 CFOs in the metals and mining industry. Andrei Bougrov, Nornickel’s Senior Vice President, was ranked among the Top 50 GR officers. Marianna Zakharova, Nornickel’s First Vice President for Corporate Governance,
Shareholder Matters and Legal, was among the Top 50 CLOs. Sergey Batekhin, Nornickel’s Senior Vice President for Sales, Procurement and Innovation, was one of the Top 25 logistics directors in the metals industry. Larisa Zelkova, Nornickel’s Senior Vice President for HR, Social Policy and Public Relations, was one of the Top 100 PR and corporate communication directors in the metals and mining sector. Svetlana Ivchenko, Head of the Social Policy Department, was among the Top 25 CSR directors.
A special category award was also given to Roger Munnings, Chairman of the Audit and Sustainable Development Committee of Nornickel’s Board of Directors, who was named the Best Independent Director, while Pavel Platov, Nornickel’s Corporate Secretary, was named the winner of the Director of the Year national award in the Corporate Governance Director/Corporate Secretary category.
STAKEHOLDER ENGAGEMENT IN CORPORATE GOVERNANCE
To achieve operational excellence and further improve corporate governance, Nornickel focuses on engaging its stakeholders in corporate governance, thus enhancing support and minimising resistance from stakeholders while boosting our prospects for success.
In 2019, the Nornickel 5+ Forum was held in the Moscow Region with a key focus on Nornickel’s commitment to building employee engagement. The forum was the fifth such meeting of top leaders from across Nornickel’s branches, with the top managers engaging in frank dialogues, debating and jointly seeking solutions, summing up progress and sharing outlooks on Nornickel’s further development.
Another highlight of the year was the Company’s first-ever videoconference between Nornickel’s senior management and employees. Employees had the chance to ask their questions directly
1/ In 2017, Nornickel prepared its inaugural report on compliance with the Corporate Governance Code using the template recommended by the Bank of Russia’s Letter No. IN-06-52/8.
Company overview Strategic report Commodity market overview
Business overview Sustainable development
Corporate governance
Risk report Shareholder information IFRS financial statements AppendixAnnual report 2019
«NORNICKEL»
178 179
to Nornickel’s top leaders – First Vice President Sergey Dyachenko, Senior Vice President Larisa Zelkova, and Senior Vice President Sergey Malyshev.
Nornickel’s continued focus on expanding the horizons of sustainable growth was highlighted during its annual Capital Markets Day in November 2019 which involved Nornickel’s Board members and senior management. Thanks to senior management’s well-coordinated and well-placed efforts, the investment community received up-to-date information on Nornickel’s operational and financial performance, and gained an insight into an outlook for the metals market, and the Company’s strategic vision to 2030.
Nornickel reiterates its commitment to follow global best practice in corporate governance and acknowledges that the Company’s long-term success stems from teamwork involving senior management alongside frontline staff, investors, bankers, and other partners. By building mutually beneficial relationships with each stakeholder, Nornickel drives its sustainable growth and strong competitive edge.
LIABILITY INSURANCE
In line with best practice and recommendations of the Corporate Governance Code, Nornickel provides liability insurance for members of its Board of Directors and Management Board. The insurance covers potential damages arising from errors in the course of managing the Company. The policy terms and conditions and the amount of insurance coverage are consistent with international best practice in insuring such risks. Material terms and conditions of the insurance policy are subject to approval by the General Meeting of Shareholders.
MANAGING CONFLICTS OF INTEREST
Nornickel has implemented measures to prevent potential conflicts of interest involving Board members and senior managers. As of December 2016, Board members have filed annual disclosure forms providing information about their relatives and family members. Nornickel also has in place procedures
for identifying interested party transactions. Nornickel’s efforts to identify and prevent conflicts of interest help minimise the probability of adverse impact on the Company.
GENERAL MEETING OF SHAREHOLDERS
The General Meeting of Shareholders is the supreme governance body of MMC Norilsk Nickel responsible for making decisions on matters most crucial to the Company. A full list of matters within the remit of the General Meeting of Shareholders is detailed in the Company’s Articles of Association. Nornickel has in place the Regulations on the General Meeting of Shareholders detailing the procedures for convening, preparing and holding general meetings.
The Annual General Meeting of Shareholders is held on an annual basis not earlier than three months before and not later than six months after the end of the financial year. General meetings other than Annual General Meeting of Shareholders are deemed Extraordinary General Meetings of Shareholders and are convened as per resolution of the Board of Directors at its discretion or at the request of the Audit Commission, the Company’s auditor, or shareholders who hold at least 10% of Nornickel’s voting shares as of the date of the request.
The notice of a General Meeting of Shareholders is published in the Rossiyskaya Gazeta and Taimyr
newspapers, and posted on Nornickel’s website at least 30 days prior to the date of the general meeting. If a general meeting is held in the form of absentee voting, the notice is given in the above mentioned newspapers at least 30 days prior to the deadline set for the collection of voting ballots.
Holders of MMC Norilsk Nickel shares who are registered in the shareholder register receive a ballot directly from the Company and are entitled to exercise their voting right by sending the ballot to the Company or by attending the General Meeting of Shareholders (in person or by proxy).
Shareholders of MMC Norilsk Nickel who own the Company shares via nominal holders receive the voting ballot from the nominal holder. They are entitled to vote at the meeting in the same way as the holders registered in the shareholder register or instruct the nominal holder to do the same as prescribed by the Russian securities law. Nominal holders duly instructed by their clients communicate the voting instructions to the registrar. The receipt of instructions by the registrar shall be equivalent to voting by ballot.
ADR holders do not receive voting ballots directly from the Company. According to the depository agreement, Nornickel notifies the depository, which as soon as possible, and provided it is not prohibited by the Russian law, notifies ADR holders about the general meeting and encloses voting materials and a document describing the voting procedure for ADR holders. To exercise their voting rights, ADR holders instruct the depository accordingly.
Except for the cumulative voting to elect members of the Board of Directors, each voting share represents one vote at the General Meeting of Shareholders.
Three General Meetings of Shareholders were held in 2019, and a high level of shareholders’ attendance was maintained. A General Meeting of Shareholders shall be considered properly convened (having a quorum) if the shareholders who hold collectively more than 50% of the votes granted by the Company’s outstanding voting shares are present at the meeting.
Regulations on the General Meeting of Shareholders
Articles of Association
the Shareholder’s Personal Accounеt
Continued successful use of e voting at the meetings held in 2018–2019 enabled shareholders to participate in the voting regardless of their location. Evoting is available both on the gosuslugi.ru website accessible to general public and via the Shareholder’s Personal Account, a dedicated online resource for Nornickel’s shareholders. The number of shareholders taking advantage of evoting has increased noticeably since the service was introduced.
BOARD OF DIRECTORSThe Board of Directors is responsible for the general management of Nornickel’s operations, excluding matters reserved to the General Meeting of Shareholders. The Board of Directors plays a crucial role in designing and developing the corporate governance system, ensures the protection and exercise of shareholders rights, and supervises executive bodies. The Board of Directors sets the fundamental principles of business conduct and is responsible for nurturing Nornickel’s business and social culture.
The Board’s authority and formation process, as well as procedures for convening and holding Board meetings are determined by the Articles of Association and Regulations on the Board of Directors.
According to Nornickel’s Articles of Association, the Board of Directors has 13 members. Members
Company overview Strategic report Commodity market overview
Business overview Sustainable development
Corporate governance
Risk report Shareholder information IFRS financial statements AppendixAnnual report 2019
«NORNICKEL»
180 181
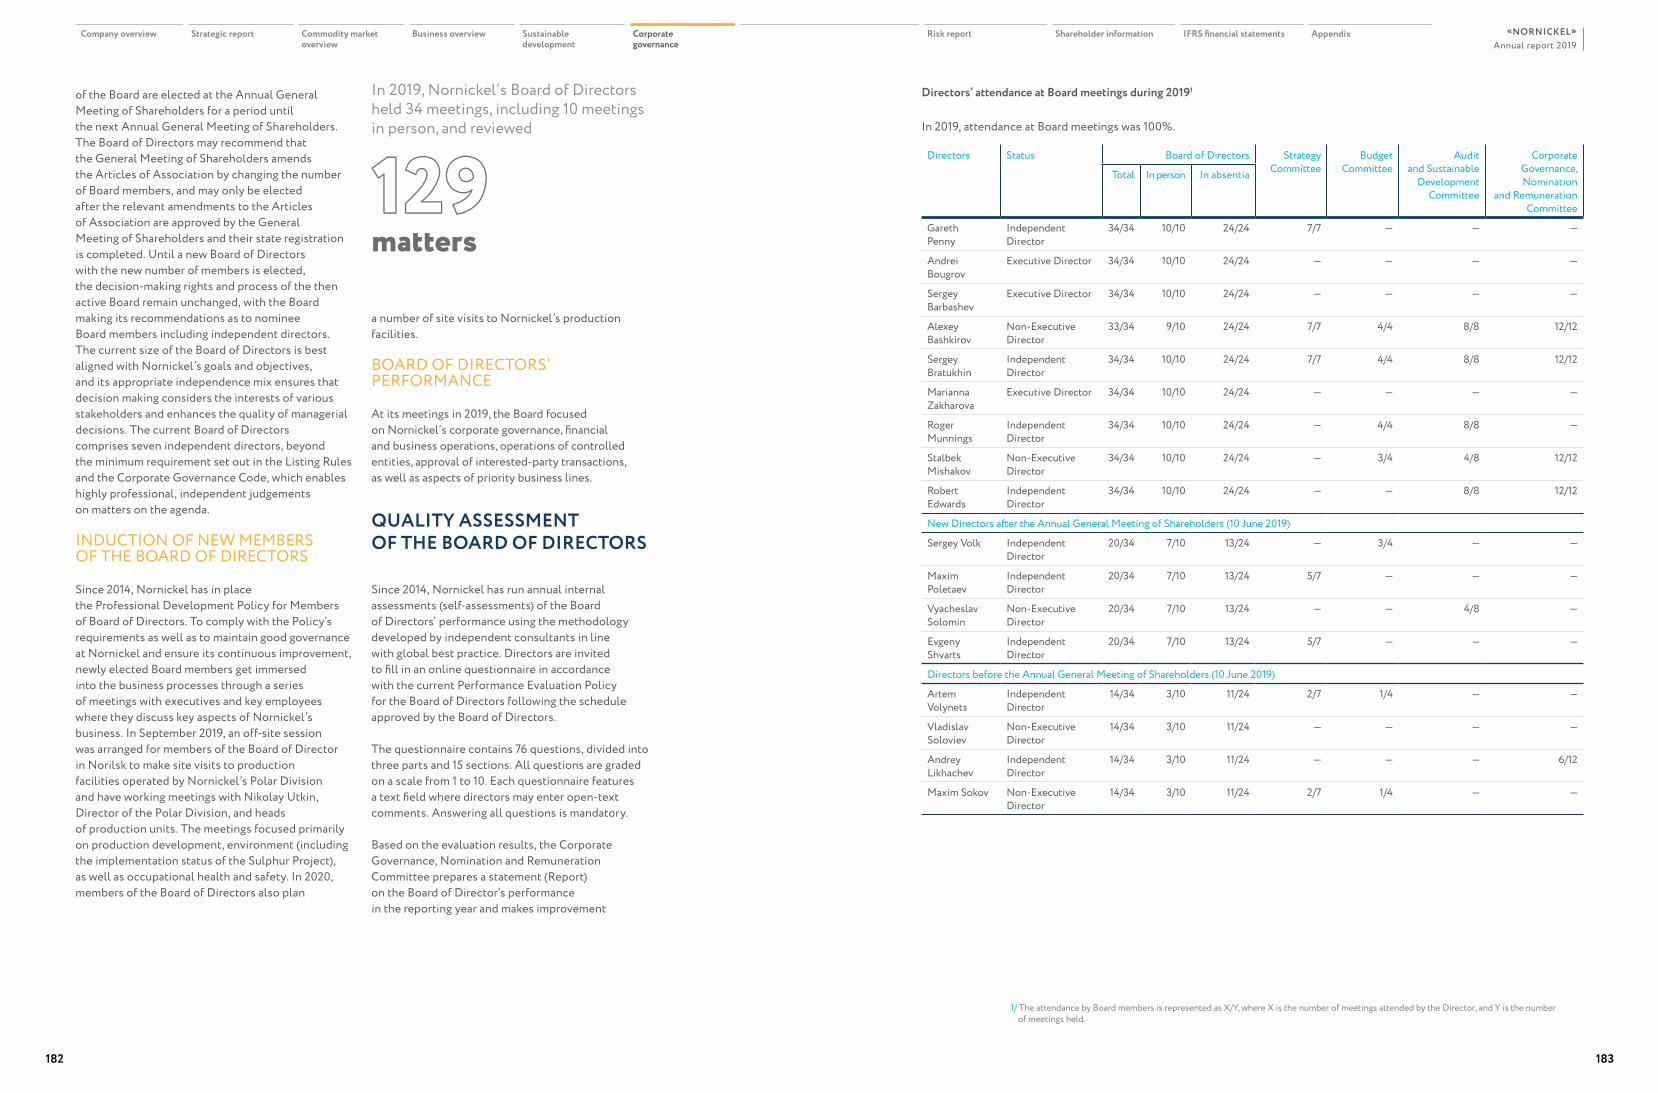
Directors’ attendance at Board meetings during 20191
Directors Status Board of Directors Strategy Committee
Budget Committee
Audit and Sustainable
Development Committee
Corporate Governance, Nomination
and Remuneration Committee
Total In person In absentia
Gareth Penny
Independent Director
34/34 10/10 24/24 7/7 — — —
Andrei Bougrov
Executive Director 34/34 10/10 24/24 — — — —
Sergey Barbashev
Executive Director 34/34 10/10 24/24 — — — —
Alexey Bashkirov
Non-Executive Director
33/34 9/10 24/24 7/7 4/4 8/8 12/12
Sergey Bratukhin
Independent Director
34/34 10/10 24/24 7/7 4/4 8/8 12/12
Marianna Zakharova
Executive Director 34/34 10/10 24/24 — — — —
Roger Munnings
Independent Director
34/34 10/10 24/24 — 4/4 8/8 —
Stalbek Mishakov
Non-Executive Director
34/34 10/10 24/24 — 3/4 4/8 12/12
Robert Edwards
Independent Director
34/34 10/10 24/24 — — 8/8 12/12
New Directors after the Annual General Meeting of Shareholders (10 June 2019)
Sergey Volk Independent Director
20/34 7/10 13/24 — 3/4 — —
Maxim Poletaev
Independent Director
20/34 7/10 13/24 5/7 — — —
Vyacheslav Solomin
Non-Executive Director
20/34 7/10 13/24 — — 4/8 —
Evgeny Shvarts
Independent Director
20/34 7/10 13/24 5/7 — — —
Directors before the Annual General Meeting of Shareholders (10 June 2019)
Artem Volynets
Independent Director
14/34 3/10 11/24 2/7 1/4 — —
Vladislav Soloviev
Non-Executive Director
14/34 3/10 11/24 — — — —
Andrey Likhachev
Independent Director
14/34 3/10 11/24 — — — 6/12
Maxim Sokov Non-Executive Director
14/34 3/10 11/24 2/7 1/4 — —
of the Board are elected at the Annual General Meeting of Shareholders for a period until the next Annual General Meeting of Shareholders. The Board of Directors may recommend that the General Meeting of Shareholders amends the Articles of Association by changing the number of Board members, and may only be elected after the relevant amendments to the Articles of Association are approved by the General Meeting of Shareholders and their state registration is completed. Until a new Board of Directors with the new number of members is elected, the decision-making rights and process of the then active Board remain unchanged, with the Board making its recommendations as to nominee Board members including independent directors. The current size of the Board of Directors is best aligned with Nornickel’s goals and objectives, and its appropriate independence mix ensures that decision making considers the interests of various stakeholders and enhances the quality of managerial decisions. The current Board of Directors comprises seven independent directors, beyond the minimum requirement set out in the Listing Rules and the Corporate Governance Code, which enables highly professional, independent judgements on matters on the agenda.
INDUCTION OF NEW MEMBERS OF THE BOARD OF DIRECTORS
Since 2014, Nornickel has in place the Professional Development Policy for Members of Board of Directors. To comply with the Policy’s requirements as well as to maintain good governance at Nornickel and ensure its continuous improvement, newly elected Board members get immersed into the business processes through a series of meetings with executives and key employees where they discuss key aspects of Nornickel’s business. In September 2019, an off-site session was arranged for members of the Board of Director in Norilsk to make site visits to production facilities operated by Nornickel’s Polar Division and have working meetings with Nikolay Utkin, Director of the Polar Division, and heads of production units. The meetings focused primarily on production development, environment (including the implementation status of the Sulphur Project), as well as occupational health and safety. In 2020, members of the Board of Directors also plan
1/ The attendance by Board members is represented as X/Y, where X is the number of meetings attended by the Director, and Y is the number of meetings held.
In 2019, Nornickel’s Board of Directors held 34 meetings, including 10 meetings in person, and reviewed
129matters
a number of site visits to Nornickel’s production facilities.
BOARD OF DIRECTORS’ PERFORMANCE
At its meetings in 2019, the Board focused on Nornickel’s corporate governance, financial and business operations, operations of controlled entities, approval of interested-party transactions, as well as aspects of priority business lines.
QUALITY ASSESSMENT OF THE BOARD OF DIRECTORS
Since 2014, Nornickel has run annual internal assessments (self-assessments) of the Board of Directors’ performance using the methodology developed by independent consultants in line with global best practice. Directors are invited to fill in an online questionnaire in accordance with the current Performance Evaluation Policy for the Board of Directors following the schedule approved by the Board of Directors.
The questionnaire contains 76 questions, divided into three parts and 15 sections. All questions are graded on a scale from 1 to 10. Each questionnaire features a text field where directors may enter open-text comments. Answering all questions is mandatory.
Based on the evaluation results, the Corporate Governance, Nomination and Remuneration Committee prepares a statement (Report) on the Board of Director’s performance in the reporting year and makes improvement
In 2019, attendance at Board meetings was 100%.
Company overview Strategic report Commodity market overview
Business overview Sustainable development
Corporate governance
Risk report Shareholder information IFRS financial statements AppendixAnnual report 2019
«NORNICKEL»
182 183
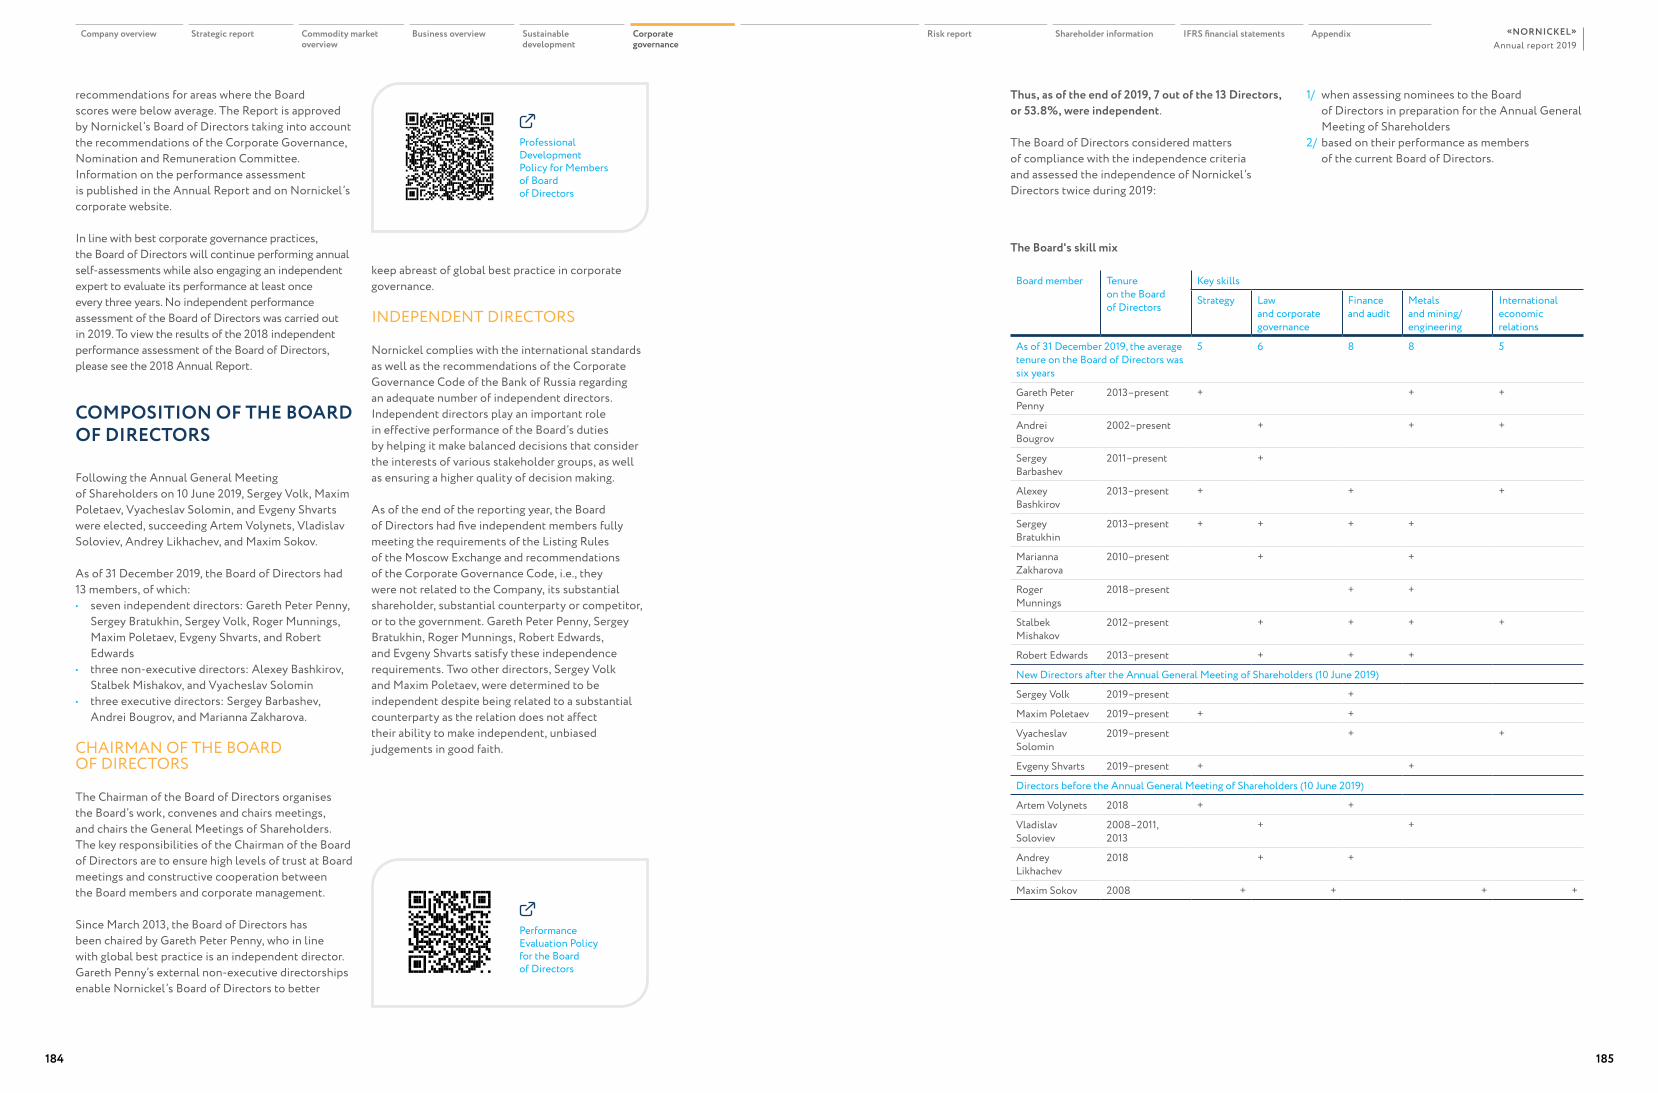
recommendations for areas where the Board scores were below average. The Report is approved by Nornickel’s Board of Directors taking into account the recommendations of the Corporate Governance, Nomination and Remuneration Committee. Information on the performance assessment is published in the Annual Report and on Nornickel’s corporate website.
In line with best corporate governance practices, the Board of Directors will continue performing annual self-assessments while also engaging an independent expert to evaluate its performance at least once every three years. No independent performance assessment of the Board of Directors was carried out in 2019. To view the results of the 2018 independent performance assessment of the Board of Directors, please see the 2018 Annual Report.
COMPOSITION OF THE BOARD OF DIRECTORS
Following the Annual General Meeting of Shareholders on 10 June 2019, Sergey Volk, Maxim Poletaev, Vyacheslav Solomin, and Evgeny Shvarts were elected, succeeding Artem Volynets, Vladislav Soloviev, Andrey Likhachev, and Maxim Sokov.
As of 31 December 2019, the Board of Directors had 13 members, of which:• seven independent directors: Gareth Peter Penny,
Sergey Bratukhin, Sergey Volk, Roger Munnings, Maxim Poletaev, Evgeny Shvarts, and Robert Edwards
• three non-executive directors: Alexey Bashkirov, Stalbek Mishakov, and Vyacheslav Solomin
• three executive directors: Sergey Barbashev, Andrei Bougrov, and Marianna Zakharova.
CHAIRMAN OF THE BOARD OF DIRECTORS
The Chairman of the Board of Directors organises the Board’s work, convenes and chairs meetings, and chairs the General Meetings of Shareholders. The key responsibilities of the Chairman of the Board of Directors are to ensure high levels of trust at Board meetings and constructive cooperation between the Board members and corporate management.
Since March 2013, the Board of Directors has been chaired by Gareth Peter Penny, who in line with global best practice is an independent director. Gareth Penny’s external non-executive directorships enable Nornickel’s Board of Directors to better
keep abreast of global best practice in corporate governance.
INDEPENDENT DIRECTORS
Nornickel complies with the international standards as well as the recommendations of the Corporate Governance Code of the Bank of Russia regarding an adequate number of independent directors. Independent directors play an important role in effective performance of the Board’s duties by helping it make balanced decisions that consider the interests of various stakeholder groups, as well as ensuring a higher quality of decision making.
As of the end of the reporting year, the Board of Directors had five independent members fully meeting the requirements of the Listing Rules of the Moscow Exchange and recommendations of the Corporate Governance Code, i.e., they were not related to the Company, its substantial shareholder, substantial counterparty or competitor, or to the government. Gareth Peter Penny, Sergey Bratukhin, Roger Munnings, Robert Edwards, and Evgeny Shvarts satisfy these independence requirements. Two other directors, Sergey Volk and Maxim Poletaev, were determined to be independent despite being related to a substantial counterparty as the relation does not affect their ability to make independent, unbiased judgements in good faith.
Performance Evaluation Policy for the Board of Directors
The Board's skill mix
Board member Tenure on the Board of Directors
Key skills
Strategy Law and corporate governance
Finance and audit
Metals and mining/engineering
International economic relations
As of 31 December 2019, the average tenure on the Board of Directors was six years
5 6 8 8 5
Gareth Peter Penny
2013–present + + +
Andrei Bougrov
2002–present + + +
Sergey Barbashev
2011–present +
Alexey Bashkirov
2013–present + + +
Sergey Bratukhin
2013–present + + + +
Marianna Zakharova
2010–present + +
Roger Munnings
2018–present + +
Stalbek Mishakov
2012–present + + + +
Robert Edwards 2013–present + + +
New Directors after the Annual General Meeting of Shareholders (10 June 2019)
Sergey Volk 2019–present +
Maxim Poletaev 2019–present + +
Vyacheslav Solomin
2019–present + +
Evgeny Shvarts 2019–present + +
Directors before the Annual General Meeting of Shareholders (10 June 2019)
Artem Volynets 2018 + +
Vladislav Soloviev
2008–2011, 2013
+ +
Andrey Likhachev
2018 + +
Maxim Sokov 2008 + + + +
Professional Development Policy for Members of Board of Directors
Thus, as of the end of 2019, 7 out of the 13 Directors, or 53.8%, were independent.
The Board of Directors considered matters of compliance with the independence criteria and assessed the independence of Nornickel’s Directors twice during 2019:
1/ when assessing nominees to the Board of Directors in preparation for the Annual General Meeting of Shareholders
2/ based on their performance as members of the current Board of Directors.
Company overview Strategic report Commodity market overview
Business overview Sustainable development
Corporate governance
Risk report Shareholder information IFRS financial statements AppendixAnnual report 2019
«NORNICKEL»
184 185
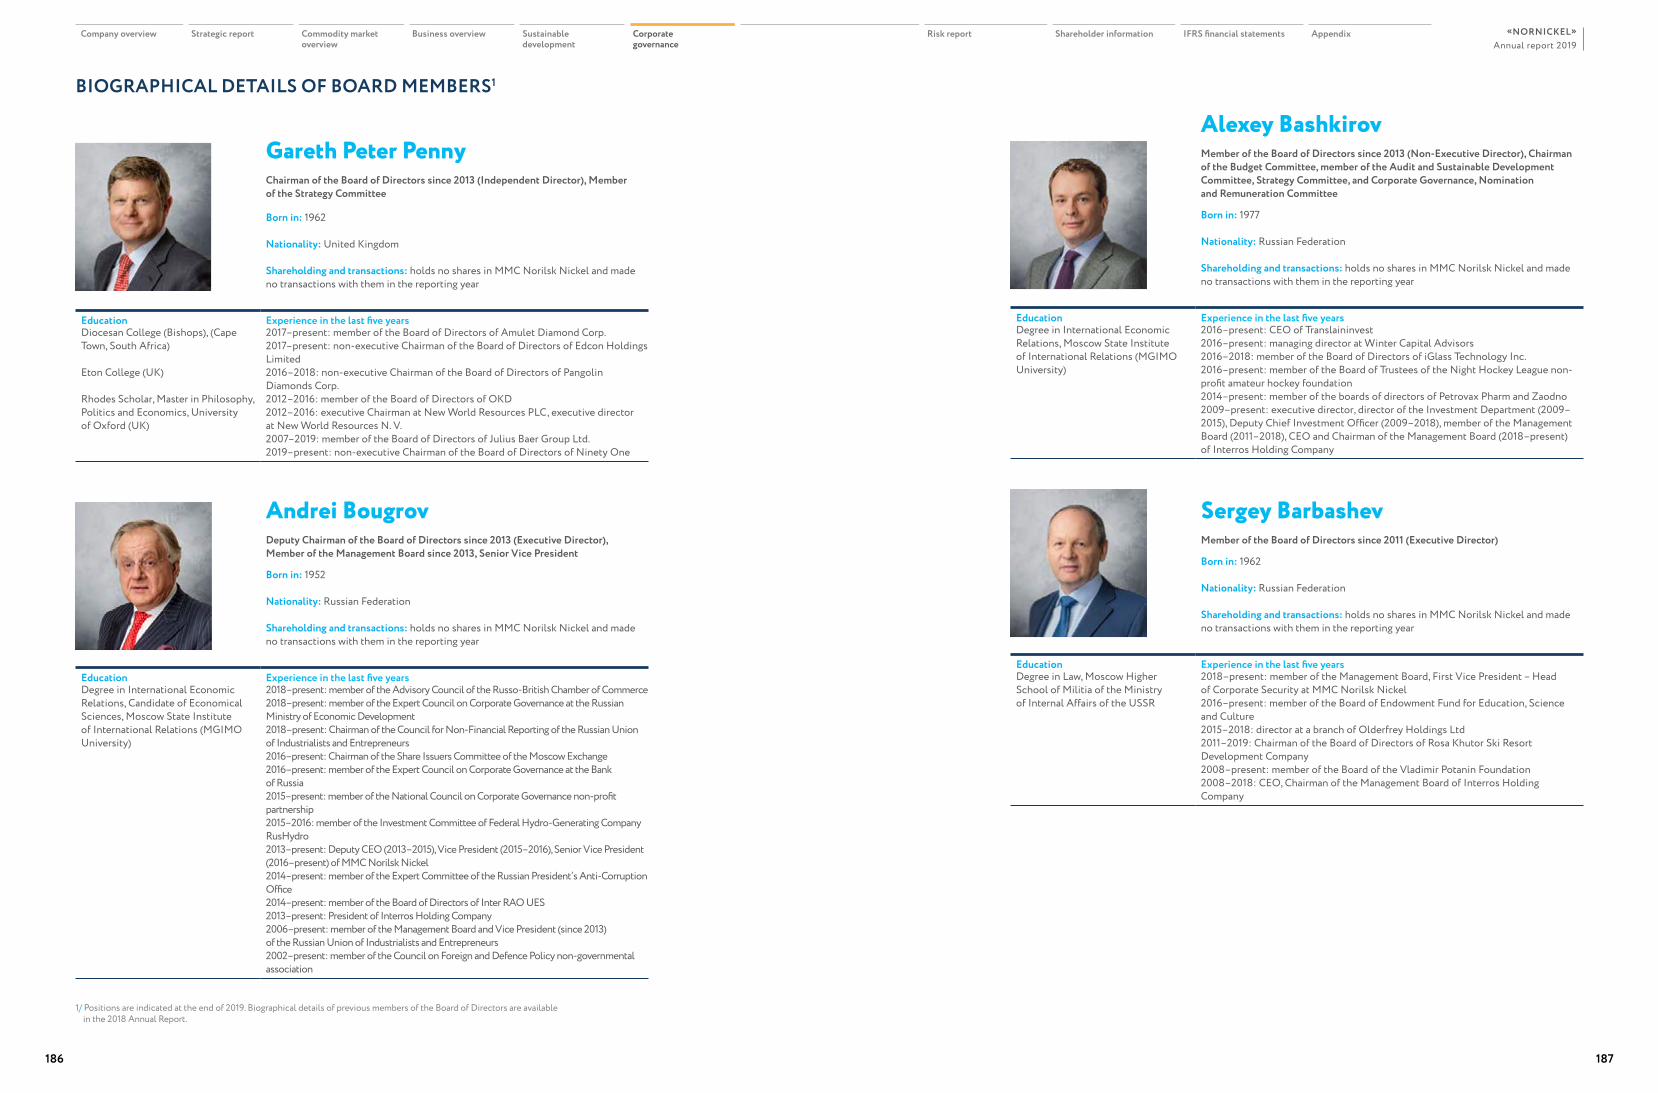
BIOGRAPHICAL DETAILS OF BOARD MEMBERS1
Gareth Peter PennyChairman of the Board of Directors since 2013 (Independent Director), Member of the Strategy Committee
Born in: 1962
Nationality: United Kingdom
Shareholding and transactions: holds no shares in MMC Norilsk Nickel and made no transactions with them in the reporting year
Education Experience in the last five yearsDiocesan College (Bishops), (Cape Town, South Africa)
Eton College (UK)
Rhodes Scholar, Master in Philosophy, Politics and Economics, University of Oxford (UK)
2017–present: member of the Board of Directors of Amulet Diamond Corp.2017–present: non-executive Chairman of the Board of Directors of Edcon Holdings Limited2016–2018: non-executive Chairman of the Board of Directors of Pangolin Diamonds Corp.2012–2016: member of the Board of Directors of OKD2012–2016: executive Chairman at New World Resources PLC, executive director at New World Resources N. V.2007–2019: member of the Board of Directors of Julius Baer Group Ltd.2019–present: non-executive Chairman of the Board of Directors of Ninety One
Sergey BarbashevMember of the Board of Directors since 2011 (Executive Director)
Born in: 1962
Nationality: Russian Federation
Shareholding and transactions: holds no shares in MMC Norilsk Nickel and made no transactions with them in the reporting year
Education Experience in the last five yearsDegree in Law, Moscow Higher School of Militia of the Ministry of Internal Affairs of the USSR
2018–present: member of the Management Board, First Vice President – Head of Corporate Security at MMC Norilsk Nickel2016–present: member of the Board of Endowment Fund for Education, Science and Culture2015–2018: director at a branch of Olderfrey Holdings Ltd2011–2019: Chairman of the Board of Directors of Rosa Khutor Ski Resort Development Company2008–present: member of the Board of the Vladimir Potanin Foundation2008–2018: CEO, Chairman of the Management Board of Interros Holding Company
Alexey BashkirovMember of the Board of Directors since 2013 (Non-Executive Director), Chairman of the Budget Committee, member of the Audit and Sustainable Development Committee, Strategy Committee, and Corporate Governance, Nomination and Remuneration Committee
Born in: 1977
Nationality: Russian Federation
Shareholding and transactions: holds no shares in MMC Norilsk Nickel and made no transactions with them in the reporting year
Education Experience in the last five yearsDegree in International Economic Relations, Moscow State Institute of International Relations (MGIMO University)
2016–present: CEO of Translaininvest2016–present: managing director at Winter Capital Advisors2016–2018: member of the Board of Directors of iGlass Technology Inc.2016–present: member of the Board of Trustees of the Night Hockey League non-profit amateur hockey foundation2014–present: member of the boards of directors of Petrovax Pharm and Zaodno2009–present: executive director, director of the Investment Department (2009–2015), Deputy Chief Investment Officer (2009–2018), member of the Management Board (2011–2018), CEO and Chairman of the Management Board (2018–present) of Interros Holding Company
Andrei BougrovDeputy Chairman of the Board of Directors since 2013 (Executive Director), Member of the Management Board since 2013, Senior Vice President
Born in: 1952
Nationality: Russian Federation
Shareholding and transactions: holds no shares in MMC Norilsk Nickel and made no transactions with them in the reporting year
Education Experience in the last five yearsDegree in International Economic Relations, Candidate of Economical Sciences, Moscow State Institute of International Relations (MGIMO University)
2018–present: member of the Advisory Council of the Russo-British Chamber of Commerce2018–present: member of the Expert Council on Corporate Governance at the Russian Ministry of Economic Development2018–present: Chairman of the Council for Non-Financial Reporting of the Russian Union of Industrialists and Entrepreneurs2016–present: Chairman of the Share Issuers Committee of the Moscow Exchange2016–present: member of the Expert Council on Corporate Governance at the Bank of Russia2015–present: member of the National Council on Corporate Governance non-profit partnership2015–2016: member of the Investment Committee of Federal Hydro-Generating Company RusHydro2013–present: Deputy CEO (2013–2015), Vice President (2015–2016), Senior Vice President (2016–present) of MMC Norilsk Nickel2014–present: member of the Expert Committee of the Russian President’s Anti-Corruption Office2014–present: member of the Board of Directors of Inter RAO UES2013–present: President of Interros Holding Company2006–present: member of the Management Board and Vice President (since 2013) of the Russian Union of Industrialists and Entrepreneurs2002–present: member of the Council on Foreign and Defence Policy non-governmental association
1/ Positions are indicated at the end of 2019. Biographical details of previous members of the Board of Directors are available in the 2018 Annual Report.
Company overview Strategic report Commodity market overview
Business overview Sustainable development
Corporate governance
Risk report Shareholder information IFRS financial statements AppendixAnnual report 2019
«NORNICKEL»
186 187
Sergey BratukhinChairman of the Board of Directors since 2013 (Independent Director), Member of the Corporate Governance, Nomination and Remuneration Committee, Strategy Committee, Budget Committee, and Audit and Sustainable Development Committee
Born in: 1971
Nationality: Russian Federation
Shareholding and transactions: holds no shares in MMC Norilsk Nickel and made no transactions with them in the reporting year
Education Experience in the last five yearsDegree in Engineering, Mendeleev University of Chemical Technology of Russia
Degree in Banking and Insurance, Finance Academy under the Government of the Russian Federation
Degree in Business Management, Warwick Business School
2014–2016: member of the Board of Directors of International Financial Club Bank2011–present: President of CIS Investment Advisers2007–2017: member of the Board of Directors of Dallesprom
Marianna Zakharova Member of the Board of Directors since 2010 (Executive Director), Member of the Management Board since 2016
Born in: 1976
Nationality: Russian Federation
Shareholding and transactions: holds no shares in MMC Norilsk Nickel and made no transactions with them in the reporting year
Education Experience in the last five yearsMaster in Law, Peoples’ Friendship University of Russia (RUDN)
2015–present: First Vice President for Shareholder Relations, Corporate and Legal at MMC Norilsk Nickel2010–2015: member of the Board of Directors of ProfEstate2010–2015: member of the Management Board, Deputy Director for Legal Affairs at Interros Holding Company
Roger Llewelyn MunningsChairman of the Board of Directors since 2018 (Independent Director), Chairman of the Audit and Sustainable Development Committee, member of the Budget Committee
Born in: 1950
Nationality: United Kingdom
Shareholding and transactions: holds no shares in MMC Norilsk Nickel and made no transactions with them in the reporting year
Education Experience in the last five yearsMaster in Politics, Philosophy and Economics (advanced course), University of Oxford (UK)
Fellow of the Institute of Chartered Accountants in England and Wales
2017–present: Director of 3 Lansdown Crescent Limited2017–present: member of the Council of National Representatives (UK) at the Association of European Businesses in Russia2015–present: member of the Board of Directors of LUKOIL2013–present: member of the Board of Trustees of International Business Leaders Forum2013–present: trustee at Kino Klassika Foundation2013–present: member of the National Council on Corporate Governance non-profit partnership2010–present: member of the Board of Directors of Sistema2010–2016: member of the Board of Directors of Wadswick Energy Limited2009–2016: trustee at the John Smith Trust2003–present: member of the Board of Directors, Chairman of the Board of Directors of the Russo-British Chamber of Commerce
Stalbek MishakovMember of the Board of Directors since 2012 (Non-Executive Director), Member of the Corporate Governance, Nomination and Remuneration Committee and Budget Committee
Born in: 1970
Nationality: Russian Federation
Shareholding and transactions: holds no shares in MMC Norilsk Nickel and made no transactions with them in the reporting year
Education Experience in the last five yearsDegree in International Law, Moscow State Institute of International Relations (MGIMO University)
Master of Science, University of Notre Dame (USA)
Candidate of Economic Sciences, Diplomatic Academy of the Russian Ministry of Foreign Affaires
2019–present: function director at RUSAL Management2018–2019: function director at RUSAL Global Management B. V.2013–2018: Deputy CEO at En+ Management2013–2016: member of the Board of Directors of United Company RUSAL PLC2010–2018: advisor to the President of RUSAL Global Management B. V.
Company overview Strategic report Commodity market overview
Business overview Sustainable development
Corporate governance
Risk report Shareholder information IFRS financial statements AppendixAnnual report 2019
«NORNICKEL»
188 189
Evgeny ShvartsMember of the Board of Directors since 2019 (Independent Director), Member of the Strategy Committee of the Board of Directors
Born in: 1958
Nationality: Russian Federation
Shareholding and transactions: holds no shares in MMC Norilsk Nickel and made no transactions with them in the reporting year
Education Experience in the last five yearsDegree in Biology/Zoology and Botanics, Lomonosov Moscow State University
Candidate of Geographical Sciences (Biogeography and Soil Geography), Institute of Geography, Academy of Sciences of the Soviet Union
Doctor of Geographical Sciences (Geoecology), Institute of Geography, Russian Academy of Sciences
2007–2019: director at the Department of Conservation Policy (2007–2016 and 2018–2019), director for Conservation Policy (2016–2018) at the World Wide Fund for Nature1993–present: member of the Board of the Biodiversity Conservation Center charitable foundation
Robert EdwardsChairman of the Board of Directors since 2013 (Independent Director), Chairman of the Corporate Governance, Nomination and Remuneration Committee and Audit and Sustainable Development Committee
Born in: 1966
Nationality: United Kingdom
Shareholding and transactions: holds no shares in MMC Norilsk Nickel and made no transactions with them in the reporting year
Education Experience in the last five yearsDegree in Mining Engineering, Camborne School of Mines (UK)
2018–present: member of the Board of Directors of Scriptfert New Zealand Ltd2018–present: member of the Board of Directors of Chaarat Gold Holdings Ltd2016: Chairman of the Board of Directors of Sierra Rutile Limited (SRX)2014–2018: member of the Board of Directors of GB Minerals Ltd2013–present: head of Highcross Resources Ltd
Maxim PoletaevMember of the Board of Directors since 2019 (Independent Director), Chairman of the Strategy Committee of the Board of Directors, member of the Corporate Governance, Nomination and Remuneration Committee
Born in: 1971
Nationality: Russian Federation
Shareholding and transactions: holds no shares in MMC Norilsk Nickel and made no transactions with them in the reporting year
Education Experience in the last five yearsDegree in Accounting and Business Analysis, P. G. Demidov Yaroslavl State University
2019–present: member of the Board of Directors of United Company RUSAL PLC2019–present: Chairman of the Board of Directors of Fortenova grupa d.d. (Zagreb, Croatia)2018–present: advisor to the President of Sberbank of Russia2013–2018: First Deputy Chairman of the Management Board of Sberbank of Russia
Vyacheslav SolominMember of the Board of Directors since 2019 (Non-Executive Director), Member of the Audit and Sustainable Development Committee of the Board of Directors
Born in: 1975
Nationality: Russian Federation
Shareholding and transactions: holds no shares in MMC Norilsk Nickel and made no transactions with them in the reporting year
Education Experience in the last five yearsDegree in International Economics, Far Eastern Federal University
2018–present: director at En+ Holding Limited and United Company RUSAL PLC2018–present: executive director at En+ Management2014–2018: CEO of EuroSibEnergo2011–present: director at YES Energo Limited
Sergey VolkMember of the Board of Directors since 2019 (Independent Director), Member of the Budget Committee of the Board of Directors
Born in: 1969
Nationality: Ukraine
Shareholding and transactions: holds no shares in MMC Norilsk Nickel and made no transactions with them in the reporting year
Education Experience in the last five yearsMaster of Business Administration (majoring in Finance), University of Texas at Austin (USA)
2019–present: member of the Board of Directors of Fortenova grupa d.d. (Zagreb, Croatia)2018–present: member of the Supervisory Board of Mercator d.d. (Ljubljana, Slovenia)2016–present: senior banker at Sberbank of Russia2013–2016: consulting specialist, business management consultant
Biographical details of previous members of the Board of Directors are available in the 2018 Annual Report.
Company overview Strategic report Commodity market overview
Business overview Sustainable development
Corporate governance
Risk report Shareholder information IFRS financial statements AppendixAnnual report 2019
«NORNICKEL»
190 191
BOARD COMMITTEES
Committees established by Nornickel’s Board of Directors are responsible for preliminary review of key matters and making recommendations to the Board of Directors. To discharge their responsibilities in the most effective way, the committees may consult Nornickel’s governance bodies and seek opinions from independent external consultants. Nornickel has four Board committees, each comprised of five members:• Audit and Sustainable Development Committee• Strategy Committee • Budget Committee• Corporate Governance, Nomination
and Remuneration Committee
AUDIT AND SUSTAINABLE DEVELOPMENT COMMITTEE
Members of the Audit and Sustainable Development Committee are appointed by the Board of Directors. In accordance with its Terms of Reference, the Audit and Sustainable Development Committee of the Board of Directors has five members, all of them independent directors. If it is reasonably impracticable to meet the above requirement, independent directors should make up the majority of Committee members, while the remaining Committee members may include members of the Board of Directors, except for the Company’s CEO and/or members of its Management Board. Only an independent director may chair the Committee.
In accordance with its Terms of Reference, the current Audit and Sustainable Development Committee is made up of five directors, three of whom are independent directors, including its Chairman (i.e. 60% of the Committee members are independent
directors). On average, Committee members have more than 10 years of experience in finance.
In 2019, the Committee held eight meetings, including six in person, and two in absentia.
The Committee discharges its responsibilities by overseeing:• financial reporting• risk management and internal controls• external and internal audit• prevention of wrongdoing by Nornickel
employees and third parties• health, safety, and environment matters.
The Audit and Sustainable Development Committee plays an important role in enabling controls and accountability, and has become an effective interface between the Board of Directors, Audit Commission, independent auditor, Internal Audit Department, and management of Nornickel.
During 2019, the Audit and Sustainable Development Committee prepared for the Board of Directors a number of recommendations on the accuracy, completeness, and reliability of Nornickel’s financial accounts, as well as on health, safety and environment matters, and approval of the Company’s auditors. The Committee also considered and took note of audit reports by the Internal Audit Department and Internal Control Department, Report by Nornickel’s management on adopting a new standard, IFRS 15 Revenue from Contracts with Customers, the Norilsk Nickel Group’s 2018 Sustainability Report, Report on Improvements to Procurement, Corporate Risk Appetite Statement for 2019, and information about the development status of the risk management framework and the implementation status of activities addressing obsolete inventories.
Members of the Audit and Sustainable Development Committee in 2019
Before the Annual General Meeting of Shareholders (before 10 June 2019)
After the Annual General Meeting of Shareholders (after 10 June 2019)
Roger Munnings (Chairman, Independent Director) Roger Munnings (Chairman, Independent Director)
Alexey Bashkirov Alexey Bashkirov
Sergey Bratukhin (Independent Director) Sergey Bratukhin (Independent Director)
Stalbek Mishakov Vyacheslav Solomin
Robert Edwards (Independent Director) Robert Edwards (Independent Director)
Members of the Strategy Committee in 2019
Before the Annual General Meeting of Shareholders (before 10 June 2019)
After the Annual General Meeting of Shareholders (after 10 June 2019)
Maxim Sokov (Chairman) Maxim Poletaev (Chairman, Independent Director)
Alexey Bashkirov Alexey Bashkirov
Sergey Bratukhin (Independent Director) Sergey Bratukhin (Independent Director)
Artem Volynets (Independent Director) Evgeny Shvarts (Independent Director)
Gareth Peter Penny (Independent Director) Gareth Peter Penny (Independent Director)
STRATEGY COMMITTEE
Members of the Committee are appointed by the Board of Directors. In accordance with its Terms of Reference, the Strategy Committee of the Board of Directors has five members, all of them non-executive directors. At least one Committee member must be an independent director. The Committee Chair may serve on other Board committees, but may not chair more than two Committees at a time.
In accordance with its Terms of Reference, the current Strategy Committee is made up of five directors, four of whom are independent directors, including its Chairman (i.e. 80% of the Committee members are independent directors). In 2019, the Committee held seven meetings in person.
The Strategy Committee assists the Board of Directors by pre-reviewing matters related to:• building a sustainability strategy• investment planning and structural changes• engagement with capital markets and government
relations.
In 2019, the Strategy Committee considered matters related to environment, health, safety, and climate change, including the infrastructure development
and energy capacity expansion strategy, as part of building Nornickel’s Environmental Vision. The Strategy Committee’s key areas of focus:• Supporting Nornickel’s Board of Directors
in developing, following up, and adjusting the corporate strategy
• Recommending updates to the strategy
During the year, the Strategy Committee made recommendations to the Board of Directors to inform decision-making on updating Nornickel’s development strategy and a number of functional strategies. The Committee also reviewed the progress and status updates on Nornickel’s major investment projects (including the Bystrinsky project, 3rd Stage of Talnakh Concentrator Upgrade, and the South Cluster), and prepared the Progress Report on Production Reconfiguration, Report on the Comprehensive Insurance Programme (including a review of property insurance quality), and Progress Report on the IT Programme, including progress on the ERP and Technology Breakthrough programmes. The Committee also considered the progress updates on Volta Shared Services Centre and Stable Coin projects. To ensure efficient strategic planning at Nornickel, the Committee reviewed its production report and progress on the programme designed to improve operational efficiency and reduce operating costs.
Status of Board Committee members as of 31 December 2019
65%Independent directors
35%Non-executive directors
Company overview Strategic report Commodity market overview
Business overview Sustainable development
Corporate governance
Risk report Shareholder information IFRS financial statements AppendixAnnual report 2019
«NORNICKEL»
192 193
BUDGET COMMITTEE
Members of the Committee are appointed by the Board of Directors. In accordance with its Terms of Reference, the Budget Committee of the Board of Directors has five members, all of them non-executive directors. At least one Committee member must be an independent director. The Committee Chair may serve on other Board committees, but may not chair more than two Committees at a time.
In accordance with its Terms of Reference, the current Budget Committee is made up of five directors, three of whom are independent
directors (i.e. 60% of the Committee members are independent directors).
In 2019, the Budget Committee focused on making recommendations to the Board of Directors to inform decision-making on the amount of dividends and on the record date to be suggested by the Board of Directors. The Budget Committee also approved and recommended that the Board of Directors approve Nornickel’s 2020 budget.
Members of the Budget Committee in 2019
Before the Annual General Meeting of Shareholders (before 10 June 2019)
After the Annual General Meeting of Shareholders (after 10 June 2019)
Alexey Bashkirov (Chairman) Alexey Bashkirov (Chairman)
Sergey Bratukhin (Independent Director) Sergey Bratukhin (Independent Director)
Artem Volynets (Independent Director) Sergey Volk (Independent Director)
Roger Munnings (Independent Director) Roger Munnings (Independent Director)
Maxim Sokov Stalbek Mishakov
Members of the Corporate Governance, Nomination and Remuneration Committee in 2019
Before the Annual General Meeting of Shareholders (before 10 June 2019)
After the Annual General Meeting of Shareholders (after 10 June 2019)
Sergey Bratukhin (Chairman, Independent Director) Robert Edwards (Chairman, Independent Director)
Alexey Bashkirov Alexey Bashkirov
Stalbek Mishakov Stalbek Mishakov
Andrey Likhachev (Independent Director) Sergey Bratukhin (Independent Director)
Robert Edwards (Independent Director) Maxim Poletaev (Independent Director)
CORPORATE GOVERNANCE, NOMINATION AND REMUNERATION COMMITTEE
Members of the Corporate Governance, Nomination and Remuneration Committee are appointed by Nornickel’s Board of Directors. The Committee has five members in accordance with its Terms of Reference. The Board of Directors, however, may increase the membership of the Committee. The Committee members may only include independent directors. If it is reasonably impracticable to meet the above requirement, independent directors other than the Company’s CEO and/or members of its Management Board should make up the majority of Committee members.
In accordance with its Terms of Reference, the current Budget Committee is made up of five directors, three of whom are independent directors, including
its Chairman (i.e. 60% of the Committee members are independent directors).
The Corporate Governance, Nomination and Remuneration Committee supports the Board of Directors by:• evaluating, overseeing, and improving Nornickel’s
corporate governance framework• ensuring succession planning for Nornickel’s Board
of Directors and Management Board• providing incentives, assessing the performance
of Nornickel’s Board of Directors, Management Board, President, and Corporate Secretary, and setting relevant remuneration policies
• supervising the development and implementation of Nornickel’s information policy.
In the reporting year, the Committee held twelve meetings, including ten in absentia, and two in person.
The Committee made recommendations to the Board of Directors to inform decision-making on convening, preparing, and holding the Annual and Extraordinary General Meetings of Shareholders, and on matters reserved to the General Meeting of Shareholders (remuneration and reimbursement of expenses of members of the Board of Directors and the Audit Commission, and liability insurance and indemnity for members of the Board of Directors and the Management Board).
The Corporate Governance, Nomination and Remuneration Committee advised the Board of Directors on assessment of the Board of Directors’
performance in 2018. The Committee reviewed the updates on the Our Home and My Home programmes, Corporate Social Subsidised Loan Programme, and Nornickel’s Charitable Policy. The Committee also considered an external assessment of the Board of Directors’ performance in 2018, which concluded that the Board of Directors and the Corporate Secretary of Nornickel were effective, and assessed the independence of nominees to the Company’s Board of Directors.
Company overview Strategic report Commodity market overview
Business overview Sustainable development
Corporate governance
Risk report Shareholder information IFRS financial statements AppendixAnnual report 2019
«NORNICKEL»
194 195
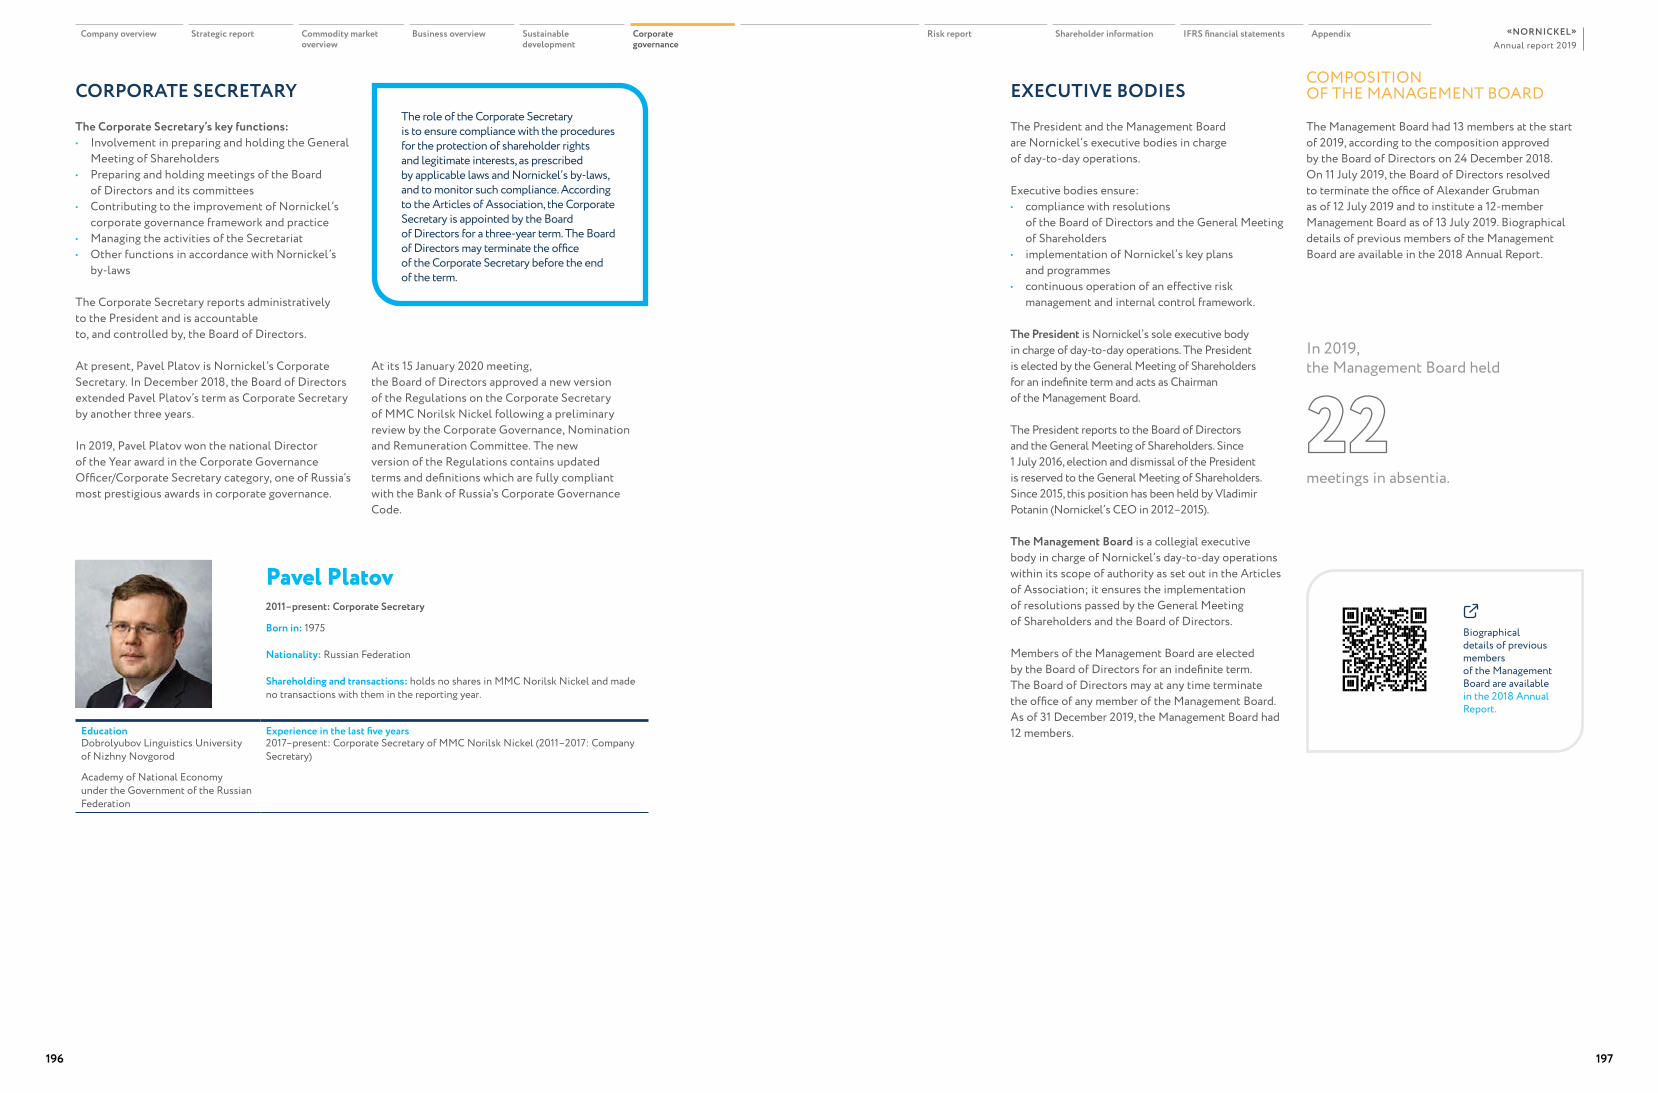
CORPORATE SECRETARY
The Corporate Secretary’s key functions:• Involvement in preparing and holding the General
Meeting of Shareholders• Preparing and holding meetings of the Board
of Directors and its committees• Contributing to the improvement of Nornickel’s
corporate governance framework and practice• Managing the activities of the Secretariat• Other functions in accordance with Nornickel’s
by-laws
The Corporate Secretary reports administratively to the President and is accountable to, and controlled by, the Board of Directors.
At present, Pavel Platov is Nornickel’s Corporate Secretary. In December 2018, the Board of Directors extended Pavel Platov’s term as Corporate Secretary by another three years.
In 2019, Pavel Platov won the national Director of the Year award in the Corporate Governance Officer/Corporate Secretary category, one of Russia’s most prestigious awards in corporate governance.
At its 15 January 2020 meeting, the Board of Directors approved a new version of the Regulations on the Corporate Secretary of MMC Norilsk Nickel following a preliminary review by the Corporate Governance, Nomination and Remuneration Committee. The new version of the Regulations contains updated terms and definitions which are fully compliant with the Bank of Russia’s Corporate Governance Code.
EXECUTIVE BODIES
The President and the Management Board are Nornickel’s executive bodies in charge of day-to-day operations.
Executive bodies ensure:• compliance with resolutions
of the Board of Directors and the General Meeting of Shareholders
• implementation of Nornickel’s key plans and programmes
• continuous operation of an effective risk management and internal control framework.
The President is Nornickel’s sole executive body in charge of day-to-day operations. The President is elected by the General Meeting of Shareholders for an indefinite term and acts as Chairman of the Management Board.
The President reports to the Board of Directors and the General Meeting of Shareholders. Since 1 July 2016, election and dismissal of the President is reserved to the General Meeting of Shareholders. Since 2015, this position has been held by Vladimir Potanin (Nornickel’s CEO in 2012–2015).
The Management Board is a collegial executive body in charge of Nornickel’s day-to-day operations within its scope of authority as set out in the Articles of Association; it ensures the implementation of resolutions passed by the General Meeting of Shareholders and the Board of Directors.
Members of the Management Board are elected by the Board of Directors for an indefinite term. The Board of Directors may at any time terminate the office of any member of the Management Board. As of 31 December 2019, the Management Board had 12 members.
COMPOSITION OF THE MANAGEMENT BOARD
The Management Board had 13 members at the start of 2019, according to the composition approved by the Board of Directors on 24 December 2018. On 11 July 2019, the Board of Directors resolved to terminate the office of Alexander Grubman as of 12 July 2019 and to institute a 12-member Management Board as of 13 July 2019. Biographical details of previous members of the Management Board are available in the 2018 Annual Report.
Biographical details of previous members of the Management Board are available in the 2018 Annual Report.
In 2019, the Management Board held
22meetings in absentia.
Pavel Platov2011–present: Corporate Secretary
Born in: 1975
Nationality: Russian Federation
Shareholding and transactions: holds no shares in MMC Norilsk Nickel and made no transactions with them in the reporting year.
Education Experience in the last five yearsDobrolyubov Linguistics University of Nizhny Novgorod
Academy of National Economy under the Government of the Russian Federation
2017–present: Corporate Secretary of MMC Norilsk Nickel (2011–2017: Company Secretary)
The role of the Corporate Secretary is to ensure compliance with the procedures for the protection of shareholder rights and legitimate interests, as prescribed by applicable laws and Nornickel’s by-laws, and to monitor such compliance. According to the Articles of Association, the Corporate Secretary is appointed by the Board of Directors for a three-year term. The Board of Directors may terminate the office of the Corporate Secretary before the end of the term.
Company overview Strategic report Commodity market overview
Business overview Sustainable development
Corporate governance
Risk report Shareholder information IFRS financial statements AppendixAnnual report 2019
«NORNICKEL»
196 197
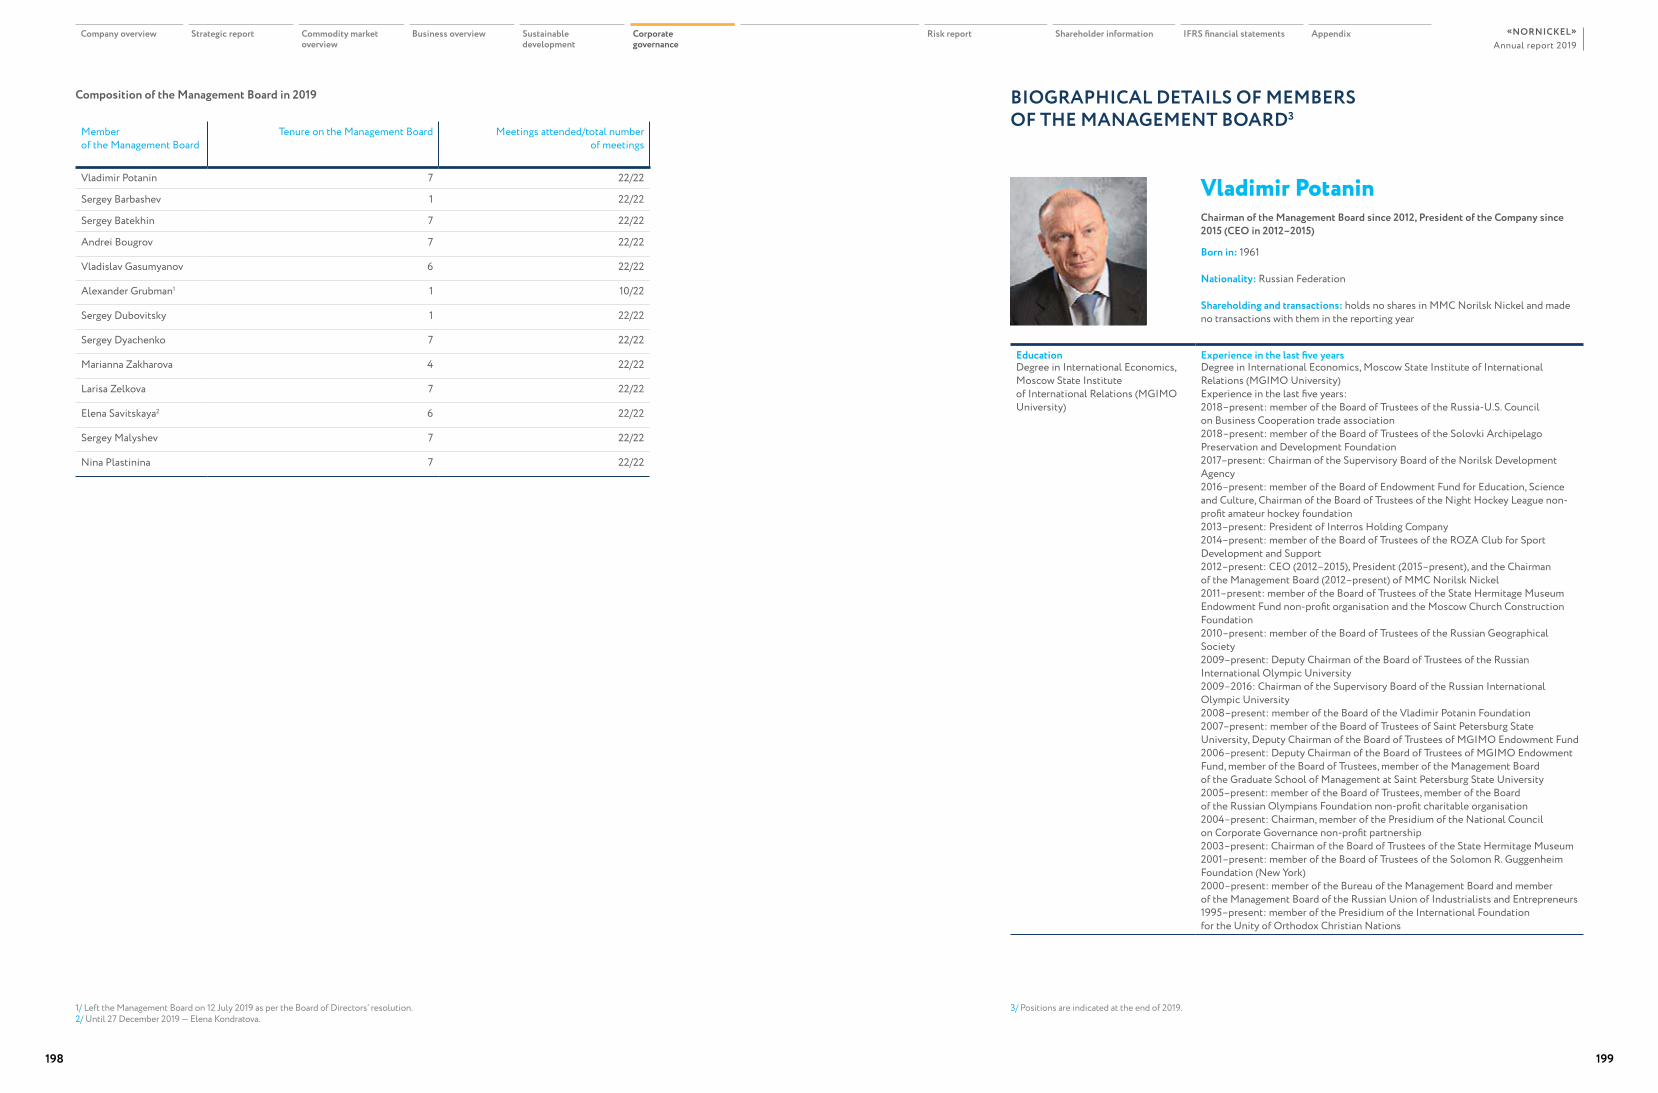
Composition of the Management Board in 2019
Member of the Management Board
Tenure on the Management Board Meetings attended/total number of meetings
Vladimir Potanin 7 22/22
Sergey Barbashev 1 22/22
Sergey Batekhin 7 22/22
Andrei Bougrov 7 22/22
Vladislav Gasumyanov 6 22/22
Alexander Grubman1 1 10/22
Sergey Dubovitsky 1 22/22
Sergey Dyachenko 7 22/22
Marianna Zakharova 4 22/22
Larisa Zelkova 7 22/22
Elena Savitskaya2 6 22/22
Sergey Malyshev 7 22/22
Nina Plastinina 7 22/22
BIOGRAPHICAL DETAILS OF MEMBERS OF THE MANAGEMENT BOARD3
Vladimir PotaninChairman of the Management Board since 2012, President of the Company since 2015 (CEO in 2012–2015)
Born in: 1961
Nationality: Russian Federation
Shareholding and transactions: holds no shares in MMC Norilsk Nickel and made no transactions with them in the reporting year
Education Experience in the last five yearsDegree in International Economics, Moscow State Institute of International Relations (MGIMO University)
Degree in International Economics, Moscow State Institute of International Relations (MGIMO University)Experience in the last five years:2018–present: member of the Board of Trustees of the Russia-U.S. Council on Business Cooperation trade association2018–present: member of the Board of Trustees of the Solovki Archipelago Preservation and Development Foundation2017–present: Chairman of the Supervisory Board of the Norilsk Development Agency2016–present: member of the Board of Endowment Fund for Education, Science and Culture, Chairman of the Board of Trustees of the Night Hockey League non-profit amateur hockey foundation2013–present: President of Interros Holding Company2014–present: member of the Board of Trustees of the ROZA Club for Sport Development and Support2012–present: CEO (2012–2015), President (2015–present), and the Chairman of the Management Board (2012–present) of MMC Norilsk Nickel2011–present: member of the Board of Trustees of the State Hermitage Museum Endowment Fund non-profit organisation and the Moscow Church Construction Foundation2010–present: member of the Board of Trustees of the Russian Geographical Society2009–present: Deputy Chairman of the Board of Trustees of the Russian International Olympic University2009–2016: Chairman of the Supervisory Board of the Russian International Olympic University2008–present: member of the Board of the Vladimir Potanin Foundation2007–present: member of the Board of Trustees of Saint Petersburg State University, Deputy Chairman of the Board of Trustees of MGIMO Endowment Fund2006–present: Deputy Chairman of the Board of Trustees of MGIMO Endowment Fund, member of the Board of Trustees, member of the Management Board of the Graduate School of Management at Saint Petersburg State University2005–present: member of the Board of Trustees, member of the Board of the Russian Olympians Foundation non-profit charitable organisation2004–present: Chairman, member of the Presidium of the National Council on Corporate Governance non-profit partnership2003–present: Chairman of the Board of Trustees of the State Hermitage Museum2001–present: member of the Board of Trustees of the Solomon R. Guggenheim Foundation (New York)2000–present: member of the Bureau of the Management Board and member of the Management Board of the Russian Union of Industrialists and Entrepreneurs1995–present: member of the Presidium of the International Foundation for the Unity of Orthodox Christian Nations
1/ Left the Management Board on 12 July 2019 as per the Board of Directors’ resolution.2/ Until 27 December 2019 — Elena Kondratova.
3/ Positions are indicated at the end of 2019.
Company overview Strategic report Commodity market overview
Business overview Sustainable development
Corporate governance
Risk report Shareholder information IFRS financial statements AppendixAnnual report 2019
«NORNICKEL»
198 199
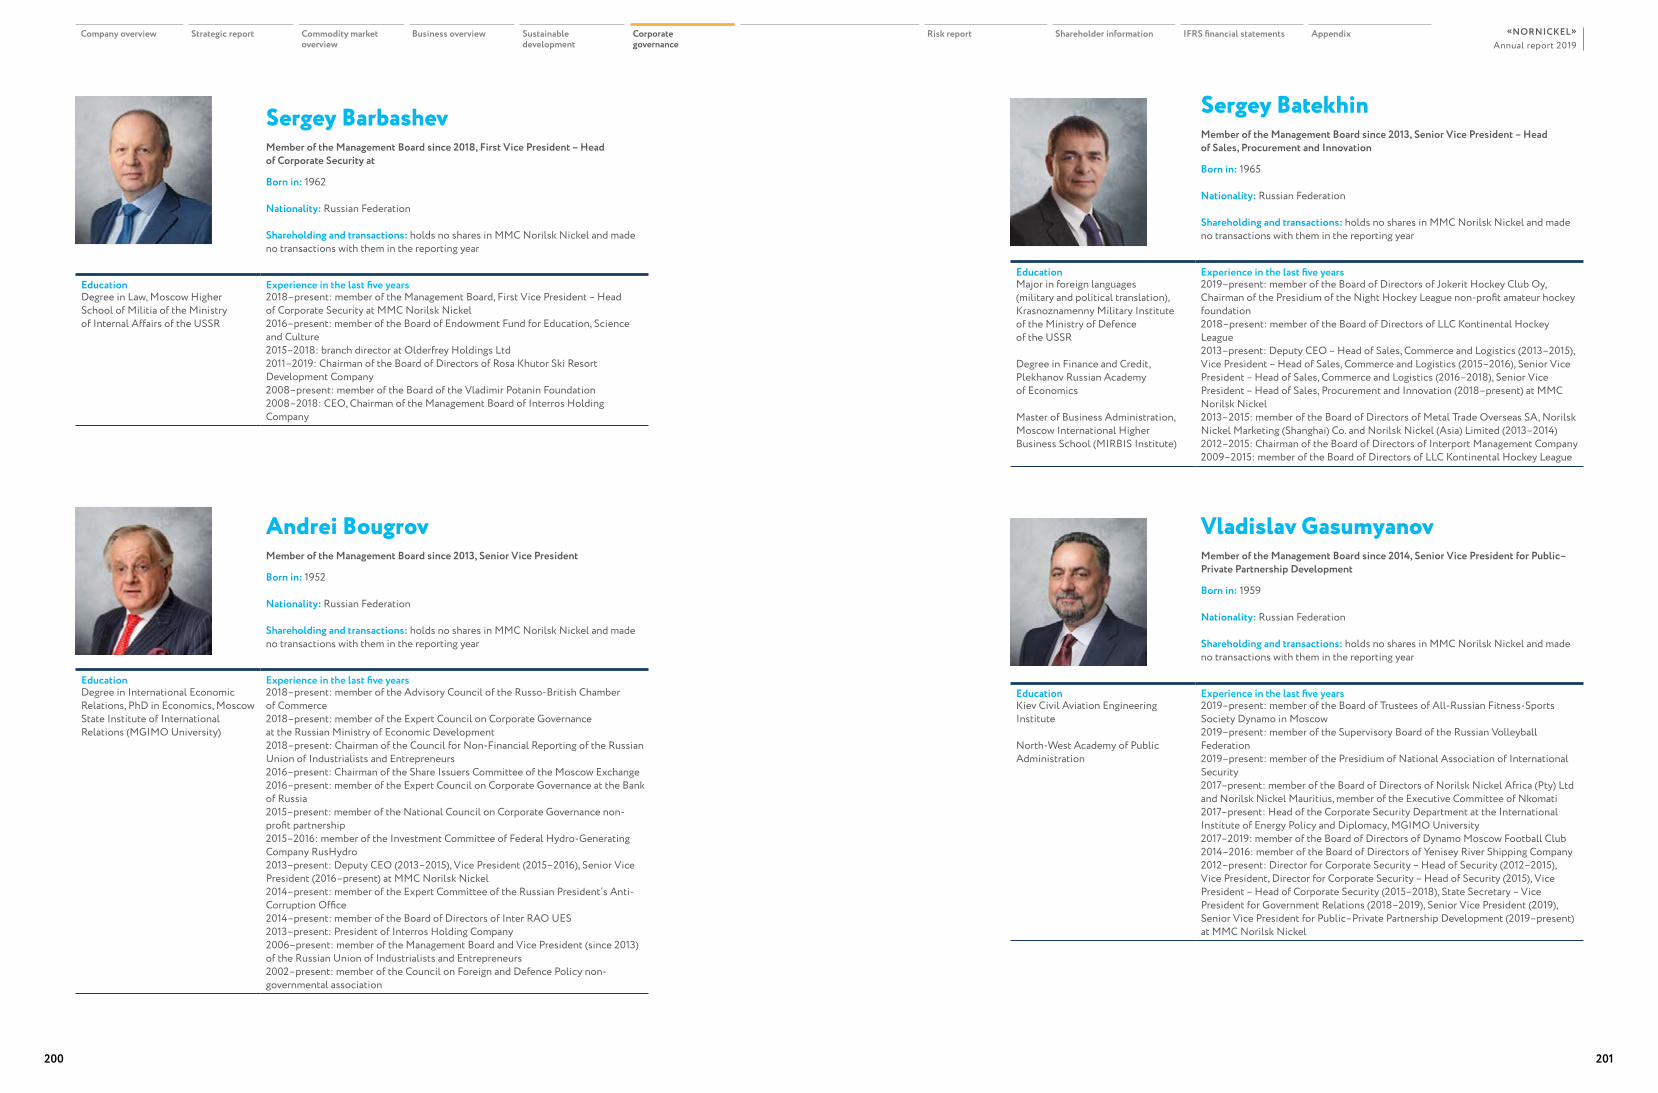
Sergey BarbashevMember of the Management Board since 2018, First Vice President – Head of Corporate Security at
Born in: 1962
Nationality: Russian Federation
Shareholding and transactions: holds no shares in MMC Norilsk Nickel and made no transactions with them in the reporting year
Education Experience in the last five yearsDegree in Law, Moscow Higher School of Militia of the Ministry of Internal Affairs of the USSR
2018–present: member of the Management Board, First Vice President – Head of Corporate Security at MMC Norilsk Nickel2016–present: member of the Board of Endowment Fund for Education, Science and Culture2015–2018: branch director at Olderfrey Holdings Ltd2011–2019: Chairman of the Board of Directors of Rosa Khutor Ski Resort Development Company2008–present: member of the Board of the Vladimir Potanin Foundation2008–2018: CEO, Chairman of the Management Board of Interros Holding Company
Sergey BatekhinMember of the Management Board since 2013, Senior Vice President – Head of Sales, Procurement and Innovation
Born in: 1965
Nationality: Russian Federation
Shareholding and transactions: holds no shares in MMC Norilsk Nickel and made no transactions with them in the reporting year
Education Experience in the last five yearsMajor in foreign languages (military and political translation), Krasnoznamenny Military Institute of the Ministry of Defence of the USSR
Degree in Finance and Credit, Plekhanov Russian Academy of Economics
Master of Business Administration, Moscow International Higher Business School (MIRBIS Institute)
2019–present: member of the Board of Directors of Jokerit Hockey Club Oy, Chairman of the Presidium of the Night Hockey League non-profit amateur hockey foundation2018–present: member of the Board of Directors of LLC Kontinental Hockey League2013–present: Deputy CEO – Head of Sales, Commerce and Logistics (2013–2015), Vice President – Head of Sales, Commerce and Logistics (2015–2016), Senior Vice President – Head of Sales, Commerce and Logistics (2016–2018), Senior Vice President – Head of Sales, Procurement and Innovation (2018–present) at MMC Norilsk Nickel2013–2015: member of the Board of Directors of Metal Trade Overseas SA, Norilsk Nickel Marketing (Shanghai) Co. and Norilsk Nickel (Asia) Limited (2013–2014)2012–2015: Chairman of the Board of Directors of Interport Management Company2009–2015: member of the Board of Directors of LLC Kontinental Hockey League
Vladislav GasumyanovMember of the Management Board since 2014, Senior Vice President for Public–Private Partnership Development
Born in: 1959
Nationality: Russian Federation
Shareholding and transactions: holds no shares in MMC Norilsk Nickel and made no transactions with them in the reporting year
Education Experience in the last five yearsKiev Civil Aviation Engineering Institute
North-West Academy of Public Administration
2019–present: member of the Board of Trustees of All-Russian Fitness-Sports Society Dynamo in Moscow2019–present: member of the Supervisory Board of the Russian Volleyball Federation2019–present: member of the Presidium of National Association of International Security2017–present: member of the Board of Directors of Norilsk Nickel Africa (Pty) Ltd and Norilsk Nickel Mauritius, member of the Executive Committee of Nkomati2017–present: Head of the Corporate Security Department at the International Institute of Energy Policy and Diplomacy, MGIMO University2017–2019: member of the Board of Directors of Dynamo Moscow Football Club2014–2016: member of the Board of Directors of Yenisey River Shipping Company2012–present: Director for Corporate Security – Head of Security (2012–2015), Vice President, Director for Corporate Security – Head of Security (2015), Vice President – Head of Corporate Security (2015–2018), State Secretary – Vice President for Government Relations (2018–2019), Senior Vice President (2019), Senior Vice President for Public–Private Partnership Development (2019–present) at MMC Norilsk Nickel
Andrei BougrovMember of the Management Board since 2013, Senior Vice President
Born in: 1952
Nationality: Russian Federation
Shareholding and transactions: holds no shares in MMC Norilsk Nickel and made no transactions with them in the reporting year
Education Experience in the last five yearsDegree in International Economic Relations, PhD in Economics, Moscow State Institute of International Relations (MGIMO University)
2018–present: member of the Advisory Council of the Russo-British Chamber of Commerce2018–present: member of the Expert Council on Corporate Governance at the Russian Ministry of Economic Development2018–present: Chairman of the Council for Non-Financial Reporting of the Russian Union of Industrialists and Entrepreneurs2016–present: Chairman of the Share Issuers Committee of the Moscow Exchange2016–present: member of the Expert Council on Corporate Governance at the Bank of Russia2015–present: member of the National Council on Corporate Governance non-profit partnership2015–2016: member of the Investment Committee of Federal Hydro-Generating Company RusHydro2013–present: Deputy CEO (2013–2015), Vice President (2015–2016), Senior Vice President (2016–present) at MMC Norilsk Nickel2014–present: member of the Expert Committee of the Russian President’s Anti-Corruption Office2014–present: member of the Board of Directors of Inter RAO UES2013–present: President of Interros Holding Company2006–present: member of the Management Board and Vice President (since 2013) of the Russian Union of Industrialists and Entrepreneurs2002–present: member of the Council on Foreign and Defence Policy non-governmental association
Company overview Strategic report Commodity market overview
Business overview Sustainable development
Corporate governance
Risk report Shareholder information IFRS financial statements AppendixAnnual report 2019
«NORNICKEL»
200 201
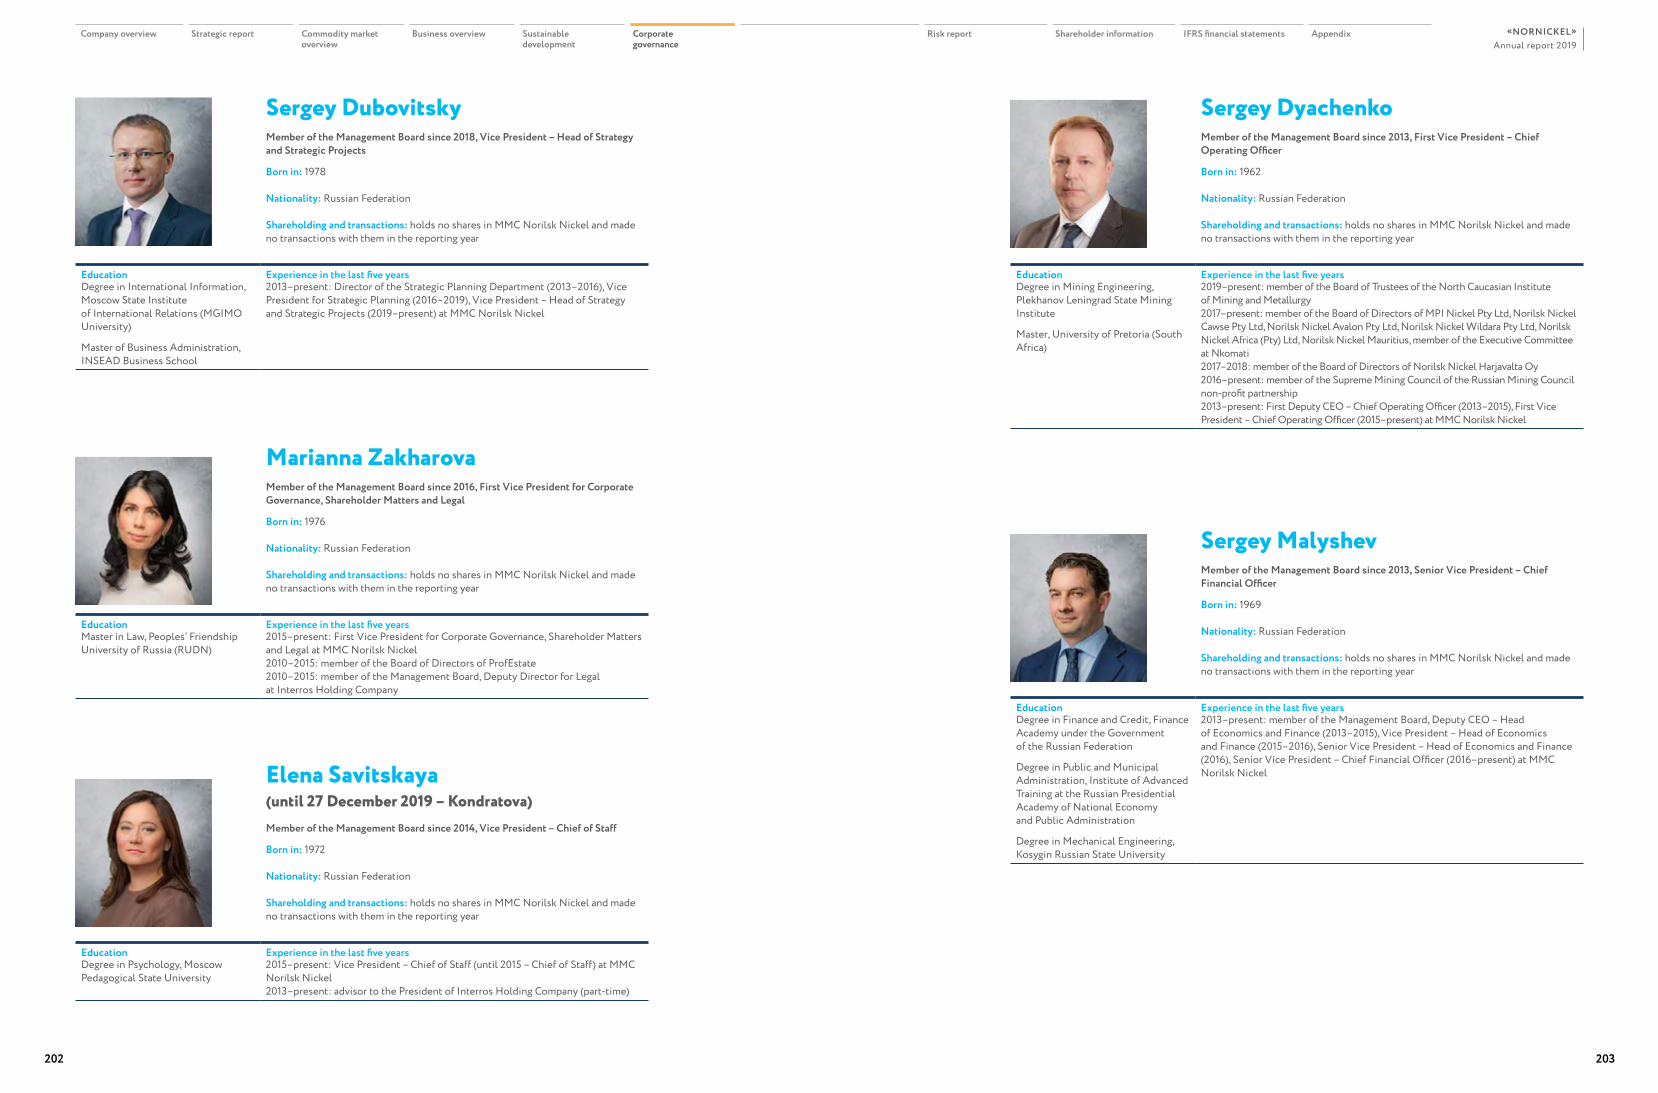
Sergey DubovitskyMember of the Management Board since 2018, Vice President – Head of Strategy and Strategic Projects
Born in: 1978
Nationality: Russian Federation
Shareholding and transactions: holds no shares in MMC Norilsk Nickel and made no transactions with them in the reporting year
Education Experience in the last five yearsDegree in International Information, Moscow State Institute of International Relations (MGIMO University)
Master of Business Administration, INSEAD Business School
2013–present: Director of the Strategic Planning Department (2013–2016), Vice President for Strategic Planning (2016–2019), Vice President – Head of Strategy and Strategic Projects (2019–present) at MMC Norilsk Nickel
Sergey DyachenkoMember of the Management Board since 2013, First Vice President – Chief Operating Officer
Born in: 1962
Nationality: Russian Federation
Shareholding and transactions: holds no shares in MMC Norilsk Nickel and made no transactions with them in the reporting year
Education Experience in the last five yearsDegree in Mining Engineering, Plekhanov Leningrad State Mining Institute
Master, University of Pretoria (South Africa)
2019–present: member of the Board of Trustees of the North Caucasian Institute of Mining and Metallurgy2017–present: member of the Board of Directors of MPI Nickel Pty Ltd, Norilsk Nickel Cawse Pty Ltd, Norilsk Nickel Avalon Pty Ltd, Norilsk Nickel Wildara Pty Ltd, Norilsk Nickel Africa (Pty) Ltd, Norilsk Nickel Mauritius, member of the Executive Committee at Nkomati2017–2018: member of the Board of Directors of Norilsk Nickel Harjavalta Oy2016–present: member of the Supreme Mining Council of the Russian Mining Council non-profit partnership2013–present: First Deputy CEO – Chief Operating Officer (2013–2015), First Vice President – Chief Operating Officer (2015–present) at MMC Norilsk Nickel
Marianna Zakharova Member of the Management Board since 2016, First Vice President for Corporate Governance, Shareholder Matters and Legal
Born in: 1976
Nationality: Russian Federation
Shareholding and transactions: holds no shares in MMC Norilsk Nickel and made no transactions with them in the reporting year
Education Experience in the last five yearsMaster in Law, Peoples’ Friendship University of Russia (RUDN)
2015–present: First Vice President for Corporate Governance, Shareholder Matters and Legal at MMC Norilsk Nickel2010–2015: member of the Board of Directors of ProfEstate2010–2015: member of the Management Board, Deputy Director for Legal at Interros Holding Company
Elena Savitskaya (until 27 December 2019 – Kondratova)Member of the Management Board since 2014, Vice President – Chief of Staff
Born in: 1972
Nationality: Russian Federation
Shareholding and transactions: holds no shares in MMC Norilsk Nickel and made no transactions with them in the reporting year
Education Experience in the last five yearsDegree in Psychology, Moscow Pedagogical State University
2015–present: Vice President – Chief of Staff (until 2015 – Chief of Staff) at MMC Norilsk Nickel 2013–present: advisor to the President of Interros Holding Company (part-time)
Sergey MalyshevMember of the Management Board since 2013, Senior Vice President – Chief Financial Officer
Born in: 1969
Nationality: Russian Federation
Shareholding and transactions: holds no shares in MMC Norilsk Nickel and made no transactions with them in the reporting year
Education Experience in the last five yearsDegree in Finance and Credit, Finance Academy under the Government of the Russian Federation
Degree in Public and Municipal Administration, Institute of Advanced Training at the Russian Presidential Academy of National Economy and Public Administration
Degree in Mechanical Engineering, Kosygin Russian State University
2013–present: member of the Management Board, Deputy CEO – Head of Economics and Finance (2013–2015), Vice President – Head of Economics and Finance (2015–2016), Senior Vice President – Head of Economics and Finance (2016), Senior Vice President – Chief Financial Officer (2016–present) at MMC Norilsk Nickel
Company overview Strategic report Commodity market overview
Business overview Sustainable development
Corporate governance
Risk report Shareholder information IFRS financial statements AppendixAnnual report 2019
«NORNICKEL»
202 203
Nina PlastininaMember of the Management Board since 2013, Vice President – Head of Internal Control and Risk Management
Born in: 1961
Nationality: Russian Federation
Shareholding and transactions: holds no shares in MMC Norilsk Nickel and made no transactions with them in the reporting year
Education Experience in the last five yearsDegree in Mechanical Engineering, Moscow Chemical Machine Building Institute
Post-graduate degree in Economics and Production Management, Bauman Moscow Technical Institute
2013–present: member of the Management Board, Director of the Internal Control Department (2013–2015), Vice President – Head of Internal Audit (2015–2016), Vice President – Head of Internal Control and Risk Management (2016–present) at MMC Norilsk Nickel
Larisa ZelkovaMember of the Management Board since 2013, Senior Vice President – Head of HR, Social Policy and Public Relations
Born in: 1969
Nationality: Russian Federation
Shareholding and transactions: holds no shares in MMC Norilsk Nickel and made no transactions with them in the reporting year
Education Experience in the last five yearsDegree in Journalism, Lomonosov Moscow State University
2019–present: member of the council on the endowment funds for the replenishment of the Tretyakov Gallery’s collection and development of its small museums2017–present: member of the Supervisory Board, member of the Management Board of the Norilsk Development Agency2016–present: member of the Board of Trustees of Endowment Fund for Education, Science and Culture2015–present: member of the Board of Trustees of the Hermitage Foundation UK, member of the Board of Trustees of the Russian Academy of Education2014 – present: Chairwoman of the Board, President (2014–2018) of the Vladimir Potanin Foundation 2013–present: member of the Management Board, Deputy CEO for Social Policy and Public Relations (2013–2015), Vice President – Head of HR, Social Policy and Public Relations (2015–2016), Senior Vice President – Head of HR, Social Policy and Public Relations (2016–present) at MMC Norilsk Nickel2012–2018: member of the Russian Presidential Council for Culture and Art2011–2016: member of the Supervisory Board of the Russian International Olympic University2011–present: member of the Board of Directors of Rosa Khutor Ski Resort Development Company, Chairwoman of the Management Board of the State Hermitage Museum Endowment Fund2009–present: member of the Board of Trustees of the Pavlovsk Gymnasium private autonomous non-profit organisation2007–present: member of the Presidium of MGIMO Endowment Fund
REMUNERATIONThe Board of Directors directly supervises the remuneration framework at Nornickel. The Corporate Governance, Nomination and Remuneration Committee of the Board of Directors is responsible for:• developing the Remuneration Policy
for Members of the Board of Directors, Members of the Management Board, and the President of Nornickel
• overseeing the implementation and execution of the Policy
• reviewing the Policy on a regular basis.
Nornickel does not issue loans to members of the Board of Directors and the Management Board but encourages them to invest in Nornickel shares.
Remuneration paid to members of Nornickel’s governance bodies in 2019 totalled RUB 6.3 bn (USD 97.0 mln), including salaries, bonuses, commissions, benefits, and reimbursed expenses)1.
DIRECTORS’ REMUNERATION
Under Paragraph 2, Article 64 of the Federal Law On Joint Stock Companies and Clause 8.8. of Nornickel’s Articles of Association, members of the Board of Directors may be paid remuneration and/or reimbursed for expenses incurred by them in performing their duties as members of the Board of Directors, subject to a resolution by the General Meeting of Shareholders. Nornickel also insures third-party liability of members of the Board of Directors related to their roles. Agreements can be signed with members of the Board of Directors
1/ The amount of remuneration paid does not include the remuneration accrued but not yet paid as of 31 December 2019, as well insurance premiums and voluntary health insurance (VHI) contributions. Adding the amounts above, remuneration of members of Nornickel’s governance bodies for 2019 as per the 2019 consolidated IFRS financial statements totalled RUB 8.7 bn (USD 134 mln).
to reimburse them for expenses incurred by them in performing their duties as members of the Board of Directors.
The Board of Directors’ annual remuneration is set out in the Remuneration Policy for Members of the Board of Directors approved by the General Meeting of Shareholders in June 2014. The Policy was adopted to attract and properly incentivise top talent with required skill sets and experience to serve on the Board of Directors. The Policy also provides for presenting shareholders with a full report on all components of the remuneration payable to members of the Board of Directors and for facilitating long-term sustainability at Nornickel. The Corporate Governance, Nomination and Remuneration Committee of the Board of Directors reviews the Policy for consistency with stated objectives and best practices in corporate governance. If the Policy needs revision, the relevant changes are submitted to Nornickel’s General Meeting of Shareholders for approval. The Policy was not updated in 2019, and is not planned to be updated in 2020.
The Remuneration Policy for Members of the Board of Directors
Company overview Strategic report Commodity market overview
Business overview Sustainable development
Corporate governance
Risk report Shareholder information IFRS financial statements AppendixAnnual report 2019
«NORNICKEL»
204 205
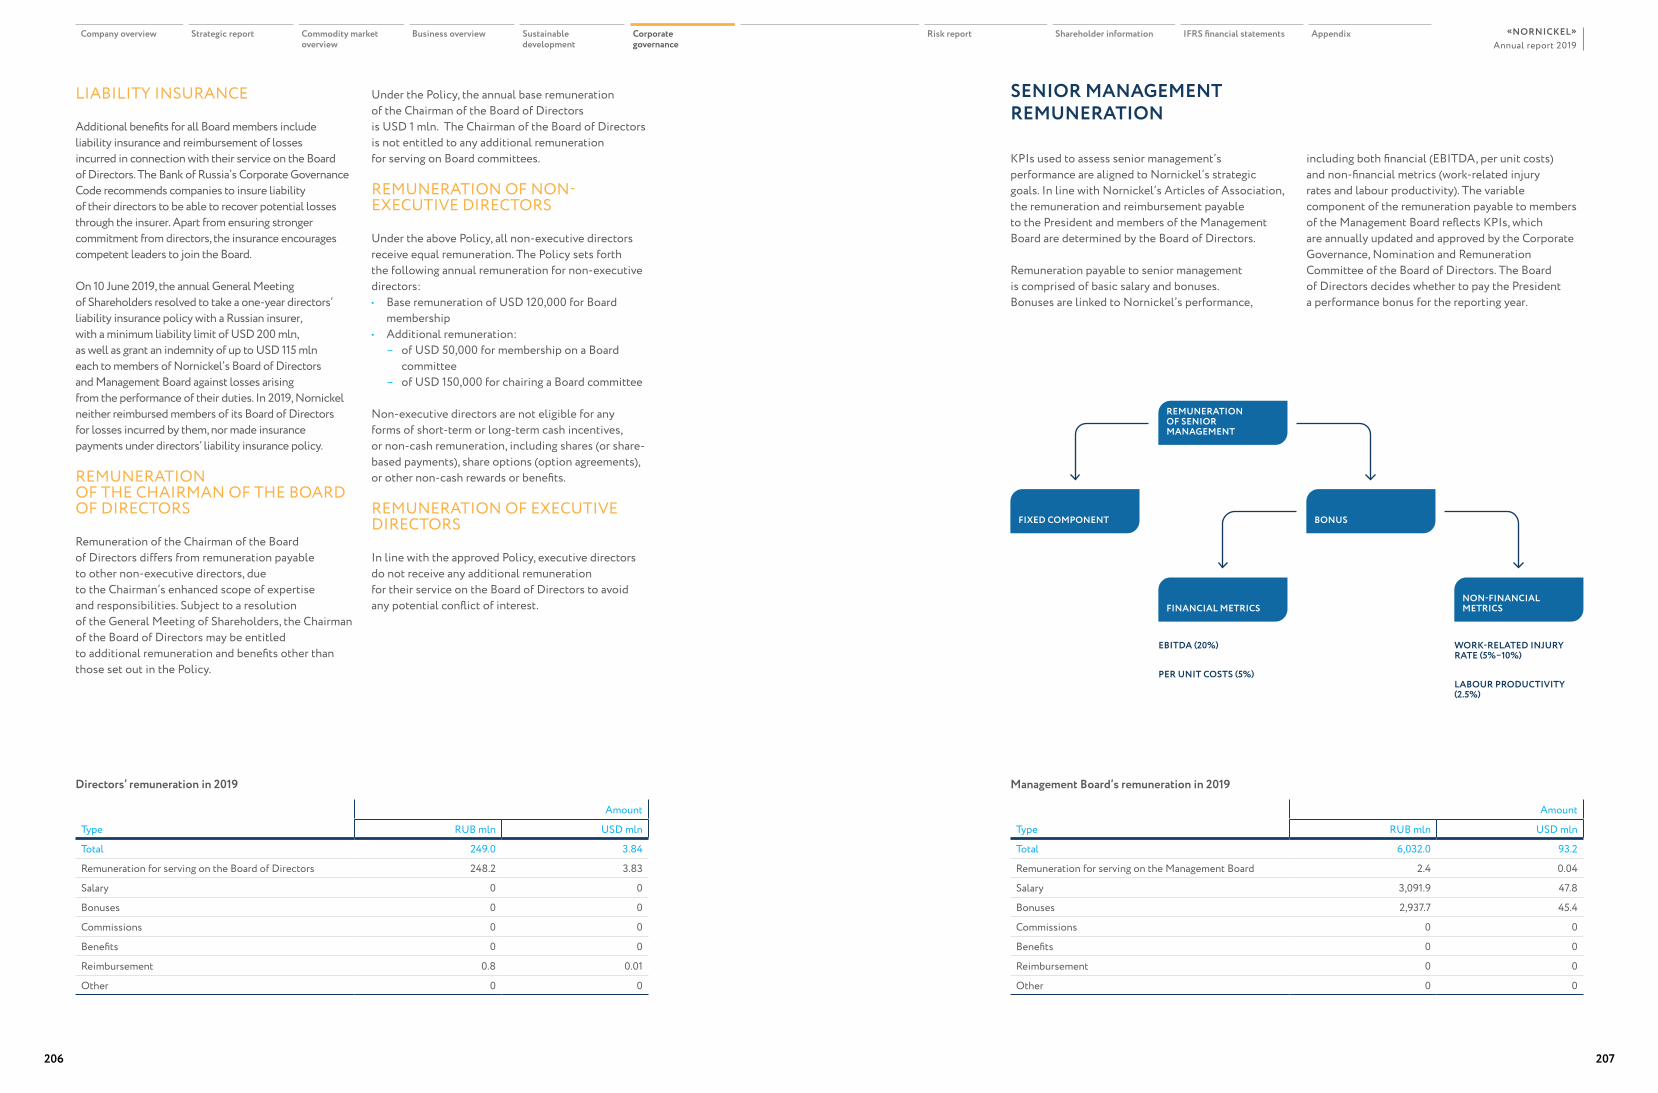
LIABILITY INSURANCE
Additional benefits for all Board members include liability insurance and reimbursement of losses incurred in connection with their service on the Board of Directors. The Bank of Russia’s Corporate Governance Code recommends companies to insure liability of their directors to be able to recover potential losses through the insurer. Apart from ensuring stronger commitment from directors, the insurance encourages competent leaders to join the Board.
On 10 June 2019, the annual General Meeting of Shareholders resolved to take a one-year directors’ liability insurance policy with a Russian insurer, with a minimum liability limit of USD 200 mln, as well as grant an indemnity of up to USD 115 mln each to members of Nornickel’s Board of Directors and Management Board against losses arising from the performance of their duties. In 2019, Nornickel neither reimbursed members of its Board of Directors for losses incurred by them, nor made insurance payments under directors’ liability insurance policy.
REMUNERATION OF THE CHAIRMAN OF THE BOARD OF DIRECTORS
Remuneration of the Chairman of the Board of Directors differs from remuneration payable to other non-executive directors, due to the Chairman’s enhanced scope of expertise and responsibilities. Subject to a resolution of the General Meeting of Shareholders, the Chairman of the Board of Directors may be entitled to additional remuneration and benefits other than those set out in the Policy.
Under the Policy, the annual base remuneration of the Chairman of the Board of Directors is USD 1 mln. The Chairman of the Board of Directors is not entitled to any additional remuneration for serving on Board committees.
REMUNERATION OF NON-EXECUTIVE DIRECTORS
Under the above Policy, all non-executive directors receive equal remuneration. The Policy sets forth the following annual remuneration for non-executive directors:• Base remuneration of USD 120,000 for Board
membership • Additional remuneration:
– of USD 50,000 for membership on a Board committee
– of USD 150,000 for chairing a Board committee
Non-executive directors are not eligible for any forms of short-term or long-term cash incentives, or non-cash remuneration, including shares (or share-based payments), share options (option agreements), or other non-cash rewards or benefits.
REMUNERATION OF EXECUTIVE DIRECTORS
In line with the approved Policy, executive directors do not receive any additional remuneration for their service on the Board of Directors to avoid any potential conflict of interest.
SENIOR MANAGEMENT REMUNERATION
KPIs used to assess senior management’s performance are aligned to Nornickel’s strategic goals. In line with Nornickel’s Articles of Association, the remuneration and reimbursement payable to the President and members of the Management Board are determined by the Board of Directors.
Remuneration payable to senior management is comprised of basic salary and bonuses. Bonuses are linked to Nornickel’s performance,
including both financial (EBITDA, per unit costs) and non-financial metrics (work-related injury rates and labour productivity). The variable component of the remuneration payable to members of the Management Board reflects KPIs, which are annually updated and approved by the Corporate Governance, Nomination and Remuneration Committee of the Board of Directors. The Board of Directors decides whether to pay the President a performance bonus for the reporting year.
Directors’ remuneration in 2019
Type
Amount
RUB mln USD mln
Total 249.0 3.84
Remuneration for serving on the Board of Directors 248.2 3.83
Salary 0 0
Bonuses 0 0
Commissions 0 0
Benefits 0 0
Reimbursement 0.8 0.01
Other 0 0
Management Board’s remuneration in 2019
Type
Amount
RUB mln USD mln
Total 6,032.0 93.2
Remuneration for serving on the Management Board 2.4 0.04
Salary 3,091.9 47.8
Bonuses 2,937.7 45.4
Commissions 0 0
Benefits 0 0
Reimbursement 0 0
Other 0 0
FINANCIAL METRICS
FIXED COMPONENT
REMUNERATION OF SENIOR MANAGEMENT
BONUS
NON-FINANCIAL METRICS
EBITDA (20%)
PER UNIT COSTS (5%)
WORK-RELATED INJURY RATE (5%–10%)
LABOUR PRODUCTIVITY (2.5%)
Company overview Strategic report Commodity market overview
Business overview Sustainable development
Corporate governance
Risk report Shareholder information IFRS financial statements AppendixAnnual report 2019
«NORNICKEL»
206 207
INTERNAL CONTROL
In addition to the risk management framework (RMF) detailed in the Risk Management section of this Report, Nornickel also has in place an internal control framework (ICF) covering key business processes and all management levels across the Group.The ICF is aimed at improving operational effectiveness and efficiency, keeping reliable and accurate financial and management accounts, and ensuring compliance with the requirements of Russian laws and Nornickel’s by-laws.Nornickel has the Internal Control Policy adopted by resolution of the Board of Directors in October 2018. In addition, internal control requirements, procedures, and processes are set forth in the Procedure for Internal Control Processes as well as in regulations on business units and other guidelines.The internal control entities are structured into a multi-level hierarchy comprising Nornickel’s and subsidiaries’ governance bodies, business units and employees as well as the following dedicated control bodies:1/ Audit and Sustainable Development Committee2/ Internal Audit Department3/ Audit Commission4/ Internal Control and Risk Management, comprising
the Internal Control Department, Financial Control Service, and the Risk Management Service.
The performance of ICF elements is evaluated annually as part of a financial statement audit and ICF self-assessment. Reports containing the ICF evaluation results are reviewed by Nornickel’s management and the Audit and Sustainable Development Committee of the Board of Directors.
The Financial Control Service audits financial and business operations of Nornickel and its subsidiaries to make updates and recommendations for the President and members of the Board of Directors. The Head of the Financial Control Service is appointed by resolution of the Board of Directors.
INTERNAL AUDIT FUNCTIONS
The Internal Audit Department was established to assist the Board of Directors and executive bodies in enhancing Nornickel’s management efficiency and improving its financial and business operations through a systematic and consistent approach to the analysis and evaluation of risk management and internal controls as tools providing reasonable assurance that Nornickel will achieve its goals.
The Internal Audit Department conducts objective and independent audits to assess the effectiveness of the internal controls and the risk management framework. Based on the audits, the Department prepares reports and proposals for management on how to improve internal controls, and monitors the development of remedial action plans. In order to ensure independence and objectivity, the Internal Audit Department functionally reports to the Board of Directors through the Audit and Sustainable Development Committee and has an administrative reporting line to Nornickel’s President.
In 2019, the Audit and Sustainable Development Committee:• reviewed the annual audit plan, and internal audit
development plans• reviewed bonus-related performance targets (KPI
scorecards) of the Internal Audit Department Director
• discussed the results of completed audits, including gaps identified and remedial actions designed by management to improve internal controls and minimise risks.
In 2019, the Board Audit and Sustainable Development Committee also reviewed performance assessment reports on internal controls and the risk management framework, as well as performance reports of the Internal Audit Department, concluding it was effective.
CONTROL SYSTEM
INTERNAL CONTROL FUNCTIONS
Internal control aims to build an effective internal control framework as a totality of organisational measures, policies and guidelines, control procedures, corporate culture standards and activities of the internal control entities to provide reasonable assurance that Nornickel will achieve its goals. This includes the following activities:• Development and improvement of the robust ICF• Ensuring a consistent approach to the design,
operation, and development of the ICF• Identification and prevention of any waste,
misuse, or embezzlement of funds or property of the Company or its subsidiaries
• Ensuring accuracy of metrics and measurement standards for the control and accounting of metal-bearing products
• Arranging and implementing internal controls to combat money laundering and financing of terrorism
• Managing the Corporate Trust Service speak-up programme
The Internal Audit Department continuously monitors the implementation of initiatives developed by management. The Department’s monitoring covered 263 initiatives of 2019, with the resulting insights regularly reviewed by the Audit and Sustainable Development Committee.
Corporate Risk Management Framework and Internal Control Framework. The frameworks were assessed according to the guidelines approved by the Board of Directors in 2018. The review concluded that the Corporate Risk Management Framework and Internal Control Framework remain effective overall, with some minor improvements required.
In 2019, the Internal Audit Department conducted a total of 21 audits of production-related business processes, as well as corporate governance, IT management, and project management processes at Nornickel.
In line with the functional development plan, the Internal Audit Department oversees the deployment of the SAP Audit Management system at Nornickel. The project was piloted in December 2019, and will enhance the effectiveness of audit through automating standard procedures for planning, auditing, reporting, and making and following up recommendations. It will also ensure the management of databases on controls and risks for internal audit.
Company overview Strategic report Commodity market overview
Business overview Sustainable development
Corporate governance
Risk report Shareholder information IFRS financial statements AppendixAnnual report 2019
«NORNICKEL»
208 209
AUDIT COMMISSION
The Audit Commission is Nornickel’s standing internal control body that monitors its financial and business operations. The activities of the Audit Commission are guided by Russian laws, Nornickel’s Articles of Association, and Regulations on the Audit Commission. The Commission audits Nornickel’s financial and business operations following the end of its fiscal year and at any time as decided by the Commission, the General Meeting of Shareholders, or the Board of Directors, or as requested by shareholders who hold collectively at least 10% of voting shares in Nornickel. The Audit Commission works in the shareholders’ interests and reports to the General Meeting of Shareholders, which elects members of the Audit Commission to hold office until the next Annual General Meeting of Shareholders. The Audit Commission is independent from the officers of Nornickel’s governance bodies, and its members do not serve on the Company’s governance bodies.
In 2019, the Audit Commission audited Nornickel’s business operations for 2018, with the auditors’ report presented to the shareholders as part of materials for the Annual General Meeting of Shareholders. Nornickel’s business operations for 2019 will be audited in 2020, with the audit findings to be presented to shareholders during the preparation for the Annual General Meeting of Shareholders reviewing the FY 2019 performance.
The following members were elected to the Audit Commission at the Annual General Meeting
Members of the Audit Commission from 10 June 2019
Name Primary employment and position
Alexey Dzybalov Analyst, United Company RUSAL PLC
Anna Masalova Chief Financial Officer, Moscow–McDonalds CJSC
Georgy Svanidze Head of the Financial Department, Member of the Management Board at Interros Holding Company
Vladimir Shilkov Chief Investment Officer at CIS Investment Advisers, Deputy Project Manager of the Financial Control Service at MMC Norilsk Nickel
Elena Yanevitch CEO of Interpromleasing
of Shareholders on 10 June 2019.Alexey Dzybalov, Georgy Svanidze, and Vladimir Shilkov were nominated to the Commission by Nornickel shareholders, while Anna Masalova and Elena Yanevitch were nominated by the Board of Directors.
Alexey Dzybalov replaced Artur Arustamov as a new member of the Audit Commission elected by the 2019 Annual General Meeting of Shareholders. Other members were reelected to the Audit Commission. The elected members of the Audit Commission have the necessary business experience and expertise in accounting, finance, and control to contribute to the Commission’s effectiveness and its objectives.
Remuneration payable to members of the Audit Commission who are not Nornickel employees was approved by the Annual General Meeting of Shareholders on 10 June 2019. Members who are Nornickel employees are remunerated for performing their roles under their employment contracts.
Regulations on the Audit Commission
Anti-Corruption Policy
MANAGING CONFLICTS OF INTEREST
Timely prevention and management of conflicts of interest are central to anti-corruption. Conflicts of interest are addressed and managed in line with the Regulations on the Prevention and Management of Conflicts of Interest. As part of the Regulations, Nornickel has approved the standard conflict of interest reporting form to be filled in by candidates applying for vacant positions at Nornickel or by its employees as required. The Regulations apply to all employees of the Company and outline key principles, which include the obligation of each employee to disclose any conflict of interest, as well as non-retaliation for reporting them.
For more details on managing conflicts of interest related to members of the Board of Directors and senior management, please see the Corporate Governance Framework section.
111USD 000’ Remuneration paid to members of the Audit Commission in 2019
COMPLIANCE
Anti-corruption
Nornickel complies with anti-corruption laws of the Russian Federation and other countries in which it operates, as well as any applicable international laws and Nornickel’s own by-laws. This commitment enhances Nornickel’s reputation and boosts trust and confidence among our shareholders, investors, business partners, and other stakeholders.
Nornickel openly declares its zero tolerance to corruption in any form or manifestation. Members of Nornickel’s Board of Directors/Management Board and senior management role model a zero-tolerance approach to corruption in any form or manifestation at all levels across the organisation. In addition, facilitation payments and political contributions to obtain or reward the retention of a business advantage are strictly prohibited by Nornickel’s policy. Nornickel will not tolerate any retaliation
against an employee who reports a concern about suspected bribery or corruption, or refuses to accept or offer a bribe, facilitate bribery, or take part in any other corrupt activities, even if their refusal to do so has resulted in a lost opportunity or a failure to obtain a business or competitive advantage for Nornickel.
The corporate Anti-Corruption Policy is Nornickel’s key anti-corruption document, setting out the main objectives, principles, and scope of anti-corruption efforts.
As part of its anti-corruption efforts, Nornickel has developed and approved the following anti-corruption policies:• Code of Business Ethics• Code of Conduct and Business Ethics for Members
of the Board of Directors• Anti-Corruption Policy• Regulations on the Product Procurement
Procedure for Norilsk Nickel Group Enterprises• Standard anti-corruption agreement – an appendix
to the employment contract• Regulations on Information Security• Regulations on the Prevention and Management
of Conflicts of Interest• Regulations on Business Gifts• Procedure for Anti-Corruption Due Diligence
of Internal Documents by the Head Office of MMC Norilsk Nickel
• Regulations on the Conflict of Interest Commission
• Regulations on the Information Policy
Having joined the Russian Anti-Corruption Charter for Business, Nornickel is implementing a range of dedicated anti-corruption measures based on the Charter and set forth in Nornickel’s Anti-Corruption Policy. In November 2016, Nornickel joined the United Nations Global Compact, which seeks to encourage businesses around the world to recognise and adopt the ten universal principles in the areas of human rights, labour, environment, and anti-corruption.
Company overview Strategic report Commodity market overview
Business overview Sustainable development
Corporate governance
Risk report Shareholder information IFRS financial statements AppendixAnnual report 2019
«NORNICKEL»
210 211
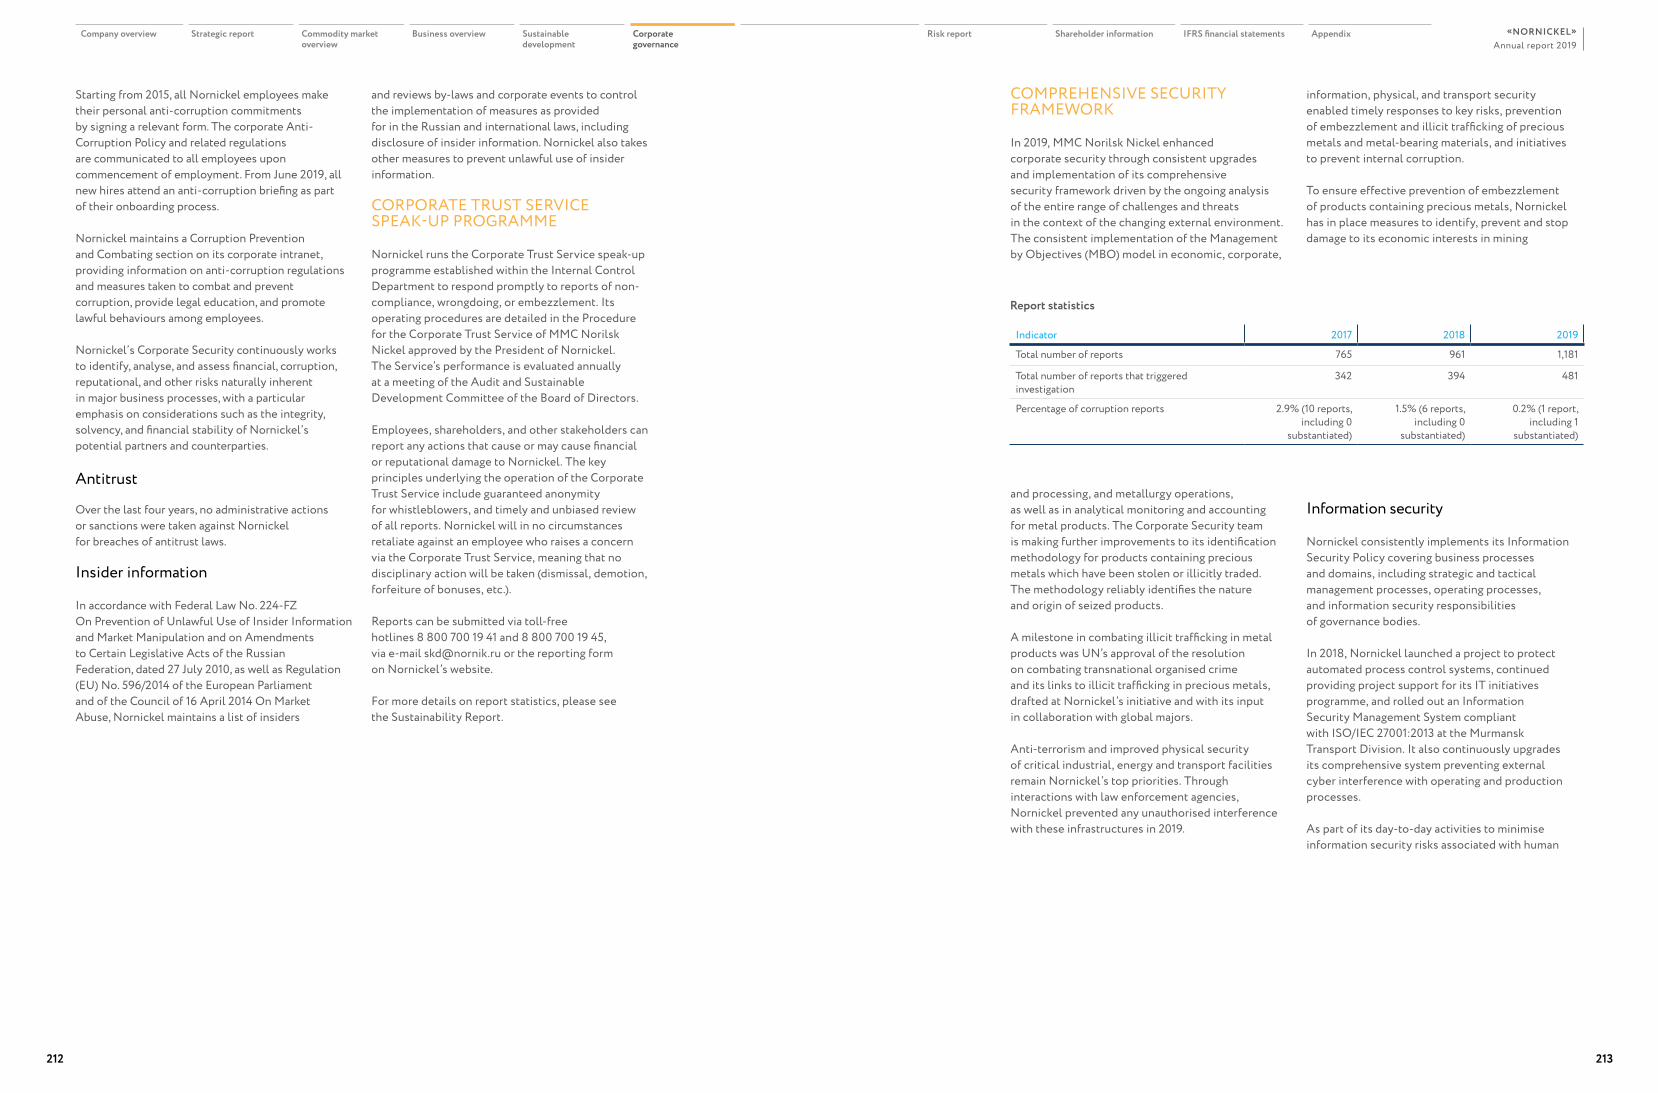
Starting from 2015, all Nornickel employees make their personal anti-corruption commitments by signing a relevant form. The corporate Anti-Corruption Policy and related regulations are communicated to all employees upon commencement of employment. From June 2019, all new hires attend an anti-corruption briefing as part of their onboarding process.
Nornickel maintains a Corruption Prevention and Combating section on its corporate intranet, providing information on anti-corruption regulations and measures taken to combat and prevent corruption, provide legal education, and promote lawful behaviours among employees.
Nornickel’s Corporate Security continuously works to identify, analyse, and assess financial, corruption, reputational, and other risks naturally inherent in major business processes, with a particular emphasis on considerations such as the integrity, solvency, and financial stability of Nornickel’s potential partners and counterparties.
Antitrust
Over the last four years, no administrative actions or sanctions were taken against Nornickel for breaches of antitrust laws.
Insider information
In accordance with Federal Law No. 224-FZ On Prevention of Unlawful Use of Insider Information and Market Manipulation and on Amendments to Certain Legislative Acts of the Russian Federation, dated 27 July 2010, as well as Regulation (EU) No. 596/2014 of the European Parliament and of the Council of 16 April 2014 On Market Abuse, Nornickel maintains a list of insiders
and reviews by-laws and corporate events to control the implementation of measures as provided for in the Russian and international laws, including disclosure of insider information. Nornickel also takes other measures to prevent unlawful use of insider information.
CORPORATE TRUST SERVICE SPEAK-UP PROGRAMME
Nornickel runs the Corporate Trust Service speak-up programme established within the Internal Control Department to respond promptly to reports of non-compliance, wrongdoing, or embezzlement. Its operating procedures are detailed in the Procedure for the Corporate Trust Service of MMC Norilsk Nickel approved by the President of Nornickel. The Service’s performance is evaluated annually at a meeting of the Audit and Sustainable Development Committee of the Board of Directors.
Employees, shareholders, and other stakeholders can report any actions that cause or may cause financial or reputational damage to Nornickel. The key principles underlying the operation of the Corporate Trust Service include guaranteed anonymity for whistleblowers, and timely and unbiased review of all reports. Nornickel will in no circumstances retaliate against an employee who raises a concern via the Corporate Trust Service, meaning that no disciplinary action will be taken (dismissal, demotion, forfeiture of bonuses, etc.).
Reports can be submitted via toll-free hotlines 8 800 700 19 41 and 8 800 700 19 45, via e-mail [email protected] or the reporting form on Nornickel’s website.
For more details on report statistics, please see the Sustainability Report.
Report statistics
Indicator 2017 2018 2019
Total number of reports 765 961 1,181
Total number of reports that triggered investigation
342 394 481
Percentage of corruption reports 2.9% (10 reports, including 0
substantiated)
1.5% (6 reports, including 0
substantiated)
0.2% (1 report, including 1
substantiated)
COMPREHENSIVE SECURITY FRAMEWORK
In 2019, MMC Norilsk Nickel enhanced corporate security through consistent upgrades and implementation of its comprehensive security framework driven by the ongoing analysis of the entire range of challenges and threats in the context of the changing external environment. The consistent implementation of the Management by Objectives (MBO) model in economic, corporate,
information, physical, and transport security enabled timely responses to key risks, prevention of embezzlement and illicit trafficking of precious metals and metal-bearing materials, and initiatives to prevent internal corruption.
To ensure effective prevention of embezzlement of products containing precious metals, Nornickel has in place measures to identify, prevent and stop damage to its economic interests in mining
and processing, and metallurgy operations, as well as in analytical monitoring and accounting for metal products. The Corporate Security team is making further improvements to its identification methodology for products containing precious metals which have been stolen or illicitly traded. The methodology reliably identifies the nature and origin of seized products.
A milestone in combating illicit trafficking in metal products was UN’s approval of the resolution on combating transnational organised crime and its links to illicit trafficking in precious metals, drafted at Nornickel’s initiative and with its input in collaboration with global majors.
Anti-terrorism and improved physical security of critical industrial, energy and transport facilities remain Nornickel’s top priorities. Through interactions with law enforcement agencies, Nornickel prevented any unauthorised interference with these infrastructures in 2019.
Information security
Nornickel consistently implements its Information Security Policy covering business processes and domains, including strategic and tactical management processes, operating processes, and information security responsibilities of governance bodies.
In 2018, Nornickel launched a project to protect automated process control systems, continued providing project support for its IT initiatives programme, and rolled out an Information Security Management System compliant with ISO/IEC 27001:2013 at the Murmansk Transport Division. It also continuously upgrades its comprehensive system preventing external cyber interference with operating and production processes.
As part of its day-to-day activities to minimise information security risks associated with human
Company overview Strategic report Commodity market overview
Business overview Sustainable development
Corporate governance
Risk report Shareholder information IFRS financial statements AppendixAnnual report 2019
«NORNICKEL»
212 213
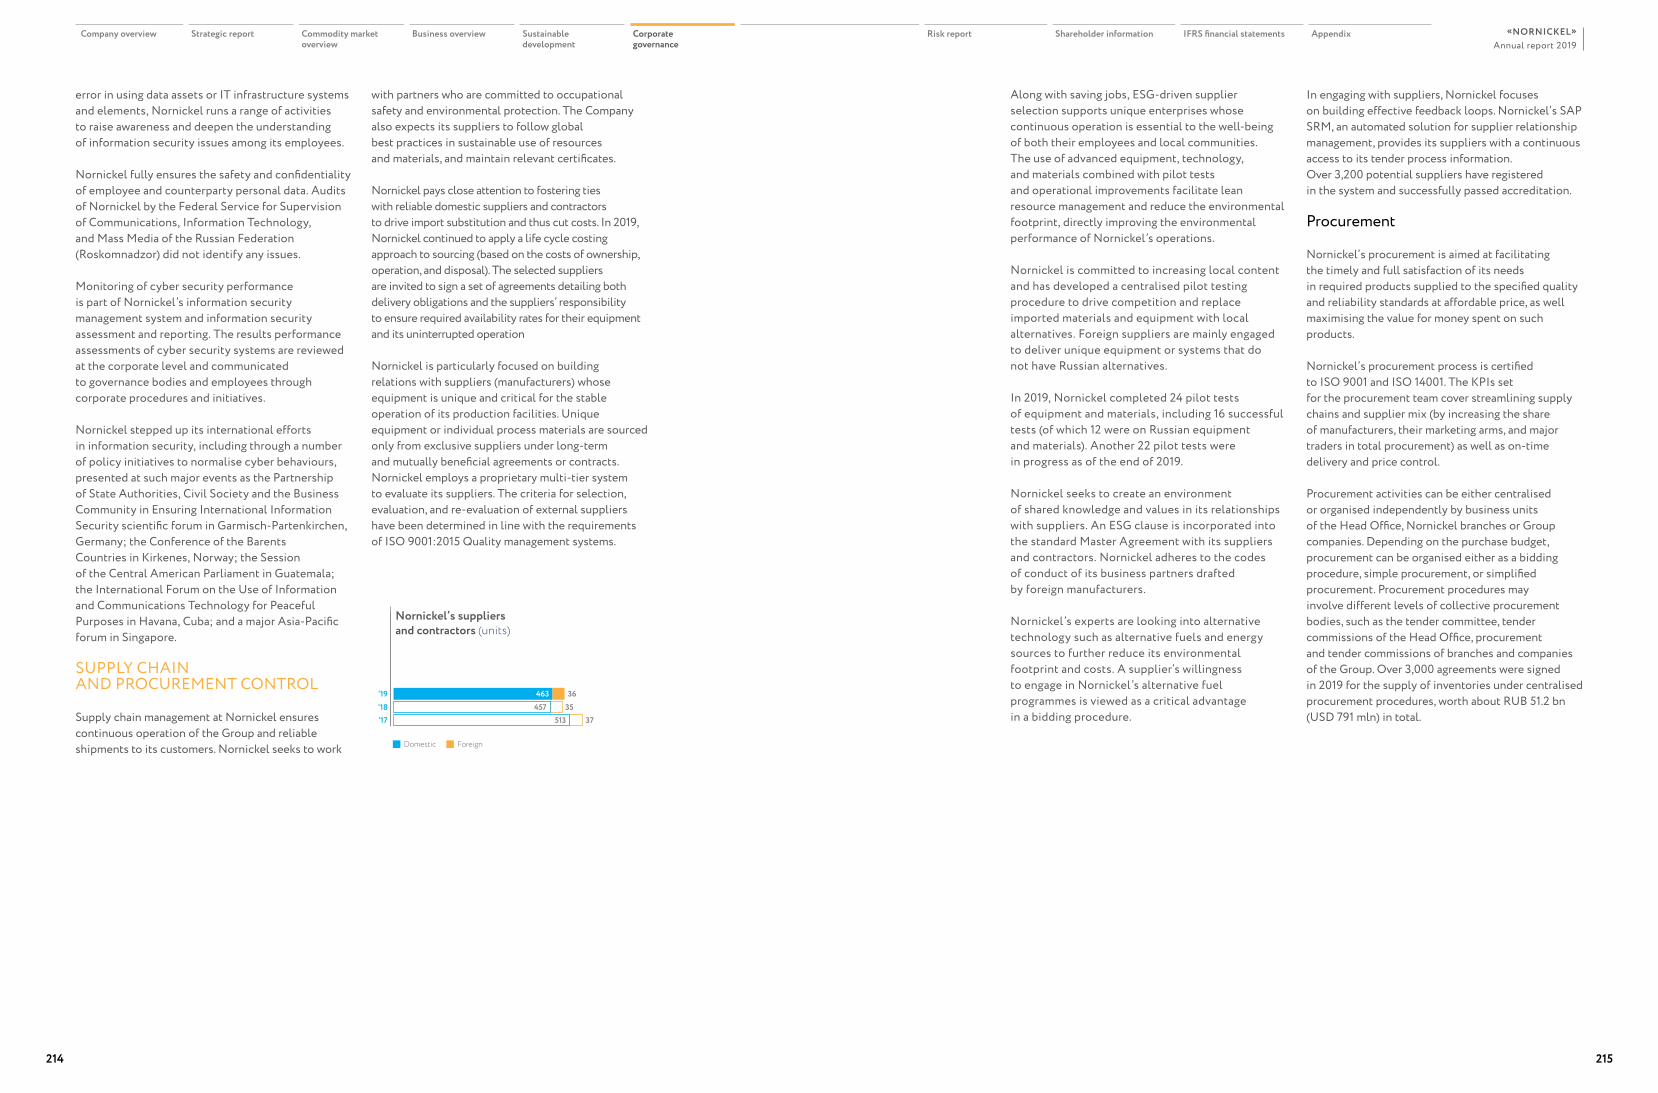
error in using data assets or IT infrastructure systems and elements, Nornickel runs a range of activities to raise awareness and deepen the understanding of information security issues among its employees.
Nornickel fully ensures the safety and confidentiality of employee and counterparty personal data. Audits of Nornickel by the Federal Service for Supervision of Communications, Information Technology, and Mass Media of the Russian Federation (Roskomnadzor) did not identify any issues.
Monitoring of cyber security performance is part of Nornickel’s information security management system and information security assessment and reporting. The results performance assessments of cyber security systems are reviewed at the corporate level and communicated to governance bodies and employees through corporate procedures and initiatives.
Nornickel stepped up its international efforts in information security, including through a number of policy initiatives to normalise cyber behaviours, presented at such major events as the Partnership of State Authorities, Civil Society and the Business Community in Ensuring International Information Security scientific forum in Garmisch-Partenkirchen, Germany; the Conference of the Barents Countries in Kirkenes, Norway; the Session of the Central American Parliament in Guatemala; the International Forum on the Use of Information and Communications Technology for Peaceful Purposes in Havana, Cuba; and a major Asia-Pacific forum in Singapore.
SUPPLY CHAIN AND PROCUREMENT CONTROL
Supply chain management at Nornickel ensures continuous operation of the Group and reliable shipments to its customers. Nornickel seeks to work
In engaging with suppliers, Nornickel focuses on building effective feedback loops. Nornickel’s SAP SRM, an automated solution for supplier relationship management, provides its suppliers with a continuous access to its tender process information. Over 3,200 potential suppliers have registered in the system and successfully passed accreditation.
Procurement
Nornickel’s procurement is aimed at facilitating the timely and full satisfaction of its needs in required products supplied to the specified quality and reliability standards at affordable price, as well maximising the value for money spent on such products.
Nornickel’s procurement process is certified to ISO 9001 and ISO 14001. The KPIs set for the procurement team cover streamlining supply chains and supplier mix (by increasing the share of manufacturers, their marketing arms, and major traders in total procurement) as well as on-time delivery and price control.
Procurement activities can be either centralised or organised independently by business units of the Head Office, Nornickel branches or Group companies. Depending on the purchase budget, procurement can be organised either as a bidding procedure, simple procurement, or simplified procurement. Procurement procedures may involve different levels of collective procurement bodies, such as the tender committee, tender commissions of the Head Office, procurement and tender commissions of branches and companies of the Group. Over 3,000 agreements were signed in 2019 for the supply of inventories under centralised procurement procedures, worth about RUB 51.2 bn (USD 791 mln) in total.
with partners who are committed to occupational safety and environmental protection. The Company also expects its suppliers to follow global best practices in sustainable use of resources and materials, and maintain relevant certificates.
Nornickel pays close attention to fostering ties with reliable domestic suppliers and contractors to drive import substitution and thus cut costs. In 2019, Nornickel continued to apply a life cycle costing approach to sourcing (based on the costs of ownership, operation, and disposal). The selected suppliers are invited to sign a set of agreements detailing both delivery obligations and the suppliers’ responsibility to ensure required availability rates for their equipment and its uninterrupted operation
Nornickel is particularly focused on building relations with suppliers (manufacturers) whose equipment is unique and critical for the stable operation of its production facilities. Unique equipment or individual process materials are sourced only from exclusive suppliers under long-term and mutually beneficial agreements or contracts. Nornickel employs a proprietary multi-tier system to evaluate its suppliers. The criteria for selection, evaluation, and re-evaluation of external suppliers have been determined in line with the requirements of ISO 9001:2015 Quality management systems.
Along with saving jobs, ESG-driven supplier selection supports unique enterprises whose continuous operation is essential to the well-being of both their employees and local communities. The use of advanced equipment, technology, and materials combined with pilot tests and operational improvements facilitate lean resource management and reduce the environmental footprint, directly improving the environmental performance of Nornickel’s operations.
Nornickel is committed to increasing local content and has developed a centralised pilot testing procedure to drive competition and replace imported materials and equipment with local alternatives. Foreign suppliers are mainly engaged to deliver unique equipment or systems that do not have Russian alternatives.
In 2019, Nornickel completed 24 pilot tests of equipment and materials, including 16 successful tests (of which 12 were on Russian equipment and materials). Another 22 pilot tests were in progress as of the end of 2019.
Nornickel seeks to create an environment of shared knowledge and values in its relationships with suppliers. An ESG clause is incorporated into the standard Master Agreement with its suppliers and contractors. Nornickel adheres to the codes of conduct of its business partners drafted by foreign manufacturers.
Nornickel’s experts are looking into alternative technology such as alternative fuels and energy sources to further reduce its environmental footprint and costs. A supplier’s willingness to engage in Nornickel’s alternative fuel programmes is viewed as a critical advantage in a bidding procedure.
Nornickel’s suppliers and contractors (units)
‘17‘18‘19 23463 36
457 35513 37
Domestic Foreign
Company overview Strategic report Commodity market overview
Business overview Sustainable development
Corporate governance
Risk report Shareholder information IFRS financial statements AppendixAnnual report 2019
«NORNICKEL»
214 215
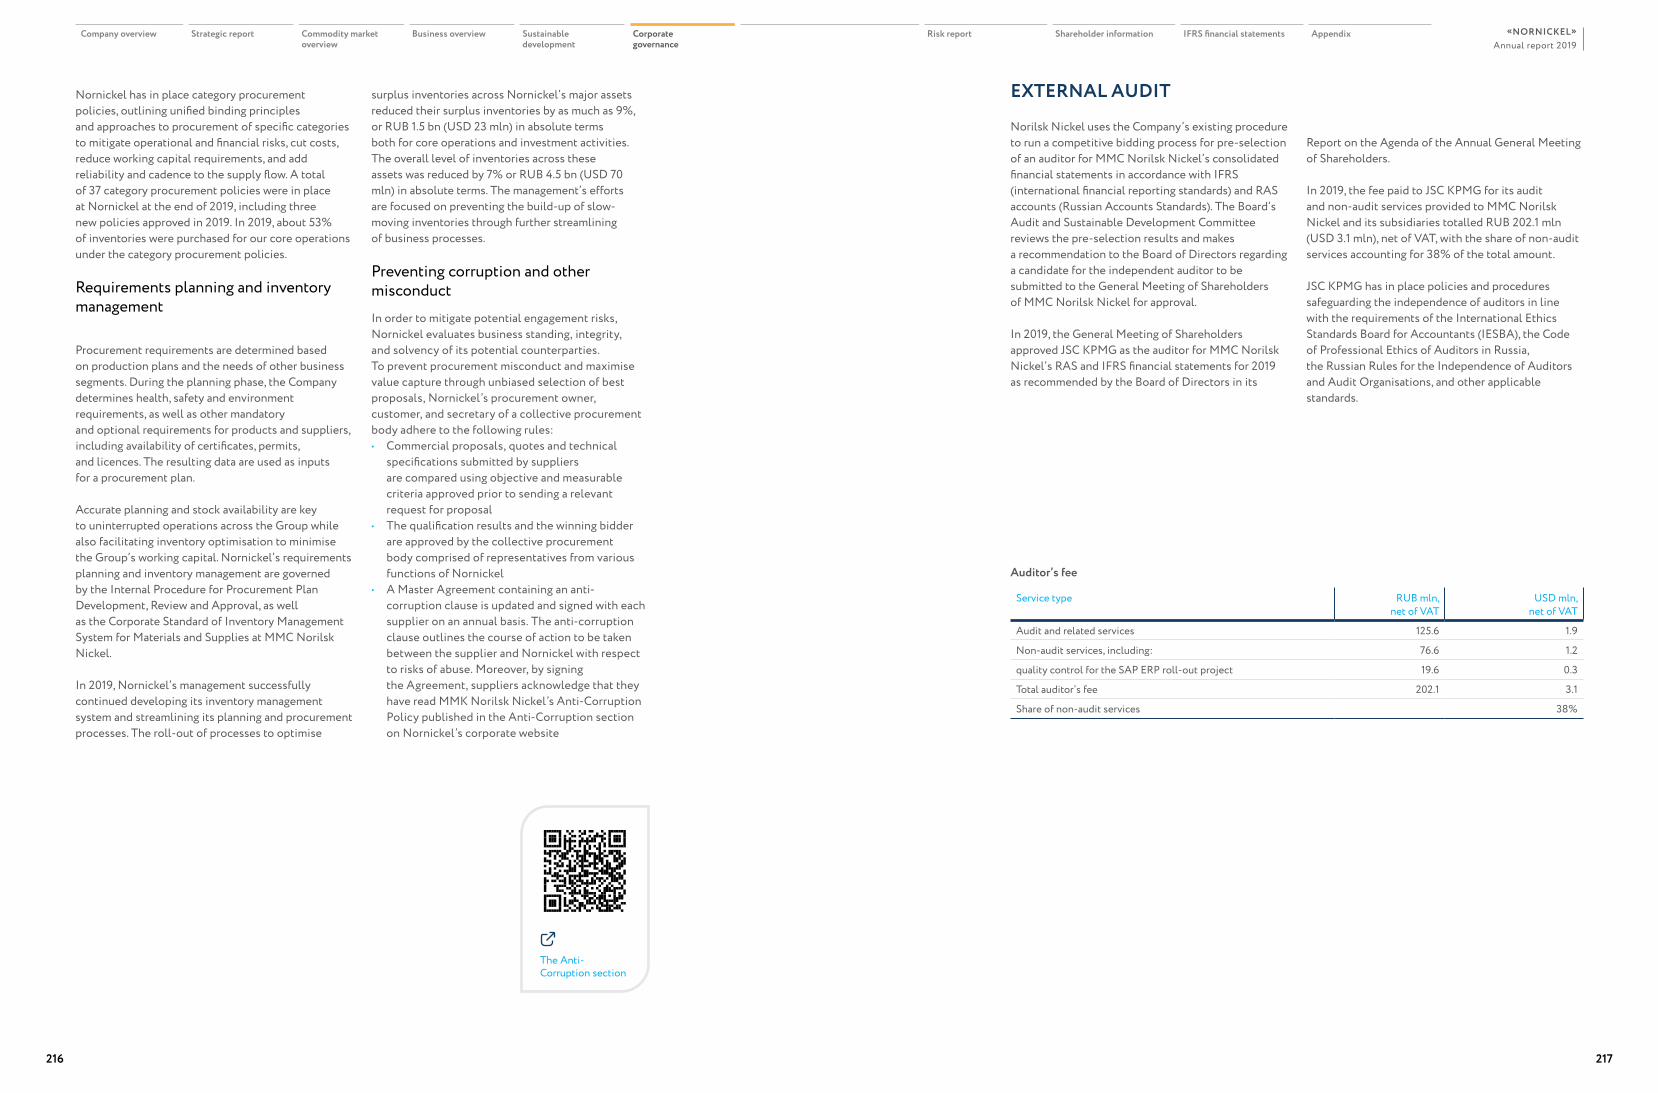
Nornickel has in place category procurement policies, outlining unified binding principles and approaches to procurement of specific categories to mitigate operational and financial risks, cut costs, reduce working capital requirements, and add reliability and cadence to the supply flow. A total of 37 category procurement policies were in place at Nornickel at the end of 2019, including three new policies approved in 2019. In 2019, about 53% of inventories were purchased for our core operations under the category procurement policies.
Requirements planning and inventory management
Procurement requirements are determined based on production plans and the needs of other business segments. During the planning phase, the Company determines health, safety and environment requirements, as well as other mandatory and optional requirements for products and suppliers, including availability of certificates, permits, and licences. The resulting data are used as inputs for a procurement plan.
Accurate planning and stock availability are key to uninterrupted operations across the Group while also facilitating inventory optimisation to minimise the Group’s working capital. Nornickel’s requirements planning and inventory management are governed by the Internal Procedure for Procurement Plan Development, Review and Approval, as well as the Corporate Standard of Inventory Management System for Materials and Supplies at MMC Norilsk Nickel.
In 2019, Nornickel’s management successfully continued developing its inventory management system and streamlining its planning and procurement processes. The roll-out of processes to optimise
surplus inventories across Nornickel’s major assets reduced their surplus inventories by as much as 9%, or RUB 1.5 bn (USD 23 mln) in absolute terms both for core operations and investment activities. The overall level of inventories across these assets was reduced by 7% or RUB 4.5 bn (USD 70 mln) in absolute terms. The management’s efforts are focused on preventing the build-up of slow-moving inventories through further streamlining of business processes.
Preventing corruption and other misconductIn order to mitigate potential engagement risks, Nornickel evaluates business standing, integrity, and solvency of its potential counterparties. To prevent procurement misconduct and maximise value capture through unbiased selection of best proposals, Nornickel’s procurement owner, customer, and secretary of a collective procurement body adhere to the following rules:• Commercial proposals, quotes and technical
specifications submitted by suppliers are compared using objective and measurable criteria approved prior to sending a relevant request for proposal
• The qualification results and the winning bidder are approved by the collective procurement body comprised of representatives from various functions of Nornickel
• A Master Agreement containing an anti-corruption clause is updated and signed with each supplier on an annual basis. The anti-corruption clause outlines the course of action to be taken between the supplier and Nornickel with respect to risks of abuse. Moreover, by signing the Agreement, suppliers acknowledge that they have read MMK Norilsk Nickel’s Anti-Corruption Policy published in the Anti-Corruption section on Nornickel’s corporate website
EXTERNAL AUDIT
Norilsk Nickel uses the Company’s existing procedure to run a competitive bidding process for pre-selection of an auditor for MMC Norilsk Nickel’s consolidated financial statements in accordance with IFRS (international financial reporting standards) and RAS accounts (Russian Accounts Standards). The Board’s Audit and Sustainable Development Committee reviews the pre-selection results and makes a recommendation to the Board of Directors regarding a candidate for the independent auditor to be submitted to the General Meeting of Shareholders of MMC Norilsk Nickel for approval.
In 2019, the General Meeting of Shareholders approved JSC KPMG as the auditor for MMC Norilsk Nickel’s RAS and IFRS financial statements for 2019 as recommended by the Board of Directors in its
Report on the Agenda of the Annual General Meeting of Shareholders.
In 2019, the fee paid to JSC KPMG for its audit and non-audit services provided to MMC Norilsk Nickel and its subsidiaries totalled RUB 202.1 mln (USD 3.1 mln), net of VAT, with the share of non-audit services accounting for 38% of the total amount.
JSC KPMG has in place policies and procedures safeguarding the independence of auditors in line with the requirements of the International Ethics Standards Board for Accountants (IESBA), the Code of Professional Ethics of Auditors in Russia, the Russian Rules for the Independence of Auditors and Audit Organisations, and other applicable standards.
The Anti-Corruption section
Auditor’s fee
Service type RUB mln,net of VAT
USD mln,net of VAT
Audit and related services 125.6 1.9
Non-audit services, including: 76.6 1.2
quality control for the SAP ERP roll-out project 19.6 0.3
Total auditor’s fee 202.1 3.1
Share of non-audit services 38%
Company overview Strategic report Commodity market overview
Business overview Sustainable development
Corporate governance
Risk report Shareholder information IFRS financial statements AppendixAnnual report 2019
«NORNICKEL»
216 217

Reportisk
220 Risk management224 Key risks
Risk report R
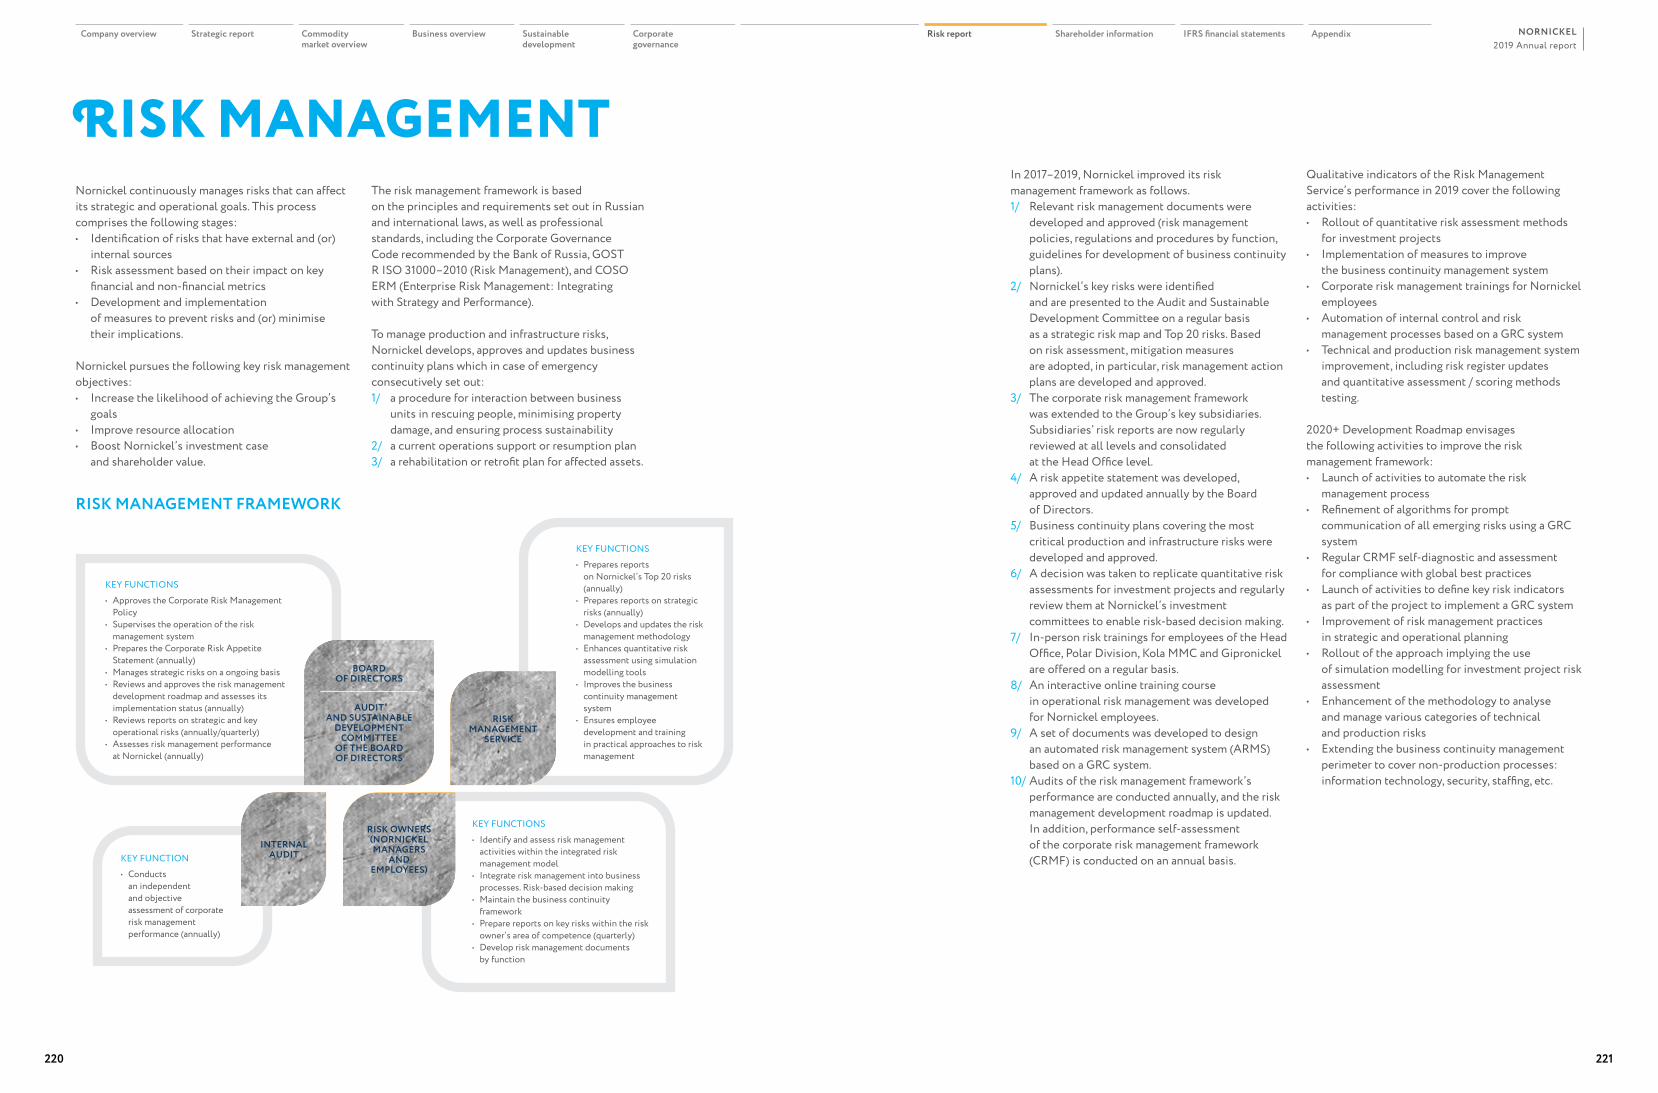
RISK MANAGEMENT FRAMEWORK
In 2017–2019, Nornickel improved its risk management framework as follows.1/ Relevant risk management documents were
developed and approved (risk management policies, regulations and procedures by function, guidelines for development of business continuity plans).
2/ Nornickel’s key risks were identified and are presented to the Audit and Sustainable Development Committee on a regular basis as a strategic risk map and Top 20 risks. Based on risk assessment, mitigation measures are adopted, in particular, risk management action plans are developed and approved.
3/ The corporate risk management framework was extended to the Group’s key subsidiaries. Subsidiaries’ risk reports are now regularly reviewed at all levels and consolidated at the Head Office level.
4/ A risk appetite statement was developed, approved and updated annually by the Board of Directors.
5/ Business continuity plans covering the most critical production and infrastructure risks were developed and approved.
6/ A decision was taken to replicate quantitative risk assessments for investment projects and regularly review them at Nornickel’s investment committees to enable risk-based decision making.
7/ In-person risk trainings for employees of the Head Office, Polar Division, Kola MMC and Gipronickel are offered on a regular basis.
8/ An interactive online training course in operational risk management was developed for Nornickel employees.
9/ A set of documents was developed to design an automated risk management system (ARMS) based on a GRC system.
10/ Audits of the risk management framework’s performance are conducted annually, and the risk management development roadmap is updated. In addition, performance self-assessment of the corporate risk management framework (CRMF) is conducted on an annual basis.
Qualitative indicators of the Risk Management Service’s performance in 2019 cover the following activities:• Rollout of quantitative risk assessment methods
for investment projects• Implementation of measures to improve
the business continuity management system• Corporate risk management trainings for Nornickel
employees• Automation of internal control and risk
management processes based on a GRC system• Technical and production risk management system
improvement, including risk register updates and quantitative assessment / scoring methods testing.
2020+ Development Roadmap envisages the following activities to improve the risk management framework:• Launch of activities to automate the risk
management process • Refinement of algorithms for prompt
communication of all emerging risks using a GRC system
• Regular CRMF self-diagnostic and assessment for compliance with global best practices
• Launch of activities to define key risk indicators as part of the project to implement a GRC system
• Improvement of risk management practices in strategic and operational planning
• Rollout of the approach implying the use of simulation modelling for investment project risk assessment
• Enhancement of the methodology to analyse and manage various categories of technical and production risks
• Extending the business continuity management perimeter to cover non-production processes: information technology, security, staffing, etc.
RISK MANAGEMENTNornickel continuously manages risks that can affect its strategic and operational goals. This process comprises the following stages:• Identification of risks that have external and (or)
internal sources• Risk assessment based on their impact on key
financial and non-financial metrics• Development and implementation
of measures to prevent risks and (or) minimise their implications.
Nornickel pursues the following key risk management objectives:• Increase the likelihood of achieving the Group’s
goals• Improve resource allocation• Boost Nornickel’s investment case
and shareholder value.
The risk management framework is based on the principles and requirements set out in Russian and international laws, as well as professional standards, including the Corporate Governance Code recommended by the Bank of Russia, GOST R ISO 31000–2010 (Risk Management), and COSO ERM (Enterprise Risk Management: Integrating with Strategy and Performance).
To manage production and infrastructure risks, Nornickel develops, approves and updates business continuity plans which in case of emergency consecutively set out:1/ a procedure for interaction between business
units in rescuing people, minimising property damage, and ensuring process sustainability
2/ a current operations support or resumption plan3/ a rehabilitation or retrofit plan for affected assets.
BOARD OF DIRECTORS
AUDIT AND SUSTAINABLE
DEVELOPMENT COMMITTEE
OF THE BOARD OF DIRECTORS
INTERNAL AUDIT
RISK MANAGEMENT
SERVICE
RISK OWNERS (NORNICKEL MANAGERS
AND EMPLOYEES)
KEY FUNCTIONS• Approves the Corporate Risk Management
Policy• Supervises the operation of the risk
management system• Prepares the Corporate Risk Appetite
Statement (annually)• Manages strategic risks on a ongoing basis• Reviews and approves the risk management
development roadmap and assesses its implementation status (annually)
• Reviews reports on strategic and key operational risks (annually/quarterly)
• Assesses risk management performance at Nornickel (annually)
KEY FUNCTIONS• Prepares reports
on Nornickel’s Top 20 risks (annually)
• Prepares reports on strategic risks (annually)
• Develops and updates the risk management methodology
• Enhances quantitative risk assessment using simulation modelling tools
• Improves the business continuity management system
• Ensures employee development and training in practical approaches to risk management
KEY FUNCTIONS• Identify and assess risk management
activities within the integrated risk management model
• Integrate risk management into business processes. Risk-based decision making
• Maintain the business continuity framework
• Prepare reports on key risks within the risk owner’s area of competence (quarterly)
• Develop risk management documents by function
KEY FUNCTION• Conducts
an independent and objective assessment of corporate risk management performance (annually)
220 221
2019 Annual reportNORNICKELCompany overview Strategic report Commodity
market overviewBusiness overview Sustainable
developmentCorporate governance
Risk report Shareholder information IFRS financial statements Appendix
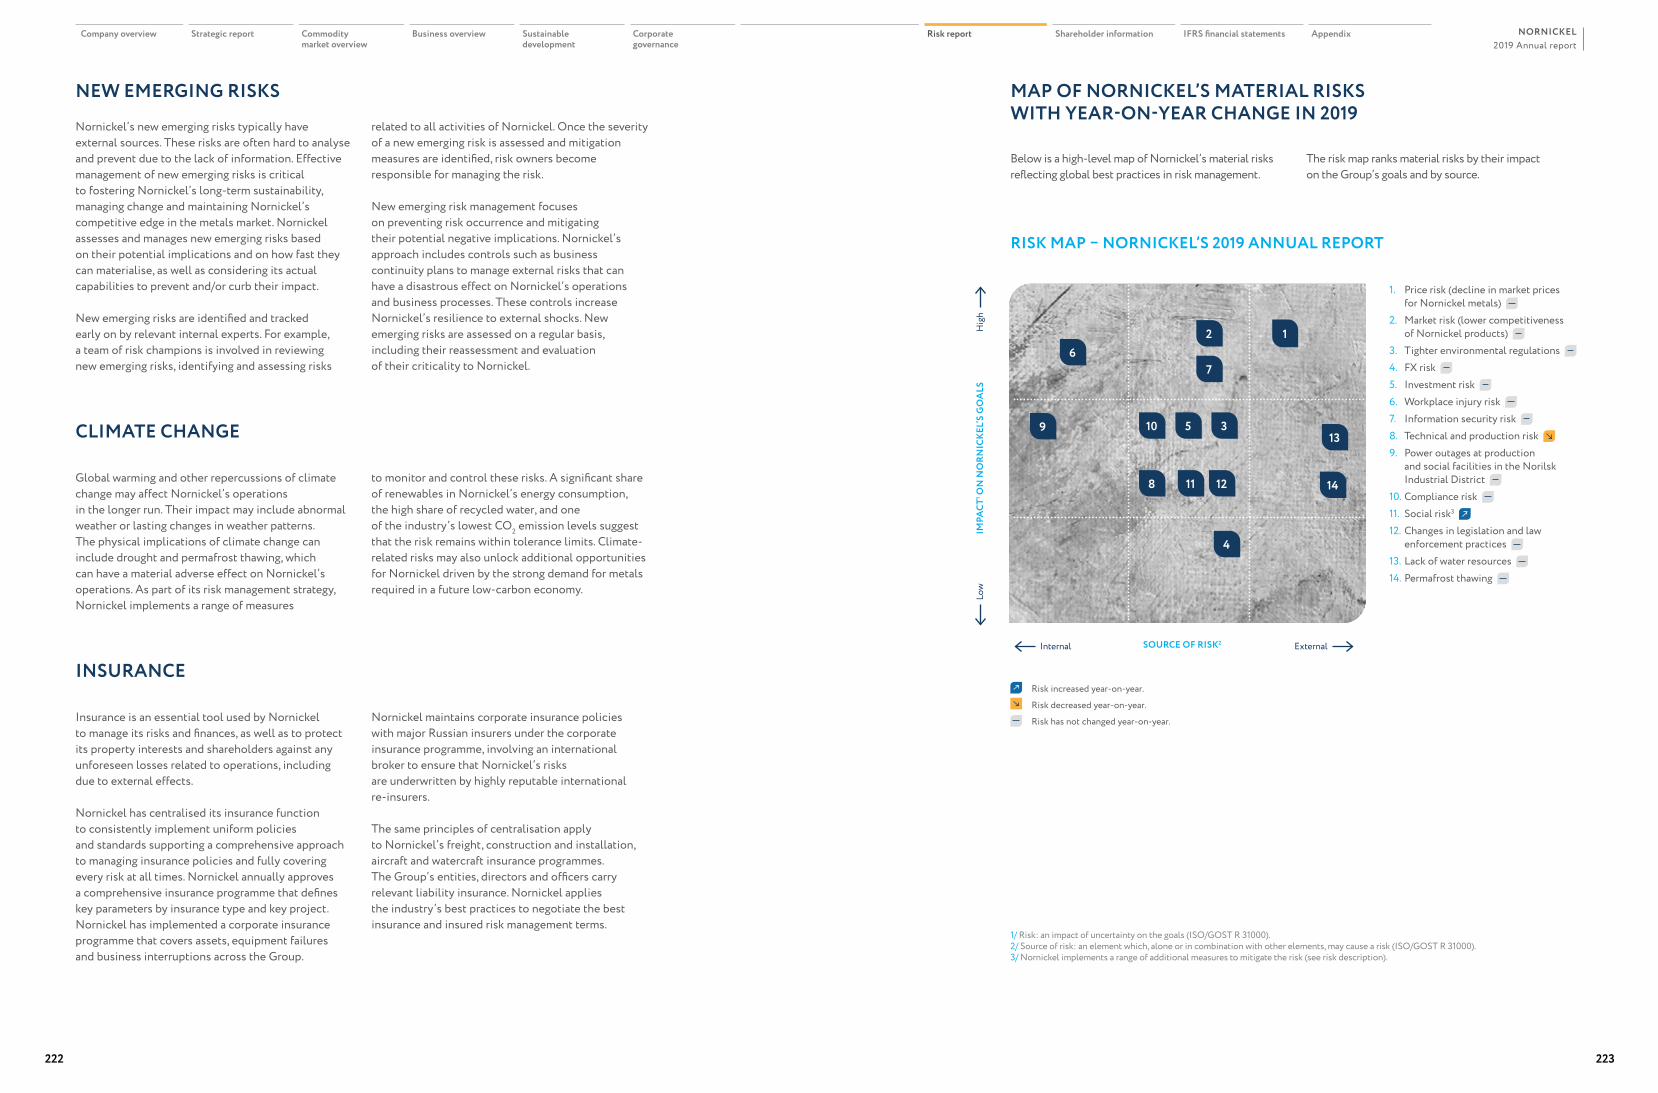
NEW EMERGING RISKS
Nornickel’s new emerging risks typically have external sources. These risks are often hard to analyse and prevent due to the lack of information. Effective management of new emerging risks is critical to fostering Nornickel’s long-term sustainability, managing change and maintaining Nornickel’s competitive edge in the metals market. Nornickel assesses and manages new emerging risks based on their potential implications and on how fast they can materialise, as well as considering its actual capabilities to prevent and/or curb their impact.
New emerging risks are identified and tracked early on by relevant internal experts. For example, a team of risk champions is involved in reviewing new emerging risks, identifying and assessing risks
related to all activities of Nornickel. Once the severity of a new emerging risk is assessed and mitigation measures are identified, risk owners become responsible for managing the risk.
New emerging risk management focuses on preventing risk occurrence and mitigating their potential negative implications. Nornickel’s approach includes controls such as business continuity plans to manage external risks that can have a disastrous effect on Nornickel’s operations and business processes. These controls increase Nornickel’s resilience to external shocks. New emerging risks are assessed on a regular basis, including their reassessment and evaluation of their criticality to Nornickel.
CLIMATE CHANGE
Global warming and other repercussions of climate change may affect Nornickel’s operations in the longer run. Their impact may include abnormal weather or lasting changes in weather patterns. The physical implications of climate change can include drought and permafrost thawing, which can have a material adverse effect on Nornickel’s operations. As part of its risk management strategy, Nornickel implements a range of measures
to monitor and control these risks. A significant share of renewables in Nornickel’s energy consumption, the high share of recycled water, and one of the industry’s lowest CO2 emission levels suggest that the risk remains within tolerance limits. Climate-related risks may also unlock additional opportunities for Nornickel driven by the strong demand for metals required in a future low-carbon economy.
INSURANCE
Insurance is an essential tool used by Nornickel to manage its risks and finances, as well as to protect its property interests and shareholders against any unforeseen losses related to operations, including due to external effects.
Nornickel has centralised its insurance function to consistently implement uniform policies and standards supporting a comprehensive approach to managing insurance policies and fully covering every risk at all times. Nornickel annually approves a comprehensive insurance programme that defines key parameters by insurance type and key project. Nornickel has implemented a corporate insurance programme that covers assets, equipment failures and business interruptions across the Group.
Nornickel maintains corporate insurance policies with major Russian insurers under the corporate insurance programme, involving an international broker to ensure that Nornickel’s risks are underwritten by highly reputable international re-insurers.
The same principles of centralisation apply to Nornickel’s freight, construction and installation, aircraft and watercraft insurance programmes. The Group’s entities, directors and officers carry relevant liability insurance. Nornickel applies the industry’s best practices to negotiate the best insurance and insured risk management terms.
MAP OF NORNICKEL’S MATERIAL RISKS WITH YEAR-ON-YEAR CHANGE IN 2019
Below is a high-level map of Nornickel’s material risks reflecting global best practices in risk management.
The risk map ranks material risks by their impact on the Group’s goals and by source.
RISK MAP – NORNICKEL’S 2019 ANNUAL REPORT
1/ Risk: an impact of uncertainty on the goals (ISO/GOST R 31000).2/ Source of risk: an element which, alone or in combination with other elements, may cause a risk (ISO/GOST R 31000).3/ Nornickel implements a range of additional measures to mitigate the risk (see risk description).
62
7
9 10
8 11 12
4
14
135 3
1
SOURCE OF RISK2
IMPA
CT1 O
N N
ORN
ICKE
L’S
GO
ALS
Internal
Low
External
Hig
h
1. Price risk (decline in market prices for Nornickel metals)
2. Market risk (lower competitiveness of Nornickel products)
3. Tighter environmental regulations 4. FX risk 5. Investment risk 6. Workplace injury risk 7. Information security risk 8. Technical and production risk 9. Power outages at production
and social facilities in the Norilsk Industrial District
10. Compliance risk 11. Social risk3
12. Changes in legislation and law enforcement practices
13. Lack of water resources 14. Permafrost thawing
Risk increased year-on-year.
Risk decreased year-on-year.
Risk has not changed year-on-year.
222 223
2019 Annual reportNORNICKELCompany overview Strategic report Commodity
market overviewBusiness overview Sustainable
developmentCorporate governance
Risk report Shareholder information IFRS financial statements Appendix
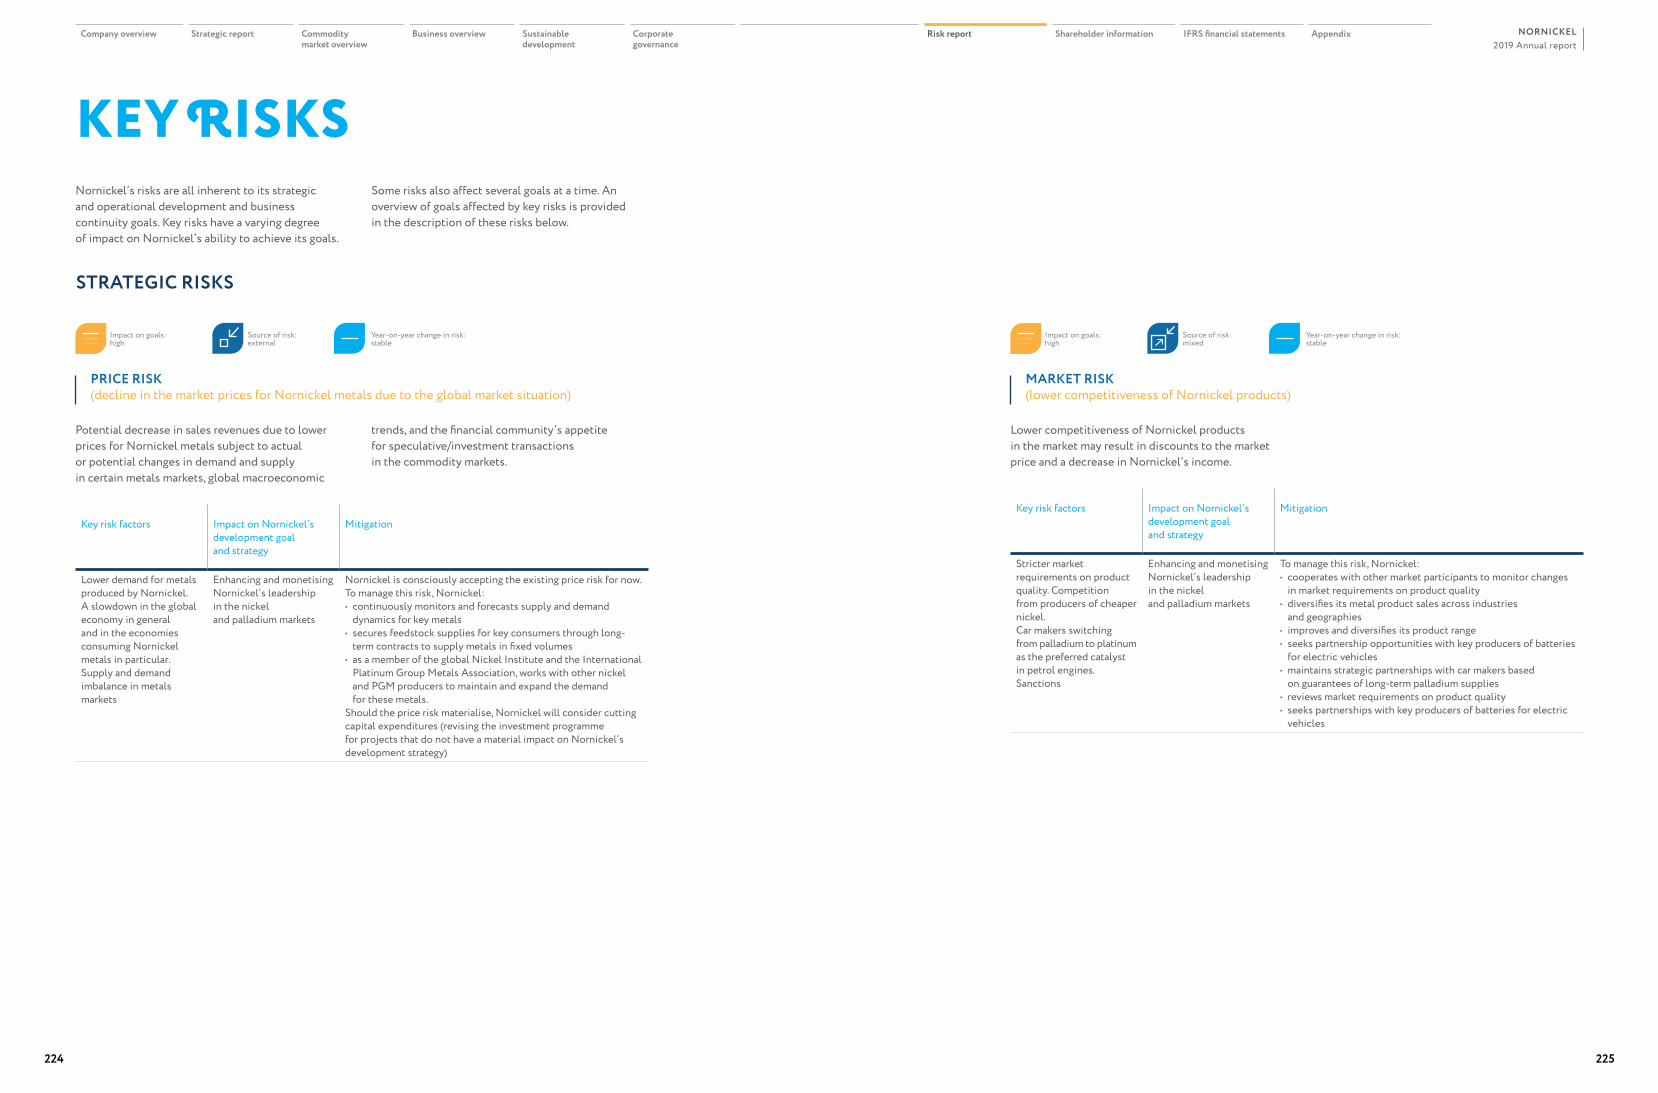
MARKET RISK (lower competitiveness of Nornickel products)
Lower competitiveness of Nornickel products in the market may result in discounts to the market price and a decrease in Nornickel’s income.
Key risk factors Impact on Nornickel’s development goal and strategy
Mitigation
Stricter market requirements on product quality. Competition from producers of cheaper nickel.Car makers switching from palladium to platinum as the preferred catalyst in petrol engines.Sanctions
Enhancing and monetising Nornickel’s leadership in the nickel and palladium markets
To manage this risk, Nornickel:• cooperates with other market participants to monitor changes
in market requirements on product quality• diversifies its metal product sales across industries
and geographies• improves and diversifies its product range• seeks partnership opportunities with key producers of batteries
for electric vehicles• maintains strategic partnerships with car makers based
on guarantees of long-term palladium supplies• reviews market requirements on product quality• seeks partnerships with key producers of batteries for electric
vehicles
Impact on goals: high
Year-on-year change in risk: stable
Source of risk: mixed
KEY RISKSNornickel’s risks are all inherent to its strategic and operational development and business continuity goals. Key risks have a varying degree of impact on Nornickel’s ability to achieve its goals.
Some risks also affect several goals at a time. An overview of goals affected by key risks is provided in the description of these risks below.
PRICE RISK (decline in the market prices for Nornickel metals due to the global market situation)
Potential decrease in sales revenues due to lower prices for Nornickel metals subject to actual or potential changes in demand and supply in certain metals markets, global macroeconomic
trends, and the financial community’s appetite for speculative/investment transactions in the commodity markets.
Key risk factors Impact on Nornickel’s development goal and strategy
Mitigation
Lower demand for metals produced by Nornickel. A slowdown in the global economy in general and in the economies consuming Nornickel metals in particular. Supply and demand imbalance in metals markets
Enhancing and monetising Nornickel’s leadership in the nickel and palladium markets
Nornickel is consciously accepting the existing price risk for now. To manage this risk, Nornickel: • continuously monitors and forecasts supply and demand
dynamics for key metals • secures feedstock supplies for key consumers through long-
term contracts to supply metals in fixed volumes• as a member of the global Nickel Institute and the International
Platinum Group Metals Association, works with other nickel and PGM producers to maintain and expand the demand for these metals.
Should the price risk materialise, Nornickel will consider cutting capital expenditures (revising the investment programme for projects that do not have a material impact on Nornickel’s development strategy)
Impact on goals: high
Source of risk: external
Year-on-year change in risk: stable
STRATEGIC RISKS
224 225
2019 Annual reportNORNICKELCompany overview Strategic report Commodity
market overviewBusiness overview Sustainable
developmentCorporate governance
Risk report Shareholder information IFRS financial statements Appendix
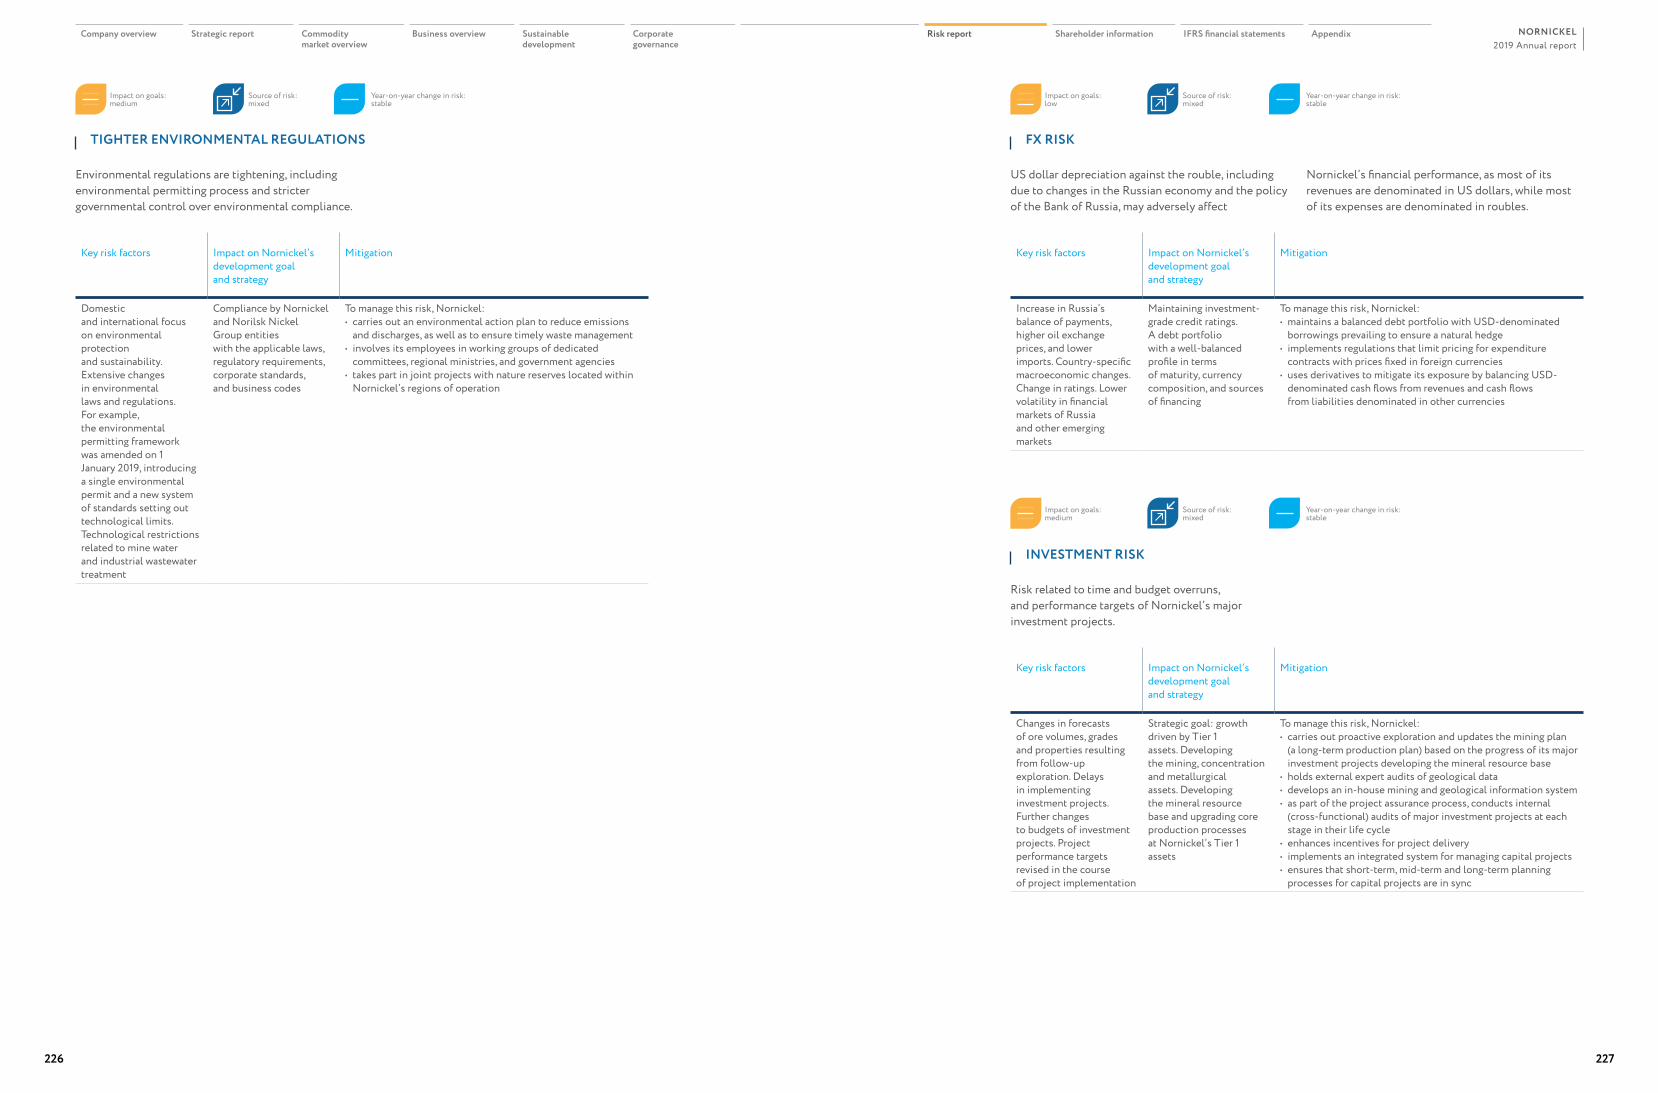
FX RISK
US dollar depreciation against the rouble, including due to changes in the Russian economy and the policy of the Bank of Russia, may adversely affect
Nornickel’s financial performance, as most of its revenues are denominated in US dollars, while most of its expenses are denominated in roubles.
Key risk factors Impact on Nornickel’s development goal and strategy
Mitigation
Increase in Russia’s balance of payments, higher oil exchange prices, and lower imports. Country-specific macroeconomic changes.Change in ratings. Lower volatility in financial markets of Russia and other emerging markets
Maintaining investment-grade credit ratings. A debt portfolio with a well-balanced profile in terms of maturity, currency composition, and sources of financing
To manage this risk, Nornickel:• maintains a balanced debt portfolio with USD-denominated
borrowings prevailing to ensure a natural hedge• implements regulations that limit pricing for expenditure
contracts with prices fixed in foreign currencies• uses derivatives to mitigate its exposure by balancing USD-
denominated cash flows from revenues and cash flows from liabilities denominated in other currencies
Impact on goals: low
Year-on-year change in risk: stable
Source of risk: mixed
INVESTMENT RISK
Risk related to time and budget overruns, and performance targets of Nornickel’s major investment projects.
Key risk factors Impact on Nornickel’s development goal and strategy
Mitigation
Changes in forecasts of ore volumes, grades and properties resulting from follow-up exploration. Delays in implementing investment projects. Further changes to budgets of investment projects. Project performance targets revised in the course of project implementation
Strategic goal: growth driven by Tier 1 assets. Developing the mining, concentration and metallurgical assets. Developing the mineral resource base and upgrading core production processes at Nornickel’s Tier 1 assets
To manage this risk, Nornickel:• carries out proactive exploration and updates the mining plan
(a long-term production plan) based on the progress of its major investment projects developing the mineral resource base
• holds external expert audits of geological data• develops an in-house mining and geological information system• as part of the project assurance process, conducts internal
(cross-functional) audits of major investment projects at each stage in their life cycle
• enhances incentives for project delivery• implements an integrated system for managing capital projects• ensures that short-term, mid-term and long-term planning
processes for capital projects are in sync
Impact on goals: medium
Year-on-year change in risk: stable
Source of risk: mixed
TIGHTER ENVIRONMENTAL REGULATIONS
Environmental regulations are tightening, including environmental permitting process and stricter governmental control over environmental compliance.
Key risk factors Impact on Nornickel’s development goal and strategy
Mitigation
Domestic and international focus on environmental protection and sustainability.Extensive changes in environmental laws and regulations. For example, the environmental permitting framework was amended on 1 January 2019, introducing a single environmental permit and a new system of standards setting out technological limits. Technological restrictions related to mine water and industrial wastewater treatment
Compliance by Nornickel and Norilsk Nickel Group entities with the applicable laws, regulatory requirements, corporate standards, and business codes
To manage this risk, Nornickel:• carries out an environmental action plan to reduce emissions
and discharges, as well as to ensure timely waste management• involves its employees in working groups of dedicated
committees, regional ministries, and government agencies• takes part in joint projects with nature reserves located within
Nornickel’s regions of operation
Impact on goals: medium
Year-on-year change in risk: stable
Source of risk: mixed
226 227
2019 Annual reportNORNICKELCompany overview Strategic report Commodity
market overviewBusiness overview Sustainable
developmentCorporate governance
Risk report Shareholder information IFRS financial statements Appendix
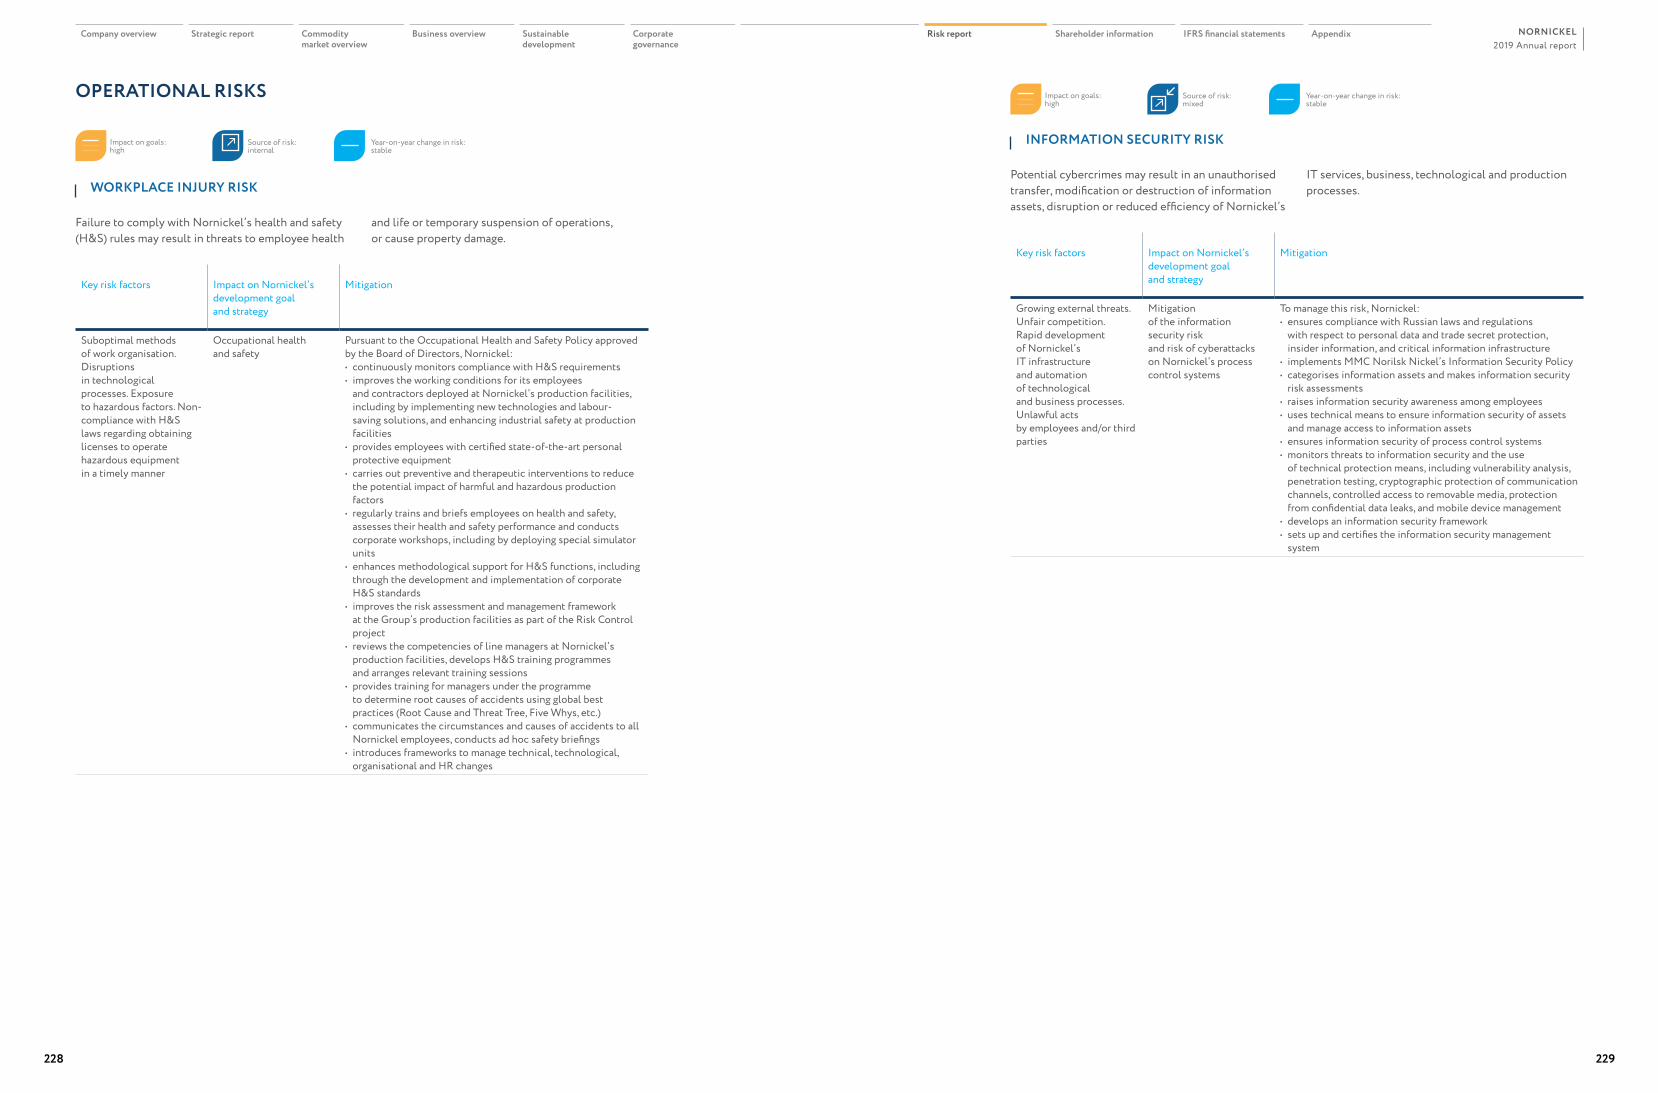
INFORMATION SECURITY RISK
Potential cybercrimes may result in an unauthorised transfer, modification or destruction of information assets, disruption or reduced efficiency of Nornickel’s
IT services, business, technological and production processes.
Key risk factors Impact on Nornickel’s development goal and strategy
Mitigation
Growing external threats. Unfair competition. Rapid development of Nornickel’s IT infrastructure and automation of technological and business processes. Unlawful acts by employees and/or third parties
Mitigation of the information security risk and risk of cyberattacks on Nornickel’s process control systems
To manage this risk, Nornickel:• ensures compliance with Russian laws and regulations
with respect to personal data and trade secret protection, insider information, and critical information infrastructure
• implements MMC Norilsk Nickel’s Information Security Policy• categorises information assets and makes information security
risk assessments• raises information security awareness among employees• uses technical means to ensure information security of assets
and manage access to information assets• ensures information security of process control systems• monitors threats to information security and the use
of technical protection means, including vulnerability analysis, penetration testing, cryptographic protection of communication channels, controlled access to removable media, protection from confidential data leaks, and mobile device management
• develops an information security framework• sets up and certifies the information security management
system
Impact on goals: high
Year-on-year change in risk: stable
Source of risk: mixed
WORKPLACE INJURY RISK
Failure to comply with Nornickel’s health and safety (H&S) rules may result in threats to employee health
and life or temporary suspension of operations, or cause property damage.
Key risk factors Impact on Nornickel’s development goal and strategy
Mitigation
Suboptimal methods of work organisation. Disruptions in technological processes. Exposure to hazardous factors. Non-compliance with H&S laws regarding obtaining licenses to operate hazardous equipment in a timely manner
Occupational health and safety
Pursuant to the Occupational Health and Safety Policy approved by the Board of Directors, Nornickel:• continuously monitors compliance with H&S requirements• improves the working conditions for its employees
and contractors deployed at Nornickel’s production facilities, including by implementing new technologies and labour-saving solutions, and enhancing industrial safety at production facilities
• provides employees with certified state-of-the-art personal protective equipment
• carries out preventive and therapeutic interventions to reduce the potential impact of harmful and hazardous production factors
• regularly trains and briefs employees on health and safety, assesses their health and safety performance and conducts corporate workshops, including by deploying special simulator units
• enhances methodological support for H&S functions, including through the development and implementation of corporate H&S standards
• improves the risk assessment and management framework at the Group’s production facilities as part of the Risk Control project
• reviews the competencies of line managers at Nornickel’s production facilities, develops H&S training programmes and arranges relevant training sessions
• provides training for managers under the programme to determine root causes of accidents using global best practices (Root Cause and Threat Tree, Five Whys, etc.)
• communicates the circumstances and causes of accidents to all Nornickel employees, conducts ad hoc safety briefings
• introduces frameworks to manage technical, technological, organisational and HR changes
Impact on goals: high
Year-on-year change in risk: stable
Source of risk: internal
OPERATIONAL RISKS
228 229
2019 Annual reportNORNICKELCompany overview Strategic report Commodity
market overviewBusiness overview Sustainable
developmentCorporate governance
Risk report Shareholder information IFRS financial statements Appendix
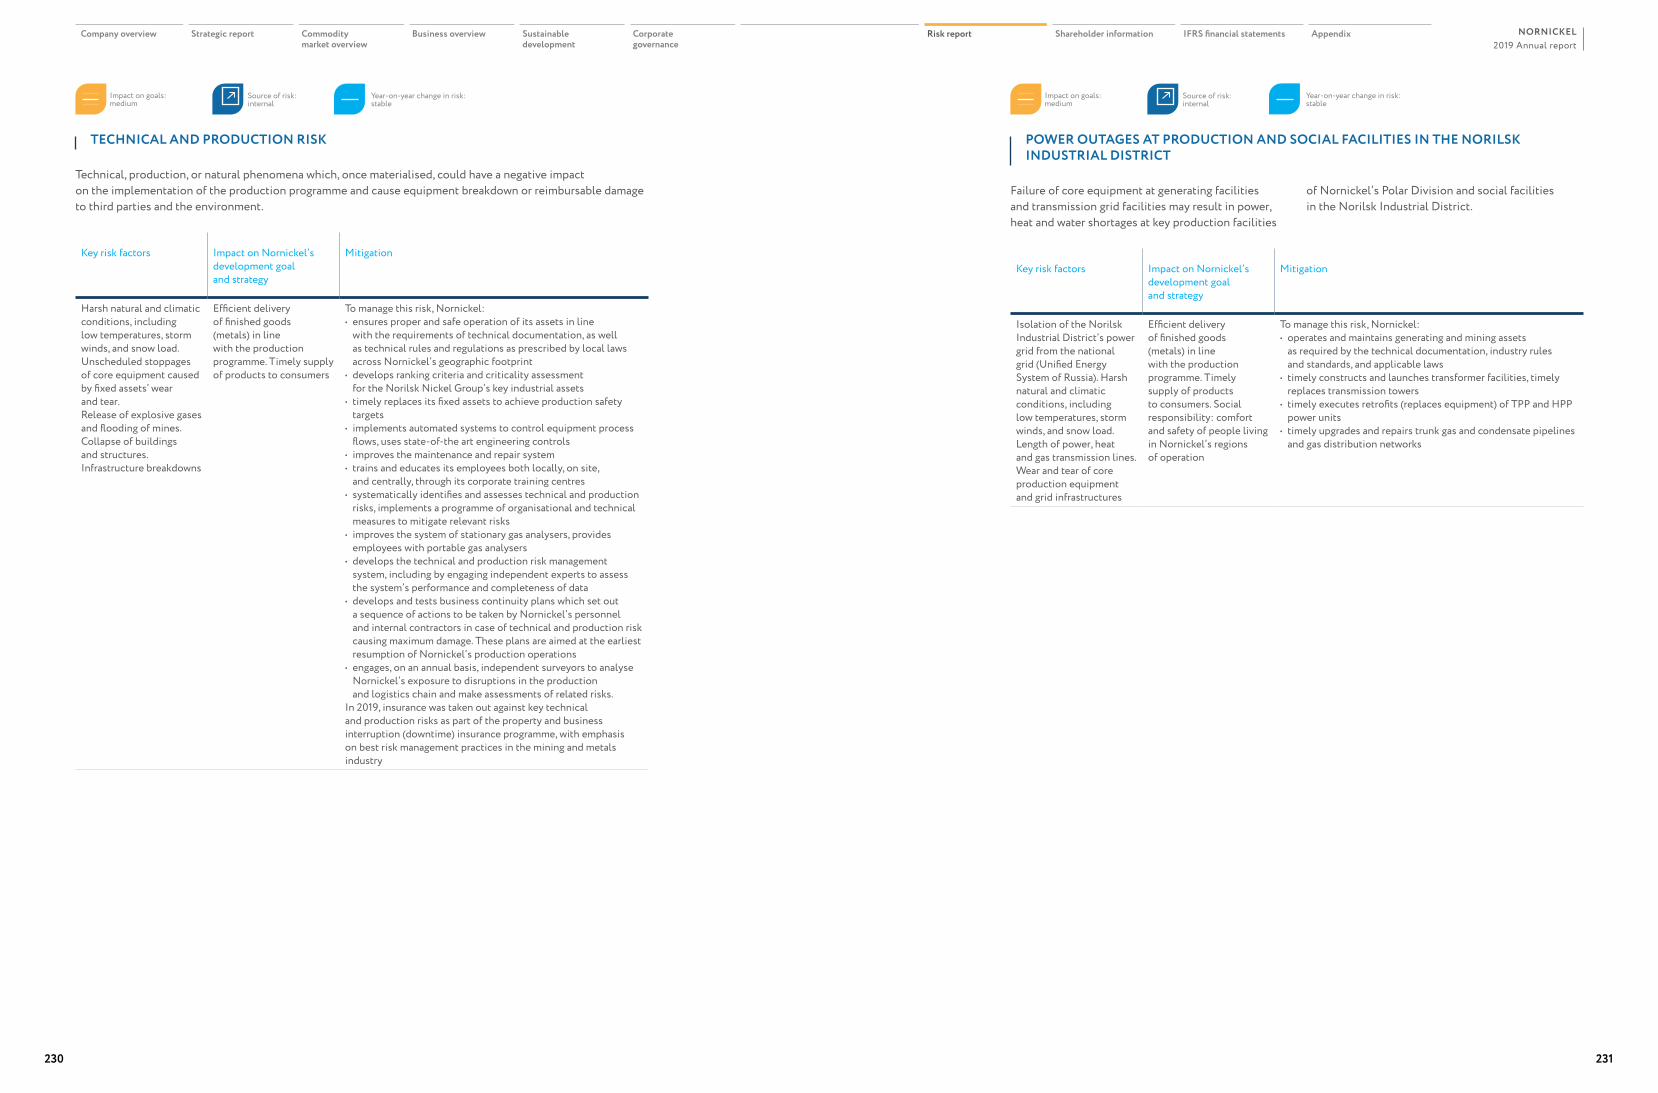
POWER OUTAGES AT PRODUCTION AND SOCIAL FACILITIES IN THE NORILSK INDUSTRIAL DISTRICT
Failure of core equipment at generating facilities and transmission grid facilities may result in power, heat and water shortages at key production facilities
of Nornickel’s Polar Division and social facilities in the Norilsk Industrial District.
Key risk factors Impact on Nornickel’s development goal and strategy
Mitigation
Isolation of the Norilsk Industrial District’s power grid from the national grid (Unified Energy System of Russia). Harsh natural and climatic conditions, including low temperatures, storm winds, and snow load. Length of power, heat and gas transmission lines. Wear and tear of core production equipment and grid infrastructures
Efficient delivery of finished goods (metals) in line with the production programme. Timely supply of products to consumers. Social responsibility: comfort and safety of people living in Nornickel’s regions of operation
To manage this risk, Nornickel:• operates and maintains generating and mining assets
as required by the technical documentation, industry rules and standards, and applicable laws
• timely constructs and launches transformer facilities, timely replaces transmission towers
• timely executes retrofits (replaces equipment) of TPP and HPP power units
• timely upgrades and repairs trunk gas and condensate pipelines and gas distribution networks
Impact on goals: medium
Year-on-year change in risk: stable
Source of risk: internal
TECHNICAL AND PRODUCTION RISK
Technical, production, or natural phenomena which, once materialised, could have a negative impact on the implementation of the production programme and cause equipment breakdown or reimbursable damage to third parties and the environment.
Key risk factors Impact on Nornickel’s development goal and strategy
Mitigation
Harsh natural and climatic conditions, including low temperatures, storm winds, and snow load. Unscheduled stoppages of core equipment caused by fixed assets’ wear and tear. Release of explosive gases and flooding of mines. Collapse of buildings and structures. Infrastructure breakdowns
Efficient delivery of finished goods (metals) in line with the production programme. Timely supply of products to consumers
To manage this risk, Nornickel:• ensures proper and safe operation of its assets in line
with the requirements of technical documentation, as well as technical rules and regulations as prescribed by local laws across Nornickel’s geographic footprint
• develops ranking criteria and criticality assessment for the Norilsk Nickel Group’s key industrial assets
• timely replaces its fixed assets to achieve production safety targets
• implements automated systems to control equipment process flows, uses state-of-the art engineering controls
• improves the maintenance and repair system• trains and educates its employees both locally, on site,
and centrally, through its corporate training centres• systematically identifies and assesses technical and production
risks, implements a programme of organisational and technical measures to mitigate relevant risks
• improves the system of stationary gas analysers, provides employees with portable gas analysers
• develops the technical and production risk management system, including by engaging independent experts to assess the system’s performance and completeness of data
• develops and tests business continuity plans which set out a sequence of actions to be taken by Nornickel’s personnel and internal contractors in case of technical and production risk causing maximum damage. These plans are aimed at the earliest resumption of Nornickel’s production operations
• engages, on an annual basis, independent surveyors to analyse Nornickel’s exposure to disruptions in the production and logistics chain and make assessments of related risks.
In 2019, insurance was taken out against key technical and production risks as part of the property and business interruption (downtime) insurance programme, with emphasis on best risk management practices in the mining and metals industry
Impact on goals: medium
Year-on-year change in risk: stable
Source of risk: internal
230 231
2019 Annual reportNORNICKELCompany overview Strategic report Commodity
market overviewBusiness overview Sustainable
developmentCorporate governance
Risk report Shareholder information IFRS financial statements Appendix
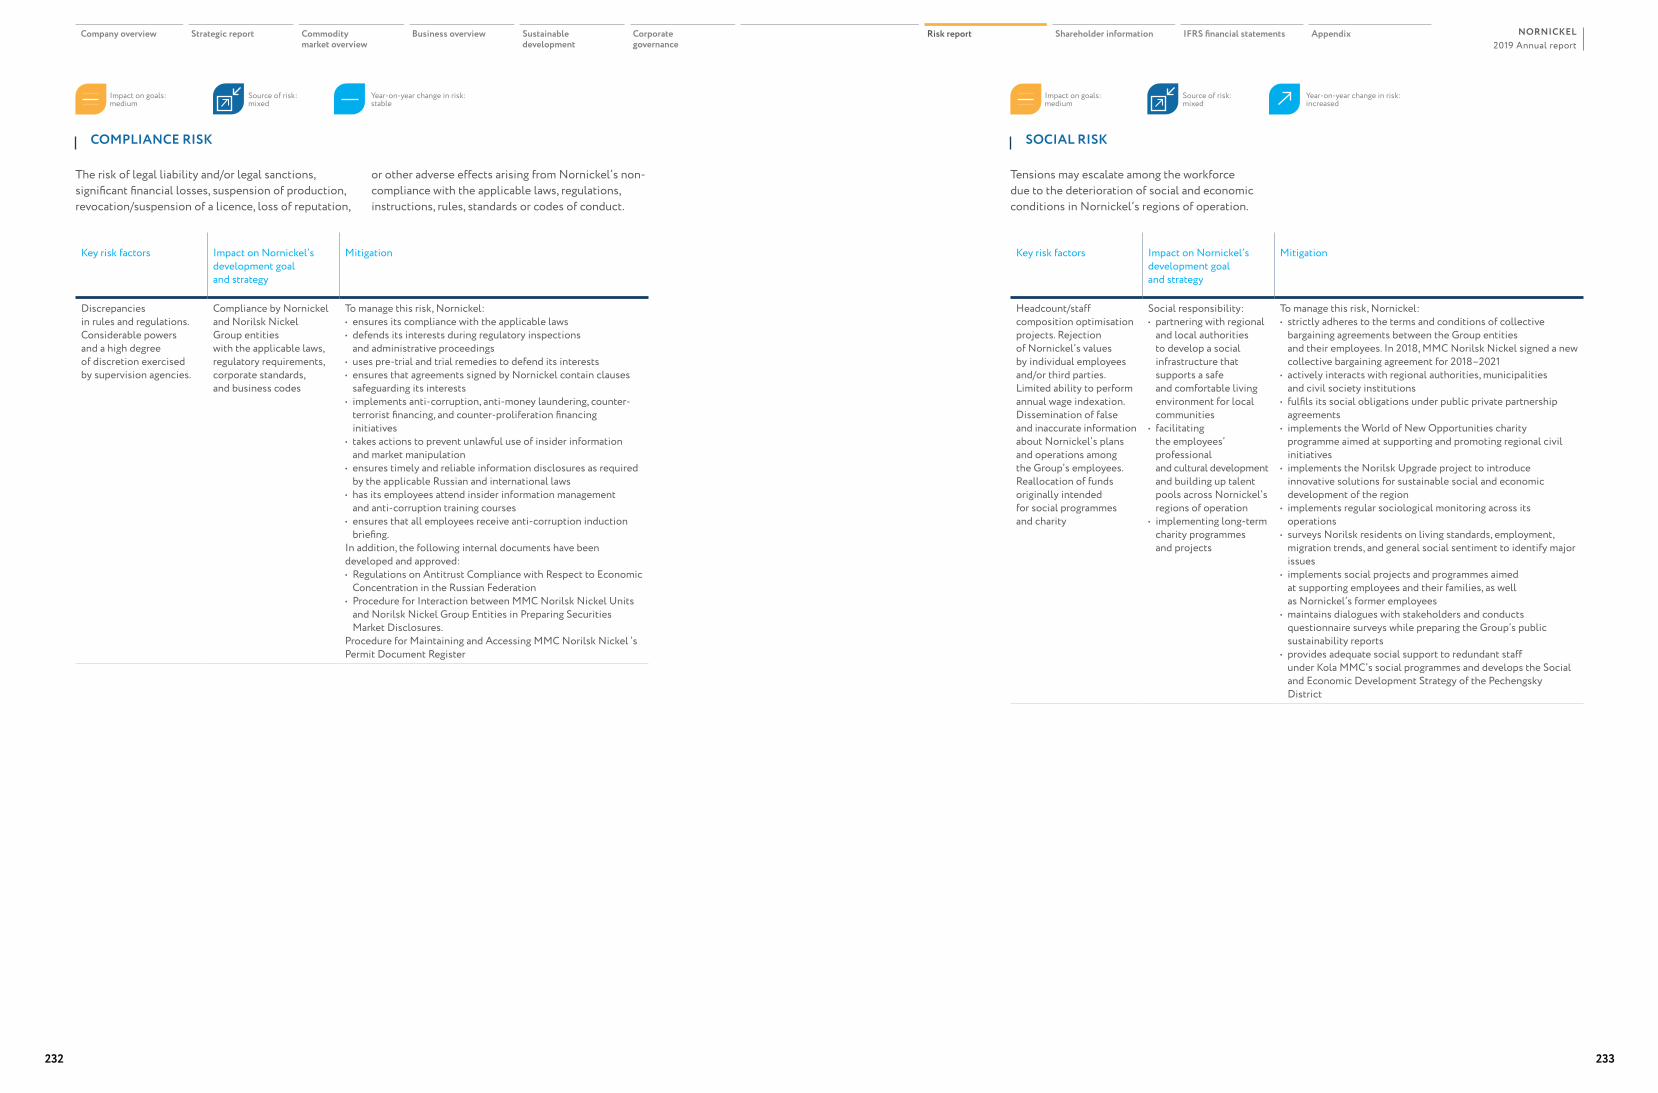
SOCIAL RISK
Tensions may escalate among the workforce due to the deterioration of social and economic conditions in Nornickel’s regions of operation.
Key risk factors Impact on Nornickel’s development goal and strategy
Mitigation
Headcount/staff composition optimisation projects. Rejection of Nornickel’s values by individual employees and/or third parties. Limited ability to perform annual wage indexation. Dissemination of false and inaccurate information about Nornickel’s plans and operations among the Group’s employees. Reallocation of funds originally intended for social programmes and charity
Social responsibility: • partnering with regional
and local authorities to develop a social infrastructure that supports a safe and comfortable living environment for local communities
• facilitating the employees’ professional and cultural development and building up talent pools across Nornickel’s regions of operation
• implementing long-term charity programmes and projects
To manage this risk, Nornickel:• strictly adheres to the terms and conditions of collective
bargaining agreements between the Group entities and their employees. In 2018, MMC Norilsk Nickel signed a new collective bargaining agreement for 2018–2021
• actively interacts with regional authorities, municipalities and civil society institutions
• fulfils its social obligations under public private partnership agreements
• implements the World of New Opportunities charity programme aimed at supporting and promoting regional civil initiatives
• implements the Norilsk Upgrade project to introduce innovative solutions for sustainable social and economic development of the region
• implements regular sociological monitoring across its operations
• surveys Norilsk residents on living standards, employment, migration trends, and general social sentiment to identify major issues
• implements social projects and programmes aimed at supporting employees and their families, as well as Nornickel’s former employees
• maintains dialogues with stakeholders and conducts questionnaire surveys while preparing the Group’s public sustainability reports
• provides adequate social support to redundant staff under Kola MMC’s social programmes and develops the Social and Economic Development Strategy of the Pechengsky District
Impact on goals: medium
Year-on-year change in risk: increased
Source of risk: mixed
COMPLIANCE RISK
The risk of legal liability and/or legal sanctions, significant financial losses, suspension of production, revocation/suspension of a licence, loss of reputation,
or other adverse effects arising from Nornickel’s non-compliance with the applicable laws, regulations, instructions, rules, standards or codes of conduct.
Key risk factors Impact on Nornickel’s development goal and strategy
Mitigation
Discrepancies in rules and regulations. Considerable powers and a high degree of discretion exercised by supervision agencies.
Compliance by Nornickel and Norilsk Nickel Group entities with the applicable laws, regulatory requirements, corporate standards, and business codes
To manage this risk, Nornickel:• ensures its compliance with the applicable laws• defends its interests during regulatory inspections
and administrative proceedings• uses pre-trial and trial remedies to defend its interests• ensures that agreements signed by Nornickel contain clauses
safeguarding its interests• implements anti-corruption, anti-money laundering, counter-
terrorist financing, and counter-proliferation financing initiatives
• takes actions to prevent unlawful use of insider information and market manipulation
• ensures timely and reliable information disclosures as required by the applicable Russian and international laws
• has its employees attend insider information management and anti-corruption training courses
• ensures that all employees receive anti-corruption induction briefing.
In addition, the following internal documents have been developed and approved:• Regulations on Antitrust Compliance with Respect to Economic
Concentration in the Russian Federation• Procedure for Interaction between MMC Norilsk Nickel Units
and Norilsk Nickel Group Entities in Preparing Securities Market Disclosures.
Procedure for Maintaining and Accessing MMC Norilsk Nickel ’s Permit Document Register
Year-on-year change in risk: stable
Impact on goals: medium
Source of risk: mixed
232 233
2019 Annual reportNORNICKELCompany overview Strategic report Commodity
market overviewBusiness overview Sustainable
developmentCorporate governance
Risk report Shareholder information IFRS financial statements Appendix
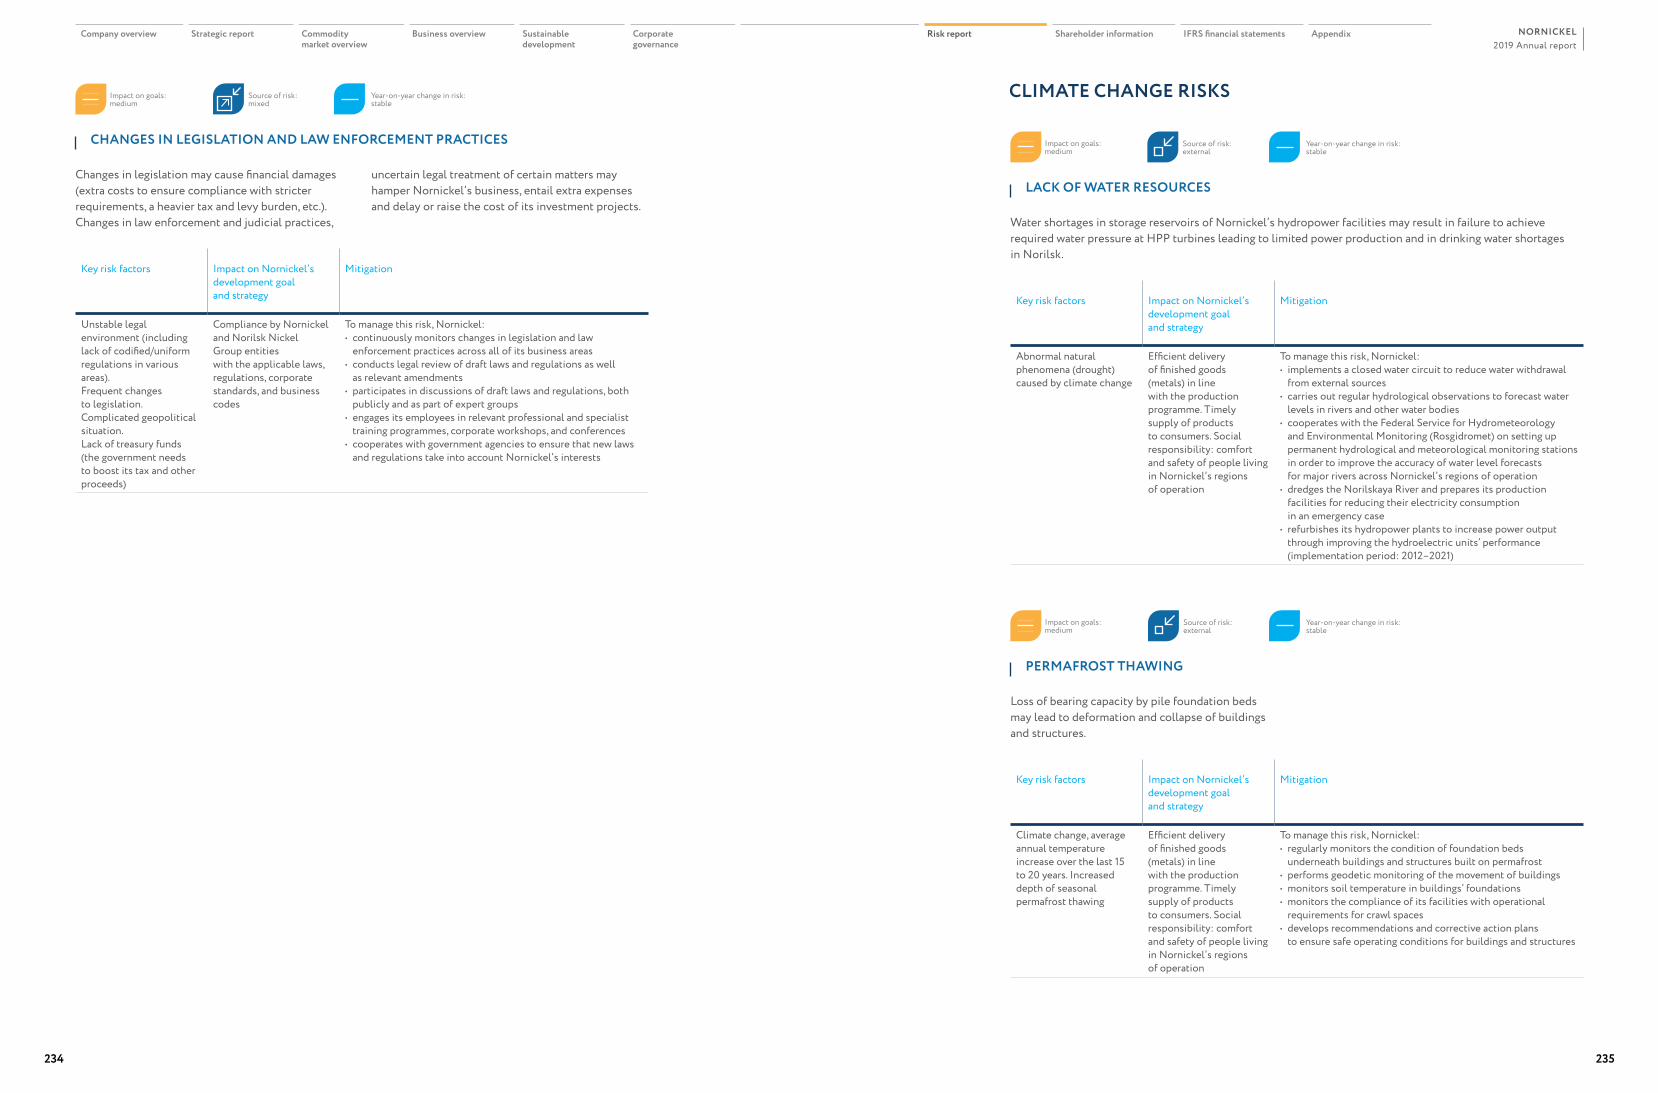
LACK OF WATER RESOURCES
Water shortages in storage reservoirs of Nornickel’s hydropower facilities may result in failure to achieve required water pressure at HPP turbines leading to limited power production and in drinking water shortages in Norilsk.
Key risk factors Impact on Nornickel’s development goal and strategy
Mitigation
Abnormal natural phenomena (drought) caused by climate change
Efficient delivery of finished goods (metals) in line with the production programme. Timely supply of products to consumers. Social responsibility: comfort and safety of people living in Nornickel’s regions of operation
To manage this risk, Nornickel:• implements a closed water circuit to reduce water withdrawal
from external sources• carries out regular hydrological observations to forecast water
levels in rivers and other water bodies• cooperates with the Federal Service for Hydrometeorology
and Environmental Monitoring (Rosgidromet) on setting up permanent hydrological and meteorological monitoring stations in order to improve the accuracy of water level forecasts for major rivers across Nornickel’s regions of operation
• dredges the Norilskaya River and prepares its production facilities for reducing their electricity consumption in an emergency case
• refurbishes its hydropower plants to increase power output through improving the hydroelectric units’ performance (implementation period: 2012–2021)
Impact on goals: medium
Year-on-year change in risk: stable
Source of risk: external
CLIMATE CHANGE RISKS
CHANGES IN LEGISLATION AND LAW ENFORCEMENT PRACTICES
Changes in legislation may cause financial damages (extra costs to ensure compliance with stricter requirements, a heavier tax and levy burden, etc.). Changes in law enforcement and judicial practices,
uncertain legal treatment of certain matters may hamper Nornickel’s business, entail extra expenses and delay or raise the cost of its investment projects.
Key risk factors Impact on Nornickel’s development goal and strategy
Mitigation
Unstable legal environment (including lack of codified/uniform regulations in various areas). Frequent changes to legislation. Complicated geopolitical situation. Lack of treasury funds (the government needs to boost its tax and other proceeds)
Compliance by Nornickel and Norilsk Nickel Group entities with the applicable laws, regulations, corporate standards, and business codes
To manage this risk, Nornickel:• continuously monitors changes in legislation and law
enforcement practices across all of its business areas• conducts legal review of draft laws and regulations as well
as relevant amendments• participates in discussions of draft laws and regulations, both
publicly and as part of expert groups• engages its employees in relevant professional and specialist
training programmes, corporate workshops, and conferences• cooperates with government agencies to ensure that new laws
and regulations take into account Nornickel’s interests
Year-on-year change in risk: stable
Impact on goals: medium
Source of risk: mixed
PERMAFROST THAWING
Loss of bearing capacity by pile foundation beds may lead to deformation and collapse of buildings and structures.
Key risk factors Impact on Nornickel’s development goal and strategy
Mitigation
Climate change, average annual temperature increase over the last 15 to 20 years. Increased depth of seasonal permafrost thawing
Efficient delivery of finished goods (metals) in line with the production programme. Timely supply of products to consumers. Social responsibility: comfort and safety of people living in Nornickel’s regions of operation
To manage this risk, Nornickel:• regularly monitors the condition of foundation beds
underneath buildings and structures built on permafrost• performs geodetic monitoring of the movement of buildings• monitors soil temperature in buildings’ foundations• monitors the compliance of its facilities with operational
requirements for crawl spaces• develops recommendations and corrective action plans
to ensure safe operating conditions for buildings and structures
Year-on-year change in risk: stable
Impact on goals: medium
Source of risk: external
234 235
2019 Annual reportNORNICKELCompany overview Strategic report Commodity
market overviewBusiness overview Sustainable
developmentCorporate governance
Risk report Shareholder information IFRS financial statements Appendix
S Information238 Share capital242 Dividend policy245 Debt instruments247 Investor relations
harehol der
Shareholder information

SHARE CAPITALNornickel’s authorised capital is made up of 158,245,476 ordinary shares with a par value of RUB 1 each. No preferred shares are issued. The Company’s capitalisation at the end of 2019 increased by 62.6% year-on-year and amounted to USD 48.3 bn.
Nornickel shares have been trading on the Russian securities market since 2001 and are included in the Blue Chip Index of the Moscow Exchange (ticker symbol: GMKN) ranking among the most liquid instruments in the Russian securities market.
In 2001, Nornickel issued American depositary receipts (ADRs) to represent its shares. Currently, shares are convertible into ADRs at a ratio of 1:10. Depositary services for the ADR programme and custody services are provided by the Bank of New York Mellon and VTB Bank, respectively. ADRs are traded in the electronic trading system of OTC markets of the London Stock Exchange (ticker symbol: MNOD), on the US OTC market (ticker symbol: NILSY), and on other exchanges. As at 31 December 2019, the total number of ADRs representing MMC Norilsk Nickel shares was 406,485,700 or 25.7% of the authorised capital. The number of ADRs traded on stock exchanges is not constant, as depositary receipt holders may convert their securities into shares and vice versa.
In the reporting period, EN+ GROUP PLC acquired 1.98% of the voting shares in UC RUSAL Plc, bringing its voting share ownership in UC RUSAL Plc to 50.1%. UC RUSAL Plc held 0.0006% of shares in Nornickel directly and 27.8238% indirectly (via indirect control over Aktivium Holding B.V. , which held 27.8238% of the voting shares in Nornickel). In 2019, EN+ GROUP PLC and Aktivium Holding B.V. were registered in Russia as EN+ GROUP International Public Joint-Stock Company (EN+ GROUP IPJSC) and International Limited Liability Company AKTIVIUM (MK AKTIVIUM), respectively.
As of the end of 2019, the largest shareholders’ stakes remained the same, with the stake of Olderfrey Holdings Ltd totalling 34.6%, and the stake of EN+ Group IPJSC (formerly UC RUSAL Plc) totalling
Share price and trading volume on the Moscow Exchange
Period Share price, RUB Trading volume,
mln shares
Market cap as at the period end,
RUB bnlow high as at the period end
2019 12,993 19,890 19,102 42 3,023
First quarter 12,993 14,594 13,720 10.9 2,171
Second quarter 13,358 14,868 14,308 8.8 2,264
Third quarter 14,146 16,686 16,686 10.6 2,640
Fourth quarter 15,894 19,890 19,102 11.8 3,023
2018 9,170 13,349 13,039 46 2,063
2017 7,791 11,610 10,850 49 1,717
2016 8,050 11,070 10,122 48 1,602
2015 8,590 12,106 9,150 58 1,448
Source: Nornickel’s calculations based on the Moscow Exchange price
At the end of 2019 Nornickel capitalisation amounted
USD 48 bn
27.8%. 37.6% of shares and ADRs are in free float or are owned by institutional and private investors based in Russia or USA, as well as in European, Asian, and other countries.
238 239
2019 Annual reportNORNICKELCompany overview Strategic report Commodity
market overviewBusiness overview Sustainable
developmentCorporate governance
Risk report Shareholder information IFRS financial statements Appendix
Nornickel share price and MOEX Index in 2019
Jan Feb Mar Apr May Jun Jul Aug Sep Oct Nov Dec
+47%+28%
60%
80%
100%
120%
140%
Nornickel shares MOEX index
Share capital structure as at calendar year-end %
’17’18’19
Free float EN+ Group IPJSC (indirect ownership via controlled entities, including UC RUSAL Plc. In 2017-2018 shows the interest (directly and indirectly) UC RUSAL Plc.)
Olderfrey Holdings Ltd. (indirect ownership via controlled entities)
41.816 4
27.8 30.437.6 27.8 34.637.6 27.8 34.6
Market cap as at calendar year-end USD bn
48.329.729.726.620.0’15
‘16’17‘18’19
Share and ADR split at the end of 2019
ADRsShares
74.3% 25.7%158,245,476
Shares
Source: Bloomberg
Source: Bloomberg
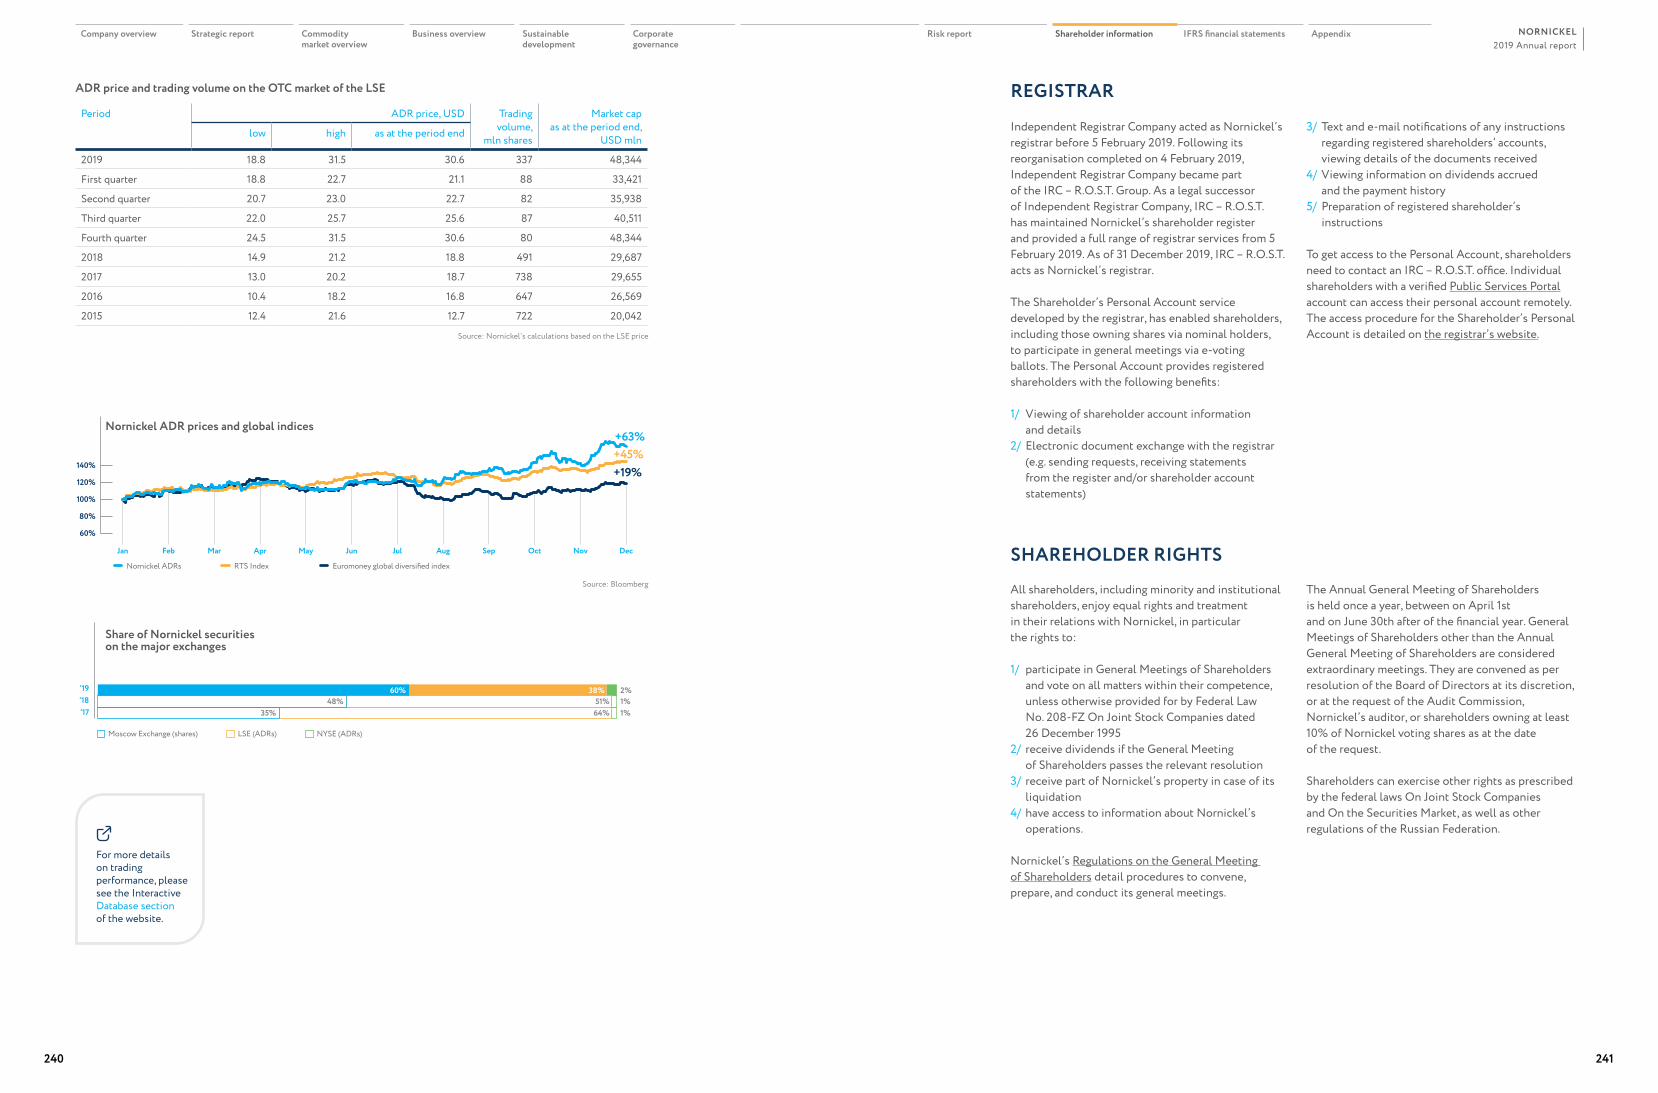
ADR price and trading volume on the OTC market of the LSE
Period ADR price, USD Trading volume,
mln shares
Market cap as at the period end,
USD mln low high as at the period end
2019 18.8 31.5 30.6 337 48,344
First quarter 18.8 22.7 21.1 88 33,421
Second quarter 20.7 23.0 22.7 82 35,938
Third quarter 22.0 25.7 25.6 87 40,511
Fourth quarter 24.5 31.5 30.6 80 48,344
2018 14.9 21.2 18.8 491 29,687
2017 13.0 20.2 18.7 738 29,655
2016 10.4 18.2 16.8 647 26,569
2015 12.4 21.6 12.7 722 20,042
Source: Nornickel’s calculations based on the LSE price
Independent Registrar Company acted as Nornickel’s registrar before 5 February 2019. Following its reorganisation completed on 4 February 2019, Independent Registrar Company became part of the IRC – R.O.S.T. Group. As a legal successor of Independent Registrar Company, IRC – R.O.S.T. has maintained Nornickel’s shareholder register and provided a full range of registrar services from 5 February 2019. As of 31 December 2019, IRC – R.O.S.T. acts as Nornickel’s registrar.
The Shareholder’s Personal Account service developed by the registrar, has enabled shareholders, including those owning shares via nominal holders, to participate in general meetings via e-voting ballots. The Personal Account provides registered shareholders with the following benefits:
1/ Viewing of shareholder account information and details
2/ Electronic document exchange with the registrar (e.g. sending requests, receiving statements from the register and/or shareholder account statements)
All shareholders, including minority and institutional shareholders, enjoy equal rights and treatment in their relations with Nornickel, in particular the rights to:
1/ participate in General Meetings of Shareholders and vote on all matters within their competence, unless otherwise provided for by Federal Law No. 208-FZ On Joint Stock Companies dated 26 December 1995
2/ receive dividends if the General Meeting of Shareholders passes the relevant resolution
3/ receive part of Nornickel’s property in case of its liquidation
4/ have access to information about Nornickel’s operations.
Nornickel’s Regulations on the General Meeting of Shareholders detail procedures to convene, prepare, and conduct its general meetings.
For more details on trading performance, please see the Interactive Database section of the websitе.
REGISTRAR
3/ Text and e-mail notifications of any instructions regarding registered shareholders’ accounts, viewing details of the documents received
4/ Viewing information on dividends accrued and the payment history
5/ Preparation of registered shareholder’s instructions
To get access to the Personal Account, shareholders need to contact an IRC – R.O.S.T. office. Individual shareholders with a verified Public Services Portal account can access their personal account remotely. The access procedure for the Shareholder’s Personal Account is detailed on the registrar’s website.
SHAREHOLDER RIGHTS
The Annual General Meeting of Shareholders is held once a year, between on April 1st and on June 30th after of the financial year. General Meetings of Shareholders other than the Annual General Meeting of Shareholders are considered extraordinary meetings. They are convened as per resolution of the Board of Directors at its discretion, or at the request of the Audit Commission, Nornickel’s auditor, or shareholders owning at least 10% of Nornickel voting shares as at the date of the request.
Shareholders can exercise other rights as prescribed by the federal laws On Joint Stock Companies and On the Securities Market, as well as other regulations of the Russian Federation.
240 241
2019 Annual reportNORNICKELCompany overview Strategic report Commodity
market overviewBusiness overview Sustainable
developmentCorporate governance
Risk report Shareholder information IFRS financial statements Appendix
Share of Nornickel securities on the major exchanges
Moscow Exchange (shares) LSE (ADRs) NYSE (ADRs)
’17‘18’19
35% 64% 1%48% 51% 1%
60% 38% 2%
Nornickel ADR prices and global indices
Jan Feb Mar Apr May Jun Jul Aug Sep Oct Nov Dec
60%
80%
100%
120%
140%
+63%+45%+19%
Nornickel ADRs RTS Index Euromoney global diversified index
Source: Bloomberg
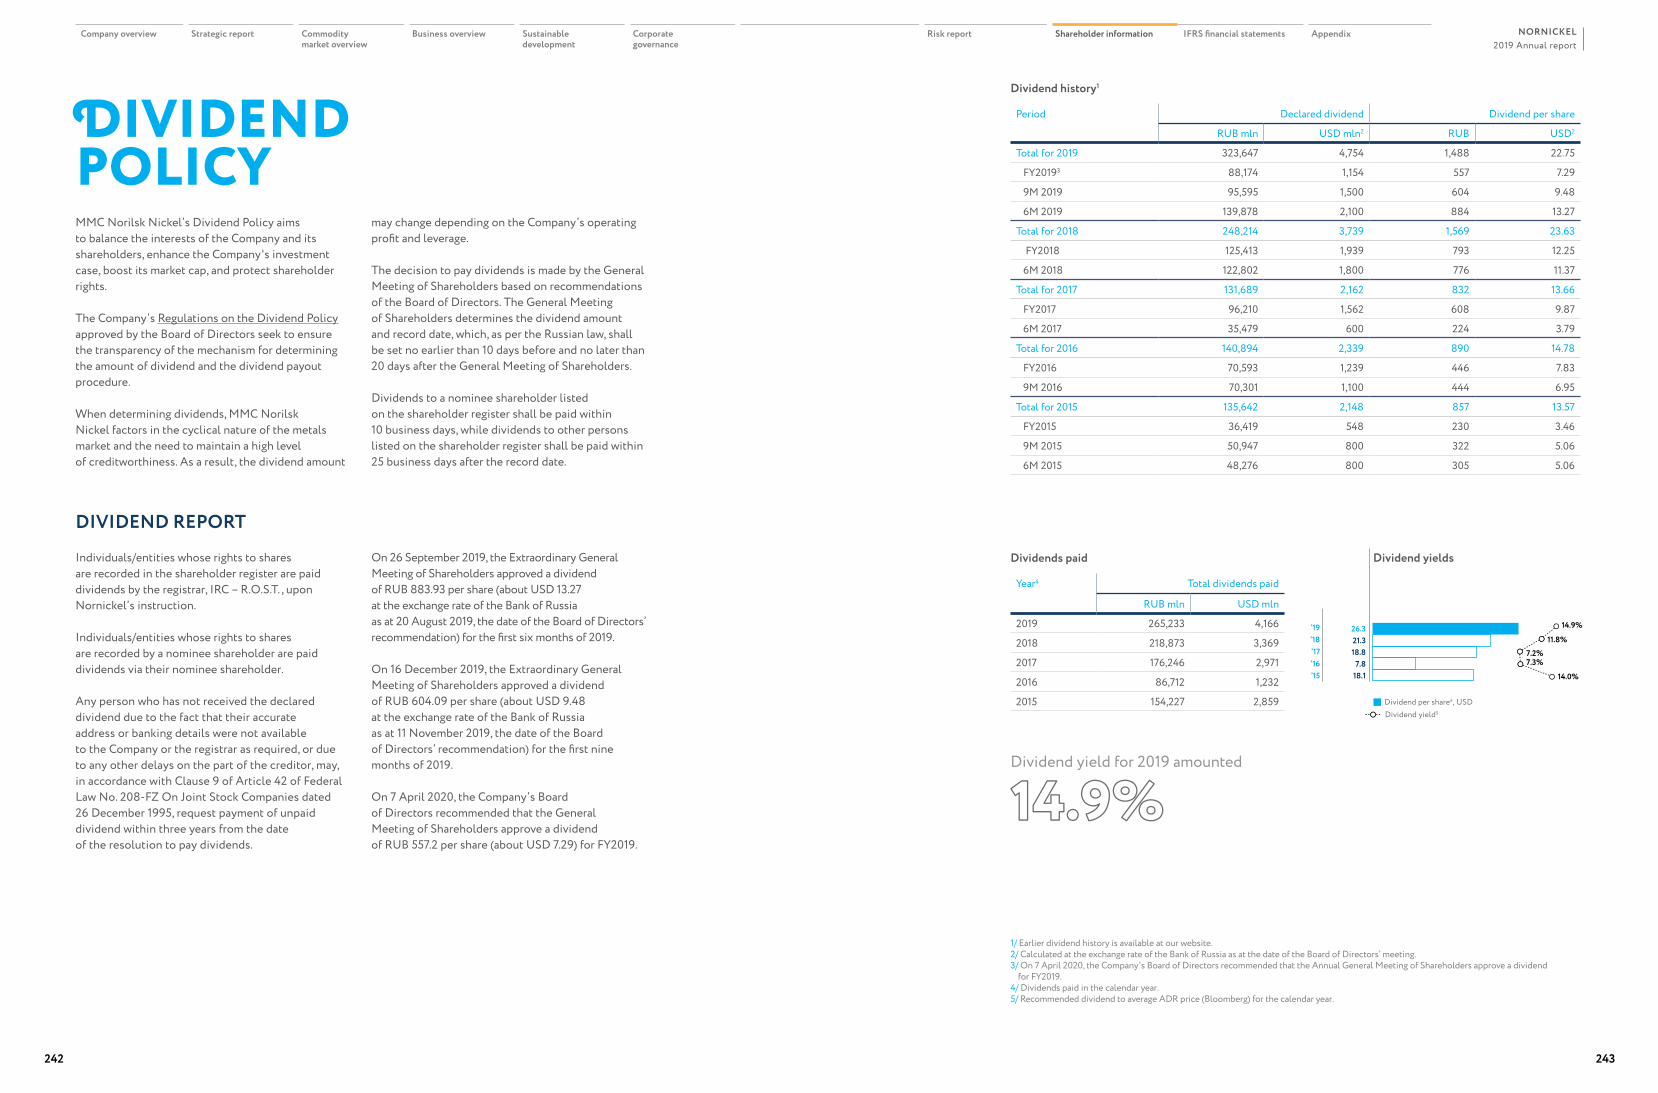
DIVIDEND POLICYMMC Norilsk Nickel’s Dividend Policy aims to balance the interests of the Company and its shareholders, enhance the Company's investment case, boost its market cap, and protect shareholder rights.
The Company’s Regulations on the Dividend Policy approved by the Board of Directors seek to ensure the transparency of the mechanism for determining the amount of dividend and the dividend payout procedure.
When determining dividends, MMC Norilsk Nickel factors in the cyclical nature of the metals market and the need to maintain a high level of creditworthiness. As a result, the dividend amount
may change depending on the Company’s operating profit and leverage.
The decision to pay dividends is made by the General Meeting of Shareholders based on recommendations of the Board of Directors. The General Meeting of Shareholders determines the dividend amount and record date, which, as per the Russian law, shall be set no earlier than 10 days before and no later than 20 days after the General Meeting of Shareholders.
Dividends to a nominee shareholder listed on the shareholder register shall be paid within 10 business days, while dividends to other persons listed on the shareholder register shall be paid within 25 business days after the record date.
Dividend history1
Period Declared dividend Dividend per share
RUB mln USD mln2 RUB USD2
Total for 2019 323,647 4,754 1,488 22.75
FY20193 88,174 1,154 557 7.29
9M 2019 95,595 1,500 604 9.48
6M 2019 139,878 2,100 884 13.27
Total for 2018 248,214 3,739 1,569 23.63
FY2018 125,413 1,939 793 12.25
6M 2018 122,802 1,800 776 11.37
Total for 2017 131,689 2,162 832 13.66
FY2017 96,210 1,562 608 9.87
6M 2017 35,479 600 224 3.79
Total for 2016 140,894 2,339 890 14.78
FY2016 70,593 1,239 446 7.83
9M 2016 70,301 1,100 444 6.95
Total for 2015 135,642 2,148 857 13.57
FY2015 36,419 548 230 3.46
9M 2015 50,947 800 322 5.06
6M 2015 48,276 800 305 5.06
1/ Earlier dividend history is available at our website.2/ Calculated at the exchange rate of the Bank of Russia as at the date of the Board of Directors’ meeting.3/ On 7 April 2020, the Company’s Board of Directors recommended that the Annual General Meeting of Shareholders approve a dividend
for FY2019.4/ Dividends paid in the calendar year.5/ Recommended dividend to average ADR price (Bloomberg) for the calendar year.
Dividends paid
Year4 Total dividends paid
RUB mln USD mln
2019 265,233 4,166
2018 218,873 3,369
2017 176,246 2,971
2016 86,712 1,232
2015 154,227 2,859
Dividend yield for 2019 amounted
14.9%
DIVIDEND REPORT
Individuals/entities whose rights to shares are recorded in the shareholder register are paid dividends by the registrar, IRC – R.O.S.T. , upon Nornickel’s instruction.
Individuals/entities whose rights to shares are recorded by a nominee shareholder are paid dividends via their nominee shareholder.
Any person who has not received the declared dividend due to the fact that their accurate address or banking details were not available to the Company or the registrar as required, or due to any other delays on the part of the creditor, may, in accordance with Clause 9 of Article 42 of Federal Law No. 208-FZ On Joint Stock Companies dated 26 December 1995, request payment of unpaid dividend within three years from the date of the resolution to pay dividends.
On 26 September 2019, the Extraordinary General Meeting of Shareholders approved a dividend of RUB 883.93 per share (about USD 13.27 at the exchange rate of the Bank of Russia as at 20 August 2019, the date of the Board of Directors’ recommendation) for the first six months of 2019.
On 16 December 2019, the Extraordinary General Meeting of Shareholders approved a dividend of RUB 604.09 per share (about USD 9.48 at the exchange rate of the Bank of Russia as at 11 November 2019, the date of the Board of Directors’ recommendation) for the first nine months of 2019.
On 7 April 2020, the Company’s Board of Directors recommended that the General Meeting of Shareholders approve a dividend of RUB 557.2 per share (about USD 7.29) for FY2019.
Dividend yields
18.17.8
18.821.326.3
’15‘16’17‘18’19
14.0%
7.3%7.2%
11.8%
14.9%
Dividend per share4, USDDividend yield5
242 243
2019 Annual reportNORNICKELCompany overview Strategic report Commodity
market overviewBusiness overview Sustainable
developmentCorporate governance
Risk report Shareholder information IFRS financial statements Appendix
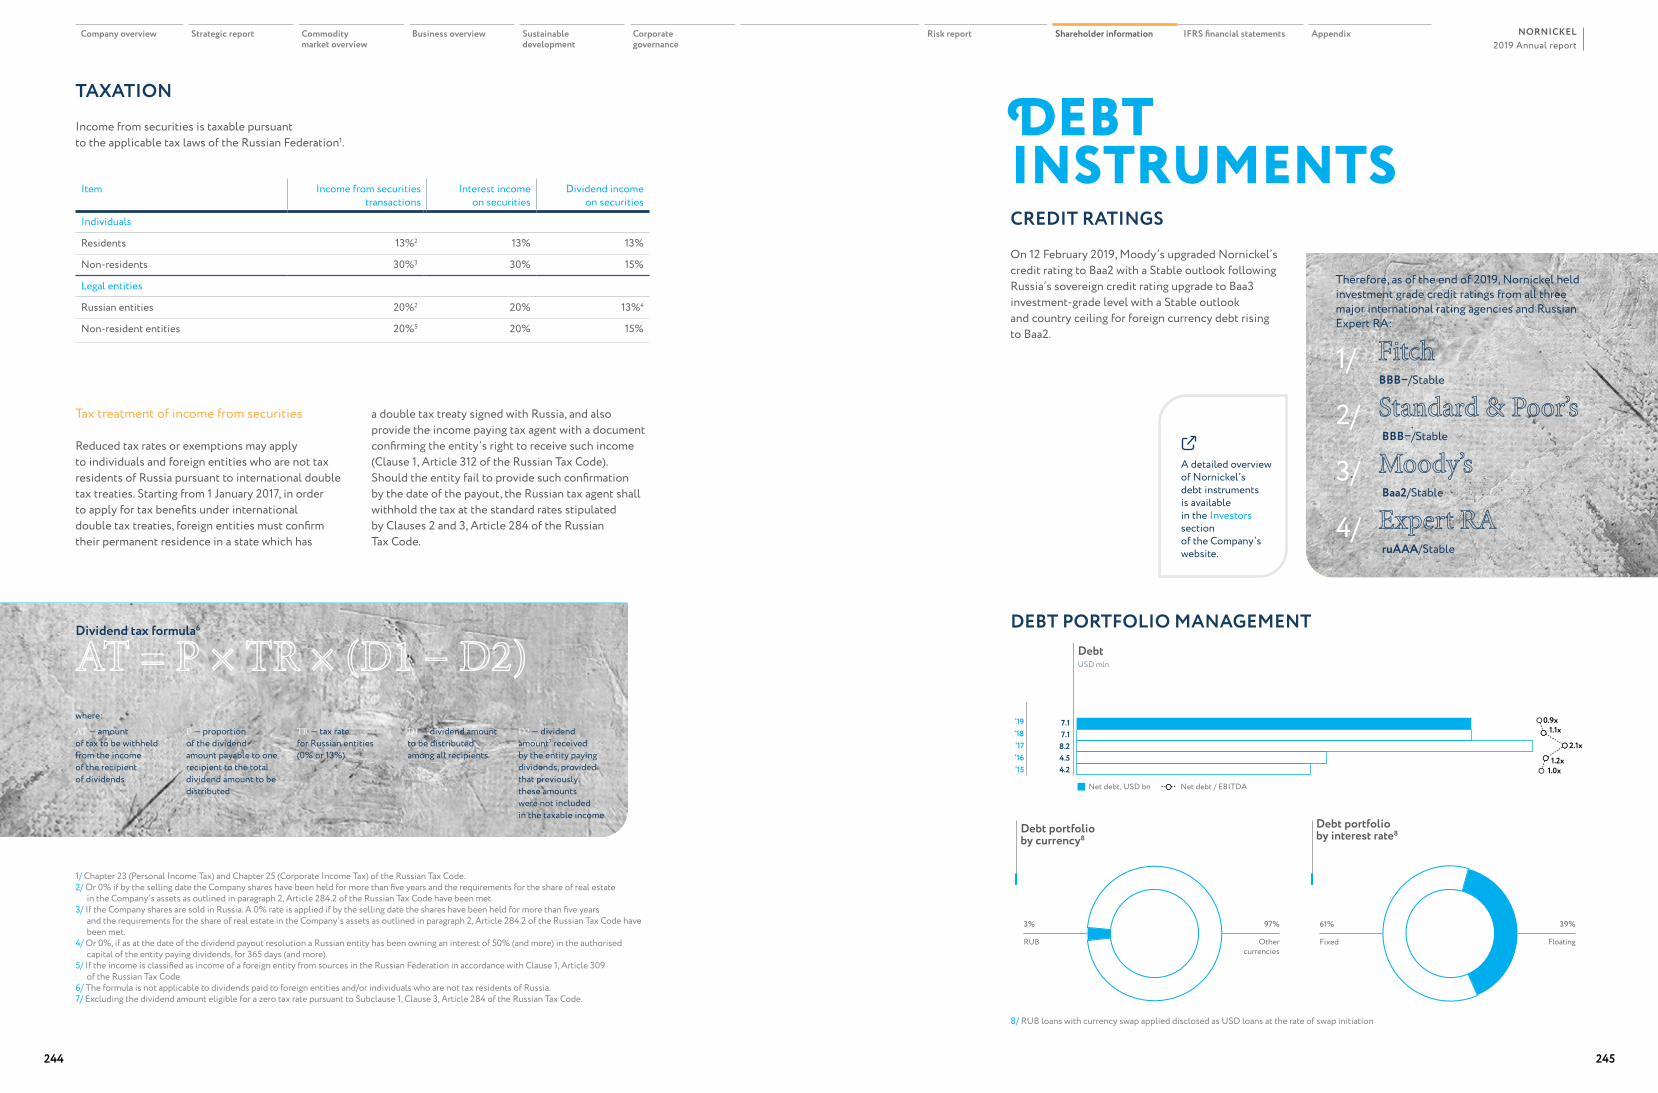
TAXATION
Income from securities is taxable pursuant to the applicable tax laws of the Russian Federation1.
1/ Chapter 23 (Personal Income Tax) and Chapter 25 (Corporate Income Tax) of the Russian Tax Code.2/ Or 0% if by the selling date the Company shares have been held for more than five years and the requirements for the share of real estate
in the Company’s assets as outlined in paragraph 2, Article 284.2 of the Russian Tax Code have been met. 3/ If the Company shares are sold in Russia. A 0% rate is applied if by the selling date the shares have been held for more than five years
and the requirements for the share of real estate in the Company’s assets as outlined in paragraph 2, Article 284.2 of the Russian Tax Code have been met.
4/ Or 0%, if as at the date of the dividend payout resolution a Russian entity has been owning an interest of 50% (and more) in the authorised capital of the entity paying dividends, for 365 days (and more).
5/ If the income is classified as income of a foreign entity from sources in the Russian Federation in accordance with Clause 1, Article 309 of the Russian Tax Code.
6/ The formula is not applicable to dividends paid to foreign entities and/or individuals who are not tax residents of Russia.7/ Excluding the dividend amount eligible for a zero tax rate pursuant to Subclause 1, Clause 3, Article 284 of the Russian Tax Code.
8/ RUB loans with currency swap applied disclosed as USD loans at the rate of swap initiation
Tax treatment of income from securities
Reduced tax rates or exemptions may apply to individuals and foreign entities who are not tax residents of Russia pursuant to international double tax treaties. Starting from 1 January 2017, in order to apply for tax benefits under international double tax treaties, foreign entities must confirm their permanent residence in a state which has
a double tax treaty signed with Russia, and also provide the income paying tax agent with a document confirming the entity’s right to receive such income (Clause 1, Article 312 of the Russian Tax Code). Should the entity fail to provide such confirmation by the date of the payout, the Russian tax agent shall withhold the tax at the standard rates stipulated by Clauses 2 and 3, Article 284 of the Russian Tax Code.
Dividend tax formula6
where:AT — amount of tax to be withheld from the income of the recipient of dividends
P — proportion of the dividend amount payable to one recipient to the total dividend amount to be distributed
TR — tax rate for Russian entities (0% or 13%)
D1 — dividend amount to be distributed among all recipients
D2 — dividend amount7 received by the entity paying dividends, provided that previously these amounts were not included in the taxable income
AT = P × TR × (D1 − D2)
DEBT INSTRUMENTSCREDIT RATINGS
On 12 February 2019, Moody’s upgraded Nornickel’s credit rating to Baa2 with a Stable outlook following Russia’s sovereign credit rating upgrade to Baa3 investment-grade level with a Stable outlook and country ceiling for foreign currency debt rising to Baa2.
DEBT PORTFOLIO MANAGEMENT
Item Income from securities transactions
Interest income on securities
Dividend income on securities
Individuals
Residents 13%2 13% 13%
Non-residents 30%3 30% 15%
Legal entities
Russian entities 20%2 20% 13%4
Non-resident entities 20%5 20% 15%
Therefore, as of the end of 2019, Nornickel held investment grade credit ratings from all three major international rating agencies and Russian Expert RA:
1/
2/
3/
4/
FitchBBB−/Stable
Standard & Poor’sBBB−/Stable
Moody’sBaa2/Stable
Expert RAruААА/Stable
A detailed overview of Nornickel’s debt instruments is available in the Investors section of the Company’s website.
Debt portfolio by currency8
Othercurrencies
RUB
3% 97%
Debt USD mln
4.24.58.27.17.1
’15‘16’17‘18’19
1.0х1.2х
2.1х
1.1х0.9x
Net debt, USD bn Net debt / EBITDA
Debt portfolio by interest rate8
FloatingFixed
61% 39%
244 245
2019 Annual reportNORNICKELCompany overview Strategic report Commodity
market overviewBusiness overview Sustainable
developmentCorporate governance
Risk report Shareholder information IFRS financial statements Appendix
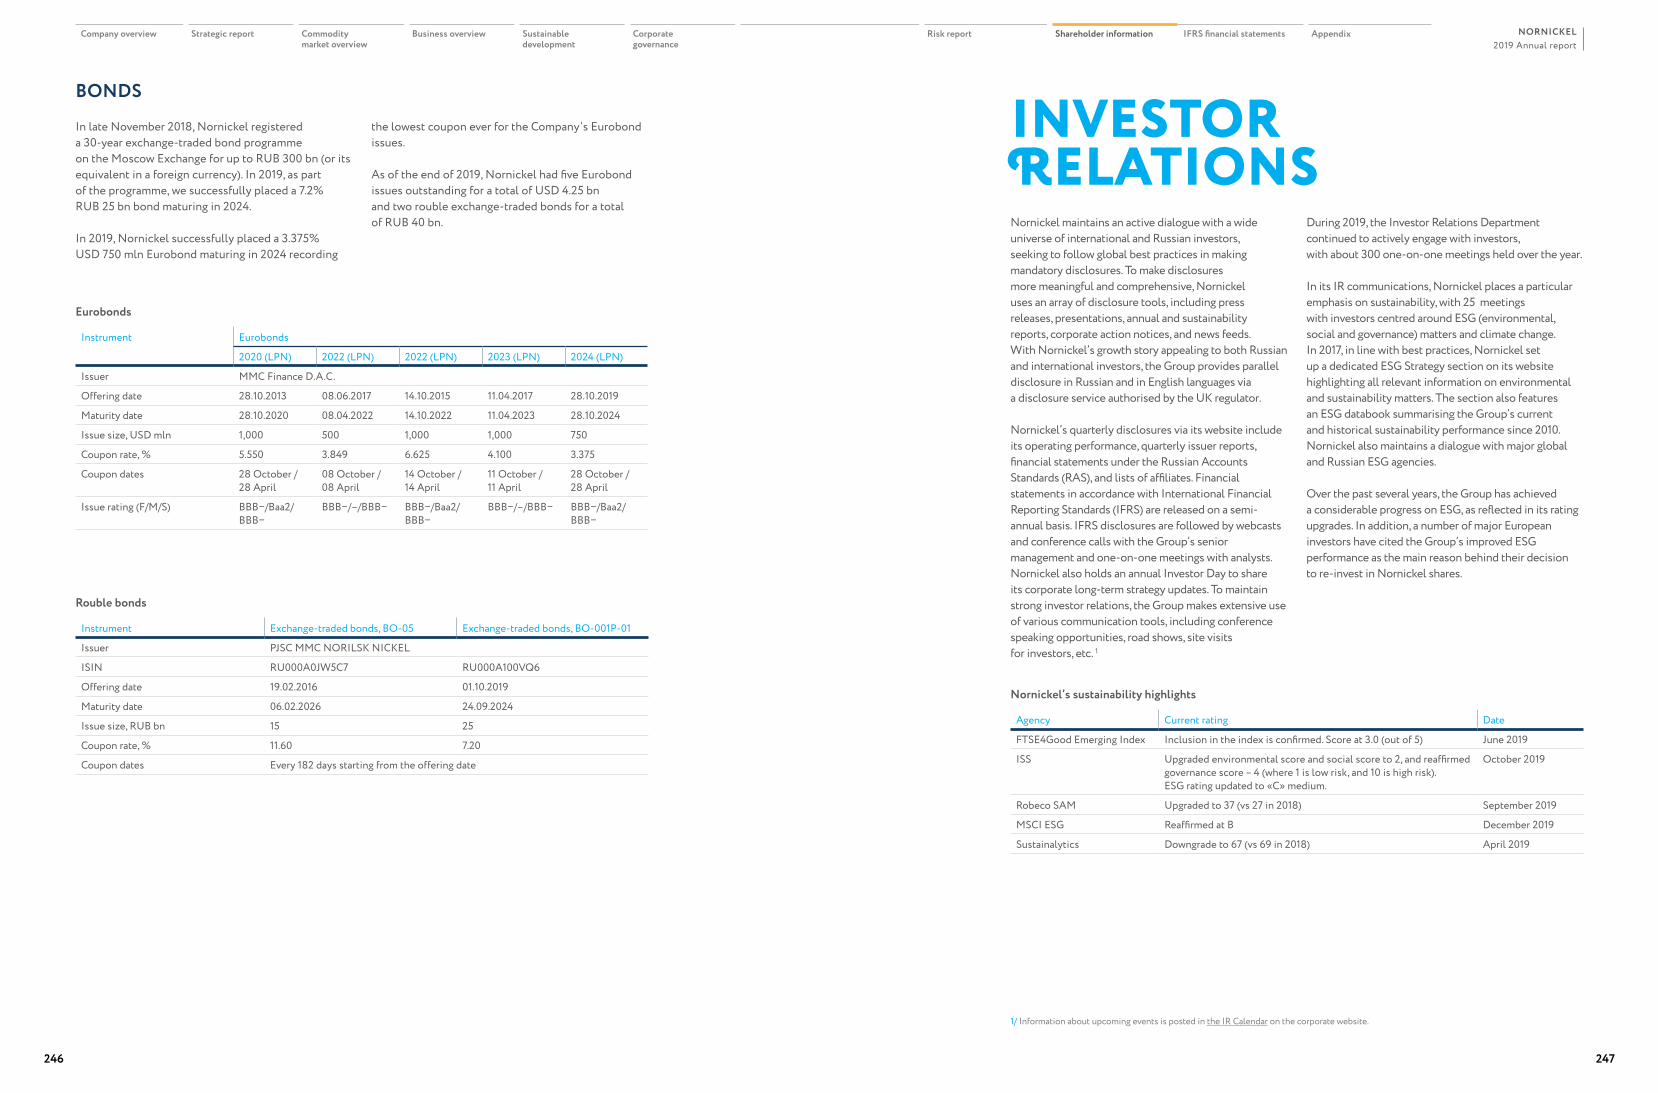
Eurobonds
Instrument Eurobonds
2020 (LPN) 2022 (LPN) 2022 (LPN) 2023 (LPN) 2024 (LPN)
Issuer MMC Finance D.A.C.
Offering date 28.10.2013 08.06.2017 14.10.2015 11.04.2017 28.10.2019
Maturity date 28.10.2020 08.04.2022 14.10.2022 11.04.2023 28.10.2024
Issue size, USD mln 1,000 500 1,000 1,000 750
Coupon rate, % 5.550 3.849 6.625 4.100 3.375
Coupon dates 28 October / 28 April
08 October / 08 April
14 October / 14 April
11 October / 11 April
28 October / 28 April
Issue rating (F/M/S) BBB−/Bаa2/BBB−
ВВВ−/–/ВВВ− BBB−/Bаa2/BBB−
ВВВ−/–/ВВВ− BBB−/Bаa2/BBB−
BONDS
In late November 2018, Nornickel registered a 30-year exchange-traded bond programme on the Moscow Exchange for up to RUB 300 bn (or its equivalent in a foreign currency). In 2019, as part of the programme, we successfully placed a 7.2% RUB 25 bn bond maturing in 2024.
In 2019, Nornickel successfully placed a 3.375% USD 750 mln Eurobond maturing in 2024 recording
the lowest coupon ever for the Company’s Eurobond issues.
As of the end of 2019, Nornickel had five Eurobond issues outstanding for a total of USD 4.25 bn and two rouble exchange-traded bonds for a total of RUB 40 bn.
Rouble bonds
Instrument Exchange-traded bonds, BO-05 Exchange-traded bonds, BO-001P-01
Issuer PJSC MMC NORILSK NICKEL
ISIN RU000A0JW5C7 RU000A100VQ6
Offering date 19.02.2016 01.10.2019
Maturity date 06.02.2026 24.09.2024
Issue size, RUB bn 15 25
Coupon rate, % 11.60 7.20
Coupon dates Every 182 days starting from the offering date
INVESTOR RELATIONSNornickel maintains an active dialogue with a wide universe of international and Russian investors, seeking to follow global best practices in making mandatory disclosures. To make disclosures more meaningful and comprehensive, Nornickel uses an array of disclosure tools, including press releases, presentations, annual and sustainability reports, corporate action notices, and news feeds. With Nornickel’s growth story appealing to both Russian and international investors, the Group provides parallel disclosure in Russian and in English languages via a disclosure service authorised by the UK regulator.
Nornickel’s quarterly disclosures via its website include its operating performance, quarterly issuer reports, financial statements under the Russian Accounts Standards (RAS), and lists of affiliates. Financial statements in accordance with International Financial Reporting Standards (IFRS) are released on a semi-annual basis. IFRS disclosures are followed by webcasts and conference calls with the Group’s senior management and one-on-one meetings with analysts. Nornickel also holds an annual Investor Day to share its corporate long-term strategy updates. To maintain strong investor relations, the Group makes extensive use of various communication tools, including conference speaking opportunities, road shows, site visits for investors, etc. 1
During 2019, the Investor Relations Department continued to actively engage with investors, with about 300 one-on-one meetings held over the year.
In its IR communications, Nornickel places a particular emphasis on sustainability, with 25 meetings with investors centred around ESG (environmental, social and governance) matters and climate change. In 2017, in line with best practices, Nornickel set up a dedicated ESG Strategy section on its website highlighting all relevant information on environmental and sustainability matters. The section also features an ESG databook summarising the Group’s current and historical sustainability performance since 2010. Nornickel also maintains a dialogue with major global and Russian ESG agencies.
Over the past several years, the Group has achieved a considerable progress on ESG, as reflected in its rating upgrades. In addition, a number of major European investors have cited the Group’s improved ESG performance as the main reason behind their decision to re-invest in Nornickel shares.
Nornickel’s sustainability highlights
Agency Current rating Date
FTSE4Good Emerging Index Inclusion in the index is confirmed. Score at 3.0 (out of 5) June 2019
ISS Upgraded environmental score and social score to 2, and reaffirmed governance score – 4 (where 1 is low risk, and 10 is high risk). ESG rating updated to «С» medium.
October 2019
Robeco SAM Upgraded to 37 (vs 27 in 2018) September 2019
MSCI ESG Reaffirmed at B December 2019
Sustainalytics Downgrade to 67 (vs 69 in 2018) April 2019
1/ Information about upcoming events is posted in the IR Calendar on the corporate website.
246 247
2019 Annual reportNORNICKELCompany overview Strategic report Commodity
market overviewBusiness overview Sustainable
developmentCorporate governance
Risk report Shareholder information IFRS financial statements Appendix
IFRSFinancial statements
IFRS financial statements
MINING AND METALLURGICAL COMPANY NORILSK NICKELONSOLIDATED FINANCIAL STATEMENTS FOR THE YEARS ENDED 31 DECEMBER 2019, 2018 AND 2017
STATEMENT OF MANAGEMENT’S RESPONSIBILITIES FOR THE PREPARATION AND APPROVAL OF THE CONSOLIDATED FINANCIAL STATEMENTS FOR THE YEARS ENDED 31 DECEMBER 2019, 2018 AND 2017
The following statement, which should be read in conjunction with the auditors’ responsibility stated in the auditors’ report set out on pages 2-5, is made with a view to distinguishing the respective responsibilities of management and those of the auditors in relation to the consolidated financial statements of Public Joint Stock Company “Mining and Metallurgical Company “Norilsk Nickel” and its subsidiaries (the “Group”).
Management of the Group is responsible for the preparation of the consolidated financial statements that present fairly in all material aspects the consolidated financial position of the Group at 31 December 2019, 2018 and 2017 and consolidated statements of income, comprehensive income, cash flows and changes in equity for the years ended 31 December 2019, 2018 and 2017, in accordance with International Financial Reporting Standards (“IFRS”).
In preparing the consolidated financial statements, management is responsible for:• selecting suitable accounting principles and applying them consistently• making judgements and estimates that are reasonable and prudent• stating whether IFRS have been followed, subject to any material departures disclosed and explained
in the consolidated financial statements; and• preparing the consolidated financial statements on a going concern basis, unless it is inappropriate
to presume that the Group will continue in business for the foreseeable future.
Management, within its competencies, is also responsible for:• designing, implementing and maintaining an effective system of internal controls throughout the Group• maintaining statutory accounting records in compliance with local legislation and accounting standards
in the respective jurisdictions in which the Group operates• taking steps to safeguard the assets of the Group; and• detecting and preventing fraud and other irregularities.
PresidentV.O. Potanin
Senior Vice President – Chief Financial OfficerS.G. Malyshev
Moscow, Russia26 February 2020
The consolidated financial statements for the years ended 31 December 2019, 2018 and 2017 were approved by:
Statement of management’s responsibilities for the preparation and approval of the consolidated financial statements for the years ended 31 December 2019, 2018 and 2017
Index
Independent Auditors’ Report
Consolidated income statement for the years ended 31 december 2019, 2018 and 2017
Consolidated income statement
Consolidated statement of comprehensive income
Consolidated statement of financial position
Consolidated statement of cash flows
Consolidated statement of changes in equity
Notes to the consolidated financial statements
251
252
256
256
257
258
260
262
264
Company overview Strategic report Commodity market overview
Business overview Sustainable development
Corporate governance
Risk report Shareholder information IFRS financial statements AppendixAnnual report 2019
«NORNICKEL»
250 251
INDEPENDENT AUDITORS’ REPORT
TO THE SHAREHOLDERS AND BOARD OF DIRECTORS OF PJSC "MINING AND METALLURGICAL COMPANY NORILSK NICKEL"
Opinion
We have audited the consolidated financial statements of PJSC “Mining and Metallurgical Company Norilsk Nickel” (the “Company”) and its subsidiaries (the “Group”), which comprise the consolidated statements of financial position as at 31 December 2019, 2018 and 2017, the consolidated income statements, the consolidated statements of comprehensive income, changes in equity and cash flows for the years then ended, and notes, comprising significant accounting policies and other explanatory information.
In our opinion, the accompanying consolidated financial statements present fairly, in all material respects, the consolidated financial position of the Group as at 31 December 2019, 2018 and 2017, and its consolidated financial performance and its consolidated cash flows for the years then ended in accordance with International Financial Reporting Standards (IFRS).
Basis for Opinion
We conducted our audit in accordance with International Standards on Auditing (ISAs). Our responsibilities under those standards are further described in the Auditors’ Responsibilities for the Audit of the Consolidated Financial Statements section of our report. We are independent of the Group in accordance with the independence requirements that are relevant to our audit of the consolidated financial statements in the Russian Federation and with the International Code of Ethics for Professional Accountants (including International Independence Standards), and we have fulfilled our other ethical responsibilities in accordance with the requirements in the Russian Federation and the International Code of Ethics. We believe that the audit evidence we have obtained is sufficient and appropriate to provide a basis for our opinion.
Key Audit Matters
Key audit matters are those matters that, in our professional judgment, were of most significance in our audit of the consolidated financial statements of the current period. These matters were addressed in the context of our audit of the consolidated financial statements as a whole, and in forming our opinion thereon, and we do not provide a separate opinion on these matters.
Audited entity: PJSC “Mining and Metallurgical Company Norilsk Nickel”
Registration No. in the Unified State Register of Legal Entities 1028400000298.
Dudinka, Krasnoyarsk region, Russian Federation
Independent auditor: JSC “KPMG”, a company incorporated under the Laws of the Russian Federation, a member firm of the KPMG network of independent member firms affiliated with KPMG International Cooperative (“KPMG International”), a Swiss entity
Registration No. in the Unified State Register of Legal Entities 1027700125628
Member of the Self-regulatory Organization of Auditors Association “Sodruzhestvo” (SRO AAS). The Principal Registration Number of the Entry in the Register of Auditors and Audit Organisations: No. 12006020351
Implementation of the SAP ERP in the Polar division
The key audit matter How the matter was addressed in our audit
Starting from 1 January 2019 SAP ERP was implemented in the Polar division. The Polar division represents mining and metallurgy operations of GMK Group segment and a major production facility of the Group.
We understood and evaluated the SAP ERP implementation project governance and data migration plan. We involved KPMG IT specialists to assist us in evaluating the design, implementation, and operating effectiveness of certain IT general controls over the migration. We evaluated design and implementation of process level controls over migration of financial data at 1 January 2019 and in addition, we tested accuracy and completeness of migrated data substantially as at 1 January 2019 by comparison to respective information as at 31 December 2018 in legacy systems.
During transition to SAP ERP system IT general and process level controls were updated in accordance with the specificity of the new IT environment.
We performed a walkthrough analysis for significant financial accounting processes that had been updated in relation to the activity of the Polar division. We evaluated design and implementation of controls applied at Group level to address risks arisen from the SAP ERP implementation in relation to the financial reporting process of the Polar division.
Given the significance of the operations of the Polar division to the Group, the increased data integrity risks inherent to migration of financial information as at 1 January 2019 and risks in respect of maintenance of accounting records throughout the reporting period, we consider implementation of SAP ERP in relation to the financial reporting process of the major production facility to be a key audit matter.
We decreased our materiality when performing our audit procedures in respect of transactions in the Polar division for the year ended 31 December 2019 resulting in further detailed substantive testing to specifically address the significant risks over accounting records.
Other Information
Management is responsible for the other information. The other information comprises the Financial Overview (MD&A) (but does not include the consolidated financial statements and our auditors’ report thereon), which we obtained prior to the date of this auditors’ report, and the information included in other sections of Annual Report for 2019, which is expected to be made available to us after that date.
Our opinion on the consolidated financial statements does not cover the other information and we do not and will not express any form of assurance conclusion thereon.
In connection with our audit of the consolidated financial statements, our responsibility is to read the other information identified above and, in doing so, consider whether the other information is materially inconsistent with the consolidated financial statements or our knowledge obtained in the audit, or otherwise appears to be materially misstated.
If, based on the work we have performed on the other information that we have obtained prior to the date of this auditors’ report, we conclude that there is a material misstatement of this other information, we are required to report that fact. We have nothing to report in this regard.
Company overview Strategic report Commodity market overview
Business overview Sustainable development
Corporate governance
Risk report Shareholder information IFRS financial statements AppendixAnnual report 2019
«NORNICKEL»
252 253
Responsibilities of Management and Those Charged with Governance for the Consolidated Financial Statements
Management is responsible for the preparation and fair presentation of the consolidated financial statements in accordance with IFRS, and for such internal control as management determines is necessary to enable the preparation of consolidated financial statements that are free from material misstatement, whether due to fraud or error.
In preparing the consolidated financial statements, management is responsible for assessing the Group’s ability to continue as a going concern, disclosing, as applicable, matters related to going concern and using the going concern basis of accounting unless management either intends to liquidate the Group or to cease operations, or has no realistic alternative but to do so.
Those charged with governance are responsible for overseeing the Group’s financial reporting process.
Auditors’ Responsibilities for the Audit of the Consolidated Financial Statements
Our objectives are to obtain reasonable assurance about whether the consolidated financial statements as a whole are free from material misstatement, whether due to fraud or error, and to issue an auditors’ report that includes our opinion. Reasonable assurance is a high level of assurance, but is not a guarantee that an audit conducted in accordance with ISAs will always detect a material misstatement when it exists. Misstatements can arise from fraud or error and are considered material if, individually or in the aggregate, they could reasonably be expected to influence the economic decisions of users taken on the basis of these consolidated financial statements.
As part of an audit in accordance with ISAs, we exercise professional judgment and maintain professional scepticism throughout the audit. We also:
• Identify and assess the risks of material misstatement of the consolidated financial statements, whether due to fraud or error, design and perform audit procedures responsive to those risks, and obtain audit evidence that is sufficient and appropriate to provide a basis for our opinion. The risk of not detecting a material misstatement resulting from fraud is higher than for one resulting from error, as fraud may involve collusion, forgery, intentional omissions, misrepresentations, or the override of internal control
• Obtain an understanding of internal control relevant to the audit in order to design audit procedures that are appropriate in the circumstances, but not for the purpose of expressing an opinion on the effectiveness of the Group’s internal control
• Evaluate the appropriateness of accounting policies used and the reasonableness of accounting estimates and related disclosures made by management
• Conclude on the appropriateness of management’s use of the going concern basis of accounting and, based on the audit evidence obtained, whether a material uncertainty exists related to events or conditions that may cast significant doubt on the Group’s ability to continue as a going concern. If we conclude that a material uncertainty exists, we are required to draw attention in our auditors’ report to the related disclosures in the consolidated financial statements or, if such disclosures are inadequate, to modify our opinion. Our conclusions are based on the audit evidence obtained up to the date of our auditors’ report. However, future events or conditions may cause the Group to cease to continue as a going concern
• Evaluate the overall presentation, structure and content of the consolidated financial statements, including the disclosures, and whether the consolidated financial statements represent the underlying transactions and events in a manner that achieves fair presentation
• Obtain sufficient appropriate audit evidence regarding the financial information of the entities or business activities within the Group to express an opinion on the consolidated financial statements. We are responsible for the direction, supervision and performance of the group audit. We remain solely responsible for our audit opinion
We communicate with those charged with governance regarding, among other matters, the planned scope and timing of the audit and significant audit findings, including any significant deficiencies in internal control that we identify during our audit.
We also provide those charged with governance with a statement that we have complied with relevant ethical requirements regarding independence, and communicate with them all relationships and other matters that may reasonably be thought to bear on our independence, and where applicable, related safeguards.
From the matters communicated with those charged with governance, we determine those matters that were of most significance in the audit of the consolidated financial statements of the current period and are therefore the key audit matters. We describe these matters in our auditors’ report unless law or regulation precludes public disclosure about the matter or when, in extremely rare circumstances, we determine that a matter should not be communicated in our report because the adverse consequences of doing so would reasonably be expected to outweigh the public interest benefits of such communication.
The engagement partner on the audit resulting in this independent auditors’ report is:
Natalia Velichko
JSC “KPMG”Moscow, Russia26 February 2020
Company overview Strategic report Commodity market overview
Business overview Sustainable development
Corporate governance
Risk report Shareholder information IFRS financial statements AppendixAnnual report 2019
«NORNICKEL»
254 255
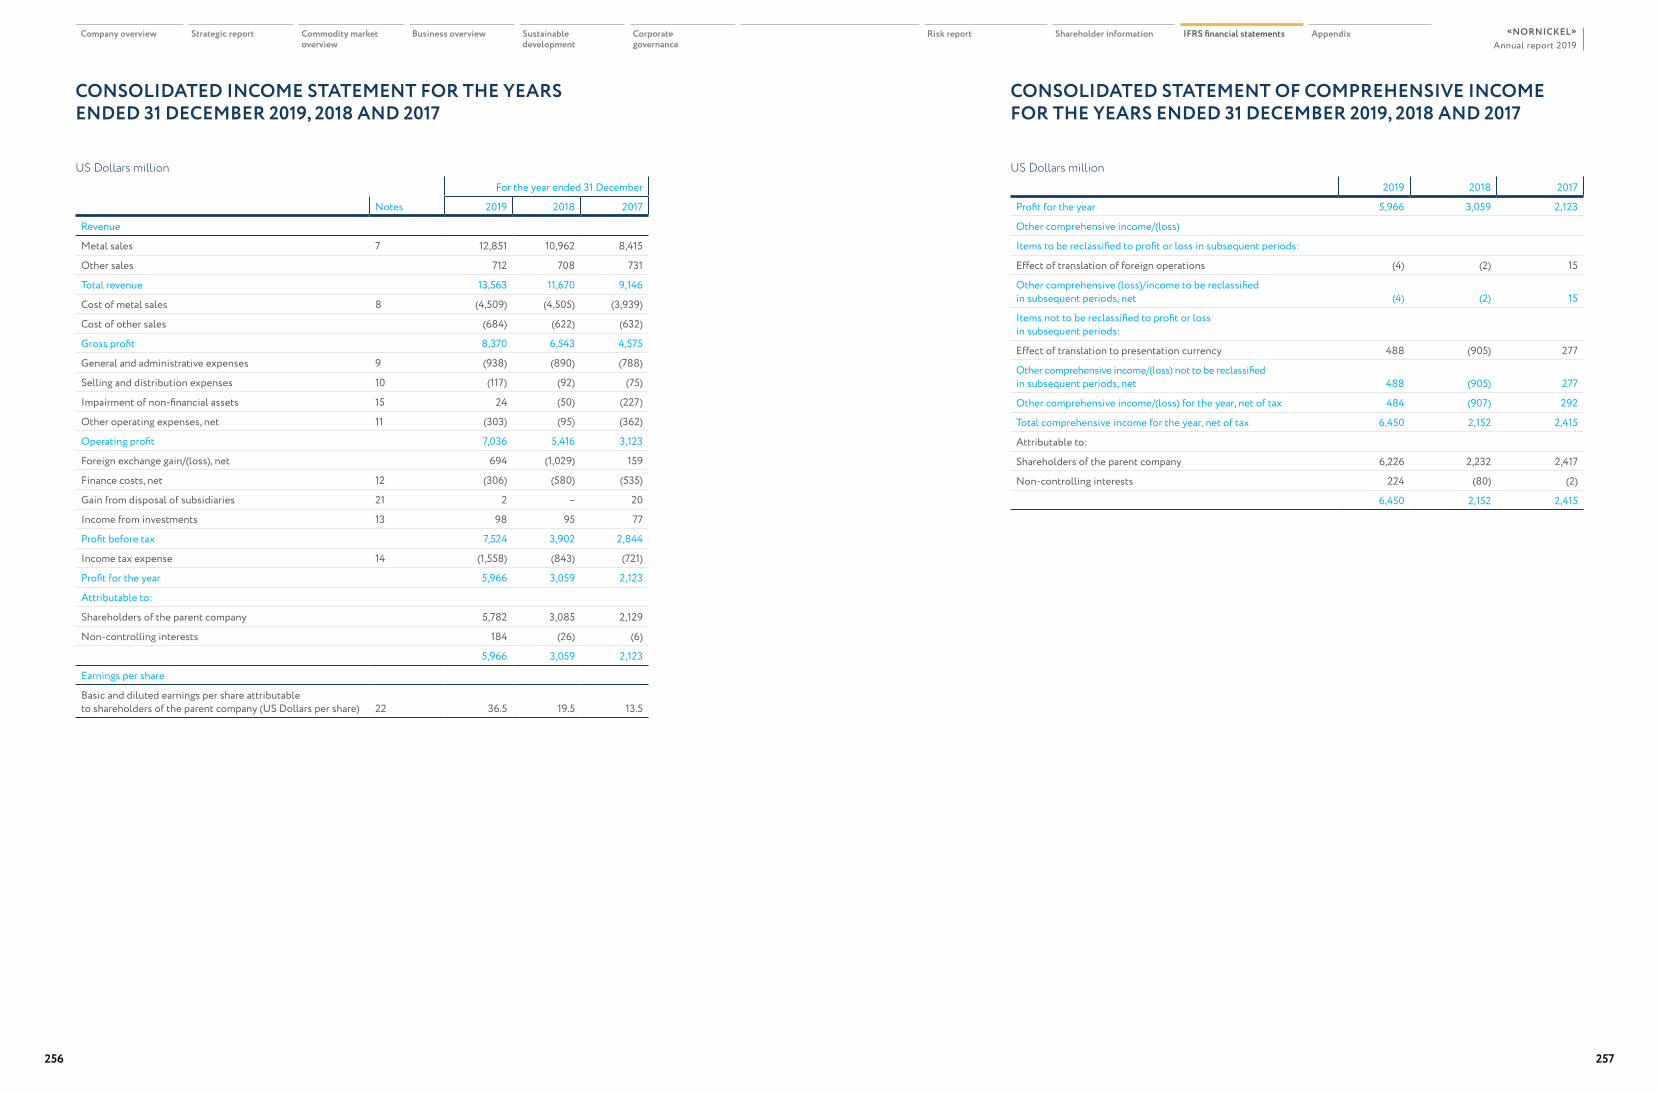
US Dollars million
For the year ended 31 December
Notes 2019 2018 2017
Revenue
Metal sales 7 12,851 10,962 8,415
Other sales 712 708 731
Total revenue 13,563 11,670 9,146
Cost of metal sales 8 (4,509) (4,505) (3,939)
Cost of other sales (684) (622) (632)
Gross profit 8,370 6,543 4,575
General and administrative expenses 9 (938) (890) (788)
Selling and distribution expenses 10 (117) (92) (75)
Impairment of non-financial assets 15 24 (50) (227)
Other operating expenses, net 11 (303) (95) (362)
Operating profit 7,036 5,416 3,123
Foreign exchange gain/(loss), net 694 (1,029) 159
Finance costs, net 12 (306) (580) (535)
Gain from disposal of subsidiaries 21 2 – 20
Income from investments 13 98 95 77
Profit before tax 7,524 3,902 2,844
Income tax expense 14 (1,558) (843) (721)
Profit for the year 5,966 3,059 2,123
Attributable to:
Shareholders of the parent company 5,782 3,085 2,129
Non-controlling interests 184 (26) (6)
5,966 3,059 2,123
Earnings per share
Basic and diluted earnings per share attributable to shareholders of the parent company (US Dollars per share) 22 36.5 19.5 13.5
CONSOLIDATED INCOME STATEMENT FOR THE YEARS ENDED 31 DECEMBER 2019, 2018 AND 2017
CONSOLIDATED STATEMENT OF COMPREHENSIVE INCOME FOR THE YEARS ENDED 31 DECEMBER 2019, 2018 AND 2017
US Dollars million
2019 2018 2017
Profit for the year 5,966 3,059 2,123
Other comprehensive income/(loss)
Items to be reclassified to profit or loss in subsequent periods:
Effect of translation of foreign operations (4) (2) 15
Other comprehensive (loss)/income to be reclassified in subsequent periods, net (4) (2) 15
Items not to be reclassified to profit or lossin subsequent periods:
Effect of translation to presentation currency 488 (905) 277
Other comprehensive income/(loss) not to be reclassified in subsequent periods, net 488 (905) 277
Other comprehensive income/(loss) for the year, net of tax 484 (907) 292
Total comprehensive income for the year, net of tax 6,450 2,152 2,415
Attributable to:
Shareholders of the parent company 6,226 2,232 2,417
Non-controlling interests 224 (80) (2)
6,450 2,152 2,415
Company overview Strategic report Commodity market overview
Business overview Sustainable development
Corporate governance
Risk report Shareholder information IFRS financial statements AppendixAnnual report 2019
«NORNICKEL»
256 257
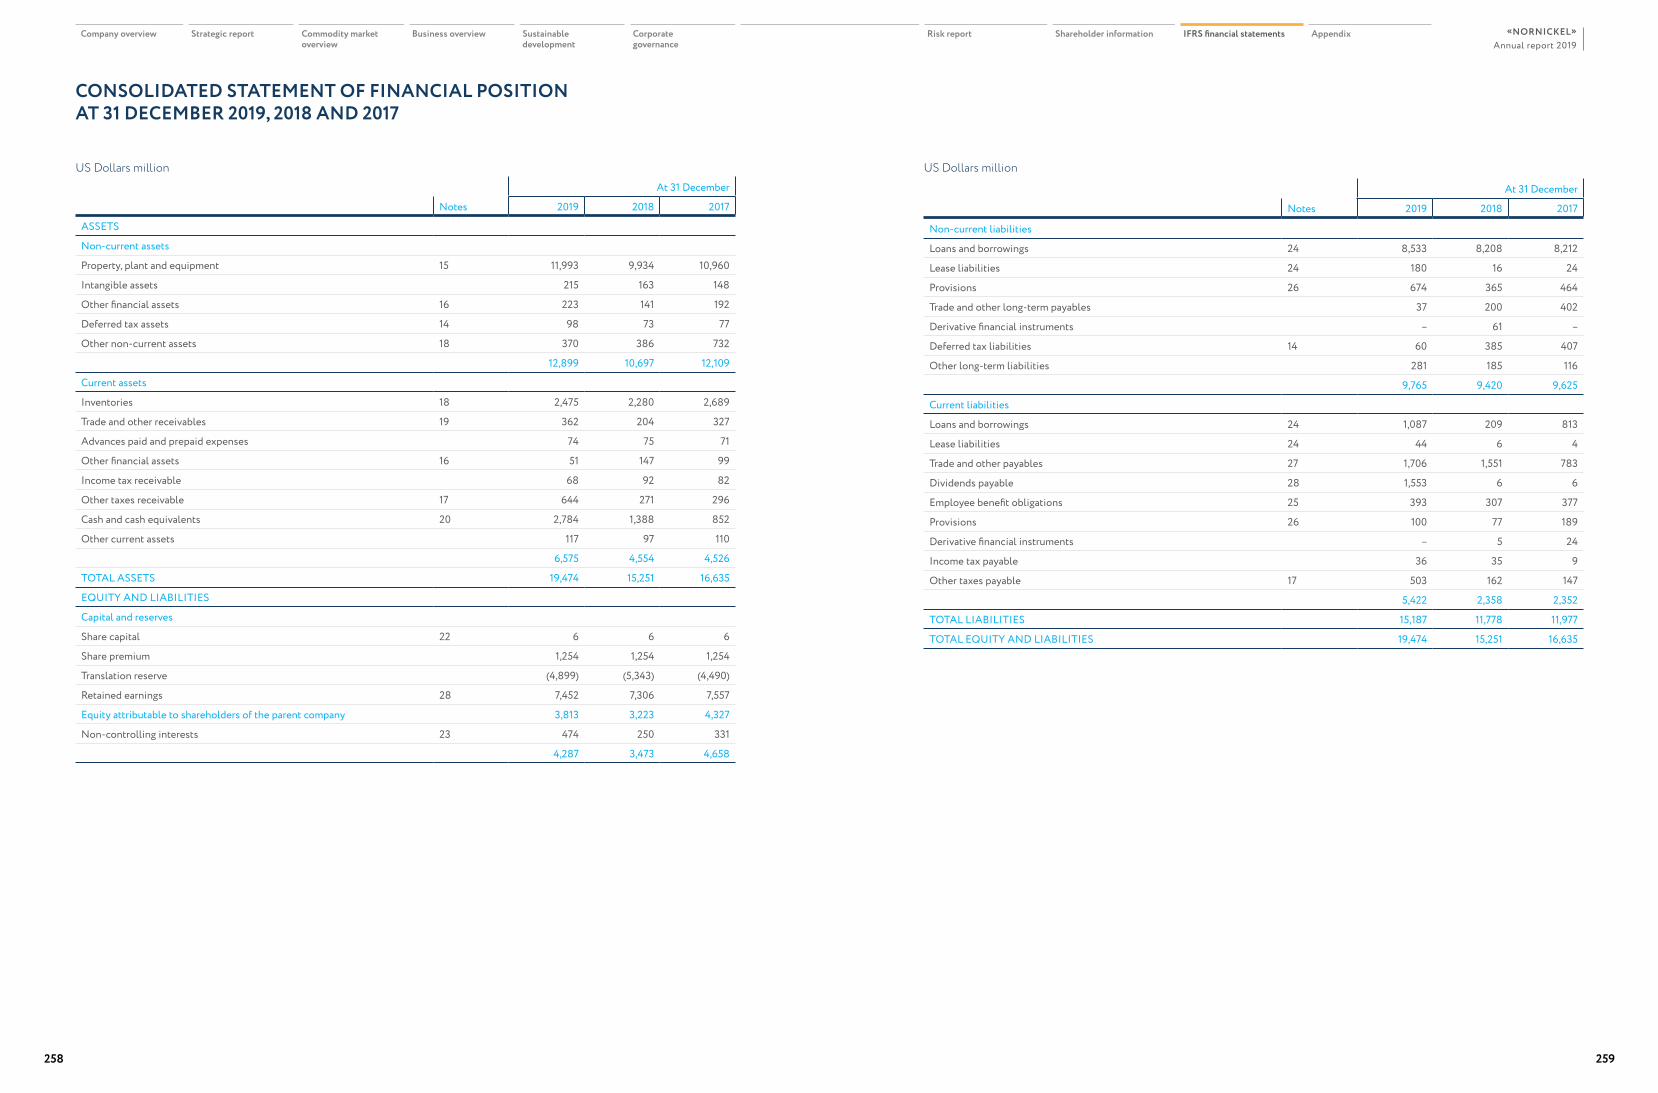
US Dollars million
At 31 December
Notes 2019 2018 2017
ASSETS
Non-current assets
Property, plant and equipment 15 11,993 9,934 10,960
Intangible assets 215 163 148
Other financial assets 16 223 141 192
Deferred tax assets 14 98 73 77
Other non-current assets 18 370 386 732
12,899 10,697 12,109
Current assets
Inventories 18 2,475 2,280 2,689
Trade and other receivables 19 362 204 327
Advances paid and prepaid expenses 74 75 71
Other financial assets 16 51 147 99
Income tax receivable 68 92 82
Other taxes receivable 17 644 271 296
Cash and cash equivalents 20 2,784 1,388 852
Other current assets 117 97 110
6,575 4,554 4,526
TOTAL ASSETS 19,474 15,251 16,635
EQUITY AND LIABILITIES
Capital and reserves
Share capital 22 6 6 6
Share premium 1,254 1,254 1,254
Translation reserve (4,899) (5,343) (4,490)
Retained earnings 28 7,452 7,306 7,557
Equity attributable to shareholders of the parent company 3,813 3,223 4,327
Non-controlling interests 23 474 250 331
4,287 3,473 4,658
CONSOLIDATED STATEMENT OF FINANCIAL POSITION AT 31 DECEMBER 2019, 2018 AND 2017
At 31 December
Notes 2019 2018 2017
Non-current liabilities
Loans and borrowings 24 8,533 8,208 8,212
Lease liabilities 24 180 16 24
Provisions 26 674 365 464
Trade and other long-term payables 37 200 402
Derivative financial instruments – 61 –
Deferred tax liabilities 14 60 385 407
Other long-term liabilities 281 185 116
9,765 9,420 9,625
Current liabilities
Loans and borrowings 24 1,087 209 813
Lease liabilities 24 44 6 4
Trade and other payables 27 1,706 1,551 783
Dividends payable 28 1,553 6 6
Employee benefit obligations 25 393 307 377
Provisions 26 100 77 189
Derivative financial instruments – 5 24
Income tax payable 36 35 9
Other taxes payable 17 503 162 147
5,422 2,358 2,352
TOTAL LIABILITIES 15,187 11,778 11,977
TOTAL EQUITY AND LIABILITIES 19,474 15,251 16,635
US Dollars million
Company overview Strategic report Commodity market overview
Business overview Sustainable development
Corporate governance
Risk report Shareholder information IFRS financial statements AppendixAnnual report 2019
«NORNICKEL»
258 259
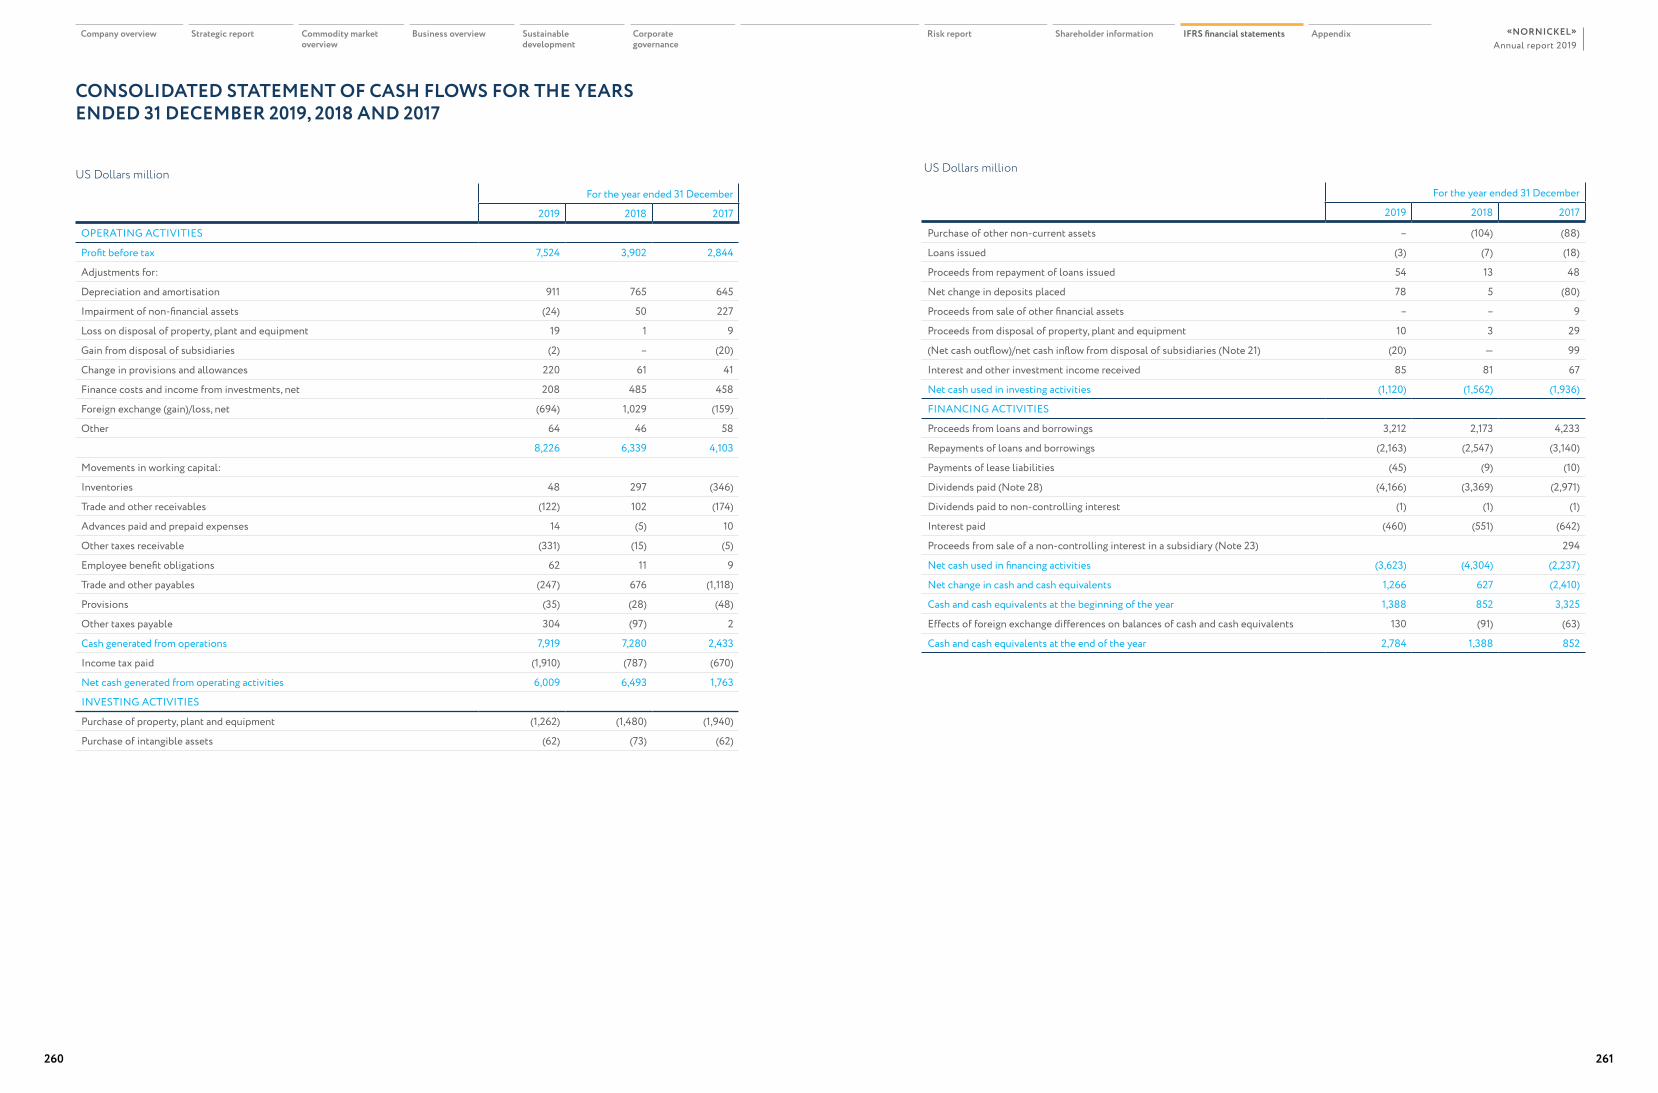
CONSOLIDATED STATEMENT OF CASH FLOWS FOR THE YEARS ENDED 31 DECEMBER 2019, 2018 AND 2017
US Dollars million
For the year ended 31 December
2019 2018 2017
OPERATING ACTIVITIES
Profit before tax 7,524 3,902 2,844
Adjustments for:
Depreciation and amortisation 911 765 645
Impairment of non-financial assets (24) 50 227
Loss on disposal of property, plant and equipment 19 1 9
Gain from disposal of subsidiaries (2) – (20)
Change in provisions and allowances 220 61 41
Finance costs and income from investments, net 208 485 458
Foreign exchange (gain)/loss, net (694) 1,029 (159)
Other 64 46 58
8,226 6,339 4,103
Movements in working capital:
Inventories 48 297 (346)
Trade and other receivables (122) 102 (174)
Advances paid and prepaid expenses 14 (5) 10
Other taxes receivable (331) (15) (5)
Employee benefit obligations 62 11 9
Trade and other payables (247) 676 (1,118)
Provisions (35) (28) (48)
Other taxes payable 304 (97) 2
Cash generated from operations 7,919 7,280 2,433
Income tax paid (1,910) (787) (670)
Net cash generated from operating activities 6,009 6,493 1,763
INVESTING ACTIVITIES
Purchase of property, plant and equipment (1,262) (1,480) (1,940)
Purchase of intangible assets (62) (73) (62)
For the year ended 31 December
2019 2018 2017
Purchase of other non-current assets – (104) (88)
Loans issued (3) (7) (18)
Proceeds from repayment of loans issued 54 13 48
Net change in deposits placed 78 5 (80)
Proceeds from sale of other financial assets – – 9
Proceeds from disposal of property, plant and equipment 10 3 29
(Net cash outflow)/net cash inflow from disposal of subsidiaries (Note 21) (20) — 99
Interest and other investment income received 85 81 67
Net cash used in investing activities (1,120) (1,562) (1,936)
FINANCING ACTIVITIES
Proceeds from loans and borrowings 3,212 2,173 4,233
Repayments of loans and borrowings (2,163) (2,547) (3,140)
Payments of lease liabilities (45) (9) (10)
Dividends paid (Note 28) (4,166) (3,369) (2,971)
Dividends paid to non-controlling interest (1) (1) (1)
Interest paid (460) (551) (642)
Proceeds from sale of a non-controlling interest in a subsidiary (Note 23) 294
Net cash used in financing activities (3,623) (4,304) (2,237)
Net change in cash and cash equivalents 1,266 627 (2,410)
Cash and cash equivalents at the beginning of the year 1,388 852 3,325
Effects of foreign exchange differences on balances of cash and cash equivalents 130 (91) (63)
Cash and cash equivalents at the end of the year 2,784 1,388 852
US Dollars million
Company overview Strategic report Commodity market overview
Business overview Sustainable development
Corporate governance
Risk report Shareholder information IFRS financial statements AppendixAnnual report 2019
«NORNICKEL»
260 261
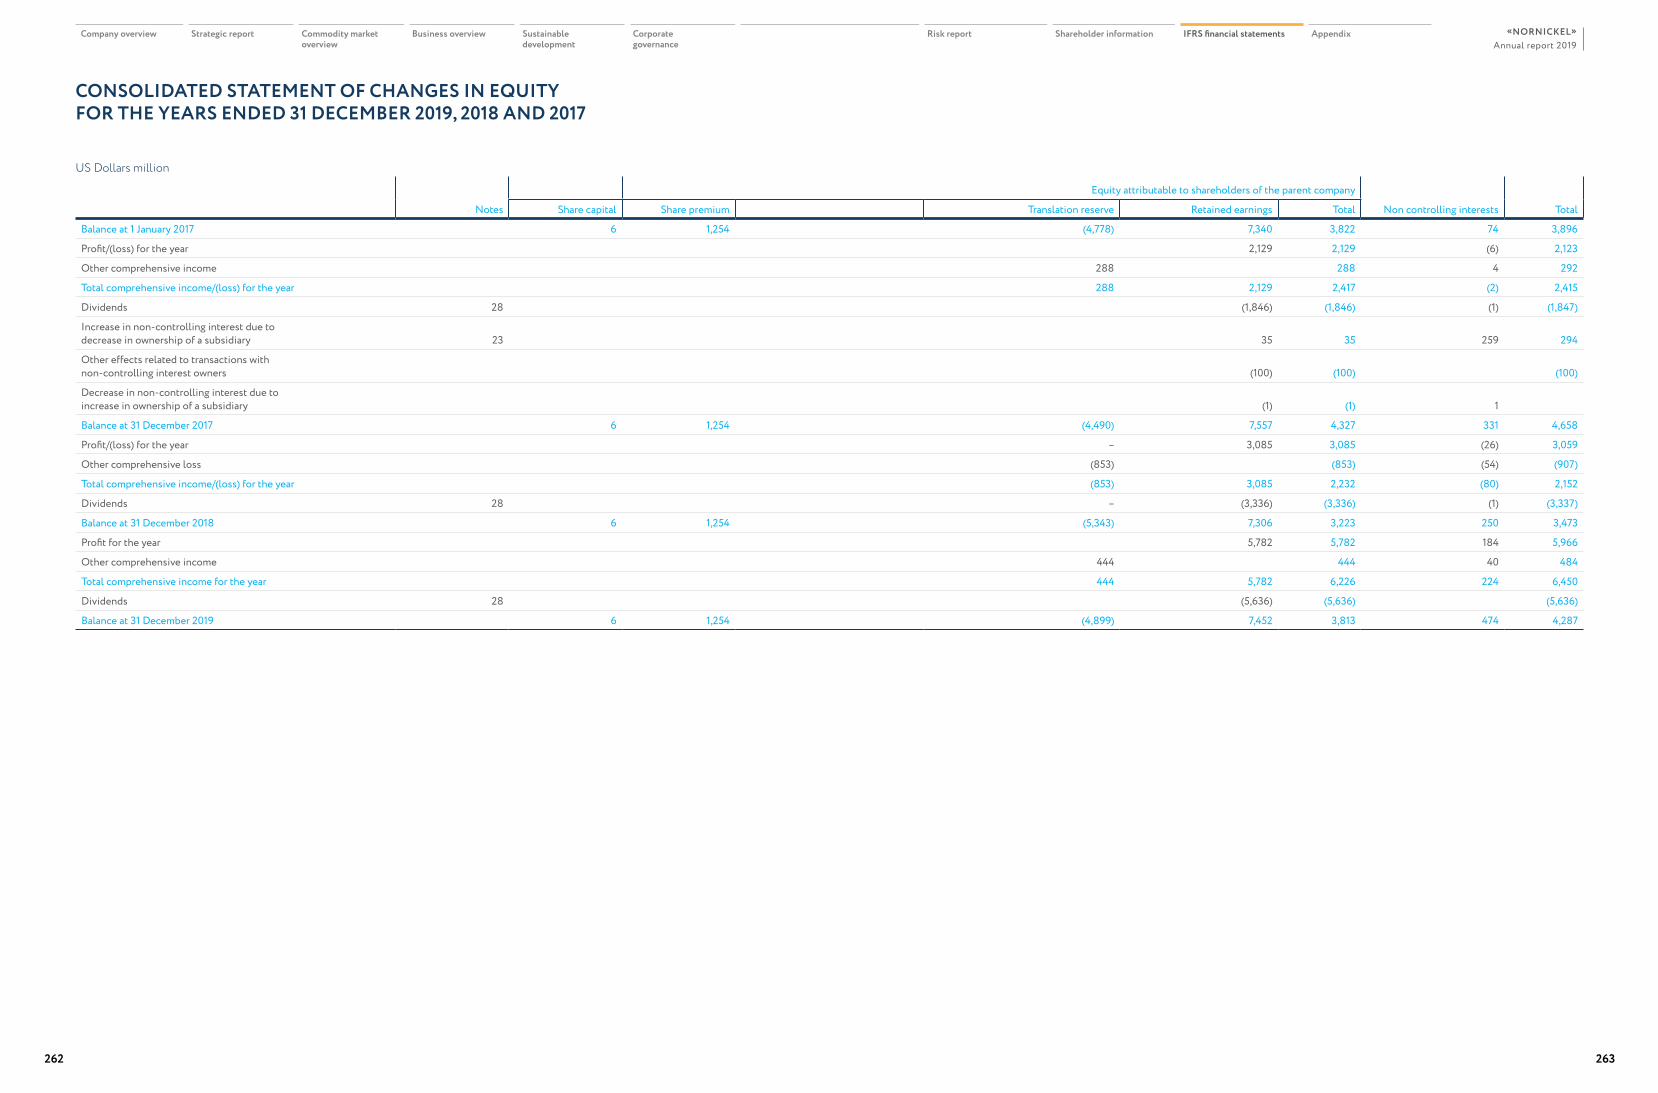
CONSOLIDATED STATEMENT OF CHANGES IN EQUITY FOR THE YEARS ENDED 31 DECEMBER 2019, 2018 AND 2017
US Dollars million
Equity attributable to shareholders of the parent company
Non controlling interests TotalNotes Share capital Share premium Translation reserve Retained earnings Total
Balance at 1 January 2017 6 1,254 (4,778) 7,340 3,822 74 3,896
Profit/(loss) for the year 2,129 2,129 (6) 2,123
Other comprehensive income 288 288 4 292
Total comprehensive income/(loss) for the year 288 2,129 2,417 (2) 2,415
Dividends 28 (1,846) (1,846) (1) (1,847)
Increase in non-controlling interest due todecrease in ownership of a subsidiary 23 35 35 259 294
Other effects related to transactions withnon-controlling interest owners (100) (100) (100)
Decrease in non-controlling interest due toincrease in ownership of a subsidiary (1) (1) 1
Balance at 31 December 2017 6 1,254 (4,490) 7,557 4,327 331 4,658
Profit/(loss) for the year – 3,085 3,085 (26) 3,059
Other comprehensive loss (853) (853) (54) (907)
Total comprehensive income/(loss) for the year (853) 3,085 2,232 (80) 2,152
Dividends 28 – (3,336) (3,336) (1) (3,337)
Balance at 31 December 2018 6 1,254 (5,343) 7,306 3,223 250 3,473
Profit for the year 5,782 5,782 184 5,966
Other comprehensive income 444 444 40 484
Total comprehensive income for the year 444 5,782 6,226 224 6,450
Dividends 28 (5,636) (5,636) (5,636)
Balance at 31 December 2019 6 1,254 (4,899) 7,452 3,813 474 4,287
Company overview Strategic report Commodity market overview
Business overview Sustainable development
Corporate governance
Risk report Shareholder information IFRS financial statements AppendixAnnual report 2019
«NORNICKEL»
262 263
1. GENERAL INFORMATION
Organisation and principal business activitiesPublic Joint-Stock Company “Mining and Metallurgical Company “Norilsk Nickel” (the “Company” or “MMC “Norilsk Nickel”) was incorporated in the Russian Federation on 4 July 1997. The principal activities of the Company and its subsidiaries (the “Group”) are exploration, extraction, refining of ore and nonmetallic minerals and sale of base and precious metals produced from ore. Further details regarding the nature of the business and structure of the Group are presented in Note 34.
Major production facilities of the Group are located in Taimyr and Kola Peninsulas and the Zabaikalsky region of the Russian Federation, and in Finland.
2. BASIS OF PREPARATION
Statement of complianceThe consolidated financial statements of the Group have been prepared in accordance with International Financial Reporting Standards (“IFRS”).
The entities of the Group maintain their accounting records in accordance with the laws, accounting and reporting regulations of the jurisdictions in which they are incorporated and registered. Accounting principles in certain jurisdictions may differ from those generally accepted under IFRS. Financial statements of such entities have been adjusted to ensure that the consolidated financial statements are presented in accordance with IFRS.
The Group issues a separate set of IFRS consolidated financial statements to comply with the requirements of Russian Federal Law No. 208-FZ On consolidated financial statements (“Law 208-FZ”) dated 27 July 2010.
Basis of measurementThe consolidated financial statements of the Group are prepared on the historical cost basis, except for mark-to-market valuation of certain classes of financial instruments, in accordance with IFRS 9 Financial Instruments (IAS 39 Financial Instruments: Recognition and Measurement for comparative information at 31 December 2017).
3. CHANGES IN ACCOUNTING POLICIES
The accounting policies applied in the preparation of these consolidated financial statements are generally consistent with those applied in the preparation of the Group’s consolidated financial statements at and for the years ended 31 December 2018 and 2017 except for changes related to the adoption of IFRS 9 Financial instruments and IFRS 15 Revenue from contracts with customers from 1 January 2018 and IFRS 16 Leases from 1 January 2019.
Adoption of new and revised standards and interpretations during the year ended 31 December 2019The Group initially adopted IFRS 16 Leases in the preparation of these consolidated financial statements for the year ended 31 December 2019 from 1 January 2019. In accordance with the modified retrospective approach on the initial application of the standard the comparative information for the years ended 31 December 2018 and 2017 has not been restated.
In accordance with modified retrospective approach as of the date of initial application:• for leases previously classified as operating lease in line with IAS 17 Leases lease liabilities were recognised
at the present value of the remaining lease payments, discounted using the weighted average incremental borrowing rate at that date (at 1 January 2019: 5.55% per annum)
NOTES TO THE CONSOLIDATED FINANCIAL STATEMENTS FOR THE YEARS ENDED 31 DECEMBER 2019, 2018 AND 2017
US Dollars million
• right-of-use assets were recognised in the amount equal to the lease liability, adjusted by the amount of any prepaid or accrued lease payments relating to the respective lease contracts
On the initial application of IFRS 16 Leases the Group has recognised additional lease liabilities (both current and non-current) in the amount of USD 204 million (see below). These leases were classified as operating lease applying IAS 17 Leases and not recognised as lease liabilities before 1 January 2019.
At 1 January 2019
Future minimum lease payments due under non-cancellable operating lease agreements at 31 December 2018 611
Less
– Current leases (13)
– Variable lease payments that do not depend on an index or a rate (103)
– Future lease payments for leased items not transferred to the lessee at 1 January 2019 (158)
– Effect of discounting of payments (133)
Lease liabilities additionally recognised at 1 January 2019 204
Plus
– Finance lease liabilities recognised at 31 December 2018 22
Lease liabilities recognised at 1 January 2019 226
The Group applied the following practical expedients on the initial application of IFRS 16 Leases:• applied this standard to the contracts that were previously identified as leases in line with IAS 17 Leases
and IFRIC 4 Determining whether an Arrangement contains a Lease• did not recognise lease liabilities in respect of the current leases expiring within 12 months of the date
of the initial application• did not perform impairment review of right-of-use assets due to the absence of the onerous lease contracts
according to IAS 37 Provisions, Contingent Liabilities and Contingent Assets immediately before the date of initial application
• excluded initial direct costs from the measurement of right-of-use assets• used hindsight, such as determination of the lease term if the contract contains options to extend
or terminate the lease
Adoption of other new and revised standards and interpretations during the year ended 31 December 2019Adoption of amendments to the following Standards did not have material impact on the accounting policies, financial position or results of the Group:• IFRIC 23 Uncertainty over Income Tax Treatments• IFRS 9 Financial Instruments (amended)• IAS 28 Investments in Associates and Joint Ventures (amended)• IAS 19 Employee Benefits (amended)• Annual Improvements to IFRSs 2015-2017 Cycle
Adoption of new and revised standards and interpretations during the year ended 31 December 2018The Group has initially adopted IFRS 15 Revenue from Contracts with Customers and IFRS 9 Financial Instruments from 1 January 2018.
The Group has adopted IFRS 15 Revenue from Contracts with Customers at the date of initial application using the cumulative effect method with no material effect on the Group’s consolidated financial statements at 31 December 2018 and for the year then ended. Comparative information for the year 31 December 2017 has not been restated.
The Group has taken an exemption not to restate comparative information for prior periods with respect to classification requirements of IFRS 9 Financial Instruments. Therefore, the information presented at 31 December 2017 does not generally reflect the requirements of classification of IFRS 9 Financial Instruments but rather those of IAS 39 Financial Instruments: Recognition and Measurement.
Company overview Strategic report Commodity market overview
Business overview Sustainable development
Corporate governance
Risk report Shareholder information IFRS financial statements AppendixAnnual report 2019
«NORNICKEL»
264 265
Trade receivables under provisionally priced contracts where price is not settled until a predetermined future date have been classified at 31 December 2018 at fair value through profit or loss and are remeasured at each reporting date using the forward price for the period till the price settlement date outlined in the contract (mark-to-market adjustment). Previously such receivables were classified as loans and receivables under IAS 39 Financial Instruments: Recognition and Measurement.
There were no material differences in the carrying amounts of financial assets and financial liabilities resulting from the adoption of IFRS 9 Financial Instruments at 31 December 2018.
The significant accounting policies in respect of revenue from contracts with customers and financial instruments in effect from 1 January 2018 are set out in Note 4.
Adoption of other new and revised standards and interpretations during the year ended 31 December 2018Adoption of amendments to the following Standards for annual periods from 1 January 2018 did not have material impact on the accounting policies, financial position or results of the Group:• IFRS 1 First-time Adoption of International Financial Reporting Standards (amended)• IFRS 2 Share-based Payment (amended)• IFRS 4 Insurance Contracts (amended)• IAS 28 Investments in Associates and Joint Ventures (amended)• IAS 40 Investment Property (amended)• IFRIC 22 Foreign Currency Transactions and Advance Consideration
Adoption of new and revised standards and interpretations during the year ended 31 December 2017Adoption of amendments to the following Standards for annual periods from 1 January 2017 did not have material impact on the accounting policies, financial position or results of the Group:• IFRS 12 Disclosure of interests in other entities (amended)• IAS 7 Statement of cash flows (amended)• IAS 12 Income taxes (amended)
Standards and interpretations in issue but not yet effectiveThe Group has not early adopted any other standard, interpretation or amendment that has been issued but is not yet effective.
Standards and Interpretations
Effective for annual periods beginning
on or after
IFRS 3 Business combinations (amended) 1 January 2020
IFRS 7 Financial Instruments: Disclosures (amended) 1 January 2020
IFRS 9 Financial Instruments (amended) 1 January 2020
IAS 1 Presentation of Financial Statements (amended) 1 January 2020
IAS 8 Accounting Policies, Changes in Accounting Estimates and Errors (amended) 1 January 2020
IAS 39 Financial Instruments: Recognition and Measurement (amended) 1 January 2020
Revised Conceptual Framework for Financial Reporting 1 January 2020
IFRS 17 Insurance Contracts 1 January 2021
Management of the Group plans to adopt all of the above standards and interpretations in the Group’s consolidated financial statements for the respective periods.
ReclassificationFinance lease liabilities recognised in line with IAS 17 Leases are presented as lease liabilities in the consolidated statement of financial position at 31 December 2018 and at 31 December 2017 (previously presented in loans and borrowings).
For the year ended 31 December 2019 and 2018, revenue from sales of semi-products is allocated to revenue from each metal sales as per respective metal content in a semi-product rather than being presented under a separate “semi-products” caption (refer to Note 7). Information for the year ended 31 December 2017 has been reclassified to conform with this presentation.
For the year ended 31 December 2017 management reassessed classification of some expenses of cost of metal sales and selling and distribution expenses in order to better align cost of sales structure with management accounts and reporting.
4. SIGNIFICANT ACCOUNTING POLICIES
Basis of consolidationSubsidiariesThe consolidated financial statements incorporate financial statements of the Company and its subsidiaries, from the date that control effectively commenced until the date that control effectively ceased. Control is achieved where the Company is exposed to, or has rights to, variable returns from its involvement with the entity and has the ability to affect those returns through its power over the entity.
Non-controlling interests in net assets (excluding goodwill) of the consolidated subsidiaries are identified separately from the equity of the shareholders of the Company therein. Non-controlling interests include interests at the date of the original business combination and a non-controlling share of changes in net assets since the date of the combination. Total comprehensive income must be attributed to the shareholders of the Company and to the non-controlling interests even if this results in the non-controlling interests having a deficit balance.
Non-controlling interests may be initially measured either at fair value or at the non-controlling interests’ proportionate share of the recognised amounts of the acquiree’s identifiable net assets. The choice of measurement basis is made on a transaction-by-transaction basis.
All intra-group balances, transactions and any unrealised profits or losses arising from intra-group transactions are eliminated in full on consolidation.
Changes in the Group’s ownership interest in a subsidiary that do not result in the Group losing control are accounted for within the equity.
When the Group loses control of a subsidiary it derecognises the assets and liabilities and related equity components of the former subsidiary. Any gain or loss is recognised in the consolidated income statement. Any investment retained in the former subsidiary is measured at its fair value at the date when control is lost.
Joint arrangementsInvestments in joint arrangements are classified as either joint operations or joint ventures, depending on the contractual rights and obligations of each investor. The Group recognises in relation to its interest in a joint operation: its assets, including its share of any assets held jointly; its liabilities, including its share of any liabilities incurred jointly; its revenue from the sale of its share of the output arising from the joint operation; its share of the revenue from the sale of the output by the joint operation; and its expenses, including its share of any expenses incurred jointly. The Group accounts for its investments in joint ventures using the equity method.
Company overview Strategic report Commodity market overview
Business overview Sustainable development
Corporate governance
Risk report Shareholder information IFRS financial statements AppendixAnnual report 2019
«NORNICKEL»
266 267
Business combinationsAcquisitions of businesses are accounted for using the acquisition method. The consideration transferred in a business combination is measured at fair value, which is calculated as the sum of fair values of the assets transferred by the Group, liabilities incurred by the Group to the former owners of the acquiree and the equity interests issued by the Group at the date of acquisition in exchange for control of the acquiree.
Where an investment in a subsidiary, an associate or a joint venture is made, any excess of the sum of the consideration transferred, the amount of any non-controlling interests in the acquiree, and the fair value of the acquirer’s previously held equity interest in the acquiree (if any) over the fair value of the identifiable assets acquired and the liabilities assumed at the acquisition date is recognised as goodwill. Goodwill in respect of subsidiaries and joint operations is disclosed separately and goodwill relating to associates and joint ventures is included in the carrying value of the investment in associates or joint ventures. Goodwill disclosed separately is reviewed for impairment at least annually. If impairment has occurred, it is recognised in the consolidated income statement during the period in which the circumstances are identified and is not subsequently reversed.
If, after reassessment, the fair value of the identifiable assets acquired and liabilities assumed at the acquisition date exceeds the sum of the consideration transferred, the amount of any non-controlling interests in the acquiree and the fair value of the acquirer’s previously held interest in the acquiree (if any), the excess is recognised in the consolidated income statement immediately as a bargain purchase gain.
Acquisition-related costs are recognised in the consolidated income statement as incurred.
If the initial accounting for a business combination is incomplete by the end of the reporting period in which the combination occurs, the Group reports provisional amounts for the items for which the accounting is incomplete. Those provisional amounts are retrospectively adjusted during the measurement period (a maximum of twelve months from the date of acquisition), or additional assets or liabilities are recognised, to reflect new information obtained about facts and circumstances that existed at the acquisition date that, if known, would have affected the amounts recognised at that date.
Functional and presentation currencyThe individual financial statements of each Group entity are presented in its functional currency.
The Russian Rouble (“RUB”) is the functional currency of the Company, all of its subsidiaries located in the Russian Federation and all foreign subsidiaries of the Group, except for the following subsidiaries operating with a significant degree of autonomy. The functional currency of Norilsk Nickel Harjavalta Oy is US Dollar, and the functional currency of Norilsk Nickel Africa Proprietary Limited and Nkomati Nickel Mine is South African Rand.
The presentation currency of the consolidated financial statements of the Group is US Dollar (“USD”). Using USD as a presentation currency is common practice for global mining companies. In addition, USD is a more relevant presentation currency for international users of the consolidated financial statements of the Group. The Group also issues consolidated financial statements to comply with Law 208-FZ, which use the Russian Rouble as the presentation currency.
The translation of components of the consolidated statement of financial position, consolidated income statement, consolidated statement of cash flows and consolidated statement of changes in equity into presentation currency is made as follows: • all assets and liabilities, both monetary and non-monetary, in the consolidated statement of financial position
are translated at the closing exchange rates at the end of the respective reporting period• income and expense are translated at the average exchange rates for each quarter (unless this average
rate is not a reasonable approximation of the cumulative effect of the rates prevailing at the dates of the transactions, in which case income and expenses are translated at exchange rates at the dates of the transactions)
• all equity items are translated at the historical exchange rates• all resulting exchange differences are recognised as a separate component in other comprehensive income;
and
• in the consolidated statement of cash flows, cash balances at the beginning and the end of each period presented are translated at exchange rates at the respective dates
• all cash flows are translated at the average exchange rates for each quarter with the exception of proceeds from and repayments of loans and borrowings, dividends paid and advances received, proceeds from disposal of subsidiaries, which are translated at exchange rates at the dates of the transactions
• resulting exchange differences are presented in the consolidated statement of cash flows as effects of foreign exchange differences on balances of cash and cash equivalents.
Foreign currency transactions Transactions in currencies other than the entity’s functional currency (foreign currencies) are recorded at exchange rates prevailing at the dates of the transactions. All monetary assets and liabilities denominated in foreign currencies are translated at the closing exchange rates at the end of the respective reporting period. Non-monetary items carried at historical cost are translated at exchange rates at the dates of the transactions. Non-monetary items carried at fair value are translated at exchange rates that existed when the fair values were determined. Exchange differences arising from changes in exchange rates are recognised in the consolidated income statement.
Exchange rates used in the preparation of the consolidated financial statements were as follows:
At 31 December
2019 2018 2017
Russian Rouble / US Dollar
31 December 61.91 69.47 57.60
Average for the year ended 31 December 64.74 62.71 58.35
South African Rand / US Dollar
31 December 13.99 14.35 12.36
Average for the year ended 31 December 14.44 13.18 13.30
Euro / US Dollar
31 December 0.89 0.87 0.84
Average for the year ended 31 December 0.89 0.85 0.89
Revenue recognition
Metal sales revenue
Accounting policies after 1 January 2018Revenue from metal sales is recognised at a point of time when control over the asset is transferred to a customer and represents the invoiced value of all metal products shipped to customers, net of value added tax (if any).
Revenue from contracts that are entered into and continue to meet the Group’s expected sale requirements designated for that purpose at their inception and are expected to be settled by physical delivery of the goods, is recognised in the consolidated financial statements as and when they are delivered. A gain or loss on forward contracts expected to be settled by physical delivery or on net basis is measured at fair value recognised in revenue and disclosed separately from revenue from contracts with customers.
As a practical expedient, the Group does not adjust the promised amount of consideration for the effects of a significant financing component, if the expected period between when the Group transfers a promised good or service to a customer and the customer pays for that good or service will be one year or less.
Certain contracts are provisionally priced so that price is not settled until a predetermined future date based on the market price at that time. Revenue from these transactions is initially recognised at the market price at the time of sale. Price adjustment on provisionally priced contracts is recorded in revenue.
Company overview Strategic report Commodity market overview
Business overview Sustainable development
Corporate governance
Risk report Shareholder information IFRS financial statements AppendixAnnual report 2019
«NORNICKEL»
268 269
Accounting policies before 1 January 2018Revenue from metal sales is recognised when the significant risks and rewards of ownership are transferred to the buyer and represents invoiced value of all metal products shipped to customers, net of value added tax.
Other revenueRevenue from contracts with customers on sale of goods, other than metals, is recognised at a point of time when control over the asset is transferred to the customer in accordance with the shipping terms specified in the sales agreements.
Revenue from service contracts is recognised over-time when the services are rendered.
Dividend and interest incomeDividend income from investments is recognised when the Group’s right to receive payment has been established. Interest income is accrued using the effective interest method.
Leases
Accounting policies after 1 January 2019The Group assesses at the inception of a contract whether it or its components is, or contains, a lease. The Group recognises a right-of-use asset and a corresponding lease liability, if a lease contract transfers to the lessee the right to control the use of the identified asset for a period of time in exchange for a consideration, except for current leases with the term of 12 months or less. The Group recognises lease payments associated with current leases as an expense on a straight-line basis over the lease term. Land plots lease payments are treated as variable payments, if they are linked to land cadastral value and changes in the latter do not depend on market rental rates. The Group recognises variable lease payments as an expense in the period when the event that triggers those payments occurs.
Right-of-use assets are initially recognised at cost that comprise when applicable:• the initial amount of the lease liability;• any lease payments made at or before the lease commencement date;• any initial direct costs incurred by the lessee;• an estimate of costs to be incurred by the lessee for retirement of the underlying asset and restoration
of the site on which it is located.
Right-of-use assets are subsequently measured at cost less any accumulated depreciation and any accumulated impairment losses, adjusted for any remeasurement of the lease liability. Right-of-use assets are depreciated on a straight-line basis over their estimated economic useful lives or over the term of the lease, if shorter. Right-of-use assets are presented in property, plant and equipment in the consolidated statement of financial position.
Lease liabilities (refer to Note 24) are initially measured at the present value of the lease payments that are not paid at the commencement date and subsequently remeasured to reflect changes to the lease payments. The lease payments are discounted using interest rate implicit in the lease (if that rate can be readily determined) or using Group incremental borrowing rate at the сommencement date determined based on lease term and currency of the lease payments.
Accounting policies before 1 January 2019Leases under which the Group assumes substantially all the risks and rewards of ownership are classified as finance leases. Assets subject to finance leases are capitalised as property, plant and equipment at the lower of fair value or present value of future minimum lease payments at the date of acquisition. Simultaneously, related lease obligation is recognised at the same value. Assets held under finance leases are depreciated over their estimated economic useful lives or over the term of the lease, if shorter. If there is reasonable certainty that the lessee will obtain ownership at the end of the lease term, the period of expected use is the useful life of the asset.
Finance lease payments are allocated using the effective interest rate method, between the lease finance cost, which is included in finance costs, and the capital repayment, which reduces the related lease obligation to the lessor.
Leases where the lessor retains substantially all the risks and benefits of ownership of the asset are classified as operating leases. Operating lease payments are recognised as an expense in the consolidated income statement on a straight-line basis over the lease term, except where another systematic basis is more representative of the time pattern in which economic benefits from the leased asset are consumed. Contingent rentals arising under operating and finance leases are expensed in the period in which they are incurred.
Finance costsFinance costs directly attributable to the acquisition, construction or production of qualifying assets, which are assets that necessarily take a substantial period of time to get ready for their intended use or sale, are added to the cost of those assets, until such time when the assets are substantially ready for their intended use or sale.
Investment income earned on the temporary investment of specific borrowings pending their expenditure on qualifying assets is deducted from the borrowing costs eligible for capitalisation.
Government grantsGovernment grants are recognised when there is reasonable assurance that the grant will be received and all conditions and requirements attaching to the grant will be met. Government grants related to assets are deducted from the cost of these assets in arriving at their carrying value.
Employee benefitsRemuneration to employees in respect of services rendered during a reporting period is recognised as an expense in that period. Long-term employee benefits obligations are discounted to present value.
Defined contribution plansThe Group contributes to the following major defined contribution plans:• Pension Fund of the Russian Federation• Mutual accumulated pension plan
The only obligation of the Group with respect to these and other defined contribution plans is to make specified contributions in the period in which they arise. These contributions are recognised in the consolidated income statement when employees have rendered respective services.
Income tax expenseIncome tax expense represents the sum of the current and deferred tax.
Income tax is recognised as an expense or income in the consolidated income statement unless it relates to other items recognised directly in other comprehensive income, in which case the tax is also recognised directly in other comprehensive income. Where current or deferred tax arises from the initial accounting for a business combination, the tax effect is included in the accounting for the business combination.
Current taxCurrent tax is based on taxable profit for the year. Taxable profit differs from profit before tax as reported in the consolidated income statement because it excludes items of income or expense that are taxable or deductible in other years and it also excludes items that are never taxable or deductible.
Deferred taxDeferred tax is recognised on temporary differences between the carrying amounts of assets and liabilities in the financial statements and the corresponding tax bases used in computation of taxable profit. As a general rule, deferred tax liabilities are recognised for all taxable temporary differences, and deferred tax assets are recognised for all deductible temporary differences to the extent that it is probable that taxable profits will be available against which those deductible temporary differences can be utilised. Deferred tax assets and liabilities are not recognised, if temporary differences arise from goodwill or from the initial recognition of assets and liabilities other than in a business combination which, at the time of the transaction, affects neither taxable profit nor accounting profit.
Company overview Strategic report Commodity market overview
Business overview Sustainable development
Corporate governance
Risk report Shareholder information IFRS financial statements AppendixAnnual report 2019
«NORNICKEL»
270 271
Deferred tax liabilities are recognised for taxable temporary differences associated with investments in subsidiaries, joint ventures, associates and interests in joint operations, unless the Group is able to control the reversal of the temporary difference, and it is probable that the temporary difference will not reverse in the foreseeable future. Deferred tax assets arising from deductible temporary differences associated with such investments and interests are only recognised to the extent that it is probable that there will be sufficient taxable profits against which to utilise the benefits of the temporary differences and they are expected to reverse in the foreseeable future.
The carrying amount of deferred tax assets is reviewed at the end of each reporting period and adjusted to the extent that it is probable that sufficient taxable profits will be available to allow all or part of the asset to be recovered.
The measurement of deferred tax liabilities and assets reflects the tax consequences of the manner in which the Group expects at the reporting date to recover or settle the carrying amount of its assets and liabilities. Deferred tax assets and liabilities are offset when there is a legally enforceable right to set off current tax assets against current tax liabilities and when they relate to income taxes levied by the same taxation authority.
Property, plant and equipment and mine development costs
Mining assetsMine development costs are capitalised and comprise expenditures directly related to:• acquiring mining and exploration licences• developing new mining operations• estimating revised content of minerals in the existing ore bodies; and• expanding capacity of a mine
Mine development costs include directly attributable borrowings costs.
Mine development costs are transferred to mining assets and start to be depreciated when a new mine reaches commercial production quantities.
Mining assets are recorded at cost less accumulated depreciation and impairment losses. Mining assets include cost of acquiring and developing mining properties, pre-production expenditure, mine infrastructure, plant and equipment that process extracted ore, mining and exploration licenses and present value of future decommissioning costs and borrowing costs eligible for capitalisation.
Carrying value of mining assets is depreciated over the lesser of their individual economic useful lives on a straight-line basis, or the remaining life of mine based on the amount of the commercial ore reserves on a units of production basis. When determining the life of mine, assumptions valid at the time of estimation may change in case new information becomes available. Useful lives are in average varying from 1 to 50 years.
Non-mining assetsNon-mining assets include metallurgical processing plants, buildings, infrastructure, machinery and equipment and other non-mining assets. Non-mining assets are stated at cost less accumulated depreciation and impairment losses.
Non-mining assets are depreciated on a straight-line basis over their economic useful lives.
Depreciation charge is calculated over the following economic useful lives: • buildings, structures and utilities 2-50 years• machinery, equipment and transport 1-30 years• other non-mining assets 1-20 years
Capital construction-in-progressCapital construction-in-progress comprises costs directly related to construction of buildings, processing plant, infrastructure, machinery and equipment, including: • advances given for purchases of property, plant and equipment and materials acquired for construction
of buildings, processing plant, infrastructure, machinery and equipment• irrevocable letters of credit opened for future fixed assets deliveries and secured with deposits placed
in banks• borrowing costs eligible for capitalisation
Depreciation of an asset begins when it is available for use and it is in the location and condition necessary for it to be capable of operating in the manner intended by management.
Exploration expenditureExploration expenditure, including geophysical, topographical, geological and similar types of expenditure made within research, mining and exploration licences acquired, is capitalised and begins to be amortised over the life of mine, when commercial viability of the project is proved. Otherwise it is expensed in the period in which it is incurred.
Exploration expenditure written-off before development and construction starts is not subsequently capitalised, even if a commercial discovery subsequently occurs.
Intangible assets, excluding goodwillIntangible assets are recorded at cost less accumulated amortisation and impairment losses. Intangible assets mainly include patents, licences, software and rights to use software and other intangible assets.
Amortisation of patents, licenses and software is charged on a straight-line basis over 1-10 years.
Impairment of tangible and intangible assets, excluding goodwillAt each reporting date, the Group analyses the triggers of impairment of its tangible and intangible assets to determine whether there is any indication that those assets have suffered an impairment loss. If any such indication exists, the recoverable amount of the asset is estimated in order to determine the extent of the impairment loss (if any). Where it is not practical to estimate the recoverable amount of an individual asset, the Group estimates the recoverable amount of the cash-generating unit to which the asset belongs.
Recoverable amount is the higher of fair value less cost to sell and value-in-use. In assessing value-in-use, the estimated future cash flows are discounted to their present value using a pre-tax discount rate that reflects current market assessments of the time value of money and the risks specific to the asset or cash-generating unit. If the recoverable amount of an asset (or cash-generating unit) is estimated to be less than its carrying amount, the carrying amount of the asset (or cash-generating unit) is reduced to its recoverable amount. An impairment loss is recognised in the consolidated income statement immediately.
Where an impairment loss subsequently reversed, the carrying amount of the asset (or cash-generating unit) is increased to the revised estimate of its recoverable amount, but only to the extent that the increased carrying amount does not exceed the original carrying amount that would have been determined had no impairment loss been recognised in prior periods. A reversal of an impairment loss is recognised in the consolidated income statement.
Company overview Strategic report Commodity market overview
Business overview Sustainable development
Corporate governance
Risk report Shareholder information IFRS financial statements AppendixAnnual report 2019
«NORNICKEL»
272 273
Inventories
Refined metalsMain jointly produced metals include nickel, copper, palladium, platinum; by-products include cobalt, gold, rhodium, silver and other metals. Main products are measured at the lower of cost of production or net realisable value. The cost of production of main products is determined as total production cost, allocated to each joint product by reference to their relative sales value. By-products are initially measured at net realisable value.
Work-in-process Work-in-process includes all costs incurred in the normal course of business including direct material and direct labour costs and allocation of production overheads, depreciation and amortisation and other costs, incurred for producing each product, given its stage of completion.
Materials and supplies Materials and supplies are valued at the weighted average cost less allowance for obsolete and slow-moving items.
Financial assets
Accounting policies after 1 January 2018Financial assets are recognised when the Group has become a party to the contractual arrangement of the instrument and are initially measured at fair value, plus transaction costs, except for those financial assets classified at fair value through profit or loss, which are initially measured at fair value.
Financial assets are classified into the following specified categories:• financial assets at amortised cost• financial assets at fair value through other comprehensive income; and• financial assets at fair value through profit or loss
The classification of financial assets depends on the Group’s business model for managing the financial assets and the contractual terms of the cash flows and is determined at the time of initial recognition.
Effective interest methodThe effective interest method is used for calculating the amortised cost of a financial asset and for allocating interest income over the relevant period. The effective interest rate is the rate that exactly discounts estimated future cash receipts (including transaction costs and other premiums or discounts) through the expected life of the financial asset, or, where appropriate, a shorter period.
Income is recognised on an effective interest basis for debt instruments other than those financial assets designated at fair value through profit or loss or fair value through other comprehensive income.
Financial assets at amortised costA financial asset is measured at amortised cost if it meets both of the following conditions and is not designated at fair value though profit or loss:• it is held within a business model whose objective is to hold assets to collect contractual cash flows; and• its contractual terms give rise on specified dates to cash flows that are solely payments of principal
and interest on the principal amount outstanding
The Group generally classifies cash and cash equivalents, trade and other receivables (excluding trade receivables under provisionally priced contracts), loans issued and bank deposits as financial assets at amortised cost.
Financial assets at fair value through other comprehensive incomeA debt instrument is measured at fair value through other comprehensive income if it meets both of the following conditions and is not designated at fair value though profit or loss:• it is held within a business model whose objective is achieved by both collecting contractual cash flows
and selling financial assets; and• its contractual terms give rise on specified dates to cash flows that are solely payments of principal
and interest on the principal amount outstanding
At initial recognition the Group may make an irrevocable election to present in other comprehensive income subsequent changes in the fair value of an investment in an equity instrument that is not held for trading. This election is made on an instrument-by-instrument basis.
Financial assets at fair value through profit or lossAll financial assets not classified as measured at amorised cost or fair value through other comprehensive income are classified as financial assets at fair value through profit or loss.
Trade receivables under provisionally priced contracts and derivative financial assets are measured at fair value through profit or loss. Trade receivables under provisionally priced contracts are remeasured at each reporting date using the forward price for the period till the price
Impairment of financial assetsThe Group recognises an allowance for expected credit losses on a financial asset measured at amortised cost using one of the two methods:
Lifetime expected credit losses Trade and other receivablesFinancial assets other than trade and other receivables if the credit risk on that financial asset has increased significantly since initial recognition
12-month expected credit losses since the reporting date
Financial assets other than trade and other receivables at initial recognitionFinancial assets other than trade and other receivables for which credit risk has not increased significantly since initial recognition
When determining whether the credit risk of the financial asset has increased significantly since initial recognition and when estimating expected credit losses, the Group considers reasonable and supportable information that is relevant and available, including both quantitative and qualitative information and analysis based on Group’s historical experience and forward-looking information.
The Group applies the IFRS 9 Financial Instruments simplified approach to measuring expected credit losses which uses a lifetime expected loss allowance for all trade receivables. The Group assumes that expected credit loss for all trade and other receivables, which are overdue in excess of 365 days is equal to their carrying amount. To measure the expected credit losses, trade and other receivables that are past due for less than 365 days are grouped based on the length of the overdue period to which respective expected loss rates are applied. The expected loss rates are based on the historical credit loss experience, adjusted to reflect current and forward-looking information on the ability of the customers to settle the receivables.
When trade and other receivables are considered uncollectible, they are written off against the allowance for expected credit losses. Changes in the allowance are recognised in the consolidated income statement.
Company overview Strategic report Commodity market overview
Business overview Sustainable development
Corporate governance
Risk report Shareholder information IFRS financial statements AppendixAnnual report 2019
«NORNICKEL»
274 275
Derecognition of financial assetsThe Group derecognises a financial asset only when the contractual rights to the cash flows from the asset expire; or it transfers the financial asset and substantially all the risks and rewards of ownership of the asset to another entity. If the Group neither transfers nor retains substantially all the risks and rewards of ownership and continues to control the transferred asset, the Group recognises its retained interest in the asset and an associated liability for the amounts it may have to pay. If the Group retains substantially all the risks and rewards of ownership of a transferred financial asset, the Group continues to recognise the financial asset and also recognises a collateralised borrowing for the proceeds received.
Accounting policies before 1 January 2018Financial assets are recognised when the Group has become a party to the contractual arrangement of the instrument and are initially measured at fair value, plus transaction costs, except for those financial assets classified as at fair value through profit or loss, which are initially measured at fair value.
Financial assets are classified into the following specified categories:• financial assets at fair value through profit or loss• held-to-maturity investments• available-for-sale financial assets; and• loans and receivables
The classification depends on the nature and purpose of the financial assets and is determined at the time of initial recognition.
Financial assets at fair value through profit or lossFinancial assets are classified as at fair value through profit or loss where the financial asset is either held for trading or it is designated as at fair value through profit or loss.
A financial asset is classified as held for trading if:• it has been acquired principally for the purpose of selling in the near future; or• it is a part of an identified portfolio of financial instruments that the Group manages together and has
a recent actual pattern of short-term profit-taking; or• it is a derivative
Financial assets at fair value through profit or loss are stated at fair value, with any resultant gain or loss recognised in the consolidated income statement. The net gain or loss recognised in the consolidated income statement incorporates any dividend or interest earned on the financial asset.
Loans and receivablesTrade receivables, loans, and other receivables that have fixed or determinable payments which are not quoted in an active market are classified as loans and receivables. Loans and receivables are measured at amortised cost using the effective interest method, less any impairment. Interest income is recognised by applying the effective interest rate, except for short-term receivables when the recognition of interest would be immaterial.
Available-for-sale financial assetsAvailable-for-sale financial assets may include investments in listed and unlisted equity securities, that are not classified in other categories.
Listed equity securities held by the Group that are traded in an active market are measured at their market value. Gains and losses arising from changes in fair value are recognised in other comprehensive income in the investments revaluation reserve with the exception of impairment losses, interest calculated using the effective interest method and foreign exchange gains and losses on monetary assets, which are recognised directly in the consolidated income statement. Where an investment is disposed of or is determined to be impaired, the cumulative gain or loss previously recognised in the investment revaluation reserve is included in the consolidated income statement for the period.
Investments in unlisted equity securities that do not have a quoted market price in an active market are recorded at managements’ estimate of fair value.
Impairment of financial assetsFinancial assets, other than those at fair value through profit or loss, are assessed for indicators of impairment at each statement of financial position date. Financial assets are impaired where there is objective evidence that, as a result of one or more events that occurred after the initial recognition of the financial asset, the estimated future cash flows of the investment have been negatively impacted.
The Group has fully provided for all trade and other receivables which were due in excess of 365 days. Trade and other receivables that are past due for less than 365 days are provided according to expected probability of repayment and the length of the overdue period.
Objective evidence of impairment for accounts receivable could include the Group’s past experience of collecting payments, an increase in the number of delayed payments as well as observable changes in economic conditions that correlate with defaults on receivables.
For financial assets carried at amortised cost, the amount of the impairment is the difference between the asset’s carrying amount and the present value of estimated future cash flows, discounted at the financial asset’s original effective interest rate.
The carrying amount of the financial asset is reduced by the impairment loss directly for all financial assets with the exception of trade and other receivables, where the carrying amount is reduced through the use of an provision for doubtful debts. When trade and other receivables are considered uncollectible, it is written off against the provision. Subsequent recoveries of amounts previously written off are credited against the provision. Changes in the provision are recognised in the consolidated income statement.
With the exception of available-for-sale debt and equity instruments, if, in a subsequent period, the amount of the impairment loss decreases and the decrease can be related objectively to an event occurring after the impairment was recognised, the previously recognised impairment loss is reversed through the consolidated income statement to the extent that the carrying amount of the investment at the date the impairment is reversed does not exceed what the amortised cost would have been had the impairment not been recognised.
When a decline in fair value of an available-for-sale investment has been recognised in other comprehensive income and there is objective evidence that investment is impaired, the cumulative loss that had been recognised in other comprehensive income is reclassified from other comprehensive income and recognised in the consolidated income statement even though the investment has not been derecognised. Impairment losses previously recognised through consolidated income statement are not reversed. Any increase in fair value subsequent to an impairment loss is recognised in other comprehensive income.
Financial liabilitiesThe Group classifies financial liabilities into loans and borrowings, trade and other payables. Such financial liabilities are recognised initially at fair value less any directly attributable transaction costs. Subsequent to initial recognition, these financial liabilities are measured at amortised cost using the effective interest method. Derivative financial liabilities are measured at fair value through profit or loss.
Effective interest methodThe effective interest method is a method of calculating the amortised cost of a financial liability and of allocating interest expense over the relevant period. The effective interest rate is the rate that exactly discounts estimated future cash outflows through the expected life of the financial liability, or where appropriate, a shorter period.
Derecognition of financial liabilitiesThe Group derecognises financial liabilities when, and only when, the Group’s obligations are discharged, cancelled or they expire.
Cash and cash equivalentsCash and cash equivalents comprise cash balances, cash deposits in banks, brokers and other financial institutions and highly liquid investments with original maturities of three months or less and on demand deposits, which are readily convertible to known amounts of cash and are subject to an insignificant risk of changes in value.
Company overview Strategic report Commodity market overview
Business overview Sustainable development
Corporate governance
Risk report Shareholder information IFRS financial statements AppendixAnnual report 2019
«NORNICKEL»
276 277
ProvisionsProvisions are recognised when the Group has a legal or constructive obligation as a result of past events for which it is probable that an outflow of economic benefits will be required to settle the obligation, and the amount of the obligation can be reliably estimated.
The amount recognised as a provision is the best estimate of the consideration required to settle the present obligation at the reporting date, taking into account the risks and uncertainties surrounding the obligation. Where a provision is measured using the cash flows estimated to settle the present obligation, its carrying amount is the present value of those cash flows.
Decommissioning obligationsDecommissioning obligations include direct asset decommissioning costs as well as related land restoration costs.
Future decommissioning and other related obligations, discounted to present value, are recognised at the moment when the legal or constructive obligation in relation to such costs arises and the future costs can be reliably estimated. These costs are capitalised as part of the initial cost of the related asset (i.e. a mine) and is depreciated over the useful life of the asset. The unwinding of the discount on decommissioning obligations is included in the consolidated income statement as finance costs. Decommissioning obligations are periodically reviewed in light of current laws and regulations, and adjustments are made as necessary.
5. CRITICAL ACCOUNTING JUDGEMENTS AND KEY SOURCES OF ESTIMATION UNCERTAINTY
In order to prepare the consolidated financial statements in accordance with IFRS the Group’s management have to make estimates and assumptions that affect the reported amounts of assets and liabilities and disclosure of contingent assets and liabilities at the reporting date, and the reported amounts of revenues and expenses for the reporting period. Making estimates may require judgement based on historical experience, current and expected economic conditions, and all other available information. Actual results may differ from such estimates.
The most significant areas requiring the use of management estimates and assumptions are as follows: • useful economic lives of property, plant and equipment• impairment of non-financial assets• provisions and allowances• decommissioning obligations• income taxes and• contingencies.
Useful economic lives of property, plant and equipmentCarrying value of the Group’s mining assets, classified within property, plant and equipment, is depreciated over the lesser of their individual economic useful lives on a straight-line basis or the remaining life of mine based on the amount of the commercial ore reserves on a unit of production basis. When determining the life of a mine, valid assumptions at the time of estimation may change in case of new information becomes available.
The factors that may affect the estimation of the life of mine include the following:• changes in proved and probable ore reserves• the grade of ore reserves varying significantly from time to time• differences between actual commodity prices and commodity price assumptions used in the estimation
and classification of ore reserves• unforeseen operational issues at mine sites; and• changes in capital, operating, mining, processing and decommissioning costs, discount rates and foreign
exchange rates could possibly adversely affect the economic viability of ore reserves
Useful economic lives of non-mining property, plant and equipment are reviewed by management periodically. The review is based on the current condition of the assets and the estimated length of the period during which they will continue to bring economic benefit to the Group.
Impairment of non-financial assetsAt the end of each reporting period, the Group reviews the carrying amounts of its tangible and intangible non-financial assets for an indication that these assets may be impaired or that a previously recognised impairment loss may have decreased. For the purpose of the impairment test, the assets that do not generate independent cash flows are allocated to an appropriate cash-generating unit. To calculate the value in use, management necessarily applies judgement in allocating assets that do not generate independent cash flows to appropriate cash-generating units, and in estimating the timing and value of the underlying cash flows. Subsequent changes to the assets allocation to cash generating units or the timing of cash flows may affect the carrying value of the respective assets.
Provisions and allowancesThe Group creates an allowance for obsolete and slow-moving inventories. In addition, certain finished goods of the Group are carried at net realisable value. Estimates of net realisable value of inventories are based on the most reliable evidence available at the time the estimates are made. These estimates take into consideration fluctuations of price or cost directly relating to events occurring subsequent to the statement of financial position date to the extent that such events confirm conditions existing at the end of the period.
The Group creates provisions for social commitments, tax and other provisions. Provisions represent present value of the best estimate of the future outflow of economic benefits to settle these obligations.
Decommissioning obligationsThe Group’s mining and exploration activities are subject to various environmental laws and regulations. The Group estimates decommissioning obligations based on management’s understanding of the current legal requirements in the various jurisdictions in which it operates, terms of the license agreements and internally generated engineering estimates. Provisions are recognised, based on present values, for decommissioning and land restoration costs as soon as the obligations arise. Actual costs incurred in future periods may differ materially from the amounts provided. Additionally, future changes to environmental laws and regulations, life of mine estimates and discount rates may affect the carrying amount of this provision.
Income taxesThe Group is subject to income taxes in numerous jurisdictions. Significant judgement is required in determining provision for income taxes due to the complexity of legislation in some jurisdictions. There are many transactions and calculations for which the ultimate tax determination is uncertain. The Group recognises provisions for anticipated tax audit issues based on estimates of whether additional taxes will be due. Where the final tax outcome of these matters is different from the amounts that were initially recorded, such differences will impact the income tax and deferred tax provisions in the period in which such determination is made.
Deferred tax assets are reviewed at each reporting date and adjusted to the extent that it is probable that sufficient taxable income will be available to allow all or part of the deferred tax asset to be utilised. The estimation of that probability includes judgements based on the expected performance.
Various factors are considered to assess the probability of the future utilisation of deferred tax assets, including past operating results, operational plans, expiration of tax losses carried forward, and tax planning strategies. If actual results differ from these estimates or if these estimates must be adjusted in future periods, the financial position, results of operations and cash flows may be affected.
ContingenciesBy their nature, contingencies will only be resolved when one or more future events occur or fail to occur. The assessment of such contingencies inherently involves the exercise of significant judgement and estimates of the outcome of future events.
Company overview Strategic report Commodity market overview
Business overview Sustainable development
Corporate governance
Risk report Shareholder information IFRS financial statements AppendixAnnual report 2019
«NORNICKEL»
278 279
6. SEGMENT INFORMATION
Operating segments are identified on the basis of internal reports on components of the Group that are regularly reviewed by the Management Board.
During the second half of 2019, the Group has updated its management accounting system to account for business changes. As a result, South Cluster segment was presented separately from GMK Group segment at 31 December 2019 and for the year then ended. In May 2019, the Group replaced certain intersegment tolling arrangements with intersegment sales of semi-products for further processing with resulting segment revenue re-distribution between inter-segment metal sales and sales of metal sales to external customers, as further detailed below.
• GMK Group segment includes main mining, processing and metallurgy operations as well as transport services, energy, repair and maintenance services located in Taimyr Peninsula. GMK Group metal sales to external customers include metal volumes produced from semi-products purchased from South Cluster segment starting May 2019. Intersegment revenue from metal sales for 2019 included primarily sale of semi-products to KGMK Group segment for further processing (previously processed under intersegment tolling arrangements). GMK Group other sales to external customers primarily include revenue for energy and utilities services provided in Taimyr Peninsula
• South Cluster segment includes certain ore mining and processing operations located in Taimyr Peninsula which were previously reviewed within GMK Group segment. Intersegment revenue from metal sales included sale of semi-products to GMK Group for further processing starting May 2019 (previously processed under intersegment tolling arrangements). South Cluster segment revenue from other sales includes intersegment ore processing services under tolling arrangements provided to GMK Group segment
• KGMK Group segment includes mining and metallurgy operations, energy, exploration activities located in Kola Peninsula. KGMK Group metal sales to external customers included metal produced from semi-products purchased from GMK Group segments starting in 2019. Intersegment revenue from metal sales includes sale of semi-products to GMK Group and NN Harjavalta for further processing. KGMK Group revenue from other sales includes intersegment metal processing services under tolling arrangements provided to other segments and energy and utilities services provided to external customers in Kola Peninsula
• NN Harjavalta segment includes refinery operations located in Finland. NN Harjavalta metal sales to external customers primarily include metal produced from semi-products purchased from GMK Group and KGMK Group segments
• GRK Bystrinskoye segment includes ore mining and processing operations located in the Zabaikalsky region of the Russian Federation
• Other mining segment primarily includes 50% Group interest in metal mining and processing joint operations of Nkomati Nickel Mine (“Nkomati”), as well as certain other mining and exploration activities located in Russia and abroad. Other mining segment sales primarily include Group 50% share in sales of metal semi-products produced by Nkomati
• Other non-metallurgical segment includes resale of third party metal products, other trading operations, supply chain management, transport services, energy and utility, research and other activities located in Russia and abroad. Other non-metallurgical segment also includes resale of 50% metal semi-products produced by Nkomati. Other sales of Other non-metallurgical segment primarily include revenue from passenger air transportation, freight transportation services and fuel sales
Corporate activities of the Group do not represent an operating segment, include primarily headquarters’ general and administrative expenses and treasury operations of the Group and are presented as Unallocated.
The amounts in respect of reportable segments in the disclosure below are stated before intersegment eliminations, excluding:• Balances of intercompany loans and borrowings and interest accruals• Intercompany investments• Accrual of intercompany dividends
Amounts are measured on the same basis as those in the consolidated financial statements. Following a change in the composition of its operating segments the Group did not restate the corresponding items of the segment information for the years ended 31 December 2018 and 2017 since the necessary information is not practically available.
Company overview Strategic report Commodity market overview
Business overview Sustainable development
Corporate governance
Risk report Shareholder information IFRS financial statements AppendixAnnual report 2019
«NORNICKEL»
280 281
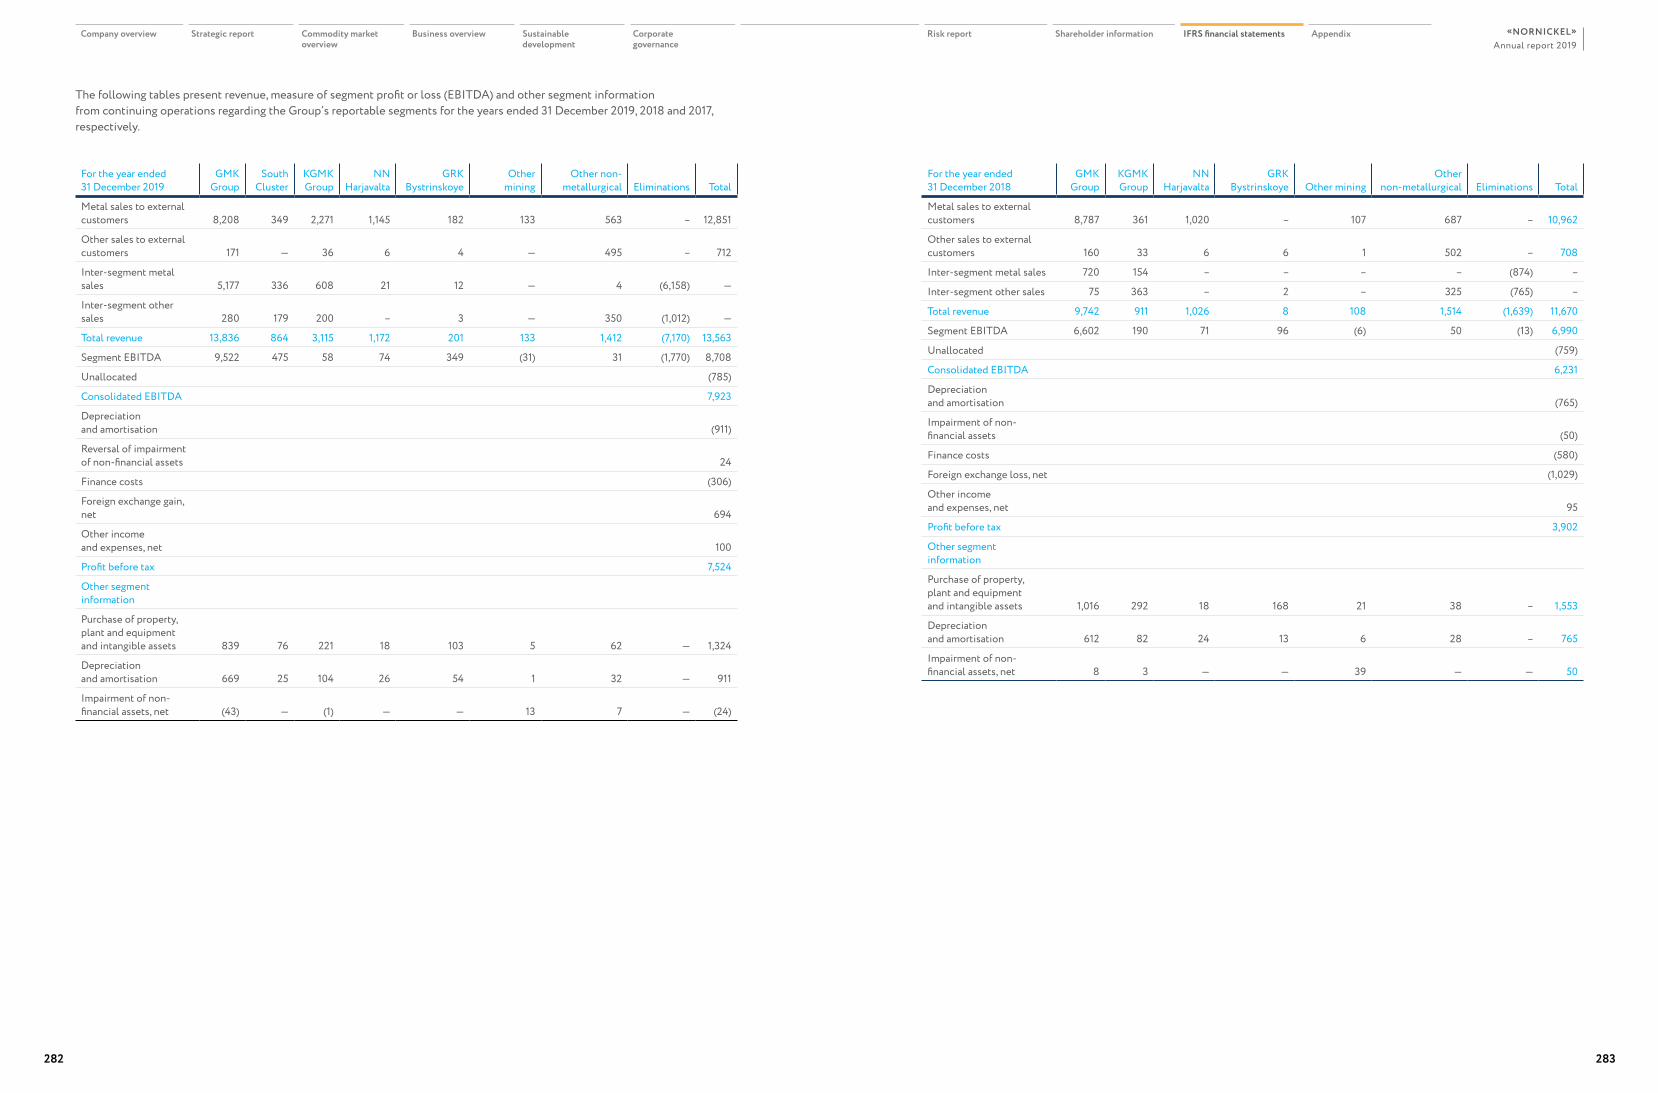
For the year ended31 December 2019
GMK Group
South Cluster
KGMK Group
NN Harjavalta
GRK Bystrinskoye
Other mining
Other non-metallurgical Eliminations Total
Metal sales to external customers 8,208 349 2,271 1,145 182 133 563 – 12,851
Other sales to external customers 171 — 36 6 4 — 495 – 712
Inter-segment metal sales 5,177 336 608 21 12 — 4 (6,158) —
Inter-segment other sales 280 179 200 – 3 — 350 (1,012) —
Total revenue 13,836 864 3,115 1,172 201 133 1,412 (7,170) 13,563
Segment EBITDA 9,522 475 58 74 349 (31) 31 (1,770) 8,708
Unallocated (785)
Consolidated EBITDA 7,923
Depreciation and amortisation (911)
Reversal of impairment of non-financial assets 24
Finance costs (306)
Foreign exchange gain, net 694
Other income and expenses, net 100
Profit before tax 7,524
Other segment information
Purchase of property, plant and equipment and intangible assets 839 76 221 18 103 5 62 — 1,324
Depreciation and amortisation 669 25 104 26 54 1 32 — 911
Impairment of non-financial assets, net (43) — (1) — — 13 7 — (24)
For the year ended31 December 2018
GMK Group
KGMK Group
NN Harjavalta
GRK Bystrinskoye Other mining
Other non-metallurgical Eliminations Total
Metal sales to external customers 8,787 361 1,020 – 107 687 – 10,962
Other sales to external customers 160 33 6 6 1 502 – 708
Inter-segment metal sales 720 154 – – – – (874) –
Inter-segment other sales 75 363 – 2 – 325 (765) –
Total revenue 9,742 911 1,026 8 108 1,514 (1,639) 11,670
Segment EBITDA 6,602 190 71 96 (6) 50 (13) 6,990
Unallocated (759)
Consolidated EBITDA 6,231
Depreciation and amortisation (765)
Impairment of non-financial assets (50)
Finance costs (580)
Foreign exchange loss, net (1,029)
Other income and expenses, net 95
Profit before tax 3,902
Other segment information
Purchase of property, plant and equipment and intangible assets 1,016 292 18 168 21 38 – 1,553
Depreciation and amortisation 612 82 24 13 6 28 – 765
Impairment of non-financial assets, net 8 3 — — 39 — — 50
The following tables present revenue, measure of segment profit or loss (EBITDA) and other segment information from continuing operations regarding the Group’s reportable segments for the years ended 31 December 2019, 2018 and 2017, respectively.
Company overview Strategic report Commodity market overview
Business overview Sustainable development
Corporate governance
Risk report Shareholder information IFRS financial statements AppendixAnnual report 2019
«NORNICKEL»
282 283
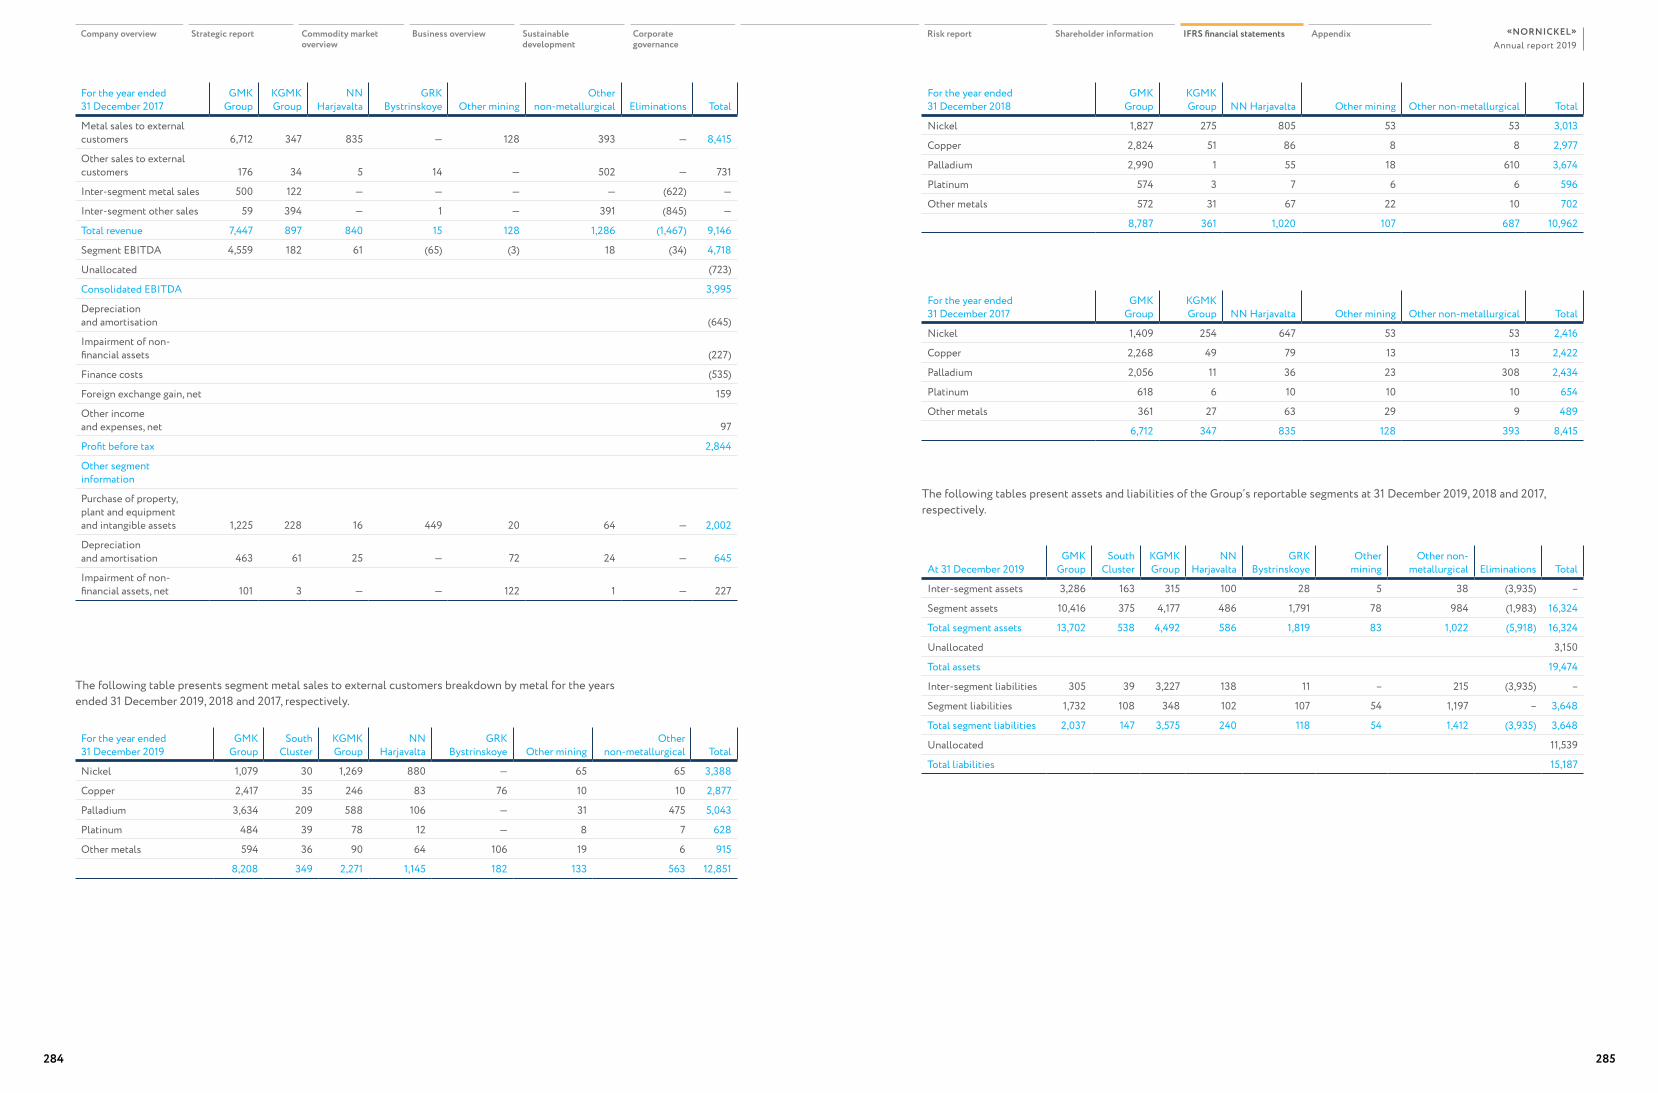
For the year ended31 December 2017
GMK Group
KGMK Group
NN Harjavalta
GRK Bystrinskoye Other mining
Other non-metallurgical Eliminations Total
Metal sales to external customers 6,712 347 835 — 128 393 — 8,415
Other sales to external customers 176 34 5 14 — 502 — 731
Inter-segment metal sales 500 122 — — — — (622) —
Inter-segment other sales 59 394 — 1 — 391 (845) —
Total revenue 7,447 897 840 15 128 1,286 (1,467) 9,146
Segment EBITDA 4,559 182 61 (65) (3) 18 (34) 4,718
Unallocated (723)
Consolidated EBITDA 3,995
Depreciation and amortisation (645)
Impairment of non-financial assets (227)
Finance costs (535)
Foreign exchange gain, net 159
Other income and expenses, net 97
Profit before tax 2,844
Other segment information
Purchase of property, plant and equipment and intangible assets 1,225 228 16 449 20 64 — 2,002
Depreciation and amortisation 463 61 25 — 72 24 — 645
Impairment of non-financial assets, net 101 3 — — 122 1 — 227
For the year ended31 December 2019
GMK Group
South Cluster
KGMK Group
NN Harjavalta
GRK Bystrinskoye Other mining
Other non-metallurgical Total
Nickel 1,079 30 1,269 880 — 65 65 3,388
Copper 2,417 35 246 83 76 10 10 2,877
Palladium 3,634 209 588 106 — 31 475 5,043
Platinum 484 39 78 12 — 8 7 628
Other metals 594 36 90 64 106 19 6 915
8,208 349 2,271 1,145 182 133 563 12,851
For the year ended31 December 2018
GMK Group
KGMK Group NN Harjavalta Other mining Other non-metallurgical Total
Nickel 1,827 275 805 53 53 3,013
Copper 2,824 51 86 8 8 2,977
Palladium 2,990 1 55 18 610 3,674
Platinum 574 3 7 6 6 596
Other metals 572 31 67 22 10 702
8,787 361 1,020 107 687 10,962
For the year ended31 December 2017
GMK Group
KGMK Group NN Harjavalta Other mining Other non-metallurgical Total
Nickel 1,409 254 647 53 53 2,416
Copper 2,268 49 79 13 13 2,422
Palladium 2,056 11 36 23 308 2,434
Platinum 618 6 10 10 10 654
Other metals 361 27 63 29 9 489
6,712 347 835 128 393 8,415
The following table presents segment metal sales to external customers breakdown by metal for the years ended 31 December 2019, 2018 and 2017, respectively.
The following tables present assets and liabilities of the Group’s reportable segments at 31 December 2019, 2018 and 2017, respectively.
At 31 December 2019GMK
GroupSouth
ClusterKGMK Group
NN Harjavalta
GRK Bystrinskoye
Other mining
Other non-metallurgical Eliminations Total
Inter-segment assets 3,286 163 315 100 28 5 38 (3,935) –
Segment assets 10,416 375 4,177 486 1,791 78 984 (1,983) 16,324
Total segment assets 13,702 538 4,492 586 1,819 83 1,022 (5,918) 16,324
Unallocated 3,150
Total assets 19,474
Inter-segment liabilities 305 39 3,227 138 11 – 215 (3,935) –
Segment liabilities 1,732 108 348 102 107 54 1,197 – 3,648
Total segment liabilities 2,037 147 3,575 240 118 54 1,412 (3,935) 3,648
Unallocated 11,539
Total liabilities 15,187
Company overview Strategic report Commodity market overview
Business overview Sustainable development
Corporate governance
Risk report Shareholder information IFRS financial statements AppendixAnnual report 2019
«NORNICKEL»
284 285
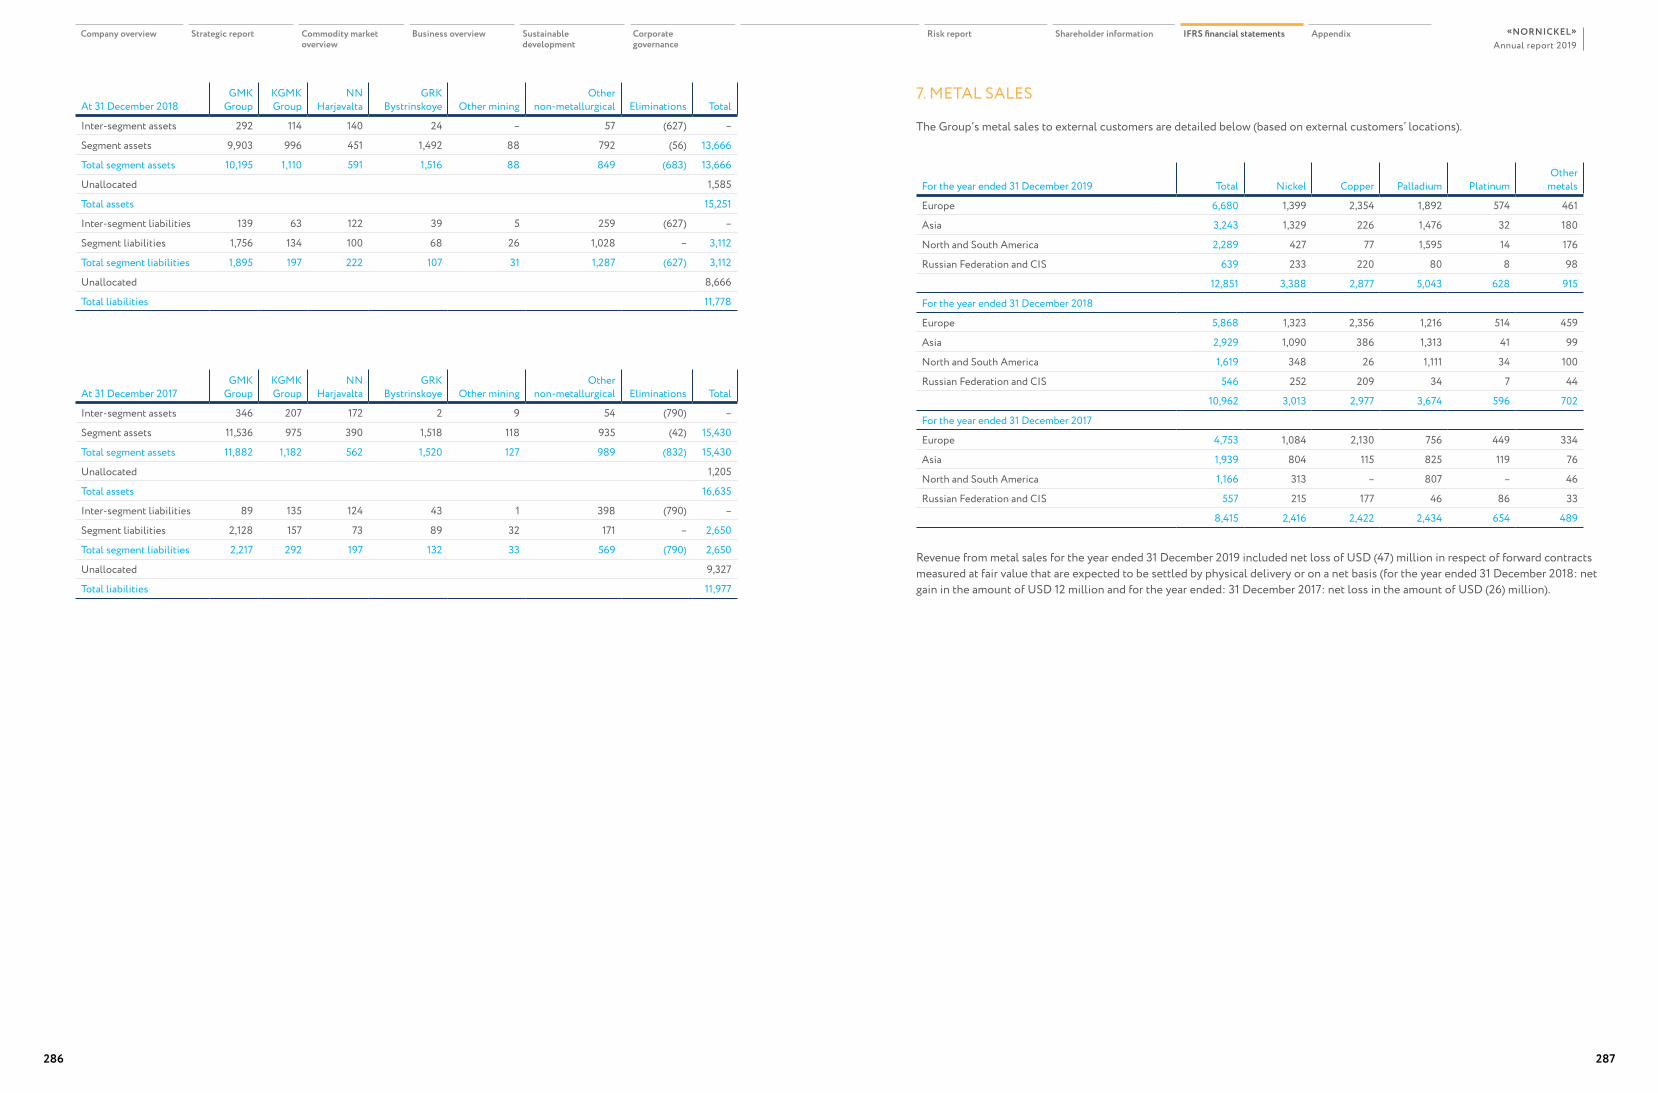
At 31 December 2018GMK
GroupKGMK Group
NN Harjavalta
GRK Bystrinskoye Other mining
Other non-metallurgical Eliminations Total
Inter-segment assets 292 114 140 24 – 57 (627) –
Segment assets 9,903 996 451 1,492 88 792 (56) 13,666
Total segment assets 10,195 1,110 591 1,516 88 849 (683) 13,666
Unallocated 1,585
Total assets 15,251
Inter-segment liabilities 139 63 122 39 5 259 (627) –
Segment liabilities 1,756 134 100 68 26 1,028 – 3,112
Total segment liabilities 1,895 197 222 107 31 1,287 (627) 3,112
Unallocated 8,666
Total liabilities 11,778
At 31 December 2017GMK
GroupKGMK Group
NN Harjavalta
GRK Bystrinskoye Other mining
Other non-metallurgical Eliminations Total
Inter-segment assets 346 207 172 2 9 54 (790) –
Segment assets 11,536 975 390 1,518 118 935 (42) 15,430
Total segment assets 11,882 1,182 562 1,520 127 989 (832) 15,430
Unallocated 1,205
Total assets 16,635
Inter-segment liabilities 89 135 124 43 1 398 (790) –
Segment liabilities 2,128 157 73 89 32 171 – 2,650
Total segment liabilities 2,217 292 197 132 33 569 (790) 2,650
Unallocated 9,327
Total liabilities 11,977
For the year ended 31 December 2019 Total Nickel Copper Palladium PlatinumOther
metals
Europe 6,680 1,399 2,354 1,892 574 461
Asia 3,243 1,329 226 1,476 32 180
North and South America 2,289 427 77 1,595 14 176
Russian Federation and CIS 639 233 220 80 8 98
12,851 3,388 2,877 5,043 628 915
For the year ended 31 December 2018
Europe 5,868 1,323 2,356 1,216 514 459
Asia 2,929 1,090 386 1,313 41 99
North and South America 1,619 348 26 1,111 34 100
Russian Federation and CIS 546 252 209 34 7 44
10,962 3,013 2,977 3,674 596 702
For the year ended 31 December 2017
Europe 4,753 1,084 2,130 756 449 334
Asia 1,939 804 115 825 119 76
North and South America 1,166 313 – 807 – 46
Russian Federation and CIS 557 215 177 46 86 33
8,415 2,416 2,422 2,434 654 489
Revenue from metal sales for the year ended 31 December 2019 included net loss of USD (47) million in respect of forward contracts measured at fair value that are expected to be settled by physical delivery or on a net basis (for the year ended 31 December 2018: net gain in the amount of USD 12 million and for the year ended: 31 December 2017: net loss in the amount of USD (26) million).
7. METAL SALES
The Group’s metal sales to external customers are detailed below (based on external customers’ locations).
Company overview Strategic report Commodity market overview
Business overview Sustainable development
Corporate governance
Risk report Shareholder information IFRS financial statements AppendixAnnual report 2019
«NORNICKEL»
286 287
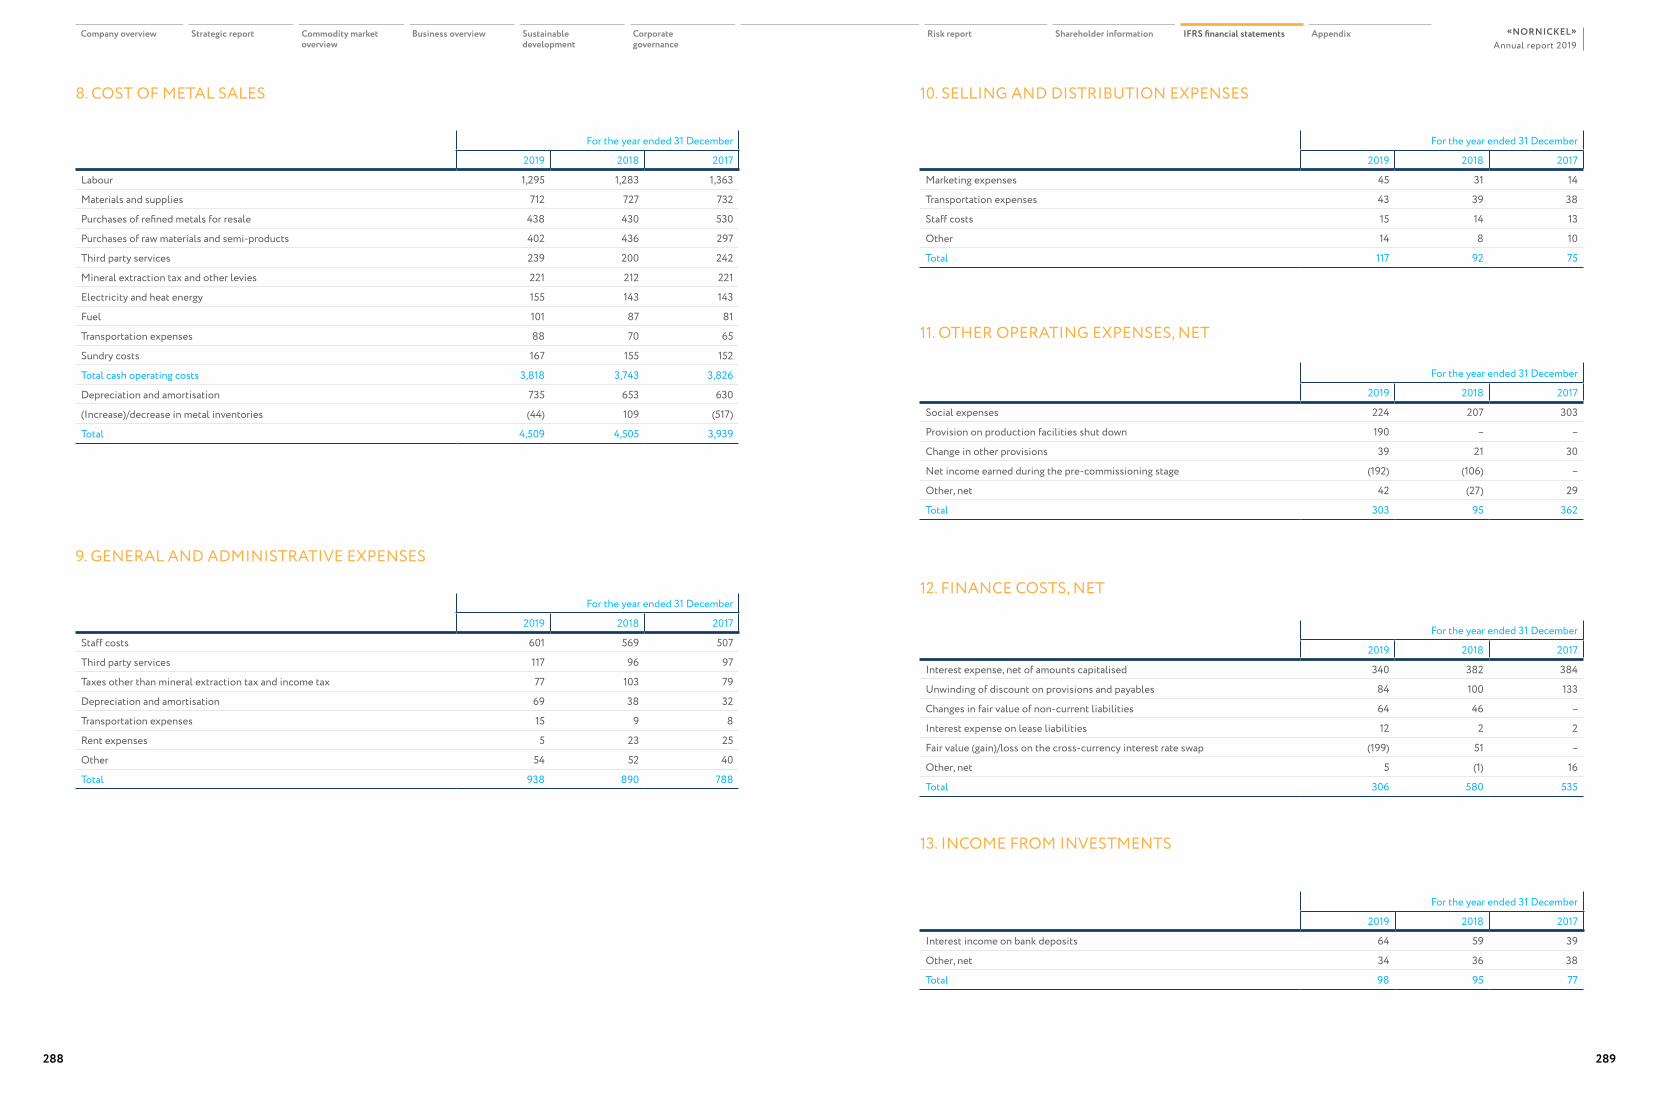
For the year ended 31 December
2019 2018 2017
Labour 1,295 1,283 1,363
Materials and supplies 712 727 732
Purchases of refined metals for resale 438 430 530
Purchases of raw materials and semi-products 402 436 297
Third party services 239 200 242
Mineral extraction tax and other levies 221 212 221
Electricity and heat energy 155 143 143
Fuel 101 87 81
Transportation expenses 88 70 65
Sundry costs 167 155 152
Total cash operating costs 3,818 3,743 3,826
Depreciation and amortisation 735 653 630
(Increase)/decrease in metal inventories (44) 109 (517)
Total 4,509 4,505 3,939
For the year ended 31 December
2019 2018 2017
Staff costs 601 569 507
Third party services 117 96 97
Taxes other than mineral extraction tax and income tax 77 103 79
Depreciation and amortisation 69 38 32
Transportation expenses 15 9 8
Rent expenses 5 23 25
Other 54 52 40
Total 938 890 788
8. COST OF METAL SALES 10. SELLING AND DISTRIBUTION EXPENSES
9. GENERAL AND ADMINISTRATIVE EXPENSES
For the year ended 31 December
2019 2018 2017
Marketing expenses 45 31 14
Transportation expenses 43 39 38
Staff costs 15 14 13
Other 14 8 10
Total 117 92 75
For the year ended 31 December
2019 2018 2017
Social expenses 224 207 303
Provision on production facilities shut down 190 – –
Change in other provisions 39 21 30
Net income earned during the pre-commissioning stage (192) (106) –
Other, net 42 (27) 29
Total 303 95 362
11. OTHER OPERATING EXPENSES, NET
For the year ended 31 December
2019 2018 2017
Interest expense, net of amounts capitalised 340 382 384
Unwinding of discount on provisions and payables 84 100 133
Changes in fair value of non-current liabilities 64 46 –
Interest expense on lease liabilities 12 2 2
Fair value (gain)/loss on the cross-currency interest rate swap (199) 51 –
Other, net 5 (1) 16
Total 306 580 535
12. FINANCE COSTS, NET
For the year ended 31 December
2019 2018 2017
Interest income on bank deposits 64 59 39
Other, net 34 36 38
Total 98 95 77
13. INCOME FROM INVESTMENTS
Company overview Strategic report Commodity market overview
Business overview Sustainable development
Corporate governance
Risk report Shareholder information IFRS financial statements AppendixAnnual report 2019
«NORNICKEL»
288 289
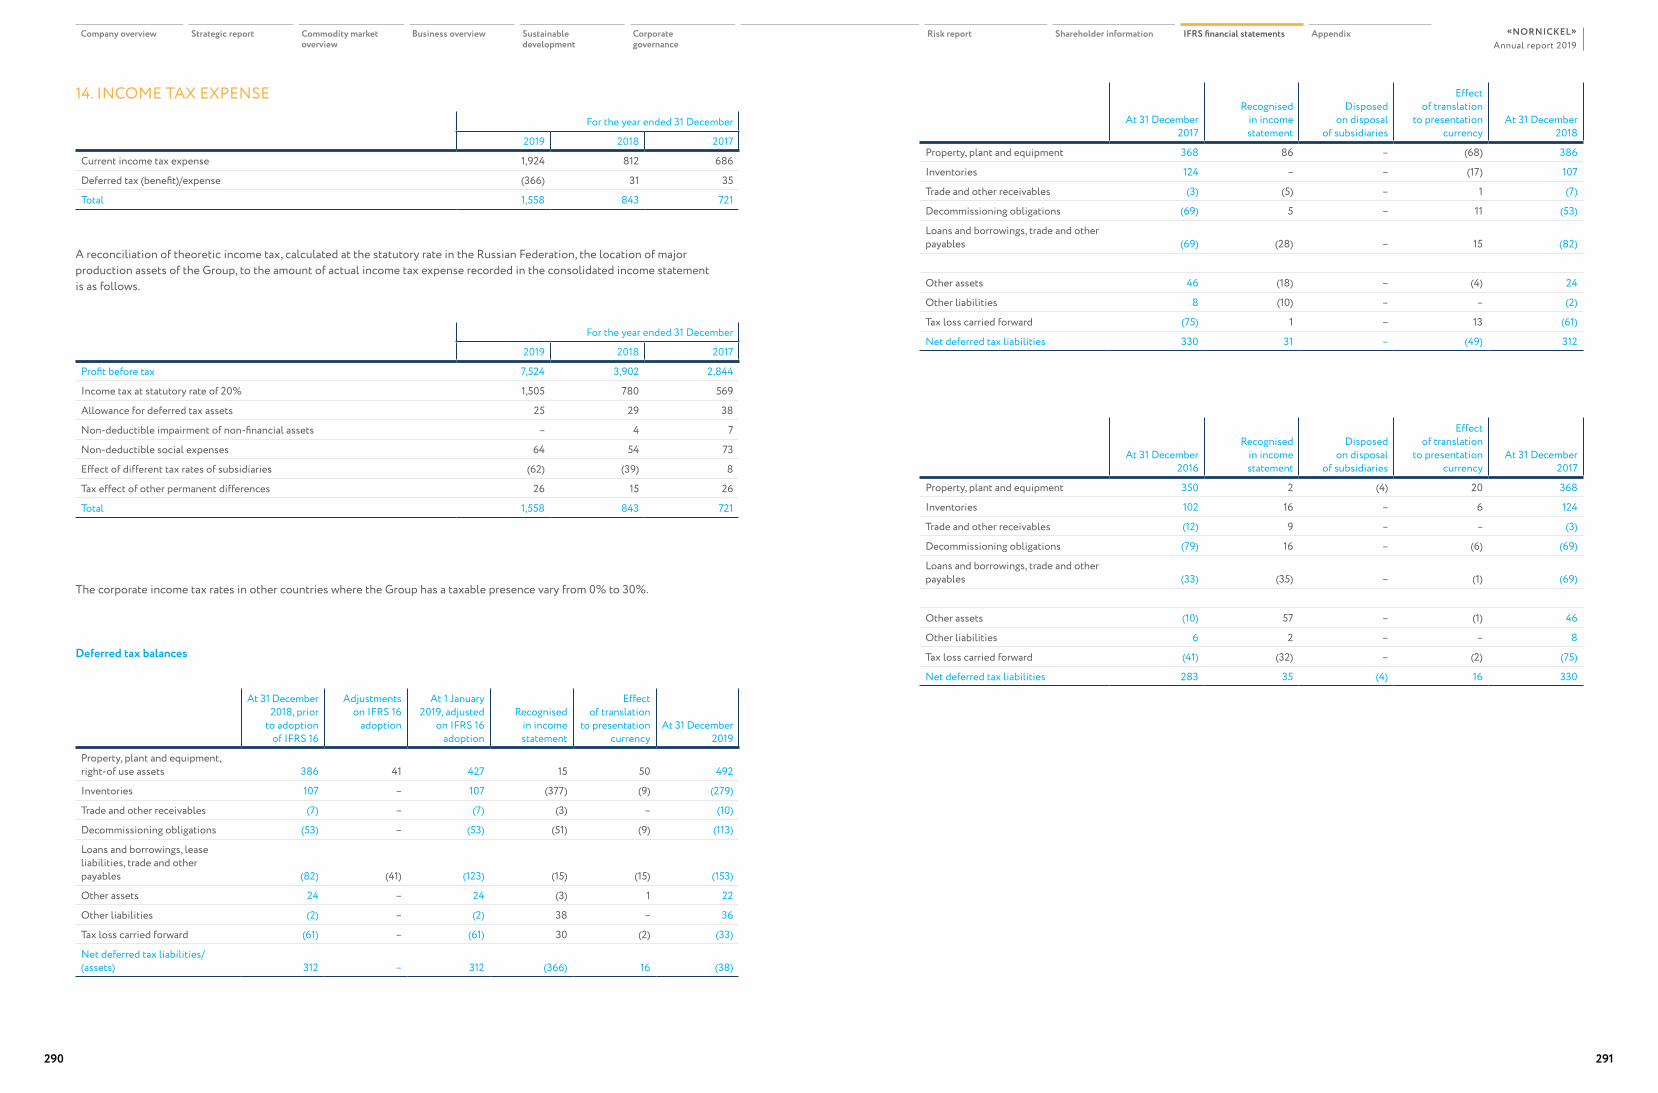
For the year ended 31 December
2019 2018 2017
Current income tax expense 1,924 812 686
Deferred tax (benefit)/expense (366) 31 35
Total 1,558 843 721
14. INCOME TAX EXPENSE
Deferred tax balances
A reconciliation of theoretic income tax, calculated at the statutory rate in the Russian Federation, the location of major production assets of the Group, to the amount of actual income tax expense recorded in the consolidated income statement is as follows.
The corporate income tax rates in other countries where the Group has a taxable presence vary from 0% to 30%.
For the year ended 31 December
2019 2018 2017
Profit before tax 7,524 3,902 2,844
Income tax at statutory rate of 20% 1,505 780 569
Allowance for deferred tax assets 25 29 38
Non-deductible impairment of non-financial assets – 4 7
Non-deductible social expenses 64 54 73
Effect of different tax rates of subsidiaries (62) (39) 8
Tax effect of other permanent differences 26 15 26
Total 1,558 843 721
At 31 December 2018, prior
to adoption of IFRS 16
Adjustments on IFRS 16
adoption
At 1 January 2019, adjusted
on IFRS 16 adoption
Recognised in income statement
Effect of translation
to presentation currency
At 31 December 2019
Property, plant and equipment, right-of use assets 386 41 427 15 50 492
Inventories 107 – 107 (377) (9) (279)
Trade and other receivables (7) – (7) (3) – (10)
Decommissioning obligations (53) – (53) (51) (9) (113)
Loans and borrowings, lease liabilities, trade and other payables (82) (41) (123) (15) (15) (153)
Other assets 24 – 24 (3) 1 22
Other liabilities (2) – (2) 38 – 36
Tax loss carried forward (61) – (61) 30 (2) (33)
Net deferred tax liabilities/(assets) 312 – 312 (366) 16 (38)
At 31 December 2017
Recognised in income statement
Disposed on disposal
of subsidiaries
Effect of translation
to presentation currency
At 31 December 2018
Property, plant and equipment 368 86 – (68) 386
Inventories 124 – – (17) 107
Trade and other receivables (3) (5) – 1 (7)
Decommissioning obligations (69) 5 – 11 (53)
Loans and borrowings, trade and other payables (69) (28) – 15 (82)
Other assets 46 (18) – (4) 24
Other liabilities 8 (10) – – (2)
Tax loss carried forward (75) 1 – 13 (61)
Net deferred tax liabilities 330 31 – (49) 312
At 31 December 2016
Recognised in income statement
Disposed on disposal
of subsidiaries
Effect of translation
to presentation currency
At 31 December 2017
Property, plant and equipment 350 2 (4) 20 368
Inventories 102 16 – 6 124
Trade and other receivables (12) 9 – – (3)
Decommissioning obligations (79) 16 – (6) (69)
Loans and borrowings, trade and other payables (33) (35) – (1) (69)
Other assets (10) 57 – (1) 46
Other liabilities 6 2 – – 8
Tax loss carried forward (41) (32) – (2) (75)
Net deferred tax liabilities 283 35 (4) 16 330
Company overview Strategic report Commodity market overview
Business overview Sustainable development
Corporate governance
Risk report Shareholder information IFRS financial statements AppendixAnnual report 2019
«NORNICKEL»
290 291
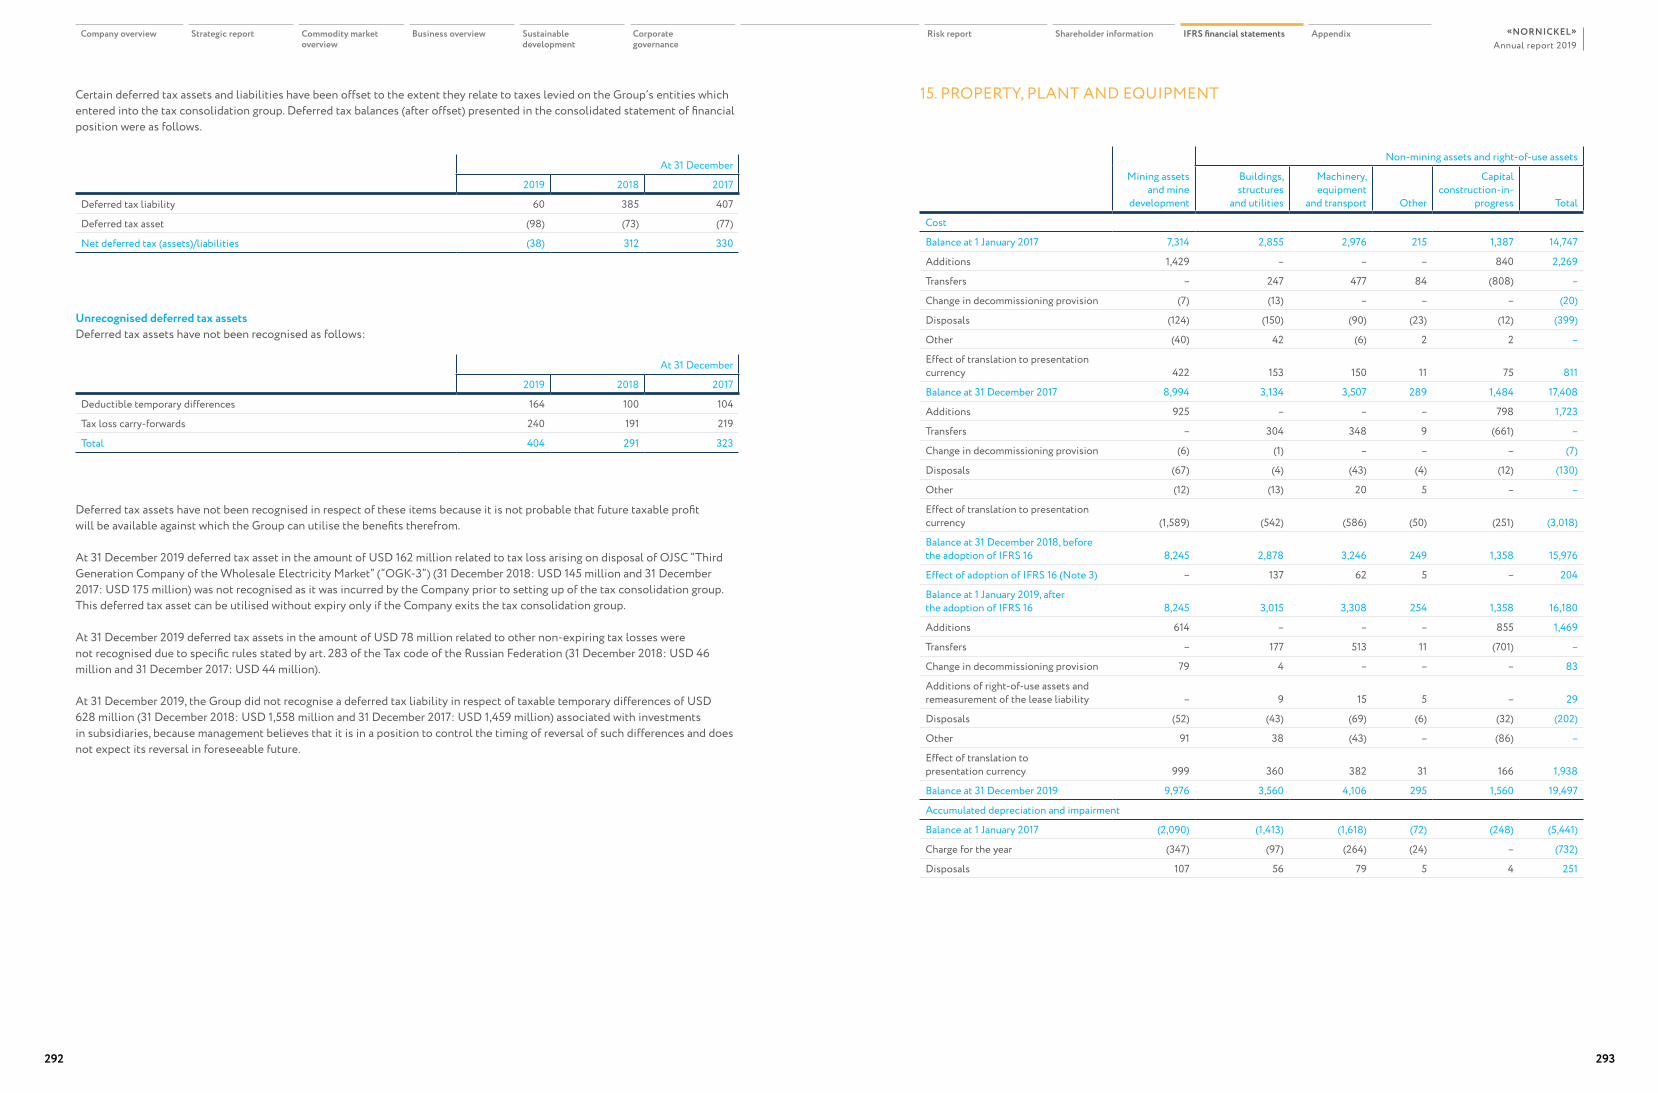
At 31 December
2019 2018 2017
Deferred tax liability 60 385 407
Deferred tax asset (98) (73) (77)
Net deferred tax (assets)/liabilities (38) 312 330
At 31 December
2019 2018 2017
Deductible temporary differences 164 100 104
Tax loss carry-forwards 240 191 219
Total 404 291 323
Unrecognised deferred tax assetsDeferred tax assets have not been recognised as follows:
Deferred tax assets have not been recognised in respect of these items because it is not probable that future taxable profit will be available against which the Group can utilise the benefits therefrom.
At 31 December 2019 deferred tax asset in the amount of USD 162 million related to tax loss arising on disposal of OJSC “Third Generation Company of the Wholesale Electricity Market” (“OGK-3”) (31 December 2018: USD 145 million and 31 December 2017: USD 175 million) was not recognised as it was incurred by the Company prior to setting up of the tax consolidation group. This deferred tax asset can be utilised without expiry only if the Company exits the tax consolidation group.
At 31 December 2019 deferred tax assets in the amount of USD 78 million related to other non-expiring tax losses were not recognised due to specific rules stated by art. 283 of the Tax code of the Russian Federation (31 December 2018: USD 46 million and 31 December 2017: USD 44 million).
At 31 December 2019, the Group did not recognise a deferred tax liability in respect of taxable temporary differences of USD 628 million (31 December 2018: USD 1,558 million and 31 December 2017: USD 1,459 million) associated with investments in subsidiaries, because management believes that it is in a position to control the timing of reversal of such differences and does not expect its reversal in foreseeable future.
15. PROPERTY, PLANT AND EQUIPMENT
Mining assets and mine
development
Non-mining assets and right-of-use assets
Buildings, structures
and utilities
Machinery, equipment
and transport Other
Capital construction-in-
progress Total
Cost
Balance at 1 January 2017 7,314 2,855 2,976 215 1,387 14,747
Additions 1,429 – – – 840 2,269
Transfers – 247 477 84 (808) –
Change in decommissioning provision (7) (13) – – – (20)
Disposals (124) (150) (90) (23) (12) (399)
Other (40) 42 (6) 2 2 –
Effect of translation to presentation currency 422 153 150 11 75 811
Balance at 31 December 2017 8,994 3,134 3,507 289 1,484 17,408
Additions 925 – – – 798 1,723
Transfers – 304 348 9 (661) –
Change in decommissioning provision (6) (1) – – – (7)
Disposals (67) (4) (43) (4) (12) (130)
Other (12) (13) 20 5 – –
Effect of translation to presentation currency (1,589) (542) (586) (50) (251) (3,018)
Balance at 31 December 2018, before the adoption of IFRS 16 8,245 2,878 3,246 249 1,358 15,976
Effect of adoption of IFRS 16 (Note 3) – 137 62 5 – 204
Balance at 1 January 2019, after the adoption of IFRS 16 8,245 3,015 3,308 254 1,358 16,180
Additions 614 – – – 855 1,469
Transfers – 177 513 11 (701) –
Change in decommissioning provision 79 4 – – – 83
Additions of right-of-use assets andremeasurement of the lease liability – 9 15 5 – 29
Disposals (52) (43) (69) (6) (32) (202)
Other 91 38 (43) – (86) –
Effect of translation topresentation currency 999 360 382 31 166 1,938
Balance at 31 December 2019 9,976 3,560 4,106 295 1,560 19,497
Accumulated depreciation and impairment
Balance at 1 January 2017 (2,090) (1,413) (1,618) (72) (248) (5,441)
Charge for the year (347) (97) (264) (24) – (732)
Disposals 107 56 79 5 4 251
Certain deferred tax assets and liabilities have been offset to the extent they relate to taxes levied on the Group’s entities which entered into the tax consolidation group. Deferred tax balances (after offset) presented in the consolidated statement of financial position were as follows.
Company overview Strategic report Commodity market overview
Business overview Sustainable development
Corporate governance
Risk report Shareholder information IFRS financial statements AppendixAnnual report 2019
«NORNICKEL»
292 293
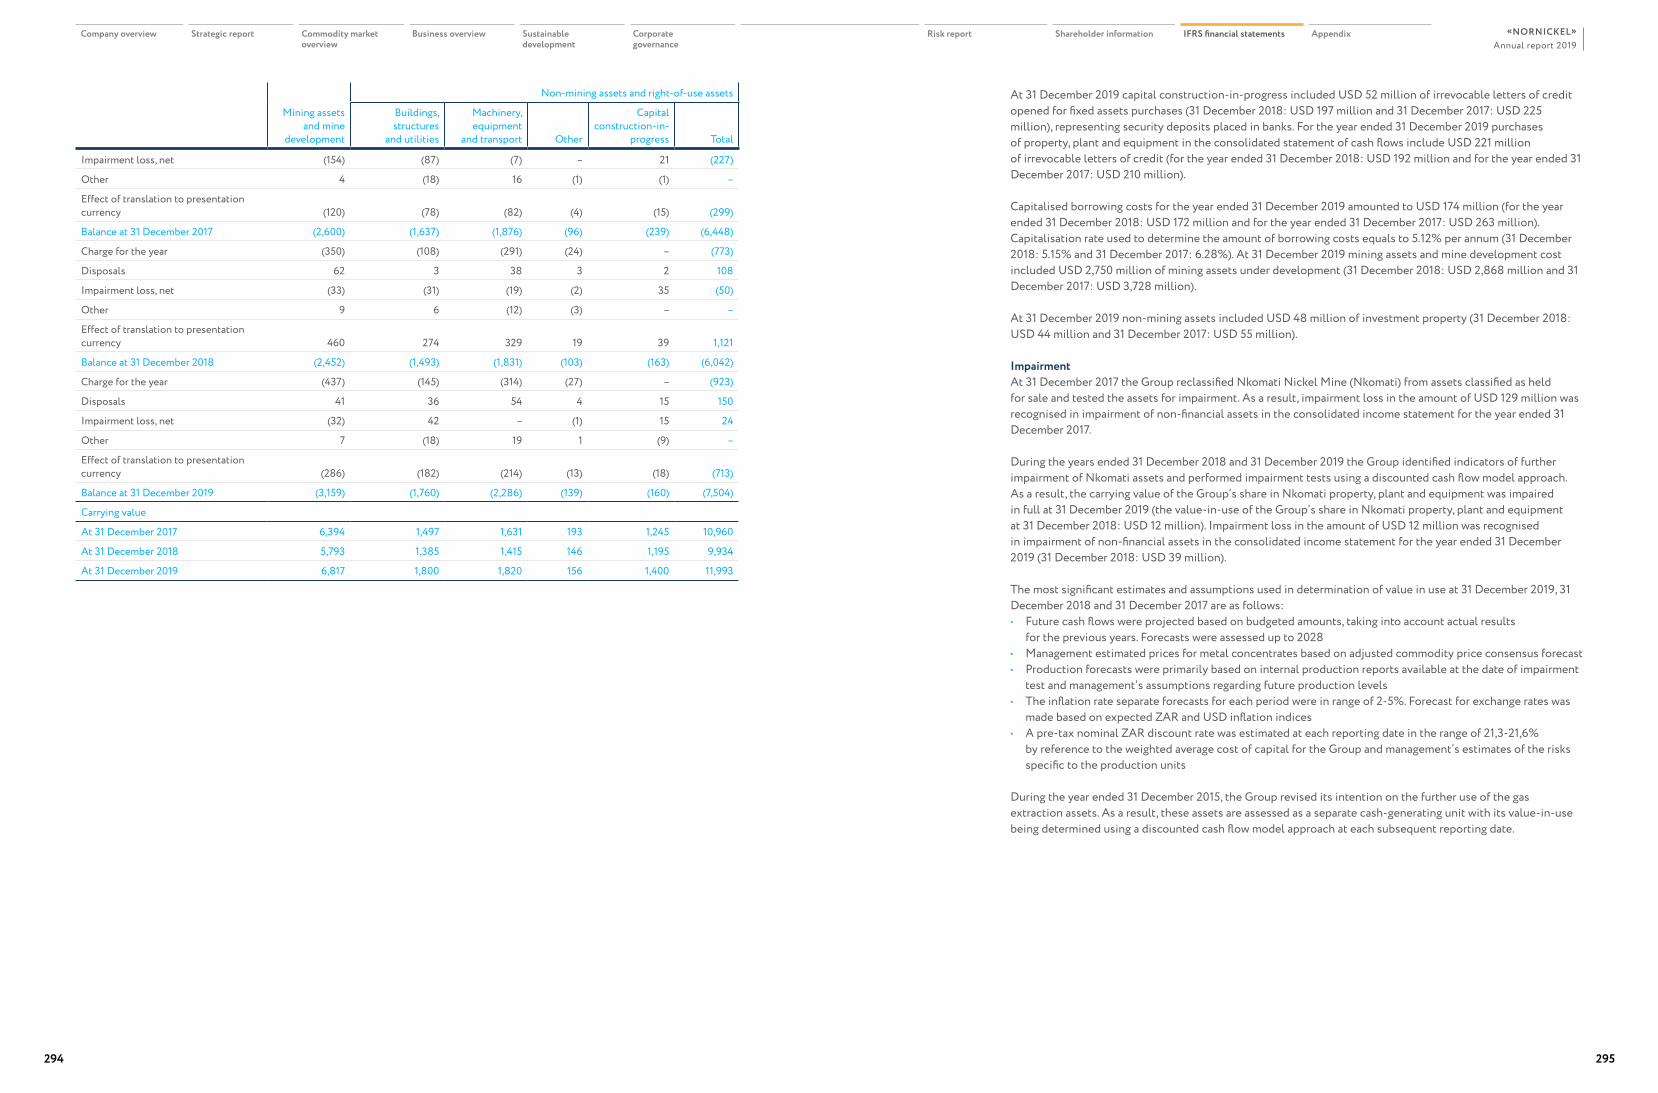
Mining assets and mine
development
Non-mining assets and right-of-use assets
Buildings, structures
and utilities
Machinery, equipment
and transport Other
Capital construction-in-
progress Total
Impairment loss, net (154) (87) (7) – 21 (227)
Other 4 (18) 16 (1) (1) –
Effect of translation to presentation currency (120) (78) (82) (4) (15) (299)
Balance at 31 December 2017 (2,600) (1,637) (1,876) (96) (239) (6,448)
Charge for the year (350) (108) (291) (24) – (773)
Disposals 62 3 38 3 2 108
Impairment loss, net (33) (31) (19) (2) 35 (50)
Other 9 6 (12) (3) – –
Effect of translation to presentation currency 460 274 329 19 39 1,121
Balance at 31 December 2018 (2,452) (1,493) (1,831) (103) (163) (6,042)
Charge for the year (437) (145) (314) (27) – (923)
Disposals 41 36 54 4 15 150
Impairment loss, net (32) 42 – (1) 15 24
Other 7 (18) 19 1 (9) –
Effect of translation to presentation currency (286) (182) (214) (13) (18) (713)
Balance at 31 December 2019 (3,159) (1,760) (2,286) (139) (160) (7,504)
Carrying value
At 31 December 2017 6,394 1,497 1,631 193 1,245 10,960
At 31 December 2018 5,793 1,385 1,415 146 1,195 9,934
At 31 December 2019 6,817 1,800 1,820 156 1,400 11,993
At 31 December 2019 capital construction-in-progress included USD 52 million of irrevocable letters of credit opened for fixed assets purchases (31 December 2018: USD 197 million and 31 December 2017: USD 225 million), representing security deposits placed in banks. For the year ended 31 December 2019 purchases of property, plant and equipment in the consolidated statement of cash flows include USD 221 million of irrevocable letters of credit (for the year ended 31 December 2018: USD 192 million and for the year ended 31 December 2017: USD 210 million).
Capitalised borrowing costs for the year ended 31 December 2019 amounted to USD 174 million (for the year ended 31 December 2018: USD 172 million and for the year ended 31 December 2017: USD 263 million). Capitalisation rate used to determine the amount of borrowing costs equals to 5.12% per annum (31 December 2018: 5.15% and 31 December 2017: 6.28%). At 31 December 2019 mining assets and mine development cost included USD 2,750 million of mining assets under development (31 December 2018: USD 2,868 million and 31 December 2017: USD 3,728 million).
At 31 December 2019 non-mining assets included USD 48 million of investment property (31 December 2018: USD 44 million and 31 December 2017: USD 55 million).
ImpairmentAt 31 December 2017 the Group reclassified Nkomati Nickel Mine (Nkomati) from assets classified as held for sale and tested the assets for impairment. As a result, impairment loss in the amount of USD 129 million was recognised in impairment of non-financial assets in the consolidated income statement for the year ended 31 December 2017.
During the years ended 31 December 2018 and 31 December 2019 the Group identified indicators of further impairment of Nkomati assets and performed impairment tests using a discounted cash flow model approach. As a result, the carrying value of the Group’s share in Nkomati property, plant and equipment was impaired in full at 31 December 2019 (the value-in-use of the Group’s share in Nkomati property, plant and equipment at 31 December 2018: USD 12 million). Impairment loss in the amount of USD 12 million was recognised in impairment of non-financial assets in the consolidated income statement for the year ended 31 December 2019 (31 December 2018: USD 39 million).
The most significant estimates and assumptions used in determination of value in use at 31 December 2019, 31 December 2018 and 31 December 2017 are as follows:• Future cash flows were projected based on budgeted amounts, taking into account actual results
for the previous years. Forecasts were assessed up to 2028• Management estimated prices for metal concentrates based on adjusted commodity price consensus forecast• Production forecasts were primarily based on internal production reports available at the date of impairment
test and management’s assumptions regarding future production levels• The inflation rate separate forecasts for each period were in range of 2-5%. Forecast for exchange rates was
made based on expected ZAR and USD inflation indices• A pre-tax nominal ZAR discount rate was estimated at each reporting date in the range of 21,3-21,6%
by reference to the weighted average cost of capital for the Group and management’s estimates of the risks specific to the production units
During the year ended 31 December 2015, the Group revised its intention on the further use of the gas extraction assets. As a result, these assets are assessed as a separate cash-generating unit with its value-in-use being determined using a discounted cash flow model approach at each subsequent reporting date.
Company overview Strategic report Commodity market overview
Business overview Sustainable development
Corporate governance
Risk report Shareholder information IFRS financial statements AppendixAnnual report 2019
«NORNICKEL»
294 295
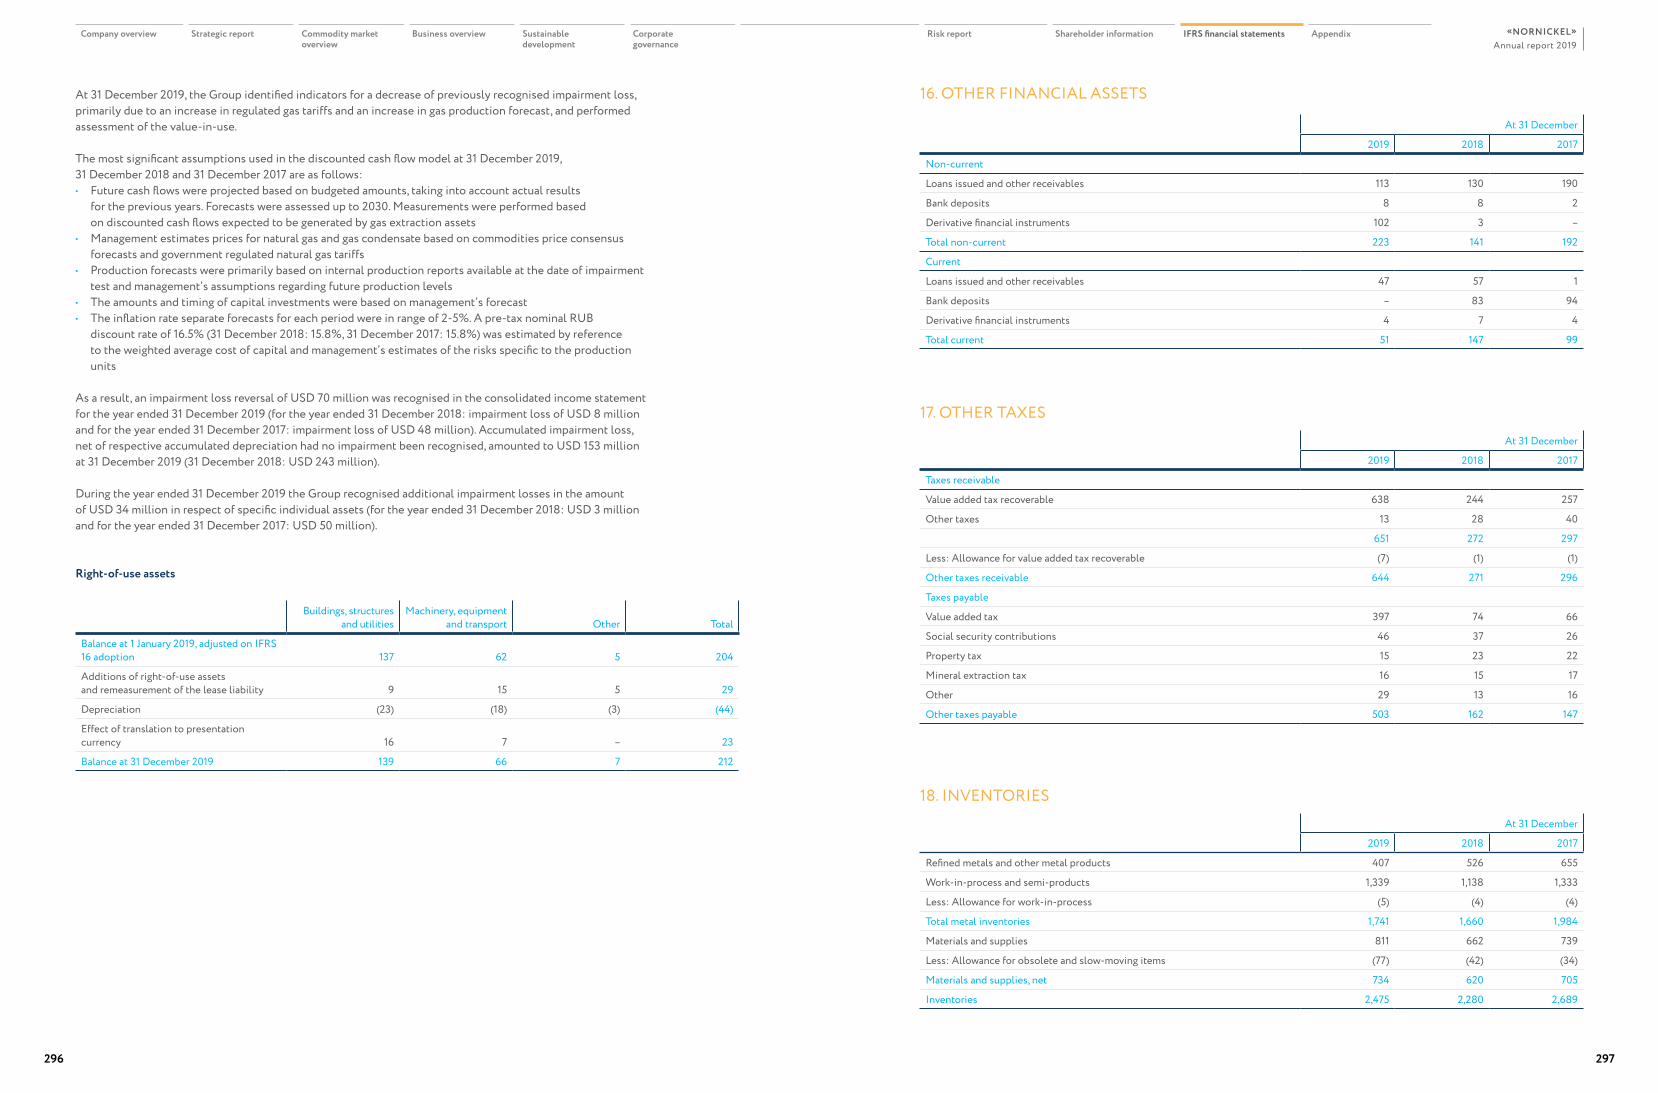
At 31 December 2019, the Group identified indicators for a decrease of previously recognised impairment loss, primarily due to an increase in regulated gas tariffs and an increase in gas production forecast, and performed assessment of the value-in-use.
The most significant assumptions used in the discounted cash flow model at 31 December 2019, 31 December 2018 and 31 December 2017 are as follows: • Future cash flows were projected based on budgeted amounts, taking into account actual results
for the previous years. Forecasts were assessed up to 2030. Measurements were performed based on discounted cash flows expected to be generated by gas extraction assets
• Management estimates prices for natural gas and gas condensate based on commodities price consensus forecasts and government regulated natural gas tariffs
• Production forecasts were primarily based on internal production reports available at the date of impairment test and management’s assumptions regarding future production levels
• The amounts and timing of capital investments were based on management’s forecast• The inflation rate separate forecasts for each period were in range of 2-5%. A pre-tax nominal RUB
discount rate of 16.5% (31 December 2018: 15.8%, 31 December 2017: 15.8%) was estimated by reference to the weighted average cost of capital and management’s estimates of the risks specific to the production units
As a result, an impairment loss reversal of USD 70 million was recognised in the consolidated income statement for the year ended 31 December 2019 (for the year ended 31 December 2018: impairment loss of USD 8 million and for the year ended 31 December 2017: impairment loss of USD 48 million). Accumulated impairment loss, net of respective accumulated depreciation had no impairment been recognised, amounted to USD 153 million at 31 December 2019 (31 December 2018: USD 243 million).
During the year ended 31 December 2019 the Group recognised additional impairment losses in the amount of USD 34 million in respect of specific individual assets (for the year ended 31 December 2018: USD 3 million and for the year ended 31 December 2017: USD 50 million).
Buildings, structures and utilities
Machinery, equipment and transport Other Total
Balance at 1 January 2019, adjusted on IFRS 16 adoption 137 62 5 204
Additions of right-of-use assets and remeasurement of the lease liability 9 15 5 29
Depreciation (23) (18) (3) (44)
Effect of translation to presentation currency 16 7 – 23
Balance at 31 December 2019 139 66 7 212
Right-of-use assets
16. OTHER FINANCIAL ASSETS
18. INVENTORIES
17. OTHER TAXES
At 31 December
2019 2018 2017
Non-current
Loans issued and other receivables 113 130 190
Bank deposits 8 8 2
Derivative financial instruments 102 3 –
Total non-current 223 141 192
Current
Loans issued and other receivables 47 57 1
Bank deposits – 83 94
Derivative financial instruments 4 7 4
Total current 51 147 99
At 31 December
2019 2018 2017
Refined metals and other metal products 407 526 655
Work-in-process and semi-products 1,339 1,138 1,333
Less: Allowance for work-in-process (5) (4) (4)
Total metal inventories 1,741 1,660 1,984
Materials and supplies 811 662 739
Less: Allowance for obsolete and slow-moving items (77) (42) (34)
Materials and supplies, net 734 620 705
Inventories 2,475 2,280 2,689
At 31 December
2019 2018 2017
Taxes receivable
Value added tax recoverable 638 244 257
Other taxes 13 28 40
651 272 297
Less: Allowance for value added tax recoverable (7) (1) (1)
Other taxes receivable 644 271 296
Taxes payable
Value added tax 397 74 66
Social security contributions 46 37 26
Property tax 15 23 22
Mineral extraction tax 16 15 17
Other 29 13 16
Other taxes payable 503 162 147
Company overview Strategic report Commodity market overview
Business overview Sustainable development
Corporate governance
Risk report Shareholder information IFRS financial statements AppendixAnnual report 2019
«NORNICKEL»
296 297
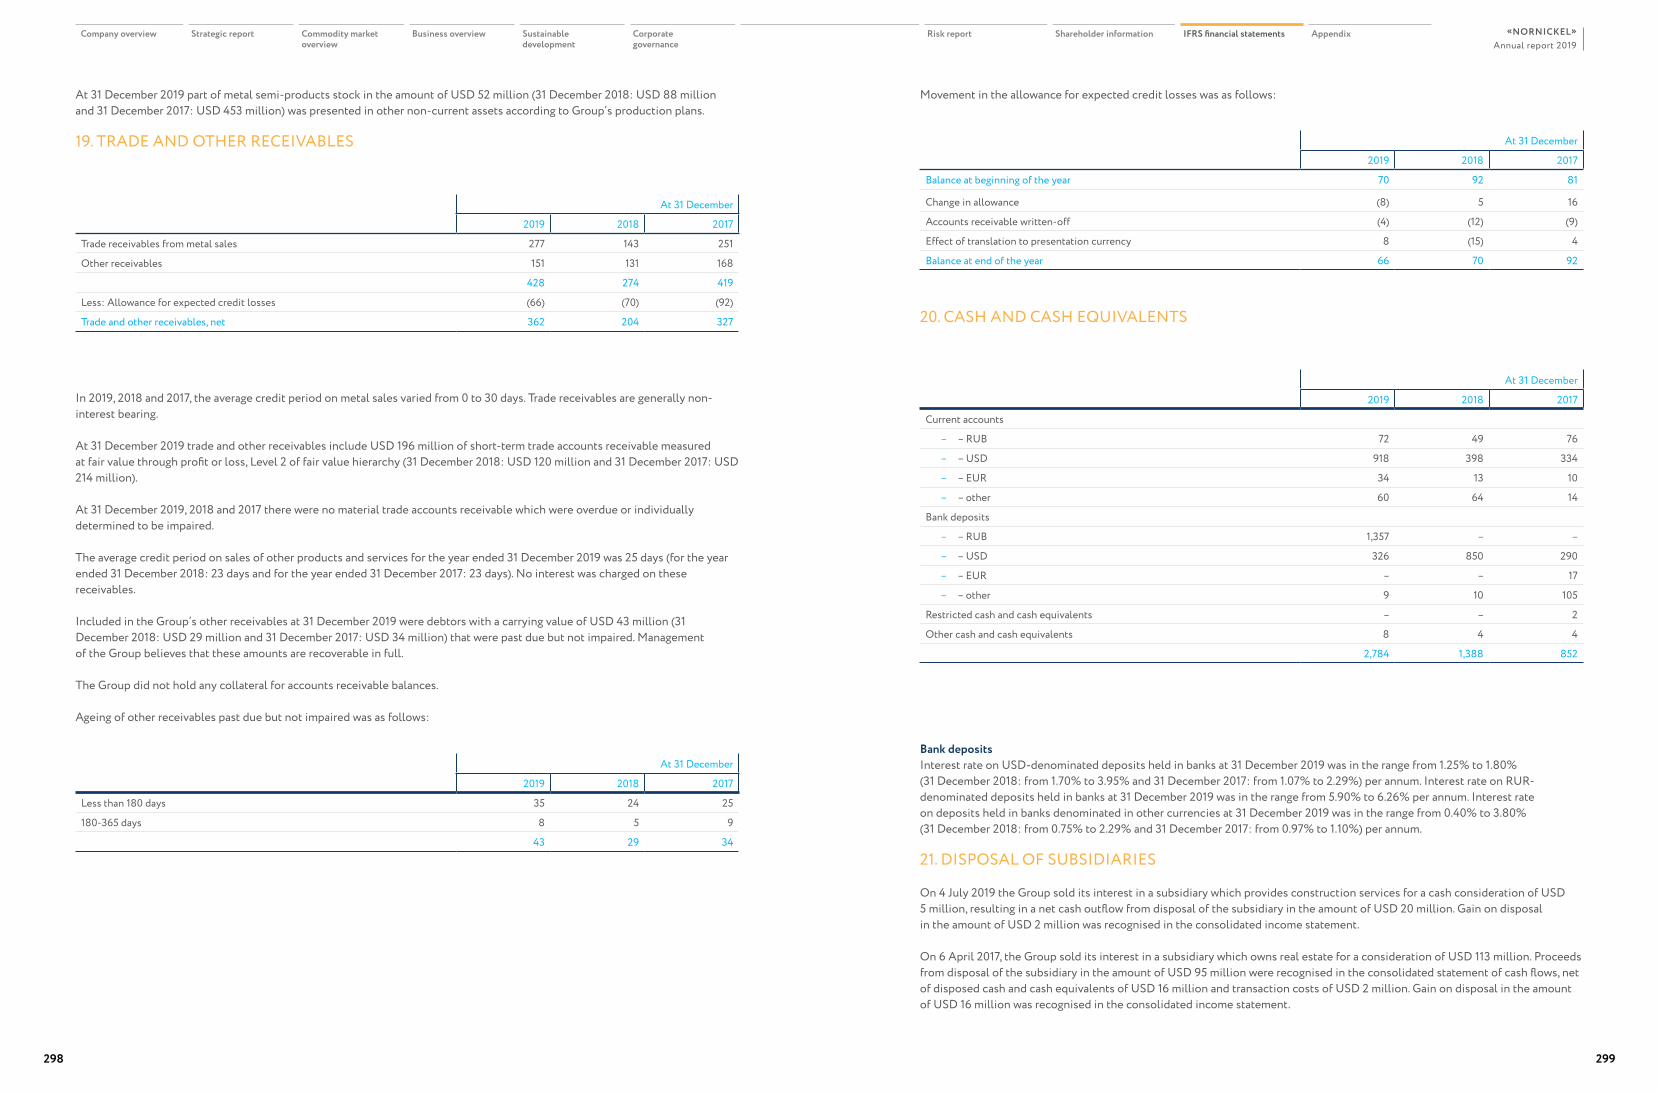
At 31 December 2019 part of metal semi-products stock in the amount of USD 52 million (31 December 2018: USD 88 million and 31 December 2017: USD 453 million) was presented in other non-current assets according to Group’s production plans.
In 2019, 2018 and 2017, the average credit period on metal sales varied from 0 to 30 days. Trade receivables are generally non-interest bearing.
At 31 December 2019 trade and other receivables include USD 196 million of short-term trade accounts receivable measured at fair value through profit or loss, Level 2 of fair value hierarchy (31 December 2018: USD 120 million and 31 December 2017: USD 214 million).
At 31 December 2019, 2018 and 2017 there were no material trade accounts receivable which were overdue or individually determined to be impaired.
The average credit period on sales of other products and services for the year ended 31 December 2019 was 25 days (for the year ended 31 December 2018: 23 days and for the year ended 31 December 2017: 23 days). No interest was charged on these receivables.
Included in the Group’s other receivables at 31 December 2019 were debtors with a carrying value of USD 43 million (31 December 2018: USD 29 million and 31 December 2017: USD 34 million) that were past due but not impaired. Management of the Group believes that these amounts are recoverable in full.
The Group did not hold any collateral for accounts receivable balances.
Ageing of other receivables past due but not impaired was as follows:
Bank depositsInterest rate on USD-denominated deposits held in banks at 31 December 2019 was in the range from 1.25% to 1.80% (31 December 2018: from 1.70% to 3.95% and 31 December 2017: from 1.07% to 2.29%) per annum. Interest rate on RUR-denominated deposits held in banks at 31 December 2019 was in the range from 5.90% to 6.26% per annum. Interest rate on deposits held in banks denominated in other currencies at 31 December 2019 was in the range from 0.40% to 3.80% (31 December 2018: from 0.75% to 2.29% and 31 December 2017: from 0.97% to 1.10%) per annum.
21. DISPOSAL OF SUBSIDIARIES
On 4 July 2019 the Group sold its interest in a subsidiary which provides construction services for a cash consideration of USD 5 million, resulting in a net cash outflow from disposal of the subsidiary in the amount of USD 20 million. Gain on disposal in the amount of USD 2 million was recognised in the consolidated income statement.
On 6 April 2017, the Group sold its interest in a subsidiary which owns real estate for a consideration of USD 113 million. Proceeds from disposal of the subsidiary in the amount of USD 95 million were recognised in the consolidated statement of cash flows, net of disposed cash and cash equivalents of USD 16 million and transaction costs of USD 2 million. Gain on disposal in the amount of USD 16 million was recognised in the consolidated income statement.
Movement in the allowance for expected credit losses was as follows:
At 31 December
2019 2018 2017
Trade receivables from metal sales 277 143 251
Other receivables 151 131 168
428 274 419
Less: Allowance for expected credit losses (66) (70) (92)
Trade and other receivables, net 362 204 327
At 31 December
2019 2018 2017
Balance at beginning of the year 70 92 81
Change in allowance (8) 5 16
Accounts receivable written-off (4) (12) (9)
Effect of translation to presentation currency 8 (15) 4
Balance at end of the year 66 70 92
At 31 December
2019 2018 2017
Less than 180 days 35 24 25
180-365 days 8 5 9
43 29 34
19. TRADE AND OTHER RECEIVABLES
20. CASH AND CASH EQUIVALENTS
At 31 December
2019 2018 2017
Current accounts
– – RUB 72 49 76
– – USD 918 398 334
– – EUR 34 13 10
– – other 60 64 14
Bank deposits
– – RUB 1,357 – –
– – USD 326 850 290
– – EUR – – 17
– – other 9 10 105
Restricted cash and cash equivalents – – 2
Other cash and cash equivalents 8 4 4
2,784 1,388 852
Company overview Strategic report Commodity market overview
Business overview Sustainable development
Corporate governance
Risk report Shareholder information IFRS financial statements AppendixAnnual report 2019
«NORNICKEL»
298 299
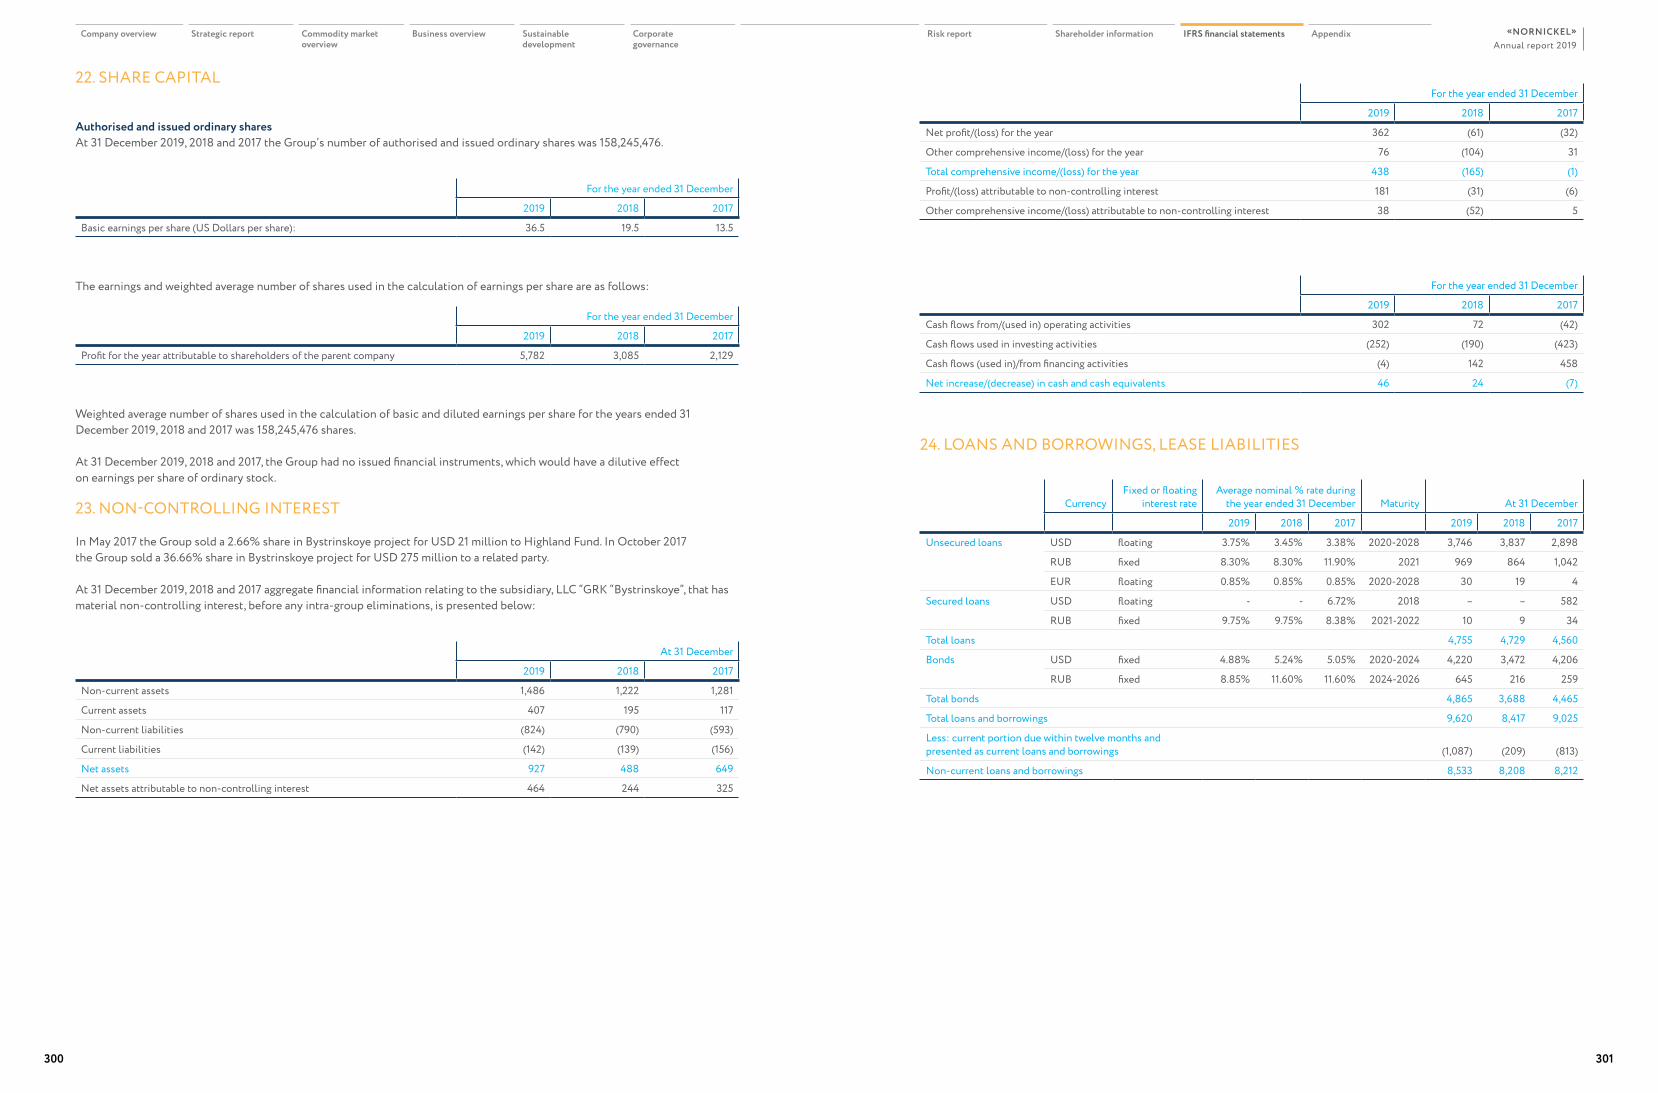
22. SHARE CAPITAL
24. LOANS AND BORROWINGS, LEASE LIABILITIES
Authorised and issued ordinary sharesAt 31 December 2019, 2018 and 2017 the Group’s number of authorised and issued ordinary shares was 158,245,476.
The earnings and weighted average number of shares used in the calculation of earnings per share are as follows:
Weighted average number of shares used in the calculation of basic and diluted earnings per share for the years ended 31 December 2019, 2018 and 2017 was 158,245,476 shares.
At 31 December 2019, 2018 and 2017, the Group had no issued financial instruments, which would have a dilutive effect on earnings per share of ordinary stock.
23. NON-CONTROLLING INTEREST
In May 2017 the Group sold a 2.66% share in Bystrinskoye project for USD 21 million to Highland Fund. In October 2017 the Group sold a 36.66% share in Bystrinskoye project for USD 275 million to a related party.
At 31 December 2019, 2018 and 2017 aggregate financial information relating to the subsidiary, LLC “GRK “Bystrinskoye”, that has material non-controlling interest, before any intra-group eliminations, is presented below:
For the year ended 31 December
2019 2018 2017
Basic earnings per share (US Dollars per share): 36.5 19.5 13.5
For the year ended 31 December
2019 2018 2017
Profit for the year attributable to shareholders of the parent company 5,782 3,085 2,129
At 31 December
2019 2018 2017
Non-current assets 1,486 1,222 1,281
Current assets 407 195 117
Non-current liabilities (824) (790) (593)
Current liabilities (142) (139) (156)
Net assets 927 488 649
Net assets attributable to non-controlling interest 464 244 325
For the year ended 31 December
2019 2018 2017
Net profit/(loss) for the year 362 (61) (32)
Other comprehensive income/(loss) for the year 76 (104) 31
Total comprehensive income/(loss) for the year 438 (165) (1)
Profit/(loss) attributable to non-controlling interest 181 (31) (6)
Other comprehensive income/(loss) attributable to non-controlling interest 38 (52) 5
For the year ended 31 December
2019 2018 2017
Cash flows from/(used in) operating activities 302 72 (42)
Cash flows used in investing activities (252) (190) (423)
Cash flows (used in)/from financing activities (4) 142 458
Net increase/(decrease) in cash and cash equivalents 46 24 (7)
CurrencyFixed or floating
interest rateAverage nominal % rate during
the year ended 31 December Maturity At 31 December
2019 2018 2017 2019 2018 2017
Unsecured loans USD floating 3.75% 3.45% 3.38% 2020-2028 3,746 3,837 2,898
RUB fixed 8.30% 8.30% 11.90% 2021 969 864 1,042
EUR floating 0.85% 0.85% 0.85% 2020-2028 30 19 4
Secured loans USD floating - - 6.72% 2018 – – 582
RUB fixed 9.75% 9.75% 8.38% 2021-2022 10 9 34
Total loans 4,755 4,729 4,560
Bonds USD fixed 4.88% 5.24% 5.05% 2020-2024 4,220 3,472 4,206
RUB fixed 8.85% 11.60% 11.60% 2024-2026 645 216 259
Total bonds 4,865 3,688 4,465
Total loans and borrowings 9,620 8,417 9,025
Less: current portion due within twelve months andpresented as current loans and borrowings (1,087) (209) (813)
Non-current loans and borrowings 8,533 8,208 8,212
Company overview Strategic report Commodity market overview
Business overview Sustainable development
Corporate governance
Risk report Shareholder information IFRS financial statements AppendixAnnual report 2019
«NORNICKEL»
300 301
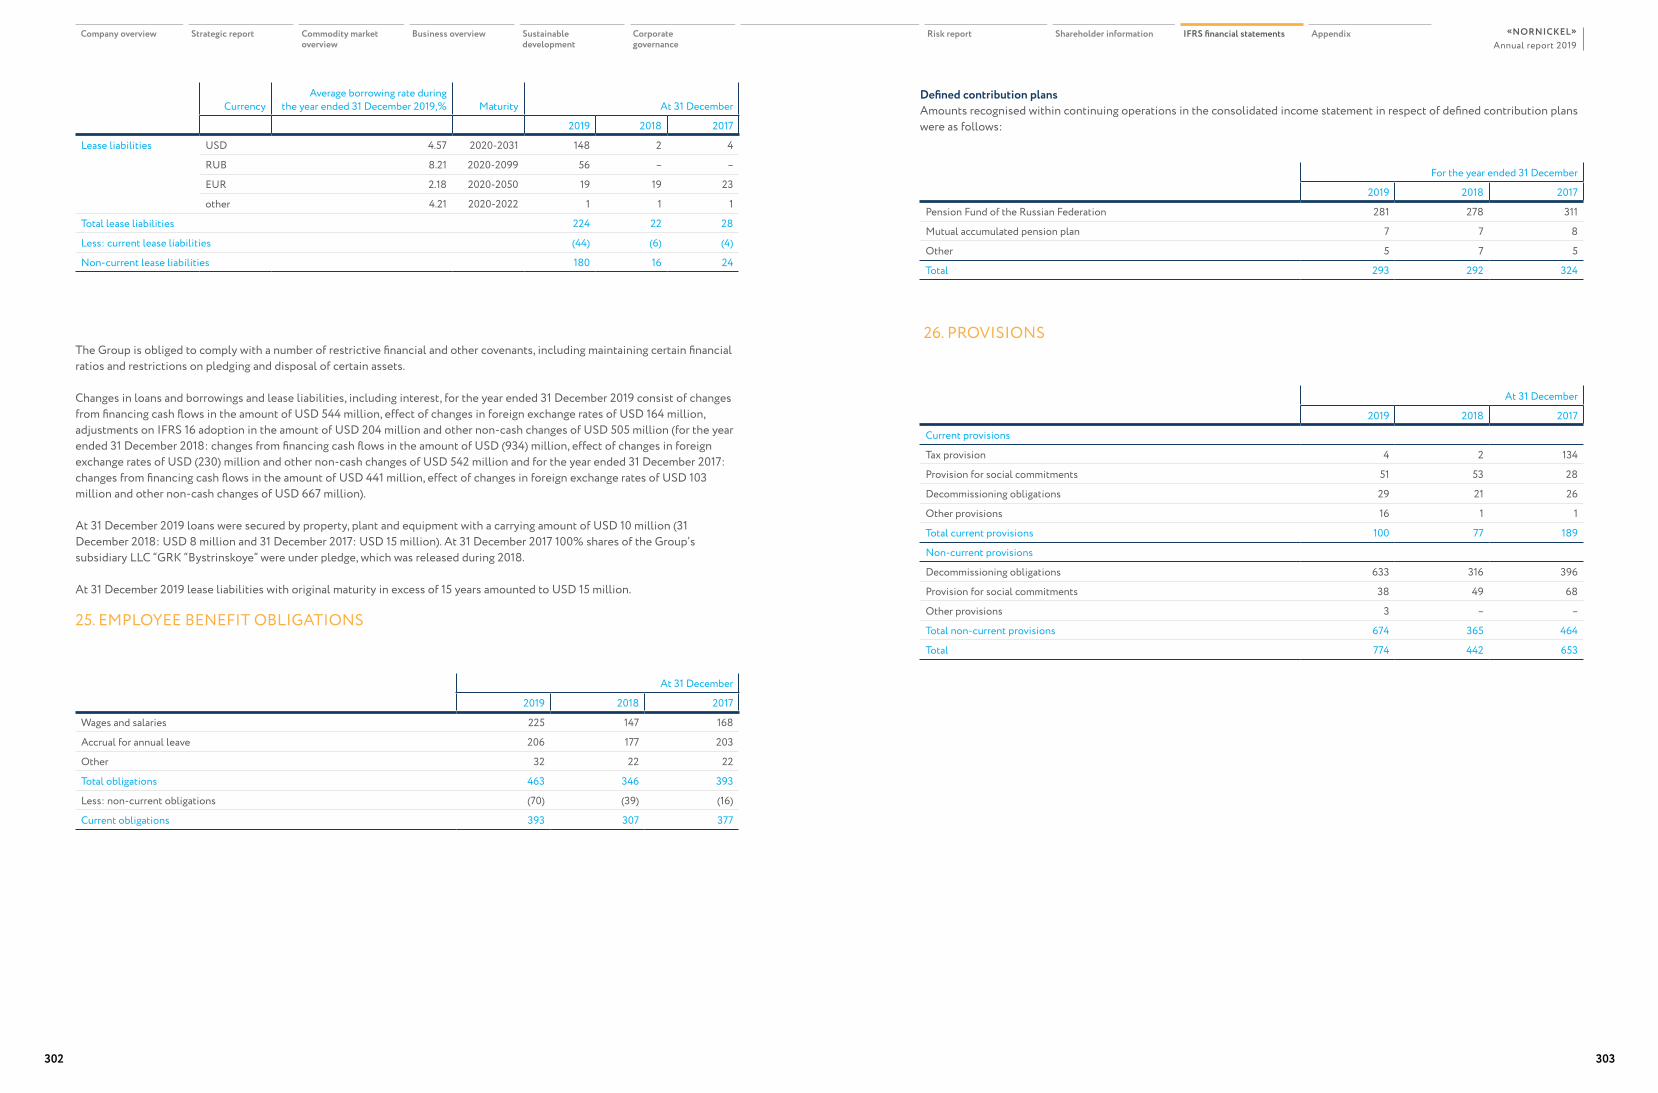
CurrencyAverage borrowing rate during
the year ended 31 December 2019,% Maturity At 31 December
2019 2018 2017
Lease liabilities USD 4.57 2020-2031 148 2 4
RUB 8.21 2020-2099 56 – –
EUR 2.18 2020-2050 19 19 23
other 4.21 2020-2022 1 1 1
Total lease liabilities 224 22 28
Less: current lease liabilities (44) (6) (4)
Non-current lease liabilities 180 16 24
The Group is obliged to comply with a number of restrictive financial and other covenants, including maintaining certain financial ratios and restrictions on pledging and disposal of certain assets.
Changes in loans and borrowings and lease liabilities, including interest, for the year ended 31 December 2019 consist of changes from financing cash flows in the amount of USD 544 million, effect of changes in foreign exchange rates of USD 164 million, adjustments on IFRS 16 adoption in the amount of USD 204 million and other non-cash changes of USD 505 million (for the year ended 31 December 2018: changes from financing cash flows in the amount of USD (934) million, effect of changes in foreign exchange rates of USD (230) million and other non-cash changes of USD 542 million and for the year ended 31 December 2017: changes from financing cash flows in the amount of USD 441 million, effect of changes in foreign exchange rates of USD 103 million and other non-cash changes of USD 667 million).
At 31 December 2019 loans were secured by property, plant and equipment with a carrying amount of USD 10 million (31 December 2018: USD 8 million and 31 December 2017: USD 15 million). At 31 December 2017 100% shares of the Group’s subsidiary LLC “GRK “Bystrinskoye” were under pledge, which was released during 2018.
At 31 December 2019 lease liabilities with original maturity in excess of 15 years amounted to USD 15 million.
Defined contribution plansAmounts recognised within continuing operations in the consolidated income statement in respect of defined contribution plans were as follows:
25. EMPLOYEE BENEFIT OBLIGATIONS
26. PROVISIONS
At 31 December
2019 2018 2017
Wages and salaries 225 147 168
Accrual for annual leave 206 177 203
Other 32 22 22
Total obligations 463 346 393
Less: non-current obligations (70) (39) (16)
Current obligations 393 307 377
At 31 December
2019 2018 2017
Current provisions
Tax provision 4 2 134
Provision for social commitments 51 53 28
Decommissioning obligations 29 21 26
Other provisions 16 1 1
Total current provisions 100 77 189
Non-current provisions
Decommissioning obligations 633 316 396
Provision for social commitments 38 49 68
Other provisions 3 – –
Total non-current provisions 674 365 464
Total 774 442 653
For the year ended 31 December
2019 2018 2017
Pension Fund of the Russian Federation 281 278 311
Mutual accumulated pension plan 7 7 8
Other 5 7 5
Total 293 292 324
Company overview Strategic report Commodity market overview
Business overview Sustainable development
Corporate governance
Risk report Shareholder information IFRS financial statements AppendixAnnual report 2019
«NORNICKEL»
302 303
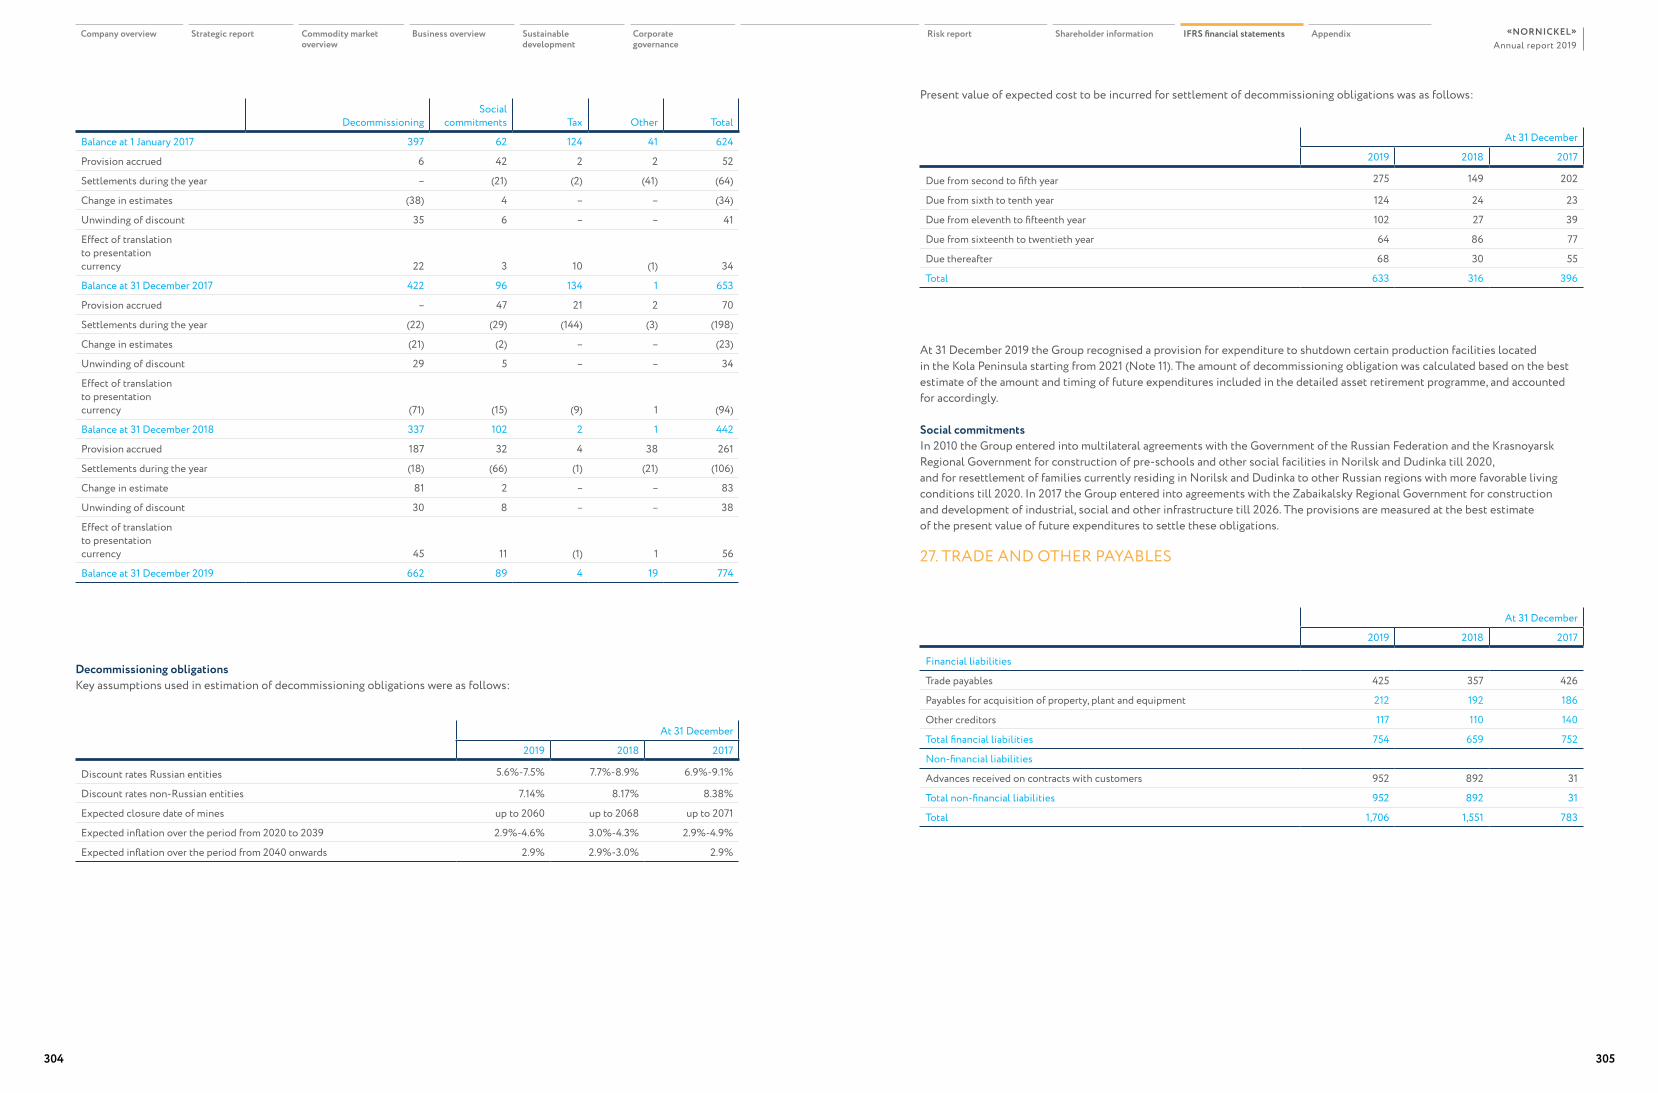
DecommissioningSocial
commitments Tax Other Total
Balance at 1 January 2017 397 62 124 41 624
Provision accrued 6 42 2 2 52
Settlements during the year – (21) (2) (41) (64)
Change in estimates (38) 4 – – (34)
Unwinding of discount 35 6 – – 41
Effect of translation to presentationcurrency 22 3 10 (1) 34
Balance at 31 December 2017 422 96 134 1 653
Provision accrued – 47 21 2 70
Settlements during the year (22) (29) (144) (3) (198)
Change in estimates (21) (2) – – (23)
Unwinding of discount 29 5 – – 34
Effect of translation to presentationcurrency (71) (15) (9) 1 (94)
Balance at 31 December 2018 337 102 2 1 442
Provision accrued 187 32 4 38 261
Settlements during the year (18) (66) (1) (21) (106)
Change in estimate 81 2 – – 83
Unwinding of discount 30 8 – – 38
Effect of translation to presentationcurrency 45 11 (1) 1 56
Balance at 31 December 2019 662 89 4 19 774
Decommissioning obligations Key assumptions used in estimation of decommissioning obligations were as follows:
Present value of expected cost to be incurred for settlement of decommissioning obligations was as follows:
At 31 December 2019 the Group recognised a provision for expenditure to shutdown certain production facilities located in the Kola Peninsula starting from 2021 (Note 11). The amount of decommissioning obligation was calculated based on the best estimate of the amount and timing of future expenditures included in the detailed asset retirement programme, and accounted for accordingly.
Social commitmentsIn 2010 the Group entered into multilateral agreements with the Government of the Russian Federation and the Krasnoyarsk Regional Government for construction of pre-schools and other social facilities in Norilsk and Dudinka till 2020, and for resettlement of families currently residing in Norilsk and Dudinka to other Russian regions with more favorable living conditions till 2020. In 2017 the Group entered into agreements with the Zabaikalsky Regional Government for construction and development of industrial, social and other infrastructure till 2026. The provisions are measured at the best estimate of the present value of future expenditures to settle these obligations.
At 31 December
2019 2018 2017
Discount rates Russian entities 5.6%-7.5% 7.7%-8.9% 6.9%-9.1%
Discount rates non-Russian entities 7.14% 8.17% 8.38%
Expected closure date of mines up to 2060 up to 2068 up to 2071
Expected inflation over the period from 2020 to 2039 2.9%-4.6% 3.0%-4.3% 2.9%-4.9%
Expected inflation over the period from 2040 onwards 2.9% 2.9%-3.0% 2.9%
At 31 December
2019 2018 2017
Due from second to fifth year 275 149 202
Due from sixth to tenth year 124 24 23
Due from eleventh to fifteenth year 102 27 39
Due from sixteenth to twentieth year 64 86 77
Due thereafter 68 30 55
Total 633 316 396
At 31 December
2019 2018 2017
Financial liabilities
Trade payables 425 357 426
Payables for acquisition of property, plant and equipment 212 192 186
Other creditors 117 110 140
Total financial liabilities 754 659 752
Non-financial liabilities
Advances received on contracts with customers 952 892 31
Total non-financial liabilities 952 892 31
Total 1,706 1,551 783
27. TRADE AND OTHER PAYABLES
Company overview Strategic report Commodity market overview
Business overview Sustainable development
Corporate governance
Risk report Shareholder information IFRS financial statements AppendixAnnual report 2019
«NORNICKEL»
304 305
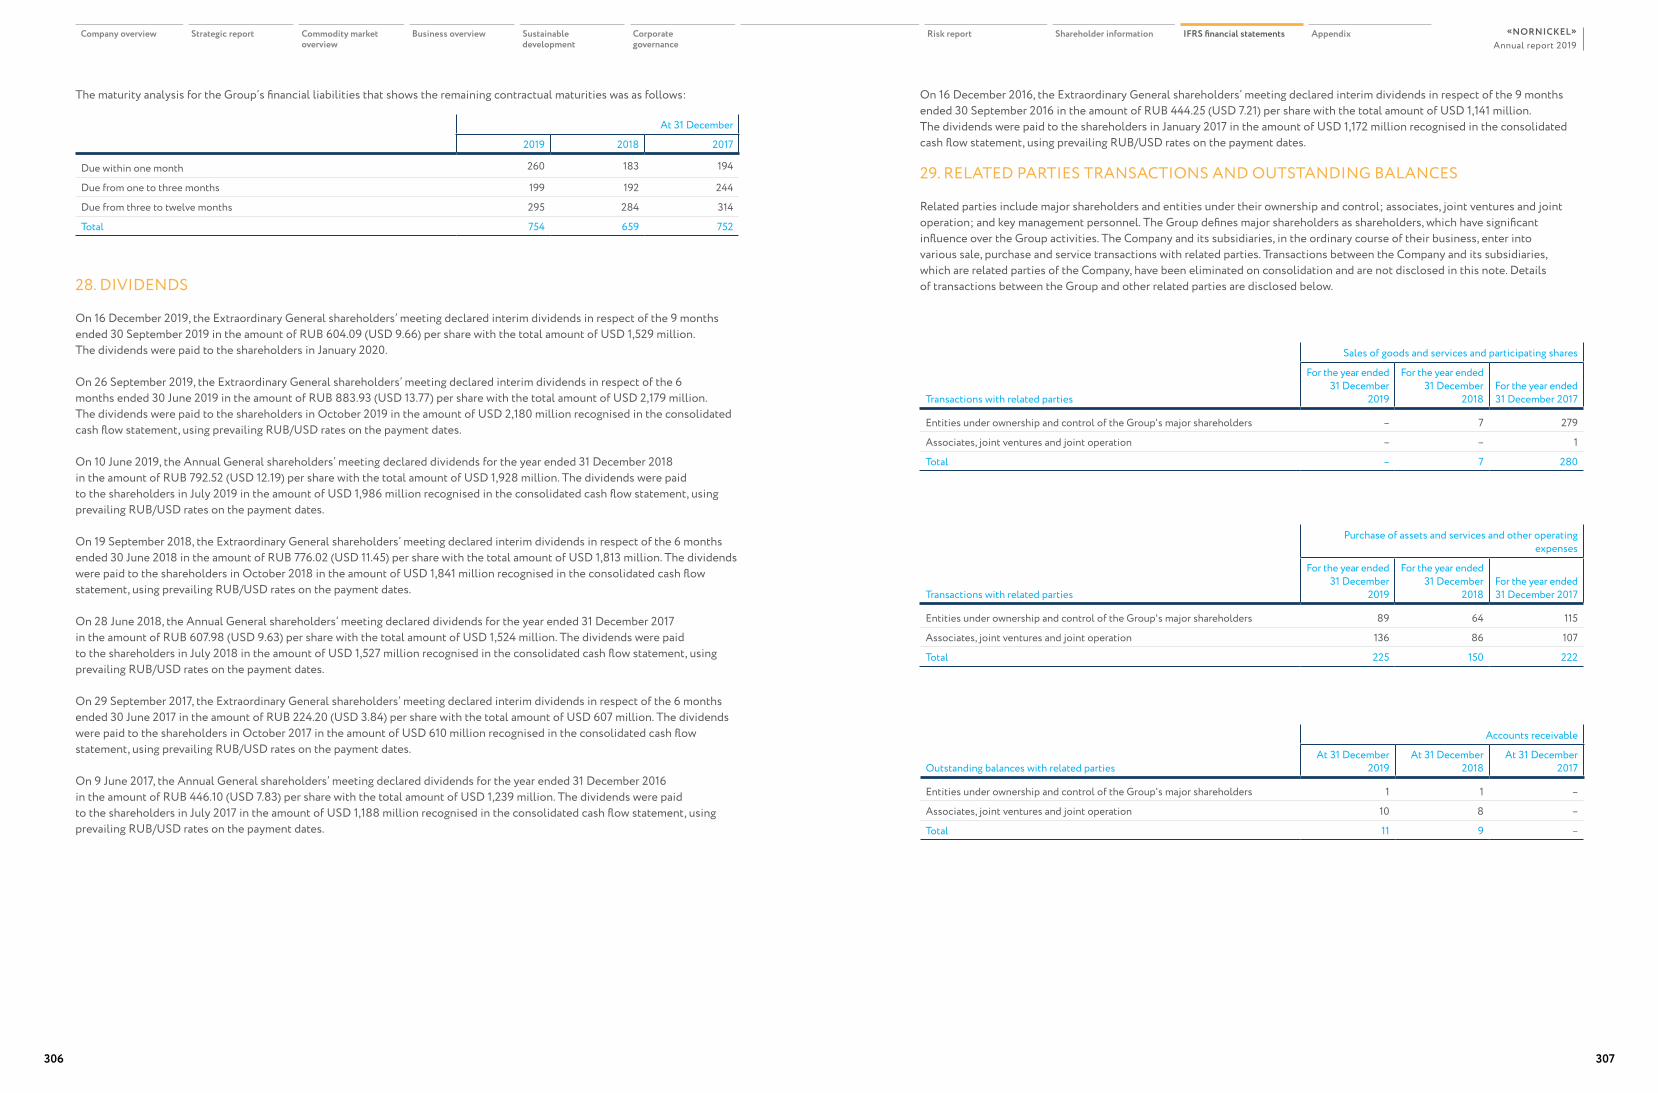
The maturity analysis for the Group’s financial liabilities that shows the remaining contractual maturities was as follows:
At 31 December
2019 2018 2017
Due within one month 260 183 194
Due from one to three months 199 192 244
Due from three to twelve months 295 284 314
Total 754 659 752
Sales of goods and services and participating shares
Transactions with related parties
For the year ended 31 December
2019
For the year ended 31 December
2018For the year ended 31 December 2017
Entities under ownership and control of the Group's major shareholders – 7 279
Associates, joint ventures and joint operation – – 1
Total – 7 280
Purchase of assets and services and other operating expenses
Transactions with related parties
For the year ended 31 December
2019
For the year ended 31 December
2018For the year ended 31 December 2017
Entities under ownership and control of the Group's major shareholders 89 64 115
Associates, joint ventures and joint operation 136 86 107
Total 225 150 222
28. DIVIDENDS
On 16 December 2019, the Extraordinary General shareholders’ meeting declared interim dividends in respect of the 9 months ended 30 September 2019 in the amount of RUB 604.09 (USD 9.66) per share with the total amount of USD 1,529 million. The dividends were paid to the shareholders in January 2020.
On 26 September 2019, the Extraordinary General shareholders’ meeting declared interim dividends in respect of the 6 months ended 30 June 2019 in the amount of RUB 883.93 (USD 13.77) per share with the total amount of USD 2,179 million. The dividends were paid to the shareholders in October 2019 in the amount of USD 2,180 million recognised in the consolidated cash flow statement, using prevailing RUB/USD rates on the payment dates.
On 10 June 2019, the Annual General shareholders’ meeting declared dividends for the year ended 31 December 2018 in the amount of RUB 792.52 (USD 12.19) per share with the total amount of USD 1,928 million. The dividends were paid to the shareholders in July 2019 in the amount of USD 1,986 million recognised in the consolidated cash flow statement, using prevailing RUB/USD rates on the payment dates.
On 19 September 2018, the Extraordinary General shareholders’ meeting declared interim dividends in respect of the 6 months ended 30 June 2018 in the amount of RUB 776.02 (USD 11.45) per share with the total amount of USD 1,813 million. The dividends were paid to the shareholders in October 2018 in the amount of USD 1,841 million recognised in the consolidated cash flow statement, using prevailing RUB/USD rates on the payment dates.
On 28 June 2018, the Annual General shareholders’ meeting declared dividends for the year ended 31 December 2017 in the amount of RUB 607.98 (USD 9.63) per share with the total amount of USD 1,524 million. The dividends were paid to the shareholders in July 2018 in the amount of USD 1,527 million recognised in the consolidated cash flow statement, using prevailing RUB/USD rates on the payment dates.
On 29 September 2017, the Extraordinary General shareholders’ meeting declared interim dividends in respect of the 6 months ended 30 June 2017 in the amount of RUB 224.20 (USD 3.84) per share with the total amount of USD 607 million. The dividends were paid to the shareholders in October 2017 in the amount of USD 610 million recognised in the consolidated cash flow statement, using prevailing RUB/USD rates on the payment dates.
On 9 June 2017, the Annual General shareholders’ meeting declared dividends for the year ended 31 December 2016 in the amount of RUB 446.10 (USD 7.83) per share with the total amount of USD 1,239 million. The dividends were paid to the shareholders in July 2017 in the amount of USD 1,188 million recognised in the consolidated cash flow statement, using prevailing RUB/USD rates on the payment dates.
On 16 December 2016, the Extraordinary General shareholders’ meeting declared interim dividends in respect of the 9 months ended 30 September 2016 in the amount of RUB 444.25 (USD 7.21) per share with the total amount of USD 1,141 million. The dividends were paid to the shareholders in January 2017 in the amount of USD 1,172 million recognised in the consolidated cash flow statement, using prevailing RUB/USD rates on the payment dates.
29. RELATED PARTIES TRANSACTIONS AND OUTSTANDING BALANCES
Related parties include major shareholders and entities under their ownership and control; associates, joint ventures and joint operation; and key management personnel. The Group defines major shareholders as shareholders, which have significant influence over the Group activities. The Company and its subsidiaries, in the ordinary course of their business, enter into various sale, purchase and service transactions with related parties. Transactions between the Company and its subsidiaries, which are related parties of the Company, have been eliminated on consolidation and are not disclosed in this note. Details of transactions between the Group and other related parties are disclosed below.
Accounts receivable
Outstanding balances with related partiesAt 31 December
2019At 31 December
2018At 31 December
2017
Entities under ownership and control of the Group's major shareholders 1 1 –
Associates, joint ventures and joint operation 10 8 –
Total 11 9 –
Company overview Strategic report Commodity market overview
Business overview Sustainable development
Corporate governance
Risk report Shareholder information IFRS financial statements AppendixAnnual report 2019
«NORNICKEL»
306 307
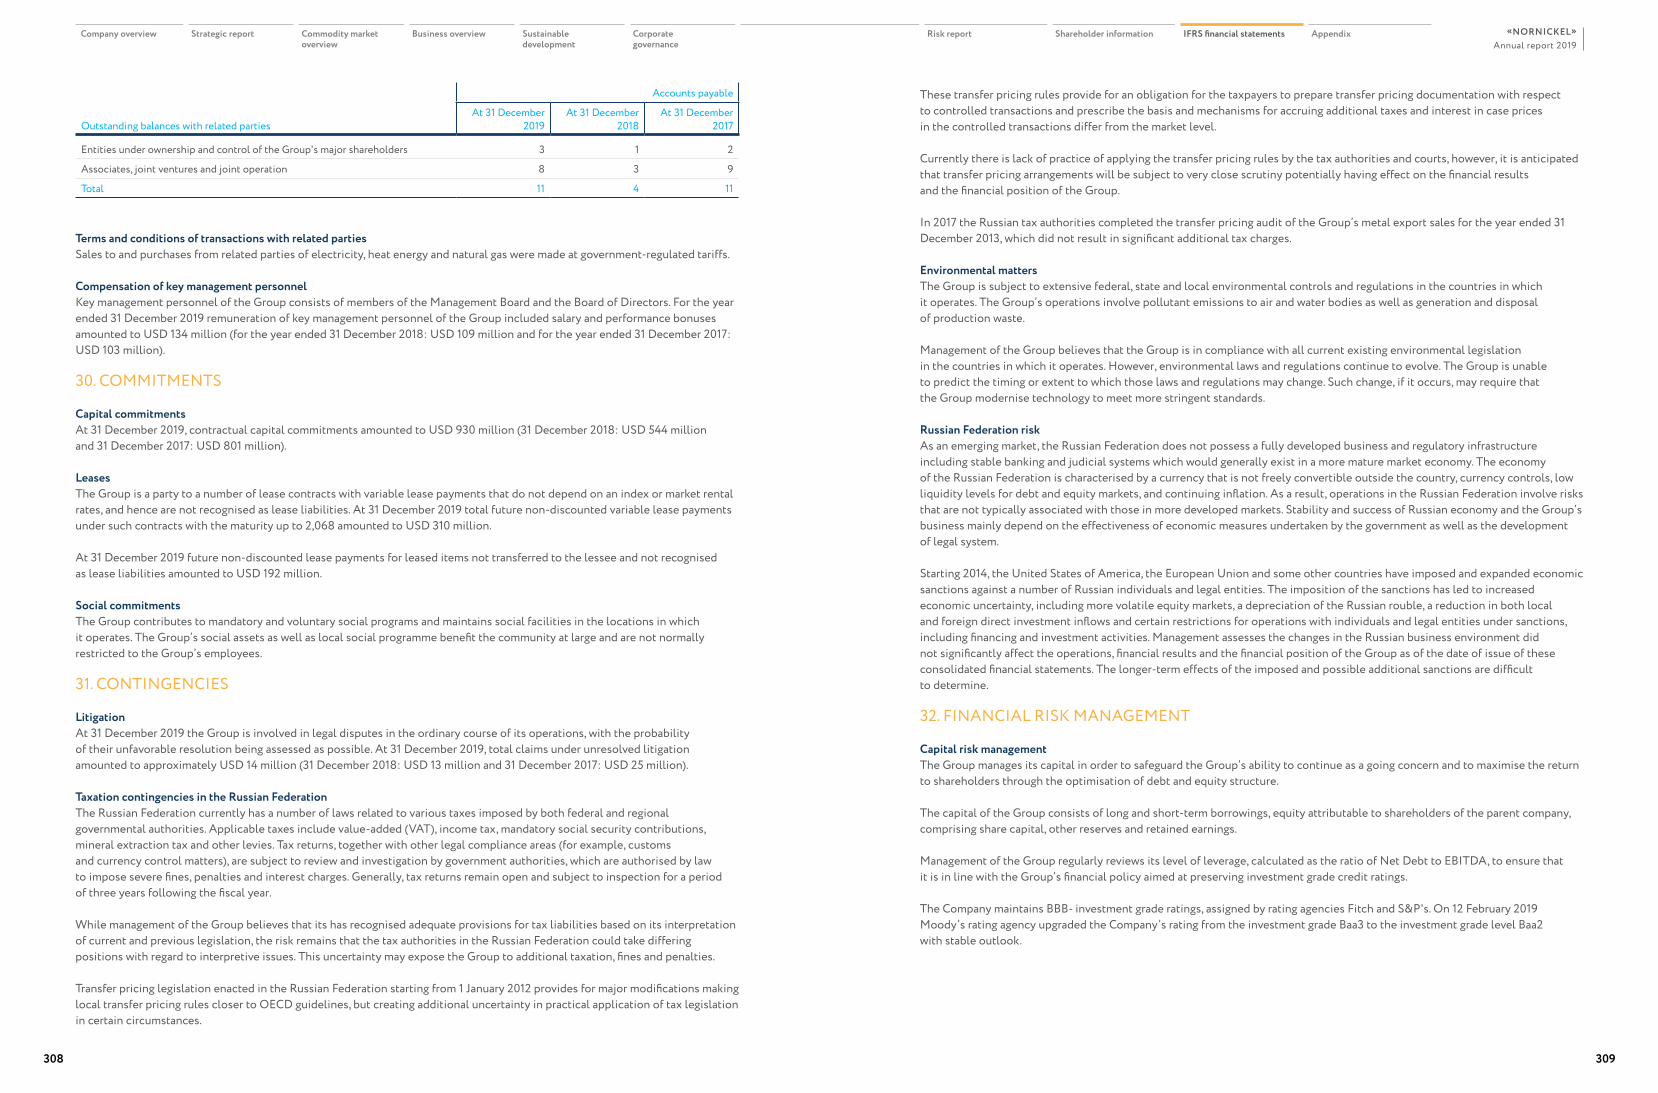
Accounts payable
Outstanding balances with related partiesAt 31 December
2019At 31 December
2018At 31 December
2017
Entities under ownership and control of the Group's major shareholders 3 1 2
Associates, joint ventures and joint operation 8 3 9
Total 11 4 11
Terms and conditions of transactions with related partiesSales to and purchases from related parties of electricity, heat energy and natural gas were made at government-regulated tariffs.
Compensation of key management personnelKey management personnel of the Group consists of members of the Management Board and the Board of Directors. For the year ended 31 December 2019 remuneration of key management personnel of the Group included salary and performance bonuses amounted to USD 134 million (for the year ended 31 December 2018: USD 109 million and for the year ended 31 December 2017: USD 103 million).
30. COMMITMENTS
Capital commitmentsAt 31 December 2019, contractual capital commitments amounted to USD 930 million (31 December 2018: USD 544 million and 31 December 2017: USD 801 million).
LeasesThe Group is a party to a number of lease contracts with variable lease payments that do not depend on an index or market rental rates, and hence are not recognised as lease liabilities. At 31 December 2019 total future non-discounted variable lease payments under such contracts with the maturity up to 2,068 amounted to USD 310 million.
At 31 December 2019 future non-discounted lease payments for leased items not transferred to the lessee and not recognised as lease liabilities amounted to USD 192 million.
Social commitmentsThe Group contributes to mandatory and voluntary social programs and maintains social facilities in the locations in which it operates. The Group’s social assets as well as local social programme benefit the community at large and are not normally restricted to the Group’s employees.
31. CONTINGENCIES
LitigationAt 31 December 2019 the Group is involved in legal disputes in the ordinary course of its operations, with the probability of their unfavorable resolution being assessed as possible. At 31 December 2019, total claims under unresolved litigation amounted to approximately USD 14 million (31 December 2018: USD 13 million and 31 December 2017: USD 25 million).
Taxation contingencies in the Russian FederationThe Russian Federation currently has a number of laws related to various taxes imposed by both federal and regional governmental authorities. Applicable taxes include value-added (VAT), income tax, mandatory social security contributions, mineral extraction tax and other levies. Tax returns, together with other legal compliance areas (for example, customs and currency control matters), are subject to review and investigation by government authorities, which are authorised by law to impose severe fines, penalties and interest charges. Generally, tax returns remain open and subject to inspection for a period of three years following the fiscal year.
While management of the Group believes that its has recognised adequate provisions for tax liabilities based on its interpretation of current and previous legislation, the risk remains that the tax authorities in the Russian Federation could take differing positions with regard to interpretive issues. This uncertainty may expose the Group to additional taxation, fines and penalties.
Transfer pricing legislation enacted in the Russian Federation starting from 1 January 2012 provides for major modifications making local transfer pricing rules closer to OECD guidelines, but creating additional uncertainty in practical application of tax legislation in certain circumstances.
These transfer pricing rules provide for an obligation for the taxpayers to prepare transfer pricing documentation with respect to controlled transactions and prescribe the basis and mechanisms for accruing additional taxes and interest in case prices in the controlled transactions differ from the market level.
Currently there is lack of practice of applying the transfer pricing rules by the tax authorities and courts, however, it is anticipated that transfer pricing arrangements will be subject to very close scrutiny potentially having effect on the financial results and the financial position of the Group.
In 2017 the Russian tax authorities completed the transfer pricing audit of the Group’s metal export sales for the year ended 31 December 2013, which did not result in significant additional tax charges.
Environmental mattersThe Group is subject to extensive federal, state and local environmental controls and regulations in the countries in which it operates. The Group’s operations involve pollutant emissions to air and water bodies as well as generation and disposal of production waste.
Management of the Group believes that the Group is in compliance with all current existing environmental legislation in the countries in which it operates. However, environmental laws and regulations continue to evolve. The Group is unable to predict the timing or extent to which those laws and regulations may change. Such change, if it occurs, may require that the Group modernise technology to meet more stringent standards.
Russian Federation riskAs an emerging market, the Russian Federation does not possess a fully developed business and regulatory infrastructure including stable banking and judicial systems which would generally exist in a more mature market economy. The economy of the Russian Federation is characterised by a currency that is not freely convertible outside the country, currency controls, low liquidity levels for debt and equity markets, and continuing inflation. As a result, operations in the Russian Federation involve risks that are not typically associated with those in more developed markets. Stability and success of Russian economy and the Group’s business mainly depend on the effectiveness of economic measures undertaken by the government as well as the development of legal system.
Starting 2014, the United States of America, the European Union and some other countries have imposed and expanded economic sanctions against a number of Russian individuals and legal entities. The imposition of the sanctions has led to increased economic uncertainty, including more volatile equity markets, a depreciation of the Russian rouble, a reduction in both local and foreign direct investment inflows and certain restrictions for operations with individuals and legal entities under sanctions, including financing and investment activities. Management assesses the changes in the Russian business environment did not significantly affect the operations, financial results and the financial position of the Group as of the date of issue of these consolidated financial statements. The longer-term effects of the imposed and possible additional sanctions are difficult to determine.
32. FINANCIAL RISK MANAGEMENT
Capital risk managementThe Group manages its capital in order to safeguard the Group’s ability to continue as a going concern and to maximise the return to shareholders through the optimisation of debt and equity structure.
The capital of the Group consists of long and short-term borrowings, equity attributable to shareholders of the parent company, comprising share capital, other reserves and retained earnings.
Management of the Group regularly reviews its level of leverage, calculated as the ratio of Net Debt to EBITDA, to ensure that it is in line with the Group’s financial policy aimed at preserving investment grade credit ratings.
The Сompany maintains BBB- investment grade ratings, assigned by rating agencies Fitch and S&P's. On 12 February 2019 Moody’s rating agency upgraded the Company’s rating from the investment grade Baa3 to the investment grade level Baa2 with stable outlook.
Company overview Strategic report Commodity market overview
Business overview Sustainable development
Corporate governance
Risk report Shareholder information IFRS financial statements AppendixAnnual report 2019
«NORNICKEL»
308 309
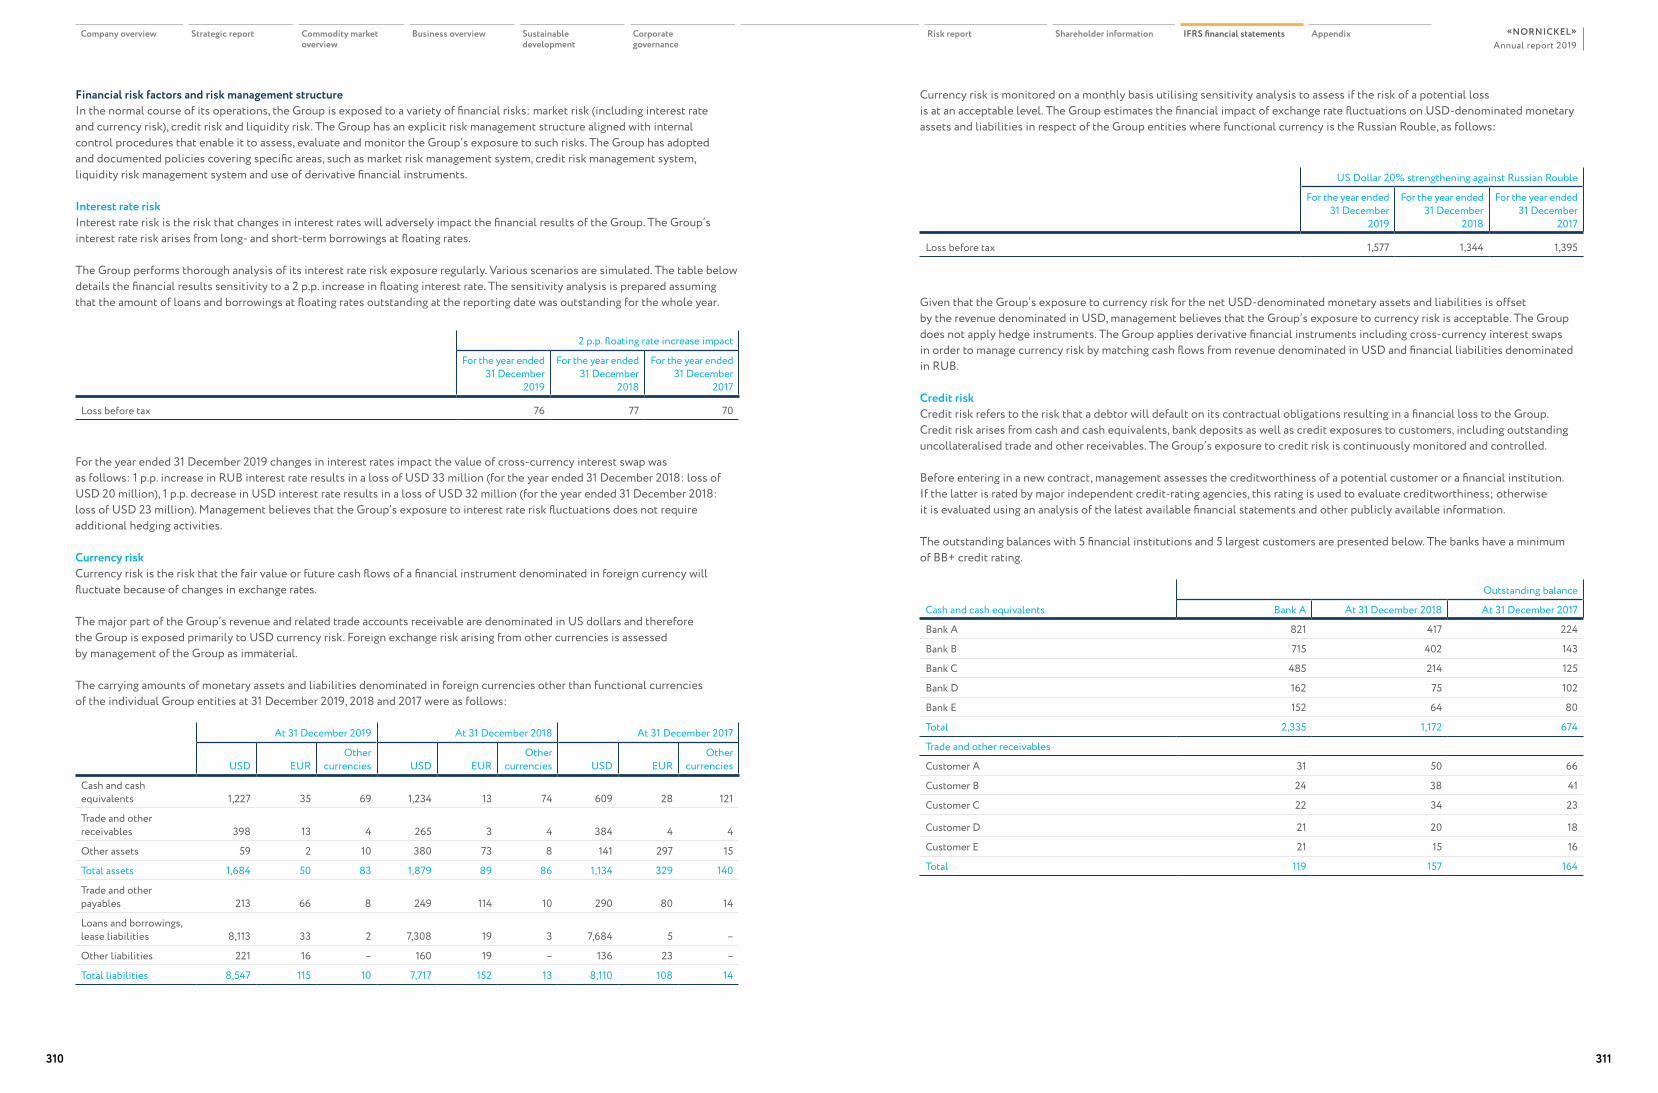
Financial risk factors and risk management structureIn the normal course of its operations, the Group is exposed to a variety of financial risks: market risk (including interest rate and currency risk), credit risk and liquidity risk. The Group has an explicit risk management structure aligned with internal control procedures that enable it to assess, evaluate and monitor the Group’s exposure to such risks. The Group has adopted and documented policies covering specific areas, such as market risk management system, credit risk management system, liquidity risk management system and use of derivative financial instruments.
Interest rate riskInterest rate risk is the risk that changes in interest rates will adversely impact the financial results of the Group. The Group’s interest rate risk arises from long- and short-term borrowings at floating rates.
The Group performs thorough analysis of its interest rate risk exposure regularly. Various scenarios are simulated. The table below details the financial results sensitivity to a 2 p.p. increase in floating interest rate. The sensitivity analysis is prepared assuming that the amount of loans and borrowings at floating rates outstanding at the reporting date was outstanding for the whole year.
2 p.p. floating rate increase impact
For the year ended 31 December
2019
For the year ended 31 December
2018
For the year ended 31 December
2017
Loss before tax 76 77 70
For the year ended 31 December 2019 changes in interest rates impact the value of cross-currency interest swap was as follows: 1 p.p. increase in RUB interest rate results in a loss of USD 33 million (for the year ended 31 December 2018: loss of USD 20 million), 1 p.p. decrease in USD interest rate results in a loss of USD 32 million (for the year ended 31 December 2018: loss of USD 23 million). Management believes that the Group’s exposure to interest rate risk fluctuations does not require additional hedging activities.
Currency riskCurrency risk is the risk that the fair value or future cash flows of a financial instrument denominated in foreign currency will fluctuate because of changes in exchange rates.
The major part of the Group’s revenue and related trade accounts receivable are denominated in US dollars and therefore the Group is exposed primarily to USD currency risk. Foreign exchange risk arising from other currencies is assessed by management of the Group as immaterial.
The carrying amounts of monetary assets and liabilities denominated in foreign currencies other than functional currencies of the individual Group entities at 31 December 2019, 2018 and 2017 were as follows:
At 31 December 2019 At 31 December 2018 At 31 December 2017
USD EUROther
currencies USD EUROther
currencies USD EUROther
currencies
Cash and cash equivalents 1,227 35 69 1,234 13 74 609 28 121
Trade and other receivables 398 13 4 265 3 4 384 4 4
Other assets 59 2 10 380 73 8 141 297 15
Total assets 1,684 50 83 1,879 89 86 1,134 329 140
Trade and other payables 213 66 8 249 114 10 290 80 14
Loans and borrowings, lease liabilities 8,113 33 2 7,308 19 3 7,684 5 –
Other liabilities 221 16 – 160 19 – 136 23 –
Total liabilities 8,547 115 10 7,717 152 13 8,110 108 14
Currency risk is monitored on a monthly basis utilising sensitivity analysis to assess if the risk of a potential loss is at an acceptable level. The Group estimates the financial impact of exchange rate fluctuations on USD-denominated monetary assets and liabilities in respect of the Group entities where functional currency is the Russian Rouble, as follows:
US Dollar 20% strengthening against Russian Rouble
For the year ended 31 December
2019
For the year ended 31 December
2018
For the year ended 31 December
2017
Loss before tax 1,577 1,344 1,395
Given that the Group’s exposure to currency risk for the net USD-denominated monetary assets and liabilities is offset by the revenue denominated in USD, management believes that the Group’s exposure to currency risk is acceptable. The Group does not apply hedge instruments. The Group applies derivative financial instruments including cross-currency interest swaps in order to manage currency risk by matching cash flows from revenue denominated in USD and financial liabilities denominated in RUB.
Credit riskCredit risk refers to the risk that a debtor will default on its contractual obligations resulting in a financial loss to the Group. Credit risk arises from cash and cash equivalents, bank deposits as well as credit exposures to customers, including outstanding uncollateralised trade and other receivables. The Group’s exposure to credit risk is continuously monitored and controlled.
Before entering in a new contract, management assesses the creditworthiness of a potential customer or a financial institution. If the latter is rated by major independent credit-rating agencies, this rating is used to evaluate creditworthiness; otherwise it is evaluated using an analysis of the latest available financial statements and other publicly available information.
The outstanding balances with 5 financial institutions and 5 largest customers are presented below. The banks have a minimum of ВВ+ credit rating.
Cash and cash equivalents
Outstanding balance
Bank A At 31 December 2018 At 31 December 2017
Bank A 821 417 224
Bank B 715 402 143
Bank C 485 214 125
Bank D 162 75 102
Bank E 152 64 80
Total 2,335 1,172 674
Trade and other receivables
Customer A 31 50 66
Customer B 24 38 41
Customer C 22 34 23
Customer D 21 20 18
Customer E 21 15 16
Total 119 157 164
Company overview Strategic report Commodity market overview
Business overview Sustainable development
Corporate governance
Risk report Shareholder information IFRS financial statements AppendixAnnual report 2019
«NORNICKEL»
310 311
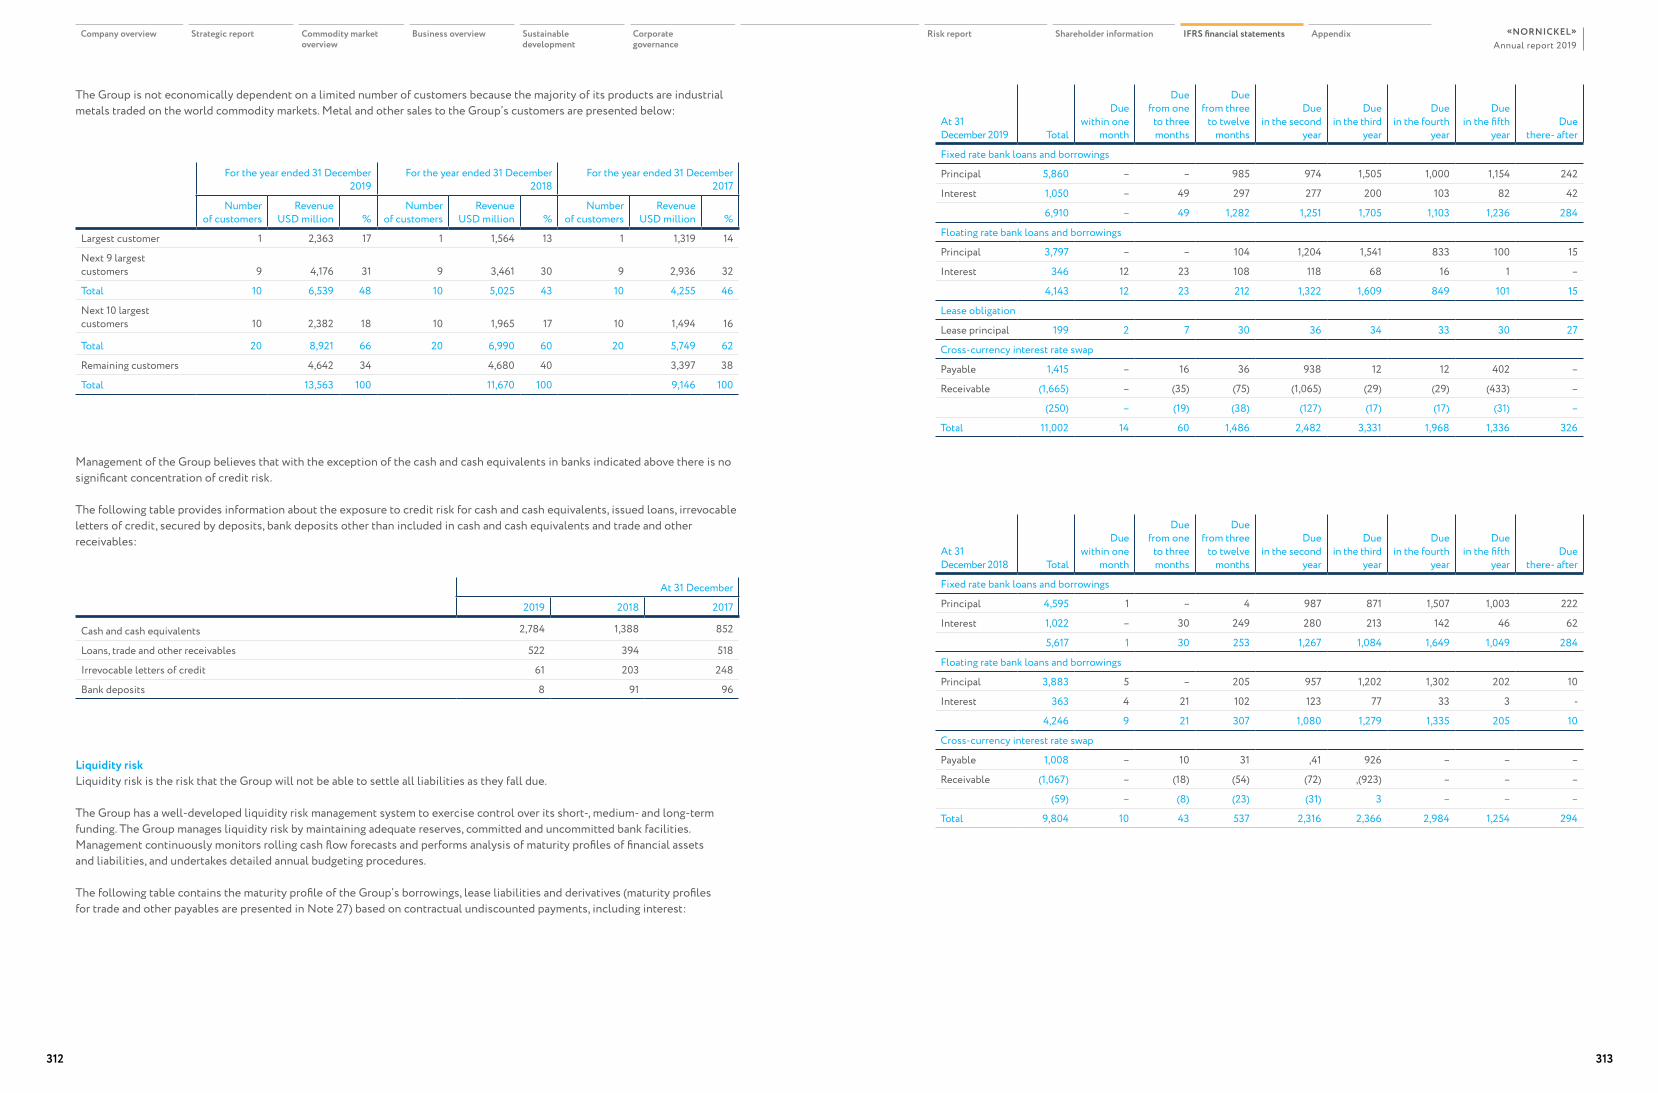
At 31 December 2019 Total
Due within one
month
Due from one
to three months
Due from three
to twelve months
Due in the second
year
Due in the third
year
Due in the fourth
year
Due in the fifth
year Due
there- after
Fixed rate bank loans and borrowings
Principal 5,860 – – 985 974 1,505 1,000 1,154 242
Interest 1,050 – 49 297 277 200 103 82 42
6,910 – 49 1,282 1,251 1,705 1,103 1,236 284
Floating rate bank loans and borrowings
Principal 3,797 – – 104 1,204 1,541 833 100 15
Interest 346 12 23 108 118 68 16 1 –
4,143 12 23 212 1,322 1,609 849 101 15
Lease obligation
Lease principal 199 2 7 30 36 34 33 30 27
Cross-currency interest rate swap
Payable 1,415 – 16 36 938 12 12 402 –
Receivable (1,665) – (35) (75) (1,065) (29) (29) (433) –
(250) – (19) (38) (127) (17) (17) (31) –
Total 11,002 14 60 1,486 2,482 3,331 1,968 1,336 326
At 31 December 2018 Total
Due within one
month
Due from one
to three months
Due from three
to twelve months
Due in the second
year
Due in the third
year
Due in the fourth
year
Due in the fifth
year Due
there- after
Fixed rate bank loans and borrowings
Principal 4,595 1 – 4 987 871 1,507 1,003 222
Interest 1,022 – 30 249 280 213 142 46 62
5,617 1 30 253 1,267 1,084 1,649 1,049 284
Floating rate bank loans and borrowings
Principal 3,883 5 – 205 957 1,202 1,302 202 10
Interest 363 4 21 102 123 77 33 3 -
4,246 9 21 307 1,080 1,279 1,335 205 10
Cross-currency interest rate swap
Payable 1,008 – 10 31 ,41 926 – – –
Receivable (1,067) – (18) (54) (72) ,(923) – – –
(59) – (8) (23) (31) 3 – – –
Total 9,804 10 43 537 2,316 2,366 2,984 1,254 294
Liquidity riskLiquidity risk is the risk that the Group will not be able to settle all liabilities as they fall due.
The Group has a well-developed liquidity risk management system to exercise control over its short-, medium- and long-term funding. The Group manages liquidity risk by maintaining adequate reserves, committed and uncommitted bank facilities. Management continuously monitors rolling cash flow forecasts and performs analysis of maturity profiles of financial assets and liabilities, and undertakes detailed annual budgeting procedures.
The following table contains the maturity profile of the Group’s borrowings, lease liabilities and derivatives (maturity profiles for trade and other payables are presented in Note 27) based on contractual undiscounted payments, including interest:
Management of the Group believes that with the exception of the cash and cash equivalents in banks indicated above there is no significant concentration of credit risk.
The following table provides information about the exposure to credit risk for cash and cash equivalents, issued loans, irrevocable letters of credit, secured by deposits, bank deposits other than included in cash and cash equivalents and trade and other receivables:
At 31 December
2019 2018 2017
Cash and cash equivalents 2,784 1,388 852
Loans, trade and other receivables 522 394 518
Irrevocable letters of credit 61 203 248
Bank deposits 8 91 96
The Group is not economically dependent on a limited number of customers because the majority of its products are industrial metals traded on the world commodity markets. Metal and other sales to the Group’s customers are presented below:
For the year ended 31 December 2019
For the year ended 31 December 2018
For the year ended 31 December 2017
Number of customers
Revenue USD million %
Number of customers
Revenue USD million %
Number of customers
Revenue USD million %
Largest customer 1 2,363 17 1 1,564 13 1 1,319 14
Next 9 largest customers 9 4,176 31 9 3,461 30 9 2,936 32
Total 10 6,539 48 10 5,025 43 10 4,255 46
Next 10 largest customers 10 2,382 18 10 1,965 17 10 1,494 16
Total 20 8,921 66 20 6,990 60 20 5,749 62
Remaining customers 4,642 34 4,680 40 3,397 38
Total 13,563 100 11,670 100 9,146 100
Company overview Strategic report Commodity market overview
Business overview Sustainable development
Corporate governance
Risk report Shareholder information IFRS financial statements AppendixAnnual report 2019
«NORNICKEL»
312 313
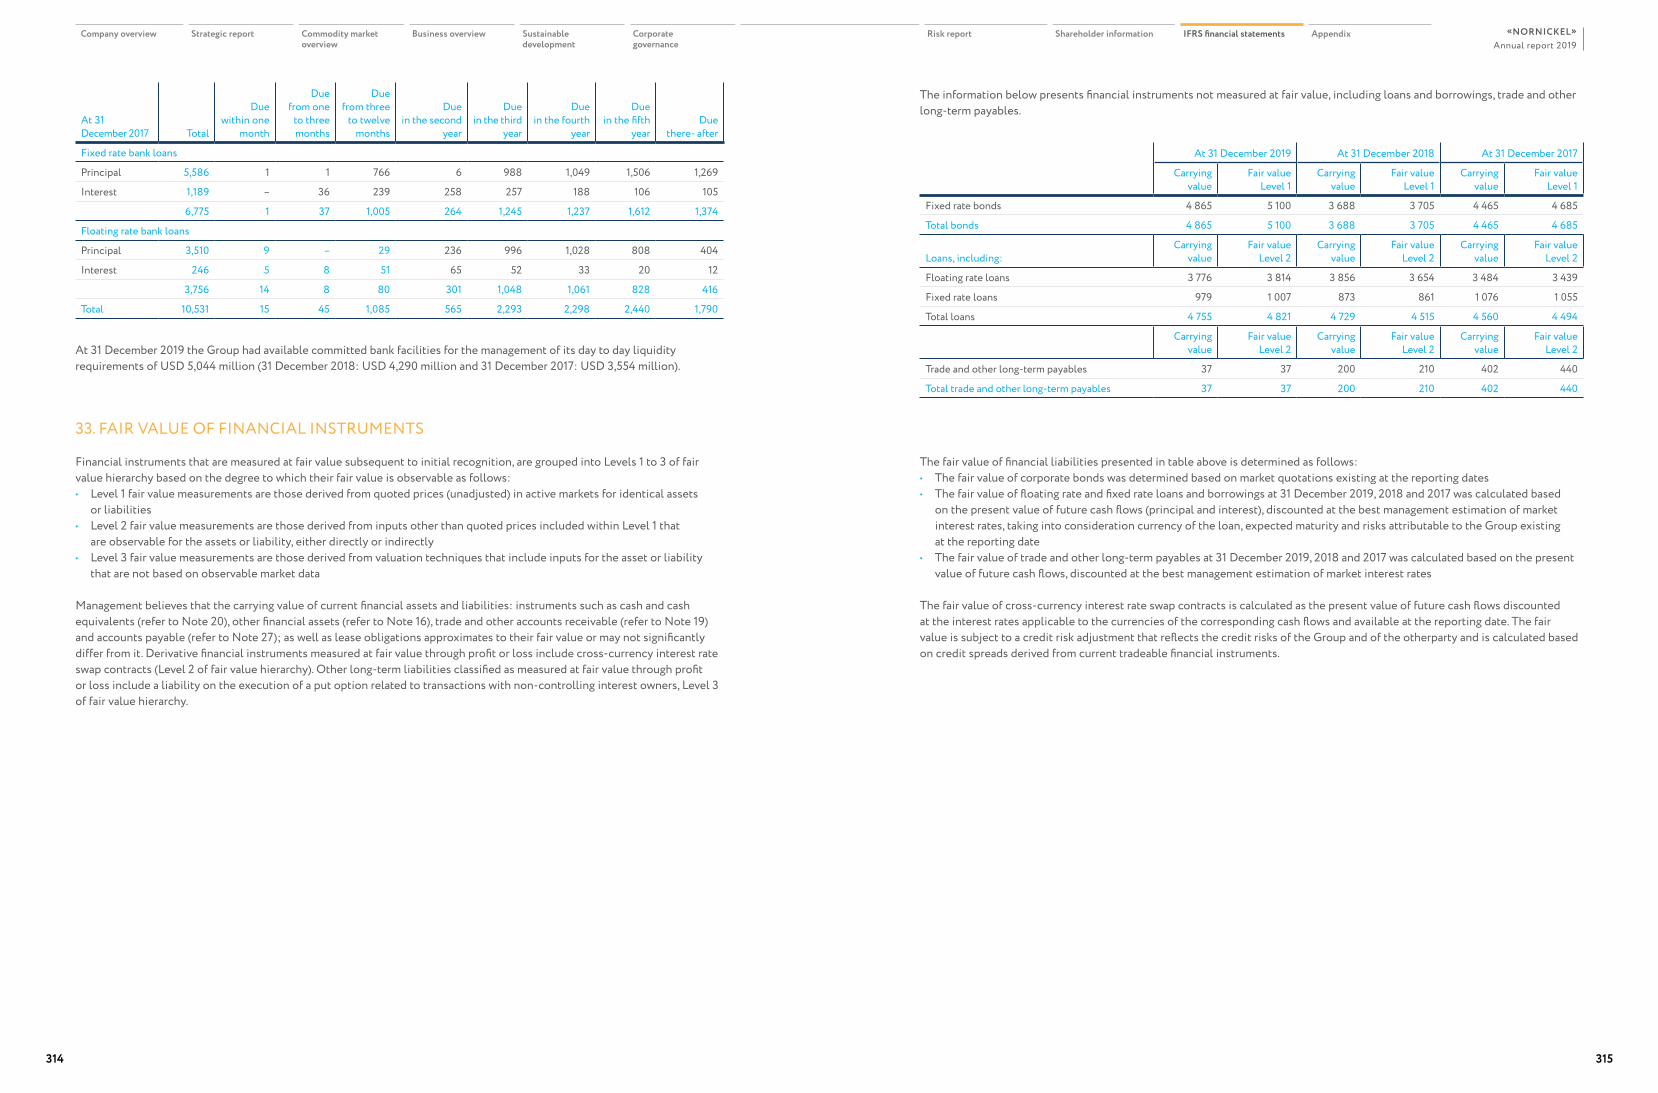
At 31 December 2019 At 31 December 2018 At 31 December 2017
Carrying value
Fair value Level 1
Carrying value
Fair value Level 1
Carrying value
Fair value Level 1
Fixed rate bonds 4 865 5 100 3 688 3 705 4 465 4 685
Total bonds 4 865 5 100 3 688 3 705 4 465 4 685
Loans, including:Carrying
valueFair value
Level 2Carrying
valueFair value
Level 2Carrying
valueFair value
Level 2
Floating rate loans 3 776 3 814 3 856 3 654 3 484 3 439
Fixed rate loans 979 1 007 873 861 1 076 1 055
Total loans 4 755 4 821 4 729 4 515 4 560 4 494
Carrying value
Fair value Level 2
Carrying value
Fair value Level 2
Carrying value
Fair value Level 2
Trade and other long-term payables 37 37 200 210 402 440
Total trade and other long-term payables 37 37 200 210 402 440
The fair value of financial liabilities presented in table above is determined as follows:• The fair value of corporate bonds was determined based on market quotations existing at the reporting dates• The fair value of floating rate and fixed rate loans and borrowings at 31 December 2019, 2018 and 2017 was calculated based
on the present value of future cash flows (principal and interest), discounted at the best management estimation of market interest rates, taking into consideration currency of the loan, expected maturity and risks attributable to the Group existing at the reporting date
• The fair value of trade and other long-term payables at 31 December 2019, 2018 and 2017 was calculated based on the present value of future cash flows, discounted at the best management estimation of market interest rates
The fair value of cross-currency interest rate swap contracts is calculated as the present value of future cash flows discounted at the interest rates applicable to the currencies of the corresponding cash flows and available at the reporting date. The fair value is subject to a credit risk adjustment that reflects the credit risks of the Group and of the otherparty and is calculated based on credit spreads derived from current tradeable financial instruments.
At 31 December 2017 Total
Due within one
month
Due from one
to three months
Due from three
to twelve months
Due in the second
year
Due in the third
year
Due in the fourth
year
Due in the fifth
year Due
there- after
Fixed rate bank loans
Principal 5,586 1 1 766 6 988 1,049 1,506 1,269
Interest 1,189 – 36 239 258 257 188 106 105
6,775 1 37 1,005 264 1,245 1,237 1,612 1,374
Floating rate bank loans
Principal 3,510 9 – 29 236 996 1,028 808 404
Interest 246 5 8 51 65 52 33 20 12
3,756 14 8 80 301 1,048 1,061 828 416
Total 10,531 15 45 1,085 565 2,293 2,298 2,440 1,790
At 31 December 2019 the Group had available committed bank facilities for the management of its day to day liquidity requirements of USD 5,044 million (31 December 2018: USD 4,290 million and 31 December 2017: USD 3,554 million).
33. FAIR VALUE OF FINANCIAL INSTRUMENTS
Financial instruments that are measured at fair value subsequent to initial recognition, are grouped into Levels 1 to 3 of fair value hierarchy based on the degree to which their fair value is observable as follows:• Level 1 fair value measurements are those derived from quoted prices (unadjusted) in active markets for identical assets
or liabilities• Level 2 fair value measurements are those derived from inputs other than quoted prices included within Level 1 that
are observable for the assets or liability, either directly or indirectly• Level 3 fair value measurements are those derived from valuation techniques that include inputs for the asset or liability
that are not based on observable market data
Management believes that the carrying value of current financial assets and liabilities: instruments such as cash and cash equivalents (refer to Note 20), other financial assets (refer to Note 16), trade and other accounts receivable (refer to Note 19) and accounts payable (refer to Note 27); as well as lease obligations approximates to their fair value or may not significantly differ from it. Derivative financial instruments measured at fair value through profit or loss include cross-currency interest rate swap contracts (Level 2 of fair value hierarchy). Other long-term liabilities classified as measured at fair value through profit or loss include a liability on the execution of a put option related to transactions with non-controlling interest owners, Level 3 of fair value hierarchy.
The information below presents financial instruments not measured at fair value, including loans and borrowings, trade and other long-term payables.
Company overview Strategic report Commodity market overview
Business overview Sustainable development
Corporate governance
Risk report Shareholder information IFRS financial statements AppendixAnnual report 2019
«NORNICKEL»
314 315
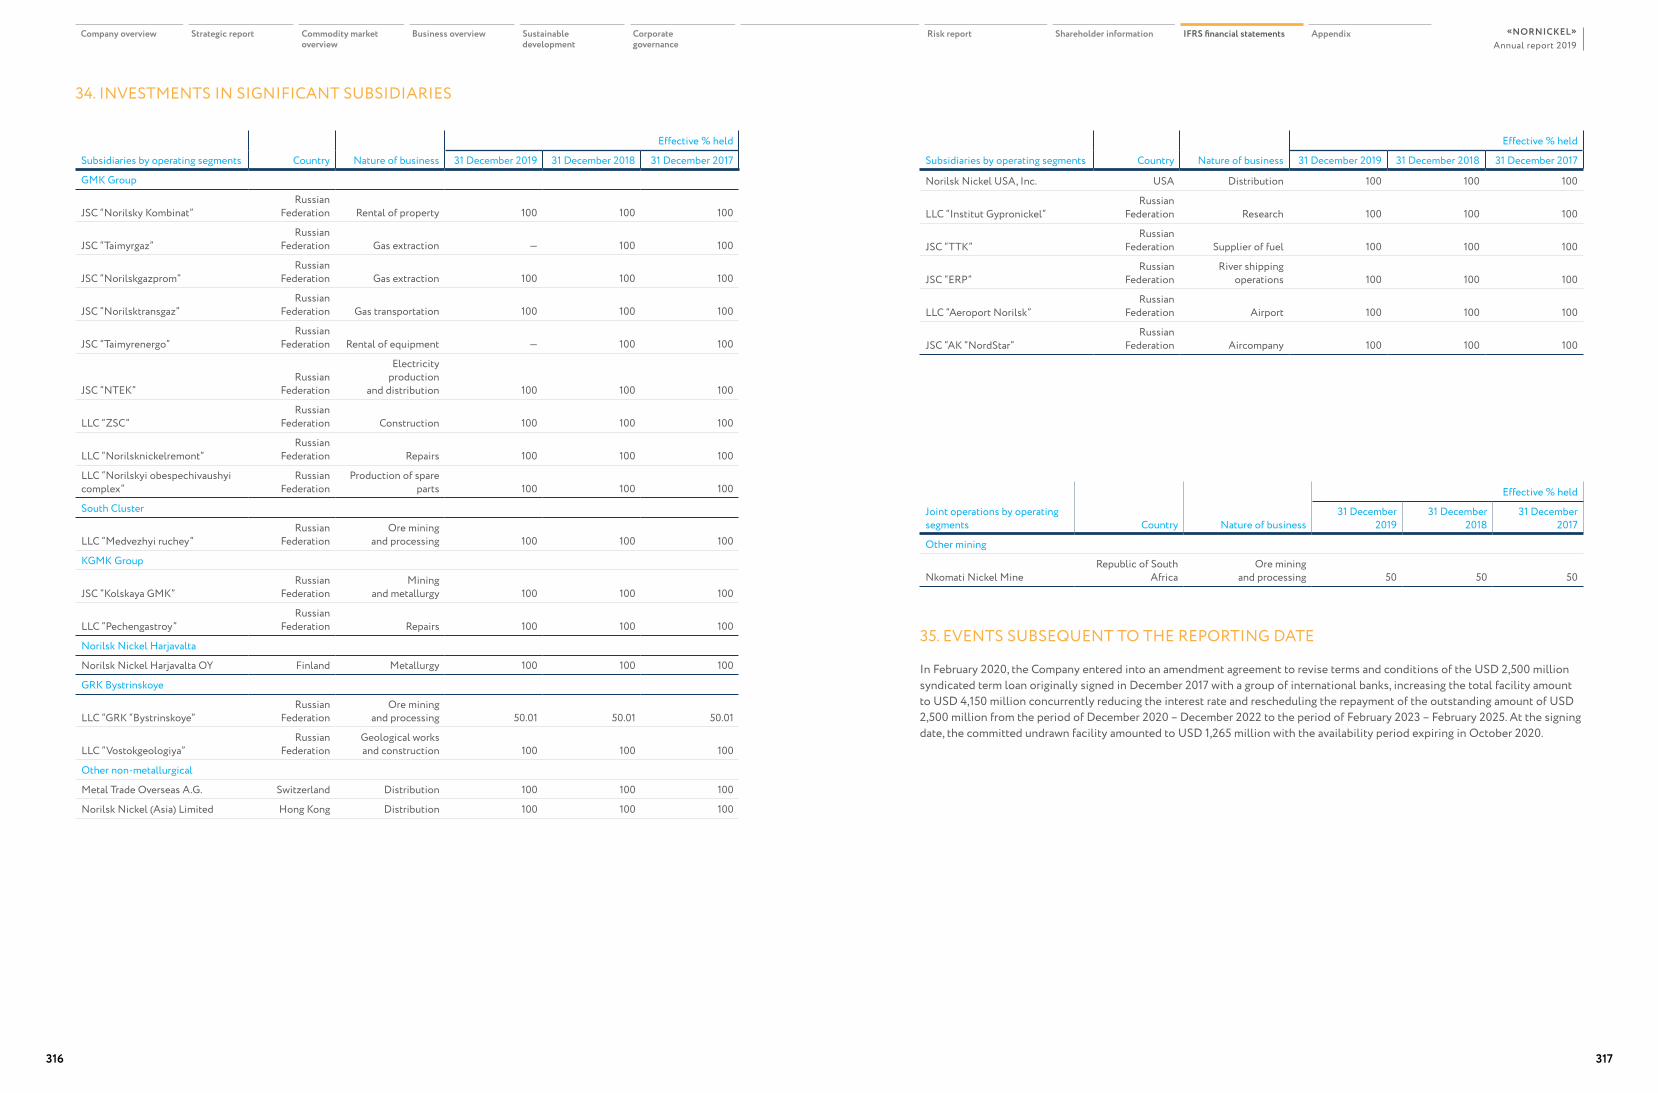
Subsidiaries by operating segments Country Nature of business
Effective % held
31 December 2019 31 December 2018 31 December 2017
GMK Group
JSC “Norilsky Kombinat”Russian
Federation Rental of property 100 100 100
JSC “Taimyrgaz”Russian
Federation Gas extraction — 100 100
JSC “Norilskgazprom” Russian
Federation Gas extraction 100 100 100
JSC “Norilsktransgaz”Russian
Federation Gas transportation 100 100 100
JSC “Taimyrenergo”Russian
Federation Rental of equipment — 100 100
JSC “NTEK”Russian
Federation
Electricity production
and distribution 100 100 100
LLC “ZSC”Russian
Federation Construction 100 100 100
LLC “Norilsknickelremont”Russian
Federation Repairs 100 100 100
LLC “Norilskyi obespechivaushyi complex”
Russian Federation
Production of spare parts 100 100 100
South Cluster
LLC “Medvezhyi ruchey”Russian
FederationOre mining
and processing 100 100 100
KGMK Group
JSC “Kolskaya GMK”Russian
FederationMining
and metallurgy 100 100 100
LLC “Pechengastroy”Russian
Federation Repairs 100 100 100
Norilsk Nickel Harjavalta
Norilsk Nickel Harjavalta OY Finland Metallurgy 100 100 100
GRK Bystrinskoye
LLC “GRK “Bystrinskoye”Russian
FederationOre mining
and processing 50.01 50.01 50.01
LLC “Vostokgeologiya”Russian
FederationGeological works and construction 100 100 100
Other non-metallurgical
Metal Trade Overseas A.G. Switzerland Distribution 100 100 100
Norilsk Nickel (Asia) Limited Hong Kong Distribution 100 100 100
Subsidiaries by operating segments Country Nature of business
Effective % held
31 December 2019 31 December 2018 31 December 2017
Norilsk Nickel USA, Inc. USA Distribution 100 100 100
LLC “Institut Gypronickel”Russian
Federation Research 100 100 100
JSC “TTK”Russian
Federation Supplier of fuel 100 100 100
JSC “ERP” Russian
FederationRiver shipping
operations 100 100 100
LLC “Aeroport Norilsk”Russian
Federation Airport 100 100 100
JSC “AK “NordStar”Russian
Federation Aircompany 100 100 100
Joint operations by operating segments Country Nature of business
Effective % held
31 December 2019
31 December 2018
31 December 2017
Other mining
Nkomati Nickel MineRepublic of South
AfricaOre mining
and processing 50 50 50
34. INVESTMENTS IN SIGNIFICANT SUBSIDIARIES
35. EVENTS SUBSEQUENT TO THE REPORTING DATE
In February 2020, the Company entered into an amendment agreement to revise terms and conditions of the USD 2,500 million syndicated term loan originally signed in December 2017 with a group of international banks, increasing the total facility amount to USD 4,150 million concurrently reducing the interest rate and rescheduling the repayment of the outstanding amount of USD 2,500 million from the period of December 2020 – December 2022 to the period of February 2023 – February 2025. At the signing date, the committed undrawn facility amounted to USD 1,265 million with the availability period expiring in October 2020.
Company overview Strategic report Commodity market overview
Business overview Sustainable development
Corporate governance
Risk report Shareholder information IFRS financial statements AppendixAnnual report 2019
«NORNICKEL»
316 317
ppendixAAppendix
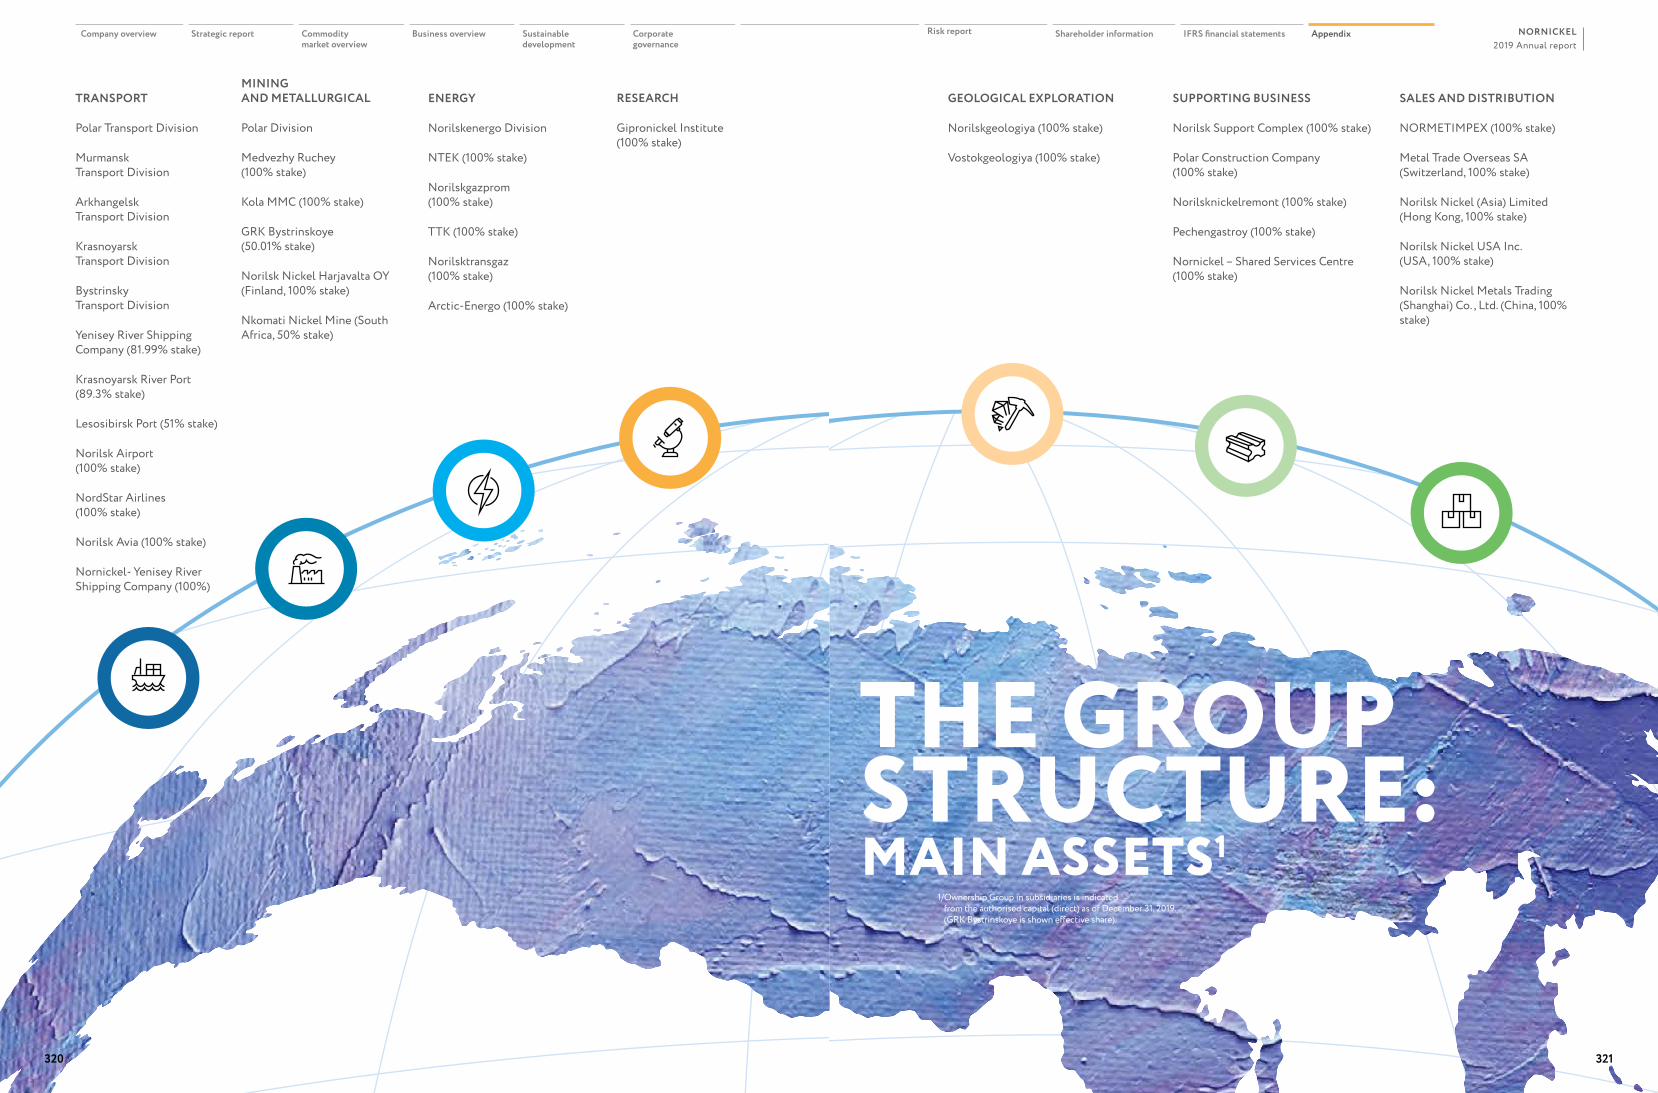
MINING AND METALLURGICAL
Polar Division
Medvezhy Ruchey (100% stake)
Kola MMC (100% stake)
GRK Bystrinskoye (50.01% stake)
Norilsk Nickel Harjavalta OY (Finland, 100% stake)
Nkomati Nickel Mine (South Africa, 50% stake)
ENERGY
Norilskenergo Division
NTEK (100% stake)
Norilskgazprom (100% stake)
TTK (100% stake)
Norilsktransgaz (100% stake)
Arctic-Energo (100% stake)
TRANSPORT
Polar Transport Division
Murmansk Transport Division
Arkhangelsk Transport Division
Krasnoyarsk Transport Division
Bystrinsky Transport Division
Yenisey River Shipping Company (81.99% stake)
Krasnoyarsk River Port (89.3% stake)
Lesosibirsk Port (51% stake)
Norilsk Airport (100% stake)
NordStar Airlines (100% stake)
Norilsk Avia (100% stake)
Nornickel- Yenisey River Shipping Company (100%)
RESEARCH
Gipronickel Institute (100% stake)
THE GROUP STRUCTURE:
SALES AND DISTRIBUTION
NORMETIMPEX (100% stake)
Metal Trade Overseas SA (Switzerland, 100% stake)
Norilsk Nickel (Asia) Limited (Hong Kong, 100% stake)
Norilsk Nickel USA Inc. (USA, 100% stake)
Norilsk Nickel Metals Trading (Shanghai) Co. , Ltd. (China, 100% stake)
SUPPORTING BUSINESS
Norilsk Support Complex (100% stake)
Polar Construction Company (100% stake)
Norilsknickelremont (100% stake)
Pechengastroy (100% stake)
Nornickel – Shared Services Centre (100% stake)
GEOLOGICAL EXPLORATION
Norilskgeologiya (100% stake)
Vostokgeologiya (100% stake)
1/ Ownership Group in subsidiaries is indicated from the authorised capital (direct) as of December 31, 2019. (GRK Bystrinskoye is shown effective share).
MAIN ASSETS1
2019 Annual reportNORNICKEL
320 321
Company overview Strategic report Commodity market overview
Business overview Sustainable development
Corporate governance
Risk report Shareholder information IFRS financial statements Appendix
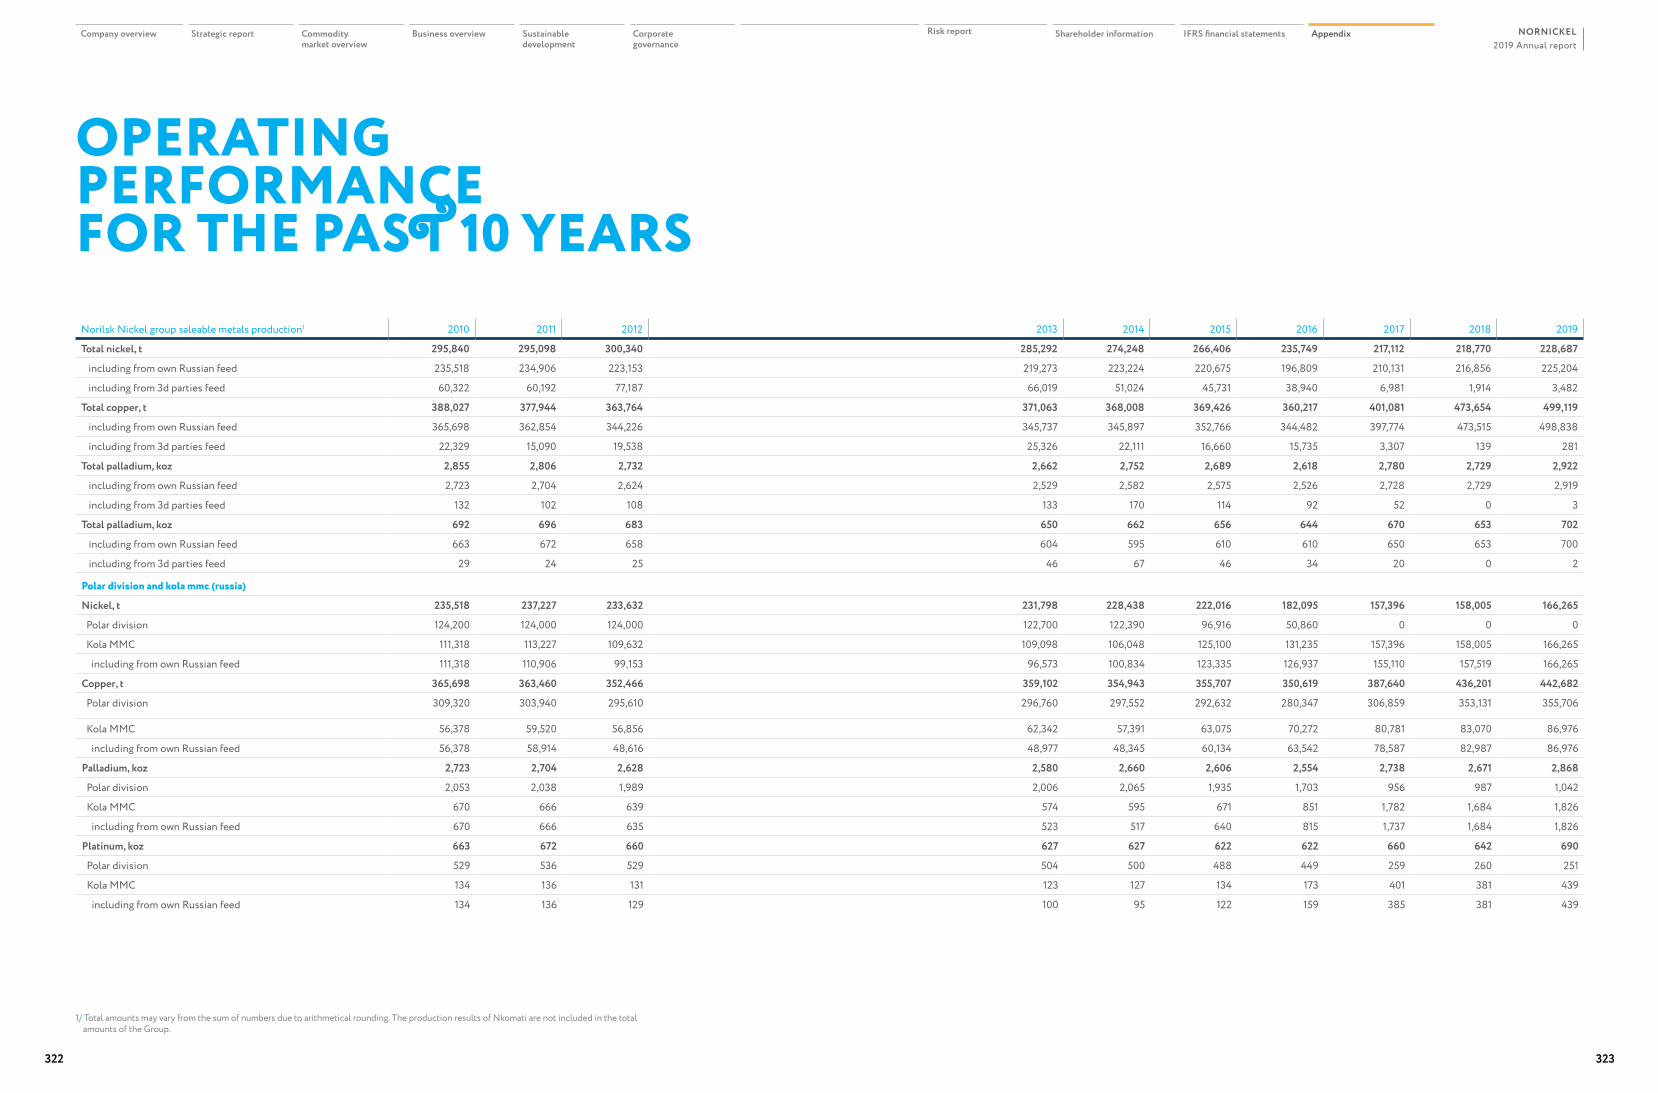
OPERATING PERFORMANCE FOR THE PAST 10 YEARS
1/ Total amounts may vary from the sum of numbers due to arithmetical rounding. The production results of Nkomati are not included in the total amounts of the Group.
Norilsk Nickel group saleable metals production1 2010 2011 2012 2013 2014 2015 2016 2017 2018 2019
Total nickel, t 295,840 295,098 300,340 285,292 274,248 266,406 235,749 217,112 218,770 228,687
including from own Russian feed 235,518 234,906 223,153 219,273 223,224 220,675 196,809 210,131 216,856 225,204
including from 3d parties feed 60,322 60,192 77,187 66,019 51,024 45,731 38,940 6,981 1,914 3,482
Total copper, t 388,027 377,944 363,764 371,063 368,008 369,426 360,217 401,081 473,654 499,119
including from own Russian feed 365,698 362,854 344,226 345,737 345,897 352,766 344,482 397,774 473,515 498,838
including from 3d parties feed 22,329 15,090 19,538 25,326 22,111 16,660 15,735 3,307 139 281
Total palladium, koz 2,855 2,806 2,732 2,662 2,752 2,689 2,618 2,780 2,729 2,922
including from own Russian feed 2,723 2,704 2,624 2,529 2,582 2,575 2,526 2,728 2,729 2,919
including from 3d parties feed 132 102 108 133 170 114 92 52 0 3
Total palladium, koz 692 696 683 650 662 656 644 670 653 702
including from own Russian feed 663 672 658 604 595 610 610 650 653 700
including from 3d parties feed 29 24 25 46 67 46 34 20 0 2
Polar division and kola mmc (russia)
Nickel, t 235,518 237,227 233,632 231,798 228,438 222,016 182,095 157,396 158,005 166,265
Polar division 124,200 124,000 124,000 122,700 122,390 96,916 50,860 0 0 0
Kola MMC 111,318 113,227 109,632 109,098 106,048 125,100 131,235 157,396 158,005 166,265
including from own Russian feed 111,318 110,906 99,153 96,573 100,834 123,335 126,937 155,110 157,519 166,265
Copper, t 365,698 363,460 352,466 359,102 354,943 355,707 350,619 387,640 436,201 442,682
Polar division 309,320 303,940 295,610 296,760 297,552 292,632 280,347 306,859 353,131 355,706
Kola MMC 56,378 59,520 56,856 62,342 57,391 63,075 70,272 80,781 83,070 86,976
including from own Russian feed 56,378 58,914 48,616 48,977 48,345 60,134 63,542 78,587 82,987 86,976
Palladium, koz 2,723 2,704 2,628 2,580 2,660 2,606 2,554 2,738 2,671 2,868
Polar division 2,053 2,038 1,989 2,006 2,065 1,935 1,703 956 987 1,042
Kola MMC 670 666 639 574 595 671 851 1,782 1,684 1,826
including from own Russian feed 670 666 635 523 517 640 815 1,737 1,684 1,826
Platinum, koz 663 672 660 627 627 622 622 660 642 690
Polar division 529 536 529 504 500 488 449 259 260 251
Kola MMC 134 136 131 123 127 134 173 401 381 439
including from own Russian feed 134 136 129 100 95 122 159 385 381 439
2019 Annual reportNORNICKEL
322 323
Company overview Strategic report Commodity market overview
Business overview Sustainable development
Corporate governance
Risk report Shareholder information IFRS financial statements Appendix
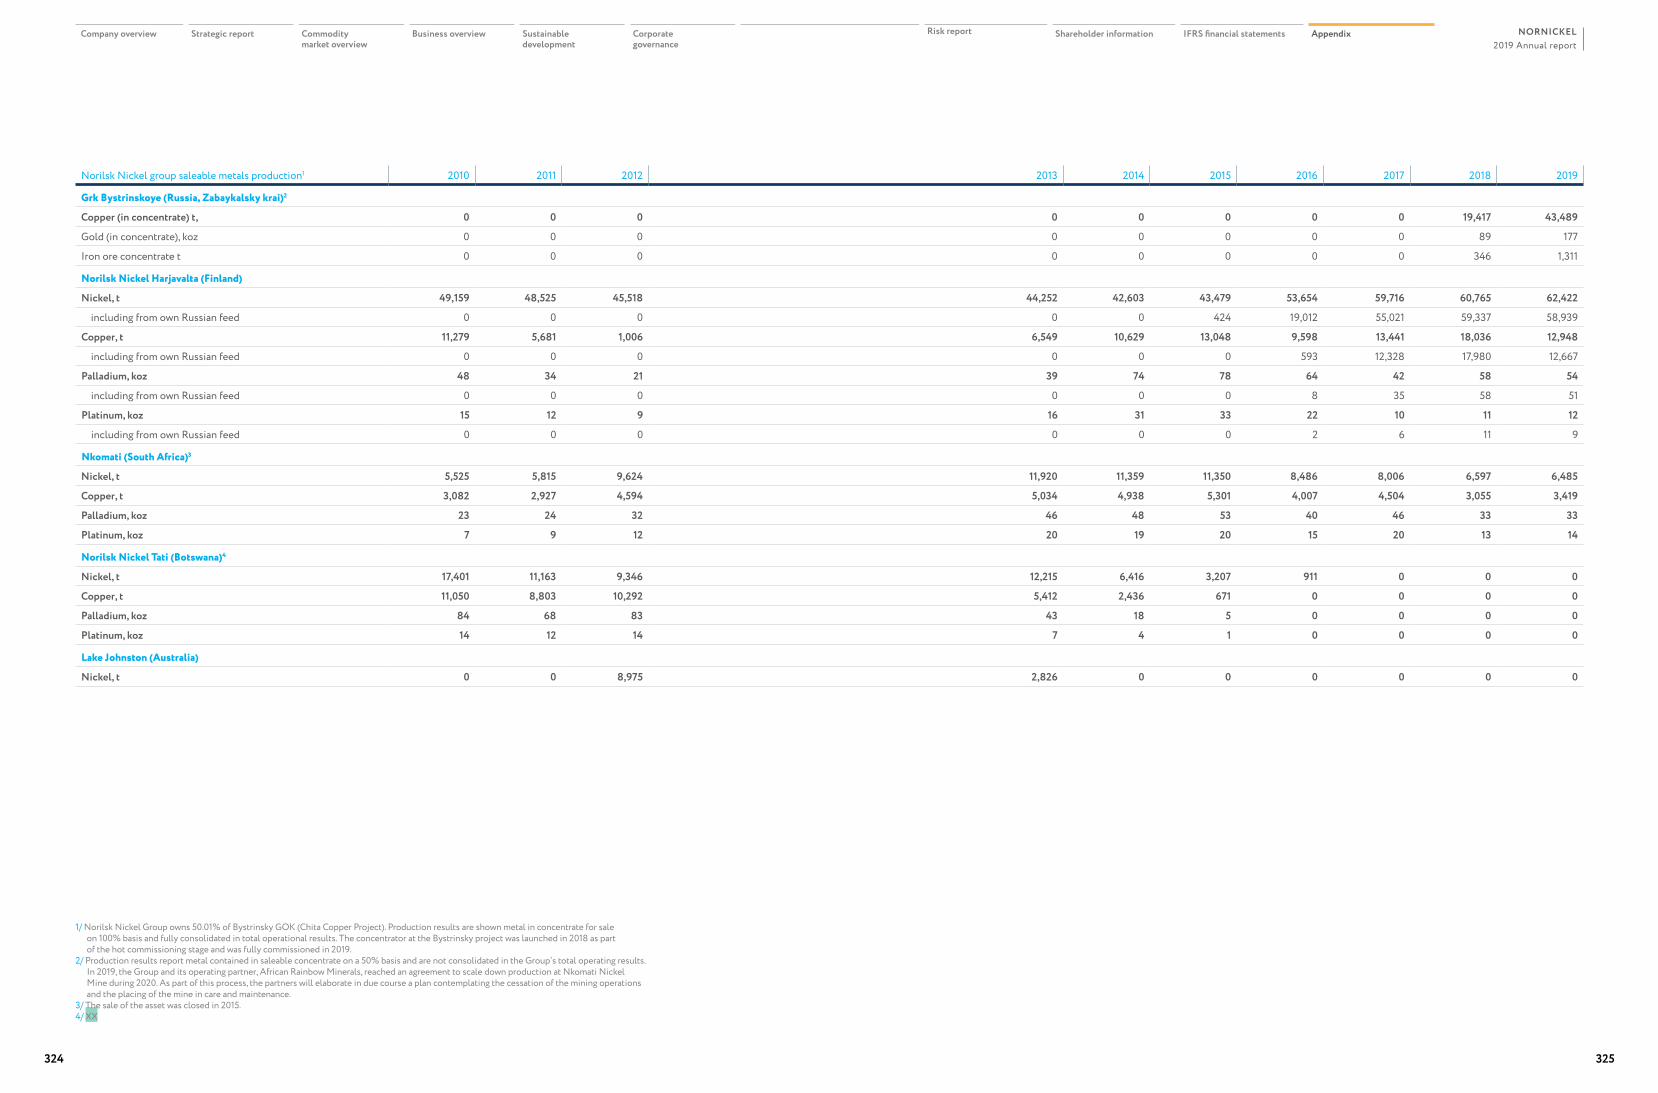
1/ Norilsk Nickel Group owns 50.01% of Bystrinsky GOK (Chita Copper Project). Production results are shown metal in concentrate for sale on 100% basis and fully consolidated in total operational results. The concentrator at the Bystrinsky project was launched in 2018 as part of the hot commissioning stage and was fully commissioned in 2019.
2/ Production results report metal contained in saleable concentrate on a 50% basis and are not consolidated in the Group’s total operating results. In 2019, the Group and its operating partner, African Rainbow Minerals, reached an agreement to scale down production at Nkomati Nickel Mine during 2020. As part of this process, the partners will elaborate in due course a plan contemplating the cessation of the mining operations and the placing of the mine in care and maintenance.
3/ The sale of the asset was closed in 2015.4/ XX
Norilsk Nickel group saleable metals production1 2010 2011 2012 2013 2014 2015 2016 2017 2018 2019
Grk Bystrinskoye (Russia, Zabaykalsky krai)2
Copper (in concentrate) t, 0 0 0 0 0 0 0 0 19,417 43,489
Gold (in concentrate), koz 0 0 0 0 0 0 0 0 89 177
Iron ore concentrate t 0 0 0 0 0 0 0 0 346 1,311
Norilsk Nickel Harjavalta (Finland)
Nickel, t 49,159 48,525 45,518 44,252 42,603 43,479 53,654 59,716 60,765 62,422
including from own Russian feed 0 0 0 0 0 424 19,012 55,021 59,337 58,939
Copper, t 11,279 5,681 1,006 6,549 10,629 13,048 9,598 13,441 18,036 12,948
including from own Russian feed 0 0 0 0 0 0 593 12,328 17,980 12,667
Palladium, koz 48 34 21 39 74 78 64 42 58 54
including from own Russian feed 0 0 0 0 0 0 8 35 58 51
Platinum, koz 15 12 9 16 31 33 22 10 11 12
including from own Russian feed 0 0 0 0 0 0 2 6 11 9
Nkomati (South Africa)3
Nickel, t 5,525 5,815 9,624 11,920 11,359 11,350 8,486 8,006 6,597 6,485
Copper, t 3,082 2,927 4,594 5,034 4,938 5,301 4,007 4,504 3,055 3,419
Palladium, koz 23 24 32 46 48 53 40 46 33 33
Platinum, koz 7 9 12 20 19 20 15 20 13 14
Norilsk Nickel Tati (Botswana)4
Nickel, t 17,401 11,163 9,346 12,215 6,416 3,207 911 0 0 0
Copper, t 11,050 8,803 10,292 5,412 2,436 671 0 0 0 0
Palladium, koz 84 68 83 43 18 5 0 0 0 0
Platinum, koz 14 12 14 7 4 1 0 0 0 0
Lake Johnston (Australia)
Nickel, t 0 0 8,975 2,826 0 0 0 0 0 0
2019 Annual reportNORNICKEL
324 325
Company overview Strategic report Commodity market overview
Business overview Sustainable development
Corporate governance
Risk report Shareholder information IFRS financial statements Appendix
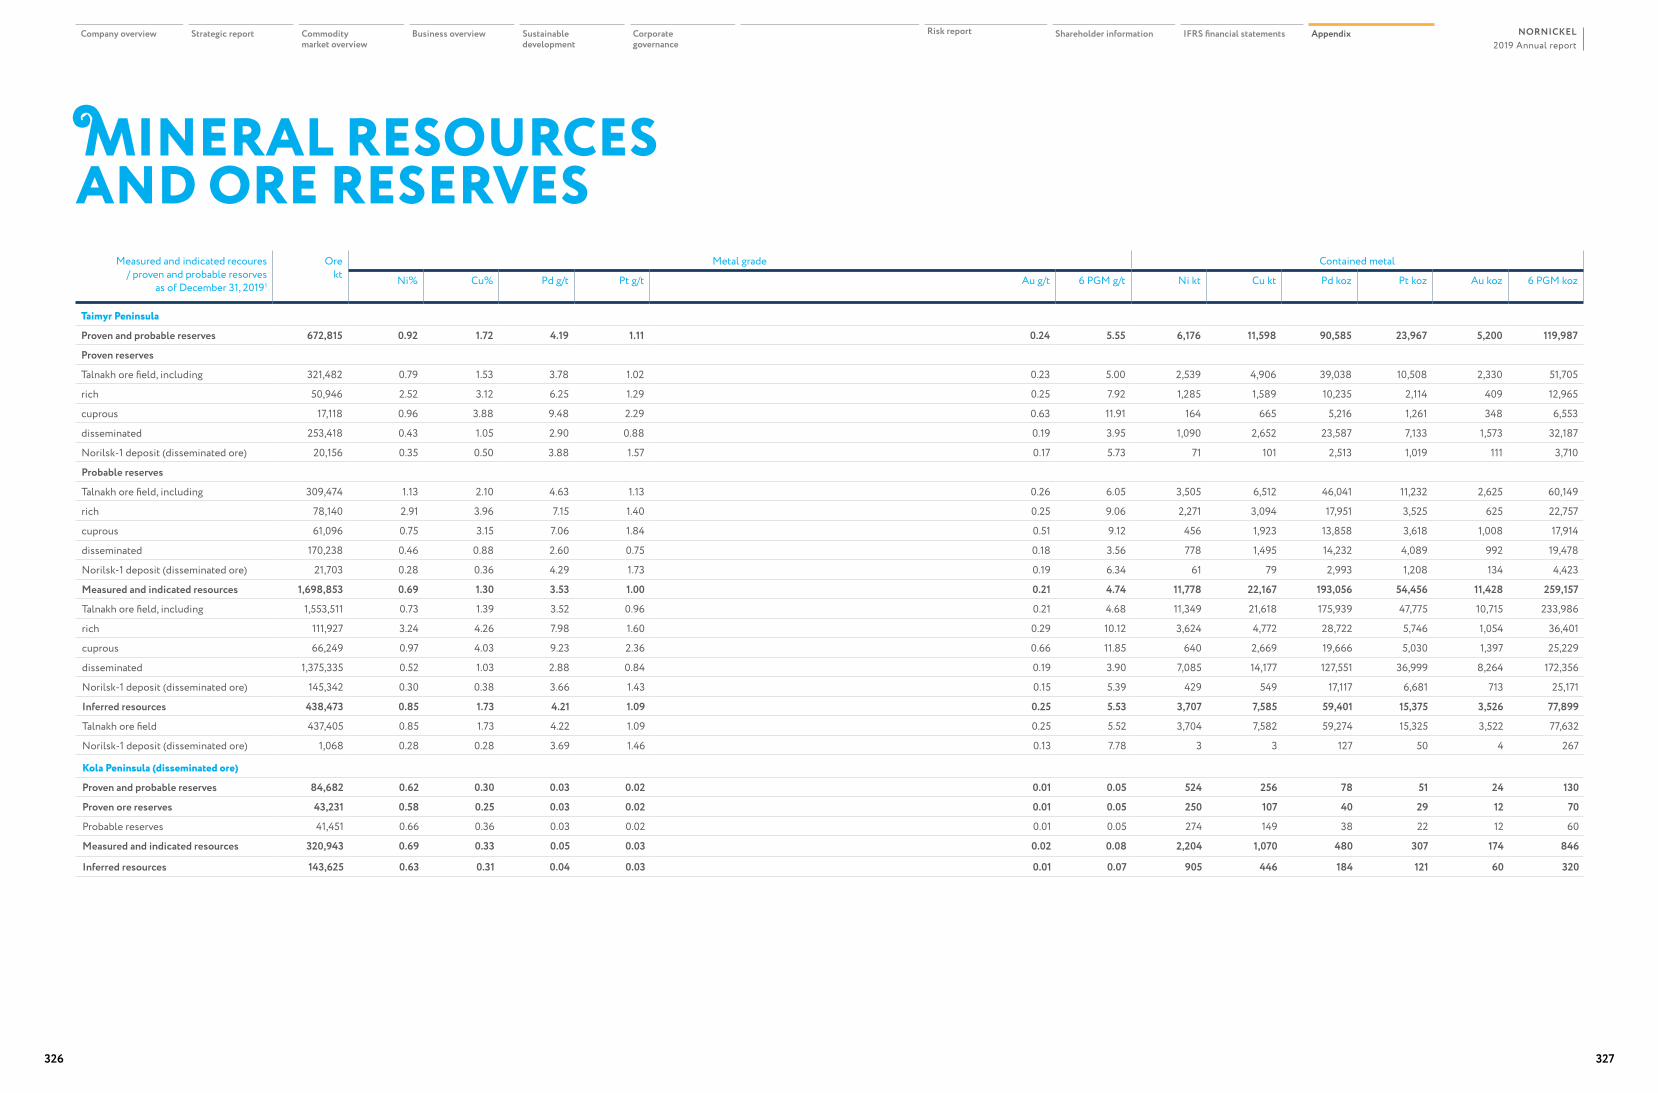
MINERAL RESOURCES AND ORE RESERVES
Measured and indicated recoures / proven and probable resorves
as of December 31, 2019 1
Ore kt
Metal grade Contained metal
Ni% Cu% Pd g/t Pt g/t Au g/t 6 PGM g/t Ni kt Cu kt Pd koz Pt koz Au koz 6 PGM koz
Taimyr Peninsula
Proven and probable reserves 672,815 0.92 1.72 4.19 1.11 0.24 5.55 6,176 11,598 90,585 23,967 5,200 119,987
Proven reserves
Talnakh ore field, including 321,482 0.79 1.53 3.78 1.02 0.23 5.00 2,539 4,906 39,038 10,508 2,330 51,705
rich 50,946 2.52 3.12 6.25 1.29 0.25 7.92 1,285 1,589 10,235 2,114 409 12,965
cuprous 17,118 0.96 3.88 9.48 2.29 0.63 11.91 164 665 5,216 1,261 348 6,553
disseminated 253,418 0.43 1.05 2.90 0.88 0.19 3.95 1,090 2,652 23,587 7,133 1,573 32,187
Norilsk-1 deposit (disseminated ore) 20,156 0.35 0.50 3.88 1.57 0.17 5.73 71 101 2,513 1,019 111 3,710
Probable reserves
Talnakh ore field, including 309,474 1.13 2.10 4.63 1.13 0.26 6.05 3,505 6,512 46,041 11,232 2,625 60,149
rich 78,140 2.91 3.96 7.15 1.40 0.25 9.06 2,271 3,094 17,951 3,525 625 22,757
cuprous 61,096 0.75 3.15 7.06 1.84 0.51 9.12 456 1,923 13,858 3,618 1,008 17,914
disseminated 170,238 0.46 0.88 2.60 0.75 0.18 3.56 778 1,495 14,232 4,089 992 19,478
Norilsk-1 deposit (disseminated ore) 21,703 0.28 0.36 4.29 1.73 0.19 6.34 61 79 2,993 1,208 134 4,423
Measured and indicated resources 1,698,853 0.69 1.30 3.53 1.00 0.21 4.74 11,778 22,167 193,056 54,456 11,428 259,157
Talnakh ore field, including 1,553,511 0.73 1.39 3.52 0.96 0.21 4.68 11,349 21,618 175,939 47,775 10,715 233,986
rich 111,927 3.24 4.26 7.98 1.60 0.29 10.12 3,624 4,772 28,722 5,746 1,054 36,401
cuprous 66,249 0.97 4.03 9.23 2.36 0.66 11.85 640 2,669 19,666 5,030 1,397 25,229
disseminated 1,375,335 0.52 1.03 2.88 0.84 0.19 3.90 7,085 14,177 127,551 36,999 8,264 172,356
Norilsk-1 deposit (disseminated ore) 145,342 0.30 0.38 3.66 1.43 0.15 5.39 429 549 17,117 6,681 713 25,171
Inferred resources 438,473 0.85 1.73 4.21 1.09 0.25 5.53 3,707 7,585 59,401 15,375 3,526 77,899
Talnakh ore field 437,405 0.85 1.73 4.22 1.09 0.25 5.52 3,704 7,582 59,274 15,325 3,522 77,632
Norilsk-1 deposit (disseminated ore) 1,068 0.28 0.28 3.69 1.46 0.13 7.78 3 3 127 50 4 267
Kola Peninsula (disseminated ore)
Proven and probable reserves 84,682 0.62 0.30 0.03 0.02 0.01 0.05 524 256 78 51 24 130
Proven ore reserves 43,231 0.58 0.25 0.03 0.02 0.01 0.05 250 107 40 29 12 70
Probable reserves 41,451 0.66 0.36 0.03 0.02 0.01 0.05 274 149 38 22 12 60
Measured and indicated resources 320,943 0.69 0.33 0.05 0.03 0.02 0.08 2,204 1,070 480 307 174 846
Inferred resources 143,625 0.63 0.31 0.04 0.03 0.01 0.07 905 446 184 121 60 320
2019 Annual reportNORNICKEL
326 327
Company overview Strategic report Commodity market overview
Business overview Sustainable development
Corporate governance
Risk report Shareholder information IFRS financial statements Appendix
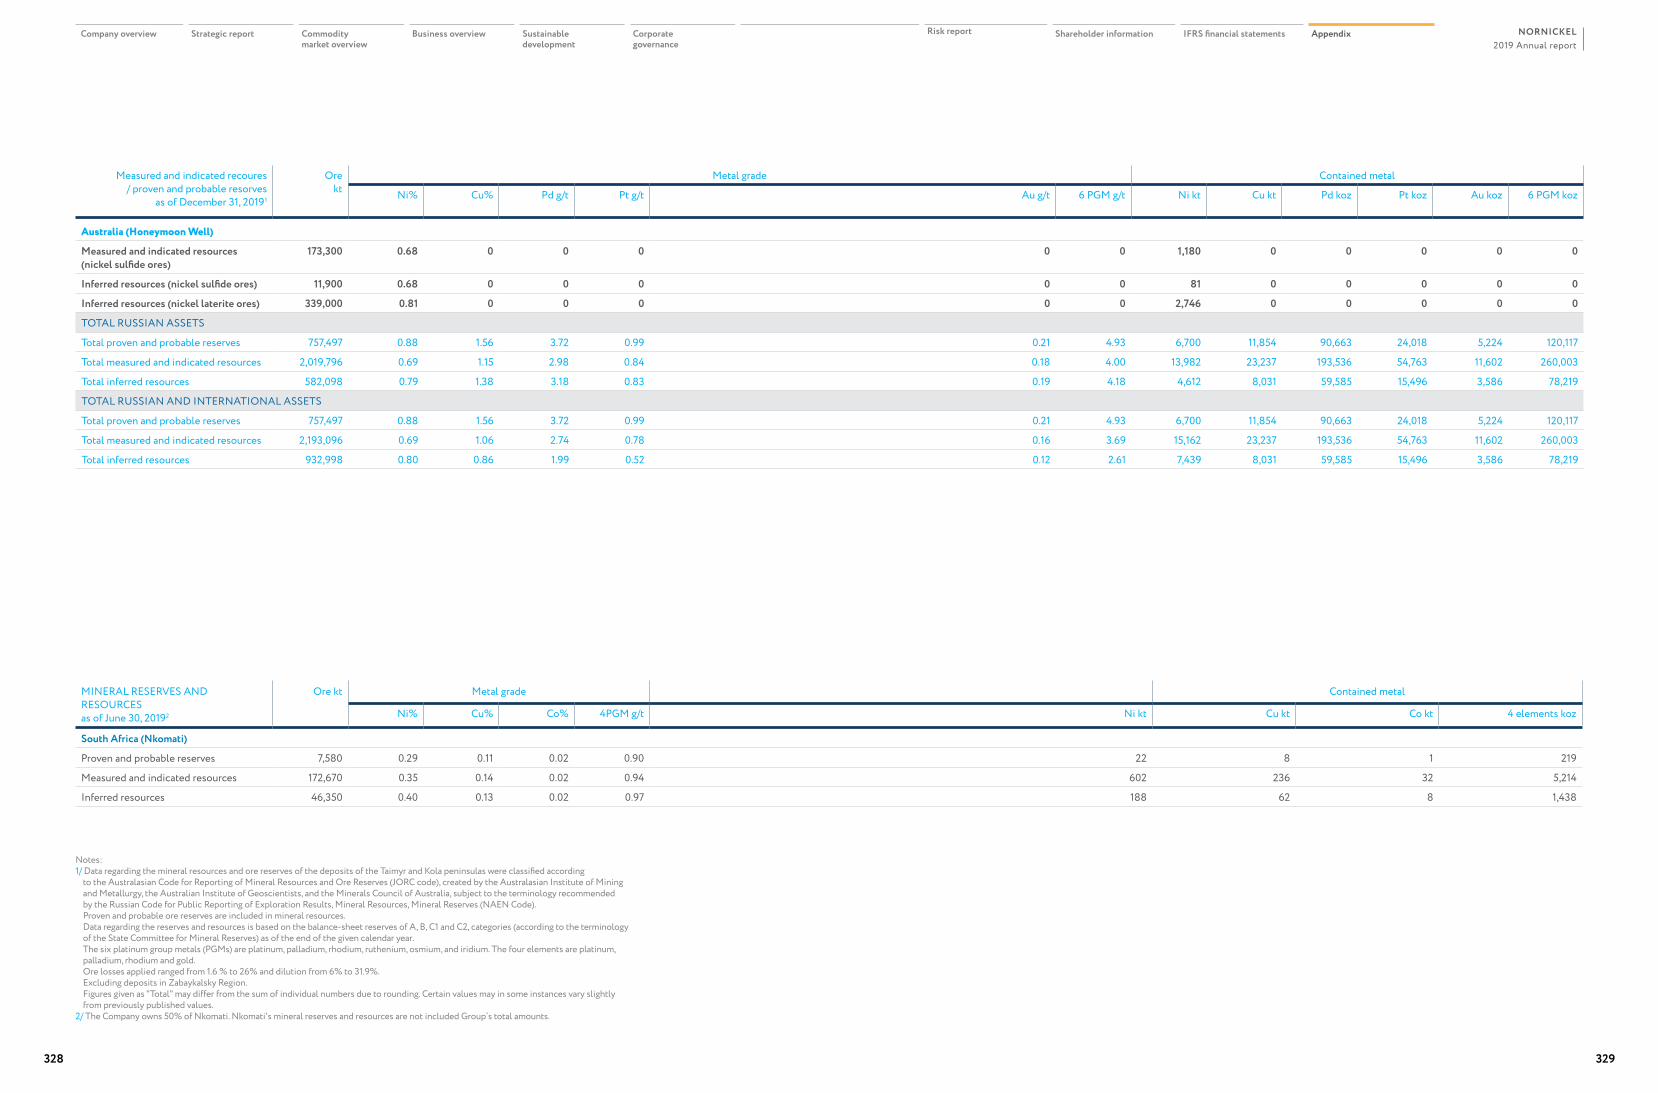
Notes:1/ Data regarding the mineral resources and ore reserves of the deposits of the Taimyr and Kola peninsulas were classified according
to the Australasian Code for Reporting of Mineral Resources and Ore Reserves (JORC code), created by the Australasian Institute of Mining and Metallurgy, the Australian Institute of Geoscientists, and the Minerals Council of Australia, subject to the terminology recommended by the Russian Code for Public Reporting of Exploration Results, Mineral Resources, Mineral Reserves (NAEN Code). Proven and probable ore reserves are included in mineral resources. Data regarding the reserves and resources is based on the balance-sheet reserves of A, B, С1 and С2, categories (according to the terminology of the State Committee for Mineral Reserves) as of the end of the given calendar year. The six platinum group metals (PGMs) are platinum, palladium, rhodium, ruthenium, osmium, and iridium. The four elements are platinum, palladium, rhodium and gold. Ore losses applied ranged from 1.6 % to 26% and dilution from 6% to 31.9%. Excluding deposits in Zabaykalsky Region. Figures given as "Total" may differ from the sum of individual numbers due to rounding. Certain values may in some instances vary slightly from previously published values.
2/ The Company owns 50% of Nkomati. Nkomati's mineral reserves and resources are not included Group’s total amounts.
Measured and indicated recoures / proven and probable resorves
as of December 31, 2019 1
Ore kt
Metal grade Contained metal
Ni% Cu% Pd g/t Pt g/t Au g/t 6 PGM g/t Ni kt Cu kt Pd koz Pt koz Au koz 6 PGM koz
Australia (Honeymoon Well)
Measured and indicated resources (nickel sulfide ores)
173,300 0.68 0 0 0 0 0 1,180 0 0 0 0 0
Inferred resources (nickel sulfide ores) 11,900 0.68 0 0 0 0 0 81 0 0 0 0 0
Inferred resources (nickel laterite ores) 339,000 0.81 0 0 0 0 0 2,746 0 0 0 0 0
TOTAL RUSSIAN ASSETS
Total proven and probable reserves 757,497 0.88 1.56 3.72 0.99 0.21 4.93 6,700 11,854 90,663 24,018 5,224 120,117
Total measured and indicated resources 2,019,796 0.69 1.15 2.98 0.84 0.18 4.00 13,982 23,237 193,536 54,763 11,602 260,003
Total inferred resources 582,098 0.79 1.38 3.18 0.83 0.19 4.18 4,612 8,031 59,585 15,496 3,586 78,219
TOTAL RUSSIAN AND INTERNATIONAL ASSETS
Total proven and probable reserves 757,497 0.88 1.56 3.72 0.99 0.21 4.93 6,700 11,854 90,663 24,018 5,224 120,117
Total measured and indicated resources 2,193,096 0.69 1.06 2.74 0.78 0.16 3.69 15,162 23,237 193,536 54,763 11,602 260,003
Total inferred resources 932,998 0.80 0.86 1.99 0.52 0.12 2.61 7,439 8,031 59,585 15,496 3,586 78,219
MINERAL RESERVES AND RESOURCESas of June 30, 20192
Ore kt Metal grade Contained metal
Ni% Cu% Co% 4PGM g/t Ni kt Cu kt Co kt 4 elements koz
South Africa (Nkomati)
Proven and probable reserves 7,580 0.29 0.11 0.02 0.90 22 8 1 219
Measured and indicated resources 172,670 0.35 0.14 0.02 0.94 602 236 32 5,214
Inferred resources 46,350 0.40 0.13 0.02 0.97 188 62 8 1,438
2019 Annual reportNORNICKEL
328 329
Company overview Strategic report Commodity market overview
Business overview Sustainable development
Corporate governance
Risk report Shareholder information IFRS financial statements Appendix
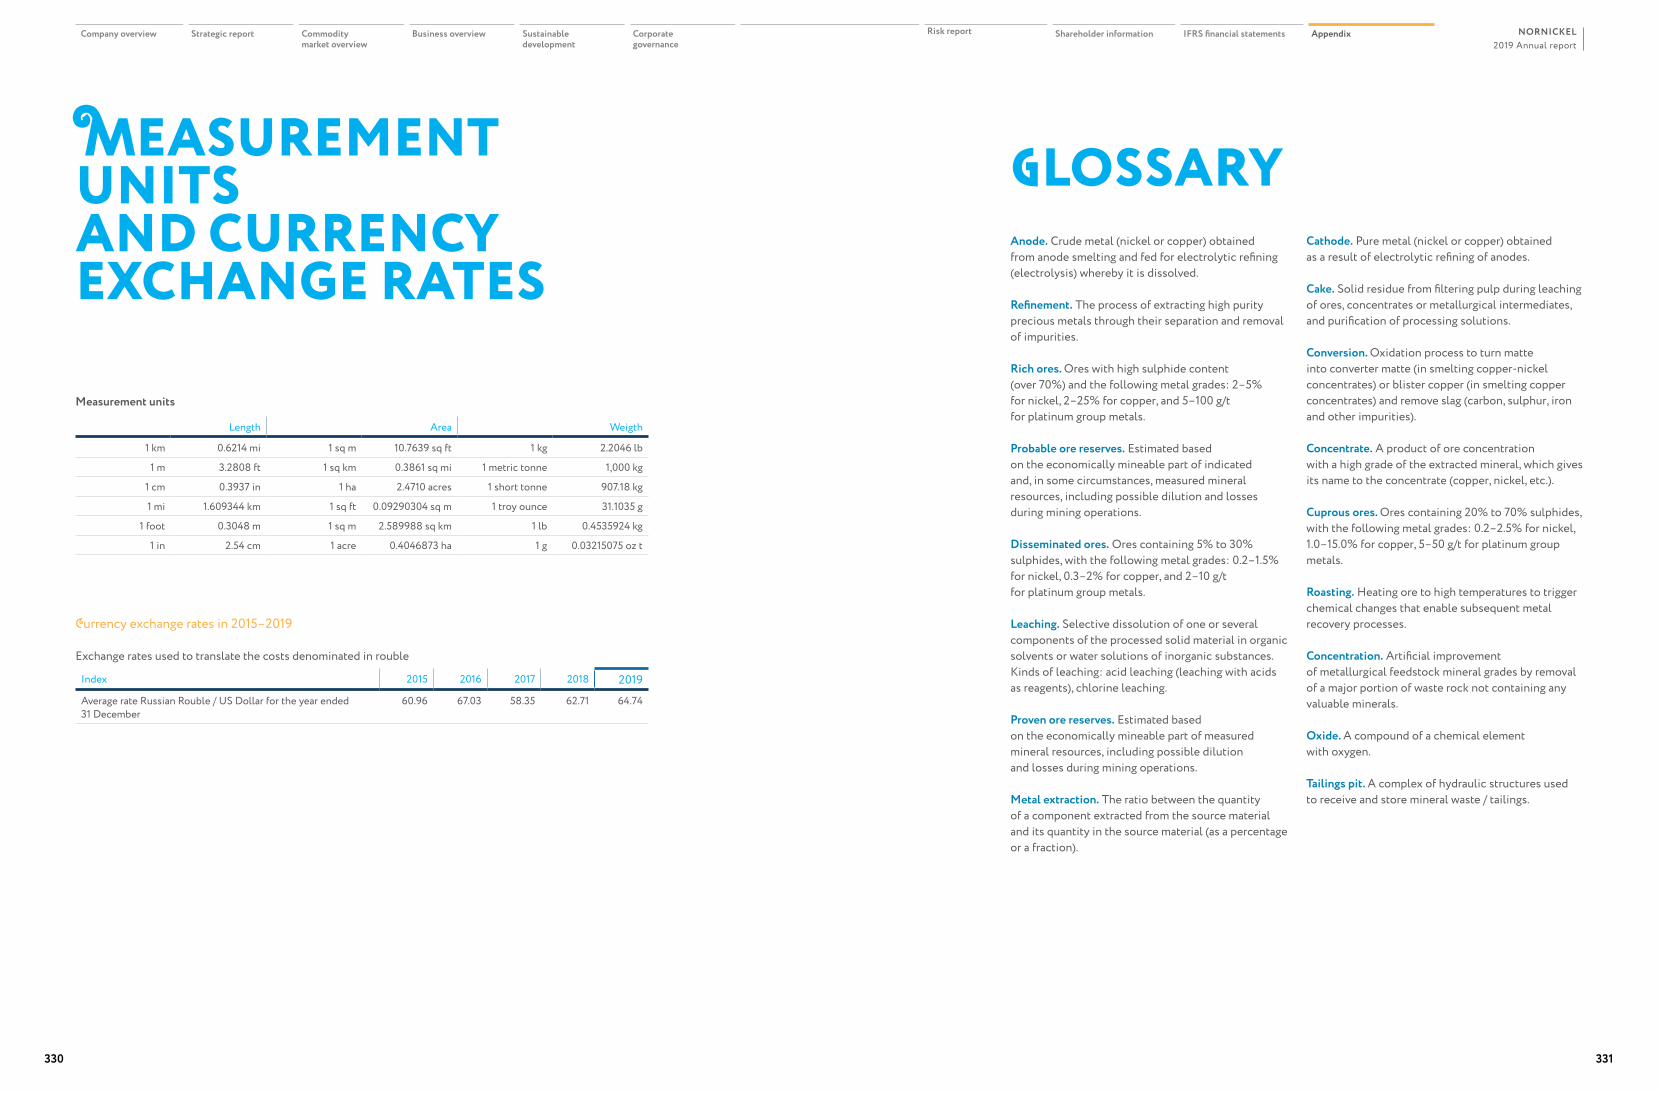
MEASUREMENT UNITS AND CURRENCY EXCHANGE RATES
Measurement units
Length Area Weigth
1 km 0.6214 mi 1 sq m 10.7639 sq ft 1 kg 2.2046 lb
1 m 3.2808 ft 1 sq km 0.3861 sq mi 1 metric tonne 1,000 kg
1 cm 0.3937 in 1 ha 2.4710 acres 1 short tonne 907.18 kg
1 mi 1.609344 km 1 sq ft 0.09290304 sq m 1 troy ounce 31.1035 g
1 foot 0.3048 m 1 sq m 2.589988 sq km 1 lb 0.4535924 kg
1 in 2.54 cm 1 acre 0.4046873 ha 1 g 0.03215075 oz t
Currency exchange rates in 2015–2019
Exchange rates used to translate the costs denominated in rouble
Index 2015 2016 2017 2018 2019Average rate Russian Rouble / US Dollar for the year ended 31 December
60.96 67.03 58.35 62.71 64.74
GLOSSARYAnode. Crude metal (nickel or copper) obtained from anode smelting and fed for electrolytic refining (electrolysis) whereby it is dissolved.
Refinement. The process of extracting high purity precious metals through their separation and removal of impurities.
Rich ores. Ores with high sulphide content (over 70%) and the following metal grades: 2–5% for nickel, 2–25% for copper, and 5–100 g/t for platinum group metals.
Probable ore reserves. Estimated based on the economically mineable part of indicated and, in some circumstances, measured mineral resources, including possible dilution and losses during mining operations.
Disseminated ores. Ores containing 5% to 30% sulphides, with the following metal grades: 0.2–1.5% for nickel, 0.3–2% for copper, and 2–10 g/t for platinum group metals.
Leaching. Selective dissolution of one or several components of the processed solid material in organic solvents or water solutions of inorganic substances. Kinds of leaching: acid leaching (leaching with acids as reagents), chlorine leaching.
Proven ore reserves. Estimated based on the economically mineable part of measured mineral resources, including possible dilution and losses during mining operations.
Metal extraction. The ratio between the quantity of a component extracted from the source material and its quantity in the source material (as a percentage or a fraction).
Cathode. Pure metal (nickel or copper) obtained as a result of electrolytic refining of anodes.
Cake. Solid residue from filtering pulp during leaching of ores, concentrates or metallurgical intermediates, and purification of processing solutions.
Conversion. Oxidation process to turn matte into converter matte (in smelting copper-nickel concentrates) or blister copper (in smelting copper concentrates) and remove slag (carbon, sulphur, iron and other impurities).
Concentrate. A product of ore concentration with a high grade of the extracted mineral, which gives its name to the concentrate (copper, nickel, etc.).
Cuprous ores. Ores containing 20% to 70% sulphides, with the following metal grades: 0.2–2.5% for nickel, 1.0–15.0% for copper, 5–50 g/t for platinum group metals.
Roasting. Heating ore to high temperatures to trigger chemical changes that enable subsequent metal recovery processes.
Concentration. Artificial improvement of metallurgical feedstock mineral grades by removal of a major portion of waste rock not containing any valuable minerals.
Oxide. A compound of a chemical element with oxygen.
Tailings pit. A complex of hydraulic structures used to receive and store mineral waste / tailings.
2019 Annual reportNORNICKEL
330 331
Company overview Strategic report Commodity market overview
Business overview Sustainable development
Corporate governance
Risk report Shareholder information IFRS financial statements Appendix
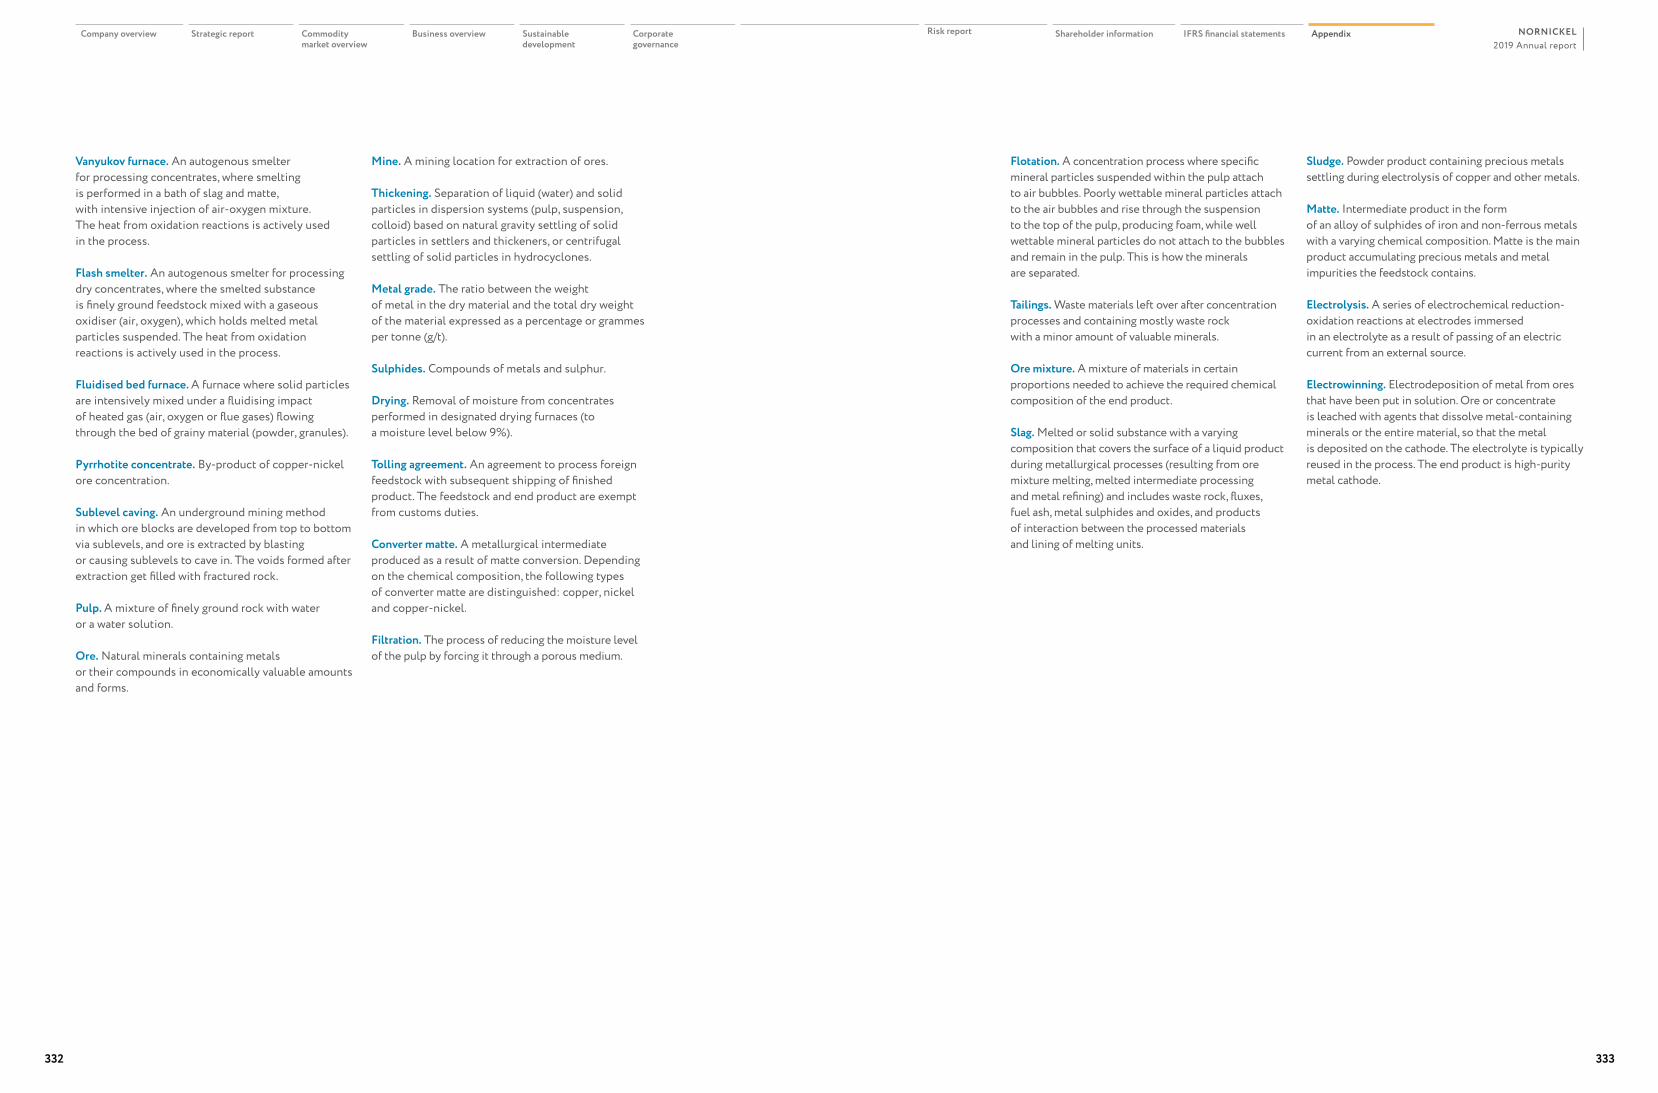
Vanyukov furnace. An autogenous smelter for processing concentrates, where smelting is performed in a bath of slag and matte, with intensive injection of air-oxygen mixture. The heat from oxidation reactions is actively used in the process.
Flash smelter. An autogenous smelter for processing dry concentrates, where the smelted substance is finely ground feedstock mixed with a gaseous oxidiser (air, oxygen), which holds melted metal particles suspended. The heat from oxidation reactions is actively used in the process.
Fluidised bed furnace. A furnace where solid particles are intensively mixed under a fluidising impact of heated gas (air, oxygen or flue gases) flowing through the bed of grainy material (powder, granules).
Pyrrhotite concentrate. By-product of copper-nickel ore concentration.
Sublevel caving. An underground mining method in which ore blocks are developed from top to bottom via sublevels, and ore is extracted by blasting or causing sublevels to cave in. The voids formed after extraction get filled with fractured rock.
Pulp. A mixture of finely ground rock with water or a water solution.
Ore. Natural minerals containing metals or their compounds in economically valuable amounts and forms.
Mine. A mining location for extraction of ores.
Thickening. Separation of liquid (water) and solid particles in dispersion systems (pulp, suspension, colloid) based on natural gravity settling of solid particles in settlers and thickeners, or centrifugal settling of solid particles in hydrocyclones.
Metal grade. The ratio between the weight of metal in the dry material and the total dry weight of the material expressed as a percentage or grammes per tonne (g/t).
Sulphides. Compounds of metals and sulphur.
Drying. Removal of moisture from concentrates performed in designated drying furnaces (to a moisture level below 9%).
Tolling agreement. An agreement to process foreign feedstock with subsequent shipping of finished product. The feedstock and end product are exempt from customs duties.
Converter matte. A metallurgical intermediate produced as a result of matte conversion. Depending on the chemical composition, the following types of converter matte are distinguished: copper, nickel and copper-nickel.
Filtration. The process of reducing the moisture level of the pulp by forcing it through a porous medium.
Flotation. A concentration process where specific mineral particles suspended within the pulp attach to air bubbles. Poorly wettable mineral particles attach to the air bubbles and rise through the suspension to the top of the pulp, producing foam, while well wettable mineral particles do not attach to the bubbles and remain in the pulp. This is how the minerals are separated.
Tailings. Waste materials left over after concentration processes and containing mostly waste rock with a minor amount of valuable minerals.
Ore mixture. A mixture of materials in certain proportions needed to achieve the required chemical composition of the end product.
Slag. Melted or solid substance with a varying composition that covers the surface of a liquid product during metallurgical processes (resulting from ore mixture melting, melted intermediate processing and metal refining) and includes waste rock, fluxes, fuel ash, metal sulphides and oxides, and products of interaction between the processed materials and lining of melting units.
Sludge. Powder product containing precious metals settling during electrolysis of copper and other metals.
Matte. Intermediate product in the form of an alloy of sulphides of iron and non-ferrous metals with a varying chemical composition. Matte is the main product accumulating precious metals and metal impurities the feedstock contains.
Electrolysis. A series of electrochemical reduction-oxidation reactions at electrodes immersed in an electrolyte as a result of passing of an electric current from an external source.
Electrowinning. Electrodeposition of metal from ores that have been put in solution. Ore or concentrate is leached with agents that dissolve metal-containing minerals or the entire material, so that the metal is deposited on the cathode. The electrolyte is typically reused in the process. The end product is high-purity metal cathode.
2019 Annual reportNORNICKEL
332 333
Company overview Strategic report Commodity market overview
Business overview Sustainable development
Corporate governance
Risk report Shareholder information IFRS financial statements Appendix
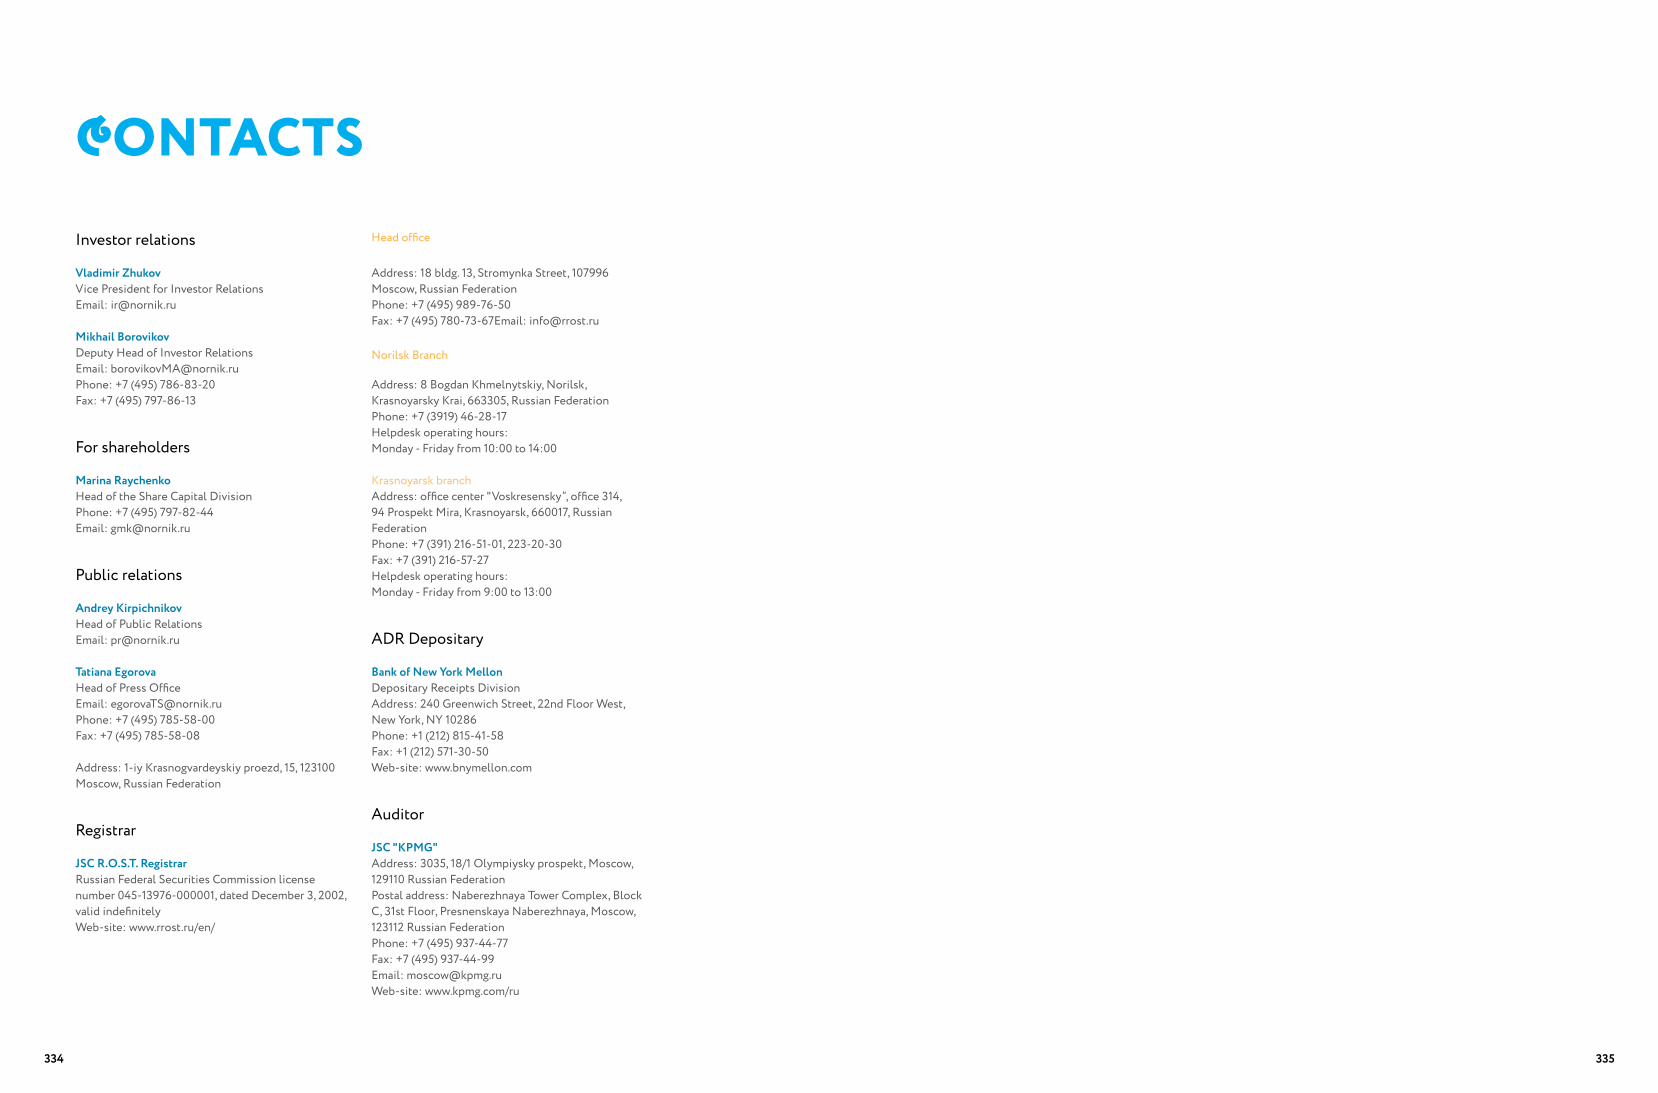
CONTACTSInvestor relations
Vladimir Zhukov Vice President for Investor Relations Email: [email protected]
Mikhail Borovikov Deputy Head of Investor Relations Email: [email protected] Phone: +7 (495) 786-83-20 Fax: +7 (495) 797-86-13
For shareholders
Marina Raychenko Head of the Share Capital Division Phone: +7 (495) 797-82-44 Email: [email protected]
Public relations
Andrey Kirpichnikov Head of Public Relations Email: [email protected]
Tatiana Egorova Head of Press Office Email: [email protected] Phone: +7 (495) 785-58-00 Fax: +7 (495) 785-58-08
Address: 1-iy Krasnogvardeyskiy proezd, 15, 123100 Moscow, Russian Federation
Registrar
JSC R.O.S.T. Registrar Russian Federal Securities Commission license number 045-13976-000001, dated December 3, 2002, valid indefinitely Web-site: www.rrost.ru/en/
Head office
Address: 18 bldg. 13, Stromynka Street, 107996 Moscow, Russian Federation Phone: +7 (495) 989-76-50 Fax: +7 (495) 780-73-67Email: [email protected]
Norilsk Branch
Address: 8 Bogdan Khmelnytskiy, Norilsk, Krasnoyarsky Krai, 663305, Russian Federation Phone: +7 (3919) 46-28-17 Helpdesk operating hours: Monday - Friday from 10:00 to 14:00
Krasnoyarsk branch Address: office center "Voskresensky”, office 314, 94 Prospekt Mira, Krasnoyarsk, 660017, Russian Federation Phone: +7 (391) 216-51-01, 223-20-30 Fax: +7 (391) 216-57-27 Helpdesk operating hours: Monday - Friday from 9:00 to 13:00
ADR Depositary
Bank of New York Mellon Depositary Receipts Division Address: 240 Greenwich Street, 22nd Floor West, New York, NY 10286 Phone: +1 (212) 815-41-58 Fax: +1 (212) 571-30-50 Web-site: www.bnymellon.com
Auditor
JSC "KPMG" Address: 3035, 18/1 Olympiysky prospekt, Moscow, 129110 Russian Federation Postal address: Naberezhnaya Tower Complex, Block C, 31st Floor, Presnenskaya Naberezhnaya, Moscow, 123112 Russian Federation Phone: +7 (495) 937-44-77 Fax: +7 (495) 937-44-99 Email: [email protected] Web-site: www.kpmg.com/ru
334 335
Related Documents