Annual Report 2018-19 Expanding. Integrating. Progressing. Start Strong. Grow Stronger. Cement

Welcome message from author
This document is posted to help you gain knowledge. Please leave a comment to let me know what you think about it! Share it to your friends and learn new things together.
Transcript
Annual Report 2018-19
Expanding. Integrating. Progressing.
Start Strong. Grow Stronger.
Cement

Way back in 1952, an age before the phrase entered public discourse, Shri O. P. Jindal heralded ‘Make in India’ with a small scale manufacturing unit in his home town of Hisar in Haryana. In its ground-breaking wake came a pipe manufacturing company, the Jindal Group and an industrial folklore built with steel and power.
For more than five decades, as young India, born from colonial subjugation to democratic freedom, built itself into a modern state, Shri O. P. Jindal epitomised enterprise, nationalism, innovation and social service. He sired and took his eponymous business organisation to stellar heights, strengthening at every step his commitment to social work and nation building.
On this day countless individuals in the Jindal family and beyond salute his spirit, which will forever guide our destiny.
GREAT LEADERS INSPIRE COUNTLESS LIVES,
LEAVE EVERLASTING MEMORIES, TO FOREVER GUIDE DESTINIES.
Shri O. P. JindalAugust 7, 1930 to March 31, 2005
Visionary and Founder ‒ O. P. Jindal Group

12.8 MTPA
J2,771.8 crores
J90.3 crores
J440.5 crores
In This ReportCorporate Overview4 About JSW Cement6 Chairman’s Insight8 Message from the MD’s Desk10 Our Value Chain11 Our Projects12 Our Brand14 Our Offerings16 Our Presence18 Our Operational Presence20 Our Journey22 Operational Highlights23 Key Performance Indicators
(Consolidated)24 Megatrends26 Value Creation Model28 Board of Directors30 Risk Management Framework32 Corporate Social Responsibility36 People at JSW Cement38 Safety41 Awards and Recognitions
Statutory Reports42 Management Discussion
and Analysis 52 Corporate Information53 Directors’ Report82 Corporate Governance
Standalone Financial Statements95 Independent Auditors' Report102 Standalone Balance Sheet103 Standalone Statement of Profit
and Loss104 Standalone Cash Flow Statement107 Notes to Standalone Financial
Statements
Consolidated Financial Statements168 Independent Auditors' Report174 Consolidated Balance Sheet175 Consolidated Statement of Profit
and Loss176 Consolidated Cash Flow Statements179 Notes to Consolidated Financial
Statements
Financial Highlights246 Financial Highlights (Standalone)247 Financial Highlights (Consolidated)
Total cement production capacity
Net profit (Profit After Tax)
Total income
Operating EBIDTA
Performance Highlights (Consolidated)
Forward-looking StatementIn this Annual Report, we have disclosed forward-looking information to enable investors to comprehend our prospects and take investment decisions. This Report and other statements – written and oral – that we periodically make, contain forward-looking statements that set out anticipated results based on the Management’s plans and assumptions. We have tried, wherever possible, to identify such statements by using words such as ‘anticipates’, ‘estimates’, ‘expects’, ‘projects’, ‘intends’, ‘plans’, ‘believes’, and words of similar substance in connection with any discussion of future performance. We cannot guarantee that these forward-looking statements will be realised, although we believe we have been prudent in our assumptions. The achievements of results are subject to risks, uncertainties and even inaccurate assumptions. Should known or unknown risks or uncertainties materialise, or underlying assumptions prove inaccurate, actual results could vary materially from those anticipated, estimated or projected. Readers should keep this in mind. We undertake no obligation to publicly update any forward-looking statement, whether as a result of new information, future event or otherwise.
Message from the MD’s Desk 8
Our Operational Presence 18
Corporate Social Responsibility 32
Annual Report 2018-192
JSW Cement Limited
At JSW Cement, we are on a journey to build a self-reliant India.
An India that is recognised globally as a strong infrastructural force.
An India that is at the fore of economic growth.
An India that is advancing towards a sustainable future.
3Expanding. Integrating. Progressing
Corporate O
verviewFinancial S
tatements
Statutory Reports
By ‘Expanding’, ‘Integrating’ and ‘Progressing, JSW Cement is on a steady path to becoming a cement leader, while creating long-term value for all its stakeholders.
Since inception, we have been making big strides in this journey, with small steps to enhance our efficiencies.
We are growing tenaciously by ramping up capacities to meet the increasing demand for cement. We are also poised to make strategic acquisitions as and when the opportunity knocks on our doors.
Sustainability and technology are two important pillars that support our dynamic growth. We leverage contemporary technology to successfully integrate sustainability in production processes by converting industrial by-products, such as slag, into cement.
With large infrastructural projects already underway in southern and western India, we are all set to expand our footprint in other parts of the country as well.
Annual Report 2018-194
JSW Cement Limited
About JSW Cement
JSW Cement – Strengthening India
Today, we are India’s leading manufacturer of ‘green cement’, thereby contributing to reduced pollution and natural resource conservation in the country. Moreover, by converting industrial by-products, such as slag, into ‘green cement’, we have been cognisant of reducing India’s ecological risk of industrial by-product dumping. We are also India’s largest manufacturers of premium-quality Portland Slag Cement (PSC), an eco-friendly alternative and a widely used variant of cement.
Our range of quality products – PSC, Ground Granulated Blast Furnace Slag (GGBS), Ordinary Portland Cement (OPC), Concreel HD and the newly launched Composite Cement – cater to the demands of our retail consumers and serve several large, prestigious infrastructure and government projects in various parts of India. We have strong market presence in southern and western India and are expanding tenaciously in the eastern part of
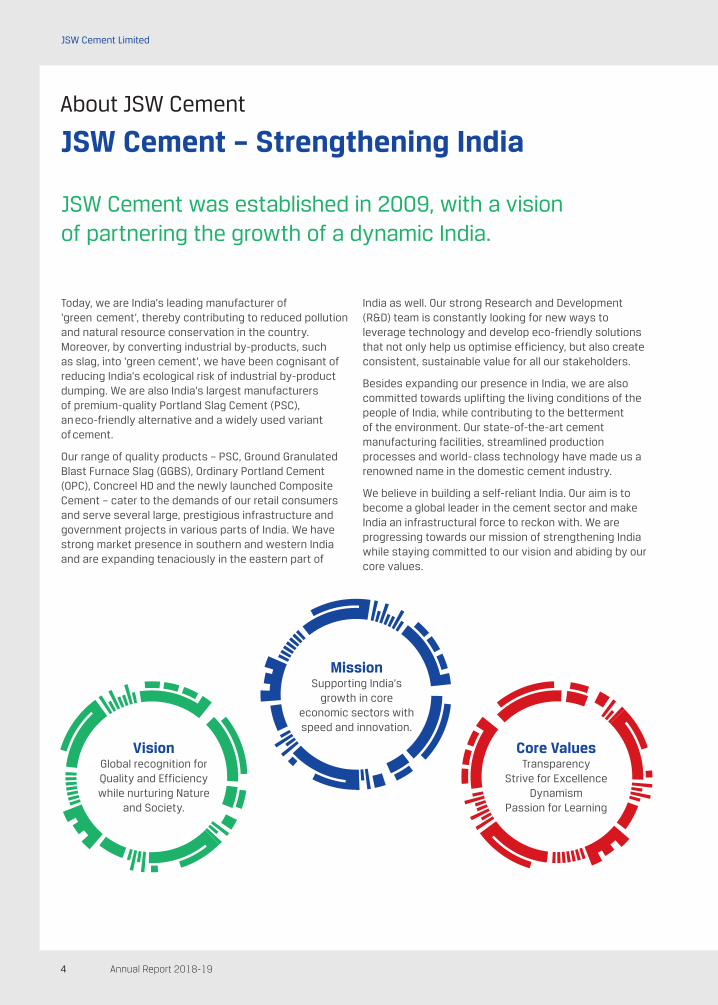
JSW Cement was established in 2009, with a vision of partnering the growth of a dynamic India.
India as well. Our strong Research and Development (R&D) team is constantly looking for new ways to leverage technology and develop eco-friendly solutions that not only help us optimise efficiency, but also create consistent, sustainable value for all our stakeholders.
Besides expanding our presence in India, we are also committed towards uplifting the living conditions of the people of India, while contributing to the betterment of the environment. Our state-of-the-art cement manufacturing facilities, streamlined production processes and world- class technology have made us a renowned name in the domestic cement industry.
We believe in building a self-reliant India. Our aim is to become a global leader in the cement sector and make India an infrastructural force to reckon with. We are progressing towards our mission of strengthening India while staying committed to our vision and abiding by our core values.
Core ValuesTransparency
Strive for Excellence Dynamism
Passion for Learning
VisionGlobal recognition for Quality and Efficiency while nurturing Nature
and Society.
MissionSupporting India’s
growth in core economic sectors with speed and innovation.
5Expanding. Integrating. Progressing
Corporate O
verviewFinancial S
tatements
Statutory Reports
Production (in MMT)
Production (in MMT)
Production (in MMT)
Production (in MMT)
Production (in MMT) Production (in MMT) *Production (in MMT)
Sales (in MMT)
Sales (in MMT)
Sales (in MMT)
Sales (in MMT)
Sales (in MMT) Sales (in MMT) Sales (in MMT)
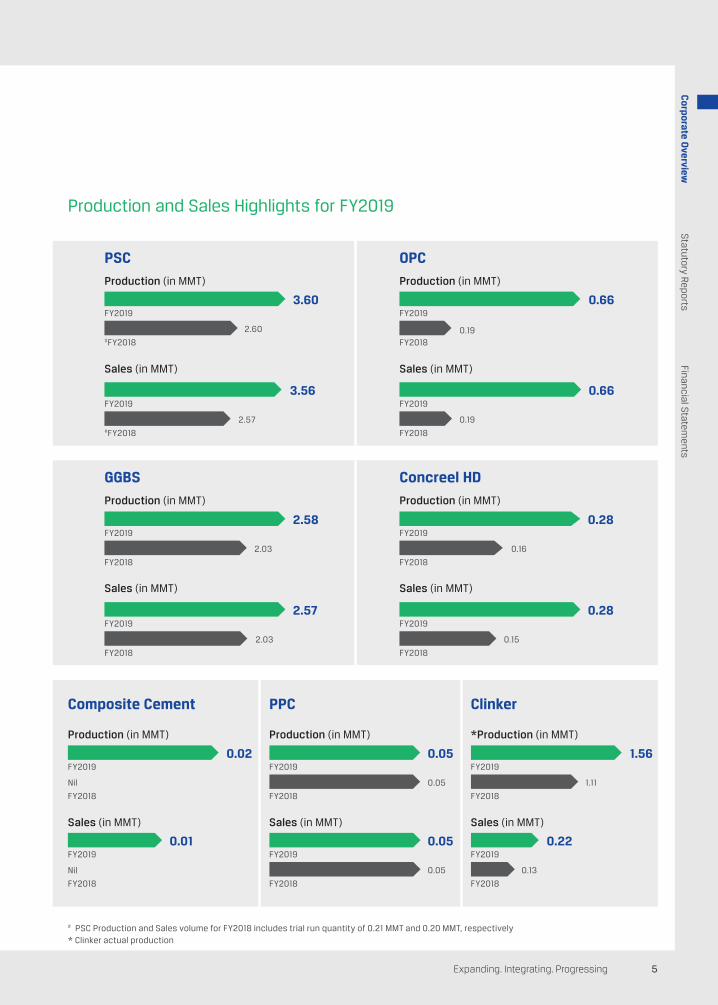
Production and Sales Highlights for FY2019
PSC
GGBS
OPC
Concreel HD
Composite Cement PPC Clinker
FY2019
FY2019
FY2019
FY2019
FY2019 FY2019 FY2019
FY2019
FY2019
FY2019
FY2019
FY2019 FY2019 FY2019
#FY2018
FY2018
FY2018
FY2018
FY2018 FY2018 FY2018
#FY2018
FY2018
FY2018
FY2018
FY2018 FY2018 FY2018
# PSC Production and Sales volume for FY2018 includes trial run quantity of 0.21 MMT and 0.20 MMT, respectively* Clinker actual production
2.60
2.03
0.19
0.16
Nil 0.05 1.11
2.57
2.03
0.19
0.15
Nil 0.05 0.13
3.60
2.58
0.66
0.28
0.02 0.05 1.56
3.56
2.57
0.66
0.28
0.01 0.05 0.22
Annual Report 2018-196
JSW Cement Limited
Chairman’s Insight
Building a Self-reliant, Strong and Dynamic India
Dear Shareholders,I inform you with immense pleasure that in FY2019, we have delivered excellent performance on both financial and operational parameters across our business. This fiscal year saw us expand our presence in Eastern India, foray into new markets and increase our cement capacities, after making use of the capacities we had in place. FY2019 has been exceptional, with our EBIDTA rising by 39%. Our capacity and revenue growth enabled us to invest a significant amount in promoting social and environmental development. On the back of this growth, we aspire to support India’s growth in core economic sectors with speed and innovation.
All these achievements are indeed commendable and have brought us closer to our vision of being globally recognised for quality, efficiency and superior value creation. I would like to thank everyone at JSW Cement for this tour de force.
While the global economy witnessed robust and integrated growth in 2017, growth moderated and weakened to 3.6% in 2018. This slowdown is due to the negative effects of tariff increases enacted in the US and China, and softer momentum in Europe in the second half of 2018. Moreover, emerging markets and developing economies were hit by substantial financial market pressures. Downside risks have increased, including the possibility of disorderly financial market movements and escalating trade disputes. All these factors could end up denting global growth. Back home, the Indian economy witnessed a growth rate of 6.8% in FY2019, marginally higher than 6.7% in FY2018. A rise in consumption, gradual revival in investments, coupled with infrastructure development, steady decline in inflation and the complementary appreciation of the Rupee contributed to this growth. Moreover, the various reform measures introduced by the government helped create an environment conducive to investments. Despite softer growth, India is one of the fastest growing economies.
India is the second-largest producer of cement in the world. According to ICRA, the country’s cement industry recorded an average 13.6% y-o-y growth in volumes to 275.7 Million Metric Tonnes (MMT) towards the end of CY2018, on the back of sustained demand from infrastructure and affordable housing. In FY2020, a capacity of ~17-18 MMT is expected to get added. At the pan-India level, prices in most markets were 3-8% lower between April 2018 and February 2019 compared to the same period in the previous fiscal. However, input costs eased in the recent months, mainly on the back of lower pet coke prices and freight expenses. Also, cement prices shot up towards the end of February and early March 2019. The government announced the setting up of an Affordable Housing Fund of `25,000 crores ($3.86 billion) under the National Housing Bank (NHB), which will ease credit to homebuyers. This move is expected to boost the demand for cement from the
Nirmal Kumar JainChairman
7Expanding. Integrating. Progressing
Corporate O
verviewFinancial S
tatements
Statutory Reports
housing segment. The future of the cement industry is expected to be bright, with the eastern states emerging as potential markets for cement companies. The increasing demand in various sectors is likely to propel the cement industry to reach 550-600 MTPA by 2025 (Source: IBEF).
Your Company has taken a giant stride in performance in FY2019. Our overall sales volume grew by 43% compared to FY2018, recording a sale of 7.35 MTPA. We continue to expand our footprint and are strategising to keep raw material costs at bay. We added an incremental capacity of 1.2 MTPA to our Dolvi plant. Demand for Ground Granulated Blast Furnace Slag (GGBS) witnessed an exponential growth of 26% this fiscal. Our capacity expansions are contributing to this increased product demand. In a bid to increase our limestone capacity, we accumulated 54.4% stake in Shiva Cement Limited in Odisha, which has sizeable limestone reserves (~120 MT). This year was a landmark one for us with the launch of various EBITDA-accretive products such as Composite Cement in South, Slag Sand and Ready Mix Concrete (RMC). This, along with a high customer satisfaction rate with Composite Cement, played an intrinsic role in our revenue growth this fiscal.
Information Technology (IT) plays a crucial role in building and sustaining the competitive edge of your Company. Through the SAP platform, we implement initiatives to strengthen our business operations, enhance productivity, improve customer engagement, enable cost reduction, embed analytics and facilitate management decision-making. During the year, we undertook several initiatives, such as digitisation of our Procure to Pay, in- plant logistics and hire-to-retire processes, to enhance our digital posture.
Looking forward, we are confident about FY2020. Global economic growth is continuing, although it is expected to weaken slightly. To leverage this growth, we plan to ramp up our capacity to 30 MTPA by FY2025. As a stepping stone to this goal, we are increasing capacities by setting up a cement-grinding facility in Odisha with a capacity of 1.2 MTPA. Including a 1.8 MTPA cement-grinding facility at Dolvi, Maharashtra and a 1 MTPA clinker facility at our wholly owned subsidiary in Fujairah, UAE. Simultaneously, we are leveraging the opportunities
created in the market due to the various government initiatives undertaken to boost infrastructure. Your Company is also gearing up to get listed within the next two years, which will lead to significant value unlocking, besides providing growth capital.
At JSW Cement, our operational efficiencies form the backbone of our production processes. To substantially reduce power costs, we plan to set up captive thermal power plants in Salboni and Nandyal of 18 MW each in FY2020 and captive solar power plants in Salboni and Nandyal of 5.45 MW and 3.5 MW, respectively. We also invested in alternate fuel systems to curtail the overall fuel costs. Additionally, your Company has decided to foray into building material products, such as adhesives for tiles to tap the brimming potential of that market.
We prioritise sustainability in our activities: for our shareholders, customers, employees, suppliers and business partners, the society and for preserving the environment. Consequently, we integrate economic, ecological and social goals into our business strategy. With the help of our employee volunteers, we are engaging in exemplary work in the areas of health, education, women empowerment, cleanliness, rural development and safety. This year, your Company contributed `5 crores for uplifting the lives of those less privileged.
JSW Cement is well positioned for sustainable and profitable growth. I would like to thank all our people, partners and stakeholders for further strengthening JSW Cement’s role in building a strong India. We are optimistic of progressing steadily in the years to come and request your unwavering trust and support in our journey.
Best regards,
Nirmal Kumar JainChairman
This year was a landmark one for us with the launch of various EBITDA-accretive products such as Composite Cement, Slag Sand and Ready Mix Concrete (RMC).
Annual Report 2018-198
JSW Cement Limited
Message from the MD’s Desk
Accelerating Momentum. Increasing Profitability.
Building for growth
We grew faster than the market and recorded a volume growth of 43%, along with a high EBITDA growth of 39%. We added 1.2 MTPA of installed capacity last year in Dolvi, Maharashtra, which increased our total installed capacity to 12.8 MTPA. We also plan to add a capacity of 1.2 MTPA by July 2019 in Jajpur, Odisha. With these additional capacities, we are well positioned to meet the demand of growing cement market. Improving efficiency and increasing throughput is crucial to maximising profitability. We have, therefore, undertaken the process of debottlenecking at Salboni, West Bengal and Vijayanagar, Karnataka. This process will help us optimise and increase the overall capacity of the plants. To expand our presence in the market, we are foraying into new products, such as the Ready Mix Concrete (RMC). As our Composite Cement product was well-received in the South, we are looking forward to launching it in the East by mid- July 2019. Additionally, on the back of the added capacity in the Jajpur plant and a large manufacturing base, we are optimistic of strengthening our position in Odisha. While we are successfully growing our cement business, we are also taking tiny steps in the chemical and automatic brick manufacturing businesses.
Tapping the sea of opportunities
Infrastructure growth and the 'Housing for All' scheme are expected to boost the demand for cement. This demand is likely to have a multiplier effect and increase retail demand. JSW Cement is geared up to capitalise on these opportunities through its product mix, project pipeline and additional capacities. We have a large footprint in the South and West, and are focusing on expanding our presence in the East. We are expanding to other parts of India as well. We successfully bid for limestone reserves in Rajasthan and Gujarat. In line with the demand emanating from these states as well as from Punjab, Haryana and NCR, we plan to set up integrated cement plants at Rajasthan and Gujarat, along with grinding units in the neighbouring states.
Innovating for success
At JSW Cement, our aim is to leverage innovation and technology along our value chain, from processes and products to the worksite. Our R&D team is constantly at work to find new solutions. Slag is a by-product in steel production. At JSW Cement, we use the slag from JSW Steel for comprehensive cement production. To enhance the
Parth JindalManaging Director
Dear Shareholders,It is with immense delight that I share with you JSW Cement’s Annual Report for FY2019. This year was marked by significant ‘Expansion,’ ‘Integration’ and ‘Progress’. Our momentum accelerated during the year – we exceeded our sales targets, recorded the highest EBITDA figures and profits increased significantly. We are deeply committed to becoming a leading player in the cement sector by continuing to manufacture eco- friendly cement and driving innovation.
9Expanding. Integrating. Progressing
Corporate O
verviewFinancial S
tatements
Statutory Reports
efficacy of this process and understand more about the different uses of slag for cement production, we have tied up with FEhS Institute, an institute for building materials research in Germany. Similarly, we have collaborated with laboratories in China to convert waste (slag) to wealth (cement). I am proud to inform you that we are the only cement company in India that is engaged in this process.
We are also enhancing the performance of our premium products by using additives. Additives help in bringing down the cost of the product as they can replace the costly raw materials, while continuing to provide optimal performance. We have undertaken extensive research in this area and are preparing ourselves to manufacture additives, if the research proves to be a success.
Our Company also plans to set up a slag sand unit of 125 TPH capacity at Dolvi, Maharashtra and has acquired a unit of 125 TPH capacity from JSW Steel at Vijayanagar, Karnataka, considering the fast growth of the cement sector and the shortage of fine aggregates (sand) needed for concrete. Slag sand is a growing segment due to the heavy scarcity of river sand. We will now be able to market slag sand as it caters to the construction industry where it is an input. This provides an opportunity to market both cement and sand as a complete solution to the construction industry.
Creating value for the society
While our financial results attest to a successful strategy, this only tells part of the story. JSW Cement aims at improving people’s lives and spurring economic growth through its products and services. We undertake social activities across areas of health, sanitation, education and livelihood. While we are implementing several projects in empowering communities, one project that stands close to my heart is the one we undertook in Nandyal, Andhra Pradesh. As part of the Swachh Bharat Mission, we constructed toilets in several parts of Nandyal, making it an Open Defecation Free (ODF) zone. Our team spread awareness about the importance of solid waste management among the people of Nandyal and encouraged them to retain the status of Nandyal as an ODF area.
In Salboni, West Bengal, we undertook a varied range of initiatives to uplift the lives of the communities in the vicinity of our plant. We organised a mobile health
camp that provided free medical consultation and tests, and distributed free medicines in several villages. Through Self Help Group (SHG) promotion and village entrepreneurship development, we provided sustainable income-generation trainings to women. Additionally, to encourage girls to pursue higher education, we organised coaching classes in Maths, Science and English for students at secondary school level, with assistance from external faculty. We also educated farmers about farm and non-farm practices to improve the yields, and thereby their livelihoods.
Respect and responsibility towards the needs of our stakeholders is part of our culture. Therefore, upholding health and safety as a core value is crucial to us. I am happy to report that we have taken a major stride in establishing a zero-harm culture in our organisation.
Marching towards a bright future
We are a green cement company with our CO2 footprint being among the lowest in India. We aspire to be a national player in the eco-friendly cement business. We are striving to develop a clear roadmap for brownfield and greenfield expansions to 30 MT per annum and beyond. We have already set the ball rolling to achieve this by strengthening our footprint in Rajasthan, Central India and some parts of Gujarat. It is our vision to be at the forefront of sustainable construction solutions and innovation, while fulfilling our commitment towards the society as a whole. We will, therefore, continue to live up to the responsibilities that accompany our presence in the country and create sustainable value for all those associated with us.
Finally, I would like to express my gratitude to the entire team of JSW Cement, who make our success possible every day. For FY2020, we expect solid demand for our products and aim to grow our business profitably. Our strengthened high-performance culture is underpinned by our core values of Transparency, Strive for Excellence, Dynamism and Passion for Learning. I am optimistic that we will continue to uphold these values and attain new heights of success and excellence.
Best regards,
Parth JindalManaging Director
At JSW Cement, our aim is to leverage innovation and technology along our value chain, from processes and products to the worksite.
Annual Report 2018-1910
JSW Cement Limited
Our Value Chain
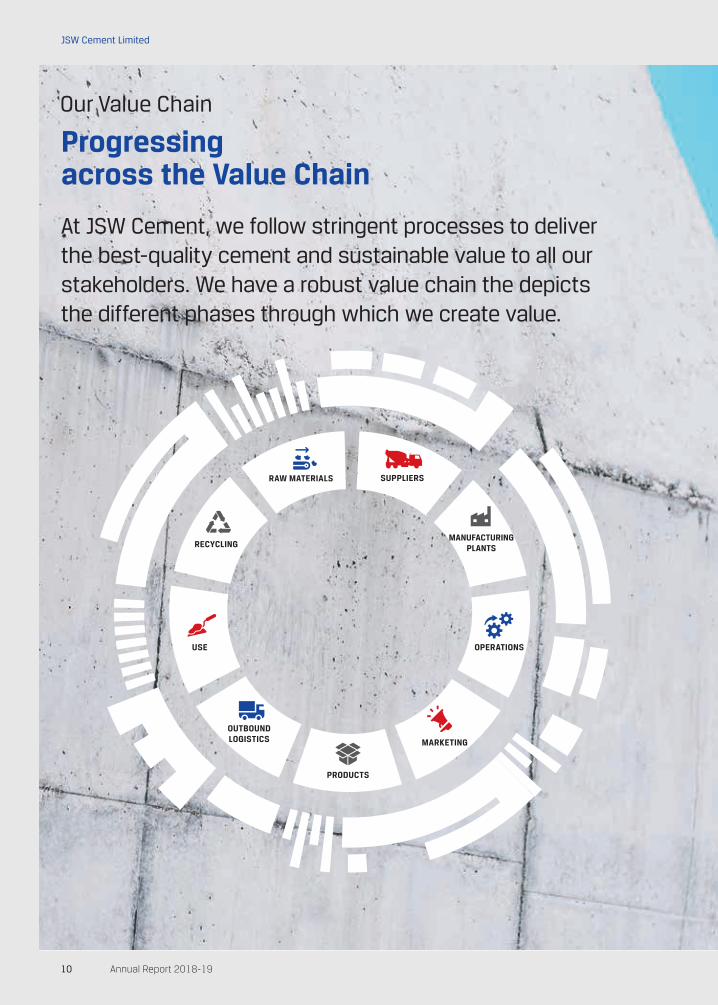
Progressing across the Value Chain
At JSW Cement, we follow stringent processes to deliver the best-quality cement and sustainable value to all our stakeholders. We have a robust value chain the depicts the different phases through which we create value.
RAW MATERIALS SUPPLIERS
MANUFACTURING PLANTS
OPERATIONS
PRODUCTS
MARKETING
OUTBOUND LOGISTICS
USE
RECYCLING

11Expanding. Integrating. Progressing
Corporate O
verviewFinancial S
tatements
Statutory Reports
Our Projects
Strengthening India’s Infrastructure
Cementing the culture of innovation and sustainability, we are a proud contributor to India’s infrastructural development through projects.
CHENNAI PORT (L&T AND ECC
GEO STRUCTURE), TAMIL NADU
MUMBAI PORT TRUST YETTINAHOLE AQUEDUCT
PROJECT, BANGALORE
NATIONAL HIGHWAY
MUMBAI, GOA
LODHA WORLD ONE, MUMBAI MUMBAI ELEVATED METRO
Annual Report 2018-1912
JSW Cement Limited
Our Brand
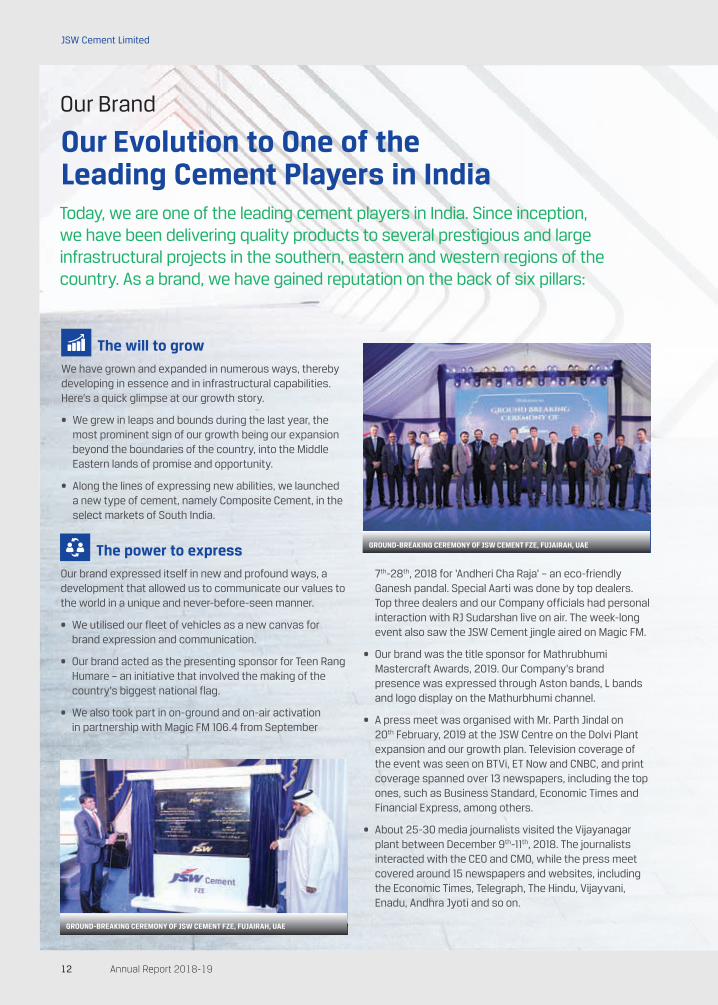
Our Evolution to One of the Leading Cement Players in IndiaToday, we are one of the leading cement players in India. Since inception, we have been delivering quality products to several prestigious and large infrastructural projects in the southern, eastern and western regions of the country. As a brand, we have gained reputation on the back of six pillars:
We have grown and expanded in numerous ways, thereby developing in essence and in infrastructural capabilities. Here’s a quick glimpse at our growth story.
• We grew in leaps and bounds during the last year, the most prominent sign of our growth being our expansion beyond the boundaries of the country, into the Middle Eastern lands of promise and opportunity.
• Along the lines of expressing new abilities, we launched a new type of cement, namely Composite Cement, in the select markets of South India.
Our brand expressed itself in new and profound ways, a development that allowed us to communicate our values to the world in a unique and never-before-seen manner.
• We utilised our fleet of vehicles as a new canvas for brand expression and communication.
• Our brand acted as the presenting sponsor for Teen Rang Humare – an initiative that involved the making of the country's biggest national flag.
• We also took part in on-ground and on-air activation in partnership with Magic FM 106.4 from September
The power to express
7th-28th, 2018 for ‘Andheri Cha Raja’ – an eco-friendly Ganesh pandal. Special Aarti was done by top dealers. Top three dealers and our Company officials had personal interaction with RJ Sudarshan live on air. The week-long event also saw the JSW Cement jingle aired on Magic FM.
• Our brand was the title sponsor for Mathrubhumi Mastercraft Awards, 2019. Our Company's brand presence was expressed through Aston bands, L bands and logo display on the Mathurbhumi channel.
• A press meet was organised with Mr. Parth Jindal on 20th February, 2019 at the JSW Centre on the Dolvi Plant expansion and our growth plan. Television coverage of the event was seen on BTVi, ET Now and CNBC, and print coverage spanned over 13 newspapers, including the top ones, such as Business Standard, Economic Times and Financial Express, among others.
• About 25-30 media journalists visited the Vijayanagar plant between December 9th-11th, 2018. The journalists interacted with the CEO and CMO, while the press meet covered around 15 newspapers and websites, including the Economic Times, Telegraph, The Hindu, Vijayvani, Enadu, Andhra Jyoti and so on.
The will to grow
GROUND-BREAKING CEREMONY OF JSW CEMENT FZE, FUJAIRAH, UAE
GROUND-BREAKING CEREMONY OF JSW CEMENT FZE, FUJAIRAH, UAE
13Expanding. Integrating. Progressing
Corporate O
verviewFinancial S
tatements
Statutory Reports
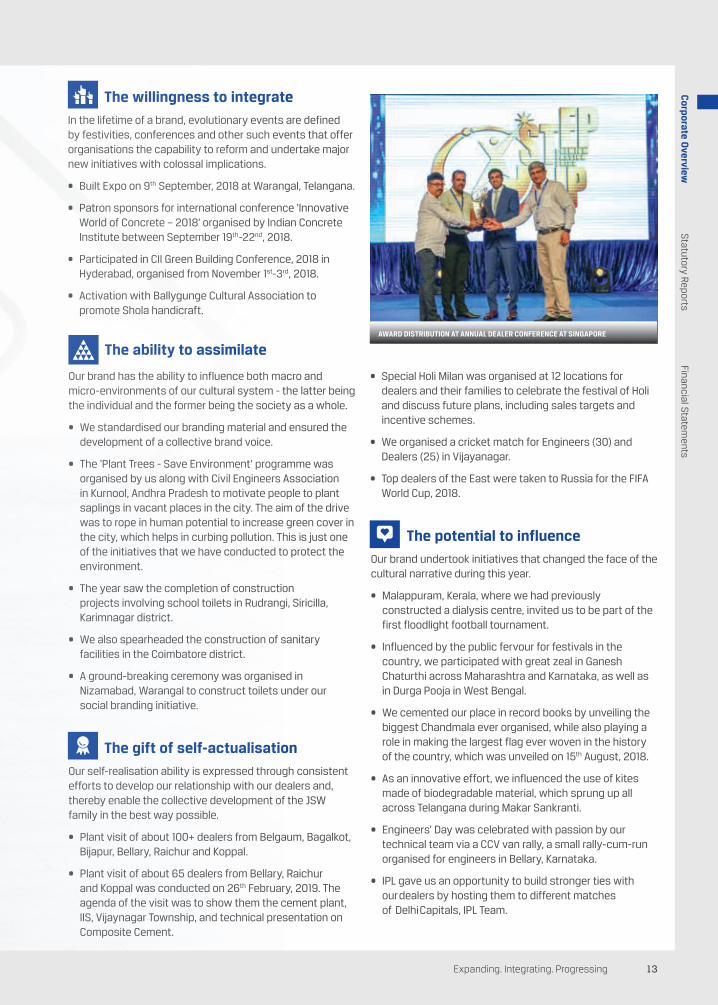
Our brand has the ability to influence both macro and micro-environments of our cultural system - the latter being the individual and the former being the society as a whole.
• We standardised our branding material and ensured the development of a collective brand voice.
• The ‘Plant Trees - Save Environment’ programme was organised by us along with Civil Engineers Association in Kurnool, Andhra Pradesh to motivate people to plant saplings in vacant places in the city. The aim of the drive was to rope in human potential to increase green cover in the city, which helps in curbing pollution. This is just one of the initiatives that we have conducted to protect the environment.
• The year saw the completion of construction projects involving school toilets in Rudrangi, Siricilla, Karimnagar district.
• We also spearheaded the construction of sanitary facilities in the Coimbatore district.
• A ground-breaking ceremony was organised in Nizamabad, Warangal to construct toilets under our social branding initiative.
In the lifetime of a brand, evolutionary events are defined by festivities, conferences and other such events that offer organisations the capability to reform and undertake major new initiatives with colossal implications.
• Built Expo on 9th September, 2018 at Warangal, Telangana.
• Patron sponsors for international conference ‘Innovative World of Concrete – 2018’ organised by Indian Concrete Institute between September 19th-22nd, 2018.
• Participated in CII Green Building Conference, 2018 in Hyderabad, organised from November 1st-3rd, 2018.
• Activation with Ballygunge Cultural Association to promote Shola handicraft.
Our self-realisation ability is expressed through consistent efforts to develop our relationship with our dealers and, thereby enable the collective development of the JSW family in the best way possible.
• Plant visit of about 100+ dealers from Belgaum, Bagalkot, Bijapur, Bellary, Raichur and Koppal.
• Plant visit of about 65 dealers from Bellary, Raichur and Koppal was conducted on 26th February, 2019. The agenda of the visit was to show them the cement plant, IIS, Vijaynagar Township, and technical presentation on Composite Cement.
The ability to assimilate
The willingness to integrate
The gift of self-actualisation
• Special Holi Milan was organised at 12 locations for dealers and their families to celebrate the festival of Holi and discuss future plans, including sales targets and incentive schemes.
• We organised a cricket match for Engineers (30) and Dealers (25) in Vijayanagar.
• Top dealers of the East were taken to Russia for the FIFA World Cup, 2018.
Our brand undertook initiatives that changed the face of the cultural narrative during this year.
• Malappuram, Kerala, where we had previously constructed a dialysis centre, invited us to be part of the first floodlight football tournament.
• Influenced by the public fervour for festivals in the country, we participated with great zeal in Ganesh Chaturthi across Maharashtra and Karnataka, as well as in Durga Pooja in West Bengal.
• We cemented our place in record books by unveiling the biggest Chandmala ever organised, while also playing a role in making the largest flag ever woven in the history of the country, which was unveiled on 15th August, 2018.
• As an innovative effort, we influenced the use of kites made of biodegradable material, which sprung up all across Telangana during Makar Sankranti.
• Engineers’ Day was celebrated with passion by our technical team via a CCV van rally, a small rally-cum-run organised for engineers in Bellary, Karnataka.
• IPL gave us an opportunity to build stronger ties with our dealers by hosting them to different matches of Delhi Capitals, IPL Team.
The potential to influence
AWARD DISTRIBUTION AT ANNUAL DEALER CONFERENCE AT SINGAPORE
Annual Report 2018-1914
JSW Cement Limited
Our Offerings
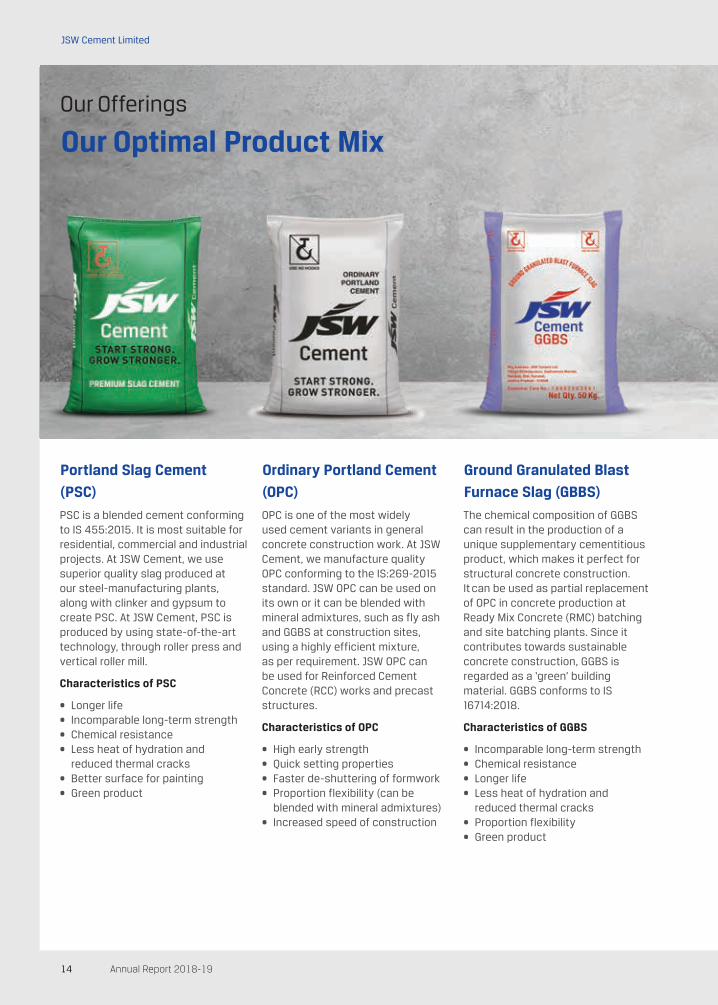
Our Optimal Product Mix
PSC is a blended cement conforming to IS 455:2015. It is most suitable for residential, commercial and industrial projects. At JSW Cement, we use superior quality slag produced at our steel-manufacturing plants, along with clinker and gypsum to create PSC. At JSW Cement, PSC is produced by using state-of-the-art technology, through roller press and vertical roller mill.
Characteristics of PSC
• Longer life• Incomparable long-term strength • Chemical resistance• Less heat of hydration and
reduced thermal cracks• Better surface for painting• Green product
OPC is one of the most widely used cement variants in general concrete construction work. At JSW Cement, we manufacture quality OPC conforming to the IS:269-2015 standard. JSW OPC can be used on its own or it can be blended with mineral admixtures, such as fly ash and GGBS at construction sites, using a highly efficient mixture, as per requirement. JSW OPC can be used for Reinforced Cement Concrete (RCC) works and precast structures.
Characteristics of OPC
• High early strength• Quick setting properties• Faster de-shuttering of formwork• Proportion flexibility (can be
blended with mineral admixtures)• Increased speed of construction
The chemical composition of GGBS can result in the production of a unique supplementary cementitious product, which makes it perfect for structural concrete construction. It can be used as partial replacement of OPC in concrete production at Ready Mix Concrete (RMC) batching and site batching plants. Since it contributes towards sustainable concrete construction, GGBS is regarded as a ‘green’ building material. GGBS conforms to IS 16714:2018.
Characteristics of GGBS
• Incomparable long-term strength • Chemical resistance• Longer life• Less heat of hydration and
reduced thermal cracks• Proportion flexibility• Green product
Portland Slag Cement
(PSC)
Ordinary Portland Cement
(OPC)
Ground Granulated Blast
Furnace Slag (GBBS)
15Expanding. Integrating. Progressing
Corporate O
verviewFinancial S
tatements
Statutory Reports
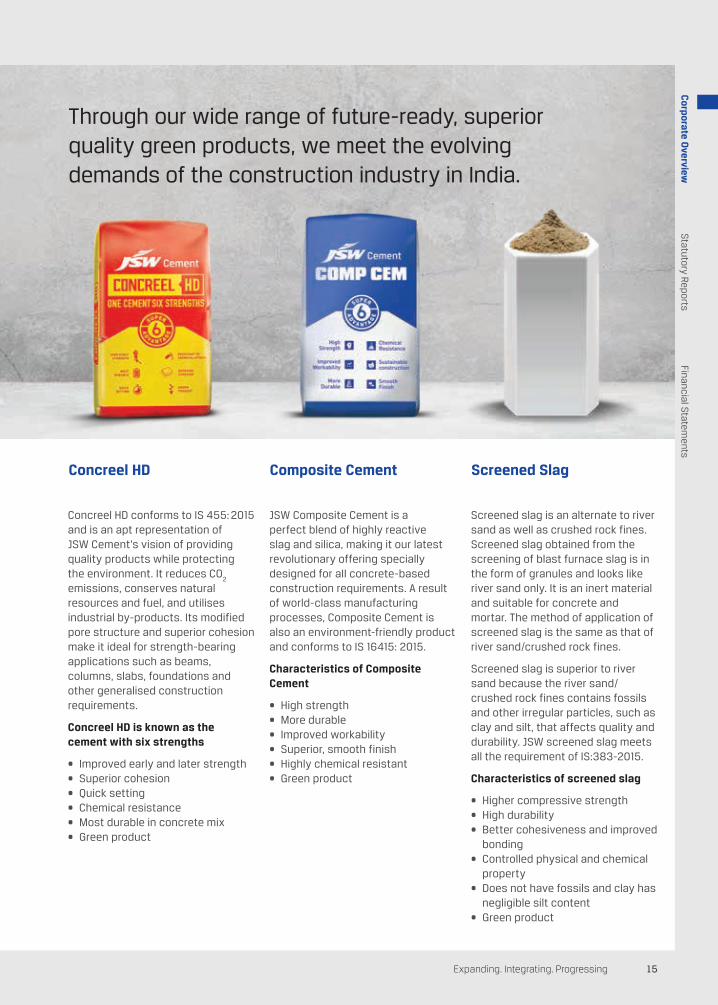
Concreel HD conforms to IS 455: 2015 and is an apt representation of JSW Cement’s vision of providing quality products while protecting the environment. It reduces CO
2
emissions, conserves natural resources and fuel, and utilises industrial by-products. Its modified pore structure and superior cohesion make it ideal for strength-bearing applications such as beams, columns, slabs, foundations and other generalised construction requirements.
Concreel HD is known as the cement with six strengths
• Improved early and later strength• Superior cohesion• Quick setting • Chemical resistance• Most durable in concrete mix• Green product
JSW Composite Cement is a perfect blend of highly reactive slag and silica, making it our latest revolutionary offering specially designed for aII concrete-based construction requirements. A result of world-class manufacturing processes, Composite Cement is also an environment-friendly product and conforms to IS 16415: 2015.
Characteristics of Composite Cement
• High strength• More durable• Improved workability• Superior, smooth finish• Highly chemical resistant• Green product
Screened slag is an alternate to river sand as well as crushed rock fines. Screened slag obtained from the screening of blast furnace slag is in the form of granules and looks like river sand only. It is an inert material and suitable for concrete and mortar. The method of application of screened slag is the same as that of river sand/crushed rock fines.
Screened slag is superior to river sand because the river sand/crushed rock fines contains fossils and other irregular particles, such as clay and silt, that affects quality and durability. JSW screened slag meets all the requirement of IS:383-2015.
Characteristics of screened slag
• Higher compressive strength• High durability• Better cohesiveness and improved
bonding• Controlled physical and chemical
property• Does not have fossils and clay has
negligible silt content• Green product
Concreel HD Composite Cement Screened Slag
Through our wide range of future-ready, superior quality green products, we meet the evolving demands of the construction industry in India.
Annual Report 2018-1916
JSW Cement Limited
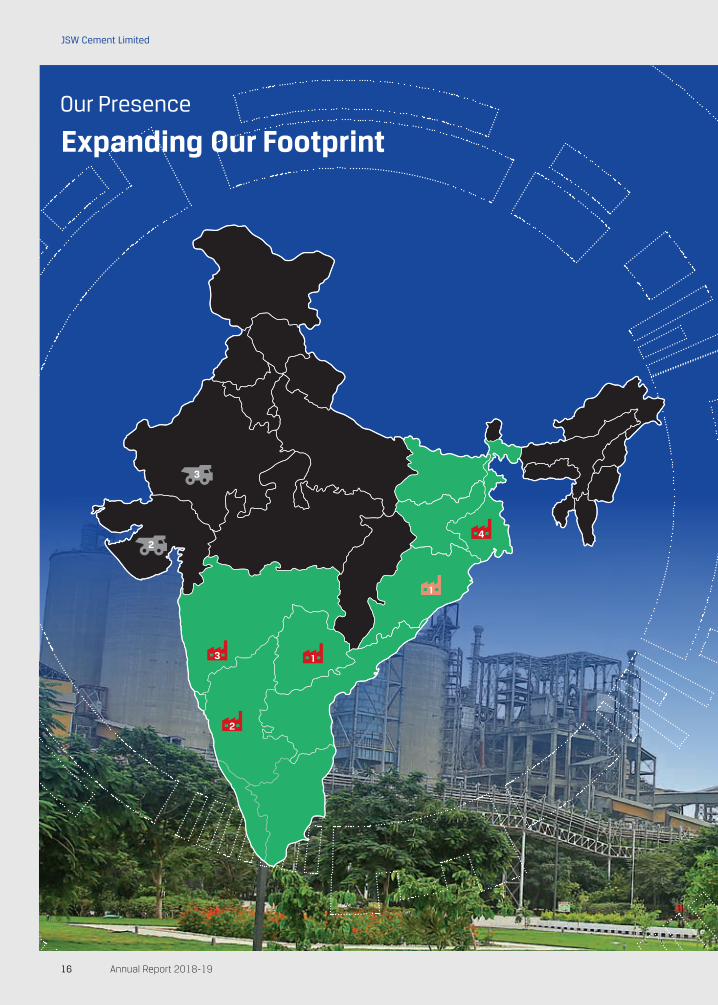
Our Presence
Expanding Our Footprint
1
1
2
4
3
2
3
17Expanding. Integrating. Progressing
Corporate O
verviewFinancial S
tatements
Statutory Reports
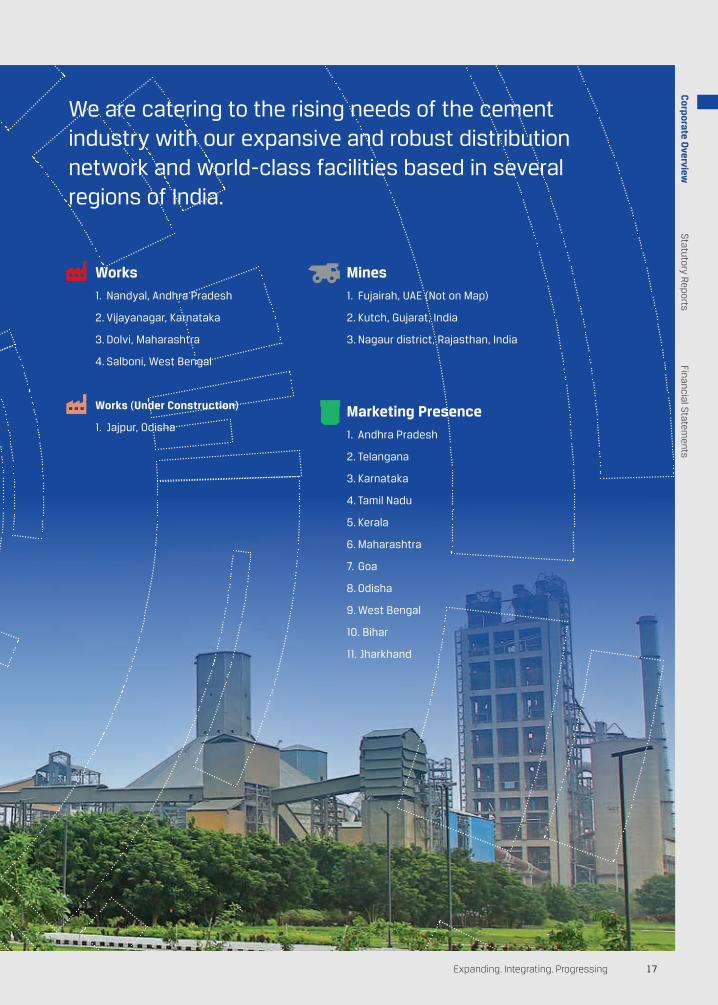
We are catering to the rising needs of the cement industry with our expansive and robust distribution network and world-class facilities based in several regions of India.
Works
1. Nandyal, Andhra Pradesh
2. Vijayanagar, Karnataka
3. Dolvi, Maharashtra
4. Salboni, West Bengal
Works (Under Construction)
1. Jajpur, Odisha
Mines
1. Fujairah, UAE (Not on Map)
2. Kutch, Gujarat, India
3. Nagaur district, Rajasthan, India
Marketing Presence
1. Andhra Pradesh
2. Telangana
3. Karnataka
4. Tamil Nadu
5. Kerala
6. Maharashtra
7. Goa
8. Odisha
9. West Bengal
10. Bihar
11. Jharkhand

Annual Report 2018-1918
JSW Cement Limited
Our Operational Presence
Our State-of-the-art Manufacturing Facilities
The installed capacity of Vijayanagar plant is 3.2 MTPA. We successfully commissioned one unit of 180 Tonnes per Hour (TPH) in March 2017 and the second unit of 180 TPH in October 2017. This has helped us increase our market share of GGBS, PSC and Composite Cement in Karnataka, Goa, Kerala, Tamil Nadu, Maharashtra and Telangana. In July 2017, we commissioned a state-of-the-art mechanised wagon loading system to dispatch our products by rail and in March 2018, we commissioned a new railway line to transfer slag from JSW Steel Limited’s blast furnace to the cement plant. The unit is an eco-friendly campus as nearly a fifth of it is covered by trees and plants.
Nandyal is the first cement plant in India with the Combi-Comflex technology and has multiple systems controlling air and dust pollution. It is one of the most energy-efficient cement plants with a production capacity of 4.8 MTPA. The unit produced PSC, GGBS, OPC and Concreel HD in FY2019. Nandyal Works consumes lesser amount of limestone compared to the conventional cement plants and contributes largely to water conservation. It has, therefore, earned several awards for being a green plant. The alternate fuel project was completed in FY2019. We have completed the carbon black firing, liquid fuel firing, and solid alternative fuel feeding projects this year. These initiatives have helped increase the Thermal Substitution Rate (TSR) to 13.9% and the fuel cost at the plant by recycling wastes from other industries.
Vijayanagar, Karnataka Nandyal, Andhra Pradesh
19Expanding. Integrating. Progressing
Corporate O
verviewFinancial S
tatements
Statutory Reports
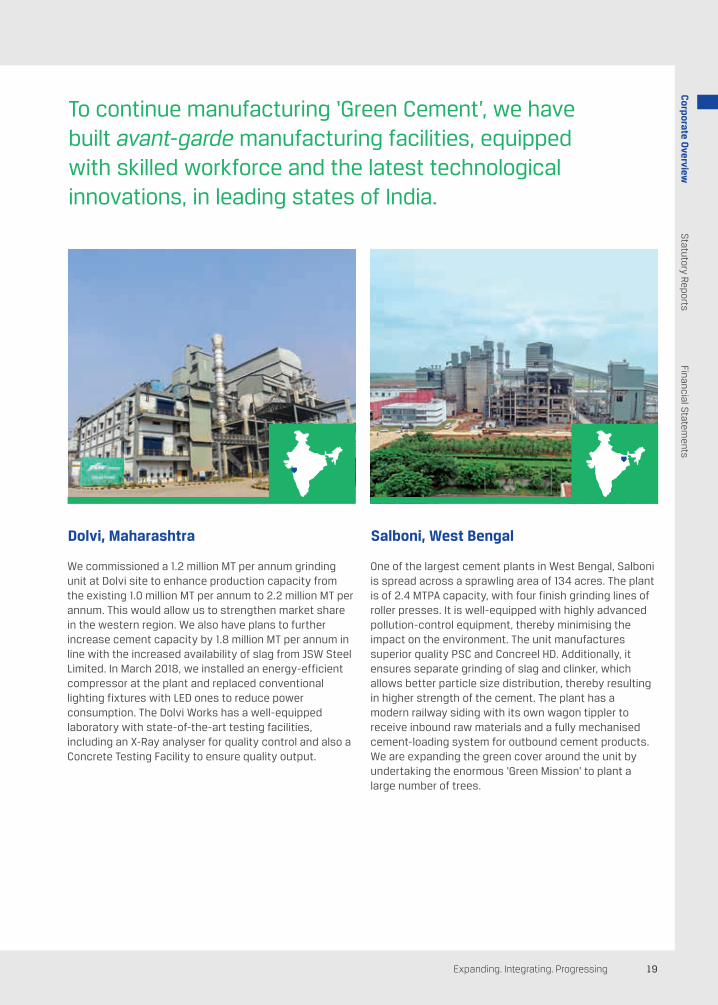
To continue manufacturing ‘Green Cement’, we have built avant-garde manufacturing facilities, equipped with skilled workforce and the latest technological innovations, in leading states of India.
We commissioned a 1.2 million MT per annum grinding unit at Dolvi site to enhance production capacity from the existing 1.0 million MT per annum to 2.2 million MT per annum. This would allow us to strengthen market share in the western region. We also have plans to further increase cement capacity by 1.8 million MT per annum in line with the increased availability of slag from JSW Steel Limited. In March 2018, we installed an energy-efficient compressor at the plant and replaced conventional lighting fixtures with LED ones to reduce power consumption. The Dolvi Works has a well-equipped laboratory with state-of-the-art testing facilities, including an X-Ray analyser for quality control and also a Concrete Testing Facility to ensure quality output.
One of the largest cement plants in West Bengal, Salboni is spread across a sprawling area of 134 acres. The plant is of 2.4 MTPA capacity, with four finish grinding lines of roller presses. It is well-equipped with highly advanced pollution-control equipment, thereby minimising the impact on the environment. The unit manufactures superior quality PSC and Concreel HD. Additionally, it ensures separate grinding of slag and clinker, which allows better particle size distribution, thereby resulting in higher strength of the cement. The plant has a modern railway siding with its own wagon tippler to receive inbound raw materials and a fully mechanised cement-loading system for outbound cement products. We are expanding the green cover around the unit by undertaking the enormous ‘Green Mission’ to plant a large number of trees.
Dolvi, Maharashtra Salboni, West Bengal
Annual Report 2018-1920
JSW Cement Limited
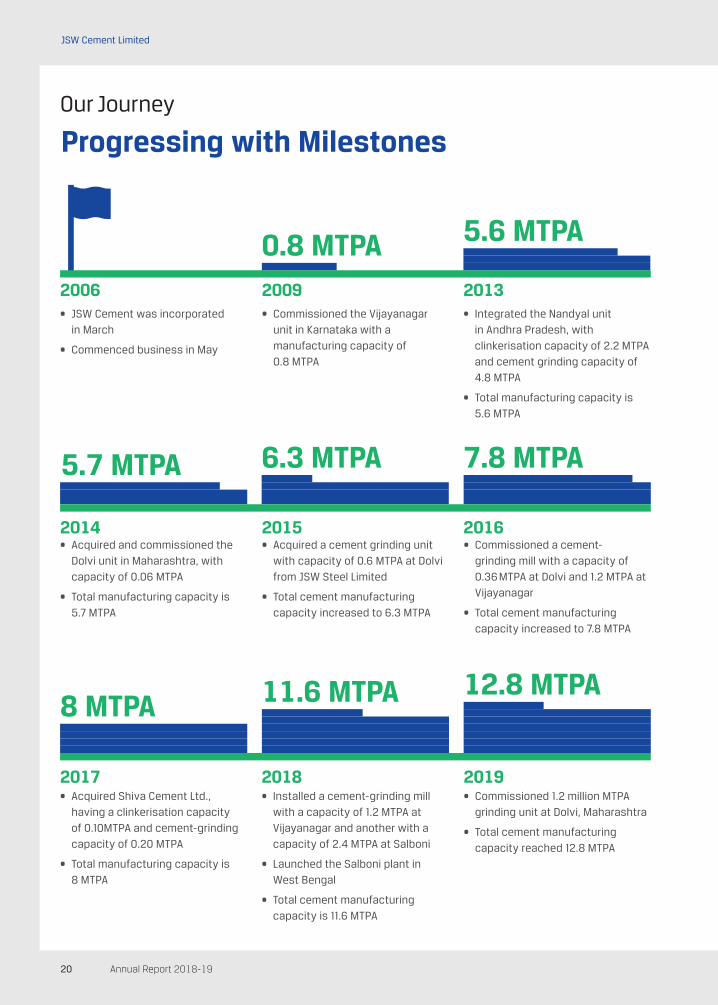
Our Journey
Progressing with Milestones
2006
2014
2017
2009
2015
2018
2013
2016
2019
• JSW Cement was incorporated in March
• Commenced business in May
• Acquired and commissioned the Dolvi unit in Maharashtra, with capacity of 0.06 MTPA
• Total manufacturing capacity is 5.7 MTPA
• Acquired Shiva Cement Ltd., having a clinkerisation capacity of 0.10MTPA and cement-grinding capacity of 0.20 MTPA
• Total manufacturing capacity is 8 MTPA
• Installed a cement-grinding mill with a capacity of 1.2 MTPA at Vijayanagar and another with a capacity of 2.4 MTPA at Salboni
• Launched the Salboni plant in West Bengal
• Total cement manufacturing capacity is 11.6 MTPA
• Commissioned 1.2 million MTPA grinding unit at Dolvi, Maharashtra
• Total cement manufacturing capacity reached 12.8 MTPA
• Acquired a cement grinding unit with capacity of 0.6 MTPA at Dolvi from JSW Steel Limited
• Total cement manufacturing capacity increased to 6.3 MTPA
• Commissioned a cement-grinding mill with a capacity of 0.36 MTPA at Dolvi and 1.2 MTPA at Vijayanagar
• Total cement manufacturing capacity increased to 7.8 MTPA
• Commissioned the Vijayanagar unit in Karnataka with a manufacturing capacity of 0.8 MTPA
• Integrated the Nandyal unit in Andhra Pradesh, with clinkerisation capacity of 2.2 MTPA and cement grinding capacity of 4.8 MTPA
• Total manufacturing capacity is 5.6 MTPA
0.8 MTPA
5.7 MTPA
8 MTPA 11.6 MTPA 12.8 MTPA
6.3 MTPA 7.8 MTPA
5.6 MTPA
21Expanding. Integrating. Progressing
Corporate O
verviewFinancial S
tatements
Statutory Reports
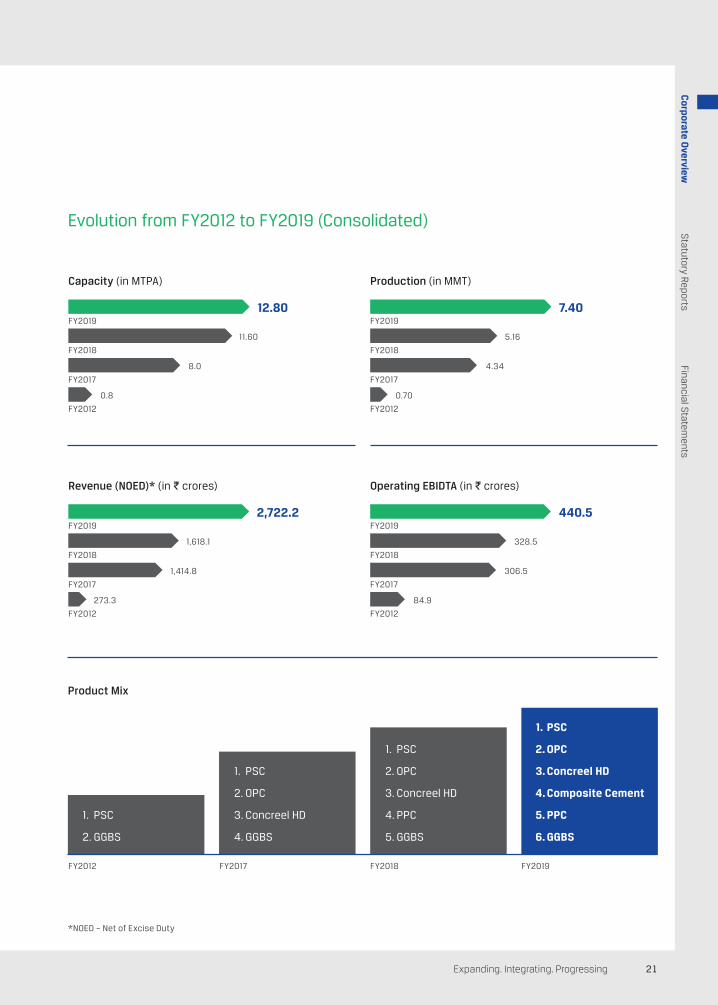
Evolution from FY2012 to FY2019 (Consolidated)
Capacity (in MTPA)
Revenue (NOED)* (in J crores)
Product Mix
Production (in MMT)
Operating EBIDTA (in J crores)
FY2019
FY2019
FY2019
FY2019
FY2019
FY2018
FY2018
FY2018
FY2018
FY2018
FY2017
FY2017
FY2017
FY2017
FY2017
FY2012
FY2012
FY2012
FY2012
FY2012
11.60
1,618.1
5.16
328.5
8.0
1,414.8
4.34
306.5
0.8
273.3
0.70
84.9
12.80
2,722.2
7.40
440.5
1. PSC
2. GGBS
1. PSC
2. OPC
3. Concreel HD
4. GGBS
1. PSC
2. OPC
3. Concreel HD
4. PPC
5. GGBS
1. PSC
2. OPC
3. Concreel HD
4. Composite Cement
5. PPC
6. GGBS
*NOED – Net of Excise Duty
Annual Report 2018-1922
JSW Cement Limited
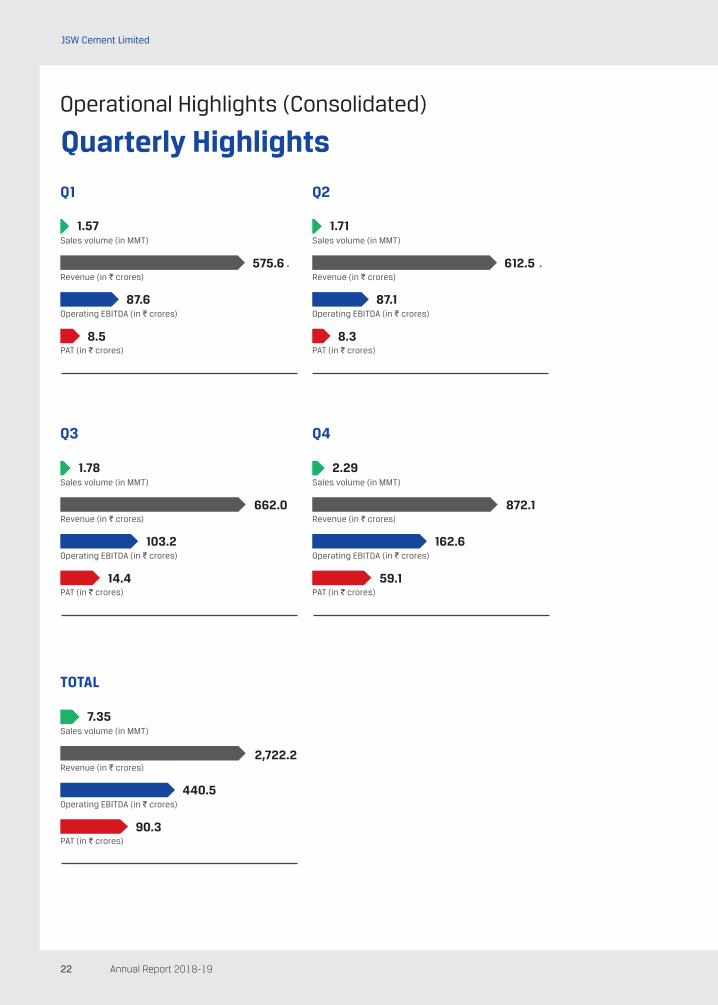
Operational Highlights (Consolidated)
Quarterly Highlights
612.5
87.1
Sales volume (in MMT) Sales volume (in MMT)
Revenue (in J crores) Revenue (in J crores)
Operating EBITDA (in J crores) Operating EBITDA (in J crores)
PAT (in J crores) PAT (in J crores)
575.6
87.6
8.5 8.3
1.57 1.71
Q1 Q2
Q3 Q4
Sales volume (in MMT) Sales volume (in MMT)
Revenue (in J crores) Revenue (in J crores)
Operating EBITDA (in J crores) Operating EBITDA (in J crores)
PAT (in J crores) PAT (in J crores)
662.0 872.1
103.2 162.6
14.4 59.1
1.78 2.29
2,722.2
TOTAL
Sales volume (in MMT)
Revenue (in J crores)
Operating EBITDA (in J crores)
PAT (in J crores)
440.5
90.3
7.35
23Expanding. Integrating. Progressing
Corporate O
verviewFinancial S
tatements
Statutory Reports
Product-wise
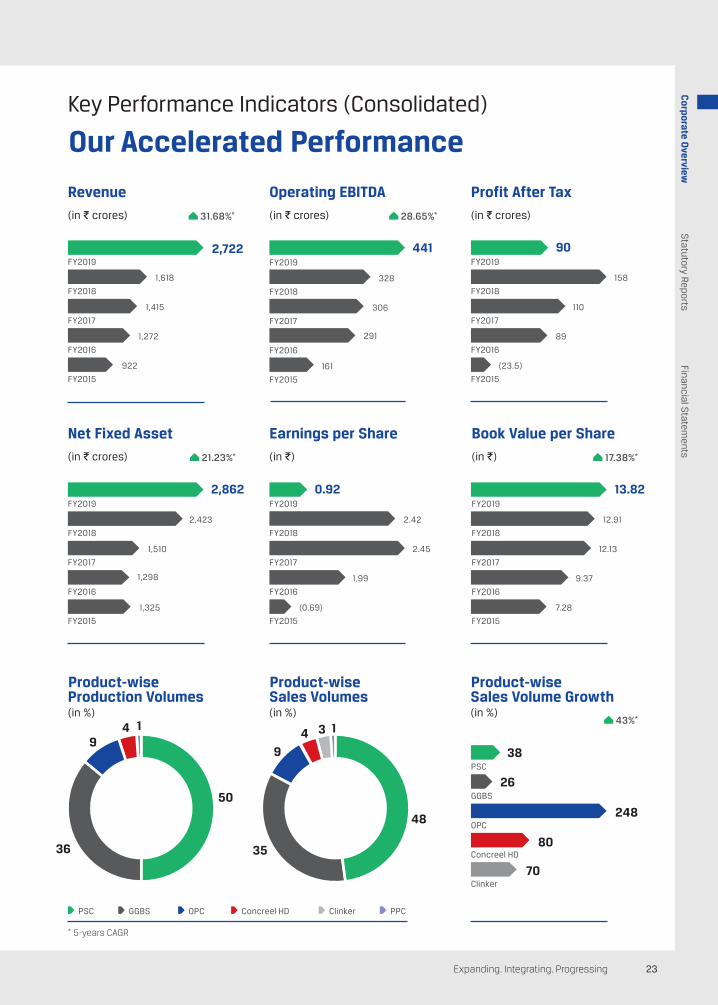
Key Performance Indicators (Consolidated)
Our Accelerated Performance
FY2019FY2019
FY2019
FY2019
FY2018FY2018
FY2018
FY2018
FY2017FY2017
FY2017
FY2017
FY2016FY2016
FY2016
FY2016
FY2015FY2015
FY2015
FY2015
2.422,423
158
12.91
2.451,510
110
12.13
1.991,298
89
9.37
(0.69)1,325
(23.5)
7.28
0.922,862
90
13.82
Earnings per Share
(in J)
Net Fixed Asset
(in J crores)
Profit After Tax
(in J crores)
Book Value per Share
(in J)
FY2019
FY2018
FY2017
FY2016
FY2015
328
306
291
161
441
Operating EBITDA
(in J crores) 28.65%*
PSC
GGBS
OPC
Concreel HD
Clinker
26
248
80
70
38
43%*
PSC GGBS OPC Concreel HD Clinker PPC
Sales Volume Growth(in %)
* 5-years CAGR
21.23%* 17.38%*
50
36
94 1
48
35
9
4 3 1
Product-wise Product-wiseProduction Volumes Sales Volumes(in %) (in %)
FY2019
FY2018
FY2017
FY2016
FY2015
1,618
1,415
1,272
922
2,722
Revenue
(in J crores) 31.68%*
Annual Report 2018-1924
JSW Cement Limited
Megatrends
Leveraging Opportunities through Robust Strategies
At JSW Cement, we are well poised to capitalise on the sea of opportunities offered by the Indian cement sector.
Boost to Real Estate and Infrastructure
The 2019 Union Budget continued with its thrust for Affordable Housing by proposing to set up 1.95 crore houses under the Pradhan Mantri Awas Yojna (PMAY) within the next two years. Additionally, the government’s thrust on 'Housing for All' and Bharatmala projects are also likely to drive cement demand. The government also plans to boost infrastructure in Tier II cities. India is expected to spend `645 billion in FY2019 on the ‘Housing for All by 2022’ programme and close to `6 trillion on infrastructure. The growth in real estate and infrastructure will also result in increased demand for cement and drive the industry’s success. JSW Cement's presence in rural markets and the strong network with influencers, such as contractors, masons and engineer put us in good stead to extract most out of the demand generated in these sectors.
Government Initiatives
The 2019 Union Budget announced several proposals to boost the Indian cement industry. The government plans to extend its rural road network scheme, connecting all eligible habitations under Phase III of Prime Minister Gram Sadak Yojana (Prime Minister’s Rural Road Scheme), set up new government medical colleges and hospitals, renovate about 600 railway stations and suburban railway infrastructure, and renew 26,000 km of railway lines. In addition, the Ministry of Urban Development is planning investments to future-proof Indian cities. A step in this direction is the Dedicated Freight Corridor (DFC) project, which is a broad gauge freight corridor being constructed by the Indian Railways. It is expected to dramatically amplify market demand upon its completion by 2019. The project involves construction of six freight corridors across India. All these initiatives are expected to create great demand for cement in the future.
Technological Advancements
Considerable technological advancements in the manufacture of cement has contributed to the growth of the cement industry. The main drivers of these advancements have been the cost and quality of cement. The application of human intervention in cement manufacturing has reduced due to automation, instrumentation, computer-aided controls and integration of expert systems. Significant developments have taken place in multi-channel burners, which have been specifically designed for co-incineration of alternative fuels. Moreover, there has been significant progress in developing continuous emission monitoring systems. All these advancements are driving the demand for cement in India, thereby benefitting cement companies.
Demand for GGBS
GGBS has established its presence in almost all the named RMCs of South and West Zone. Slag is perfect for concrete construction. The boost to real estate and infrastructure in India is propelling the demand for GGBS. JSW Cement manufactures quality GGBS, which has ensured our presence in almost all major infrastructure, road and other turnkey projects in South and West India. We aim to further increase our GGBS distribution by encouraging sites to use slag as it is a more environment-friendly, sustainable and durable concrete mix.
25Expanding. Integrating. Progressing
Corporate O
verviewFinancial S
tatements
Statutory Reports
Key Priorities
Our Strategic Roadmap to the Future
Though the dynamics of the cement industry are changing, we are ready to leverage the opportunities by focusing on our strategic priorities.
Capacity Expansion
• Plan to ramp-up capacity to 30 MTPA by FY2025
• Added 1.2 MTPA of installed capacity last year at Dolvi, Maharshtra, which increased our total installed capacity to 12.8 MTPA
• Plan to add a capacity of 1.2 MTPA by July 2019 in Jajpur, Odisha
• Plan to add a 1.8 MTPA cement-grinding facility at Dolvi, Maharashtra
• Plan to add 1 MTPA clinker facility at Fujairah, UAE
Operational Efficiency
• Set up plants in strategic locations for better efficiency and uninterrupted power supply
• Manage resources through technological innovations
• Manage inbound logistics through investment in wagon tipplers
• Dedicated railway rakes for timely delivery of raw materials and transportation of finished goods
Superior Products
• Introduced two premium products – Concreel HD in all markets and Composite Cement in Karnataka and Kerala
• Plan to launch Composite Cement in East from Salboni and Jajpur units
Innovation
• Tied up with the FEhS Institute to use slag for comprehensive cement production
• Collaborated with laboratories in China to effectively convert slag to cement
Environment Protection
• Reduced GHG emissions by eliminating about 0.85 tonne of CO
2 for each tonne of Portland cement
replaced
• Diminished energy consumption, since a tonne of slag cement requires nearly 90% less energy to produce than a tonne of Portland cement
• Curtailed the ‘urban heat island’ effect by making concrete lighter in colour, enabling it to reflect more light, and utilised cooling structures and pavements with exposed concrete
Enhanced Brand Visibility
• Utilised our vehicle fleet for brand expression and communication
• Acted as the presenting sponsor for Teen Rang Humare – an initiative that involved the making of India's biggest national flag
• Participated in CII Green Building Conference, 2018 in Hyderabad
Annual Report 2018-1926
JSW Cement Limited
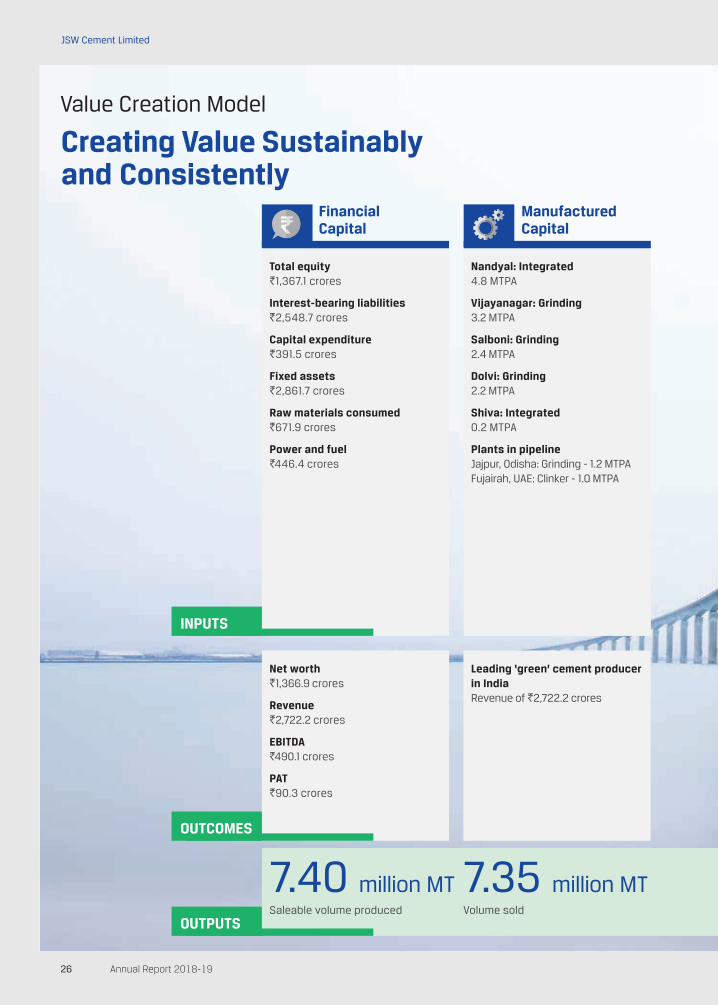
Value Creation Model
Creating Value Sustainably and Consistently
Financial Capital
Manufactured Capital
Total equity`1,367.1 crores
Interest-bearing liabilities`2,548.7 crores
Capital expenditure`391.5 crores
Fixed assets`2,861.7 crores
Raw materials consumed `671.9 crores
Power and fuel`446.4 crores
Net worth `1,366.9 crores
Revenue`2,722.2 crores
EBITDA`490.1 crores
PAT`90.3 crores
Nandyal: Integrated4.8 MTPA
Vijayanagar: Grinding3.2 MTPA
Salboni: Grinding2.4 MTPA
Dolvi: Grinding2.2 MTPA
Shiva: Integrated0.2 MTPA
Plants in pipelineJajpur, Odisha: Grinding - 1.2 MTPAFujairah, UAE: Clinker - 1.0 MTPA
Leading ‘green’ cement producer in IndiaRevenue of `2,722.2 crores
OUTPUTS
7.40 million MT 7.35 million MTSaleable volume produced Volume sold
INPUTS
OUTCOMES
27Expanding. Integrating. Progressing
Corporate O
verviewFinancial S
tatements
Statutory Reports
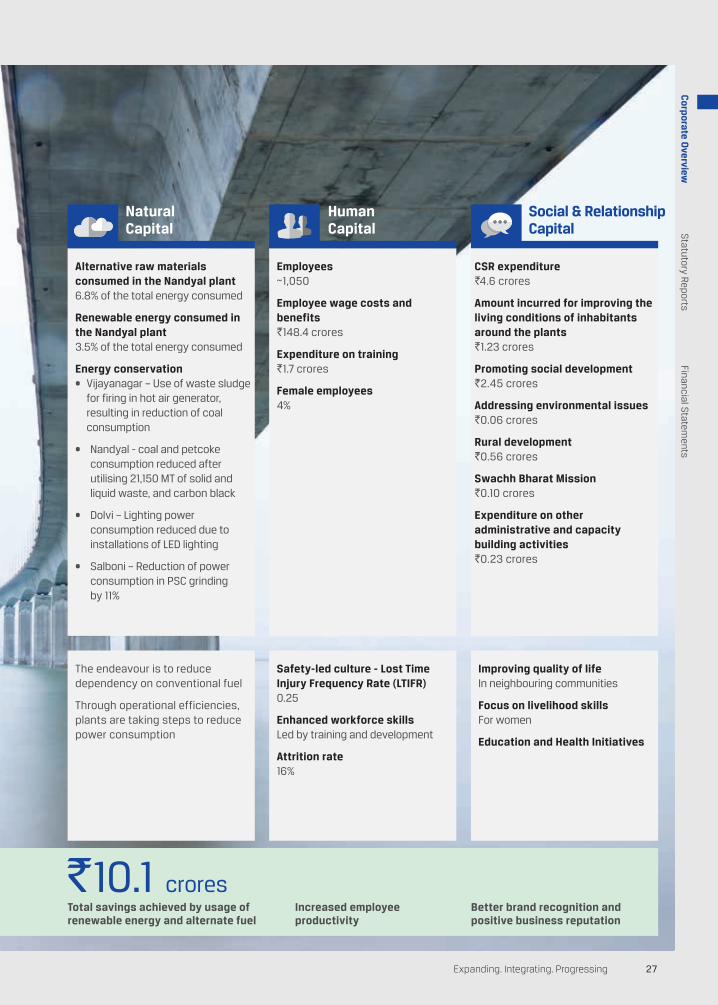
Natural Capital
Alternative raw materials consumed in the Nandyal plant 6.8% of the total energy consumed
Renewable energy consumed in the Nandyal plant 3.5% of the total energy consumed
Energy conservation• Vijayanagar – Use of waste sludge
for firing in hot air generator, resulting in reduction of coal consumption
• Nandyal - coal and petcoke consumption reduced after utilising 21,150 MT of solid and liquid waste, and carbon black
• Dolvi – Lighting power consumption reduced due to installations of LED lighting
• Salboni – Reduction of power consumption in PSC grinding by 11%
The endeavour is to reduce dependency on conventional fuel
Through operational efficiencies, plants are taking steps to reduce power consumption
Improving quality of lifeIn neighbouring communities
Focus on livelihood skills For women
Education and Health Initiatives
Human Capital
Employees
~1,050
Employee wage costs and benefits`148.4 crores
Expenditure on training`1.7 crores
Female employees4%
CSR expenditure`4.6 crores
Amount incurred for improving the living conditions of inhabitants around the plants`1.23 crores
Promoting social development `2.45 crores
Addressing environmental issues `0.06 crores
Rural development `0.56 crores
Swachh Bharat Mission `0.10 crores
Expenditure on other administrative and capacity building activities `0.23 crores
Safety-led culture - Lost Time Injury Frequency Rate (LTIFR) 0.25
Enhanced workforce skillsLed by training and development
Attrition rate 16%
Social & Relationship Capital
`10.1 croresTotal savings achieved by usage of renewable energy and alternate fuel
Increased employee productivity
Better brand recognition and positive business reputation
Annual Report 2018-1928
JSW Cement Limited
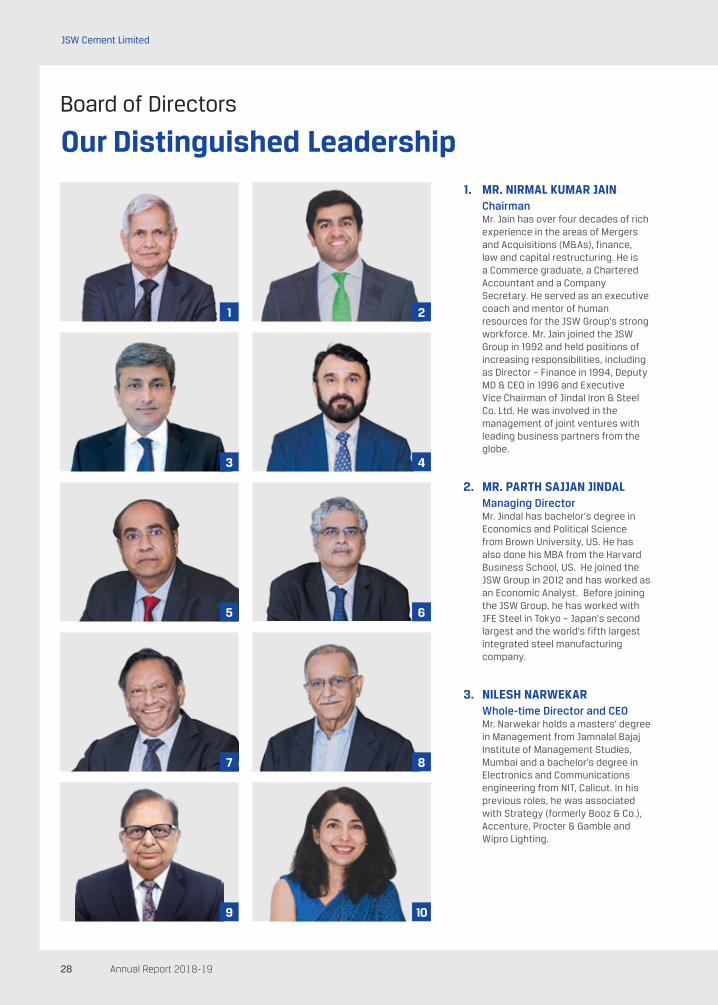
Board of Directors
Our Distinguished Leadership1. MR. NIRMAL KUMAR JAIN Chairman Mr. Jain has over four decades of rich
experience in the areas of Mergers and Acquisitions (M&As), finance, law and capital restructuring. He is a Commerce graduate, a Chartered Accountant and a Company Secretary. He served as an executive coach and mentor of human resources for the JSW Group’s strong workforce. Mr. Jain joined the JSW Group in 1992 and held positions of increasing responsibilities, including as Director – Finance in 1994, Deputy MD & CEO in 1996 and Executive Vice Chairman of Jindal Iron & Steel Co. Ltd. He was involved in the management of joint ventures with leading business partners from the globe.
2. MR. PARTH SAJJAN JINDAL Managing Director Mr. Jindal has bachelor’s degree in
Economics and Political Science from Brown University, US. He has also done his MBA from the Harvard Business School, US. He joined the JSW Group in 2012 and has worked as an Economic Analyst. Before joining the JSW Group, he has worked with JFE Steel in Tokyo – Japan’s second largest and the world’s fifth largest integrated steel manufacturing company.
3. NILESH NARWEKAR Whole-time Director and CEO Mr. Narwekar holds a masters' degree
in Management from Jamnalal Bajaj Institute of Management Studies, Mumbai and a bachelor's degree in Electronics and Communications engineering from NIT, Calicut. In his previous roles, he was associated with Strategy (formerly Booz & Co.), Accenture, Procter & Gamble and Wipro Lighting.
1 2
3 4
5 6
7
9 10
8
29Expanding. Integrating. Progressing
Corporate O
verviewFinancial S
tatements
Statutory Reports
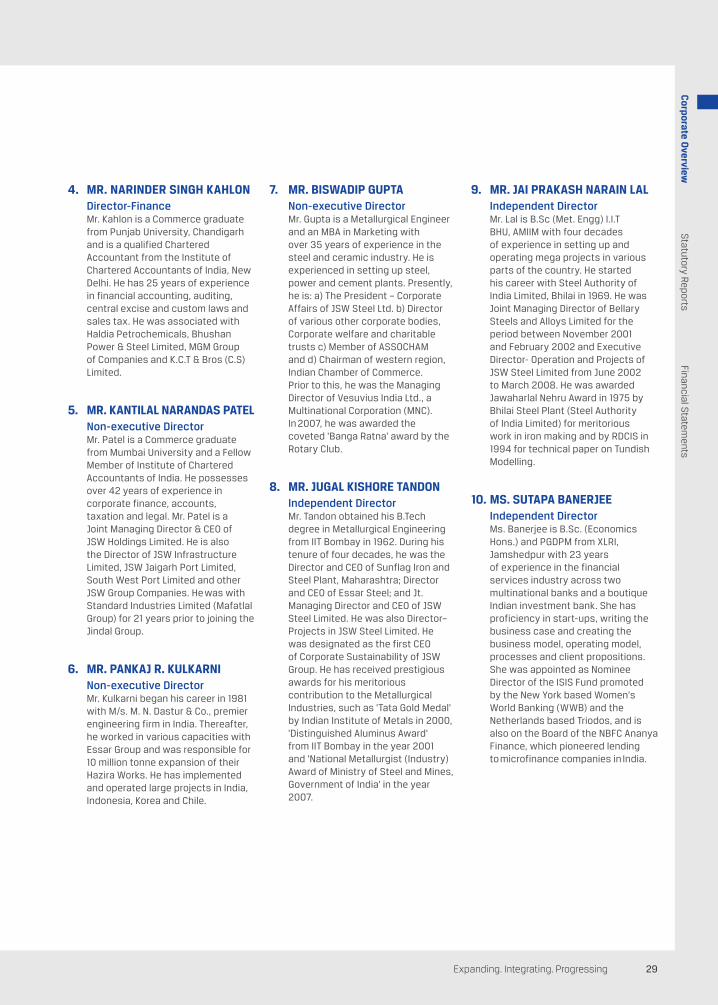
4. MR. NARINDER SINGH KAHLON Director-Finance Mr. Kahlon is a Commerce graduate
from Punjab University, Chandigarh and is a qualified Chartered Accountant from the Institute of Chartered Accountants of India, New Delhi. He has 25 years of experience in financial accounting, auditing, central excise and custom laws and sales tax. He was associated with Haldia Petrochemicals, Bhushan Power & Steel Limited, MGM Group of Companies and K.C.T & Bros (C.S) Limited.
5. MR. KANTILAL NARANDAS PATEL Non-executive Director Mr. Patel is a Commerce graduate
from Mumbai University and a Fellow Member of Institute of Chartered Accountants of India. He possesses over 42 years of experience in corporate finance, accounts, taxation and legal. Mr. Patel is a Joint Managing Director & CEO of JSW Holdings Limited. He is also the Director of JSW Infrastructure Limited, JSW Jaigarh Port Limited, South West Port Limited and other JSW Group Companies. He was with Standard Industries Limited (Mafatlal Group) for 21 years prior to joining the Jindal Group.
6. MR. PANKAJ R. KULKARNI Non-executive Director Mr. Kulkarni began his career in 1981
with M/s. M. N. Dastur & Co., premier engineering firm in India. Thereafter, he worked in various capacities with Essar Group and was responsible for 10 million tonne expansion of their Hazira Works. He has implemented and operated large projects in India, Indonesia, Korea and Chile.
7. MR. BISWADIP GUPTA Non-executive Director Mr. Gupta is a Metallurgical Engineer
and an MBA in Marketing with over 35 years of experience in the steel and ceramic industry. He is experienced in setting up steel, power and cement plants. Presently, he is: a) The President – Corporate Affairs of JSW Steel Ltd. b) Director of various other corporate bodies, Corporate welfare and charitable trusts c) Member of ASSOCHAM and d) Chairman of western region, Indian Chamber of Commerce. Prior to this, he was the Managing Director of Vesuvius India Ltd., a Multinational Corporation (MNC). In 2007, he was awarded the coveted 'Banga Ratna' award by the Rotary Club.
8. MR. JUGAL KISHORE TANDON Independent Director Mr. Tandon obtained his B.Tech
degree in Metallurgical Engineering from IIT Bombay in 1962. During his tenure of four decades, he was the Director and CEO of Sunflag Iron and Steel Plant, Maharashtra; Director and CEO of Essar Steel; and Jt. Managing Director and CEO of JSW Steel Limited. He was also Director–Projects in JSW Steel Limited. He was designated as the first CEO of Corporate Sustainability of JSW Group. He has received prestigious awards for his meritorious contribution to the Metallurgical Industries, such as 'Tata Gold Medal' by Indian Institute of Metals in 2000, 'Distinguished Aluminus Award' from IIT Bombay in the year 2001 and 'National Metallurgist (Industry) Award of Ministry of Steel and Mines, Government of India' in the year 2007.
9. MR. JAI PRAKASH NARAIN LAL Independent Director Mr. Lal is B.Sc (Met. Engg) I.I.T
BHU, AMIIM with four decades of experience in setting up and operating mega projects in various parts of the country. He started his career with Steel Authority of India Limited, Bhilai in 1969. He was Joint Managing Director of Bellary Steels and Alloys Limited for the period between November 2001 and February 2002 and Executive Director- Operation and Projects of JSW Steel Limited from June 2002 to March 2008. He was awarded Jawaharlal Nehru Award in 1975 by Bhilai Steel Plant (Steel Authority of India Limited) for meritorious work in iron making and by RDCIS in 1994 for technical paper on Tundish Modelling.
10. MS. SUTAPA BANERJEE Independent Director Ms. Banerjee is B.Sc. (Economics
Hons.) and PGDPM from XLRI, Jamshedpur with 23 years of experience in the financial services industry across two multinational banks and a boutique Indian investment bank. She has proficiency in start-ups, writing the business case and creating the business model, operating model, processes and client propositions. She was appointed as Nominee Director of the ISIS Fund promoted by the New York based Women’s World Banking (WWB) and the Netherlands based Triodos, and is also on the Board of the NBFC Ananya Finance, which pioneered lending to microfinance companies in India.
Annual Report 2018-1930
JSW Cement Limited
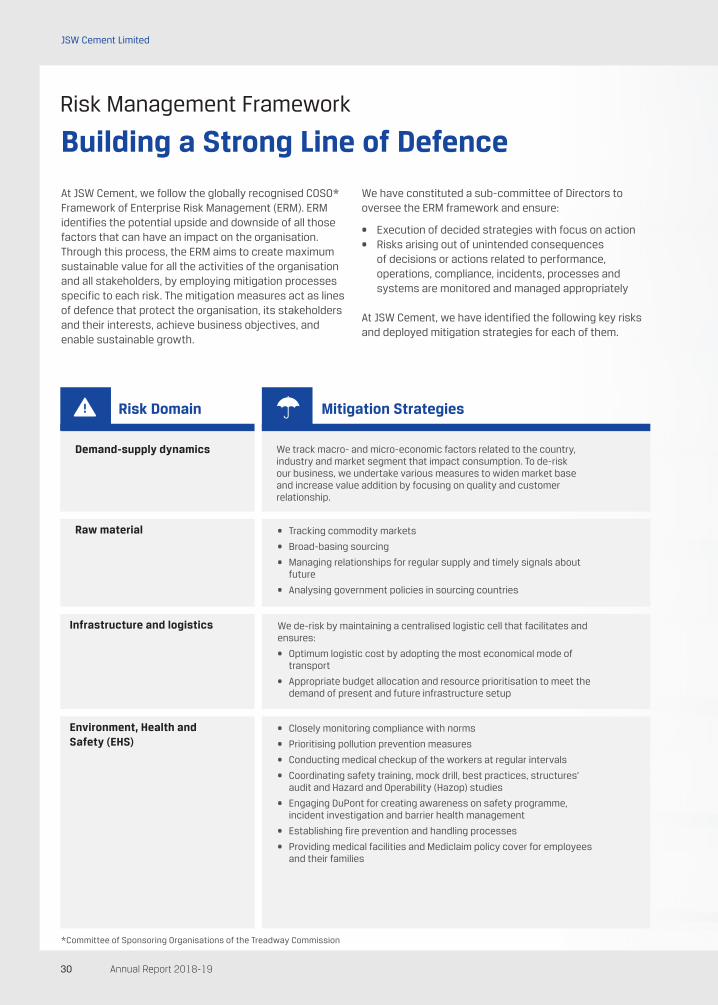
Risk Management Framework
Building a Strong Line of Defence
At JSW Cement, we follow the globally recognised COSO* Framework of Enterprise Risk Management (ERM). ERM identifies the potential upside and downside of all those factors that can have an impact on the organisation. Through this process, the ERM aims to create maximum sustainable value for all the activities of the organisation and all stakeholders, by employing mitigation processes specific to each risk. The mitigation measures act as lines of defence that protect the organisation, its stakeholders and their interests, achieve business objectives, and enable sustainable growth.
Risk Domain Mitigation Strategies
Demand-supply dynamics We track macro- and micro-economic factors related to the country, industry and market segment that impact consumption. To de-risk our business, we undertake various measures to widen market base and increase value addition by focusing on quality and customer relationship.
We de-risk by maintaining a centralised logistic cell that facilitates and ensures:
• Optimum logistic cost by adopting the most economical mode of transport
• Appropriate budget allocation and resource prioritisation to meet the demand of present and future infrastructure setup
• Closely monitoring compliance with norms
• Prioritising pollution prevention measures
• Conducting medical checkup of the workers at regular intervals
• Coordinating safety training, mock drill, best practices, structures’ audit and Hazard and Operability (Hazop) studies
• Engaging DuPont for creating awareness on safety programme, incident investigation and barrier health management
• Establishing fire prevention and handling processes
• Providing medical facilities and Mediclaim policy cover for employees and their families
• Tracking commodity markets
• Broad-basing sourcing
• Managing relationships for regular supply and timely signals about future
• Analysing government policies in sourcing countries
We have constituted a sub-committee of Directors to oversee the ERM framework and ensure:
• Execution of decided strategies with focus on action • Risks arising out of unintended consequences
of decisions or actions related to performance, operations, compliance, incidents, processes and systems are monitored and managed appropriately
At JSW Cement, we have identified the following key risks and deployed mitigation strategies for each of them.
Raw material
Infrastructure and logistics
Environment, Health and Safety (EHS)
*Committee of Sponsoring Organisations of the Treadway Commission
31Expanding. Integrating. Progressing
Corporate O
verviewFinancial S
tatements
Statutory Reports
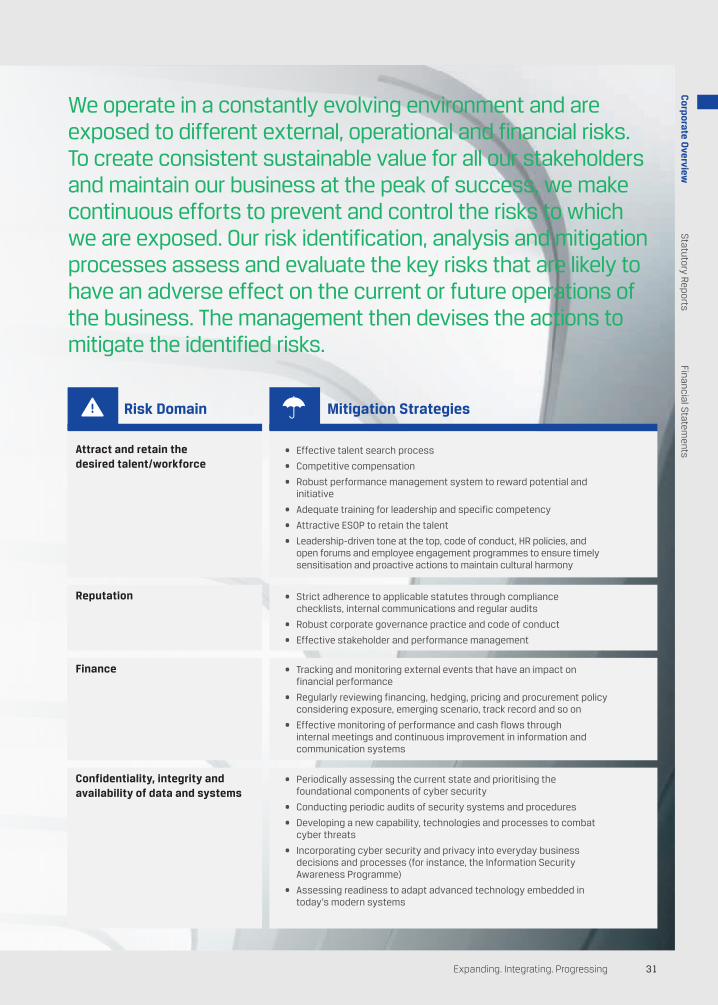
We operate in a constantly evolving environment and are exposed to different external, operational and financial risks. To create consistent sustainable value for all our stakeholders and maintain our business at the peak of success, we make continuous efforts to prevent and control the risks to which we are exposed. Our risk identification, analysis and mitigation processes assess and evaluate the key risks that are likely to have an adverse effect on the current or future operations of the business. The management then devises the actions to mitigate the identified risks.
Risk Domain Mitigation Strategies
• Effective talent search process
• Competitive compensation
• Robust performance management system to reward potential and initiative
• Adequate training for leadership and specific competency
• Attractive ESOP to retain the talent
• Leadership-driven tone at the top, code of conduct, HR policies, and open forums and employee engagement programmes to ensure timely sensitisation and proactive actions to maintain cultural harmony
• Strict adherence to applicable statutes through compliance checklists, internal communications and regular audits
• Robust corporate governance practice and code of conduct
• Effective stakeholder and performance management
• Tracking and monitoring external events that have an impact on financial performance
• Regularly reviewing financing, hedging, pricing and procurement policy considering exposure, emerging scenario, track record and so on
• Effective monitoring of performance and cash flows through internal meetings and continuous improvement in information and communication systems
• Periodically assessing the current state and prioritising the foundational components of cyber security
• Conducting periodic audits of security systems and procedures
• Developing a new capability, technologies and processes to combat cyber threats
• Incorporating cyber security and privacy into everyday business decisions and processes (for instance, the Information Security Awareness Programme)
• Assessing readiness to adapt advanced technology embedded in today’s modern systems
Attract and retain the desired talent/workforce
Reputation
Finance
Confidentiality, integrity and availability of data and systems
Annual Report 2018-1932
JSW Cement Limited
Corporate Social Responsibility
Creating an Empowered India – EverydayWe are committed to driving positive change and taking conscious steps to support and empower communities. Through the JSW Foundation, the Corporate Social Responsibility (CSR) arm of the JSW Group, we pursue six strategic spheres of activity: Health, Education, Women Empowerment, Cleanliness, Rural Development and Safety.
Health
• We conducted 364 mobile health camps and special health camps for diabetes, hypertension, anaemia, dental, cardiac and nephrology related issues. Our blood donation camps were successful in collecting 143 units of blood. Door-to-door screening to control non-communicable diseases was also undertaken across 43 villages in Nandyal, Salboni and Rajgangpur.
• At the Primary Health Centre (PHC) in Gadivemula, Nandyal, the services of laboratory technicians and staff nurses helped in strengthening mother and child health care, and general health, benefitting 24,098 persons.
• 18,456 persons were counselled through the HIV/AIDS Prevention Programme among the truckers in association with Bhoruka Charitable Trust at Nandyal.
• Fogging to prevent malaria and awareness campaigns on personal hygiene and sanitation in Nandyal and Rajgangpur helped 16,000 persons.
• A water-purifying unit was installed at the PHC in Gadivemula, Kurnool.
• We undertook the maintenance of two RO water plants at Bilakalagudur and Bujunur to provide safe drinking water to more than 8,000 people.
Education
• We renovated nine classrooms in three schools of Gadivemula mandal, Kurnool, benefitting 810 students.
• We provided study material kits to 1,200 students studying in government schools of Rajgangpur, Odisha.
• To encourage girl child education, we provided 81 bicycles to girl students pursuing secondary education so that the lack of transport facilities doesn’t deter their pursuit of education.
• The 20 digital classrooms, established in 13 government schools of Gadivemula, Andhra Pradesh, continue to serve the children. Our Company also maintained, repaired and established digital classes in five schools of the Kutra block, Odisha and 12 schools at Salboni, West Bengal to improve the quality of education and build strong conceptual understanding among the students.
• Tuition support was provided to 90 students appearing for the secondary board examination.
• We provided scholarships to 42 merit students from four high schools and four primary schools to promote secondary education and reduce the dropout rate in upper primary and primary sections.
• Uniforms and notebooks were provided to 400 students studying in government primary and upper primary schools in Bilakalagudur and Bujunur villages of Andhra Pradesh.
• By providing coaching support, we aim to sharpen student’s skills and boost their confidence, with special focus on girls. Our Company organised coaching classes in Maths, Science and English for students of classes 8-10, with the assistance of external faculty. Special classes were also organised before and after school hours. Of the total number of students, over 50% are girls.
33Expanding. Integrating. Progressing
Corporate O
verviewFinancial S
tatements
Statutory Reports
At JSW Cement, we are take responsibility every day, to make India an empowered country. We are cognisant of the fact that our business success depends on our responsible conduct towards our employees, stakeholders, products, environment and the society at large.
Woman Empowerment
• We imparted tailoring skills to rural women of Gadivemula, Andhra Pradesh to uplift their economic status. 276 women are availing training on stitching clothes, saree painting, acid and phenyl and jute products manufacturing. We established two tailoring units in Kutra block, Odisha and imparted training to women.
• The main aim of establishing the jute training centre is to empower women through new skill set and create a pollution-free environment as jute is biodegradable and eco-friendly. The training will enhance the skill of women, thereby enhancing their income. This will enable them to support their families and improve their quality of life. A batch of 30 women have completed the course. They formed a group named ‘Spoorthy’, which has been enrolled and registered in District Rural Development Agencies (DRDAs) for availing benefits from the government.
• We trained women 126 women in Salboni, West Bengal from the SHGs for establishing kitchen gardens.
• Sanitary napkins were provided to 500 girl students from classes 7th to 10th to promote menstrual hygiene. We also set up incinerators in schools for safe disposal of sanitary napkins.
• We created awareness among rural women about personal/menstrual hygiene and provide sanitary napkins to 603 women every month.
• A new product ‘saafkin’ has also been introduced. This sanitary napkin is washable, reusable and biodegradable. It has the following properties:
• Properties of bacterial killing• Special leak-proof lining• Absorbs fluid up to 12 hours• Can be used for one year
• We are utilising the services of Accredited Social Health Activists (ASHAs) for the distribution of sanitary napkins in villages.
Environment
• Our Company planted 2,500 saplings in DIZ villages.
• We installed 28 solar street lights and undertook the maintenance of 82 solar street lights in Gadivemula , Andhra Pradesh and 50 in Kutra block, Odisha.
Rural Development
• We constructed CC drains in Bilakalagudur village, Andhra Pradesh, which benefitted 5,000 people.
• We provided training to 160 farmers in more than 70 acres of land on improved farming practice, introducing climate-resilient cash crops, and so on.
• We supported farmers in managing their crops better, converting mono-crops to multi-crops and using bio-fertiliser.
• Through Krishi Vigyan Kendra (KVK) and other government schemes, we ensured better production and returns for the farmers.
• We established liaisons with banks for credit linkage.
• Our Company undertook a livestock rearing and vaccination programme by involving government department and leveraging resources.
Cleanliness
JSW Cement undertook various initiatives to support the government’s Swachh Bharat Mission:
• We constructed toilet blocks at 13 schools, benefitting 1,250 students in Kutra block.
• We spread awareness about good sanitary habits among the people of Gadivemula, Andhra Pradesh and encouraged them to use constructed toilets by regularly organising awareness camps, distributing leaflets, and encouraging local students in nearby villages and schools to perform skits.
• Our Company conducted the Swach Village programme, with employees cleaning streets, and removing roadside bushes and dirt at Bilakalagudur and Bujunur, Andhra Pradesh.
Annual Report 2018-1934
JSW Cement Limited
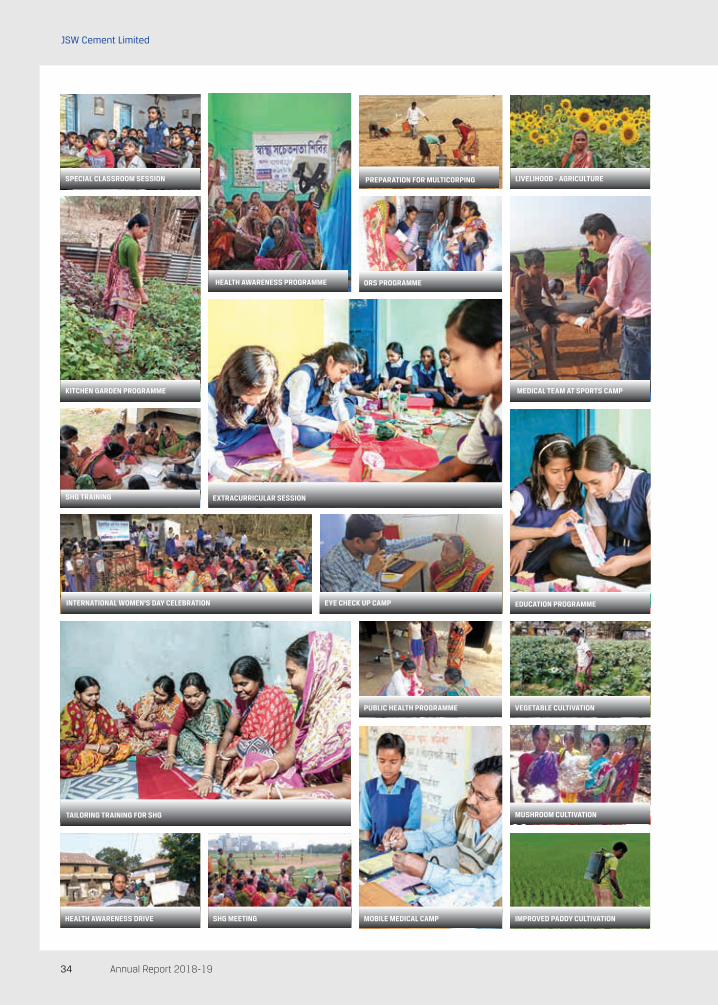
INTERNATIONAL WOMEN'S DAY CELEBRATION
SHG TRAINING
EDUCATION PROGRAMME
TAILORING TRAINING FOR SHG
VEGETABLE CULTIVATIONPUBLIC HEALTH PROGRAMME
MUSHROOM CULTIVATION
ORS PROGRAMME
MOBILE MEDICAL CAMP
EYE CHECK UP CAMP
SPECIAL CLASSROOM SESSION LIVELIHOOD - AGRICULTURE
KITCHEN GARDEN PROGRAMME
EXTRACURRICULAR SESSION
SHG MEETINGHEALTH AWARENESS DRIVE
PREPARATION FOR MULTICORPING
HEALTH AWARENESS PROGRAMME
MEDICAL TEAM AT SPORTS CAMP
IMPROVED PADDY CULTIVATION
35Expanding. Integrating. Progressing
Corporate O
verviewFinancial S
tatements
Statutory Reports
Corporate Social Responsibility
Creating an Empowered India – EverydayKey Initiatives Undertaken during FY2019
International Women’s Day
On the occasion of International Women’s Day, the Company organised an awareness and thought-sharing programme on various areas of women’s empowerment with the village women. The session began with the reception and tribute to women on the occasion of Women’s Day. In this programme, employees from the plants, including women employees, volunteered and discussed with the women on topics including the history behind celebrating Women’s Day and its significance, the rights of women, how women can play role in the development of the society, importance of a girl children’s education, etc. Participants also enthusiastically shared their experiences and thoughts and asked many questions to the volunteers. Local school authorities also participated in the programme.
Public Health Programme (PHP)
The Company undertook a PHP to sensitise people about diabetes, hypertension, cervical cancer, breast cancer and anaemia. Rural Health Assistants (RHAs) visited every household in DIZ villages with a set of questionnaire on these diseases. They collected data through 1:1 interactions with the villagers, and measured blood pressure and checked the blood sugar levels of people above 40 years of age. They also measured the height and weight of women (15-40 years) and children (5-12 years) and provided Information, Education and Communication (IEC) materials to every household.
Medical Camp and Water Distribution at Mahanandi and Bhogeswaram
Mahanandi is renowned for Mahanandeeswara Temple dedicated to Lord Shiva. A festival is held during February and March every year to celebrate ‘Maha Shivaratri’. Pilgrims from all over the world attend this festival. The Company conducted a medical camp and also provided drinking water for the pilgrims for four days (March 3rd-6th, 2019) at Mahanandi and Bhogeswaram. The medical team treated 2,967 pilgrims with minor ailments and gave free medicine. The initiative has been appreciated by the Executive Officer of Mahanandi Temple and the Deputy Collector of Nandyal.
This year, JSW Cement, Nandyal was awarded the Silver award in the cement sector for outstanding achievement in CSR Management. The plant was recognised by Apex India CSR Excellence Award 2018 for its consistent efforts to produce eco-friendly cement, while catering to the evolving demands of our customers.
Modular Kitchens in Schools
The Government of India has launched a Mid-Day Meal Programme with an aim to improve the nutrition of school children and to boost school attendance. However, the food provided in schools is not prepared in hygienic conditions and has less nutritious value.
The Company rolled out a pilot project in association with Radhakrishna Food Services Private Limited by establishing a modular kitchen in two schools, MPP School in Bujunur, Andhra Pradesh and MPUP School in Bilakalagudur, Andhra Pradesh. The pilot project has been appreciated by school teachers, students, cooks, education department officials and public representatives. We have also planned to replicate the project in the remaining 36 government schools of Gadivemula mandal in a phased manner. We also installed nine modular kitchens in FY2019 and further requested the Government of Andhra Pradesh to provide approval to obtain the required food grains and spices for cooking nutritious meal for students.
OUR MOMENT OF PRIDE
Annual Report 2018-1936
JSW Cement Limited
We have a diverse workforce of ~1,050 employees and each of them plays a unique and valuable role in our growth journey. Our solid group of committed people contribute to the expansion, integration and progress of the Company, propelling it on the path to become a global leader in the cement sector. Our human resources management framework is aligned to our business goals and drives key decisions on business processes and introduction of new technology. To support the Company’s growth, our Human Resources (HR) team focuses on further motivating capable talents and developing empowered leaders.
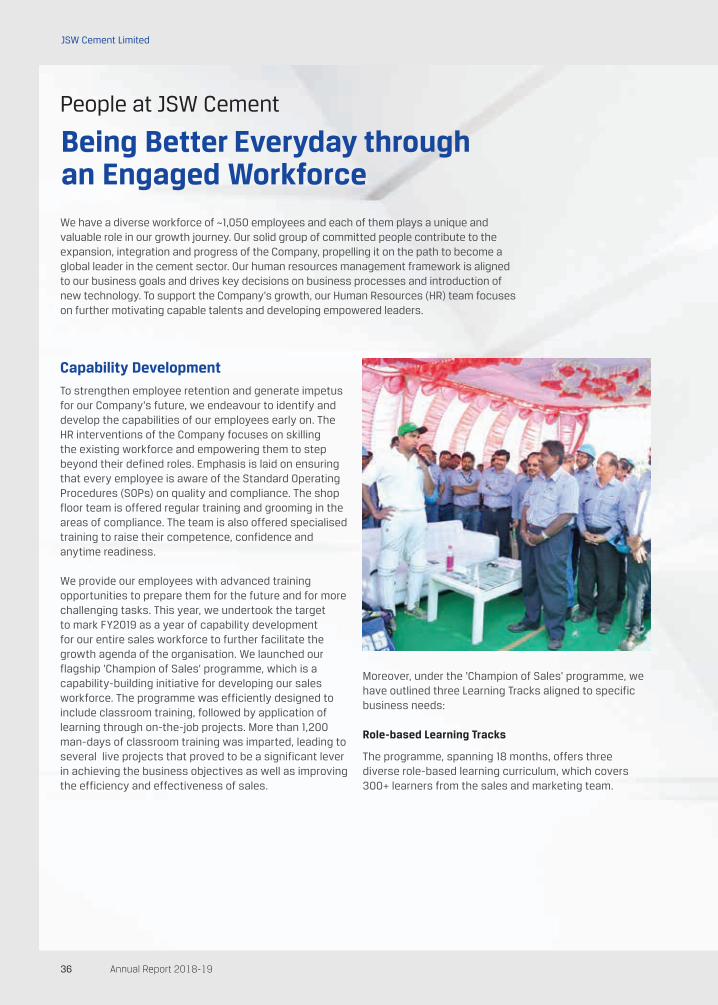
Capability Development
To strengthen employee retention and generate impetus for our Company’s future, we endeavour to identify and develop the capabilities of our employees early on. The HR interventions of the Company focuses on skilling the existing workforce and empowering them to step beyond their defined roles. Emphasis is laid on ensuring that every employee is aware of the Standard Operating Procedures (SOPs) on quality and compliance. The shop floor team is offered regular training and grooming in the areas of compliance. The team is also offered specialised training to raise their competence, confidence and anytime readiness.
We provide our employees with advanced training opportunities to prepare them for the future and for more challenging tasks. This year, we undertook the target to mark FY2019 as a year of capability development for our entire sales workforce to further facilitate the growth agenda of the organisation. We launched our flagship ‘Champion of Sales’ programme, which is a capability-building initiative for developing our sales workforce. The programme was efficiently designed to include classroom training, followed by application of learning through on-the-job projects. More than 1,200 man-days of classroom training was imparted, leading to several live projects that proved to be a significant lever in achieving the business objectives as well as improving the efficiency and effectiveness of sales.
Moreover, under the ‘Champion of Sales’ programme, we have outlined three Learning Tracks aligned to specific business needs:
Role-based Learning Tracks
The programme, spanning 18 months, offers three diverse role-based learning curriculum, which covers 300+ learners from the sales and marketing team.
People at JSW Cement
Being Better Everyday through an Engaged Workforce
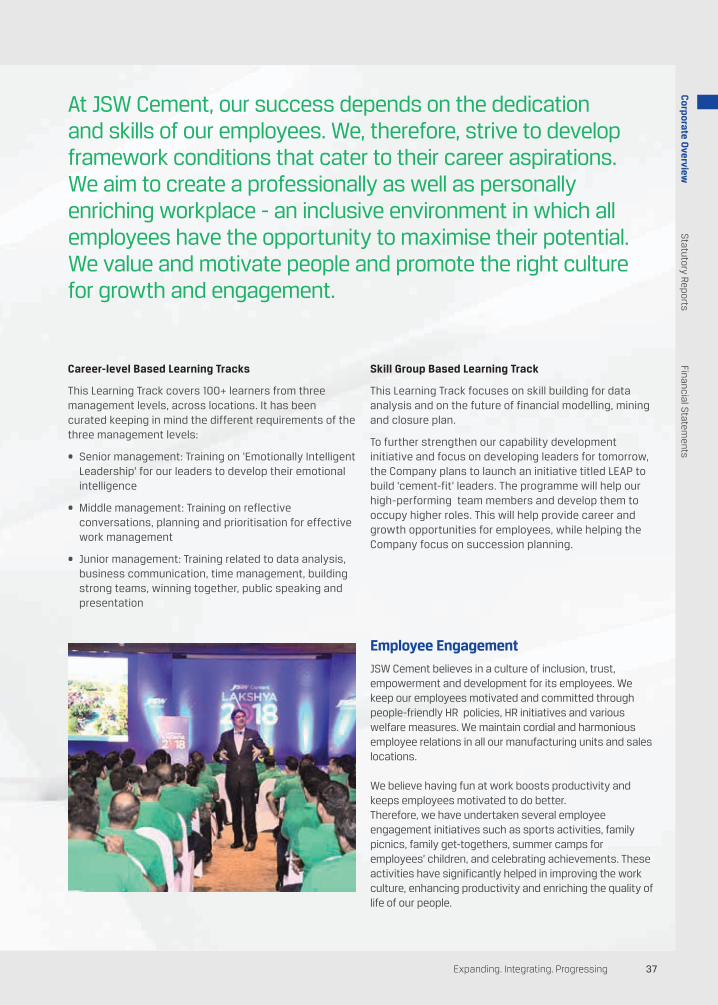
37Expanding. Integrating. Progressing
Corporate O
verviewFinancial S
tatements
Statutory Reports
Employee Engagement
JSW Cement believes in a culture of inclusion, trust, empowerment and development for its employees. We keep our employees motivated and committed through people-friendly HR policies, HR initiatives and various welfare measures. We maintain cordial and harmonious employee relations in all our manufacturing units and sales locations.
We believe having fun at work boosts productivity and keeps employees motivated to do better.Therefore, we have undertaken several employee engagement initiatives such as sports activities, family picnics, family get-togethers, summer camps for employees’ children, and celebrating achievements. These activities have significantly helped in improving the work culture, enhancing productivity and enriching the quality of life of our people.
At JSW Cement, our success depends on the dedication and skills of our employees. We, therefore, strive to develop framework conditions that cater to their career aspirations. We aim to create a professionally as well as personally enriching workplace - an inclusive environment in which all employees have the opportunity to maximise their potential. We value and motivate people and promote the right culture for growth and engagement.
Career-level Based Learning Tracks
This Learning Track covers 100+ learners from three management levels, across locations. It has been curated keeping in mind the different requirements of the three management levels:
• Senior management: Training on ‘Emotionally Intelligent Leadership’ for our leaders to develop their emotional intelligence
• Middle management: Training on reflective conversations, planning and prioritisation for effective work management
• Junior management: Training related to data analysis, business communication, time management, building strong teams, winning together, public speaking and presentation
Skill Group Based Learning Track
This Learning Track focuses on skill building for data analysis and on the future of financial modelling, mining and closure plan.
To further strengthen our capability development initiative and focus on developing leaders for tomorrow, the Company plans to launch an initiative titled LEAP to build 'cement-fit' leaders. The programme will help our high-performing team members and develop them to occupy higher roles. This will help provide career and growth opportunities for employees, while helping the Company focus on succession planning.
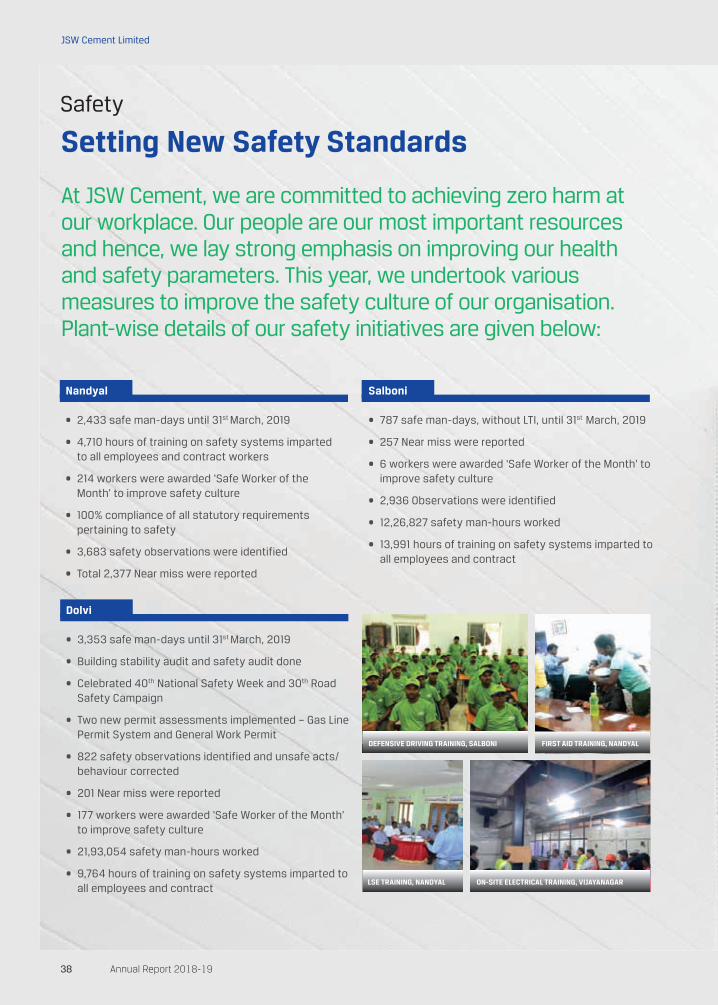
Annual Report 2018-1938
JSW Cement Limited
Nandyal
• 2,433 safe man-days until 31st March, 2019
• 4,710 hours of training on safety systems imparted to all employees and contract workers
• 214 workers were awarded ‘Safe Worker of the Month’ to improve safety culture
• 100% compliance of all statutory requirements pertaining to safety
• 3,683 safety observations were identified
• Total 2,377 Near miss were reported
Dolvi
• 3,353 safe man-days until 31st March, 2019
• Building stability audit and safety audit done
• Celebrated 40th National Safety Week and 30th Road Safety Campaign
• Two new permit assessments implemented – Gas Line Permit System and General Work Permit
• 822 safety observations identified and unsafe acts/behaviour corrected
• 201 Near miss were reported
• 177 workers were awarded ‘Safe Worker of the Month’ to improve safety culture
• 21,93,054 safety man-hours worked
• 9,764 hours of training on safety systems imparted to all employees and contract
Salboni
• 787 safe man-days, without LTI, until 31st March, 2019
• 257 Near miss were reported
• 6 workers were awarded ‘Safe Worker of the Month’ to improve safety culture
• 2,936 Observations were identified
• 12,26,827 safety man-hours worked
• 13,991 hours of training on safety systems imparted to all employees and contract
Safety
Setting New Safety Standards
At JSW Cement, we are committed to achieving zero harm at our workplace. Our people are our most important resources and hence, we lay strong emphasis on improving our health and safety parameters. This year, we undertook various measures to improve the safety culture of our organisation. Plant-wise details of our safety initiatives are given below:
FIRST AID TRAINING, NANDYAL
ON-SITE ELECTRICAL TRAINING, VIJAYANAGARLSE TRAINING, NANDYAL
DEFENSIVE DRIVING TRAINING, SALBONI

39Expanding. Integrating. Progressing
Corporate O
verviewFinancial S
tatements
Statutory Reports
Vijayanagar
• 109 safe man-days until 31st March, 2019
• 574 workers were awarded ‘Safe Worker of the Month’ to improve safety culture
• National Safety Day and Week celebrated from March 4th-10th, 2019
• Successfully completed Composite Cement and PSC bulk-loading projects without any incident
• Third-party inspection and certification of pressure vessels and all lifting tools
• 973 Near miss were reported
• 9,764 hours of training on safety systems imparted to all employees and contract workers
• 3,202 Observations were identified
Jajpur
• 558 safe man-days until 31st March, 2019
• 6,920 training hours imparted during
• Hand railing provided in all buildings
• Emergency contact number displayed in all locations
• 135 near-misses reported during FY2019
DuPont Safety Excellence Journey
We undertook the Safety Excellence Journey with the help of DuPont Sustainable Solution to imbibe safety practices to protect the employees who form the backbone of our organisation. Some of the safety measures that form part of the Journey includes:
• 58,371 hours’ safety training conducted for all workers and employees.
• Two days’ induction programme for all new workers and employees conducted successfully to in all locations.
• Prepared Job Safety Analysis (JSA) for all routine and non-routine activities and explaining the hazards and implementing the mitigation measures to avoid any unwanted incidents while performing the task at all locations.
• Prepared, approved and explained the Cardinal and General Safety Rules to all employees.
• Personal Protective Equipment (PPE), Lock Out & Tag Out (LOTO) and Permit to Work (PTW) task force teams have prepared the procedure and training modules and have also commenced the training programme.
• All senior employees have been trained on Safety Observation procedure (SO). SO tours have been carried out as per schedule in all operating locations.
• To ensure Contractor Safety Management (CSM), all contractors go through the Pre-qualification Assessment before being recruited.
• Rewarding safe working employees to encourage the safety culture in all locations.
Total
NDL
VJNR
Dolvi
Salboni
26.27
60.40
22.00
6.92
125.22
Budget Allocated and Amount Spent for Better Safety Location Wise
(in J lakhs)
Jajpur
7.06
Shiva
2.57
DUPONT SAFETY EXCELLENCY JOURNEY IN THE CEMENT DIVISION AT NANDYAL PLANT
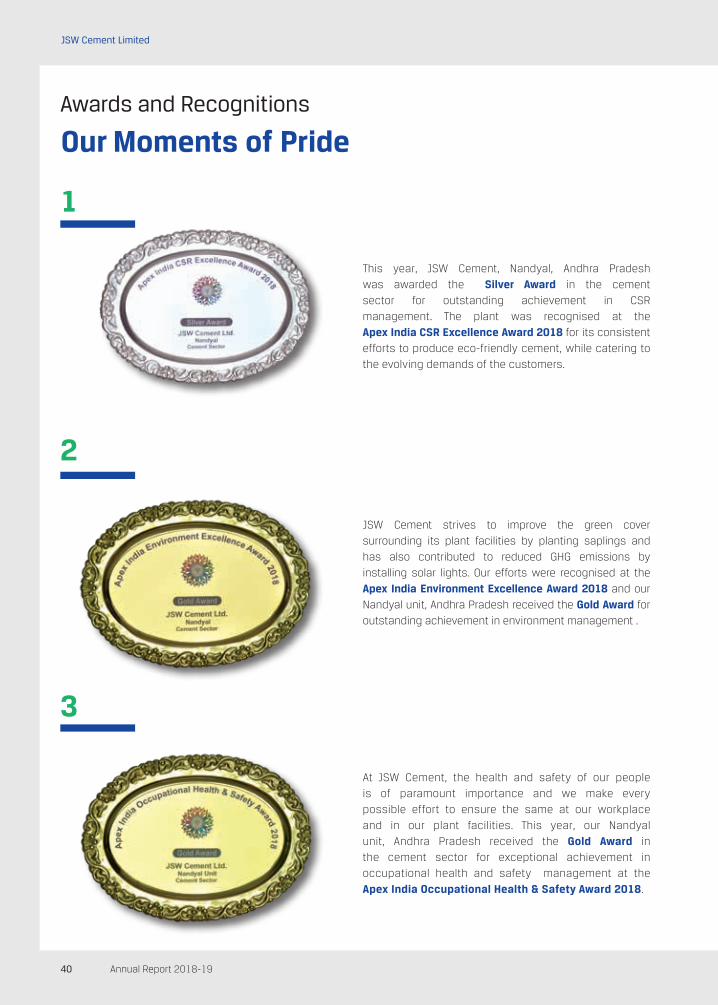
Annual Report 2018-1940
JSW Cement Limited
Awards and Recognitions
Our Moments of Pride
This year, JSW Cement, Nandyal, Andhra Pradesh
was awarded the Silver Award in the cement
sector for outstanding achievement in CSR
management. The plant was recognised at the
Apex India CSR Excellence Award 2018 for its consistent
efforts to produce eco-friendly cement, while catering to
the evolving demands of the customers.
JSW Cement strives to improve the green cover
surrounding its plant facilities by planting saplings and
has also contributed to reduced GHG emissions by
installing solar lights. Our efforts were recognised at the
Apex India Environment Excellence Award 2018 and our
Nandyal unit, Andhra Pradesh received the Gold Award for
outstanding achievement in environment management .
At JSW Cement, the health and safety of our people
is of paramount importance and we make every
possible effort to ensure the same at our workplace
and in our plant facilities. This year, our Nandyal
unit, Andhra Pradesh received the Gold Award in
the cement sector for exceptional achievement in
occupational health and safety management at the
Apex India Occupational Health & Safety Award 2018.
1
2
3
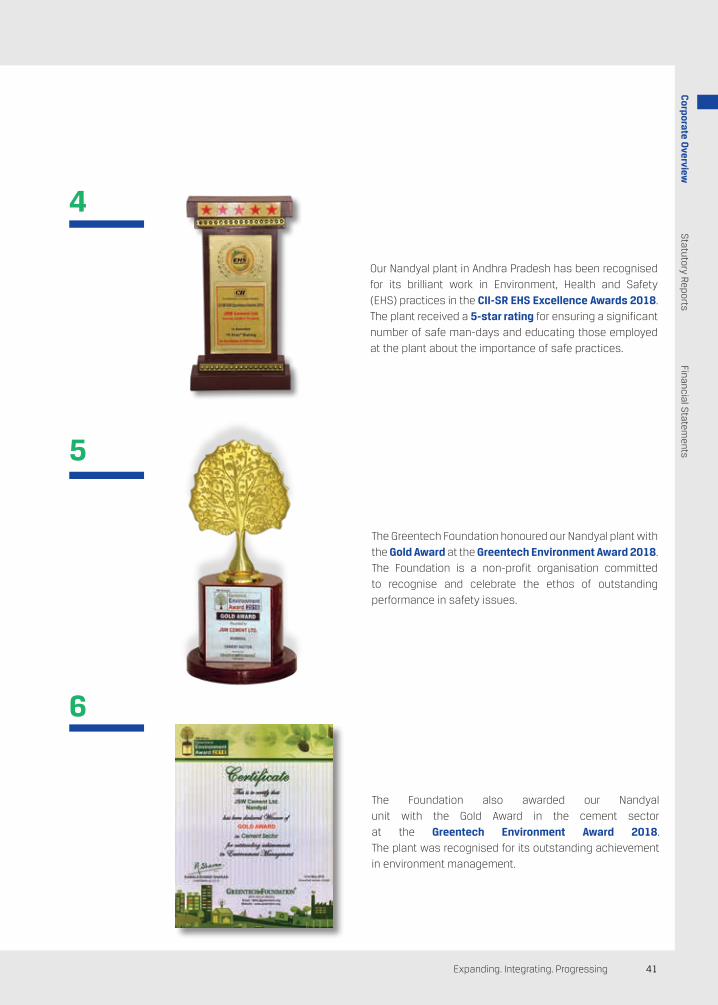
41Expanding. Integrating. Progressing
Corporate O
verviewFinancial S
tatements
Statutory Reports
Our Nandyal plant in Andhra Pradesh has been recognised
for its brilliant work in Environment, Health and Safety
(EHS) practices in the CII-SR EHS Excellence Awards 2018.
The plant received a 5-star rating for ensuring a significant
number of safe man-days and educating those employed
at the plant about the importance of safe practices.
The Greentech Foundation honoured our Nandyal plant with
the Gold Award at the Greentech Environment Award 2018.
The Foundation is a non-profit organisation committed
to recognise and celebrate the ethos of outstanding
performance in safety issues.
The Foundation also awarded our Nandyal
unit with the Gold Award in the cement sector
at the Greentech Environment Award 2018.
The plant was recognised for its outstanding achievement
in environment management.
4
5
6

Annual Report 2018-1942
JSW Cement Limited
1.CompanyStatusandPerformance JSW Cement, a leading cement producer from the house of JSW Group, was incorporated in 2006 and started its commercial operations in 2009. It has plants at Nandyal (Andhra Pradesh), Vijayanagar (Karnataka), Dolvi (Maharashtra) and Salboni (West Bengal), which produce varieties of cement such as Portland Slag Cement (PSC), Ordinary Portland Cement (OPC), Concreel HD, Ground Granulated Blast Furnace Slag (GGBS) and Composite Cement. JSW Cement primarily utilises slag from JSW Steel’s plants to produce green cement.
JSW Cement’s flagship plant at Nandyal uses world-class technology to manufacture cement. It has also won prestigious awards for its energy-saving processes. With key markets in Telangana, Andhra Pradesh, Karnataka, Tamil Nadu, Kerala, Goa, Maharashtra, West Bengal, Jharkhand, Bihar and Odisha, JSW Cement has been delivering high-quality products to several prominent and large infrastructural projects in the eastern, southern and western regions of the country.
The Company’s current production capacity is 12.8 MTPA. During the year, at the Dolvi location, the Company has commissioned a 1.2 million MT per annum grinding unit.
The Company has further plans to add 1.2 MTPA grinding capacity at Jajpur, Odisha by July 2019. Blast furnace slag from nearby steel plants as well as fly ash from Jindal Stainless Steel’s plant will be sourced for manufacture of PSC and Portland Pozzolana Cement (PPC) at Jajpur, Odisha.
The Company has started mining limestone and also has plans to set up a 1 million MT clinker manufacturing facility at Fujairah, UAE by January 2020. The clinker from Fujairah will be imported to India to meet the clinker requirements of the Dolvi plant.
The main thrust of the Company is to produce green cement, i.e., PSC which is engineered for strength and durability, by converting industrial by-product (blast furnace slag) into a useful product, and this has reduced the carbon footprint of the Group.
2.GlobalEconomyOverview According to the World Economic Outlook, global growth softened marginally from 3.8% in 2017 to 3.6% in 2018. Weakening market sentiment, trade policy uncertainty and concerns regarding China’s outlook played a major role in this slowdown. However, the fiscal boost in the US provided a thrust to the country’s economy, while the
ManagementDiscussionandAnalysis
STUDYMATERIALDISTRIBUTIONTOKIDSATROURKELA,ODISHA
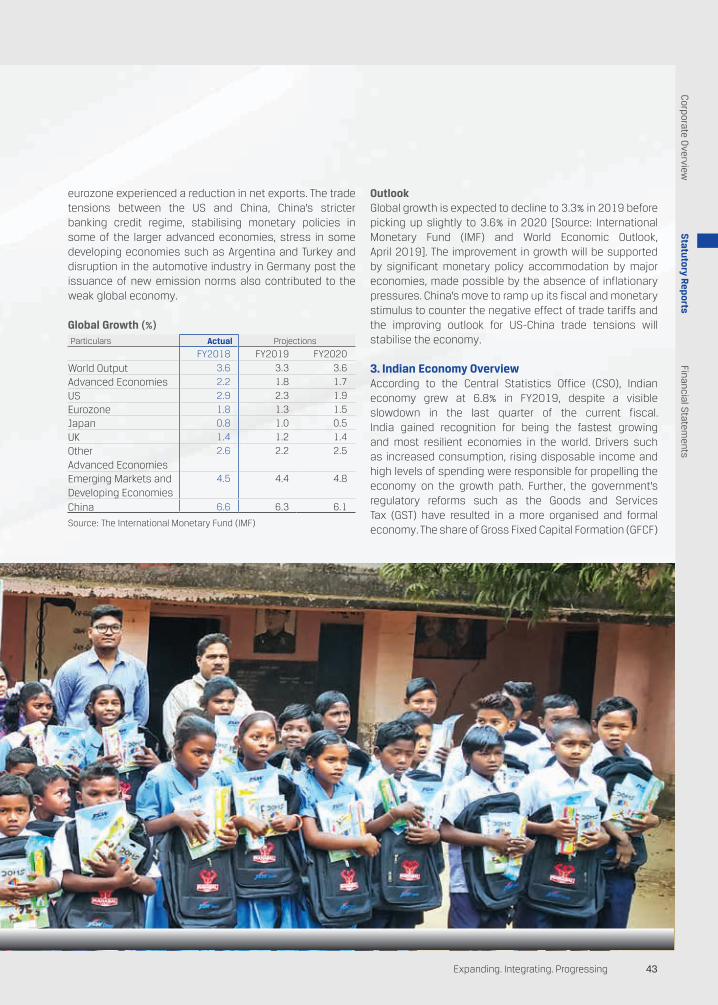
43Expanding. Integrating. Progressing
Corporate O
verviewFinancial S
tatements
Statutory Reports
eurozone experienced a reduction in net exports. The trade tensions between the US and China, China’s stricter banking credit regime, stabilising monetary policies in some of the larger advanced economies, stress in some developing economies such as Argentina and Turkey and disruption in the automotive industry in Germany post the issuance of new emission norms also contributed to the weak global economy.
GlobalGrowth(%)Particulars Actual Projections
FY2018 FY2019 FY2020
World Output 3.6 3.3 3.6
Advanced Economies 2.2 1.8 1.7
US 2.9 2.3 1.9
Eurozone 1.8 1.3 1.5
Japan 0.8 1.0 0.5
UK 1.4 1.2 1.4
Other Advanced Economies
2.6 2.2 2.5
Emerging Markets and Developing Economies
4.5 4.4 4.8
China 6.6 6.3 6.1
Source: The International Monetary Fund (IMF)
Outlook Global growth is expected to decline to 3.3% in 2019 before picking up slightly to 3.6% in 2020 [Source: International Monetary Fund (IMF) and World Economic Outlook, April 2019]. The improvement in growth will be supported by significant monetary policy accommodation by major economies, made possible by the absence of inflationary pressures. China’s move to ramp up its fiscal and monetary stimulus to counter the negative effect of trade tariffs and the improving outlook for US-China trade tensions will stabilise the economy.
3.IndianEconomyOverview According to the Central Statistics Office (CSO), Indian economy grew at 6.8% in FY2019, despite a visible slowdown in the last quarter of the current fiscal. India gained recognition for being the fastest growing and most resilient economies in the world. Drivers such as increased consumption, rising disposable income and high levels of spending were responsible for propelling the economy on the growth path. Further, the government’s regulatory reforms such as the Goods and Services Tax (GST) have resulted in a more organised and formal economy. The share of Gross Fixed Capital Formation (GFCF)

Annual Report 2018-1944
JSW Cement Limited
in GDP improved to 32.3% in FY2019 from 31.4% a year ago, indicating the strengthening of investment demand. The pickup in fixed investment was supported by higher construction activity, led by the government’s drive to boost spending on the road sector and affordable housing. India’s ranking in the World Bank’s Ease of Doing Business Index continued to improve, jumping 23 places in the 2018 edition to assume the 77th position. Growing investor confidence is also reflected in the total Foreign Direct Investment (FDI) inflow in India, which stood at ~$38 billion in 2018, surpassing China for the first time in 20 years.
Outlook India is projected to remain robust and grow at a rate of 7.1% in 2019. This growth is expected to be driven by factors such as lower oil prices, sustained growth in private consumption and favourable monetary policy. As per the IMF – World Economic Outlook January 2019 update, the projections will continue to grow to 7.5% in 2019 and continue expanding to 7.7% for 2020. The Indian economy is, therefore, well-poised to grow in the midst of growing global uncertainties. According to a Boston Consulting Group (BCG) report, India is expected to be the third largest consumer economy as its consumption may triple to $4 trillion by 2025, owing to a shift in consumer behaviour and expenditure pattern. According to PwC, the country is estimated to surpass the US to become the second largest economy in terms of Purchasing Power Parity (PPP) by 2040.
4.CementIndustryOverviewIndustryLandscape India is home to the world’s second-largest cement industry and accounts for over 8% of the global installed capacity. As per Crisil, with the addition of 23 MTPA cement production capacity in FY2019, the total production capacity increased to 478 MT. Of the total capacity, 98% lies
with the private sector and the rest with the public sector. 210 large cement plants account for a cumulative installed capacity of over 410 MT, while over 350 mini cement plants have an estimated production capacity of nearly 11.10 MT. Of the total 210 large cement plants in India, 77 are situated in the states of Andhra Pradesh, Rajasthan and Tamil Nadu. India’s cement exports and imports reached $280.10 million and $88.56 million, respectively, between April and October 2018. The Indian cement industry has the lowest energy consumption and CO
2 emissions.
TopCement-producingCountriesintheWorldin2018
Rank CountryProductioninmillion
MetricTonne1 China 2,3702 India 2903 US 88.54 Turkey 845 Vietnam 806 Indonesia 677 South Korea 568 Japan 55.59 Russia and Egypt 55
10 Iran 53
Source: statista.com
PerformanceinFY2019According to the Economic Advisor, Ministry of Commerce & Industry, the cement industry has shown a CAGR of over 5% in the year FY2019 from FY2015 (April-November). During FY2019, the industry has shown a double-digit growth of over 14% as compared to a marginal growth of around 1% in FY2018. As per CRISIL, cement demand for FY2019 is 335 MTPA, thereby registering a growth of 12%. The housing sector is still a main demand driver accounting for 60-65% of total consumption. Other demand drivers are infrastructure, and commercial and industrial with 15-20 % share each.
GROUND-BREAKINGCEREMONYOFJSWCEMENTFZE,FUJAIRAH,UAE
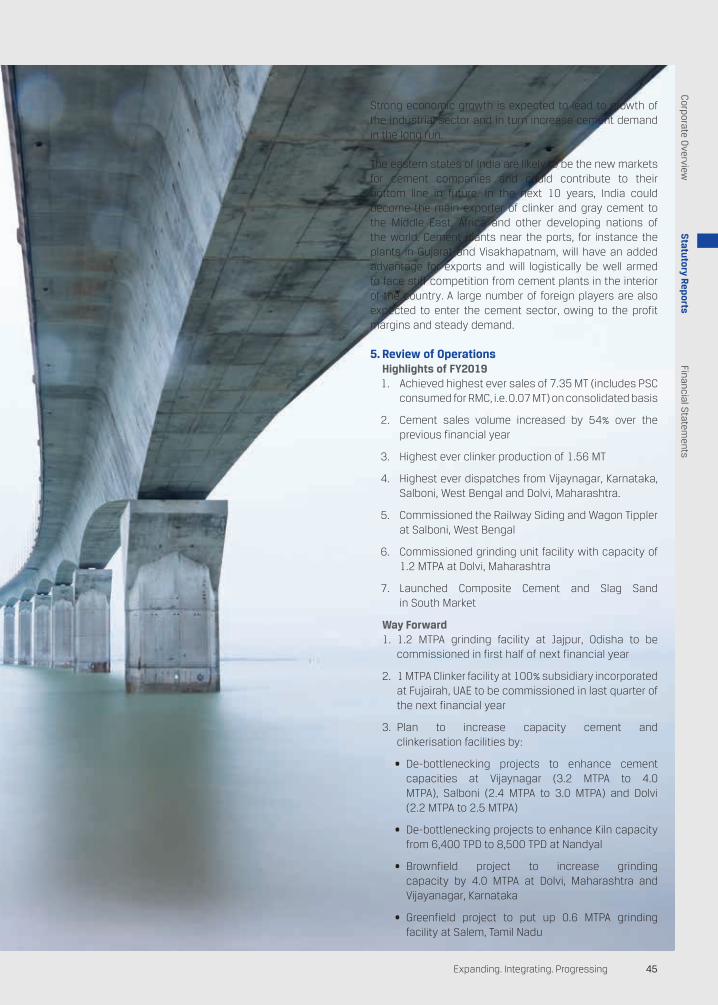
45Expanding. Integrating. Progressing
Corporate O
verviewFinancial S
tatements
Statutory Reports
The year witnessed steady implementation and completion of mega-infrastructure projects especially in the Northern and Central regions, with Rajasthan and Madhya Pradesh set for Assembly Election in November-December. Union Government-backed mega-infrastructure projects such as ‘Bharatmala’ for roads, ‘Sagarmala’ for ports and development of dedicated freight corridors and smart city projects witnessed a surge in activity in terms of award and implementation of new and existing projects, respectively. Around 34 infrastructure projects with an outlay of over `150 crores have been completed in the April-August period across major infrastructure sectors.
GovernmentInitiativesThe growth in cement demand is mainly driven by the following government initiatives:
• UnionBudgetFY2019: In the Union Budget FY2019, the Finance Minister announced the government’s intentions of undertaking a major infrastructure expansion programme. The government is undertaking several measures to boost the real estate sector, which could have a multiplier effect on the economy, as it would spur demand for cement and allied industries, particularly in the unorganised sector.
• Housing for All: The government’s efforts to provide housing for all will be a major source of cement consumption. A total of 1.54 crores rural homes have been completed under the PMAY-Urban scheme in the last five years. In the second phase of the scheme, during 2019-20 to 2021-22, 1.95 crores houses are proposed to be provided to the eligible beneficiaries. Further, Real Estate Regulation and Development Act (RERA) 2016 and Benami Transaction Act brought more transparency in the construction sector, thereby boosting it and in turn driving the demand for cement.
• AffordableHousingFund: In the Union Budget FY2019, the government announced setting up of an Affordable Housing Fund of `25,000 crores ($3.86 billion) under the National Housing Bank (NHB), which will be utilised for easing credit to homebuyers. The move is expected to boost the demand of cement from the housing segment.
• Auction of the limestone block: As of October 2018, the Government of India has auctioned 23 limestone blocks and 42 more limestone blocks are expected to be auctioned by March 2019.
GrowthDriversandOpportunitiesCement industry demand is expected to grow at 7% to 502 MT by FY2020. The demand for cement in India can be attributed to three main sectors – Housing and Real Estate, Public Infrastructure and Industrial Development. Government initiatives such as Housing For All are expected to push demand in the cement sector. The real estate market in India is expected to reach $1 trillion by 2023 from $120 billion in 2017. Strong growth in rural housing and low-cost housing will also amplify cement demand.
Strong economic growth is expected to lead to growth of the industrial sector and in turn increase cement demand in the long run.
The eastern states of India are likely to be the new markets for cement companies and could contribute to their bottom line in future. In the next 10 years, India could become the main exporter of clinker and gray cement to the Middle East, Africa and other developing nations of the world. Cement plants near the ports, for instance the plants in Gujarat and Visakhapatnam, will have an added advantage for exports and will logistically be well armed to face stiff competition from cement plants in the interior of the country. A large number of foreign players are also expected to enter the cement sector, owing to the profit margins and steady demand.
5.ReviewofOperations HighlightsofFY2019
1. Achieved highest ever sales of 7.35 MT (includes PSC consumed for RMC, i.e. 0.07 MT) on consolidated basis
2. Cement sales volume increased by 54% over the previous financial year
3. Highest ever clinker production of 1.56 MT
4. Highest ever dispatches from Vijaynagar, Karnataka, Salboni, West Bengal and Dolvi, Maharashtra.
5. Commissioned the Railway Siding and Wagon Tippler at Salboni, West Bengal
6. Commissioned grinding unit facility with capacity of 1.2 MTPA at Dolvi, Maharashtra
7. Launched Composite Cement and Slag Sand in South Market
WayForward1. 1.2 MTPA grinding facility at Jajpur, Odisha to be
commissioned in first half of next financial year
2. 1 MTPA Clinker facility at 100% subsidiary incorporated at Fujairah, UAE to be commissioned in last quarter of the next financial year
3. Plan to increase capacity cement and clinkerisation facilities by:
• De-bottlenecking projects to enhance cement capacities at Vijaynagar (3.2 MTPA to 4.0 MTPA), Salboni (2.4 MTPA to 3.0 MTPA) and Dolvi (2.2 MTPA to 2.5 MTPA)
• De-bottlenecking projects to enhance Kiln capacity from 6,400 TPD to 8,500 TPD at Nandyal
• Brownfield project to increase grinding capacity by 4.0 MTPA at Dolvi, Maharashtra and Vijayanagar, Karnataka
• Greenfield project to put up 0.6 MTPA grinding facility at Salem, Tamil Nadu
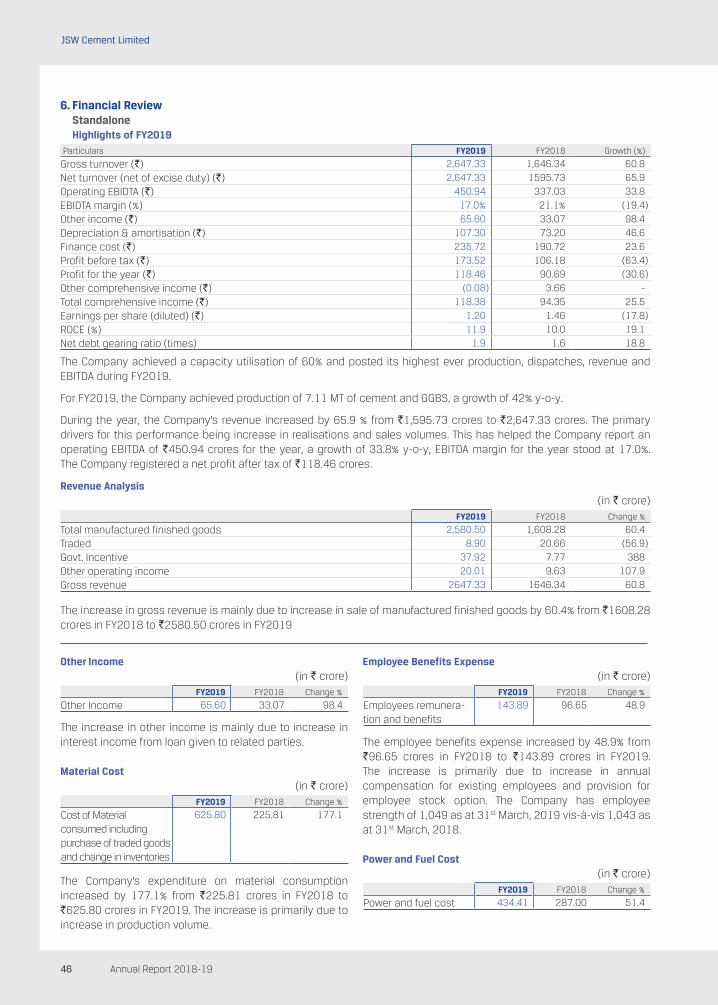
Annual Report 2018-1946
JSW Cement Limited
6.FinancialReview Standalone HighlightsofFY2019Particulars FY2019 FY2018 Growth (%)
Gross turnover (`) 2,647.33 1,646.34 60.8
Net turnover (net of excise duty) (`) 2,647.33 1595.73 65.9
Operating EBIDTA (`) 450.94 337.03 33.8
EBIDTA margin (%) 17.0% 21.1% (19.4)
Other income (`) 65.60 33.07 98.4
Depreciation & amortisation (`) 107.30 73.20 46.6
Finance cost (`) 235.72 190.72 23.6
Profit before tax (`) 173.52 106.18 (63.4)
Profit for the year (`) 118.46 90.69 (30.6)
Other comprehensive income (`) (0.08) 3.66 -
Total comprehensive income (`) 118.38 94.35 25.5
Earnings per share (diluted) (`) 1.20 1.46 (17.8)
ROCE (%) 11.9 10.0 19.1
Net debt gearing ratio (times) 1.9 1.6 18.8
The Company achieved a capacity utilisation of 60% and posted its highest ever production, dispatches, revenue and EBITDA during FY2019.
For FY2019, the Company achieved production of 7.11 MT of cement and GGBS, a growth of 42% y-o-y.
During the year, the Company’s revenue increased by 65.9 % from `1,595.73 crores to `2,647.33 crores. The primary drivers for this performance being increase in realisations and sales volumes. This has helped the Company report an operating EBITDA of `450.94 crores for the year, a growth of 33.8% y-o-y, EBITDA margin for the year stood at 17.0%. The Company registered a net profit after tax of `118.46 crores.
RevenueAnalysis(in ` crore)
FY2019 FY2018 Change %
Total manufactured finished goods 2,580.50 1,608.28 60.4
Traded 8.90 20.66 (56.9)
Govt. Incentive 37.92 7.77 388
Other operating income 20.01 9.63 107.9
Gross revenue 2647.33 1646.34 60.8
The increase in gross revenue is mainly due to increase in sale of manufactured finished goods by 60.4% from `1608.28 crores in FY2018 to `2580.50 crores in FY2019
OtherIncome (in ` crore)
FY2019 FY2018 Change %
Other Income 65.60 33.07 98.4
The increase in other income is mainly due to increase in interest income from loan given to related parties.
MaterialCost(in ` crore)
FY2019 FY2018 Change %
Cost of Material consumed including purchase of traded goods and change in inventories
625.80 225.81 177.1
The Company’s expenditure on material consumption increased by 177.1% from `225.81 crores in FY2018 to `625.80 crores in FY2019. The increase is primarily due to increase in production volume.
EmployeeBenefitsExpense(in ` crore)
FY2019 FY2018 Change %
Employees remunera-tion and benefits
143.89 96.65 48.9
The employee benefits expense increased by 48.9% from `96.65 crores in FY2018 to `143.89 crores in FY2019. The increase is primarily due to increase in annual compensation for existing employees and provision for employee stock option. The Company has employee strength of 1,049 as at 31st March, 2019 vis-à-vis 1,043 as at 31st March, 2018.
PowerandFuelCost(in ` crore)
FY2019 FY2018 Change %
Power and fuel cost 434.41 287.00 51.4
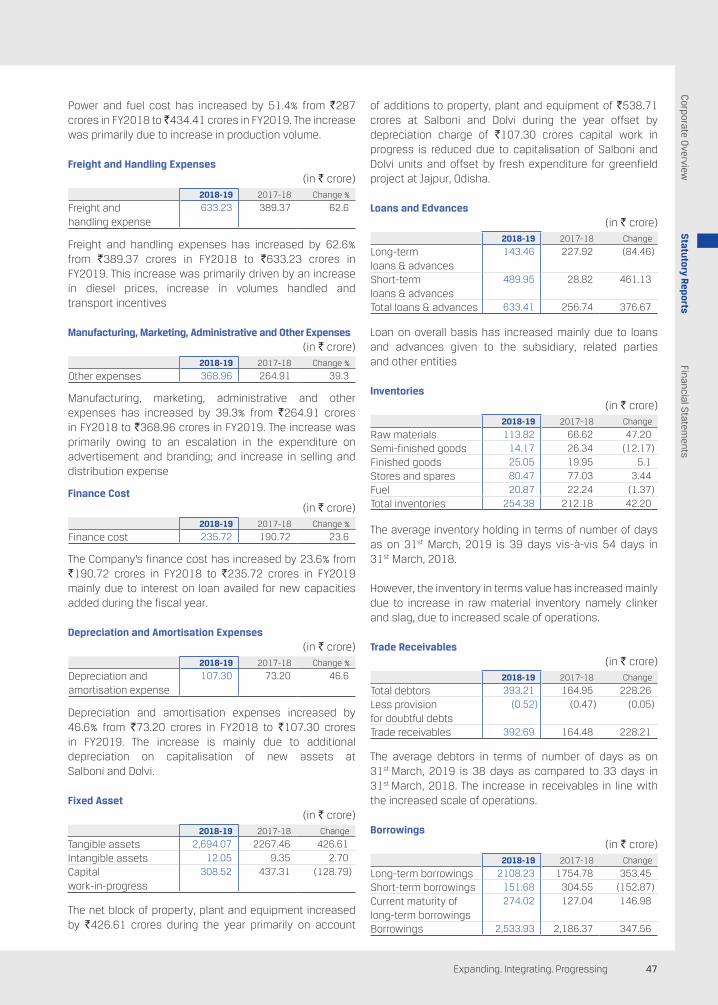
47Expanding. Integrating. Progressing
Corporate O
verviewFinancial S
tatements
Statutory Reports
Power and fuel cost has increased by 51.4% from `287 crores in FY2018 to ̀ 434.41 crores in FY2019. The increase was primarily due to increase in production volume.
FreightandHandlingExpenses(in ` crore)
2018-19 2017-18 Change %
Freight and handling expense
633.23 389.37 62.6
Freight and handling expenses has increased by 62.6% from `389.37 crores in FY2018 to `633.23 crores in FY2019. This increase was primarily driven by an increase in diesel prices, increase in volumes handled and transport incentives
Manufacturing,Marketing,AdministrativeandOtherExpenses(in ` crore)
2018-19 2017-18 Change %
Other expenses 368.96 264.91 39.3
Manufacturing, marketing, administrative and other expenses has increased by 39.3% from `264.91 crores in FY2018 to `368.96 crores in FY2019. The increase was primarily owing to an escalation in the expenditure on advertisement and branding; and increase in selling and distribution expense
FinanceCost(in ` crore)
2018-19 2017-18 Change %
Finance cost 235.72 190.72 23.6
The Company’s finance cost has increased by 23.6% from `190.72 crores in FY2018 to `235.72 crores in FY2019 mainly due to interest on loan availed for new capacities added during the fiscal year.
DepreciationandAmortisationExpenses(in ` crore)
2018-19 2017-18 Change %
Depreciation and amortisation expense
107.30 73.20 46.6
Depreciation and amortisation expenses increased by 46.6% from `73.20 crores in FY2018 to `107.30 crores in FY2019. The increase is mainly due to additional depreciation on capitalisation of new assets at Salboni and Dolvi.
FixedAsset(in ` crore)
2018-19 2017-18 Change
Tangible assets 2,694.07 2267.46 426.61
Intangible assets 12.05 9.35 2.70
Capital work-in-progress
308.52 437.31 (128.79)
The net block of property, plant and equipment increased by `426.61 crores during the year primarily on account
of additions to property, plant and equipment of `538.71 crores at Salboni and Dolvi during the year offset by depreciation charge of `107.30 crores capital work in progress is reduced due to capitalisation of Salboni and Dolvi units and offset by fresh expenditure for greenfield project at Jajpur, Odisha.
LoansandEdvances(in ` crore)
2018-19 2017-18 Change
Long-term loans & advances
143.46 227.92 (84.46)
Short-term loans & advances
489.95 28.82 461.13
Total loans & advances 633.41 256.74 376.67
Loan on overall basis has increased mainly due to loans and advances given to the subsidiary, related parties and other entities
Inventories(in ` crore)
2018-19 2017-18 Change
Raw materials 113.82 66.62 47.20
Semi-finished goods 14.17 26.34 (12.17)
Finished goods 25.05 19.95 5.1
Stores and spares 80.47 77.03 3.44
Fuel 20.87 22.24 (1.37)
Total inventories 254.38 212.18 42.20
The average inventory holding in terms of number of days as on 31st March, 2019 is 39 days vis-à-vis 54 days in 31st March, 2018.
However, the inventory in terms value has increased mainly due to increase in raw material inventory namely clinker and slag, due to increased scale of operations.
TradeReceivables(in ` crore)
2018-19 2017-18 Change
Total debtors 393.21 164.95 228.26
Less provision for doubtful debts
(0.52) (0.47) (0.05)
Trade receivables 392.69 164.48 228.21
The average debtors in terms of number of days as on 31st March, 2019 is 38 days as compared to 33 days in 31st March, 2018. The increase in receivables in line with the increased scale of operations.
Borrowings(in ` crore)
2018-19 2017-18 Change
Long-term borrowings 2108.23 1754.78 353.45
Short-term borrowings 151.68 304.55 (152.87)
Current maturity of long-term borrowings
274.02 127.04 146.98
Borrowings 2,533.93 2,186.37 347.56
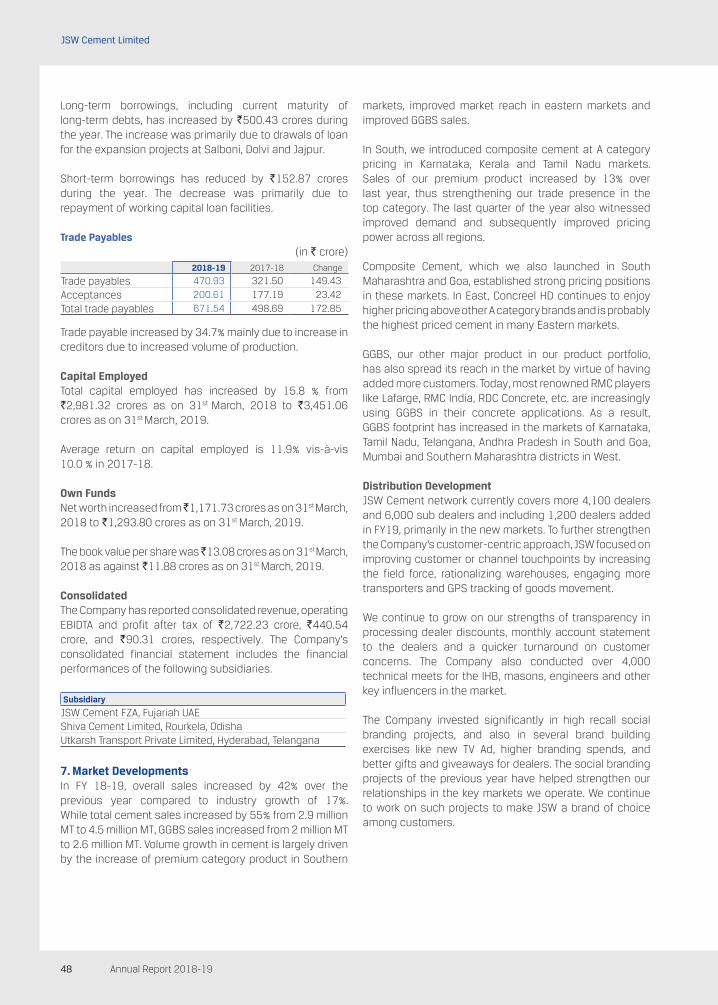
Annual Report 2018-1948
JSW Cement Limited
Long-term borrowings, including current maturity of long-term debts, has increased by `500.43 crores during the year. The increase was primarily due to drawals of loan for the expansion projects at Salboni, Dolvi and Jajpur.
Short-term borrowings has reduced by `152.87 crores during the year. The decrease was primarily due to repayment of working capital loan facilities.
TradePayables(in ` crore)
2018-19 2017-18 Change
Trade payables 470.93 321.50 149.43
Acceptances 200.61 177.19 23.42
Total trade payables 671.54 498.69 172.85
Trade payable increased by 34.7% mainly due to increase in creditors due to increased volume of production.
CapitalEmployedTotal capital employed has increased by 15.8 % from `2,981.32 crores as on 31st March, 2018 to `3,451.06 crores as on 31st March, 2019.
Average return on capital employed is 11.9% vis-à-vis 10.0 % in 2017-18.
OwnFundsNet worth increased from ̀ 1,171.73 crores as on 31st March, 2018 to `1,293.80 crores as on 31st March, 2019.
The book value per share was ̀ 13.08 crores as on 31st March, 2018 as against `11.88 crores as on 31st March, 2019.
ConsolidatedThe Company has reported consolidated revenue, operating EBIDTA and profit after tax of `2,722.23 crore, `440.54 crore, and `90.31 crores, respectively. The Company’s consolidated financial statement includes the financial performances of the following subsidiaries.
Subsidiary
JSW Cement FZA, Fujariah UAEShiva Cement Limited, Rourkela, OdishaUtkarsh Transport Private Limited, Hyderabad, Telangana
7.MarketDevelopments In FY 18-19, overall sales increased by 42% over the previous year compared to industry growth of 17%. While total cement sales increased by 55% from 2.9 million MT to 4.5 million MT, GGBS sales increased from 2 million MT to 2.6 million MT. Volume growth in cement is largely driven by the increase of premium category product in Southern
markets, improved market reach in eastern markets and improved GGBS sales.
In South, we introduced composite cement at A category pricing in Karnataka, Kerala and Tamil Nadu markets. Sales of our premium product increased by 13% over last year, thus strengthening our trade presence in the top category. The last quarter of the year also witnessed improved demand and subsequently improved pricing power across all regions.
Composite Cement, which we also launched in South Maharashtra and Goa, established strong pricing positions in these markets. In East, Concreel HD continues to enjoy higher pricing above other A category brands and is probably the highest priced cement in many Eastern markets.
GGBS, our other major product in our product portfolio, has also spread its reach in the market by virtue of having added more customers. Today, most renowned RMC players like Lafarge, RMC India, RDC Concrete, etc. are increasingly using GGBS in their concrete applications. As a result, GGBS footprint has increased in the markets of Karnataka, Tamil Nadu, Telangana, Andhra Pradesh in South and Goa, Mumbai and Southern Maharashtra districts in West.
DistributionDevelopmentJSW Cement network currently covers more 4,100 dealers and 6,000 sub dealers and including 1,200 dealers added in FY19, primarily in the new markets. To further strengthen the Company’s customer-centric approach, JSW focused on improving customer or channel touchpoints by increasing the field force, rationalizing warehouses, engaging more transporters and GPS tracking of goods movement.
We continue to grow on our strengths of transparency in processing dealer discounts, monthly account statement to the dealers and a quicker turnaround on customer concerns. The Company also conducted over 4,000 technical meets for the IHB, masons, engineers and other key influencers in the market.
The Company invested significantly in high recall social branding projects, and also in several brand building exercises like new TV Ad, higher branding spends, and better gifts and giveaways for dealers. The social branding projects of the previous year have helped strengthen our relationships in the key markets we operate. We continue to work on such projects to make JSW a brand of choice among customers.
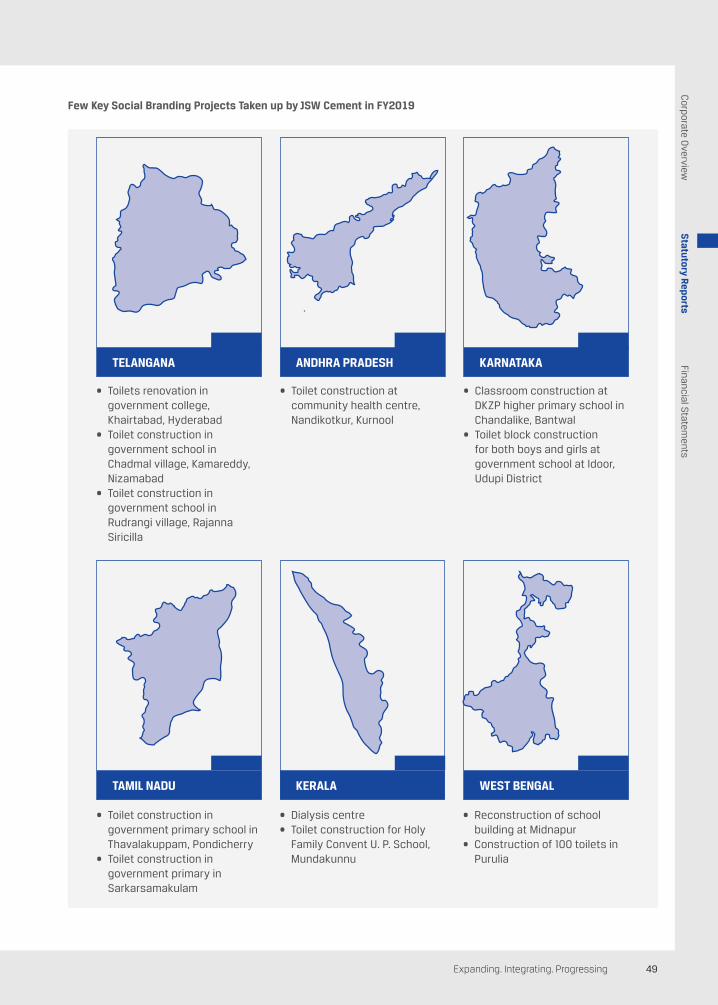
49Expanding. Integrating. Progressing
Corporate O
verviewFinancial S
tatements
Statutory Reports
FewKeySocialBrandingProjectsTakenupbyJSWCementinFY2019
• Toilets renovation in government college, Khairtabad, Hyderabad
• Toilet construction in government school in Chadmal village, Kamareddy, Nizamabad
• Toilet construction in government school in Rudrangi village, Rajanna Siricilla
• Toilet construction at community health centre, Nandikotkur, Kurnool
• Classroom construction at DKZP higher primary school in Chandalike, Bantwal
• Toilet block construction for both boys and girls at government school at Idoor, Udupi District
KARNATAKATELANGANA ANDHRAPRADESH
• Toilet construction in government primary school in Thavalakuppam, Pondicherry
• Toilet construction in government primary in Sarkarsamakulam
• Dialysis centre• Toilet construction for Holy
Family Convent U. P. School, Mundakunnu
• Reconstruction of school building at Midnapur
• Construction of 100 toilets in Purulia
TAMILNADU KERALA WESTBENGAL
Annual Report 2018-1950
JSW Cement Limited
8.RiskandAreasofConcernThe Company has a comprehensive and robust risk management framework that identifies and evaluates business risks and opportunities. The Company recognises that the emerging and identified risks need to be managed and mitigated to protect its shareholders and other stakeholders’ interest, achieve its business objectives, and enable sustainable growth.
Identified risks are prioritised based on the impact and likelihood of occurrence. The Company has constituted a sub-committee of Directors to oversee Enterprise Risk Management framework to ensure: execution of decided strategies with focus on action, monitoring risks arising out of unintended consequences of decisions or actions related to performance, operations, compliance, incidents, processes and systems, managing risks appropriately.
The key risks and the response strategies considered by the Company are as under:
Competitivedynamicsandindustrialcyclicality: The risk is managed through widening and deepening customer reach and focus on consistent quality.
Rawmaterial availabilityandcost: The risk is managed by broad-basing vendors from different geographies, exploring various contract options like long-term/spot, relationship management with vendors, etc.
Logistics and infrastructure: The risk is managed by creating a centralised logistics cell to ensure end-to-end integration and optimisation of infrastructure spend.
Technology and operational disruptions: The risk is managed by effective management of automation systems, spares management, maintenance scheduling, insurance cover for plant interruptions and loss of profit.
Environment, health and safety: The risk is managed by compliance with norms through right selection of equipment, processes, inputs and tracking emissions, tracking changing technology and future norms for advance planning, safety training, medical facilities and health insurance policy for employees and their families.
Manpower availabilitywith desired skillsets: The risk is managed by manpower planning in line with growth strategy and on the job/ online trainings to develop competencies and soft skills. Risk of labour turnover is mitigated by proper recruitment policy and appraisal system.
Reputation: The risk is managed by value-driven leadership adhering to the highest standards of governance and code of conduct, extending even to business partners.
Finance: The financial risks are managed by proactive tracking of funding and covenants and regular review of hedging strategy, cost optimisation, inventory, receivables and vendor credit management.
Confidentiality, integrity and security of data andsystems: The risk is managed by implementing security policies and procedures, antivirus/ endpoint security deployment, operationalisation of disaster recovery site, implementation of disaster recovery plan and regular training on IT security.
9.GreenInitiative The cement sector is the third-largest industrial energy consumer in the world, responsible for 7% of industrial energy use, and the second industrial CO
2 emitter, with about
7% of global CO2 emissions. Cement is the key ingredient of
concrete, which is used to build homes, schools, hospitals and infrastructure, all of which are important for quality of life and social and economic well-being. As the global population rises and more people move into cities, global cement production is set to grow, and despite increasing efficiencies, direct carbon emissions from the cement industry are expected to increase by 4% globally by 2050.
A combination of technology and policy solutions could provide a pathway to reduce direct CO
2 emissions from
the cement industry by 24% below the current levels by 2050, according to a new report by the International Energy Agency (IEA) and the Cement Sustainability Initiative (CSI).
Pursuant to our belief in Green, we continue to strengthen our green initiative , which was born during our inception. In recent years, the fruits of our green initiative germination have begun to reap good results and have gained acceptance. The use of low-carbon GGBS enables our range of blended cement products to be low carbon when compared to the conventional Ordinary Portland Cement (OPC). Portland cement generates about 1 tonne of CO
2 for
each tonne of cement, while PSC reduces the production and release of damaging pollutants and greenhouse gasses, particularly CO
2. Hence, PSC is considered as
Green Cement or eco-friendly cement. The manufacturing of green cement effectively helps not only in pollution management but also in natural resource conservation. As a common practice, blast furnace slag is incorporated in Portland cement production for environmental, technical
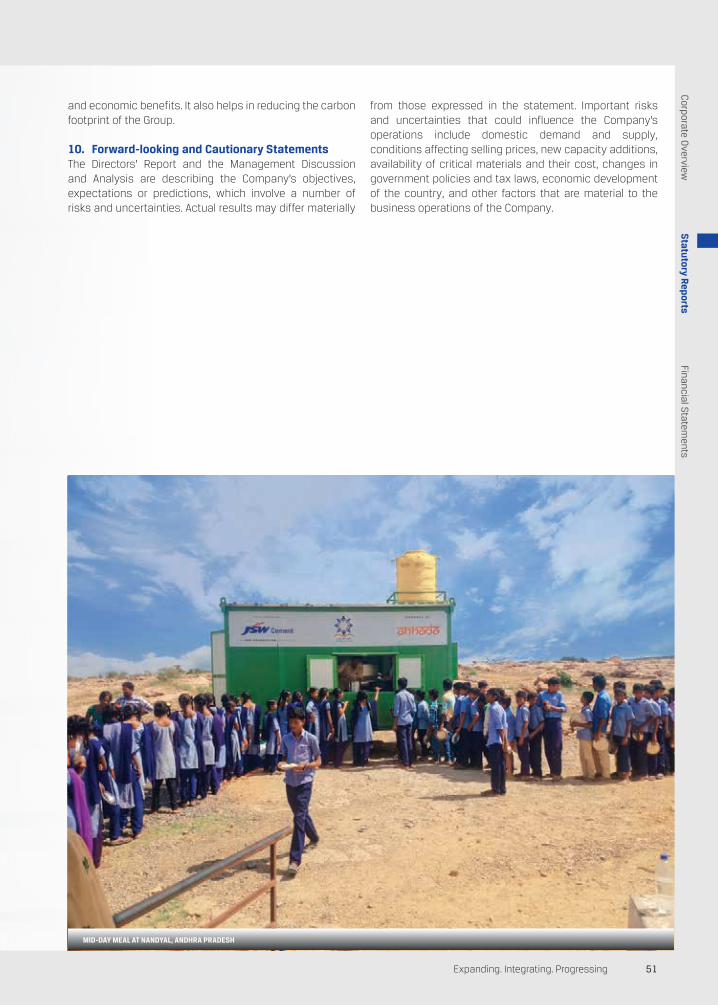
51Expanding. Integrating. Progressing
Corporate O
verviewFinancial S
tatements
Statutory Reports
and economic benefits. It also helps in reducing the carbon footprint of the Group.
10. Forward-lookingandCautionaryStatements The Directors’ Report and the Management Discussion and Analysis are describing the Company’s objectives, expectations or predictions, which involve a number of risks and uncertainties. Actual results may differ materially
from those expressed in the statement. Important risks and uncertainties that could influence the Company’s operations include domestic demand and supply, conditions affecting selling prices, new capacity additions, availability of critical materials and their cost, changes in government policies and tax laws, economic development of the country, and other factors that are material to the business operations of the Company.
MID-DAYMEALATNANDYAL,ANDHRAPRADESH

Annual Report 2018-1952
JSW Cement Limited
Corporate Information
BoardofDirectors
Mr.NirmalKumarJainNon-executive Chairman
Mr.ParthJindalManaging Director
Mr.NileshNarwekarWhole-time Director and CEO
Mr.NarinderSinghKahlonDirector Finance and CFO
Mr.KantilalNarandasPatelNon-executive Director
Mr.PankajKulkarniNon-executive Director
Mr.BiswadipGuptaNon-executive Director
Mr.JugalKishoreTandonIndependent Director
Mr.JaiprakashNarainLalIndependent Director
Ms.SutapaBanerjeeIndependent Director
CompanySecretary
Mr.RahulDubey
StatutoryAuditors
M/s.HPVS&AssociatesChartered Accountants, Mumbai
RegistrarandShare
TransferAgent
KarvyComputerSharePrivateLimitedKarvy Selenium Tower B,Plot 31-32, Gachibowli, Financial District, Nanakramguda,Hyderabad - 500 032Tel: 040 - 6716 1500Fax: 040 - 2300 1153Toll Free No.: 1800 345 4001Email: [email protected]
CostAuditors
M/s.R.Nanabhoy&Co.Chartered Accountants, Mumbai
SecretarialAuditors
M/s.S.K.Jain&Co.Company Secretaries
Bankers
AxisBankBankofIndiaBankofBahrainandKuwaitCanaraBankEximBankICICIBankIndianBankRBLbankSyndicateBankSouthIndianBankKotakMahindraBankIndusindBankYesBank
Works
VijayanagarWorksP. O. Vidyanagar, Toranagallu Village, Sandur Taluk, Bellary District, Karnataka - 583 275 Tel: 08395 - 250120 - 130 Fax: 08395 - 241003 / 241030
NandyalWorksVillage Bilakalaguduru, Gadivemula Mandal, Nandyal, Dist. Kurnool, Andhra Pradesh - 518 501 Tel: 08514 - 202301 - 08
DolviWorksUnit 1Survey No. 96/1, 96/2, 97/0Village Khar Karavi, Dolvi,Taluka - Pen, District - Raigad, Maharashtra - 402 107Unit 2Survey No. 107/B, 109, 114-118, Village Khar Karavi, Dolvi,Taluka-Pen,District - Raigad, Maharashtra - 402 107
SalboniWorksAnkur Complex, VILL - Jambedia, P.O. - Sayedpur (Viya Salboni), PS - Salboni, Dist:- Paschim, Midnapur - 721 306,West Bengal
RegisteredOffice
JSWCentreOpp. MMRDA Ground, Bandra-Kurla Complex,Bandra (East), Mumbai - 400 051 Tel: 022 - 4286 1000Fax: 022 - 2650 2001Website: www.jswcement.in
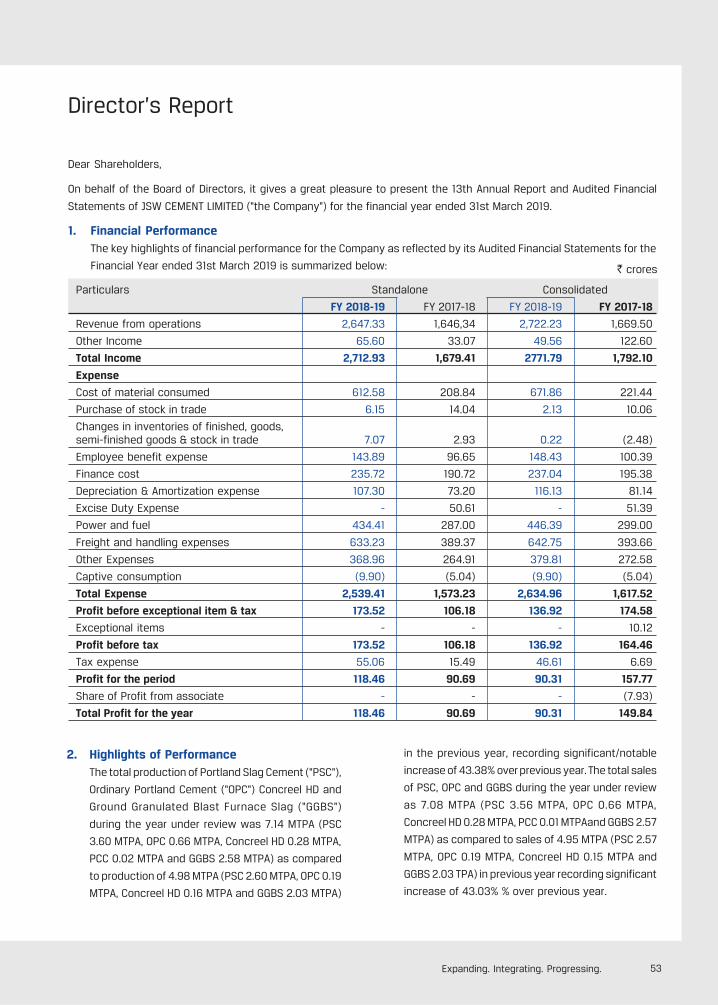
53Expanding. Integrating. Progressing.
Director’s Report
Dear Shareholders,
On behalf of the Board of Directors, it gives a great pleasure to present the 13th Annual Report and Audited Financial
Statements of JSW CEMENT LIMITED ("the Company") for the financial year ended 31st March 2019.
1. Financial PerformanceThe key highlights of financial performance for the Company as reflected by its Audited Financial Statements for the
Financial Year ended 31st March 2019 is summarized below:
Particulars Standalone Consolidated
FY 2018-19 FY 2017-18 FY 2018-19 FY 2017-18
Revenue from operations 2,647.33 1,646,34 2,722.23 1,669.50
Other Income 65.60 33.07 49.56 122.60
Total Income 2,712.93 1,679.41 2771.79 1,792.10
Expense
Cost of material consumed 612.58 208.84 671.86 221.44
Purchase of stock in trade 6.15 14.04 2.13 10.06
Changes in inventories of finished, goods,semi-finished goods & stock in trade 7.07 2.93 0.22 (2.48)
Employee benefit expense 143.89 96.65 148.43 100.39
Finance cost 235.72 190.72 237.04 195.38
Depreciation & Amortization expense 107.30 73.20 116.13 81.14
Excise Duty Expense - 50.61 - 51.39
Power and fuel 434.41 287.00 446.39 299.00
Freight and handling expenses 633.23 389.37 642.75 393.66
Other Expenses 368.96 264.91 379.81 272.58
Captive consumption (9.90) (5.04) (9.90) (5.04)
Total Expense 2,539.41 1,573.23 2,634.96 1,617.52
Profit before exceptional item & tax 173.52 106.18 136.92 174.58
Exceptional items - - - 10.12
Profit before tax 173.52 106.18 136.92 164.46
Tax expense 55.06 15.49 46.61 6.69
Profit for the period 118.46 90.69 90.31 157.77
Share of Profit from associate - - - (7.93)
Total Profit for the year 118.46 90.69 90.31 149.84
2. Highlights of PerformanceThe total production of Portland Slag Cement ("PSC"),
Ordinary Portland Cement ("OPC") Concreel HD and
Ground Granulated Blast Furnace Slag ("GGBS")
during the year under review was 7.14 MTPA (PSC
3.60 MTPA, OPC 0.66 MTPA, Concreel HD 0.28 MTPA,
PCC 0.02 MTPA and GGBS 2.58 MTPA) as compared
to production of 4.98 MTPA (PSC 2.60 MTPA, OPC 0.19
MTPA, Concreel HD 0.16 MTPA and GGBS 2.03 MTPA)
in the previous year, recording significant/notable
increase of 43.38% over previous year. The total sales
of PSC, OPC and GGBS during the year under review
as 7.08 MTPA (PSC 3.56 MTPA, OPC 0.66 MTPA,
Concreel HD 0.28 MTPA, PCC 0.01 MTPAand GGBS 2.57
MTPA) as compared to sales of 4.95 MTPA (PSC 2.57
MTPA, OPC 0.19 MTPA, Concreel HD 0.15 MTPA and
GGBS 2.03 TPA) in previous year recording significant
increase of 43.03% % over previous year.
` crores
54 Annual Report 2018-19
JSW Cement Limited
3. Transfer to ReservesNo amount is proposed to be transferred to reserves.
4. DividendIn view of the Company's expansion plan, the Board
of Directors has not recommended any dividend on
the Share Capital of the Company.
5. Economic OutlookAccording to the Central Statistics Office (CSO),
India’s economy grew at 6.8% in FY19, a marginal
growth from 6.7% in FY20. Despite softer growth, the
Indian economy remains one of the fastest growing
economies in the world. It is expected to only grow
further on the back of sustained rise in consumption
and a gradual revival in investments. The growth is
also expected to be fuelled by factors such as easier
financial conditions, fiscal or quasi-fiscal support,
steadily growing export orders and accelerating
investment growth as capacity utilisation rises,
interest rates decline, and geopolitical tensions and
political uncertainty are assumed to wane.
Growth in government final consumption
expenditure is pegged at 9.2% in FY20 compared
with 10.9% in FY19. Several foreign companies are
setting up facilities in India owing to various
government initiatives such as ‘Make in India’ aimed
at boosting the domestic manufacturing sector.
These initiatives will not only drive manufacturing,
but will also create employment opportunities. The
government has also undertaken a several initiatives
to create education avenues as also to provide a
thrust to real estate and infrastructure. Moreover,
digitisation is also expected to benefit every sector,
ranging from agriculture to manufacturing, as India
strives to become one of the early adopters of 5G
technology.
The future of the Indian economy, therefore, looks
bright, with the country’s GDP expected to reach $6
trillion by FY27 on the back of digitisation,
globalisation, favourable demographics and
economic reforms.
6. Cement Industry Outlook and OpportunitiesIndia is the second-largest producer of cement
globally and the cement industry forms a integral
part of the country’s economy. The sector is
dominated by private players and has a large
concentration in the South and West of India. 210
large cement plants account for a cumulative
installed capacity of over 410 million tonnes, while
over 350 mini cement plants have an estimated
production capacity of nearly 11.10 million tonnes.
According to ICRA, the industry saw a 13.6% y-o-y
increase in volume to 275.7 million metric tonnes in
the first 10 months of FY19. This growth was primarily
driven by rural and affordable housing, and demand
and improved focus on infrastructure segments
such as road, metro and irrigation projects. The
government’s ‘Housing For All’ initiative is expected
to augur well for the cement sector. The real estate
market in India is expected to reach $1 Trillion by
2023 from US$ 120 billion in 2017. Moreover, rural
housing is expected to witness strong growth
including low-cost housing. Both these factors are
expected to amplify demand for cement in the
country. The government’s thrust on infrastructure
through projects such as Dedicated Freight Corridors
(DFCs), Smart Cities Mission and ports will further
propel the sector. On the back of these factors,
India’s cement industry is expected to produce a
capacity of 550 million tonnes by 2025 and the
industry is expected to grow at a CAGR of 5-6% until
FY2020.
In the upcoming 10 years, India is expected to
become the main exporter of clinker and gray
cement to the Middle East, Africa and other
developing nations of the world. Cement plants near
the ports, for instance, the plants in Gujarat and
Visakhapatnam, will have an added advantage for
exports and will be well-equipped to face stiff
competition from cement plants in the interior of the
country. With help from the government in terms
of friendlier laws, lower taxation and more
infrastructure spending, the sector is expected
to grow and take India’s economy forward along
with it.
7. Capital Expenditure and New ProjectsThe Company at present has its presence in
Maharashtra, Karnataka, Andhra Pradesh, West
Bengal and Odisha. As a part of its growth strategy,
the Company is continuously evaluating organic and
inorganic opportunities with an aim to have strong
foothold across the country. The major projects
55Expanding. Integrating. Progressing.
initiated by the Company to serve its customers in a
more cost effective, reliable and environment
friendly manner are given as under:
7.1 Nandyal, Andhra Pradesh
a. Additional 6 bays of truck loading system have
been completed to increase dispatch from the
plant.
b. To streamline dispatches via Rail, 1.2 km of
railway line and platform at Panyam siding has
been completed and a Detailed Project Report
(DPR) has been approved by Railway Authorities
to connect it to the main line.
c. A covered Coal Yard has been completed in
compliance with APCB (Andhra Pradesh
Pollution Control Board).
d. Coal Dust Cyclones have been installed to
increase efficiency of kiln combustion process.
e. Solar power plant of 5.45 MW, 5 MW ground
mounted and 0.45 MW on roof top, has been
commissioned. This would reduce dependency
on grid power and would help reduce energy
cost and thereby manufacturing cost.
f. Installed Liquid Alternative Fuel feeding System
for calciner firing in April 2018 which saved
Rs. 227.8 lakhs in the financial year of 2018-19.
Such saving will continue every year.
g. Installed Solid Alternative Fuel feeding system
in October 2018 which saved Rs.104.6 lakhs in
the financial year 2018-19. This will be a
recurring saving every year.
h. Installed Carbon black firing feeding system in
coal mill in April 2018 which saved Rs.1113.2
lakhs in the financial year of 2018-19. This will
be a recurring saving every year.
i. A 1600 MT OPC steel silo project has been
completed in September 2018, resulting in
saving of Rs.1113.2 lakhs in the financial year of
2018-19. Such saving will continue every year.
j. The Company plans to increase Clinker
production capacity from 6000 TPD to 8500 TPD
and feasibility study to increase clinker capacity
has been completed.
k. Engineering work is under progress for
launching a new cement product i.e. Portland
Composite Cement by December 2019.
7.2 Vijayanagar, Karnataka
l Present plant capacity is 3.2 MTPA , consisting
of 4 RP's and one VRM.
l Portland Composite Cement project has been
commissioned in January, 2019.
l Engineering study is under progress for
increasing the capacity from 3.2 MTPA to 4.0
MTPA.
l The Company is also working on feasibility to
add another grinding unit of 2.0 MTPA to
increase capacity up to 6.0 MTPA.
l Green belt developed around the plant by
planting 5000 trees.
l Acquisition of Slag Sand plant from JSW Steel.
l RMC requirement for JSW steel expansion
project will be supplied from four batching
plants is being set up.
l A new railway line has been commissioned to
transfer slag from JSW Steel Limited's blast
furnace to the cement plant in the month of
March 2018, which not only simplifies the
logistics but is also environment friendly.
7.3 Salboni, West Bengal
l The Company has also installed its own railway
siding to receive raw materials viz. imported
clinker and slag by rail, and also mechanized
wagon loading system, to dispatch its products
by Rail. The railway siding and wagon loading
have been Commissioned on May 2018 while
the wagon tippler has been commissioned on
January 2019.
l Composite Cement Project is nearing
completion and it is expected to commission
by July 2019.
l Solar power plant-3 MW ground mounted &
0.5 MW Roof top plant has been commissioned
and 0.18 MW Captive power plant is under
construction by JSW Energy. This would make
the plant self sufficient. Power plant is
scheduled for completion by August 2019
Corporate O
verviewStatutory Reports
Financial Statem
ents
56 Annual Report 2018-19
JSW Cement Limited
7.4 Dolvi, Maharashtra
l The Company has commissioned 1.2 million MT
in March 2019 comprises of one unit of Roller
Press of 180 TPH capacity. This would allow
Company to strengthen its market in west
region. This has increased the production
capacity from 1.0 mtpa to 2.2 million MT.
l The Company also plans to further increase
cement capacity in line with the increased
availability of slag from JSW Steel. A feasibility
report has been prepared, master plan has been
formalized and technical discussions with
various OEM supplier is under progress and is
expected to be completed by 2020.
7.5 Shiva Cement, Rourkela, Orissa
The Company plans to install a new clinkerisation
unit of 1.5 MTPA to cater to the requirements of
Salboni and Jajpur grinding units in order to de-risk
against the volatility in the imported clinker prices.
Feasibility studies are being done for this project.
l Regulatory approvals for expansion
n Consent to establish (CTE) approved for
expansion of mines from 0.12 to 0.345
MTPA. Letter is awaited.
n Consent to Operate (CTO) has been
submitted on 15.08.2018 and approval is
under process for Portland Pozzolona
Cement (PPC) and Increase in clinker
capacity from 9625 TPM to 13750 TPM
and cement capacity form 11000 TPM to
21000 TPM.
l Project activities for new 1.0 MTPA clinker Plant
n Tender document with layout is under
progress by project team departmentally
and will be completed in June 2019.
n Final copy of mining plan for 1.5 MTPA after
rectification of scrutiny comment will be
submitted to IBM on 22th April 2019. Mining
plan approval is expected in May' 2019.
n Consultant for obtaining environment
clearance from MOEF for 1.5 MTPA mining
has been finalized.
7.6 Jajpur, Orissa
l A grinding unit of 1.2 MTPA capacity, comprises
of 1 Unit of Roller Presses of 180 TPH capacity is
being installed at Jajpur, Odisha to cater market
share in the state of Odisha. The Construction
work is under progress and is scheduled for
completion by June 2019.
7.7 Fujairah, UAE
l As a part of its growth strategy, The Company
has acquired high grade lime stone mines at
Fujairah, UAE through its wholly owned
subsidiary JSW Cement FZE. The plan is to have
mining capacity of 10 MTPA and 1.0 MTPA Clinker
plant. Mine Development and haul road
preparation is in progress. The limestone
excavated is being crushed and screened using
mobile crushing and screening unit. The high
grade limestone is being exported to India while
low grade screen rejects, being stacked at site,
will be utilized for the production of Clinker near
to mines.
l JSW Cement FZE has planned two separate lines
of crushing & screening, one for 4.0 MTPA
capacity and other for 6.0 MTPA capacity. The
first line of 4.0 MTPA crushing and screening at
mines has been commissioned in February 2019
and trial runs are going on. Second line of
additional 6.0 MTPA crushing and screening unit
is planned to be commissioned by May 2019.
l Setting up of Clinkerisation unit of 1.0 MTPA close
to the mines is in progress and kiln firing is
expected to be completed by first quarter of
FY 2020.
l In October 2018, the local power grid, FEWA,
introduced an Industrial Initiative Scheme with
reduced power tariff and other benefits for
industries. Accordingly, plan to install captive
power plant to meet power requirement has
been deferred and power shall be sourced from
FEWA. Process has been initiated to obtain
necessary approval / permits / sanctions from
relevant local authorities for the same. A 33/11
kV substation would also be installed at the
clinker plant site.
57Expanding. Integrating. Progressing.
7.8 New Mines / Auction status
(a) Gujarat:
l The Company won Mudhvay sub block D in
Kutch district in May 2017, through the auction
process, thereby securing limestone mines with
125 Million Tonnes Geological resources.
l The Company has subsequently got approval
from IBM for the proposed mining plan in
September 2018.
l The Company signed MoU with Government of
Gujarat in January 2019 during the Vibrant
Gujarat Summit 2019 for setting up of Clinker
Plant in Kutch district.
l The Company at present is in process of
obtaining statutory clearances for
commencement of mining operations by FY 21.
(b) Rajasthan:
l The Company won 3B2 Limestone block in
Nagaur district in Feb 2018, through the auction
process, thereby securing limestone mines with
205 Million Tonnes Geological resources.
l The Company has subsequently got approval
from IBM for the proposed mining plan in
September 2018 and got terms of reference
(ToR) from MoEF & CC, New Delhi for grant of
environment clearance (EC) for mining in
December 2018.
l The Company at present is in process of
obtaining statutory clearances for
commencement of mining operations by FY 22.
8 Holding and Subsidiary CompanyAdarsh Advisory Services Private Limited is the
Holding Company. Presently, there are three
subsidiaries of the Company which are as under:
a) JSW Cement FZE is a Wholly Owned Subsidiary
incorporated at Fujairah, Free Zone, UAE on 24th
November 2016.
b) Shiva Cement Limited is a Subsidiary Company
acquired through open offer and having its
registered office at YY 5, Civil Township 7/8 Area
Rourkela, Odisha.
c) Utkarsh Transport Private Limited is a Wholly
Owned Subsidiary Company incorporate on 25th
April 2018 and having Registered office at
Babukhan Millenium Centre, 6-3-1099/1100, No.
702, A Block Somajiguda, Hyderabad - 500082.
9 Internal Control, Audit and Internal FinancialcontrolInternal control
Your Company has an effective internal control and
risk mitigation system, which is constantly assessed
and strengthened with new/revised standard
operating procedures. The Company's internal
control system is commensurate with its size, scale
and complexities of its operations. The main thrust
of internal audit is to test and review controls,
appraisal of risks and business processes, besides
benchmarking controls with best practices in the
industry. The Audit Committee of the Board of
Directors actively reviews the adequacy and
effectiveness of the internal control systems and
suggests improvements to strengthen the same.
The Company has a robust Management Information
System, which is an integral part of the control
mechanism. Significant audit observations and
corrective actions taken by the management are
presented to the Audit Committee of the Board. To
maintain its objectivity and independence, the
Internal Audit function reports to the Chairman of
the Audit Committee.
Internal audit
JSW Group Audit Team perform the Internal Audit
function and followed best standard practices. The
Internal Audit function covers all the factories, sales
offices, warehouses and centrally controlled
businesses and functions, as per the annual plan
agreed with the Audit Committee. The audit coverage
plan is approved by the Audit Committee at the
beginning of every year. Every quarter, the Audit
Committee is presented with key control issues and
actions taken on the issues highlighted in previous
report.
Internal Financial Controls
As per section 134(5)(e) of the Companies Act 2013,
the Directors have an overall responsibility for
ensuring that the Company has implemented robust
system and framework of Internal Financial Controls.
The Company has in place adequate internal financial
controls with reference to the Financial Statements.
Such controls have been assessed during the year
Corporate O
verviewStatutory R
eportsFinancial S
tatements
58 Annual Report 2018-19
JSW Cement Limited
taking into consideration the essential components
of internal controls stated in the Guidance Note on
Audit of Internal Financial Controls over Financial
Reporting issued by The Institute of Chartered
Accountants of India. Based on the results of such
assessment carried out by management, no
reportable material weakness or significant
deficiencies in the design or operation of internal
financial controls was observed. Nonetheless, the
Company recognizes that any internal control
framework, no matter how well designed, has
inherent limitations and accordingly, regular audit
and review processes ensure that such systems are
reinforced on an ongoing basis.
This framework includes entity level policies, process
and operating level standard operating
procedures.The entity level policies include anti-fraud
policies, whistle blower policy, HR policy, treasury
policy. The Company has also prepared Standard
Operating Procedures (SOP) for each of its processes
like procure to pay, order to cash, hire to retire,
treasury, fixed assets, inventory, manufacturing
operations etc.
10 Credit RatingCredit Analysis and Research Limited (CARE) has
conducted annual surveillance and rated long term
loans as "A" and short term loans as "A1" due to
ongoing capex and considering high debt leverage
on account of expansion projects despite
the improvement in Company's operational
performance.
11 Fixed Deposit
The Company has not accepted any deposits from
public in terms of section 73, 74, 75, 76 of the
Companies Act, 2013.
12 Directors and Key Managerial PersonnelThe Company has a balanced mix of Executive, Non-
Executive and Independent Directors. As at 31st
March 2019, the Board comprises of 10 Directors of
which three are Executive Directors, four are Non-
Executive Directors and three are Independent
Directors including one Woman Director. All the
Directors are persons of eminence and bring a wide
range of expertise and experience to the Board,
thereby ensuring the best interest of stakeholders
and the Company.
None of the Directors are related to any other Director
on the Board in terms of the definition of "relative" as
defined in section 2(77) of the Companies Act, 2013.
During the year under review, Mr. Narinder Singh
Kahlon (DIN-06908109) has been appointed as
Whole-Time Director and designated as Director
Finance with effect from 8th May 2018. He continued
to be Chief Financial Officer of the Company.
According to provisions of the Companies Act, 2013
and Articles of Association of the Company, Mr.
Pankaj Kulkarni (DIN-00725144), is liable to retire by
rotation and being eligible, he has offered himself for
re-appointment. The Board has recommended his
re-appointment as Director.
The Board met four times during the year under
review on 8th May 2018, 3rd August 2018,
24th October 2018 and 5th February 2019.
13 Share Capital:During the year under review, the Capital Clause of
the Company was `1500,00,00,000 (Rupees One
Thousand Five Hundred Crores) divided into
125,00,00,000 (One Hundred Twenty Five Crores)
Equity Shares of `10 (Rupees Ten) each and
2,50,00,000 (Two Crores Fifty Lakhs) Preference
Shares of `100 each.
The issued, subscribed and paid up equity share
capital of the Company as on 31st March 2019 was
`9,86,35,22,300/-(Ninety hundred Eight Six Crores
Thirty Five LakhsTwenty TwoThousand Three Hundred
only), comprising of 98,63,52,230, (Ninety Eight
Crores Sixty Three Lakhs Fifty Two Thousand Two
Hundred Thirty) Equity shares of `10/- (Rupees Ten)
each.
14 Disclosure under section 149(7)of theCompanies Act, 2013Mr. Jugal Kishore Tandon, Mr. JaiprakashNarain Lal and
Ms. Sutapa Banerjee, Independent Directors of the
Company have given their declarations under section
149(7) of the Companies Act, 2013.
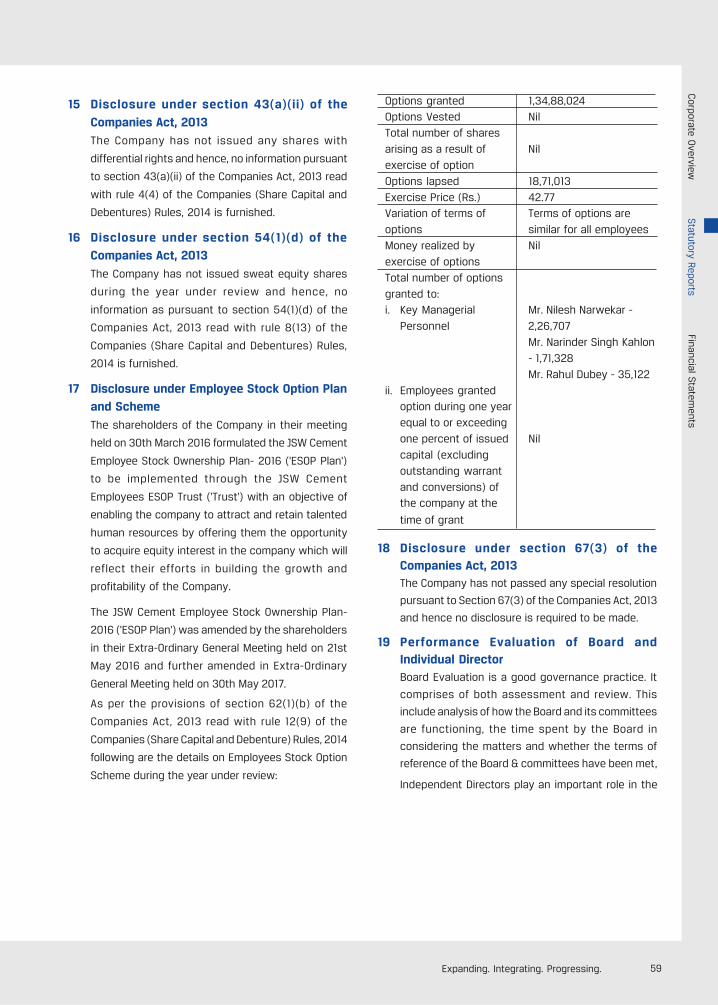
59Expanding. Integrating. Progressing.
15 Disclosure under section 43(a)(ii) of theCompanies Act, 2013The Company has not issued any shares with
differential rights and hence, no information pursuant
to section 43(a)(ii) of the Companies Act, 2013 read
with rule 4(4) of the Companies (Share Capital and
Debentures) Rules, 2014 is furnished.
16 Disclosure under section 54(1)(d) of theCompanies Act, 2013The Company has not issued sweat equity shares
during the year under review and hence, no
information as pursuant to section 54(1)(d) of the
Companies Act, 2013 read with rule 8(13) of the
Companies (Share Capital and Debentures) Rules,
2014 is furnished.
17 Disclosure under Employee Stock Option Planand SchemeThe shareholders of the Company in their meeting
held on 30th March 2016 formulated the JSW Cement
Employee Stock Ownership Plan- 2016 ('ESOP Plan')
to be implemented through the JSW Cement
Employees ESOP Trust ('Trust') with an objective of
enabling the company to attract and retain talented
human resources by offering them the opportunity
to acquire equity interest in the company which will
reflect their efforts in building the growth and
profitability of the Company.
The JSW Cement Employee Stock Ownership Plan-
2016 ('ESOP Plan') was amended by the shareholders
in their Extra-Ordinary General Meeting held on 21st
May 2016 and further amended in Extra-Ordinary
General Meeting held on 30th May 2017.
As per the provisions of section 62(1)(b) of the
Companies Act, 2013 read with rule 12(9) of the
Companies (Share Capital and Debenture) Rules, 2014
following are the details on Employees Stock Option
Scheme during the year under review:
Options granted 1,34,88,024Options Vested Nil
Total number of shares
arising as a result of Nil
exercise of option
Options lapsed 18,71,013
Exercise Price (Rs.) 42.77Variation of terms of Terms of options are
options similar for all employees
Money realized by Nil
exercise of options
Total number of options
granted to:i. Key Managerial Mr. Nilesh Narwekar -
Personnel 2,26,707
Mr. Narinder Singh Kahlon
- 1,71,328
Mr. Rahul Dubey - 35,122
ii. Employees grantedoption during one year
equal to or exceeding
one percent of issued Nil
capital (excluding
outstanding warrant
and conversions) ofthe company at the
time of grant
18 Disclosure under section 67(3) of theCompanies Act, 2013The Company has not passed any special resolution
pursuant to Section 67(3) of the Companies Act, 2013
and hence no disclosure is required to be made.
19 Performance Evaluation of Board andIndividual DirectorBoard Evaluation is a good governance practice. It
comprises of both assessment and review. This
include analysis of how the Board and its committees
are functioning, the time spent by the Board in
considering the matters and whether the terms of
reference of the Board & committees have been met,
Independent Directors play an important role in the
Corporate O
verviewStatutory Reports
Financial Statem
ents
60 Annual Report 2018-19
JSW Cement Limited
governance processes of the Board. The evaluation
of Individual Director focus on the contribution of
Director in Board and Committee. The performance
of Individual Director is assessed against a range of
criteria including the ability of director in creating
shareholder value, development of strategies, major
risk affecting the Company and listen & respect the
idea of fellow director and member of the
management.
Pursuant to the provisions of the Companies Act,
2013, the Independent Director(s) on the Board of
the Company shall evaluate the performance of Non-
Independent Director(s), and review the
performance of the Chairperson. Nomination and
Remuneration Committee constituted under section
178 of the Companies Act, 2013 has been made
responsible for review of self-evaluation of Directors
and to carry out evaluation of every Director's
performance.
The Board believes, the evaluation process should
be used constructively as a mechanism to improve
Board effectiveness, maximise strengths and tackle
weaknesses.
20 PolicyThe company has adopted various policies which
has been available on website (jsw cement.in/about-
jsw-cement/organisation) of the Company. The brief
detail of few policies are as under:
20.1 Whistle Blower Policy and Vigil MechanismPursuant to the provisions of the Companies Act,
2013, the Company has adopted Whistle Blower
Policy and Vigil Mechanism ("the Policy").
This Policy aims to provide an avenue for employees
to raise their concerns that could have grave impact
on the operations, performance, value and the
reputation of the Company and it also empowers the
Audit Committee of the Board of Directors to
investigate the concerns raised by the employees.
The policy provides adequate safeguards against
victimization or unfair treatment of employees who
avail the vigil mechanism.
20.2 Corporate Social Responsibility (CSR) PolicyAs a responsible and proactive corporate, the
Company has adopted a CSR Policy in compliance
of section 135 of the Companies Act, 2013. The
Company aims to follow a complete life cycle
approach, focusing, inter alia, on women
empowerment through education, sanitation and a
range of such access related issues that hinder a
holistic development of the communities. Specific
interventions recommended by the policy are
efficient maternal and child health care with
enhanced access to improved nutrition services;
early childhood/ pre-primary education and its
effective completion till secondary education; better
access to life skill education for adolescents; and
enhancing of the output of prevalent occupations
along with vocation education.
The Company decided its priority towards villages
in the immediate vicinity of the plant locations
defined as Direct Influence Zone (DIZ). However,
certain programs might have been expanded
beyond this geographical preview for upscaling and
defined as Indirect Influence Zone (IIZ). Details of the
CSR initiatives under taken by the Company
pursuant to provisions of the Companies Act, 2013
are given in "Annexure-A" to this report.
20.3 Company's policy on appointment andremunerationThe Board of Directors has framed a policy named
as Nomination Policy and Remuneration Policy which
lays down a framework in relation to criteria for
selection and appointment of Board Members, Key
Managerial Personnel and Senior Management of the
Company as well as remuneration to be paid to
Directors, Key Managerial Personnel and Senior
Management of the Company.
While recommending the candidate for appointment,
the Nomination and Remuneration Committee shall
assess the candidate against a range of criteria, i.e.
qualification, age, experience, positive attributes,
independence, relationships, diversity of gender,
background, professional skills and personal
qualities, required to operate the position
successfully and has discretion to decide adequacy
of such criteria for the concern position. All
candidates shall be assessed on the basis of the
merit, related skills and competencies. There shall
be no discrimination on the basis of religion, caste,
creed or sex. Further the Committee also
recommend to the Board remuneration to be paid to
such candidates with following broad objective:
61Expanding. Integrating. Progressing.
a) Remuneration is reasonable and sufficient to
attract, retain and motivate directors,
b) Motivate KMP and other employees and to
stimulate excellence in their performance,
c) Remuneration is linked to Company's
performance, individual performance and such
other factors considered relevant from time to
time,
d) The policy balances fixed and variable pay and
reflects short and long term performance
objectives.
20.4 Risk Management and Areas of ConcernThe Company is faced with risks of different types,
all of which need different approaches for mitigation.
Details of various risks faced by the Company are
provided in MDAR section of this Annual Report.
Based on the Risk Management Policy, a
standardized Risk Management Process and System
has been implemented across the JSW group. Risk
plans have been framed for all identified risks with
mitigation action, target dates and responsibility.
Risk Management Committees closely monitor and
review the risk plans. The Committee meets every
half-year to review key strategic and tactical risks,
identify new risks and assess the status of
mitigation measures.
21 Auditors21.1 Statutory Auditors
M/s HPVS & Associates, Chartered Accountants,
Mumbai was appointed as Statutory Auditors for the
period of five years with effect from 12th Annual
General Meeting to the conclusion of 17th Annual
General Meeting.
21.2 Cost Auditors
As per the requirement of Central Government and
pursuant to Section 148 of the Companies Act, 2013
read with the Companies (Cost Records and Audit)
Rules, 2014 as amended from time to time, The Board
of Directors, on the recommendation of the Audit
Committee, has re-appointed M/s R. Nanabhoy & Co.,
Cost Accountants, as Cost Auditor to audit the cost
records of the Company for the Financial Year 2019-
20. As required under the Companies Act, 2013, a
resolution seeking members' approval for the
remuneration payable to the Cost Auditor forms part
of the Notice convening the Annual General Meeting
for their ratification.
The Cost Audit Report for the financial year 2017-18,
on audit of cost accounting records by the Cost
Auditor, was filed on 26th July 2018.
21.3 Secretarial Auditor
Pursuant to the provisions of Section 204 of the
Companies Act, 2013 and rules made thereunder, the
Board has appointed M/s. S. K. Jain & Co., Practicing
Company Secretary to undertake the Secretarial
Audit of the Company for the financial year 2018-19.
The Secretarial Audit Report is annexed as
Annexure-B and forms an integral part of this Report.
21.4 Auditor’s Remark
The Factory Inspector has visited the plant located
at Dolvi, Maharashtra. The Secretarial Auditor has
mentioned the comment of Factory Inspector in the
report. A reply of this has been submitted to the
office of the Factory Inspector. The reply to the office
of Factory Inspector includes the name of Medical
Officer, Welfare Officer, Safety Officer and about
silica content at working environment. Further, as
the Dolvi unit is located within the premises of the
JSW Steel Limited, hence, the Company is using the
facilities of OHC, ambulance, Van, Kitchen of JSW
Steel Limited.
The manufacturing unit of Salboni, West Bengal
location is new unit and the unit is taking necessary
step for submission of Form ER-1 and ER-2 required
pursuant to the provisions of the Employment
Exchange Act, 1959. Further, the Company is also in
process of taking necessary steps to avoid such
remarks in future.
22 Related Party TransactionsDuring the year under review, the Audit Committee
has granted omnibus approval for the Related Party
Transactions. The Related Party Transactions which
exceed omnibus limits were placed before the Audit
Committee for review and further approval on
quarterly basis and subsequently before the Board
for noting. All the Related Party Transactions that
were entered during the financial year were on arm's
length basis and in the ordinary course of business.
Hence, provisions of section 188 of the Companies
Act, 2013 are not applicable.
Corporate O
verviewStatutory Reports
Financial Statem
ents
62 Annual Report 2018-19
JSW Cement Limited
The contracts or arrangements with related parties
referred to section 188(1) of the Companies Act, 2013
are required to be disclosed in pursuance of section
134(3)(h), the Companies Act, 2013 in Form AOC-2.
Accordingly, Related Party with the whom
transactions have been entered during the year
under review are given in "Annexure-C" to this report.
23 Disclosure under the Sexual Harassment ofWomen at Workplace (Prevention, Prohibitionand Redressal) Act, 2013:The Company has a policy on Prevention of Sexual
Harassment at workplace. The policy has been
framed as per "The Sexual Harassment of Women at
Workplace (Prevention, Prohibition and Redressal)
Act, 2013" and an internal Committee has been
constituted for redressal of the complaints.
24 Particulars of Loans, Guarantees, Investmentsand Securities:
Details of Loans, Guarantees and Investments
covered under the provisions of Section 186 of the
Companies Act, 2013 are provided in Notes to the
Financial Statements.
25 Material Change and Commitments:
In terms of section 134(3)(l) of the Companies Act,
2013, except as disclosed elsewhere in this report,
no material changes and commitments which could
affect the company's financial position have
occurred between 31st March 2019 and the date of
the report.
26 Significant and material orders passed by theregulators:
There were no significant material orders passed by
the Regulators or Courts or Tribunals which would
impact the going concern status of the Company
and its future operations.
27 Extract of Annual Return:In accordance with the provisions of section
134(3)(a) of the Companies Act, 2013, the extract of
the annual return in Form No. MGT-9 is given in
"Annexure-D" and forms part of this report. The same
is available on the website (www.jswcement.in) of
the Company.
28 Compliance with Secretarial Standards:The Company is in compliance with the applicable
Secretarial Standards issued by the Institute of
Company Secretaries of India and approved by the
Central Government under Section 118(10) of the Act.
29 Awards and RecognitionThe Company has received awards and accolades
from the Government and Non-Governmental
Organizations/ Associations detailed as hereunder:-
30 Human Resource:The 'Better Everyday' caption of the Company has
orchestrated its workforce into a solid group of
committed people who have persevered to elevate
the Company as one of the best among equals in
the cement industry. JSW Cement human resources
management framework is aligned to the business
goals and drives key decisions on business
processes and introduction of new technology.
Capability Development
The HR interventions of the Company focuses on
skilling the existing workforce and empowering them
to step beyond their defined roles. Emphasis is laid
on ensuring that every employee is well informed
with the Standard Operating Procedures on quality
and compliance. Shop floor team are continuously
trained and groomed in the area of compliance,
supported adequately to raise their competence,
confidence and anytime readiness.
We had undertaken the target to mark FY 19 as year
of capability development for our entire sales
workforce to further facilitate the growth agenda of
the organization. Wave of "CHAMPION OF SALES" was
launched during the year covering a total of 308
employees in sales and marketing function. The
program was efficiently designed to include class
room training followed by application of the learning
through on the job projects. Close to 1232 man-days
of class room training was imparted leading to
several live projects which proved to be a significant
lever in achieving the business objectives as well
as improve efficiency and effectiveness of sales.
63Expanding. Integrating. Progressing.
To further strengthen our capability development
initiative and focus on developing leaders for
tomorrow, the company plans to launch an initiative
titled LEAP - building 'cement fit' leaders. The program
will help the Company to identify high performing
team members and to develop them to occupy higher
roles. This will help provide career and growth
opportunity for the employees as well as help the
Company focus on succession planning.
Employee Engagement
JSW Cement believes in a culture of inclusion, trust,
empowerment and development for employees. JSW
Cement has been able to keep the employees
motivated and dedicated through people friendly HR
policies, HR initiatives and various welfare measures.
The Company maintained cordial and harmonious
Employee relations in all our manufacturing units
and sales locations. Several Employee Engagement
initiatives like - Employee Sports, Family Picnic,
Family Get-together, Summer Camp for Employees
Children, Celebrations on achievements have
significantly helped in improving the work culture,
enhancing productivity and enriching the quality of
life of the people in the Organization.
31 Occupational Health & Safety (OH&S)The Company's primary objective is to achieve OH&S
by providing training to its employees through
various training programs. Presently, the Company
is conducting various internal and external training
programs like tool box talk, fire-fighting awareness
class, implementation of 5S technique
for improvement in housekeeping & safety,
strengthening of LOTO (Lock out and Tag out)
systemby providing lock & tags, mock drill on
medical emergency, gate meeting, etc. 47th National
safety week celebrated with various programmes
to improve the safety awareness.The number of
days worked without lost time incidentare as under:
a. Nandyal- 2608 days
b. Vijayanagar- 152 days
c. Dolvi - 2988 days
d. Salboni - 424 days
32 Directors' Responsibility StatementPursuant to the requirement of clause (c) of sub-
section (3) of section 134 of the Companies Act, 2013,
the Directors confirm that:
(a) in the preparation of the annual accounts,
applicable accounting standards have been
followed along with proper explanation relating
to material departures;
(b) the directors have selected such accounting
policies and applied them consistently and
made judgments and estimates that are
reasonable and prudent so as to give a true and
fair view of the state of affairs of the Company
at the end of the financial year and of the profit
and loss of the Company for that period;
(c) the directors have taken proper and sufficient
care for the maintenance of adequate
accounting records in accordance with the
provisions of the Companies Act for
safeguarding the assets of the Company and
for preventing and detecting fraud and other
irregularities;
(d) the directors have prepared the annual
accounts for the year under review on a going
concern basis; and
(e) the directors have devised proper systems to
ensure compliance with the provisions of all
applicable laws and that such systems were
adequate and operating effectively.
33 Particulars of EmployeesDisclosure pertaining to remuneration and other
details as required under section 197(12) of the
Companies Act, 2013 read with rules 5(1) of the
Companies (Appointment and Remuneration) Rules,
2014, are given in "Annexure-E" to this report.
34 Conservation of energy, technologyabsorption and innovationThe information required pursuant to the provisions
of section 134 of the Companies Act, 2013 read with
rule 8 of the Companies (Accounts) Rules, 2014
regarding conservation of energy, technology
Corporate O
verviewStatutory Reports
Financial Statem
ents
64 Annual Report 2018-19
JSW Cement Limited
absorption, adoption or innovation is attached hereto
as "Annexure-F" and forms part of this report.
35 Foreign exchange earnings and OutgoThe details of foreign exchange outgo and earnings
are furnished in the notes to accounts.
36 AppreciationOn behalf of the Directors of the Company, I would
like to place on record our deep appreciation to our
shareholders, customers, business partners,
vendors - both international and domestic, bankers,
financial institutions for all the support rendered
during the year.
The Directors are thankful to the Government of India,
the various ministries of the state governments, the
central and state electricity regulatory authorities,
communities in the neighbourhood of our operations,
municipal authorities of Mumbai, and local
authorities in areas where we are operational in India;
for all the support rendered during the year.
Finally, we appreciate and value the contributions
made by all our employees and their families for
making the Company what it is.
For and on behalf of the Board
JSW Cement Limited
Chairman
Date: 3rd May 2019
Place: Mumbai
65Expanding. Integrating. Progressing.
A. Brief outline of the Company's CSR Policy,including overview of the projects orprogrammes undertaken.The brief outline of the CSR policy has beenmentioned elsewhere in the report. The Companyhas spent `463.15 lakhs on various CSR initiativesin Bilakalagudur & Bujunur villages, GadivemulaMandal, Nandyal, Andhra Pradesh; Jambedia andAsnasuli and other DIZ villages, Salboni, West Bengal;Torangullu, Vijayanagar, Karnataka and two GramPanchayat (Kandeimunda & Khatkurbahal) of Kutrablock, Rajgangpur, Sundergarh district, Odishaduring the FY 2018-19. The comprehensive summaryof the initiatives undertaken by the Company are asunder:
1. Improving Living Conditions: The Company hasincurred `123.20 lakhs for initiative undertaken toimprove the living conditions of inhabitants aroundthe plant and the brief details of activitiesundertaken are as under:
l Health Camp have been organized in all the DIZvillages which includes 364 mobile healthcamps, services through static clinic andspecial health camps for diabetic &hypertension, anemia, dental, chest,nephrology. Blood donation camps has alsobeen organized and 143 units of blood havebeen donated. Steps have been taken to doorto door screening to control non communicablediseases. These activities cover 30,000 personsof 43 DIZ villages.
l Lab technicians and staff nurses have beenengaged to strengthen mother & child healthcare & to provide general health services atPrimary Health Centre, Gadivemula Mandal,Nandyal. Total 24098 beneficiaries werebenefited.
l 18456 persons were counselled with the helpof Bhoruka Charitable Trust, Nandyal throughthe HIV/AIDS prevention program.
l Awareness campaigns on personal hygiene,sanitation and prevention of malaria and 16,000persons of DIZ Villages of Nandyal & Rajgangpurwere beniffited.
Annexure-A
Report on CSR Activities/Initiatives[Pursuant to section 135 of the Companies Act, 2013 & Rules made thereunder]
l A water purifying unit has been installed atPrimary Health Centre (PHC), Gadivemula for thebenefit of the patients.
l Maintenance of 2 RO water plants, installed oneeach at Bilakalagudur and Bujunur villages, havebeen carried out on regular basis to provide safedrinking water to the population around 8,000.
2. Promoting Social Development: The Company hasincurred `245.07 lakhs for promoting socialdevelopment and the activities undertaken are asunder:
l To ensure good kitchen hygiene and to ensurefood safety in mid-day meal, 5 modular kitchenswere provided to Government schools ofGadivemula Mandal and 1290 students werebenefited.
l Renovated 9 class rooms in 3 schools ofGadivemula Mandal. Around 810 students gotbenefitted.
l Provided study material kits to 1200 studentsstudying in Govt schools of Rajgangpur, Odisha.
l Installed water purifiers in 13 Govt schools ofGadivemula Mandal, and 7 schools & 13anganwadis of Kutra block for access to purifieddrinking water at schools. The total number ofpersons likely to benefit from the initiative is3200.
l Provided 81 bicycles to girl students toencourage them for pursuing secondaryeducation.
l Established 20 digital classrooms in 13government schools of Gadivemula Mandal, 11Digi classes in 5 schools of Kutra block and 6Digi Classes in 3 schools of Jambedia andAsnasuli Villages, to improve the quality of theeducation of the students and to build strongconceptual understanding in the students.
l Provided tuition support to 90 studentsappearing in secondary board examination.
l Services of 5 vidya volunteers engaged to teachcomputers, social studies (Urdu) and Urdulanguage.
Corporate O
verviewStatutory Reports
Financial Statem
ents
66 Annual Report 2018-19
JSW Cement Limited
l Provided scholarships to 42 meritoriousstudents from four high schools & four primaryschools for promoting secondary education andto reduce dropout rate in upper primary &primary sections.
l Provided Uniforms & Notebooks to 400 studentsstudying in Govt primary & upper primaryschools of Bilakalagudur & Bujunur villages.
l Organized anemia screening & General Healthcamps at government schools. Providedmedicine & created awareness on anemia & itsassociate factors, prevention & control ofanemia and awareness on oral hygiene. Around2250 students got benefitted.
l Provided sanitary napkins to 500 girl studentsof 7th to 10th class to promote menstrualhygiene and installed incinerators at schools forsafe disposal of sanitary napkins.
l Created awareness for rural women aboutpersonal/menstrual hygiene and providingsanitary napkins to 603 women every month.
l Imparting skills in tailoring to rural women ofGadivemula Mandal to improve their economicstatus. 276 women are availing training onstitching of clothes, Saree Painting, Acid &Phenyl making and making Jute diversifiedproducts.
l Established 2 tailoring units in Kutra block forthe benefit of 60 women.
l Organized training programs and hand holdingsupport to 200 SHGs women focusing bookkeeping, credit linkage, skill development onagriculture, gottary, mushroom cultivation andtailoring etc. in Salboni.
l Provided Student Desks to 7 governmentschools of Toranagallu and 850 students gotbenefitted.
l Provided utensils to 13 anganwadi centers inToranagallu, Karnataka and 390 students gotbenefitted.
3. Addressing Environmental issues: The Companyhas incurred `5.50 lakhs for addressing socialinequalities and the activities undertaken are asunder:
l 2500 saplings were planted in DIZ villages.
l Installed 28 more solar street lights &maintenance of 82 solar street lights inGadivemula Mandal & 50 solar street lights inKutra block.
4. Rural Development: The Company has incurred`56.52 lakhs for rural development and the activitiesundertaken are as under:
l Constructed CC drains in Bilakalagudur village.Around 5000 people are benefitted.
l Renovation of the Gadivemula Bus station &installed an RO unit at Bus Station.
l Installed 2 RO units in Kutra block.
5. Swachh Bharath Mission: The Company hasincurred `10.13 lakhs for Swachh Bharath Missionand the activities undertaken are as under:
l Constructed toilet blocks at 13 schools of kurtablock for the benefit of around 1250 students.
l Spreading awareness about good sanitaryhabits and use of toilets by organizingawareness camps, door to door distribution ofleaflets, skits performed by local students innearby villages and schools of Gadivemulamandal.
l Conducted swacch village program with theparticipation of employees for cleaning ofstreets, removing roadside bushes & dirt atBilakalagudur & Bujunur villages.
l Renovated Gadivemula Bus station andinstalled a water purifying unit for the benefitof passengers.
6. Expenditure on other administrative and capacitybuilding activities: `22.73 lakhs.
B. The composition of the CSR CommitteePresently, the CSR Committee comprises of 5Directors Mr. K. N. Patel-chairman, Mr. BiswadipGupta-member, Mr. Jugal Kishore Tandon-member,Ms. Sutapa Banerjee-member & Mr. Nirmal KumarJain-member.
C. Average Net Profit of the company for last3 financial years: `98.53 crores
D. Prescribed CSR expenditure (2% of amount): `1.97croreThe Company has voluntarily proposed `5.00 crorefor CSR Activities. `3.03 crores above `1.97 crore(2% as prescribed by the Companies Act, 2013).
E. Details of CSR activities/projects undertakenduring the yeara) total amount spent for the financial year:
`463.15 lakhs,b) amount un-spent, if any: Nil (as the Company
proposed voluntary `3.03 crores above ` 1.97crores)
c) manner in which the amount spent duringfinancial year, is detailed below:
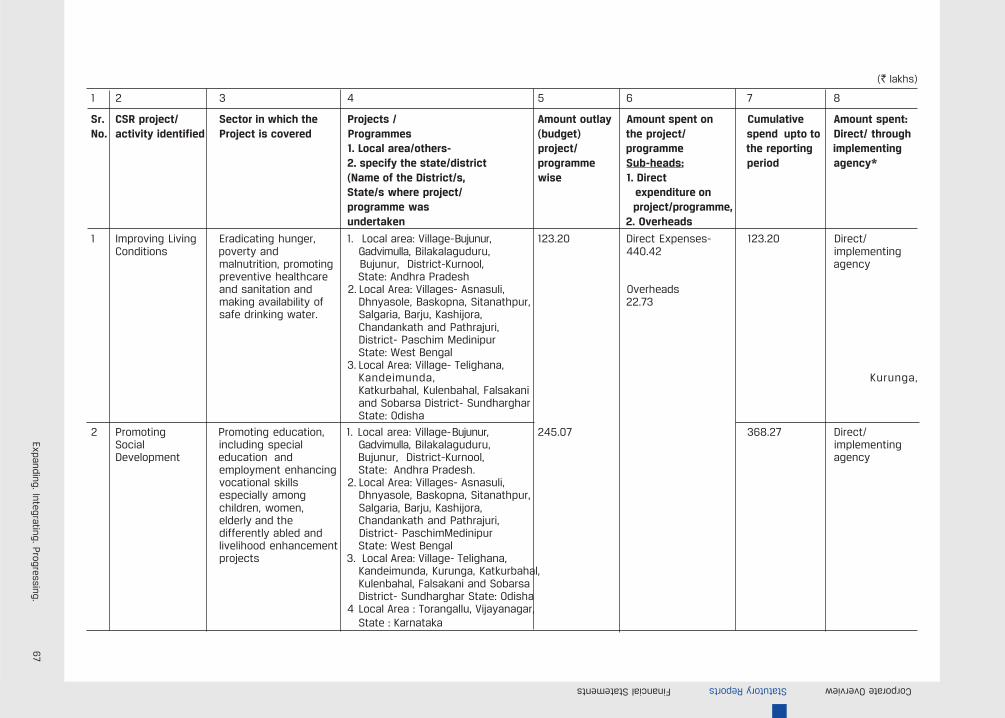
67Expanding. Integrating. P
rogressing.
Corporate OverviewStatutory ReportsFinancial Statements
(` lakhs)
1 2 3 4 5 6 7 8
Sr. CSR project/ Sector in which the Projects / Amount outlay Amount spent on Cumulative Amount spent:No. activity identified Project is covered Programmes (budget) the project/ spend upto to Direct/ through
1. Local area/others- project/ programme the reporting implementing2. specify the state/district programme Sub-heads: period agency*(Name of the District/s, wise 1. DirectState/s where project/ expenditure onprogramme was project/programme,undertaken 2. Overheads
1 Improving Living Eradicating hunger, 1. Local area: Village-Bujunur, 123.20 Direct Expenses- 123.20 Direct/Conditions poverty and Gadvimulla, Bilakalaguduru, 440.42 implementing
malnutrition, promoting Bujunur, District-Kurnool, agencypreventive healthcare State: Andhra Pradeshand sanitation and 2. Local Area: Villages- Asnasuli, Overheadsmaking availability of Dhnyasole, Baskopna, Sitanathpur, 22.73safe drinking water. Salgaria, Barju, Kashijora,
Chandankath and Pathrajuri,District- Paschim MedinipurState: West Bengal
3. Local Area: Village- Telighana,Kandeimunda, Kurunga,Katkurbahal, Kulenbahal, Falsakaniand Sobarsa District- SundhargharState: Odisha
2 Promoting Promoting education, 1. Local area: Village-Bujunur, 245.07 368.27 Direct/Social including special Gadvimulla, Bilakalaguduru, implementingDevelopment education and Bujunur, District-Kurnool, agency
employment enhancing State: Andhra Pradesh.vocational skills 2. Local Area: Villages- Asnasuli,especially among Dhnyasole, Baskopna, Sitanathpur,children, women, Salgaria, Barju, Kashijora,elderly and the Chandankath and Pathrajuri,differently abled and District- PaschimMedinipurlivelihood enhancement State: West Bengalprojects 3. Local Area: Village- Telighana,
Kandeimunda, Kurunga, Katkurbahal,Kulenbahal, Falsakani and SobarsaDistrict- Sundharghar State: Odisha
4 Local Area : Torangallu, Vijayanagar,State : Karnataka
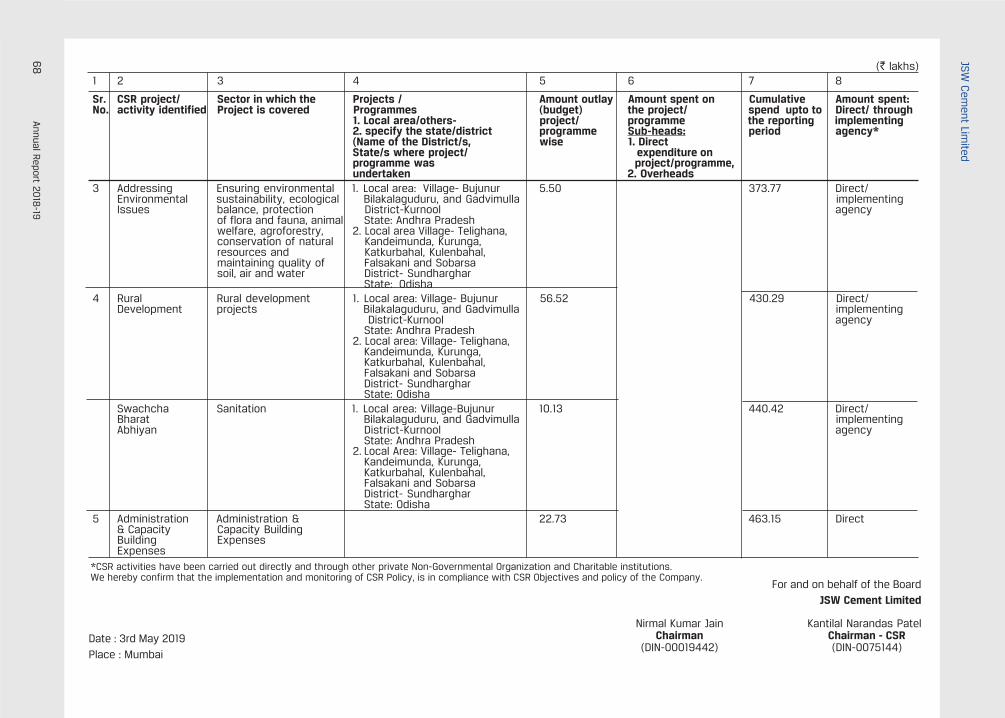
68
Annual Report 20
18-19
JSW C
ement Lim
ited
For and on behalf of the BoardJSW Cement Limited
Nirmal Kumar Jain Kantilal Narandas PatelChairman Chairman - CSR
(DIN-00019442) (DIN-0075144)Date : 3rd May 2019Place : Mumbai
(` lakhs)1 2 3 4 5 6 7 8
Sr. CSR project/ Sector in which the Projects / Amount outlay Amount spent on Cumulative Amount spent:No. activity identified Project is covered Programmes (budget) the project/ spend upto to Direct/ through
1. Local area/others- project/ programme the reporting implementing2. specify the state/district programme Sub-heads: period agency*(Name of the District/s, wise 1. DirectState/s where project/ expenditure onprogramme was project/programme,undertaken 2. Overheads
3 Addressing Ensuring environmental 1. Local area: Village- Bujunur 5.50 373.77 Direct/Environmental sustainability, ecological Bilakalaguduru, and Gadvimulla implementingIssues balance, protection District-Kurnool agency
of flora and fauna, animal State: Andhra Pradeshwelfare, agroforestry, 2. Local area Village- Telighana,conservation of natural Kandeimunda, Kurunga,resources and Katkurbahal, Kulenbahal,maintaining quality of Falsakani and Sobarsasoil, air and water District- Sundharghar
State: Odisha4 Rural Rural development 1. Local area: Village- Bujunur 56.52 430.29 Direct/
Development projects Bilakalaguduru, and Gadvimulla implementing District-Kurnool agencyState: Andhra Pradesh
2. Local area: Village- Telighana,Kandeimunda, Kurunga,Katkurbahal, Kulenbahal,Falsakani and SobarsaDistrict- SundhargharState: Odisha
Swachcha Sanitation 1. Local area: Village-Bujunur 10.13 440.42 Direct/Bharat Bilakalaguduru, and Gadvimulla implementingAbhiyan District-Kurnool agency
State: Andhra Pradesh2. Local Area: Village- Telighana,
Kandeimunda, Kurunga,Katkurbahal, Kulenbahal,Falsakani and SobarsaDistrict- SundhargharState: Odisha
5 Administration Administration & 22.73 463.15 Direct& Capacity Capacity BuildingBuilding ExpensesExpenses
*CSR activities have been carried out directly and through other private Non-Governmental Organization and Charitable institutions.We hereby confirm that the implementation and monitoring of CSR Policy, is in compliance with CSR Objectives and policy of the Company.

69Expanding. Integrating. Progressing.
To
The Members,
JSW Cement Limited.
JSW Centre, Bandra Kurla Complex,
Bandra (East),
Mumbai-400051
I have conducted the Secretarial Audit of the Compliance
of applicable statutory provisions and the adherence to
good Corporate Governance practice by JSW CEMENT
LIMITED (hereinafter called "the Company"). Secretarial
Audit was conducted in a manner that provided me a
reasonable basis for evaluating the corporate conducts/
statutory compliances and expressing our opinion
thereon.
Based on my verification of the Company's books, papers,
minutes books, forms and returns filed and other records
maintained by the Company and also the information
provided by the Company, its officers, agents and
authorized representatives during the conduct of
secretarial audit, I hereby report that in my opinion, the
Company has, during the audit period 1st April, 2018 to
31st March, 2019 ("the reporting period") complied with
the statutory provisions listed hereunder and also that
the Company has proper Board-processes and
compliance-mechanism in place to the extent, in the
manner and subject to the reporting made hereinafter:
1. I have examined the books, papers, minute books,
forms and returns filed and other records maintained
by JSW CEMENT LIMITED ("the Company") as given
in Annexure I, for the period 1st April, 2018 to
31st March, 2019 according to the provisions of:
(i) The Companies Act, 2013 (the Act) and the Rules
made thereunder;
(ii) The Securities Contracts (Regulation) Act, 1956
('SCRA') and the Rules made thereunder; (This
Act is not applicable as the Company has not
issued any marketable Securities)
(iii) The Depositories Act, 1996 and Regulations &
the Bye-laws, 1996 thereunder;
Secretarial Audit Report
Annexure-B
[Pursuant to section 204(1) of the Companies Act, 2013 and rule 9 of the Companies(Appointment and Remuneration of Managerial Personnel) Rules, 2014]
FOR THE FINANCIAL YEAR ENDED 31st MARCH 2019
(iv) Foreign Exchange Management Act, 1999 and
the Rules and Regulations made there under to
the extent of External Commercial Borrowings,
Foreign Direct Investment and Overseas Direct
Investment; The Company has not availed any
Foreign Direct Investment and External
Commercial Borrowings during the period under
review. The Company has granted Unsecured
Loan of `104.73 crores to JSW Cement FZE at
Fujairah, UAE, a Wholly Owned Subsidiary of the
Company.
(v) The following Regulations and Guidelines
prescribed under the Securities and Exchange
Board of India Act, 1992 ('SEBI Act'):-
i. The Securities and Exchange Board of India
(Substantial Acquisition of Shares
and Takeovers) Regulations, 2011; (Not
Applicable since it is an Unlisted Public
Company)
ii. The Securities and Exchange Board of India
(Prohibition of Insider Trading) Regulations,
2015; (Not Applicable since it is an Unlisted
Public Company)
iii. The Securities and Exchange Board of India
(Registrars to an Issue and Share Transfer
Agents) Regulations, 1993, regarding the
Companies Act and dealing with client;
iv. The Securities and Exchange Board of India
(Issue of Capital and Disclosure
Requirements) Regulations, 2018; (Not
Applicable since Company has not issued
securities at any Stock Exchanges)
v. The Securities and Exchange Board of India
(Share Based Employee Benefits)
Regulations, 2014; (Not Applicable since it
is an Unlisted Public Company)
vi. The Securities and Exchange Board of India
(Issue and Listing of Debt Securities)
Corporate O
verviewStatutory Reports
Financial Statem
ents

70 Annual Report 2018-19
JSW Cement Limited
Regulations, 2008; (Not Applicable since
Company has not issued debt securities
at any Stock Exchanges)
vii. The Securities and Exchange Board of India
(Delisting of Equity Shares) Regulations,
2009; (Not Applicable since it is an
Unlisted Public Company)
viii. The Securities and Exchange Board of India
(Buy Back of Securities) Regulations, 1998;
(Not Applicable since Company has not
issued any Buy Back of securities at any
Stock Exchanges)
II Other laws specifically applicable to the Company
are:
a) The Mines Act, 1952;
b) The Mines and Minerals (Regulation and
Development) Amendment Act, 2015;
c) The Limestone & Dolomite Mines Labour Welfare
Fund Act, 1972;
d) The Explosives Act, 1884;
e) The Batteries (Management and Handling)
Rules, 2011;
III I have relied on the Representation made by the
Company and its Officers for systems and
mechanism formed by the Company for compliances
under other applicable Acts, Laws and Regulations
to the Company. The compliance of the provisions
of corporate and other applicable laws, rules,
regulations, standards is the responsibly of the
management. My examination was limited to the
verification of procedure on test basis. The list of
major head/groups of Acts, Laws and Regulations
as generally applicable to the Company is as per
Annexure II.
IV In case of Direct and Indirect Tax Laws like Income
Tax Act, 1961, The Customs Acts, 1962 and Goods
and Services Act, I have relied on the Reports given
by the Statutory Auditors of the Company.
I have also examined Compliance with the applicable
clauses of the following:
i. Secretarial Standards issued by The Institute
of Company Secretaries of India under the
provisions of Companies Act, 2013;
During the period under review the Company has
complied with the provisions of the Act, Rules,
Regulations, Guidelines, Standards etc. mentioned
above.
During the year, The Company has filed certain E-
forms MGT-14 u/sec 117 r/w sec 179(3) of the
Companies Act, 2013 and rules made thereunder for
resolutions passed in the meeting of Board of
Directors and Special Resolutions passed by
Shareholders in General Meetings along with
payment of Additional Filing Fees.
I further report that:
The Board of Directors of the Company is duly
constituted with proper balance of Executive
Directors, Non-Executive Directors and Independent
Directors. The changes in the composition of the
Board of Directors that took place during the period
under review were carried out in compliance with
the provisions of the Act.
Adequate Notice was given to all Directors to
schedule the Board Meetings, agenda and detailed
notes on agenda were sent at least seven days in
advance, and a system exists for seeking and
obtaining further information and clarifications on
the agenda items before the meeting and for
meaningful participation at the meeting.
Majority decision is carried through and recorded as
part of the minutes.
I further report that there are adequate systems and
processes in the Company commensurate with the
size and operations of the Company to monitor and
ensure compliance with applicable laws, rules,
regulations and guidelines.
I further report that during the year/audit period
under report, the Company has undertaken the
following events/ actions having a major bearing on
the Company's affairs in pursuance of the above
referred laws, Rules, Regulations, Guidelines,
Standards, etc.
I further Report that during the Audit Period the
Company has the following specific events:
l During the year, the Company has appointed Mr.
Narinder Singh Kahlon as Additional Director
with effect from 8th May, 2018. Mr. Narinder
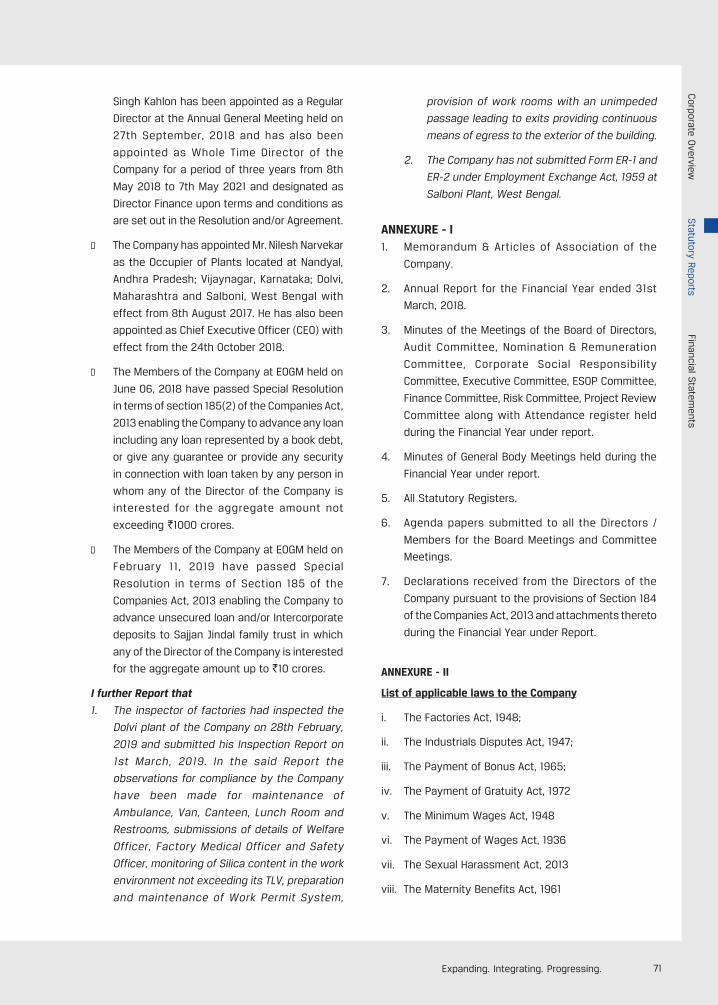
71Expanding. Integrating. Progressing.
Singh Kahlon has been appointed as a Regular
Director at the Annual General Meeting held on
27th September, 2018 and has also been
appointed as Whole Time Director of the
Company for a period of three years from 8th
May 2018 to 7th May 2021 and designated as
Director Finance upon terms and conditions as
are set out in the Resolution and/or Agreement.
l The Company has appointed Mr. Nilesh Narvekar
as the Occupier of Plants located at Nandyal,
Andhra Pradesh; Vijaynagar, Karnataka; Dolvi,
Maharashtra and Salboni, West Bengal with
effect from 8th August 2017. He has also been
appointed as Chief Executive Officer (CEO) with
effect from the 24th October 2018.
l The Members of the Company at EOGM held on
June 06, 2018 have passed Special Resolution
in terms of section 185(2) of the Companies Act,
2013 enabling the Company to advance any loan
including any loan represented by a book debt,
or give any guarantee or provide any security
in connection with loan taken by any person in
whom any of the Director of the Company is
interested for the aggregate amount not
exceeding `1000 crores.
l The Members of the Company at EOGM held on
February 11, 2019 have passed Special
Resolution in terms of Section 185 of the
Companies Act, 2013 enabling the Company to
advance unsecured loan and/or Intercorporate
deposits to Sajjan Jindal family trust in which
any of the Director of the Company is interested
for the aggregate amount up to `10 crores.
I further Report that
1. The inspector of factories had inspected the
Dolvi plant of the Company on 28th February,
2019 and submitted his Inspection Report on
1st March, 2019. In the said Report the
observations for compliance by the Company
have been made for maintenance of
Ambulance, Van, Canteen, Lunch Room and
Restrooms, submissions of details of Welfare
Officer, Factory Medical Officer and Safety
Officer, monitoring of Silica content in the work
environment not exceeding its TLV, preparation
and maintenance of Work Permit System,
provision of work rooms with an unimpeded
passage leading to exits providing continuous
means of egress to the exterior of the building.
2. The Company has not submitted Form ER-1 and
ER-2 under Employment Exchange Act, 1959 at
Salboni Plant, West Bengal.
ANNEXURE - I1. Memorandum & Articles of Association of the
Company.
2. Annual Report for the Financial Year ended 31st
March, 2018.
3. Minutes of the Meetings of the Board of Directors,
Audit Committee, Nomination & Remuneration
Committee, Corporate Social Responsibility
Committee, Executive Committee, ESOP Committee,
Finance Committee, Risk Committee, Project Review
Committee along with Attendance register held
during the Financial Year under report.
4. Minutes of General Body Meetings held during the
Financial Year under report.
5. All Statutory Registers.
6. Agenda papers submitted to all the Directors /
Members for the Board Meetings and Committee
Meetings.
7. Declarations received from the Directors of the
Company pursuant to the provisions of Section 184
of the Companies Act, 2013 and attachments thereto
during the Financial Year under Report.
ANNEXURE - II
List of applicable laws to the Company
i. The Factories Act, 1948;
ii. The Industrials Disputes Act, 1947;
iii. The Payment of Bonus Act, 1965;
iv. The Payment of Gratuity Act, 1972
v. The Minimum Wages Act, 1948
vi. The Payment of Wages Act, 1936
vii. The Sexual Harassment Act, 2013
viii. The Maternity Benefits Act, 1961
Corporate O
verviewStatutory Reports
Financial Statem
ents
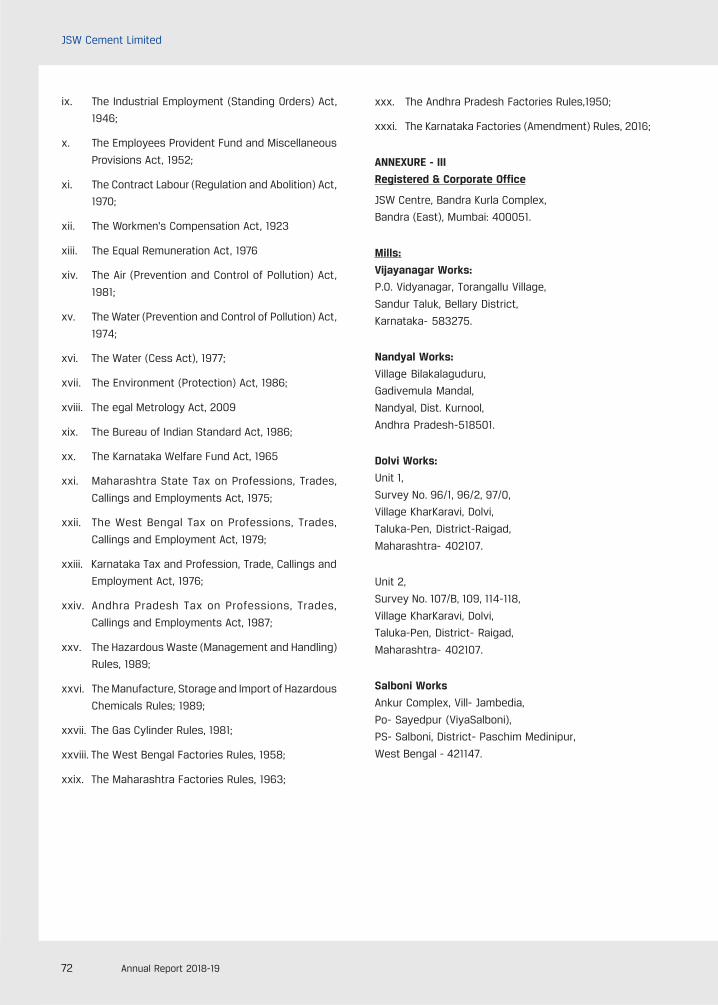
72 Annual Report 2018-19
JSW Cement Limited
ix. The Industrial Employment (Standing Orders) Act,
1946;
x. The Employees Provident Fund and Miscellaneous
Provisions Act, 1952;
xi. The Contract Labour (Regulation and Abolition) Act,
1970;
xii. The Workmen's Compensation Act, 1923
xiii. The Equal Remuneration Act, 1976
xiv. The Air (Prevention and Control of Pollution) Act,
1981;
xv. The Water (Prevention and Control of Pollution) Act,
1974;
xvi. The Water (Cess Act), 1977;
xvii. The Environment (Protection) Act, 1986;
xviii. The egal Metrology Act, 2009
xix. The Bureau of Indian Standard Act, 1986;
xx. The Karnataka Welfare Fund Act, 1965
xxi. Maharashtra State Tax on Professions, Trades,
Callings and Employments Act, 1975;
xxii. The West Bengal Tax on Professions, Trades,
Callings and Employment Act, 1979;
xxiii. Karnataka Tax and Profession, Trade, Callings and
Employment Act, 1976;
xxiv. Andhra Pradesh Tax on Professions, Trades,
Callings and Employments Act, 1987;
xxv. The Hazardous Waste (Management and Handling)
Rules, 1989;
xxvi. The Manufacture, Storage and Import of Hazardous
Chemicals Rules; 1989;
xxvii. The Gas Cylinder Rules, 1981;
xxviii. The West Bengal Factories Rules, 1958;
xxix. The Maharashtra Factories Rules, 1963;
xxx. The Andhra Pradesh Factories Rules,1950;
xxxi. The Karnataka Factories (Amendment) Rules, 2016;
ANNEXURE - III
Registered & Corporate Office
JSW Centre, Bandra Kurla Complex,
Bandra (East), Mumbai: 400051.
Mills:
Vijayanagar Works:
P.O. Vidyanagar, Torangallu Village,
Sandur Taluk, Bellary District,
Karnataka- 583275.
Nandyal Works:
Village Bilakalaguduru,
Gadivemula Mandal,
Nandyal, Dist. Kurnool,
Andhra Pradesh-518501.
Dolvi Works:
Unit 1,
Survey No. 96/1, 96/2, 97/0,
Village KharKaravi, Dolvi,
Taluka-Pen, District-Raigad,
Maharashtra- 402107.
Unit 2,
Survey No. 107/B, 109, 114-118,
Village KharKaravi, Dolvi,
Taluka-Pen, District- Raigad,
Maharashtra- 402107.
Salboni Works
Ankur Complex, Vill- Jambedia,
Po- Sayedpur (ViyaSalboni),
PS- Salboni, District- Paschim Medinipur,
West Bengal - 421147.
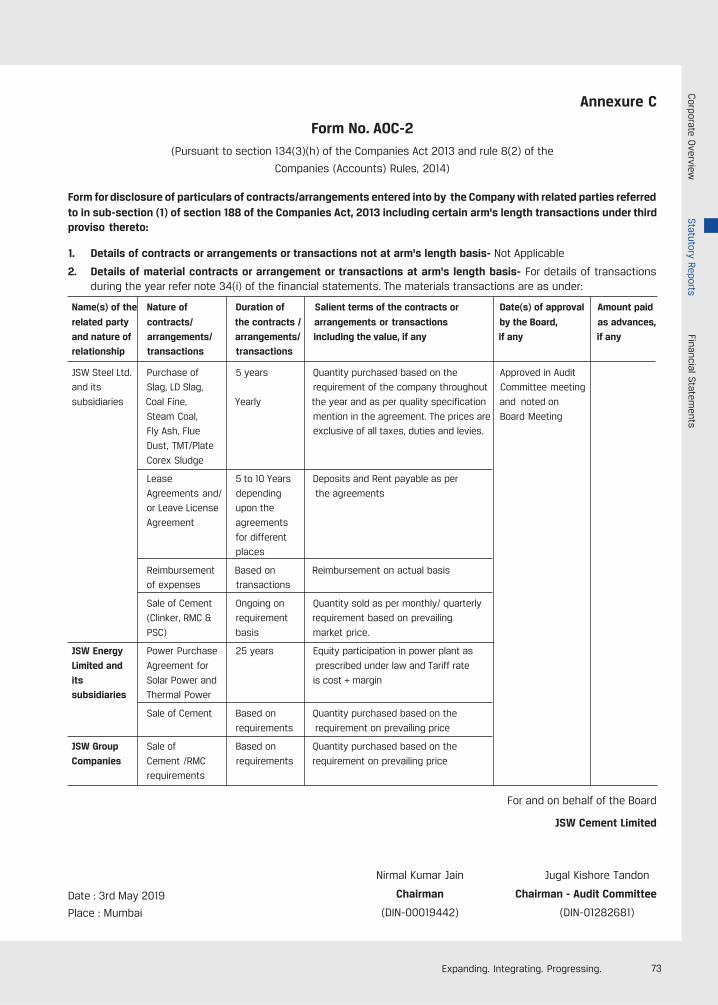
73Expanding. Integrating. Progressing.
Annexure C
Form No. AOC-2(Pursuant to section 134(3)(h) of the Companies Act 2013 and rule 8(2) of the
Companies (Accounts) Rules, 2014)
Form for disclosure of particulars of contracts/arrangements entered into by the Company with related parties referredto in sub-section (1) of section 188 of the Companies Act, 2013 including certain arm's length transactions under thirdproviso thereto:
1. Details of contracts or arrangements or transactions not at arm's length basis- Not Applicable
2. Details of material contracts or arrangement or transactions at arm's length basis- For details of transactionsduring the year refer note 34(i) of the financial statements. The materials transactions are as under:
Name(s) of the Nature of Duration of Salient terms of the contracts or Date(s) of approval Amount paid
related party contracts/ the contracts / arrangements or transactions by the Board, as advances,
and nature of arrangements/ arrangements/ including the value, if any if any if anyrelationship transactions transactions
JSW Steel Ltd. Purchase of 5 years Quantity purchased based on the Approved in Audit
and its Slag, LD Slag, requirement of the company throughout Committee meeting
subsidiaries Coal Fine, Yearly the year and as per quality specification and noted on
Steam Coal, mention in the agreement. The prices are Board Meeting
Fly Ash, Flue exclusive of all taxes, duties and levies.
Dust, TMT/Plate
Corex Sludge
Lease 5 to 10 Years Deposits and Rent payable as per
Agreements and/ depending the agreements
or Leave License upon the
Agreement agreements
for different
places
Reimbursement Based on Reimbursement on actual basis
of expenses transactions
Sale of Cement Ongoing on Quantity sold as per monthly/ quarterly
(Clinker, RMC & requirement requirement based on prevailing
PSC) basis market price.
JSW Energy Power Purchase 25 years Equity participation in power plant as
Limited and Agreement for prescribed under law and Tariff rate
its Solar Power and is cost + margin
subsidiaries Thermal Power
Sale of Cement Based on Quantity purchased based on the
requirements requirement on prevailing price
JSW Group Sale of Based on Quantity purchased based on the
Companies Cement /RMC requirements requirement on prevailing price
requirements
For and on behalf of the Board
JSW Cement Limited
Nirmal Kumar Jain Jugal Kishore Tandon
Chairman Chairman - Audit Committee
(DIN-00019442) (DIN-01282681)
Date : 3rd May 2019
Place : Mumbai
Corporate O
verviewStatutory Reports
Financial Statem
ents
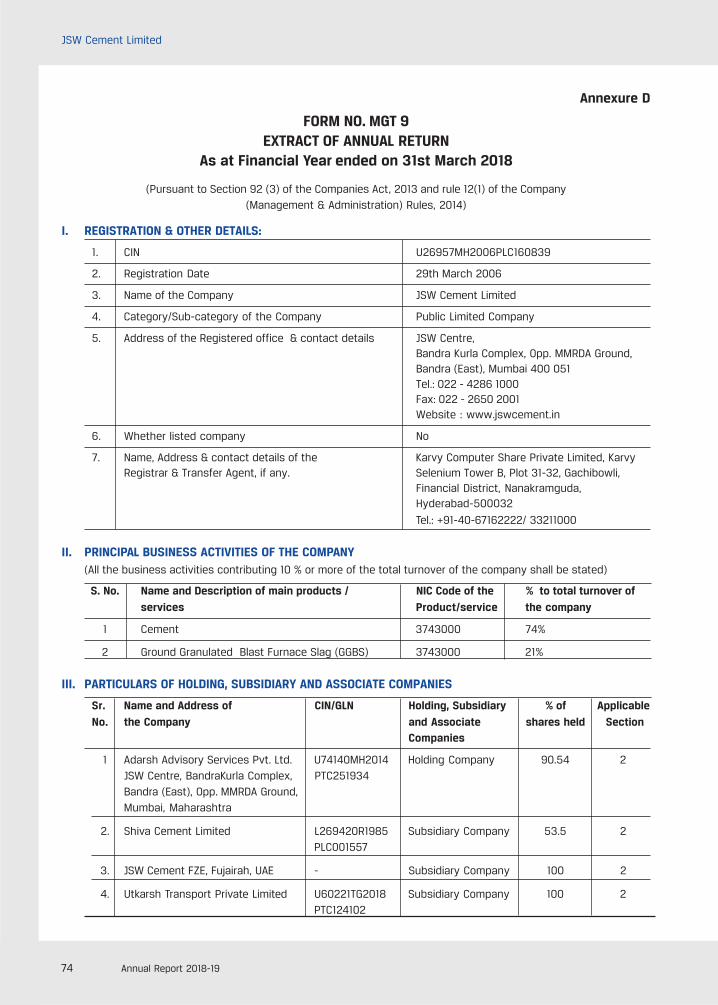
74 Annual Report 2018-19
JSW Cement Limited
Annexure D
FORM NO. MGT 9EXTRACT OF ANNUAL RETURN
As at Financial Year ended on 31st March 2018
(Pursuant to Section 92 (3) of the Companies Act, 2013 and rule 12(1) of the Company(Management & Administration) Rules, 2014)
I. REGISTRATION & OTHER DETAILS:
1. CIN U26957MH2006PLC160839
2. Registration Date 29th March 2006
3. Name of the Company JSW Cement Limited
4. Category/Sub-category of the Company Public Limited Company
5. Address of the Registered office & contact details JSW Centre,Bandra Kurla Complex, Opp. MMRDA Ground,Bandra (East), Mumbai 400 051Tel.: 022 - 4286 1000Fax: 022 - 2650 2001Website : www.jswcement.in
6. Whether listed company No
7. Name, Address & contact details of the Karvy Computer Share Private Limited, KarvyRegistrar & Transfer Agent, if any. Selenium Tower B, Plot 31-32, Gachibowli,
Financial District, Nanakramguda,Hyderabad-500032
Tel.: +91-40-67162222/ 33211000
II. PRINCIPAL BUSINESS ACTIVITIES OF THE COMPANY(All the business activities contributing 10 % or more of the total turnover of the company shall be stated)
S. No. Name and Description of main products / NIC Code of the % to total turnover of
services Product/service the company
1 Cement 3743000 74%
2 Ground Granulated Blast Furnace Slag (GGBS) 3743000 21%
III. PARTICULARS OF HOLDING, SUBSIDIARY AND ASSOCIATE COMPANIES
Sr. Name and Address of CIN/GLN Holding, Subsidiary % of Applicable
No. the Company and Associate shares held SectionCompanies
1 Adarsh Advisory Services Pvt. Ltd. U74140MH2014 Holding Company 90.54 2JSW Centre, BandraKurla Complex, PTC251934Bandra (East), Opp. MMRDA Ground,Mumbai, Maharashtra
2. Shiva Cement Limited L26942OR1985 Subsidiary Company 53.5 2PLC001557
3. JSW Cement FZE, Fujairah, UAE - Subsidiary Company 100 2
4. Utkarsh Transport Private Limited U60221TG2018 Subsidiary Company 100 2PTC124102
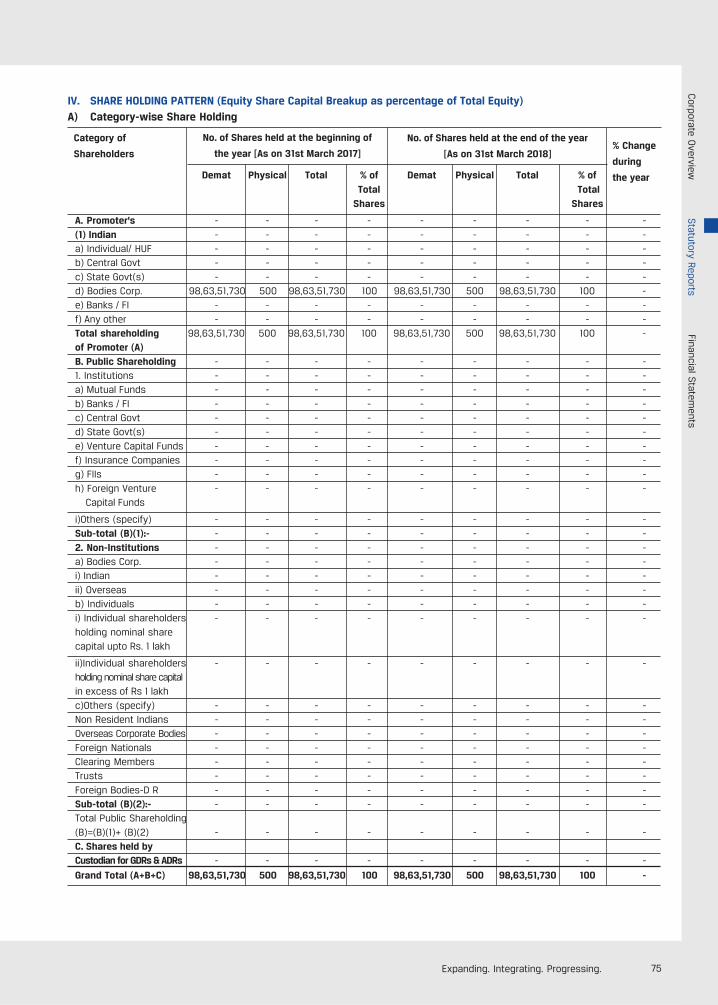
75Expanding. Integrating. Progressing.
IV. SHARE HOLDING PATTERN (Equity Share Capital Breakup as percentage of Total Equity)A) Category-wise Share Holding
Demat Physical Total % of Demat Physical Total % ofTotal Total
Shares Shares
A. Promoter's - - - - - - - - -(1) Indian - - - - - - - - -a) Individual/ HUF - - - - - - - - -b) Central Govt - - - - - - - - -c) State Govt(s) - - - - - - - - -d) Bodies Corp. 98,63,51,730 500 98,63,51,730 100 98,63,51,730 500 98,63,51,730 100 -e) Banks / FI - - - - - - - - -f) Any other - - - - - - - - -Total shareholding 98,63,51,730 500 98,63,51,730 100 98,63,51,730 500 98,63,51,730 100 -of Promoter (A)B. Public Shareholding - - - - - - - - -1. Institutions - - - - - - - - -a) Mutual Funds - - - - - - - - -b) Banks / FI - - - - - - - - -c) Central Govt - - - - - - - - -d) State Govt(s) - - - - - - - - -e) Venture Capital Funds - - - - - - - - -f) Insurance Companies - - - - - - - - -g) FIIs - - - - - - - - -h) Foreign Venture - - - - - - - - - Capital Funds
i)Others (specify) - - - - - - - - -Sub-total (B)(1):- - - - - - - - - -2. Non-Institutions - - - - - - - - -a) Bodies Corp. - - - - - - - - -i) Indian - - - - - - - - -ii) Overseas - - - - - - - - -b) Individuals - - - - - - - - -i) Individual shareholders - - - - - - - - -holding nominal sharecapital upto Rs. 1 lakh
ii)Individual shareholders - - - - - - - - -holding nominal share capitalin excess of Rs 1 lakhc)Others (specify) - - - - - - - - -Non Resident Indians - - - - - - - - -Overseas Corporate Bodies - - - - - - - - -Foreign Nationals - - - - - - - - -Clearing Members - - - - - - - - -Trusts - - - - - - - - -Foreign Bodies-D R - - - - - - - - -Sub-total (B)(2):- - - - - - - - - -Total Public Shareholding(B)=(B)(1)+ (B)(2) - - - - - - - - -C. Shares held byCustodian for GDRs & ADRs - - - - - - - - -
Grand Total (A+B+C) 98,63,51,730 500 98,63,51,730 100 98,63,51,730 500 98,63,51,730 100 -
Category of
Shareholders
No. of Shares held at the beginning of
the year [As on 31st March 2017]% Change
during
the year
No. of Shares held at the end of the year
[As on 31st March 2018]
Corporate O
verviewStatutory Reports
Financial Statem
ents
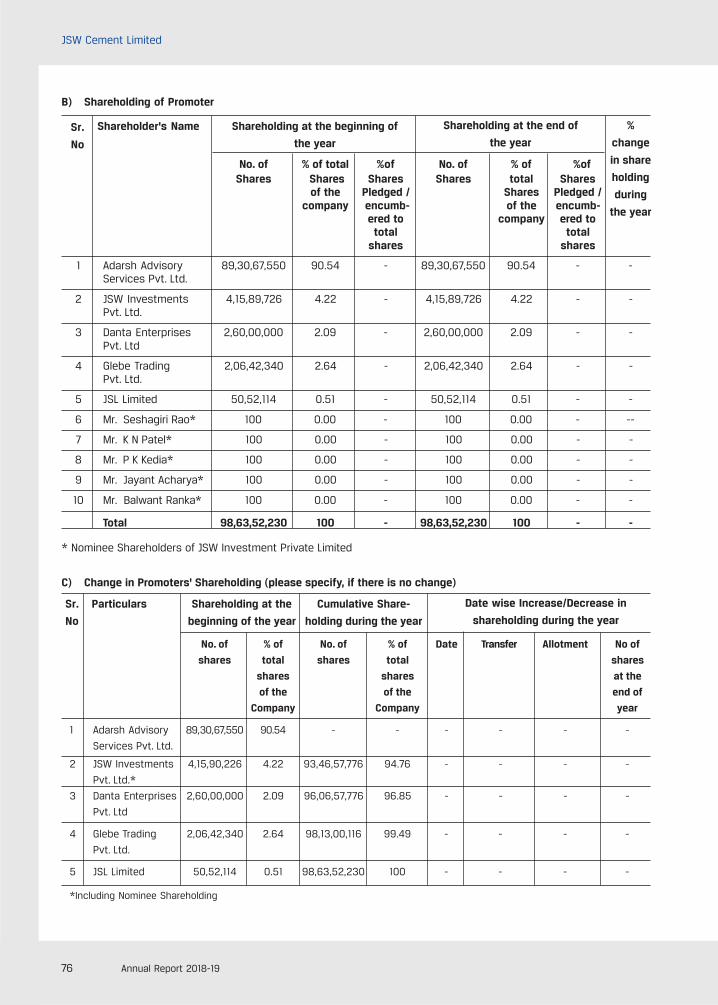
76 Annual Report 2018-19
JSW Cement Limited
B) Shareholding of Promoter
No. of % of total %of No. of % of %ofShares Shares Shares Shares total Shares
of the Pledged / Shares Pledged /company encumb- of the encumb-
ered to company ered tototal total
shares shares
1 Adarsh Advisory 89,30,67,550 90.54 - 89,30,67,550 90.54 - -Services Pvt. Ltd.
2 JSW Investments 4,15,89,726 4.22 - 4,15,89,726 4.22 - -Pvt. Ltd.
3 Danta Enterprises 2,60,00,000 2.09 - 2,60,00,000 2.09 - -Pvt. Ltd
4 Glebe Trading 2,06,42,340 2.64 - 2,06,42,340 2.64 - -Pvt. Ltd.
5 JSL Limited 50,52,114 0.51 - 50,52,114 0.51 - -
6 Mr. Seshagiri Rao* 100 0.00 - 100 0.00 - --
7 Mr. K N Patel* 100 0.00 - 100 0.00 - -
8 Mr. P K Kedia* 100 0.00 - 100 0.00 - -
9 Mr. Jayant Acharya* 100 0.00 - 100 0.00 - -
10 Mr. Balwant Ranka* 100 0.00 - 100 0.00 - -
Total 98,63,52,230 100 - 98,63,52,230 100 - -
* Nominee Shareholders of JSW Investment Private Limited
Shareholding at the beginning of
the year
Shareholder's Name Shareholding at the end of
the yearSr.
No
%
change
in share
holding
during
the year
C) Change in Promoters' Shareholding (please specify, if there is no change)
No. of % of No. of % of Date Transfer Allotment No of
shares total shares total shares
shares shares at the
of the of the end of
Company Company year
1 Adarsh Advisory 89,30,67,550 90.54 - - - - - -
Services Pvt. Ltd.
2 JSW Investments 4,15,90,226 4.22 93,46,57,776 94.76 - - - -
Pvt. Ltd.*
3 Danta Enterprises 2,60,00,000 2.09 96,06,57,776 96.85 - - - -
Pvt. Ltd
4 Glebe Trading 2,06,42,340 2.64 98,13,00,116 99.49 - - - -
Pvt. Ltd.
5 JSL Limited 50,52,114 0.51 98,63,52,230 100 - - - -
*Including Nominee Shareholding
Date wise Increase/Decrease in
shareholding during the year
Sr.
No
Particulars Shareholding at the
beginning of the year
Cumulative Share-
holding during the year
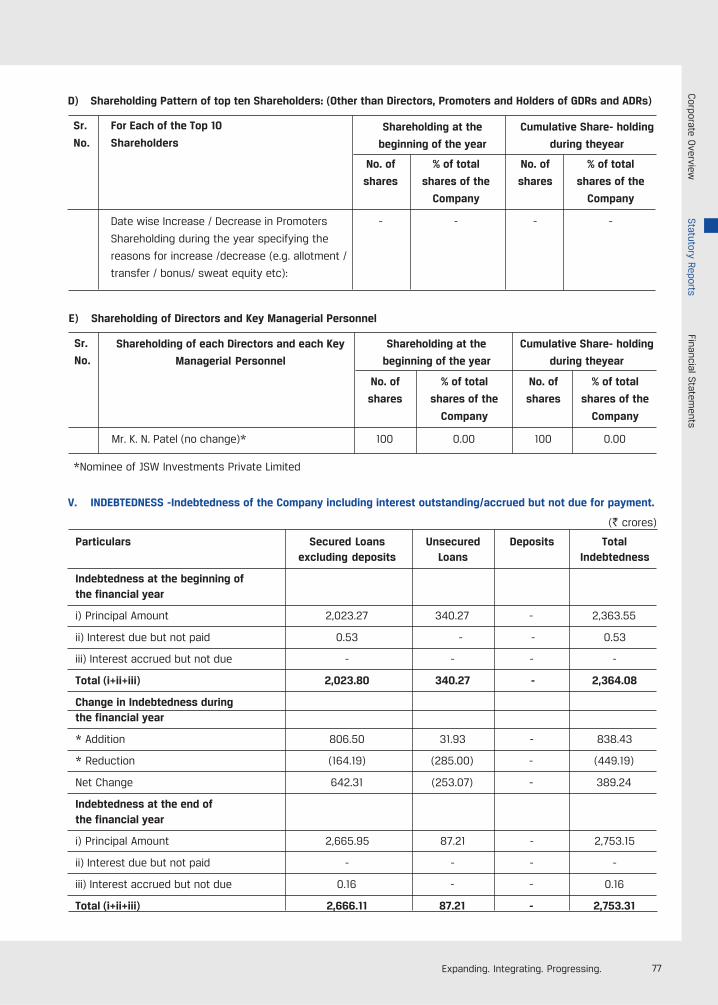
77Expanding. Integrating. Progressing.
D) Shareholding Pattern of top ten Shareholders: (Other than Directors, Promoters and Holders of GDRs and ADRs)
Sr. For Each of the Top 10
No. Shareholders
No. of % of total No. of % of total
shares shares of the shares shares of the
Company Company
Date wise Increase / Decrease in Promoters - - - -
Shareholding during the year specifying the
reasons for increase /decrease (e.g. allotment /
transfer / bonus/ sweat equity etc):
Shareholding at the
beginning of the year
Cumulative Share- holding
during theyear
E) Shareholding of Directors and Key Managerial Personnel
Sr.
No.
No. of % of total No. of % of total
shares shares of the shares shares of the
Company Company
Mr. K. N. Patel (no change)* 100 0.00 100 0.00
Cumulative Share- holding
during theyear
Shareholding of each Directors and each Key
Managerial Personnel
Shareholding at the
beginning of the year
V. INDEBTEDNESS -Indebtedness of the Company including interest outstanding/accrued but not due for payment.
(` crores)
Particulars Secured Loans Unsecured Deposits Totalexcluding deposits Loans Indebtedness
Indebtedness at the beginning ofthe financial year
i) Principal Amount 2,023.27 340.27 - 2,363.55
ii) Interest due but not paid 0.53 - - 0.53
iii) Interest accrued but not due - - - -
Total (i+ii+iii) 2,023.80 340.27 - 2,364.08
Change in Indebtedness duringthe financial year
* Addition 806.50 31.93 - 838.43
* Reduction (164.19) (285.00) - (449.19)
Net Change 642.31 (253.07) - 389.24
Indebtedness at the end ofthe financial year
i) Principal Amount 2,665.95 87.21 - 2,753.15
ii) Interest due but not paid - - - -
iii) Interest accrued but not due 0.16 - - 0.16
Total (i+ii+iii) 2,666.11 87.21 - 2,753.31
*Nominee of JSW Investments Private Limited
Corporate O
verviewStatutory Reports
Financial Statem
ents
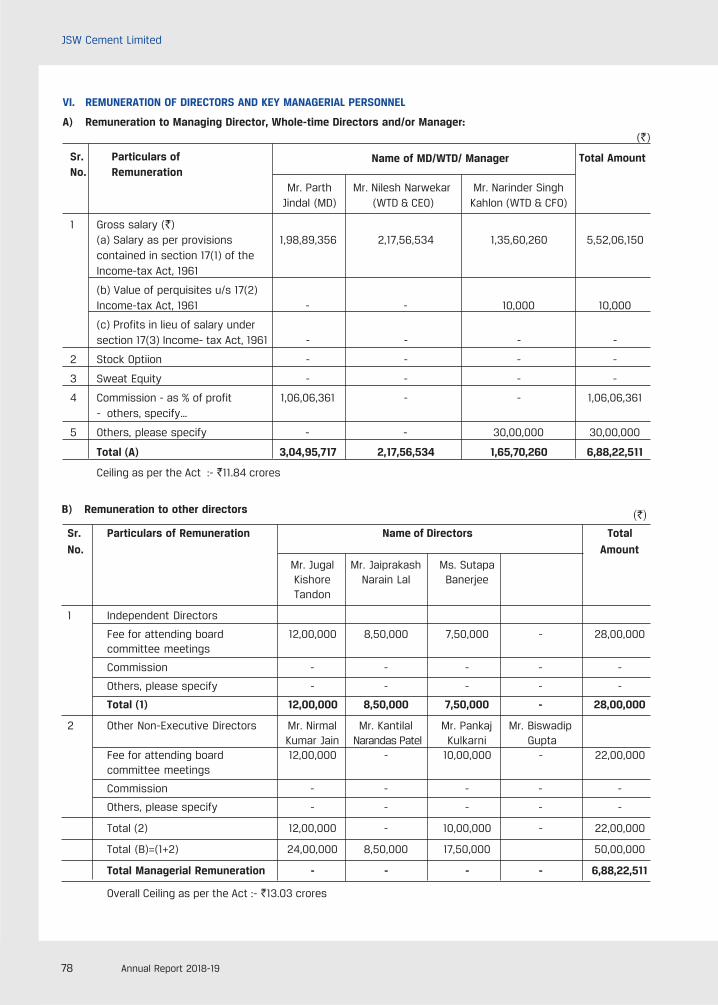
78 Annual Report 2018-19
JSW Cement Limited
VI. REMUNERATION OF DIRECTORS AND KEY MANAGERIAL PERSONNEL
A) Remuneration to Managing Director, Whole-time Directors and/or Manager:(`)
Sr. Particulars ofNo. Remuneration
Mr. Parth Mr. Nilesh Narwekar Mr. Narinder SinghJindal (MD) (WTD & CEO) Kahlon (WTD & CFO)
1 Gross salary (`)(a) Salary as per provisions 1,98,89,356 2,17,56,534 1,35,60,260 5,52,06,150contained in section 17(1) of theIncome-tax Act, 1961
(b) Value of perquisites u/s 17(2)Income-tax Act, 1961 - - 10,000 10,000
(c) Profits in lieu of salary undersection 17(3) Income- tax Act, 1961 - - - -
2 Stock Optiion - - - -
3 Sweat Equity - - - -
4 Commission - as % of profit 1,06,06,361 - - 1,06,06,361- others, specify…
5 Others, please specify - - 30,00,000 30,00,000
Total (A) 3,04,95,717 2,17,56,534 1,65,70,260 6,88,22,511
Ceiling as per the Act :- `11.84 crores
B) Remuneration to other directors
Sr. Particulars of Remuneration Name of Directors Total
No. AmountMr. Jugal Mr. Jaiprakash Ms. SutapaKishore Narain Lal BanerjeeTandon
1 Independent Directors
Fee for attending board 12,00,000 8,50,000 7,50,000 - 28,00,000committee meetings
Commission - - - - -
Others, please specify - - - - -
Total (1) 12,00,000 8,50,000 7,50,000 - 28,00,000
2 Other Non-Executive Directors Mr. Nirmal Mr. Kantilal Mr. Pankaj Mr. BiswadipKumar Jain Narandas Patel Kulkarni Gupta
Fee for attending board 12,00,000 - 10,00,000 - 22,00,000committee meetings
Commission - - - - -
Others, please specify - - - - -
Total (2) 12,00,000 - 10,00,000 - 22,00,000
Total (B)=(1+2) 24,00,000 8,50,000 17,50,000 50,00,000
Total Managerial Remuneration - - - - 6,88,22,511
Overall Ceiling as per the Act :- `13.03 crores
(`)
Total AmountName of MD/WTD/ Manager
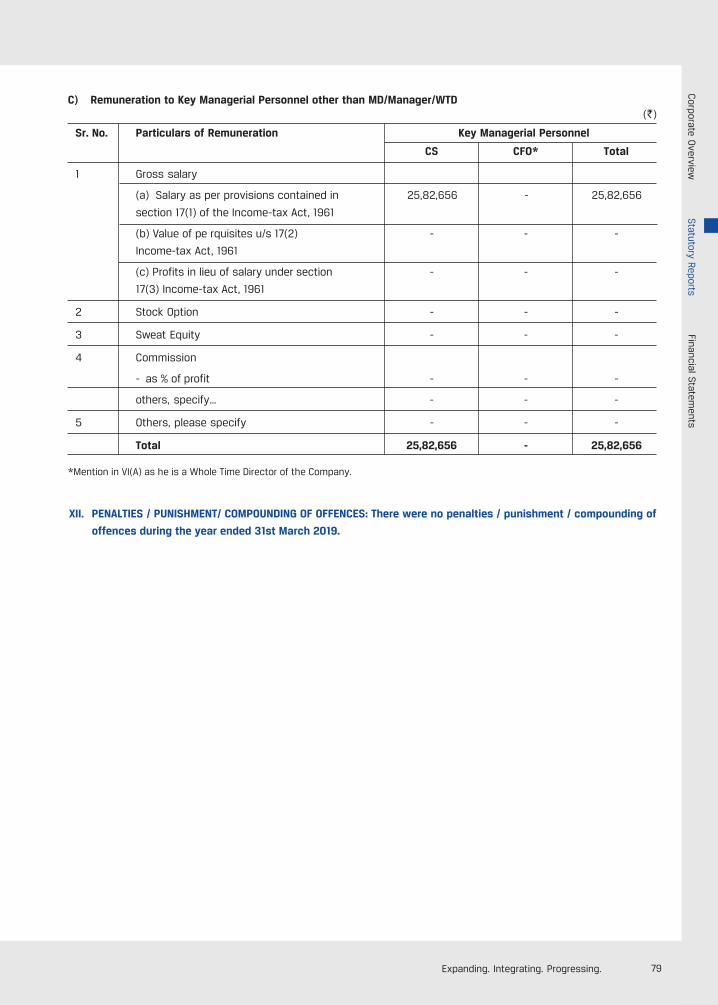
79Expanding. Integrating. Progressing.
C) Remuneration to Key Managerial Personnel other than MD/Manager/WTD(`)
Sr. No. Particulars of Remuneration Key Managerial Personnel
CS CFO* Total
1 Gross salary
(a) Salary as per provisions contained in 25,82,656 - 25,82,656
section 17(1) of the Income-tax Act, 1961
(b) Value of pe rquisites u/s 17(2) - - -
Income-tax Act, 1961
(c) Profits in lieu of salary under section - - -
17(3) Income-tax Act, 1961
2 Stock Option - - -
3 Sweat Equity - - -
4 Commission
- as % of profit - - -
others, specify… - - -
5 Others, please specify - - -
Total 25,82,656 - 25,82,656
*Mention in VI(A) as he is a Whole Time Director of the Company.
XII. PENALTIES / PUNISHMENT/ COMPOUNDING OF OFFENCES: There were no penalties / punishment / compounding of
offences during the year ended 31st March 2019.
Corporate O
verviewStatutory Reports
Financial Statem
ents
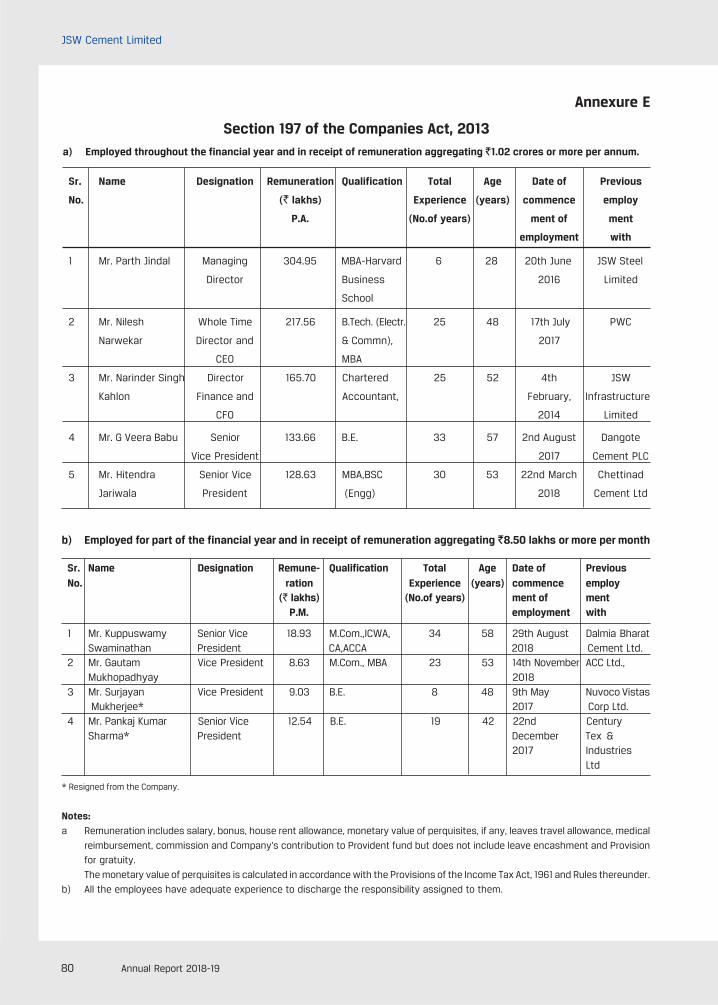
80 Annual Report 2018-19
JSW Cement Limited
Annexure E
Section 197 of the Companies Act, 2013a) Employed throughout the financial year and in receipt of remuneration aggregating `1.02 crores or more per annum.
Sr. Name Designation Remuneration Qualification Total Age Date of Previous
No. (` lakhs) Experience (years) commence employ
P.A. (No.of years) ment of ment
employment with
1 Mr. Parth Jindal Managing 304.95 MBA-Harvard 6 28 20th June JSW Steel
Director Business 2016 Limited
School
2 Mr. Nilesh Whole Time 217.56 B.Tech. (Electr. 25 48 17th July PWC
Narwekar Director and & Commn), 2017
CEO MBA
3 Mr. Narinder Singh Director 165.70 Chartered 25 52 4th JSW
Kahlon Finance and Accountant, February, Infrastructure
CFO 2014 Limited
4 Mr. G Veera Babu Senior 133.66 B.E. 33 57 2nd August Dangote
Vice President 2017 Cement PLC
5 Mr. Hitendra Senior Vice 128.63 MBA,BSC 30 53 22nd March Chettinad
Jariwala President (Engg) 2018 Cement Ltd
b) Employed for part of the financial year and in receipt of remuneration aggregating `8.50 lakhs or more per month
Sr. Name Designation Remune- Qualification Total Age Date of PreviousNo. ration Experience (years) commence employ
(` lakhs) (No.of years) ment of mentP.M. employment with
1 Mr. Kuppuswamy Senior Vice 18.93 M.Com.,ICWA, 34 58 29th August Dalmia BharatSwaminathan President CA,ACCA 2018 Cement Ltd.
2 Mr. Gautam Vice President 8.63 M.Com., MBA 23 53 14th November ACC Ltd.,Mukhopadhyay 2018
3 Mr. Surjayan Vice President 9.03 B.E. 8 48 9th May Nuvoco Vistas Mukherjee* 2017 Corp Ltd.
4 Mr. Pankaj Kumar Senior Vice 12.54 B.E. 19 42 22nd CenturySharma* President December Tex &
2017 IndustriesLtd
* Resigned from the Company.
Notes:
a Remuneration includes salary, bonus, house rent allowance, monetary value of perquisites, if any, leaves travel allowance, medical
reimbursement, commission and Company's contribution to Provident fund but does not include leave encashment and Provision
for gratuity.
The monetary value of perquisites is calculated in accordance with the Provisions of the Income Tax Act, 1961 and Rules thereunder.
b) All the employees have adequate experience to discharge the responsibility assigned to them.
81Expanding. Integrating. Progressing.
Annexure F
Energy Conservation
A. VIJAYANAGAR
a. VFD installed for bag filter fan of old Roto-Packer to achieve the energy savings by reducing the speed according
to operation requirement.
b. One blower is running for all 3 new Roto-Packer instead of 3 blowers in operation to achieve the saving in
energyof 65000 kWh annually.
c. Replacement of 300 nos. 160W HPSV lamps with 70W LED fittings to reduce energy consumption and 50 Nos.
250W streets light with 150W LED fitting.
d. With optimized running of VRM (GGBS) power consumption got reduced by 13% i.e. from 36.58 (FY18) units to
31.92 units (FY19).
e. RP (GGBS) power consumption got reduced by 9% i.e. from 33.94 units (April, 2018) to 30.76 units(April 2019).
f. RP (OPC) power consumption got reduced by 1% i.e. from 32.09 units (April 2018) to 31.76 units (April 2019).
B. NANDYAL
a. Carbon black feeding system consumed 3381 MT in coal mill and firing in calciner which has reducedthe Coal
consumption by 1.9%.
b. The coal consumption reduced after utilizing 6851 MT of waste liquid as alternate fuel from pharmaceutical
companies and achieved TSR of 1.43 %.
c. Cake breaker installation in Slagmill-1 will improve the separation of material in separator which has increased
the mill output and power consumption reduced by 0.3 kWh/ MT.
d. Bag House material entry modified. Material entry line given in hopper in Slagmill-1 which has helped in reduction
of frequent stoppages due to High DP and increased the life of bag filter bags, resulting in optimized operation
as well as saving in energy approximately 0.1 KwH/Material.
e. Conversion of plant lighting from HPSV fittings to LED fittings (1200 nos.) to reduce power consumption saving
of Rs. 9.98 lakhs/Year.
f. Usage of Open Access & Solar power to reduce power cost, which has helped in saving Rs. 336.33 Lakhs.
C. DOLVI:
a. Lighting power consumption reduced due to installations of LED lighting in VRM-2 Section and after
implementation, savings 750 Units/Day @ cost `8.70 per unit.
b. 500 KVAR Capacitor bank installed in VRM-2 led to improvement in power factor by 1% i.e. from 0.984 to 0.995.
c. Energy efficient Compressor installed and after Implementation saving is 1166 Kwh/Day.
d. Change of voltage level from 22KV to 220KV the electrical unit cost has been reduced.
D. SALBONI:
a. Reduction of power consumption in PSC grinding by 15% ( 44.08 units to 37.35 units per MT) and CHD grinding
by 15% (44.09 to 37.63 units per MT)
b. 22% Reduction of coal consumption in OPC (12.48 kg/T to 9.73 kg/T).
c. 54% Reduction of fuel oil in OPC (3.22 L/T to 1.48 L/T) and 67% reduction of Fuel oil in GGBS (2.97 L/T to 0.98 L/T).
d. 31% Reduction of Unit cost of Power (12.40 `/kWh to 8.57 `/kWh)by optimising the plant operations and reducing
the contract demand as per the requirement of the plant
e. Solar power generation of 3,479,778 kWh in FY19.
Corporate O
verviewStatutory Reports
Financial Statem
ents
82 Annual Report 2018-19
JSW Cement Limited
Report on Corporate Governance for the Year 2018 - 19
1. Company's Governance PhilosophyThe principles of Corporate Governance are basedon transparency, accountability and focus on thesustainable success of the Company over thelong-term. The Company feel proud to belong to aGroup whose visionary founders laid the foundationstone for good governance long back and made itan integral principle of the business. Responsiblecorporate conduct is integral to the way we do ourbusiness. Our actions are governed by our valuesand principles, which are reinforced at all levelswithin the Company. The Company are committedto doing things the right way which means takingbusiness decisions and acting in a way that is ethicaland is in compliance with applicable legislation andalso acknowledge individual and collectiveresponsibilities to manage business activities withintegrity. The Company keep governance practicesunder continuous review and benchmark ourselvesto best practices.
The Board of Directors are responsible for andcommitted to sound principles of CorporateGovernance in the Company. The Board of Directorsplays a crucial role in overseeing how theManagement serves the short and long-terminterests of members and other stakeholders. Thisbelief is reflected in our governance practices, underwhich we strive to maintain an effective, informedand independent Board.
2. Governance Structure
The Company's Governance structure is based on
the principles of freedom to the executive
management within a given framework to ensure
that the powers vested in the executive
management are exercised with due care and
responsibility so as to meet the expectation of all
the stakeholders. In line with these principles, the
Company has formed three tiers of Corporate
Governance structure, viz.:
2.1 The Board of Directors:The Board of Directors play a fundamental role inupholding and nurturing the principles of goodgovernance which translates into ethical businesspractices, transparency and accountability. Theprimary role of the Board is to protect the interest
Corporate Governance
and enhance value for all the stakeholders. Itconducts overall strategic, supervision and controlby setting the goals and targets, policies,governance standards, reporting mechanism,accountability and decision making process to befollowed.
2.2 Committees of BoardThe Board Committees play a crucial role in thegovernance structure of the Company and havebeen constituted to deal with specific areas /activities as mandated under applicable regulation.
2.3 Executive ManagementThe entire business including the support functionsare managed with clearly demarcatedresponsibilities and authorities at different levels.The Executive Management consist of WorkingCommittee, Executive Committee, ExecutiveDirectors, CFO. The Heads of Manufacturing,Marketing, Logistics, Corporate Affairs and HR are itsother members. The Working Committee consists ofthe different functional heads at plant level whilethe Executive Committee comprises of all functionalhead including plant head of each location. Thiscommittee is a brain storming committee, whichmeets once in a month, wherein all importantbusiness issues are discussed and decisions aretaken. These Committee reviews and monitorsmonthly performances, challenges faced by thebusiness, draws strategies and policies and keepthe Board informed about important developmentshaving bearing on the operational and financialperformance of the Company. Additionally, theCommittee also reviews CSR, Health and Safety,Environment and Sustainability initiatives of theCompany.
2.4 The Compliance FrameworkThe Company has a robust and effective frameworkfor monitoring compliances with applicable lawswithin the organization and to provide updates tosenior management and the Board on a periodicbasis. The Board and Committees periodicallydiscuss the status of compliances with applicablelaws and provide valuable guidance to themanagement team wherever necessary.
2.5 Independent Directors Meeting
A meeting of the Independent Directors of theCompany was held without the presence of Non-
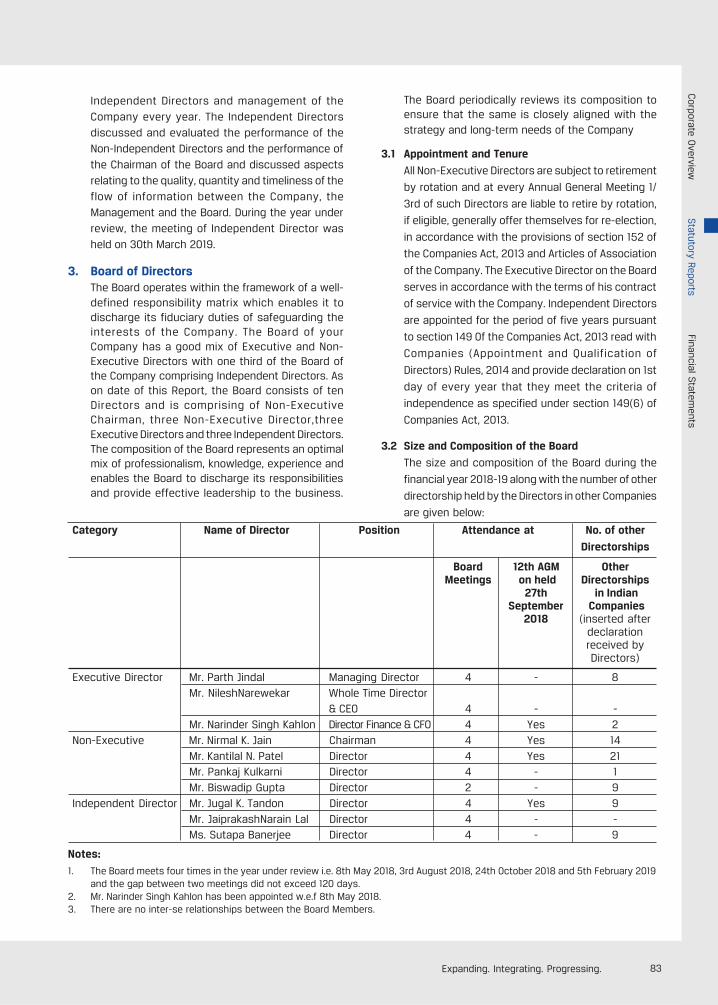
83Expanding. Integrating. Progressing.
Independent Directors and management of theCompany every year. The Independent Directorsdiscussed and evaluated the performance of theNon-Independent Directors and the performance ofthe Chairman of the Board and discussed aspectsrelating to the quality, quantity and timeliness of theflow of information between the Company, theManagement and the Board. During the year underreview, the meeting of Independent Director washeld on 30th March 2019.
3. Board of DirectorsThe Board operates within the framework of a well-defined responsibility matrix which enables it todischarge its fiduciary duties of safeguarding theinterests of the Company. The Board of yourCompany has a good mix of Executive and Non-Executive Directors with one third of the Board ofthe Company comprising Independent Directors. Ason date of this Report, the Board consists of tenDirectors and is comprising of Non-ExecutiveChairman, three Non-Executive Director,threeExecutive Directors and three Independent Directors.The composition of the Board represents an optimalmix of professionalism, knowledge, experience andenables the Board to discharge its responsibilitiesand provide effective leadership to the business.
The Board periodically reviews its composition toensure that the same is closely aligned with thestrategy and long-term needs of the Company
3.1 Appointment and Tenure
All Non-Executive Directors are subject to retirement
by rotation and at every Annual General Meeting 1/
3rd of such Directors are liable to retire by rotation,
if eligible, generally offer themselves for re-election,
in accordance with the provisions of section 152 of
the Companies Act, 2013 and Articles of Association
of the Company. The Executive Director on the Board
serves in accordance with the terms of his contract
of service with the Company. Independent Directors
are appointed for the period of five years pursuant
to section 149 0f the Companies Act, 2013 read with
Companies (Appointment and Qualification of
Directors) Rules, 2014 and provide declaration on 1st
day of every year that they meet the criteria of
independence as specified under section 149(6) of
Companies Act, 2013.
3.2 Size and Composition of the Board
The size and composition of the Board during the
financial year 2018-19 along with the number of other
directorship held by the Directors in other Companies
are given below:
Category Name of Director Position Attendance at No. of other
Directorships
Board 12th AGM OtherMeetings on held Directorships
27th in IndianSeptember Companies
2018 (inserted afterdeclarationreceived byDirectors)
Executive Director Mr. Parth Jindal Managing Director 4 - 8Mr. NileshNarewekar Whole Time Director
& CEO 4 - -Mr. Narinder Singh Kahlon Director Finance & CFO 4 Yes 2
Non-Executive Mr. Nirmal K. Jain Chairman 4 Yes 14Mr. Kantilal N. Patel Director 4 Yes 21Mr. Pankaj Kulkarni Director 4 - 1Mr. Biswadip Gupta Director 2 - 9
Independent Director Mr. Jugal K. Tandon Director 4 Yes 9Mr. JaiprakashNarain Lal Director 4 - -Ms. Sutapa Banerjee Director 4 - 9
Notes:
1. The Board meets four times in the year under review i.e. 8th May 2018, 3rd August 2018, 24th October 2018 and 5th February 2019and the gap between two meetings did not exceed 120 days.
2. Mr. Narinder Singh Kahlon has been appointed w.e.f 8th May 2018.3. There are no inter-se relationships between the Board Members.
Corporate O
verviewStatutory Reports
Financial Statem
ents
84 Annual Report 2018-19
JSW Cement Limited
3.3 Board Meetings and ProceduresA minimum of four Board meetings are held everyyear. Additional meetings are held as and whennecessary. Dates for the Board Meetings for theensuing quarters are decided well in the Boardmeeting. Agenda papers supported by relevantinformation, documents and presentations aregenerally circulated well in advance to the BoardMembers to enable the Board to take informeddecisions. Where it is not practicable to attach anydocument to the Agenda, the same is tabled beforethe meeting. In special and exceptionalcircumstances, additional or supplementary item(s)on the Agenda are considered.
Committees of the Board usually meet before theformal Board meeting, or whenever the need arises,for transacting business. The recommendations ofthe Committees are placed before the Board fornecessary approval and noting.
In case of business exigencies or urgency ofmatters, the resolutions are passed by circulationand later placed at the subsequent Board/Committee meeting for noting.
The Company Secretary records minutes ofproceedings of each Board and Committee meeting.All important decisions taken at the meeting andsuggestion of Board and Committee members arecirculated to the concerned officials and departmentfor necessary action.
3.4 Invitees and Proceedings:Chief Financial Officer, Chief Marketing Officer, SafetyOfficer and HR Head are invited on regular basis togive their presentation before the Board. Otheremployees are invited when necessary, to provideadditional inputs for the items being discussed bythe Board. The Chairman of various BoardCommittees brief the Board on all the importantmatters discussed and decided at their respectivecommittee meetings, which are generally held priorto the Board meeting.
3.5 Post Meeting Action and Follow-up system:
Post meetings, all important decisions taken at themeeting are communicated to the concernedofficials and departments. Action Taken Report isprepared and reviewed periodically by the CEO & CFOfor the action taken / pending to be taken.
4. Committee of the BoardThe Board Committees are set up under the formalapproval of the Board to carry out clearly definedroles which are considered to be performed bymembers of the Board, as a part of good governancepractice. The Chairman of the respectiveCommittees informs the Board about the summaryof the discussions held in the Committee meetings.The minutes of the meetings of all Committees areplaced before the Board for review. The BoardCommittees can request special invitees to join themeeting, as appropriate.
The Board has established the following statutoryand non-statutory Committees: -
4.1 Audit CommitteeThe Board has constituted a well-qualified AuditCommittee. All the members of the Committee areNon-Executive Directors with majority of them areIndependent Directors including Chairman and itscomposition meet the provisions of section 177 ofthe Companies Act, 2013. They possess soundknowledge on accounts, audit, finance, taxation,internal controls etc.
a) Composition and MeetingsThe Committee comprises of three IndependentDirectors and Two Non-Executive Directors. TheCompany Secretary acts as the Secretary of theCommittee. Mr. Jugal Kishore Tandon, Chairmanof Audit Committee, has attended the AnnualGeneral Meeting for answering the shareholdersqueries. During the year under review, theCommittee had met four times on 7th May 2018,2nd August 2018, 23rd October 2018 and 4thFebruary 2019. The attendance of eachcommittee member was as under: -
Name of Members Category No. of Meetings
attended
Mr. Jugal Kishor Tandon Independent 4
Chairman Director
Mr. Jaiprakash Narain Lal Independent 4
Member Director
Mrs. Sutapa Banerjee Independent 4
Member Director
Mr. Nirmal Kumar Jain Non-Executive 4
Member Director
Mr. Pankaj Kulkarni Non-Executive 4
Member Director
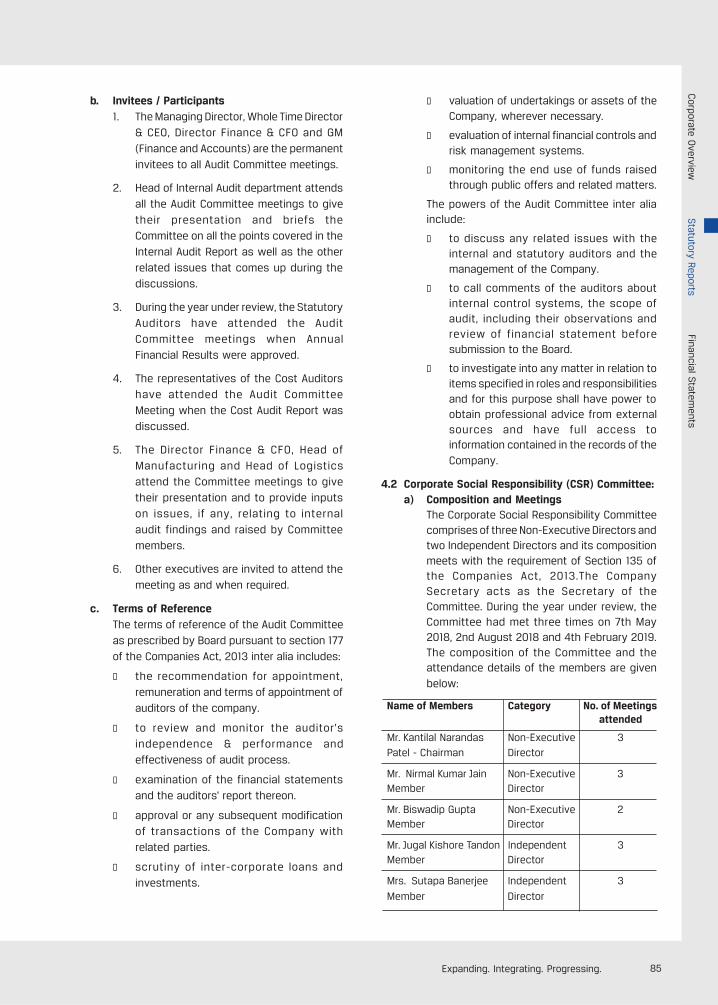
85Expanding. Integrating. Progressing.
Name of Members Category No. of Meetingsattended
Mr. Kantilal Narandas Non-Executive 3
Patel - Chairman Director
Mr. Nirmal Kumar Jain Non-Executive 3Member Director
Mr. Biswadip Gupta Non-Executive 2Member Director
Mr. Jugal Kishore Tandon Independent 3Member Director
Mrs. Sutapa Banerjee Independent 3
Member Director
b. Invitees / Participants1. The Managing Director, Whole Time Director
& CEO, Director Finance & CFO and GM(Finance and Accounts) are the permanentinvitees to all Audit Committee meetings.
2. Head of Internal Audit department attendsall the Audit Committee meetings to givetheir presentation and briefs theCommittee on all the points covered in theInternal Audit Report as well as the otherrelated issues that comes up during thediscussions.
3. During the year under review, the StatutoryAuditors have attended the AuditCommittee meetings when AnnualFinancial Results were approved.
4. The representatives of the Cost Auditorshave attended the Audit CommitteeMeeting when the Cost Audit Report wasdiscussed.
5. The Director Finance & CFO, Head ofManufacturing and Head of Logisticsattend the Committee meetings to givetheir presentation and to provide inputson issues, if any, relating to internalaudit findings and raised by Committeemembers.
6. Other executives are invited to attend themeeting as and when required.
c. Terms of ReferenceThe terms of reference of the Audit Committeeas prescribed by Board pursuant to section 177of the Companies Act, 2013 inter alia includes:
l the recommendation for appointment,remuneration and terms of appointment ofauditors of the company.
l to review and monitor the auditor'sindependence & performance andeffectiveness of audit process.
l examination of the financial statementsand the auditors' report thereon.
l approval or any subsequent modificationof transactions of the Company withrelated parties.
l scrutiny of inter-corporate loans andinvestments.
l valuation of undertakings or assets of theCompany, wherever necessary.
l evaluation of internal financial controls andrisk management systems.
l monitoring the end use of funds raisedthrough public offers and related matters.
The powers of the Audit Committee inter aliainclude:
l to discuss any related issues with theinternal and statutory auditors and themanagement of the Company.
l to call comments of the auditors aboutinternal control systems, the scope ofaudit, including their observations andreview of financial statement beforesubmission to the Board.
l to investigate into any matter in relation toitems specified in roles and responsibilitiesand for this purpose shall have power toobtain professional advice from externalsources and have full access toinformation contained in the records of theCompany.
4.2 Corporate Social Responsibility (CSR) Committee:a) Composition and Meetings
The Corporate Social Responsibility Committeecomprises of three Non-Executive Directors andtwo Independent Directors and its compositionmeets with the requirement of Section 135 ofthe Companies Act, 2013.The CompanySecretary acts as the Secretary of theCommittee. During the year under review, theCommittee had met three times on 7th May2018, 2nd August 2018 and 4th February 2019.The composition of the Committee and theattendance details of the members are givenbelow:
Corporate O
verviewStatutory Reports
Financial Statem
ents
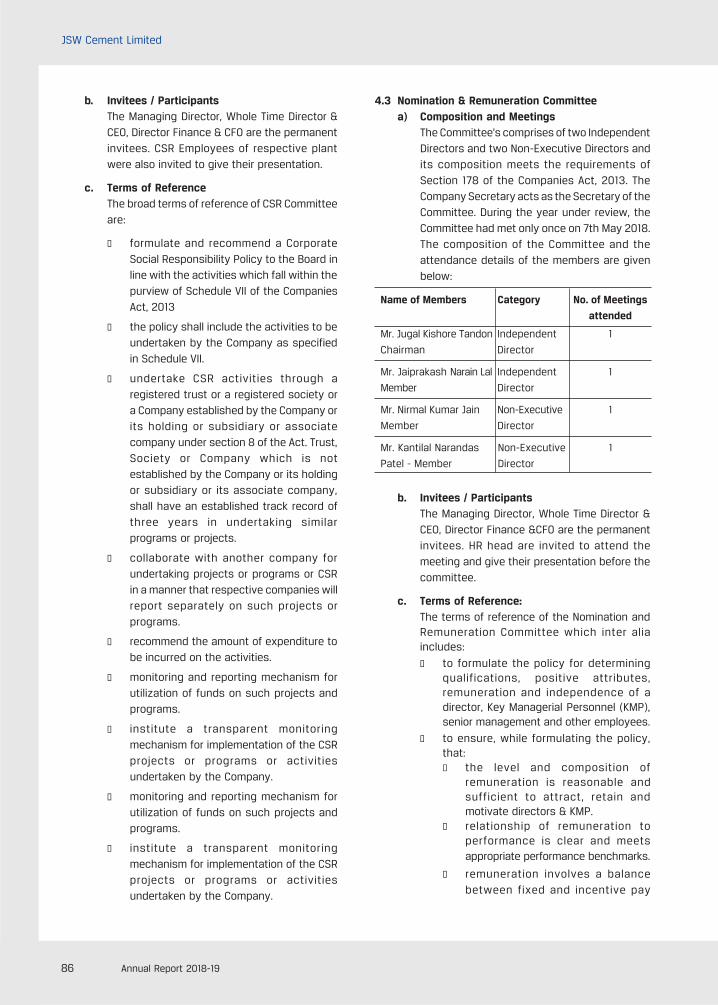
86 Annual Report 2018-19
JSW Cement Limited
b. Invitees / ParticipantsThe Managing Director, Whole Time Director &CEO, Director Finance & CFO are the permanentinvitees. CSR Employees of respective plantwere also invited to give their presentation.
c. Terms of ReferenceThe broad terms of reference of CSR Committeeare:
l formulate and recommend a CorporateSocial Responsibility Policy to the Board inline with the activities which fall within thepurview of Schedule VII of the CompaniesAct, 2013
l the policy shall include the activities to beundertaken by the Company as specifiedin Schedule VII.
l undertake CSR activities through aregistered trust or a registered society ora Company established by the Company orits holding or subsidiary or associatecompany under section 8 of the Act. Trust,Society or Company which is notestablished by the Company or its holdingor subsidiary or its associate company,shall have an established track record ofthree years in undertaking similarprograms or projects.
l collaborate with another company forundertaking projects or programs or CSRin a manner that respective companies willreport separately on such projects orprograms.
l recommend the amount of expenditure tobe incurred on the activities.
l monitoring and reporting mechanism forutilization of funds on such projects andprograms.
l institute a transparent monitoringmechanism for implementation of the CSRprojects or programs or activitiesundertaken by the Company.
l monitoring and reporting mechanism forutilization of funds on such projects andprograms.
l institute a transparent monitoringmechanism for implementation of the CSRprojects or programs or activitiesundertaken by the Company.
4.3 Nomination & Remuneration Committeea) Composition and Meetings
The Committee's comprises of two IndependentDirectors and two Non-Executive Directors andits composition meets the requirements ofSection 178 of the Companies Act, 2013. TheCompany Secretary acts as the Secretary of theCommittee. During the year under review, theCommittee had met only once on 7th May 2018.The composition of the Committee and theattendance details of the members are givenbelow:
Name of Members Category No. of Meetings
attended
Mr. Jugal Kishore Tandon Independent 1
Chairman Director
Mr. Jaiprakash Narain Lal Independent 1
Member Director
Mr. Nirmal Kumar Jain Non-Executive 1
Member Director
Mr. Kantilal Narandas Non-Executive 1
Patel - Member Director
b. Invitees / ParticipantsThe Managing Director, Whole Time Director &CEO, Director Finance &CFO are the permanentinvitees. HR head are invited to attend themeeting and give their presentation before thecommittee.
c. Terms of Reference:The terms of reference of the Nomination andRemuneration Committee which inter aliaincludes:
l to formulate the policy for determiningqualifications, positive attributes,remuneration and independence of adirector, Key Managerial Personnel (KMP),senior management and other employees.
l to ensure, while formulating the policy,that:n the level and composition of
remuneration is reasonable andsufficient to attract, retain andmotivate directors & KMP.
n relationship of remuneration toperformance is clear and meetsappropriate performance benchmarks.
n remuneration involves a balancebetween fixed and incentive pay
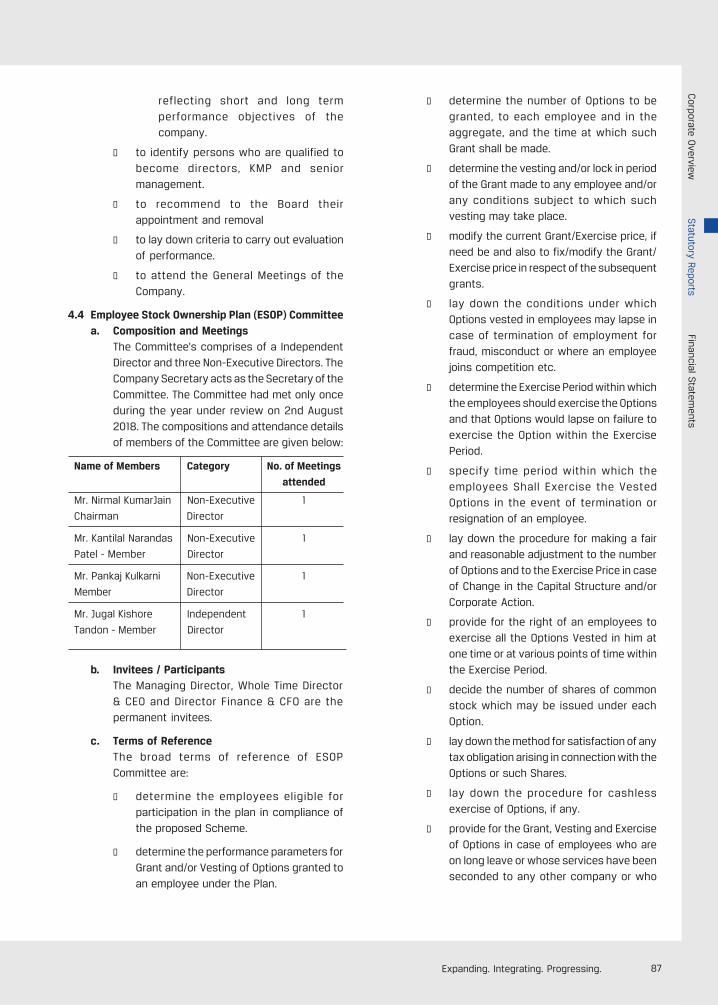
87Expanding. Integrating. Progressing.
reflecting short and long termperformance objectives of thecompany.
l to identify persons who are qualified tobecome directors, KMP and seniormanagement.
l to recommend to the Board theirappointment and removal
l to lay down criteria to carry out evaluationof performance.
l to attend the General Meetings of theCompany.
4.4 Employee Stock Ownership Plan (ESOP) Committeea. Composition and Meetings
The Committee's comprises of a IndependentDirector and three Non-Executive Directors. TheCompany Secretary acts as the Secretary of theCommittee. The Committee had met only onceduring the year under review on 2nd August2018. The compositions and attendance detailsof members of the Committee are given below:
Name of Members Category No. of Meetings
attended
Mr. Nirmal KumarJain Non-Executive 1
Chairman Director
Mr. Kantilal Narandas Non-Executive 1
Patel - Member Director
Mr. Pankaj Kulkarni Non-Executive 1
Member Director
Mr. Jugal Kishore Independent 1
Tandon - Member Director
b. Invitees / ParticipantsThe Managing Director, Whole Time Director& CEO and Director Finance & CFO are thepermanent invitees.
c. Terms of ReferenceThe broad terms of reference of ESOPCommittee are:
l determine the employees eligible forparticipation in the plan in compliance ofthe proposed Scheme.
l determine the performance parameters forGrant and/or Vesting of Options granted toan employee under the Plan.
l determine the number of Options to begranted, to each employee and in theaggregate, and the time at which suchGrant shall be made.
l determine the vesting and/or lock in periodof the Grant made to any employee and/orany conditions subject to which suchvesting may take place.
l modify the current Grant/Exercise price, ifneed be and also to fix/modify the Grant/Exercise price in respect of the subsequentgrants.
l lay down the conditions under whichOptions vested in employees may lapse incase of termination of employment forfraud, misconduct or where an employeejoins competition etc.
l determine the Exercise Period within whichthe employees should exercise the Optionsand that Options would lapse on failure toexercise the Option within the ExercisePeriod.
l specify time period within which theemployees Shall Exercise the VestedOptions in the event of termination orresignation of an employee.
l lay down the procedure for making a fairand reasonable adjustment to the numberof Options and to the Exercise Price in caseof Change in the Capital Structure and/orCorporate Action.
l provide for the right of an employees toexercise all the Options Vested in him atone time or at various points of time withinthe Exercise Period.
l decide the number of shares of commonstock which may be issued under eachOption.
l lay down the method for satisfaction of anytax obligation arising in connection with theOptions or such Shares.
l lay down the procedure for cashlessexercise of Options, if any.
l provide for the Grant, Vesting and Exerciseof Options in case of employees who areon long leave or whose services have beenseconded to any other company or who
Corporate O
verviewStatutory Reports
Financial Statem
ents
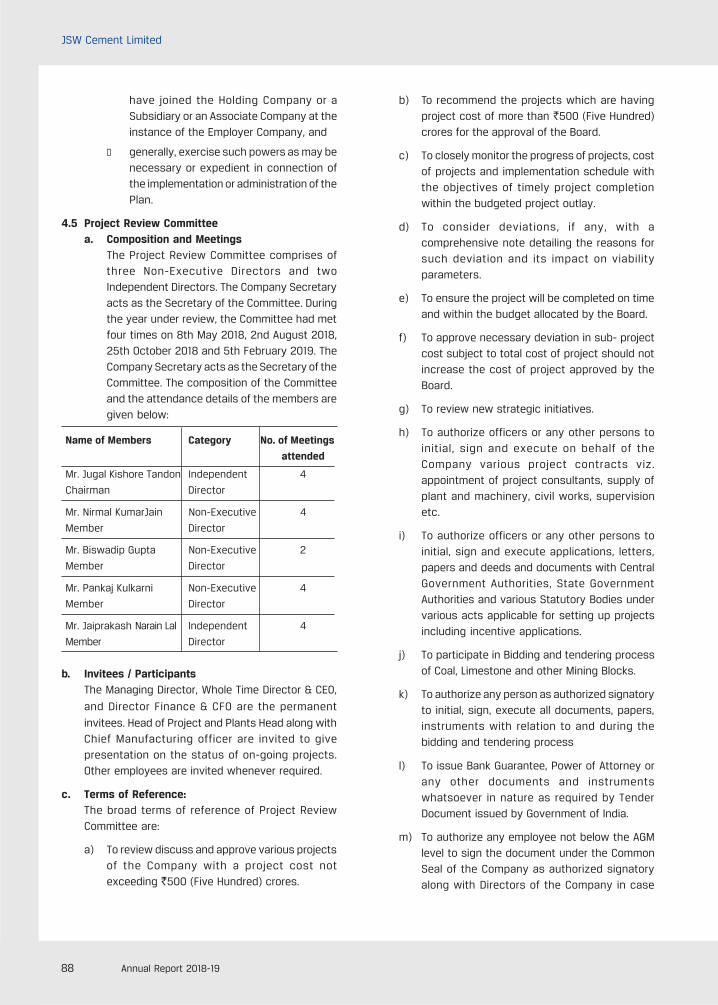
88 Annual Report 2018-19
JSW Cement Limited
have joined the Holding Company or aSubsidiary or an Associate Company at theinstance of the Employer Company, and
l generally, exercise such powers as may benecessary or expedient in connection ofthe implementation or administration of thePlan.
4.5 Project Review Committeea. Composition and Meetings
The Project Review Committee comprises ofthree Non-Executive Directors and twoIndependent Directors. The Company Secretaryacts as the Secretary of the Committee. Duringthe year under review, the Committee had metfour times on 8th May 2018, 2nd August 2018,25th October 2018 and 5th February 2019. TheCompany Secretary acts as the Secretary of theCommittee. The composition of the Committeeand the attendance details of the members aregiven below:
Name of Members Category No. of Meetings
attended
Mr. Jugal Kishore Tandon Independent 4
Chairman Director
Mr. Nirmal KumarJain Non-Executive 4
Member Director
Mr. Biswadip Gupta Non-Executive 2
Member Director
Mr. Pankaj Kulkarni Non-Executive 4
Member Director
Mr. Jaiprakash Narain Lal Independent 4
Member Director
b. Invitees / ParticipantsThe Managing Director, Whole Time Director & CEO,
and Director Finance & CFO are the permanent
invitees. Head of Project and Plants Head along withChief Manufacturing officer are invited to givepresentation on the status of on-going projects.Other employees are invited whenever required.
c. Terms of Reference:The broad terms of reference of Project ReviewCommittee are:
a) To review discuss and approve various projectsof the Company with a project cost notexceeding `500 (Five Hundred) crores.
b) To recommend the projects which are havingproject cost of more than `500 (Five Hundred)crores for the approval of the Board.
c) To closely monitor the progress of projects, costof projects and implementation schedule withthe objectives of timely project completionwithin the budgeted project outlay.
d) To consider deviations, if any, with acomprehensive note detailing the reasons forsuch deviation and its impact on viabilityparameters.
e) To ensure the project will be completed on timeand within the budget allocated by the Board.
f) To approve necessary deviation in sub- projectcost subject to total cost of project should notincrease the cost of project approved by theBoard.
g) To review new strategic initiatives.
h) To authorize officers or any other persons toinitial, sign and execute on behalf of theCompany various project contracts viz.appointment of project consultants, supply ofplant and machinery, civil works, supervisionetc.
i) To authorize officers or any other persons toinitial, sign and execute applications, letters,papers and deeds and documents with CentralGovernment Authorities, State GovernmentAuthorities and various Statutory Bodies undervarious acts applicable for setting up projectsincluding incentive applications.
j) To participate in Bidding and tendering processof Coal, Limestone and other Mining Blocks.
k) To authorize any person as authorized signatoryto initial, sign, execute all documents, papers,instruments with relation to and during thebidding and tendering process
l) To issue Bank Guarantee, Power of Attorney orany other documents and instrumentswhatsoever in nature as required by TenderDocument issued by Government of India.
m) To authorize any employee not below the AGMlevel to sign the document under the CommonSeal of the Company as authorized signatoryalong with Directors of the Company in case

89Expanding. Integrating. Progressing.
Name of Members Category No. of Meetingsattended
Mr. Nirmal Kumar Jain Non-Executive 1Member Director
Mr. Nilesh Narwekar Executive 2Member Director
Mr. Kantilal Narandas Non-Executive 2Patel - Member Director
Name of Members Category No. of Meetings
attended
Mr. Nirmal Kumar Jain Non-Executive 3
Chairman Director
Mr. Jugal Kishore Tandon Independent 3
Member Director
Mr. Kantilal Narandas Non-Executive 3
Patel - Member Director
Mr. Pankaj Kulkarni Non-Executive 3
Member Director
Company Secretary and CFO of the Company isnot available in the city where document isrequired to be signed.
n) To do all such acts deeds as specified in TenderDocuments.
o) To exercise such powers as may be delegatedby the Board of Directors from time to time.
4.6 Risk Committeea. Composition and Meetings
The Risk Committee comprises of three Non-Executive Directors and a Independent Director.The Company Secretary acts as the Secretaryof the Committee. During the year under review,the Committee had met three times on 7th May2018, 23rd October 2018 and 4th February 2019.The composition of the Committee and theattendance details of the members are givenbelow:
b. Invitees / ParticipantsThe Managing Director, Whole Time Director & CEOand Director Finance & CFO are the permanentinvitees. Head of Group Risk Team are invited to givetheir presentation before the Committee. ChiefManufacturing Officer are invited to address thequeries raised by Risk Team or Committee members.Other employees are invited wherever required.
c. Terms of ReferenceThe broad terms of reference of Risk Committee are:
a) To formulate and recommend to the Board RiskManagement Policy for approval.
b) To review the Risk Management Policy from timeto time and recommend to the Board for review.
c) Implement the Risk Management Policy asapproved by the Board.
d) To access the Company's risk profile and Keyarea of risk in particular.
e) To recommend to the Board adoption of riskassessment and rating procedures.
f) To periodically review risk assessment andminimization procedure to ensure thatExecutive Management controls risk throughmeans of defined frame work
g) Provide a methodology to identify and analyzethe financial impact of loss to the organization,employees, the public, and the environment.
h) To access and recommend to the Boardacceptable level of risk.
i) To review and nature and level of InsuranceCoverage.
j) Prepare risk management and insurancebudgets and allocate claim costs and premiumsto departments and divisions.
k) To define risk appetite of the Company andreview the risk profile of the Company from timeto time to ensure that risk is not higher thanthe risk appetite approved by the Board.
l) Provide for the establishment and maintenanceof records including insurance policies, claimand loss experience.
m) To exercise such powers as may be delegatedby the Board of Directors from time to time.
4.7 Finance Committee:a. Composition and Meetings
The Finance Committee was reconstituted on24th October 2018 and comprises of oneExecutive Director and two Non-ExecutiveDirectors. The Company Secretary acts as theSecretary of the Committee. During the yearunder review, the Committee met two times on28th June 2018 and 26th November 2018. Thecomposition of the Committee and theattendance details of the members are givenbelow:
Corporate O
verviewStatutory Reports
Financial Statem
ents
90 Annual Report 2018-19
JSW Cement Limited
b. Invitees / ParticipantsThe Director Finance & CFO is the permanentinvitees. Other employees are invited whereverrequired.
c. Terms of ReferenceThe roles and responsibilities approved by theBoard, for the functioning of Finance Committee,inter alia include:
a) To avail credit/financial facilities of anydescription including refinancing(hereinafter called as "Facilities") fromBanks/Financial Institutions/ BodiesCorporate (hereinafter referred to as'Lenders') upon such security as may berequired by the 'Lenders' and agreed by theCommittee including any alteration ofsanction terms, provided, the aggregateamount of such credit/ financial facilitiesto be availed by the Committee shall not
exceed `5000 crores.
b) to Borrow and/or avail facilities includingany non-fund based facilities (Letter ofCredits/ Bank Guarantees, etc) on behalfof for the benefit of its subsidiariesCompanies, domestic as well as overseas,
upto an amount of `300 crores within the
overall limit of amount not exceeding
`5000 crores as delegated to the
Committee as per clause (a) on the termsand conditions as required by banks/financial institutions and/or such furthermodification/changes in the terms andconditions and as may be agreed from timeto time.
c) To alter/vary terms, conditions, repaymentschedules including premature paymentsof the credit/ financial facilities availedfrom Lenders, with or without premium onsuch payments.
d) To hypothecate/pledge/ create charge onmovable and immovable properties/ assetsof the Company and to initial, sign,execute necessary deeds, documents,agreements, writings etc. to avail the saidfacilities.
e) To invest and deal with fund of theCompany upon such security (not beingshares of the Company) or without securityin such manner as the Committee may
deem fit, and from time to time to vary orrealize such investments, provided that allinvestments shall be made and held in theCompany's name and provided further thatmonies to be invested and dealt with asaforesaid by the Committee shall not
exceed `1000 crores and decide the
authorized persons to take all necessaryactions in that regard.
f) to grant loans or give guarantee or providesecurity in respect of loans given toIndividuals/Bodies Corporate includingSubsidiaries, Domestic and overseas and/or to place deposits with other Companies/Firms upon such security or withoutsecurity in such manner as the Committeemay deem fit and from time to time vary/recover such loans/deposits, providedhowever, that the aggregate amount ofsuch loans/deposits shall not at any time
exceed `1000 crores including the limit if
any utilized under para (e) .
g) to allow financial commitment for OverseasDirect Investment in form of BankGuarantee, performance guarantee,Corporate Guarantee, Letter of Credits,Standby Letter of Credits and any othernon-fund based facilities by creation ofcharge (pledge / mortgage /hypothecation) on the movable /immovable property or other financialassets on behalf or for the benefit ofoverseas wholly owned subsidiaries for the
amount not exceeding `300 crores
within the overall limit of amount not
exceeding `1000 crores as delegated to
the Committee as per clause (f).
h) To open Current Account(s), CollectionAccount(s), Operation Account(s), invest/renew/withdraw fixed deposits/timedeposits/margin money deposits or anyother deposits as per requirement, or anyother Account(s) with Banks whether inIndian Rupees or in Foreign Currencies,whether in India or abroad, and also toclose such accounts, which the Committeemay consider necessary and expedientand to decide/appoint/change/remove theauthorized signatories and mode ofoperation of the bank accounts; toauthorize persons for internet banking and
91Expanding. Integrating. Progressing.
modifications in the signatories and modeof operation from time to time.
i) To avail guarantees/letter of credits/enterinto bill purchase schemes with any of thebanks/institutions.
j) To appoint / replace Credit Rating Agenciesand to apply, review and accept CreditRatings.
k) To authorize officers or any other personsto sign and execute Letter of Indemnity(LOI) on behalf of the Company, for allexport & import documentation purpose,including for releasing cargo withoutoriginal Bills of Lading, for clean Bills ofLading, any changes required to be madein Bills of Lading and any changes requiredto be made in discharge port as againstwhat is declared in Bills of Lading.
l) To allot/transfer/transmission of securitiesof the Company to promoter(s) and / ornon-promoter(s) and / or any individuals,body corporate, any other incorporated orun-incorporated entities whether residentor non-resident.
m) To allot/redeem Non-ConvertibleDebentures (NCDs), to change/modify/alter the terms of issued NCDs/to createsecurity/additional securities/modificationin security created for allotment ofdebentures, to delegate power for creationof security viz signing of Debenture TrustDeed, other Documents and relevantpapers, to appoint R&T agents, to appointDepository(s) and to delegate powers forsigning agreements in relation to theDepository, to issue debenture certificatesor allotment of debentures in demat modeand to do all other acts and deedsincidental thereto allot/redeemdebentures, to change/modify/alter theterms of issues
n) To authorize officers or other persons forthe purpose of acquisition of land, dealingand registration with the statutoryauthorities.
o) To authorize officers or other persons todeal with as Goods and Service Tax, Excise,
Service Tax, Customs, Income Tax,profession Tax, Commercial Tax, State &Central Sales tax, VAT authorities and suchother State and Central Governmentauthorities, on such terms and conditionsand limitations as the said Committee shalldetermine and initial, Sign execute allapplications, papers, contracts, deeds anddocuments in this regard.
p) To appoint Occupier under various actsapplicable to the factory and to appointFactory Manager pursuant to Factories Act,1948 and authorized them to initial, sign,execute all necessary applications, forms,contracts, deeds and documents pursuantto various acts applicable to the factorylocated at various places within theterritory of India.
q) To authorize officers or any other personsto issue, sign and give indemnities, bonds,guarantees or documents of similar naturehaving financial exposure to the State andCentral Government Authorities and also toaccept, enter into and sign anycompromise in relation to the direct orindirect tax matters.
r) To issue power of attorneys, open/closebranch offices, authorize persons forsigning Vakalatnama, authorize persons toattend meeting pursuant to section 113 ofthe Companies Act, 2013, affixation ofCommon seal.
s) To do all acts, deeds and things as theCommittee deem fit and considernecessary by exercising the powers of theBoard which the Committee may lawfullyexercise by virtue of the powershereinabove conferred
t) To exercise such powers as may bedelegated by the Board of Directors fromtime to time.
5. General Meetingsa. Annual General Meetings
The date and time of Annual General Meetingsheld during last three years, and the specialresolution(s) passed thereat, are as follows:
Corporate O
verviewStatutory Reports
Financial Statem
ents
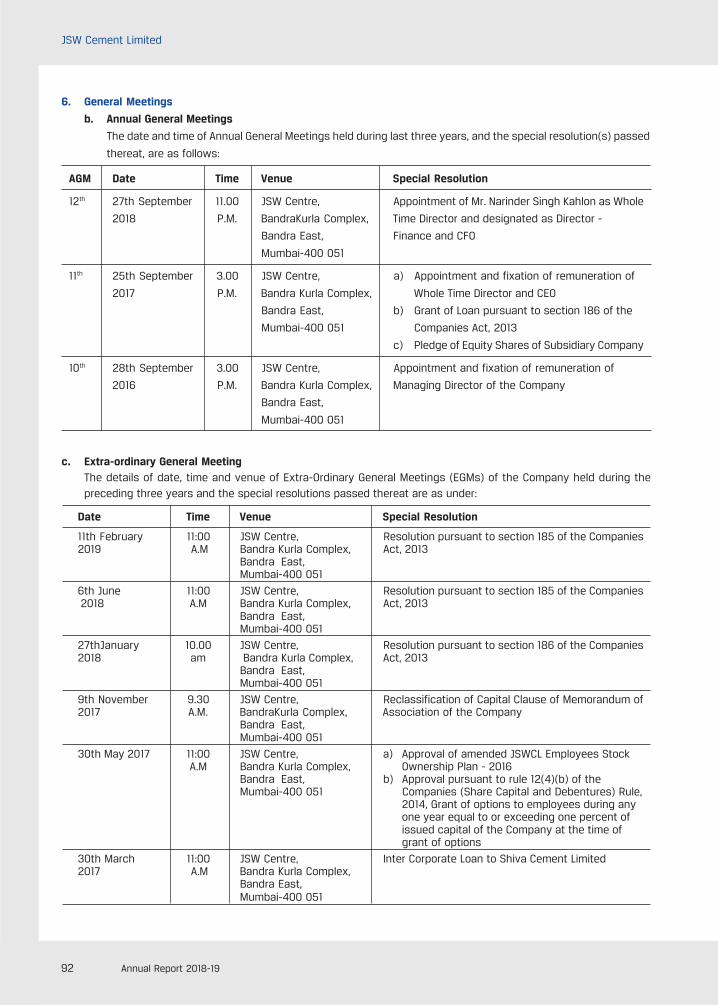
92 Annual Report 2018-19
JSW Cement Limited
6. General Meetings
b. Annual General Meetings
The date and time of Annual General Meetings held during last three years, and the special resolution(s) passed
thereat, are as follows:
AGM Date Time Venue Special Resolution
12th 27th September 11.00 JSW Centre, Appointment of Mr. Narinder Singh Kahlon as Whole
2018 P.M. BandraKurla Complex, Time Director and designated as Director -
Bandra East, Finance and CFO
Mumbai-400 051
11th 25th September 3.00 JSW Centre, a) Appointment and fixation of remuneration of
2017 P.M. Bandra Kurla Complex, Whole Time Director and CEO
Bandra East, b) Grant of Loan pursuant to section 186 of the
Mumbai-400 051 Companies Act, 2013
c) Pledge of Equity Shares of Subsidiary Company
10th 28th September 3.00 JSW Centre, Appointment and fixation of remuneration of
2016 P.M. Bandra Kurla Complex, Managing Director of the Company
Bandra East,
Mumbai-400 051
c. Extra-ordinary General MeetingThe details of date, time and venue of Extra-Ordinary General Meetings (EGMs) of the Company held during thepreceding three years and the special resolutions passed thereat are as under:
Date Time Venue Special Resolution
11th February 11:00 JSW Centre, Resolution pursuant to section 185 of the Companies2019 A.M Bandra Kurla Complex, Act, 2013
Bandra East,Mumbai-400 051
6th June 11:00 JSW Centre, Resolution pursuant to section 185 of the Companies 2018 A.M Bandra Kurla Complex, Act, 2013
Bandra East,Mumbai-400 051
27thJanuary 10.00 JSW Centre, Resolution pursuant to section 186 of the Companies2018 am Bandra Kurla Complex, Act, 2013
Bandra East,Mumbai-400 051
9th November 9.30 JSW Centre, Reclassification of Capital Clause of Memorandum of2017 A.M. BandraKurla Complex, Association of the Company
Bandra East,Mumbai-400 051
30th May 2017 11:00 JSW Centre, a) Approval of amended JSWCL Employees StockA.M Bandra Kurla Complex, Ownership Plan - 2016
Bandra East, b) Approval pursuant to rule 12(4)(b) of theMumbai-400 051 Companies (Share Capital and Debentures) Rule,
2014, Grant of options to employees during anyone year equal to or exceeding one percent ofissued capital of the Company at the time ofgrant of options
30th March 11:00 JSW Centre, Inter Corporate Loan to Shiva Cement Limited2017 A.M Bandra Kurla Complex,
Bandra East,Mumbai-400 051
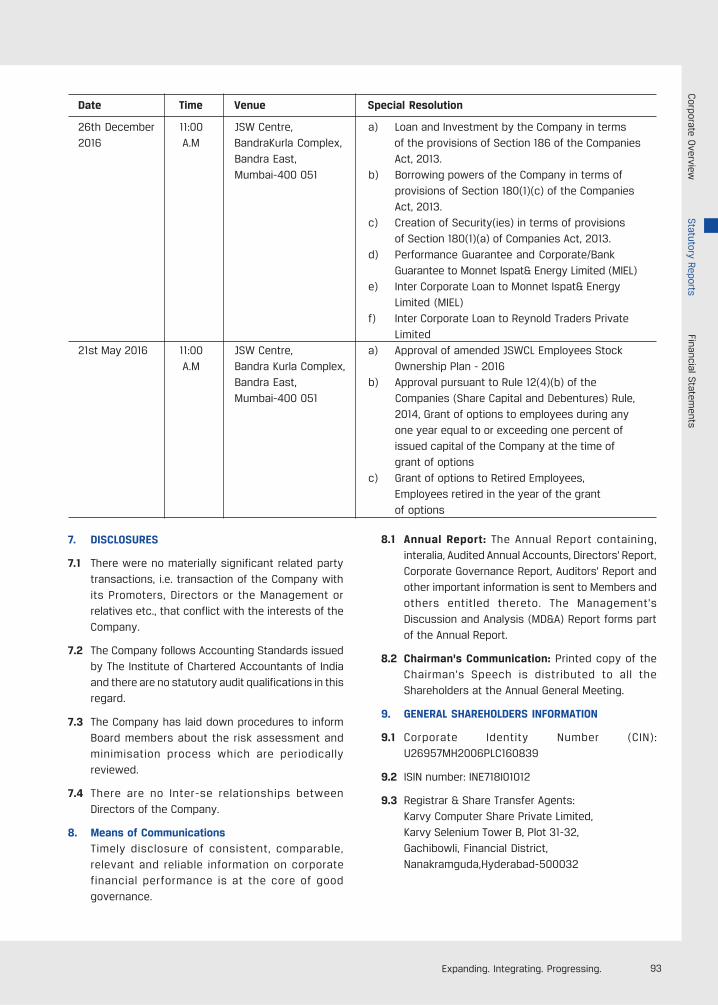
93Expanding. Integrating. Progressing.
7. DISCLOSURES
7.1 There were no materially significant related partytransactions, i.e. transaction of the Company withits Promoters, Directors or the Management orrelatives etc., that conflict with the interests of theCompany.
7.2 The Company follows Accounting Standards issuedby The Institute of Chartered Accountants of Indiaand there are no statutory audit qualifications in thisregard.
7.3 The Company has laid down procedures to informBoard members about the risk assessment andminimisation process which are periodicallyreviewed.
7.4 There are no Inter-se relationships betweenDirectors of the Company.
8. Means of CommunicationsTimely disclosure of consistent, comparable,relevant and reliable information on corporatefinancial performance is at the core of goodgovernance.
8.1 Annual Report: The Annual Report containing,interalia, Audited Annual Accounts, Directors' Report,Corporate Governance Report, Auditors' Report andother important information is sent to Members andothers entitled thereto. The Management'sDiscussion and Analysis (MD&A) Report forms partof the Annual Report.
8.2 Chairman's Communication: Printed copy of theChairman's Speech is distributed to all theShareholders at the Annual General Meeting.
9. GENERAL SHAREHOLDERS INFORMATION
9.1 Corporate Identity Number (CIN):U26957MH2006PLC160839
9.2 ISIN number: INE718I01012
9.3 Registrar & Share Transfer Agents:Karvy Computer Share Private Limited,Karvy Selenium Tower B, Plot 31-32,Gachibowli, Financial District,Nanakramguda,Hyderabad-500032
Date Time Venue Special Resolution
26th December 11:00 JSW Centre, a) Loan and Investment by the Company in terms2016 A.M BandraKurla Complex, of the provisions of Section 186 of the Companies
Bandra East, Act, 2013.Mumbai-400 051 b) Borrowing powers of the Company in terms of
provisions of Section 180(1)(c) of the CompaniesAct, 2013.
c) Creation of Security(ies) in terms of provisionsof Section 180(1)(a) of Companies Act, 2013.
d) Performance Guarantee and Corporate/BankGuarantee to Monnet Ispat& Energy Limited (MIEL)
e) Inter Corporate Loan to Monnet Ispat& EnergyLimited (MIEL)
f) Inter Corporate Loan to Reynold Traders Private
Limited21st May 2016 11:00 JSW Centre, a) Approval of amended JSWCL Employees Stock
A.M Bandra Kurla Complex, Ownership Plan - 2016Bandra East, b) Approval pursuant to Rule 12(4)(b) of theMumbai-400 051 Companies (Share Capital and Debentures) Rule,
2014, Grant of options to employees during anyone year equal to or exceeding one percent ofissued capital of the Company at the time ofgrant of options
c) Grant of options to Retired Employees,Employees retired in the year of the grant
of options
Corporate O
verviewStatutory Reports
Financial Statem
ents
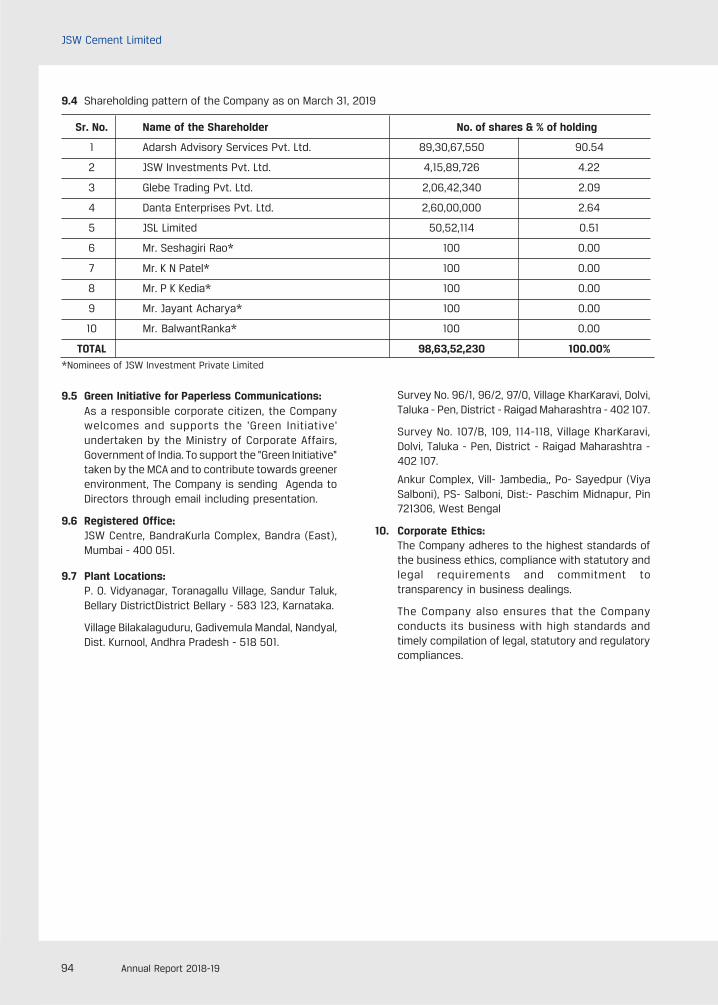
94 Annual Report 2018-19
JSW Cement Limited
Sr. No. Name of the Shareholder No. of shares & % of holding
1 Adarsh Advisory Services Pvt. Ltd. 89,30,67,550 90.54
2 JSW Investments Pvt. Ltd. 4,15,89,726 4.22
3 Glebe Trading Pvt. Ltd. 2,06,42,340 2.09
4 Danta Enterprises Pvt. Ltd. 2,60,00,000 2.64
5 JSL Limited 50,52,114 0.51
6 Mr. Seshagiri Rao* 100 0.00
7 Mr. K N Patel* 100 0.00
8 Mr. P K Kedia* 100 0.00
9 Mr. Jayant Acharya* 100 0.00
10 Mr. BalwantRanka* 100 0.00
TOTAL 98,63,52,230 100.00%
9.4 Shareholding pattern of the Company as on March 31, 2019
*Nominees of JSW Investment Private Limited
9.5 Green Initiative for Paperless Communications:As a responsible corporate citizen, the Companywelcomes and supports the 'Green Initiative'undertaken by the Ministry of Corporate Affairs,Government of India. To support the "Green Initiative"taken by the MCA and to contribute towards greenerenvironment, The Company is sending Agenda toDirectors through email including presentation.
9.6 Registered Office:JSW Centre, BandraKurla Complex, Bandra (East),Mumbai - 400 051.
9.7 Plant Locations:P. O. Vidyanagar, Toranagallu Village, Sandur Taluk,Bellary DistrictDistrict Bellary - 583 123, Karnataka.
Village Bilakalaguduru, Gadivemula Mandal, Nandyal,Dist. Kurnool, Andhra Pradesh - 518 501.
Survey No. 96/1, 96/2, 97/0, Village KharKaravi, Dolvi,Taluka - Pen, District - Raigad Maharashtra - 402 107.
Survey No. 107/B, 109, 114-118, Village KharKaravi,Dolvi, Taluka - Pen, District - Raigad Maharashtra -402 107.
Ankur Complex, Vill- Jambedia,, Po- Sayedpur (ViyaSalboni), PS- Salboni, Dist:- Paschim Midnapur, Pin721306, West Bengal
10. Corporate Ethics:The Company adheres to the highest standards ofthe business ethics, compliance with statutory andlegal requirements and commitment totransparency in business dealings.
The Company also ensures that the Companyconducts its business with high standards andtimely compilation of legal, statutory and regulatorycompliances.
95Expanding. Integrating. Progressing.
Independent Auditor’s Report
TO THE MEMBERS OF JSW CEMENT LIMITED
Report on Audit of the Standalone Financial Statements
Opinion
We have audited the financial statements of JSW Cement
Limited (hereinafter referred to as "the Company"), which
comprise the Balance Sheet as at March 31, 2019, the
Statement of Profit and Loss (including other
comprehensive income), the Statement of Changes in
Equity and Statement of Cash Flows for the year then
ended, and Notes to the financial statements, including
a summary of the significant accounting policies and
other explanatory information.
In our opinion and to the best of our information and
according to the explanations given to us, the aforesaid
financial statements give the information required by the
Companies Act, 2013 (the 'Act') in the manner so required
and give a true and fair view in conformity with the
accounting principles generally accepted in India, of the
state of affairs of the Company as at March 31, 2019, and
profit, total comprehensive income, changes in equity
and its cash flows for the year ended on that date.
Basis of Opinion
We conducted our audit in accordance with the
Standards on Auditing specified under sub-section (10)
of section 143 of the Act ('SAs'). Our responsibilities under
those SAs are further described in the Auditor's
Responsibilities for the Audit of the Financial Statements
section of our report. We are independent of the Company
in accordance with the Code of Ethics issued by the
Institute of Chartered Accountants of India ('ICAI')
together with the ethical requirements that are relevant
to our audit of the financial statements under the
provisions of the Act and the Rules thereunder, and we
have fulfilled our other ethical responsibilities in
accordance with these requirements and the ICAI's Code
of Ethics. We believe that the audit evidence we have
obtained is sufficient and appropriate to provide a basis
for our opinion.
Information Other than the Standalone Financial
Statements and Auditor's Report Thereon
The Company's management and Board of Directors are
responsible for the preparation of the other information.
The other information comprises the information included
in the Director's report and Management Discussion &
Analysis (MD&A) report, but does not include the
standalone financial statements and our auditor's report
thereon. The Director's report and MD&A report is
expected to be made available to us after the date of
this auditor's report.
Our opinion on the standalone financial statements does
not cover the other information and we do not express
any form of assurance conclusion thereon.
In connection with our audit of the standalone financial
statements, our responsibility is to read the other
information identified above when it becomes available
and, in doing so, consider whether the other information
is materially inconsistent with the standalone financial
statements or our knowledge obtained in the audit, or
otherwise appears to be materially misstated.
Responsibilities of Management and Those Charged
with Governance for the Standalone Financial
Statements
The Company's management and Board of Directors are
responsible for the matters stated in sub-section (5) of
section 134 of the Act with respect to the preparation of
these standalone financial statements that give a true
and fair view of the financial position, financial
performance, total comprehensive income, changes in
equity and cash flows of the Company in accordance
with the accounting principles generally accepted in
India, including the accounting standards specified under
section 133 of the Act. This responsibility also includes
maintenance of adequate accounting records in
accordance with the provisions of the Act for
safeguarding of the assets of the Company and for
preventing and detecting frauds and other irregularities;
selection and application of appropriate accounting
policies; making judgments and estimates that are
reasonable and prudent; and design, implementation and
maintenance of adequate internal financial controls, that
were operating effectively for ensuring the accuracy and
completeness of the accounting records, relevant to the
preparation and presentation of the standalone financial
statements that give a true and fair view and are free
from material misstatement, whether due to fraud or
error.
Corporate O
verviewStatutory Reports
Financial Statem
ents
96 Annual Report 2018-19
JSW Cement Limited
In preparing the standalone financial statements,
management and Board of Directors are responsible for
assessing the Company's ability to continue as a going
concern, disclosing, as applicable, matters related to
going concern and using the going concern basis of
accounting unless management either intends to
liquidate the Company or to cease operations, or has no
realistic alternative but to do so.
Those Board of Directors are also responsible for
overseeing the Company's financial reporting process.
Auditor's Responsibilities for the Audit of the Standalone
Financial Statements
Our objectives are to obtain reasonable assurance about
whether the standalone financial statements as a whole
are free from material misstatement, whether due to
fraud or error, and to issue an auditor's report that
includes our opinion. Reasonable assurance is a high
level of assurance, but is not a guarantee that an audit
conducted in accordance with SAs will always detect a
material misstatement when it exists. Misstatements can
arise from fraud or error and are considered material if,
individually or in the aggregate, they could reasonably
be expected to influence the economic decisions of users
taken on the basis of these standalone financial
statements.
As part of an audit in accordance with SAs, we exercise
professional judgment and maintain professional
skepticism throughout the audit. We also:
l Identify and assess the risks of material
misstatement of the financial statements, whether
due to fraud or error, design and perform audit
procedures responsive to those risks, and obtain
audit evidence that is sufficient and appropriate to
provide a basis for our opinion. The risk of not
detecting a material misstatement resulting from
fraud is higher than for one resulting from error, as
fraud may involve collusion, forgery, intentional
omissions, misrepresentations, or the override of
internal control.
l Obtain an understanding of internal control relevant
to the audit in order to design audit procedures that
are appropriate in the circumstances. Under sub-
section (3)(i) of section 143 of the Act, we are also
responsible for expressing our opinion on whether
the Company has adequate internal financial
controls with reference to standalone financial
statements of in place and the operating
effectiveness of such controls.
l Evaluate the appropriateness of accounting policies
used and the reasonableness of accounting
estimates and related disclosures made by
management.
l Conclude on the appropriateness of management's
use of the going concern basis of accounting and,
based on the audit evidence obtained, whether a
material uncertainty exists related to events or
conditions that may cast significant doubt on the
Company's ability to continue as a going concern. If
we conclude that a material uncertainty exists, we
are required to draw attention in our auditor's report
to the related disclosures in the Standalone financial
statements or, if such disclosures are inadequate,
to modify our opinion. Our conclusions are based on
the audit evidence obtained up to the date of our
auditor's report. However, future events or
conditions may cause the Company to cease to
continue as a going concern.
l Evaluate the overall presentation, structure and
content of the Standalone financial statements,
including the disclosures, and whether the
Standalone financial statements represent the
underlying transactions and events in a manner that
achieves fair presentation.
We communicate with those charged with governance
regarding, among other matters, the planned scope and
timing of the audit and significant audit findings,
including any significant deficiencies in internal control
that we identify during our audit.
We also provide those charged with governance with a
statement that we have complied with relevant ethical
requirements regarding independence, and to
communicate with them all relationships and other
matters that may reasonably be thought to bear on our
independence, and where applicable, related safeguards.
Other Matter
The Standalone financial statement of the Company for
the year ended 31st March 2018 included in these
Standalone financial statement, has been audited by the
predecessor auditor who expressed an unmodified
opinion on those statements on 8th May 2018.
97Expanding. Integrating. Progressing.
Report on Other Legal and Regulatory Requirements
1. As required by the Companies (Auditor's Report)
Order, 2016 ("the Order") issued by the Central
Government of India in terms of sub-section (11) of
Section 143 of the Act, we give in the "Annexure A", a
statement on the matters specified in paragraphs 3
and 4 of the Order, to the extent applicable.
2. As required by sub-section (3) of Section 143 of the
Act, based on our audit we report that:
(a) We have sought and obtained all the information and
explanations which to the best of our knowledge and
belief were necessary for the purposes of our audit;
(b) In our opinion, proper books of account as required
by law have been kept by the Company so far as it
appears from our examination of those books;
(c) The Balance Sheet, the Statement of Profit and Loss
(including Other Comprehensive Income), the
Statement of Changes in Equity and the Statement
of Cash Flow dealt with by this Report are in
agreement with the books of account;
(d) In our opinion, the aforesaid standalone financial
statements comply with the Accounting Standards
specified under Section 133 of the Act, read with
Companies (Indian Accounting Standards) Rules,
2015, as amended;
(e) On the basis of the written representations received
from the directors as on March 31, 2019 taken on
record by the Board of Directors, none of the
directors is disqualified as on March 31, 2019 from
being appointed as a director in terms of sub-section
(2) of Section 164 of the Act.
(f) With respect to the adequacy of the internal financial
controls over financial reporting of the Company with
reference to these standalone financial statements
and the operating effectiveness of such controls,
refer to our separate Report in "Annexure B".
(g) With respect to the other matters to be included in
the Auditor's report in accordance with the
requirements of the sub-section 16 of Section 197
of the Act, as amended:
In our opinion, the managerial remuneration for the
year ended March 31, 2019 has been paid / provided
by the Company to its directors in accordance with
the provisions of section 197 read with Schedule V
to the Act.
(h) With respect to the other matters to be included in
the Auditor's Report in accordance with Rule 11 of
the Companies (Audit and Auditors) Rules, 2014, as
amended, in our opinion and to the best of our
information and according to the explanations given
to us:
i. The Company has disclosed the impact of
pending litigations on its financial position in its
standalone financial statements - Refer Note
34(a) of the standalone financial statements;
ii. The Company has made provision, as required
under the applicable law or accounting
standards, for material foreseeable losses, if
any, on long-term contracts. The company has
not entered into any derivative contracts during
the year; and
iii. There were no amounts which were required to
be transferred to the Investor Education and
Protection Fund by the Company.
For H P V S & Associates.,
Chartered Accountants
Firm Registration No.: 137533W
Vaibhav L Dattani
Partner
M. No.144084
Place: Mumbai
Date: 3rd May 2019
Corporate O
verviewStatutory Reports
Financial Statem
ents
98 Annual Report 2018-19
JSW Cement Limited
Annexure ATo The Independent Auditor’s Report
(Referred to in paragraph 1 under 'Report on Other Legal
and Regulatory Requirements' section of our report tothe Members of JSW Cement Limited of even date)
(i) (a) The Company has maintained proper recordsshowing full particulars, including quantitativedetails and situation of fixed assets on the basisof available information.
(b) The Company has a program of verification tocover all the items of fixed assets in a phasedmanner which, in our opinion, is reasonablehaving regard to the size of the Company andthe nature of its assets. Pursuant to theprogram, certain fixed assets were physicallyverified by the management during the year.According to the information and explanationsgiven to us, no material discrepancies werenoticed on such verification.
(c) According to the information and explanationsgiven to us, the records examined by us andbased on the examination of the conveyancedeeds provided to us, we report that, the titledeeds, comprising all the immovable propertiesof land and buildings which are freehold, areheld in the name of the Company as at thebalance sheet date. In respect of immovableproperties of land that have been taken on leaseand disclosed as fixed assets in the standalonefinancial statements, the lease agreements arein the name of the Company.
(ii) The inventory, except goods in transit, has beenphysically verified by the Company at reasonableintervals during the year. In our opinion, thefrequency of such verification is reasonable. Inrespect of inventory lying with third parties, thesehave been substantially been confirmed by them.The discrepancies noticed on verification betweenthe physical stocks and the book records were notmaterial.
(iii) According to the information and explanations givento us, the Company has not granted any loans,secured or unsecured to companies, firms, LimitedLiability Partnerships or other parties covered in theregister maintained under Section 189 of the Act.Accordingly, reporting under the provisions of clause3 (iii) (a), (b) and (c) of the Order are not applicable.
(iv) In our opinion and according to the informationand explanations given to us, the Company hascomplied with the provisions of Section 185 and186 of the Companies Act, 2013 in respect ofgrant of loans, making investments andproviding guarantees and securities, asapplicable.
(v) According to the information and explanationsgiven to us, the Company has not accepted anydeposits from the public and hence, reportingunder paragraph 3 (v) of the Order is notapplicable to the Company.
(vi) The maintenance of cost records has beenspecified by the Central Government underSection 148 of the Act. We have broadlyreviewed the records maintained by theCompany pursuant to the rules prescribed bythe Central Government for maintenance of costrecords under sub-section 1 of Section 148 ofthe Act and are of the opinion that, prima facie,the prescribed cost records have been madeand maintained. We have, however, not requiredto make a detailed examination of the costrecords with a view to determine whether theyare accurate or complete.
(vii) (a) According to the information and explanationsgiven to us, and the records of the companyexamined by us, in our opinion, the Company isregular in depositing with the appropriateauthorities undisputed statutory dues includingprovident fund, employees' state insurance,income tax, sales-tax, service tax, goods andservice tax, duty of customs, duty of excise,value added tax, cess and other materialstatutory dues applicable to it. According toinformation and explanations given to us, noundisputed amounts payable were outstanding,at the year end, for a period of more than sixmonths from the date they became payable.
(b) According to the information and explanationsgiven to us, details of dues of income tax, dutyof customs, duty of excise, value added tax andcess which have not been deposited as on 31stMarch 2019 on account of disputes are given
below:
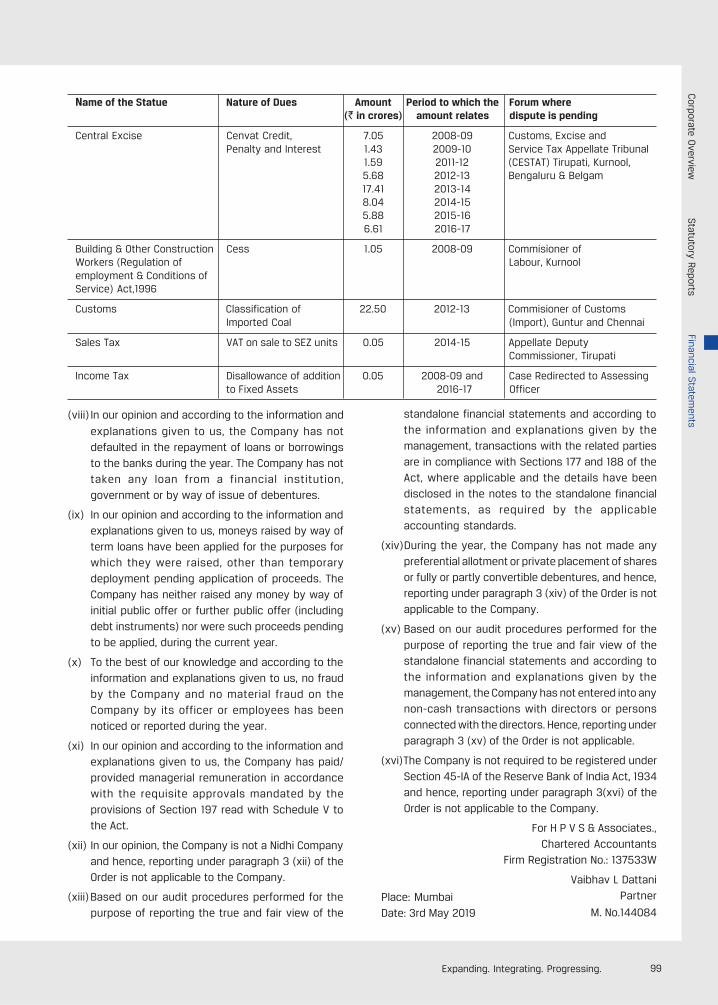
99Expanding. Integrating. Progressing.
(viii) In our opinion and according to the information and
explanations given to us, the Company has notdefaulted in the repayment of loans or borrowingsto the banks during the year. The Company has nottaken any loan from a financial institution,government or by way of issue of debentures.
(ix) In our opinion and according to the information andexplanations given to us, moneys raised by way ofterm loans have been applied for the purposes forwhich they were raised, other than temporarydeployment pending application of proceeds. TheCompany has neither raised any money by way ofinitial public offer or further public offer (includingdebt instruments) nor were such proceeds pendingto be applied, during the current year.
(x) To the best of our knowledge and according to theinformation and explanations given to us, no fraudby the Company and no material fraud on theCompany by its officer or employees has beennoticed or reported during the year.
(xi) In our opinion and according to the information andexplanations given to us, the Company has paid/provided managerial remuneration in accordancewith the requisite approvals mandated by theprovisions of Section 197 read with Schedule V tothe Act.
(xii) In our opinion, the Company is not a Nidhi Companyand hence, reporting under paragraph 3 (xii) of theOrder is not applicable to the Company.
(xiii) Based on our audit procedures performed for thepurpose of reporting the true and fair view of the
Name of the Statue Nature of Dues Amount Period to which the Forum where(` in crores) amount relates dispute is pending
Central Excise Cenvat Credit, 7.05 2008-09 Customs, Excise andPenalty and Interest 1.43 2009-10 Service Tax Appellate Tribunal
1.59 2011-12 (CESTAT) Tirupati, Kurnool,5.68 2012-13 Bengaluru & Belgam17.41 2013-148.04 2014-155.88 2015-166.61 2016-17
Building & Other Construction Cess 1.05 2008-09 Commisioner ofWorkers (Regulation of Labour, Kurnoolemployment & Conditions ofService) Act,1996
Customs Classification of 22.50 2012-13 Commisioner of CustomsImported Coal (Import), Guntur and Chennai
Sales Tax VAT on sale to SEZ units 0.05 2014-15 Appellate DeputyCommissioner, Tirupati
Income Tax Disallowance of addition 0.05 2008-09 and Case Redirected to Assessingto Fixed Assets 2016-17 Officer
standalone financial statements and according tothe information and explanations given by themanagement, transactions with the related partiesare in compliance with Sections 177 and 188 of theAct, where applicable and the details have beendisclosed in the notes to the standalone financialstatements, as required by the applicableaccounting standards.
(xiv)During the year, the Company has not made anypreferential allotment or private placement of sharesor fully or partly convertible debentures, and hence,reporting under paragraph 3 (xiv) of the Order is notapplicable to the Company.
(xv) Based on our audit procedures performed for thepurpose of reporting the true and fair view of thestandalone financial statements and according tothe information and explanations given by themanagement, the Company has not entered into anynon-cash transactions with directors or personsconnected with the directors. Hence, reporting underparagraph 3 (xv) of the Order is not applicable.
(xvi)The Company is not required to be registered underSection 45-IA of the Reserve Bank of India Act, 1934and hence, reporting under paragraph 3(xvi) of theOrder is not applicable to the Company.
For H P V S & Associates.,Chartered Accountants
Firm Registration No.: 137533W
Vaibhav L DattaniPartner
M. No.144084Place: MumbaiDate: 3rd May 2019
Corporate O
verviewStatutory Reports
Financial Statem
ents
100 Annual Report 2018-19
JSW Cement Limited
Annexure BTo The Independent Auditor’s Report
Report on the internal financial controls with reference
to the aforesaid Standalone financial statements under
Clause (i) of sub-section (3) of Section 143 of the
Companies Act, 2013 (the 'Act')
We have audited the internal financial controls over
financial reporting of JSW CEMENT LIMITED(hereinafter
referred to as "the Company") as of 31st March 2019, in
conjunction with our audit of the standalone financial
statements of the Company for the year ended on that
date.
Management's Responsibility for Internal Financial
Controls
The Company's management and Board of Directors are
responsible for establishing and maintaining internal
financial controls based on the internal control over
financial reporting criteria established by the Company
considering the essential components of internal control
stated in the Guidance Note on Audit of Internal Financial
Controls Over Financial Reporting (the 'Guidance Note')
issued by the Institute of Chartered Accountants of India.
These responsibilities include the design, implementation
and maintenance of adequate internal financial controls
that were operating effectively for ensuring the orderly
and efficient conduct of its business, the safeguarding
of its assets, the prevention and detection of frauds and
errors, the accuracy and completeness of the accounting
records, and the timely preparation of reliable financial
information, as required under the Act.
Auditor's Responsibility
Our responsibility is to express an opinion on the
Company's internal financial controls over financial
reporting of the Company based on our audit. We
conducted our audit in accordance with the Guidance
Note issued by the Institute of Chartered Accountants of
India and the Standards on Auditing prescribed under
sub-section (10) of Section 143 of the Act, to the extent
applicable to an audit of internal financial controls, both
applicable to an audit of Internal Financial Controls and,
both issued by the Institute of Chartered Accountants of
India. Those Standards and the Guidance Note require
that we comply with ethical requirements and plan and
perform the audit to obtain reasonable assurance about
whether adequate internal financial controls over
financial reporting was established and maintained and
if such controls operated effectively in all material
respects.
Our audit involves performing procedures to obtain audit
evidence about the adequacy of the internal financial
controls system over financial reporting and their
operating effectiveness. Our audit of internal financial
controls over financial reporting included obtaining an
understanding of internal financial controls over financial
reporting, assessing the risk that a material weakness
exists, and testing and evaluating the design and
operating effectiveness of internal control based on the
assessed risk. The procedures selected depend on the
auditor's judgement, including the assessment of the
risks of material misstatement of the standalone financial
statements, whether due to fraud or error.
We believe that the audit evidence we have obtained is
sufficient and appropriate to provide a basis for our audit
opinion on the internal financial controls system over
financial reporting.
Meaning of Internal Financial Controls Over Financial
Reporting
A Company's internal financial control over financial
reporting is a process designed to provide reasonable
assurance regarding the reliability of financial reporting
and the preparation of financial statements for external
purposes in accordance with generally accepted
accounting principles. A Company's internal financial
control over financial reporting includes those policies
and procedures that (1) pertain to the maintenance of
records that, in reasonable detail, accurately and fairly
reflect the transactions and dispositions of the assets
of the Company; (2) provide reasonable assurance that
transactions are recorded as necessary to permit
preparation of financial statements in accordance with
generally accepted accounting principles, and that
receipts and expenditures of the Company are being
made only in accordance with authorisations of
management and directors of the Company; and (3)
101Expanding. Integrating. Progressing.
provide reasonable assurance regarding prevention or
timely detection of unauthorised acquisition, use, or
disposition of the Company's assets that could have a
material effect on the standalone financial statements.
Inherent Limitations of Internal Financial Controls Over
Financial Reporting
Because of the inherent limitations of internal financial
controls over financial reporting, including the possibility
of collusion or improper management override of
controls, material misstatements due to error or fraud
may occur and not be detected. Also, projections of any
evaluation of the internal financial controls over financial
reporting to future periods are subject to the risk that
the internal financial control over financial reporting may
become inadequate because of changes in conditions,
or that the degree of compliance with the policies or
procedures may deteriorate.
Opinion
In our opinion, to the best of our information and
according to the explanations given to us, the Company
has, in all material respects, an adequate internal
financial controls with reference to standalone financial
statements and such internal financial controls were
operating effectively as at 31st March 2019, based on
the internal financial controls with reference to financial
statements criteria established by the Company
considering the essential components of internal control
stated in the Guidance Note on Audit of Internal Financial
Controls Over
Financial Reporting issued by the Institute of Chartered
Accountants of India.
For H P V S & Associates.,
Chartered Accountants
Firm Registration No.: 137533W
Vaibhav L Dattani
Partner
M. No.144084
Place: Mumbai
Date: 3rd May 2019
Corporate O
verviewStatutory Reports
Financial Statem
ents
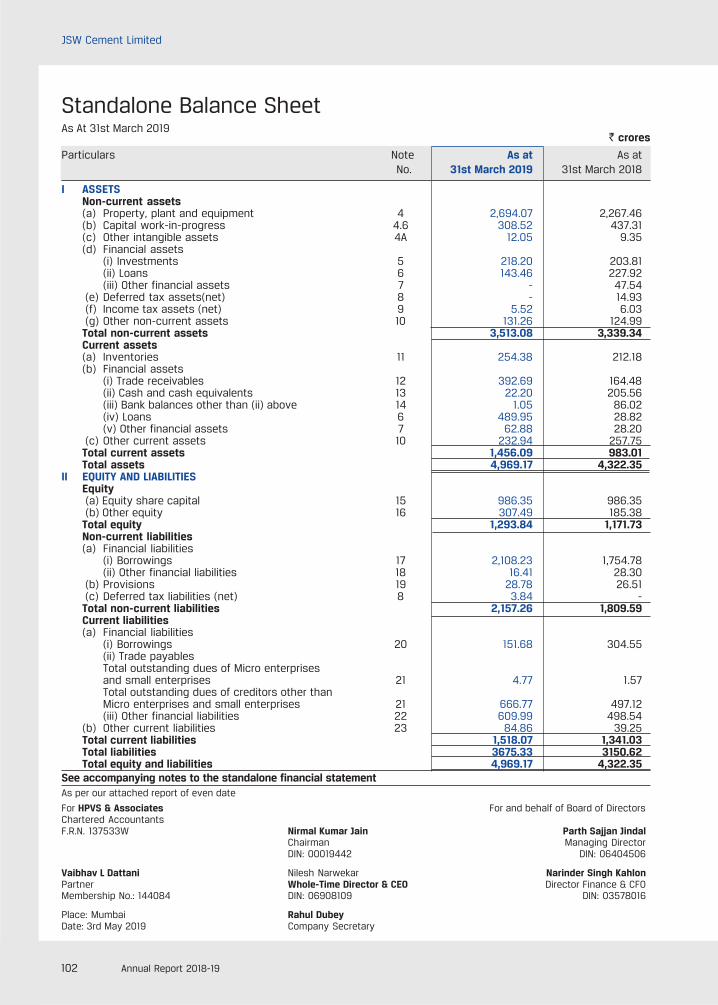
102 Annual Report 2018-19
JSW Cement Limited
As per our attached report of even date
For HPVS & Associates For and behalf of Board of DirectorsChartered AccountantsF.R.N. 137533W Nirmal Kumar Jain Parth Sajjan Jindal
Chairman Managing DirectorDIN: 00019442 DIN: 06404506
Vaibhav L Dattani Nilesh Narwekar Narinder Singh KahlonPartner Whole-Time Director & CEO Director Finance & CFOMembership No.: 144084 DIN: 06908109 DIN: 03578016
Place: Mumbai Rahul DubeyDate: 3rd May 2019 Company Secretary
Standalone Balance SheetAs At 31st March 2019
` crores
Particulars Note As at As at No. 31st March 2019 31st March 2018
I ASSETSNon-current assets(a) Property, plant and equipment 4 2,694.07 2,267.46(b) Capital work-in-progress 4.6 308.52 437.31(c) Other intangible assets 4A 12.05 9.35(d) Financial assets
(i) Investments 5 218.20 203.81(ii) Loans 6 143.46 227.92(iii) Other financial assets 7 - 47.54
(e) Deferred tax assets(net) 8 - 14.93 (f) Income tax assets (net) 9 5.52 6.03 (g) Other non-current assets 10 131.26 124.99Total non-current assets 3,513.08 3,339.34Current assets(a) Inventories 11 254.38 212.18(b) Financial assets
(i) Trade receivables 12 392.69 164.48(ii) Cash and cash equivalents 13 22.20 205.56(iii) Bank balances other than (ii) above 14 1.05 86.02(iv) Loans 6 489.95 28.82(v) Other financial assets 7 62.88 28.20
(c) Other current assets 10 232.94 257.75Total current assets 1,456.09 983.01Total assets 4,969.17 4,322.35
II EQUITY AND LIABILITIESEquity (a) Equity share capital 15 986.35 986.35 (b) Other equity 16 307.49 185.38Total equity 1,293.84 1,171.73Non-current liabilities(a) Financial liabilities
(i) Borrowings 17 2,108.23 1,754.78(ii) Other financial liabilities 18 16.41 28.30
(b) Provisions 19 28.78 26.51 (c) Deferred tax liabilities (net) 8 3.84 -Total non-current liabilities 2,157.26 1,809.59Current liabilities(a) Financial liabilities
(i) Borrowings 20 151.68 304.55(ii) Trade payablesTotal outstanding dues of Micro enterprisesand small enterprises 21 4.77 1.57Total outstanding dues of creditors other thanMicro enterprises and small enterprises 21 666.77 497.12(iii) Other financial liabilities 22 609.99 498.54
(b) Other current liabilities 23 84.86 39.25Total current liabilities 1,518.07 1,341.03Total liabilities 3675.33 3150.62Total equity and liabilities 4,969.17 4,322.35
See accompanying notes to the standalone financial statement
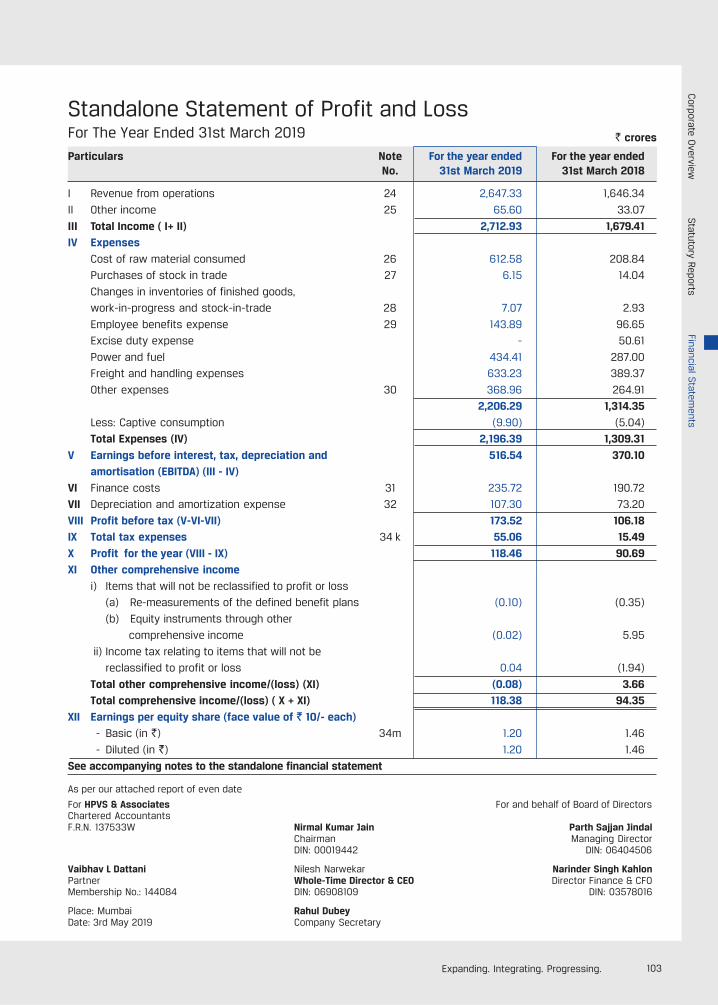
103Expanding. Integrating. Progressing.
Standalone Statement of Profit and LossFor The Year Ended 31st March 2019
Particulars Note For the year ended For the year endedNo. 31st March 2019 31st March 2018
I Revenue from operations 24 2,647.33 1,646.34
II Other income 25 65.60 33.07
III Total Income ( I+ II) 2,712.93 1,679.41IV Expenses
Cost of raw material consumed 26 612.58 208.84
Purchases of stock in trade 27 6.15 14.04
Changes in inventories of finished goods,
work-in-progress and stock-in-trade 28 7.07 2.93
Employee benefits expense 29 143.89 96.65
Excise duty expense - 50.61
Power and fuel 434.41 287.00
Freight and handling expenses 633.23 389.37
Other expenses 30 368.96 264.91
2,206.29 1,314.35
Less: Captive consumption (9.90) (5.04)
Total Expenses (IV) 2,196.39 1,309.31
V Earnings before interest, tax, depreciation and 516.54 370.10amortisation (EBITDA) (III - IV)
VI Finance costs 31 235.72 190.72
VII Depreciation and amortization expense 32 107.30 73.20
VIII Profit before tax (V-VI-VII) 173.52 106.18IX Total tax expenses 34 k 55.06 15.49
X Profit for the year (VIII - IX) 118.46 90.69XI Other comprehensive income
i) Items that will not be reclassified to profit or loss
(a) Re-measurements of the defined benefit plans (0.10) (0.35)
(b) Equity instruments through other
comprehensive income (0.02) 5.95
ii) Income tax relating to items that will not be
reclassified to profit or loss 0.04 (1.94)
Total other comprehensive income/(loss) (XI) (0.08) 3.66Total comprehensive income/(loss) ( X + XI) 118.38 94.35
XII Earnings per equity share (face value of ` 10/- each) - Basic (in `) 34m 1.20 1.46
- Diluted (in `) 1.20 1.46
See accompanying notes to the standalone financial statement
` crores
As per our attached report of even date
For HPVS & Associates For and behalf of Board of DirectorsChartered AccountantsF.R.N. 137533W Nirmal Kumar Jain Parth Sajjan Jindal
Chairman Managing DirectorDIN: 00019442 DIN: 06404506
Vaibhav L Dattani Nilesh Narwekar Narinder Singh KahlonPartner Whole-Time Director & CEO Director Finance & CFOMembership No.: 144084 DIN: 06908109 DIN: 03578016
Place: Mumbai Rahul DubeyDate: 3rd May 2019 Company Secretary
Corporate O
verviewStatutory Reports
Financial Statem
ents
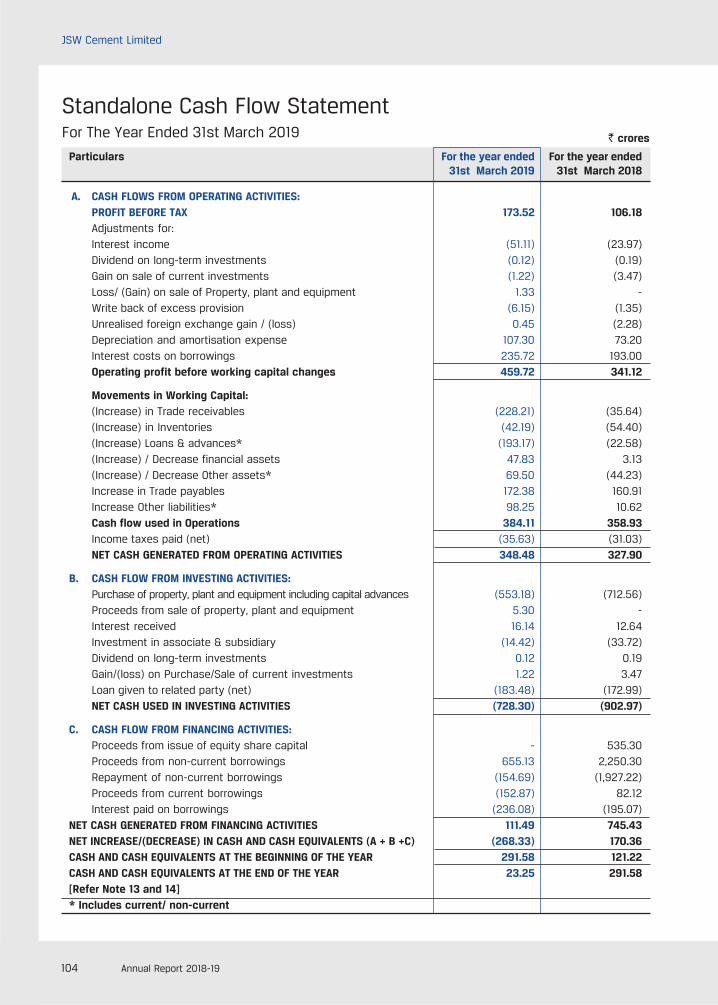
104 Annual Report 2018-19
JSW Cement Limited
Standalone Cash Flow StatementFor The Year Ended 31st March 2019
Particulars For the year ended For the year ended31st March 2019 31st March 2018
A. CASH FLOWS FROM OPERATING ACTIVITIES:PROFIT BEFORE TAX 173.52 106.18Adjustments for:Interest income (51.11) (23.97)Dividend on long-term investments (0.12) (0.19)Gain on sale of current investments (1.22) (3.47)Loss/ (Gain) on sale of Property, plant and equipment 1.33 -Write back of excess provision (6.15) (1.35)Unrealised foreign exchange gain / (loss) 0.45 (2.28)Depreciation and amortisation expense 107.30 73.20Interest costs on borrowings 235.72 193.00Operating profit before working capital changes 459.72 341.12
Movements in Working Capital:(Increase) in Trade receivables (228.21) (35.64)(Increase) in Inventories (42.19) (54.40)(Increase) Loans & advances* (193.17) (22.58)(Increase) / Decrease financial assets 47.83 3.13(Increase) / Decrease Other assets* 69.50 (44.23)Increase in Trade payables 172.38 160.91Increase Other liabilities* 98.25 10.62Cash flow used in Operations 384.11 358.93Income taxes paid (net) (35.63) (31.03)NET CASH GENERATED FROM OPERATING ACTIVITIES 348.48 327.90
B. CASH FLOW FROM INVESTING ACTIVITIES:Purchase of property, plant and equipment including capital advances (553.18) (712.56)Proceeds from sale of property, plant and equipment 5.30 -Interest received 16.14 12.64Investment in associate & subsidiary (14.42) (33.72)Dividend on long-term investments 0.12 0.19Gain/(loss) on Purchase/Sale of current investments 1.22 3.47Loan given to related party (net) (183.48) (172.99)NET CASH USED IN INVESTING ACTIVITIES (728.30) (902.97)
C. CASH FLOW FROM FINANCING ACTIVITIES:Proceeds from issue of equity share capital - 535.30Proceeds from non-current borrowings 655.13 2,250.30Repayment of non-current borrowings (154.69) (1,927.22)Proceeds from current borrowings (152.87) 82.12Interest paid on borrowings (236.08) (195.07)
NET CASH GENERATED FROM FINANCING ACTIVITIES 111.49 745.43NET INCREASE/(DECREASE) IN CASH AND CASH EQUIVALENTS (A + B +C) (268.33) 170.36CASH AND CASH EQUIVALENTS AT THE BEGINNING OF THE YEAR 291.58 121.22CASH AND CASH EQUIVALENTS AT THE END OF THE YEAR 23.25 291.58[Refer Note 13 and 14]* Includes current/ non-current
` crores
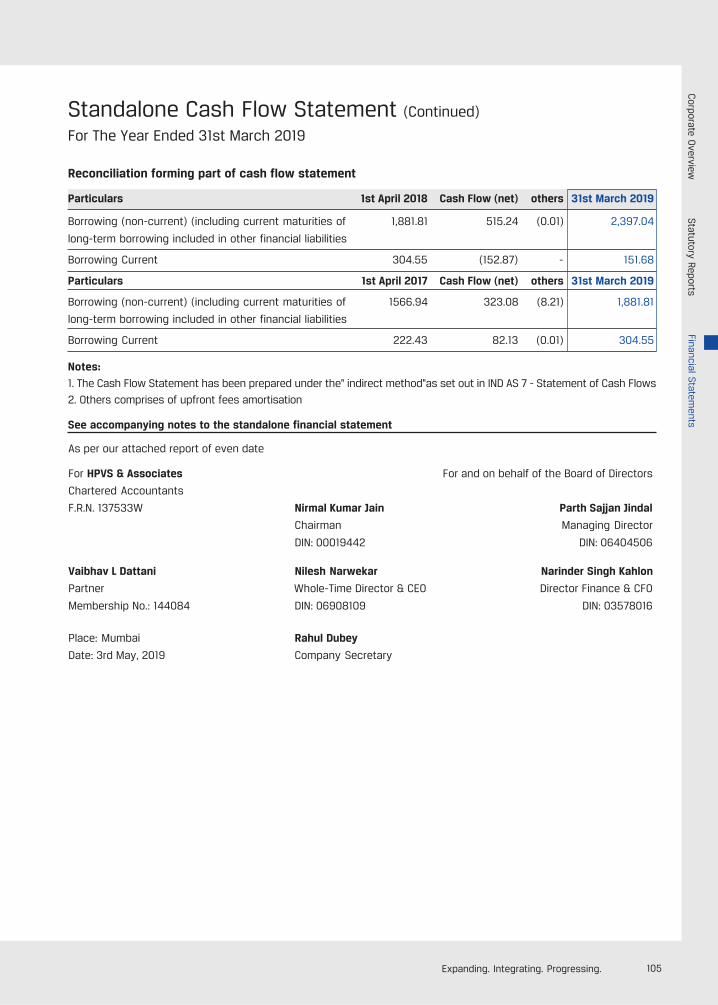
105Expanding. Integrating. Progressing.
Standalone Cash Flow Statement (Continued)
For The Year Ended 31st March 2019
Reconciliation forming part of cash flow statement
Particulars 1st April 2018 Cash Flow (net) others 31st March 2019
Borrowing (non-current) (including current maturities of 1,881.81 515.24 (0.01) 2,397.04
long-term borrowing included in other financial liabilities
Borrowing Current 304.55 (152.87) - 151.68
Particulars 1st April 2017 Cash Flow (net) others 31st March 2019
Borrowing (non-current) (including current maturities of 1566.94 323.08 (8.21) 1,881.81
long-term borrowing included in other financial liabilities
Borrowing Current 222.43 82.13 (0.01) 304.55
Notes:
1. The Cash Flow Statement has been prepared under the" indirect method"as set out in IND AS 7 - Statement of Cash Flows
2. Others comprises of upfront fees amortisation
See accompanying notes to the standalone financial statement
As per our attached report of even date
For HPVS & Associates For and on behalf of the Board of Directors
Chartered Accountants
F.R.N. 137533W Nirmal Kumar Jain Parth Sajjan Jindal
Chairman Managing Director
DIN: 00019442 DIN: 06404506
Vaibhav L Dattani Nilesh Narwekar Narinder Singh Kahlon
Partner Whole-Time Director & CEO Director Finance & CFO
Membership No.: 144084 DIN: 06908109 DIN: 03578016
Place: Mumbai Rahul Dubey
Date: 3rd May, 2019 Company Secretary
Corporate O
verviewStatutory Reports
Financial Statem
ents
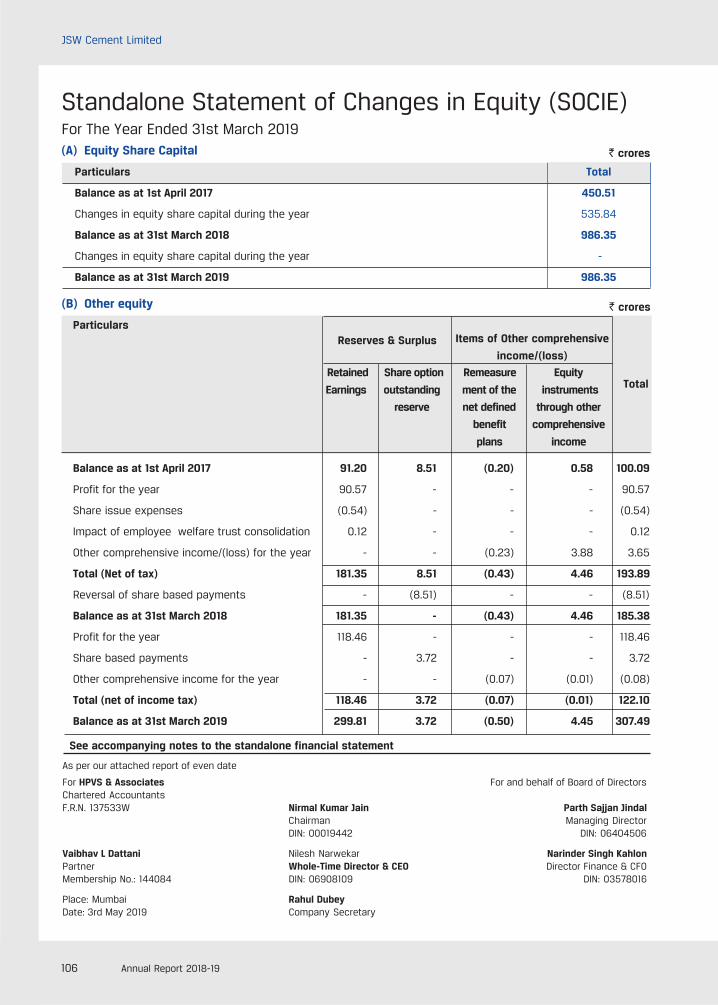
106 Annual Report 2018-19
JSW Cement Limited
Standalone Statement of Changes in Equity (SOCIE)For The Year Ended 31st March 2019(A) Equity Share Capital
Particulars Total
Balance as at 1st April 2017 450.51
Changes in equity share capital during the year 535.84
Balance as at 31st March 2018 986.35
Changes in equity share capital during the year -
Balance as at 31st March 2019 986.35
(B) Other equity
Particulars
Retained Share option Remeasure Equity
Earnings outstanding ment of the instruments
reserve net defined through other
benefit comprehensive
plans income
Balance as at 1st April 2017 91.20 8.51 (0.20) 0.58 100.09
Profit for the year 90.57 - - - 90.57
Share issue expenses (0.54) - - - (0.54)
Impact of employee welfare trust consolidation 0.12 - - - 0.12
Other comprehensive income/(loss) for the year - - (0.23) 3.88 3.65
Total (Net of tax) 181.35 8.51 (0.43) 4.46 193.89
Reversal of share based payments - (8.51) - - (8.51)
Balance as at 31st March 2018 181.35 - (0.43) 4.46 185.38
Profit for the year 118.46 - - - 118.46
Share based payments - 3.72 - - 3.72
Other comprehensive income for the year - - (0.07) (0.01) (0.08)
Total (net of income tax) 118.46 3.72 (0.07) (0.01) 122.10
Balance as at 31st March 2019 299.81 3.72 (0.50) 4.45 307.49
` crores
` crores
See accompanying notes to the standalone financial statement
Total
Reserves & Surplus Items of Other comprehensive
income/(loss)
As per our attached report of even date
For HPVS & Associates For and behalf of Board of DirectorsChartered AccountantsF.R.N. 137533W Nirmal Kumar Jain Parth Sajjan Jindal
Chairman Managing DirectorDIN: 00019442 DIN: 06404506
Vaibhav L Dattani Nilesh Narwekar Narinder Singh KahlonPartner Whole-Time Director & CEO Director Finance & CFOMembership No.: 144084 DIN: 06908109 DIN: 03578016
Place: Mumbai Rahul DubeyDate: 3rd May 2019 Company Secretary

107Expanding. Integrating. Progressing.
Notes To Standalone Financial StatementsAs At and For The Year Ended 31st March 2019
1. General InformationJSW Cement Limited ("the Company") is engaged in the business of manufacture and sale of cement, ground
granulated blast furnace slag and clinker and trading of allied products. The Company is operating ~3.20 million
tonne per annum grinding unit at Vijayanagar- Karnataka, ~4.80 million tonne per annum green field cement
manufacturing unit at Bilkalguduru village near Nandyal- Andhra Pradesh, ~2.20 million tonne per annum grinding
unit at Dolvi Maharashtra and ~2.40 million tonne per annum grinding unit at Salboni village in West Bengal.
JSW Cement Limited is a public limited company incorporated in India on March 29, 2006 under the Companies Act,
1956. The registered office of the Company is JSW Centre, Bandra Kurla Complex, Bandra (East), Mumbai - 400 051.
2. SIGNIFICANT ACCOUNTING POLICIESI. Statement of Compliances
Standalone Financial Statements have been prepared in accordance with the accounting principles generally
accepted in India including Indian Accounting Standards (Ind AS) prescribed under the section 133 of the
Companies Act, 2013 read with rule 3 of the Companies (Indian Accounting Standards) Rules, 2015 as amended.
The aforesaid financial statements have been approved by the Board of Directors in the meeting held on 3rd
May 2019.
Accordingly, the Company has prepared these Standalone Financial Statements which comprise the Balance
sheet as at 31 March 2019, the Statement of Profit and Loss, the Statement of Cash Flows and Statement of
Changes in Equity for the year ended as on that date, and accounting policies and other explanatory information
(together hereinafter referred to as Standalone Financials Statements' or ' financial statements).
II. Basis of preparation and presentation
The Standalone Financial Statements have been prepared on the historical cost basis except for certain financial
instruments measured at fair values at the end of each reporting year, as explained in the accounting policies
below.
Fair value is the price that would be received to sell an asset or paid to transfer a liability in an orderly transaction
between market participants at the measurement date, regardless of whether that price is directly observable
or estimated using another valuation technique. In estimating the fair value of an asset or a liability, the Company
takes into account the characteristics of the asset or liability if market participants would take those
characteristics into account when pricing the asset or liability at the measurement date. Fair value for
measurement and/or disclosure purposes in these financial statements is determined on such a basis, except
for share-based payment transactions that are within the scope of Ind AS 102 and measurements that have
some similarities to fair value but are not fair value, such as net realizable value in Ind AS 2 or value in use in Ind
AS 36.
In addition, for financial reporting purposes, fair value measurements are categorized into Level 1,2, or 3 based
on the degree to which the inputs to the fair value measurements are observable and the significance of the
inputs to the fair value measurements in its entirety, which are described as follows:
l Level 1 inputs are quoted prices (unadjusted) in active markets for identical assets or liabilities that the
entity can access at the measurement date;
l Level 2 inputs are inputs, other than quoted prices included within level 1, that are observable for the asset
or liability, either directly or indirectly; and
l Level 3 inputs are unobservable inputs for the asset or liability.
The Financial Statement is presented in INR.
Corporate O
verviewStatutory Reports
Financial Statem
ents
108 Annual Report 2018-19
JSW Cement Limited
Current and non-current classification
The Company presents assets and liabilities in the balance sheet based on current / non current classification
An asset is classified as current when it satisfies any of the following criteria
l It is expected to be realized in or is intended for sale or consumption in, its normal operating cycle;
l it is held primarily for the purpose of being traded;
l It is expected to be realised within 12 months after the reporting date; or
l It is cash or cash equivalent unless it is restricted from being exchanged or used to settle a liability for at
least 12 months after the reporting date.
All other assets are classified as non-current.
A liability is classified as current when it satisfies any of the following criteria
l It is expected to be settled in the Company's normal operating cycle;
l It is held primarily for the purpose of being traded;
l It is due to be settled within 12 months after the reporting date; or the Company does not have an
unconditional right to defer settlement of the liability for at least 12 months after the reporting date.
All other liabilities are classified as non-current.
Deferred tax assets and liabilities are classified as non- current only.
III. Revenue Recognition
Revenue is recognized on the basis of approved contracts regarding the transfer of goods or services to a
customer for an amount that reflects the consideration to which the entity expects to be entitled in exchange
for those goods or services.
Revenue is measured at the fair value of consideration received or receivable taking into account the amount
of discounts, incentives, volume rebates, outgoing taxes on sales. Any amounts receivable from the customer
is recognized as revenue after the control over the goods sold are transferred to the customer which is generally
on dispatch/delivery of goods.
On March 28, 2018, Ministry of Corporate Affairs has notified Ind AS 115, "Revenue from Contracts with Customers",
effective date of adoption of the Standard is financial period beginning on or after 1st April, 2018. The core
principle of the Standard is that an entity shall recognize revenue to depict the transfer of promised goods or
services to customers in an amount that reflects the consideration to which the entity expects to be entitled in
exchange for those goods or services, besides reporting useful information about the nature, amount, timing
and uncertainty of revenue and cash flows arising from a contract with a customer.
The Standard permits entities to apply one of the following transitional methods:
i) Retrospective approach - Under this approach the standard will be applied retrospectively to each prior
reporting period presented in accordance with Ind AS 8 - Accounting Policies, Changes in Accounting
Estimates and Errors.
ii) Retrospectively with cumulative effect of initially applying the standard recognized at the date of initial
application (Cumulative catch - up approach).
Company have adopted Cumulative catch - up approach and there were no significant adjustments required to
the retained earnings at 1st April, 2018. Also, the application of Ind AS 115 did not have any significant impact on
recognition and measurement of revenue and related items in the financial results.
Dividend and interest income
Dividend income from investments is recognised when the shareholder's right to receive payment has been
established (provided that it is probable that the economic benefits will flow to the Company and the amount of
income can be measured reliably).
109Expanding. Integrating. Progressing.
Interest income from a financial asset is recognised when it is probable that the economic benefits will flow to
the Company and the amount of income can be measured reliably. Interest income is accrued on a time basis,
by reference to the principal outstanding and at the effective interest rate applicable, which is the rate that
exactly discounts estimated future cash receipts through the expected life of the financial asset to that asset's
net carrying amount on initial recognition.
IV. Leasing - Operating Lease
Leases are classified as finance leases whenever the terms of the lease transfer substantially all the risks and
rewards of ownership to the lessee. All other leases are classified as operating leases.
As lessee
Lease payments under an operating lease shall be recognised as an expense on a straight-line basis over the
lease term unless either:
a) another systematic basis is more representative of the time pattern of the user's benefit even if the
payments to the lessors are not on that basis; or
b) the payments to the lessor are structured to increase in line with expected general inflation to compensate
for the lessor's expected inflationary cost increases. If payments to the lessor vary because of factors
other than general inflation, then this condition is not met.
Contingent rentals arising under operating leases are recognized as an expense in the year in which they are
incurred.
In the event that lease incentives are received to enter into operating leases, such incentives are recognised
as a liability. The aggregate benefit of incentives is recognised as a reduction of rental expense on a straight-
line basis, except where another systematic basis is more representative of the time pattern in which economic
benefits from the leased asset are consumed.
As a lessor
Rental income from operating leases is recognized on straight-line basis over the term of the relevant lease.
Arrangements in the nature of lease
Lease agreements, comprising a transaction or series of related transactions, that does not take the legal form
of a lease but conveys the right to use the asset in return for a payment or series of payments. In case of such
arrangements, the Company applies the requirements of Appendix C of Ind AS 17 – Leases to the lease element
of the arrangement. For the purpose of applying the requirements under Ind AS 17 – Leases, payments and
other consideration required by the arrangement are separated at the inception of the arrangement into those
for lease and those for other elements on the basis of their relative fair values.
V. Foreign Currency Transactions
The functional currency of the Company is determined on the basis of the primary economic environment in
which it operates. The functional currency of the Company is Indian National Rupee (INR).
The transactions in currencies other than the entity's functional currency (foreign currencies) are recognised
at the rates of exchange prevailing at the dates of the transactions. At the end of each reporting period, monetary
items denominated in foreign currencies are retranslated at the rates prevailing at that date. Non-monetary
items carried at fair value that are denominated in foreign currencies are retranslated at the rates prevailing at
the date when the fair value was determined. Non-monetary items that are measured in terms of historical cost
in a foreign currency are not retranslated.
Exchange differences on monetary items are recognised in Statement of Profit and Loss in the period in which
they arise except for:
a. exchange differences on foreign currency borrowings relating to assets under construction for future
productive use, which are included in the cost of those assets when they are regarded as an adjustment
to interest costs on those foreign currency borrowings;
Corporate O
verviewStatutory Reports
Financial Statem
ents
110 Annual Report 2018-19
JSW Cement Limited
b. exchange differences on transactions entered into in order to hedge certain foreign currency risks (see
below the policy on hedge accounting in 2 (xvii) (e);
c. exchange difference arising on settlement / restatement of long-term foreign currency monetary items
recognized in the financial statements upto 31st March, 2016 prepared under previous GAAP, are capitalized
as a part of the depreciable Property, Plant and equipment to which the monetary item relates and
depreciated over the remaining useful life of such assets. If such monetary items do not relate to acquisition
of depreciable Property, Plant and equipment, the exchange difference is amortised over the maturity
period / upto the date of settlement of such monetary item, whichever is earlier and charged to the Statement
of Profit and Loss.
VI. Borrowing Costs
Borrowing costs attributable to the acquisition and construction of qualifying assets, are capitalized as part of
the cost of such asset up to the date when the asset is ready for its intended use. A qualifying asset is one that
necessarily takes substantial period of time to get ready for its intended use.
All other borrowing costs are recognised in the Statement of Profit and Loss in the period in which they are
incurred.
The Company determines the amount of borrowing costs eligible for capitalisation as the actual borrowing
costs incurred on that borrowing during the period less any interest income earned on temporary investment
of specific borrowings pending their expenditure on qualifying assets, to the extent that an entity borrows
funds specifically for the purpose of obtaining a qualifying asset. In case if the Company borrows generally and
uses the funds for obtaining a qualifying asset, borrowing costs eligible for capitalisation are determined by
applying a capitalisation rate to the expenditures on that asset.
The Company suspends capitalisation of borrowing costs during extended periods in which it suspends active
development of a qualifying asset.
Borrowing cost includes exchange difference arising from foreign currency borrowings to the extent they are
regarded as an adjustment to finance cost.
VII. Government grants and subsidies
Grants and subsidies from the government are recognized when there is reasonable assurance that the grant/
subsidy will be received and all attaching conditions will be complied with.
When the grant or subsidy relates to an expense item, it is recognized as income over the periods necessary to
match them on a systematic basis to the costs, which it is intended to compensate or when the performance
obligation is met.
Government Grant relating to tangible Property, Plant and equipment are treated as deferred income and released
to statement of profit and loss over the expected useful lives of the assets concerned
VIII. Employee Benefits
Retirement benefit costs and termination benefits
Payments to defined contribution retirement benefit plans are recognised as an expense when employees
have rendered service entitling them to the contributions.
For defined benefit retirement benefit plans, the cost of providing benefits is determined using the projected
unit credit method, with actuarial valuations being carried out at the end of each annual reporting period. Re-
measurement, comprising actuarial gains and losses, the effect of the changes to the asset ceiling (if applicable)
and the return on plan assets (excluding interest), is reflected immediately in the statement of financial position
with a charge or credit recognised in other comprehensive income in the period in which they occur. Re-
measurement recognised in other comprehensive income is reflected immediately in retained earnings and
will not be reclassified to profit or loss. Past service cost is recognised in profit or loss in the period of a plan
amendment. Net interest is calculated by applying the discount rate at the beginning of the period to the net
defined benefit liability or asset. Defined benefit costs are categorised as follows:
111Expanding. Integrating. Progressing.
l service cost (including current service cost, past service cost, as well as gains and losses on curtailments
and settlements);
l net interest expense or income; and
l re-measurement
The Company presents the first two components of defined benefit costs in profit or loss in the line item 'Employee
benefits expenses'. Curtailment gains and losses are accounted for as past service costs.
The retirement benefit obligation recognised in the statement of financial position represents the actual deficit
or surplus in the Company's defined benefit plans. Any surplus resulting from this calculation is limited to the
present value of any economic benefits available in the form of refunds from the plans or reductions in future
contributions to the plans.
A liability for a termination benefit is recognised at the earlier of when the entity can no longer withdraw the
offer of the termination benefit and when the entity recognises any related restructuring costs.
Short-term and other long-term employee benefits
A liability is recognised for benefits accruing to employees in respect of wages and salaries, annual leave and
sick leave in the period the related service is rendered at the undiscounted amount of the benefits expected to
be paid in exchange for that service.
Liabilities recognised in respect of short-term employee benefits are measured at the undiscounted amount of
the benefits expected to be paid in exchange for the related service.
Liabilities recognised in respect of other long-term employee benefits are measured at the present value of the
estimated future cash outflows expected to be made by the Company in respect of services provided by
employees up to the reporting date.
IX. Employee Share based payments
Equity-settled share-based payments to employees and others providing similar services are measured at the
fair value of the equity instruments at the grant date. Details regarding the determination of the fair value of
equity-settled share-based transactions are set out in note 34f.
The fair value determined at the grant date of the equity settled share-based payments is expensed on a
straight line basis over the vesting period, based on the Company's estimate of equity instruments that will
eventually vest, with a corresponding increase in equity. At the end of each reporting period, the Company
revises its estimate of the number of equity instruments expected to vest. The impact of the revision of the
original estimates, if any, is recognised in profit or loss such that the cumulative expense reflects the revised
estimate, with a corresponding adjustment to the equity-settled employee benefits reserve.
X. Taxes
Income tax expense represents the sum of the tax currently payable and deferred tax.
Current tax
Current tax is the amount of tax payable based on the taxable profit for the year as determined in accordance
with the applicable tax rates and the provisions of the Income Tax Act, 1961 and other applicable tax laws in the
countries where the Company operates and generates taxable income.
Deferred tax
Deferred tax is recognised on temporary differences between the carrying amounts of assets and liabilities in
the financial statements and the corresponding tax bases used in the computation of taxable profit. Deferred
tax liabilities are generally recognised for all taxable temporary differences. Deferred tax assets are generally
recognised for all deductible temporary differences to the extent that it is probable that taxable profits will be
available against which those deductible temporary differences can be utilised. Such deferred tax assets and
liabilities are not recognised if the temporary difference arises from the initial recognition (other than in a business
combination) of assets and liabilities in a transaction that affects neither the taxable profit nor the accounting
Corporate O
verviewStatutory Reports
Financial Statem
ents
112 Annual Report 2018-19
JSW Cement Limited
profit. In addition, deferred tax liabilities are not recognised if the temporary difference arises from the initial
recognition of goodwill.
The carrying amount of deferred tax assets is reviewed at the end of each reporting period and reduced to the
extent that it is no longer probable that sufficient taxable profits will be available to allow all or part of the asset
to be recovered.
Minimum Alternate Tax (MAT) paid in accordance with the tax laws, which gives future economic benefits in the
form of adjustment to future income tax liability, is considered as an asset if there is convincing evidence that
the Company will pay normal income tax. Accordingly, MAT is recognised as an asset in the Balance Sheet when
it is highly probable that future economic benefit associated with it will flow to the Company. The Company
reviews the same at each balance sheet date and writes down the carrying amount of MAT Credit Entitlement
to the extent there is no longer convincing evidence to the effect that the Company will pay normal Income Tax
during the specified period.
Deferred tax assets and liabilities are measured at the tax rates that are expected to apply in the period in
which the liability is settled or the asset realised, based on tax rates (and tax laws) that have been enacted or
substantively enacted by the end of the reporting year.
Deferred tax assets and deferred tax liabilities are offset if a legally enforceable right exists to set off current
tax assets against current tax liabilities and the deferred taxes relate to the same taxable entity and the same
taxation authority.
Current and deferred tax for the year
Current and deferred tax are recognised in profit or loss, except when they are relate to items that are recognised
in other comprehensive income or directly in equity, in which case, the current and deferred tax are also
recognized in other comprehensive income or directly in equity respectively. Where current tax or deferred tax
arises from the initial accounting for a business combination, the tax effect is included in the accounting for
the business combination.
XI. Property, Plant and Equipment
The cost of property, plant and equipment comprises its purchase price net of any trade discounts and rebates,
any import duties and other taxes (other than those subsequently recoverable from the tax authorities), any
directly attributable expenditure on making the asset ready for its intended use, including relevant borrowing
costs for qualifying assets and any expected costs of decommissioning.
Expenditure incurred after the property, plant & equipment has put into the operation, such as repairs and
maintenance, are charged to statement of profit and loss in the period in which cost are incurred. Major shutdown
and overhaul expenditure is capitalised as the activity undertaken improves the economic benefit expected to
arise from the assets.
Spares parts, servicing equipment and standby equipment which can be used only in connection with a particular
Plant & Equipment of the Company and their use is expected to be irregular, are capitalised at cost.
An item of property, plant and equipment is derecognised upon disposal or when no future economic benefits
are expected to arise from the continued use of the asset. Any gain or loss arising on the disposal or retirement
of an item of property, plant and equipment is determined as the difference between the sales proceeds and
the carrying amount of the asset and is recognized in Statement of Profit and Loss.
Property, plant and equipment except freehold land held for use in the production, supply or administrative
purposes, are stated in the balance sheet at cost less accumulated depreciation and accumulated impairment
losses., if any.
Capital Work In Progress
Assets in the course of construction are shown as Capital Work-in-progress ("CWIP") for capitalisation and
includes cost of material consumed, erection charges thereon along with other related expenses incurred for
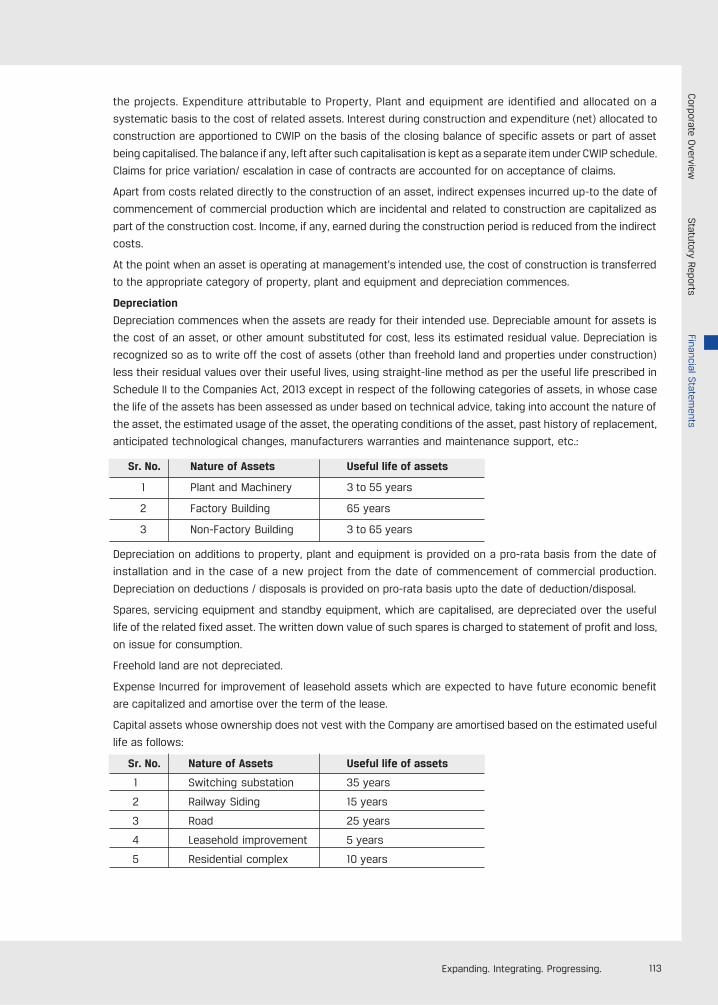
113Expanding. Integrating. Progressing.
the projects. Expenditure attributable to Property, Plant and equipment are identified and allocated on a
systematic basis to the cost of related assets. Interest during construction and expenditure (net) allocated to
construction are apportioned to CWIP on the basis of the closing balance of specific assets or part of asset
being capitalised. The balance if any, left after such capitalisation is kept as a separate item under CWIP schedule.
Claims for price variation/ escalation in case of contracts are accounted for on acceptance of claims.
Apart from costs related directly to the construction of an asset, indirect expenses incurred up-to the date of
commencement of commercial production which are incidental and related to construction are capitalized as
part of the construction cost. Income, if any, earned during the construction period is reduced from the indirect
costs.
At the point when an asset is operating at management's intended use, the cost of construction is transferred
to the appropriate category of property, plant and equipment and depreciation commences.
Depreciation
Depreciation commences when the assets are ready for their intended use. Depreciable amount for assets is
the cost of an asset, or other amount substituted for cost, less its estimated residual value. Depreciation is
recognized so as to write off the cost of assets (other than freehold land and properties under construction)
less their residual values over their useful lives, using straight-line method as per the useful life prescribed in
Schedule II to the Companies Act, 2013 except in respect of the following categories of assets, in whose case
the life of the assets has been assessed as under based on technical advice, taking into account the nature of
the asset, the estimated usage of the asset, the operating conditions of the asset, past history of replacement,
anticipated technological changes, manufacturers warranties and maintenance support, etc.:
Sr. No. Nature of Assets Useful life of assets
1 Plant and Machinery 3 to 55 years
2 Factory Building 65 years
3 Non-Factory Building 3 to 65 years
Depreciation on additions to property, plant and equipment is provided on a pro-rata basis from the date of
installation and in the case of a new project from the date of commencement of commercial production.
Depreciation on deductions / disposals is provided on pro-rata basis upto the date of deduction/disposal.
Spares, servicing equipment and standby equipment, which are capitalised, are depreciated over the useful
life of the related fixed asset. The written down value of such spares is charged to statement of profit and loss,
on issue for consumption.
Freehold land are not depreciated.
Expense Incurred for improvement of leasehold assets which are expected to have future economic benefit
are capitalized and amortise over the term of the lease.
Capital assets whose ownership does not vest with the Company are amortised based on the estimated useful
life as follows:
Sr. No. Nature of Assets Useful life of assets
1 Switching substation 35 years
2 Railway Siding 15 years
3 Road 25 years
4 Leasehold improvement 5 years
5 Residential complex 10 years
Corporate O
verviewStatutory Reports
Financial Statem
ents
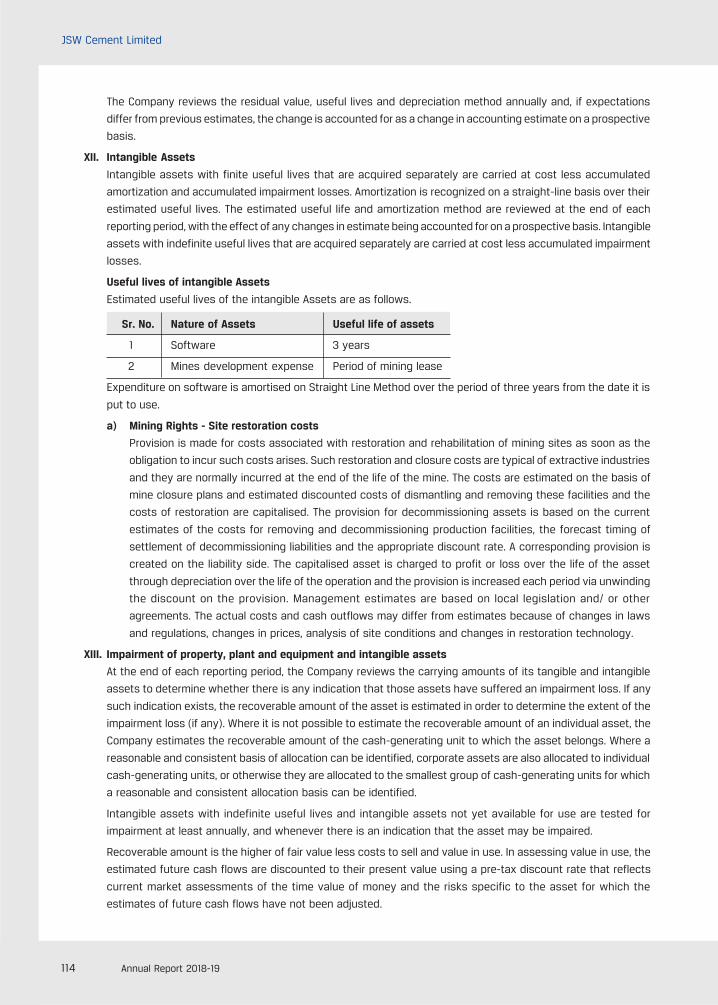
114 Annual Report 2018-19
JSW Cement Limited
The Company reviews the residual value, useful lives and depreciation method annually and, if expectations
differ from previous estimates, the change is accounted for as a change in accounting estimate on a prospective
basis.
XII. Intangible Assets
Intangible assets with finite useful lives that are acquired separately are carried at cost less accumulated
amortization and accumulated impairment losses. Amortization is recognized on a straight-line basis over their
estimated useful lives. The estimated useful life and amortization method are reviewed at the end of each
reporting period, with the effect of any changes in estimate being accounted for on a prospective basis. Intangible
assets with indefinite useful lives that are acquired separately are carried at cost less accumulated impairment
losses.
Useful lives of intangible Assets
Estimated useful lives of the intangible Assets are as follows.
Sr. No. Nature of Assets Useful life of assets
1 Software 3 years
2 Mines development expense Period of mining lease
Expenditure on software is amortised on Straight Line Method over the period of three years from the date it is
put to use.
a) Mining Rights - Site restoration costs
Provision is made for costs associated with restoration and rehabilitation of mining sites as soon as the
obligation to incur such costs arises. Such restoration and closure costs are typical of extractive industries
and they are normally incurred at the end of the life of the mine. The costs are estimated on the basis of
mine closure plans and estimated discounted costs of dismantling and removing these facilities and the
costs of restoration are capitalised. The provision for decommissioning assets is based on the current
estimates of the costs for removing and decommissioning production facilities, the forecast timing of
settlement of decommissioning liabilities and the appropriate discount rate. A corresponding provision is
created on the liability side. The capitalised asset is charged to profit or loss over the life of the asset
through depreciation over the life of the operation and the provision is increased each period via unwinding
the discount on the provision. Management estimates are based on local legislation and/ or other
agreements. The actual costs and cash outflows may differ from estimates because of changes in laws
and regulations, changes in prices, analysis of site conditions and changes in restoration technology.
XIII. Impairment of property, plant and equipment and intangible assets
At the end of each reporting period, the Company reviews the carrying amounts of its tangible and intangible
assets to determine whether there is any indication that those assets have suffered an impairment loss. If any
such indication exists, the recoverable amount of the asset is estimated in order to determine the extent of the
impairment loss (if any). Where it is not possible to estimate the recoverable amount of an individual asset, the
Company estimates the recoverable amount of the cash-generating unit to which the asset belongs. Where a
reasonable and consistent basis of allocation can be identified, corporate assets are also allocated to individual
cash-generating units, or otherwise they are allocated to the smallest group of cash-generating units for which
a reasonable and consistent allocation basis can be identified.
Intangible assets with indefinite useful lives and intangible assets not yet available for use are tested for
impairment at least annually, and whenever there is an indication that the asset may be impaired.
Recoverable amount is the higher of fair value less costs to sell and value in use. In assessing value in use, the
estimated future cash flows are discounted to their present value using a pre-tax discount rate that reflects
current market assessments of the time value of money and the risks specific to the asset for which the
estimates of future cash flows have not been adjusted.
115Expanding. Integrating. Progressing.
If the recoverable amount of an asset (or cash-generating unit) is estimated to be less than its carrying amount,
the carrying amount of the asset (or cash-generating unit) is reduced to its recoverable amount. An impairment
loss is recognised immediately in the Statement of Profit and Loss, unless the relevant asset is carried at a
revalued amount, in which case the impairment loss is treated as a revaluation decrease.
Any reversal of the previously recognised impairment loss is limited to the extent that the asset's carrying
amount does not exceed the carrying amount that would have been determined if no impairment loss had
previously been recognised.
XIV. Inventories
Inventories are valued after providing for obsolescence as follows:
i. Raw material, stores & spares, packing material and fuels are valued at lower of cost and net realisable
value. However, these items are considered to be realisable at cost, if the finished products, in which they
will be used, are expected to be sold at or above cost.
ii. Work-in-progress and Finished Goods are valued at lower of cost and net realisable value. Cost of finished
goods and work-In -progress include cost of direct material and labour and a proportion of manufacturing
overheads based on the normal operating capacity but excluding borrowing cost.
iii. Waste/Scrap inventory is valued at net realisable value.
iv. Obsolete, defective and unserviceable stock is duly provided for wherever applicable.
v. Costs of inventories are determined on weighted average basis. Net realisable value represents the
estimated selling price for inventories less all estimated costs of completion and costs necessary to make
the sale.
XV. Provisions, Contingent Liabilities and Contingent Assets
Provisions are recognised when the Company has a present obligation (legal or constructive), as a result of
past events, and it is probable that an outflow of resources, that can be reliably estimated, will be required to
settle such an obligation.
If the effect of the time value of money is material, provisions are determined by discounting the expected
future cash flows to net present value using an appropriate pre-tax discount rate that reflects current market
assessments of the time value of money and, where appropriate, the risks specific to the liability. Unwinding of
the discount is recognised in the Statement of Profit and Loss as a finance cost. Provisions are reviewed at
each reporting date and are adjusted to reflect the current best estimate.
A present obligation that arises from past events where it is either not probable that an outflow of resources
will be required to settle or a liable estimate of the amount cannot be made, is disclosed as a contingent
liability. Contingent liabilities are also disclosed when there is a possible obligation arising from past events,
the existence of which will be confirmed only by the occurrence or non -occurrence of one or more uncertain
future events not wholly within the control of the Company.
Claims against the Company where the possibility of any outflow of resources in settlement is remote, are not
disclosed as contingent liabilities.
Contingent assets are not recognised in financial statements since this may result in the recognition of income
that may never be realised. However, when the realisation of income is virtually certain, then the related asset
is not a contingent asset and is recognised.
Onerous contracts
Present obligations arising under onerous contracts are recognised and measured as provisions. An onerous
contract is considered to exist where the Company has a contract under which the unavoidable costs of meeting
the obligations under the contract exceed the economic benefits expected to be received from the contract.
Corporate O
verviewStatutory Reports
Financial Statem
ents
116 Annual Report 2018-19
JSW Cement Limited
XVI. Investment in subsidiaries and associates
Investment in subsidiaries and associates are shown at cost. Where the carrying amount of an investment in
greater than its estimated recoverable amount, it is written down immediately to its recoverable amount and
the difference is transferred to the Statement of Profit and Loss. On disposal of investment, the difference
between the net disposal proceeds and the carrying amount is charged or credited to the Statement of Profit
and Loss.
XVII.Financial Instruments
Financial assets and financial liabilities are recognised when an entity becomes a party to the contractual
provisions of the instrument.
Financial assets and financial liabilities are initially measured at fair value. Transaction costs that are directly
attributable to the acquisition or issue of financial assets and financial liabilities (other than financial assets
and financial liabilities at fair value through Statement of Profit and Loss (FVTPL)) are added to or deducted
from the fair value of the financial assets or financial liabilities, as appropriate, on initial recognition. Transaction
costs directly attributable to the acquisition of financial assets or financial liabilities at fair value through profit
and loss are recognised immediately in Statement of Profit and Loss.
A. Financial assets
a) Recognition and initial measurement
The Company initially recognises loans and advances, deposits, debt securities issues and
subordinated liabilities on the date on which they originate. All other financial instruments (including
regular way purchases and sales of financial assets) are recognised on the trade date, which is the
date on which the Company becomes a party to the contractual provisions of the instrument. A financial
asset or liability is initially measured at fair value plus, for an item not at FVTPL, transaction costs that
are directly attributable to its acquisition or issue.
b) Classification of financial assets
On initial recognition, a financial asset is classified to be measured at amortised cost, fair value through
other comprehensive income (FVTOCI) or FVTPL.
A financial asset is measured at amortised cost if it meets both of the following conditions and is not
designated at FVTPL:
l The asset is held within a business model whose objective is to hold assets to collect contractual
cash flows; and
l The contractual terms of the financial asset give rise on specified dates to cash flows that are solely
payments of principal and interest on the principal amount outstanding.
A debt instrument is classified as FVTOCI only if it meets both of the following conditions and is not
recognised at FVTPL;
l The asset is held within a business model whose objective is achieved by both collecting contractual
cash flows and selling financial assets; and
l The contractual terms of the financial asset give rise on specified dates to cash flows that are solely
payments of principal and interest on the principal amount outstanding.
Debt instruments included within the FVTOCI category are measured initially as well as at each reporting
date at fair value. Fair value movements are recognized in the Other Comprehensive Income (OCI). However,
the Company recognizes interest income, impairment losses & reversals and foreign exchange gain or
loss in the Statement of Profit and Loss. On derecognition of the asset, cumulative gain or loss previously
recognised in OCI is reclassified from the equity to Statement of Profit and Loss. Interest earned whilst
holding FVTOCI debt instrument is reported as interest income using the EIR method.
117Expanding. Integrating. Progressing.
All equity investments in scope of Ind AS 109 are measured at fair value.. For all other equity instruments,
the Company may make an irrevocable election to present in other comprehensive income subsequent
changes in the fair value. The Company makes such election on an instrument-by-instrument basis. The
classification is made on initial recognition and is irrevocable.
If the Company decides to classify an equity instrument as at FVTOCI, then all fair value changes on the
instrument, excluding dividends, are recognized in the OCI. There is no recycling of the amounts from OCI
to Statement of Profit and Loss, even on sale of investment. However, the Company may transfer the
cumulative gain or loss within equity.
Equity instruments included within the FVTPL category are measured at fair value with all changes
recognized in the Statement of Profit and Loss.
All other financial assets are classified as measured at FVTPL.
In addition, on initial recognition, the Company may irrevocably designate a financial asset that otherwise
meets the requirements to be measured at amortised cost or at FVTOCI as at FVTPL if doing so eliminates or
significantly reduces and accounting mismatch that would otherwise arise.
Financial assets at FVTPL are measured at fair value at the end of each reporting period, with any gains and
losses arising on remeasurement recognized in statement of profit or loss. The net gain or loss recognized
in statement of profit or loss incorporates any dividend or interest earned on the financial asset and is
included in the 'other income' line item. Dividend on financial assets at FVTPL is recognized when:
l The Company's right to receive the dividends is established,
l It is probable that the economic benefits associated with the dividends will flow to the entity,
l The dividend does not represent a recovery of part of cost of the investment and the amount of dividend
can be measured reliably.
c) Derecognition of financial assets
The Company derecognises a financial asset when the contractual rights to the cash flows from the asset
expire, or when it transfers the financial asset and substantially all the risks and rewards of ownership of
the asset to another party. If the Company neither transfers nor retains substantially all the risks and
rewards of ownership and continues to control the transferred asset, the Company recognises its retained
interest in the asset and an associated liability for amounts it may have to pay. If the Company retains
substantially all the risks and rewards of ownership of a transferred financial asset, the Company continues
to recognise the financial asset and also recognises a collateralised borrowing for the proceeds received.
On derecognition of a financial asset in its entirety, the difference between the asset's carrying amount
and the sum of the consideration received and receivable and the cumulative gain or loss that had been
recognised in other comprehensive income and accumulated in equity is recognised in profit or loss if
such gain or loss would have otherwise been recognised in profit or loss on disposal of that financial
asset.
On derecognition of a financial asset other than in its entirety (e.g. when the Company retains an option to
repurchase part of a transferred asset), the Company allocates the previous carrying amount of the financial
asset between the part it continues to recognise under continuing involvement, and the part it no longer
recognises on the basis of the relative fair values of those parts on the date of the transfer. The difference
between the carrying amount allocated to the part that is no longer recognised and the sum of the
consideration received for the part no longer recognised and any cumulative gain or loss allocated to it
that had been recognised in other comprehensive income is recognised in profit or loss if such gain or loss
would have otherwise been recognised in profit or loss on disposal of that financial asset. A cumulative
gain or loss that had been recognised in other comprehensive income is allocated between the part that
continues to be recognised and the part that is no longer recognised on the basis of the relative fair values
of those parts.
Corporate O
verviewStatutory Reports
Financial Statem
ents
118 Annual Report 2018-19
JSW Cement Limited
d) Impairment
The Company applies the expected credit loss model for recognising impairment loss on financial assets
measured at amortised cost, debt instruments at FVTOCI, lease receivables, trade receivables, other
contractual rights to receive cash or other financial asset, and financial guarantees not designated as at
FVTPL.
Expected credit losses are the weighted average of credit losses with the respective risks of default
occurring as the weights. Credit loss is the difference between all contractual cash flows that are due to
the Company in accordance with the contract and all the cash flows that the Company expects to receive
(i.e. all cash shortfalls), discounted at the original effective interest rate (or credit-adjusted effective interest
rate for purchased or originated credit-impaired financial assets). The Company estimates cash flows by
considering all contractual terms of the financial instrument (for example, prepayment, extension, call and
similar options) through the expected life of that financial instrument.
The Company measures the loss allowance for a financial instrument at an amount equal to the lifetime
expected credit losses if the credit risk on that financial instrument has increased significantly since initial
recognition. If the credit risk on a financial instrument has not increased significantly since initial recognition,
the Company measures the loss allowance for that financial instrument at an amount equal to 12-months
expected credit losses are portion of the life-time expected credit losses and represent the lifetime cash
shortfalls that will result if default occurs within the 12 months after the reporting date and thus, are not
cash shortfalls that are predicted over the next 12 months.
If the Company measured loss allowance for a financial instrument at lifetime expected credit loss model
in the previous period, but determines at the end of a reporting period that the credit risk has not increased
significantly since initial recognition due to improvement in credit quality as compared to the previous
period, the Company again measures the loss allowance based on 12-months expected credit losses.
When making the assessment of whether there has been a significant increase in credit risk since initial
recognition, the Company uses the change in the risk of a default occurring over the expected life of the
financial instrument instead of the change in the amount of expected credit losses. To make that
assessment, the Company compares the risk of a default occurring on the financial instrument as at the
reporting date with the risk of a default occurring on the financial instrument as at the date of initial
recognition and considers reasonable and supportable information, that is available without undue cost or
effort, that is indicative of significant increases in credit risk since initial recognition.
For trade receivables or any contractual right to receive cash or another financial asset that result from
transactions that are within the scope of Ind AS 11 and Ind AS 18, the Company always measures the loss
allowance at an amount equal to lifetime expected credit losses.
Further, for the purpose of measuring lifetime expected credit loss allowance for trade receivables, the
Company has used a practical expedient as permitted under Ind AS 109. This expected credit loss allowance
is computed based on a provision matrix which takes into account historical credit loss experience and
adjusted for forward-looking information.
The impairment requirements for the recognition and measurement of a loss allowance are equally applied
to debt instruments at FVTOCI except that the loss allowance is recognised in other comprehensive income
and is not reduced from the carrying amount in the balance sheet
e) Effective interest method
The effective interest method is a method of calculating the amortised cost of a debt instrument and of
allocating interest income over the relevant period. The effective interest rate is the rate that exactly
discounts estimated future cash receipts (including all fees and points paid or received that form an integral
part of the effective interest rate, transaction costs and other premiums or discounts) through the expected
life of the debt instrument, or, where appropriate, a shorter period, to the net carrying amount on initial
recognition.
119Expanding. Integrating. Progressing.
Income is recognised on an effective interest basis for debt instruments other than those financial assets
classified as at FVTPL. Interest income is recognized in profit or loss and is included in the 'Other income'
line item.
B. Financial liabilities and equity instruments
a) Classification as debt or equity
Debt and equity instruments issued by a company are classified as either financial liabilities or as equity in
accordance with the substance of the contractual arrangements and the definitions of a financial liability
and an equity instrument.
b) Equity instruments
An equity instrument is any contract that evidences a residual interest in the assets of an entity after
deducting all of its liabilities. Equity instruments issued by the Company are recognised at the proceeds
received, net of direct issue costs.
Repurchase of the Company's own equity instruments is recognised and deducted directly in equity. No
gain or loss is recognised in Statement of Profit and Loss on the purchase, sale, issue or cancellation of the
Company's own equity instruments.
c) Financial liabilities
Financial liabilities are classified as either financial liabilities 'at FVTPL' or 'other financial liabilities'.
Financial liabilities at FVTPL:
Financial liabilities are classified as at FVTPL when the financial liability is either held for trading or it is
designated as at FVTPL.
A financial liability is classified as held for trading if:
l It has been incurred principally for the purpose of repurchasing it in the near term; or
l on initial recognition it is part of a portfolio of identified financial instruments that the Company manages
together and has a recent actual pattern of short-term profit-taking; or
l it is a derivative that is not designated and effective as a hedging instrument.
A financial liability other than a financial liability held for trading may be designated as at FVTPL upon initial
recognition if:
l such designation eliminates or significantly reduces a measurement or recognition inconsistency
that would otherwise arise;
l the financial liability forms part of a group of financial assets or financial liabilities or both, which is
managed and its performance is evaluated on a fair value basis, in accordance with the Company's
documented risk management or investment strategy, and information about the grouping is provided
internally on that basis; or
l it forms part of a contract containing one or more embedded derivatives, and Ind AS 109 permits the
entire combined contract to be designated as at FVTPL in accordance with Ind AS 109.
Financial liabilities at FVTPL are stated at fair value, with any gains or losses arising on remeasurement
recognised in Statement of Profit and Loss. The net gain or loss recognised in Statement of Profit and Loss
incorporates any interest paid on the financial liability and is included in the 'other gains and losses' line
item in the Statement of Profit and Loss.
The Company derecognises financial liabilities when, and only when, the Company's obligations are
discharged, cancelled or they expire. The difference between the carrying amount of the financial liability
derecognised and the consideration paid and payable is recognised in Statement of Profit and Loss.
Other financial liabilities:
Other financial liabilities (including borrowings and trade and other payables) are subsequently measured
at amortised cost using the effective interest method.
Corporate O
verviewStatutory Reports
Financial Statem
ents
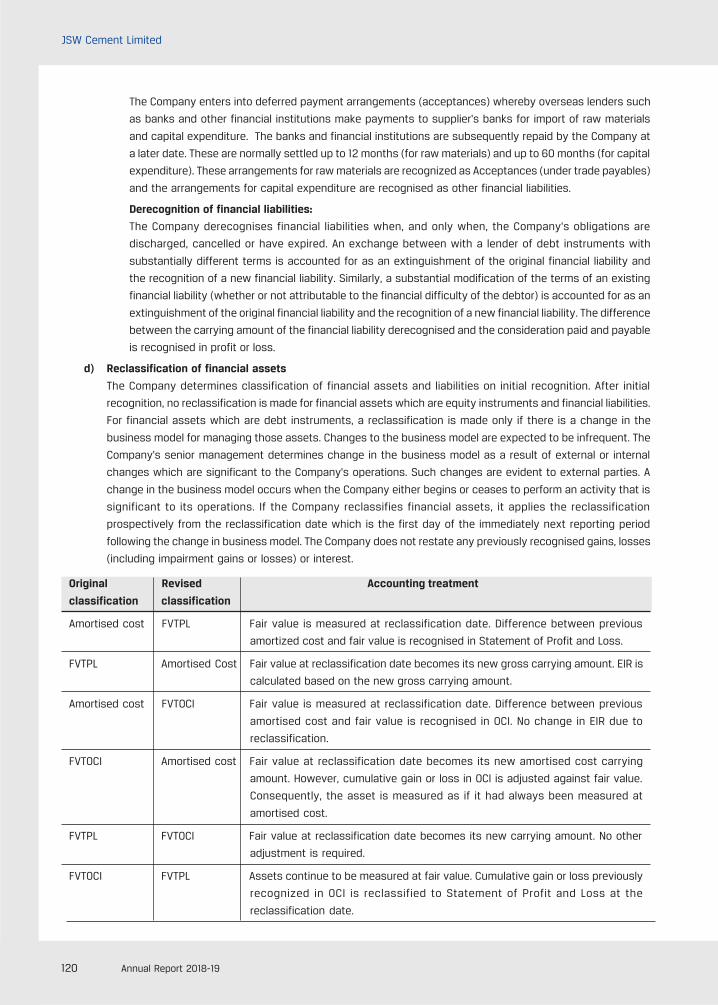
120 Annual Report 2018-19
JSW Cement Limited
The Company enters into deferred payment arrangements (acceptances) whereby overseas lenders such
as banks and other financial institutions make payments to supplier's banks for import of raw materials
and capital expenditure. The banks and financial institutions are subsequently repaid by the Company at
a later date. These are normally settled up to 12 months (for raw materials) and up to 60 months (for capital
expenditure). These arrangements for raw materials are recognized as Acceptances (under trade payables)
and the arrangements for capital expenditure are recognised as other financial liabilities.
Derecognition of financial liabilities:
The Company derecognises financial liabilities when, and only when, the Company's obligations are
discharged, cancelled or have expired. An exchange between with a lender of debt instruments with
substantially different terms is accounted for as an extinguishment of the original financial liability and
the recognition of a new financial liability. Similarly, a substantial modification of the terms of an existing
financial liability (whether or not attributable to the financial difficulty of the debtor) is accounted for as an
extinguishment of the original financial liability and the recognition of a new financial liability. The difference
between the carrying amount of the financial liability derecognised and the consideration paid and payable
is recognised in profit or loss.
d) Reclassification of financial assets
The Company determines classification of financial assets and liabilities on initial recognition. After initial
recognition, no reclassification is made for financial assets which are equity instruments and financial liabilities.
For financial assets which are debt instruments, a reclassification is made only if there is a change in the
business model for managing those assets. Changes to the business model are expected to be infrequent. The
Company's senior management determines change in the business model as a result of external or internal
changes which are significant to the Company's operations. Such changes are evident to external parties. A
change in the business model occurs when the Company either begins or ceases to perform an activity that is
significant to its operations. If the Company reclassifies financial assets, it applies the reclassification
prospectively from the reclassification date which is the first day of the immediately next reporting period
following the change in business model. The Company does not restate any previously recognised gains, losses
(including impairment gains or losses) or interest.
Original Revised Accounting treatment
classification classification
Amortised cost FVTPL Fair value is measured at reclassification date. Difference between previous
amortized cost and fair value is recognised in Statement of Profit and Loss.
FVTPL Amortised Cost Fair value at reclassification date becomes its new gross carrying amount. EIR is
calculated based on the new gross carrying amount.
Amortised cost FVTOCI Fair value is measured at reclassification date. Difference between previous
amortised cost and fair value is recognised in OCI. No change in EIR due to
reclassification.
FVTOCI Amortised cost Fair value at reclassification date becomes its new amortised cost carrying
amount. However, cumulative gain or loss in OCI is adjusted against fair value.
Consequently, the asset is measured as if it had always been measured at
amortised cost.
FVTPL FVTOCI Fair value at reclassification date becomes its new carrying amount. No other
adjustment is required.
FVTOCI FVTPL Assets continue to be measured at fair value. Cumulative gain or loss previously
recognized in OCI is reclassified to Statement of Profit and Loss at the
reclassification date.
121Expanding. Integrating. Progressing.
e) Hedge accounting
The Company designates certain hedging instruments, which include derivatives, embedded derivatives and
non-derivatives in respect of foreign currency, interest rate and commodity risk, as either cash flow hedge, fair
value hedge or hedges of net investments in foreign operations. Hedges of foreign currency risk on firm
commitments are accounted for as cash flow hedges.
At the inception of the hedge relationship, the entity documents the relationship between the hedging instrument
and the hedged item, along with its risk management objectives and its strategy for undertaking various hedge
transactions. Furthermore, at the inception of the hedge and on an ongoing basis, the Company documents
whether the hedging instrument is highly effective in offsetting changes in fair values or cash flows of the
hedged item attributable to hedged risk.
Fair value hedges
Changes in fair value of the designated portion of derivatives that qualify as fair value hedges are recognized in
profit or loss immediately, together with any changes in the fair value of the hedged asset or liability that are
attributable to the hedged risk. The change in the fair value of the designated portion of hedging instrument
and the change in the hedged item attributable to hedged risk are recognized in profit or loss. in the line item
relating to the hedged item.
Hedge accounting is discontinued when the hedging instrument expires or is sold, terminated, or exercised, or
when it no longer qualifies for hedge accounting. The fair value adjustment to the carrying amount of the
hedged item arising from the hedged risk is amortised to profit or loss from that date.
XVIII. Cash and cash equivalents:
Cash and cash equivalent in the Balance Sheet comprise cash at banks and on hand and short-term deposits
with an original maturity of three months or less, which are subject to insignificant risk of changes in value.
For the purpose of the Statement of cash flows, cash and cash equivalent consists of cash and short term
deposits, as defined above.
XIX. Earnings Per Share
Basic EPS is computed by dividing the net profit or loss after tax for the year attributable to the equity
shareholders by the weighted average number of equity shares outstanding during the year.
Diluted EPS is computed by dividing the net profit or loss for the year by the weighted average number of equity
shares outstanding during the year as adjusted for the effects of all dilutive potential equity shares, except
where the results are anti-dilutive.
3. Key sources of estimation uncertainty and recent accounting pronouncement
In the course of applying the policies outlined in all notes under section 2 above, the Company is required to make
judgements, estimates and assumptions about the carrying amount of assets and liabilities that are not readily
apparent from other sources. The estimates and associated assumptions are based on historical experience and
other factors that are considered to be relevant. Actual results may differ from these estimates.
The estimates and underlying assumptions are reviewed on an ongoing basis. Revisions to accounting estimates
are recognized in the period in which the estimate is revised if the revision affects only that period, or in the period
of the revision and future period, if the revision affects current and future period.
A) Key sources of estimation uncertainty
i) Useful lives of property, plant and equipment
Management reviews the useful lives of property, plant and equipment at least once a year. Such lives are
dependent upon an assessment of both the technical lives of the assets and also their likely economic
lives based on various internal and external factors including relative efficiency and operating costs.
Accordingly, depreciable lives are reviewed annually using the best information available to the Management.
Corporate O
verviewStatutory Reports
Financial Statem
ents
122 Annual Report 2018-19
JSW Cement Limited
ii) Impairment of investments in subsidiaries and associates
Determining whether the investments in subsidiaries, associates are impaired requires an estimate in the
value in use of investments. In considering the value in use, Management have anticipated the future
commodity prices, capacity utilization of plants, operating margins, mineable resources and availability of
infrastructure of mines, discount rates and other factors of the underlying businesses / operations of the
investee companies. Any subsequent changes to the cash flows due to changes in the above mentioned
factors could impact the carrying value of investments.
iii) Provisions and liabilities
Provisions and liabilities are recognized in the period when it becomes probable that there will be a future
outflow of funds resulting from past operations or events that can reasonably be estimated. The timing of
recognition requires application of judgement to existing facts and circumstances which may be subject
to change. The amounts are determined by discounting the expected future cash flows at a pre-tax rate
that reflects current market assessments of the time value of money and the risks specific to the liability.
iv) Contingencies
In the normal course of business, contingent liabilities may arise from litigation and other claims against
the Company. Potential liabilities that are possible but not probable of crystalising or are very difficult to
quantify reliably are treated as contingent liabilities. Such liabilities are disclosed in the notes but are not
recognized.
v) Fair value measurements
When the fair values of financial assets or financial liabilities recorded or disclosed in the financial
statements cannot be measured based on quoted prices in active markets, their fair value is measured
using valuation techniques including the DCF model. The inputs to these models are taken from observable
markets where possible, but where this is not feasible, a degree of judgment is required in establishing fair
values. Judgements include consideration of inputs such as liquidity risk, credit risk and volatility
vi) Taxes
Deferred tax assets are recognized for unused tax losses to the extent that it is probable that taxable
profit will be available against which the losses can be utilized. Significant management judgement is
required to determine the amount of deferred tax assets that can be recognised, based upon the likely
timing and the level of future taxable profits together with future tax planning strategies.
vii) Mines restoration obligation
In determining the fair value of the Mines Restoration Obligation, assumptions and estimates are made in
relation to mining reserve, discount rates, the expected cost of mines restoration and the expected timing
of those costs.
viii) Defined benefits plans
The cost of defined benefit plan and other postemployment benefits and the present value of such
obligations are determined using actuarial valuations. An actuarial valuation involves making various
assumptions that may differ from actual development in the future. These include the determination of the
discount rate, future salary escalations and mortality rates etc. Due to the complexities involved in the
valuation and its long term nature, a defined benefit obligation is highly sensitive to changes in these
assumptions. All assumptions are reviewed at each reporting date.
B) Recent Accounting Pronouncements
IND AS 116 - Leases:
On 30th March 2019, Ministry of Corporate Affairs has notified Ind AS 116, Leases. Ind AS 116 will replace the
existing leases Standard, Ind AS 17 Leases, and related Interpretations. The Standard sets out the principles for
the recognition, measurement, presentation and disclosure of leases for both parties to a contract i.e., the
123Expanding. Integrating. Progressing.
lessee and the lessor. Ind AS 116 introduces a single lessee accounting model and requires a lessee to recognize
assets and liabilities for all leases with a term of more than twelve months, unless the underlying asset is of
low value. Currently, operating lease expenses are charged to the statement of Profit & Loss. The Standard also
contains enhanced disclosure requirements for lessees. Ind AS 116 substantially carries forward the lessor
accounting requirements in Ind AS 17. The management is yet to assess the impact of the aforesaid amendments
on the Company's financial information.
Amendments to Ind AS 12- Income taxes
On 30th March 2019, Ministry of Corporate Affairs issued amendments to the guidance in Ind AS 12, 'Income
Taxes', in connection with accounting for dividend distribution taxes. The amendment clarifies that an entity
shall recognize the income tax consequences of dividends in profit or loss, other comprehensive income or
equity according to where the entity originally recognized those past transactions or events. Effective date for
application of this amendment is annual period beginning on or after 1st April, 2019. At present, IND AS 12 is not
applicable to Company as no Dividend is declared by Company till current year.
Amendment to Ind AS 19 - plan amendment, curtailment or settlement
On 30th March 2019, Ministry of Corporate Affairs issued amendments to Ind AS 19, 'Employee Benefits', in
connection with accounting for plan amendments, curtailments and settlements.
The amendments require an entity:
l to use updated assumptions to determine current service cost and net interest for the remainder of the
period after a plan amendment, curtailment or settlement; and
l to recognize in profit or loss as part of past service cost, or a gain or loss on settlement, any reduction in a
surplus, even if that surplus was not previously recognized because of the impact of the asset ceiling.
Effective date for application of this amendment is annual period beginning on or after 1st April, 2019.
The management is yet to assess the impact of the aforesaid amendments on the Company's financial
information.
Amendment to Ind AS 23 - Borrowing Cost
On 30th March 2019, Ministry of Corporate Affairs issued amendments to Ind AS 23, 'Borrowing Cost', in connection
with capitalization of Borrowing Cost when an entity borrows funds generally and uses them for the purpose of
obtaining a qualifying asset.
The amendments require an entity:
l To the extent that an entity borrows funds generally and uses them for the purpose of obtaining a qualifying
asset, the entity shall determine the amount of borrowing costs eligible for capitalisation by applying a
capitalisation rate to the expenditures on that asset. The capitalisation rate shall be the weighted average
of the borrowing costs applicable to all borrowings of the entity that are outstanding during the period.
However, an entity shall exclude from this calculation borrowing costs applicable to borrowings made
specifically for the purpose of obtaining a qualifying asset until substantially all the activities necessary to
prepare that asset for its intended use or sale are complete. The amount of borrowing costs that an entity
capitalises during a period shall not exceed the amount of borrowing costs it incurred during that period."
The management is yet to assess the impact of the aforesaid amendments on the Company's financial
information.
Corporate O
verviewStatutory Reports
Financial Statem
ents
124 Annual Report 2018-19
JSW Cement Limited
Amendment to Ind AS 103 - Business Combinations
On 30th March 2019, Ministry of Corporate Affairs issued amendments to Ind AS 103, 'Business Combinations'.
The amendments require that:
l When a party to a joint arrangement (as defined in Ind AS 111, Joint Arrangements) obtains control of a
business that is a joint operation (as defined in Ind AS 111), and had rights to the assets and obligations for
the liabilities relating to that joint operation immediately before the acquisition date, the transaction is a
business combination achieved in stages. The acquirer shall therefore apply the requirements for a business
combination achieved in stages, including re-measuring its previously held interest in the joint operation in
the manner described in paragraph 42. In doing so, the acquirer shall re-measure its entire previously held
interest in the joint operation.";
Aforesaid amendment is not applicable to the Company, hence will not have any impact on Financial
Statement.
Amendment to Ind AS 28 - Investment in Associates and Joint Ventures
On 30th March 2019, Ministry of Corporate Affairs issued amendments to Ind AS 128, 'Investment in Associates
and Joint Ventures'. The amendment clarifies the accounting for the share of losses of an associate or joint
venture after the equity interest has been reduced to nil.
Aforesaid amendment is not applicable to the Company, hence will not have any impact on Financial Statement
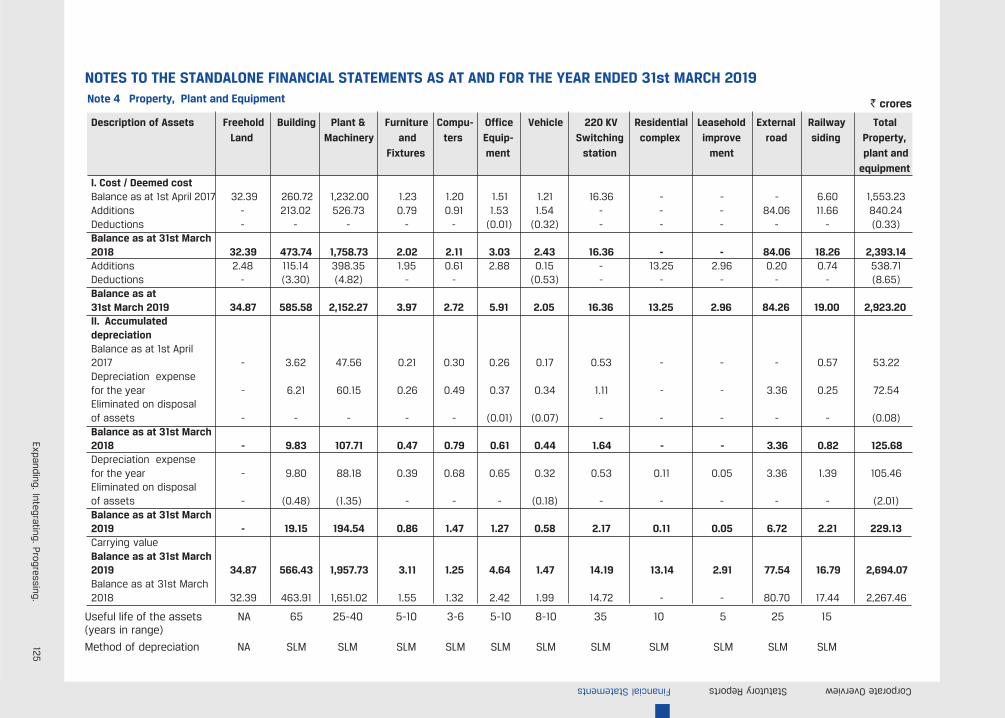
125Expanding. Integrating. P
rogressing.
Note 4 Property, Plant and Equipment
Description of Assets Freehold Building Plant & Furniture Compu- Office Vehicle 220 KV Residential Leasehold External Railway TotalLand Machinery and ters Equip- Switching complex improve road siding Property,
Fixtures ment station ment plant andequipment
I. Cost / Deemed costBalance as at 1st April 2017 32.39 260.72 1,232.00 1.23 1.20 1.51 1.21 16.36 - - - 6.60 1,553.23Additions - 213.02 526.73 0.79 0.91 1.53 1.54 - - - 84.06 11.66 840.24Deductions - - - - - (0.01) (0.32) - - - - - (0.33)Balance as at 31st March2018 32.39 473.74 1,758.73 2.02 2.11 3.03 2.43 16.36 - - 84.06 18.26 2,393.14Additions 2.48 115.14 398.35 1.95 0.61 2.88 0.15 - 13.25 2.96 0.20 0.74 538.71Deductions - (3.30) (4.82) - - (0.53) - - - - - (8.65)Balance as at31st March 2019 34.87 585.58 2,152.27 3.97 2.72 5.91 2.05 16.36 13.25 2.96 84.26 19.00 2,923.20II. AccumulateddepreciationBalance as at 1st April2017 - 3.62 47.56 0.21 0.30 0.26 0.17 0.53 - - - 0.57 53.22Depreciation expensefor the year - 6.21 60.15 0.26 0.49 0.37 0.34 1.11 - - 3.36 0.25 72.54Eliminated on disposalof assets - - - - - (0.01) (0.07) - - - - - (0.08)Balance as at 31st March2018 - 9.83 107.71 0.47 0.79 0.61 0.44 1.64 - - 3.36 0.82 125.68Depreciation expensefor the year - 9.80 88.18 0.39 0.68 0.65 0.32 0.53 0.11 0.05 3.36 1.39 105.46Eliminated on disposalof assets - (0.48) (1.35) - - - (0.18) - - - - - (2.01)Balance as at 31st March2019 - 19.15 194.54 0.86 1.47 1.27 0.58 2.17 0.11 0.05 6.72 2.21 229.13Carrying valueBalance as at 31st March2019 34.87 566.43 1,957.73 3.11 1.25 4.64 1.47 14.19 13.14 2.91 77.54 16.79 2,694.07Balance as at 31st March2018 32.39 463.91 1,651.02 1.55 1.32 2.42 1.99 14.72 - - 80.70 17.44 2,267.46
NOTES TO THE STANDALONE FINANCIAL STATEMENTS AS AT AND FOR THE YEAR ENDED 31st MARCH 2019
Useful life of the assets NA 65 25-40 5-10 3-6 5-10 8-10 35 10 5 25 15(years in range)
Method of depreciation NA SLM SLM SLM SLM SLM SLM SLM SLM SLM SLM SLM
` crores
Corporate OverviewStatutory ReportsFinancial Statements

126 Annual Report 2018-19
JSW Cement Limited
4.1 Asset include Gross Block of `645.27 crores (previous year `592.04 crores) constructed on lease land under
sub-lease agreements with JSW Steel Limited, for 150 acres of land situated at Tornagallu village, District Bellary,
Karnataka at an annual rent of `0.60 crores.
4.2 Asset include Gross Block of `392.29 crores (previous year `165.45 crores) constructed on lease land under lease
agreements with JSW Steel Limited,for 20.55 acres of land situated at Dolvi, District Raigad, Maharshatra at an
annual rent of `1.94 crores.
4.3 Additions to Plant & Machinery includes adjustment of `12.45 crores on account of finance cost.
4.4 Certain property, plant and equipment are pledged against borrowing, the detail relating to which have been described
in note 17.
4.5 Property, plant and equipment include assets with net block of `124.56 crores (previous year `112.86 crores) for
which ownership is not in the name of the company.
4.6 Capital work in progress includes finance cost `12.07 crores (As at 31 March 2018: `0.33 crores).
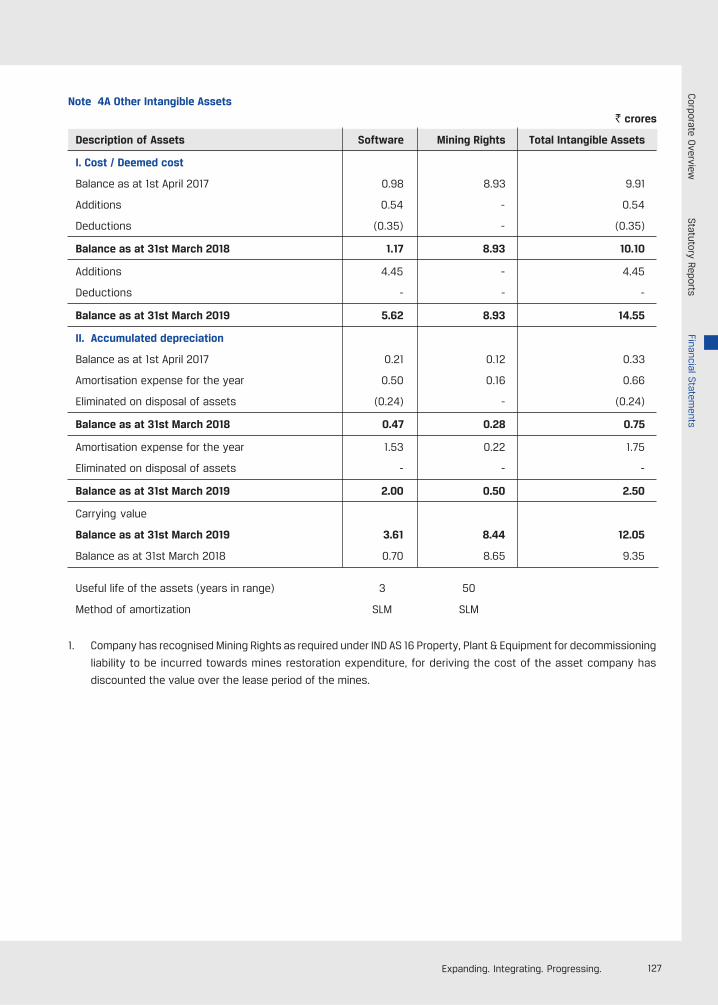
127Expanding. Integrating. Progressing.
Note 4A Other Intangible Assets
` crores
Description of Assets Software Mining Rights Total Intangible Assets
I. Cost / Deemed cost
Balance as at 1st April 2017 0.98 8.93 9.91
Additions 0.54 - 0.54
Deductions (0.35) - (0.35)
Balance as at 31st March 2018 1.17 8.93 10.10
Additions 4.45 - 4.45
Deductions - - -
Balance as at 31st March 2019 5.62 8.93 14.55
II. Accumulated depreciation
Balance as at 1st April 2017 0.21 0.12 0.33
Amortisation expense for the year 0.50 0.16 0.66
Eliminated on disposal of assets (0.24) - (0.24)
Balance as at 31st March 2018 0.47 0.28 0.75
Amortisation expense for the year 1.53 0.22 1.75
Eliminated on disposal of assets - - -
Balance as at 31st March 2019 2.00 0.50 2.50
Carrying value
Balance as at 31st March 2019 3.61 8.44 12.05
Balance as at 31st March 2018 0.70 8.65 9.35
Useful life of the assets (years in range) 3 50
Method of amortization SLM SLM
1. Company has recognised Mining Rights as required under IND AS 16 Property, Plant & Equipment for decommissioning
liability to be incurred towards mines restoration expenditure, for deriving the cost of the asset company has
discounted the value over the lease period of the mines.
Corporate O
verviewStatutory Reports
Financial Statem
ents
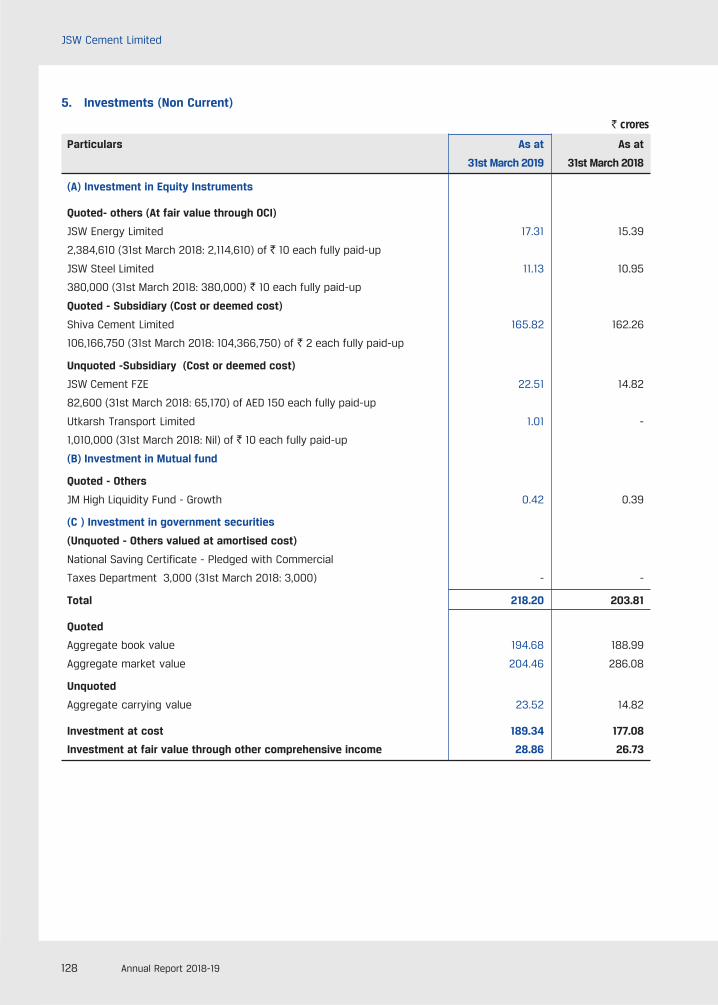
128 Annual Report 2018-19
JSW Cement Limited
5. Investments (Non Current)
Particulars As at As at
31st March 2019 31st March 2018
(A) Investment in Equity Instruments
Quoted- others (At fair value through OCI)
JSW Energy Limited 17.31 15.39
2,384,610 (31st March 2018: 2,114,610) of ` 10 each fully paid-up
JSW Steel Limited 11.13 10.95
380,000 (31st March 2018: 380,000) ` 10 each fully paid-up
Quoted - Subsidiary (Cost or deemed cost)
Shiva Cement Limited 165.82 162.26
106,166,750 (31st March 2018: 104,366,750) of ` 2 each fully paid-up
Unquoted -Subsidiary (Cost or deemed cost)
JSW Cement FZE 22.51 14.82
82,600 (31st March 2018: 65,170) of AED 150 each fully paid-up
Utkarsh Transport Limited 1.01 -
1,010,000 (31st March 2018: Nil) of ` 10 each fully paid-up
(B) Investment in Mutual fund
Quoted - Others
JM High Liquidity Fund - Growth 0.42 0.39
(C ) Investment in government securities
(Unquoted - Others valued at amortised cost)
National Saving Certificate - Pledged with Commercial
Taxes Department 3,000 (31st March 2018: 3,000) - -
Total 218.20 203.81
Quoted
Aggregate book value 194.68 188.99
Aggregate market value 204.46 286.08
Unquoted
Aggregate carrying value 23.52 14.82
Investment at cost 189.34 177.08
Investment at fair value through other comprehensive income 28.86 26.73
` crores
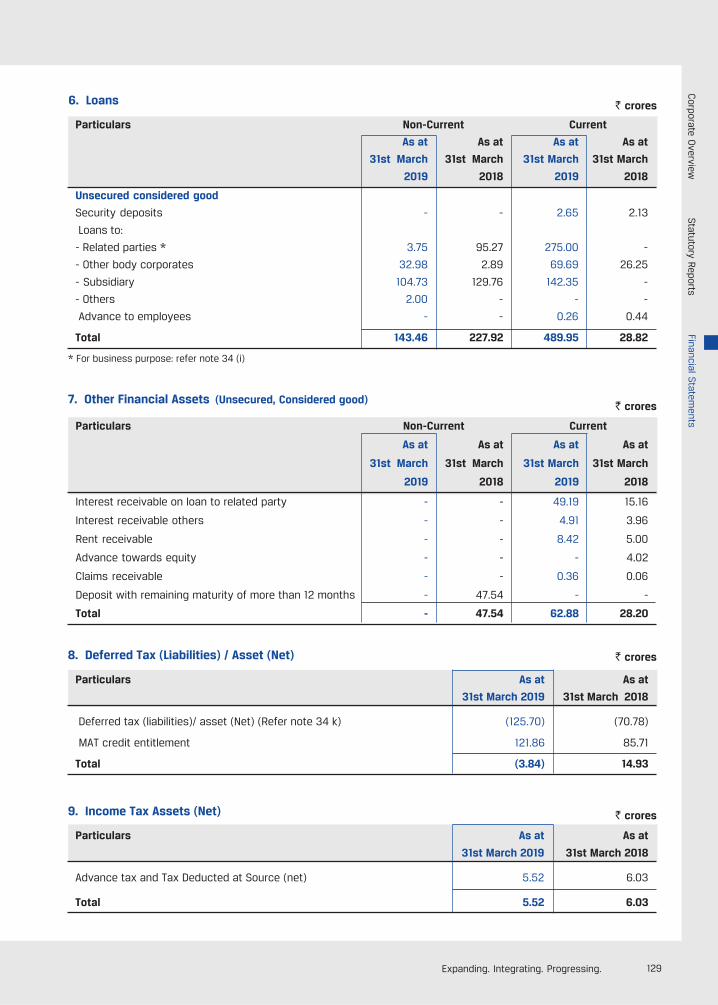
129Expanding. Integrating. Progressing.
6. Loans ` crores
7. Other Financial Assets (Unsecured, Considered good)` crores
Particulars Non-Current Current
As at As at As at As at
31st March 31st March 31st March 31st March
2019 2018 2019 2018
Unsecured considered good
Security deposits - - 2.65 2.13
Loans to:
- Related parties * 3.75 95.27 275.00 -
- Other body corporates 32.98 2.89 69.69 26.25
- Subsidiary 104.73 129.76 142.35 -
- Others 2.00 - - -
Advance to employees - - 0.26 0.44
Total 143.46 227.92 489.95 28.82
8. Deferred Tax (Liabilities) / Asset (Net) ` crores
9. Income Tax Assets (Net) ` crores
Particulars Non-Current Current
As at As at As at As at
31st March 31st March 31st March 31st March
2019 2018 2019 2018
Interest receivable on loan to related party - - 49.19 15.16
Interest receivable others - - 4.91 3.96
Rent receivable - - 8.42 5.00
Advance towards equity - - - 4.02
Claims receivable - - 0.36 0.06
Deposit with remaining maturity of more than 12 months - 47.54 - -
Total - 47.54 62.88 28.20
Particulars As at As at
31st March 2019 31st March 2018
Deferred tax (liabilities)/ asset (Net) (Refer note 34 k) (125.70) (70.78)
MAT credit entitlement 121.86 85.71
Total (3.84) 14.93
Particulars As at As at
31st March 2019 31st March 2018
Advance tax and Tax Deducted at Source (net) 5.52 6.03
Total 5.52 6.03
* For business purpose: refer note 34 (i)
Corporate O
verviewStatutory Reports
Financial Statem
ents
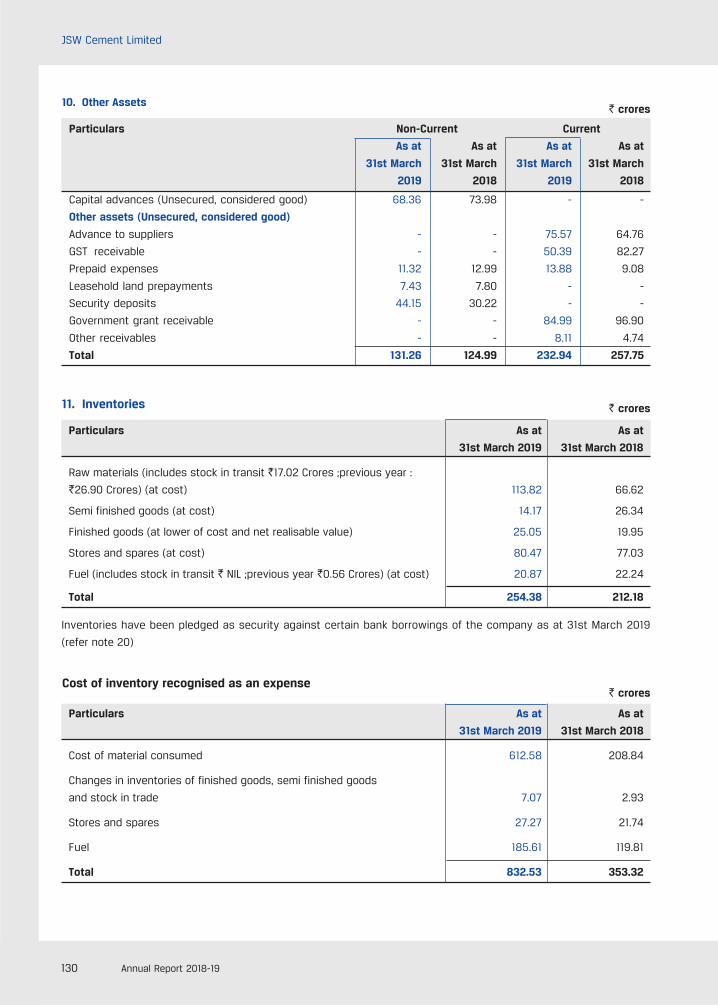
130 Annual Report 2018-19
JSW Cement Limited
Inventories have been pledged as security against certain bank borrowings of the company as at 31st March 2019
(refer note 20)
Cost of inventory recognised as an expense
10. Other Assets` crores
11. Inventories ` crores
Particulars Non-Current Current
As at As at As at As at
31st March 31st March 31st March 31st March
2019 2018 2019 2018
Capital advances (Unsecured, considered good) 68.36 73.98 - -
Other assets (Unsecured, considered good)
Advance to suppliers - - 75.57 64.76
GST receivable - - 50.39 82.27
Prepaid expenses 11.32 12.99 13.88 9.08
Leasehold land prepayments 7.43 7.80 - -
Security deposits 44.15 30.22 - -
Government grant receivable - - 84.99 96.90
Other receivables - - 8.11 4.74
Total 131.26 124.99 232.94 257.75
Particulars As at As at
31st March 2019 31st March 2018
Raw materials (includes stock in transit `17.02 Crores ;previous year :
`26.90 Crores) (at cost) 113.82 66.62
Semi finished goods (at cost) 14.17 26.34
Finished goods (at lower of cost and net realisable value) 25.05 19.95
Stores and spares (at cost) 80.47 77.03
Fuel (includes stock in transit ` NIL ;previous year `0.56 Crores) (at cost) 20.87 22.24
Total 254.38 212.18
Particulars As at As at
31st March 2019 31st March 2018
Cost of material consumed 612.58 208.84
Changes in inventories of finished goods, semi finished goods
and stock in trade 7.07 2.93
Stores and spares 27.27 21.74
Fuel 185.61 119.81
Total 832.53 353.32
` crores
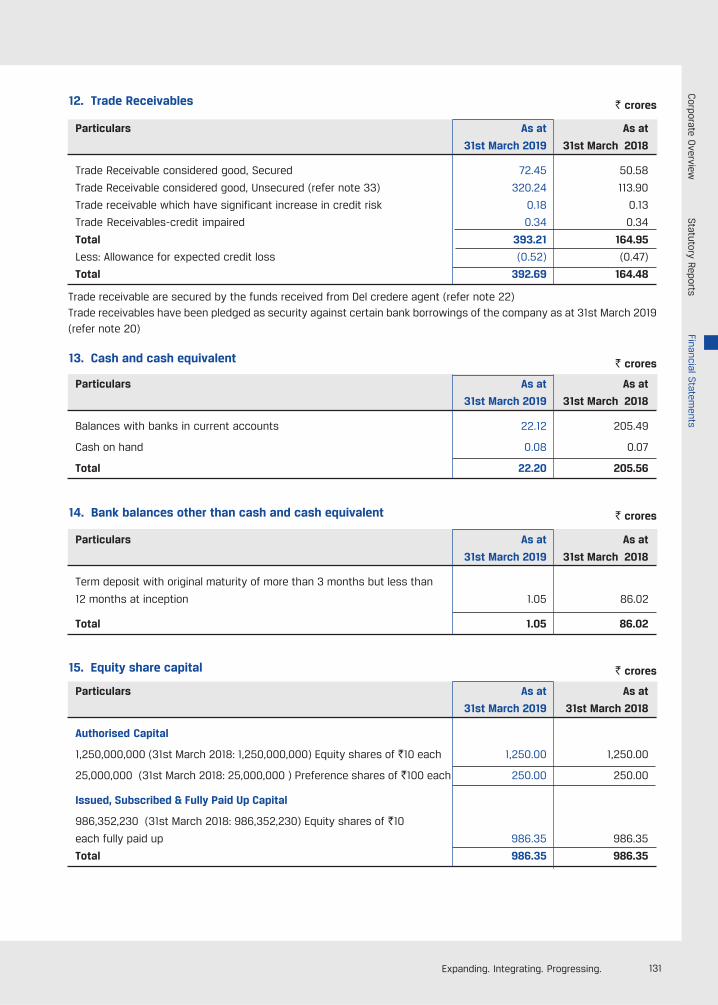
131Expanding. Integrating. Progressing.
12. Trade Receivables ` crores
13. Cash and cash equivalent ` crores
14. Bank balances other than cash and cash equivalent ` crores
15. Equity share capital ` crores
Particulars As at As at
31st March 2019 31st March 2018
Trade Receivable considered good, Secured 72.45 50.58
Trade Receivable considered good, Unsecured (refer note 33) 320.24 113.90
Trade receivable which have significant increase in credit risk 0.18 0.13
Trade Receivables-credit impaired 0.34 0.34
Total 393.21 164.95
Less: Allowance for expected credit loss (0.52) (0.47)
Total 392.69 164.48
Trade receivable are secured by the funds received from Del credere agent (refer note 22)Trade receivables have been pledged as security against certain bank borrowings of the company as at 31st March 2019(refer note 20)
Particulars As at As at
31st March 2019 31st March 2018
Balances with banks in current accounts 22.12 205.49
Cash on hand 0.08 0.07
Total 22.20 205.56
Particulars As at As at
31st March 2019 31st March 2018
Term deposit with original maturity of more than 3 months but less than
12 months at inception 1.05 86.02
Total 1.05 86.02
Particulars As at As at
31st March 2019 31st March 2018
Authorised Capital
1,250,000,000 (31st March 2018: 1,250,000,000) Equity shares of `10 each 1,250.00 1,250.00
25,000,000 (31st March 2018: 25,000,000 ) Preference shares of `100 each 250.00 250.00
Issued, Subscribed & Fully Paid Up Capital
986,352,230 (31st March 2018: 986,352,230) Equity shares of `10
each fully paid up 986.35 986.35
Total 986.35 986.35
Corporate O
verviewStatutory Reports
Financial Statem
ents
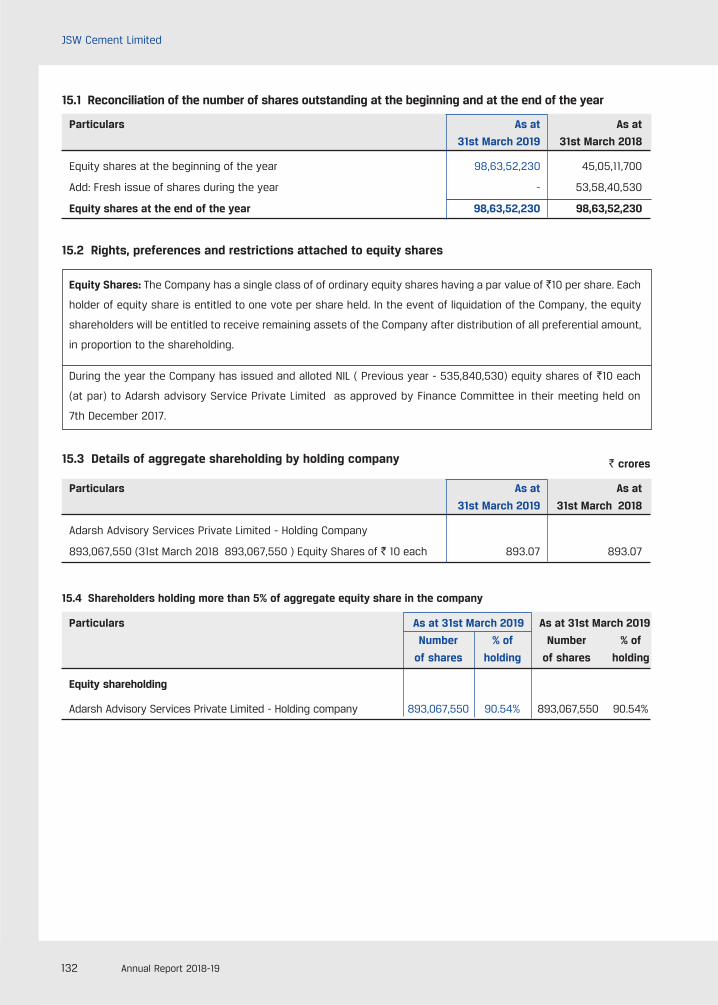
132 Annual Report 2018-19
JSW Cement Limited
15.1 Reconciliation of the number of shares outstanding at the beginning and at the end of the year
15.2 Rights, preferences and restrictions attached to equity shares
Equity Shares: The Company has a single class of of ordinary equity shares having a par value of `10 per share. Each
holder of equity share is entitled to one vote per share held. In the event of liquidation of the Company, the equity
shareholders will be entitled to receive remaining assets of the Company after distribution of all preferential amount,
in proportion to the shareholding.
During the year the Company has issued and alloted NIL ( Previous year - 535,840,530) equity shares of `10 each
(at par) to Adarsh advisory Service Private Limited as approved by Finance Committee in their meeting held on
7th December 2017.
15.3 Details of aggregate shareholding by holding company ` crores
15.4 Shareholders holding more than 5% of aggregate equity share in the company
Particulars As at 31st March 2019 As at 31st March 2019
Number % of Number % of
of shares holding of shares holding
Equity shareholding
Adarsh Advisory Services Private Limited - Holding company 893,067,550 90.54% 893,067,550 90.54%
Particulars As at As at
31st March 2019 31st March 2018
Equity shares at the beginning of the year 98,63,52,230 45,05,11,700
Add: Fresh issue of shares during the year - 53,58,40,530
Equity shares at the end of the year 98,63,52,230 98,63,52,230
Particulars As at As at
31st March 2019 31st March 2018
Adarsh Advisory Services Private Limited - Holding Company
893,067,550 (31st March 2018 893,067,550 ) Equity Shares of ` 10 each 893.07 893.07
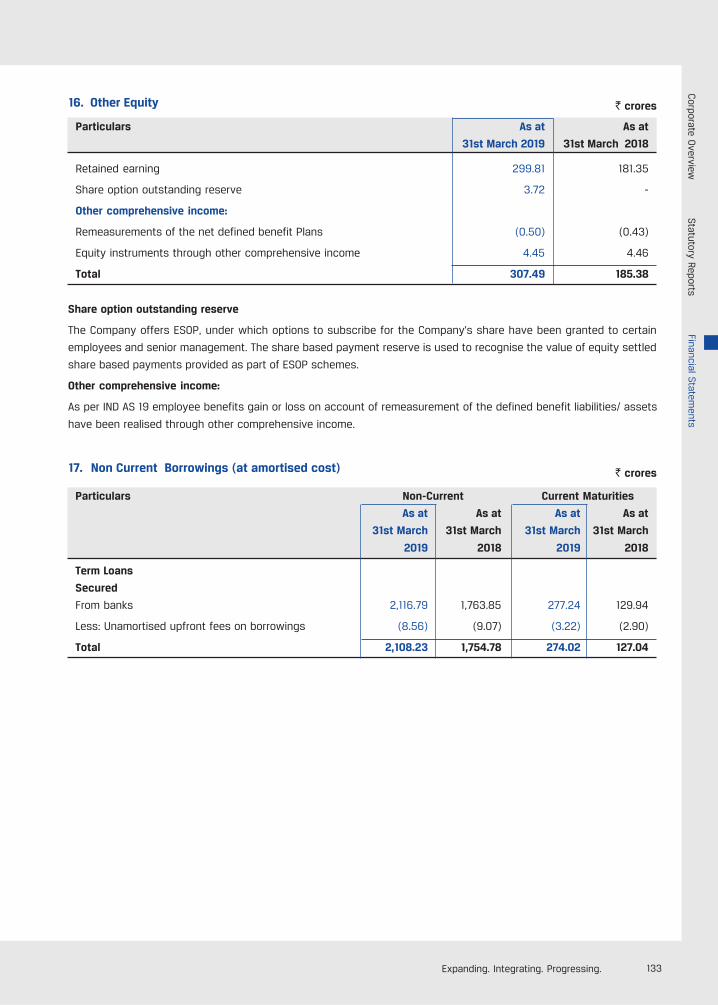
133Expanding. Integrating. Progressing.
16. Other Equity ` crores
Share option outstanding reserve
The Company offers ESOP, under which options to subscribe for the Company's share have been granted to certain
employees and senior management. The share based payment reserve is used to recognise the value of equity settled
share based payments provided as part of ESOP schemes.
Other comprehensive income:
As per IND AS 19 employee benefits gain or loss on account of remeasurement of the defined benefit liabilities/ assets
have been realised through other comprehensive income.
17. Non Current Borrowings (at amortised cost) ` crores
Particulars As at As at
31st March 2019 31st March 2018
Retained earning 299.81 181.35
Share option outstanding reserve 3.72 -
Other comprehensive income:
Remeasurements of the net defined benefit Plans (0.50) (0.43)
Equity instruments through other comprehensive income 4.45 4.46
Total 307.49 185.38
Particulars Non-Current Current Maturities
As at As at As at As at
31st March 31st March 31st March 31st March
2019 2018 2019 2018
Term Loans
Secured
From banks 2,116.79 1,763.85 277.24 129.94
Less: Unamortised upfront fees on borrowings (8.56) (9.07) (3.22) (2.90)
Total 2,108.23 1,754.78 274.02 127.04
Corporate O
verviewStatutory Reports
Financial Statem
ents

134 Annual Report 2018-19
JSW Cement Limited
Rupee Term Loan from Banks (Secured)As on 31st March 2019 As on 31st March 2018 Terms of Repayment* Security
Non-current Current Non-current Current
545.17 45.76 590.99 45.76 9 quarterly instalment of `11.44 Crores secured on pari passu basis by wayeach from 01.07.2019 to 01.07.2021, of equitable mortgage on present4 quarterly instalment of `13.34 Crores and future immovable fixed assetseach from 01.10.2021 to 01.07.2022, of the company and by way of deed4 quarterly instalment of `30.50 Crores of hypothecation on present andeach from 01.10.2022 to 01.07.2023, future moveable fixed assets of4 quarterly instalment of `38.13 Crores the companyeach from 01.10.2023 to 01.07.2024,4 quarterly instalment of `40.03 Croreseach from 01.10.2024 to 01.07.2025
243.22 90.35 333.54 52.76 3 quarterly instalment of `21.11 Crores secured on pari passu basis by wayeach from 14.04.2019 to 14.10.2019, of equitable mortgage on present10 quarterly instalment of `27.02 Crores and future immovable fixed assetseach from 14.01.2020 to 14.01.2022 of the company and by way of deed
of hypothecation on present andfuture moveable fixed assetsof the company
730.41 59.22 720.19 - 4 quarterly instalment of `19.74 Crores secured on pari passu basis by wayeach from 30.09.2019 to 30.06.2020, of equitable mortgage on present4 quarterly instalment of `21,71 Crores and future immovable fixed assetseach from 30.09.2020 to 30.06.2021, of the company and by way of deed4 quarterly instalment of `25.66 Crores of hypothecation on present andeach from 30.09.2021 to 30.06.2022, and future moveable fixed assets4 quarterly instalment of `29.61 Crores of the companyeach from 30.09.2022 to 30.06.2023,12 quarterly instalment of `33.56 Croreseach from 30.09.2023 to 30.06.2026
201.50 - - - 4 quarterly instalment of `5.04 Crores secured on pari passu basis by wayeach from 20.04.2021 to 20.01.2022, of equitable mortgage on present4 quarterly instalment of `5.54 Crores and future immovable fixed assetseach from 20.04.2022 to 20.01.2023, of the company and by way of deed4 quarterly instalment of `6.55 Crores of hypothecation on present andeach from 20.04.2023 to 20.01.2024, future moveable fixed assets of the4 quarterly instalment of `7.56 Crores companyeach from 20.04.2024 to 20.01.2025,12 quarterly instalment of `8.56 Croreseach from 20.04.2025 to 20.01.2028
29.00 19.70 19.70 19.70 Annual instalment of `19.70 Crores secured on pari passu basis by wayeach on 30.10.2019 & ` 29.00 Crores of equitable mortgage on presenton 22.03.2021 and future immovable fixed assets
of the company and by way of deedof hypothecation on present andfuture moveable fixed assets of thecompany
191.74 47.96 99.43 11.72 20 quarterly instalment of `11.99 Crores secured on pari passu basis by wayeach from 09.06.2019 to 09.03.2024 of equitable mortgage on present
and future immovable fixed assetsof the company and by way of deedof hypothecation on present andfuture moveable fixed assets of thecompany
175.75 14.25 - - 4 quarterly instalment of `4.75 Crores secured on pari passu basis by wayeach from 30.09.2019 to 30.06.2020, of equitable mortgage on present4 quarterly instalment of `5.23 Crores and future immovable fixed and byeach from 30.09.2020 to 30.06.2021, way of deed of hypothecation on4 quarterly instalment of `6.18 Crores present and future moveableeach from 30.09.2021 to 30.06.2022, fixed assets of the company4 quarterly instalment of `7.13_ Crores assets of the companyeach from 30.09.2022 to 30.06.2023,12 quarterly instalment of `8.07 Croreseach from 30.09.2023 to 30.06.2026
2,116.79 277.24 1,763.85 129.94
` crores
* Borrowing have been drawn at rate of interest at 9% - 9.85%
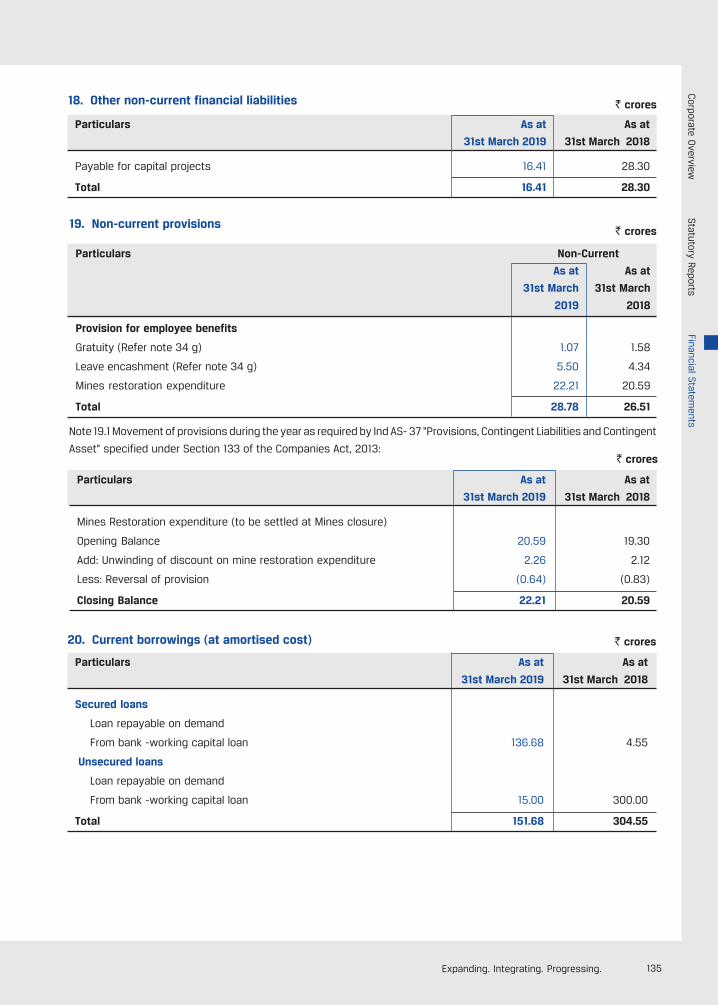
135Expanding. Integrating. Progressing.
18. Other non-current financial liabilities ` crores
19. Non-current provisions` crores
Note 19.1 Movement of provisions during the year as required by Ind AS- 37 “Provisions, Contingent Liabilities and Contingent
Asset” specified under Section 133 of the Companies Act, 2013:
20. Current borrowings (at amortised cost)
Particulars As at As at
31st March 2019 31st March 2018
Payable for capital projects 16.41 28.30
Total 16.41 28.30
Particulars Non-Current
As at As at
31st March 31st March
2019 2018
Provision for employee benefits
Gratuity (Refer note 34 g) 1.07 1.58
Leave encashment (Refer note 34 g) 5.50 4.34
Mines restoration expenditure 22.21 20.59
Total 28.78 26.51
Particulars As at As at
31st March 2019 31st March 2018
Mines Restoration expenditure (to be settled at Mines closure)
Opening Balance 20.59 19.30
Add: Unwinding of discount on mine restoration expenditure 2.26 2.12
Less: Reversal of provision (0.64) (0.83)
Closing Balance 22.21 20.59
Particulars As at As at
31st March 2019 31st March 2018
Secured loans
Loan repayable on demand
From bank -working capital loan 136.68 4.55
Unsecured loans
Loan repayable on demand
From bank -working capital loan 15.00 300.00
Total 151.68 304.55
` crores
` crores
Corporate O
verviewStatutory Reports
Financial Statem
ents
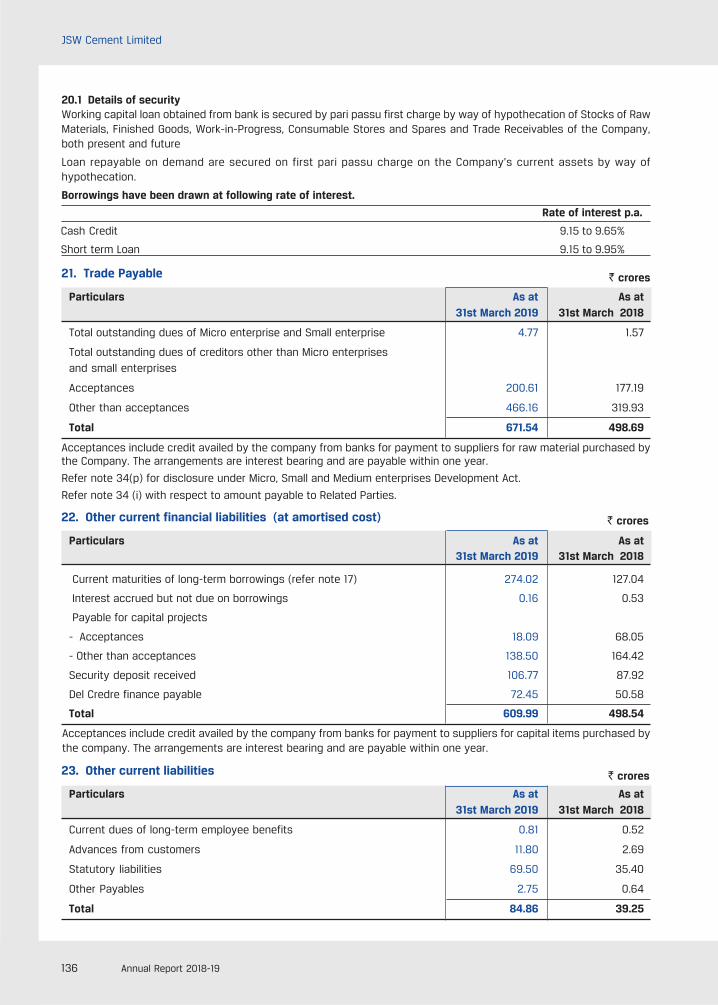
136 Annual Report 2018-19
JSW Cement Limited
21. Trade Payable ` crores
Particulars As at As at31st March 2019 31st March 2018
Total outstanding dues of Micro enterprise and Small enterprise 4.77 1.57
Total outstanding dues of creditors other than Micro enterprisesand small enterprises
Acceptances 200.61 177.19
Other than acceptances 466.16 319.93
Total 671.54 498.69
Acceptances include credit availed by the company from banks for payment to suppliers for raw material purchased bythe Company. The arrangements are interest bearing and are payable within one year.
Refer note 34(p) for disclosure under Micro, Small and Medium enterprises Development Act.
Refer note 34 (i) with respect to amount payable to Related Parties.
22. Other current financial liabilities (at amortised cost) ` crores
Particulars As at As at31st March 2019 31st March 2018
Current maturities of long-term borrowings (refer note 17) 274.02 127.04
Interest accrued but not due on borrowings 0.16 0.53
Payable for capital projects
- Acceptances 18.09 68.05
- Other than acceptances 138.50 164.42
Security deposit received 106.77 87.92
Del Credre finance payable 72.45 50.58
Total 609.99 498.54
Acceptances include credit availed by the company from banks for payment to suppliers for capital items purchased bythe company. The arrangements are interest bearing and are payable within one year.
23. Other current liabilities ` crores
Particulars As at As at31st March 2019 31st March 2018
Current dues of long-term employee benefits 0.81 0.52
Advances from customers 11.80 2.69
Statutory liabilities 69.50 35.40
Other Payables 2.75 0.64
Total 84.86 39.25
20.1 Details of securityWorking capital loan obtained from bank is secured by pari passu first charge by way of hypothecation of Stocks of RawMaterials, Finished Goods, Work-in-Progress, Consumable Stores and Spares and Trade Receivables of the Company,both present and future
Loan repayable on demand are secured on first pari passu charge on the Company’s current assets by way ofhypothecation.
Borrowings have been drawn at following rate of interest.
Rate of interest p.a.
Cash Credit 9.15 to 9.65%
Short term Loan 9.15 to 9.95%
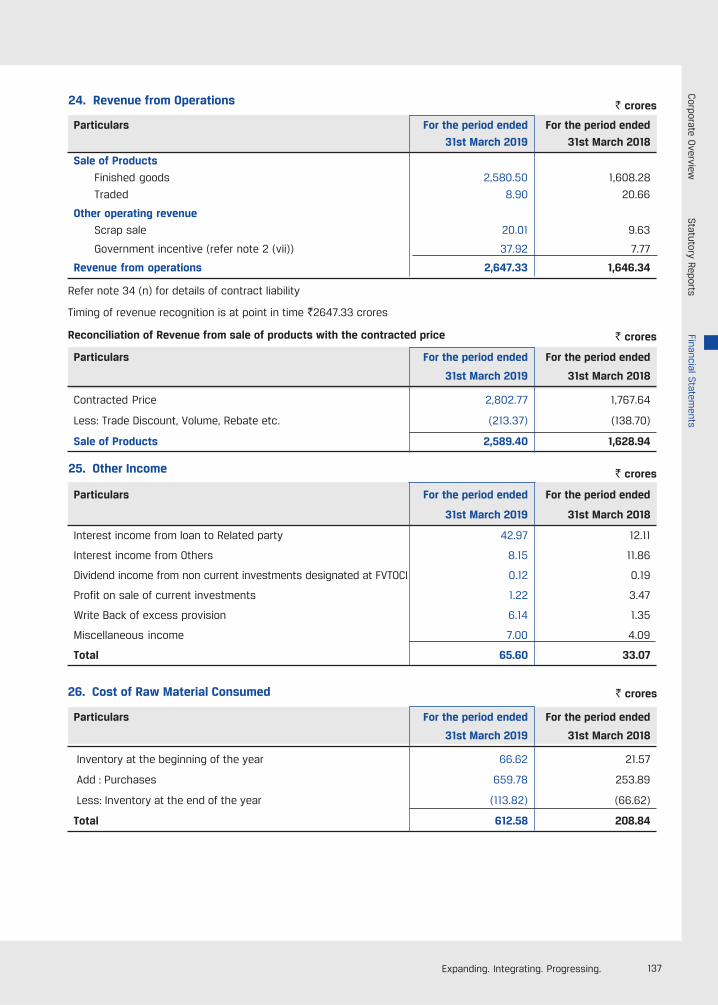
137Expanding. Integrating. Progressing.
24. Revenue from Operations ` crores
Particulars For the period ended For the period ended
31st March 2019 31st March 2018
Sale of Products
Finished goods 2,580.50 1,608.28
Traded 8.90 20.66
Other operating revenue
Scrap sale 20.01 9.63
Government incentive (refer note 2 (vii)) 37.92 7.77
Revenue from operations 2,647.33 1,646.34
Refer note 34 (n) for details of contract liability
Particulars For the period ended For the period ended
31st March 2019 31st March 2018
Contracted Price 2,802.77 1,767.64
Less: Trade Discount, Volume, Rebate etc. (213.37) (138.70)
Sale of Products 2,589.40 1,628.94
Reconciliation of Revenue from sale of products with the contracted price ` crores
25. Other Income ` crores
Particulars For the period ended For the period ended
31st March 2019 31st March 2018
Interest income from loan to Related party 42.97 12.11
Interest income from Others 8.15 11.86
Dividend income from non current investments designated at FVTOCI 0.12 0.19
Profit on sale of current investments 1.22 3.47
Write Back of excess provision 6.14 1.35
Miscellaneous income 7.00 4.09
Total 65.60 33.07
26. Cost of Raw Material Consumed ` crores
Particulars For the period ended For the period ended
31st March 2019 31st March 2018
Inventory at the beginning of the year 66.62 21.57
Add : Purchases 659.78 253.89
Less: Inventory at the end of the year (113.82) (66.62)
Total 612.58 208.84
Timing of revenue recognition is at point in time `2647.33 crores
Corporate O
verviewStatutory Reports
Financial Statem
ents
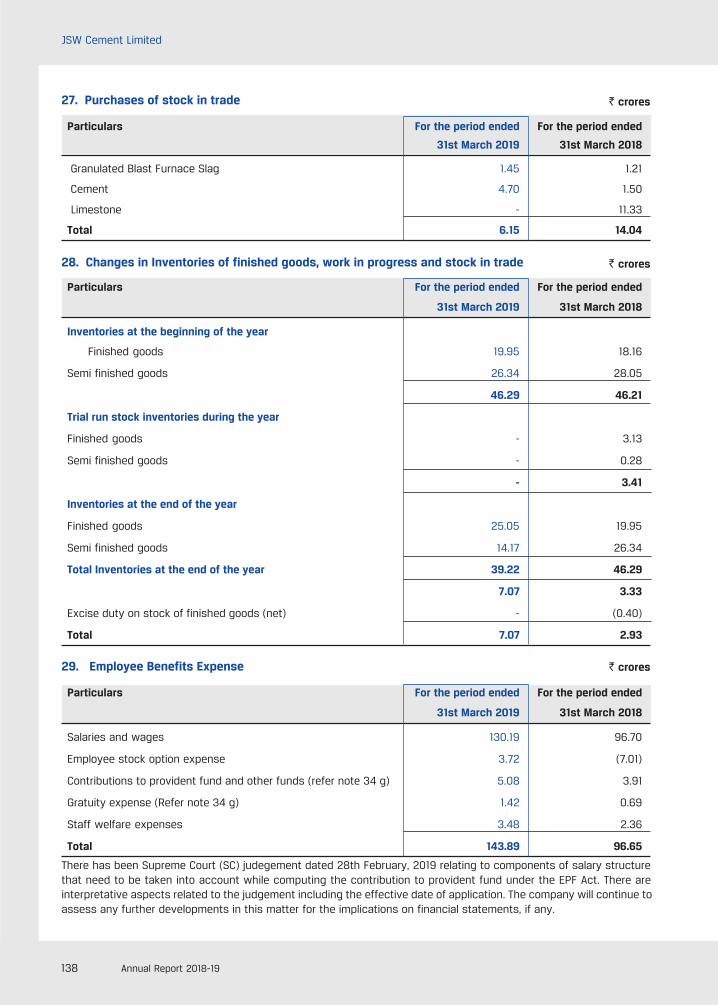
138 Annual Report 2018-19
JSW Cement Limited
28. Changes in Inventories of finished goods, work in progress and stock in trade ` crores
29. Employee Benefits Expense ` crores
Particulars For the period ended For the period ended
31st March 2019 31st March 2018
Salaries and wages 130.19 96.70
Employee stock option expense 3.72 (7.01)
Contributions to provident fund and other funds (refer note 34 g) 5.08 3.91
Gratuity expense (Refer note 34 g) 1.42 0.69
Staff welfare expenses 3.48 2.36
Total 143.89 96.65
27. Purchases of stock in trade ` crores
Particulars For the period ended For the period ended
31st March 2019 31st March 2018
Granulated Blast Furnace Slag 1.45 1.21
Cement 4.70 1.50
Limestone - 11.33
Total 6.15 14.04
There has been Supreme Court (SC) judegement dated 28th February, 2019 relating to components of salary structurethat need to be taken into account while computing the contribution to provident fund under the EPF Act. There areinterpretative aspects related to the judgement including the effective date of application. The company will continue toassess any further developments in this matter for the implications on financial statements, if any.
Particulars For the period ended For the period ended
31st March 2019 31st March 2018
Inventories at the beginning of the year
Finished goods 19.95 18.16
Semi finished goods 26.34 28.05
46.29 46.21
Trial run stock inventories during the year
Finished goods - 3.13
Semi finished goods - 0.28
- 3.41
Inventories at the end of the year
Finished goods 25.05 19.95
Semi finished goods 14.17 26.34
Total Inventories at the end of the year 39.22 46.29
7.07 3.33
Excise duty on stock of finished goods (net) - (0.40)
Total 7.07 2.93
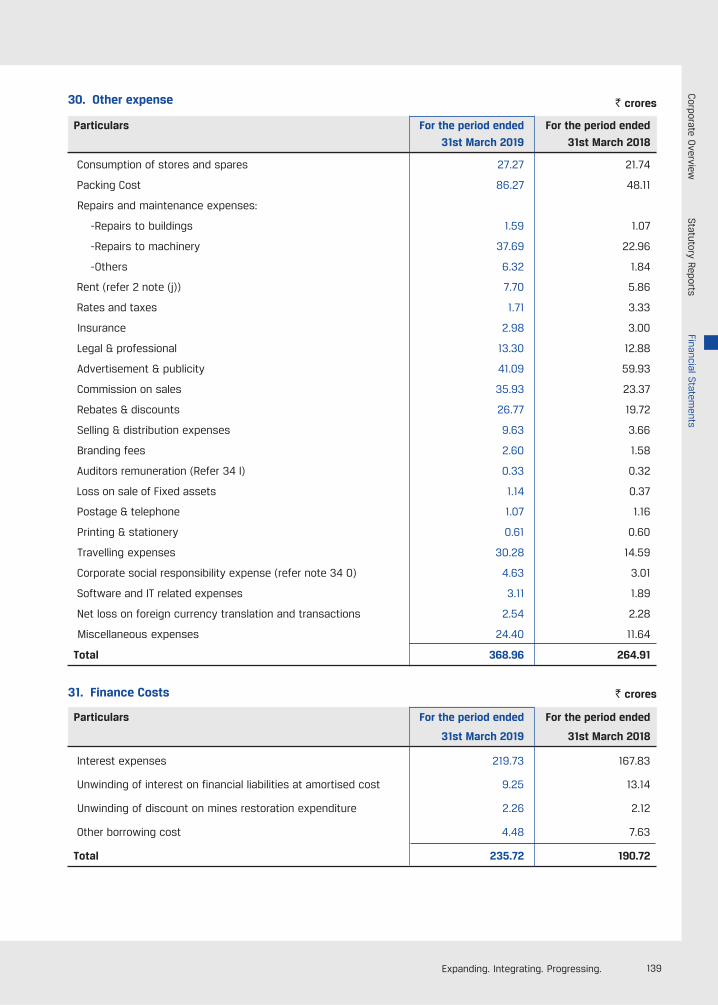
139Expanding. Integrating. Progressing.
30. Other expense ` crores
Particulars For the period ended For the period ended
31st March 2019 31st March 2018
Consumption of stores and spares 27.27 21.74
Packing Cost 86.27 48.11
Repairs and maintenance expenses:
-Repairs to buildings 1.59 1.07
-Repairs to machinery 37.69 22.96
-Others 6.32 1.84
Rent (refer 2 note (j)) 7.70 5.86
Rates and taxes 1.71 3.33
Insurance 2.98 3.00
Legal & professional 13.30 12.88
Advertisement & publicity 41.09 59.93
Commission on sales 35.93 23.37
Rebates & discounts 26.77 19.72
Selling & distribution expenses 9.63 3.66
Branding fees 2.60 1.58
Auditors remuneration (Refer 34 l) 0.33 0.32
Loss on sale of Fixed assets 1.14 0.37
Postage & telephone 1.07 1.16
Printing & stationery 0.61 0.60
Travelling expenses 30.28 14.59
Corporate social responsibility expense (refer note 34 O) 4.63 3.01
Software and IT related expenses 3.11 1.89
Net loss on foreign currency translation and transactions 2.54 2.28
Miscellaneous expenses 24.40 11.64
Total 368.96 264.91
31. Finance Costs ` crores
Particulars For the period ended For the period ended
31st March 2019 31st March 2018
Interest expenses 219.73 167.83
Unwinding of interest on financial liabilities at amortised cost 9.25 13.14
Unwinding of discount on mines restoration expenditure 2.26 2.12
Other borrowing cost 4.48 7.63
Total 235.72 190.72
Corporate O
verviewStatutory Reports
Financial Statem
ents
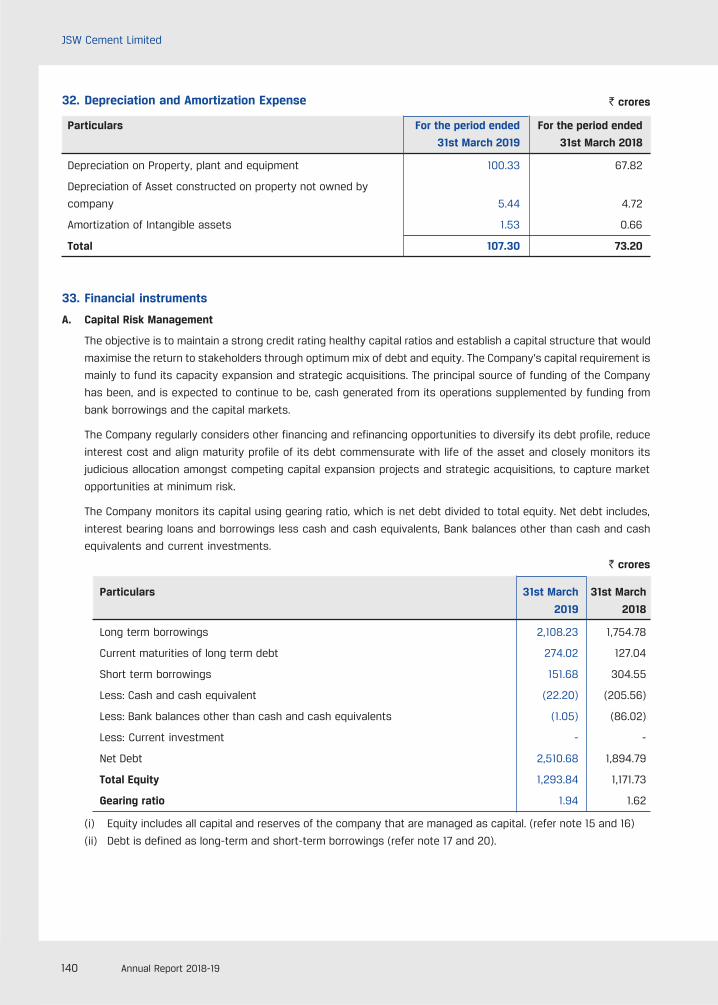
140 Annual Report 2018-19
JSW Cement Limited
32. Depreciation and Amortization Expense ` crores
Particulars For the period ended For the period ended
31st March 2019 31st March 2018
Depreciation on Property, plant and equipment 100.33 67.82
Depreciation of Asset constructed on property not owned by
company 5.44 4.72
Amortization of Intangible assets 1.53 0.66
Total 107.30 73.20
33. Financial instruments
A. Capital Risk Management
The objective is to maintain a strong credit rating healthy capital ratios and establish a capital structure that would
maximise the return to stakeholders through optimum mix of debt and equity. The Company’s capital requirement is
mainly to fund its capacity expansion and strategic acquisitions. The principal source of funding of the Company
has been, and is expected to continue to be, cash generated from its operations supplemented by funding from
bank borrowings and the capital markets.
The Company regularly considers other financing and refinancing opportunities to diversify its debt profile, reduce
interest cost and align maturity profile of its debt commensurate with life of the asset and closely monitors its
judicious allocation amongst competing capital expansion projects and strategic acquisitions, to capture market
opportunities at minimum risk.
The Company monitors its capital using gearing ratio, which is net debt divided to total equity. Net debt includes,
interest bearing loans and borrowings less cash and cash equivalents, Bank balances other than cash and cash
equivalents and current investments.
Particulars 31st March 31st March
2019 2018
Long term borrowings 2,108.23 1,754.78
Current maturities of long term debt 274.02 127.04
Short term borrowings 151.68 304.55
Less: Cash and cash equivalent (22.20) (205.56)
Less: Bank balances other than cash and cash equivalents (1.05) (86.02)
Less: Current investment - -
Net Debt 2,510.68 1,894.79
Total Equity 1,293.84 1,171.73
Gearing ratio 1.94 1.62
(i) Equity includes all capital and reserves of the company that are managed as capital. (refer note 15 and 16)
(ii) Debt is defined as long-term and short-term borrowings (refer note 17 and 20).
` crores
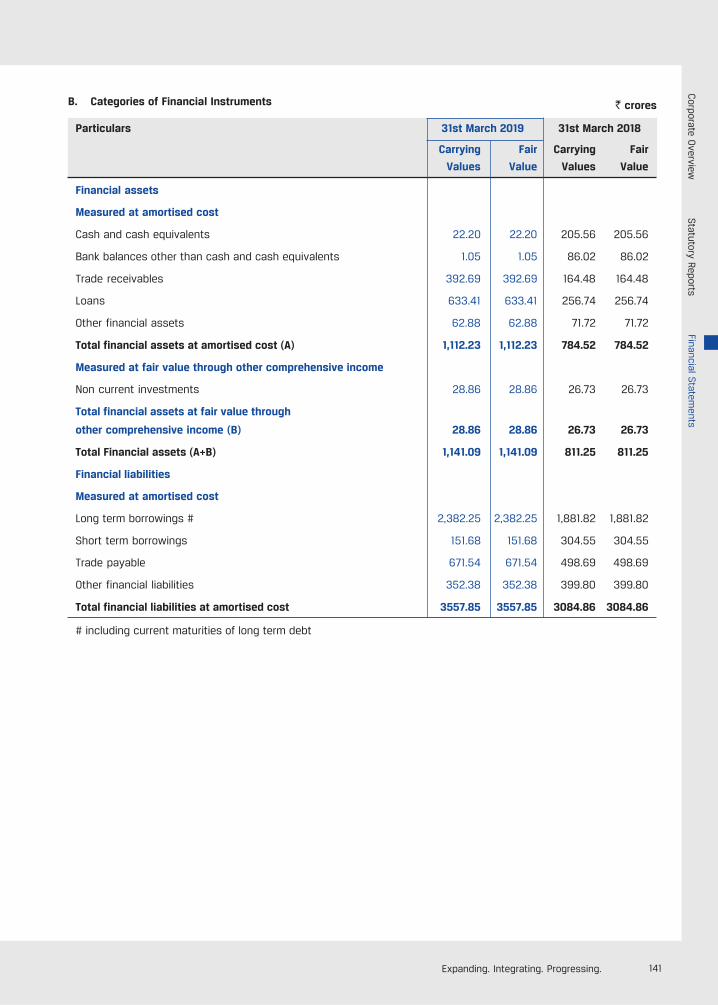
141Expanding. Integrating. Progressing.
B. Categories of Financial Instruments
Particulars 31st March 2019 31st March 2018
Carrying Fair Carrying Fair
Values Value Values Value
Financial assets
Measured at amortised cost
Cash and cash equivalents 22.20 22.20 205.56 205.56
Bank balances other than cash and cash equivalents 1.05 1.05 86.02 86.02
Trade receivables 392.69 392.69 164.48 164.48
Loans 633.41 633.41 256.74 256.74
Other financial assets 62.88 62.88 71.72 71.72
Total financial assets at amortised cost (A) 1,112.23 1,112.23 784.52 784.52
Measured at fair value through other comprehensive income
Non current investments 28.86 28.86 26.73 26.73
Total financial assets at fair value through
other comprehensive income (B) 28.86 28.86 26.73 26.73
Total Financial assets (A+B) 1,141.09 1,141.09 811.25 811.25
Financial liabilities
Measured at amortised cost
Long term borrowings # 2,382.25 2,382.25 1,881.82 1,881.82
Short term borrowings 151.68 151.68 304.55 304.55
Trade payable 671.54 671.54 498.69 498.69
Other financial liabilities 352.38 352.38 399.80 399.80
Total financial liabilities at amortised cost 3557.85 3557.85 3084.86 3084.86
# including current maturities of long term debt
` crores
Corporate O
verviewStatutory Reports
Financial Statem
ents
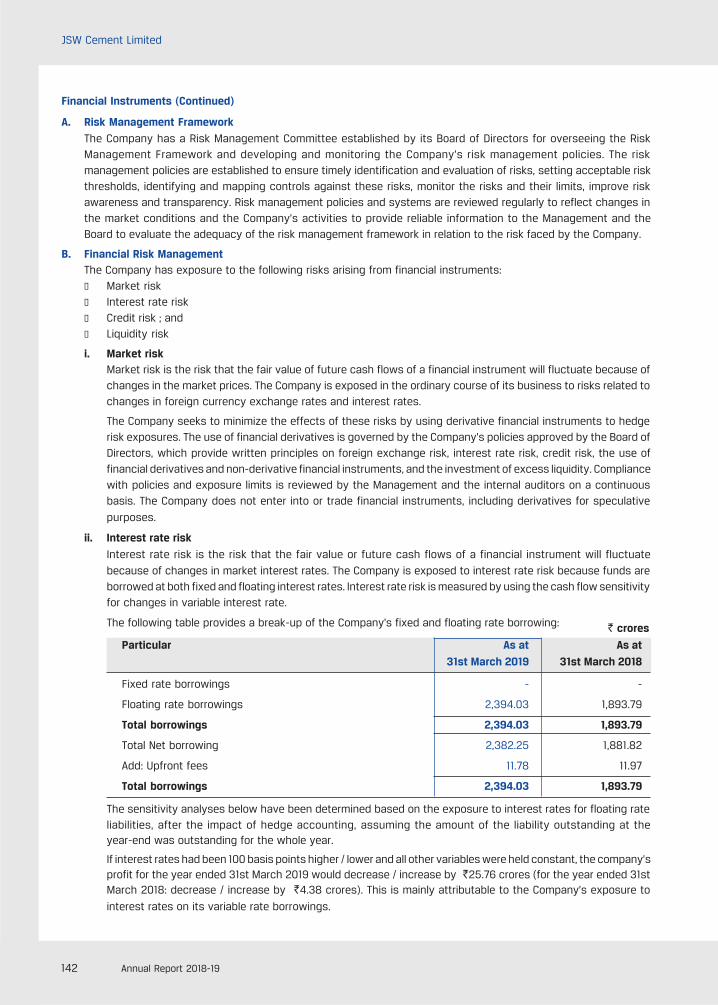
142 Annual Report 2018-19
JSW Cement Limited
Financial Instruments (Continued)
A. Risk Management Framework
The Company has a Risk Management Committee established by its Board of Directors for overseeing the RiskManagement Framework and developing and monitoring the Company’s risk management policies. The riskmanagement policies are established to ensure timely identification and evaluation of risks, setting acceptable riskthresholds, identifying and mapping controls against these risks, monitor the risks and their limits, improve riskawareness and transparency. Risk management policies and systems are reviewed regularly to reflect changes inthe market conditions and the Company’s activities to provide reliable information to the Management and theBoard to evaluate the adequacy of the risk management framework in relation to the risk faced by the Company.
B. Financial Risk ManagementThe Company has exposure to the following risks arising from financial instruments:
l Market riskl Interest rate riskl Credit risk ; andl Liquidity risk
i. Market riskMarket risk is the risk that the fair value of future cash flows of a financial instrument will fluctuate because ofchanges in the market prices. The Company is exposed in the ordinary course of its business to risks related tochanges in foreign currency exchange rates and interest rates.
The Company seeks to minimize the effects of these risks by using derivative financial instruments to hedgerisk exposures. The use of financial derivatives is governed by the Company’s policies approved by the Board ofDirectors, which provide written principles on foreign exchange risk, interest rate risk, credit risk, the use offinancial derivatives and non-derivative financial instruments, and the investment of excess liquidity. Compliancewith policies and exposure limits is reviewed by the Management and the internal auditors on a continuousbasis. The Company does not enter into or trade financial instruments, including derivatives for speculative
purposes.
ii. Interest rate risk
Interest rate risk is the risk that the fair value or future cash flows of a financial instrument will fluctuate
because of changes in market interest rates. The Company is exposed to interest rate risk because funds areborrowed at both fixed and floating interest rates. Interest rate risk is measured by using the cash flow sensitivityfor changes in variable interest rate.
The following table provides a break-up of the Company's fixed and floating rate borrowing:
Particular As at As at
31st March 2019 31st March 2018
Fixed rate borrowings - -
Floating rate borrowings 2,394.03 1,893.79
Total borrowings 2,394.03 1,893.79
Total Net borrowing 2,382.25 1,881.82
Add: Upfront fees 11.78 11.97
Total borrowings 2,394.03 1,893.79
The sensitivity analyses below have been determined based on the exposure to interest rates for floating rateliabilities, after the impact of hedge accounting, assuming the amount of the liability outstanding at theyear-end was outstanding for the whole year.
If interest rates had been 100 basis points higher / lower and all other variables were held constant, the company’sprofit for the year ended 31st March 2019 would decrease / increase by `25.76 crores (for the year ended 31stMarch 2018: decrease / increase by `4.38 crores). This is mainly attributable to the Company’s exposure to
interest rates on its variable rate borrowings.
` crores
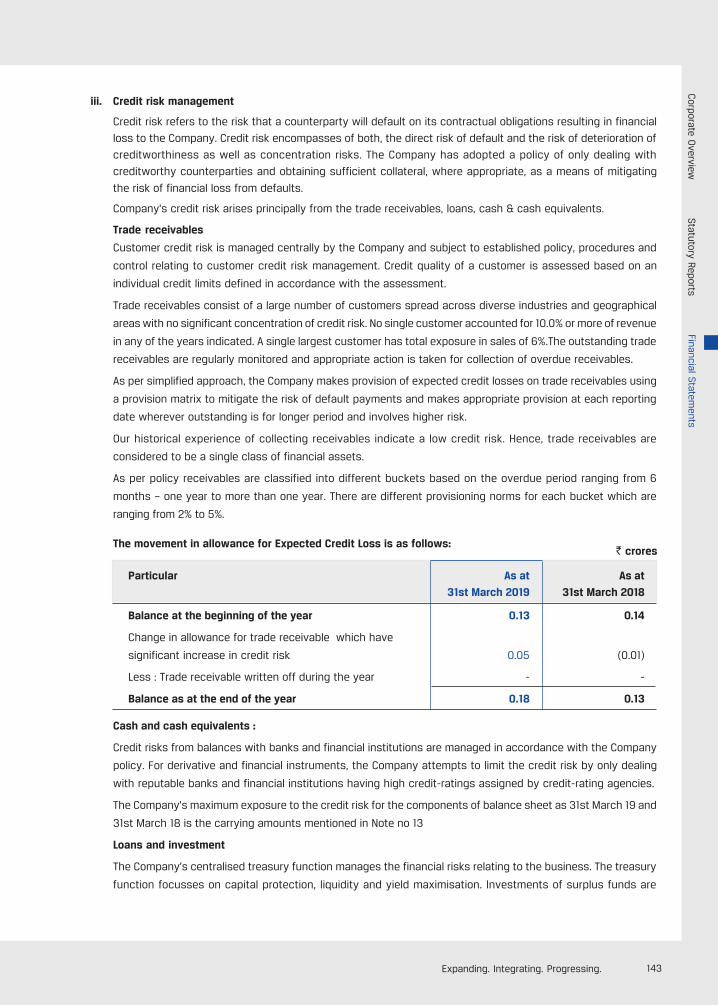
143Expanding. Integrating. Progressing.
iii. Credit risk management
Credit risk refers to the risk that a counterparty will default on its contractual obligations resulting in financial
loss to the Company. Credit risk encompasses of both, the direct risk of default and the risk of deterioration of
creditworthiness as well as concentration risks. The Company has adopted a policy of only dealing with
creditworthy counterparties and obtaining sufficient collateral, where appropriate, as a means of mitigating
the risk of financial loss from defaults.
Company’s credit risk arises principally from the trade receivables, loans, cash & cash equivalents.
Trade receivables
Customer credit risk is managed centrally by the Company and subject to established policy, procedures and
control relating to customer credit risk management. Credit quality of a customer is assessed based on an
individual credit limits defined in accordance with the assessment.
Trade receivables consist of a large number of customers spread across diverse industries and geographical
areas with no significant concentration of credit risk. No single customer accounted for 10.0% or more of revenue
in any of the years indicated. A single largest customer has total exposure in sales of 6%.The outstanding trade
receivables are regularly monitored and appropriate action is taken for collection of overdue receivables.
As per simplified approach, the Company makes provision of expected credit losses on trade receivables using
a provision matrix to mitigate the risk of default payments and makes appropriate provision at each reporting
date wherever outstanding is for longer period and involves higher risk.
Our historical experience of collecting receivables indicate a low credit risk. Hence, trade receivables are
considered to be a single class of financial assets.
As per policy receivables are classified into different buckets based on the overdue period ranging from 6
months – one year to more than one year. There are different provisioning norms for each bucket which are
ranging from 2% to 5%.
The movement in allowance for Expected Credit Loss is as follows:
Particular As at As at
31st March 2019 31st March 2018
Balance at the beginning of the year 0.13 0.14
Change in allowance for trade receivable which have
significant increase in credit risk 0.05 (0.01)
Less : Trade receivable written off during the year - -
Balance as at the end of the year 0.18 0.13
Cash and cash equivalents :
Credit risks from balances with banks and financial institutions are managed in accordance with the Company
policy. For derivative and financial instruments, the Company attempts to limit the credit risk by only dealing
with reputable banks and financial institutions having high credit-ratings assigned by credit-rating agencies.
The Company’s maximum exposure to the credit risk for the components of balance sheet as 31st March 19 and
31st March 18 is the carrying amounts mentioned in Note no 13
Loans and investment
The Company’s centralised treasury function manages the financial risks relating to the business. The treasury
function focusses on capital protection, liquidity and yield maximisation. Investments of surplus funds are
` crores
Corporate O
verviewStatutory Reports
Financial Statem
ents
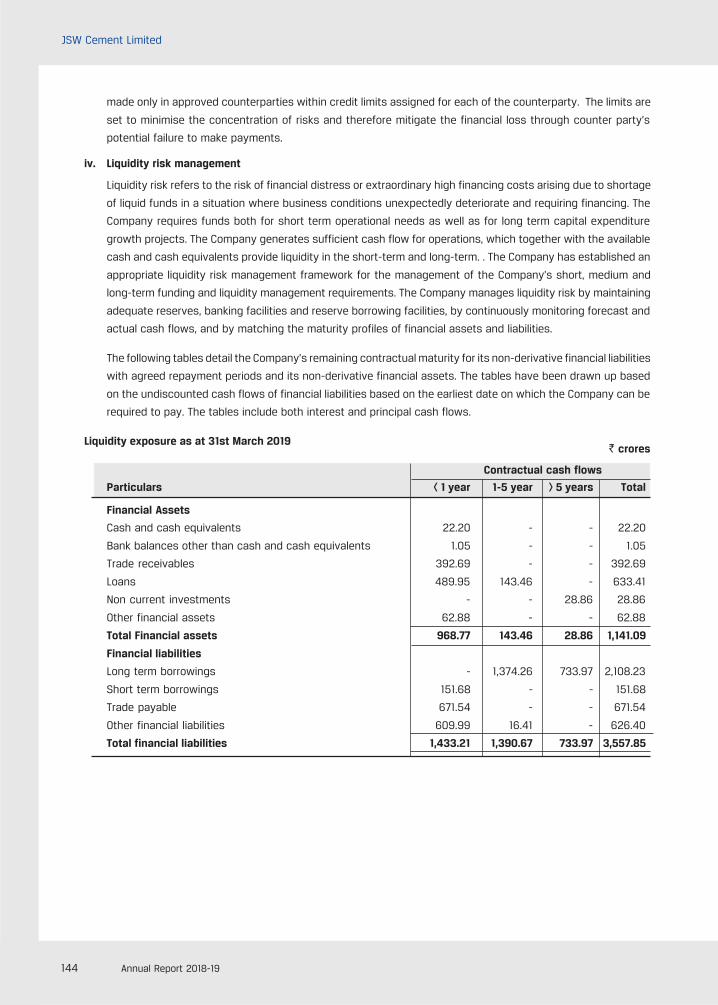
144 Annual Report 2018-19
JSW Cement Limited
made only in approved counterparties within credit limits assigned for each of the counterparty. The limits are
set to minimise the concentration of risks and therefore mitigate the financial loss through counter party’s
potential failure to make payments.
iv. Liquidity risk management
Liquidity risk refers to the risk of financial distress or extraordinary high financing costs arising due to shortage
of liquid funds in a situation where business conditions unexpectedly deteriorate and requiring financing. The
Company requires funds both for short term operational needs as well as for long term capital expenditure
growth projects. The Company generates sufficient cash flow for operations, which together with the available
cash and cash equivalents provide liquidity in the short-term and long-term. . The Company has established an
appropriate liquidity risk management framework for the management of the Company’s short, medium and
long-term funding and liquidity management requirements. The Company manages liquidity risk by maintaining
adequate reserves, banking facilities and reserve borrowing facilities, by continuously monitoring forecast and
actual cash flows, and by matching the maturity profiles of financial assets and liabilities.
The following tables detail the Company’s remaining contractual maturity for its non-derivative financial liabilities
with agreed repayment periods and its non-derivative financial assets. The tables have been drawn up based
on the undiscounted cash flows of financial liabilities based on the earliest date on which the Company can be
required to pay. The tables include both interest and principal cash flows.
Liquidity exposure as at 31st March 2019
Contractual cash flows
Particulars < 1 year 1-5 year > 5 years Total
Financial Assets
Cash and cash equivalents 22.20 - - 22.20
Bank balances other than cash and cash equivalents 1.05 - - 1.05
Trade receivables 392.69 - - 392.69
Loans 489.95 143.46 - 633.41
Non current investments - - 28.86 28.86
Other financial assets 62.88 - - 62.88
Total Financial assets 968.77 143.46 28.86 1,141.09
Financial liabilities
Long term borrowings - 1,374.26 733.97 2,108.23
Short term borrowings 151.68 - - 151.68
Trade payable 671.54 - - 671.54
Other financial liabilities 609.99 16.41 - 626.40
Total financial liabilities 1,433.21 1,390.67 733.97 3,557.85
` crores
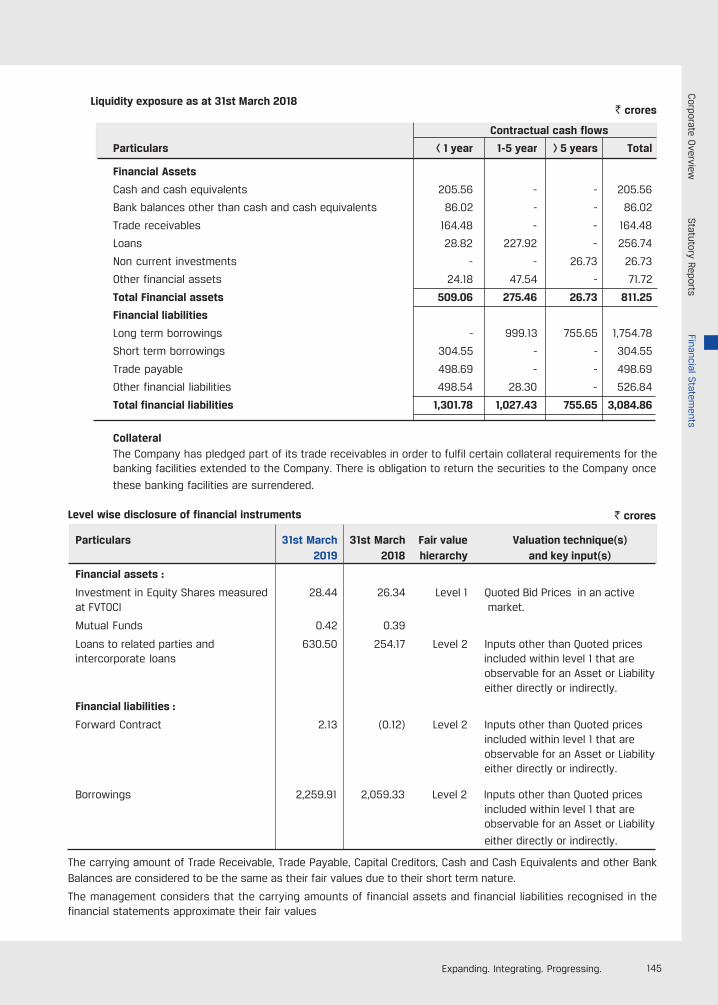
145Expanding. Integrating. Progressing.
Liquidity exposure as at 31st March 2018
Contractual cash flows
Particulars < 1 year 1-5 year > 5 years Total
Financial Assets
Cash and cash equivalents 205.56 - - 205.56
Bank balances other than cash and cash equivalents 86.02 - - 86.02
Trade receivables 164.48 - - 164.48
Loans 28.82 227.92 - 256.74
Non current investments - - 26.73 26.73
Other financial assets 24.18 47.54 - 71.72
Total Financial assets 509.06 275.46 26.73 811.25
Financial liabilities
Long term borrowings - 999.13 755.65 1,754.78
Short term borrowings 304.55 - - 304.55
Trade payable 498.69 - - 498.69
Other financial liabilities 498.54 28.30 - 526.84
Total financial liabilities 1,301.78 1,027.43 755.65 3,084.86
CollateralThe Company has pledged part of its trade receivables in order to fulfil certain collateral requirements for thebanking facilities extended to the Company. There is obligation to return the securities to the Company once
these banking facilities are surrendered.
Level wise disclosure of financial instruments
Particulars 31st March 31st March Fair value Valuation technique(s) 2019 2018 hierarchy and key input(s)
Financial assets :
Investment in Equity Shares measured 28.44 26.34 Level 1 Quoted Bid Prices in an activeat FVTOCI market.
Mutual Funds 0.42 0.39
Loans to related parties and 630.50 254.17 Level 2 Inputs other than Quoted pricesintercorporate loans included within level 1 that are
observable for an Asset or Liabilityeither directly or indirectly.
Financial liabilities :
Forward Contract 2.13 (0.12) Level 2 Inputs other than Quoted pricesincluded within level 1 that areobservable for an Asset or Liabilityeither directly or indirectly.
Borrowings 2,259.91 2,059.33 Level 2 Inputs other than Quoted pricesincluded within level 1 that areobservable for an Asset or Liability
either directly or indirectly.
The carrying amount of Trade Receivable, Trade Payable, Capital Creditors, Cash and Cash Equivalents and other BankBalances are considered to be the same as their fair values due to their short term nature.
The management considers that the carrying amounts of financial assets and financial liabilities recognised in thefinancial statements approximate their fair values
` crores
` crores
Corporate O
verviewStatutory Reports
Financial Statem
ents
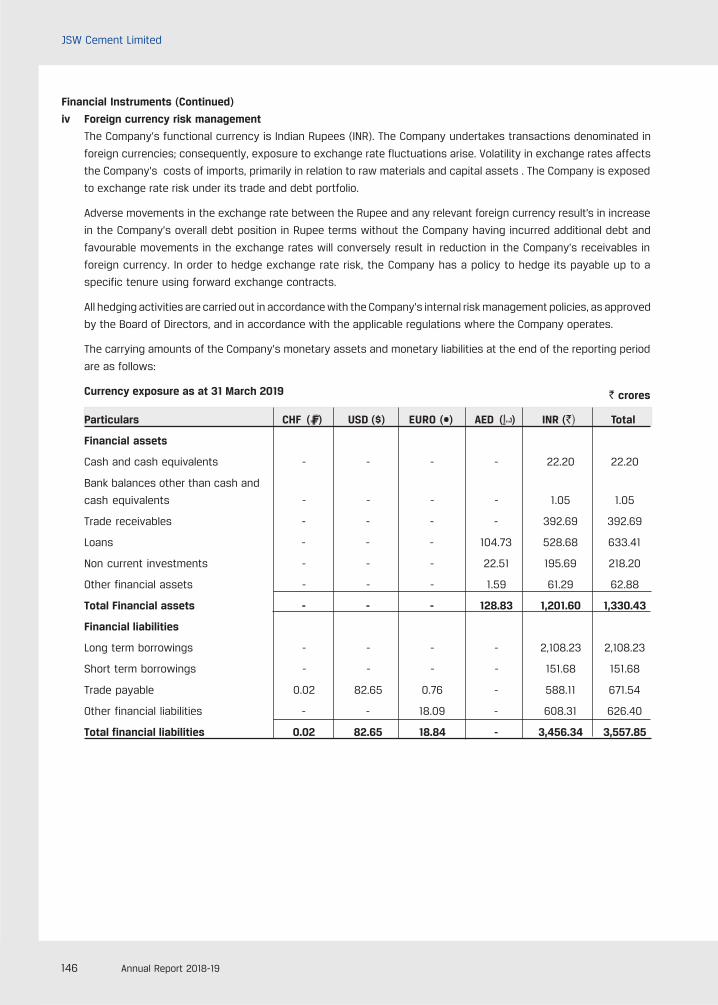
146 Annual Report 2018-19
JSW Cement Limited
Financial Instruments (Continued)
iv Foreign currency risk management
The Company’s functional currency is Indian Rupees (INR). The Company undertakes transactions denominated in
foreign currencies; consequently, exposure to exchange rate fluctuations arise. Volatility in exchange rates affects
the Company’s costs of imports, primarily in relation to raw materials and capital assets . The Company is exposed
to exchange rate risk under its trade and debt portfolio.
Adverse movements in the exchange rate between the Rupee and any relevant foreign currency result’s in increase
in the Company’s overall debt position in Rupee terms without the Company having incurred additional debt and
favourable movements in the exchange rates will conversely result in reduction in the Company’s receivables in
foreign currency. In order to hedge exchange rate risk, the Company has a policy to hedge its payable up to a
specific tenure using forward exchange contracts.
All hedging activities are carried out in accordance with the Company’s internal risk management policies, as approved
by the Board of Directors, and in accordance with the applicable regulations where the Company operates.
The carrying amounts of the Company’s monetary assets and monetary liabilities at the end of the reporting period
are as follows:
Currency exposure as at 31 March 2019
Particulars CHF ( ) USD ($) EURO (•) AED ( ) INR (`) Total
Financial assets
Cash and cash equivalents - - - - 22.20 22.20
Bank balances other than cash and
cash equivalents - - - - 1.05 1.05
Trade receivables - - - - 392.69 392.69
Loans - - - 104.73 528.68 633.41
Non current investments - - - 22.51 195.69 218.20
Other financial assets - - - 1.59 61.29 62.88
Total Financial assets - - - 128.83 1,201.60 1,330.43
Financial liabilities
Long term borrowings - - - - 2,108.23 2,108.23
Short term borrowings - - - - 151.68 151.68
Trade payable 0.02 82.65 0.76 - 588.11 671.54
Other financial liabilities - - 18.09 - 608.31 626.40
Total financial liabilities 0.02 82.65 18.84 - 3,456.34 3,557.85
` crores
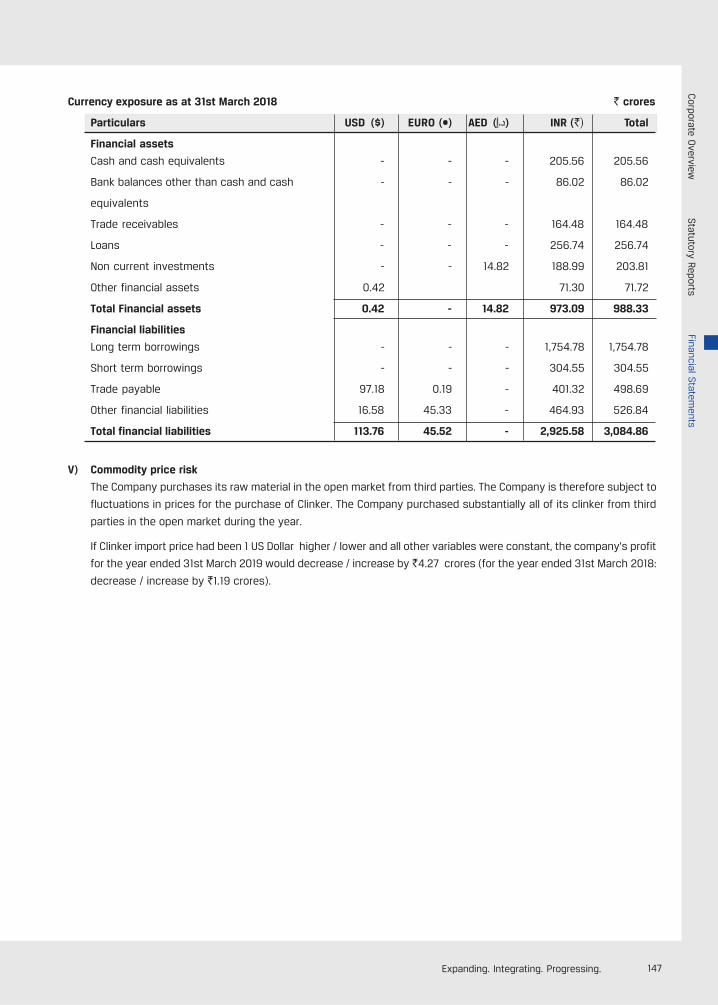
147Expanding. Integrating. Progressing.
Currency exposure as at 31st March 2018
Particulars USD ($) EURO (•) AED ( ) INR (`) Total
Financial assets
Cash and cash equivalents - - - 205.56 205.56
Bank balances other than cash and cash - - - 86.02 86.02
equivalents
Trade receivables - - - 164.48 164.48
Loans - - - 256.74 256.74
Non current investments - - 14.82 188.99 203.81
Other financial assets 0.42 71.30 71.72
Total Financial assets 0.42 - 14.82 973.09 988.33
Financial liabilities
Long term borrowings - - - 1,754.78 1,754.78
Short term borrowings - - - 304.55 304.55
Trade payable 97.18 0.19 - 401.32 498.69
Other financial liabilities 16.58 45.33 - 464.93 526.84
Total financial liabilities 113.76 45.52 - 2,925.58 3,084.86
V) Commodity price risk
The Company purchases its raw material in the open market from third parties. The Company is therefore subject to
fluctuations in prices for the purchase of Clinker. The Company purchased substantially all of its clinker from third
parties in the open market during the year.
If Clinker import price had been 1 US Dollar higher / lower and all other variables were constant, the company’s profit
for the year ended 31st March 2019 would decrease / increase by `4.27 crores (for the year ended 31st March 2018:
decrease / increase by `1.19 crores).
` crores
Corporate O
verviewStatutory Reports
Financial Statem
ents
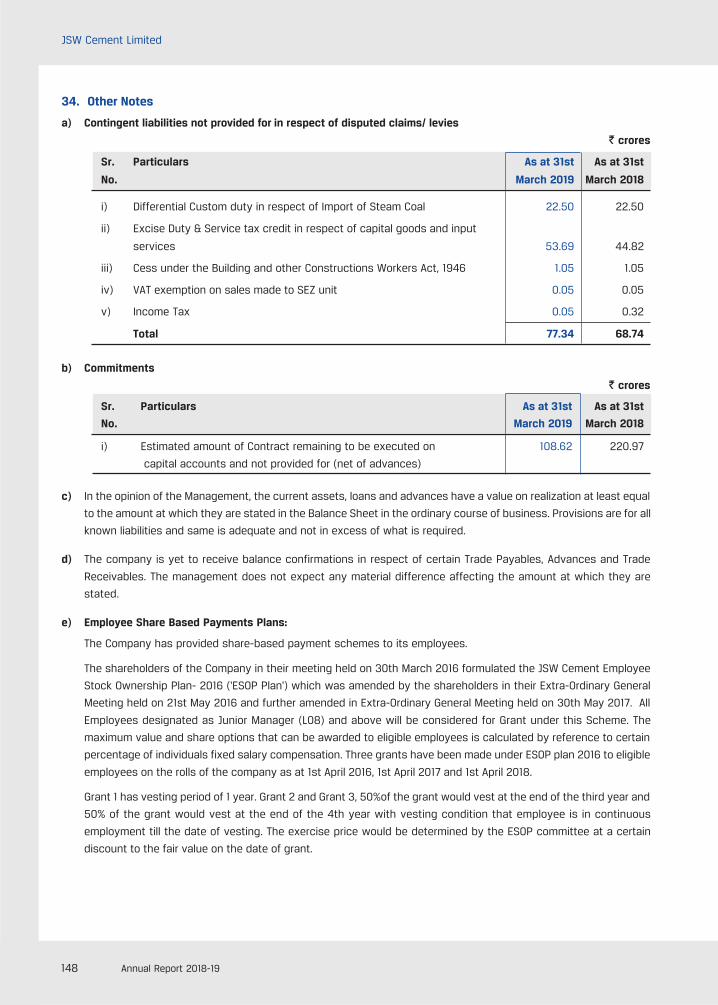
148 Annual Report 2018-19
JSW Cement Limited
34. Other Notes
a) Contingent liabilities not provided for in respect of disputed claims/ levies
` crores
Sr. Particulars As at 31st As at 31st
No. March 2019 March 2018
i) Differential Custom duty in respect of Import of Steam Coal 22.50 22.50
ii) Excise Duty & Service tax credit in respect of capital goods and input
services 53.69 44.82
iii) Cess under the Building and other Constructions Workers Act, 1946 1.05 1.05
iv) VAT exemption on sales made to SEZ unit 0.05 0.05
v) Income Tax 0.05 0.32
Total 77.34 68.74
b) Commitments
` crores
Sr. Particulars As at 31st As at 31st
No. March 2019 March 2018
i) Estimated amount of Contract remaining to be executed on 108.62 220.97
capital accounts and not provided for (net of advances)
c) In the opinion of the Management, the current assets, loans and advances have a value on realization at least equal
to the amount at which they are stated in the Balance Sheet in the ordinary course of business. Provisions are for all
known liabilities and same is adequate and not in excess of what is required.
d) The company is yet to receive balance confirmations in respect of certain Trade Payables, Advances and Trade
Receivables. The management does not expect any material difference affecting the amount at which they are
stated.
e) Employee Share Based Payments Plans:
The Company has provided share-based payment schemes to its employees.
The shareholders of the Company in their meeting held on 30th March 2016 formulated the JSW Cement Employee
Stock Ownership Plan- 2016 ('ESOP Plan') which was amended by the shareholders in their Extra-Ordinary General
Meeting held on 21st May 2016 and further amended in Extra-Ordinary General Meeting held on 30th May 2017. All
Employees designated as Junior Manager (L08) and above will be considered for Grant under this Scheme. The
maximum value and share options that can be awarded to eligible employees is calculated by reference to certain
percentage of individuals fixed salary compensation. Three grants have been made under ESOP plan 2016 to eligible
employees on the rolls of the company as at 1st April 2016, 1st April 2017 and 1st April 2018.
Grant 1 has vesting period of 1 year. Grant 2 and Grant 3, 50%of the grant would vest at the end of the third year and
50% of the grant would vest at the end of the 4th year with vesting condition that employee is in continuous
employment till the date of vesting. The exercise price would be determined by the ESOP committee at a certain
discount to the fair value on the date of grant.
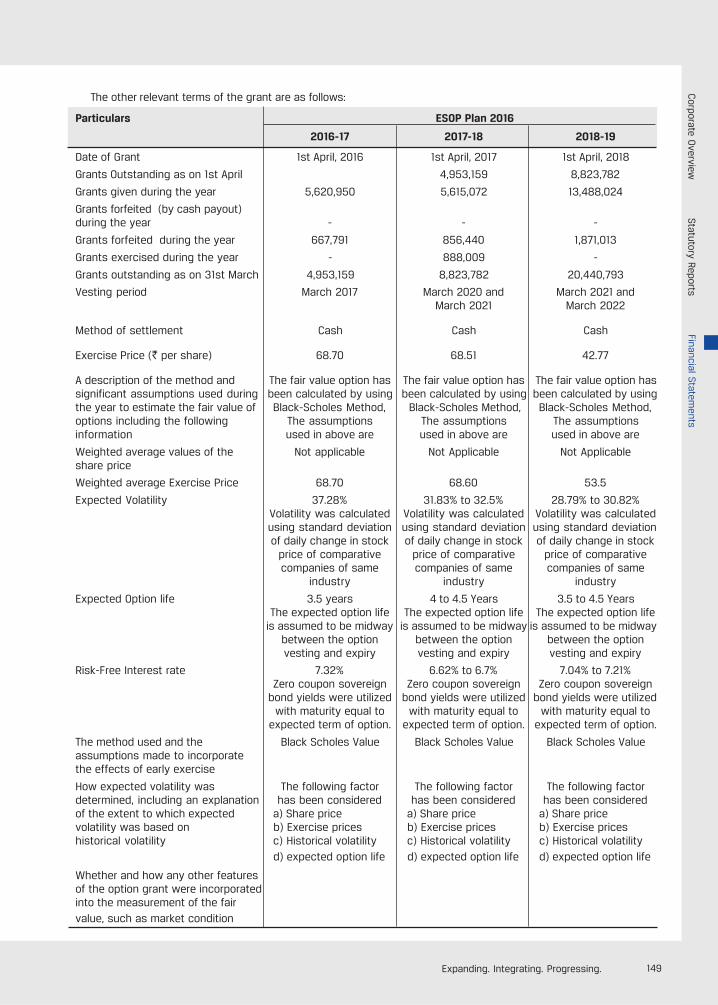
149Expanding. Integrating. Progressing.
The other relevant terms of the grant are as follows:
Particulars ESOP Plan 2016
2016-17 2017-18 2018-19
Date of Grant 1st April, 2016 1st April, 2017 1st April, 2018
Grants Outstanding as on 1st April 4,953,159 8,823,782
Grants given during the year 5,620,950 5,615,072 13,488,024
Grants forfeited (by cash payout)during the year - - -
Grants forfeited during the year 667,791 856,440 1,871,013
Grants exercised during the year - 888,009 -
Grants outstanding as on 31st March 4,953,159 8,823,782 20,440,793
Vesting period March 2017 March 2020 and March 2021 andMarch 2021 March 2022
Method of settlement Cash Cash Cash
Exercise Price (` per share) 68.70 68.51 42.77
A description of the method and The fair value option has The fair value option has The fair value option hassignificant assumptions used during been calculated by using been calculated by using been calculated by usingthe year to estimate the fair value of Black-Scholes Method, Black-Scholes Method, Black-Scholes Method,options including the following The assumptions The assumptions The assumptionsinformation used in above are used in above are used in above are
Weighted average values of the Not applicable Not Applicable Not Applicableshare price
Weighted average Exercise Price 68.70 68.60 53.5
Expected Volatility 37.28% 31.83% to 32.5% 28.79% to 30.82%Volatility was calculated Volatility was calculated Volatility was calculatedusing standard deviation using standard deviation using standard deviationof daily change in stock of daily change in stock of daily change in stock
price of comparative price of comparative price of comparativecompanies of same companies of same companies of same
industry industry industry
Expected Option life 3.5 years 4 to 4.5 Years 3.5 to 4.5 YearsThe expected option life The expected option life The expected option life
is assumed to be midway is assumed to be midway is assumed to be midwaybetween the option between the option between the optionvesting and expiry vesting and expiry vesting and expiry
Risk-Free Interest rate 7.32% 6.62% to 6.7% 7.04% to 7.21%Zero coupon sovereign Zero coupon sovereign Zero coupon sovereign
bond yields were utilized bond yields were utilized bond yields were utilizedwith maturity equal to with maturity equal to with maturity equal to
expected term of option. expected term of option. expected term of option.
The method used and the Black Scholes Value Black Scholes Value Black Scholes Valueassumptions made to incorporatethe effects of early exercise
How expected volatility was The following factor The following factor The following factordetermined, including an explanation has been considered has been considered has been consideredof the extent to which expected a) Share price a) Share price a) Share pricevolatility was based on b) Exercise prices b) Exercise prices b) Exercise priceshistorical volatility c) Historical volatility c) Historical volatility c) Historical volatility
d) expected option life d) expected option life d) expected option life
Whether and how any other featuresof the option grant were incorporatedinto the measurement of the fairvalue, such as market condition
Corporate O
verviewStatutory Reports
Financial Statem
ents
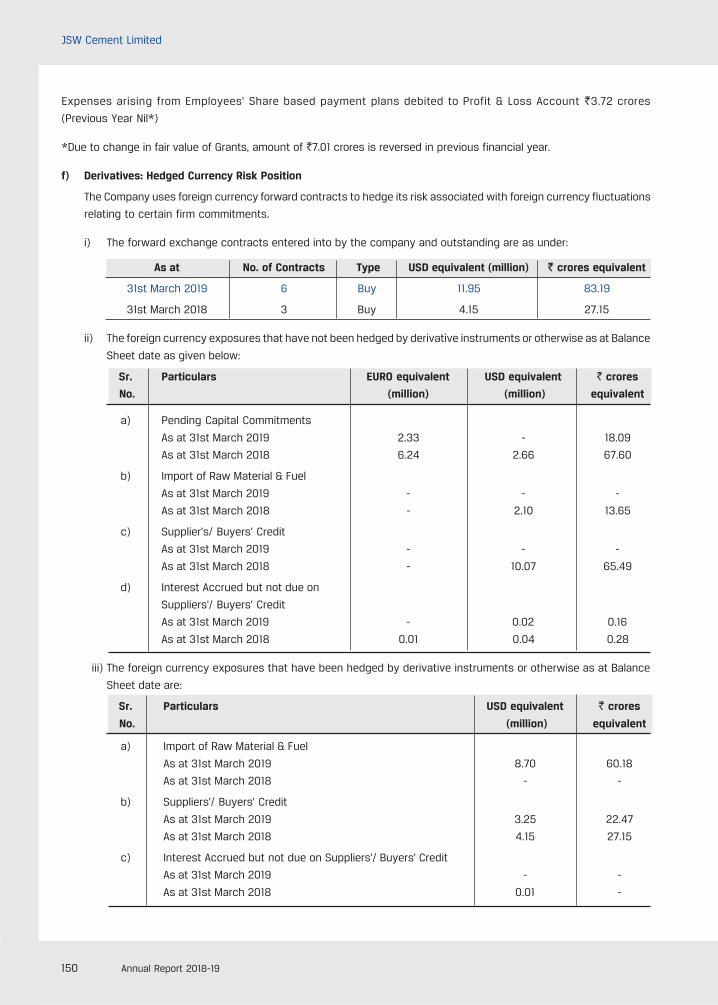
150 Annual Report 2018-19
JSW Cement Limited
Expenses arising from Employees' Share based payment plans debited to Profit & Loss Account `3.72 crores
(Previous Year Nil*)
*Due to change in fair value of Grants, amount of `7.01 crores is reversed in previous financial year.
f) Derivatives: Hedged Currency Risk Position
The Company uses foreign currency forward contracts to hedge its risk associated with foreign currency fluctuations
relating to certain firm commitments.
i) The forward exchange contracts entered into by the company and outstanding are as under:
As at No. of Contracts Type USD equivalent (million) ` crores equivalent
31st March 2019 6 Buy 11.95 83.19
31st March 2018 3 Buy 4.15 27.15
ii) The foreign currency exposures that have not been hedged by derivative instruments or otherwise as at Balance
Sheet date as given below:
Sr. Particulars EURO equivalent USD equivalent ` crores
No. (million) (million) equivalent
a) Pending Capital Commitments
As at 31st March 2019 2.33 - 18.09
As at 31st March 2018 6.24 2.66 67.60
b) Import of Raw Material & Fuel
As at 31st March 2019 - - -
As at 31st March 2018 - 2.10 13.65
c) Supplier's/ Buyers' Credit
As at 31st March 2019 - - -
As at 31st March 2018 - 10.07 65.49
d) Interest Accrued but not due on
Suppliers'/ Buyers' Credit
As at 31st March 2019 - 0.02 0.16
As at 31st March 2018 0.01 0.04 0.28
iii) The foreign currency exposures that have been hedged by derivative instruments or otherwise as at Balance
Sheet date are:
Sr. Particulars USD equivalent ` crores
No. (million) equivalent
a) Import of Raw Material & Fuel
As at 31st March 2019 8.70 60.18
As at 31st March 2018 - -
b) Suppliers'/ Buyers' Credit
As at 31st March 2019 3.25 22.47
As at 31st March 2018 4.15 27.15
c) Interest Accrued but not due on Suppliers'/ Buyers' Credit
As at 31st March 2019 - -
As at 31st March 2018 0.01 -
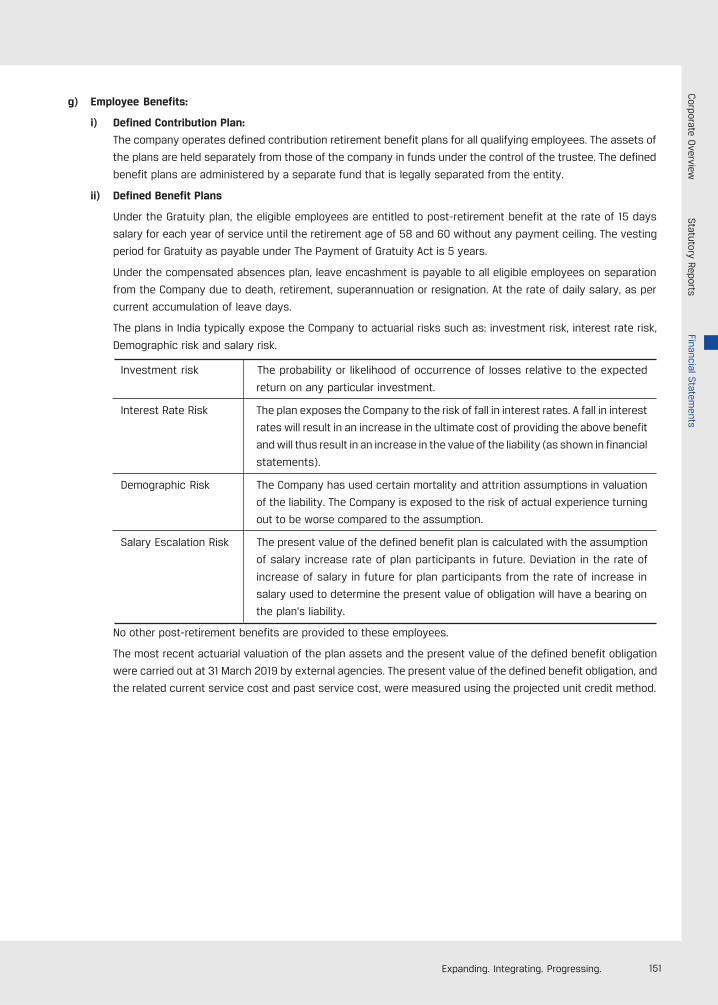
151Expanding. Integrating. Progressing.
g) Employee Benefits:
i) Defined Contribution Plan:
The company operates defined contribution retirement benefit plans for all qualifying employees. The assets of
the plans are held separately from those of the company in funds under the control of the trustee. The defined
benefit plans are administered by a separate fund that is legally separated from the entity.
ii) Defined Benefit Plans
Under the Gratuity plan, the eligible employees are entitled to post-retirement benefit at the rate of 15 days
salary for each year of service until the retirement age of 58 and 60 without any payment ceiling. The vesting
period for Gratuity as payable under The Payment of Gratuity Act is 5 years.
Under the compensated absences plan, leave encashment is payable to all eligible employees on separation
from the Company due to death, retirement, superannuation or resignation. At the rate of daily salary, as per
current accumulation of leave days.
The plans in India typically expose the Company to actuarial risks such as: investment risk, interest rate risk,
Demographic risk and salary risk.
Investment risk The probability or likelihood of occurrence of losses relative to the expected
return on any particular investment.
Interest Rate Risk The plan exposes the Company to the risk of fall in interest rates. A fall in interest
rates will result in an increase in the ultimate cost of providing the above benefit
and will thus result in an increase in the value of the liability (as shown in financial
statements).
Demographic Risk The Company has used certain mortality and attrition assumptions in valuation
of the liability. The Company is exposed to the risk of actual experience turning
out to be worse compared to the assumption.
Salary Escalation Risk The present value of the defined benefit plan is calculated with the assumption
of salary increase rate of plan participants in future. Deviation in the rate of
increase of salary in future for plan participants from the rate of increase in
salary used to determine the present value of obligation will have a bearing on
the plan's liability.
No other post-retirement benefits are provided to these employees.
The most recent actuarial valuation of the plan assets and the present value of the defined benefit obligation
were carried out at 31 March 2019 by external agencies. The present value of the defined benefit obligation, and
the related current service cost and past service cost, were measured using the projected unit credit method.
Corporate O
verviewStatutory Reports
Financial Statem
ents
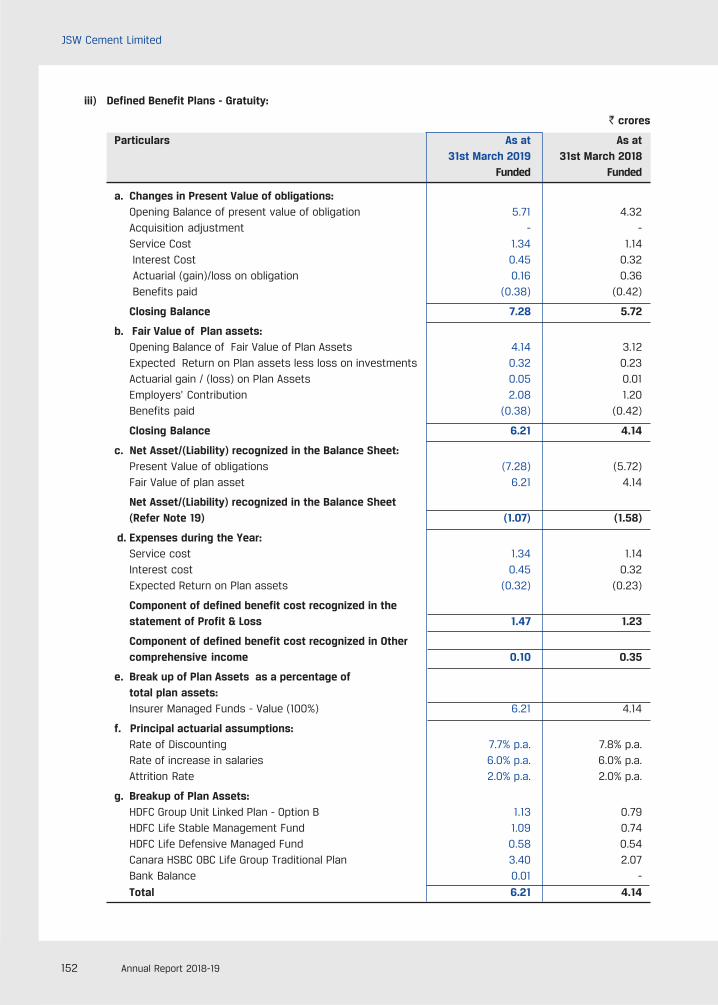
152 Annual Report 2018-19
JSW Cement Limited
iii) Defined Benefit Plans - Gratuity:
` crores
Particulars As at As at31st March 2019 31st March 2018
Funded Funded
a. Changes in Present Value of obligations:Opening Balance of present value of obligation 5.71 4.32Acquisition adjustment - -Service Cost 1.34 1.14 Interest Cost 0.45 0.32 Actuarial (gain)/loss on obligation 0.16 0.36 Benefits paid (0.38) (0.42)
Closing Balance 7.28 5.72
b. Fair Value of Plan assets:Opening Balance of Fair Value of Plan Assets 4.14 3.12Expected Return on Plan assets less loss on investments 0.32 0.23Actuarial gain / (loss) on Plan Assets 0.05 0.01Employers' Contribution 2.08 1.20Benefits paid (0.38) (0.42)
Closing Balance 6.21 4.14
c. Net Asset/(Liability) recognized in the Balance Sheet:Present Value of obligations (7.28) (5.72)Fair Value of plan asset 6.21 4.14
Net Asset/(Liability) recognized in the Balance Sheet(Refer Note 19) (1.07) (1.58)
d. Expenses during the Year:Service cost 1.34 1.14Interest cost 0.45 0.32Expected Return on Plan assets (0.32) (0.23)
Component of defined benefit cost recognized in thestatement of Profit & Loss 1.47 1.23
Component of defined benefit cost recognized in Othercomprehensive income 0.10 0.35
e. Break up of Plan Assets as a percentage oftotal plan assets:Insurer Managed Funds - Value (100%) 6.21 4.14
f. Principal actuarial assumptions:Rate of Discounting 7.7% p.a. 7.8% p.a.Rate of increase in salaries 6.0% p.a. 6.0% p.a.Attrition Rate 2.0% p.a. 2.0% p.a.
g. Breakup of Plan Assets:HDFC Group Unit Linked Plan - Option B 1.13 0.79HDFC Life Stable Management Fund 1.09 0.74HDFC Life Defensive Managed Fund 0.58 0.54Canara HSBC OBC Life Group Traditional Plan 3.40 2.07Bank Balance 0.01 -
Total 6.21 4.14
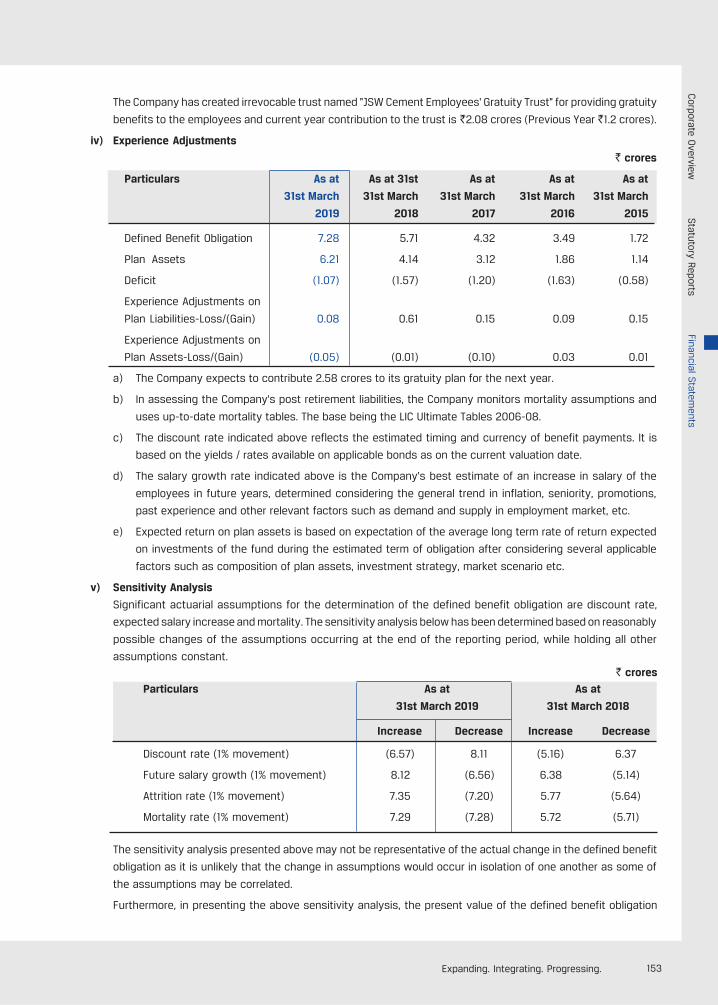
153Expanding. Integrating. Progressing.
The Company has created irrevocable trust named "JSW Cement Employees' Gratuity Trust" for providing gratuity
benefits to the employees and current year contribution to the trust is `2.08 crores (Previous Year `1.2 crores).
iv) Experience Adjustments
` crores
Particulars As at As at 31st As at As at As at
31st March 31st March 31st March 31st March 31st March
2019 2018 2017 2016 2015
Defined Benefit Obligation 7.28 5.71 4.32 3.49 1.72
Plan Assets 6.21 4.14 3.12 1.86 1.14
Deficit (1.07) (1.57) (1.20) (1.63) (0.58)
Experience Adjustments on
Plan Liabilities-Loss/(Gain) 0.08 0.61 0.15 0.09 0.15
Experience Adjustments on
Plan Assets-Loss/(Gain) (0.05) (0.01) (0.10) 0.03 0.01
a) The Company expects to contribute 2.58 crores to its gratuity plan for the next year.
b) In assessing the Company's post retirement liabilities, the Company monitors mortality assumptions and
uses up-to-date mortality tables. The base being the LIC Ultimate Tables 2006-08.
c) The discount rate indicated above reflects the estimated timing and currency of benefit payments. It is
based on the yields / rates available on applicable bonds as on the current valuation date.
d) The salary growth rate indicated above is the Company's best estimate of an increase in salary of the
employees in future years, determined considering the general trend in inflation, seniority, promotions,
past experience and other relevant factors such as demand and supply in employment market, etc.
e) Expected return on plan assets is based on expectation of the average long term rate of return expected
on investments of the fund during the estimated term of obligation after considering several applicable
factors such as composition of plan assets, investment strategy, market scenario etc.
v) Sensitivity Analysis
Significant actuarial assumptions for the determination of the defined benefit obligation are discount rate,
expected salary increase and mortality. The sensitivity analysis below has been determined based on reasonably
possible changes of the assumptions occurring at the end of the reporting period, while holding all other
assumptions constant.
Particulars As at As at
31st March 2019 31st March 2018
Increase Decrease Increase Decrease
Discount rate (1% movement) (6.57) 8.11 (5.16) 6.37
Future salary growth (1% movement) 8.12 (6.56) 6.38 (5.14)
Attrition rate (1% movement) 7.35 (7.20) 5.77 (5.64)
Mortality rate (1% movement) 7.29 (7.28) 5.72 (5.71)
The sensitivity analysis presented above may not be representative of the actual change in the defined benefit
obligation as it is unlikely that the change in assumptions would occur in isolation of one another as some of
the assumptions may be correlated.
Furthermore, in presenting the above sensitivity analysis, the present value of the defined benefit obligation
` crores
Corporate O
verviewStatutory Reports
Financial Statem
ents
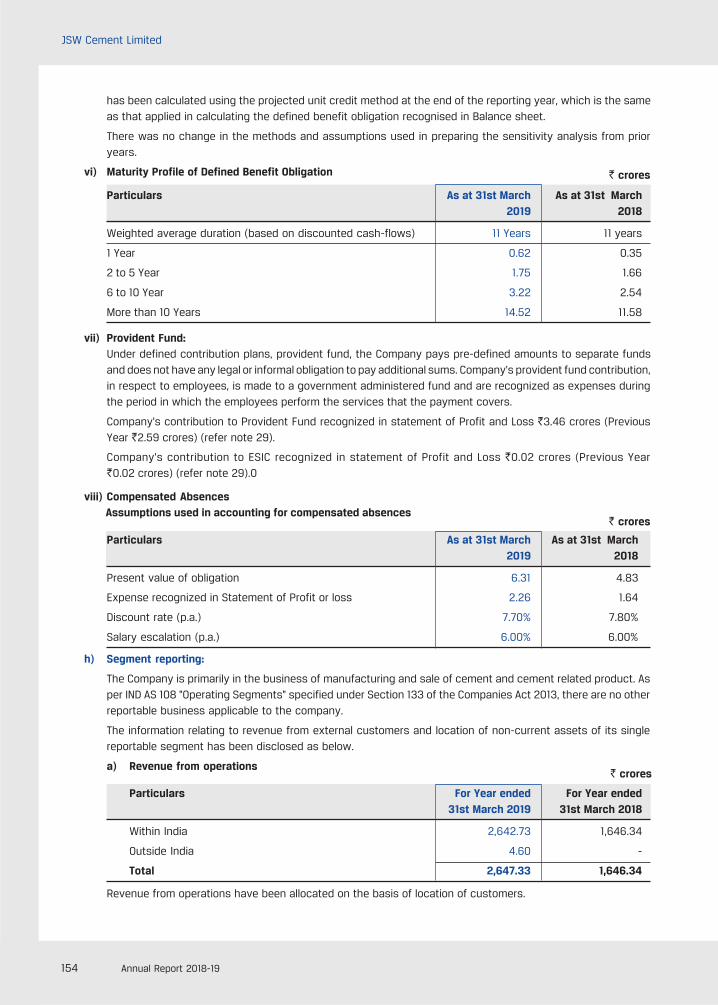
154 Annual Report 2018-19
JSW Cement Limited
has been calculated using the projected unit credit method at the end of the reporting year, which is the sameas that applied in calculating the defined benefit obligation recognised in Balance sheet.
There was no change in the methods and assumptions used in preparing the sensitivity analysis from prioryears.
vi) Maturity Profile of Defined Benefit Obligation
Particulars As at 31st March As at 31st March2019 2018
Weighted average duration (based on discounted cash-flows) 11 Years 11 years
1 Year 0.62 0.35
2 to 5 Year 1.75 1.66
6 to 10 Year 3.22 2.54
More than 10 Years 14.52 11.58
vii) Provident Fund:Under defined contribution plans, provident fund, the Company pays pre-defined amounts to separate fundsand does not have any legal or informal obligation to pay additional sums. Company's provident fund contribution,in respect to employees, is made to a government administered fund and are recognized as expenses duringthe period in which the employees perform the services that the payment covers.
Company's contribution to Provident Fund recognized in statement of Profit and Loss `3.46 crores (PreviousYear `2.59 crores) (refer note 29).
Company's contribution to ESIC recognized in statement of Profit and Loss `0.02 crores (Previous Year`0.02 crores) (refer note 29).0
viii) Compensated Absences Assumptions used in accounting for compensated absences
Particulars As at 31st March As at 31st March2019 2018
Present value of obligation 6.31 4.83
Expense recognized in Statement of Profit or loss 2.26 1.64
Discount rate (p.a.) 7.70% 7.80%
Salary escalation (p.a.) 6.00% 6.00%
h) Segment reporting:
The Company is primarily in the business of manufacturing and sale of cement and cement related product. Asper IND AS 108 "Operating Segments" specified under Section 133 of the Companies Act 2013, there are no otherreportable business applicable to the company.
The information relating to revenue from external customers and location of non-current assets of its singlereportable segment has been disclosed as below.
a) Revenue from operations
Particulars For Year ended For Year ended31st March 2019 31st March 2018
Within India 2,642.73 1,646.34
Outside India 4.60 -
Total 2,647.33 1,646.34
Revenue from operations have been allocated on the basis of location of customers.
` crores
` crores
` crores
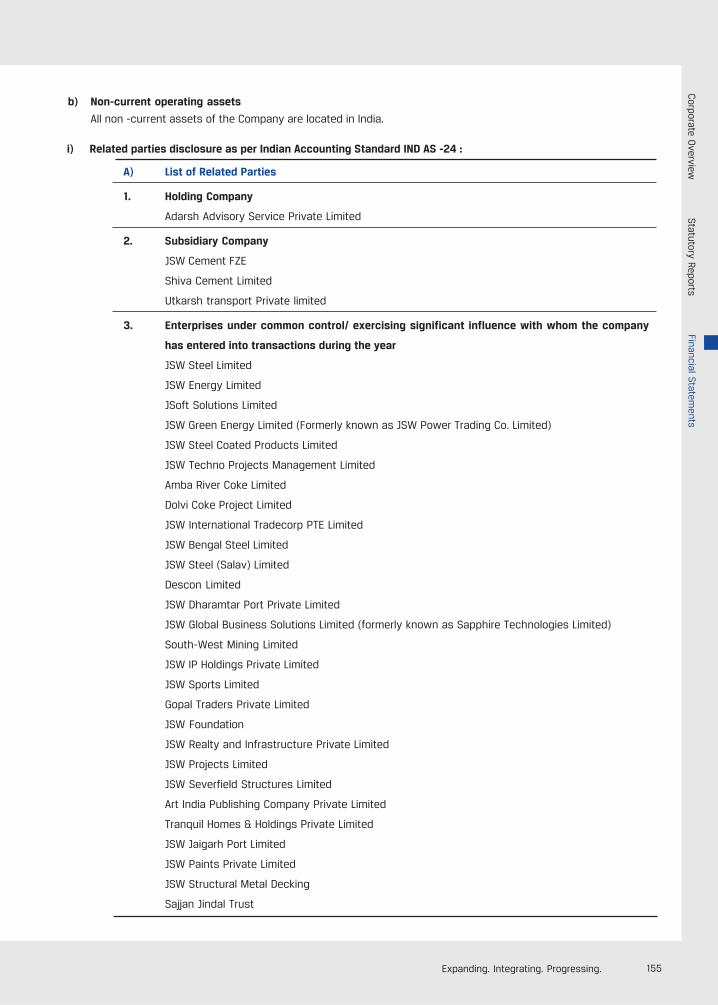
155Expanding. Integrating. Progressing.
i) Related parties disclosure as per Indian Accounting Standard IND AS -24 :
A) List of Related Parties
1. Holding Company
Adarsh Advisory Service Private Limited
2. Subsidiary Company
JSW Cement FZE
Shiva Cement Limited
Utkarsh transport Private limited
3. Enterprises under common control/ exercising significant influence with whom the company
has entered into transactions during the year
JSW Steel Limited
JSW Energy Limited
JSoft Solutions Limited
JSW Green Energy Limited (Formerly known as JSW Power Trading Co. Limited)
JSW Steel Coated Products Limited
JSW Techno Projects Management Limited
Amba River Coke Limited
Dolvi Coke Project Limited
JSW International Tradecorp PTE Limited
JSW Bengal Steel Limited
JSW Steel (Salav) Limited
Descon Limited
JSW Dharamtar Port Private Limited
JSW Global Business Solutions Limited (formerly known as Sapphire Technologies Limited)
South-West Mining Limited
JSW IP Holdings Private Limited
JSW Sports Limited
Gopal Traders Private Limited
JSW Foundation
JSW Realty and Infrastructure Private Limited
JSW Projects Limited
JSW Severfield Structures Limited
Art India Publishing Company Private Limited
Tranquil Homes & Holdings Private Limited
JSW Jaigarh Port Limited
JSW Paints Private Limited
JSW Structural Metal Decking
Sajjan Jindal Trust
b) Non-current operating assets
All non -current assets of the Company are located in India.
Corporate O
verviewStatutory Reports
Financial Statem
ents
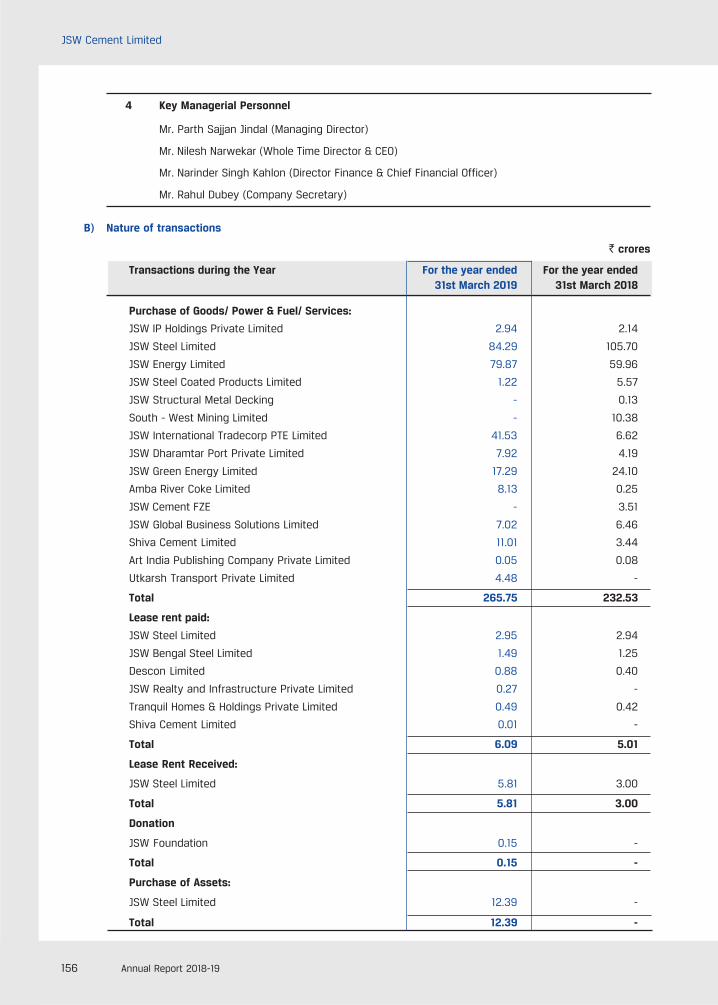
156 Annual Report 2018-19
JSW Cement Limited
4 Key Managerial Personnel
Mr. Parth Sajjan Jindal (Managing Director)
Mr. Nilesh Narwekar (Whole Time Director & CEO)
Mr. Narinder Singh Kahlon (Director Finance & Chief Financial Officer)
Mr. Rahul Dubey (Company Secretary)
B) Nature of transactions
` crores
Transactions during the Year For the year ended For the year ended31st March 2019 31st March 2018
Purchase of Goods/ Power & Fuel/ Services:
JSW IP Holdings Private Limited 2.94 2.14
JSW Steel Limited 84.29 105.70
JSW Energy Limited 79.87 59.96
JSW Steel Coated Products Limited 1.22 5.57
JSW Structural Metal Decking - 0.13
South - West Mining Limited - 10.38
JSW International Tradecorp PTE Limited 41.53 6.62
JSW Dharamtar Port Private Limited 7.92 4.19
JSW Green Energy Limited 17.29 24.10
Amba River Coke Limited 8.13 0.25
JSW Cement FZE - 3.51
JSW Global Business Solutions Limited 7.02 6.46
Shiva Cement Limited 11.01 3.44
Art India Publishing Company Private Limited 0.05 0.08
Utkarsh Transport Private Limited 4.48 -
Total 265.75 232.53
Lease rent paid:
JSW Steel Limited 2.95 2.94
JSW Bengal Steel Limited 1.49 1.25
Descon Limited 0.88 0.40
JSW Realty and Infrastructure Private Limited 0.27 -
Tranquil Homes & Holdings Private Limited 0.49 0.42
Shiva Cement Limited 0.01 -
Total 6.09 5.01
Lease Rent Received:
JSW Steel Limited 5.81 3.00
Total 5.81 3.00
Donation
JSW Foundation 0.15 -
Total 0.15 -
Purchase of Assets:
JSW Steel Limited 12.39 -
Total 12.39 -
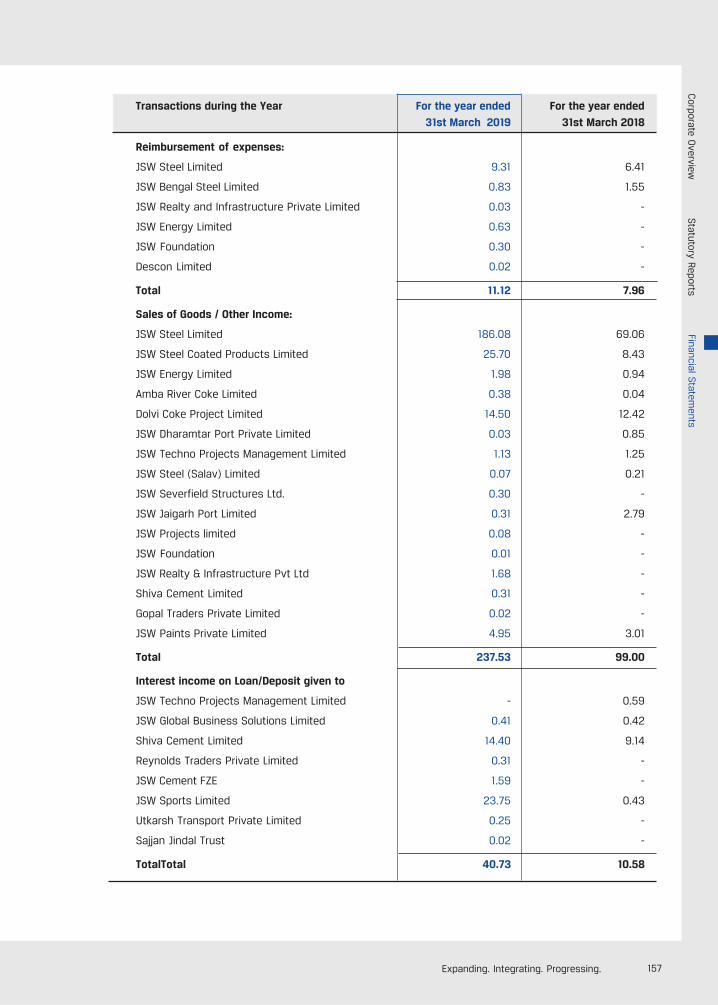
157Expanding. Integrating. Progressing.
Transactions during the Year For the year ended For the year ended
31st March 2019 31st March 2018
Reimbursement of expenses:
JSW Steel Limited 9.31 6.41
JSW Bengal Steel Limited 0.83 1.55
JSW Realty and Infrastructure Private Limited 0.03 -
JSW Energy Limited 0.63 -
JSW Foundation 0.30 -
Descon Limited 0.02 -
Total 11.12 7.96
Sales of Goods / Other Income:
JSW Steel Limited 186.08 69.06
JSW Steel Coated Products Limited 25.70 8.43
JSW Energy Limited 1.98 0.94
Amba River Coke Limited 0.38 0.04
Dolvi Coke Project Limited 14.50 12.42
JSW Dharamtar Port Private Limited 0.03 0.85
JSW Techno Projects Management Limited 1.13 1.25
JSW Steel (Salav) Limited 0.07 0.21
JSW Severfield Structures Ltd. 0.30 -
JSW Jaigarh Port Limited 0.31 2.79
JSW Projects limited 0.08 -
JSW Foundation 0.01 -
JSW Realty & Infrastructure Pvt Ltd 1.68 -
Shiva Cement Limited 0.31 -
Gopal Traders Private Limited 0.02 -
JSW Paints Private Limited 4.95 3.01
Total 237.53 99.00
Interest income on Loan/Deposit given to
JSW Techno Projects Management Limited - 0.59
JSW Global Business Solutions Limited 0.41 0.42
Shiva Cement Limited 14.40 9.14
Reynolds Traders Private Limited 0.31 -
JSW Cement FZE 1.59 -
JSW Sports Limited 23.75 0.43
Utkarsh Transport Private Limited 0.25 -
Sajjan Jindal Trust 0.02 -
TotalTotal 40.73 10.58
Corporate O
verviewStatutory Reports
Financial Statem
ents

158 Annual Report 2018-19
JSW Cement Limited
Transactions during the Year For the year ended For the year ended31st March 2019 31st March 2018
Subscription to Equity Share Capital by:
Adarsh Advisory Service Private Limited - 535.84
Total - 535.84
Recovery of expenses:
JSW Energy Limited 0.83 0.46
JSW Bengal Steel Ltd 0.17 -
Total 1.00 0.46
Purchase of Equity Share:
JSW Cement FZE 7.69 14.82
Utkarsh Transport Private Limited 1.01 -
Shiva Cement Limited 3.56 -
Total 12.26 14.82
Share Application Money:
JSW Cement FZE - 4.01
Total - 4.01
Deposit given
JSW Steel Limited 10.32 -
JSW Realty and Infrastructure Private Limited 0.90 -
Total 11.22 -
Loan given
JSW Global Business Solutions Limited - 0.76
JSW Sports Limited 206.25 68.75
Shiva Cement Limited 14.77 124.03
Utkarsh Transport Private Limited 4.79 -
Sajjan Jindal trust 9.00 -
JSW Cement FZE 104.73 -
Total 339.54 193.54
Loan Given- Received Back
JSW Global Business Solutions Limited - 0.55
Sajjan Jindal Trust 9.00 -
JSW Techno Projects Management Limited - 20.00
UUtkarsh transport private limited 10.00 -
Shiva Cement Limited 6.97 -
Reynolds Traders Private Limited 2.89 -
Total 28.86 20.55
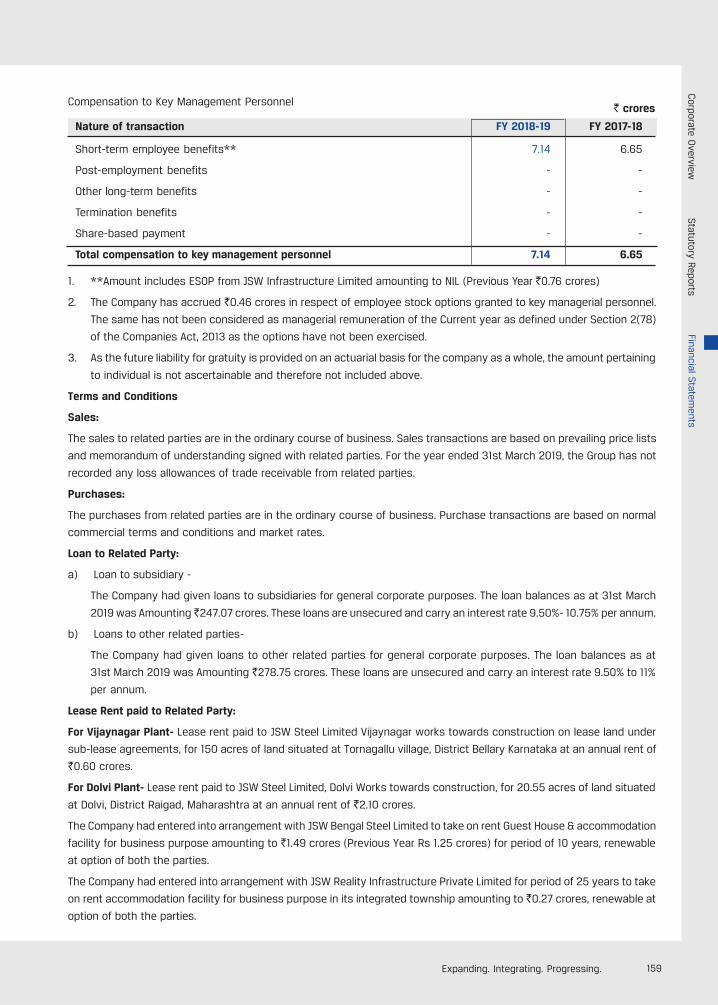
159Expanding. Integrating. Progressing.
Compensation to Key Management Personnel
Nature of transaction FY 2018-19 FY 2017-18
Short-term employee benefits** 7.14 6.65
Post-employment benefits - -
Other long-term benefits - -
Termination benefits - -
Share-based payment - -
Total compensation to key management personnel 7.14 6.65
1. **Amount includes ESOP from JSW Infrastructure Limited amounting to NIL (Previous Year `0.76 crores)
2. The Company has accrued `0.46 crores in respect of employee stock options granted to key managerial personnel.
The same has not been considered as managerial remuneration of the Current year as defined under Section 2(78)
of the Companies Act, 2013 as the options have not been exercised.
3. As the future liability for gratuity is provided on an actuarial basis for the company as a whole, the amount pertaining
to individual is not ascertainable and therefore not included above.
Terms and Conditions
Sales:
The sales to related parties are in the ordinary course of business. Sales transactions are based on prevailing price lists
and memorandum of understanding signed with related parties. For the year ended 31st March 2019, the Group has not
recorded any loss allowances of trade receivable from related parties.
Purchases:
The purchases from related parties are in the ordinary course of business. Purchase transactions are based on normal
commercial terms and conditions and market rates.
Loan to Related Party:
a) Loan to subsidiary -
The Company had given loans to subsidiaries for general corporate purposes. The loan balances as at 31st March
2019 was Amounting `247.07 crores. These loans are unsecured and carry an interest rate 9.50%- 10.75% per annum.
b) Loans to other related parties-
The Company had given loans to other related parties for general corporate purposes. The loan balances as at
31st March 2019 was Amounting `278.75 crores. These loans are unsecured and carry an interest rate 9.50% to 11%
per annum.
Lease Rent paid to Related Party:
For Vijaynagar Plant- Lease rent paid to JSW Steel Limited Vijaynagar works towards construction on lease land under
sub-lease agreements, for 150 acres of land situated at Tornagallu village, District Bellary Karnataka at an annual rent of
`0.60 crores.
For Dolvi Plant- Lease rent paid to JSW Steel Limited, Dolvi Works towards construction, for 20.55 acres of land situated
at Dolvi, District Raigad, Maharashtra at an annual rent of `2.10 crores.
The Company had entered into arrangement with JSW Bengal Steel Limited to take on rent Guest House & accommodation
facility for business purpose amounting to `1.49 crores (Previous Year Rs 1.25 crores) for period of 10 years, renewable
at option of both the parties.
The Company had entered into arrangement with JSW Reality Infrastructure Private Limited for period of 25 years to take
on rent accommodation facility for business purpose in its integrated township amounting to `0.27 crores, renewable at
option of both the parties.
` crores
Corporate O
verviewStatutory Reports
Financial Statem
ents
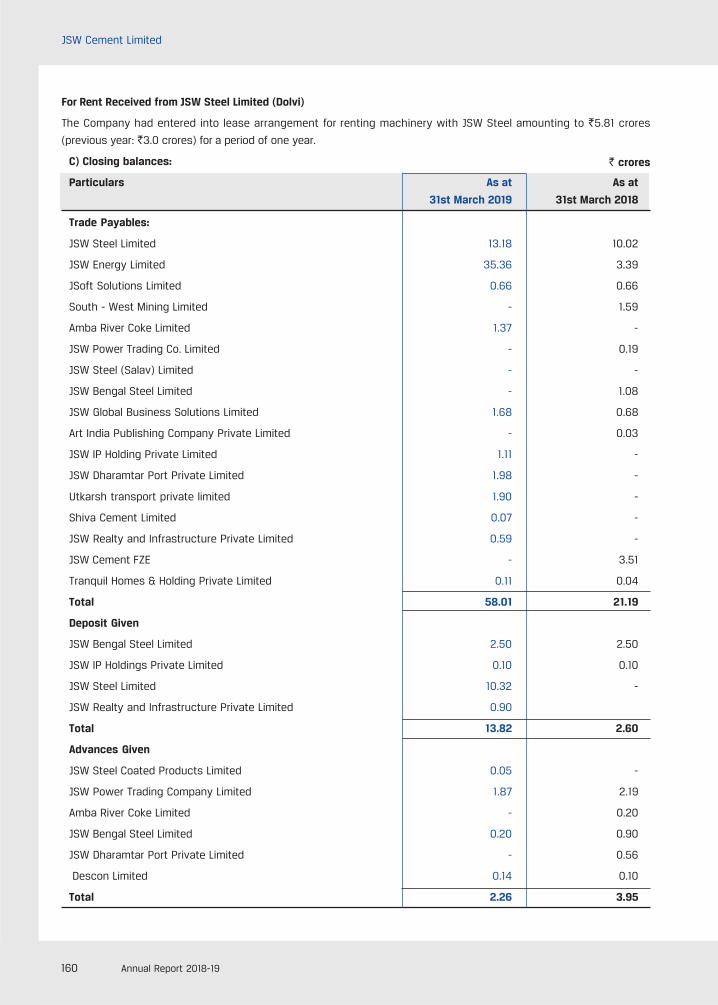
160 Annual Report 2018-19
JSW Cement Limited
For Rent Received from JSW Steel Limited (Dolvi)
The Company had entered into lease arrangement for renting machinery with JSW Steel amounting to `5.81 crores
(previous year: `3.0 crores) for a period of one year.
C) Closing balances:
Particulars As at As at
31st March 2019 31st March 2018
Trade Payables:
JSW Steel Limited 13.18 10.02
JSW Energy Limited 35.36 3.39
JSoft Solutions Limited 0.66 0.66
South - West Mining Limited - 1.59
Amba River Coke Limited 1.37 -
JSW Power Trading Co. Limited - 0.19
JSW Steel (Salav) Limited - -
JSW Bengal Steel Limited - 1.08
JSW Global Business Solutions Limited 1.68 0.68
Art India Publishing Company Private Limited - 0.03
JSW IP Holding Private Limited 1.11 -
JSW Dharamtar Port Private Limited 1.98 -
Utkarsh transport private limited 1.90 -
Shiva Cement Limited 0.07 -
JSW Realty and Infrastructure Private Limited 0.59 -
JSW Cement FZE - 3.51
Tranquil Homes & Holding Private Limited 0.11 0.04
Total 58.01 21.19
Deposit Given
JSW Bengal Steel Limited 2.50 2.50
JSW IP Holdings Private Limited 0.10 0.10
JSW Steel Limited 10.32 -
JSW Realty and Infrastructure Private Limited 0.90
Total 13.82 2.60
Advances Given
JSW Steel Coated Products Limited 0.05 -
JSW Power Trading Company Limited 1.87 2.19
Amba River Coke Limited - 0.20
JSW Bengal Steel Limited 0.20 0.90
JSW Dharamtar Port Private Limited - 0.56
Descon Limited 0.14 0.10
Total 2.26 3.95
` crores
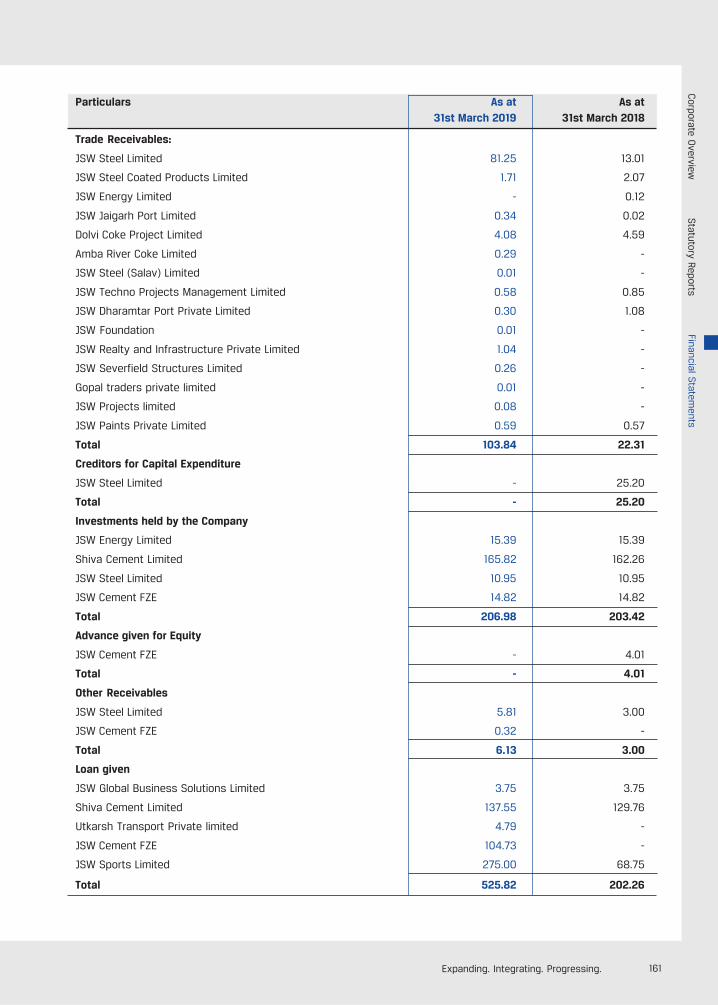
161Expanding. Integrating. Progressing.
Particulars As at As at31st March 2019 31st March 2018
Trade Receivables:
JSW Steel Limited 81.25 13.01
JSW Steel Coated Products Limited 1.71 2.07
JSW Energy Limited - 0.12
JSW Jaigarh Port Limited 0.34 0.02
Dolvi Coke Project Limited 4.08 4.59
Amba River Coke Limited 0.29 -
JSW Steel (Salav) Limited 0.01 -
JSW Techno Projects Management Limited 0.58 0.85
JSW Dharamtar Port Private Limited 0.30 1.08
JSW Foundation 0.01 -
JSW Realty and Infrastructure Private Limited 1.04 -
JSW Severfield Structures Limited 0.26 -
Gopal traders private limited 0.01 -
JSW Projects limited 0.08 -
JSW Paints Private Limited 0.59 0.57
Total 103.84 22.31
Creditors for Capital Expenditure
JSW Steel Limited - 25.20
Total - 25.20
Investments held by the Company
JSW Energy Limited 15.39 15.39
Shiva Cement Limited 165.82 162.26
JSW Steel Limited 10.95 10.95
JSW Cement FZE 14.82 14.82
Total 206.98 203.42
Advance given for Equity
JSW Cement FZE - 4.01
Total - 4.01
Other Receivables
JSW Steel Limited 5.81 3.00
JSW Cement FZE 0.32 -
Total 6.13 3.00
Loan given
JSW Global Business Solutions Limited 3.75 3.75
Shiva Cement Limited 137.55 129.76
Utkarsh Transport Private limited 4.79 -
JSW Cement FZE 104.73 -
JSW Sports Limited 275.00 68.75
Total 525.82 202.26
Corporate O
verviewStatutory Reports
Financial Statem
ents
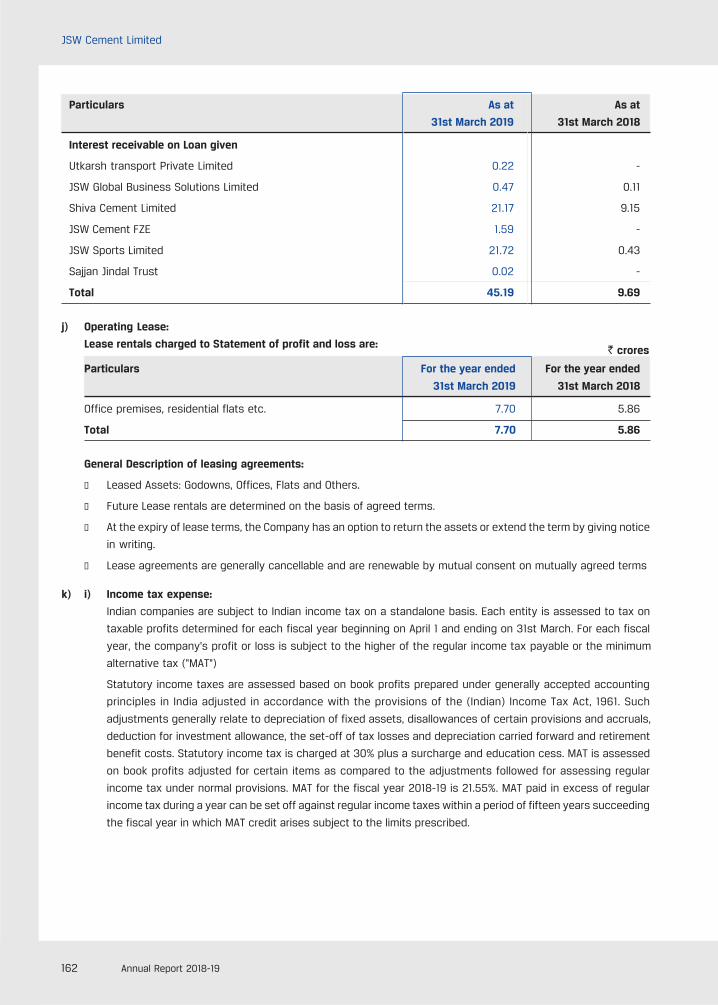
162 Annual Report 2018-19
JSW Cement Limited
Particulars As at As at
31st March 2019 31st March 2018
Interest receivable on Loan given
Utkarsh transport Private Limited 0.22 -
JSW Global Business Solutions Limited 0.47 0.11
Shiva Cement Limited 21.17 9.15
JSW Cement FZE 1.59 -
JSW Sports Limited 21.72 0.43
Sajjan Jindal Trust 0.02 -
Total 45.19 9.69
j) Operating Lease:
Lease rentals charged to Statement of profit and loss are:
Particulars For the year ended For the year ended
31st March 2019 31st March 2018
Office premises, residential flats etc. 7.70 5.86
Total 7.70 5.86
General Description of leasing agreements:
l Leased Assets: Godowns, Offices, Flats and Others.
l Future Lease rentals are determined on the basis of agreed terms.
l At the expiry of lease terms, the Company has an option to return the assets or extend the term by giving notice
in writing.
l Lease agreements are generally cancellable and are renewable by mutual consent on mutually agreed terms
k) i) Income tax expense:
Indian companies are subject to Indian income tax on a standalone basis. Each entity is assessed to tax on
taxable profits determined for each fiscal year beginning on April 1 and ending on 31st March. For each fiscal
year, the company's profit or loss is subject to the higher of the regular income tax payable or the minimum
alternative tax ("MAT")
Statutory income taxes are assessed based on book profits prepared under generally accepted accounting
principles in India adjusted in accordance with the provisions of the (Indian) Income Tax Act, 1961. Such
adjustments generally relate to depreciation of fixed assets, disallowances of certain provisions and accruals,
deduction for investment allowance, the set-off of tax losses and depreciation carried forward and retirement
benefit costs. Statutory income tax is charged at 30% plus a surcharge and education cess. MAT is assessed
on book profits adjusted for certain items as compared to the adjustments followed for assessing regular
income tax under normal provisions. MAT for the fiscal year 2018-19 is 21.55%. MAT paid in excess of regular
income tax during a year can be set off against regular income taxes within a period of fifteen years succeeding
the fiscal year in which MAT credit arises subject to the limits prescribed.
` crores
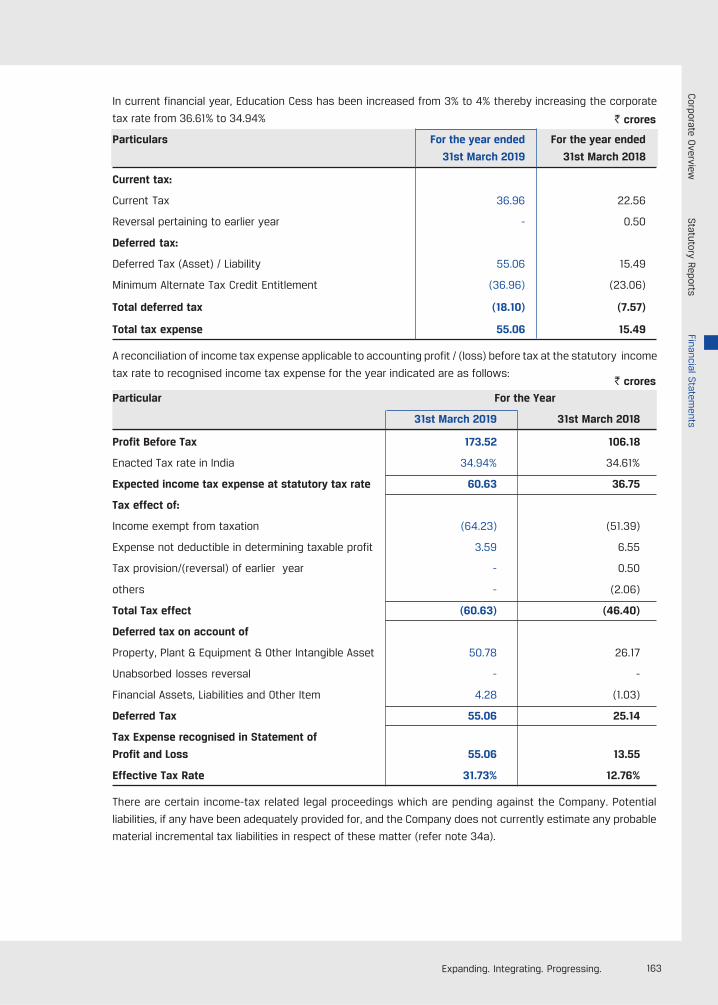
163Expanding. Integrating. Progressing.
In current financial year, Education Cess has been increased from 3% to 4% thereby increasing the corporate
tax rate from 36.61% to 34.94%
Particulars For the year ended For the year ended
31st March 2019 31st March 2018
Current tax:
Current Tax 36.96 22.56
Reversal pertaining to earlier year - 0.50
Deferred tax:
Deferred Tax (Asset) / Liability 55.06 15.49
Minimum Alternate Tax Credit Entitlement (36.96) (23.06)
Total deferred tax (18.10) (7.57)
Total tax expense 55.06 15.49
A reconciliation of income tax expense applicable to accounting profit / (loss) before tax at the statutory income
tax rate to recognised income tax expense for the year indicated are as follows:
Particular For the Year
31st March 2019 31st March 2018
Profit Before Tax 173.52 106.18
Enacted Tax rate in India 34.94% 34.61%
Expected income tax expense at statutory tax rate 60.63 36.75
Tax effect of:
Income exempt from taxation (64.23) (51.39)
Expense not deductible in determining taxable profit 3.59 6.55
Tax provision/(reversal) of earlier year - 0.50
others - (2.06)
Total Tax effect (60.63) (46.40)
Deferred tax on account of
Property, Plant & Equipment & Other Intangible Asset 50.78 26.17
Unabsorbed losses reversal - -
Financial Assets, Liabilities and Other Item 4.28 (1.03)
Deferred Tax 55.06 25.14
Tax Expense recognised in Statement of
Profit and Loss 55.06 13.55
Effective Tax Rate 31.73% 12.76%
There are certain income-tax related legal proceedings which are pending against the Company. Potential
liabilities, if any have been adequately provided for, and the Company does not currently estimate any probable
material incremental tax liabilities in respect of these matter (refer note 34a).
` crores
` crores
Corporate O
verviewStatutory Reports
Financial Statem
ents
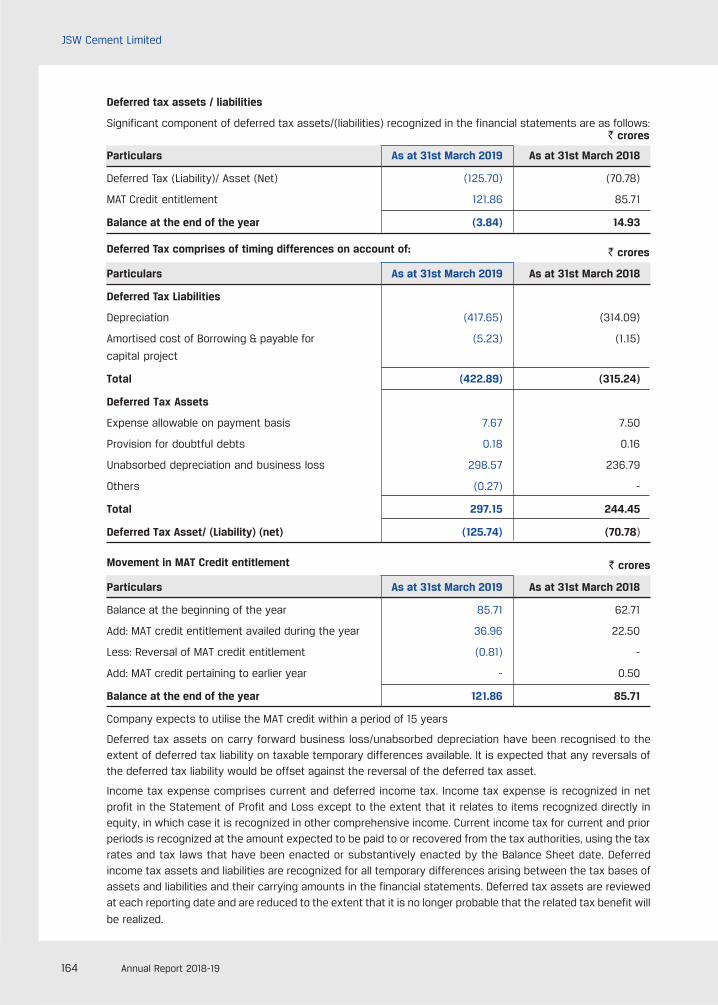
164 Annual Report 2018-19
JSW Cement Limited
Deferred tax assets / liabilities
Significant component of deferred tax assets/(liabilities) recognized in the financial statements are as follows:
Particulars As at 31st March 2019 As at 31st March 2018
Deferred Tax (Liability)/ Asset (Net) (125.70) (70.78)
MAT Credit entitlement 121.86 85.71
Balance at the end of the year (3.84) 14.93
Deferred Tax comprises of timing differences on account of:
Particulars As at 31st March 2019 As at 31st March 2018
Deferred Tax Liabilities
Depreciation (417.65) (314.09)
Amortised cost of Borrowing & payable for (5.23) (1.15)
capital project
Total (422.89) (315.24)
Deferred Tax Assets
Expense allowable on payment basis 7.67 7.50
Provision for doubtful debts 0.18 0.16
Unabsorbed depreciation and business loss 298.57 236.79
Others (0.27) -
Total 297.15 244.45
Deferred Tax Asset/ (Liability) (net) (125.74) (70.78)
Movement in MAT Credit entitlement
Particulars As at 31st March 2019 As at 31st March 2018
Balance at the beginning of the year 85.71 62.71
Add: MAT credit entitlement availed during the year 36.96 22.50
Less: Reversal of MAT credit entitlement (0.81) -
Add: MAT credit pertaining to earlier year - 0.50
Balance at the end of the year 121.86 85.71
Company expects to utilise the MAT credit within a period of 15 years
Deferred tax assets on carry forward business loss/unabsorbed depreciation have been recognised to theextent of deferred tax liability on taxable temporary differences available. It is expected that any reversals ofthe deferred tax liability would be offset against the reversal of the deferred tax asset.
Income tax expense comprises current and deferred income tax. Income tax expense is recognized in netprofit in the Statement of Profit and Loss except to the extent that it relates to items recognized directly inequity, in which case it is recognized in other comprehensive income. Current income tax for current and priorperiods is recognized at the amount expected to be paid to or recovered from the tax authorities, using the taxrates and tax laws that have been enacted or substantively enacted by the Balance Sheet date. Deferredincome tax assets and liabilities are recognized for all temporary differences arising between the tax bases ofassets and liabilities and their carrying amounts in the financial statements. Deferred tax assets are reviewedat each reporting date and are reduced to the extent that it is no longer probable that the related tax benefit will
be realized.
` crores
` crores
` crores
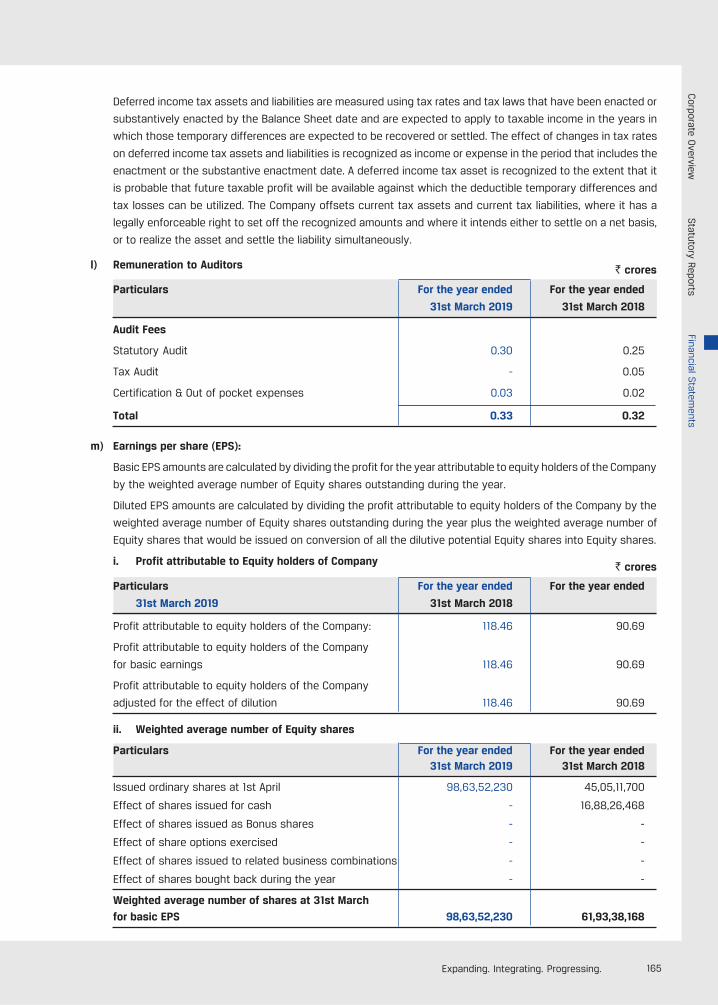
165Expanding. Integrating. Progressing.
Deferred income tax assets and liabilities are measured using tax rates and tax laws that have been enacted or
substantively enacted by the Balance Sheet date and are expected to apply to taxable income in the years in
which those temporary differences are expected to be recovered or settled. The effect of changes in tax rates
on deferred income tax assets and liabilities is recognized as income or expense in the period that includes the
enactment or the substantive enactment date. A deferred income tax asset is recognized to the extent that it
is probable that future taxable profit will be available against which the deductible temporary differences and
tax losses can be utilized. The Company offsets current tax assets and current tax liabilities, where it has a
legally enforceable right to set off the recognized amounts and where it intends either to settle on a net basis,
or to realize the asset and settle the liability simultaneously.
l) Remuneration to Auditors
Particulars For the year ended For the year ended
31st March 2019 31st March 2018
Audit Fees
Statutory Audit 0.30 0.25
Tax Audit - 0.05
Certification & Out of pocket expenses 0.03 0.02
Total 0.33 0.32
m) Earnings per share (EPS):
Basic EPS amounts are calculated by dividing the profit for the year attributable to equity holders of the Company
by the weighted average number of Equity shares outstanding during the year.
Diluted EPS amounts are calculated by dividing the profit attributable to equity holders of the Company by the
weighted average number of Equity shares outstanding during the year plus the weighted average number of
Equity shares that would be issued on conversion of all the dilutive potential Equity shares into Equity shares.
i. Profit attributable to Equity holders of Company
Particulars For the year ended For the year ended
31st March 2019 31st March 2018
Profit attributable to equity holders of the Company: 118.46 90.69
Profit attributable to equity holders of the Company
for basic earnings 118.46 90.69
Profit attributable to equity holders of the Company
adjusted for the effect of dilution 118.46 90.69
ii. Weighted average number of Equity shares
Particulars For the year ended For the year ended31st March 2019 31st March 2018
Issued ordinary shares at 1st April 98,63,52,230 45,05,11,700
Effect of shares issued for cash - 16,88,26,468
Effect of shares issued as Bonus shares - -
Effect of share options exercised - -
Effect of shares issued to related business combinations - -
Effect of shares bought back during the year - -
Weighted average number of shares at 31st March
for basic EPS 98,63,52,230 61,93,38,168
` crores
` crores
Corporate O
verviewStatutory Reports
Financial Statem
ents
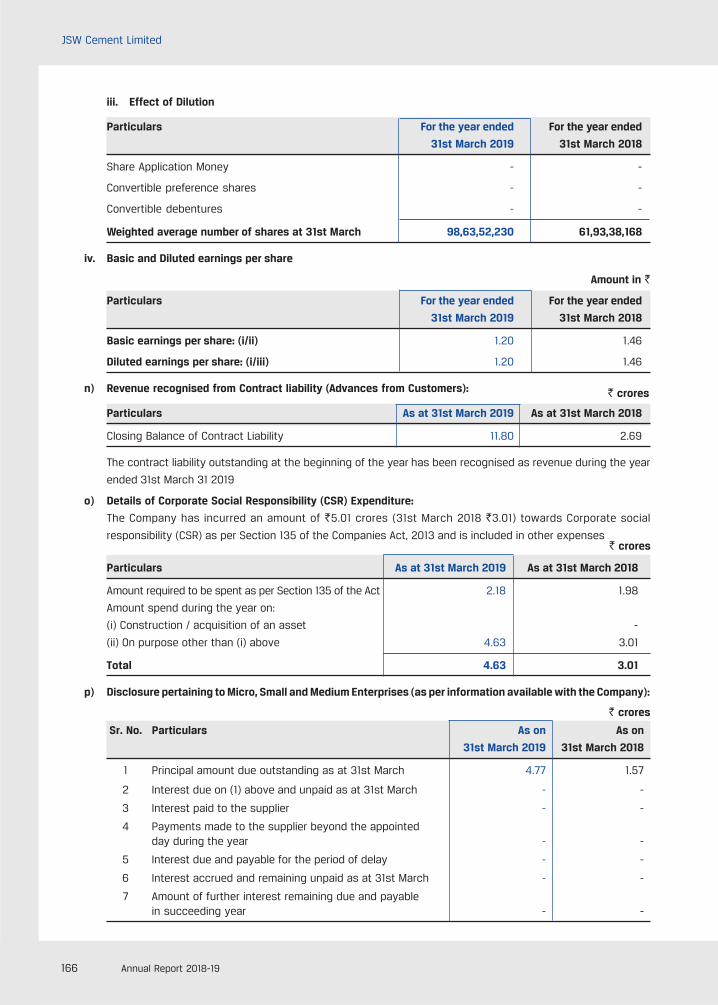
166 Annual Report 2018-19
JSW Cement Limited
iii. Effect of Dilution
Particulars For the year ended For the year ended
31st March 2019 31st March 2018
Share Application Money - -
Convertible preference shares - -
Convertible debentures - -
Weighted average number of shares at 31st March 98,63,52,230 61,93,38,168
iv. Basic and Diluted earnings per share
Amount in `
Particulars For the year ended For the year ended
31st March 2019 31st March 2018
Basic earnings per share: (i/ii) 1.20 1.46
Diluted earnings per share: (i/iii) 1.20 1.46
n) Revenue recognised from Contract liability (Advances from Customers):
Particulars As at 31st March 2019 As at 31st March 2018
Closing Balance of Contract Liability 11.80 2.69
The contract liability outstanding at the beginning of the year has been recognised as revenue during the year
ended 31st March 31 2019
o) Details of Corporate Social Responsibility (CSR) Expenditure:
The Company has incurred an amount of `5.01 crores (31st March 2018 `3.01) towards Corporate social
responsibility (CSR) as per Section 135 of the Companies Act, 2013 and is included in other expenses
Particulars As at 31st March 2019 As at 31st March 2018
Amount required to be spent as per Section 135 of the Act 2.18 1.98
Amount spend during the year on:
(i) Construction / acquisition of an asset -
(ii) On purpose other than (i) above 4.63 3.01
Total 4.63 3.01
p) Disclosure pertaining to Micro, Small and Medium Enterprises (as per information available with the Company):
Sr. No. Particulars As on As on
31st March 2019 31st March 2018
1 Principal amount due outstanding as at 31st March 4.77 1.57
2 Interest due on (1) above and unpaid as at 31st March - -
3 Interest paid to the supplier - -
4 Payments made to the supplier beyond the appointedday during the year - -
5 Interest due and payable for the period of delay - -
6 Interest accrued and remaining unpaid as at 31st March - -
7 Amount of further interest remaining due and payablein succeeding year - -
` crores
` crores
` crores
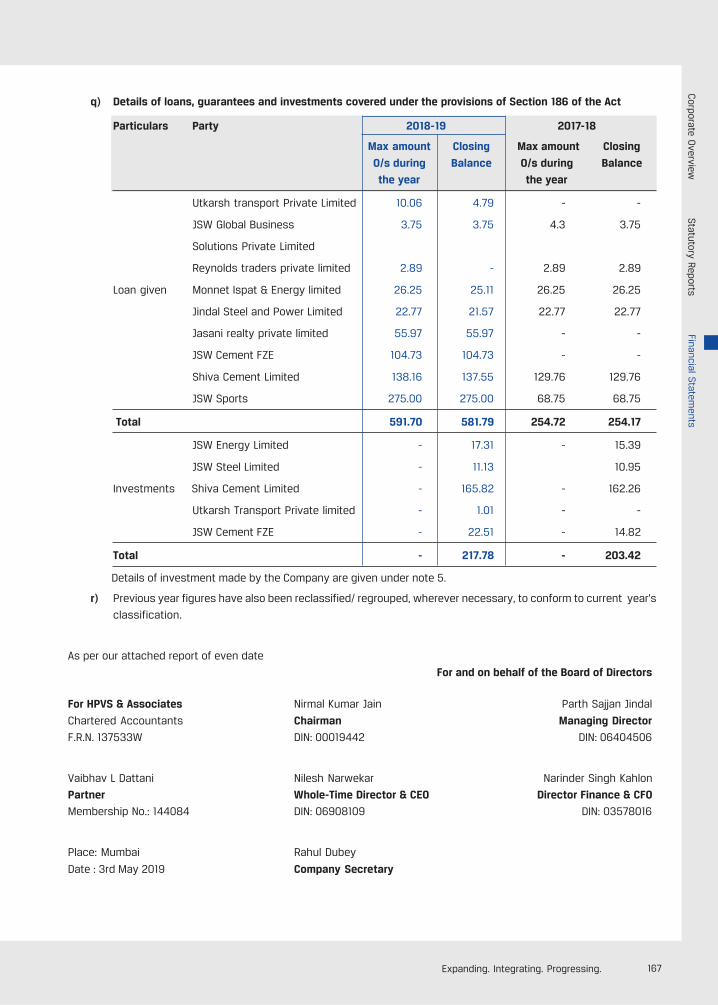
167Expanding. Integrating. Progressing.
q) Details of loans, guarantees and investments covered under the provisions of Section 186 of the Act
Particulars Party 2018-19 2017-18
Max amount Closing Max amount Closing
O/s during Balance O/s during Balance
the year the year
Utkarsh transport Private Limited 10.06 4.79 - -
JSW Global Business 3.75 3.75 4.3 3.75
Solutions Private Limited
Reynolds traders private limited 2.89 - 2.89 2.89
Loan given Monnet Ispat & Energy limited 26.25 25.11 26.25 26.25
Jindal Steel and Power Limited 22.77 21.57 22.77 22.77
Jasani realty private limited 55.97 55.97 - -
JSW Cement FZE 104.73 104.73 - -
Shiva Cement Limited 138.16 137.55 129.76 129.76
JSW Sports 275.00 275.00 68.75 68.75
Total 591.70 581.79 254.72 254.17
JSW Energy Limited - 17.31 - 15.39
JSW Steel Limited - 11.13 10.95
Investments Shiva Cement Limited - 165.82 - 162.26
Utkarsh Transport Private limited - 1.01 - -
JSW Cement FZE - 22.51 - 14.82
Total - 217.78 - 203.42
Details of investment made by the Company are given under note 5.
r) Previous year figures have also been reclassified/ regrouped, wherever necessary, to conform to current year's
classification.
As per our attached report of even date
For and on behalf of the Board of Directors
For HPVS & Associates Nirmal Kumar Jain Parth Sajjan Jindal
Chartered Accountants Chairman Managing Director
F.R.N. 137533W DIN: 00019442 DIN: 06404506
Vaibhav L Dattani Nilesh Narwekar Narinder Singh Kahlon
Partner Whole-Time Director & CEO Director Finance & CFO
Membership No.: 144084 DIN: 06908109 DIN: 03578016
Place: Mumbai Rahul Dubey
Date : 3rd May 2019 Company Secretary
Corporate O
verviewStatutory Reports
Financial Statem
ents
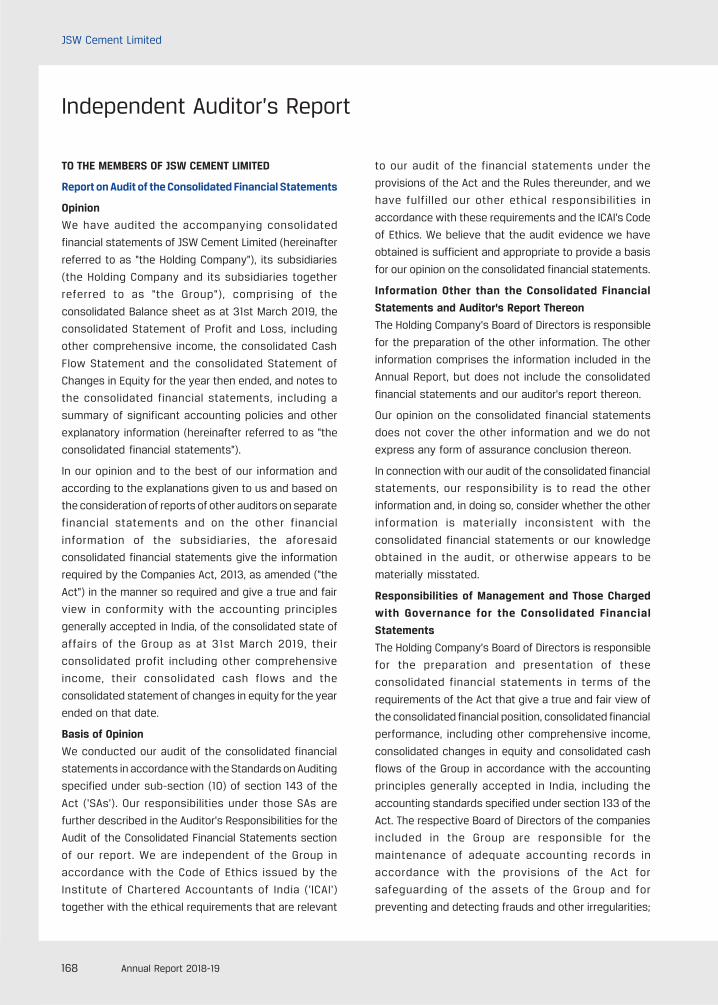
168 Annual Report 2018-19
JSW Cement Limited
Independent Auditor’s Report
TO THE MEMBERS OF JSW CEMENT LIMITED
Report on Audit of the Consolidated Financial Statements
Opinion
We have audited the accompanying consolidated
financial statements of JSW Cement Limited (hereinafter
referred to as "the Holding Company"), its subsidiaries
(the Holding Company and its subsidiaries together
referred to as "the Group"), comprising of the
consolidated Balance sheet as at 31st March 2019, the
consolidated Statement of Profit and Loss, including
other comprehensive income, the consolidated Cash
Flow Statement and the consolidated Statement of
Changes in Equity for the year then ended, and notes to
the consolidated financial statements, including a
summary of significant accounting policies and other
explanatory information (hereinafter referred to as "the
consolidated financial statements").
In our opinion and to the best of our information and
according to the explanations given to us and based on
the consideration of reports of other auditors on separate
financial statements and on the other financial
information of the subsidiaries, the aforesaid
consolidated financial statements give the information
required by the Companies Act, 2013, as amended ("the
Act") in the manner so required and give a true and fair
view in conformity with the accounting principles
generally accepted in India, of the consolidated state of
affairs of the Group as at 31st March 2019, their
consolidated profit including other comprehensive
income, their consolidated cash flows and the
consolidated statement of changes in equity for the year
ended on that date.
Basis of Opinion
We conducted our audit of the consolidated financial
statements in accordance with the Standards on Auditing
specified under sub-section (10) of section 143 of the
Act ('SAs'). Our responsibilities under those SAs are
further described in the Auditor's Responsibilities for the
Audit of the Consolidated Financial Statements section
of our report. We are independent of the Group in
accordance with the Code of Ethics issued by the
Institute of Chartered Accountants of India ('ICAI')
together with the ethical requirements that are relevant
to our audit of the financial statements under the
provisions of the Act and the Rules thereunder, and we
have fulfilled our other ethical responsibilities in
accordance with these requirements and the ICAI's Code
of Ethics. We believe that the audit evidence we have
obtained is sufficient and appropriate to provide a basis
for our opinion on the consolidated financial statements.
Information Other than the Consolidated Financial
Statements and Auditor's Report Thereon
The Holding Company's Board of Directors is responsible
for the preparation of the other information. The other
information comprises the information included in the
Annual Report, but does not include the consolidated
financial statements and our auditor's report thereon.
Our opinion on the consolidated financial statements
does not cover the other information and we do not
express any form of assurance conclusion thereon.
In connection with our audit of the consolidated financial
statements, our responsibility is to read the other
information and, in doing so, consider whether the other
information is materially inconsistent with the
consolidated financial statements or our knowledge
obtained in the audit, or otherwise appears to be
materially misstated.
Responsibilities of Management and Those Charged
with Governance for the Consolidated Financial
Statements
The Holding Company's Board of Directors is responsible
for the preparation and presentation of these
consolidated financial statements in terms of the
requirements of the Act that give a true and fair view of
the consolidated financial position, consolidated financial
performance, including other comprehensive income,
consolidated changes in equity and consolidated cash
flows of the Group in accordance with the accounting
principles generally accepted in India, including the
accounting standards specified under section 133 of the
Act. The respective Board of Directors of the companies
included in the Group are responsible for the
maintenance of adequate accounting records in
accordance with the provisions of the Act for
safeguarding of the assets of the Group and for
preventing and detecting frauds and other irregularities;
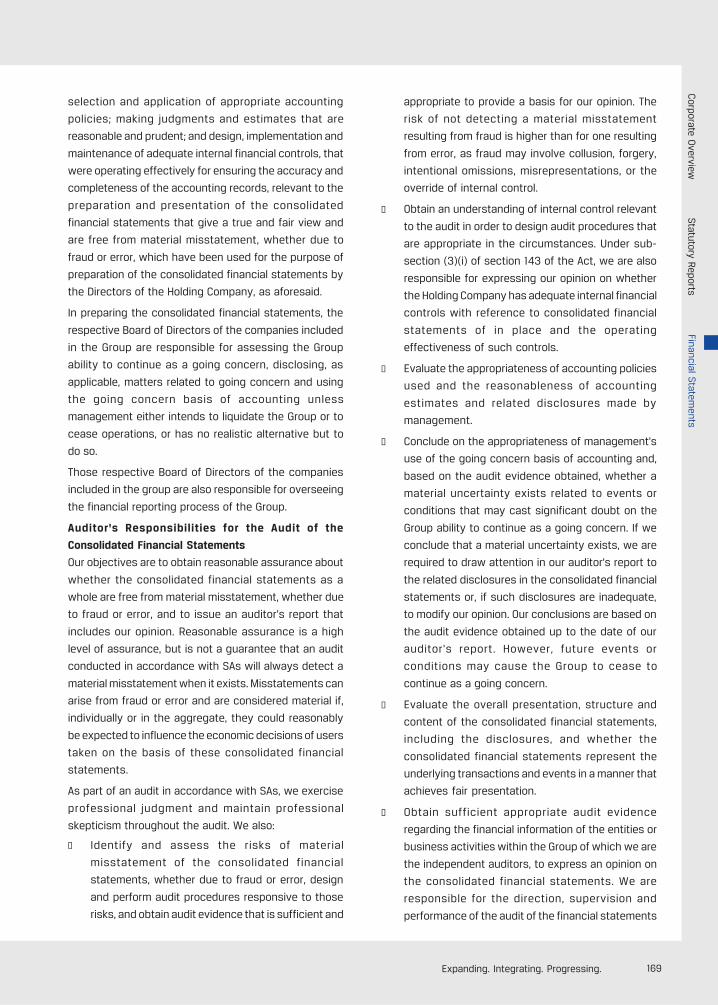
169Expanding. Integrating. Progressing.
selection and application of appropriate accounting
policies; making judgments and estimates that are
reasonable and prudent; and design, implementation and
maintenance of adequate internal financial controls, that
were operating effectively for ensuring the accuracy and
completeness of the accounting records, relevant to the
preparation and presentation of the consolidated
financial statements that give a true and fair view and
are free from material misstatement, whether due to
fraud or error, which have been used for the purpose of
preparation of the consolidated financial statements by
the Directors of the Holding Company, as aforesaid.
In preparing the consolidated financial statements, the
respective Board of Directors of the companies included
in the Group are responsible for assessing the Group
ability to continue as a going concern, disclosing, as
applicable, matters related to going concern and using
the going concern basis of accounting unless
management either intends to liquidate the Group or to
cease operations, or has no realistic alternative but to
do so.
Those respective Board of Directors of the companies
included in the group are also responsible for overseeing
the financial reporting process of the Group.
Auditor's Responsibilities for the Audit of the
Consolidated Financial Statements
Our objectives are to obtain reasonable assurance about
whether the consolidated financial statements as a
whole are free from material misstatement, whether due
to fraud or error, and to issue an auditor's report that
includes our opinion. Reasonable assurance is a high
level of assurance, but is not a guarantee that an audit
conducted in accordance with SAs will always detect a
material misstatement when it exists. Misstatements can
arise from fraud or error and are considered material if,
individually or in the aggregate, they could reasonably
be expected to influence the economic decisions of users
taken on the basis of these consolidated financial
statements.
As part of an audit in accordance with SAs, we exercise
professional judgment and maintain professional
skepticism throughout the audit. We also:
l Identify and assess the risks of material
misstatement of the consolidated financial
statements, whether due to fraud or error, design
and perform audit procedures responsive to those
risks, and obtain audit evidence that is sufficient and
appropriate to provide a basis for our opinion. The
risk of not detecting a material misstatement
resulting from fraud is higher than for one resulting
from error, as fraud may involve collusion, forgery,
intentional omissions, misrepresentations, or the
override of internal control.
l Obtain an understanding of internal control relevant
to the audit in order to design audit procedures that
are appropriate in the circumstances. Under sub-
section (3)(i) of section 143 of the Act, we are also
responsible for expressing our opinion on whether
the Holding Company has adequate internal financial
controls with reference to consolidated financial
statements of in place and the operating
effectiveness of such controls.
l Evaluate the appropriateness of accounting policies
used and the reasonableness of accounting
estimates and related disclosures made by
management.
l Conclude on the appropriateness of management's
use of the going concern basis of accounting and,
based on the audit evidence obtained, whether a
material uncertainty exists related to events or
conditions that may cast significant doubt on the
Group ability to continue as a going concern. If we
conclude that a material uncertainty exists, we are
required to draw attention in our auditor's report to
the related disclosures in the consolidated financial
statements or, if such disclosures are inadequate,
to modify our opinion. Our conclusions are based on
the audit evidence obtained up to the date of our
auditor's report. However, future events or
conditions may cause the Group to cease to
continue as a going concern.
l Evaluate the overall presentation, structure and
content of the consolidated financial statements,
including the disclosures, and whether the
consolidated financial statements represent the
underlying transactions and events in a manner that
achieves fair presentation.
l Obtain sufficient appropriate audit evidence
regarding the financial information of the entities or
business activities within the Group of which we are
the independent auditors, to express an opinion on
the consolidated financial statements. We are
responsible for the direction, supervision and
performance of the audit of the financial statements
Corporate O
verviewStatutory Reports
Financial Statem
ents

170 Annual Report 2018-19
JSW Cement Limited
of such entities included in the consolidated
financial statements of which we are the
independent auditors. For the other entities included
in the consolidated financial statements, which have
been audited by other auditors, such other auditors
remain responsible for the direction, supervision and
performance of the audits carried out by them. We
remain solely responsible for our audit opinion.
We communicate with those charged with governance
of the Holding Company and such other entities included
in the consolidated financial statements of which we are
the independent auditors regarding, among other
matters, the planned scope and timing of the audit and
significant audit findings, including any significant
deficiencies in internal control that we identify during
our audit.
We also provide those charged with governance with a
statement that we have complied with relevant ethical
requirements regarding independence, and to
communicate with them all relationships and other
matters that may reasonably be thought to bear on our
independence, and where applicable, related safeguards.
Other Matter
(a) We did not audit the financial statements and other
financial information, in respect of 2 subsidiaries,
whose Ind AS financial statements include total
assets of `221.27 crores as at 31st March 2019, and
total revenues of ̀ 33.59 crores and net cash inflows
of `0.02 crores for the year ended on that date.
These financial statement and other financial
information have been audited by other auditors,
which financial statements, other financial
information and auditor's reports have been
furnished to us by the management. Our opinion on
the consolidated financial statements, in so far as
it relates to the amounts and disclosures included
in respect of these subsidiaries and our report in
terms of sub-sections (3) of Section 143 of the Act,
in so far as it relates to the aforesaid subsidiaries is
based solely on the reports of such other auditors.
(b) The consolidated financial statements include a
subsidiary incorporated outside India. Its unaudited
standalone financial statements are provided by the
Management by translating to the Indian Accounting
Standards prescribed under section 133 of the Act.
The consolidated financial statements reflect total
assets of ̀ 232.66 crores as at 31st March 2019, total
revenues of `54.63 crores and net cash flows
amounting to `9.34.crores for the period ended on
that date, as considered in the consolidated financial
statements. We have relied on the standalone
financial statements provided to us by the
Management and our opinion on the consolidated
financial statements, in so far as it relates to the
amounts and disclosures included in respect of this
subsidiary is based on the Management certified
standalone financial statements.
(c) The consolidated financial statements of the
Company for the year ended 31st March 2019,
included in these consolidated financial statements,
have been audited by the predecessor auditor who
expressed an unmodified opinion on those
statements on 8th May 2018.
Our opinion on the above consolidated financial statment
and our report on Other Legal and Regulatory
Requirements below, is not modified in respect of the
above matters with respect to our reliance on the work
done and the reports of the other auditors and the
financial statements and other financial information
certified by the management.
Report on Other Legal and Regulatory Requirements
1. As required by sub-section (3) of the Act, based on
our audit and on the consideration of report of the
other auditors on separate financial statements and
the other financial information of subsidiaries, as
noted in the 'other matter' paragraph we report, to
the extent applicable, that:
(a) We/the other auditors whose report we have
relied upon have sought and obtained all the
information and explanations which to the best
of our knowledge and belief were necessary for
the purposes of our audit of the aforesaid
consolidated financial statements;
(b) In our opinion, proper books of account as
required by law relating to preparation of the
aforesaid consolidation of the financial
statements have been kept so far as it appears
from our examination of those books and
reports of the other auditors;
(c) The Consolidated Balance Sheet, the
Consolidated Statement of Profit and Loss
including the Statement of Other
Comprehensive Income, the Consolidated Cash
171Expanding. Integrating. Progressing.
Flow Statement and Consolidated Statement of
Changes in Equity dealt with by this Report are
in agreement with the books of account
maintained for the purpose of preparation of the
consolidated financial statements;
(d) In our opinion, the aforesaid consolidated
financial statements comply with the
Accounting Standards specified under Section
133 of the Act, read with Companies (Indian
Accounting Standards) Rules, 2015, as
amended;
(e) On the basis of the written representations
received from the directors of the Parent as on
31st March 2019 taken on record by the Board
of Directors of the Holding Company, none of
the directors of the Holding Company is
disqualified as on 31st March 2019 from being
appointed as a Director in terms of sub-section
2 of Section 164 of the Act.
(f) With respect to the adequacy of the internal
financial controls over financial reporting and
the operating effectiveness of such controls,
refer to our separate Report in "Annexure A". Our
report expresses an unmodified opinion on the
adequacy and operating effectiveness of the
Holding Company and its subsidiary
incorporated in India.
(g) In our opinion and based on the consideration
of reports of other statutory auditors of the
subsidiaries incorporated in India, the
managerial remuneration for the year ended
31st March 2019 has been paid / provided by
the Holding Company, its subsidiaries
incorporated in India to their directors in
accordance with the provisions of section 197
read with Schedule V to the Act;
(h) With respect to the other matters to be included
in the Auditor's Report in accordance with Rule
11 of the Companies (Audit and Auditors) Rules,
2014, as amended, in our opinion and to the best
of our information and according to the
explanations given to us and based on the
consideration of the report of the other auditors
on separate financial statements as also the
other financial information of the subsidiaries,
as noted in the 'Other matter' paragraph:
i. The consolidated financial statements
disclose the impact of pending litigations
on the consolidated financial position
of the Group - Refer Note 34(a) to the
consolidated financial statements;
ii. The Group did not have any long-term
contracts including derivative contracts as
at 31st March 2019 for which there were
any material foreseeable losses; and
iii. There has been no delay in transferring
amounts, required to be transferred to the
Investor Education and Protection Fund by
the Holding Company and its subsidiary
incorporated in India.
For H P V S & Associates.,
Chartered Accountants
Firm Registration No.: 137533W
Vaibhav L Dattani
Partner
M. No.144084
Place: Mumbai
Date: 3rd May 2019
Corporate O
verviewStatutory Reports
Financial Statem
ents
172 Annual Report 2018-19
JSW Cement Limited
Annexure ATo The Independent Auditor’s Report
Report on the internal financial controls with reference
to the aforesaid financial statements under Clause (i)
of sub-section (3) of Section 143 of the Companies Act,
2013 (the 'Act')
In conjunction with our audit of the consolidated financial
statements of JSW Cement Limited as of and for the year
ended March 31, 2019, we have audited the internal
financial controls over financial reporting of JSW Cement
Limited (hereinafter referred to as the "Holding Company")
and its subsidiary companies which are companies
incorporated in India, as of that date.
Management's Responsibility for Internal Financial
Controls
The respective Board of Directors of the Holding
Company, its subsidiary companies, which are
companies incorporated in India, are responsible for
establishing and maintaining internal financial controls
based on the internal control over financial reporting
criteria established by the Holding Company considering
the essential components of internal control stated in
the Guidance Note on Audit of Internal Financial Controls
Over Financial Reporting issued by the Institute of
Chartered Accountants of India. These responsibilities
include the design, implementation and maintenance of
adequate internal financial controls that were operating
effectively for ensuring the orderly and efficient conduct
of its business, including adherence to the respective
company's policies, the safeguarding of its assets, the
prevention and detection of frauds and errors, the
accuracy and completeness of the accounting records,
and the timely preparation of reliable financial
information, as required under the Act.
Auditor's Responsibility
Our responsibility is to express an opinion on the
company's internal financial controls over financial
reporting with reference to these consolidated financial
statements based on our audit. We conducted our audit
in accordance with the Guidance Note on Audit of Internal
Financial Controls Over Financial Reporting (the "Guidance
Note") and the Standards on Auditing, both, issued by
Institute of Chartered Accountants of India, and deemed
to be prescribed under section 143 (10) of the Act, to the
extent applicable to an audit of internal financial controls.
Those Standards and the Guidance Note require that we
comply with ethical requirements and plan and perform
the audit to obtain reasonable assurance about whether
adequate internal financial controls over financial
reporting with reference to these consolidated financial
statements was established and maintained and if such
controls operated effectively in all material respects.
Our audit involves performing procedures to obtain audit
evidence about the adequacy of the internal financial
controls over financial reporting with reference to these
consolidatedfinancial statements and their operating
effectiveness. Our audit of internal financial controls over
financial reporting included obtaining an understanding
of internal financial controls over financial reporting with
reference to these consolidated financial statements,
assessing the risk that a material weakness exists, and
testing and evaluating the design and operating
effectiveness of internal control based on the assessed
risk. The procedures selected depend on the auditor's
judgement, including the assessment of the risks of
material misstatement of the financial statements,
whether due to fraud or error.
We believe that the audit evidence we have obtained and
the audit evidence obtained by the other auditors in
terms of their reports referred to in the Other Matters
paragraph below, is sufficient and appropriate to provide
a basis for our audit opinion on the internal financial
controls over financial reporting with reference to these
consolidated financial statements.
Meaning of Internal Financial Controls Over Financial
Reporting
A Company's internal financial control over financial
reporting is a process designed to provide reasonable
assurance regarding the reliability of financial reporting
and the preparation of financial statements for external
purposes in accordance with generally accepted
accounting principles. A company's internal financial
control over financial reporting includes those policies
and procedures that (1) pertain to the maintenance of
records that, in reasonable detail, accurately and fairly
reflect the transactions and dispositions of the assets
173Expanding. Integrating. Progressing.
of the Company; (2) provide reasonable assurance that
transactions are recorded as necessary to permit
preparation of financial statements in accordance with
generally accepted accounting principles, and that
receipts and expenditures of the company are being
made only in accordance with authorisations of
management and directors of the company; and (3)
provide reasonable assurance regarding prevention or
timely detection of unauthorised acquisition, use, or
disposition of the company's assets that could have a
material effect on the financial statements.
Inherent Limitations of Internal Financial Controls Over
Financial Reporting
Because of the inherent limitations of internal financial
controls over financial reporting with reference to these
consolidatedfinancial statements, including the
possibility of collusion or improper management override
of controls, material misstatements due to error or fraud
may occur and not be detected. Also, projections of any
evaluation of the internal financial controls over financial
reporting with reference to these consolidated financial
statements to future periods are subject to the risk that
the internal financial control over financial reporting with
reference to these consolidated financial statements
may become inadequate because of changes in
conditions, or that the degree of compliance with the
policies or procedures may deteriorate.
Opinion
In our opinion, the Holding Company and its subsidiary
companies, which are companies incorporated in India,
have, maintained in all material respects, adequate
internal financial controls over financial reporting with
reference to these consolidated financial statements and
such internal financial controls over financial reporting
with reference to these consolidated financial
statements were operating effectively as at March 31,
2019, based on the internal control over financial
reporting criteria established by the Holding Company
considering the essential components of internal control
stated in the Guidance Note on Audit of Internal Financial
Controls Over Financial Reporting issued by the Institute
of Chartered Accountants of India.
Other Matters
Our report under section 143(3)(i) of the Act on the
adequacy and operating effectiveness of the internal
financial controls over financial reporting with reference
to these consolidated financial statements of the Holding
Company, insofar as it relates to these 2 subsidiary
companies, which are companies incorporated in India,
is based on the corresponding reports of the auditors of
such subsidiary incorporated in India.
For H P V S & Associates.,
Chartered Accountants
Firm Registration No.: 137533W
Vaibhav L Dattani
Partner
M. No.144084
Place: Mumbai
Date: 3rd May 2019
Corporate O
verviewStatutory Reports
Financial Statem
ents
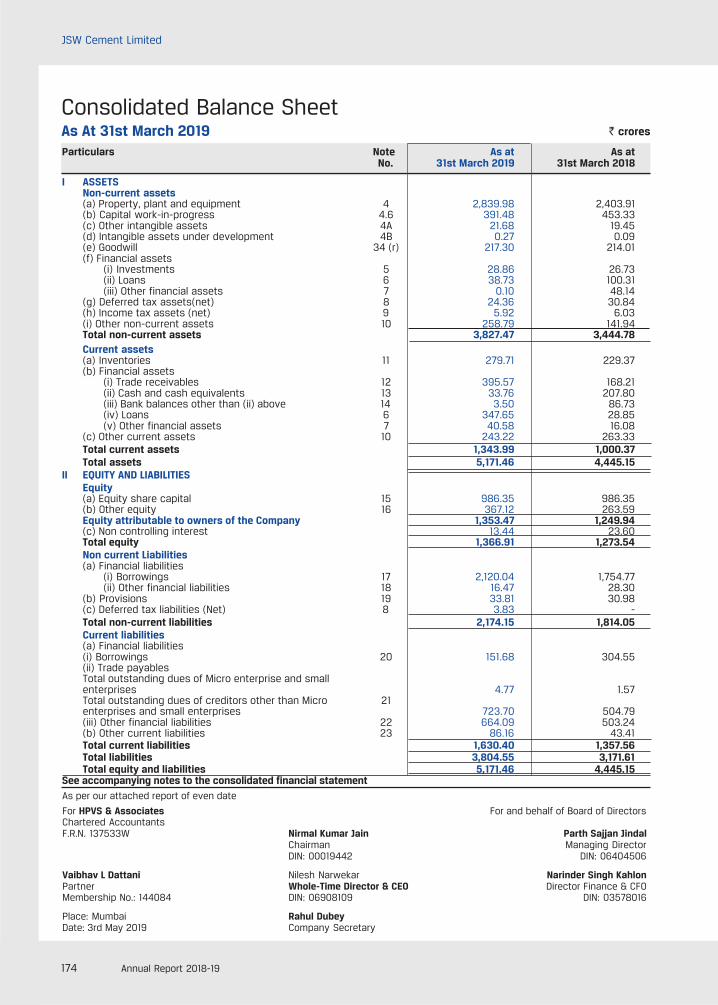
174 Annual Report 2018-19
JSW Cement Limited
Consolidated Balance SheetAs At 31st March 2019 ` crores
Particulars Note As at As at No. 31st March 2019 31st March 2018
I ASSETSNon-current assets(a) Property, plant and equipment 4 2,839.98 2,403.91(b) Capital work-in-progress 4.6 391.48 453.33(c) Other intangible assets 4A 21.68 19.45(d) Intangible assets under development 4B 0.27 0.09(e) Goodwill 34 (r) 217.30 214.01(f) Financial assets
(i) Investments 5 28.86 26.73(ii) Loans 6 38.73 100.31(iii) Other financial assets 7 0.10 48.14
(g) Deferred tax assets(net) 8 24.36 30.84(h) Income tax assets (net) 9 5.92 6.03(i) Other non-current assets 10 258.79 141.94Total non-current assets 3,827.47 3,444.78Current assets(a) Inventories 11 279.71 229.37(b) Financial assets
(i) Trade receivables 12 395.57 168.21(ii) Cash and cash equivalents 13 33.76 207.80(iii) Bank balances other than (ii) above 14 3.50 86.73(iv) Loans 6 347.65 28.85(v) Other financial assets 7 40.58 16.08
(c) Other current assets 10 243.22 263.33Total current assets 1,343.99 1,000.37Total assets 5,171.46 4,445.15
II EQUITY AND LIABILITIESEquity(a) Equity share capital 15 986.35 986.35(b) Other equity 16 367.12 263.59Equity attributable to owners of the Company 1,353.47 1,249.94(c) Non controlling interest 13.44 23.60Total equity 1,366.91 1,273.54Non current Liabilities(a) Financial liabilities
(i) Borrowings 17 2,120.04 1,754.77(ii) Other financial liabilities 18 16.47 28.30
(b) Provisions 19 33.81 30.98(c) Deferred tax liabilities (Net) 8 3.83 -Total non-current liabilities 2,174.15 1,814.05Current liabilities(a) Financial liabilities(i) Borrowings 20 151.68 304.55(ii) Trade payablesTotal outstanding dues of Micro enterprise and smallenterprises 4.77 1.57Total outstanding dues of creditors other than Micro 21enterprises and small enterprises 723.70 504.79(iii) Other financial liabilities 22 664.09 503.24(b) Other current liabilities 23 86.16 43.41Total current liabilities 1,630.40 1,357.56Total liabilities 3,804.55 3,171.61Total equity and liabilities 5,171.46 4,445.15
See accompanying notes to the consolidated financial statementAs per our attached report of even date
For HPVS & Associates For and behalf of Board of DirectorsChartered AccountantsF.R.N. 137533W Nirmal Kumar Jain Parth Sajjan Jindal
Chairman Managing DirectorDIN: 00019442 DIN: 06404506
Vaibhav L Dattani Nilesh Narwekar Narinder Singh KahlonPartner Whole-Time Director & CEO Director Finance & CFOMembership No.: 144084 DIN: 06908109 DIN: 03578016
Place: Mumbai Rahul DubeyDate: 3rd May 2019 Company Secretary
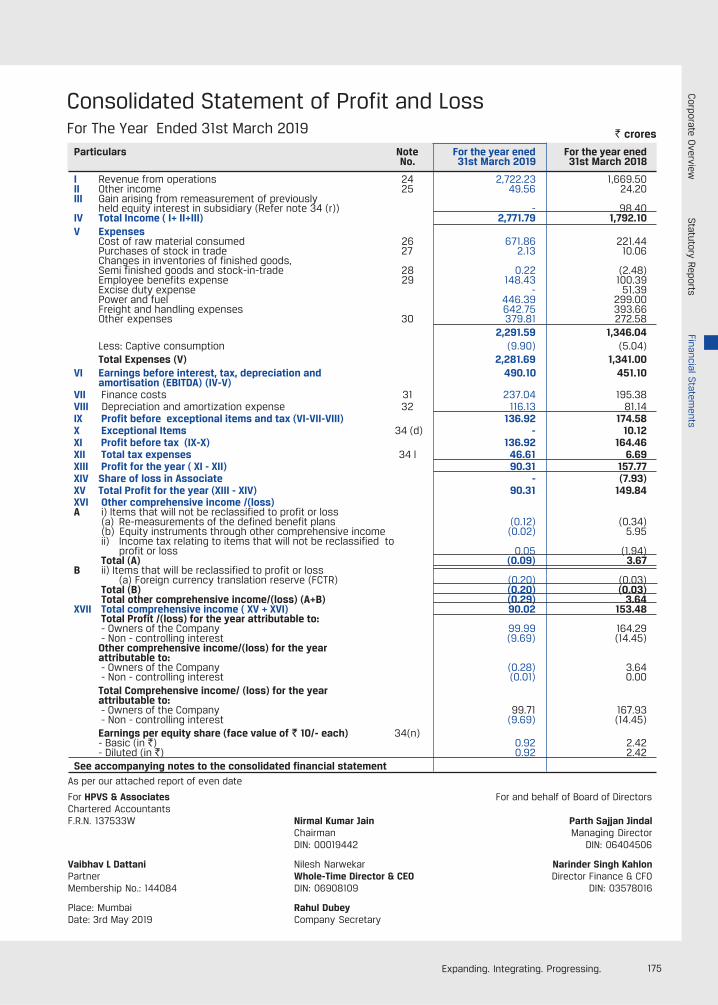
175Expanding. Integrating. Progressing.
Consolidated Statement of Profit and Loss
Particulars Note For the year ened For the year enedNo. 31st March 2019 31st March 2018
I Revenue from operations 24 2,722.23 1,669.50II Other income 25 49.56 24.20III Gain arising from remeasurement of previously
held equity interest in subsidiary (Refer note 34 (r)) - 98.40IV Total Income ( I+ II+III) 2,771.79 1,792.10V Expenses
Cost of raw material consumed 26 671.86 221.44Purchases of stock in trade 27 2.13 10.06Changes in inventories of finished goods,Semi finished goods and stock-in-trade 28 0.22 (2.48)Employee benefits expense 29 148.43 100.39Excise duty expense - 51.39Power and fuel 446.39 299.00Freight and handling expenses 642.75 393.66Other expenses 30 379.81 272.58
2,291.59 1,346.04Less: Captive consumption (9.90) (5.04)Total Expenses (V) 2,281.69 1,341.00
VI Earnings before interest, tax, depreciation and 490.10 451.10amortisation (EBITDA) (IV-V)
VII Finance costs 31 237.04 195.38VIII Depreciation and amortization expense 32 116.13 81.14IX Profit before exceptional items and tax (VI-VII-VIII) 136.92 174.58X Exceptional Items 34 (d) - 10.12XI Profit before tax (IX-X) 136.92 164.46XII Total tax expenses 34 l 46.61 6.69XIII Profit for the year ( XI - XII) 90.31 157.77XIV Share of loss in Associate - (7.93)XV Total Profit for the year (XIII - XIV) 90.31 149.84XVI Other comprehensive income /(loss)A i) Items that will not be reclassified to profit or loss
(a) Re-measurements of the defined benefit plans (0.12) (0.34) (b) Equity instruments through other comprehensive income (0.02) 5.95 ii) Income tax relating to items that will not be reclassified to
profit or loss 0.05 (1.94) Total (A) (0.09) 3.67
B ii) Items that will be reclassified to profit or loss(a) Foreign currency translation reserve (FCTR) (0.20) (0.03)
Total (B) (0.20) (0.03) Total other comprehensive income/(loss) (A+B) (0.29) 3.64
XVII Total comprehensive income ( XV + XVI) 90.02 153.48 Total Profit /(loss) for the year attributable to: - Owners of the Company 99.99 164.29 - Non - controlling interest (9.69) (14.45)Other comprehensive income/(loss) for the yearattributable to: - Owners of the Company (0.28) 3.64 - Non - controlling interest (0.01) 0.00Total Comprehensive income/ (loss) for the yearattributable to: - Owners of the Company 99.71 167.93 - Non - controlling interest (9.69) (14.45)Earnings per equity share (face value of ` 10/- each) 34(n)- Basic (in `) 0.92 2.42- Diluted (in `) 0.92 2.42
See accompanying notes to the consolidated financial statement
` croresFor The Year Ended 31st March 2019
As per our attached report of even date
For HPVS & Associates For and behalf of Board of DirectorsChartered AccountantsF.R.N. 137533W Nirmal Kumar Jain Parth Sajjan Jindal
Chairman Managing DirectorDIN: 00019442 DIN: 06404506
Vaibhav L Dattani Nilesh Narwekar Narinder Singh KahlonPartner Whole-Time Director & CEO Director Finance & CFOMembership No.: 144084 DIN: 06908109 DIN: 03578016
Place: Mumbai Rahul DubeyDate: 3rd May 2019 Company Secretary
Corporate O
verviewStatutory Reports
Financial Statem
ents
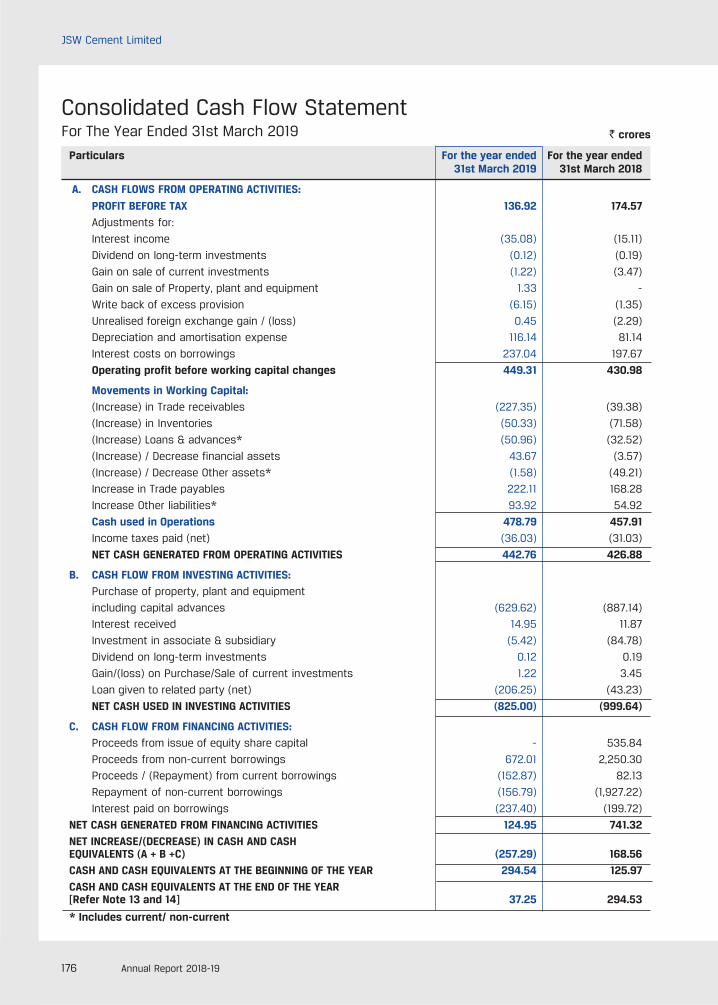
176 Annual Report 2018-19
JSW Cement Limited
Particulars For the year ended For the year ended31st March 2019 31st March 2018
A. CASH FLOWS FROM OPERATING ACTIVITIES:
PROFIT BEFORE TAX 136.92 174.57
Adjustments for:
Interest income (35.08) (15.11)
Dividend on long-term investments (0.12) (0.19)
Gain on sale of current investments (1.22) (3.47)
Gain on sale of Property, plant and equipment 1.33 -
Write back of excess provision (6.15) (1.35)
Unrealised foreign exchange gain / (loss) 0.45 (2.29)
Depreciation and amortisation expense 116.14 81.14
Interest costs on borrowings 237.04 197.67
Operating profit before working capital changes 449.31 430.98
Movements in Working Capital:
(Increase) in Trade receivables (227.35) (39.38)
(Increase) in Inventories (50.33) (71.58)
(Increase) Loans & advances* (50.96) (32.52)
(Increase) / Decrease financial assets 43.67 (3.57)
(Increase) / Decrease Other assets* (1.58) (49.21)
Increase in Trade payables 222.11 168.28
Increase Other liabilities* 93.92 54.92
Cash used in Operations 478.79 457.91
Income taxes paid (net) (36.03) (31.03)
NET CASH GENERATED FROM OPERATING ACTIVITIES 442.76 426.88
B. CASH FLOW FROM INVESTING ACTIVITIES:
Purchase of property, plant and equipment
including capital advances (629.62) (887.14)
Interest received 14.95 11.87
Investment in associate & subsidiary (5.42) (84.78)
Dividend on long-term investments 0.12 0.19
Gain/(loss) on Purchase/Sale of current investments 1.22 3.45
Loan given to related party (net) (206.25) (43.23)
NET CASH USED IN INVESTING ACTIVITIES (825.00) (999.64)
C. CASH FLOW FROM FINANCING ACTIVITIES:
Proceeds from issue of equity share capital - 535.84
Proceeds from non-current borrowings 672.01 2,250.30
Proceeds / (Repayment) from current borrowings (152.87) 82.13
Repayment of non-current borrowings (156.79) (1,927.22)
Interest paid on borrowings (237.40) (199.72)
NET CASH GENERATED FROM FINANCING ACTIVITIES 124.95 741.32
NET INCREASE/(DECREASE) IN CASH AND CASHEQUIVALENTS (A + B +C) (257.29) 168.56
CASH AND CASH EQUIVALENTS AT THE BEGINNING OF THE YEAR 294.54 125.97
CASH AND CASH EQUIVALENTS AT THE END OF THE YEAR[Refer Note 13 and 14] 37.25 294.53
* Includes current/ non-current
` crores
Consolidated Cash Flow StatementFor The Year Ended 31st March 2019
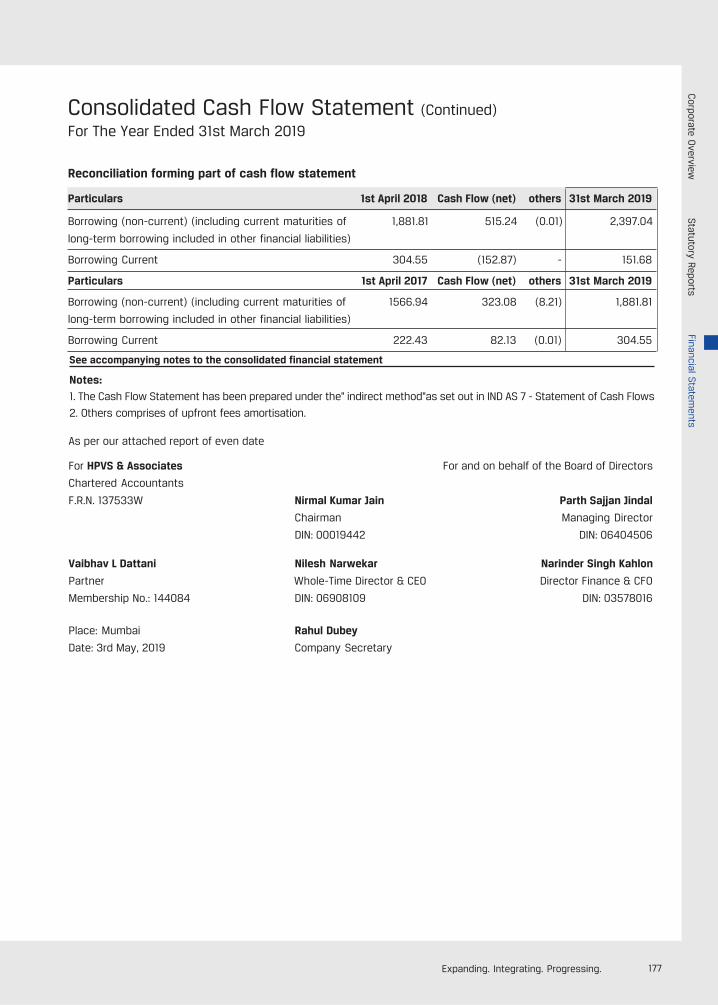
177Expanding. Integrating. Progressing.
Consolidated Cash Flow Statement (Continued)For The Year Ended 31st March 2019
See accompanying notes to the consolidated financial statement
Notes:
1. The Cash Flow Statement has been prepared under the" indirect method"as set out in IND AS 7 - Statement of Cash Flows
2. Others comprises of upfront fees amortisation.
Reconciliation forming part of cash flow statement
Particulars 1st April 2018 Cash Flow (net) others 31st March 2019
Borrowing (non-current) (including current maturities of 1,881.81 515.24 (0.01) 2,397.04
long-term borrowing included in other financial liabilities)
Borrowing Current 304.55 (152.87) - 151.68
Particulars 1st April 2017 Cash Flow (net) others 31st March 2019
Borrowing (non-current) (including current maturities of 1566.94 323.08 (8.21) 1,881.81
long-term borrowing included in other financial liabilities)
Borrowing Current 222.43 82.13 (0.01) 304.55
As per our attached report of even date
For HPVS & Associates For and on behalf of the Board of Directors
Chartered Accountants
F.R.N. 137533W Nirmal Kumar Jain Parth Sajjan Jindal
Chairman Managing Director
DIN: 00019442 DIN: 06404506
Vaibhav L Dattani Nilesh Narwekar Narinder Singh Kahlon
Partner Whole-Time Director & CEO Director Finance & CFO
Membership No.: 144084 DIN: 06908109 DIN: 03578016
Place: Mumbai Rahul Dubey
Date: 3rd May, 2019 Company Secretary
Corporate O
verviewStatutory Reports
Financial Statem
ents
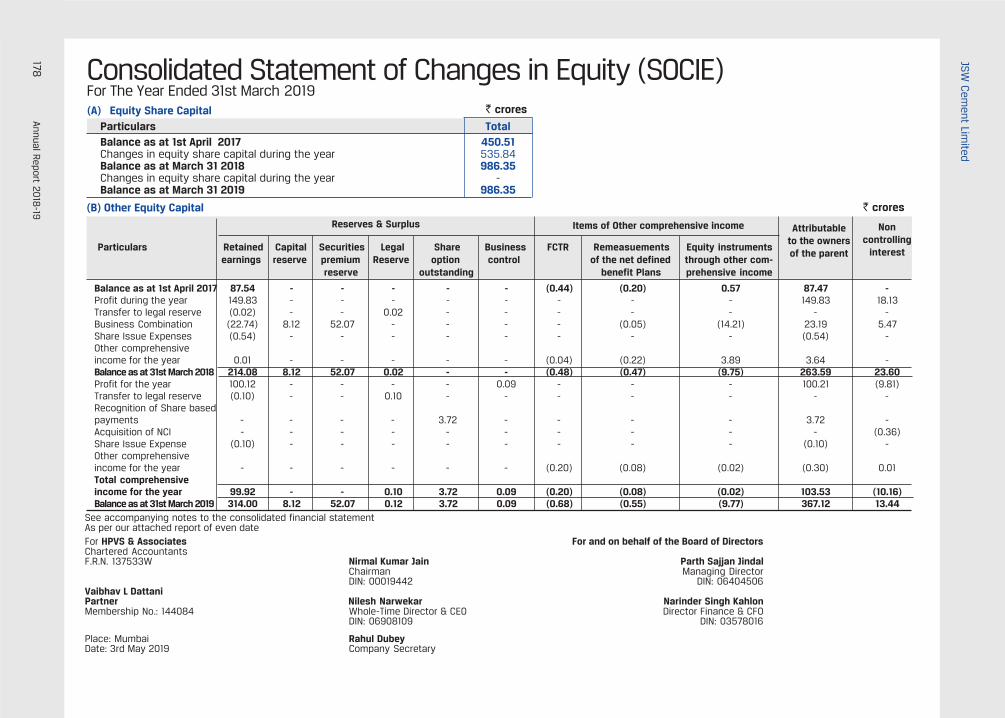
178Annual R
eport 2018
-19
JSW C
ement Lim
ited
Consolidated Statement of Changes in Equity (SOCIE)For The Year Ended 31st March 2019
Particulars Retained Capital Securities Legal Share Business FCTR Remeasuements Equity instrumentsearnings reserve premium Reserve option control of the net defined through other com-
reserve outstanding benefit Plans prehensive income
Balance as at 1st April 2017 87.54 - - - - - (0.44) (0.20) 0.57 87.47 -Profit during the year 149.83 - - - - - - - - 149.83 18.13Transfer to legal reserve (0.02) - - 0.02 - - - - - - -Business Combination (22.74) 8.12 52.07 - - - - (0.05) (14.21) 23.19 5.47Share Issue Expenses (0.54) - - - - - - - - (0.54) -Other comprehensiveincome for the year 0.01 - - - - - (0.04) (0.22) 3.89 3.64 -Balance as at 31st March 2018 214.08 8.12 52.07 0.02 - - (0.48) (0.47) (9.75) 263.59 23.60Profit for the year 100.12 - - - - 0.09 - - - 100.21 (9.81)Transfer to legal reserve (0.10) - - 0.10 - - - - - - -Recognition of Share basedpayments - - - - 3.72 - - - - 3.72 -Acquisition of NCI - - - - - - - - - - (0.36)Share Issue Expense (0.10) - - - - - - - - (0.10) -Other comprehensiveincome for the year - - - - - - (0.20) (0.08) (0.02) (0.30) 0.01Total comprehensiveincome for the year 99.92 - - 0.10 3.72 0.09 (0.20) (0.08) (0.02) 103.53 (10.16)Balance as at 31st March 2019 314.00 8.12 52.07 0.12 3.72 0.09 (0.68) (0.55) (9.77) 367.12 13.44
` crores
(A) Equity Share CapitalParticulars TotalBalance as at 1st April 2017 450.51Changes in equity share capital during the year 535.84Balance as at March 31 2018 986.35Changes in equity share capital during the year -Balance as at March 31 2019 986.35
` crores
(B) Other Equity CapitalReserves & Surplus Items of Other comprehensive income
See accompanying notes to the consolidated financial statementAs per our attached report of even dateFor HPVS & Associates For and on behalf of the Board of DirectorsChartered AccountantsF.R.N. 137533W Nirmal Kumar Jain Parth Sajjan Jindal
Chairman Managing DirectorDIN: 00019442 DIN: 06404506
Vaibhav L DattaniPartner Nilesh Narwekar Narinder Singh KahlonMembership No.: 144084 Whole-Time Director & CEO Director Finance & CFO
DIN: 06908109 DIN: 03578016
Place: Mumbai Rahul DubeyDate: 3rd May 2019 Company Secretary
Attributableto the ownersof the parent
Noncontrolling
interest
179Expanding. Integrating. Progressing.
Notes To Consolidated Financial StatementsAs At And For The Year Ended 31st March 2019
1. General InformationJSW Cement Limited ("the Parent Company") and its Subsidiaries collectively is referred to as 'the Group'. The Group
is primarily engaged in the business of manufacture and sale of cement, ground granulated blast furnace slag and
clinker, trading of allied products and logistic services dealing mainly in domestic transportation of goodss.
2. SIGNIFICANT ACCOUNTING POLICIES
I. Statement of Compliances
Consolidated Financial Statements have been prepared in accordance with the accounting principles generally
accepted in India including Indian Accounting Standards (Ind AS) prescribed under the section 133 of the
Companies Act, 2013 read with rule 3 of the Companies (Indian Accounting Standards) Rules, 2015 as amended.
The aforesaid financial statements have been approved by the Board of Directors in the meeting held on 03rd
May 2019.
Accordingly, the Company has prepared these Consolidated Balance sheet as at 31 March 2019, the Consolidated
Statement of Profit and Loss, the Consolidated Statement of Cash Flows and the Consolidated Statement of
Changes in Equity for the year ended 31 Mmarch 2019 and a summary of the significant accounting policies and
other explanatory information (together hereinafter referred to as 'Consolidated Financial Statements' or '
Financial statements).
II. Basis of preparation and presentation
The Consolidated Financial Statements have been prepared on the historical cost basis except for certain
financial instruments measured at fair values at the end of each reporting period, as explained in the accounting
policies below.
Historical cost is generally based on the fair value of the consideration given in exchange for goods and services.
Fair value is the price that would be received to sell an asset or paid to transfer a liability in an orderly transaction
between market participants at the measurement date, regardless of whether that price is directly observable
or estimated using another valuation technique. In estimating the fair value of an asset or a liability, the Group
takes into account the characteristics of the asset or liability if market participants would take those
characteristics into account when pricing the asset or liability at the measurement date. Fair value for
measurement and/or disclosure purposes in these financial statements is determined on such a basis, except
for share-based payment transactions that are within the scope of Ind AS 102 and measurements that have
some similarities to fair value but are not fair value, such as net realizable value in Ind AS 2 or value in use in Ind
AS 36.
In addition, for financial reporting purposes, fair value measurements are categorized into Level 1,2, or 3 based
on the degree to which the inputs to the fair value measurements are observable and the significance of the
inputs to the fair value measurements in its entirety, which are described as follows:
l Level 1 inputs are quoted prices (unadjusted) in active markets for identical assets or liabilities that the
entity can access at the measurement date;
l Level 2 inputs are inputs, other than quoted prices included within level 1, that are observable for the asset
or liability, either directly or indirectly; and
l Level 3 inputs are unobservable inputs for the asset or liability.
The Financial Statement is presented in INR.
Corporate O
verviewStatutory Reports
Financial Statem
ents
180 Annual Report 2018-19
JSW Cement Limited
Current and non-current classification
The Group presents assets and liabilities in the balance sheet based on current / non current classification
An asset is classified as current when it satisfies any of the following criteria
l It is expected to be realized in or is intended for sale or consumption in, its normal operating cycle;
l it is held primarily for the purpose of being traded;
l It is expected to be realised within 12 months after the reporting date; or
l It is cash or cash equivalent unless it is restricted from being exchanged or used to settle a liability for at least 12
months after the reporting date.
All other assets are classified as non-current.
A liability is classified as current when it satisfies any of the following criteria
l It is expected to be settled in the CompanyGroup's normal operating cycle;
l It is held primarily for the purpose of being traded;
l It is due to be settled within 12 months after the reporting date; or the CompanyGroup does not have an unconditional
right to defer settlement of the liability for at least 12 months after the reporting date.
All other liabilities are classified as non-current.
Deferred tax assets and liabilities are classified as non- current only.
III. Basis of consolidation
The Consolidated Financial Statements incorporate the financial statements of the Company and its subsidiaries.
Control is achieved where the Company:
l has power over the investee
l is exposed to, or has rights, to variable returns from its involvement with the investee; and
l has the ability to use its power to affect its returns
The Company reassess whether or not it controls an investee if facts and circumstances indicate that there are
changes to one or more of the three elements of control listed above.
Consolidation of a subsidiary begins when the Company obtains control over the subsidiary and ceases when the
Company loses control of the subsidiary. Specifically, income and expenses of a subsidiary acquired or disposed of
during the year are included in the Consolidated Statement of Profit or Loss and Other Comprehensive Income from
the date the Company gains control until the date when the Company ceases to control the subsidiary.
Profit or loss and each component of other comprehensive income are attributed to the owners of the Company and
to the non-controlling interests. Total comprehensive income of subsidiaries is attributed to the owners of the
Company and to the non-controlling interests even if this results in the non-controlling interests having a deficit
balance.
When necessary, adjustments are made to the financial statements of subsidiaries to bring their accounting policies
in line with the Group's accounting policies.
All intra Group assets and liabilities, equity, income, expenses and cash flows relating to transactions between
members of the Group are eliminated in full on consolidation.
IV. Business combination
Acquisitions of businesses are accounted for using the acquisition method. The consideration transferred in a
business combination is measured at fair value, which is calculated as the sum of the acquisition-date fair values
of the assets transferred by the Group, liabilities incurred by the Group to the former owners of the acquiree and the
equity interests issued by the Group in exchange for control of the acquiree. Acquisition-related costs are generally
recognised in Statement of Profit and Loss as incurred.
181Expanding. Integrating. Progressing.
At the acquisition date, the identifiable assets acquired and the liabilities assumed are recognised at their fair value
at the acquisition date, except that:
l deferred tax assets or liabilities and liabilities or assets related to employee benefit arrangements are recognised
and measured in accordance with Ind AS 12 Income Taxes and Ind AS 19 Employee Benefits respectively;
l liabilities or equity instruments related to share-based payment arrangements of the acquiree or share-based
payment arrangements of the Group entered into to replace share-based payment arrangements of the acquiree
are measured in accordance with Ind AS 102 Share-based Payments at the acquisition date; and
l assets (or disposal Groups) that are classified as held for sale in accordance with Ind AS 105 Non-current
Assets Held for Sale and Discontinued Operations are measured in accordance with that Standard.
Goodwill is measured as the excess of the sum of the consideration transferred, the amount of any non controlling
interests in the acquiree, and the fair value of the acquirer's previously held equity interest in the acquiree (if any)
over the net of the acquisition-date amounts of the identifiable assets acquired and the liabilities assumed.
Non-controlling interests that are present ownership interests and entitle their holders to a proportionate share of
the entity's net assets in the event of liquidation may be initially measured either at fair value or at the non-controlling
interests' proportionate share of the recognised amounts of the acquiree's identifiable net assets. The choice of
measurement basis is made on a transaction-by-transaction basis. Other types of non-controlling interests are
measured at fair value or, when applicable, on the basis specified in another Ind AS. When a business combination
is achieved in stages, the Group's previously held equity interest in the acquiree is remeasured to fair value at the
acquisition date (i.e. the date when the Group obtains control) and the resulting gain or loss, if any, is recognised in
the Consolidated Statement of Profit and Loss.
V. Goodwill
Goodwill arising on an acquisition of a business is carried at cost as established at the date of acquisition of the
business less accumulated impairment losses, if any.
For the purposes of impairment testing, goodwill is allocated to each of the Group's cash-generating units (or Groups
of cash-generating units) that is expected to benefit from the synergies of the combination.
A cash-generating unit to which goodwill has been allocated is tested for impairment annually, or more frequently
when there is indication that the unit may be impaired. If the recoverable amount of the cash-generating unit is less
than its carrying amount, the impairment loss is allocated first to reduce the carrying amount of any goodwill allocated
to the unit and then to the other assets of the unit pro rata based on the carrying amount of each asset in the unit.
Any impairment loss for goodwill is recognised directly in the Consolidated Statement of Profit and Loss. An impairment
loss recognised for goodwill is not reversed in subsequent periods.
On disposal of the relevant cash-generating unit, the attributable amount of goodwill is included in the determination
of the profit or loss on disposal.
VI. Revenue Recognition
Sale of goods
Revenue is recognized on the basis of approved contracts regarding the transfer of goods or services to a customer
for an amount that reflects the consideration to which the entity expects to be entitled in exchange for those goods
or services.
Revenue is measured at the fair value of consideration received or receivable taking into account the amount of
discounts, incentives, volume rebates, outgoing taxes on sales. Any amounts receivable from the customer is
recognized as revenue after the control over the goods sold are transferred to the customer which is generally on
dispatch/delivery of goods.
On March 28, 2018, Ministry of Corporate Affairs has notified Ind AS 115, "Revenue from Contracts with Customers",
effective date of adoption of the Standard is financial period beginning on or after 1stApril, 2018. The core principle of
the Standard is that an entity shall recognize revenue to depict the transfer of promised goods or services to
Corporate O
verviewStatutory Reports
Financial Statem
ents
182 Annual Report 2018-19
JSW Cement Limited
customers in an amount that reflects the consideration to which the entity expects to be entitled in exchange for
those goods or services, besides reporting useful information about the nature, amount, timing and uncertainty of
revenue and cash flows arising from a contract with a customer.
The Standard permits entities to apply one of the following transitional methods:
i) Retrospective approach - Under this approach the standard will be applied retrospectively to each prior reporting
period presented in accordance with Ind AS 8 - Accounting Policies, Changes in Accounting Estimates and
Errors.
ii) Retrospectively with cumulative effect of initially applying the standard recognized at the date of initial
application (Cumulative catch - up approach).
Group haves adopted Cumulative catch - up approach and there were no significant adjustments required to the
retained earnings at April 1, 2018. Also, the application of Ind AS 115 did not have any significant impact on recognition
and measurement of revenue and related items in the financial results.
Dividend and interest income:
Dividend income from investments is recognised when the shareholder's right to receive payment has been
established (provided that it is probable that the economic benefits will flow to the Group and the amount of income
can be measured reliably).
Interest income from a financial asset is recognised when it is probable that the economic benefits will flow to the
Group and the amount of income can be measured reliably. Interest income is accrued on a time basis, by reference
to the principal outstanding and at the effective interest rate applicable, which is the rate that exactly discounts
estimated future cash receipts through the expected life of the financial asset to that asset's net carrying amount
on initial recognition.
VII. Leasing - Operating Lease
Leases are classified as finance leases whenever the terms of the lease transfer substantially all the risks and
rewards of ownership to the lessee. All other leases are classified as operating leases.
As lessee
Lease payments under an operating lease shall be recognised as an expense on a straight-line basis over the lease
term unless either:
a) another systematic basis is more representative of the time pattern of the user's benefit even if the payments
to the lessors are not on that basis; or
b) the payments to the lessor are structured to increase in line with expected general inflation to compensate for
the lessor's expected inflationary cost increases. If payments to the lessor vary because of factors other than
general inflation, then this condition is not met.
In the event that lease incentives are received to enter into operating leases, such incentives are recognised as a
liability. The aggregate benefit of incentives is recognised as a reduction of rental expense on a straight-line basis,
except where another systematic basis is more representative of the time pattern in which economic benefits from
the leased asset are consumed.
Arrangements in the nature of lease
Lease agreements, comprising a transaction or series of related transactions, that does not take the legal form of a
lease but conveys the right to use the asset in return for a payment or series of payments. In case of such
arrangements, the Group applies the requirements of Appendix C of Ind AS 17 - Leases to the lease element of the
arrangement. For the purpose of applying the requirements under Ind AS 17 - Leases, payments and other
consideration required by the arrangement are separated at the inception of the arrangement into those for lease
and those for other elements on the basis of their relative fair values.
183Expanding. Integrating. Progressing.
As a lessorRental income from operating leases is recognized on straight-line basis over the term of the relevant lease.
Arrangements in the nature of leaseLease agreements, comprising a transaction or series of related transactions, that does not take the legal form of alease but conveys the right to use the asset in return for a payment or series of payments. In case of sucharrangements, the Group applies the requirements of Appendix C of Ind AS 17 – Leases to the lease element of thearrangement. For the purpose of applying the requirements under Ind AS 17 – Leases, payments and otherconsideration required by the arrangement are separated at the inception of the arrangement into those for leaseand those for other elements on the basis of their relative fair values.
VIII. Foreign Currency TransactionsThe functional currency of the Group and its subsidiaries is determined on the basis of the primary economicenvironment in which it operates. The functional currency of the Group is Indian Rupee (INR).
In preparing the financial statements of each individual group entity, transactions in currencies other than theentity's functional currency (foreign currencies) are recognized at the rates of exchange prevailing at the dates ofthe transactions. At the end of each reporting period, monetary items denominated in foreign currencies areretranslated at the rates prevailing at that date. Non-monetary items carried at fair value that are denominated inforeign currencies are retranslated at the rates prevailing at the date when the fair value was determined. Non-monetary items that are measured in terms of historical cost in a foreign currency are not retranslated.
Exchange differences on monetary items are recognised in Statement of Profit and Loss in the period in which theyarise except for:
a. exchange differences on foreign currency borrowings relating to assets under construction for future productiveuse, which are included in the cost of those assets when they are regarded as an adjustment to interest costson those foreign currency borrowings;
b. exchange differences on transactions entered into in order to hedge certain foreign currency risks (see belowthe policy on hedge accounting in 2 (xix) (e);
c. exchange difference arising on settlement / restatement of long-term foreign currency monetary itemsrecognized in the financial statements upto 31st March 2016 prepared under previous GAAP, are capitalized asa part of the depreciable fixed assets to which the monetary item relates and depreciated over the remaininguseful life of such assets. If such monetary items do not relate to acquisition of depreciable fixed assets, theexchange difference is amortised over the maturity period / upto the date of settlement of such monetary item,whichever is earlier and charged to the Statement of Profit and Loss.
For the purposes of presenting these consolidated financial statements, the assets and liabilities of the groupsforeign operations are translated into INR using exchange rates prevailing at the end of each reporting period.Income and expense items are translated at the average exchange rates for the period, unless exchange ratefluctuate significantly during the period, in which case the exchange rates at the dates of the transaction are used.Exchange difference arising, if any, are recognised in other comprehensive income and accumulated in equity.
IX. Borrowing CostsBorrowing costs attributable to the acquisition and construction of qualifying assets, are capitalized as part of thecost of such asset up to the date when the asset is ready for its intended use. A qualifying asset is one thatnecessarily takes substantial period of time to get ready for its intended use.
All other borrowing costs are recognised in the Statement of Profit and Loss in the period in which they are incurred.
The Group determines the amount of borrowing costs eligible for capitalisation as the actual borrowing costs incurredon that borrowing during the period less any interest income earned on temporary investment of specific borrowingspending their expenditure on qualifying assets, to the extent that an entity borrows funds specifically for the purposeof obtaining a qualifying asset. In case if the Group borrows generally and uses the funds for obtaining a qualifyingasset, borrowing costs eligible for capitalisation are determined by applying a capitalisation rate to the expenditureson that asset.
Corporate O
verviewStatutory Reports
Financial Statem
ents
184 Annual Report 2018-19
JSW Cement Limited
The Group suspends capitalisation of borrowing costs during extended periods in which it suspends activedevelopment of a qualifying asset.
X. Government grants and subsidiesGrants and subsidies from the government are recognized when there is reasonable assurance that the grant/subsidy will be received and all attaching conditions will be complied with.
When the grant or subsidy relates to an expense item, it is recognized as income over the periods necessary tomatch them on a systematic basis to the costs, which it is intended to compensate or when the performanceobligation is met.
Government Grant relating to tangible Property, Plant and equipment are treated as deferred income and releasedto statement of profit and loss over the expected useful lives of the assets concerned.
XI. Employee BenefitsRetirement benefit costs and termination benefitsPayments to defined contribution retirement benefit plans are recognised as an expense when employees haverendered service entitling them to the contributions.
For defined benefit retirement benefit plans, the cost of providing benefits is determined using the projected unitcredit method, with actuarial valuations being carried out at the end of each annual reporting period. Re-measurement,comprising actuarial gains and losses, the effect of the changes to the asset ceiling (if applicable) and the return onplan assets (excluding interest), is reflected immediately in the statement of financial position with a charge orcredit recognised in other comprehensive income in the period in which they occur. Re-measurement recognised inother comprehensive income is reflected immediately in retained earnings and will not be reclassified to profit orloss. Past service cost is recognised in profit or loss in the period of a plan amendment. Net interest is calculated byapplying the discount rate at the beginning of the period to the net defined benefit liability or asset. Defined benefitcosts are categorised as follows:
l service cost (including current service cost, past service cost, as well as gains and losses on curtailments andsettlements);
l net interest expense or income; andl re-measurement
The Group presents the first two components of defined benefit costs in profit or loss in the line item 'Employeebenefits expenses'. Curtailment gains and losses are accounted for as past service costs.
The retirement benefit obligation recognised in the statement of financial position represents the actual deficit orsurplus in the Group's defined benefit plans. Any surplus resulting from this calculation is limited to the presentvalue of any economic benefits available in the form of refunds from the plans or reductions in future contributionsto the plans.
A liability for a termination benefit is recognised at the earlier of when the entity can no longer withdraw the offer ofthe termination benefit and when the entity recognises any related restructuring costs.
Short-term and other long-term employee benefitsA liability is recognised for benefits accruing to employees in respect of wages and salaries, annual leave and sickleave in the period the related service is rendered at the undiscounted amount of the benefits expected to be paidin exchange for that service.
Liabilities recognised in respect of short-term employee benefits are measured at the undiscounted amount of thebenefits expected to be paid in exchange for the related service.
Liabilities recognised in respect of other long-term employee benefits are measured at the present value of theestimated future cash outflows expected to be made by the Group in respect of services provided by employees upto the reporting date.
XII. Employee Share based paymentsEquity-settled share-based payments to employees and others providing similar services are measured at the fairvalue of the equity instruments at the grant date. Details regarding the determination of the fair value of equity-
settled share-based transactions are set out in note 34.
185Expanding. Integrating. Progressing.
The fair value determined at the grant date of the equity settled share-based payments is expensed on a straight
line basis over the vesting period, based on the Group's estimate of equity instruments that will eventually vest,
with a corresponding increase in equity. At the end of each reporting period, the Group revises its estimate of the
number of equity instruments expected to vest. The impact of the revision of the original estimates, if any, is
recognised in profit or loss such that the cumulative expense reflects the revised estimate, with a corresponding
adjustment to the equity-settled employee benefits reserve.
XIII. Taxation
Income tax expense represents the sum of the tax currently payable and deferred tax.
Current tax
Current tax is the amount of tax payable based on the taxable profit for the year as determined in accordance with
the applicable tax rates and the provisions of the Income Tax Act, 1961 and other applicable tax laws in the countries
where the Group operates and generates taxable income.
Deferred tax
Deferred tax is recognised on temporary differences between the carrying amounts of assets and liabilities in the
financial statements and the corresponding tax bases used in the computation of taxable profit. Deferred tax liabilities
are generally recognised for all taxable temporary differences. Deferred tax assets are generally recognised for all
deductible temporary differences to the extent that it is probable that taxable profits will be available against which
those deductible temporary differences can be utilised. Such deferred tax assets and liabilities are not recognised
if the temporary difference arises from the initial recognition (other than in a business combination) of assets and
liabilities in a transaction that affects neither the taxable profit nor the accounting profit. In addition, deferred tax
liabilities are not recognised if the temporary difference arises from the initial recognition of goodwill.
Deferred tax liabilities are recognized for taxable temporary differences associated with investments in subsidiaries
except where the group is able to control the reversal of the temporary difference and it is probable that the temporary
difference will not reverse in the foreseeable future. Deferred tax assets arising from deductible temporary differences
associated with such investments are only recognized to the extent that it is probable that there will be sufficient
taxable profits against which the benefit of the temporary differences can be utilized and they are expected to
reverse in the foreseeable future.
The carrying amount of deferred tax assets is reviewed at the end of each reporting period and reduced to the
extent that it is no longer probable that sufficient taxable profits will be available to allow all or part of the asset to
be recovered.
Minimum Alternate Tax (MAT) paid in accordance with the tax laws, which gives future economic benefits in the
form of adjustment to future income tax liability, is considered as an asset if there is convincing evidence that the
Group will pay normal income tax. Accordingly, MAT is recognised as an asset in the Balance Sheet when it is highly
probable that future economic benefit associated with it will flow to the Group. The Group reviews the same at each
balance sheet date and writes down the carrying amount of MAT Credit Entitlement to the extent there is no longer
convincing evidence to the effect that the Group will pay normal Income Tax during the specified period.
Deferred tax assets and liabilities are measured at the tax rates that are expected to apply in the period in which the
liability is settled or the asset realised, based on tax rates (and tax laws) that have been enacted or substantively
enacted by the end of the reporting period.
Deferred tax assets and deferred tax liabilities are offset if a legally enforceable right exists to set off current tax
assets against current tax liabilities and the deferred taxes relate to the same taxable entity and the same taxation
authority.
Current and deferred tax for the period
Current and deferred tax are recognised in profit or loss, except when they are relate to items that are recognised in
other comprehensive income or directly in equity, in which case, the current and deferred tax are also recognized in
Corporate O
verviewStatutory Reports
Financial Statem
ents
186 Annual Report 2018-19
JSW Cement Limited
other comprehensive income or directly in equity respectively. Where current tax or deferred tax arises from the
initial accounting for a business combination, the tax effect is included in the accounting for the business combination.
XIV. Property, Plant and Equipment
The cost of property, plant and equipment comprises its purchase price net of any trade discounts and rebates, any
import duties and other taxes (other than those subsequently recoverable from the tax authorities), any directly
attributable expenditure on making the asset ready for its intended use, including relevant borrowing costs for
qualifying assets and any expected costs of decommissioning.
Expenditure incurred after the property, plant & equipment has put into the operation, such as repairs and
maintenance, are charged to Statement of Profit and Loss in the period in which cost are incurred. Major shutdown
and overhaul expenditure is capitalised as the activity undertaken improves the economic benefit expected to arise
from the assets.
Spares parts, servicing equipment and standby equipment which can be used only in connection with a particular
Plant & Equipment of the Group and their use is expected to be irregular, are capitalised at cost.
An item of property, plant and equipment is derecognised upon disposal or when no future economic benefits are
expected to arise from the continued use of the asset. Any gain or loss arising on the disposal or retirement of an
item of property, plant and equipment is determined as the difference between the sales proceeds and the carrying
amount of the asset and is recognized in Statement of Profit and Loss.
Property, plant and equipment except freehold land held for use in the production, supply or administrative purposes,
are stated in the balance sheet at cost less accumulated depreciation and accumulated impairment losses., if any.
Capital Work In Progress
Assets in the course of construction are shown as Capital Work-in-progress ("CWIP") for capitalisation and includes
cost of material consumed, erection charges thereon along with other related expenses incurred for the projects.
Expenditure attributable to fixed assets are identified and allocated on a systematic basis to the cost of related
assets. Interest during construction and expenditure (net) allocated to construction are apportioned to CWIP on the
basis of the closing balance of specific assets or part of asset being capitalised. The balance if any, left after such
capitalisation is kept as a separate item under CWIP schedule. Claims for price variation/ escalation in case of
contracts are accounted for on acceptance of claims.
Apart from costs related directly to the construction of an asset, indirect expenses incurred up-to the date of
commencement of commercial production which are incidental and related to construction are capitalized as part
of the construction cost. Income, if any, earned during the construction period is reduced from the indirect costs.
At the point when an asset is operating at management's intended use, the cost of construction is transferred to
the appropriate category of property, plant and equipment and depreciation commences.
Depreciation
Depreciation commences when the assets are ready for their intended use. Depreciable amount for assets is the
cost of an asset, or other amount substituted for cost, less its estimated residual value. Depreciation is recognized
so as to write off the cost of assets (other than freehold land and properties under construction) less their residual
values over their useful lives, using straight-line method as per the useful life prescribed in Schedule II to the
Companies Act, 2013 except in respect of the following categories of assets, in whose case the life of the assets
has been assessed as under based on technical advice, taking into account the nature of the asset, the estimated
usage of the asset, the operating conditions of the asset, past history of replacement, anticipated technological
changes, manufacturers warranties and maintenance support, etc.:
Sr. No. Nature of Assets Useful life of assets
1 Plant and Machinery 2 to 55 years
2 Factory Building 30- 65 years
3 Non-Factory Building 3 to 65 years
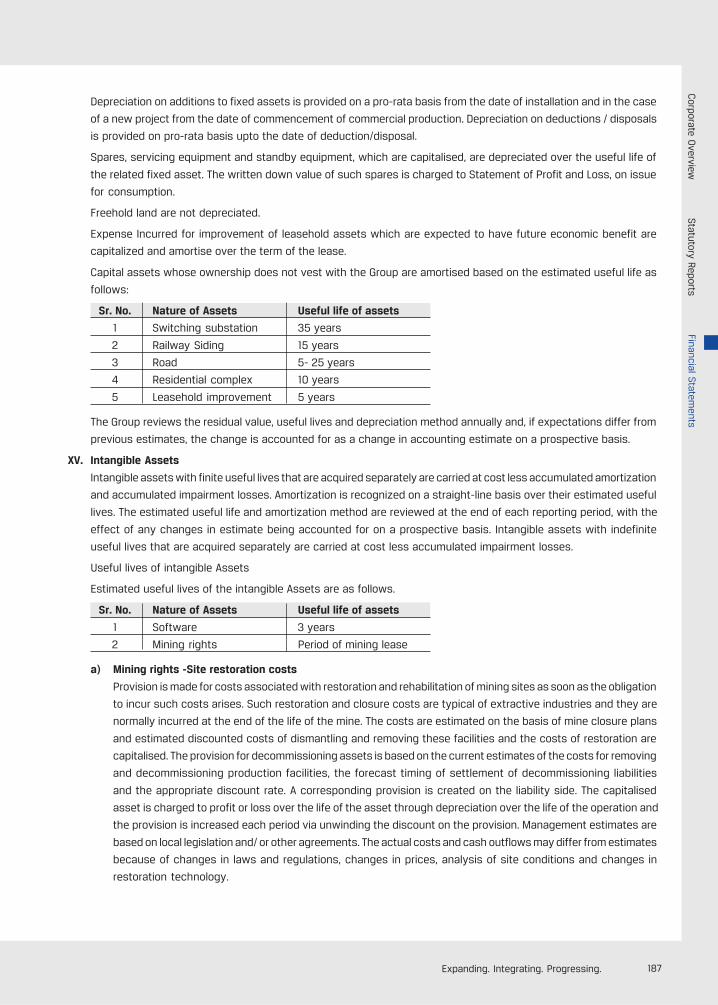
187Expanding. Integrating. Progressing.
Depreciation on additions to fixed assets is provided on a pro-rata basis from the date of installation and in the case
of a new project from the date of commencement of commercial production. Depreciation on deductions / disposals
is provided on pro-rata basis upto the date of deduction/disposal.
Spares, servicing equipment and standby equipment, which are capitalised, are depreciated over the useful life of
the related fixed asset. The written down value of such spares is charged to Statement of Profit and Loss, on issue
for consumption.
Freehold land are not depreciated.
Expense Incurred for improvement of leasehold assets which are expected to have future economic benefit are
capitalized and amortise over the term of the lease.
Capital assets whose ownership does not vest with the Group are amortised based on the estimated useful life as
follows:
Sr. No. Nature of Assets Useful life of assets
1 Switching substation 35 years
2 Railway Siding 15 years
3 Road 5- 25 years
4 Residential complex 10 years
5 Leasehold improvement 5 years
The Group reviews the residual value, useful lives and depreciation method annually and, if expectations differ from
previous estimates, the change is accounted for as a change in accounting estimate on a prospective basis.
XV. Intangible Assets
Intangible assets with finite useful lives that are acquired separately are carried at cost less accumulated amortization
and accumulated impairment losses. Amortization is recognized on a straight-line basis over their estimated useful
lives. The estimated useful life and amortization method are reviewed at the end of each reporting period, with the
effect of any changes in estimate being accounted for on a prospective basis. Intangible assets with indefinite
useful lives that are acquired separately are carried at cost less accumulated impairment losses.
Useful lives of intangible Assets
Estimated useful lives of the intangible Assets are as follows.
Sr. No. Nature of Assets Useful life of assets
1 Software 3 years
2 Mining rights Period of mining lease
a) Mining rights -Site restoration costs
Provision is made for costs associated with restoration and rehabilitation of mining sites as soon as the obligation
to incur such costs arises. Such restoration and closure costs are typical of extractive industries and they are
normally incurred at the end of the life of the mine. The costs are estimated on the basis of mine closure plans
and estimated discounted costs of dismantling and removing these facilities and the costs of restoration are
capitalised. The provision for decommissioning assets is based on the current estimates of the costs for removing
and decommissioning production facilities, the forecast timing of settlement of decommissioning liabilities
and the appropriate discount rate. A corresponding provision is created on the liability side. The capitalised
asset is charged to profit or loss over the life of the asset through depreciation over the life of the operation and
the provision is increased each period via unwinding the discount on the provision. Management estimates are
based on local legislation and/ or other agreements. The actual costs and cash outflows may differ from estimates
because of changes in laws and regulations, changes in prices, analysis of site conditions and changes in
restoration technology.
Corporate O
verviewStatutory Reports
Financial Statem
ents
188 Annual Report 2018-19
JSW Cement Limited
b) Stripping Cost
Developmental stripping costs in order to obtain access to quantities of mineral reserves that will be mined in
future periods are capitalised as part of mining assets. Capitalisation of developmental stripping costs ends
when the commercial production of the mineral reserves begins.
Such costs are presented within mining assets. After initial recognition , stripping assets are carried at cost
less accumulated amortisation and impairment. The expected useful life of the identified component of limestone
is used to depreciate or amortise stripping cost.
XVI. Impairment of Property, plant and equipment and intangible assets other than goodwill
At the end of each reporting period, the Group reviews the carrying amounts of its tangible and intangible assets to
determine whether there is any indication that those assets have suffered an impairment loss. If any such indication
exists, the recoverable amount of the asset is estimated in order to determine the extent of the impairment loss (if
any). Where it is not possible to estimate the recoverable amount of an individual asset, the Group estimates the
recoverable amount of the cash-generating unit to which the asset belongs. Where a reasonable and consistent
basis of allocation can be identified, corporate assets are also allocated to individual cash-generating units, or
otherwise they are allocated to the smallest Group of cash-generating units for which a reasonable and consistent
allocation basis can be identified.
Intangible assets with indefinite useful lives and intangible assets not yet available for use are tested for impairment
at least annually, and whenever there is an indication that the asset may be impaired.
Recoverable amount is the higher of fair value less costs to sell and value in use. In assessing value in use, the
estimated future cash flows are discounted to their present value using a pre-tax discount rate that reflects current
market assessments of the time value of money and the risks specific to the asset for which the estimates of future
cash flows have not been adjusted.
If the recoverable amount of an asset (or cash-generating unit) is estimated to be less than its carrying amount, the
carrying amount of the asset (or cash-generating unit) is reduced to its recoverable amount. An impairment loss is
recognised immediately in the Statement of Profit and Loss, unless the relevant asset is carried at a revalued amount,
in which case the impairment loss is treated as a revaluation decrease.
Any reversal of the previously recognised impairment loss is limited to the extent that the asset's carrying amount
does not exceed the carrying amount that would have been determined if no impairment loss had previously been
recognised.
XVII. Inventories
Inventories are valued after providing for obsolescence as follows:
i. Raw material, stores & spares, packing material and fuels are valued at lower of cost and net realisable value.
However, these items are considered to be realisable at cost, if the finished products, in which they will be
used, are expected to be sold at or above cost.
ii. Semi finished goods and Finished Goods are valued at lower of cost and net realisable value. Cost of finished
goods and Semi finished goods include cost of direct material and labour and a proportion of manufacturing
overheads based on the normal operating capacity but excluding borrowing cost.
iii. Waste/Scrap inventory is valued at net realisable value.
iv. Obsolete, defective and unserviceable stock is duly provided for wherever applicable.
v. Costs of inventories are determined on weighted average basis. Net realisable value represents the estimated
selling price for inventories less all estimated costs of completion and costs necessary to make the sale.

189Expanding. Integrating. Progressing.
XVIII. Provisions, Contingent Liabilities and Contingent Assets
Provisions are recognised when the Group has a present obligation (legal or constructive), as a result of past events,
and it is probable that an outflow of resources, that can be reliably estimated, will be required to settle such an
obligation.
If the effect of the time value of money is material, provisions are determined by discounting the expected future
cash flows to net present value using an appropriate pre-tax discount rate that reflects current market assessments
of the time value of money and, where appropriate, the risks specific to the liability. Unwinding of the discount is
recognised in the Statement of Profit and Loss as a finance cost. Provisions are reviewed at each reporting date and
are adjusted to reflect the current best estimate.
A present obligation that arises from past events where it is either not probable that an outflow of resources will be
required to settle or a liable estimate of the amount cannot be made, is disclosed as a contingent liability. Contingent
liabilities are also disclosed when there is a possible obligation arising from past events, the existence of which will
be confirmed only by the occurrence or non -occurrence of one or more uncertain future events not wholly within
the control of the Group.
Claims against the Group where the possibility of any outflow of resources in settlement is remote, are not disclosed
as contingent liabilities.
Contingent assets are not recognised in financial statements since this may result in the recognition of income that
may never be realised. However, when the realisation of income is virtually certain, then the related asset is not a
contingent asset and is recognised.
Onerous contracts
Present obligations arising under onerous contracts are recognised and measured as provisions. An onerous contract
is considered to exist where the Group has a contract under which the unavoidable costs of meeting the obligations
under the contract exceed the economic benefits expected to be received from the contract.
XIX. Financial Instruments
Financial assets and financial liabilities are recognised when an entity becomes a party to the contractual provisions
of the instrument.
Financial assets and financial liabilities are initially measured at fair value. Transaction costs that are directly
attributable to the acquisition or issue of financial assets and financial liabilities (other than financial assets and
financial liabilities at fair value through Statement of Profit and Loss (FVTPL)) are added to or deducted from the fair
value of the financial assets or financial liabilities, as appropriate, on initial recognition. Transaction costs directly
attributable to the acquisition of financial assets or financial liabilities at fair value through profit and loss are
recognised immediately in Statement of Profit and Loss.
A. Financial assets
a) Recognition and initial measurement
The Group initially recognises loans and advances, deposits, debt securities issues and subordinated
liabilities on the date on which they originate. All other financial instruments (including regular way purchases
and sales of financial assets) are recognised on the trade date, which is the date on which the Group
becomes a party to the contractual provisions of the instrument. A financial asset or liability is initially
measured at fair value plus, for an item not at FVTPL, transaction costs that are directly attributable to its
acquisition or issue.
b) Classification of financial assets
On initial recognition, a financial asset is classified to be measured at amortised cost, fair value through
other comprehensive income (FVTOCI) or FVTPL.
Corporate O
verviewStatutory Reports
Financial Statem
ents
190 Annual Report 2018-19
JSW Cement Limited
A financial asset is measured at amortised cost if it meets both of the following conditions and is not designated
at FVTPL:
l The asset is held within a business model whose objective is to hold assets to collect contractual cash flows;
and
l The contractual terms of the financial asset give rise on specified dates to cash flows that are solely payments
of principal and interest on the principal amount outstanding.
A debt instrument is classified as FVTOCI only if it meets both of the following conditions and is not recognised at
FVTPL;
l The asset is held within a business model whose objective is achieved by both collecting contractual cash
flows and selling financial assets; and
l The contractual terms of the financial asset give rise on specified dates to cash flows that are solely payments
of principal and interest on the principal amount outstanding.
Debt instruments included within the FVTOCI category are measured initially as well as at each reporting date at fair
value. Fair value movements are recognized in the Other Comprehensive Income (OCI). However, the Group recognizes
interest income, impairment losses & reversals and foreign exchange gain or loss in the Statement of Profit and
Loss. On derecognition of the asset, cumulative gain or loss previously recognised in OCI is reclassified from the
equity to Statement of Profit and Loss. Interest earned while holding FVTOCI debt instrument is reported as interest
income using the EIR method.
All equity investments in scope of Ind AS 109 are measured at fair value.. For all other equity instruments, the Group
may make an irrevocable election to present in other comprehensive income subsequent changes in the fair value.
The Group makes such election on an instrument-by-instrument basis. The classification is made on initial recognition
and is irrevocable.
If the Group decides to classify an equity instrument as at FVTOCI, then all fair value changes on the instrument,
excluding dividends, are recognized in the OCI. There is no recycling of the amounts from OCI to Statement of Profit
and Loss, even on sale of investment. However, the Group may transfer the cumulative gain or loss within equity.
Equity instruments included within the FVTPL category are measured at fair value with all changes recognized in the
Statement of Profit and Loss.
All other financial assets are classified as measured at FVTPL.
In addition, on initial recognition, the Group may irrevocably designate a financial asset that otherwise meets the
requirements to be measured at amortised cost or at FVTOCI as at FVTPL if doing so eliminates or significantly
reduces and accounting mismatch that would otherwise arise.
Financial assets at FVTPL are measured at fair value at the end of each reporting period, with any gains and losses
arising on remeasurement recognized in statement of profit or loss. The net gain or loss recognized in statement of
profit or loss incorporates any dividend or interest earned on the financial asset and is included in the 'other income'
line item. Dividend on financial assets at FVTPL is recognized when:
l The Group's right to receive the dividends is established,
l It is probable that the economic benefits associated with the dividends will flow to the entity,
l The dividend does not represent a recovery of part of cost of the investment and the amount of dividend can be
measured reliably.
c) Derecognition of financial assets
The Group derecognises a financial asset when the contractual rights to the cash flows from the asset expire,
or when it transfers the financial asset and substantially all the risks and rewards of ownership of the asset to
another party. If the Group neither transfers nor retains substantially all the risks and rewards of ownership and
continues to control the transferred asset, the Group recognises its retained interest in the asset and an
associated liability for amounts it may have to pay. If the Group retains substantially all the risks and rewards of
191Expanding. Integrating. Progressing.
ownership of a transferred financial asset, the Group continues to recognise the financial asset and also
recognises a collateralised borrowing for the proceeds received.
On derecognition of a financial asset in its entirety, the difference between the asset's carrying amount and
the sum of the consideration received and receivable and the cumulative gain or loss that had been recognised
in other comprehensive income and accumulated in equity is recognised in profit or loss if such gain or loss
would have otherwise been recognised in profit or loss on disposal of that financial asset.
On derecognition of a financial asset other than in its entirety (e.g. when the Group retains an option to repurchase
part of a transferred asset), the Group allocates the previous carrying amount of the financial asset between
the part it continues to recognise under continuing involvement, and the part it no longer recognises on the
basis of the relative fair values of those parts on the date of the transfer. The difference between the carrying
amount allocated to the part that is no longer recognised and the sum of the consideration received for the part
no longer recognised and any cumulative gain or loss allocated to it that had been recognised in other
comprehensive income is recognised in profit or loss if such gain or loss would have otherwise been recognised
in profit or loss on disposal of that financial asset. A cumulative gain or loss that had been recognised in other
comprehensive income is allocated between the part that continues to be recognised and the part that is no
longer recognised on the basis of the relative fair values of those parts.
d) Impairment
The Group applies the expected credit loss model for recognising impairment loss on financial assets measured
at amortised cost, debt instruments at FVTOCI, lease receivables, trade receivables, other contractual rights to
receive cash or other financial asset, and financial guarantees not designated as at FVTPL.
Expected credit losses are the weighted average of credit losses with the respective risks of default occurring
as the weights. Credit loss is the difference between all contractual cash flows that are due to the Group in
accordance with the contract and all the cash flows that the Group expects to receive (i.e. all cash shortfalls),
discounted at the original effective interest rate (or credit-adjusted effective interest rate for purchased or
originated credit-impaired financial assets). The Group estimates cash flows by considering all contractual
terms of the financial instrument (for example, prepayment, extension, call and similar options) through the
expected life of that financial instrument.
The Group measures the loss allowance for a financial instrument at an amount equal to the lifetime expected
credit losses if the credit risk on that financial instrument has increased significantly since initial recognition. If
the credit risk on a financial instrument has not increased significantly since initial recognition, the Group
measures the loss allowance for that financial instrument at an amount equal to 12-month expected credit
losses. 12-month expected credit losses are portion of the life-time expected credit losses and represent the
lifetime cash shortfalls that will result if default occurs within the 12 months after the reporting date and thus,
are not cash shortfalls that are predicted over the next 12 months.
If the Group measured loss allowance for a financial instrument at lifetime expected credit loss model in the
previous period, but determines at the end of a reporting period that the credit risk has not increased significantly
since initial recognition due to improvement in credit quality as compared to the previous period, the Group
again measures the loss allowance based on 12-month expected credit losses.
When making the assessment of whether there has been a significant increase in credit risk since initial
recognition, the Group uses the change in the risk of a default occurring over the expected life of the financial
instrument instead of the change in the amount of expected credit losses. To make that assessment, the
Group compares the risk of a default occurring on the financial instrument as at the reporting date with the risk
of a default occurring on the financial instrument as at the date of initial recognition and considers reasonable
and supportable information, that is available without undue cost or effort, that is indicative of significant
increases in credit risk since initial recognition.
Corporate O
verviewStatutory Reports
Financial Statem
ents
192 Annual Report 2018-19
JSW Cement Limited
For trade receivables or any contractual right to receive cash or another financial asset that result from
transactions that are within the scope of Ind AS 11 and Ind AS 18, the Group always measures the loss allowance
at an amount equal to lifetime expected credit losses.
Further, for the purpose of measuring lifetime expected credit loss allowance for trade receivables, the Group
has used a practical expedient as permitted under Ind AS 109. This expected credit loss allowance is computed
based on a provision matrix which takes into account historical credit loss experience and adjusted for forward-
looking information.
The impairment requirements for the recognition and measurement of a loss allowance are equally applied to
debt instruments at FVTOCI except that the loss allowance is recognised in other comprehensive income and is
not reduced from the carrying amount in the balance sheet
e) Effective interest method
The effective interest method is a method of calculating the amortised cost of a debt instrument and of allocating
interest income over the relevant period. The effective interest rate is the rate that exactly discounts estimated
future cash receipts (including all fees and points paid or received that form an integral part of the effective
interest rate, transaction costs and other premiums or discounts) through the expected life of the debt
instrument, or, where appropriate, a shorter period, to the net carrying amount on initial recognition.
Income is recognised on an effective interest basis for debt instruments other than those financial assets
classified as at FVTPL. Interest income is recognized in profit or loss and is included in the 'Other income' line
item.
B. Financial liabilities and equity instruments
a) Classification as debt or equity
Debt and equity instruments issued by a Group are classified as either financial liabilities or as equity in
accordance with the substance of the contractual arrangements and the definitions of a financial liability and
an equity instrument.
b) Equity instruments
An equity instrument is any contract that evidences a residual interest in the assets of an entity after deducting
all of its liabilities. Equity instruments issued by the Group are recognised at the proceeds received, net of
direct issue costs.
Repurchase of the Group's own equity instruments is recognised and deducted directly in equity. No gain or
loss is recognised in Statement of Profit and Loss on the purchase, sale, issue or cancellation of the Group's
own equity instruments.
c) Financial liabilities
Financial liabilities are classified as either financial liabilities 'at FVTPL' or 'other financial liabilities'.
Financial liabilities at FVTPL:
Financial liabilities are classified as at FVTPL when the financial liability is either held for trading or it is designated
as at FVTPL.
A financial liability is classified as held for trading if:
l It has been incurred principally for the purpose of repurchasing it in the near term; or
l on initial recognition it is part of a portfolio of identified financial instruments that the Group manages
together and has a recent actual pattern of short-term profit-taking; or
l it is a derivative that is not designated and effective as a hedging instrument.
193Expanding. Integrating. Progressing.
A financial liability other than a financial liability held for trading may be designated as at FVTPL upon initial
recognition if:
l such designation eliminates or significantly reduces a measurement or recognition inconsistency that would
otherwise arise;
l the financial liability forms part of a Group of financial assets or financial liabilities or both, which is managed
and its performance is evaluated on a fair value basis, in accordance with the Group's documented risk
management or investment strategy, and information about the Grouping is provided internally on that basis; or
l it forms part of a contract containing one or more embedded derivatives, and Ind AS 109 permits the entire
combined contract to be designated as at FVTPL in accordance with Ind AS 109.
Financial liabilities at FVTPL are stated at fair value, with any gains or losses arising on remeasurement recognised
in Statement of Profit and Loss. The net gain or loss recognised in Statement of Profit and Loss incorporates any
interest paid on the financial liability and is included in the 'other gains and losses' line item in the Statement of
Profit and Loss.
The Group derecognises financial liabilities when, and only when, the Group's obligations are discharged, cancelled
or they expire. The difference between the carrying amount of the financial liability derecognised and the
consideration paid and payable is recognised in Statement of Profit and Loss.
Other financial liabilities:
Other financial liabilities (including borrowings and trade and other payables) are subsequently measured at amortised
cost using the effective interest method.
The Group enters into deferred payment arrangements (acceptances) whereby overseas lenders such as banks
and other financial institutions make payments to supplier's banks for import of raw materials and capital expenditure.
The banks and financial institutions are subsequently repaid by the Group at a later date. These are normally settled
up to 12 months (for raw materials) and up to 60 months (for capital expenditure). These arrangements for raw
materials are recognized as Acceptances (under trade payables) and the arrangements for capital expenditure are
recognised as other financial liabilities.
Derecognition of financial liabilities:
The Group derecognises financial liabilities when, and only when, the Group's obligations are discharged, cancelled
or have expired. An exchange between with a lender of debt instruments with substantially different terms is
accounted for as an extinguishment of the original financial liability and the recognition of a new financial liability.
Similarly, a substantial modification of the terms of an existing financial liability (whether or not attributable to the
financial difficulty of the debtor) is accounted for as an extinguishment of the original financial liability and the
recognition of a new financial liability. The difference between the carrying amount of the financial liability
derecognised and the consideration paid and payable is recognised in profit or loss.
d) Reclassification of financial assets
The Group determines classification of financial assets and liabilities on initial recognition. After initial recognition,
no reclassification is made for financial assets which are equity instruments and financial liabilities. For financial
assets which are debt instruments, a reclassification is made only if there is a change in the business model for
managing those assets. Changes to the business model are expected to be infrequent. The Group's senior
management determines change in the business model as a result of external or internal changes which are significant
to the Group's operations. Such changes are evident to external parties. A change in the business model occurs
when the Group either begins or ceases to perform an activity that is significant to its operations. If the Group
reclassifies financial assets, it applies the reclassification prospectively from the reclassification date which is the
first day of the immediately next reporting period following the change in business model. The Group does not
restate any previously recognised gains, losses (including impairment gains or losses) or interest.
Corporate O
verviewStatutory Reports
Financial Statem
ents
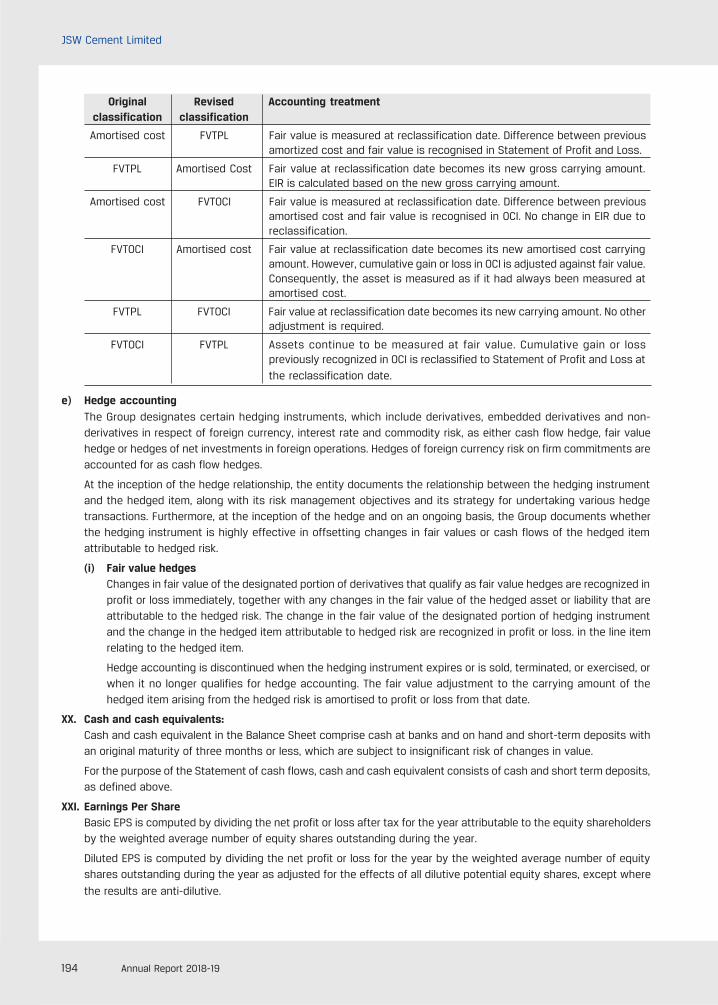
194 Annual Report 2018-19
JSW Cement Limited
Original Revised Accounting treatmentclassification classification
Amortised cost FVTPL Fair value is measured at reclassification date. Difference between previousamortized cost and fair value is recognised in Statement of Profit and Loss.
FVTPL Amortised Cost Fair value at reclassification date becomes its new gross carrying amount.EIR is calculated based on the new gross carrying amount.
Amortised cost FVTOCI Fair value is measured at reclassification date. Difference between previousamortised cost and fair value is recognised in OCI. No change in EIR due toreclassification.
FVTOCI Amortised cost Fair value at reclassification date becomes its new amortised cost carryingamount. However, cumulative gain or loss in OCI is adjusted against fair value.Consequently, the asset is measured as if it had always been measured atamortised cost.
FVTPL FVTOCI Fair value at reclassification date becomes its new carrying amount. No otheradjustment is required.
FVTOCI FVTPL Assets continue to be measured at fair value. Cumulative gain or losspreviously recognized in OCI is reclassified to Statement of Profit and Loss at
the reclassification date.
e) Hedge accounting
The Group designates certain hedging instruments, which include derivatives, embedded derivatives and non-derivatives in respect of foreign currency, interest rate and commodity risk, as either cash flow hedge, fair valuehedge or hedges of net investments in foreign operations. Hedges of foreign currency risk on firm commitments areaccounted for as cash flow hedges.
At the inception of the hedge relationship, the entity documents the relationship between the hedging instrumentand the hedged item, along with its risk management objectives and its strategy for undertaking various hedgetransactions. Furthermore, at the inception of the hedge and on an ongoing basis, the Group documents whetherthe hedging instrument is highly effective in offsetting changes in fair values or cash flows of the hedged itemattributable to hedged risk.
(i) Fair value hedgesChanges in fair value of the designated portion of derivatives that qualify as fair value hedges are recognized inprofit or loss immediately, together with any changes in the fair value of the hedged asset or liability that areattributable to the hedged risk. The change in the fair value of the designated portion of hedging instrumentand the change in the hedged item attributable to hedged risk are recognized in profit or loss. in the line itemrelating to the hedged item.
Hedge accounting is discontinued when the hedging instrument expires or is sold, terminated, or exercised, orwhen it no longer qualifies for hedge accounting. The fair value adjustment to the carrying amount of thehedged item arising from the hedged risk is amortised to profit or loss from that date.
XX. Cash and cash equivalents:Cash and cash equivalent in the Balance Sheet comprise cash at banks and on hand and short-term deposits withan original maturity of three months or less, which are subject to insignificant risk of changes in value.
For the purpose of the Statement of cash flows, cash and cash equivalent consists of cash and short term deposits,as defined above.
XXI. Earnings Per ShareBasic EPS is computed by dividing the net profit or loss after tax for the year attributable to the equity shareholdersby the weighted average number of equity shares outstanding during the year.
Diluted EPS is computed by dividing the net profit or loss for the year by the weighted average number of equityshares outstanding during the year as adjusted for the effects of all dilutive potential equity shares, except where
the results are anti-dilutive.
195Expanding. Integrating. Progressing.
3. Key sources of estimation uncertainty and recent accounting pronouncement
In the course of applying the policies outlined in all notes under section 2 above, the Group is required to make
judgements, estimates and assumptions about the carrying amount of assets and liabilities that are not readily
apparent from other sources. The estimates and associated assumptions are based on historical experience and
other factors that are considered to be relevant. Actual results may differ from these estimates.
The estimates and underlying assumptions are reviewed on an ongoing basis. Revisions to accounting estimates
are recognized in the period in which the estimate is revised if the revision affects only that period, or in the period
of the revision and future period, if the revision affects current and future period.
A) Key sources of estimation uncertainty
i) Useful lives of property, plant and equipment
Management reviews the useful lives of property, plant and equipment at least once a year. Such lives
depend upon an assessment of both the technical lives of the assets and also their likely economic lives
based on various internal and external factors including relative efficiency and operating costs. Accordingly,
depreciable lives are reviewed annually using the best information available to the Management.
ii) Provisions and liabilities
Provisions and liabilities are recognized in the period when it becomes probable that there will be a future
outflow of funds resulting from past operations or events that can reasonably be estimated. The timing of
recognition requires application of judgement to existing facts and circumstances which may be subject
to change. The amounts are determined by discounting the expected future cash flows at a pre-tax rate
that reflects current market assessments of the time value of money and the risks specific to the liability.
iii) Contingencies
In the normal course of business, contingent liabilities may arise from litigation and other claims against
the Group. Potential liabilities that are possible but not probable of crystalising or are very difficult to quantify
reliably are treated as contingent liabilities. Such liabilities are disclosed in the notes but are not recognized.
iv) Fair value measurements
When the fair values of financial assets or financial liabilities recorded or disclosed in the financial
statements cannot be measured based on quoted prices in active markets, their fair value is measured
using valuation techniques including the DCF model. The inputs to these models are taken from observable
markets where possible, but where this is not feasible, a degree of judgment is required in establishing fair
values. Judgements include consideration of inputs such as liquidity risk, credit risk and volatility
v) Taxes
Deferred tax assets are recognized for unused tax losses to the extent that it is probable that taxable
profit will be available against which the losses can be utilized. Significant management judgement is
required to determine the amount of deferred tax assets that can be recognised, based upon the likely
timing and the level of future taxable profits together with future tax planning strategies.
vi) Mines restoration obligation
In determining the fair value of the Mines Restoration Obligation, assumptions and estimates are made in
relation to mining reserve, discount rates, the expected cost of mines restoration and the expected timing
of those costs.
vii) Defined benefits plans
The cost of defined benefit plan and other postemployment benefits and the present value of such
obligations are determined using actuarial valuations. An actuarial valuation involves making various
assumptions that may differ from actual development in the future. These include the determination of the
discount rate, future salary escalations and mortality rates etc. Due to the complexities involved in the
valuation and its long term nature, a defined benefit obligation is highly sensitive to changes in these
assumptions. All assumptions are reviewed at each reporting date.
Corporate O
verviewStatutory Reports
Financial Statem
ents
196 Annual Report 2018-19
JSW Cement Limited
viii) Goodwill
Determining whether the goodwill acquired in business combinations are impaired, requires an estimate
of recoverable amount of the group's cash generating unit. In considering the recoverable value of cash
generating unit, the management has anticipated the future benefits to arise from commodity prices,
capacity utilization of plants, mineable resources and availability of infrastructure of mines, discount rates
and other factors of the underlying unit. If the recoverable amount of the cash generating unit is less than
its carrying amount, the impairment loss is allocated first to reduce the carrying amount of any goodwill
allocated to the unit and then to the other assets of the unit prorate based on carrying amount of each
asset in the unit. Any impairment loss of goodwill is recognized directly in the consolidated statement of
profit or loss.
B) Recent Accounting Pronouncements
IND AS 116 - Leases:
On 30th March, 2019, Ministry of Corporate Affairs has notified Ind AS 116, Leases. Ind AS 116 will replace the
existing leases Standard, Ind AS 17 Leases, and related Interpretations. The Standard sets out the principles for
the recognition, measurement, presentation and disclosure of leases for both parties to a contract i.e., the
lessee and the lessor. Ind AS 116 introduces a single lessee accounting model and requires a lessee to recognize
assets and liabilities for all leases with a term of more than twelve months, unless the underlying asset is of
low value. Currently, operating lease expenses are charged to the statement of Profit & Loss. The Standard also
contains enhanced disclosure requirements for lessees. Ind AS 116 substantially carries forward the lessor
accounting requirements in Ind AS 17. The management is yet to assess the impact of the aforesaid amendments
on the Group's financial information.
Amendments to Ind AS 12- Income taxes
On 30th March, 2019, Ministry of Corporate Affairs issued amendments to the guidance in Ind AS 12, 'Income
Taxes', in connection with accounting for dividend distribution taxes. The amendment clarifies that an entity
shall recognize the income tax consequences of dividends in profit or loss, other comprehensive income or
equity according to where the entity originally recognized those past transactions or events. Effective date for
application of this amendment is annual period beginning on or after 1st April, 2019. At present, IND AS 12 is not
applicable to CompanyGroup as no Dividend is declared by Group till current year.
Amendment to Ind AS 19 - plan amendment, curtailment or settlement
On March 30, 2019, Ministry of Corporate Affairs issued amendments to Ind AS 19, 'Employee Benefits', in
connection with accounting for plan amendments, curtailments and settlements.
The amendments require an entity:
l to use updated assumptions to determine current service cost and net interest for the remainder of the
period after a plan amendment, curtailment or settlement; and
l to recognize in profit or loss as part of past service cost, or a gain or loss on settlement, any reduction in
a surplus, even if that surplus was not previously recognized because of the impact of the asset ceiling.
Effective date for application of this amendment is annual period beginning on or after 1 April 2019.
The management is yet to assess the impact of the aforesaid amendments on the Group's financial information.
Amendment to Ind AS 23 - Borrowing Cost
On 30th March, 2019, Ministry of Corporate Affairs issued amendments to Ind AS 23, 'Borrowing Cost', in
connection with capitalization of Borrowing Cost when an entity borrows funds generally and uses them for
the purpose of obtaining a qualifying asset.
The amendments require an entity:
l To the extent that an entity borrows funds generally and uses them for the purpose of obtaining a qualifying
asset, the entity shall determine the amount of borrowing costs eligible for capitalisation by applying a
197Expanding. Integrating. Progressing.
capitalisation rate to the expenditures on that asset. The capitalisation rate shall be the weighted average
of the borrowing costs applicable to all borrowings of the entity that are outstanding during the period.
However, an entity shall exclude from this calculation borrowing costs applicable to borrowings made
specifically for the purpose of obtaining a qualifying asset until substantially all the activities necessary to
prepare that asset for its intended use or sale are complete. The amount of borrowing costs that an entity
capitalises during a period shall not exceed the amount of borrowing costs it incurred during that period..
The management is yet to assess the impact of the aforesaid amendments on the Group's financial
information.
Amendment to Ind AS 103 - Business Combinations
On 30th March, 2019, Ministry of Corporate Affairs issued amendments to Ind AS 103, 'Business Combinations'.
The amendments require that:
l When a party to a joint arrangement (as defined in Ind AS 111, Joint Arrangements) obtains control of a
business that is a joint operation (as defined in Ind AS 111), and had rights to the assets and obligations for
the liabilities relating to that joint operation immediately before the acquisition date, the transaction is a
business combination achieved in stages. The acquirer shall therefore apply the requirements for a business
combination achieved in stages, including re-measuring its previously held interest in the joint operation
in the manner described in paragraph 42. In doing so, the acquirer shall re-measure its entire previously
held interest in the joint operation.
Aforesaid amendment is not applicable to the CompanyGroup, hence will not have any impact on Financial
Statement.
Corporate O
verviewStatutory Reports
Financial Statem
ents
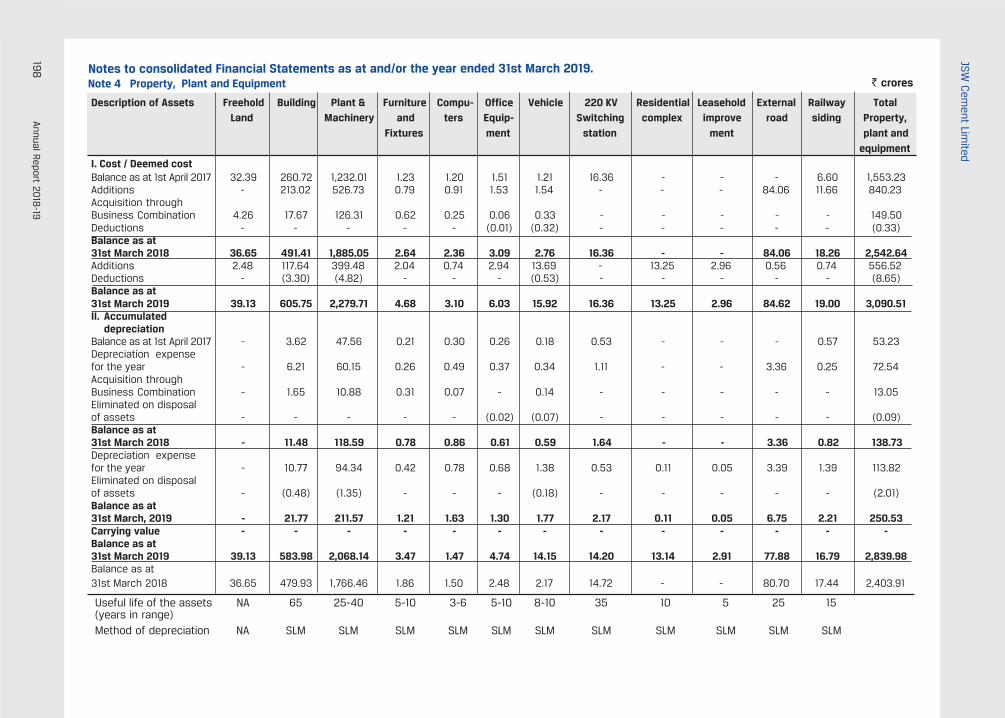
198
Annual Report 20
18-19
JSW C
ement Lim
ited
Note 4 Property, Plant and Equipment
Description of Assets Freehold Building Plant & Furniture Compu- Office Vehicle 220 KV Residential Leasehold External Railway TotalLand Machinery and ters Equip- Switching complex improve road siding Property,
Fixtures ment station ment plant andequipment
I. Cost / Deemed costBalance as at 1st April 2017 32.39 260.72 1,232.01 1.23 1.20 1.51 1.21 16.36 - - - 6.60 1,553.23Additions - 213.02 526.73 0.79 0.91 1.53 1.54 - - - 84.06 11.66 840.23Acquisition throughBusiness Combination 4.26 17.67 126.31 0.62 0.25 0.06 0.33 - - - - - 149.50Deductions - - - - - (0.01) (0.32) - - - - - (0.33)Balance as at31st March 2018 36.65 491.41 1,885.05 2.64 2.36 3.09 2.76 16.36 - - 84.06 18.26 2,542.64Additions 2.48 117.64 399.48 2.04 0.74 2.94 13.69 - 13.25 2.96 0.56 0.74 556.52Deductions - (3.30) (4.82) - - - (0.53) - - - - - (8.65)Balance as at31st March 2019 39.13 605.75 2,279.71 4.68 3.10 6.03 15.92 16.36 13.25 2.96 84.62 19.00 3,090.51II. Accumulated
depreciationBalance as at 1st April 2017 - 3.62 47.56 0.21 0.30 0.26 0.18 0.53 - - - 0.57 53.23Depreciation expensefor the year - 6.21 60.15 0.26 0.49 0.37 0.34 1.11 - - 3.36 0.25 72.54Acquisition throughBusiness Combination - 1.65 10.88 0.31 0.07 - 0.14 - - - - - 13.05Eliminated on disposalof assets - - - - - (0.02) (0.07) - - - - - (0.09)Balance as at31st March 2018 - 11.48 118.59 0.78 0.86 0.61 0.59 1.64 - - 3.36 0.82 138.73Depreciation expensefor the year - 10.77 94.34 0.42 0.78 0.68 1.38 0.53 0.11 0.05 3.39 1.39 113.82Eliminated on disposalof assets - (0.48) (1.35) - - - (0.18) - - - - - (2.01)Balance as at31st March, 2019 - 21.77 211.57 1.21 1.63 1.30 1.77 2.17 0.11 0.05 6.75 2.21 250.53Carrying value - - - - - - - - - - - - -Balance as at31st March 2019 39.13 583.98 2,068.14 3.47 1.47 4.74 14.15 14.20 13.14 2.91 77.88 16.79 2,839.98Balance as at31st March 2018 36.65 479.93 1,766.46 1.86 1.50 2.48 2.17 14.72 - - 80.70 17.44 2,403.91
` croresNotes to consolidated Financial Statements as at and/or the year ended 31st March 2019.
Useful life of the assets NA 65 25-40 5-10 3-6 5-10 8-10 35 10 5 25 15(years in range)Method of depreciation NA SLM SLM SLM SLM SLM SLM SLM SLM SLM SLM SLM
199Expanding. Integrating. Progressing.
4.1 Asset include Gross Block of `645.27 crores (previous year `592.04 crores) constructed on lease land under
sub-lease agreements with JSW Steel Limited, for 150 Acres of land situated at Tornagallu village, District Bellary
Karnataka at an annual rent of `0.60 crores.
4.2 Asset include Gross Block of `392.29 crores (previous year `165.45 crores) constructed on lease land under lease
agreements with JSW Steel Limited, for 20.55 acres of land situated at Dolvi, District Raigad, Maharshatra at an
annual rent of `1.94 crores.
4.3 Additions to Plant & Machinery includes adjustment of `12.45 crores on account of finance cost.
4.4 Certain property, plant and equipment are pledged against borrowing, the detail relating to which have been described
in note 17.
4.5 Property, plant and equipment include assets with net block of `124.91 crores (previous year `112.86 crores) for
which ownership is not in the name of the group.
4.6 Capital work in progress includes finance cost `12.07 crores (As at 31st March 2018: `0.33 crores).
Corporate O
verviewStatutory Reports
Financial Statem
ents
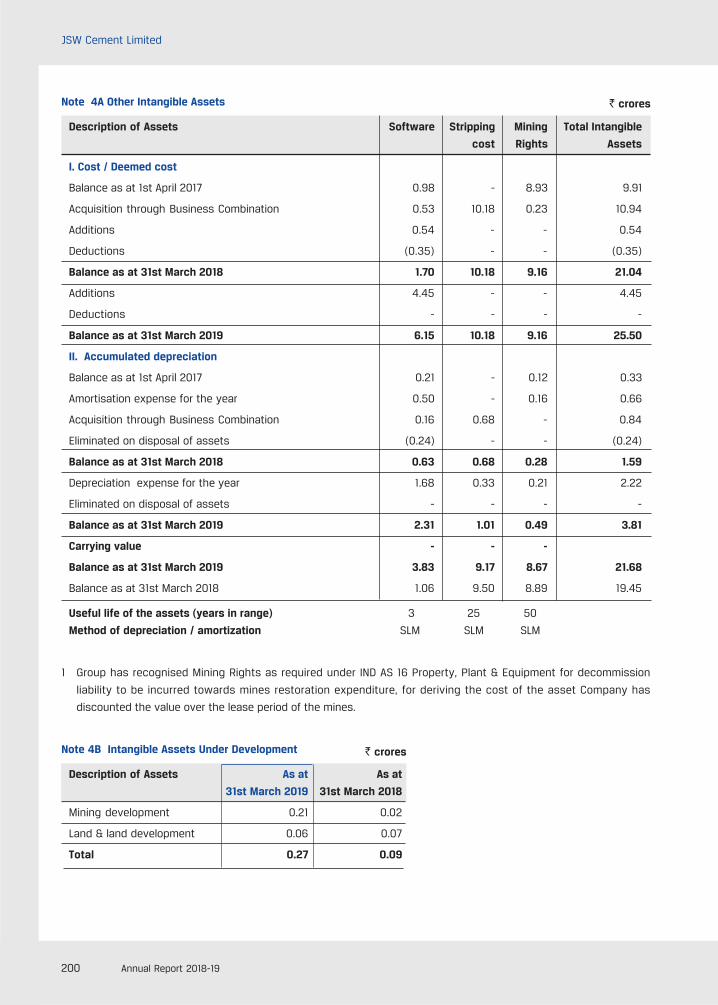
200 Annual Report 2018-19
JSW Cement Limited
Note 4A Other Intangible Assets
Description of Assets Software Stripping Mining Total Intangible
cost Rights Assets
I. Cost / Deemed cost
Balance as at 1st April 2017 0.98 - 8.93 9.91
Acquisition through Business Combination 0.53 10.18 0.23 10.94
Additions 0.54 - - 0.54
Deductions (0.35) - - (0.35)
Balance as at 31st March 2018 1.70 10.18 9.16 21.04
Additions 4.45 - - 4.45
Deductions - - - -
Balance as at 31st March 2019 6.15 10.18 9.16 25.50
II. Accumulated depreciation
Balance as at 1st April 2017 0.21 - 0.12 0.33
Amortisation expense for the year 0.50 - 0.16 0.66
Acquisition through Business Combination 0.16 0.68 - 0.84
Eliminated on disposal of assets (0.24) - - (0.24)
Balance as at 31st March 2018 0.63 0.68 0.28 1.59
Depreciation expense for the year 1.68 0.33 0.21 2.22
Eliminated on disposal of assets - - - -
Balance as at 31st March 2019 2.31 1.01 0.49 3.81
Carrying value - - -
Balance as at 31st March 2019 3.83 9.17 8.67 21.68
Balance as at 31st March 2018 1.06 9.50 8.89 19.45
Useful life of the assets (years in range) 3 25 50
Method of depreciation / amortization SLM SLM SLM
1 Group has recognised Mining Rights as required under IND AS 16 Property, Plant & Equipment for decommission
liability to be incurred towards mines restoration expenditure, for deriving the cost of the asset Company has
discounted the value over the lease period of the mines.
Note 4B Intangible Assets Under Development
Description of Assets As at As at
31st March 2019 31st March 2018
Mining development 0.21 0.02
Land & land development 0.06 0.07
Total 0.27 0.09
` crores
` crores
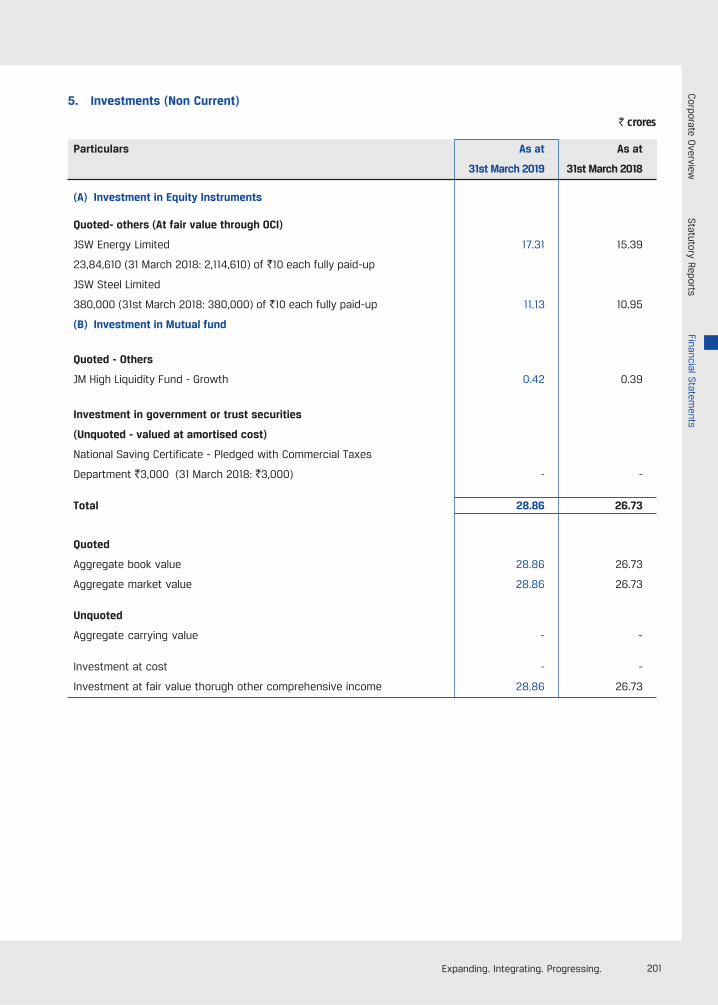
201Expanding. Integrating. Progressing.
5. Investments (Non Current)
` crores
Particulars As at As at
31st March 2019 31st March 2018
(A) Investment in Equity Instruments
Quoted- others (At fair value through OCI)
JSW Energy Limited 17.31 15.39
23,84,610 (31 March 2018: 2,114,610) of `10 each fully paid-up
JSW Steel Limited
380,000 (31st March 2018: 380,000) of `10 each fully paid-up 11.13 10.95
(B) Investment in Mutual fund
Quoted - Others
JM High Liquidity Fund - Growth 0.42 0.39
Investment in government or trust securities
(Unquoted - valued at amortised cost)
National Saving Certificate - Pledged with Commercial Taxes
Department `3,000 (31 March 2018: `3,000) - -
Total 28.86 26.73
Quoted
Aggregate book value 28.86 26.73
Aggregate market value 28.86 26.73
Unquoted
Aggregate carrying value - -
Investment at cost - -
Investment at fair value thorugh other comprehensive income 28.86 26.73
Corporate O
verviewStatutory Reports
Financial Statem
ents
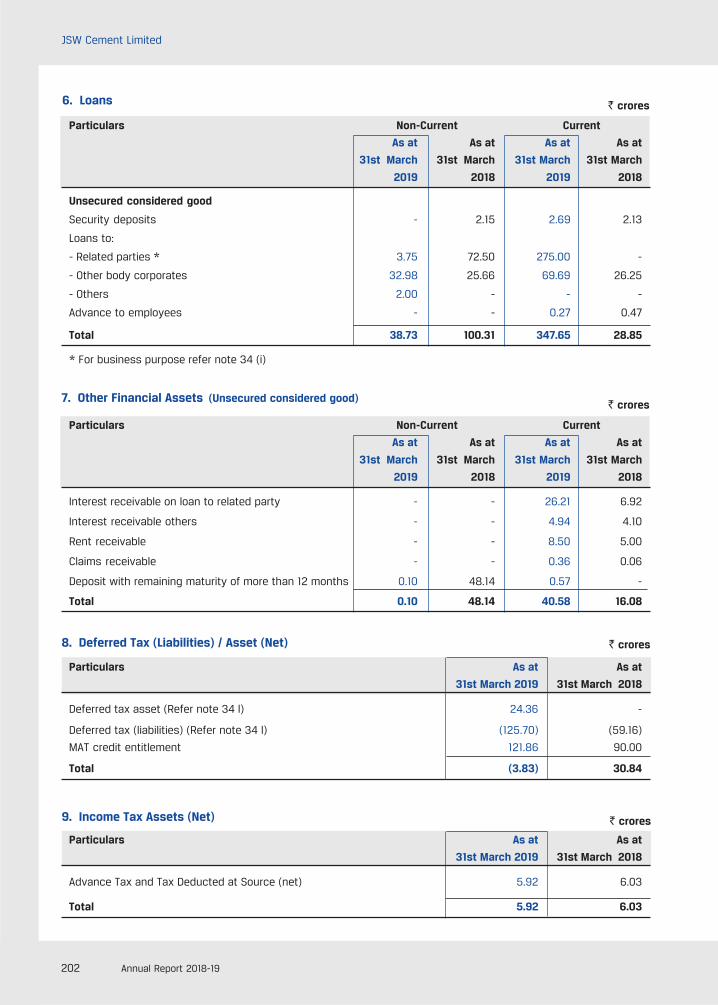
202 Annual Report 2018-19
JSW Cement Limited
6. Loans ` crores
7. Other Financial Assets (Unsecured considered good)` crores
Particulars Non-Current Current
As at As at As at As at
31st March 31st March 31st March 31st March
2019 2018 2019 2018
Unsecured considered good
Security deposits - 2.15 2.69 2.13
Loans to:
- Related parties * 3.75 72.50 275.00 -
- Other body corporates 32.98 25.66 69.69 26.25
- Others 2.00 - - -
Advance to employees - - 0.27 0.47
Total 38.73 100.31 347.65 28.85
9. Income Tax Assets (Net) ` crores
Particulars Non-Current Current
As at As at As at As at
31st March 31st March 31st March 31st March
2019 2018 2019 2018
Interest receivable on loan to related party - - 26.21 6.92
Interest receivable others - - 4.94 4.10
Rent receivable - - 8.50 5.00
Claims receivable - - 0.36 0.06
Deposit with remaining maturity of more than 12 months 0.10 48.14 0.57 -
Total 0.10 48.14 40.58 16.08
Particulars As at As at
31st March 2019 31st March 2018
Advance Tax and Tax Deducted at Source (net) 5.92 6.03
Total 5.92 6.03
* For business purpose refer note 34 (i)
8. Deferred Tax (Liabilities) / Asset (Net) ` crores
Particulars As at As at
31st March 2019 31st March 2018
Deferred tax asset (Refer note 34 l) 24.36 -
Deferred tax (liabilities) (Refer note 34 l) (125.70) (59.16)
MAT credit entitlement 121.86 90.00
Total (3.83) 30.84
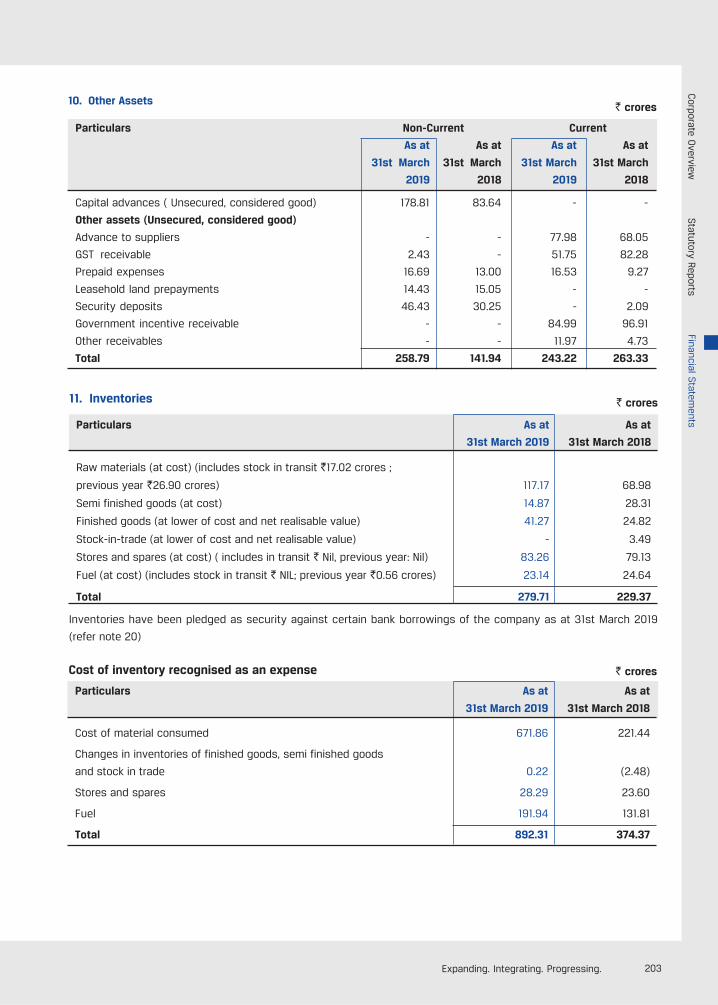
203Expanding. Integrating. Progressing.
Cost of inventory recognised as an expense
10. Other Assets` crores
Particulars Non-Current Current
As at As at As at As at
31st March 31st March 31st March 31st March
2019 2018 2019 2018
Capital advances ( Unsecured, considered good) 178.81 83.64 - -
Other assets (Unsecured, considered good)
Advance to suppliers - - 77.98 68.05
GST receivable 2.43 - 51.75 82.28
Prepaid expenses 16.69 13.00 16.53 9.27
Leasehold land prepayments 14.43 15.05 - -
Security deposits 46.43 30.25 - 2.09
Government incentive receivable - - 84.99 96.91
Other receivables - - 11.97 4.73
Total 258.79 141.94 243.22 263.33
Particulars As at As at
31st March 2019 31st March 2018
Cost of material consumed 671.86 221.44
Changes in inventories of finished goods, semi finished goods
and stock in trade 0.22 (2.48)
Stores and spares 28.29 23.60
Fuel 191.94 131.81
Total 892.31 374.37
` crores
Inventories have been pledged as security against certain bank borrowings of the company as at 31st March 2019
(refer note 20)
11. Inventories ` crores
Particulars As at As at
31st March 2019 31st March 2018
Raw materials (at cost) (includes stock in transit `17.02 crores ;
previous year `26.90 crores) 117.17 68.98
Semi finished goods (at cost) 14.87 28.31
Finished goods (at lower of cost and net realisable value) 41.27 24.82
Stock-in-trade (at lower of cost and net realisable value) - 3.49
Stores and spares (at cost) ( includes in transit ` Nil, previous year: Nil) 83.26 79.13
Fuel (at cost) (includes stock in transit ` NIL; previous year `0.56 crores) 23.14 24.64
Total 279.71 229.37
Corporate O
verviewStatutory Reports
Financial Statem
ents
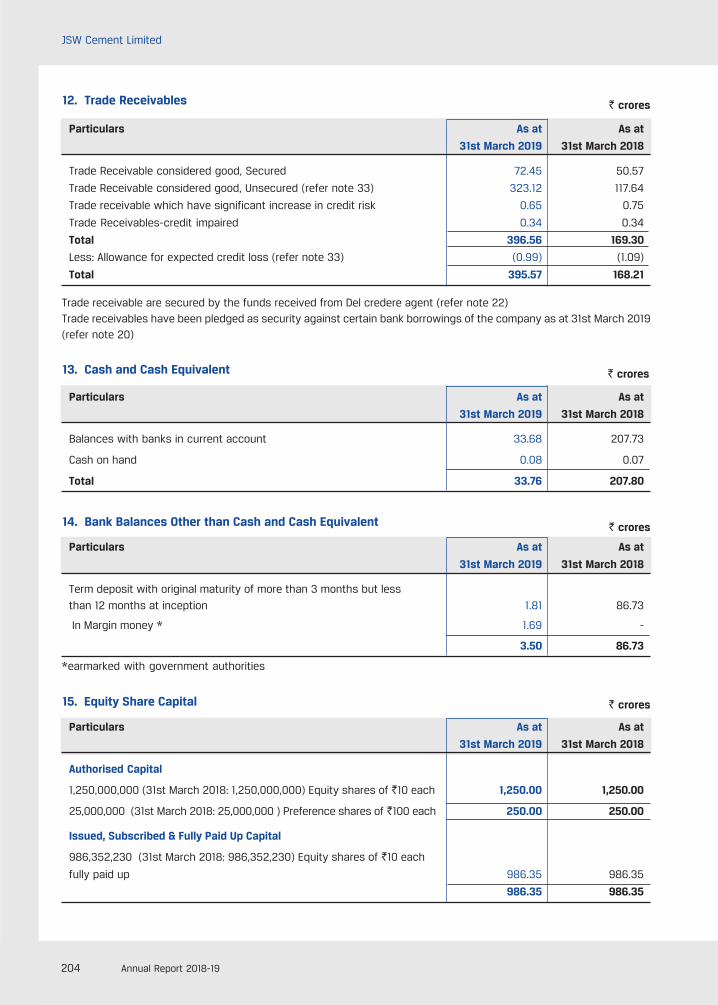
204 Annual Report 2018-19
JSW Cement Limited
12. Trade Receivables ` crores
13. Cash and Cash Equivalent ` crores
14. Bank Balances Other than Cash and Cash Equivalent ` crores
15. Equity Share Capital ` crores
Particulars As at As at
31st March 2019 31st March 2018
Trade Receivable considered good, Secured 72.45 50.57
Trade Receivable considered good, Unsecured (refer note 33) 323.12 117.64
Trade receivable which have significant increase in credit risk 0.65 0.75
Trade Receivables-credit impaired 0.34 0.34
Total 396.56 169.30
Less: Allowance for expected credit loss (refer note 33) (0.99) (1.09)
Total 395.57 168.21
Trade receivable are secured by the funds received from Del credere agent (refer note 22)Trade receivables have been pledged as security against certain bank borrowings of the company as at 31st March 2019(refer note 20)
Particulars As at As at
31st March 2019 31st March 2018
Balances with banks in current account 33.68 207.73
Cash on hand 0.08 0.07
Total 33.76 207.80
Particulars As at As at
31st March 2019 31st March 2018
Term deposit with original maturity of more than 3 months but less
than 12 months at inception 1.81 86.73
In Margin money * 1.69 -
3.50 86.73
Particulars As at As at
31st March 2019 31st March 2018
Authorised Capital
1,250,000,000 (31st March 2018: 1,250,000,000) Equity shares of `10 each 1,250.00 1,250.00
25,000,000 (31st March 2018: 25,000,000 ) Preference shares of `100 each 250.00 250.00
Issued, Subscribed & Fully Paid Up Capital
986,352,230 (31st March 2018: 986,352,230) Equity shares of `10 each
fully paid up 986.35 986.35
986.35 986.35
*earmarked with government authorities
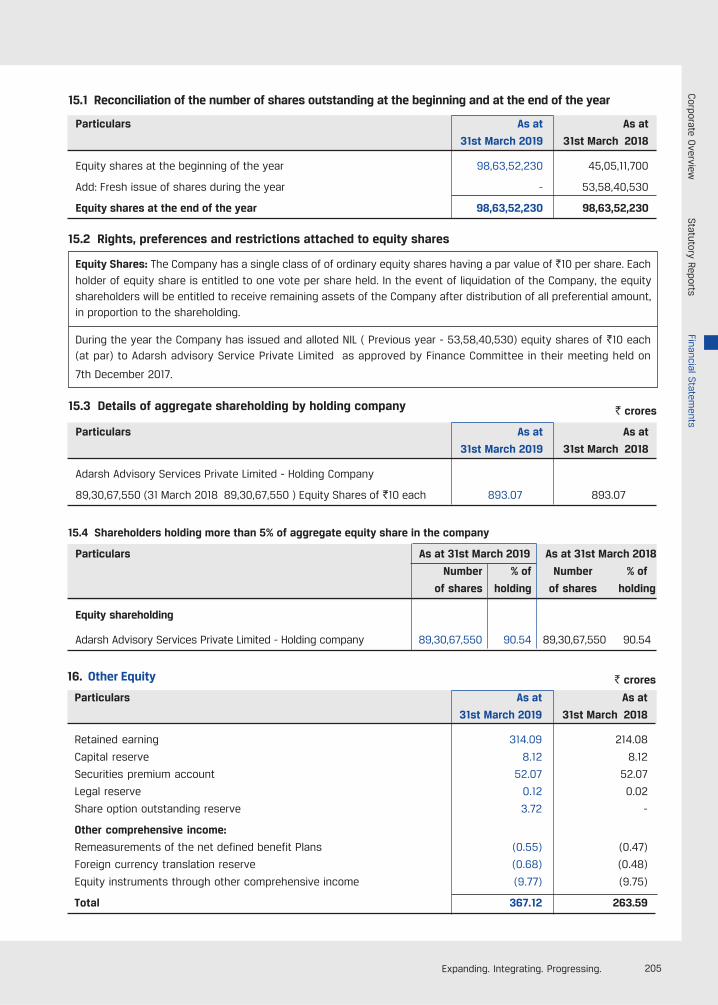
205Expanding. Integrating. Progressing.
15.1 Reconciliation of the number of shares outstanding at the beginning and at the end of the year
15.2 Rights, preferences and restrictions attached to equity shares
Equity Shares: The Company has a single class of of ordinary equity shares having a par value of `10 per share. Each
holder of equity share is entitled to one vote per share held. In the event of liquidation of the Company, the equityshareholders will be entitled to receive remaining assets of the Company after distribution of all preferential amount,in proportion to the shareholding.
During the year the Company has issued and alloted NIL ( Previous year - 53,58,40,530) equity shares of `10 each(at par) to Adarsh advisory Service Private Limited as approved by Finance Committee in their meeting held on
7th December 2017.
15.3 Details of aggregate shareholding by holding company ` crores
15.4 Shareholders holding more than 5% of aggregate equity share in the company
Particulars As at 31st March 2019 As at 31st March 2018
Number % of Number % of
of shares holding of shares holding
Equity shareholding
Adarsh Advisory Services Private Limited - Holding company 89,30,67,550 90.54 89,30,67,550 90.54
Particulars As at As at
31st March 2019 31st March 2018
Equity shares at the beginning of the year 98,63,52,230 45,05,11,700
Add: Fresh issue of shares during the year - 53,58,40,530
Equity shares at the end of the year 98,63,52,230 98,63,52,230
Particulars As at As at
31st March 2019 31st March 2018
Adarsh Advisory Services Private Limited - Holding Company
89,30,67,550 (31 March 2018 89,30,67,550 ) Equity Shares of `10 each 893.07 893.07
16. Other Equity ` crores
Particulars As at As at
31st March 2019 31st March 2018
Retained earning 314.09 214.08
Capital reserve 8.12 8.12
Securities premium account 52.07 52.07
Legal reserve 0.12 0.02
Share option outstanding reserve 3.72 -
Other comprehensive income:
Remeasurements of the net defined benefit Plans (0.55) (0.47)
Foreign currency translation reserve (0.68) (0.48)
Equity instruments through other comprehensive income (9.77) (9.75)
Total 367.12 263.59
Corporate O
verviewStatutory Reports
Financial Statem
ents
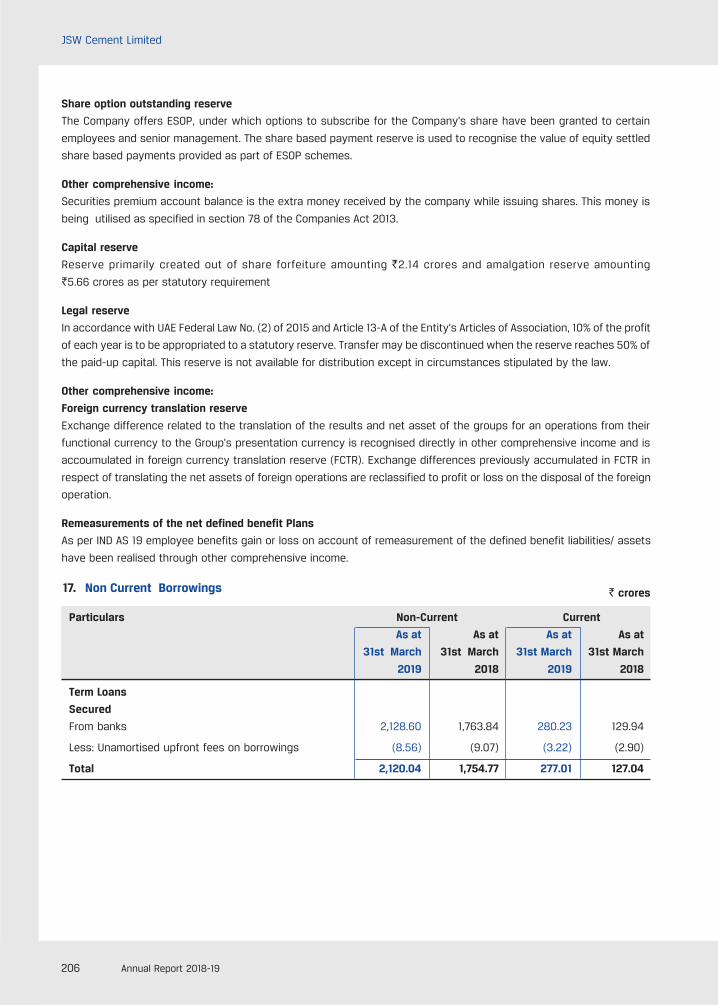
206 Annual Report 2018-19
JSW Cement Limited
Share option outstanding reserve
The Company offers ESOP, under which options to subscribe for the Company's share have been granted to certain
employees and senior management. The share based payment reserve is used to recognise the value of equity settled
share based payments provided as part of ESOP schemes.
Other comprehensive income:
Securities premium account balance is the extra money received by the company while issuing shares. This money is
being utilised as specified in section 78 of the Companies Act 2013.
Capital reserve
Reserve primarily created out of share forfeiture amounting `2.14 crores and amalgation reserve amounting
`5.66 crores as per statutory requirement
Legal reserve
In accordance with UAE Federal Law No. (2) of 2015 and Article 13-A of the Entity’s Articles of Association, 10% of the profit
of each year is to be appropriated to a statutory reserve. Transfer may be discontinued when the reserve reaches 50% of
the paid-up capital. This reserve is not available for distribution except in circumstances stipulated by the law.
Other comprehensive income:
Foreign currency translation reserve
Exchange difference related to the translation of the results and net asset of the groups for an operations from their
functional currency to the Group's presentation currency is recognised directly in other comprehensive income and is
accoumulated in foreign currency translation reserve (FCTR). Exchange differences previously accumulated in FCTR in
respect of translating the net assets of foreign operations are reclassified to profit or loss on the disposal of the foreign
operation.
Remeasurements of the net defined benefit Plans
As per IND AS 19 employee benefits gain or loss on account of remeasurement of the defined benefit liabilities/ assets
have been realised through other comprehensive income.
17. Non Current Borrowings ` crores
Particulars Non-Current Current
As at As at As at As at
31st March 31st March 31st March 31st March
2019 2018 2019 2018
Term Loans
Secured
From banks 2,128.60 1,763.84 280.23 129.94
Less: Unamortised upfront fees on borrowings (8.56) (9.07) (3.22) (2.90)
Total 2,120.04 1,754.77 277.01 127.04
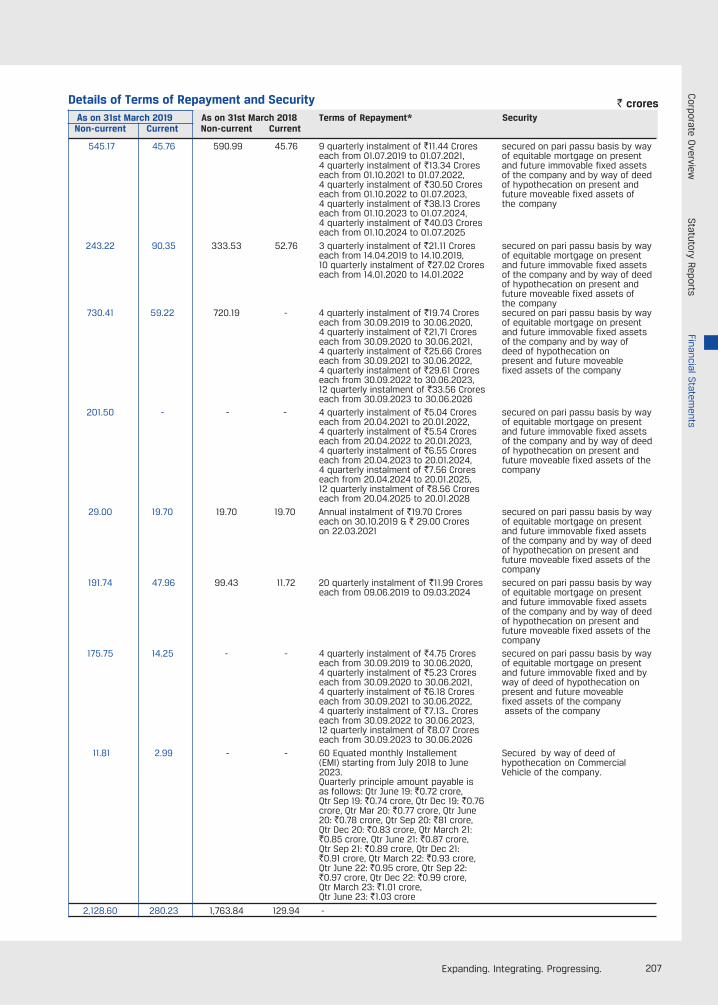
207Expanding. Integrating. Progressing.
Details of Terms of Repayment and SecurityAs on 31st March 2019 As on 31st March 2018 Terms of Repayment* Security
Non-current Current Non-current Current
545.17 45.76 590.99 45.76 9 quarterly instalment of `11.44 Crores secured on pari passu basis by wayeach from 01.07.2019 to 01.07.2021, of equitable mortgage on present4 quarterly instalment of `13.34 Crores and future immovable fixed assetseach from 01.10.2021 to 01.07.2022, of the company and by way of deed4 quarterly instalment of `30.50 Crores of hypothecation on present andeach from 01.10.2022 to 01.07.2023, future moveable fixed assets of4 quarterly instalment of `38.13 Crores the companyeach from 01.10.2023 to 01.07.2024,4 quarterly instalment of `40.03 Croreseach from 01.10.2024 to 01.07.2025
243.22 90.35 333.53 52.76 3 quarterly instalment of `21.11 Crores secured on pari passu basis by wayeach from 14.04.2019 to 14.10.2019, of equitable mortgage on present10 quarterly instalment of `27.02 Crores and future immovable fixed assetseach from 14.01.2020 to 14.01.2022 of the company and by way of deed
of hypothecation on present andfuture moveable fixed assets ofthe company
730.41 59.22 720.19 - 4 quarterly instalment of `19.74 Crores secured on pari passu basis by wayeach from 30.09.2019 to 30.06.2020, of equitable mortgage on present4 quarterly instalment of `21,71 Crores and future immovable fixed assetseach from 30.09.2020 to 30.06.2021, of the company and by way of4 quarterly instalment of `25.66 Crores deed of hypothecation oneach from 30.09.2021 to 30.06.2022, present and future moveable4 quarterly instalment of `29.61 Crores fixed assets of the companyeach from 30.09.2022 to 30.06.2023,12 quarterly instalment of `33.56 Croreseach from 30.09.2023 to 30.06.2026
201.50 - - - 4 quarterly instalment of `5.04 Crores secured on pari passu basis by wayeach from 20.04.2021 to 20.01.2022, of equitable mortgage on present4 quarterly instalment of `5.54 Crores and future immovable fixed assetseach from 20.04.2022 to 20.01.2023, of the company and by way of deed4 quarterly instalment of `6.55 Crores of hypothecation on present andeach from 20.04.2023 to 20.01.2024, future moveable fixed assets of the4 quarterly instalment of `7.56 Crores companyeach from 20.04.2024 to 20.01.2025,12 quarterly instalment of `8.56 Croreseach from 20.04.2025 to 20.01.2028
29.00 19.70 19.70 19.70 Annual instalment of `19.70 Crores secured on pari passu basis by wayeach on 30.10.2019 & ` 29.00 Crores of equitable mortgage on presenton 22.03.2021 and future immovable fixed assets
of the company and by way of deedof hypothecation on present andfuture moveable fixed assets of thecompany
191.74 47.96 99.43 11.72 20 quarterly instalment of `11.99 Crores secured on pari passu basis by wayeach from 09.06.2019 to 09.03.2024 of equitable mortgage on present
and future immovable fixed assetsof the company and by way of deedof hypothecation on present andfuture moveable fixed assets of thecompany
175.75 14.25 - - 4 quarterly instalment of `4.75 Crores secured on pari passu basis by wayeach from 30.09.2019 to 30.06.2020, of equitable mortgage on present4 quarterly instalment of `5.23 Crores and future immovable fixed and byeach from 30.09.2020 to 30.06.2021, way of deed of hypothecation on4 quarterly instalment of `6.18 Crores present and future moveableeach from 30.09.2021 to 30.06.2022, fixed assets of the company4 quarterly instalment of `7.13_ Crores assets of the companyeach from 30.09.2022 to 30.06.2023,12 quarterly instalment of `8.07 Croreseach from 30.09.2023 to 30.06.2026
11.81 2.99 - - 60 Equated monthly Installement Secured by way of deed of(EMI) starting from July 2018 to June hypothecation on Commercial2023. Vehicle of the company.Quarterly principle amount payable isas follows: Qtr June 19: `0.72 crore,Qtr Sep 19: `0.74 crore, Qtr Dec 19: `0.76crore, Qtr Mar 20: `0.77 crore, Qtr June20: `0.78 crore, Qtr Sep 20: `81 crore,Qtr Dec 20: `0.83 crore, Qtr March 21:`0.85 crore, Qtr June 21: `0.87 crore,Qtr Sep 21: `0.89 crore, Qtr Dec 21:`0.91 crore, Qtr March 22: `0.93 crore,Qtr June 22: `0.95 crore, Qtr Sep 22:`0.97 crore, Qtr Dec 22: `0.99 crore,Qtr March 23: `1.01 crore,Qtr June 23: `1.03 crore
2,128.60 280.23 1,763.84 129.94 -
` crores
Corporate O
verviewStatutory Reports
Financial Statem
ents
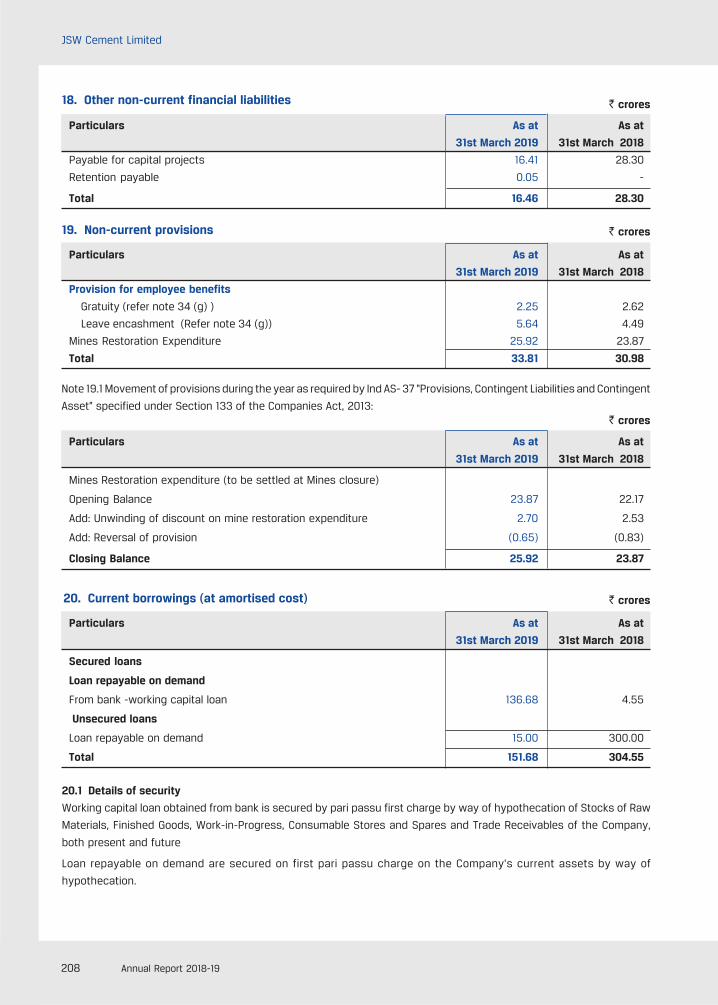
208 Annual Report 2018-19
JSW Cement Limited
18. Other non-current financial liabilities ` crores
19. Non-current provisions ` crores
Note 19.1 Movement of provisions during the year as required by Ind AS- 37 “Provisions, Contingent Liabilities and Contingent
Asset” specified under Section 133 of the Companies Act, 2013:
Particulars As at As at
31st March 2019 31st March 2018
Payable for capital projects 16.41 28.30
Retention payable 0.05 -
Total 16.46 28.30
Particulars As at As at
31st March 2019 31st March 2018
Mines Restoration expenditure (to be settled at Mines closure)
Opening Balance 23.87 22.17
Add: Unwinding of discount on mine restoration expenditure 2.70 2.53
Add: Reversal of provision (0.65) (0.83)
Closing Balance 25.92 23.87
Particulars As at As at
31st March 2019 31st March 2018
Secured loans
Loan repayable on demand
From bank -working capital loan 136.68 4.55
Unsecured loans
Loan repayable on demand 15.00 300.00
Total 151.68 304.55
20.1 Details of security
Working capital loan obtained from bank is secured by pari passu first charge by way of hypothecation of Stocks of Raw
Materials, Finished Goods, Work-in-Progress, Consumable Stores and Spares and Trade Receivables of the Company,
both present and future
Loan repayable on demand are secured on first pari passu charge on the Company’s current assets by way of
hypothecation.
` crores
` crores
Particulars As at As at
31st March 2019 31st March 2018
Provision for employee benefits
Gratuity (refer note 34 (g) ) 2.25 2.62
Leave encashment (Refer note 34 (g)) 5.64 4.49
Mines Restoration Expenditure 25.92 23.87
Total 33.81 30.98
20. Current borrowings (at amortised cost)

209Expanding. Integrating. Progressing.
21. Trade Payable ` crores
Particulars As at As at
31st March 2019 31st March 2018
Total outstanding dues of Micro enterprise and Small enterprise 4.77 1.57
Total outstanding dues of creditors other than Micro enterprisesand small enterprises
Acceptances 200.61 177.19
Other than acceptances 523.09 327.60
Total 728.47 506.36
Acceptances include credit availed by the company from banks for payment to suppliers for raw material purchased bythe company. The arrangements are interest bearing and are payable within one year.
Refer note 34(q) for disclosure under Micro, Small and Medium enterprises Development Act.
Refer note 34 (i) with respect to amount payable to Related Parties.
22. Other current financial liabilities (at amortised cost)` crores
Particulars As at As at
31st March 2019 31st March 2018
Current maturities of long-term borrowings (refer note 17) 277.01 127.04
Interest accrued but not due on borrowings 0.16 0.53
Payable for capital projects
- Acceptances 32.14 68.05
- Other than acceptances 174.02 165.92
Security Deposit from customers 108.31 89.94
Del Credre Finance payable 72.45 50.58
Others - 1.19
Total 664.09 503.25
Acceptances include credit availed by the company from banks for payment to suppliers for capital items purchased by
the company. The arrangements are interest bearing and are payable within one year.
23. Other Current Liabilities ` crores
Particulars As at As at
31st March 2019 31st March 2018
Current dues of long-term employee benefits 1.00 0.67
Advances from customers 11.95 2.73
Statutory liabilities 70.45 39.37
Other Payables 2.75 0.63
Total 86.15 43.40
Borrowing have been drawn at following rate of interest
Particulars Rates of Interest (p.a)
Cash Credit 9.15% to 9.65%Short Term Loan 9.15% to 9.95%
Corporate O
verviewStatutory Reports
Financial Statem
ents
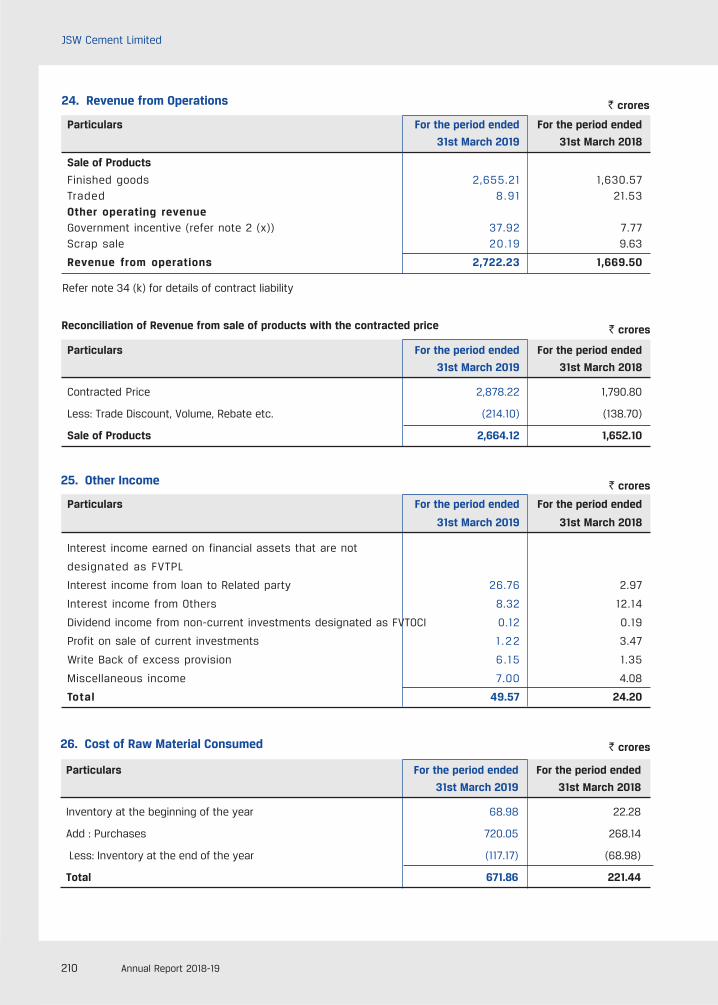
210 Annual Report 2018-19
JSW Cement Limited
24. Revenue from Operations ` crores
Particulars For the period ended For the period ended
31st March 2019 31st March 2018
Sale of Products
Finished goods 2,655.21 1,630.57Traded 8.91 21.53Other operating revenueGovernment incentive (refer note 2 (x)) 37.92 7.77Scrap sale 20.19 9.63
Revenue from operations 2,722.23 1,669.50
Refer note 34 (k) for details of contract liability
Particulars For the period ended For the period ended
31st March 2019 31st March 2018
Contracted Price 2,878.22 1,790.80
Less: Trade Discount, Volume, Rebate etc. (214.10) (138.70)
Sale of Products 2,664.12 1,652.10
Reconciliation of Revenue from sale of products with the contracted price ` crores
25. Other Income ` crores
Particulars For the period ended For the period ended
31st March 2019 31st March 2018
Interest income earned on financial assets that are not
designated as FVTPL
Interest income from loan to Related party 26.76 2.97
Interest income from Others 8.32 12.14
Dividend income from non-current investments designated as FVTOCI 0.12 0.19
Profit on sale of current investments 1 .22 3.47
Write Back of excess provision 6.15 1.35
Miscellaneous income 7.00 4.08
Total 49.57 24.20
26. Cost of Raw Material Consumed ` crores
Particulars For the period ended For the period ended
31st March 2019 31st March 2018
Inventory at the beginning of the year 68.98 22.28
Add : Purchases 720.05 268.14
Less: Inventory at the end of the year (117.17) (68.98)
Total 671.86 221.44
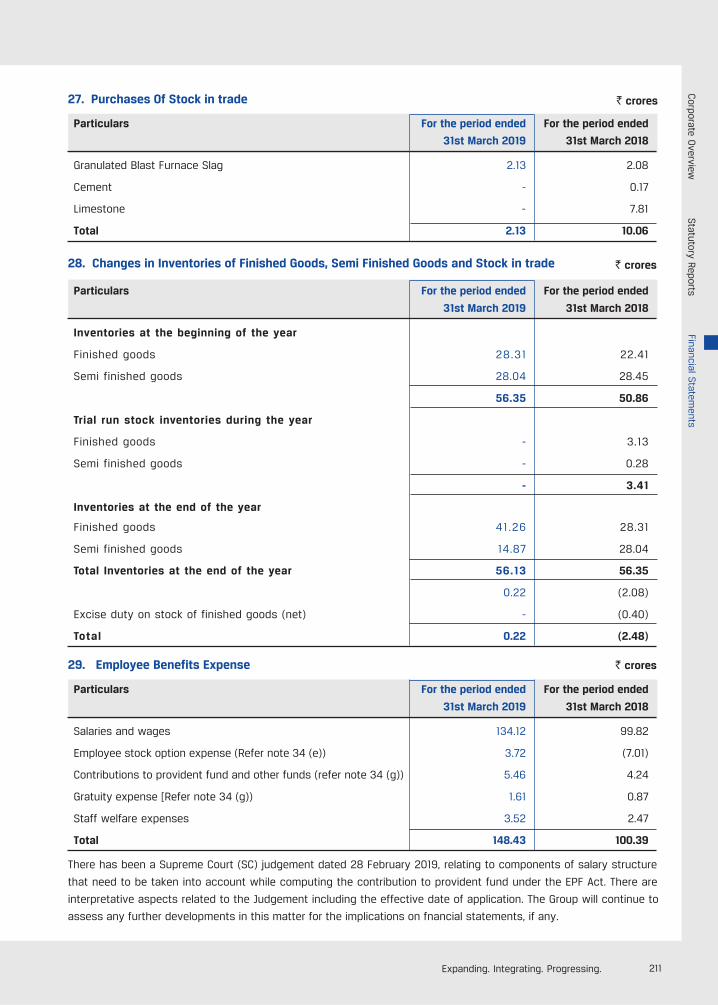
211Expanding. Integrating. Progressing.
28. Changes in Inventories of Finished Goods, Semi Finished Goods and Stock in trade ` crores
29. Employee Benefits Expense ` crores
Particulars For the period ended For the period ended
31st March 2019 31st March 2018
Salaries and wages 134.12 99.82
Employee stock option expense (Refer note 34 (e)) 3.72 (7.01)
Contributions to provident fund and other funds (refer note 34 (g)) 5.46 4.24
Gratuity expense [Refer note 34 (g)) 1.61 0.87
Staff welfare expenses 3.52 2.47
Total 148.43 100.39
27. Purchases Of Stock in trade ` crores
Particulars For the period ended For the period ended
31st March 2019 31st March 2018
Granulated Blast Furnace Slag 2.13 2.08
Cement - 0.17
Limestone - 7.81
Total 2.13 10.06
Particulars For the period ended For the period ended
31st March 2019 31st March 2018
Inventories at the beginning of the year
Finished goods 28.31 22.41
Semi finished goods 28.04 28.45
56.35 50.86
Trial run stock inventories during the year
Finished goods - 3.13
Semi finished goods - 0.28
- 3.41
Inventories at the end of the year
Finished goods 41.26 28.31
Semi finished goods 14.87 28.04
Total Inventories at the end of the year 56.13 56.35
0.22 (2.08)
Excise duty on stock of finished goods (net) - (0.40)
Total 0.22 (2.48)
There has been a Supreme Court (SC) judgement dated 28 February 2019, relating to components of salary structure
that need to be taken into account while computing the contribution to provident fund under the EPF Act. There are
interpretative aspects related to the Judgement including the effective date of application. The Group will continue to
assess any further developments in this matter for the implications on fnancial statements, if any.
Corporate O
verviewStatutory Reports
Financial Statem
ents
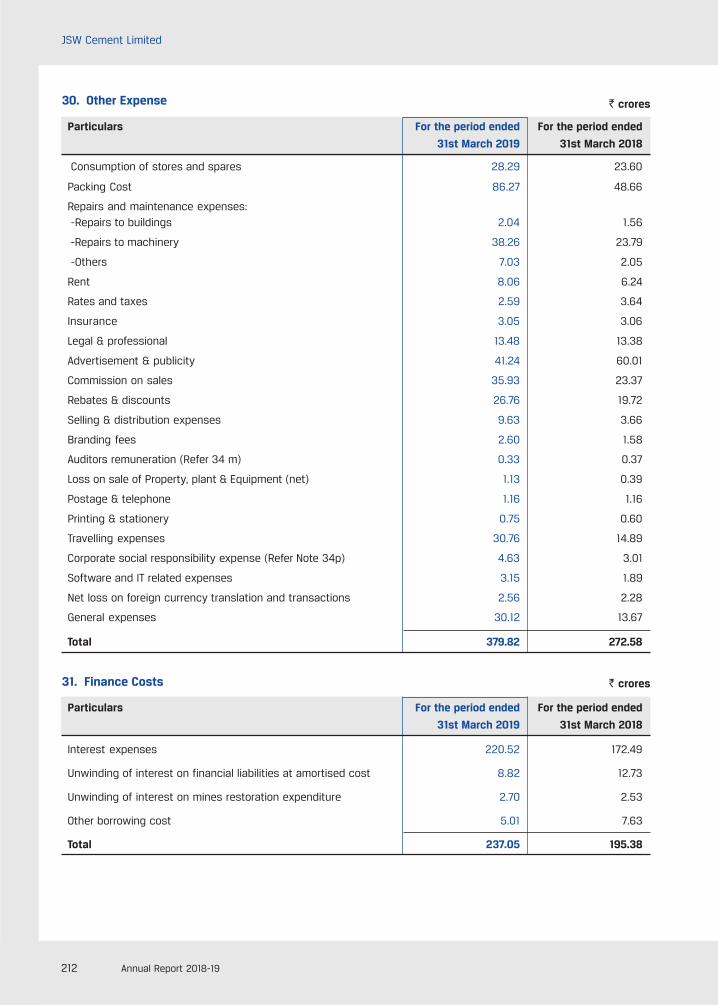
212 Annual Report 2018-19
JSW Cement Limited
30. Other Expense ` crores
Particulars For the period ended For the period ended
31st March 2019 31st March 2018
Consumption of stores and spares 28.29 23.60
Packing Cost 86.27 48.66
Repairs and maintenance expenses: -Repairs to buildings 2.04 1.56
-Repairs to machinery 38.26 23.79
-Others 7.03 2.05
Rent 8.06 6.24
Rates and taxes 2.59 3.64
Insurance 3.05 3.06
Legal & professional 13.48 13.38
Advertisement & publicity 41.24 60.01
Commission on sales 35.93 23.37
Rebates & discounts 26.76 19.72
Selling & distribution expenses 9.63 3.66
Branding fees 2.60 1.58
Auditors remuneration (Refer 34 m) 0.33 0.37
Loss on sale of Property, plant & Equipment (net) 1.13 0.39
Postage & telephone 1.16 1.16
Printing & stationery 0.75 0.60
Travelling expenses 30.76 14.89
Corporate social responsibility expense (Refer Note 34p) 4.63 3.01
Software and IT related expenses 3.15 1.89
Net loss on foreign currency translation and transactions 2.56 2.28
General expenses 30.12 13.67
Total 379.82 272.58
31. Finance Costs ` crores
Particulars For the period ended For the period ended
31st March 2019 31st March 2018
Interest expenses 220.52 172.49
Unwinding of interest on financial liabilities at amortised cost 8.82 12.73
Unwinding of interest on mines restoration expenditure 2.70 2.53
Other borrowing cost 5.01 7.63
Total 237.05 195.38
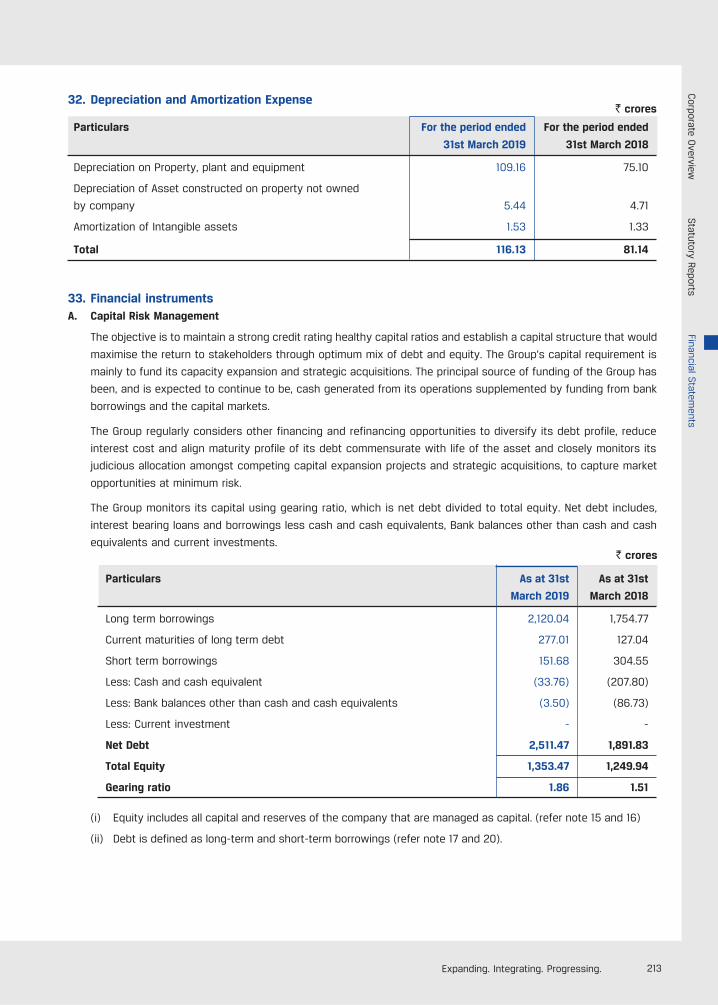
213Expanding. Integrating. Progressing.
32. Depreciation and Amortization Expense` crores
Particulars For the period ended For the period ended
31st March 2019 31st March 2018
Depreciation on Property, plant and equipment 109.16 75.10
Depreciation of Asset constructed on property not owned
by company 5.44 4.71
Amortization of Intangible assets 1.53 1.33
Total 116.13 81.14
33. Financial instrumentsA. Capital Risk Management
The objective is to maintain a strong credit rating healthy capital ratios and establish a capital structure that would
maximise the return to stakeholders through optimum mix of debt and equity. The Group’s capital requirement is
mainly to fund its capacity expansion and strategic acquisitions. The principal source of funding of the Group has
been, and is expected to continue to be, cash generated from its operations supplemented by funding from bank
borrowings and the capital markets.
The Group regularly considers other financing and refinancing opportunities to diversify its debt profile, reduce
interest cost and align maturity profile of its debt commensurate with life of the asset and closely monitors its
judicious allocation amongst competing capital expansion projects and strategic acquisitions, to capture market
opportunities at minimum risk.
The Group monitors its capital using gearing ratio, which is net debt divided to total equity. Net debt includes,
interest bearing loans and borrowings less cash and cash equivalents, Bank balances other than cash and cash
equivalents and current investments.
Particulars As at 31st As at 31st
March 2019 March 2018
Long term borrowings 2,120.04 1,754.77
Current maturities of long term debt 277.01 127.04
Short term borrowings 151.68 304.55
Less: Cash and cash equivalent (33.76) (207.80)
Less: Bank balances other than cash and cash equivalents (3.50) (86.73)
Less: Current investment - -
Net Debt 2,511.47 1,891.83
Total Equity 1,353.47 1,249.94
Gearing ratio 1.86 1.51
(i) Equity includes all capital and reserves of the company that are managed as capital. (refer note 15 and 16)
(ii) Debt is defined as long-term and short-term borrowings (refer note 17 and 20).
` crores
Corporate O
verviewStatutory Reports
Financial Statem
ents
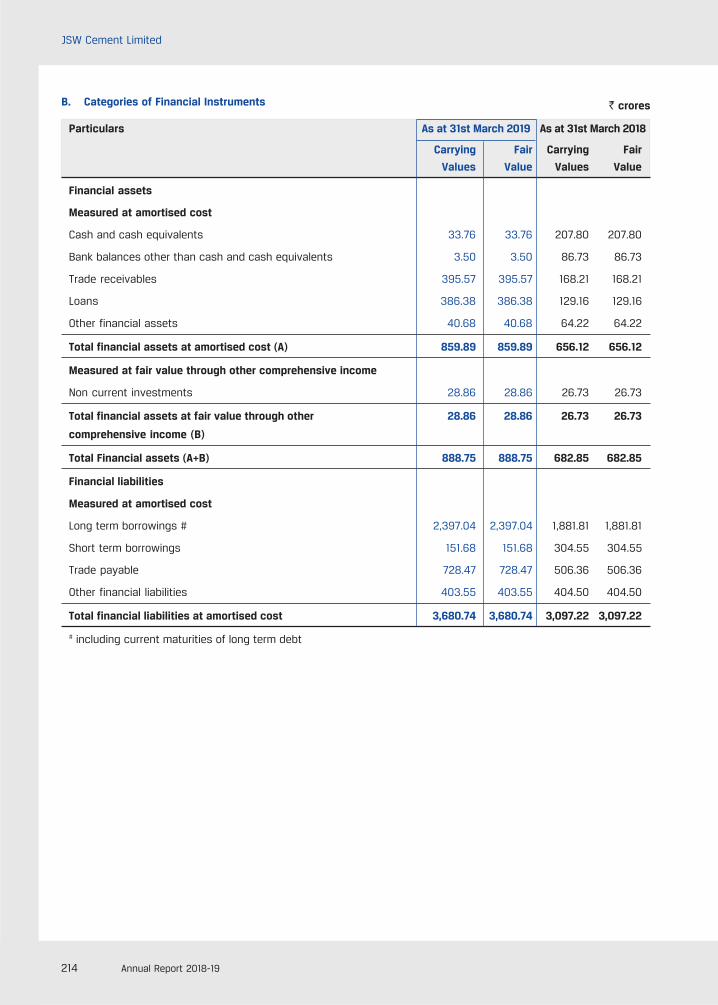
214 Annual Report 2018-19
JSW Cement Limited
B. Categories of Financial Instruments
Particulars As at 31st March 2019 As at 31st March 2018
Carrying Fair Carrying Fair
Values Value Values Value
Financial assets
Measured at amortised cost
Cash and cash equivalents 33.76 33.76 207.80 207.80
Bank balances other than cash and cash equivalents 3.50 3.50 86.73 86.73
Trade receivables 395.57 395.57 168.21 168.21
Loans 386.38 386.38 129.16 129.16
Other financial assets 40.68 40.68 64.22 64.22
Total financial assets at amortised cost (A) 859.89 859.89 656.12 656.12
Measured at fair value through other comprehensive income
Non current investments 28.86 28.86 26.73 26.73
Total financial assets at fair value through other 28.86 28.86 26.73 26.73
comprehensive income (B)
Total Financial assets (A+B) 888.75 888.75 682.85 682.85
Financial liabilities
Measured at amortised cost
Long term borrowings # 2,397.04 2,397.04 1,881.81 1,881.81
Short term borrowings 151.68 151.68 304.55 304.55
Trade payable 728.47 728.47 506.36 506.36
Other financial liabilities 403.55 403.55 404.50 404.50
Total financial liabilities at amortised cost 3,680.74 3,680.74 3,097.22 3,097.22
# including current maturities of long term debt
` crores
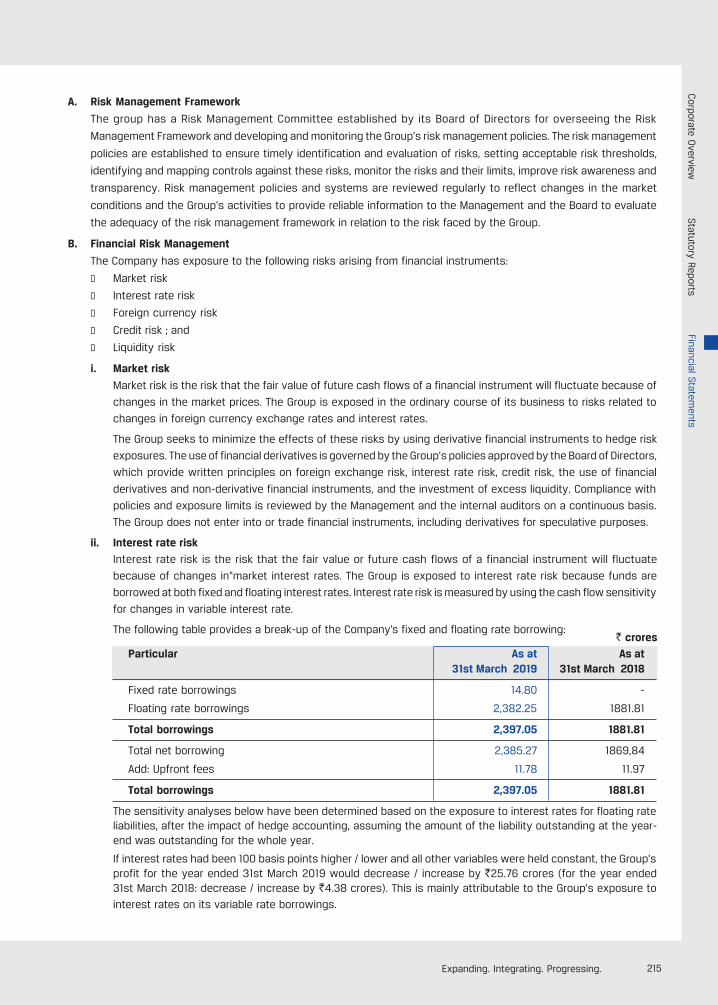
215Expanding. Integrating. Progressing.
A. Risk Management Framework
The group has a Risk Management Committee established by its Board of Directors for overseeing the Risk
Management Framework and developing and monitoring the Group’s risk management policies. The risk management
policies are established to ensure timely identification and evaluation of risks, setting acceptable risk thresholds,
identifying and mapping controls against these risks, monitor the risks and their limits, improve risk awareness and
transparency. Risk management policies and systems are reviewed regularly to reflect changes in the market
conditions and the Group’s activities to provide reliable information to the Management and the Board to evaluate
the adequacy of the risk management framework in relation to the risk faced by the Group.
B. Financial Risk Management
The Company has exposure to the following risks arising from financial instruments:
l Market risk
l Interest rate risk
l Foreign currency risk
l Credit risk ; and
l Liquidity risk
i. Market risk
Market risk is the risk that the fair value of future cash flows of a financial instrument will fluctuate because of
changes in the market prices. The Group is exposed in the ordinary course of its business to risks related to
changes in foreign currency exchange rates and interest rates.
The Group seeks to minimize the effects of these risks by using derivative financial instruments to hedge risk
exposures. The use of financial derivatives is governed by the Group’s policies approved by the Board of Directors,
which provide written principles on foreign exchange risk, interest rate risk, credit risk, the use of financial
derivatives and non-derivative financial instruments, and the investment of excess liquidity. Compliance with
policies and exposure limits is reviewed by the Management and the internal auditors on a continuous basis.
The Group does not enter into or trade financial instruments, including derivatives for speculative purposes.
ii. Interest rate risk
Interest rate risk is the risk that the fair value or future cash flows of a financial instrument will fluctuate
because of changes in“market interest rates. The Group is exposed to interest rate risk because funds are
borrowed at both fixed and floating interest rates. Interest rate risk is measured by using the cash flow sensitivity
for changes in variable interest rate.
The following table provides a break-up of the Company's fixed and floating rate borrowing:
Particular As at As at 31st March 2019 31st March 2018
Fixed rate borrowings 14.80 -
Floating rate borrowings 2,382.25 1881.81
Total borrowings 2,397.05 1881.81
Total net borrowing 2,385.27 1869,84
Add: Upfront fees 11.78 11.97
Total borrowings 2,397.05 1881.81
The sensitivity analyses below have been determined based on the exposure to interest rates for floating rateliabilities, after the impact of hedge accounting, assuming the amount of the liability outstanding at the year-end was outstanding for the whole year.
If interest rates had been 100 basis points higher / lower and all other variables were held constant, the Group’sprofit for the year ended 31st March 2019 would decrease / increase by `25.76 crores (for the year ended31st March 2018: decrease / increase by `4.38 crores). This is mainly attributable to the Group’s exposure to
interest rates on its variable rate borrowings.
` crores
Corporate O
verviewStatutory Reports
Financial Statem
ents
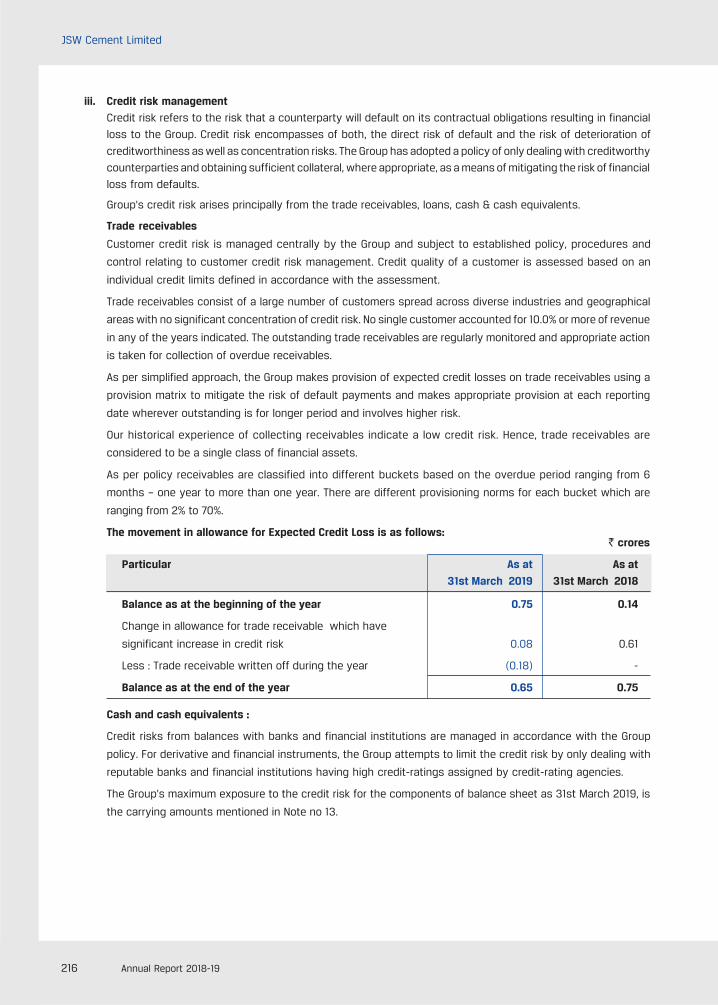
216 Annual Report 2018-19
JSW Cement Limited
iii. Credit risk management
Credit risk refers to the risk that a counterparty will default on its contractual obligations resulting in financial
loss to the Group. Credit risk encompasses of both, the direct risk of default and the risk of deterioration of
creditworthiness as well as concentration risks. The Group has adopted a policy of only dealing with creditworthy
counterparties and obtaining sufficient collateral, where appropriate, as a means of mitigating the risk of financial
loss from defaults.
Group’s credit risk arises principally from the trade receivables, loans, cash & cash equivalents.
Trade receivables
Customer credit risk is managed centrally by the Group and subject to established policy, procedures and
control relating to customer credit risk management. Credit quality of a customer is assessed based on an
individual credit limits defined in accordance with the assessment.
Trade receivables consist of a large number of customers spread across diverse industries and geographical
areas with no significant concentration of credit risk. No single customer accounted for 10.0% or more of revenue
in any of the years indicated. The outstanding trade receivables are regularly monitored and appropriate action
is taken for collection of overdue receivables.
As per simplified approach, the Group makes provision of expected credit losses on trade receivables using a
provision matrix to mitigate the risk of default payments and makes appropriate provision at each reporting
date wherever outstanding is for longer period and involves higher risk.
Our historical experience of collecting receivables indicate a low credit risk. Hence, trade receivables are
considered to be a single class of financial assets.
As per policy receivables are classified into different buckets based on the overdue period ranging from 6
months – one year to more than one year. There are different provisioning norms for each bucket which are
ranging from 2% to 70%.
The movement in allowance for Expected Credit Loss is as follows:
Particular As at As at
31st March 2019 31st March 2018
Balance as at the beginning of the year 0.75 0.14
Change in allowance for trade receivable which have
significant increase in credit risk 0.08 0.61
Less : Trade receivable written off during the year (0.18) -
Balance as at the end of the year 0.65 0.75
Cash and cash equivalents :
Credit risks from balances with banks and financial institutions are managed in accordance with the Group
policy. For derivative and financial instruments, the Group attempts to limit the credit risk by only dealing with
reputable banks and financial institutions having high credit-ratings assigned by credit-rating agencies.
The Group’s maximum exposure to the credit risk for the components of balance sheet as 31st March 2019, is
the carrying amounts mentioned in Note no 13.
` crores
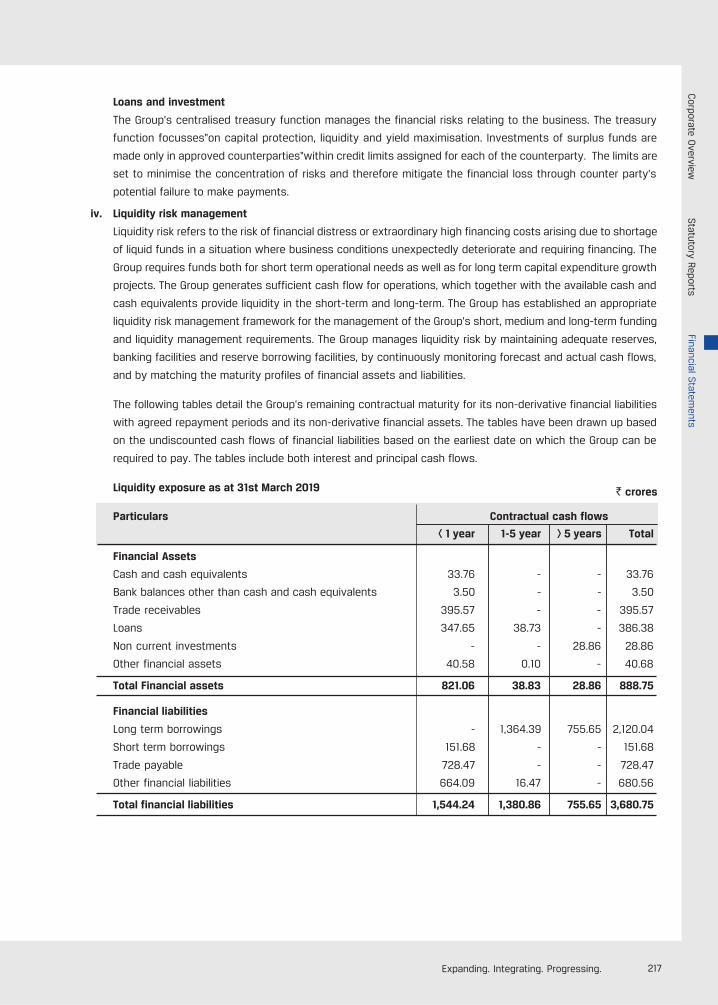
217Expanding. Integrating. Progressing.
Loans and investment
The Group’s centralised treasury function manages the financial risks relating to the business. The treasury
function focusses“on capital protection, liquidity and yield maximisation. Investments of surplus funds are
made only in approved counterparties“within credit limits assigned for each of the counterparty. The limits are
set to minimise the concentration of risks and therefore mitigate the financial loss through counter party’s
potential failure to make payments.
iv. Liquidity risk management
Liquidity risk refers to the risk of financial distress or extraordinary high financing costs arising due to shortage
of liquid funds in a situation where business conditions unexpectedly deteriorate and requiring financing. The
Group requires funds both for short term operational needs as well as for long term capital expenditure growth
projects. The Group generates sufficient cash flow for operations, which together with the available cash and
cash equivalents provide liquidity in the short-term and long-term. The Group has established an appropriate
liquidity risk management framework for the management of the Group’s short, medium and long-term funding
and liquidity management requirements. The Group manages liquidity risk by maintaining adequate reserves,
banking facilities and reserve borrowing facilities, by continuously monitoring forecast and actual cash flows,
and by matching the maturity profiles of financial assets and liabilities.
The following tables detail the Group’s remaining contractual maturity for its non-derivative financial liabilities
with agreed repayment periods and its non-derivative financial assets. The tables have been drawn up based
on the undiscounted cash flows of financial liabilities based on the earliest date on which the Group can be
required to pay. The tables include both interest and principal cash flows.
Liquidity exposure as at 31st March 2019
Particulars Contractual cash flows
< 1 year 1-5 year > 5 years Total
Financial Assets
Cash and cash equivalents 33.76 - - 33.76
Bank balances other than cash and cash equivalents 3.50 - - 3.50
Trade receivables 395.57 - - 395.57
Loans 347.65 38.73 - 386.38
Non current investments - - 28.86 28.86
Other financial assets 40.58 0.10 - 40.68
Total Financial assets 821.06 38.83 28.86 888.75
Financial liabilities
Long term borrowings - 1,364.39 755.65 2,120.04
Short term borrowings 151.68 - - 151.68
Trade payable 728.47 - - 728.47
Other financial liabilities 664.09 16.47 - 680.56
Total financial liabilities 1,544.24 1,380.86 755.65 3,680.75
` crores
Corporate O
verviewStatutory Reports
Financial Statem
ents
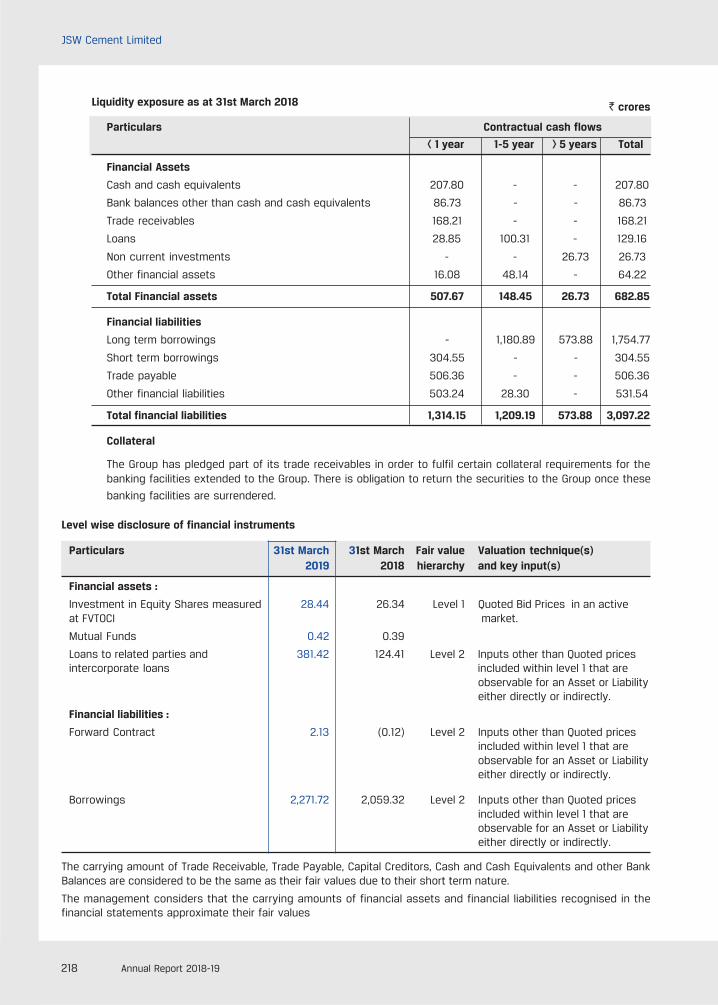
218 Annual Report 2018-19
JSW Cement Limited
Liquidity exposure as at 31st March 2018
Particulars Contractual cash flows
< 1 year 1-5 year > 5 years Total
Financial Assets
Cash and cash equivalents 207.80 - - 207.80
Bank balances other than cash and cash equivalents 86.73 - - 86.73
Trade receivables 168.21 - - 168.21
Loans 28.85 100.31 - 129.16
Non current investments - - 26.73 26.73
Other financial assets 16.08 48.14 - 64.22
Total Financial assets 507.67 148.45 26.73 682.85
Financial liabilities
Long term borrowings - 1,180.89 573.88 1,754.77
Short term borrowings 304.55 - - 304.55
Trade payable 506.36 - - 506.36
Other financial liabilities 503.24 28.30 - 531.54
Total financial liabilities 1,314.15 1,209.19 573.88 3,097.22
Collateral
The Group has pledged part of its trade receivables in order to fulfil certain collateral requirements for thebanking facilities extended to the Group. There is obligation to return the securities to the Group once these
banking facilities are surrendered.
Level wise disclosure of financial instruments
Particulars 31st March 31st March Fair value Valuation technique(s) 2019 2018 hierarchy and key input(s)
Financial assets :
Investment in Equity Shares measured 28.44 26.34 Level 1 Quoted Bid Prices in an activeat FVTOCI market.
Mutual Funds 0.42 0.39
Loans to related parties and 381.42 124.41 Level 2 Inputs other than Quoted pricesintercorporate loans included within level 1 that are
observable for an Asset or Liabilityeither directly or indirectly.
Financial liabilities :
Forward Contract 2.13 (0.12) Level 2 Inputs other than Quoted pricesincluded within level 1 that areobservable for an Asset or Liabilityeither directly or indirectly.
Borrowings 2,271.72 2,059.32 Level 2 Inputs other than Quoted pricesincluded within level 1 that areobservable for an Asset or Liabilityeither directly or indirectly.
The carrying amount of Trade Receivable, Trade Payable, Capital Creditors, Cash and Cash Equivalents and other BankBalances are considered to be the same as their fair values due to their short term nature.
The management considers that the carrying amounts of financial assets and financial liabilities recognised in thefinancial statements approximate their fair values
` crores
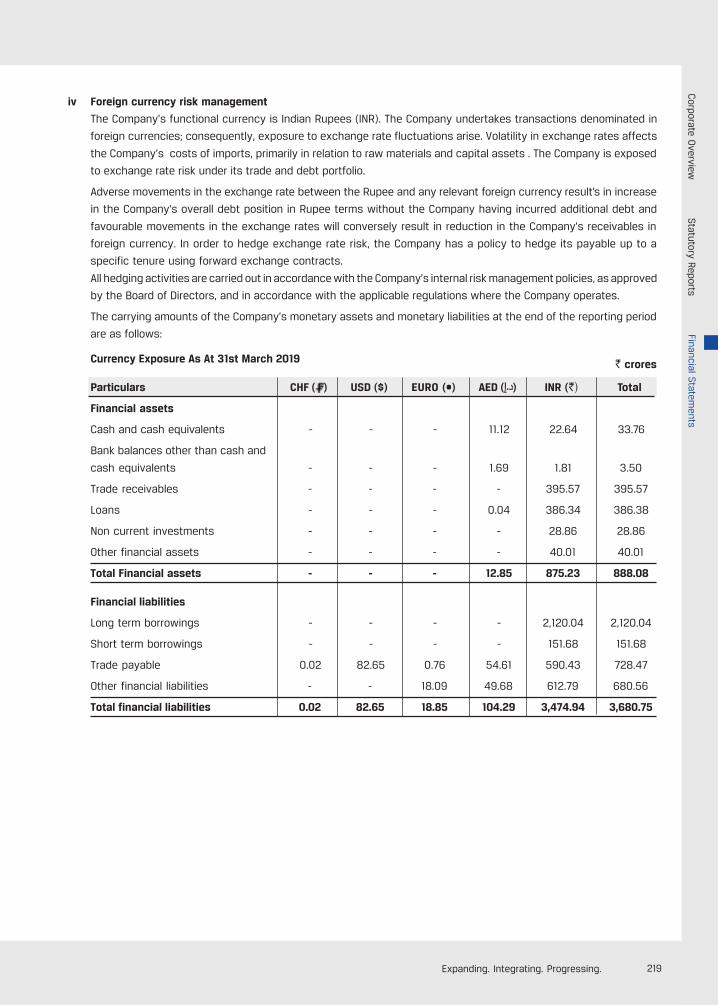
219Expanding. Integrating. Progressing.
iv Foreign currency risk management
The Company’s functional currency is Indian Rupees (INR). The Company undertakes transactions denominated in
foreign currencies; consequently, exposure to exchange rate fluctuations arise. Volatility in exchange rates affects
the Company’s costs of imports, primarily in relation to raw materials and capital assets . The Company is exposed
to exchange rate risk under its trade and debt portfolio.
Adverse movements in the exchange rate between the Rupee and any relevant foreign currency result’s in increase
in the Company’s overall debt position in Rupee terms without the Company having incurred additional debt and
favourable movements in the exchange rates will conversely result in reduction in the Company’s receivables in
foreign currency. In order to hedge exchange rate risk, the Company has a policy to hedge its payable up to a
specific tenure using forward exchange contracts.
All hedging activities are carried out in accordance with the Company’s internal risk management policies, as approved
by the Board of Directors, and in accordance with the applicable regulations where the Company operates.
The carrying amounts of the Company’s monetary assets and monetary liabilities at the end of the reporting period
are as follows:
Currency Exposure As At 31st March 2019
Particulars CHF ( ) USD ($) EURO (•) AED ( ) INR (`) Total
Financial assets
Cash and cash equivalents - - - 11.12 22.64 33.76
Bank balances other than cash and
cash equivalents - - - 1.69 1.81 3.50
Trade receivables - - - - 395.57 395.57
Loans - - - 0.04 386.34 386.38
Non current investments - - - - 28.86 28.86
Other financial assets - - - - 40.01 40.01
Total Financial assets - - - 12.85 875.23 888.08
Financial liabilities
Long term borrowings - - - - 2,120.04 2,120.04
Short term borrowings - - - - 151.68 151.68
Trade payable 0.02 82.65 0.76 54.61 590.43 728.47
Other financial liabilities - - 18.09 49.68 612.79 680.56
Total financial liabilities 0.02 82.65 18.85 104.29 3,474.94 3,680.75
` crores
Corporate O
verviewStatutory Reports
Financial Statem
ents
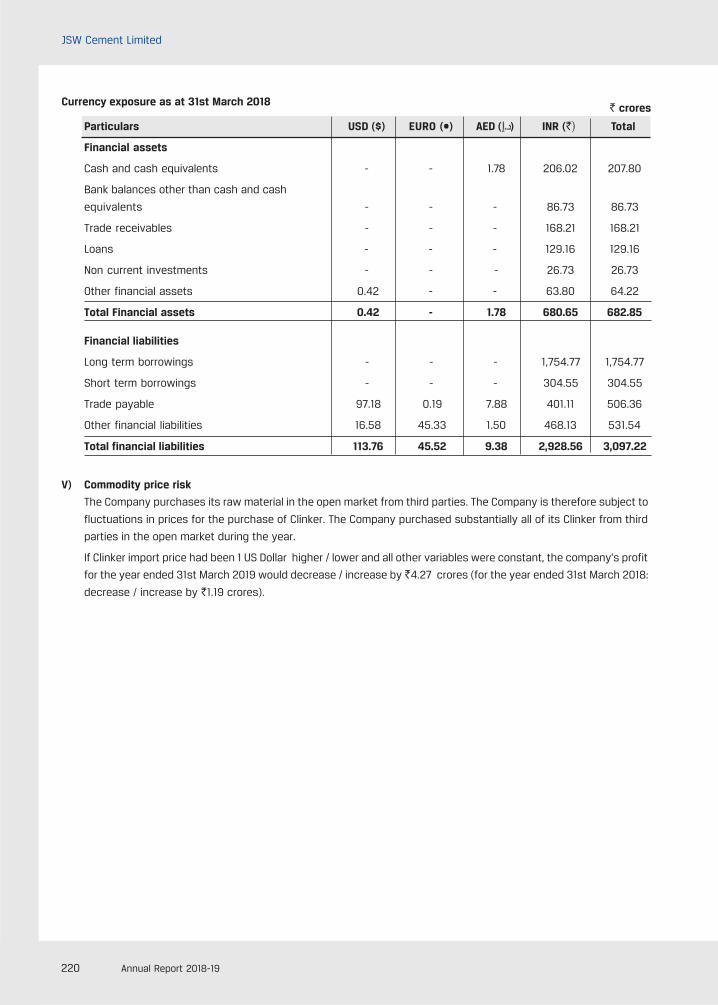
220 Annual Report 2018-19
JSW Cement Limited
Currency exposure as at 31st March 2018
Particulars USD ($) EURO (•) AED ( ) INR (`) Total
Financial assets
Cash and cash equivalents - - 1.78 206.02 207.80
Bank balances other than cash and cash
equivalents - - - 86.73 86.73
Trade receivables - - - 168.21 168.21
Loans - - - 129.16 129.16
Non current investments - - - 26.73 26.73
Other financial assets 0.42 - - 63.80 64.22
Total Financial assets 0.42 - 1.78 680.65 682.85
Financial liabilities
Long term borrowings - - - 1,754.77 1,754.77
Short term borrowings - - - 304.55 304.55
Trade payable 97.18 0.19 7.88 401.11 506.36
Other financial liabilities 16.58 45.33 1.50 468.13 531.54
Total financial liabilities 113.76 45.52 9.38 2,928.56 3,097.22
V) Commodity price risk
The Company purchases its raw material in the open market from third parties. The Company is therefore subject to
fluctuations in prices for the purchase of Clinker. The Company purchased substantially all of its Clinker from third
parties in the open market during the year.
If Clinker import price had been 1 US Dollar higher / lower and all other variables were constant, the company’s profit
for the year ended 31st March 2019 would decrease / increase by `4.27 crores (for the year ended 31st March 2018:
decrease / increase by `1.19 crores).
` crores
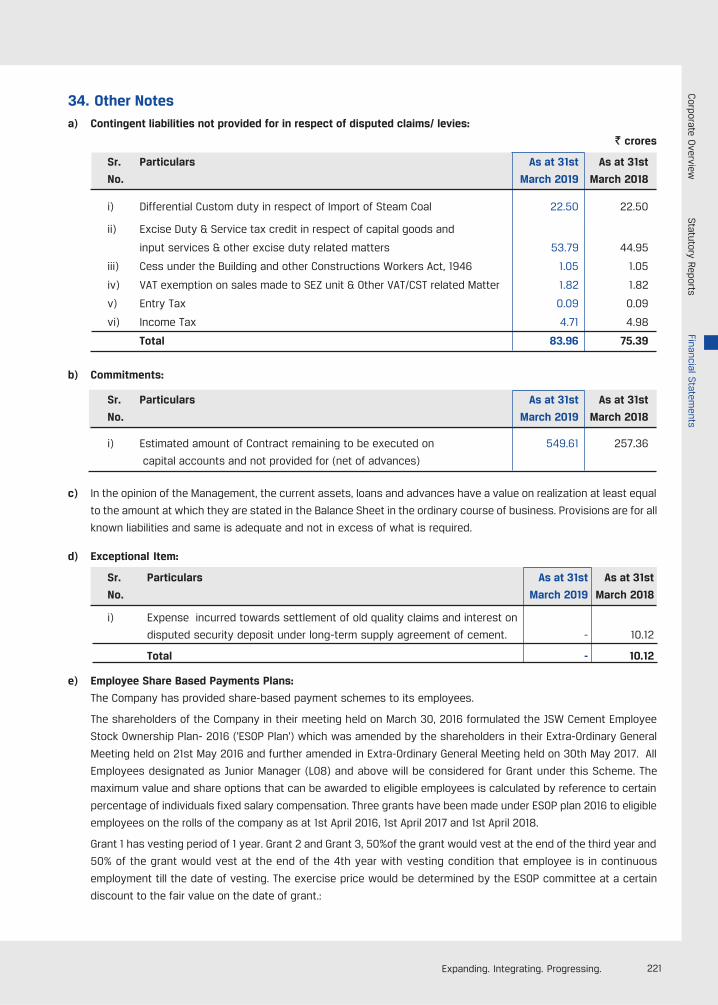
221Expanding. Integrating. Progressing.
34. Other Notesa) Contingent liabilities not provided for in respect of disputed claims/ levies:
` crores
Sr. Particulars As at 31st As at 31st
No. March 2019 March 2018
i) Differential Custom duty in respect of Import of Steam Coal 22.50 22.50
ii) Excise Duty & Service tax credit in respect of capital goods and
input services & other excise duty related matters 53.79 44.95
iii) Cess under the Building and other Constructions Workers Act, 1946 1.05 1.05
iv) VAT exemption on sales made to SEZ unit & Other VAT/CST related Matter 1.82 1.82
v) Entry Tax 0.09 0.09
vi) Income Tax 4.71 4.98
Total 83.96 75.39
b) Commitments:
Sr. Particulars As at 31st As at 31st
No. March 2019 March 2018
i) Estimated amount of Contract remaining to be executed on 549.61 257.36
capital accounts and not provided for (net of advances)
c) In the opinion of the Management, the current assets, loans and advances have a value on realization at least equal
to the amount at which they are stated in the Balance Sheet in the ordinary course of business. Provisions are for all
known liabilities and same is adequate and not in excess of what is required.
d) Exceptional Item:
Sr. Particulars As at 31st As at 31st
No. March 2019 March 2018
i) Expense incurred towards settlement of old quality claims and interest on
disputed security deposit under long-term supply agreement of cement. - 10.12
Total - 10.12
e) Employee Share Based Payments Plans:
The Company has provided share-based payment schemes to its employees.
The shareholders of the Company in their meeting held on March 30, 2016 formulated the JSW Cement Employee
Stock Ownership Plan- 2016 ('ESOP Plan') which was amended by the shareholders in their Extra-Ordinary General
Meeting held on 21st May 2016 and further amended in Extra-Ordinary General Meeting held on 30th May 2017. All
Employees designated as Junior Manager (L08) and above will be considered for Grant under this Scheme. The
maximum value and share options that can be awarded to eligible employees is calculated by reference to certain
percentage of individuals fixed salary compensation. Three grants have been made under ESOP plan 2016 to eligible
employees on the rolls of the company as at 1st April 2016, 1st April 2017 and 1st April 2018.
Grant 1 has vesting period of 1 year. Grant 2 and Grant 3, 50%of the grant would vest at the end of the third year and
50% of the grant would vest at the end of the 4th year with vesting condition that employee is in continuous
employment till the date of vesting. The exercise price would be determined by the ESOP committee at a certain
discount to the fair value on the date of grant.:
Corporate O
verviewStatutory Reports
Financial Statem
ents
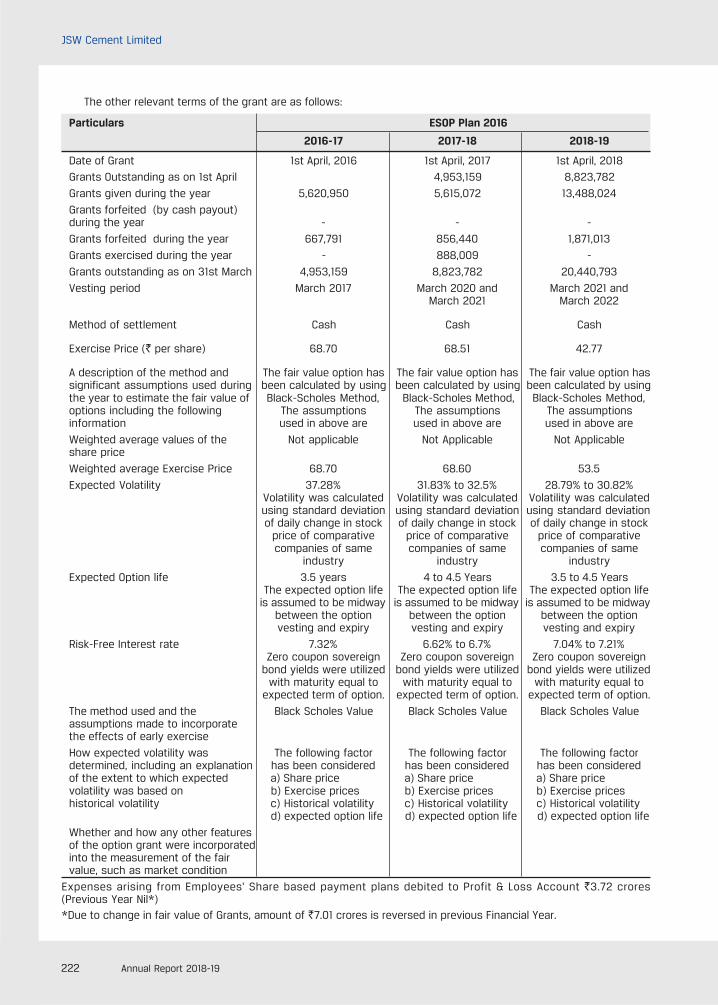
222 Annual Report 2018-19
JSW Cement Limited
The other relevant terms of the grant are as follows:
Particulars ESOP Plan 2016
2016-17 2017-18 2018-19
Date of Grant 1st April, 2016 1st April, 2017 1st April, 2018
Grants Outstanding as on 1st April 4,953,159 8,823,782
Grants given during the year 5,620,950 5,615,072 13,488,024
Grants forfeited (by cash payout)during the year - - -
Grants forfeited during the year 667,791 856,440 1,871,013
Grants exercised during the year - 888,009 -
Grants outstanding as on 31st March 4,953,159 8,823,782 20,440,793
Vesting period March 2017 March 2020 and March 2021 andMarch 2021 March 2022
Method of settlement Cash Cash Cash
Exercise Price (` per share) 68.70 68.51 42.77
A description of the method and The fair value option has The fair value option has The fair value option hassignificant assumptions used during been calculated by using been calculated by using been calculated by usingthe year to estimate the fair value of Black-Scholes Method, Black-Scholes Method, Black-Scholes Method,options including the following The assumptions The assumptions The assumptionsinformation used in above are used in above are used in above are
Weighted average values of the Not applicable Not Applicable Not Applicableshare price
Weighted average Exercise Price 68.70 68.60 53.5
Expected Volatility 37.28% 31.83% to 32.5% 28.79% to 30.82%Volatility was calculated Volatility was calculated Volatility was calculatedusing standard deviation using standard deviation using standard deviationof daily change in stock of daily change in stock of daily change in stock
price of comparative price of comparative price of comparativecompanies of same companies of same companies of same
industry industry industry
Expected Option life 3.5 years 4 to 4.5 Years 3.5 to 4.5 YearsThe expected option life The expected option life The expected option life
is assumed to be midway is assumed to be midway is assumed to be midwaybetween the option between the option between the optionvesting and expiry vesting and expiry vesting and expiry
Risk-Free Interest rate 7.32% 6.62% to 6.7% 7.04% to 7.21%Zero coupon sovereign Zero coupon sovereign Zero coupon sovereign
bond yields were utilized bond yields were utilized bond yields were utilizedwith maturity equal to with maturity equal to with maturity equal to
expected term of option. expected term of option. expected term of option.
The method used and the Black Scholes Value Black Scholes Value Black Scholes Valueassumptions made to incorporatethe effects of early exercise
How expected volatility was The following factor The following factor The following factordetermined, including an explanation has been considered has been considered has been consideredof the extent to which expected a) Share price a) Share price a) Share pricevolatility was based on b) Exercise prices b) Exercise prices b) Exercise priceshistorical volatility c) Historical volatility c) Historical volatility c) Historical volatility
d) expected option life d) expected option life d) expected option life
Whether and how any other featuresof the option grant were incorporatedinto the measurement of the fairvalue, such as market condition
Expenses arising from Employees' Share based payment plans debited to Profit & Loss Account `3.72 crores(Previous Year Nil*)*Due to change in fair value of Grants, amount of `7.01 crores is reversed in previous Financial Year.
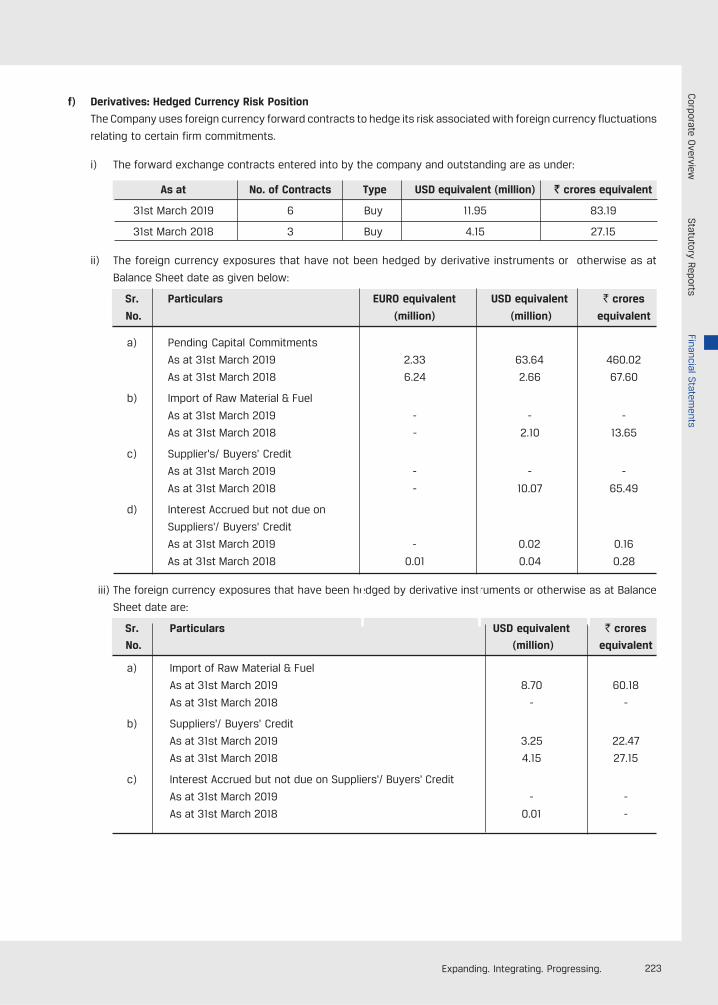
223Expanding. Integrating. Progressing.
f) Derivatives: Hedged Currency Risk Position
The Company uses foreign currency forward contracts to hedge its risk associated with foreign currency fluctuations
relating to certain firm commitments.
i) The forward exchange contracts entered into by the company and outstanding are as under:
As at No. of Contracts Type USD equivalent (million) ` crores equivalent
31st March 2019 6 Buy 11.95 83.19
31st March 2018 3 Buy 4.15 27.15
ii) The foreign currency exposures that have not been hedged by derivative instruments or otherwise as at
Balance Sheet date as given below:
Sr. Particulars EURO equivalent USD equivalent ` crores
No. (million) (million) equivalent
a) Pending Capital Commitments
As at 31st March 2019 2.33 63.64 460.02
As at 31st March 2018 6.24 2.66 67.60
b) Import of Raw Material & Fuel
As at 31st March 2019 - - -
As at 31st March 2018 - 2.10 13.65
c) Supplier's/ Buyers' Credit
As at 31st March 2019 - - -
As at 31st March 2018 - 10.07 65.49
d) Interest Accrued but not due on
Suppliers'/ Buyers' Credit
As at 31st March 2019 - 0.02 0.16
As at 31st March 2018 0.01 0.04 0.28
iii) The foreign currency exposures that have been hedged by derivative instruments or otherwise as at Balance
Sheet date are:
Sr. Particulars USD equivalent ` crores
No. (million) equivalent
a) Import of Raw Material & Fuel
As at 31st March 2019 8.70 60.18
As at 31st March 2018 - -
b) Suppliers'/ Buyers' Credit
As at 31st March 2019 3.25 22.47
As at 31st March 2018 4.15 27.15
c) Interest Accrued but not due on Suppliers'/ Buyers' Credit
As at 31st March 2019 - -
As at 31st March 2018 0.01 -
Corporate O
verviewStatutory Reports
Financial Statem
ents
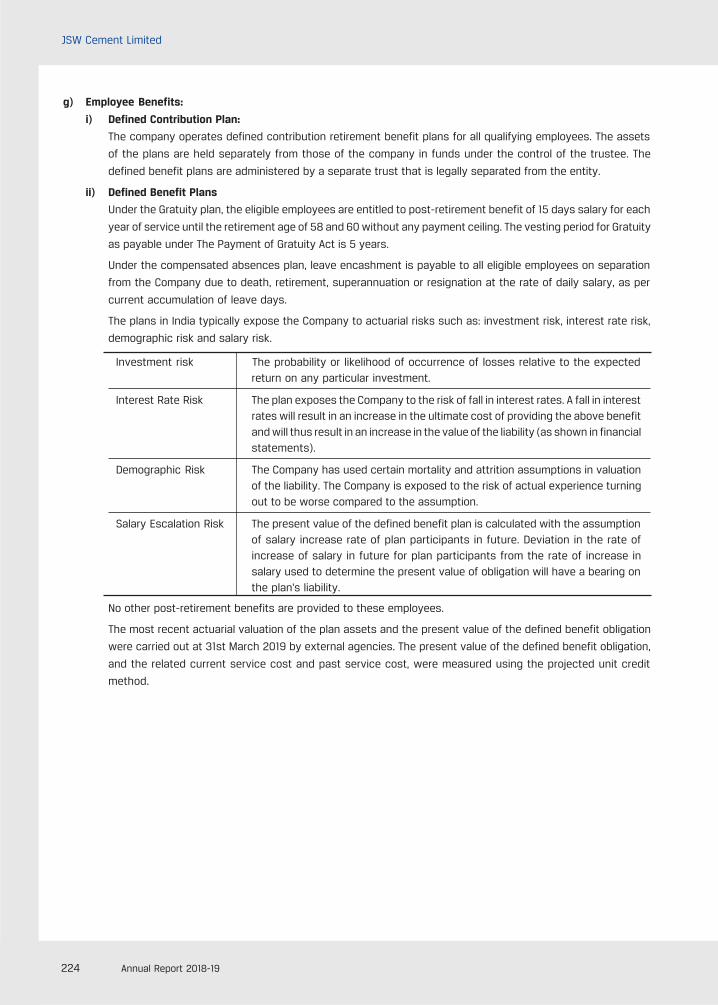
224 Annual Report 2018-19
JSW Cement Limited
g) Employee Benefits:
i) Defined Contribution Plan:
The company operates defined contribution retirement benefit plans for all qualifying employees. The assets
of the plans are held separately from those of the company in funds under the control of the trustee. The
defined benefit plans are administered by a separate trust that is legally separated from the entity.
ii) Defined Benefit Plans
Under the Gratuity plan, the eligible employees are entitled to post-retirement benefit of 15 days salary for each
year of service until the retirement age of 58 and 60 without any payment ceiling. The vesting period for Gratuity
as payable under The Payment of Gratuity Act is 5 years.
Under the compensated absences plan, leave encashment is payable to all eligible employees on separation
from the Company due to death, retirement, superannuation or resignation at the rate of daily salary, as per
current accumulation of leave days.
The plans in India typically expose the Company to actuarial risks such as: investment risk, interest rate risk,
demographic risk and salary risk.
Investment risk The probability or likelihood of occurrence of losses relative to the expectedreturn on any particular investment.
Interest Rate Risk The plan exposes the Company to the risk of fall in interest rates. A fall in interestrates will result in an increase in the ultimate cost of providing the above benefitand will thus result in an increase in the value of the liability (as shown in financialstatements).
Demographic Risk The Company has used certain mortality and attrition assumptions in valuationof the liability. The Company is exposed to the risk of actual experience turningout to be worse compared to the assumption.
Salary Escalation Risk The present value of the defined benefit plan is calculated with the assumptionof salary increase rate of plan participants in future. Deviation in the rate ofincrease of salary in future for plan participants from the rate of increase insalary used to determine the present value of obligation will have a bearing onthe plan's liability.
No other post-retirement benefits are provided to these employees.
The most recent actuarial valuation of the plan assets and the present value of the defined benefit obligation
were carried out at 31st March 2019 by external agencies. The present value of the defined benefit obligation,
and the related current service cost and past service cost, were measured using the projected unit credit
method.

225Expanding. Integrating. Progressing.
iii) Defined Benefit Plans - Gratuity: Funded
` crores
Particulars As at As at
31st March 2019 31st March 2018Funded Funded
a. Changes in Present Value of obligations:Opening Balance of present value of obligation 5.71 4.32Acquisition adjustment - -Service Cost 1.34 1.14Interest Cost 0.45 0.32Actuarial (gain)/loss on obligation 0.16 0.36Benefits paid (0.38) (0.42)
Closing Balance 7.28 5.72
b. Fair Value of Plan assets:Opening Balance of Fair Value of Plan Assets 4.14 3.12Expected Return on Plan assets less loss on investments 0.32 0.23Actuarial gain / (loss) on Plan Assets 0.05 0.01Employers' Contribution 2.08 1.20Benefits paid (0.38) (0.42)
Closing Balance 6.21 4.14
c. Net Asset/(Liability) recognized in the Balance Sheet:Present Value of obligations (7.28) (5.72)Fair Value of plan asset 6.21 4.14
Net Asset/(Liability) recognized in the Balance Sheet(Refer Note 19) (1.07) (1.58)
d. Expenses during the Year:Service cost 1.34 1.14Interest cost 0.45 0.32Expected Return on Plan assets (0.32) (0.23)
Component of defined benefit cost recognized inthe statement of Profit & Loss 1.47 1.23
Component of defined benefit cost recognized inOther comprehensive income 0.10 0.35
Total 1.57 1.55
e. Break up of Plan Assets as a percentage oftotal plan assets:Insurer Managed Funds - Value (100%) 6.21 4.14
f. Principal actuarial assumptions:Rate of Discounting 7.7% p.a. 7.8% p.a.Rate of increase in salaries 6.0% p.a. 6.0% p.a.Attrition Rate 2.0% p.a. 2.0% p.a.
g. Breakup of Plan Assets:HDFC Group Unit Linked Plan - Option B 1.13 0.79HDFC Life Stable Management Fund 1.09 0.74HDFC Life Defensive Managed Fund 0.58 0.54Canara HSBC OBC Life Group Traditional Plan 3.40 2.07Bank Balance 0.01 -
Total 6.21 4.14
Corporate O
verviewStatutory Reports
Financial Statem
ents
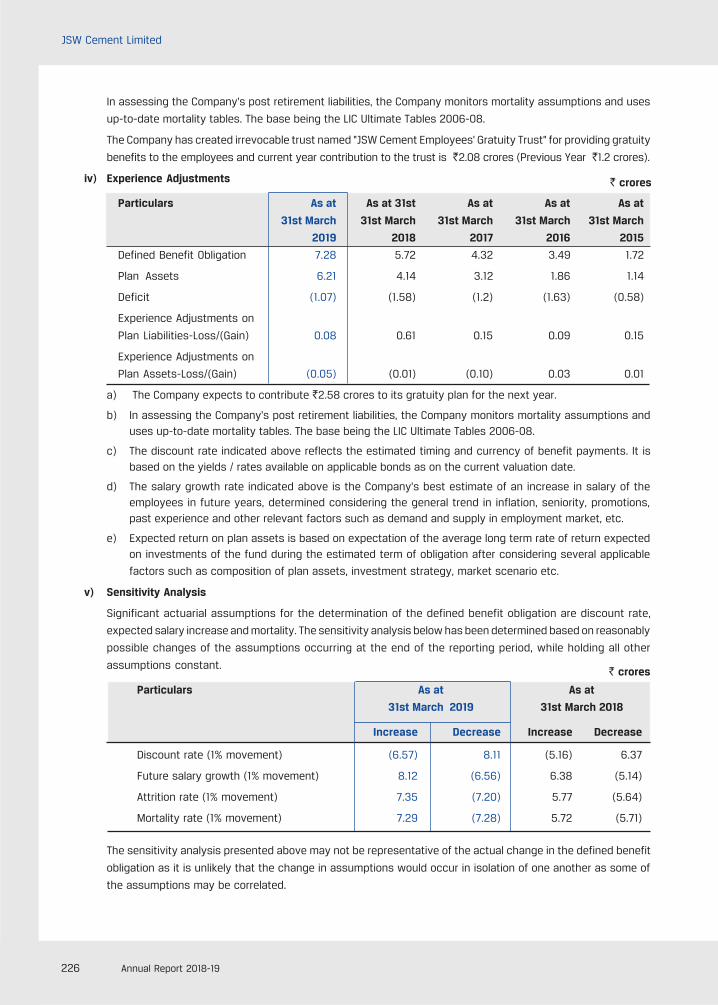
226 Annual Report 2018-19
JSW Cement Limited
In assessing the Company's post retirement liabilities, the Company monitors mortality assumptions and uses
up-to-date mortality tables. The base being the LIC Ultimate Tables 2006-08.
The Company has created irrevocable trust named "JSW Cement Employees' Gratuity Trust" for providing gratuity
benefits to the employees and current year contribution to the trust is `2.08 crores (Previous Year `1.2 crores).
iv) Experience Adjustments
Particulars As at As at 31st As at As at As at
31st March 31st March 31st March 31st March 31st March
2019 2018 2017 2016 2015
Defined Benefit Obligation 7.28 5.72 4.32 3.49 1.72
Plan Assets 6.21 4.14 3.12 1.86 1.14
Deficit (1.07) (1.58) (1.2) (1.63) (0.58)
Experience Adjustments on
Plan Liabilities-Loss/(Gain) 0.08 0.61 0.15 0.09 0.15
Experience Adjustments on
Plan Assets-Loss/(Gain) (0.05) (0.01) (0.10) 0.03 0.01
a) The Company expects to contribute `2.58 crores to its gratuity plan for the next year.
b) In assessing the Company's post retirement liabilities, the Company monitors mortality assumptions anduses up-to-date mortality tables. The base being the LIC Ultimate Tables 2006-08.
c) The discount rate indicated above reflects the estimated timing and currency of benefit payments. It isbased on the yields / rates available on applicable bonds as on the current valuation date.
d) The salary growth rate indicated above is the Company's best estimate of an increase in salary of theemployees in future years, determined considering the general trend in inflation, seniority, promotions,past experience and other relevant factors such as demand and supply in employment market, etc.
e) Expected return on plan assets is based on expectation of the average long term rate of return expectedon investments of the fund during the estimated term of obligation after considering several applicable
factors such as composition of plan assets, investment strategy, market scenario etc.
v) Sensitivity Analysis
Significant actuarial assumptions for the determination of the defined benefit obligation are discount rate,
expected salary increase and mortality. The sensitivity analysis below has been determined based on reasonably
possible changes of the assumptions occurring at the end of the reporting period, while holding all other
assumptions constant.
Particulars As at As at
31st March 2019 31st March 2018
Increase Decrease Increase Decrease
Discount rate (1% movement) (6.57) 8.11 (5.16) 6.37
Future salary growth (1% movement) 8.12 (6.56) 6.38 (5.14)
Attrition rate (1% movement) 7.35 (7.20) 5.77 (5.64)
Mortality rate (1% movement) 7.29 (7.28) 5.72 (5.71)
The sensitivity analysis presented above may not be representative of the actual change in the defined benefit
obligation as it is unlikely that the change in assumptions would occur in isolation of one another as some of
the assumptions may be correlated.
` crores
` crores
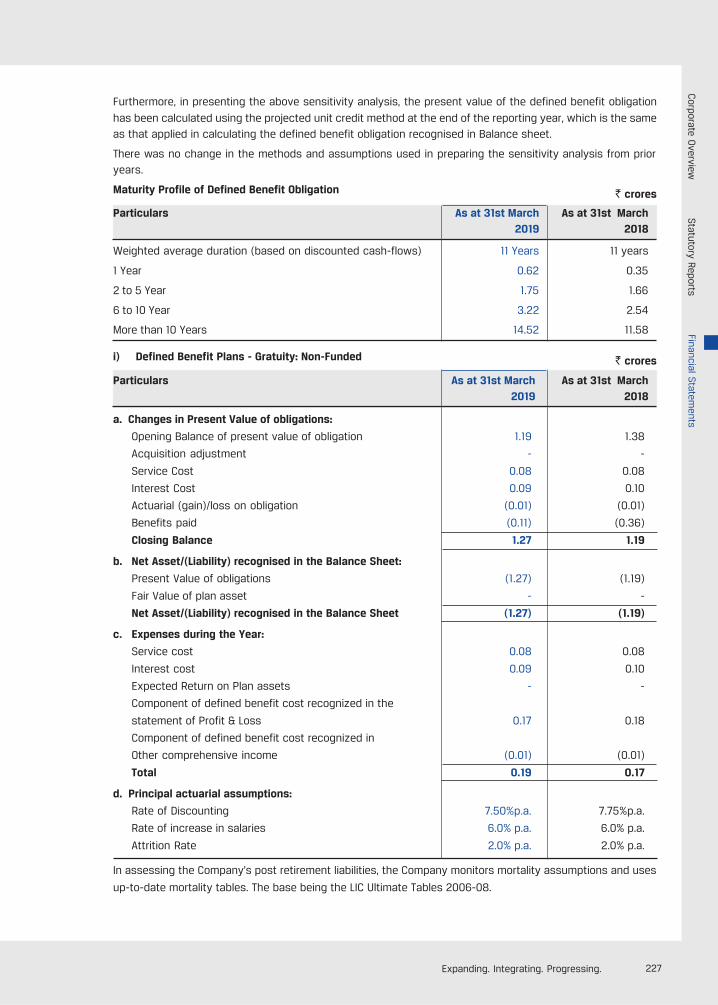
227Expanding. Integrating. Progressing.
` crores
Furthermore, in presenting the above sensitivity analysis, the present value of the defined benefit obligation
has been calculated using the projected unit credit method at the end of the reporting year, which is the sameas that applied in calculating the defined benefit obligation recognised in Balance sheet.
There was no change in the methods and assumptions used in preparing the sensitivity analysis from prioryears.
Maturity Profile of Defined Benefit Obligation
Particulars As at 31st March As at 31st March2019 2018
Weighted average duration (based on discounted cash-flows) 11 Years 11 years
1 Year 0.62 0.35
2 to 5 Year 1.75 1.66
6 to 10 Year 3.22 2.54
More than 10 Years 14.52 11.58
i) Defined Benefit Plans - Gratuity: Non-Funded
Particulars As at 31st March As at 31st March2019 2018
a. Changes in Present Value of obligations:
Opening Balance of present value of obligation 1.19 1.38
Acquisition adjustment - -
Service Cost 0.08 0.08
Interest Cost 0.09 0.10
Actuarial (gain)/loss on obligation (0.01) (0.01)
Benefits paid (0.11) (0.36)
Closing Balance 1.27 1.19
b. Net Asset/(Liability) recognised in the Balance Sheet:
Present Value of obligations (1.27) (1.19)
Fair Value of plan asset - -
Net Asset/(Liability) recognised in the Balance Sheet (1.27) (1.19)
c. Expenses during the Year:
Service cost 0.08 0.08
Interest cost 0.09 0.10
Expected Return on Plan assets - -
Component of defined benefit cost recognized in the
statement of Profit & Loss 0.17 0.18
Component of defined benefit cost recognized in
Other comprehensive income (0.01) (0.01)
Total 0.19 0.17
d. Principal actuarial assumptions:
Rate of Discounting 7.50%p.a. 7.75%p.a.
Rate of increase in salaries 6.0% p.a. 6.0% p.a.
Attrition Rate 2.0% p.a. 2.0% p.a.
In assessing the Company's post retirement liabilities, the Company monitors mortality assumptions and uses
up-to-date mortality tables. The base being the LIC Ultimate Tables 2006-08.
` crores
Corporate O
verviewStatutory Reports
Financial Statem
ents
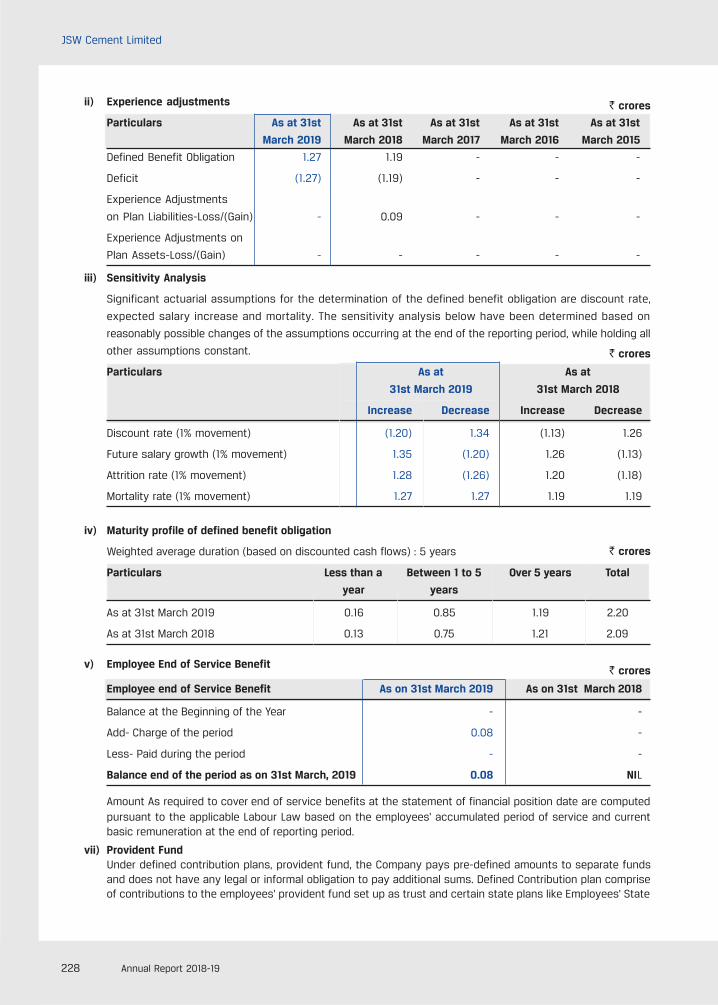
228 Annual Report 2018-19
JSW Cement Limited
ii) Experience adjustments
Particulars As at 31st As at 31st As at 31st As at 31st As at 31st
March 2019 March 2018 March 2017 March 2016 March 2015
Defined Benefit Obligation 1.27 1.19 - - -
Deficit (1.27) (1.19) - - -
Experience Adjustments
on Plan Liabilities-Loss/(Gain) - 0.09 - - -
Experience Adjustments on
Plan Assets-Loss/(Gain) - - - - -
iii) Sensitivity Analysis
Significant actuarial assumptions for the determination of the defined benefit obligation are discount rate,
expected salary increase and mortality. The sensitivity analysis below have been determined based on
reasonably possible changes of the assumptions occurring at the end of the reporting period, while holding all
other assumptions constant.
Particulars As at As at
31st March 2019 31st March 2018
Increase Decrease Increase Decrease
Discount rate (1% movement) (1.20) 1.34 (1.13) 1.26
Future salary growth (1% movement) 1.35 (1.20) 1.26 (1.13)
Attrition rate (1% movement) 1.28 (1.26) 1.20 (1.18)
Mortality rate (1% movement) 1.27 1.27 1.19 1.19
iv) Maturity profile of defined benefit obligation
Weighted average duration (based on discounted cash flows) : 5 years
Particulars Less than a Between 1 to 5 Over 5 years Total
year years
As at 31st March 2019 0.16 0.85 1.19 2.20
As at 31st March 2018 0.13 0.75 1.21 2.09
v) Employee End of Service Benefit
Employee end of Service Benefit As on 31st March 2019 As on 31st March 2018
Balance at the Beginning of the Year - -
Add- Charge of the period 0.08 -
Less- Paid during the period - -
Balance end of the period as on 31st March, 2019 0.08 NIL
Amount As required to cover end of service benefits at the statement of financial position date are computedpursuant to the applicable Labour Law based on the employees' accumulated period of service and currentbasic remuneration at the end of reporting period.
vii) Provident FundUnder defined contribution plans, provident fund, the Company pays pre-defined amounts to separate fundsand does not have any legal or informal obligation to pay additional sums. Defined Contribution plan compriseof contributions to the employees' provident fund set up as trust and certain state plans like Employees' State
` crores
` crores
` crores
` crores
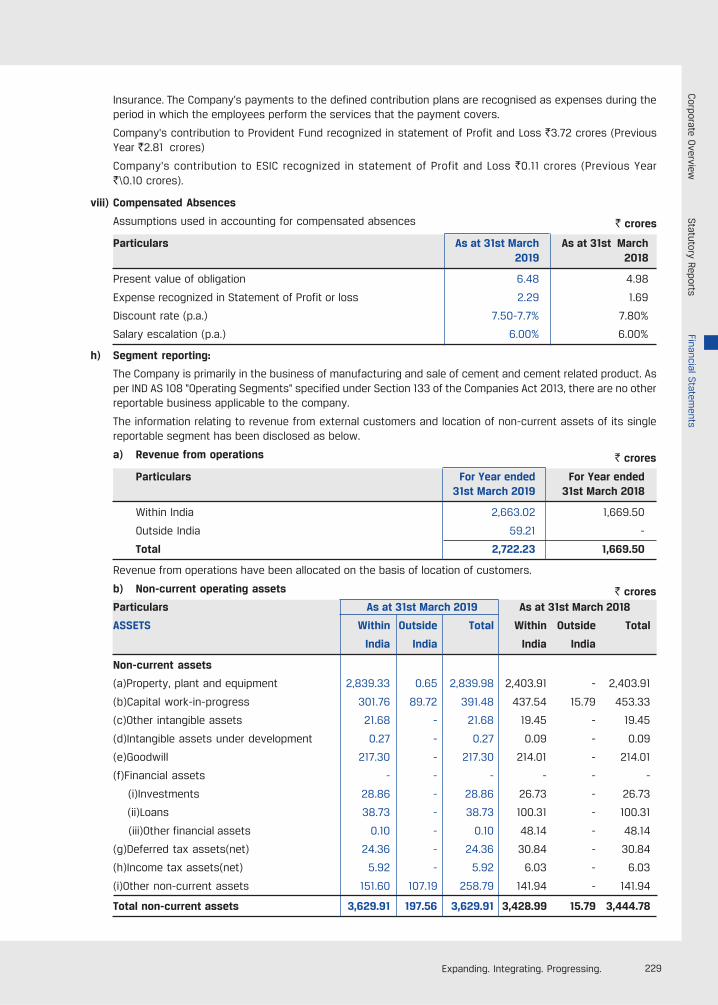
229Expanding. Integrating. Progressing.
Insurance. The Company's payments to the defined contribution plans are recognised as expenses during theperiod in which the employees perform the services that the payment covers.
Company's contribution to Provident Fund recognized in statement of Profit and Loss `3.72 crores (PreviousYear `2.81 crores)
Company's contribution to ESIC recognized in statement of Profit and Loss `0.11 crores (Previous Year`\0.10 crores).
viii) Compensated Absences
Assumptions used in accounting for compensated absences
Particulars As at 31st March As at 31st March2019 2018
Present value of obligation 6.48 4.98
Expense recognized in Statement of Profit or loss 2.29 1.69
Discount rate (p.a.) 7.50-7.7% 7.80%
Salary escalation (p.a.) 6.00% 6.00%
h) Segment reporting:
The Company is primarily in the business of manufacturing and sale of cement and cement related product. Asper IND AS 108 "Operating Segments" specified under Section 133 of the Companies Act 2013, there are no otherreportable business applicable to the company.
The information relating to revenue from external customers and location of non-current assets of its singlereportable segment has been disclosed as below.
a) Revenue from operations
Particulars For Year ended For Year ended31st March 2019 31st March 2018
Within India 2,663.02 1,669.50
Outside India 59.21 -
Total 2,722.23 1,669.50
Revenue from operations have been allocated on the basis of location of customers.
b) Non-current operating assets
Particulars As at 31st March 2019 As at 31st March 2018
ASSETS Within Outside Total Within Outside Total
India India India India
Non-current assets
(a)Property, plant and equipment 2,839.33 0.65 2,839.98 2,403.91 - 2,403.91
(b)Capital work-in-progress 301.76 89.72 391.48 437.54 15.79 453.33
(c)Other intangible assets 21.68 - 21.68 19.45 - 19.45
(d)Intangible assets under development 0.27 - 0.27 0.09 - 0.09
(e)Goodwill 217.30 - 217.30 214.01 - 214.01
(f)Financial assets - - - - - -
(i)Investments 28.86 - 28.86 26.73 - 26.73
(ii)Loans 38.73 - 38.73 100.31 - 100.31
(iii)Other financial assets 0.10 - 0.10 48.14 - 48.14
(g)Deferred tax assets(net) 24.36 - 24.36 30.84 - 30.84
(h)Income tax assets(net) 5.92 - 5.92 6.03 - 6.03
(i)Other non-current assets 151.60 107.19 258.79 141.94 - 141.94
Total non-current assets 3,629.91 197.56 3,629.91 3,428.99 15.79 3,444.78
` crores
` crores
` crores
Corporate O
verviewStatutory Reports
Financial Statem
ents
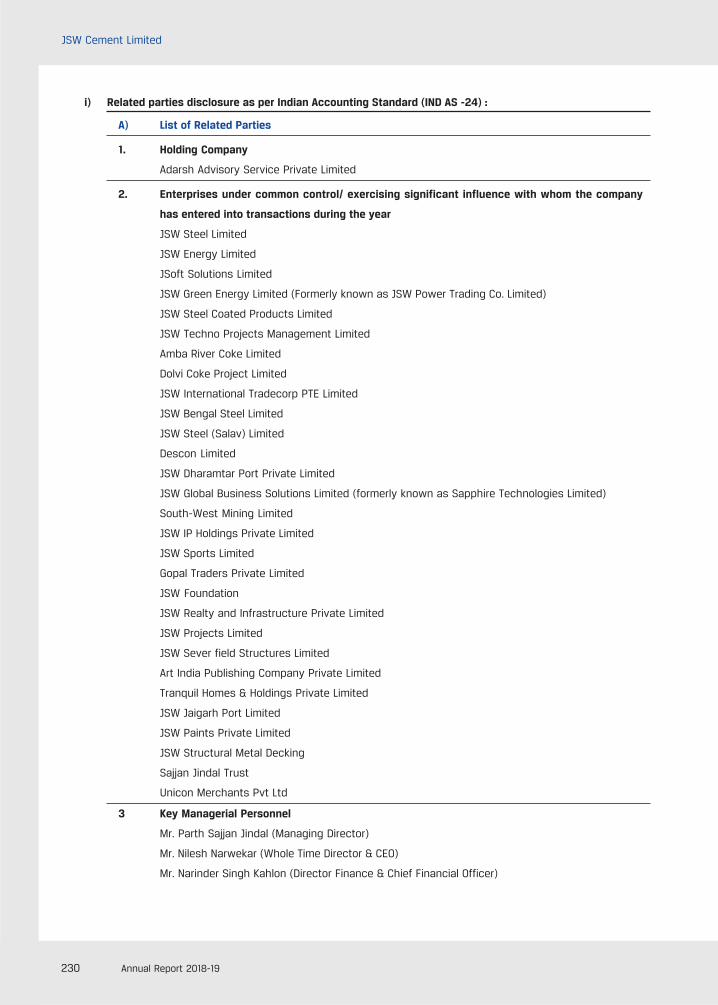
230 Annual Report 2018-19
JSW Cement Limited
i) Related parties disclosure as per Indian Accounting Standard (IND AS -24) :
A) List of Related Parties
1. Holding Company
Adarsh Advisory Service Private Limited
2. Enterprises under common control/ exercising significant influence with whom the company
has entered into transactions during the year
JSW Steel Limited
JSW Energy Limited
JSoft Solutions Limited
JSW Green Energy Limited (Formerly known as JSW Power Trading Co. Limited)
JSW Steel Coated Products Limited
JSW Techno Projects Management Limited
Amba River Coke Limited
Dolvi Coke Project Limited
JSW International Tradecorp PTE Limited
JSW Bengal Steel Limited
JSW Steel (Salav) Limited
Descon Limited
JSW Dharamtar Port Private Limited
JSW Global Business Solutions Limited (formerly known as Sapphire Technologies Limited)
South-West Mining Limited
JSW IP Holdings Private Limited
JSW Sports Limited
Gopal Traders Private Limited
JSW Foundation
JSW Realty and Infrastructure Private Limited
JSW Projects Limited
JSW Sever field Structures Limited
Art India Publishing Company Private Limited
Tranquil Homes & Holdings Private Limited
JSW Jaigarh Port Limited
JSW Paints Private Limited
JSW Structural Metal Decking
Sajjan Jindal Trust
Unicon Merchants Pvt Ltd
3 Key Managerial Personnel
Mr. Parth Sajjan Jindal (Managing Director)
Mr. Nilesh Narwekar (Whole Time Director & CEO)
Mr. Narinder Singh Kahlon (Director Finance & Chief Financial Officer)
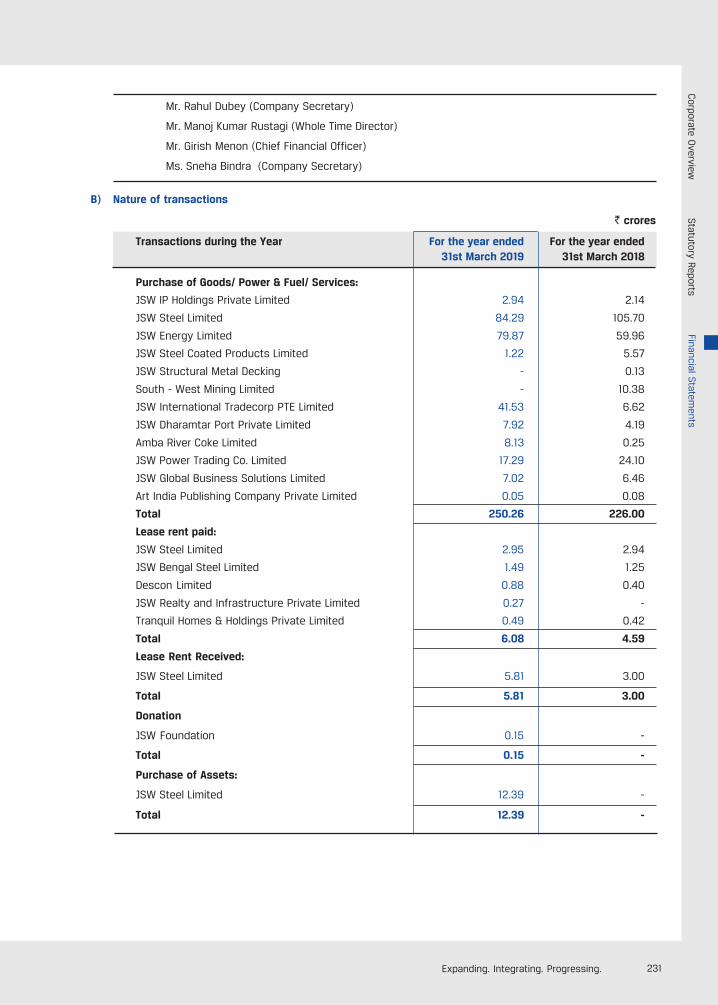
231Expanding. Integrating. Progressing.
Mr. Rahul Dubey (Company Secretary)
Mr. Manoj Kumar Rustagi (Whole Time Director)
Mr. Girish Menon (Chief Financial Officer)
Ms. Sneha Bindra (Company Secretary)
B) Nature of transactions
` crores
Transactions during the Year For the year ended For the year ended31st March 2019 31st March 2018
Purchase of Goods/ Power & Fuel/ Services:
JSW IP Holdings Private Limited 2.94 2.14
JSW Steel Limited 84.29 105.70
JSW Energy Limited 79.87 59.96
JSW Steel Coated Products Limited 1.22 5.57
JSW Structural Metal Decking - 0.13
South - West Mining Limited - 10.38
JSW International Tradecorp PTE Limited 41.53 6.62
JSW Dharamtar Port Private Limited 7.92 4.19
Amba River Coke Limited 8.13 0.25
JSW Power Trading Co. Limited 17.29 24.10
JSW Global Business Solutions Limited 7.02 6.46
Art India Publishing Company Private Limited 0.05 0.08
Total 250.26 226.00
Lease rent paid:
JSW Steel Limited 2.95 2.94
JSW Bengal Steel Limited 1.49 1.25
Descon Limited 0.88 0.40
JSW Realty and Infrastructure Private Limited 0.27 -
Tranquil Homes & Holdings Private Limited 0.49 0.42
Total 6.08 4.59
Lease Rent Received:
JSW Steel Limited 5.81 3.00
Total 5.81 3.00
Donation
JSW Foundation 0.15 -
Total 0.15 -
Purchase of Assets:
JSW Steel Limited 12.39 -
Total 12.39 -
Corporate O
verviewStatutory Reports
Financial Statem
ents
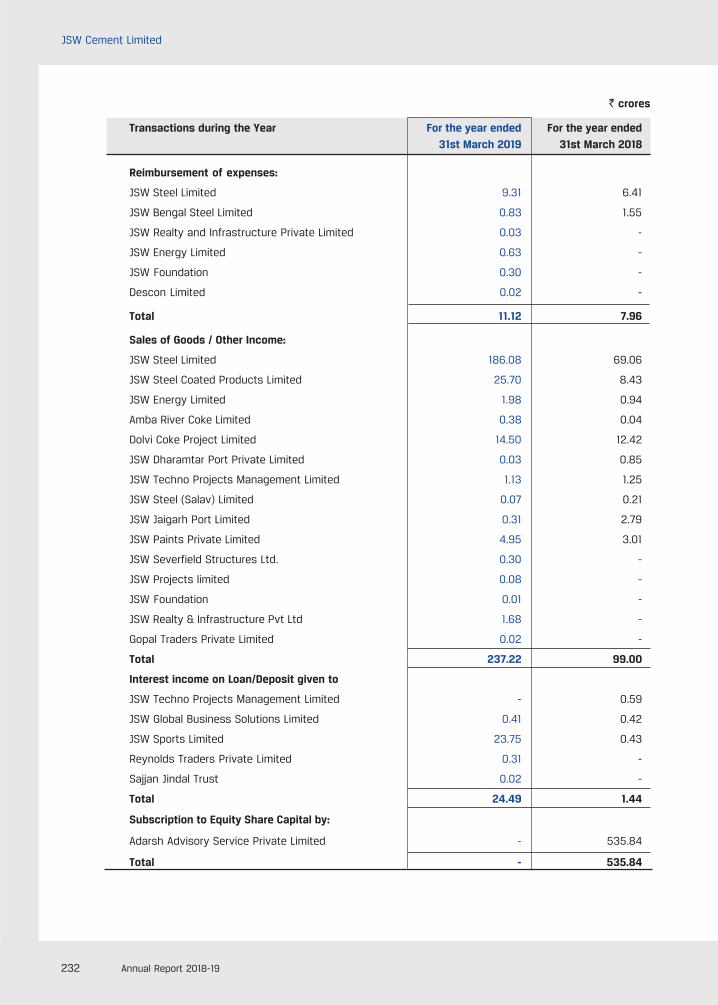
232 Annual Report 2018-19
JSW Cement Limited
Transactions during the Year For the year ended For the year ended
31st March 2019 31st March 2018
Reimbursement of expenses:
JSW Steel Limited 9.31 6.41
JSW Bengal Steel Limited 0.83 1.55
JSW Realty and Infrastructure Private Limited 0.03 -
JSW Energy Limited 0.63 -
JSW Foundation 0.30 -
Descon Limited 0.02 -
Total 11.12 7.96
Sales of Goods / Other Income:
JSW Steel Limited 186.08 69.06
JSW Steel Coated Products Limited 25.70 8.43
JSW Energy Limited 1.98 0.94
Amba River Coke Limited 0.38 0.04
Dolvi Coke Project Limited 14.50 12.42
JSW Dharamtar Port Private Limited 0.03 0.85
JSW Techno Projects Management Limited 1.13 1.25
JSW Steel (Salav) Limited 0.07 0.21
JSW Jaigarh Port Limited 0.31 2.79
JSW Paints Private Limited 4.95 3.01
JSW Severfield Structures Ltd. 0.30 -
JSW Projects limited 0.08 -
JSW Foundation 0.01 -
JSW Realty & Infrastructure Pvt Ltd 1.68 -
Gopal Traders Private Limited 0.02 -
Total 237.22 99.00
Interest income on Loan/Deposit given to
JSW Techno Projects Management Limited - 0.59
JSW Global Business Solutions Limited 0.41 0.42
JSW Sports Limited 23.75 0.43
Reynolds Traders Private Limited 0.31 -
Sajjan Jindal Trust 0.02 -
Total 24.49 1.44
Subscription to Equity Share Capital by:
Adarsh Advisory Service Private Limited - 535.84
Total - 535.84
` crores
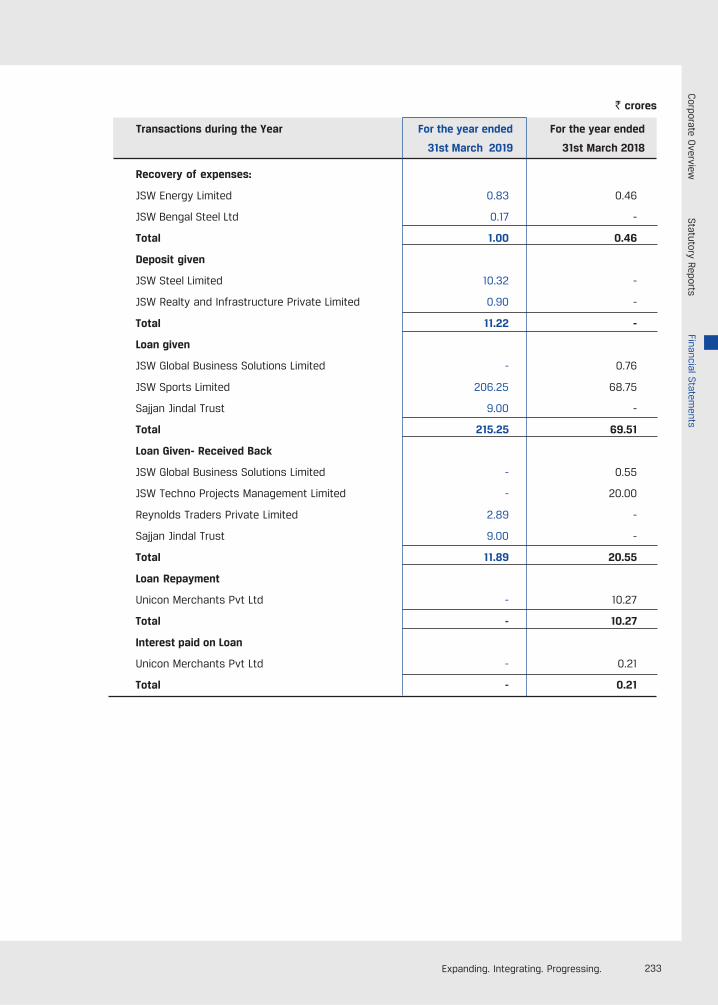
233Expanding. Integrating. Progressing.
Transactions during the Year For the year ended For the year ended
31st March 2019 31st March 2018
Recovery of expenses:
JSW Energy Limited 0.83 0.46
JSW Bengal Steel Ltd 0.17 -
Total 1.00 0.46
Deposit given
JSW Steel Limited 10.32 -
JSW Realty and Infrastructure Private Limited 0.90 -
Total 11.22 -
Loan given
JSW Global Business Solutions Limited - 0.76
JSW Sports Limited 206.25 68.75
Sajjan Jindal Trust 9.00 -
Total 215.25 69.51
Loan Given- Received Back
JSW Global Business Solutions Limited - 0.55
JSW Techno Projects Management Limited - 20.00
Reynolds Traders Private Limited 2.89 -
Sajjan Jindal Trust 9.00 -
Total 11.89 20.55
Loan Repayment
Unicon Merchants Pvt Ltd - 10.27
Total - 10.27
Interest paid on Loan
Unicon Merchants Pvt Ltd - 0.21
Total - 0.21
` crores
Corporate O
verviewStatutory Reports
Financial Statem
ents
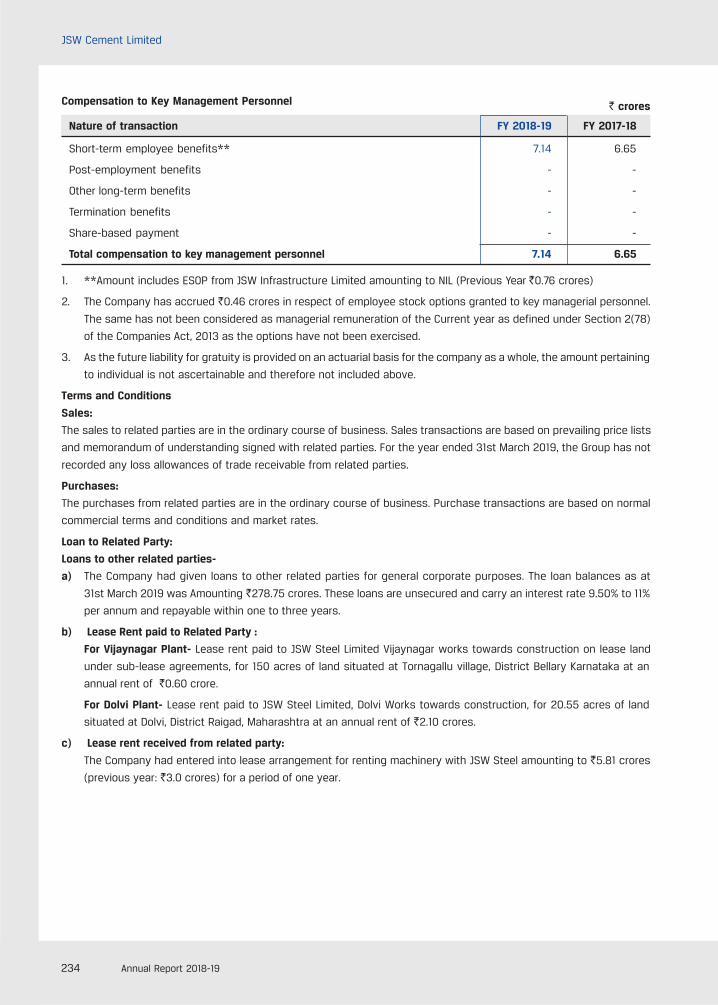
234 Annual Report 2018-19
JSW Cement Limited
Compensation to Key Management Personnel
Nature of transaction FY 2018-19 FY 2017-18
Short-term employee benefits** 7.14 6.65
Post-employment benefits - -
Other long-term benefits - -
Termination benefits - -
Share-based payment - -
Total compensation to key management personnel 7.14 6.65
1. **Amount includes ESOP from JSW Infrastructure Limited amounting to NIL (Previous Year `0.76 crores)
2. The Company has accrued `0.46 crores in respect of employee stock options granted to key managerial personnel.
The same has not been considered as managerial remuneration of the Current year as defined under Section 2(78)
of the Companies Act, 2013 as the options have not been exercised.
3. As the future liability for gratuity is provided on an actuarial basis for the company as a whole, the amount pertaining
to individual is not ascertainable and therefore not included above.
Terms and Conditions
Sales:
The sales to related parties are in the ordinary course of business. Sales transactions are based on prevailing price lists
and memorandum of understanding signed with related parties. For the year ended 31st March 2019, the Group has not
recorded any loss allowances of trade receivable from related parties.
Purchases:
The purchases from related parties are in the ordinary course of business. Purchase transactions are based on normal
commercial terms and conditions and market rates.
Loan to Related Party:
Loans to other related parties-
a) The Company had given loans to other related parties for general corporate purposes. The loan balances as at
31st March 2019 was Amounting `278.75 crores. These loans are unsecured and carry an interest rate 9.50% to 11%
per annum and repayable within one to three years.
b) Lease Rent paid to Related Party :
For Vijaynagar Plant- Lease rent paid to JSW Steel Limited Vijaynagar works towards construction on lease land
under sub-lease agreements, for 150 acres of land situated at Tornagallu village, District Bellary Karnataka at an
annual rent of `0.60 crore.
For Dolvi Plant- Lease rent paid to JSW Steel Limited, Dolvi Works towards construction, for 20.55 acres of land
situated at Dolvi, District Raigad, Maharashtra at an annual rent of `2.10 crores.
c) Lease rent received from related party:
The Company had entered into lease arrangement for renting machinery with JSW Steel amounting to `5.81 crores
(previous year: `3.0 crores) for a period of one year.
` crores
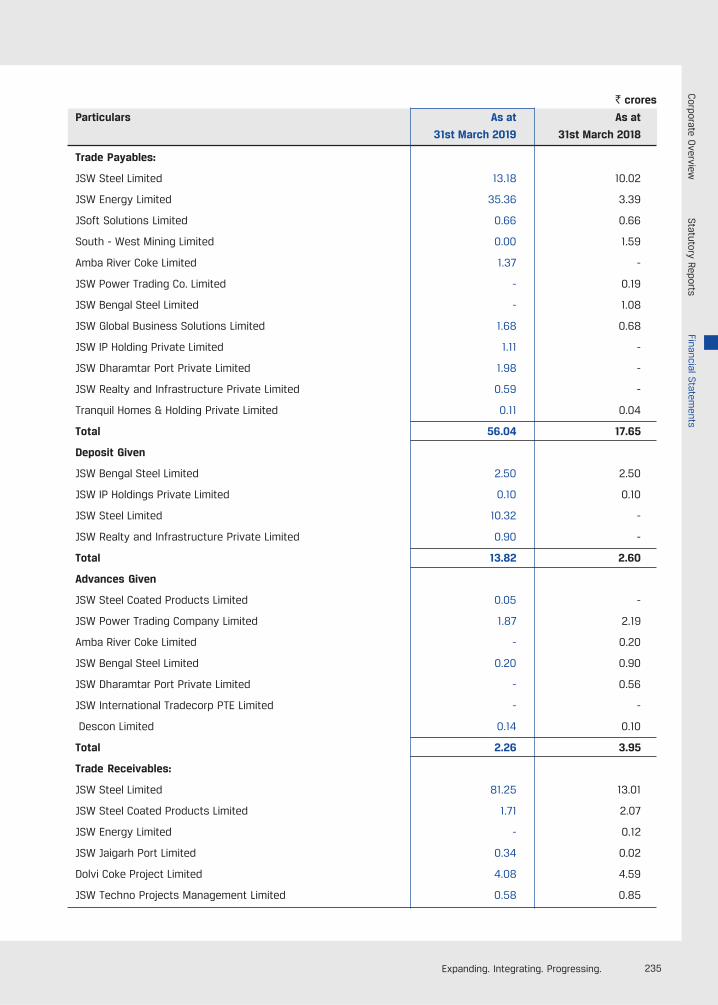
235Expanding. Integrating. Progressing.
Particulars As at As at
31st March 2019 31st March 2018
Trade Payables:
JSW Steel Limited 13.18 10.02
JSW Energy Limited 35.36 3.39
JSoft Solutions Limited 0.66 0.66
South - West Mining Limited 0.00 1.59
Amba River Coke Limited 1.37 -
JSW Power Trading Co. Limited - 0.19
JSW Bengal Steel Limited - 1.08
JSW Global Business Solutions Limited 1.68 0.68
JSW IP Holding Private Limited 1.11 -
JSW Dharamtar Port Private Limited 1.98 -
JSW Realty and Infrastructure Private Limited 0.59 -
Tranquil Homes & Holding Private Limited 0.11 0.04
Total 56.04 17.65
Deposit Given
JSW Bengal Steel Limited 2.50 2.50
JSW IP Holdings Private Limited 0.10 0.10
JSW Steel Limited 10.32 -
JSW Realty and Infrastructure Private Limited 0.90 -
Total 13.82 2.60
Advances Given
JSW Steel Coated Products Limited 0.05 -
JSW Power Trading Company Limited 1.87 2.19
Amba River Coke Limited - 0.20
JSW Bengal Steel Limited 0.20 0.90
JSW Dharamtar Port Private Limited - 0.56
JSW International Tradecorp PTE Limited - -
Descon Limited 0.14 0.10
Total 2.26 3.95
Trade Receivables:
JSW Steel Limited 81.25 13.01
JSW Steel Coated Products Limited 1.71 2.07
JSW Energy Limited - 0.12
JSW Jaigarh Port Limited 0.34 0.02
Dolvi Coke Project Limited 4.08 4.59
JSW Techno Projects Management Limited 0.58 0.85
` crores
Corporate O
verviewStatutory Reports
Financial Statem
ents
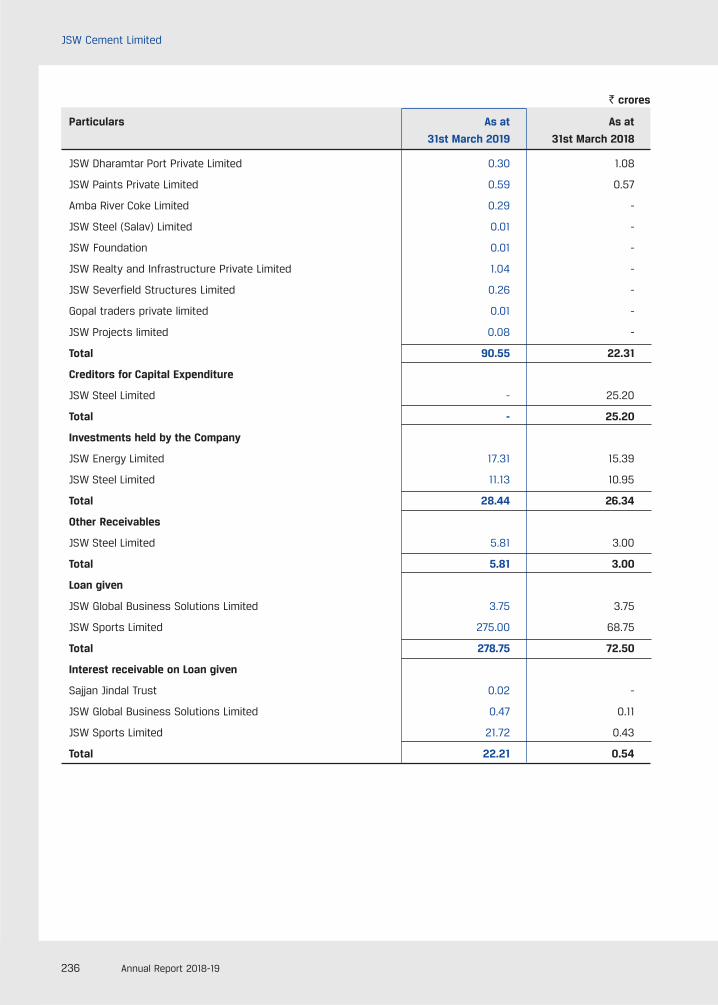
236 Annual Report 2018-19
JSW Cement Limited
JSW Dharamtar Port Private Limited 0.30 1.08
JSW Paints Private Limited 0.59 0.57
Amba River Coke Limited 0.29 -
JSW Steel (Salav) Limited 0.01 -
JSW Foundation 0.01 -
JSW Realty and Infrastructure Private Limited 1.04 -
JSW Severfield Structures Limited 0.26 -
Gopal traders private limited 0.01 -
JSW Projects limited 0.08 -
Total 90.55 22.31
Creditors for Capital Expenditure
JSW Steel Limited - 25.20
Total - 25.20
Investments held by the Company
JSW Energy Limited 17.31 15.39
JSW Steel Limited 11.13 10.95
Total 28.44 26.34
Other Receivables
JSW Steel Limited 5.81 3.00
Total 5.81 3.00
Loan given
JSW Global Business Solutions Limited 3.75 3.75
JSW Sports Limited 275.00 68.75
Total 278.75 72.50
Interest receivable on Loan given
Sajjan Jindal Trust 0.02 -
JSW Global Business Solutions Limited 0.47 0.11
JSW Sports Limited 21.72 0.43
Total 22.21 0.54
Particulars As at As at
31st March 2019 31st March 2018
` crores
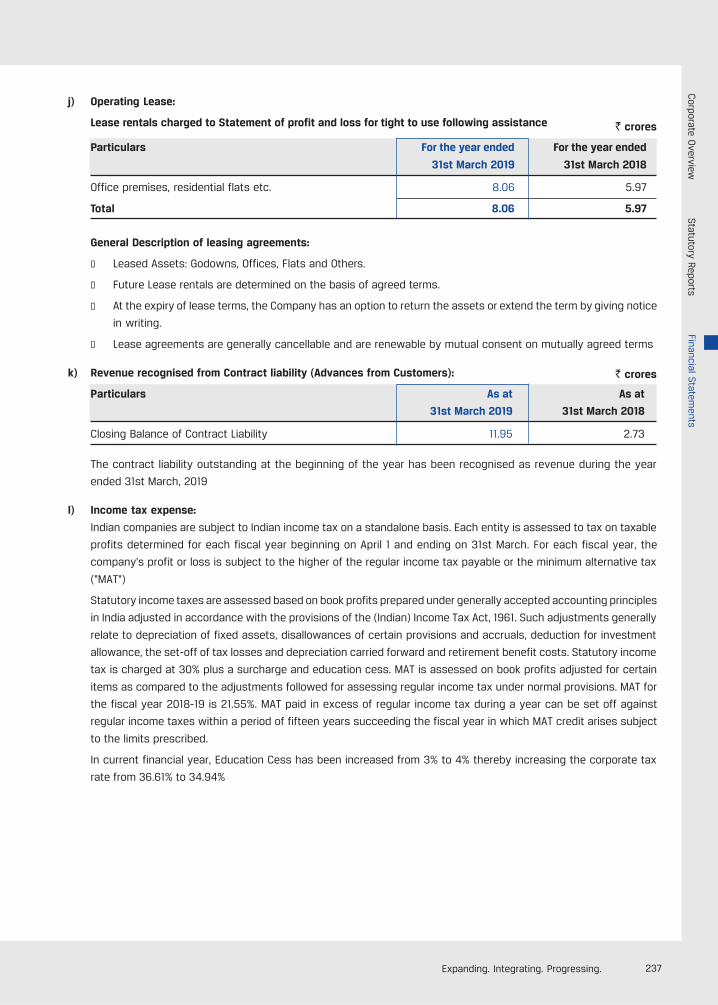
237Expanding. Integrating. Progressing.
j) Operating Lease:
Lease rentals charged to Statement of profit and loss for tight to use following assistance
Particulars For the year ended For the year ended
31st March 2019 31st March 2018
Office premises, residential flats etc. 8.06 5.97
Total 8.06 5.97
General Description of leasing agreements:
l Leased Assets: Godowns, Offices, Flats and Others.
l Future Lease rentals are determined on the basis of agreed terms.
l At the expiry of lease terms, the Company has an option to return the assets or extend the term by giving notice
in writing.
l Lease agreements are generally cancellable and are renewable by mutual consent on mutually agreed terms
k) Revenue recognised from Contract liability (Advances from Customers):
Particulars As at As at
31st March 2019 31st March 2018
Closing Balance of Contract Liability 11.95 2.73
The contract liability outstanding at the beginning of the year has been recognised as revenue during the year
ended 31st March, 2019
l) Income tax expense:
Indian companies are subject to Indian income tax on a standalone basis. Each entity is assessed to tax on taxable
profits determined for each fiscal year beginning on April 1 and ending on 31st March. For each fiscal year, the
company's profit or loss is subject to the higher of the regular income tax payable or the minimum alternative tax
("MAT")
Statutory income taxes are assessed based on book profits prepared under generally accepted accounting principles
in India adjusted in accordance with the provisions of the (Indian) Income Tax Act, 1961. Such adjustments generally
relate to depreciation of fixed assets, disallowances of certain provisions and accruals, deduction for investment
allowance, the set-off of tax losses and depreciation carried forward and retirement benefit costs. Statutory income
tax is charged at 30% plus a surcharge and education cess. MAT is assessed on book profits adjusted for certain
items as compared to the adjustments followed for assessing regular income tax under normal provisions. MAT for
the fiscal year 2018-19 is 21.55%. MAT paid in excess of regular income tax during a year can be set off against
regular income taxes within a period of fifteen years succeeding the fiscal year in which MAT credit arises subject
to the limits prescribed.
In current financial year, Education Cess has been increased from 3% to 4% thereby increasing the corporate tax
rate from 36.61% to 34.94%
` crores
` crores
Corporate O
verviewStatutory Reports
Financial Statem
ents
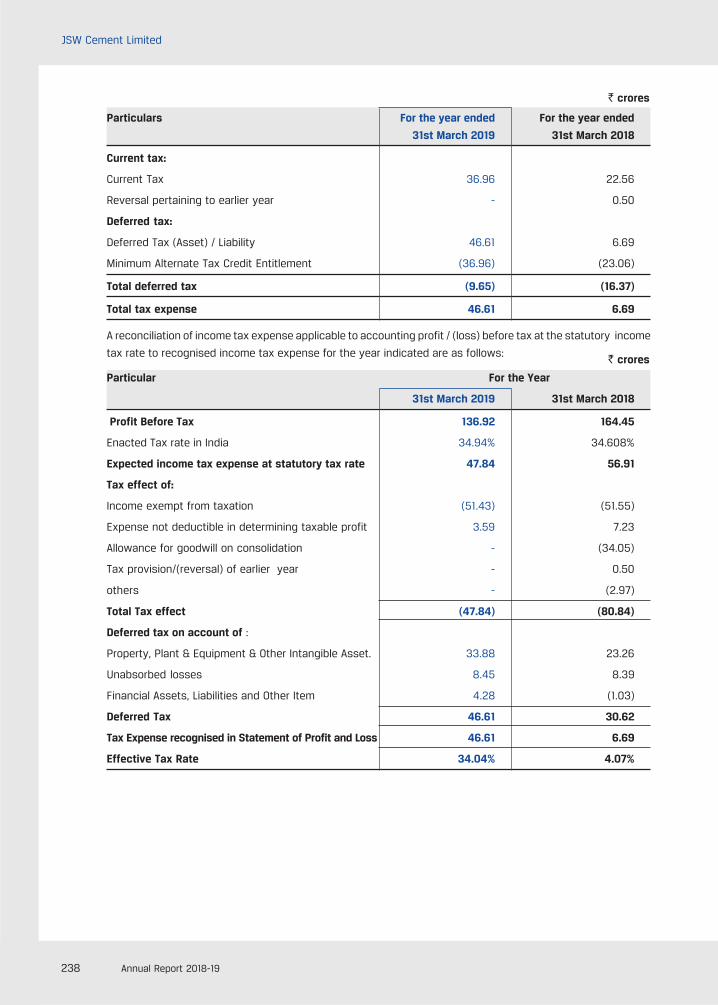
238 Annual Report 2018-19
JSW Cement Limited
Particulars For the year ended For the year ended
31st March 2019 31st March 2018
Current tax:
Current Tax 36.96 22.56
Reversal pertaining to earlier year - 0.50
Deferred tax:
Deferred Tax (Asset) / Liability 46.61 6.69
Minimum Alternate Tax Credit Entitlement (36.96) (23.06)
Total deferred tax (9.65) (16.37)
Total tax expense 46.61 6.69
A reconciliation of income tax expense applicable to accounting profit / (loss) before tax at the statutory income
tax rate to recognised income tax expense for the year indicated are as follows:
Particular For the Year
31st March 2019 31st March 2018
Profit Before Tax 136.92 164.45
Enacted Tax rate in India 34.94% 34.608%
Expected income tax expense at statutory tax rate 47.84 56.91
Tax effect of:
Income exempt from taxation (51.43) (51.55)
Expense not deductible in determining taxable profit 3.59 7.23
Allowance for goodwill on consolidation - (34.05)
Tax provision/(reversal) of earlier year - 0.50
others - (2.97)
Total Tax effect (47.84) (80.84)
Deferred tax on account of :
Property, Plant & Equipment & Other Intangible Asset. 33.88 23.26
Unabsorbed losses 8.45 8.39
Financial Assets, Liabilities and Other Item 4.28 (1.03)
Deferred Tax 46.61 30.62
Tax Expense recognised in Statement of Profit and Loss 46.61 6.69
Effective Tax Rate 34.04% 4.07%
` crores
` crores
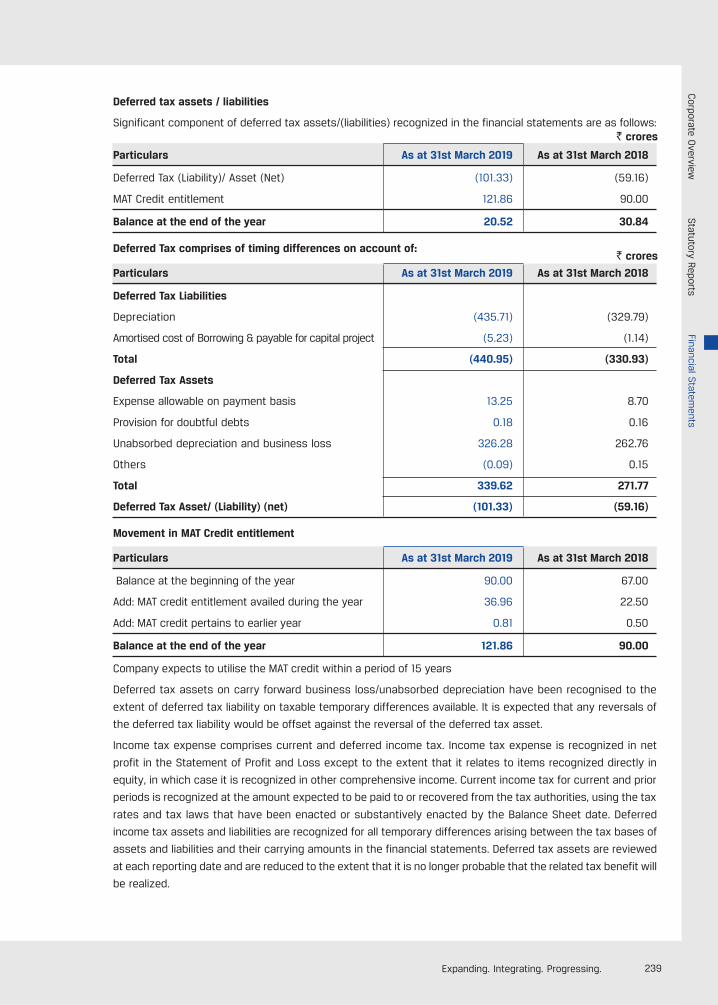
239Expanding. Integrating. Progressing.
Deferred tax assets / liabilities
Significant component of deferred tax assets/(liabilities) recognized in the financial statements are as follows:
Particulars As at 31st March 2019 As at 31st March 2018
Deferred Tax (Liability)/ Asset (Net) (101.33) (59.16)
MAT Credit entitlement 121.86 90.00
Balance at the end of the year 20.52 30.84
Deferred Tax comprises of timing differences on account of:
Particulars As at 31st March 2019 As at 31st March 2018
Deferred Tax Liabilities
Depreciation (435.71) (329.79)
Amortised cost of Borrowing & payable for capital project (5.23) (1.14)
Total (440.95) (330.93)
Deferred Tax Assets
Expense allowable on payment basis 13.25 8.70
Provision for doubtful debts 0.18 0.16
Unabsorbed depreciation and business loss 326.28 262.76
Others (0.09) 0.15
Total 339.62 271.77
Deferred Tax Asset/ (Liability) (net) (101.33) (59.16)
Movement in MAT Credit entitlement
Particulars As at 31st March 2019 As at 31st March 2018
Balance at the beginning of the year 90.00 67.00
Add: MAT credit entitlement availed during the year 36.96 22.50
Add: MAT credit pertains to earlier year 0.81 0.50
Balance at the end of the year 121.86 90.00
Company expects to utilise the MAT credit within a period of 15 years
Deferred tax assets on carry forward business loss/unabsorbed depreciation have been recognised to the
extent of deferred tax liability on taxable temporary differences available. It is expected that any reversals of
the deferred tax liability would be offset against the reversal of the deferred tax asset.
Income tax expense comprises current and deferred income tax. Income tax expense is recognized in net
profit in the Statement of Profit and Loss except to the extent that it relates to items recognized directly in
equity, in which case it is recognized in other comprehensive income. Current income tax for current and prior
periods is recognized at the amount expected to be paid to or recovered from the tax authorities, using the tax
rates and tax laws that have been enacted or substantively enacted by the Balance Sheet date. Deferred
income tax assets and liabilities are recognized for all temporary differences arising between the tax bases of
assets and liabilities and their carrying amounts in the financial statements. Deferred tax assets are reviewed
at each reporting date and are reduced to the extent that it is no longer probable that the related tax benefit will
be realized.
` crores
` crores
Corporate O
verviewStatutory Reports
Financial Statem
ents
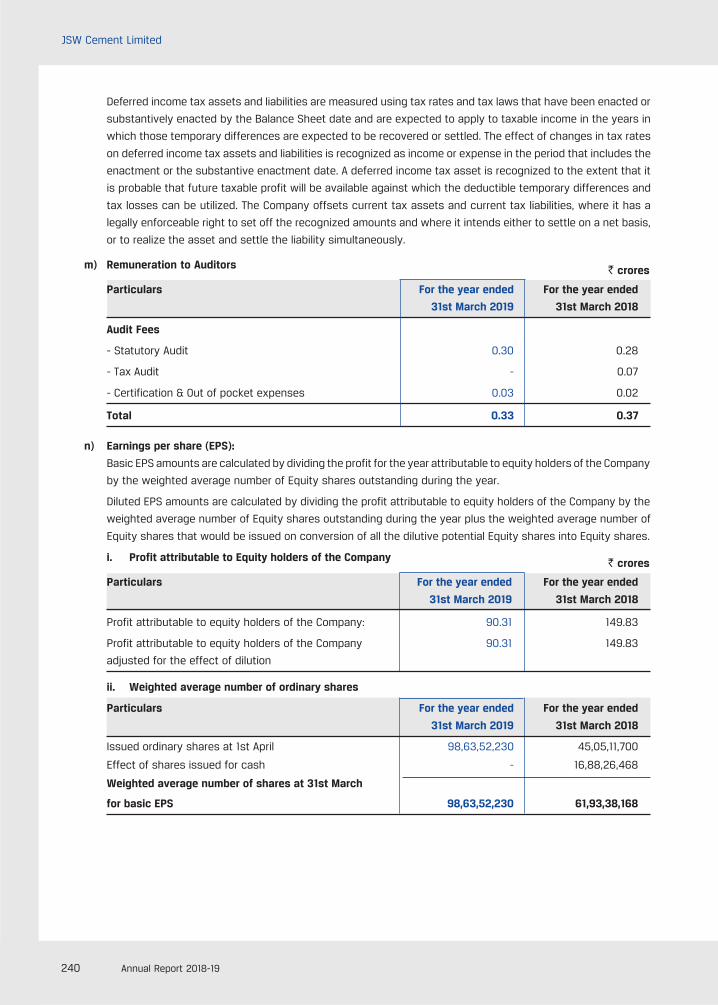
240 Annual Report 2018-19
JSW Cement Limited
Deferred income tax assets and liabilities are measured using tax rates and tax laws that have been enacted or
substantively enacted by the Balance Sheet date and are expected to apply to taxable income in the years in
which those temporary differences are expected to be recovered or settled. The effect of changes in tax rates
on deferred income tax assets and liabilities is recognized as income or expense in the period that includes the
enactment or the substantive enactment date. A deferred income tax asset is recognized to the extent that it
is probable that future taxable profit will be available against which the deductible temporary differences and
tax losses can be utilized. The Company offsets current tax assets and current tax liabilities, where it has a
legally enforceable right to set off the recognized amounts and where it intends either to settle on a net basis,
or to realize the asset and settle the liability simultaneously.
m) Remuneration to Auditors
Particulars For the year ended For the year ended
31st March 2019 31st March 2018
Audit Fees
- Statutory Audit 0.30 0.28
- Tax Audit - 0.07
- Certification & Out of pocket expenses 0.03 0.02
Total 0.33 0.37
n) Earnings per share (EPS):
Basic EPS amounts are calculated by dividing the profit for the year attributable to equity holders of the Company
by the weighted average number of Equity shares outstanding during the year.
Diluted EPS amounts are calculated by dividing the profit attributable to equity holders of the Company by the
weighted average number of Equity shares outstanding during the year plus the weighted average number of
Equity shares that would be issued on conversion of all the dilutive potential Equity shares into Equity shares.
i. Profit attributable to Equity holders of the Company
Particulars For the year ended For the year ended
31st March 2019 31st March 2018
Profit attributable to equity holders of the Company: 90.31 149.83
Profit attributable to equity holders of the Company 90.31 149.83
adjusted for the effect of dilution
ii. Weighted average number of ordinary shares
Particulars For the year ended For the year ended
31st March 2019 31st March 2018
Issued ordinary shares at 1st April 98,63,52,230 45,05,11,700
Effect of shares issued for cash - 16,88,26,468
Weighted average number of shares at 31st March
for basic EPS 98,63,52,230 61,93,38,168
` crores
` crores
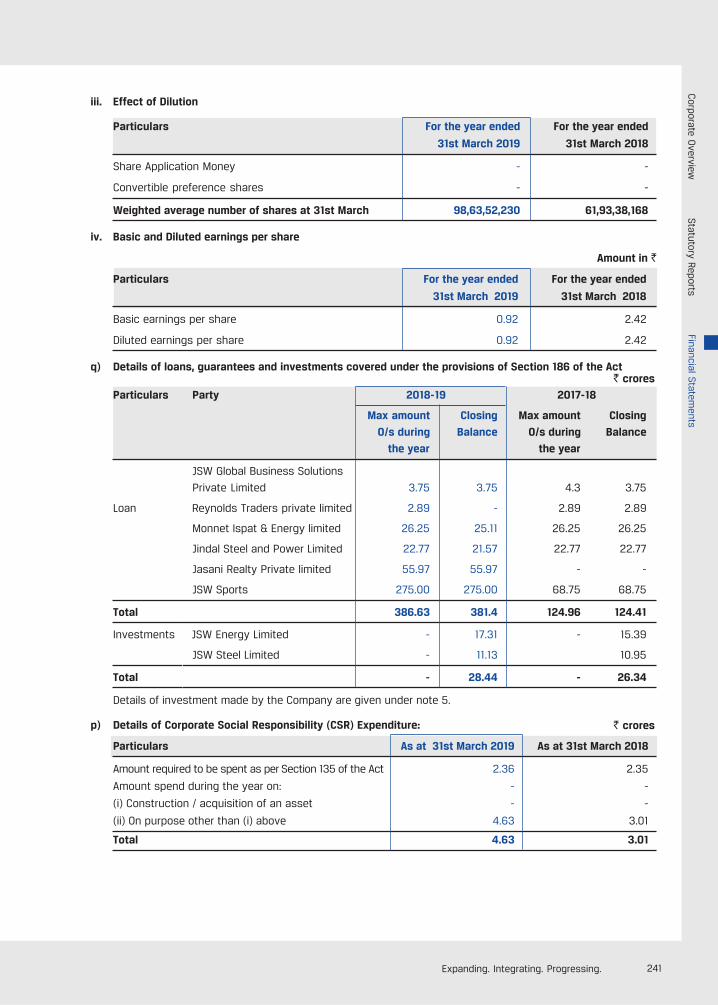
241Expanding. Integrating. Progressing.
iii. Effect of Dilution
Particulars For the year ended For the year ended
31st March 2019 31st March 2018
Share Application Money - -
Convertible preference shares - -
Weighted average number of shares at 31st March 98,63,52,230 61,93,38,168
iv. Basic and Diluted earnings per share
Amount in `
Particulars For the year ended For the year ended
31st March 2019 31st March 2018
Basic earnings per share 0.92 2.42
Diluted earnings per share 0.92 2.42
q) Details of loans, guarantees and investments covered under the provisions of Section 186 of the Act
Particulars Party 2018-19 2017-18
Max amount Closing Max amount Closing
O/s during Balance O/s during Balance
the year the year
JSW Global Business Solutions
Private Limited 3.75 3.75 4.3 3.75
Loan Reynolds Traders private limited 2.89 - 2.89 2.89
Monnet Ispat & Energy limited 26.25 25.11 26.25 26.25
Jindal Steel and Power Limited 22.77 21.57 22.77 22.77
Jasani Realty Private limited 55.97 55.97 - -
JSW Sports 275.00 275.00 68.75 68.75
Total 386.63 381.4 124.96 124.41
Investments JSW Energy Limited - 17.31 - 15.39
JSW Steel Limited - 11.13 10.95
Total - 28.44 - 26.34
Details of investment made by the Company are given under note 5.
p) Details of Corporate Social Responsibility (CSR) Expenditure:
Particulars As at 31st March 2019 As at 31st March 2018
Amount required to be spent as per Section 135 of the Act 2.36 2.35
Amount spend during the year on: - -
(i) Construction / acquisition of an asset - -
(ii) On purpose other than (i) above 4.63 3.01
Total 4.63 3.01
` crores
` crores
Corporate O
verviewStatutory Reports
Financial Statem
ents
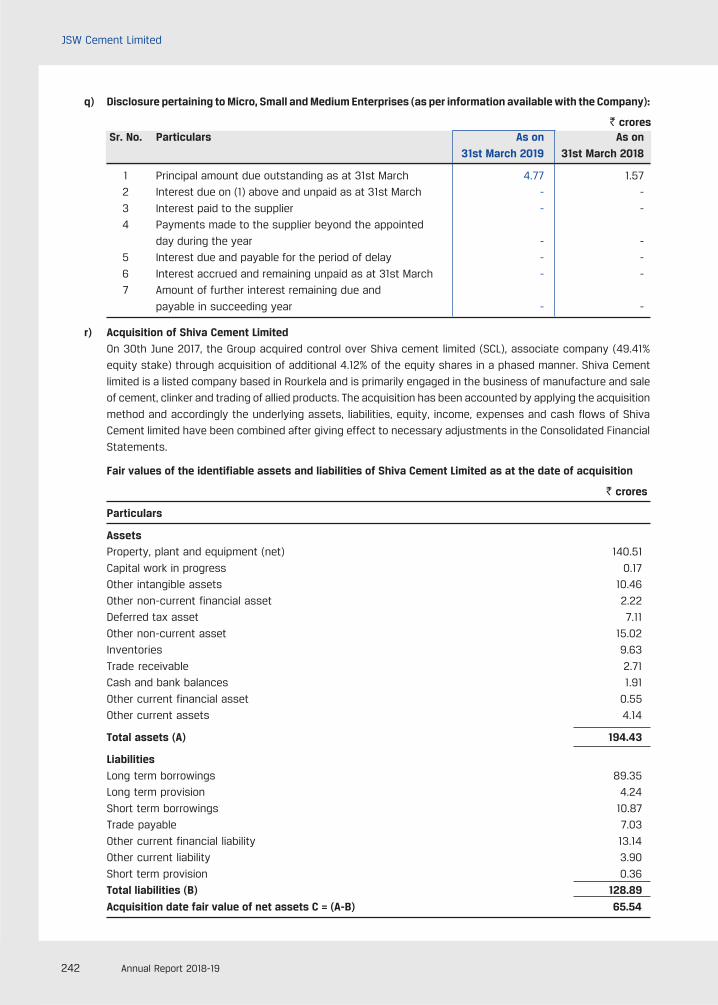
242 Annual Report 2018-19
JSW Cement Limited
q) Disclosure pertaining to Micro, Small and Medium Enterprises (as per information available with the Company):
Sr. No. Particulars As on As on
31st March 2019 31st March 2018
1 Principal amount due outstanding as at 31st March 4.77 1.57
2 Interest due on (1) above and unpaid as at 31st March - -
3 Interest paid to the supplier - -
4 Payments made to the supplier beyond the appointed
day during the year - -
5 Interest due and payable for the period of delay - -
6 Interest accrued and remaining unpaid as at 31st March - -
7 Amount of further interest remaining due and
payable in succeeding year - -
r) Acquisition of Shiva Cement Limited
On 30th June 2017, the Group acquired control over Shiva cement limited (SCL), associate company (49.41%
equity stake) through acquisition of additional 4.12% of the equity shares in a phased manner. Shiva Cement
limited is a listed company based in Rourkela and is primarily engaged in the business of manufacture and sale
of cement, clinker and trading of allied products. The acquisition has been accounted by applying the acquisition
method and accordingly the underlying assets, liabilities, equity, income, expenses and cash flows of Shiva
Cement limited have been combined after giving effect to necessary adjustments in the Consolidated Financial
Statements.
Fair values of the identifiable assets and liabilities of Shiva Cement Limited as at the date of acquisition
Particulars
AssetsProperty, plant and equipment (net) 140.51
Capital work in progress 0.17
Other intangible assets 10.46
Other non-current financial asset 2.22
Deferred tax asset 7.11
Other non-current asset 15.02
Inventories 9.63
Trade receivable 2.71
Cash and bank balances 1.91
Other current financial asset 0.55
Other current assets 4.14
Total assets (A) 194.43
Liabilities
Long term borrowings 89.35
Long term provision 4.24
Short term borrowings 10.87
Trade payable 7.03
Other current financial liability 13.14
Other current liability 3.90
Short term provision 0.36
Total liabilities (B) 128.89
Acquisition date fair value of net assets C = (A-B) 65.54
` crores
` crores
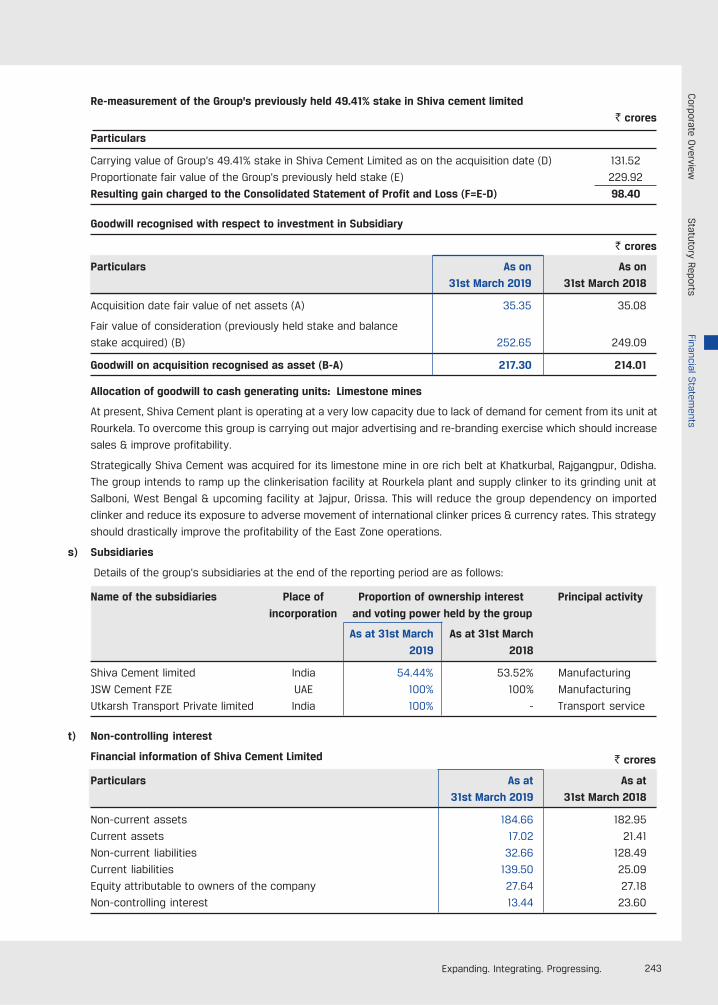
243Expanding. Integrating. Progressing.
Re-measurement of the Group's previously held 49.41% stake in Shiva cement limited
` crores
Particulars
Carrying value of Group's 49.41% stake in Shiva Cement Limited as on the acquisition date (D) 131.52
Proportionate fair value of the Group's previously held stake (E) 229.92
Resulting gain charged to the Consolidated Statement of Profit and Loss (F=E-D) 98.40
Goodwill recognised with respect to investment in Subsidiary
` crores
Particulars As on As on
31st March 2019 31st March 2018
Acquisition date fair value of net assets (A) 35.35 35.08
Fair value of consideration (previously held stake and balance
stake acquired) (B) 252.65 249.09
Goodwill on acquisition recognised as asset (B-A) 217.30 214.01
Allocation of goodwill to cash generating units: Limestone mines
At present, Shiva Cement plant is operating at a very low capacity due to lack of demand for cement from its unit at
Rourkela. To overcome this group is carrying out major advertising and re-branding exercise which should increase
sales & improve profitability.
Strategically Shiva Cement was acquired for its limestone mine in ore rich belt at Khatkurbal, Rajgangpur, Odisha.
The group intends to ramp up the clinkerisation facility at Rourkela plant and supply clinker to its grinding unit at
Salboni, West Bengal & upcoming facility at Jajpur, Orissa. This will reduce the group dependency on imported
clinker and reduce its exposure to adverse movement of international clinker prices & currency rates. This strategy
should drastically improve the profitability of the East Zone operations.
s) Subsidiaries
Details of the group's subsidiaries at the end of the reporting period are as follows:
Name of the subsidiaries Place of Proportion of ownership interest Principal activity
incorporation and voting power held by the group
As at 31st March As at 31st March
2019 2018
Shiva Cement limited India 54.44% 53.52% Manufacturing
JSW Cement FZE UAE 100% 100% Manufacturing
Utkarsh Transport Private limited India 100% - Transport service
t) Non-controlling interest
Financial information of Shiva Cement Limited
Particulars As at As at
31st March 2019 31st March 2018
Non-current assets 184.66 182.95
Current assets 17.02 21.41
Non-current liabilities 32.66 128.49
Current liabilities 139.50 25.09
Equity attributable to owners of the company 27.64 27.18
Non-controlling interest 13.44 23.60
` crores
Corporate O
verviewStatutory Reports
Financial Statem
ents
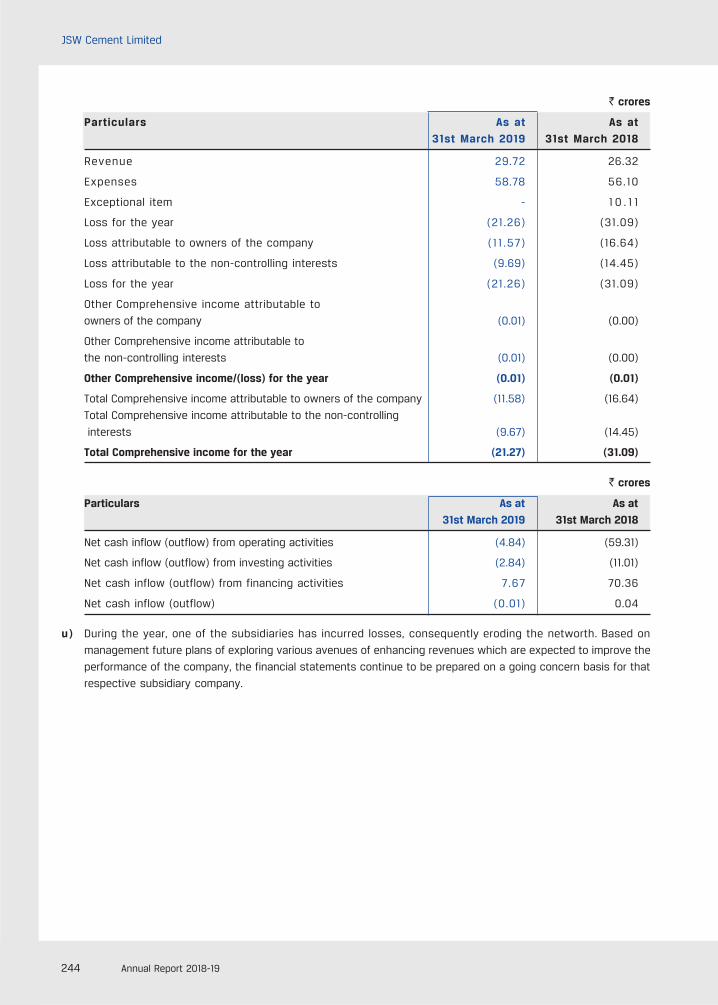
244 Annual Report 2018-19
JSW Cement Limited
` crores
Particulars As at As at
31st March 2019 31st March 2018
Revenue 29.72 26.32
Expenses 58.78 56.10
Exceptional item - 1 0 . 1 1
Loss for the year (21.26) (31.09)
Loss attributable to owners of the company (11 .57) (16.64)
Loss attributable to the non-controlling interests (9.69) (14.45)
Loss for the year (21.26) (31.09)
Other Comprehensive income attributable to
owners of the company (0.01) (0.00)
Other Comprehensive income attributable to
the non-controlling interests (0.01) (0.00)
Other Comprehensive income/(loss) for the year (0.01) (0.01)
Total Comprehensive income attributable to owners of the company (11.58) (16.64)
Total Comprehensive income attributable to the non-controlling
interests (9.67) (14.45)
Total Comprehensive income for the year (21.27) (31.09)
` crores
Particulars As at As at
31st March 2019 31st March 2018
Net cash inflow (outflow) from operating activities (4.84) (59.31)
Net cash inflow (outflow) from investing activities (2.84) (11.01)
Net cash inflow (outflow) from financing activities 7.67 70.36
Net cash inflow (outflow) (0.01) 0.04
u) During the year, one of the subsidiaries has incurred losses, consequently eroding the networth. Based on
management future plans of exploring various avenues of enhancing revenues which are expected to improve the
performance of the company, the financial statements continue to be prepared on a going concern basis for that
respective subsidiary company.
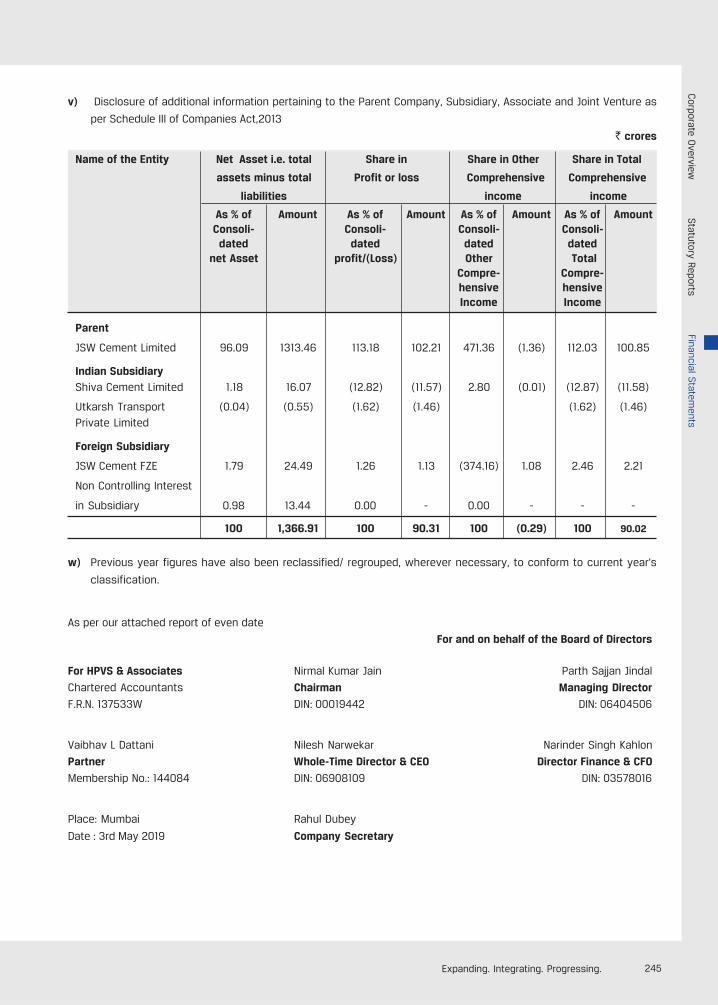
245Expanding. Integrating. Progressing.
v) Disclosure of additional information pertaining to the Parent Company, Subsidiary, Associate and Joint Venture as
per Schedule III of Companies Act,2013
` crores
Name of the Entity Net Asset i.e. total Share in Share in Other Share in Total
assets minus total Profit or loss Comprehensive Comprehensive
liabilities income income
As % of Amount As % of Amount As % of Amount As % of AmountConsoli- Consoli- Consoli- Consoli-
dated dated dated datednet Asset profit/(Loss) Other Total
Compre- Compre-hensive hensiveIncome Income
Parent
JSW Cement Limited 96.09 1313.46 113.18 102.21 471.36 (1.36) 112.03 100.85
Indian SubsidiaryShiva Cement Limited 1.18 16.07 (12.82) (11.57) 2.80 (0.01) (12.87) (11.58)
Utkarsh Transport (0.04) (0.55) (1.62) (1.46) (1.62) (1.46)Private Limited
Foreign Subsidiary
JSW Cement FZE 1.79 24.49 1.26 1.13 (374.16) 1.08 2.46 2.21
Non Controlling Interest
in Subsidiary 0.98 13.44 0.00 - 0.00 - - -
100 1,366.91 100 90.31 100 (0.29) 100 90.02
w) Previous year figures have also been reclassified/ regrouped, wherever necessary, to conform to current year's
classification.
As per our attached report of even date
For and on behalf of the Board of Directors
For HPVS & Associates Nirmal Kumar Jain Parth Sajjan Jindal
Chartered Accountants Chairman Managing Director
F.R.N. 137533W DIN: 00019442 DIN: 06404506
Vaibhav L Dattani Nilesh Narwekar Narinder Singh Kahlon
Partner Whole-Time Director & CEO Director Finance & CFO
Membership No.: 144084 DIN: 06908109 DIN: 03578016
Place: Mumbai Rahul Dubey
Date : 3rd May 2019 Company Secretary
Corporate O
verviewStatutory Reports
Financial Statem
ents
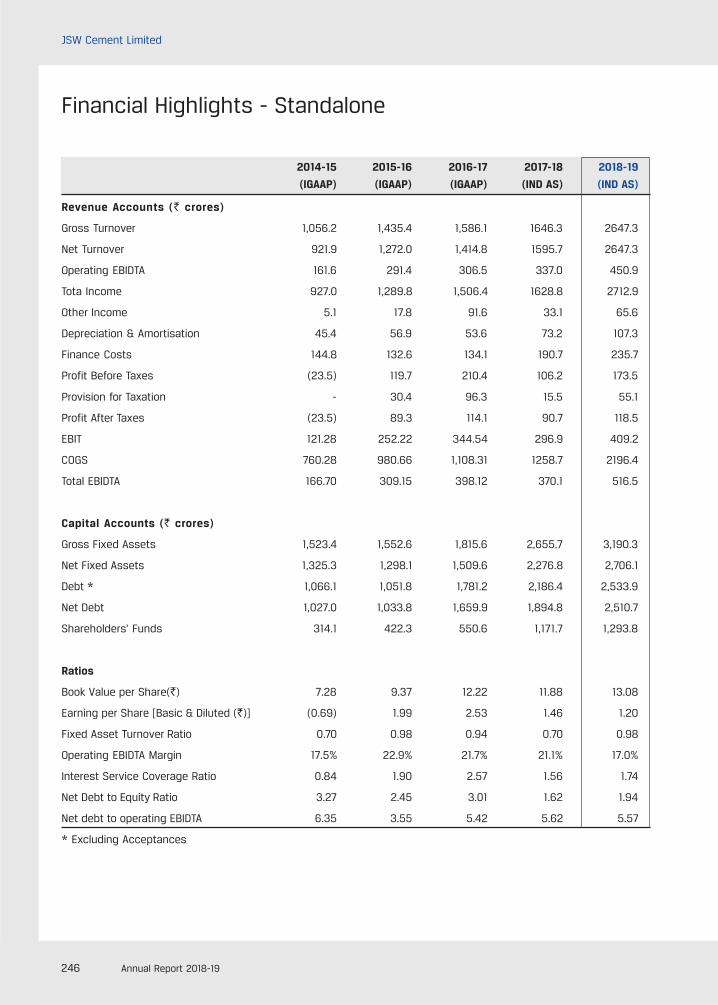
246 Annual Report 2018-19
JSW Cement Limited
Financial Highlights - Standalone
2014-15 2015-16 2016-17 2017-18 2018-19
(IGAAP) (IGAAP) (IGAAP) (IND AS) (IND AS)
Revenue Accounts (` crores)
Gross Turnover 1,056.2 1,435.4 1,586.1 1646.3 2647.3
Net Turnover 921.9 1,272.0 1,414.8 1595.7 2647.3
Operating EBIDTA 161.6 291.4 306.5 337.0 450.9
Tota Income 927.0 1,289.8 1,506.4 1628.8 2712.9
Other Income 5.1 17.8 91.6 33.1 65.6
Depreciation & Amortisation 45.4 56.9 53.6 73.2 107.3
Finance Costs 144.8 132.6 134.1 190.7 235.7
Profit Before Taxes (23.5) 119.7 210.4 106.2 173.5
Provision for Taxation - 30.4 96.3 15.5 55.1
Profit After Taxes (23.5) 89.3 114.1 90.7 118.5
EBIT 121.28 252.22 344.54 296.9 409.2
COGS 760.28 980.66 1,108.31 1258.7 2196.4
Total EBIDTA 166.70 309.15 398.12 370.1 516.5
Capital Accounts (` crores)
Gross Fixed Assets 1,523.4 1,552.6 1,815.6 2,655.7 3,190.3
Net Fixed Assets 1,325.3 1,298.1 1,509.6 2,276.8 2,706.1
Debt * 1,066.1 1,051.8 1,781.2 2,186.4 2,533.9
Net Debt 1,027.0 1,033.8 1,659.9 1,894.8 2,510.7
Shareholders' Funds 314.1 422.3 550.6 1,171.7 1,293.8
Ratios
Book Value per Share(`) 7.28 9.37 12.22 11.88 13.08
Earning per Share [Basic & Diluted (`)] (0.69) 1.99 2.53 1.46 1.20
Fixed Asset Turnover Ratio 0.70 0.98 0.94 0.70 0.98
Operating EBIDTA Margin 17.5% 22.9% 21.7% 21.1% 17.0%
Interest Service Coverage Ratio 0.84 1.90 2.57 1.56 1.74
Net Debt to Equity Ratio 3.27 2.45 3.01 1.62 1.94
Net debt to operating EBIDTA 6.35 3.55 5.42 5.62 5.57
* Excluding Acceptances
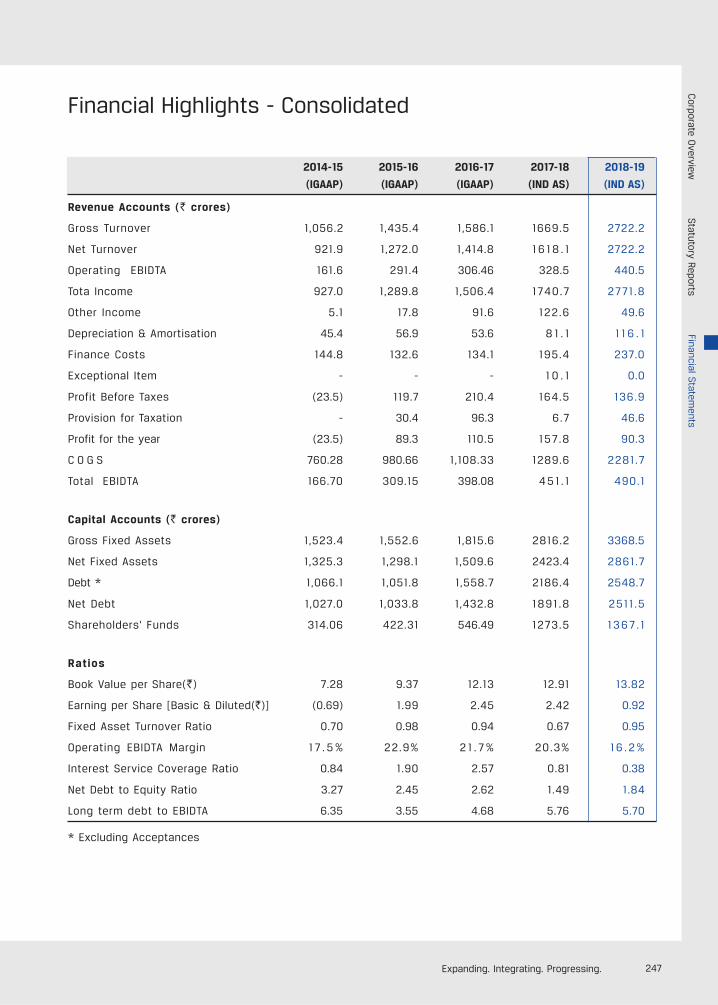
247Expanding. Integrating. Progressing.
Financial Highlights - Consolidated
2014-15 2015-16 2016-17 2017-18 2018-19
(IGAAP) (IGAAP) (IGAAP) (IND AS) (IND AS)
Revenue Accounts (` crores)
Gross Turnover 1,056.2 1,435.4 1,586.1 1669.5 2722.2
Net Turnover 921.9 1,272.0 1,414.8 1 6 1 8 . 1 2722.2
Operating EBIDTA 161.6 291.4 306.46 328.5 440.5
Tota Income 927.0 1,289.8 1,506.4 1740.7 2771 .8
Other Income 5.1 17.8 91.6 122.6 49.6
Depreciation & Amortisation 45.4 56.9 53.6 8 1 . 1 1 1 6 . 1
Finance Costs 144.8 132.6 134.1 195.4 237.0
Exceptional Item - - - 1 0 . 1 0.0
Profit Before Taxes (23.5) 119.7 210.4 164.5 136.9
Provision for Taxation - 30.4 96.3 6.7 46.6
Profit for the year (23.5) 89.3 110.5 157.8 90.3
C O G S 760.28 980.66 1,108.33 1289.6 2281.7
Total EBIDTA 166.70 309.15 398.08 4 5 1 . 1 490.1
Capital Accounts (` crores)
Gross Fixed Assets 1,523.4 1,552.6 1,815.6 2816.2 3368.5
Net Fixed Assets 1,325.3 1,298.1 1,509.6 2423.4 2861.7
Debt * 1,066.1 1,051.8 1,558.7 2186.4 2548.7
Net Debt 1,027.0 1,033.8 1,432.8 1891 .8 2511 .5
Shareholders' Funds 314.06 422.31 546.49 1273.5 1 3 6 7 . 1
Ratios
Book Value per Share(`) 7.28 9.37 12.13 12.91 13.82
Earning per Share [Basic & Diluted(`)] (0.69) 1.99 2.45 2.42 0.92
Fixed Asset Turnover Ratio 0.70 0.98 0.94 0.67 0.95
Operating EBIDTA Margin 1 7 . 5 % 22.9% 2 1 . 7 % 20.3% 1 6 . 2 %
Interest Service Coverage Ratio 0.84 1.90 2.57 0.81 0.38
Net Debt to Equity Ratio 3.27 2.45 2.62 1.49 1.84
Long term debt to EBIDTA 6.35 3.55 4.68 5.76 5.70
* Excluding Acceptances
Corporate O
verviewStatutory Reports
Financial Statem
ents
If undelivered, please return to:
JSW Cement LimtedJSW Centre,Bandra-Kurla Complex,Bandra (E), Mumbai - 400 051
Tel: 022 4286 1000Fax: 022 4826 3000
CIN: U26957MH2006PLC160839
www.jsw.inwww.jswcement.in
Related Documents