EXPANDING HORIZONS ANNUAL REPORT 2009-10

Welcome message from author
This document is posted to help you gain knowledge. Please leave a comment to let me know what you think about it! Share it to your friends and learn new things together.
Transcript

EXPANDINGHORIZONS
ANNUAL REPORT 2009-10

Safe Harbour Statement
This report contains forward-looking statements, which may be
identified by their use of words like ‘plans’, ‘expects’, ‘will’, ‘anticipates’,
‘believes’, ‘intends’, ‘projects’, ‘estimates’, or other words of similiar
meaning. All statements that address expectations or projections
about the future, including but not limited to statements about
Company’s future growth drivers, product development, market
position and expenditures are forward looking statements. Forward-
looking statements are based on certain assumptions and expectations
for future events. The company may not guarantee that these
assumptions and expectations are accurate and will be realised. The
Company’s actual results, performance or achievements could thus
differ materially from those projeted in any forward-looking statments.
The company assumes no responsibility to publicly amend, modify,
revise any forward-looking statements, on the basis of any subsequent
developments, information and events.
Contents- 1
- 4- 6
- 8- 10
- 12- 14
- 16- 17
- 51- 53
- 65- 79
- 82
- 121- 122
Corporate Information Know Panacea Biotec Our Values, Vision & Mission Chairman’s Message Managing Director’s Message Our Nucleus of Strengths Milestones Setting the Scene
Management Discussion & Analysis Financial Highlights
Director’s Report Corporate Governance Report Auditors’ Report Financial Statements Auditors’ Report on Consolidated
Financial Statements Consolidated Financial Statements

1
Panacea Biotec|Annual Report 2009-10
Corporate Information
Board of Directors
Promoter-Directors
Mr. Soshil Kumar JainChairman
Mr. Ravinder JainManaging Director
Dr. Rajesh JainJoint Managing Director
Mr. Sandeep JainJoint Managing Director
Mr. Sumit JainDirector - Operations & Projects
Independent Directors
Mr. R.L. Narasimhan
Mr. N.N. Khamitkar
Mr. Sunil Kapoor
Mr. Gurmeet Singh
Mr. K.M. Lal
Dr. A.N. Saksena
G.M. Legal & Company Secretary
Mr. Vinod Goel
Registered Office
Ambala-Chandigarh Highway
Lalru – 140 501, Punjab, India
Corporate Offices
B-1 Extn./G-3, Mohan Co-operative Indl. Estate
Mathura Road, New Delhi – 110 044, India
B-1 Extn./A-27, Mohan Co-operative Indl. Estate
Mathura Road, New Delhi – 110 044, India
Works
Ambala-Chandigarh Highway
Lalru – 140 501, Punjab, India
Malpur, Baddi, Dist. Solan
Himachal Pradesh – 173 205, India
B-1/E-12, Mohan Co-operative Indl. Estate
Mathura Road, New Delhi – 110 044, India
A-241/242, Okhla Indl. Area, Phase – I
New Delhi – 110 020, India
R & D Centers
Ambala-Chandigarh Highway
Lalru – 140 501, Punjab, India
B-1/E-12, Mohan Co-operative Indl. Estate
Mathura Road, New Delhi – 110 044, India
A-224, Okhla Indl. Area, Phase – I
New Delhi – 110 020, India
Plot No. E-4, Phase II, Indl. Area
Mohali – 160 055, Punjab, India
Plot No. 72/3, Gen Block, T.T.C. Indl.
Area Mahape, Navi Mumbai – 400 710, India
Sales & Marketing Office
701, Sagar Tech Plaza, ‘A’Wing, Saki Naka,
Andheri (East), Mumbai – 400 072, India
Statutory Auditors
M/s. S.R. Batliboi & Co.
Chartered Accountants, Gurgaon, India
Cost Auditors
M/s. J.P. Gupta & Associates
Cost Accountants, New Delhi, India
Registrar & Transfer Agents
M/s. Skyline Financial Services Pvt. Ltd.
D-153 A, Ist Floor, Okhla Indl. Area, Phase-I,
New Delhi - 110020
Banks
Axis Bank Ltd.
Bank of India
IDBI Bank Ltd.
Indian Overseas Bank
State Bank of India
State Bank of Mysore
State Bank of Travancore
Union Bank of India
Website
www.panaceabiotec.com

2
“We have always held to the hope, thebelief, the conviction that there is abetter life, a better world, beyond thehorizon.” --Franklin D. Roosevelt

3
Panacea Biotec|Annual Report 2009-10
That is the world that Panacea Biotec iscontinuously aiming for.
A world where affordable healthcare is not a distant
dream but an achievable goal
Where human life is nurtured in a spirit of complete
care for the individual and the environment
Where distinctive innovation collaborates with
excellence in execution for a growing portfolio
of quality products & services
At Panacea Biotec, we are constantly striving to
reach that world by expanding our horizons:
Across the widest possible portfolio of our brands
& services
Beyond the furthest boundaries within our reach
Extending to newer and bigger markets every day
And touching human lives in the remotest corners of
the globe
On the back of our robust strengths and our
ever-growing basket of innovations, driven by the
pioneering & dedicated efforts of our people, and
steered by our unique brand of quality & credibility,
we are relentlessly expanding our horizons to reach
out to that new & better world.

4
Innovative product portfolio
The Company has a large bouquet of brands that includes
highly innovative prescription products in important
therapeutic areas such as pain management, diabetes
management, cardiovascular disease managment, organ
transplantation, renal-disease management, oncology, anti-
osteoporosis, gastro-intestinal care products and vaccines. The
Company has 26 product patents in more than 60 countries
worldwide.
Global footprints
Backed by strong collaborations and tie-ups with leading
national and international research organizations and
corporations, the Company has extensive global footprints
spanning more than 55 countries.
Quality hallmark
Quality lies at the core of the Company’s business processes and
systems and its state-of-the-art manufacturing facilities for
vaccines and pharmaceutical formulations comply with
international regulatory standards like WHO cGMP, US FDA,
UK MHRA, TGA Australia and SA MCC.
With five dedicated research and development centers, and an
employee base of around 3,300 including around 300 scientists,
the Company stands at the forefront of delivering innovative
healthcare solutions aimed at fulfilling unmet medical needs of
the people.
Know Panacea BiotecPanacea Biotec occupies a distinct position in the Indian pharmaceutical and biotechnology industry with its business model focusing
on innovation, collaboration and brand building. The Company has endeavoured to provide research based products to fulfill unmet
medical needs. The Company has established infrastructure and capabilities in R&D, manufacturing and marketing of vaccines,
pharmaceuticals and biopharmaceuticals. Panacea Biotec occupies the position of the 2nd largest vaccine producer in India and has
been ranked as the 3rd largest biotechnology Company (ABLE Survey 2010). Based on the finished pharmaceutical formulations
business, the Company is placed at 49th rank amongst pharmaceutical companies in India (ORG IMS MAT March 2010).
GRAND R&D Center at Navi Mumbai

5

6
OurValues
IInntteeggrriittyyHonesty
Ethical practices
Transparent and clear communication
Always learning & improving
PPiioonneeeerrStriving for leadership in every
activity and to become the guiding
star
Having a vision of the future and
succeed in reaching there before
anyone else
Persevere in owning innovation and
be the first mover in the market
Empowering people to speed up the
organization growth
Always embracing new technology
and processes
Confidence to stand apart from
competitive organizations
IInnnnoovvaattiioonnA process which transforms business
ideas to marketable products
Bringing together different functions
of the organization like marketing,
finance, R&D, manufacturing to meet
a common goal
A `way of life’ in every activity, from
administration to innovation
To challenge every process & solution
to discover ways to make them better
Intolerance towards stability,
encouraging continuous change
Thinking about the impossible and
discovering ways to
execute it
Deep rooted and sustainable change
and superficial efforts
Mission : Innovation in support of life

7
HHuummaanneeHumility to respect all individuals
Care for individuals and environment
Placing betterment of people (external
and internal) at the core of each activity
Core of new developments
Vision : Leading Health Management Company
Goal : To meet every healthcare need with a Panacea Biotec brand and service
Objective : Take ideas from Grey Cell to Market in a Proactive Manner

8
Chairman’s Message
Dear friendsBeyond every horizon is a rainbow, in the colours of which lie
the hopes of those millions of people around the world who are
constantly striving to improve their lives. As I speak to you today,
it is my endeavour to try and capture those myriad hues that
brighten lives from beyond the expanding horizons of your
Company.
It was for all of us, at Panacea Biotec, an year of expansion across
every aspect of our business. It was an year when our vision to
become the largest and most admired health management
company, leading the industry in developing brands and
vaccines that preserve and improve human life across the globe,
scaled new heights of achievement, as manifested by our
expanding numbers and our exemplary performance.
Exemplary performance
It gives me immense pride to report excellent numbers for the
year gone by, with your Company leaving the tough times
behind to be back on the growth track. Consolidation and
optimization of product mix and increased thrust on overseas
market saw revenues go up during the financial year under
review.
The company’s net turnover, with a growth of 14%, stood at
Rs. 8,844 million for the year ended 31st March 2010, up from
Rs. 7,734 million for the previous year. This was a clear reflection
of the success of your Company’s growth strategy during the
year gone by.
In another endorsement of its exemplary performance, your
Company went on to report substantial growth in its PBT at
Rs. 1,181 million, significantly up from a negative PBT of Rs. 924
million during FY09.
This growth is very much in line with our expectations, and a
true reflection of the dedication and commitment of each
member of the Panacea Biotec family to perform well at all
times and to chart a firm course to future success.
Expanding horizons
Committed to remain globally and regionally attractive to
customers and investors, we saw the Company expand its
horizons across every aspect of its business – from innovations
to products, from customers to markets, from manufacturing to
regulatory approvals – during the fiscal under review.
During the year, your Company firmly entrenched in the roots of
our historical success in developing products, projects and
exploring new opportunities - on which we have developed the

9
Panacea Biotec|Annual Report 2009-10
foundation for our future. Further nurturing these roots, your
Company continued to innovate new brands and products to
expand its portfolio of offerings, even as it engaged itself in the
growth of the existing brands.
The development of the indigenously produced PandyfluTM
vaccine against H1N1 (Swine flu) virus marked a milestone in the
brand expansion programme of your Company, which has
always seen vaccine development and production as one of its
greatest strengths and a manifestation of its innovation
prowess.
What makes this achievement even more noteworthy is that it
reflects the ability of the Company and its scientists to respond
effectively and efficiently to a global emergency of such an
unparalleled scale.
Another remarkable achievement, which has considerably
augmented our presence in the global markets, is the approval
received from US Food and Drug Administration (USFDA) for our
state-of-the-art Pharmaceutical Formulation facility at Baddi in
Himachal Pradesh.
This approval, coupled with the recent approvals from
regulatory agencies of Germany and Australia, is in line with the
Company’s strategic plan to expand formulation business to ICH
markets. It gives me pleasure, indeed, to inform you that we
expect to launch products in US soon through our distribution
partner.
Conclusion
The expansion, as you can gauge, is across the board and a clear
vindication of our commitment to take the Company to the next
level in its growth trajectory. We have already laid the platform
for this growth through enhancement of operational efficiencies
and focus on prudent financial management, which has enabled
us to reduce forex-related losses substantially.
However, I am well aware that none of these would have been
possible without the unwavering commitment and hard work of
every member and employee of Panacea Biotec, as also the
encouragement and support of all our partners and associates. I
am confident that this support and commitment shall continue
to steer the Company as it transcends into new horizons in its
onward journey.
Thank you
Soshil Kumar Jain
“The Company’s net turnover, with agrowth of 14%, stood at Rs. 8,844million for the year ended 31st March2010, up from Rs. 7,734 million forthe previous year. ”

10
Managing Director’s Message
Not long ago, we saw a dream, a vision to be known as a truly
global organization. The year under review laid the foundation
for the translation of that vision into a realizable goal.
On the back of strong financial performance, an expanding
customer network, innovative developments of far-reaching
impact and growing technological prowess, your Company
expanded its global footprints during the year to reach out to
new horizons.
While the development of PandyfluTM to tackle Swine flu
reflected our commitment to dedicated service to the people at
large, the Award Notification from UNICEF for supply of EasyFive
(pentavalent vaccine) for 2010, 2011 and 2012 marked a giant
leap in our efforts to save precious lives of millions of children in
the developing world. For us, these two developments proved
to be a successful test of our technological, managerial,
operative and administrative competency that went beyond
commercial aspects into the realm of global corporate social
responsibility.
The speed with which your Company responded to the global
emergency situation triggered by the widespread outbreak of
Swine flu was a clear reflection of our supply chain management
competencies and the robust R&D capabilities which constitute
the nucleus of Panacea Biotec’s growth.
Innovation, in fact, is one of the key growth drivers which, we
expect, will have a significant impact on our overall
performance in the coming years. I am confident that, going
ahead, we shall be able to further capitalize our strengths in
R&D to establish a firm foothold in various immunization and
other healthcare programmes across the globe, thereby
leveraging our execution capabilities to improve our operational
and financial performance year after year.
Going ahead, our aim is to continue to invest funds and
efficiencies in an increasing number of healthcare and vaccine
products to fulfill the unmet healthcare needs of the masses
around the world, and thus successfully take forward our efforts
to build the world’s leading health management company.
The future, as I see from here, is one of expanding horizons for
the Company, and for each of its members, employees, partners
and stakeholders. Together, we have come this far. And together,
we shall scale the next level of growth and expansion.
Thank you
Ravinder Jain
“The future, as I see fromhere, is one of expandinghorizons for the Company,and for each of its members,employees, partners andstakeholders.”

11
Panacea Biotec|Annual Report 2009-10

12
Our Nucleus of Strengths

13
Panacea Biotec|Annual Report 2009-10
ExtensiveLogisticsNetwork
EstablishedR&D
Capabilities
InnovativeBrandPortfolio
GlobalPresence
SkilledManpower
ManagementBandwidth
State-of-the-art
ManufacturingFacilities
Long-standingPartnerships/JVs/Alliances
WHOPre-
qualificationof Vaccines

14
This is How we Have expanded OurHorizons…
1988Established a plant for
vaccines production at New
Delhi, under the name of
Radicura Pharma.
1989Established
Pharmaceutical formulations
plant at New Delhi, under the
name of Panacea Drugs
(P) Ltd.
1993Merger of Panacea
Drugs (P) Ltd. & Radicura
Pharma to form Panacea
Biotec Ltd.
1995IPO of Equity Shares
of Rs.180 Million
Set-up State-of-the-art Drug
Delivery R&D centre at Lalru,
Punjab.
1997First Product Patent
in several countries.
2002Commissioned
Recombinant Vaccine
Production facility at
Lalru, Punjab.
2001In-licensing Agreement with
Biotechnology Consortium of India
for Development &
Commercialization of Anthrax
Vaccine.
R&D tie up with European
MNC.
2003WHO pre-
qualification for
trivalent OPV.
2004In-licensing agreement with
National Institute of Immunology,
New Delhi, for Japanese Encephalitis
Candidate Vaccine.
Marketing Joint Venture with
Chiron (now Novartis) Vaccines,
UK.
1984Panacea Drugs (P) Ltd.
was formed.

15
Panacea Biotec|Annual Report 2009-10
2006International offering by way issue of
FCCBs of USD 100 million.
Commissioned cGMP compliant Pharmaceutical
Formulation facility at Baddi.
Inauguration of Drug Discovery Center at Mohali.
Inauguration of Biopharmaceutical R&D Centre at New Delhi.
WHO pre-qualification for Enivac HB Vaccine.
Landmark collaboration with The Nederlands Vaccin Instituut
(NVI) for manufacture & marketing of finished IPV and IPV based
combination vaccines in India and across the globe.
Collaboration with PT Bio Farma to manufacture & market
Measles Vaccine.
In-licensing Agreement with National Institutes
of Health, USA for Dengue Vaccine.
2009WHO pre-qualification for
mOPV Type 1, bOPV Type 1 & Type 3.
Received award worth US$ 222 million
from UNICEF for supply of Easyfive Vaccine.
Received cGMP certification for
Pharmaceutical Formulation facility at
Baddi from German Regulatory
Authority.
2008Inauguration of GRAND R&D
Center at Navi Mumbai
WHO pre-qualification for fully liquid
innovative combination Pentavalent
Vaccine Easyfive.
Received award from UNICEF for supplying
Easyfive vaccine for the first time worth US$ 34.20
million to UNICEF in years 2008 & 2009.
Got US Patent for ThankGodTM, a product
for effective management of
hemorrhoids & piles.
2010Received cGMP certification for
Pharmaceutical Formulation facility at Baddi
from US FDA, TGA Australia.
Launch of bivalent OPV.
Strategic Alliances for marketing & distribution of
products in U.S., Australia and New Zealand.
Commissioned state-of-the-art manufacturing facility
for Pandemic flu (H1N1)and cell culture based vaccines.
Received financial assistance of Rs.100 million from
DBT for development of Influenza A (H1N1) vaccines.
Received Grant from DSIR for development
& demonstration of technology for a
NCE.
2005In-licensing agreement
with National Institutes of
Health, USA for Hair
Growth Hormone.
2007WHO pre-qualification for
Ecovac4 and Easyfour Vaccines.
Commissioned State-of-the-art
Vaccine Formulation Plant at Baddi.
Research Agreement with Punjab
University to develop New
Chemical Entities for
Psychiatric Disorders.

16
Setting the ScenePanacea Biotec is India’s 2nd largest Vaccine producer.
Panacea Biotec is India’s 3rd largest Biotechnology
Company.*
Panacea Biotec is ranked 49th amongst Pharmaceutical
Companies in India.**
Panacea Biotec is the first company to develop and launch
the innovative fully liquid pentavalent combination vaccine
Easyfive globally.
Panacea Biotec is the first company to develop bivalent Oral
Polio Vaccine globally.
The Company’s Oral Polio (tOPV, mOPV & bOPV), Enivac HB
(Recombinant Hepatitis B), Ecovac 4 (DTwP-Hep B), Easyfour
(DTwP-Hib) and Easyfive (DTwP-Hep B-Hib) Vaccines are pre-
qualified by World Health Organisation (WHO).
The Company’s Pharmaceutical Formulation facility at Baddi
is certified as cGMP compliant by various regulatory
authorities including US FDA, German Regulatory Authority,
TGA Australia and ANVISA Brazil.
The Company has played a key role in polio eradication
program by supplying more than 7 billion doses of Oral Polio
Vaccine to Govt. of India and UNICEF.
The Company’s Products reach more than 55 countries
globally. Organ transplantation products are at an
advanced stage of registration in U.S. and Europe.
The Company has 26 product patents valid in more than 60
countries world wide.
Panacea Biotec has over 1,300 patent applications filed, 380
either granted or accepted for grant globally.
Established Brand Equity in niche therapeutic areas like Pain
Management, Diabetes Management, Cardiovascular Disease
Management, Organ Transplant, Renal Disease Management,
Oncology and Pediatric Immunization.
Over the years, continued contribution made by the
Company has enabled millions of patients enjoy happy and
healthy life through our well established brands and services.
The Company has made a significant contribution to
Shareholders’ value.
Research & Development activities is core focus with around
9% of net turnover invested during fiscal 2010.
Panacea Biotec has around 300 scientists working in 5 state-
of-the art R&D Centers.
Panacea Biotec is a family of around 3,300 people working
relentlessly in improving quality of life of billions of people
across the globe.
* (Able Survey 2010) **(ORG IMS MAT March’10).
LAKSH Drug Discovery Center at Mohali

17
Panacea Biotec|Annual Report 2009-10
ManagementDiscussionand Analysis
Industry Structure & Developments
Global Vaccine Industry
Vaccines are important preventive medicines for primary
health care and are a critical component of a nation's health
security. The Vaccines have emerged as one of the most
lucrative segment in the global pharmaceutical industry. The
global market for vaccines is expected to grow at a
Compounded Annual Growth Rate (CAGR) of more than 13%
in the next five years and is expected to reach USD 36 bn by
2013, as per various industry estimates. The vaccine industry
will emerge as the fastest growing prophylactic/therapeutic
area. While U.S. and Europe represent the two largest vaccine
markets and will continue to experience healthy growth in
future, at the same time developing markets with over 124
million birth cohort will become key growth drivers.

18
Presently, Pediatric vaccines dominate the global vaccines
market and growth in this segment is expected to continue in
future. At the same time, the share of adult and therapeutic
vaccines is likely to increase and will continue to fuel the future
growth in the global vaccines market. Successful development
of vaccines against infectious diseases like Pandemic Flu,
Pneumonia, Dengue, HIV, rotavirus and cervical cancer in
addition to the Hexavalent pediatric combination vaccines
would add to the growth of the vaccine industry.
Immunization is a cornerstone of public health programs and
serves as a platform for other interventions. These programs
have been sustained for decades, even through war and conflict.
In one of the greatest successes in public health history,
smallpox was eradicated by immunization campaigns in 1979,
and polio eradication is now within reach.
Each year approximately 25 million infants do not receive the
necessary immunizations, and at least 2.4 million children die
from vaccine-preventable diseases — approximately 14 % of
deaths in children under 5 years of age. 14 millions survive, but
are left severely impaired. The long-term effects of these
childhood illnesses limit the ability of those who survive to
become educated, to work, or to care for themselves or others.
The WHO and The United Nations Children's Fund (UNICEF) have
taken a number of measures to boost the awareness and access
to vaccines in their efforts to meet the challenges in global
immunization. One such program launched in 2005 is the Global
Immunization Vision and Strategy (GIVS). In brief, GIVS aims to
assist countries to immunize more people, from infants to seniors,
with a greater range of vaccines. GIVS is the first ever global ten-
year framework to fight vaccine-preventable diseases through
immunization and covers the period 2006 to 2015.
Indian Vaccine Market
India represents one of the fastest growing vaccine markets in
the world. India is among the major buyers and manufacturers
of vaccines, locally as well as globally, and has traditionally
aimed at self-reliance in vaccine technologies and production.
The Indian Vaccine market is currently at the centre of attraction
for all leading pharmaceutical majors. Now, the vaccine market
is registering growth rates much faster than the conventional
pharma market. As many blockbuster vaccines are going to hit
the market in near future, the growth is expected at a much
faster pace. Though market analysis has identified pediatric
vaccines as the largest constituent of the vaccines segment, the
future holds promise for adult, therapeutic, influenza and cancer
vaccine segments as well.
Presently, domestic companies dominate the vaccines market
The Indian Vaccine market is currentlyat the centre of attraction for all leadingpharmaceutical majors. Now, thevaccine market is registering growthrates much faster than the conventionalpharma market.
covering around seven out of top 10 players. But with India’s
Intellectual Property Rights (IPR) laws improving considerably
and healthcare expenditure increasing, foreign companies have
now begun to acknowledge India’s potential as a vaccine hub.
Taking into consideration the factors like increasing public and
private healthcare spending, birth of around 24 million babies
each year and a large prevalence of both infectious and chronic
diseases, the domestic demand for vaccines in India will
continue to grow at a significant rate, offering vaccine players
enough opportunities to expand their horizon in the country.
Along with the improvements in the domestic market, India has
also emerged as a centre for exports. Exports presently account
for more than 50% of the country’s vaccine market and with
growing investment by both domestic and international players,
India is expected to fulfill the vaccine demand of both
developing and developed countries.
Polio Eradication in India
The goal of Global Polio Eradication Initiative (GPEI) is to ensure
that no child will ever again know the crippling effects of polio.
There is no cure for polio, but the disease can be prevented by
immunization with polio vaccine.
Alarmed that polio remained entrenched in the four countries
that had never stopped transmission, and that an increasing
number of polio-free areas were becoming re-infected, in May
2008 the World Health Assembly (WHA) called for a new
strategy to complete polio eradication.
The new Global Polio Eradication Initiative - `GPEI Strategic Plan
2010-2012’ builds on the special 2009 Programme of Work and
incorporates the myriad lessons learnt since the GPEI began.
The multi-year planning process of the Global Polio Eradication
Initiative (GPEI) was subsequently replaced with a one-year 2009
Programme of Work which examined the major barriers to
interrupting Wild Polio Virus (WPV) transmission in each of the
remaining endemic areas (through an Independent Evaluation);
fast-tracked the development and clinical trials of four new
vaccines or vaccine approaches; and assessed new approaches
to reach children previously missed by vaccination efforts due to

19
Panacea Biotec|Annual Report 2009-10
weak operations management, insecurity or other factors.
Though the number of Polio cases in India have reduced
significantly from 1,934 in 1998 to 741 in 2009 and 25 till June,
2010 (source: www.npspindia.org), as per WHO guidelines, a
WHO region can be certified polio free only if it does not record
any case of polio during three consecutive years; following the
year; in which zero case is registered first time. Assuming that
India achieves zero case for the first time in 2011 and thereafter,
if it does not record any case of polio in 2012, 2013 and 2014,
India can achieve its target of becoming polio free and become
eligible for being declared as a polio free nation by WHO.
However, immunization activities will continue until the entire
region (including Pakistan & Afghanistan) becomes polio free.
Immunization against Polio to Continue: In developing
countries, low effectivness of Oral Polio Vaccine (OPV) in the
highest-risk communities (believed to be caused by a
combination of high incidence of diarrheal diseases,
malnutrition and the high force of Wild Polio Virus infection
attributed to crowding) has been identified as the key challenge
to interrupting Wild Polio Virus transmission. Responses being
explored include enhanced inactivated poliovirus vaccine (eIPV)
as a supplement to Oral Polio Vaccine (tOPV, mOPV1 & mOPV3)
and development of a bivalent OPV (bOPV) containing both
type 1 and type 3 virus. The immunization against polio will
continue in the post polio eradication era.
Global Pharmaceutical Market
As per IMS, the global market for pharmaceuticals is expected to
grow nearly USD 300 bn over the next five years, reaching USD
1.1 trillion in 2014. The 5-8% Compound Annual Growth Rate
(CAGR) during this period reflects the impact of leading
products losing patent protection in developed markets, as well
as strong overall growth in the world’s emerging countries.
Global pharmaceutical sales growth of 4-6% is expected in 2010.
In 2009, the market grew 7% to USD 837 bn, compared with a
4.8% growth rate in 2008.
Patient demand for pharmaceuticals is expected to remain
robust, despite the ongoing effects of the economic downturn
being felt in many parts of the world. In developed markets with
publicly funded healthcare plans, pressure by payers to curb
drug spending growth will only intensify, but that will be more
than offset by the ongoing rapid expansion of demand in the
emerging markets. Net growth over the next five years is

20
expected to be strong - even as the industry faces the peak
years of patent expiries for innovative drugs introduced 10-15
years ago and subsequent entry of lower-cost generic
alternatives.
As the pharmaceutical industry’s research & development
programs adjust to the broad availability of low-cost generic
options in many chronic therapy areas, higher growth will occur
in those therapy areas where there is significant unmet clinical
need, high-cost burden of disease, and innovative science that
can bring new treatment options to patients. In the areas of
oncology, diabetes, multiple sclerosis and HIV, annual growth is
Total Unaudited and Audited Global Pharmaceutical Market By Region
2009 2008 2004-2009 2010 2009-2014
Mkt Size Mkt Size % Growth % Growth CAGR % Forecast CAGR %*USD bn **Const. **Const. **Const **Const % Growth **Const
USD USD USD USD **Const USDUSD
Total global market 808.3 837.3 7.0% 5.5% 6.7% 4-6% 5-8%
North America 322.1 323.8 5.5% 1.9% 5.2% 3-5% 3-6%
Europe 247.6 263.9 4.8% 7.0% 6.6% 3-5% 3-6%
Asia/Africa/ Australia 102.6 106.6 15.9% 15.0% 13.9% 13-15% 12-15%
Japan 90.3 95.0 7.6% 2.1% 3.9% 0-2% 2-5%
Latin America 45.8 47.9 10.6% 12.7% 10.9% 10-12% 12-15%
(Source: IMS Health Market Prognosis, March 2010)
* USD uses actual quarterly exchange rates
** Constant USD uses Q409 average exchange rates
Notes: All forecasts are from IMS Market Prognosis International 2010-2014 which provides a view of the audited andunaudited market, using audited sales and adjusting for unaudited sales. The forecasts are based on the March 2010Market Prognosis release. Includes IMS Audited and Unaudited markets.
expected to exceed 10% through 2014 as new drugs are
brought to market, patient access is expanded and funding is
redirected from other areas where lower-cost generics will be
available.
Geographic balance of the pharmaceutical market continues
to shift towards emerging countries. Emerging markets are
expected to grow at a 14-17% pace through 2014, while major
developed markets will grow 3-6%. As a result, the aggregate
growth through 2014 from emerging markets will be similar
to the growth experienced in developed markets - about USD
120-140 bn. This compares to aggregate growth over the past
five years of USD 69 bn in emerging markets and
USD 126 bn in developed markets. The U.S. will remain the
single largest market, with 3-6% growth expected annually in
the next five years and reaching USD 360-390 bn in 2014,
up from USD 300 bn in 2009.

21
Panacea Biotec|Annual Report 2009-10
The pharma market world over will experience significant shifts.
Asia-Pacific region will emerge as the fastest growing
pharmaceutical market over the recent past. Here, the
pharmaceutical industry is expected to grow at a CAGR of
around 12.6% during 2010-2012. It can, in fact, become the
global API production hub in next few years.
Pharmaceutical sales are growing at a fast rate in India, China,
Malaysia, South Korea and Indonesia due to the rising
disposable income, several health insurance schemes, fast-
growing medical tourism and intense competition among top
pharmaceutical companies in the region that has boosted the
availability of low cost drugs.
As a result of the pharmaceutical industry’s increased focus on
these high-growth markets, the developing countries are
benefiting from greater government spending on healthcare
and broader public and private healthcare funding - which is
driving greater access to, and demand for, innovative medicines.
The pharmaceutical industry has, in the recent past, seen a
trend of alliances and deals between innovators and generic
companies creating a collaborative business model. The generic
partner gets access to rich product pipeline under development
& the research capabilities of the innovator while the innovator
benefits from lower R&D costs and makes a faster entry into
emerging markets through the generic partner, hence realizing
higher gains from existing portfolio. With competitive
advantages in terms of R&D, manufacturing and marketing,
Indian companies are today in a strong position to partner with
innovator pharmaceutical companies.
Indian Pharmaceutical Market
The pharmaceutical industry in India is among the most highly
organized sectors and is one of the fastest growing and the
safest sectors in Indian economy. This industry plays an
important role in promoting and sustaining development in the
field of global medicine. Due to the presence of low cost
manufacturing facilities, educated and skilled manpower and
cheap labour force, the industry is set to scale new heights in
the fields of production, development, manufacturing and
research.
The Indian Pharmaceutical Market (IPM) is the third largest in
world in terms of volume and ranks 14th in terms of value at
over Rs.1.0 trillion and by 2015, it is slated to be amongst the
top 10 overtaking Brazil, Mexico, South Korea and Turkey. The
incremental 14 bn USD which it is expected to add, will be the
third largest, next only to US (200 bn USD) and China (23 bn
The pharma market world over willexperience significant shifts. Asia-Pacific region will emerge as the fastestgrowing pharmaceutical market overthe recent past.

22
USD). The Indian Pharma market is slated to be a high growth
market growing at 14-18% every year for the next 10 years. The
market is expected to grow from 6.3 bn USD in 2005 to 20 bn
USD in 2015 which implies CAGR of around 12.3%.
One of the major factor contributing the growth of Indian
Pharma market is the increasing prevalence of the chronic
diseases. The prevalence of Diabetes will rise from 2.8% in 2005
to 3.7% in 2015; Coronary Heart Disease from 3.3 to 4.9%; and
Obesity from 1.3 to 2.7%. The population with Hypertension is
expected to grow by another 50 mio cases over the next
decade.
IPM Performance in last 5 years
The growth of the Indian pharmaceutical industry has been
fuelled by exports. Exports of pharmaceuticals have consistently
outstripped imports. India exports drug, intermediaries, active
pharmaceutical ingredients, finished dosage formulations, bio-
pharmaceuticals and clinical services. The top five destinations for
such exports are U.S., Germany, Russia, U.K. and China. Several
units are approved by regulatory authorities in U.S. and U.K.
Industry Structure
The Indian Pharmaceutical sector is highly fragmented with
more than 20,000 registered units, severe price competition and
government price control. The leading 250 pharmaceutical
companies control around 70% of the market with market
leader holding nearly 7% of the market share. The
pharmaceutical industry in India meets around 70% of the
country’s demand for bulk drugs, drug intermediates and
pharmaceutical formulations. Today over 90% of medicine
consumed in India is produced domestically.
Growth Drivers
Growing population: India is the world’s second most
populous country and by 2050, the population is projected
to reach 1.6 bn.
Rising disposable income: Per capita disposable income
will rise from 463 USD in 2005 to 765 USD in 2015.
Growing middle class: India’s thriving economy is creating
an expanding middle class which has more disposable
income to spend on healthcare. Middle income category will
experience, the steepest rise with an additional 59 million
households.
Increasing healthcare infrastructure: Driven largely
through private investments, the number of hospital beds
and physicians is expected to double by 2015 (i.e. additional
24,734
MAT APR 06 MAT APR 07 MAT APR 08 MAT APR 09 MAT APR 10
28,25832,477
35,782
42,525
India’s thriving economy is creating anexpanding middle class which hasmore disposable income to spend onhealthcare.
Rs. in Crores

23
Panacea Biotec|Annual Report 2009-10
2 million beds and 4 million physicians). Corporate hospital
chains will play a leading role in transforming the quality of
secondary and tertiary care.
Health insurance penetration: Health Insurance
penetration is expected to double by 2015 to cover 220
million people.
Medical advancements: Patent infrastructure will scale up
to 30 approvals annually and an average approval timeframe
of two years. Patented products will be concentrated in five
therapeutic areas: Neuropsychiatry, Oncology, Anti-infective,
Gastro-intestinal and Cardiovascular. These five therapies are
expected to contribute approximately 60 to 70% of the
growth.
India growing as a medical tourism center: India provides
best-in-class treatment at about less than one-tenth the cost
incurred in the U.S. English speaking medical staff and
relatively low cost is attracting more tourists year-on- year.
Indian medical tourism is expected to grow into a 2 bn USD
by 2012.
Large talented pool: India has a large, talented human
resource pool including dedicated scientists and
professionals in niche specialized and knowledge-based
scientific fields.
Cost-competitiveness: Unmatched cost competitiveness
with lower cost of infrastructure, skilled manpower and
vertical integration.
Value-added services: Leading Indian companies are
climbing the value chain in the field of innovative research
and developing into a Drug Discovery services outsourcing
destination.
The leading 250 pharmaceuticalcompanies control around 70% of themarket with market leader holdingnearly 7% of the market share.

24

Panacea Biotec – Innovation in Support of Life
Healthcare beckons innovation and it goes well with Panacea
Biotec. Panacea Biotec is recognized as a leading, research based
Health Management Company engaged in research and
development, manufacturing and marketing of innovative
products to meet unmet medical needs. To achieve these
objectives, Panacea Biotec has the following core strengths:
Established capabilities in R&D: Panacea Biotec has
established five state-of-the-art R&D Centers with each center
dedicated to specific research areas, driven by the intellectual
capabilities of around 300 scientists.
The research facilities are self-reliant with cross-functional
capabilities for research and development of drugs starting
right from lead identification to pre-clinical and clinical
development and product registration.
The current research strengths of Panacea Biotec are focused,
inter-alia, on:
Drug delivery system design and optimization;
Discovery and synthesis of new chemical and biological
entities;
Design and development of new generation prophylactic
and therapeutic vaccines; and
Development of humanized and fully human therapeutic
monoclonal antibodies.
The Company has been granted 26 product patents worldwide
valid in more than 60 countries including the U.S., E.U. Member
States, Russia, Japan, China, South Korea, Australia and Brazil.
State-of-the-art manufacturing facilities: Panacea Biotec has
state-of-the-art manufacturing facilities for vaccines,
pharmaceuticals and biopharmaceuticals complying to cGMP
standards. The Vaccine Formulation facility at New Delhi is
approved by WHO for Oral Polio (tOPV, mOPV and bOPV), Enivac
HB (Recombinant Hepatitis B) and Combination vaccines
Ecovac-4 (DTwP-HepB), Easyfour (DTwP-Hib) and Easyfive
(DTwP-HepB-Hib). The Pharmaceutical Formulations facility at
Baddi has been audited and certified as cGMP compliant by
various regulatory agencies, including the US FDA, German
Regulatory Authority, TGA Australia and ANVISA Brazil.
WHO Pre-qualification Status: The pre-qualified supplier
status enables the Company to participate in UN Organizations
procurement process around the world. The Company’s Oral
25
Polio (tOPV, mOPV & bOPV), Enivac HB, Ecovac-4, Easyfour and
Easyfive Vaccines are pre-qualified by WHO.
The Company is currently supplying Oral Polio and Easyfive
Vaccines to UNICEF and Easyfive Vaccine to Pan American Health
Organization (PAHO).
Established Brand Equity: Panacea Biotec has established
brand equity in a number of therapeutic areas like Diabetes
Management, Pain Management, Cardiovascular Disease
Management, Organ Transplantation, Renal Disease
Management, Oncology and Pediatric immunization. The
Company's leading brands include Glizid-M, Nimulid, Panimun
Bioral, Pangraf and Mycept which are amongst the top five
positions in their respective therapeutic segments. Its flagship
brand, Glizid-M is ranked 178th amongst the top brands in
Indian Pharmaceutical Market, according to the stockists
secondary audit by ORG IMS (MAT Mar’10).
Global Presence: In addition to the strategic alliances with
Panacea Biotec is recognized as aleading, research based HealthManagement Company engaged inresearch and development,manufacturing and marketing ofinnovative products to meet unmetmedical needs.

26
multinational and leading regional companies in United States,
Europe, Latin America, South East Asia, CIS and Africa; Panacea
Biotec has created a global presence through its wholly-owned
subsidiaries in strategic markets including U.S., Germany,
Switzerland and UAE.
Relationship with Key Business Associates: Panacea Biotec
has a long-standing relationship with its key customers and
business partners including a successful business record
spanning more than a decade with UNICEF. It has been
supplying oral polio vaccines to UNICEF since fiscal 2000. The
Company has successfully nurtured this relationship and has
steadily expanded the same with the supply of Easyfive vaccines
since fiscal 2009. In addition to long-standing relationship with
its customers, the relationships with key suppliers like Novartis
Vaccines, Sanofi Pasteur, PT Bio Farma and Nederlands Vaccine
Institute are also a source of its competitive strength.
Collaborations & Joint Ventures with Key Industry Players:
Panacea Biotec has a rich history of successful collaborations,
ventures and business relationships with several
national/international research institutes, academic universities
and commercial corporations including National Institutes of
Health (U.S.), Novartis Vaccines, Sanofi Aventis, Biotech
Consortium India Ltd., Nederland Vaccine Institute (NVI), PT Bio
Farma, etc. These collaborations, ventures and relationships
enable the Company to secure in-licensing, out-sourcing and
other business opportunities.
Qualified & Experienced Manpower: Panacea Biotec has close
to 3,300 employees including around 300 scientists engaged in
R&D, over 1,000 employees engaged in production & Quality
Control /Quality Assurance and over 1,400 employees engaged
in sales & marketing activities.
Panacea Biotec has a rich history ofsuccessful collaborations, ventures &business relationships with severalnational/international researchinstitutes, academic universities andcommercial corporations.

27
Panacea Biotec|Annual Report 2009-10
Business Segments
Pharmaceutical Formulations
Domestic Sales & Marketing Network
Panacea Biotec has successfully established leading brands
through a focused scientific marketing approach. To cater to the
individual nuances of specific therapeutic segments, Panacea
Biotec operates through seven Strategic Business Units (SBUs).
The domestic pharmaceutical business is organized into three
classes – Super-specialty i.e. Critical Care (Nephrology &
Transplantation) & OncoTrust, Specialty i.e., Diacar Alpha &
Diacar Delta and Multi-specialty i.e., Procare & Growcare. To
cater to the large and voluminous bottom of the Indian
Pharmaceutical Market pyramid, the Company has launched a
new SBU, viz. Value India Healthcare in fiscal 2009.
The aim of each SBU is to attain leadership position in its chosen
markets and establish brand equity in respective therapeutic
segment by way of innovative products as well as innovative &
aggressive marketing approach. The SBUs promote a portfolio
of brands with a special focus on Orthopaedicians, Cardiologists,
Diabetologists, Endocrinologists, Nephrologists, Oncologists,
Chest Physicians, Surgeons, Dentists, Consulting Physicians,
General Practitioners, Pediatricians and Gastroenterologists.
Diacar Alpha
Diacar Alpha has dedicated marketing and sales infrastructure
for Diabetes and Cardiovascular Disease Management. Diacar
Alpha SBU is committed to provide new therapies and
innovations in drug delivery in overall Diabetes and
Cardiovascular disease management. Today India is already the
Diabetes and Hypertension capital of the world and by end
2010, India is heading towards becoming the CAD capital of the
world. WHO estimates that diabetes related mortality could
increase to an alarming 35% by 2015. In this context, Diacar
promises to be in one of the most promising markets in the IPM.
DIACAR Alpha team promotes the brands to target
specialist’s viz. Endocrinologists, Diabetologists, Cardiologists
and Physicians in a fiercely competitive scenario and has
achieved significant leadership position in oral anti-diabetic
segment. The SBU has also recently started focusing on
Nephrologists.
The flagship brand of Diacar Alpha, Glizid-M (Gliclazide +
Metformin) is the No. 1 brand in its respective categories.
Today, Glizid-M is ranked at 178th position amongst 30,000
pharmaceutical brands. Apart from Glizid-M, the brand portfolio
of Diacar Alpha includes:
Oral Hypoglycemic agents: Metlong & Metlong DS
(Metformin), Gliben Total (Glibenclamide+Metformin+
Rosiglitazone) and Glizid Total (Gliclazide+Metformin+
Rosiglitazone).
Cardiovascular agents: Hitarget (Telmisartan) range and
Oglibo (Voglibose).
Co-prescriptive: In co-morbid conditions like Diabetic
peripheral neuropathy Diacar Alpha has Myelogen Forte
(Methylcobalamin combination).
Diacar Delta
Diacar Delta SBU is committed to provide new therapies and
innovations in drug delivery and overall Diabetes and
Cardiovescular disease management. Diacar Delta promotes the
brands to target specialists viz. Endocrinologists, Diabetologists,
Cardiologists and Physicians in a fiercely competitive scenario
and has achieved significant leadership position in oral anti-
diabetic segment. To tap the growing cardiology segment the
SBU now has sharpened its focus on Cardiology and plans to
launch innovative molecules in that segment.
The brand portfolio of Diacar Delta includes:
Oral Hypoglycemic agents: Glizid MR (Gliclazide modified
release), Betaglim (Glimepiride), Betaglim M (Glimepiride +
Metformin), Glim Total (Glimeperide, Metformin &
Pioglitazone), Pioryl (Pioglitazone + Glimepiride), Oglo
(Pioglitazone).
Cardiovascular agents: Lower A (Atorvastatin), Lower EZ
(Atorvastatin + Ezetimibe), Lower TG (Atorvastatin +
Fenofibrate), Kingbeta (Metoprolol) Kingbeta AM
(Metoprolol & Amlodipine).
Critical Care
Critical Care, a Super Specialty SBU of the company, is focused
on the highly specialized organ transplantation and dialysis
management segments. It offers a complete range of pre-
transplant and post transplant therapies. The SBU has carved a
niche in super – specialty segment and created a scientific
image and has achieved clear leadership in these segments.
Panacea Biotec has established brandequity in a number of therapeutic areaslike Diabetes Management, PainManagement, Organ Transplantationand Pediatric immunization.

28
This Super Specialty division has now progressed to branch itself
into two strategic arms of Transplantation and Nephrology SBUs.
The Nephrology SBU focuses on the Chronic Kidney Disease and
dialysis therapy and the Transplantation SBU continues to cater
to multi organ transplant patients primarily kidney, liver, heart
transplants, etc.
The move to create two business arms was made to tap on the
vast potential of the nephrology and the dialysis market along
with continued services in the Post organ transplant segment.
The SBUs together aim to provide complete care to patients
suffering from initial stages of organ failure till the improvement
of the quality of life post organ transplant.
Transplantation
The transplantation SBU further consolidated and strengthened
its leadership status in organ transplantation in the year 2009-10
with all major brands in the SBU either at No. 1 or No. 2 position
in the respective market of immuno-suppressants. With the high
penetration of the SBU in the post organ transplantation
segment, PanGraf (Tacrolimus) continued to dominate the
market and is the major brand for the SBU with an aggressive
growth.
The launch of Mycept 750 for the first time globally gave a boost
to existing Mycept brand and family. Mycept was also launched
in the Rheumatology segment which will become growth lever
for future.
OncoTrust
OncoTrust, the oncology SBU of Panacea Biotec has completed
2 years in the market, gaining the familiarity and wisdom to
compete in the highly competitive oncology market of India.
The position of OncoTrust as an ethical and scientific
organization has been cemented in the oncology community
with the several initiatives including foray of OncoTrust in
Hematology, the first international speaker program and
restructuring the Field force.
With a view to provide a clear understanding on the right
patient selection for BorteTrust, OncoTrust has launched for the
first time the test del 13q cytogenetics for the onco-hemato
community.
Brain tumor therapy, the other core segment of OncoTrust,
continued its initiatives involving various segment of doctors
like Oncologists, Neuro Surgeons etc.
Lung cancer therapeutic area was further strengthened by the
launch of PexeTrust (pemetrexed). PexeTrust that contributes to
enhancing life of a major sub group of Non-Small Cell Lung
Cancer (NSCLC) patients has strengthened our endeavor to offer
enhanced and excellent quality of life in Lung cancer.
This SBU looks forward to further strengthen its hematology
and Lung cancer segments in FY 2010-11, with new molecule
launches and continued marketing activities.
Procare
Procare SBU of the Company endeavours to consolidate and
strengthen its image in the field of chronic health care
management in Orthopedic and Gastroenterology through
specific focus on Osteoporosis, Osteoarthritis & Rheumatoid
arthritis. As far as Gastrointestinal disorders are concerned,
focus is on IBD, Hepatology & Chronic constipation.
Procare has taken definite steps towards making significant
inroads in the Gastroenterology segment with two important
launches of Livoluk Fibre (Lactulose + Ispaghula) and Sitcom
tab & cream (Euphorbia Prostrata) during the year.
In the process of establishing the SBU in Orthopedic segment,
the company has introduced Vacosteo (Zoledronic acid, 3rd
generation injectable bisphosphonate) once in a year injection
for an effective management of Osteoporosis. Keeping the
overall potential in mind, this SBU has also initiated the process
of launching Ibandronic acid kit, the oral form of
bisphosphonate to ensure having a basket approach to increase
reach to the targeted segment of Osteoporosis.
The flagship brand Panimun Bioral is also being rejuvenated by
entering in Hematology segment.
Nephrology
The Nephrology SBU was launched in April 2010. It covers a
number of brands catering to nephrology patients in its
umbrella including Epotrust (Erythropoietin Alpha), Overcom
(Iron Sucrose), Kbait (Calcium Polystyrene Sulphonate), Fosbait
(Lanthanum Carbonate), Mimcipar (Cinacalcet Hydrochloride)
and Alphadol (Alphacalcidol).
Fosbait continues its leadership stance in the Lanthanum
Segment. Mimcipar, launched last year, has been growing
steadily in the Cinacalcet Market in India.
The market is currently at the centre ofattraction for all leading pharmaceuticalmajors. Now, the vaccine market isregistering growth rates much fasterthan the conventional pharma market.

29
Panacea Biotec|Annual Report 2009-10
The SBU is progressing towards achieving significant growth
during the current financial year by building Sitcom & Vacosteo
as the mega brands.
This SBU promotes a portfolio of brands with special focus on
Orthopedicians, Surgeons, Dentists & Gastroenterologists apart
from Consulting Physicians & General practitioners. Some
of the major brands of Procare across different therapeutic
segments are:
Anti-arthritis: Willgo, Kondro OD, Kondro Acute.
Pain relievers: Nimulid, Nimulid SP, Nimulid MR, Nimulid
HF, Jaiho, Dolzero.
Gastrointestinal: Livoluk, Livoluk Fibre, OD-pep, Sitcom tab
& Cream.
Anti-osteoporosis: Vacosteo, Alphadol-C, Kingcal.
Growcare
Growcare is the non-chronic care business of Panacea Biotec
with special focus in Respiratory Disorders, Tuberculosis, Gastro-
Intestinal (GI) and Pain Management therapies.
Committed to reduce the burden of disease, Growcare marks
Panacea Biotec’s presence in therapy areas like Anorectal
Disorders (Piles & Hemorrhoids), Gastro-Intestinal, Respiratory
(Cough, Cold & Allergy), Anti-Infectives, Anti-TB & Pain Relievers.
The different specialties serviced by Growcare are General
Practitioners, Chest physicians, Consulting Physicians, ENT
Surgeons, Paediatricians, General Surgeons and
Gastroenterologists.
A strong and committed Growcare team of over 350
professionals services to over 50,000 doctors across 270
territories in India, marketing 24 different products with
presence in multiple therapy areas.
Some of the popular brands of Growcare include:
Anti haemmorohidal: Thank OD (Euphorbia Prostrata)
Tablets & Cream, Fiberforte (Lactulose+Ispaghula)
granules.
Anti-infective: Cefmentin (Cefixime), Ocimix
(Ornidozole+Ofloxacin).
Anti-Allergic: Zomont AL (Montelukast+Levocetrizine) Tab,
Zomont AL Kid.
Cough, Cold and Fever: Toff MD, Toff DC & Toff expectorant,
Orangemol Suspension.
Pain Management: Nimulid MD & Nimulid MD Kid (Mouth
dissolving) tablets, Nimulid Suspension, Nimulid Transgel.
Anti TB: Xeed 2, Xeed 3E & Xeed 4 tablets (fixed dose
combinations with Rifampicin), Myser (Cycloserine) &
Myobid (Ethionamide).

30
Value India Healthcare
To cater to the needs of the ever growing mass markets in
upwardly mobile extra urban & rural areas, ValueIndia
Healthcare was launched by Panacea Biotec in July 2008 in Rest
of Maharashtra (ROM). July 2009 saw this SBU expanding its field
force in ROM & launching the brands in Madhya Pradesh &
Chattisgarh.
The trend set by Panacea Biotec in offering significant
innovative brands to fight pain, allergy and gastro-intestinal
disorders to the extra urban and rural markets via this SBU has
started paying rich dividends reflecting high growth for
Panacea Biotec in ROM. Panacea Biotec’s ranking in ROM
pharma market has improved from 55 to 46. The Company is
now recognized as one of the fastest growing pharma
companies in ROM.
The current brand portfolio of ValueIndia Healthcare covers all
general practice therapy areas like Anti–infectives, Gastro–
intestinal products, Respiratory products & NSAIDs. The main
brands are ValueCef, ValueOrni, ValueMentin, ValueThral,
ValueMox, Instanim MD, Instanim HF, TwinEase ER, Combipunch,
KofZero, KoldZero, Roj OD & TwoWks. Two Brands of ValueIndia
Healthcare, TwoWks (Euphorbia Prostrata) & ValueCef (Cefixime),
with sales of over Rs.10 million each in ROM, are amongst the
top 25 new introductions in ROM in the last two years.
Success of the penetration model is seen by the improvement in
prescription generation for Panacea Biotec products in the areas
covered by this SBU. Panacea Biotec’s ranking in the latest
prescription audit by CMarc shows a sharp improvement from
over 50 to now 27.
Brands Review
Over the years, Panacea Biotec has established leading brands
that enjoy top of the mind recall by the medical fraternity. The
Company’s brands command excellent market share in their
therapeutic segments. By ORG (MAT Mar’10) Sales value,
Panacea Biotec is the 49th ranked company in the Indian
Pharmaceutical Market with Nephrologists, Dentists,
Orthopaedicians and Diabetologists giving the best support. As
per Stockist Secondary Audit of ORG (MAT Mar’10), Glizid-M
stands at 178th rank among top brands in the Indian
Pharmaceutical market and retain number one position within
its category.
The following table sets forth the key brands of the Company
across therapeutic categories and their ranking/ market share in
India as per ORG IMS audit (MAT MAR’10):
Brand Standing and Market share
Brands Market Ranking
Share %
Diabetes and Cardiac Care:Glizid M 24 1
Glizid 80mg 23 2
Glizid 40mg 28 2
Glizid MR 60mg 11 3
Glizid MR 30mg 15 2
Glizid Total 23 2
Pain Management:Willgo 60 1
Nimulid MD 29 1
Nimulid 100mg 9 2
Nimulid Suspension 21 2
Nimulid SP 8 4
Nimulid MR 11 4
Softdiclo 10 3
Kondro OD 22 3
Vacosteo 38 1
Tuberculosis Management:Myser 14 3
Gastro-intestinal:Livoluk 7 4
*Source: ORG IMS SSA audit MAR2010.
*Market Share and rank is calculated within its immediate operating market i.e. the
strength or the immediate market (wherever applicable).
Critical care brands, Panimun Bioral, Mycept and Pangraf are also
the leading brands in the Organ Transplantation segment but
have a poor reflection in ORG IMS audit, as ORG IMS SSA audit
does not track institutional sales or sales made directly to
patients.
International Pharmaceuticals Business
The year under review marked the consolidation year for the
international pharmaceutical business – wherein, several new
products/therapies were scheduled for commercialization
across various regions. During the year, the Company’s
pharmaceutical formulation business clocked export sales of
Panacea Biotec has establishedleading brands that enjoy top ofthe mind recall by the medicalfraternity.

31
Panacea Biotec|Annual Report 2009-10
Rs. 292.9 million as compared to Rs. 426.1 million during
previous financial year. The Company has identified Organ
Transplantation, Nephrology, Metabolic Disorders, Pain
management, Oncology, Gastro-intestinal & Anti-infective
products as major thrust areas for the future. The Company is
currently in the process of registering its products in key new
markets including US, European Union, Switzerland, South
Africa, Turkey, Brazil, Mexico, Columbia, Venezuela, Chile,
Philippines & Malaysia. The Company has set-up international
subsidiaries in US, Germany, Switzerland and U.A.E. to steer
product registration. The Company focuses on brand building
primarily leveraging its portfolio of novel patented therapeutic
products in key segments.
The major achievements in terms of international
pharmaceutical formulation business during the year have
been:
The Company signed a Licensing and Distribution
Agreement with a leading MNC for distribution of the
Company’s organ transplantation products in U.S.
Strategic Alliances for marketing and distribution of the
Company’s products in Australia and New Zealand.
One of the key markets – Brazil saw the registration
clearance for Tacrolimus 5mg. This marked the Company’s
first registration clearance in the hugely potential Brazil
market.
Nephrology line of Products got accepted in the “Originator
dominated” Middle East markets of Jordan & Syria.
Entry into Asian markets like Philippines with Tacrolimus &
Mycophenolate Mofetil.
Sustained promotional endeavors have resulted in our
product Mycept being included in the Federal Purchase list
of Ministry of Health, Russia.
Nephrology products included in the MOH formularies of
the following markets of Syria, Sri Lanka, Brazil & Ukraine.
The Company plans to boost its growth prospects significantly in
the coming years by registering and commercializing a series of
innovative & potential products across all the targeted markets.
With a view to create a strong and positive image of the Company
in the minds of the local doctors through our Innovative
strategies & robust promotional efforts for the unique products,
the Company has steadily but surely moved from a trading
business model to a “Promotional oriented” approach in markets
like Sri Lanka, Vietnam, Kazakhstan, Philippines, Syria. The
Company has placed specialized personnel in these markets to
exercise & enforce the promotional initiatives in these markets.
The Company also has plans to extend this band width to other
existing and/or planned potential markets with more robust
strategies and control.
Vaccines
Domestic Vaccines Business
Immunization has become one of the most important & cost
effective ways of reducing morbidity and mortality. Keeping this
trend in mind, Panacea Biotec has adopted a strategy of
development of advanced combination vaccines; opening a
whole new dimension towards protecting multiple diseases
with a single vaccine.
The Company has set-up a joint venture company, viz. Chiron
Panacea Vaccines Pvt. Ltd. in fiscal 2005, for marketing of
innovative combination and other vaccines in India. The
Company has a strong portfolio of vaccines including the
Company’s innovative Pediatric combination vaccines Easyfive
& Easyfour, PolProtec (enhanced Injectable Polio Vaccine) and
PrimOpol (Triavalent Oral Poliomyelitis Vaccine). The JV
Company commands a significant market share in the pediatric
combination vaccines segment in India.
International Vaccines Business
Panacea Biotec is one of the largest vaccine suppliers to UNICEF.
The Company has been supplying Oral Polio Vaccines to UNICEF
and has steadily expanded and grown on this relationship with
the commencement of supply of Easyfive and bivalent Oral
Polio Vaccines to UNICEF. The Company has also commenced
supply of Easyfive Vaccines to Pan American Health
Organisation (PAHO).
The Company is poised to make further inroads into global
markets and has deployed a specialized team for its Vaccine
Business in the emerging & rest of world markets.
The vaccines of focus to start with would be Easyfive and
Polprotec (enhanced Inactivated Polio vaccine, eIPV). These
would be followed by new introductions from a strong &
innovative vaccine pipeline on a consistent note.
The year 2009-10 marked the introduction of Easyfive through
direct supplies in Nepal, Pakistan as well an entry into the Latin
American Market of Chile. During the close of the year,
Bangladesh started featuring in the list of countries where
Easyfive has been registered for direct supply.
Going forward, about 20 key markets have been identified
wherein extensive work has been initiated on Customization of
business models, Identification & collaboration with partners in
accordance with the business strategy and Regulatory filings.

32
Logistics Network
Panacea Biotec has an advanced professional logistics network
throughout the country. The Company has a nationwide sales
and marketing network covering approximately 450 districts in
India and targets more than 1.1 million customers through a
field force of over 1,000 trained marketing and sales
professionals and 23 sales depots/carrying and forwarding
agents all over India. The Company through its efficient sales
force reaches more customers, effectively. The Company has its
Central Warehouse at Delhi. Besides this the Company also has
expertise in cold chain management for storage and
distribution of Vaccines under monitored conditions using a
system of Vaccine Vial Monitors, Data Loggers, Ice Boxes,
Coolant, Cold Rooms and Refrigerated Vehicles. This ensures
that the Vaccines remain safe and effective against changes in
the variant temperature conditions.
Supply Chain Management
Panacea Biotec has created new business processes of Supply
Chain Management (SCM) in both Pharmaceuticals and Vaccines
segments, with an objective to ensure customer satisfaction by
monitoring and improving delivery performance on various
parameters including Turn-around Time (TAT), On-time in Full
(OTIF) and Error-free delivery of products and promotional
materials. SCM has been designed for creating end-to-end
visibility and controls right from sourcing of materials till
collection of receivables. SCM team has designed its processes
aimed to achieve Distributors and Vendors WOW.
Manufacturing Facilities
Panacea Biotec has its manufacturing facilities for vaccines and
pharmaceutical formulations in India in Delhi, at Lalru in Punjab
and at Baddi in Himachal Pradesh. The Company also has state
of the art integrated facility for bulk vaccines, antigens and
biopharmaceuticals at Lalru in Punjab. The manufacturing
facilities have been set up in compliance with international
regulatory standards including WHO-cGMP and European Union
standards.
The Company’s manufacturing expertise lies in various solid,
semi solid & liquid oral dosage forms and vaccines such as:
Oral-solids-Conventional tablets/capsules, Controlled/delayedrelease/enteric coated tablets and capsules, Tablet in Tablet,Tablet in Capsule, Multi Layered Capsules, Hard gelatin/ SoftGelatin capsules, Mouth Dissolving/Chewable Tablets, BeadsEncapsulation, Coating (film, sugar & functional), Tastemasking and fast-dissolving tablets.
Semi-solids - Ointments/Creams/Gels, Transdermal DrugDelivery System.
Liquids - Suspensions/Syrups/Solutions.
Vaccines - Recombinant Vaccines, Combination Vaccines, Cellculture Vaccines and live vaccines.
Manufacturing Facilities for Vaccine Antigens at Lalru,
Punjab
The Company has separate dedicated bulk vaccine
manufacturing facilities with dedicated blocks for manufacture
of Recombinant, Bacterial, Tetanus & cell culture based vaccines
and biopharmaceuticals at Lalru in Punjab. All the facilities have
been designed, constructed, adapted and maintained following
current Good Manufacturing Practices (cGMPs) prescribed by
WHO. Two bulk vaccines manufactured at Company’s Lalru unit
(Recombinant Hepatitis B Vaccine and Haemophilus influenzae
type b conjugate vaccine) are WHO pre-qualified which are
being used for manufacture of innovative combination vaccines
Easyfive for supply to UNICEF and Pan American Health
Organization (PAHO). The Bacterial and Tetanus vaccine
manufacturing facilities are approved by National Regulatory
Authorities (NRA) for commercial production. The recent
integrated facility comprising three lines will cater to the
biopharmaceutical / vaccine on mammalian cell culture system
with the option of conventional as well as disposable
bioreactors; microbial products and egg based viral vaccines.
Pharmaceutical Formulations facility at Baddi
The Company’s state-of-the-art pharmaceuticals formulations
manufacturing facility at Baddi, built in compliance with cGMP
standards, received encouraging acclaim and numerous plant
approvals from various regulatory authorities. The facility has
been audited and certified as cGMP compliant by various
regulatory agencies including the US FDA, German Regulatory
Authority, TGA Australia and ANVISA Brazil. The Company’s soft
gelatin manufacturing facility is also approved for markets in
European Union. The Company is expecting clearances from
other regulatory agencies like MCC South Africa and UK MHRA
in the current fiscal. The facility has annual capacity for
producing 900 million tablets, 120 million hard gelatin capsules,
12 million tubes for gels, ointments, etc. and 12 million bottles
for liquids, syrups, suspensions, etc.,150 million soft gelatin
capsules and 60 million herbal tablets.
The Company’s PharmaceuticalFormulations facility at Baddi has beencertified as cGMP compliant by variousregulatory agencies including the USFDA, German Regulatory Authority, TGAAustralia and ANVISA Brazil.

33
Panacea Biotec|Annual Report 2009-10
Tree Plantation by US FDA Official at Pharmaceutical Formulation Facility at Baddi

34
Vaccines Formulation facility at Baddi
The state-of-the-art Vaccine Formulation plant at Baddi in
Himachal Pradesh, has two filling lines complying with WHO-
cGMP norms for liquid Vaccines in pre-filled syringe and liquid &
lyophilized Vaccines in vials. The total production capacity of
this facility is 600 million doses per annum which may be
increased by the addition of third line to one billion doses per
annum. This facility would significantly improve our market
presence globally and augment our plans to become a global
leader in this field. The three-storey main building consisting of
production, quality control and quality assurance is spread over
approximately 2800 square meters construction area at each
floor. The plant also has a five-storey block of Warehouse-cum-
Cold Storage facility admeasuring approximately 2500 square
meters on each floor.
Vaccines Formulation facility in Delhi
Vaccines formulation facility in Delhi is also a WHO cGMP
approved facility with WHO Prequalification for Oral Polio (tOPV,
mOPV & bOPV), Enivac HB and combination vaccines Ecovac-4,
Easyfour & Easyfive. The facility has been designed, constructed
and maintained to suit production of Vaccines following Good
Manufacturing Practices. It has three vial filling lines – two lines
dedicated to Oral Polio Vaccines and one line dedicated to
injectable Vaccines (Hepatitis B & Combination Vaccines).
Manufacturing Facility for Anti-Cancer Products at Navi
Mumbai
The Company is setting-up a manufacturing facility for
manufacture of Anti-Cancer products at Mahape, Navi Mumbai.
This state-of-the-art containment facility will be unique and
capable of providing clinical supply and production of high
value cytotoxic products. Products from this facility will
augment the strength and presence of Panacea Biotec in
Oncology segment.
Research & Development
Panacea Biotec has built a strong R&D base over the last decade
to support its business segments, vaccines, pharmaceutical
formulations and biopharmaceuticals. It has five highly
sophisticated ultra-modern R&D centers with 392 employees
including around 300 qualified and experienced scientists for its
various research projects. The core area of research &
development includes new Vaccine Development,
Biopharmaceuticals, proteins, peptides, monoclonal antibodies,
Novel Drug Delivery Systems, Advanced Drug Delivery System
and Drug Discovery (small molecules), in compliance with

35
international regulatory standards. All the five R&D Centers have
been accorded registration by Department of Scientific and
Industrial Research, Ministry of Science & Technology, New Delhi.
As a result of its research efforts, the Company has been granted
more than 300 patents in India and worldwide including major
countries like U.S., Europe, Australia, Canada, China, Japan, Russia
etc. For carrying out pre-clinical research, the Company has a
state-of-the-art animal house and facilities for undertaking in-
vitro and in-vivo microbiology, pharmacology, safety, efficacy,
proof of concept and toxicology studies.
The Company has been steadily increasing its expenditure on
R&D, both revenue and capital expenditure, and has spent
Rs.577.2 million (6.5% of net turnover) in fiscal 2010, as
compared to Rs.500.9 million (6.5% of net turnover) in fiscal
2009, an increase of around 15% in value terms. Further, the
Company has also invested an amount of Rs.231.4 million in
fiscal 2010 as capital expenditure on R&D. The total R&D
Expenditure during the year has been Rs.808.6 million (9.1% of
net turnover). The Company has plans to further strengthen the
R&D base to cater to more healthcare needs and expanding
niches in vaccines, pharmaceuticals formulations and
biopharmaceutical segments, both in domestic as well as
international markets.
LAKSH Drug Discovery R&D Center at Mohali in Punjab
Laksh, the Company’s state-of-the-art Research Center for
development of New Chemical Entities (small molecules) at
Mohali, Punjab is spread over 70,000 sq. ft. of Laboratory Space
with latest infrastructure. The R&D Centre employs more than 96
scientists including 12 PhDs. LAKSH has expertise to carry out
work on different aspects of drug discovery which include
medicinal chemistry, process chemistry, in vitro and in vivo
biology, analytical & bio-analytical research with high
throughout capability to analyze clinical samples,
pharmacokinetics, drug metabolism and toxicology studies. The
focus of research is on development of NCEs for the treatment
of metabolic disorders, CNS and infectious diseases. This R&D
center has successfully delivered two Pre-Clinical Candidates
(PCCs) which are currently under Investigational New Drug
(IND) directed toxicology phase.
The Company has recently entered into an agreement with
Department of Scientific & Industrial Research (DSIR) as per
The total R&D Expenditure during theyear has been Rs.808.6 million (9.1% ofnet turnover).
which DSIR has agreed to provide a grant of Rs.37.8 million to
partially fund one of this R&D Center’s project for development
and demonstration of the technology.
SAMPANN Drug Delivery R&D Center at Lalru in Punjab
The Research & Development Centre at Lalru named as
SAMPANN Drug Delivery is spread across 40,000 sq. ft. of
laboratory space with superior infrastructure, specialized
laboratory equipments, adequate resources and skilled
manpower. This center’s primary focus is to develop value added
drug delivery products that would address unmet medical
needs, enhanced patient convenience and compliance.
A large number of high potential drug delivery based projects
have been selected for development, based on highly
specialized drug delivery technologies, including controlled
release formulations, controlled release liquid suspensions and
protein-peptide formulations. Apart from this in fiscal 2010,
product development has been done for different categories of
drugs which include Anti-inflammatory, Anti-allergics, Anti-
tubercular, Anti-haemmorrhoidal, Anti-emetics, Anti-psychotics,
Anti-bacterials, Anti-hypertensives, Immuno-suppressants, Anti-
arrhythmics, Anti-retrovirals, Anti-diabetics, Anti-cancer etc. and
various combinations thereof in the above category of drugs.
Vaccine Research and Development of SAMPANN Drug Delivery
has a portfolio of innovative pediatric vaccines which protect
children against dreadful diseases such as Polio, Hepatitis,
Diphtheria, Tetanus, Pertusis and Haemophilus Influenzae
type b. Responding to the worldwide need of prevention
against widespread deadly disease of Swine Flu, the Vaccine
Research has expedited development of candidate vaccine for
H1N1 Swine Flu.

36
Saha Vaccine Research Center in Delhi
The Saha Vaccine Research Center in Delhi, spread across 24,000
Sq ft has been established with an objective to develop novel,
effective and affordable vaccines for prevention against various
epidemic /endemic life threatening diseases for global market.
SVRC has the infrastructure and expertise to take an ‘idea’
through different stages of product development towards a
successful commercialization. In line with the Company’s
strategy for expanding its scientific strength to innovate more
vaccines, this center is carrying out extensive research in
vaccines and biologicals using animal cell culture, fermentation,
purification, serology, analytical and bioanalytical development.
Biopharmaceutical R&D Center in Delhi
The Biopharmaceutical R&D center (BRC) has around 40
scientists working in the areas of molecular biology, cell biology,
immunology and peptides. BRC is focusing on development of
novel preventive & therapeutic vaccines, novel therapeutic
peptides and therapeutic fully human monoclonal antibodies
for treating infectious diseases and life style related disorders
are the focus of discovery projects. BRC is also actively involved
in developing different bio-similar products.
During the year 2009-10 the highlight of the Center’sperformance was development of the Company’s candidatevaccine for H1N1 Swine Flu. This has enabled the Company to procure an advanced marketing commitment ofRs.100 million from Ministry of Health & Family Welfare,Government of India.
Department of Biotechnology (DBT) has also awarded financialassistance of Rs.100 million in the form of a long-term loan onconcessional rate of interest of 2% p.a. for indigenous research &development of Influenza A (H1N1) and / or other Pandemic Fluvaccines of paramount national importance.
Additionally, during 2009-10 the Biopharmaceutical researchcenter has been on a progressive path for the development ofhair growth peptide, a technology for Alopecia (hair loss)management in-licensed from National Institute of Health, USA,a novel peptide for the treatment of Rheumatoid Arthritis,biosimilars, Dengue Vaccine and fully human monoclonalantibodies.
The research work as BRC has enabled filing of three productpatents during the year.
GRAND R&D Center at Navi Mumbai
Global Research and Development (GRAND) Center at Mahape,Navi Mumbai is dedicated to research activities involving NovelDrug Delivery Systems (NDDS). At GRAND more than 50 highlyskilled and committed research scientists including 19 Ph.Ds areworking to innovate in the field of novel therapeutic alternatesfor unmet medical needs.
The Research Center is involved in development of productsbased drug delivery technologies and working segments aredivided broadly into:
Oral delivery of bioactives using controlled drug deliveryby utilizing the concept of Gastro-retentive systems, zeroorder release systems and site specific delivery system ingastrointestinal tract.
Topical delivery of antimicrobial loaded nanoparticles forbetter patient compliance and reduced frequency ofapplication at infected site.
Parenteral formulations based on Nanotechnology fortarget oriented delivery of Anti-cancer molecules leadingto reduced side effect and better patient compliance.
Controlled and sustained delivery of actives usinginjectable micro-particulate delivery systems with anadvantage of reduced frequency of dosing and improvedtherapeutic outcome.
Drug delivery of immunosuppressants for better efficacyand compliance.
During the year 2009-10 the highlightof Biopharmaceutical R&D Center’sperformance was development of theCompany’s candidate vaccine for H1N1Swine Flu.

37
Liposomal delivery using the“Stealth” concept of prolongation insystemic circulation to achievebetter therapeutic effects andreduced untoward effects.
GRAND center has earned strong
intellectual property for Panacea
Biotec.
Quality Assurance
Quality is among the most important reasons
to persuade a customer to buy a product.
Total Quality Management has always been
the cornerstone of your Company which has
resulted in achieving greater milestones in
the past couple of years. At Panacea Biotec,
quality is in-built in products & services and it
is integrated in each step of R&D, production,
packaging, storage, marketing, sales & distribution. Your
Company is committed to adhere to the highest quality
standards for products it manufactures which is enabled
through a highly qualified, techno-innovative & dedicated team.
Clinical Research Operations
Clinical Research plays a pivotal role in the drug development
process. Clinical development establishes the safety and efficacy
of a new drug product involving significant expertise, time and
investment. Panacea Biotec is the first Indian pharmaceutical
company to indigenously implement the Oracle Remote Data
Capture (RDC) enabling it to conduct e-clinical trials.
Recently, the Company successfully completed clinical part of
trial of bOPV, aimed towards the planned application for WHO
prequalification.
The year 2009-10 witnessed several milestone achievements
from Clinical Research Operations of the Company, including:
A large randomized controlled trial in ~1,800 subjectsacross 40 centers for a novel drug delivery product forOsteoarthritis;
A multinational trial, spread across two geographicalregions (Asia/EU) and three countries(India/Germany/Poland) for a GI product;
A long duration trial with a 2-year follow-up to evaluatethe relapse rate 24 months after the completion of therapyfor an anti-infective product; and
Phase I trial of indigenously developed influenza A (H1N1)vaccines.
Pharmaco vigilance: Pharmaco vigilance is getting recognized
today as a specialized function. It has evolved as a science of
collecting, monitoring, researching, assessing and evaluating
information from healthcare providers and patients on the
adverse effects of medicines, biological products, herbals and
traditional medicines with a view to identifying information
about potential new hazards and preventing harm to patients.
Intellectual Property
Panacea Biotec has a full fledged Intellectual Property Rights
department which manages all the Intellectual Property from
inception to enforcement. As at the end of fiscal 2010, the
Company has filed over 1,300 patent applications worldwide
including 189 Indian patent applications and 67 applications
filed through the PCT (Patent Cooperation Treaty) route.
Out of the total number of patent applications filed, 380 patents
had been granted / accepted for grant. Apart from this, the
Company had in-licensed several patent applications, some of
which are under process in different countries of the world.
Panacea Biotec has been granted 11 product patents in India
and 26 product patents worldwide for different products/
technologies, so far. During fiscal 2010, 20 patents were granted
including in Mexico, Indonesia, Serbia, Morocco, Eurasia, India,
South Africa and Ukraine.
Besides this, the Company had filed 123 applications for the
registration of Copyrights of which 81 had been granted.
So far the company has filed over 300 applications for registration
Dr. Rajesh Jain inaugurating 10th International Symposiumon Advances in Technology and Business Potential of New
Drug Delivery Systems organised by Controlled Release Society (CRS), India Chapter.

38
of Trade Marks of which 275 have been registered. In addition to
this, the Company has also filed 51 International Trade Mark
Applications in various countries during 2009-10 of which 23
have been granted. The Company has till date filed four Design
Applications and all of them have already been registered.
Human Resources
Human Resources have been a strategic partner in the
organization in its endeavour to build a leadership position in
the market with its differentiated products. Human resources
have been taking up challenges and initiatives for bringing in a
remarkable change in its mode of operation and decision
making and to bring in a new paradigm to ensure a hassle free
transaction of HR services. Along with this, the Company took
great strides in strengthening connectivity with the entire cross
section of employees.
The Company has 3,229 permanent employees which include
2,838 skilled employees including corporate and managerial
staff, sales staff and staff located at its manufacturing facilities.
Of these permanent employees, 392 are engaged in R&D
Centers, over 1,000 are engaged in manufacturing, Quality
Control & Quality Assurance, over 1,400 are engaged in sales
and marketing and rest are engaged in support functions.
Panacea Biotec’s human capital constitutes a diverse pool of
knowledge & expertise, a judicious blend of youth, imagination,
risk-taking ability and experience. The Company enjoys
excellent industrial relations and there have been no work
disruptions, strikes, lock-outs or any other employee unrest.
In order to make its human capital as an important differentiator
for its long term business objectives, your Company has
embarked upon number of initiatives, including:
Annual Day Celebrations: 14th Annual Day celebrations were
organised on 25th September with a new innovative turn,
where all employees of the Company at all locations were
involved. A video recording of warm and inspiring address
voiced by Mr. Soshil Kumar Jain, Chairman was created and
shown to all the employees at all locations, followed by our
corporate Anthem. The audio-video presentation was followed
by the awe-inspiring performances of our employees made the
day all the more colorful and memorable across locations to
celebrate the “Spirit of Togetherness”. With enthusiastic
participation, the Annual Day was a great success.
Company Newsletter: A quarterly Company Newsletter is
developed with the key objective to develop strong
communication links and connect with the employees and
imbibe the true spirit of togetherness and infuse a sense of
pride for the significant achievements made together at the
Company.
HR Buddy: HR4U, an email based employee connect initiative, is
an friendly channel that helps employees connect with the
Company and efficiently resolve any problems which they may
face. This HR buddy program also seeks to provide answers to
every query within a short span of time.
Aap Ki Awaaz: This is an annual online employee satisfaction
survey across the organization. This year more than 65 %
employee participated in the survey. The survey has shown 24
% improvement in the satisfaction level across the company.
One of the major area of improvement has been in the area of
“Follow through and delivery on commitment” shown by HR.
14th Annual Day celebrations

39
Panacea Biotec|Annual Report 2009-10
Learning and Performance management: Continuousdevelopment of its human resources has always been the focusof the Company. Panacea Biotec continuously strives to provideseminars and training programs to assure the development ofemployees.
Information Technology
As a research based organization, your Company believes inaccelerating value realization and delivering operationalefficiencies in healthcare. Panacea Biotec has been continuouslyinvesting in information technology to enhance communicationchannels with a view to provide a strong knowledge base to itsemployees, enable faster scanning & monitoring of externalenvironment, improve the knowledge of best practices andrelevant leading-edge technologies and improve efficienc ies.
Microsoft Exchange and Share point portal solution is availablefor messaging & collaboration, addressing the internal &external communication and workflow needs. The Company’ssales depots & manufacturing facilities are well connectedthrough secure and robust Virtual Private Network (VPN) As an effort towards implementation and leveraging oftechnology initiatives to improve the efficiency of variousdepartments, your Company has already implemented SystemAnalysis and Product in Data Processing (SAP) covering FinancialAccounting, Controlling, Asset Management, MaterialsManagement, Production Planning and Sales Distribution. The
Company’s SAP HR Module is successfully running. During theyear under review, the Company has implemented projectsystems and systems for plant maintenance, business processconsolidation & strategy management.
The Company has also adopted Oracle clinical trial software andSAS analysis tool to manage, standardize and control clinicaldata for fast study set-up and consistent interpretation of datain compliance with regulatory requirements. Considering thecoming requirement of Phama-co-vigilance, the company isimplementing ARGUS (Adverse Event Reporting System).
BestOnHealth Portal: The Company’s health portal
“www.bestonhealth.com”, developed and launched in the year
2002 with an objective to provide comprehensive health related
information and services to the people and medical
practitioners. It offers a unique interactive ‘Individualized Health
Management plan’ which links individual health record with
investigations, diet, exercise, yoga and medication. The portal is
a treasure trove of knowledge based health information
featuring information on Holistic healing through Ayurveda,
Homeopathy and Yoga apart from Allopathy; Health Calculators
and other useful ready reckoners. An additional feature is the
search facility for various common illnesses and diseases. The
portal also features: comprehensive health information focusing
on children & elderly; and neighborhood resources for doctors,
labs, chemists etc.
Christmas Day Celebrations at SAMPANN R&D Center at Lalru, Punjab
International Women's Day Celebrations at Lalruon 8th March, 2009

40
It also offers unique interactive facility for Medical practitioners,
including creation of their own Information & Resource Centre;
tools to create and maintain patient records & interact with
them online; latest information on diseases & therapeutic areas
of their interest; interface with peers and specialists from related
fields online; explore placement opportunities; opportunities for
participation in clinical trials; and holding patient/public
awareness programs.
The portal has received excellent response and is being
regularly accessed by healthy individuals, patients & medical
practitioners from all across the globe.
Internal Audit & Control System
Your Company has internal control systems that commensurate
with the size of operations and for business processes across
various Plants, Research & Development centres, Warehouses
and Sales offices besides Corporate Office with regard to
efficiency of operations, financial reporting, compliance of
applicable laws, rules and regulations.
The business processes and Internal control systems are
evaluated periodically by independent auditors from M/s Dass
Gupta & Associates, Chartered Accountants, M/s S.K. Badjatya &
Co., Chartered Accountants and M/s K.K. Garg & Associates,
Chartered Accountants who continue to act as Internal Auditors
of the Company.
The Audit Committee of Board of Directors comprising of
Independent Directors viz., Mr. R.L. Narasimhan, Mr. N.N.
Khamitkar and Mr. Sunil Kapoor actively review the adequacy,
effectiveness of internal control and internal audit systems and
suggest improvements where necessary.
Post audit follow-ups are carried out to ensure identified risks
are adequately addressed and the recommendations of the
Audit Committee are implemented.
An effective budgetary control mechanism on both revenue
and capital expenditure through SAP fund management
process ensures that actual expenditure is within budgeted
outlay.
Any material change in the business process or outlook is
reported to the Board of Directors.
Bhoomi Pujan for upcoming multi super-specialty hospital at Gurgaon

41
Panacea Biotec|Annual Report 2009-10
Subsidiaries, Joint Ventures, Collaborations& Tie-ups
The Company is continuously expanding its horizon through its
subsidiaries, joint ventures and associates including the
following:
Subsidiaries
Best On Health Limited: The Company’s wholly-owned
subsidiary (WOS) namely Best On Health Ltd. (“BOH”), which
owns a prime immovable property being used by the Company
as its Corporate Office, has charted out a plan for diversification
in related health management space as part of its future growth
plans.
BOH has purchased a substantial piece of land on its own and
through its four wholly owned subsidiaries (namely Radicura &
Co. Ltd., Panacea Hospitality Services Pvt. Ltd., Panacea
Educational Institute Pvt. Ltd. and Sunanda Steel Company Ltd.)
for setting up of Sector-Specific Bio-tech Special Economic Zone
located at Pataudi Road, Gurgaon, Haryana. BOH has got the
formal approval for setting up Sector Specific Bio-tech SEZ and
is to apply for its Notification and is taking the necessary steps
for business modeling exercises, approaching prospective
investors/ clients/ service providers for its SEZ project.
Umkal Medical Institute Pvt. Ltd.: The Company is expanding
its portfolio by entering the fast growing healthcare sector by
way of setting-up a multi super-specialty hospital with the
modern equipments in the NCR of Delhi at Gurgaon through its
subsidiary, viz. Umkal Medical Institute Private Limited. Your
Company has invested an amount of Rs.166.38 million for
acquiring 75.2% stake (59% paid-up) in Umkal Medical Institute
Private Limited.
Panacea Biotec Inc.: A Wholly Owned Subsidiary (WOS) in U.S.
has been set-up during previous year, with its main objects of,
inter-alia, research, development, manufacture, register, market,
distribute, import and export pharmaceutical and biological
products etc. in United States. The Company has remitted an
amount of Rs.2.4 million (USD 50,000) as a capital contribution,
during the year.
Panacea Biotec FZE: This WOS was incorporated in UAE to
perform the activities relating to registration and marketing of
the Company’s patented products worldwide and an amount of
Rs.5.5 million (AED 500,000) had been remitted towards its
capital contribution.
Rees Investments Limited: It has been set-up as a Company’s
WOS in Islands of Guernsey (located in the bay of St. Malo in the
English Channel) with its main objects including, inter-alia,
making strategic investments in other entities, entering into
joint venture and collaborations and/or for carrying out other
permissible activities.
Rees Investments has further established its WOS Company
namely, Kelisia Holdings Limited, Cyprus whose principal
activity is holding of Investments. Kelisia Investment Holding AG
and Panacea Biotec (International) SA had been set-up in
Switzerland as step-down WOS companies of Rees Investments
Ltd., with the purpose of carrying out investment activity as well
as to engage in all other related activities.
Kelisia Holdings Ltd. has a strategic equity investment of
USD13.1 million in PharmAthene, Inc., Annapolis, MD, US, a bio-
defense company developing medical countermeasures against
biological and chemical threats, in exchange for the purchase of
common stock and warrants in PharmAthene.
During the year, Panacea Biotec (Europe) AG had been set-up in
Switzerland as step-down WOS company of Panacea Biotec
(International) SA with its main objects of manufacture,
marketing and/or import/ export of pharmaceutical
formulations, vaccines and other products.
Joint Ventures & Associates
Chiron Panacea Vaccines Pvt. Ltd.: Your Company’s Joint
Venture Company (JV Company), Chiron Panacea Vaccines Pvt.
Ltd. (“CPV”), was incorporated in fiscal 2005 in India with Chiron
Vaccines Holding Srl., Italy (now Novartis Vaccines and
Diagnostics), a division of Novartis, the world’s fifth largest
vaccines manufacturer, for marketing of innovative combination
and other vaccines in India. The Company has invested Rs.23.0
million in CPV for a 50% equity stake.
CPV has a strong portfolio of vaccines including the Company’s
innovative fully-liquid pediatric combination vaccines Easyfive &
Easyfour, PolProtec (enhanced Injectable Polio Vaccine) and
PrimOpol (Triavalent Oral Poliomyelitis Vaccine). Polprotec has
captured 28% market share in its category within a short span of
two years since its launch. CPV achieved a turnover of Rs.559.2
million and net profit of Rs.33.4 million during the year under
review as compared to turnover of Rs.538.4 million and net
profit of Rs.41.6 million during previous year and commands a
significant market share in the pediatric combination vaccines
segment in India.
PanEra Biotec Private Limited: Your Company’s associate
Company, PanEra Biotec Pvt. Ltd. (PanEra) is continuing to meet
the Company’s requirement of bulk vaccines and antigens for
the manufacture of Hepatitis B and Combination Vaccines by
the Company. PanEra has become a specialized company

42
focused on bulk manufacture of vaccines and plans to venture
into new products and technologies. It has also launched its
web-site namely www.panerabiotec.com.
Collaborations and Tie-ups
Apart from the above, Panacea Biotec has important business
relationships with various research institutes, academic
universities & commercial corporations, including:
National Institute of Immunology, India: The Company has an
exclusive ten-year license agreement with National Institute of
Immunology, India for in-licensing of technology and processes
for production of tissue culture derived formalin inactivated,
Japanese encephalitis vaccine. The technology has been further
modified significantly at our research center to yield a
commercially viable and safer vaccine.
Biotech Consortium India Ltd.: The Company has a ten-year
in-licensing arrangement with Biotech Consortium India Ltd. for
the development, manufacture and marketing of anthrax
vaccine developed by Jawahar Lal Nehru University, India. Phase
I/IIa of human trials have been successfully completed, the
Company has plans to submit an IND application to US FDA for
performing Phase IIb clinical trial in India. After successful Phase
IIb trials in India, the Company plans to perform Phase III clinical
trials in US for supplying the anthrax vaccine to the U.S.
Government under Emergency Use Authorisation.
National Institutes of Health (NIH), U.S.: The Company has an
in-licensing arrangement with NIH, USA, for use of a peptide-
based product for generation of hair follicles and hair growth for
alopecia (hair loss) management.
Dr. Reddy’s Laboratories Ltd.: The Company has a License and
Supply Agreement with Dr. Reddy’s for the supply of its
patented product, Nimesulide Injection, for marketing in India.
The Company has another License and Supply Agreement with
Dr. Reddy’s for another patented product, Nimesulide
Transdermal Gel, for marketing, distribution and sale in Russian
Federatio n.
Nederlands Vaccine Institute (NVI), Netherlands: The
Company has an agreement with NVI for manufacturing and
marketing of Inactivated Polio Vaccine (PolProtec) in global
markets except Netherlands, Denmark, Norway, Finland and
South Korea.
National Research Development Corporation (NRDC), India:
The Company has in-licensing arrangement with NRDC for
manufacturing the Foot and Mouth Disease (FMD) Vaccine
developed by Indian Veterinary Research Institute (IVRI).
PT BioFarma, Indonesia: The Company has an agreement with
PT BioFarma, Indonesia to manufacture & market the Measles
Vaccine and plans to supply the vaccine to UNICEF, PAHO and
CIS, African, LATAM and Asian Countries in furtherance to Global
Measles Reduction Strategy of WHO and UNICEF.
Punjab University, Chandigarh: The Company has a MoU with
Punjab University, Chandigarh for a Drug Discovery Project to
identify lead molecules with an aim to bring a New Chemical
Entity (NCE) superior to existing marketed products in the
therapeutic area of Psychiatric Disorders. Panacea Biotec will
undertake their preclinical and clinical development leading to
their launch worldwide.
Tree Plantation by Strategic Partner in New Zealand,at Pharmaceutical Formulation Facility at Baddi

43
Panacea Biotec|Annual Report 2009-10
Financial Performance
Summarised Balance Sheet
(Rs. in million)
Particulars As at March 31, As at March 31,
2010 2009
Sources of Funds:
Shareholders Funds 6,965.0 6,151.5
Loan Funds 7,054.4 7,002.9
Deferred Tax Liability 708.9 333.8
FCMITDA* 16.8 -
Total Liabilities 14,745.1 13,488.2
Application of Funds:
Net Fixed Assets 6,946.6 6,938.7
Investments 2,258.3 2,165.7
FCMITDA* - 96.0
Net Current Assets 5,538.2 4,284.2
Miscellaneous Expenses not 2.0 3.6
written off
Total Assets 14,745.1 13,488.2
(*Foreign Currency Monetary Item Translation Difference Account)
Net Worth: The Net Worth of your Company has increased to
Rs.6,963.0 million during the year under review from Rs.6,147.8
million as at the end of previous year registering an increase of
around 13.3%.
Loan Funds: The total loan funds as at 31st March, 2010, has
marginally increased to Rs.7,054.4 million as against Rs.7,002.9
million mainly on account of the working capital loans and a
soft loan of Rs.30.0 million received from Government of India
under Biotechnology Industrial Partnership Programme (BIPP)
for swine flu (H1N1) vaccine development project.
Deferred Tax Liability: The deferred tax liability has increased
to Rs.708.9 million as at the end of fiscal 2010 as compared to
Rs.333.8 million as at the end of the previous year.
Fixed Assets: The net fixed assets have grown to Rs.6,946.6
million as against Rs.6,938.7 million as at the end of the previous
year on account of capital expenditure on ongoing expansion/
new projects and de-capitalization of forex exchange gains as
per option given by the Companies (Accounting Standards)
Amendment Rules, 2009.
Investments: The investments have increased to Rs. 2,258.3
million from Rs. 2,165.7 million as at the end of previous year
primarily on account of investment of Rs. 90.3 million in its
subsidiary Umkal Medical Institute Pvt. Ltd. to finance the
Company’s foray in healthcare industry and Rs. 2.3 million in its
WOS Panacea Biotec Inc., USA.
Net Current Assets: The Company’s net current assets have
improved to Rs.5,538.2 million as against Rs. 4,284.2 million as at
the end of previous financial year. The inventories have
increased to Rs.4,555.1 million from Rs.4,478.0 million and the
inventories to net turnover ratio decreased marginally to 52%
from 58% during previous year. The receivables decreased to
Rs.1,094.1 million as against Rs.1,238.8 million as at the end of
previous financial year and the receivables to net turnover ratio
decreased to 12% from 16% during previous year. The Cash and
bank balances declined to Rs.363.4 million as against Rs.594.8
million as at the end of previous financial year. Other current
assets increased marginally to Rs.1,391.4 million as against
Rs.1,358.2 million as at the end of the previous year.
The current liabilities decreased to Rs.1,382.2 million as
compared to Rs.1,528.1 million as at the end of previous
financial year. Decrease in current liabilities is mainly on account
of decrease in amount payable to vendors for vaccines raw
material. The Provisions decreased to Rs.483.5 million as against
Rs.1,857.5 million mainly on account of decrease in provision for
Open Derivative Contracts to Rs.356.9 million as compared to
Rs.1,743.1 million as at the end of previous financial year.
Summarized Profit & Loss Account
(Rs. in million)
Particulars For the year ended
31.03.2010 31.03.2009
Net Turnover 8,843.7 7,734.2
Other Operating Income 172.1 30.9
Total Income 9,015.8 7,765.1
Materials & Finished Goods 4,680.22,660.9
Purchases
Operating & Other Expenses 863.9 806.4
Personnel Expenses 990.2 916.1
Selling & Distribution Expenses 396.7 434.5
Research & Development 577.2500.9
Expenses (Excl. Depreciation)
Misc. Expenses written off 1.7 1.7
Earnings Before Interest, 1,505.92,444.6
Depreciation, Taxes &
Amortization (EBITDA)
Foreign Exchange Fluctuation Loss - 2,260.4
Financial Expenses 423.4 347.4
Depreciation / Amortization 664.5 705.1
Other Income 762.8 228.8
Provision for impairment - 284.2
Profit/ (Loss) Before Tax (PBT) 1,180.8 (923.7)
Provision for Taxes
(including deferred tax) 380.6 (233.2)
Profit/(Loss) After Tax (PAT) 800.2 (690.5)

44
The Vaccine sales to JV company for domestic market has
increased marginally to Rs.243.5 million as against Rs.243.3
million during fiscal 2009. Despite having pricing pressure from
entry of generic players, the JV company continued to grow and
maintained leadership position in the pediatric combination
vaccines segment.
Pharmaceutical formulations: The pharmaceutical
formulations segment’s turnover grew by 6% and contributed
Rs.2,398.8 million or 27.1% of net turnover during fiscal 2010, as
compared to Rs.2,262.3 million or 29.2% of the net turnover for
fiscal 2009.
In the pharmaceutical formulations segment, the domestic net
turnover increased by 14.5% to Rs. 2,077.7 million during fiscal
2010 from Rs.1,815.3 million during fiscal 2009. The export
turnover of formulations was Rs. 292.9 million during fiscal 2010
as against Rs. 426.0 million during fiscal 2009.
The following table sets forth the Company’s gross turnover(inclusive of excise duty but exclusive of income from contractmanufacturing activities) from pharmaceutical formulations invarious categories:
Turnover: The Company has achieved a net turnover of
Rs.8,843.7 million during financial year 2009-10 as compared to
Rs.7,734.2 million during financial year 2008-09 registering a
growth of 14%. The increase in net turnover is mainly on
account of higher sales of Easyfive vaccines. This has enabled
the Company to reduce the reliance on oral polio vaccine with
the enhanced performance of other vaccines and
pharmaceutical formulation products.
Segment-wise Turnover
Fiscal 2010 2009
Rs. Million % Rs. Million %
Vaccines 6,443.9 72.8 5,470.2 70.7
Pharmaceutical
Formulations* 2,398.8 27.1 2,262.3 29.2
Research &
Development 1.0 0.1 1.7 0.1
Total 8,843.7 100.0 7,734.2 100.0
(*Net of excise duty of Rs.7.9 million and Rs.18.8 million during fiscal 2010 & 2009,
respectively.)
Vaccines: In fiscal 2010, the Vaccines segment’s turnover grew
by 18% and contributed Rs.6,443.9 million or 72.8% of net
turnover, as compared to Rs.5,470.2 or 70.7% of net turnover for
fiscal 2009.
The institutional vaccine business contributed Rs.6,198.8 million
as against Rs.5,186.9 million during the fiscal 2009, registering a
growth of 19.5%. This increase is mainly on account of higher
sales of Easyfive vaccines.

Fiscal 2010 2009
Rs. Million % Rs. Million %
Pain Management 481.4 20 397.9 18
Diabetes & Cardiovascular
Management 682.1 29 619.6 28
Renal Disease Management 582.1 24 658.6 30
Oncology 96.0 4 45.0 2
Anti-Osteoporosis 64.2 3 144.9 7
Anti-Tubercular 67.9 3 50.7 2
Gastro-Intestinal &
Constipation 216.8 9 127.6 6
Other Segments 188.1 8 172.9 7
Total 2,378.5 100 2,217.2 100
Expenditures:
Materials & Finished Goods Purchases: The raw and packing
materials and finished goods purchases during the year under
review has increased by 75.9% at Rs.4,680.2 million as against
Rs.2,660.9 million during the previous financial year. In view of
increase in material consumption mainly on account of change
in product mix and increase in overages, the materials
consumption ratio as a percentage to net turnover has
increased to 52.9% from 34.4% during previous year.
Operating & Other Expenses: The operating & other expenses
increased by 7.1% to Rs.863.9 million for fiscal 2010 from
Rs.806.4 million for fiscal 2009. As a percentage of net turnover,
the said expenses marginally decreased to 9.8% in fiscal 2010
from 10.4% in fiscal 2009.
Personnel Expenses: The personnel expenses increased by 8.1%
to Rs.990.2 million for fiscal 2010 from Rs.916.1 million for fiscal
2009. As a percentage of net turnover, these expenses marginally
decreased to 11.2% in fiscal 2010 from 11.8% in fiscal 2009.
Selling & Distribution Expenses: The selling & distribution
expenses decreased by 8.7% to Rs.396.7 million for fiscal 2010
from Rs.434.5 million for fiscal 2009. As a percentage of net
turnover, these expenses decreased to 4.5% in fiscal 2010 from
5.6% in fiscal 2009.
Research & Development (R&D) Expenses: The R&D expenses,
excluding depreciation on R&D assets, increased by 15.2% to
Rs.577.2 million for fiscal 2010 as against Rs.500.9 million for
fiscal 2009. The increase is mainly on account of expenses
related to research & analysis and increase in personnel cost of
R&D Centers. During the year under review, depreciation on
R&D assets increased by 4.1% at Rs.175.9 million as against
Rs.169.0 million during previous financial year. Total R&D
expenses (including depreciation) increased to 12.4% of net
turnover during fiscal 2010 as against 8.7% during previous year.
Interest: Interest charges increased to Rs.382.7 million during
fiscal 2010 as against Rs.321.1 million during fiscal 2009. The
increase in interest charges is attributable to overall increase in
interest rates, higher utilization of borrowed funds on account of
Foreign Currency Loan and utilization of increased working capital
limits from Banks. As a percentage of net turnover, the interest
charges marginally increased to 4.3% from 4.1% in fiscal 2009.
Finance & Miscellaneous Charges: Finance and miscellaneous
charges increased to Rs.42.5 million during fiscal 2010 from
Rs.28.0 million during fiscal 2009. As a percentage of net
turnover, these expenses were at 0.5%.
Depreciation: Depreciation decreased by 5.75% to Rs.664.5
million as compared to Rs.705.1 million during fiscal 2009
mainly due to de-capitalization of exchange fluctuation gains in
terms of the Companies (Accounting Standards) Amendment
Rules, 2009. Depreciation as a percentage of net turnover
decreased to 7.5% in fiscal 2010 from 9.1% in fiscal 2009.
Panacea Biotec|Annual Report 2009-10

46
Profitability
Earnings Before Interest, Tax, Depreciation & Amortizations
(EBITDA): The Company registered EBITDA of Rs.1,505.9 million
for fiscal 2010 as compared to Rs.2,444.6 million for fiscal 2009.
The EBITDA margin was 17% during fiscal 2010 as against 31.6%
during fiscal 2009 mainly on account of change in product mix
and increase in overages.
Profit/(Loss) Before Tax (PBT): The Company earned a profit
before tax of Rs.1,180.8 million for fiscal 2010 as against loss of
Rs.923.7 million for fiscal 2009.
Profit/(Loss) After Tax (PAT): The PAT was Rs.800.2 million for
fiscal year 2010 against negative PAT of Rs.690.5 million for fiscal
2009.
Earning per Share (EPS): The basic EPS and diluted EPS stood at
Rs.12.0 and Rs.11.2 per share of Re.1, respectively, as compared
to negative EPS of Rs.10.35 per share, for the fiscal 2009.
Cash Flow Statement
The following table summarizes our statements of cash flows:
(Rs. in million)
Cash Flows from: Fiscal 2010 Fiscal 2009
Operating Cash Profit 738.8 1,917.7
Changes in Working Capital 127.2 (1,632.6)
Net Direct Taxes Paid (108.6) (235.2)
Operating Activities 757.4 49.9
Investing Activities (1,216.8) (1,261.9)
Financing Activities 305.2 1,571.3
Net Cash Flows (154.2) 359.3
Cash Flow from Operating Activities: The operating cash
profits decreased by 61.5% during fiscal 2010 to Rs.738.8 million
as compared to Rs.1,917.7 million during fiscal 2009. The net
cash flow from operating activities increased 1,417% during
fiscal 2010 primarily on account of increase in inventories and
decline in trade and other receivables and current liabilities.
Cash Flow from Investing Activities: Net cash used in
investing activities amounted to Rs.1,216.8 million as primarily
used for acquiring fixed assets for various ongoing expansion/
new projects and loans/ investment in subsidiaries during the
year under review.
Cash Flow from Financing Activities: The Cash Flow from
Financial Activities had declined by 80.5% to Rs.305.2 million,
which basically consists of funds raised by way of long term/
working capital loans to fund various ongoing projects/working
capital requirement.
Consolidated Financial Statements:
The consolidated net turnover of the Company as a group has
increased to Rs.9,001.5 million during financial year 2009-10 as
compared to Rs.7,881.7 million during financial year 2008-09
registering a growth of 14%. The consolidated EBITDA was
Rs.2,401.5 million for fiscal 2010 as compared to Rs.2,473.0
million for fiscal 2009. On consolidated basis, the Company
earned profit before tax of Rs.1,127.7 million for fiscal 2010 as
against loss before tax of Rs.866.7 million for fiscal 2009. The
consolidated PAT was Rs.724.1 million for fiscal year 2010
against negative of Rs.659.9 million for fiscal 2009.
The consolidated net turnover of theCompany as a group has increased toRs.9,001.5 million during financial year2009-10 as compared to Rs.7,881.7million during financial year 2008-09registering a growth of 14%.

47
Panacea Biotec|Annual Report 2009-10
Opportunities and Outlook
India accounts for over one-third of Drug Master Files (DMFs) inbiggest market, viz. US and ranks 2nd in approved AbbreviatedNew Drug Applications (ANDAs) with a major share of 30% oftotal approvals in U.S. India has the highest number of U.S. FDAapproved plans outside the U.S. Despite all hue and cries aboutfinancial turmoil across the globe in recent times, IndianContract Research and Manufacturers (CRAMs) with their readyinfrastructure and R&D capability in hand stands strong todeliver better growth.
SWOT Analysis
Strengths:
Cost competitiveness.
Well Developed industry with strong manufacturing base.
Third largest English speaking scientific and technicalmanpower in the world.
Strong research & development focus and portfolio ofpatented products.
A brand focused model.
Strong marketing and distribution network and presencein major markets.
Weakness:
Highly fragmented industry.
Low investments in innovative R&D.
High Price Regulation.
Production of spurious and low quality drugs.
Strong linkages between industry and academia is lacking.
Opportunities:
Significant export potential in regulated as well asemerging geographical markets.
Huge unmet need for medication.
Increased expenditure on healthcare due to inter-alia, India
being the world’s second most populous country, increased
disposable income, the ageing population, emergence of
“life-style” drugs, a shift to newer and more expensive drugs,
an increase in therapeutic coverage (i.e. new drugs for
diseases that previously could not be treated).
Increased penetration of the health insurance sector.
Edge in CRAMs due to unmatched cost competitiveness
with lower cost of infrastructure and skilled manpower &
vertical integration.
Marketing alliances with MNCs to sell their products in
domestic market.
Potential for developing India as a centre for international
clinical trials.
Niche player in global pharmaceutical R&D.
Innovation in Biotechnology.
Rapidly increasing global population of seniors and obese
patients leading to higher risks for cardiovascular diseases,
certain types of cancer, diabetes and arthritis.
Over 150 countries, including 65 GAVI countries, have
introduced Hib vaccine or have applied for GAVI funding
for Hib vaccine.
Global demand of pandemic as well as universal flu vaccine.
Huge potential of pediatric combination vaccines in U.S.,
Europe & Emerging markets.
Rising per-capita income coupled with increasing
awareness in most of the developing countries.
Threats, Risks and Concerns:
Risks, challenges and threats are inherent in any type of industry
and needs to be mitigated through well planned strategies. The
major risks associated to the industry as a whole are as under:
Global recession – The recent global recession has resulted
in lower investments both in existing business and new
drug research. However, this has not impacted your
Company much.
Pricing pressure imposed by Government of India.
Foreign Exchange fluctuations due to the unprecedented
international currency imbalances in the aftermath of the
global financial crisis.
Increased competition from low cost manufacturing base
such as China, Korea and Taiwan.
FDA Compliance - Rising audit burdens, inspections and
fines.
Risk of Product failure.
Strong lobbying by MNC players.
Risk of IPR challenges.
Apart from the above, there are a few risk factors that are relevant
to the Company’s operations and business. While the Company
takes effective measures to minimize or eliminate the impact of
these risks on its business performance, they nonetheless exist.
Some such risks, challenges or threats are outlined below:
The Company operates in a highly regulated industry and
must comply with a broad range of dynamic regulatory
controls.
In an industry where R&D is of critical importance, the
Company faces a risk of all R&D initiatives not leading to
commercially viable and successful products.
Patent challenges or delay in receipt of regulatory

48
approvals could delay product launch in
key markets.
Failure to obtain regulatory approval for
new drugs under development could affect
long term business opportunities.
The Company has several joint ventures and
collaborations with varied partners. Any adverse
developments in such JVs and collaborations may
impact the Company.
The Company also faces competition from other players
in the industry.
Delay in approvals from regulatory agencies in various
international markets.
Other risks include rise in input costs, rise in interest rates,
loss of key personnel, exchange rate fluctuations,
environmental liabilities, tax laws, litigations, labour
relations and significant changes in the global political and
economic environment.
The Company is strategically positionedto create sustainable competitiveadvantage through Innovation.
The Company’s key growth drivers are as under:
Short-term < 2 years
Global launch of a NCE of herbal origin in GI segment.
Launch of Vaccine for Swine flu (H1N1) and seasonal flu.
Launch of organ transplantation products in ICH regions
and key emerging markets.
Launch of drug delivery based products in anti-cancer,
CVD, GI and Pain Management therapeutic segments in
key markets across the world.
Diversification in related healthcare segment.
Medium-term 2-5 years
Launch of new IPV based combination and other Vaccines
currently under development for pediatric and adults.
Supply of anti-TB and ARV products to WHO/UNICEF.
Launch of biosimilars
Long-term > 5 years
Global Launch of NCEs and NBEs.
Potential supply of Anthrax Vaccine to US for national
stockpiling program.
Expansion of healthcare segment.
In addition to above identified growth factors, the Company
will continue to explore in-licensing of technologies and
products from national/ international research agencies/
institutions to fasten its growth strategy.
Way Forward
With the inherent strengths of Indian economy, medicines
becoming almost a necessity and Indian drug companies being
generic manufacturers, export growth is unlikely to fall.
Domestic growth is expected to remain healthy especially with
the Government expected to open more `Jan Aushadhis’ (a new
low-priced medicine store chain). The outbreak of Swine Flu is
also expected to aid the sales growth of Indian drug companies.
Further, this industry has witnessed a tremendous growth in
consumer spending on healthcare and is expected to continue
the same. There is no doubt about the capacity of Indian
pharmaceutical sector in taking the big leap forward. Therefore,
with the rise in disposable income, tremendous growth in
exports, edge in CRAMS, stunning interest of global investors in
Indian pharma and large number of USFDA approved plants,
Indian pharmaceuticals industry’s growth potential is vast.
Future Growth Drivers
Panacea Biotec aims to become a leading global research based
health management company with an established leadership in
niche therapeutic areas and aims to become the world’s
greatest, largest and most admired Biotechnology Company by
2020. The Company is strategically positioned to create
sustainable competitive advantage through Innovation
(Incremental & Disruptive). Innovation & Global Brand building
is a distinctive position the Company has acquired. The
Company has well laid strategy for its future growth with clearly
identified growth drivers to sustain and boost its revenues and
profitability over the short, medium to long term.
Brainstorming Session on Vision 2020

49
Corporate Social Responsibility
Safety, Health and Environment Protection
Panacea Biotec undertakes all its operations with a high concernfor safety, health and environment and is committed tomaintaining high standards in these areas. Substantialinvestments have been made in setting up Effluent TreatmentPlants and in developing a “Green Belt” and green landscapingat the manufacturing sites at Lalru & Baddi to prevent possibleadverse environmental impact on the community.
The vaccine R&D facility has been created with classifiedlaboratories including BL-3 facility for carrying out certain R&Dactivities which require containment. All personnel working inR&D are vaccinated as per the Vaccination Policy. Bio-waste isdisposed off as per the bio-waste management system. All thebio-safety measures are periodically reviewed by the Bio-safetyCommittee.
The Company has installed Modern Fire Hydrant System withsprinkler system and smoke detection & sensing devices at its allmajor facilities, for an early detection and extinguishing ofaccidental fire. Surprise mock fire-fighting drills are alsoundertaken to create awareness amongst the employees tomeet any challenge which may arise out of such incidents.Regular training is also provided to the Company’s employeesabout the importance of safety in day-to-day life in general andwork in particular. The integration of environment friendlymeasures and cleaner production practices in the businessprocess has resulted in better efficiency of operations.
Panacea Biotec undertakes all itsoperations with a high concern forsafety, health and environment and iscommitted to maintaining highstandards in these areas.
Panacea Biotec|Annual Report 2009-10
Donation of life saving drugs to hospitals as per their need.
Transplant Fortnight - Patient awareness activities spreadacross India covering 72 Organ Transplant centers anddrawing more than 3500 patients. Major emphasis hasbeen on ways and means to improve the post-transplantlife of transplant recipients
Organized a symposium on “Challenges in Prevention andManagement of Dengue” at Delhi, with a view to provide aglobal snap shot of Dengue to the medical fraternity andfacilitate deep insights about prevention and managementof Dengue.
Organized various renal function detection camps as partof the awareness towards prevention of Chronic KidneyDisease on World Kidney Day.
Vigorously involved in spreading awareness andfacilitating detection for diabetes and neuropathiccomplications of diabetes through regular diabetesdetection and neuropathy screening initiatives.
Use of BMD machines to conduct highly subsidized tests tomeasure bone mineral density of patients for facilitatingearly diagnosis of osteoporosis, which not only has a hugemorbidity burden but also is a leading cause of death inolder patients due to hip fractures. In last 12 months,Panacea Biotec has screened more than 1 lakh patients.
On the occasion of ‘World Piles Day‘ on November 20th,and on 20th May, 20th Aug, 20th Feb, the Companyconducted 520 Piles Detection Camps across geographiesin India with a view to facilitate piles detection across allstrata of patient population and to bring awareness forpiles, which is highly under diagnosed in India.
One of the first Indian companies to successfully run amonth long Breast Cancer Awareness Program to createawareness on Importance of Early Detection in BreastCancer.
To keep pace with the rapidly advancing field of Oncology,3 therapy specific symposiums were conducted on BreastCancer, Lung Cancer and Radiation Oncology.
Indian Diabetes Guidelines, an academic initiative hasbeen taken, with primary focus to prevent and cureDiabetes and improve the life of all people affected byDiabetes.
DHRUVARSITY: An innovative step of conducting“DHRUVARSITY - Workshop in Cardiology” in order todisseminate expert knowledge in cardiology field.
CONTROL: An initiative with the help of Elsevier toformulate guidelines relevant for Indian population basedon the pattern for Dyslipidaemia – Abnormal lipid contentin the body which is different in different parts of theworld.
Hepatitis B Immunization Camp: Striding towards its Vision2020 of becoming the “Greatest, Largest and the most
Social Responsibility
Panacea Biotec works closely towards the development ofsociety, in line with its philosophy of creating happier andhealthier society. Health, education, disaster relief and patientawareness have been identified as the areas of priority. Theemphasis has been to provide assistance on a need basis, andthat too, assistance at a local level. The Company also regularlyprovides financial assistance/ sponsorship for pursuing postgraduates/ doctorate studies and carrying out Research Projectsbeing undertaken by Research Associates in various Institutes &Universities.
The Company regularly takes initiatives towards fulfilling itscorporate social responsibility including:

50
Admired Biotechnology Company by the year 2020”, theCompany initiated a series of activities to bring health andhygiene in the nearby society. As a step towards the goalof bringing health hygiene to people around, the HepatitisB immunization camp was successfully organised underthe aegis of Mohan Cooperative Industrial EstateAssociation and Amrapali Cultural Foundation, a non-profitNGO Delhi in which more than 4,000 denizens wereimmunized.
Doctor’s Day: Continuing the gesture of showing it’sgratitude towards the medical fraternity, the Companywished all the doctors a `Happy Doctor’s Day’ on 1st July2009. Messages of good wishes from the Chairman Mr.Soshil Kumar Jain for the doctors were released throughNewspapers, SMS as well as FM Radio.
The patients were also encouraged to show their gratitudetowards their doctors by wishing them on the occasion.Many doctors responded to the message of the Chairmanby sending e-mails and SMS. This pioneering activity fromPanacea Biotec would strengthen the relationshipbetween the doctors and the people at large.
CHINH: As in the past, during the current year, theCompany continued to support CHINH to make adifference in lives of nomads in foothills of Aravali andbegan a tradition of development that must continue.CHINH is an NGO’s initiative to support Nomadiccommunities in generating livelihood through harnessingtheir traditional wisdom, art and culture. Dedicated tonomads of India, this initiative’s prime focus is helpingfuture generation of nomads in creating space for them incivil society and encouraging them to lead a life of dignity.
People for Animals: As in the past, during the year underreview, the Company continued to support People forAnimals an NGO based at Delhi to bring help and hope tothousands of needy animals around the Country.
Cautionary Note
Certain statements in the “Management Discussion and Analysis”and other sections in the Annual Report are forward-lookingstatements. These statements and expectations envisaged by themanagement are only estimates in nature and are based oncurrent expectations and forecasts about future events. Suchstatements involve known/unknown risks, uncertainties and otherfactors and may cause and defer the actual results materially. Suchfactors include, but are not limited to, changes in local and globaleconomic conditions, the Company’s ability to successfullyimplement its strategies, the market acceptance and demand ofthe Company’s products and services, the Company’s growth rates,expansion, technological changes and the Company’s exposure tomarket risks. By this nature, these indications andforecasts/projections are only estimates and actual results coulddi0er from these in future. The Company does not undertake anyobligation to update forward-looking statements to re2ect eventsor circumstances after the date hereof.
Panacea Biotec works closely towardsthe development of society, in line withits philosophy of creating happier andhealthier society.
Note: As a result of rounding-o0 adjustments, the 1gures/percentages in a column in various sections in the Annual Report may not add up tothe total for such column.
Hepatitis B Immunization Camp

51
Financial Highlights
+Foreign Currency Monetary item Translation Difference Account* Per Equity Share of Re.1.each
Panacea Biotec|Annual Report 2009-10
Particulars 2009-10 2008-09 2007-08 2006-07 2005-06 2004-05 2003-04 2002-03 2001-02 2000-01
Rs. in mn USD mn Rs. in mn
Financial Performance Summary
Net Turnover 8,843.7 197.0 7,734.2 8,304.4 8,315.5 5,363.5 3,255.4 2,616.2 2,691.5 2,739.3 2,176.7
Total Income 9,778.6 217.8 7,993.9 8,676.2 8,615.1 5,434.5 3,309.9 2,686.7 2,733.0 2,763.4 2,251.7
EBITDA 1,506.0 33.5 2,444.6 2,177.6 2,298.8 1,233.8 652.3 389.2 520.5 547.0 480.0
PBT 1,180.8 26.3 (923.7) 1,903.9 2,091.0 1,002.1 429.4 217.6 336.3 406.4 426.1
PAT 800.2 17.8 (690.5) 1,331.7 1,468.1 609.4 300.7 164.5 214.2 249.3 228.8
Cash Accurals 1,095.8 24.4 2,001.4 1,802.2 1,823.2 791.6 463.1 283.2 310.5 314.5 287.6
Balance Sheet Summary
Equity Share Capital 66.8 1.5 66.8 66.8 65.8 57.2 57.2 57.2 57.2 57.2 57.2
Preference Share Capital - - - - - 904.3 904.3 957.8 53.5 63.0 68.0
Reserves & Surplus 6,898.2 153.6 6,084.7 6,905.3 5,325.1 1,546.0 1,192.4 1,039.0 948.1 805.8 701.6
Net Worth 6,963.0 155.1 6,147.9 6,966.7 5,383.9 1,593.6 1,235.1 1,076.9 981.2 839.9 754.5
Loan Funds 7,054.4 157.1 7,002.9 3,982.4 2,134.2 5,866.5 1,610.4 1,680.2 1,292.2 1,060.1 719.8
Deferred Tax Liablity 708.9 15.8 333.8 595.0 383.9 246.8 135.1 74.8 60.6 73.5 -
FCMITDA+ 16.8 0.4 - - - - - - - - -
Total Liabilities 14,745.1 328.4 13,488.2 11,549.5 7,909.0 8,620.9 3,899.3 3,808.9 2,411.6 2,059.6 1,546.6
Net Fixed Assets 6,946.6 154.7 6,938.7 5,343.7 4,136.1 2,337.1 1,376.8 1,054.5 963.0 893.5 565.3
Investments 2,258.3 50.3 2,165.7 2,049.3 229.5 61.4 61.4 39.1 52.6 52.6 47.1
FCMITDA+ - - 96.0 - - - - - - - -
Net Current Assets 5,538.2 123.3 4,284.2 4,151.2 3,536.4 6,212.8 2,446.7 2,696.0 1,371.8 1,090.4 929.9
Miscllaneous Expenditure 2.0 0.0 3.6 5.3 7.0 9.6 14.4 19.3 24.1 23.1 4.3
Total Assets 14,745.1 328.4 13,488.2 11,549.5 7,909.0 8,620.9 3,899.3 3,808.9 2,411.6 2,059.6 1,546.6
Key Performance Indicators
Profitability Ratios
EBITDA Margin 17% 32% 26% 28% 23% 20% 15% 19% 20% 22%
PBT Margin 13% -12% 23% 25% 19% 13% 8% 12% 15% 20%
PAT Margin 9% -9% 16% 18% 11% 9% 6% 8% 9% 11%
Shareholders Related Ratios
Equity Dividend 25.0% - 100% 100% 100% 150% 100% 100% 100% 100%
EPS (Basic)* (In Rs.) 12.0 (10.3) 20.1 23.7 9.9 4.4 2.7 3.6 4.2 3.8
Cash EPS (Basic)* (In Rs.) 31.1 30.0 27.0 29.5 13.1 7.2 4.8 5.3 5.4 4.9
Book Value* (In Rs.) 104.2 92.1 104.3 81.9 27.9 21.6 18.8 17.2 14.7 13.2
Return on Net Worth 11% -11% 19% 27% 35% 19% 14% 20% 29% 28%
Other Ratios
Current Ratios 1.9 1.6 2.8 3.0 2.8 1.4 1.7 1.3 1.3 1.3
Debt Equity Ratio 0.7 0.9 0.5 0.4 2.9 0.3 0.5 0.4 0.4 0.1
Return on Capital Employed 16% -6% 13% 20% 8% 10% 8% 14% 17% 19%
Interest Coverage Ratio 5.9 7.6 18.7 15.1 10.4 6.6 3.2 4.0 5.5 6.8
Debt Service Coverage Ratio 5.7 7.2 16.2 6.8 4.1 2.3 1.6 2.8 3.5 1.8

52
Performance Highlights and Growth
Growth in Profitability
1999-2000
259329 413
2004-2005
301
429
652
2009-2010
800
1,181
1,506
Gross Turnover
1999-2000
1,866
2004-2005
3,255
2009-2010
8,844
Rs. in million Rs. in million
PAT
EPS, CEPS & Book Value
1999-2000
4.4 4.9
2004-2005
4.4
7.2
2009-2010
12.0
31.1
Growing Net Worth
1999-2000
603
2004-2005
1,235
2009-2010
6,963
Growing investment in R&D
1999-2000
3888
2004-2005
116 84
2009-2010
577
808
Growing Asset Base
1999-2000
408
2004-2005
1,377
2009-2010
6,947
126
200 231
Amount in Rs. Rs. in million
Rs. in million Rs. in million
*Graphs not to scale
PBT EBIDTA
Revenue Capital TOTAL
10.621.6
104.2
EPS CASH EPS BOOK VALUE

Dear Members,
Backed by strong credentials and expanding footprints, theCompany has reported excellent business and operationalperformance during the fiscal 2009-10.
Your Directors have pleasure in presenting here the 26th AnnualReport on business and operations, along with the auditedstandalone and consolidated financial accounts and the auditors’report thereon for the financial year ended March 31, 2010. Thefinancial highlights for the year under review are given below:
FINANCIAL RESULTS
OPERATING RESULTS AND PROFITS
The exemplary performance of the Company is manifest in the
numbers posted for the year under review. During the year ended
March 31, 2010, the Company registered a record net turnover of
Rs.8,843.7 million as against Rs.7,734.2 million during the
corresponding previous financial year, a growth of 14%. The
(Rs. in million)
Particulars For the For theyear ended year ended
March 31, 2010 March 31, 2009
Net Turnover 8,843.7 7,734.2Other Income 934.9 259.7Total Income 9,778.6 7,993.9Profit before Interest,Depreciation, Exceptionalitems & Tax (EBITDA) 1,506.0 2,444.6Financial Expenses 423.4 347.4Depreciation 664.5 705.1Unrealized Foreign ExchangeFluctuation Loss - 1,750.7Profit/(Loss) beforeExceptional items & Tax 1,180.8 (639.5)Exceptional Item - 284.2Profit/(Loss) before Tax (PBT) 1,180.8 (923.7)Provision for Taxation (380.6) (233.2)Profit/(Loss) after Tax (PAT) 800.2 (690.5)Dividend proposed onEquity Shares 16.7 -Tax on Dividend 2.8 -Transfer to General Reserve 80.0 -Balance in Profit & Loss Account 2,855.8 2,155.2Basic EPS (Rs.)* 12.0 (10.3)Cash EPS (Rs.)* 31.1 30.0Book Value per Share (Rs.)* 104.2 92.1Dividend per Equity Shares (Rs.) 0.25 -
* Face value Re.1/- per share
DIRECTORS’ REPORT
Company registered EBITDA of Rs.1,506.0 million as compared toRs.2,444.6 million during the corresponding previous financial year.The PBT and PAT for the year under review grew to stand atRs.1,180.8 million and Rs.800.2 million respectively, as compared tothe negative PBT and PAT at Rs.923.7 million and Rs.690.5 millionrespectively in the previous fiscal.
This growth was recorded across our business segments, with thedomestic pharmaceutical formulations segment growing by 14%.The Formulations Segment registered net turnover of Rs.2,398.8million as compared to Rs.2,262.3 million during the previousfinancial year. The Vaccines Segment grew by 18% and registerednet turnover of Rs.6,443.9 million as against Rs.5,470.2 millionduring previous financial year.
Your Company strives to remain globally and regionally attractive tocustomers and investors by continuing to focus on sustainedgrowth, cost optimization and efficient management of workingcapital. These strategic initiatives are continually fueling theCompany’s growth across its business operations.
A detailed discussion on operations for the year ended March 31,2010 is given in the Management Discussion and Analysis section.
DIVIDEND
The Directors are pleased to recommend a dividend of Re.0.25(25%) per share on Equity Share Capital of the Company for thefinancial year 2009-10.
The Company has made a provision for dividend in the books ofaccounts on the Equity Share Capital as at the date of the BoardMeeting for approval of Financial Statements. The Company isobliged to pay dividend to those bond holders who convert theirbonds into Equity Shares after approval of the financial statementsby the Board of Directors and upto the book closure date fordividend purposes. Incremental dividend, if any, and dividenddistribution tax thereon will be paid out of the balance available inthe Profit & Loss Account.
The dividend on Equity Shares is placed before you for approval atthe ensuing Annual General Meeting and, if approved, will absorban amount of Rs.16.7 million. However, the amount of dividend onEquity Shares may increase in case any bonds are converted intoEquity Shares before the book closure date. On the other hand, suchamount may also decrease due to buyback of Equity Shares, if any,in terms of the proposed scheme of buyback before the bookclosure date.
Pursuant to the provisions of Section 205A(5) of the Companies Act,1956 (“the Act”), dividend for the year 2001-02, which remainedunpaid or unclaimed for a period of 7 years, amounting toRs.122,880 has been transferred by the Company to the CentralGovernment’s Investors Education and Protection Fund.
53
Panacea Biotec|Annual Report 2009-10

54
TRANSFER TO RESERVES
An amount of Rs.80.0 million is proposed to be transferred to thegeneral reserves of the Company out of the profits of the Companyfor the year.
SHARE CAPITAL
The Issued & Subscribed Equity Share Capital of the Companyremained unchanged at Rs.66.8 million, consisting of 66,842,746Equity Shares of Re.1 each.
During the year under review, 149,000 forfeited Equity Shares ofthe Company, which were earlier re-issued and held in the nameof the Company’s employees as nominees/trustees, were soldduring the year in the open market for Rs.29.9 million, out of whichRs.29.8 million has been credited in the Securities PremiumAccount. As a result, the paid-up Equity Share Capital of theCompany stands increased from 66.7 million to Rs.66.8 million,consisting of 66,842,746 Equity Shares of Re.1 each.
BUYBACK OF SHARES
In a strategic measure, as approved by the shareholders, theCompany has decided to purchase its Equity Shares upto 5,592,000Equity Shares at a price not exceeding Rs.229 per share, with thetotal aggregate amount to be expended not to exceed Rs.1,280.6million, from the existing holders of Equity Shares other than thePromoters, Persons who are in control of the Company andPromoter Group, through the methodology of Open marketpurchases through stock exchanges using the electronic tradingfacilities of the Bombay Stock Exchange Limited (“BSE”) and theNational Stock Exchange of India Limited (“NSE”).
The exemption from SEBI under regulation 4(2) read withregulation 3(1)(l) of SEBI (Substantial Acquisition & Takeover)Regulations, 1997 has been obtained. The Buyback is slated tocommence w.e.f. 21st July, 2010.
FOREX IMPACT
As per advice of its Bankers, the Company signed two derivativedocuments dated 24th October, 2007 and 21st January, 2008 withan exposure of US$ 4.0 million and US$ 3.0 million per month,and which are expiring in October, 2010 and January, 2011respectively.
The advice given and the representations made by the Bank haveturned out to be not correct with the result the Company suffereda direct loss of Rs. 730.7 Million during the year. The cumulativelosses till the end of the year under review have been Rs.1,226.1million, which have further increased to Rs.1,365.5 million till 30thJune, 2010.
In addition to the said direct losses, the Company has also sufferedconsequential losses on account of interest accrued on actuallosses, additional interest charged by Banks on FCNR B Loans andnon-hedging of future obligations including for imports, etc., andother consequential losses, which are being quantified.
As there seems to have been more than meets the eye, the matteris being investigated and once the investigations are complete, thecompany will take up the matter with the bank to see how thelosses suffered by the Company can be made good, and if soadvised, the Company may take such other steps in this behalf asare considered appropriate.
But for the above direct losses during the year, and in thecircumstances aforesaid, the Company has earned a Profit after Taxof Rs.801.8 million during the fiscal 2010. Had the Company notbeen a victim of the derivatives, the net worth of the Companywould have been increased by Rs.1,226.1 million as at 31st March,2010.
REPORT ON CORPORATE GOVERNANCE
An organization’s Corporate Governance philosophy is directlylinked to its excellence in performance. Keeping this importantdictum in view, your Company has always placed major thrust onmanaging its affairs with diligence, transparency, responsibility andaccountability.
The Company is committed to adopting and adhering to the bestcorporate governance practices recognized globally. The Companyunderstands and respects its fiduciary role and responsibilitytowards stakeholders and the society at large, and strives hard toserve their interests, resulting in creation of value and wealth for allstakeholders at all times.
The compliance report on Corporate Governance and a certificatefrom M/s. Dass Gupta & Associates, Chartered Accountantsregarding compliance of the conditions of Corporate Governance,as stipulated under Clause 49 of the Listing Agreement with theStock Exchanges, is attached herewith and forms part of this AnnualReport.
Certificate from Managing Director and Chief Financial Officer, inter-alia, confirming the correctness of the financial statements,compliance with Company’s Code of Conduct, adequacy of theInternal Control measures and reporting of matters to the AuditCommittee in terms of Clause 49 of the Listing Agreement with theStock Exchanges, is also enclosed as a part of the Annual Report.
MANAGEMENT DISCUSSION & ANALYSIS REPORT
As required by Clause 49 of the Listing Agreement with the StockExchanges, a detailed Management Discussion and Analysis Reportforms a part of the Annual Report.
SUBSIDIARIES
Driven by prudent operational stratagem and aimed at facilitatingease of functioning, the Company has put in place a network ofSubsidiaries.
The Company, as on March 31, 2010, had 5 wholly ownedsubsidiaries (WOS), viz. Best On Health Ltd., Panacea Biotec Inc.,Panacea Biotec FZE, Panacea Biotec GmbH and Rees InvestmentsLtd. Umkal Medical Institute Pvt. Ltd. is also a subsidiary in terms of

CPV has retained its position of having most satisfied customers byoffering value added products and services by introducingcombination vaccines in pre-filled syringes, and throughintroduction of Luer Lok syringes, which help prevent needle stickinjury and are safe for vaccine administration and newer medicaleducation initiatives in developing the overall vaccine market.
During the year, the polio franchise of CPV gained momentum, withPolprotec attaining significant market share in spite of not havingthe first mover advantage.
CPV continues to have a strong portfolio of innovative pediatricvaccines and enjoys its significant position at market place. CPVachieved a turnover of Rs.559.2 million and net profit of Rs.33.4million during the year under review and commands a significantmarket share in the pediatric combination vaccines segment inIndia.
Cambridge Biostability Ltd.
The Company’s another JV Company, Cambridge Biostability Ltd.(CBL), a U.K-based company in which Panacea Biotec acquired 10%stake and also given a convertible loan of £ 1.5 million in previousyears, has gone into creditors' voluntary liquidation proceedings,during the year under review, due to its adverse financial position.The insolvency Administrator is in the process of deciding thequantum and timing of distribution of returns to stakeholders,including Panacea Biotec.
ASSOCIATES
Your Company’s associate Company, PanEra Biotec Pvt. Ltd. iscontinuing to meet requirement of bulk vaccines and antigens forthe manufacture of Hepatitis B and Combination Vaccines by yourCompany. The Company’s another Associate Company, Lakshmi &Manager Holdings Ltd. is mainly engaged in the business of makinginvestments.
CONSOLIDATED FINANCIAL STATEMENTS
As required under clause 41 of the Listing Agreement with the stockexchanges, a consolidated financial statement of the Company andits subsidiaries, joint ventures and associates, as prepared inaccordance with the Accounting Standard AS-21 on ‘ConsolidatedFinancial Statements’ read with Accounting Standard AS-27 on‘Financial Reporting of Interest in Joint Ventures’ and AccountingStandard AS-23 on ‘Accounting for Investments in Associates’, asissued by the Institute of Chartered Accountants of India, isattached herewith and the same, together with Auditors’ Reportthereon, forms part of the Annual Report of the Company.
LISTING OF EQUITY SHARES / BONDS
The Equity Shares of the Company continue to be listed on NSE andBSE and the Foreign Currency Convertible Bonds (FCCBs) are listedat Singapore Stock Exchange. The requisite annual listing fees havebeen paid to these Exchanges.
PUBLIC DEPOSITS
During the year under review, your Company has not invited oraccepted any deposits from the public pursuant to the provisions of
55
Panacea Biotec|Annual Report 2009-10
Section 4(1)(b)(ii) of the Act. The Company has 8 other subsidiariesin terms of Section 4(1)(c) of the Act, as under:
� Radicura & Co. Ltd., Panacea Hospitality Services Pvt. Ltd.,Sunanda Steel Company Ltd. & Panacea Educational InstitutePvt. Ltd., all being WOS of Best On Health Ltd.;
� Kelisia Holdings Limited, Cyprus, the WOS of Rees InvestmentLimited; and
� Kelisia Investment Holding AG, Switzerland, Panacea Biotec(International) SA, Switzerland and Panacea Biotec (Europe) AG,all being the step-down subsidiaries of Rees Investments Ltd.
In terms of the approval granted by the Central Government underSection 212(8) of the Act, copies of the Balance Sheet, Profit andLoss Account and Reports of the Board of Directors and Auditors ofthe subsisting Subsidiaries have not been attached with the BalanceSheet of the Company. However, these documents will be madeavailable upon request by any investor of the Company/ Subsidiary,interested in obtaining the same. The annual accounts of theSubsidiary companies will be kept for inspection by any investor atthe Company’s Corporate Office at B-1 Extn./G-3, Mohan Co-operative Industrial Estate, Mathura Road, New Delhi – 110044,India and at the office of the respective Subsidiary companiesduring business hours of the respective company. However,pursuant to Accounting Standard AS-21 issued by the Institute ofChartered Accountants of India, Consolidated Financial Statementspresented by the Company include the financial statements ofeach of its Subsidiaries. The Financial Statements of each Subsidiaryshall also be available on the Company’s websitewww.panaceabiotec.com.
As required, pursuant to the provisions of Section 212 of the Act, astatement of the holding company’s interest in the Subsidiarycompanies is attached herewith and forms part of the AnnualReport. The following information, in aggregate, for each Subsidiaryis also being disclosed (a) capital, (b) reserves & surplus, (c) totalassets, (d) total liabilities, (e) details of investment (except in caseof investment in subsidiaries), (f ) turnover including other income,(g) profit/loss before tax, (h) provision for tax, (i) profit after tax, and(j) proposed dividend. The said information is given at some otherplace herein and forms part of the Annual Report.
JOINT VENTURES
Chiron Panacea Vaccines Pvt. Ltd.
Panacea Biotec’s strong legacy of growth and excellence makes it anideal Joint Venture partner for Indian and global companies. TheCompany has nurtured several important JVs that enable it tostrengthen its growth fundamentals and to enhance its customervalue.
During the year under review, your Company’s Joint VentureCompany (JV Company), Chiron Panacea Vaccines Pvt. Ltd. (“CPV”),has grown its business by 4% as compared to the previous financialyear in spite of intense competitive price pressure within thepediatric combination vaccine market.

56
Section 58A of the Act and no amount of principal or interest wasoutstanding in respect of deposits from the public as of the date ofBalance Sheet. However, during the year under review, theCompany has continued to accept deposits from the Company’sDirectors, their relatives, associates and the Company’s employeeswithout inviting deposits from them.
INSURANCE
Risk mitigation continues to be a key area of concern for theCompany, which has regularly invested in insuring itself againstunforeseen risks. The Company’s properties and insurable assetslike building, plant & machinery, stocks and upcoming projects havebeen adequately insured against major risks. The Company has alsotaken appropriate product liability insurance policies forconducting clinical trials and for insuring its products(manufactured & sold) with an add-on cover of pollution liabilityand limited unnamed vendor extension liability to cover the risk onaccount of claims, if any, filed against the Company.
INTERNAL CONTROL SYSTEM
The Company has devised a strong Internal Control System throughits extensive experience that ensures control over various functionsin its business.
The Company has a well placed, proper and adequate InternalControl System, which ensures that all assets are protected againstloss from unauthorized use and all transactions are recorded andreported correctly. The Company’s internal control systemcomprises internal audit carried out by independent firms ofChartered Accountants and periodical review by management. TheAudit Committee of the Board addresses significant issues raisedby both, the internal Auditors and the Statutory Auditors.
DIRECTORS
There was no change in the composition of the Board of Directorsof the Company during the year under review.
In accordance with the provisions of the Act and Articles ofAssociation of the Company, Mr. Soshil Kumar Jain, Mr. GurmeetSingh and Mr. K.M. Lal, Directors of the Company, are liable to retireby rotation and being eligible, offer themselves for re-appointment.
The brief resumes of the Directors who are to be re-appointed, thenature of their expertise in specific functional areas, names ofcompanies in which they have held directorships, committeememberships/chairmanships, their shareholding, etc. are furnishedin the explanatory statement to the notice of the ensuing AnnualGeneral Meeting.
The Board recommends their re-appointment at the ensuingAnnual General Meeting.
AUDITORS
M/s. S.R. Batliboi & Co., Chartered Accountants, Statutory Auditorsof your Company, will retire at the conclusion of the ensuing AnnualGeneral Meeting and being eligible, offer themselves for re-appointment as statutory auditors for the financial year 2010-11.
The Company has received a letter dated May 5, 2010 from them tothe effect that their re-appointment, if made, would be within thelimit prescribed under section 224(1B) of the Act, and that they arenot disqualified for such re-appointment within the meaning ofSection 226 of the Act.
Based on the recommendation of the Audit Committee, the Boardof Directors of the Company proposes the re-appointment of M/s.S.R. Batliboi & Co., Chartered Accountants, as the Statutory Auditorsof the Company.
AUDITORS’ REPORT
With regard to the matters of emphasis and observations contained inthe Auditors’Report, the Management’s explanations are given below:
� Non-provision of proportionate premium on redemption of‘US$ 50 Million Zero Coupon Convertible Bonds due 2011’amounting to Rs.565 million: The Board of Directors are of theopinion that the bonds are redeemable only if there is noconversion of bonds earlier, the probability of which cannot bepresently ascertained. Hence, the payment of premium onredemption is contingent in nature, the outcome of which isdependent upon uncertain future events. Therefore, the samehas been disclosed as a contingent liability. Moreover, in caseof redemption, the redemption premium will be offset againstthe Securities Premium Account, thus having no impact on theProfit and Loss Account.
� Capitalization of expenditure on clinical trials amounting toRs.32.1 million for the year ended March 31, 2010 for thepurpose of registration of Company’s products in US and/orEurope: The expenditure is not towards basic research andtherefore no New Chemical Entity comes into being. BasicResearch is conducted by the Company in its own R&D Centresbut such developmental work is performed through externalagencies (CROs). Safety profile of the basic molecule is wellestablished in several countries in Europe and in India and theproducts are being marketed successfully in several countries.There is no experience to suggest that the studies conductedby CROs on behalf of the Company would lead to or make itdifficult for the Company to obtain regulatory approvals in USand/or Europe. The management believes that these productswould be commercially viable and there is no reason to believethat there is any uncertainty that may lead to not securingregistration for the products from regulatory authorities in USand/or Europe.
� Payment of managerial remuneration of approx. Rs.38.17million during financial year 2008-09, in excess of the limitsprescribed under Section 198 and 309 read with Part II ofSchedule XIII to the Act, without obtaining approval of CentralGovernment: The Company had adequate profits for past manyyears and thus was paying remuneration to its managerialpersonnel within overall limits as specified under the Act.However, in view of the losses incurred during the financialyear 2008-09, the managerial remuneration paid during thatyear exceeded the limits prescribed under the Act. While the

57
Panacea Biotec|Annual Report 2009-10
approvals from Central Government to the extent of Rs.14.6million of excess remuneration in respect of Dr. Rajesh Jain andMr. Sandeep Jain, Joint Managing Directors, have beenreceived, the requisite approvals for balance amount of excessremuneration of Rs.23.6 million in respect of Mr. Soshil KumarJain, Chairman and Mr. Ravinder Jain, Managing Director areawaited.
� Slight delay in deposition of Value Added Tax (VAT)in few cases:The amount involved was not significant and the said delayswere due to normal operational difficulties and that too for amaximum period of 4 days from the due date. The totalamount of such VAT was Rs.5,530,132 only, and the Companyhas already deposited the said amount.
Further, with regard to the matters of emphasis and observationscontained in the Auditors’ Report on the Consolidated FinancialStatement, the Management’s explanations are given below:
� Unaudited Annual Accounts of Subsidiary, Panacea BiotecGmbH, Germany: Though the Annual Accounts of PanaceaBiotec GmbH were prepared by its Board of Directors, the auditthereof could not be completed till the date on which theCompany’s Accounts were finalised.
COST AUDITORS
Pursuant to the provisions of Section 233B of the Act, M/s J.P. Gupta& Associates, Cost Accountants, have been appointed as the CostAuditors to conduct the audit of the Company’s Cost Records inrespect of formulations for the year ended 31st March, 2010, withthe approval of the Central Government. The cost audit is underprocess and the Company will submit the Cost Auditors’ Report tothe Central Government in time. They have also been appointed bythe Board as the Cost Auditors for the financial year 2010-11,subject to the approval of Central Government.
DISCLOSURES UNDER SECTION 217 OF THE ACT
Except as disclosed elsewhere in the report, there have been nomaterial changes and commitments which can affect the financialposition of the Company between the end of the financial year andthe date of report.
As required under Section 217(2) of the Act, the Board of Directorsinform the members that during the financial year, there have beenno material changes, except as disclosed elsewhere in this report:
� in the nature of Company’s business,
� in the Company’s subsidiaries or in the nature of businesscarried out by them,
� in the classes of business in which the Company has an interest.
ENERGY CONSERVATION, TECHNOLOGY ABSORPTION &FOREIGN EXCHANGE
Particulars required under Section 217(1)(e) of the Act, read withthe Companies (Disclosure of Particulars in the Report of Board of
Directors) Rules, 1988, regarding conservation of energy,technology absorption and foreign exchange earnings & outgo, aregiven in Annexure A, forming part of this Report.
INFORMATION REGARDING EMPLOYEES
The information required to be furnished under section 217(2A) of theAct, read with Companies (Particulars of Employees) Rules, 1975 asamended, the names and other particulars of employees covered underthese Rules are set out in Annexure B, forming part of this Report.
DIRECTORS’ RESPONSIBILITY STATEMENT
The Directors hereby confirm:
i) that in the preparation of the annual accounts, the applicableaccounting standards had been followed, along with properexplanation relating to material departures;
ii) that the directors had selected such accounting policies andapplied them consistently and made judgments and estimatesthat are reasonable and prudent so as to give a true and fair viewof the state of affairs of the Company at the end of the financialyear and of the profit or loss of the Company for that period;
iii) that the directors had taken proper and sufficient care for themaintenance of adequate accounting records in accordancewith the provisions of the Act for safeguarding the assets of theCompany and for preventing and detecting fraud and otherirregularities; and
iv) that the directors had prepared the annual accounts on a goingconcern basis.
ACKNOWLEDGEMENTS
Your Directors place on record their gratitude to the UN Agencies,Central Government, State Governments and all other Governmentagencies for the assistance, co-operation and encouragement theyhave extended to the Company.
Your Directors also take this opportunity to extend a special thanksto the medical fraternity and patients for their continued co-operation, patronage and trust reposed in the Company and itsproducts.
Your Directors also greatly appreciate the commitment anddedication of all the employees at all levels, that has contributed tothe growth and success of the Company. We also thank all ourcustomers, strategic partners, business associates, Banks, financialinstitutions and our shareholders for their assistance, co-operationand encouragement to the Company during the year.
For and on behalf of the Board
New Delhi Soshil Kumar Jain20th July, 2010 Chairman
58
I. Conservation of Energy
In line with the increasing global focus on the critical need forenergy conservation, the Company has undertaken strongmeasures to keep its power consumption levels under strictcontrol and ensure sustainable energy utilization.
1. Energy Conservation measures taken:
The Company accords the highest priority to energyconservation and is committed to stringent energyconservation measures, including regular review of energyconsumption and effective control on utilization of energy. TheCompany had devised its production lines and other facilitieskeeping in view the objective of minimum energy losses.
The following are the major energy conservation measuresimplemented during the financial year 2009-10:
� Installed heat recovery unit at Mohali.
� Stoppage 02 Nos Packaged Compressor at Baddi Unit 1.
� Increased condensate recovery up to 90% in place of 80%and 2% fuel at Baddi Unit I.
� Reduced running frequency in HZ of Production & QCAHUs in Baddi Unit II.
� Conducted Leakage test of Compressor, rectified leakagesand improved efficiency at Lalru.
� Installed hot water recovery system from Incinerator atLalru.
� Sample evaporated system in LCMS (R&D) to use N2cylinder, and use of compressed air through refrigeratedair dryer already running for other use.
� Modified the air line of root blower at ETP plant at Lalruand reduced from 2 nos. of root blower to only 1.
� Optimized operation of AHUs at Lalru.
� To have a better load sharing / part load conditions, threeCooling Towers are interlinked to cater the need of partload.
� Increased Condensate water recovery from 15% to 50%from Herbal plant & cell culture & Vaccine Block I, II & III atLalru.
Annexure to the Directors’ ReportStatement of particulars pursuant to the Companies (Disclosure of Particulars in the Report of Board of Directors) Rules, 1988.
� New boiler procured with economizer, which will help inincreasing the efficiency of boiler by 2%.
� Incorporating temperature controller in CT fan of 200TRchiller at Okhla.
� Reduced Air compressor Pressure from 8.5kg/cm2 to7.5kg/cm2 at Okhla.
� Reduced/replaced the GLS, flouroscent tube lights withCFL.
� Reduced Boiler Working pressure from 10 to 9 Kg/Sq. cmat Okhla.
� Installed signal isolator in Main Autoclave of Line three soas to produce two charts at a time.
Electrical and Instrumentation audit is also performed onregular basis and no major points/ observations have beenrecorded in recent audit reports.
2. Additional Investments/ Proposals, if any, for reduction ofEnergy Consumption:
The Company’s initiatives in energy consumption extendbeyond the needs of the present to ensure sustainable growthfor years ahead. Continuous efforts are being made to furtherreduce the expenditure on power & fuel in the time to come.
The following proposals are being considered for reduction inEnergy Consumption:
� Alternate source of power being explored to reduce perunit generation cost.
� Conversion of HSD-based 1250 Kg/hr Boiler to CNG-basedfuel at Okhla.
� Increase in batch sizes wherever feasible.
3. Impact of measures taken and impact on cost of productionof goods:
The energy conservation measures indicated above havehelped the Company to restrict the impact of increase in thecost of energy, thereby reducing the cost of production ofgoods to that extent.

59
Panacea Biotec|Annual Report 2009-10
FORM A
The particulars of consumption of energy are given below:
Current year Previous Year
A. Power and Fuel Consumption1. Electricity
(a) PurchasedUnits (Nos.) 16,854,197 15,011,387Total Amount (Rs.) 78,145,453 67,830,374Rate/Unit (Rs.) 4.64 4.52
(b) Own Generationi) through Diesel Generator
Units (Nos.) 3,615,835 3,397,584Unit per litre of Diesel Oil 3.56 3.49Cost/Unit (Rs.) 8.29 8.91
ii) through Steam/ Turbine Generator Nil NilUnits (Nos.)Unit per litre of Diesel OilCost/Unit (Rs.)
2. CoalQuantity (tones) Nil NilTotal CostRate/Unit
3. Furnace OilQuantity (Litres) 955,707 505,115Total Cost 25,718,310 11,824,571Rate/Unit 26.91 23.41
4. Others/ Internal generationQuantity Nil Nil NilTotal CostRate/Unit
B. Consumption per unit of productionTabletsProduction (Nos. in thousand) 1,233,584 504,389Electricity Consumption (Units per thousand) 1.52 4.52CapsulesProduction (Nos. in thousand) 152,705 61,027Electricity Consumption (Units per thousand) 8.54 24.33SyrupsProduction (in liters) 983,821 283,921Electricity Consumption (Units per thousand) 0.27 0.76GelsProduction (in kilograms) 64,697 23,475Electricity Consumption (Units per thousand) 3.11 2.62VaccinesProduction (no. of vials in thousand) 50,011 50,554Electricity Consumption (Units per thousand) 70.36 65.44Pre-Alled Syringes (PFS)*Production (no. of PFS in thousand) 3,774 1,680Electricity Consumption (Units per thousand) 226.74 244.15GranulesProduction (Packs in thousands) 114,955 17,639Electricity Consumption (Units per thousand) 4.45 17.07
* Higher due to under utilisation of Baddi Vaccine Facility

60
Research & Development
1. Specific areas in which R & D carried out by the Company
Strong Research & Development capabilities have always beena key fundamental strength of the Company.
The Company is a research-focused & IPR oriented company,with one of its end objectives as innovation and developmentof patentable products and technologies.
The areas of research being pursued by the Company include:
� Development of novel preventive & therapeutic vaccines,novel therapeutic peptides, therapeutic fully humanmonoclonal antibodies and biopharmaceuticals.
� Development of advanced drug delivery technologies.
� Discovery and synthesis of new chemical and biologicalentities.
� Development of recombinant clones for biosimilars.
2. Benefits derived as a result of above R&D
� Improved product quality, leading to customersatisfaction
� Vaccine against bioterrorism
� Safe and environment friendly process
� Fulfilling the unmet therapeutic needs
� Novel drug delivery products
� Competitively priced products
� Waste minimisation
� Grant of Product/Process Patents
� Import substitution, leading to lower cost of goods
� Enhanced global presence
� Export of Quality Products
3. Future Plan of Action
The Company will continue to focus its Research &Development activities for growing revenues & profitability,inter-alia, in the following areas:
� Development and improvement in existing conjugationtechnology for better yield and quality.
� Further development of recombinant, polysaccharideconjugate and cell culture based vaccines.
� Development of IPV based pentavalent and hexavalentcombination vaccines.
� Drug Discovery Research.
II. TECHNOLOGY ABSORPTION
FORM B
Form for disclosure of particulars with respect to Technology Absorption –
� Advanced Drug Delivery Research.
� Bio-pharmaceuticals Research for development of novelpreventive & therapeutic vaccines, therapeutic fullyhuman monoclonal antibodies and therapeutic peptides.
� Natural Products Research.
� Chemical Research & Development.
4. Expenditure on R&D
(Rs. in million)
2009-10 2008-09
a) Revenue (excl. Deprecia%on on 577.2 500.9R&D assets)
b) Capital 231.4 578.4c) Total 808.6 1,079.3d) Total R&D expenditure as a
percentage of net sales 9.1% 14.0%
Technology absorption, adaptation and innovation
1. Efforts, in brief, made towards technology adaptation andinnovation: The Company R&D focus has been translated intothe development of a strong R&D pentagon to support itsbusiness segments, vaccines, pharmaceutical formulations andbiopharmaceuticals. It has 5 highly sophisticated ultra-modernR&D centers with around 300 qualified and experiencedscientists for its various research projects. The core areas ofresearch & development include new Vaccine Development,Biopharmaceuticals, Proteins, Peptides, MonoclonalAntibodies, Novel Drug Delivery Systems, Advanced DrugDelivery Systems and Drug Discovery (small molecules), incompliance with international regulatory standards.
The Company has developed indigenous technologies inrespect of various products being manufactured by it and is atpresent working on several novel products and technologies.Further, the Company has, during earlier financial years, in-licensed technologies for development of:
� Hepatitis B Antigen and Bulk Vaccines,
� Vero cell adapted Japanese encephalitis (JE) Vaccine,
� Peptide based product for generation of hair follicles andhair growth
� Recombinant Chimeric Dengue Vaccine, and
� Recombinant Anthrax Vaccine
The technology for Hepatitis B Antigen and Bulk Vaccines hasalready been fully absorbed in earlier years. The technology in-licensed for JE Vaccine has been further modified significantlyat our research center to yield a commercially viable and saferproduct. The candidate vaccine is in trial stages of

61
Panacea Biotec|Annual Report 2009-10
development and should enter pre-clinical/ clinical
development by next year. The process for the scale-up
production of hair growth peptide, a technology for alopecia
(hair loss) management has been optimised.
As regards recombinant anthrax vaccine, Phase I/IIa of human
trials have been successfully completed. The Company has
plans to submit an IND application to US FDA for performing
Phase IIb clinical trial in India.
2. Benefits derived as a result of the above efforts include productimprovement, cost reduction, product development, importsubstitution, competitive products, Product qualityimprovement, Product Development and Import Substitution.With in-licensing arrangements, the Company will be able tocommercialise these products in domestic and internationalmarkets.
3. In case of imported technology (imported during the last 5years reckoned from the beginning of the financial year),following information may be furnished:
III. FOREIGN EXCHANGE EARNINGS AND OUTGO
1. Activities relating to exports
The total export turnover of the Company was Rs.5,612.9million (including deemed exports of Rs.3,708.4 million) duringfiscal 2010, as against Rs.6,442.8 million (including deemedexports of Rs.5,797.3 million).
The Company is supplying Oral Polio and CombinationVaccines to various countries through UNICEF against its globaltenders and achieved an export turnover of Rs.2,716.5 millionduring fiscal 2010, an excellent growth of around 84% overprevious year, by way of supplies of vaccines to variouscountries, including Afghanistan, Bangladesh, Bhutan, CentralAfrica, Kenya, Kyrgyzstan, Myanmar, Nigeria, Philippines,Sudan, Tanzania, Uganda, Uzbekistan, Yemen, Zambia andZimbabwe.
The Company has also achieved an export turnover of Rs.85.8million during fiscal 2010 by way of direct supply of vaccines toNepal, Pakistan and the Latin American Market of Chile.
As regards pharmaceutical formulations, the Company iscontinuously expanding its global aspirations by improving itsinternational marketing efforts into various markets across theglobe and is currently exporting its branded formulations in
CIS countries, Asia, Eastern Europe and African region. Today,the Company’s products are available to people in variouscountries across the globe. The export turnover of formulationsduring fiscal 2010 was Rs.292.9 million as against Rs.426.0million during fiscal 2009. The exports to most of the countrieswhere the Company has presence have shown a growth, thehighlights being Ukraine, Mongolia and Sri Lanka, over theprevious fiscal.
2. Initiatives taken to increase export
The Company has continuously striven to expand its globalfootprints and plans to boost its growth prospects significantlyin the coming years by registering & commercialising a seriesof innovative products across all the potential markets. With aview to creating a strong & positive image of the Company inthe minds of the local doctors through its innovative strategies& robust promotional efforts for its unique products, theCompany has steadily but surely moved from a tradingbusiness model to a “promotional oriented” approach inmarkets like Sri Lanka, Vietnam, Kazakhstan, Philippines, Syria.The Company has placed specialised personnel in thesemarkets to implement the promotional initiatives in thesemarkets. The Company has plans to extend this bandwidth toother existing and/or planned potential markets with morerobust strategies & control.
Technology imported Year of Has If not fully absorbed, areas where this has not takenimport technology been place, reasons thereof and future plan(s) of action
fully absorbed
(a) (b) (c) (d)
1. Technology for use of peptide 2004-05 No The technologies are being worked upon. The processbased products for generation for the scale-up production of hair growth peptide hasof hair follicles and hair growth been optimised. A pre-clinical toxicological study has
been planned.
2. Tetravalent Dengue Virus Vaccine 2006-07 No The technologies are being worked upon at theCompany’s Biopharmaceutical Research Centre. Asuitable cell line for the assay and amplificationtechnology has been prepared & appropriate Dengueviruses have been amplified. Immunogenicity of thetetravalent vaccine has been done. An efficacy studywith certain modification in the tetravalent vaccine isplanned.
3. Technology for manufacture of 2007-08 Yes NAHepatitis B Antigen and BulkVaccines

62
(Rs. in million)
2009-10 2008-09
Foreign Exchange EarnedF.O.B. value of Exports (including deemed export of Rs.3,396,590,606 (Previous Year Rs.3,708,466,456)) 6,465.4 5,589.0R & D Services (Know-how) Income 0.9 1.7Interest received on loan from Joint Venture Company - 16.9Interest accrued but not due on loan from subsidiary company 45.0 28.9Total 6,511.3 5,636.5Foreign Exchange UsedRaw Materials & Packing Materials 3,137.2 4,571.3Capital Goods 406.5 457.2Know-how Fee 12.5 12.8Royalty 2.7 0.0Interest 218.1 206.2Professional & Consultation Fees 19.6 54.7Other Expenses- Patents, Trade Marks & Product Registration 20.2 26.3- Advertising and Sales Promotion 14.6 5.3- Printing & Stationery 0.0 0.1- Commission on Sales 18.9 65.8- Market Research 8.0 30.3- Others 34.1 39.6Total 3,892.4 5,469.6
For and on behalf of the Board
Place : New Delhi Soshil Kumar JainDate : 20th July, 2010 Chairman
The Company focuses on brand building, primarily leveragingits portfolio of novel patented products in key segments. Theyear under review marked an year of consolidation for thebusiness, wherein lot of new products / therapies werescheduled for commercialisation across various regions. TheCompany has identified Organ Transplantation, Nephrology,Metabolic Disorders, Pain management, Oncology, Gastro-intestinal & Anti-infective products as major thrust areas forthe future. The Company has also set up internationalsubsidiaries in US, Germany, Switzerland and UAE to steerproduct registration.
3. Development of new export markets for Products and ExportPlans
With a view to increasing global opportunities, the Company’sefforts on international marketing have been intensified. TheCompany has been adopting a strategy of increasing itsinternational brand image and is actively exploringopportunities for launching as well as licensing out some of itspatented products for manufacture/ marketing in key new
markets including US, European Union, Switzerland, SouthAfrica, Turkey, Brazil, Mexico, Columbia, Venezuela, Chile,Philippines & Malaysia.
The Company has adopted a strategy of development ofadvanced combination vaccines, opening a whole newdimension towards protecting multiple diseases with a singlevaccine. The Company is poised to make inroads into globalmarkets and has deployed a specialised team for its VaccineBusiness in the emerging & rest of world markets. TheCompany is all set to launch Easyfive and Polprotec vaccines inthe emerging markets in the coming years. These would befollowed by new introductions from a strong & innovativevaccine pipeline on a consistent note.
Going forward, about 20 key markets have been identified forlaunch of vaccines, wherein extensive work on customisationof business models, identification & collaboration with partnersin accordance with the business strategy and regulatory filingshas been initiated.
4. Total foreign exchange earned and used

63
Panacea Biotec|Annual Report 2009-10
ANNEXURE BStatement pursuant to Section 217(2A) of the Companies Act, 1956 and the Companies (Particulars of Employees) Rules,1975 and forming part of the Directors' Report for the year ended 31st March, 2010
S Name Designation and Remuneration Quali/cations Experience Date of Age Particulars of LastNo. Nature of Duties (Rs.) (Years) Commence- (Yrs,) Employment
ment Name of Employer,Designation, Periodof Service (Years)
A. Persons employed throughout the Financial Year ended 31st March, 2010, whowere in receipt of remuneration for the year in which the aggregate was not less thanRs.2,400,000.
1. Mr. Soshil Kumar Jain Chairman Pharmacist 55 02.02.1984 77 None, NA, NA2. Mr. Ravinder Jain Managing Director Matriculate 30 15.11.1984 53 None, NA, NA3. Dr. Rajesh Jain Joint Managing Director B.Sc., PGDBM & Advanced Mgmt. 26 15.11.1984 46 None, NA, NA
Diploma in Market Research, Ph.D.4. Mr. Sandeep Jain Joint Managing Director B.Com 25 15.11.1984 44 None, NA, NA5. Mr. Sumit Jain Director Operations & Projects B.Com, MBA 7 16.05.2003 29 None, NA, NA6. Dr. Lallan Giri President & Chief Operating OLcer Ph.D. - Doctor of Philosophy 27 01.07.2008 64 Oshiva Enterprise LLC, USA.
C.E.O./ M.D., 3 years.7. Mr. Narayan B. Gad Chief Executive Formulations B.Sc, D. Pharma, MBA 34 26.10.2005 59 Nicholas Piramal India Ltd.,
(Marketing) President Mktg. & Org. Dev.,4 years
8. Mr. Partha Sarathi De C.F.O and Head IT & BPR B.Sc. (Econ), ACA, AICWA 22 02.06.2008 48 Gujrat Glass Ltd., President-Finance Glass Group, 2.5 years
9. Mr. R.K. Suri Chief Executive Biologicals M.Sc. (Hons) 32 12.11.2007 55 SanoM Aventis, Sr. Dir.-Bus.EKect., 10 years
10. Dr. S. C. Marwah C.E.O Healthcare Venture M.B.B.S., Diploma - Av. Med., 39 16.06.2008 63 Fortis Health Care Ltd., HeadPGADHM, MBA Medical Edu. & Facility
Planning, 4.5 Months11. Dr. Sanjay Trehan Sr. Vice President Drug Ph.D. - Doctor of Philosophy, M.Sc. (H) 22 01.07.2004 51 Dr. Reddy’s Laboratories Ltd.,
Discovery Research Research Director, 3 years12. Dr. V.K. Vinayak President (R&D) BRC Ph.D. - Doctor of Philosophy, M.Sc, 39 01.10.2005 67 Dept. of Biotechnology, Govt.
FICAI, FRSTMH (London) of India, Sr. Advisor, 11 years13. Dr. Arani Chatterjee Vice President Clinical Research MBBS, M. Phil, PGCPM 19 24.07.2004 42 Dr. Reddy's Laboratories Ltd.,
Principal Physician, 6 years14. Dr. Ashok Panwar Vice President Quality & Ph.D. - Doctor 16 01.05.2001 42 Dishman
Compliances of Philosophy, M.Sc. Pharmaceuticals & ChemicalsLtd., AGM-Q.C., 2 years
15. Dr. Goutam Ghosh Vice President Tech Mgmt Group M. Tech, Ph.D. - Doctor of Philosophy 24 02.06.2008 49 The Pearey Lal Group L Group,CEO, 1 year
16. Mr. Kallol Chakraborty Vice President H.R. PG Dip. in Pers. Mgmt., LL.B. 20 19.11.2007 46 Federal Mogul Goetze (India)Ltd., Director HR, 8 months
17. Mr. Karunakar J. Shetty Head Training & Sales B.Com. 25 01.01.2006 51 Nicholas Piramal India Ltd.,Administration Vice - President Sales & Mktg.,
4.5 years18. Mr. Kulvinder Sarao Vice President Audit & PGDPMIR 25 14.01.2005 48 Hero Honda Motors Ltd.,
Compliances (HR) DGM-HR, 5 Mths19. Dr. M. Sitaram Kumar Vice President (R&D) Ph.D. - Doctor of Philosophy, M. Sc 33 17.06.2005 59 Dr. Reddy’s Laboratories Ltd.,
Sr. Director, 4.5 years20. Dr. S. Mahender Rao Vice President CRD Ph.D. - Doctor of Philosophy 14 08.12.2008 44 Orchid Chemicals & Pharma
Ltd., Vice President, 4.5 years21. Dr. Sanjiv Sharma Vice President Regulatory AKairs. Ph.D. - Doctor of Philosophy 21 30.06.2008 44 Orchid Chemicals & Pharma
Org. Chem. Ltd., VP-RA & QA, 3 years22. Mr. Sukhjeet Singh Vice President (R&D) Post Graduate 16 17.08.2006 41 Strides Acrolabs Ltd. VP-
Formulations & Development,1 year
23. Mr. Sunil K. Bajaj Country Head Super Specialties B Sc. 30 15.09.2004 49 Novartis India Ltd., NSM,20 years
24. Dr. Jagattaran Das General Manager (R&D) Laksh Ph.D. - Doctor of Philosophy, M.Sc. 16 01.07.2005 46 Dr. Reddy’s Laboratories Ltd.,Research Director, 6 years
25. Mr. Kaustubh Y. Berde General Manager International B.Pharma, M.Pharma, M-Marketing 15 13.03.2006 39 USV Ltd., Deputy GeneralMarketing Management Manager, 5 years
26. Dr. Manish Kumar General Manager Analytical & Ph.D. -Chemistry 15 29.11.1996 41 Cipla Ltd., Executive -QC, 1 yearBioanalytical
27. Ms. Neeta S. Sanghi Head Value India Health Care B.Sc. & B.Sc. Tech (Pharmaceutical 25 01.06.2007 51 Nicholas Piramal (I) Ltd., V.P.& Fine Chemicals) Dom. Form. Supply Chain,
11 years28. Mr. Pawan Malik General Manager Business PGDBM, B.Pharma 13 10.06.2008 35 Bilcare Research, Head, 1 year
Development
16,750,92821,229,33114,203,889
14,099,1193,523,735
10,774,000
9,014,125
6,337,621
3,326,637
4,862,865
7,187,935
4,501,194
4,633,209
4,831,768
3,169,843
5,498,945
5,248,412
4,775,985
5,914,509
4,237,242
5,174,714
5,269,408
4,223,344
3,523,191
3,127,984
2,605,500
4,075,644
2,467,940
Contd...

64
Notes:1. Remuneration includes salary, house rent allowance, bonus, Company’s contribution to Provident Fund, Leave Travel Allowance, Medical Assistance and
all allowances paid in cash and monetary value of taxable perquisites wherever applicable and also includes Gratuity/ Retirement Benefit.2. There was no employee who was employed either throughout the financial year or part thereof, who was holding either by himself or along with the
spouse and dependent children 2% or more of the Shares of the Company and drawing remuneration in excess of the remuneration drawn by ManagingDirector / Joint Managing Director / Whole-time Director.
3. The terms and conditions of employees at Sl. No. 1 to 5 are as approved by the Board of Directors and Shareholders. The employees at Sl. No. 6 to 40are paid remuneration as per the policy/rules of the Company.
4. All the above said appointments are contractual.5. None of the above employees is related to any of the Directors except that Mr. Soshil Kumar Jain, Mr. Ravinder Jain, Dr. Rajesh Jain, Mr. Sandeep Jain
and Mr. Sumit Jain are related to each other.6. The nature of duties of Chairman, Managing Director and Joint Managing Directors is as under: Mr. Soshil Kumar Jain, Chairman - Strategic planning,
vision and formulation of strategies. Mr. Ravinder Jain, Managing Director - Overall supervision of day-to-day operations with emphasis on strategicplanning and business development. Dr. Rajesh Jain, Joint Managing Director - Overall supervision of day-to-day operations with emphasis on R&D,business development and marketing. Mr. Sandeep Jain, Joint Managing Director - Overall supervision of day-to-day operations with emphasis onfinance, international marketing and regulatory affairs.
For and on behalf of the Board
Place : New Delhi Soshil Kumar JainDate : 20th July, 2010 Chairman
S Name Designation and Remuneration Quali/cations Experience Date of Age Particulars of LastNo. Nature of Duties (Rs.) (Years) Commencement (Yrs,) Employment
Name of Employer,Designation, Periodof Service (Years)
29. Mr. Rajneesh Chatrath General Manager Q.A PGDIM, M.Sc Microbiology, B.Sc 18 03.10.2000 42 Eco Med Pharmaceuticals,Quality Assurance Associate,3 months
30. Mr. Sanjay Mishra Head Sales & Marketing MBA, PGHRM, B.Com 17 20.04.2006 41 J K Organisation, DGM HR,(Human Resources) 2 years
31. Mr. Sarabjit Singh Sr. General Manager Pharma M.Pharma, B. Pharma 15 21.05.2005 40 Lupin Research Park, Sr.Manager, 1.5 years
32. Mr. Syed. Saadir Ahmed Head International Vaccine B. Pharma, M.B.A. 16 14.01.2006 40 Nicholas Piramal India Ltd.,Business GM. S&M., 4 years.
33. Mr. Vikas Katial General Manager Production B.Tech Chemical Technology, 20 23.07.2007 41 Wockhardt Ltd., DGM, 3.5 yearsMMS (Finance)
34. Mr. Vinod Goel General Manager Legal & AICWA, FCS, LL.B., M.Com 23 13.01.1999 45 Prakash Industries Ltd.,Company Secretary Company Secretary, 9 years
B. Persons employed for a part of the Financial Year ended 31st March, 2010, whowere in receipt of remuneration for any part of the year, at the rate which in the aggregate wasnot less than Rs.200,000 per month.
35. Mr. Narotam Kumar Juneja COO Order Execution B. Pharma, M. Pharma 30 01.01.2010 54 Magbro Pvt. Ltd., Director,(Pharma Opr. Proj. & Eng.) 1 year
36. Mr. Abhay N. Lonkar Country Head India Post Graduate Dip. in Mktg. 21 11.06.2008 50 Unichem Labs Ltd. , VP, 5 years37. Mr. M. M. S. Raju Vice President Projects B.E. ( Mechanical), PGDIM 25 28.12.2006 47 Ranbaxy Laboratories Ltd.,
GM Engineering, 2 years38. Mr. Sanjiv Kumar Pant Chief Information OLcer B Sc, PGD- Computer Science 24 10.04.2009 46 HCL Technical Ltd., AGM,
3 years39. Mr. V. Punya Kumar Country Head Acute & Chronic Care B. Sc Chemistry, Botany 29 21.10.2009 51 Emcure Pharmaceutical,
Director-Mktg. & Sales, 5 years40. Dr. Shekhar Patel General Manager Risk Treatment Ph. D- Bio-systems Engineering, 11 01.02.2010 37 Quest Diagnostics India Pvt.
M. Tech, B. Tech., CertiMcate in Ltd., Business Head (Director) -Finance & Accounting Insurer Solutions Segment,
1.5 Years
2,648,712
2,446,697
3,181,495
3,603,316
2,669,633
2,568,929
872,173
3,459,7542,425,151
2,529,438
1,803,217
443,336

65
Panacea Biotec|Annual Report 2009-10
1. PHILOSOPHY ON CORPORATE GOVERNANCE
A good Corporate Governance system is the key to meaningfuland holistic growth of an organization and the foundationthrough which is nurtured its sustainable progress into thefuture. The Corporate Governance philosophy of the Companystems from its belief that attainment of the highest levels oftransparency, disclosure, financial controls, accountability andequity are the pillars of any good system of CorporateGovernance. Panacea Biotec is committed to continuouslyevolving and adopting Corporate Governance’s best practicesin all facets of its operations and in all interactions with itsstakeholders, including shareholders, employees, consumers,lenders and the community at large.
At Panacea Biotec, good Corporate Governance processincludes independence, integrity, commitment to values,ethical business conduct and a high degree of transparencydirecting the intellectual capabilities and moral authority of itsindependent Board, that go a long way in preservingstakeholders trust while maximizing long-term corporatevalues.
2. BOARD OF DIRECTORS
Composition & size of the Board
Panacea Biotec’s Board consists of an optimal combination ofExecutive Directors and Independent Non-executive Directors,representing a judicious mix of professionalism, knowledgeand experience.
The Directors bring in expertise in the fields of human resourcedevelopment, strategy, management, finance and economics,among others. The Board provides leadership, strategicguidance, objective and independent view to the Company’smanagement while discharging its fiduciary responsibilities,thereby ensuring that the management adheres to highstandards of ethics, transparency and disclosure.
REPORT ON CORPORATE GOVERNANCE
At present, the Board comprises 5 (Five) Executive Directors (1Executive Chairman, 1 Managing Director, 2 Joint ManagingDirectors and 1 Whole-time Director) and 6 (Six) Non-ExecutiveDirectors. All the non-executive Directors are IndependentDirectors. The non-executive Directors bring external andwider perspective in the Board’s deliberations and decisions.
The size and composition of the Board exceeds therequirements of the Clause 49 of the Listing Agreement(Corporate Governance Guidelines) with the Stock Exchanges.
Board functioning & procedure
Panacea Biotec’s Board is committed to ensuring goodgovernance through a style of functioning that is self-governing. The members of the Board always have completeliberty to express their opinion and decisions are taken on thebasis of consensus arrived at after detailed discussion. They arealso free to bring up any matter for discussion at the BoardMeetings.
Panacea Biotec’s Board meets at least once in every quarter todiscuss and review the quarterly results and other items ofagenda, including the information required to be placedbefore the Board, as required under Annexure 1A of Clause 49of Listing Agreement, and additional meetings are held as andwhen required. Dates for the Board Meetings are decided wellin advance and communicated to the Directors. TheChairman/Joint Managing Director of the Board and theCompany Secretary discuss the items to be included in theagenda and the agenda is sent in advance to the Directorsalong with the draft of relevant documents and explanatorynotes.
During the financial year 2009-10, six (6) Board Meetings wereheld on 27th May 2009, 30th July 2009, 29th October 2009, 30thDecember 2009, 21st January 2010 and 29th January 2010.
Attendance of Directors at the Board Meetings & last Annual General Meeting and number of other Directorships & Committee membershipas on 31st March, 2010:
Sl. Name of Director Category of No. of No. of AttendanceNo. Directorship Board Board at last
Meetings Meetings AGMheld attended
Other Committee CommitteeDirector- Member- Chairman-
ship ship ship
1. Mr. Soshil Kumar Jain Promoter – WTD Chairman 6 6 No 1 - -2. Mr. Ravinder Jain Promoter – MD 6 5 No 3 1 -
3. Dr. Rajesh Jain Promoter –JMD 6 5 No - - -
4. Mr. Sandeep Jain Promoter –JMD 6 5 Yes 1 - -
5. Mr. Sumit Jain Promoter Group –WTD 6 4 No 1 - -
6. Mr. Sunil Kapoor Non–Executive – ID 6 5 Yes 6 - -
No. of other Directorship$
and Committeememberships/chairmanships*
Contd...

66
Sl. Name of Director Category of No. of No. of Attendance No. of other Directorship$ andNo. Directorship Board Board at last committee memberships/
Meetings Meetings AGM chairmanships*held attended
Other Committee CommitteeDirector- Member- Chairman-
ship ship ship
7. Mr. R.L. Narasimhan - do - 6 6 Yes 1 - -8. Mr. N.N. Khamitkar - do - 6 5 Yes 1 - -
9. Mr. Gurmeet Singh - do - 6 0 Yes - - -
10. Mr. K.M. Lal - do - 6 5 No 6 4 -
11. Dr. A.N. Saksena - do - 6 4 No - - -
Note: WTD = Whole-time Director, MD = Managing Director, JMD = Joint Managing Director, ID = Independent Director$ Excludes directorships in Private Limited Companies, Foreign Companies, membership of managing committees of various chambers/bodies/Section 25companies*Membership in Audit and Shareholders’ Grievance Committees.
None of the Directors on the Board is a member in more than ten committees and/or acts as chairman of more than five committees acrossall the companies in which he is a Director.
Brief information on Directors proposed for re-appointment
The brief resume, experience and other details pertaining to the Directors seeking appointment / re-appointment in the ensuing AnnualGeneral Meeting, to be provided in terms of Clause 49 of the Listing Agreement with the Stock Exchanges, are furnished below:
a) Name : Mr. Soshil Kumar Jain
Age : 77 Years
Qualification : Qualified Pharmacist
Professional Expertise : He has more than 54 years experience in the pharmaceutical industry. He is the founderpromoter/director of the company and has been the Chairman of the Company sinceOctober, 1984. He started his career in the Indian pharmaceutical industry by joining hisfamily business in the form of a chemist shop set up by his father. Prior to promoting thecompany, he was associated with Radicura & Co., a partnership firm (formerly owned by thepromoters of Panacea Biotec Ltd. and subsequently taken over by Radicura & Co. Ltd.)engaged in the retail and wholesale trading of pharmaceutical products.
Directorships : He is chairman of PanEra Biotec Pvt. Ltd. & Neophar Alipro Ltd.
Shareholding in the Company : He holds 5,000,000 Equity Shares of Re.1 each, comprising 7.48% shareholding of theCompany.
b) Name : Mr. Gurmeet Singh
Age : 48 Years
Qualification : Bachelor of Commerce
Professional Expertise : He is having experience of more than 27 years in the pharmaceutical industry. He wasappointed as a Director of the Company w.e.f. 29.06.1996 and has worked with the Companyas Whole-time Director designated as Director (Logistics) till 26th October, 2002. He has vastexperience in the areas of finance, commercial, logistics and general management.
Directorships : He is director of Angad Hospitality Pvt. Ltd., Raga Entertainment Pvt. Ltd., Raga BusinessSolutions Pvt. Ltd., Richa Construction Pvt. Ltd., A to Z Amusement Concept Pvt. Ltd., GSAEnterprises Pvt. Ltd., Ulterior Holding Pvt. Ltd., Excellion Capital Ventures Pvt. Ltd., ParvPromoters (P) Ltd., Raga Softech Pvt. Ltd., Grandslam Developers Pvt. Ltd., Union DevelopersPvt. Ltd., Ahuja and Anand Buildwell Pvt. Ltd.
Shareholding in the Company : Nil

67
Panacea Biotec|Annual Report 2009-10
c) Name : Mr. K.M. Lal
Age : 70 Years
Qualification : M.Sc. (Chemistry)
Professional Expertise : He is a retired Government official belonging to Indian Administrative Services and retired asChairman, Staff Selection Commission, Government of India. He has vast experience in thefield of finance, accounts, audit, taxation, legal, project and general management. He hadheld various senior level positions in Government Ministries and offices.
Directorships : He is director of SREI Capital Markets Ltd., GEM Spinners Ltd., Hindustan Wires Ltd., PolylinkPolymer Ltd., Gem Sugar Ltd. & Ram Sarup Industries Ltd.
Shareholding in the Company : Nil
Information supplied to the Board
In addition to the regular business items, the Companyprovides the following information to the Board and BoardCommittees as and when required. Such information issubmitted either as part of the agenda papers in advance ofthe meetings or by way of presentations and discussionsmaterial during the meetings:
� Annual operating plans and budgets and any updates.
� Capital budgets and any updates.
� Quarterly results for the company and its operatingdivisions or business segments.
� Minutes of meetings of audit committee and othercommittees of the Board.
� The information on recruitment and remuneration ofsenior officers just below the Board level, includingappointment or removal of Chief Financial Officer and theCompany Secretary.
� Show cause, demand, prosecution notices and penaltynotices which are materially important.
� Fatal or serious accidents, dangerous occurrences, anymaterial effluent or pollution problems.
� Any material default in financial obligations to and by thecompany, or substantial non-payment for goods sold bythe company.
� Any issue, which involves possible public or productliability claims of substantial nature, including anyjudgment or order which may have passed strictures onthe conduct of the company or taken an adverse viewregarding another enterprise that can have negativeimplications on the company.
� Details of any joint venture or collaboration agreement.
� Transactions that involve substantial payment towardsgoodwill, brand equity or intellectual property.
� Significant labour problems and their proposed solutions
and any significant development in Human Resources/Industrial Relations front.
� Sale of material nature of investments, subsidiaries, assets,which is not in normal course of business.
� Quarterly details of foreign exchange exposures and thesteps taken by management to limit the risks of adverseexchange rate movement, if material.
� Non-compliance of any regulatory, statutory or listingrequirements and shareholders service such as non-payment of dividend, delay in share transfer etc., if any
Statutory Compliance of Laws
The Board periodically reviews the compliance report of thelaws applicable to the Company as well as steps taken by theCompany to rectify the instances of non-compliances, if any.
Code of Conduct
The Board has laid down a code of conduct for all BoardMembers and senior management of the Company. The saidCode has been communicated to the Directors and SeniorManagement Personnel and is also posted on the web-site ofthe company viz. www.panaceabiotec.com.
Declaration from the Managing Director confirming that theCompany has received affirmations from the Board Membersand the Senior Management Personnel regarding complianceof Code of Conduct during the year under review, is attached asAnnexure-I.
3. AUDIT COMMITTEE
Composition & Terms of Reference
The Audit Committee of the Company has been constituted asper Section 292A of the Companies Act, 1956 and theguidelines set out in the Listing Agreements with the StockExchanges. The Audit Committee of the Company comprisesthree non-executive directors, all of them being independentDirectors viz. Mr. R.L. Narasimhan, Mr. N.N. Khamitkar and Mr.Sunil Kapoor. Mr. R.L. Narasimhan is the Chairman of theCommittee. All the members are financially literate and one

68
member is having requisite accounting and financialmanagement expertise.
The management is responsible for the Company’s internalcontrols and the financial reporting process, while thestatutory auditors are responsible for performing independentaudits of the Company’s financial statements in accordancewith generally accepted auditing practices and for issuingreports based on such audits. The Board of Directors hasentrusted the Audit Committee to supervise these processesand thus ensure accurate and timely disclosures that maintainthe transparency, integrity and quality of financial control andreporting.
The terms of reference and scope of the activities of the AuditCommittee are as set out in Clause 49 of the ListingAgreements with the Stock Exchanges, as well as in Section292A of the Companies Act, 1956, including the following:
� To review compliance with internal control systems;
� To review the findings of the Internal Auditor relating tovarious functions of the Company;
� To hold periodic discussions with the Statutory Auditorsand Internal Auditors of the Company concerning theaccounts of the Company, internal control systems, scopeof audit and observations of the Auditors/InternalAuditors;
� To review the quarterly, half-yearly and annual financialresults of the Company before submission to the Board;
� To make recommendations to the Board on any matterrelating to the financial management of the Company,
including Statutory & Internal Audit Reports;
� Recommending the appointment of statutory auditorsand branch auditors and fixation of their remuneration.
Review of information by Audit Committee
Apart from other matters, as per Clause 49 of the ListingAgreement the Audit Committee reviewed, to the extentapplicable, the following information:
� Management discussion and analysis of financialcondition and results of operations;
� Statement of significant transactions, submitted by theManagement;
� Management letters/letters of internal control weaknessissued by statutory auditors;
� Internal Audit Reports relating to internal controlweakness;
� The appointment, removal and terms of remuneration ofthe Internal Auditors;
� Related party transactions.
Meetings of Audit Committee and attendance of membersduring the year
During the year, 4 (four) Audit Committee meetings were heldon 26th May, 2009, 29th July, 2009, 28th October, 2009 and28th January, 2010.
The attendance of members of the Audit Committee at thesemeetings was as follows:
Sl. Name of the Member Designation Category of Directorship No. of No. ofNo. Meetings held Meetings
attended
1. Mr. R.L. Narasimhan Chairman Independent Director 4 4
2. Mr. N.N. Khamitkar Member Independent Director 4 4
3. Mr. Sunil Kapoor Member Independent Director 4 3
The Statutory Auditors, Internal Auditors, Associate Director,Cost Auditors, DGM - Accounts & Finance, D.G.M. Accounts &Taxation, Chief Financial Officer and A.G.M. Audit & Compliance& Co-ordinator of Audit Committee are the permanent inviteesto the meetings of Audit Committee. Apart from them, JointManaging Director, Asst. Manger Finance, Vice President H.R. &Manager Personnel etc. attended one of the Audit CommitteeMeeting(s).
The Company Secretary is acting as the Secretary to the AuditCommittee.
The Chairman of the Audit Committee, Mr. R.L. Narasimhan,was present at the Annual General Meeting of the Companyheld on 25.09.2009.
Subsidiary Companies
Best on Health Limited is a material non-listed Indiansubsidiary of the Company as its net worth (i.e. paid-up capitaland free reserves) exceeded 20% of the consolidated net worthof the Company. The Company’s independent Directors, Mr.R.L. Narasimhan, Mr. N.N. Khamitkar and Mr. Sunil Kapoor aredirectors on the Board of Directors of Best on Health Limited.
The Audit Committee of the Company reviewed the financialstatements, in particular the investments made by all unlistedsubsidiary companies, except the financial statements of oneof its subsidiaries namely Panacea Biotec GmbH, whoseunaudited financial results were reviewed by the committeefor the fiscal period ended 31st March, 2010.

69
Panacea Biotec|Annual Report 2009-10
The Board’s minutes of unlisted subsidiary companies are placedat the Board Meeting of the Company and the significanttransactions or arrangements entered into by the unlistedsubsidiary companies are periodically informed to the Board.
4. REMUNERATION COMMITTEE
Brief description of terms of reference
The Company has constituted a Remuneration Committee. Theterms of reference of the Committee include:
� to decide elements of remuneration package of all thedirectors;
� to decide the service contracts, notice period andseverance fees of executive directors.
Composition
Remuneration Committee comprises three non-executiveIndependent Directors viz. Mr. R.L. Narasimhan, Mr. N.N.Khamitkar and Mr. Sunil Kapoor. Mr. R.L. Narasimhan is theChairman of the Committee. The Company Secretary is actingas the Secretary to the Remuneration Committee.
Meetings of Remuneration Committee and attendance ofmembers during the year
During the year, 1 (one) Remuneration Committee meetingwas held on 27th May, 2009.
The attendance of members of the Remuneration Committeeat such meeting was as follows:
Remuneration Policy
The Directors’ Remuneration Policy of your Company is inconformity with the provisions under the Companies Act,1956. Subject to the approval of the Company’s shareholdersin general meeting and such other approvals as may benecessary, the Managing/Joint Managing Directors and theWhole-time Directors are paid remuneration as per the termsof remuneration decided by the Board/ RemunerationCommittee and approved by the Shareholders. Theremuneration payable to the executive Directors is decidedfrom time to time, keeping in view the overall performance ofthe Company, the performance of the concerned Director andthe industry trends.
The key components of the Company’s Remuneration Policy are:
� Compensation will be a major driver of performance;
� Compensation will be competitive and benchmarked with aselect group of companies from the pharmaceutical sector;
� Compensation will be fully transparent and tax compliant.
Directors’ remuneration
The details of remuneration paid to Directors during thefinancial year ended 2009-10 are as under:
i) Executive Directors (Managing/Joint Managing/Whole-time Directors)
Notes:
1. The tenure of office of Mr. Soshil Kumar Jain, Chairman, Mr. Ravinder Jain, Managing Director, Dr. Rajesh Jain and Mr. Sandeep Jain, Joint ManagingDirectors of the Company is for 5 years w.e.f. 1st April, 2006.The tenure of office of Mr. Sumit Jain, Director (Operations and Projects) is for 5 yearsw.e.f. 20th July, 2010.
2. Notice period for termination of appointment of Managing/Joint Managing/ Whole time Directors is three months by either party or a shorterperiod decided mutually. No severance fee is payable on termination of contract.
3. The Company does not have any Stock Option Scheme.
4. All elements of remuneration of the Managing/Joint Managing/ Whole-time Directors, i.e., Salary, Perquisites and other benefits, etc. are given inSchedule XX C annexed to and forming part of Balance Sheet and Profit & Loss Account of the Company.
5. Provision for Gratuity and Leave Encashment amounting to Rs.38.14 Lac and Rs.13.09 Lac respectively, made during the year, has not been includedabove.
SI. No. Name Salary Allowances Perquisites Total
1. Mr. Soshil Kumar Jain 144.00 6.46 3.16 153.62
2. Mr. Ravinder Jain 144.00 6.46 48.26 198.72
3. Dr. Rajesh Jain 120.00 5.38 5.34 130.72
4. Mr. Sandeep Jain 120.00 5.38 4.30 129.68
5. Mr. Sumit Jain 27.00 1.21 5.87 34.08
(Rs. in Lac)
Sl. Name of the Member Designation Category of Directorship No. of No. ofNo. Meetings held Meetings
attended
1. Mr. R.L. Narasimhan Chairman Independent Director 1 1
2. Mr. Sunil Kapoor Member Independent Director 1 1
3. Mr. N.N. Khamitkar Member Independent Director 1 1

70
Sl. No. Name Allowances Sitting Fees Total
1. Mr. R.L. Narasimhan 1.86 1.05 2.91
2. Mr. N.N. Khamitkar 1.86 0.95 2.81
3. Mr. Sunil Kapoor 1.86 0.85 2.71
4. Mr. Gurmeet Singh - 0.50 0.50
5. Mr. K.M. Lal 1.86 0.50 2.36
6. Dr. A.N. Saksena 1.86 1.00 2.86
(Rs. in Lac)
ii) Non-Executive Directors
Payment Criteria:
The Board of Directors determines the remuneration of thenon-executive Directors within the limits approved by theshareholders. Apart from the sitting fees for attendingmeetings of the Board or Committee thereof, the remunerationis paid to the non-executive Directors (other than Mr. Gurmeet
Singh) by way of monthly allowances for telephone, mobile,conveyance expenses, etc. @ Rs.15,500 p.m. (with theconfirmation obtained from Central Government) to enablethem to meet their expenses for attending to theirresponsibilities as non-executive director.
The details of remuneration paid to the non-executive directorsduring financial year ended 31st March, 2010 are as under:
None of the non-executive Directors holds any shares/ convertible securities of the Company.
5. SHARE TRANSFER CUM INVESTORS’ GRIEVANCECOMMITTEE
The Investors Grievance Committee aims at redressal ofshareholder complaints and oversees investor services.
The Board of Directors of the Company has, with a view toexpediting the process of share transfers, delegated the powerof share transfer to the Company Secretary, who attends toshare transfer formalities on a weekly basis.
Terms of reference
The terms of reference of Share Transfer cum Investors’Grievance Committee include transfer or transmission ofshares, issue of duplicate share certificates, review or redressalof investors’ grievances and other areas of investor service.
Composition
The Share Transfer-cum-Investors’ Grievance Committeecomprises three Directors viz. Dr. A.N. Saksena, Mr. RavinderJain and Mr. Gurmeet Singh. Dr A.N. Saksena, an independentnon-executive Director acts as Chairman of the Committee.
Mr. Vinod Goel, Company Secretary, is acting as the Secretaryto the Committee as well as the Compliance Officer pursuantto Clause 47(a) of the Listing Agreement with Stock Exchanges.
Meetings of Share Transfer-cum-Investors’ GrievanceCommittee and attendance of members during the year
During the year, 12 (twelve) meetings of Share Transfer-cum-Investors’ Grievance Committee were held. The attendance ofmembers at such meetings was as follows:
Sl. Name of the Member Designation Category of Directorship No. of No. ofNo. Meetings held Meetings
attended
1. Dr. A. N. Saksena Member Chairman 12 12
2. Mr. Ravinder Jain Member Promoter Director 12 10
3. Mr. Gurmeet Singh Member Independent Director 12 10
Details of investors’ complaints received during the year 2009-10:
Sl. No. Nature of Complaints Received Resolved Pending
1 Non-receipt of desired information 1 1 0
2 Non-receipt of dividend 3 3 0
3 Non-receipt of new Share Certificate 2 2 0
4 Non-receipt of postal ballot notice seeking consent for buy back offer 1 1 0
Total 7 7 0

71
Panacea Biotec|Annual Report 2009-10
The Company put utmost priority to the satisfaction of its shareholders, which is evident from the fact that only very few complaintswere received by the Company. The Company addresses all complaints, suggestions and grievances expeditiously and replies havebeen sent/issues have been resolved expeditiously, except in case of dispute over facts or other legal constraints.
There were no share transfers lying pending as on 31st March, 2010.
6. CEO/CFO Certification
The Managing Director and D.G.M (Accounts & Finance) have certified, in terms of revised clause 49 of the Listing Agreement, to theBoard that the financial statements present a true and fair view of the Company’s affairs and are in compliance with existing accountingstandards.
The CEO and CFO certification of the financial statements and the cash flow statement for the year is enclosed as Annexure – II to thisreport.
7. GENERAL BODY MEETINGS
The last three Annual General Meetings were held as under:
Financial Date Time Venue Special Resolution passedYear
2008-09 25.09.09 11:00 AM Regd. Office at Ambala • Approval for protection of Remuneration paid to Mr. SoshilChandigarh Highway, Kumar Jain, Chairman, for the financial year 2008-09.
Lalru-140501,Punjab • Approval for protection of Remuneration paid toMr. Ravinder Jain, Managing Director, for the financialyear 2008-09.
• Approval for protection of Remuneration paid to Dr. RajeshJain, Joint Managing Director, for the financial year 2008-09.
• Approval for protection of Remuneration paid to
Mr. Sandeep Jain, Joint Managing Director, for the financialyear 2008-09.
2007-08 27.09.08 11:00 AM -do- • No Special Resolution was passed.
2006-07 29.09.07 10:30 AM -do- • Approval for promotion of Mr. Shagun Jain, as DeputyGeneral Manager Systems and increase in remunerationw.e.f. 1st April 2007 under section 314 of the Companies Act,1956(“Act”).
• Approval for promotion of Mrs. Radhika Jain as Sr. Managerw.e.f 1st April 2007 under section 314 of the Act.
• Approval for increase in remuneration to Ms. Shilpy Jain, asManager- Food & Beverages, under section 314 of the Act.
Postal Ballot
During the year, the Company had conducted voting through two Postal Ballots on 10th February 2010 & 8th March 2010, respectively.The Company complied with the procedures for the Postal Ballot in terms of the Companies (Passing of Resolution by Postal Ballot)Rules, 2001 and the amendments thereto. Ms. Shikha Singhal of M/s U.S. & Associates, Company Secretaries, acted as scrutinizer for firstPostal Ballot whose results were announced on 10th February 2010 and voting pattern of the same was as under:
S. No. Item Votes castFor Against
1 Special Resolution under Section 77A of the Companies Act, 1956 and Securities &Exchange Board of India (Buy back of Securities) Regulations, 1998 for the Buy-backof 5,592,000 Equity Shares of the Company at a price not exceeding Rs.189 per EquityShare with the total aggregate amount to be expended not to exceed Rs.1,056,888,000. 30,309 33,087,535
The above resolution was therefore not approved by the requisite majority.
The second postal ballot was conducted by Mr. U. K. Singhal of M/s Singhal Law Associates, Advocates and the results of the samewere announced on 8th March, 2010 and voting pattern for these resolutions was as under:

72
S. No. Item Votes castFor Against
1. Special Resolution under Section 77A of the Companies Act, 1956 and Securities &Exchange Board of India (Buy back of Securities) Regulations, 1998 for the Buy-back of5,592,000 Equity Shares of the Company at a price not exceeding Rs.229 per Equity Sharewith the total aggregate amount to be expended not to exceed Rs.1,280,568,000. 33,276,597 7,703
The above special resolution has therefore, been approved bythe overwhelming majority.
Procedure for voting by Postal Ballot:
The Postal Ballot Forms and the draft Resolution(s), along withthe Explanatory Statement pertaining to the said Resolution(s)explaining in detail the material facts and the self-addressed,postage prepaid envelope, are sent to all the members underCertificate of Posting.
The members are required to carefully read the instructionsprinted in the Postal Ballot Form, give their assent or dissenton the resolution (s) at the end of the Form and sign the sameas per the specimen signatures available with the Company orDepository Participant, as the case may be, and return the formduly completed in the attached self-addressed, postageprepaid envelope so as to reach the scrutinizer before the closeof working hours of the last date fixed for the purpose. PostalBallot Forms received after this date are strictly treated as if theform has not been received from the member.
The scrutinizer appointed for the purpose scrutinizes the postalballots received and submit his report to the Company.
Voting rights are reckoned on the basis of number of sharesand paid-up value of shares registered in the name of theshareholders as on the date of dispatch of the postal ballotnotice. A resolution is deemed to have been passed as specialresolution if the votes cast in favour are at least three timesthan the votes cast against and in case of ordinary resolution,the resolution is deemed to have been passed, if votes cast infavour are more than the votes cast against.
8. DISCLOSURE
a) Related Party Transactions
During the year, there were no materially significant relatedparty transactions with the promoters, the directors or themanagement, their subsidiaries or relatives, etc., that may havepotential conflict with the interests of the Company at large.The other related party transactions are given in Note No.9 ofSchedule XXC annexed to and forming part of Balance Sheetand Profit & Loss Account of the Company.
b) Disclosure of Accounting Treatment
There has not been any change in accounting policies of theCompany during the year except as stated in Note No.2 ofSchedule XXB annexed to and forming part of Balance Sheetand Profit & Loss Account of the Company.
c) Risk Management
The Company has a procedure to inform the Board about therisk assessment and minimization procedures. The Board ofDirectors periodically reviews the risk management frameworkof the Company and comes out with strategic risk mitigationmeasures.
d) Compliances by the Company
During the last three years, there were no strictures or penaltiesimposed by either SEBI or the Stock Exchanges or any otherstatutory authority for non-compliance of any matter related tothe capital markets.
e) Non-Mandatory Requirements under Clause 49 of theListing Agreement
The Company has complied with all the mandatoryrequirements of clause 49 of the listing Agreement. As regardsthe adoption of non-mandatory requirements as contained inAnnexure I-D to clause 49 of the listing agreement, theCompany has implemented the requirements as per detailsgiven below:
i) Chairman of the Board
The Chairman of Panacea Biotec is an Executive Directorand he maintains the Chairman’s Office at the Company’sexpenses.
ii) Remuneration Committee
The Board of Directors has constituted a RemunerationCommittee, which is composed of Independent Directors.The details of the Remuneration Committee and itspowers have already been discussed in this Report.
iii) Shareholders’ rights
The quarterly/ half-yearly results, after they are approvedby the Board of Directors, are sent forthwith to the StockExchanges where the Company’s shares are listed,published in the newspapers as mentioned under theheading “Means of Communication” at Sl. No. 10hereinbelow, and also displayed on the Company’s web-site www.panaceabiotec.com. The results are notseparately circulated to the shareholders.
iv) Training of Board Members
No specific training programme was arranged for Boardmembers. However, at the Board/Committee meetings,detailed presentations are made by Professionals,Consultants, as well as Senior Executives of the Company

73
Panacea Biotec|Annual Report 2009-10
on business related matters, risk assessment, strategy,effect of the regulatory changes, etc.
v) Mechanism for evaluating non-executive Board members
The Company has not adopted any mechanism forevaluating individual performance of Non- ExecutiveDirectors.
vi) Whistle Blower Policy
The Company has implemented a Whistle Blower Policyin the Company and no personnel is denied access to theAudit Committee of the Company.
f) Corporate Governance Voluntary Guidelines 2009
The Company’s policies and practices embrace most of theelements of Corporate Governance Voluntary Guidelines 2009issued by the Ministry of Corporate Affairs. The Company willbe reviewing its Corporate Governance parameters in thecontext of other recommendations under said Guidelines forappropriate adoption in due course of time.
9. PROHIBITION OF INSIDER TRADING
In compliance with the SEBI Regulations on Prevention ofInsider Trading, the Company has instituted a comprehensiveCode of Conduct for its management, staff and relevantbusiness associates. The Code lays down guidelines, whichadvises them on procedures to be followed and disclosures tobe made while dealing with the Shares of the Company.
10. MEANS OF COMMUNICATION
i) The Quarterly and Half-Yearly results are published in one ormore of the prominent daily newspapers, viz. BusinessStandard, All editions, New Delhi, Chandigarh, Lucknow,Kolkata, Pune, Kochi, Mumbai; Ahmedabad, Bangalore,Bhuwaneshwar, Hyderabad, Chennai and Financial Express, alleditions Delhi, Mumbai, Ahmedabad, Bangalore, Chandigarh,Hyderabad, Lucknow, Kolkata, Pune, Kochi, Chennai and in
Punjabi Tribune, Chandigarh, the local newspaper publishedin the language of the region in which Registered Office issituated.
ii) The Company also intimates the Stock Exchanges all pricesensitive matters or such matters which, in its opinion, arematerial and of relevance to the shareholders, andsubsequently issues a Press Release on the matter, wherevernecessary.
iii) The Annual Results (Annual Report containing Balance Sheetetc.) are posted to every shareholder of the Company.
iv) The Company’s web-site, viz. www.panaceabiotec.com, isregularly updated with the financial results, annual report andother important events.
v) As per the requirements, pursuant to clause 51 of the listingagreement, financial information like annual and quarterlyfinancial statements, segment-wise results, shareholdingpattern and annual report were made available on SEBI’s web-site www.sebiedifar.nic.in.
vi) Management’s Discussion and Analysis Report has beenincluded in the Annual Report being sent to the shareholdersof the Company.
11. GENERAL SHAREHOLDER INFORMATION
i) Date of AGM
The Annual General Meeting is proposed to be held onSaturday, the 25th day of September, 2010, at 11:00 A.M. at theregistered office of the Company at Ambala-ChandigarhHighway, Lalru - 140501, Punjab.
Posting of Annual Report On or before 1st September,2010
Last date of receipt of 23rd September, 2010 beforeProxy Form 11.00 A.M.
ii) Financial Calendar 2010-11 (tentative):
S. No. Tentative Schedule Tentative Date
1. Financial reporting for the quarter ended 30th June, 2010 20th July, 2010 (Actual)2. Financial reporting for the half year ending 30th September, 2010 Mid of November, 20103. Financial reporting for the quarter ending 31st December, 2010 Mid of February, 20114. Financial reporting for the quarter ending 31st March, 2011 Mid of May, 2011*5. Annual General Meeting for the year ending 31st March, 2011 End of September, 2011
*As provided in clause 41 of Listing Agreement, the Board may also consider publishing Audited Results for the year 2010-11 in lieu of Unaudited
Results for fourth quarter, by 30th May, 2011 (or such other period as may be stipulated from time to time).
iii) Date of Book Closure
The Share Transfer Books and Register of Members of theCompany will remain closed from 20th September, 2010 to25th September, 2010 (both days inclusive).
iv) Dividend Payment Date
a) The Company will pay dividend, if declared by the members inthe forthcoming Annual General Meeting, on or before 24thday of October, 2010:
- to those members whose names appear in the Register ofMembers of the Company as on 25th September, 2010,after giving effect to all valid transfer of shares in physicalform lodged with the Company on or before 20thSeptember, 2010 and registered before 25th September,2010.
- in respect of Shares held in electronic form to those“deemed members” whose names appear on thestatement of beneficial ownership furnished by NSDL and

74
CDSL at the end of business hours on 17th September,2010 (i.e. before the date of commencement of closure ofRegister of Members and Share Transfer Books, viz. 20thSeptember, 2010).
b) Dividend payment date On or before 24th October,2010
c) Probable date of dispatch On or before 24thof dividend Warrants October, 2010
v) Unclaimed Dividends
As provided in Section 205A and 205C of the Companies Act,
1956, dividend for the financial year ended 31st March, 2003and thereafter, which remain unpaid or unclaimed for a periodof 7 years, will be transferred to the Investor Education andProtection Fund (IEP Fund) established by the CentralGovernment, and no payments shall be made in respect of anysuch claims by the IEP Fund.
During the year, the Company had transferred Rs.122,880 lyingunclaimed in Unpaid Dividend Account in respect of Dividendfor the Year 2001-02 to the said Fund on 15th October 2009.
Information in respect of other unclaimed dividend when duefor transfer to the said Fund is given below:
Financial Year Date of declaration Last date for claiming Due date for transferof Dividend unpaid Dividend to IEP Fund
2002-03 20.09.2003 18.10.2010 16.11.2010
2003-04 18.09.2004 16.10.2011 14.11.2011
2004-05 20.08.2005 17.09.2012 16.10.2012
2005-06 30.09.2006 29.10.2013 28.11.2013
2006-07 29.09.2007 28.10.2014 27.11.2014
2007-08 27.09.2008 26.10.2015 25.11.2015
Shareholders who have not yet encashed their dividendwarrant(s) for the above said financial year(s) may send theirrequest for revalidation of Dividend Warrant(s) or issue ofduplicate Dividend Warrant(s), as the case may be, to theCompany’s Corporate Office immediately. Shareholders arerequested to note that no claims shall lie against the Companyor the said Fund in respect of any amounts, which wereunclaimed or unpaid for a period of 7 years from the dates onwhich they first became due for payment, and no paymentshall be made in respect of any such claims.
vi) Listing on Stock Exchange
The Company’s Equity Shares are listed on the following StockExchanges:
� The National Stock Exchange of India Ltd. (NSE), BandraKurla Complex, Bandra (E), Mumbai.
� Bombay Stock Exchange Ltd. (BSE), P J Tower, Dalal Street,
Fort, Mumbai.
The Foreign Currency Convertible Bonds (FCCBs) of the
Company are listed on Singapore Exchange Ltd.(SGX), 2
Shenton Way, #19-00 SGX Centre 1, Singapore 068804, under
the BONDS Sector.
The Company has paid listing fees to all the above stock
exchanges and there is no outstanding payment as on date.
vii) Stock Code of Equity Shares / FCCBs
Trade symbol at National Stock Exchange is PANACEABIO.
Stock Code at Bombay Stock Exchange is 531349.
ISIN No. for Dematerialization : INE922B01023.
Stock Code of FCCBs : XS0243888830

75
Panacea Biotec|Annual Report 2009-10
viii) Market Price data:
The High and Low prices of the shares of the Company atBombay Stock Exchange Limited (BSE) and The National Stock
Exchange of India Ltd. (NSE) for the year ended 31st March,2010 are as under:
Month Share Prices (Rs.) at BSE Share Prices (Rs.) at NSE
High Low High Low
April, 2009 77.95 58.95 78.00 58.75
May, 2009 136.00 72.00 136.05 71.75
June, 2009 173.45 130.00 173.70 128.25
July, 2009 179.95 118.00 179.10 117.00
August, 2009 201.35 147.35 204.45 147.10
September, 2009 204.95 177.35 204.40 175.70
October, 2009 207.00 148.50 209.00 147.30
November, 2009 192.35 128.25 192.85 127.90
December, 2009 212.00 180.00 215.00 180.50
January, 2010 234.90 193.35 238.90 193.10
February, 2010 226.00 180.00 224.40 180.00
March, 2010 248.00 159.50 246.75 174.20
ix) Registrar and Transfer Agents
Skyline Financial Services Pvt. Ltd. are acting as Registrar &Transfer Agents (RTA) for handling the Shares-related matters,both in physical as well as dematerialized mode. All worksrelating to Equity Shares are being done by them. TheShareholders are, therefore, advised to send all theircorrespondence to the RTA.
However, for the convenience of shareholders, documentsrelating to Shares received by the Company are forwarded tothe RTA for necessary action thereon.
x) Nomination Facility
The shareholders holding Shares in physical form may, if theyso want, send their nominations in prescribed Form 2B of theCompanies (Central Government’s) General Rules andForms, 1956, (which can be obtained from the Company’sRTA or downloaded from the Company’s websitewww.panaceabiotec.com under the section‘Investor Zone’) tothe Company’s RTA. Those holding shares in dematerializedform may contact their respective Depository Participant (DP)to avail the nomination facility.
xi) Share Certificates in respect of sub-divided Shares
After the sub-division of the Company’s Equity Shares of Rs.10each into shares of Re.1 each, in the year 2003, the Companyhad sent letters to all shareholders holding shares of the facevalue of Rs.10 in physical form, requesting them to exchangetheir share certificates into new share certificate(s) in respect ofshares of face value of Re.1 each.
All the shareholders who have not yet sent their request forexchange of share certificates are requested to forward theirold share certificates in respect of shares of face value of Rs.10
each (which are no longer tradable) to the Company, alongwith a request letter duly signed by all the joint holders.
xii) Elimination of Duplicate Mailing
The shareholders who are holding Shares in more than onefolio in identical name, or in joint holder’s name in similar order,may send the Share certificate(s), along with request forconsolidation of holding in one folio, to avoid mailing ofmultiple Annual Reports.
xiii) Share Transfer System
The Company’s Shares transfer authority has been delegated tothe Company Secretary. The delegated authority generallyattends the Share transfer formalities on weekly basis and asand when required to expedite all matters relating to transfer,transmission, transposition and dematerialization of shares andredressal of Investors’grievance, etc., if any. The Shares receivedby the Company/ RTA for registration of transfers are processedby RTA (generally within a week of receipt) and transferredexpeditiously and the Share Certificate(s) are returned to theshareholder(s) by registered post.
As per the requirement of clause 47 (c) of the ListingAgreement with the Stock Exchanges, the Company hasobtained the half yearly certificates from a Company Secretaryin Practice for due compliance of share transfer formalities.
The Securities and Exchange Board of India (SEBI), vide circulardated 20th May, 2009, directed that for securities markettransactions and off-market/private transactions involvingtransfer of shares in physical form of listed companies, it shallbe mandatory for the transferee(s) to furnish copy of PAN cardto the Company/RTAs for registration of such transfer of shares.Further, in continuation to above, based on representations/

76
clarifications sought by market participants, SEBI, vide circulardated January 07, 2010, clarified that it shall be mandatory tofurnish a copy of PAN in the following cases –
a) Deletion of name of the deceased shareholder(s), wherethe shares are held in the name of two or moreshareholders.
b) Transmission of shares to the legal heir(s), where deceasedshareholder was the sole holder of shares.
c) Transposition of shares – when there is a change in theorder of names in which physical shares are held jointly inthe names of two or more shareholders.
Hence, all prospective shareholders acquiring Shares inphysical form are requested to provide a copy of their PAN card,along with their request for registration of transfer/transmission/ transposition of shares sent by them.
xiv) Secretarial Audit
A Practising Company Secretary carries out secretarial audit ineach quarter to reconcile the total admitted capital withNational Securities Depository Limited (NSDL) and CentralDepository Services (India) Ltd. (CDSL) and total issued andlisted capital. The audit reports confirm that the total issued/paid up capital is in agreement with the total number of Sharesin physical form and the total number of dematerialized Sharesheld with NSDL and CDSL. The Secretarial Audit Reports foreach quarter of the Financial Year ended March 31, 2010 havebeen filed with Stock Exchanges within one month of the endof each quarter.
No. of Shares No. of Shareholders No. of Shares
0-2500 8,701 2,084,297
2501-5000 112 400,046
5001-10000 39 274,991
10001-100000 53 1,606,955
100001 and above 45 62,476,457
Total 8,950 66,842,746
xv) Dematerialization of Shares and its liquidity
The Company has been among the few top-most companies in
India in which maximum number of shares have been
dematerialized. As on 31st March, 2010, 99.09% of the
Company’s total Equity Share Capital representing 66,236,975
Equity Shares were held in dematerialized form and only
605,771 Equity Shares were in paper/physical form.
The shareholders holding Shares in physical form are requested
to get their Shares dematerialized at the earliest, as the
Company’s Shares are required to be compulsorily traded at
Stock Exchanges in dematerialized form only.
The Shares of the Company are regularly traded at the National
Stock Exchange and the Bombay Stock Exchange.
xvi) Share Dematerialization System
The requests for dematerialization of Shares are processed by
RTA expeditiously and the confirmation in respect of
dematerialization of Shares is entered by RTA in the depository
system of the respective depositories, by way of electronic
entries for dematerialization of Shares generally on a weekly
basis. In case of rejections, the documents are returned under
objecton to the Depository Participant with a copy to the
shareholder, and electronic entry for rejection is made by RTA
in the Depository System.
xvii)Distribution of Shareholding as on 31st March, 2010:
S. No. Category No. of Shares Percentage
1. Promoters, Relatives & Associates 45,937,834 68.73
2. Institutional Investors (FIIs, Banks & Mutual Funds) 10,915,118 16.33
3. Domestic Companies 5,241,464 7.84
4. Indian Public 3,134,312 4.69
5. NRIs / OCBs / Foreign Corporate Bodies 1,269,859 1.90
6. Clearing Member(s)/House 316,829 0.47
7. Others 27,330 0.04
Total 66,842,746 100.00
xviii) Pattern of Shareholding as on 31st March, 2010:

77
Panacea Biotec|Annual Report 2009-10
xxi) Address for correspondenceFor transfer/ Skyline Financial Services Pvt. Ltd.dematerialization of shares, 246, Sant Nagar, 1st Floor, ISKCON Temple Road,payment of dividend and any East of Kailash , New Delhi – 110 065, India.other query relating to shares Phone : +91-11-26292682-83
Fax : +91-11- 26292681E-mail : [email protected], [email protected]
For investors assistance The Company Secretary,Panacea Biotec LimitedB-1 Extn./G-3, Mohan Co-operative Indl. Estate, Mathura Road,New Delhi - 110 044, India.Phone : +91-11-41679000 Extn. 2081 (D) 41578024Fax : +91-11-41679075, 41679070E-mail : [email protected]
Contact Person: Ms. Sangeeta Nagpal, Dy. Manager Secretarial
For query relating to Mr. Chandresh Ohri, Manager - Banking & Treasuryfinancial matters Phone : +91-11-41679000
Fax : +91-11-41679066, 41679070E-mail : [email protected]
For and on behalf of the Board
Place: New Delhi Soshil Kumar JainDate : 20th July, 2010 Chairman
Annexure - I
Declaration under Clause 49-I (D) of the Listing Agreement
To
The Members of Panacea Biotec Ltd.
I hereby declare that all the Board Members and the Senior Management Personnel of the Company have affirmed the compliance with theprovisions of the Code of Conduct for the period ended 31st March, 2010.
For Panacea Biotec Ltd.
Date : 20th July, 2010 Ravinder Jain
Place : New Delhi Managing Director
xix) GDRs / ADRs / Warrants or other convertible instruments
No GDRs/ ADRs/ Warrants were outstanding as on 31st March2010. However, Foreign Currency Convertible Bonds (FCCBs)outstanding as on 31st March 2010 were for Rs.1,652,504,000(comprising US $ 3,68,00,000 Zero coupon convertible Bondsdue 2011).
xx) Plant Locations
� Bulk Vaccine facilities at Village Samalheri, Ambala-ChandigarhHighway, Lalru-140501, Punjab.
� Pharmaceutical Formulations facility at Malpur, Baddi, Tehsil
Nalagarh, Dist. Solan, Himachal Pradesh-173 205.
� Vaccines Formulations facility at Malpur, Baddi, Tehsil Nalagarh,
Dist. Solan, Himachal Pradesh -173 205.
� Vaccines Formulations facility at A-241/242, Okhla Indl. Area,
Phase I, New Delhi - 110 020.
� Pharmaceutical Formulations facility at B-1/E-12, Mohan Co-
operative Indl. Estate, Mathura Road, New Delhi - 110 044.

78
Annexure - II
Certificate from Managing Director & Chief Financial Officer
To
The Board of Directors
Panacea Biotec Limited
We do hereby confirm and certify that:
a) We have reviewed financial statements and the cash flow statement for the year and that, to the best of our knowledge and belief:
i) These statements do not contain any materially untrue statement or omit any material fact or contain statements that might bemisleading;
ii) These statements together present a true and fair view of the Company’s affairs and are in compliance with existing accountingstandards, applicable laws and regulations.
b) There are, to the best of our knowledge and belief, no transactions entered into by the Company during the year which are fraudulent,illegal or violative of the Company’s code of conduct.
c) We accept responsibility for establishing and maintaining internal controls, and that we have evaluated the effectiveness of the internalcontrol systems of the Company and we have disclosed to the auditors and the Audit Committee deficiencies in the design or operationof internal controls, if any, of which we are aware of and the steps we have taken or propose to take to rectify these deficiencies.
d) We have indicated to the auditors and the Audit committee:
i) significant changes in internal control during the year;
ii) significant changes in accounting policies during the year and that the same have been disclosed in the notes to the financialstatements; and
iii) instances of significant fraud of which we are aware and the involvement therein, if any, of the management or an employeehaving a significant role in the company’s internal control system.
For Panacea Biotec Ltd.
Date : 07.05.2010 Ravinder Jain I.K. SharmaPlace : New Delhi Managing Director DGM (Accounts & Finance)
AUDITORS’ CERTIFICATE
To
The Members of Panacea Biotec Limited
We have examined the compliance of conditions of Corporate Governance by Panacea Biotec Limited, for the year ended on 31st March2010, as stipulated in clause 49 of the Listing Agreement of the said Company with stock exchange(s).
The compliance of conditions of Corporate Governance is the responsibility of the management. Our examination was limited to proceduresand implementation thereof, adopted by the Company for ensuring the compliance of the conditions of the Corporate Governance. It isneither an audit nor an expression of opinion on the financial statements of the Company.
In our opinion, and to the best of our information and according to the explanations given to us, we certify that the Company has compliedwith the conditions of Corporate Governance as stipulated in the above-mentioned Listing Agreement.
We state that no investor’s grievance is pending for a period exceeding one month against the Company, as per the records maintained bythe Shareholders/ Investors’ Grievance Committee.
We further state that such compliance is neither an assurance as to the future viability of the Company nor the efficiency or effectivenesswith which the management has conducted the affairs of the Company.
Dass Gupta & AssociatesChartered Accountants
Raaja JindalPlace : New Delhi PartnerDate : 20th July, 2010 Membership No. 504111

79
Panacea Biotec|Annual Report 2009-10
To the Members of Panacea Biotec Limited
1. We have audited the attached balance sheet of Panacea BiotecLimited (“the Company”) as at March 31, 2010 and also theprofit and loss account and the cash flow statement for theyear ended on that date annexed thereto. These financialstatements are the responsibility of the Company’smanagement. Our responsibility is to express an opinion onthese financial statements based on our audit.
2. We conducted our audit in accordance with auditing standardsgenerally accepted in India. Those Standards require that weplan and perform the audit to obtain reasonable assuranceabout whether the financial statements are free of materialmisstatement. An audit includes examining, on a test basis,evidence supporting the amounts and disclosures in thefinancial statements. An audit also includes assessing theaccounting principles used and significant estimates made bymanagement, as well as evaluating the overall financialstatement presentation. We believe that our audit provides areasonable basis for our opinion.
3. As required by the Companies (Auditor’s Report) Order, 2003(as amended) issued by the Central Government of India interms of sub-section (4A) of Section 227 of the Companies Act,1956, we enclose in the Annexure a statement on the mattersspecified in paragraphs 4 and 5 of the said Order.
4. Without qualifying our opinion, we draw attention to:
a) Note 3(ii) of Schedule XX C to the financial statementsregarding non-provision of proportionate premium onredemption of ‘US$ 50 Million Zero Coupon Convertible Bondsdue 2011’ amounting to Rs. 564,995,867. The same has beendisclosed as a contingent liability. Management hasrepresented, that the redemption premium will be offsetagainst the securities premium account and, hence, noadjustments have been considered in the accounts.
b) Note 17 of Schedule XX C to the financial statements regardingcapitalization of expenditure on clinical trials amountingto Rs. 32,125,547 for year ended March 31, 2010 andRs. 479,497,285 as of March 31, 2010. The ultimate approval ofsuch products, which has been considered as highly likely bythe management, is not within direct control of the Company.Pending such final approval, no adjustments have been madeto the accompanying financial statements.
c) Note 5 (b) of Schedule XX C to the financial statements, TheCompany had incurred managerial remuneration ofRs. 63,035,463 for the financial year ending 31st March 2009,which was in excess of the limits specified by the relevantprovisions of the Companies Act, 1956, by Rs. 38,169,706. TheCompany has obtained approval from Central Governmentvide its letter dated December 23, 2009 in respect to
remuneration paid amounting to Rs.25,296,096 and therequisite approval for balance remuneration is awaited.Pending the final outcome of the Company's application forbalance remuneration, no adjustments have been made to theaccompanying financial statements in this regard.
5. Further to our comments in the annexure referred to in para 3above, we report that: -
i) We have obtained all the information and explanations which,to the best of our knowledge and belief, were necessary for thepurposes of our audit;
ii) In our opinion, proper books of account as required by law,have been kept by the Company, so far as appears from ourexamination of the books;
iii) The balance sheet, profit and loss account and cash flowstatement dealt with by this report are in agreement with thebooks of account;
iv) In our opinion, the balance sheet, profit and loss account andcash flow statement dealt with by this report comply with theaccounting standards referred to in sub-section (3C) of section211 of the Companies Act, 1956;
v) On the basis of written representations received from thedirectors, as on March 31, 2010, and taken on record by theBoard of Directors, we report that none of the directors isdisqualified as on March 31, 2010 from being appointed as adirector in terms of clause (g) of sub-section (1) of section 274of the Companies Act, 1956;
vi) In our opinion and to the best of our information andaccording to the explanations given to us, the said accountsgive the information required by the Companies Act, 1956, inthe manner so required and give a true and fair view inconformity with the accounting principles generally acceptedin India;
a) in the case of the balance sheet, of the state of the affairsof the Company as at March 31, 2010;
b) in the case of the profit and loss account, of the profit forthe year ended on that date; and
c) in the case of the cash flow statement, of the cash flowsfor the year ended on that date.
S.R. Batliboi & Co.Firm registration number: 301003E
Chartered Accountants
per Rajiv GoyalPlace : New Delhi PartnerDate : May 07, 2010 Membership No.: 94549
AUDITORS’ REPORT

80
Annexure referred to in paragraph [3] of our report of even dateRe: Panacea Biotec Limited (‘the Company’)
(i) a) The Company has maintained proper records showing fullparticulars, including quantitative details and situation offixed assets.
b) All fixed assets have not been physically verified by themanagement during the year but there is a regularprogram of verification, which in our opinion, isreasonable having regard to the size of the Company andthe nature of its assets. No material discrepancies werenoticed in respect of the fixed assets physically verifiedduring the year.
c) There was no substantial disposal of fixed assets duringthe year.
(ii) a) The management has conducted physical verification ofinventory at reasonable intervals during the year.
b) The procedures of physical verification of inventoryfollowed by the management are reasonable andadequate in relation to the size of the Company and thenature of its business.
c) The Company is maintaining proper records of inventoryand no material discrepancies were noticed on physicalverification.
(iii) a) The Company has granted loan to two companies coveredin the register maintained under section 301 of theCompanies Act, 1956. The maximum amount involvedduring the year was Rs. 739,605,679 and the year- endbalance of loans granted to such parties wasRs. 733,461,803.
b) In our opinion and according to the information andexplanations given to us, the rate of interest and otherterms and conditions for such loans are not prima facieprejudicial to the interest of the Company.
c) The loans granted are re-payable on demand. Asinformed, the company has not demanded repayment ofany such loan during the year, thus, there has been nodefault on the part of the parties to whom the money hasbeen lent. The payment of interest (whenever due) forloans has been regular.
d) There is no overdue amount of loans granted tocompanies, firms or other parties listed in the registermaintained under section 301 of the Companies Act, 1956.
e) The Company has taken loan from one partnership firmcovered in the register maintained under Section 301 of
the Companies Act, 1956. The maximum amount involvedduring the year was Rs. 335,147,700 and the year-endbalance of loans taken from such parties wasRs. 315,000,000.
f ) In our opinion and according to the information andexplanations given to us, the rate of interest and otherterms and conditions for such loans are not prima facieprejudicial to the interest of the Company.
g) In respect of loans taken, repayment of the principalamount is as stipulated and payment of interest has beenregular.
(iv) In our opinion and according to the information andexplanations given to us, there is an adequate internal controlsystem commensurate with the size of the Company and thenature of its business, for the purchase of inventory and fixedassets and for the sale of goods and services. During the courseof our audit, no major weakness has been noticed in theinternal control system in respect of these areas.
(v) a) According to the information and explanations providedby the management, we are of the opinion that theparticulars of contracts or arrangements referred to insection 301 of the Act that need to be entered into theregister maintained under section 301 have been soentered.
b) In our opinion and according to the information andexplanations given to us, the transactions made inpursuance of such contracts or arrangements exceedingvalue of Rupees five lakhs have been entered into duringthe financial year at prices which are reasonable havingregard to the prevailing market prices at the relevant time.
(vi) In respect of deposits accepted, in our opinion and accordingto the information and explanations given to us, directivesissued by the Reserve Bank of India and the provisions ofsections 58A, 58AA or any other relevant provisions of theCompanies Act, 1956 and the rules framed there under, to theextent applicable, have been complied with. We are informedby the management that no order has been passed by theCompany Law Board, National Company Law Tribunal or Re-serve Bank of India or any Court or any other Tribunal.
(vii) In our opinion, the Company has an internal audit systemcommensurate with the size and nature of its business.
(viii) We have broadly reviewed the books of account maintainedby the Company pursuant to the rules made by the CentralGovernment for the maintenance of cost records under section209(1) (d) of the Companies Act, 1956, and are of the opinionthat prima facie, the prescribed accounts and records havebeen made and maintained.

81
Panacea Biotec|Annual Report 2009-10
Name of the statute Nature of dues Amount (Rs) Period to which the Forum where disputeamount relates is pending
The Income Tax Act, 1961 Demand raised by Assessing Officer 39,255,799 Financial Year 2003-04 Pending with Delhi High Court
The Income Tax Act, 1961 Demand raised by Assessing Officer 30,084 Financial Year 2005-06 Pending with ITAT
The Income Tax Act, 1961 Demand raised by Assessing Officer 5,488,062 Financial Year 2007-08 Pending with CIT(Appeals)
The Finance Act, 1994 Demand raised by Assessing Officer 27,883,707 Financial Year 2003-04 Pending with Assessing Officer(Service tax) to 2007-08
(ix) a) Undisputed statutory dues including provident fund,investor education and protection fund, employees’ stateinsurance, income-tax, sales-tax, wealth-tax, service tax,custom duty, excise duty and other statutory dues havegenerally been regularly deposited with the appropriateauthorities except for slight delay in fewcases in Value addedtax (VAT) deposition, where amount involved is notsigniAcant.
b) According to the information and explanations given tous there are no undisputed amounts payable in respect of
provident fund, investor education and protection fund,employees’ state insurance, income-tax, wealth-tax,service tax, sales-tax, customs duty, excise duty and otherundisputed statutory dues were outstanding, at the yearend, for a period of more than six months from the datethey became payable.
c) According to the records of the Company, the duesoutstanding of income-tax, sales-tax, wealth-tax, servicetax, customs duty and excise duty on account of anydispute, are as follows:
(x) The Company has no accumulated losses at the end of thefinancial year and it has not incurred cash losses in the currentand immediately preceding financial year.
(xi) Based on our audit procedures and as per the information andexplanations given by the management, we are of the opinionthat the Company has not defaulted in repayment of dues to afinancial institution, bank or debenture holders.
(xii) According to the information and explanations given to us andbased on the documents and records produced to us, theCompany has not granted loans and advances on the basis ofsecurity by way of pledge of shares, debentures and othersecurities.
(xiii) In our opinion, the Company is not a chit fund or a nidhi /mutual benefit fund / society. Therefore, the provisions ofclause 4(xiii) of the Companies (Auditor’s Report) Order, 2003(as amended) are not applicable to the Company.
(xiv) In our opinion, the Company is not dealing in or trading inshares, securities, debentures and other investments.Accordingly, the provisions of clause 4(xiv) of the Companies(Auditor’s Report) Order, 2003 (as amended) are not applicableto the Company.
(xv) According to the information and explanations given to us, theCompany has not given any guarantee for loans taken byothers from banks or financial institutions.
(xvi) Based on information and explanations given to us by themanagement, term loans were applied for the purpose forwhich the loans were obtained.
(xvii) According to the information and explanations given to usand on overall examination of the balance sheet and cash flowstatement of the Company, we report that no funds raised onshort-term basis have been used for long term investments.
(xviii)The Company has not made any preferential allotment ofshares to parties or companies covered in the registermaintained under Section 301 of the Companies Act, 1956.
(xix) The Company has unsecured‘Zero Coupon Convertible Bondsdue 2011’outstanding during the year on which no security orcharge is required to be created.
(xx) We have verified that the end use of money raised by publicissues is as disclosed in the notes to the financial statements(Refer Note 3(iii) of Schedule XX C to Financial Statements).
(xxi) Based upon the audit procedures performed for the purposeof reporting the true and fair view of the financial statementsand as per the information and explanations given by themanagement, we report that no fraud on or by the Companyhas been noticed or reported during the course of our audit.
S.R. Batliboi & Co.Firm registration number: 301003E
Chartered Accountants
per Rajiv GoyalPlace : New Delhi PartnerDate : May 07, 2010 Membership No.: 94549

82
The Schedules referred to above and notes thereon form an integral part of the Balance Sheet.As per our attached report of even dateS.R. Batliboi & Co. For and on behalf of the BoardFirm registration number: 301003EChartered Accountants Ravinder Jain
Managing Director
Per Rajiv Goyal I.K. Sharma Dr. Rajesh JainPartner D.G.M. (Accounts & Finance) Joint Managing DirectorMembership No. 94549Place : New Delhi Vinod GoelDated : May 7, 2010 G.M. Legal & Company Secretary
BALANCE SHEET AS AT 31ST MARCH, 2010
Amount in Rs.
Schedule As at As atNo. March 31, 2010 March 31, 2009
SOURCES OF FUNDSShareholders’ FundsShare Capital I 66,842,746 66,786,312Reserves and Surplus II 6,898,199,947 6,965,042,693 6,084,706,629 6,151,492,941Loan FundsSecured Loans III 5,081,382,387 4,835,939,044Unsecured Loans IV 1,973,004,000 7,054,386,387 2,166,996,000 7,002,935,044Deferred Tax Liability (Net) 708,903,079 333,785,665(Refer note no.7 of Schedule XX C)Foreign Currency Monetary Item Translation 16,773,412 -Difference Account (net of amortisation)(Refer note no.19 of Schedule XX C)Total 14,745,105,571 13,488,213,650APPLICATION OF FUNDSFixed Assets VGross Block 8,090,262,108 7,411,174,436Less : Accumulated Depreciation/Amortisation 2,769,219,976 2,170,081,361Net Block 5,321,042,132 5,241,093,075Capital Work-in-Progress (including 1,625,538,270 6,946,580,402 1,697,610,032 6,938,703,107Capital Advances)Investments VI 2,258,323,398 2,165,697,596Foreign Currency Monetary Item Translation - 95,961,134Difference Account (net of amortisation)(Refer note no.19 of Schedule XX C)Current Assets, Loans & Advances VIIInventories 4,555,094,297 4,478,012,741Sundry Debtors 1,094,076,757 1,238,801,509Cash and Bank Balances 363,367,613 594,809,396Other Current Assets 72,267,120 54,409,736Loans and Advances 1,319,113,259 1,303,765,120Sub-total (A) 7,403,919,046 7,669,798,502Less : Current Liabilities and Provisions VIIICurrent Liabilities 1,382,207,188 1,528,090,478Provisions 483,479,606 1,857,508,130Sub-total (B) 1,865,686,794 3,385,598,608Net Current Assets (A)-(B) 5,538,232,252 4,284,199,894Miscellaneous Expenditure IX 1,969,519 3,651,919(To the extent not written off or adjusted)Total 14,745,105,571 13,488,213,650Significant Accounting Policies andNotes to Accounts XX

83
Panacea Biotec|Annual Report 2009-10
PROFIT & LOSS ACCOUNT FOR THE YEAR ENDED ON 31ST MARCH, 2010
The Schedules referred to above and notes thereon form an integral part of the Balance Sheet.As per our attached report of even dateS.R. Batliboi & Co. For and on behalf of the BoardFirm registration number: 301003EChartered Accountants Ravinder Jain
Managing Director
Per Rajiv Goyal I.K. Sharma Dr. Rajesh JainPartner D.G.M. (Accounts & Finance) Joint Managing DirectorMembership No. 94549Place : New Delhi Vinod GoelDated : May 7, 2010 G.M. Legal & Company Secretary
Amount in Rs.
Schedule For the year ended For the year endedNo. March 31, 2010 March 31, 2009
INCOMETurnover (Gross) X 8,851,642,430 7,753,017,108Less: Excise Duty 7,969,727 8,843,672,703 18,845,112 7,734,171,996Other Income XI 934,911,772 259,677,471Total 9,778,584,475 7,993,849,467EXPENDITUREPurchases of traded goods 180,100,823 155,870,989Raw and packing material consumed XII 5,014,889,893 2,951,977,608Operating and other expenses XIII 863,892,304 3,350,885,603(Increase)/Decrease in inventories XIV (514,763,491) (446,904,922)Personnel expenses XV 990,176,981 916,095,844Selling and distribution expenses XVI 396,701,820 434,544,751Research and development expenses XVII 753,062,612 669,944,045Financial expenses XVIII 423,448,208 347,420,187Depreciation / Amortisation V 488,594,089 536,073,835Miscellaneous expenditure written off 1,682,400 1,682,400during the yearTotal 8,597,785,639 8,917,590,340Profit / (Loss) before tax 1,180,798,836 (923,740,873)Provision for Income Tax 182,474,920 -Less: MAT Credit entitlement 177,691,380 -Net Current Tax Liability 4,783,540 -Deferred Income Tax (Credit)/Charge 375,117,414 (261,243,988)(Refer note no.7 of Schedule XX C)Provision for Tax (Earlier years) 708,188 -Provision for Fringe Benefit Tax - 28,000,000Profit / (Loss) after Tax 800,189,694 (690,496,885)Add : Balance brought forward from previous year 2,155,223,908 2,845,720,793Profit available for Appropriations 2,955,413,602 2,155,223,908APPROPRIATIONSDividend on Equity Shares - Proposed 16,710,687 -(not liable to TDS)Dividend Distribution Tax 2,839,981 -Transfer to General Reserve 80,018,969 -Balance carried to Balance Sheet 2,855,843,965 2,155,223,908Basic Earnings per Share XIX 11.98 (10.35)Diluted Earnings per Share XIX 11.22 (10.35)Face / Nominal Value per Share 1.00 1.00Significant Accounting Policies and XXNotes to Accounts

84
SCHEDULES TO BALANCE SHEET AND PROFIT & LOSS ACCOUNT
Amount in Rs.
As at As atMarch 31, 2010 March 31, 2009
SCHEDULE I - SHARE CAPITALAuthorisedComprising ofi. 125,000,000 (Previous Year 125,000,000) 125,000,000 125,000,000
Equity Shares of Re.1 eachii. 110,000,000 (Previous Year 110,000,000) 1,100,000,000 1,100,000,000
Preference Shares of Rs.10 each1,225,000,000 1,225,000,000
Issued, Subscribed and Paid up66,842,746 (Previous Year 66,693,746) Equity Shares of 66,842,746 66,693,746Re.1 each fully paid-up
Add: Forfeited Shares(14,900 Shares @ Rs.10 each forfeited on May 15, 1999, - 66,842,746 92,566 66,786,312which were later on sub-divided into 1,49,000 EquityShares of Re.1 each on February 12, 2003)
(1,49,000 Forfeited Shares which were earlier allotted on 24th August, 2005in the name of employees of the Company (in their capacity as Company’snominees/trustees) for sale thereof at the prevailing market prices throughrecognised Stock Exchanges on the terms & conditions as specified byManaging / Joint Managing Directors or Director of the Company,have beensold during the year and net proceeds aggregating Rs.299.11 Lacs has beenreceived by the Company)(Out of the above shares, 1,814,240 Equity Shares of Rs.10 each were issuedas fully paid up bonus shares by capitalisation of General Reserves in earlieryears,which were later on sub-divided into 18,142,400 Equity Shares ofRe.1 each on February 12,2003.These shares have been sold in the openmarket in the current year as fully paid.Consequently, amount of Rs.92,566has been transferred to Capital Reserve)
66,842,746 66,786,312SCHEDULE II - RESERVES AND SURPLUSCapital Redemption Reserve 1,016,849,140 1,016,849,140Capital Reserve [Refer note below] 3,092,566 -Securities PremiumAmount as per last Balance Sheet 2,762,712,068 2,762,712,068Add: Credited upon sale of Forfeited Equity Shares 29,761,726 2,792,473,794 - 2,762,712,068
General ReserveAmount as per last Balance Sheet 149,921,513 279,978,346Less: Exchange Differences of Earlier Years Capitalised to - 37,586,515Fixed Assets (Net of Depreciation Rs. 1,609,882)Less: Exchange Differences of Earlier Years Transferred to - 92,470,318the “Foreign Currency Monetary ItemTranslation Difference Account”Add: Transfer from Profit & Loss Account 80,018,969 229,940,482 - 149,921,513Profit & Loss Account 2,855,843,965 2,155,223,908
6,898,199,947 6,084,706,629
Note:Company has received a capital subsidy of Rs. 3,000,000 under the Central Investment Subsidy Scheme, 2003. [Refer to note 21 of schedule XXC]During the year, 149,000 Forfeited Equity Shares of the Company, which were earlier re-issued and held in the name of the Company’s employees as nominees/trustees, were sold during the year in the open market for Rs. 29,910,726. Out of the above, Rs.29,761,726 has been credited in the Securities Premium Account.

85
Panacea Biotec|Annual Report 2009-10
Amount in Rs.
As at As atMarch 31, 2010 March 31, 2009
SCHEDULE III - SECURED LOANS1. Foreign Currency Term Loans (from Banks)i) State Bank of India 1,796,200,000 2,028,800,000
(Due within one Year Rs. Nil (Previous Year Rs.Nil)Interest Accrued & Due on the same 8,553,385 12,416,668
ii) State Bank of Travancore 1,126,992,100 1,272,932,614(Due within one Year Rs. Nil (Previous Year Rs.Nil)Interest Accrued & Due on the same 5,642,204 -
2. Term Loan (from Government of India) 30,000,000 -(Due within one Year Rs. Nil (Previous Year Rs.Nil)
3. Working Capital Loans from Scheduled Banks 793,577,675 1,521,789,762Interest Accrued & Due on the same 4,736,147 -
4. Buyers’ Credit 1,315,680,876 -(Due within one year Rs. 1,315,680,876 (Previous Year Rs.Nil)
5,081,382,387 4,835,939,044
Notes:1. Foreign currency Term Loans From State Bank of India and State Bank of Travancore are secured by way of first pari-passu charge by hypothecation
of the company’s entire movable fixed assets, both present and future and mortgage of immovable properties of the company being landadmeasuring 96 bighas, 19 biswas & 93 bighas 12 biswas & 10 biswasi situated at village Samalheri, Tehsil Dera Bassi, District S.A.S. Nagar (Mohali),Punjab and land admeasuring 26 bighas, 3 biswas situated at Village Manpura, Tehsil Nalagarh, District Solan and land admeasuring 91 bighas, 1biswas situated at Village Malpura, Tehsil Nalagarh, District Solan in the state of Himachal Pradesh. Foreign currency term loan from State Bank ofIndia is also collaterally secured by personal guarantees of the promoter- directors of the Company, viz. Mr. Soshil Kumar Jain, Mr. Ravinder Jain, Dr.Rajesh Jain and Mr. Sandeep Jain.
2. The loan from Government of India is secured by way of hypothecation of the company’s all equipments, apparatus, machineries, machineries spares,tools and other accessories, goods and/or other movable property present and future on a first charges on pari-passu basis. The creation of chargefor hypothecation is under progress. (Refer note no. 23 of schedule XX C)
3. Working capital loans from Schedule Banks & Buyers’Credit are secured by way of first pari passu charge by hypothecation of all current assets and also byway of second pari-passu charge on all the movable fixed assets (including machinery and spares) of the Company and existing immovable properties of theCompany being land admeasuring 96 bighas, 19 biswas & 93 bighas 12 biswas & 10 biswasi situated at village Samalheri,Tehsil Dera Bassi, District S.A.S. Nagar(Mohali), Punjab and land admeasuring 26 bighas, 3 biswas situated atVillage Manpura,Tehsil Nalagarh, District Solan and land admeasuring 91 bighas, 1 biswassituated at Village Malpura, Tehsil Nalagarh, District Solan in the state of Himachal Pradesh. These are also collaterally secured by personal guarantees of thePromoter- directors of the Company, viz Mr. Soshil Kumar Jain, Mr. Ravinder Jain, Dr. Rajesh Jain and Mr. Sandeep Jain.
SCHEDULE IV - UNSECURED LOANSFixed Deposits* 320,500,000 300,500,000(Due within one Year Rs.181,000,000 (Previous Year Rs. 55,000,000))
Other Loans:Foreign Currency Convertible Bonds**US$ 36,800,000 (Previous Year US$ 36,800,000) 1,652,504,000 1,866,496,000Zero Coupon Convertible Bonds due 2011(Due within one year Rs.1,652,504,000 (Previous Year Rs.Nil)
1,973,004,000 2,166,996,000
Notes:* It includes Rs.315,000,000 (Previous Year Rs.300,000,000) from partnership firm in which some directors and their relatives are partner.
** Unless previously converted, redeemed or repurchased & cancelled, the remaining FCCBs of US $ 36,800,000,which were issued on 13.02.2006, willbe redeemed on Feb 14, 2011 at 142.80% of their outstanding principal amount.

86
DES
CRI
PTIO
NG
ROSS
BLO
CK
DEP
REC
IATI
ON
/AM
ORT
ISAT
ION
NET
BLO
CK
As
At
Add
ition
sA
djus
tmen
ts**
Sale
/A
sA
tA
sA
tPr
ovid
edD
educ
tions
As
At
As
At
As
At
Ap
ril,0
1,20
09du
ring
Adj
ustm
ents
Mar
ch31
,201
0A
pril
01,2
009
durin
g&
Adj
ustm
ents
Mar
ch31
,201
0M
arch
31,2
010
Mar
ch31
,200
9th
eYe
ar*
durin
gth
eYe
arth
eYe
ardu
ring
the
Year
A.T
ang
ible
Ass
ets
Land
-Fre
ehol
d29
3,49
0,94
5-
-29
3,49
0,94
5-
--
-29
3,49
0,94
529
3,49
0,94
5
Land
-Lea
seho
ld54
,832
,230
--
54,8
32,2
3083
2,61
576
5,63
8-
1,59
8,25
353
,233
,977
53,9
99,6
15
Build
ings
1,73
3,71
5,61
214
2,83
5,74
078
,517
,450
302,
980
1,79
7,73
0,92
231
1,37
1,61
510
6,70
9,73
325
,036
418,
056,
312
1,37
9,67
4,61
01,
422,
343,
997
Leas
ehol
d78
,482
,944
5,14
6,11
421
7,88
1-
83,4
11,1
7771
,346
,031
5,77
9,49
3-
77,1
25,5
246,
285,
653
7,13
6,91
3
Imp
rove
men
t
Plan
t&M
achi
nery
4,23
8,67
1,30
899
2,63
5,84
337
2,93
7,10
039
,149
,343
4,81
9,22
0,70
81,
241,
031,
086
435,
513,
225
30,0
23,3
441,
646,
520,
967
3,17
2,69
9,74
12,
997,
640,
222
Furn
iture
&Fi
ttin
gs28
7,88
5,24
217
,458
,575
6,40
5,69
12,
264,
954
296,
673,
172
135,
028,
371
28,3
86,8
401,
709,
689
161,
705,
522
134,
967,
650
152,
856,
871
Vehi
cles
138,
811,
922
28,9
00,1
0514
,890
,446
152,
821,
581
72,2
60,3
1019
,174
,732
10,4
97,2
7380
,937
,769
71,8
83,8
1266
,551
,612
Offi
ceEq
uip
men
ts20
4,98
7,28
86,
079,
737
1,70
9,98
913
,429
,247
195,
927,
789
84,2
68,9
1416
,835
,230
8,98
1,92
092
,122
,224
103,
805,
565
120,
718,
374
Com
put
er16
6,90
6,16
610
,604
,015
1,69
8,67
314
,426
,040
161,
385,
468
122,
410,
114
18,8
35,8
2014
,019
,119
127,
226,
815
34,1
58,6
5344
,496
,052
Equi
pm
ents
TOTA
L7,
197,
783,
657
1,20
3,66
0,12
946
1,48
6,78
484
,463
,010
7,85
5,49
3,99
22,
038,
549,
056
632,
000,
711
65,2
56,3
812,
605,
293,
386
5,25
0,20
0,60
65,
159,
234,
601
Cap
italW
ork
in88
3,30
5,22
81,
049,
891,
106
Prog
ress
PREV
IOU
SYE
AR
4,47
3,27
6,66
42,
780,
994,
067
11,6
95,1
8644
,791
,888
7,19
7,78
3,65
71,
371,
139,
029
678,
471,
332
9,45
1,42
32,
038,
549,
056
5,15
9,23
4,60
13,
102,
137,
635
B.I
nta
ng
ible
Ass
ets
Pate
nts,
Trad
emar
ks58
,202
,844
4,35
9,33
9-
617,
828
61,9
44,3
5546
,421
,326
3,55
2,60
975
,888
49,8
98,0
4712
,046
,308
11,7
81,5
18
&C
opyr
ight
s
Soft
war
e85
,404
,724
11,4
62,0
98-
82,6
0096
,784
,222
54,1
18,9
9015
,716
,472
67,4
5369
,768
,009
27,0
16,2
1331
,285
,734
Web
site
9,20
2,69
5-
--
9,20
2,69
59,
202,
695
--
9,20
2,69
5-
-
Prod
uctD
evel
opm
ent
60,5
80,5
166,
256,
328
--
66,8
36,8
4421
,789
,294
13,2
68,5
45-
35,0
57,8
3931
,779
,005
38,7
91,2
22
TOTA
L21
3,39
0,77
922
,077
,765
-70
0,42
823
4,76
8,11
613
1,53
2,30
532
,537
,626
143,
341
163,
926,
590
70,8
41,5
2681
,858
,474
Cap
italW
ork
in74
2,23
3,04
364
7,71
8,92
6
Prog
ress
PREV
IOU
SYE
AR
184,
829,
374
28,5
61,4
05-
-21
3,39
0,77
910
4,90
1,29
026
,627
,910
(3,1
05)
131,
532,
305
81,8
58,4
7479
,928
,084
TOTA
L(A
+B
)7,
411,
174,
436
1,22
5,73
7,89
446
1,48
6,78
485
,163
,438
8,09
0,26
2,10
82,
170,
081,
361
664,
538,
337
65,3
99,7
222,
769,
219,
976
5,32
1,04
2,13
25,
241,
093,
075
Cap
italW
ork
in1,
625,
538,
270
1,69
7,61
0,03
2
Prog
ress
PREV
IOU
SYE
AR
4,65
8,10
6,03
82,
809,
555,
472
11,6
95,1
8644
,791
,888
7,41
1,17
4,43
61,
476,
040,
319
705,
099,
242
9,44
8,31
82,
170,
081,
361
5,24
1,09
3,07
53,
182,
065,
719
SCH
EDU
LEV
-Fix
edA
sset
s
Not
es:
1.Fr
eeho
ldLa
ndin
clud
esLa
ndam
ount
ing
toRs
.16,
395,
690
(Pre
viou
sYea
rRs.
17,2
85,6
90)p
endi
ngre
gist
ratio
nin
the
nam
eof
the
Com
pan
y.2.
Build
ing
incl
udes
Offi
cePr
emis
esam
ount
ing
toRs
.155
,892
,400
(Pre
viou
sYea
rRs.
155,
892,
400)
pen
ding
regi
stra
tion
inth
ena
me
ofth
eC
omp
any.
3.Pl
ant&
Mac
hine
ryin
clud
esPl
ant&
Mac
hine
ryam
ount
ing
toRs
.3,5
21,3
31(P
revi
ousY
earR
s.4,
543,
083)
(Net
Bloc
k)ly
ing
with
third
par
ties.
4.D
epre
ciat
ion
fort
heye
arin
clud
esD
epre
ciat
ion
onRe
sear
ch&
Dev
elop
men
tAss
ets
amou
ntin
gto
Rs.1
75,9
44,2
48(P
revi
ousY
earR
s.16
9,02
5,40
7).
5.C
apita
lWor
kin
Prog
ress
incl
udes
pre
-op
erat
ive
exp
endi
ture
.Ref
erN
ote
No.
4of
sche
dule
XXC
.6.
All
Inta
ngib
leas
sets
(exc
eptS
oftw
are)
are
inte
rnal
lyge
nera
ted
Inta
ngib
leas
sets
.*
Incl
udes
exch
ange
diff
eren
ces
cap
italiz
eddu
ring
the
year
Rs.N
il(P
revi
ous
year
Rs.7
30,7
64,4
77)
**Ex
chan
gedi
ffer
ence
s(c
apita
lised
)/de
cap
italiz
eddu
ring
the
year
.
(Am
ount
inRs
.)

87
Panacea Biotec|Annual Report 2009-10
Amount in Rs.
As at As atMarch 31, 2010 March 31, 2009
SCHEDULE VI - INVESTMENTSLong Term Investments (At cost)
Trade (Unquoted)1) Subsidiary Companies:a) 1,902,160 (Previous Year 1,902,160) Equity Shares of 22,883,050 22,883,050
Re.1 each, fully paid in Best On Health Ltd.
b) 6,636,666 (Previous Year 6,636,666) 1,990,999,800 1,990,999,8000.5% Optionally Convertible Non-CumulativeRedeemable Preference Shares of Re.1 each,fully paid in Best On Health Ltd.
c) 5 (Previous Year 5) Equity Shares of AED 100,000 each, 5,474,520 5,474,520fully paid in Panacea Biotec FZE.
d) 3,765,701 (Previous Year 3,765,701) Equity Shares of 166,387,876 76,143,604Rs.10 each, Rs.5.90 (Previous Year Rs. 2.70) paid inUmkal Medical Institute Pvt. Ltd.(Refer note no.1 of Schedule XX C)
e) 25,000 (Previous Year 25,000) Equity Shares of 1,582,250 1,582,250€ 1 each, fully paid in Panacea Biotec GmbH
f) 1,000 (Previous Year 1,000) Equity Shares of US $ 0.01 476 476each, fully paid in Rees Investments Limited
g) 501 (Previous Year Nil) Equity Shares of US $ 100 2,379,030 2,189,707,002 - 2,097,083,700each, fully paid up in Panacea Biotec Inc., USA
2) Joint Venture Companies:
a) 2,295,910 (Previous Year 2,295,910) Equity Shares of 22,959,100 22,959,100Rs.10 each, fully paid up in Chiron Panacea VaccinesPvt. Ltd.
b) 4,608,608 (Previous Year 4,608,608) Ordinary Shares 168,068,998 168,068,998of GBP 0.01 (Face Value) each, fully paid up inCambridge Biostability Limited, U.K.Less: Provision for Permanent Diminution in the value 168,068,998 22,959,100 168,068,998 22,959,100of Investments (Refer note no. 13(e) of Schedule XX C)
3) 419,767 (Previous Year 419,767) Equity Shares of 4,197,670 4,197,670Rs.10 each fully paid in PanEra Biotec Pvt. Ltd.
4) 20,250 (Previous Year 20,000) Equity Shares of 202,500 200,000Rs.10 each fully paid up in Shivalik Solid WasteManagement Ltd.
Non-Traded (Unquoted)1) 41,257,126 (Previous Year 41,257,126) Equity Shares 41,257,126 41,257,126
of Re.1 each, fully paid up in Lakshmi & The ManagerHoldings Ltd*
2,258,323,398 2,165,697,596
* Company under the same management as defined under section 370(1B) of the Companies Act, 1956.
Note:1. The aggregate amount of unquoted investments is Rs. 2,258,323,398 (net of Provision for Permanent Diminution in the value of Investments of
Rs. 168,068,998) (Previous Year Rs. 2,165,697,596)

88
Amount in Rs.
As at As atMarch 31, 2010 March 31, 2009
SCHEDULE VII - CURRENT ASSETS, LOANS & ADVANCESInventories (at lower of cost or net realisable value):i) Raw Materials (including Packing Materials) 2,751,348,215 3,206,780,619
(Including lying with third parties Rs. 6,884,502(Previous Year Rs.34,062,940))
ii) Finished Goods 1,556,986,054 985,858,105(Including goods in transit of Rs. 10,245,325(Previous Year Rs. 1,192,568) & lying with third partiesRs. 208,800 (Previous Year Rs.844,654))
iii) Work in Progress 146,469,079 202,833,537(Including lying with third parties Rs. 4,068,010(Previous Year Rs.67,135,348))
iv) Stores & Spare Parts 100,290,949 4,555,094,297 82,540,480 4,478,012,741Sundry Debtors (Refer note no 8 (i) & (iii) ofSchedule XX C)*
(Unsecured, Considered good, unless otherwise stated)Over six months (including Rs 3,108,712 considered 93,909,262 83,409,270doubtful of recovery (Previous Year Rs.3,108,712))Others Debts 1,003,276,207 1,158,500,951
1,097,185,469 1,241,910,221Less : Provision for Bad & Doubtful Debts 3,108,712 1,094,076,757 3,108,712 1,238,801,509* Rs. 66,208,504 (Previous Year Rs. Nil) due fromPanEra Biotec Pvt. Ltd.
Cash and Bank Balancesi) Cash balance on hand 311,035 579,589ii) Balance with scheduled banksa) On Cash Credit Accounts 108,977,118 -b) On Current Accounts 46,933,851 25,557,539c) On Unpaid Dividend Accounts* 1,392,070 1,583,956d) On Fixed Deposits ** 921,813 70,467,843e) On Exchange Earner Foreign Currency 204,831,726 363,367,613 496,620,469 594,809,396
Current Accounts* Not available for use by the company as they represent
corresponding unpaid dividend liabilities.
** Fixed Deposits amounting to Rs. 921,813 (Previous Year
Rs.1,024,123) are pledged with Banks and various
Government Authorities.
Other Current AssetsExport Benefits receivable 29,209,403 25,521,973Interest accrued but not due on Loans & Deposits 50,333,187 36,163,233Less : Provision for doubtful of recovery (Refer note 7,275,470 72,267,120 7,275,470 54,409,736no. 13(e) of Schedule XX C)
Contd...

89
Panacea Biotec|Annual Report 2009-10
Amount in Rs.
As at As atMarch 31, 2010 March 31, 2009
Loans and Advances(Unsecured, considered good, unless otherwise stated)Advances recoverable in cash or in kind or for value to 68,679,787 116,431,593be received(Including Rs.5,327,443 (Previous Year Rs.818,322 )considered doubtful)Due from PanEra Biotec Pvt. Ltd. * - 153,950,194(Including Rs Nil (Previous Year Rs.135,532,654)considered doubtful)Balance with Excise, Custom etc. 14,274,321 15,027,362Loans & Advances to Subsidiary Company ** 688,547,588 710,811,071Loan to Joint Venture Company 108,833,850 108,833,850Staff Loans & Advances (including Rs 4,191,959 18,515,443 16,333,010(Previous Year Rs.4,191,959) considered doubtful) 898,850,989 1,121,387,080Less : Provision for doubtful Loans & Advances (Refer 108,833,850 108,833,850note no. 13(e) of Schedule XX C)Less : Provision for Bad & Doubtful Advances 9,519,402 140,542,935
780,497,737 872,010,295
Security Deposits 24,048,446 20,534,409Advance Income Tax (Net of Provision of Rs.1,169,208,188 336,875,696 411,220,416(Previous Year Rs.1,168,500,000))MAT Credit 177,691,380 1,319,113,259 - 1,303,765,120
7,403,919,046 7,669,798,502
* Company’s two directors are also directors in PanEra Biotec Private Limited.
** Advances include due from Company under the Same Management (wholly owned subsidiary company) as defined under section 370(1B) of theCompanies Act, 1956. Refer note no.8(i) & (ii) of Schedule XX C
SCHEDULE VIII - CURRENT LIABILITIES & PROVISIONSA. Liablitiesi) Acceptances 693,348,119 1,115,093,540ii) Sundry Creditorsa) Dues to Micro & Small Enterprises 2,793,052 1,274,843
(Refer note no.6 of Schedule XX C)b) Dues to other than Micro & Small Enterprises 631,834,283 358,326,378iii) Advances from Customers 5,239,440 5,367,817iv) Sundry Deposits 14,782,800 15,195,000v) Unpaid dividend on Equity Shares* 1,392,070 1,585,056vi) Other Liabilities 28,266,914 31,002,816vii) Payable to Subsidiary Company 207,650 202,620viii) Interest accrued but not due on Loans 4,342,860 1,382,207,188 42,408 1,528,090,478* This amount does not include amount due/outstanding to becredited to Investor Education & Protection Fund, same shall becredited as and when due.B. Provisionsi) Provision for Wealth Tax 1,986,550 913,479ii) Provision for Fringe Benefit Tax (Net of Advance 4,171,662 5,045,455
Payment of Rs. 101,828,338 (Previous YearRs.100,954,545))
iii) Proposed Dividend on Equity Shares 16,710,687 -iv) Provision for Dividend Distribution Tax 2,839,981 -v) Provision for Gratuity 48,181,817 56,754,771vi) Provision for Leave Encashment 52,656,070 51,690,425vii) Provision for Open Derivative Contracts 356,932,839 483,479,606 1,743,104,000 1,857,508,130
1,865,686,794 3,385,598,608

90
Amount in Rs.
As at As atMarch 31, 2010 March 31, 2009
SCHEDULE IX - MISCELLANEOUS EXPENDITURE(To the extent not written off or adjusted)i) License fees
As per last Balance Sheet 3,651,919 5,334,319Less: Written off during the year 1,682,400 1,969,519 1,682,400 3,651,919
1,969,519 3,651,919
SCHEDULE X - TURNOVERSales 8,822,400,595 7,730,417,599Services (R&D Income) 973,807 1,699,562Income from Contract Manufacturing 28,268,028 20,899,947
8,851,642,430 7,753,017,108
SCHEDULE XI - OTHER INCOMEInterest received -- from Banks (Tax deducted at source Rs.117,188 646,872 121,771,587
(Previous Year Rs.25,897,168))- from Inter Company Loans / Deposits (Tax deducted 44,996,688 45,756,516
at source Rs.Nil (Previous Year Rs.Nil))- on Income Tax Refund 7,196,265 -- from others* (Tax deducted at source Rs.100,722 806,944 534,417
(Previous Year Rs.Nil))Export Incentives 36,649,135 30,855,454Sale of Scrap 3,617,153 1,779,942Lease Rent (Tax deducted at source Rs.4,784,050 47,624,800 17,823,031(Previous Year Rs. 2,403,497))Profit on Sale of Fixed Assets (Net of loss Rs. Nil - 7,171,144(Previous Year Rs.2,039,733))Exchange Fluctuation Gain (Net of loss Rs.44,959,517 627,196,228 -(Previous Year Rs.Nil))**Share of Profit From Partnership Firm, in which - 1,257,126Company was PartnerInsurance Claim Received 1,910,000 4,430,371Royalty Income 28,555,552 9,266,380Dividend Received From Long Term Trade Investments 33,184 18,367,280(from Subsidiary companies)Provisions for doubtful advances written back 135,532,654 -Miscellaneous Income 146,297 664,223
934,911,772 259,677,471
* Interest from others includes Rs.157,260 (Previous Year Rs.87,800) from employees, Rs.205,193 (Previous Year Rs.188,248) from debtors, Rs.444,491(Previous Year Rs.Nil)from Punjab State Electricity Board & Rs. Nil (Previous Year Rs.258,369) from Excise department.
** It includes the amortisation of Exchange differences on Foreign Currency Monetary Items Translation Difference Account Rs.16,773,412 (Previous Year Rs.Nil)
For the year ended For the year endedMarch 31, 2010 March 31, 2009
SCHEDULE XII - RAW & PACKING MATERIALS CONSUMEDRaw & Packing Materials consumedOpening Stock 3,206,780,619 1,320,981,788Add : Material purchased during the year 4,582,492,919 4,857,397,558
7,789,273,538 6,178,379,346Less : Closing Stock 2,751,348,215 3,206,780,619
5,037,925,323 2,971,598,727Less: Material consumed for Research & Development 23,035,430 19,621,119
5,014,889,893 2,951,977,608

91
Panacea Biotec|Annual Report 2009-10
Amount in Rs.
For the year ended For the year endedMarch 31, 2010 March 31, 2009
SCHEDULE XIII - OPERATING AND OTHER EXPENSESProcessing Charges 14,494,811 35,289,443Analytical Testing & Trial Charges 7,721,905 6,995,652Stores & Spare Parts consumed (Refer note no.4 of 63,585,872 57,939,559Schedule XX C)Power & Fuel (Refer note no.4 of Schedule XX C) 130,397,709 112,167,409Repair & Maintenance (Refer note no.4 of Schedule XX C)
- Buildings 37,379,078 16,628,948- Plant & Machinery 16,879,018 22,609,114- Others 29,777,021 28,139,583
84,035,117 67,377,645Rent (Refer note no.4 of Schedule XX C) 63,577,656 53,248,013Royalty 17,409,841 14,742,764Directors’ Sitting Fees 485,000 345,000Printing & Stationery 59,259,270 40,206,382Postage & Communication expenses 47,755,175 45,366,215Insurance 33,998,771 41,379,420Travelling & Conveyance expenses (Refer note 119,210,034 103,288,987no.4 of Schedule XX C)Books & Periodicals 864,964 2,240,467Legal & Professional charges (Refer note no.4 of 94,891,894 108,984,641Schedule XX C)Vehicle Running & Maintenance 17,299,109 17,147,781Payment made to Auditors: (Refer note no.14 ofSchedule XX C)
- As Auditor:Statutory Audit Fee 3,000,000 3,309,000Limited Review Fees 1,603,235 1,685,400Out of pocket expenses 179,742 161,721
- As Advisor in respect ofManagement Services 2,500,000 -Out of pocket expenses 45,205 -
- In other manner - Certification 434,120 7,762,302 134,832 5,290,953Rates & Taxes (Refer note no.4 of Schedule XX C) 10,334,388 15,252,931Donation 3,948,651 3,408,970Subscription 12,153,460 13,700,941Staff Training & Recruitment 23,749,210 31,477,974Bad Debts & Advances written off - 72,285Provision for Doubtful Debts & Advances 4,509,121 116,494,114Loss on Sale of Fixed assets (Net of profit Rs.793,900 11,382,127 -(Previous Year Rs.Nil))Wealth Tax 1,985,248 936,368Foreign Exchange Fluctuation Loss (Net of Gain Rs.Nil - 557,888,608(Previous Year Rs.214,791,328))*Provision for Loss on Open Derivative Contracts - 1,702,604,000Provision for Permanent Diminution in the value of - 168,068,998Investments (Refer Note no 13(e) of schedule XXC)Miscellaneous expenses (Refer note no.4 of Schedule XX C) 33,080,669 28,970,083
863,892,304 3,350,885,603
* It includes the amortisation of Exchange differences on Foreign Currency Monetary Items Translation Difference Account Rs. Nil (Previous Year Rs. 47,980,567)

92
Amount in Rs.
For the year ended For the year endedMarch 31, 2010 March 31, 2009
SCHEDULE XIV - (INCREASE) / DECREASE IN INVENTORIESClosing Stock :
Finished Goods 1,556,986,054 985,858,105Work in Progress 146,469,079 1,703,455,133 202,833,537 1,188,691,642
Less: Opening Stock :Finished Goods 985,858,105 684,208,806Work in Progress 202,833,537 1,188,691,642 57,577,914 741,786,720
(514,763,491) (446,904,922)
SCHEDULE XV - PERSONNEL EXPENSESSalary, Wages and Bonus* (Refer note no.4 of 907,524,870 837,086,165Schedule XX C)Contribution to Provident and other Funds 27,542,325 26,949,018Workmen/Staff Welfare expenses 44,065,920 39,995,607Gratuity 11,043,866 12,065,054
990,176,981 916,095,844* For Director’s Remuneration refer note no.5(a) of schedule XX C
SCHEDULE XVI - SELLING & DISTRIBUTION EXPENSESAdvertising & Sales Promotion 250,749,594 226,910,009Meetings & Conferences 53,167,133 62,306,063Freight & Cartage 64,933,404 64,098,422Commission on Sales (other than sole selling agents) 27,851,689 81,230,257
396,701,820 434,544,751
SCHEDULE XVII - RESEARCH ANDDEVELOPMENT EXPENSESRaw Material & Packing Material consumed 23,035,430 19,621,119Stores & Spare Parts consumed 142,338,139 134,104,256Processing charges 57,908 -Salary, Wages and Bonus 223,009,679 182,045,564Contribution to Provident & other Funds 4,671,782 4,096,340Workmen/Staff Welfare expenses 7,083,667 9,504,657Gratuity 1,129,063 1,062,491Analytical Testing & Trial charges 47,323,372 26,736,975Rent 6,729,834 6,401,077Printing & Stationery 2,407,261 2,212,425Postage & Communication 3,035,056 3,151,204Travelling expenses 9,519,317 15,897,191Books & Periodicals 1,797,969 6,317,043Legal & Professional expenses 4,952,867 12,052,167Vehicle Running & Maintenance 3,474,942 2,424,344Donation - 30,251Repair & Maintenance:
- Buildings 3,400,824 5,726,552- Plant & Machinery 6,659,271 14,628,824- Others 4,255,411 14,315,506 3,728,604 24,083,980
Rates, Fees & Taxes 5,466,612 622,995Subscription 12,857,795 9,467,437Electricity & Water charges 33,845,096 33,714,494Meeting & Conferences 1,500,659 2,460,794Staff Training & Recruitment 2,057,087 765,564Loss on Sale of Fixed assets 2,757,048Product Development Expenses written off 19,395,518 -Depreciation/Amortisation 175,944,248 169,025,407Sundry expenses 4,356,757 4,146,270
753,062,612 669,944,045

93
Panacea Biotec|Annual Report 2009-10
Amount in Rs.
For the year ended For the year endedMarch 31, 2010 March 31, 2009
SCHEDULE XVIII - FINANCIAL EXPENSESInterest on:a) Fixed Loans 195,322,184 206,237,568b) Others (Including interest on Working Capital Loans) 187,350,501 382,672,685 114,833,232 321,070,800Bank charges 40,775,523 26,349,387
423,448,208 347,420,187
SCHEDULE XIX - EARNING PER SHARECalculation of Profit/(Loss) for Basic EPSNet profit/(Loss) before Tax 1,180,798,836 (923,740,873)Less: Adjustment for Tax Expenses 380,609,142 (233,243,988)Net profit/(Loss) for calculation of Basic EPS 800,189,694 (690,496,885)
Calculation of Profit/(Loss) for Diluted EPSAdjusted Net Profit/(Loss) for calculating Diluted EPS 800,189,694 (690,496,885)
No. of Equity Shares resulting from conversion of ForeignCurrency Convertible Bonds
‘US$ 50 Million Zero Coupon Convertible Bonds due 2011' 4,542,752 4,542,752(Outstanding US$36.80 Million) at conversionprice Rs. 357.57
Add: Weighted average number of Equity Shares in 66,781,921 66,693,746calculating basic EPS
Weighted average number of Equity Shares in 71,324,673 71,236,498calculating diluted EPS
Basic Earnings per Share 11.98 (10.35)Diluted Earnings per Share 11.22 (10.35)Face / Nominal Value per Share 1.00 1.00
SCHEDULE XX - SIGNIFICANT ACCOUNTING POLICIES ANDNOTES ON ACCOUNTS
A. NATURE OF OPERATIONS
Panacea Biotec Limited is one of the India’s leading research
based companies engaged in the business of research,
development, manufacture and marketing of Branded
Pharmaceutical Formulations and Vaccines. The Company has
products for various segments, which include pain
management, diabetes management, organ transplantation
and pediatric vaccines.
B. SIGNIFICANT ACCOUNTING POLICIES
1. Basis of Preparation
The financial statements have been prepared to comply in all
material respects with the Notified Accounting Standards
pursuant to Companies (Accounting Standards) Rules, 2006
(as amended) and the relevant provisions of the Companies
Act, 1956. The financial statements have been prepared under
the historical cost convention on an accrual basis except in
case of assets for which provision for impairment is made and
revaluation is carried out. The accounting policies have been
consistently applied by the Company and are consistent with
those used in the previous year.
2. Use of Estimates
The presentation of financial statements in conformity withthe Generally Accepted Accounting Principles requiresmanagement to make estimates and assumptions that affectthe reported amount of assets and liabilities and disclosure ofcontingent liabilities on the date of the financial statementsand the results of operations during the reporting period.Difference between the actual results and estimates arerecognized in the period in which the results are known/materialized.
3. Revenue Recognition
Revenue is recognized to the extent that it is probable that theeconomic benefits will flow to the Company and the revenuecan be reliably measured.
Sale of Goods - Revenue is recognized when the significantrisks and rewards of ownership of the goods have passed tothe buyer and is stated net of trade discounts, returns andSales Tax /VAT but includes Excise Duty. Excise Duty deductedfrom turnover is the amount that is included in the amount ofturnover (gross) and not the entire amount of liability arisenduring the year.
Research & Development - Income from Research &

94
Tangibles Assets WDV %
Building – Factory 10.00Building – Office Premises 5.00Plant & Machinery 13.91Furniture & Fi&ngs 18.10Vehicles 25.89Office Equipments 13.91Computer Equipments 40.00
Development Services is accounted for as per the stage ofcompletion.
ContractManufacturing - Revenue is recognized on an accrualbasis in accordance with the terms of the relevant agreement.
Interest - Revenue is recognized on a time proportion basistaking into account the amount outstanding and the rateapplicable.
Dividend - Revenue is recognized when the shareholders’ rightto receive payment is established by the balance sheet date.Dividend from subsidiaries is recognized even if same aredeclared after the Balance Sheet date but pertains to theperiod on or before the date of Balance Sheet, as per therequirements of Schedule VI to the Companies Act, 1956.
Royalty - Revenue is recognized on an accrual basis inaccordance with the term of the relevant agreement.
Export BeneAts - Export entitlements under Duty EntitlementPass Book Schemes and Advance Licenses are recognized inthe Profit & Loss Account when the right to receive credit asper terms of scheme is established in respect of export madeand where there is no significant uncertainty regarding theultimate collection of the relevant export proceeds.
4. Fixed Assets
Fixed assets are stated at cost less accumulated depreciationand impairment losses, if any. Cost comprises the purchaseprice and any attributable cost of bringing the asset to itsworking condition for its intended use. Borrowing costsrelating to acquisition of fixed assets which takes substantialperiod of time to get ready for its intended use are alsoincluded to the extent they relate to the period till such assetsare ready to be put to use.
As a result of change in Accounting Policy during the previousyear in respect of accounting periods commencing on or after7th December, 2006, exchange differences arising onreporting of the long-term foreign currency monetary itemsat rates different from those at which they were initiallyrecorded during the period, or reported in the previousfinancial statements are added to or deducted from the cost ofthe asset and are depreciated over the balance life of the asset,if these monetary items pertain to the acquisition of adepreciable fixed asset.
5. Impairment of Fixed Assets
The carrying amounts of assets are reviewed at each Balance Sheetdate as to whether if there is any indication of impairment based oninternal/external factors. An impairment loss is recognizedwherever the carrying amount of an asset exceeds its recoverableamount. The recoverable amount is the greater of the assets netselling price and value in use. In assessing value in use, theestimated future cash flows are discounted to their present valueat the weighted average cost of capital.
After impairment, depreciation is provided on the revisedcarrying amount of the assets over its remaining useful life.
6. Intangibles
Patents, Trademarks & Designs - Costs relating to patents,trademarks and designs, which are acquired, are capitalized.
Research andDevelopment Costs - Research costs are expensedas incurred. Development expenditure incurred on anindividual project is carried forward when its futurerecoverability can reasonably be regarded as assured.
Product Development - Product Development is capitalized onsuccessful completion of development activities andcommercial launch of developed products.
Technical Knowhow -Technical Know how is being capitalizedon successful transfer of technology when its futurerecoverability can reasonably be regarded as assured.
Software and Website - Software and website is stated at costof acquisition and includes all attributable costs of bringingthem to their working condition for their intended use.
The carrying value of intangible assets is reviewed forimpairment annually when the asset is not yet in use, andotherwise when events or changes in circumstances indicatethat the carrying value may not be recoverable.
7. Depreciation / Amortization
a) Depreciation on fixed assets is provided on written down valuemethod as per the rates based on the useful life of the assetsestimated by the management, or as per rates prescribed inSchedule XIV to the Companies Act, 1956, whichever is higher.Depreciation is provided on the following rates:
b) Amortization on intangibles is provided on the basis of theestimated useful lives as follows:-
Patents, Trademarks - Amortized on straight line basis& Designs over a period of 7 years.Product Development - Amortized on straight line basis
over a period of 5 years.Technical Know-how - Amortized on straight line basis
over a period of 5 years.Software - Amortized on straight line basis
over a period of 5 years.Websites - Amortized on straight line basis
over a period of 2 years.

95
Panacea Biotec|Annual Report 2009-10
c) Leasehold Land is amortized over the period of lease or usefullife, whichever is shorter.
d) Leasehold Improvements are amortized over the initial periodof lease or useful life, whichever is shorter.
e) No Depreciation is provided on freehold land, as AccountingStandard-6 on ‘Depreciation Accounting’ notified by theCompanies Accounting Standard Rules, 2006, does not applyto land unless it has a limited useful life.
8. Borrowing Costs
Borrowing costs attributable to the acquisition, constructionor production of a qualifying asset are capitalized as part ofthe cost of that asset. Borrowing costs, which are not relatableto qualifying assets, are recognized as an expense in theperiod in which they are incurred.
9. Government grants and subsidies
Grants and subsidies from the government are recognizedwhen there is reasonable assurance that the grant/subsidy willbe received and all attaching conditions will be complied with.
Government grants of the nature of promoters’ contributionare credited to capital reserve and treated as a part ofshareholders’ funds.
10. Leases
Where the Company is the Lessee:
Finance leases, which effectively transfer to the Companysubstantially all the risks and benefits incidental to ownershipof the leased item, are capitalized at the lower of the fair valueand present value of the minimum lease payments at theinception of the lease term and disclosed as leased assets.Lease payments are apportioned between the finance chargesand reduction of the lease liability based on the implicit rateof return. Finance charges are charged directly againstincome. Lease management fees, legal charges and otherinitial direct costs are capitalised.
If there is no reasonable certainty that the Company willobtain the ownership by the end of the lease term, capitalizedleased assets are depreciated over the shorter of theestimated useful life of the asset or the lease term
Leases, where the lesser effectively retains substantially all therisks and benefits of ownership of the leased term, areclassified as operating leases. Operating lease payments arerecognized as an expense in the Profit and Loss account on astraight-line basis over the lease term.
Where the Company is the Lessor:
Assets given under a finance lease are recognized as areceivable at an amount equal to the net investment in thelease. Lease rentals are apportioned between principal andinterest on the IRR method. The principal amount receivedreduces the net investment in the lease and interest is
recognized as revenue. Initial direct costs such as legal costs,brokerage costs, etc. are recognized immediately in the Profitand Loss Account.
Assets subject to operating leases are included in fixed assets.Lease income is recognized in the Profit and Loss Account ona straight-line basis over the lease term. Costs, includingdepreciation are recognized as an expense in the Profit andLoss Account. Initial direct costs such as legal costs, brokeragecosts, etc. are recognized immediately in the Profit and LossAccount.
11. Deferred Revenue Expenditure
Expenditure incurred prior to April 1, 2003 towards procuringlicense for new products is written off over the period of agreementor ten years whichever is shorter. Expenditure of the similar natureincurred during the year is charged off to revenue.
12. Investments
Investments that are readily realizable and intended to be heldfor not more than a year are classified as current investments.All other investments are classified as long-term investments.Current investments are carried at lower of cost and fair valuedetermined on an individual investment basis. Long-terminvestments are carried at cost. However, provision fordiminution, if any, in value is made to recognize a declineother than temporary in the value of the investments.
13. Inventories
Finished Goods, Work in Progress, Goods held for Resale, RawMaterials, Packing Materials and Stores & Spare parts arestated at lower of cost and net realizable value. However,materials and other items held for use in the production ofinventories are not written down below cost if the finishedgoods in which they will be incorporated are expected to besold at or above cost.
'Cost' of Finished Goods, Work in progress, Raw Materials,Packing Materials and Stores & Spare parts is arrived at byusing ‘Moving Average Price’ method.
Cost of Work in Progress and Finished Goods is determined byconsidering direct material cost and appropriate portion ofmanufacturing overheads based on normal operatingcapacity. Cost of traded goods is arrived at by using ‘MovingAverage Price’method. Cost of Finished Goods includes ExciseDuty.
Net realizable value is the estimated selling price in theordinary course of business, less estimated costs ofcompletion and to make the sale.
14. Retirement and Other Employee Benefits
a) Retirement benefits in the form of Provident Fund are definedcontribution schemes and the contributions are charged tothe Profit and Loss Account of the year when the contributions

96
to the respective funds are due. There are no other obligationsother than the contribution payable to the respective funds.
b) The contribution to Gratuity Fund, which is a defined benefitplan, is expensed on the basis of funding claims of the fundmanager, Life Insurance Corporation of India. At the end of theaccounting year, actuarial valuation is done as per projectedunit credit method by an independent Actuary and anyshortfall in the fund balance is further provided for.
c) Short term compensated absences are provided for based onestimates. Long term compensated absences are provided forbased on actuarial valuation done as per projected unit creditmethod.
d) Leave encashment payable /adjustable during the year isprovided on the basis of last salary drawn by employees.
e) Actuarial gains/losses are immediately taken to Profit & LossAccount and are not deferred.
15. Foreign Currency Transactions
Initial Recognition
Foreign currency transactions are recorded in the reportingcurrency, by applying to the foreign currency amount, theexchange rate between the reporting currency and theforeign currency at the date of the transaction.
Conversion
Foreign currency monetary items are reported using theclosing rate. Non-monetary items which are carried in terms ofhistorical cost denominated in a foreign currency are reportedusing the exchange rate at the date of the transaction andnon-monetary items which are carried at fair value or othersimilar valuation denominated in a foreign currency arereported using the exchange rates that existed when thevalues were determined.
Exchange Di@erences
Exchange differences arising on the settlement of monetaryitems or on reporting such monetary items at rates differentfrom those at which they were initially recorded during theyear, or reported in previous financial statements, arerecognized as income or as expenses in the year in which theyarise except those monetary items as mentioned below.
Exchange differences, in respect of accounting periodscommencing on or after 7th December, 2006, arising onreporting of long-term foreign currency monetary items atrates different from those at which they were initially recordedduring the period, or reported in previous financialstatements, in so far as they relate to the acquisition of adepreciable capital asset, are added to, or deducted from, thecost of the asset and are depreciated over the balance life of
the asset, and in other cases, are accumulated in a “ForeignCurrency Monetary Item Translation Difference Account” inthe financial statements and amortized over the balanceperiod of such long-term asset/liability but not beyondaccounting period ending on or before 31st March, 2011.
Exchange differences arising on a monetary item that, insubstance, form part of company's net investment in a non-integral foreign operation is accumulated in a foreign currencytranslation reserve in the financial statements until thedisposal of the net investment, at which time they arerecognized as income or as expenses.
Forward Exchange Contracts not intended for trading orspeculation purposes
The premium or discount arising at the inception of forwardexchange contracts is amortized as an expense or income overthe life of the contract. Exchange differences on such contractsare recognized in the statement of Profit and Loss Account inthe year in which the exchange rates change. Any profit or lossarising on cancellation or renewal of forward exchangecontract is recognized as income or as expense for the year.
16. Income Taxes
Tax expense comprises of current, deferred & fringe benefit tax.Current Income Tax & fringe benefit tax is measured at theamount expected to be paid to the tax authorities inaccordance with the Income Tax Act, 1961, enacted in India.Deferred Income Taxes reflect the impact of current year timingdifferences between taxable income and accounting incomefor the year and reversal of timing differences of earlier years.
Deferred Income Tax is measured based on the tax rates andthe tax laws enacted or substantively enacted at the balancesheet date. Deferred tax assets and deferred tax liabilities areoffset, if a legally enforceable right exists to set off current taxassets against current tax liabilities and the deferred tax assetsand deferred tax liabilities relate to the taxes on income leviedby same governing taxation laws. Deferred tax assets arerecognized only to the extent that there is reasonablecertainty that sufficient future taxable income will be availableagainst which such deferred tax assets can be realized. If theCompany has unabsorbed depreciation or carry forward taxlosses, deferred tax assets are recognized only if there is virtualcertainty supported by convincing evidence that suchdeferred tax assets can be realized against future taxableprofits.
At each Balance Sheet date the Company re-assessesunrecognized deferred tax assets. It recognizes unrecognizeddeferred tax assets to the extent that it has become reasonablycertain or virtually certain, as the case may be, that sufficient

97
Panacea Biotec|Annual Report 2009-10
future taxable income will be available against which suchdeferred tax assets can be realized.
The carrying amount of deferred tax assets are reviewed ateach balance sheet date. The Company writes down thecarrying amount of a deferred tax assets to the extent that itis no longer reasonably certain or virtually certain, as the casemay be, that sufficient future taxable income will be availableagainst which deferred tax assets can be realized. Any suchwrite-down is reversed to the extent that it becomesreasonably certain or virtually certain, as the case may be, thatsufficient future taxable income will be available.
MAT credit is recognised as an asset only when and to theextent there is convincing evidence that the company will paynormal income tax during the specified period. In the year inwhich the Minimum Alternative tax (MAT) credit becomeseligible to be recognized as an asset in accordance with therecommendations contained in guidance Note issued by theInstitute of Chartered Accountants of India, the said asset iscreated by way of a credit to the profit and loss account andshown as MAT Credit Entitlement. The Company reviews thesame at each balance sheet date and writes down the carryingamount of MAT Credit Entitlement to the extent there is nolonger convincing evidence to the effect that Company willpay normal Income Tax during the specified period.
17. Earnings per Share
Basic Earnings per Share are calculated by dividing the netprofit or loss for the period attributable to equity shareholders(after deducting preference dividends and attributable taxes)by the weighted average number of equity shares outstandingduring the period. The weighted average number of equityshares outstanding during the period is adjusted for events ofbonus issue, bonus element in a rights issue to existingshareholders, share split, and reverse share split (consolidationof shares), if any.
For the purpose of calculating diluted earnings per share, thenet profit or loss for the period attributable to equityshareholders and the weighted average number of Sharesoutstanding during the period are adjusted for the effects ofall dilutive potential equity shares.
18. Provisions
A provision is recognized when the Company has a presentobligation as a result of past event and it is probable that anoutflow of resources will be required to settle the obligation, inrespect of which a reliable estimate can be made. Provisions arenot discounted to its present value and are determined based onmanagement’s best estimate required to settle the obligation atthe balance sheet date. These are reviewed at each balance sheetdate and adjusted to reflect the current best estimates.
19. Segment Reporting Policies
a) Identification of Segments:
Primary Segment
Business Segment: The Company’s operating businesses areorganized and managed separately according to the natureof products, with each segment representing a strategicbusiness unit that offers different products. The identifiedsegments are Vaccines, Formulations and Research &Development Activities.
Secondary Segment
Geographical Segment: The analysis of geographical segmentis based on the geographical location of the customers.
The geographical segments considered for disclosure are asfollows:
• Revenue from domestic market includes sales tocustomers located within India.
• Revenue from overseas market includes sales tocustomers located outside India.
b) Allocation of Common Costs: Common allocable costs areallocated to each segment on a rational basis based on natureof each such common cost.
c) Unallocated Items: Corporate income and expenses areconsidered as a part of unallocable income & expense, whichare not identifiable to any business segment.
d) Segmental Policies: The Company prepares its segmentinformation in conformity with the accounting policiesadopted for preparing and presenting the financialstatements of the company as a whole.
20. Derivative Instruments
As per announcement of Institute of Chartered Accountantsof India, accounting for derivative contracts, other than thosecovered under AS-11, are marked to market on a portfoliobasis, and the net loss after considering the offsetting effecton the underlying hedge item is charged to the Profit and LossAccount. Net gains are ignored.
21. Cash & Cash Equivalent
Cash and cash equivalents in the cash flow statementcomprise cash at bank and in hand and short-terminvestments with an original maturity of three months or less.
22. Expenditure on new projects and substantial expansion
Expenditure directly relating to construction activity iscapitalized. Direct expenditure incurred during constructionperiod is capitalized as part of the direct construction cost tothe extent to which the expenditure is directly related toconstruction.

98
C. NOTES TO ACCOUNTS(All amounts are in Rs. unless otherwise stated)
1. Contingent Liabilities (to the extent not provided for)
PARTICULARS As at As atMarch 31, 2010 March 31, 2009
Disputed demands/ show-cause notices under:-a) Income Tax cases 777,204 110,557b) Customs Duty cases 3,999,923 3,999,923c) Central Excise Duty cases 6,596,620 6,596,620d) Service Tax 2,744,567 29,789,842Total 14,118,314 40,496,942Uncalled liability on partly paid shares of Umkal Medical Institute Pvt. Ltd. 115,625,473 205,869,745(Refer Schedule VI – Investments)Demand from Maharashtra State Electricity Distribution Company Limited 8,055,506 -(Refer note (e) below)Labour cases (in view of large number of cases, it is impracticable to disclose each of them) 2,003,390 2,803,586Premium on Redemption of ‘US$ 50 Million Zero Coupon Convertible Bonds due 2011’ 564,995,867 470,992,269(Refer note 3(ii) below)
Notes:a) In respect of Income Tax demand for the Assessment Year 2007-08, the Assessing Officer disallowed Rs.2,259,000 under section 14A of the Act,
computed in accordance with Rule 8D of the Act, contending the same to be expenditure incurred in relation to income which does not formpart of the total income under the Act in the Order passed under section 143(3) of the Act. The company preferred appeal before the CIT(Appeals). The appeal is yet to be disposed off by the CIT (Appeals).
b) In respect of Customs Duty demand of Rs.3,999,923 towards Customs Duty on certain items imported as exempted by the Company, the Companyhas deposited the entire amount under protest. The matter is pending before the Honorable Supreme Court of India. No provision is considerednecessary in this regard since the Company believes it has a good case based on nature of the case and legal advice obtained by it.
c) In respect of Central Excise Duty demand of Rs.6,596,620 towards Excise Duty on common inputs used in manufacture of exempted and taxableproducts, the Company has deposited the entire amount under protest. The matter is pending before Central Excise and Customs Tribunal. Noprovision is considered necessary in this regard since the Company believes it has a good case based on nature of the case and legal adviceobtained by it.
d) In respect of service tax demand of Rs. 29,789,842 relating to foreign services rendered & delivered outside India & others services, which werebrought in service tax net w.e.f. 18.04.06 and against which numerous decisions/ judgments have been pronounced by the competentcourts/judicial authorities, the Company has sent suitable reply to the concerned authority. The Company has assessed Rs.2,744,567 as contingentliability out of total demand. No provision is considered necessary on the balance amount in this regard since the Company believes it has a goodcase based on nature of the demand and legal advice obtained by it.
e) In respect of demand notice of Rs. 8,055,506 received from Maharashtra State Electricity Distribution Company Ltd. on account of wrong tariffrates for the activities at R&D center, Navi Mumbai, the Company has taken legal opinion which is in favor of the Company & thus no provisionis considered necessary in this regard.
2. Estimated amount of contracts remaining to be executed on capital account, net of advances and not provided in the booksare as follows:-
3. Foreign Currency Convertible Bonds
i) Conversion price of ‘US$ 50 Million Zero Coupon Convertible Bonds due 2011’ (FCCBs) has already been fixed at Rs. 357.57 per Share.This rate is used to determine dilutive Equity Shares against outstanding Bonds.
ii) ‘US$ 50 Million Zero Coupon Convertible Bonds due 2011’ amounting to US$ 36,800,000 are pending for redemption as on 31stMarch 2010. Unless these Bonds have been previously converted, redeemed, repurchased and cancelled, the Company will redeem
PARTICULARS As at As atMarch 31, 2010 March 31, 2009
Tangibles Assets 279,959,672 420,258,712Intangible Assets 11,907,371 21,946,833Total 291,867,043 442,205,545

99
Panacea Biotec|Annual Report 2009-10
these Bonds at a price equal to 142.80% of the outstanding principal amount on the maturity date i.e February 14, 2011 (includingpremium amounting to Rs. 707,271,712). Since the redemption of bonds is contingent upon its non-conversion into Equity Sharesand the probability of redemption cannot presently be ascertained, the Company has not provided for the proportionate premiumon redemption for the period up to 31st March, 2010 amounting to Rs. 564,995,867 (Previous Year Rs. 470,992,269). Such premiumhas been disclosed as contingent liability. These Bonds are considered a monetary liability and are redeemable only if there is noconversion before maturity date.
iii) The Company has fully utilized the issue proceeds of ‘US$ 50 Million Zero Coupon Convertible Bonds due 2011’ in earlier years.
iv) The Company is obliged to pay dividend to those bondholders who convert their Bonds into Equity Shares after approval by theBoard of the financial statements and upto the book closure date for dividend purposes. Incremental dividend and dividenddistribution tax, if any, will be paid out of the balance available in the Profit & Loss Account.
4. Details of pre-operative expenses (included in Capital Work in Progress) relating to Fixed Assets are as follows:
PARTICULARS As at Additions Capitalized As atApril 1, 2009 during the year during the year March 31, 2010
Legal & Professional - 5,185,650 - 5,185,650(3,681,923) (168,360) (3,850,283) (-)
Store & Spare parts consumed - 3,730,673 1,633,987 2,096,686(22,419,030) (50,376) (22,469,406) (-)
Power & Fuel 82,124 1,244,706 1,234,706 92,124(31,254,050) (357,323) (31,529,249) (82,124)
Rates & Taxes 285,008 41,142 - 326,150(9,857,569) (-) (9,572,561) (285,008)
Repair & Maintenance :- Plant & Machinery - - - -
(4,452,852) (-) (4,452,852) (-)- Others 90,281 9,257 9,257 90,281
(5,861,464) (773,882) (6,545,065) (90,281)Salary & Wages - 5,129,289 5,129,289 -
(13,191,507) (-) (13,191,507) (-)Office Expenses - - - -
(2,733,205) (73,934) (2,807,139) (-)Travel & Conveyance Expenses 769,537 426,622 1,044,500 151,659
(3,736,531) (764,537) (3,731,531) (769,537)Rent - 7,116 - 7,116
(25,800) (-) (25,800) (-)Miscellaneous Expenses - 67,279 42,938 24,342
(4,444,120) (4,310,572) (8,754,693) (-)Total 12,26,950 15,841,734 9,094,677 7,974,008
(101,658,051) (6,498,984) (106,930,086) (1,226,949)
Note: Figures in brackets represent previous year figures (2008-09).
5. a) Directors’ Remuneration:
PARTICULARS As at As atMarch 31, 2010 March 31, 2009
Managing / Joint Managing Directors/ Whole-time DirectorsSalary and Allowances* 58,260,386 58,346,813Perquisites (taxable value) 6,413,989 4,679,290Contribution to Provident Fund 9,360 9,360Total 64,683,735 63,035,463Non Whole-time DirectorsAllowances 930,000 930,000Sitting Fees 485,000 345,000Total 1,415,000 1,275,000Grand Total [Refer Note 1] 66,098,735 64,310,463
*Provision for leave encashment and gratuity amounting to Rs.1,309,051 (Previous year Rs.3,263,596) and Rs.3,814,217 (Previous year Rs.6,007,834)
respectively, made during the year, is not included above.

100
b) Computation of net profit in accordance with Section 198 read with section 349 of the Companies Act, 1956 (“the Act”) and maximumamount permissible for managerial remuneration:
PARTICULARS As at As atMarch 31, 2010 March 31, 2009
Profit/ (Loss) as per Profit & Loss Account (before taxes & extraordinary items) 1,180,798,836 (923,740,873)Add:Directors’ Remuneration 66,098,735 64,310,463Depreciation as per books 664,538,337 705,099,242Loss /(Profit) on sale of fixed assets (net) 14,139,175 (7,171,144)Provision / (Write back) for Doubtful Debts and Advances (131,023,533) 384,794Product Development Expenses written off 19,395,518 -Depreciation under section 350 of the Companies Act, 1956 (664,538,337) (705,099,242)Net profit in accordance with Section 198 of the Act 1,149,408,731 (866,216,760)Maximum amount permissible under Section 309 read with Section II of Part II of Schedule XIII 114,940,873 24,865,757of the Act for payment to Managing/Joint Managing Directors and Whole-time DirectorsMaximum amount permissible under Section 309 of the Act for payment to Non 11,494,087 930,000*Whole -time DirectorsTotal Allowable to Managing/ Joint Managing/ Whole-time and Non Whole-time Directors 126,434,960 25,795,757
Note:
1. With regard to payment of managerial remuneration of Rs.38,169,706 during Financial Year 2008-09, in excess of limits prescribed under Section
198 and 309 read with part II of Schedule XIII of the Companies, Act, 1956, without obtaining Central Government approval, the Company has
sought approval of the Central Government for such remuneration. While the approvals in respect of remuneration to Dr. Rajesh Jain and
Mr. Sandeep Jain, Joint Managing Directors of the Company, have been received, the requisite approvals in respect of Mr. Soshil Kumar Jain,
Chairman and Mr. Ravinder Jain, Managing Director are awaited and that shall be received in due course.
*This amount is as per the approvals of Ministry of Corporate Affairs , New Delhi vide their letters no. 12/301/2006-CL.VII dated 08.02.2007,
F.No.2/119/2005-CL.VII dated 16.01.2005 and 12/304/2006-CL.VII dated 08.02.2007.
6. Disclosure of Micro & Small Enterprises
Details of dues to Micro, Small and Medium Enterprises As at March 31, 2010 As at March 31, 2009as per Micro, Small and Medium Enterprise Development Principal Interest Principal InterestAct, 2006 (MSMED Act)
Principal amount and interest due thereon remaining 2,793,052 Nil 1,274,843 Nilunpaid to any supplier as at year end
Interest paid by the Company in terms of section 16 of 2,147,609 44,081 3,552,413 68,868the MSMED Act along with the amounts of thepayment made to the supplier beyond the appointedday during accounting year
Interest due and payable for the period of delay in Nil Nil Nil Nilmaking payment (which have been paid but beyondthe appointed day during the year) but without addingthe interest specified under MSMED Act
Interest accrued and remaining unpaid at the Nil Nil Nil Nilend of the year
Further interest remaining due and payable in Nil Nil Nil Nilsucceeding years, until such date when the interestdues as above are actually paid to the small enterprisesfor the purpose of disallowance as a deductibleexpenditure under section 23 of the MSMED Act

101
Panacea Biotec|Annual Report 2009-10
7. Deferred Tax Liabilities (Net):
The break-up of deferred tax liability is as follows:- As at As atMarch 31, 2010 March 31, 2009
Deferred Tax LiabilitiesDifferences in depreciation and amortization in block of fixed assets as per Income 535,112,858 498,736,734Tax Act and books of accountsDeferred revenue expenditure 654,225 1,241,287Capital expenditure on research & development 306,905,561 267,365,739Forex Loss (revenue) deferred as per notification on AS-11 (Revised) 4,232,082 50,254,492Gross Deferred Tax Liabilities 846,904,726 817,598,252Deferred Tax AssetsEffect of expenditure debited to Profit and Loss Account in the current year but allowed for 43,743,753 47,441,741tax purposes in following yearsLoss as per Income Tax Act carried forward 24,029,627 364,509,363Unabsorbed Depreciation as per Income Tax Act carried forward 70,228,267 71,861,483Gross Deferred Tax Assets 138,001,647 483,812,587Net Deferred Tax Liability 708,903,079 333,785,665
8. i) Amounts due from/ payable to group companies (including companies under the same management as defined under section370 (1B) of the Companies Act, 1956), are as follows:-
PARTICULARS As at As atMarch 31, 2010 March 31, 2009
a) Loans and Advances to wholly owned subsidiaries- Rees Investments Ltd.
Balance Recoverable 688,465,116 710,717,916Maximum amount due at any time during the year 739,605,679 716,413,472Accrued Interest on loan but not due 44,996,687 28,887,763
- Panacea Biotec Inc.Balance Recoverable 82,472 93,154Maximum amount due at any time during the year 93,154 93,154
b) Dues from Associates- PanEra Biotec Pvt. Ltd.
Balance Recoverable (including Rs. 9,69,38,174 (Previous Year 41,137,053) on account ofsale of raw material grouped as sundry debtors under Schedule VII) 66,208,504 195,087,247Maximum amount due at any time during the year 243,887,545 195,087,247
c) Amount payable to wholly owned subsidiaries- Best On Health Ltd.
Balance Payable - -Maximum amount due at any time during the year 401,200 3,079,105
- Panacea Biotec Inc.Balance payable 5,030 -Maximum amount due at any time during the year 5,030 -
- Panacea Biotec GmbHBalance Payable 202,620 202,620Maximum amount due at any time during the year 202,620 202,620
ii) Debtors include Rs.38,190,606 (Previous Year Rs.78,154,432) receivable from Joint Venture Company in which company’s twodirectors are inter-alia, directors.
iii) Details of Loans and advances to subsidiaries, associates and parties in which directors are interested (as required by clause 32of listing agreement):

102
PARTICULARS As at As atMarch 31, 2010 March 31, 2009
a) Loans and Advances to wholly owned subsidiaries (refer note no.8 (i) above) - -b) Loan to Joint Venture Company- Cambridge Biostability Ltd. 108,833,850 108,833,850
Maximum amount due at any time during the year 116,109,320 133,075,781Accrued interest receivable on loan 7,275,470 7,275,470
c) Dues from Associates (refer note no.8 (i) above) - -
Note:During the year, Company’s erstwhile Joint Venture Cambridge Biostability Limited (CBL), has initiated steps to place it into creditors’ voluntary
liquidation. Due to the financial position of erstwhile Joint Venture company, Company considers its investment and loan given to it doubtful for
recovery. Accordingly, provision created in earlier years for said amount has been continued in the current year. No interest has been accrued during
the year on outstanding loan amount.
9. Related Party Disclosures
A. Names of Related PartiesNames of related parties where control exists irrespective of whether transactions have occurred or not
a) Joint Ventures - Chiron Panacea Vaccines Private Limited,Cambridge Biostability Limited
b) Subsidiaries - Best On Health Limited (BOH) (Wholly-owned subsidiary (WOS))Radicura & Co. Limited (Indirect WOS through BOH),Panacea Hospitality Services Pvt. Ltd. (Indirect WOS through BOH)Panacea Educational Institute Pvt. Ltd. (Indirect WOS through BOH)Sunanda Steel Company Ltd. (Indirect WOS through BOH)Rees Investments Ltd. (Rees) (Guernsey): (WOS)Kelisia Holdings Ltd. (Cyprus): (Indirect WOS through Rees)Kelisia Investment Holding AG (KIH) (Switzerland): (Indirect WOS through Kelisia Holdings Ltd.)Panacea Biotec (International) SA (PBS) (Switzerland): (Indirect WOS through KIH)Panacea Biotec (Europe) AG, (Switzerland): (Indirect WOS w.e.f. 10th June, 2009 through PBS)Panacea Biotec FZE, (UAE): (WOS)Panacea Biotec GmbH (Germany): (WOS)Panacea Biotec, Inc. (USA): (WOS)Umkal Medical Institute Pvt. Ltd.: (Subsidiary)
c) Associates - PanEra Biotec Private LimitedLakshmi & Manager Holdings Ltd. (LMH)Best General Insurance Co. Ltd (Indirect Associate (subsidiary of LMH))
d) Key Management PersonnelMr. Soshil Kumar Jain - Chairman and Whole-time DirectorMr. Ravinder Jain - Managing DirectorDr. Rajesh Jain - Joint Managing DirectorMr. Sandeep Jain - Joint Managing DirectorMr. Sumit Jain - Whole-time Director

103
Panacea Biotec|Annual Report 2009-10
e) List of Persons having controlling interest together with their relatives*
Key Father Mother Wife Brother Sister Son DaughterManagementPersonnel
Soshil Kumar - - Nirmala Jain - - Ravinder Jain, -Jain Rajesh Jain,
Sandeep JainRavinder Jain Soshil Kumar Jain Nirmala Jain Sunanda Jain Rajesh Jain, - Sumit Jain, Radhika Jain
Sandeep Jain Nipun Jain
Rajesh Jain Soshil Kumar Jain Nirmala Jain Meena Jain Ravinder Jain, - Ankesh Jain, -Sandeep Jain Harshet Jain
Sandeep Jain Soshil Kumar Jain Nirmala Jain Pamilla Jain Ravinder Jain,Rajesh Jain - - Priyanka Jain
Sumit Jain Ravinder Jain Sunanda Jain - Nipun Jain Radhika Jain - -
* Relatives holding Equity Shares in the Company have been disclosed.
f ) Relatives of Key Management personnel having transactions with the CompanyMr. Ashwani Jain, Son-in-law of Mr. Soshil Kumar JainMr. Shagun Jain, Son-in-law of Mr. Ravinder JainMrs. Radhika Jain, Daughter of Mr. Ravinder JainMrs. Shilpy Jain, Wife of Mr. Sumit Jain
g) Enterprises over which Person(s) having control or significant influence over the Company / Key management personnel(s),along with their relatives, are able to exercise significant influence:i) Neophar Alipro Limitedii) All India S. L. Jain Charitable Foundationiii) First Lucre Partnership Co.*iv) Second Lucre Partnership Co.*v) Radhika Associatesvi) Sumit Nipun & Co.vii) Rattan Sonsviii) Tahir & Co.ix) Best On Health Foods Ltd.x) Soshil Kumar Jain (HUF)*xi) Ravinder Jain (HUF)*xii) Rajesh Jain (HUF)*xiii) Sandeep Jain (HUF)*
* These enterprises are also holding Shares in the Company.

104
Panacea Biotec | Annual Report 2009-10
B.D
etai
loft
ran
sact
ion
sw
ith
the
Rel
ated
par
ties
Particu
lars
Subsidi
aries
Joint
Ventures
Associa
tes
BestOn
Healt
hLtd.
Radic
ura&
Co.Ltd.
Rees
Investm
entL
td.
Pana
ceaB
iotec
Inc.
Pana
ceaB
iotec
GmbH
Umka
lMed
ical
Pana
ceaB
iotec
FZE
Chiro
nPan
acea
Cambridg
ePa
nEra
Biotec
Lakshm
i&Man
ager
Lakshm
i&Man
ager
KeyM
anag
emen
tRe
lative
sofK
eyEn
terprise
sover
Total
InstituteP
vt.Ltd
.Va
ccine
sPvt.
Ltd.
Biosta
bility
Ltd.**
Pvt.L
td.
Holdi
ngsL
td.
Perso
nnel
Man
agem
ent
which
Perso
n(s)
Perso
nnel
havin
gcon
trolo
rsig
nificant
influe
nce
over
theC
ompa
ny/
Keym
anag
emen
tpe
rsonn
el(s),
along
with
their
relati
ves,are
able
toexerc
isesig
nificant
influe
nce
A.Du
ringt
heYe
arPu
rchaseo
fraw
mate
rials
--
--
--
--
-62
4,650
,164
--
--
-62
4,650
,164
(-)(-)
(-)(-)
(-)(-)
(-)(-)
(-)(126
,185,3
79)
(-)(-)
(-)(-)
(-)(126
,185,3
79)
Sale
--
--
--
-24
3,530
,697
-96
,938,1
74-
--
--
340,4
68,87
1(-)
(-)(-)
(-)(-)
(-)(-)
(243
,277,9
70)
(-)(41,1
37,05
3)(-)
(-)(-)
(-)(-)
(284
,415,0
23)
Purch
aseo
fFixe
dAsse
ts-
--
--
--
--
--
--
--
-(-)
(45,0
00)
(-)(-)
(-)(-)
(-)(-)
(-)(-)
(-)(-)
(-)(-)
(-)(45,0
00)
Processi
ngCh
arges
paid
--
--
--
--
-1,5
85,08
0-
--
--
1,585
,080
(-)(-)
(-)(-)
(-)(-)
(-)(-)
(7,89
2,040
)(25,1
57,13
5)(-)
(-)(-)
(-)(-)
(33,0
49,17
5)Re
covery
ofdu
eson
Accoun
tofE
xpen
ses
273,1
97-
--
--
--
-50
,767,5
04-
--
--
51,04
0,701
(273
,197)
(-)(-)
(-)(-)
(-)(-)
(-)(-)
(66,9
62,82
2)(-)
(-)(-)
(-)(-)
(67,2
36,01
9)Re
imbu
rsemen
tonA
ccou
ntof
Expe
nses
--
--
--
--
--
--
--
--
(-)(-)
(-)(-)
(202
,620)
(-)(-)
(-)(-)
(-)(-)
(-)(-)
(-)(-)
(202
,620)
Rent
paid
5,294
,400
--
--
--
--
--
--
--
5,294
,400
(5,38
5,040
)(-)
(-)(-)
(-)(-)
(-)(-)
(-)(-)
(-)(-)
(-)(-)
(-)(5,38
5,040
)Re
ntrec
eived
--
--
--
--
-47
,289,0
00-
--
-72
,000
47,36
1,000
(-)(-)
(-)(-)
(-)(-)
(-)(-)
(-)(17,7
72,03
1)(-)
(-)(-)
(-)(-)
(17,7
72,03
1)Re
mun
eratio
n-
--
--
--
--
--
-64
,683,7
355,0
59,34
4-
69,74
3,079
(-)(-)
(-)(-)
(-)(-)
(-)(-)
(-)(-)
(-)(-)
(63,0
35,46
3)(4,84
3,885
)-
(67,8
79,34
8)Lo
an/A
dvan
cegiv
en-
-59
,246,4
05-
--
--
--
--
-59
,246,4
05(200
)(-)
(667
,448,5
07)
(79,3
22)
(-)(-)
(-)(-)
(79,7
90,00
0)(-)
(-)(-)
(-)(-)
(-)(747
,318,0
29)
Loan
s/Fixe
dDep
osits
receiv
ed-
--
--
--
--
--
--
255,0
00,00
025
5,000
,000
(-)(-)
(-)(-)
(-)(-)
(-)(-)
(-)(-)
(-)(-)
(-)(-)
(300
,000,0
00)
(300
,000,0
00)
Loan
s/Fixe
dDep
osits
repaid
--
--
--
--
--
--
-24
0,000
,000
240,0
00,00
0(-)
(-)(-)
(-)(-)
(-)(-)
(-)(-)
(-)(-)
(-)(-)
(-)(432
,500,0
00)
(432
,500,0
00)
Intere
stpa
idon
Depo
sits/
loans
--
--
--
--
--
--
-26
,831,3
6426
,831,3
64(-)
(-)(-)
(-)(-)
(-)(-)
(-)(-)
(-)(-)
(-)(-)
(-)(35,8
93,71
4)(35,8
93,71
4)Divid
endp
aid-E
quity
Share
s-
--
--
--
--
--
--
--
-(-)
(-)(-)
(-)(-)
(-)(-)
(-)(-)
(-)(-)
(-)(19,5
03,70
0)(24,1
37,90
0)(-)
(43,6
41,60
0)Divid
endr
eceiv
ed-Pre
feren
ceSh
ares
33,18
4-
--
--
--
--
--
--
33,18
4(-)
(-)(-)
(-)(-)
(-)(-)
(-)(-)
(-)(-)
(-)(-)
(-)(-)
-Inv
estm
entsmad
e-
--
2,379
,030
90,24
4,272
--
--
--
--
92,62
3,302
(199
,999,8
00)
(-)(476
)(-)
(1,58
2,250
)(76,1
43,60
4)(5,47
4,520
)(-)
(-)(-)
(-)(41,2
57,12
6)(-)
(-)(-)
(324
,457,7
76)
Sale
ofInv
estm
ent/
Conv
ersion
ofloa
ninto
--
--
--
--
--
--
--
--
Equit
ySha
reCa
pital
(-)(-)
(-)(-)
(-)(-)
(-)(-)
(-)(-)
(41,2
57,12
6)(-)
(-)(-)
(-)(41,2
57,12
6)Re
paym
ento
fLoa
n/Ad
vanc
egive
n-
--
--
--
--
--
--
--
-(200
)(-)
(-)(-)
(-)(-)
(-)(-)
(-)(-)
(-)(-)
(-)(-)
(-)(200
)Int
erestInc
ome
--
44,99
6,688
--
--
--
--
--
--
44,99
6,688
(-)(-)
(28,8
87,76
3)(-)
(-)(-)
(-)(-)
(16,8
68,75
3)(-)
(-)(-)
(-)(-)
(-)(45,7
56,51
6)Do
natio
n-
--
--
--
--
--
--
--
(-)(-)
(-)(-)
(-)(-)
(-)(-)
(-)(-)
(-)(-)
(-)(-)
(300
,000)
(300
,000)
Emplo
yeeb
enefi
tstra
nsfer
*-
--
--
--
--
5,806
,271
--
--
-5,8
06,27
1(-)
(-)(-)
(-)(-)
(-)(-)
(-)(-)
(-)(-)
(-)(-)
(-)(-)
-B.Ye
aren
dbala
nces
Investm
ents
2,013
,882,8
50-
476
2,379
,030
1,582
,250
166,3
87,87
65,4
74,52
022
,959,1
0016
8,068
,998
4,197
,670
-41
,257,1
26-
--
2,426
,189,8
96(2,01
3,882
,850)
(-)(476
)(-)
(1,58
2,250
)(76,1
43,60
4)(5,47
4,520
)(22,9
59,10
0)(168
,068,9
98)
(4,19
7,670
)(-)
(41,2
57,12
6)(-)
(-)(-)
(2,33
3,566
,594)
Intere
staccru
edbu
tnot
Due
--
43,05
7,717
--
--
-7,2
75,47
0-
--
--
-50
,333,1
87(-)
(-)(28,8
87,76
3)(-)
(-)(-)
(-)(-)
(7,27
5,470
)(-)
(-)(-)
(-)(-)
(-)(36,1
63,23
3)Ou
tstan
dingr
eceiv
able
--
-82
,472
--
-38
,190,6
06-
66,20
8,504
--
--
-10
4,481
,583
(-)(-)
(-)(93,1
54)
(-)(-)
(-)(78,1
54,43
2)(-)
(195
,087,2
47)
(-)(-)
(-)(-)
(-)(273
,334,8
33)
Provis
ionfor
bada
nddo
ubtful
advanc
es-
--
--
--
-11
6,109
,320
--
--
--
116,1
09,32
0(-)
(-)(-)
(-)(-)
(-)(-)
(-)(116
,109,3
20)
(135
,532,6
54)
(-)(-)
(-)(-)
(-)(135
,532,6
54)
Provis
ionfor
impa
irmen
tlosse
s-
--
--
--
-16
8,068
,998
--
--
--
168,0
68,99
8(-)
(-)(-)
(-)(-)
(-)(-)
(-)(168
,068,9
98)
(-)(-)
(-)(-)
(-)(-)
(284
,178,3
18)
Outst
andin
gLoa
n-
-68
8,465
,116
--
--
-10
8,833
,850
--
--
--
797,2
98,96
6(-)
(-)(710
,717,9
16)
(-)(-)
(-)(-)
(-)(108
,833,8
50)
(-)(-)
(-)(-)
(-)(-)
(819
,551,7
66)
Outst
andin
gFixe
ddep
osits
--
--
--
--
--
--
-31
5,000
,000
315,0
00,00
0(-)
(-)(-)
(-)(-)
(-)(-)
(-)(-)
(-)(-)
(-)(-)
(-)(300
,000,0
00)
(300
,000,0
00)
Outst
andin
gpayab
le-
--
5,030
202,6
20-
--
--
--
--
207,6
50-
--
(202
,620)
--
--
--
--
--
(202
,620)
Notes
:1.Figu
resin
bracketrep
resen
tprev
iousy
earfi
gures
.2.
Inres
pect
ofpe
rsona
lgua
rantee
given
byPro
moters
-Dire
ctorsref
erNo
teno
.2of
Sche
dule
III.*R
efertoN
ote1
6ofS
ched
uleXX
C.**
Refer
toNo
te13
(e)o
fSch
edule
XXC.

105
Panacea Biotec|Annual Report 2009-10
3. Material related party transactions (More than 10% of aggregate) with individual parties are as follows:
10. Derivative Instruments and Hedged/Unhedged Foreign Currency Exposure
i) Forward contract outstanding as at Balance Sheet dateSell NilBuy Nil
ii) Particulars of Hedged Future Export Receivables at applicable exchange rates in respect of Options Contracts outstanding as atBalance Sheet date
Currency Exchange Amount in Amount in Amount in Amount in Purposerates Foreign Currency Indian Rupees Foreign Currency Indian Rupees
As at As at As at As atMarch 31, 2010 March 31, 2010 March 31, 2009 March 31, 2009
USD 40.00 - - 58,000,000 2,320,000,000 To hedgeUSD 39.00 28,000,000 1,092,000,000 48,000,000 1,872,000,000 Future ExportUSD 39.60 30,000,000 1,188,000,000 36,000,000 1,425,600,000 Receivables
58,000,000 2,280,000,000 142,000,000 5,617,600,000
Accordingly, exchange fluctuation loss on marking them to market as of year end amounting to Rs.356,939,000 (Previous YearRs.1,702,604,000) has been accounted for and included in “Exchange Fluctuation Gain” under Schedule XI – Other Income (PreviousYear: included in “Provision for Loss on Open Derivative Contracts" under Schedule XIII - Operating and Other Expenses).
iii) Particulars of Hedged Foreign Currency Exposure as at Balance Sheet date
PARTICULARS Amount as at Currency Closing Amount as at Amount as at Currency Closing Amount as atMarch 31, 2010 Exchange March 31, 2010 March 31, 2009 Exchange March 31,2009
(in Foreign Rate* (INR) (in Foreign Rate* (INR)Currency) Currency)
Export Debtors 8,120,848 USD 44.90 364,585,489 15,038,066 USD 50.71 762,580,345
Unsecured Loans/ Fixed Interest Managerial Remuneration Equity Dividend
Deposits received/(repaid)
As at As at As at As at As at As at As at As at
March 31, 2010 March 31, 2009 March 31, 2010 March 31, 2009 March 31, 2010 March 31, 2009 March 31, 2010 Mar h 31, 2009
Key Management
personnel:
Mr. Soshil Kumar - - - - 15,362,222 15,155,738 - 5,000,000
Jain
Mr. Ravinder Jain - - - - 19,872,138 19,287,108 - 4,646,200
Dr. Rajesh Jain - - - - 13,072,895 12,648,046 - 4,706,900
Mr. Sandeep Jain - - - - 12,968,125 12,648,046 - 4,792,100
Enterprises over which Person(s) having control or significant influence over the Company / Key management personnel(s), along with their relatives,
are able to exercise significant influence
First Lucre 255,000,000 300,000,000 26,831,364 35,893,714 - - - -
Partnership Co. (240,000,000) (432,500,000) - - - - -
Year end balances:
First Lucre 315,000,000 300,000,000 - - - - -
Partnership Co.

106
* Closing Exchange rate has been rounded off to two decimal places.
11. Segment Information
Business Segments:
Panacea Biotec Limited is one of the India’s leading research based companies engaged in the business of research, development,manufacture and marketing of Vaccines and Branded Pharmaceutical Formulations. The Company has products for various segments,which include pediatric vaccines, pain management, diabetes management and organ transplantation.
iv) Particulars of Unhedged Foreign Currency Exposure as at Balance Sheet date
ImportCreditors(net ofadvances tosuppliers)
2,379,030
PARTICULARS Amount as at Currency Closing Amount as at Amount as at Currency Closing Amount as atMarch 31, 2010 Exchange March 31, 2010 March 31, 2009 Exchange March 31, 2009
(in Foreign Rate* (INR) (in Foreign Rate* (INR)Currency) Currency)
9,753,991 USD 44.91 438,002,956 5,542,275 USD 50.72 281,104,2064,768,149 Euro 60.55 288,711,392 12,841,668 Euro 67.54 867,327,519
42,000 CHF 42.43 1,782,060 33,538 CHF 44.56 1,494,4815,941 GBP 68.08 404,463 12,289 GBP 72.60 892,159
- JPY / 100 - - 1,217,220 JPY / 100 51.55 627,52116,820 SEK 6.26 105,293 16,820 SEK 6.13 103,140
2,178 CAD 44.32 96,509 1,010 CAD 40.47 40,856(6,140) AUD 41.23 (253,164) - - - -
(10,000) AED 12.26 (122,600) - - - -80 SGD 32.13 2,570 - - - -
Export Debtors 2,616,978 Euro 60.51 158,353,310 2,990,037 Euro 67.50 201,827,823Foreign 65,097,252 USD 44.91 2,923,192,101 65,097,252 USD 50.72 3,301,732,614Currency LoansBalance with 3,253,949 USD 44.90 146,086,036 9,652,566 USD 50.71 489,481,613Banks 970,843 Euro 60.51 58,745,690 105,761 Euro 67.50 7,138,856FCCBs 36,800,000 USD 44.91 1,652,504,000 36,800,000 USD 50.72 1,866,496,000
10 USD 47.62 476 10 USD 47.62 476Investment in 137,000 USD 39.96 5,474,520 137,000 USD 39.96 5,474,520Subsidiaries 25,000 Euro 63.29 1,582,250 25,000 Euro 63.29 1,582,250
50,000 USD 47.48 - - - -100 USD 50.30 - - - -
Investment in JV 1,935,615 GBP 86.83 168,068,998 1,935,615 GBP 86.83 168,068,998Loan to JV 1,500,000 GBP 72.56 108,833,850 1,500,000 GBP 72.56 108,833,850Loan to 15,335,006 USD 44.90 688,465,116 14,015,340 USD 50.71 710,717,916subsidiariesPayable to 100 USD 50.30 5,030 - - - -SubsidiaryInterest accrued 959,076 USD 44.90 43,057,717 569,666 USD 50.71 28,887,763on loan 100,274 GBP 72.56 7275,470 100,274 GBP 72.56 7,275,470Advance to 1,837 USD 44.90 82,472 1,832 USD 50.71 93,154subsidiaries
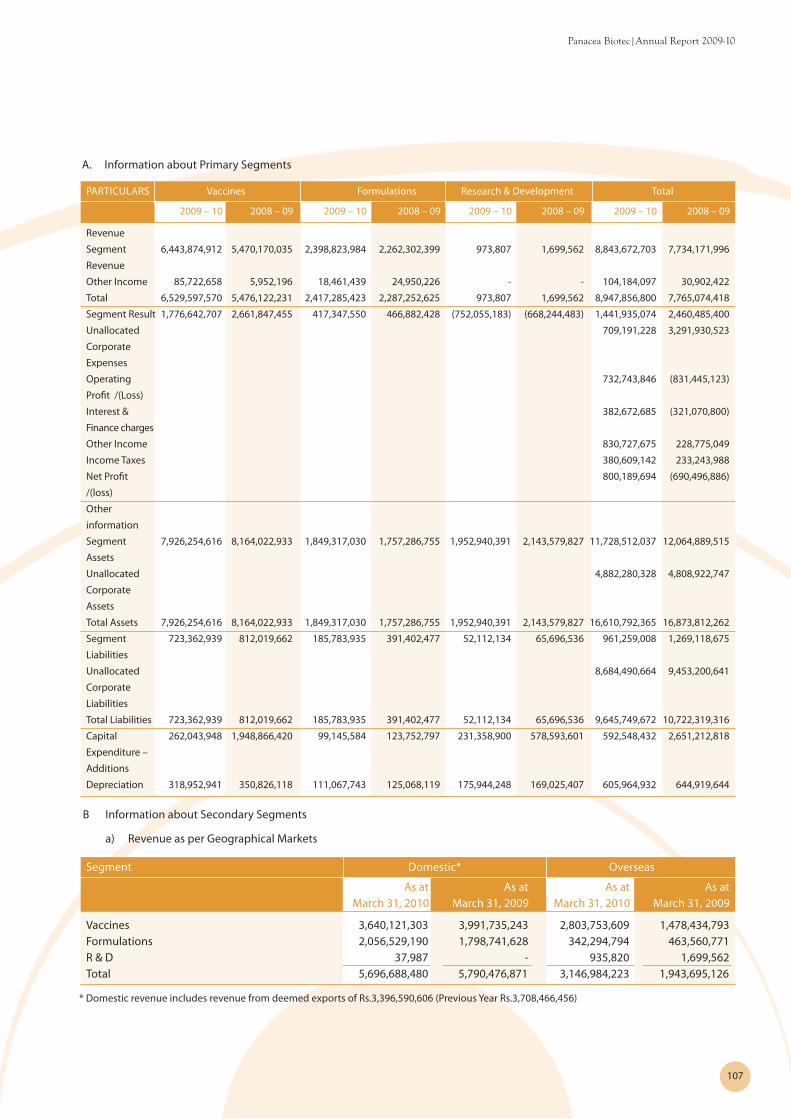
107
Panacea Biotec|Annual Report 2009-10
A. Information about Primary Segments
PARTICULARS Vaccines Formulations Research & Development Total
2009 – 10 2008 – 09 2009 – 10 2008 – 09 2009 – 10 2008 – 09 2009 – 10 2008 – 09
Revenue
Segment 6,443,874,912 5,470,170,035 2,398,823,984 2,262,302,399 973,807 1,699,562 8,843,672,703 7,734,171,996
Revenue
Other Income 85,722,658 5,952,196 18,461,439 24,950,226 - - 104,184,097 30,902,422
Total 6,529,597,570 5,476,122,231 2,417,285,423 2,287,252,625 973,807 1,699,562 8,947,856,800 7,765,074,418
Segment Result 1,776,642,707 2,661,847,455 417,347,550 466,882,428 (752,055,183) (668,244,483) 1,441,935,074 2,460,485,400
Unallocated 709,191,228 3,291,930,523
Corporate
Expenses
Operating 732,743,846 (831,445,123)
Profit /(Loss)
Interest & 382,672,685 (321,070,800)
Finance charges
Other Income 830,727,675 228,775,049
Income Taxes 380,609,142 233,243,988
Net Profit 800,189,694 (690,496,886)
/(loss)
Other
information
Segment 7,926,254,616 8,164,022,933 1,849,317,030 1,757,286,755 1,952,940,391 2,143,579,827 11,728,512,037 12,064,889,515
Assets
Unallocated 4,882,280,328 4,808,922,747
Corporate
Assets
Total Assets 7,926,254,616 8,164,022,933 1,849,317,030 1,757,286,755 1,952,940,391 2,143,579,827 16,610,792,365 16,873,812,262
Segment 723,362,939 812,019,662 185,783,935 391,402,477 52,112,134 65,696,536 961,259,008 1,269,118,675
Liabilities
Unallocated 8,684,490,664 9,453,200,641
Corporate
Liabilities
Total Liabilities 723,362,939 812,019,662 185,783,935 391,402,477 52,112,134 65,696,536 9,645,749,672 10,722,319,316
Capital 262,043,948 1,948,866,420 99,145,584 123,752,797 231,358,900 578,593,601 592,548,432 2,651,212,818
Expenditure –
Additions
Depreciation 318,952,941 350,826,118 111,067,743 125,068,119 175,944,248 169,025,407 605,964,932 644,919,644
B Information about Secondary Segments
a) Revenue as per Geographical Markets
Segment Domestic* Overseas
As at As at As at As atMarch 31, 2010 March 31, 2009 March 31, 2010 March 31, 2009
Vaccines 3,640,121,303 3,991,735,243 2,803,753,609 1,478,434,793Formulations 2,056,529,190 1,798,741,628 342,294,794 463,560,771R & D 37,987 - 935,820 1,699,562Total 5,696,688,480 5,790,476,871 3,146,984,223 1,943,695,126
* Domestic revenue includes revenue from deemed exports of Rs.3,396,590,606 (Previous Year Rs.3,708,466,456)

108
b) Sundry debtors as per Geographical Markets
Segment Domestic* Overseas
As at As at As at As atMarch 31, 2010 March 31, 2009 March 31, 2010 March 31, 2009
Vaccines 426,601,008 336,012,170 344,959,164 536,329,974Formulations 129,393,970 143,513,828 196,231,327 226,054,249Total 555,994,978 479,525,998 541,190,491 762,384,223
c) The Company has common fixed assets for producing goods for Domestic Market and Overseas Markets. Hence, separate figuresfor segment assets / additions to segment assets cannot be furnished.
12. Leases
i. For assets given under Operating Lease agreements:
a) The Company has leased out the assets situated at Lalru, Punjab on operating lease to its Associate, PanEra Biotec Private Limited.
PARTICULARS Gross Block Accumulated Depreciation Depreciation chargedto P&L Account
As at As at As at As at As at As atMarch 31, 2010 March 31, 2009 March 31, 2010 MArch 31, 2009 March 31, 2010 March 31, 2009
Building 91,001,316 89,955,066 38,146,989 33,159,226 4,843,737 5,327,263Furniture and Fixture 10,879,579 10,659,476 6,587,888 5,639,670 948,219 1,151,292Office Equipment 1,858,933 1,904,239 924,829 769,438 154,389 270,436Plant & Machinery 717,624,285 663,486,845 312,037,079 247,986,666 64,040,256 66,307,911Computer Equipment 2,598,987 5,950,080 1,979,344 1,549,742 413,095 688,492Total 823,963,100 771,955,706 359,676,129 289,104,742 70,399,696 73,745,394
The total of Minimum Future Lease Payments under non-cancelable operating lease for various periods for assets stated above is asfollows:
PARTICULARS As at As atMarch 31, 2010* March 31, 2009*
a) Receivable within 1 year 67,600,000 67,600,000b) Later than 1 year but not later than 5 years - 67,600,000c) Later than 5 years - -
* The Lease term for the assets given on lease vide Agreement for providing Manufacturing Facility, Utilities and Services of Employees with PanEraBiotec Pvt. Ltd. is valid till 31.03.2011. As per the said Agreement, during the period of usage, if any facility is used for manufacture of the Company’sVaccines other than those mentioned therein or the facility remains idle due to insufficiency of orders from the Company, no lease rental shall bepayable by PanEra Biotec Pvt. Ltd. during the relevant period.
b) The Company has also given an office space in its building situated at B-1 Extn./A-27, Mohan Co-operative Industrial Estate, NewDelhi on operating lease to PanEra Biotec Pvt. Ltd..
Total of future minimum lease payments under operating lease mentioned above:
PARTICULARS As at As atMarch 31. 2010 March 31, 2009
a) Receivable within 1 year 7,500 14,000b) Later than 1 year but not later than 5 years - -c) Later than 5 years - -
ii. For assets taken on Lease
a) The Company has taken various residential, office and godown premises under operating lease agreements. These are generallynot non-cancelable and are renewable by mutual consent on mutually agreed terms. There is no sublease payments expectedto be received under non-cancellable subleases at the balance sheet date and no restrictions is imposed by lease arrangements

109
Panacea Biotec|Annual Report 2009-10
b) Lease payments for the year are Rs.70,307,490 (Previous Year Rs.59,649,090).
c) Total of future minimum lease payments under non cancelable operating leases :
PARTICULARS As at As atMarch 31, 2010 March 31, 2009
a) Payable within 1 year 6,702,737 4,796,232b) Later than 1 year but not later than 5 years 19,425,000 402,737c) Later than 5 years - -
13. a) The Company’s interest in Joint Venture Companies is as follows:
S. No. Name of the Company Nature of Country of (%) Holding as onrelationship Incorporation March 31, 2010
1. Chiron Panacea Vaccines Private Limited Joint Venture India 502. Cambridge Biostability Limited* Joint Venture UK 10
* Cambridge Biostability Limited, UK has not been considered while giving the disclosures relating to joint ventures in the current year as the investeecompany is in the process of liquidation.
b) Aggregate interest of the Company in Assets, Liabilities, Revenue & Expenses in the jointly controlled entities are as follows:
PARTICULARS As at As atMarch 31, 2010 March 31, 2009
(Audited) (Audited)
Reserves and Surplus 63,835,582 46,571,024Secured Loans - 163,121Fixed Assets 3,104,941 3,209,287Deferred Tax Assets 2,375,937 1,994,049Current Assets 117,741,090 143,485,483Current Liabilities 36,427,286 78,995,574Revenue 287,574,252 274,923,479Expenses 260,424,922 241,498,029
c) The purchase commitments for fixed assets incidental to the ordinary course of business of companies with which the Companyhas a joint venture, are as follows:
Name of Company As at As atMarch 31, 2010 March 31, 2009
Chiron Panacea Vaccines Pvt. Ltd. (50% interest) - -Cambridge Biostability Ltd. (10% interest) - -Total - -
d) During the year, Company’s erstwhile Joint Venture Cambridge Biostability Limited (CBL), has initiated steps to place it intocreditors’ voluntary liquidation. Due to the financial position of erstwhile Joint Venture company, Company considers itsinvestment and loan given to it doubtful for recovery. Accordingly provision created in earlier years for said amount has beencontinued in the current year. No interest has been accrued during the year on outstanding loan amount:-
PARTICULARS As at As atMarch 31, 2010 March 31, 2009
Investment made 168,068,998 168,068,998Loan Given 108,833,850 108,833,850Interest accrued on above loan 7,275,470 7,275,470Total 284,178,318 284,178,318
e) Contingent Liabilities (to the extent not provided for)
PARTICULARS As at As atMarch 31, 2010 March 31, 2009
Income tax demand of Rs 2,484,933/- for Assessment Year 2006-07 Rs 1,242,466 -
Note: The joint venture company, Chiron Panacea Vaccines Pvt. Ltd., has filed an appeal against the said demand. Based on Judicial pronouncements,claim is likely to be accepted by appellate authorities,

110
14. Auditors` Remuneration:
PARTICULARS As at As atMarch 31, 2010 March 31, 2009
Statutory Auditors- Statutory Audit 3,000,000 3,309,000- Quarterly Limited Reviews 1,603,235 1,685,400- Management Services 2,500,000 -- Certification 234,120 134,833- Out of Pocket Expenses 224,947 161,720Total 7,562,302 5,290,953Tax Auditors* 125,000 140,450Cost Auditors* 40,000 44,944
* included in Legal & Professional charges given in Schedule XIII.
15. Additional information as required under Para 3 & 4 of Part II of Schedule VI of the Companies Act, 1956.
A. Particulars of Licensed Capacity, Installed Capacity & Production
a) Licensed Capacity per annum
Recombinant Bulk Vaccines – 18 million doses
Others – Not Applicable
b) Installed Capacity per annum*
PRODUCTS Units of Measure As at As atMarch 31, 2010 March 31, 2009
Tablets Nos./ Million 1,684.00 1,684.00Capsules Nos. / Million 370.00 370.00Syrups/Liquids Bottles / Million 15.80 15.80Gels Tubes / Million 21.20 21.20Vaccines (Finished Doses) Doses / Million 861.50 861.50Pre-filled Syringes Doses/ Millions 17.00 17.00Recombinant Bulk Vaccines1 Doses / Million 12.50 12.50Tetanus Bulk Vaccines2 Doses/ Millions 75.00 75.00Bacterial Bulk Vaccines2 Doses/ Millions 68.75 68.75Bulk Vaccine – Plant3 Doses/ Millions 18.00 -
*As Certified by the management
1 This facility has been leased to Associate Company, PanEra Biotec Pvt. Ltd. and is capable of manufacturing various bulk vaccines including HepB, Hib TT and Anthrax.
2 These facilities have been leased to Associate Company, PanEra Biotec Pvt. Ltd. Bacterial Bulk Vaccines Plant is capable of manufacturing variousbulk vaccine including Diphtheria, Whole Cell Pertussis (wP), Acellular Pertussis (aP) and its capacity will come down by 5 Million doses to 63.75million doses in case of production of Acellular Pertussis (aP).
3 Bulk Vaccine Plant is capable of manufacturing various bulk vaccine including Hib TT, Hep B Vaccine (new clone) & aP Bulk etc.
c) Actual Production during the year
PRODUCTS Units of Measure As at As atMarch 31, 2010* March 31, 2009*
Tablets Nos. 585,390,618** 504,389,489**Capsules Nos. 85,037,342 64,354,858Syrups / Liquids Ml 351,255,280 283,920,530Gels Gms 41,264,545 23,474,760Vaccines Vials 45,585,705 50,553,815Pre Fill Syringe PFS 1,201,221 1,679,769Injection Nos. 512,320 456,656Other Products Gms. 41,163,240 17,638,965
*Actual Production includes production at Loan Licensee locations meant for sale by the Company
** Actual Production includes 185,577,426 (Previous Year 155,993,730) Tablets manufactured for others under Loan License basis.

111
Panacea Biotec|Annual Report 2009-10
B. Particulars of Stocks & Sales
Units Opening Stock Closing Stock Sample/Destroyed/ Sales
Expired / Shortages
Current Previous Current Previous Current Previous Current Previous
Year Year Year Year Year Year Year Year
a) Own Manufacturing
Tablets Nos. 59,005,305 78,301,586 103,812,036 59,005,305 16,335,635 4,550,993 524,248,252 519,134,777
Rs. 46,940,103 63,382,524 227,333,781 46,940,103 - - 1,596,992,275 1,210,177,962
Capsules Nos. 9,873,246 14,547,473 16,272,418 9,873,246 2,410,687 2,091,314 76,227,483 66,937,771
Rs. 40,651,005 63,436,317 56,734,281 40,651,005 - - 590,637,539 557,856,427
Syrups / Ml. 66,737,470 50,579,060 95,083,490 66,737,470 17,358,230 2,183,150 305,551,030 265,578,970
Liquids Rs. 17,837,248 15,939,607 23,140,557 17,837,248 - - 136,802,046 110,582,967
Gels Gms. 8,458,210 16,354,230 23,444,095 8,458,210 1,347,000 1,132,500 24,931,660 30,238,280
Rs. 3,873,051 7,689,660 15,757,786 3,873,051 - - 30,883,483 35,179,463
Vaccines Vials. 14,913,671 9,372,994 15,984,904 14,913,671 379,068 295,038 44,135,404 44,718,100
Rs. 733,972,131 477,630,816 1,096,150,202 733,972,131 - - 5,801,886,473 5,277,342,364
Pre Fill Syringe PFS 723,796 - 421,968 723,796 103,364 46,492 1,399,685 909,481
Rs. 92,961,982 - 71,942,278 92,961,982 - - 216,927,697 142,003,221
Injections Vials. 66,104 122,833 104,294 66,104 9,324 45,449 464,806 467,936
Rs. 23,805 309,429 175,909 23,805 - - 3,354,745 3,278,010
Husk Gms. - 9 - - 45 85 (45) (76)
Rs. - 203 - - - - (34) (2,097)
Kit Nos. - - - - 5 - - -
Rs. - - - - - - - -
Granules Nos. 4,244,340 - 8,840,790 4,244,340 4,564,500 102,225 32,002,290 13,292,400
Rs. 4,872,951 - 9,165,265 4,872,951 - - 43,900,253 16,494,980
Total Rs. 941,132,276 628,388,556 1,500,400,059 941,132,276 - - 8,421,384,477 7,352,913,297
b) Trading Activities
Tablets Nos. 14,665,408 12,708,601 15,015,084 14,665,408 5,989,850 4,149,231 49,189,412 49,202,158
Rs. 23,835,584 27,372,156 28,751,861 23,835,584 - - 257,835,485 240,420,372
Capsules Nos. 2,454,871 3,449,624 1,895,146 2,454,871 845,862 1,404,069 5,932,560 6,654,519
Rs. 6,923,483 12,941,050 5,122,652 6,923,483 - - 34,572,493 35,693,185
Syrups / Ml. 11,143,960 23,796,760 7,443,680 11,143,960 11,660,770 4,201,200 26,486,420 39,995,770
Liquids Rs. 1,559,658 3,171,290 1,361,134 1,559,658 - - 8,033,712 12,547,652
Gels Gms. 1,830 89,460 2,010 1,830 960 5,700 (1,140) (80,880)
Rs. 876 48,430 (517) 876 - - (1,450) (102,920)
Injections Vials. 58,533 15,422 71,817 58,533 5,253 2,819 157,322 105,112
Rs. 11,716,770 12,210,592 21,138,954 11,716,770 - - 97,070,972 47,473,275
Biscuits Nos. - 3,659 - - 39 7,867 (39) (4,208)
Rs. - 76,730 - - - - (1,210) (162,354)
Granules Nos. 1,330,725 - 510,795 1,330,725 476,190 - 1,881,690 505,005
Rs. 689,458 - 211,911 689,458 - - 3,501,243 1,640,666
Total Rs. 44,725,829 55,820,248 56,585,995 44,725,829 - - 401,011,245 337,509,876
c) Others* Nos. - - - - - - - -
Rs. - - - - - - 4,873 39,994,426
Total Rs. - - - - - - 4,873 39,994,426
Grand Total Rs. 985,858,105 684,208,804 1,556,986,054 985,858,105 - - 8,822,400,595 7,730,417,599
* Sales of Raw Materials

112
C. Purchase of Finished Goods
PRODUCTS Units Current Year Previous Year
Tablets Nos. 55,528,938 55,308,196Rs. 102,745,415 100,757,694
Capsules Nos. 6,218,697 7,063,835Rs. 16,781,357 19,211,568
Syrups/Liquids Ml. 34,446,910 31,544,170Rs. 6,295,442 4,920,952
Gel Gms. - (162,810)Rs. - (75,949)
Injections Vials. 175,859 151,042Rs. 53,395,259 29,913,166
Others Gms. 1,537,950 1,835,730Rs. 883,350 1,143,558
Total Rs. 180,100,823 155,870,989
D. Consumption of Raw Materials & Packing Materials
PRODUCTS Current Year Previous Year
Qty. (In doses) Value Qty. (In doses) Value
Polio Virus 753,033,000 3,456,319,832 879,425,400 1,824,633,064Others* - 1,581,605,491 - 1,146,965,663Total - 5,037,925,323 - 2,971,598,727
* Items comprised in others are individually less than 10% of total value.
E. Value of Imports on CIF basis (on accrual basis)
PARTICULARS Current Year Previous Year
Raw Materials & Packing Materials 3,137,158,597 4,571,336,927Capital Goods 406,552,457 457,267,055
F. Expenditure in Foreign Currency (on accrual basis)
PARTICULARS Current Year Previous Year
Know-how Fee 12,463,842 12,847,257Royalty 2,727,870 38,025Interest 218,116,913 206,189,558Legal & Professional Fees 19,643,331 54,682,275Other Expenses- Patents, Trade Marks & Product Registration 20,219,666 26,319,097- Advertising and Sales Promotion 14,594,504 5,258,076- Printing & Stationery 3,218 110,588- Commission on Sales 18,868,008 65,806,641- Market Research 8,045,375 30,286,500- Others 34,136,629 39,604,033
G. Earnings in Foreign Exchange (on accrual basis)
PARTICULARS Current Year Previous Year
F.O.B. value of Exports (including deemed export of Rs. 3,396,590,606 6,465,393,668 5,588,991,868(Previous Year Rs. 3,708,466,456)R & D Services (Know-how) Income 935,820 1,699,562Interest accrued but not due on loan from Subsidiary Company 44,996,688 28,887,763

113
Panacea Biotec|Annual Report 2009-10
H. Value of Imported/Indigenous Raw Materials & Packing Materials consumed
PRODUCTS Current Year Previous Year
Amount in Rs. % Amount in Rs. %
Indigenous 868,850,134 17.25 605,547,690 20.38Imported 4,169,075,189 82.75 2,366,051,037 79.62Total 5,037,925,323 100.00 2,971,598,727 100.00
I. Value of Imported/Indigenous Stores & Spare parts consumed
PRODUCTS Current Year Previous Year
Amount in Rs. % Amount in Rs. %
Indigenous 168,801,875 81.97 163,479,798 85.13Imported 37,122,136 18.03 28,564,016 14.87Total 205,924,011 100.00 192,043,814 100.00
J. Remittance in foreign currency on account of dividend
PARTICULARS Current Year Previous Year
Dividend on Equity Shares * - 1,045,000Number of Non-resident Equity Shareholders 1 1No. of Equity Shares held by them 1,045,000 1,045,000
* Dividend of previous year Rs.1,045,000 pertains to 2007-08.
16. The Company has a defined benefit gratuity plan. Every employee who has completed five years or more of service gets a gratuityon departure at 15 days salary (last drawn salary) for each completed year of service subject to maximum of Rs.350,000 (except in caseof Managing/ Joint Managing/ Whole time Directors). The scheme is funded with an insurance company in the form of a qualifyinginsurance policy.
The following tables summarize the components of net benefit expense recognized in the Profit & Loss Account and the fundedstatus and amounts recognized in the Balance Sheet for the respective plans.
Profit and Loss Account:
Net employee benefit expense for Gratuity (recognized in Employee Cost)
PARTICULARS 2009-10 2008-09
Current service cost 13,810,838 13,052,834Interest cost on benefit obligation 7,463,438 6,518,123Expected return on plan assets (3,955,091) (2,703,704)Net actuarial (gain)/loss recognized in the year on account of return on plan assets (8,576,541) (3,739,708)Net benefit expense* (Refer note below) 12,172,929 13,127,545Actual return on plan assets (4,806,653) (3,501,808)
* Includes Gratuity expense of Rs.1,129,063 (Previous Year Rs.1,062,491) accounted under Research & Development Expenses.
Balance Sheet:
Details of Provision for Gratuity
PARTICULARS 2009-10 2008-09
Defined benefit obligation 109,421,629 99,512,513Fair value of plan assets 61,239,812 42,757,742
48,181,817 56,754,771Less: Unrecognized past service cost Plan (liability) (48,181,817) (56,754,771)

114
Changes in the present value of the defined benefit obligation for Gratuity are as follows:
PARTICULARS 2009-10 2008-09
Opening defined benefit obligation 99,512,513 86,908,312Interest cost 7,463,438 6,518,123Current service cost 13,810,838 13,052,834Actual return on plan assets - -Benefits paid (3,640,181) (4,025,152)Actuarial (Gain)/losses on obligation (7,724,979) (2,941,604)Closing defined benefit obligation 109,421,629 99,512,513
Changes in the fair value of plan assets for Gratuity are as follows:
PARTICULARS 2009-10 2008-09
Opening fair value of plan assets 42,757,742 29,229,237Expected return 3,955,091 2,703,704Contributions by employer 17,315,598 14,051,849Benefits paid (3,640,181) (4,025,152)Actuarial Gain /(losses) 851,562 798,104Closing fair value of plan assets 61,239,812 42,757,742
The Company has since contributed Rs.17,315,598 to the gratuity fund.
The major categories of plan assets as a percentage of the fair value of total plan assets for Gratuity are as follows:
PARTICULARS 2009-10 2008-09
% %Investments with insurer 100 100Cash and bank balance with the insurer 0 0
The overall expected rate of return on assets is determined based on the market prices prevailing on that date, applicable to theperiod over which the obligation is to be settled. There has been significant change in expected rate of return on assets due to theimproved debt market scenario.
The principal assumptions used in determining Gratuity for the Company’s plans are shown below:
PARTICULARS 2009-10 2008-09
% %Discount rate 7.50 7.50Expected rate of return on plan assets 9.25 9.25Increase in compensation cost 5.00 5.00Employee turnover:upto 30 years 10.00 10.00above 30 years but upto 44 years 5.00 5.00above 44 years 1.00 1.00
The estimates of future salary increases, considered in actuarial valuation, take account of inflation, seniority, promotion and otherrelevant factors, such as supply and demand in the employment market.
Gratuity amount for the current and previous four periods are as follows*:
PARTICULARS 2009-10 2008-09 2007-08 2006-07
Defined benefit obligation 109,421,629 99,512,513 86,908,312 53,612,703Plan assets 61,239,812 42,757,742 29,229,237 21,292,086Deficit 48,181,817 56,754,771 57,679,075 32,320,617Experience adjustments on plan liabilities-(Gain)/Loss (7,724,979) (3,269,245) - -Experience adjustments on plan assets-(Gain)/Loss (851,562) (798,104) - -
*The revised accounting standard AS-15 – Employee Benefits which provides for Acturial Valuation of Gratuity Liability was adoptedin the year 2006-07. In the earlier years, acturial valuation was done in accordance with the pre-revised Accounting Standard, AS-15.Accordingly, comparative numbers of one year earlier than the year 2006-07 have not been furnished.

115
Panacea Biotec|Annual Report 2009-10
Defined Contribution Plan:
2009-10 2008-09
Contribution to Provident Fund Charged to Profit and Loss Account 32,214,107 31,045,359
The Company expects to contribute Rs.16,000,000 to gratuity fund in the year 2010-11.
Note: During the year some employees of the Company have been transferred to its Associate Company PanEra Biotec Pvt. Ltd. As per the agreed terms,the tenure of the service for computation for post employment benefits would be taken in computation of period served with the Company.Accordingly, the liability of Rs.3,430,285 for Gratuity and Rs.2,375,986 for Leave Encashment in respect of transferred employees as at the date oftransfer has also been transferred to PanEra Biotec Pvt. Ltd. The process of transferring the gratuity amount lying in the Company’s gratuity fund is inprogress.
17. The Company has incurred expenditure on Pre-Clinical Development studies amounting to Rs.32,125,547 during the year (PreviousYear Rs.123,978,449) and Rs.479,497,285 as of March 31, 2010 (Rs.426,493,761 as of March 31, 2009). This expenditure relates to studiescarried out by Clinical Research Organization (CRO) towards obtaining registration of Company's products in US and / or Europe. Theexpenditure incurred has been capitalized and carried in Capital Work in Progress. Management believes that it is in the nature ofdevelopment expenditure and meets the capitalization criteria set out in Accounting Standard 26 on Intangible Assets notified bythe Companies Accounting Standard Rules, 2006 due to the following reasons:
• The expenditure is not towards basic research and therefore no new chemical entity comes into being. This expenditure relatesto the developmental work performed through external agencies (CROs). Safety profile of the basic molecule is well establishedin several countries in Europe and in India and the products are being marketed successfully in several countries under differentbrand names.
• There is no experience to suggest that the studies conducted by CROs on behalf of the Company would lead to or make it difficultfor the Company to obtain regulatory approvals in US and / or Europe.
The management believes that these products would be commercially viable and there is no reason to believe that there is anyuncertainty that may lead to not securing registration for the products from regulatory authorities in US and / or Europe.
18. In accordance with Accounting Standard 9 on ‘Revenue Recognition’ notified by the Companies Accounting Standard Rules, 2006,Excise Duty on turnover amounting to Rs.7,969,727 (Previous year Rs.18,845,112) has been reduced from turnover in Profit & LossAccount and differential Excise Duty on opening and closing stock of finished goods amounting to Rs.Nil (Previous year Rs.Nil) hasbeen adjusted from Raw Materials, Finished Goods, Work in Progress and Job Processing charges in Schedule XIII.
19. The Company had exercised the option as per the Companies (Accounting Standard) Amendment Rules, 2009 in the financial year2008-09. As per the option, exchange differences related to long term foreign currency monetary items so far as they relate to theacquisition of a depreciable capital assets are capitalized and depreciated the same over the useful life of the assets. In other cases,have transferred to Foreign Currency Monetary Item Translation Difference Account and amortized over the balance period of suchlong term assets/liabilities but not beyond accounting period ending on or before 31st March 2011. The unamortized balance in thisaccount is Rs.16,773,412 (liability) (Previous year Rs. 95,961,134 (asset)).
20. The Company has appointed independent consultants for conducting a Transfer Pricing study to determine whether the transactionswith associated enterprises were undertaken at “arms length basis”. The management confirms that all international transactionswith associated enterprises are undertaken at negotiated contracted prices on usual commercial terms. Further there has been nochange in the terms of such international transactions till March 31, 2010.
21. In the current year, the Company has received a capital subsidy of Rs.3,000,000 under the Central Investment Subsidy Scheme, 2003based on investment in plant & machinery as its manufacturing unit at Baddi, in the state of Himachal Pradesh which is in the natureof promoters’contribution. As per the scheme, the Company has to maintain such investment for a minimum period of five years. Thishas been treated as capital reserve in books of account.
22. Owing to recoveries, during the year, the Company has written back the provision for bad and doubtful advances of Rs. 135,532,654created during earlier years on account of old recoverable from PanEra Biotec Pvt. Ltd., an associate company. The same has beenshown as other income during the year.
23. The Company has received a soft loan from President of India acting through Department of Biotechnology, Ministry of Science &Technology, Government of India under Biotechnology Industrial Partnership Programme (BIPP) for its H1N1 project. Repayment ofthe loan shall be in 10 equal half-yearly installments and repayment would commence one year after the completion of the saidproject.
24. Previous year’s figures have been rearranged and reclassified wherever necessary to make them comparable with the current year'sfigures.
As per our attached report of even date
S.R. Batliboi & Co. For and on behalf of the BoardFirm registration number: 301003EChartered Accountants Ravinder Jain
Managing Director
Per Rajiv Goyal I.K. Sharma Dr. Rajesh JainPartner D.G.M. (Accounts & Finance) Joint Managing DirectorMembership No. 94549Place : New Delhi Vinod GoelDated : May 7, 2010 G.M. Legal & Company Secretary

116
1. Registration Details
Registration No. 22350 State Code 16
Balance Sheet Date 31/03/2010
2. Capital Raised during the year (Amount in Rs. Thousand)
Public Issue Nil Right Issue Nil
Bonus Issue Nil Private Placement Nil
3. Position of mobilization and deployment of Funds (Amount in Rs. Thousand)
Total Liabilities 14,745,105 Total Assets 14,745,105Source of Funds
Paid up Capital 66,843 Reserves & Surplus 6,898,200
Secured Loans 5,081,382 Unsecured Loans 1,973,004
Deferred Tax Liability 708,903 Foreign Currency Monetary 16,773
Item Translation Difference Account
Application of Funds
Net Fixed Assets 6,946,580 Investments 2,258,323
Net Current Assets 5,538,232 Misc. Expenditure 1,970
Accumulated Losses Nil (to the extent not W/off )
4. Performance of Company (Amount in Rs. Thousand)
Turnover (Including Other Income) 9,778,584 Total Expenditure 8,597,785
Profit/(Loss) before Tax 1,180,799 Profit/Loss after Tax 800,190
Earnings per share (Rs.) 11.98 Dividend @ 25%
5. Generic Name of Three Principal Products/ Services of Company
Item Code No. (ITC Code) 3002 20 14
Product Description Vaccine-Polio
Item Code No. (ITC Code) 3004 20 99
Product Description Gliclazide Tab
Item Code No. (ITC Code) 3002 20 29
Product Description Vaccine-Mixed
ADDITIONAL INFORMATIONAS REQUIRED UNDER PART IV OF SCHEDULE VI TO THE COMPANIES ACT, 1956
For and on behalf of the Board
Ravinder JainManaging Director
I.K. Sharma Dr. Rajesh JainD.G.M. (Accounts & Finance) Joint Managing Director
Place : New Delhi Vinod GoelDated : May 7, 2010 G.M. Legal & Company Secretary

117
Panacea Biotec|Annual Report 2009-10
CASH FLOW STATEMENTANNEXED TO THE BALANCE SHEET FOR THE YEAR ENDED 31ST MARCH, 2010
A. Cash Flow from Operating ActivitiesNet Operating Profit / (Loss) before Tax & Extraordinary Items 1,180,798,836 (923,740,873)Adjustments for:Depreciation 664,538,337 705,099,242Interest Expenses 382,672,685 321,070,800Provision for Doubtful Debts & Advances (131,023,533) 384,794Interest Income (53,646,769) (168,062,520)Dividend Income (33,184) (18,367,280)Loss/ (Profit) on sale of Fixed Assets (Net) 14,139,175 (7,171,144)Profit on sale of Investments - (1,257,126)Unrealized foreign exchange loss/(gain) (net) (1,322,898,935) 1,675,903,989Amortised exchange differences Charge/(Credit) (16,773,412) 47,980,567Deferred Revenue Expenditure written off during the year 1,682,400 1,682,400Product Development Expenses written off 19,395,518 -Provision for Impairment - 284,178,318
(441,947,718) 2,841,442,040Operating Profit before Working Capital changes 738,851,118 1,917,701,167(Increase) / Decrease in Trade and Other Receivables 315,601,084 221,686,892(Increase)/Decrease in Inventories (77,081,556) (2,361,589,208)Increase / (Decrease) in Current Liabilities & Provisions (111,321,901) 507,284,405
127,197,627 (1,632,617,911)Cash generated from Operations 866,048,745 285,083,256Net Income Taxes Paid 108,639,110 235,177,426Net cash from Operating Activities 757,409,635 49,905,830
B. Cash flow from Investing ActivitiesPurchase of Fixed Assets (1,172,773,839) (1,614,772,785)Proceeds of deposits matured (with maturity more 69,546,030 1,250,968,300than three months)Deposits (with maturity more than three months) - (70,467,843)Trade Investment in Shares of Joint Venture/ (92,623,302) (283,200,650)Subsidiary CompaniesNon-trade Investment in Shares of Associate (2,500) (41,257,126)Loan to Joint Venture & Subsidiary Companies (65,761,732) (747,317,829)Sale of Non-trade Investments in Partnership Firm - 41,257,126Sale of Fixed Assets 5,334,741 42,514,714Interest Received 39,476,815 142,045,313Dividends received 33,184 18,367,280Net cash used in investing activities (1,216,770,603) (1,261,863,500)Net cash from Operating and Investing Activities (459,360,968) (1,211,957,670)
C. Cash flow from Financing ActivitiesIssue of Equity Share Capital (incl premium) 29,910,726 -Capital Subsidy received 3,000,000Net increase / (Decrease) in Working Capital Borrowings 602,186,740 1,265,036,897Long Term Borrowings raised 30,000,000 840,998,055Fixed Deposits received 320,500,000 300,500,000Fixed Deposits repaid (300,500,000) (436,110,000)Interest paid (379,910,006) (321,130,220)Dividend paid - (66,693,746)Tax paid on Dividend Distribution - (11,334,602)Net Cash from Financing activities 305,187,460 1,571,266,384Net Cash from Operating, Investing & Financing Activities (154,173,508) 359,308,714Net increase/ (decrease) in Cash & Cash equivalent (154,173,508) 359,308,714Opening balance of Cash & Cash equivalent 524,341,553 160,834,507Add/Less: Effect of Exchange Differences on Cash andCash Equivalents held in foreign currency (7,722,245) 4,198,332Closing balance of Cash & Cash equivalent 362,445,800 524,341,553
For the year ended For the year ended31st March, 2010 31st March, 2009
Amount in Rs.
Contd...

118
Components of cash and cash equivalentsi) Cash Balance on Hand 311,035 579,589ii) Balance with Scheduled Banks :
a) In Cash Credit Accounts 108,977,118 -a) In Current Accounts 46,933,851 25,557,539b) In Unpaid Dividend Accounts* 1,392,070 1,583,956c) On Fixed Deposits 921,813 70,467,843d) In Exchange Earner Foreign Currency Current Accounts 204,831,726 496,620,469
Cash & Bank Balances as per Schedule VII 363,367,613 594,809,396Less: Fixed deposits not considered as cash equivalents (921,813) (70,467,843)Cash & Cash Equivalents in Cash Flow Statement 362,445,800 524,341,553
* These balances are not available for use by the Company as they represent corresponding unpaid dividend liabilities.
For the year ended For the year ended31st March, 2010 31st March, 2009
Amount in Rs.
As per our attached report of even dateS.R. Batliboi & Co. For and on behalf of the BoardFirm registration number: 301003EChartered Accountants Ravinder Jain
Managing Director
Per Rajiv Goyal I.K. Sharma Dr. Rajesh JainPartner D.G.M. (Accounts & Finance) Joint Managing DirectorMembership No. 94549Place : New Delhi Vinod GoelDated : May 7, 2010 G.M. Legal & Company Secretary

119
Panacea Biotec|Annual Report 2009-10
STATEMENT U/S 212OF THE COMPANIES ACT, 1956 RELATING TO SUBSIDIARY COMPANIES
Sr. No. Name of the Date from which Financial Year of Shares of the subsidiary held by Panacea Net aggregate Net aggregate amounts of the Net aggregate amounts of theCompany they became the subsidiary Biotec Ltd. on the above dates ProMt or (Loss) proMts or losses of the subsidiary proMts or losses of the subsidiary
subsidiary ended on for the current so far as it concerns the members so far as it concerns the membersCompany year (in Rs.) of the holding company and is of the holding company and is
dealt with in the accounts of not dealt with in the accountsholding company of holding company
i) Number & face value ii) Extent of a) for the b) for the a) for the b) for theholding Mnancial year previous Mnancial year of previous
of the Mnancial years the subsidiary Mnancial yearssubsidiary of the of the subsidiary
subsidiary since it becamesince it became its subsidiary
its subsidiary.
1 Best On Health Ltd. 15.03.2000 31.03.2010 1,902,160 Re.1 100% 16,792,880 - - 16,792,880 34,870,682
2 Radicura & Co. Ltd. 16.07.1999* 31.03.2010 1,98,250 Rs.10 100% (130,824) - - (130,824) (151,553)
3 Panacea HospitalityServices Pvt. Ltd. 23.08.2007* 31.03.2010 100,000 Re.1 100% 10,602 - - 10,602 (95,257)
4 PanaceaEducationalInstitute Pvt. Ltd. 23.08.2007* 31.03.2010 100,000 Re.1 100% 9,249 - - 9,249 (94,101)
5 Sunanda SteelCo. Ltd. 05.09.2007* 31.03.2010 500,000 Re.1 100% (31,464) - - (31,464) (172,808)
6 Umkal MedicalInstitute Pvt Ltd. 30.06.2008 31.03.2010 3,765,701 Rs.10 75.2% (82,817) - - (82,817) 812,693
7 Panacea BiotecGmbH 11.06.2008 31.03.2010 25,000 Euro 1 100% (490,993) - - (490,993) 59,639
8 Panacea Biotec, Inc 15.07.2008 31.03.2010 501 US $ 100 100% (495,451) - - (495,451) (485,926)
9 Panacea Biotec, FZE 16.03.2008 31.03.2010 5 AED 100000 100% (692,994) - - (692,994) (82,560)
10 Rees InvestmentsLtd. 16.09.2008 31.03.2010 1,000 US $ 0.01 100% (1,305,329) - - (1,305,329) (1,706,647)
11 Kelisia HoldingsLtd.** 18.09.2008 31.03.2010 1000 Euro 1 100% (39,782,508) - - (39,782,508) (41,380,725)
12 Kelisia InvestmentHoldings Ltd.*** 22.10.2008 31.03.2010 5000 CHF 100 100% (3,808,315) - - (3,808,315) (817,345)
13 Panacea BiotecInternationalSA**** 19.02.2009 31.03.2010 6000 CHF 100 100% (58,052,805) - - (58,052,805) (312,976)
14 Panacea Biotec(Europe) AG***** 10.06.2009 31.03.2010 1000 CHF 100 100% (1,234,417) - - (1,234,417) -
** Indirect Subsidiary through Rees Investment Ltd.
*** Indirect Subsidiary through Kelisia Holdings Ltd.
**** Indirect Subsidiary through Kelisia Investment Holdings Ltd.
***** Indirect Subsidiary through Panacea Biotec International SA Ltd.
For and on behalf of the Board
Ravinder JainManaging Director
I.K. Sharma Dr. Rajesh JainD.G.M. (Accounts & Finance) Joint Managing Director
Place : New Delhi Vinod GoelDated : May 7, 2010 G.M. Legal & Company Secretary

120
FINANCIAL DETAILS OF SUBSIDIARY COMPANIES
Name of the Company As on 31st March, 2010 For the year/ period ended 31st March, 2010
Capital Reserves & Total Assets Total Liabilities Details of Turnover ProMt/ (Loss) Provision for ProMt after Tax ProposedSurplus investment including other before Tax Tax Dividend
(except in case income)of investmentin subsidiary)
1 Best On Health Ltd 18,538,826 2,046,437,400 2,102,261,642 2,102,261,642 164,380 36,707,673 29,776,851 12,983,971 16,792,880 -
2 Radicura & Co. Ltd.* 1,982,500 8,350,994 412,224,264 412,224,264 - 64,461 (131,524) (700) (130,824) -
3 Panacea Hospitality 100,000 (84,655) 298,692,304 298,692,304 - 54,167 27,340 16,738 10,602 -Services Pvt. Ltd.*
4 Panacea Educational 100,000 (84,852) 319,545,148 319,545,148 - 52,212 25,383 16,134 9,249 -Institute Pvt. Ltd.*
5 Sunanda Steel Co. Ltd.* 500,000 (204,272) 212,785,036 212,785,036 - 13,765 (27,609) 3,855 (31,464) -
6 Umkal Medical 34,636,437 144,845,608 179,548,225 179,548,225 - - (119,851) (37,034) (82,817) -Institute Pvt. Ltd.
7 Panacea Biotec GmbH 1,513,750 26,794 1,661,644 1,661,644 - - (490,993) - (490,993) -
8 Panacea Biotec, Inc 2,249,741 30,146 2,611,689 2,611,689 - - (495,451) - (495,451) -
9 Panacea Biotec, FZE 6,151,356 42,141 6,255,017 6,255,017 - - (692,994) - (692,994) -
10 Rees Investments Ltd. 449 (2,913,571) 729,290,340 729,290,340 - 46,334,855 (1,305,329) - (1,305,329) -
11 Kelisia HoldingsLtd.** 60,550 (415,252,000) 299,720,644 299,720,644 243,176,342 - (39,782,508) - (39,782,508) -
12 Kelisia InvestmentHoldings Ltd. *** 21,215,000 (4,521,856) 52,689,156 52,689,156 - - (3,797,853) 10,462 (3,808,315) -
13 Panacea Biotec 25,458,000 (56,822,032) 6,615,719 6,615,719 - - (58,037,112) 15,693 (58,052,805) -InternationalSA ****
14 Panacea Biotec 4,243,000 (1,201,508) 4,622,748 4,622,748 - - (1,216,980) (17,437) (1,234,417) -(Europe) AG *****
Notes:* Wholly owned subsidiary till 24.01.2008 and became indirect subsidiary through Best On Health Ltd. from 25.01.2008.** Indirect Subsidiary through Rees Investment Ltd.*** Indirect Subsidiary through Kelisia Holdings Ltd.**** Indirect Subsidiary through Kelisia Investment Holdings Ltd.***** Indirect Subsidiary through Panacea Biotec International SA Ltd.

121
Panacea Biotec|Annual Report 2009-10
AUDITORS’ REPORT ON THE CONSOLIDATED FINANCIAL STATEMENTS
To
The Board of Directors of Panacea Biotec Limited on Consolidated
Financial Statements of Panacea Biotec Limited, its Subsidiaries,
Associates and Joint Venture.
1. We have audited the attached consolidated balance sheet of Panacea
Biotec Limited (“the Company”), its Subsidiaries, Associates and Joint
Venture (together referred to as “PBL Group”), as at March 31, 2010
and also the consolidated profit and loss account and the
consolidated cash flow statement for the year ended on that date
annexed thereto. These financial statements are the responsibility of
the Panacea Biotec Limited’s management and have been prepared
by the management on the basis of separate financial statements and
other financial information regarding components. Our responsibility
is to express an opinion on these financial statements based on our
audit.
2. We conducted our audit in accordance with auditing standards
generally accepted in India. Those Standards require that we plan and
perform the audit to obtain reasonable assurance about whether the
financial statements are free of material misstatements. An audit
includes examining, on a test basis, evidence supporting the amounts
and disclosures in the financial statements. An audit also includes
assessing the accounting principles used and significant estimates
made by management, as well as evaluating the overall financial
statement presentation. We believe that our audit provides a
reasonable basis for our opinion.
3. (a) We have not audited the financial statements of the Subsidiaries
and Associates whose financial statements reflect PBL Group’s
share of total assets of Rs.2,986,339,336 as at 31st March 2010,
the total revenue of Rs.37,814,598 and net cash out flows of
Rs.39,263,835 for the year then ended as considered in the
consolidated financial statements. These financial statements
and other financial information of the Subsidiaries and
Associates have been audited by other auditors whose report
have been furnished to us, and our opinion, in so far as it relates
to the amount included in respect of these Subsidiaries and
Associates, is based solely on the report of other auditors.
(b) The consolidated Anancial statements of PBLGroup includes assets,revenues and cash out Bows of Rs.1,225,830, Rs. Nil and Rs.569,831respectively in relation to Group’s share in Subsidiary (PanaceaBiotec GmbH-Germany), based on unaudited Anancial statements.The e@ect of adjustments, if any, thatmay have been required to bemade to the accompanying consolidated Anancial statements, hadthose component been audited, is not currently ascertainable.
4. We report that the consolidated financial statements have been
prepared by the Company’s management in accordance with the
requirements of Accounting Standard (AS) 21, Consolidated financial
statements, Accounting Standard (AS) 23, Accounting for Investments
in Associates in Consolidated Financial Statements, and Accounting
Standard (AS) 27, Financial Reporting of Interests in Joint Venture,
notified pursuant to the Companies (Accounting Standards) Rules
2006.
5. (a) Without qualifying our opinion, we draw attention to Note 3(ii)
of Schedule XXI B to the financial statements regarding non-
provision of proportionate premium on redemption of ‘US$ 50
Million Zero Coupon Convertible Bonds due 2011’amounting to
Rs. 564,995,867. The same has been disclosed as a contingent
liability. Management has represented, that the redemption
premium will be offset against the securities premium account
and, hence, no adjustments have been considered in the
accounts.
(b) Without qualifying our opinion, we draw attention to Note 14 of
Schedule XXI B to the financial statements regarding
capitalization of expenditure on clinical trials amounting to Rs.
32,125,547 for year ended March 31, 2010 and Rs.479,497,285 as
of March 31, 2010. The ultimate approval of such products, which
has been considered as highly likely by the management, is not
within direct control of the Company. Pending such final
approval, no adjustments have been made to the accompanying
financial statements.
(c) Without qualifying our opinion, we draw attention that the
Company had incurred managerial remuneration of Rs.
63,035,463 for the financial year ending 31st March 2009, which
was in excess of the limits specified by the relevant provisions of
the Companies Act, 1956, by Rs. 38,169,706. The Company has
obtained approval from Central Government vide its letter dated
December 23, 2009 in respect to remuneration paid amounting
to Rs.25,296,096 and the requisite approval for balance
remuneration is awaited. Pending the final outcome of the
Company's application for balance remuneration, no
adjustments have been made to the accompanying financial
statements in this regard.
6. Based on our audit on consideration of reports of other auditors
on separate financial statements and on the other financial
information of the components, and to the best of our
information and according to the explanation given to us, we are
of the opinion that the attached consolidated financial
statements, subject to matter referred to para 3(b), the e@ect ofwhich is not currently ascertainable; give a true and fair view in
conformity with the accounting principles generally accepted in
India.
(a) in the case of the consolidated balance sheet, of the state of the
affairs of the PBL Group as at March 31, 2010;
(b) in the case of the consolidated profit and loss account, of the
profit of PBL Group for the year ended on that date; and
(c) in the case of the consolidated cash flow statement, of the cash
flows of PBL Group for the year ended on that date.
S.R. Batliboi & Co.Firm registration number: 301003E
Chartered Accountants
per Rajiv GoyalPlace : New Delhi PartnerDate : May 07, 2010 Membership No.: 94549

122
CONSOLIDATED BALANCE SHEETAS AT 31st MARCH, 2010
The Schedules referred to above and notes thereon form an integral part of the Profit & Loss Account.As per our attached report of even dateS.R. Batliboi & Co. For and on behalf of the BoardFirm registration number: 301003EChartered Accountants Ravinder Jain
Managing Director
Per Rajiv Goyal I.K. Sharma Dr. Rajesh JainPartner D.G.M. (Accounts & Finance) Joint Managing DirectorMembership No. 94549Place : New Delhi Vinod GoelDated : May 7, 2010 G.M. Legal & Company Secretary
SOURCES OF FUNDSShareholders' FundsShare Capital I 66,842,746 66,786,312Reserves & Surplus II 6,940,442,926 7,007,285,672 6,100,715,573 6,167,501,885
Minority Interest IIIEquity 12,418,800 12,418,800Non Equity 35,921,710 48,340,510 16,550,130 28,968,930
Loan FundsSecured Loans IV 5,081,382,387 4,836,102,165Unsecured Loans V 1,973,004,000 7,054,386,387 2,193,996,000 7,030,098,165
Deferred Tax Liability (Net) 710,078,177 334,786,544(Refer note no. 7 of Schedule XXI B)Foreign Currency Monetary Item TranslationDifference Account (net of amortisation) 16,773,412 -(Refer note no.16 of Schedule XXI B)
Total 14,836,864,158 13,561,355,524APPLICATION OF FUNDSFixed AssetsGross Block VI 9,737,165,372 9,025,576,963Less : Depreciation/Amortisation 2,822,827,634 2,213,043,241Net Block 6,914,337,738 6,812,533,722Capital Work-in-Progress (including capital advances) 1,719,607,602 8,633,945,340 1,777,023,749 8,589,557,471
Investments VII 726,682,719 700,599,288Foreign Currency Monetary Item TranslationDifference Account (net of amortisation) - 95,961,134(Refer note no.16 of Schedule XXI B)
Current Assets, Loans & Advances VIIIInventories 4,576,716,912 4,513,037,066Sundry Debtors 1,075,893,668 1,201,730,208Cash & Bank Balances 470,448,888 748,422,730Other Current Assets 31,253,974 28,502,889Loans and Advances 1,340,791,766 1,233,020,316
(A) 7,495,105,208 7,724,713,209
Less : Current Liabilities & Provisions IXCurrent Liabilities 1,532,355,354 1,692,582,309Provisions 488,483,274 1,861,052,904
(B) 2,020,838,628 3,553,635,213Net Current Assets (A)-(B) 5,474,266,580 4,171,077,996
Miscellaneous Expenditure X 1,969,519 4,159,635(To the extent not written off or adjusted)
Total 14,836,864,158 13,561,355,524Significant Accounting Policies andNotes to Accounts XXI
Schedule As at As atNo. 31st March, 2010 31st March, 2009
Amount in Rs.

123
Panacea Biotec|Annual Report 2009-10
CONSOLIDATED PROFIT & LOSS ACCOUNTFOR THE YEAR ENDED 31ST MARCH, 2010
INCOMETurnover (Gross) XI 9,009,467,958 7,900,564,192Less: Excise Duty 7,969,727 9,001,498,231 18,845,112 7,881,719,080Other Income XII 936,346,858 311,956,924Total Income 9,937,845,089 8,193,676,004
EXPENDITUREPurchases of Finished Goods 205,753,312 186,401,696Raw and packing material consumed XIII 5,015,567,380 2,952,548,877Operating and other expenses XIV 898,374,304 3,393,917,326(Increase)/Decrease in inventories XV (501,408,435) (452,622,474)Personnel Expenses XVI 1,036,099,036 956,778,484Selling & Distribution Expenses XVII 474,655,532 458,230,492Research & Development Expenses XVIII 753,062,612 669,944,045Financial expenses XIX 426,233,420 348,181,812Depreciation/Amortisation VI 499,609,623 545,172,635Miscellaneous Expenditure written offduring the year X 2,190,116 1,787,071Total Expenditure 8,810,136,900 9,060,339,964Profit/(Loss) Before Tax 1,127,708,189 (866,663,960)Provision for Income Tax 204,533,320 24,396,207Less: MAT Credit entitlement 177,691,380 -Net Current Tax Liability 26,841,940 24,396,207Provision for Tax (Earlier years) 1,454,423 89,323Deferred Income Tax (Credit)/ Charge(Refer note no.7 of Schedule XXI B) 375,291,633 (260,618,147)Provision for Fringe Benefit Tax - 29,393,489Profit/(Loss) After Tax 724,120,193 (659,924,832)Add: Share of Profit / (Loss) in Associates 93,039,141 5,306,590Add: Share of Minority Interests in (Profit) / Losses 20,538 (188,030)Net Profit/(Loss) for the Year 817,179,872 (654,806,272)Add : Balance brought forward from previous year 2,145,733,324 2,806,000,020Profit available for Appropriations 2,962,913,196 2,151,193,748
APPROPRIATIONSDividend- Equity Shares-Proposed (not liable to TDS) 16,710,687 -- Preference Shares - Interim (not liable to TDS) - 33,184Dividend Distribution Tax 2,839,981 3,127,240Transfer to General Reserve 80,018,969 2,300,000Balance carried to Balance Sheet 2,863,343,559 2,145,733,324Basic Earnings per Share XX 12.24 (9.82)Diluted Earnings per Share XX 11.46 (9.82)Face value/Nominal Value per Share 1.00 1.00Significant Accounting Policies and Notes toAccounts XXI
The Schedules referred to above and notes thereon form an integral part of the Profit & Loss Account.As per our attached report of even dateS.R. Batliboi & Co. For and on behalf of the BoardFirm registration number: 301003EChartered Accountants Ravinder Jain
Managing Director
Per Rajiv Goyal I.K. Sharma Dr. Rajesh JainPartner D.G.M. (Accounts & Finance) Joint Managing DirectorMembership No. 94549Place : New Delhi Vinod GoelDated : May 7, 2010 G.M. Legal & Company Secretary
Schedule As at As atNo. 31st March, 2010 31st March, 2009
Amount in Rs.

124
As at As at31st March, 2010 31st March, 2009
SCHEDULE I - SHARE CAPITALAuthorisedComprising ofi. 125,000,000 (Previous Year 125,000,000)
Equity Shares of Re.1 each 125,000,000 125,000,000ii. 110,000,000 (Previous Year 110,000,000)
Preference Shares of Rs.10 each 1,100,000,000 1,100,000,0001,225,000,000 1,225,000,000
Issued, Subscribed & Paid up66,842,746 (Previous Year 66,693,746)Equity Shares of Re 1 each fully paid-up 66,842,746 66,693,746
Add: Forfeited Shares(14,900 Shares @ Rs.10 each forfeited onMay 15, 1999, which were later on sub-divided into1,49,000 Equity Shares of Re.1 each onFebruary 12, 2003) - 66,842,746 92,566 66,786,312(1,49,000 Forfeited Shares which were earlier allotted on24th August, 2005 in the name of employees of theCompany (in their capacity as Company's nominees/trustees) for sale thereof at the prevailing market pricesthrough recognised Stock Exchanges on the terms &conditions as specified by Managing/Joint ManagingDirectors or Director of the Company, have been soldduring the year and net proceeds aggregating Rs. 299.11Lacs has been received by the Company)
(Out of the above shares, 1,814,240 Equity Shares of Rs.10each were issued as fully paid up bonus shares bycapitalisation of General Reserves in earlier years, whichwere later on sub-divided into 18,142,400 Equity Shares ofRe.1 each on February 12, 2003, these shares have beensold in the open market in the current year as fully paid,consequently amount of Rs.92,566 has been transferred toCapital Reserve)
66,842,746 66,786,312
SCHEDULE II - RESERVES AND SURPLUSCapital Redemption Reserve 1,016,849,140 1,016,849,140Capital Reserve (Refer Note below) 3,092,566 -Securities PremiumAmount as per last Balance Sheet 2,785,103,626 2,785,103,626Add: Credited Upon Issue of Forfeited Equity Shares 29,761,726 2,814,865,352 - 2,785,103,626General ReserveAmount as per last Balance Sheet 151,577,286 279,334,119Less: Exchange Differences of Earlier YearsCapitalised to Fixed Assets (Net of Depreciation - 37,586,515Rs. 1,609,882)Less: Exchange Differences of Earlier YearsTransferred to the "Foreign Currency Monetary Item - 92,470,318Translation Difference Account”Add: Transfer from Profit & Loss Account 80,018,969 231,596,255 2,300,000 151,577,286Foreign Curreny Translation ReserveAmount as per last Balance Sheet 1,452,197 7,009,383Less: Transfer to P&L Account - 7,009,383Add: Additions during the year 9,243,857 10,696,054 1,452,197 1,452,197Profit & Loss Account 2,863,343,559 2,145,733,324
6,940,442,926 6,100,715,573
Note:Company has received a capital subsidy of Rs.3,000,000 under the Central Investment Subsidy Scheme, 2003 [Refer note 20 of Schedule XXI B].During the year, 149,000 Forfeited Equity Shares of the Company, which were earlier re-issued and held in the name of the Company’s employees asnominees/ trustees, were sold during the year in the open market for Rs. 29,910,726. Out of the above, Rs.29,761,726 has been credited in the SecuritiesPremium Account.
Amount in Rs.
SCHEDULES TO CONSOLIDATED BALANCE SHEET AND PROFIT & LOSS ACCOUNT

125
Panacea Biotec|Annual Report 2009-10
SCHEDULE - III MINORITY INTERESTi) Minority Interest in Equity of Umkal Medical
Institute Pvt. Ltd.1,241,880 Equity Shares of Rs.10 each, fully paid up 12,418,800 12,418,800
ii) Minority Interest in Non-Equity of UmkalMedical Institute Pvt. Ltd.a) Securities Premium 35,754,218 16,362,100b) Balance in Profit & Loss Account
Share of Profit/(Loss) brought forward 188,030 -Share of Profit/(Loss) of the year (20,538) 167,492 188,030 188,030
48,340,510 28,968,930
SCHEDULE IV- SECURED LOANSForeign Currency Term Loans (from Banks)i) State Bank of India 1,796,200,000 2,028,800,000
(Due within one year Rs. Nil (Previous Year Rs.Nil))Interest Accrued & Due 8,553,385 12,416,668
ii) State Bank of Travancore 1,126,992,100 1,272,932,614(Due within one year Rs. Nil (Previous Year Rs.Nil))Interest Accrued & Due 5,642,204 -
Term Loan (from Government of India) 30,000,000 -(Due within one year Rs. Nil (Previous Year Rs.Nil))
Working Capital Loans from Scheduled Banks 793,577,675 1,521,789,762Interest Accrued & Due 4,736,147 -
Buyers' Credit 1,315,680,876 -(Due within one year Rs. 1,315,680,876(Previous Year Rs.Nil))
Vehicle Loan - 163,121Secured by hypothecation of Vehicle
5,081,382,387 4,836,102,165
As at As at31st March, 2010 31st March, 2009
Amount in Rs.
Notes :
1. Foreign currencyTerm Loans from State Bank of India and State Bank of Travancore are secured by way of first pari-passu charge by hypothecation of the company’s entiremovable fixed assets, both present and future and mortgage of immovable properties of the company being land admeasuring 96 bighas, 19 biswas & 93 bighas, 12 biswas& 10 biswasi situated at village Samalheri, Tehsil Dera Bassi, District S.A.S. Nagar (Mohali), Punjab and land admeasuring 26 bighas, 3 biswas situated at Village Manpura,Tehsil Nalagarh, District Solan and land admeasuring 91 bighas, 1 biswas situated at Village Malpura, Tehsil Nalagarh, District Solan in the state of Himachal Pradesh. Foreigncurrency term loan from State Bank of India is also collaterally secured by personal guarantees of the promoter- Directors of the company, viz. Mr. Soshil Kumar Jain, Mr.Ravinder Jain, Dr. Rajesh Jain and Mr. Sandeep Jain.
2. Company has received a soft loan from President of India acting through Department of Biotechnology, Ministry of Science & Technology, Government of India underBiotechnology Industrial Partnership Programme (BIPP).This loan is secured by way of hypothecation of the company’s all equipments, apparatus, machineries, machineriesspares, tools, and other accessories, goods and/or other movable property present and future on a pari-passu basis. The creation of charge for the hypothecation is inprogress. (Refer note no. 21 of schedule XXI B)
3. Working capital loans from schedule banks & Buyers’Credit are secured by way of first pari passu charge by hypothecation of all current assets and also by way of secondpari-passu charge on all the movable fixed assets (including machinery and spares) of the company and existing immovable properties of the company being landadmeasuring 96 bighas, 19 biswas & 93 bighas, 12 biswas & 10 biswasi situated at village Samalheri, Tehsil Dera Bassi, District S.A.S. Nagar (Mohali), Punjab and landadmeasuring 26 bighas, 3 biswas situated at Village Manpura, Tehsil Nalagarh, District Solan and land admeasuring 91 bighas, 1 biswas situated at Village Malpura, TehsilNalagarh, District Solan in the state of Himachal Pradesh. These are also collaterally secured by personal guarantees of the Promoter- Directors of the company, viz Mr.Soshil Kumar Jain, Mr. Ravinder Jain, Dr. Rajesh Jain and Mr. Sandeep Jain.

126
As at As at31st March, 2010 31st March, 2009
Amount in Rs.
SCHEDULE V - UNSECURED LOANSFixed Deposits* 320,500,000 300,500,000(Due within one Year Rs.181,000,000(Previous Year Rs. 55,000,000))Other Loans:Foreign Currency Convertible Bonds**US$ 36,800,000 (Previous Year US$ 36,800,000)Zero Coupon Convertible Bonds due 2011 1,652,504,000 1,866,496,000(Due within one year Rs.1,652,504,000 (Previous YearRs.Nil))Loan from Lakshmi & Manager Holdings Ltd. - 27,000,000(Due within one year Rs.Nil (Previous Year Rs.27,000,000)
1,973,004,000 2,193,996,000
Notes:*It includes Rs.315,000,000 (Previous Year Rs.300,000,000) from partnership firm in which some directors and their relatives are partner.**Unless previously converted, redeemed or repurchased & cancelled, the remaining FCCBs of US $ 36,800,000, which were issued on 13.02.2006, will be redeemedon Feb 14, 2011 at 142.80% of their outstanding principal amount.

127
Panacea Biotec|Annual Report 2009-10
Not
es:
1.Fr
eeho
ldLa
ndin
clud
esLa
ndam
ount
ing
toRs
.16,
395,
690
(Pre
viou
sYea
rRs.
17,2
85,6
90)p
endi
ngre
gist
ratio
nin
the
nam
eof
the
Com
pan
y2.
Build
ing
incl
udes
Offi
cePr
emis
esam
ount
ing
toRs
.155
,892
,400
(Pre
viou
sYea
rRs.
155,
892,
400)
pen
ding
regi
stra
tion
inth
ena
me
ofth
eC
omp
any.
3.Pl
ant&
Mac
hine
ryin
clud
esPl
ant&
Mac
hine
ryam
ount
ing
toRs
.3,5
21,3
31(P
revi
ousY
ear4
,543
,083
)(N
etBl
ock)
lyin
gw
ithth
irdp
artie
s.4.
Dep
reci
atio
nfo
rthe
year
incl
udes
Dep
reci
atio
non
Rese
arch
&D
evel
opm
entA
sset
sam
ount
ing
toRs
.175
,944
,248
(Pre
viou
sYea
rRs.
169,
025,
407)
.5.
Cap
italW
ork
inPr
ogre
ssin
clud
esp
re-o
per
ativ
eex
pen
ditu
re.(
Refe
rNot
eN
o.4
ofsc
hedu
leXX
IB)
6.A
llIn
tang
ible
asse
ts(e
xcep
tSof
twar
es)a
rein
tern
ally
gene
rate
dIn
tang
ible
asse
ts.
*In
clud
esex
chan
gedi
ffer
ence
sca
pita
lized
durin
gth
eye
arRs
.Nil
(Pre
viou
sye
arRs
.730
,764
,477
)**
Exch
ange
diff
eren
ces
(cap
italis
ed)/
deca
pita
lized
durin
gth
eye
ar.
DES
CRI
PTIO
NG
ROSS
BLO
CK
DEP
REC
IATI
ON
/AM
ORT
ISAT
ION
NET
BLO
CK
As
At
Add
ition
sA
djus
tmen
ts**
Sale
/A
sA
tA
sA
tPr
ovid
edSa
le/A
djus
tmen
tA
sA
tA
sA
tA
sA
t1/
4/20
09du
ring
Adj
ustm
ent
31/3
/201
01/
4/20
09du
ring
durin
g31
/3/2
010
31/3
/201
031
/3/2
009
the
Year
*du
ring
the
Year
the
Year
the
Year
A.T
angi
ble
Ass
ets
Land
-Fre
ehol
d1,
782,
408,
983
9,73
5,17
0-
54,0
001,
792,
090,
153
--
--
1,79
2,09
0,15
31,
782,
408,
983
Land
-Lea
seho
ld54
,832
,230
--
-54
,832
,230
832,
615
765,
638
-1,
598,
253
53,2
33,9
7753
,999
,615
Build
ings
1,80
3,63
9,61
714
2,83
5,74
078
,517
,450
302,
980
1,86
7,65
4,92
732
1,03
9,40
110
9,69
7,72
225
,036
430,
712,
087
1,43
6,94
2,84
01,
482,
600,
216
Leas
edho
ldIm
pro
vem
ent
81,0
39,4
225,
146,
114
217,
881
-85
,967
,655
77,5
18,5
955,
779,
493
-83
,298
,088
2,66
9,56
73,
520,
827
Plan
t&M
achi
nery
4,23
8,94
1,69
299
2,63
5,84
137
2,93
7,10
039
,149
,343
4,81
9,49
1,09
01,
240,
572,
196
435,
552,
949
30,0
23,3
431,
646,
101,
802
3,17
3,38
9,28
82,
998,
369,
496
Furn
iture
&Fi
ttin
gs28
9,41
8,86
517
,458
,575
6,40
5,69
12,
264,
954
298,
206,
795
132,
123,
747
28,5
85,4
241,
709,
689
158,
999,
482
139,
207,
313
157,
295,
118
Vehi
cles
144,
617,
819
31,8
13,4
92-
14,8
90,4
4616
1,54
0,86
574
,191
,606
20,3
87,2
9110
,497
,273
84,0
81,6
2477
,459
,241
70,4
26,2
13O
ffice
Equi
pm
ents
209,
422,
526
6,22
6,36
31,
709,
989
13,6
33,7
3920
0,30
5,16
185
,807
,456
17,3
07,6
539,
162,
889
93,9
52,2
2010
6,35
2,94
112
3,61
5,07
0C
omp
uter
Equi
pm
ents
170,
422,
507
10,8
75,1
001,
698,
673
14,6
42,9
8316
4,95
5,95
112
5,00
5,14
719
,270
,120
14,2
07,9
0713
0,06
7,36
034
,888
,591
45,4
17,3
60TO
TAL
(A)
8,77
4,74
3,66
11,
216,
726,
395
461,
486,
784
84,9
38,4
459,
445,
044,
827
2,05
7,09
0,76
363
7,34
6,29
065
,626
,137
2,62
8,81
0,91
66,
816,
233,
911
6,71
7,65
2,89
8C
apita
lWor
kin
Prog
ress
974,
206,
821
1,12
9,30
4,82
3Pr
evio
usYe
ar5,
696,
516,
544
3,14
2,22
7,27
311
,695
,186
52,3
04,9
708,
774,
743,
661
1,38
9,13
2,58
668
3,96
2,96
014
,394
,901
2,05
7,09
0,76
36,
717,
652,
898
4,30
7,38
3,95
8B.
Inta
ngib
leA
sset
sG
oodw
ill36
,248
,978
19,3
92,1
18-
-55
,641
,096
22,9
01,2
795,
276,
136
-28
,177
,415
27,4
63,6
8113
,347
,699
Pate
nts,
Trad
emar
ks&
Des
igns
58,0
54,6
404,
359,
340
-61
7,82
861
,796
,152
46,8
65,7
963,
552,
609
75,8
8850
,342
,517
11,4
53,6
3511
,188
,844
Soft
war
es86
,746
,473
11,8
43,3
85-
82,6
0098
,507
,258
55,1
93,4
1416
,078
,316
67,4
5371
,204
,277
27,3
02,9
8131
,553
,059
Web
site
9,20
2,69
513
6,50
0-
-9,
339,
195
9,20
2,69
531
,975
-9,
234,
670
104,
525
-Pr
oduc
tDev
elop
men
t60
,580
,516
6,25
6,32
8-
-66
,836
,844
21,7
89,2
9413
,268
,545
-35
,057
,839
31,7
79,0
0538
,791
,222
TOTA
L(B
)25
0,83
3,30
241
,987
,671
-70
0,42
829
2,12
0,54
515
5,95
2,47
838
,207
,581
143,
341
194,
016,
718
98,1
03,8
2794
,880
,824
Cap
italW
ork
in74
5,40
0,78
164
7,71
8,92
6Pr
ogre
ssPr
evio
usYe
ar36
8,05
5,88
354
,813
,775
-17
2,03
6,35
625
0,83
3,30
217
2,08
9,81
230
,235
,082
46,3
72,4
1615
5,95
2,47
894
,880
,824
195,
966,
071
TOTA
L(A
+B)
9,02
5,57
6,96
31,
258,
714,
066
461,
486,
784
85,6
38,8
739,
737,
165,
372
2,21
3,04
3,24
167
5,55
3,87
165
,769
,478
2,82
2,82
7,63
46,
914,
337,
738
6,81
2,53
3,72
2C
apita
lWor
kin
1,71
9,60
7,60
21,
777,
023,
749
Prog
ress
Prev
ious
Year
6,06
4,57
2,42
73,
197,
041,
048
11,6
95,1
8622
4,34
1,32
69,
025,
576,
963
1,56
1,22
2,39
871
4,19
8,04
260
,767
,317
2,21
3,04
3,24
16,
812,
533,
722
4,50
3,35
0,02
9

128
As at As at31st March, 2010 31st March, 2009
Amount in Rs.
SCHEDULE VII - INVESTMENTSLong Term Investments (At cost)A. Non-Trade - Quoted:
10,000 (Previous Year 10,000)Equity Shares of Rs.10 each fully paid up 100,000 100,000of Medicamen Biotec Ltd.- Unquoted:41,257,126 (Previous Year 41,257,126)Equity Shares of Re.1 each fully 39,853,180 41,957,109paid up in Lakshmi & Manager Holdings Ltd.Add: Profit / (Loss) for the year 3,284,576 43,137,756 (2,103,929) 39,853,180
B. Trade -Quoted:3,733,334 (Previous Year 3,733,334)Equity Shares of US $ 0.0001 each fully 582,654,761 649,777,351paid up in PharmAthene Inc.- Unquoted :
a) 419,767 (Previous Year 419,767)Equity Shares of Rs.10 each fully paid up 10,668,757 3,258,238in PanEra Biotec Pvt. Ltd.Add: Profit / (Loss) for the year 89,754,565 100,423,322 7,410,519 10,668,757
b) 20,250 (Previous Year 20,000) EquityShares of Rs.10 each fully paid up 202,500 200,000in Shivalik Solid Waste Management Ltd.
c) 4,608,608 (Previous Year 4,608,608)Ordinary Shares of GBP 0.01(Face Value) each fully paid up in CambridgeBiostability Limited, U.K. 168,068,998 168,068,998Less : Provision for Permanent Diminution inthe value of Investments 168,068,998 - 168,068,998 -(Refer note no. 12(b) of Schedule XXI B)
Current Investments (at lower of cost ormarket value)
- Quoted164.201 Units (Previous Year NIL) ofRs. 1,001.1364 NAV in Reliance Liquid PlusFund - Inst - Daily Dividend 164,380 -
726,682,719 700,599,288
Notes:1. Aggregate value of Unquoted Investments 143,763,578 50,721,937
(Net of Provision for Permanent Diminutionin the value of Investments of Rs.168,068,998)(Previous Year Rs. 168,068,998)
2. Aggregate value of Quoted Investments 582,919,141 649,877,351(Market value of Quoted Investment) 243,491,257 466,069,086

129
Panacea Biotec|Annual Report 2009-10
Amount in Rs.
SCHEDULE VIII - CURRENT ASSETS,LOANS & ADVANCESInventories (at lower of cost or net realisable value)i) Raw Materials (including Packing Materials) 2,751,457,008 3,206,936,066
(Including lying with third parties Rs. 6,884,502(Previous Year Rs.34,062,940))
ii) Finished Goods 1,578,499,876 1,020,726,983(Including goods in transit of Rs.10,245,325(Previous Year Rs.1,192,568) & lying with thirdparties Rs. 208,800 (Previous Year Rs.844,654))
iii) Work in Progress 146,469,079 202,833,537(Including lying with third parties Rs.4,068,010(Previous Year Rs.67,135,348))
iv) Stores & Spare Parts 100,290,949 4,576,716,912 82,540,480 4,513,037,066Sundry Debtors
(Unsecured, Considered good, unless otherwisestated)Over six months (including Rs 3,114,130considered doubtful of recovery 93,914,680 83,446,581(Previous Year Rs.3,146,023))Others Debts 985,093,118 1,121,429,650
1,079,007,798 1,204,876,231Less : Provision for Bad & Doubtful Debts 3,114,130 1,075,893,668 3,146,023 1,201,730,208*Rs. 66,208,504 (Previous Year Rs. Nil)due from PanEra Biotec Pvt. Ltd.Cash and Bank Balancesi) Cash balance on hand 426,053 9,243,607ii) Balance with scheduled banks
a) On Cash Credit Accounts 108,977,118 -b) On Current Accounts 80,187,846 100,130,657c) On Unpaid Dividend Accounts* 1,392,070 1,583,956d) On Fixed Deposits** 74,634,075 140,844,041e) On Exchange Earner Foreign Currency
Current Accounts 204,831,726 470,448,888 496,620,469 748,422,730
*Not available for use by the Company as they represent corresponding unpaid dividend liabilities.**Fixed Deposits amounting to Rs.20,690,627 (Previous Year Rs.26,779,030) are pledged with Banks and various Government Authorities.
Other Current AssetsExport Benefits receivable 29,209,403 25,521,973Interest accrued but not due on Loans & Deposits 9,320,041 10,256,386Less : Provision for doubtful of recovery(Refer note no. 12(b) of Schedule XXI B) 7,275,470 31,253,974 7,275,470 28,502,889Loans and Advances(Unsecured, considered good, unless otherwise stated)Advances recoverable in cash or in kind or for value tobe received 776,438,459 749,656,508(Including Rs.5,327,443 (Previous Year Rs.818,322 )considered doubtful)Due from PanEra Biotec Pvt. Ltd.* - 153,950,194(Refer note no. 19 of Schedule XXI B) (Including Rs. Nil(Previous Year Rs.135,532,654) considered doubtful)Balance with Excise, Customs, etc. 14,274,321 15,042,362Loan to Joint Venture Company 108,833,850 108,833,850Staff Loans & Advances (including Rs 4,191,959(Previous Year Rs.4,191,959) considered doubtful) 18,533,443 16,357,286
918,080,073 1,043,840,200Less : Provision for doubtful Loans & Advances(Refer note no. 12(b) of Schedule XXI B) 108,833,850 108,833,850Less : Provision for Bad & Doubtful Advances 9,519,402 140,542,935
799,726,821 794,463,415Security Deposits 26,727,721 23,446,850Advance Income Tax (Net of Provision ofRs.1,192,468,836 (Previous Year Rs.1,180,600,195)) 336,645,844 415,110,051MAT Credit 177,691,380 1,340,791,766 - 1,233,020,316
7,495,105,208 7,724,713,209
* Company's two directors are also directors in PanEra Biotec Private Limited.
As at As at31st March, 2010 31st March, 2009

130
As at As at31st March, 2010 31st March, 2009
Amount in Rs.
SCHEDULE IX - CURRENT LIABILITIES& PROVISIONSA. Liabilities
i) Acceptances 693,348,119 1,140,108,339ii) Sundry Creditorsa) Dues to Micro & Small Enterprises
(Refer note no.6 of Schedule XXI B) 2,793,052 1,274,843b) Dues to other than Micro &
Small Enterprises 778,822,356 482,859,566iii) Advances from Customers 7,308,682 7,060,675iv) Sundry Deposits 14,782,800 15,195,000v) Unpaid dividend on Equity Shares* 1,392,070 1,291,245vi) Other Liabilities 29,565,415 44,401,611vii) Interest accrued but not due on Loans 4,342,860 1,532,355,354 391,030 1,692,582,309
* This amount does not include amount due/outstanding to be credited to Investor Education &Protection Fund, same shall be credited as andwhen due.B. Provisions
i) Provision for Wealth Tax 2,927,142 1,371,020ii) Provision for Fringe Benefit Tax
(Net of Advance Payment ofRs. 101,828,338(Previous Year Rs.72,954,545)) 4,171,662 5,174,455
iii) Proposed Dividend on Preference Shares - 33,184iv) Proposed Dividend on Equity Shares 16,710,687 -v) Provision for Dividend Distribution Tax 2,839,981 5,640vi) Provision for Gratuity 48,753,786 57,056,954vii) Provision for Leave Encashment 56,147,177 54,307,651viii) Provision for Open Derivative Contracts 356,932,839 488,483,274 1,743,104,000 1,861,052,904
2,020,838,628 3,553,635,213
SCHEDULE X - MISCELLANEOUSEXPENDITURE(To the extent not written off or adjusted)i) License fees
As per last Balance Sheet 3,651,919 5,334,319Less: Written off during the year 1,682,400 1,969,519 1,682,400 3,651,919
ii) Preliminary ExpensesAs per last Balance Sheet 507,716 132,006Add: Addition during the year - 480,381Less: Written off during the year 507,716 - 104,671 507,716
1,969,519 4,159,635
SCHEDULE XI - TURNOVERSales 8,980,226,123 7,877,964,683Services (R&D Income) 973,807 1,699,562Income from Contract Manufacturing 28,268,028 20,899,947
9,009,467,958 7,900,564,192
For the year ended For the year endedMarch 31, 2010 March 31, 2009

131
Panacea Biotec|Annual Report 2009-10
Amount in Rs.For the year ended For the year ended
March 31, 2010 March 31, 2009
SCHEDULE XII - OTHER INCOMEInterest received -
-from Banks (Tax deducted at sourceRs.770,971 (Previous Year Rs.27,038,973)) 6,810,287 127,865,846-from Inter Company Loans/Deposits
(Tax deducted at source Rs.3,181,346(Previous Year Rs.Nil)) 31,813,465 16,878,059-on Income Tax Refund 7,196,265 --from others* (Tax deducted at sourceRs.100,722 (Previous Year Rs.7,455,603)) 806,944 35,037,872
Export Incentives 36,649,135 30,855,454Miscellaneous Balances/ Provisions written back - 123,707Sale of Scrap 3,617,153 1,779,942Lease Rent (Tax deducted at source Rs.4,784,050(Previous Year Rs. 2,403,497)) 47,624,800 17,823,031Profit on Sale of Fixed Assets(Net of loss Rs. Nil (Previous Year Rs.2,039,733)) - 6,937,487Exchange Fluctuation Gain(Net of loss Rs.44,959,517 (Previous Year Rs.Nil))** 635,300,516 -Profit on Sale of Investment - 1,257,126Insurance Claim Received 1,998,548 4,430,371Royalty Income 28,555,552 9,266,380Income from Short Term Investments 80,259 -Dividend on other than Trade Investments LongTerm (Gross) 33,184 5,453,494Foreign Currency Translation Account - 7,009,383Income from Derecognition of JV company - 46,263,349Provisions for doubtful advances written back 135,564,546 -Miscellaneous Income 296,204 975,422
936,346,858 311,956,924
*Interest from others includes Rs.157,260 (Previous Year Rs.87,800) from employees Rs.205,193 (Previous Year Rs.188,248) from debtors,Rs. 444,491(Previous Year Rs.Nil) from Punjab State Electricity Board & Rs. Nil (Previous Year Rs.258,369) from Excise department.** It includes the amortisation of Exchange differences on Foreign Currency Monetary Items Translation Difference Account Rs.16,773,412(Previous Year Rs. Nil)
SCHEDULE XIII - RAW & PACKINGMATERIALS CONSUMEDRaw & Packing Materials consumedOpening Stock 3,206,936,066 1,321,160,291Add : Material purchased during the year 4,583,014,959 4,857,945,771
7,789,951,025 6,179,106,062Less : Closing Stock 2,751,348,215 3,206,936,066
5,038,602,810 2,972,169,996Less: Material consumed for Research &Development 23,035,430 19,621,119
5,015,567,380 2,952,548,877

132
Amount in Rs.
SCHEDULE XIV - OPERATING ANDOTHER EXPENSESProcessing Charges 14,494,811 35,289,443Analytical Testing & Trial Charges 7,721,905 6,995,652Stores & Spare Parts consumed(Refer note no.4 of Schedule XXI B) 63,585,872 57,939,559Power & Fuel (Refer note no.4 ofSchedule XXI B) 130,932,044 112,861,694Repair & Maintenance(Refer note no.4 of Schedule XXI B)
-Buildings 37,392,116 16,628,948-Plant & Machinery 16,879,018 22,609,114-Others 30,201,380 84,472,514 28,492,441 67,730,503
Rent (Refer note no.4 of Schedule XXI B) 63,688,346 53,624,943Royalty 17,409,841 14,742,764Directors' Sitting Fees 540,000 345,000Printing & Stationery 59,269,516 40,222,731Postage & Communication expenses 49,874,578 47,716,557Insurance 35,917,333 42,835,287Travelling & Conveyance expenses(Refer note no.4 of Schedule XXI B) 131,079,919 116,933,775Books & Periodicals 864,964 2,240,467Legal & Professional charges(Refer note no.4 of Schedule XXI B) 105,640,794 113,140,386Vehicle Running & Maintenance 17,347,843 17,155,503Auditors Remuneration (Refer note no.5of Schedule XXI B) 9,184,863 6,166,087
Rates & Taxes (Refer note no.4 ofSchedule XXI B) 11,589,184 15,615,884Donation 3,948,651 3,420,245Subscription 12,153,460 13,700,941Staff Training & Recruitment 23,749,210 31,477,974Bad Debts & Advances written off 24,468 115,891Provision for Doubtful Debts & Advances 4,509,121 116,531,425Loss on Sale of Fixed assets(Net of profit Rs.793,900 (Previous Year Rs.Nil)) 11,400,361 -Wealth Tax 2,468,299 1,393,909Foreign Exchange Fluctuation Loss(Net of Gain Rs.Nil (Previous YearRs.214,791,328))* - 571,574,318Provision for Loss on Open DerivativeContracts - 1,702,604,000Provision for Permanent Diminutionin the value of Investments (Refer Note no 12(b) of schedule XXI B) - 168,068,998Miscellaneous expenses(Refer note no.4 of Schedule XXI B) 36,506,407 33,473,390
898,374,304 3,393,917,326
* It includes the amortisation of Exchange differences on Foreign Currency Monetary Items Translation Difference Account Rs. Nil (PreviousYear Rs.47,980,567)
For the year ended For the year endedMarch 31, 2010 March 31, 2009

133
Panacea Biotec|Annual Report 2009-10
Amount in Rs.For the year ended For the year ended
March 31, 2010 March 31, 2009
SCHEDULE XV - (INCREASE)/DECREASE IN INVENTORIESClosing Stock :Finished Goods 1,578,499,876 1,020,726,983Work in Progress 146,469,079 1,724,968,955 202,833,537 1,223,560,520Less: Opening Stock :Finished Goods 1,020,726,983 713,360,132Work in Progress 202,833,537 1,223,560,520 57,577,914 770,938,046
(501,408,435) (452,622,474)SCHEDULE XVI - PERSONNELEXPENSESSalary, Wages and Bonus(Refer note no.4 of Schedule XXI B) 949,225,348 874,951,893Contribution to Provident and other Funds 28,674,755 27,589,020Workmen/Staff Welfare expenses 46,862,417 42,098,929Gratuity 11,336,516 12,138,642
1,036,099,036 956,778,484SCHEDULE XVII - SELLING &DISTRIBUTION EXPENSESAdvertising & Sales Promotion 318,391,390 242,016,163Meetings & Conferences 53,167,133 62,306,063Freight & Cartage 70,014,572 67,411,807Commission on Sales (other than sole selling agents) 33,082,437 86,496,459
474,655,532 458,230,492SCHEDULE XVIII - RESEARCH ANDDEVELOPMENT EXPENSESRaw Material & Packing Material consumed 23,035,430 19,621,119Stores & Spare Parts consumed 142,338,139 134,104,256Processing charges 57,908 -Salary, Wages and Bonus 223,009,679 182,045,564Contribution to Provident & other Funds 4,671,782 4,096,340Workmen/Staff Welfare expenses 7,083,667 9,504,657Gratuity 1,129,063 1,062,491Analytical Testing & Trial charges 47,323,372 14,959,224Rent 6,729,834 6,401,077Printing & Stationery 2,407,261 2,212,425Postage & Communication 3,035,056 3,151,204Travelling expenses 9,519,317 15,897,191Books & Periodicals 1,797,969 6,317,043Legal & Professional expenses 4,952,867 12,052,167Vehicle Running & Maintenance 3,474,942 2,424,344Donation - 30,251Repair & Maintenance :- Buildings 3,400,824 5,726,552- Plant & Machinery 6,659,271 14,628,824- Others 4,255,411 14,315,506 3,728,604 24,083,980Rates, Fees & Taxes 5,466,612 622,995Subscription 12,857,795 9,467,437Electricity & Water charges 33,845,096 33,714,494Meeting & Conferences 1,500,659 2,460,794Staff Training & Recruitment 2,057,087 765,564Loss on Sale of Fixed assets 2,757,048 -Product Development Expenses written off 19,395,518 -Depreciation/Amortisation 175,944,248 169,025,407Sundry expenses 4,356,757 15,924,021
753,062,612 669,944,045

134
Amount in Rs.For the year ended For the year ended
March 31, 2010 March 31, 2009
SCHEDULE XIX -FINANCIAL EXPENSESInterest on:a) Fixed Loans 195,327,615 206,260,720b) Others (Including interest on WorkingCapital Loans) 189,391,155 384,718,770 115,282,862 321,543,582Bank charges 41,514,650 26,638,230
426,233,420 348,181,812SCHEDULE XX - EARNING PER SHARECalculation of Profit/(Loss) for Basic EPSNet profit/(Loss) before Tax 1,127,708,189 (866,663,960)Less: Adjustment for Tax Expenses 403,587,996 (206,739,128)Less: Dividend on Redeemable Preference Shares - 33,184Less: Dividend Distribution Tax onRedeemable Preference Shares - 5,640Add: Net Profit/(Loss) share of Associates and Minority Interest 93,059,679 5,118,560Net Profit/(Loss) for calculation of Basic EPS 817,179,872 (654,845,096)
Calculation of Profit/(Loss) for Diluted EPSNet profit/(Loss) for calculation of basic EPS 817,179,872 (654,845,096)Adjusted Net Profit/(Loss) for calculating Diluted EPS 817,179,872 (654,845,096)
No. of Equity Shares resulting from conversion ofForeign Currency Convertible Bonds
US$ 50 Million Zero Coupon ConvertibleBonds due 2011' (Outstanding US$36.80 Million) 4,542,752 4,542,752at conversion price Rs. 357.57Add: Weighted average number ofEquity Shares in calculating basic EPS 66,781,921 66,693,746Weighted average number ofEquity Shares in calculating diluted EPS 71,324,673 71,236,498Basic Earnings per Share 12.24 (9.82)Diluted Earnings per Share 11.46 (9.82)Face / Nominal Value per Share 1.00 1.00

135
Panacea Biotec|Annual Report 2009-10
A. SIGNIFICANT ACCOUNTING POLICIES
1 I BASIS OF PREPARATION
The Consolidated Financial Statements relate to PanaceaBiotec Limited (Parent Company), its Subsidiary Companies,Joint Venture and Associates (hereinafter collectively referredas the “Group”).
The Consolidated Financial Statements (CFS) have beenprepared to comply in all material respects with the notifiedAccounting Standards issued by Companies (AccountingStandard) Rules, 2006 (as amended) and the relevantprovisions of the Companies Act, 1956. The financialstatements have been prepared under the historical costconvention on an accrual basis except in case of assets forwhich provision for impairment is made and revaluation iscarried out. The accounting policies have been consistentlyapplied by the Company and except for the changes inaccounting policies discussed more fully below, are consistentwith those used in the previous year.
II PRINCIPLES OF CONSOLIDATION
The Consolidated Financial Statements have been preparedon the following basis:
a) The financial statements of the Parent Company and itsSubsidiary Companies have been combined on a line by linebasis by adding together the book values of like items ofassets, liabilities, income and expenses after fully eliminatingintra group balances and intra group transactions resulting inunrealized profits or losses, if any, as per AccountingStandard–21, Consolidated Financial Statements.
b) Interest in assets, liabilities, income and expenses of theJoint Venture have been consolidated usingproportionate consolidation method. Intra groupbalances, transactions and unrealized profits/losses havebeen eliminated to the extent of Company’sproportionate shares as per Accounting Standard –27,Financial reporting of interests in Joint Venture.
c) In case of Associates, where the Company directly orindirectly through subsidiaries holds more than 20% ofequity, investment in Associate is accounted for by EquityMethod in accordance with Accounting Standards -23,Accounting for Investment in Associates.
d) The financial statements of the Subsidiary Companies,Joint Venture and Associates used in the consolidationare drawn for the same period as that of the ParentCompany i.e. year ended March 31, 2010.
e) Minorities’ interest in net profit/(loss) of consolidatedSubsidiary Companies for the year has been identifiedand adjusted against the income in order to arrive at thenet income attributable to the shareholders of the ParentCompany. Minorities’ share of net assets has beenidentified and presented in Consolidated Balance Sheetseparately. Where accumulated losses attributable to theminorities are in excess of their equity, in the absence ofthe contractual obligation on the minorities, the same isaccounted for by the Parent Company.
f ) List of Subsidiaries, Joint Venture and Associatesconsidered for consolidation:
Best On Health Ltd.Panacea Educational Institute Pvt. Ltd.Radicura & Co. Ltd.Panacea Hospitality Services Pvt. Ltd.Sunanda Steel Company Ltd.Umkal Medical Institute Pvt. Ltd.Panacea Biotec GmbHPanacea Biotec, Inc.Panacea Biotec FZERees Investments Ltd.Kelisia Holdings Ltd.Kelisia Investment Holdings AGPanacea Biotec (International) SAPanacea Biotec (Europe) AG (w.e.f. 10th June, 2009)Chiron Panacea Vaccines Pvt. Ltd.PanEra Biotec Pvt Ltd.Lakshmi & Manager Holdings Ltd.Best General Insurance Company Ltd.
123456789101112131415161718
SubsidiaryIndirect Subsidiary*Indirect Subsidiary*Indirect Subsidiary*Indirect Subsidiary*
SubsidiarySubsidiarySubsidiarySubsidiarySubsidiary
Indirect Subsidiary†Indirect Subsidiary††
Indirect Subsidiary†††Indirect Subsidiary††††
Joint VentureAssociateAssociate
Indirect Associate**
IndiaIndiaIndiaIndiaIndiaIndia
GermanyUSAUAE
GuernseyCyprus
SwitzerlandSwitzerlandSwitzerland
IndiaIndiaIndiaIndia
100.0100.0100.0100.0100.075.2
100.0100.0100.0100.0100.0100.0100.0100.050.050.040.032.0
Name of the CompanyS.No Nature of relationship Country ofIncorporation
Extent of Holding/Voting Power (%) as on
March 31, 2010
* Wholly Owned Subsidiary Best on Health Ltd. †† Wholly Owned Subsidiary of Kelisia Holdings Ltd.** Subsidiary of Lakshmi & Manager Holdings Ltd. †††Wholly Owned Subsidiary of Kelisia Investment Holdings AG.† Wholly Owned Subsidiary of Rees Investments Ltd. †††† Wholly Owned Subsidiary of Panacea Biotec (International) SA
SCHEDULE XXI - SIGNIFICANT ACCOUNTING POLICIES AND NOTES ON ACCOUNTS (Consolidated Financial Statements)

136
g) Goodwill represents the difference between the ParentCompany’s shares in the net worth of the Subsidiary / JointVenture Company and the cost of acquisition at the timeof making the investment in the Subsidiary / Joint VentureCompanies. For this purpose, the Parent Company’s shareof net worth of the Subsidiary/ Joint Venture Company isdetermined on the basis of the latest financial statementsof the Subsidiary/ Joint Venture Company prior toacquisition, after making the necessary adjustments formaterial events between the date of such financialstatements and the date of respective acquisition.
h) The Consolidated Financial Statements have beenprepared using uniform accounting policies to the extentpossible for like transactions and other events in similarcircumstances and are presented in the same manner asthe Parent Company’s separate financial statements.
2 USES OF ESTIMATES
The presentation of financial statements in conformity withthe Generally Accepted Accounting Principles requiresestimates and assumptions to be made that affect thereported amount of assets and liabilities on the date of thefinancial statements and the reported amount of revenuesand expenses during the reporting period. Differencebetween the actual result and estimates are recognized in theperiod in which the results are known/materialized.
3 REVENUE RECOGNITION
Revenue is recognized to the extent that it is probable thatthe economic benefits will flow to the Company and therevenue can be reliably measured.
Sale of Goods - Revenue is recognized when the significantrisks and rewards of ownership of the goods have passed tothe buyer and is stated net of trade discounts, free quantities,returns and sales tax but includes excise duty. Excise Dutydeducted from turnover is the amount that is included in theamount of turnover (gross) and not the entire amount ofliability arise during the year.
Research & Development - Income from Research &Development Services is accounted for as per the stage ofcompletion.
ContractManufacturing - Revenue is recognized on an accrualbasis in accordance with the terms of the relevant agreement.
Interest - Revenue is recognized on a time proportion basistaking into account the amount outstanding and the rateapplicable.
Dividend - Revenue is recognized when the shareholders’ rightto receive payment is established by the Balance sheet date.
Royalty - Revenue is recognized on an accrual basis inaccordance with the term of the relevant agreement.
Export BeneAts - Export entitlements under Duty EntitlementPass Book Schemes and Advance Licenses are recognized inthe Profit & Loss Account when the right to receive credit asper terms of scheme is established in respect of export madeand where there is no significant uncertainty regarding theultimate collection of the relevant export proceeds.
4 FIXED ASSETS
Fixed assets are stated at cost less accumulated depreciation andimpairment losses, if any. Cost comprises the purchase price andany attributable cost of bringing the asset to its working conditionfor its intended use. Borrowing costs relating to acquisition of fixedassets which takes substantial period of time to get ready for itsintended use are also included to the extent they relate to theperiod till such assets are ready to be put to use.
As a result of change in Accounting Policy during the previousyear in respect of accounting periods commencing on or after7th December, 2006, exchange differences arising on reportingof the long-term foreign currency monetary items at ratesdifferent from those at which they were initially recorded duringthe period, or reported in the previous financial statements areadded to or deducted from the cost of the asset and aredepreciated over the balance life of the asset, if these monetaryitems pertain to the acquisition of a depreciable fixed asset.
5 IMPAIRMENT OF FIXED ASSETS
The carrying amounts of assets are reviewed at each BalanceSheet date as to whether there is any indication of impairmentbased on internal/external factors. An impairment loss isrecognized wherever the carrying amount of an asset exceedsits recoverable amount. The recoverable amount is the greaterof the assets net selling price and value in use. In assessingvalue in use, the estimated future cash flows are discountedto their present value at the weighted average cost of capital.
After impairment, depreciation is provided on the revisedcarrying amount of the assets over its remaining useful life.
6 EXPENDITURE ON NEW PROJECTS AND SUBSTANTIALEXPANSION
Expenditure directly relating to construction activity iscapitalized. Direct expenditure incurred during constructionperiod is capitalized as part of the direct construction cost to theextent to which the expenditure is directly related toconstruction.
7 INTANGIBLES
Patents and Trademarks - Costs relating to patents andtrademarks, which are acquired, are capitalized.
Research andDevelopment Costs - Research costs are expensedas incurred. Development expenditure incurred on anindividual project is carried forward when its futurerecoverability can reasonably be regarded as assured.
Product Development - Product Development is capitalized on

137
Panacea Biotec|Annual Report 2009-10
successful completion of development activities andcommercial launch of developed products.
Technical Knowhow - Technical Know how is being capitalizedon successful transfer of technology when its futurerecoverability can reasonably be regarded as assured.
Software andWebsite - Software is stated at cost of acquisitionand includes all attributable costs of bringing the software toits working condition for its intended use.
Goodwill - Goodwill on consolidation is amortized pro-rataover a period of 5 years.
The carrying value of intangible assets is reviewed forimpairment annually when the asset is not yet in use, andotherwise when events or changes in circumstances indicatethat the carrying value may not be recoverable.
8 DEPRECIATION / AMORTIZATION
a) Depreciation on fixed assets is provided on written downvalue method as per the rates based on the estimated usefullife or as per rates prescribed in Schedule XIV to theCompanies Act, 1956 whichever is higher. Depreciation isprovided on the following rates:
to land unless it has a limited useful life.
9 BORROWING COSTS
Borrowing costs attributable to the acquisition, constructionor production of a qualifying asset are capitalized as part ofthe cost of that asset. Borrowing costs, which are not relatableto qualifying assets, are recognized as an expense in the periodin which they are incurred.
10 GOVERNMENT GRANTS AND SUBSIDIES
Grants and subsidies from the government are recognizedwhen there is reasonable assurance that the grant/subsidy willbe received and all attaching conditions will be complied with.
Government grants of the nature of promoters’ contributionare credited to capital reserve and treated as a part ofshareholders’ funds
11 LEASES
Where the Company is the Lessee:
Finance leases, which effectively transfer to the Companysubstantially all the risks and benefits incidental to ownershipof the leased item, are capitalized at the lower of the fair valueand present value of the minimum lease payments at theinception of the lease term and disclosed as leased assets.Lease payments are apportioned between the finance chargesand reduction of the lease liability based on the implicit rate ofreturn. Finance charges are charged directly against income.Lease management fees, legal charges and other initial directcosts are capitalised.
If there is no reasonable certainty that the Company will obtainthe ownership by the end of the lease term, capitalized leasedassets are depreciated over the shorter of the estimated usefullife of the asset or the lease term.
Leases, where the lesser effectively retains substantially all therisks and benefits of ownership of the leased term, areclassified as operating leases. Operating lease payments arerecognized as an expense in the Profit and Loss account on astraight-line basis over the lease term.
Where the Company is the Lessor:
Assets given under a finance lease are recognized as a receivableat an amount equal to the net investment in the lease. Leaserentals are apportioned between principal and interest on the IRRmethod. The principal amount received reduces the netinvestment in the lease and interest is recognized as revenue.Initial direct costs such as legal costs, brokerage costs, etc. arerecognized immediately in the Profit and Loss Account.
Assets subject to operating leases are included in fixed assets.Lease income is recognized in the Profit and Loss Account on astraight-line basis over the lease term. Costs, includingdepreciation are recognized as an expense in the Profit and Loss
Tangibles Assets WDV %Building – Factory 10.00Building – Office Premises 5.00Plant & Machinery 13.91Furniture & Fittings 18.10Vehicles 25.89Office Equipments 13.91Computer Equipments 40.00
b) Amortisation on intangibles is provided on the basis of theestimated useful lives as follows:-
Patents, Trademarks & - Amortized on straight lineDesigns basis over a period of 7 years.
Product Development - Amortized on straight linebasis over a period of 5 years.
Technical Know-how - Amortized on straight linebasis over a period of 5 years.
Software - Amortized on straight linebasis over a period of 5 years.
Websites - Amortized on straight linebasis over a period of 2 years.
c) Leasehold Land is amortized over the period of lease or usefullife, whichever is shorter.
d) Leasehold Improvements are amortized over the initial periodof lease or useful life, whichever is shorter.
e) No Depreciation is provided on freehold land, as AccountingStandard -6 on ‘Depreciation Accounting’ notified by theCompanies Accounting Standard Rules, 2006, does not apply

138
Account. Initial direct costs such as legal costs, brokerage costs,etc. are recognized immediately in the Profit and Loss Account.
12 DEFERRED REVENUE EXPENDITURE
Expenditure incurred prior to April 1, 2003 towards procuringlicense for new products is written off over the period ofagreement or ten years whichever is shorter. Expenditure ofthe similar nature incurred during the year is charged off torevenue.
13 INVESTMENTS
Investments that are readily realizable and intended to beheld for not more than a year are classified as currentinvestments. All other investments are classified as long-terminvestments. Current investments are carried at lower of costand fair value determined on an individual investment basis.Long-term investments are carried at cost. However, provisionfor diminution, if any, in value is made to recognize a declineother than temporary in the value of the investments.
14 INVENTORIES
Finished Goods, Work in Progress, Goods held for Resale, RawMaterials, Packing Materials and Stores & Spare parts are statedat lower of cost and net realizable value. However, materials andother items held for use in the production of inventories are notwritten down below cost if the finished goods in which theywill be incorporated are expected to be sold at or above cost.
'Cost' of Finished Goods, Work in progress, Raw Materials,Packing Materials and Stores & Spare parts is arrived at byusing ‘Moving Average Price’ method.
Cost of Work in Progress and Finished Goods is determined byconsidering direct material cost and appropriate portion ofmanufacturing overheads based on normal operatingcapacity. Cost of traded goods is arrived at by using ‘MovingAverage Price’ method and in Joint Venture as First in first outbasis. Cost of finished goods includes Excise Duty.
Net realizable value is the estimated selling price in theordinary course of business, less estimated costs ofcompletion and to make the sale.
15 RETIREMENT AND OTHER EMPLOYEES BENEFITS
a) Retirement benefits in the form of Provident Fund and PensionSchemes are defined contribution schemes and thecontributions are charged to the Profit and Loss Account of theyear when the contributions to the respective funds are due.There are no other obligations other than the contributionpayable to the respective funds.
b) Gratuity liability and Post employment Medical Benefit liabilityare defined benefit obligations and are provided for on thebasis of an actuarial valuation on projected unit creditmethod made at the end of each financial year.
c) Short term compensated absences are provided for based onestimates. Long term compensated absences are provided forbased on actuarial valuation done as per projected unit creditmethod.
d) Leave encashment payable/adjustable during the year isprovided on the basis of last salary drawn by employees.
e) Actuarial gains/losses are immediately taken to Profit & LossAccount and are not deferred.
16 FOREIGN CURRENCY TRANSACTIONS
Initial Recognition
Foreign currency transactions are recorded in the reportingcurrency, by applying to the foreign currency amount, theexchange rate between the reporting currency and theforeign currency at the date of the transaction.
Conversion
Foreign currency monetary items are reported using theclosing rate. Non-monetary items which are carried in terms ofhistorical cost denominated in a foreign currency are reportedusing the exchange rate at the date of the transaction andnon-monetary items which are carried at fair value or othersimilar valuation denominated in a foreign currency arereported using the exchange rates that existed when thevalues were determined.
Exchange Di@erences
Exchange differences arising on the settlement of monetaryitems or on reporting such monetary items at rate differentfrom those at which they were initially recorded during theyear, or reported in previous financial statements, arerecognized as income or as expenses in the year in which theyarise except those monetary items as mentioned below.
Exchange differences, in respect of accounting periodscommencing on or after 7th December, 2006, arising onreporting of long-term foreign currency monetary items atrates different from those at which they were initially recordedduring the period, or reported in previous financialstatements, in so far as they relate to the acquisition of adepreciable capital asset, are added to or deducted from thecost of the asset and are depreciated over the balance life ofthe asset, and in other cases, are accumulated in a “ForeignCurrency Monetary Item Translation Difference Account” inthe financial statements and amortized over the balanceperiod of such long-term asset/liability but not beyondaccounting period ending on or before 31st March, 2011.
Exchange differences arising on a monetary item that, insubstance, form part of company's net investment in a non-integral foreign operation is accumulated in a foreigncurrency translation reserve in the financial statements untilthe disposal of the net investment, at which time they arerecognized as income or as expenses.

139
Panacea Biotec|Annual Report 2009-10
recommendations contained in guidance note issued by theInstitute of Chartered Accountants of India, the said asset iscreated by way of a credit to the profit and loss account andshown as MAT Credit Entitlement. The Company reviews thesame at each balance sheet date and writes down the carryingamount of MAT Credit Entitlement to the extent there is nolonger convincing evidence to the effect that Company willpay normal Income Tax during the specified period.
18 EARNINGS PER SHARE
Basic Earnings per Share are calculated by dividing the net profitor loss for the period attributable to equity shareholders (afterdeducting preference dividends and attributable taxes) by theweighted average number of equity shares outstanding duringthe period. The weighted average number of equity sharesoutstanding during the period is adjusted for events of bonusissue, bonus element in a rights issue to existing shareholders,share split, and reverse share split (consolidation of shares), if any.
For the purpose of calculating diluted earnings per share, thenet profit or loss for the period attributable to equityshareholders and the weighted average number of Sharesoutstanding during the period are adjusted for the effects ofall dilutive potential equity shares.
19 PROVISIONS
A provision is recognized when the Company has a presentobligation as a result of past event and it is probable that anoutflow of resources will be required to settle the obligation,in respect of which a reliable estimate can be made.Provisions are not discounted to its present value and aredetermined based on management’s best estimate requiredto settle the obligation at the balance sheet date. These arereviewed at each balance sheet date and adjusted to reflectthe current best estimates.
20 SEGMENT REPORTING POLICIES
a) Identification of Segments:
Primary Segment
Business Segment: The Company’s operating businesses areorganized and managed separately according to the natureof products, with each segment representing a strategicbusiness unit that offers different products. The identifiedsegments are Vaccines, Formulations, Research &Development and Healthcare Activities.
Secondary Segment
Geographical Segment: The analysis of geographical segmentis based on the geographical location of the customers.
The geographical segments considered for disclosure are asfollows:
• Revenue from domestic market includes sales tocustomers located within India.
Forward Exchange Contracts not intended for trading orspeculation purposes
The premium or discount arising at the inception of forwardexchange contracts is amortized as an expense or income overthe life of the contract. Exchange differences on such contractsare recognized in the statement of Profit and Loss Account inthe year in which the exchange rates change. Any profit or lossarising on cancellation or renewal of forward exchangecontract is recognized as income or as expense for the year.
17 INCOME TAXES
Tax expense comprises of current, deferred and fringe benefittax. Current Income Tax and Fringe Benefit Tax is measured atthe amount expected to be paid to the tax authorities inaccordance with the Income Tax Act, 1961, enacted in India.Deferred Income Taxes reflect the impact of current year timingdifferences between taxable income and accounting incomefor the year and reversal of timing differences of earlier years.
Deferred Income Tax is measured based on the tax rates andthe tax laws enacted or substantively enacted at the balancesheet date. Deferred tax assets and deferred tax liabilities areoffset, if a legally enforceable right exists to set off current taxassets against current tax liabilities and the deferred tax assetsand deferred tax liabilities relate to the taxes on income leviedby same governing taxation laws. Deferred tax assets arerecognized only to the extent that there is reasonablecertainty that sufficient future taxable income will be availableagainst which such deferred tax assets can be realized. If theCompany has unabsorbed depreciation or carry forward taxlosses, deferred tax assets are recognized only if there is virtualcertainty supported by convincing evidence that suchdeferred tax assets can be realized against future taxableprofits. At each Balance Sheet date the Company re-assessesunrecognized deferred tax assets. It recognizes unrecognizeddeferred tax assets to the extent that it has becomereasonably certain or virtually certain, as the case may be, thatsufficient future taxable income will be available againstwhich such deferred tax assets can be realized.
The carrying amount of deferred tax assets are reviewed ateach balance sheet date. The Company writes down thecarrying amount of a deferred tax assets to the extent that itis no longer reasonably certain or virtually certain, as the casemay be, that sufficient future taxable income will be availableagainst which deferred tax assets can be realized. Any suchwrite-down is reversed to the extent that it becomesreasonably certain or virtually certain, as the case may be, thatsufficient future taxable income will be available.
MAT credit is recognised as an asset only when and to theextent there is convincing evidence that the company will paynormal income tax during the specified period. In the year inwhich the Minimum Alternative tax (MAT) credit becomeseligible to be recognized as an asset in accordance with the

140
• Revenue from overseas market includes sales tocustomers located outside India.
(b) Allocation of Common Costs: Common allocable costs areallocated to each segment on a rational basis based on natureof each such common cost.
(c) Unallocated Items: Corporate income and expenses areconsidered as a part of unallocable income & expense, whichare not identifiable to any business segment.
(d) Segmental Policies: The Company prepares its segmentinformation in conformity with the accounting policiesadopted for preparing and presenting the financialstatements of the company as a whole.
21 DERIVATIVE INSTRUMENTS
As per announcement of Institute of Chartered Accountants ofIndia, accounting for derivative contracts, other than thosecovered under AS-11, are marked to market on a portfoliobasis, and the net loss after considering the offsetting effecton the underlying hedge item is charged to the Profit and LossAccount. Net gains are ignored.
22 CASH & CASH EQUIVALENT
Cash and cash equivalents in the cash flow statementcomprise cash at bank and in hand and short-terminvestments with an original maturity of three months or less.
B. NOTES TO ACCOUNTS (All amounts are in Rs. unlessotherwise stated)
1. Contingent Liabilities (to the extent not provided for)
Particulars 31/03/2010 31/03/2009Disputed demands/ show-causenotices under:-a) Income Tax cases 2,019,671 110,557b)Customs Duty cases 3,999,923 3,999,923c) Central Excise Duty cases 6,596,620 6,596,620d)Service Tax 2,744,567 29,789,842Total 15,360,781 40,496,942Demand from Maharashtra StateElectricity Distribution CompanyLimited ;(Refer to note (e) below) 8,055,506 -Labour cases (in view of largenumber of cases, it isimpracticable to discloseeach of them) 2,003,390 2,803,586Premium on Redemption of‘US$ 50 Million Zero CouponConvertible Bonds due 2011’(Refer note 3(ii) below) 564,995,867 470,992,269
Notes:
a) In respect of Income Tax demand for the Assessment Year2007-08, the Assessing Officer disallowed Rs.22,59,000 undersection 14A of the Income Tax Act, computed in accordancewith Rule 8D of the Act, contending the same to beexpenditure incurred in relation to income which does notform part of the total income under the Act in the Order passedunder section 143(3) of the Act. The company preferred appealbefore the CIT (Appeals). The appeal is yet to be disposed off bythe CIT (Appeals).
The joint venture company, Chiron Panacea Vaccines Pvt. Ltd.,has filed an appeal against the Income Tax demand ofRs.2,484,933 for Assessment Year 2006-07. Based on Judicialpronouncements, claim is likely to be accepted by appellateauthorities.
b) In respect of Customs Duty demand of Rs.3,999,923 towardsCustoms Duty on certain items imported as exempted by theCompany, the Company has deposited the entire amountunder protest. The matter is pending before the HonorableSupreme Court of India. No provision is considered necessaryin this regard since the Company believes it has a good casebased on nature of the case and legal advice obtained by it.
c) In respect of Central Excise Duty demand of Rs.6,596,620 towardsExcise Duty on common inputs used in manufacture ofexempted and taxable products, the Company has deposited theentire amount under protest. The matter is pending beforeCentral Excise and Customs Tribunal. No provision is considerednecessary in this regard since the Company believes it has a goodcase based on nature of the case and legal advice obtained by it.
d) In respect of service tax demand of Rs.29,789,842 relating toforeign services rendered & delivered outside India & othersservices, which were brought in service tax net w.e.f. 18.04.06and against which numerous decisions/ judgments have beenpronounced by the competent courts/judicial authorities, theCompany has sent suitable reply to the concerned authority.The Company has assessed Rs.2,744,567 as contingent liabilityout of total demand. No provision is considered necessary onthe balance amount in this regard since the Company believesit has a good case based on nature of the demand and legaladvice obtained by it.
e) In respect of demand notice of Rs.8,055,506 received fromMaharashtra State Electricity Distribution Company Ltd. onaccount of wrong tariff rates for the activities at R&D Center,Mumbai, the Company has taken legal opinion which is infavour of the Company & thus no provision is considerednecessary in this regard.

141
Panacea Biotec|Annual Report 2009-10
Particulars 31.03.2010 31.03.2009Tangibles Assets 302,782,857 529,633,712Intangible Assets 11,907,371 21,946,833Total 314,690,228 551,580,545
cannot presently be ascertained, the Company has not providedfor the proportionate premium on redemption for the periodupto 31st March, 2010 amounting to Rs. 564,995,867 (PreviousYear Rs. 470,992,269). Such premium has been disclosed ascontingent liability. These Bonds are considered a monetaryliability and are redeemable only if there is no conversion beforematurity date.
(iii) The Company has fully utilized the issue proceeds of ‘US$ 50Million Zero Coupon Convertible Bonds due 2011’ inearlier years
(iv) The Company has made a provision for dividend in the books ofaccount after considering the application for conversions received,if any, as at the date of the Board Meeting held for approval ofAnnual Financial Statements. Company is obliged to pay dividendto those bondholders who convert their Bonds into Equity Sharesafter approval by the Board of the financial statements and uptothe book closure date for dividend purposes. Incremental dividendand dividend distribution tax, if any, will be paid out of the balanceavailable in the Profit & Loss Account.
4. Details of pre-operative expenses (included in Capital Work inProgress) relating to Fixed Assets are as follows:
2. Estimated amount of contracts remaining to be executed oncapital account, net of advances and not provided in thebooks are as follows:-
3. Foreign Currency Convertible Bonds
(i) Conversion price of ‘US$ 50 Million Zero Coupon ConvertibleBonds due 2011’(FCCBs) has already been fixed at Rs.357.57 perShare. This rate is used to determine dilutive Equity Sharesagainst outstanding Bonds.
(ii) ‘US$ 50 Million Zero Coupon Convertible Bonds due 2011’amounting to US$ 36,800,000 are pending for redemption as on31st March 2010. Unless these Bonds have been previouslyconverted, redeemed, repurchased and cancelled, the Companywill redeem these Bonds at a price equal to 142.80% of theoutstanding principal amount on the maturity date i.e February14, 2011 (including premium amounting to Rs. 707,271,712).Since the redemption of bonds is contingent upon its non-conversion into Equity Shares and the probability of redemption
Particulars As at Additions Capitalized As at1-April-09 during the year during the year 31-March-10
Legal & Professional 61,120,785 7,904,843 - 69,025,628(53,548,946) (11,434,122) (3,862,283) (61,120,785)
Store & Spares consumed - 3,730,673 1,633,987 2,096,686(22,419,030) (50,376) (22,469,406) -
Power and Fuel 82,124 1,244,706 1,234,706 92,124(31,254,050) (357,323) (31,529,249) (82,124)
Rates & Taxes 289,880 542,243 - 832,123(9,860,525) (4,872) (9,575,517) (289,880)
Repair & Maintenance:Plant and Machinery - - - -
(4,452,852) - (4,452,852) -Others 451,747 9,257 9,257 451,747
(6,222,930) (773,882) (6,545,065) (451,747)Salary and Wages 5,788,058 11,362,875 5,129,289 12,021,644
(14,399,373) (4,580,192) (13,191,507) (5,788,058)Office Expenses - - - -
(2,733,205) (73,934) (2,807,139) -Travel and ConveyanceExpenses 1,981,700 649,596 1,044,500 1,586,796
(3,855,848) (1,857,383) (3,731,531) (1,981,700)Rent 4,094,446 3,280,568 - 7,375,014
(1,038,300) (3,081,945) (25,799) (4,094,446)Miscellaneous Expenses 3,008,227 1,544,493 42,938 4,509,782
(4,595,999) (7,215,152) (8,802,924) (3,008,227)Total 76,816,967 30,269,254 9,094,677 97,991,544
(154,381,058) (29,429,181) (106,993,272) (76,816,967)
Note: Figures in brackets represent previous year figures (2008-09)

142
Particulars Year ended March 31, 2010 Year ended March 31, 2009Parent Subsidiaries Joint Parent Subsidiaries Joint
Company Ventures Company VentureStatutory Auditors- Statutory Audit # 3,000,000 1,187,835 444,180 3,309,000 382,919 4,68,762- Quarterly Limited Reviews 1,603,235 - - 1,685,400 - -- Certificates 234,120 - - 134,832 1,500 -- Other Advisory 2,500,000 15,000 - - 15,000 -- Out of Pocket Expenses 224,947 2,206 6,375 161,721 - 6,953
7,562,302 1,205,041 450,555 5,290,953 399,419 475,715Tax Auditor* 125,000 22,060 104,413 140,450 - 93,038Cost Auditor* 40,000 - - 44,944 - -
5. Auditors’ Remuneration:
* included in the Legal & Professional charges given in Schedule XIV# Audit remuneration includes Rs.33,090 (Previous Year Rs. Nil) transferred to Pre-operative Expenses.
Details of dues to Micro, Small and Medium Enterprises as perMicro, Small and Medium Enterprise Development Act, 31.03.2010 31.03.20092006 (MSMED Act) Principal Interest Principal InterestPrincipal amount and interest due thereon remaining unpaid toany supplier as at year end. 2,793,052 Nil 1,274,843 NilInterest paid by the Company in terms of section 16 of the MSMEDAct along with the amounts of the payment made to the supplierbeyond the appointed day during accounting year 2,147,609 44,081 3,552,413 68,868Interest due and payable for the period of delay in making payment(which have been paid but beyond the appointed day during the year)but without adding the interest specified under MSMED Act Nil Nil Nil NilInterest accrued and remaining unpaid at the end of the year. Nil Nil Nil NilFurther interest remaining due and payable in succeeding years,until such date when the interest dues as above are actually paidto the small enterprises for the purpose of disallowance as adeductible expenditure under section 23 of the MSMED Act Nil Nil Nil Nil
6. Disclosure of Micro & Small Enterprises
7. Deferred Tax Liabilities (Net):The breakup of deferred tax liability is as follows:-
31.03.2010 31.03.2009Deferred Tax LiabilitiesDifferences in depreciation and amortization in block of fixed assets asper Income Tax Act and books of accounts 538,235,439 501,434,945Deferred revenue expenditure 654,225 1,241,287Capital expenditure on research & development 306,905,561 267,365,738Forex Loss (revenue) deferred as per notification on AS-11 (Revised) 4,232,082 50,254,492Gross Deferred Tax Liabilities 850,027,307 820,296,462Deferred Tax AssetsEffect of expenditure debited to Profit and Loss Account in the current yearbut allowed for tax purposes in following years 58,978,236 49,139,072Loss as per Income Tax Act carried forward 24,029,627 364,509,363Unabsorbed Depreciation as per Income Tax Act carried forward 70,228,267 71,861,483Gross Deferred Tax Assets 139,949,130 485,509,918Net Deferred Tax Liability 710,078,177 334,786,544

143
Panacea Biotec|Annual Report 2009-10
8. Related Party DisclosuresA. Names of Related Parties:
(a) Key Management Personnel:Mr. Soshil Kumar Jain - Chairman and Whole-time DirectorMr. Ravinder Jain - Managing DirectorDr. Rajesh Jain - Joint Managing DirectorMr. Sandeep Jain - Joint Managing DirectorMr. Sumit Jain - Whole-time Director
(b) List of Persons having controlling interest together with their relatives*:
Key Management Father Mother Wife Brother Sister Son Daughter
Personnel
Soshil Kumar Jain - - Nirmala Jain - - Ravinder Jain, Rajesh Jain, -
Sandeep Jain
Ravinder Jain Soshil Kumar Jain Nirmala Jain Sunanda Jain Rajesh Jain, Sandeep Jain - Sumit Jain, Nipun Jain Radhika Jain
Rajesh Jain Soshil Kumar Jain Nirmala Jain Meena Jain Ravinder Jain, Sandeep Jain - Ankesh Jain, Harshet Jain -
Sandeep Jain Soshil Kumar Jain Nirmala Jain Pamilla Jain Ravinder Jain, Rajesh Jain - - Priyanka Jain
Sumit Jain Ravinder Jain Sunanda Jain - Nipun Jain Radhika Jain - -
* Relatives holding Equity shares in the Company have been disclosed
(c) Relatives of Key Management personnel having transactions with the Company:Mr. Ashwani Jain, Son-in-law of Mr. Soshil Kumar JainMr. Shagun Jain, Son-in-law of Mr. Ravinder JainMrs. Radhika Jain, Daughter of Mr. Ravinder JainMrs. Shilpy Jain, Wife of Mr. Sumit Jain
(d) Enterprises over which person(s) having controlling interest in Company / Key management personnel (s) along with their relativesare able to exercise significant influence:(i) Neophar Alipro Limited(ii) All India S. L. Jain Charitable Foundation(iii) First Lucre Partnership Co.*(iv) Second Lucre Partnership Co.*(v) Radhika Associates(vi) Sumit Nipun & Co.(vii) Rattan Sons(viii) Tahir & Co.(ix) Best On Health Foods Ltd.(x) Soshil Kumar Jain (HUF)*(xi) Ravinder Jain (HUF)*(xii) Rajesh Jain (HUF)*(xiii) Sandeep Jain (HUF)*
* These enterprises are also holding Shares in the Company.

144
A. During the YearPurchase ofraw materials - 312,325,082 - - - - - 312,325,082
(-) (63,092,690) (-) (-) (-) (-) (-) (63,092,690)Sale 121,765,348 48,469,087 - - - - - 170,234,435
(121,638,985) (20,568,527) (-) (-) (-) (-) (-) (142,207,511)ProcessingCharges paid - 792,540 - - - - - 792,540
(-) (12,578,568) (-) (-) (-) (-) (-) (12,578,568)Recovery of dues onAccount of Expenses - 25,383,752 - - - - - 25,383,752
(-) (33,481,411) (-) (-) (-) (-) (-) (33,481,411)Rent received - 23,644,500 - - - - 72,000 23,716,500
(-) (8,886,016) (-) (-) (-) (-) (-) (8,886,016)Remuneration - - - - 64,683,735 5,059,344 - 69,743,079
(-) (-) (-) (-) (63,035,463) (4,843,885) - (67,879,348)Loans/FixedDeposits received - - - - - 255,000,000 255,000,000
(-) (-) (-) (-) (-) (-) (300,000,000) (300,000,000)Loans/FixedDeposits repaid - - - - - 240,000,000 240,000,000
(-) (-) (-) (-) (-) (-) (432,500,000) (432,500,000)Interest paid onDeposits/loans - - - - - - 26,831,364 26,831,364
(-) (-) (-) (-) (-) (-) (35,893,714) (35,893,714)Dividend paid -Equity Shares - - - - - - - -
(-) (-) (-) (-) (19,503,700) (24,137,900) (-) (43,641,600)Investments made - - - - - - - -
(-) (-) (-) (24,754,276) (-) (-) (-) (24,754,276)Sale of Investment/Conversion of loan intoEquity share capital - - - - - - - -
(-) (-) (24,754,276) (-) (-) (-) (-) (24,754,276)Donation - - - - - - - -
(-) (-) (-) (-) (-) (-) (300,000) (300,000)Employee benefitstransfer * - 2,903,136 - - - - - 2,903,136
(-) (-) (-) (-) (-) (-) (-) (-)B. Year end balances
- Investments 11,479,550 2,098,835 - 24,754,276 - - - 38,332,661(11,479,550) (2,098,835) (-) (24,754,276) (-) (-) (-) (38,332,661)
Outstanding 19,095,303 33,104,252 - - - - - 52,199,555receivable (39,077,216) (97,543,624) (-) (-) (-) (-) (-) (136,620,840)Provision for badand doubtfuladvances - - - - - - - -
(-) (67,766,327) (-) (-) (-) (-) (-) (67,766,327)Outstanding Fixeddeposits - - - - - - 315,000,000 315,000,000
(-) (-) (-) (-) (-) (-) (300,000,000) (300,000,000)
Particulars Joint Venture
ChironPanaceaVaccinesPvt. Ltd.
PanEraBiotec Pvt.Ltd. (w.e.f
21.11.2007)
Lakshmi &
Manager
Lakshmi &Manager
Holdings Ltd.
Associates KeyManagement Personnel
Relatives ofKey Manage-
mentPersonnel
Enterprises overwhich Person(s)
having control orsignificant influenceover the Company /
Key managementpersonnel(s), alongwith their relatives,are able to exercise
significant influence
Total
B. Detail of transactions with the Related parties:

145
Panacea Biotec|Annual Report 2009-10
Note: 1. Figures in bracket represent previous year figures.
2. In respect of personal guarantee by promoter-Directors refer Note No. 1 & 3 of Schedule IV.
3. In respect of Joint Venture & Associates, figures represents other than Panacea Biotec Ltd.’s share.
4. Material related party transactions (More than 10% of aggregate) with individual parties are as follows:
Unsecured Loans / Interest Managerial Equity DividendDuring the year Fixed Deposits received / Remuneration
(repaid)31.03.2010 31.03.2009 31.03.2010 31.03.2009 31.03.2010 31.03.2009 31.03.2010 31.03.2009
Key Management personnelMr. Soshil Kumar Jain - - - - 15,362,222 15,155,738 - 5,000,000Mr. Ravinder Jain - - - - 19,872,138 19,287,108 - 4,646,200Dr. Rajesh Jain - - - - 13,072,895 12,648,046 - 4,706,900Mr. Sandeep Jain - - - - 12,968,125 12,648,046 - 4,792,100Enterprises over whichPerson(s) having controlor significant influence overthe Company / Keymanagement personnel(s),along with their relatives,are able to exercisesignificant influenceFirst Lucre Partnership Co. 255,000,000 300,000,000 26,831,364 35,893,714 - - - -
(240,000,000) (432,500,000) - - - - - -Year end balancesFirst Lucre Partnership Co. 315,000,000 300,000,000 - - - - - -

146
9. Derivative Instruments and Hedged / Unhedged Foreign Currency Exposure(i) Forward contract outstanding as at Balance Sheet date:
Sell NilBuy Nil
(ii) Particulars of Hedged Future Export Receivables at applicable exchange rates in respect of Options Contracts outstanding as at Balance Sheet date
Accordingly, exchange fluctuation loss on marking them to market as of year end amounting to Rs.356,939,000 (PreviousYear Rs. 1,702,604,000) has been accountedfor and included in “Exchange Fluctuation Gain”under Schedule XII – Other Income (Previous Year: included in “Provision for Loss on Open Derivative Contracts"under Schedule XIV - Operating and Other Expenses).
(iii) Particulars of Hedged Foreign Currency Exposure as at Balance Sheet date
* The amount converted in INR have been round off to two decimal places.
Currency Exchange rates Amount in Amount in Amount Amount in Purposein Foreign Currency in Indian Rupees in Foreign Currency in Indian Rupees
31.03.2010 31.03.2010 31.03.2009 31.03.2009 To hedgeUSD 40.00 - - 58,000,000 2,320,000,000 FutureUSD 39.00 28,000,000 1,092,000,000 48,000,000 1,872,000,000 ExportUSD 39.60 30,000,000 1,188,000,000 36,000,000 1,425,600,000 Receivables
58,000,000 2,280,000,000 142,000,000 5,617,600,000
(iv) Particulars of Unhedged Foreign Currency Exposure as at Balance Sheet date
* The amount converted in INR have been rounded off to two decimal places.
Particulars Amount as at Currency Closing Amount as at Amount as at Currency Closing Amount as at31st March’10 Exchange 31st March’10 31st March’09 Exchange 31st March’09
(in Foreign Rate* (INR) (in Foreign Rate* ( INR)Currency) Currency)
Import Creditors 9,753,991 USD 44.91 438,002,956 6,035,469 USD 50.72 306,119,006(net of advances 4,768,149 Euro 60.55 288,711,392 12,841,668 Euro 67.54 867,327,519to suppliers) 42,000 CHF 42.43 1,782,060 33,538 CHF 44.56 1,494,481
5,941 GBP 68.08 404,463 12,289 GBP 72.60 892,159- JPY / 100 - - 1,217,220 JPY/100 51.55 627,521
16,820 SEK 6.26 105,293 16,820 SEK 6.13 103,1402,178 CAD 44.32 96,509 1,010 CAD 40.47 40,856
(6,140) AUD 41.23 (253,164) - - - -(10,000) AED 12.26 (122,600) - - - -
80 SGD 32.13 2,570 - - - -Export Debtors 2,616,978 Euro 60.51 158,353,310 2,990,037 Euro 67.50 201,827,823Foreign CurrencyLoans 65,097,252 USD 44.91 2,923,192,101 65,097,252 USD 50.72 3,301,732,614Balance with 3,253,949 USD 44.90 146,086,036 9,652,566 USD 50.71 489,481,613Banks 970,843 Euro 60.51 58,745,690 105,761 Euro 67.50 7,138,856FCCBs 36,800,000 USD 44.91 1,652,504,000 36,800,000 USD 50.72 1,866,496,000
Particulars Amount as at Currency Closing Amount as at Amount as at Currency Closing Amount as at31st March’10 Exchange 31st March’10 31st March’09 Exchange 31st March’09
(in Foreign Rate* (INR) (in Foreign Rate* ( INR)Currency) Currency)
Export Debtors 8,120,848 USD 44.90 364,585,489 15,038,066 USD 50.71 762,580,345

147
Panacea Biotec|Annual Report 2009-10
10.
Seg
men
talI
nfo
rmat
ion
A.
Info
rmat
ion
abou
tPri
mar
ySe
gmen
ts(A
mou
ntin
Rs.)
Segm
ent
Dom
estic
*O
vers
eas
31/0
3/20
1031
/03/
2009
31/0
3/20
1031
/03/
2009
Vacc
ines
3,79
7,94
6,83
14,
139,
282,
326
2,80
3,75
3,60
91,
478,
434,
793
Form
ulat
ion
2,05
6,52
9,19
01,
798,
741,
628
342,
294,
794
463,
560,
771
R&D
37,9
87-
935,
820
1,69
9,56
2To
tal
5,85
4,51
4,00
85,
938,
023,
954
3,14
6,98
4,22
31,
943,
695,
126
B.IN
FORM
ATIO
NA
BOU
TSE
CON
DA
RYSE
GM
ENTS
a)Re
venu
eas
per
Geo
grap
hica
lSeg
men
t
*D
omes
ticre
venu
ein
clud
esre
venu
efr
omde
emed
exp
orts
ofRs
3,39
6,59
0,60
6(P
revi
ousY
earR
s.3,
708,
466,
456)
Part
icul
ars
Vacc
ines
Form
ulat
ions
Rese
arch
&D
evel
opm
ent
Hea
lthc
are
Tota
l
2009
-10
2008
-09
2009
-100
2008
-09
2009
-10
2008
-09
2009
-10
2008
-09
2009
-10
2008
-09
Reve
nue
Segm
entR
even
ue6,
601,
700,
440
5,61
7,71
7,12
02,
398,
823,
984
2,26
2,30
2,39
897
3,80
71,
699,
562
--
9,00
1,49
8,23
17,
881,
719,
080
Oth
erIn
com
e85
,722
,658
5,95
2,19
618
,461
,439
24,9
50,2
26-
--
-10
4,18
4,09
730
,902
,422
Tota
l6,
687,
423,
098
5,62
3,66
9,31
62,
417,
285,
423
2,28
7,25
2,62
497
3,80
71,
699,
562
--
9,10
5,68
2,32
87,
912,
621,
502
Segm
entR
esul
ts1,
797,
507,
922
2,68
9,74
9,97
441
7,34
7,55
046
6,88
2,42
8(7
52,0
55,1
83)
(668
,244
,483
)(5
,007
,846
)(5
,658
,514
)1,
457,
792,
443
2,48
2,72
9,40
5
Una
lloca
ted
Cor
por
ate
Exp
ense
s77
7,52
8,24
13,
308,
904,
285
Op
erat
ing
Profi
t/(L
oss)
680,
264,
202
(826
,174
,880
)
Inte
rest
&Fi
nanc
eC
harg
es38
4,71
8,77
032
1,54
3,58
2
Oth
erIn
com
e83
2,16
2,75
728
1,05
4,50
3
Inco
me
Taxe
s40
3,58
7,99
6(2
06,7
39,1
27)
Net
Profi
t/(L
oss)
724,
120,
193
(659
,924
,832
)
Oth
erIn
form
atio
n
Segm
entA
sset
s7,
940,
023,
038
8,24
2,80
4,70
21,
849,
317,
030
1,75
7,28
6,75
51,
952,
940,
391
2,14
3,57
9,82
71,
115,
567,
453
2,30
5,49
9,09
612
,857
,847
,912
14,4
49,1
70,3
80
Una
lloca
ted
Cor
por
ate
Ass
ets
3,99
9,85
4,87
72,
680,
016,
136
Tota
lAss
ets
7,94
0,02
3,03
88,
242,
804,
702
1,84
9,31
7,03
01,
757,
286,
755
1,95
2,94
0,39
12,
143,
579,
827
1,11
5,56
7,45
32,
305,
499,
096
16,8
57,7
02,7
8917
,129
,186
,516
Segm
enta
lLia
bili
ties
736,
483,
735
852,
101,
141
185,
783,
935
391,
402,
477
52,1
12,1
3465
,696
,536
8,88
1,85
716
7,89
3,00
598
3,26
1,66
01,
477,
093,
159
Una
lloca
ted
Cor
por
ate
Liab
ilitie
s8,
867,
155,
455
9,45
5,62
2,54
2
Tota
lLia
bili
ties
736,
483,
735
852,
101,
141
185,
783,
935
391,
402,
477
52,1
12,1
3465
,696
,536
8,88
1,85
716
7,89
3,00
59,
850,
417,
115
10,9
32,7
15,7
01
Cap
ital
Exp
endi
ture
-
Add
ition
s26
3,23
7,55
21,
950,
193,
086
99,1
45,5
8412
3,75
2,79
723
1,35
8,90
057
8,59
3,60
126
,946
,664
375,
658,
708
620,
688,
700
3,02
8,19
8,19
2
Non
Cas
hEx
pen
ses
Dep
reci
atio
n32
0,19
9,21
335
1,93
3,81
911
1,06
7,74
312
5,06
8,11
917
5,94
4,24
816
9,02
5,40
74,
381,
965
7,99
1,09
961
1,59
3,16
965
4,01
8,44
4

148
b) Debtors as per Geographical Segment
c) The Company has common fixed assets and other current assets for producing goods for Domestic Market and Overseas Market.Hence, separate figures for fixed assets, other current assets and additions cannot be furnished.
11. Leasesi. For assets given under Operating Lease agreements:
(a) The Company has leased out the assets situated at Lalru, Punjab on operating lease to its Associate, PanEra Biotec Private Limited.
The total of Minimum Future Lease Payments under non-cancelable operating lease for various periods for assets stated above is as follows:
*The Lease term for the assets given on lease vide Agreement for providing Manufacturing Facility, Utilities and Services ofEmployees and transfer of raw material with PanEra Biotec Pvt. Ltd. is valid till 31.03.2011. As per the said Agreement, during theperiod of usage, if any Facility is used for manufacture of the Company’s Vaccines other than those mentioned therein or thefacility remains idle due to insufficiency of orders from the Company, no lease rental shall be payable by PanEra Biotec Pvt. Ltd.during the relevant period.The Company has also given an office space in its building situated at B-1 Extn./A-27, Mohan Co-operative Industrial Estate, NewDelhi on operating lease to PanEra Biotec Pvt. Ltd.
b) Total of future minimum lease payments under operating lease mentioned above:
ii. For assets taken on Leasea) The Company has taken various residential, office and godown premises under operating lease agreements. These are generally
not non-cancelable and are renewable by mutual consent on mutually agreed terms. There is no sublease payments expectedto be received at the balance sheet date and no restrictions is imposed by lease arrangements.
b) Lease payments for the year are Rs.70,418,180 (Previous Year Rs.63,107,965).c) Total of future minimum lease payments under Non Cancelable operating lease:
Particulars As at March 31, 2010* As at March 31, 2009a) Receivable within 1 year 67,600,000 67,600,000b) Later than 1 year but not later than 5 years - 67,600,000c) Later than 5 years - -
As at March 31, 2010 As at March 31, 2009a) Receivable within 1 year 7,500 14,000
b) Later than 1 year but not later than 5 years - -c) Later than 5 years - -
Particulars As at March 31, 2010 As at March 31, 2009a) Payable within 1 year 12,779,377 12,633,415b) Later than 1 year but not later than 5 years 27,625,774 13,847,545c) Later than 5 years 3,843,948 4,013,276
Segment Domestic Overseas31/03/2010 31/03/2009 31/03/2010 31/03/2009
Vaccines 408,423,337 298,978,180 344,959,164 536,329,974Formulation 129,393,970 143,513,828 196,231,327 226,054,249Total 537,817,307 442,492,008 541,190,491 762,384,223
Particulars Gross Block Accumulated Depreciation Depreciation charged toP&L Account
31/03/2010 31/03/2009 31/03/2010 31/03/2009 31/03/2010 31/03/2009Building 91,001,316 89,955,066 38,146,989 33,159,226 4,843,737 5,327,263Furniture and Fixture 10,879,579 10,659,476 6,587,888 5,639,670 948,219 1,151,292Office Equipment 1,858,933 1,904,239 924,829 769,438 154,389 270,436Plant & Machinery 717,624,285 663,486,845 312,037,079 247,986,666 64,040,256 66,307,911Computer Equipment 2,598,987 5,950,080 1,979,344 1,549,742 413,095 688,492Total 823,963,100 771,955,706 359,676,129 289,104,742 70,399,696 73,745,394

149
Panacea Biotec|Annual Report 2009-10
b) During the year, Company’s erstwhile Joint VentureCambridge Biostability Limited (CBL), has initiated stepsto place it into creditors’voluntary liquidation. Due to thefinancial position of erstwhile Joint Venture company,Company considers its investment and loan given to itdoubtful for recovery. Accordingly provision created inearlier years for said amount has been continued in thecurrent year. No interest has been accrued during the yearon outstanding loan amount.
*Includes Gratuity expense of Rs.1,129,063 (Previous YearRs.1,062,491) accounted under Research & DevelopmentExpenses.#Gratuity Expenses includes Rs.109,412 (Previous YearRs.44,937) transferred to Pre-operative Expenses.
13. The Company has a defined benefit gratuity plan. Everyemployee who has completed five years or more of servicegets a gratuity on departure at 15 days salary (last drawnsalary) for each completed year of service subject to maximumof Rs.350,000. The scheme is funded with an insurancecompany in the form of a qualifying insurance policy.
The following tables summarize the components of netbenefit expense recognized in the Profit & Loss Account andthe funded status and amounts recognized in the BalanceSheet for the respective plans.
Profit and Loss Account:
Net employee benefit expense - Gratuity (recognized inEmployee Cost)
Particulars As at As atMarch 31, 2010 March 31, 2009
SOURCES OF FUNDS1. Shareholders' Fundsa) Share Capital - -b) Reserves & Surplus 63,835,582 46,571,0242. Loan Fundsa) Secured Loans - 163,121b) Unsecured Loans - -APPLICATION OF FUNDS1. Fixed AssetsGross Block 11,772,451 11,000,281Less : Depreciation 8,667,510 7,790,995Net Block 3,104,941 3,209,286
2. Deferred Tax Assets 2,375,937 1,994,0493. Current Assets, Loans &AdvancesA. Current Assets 117,741,090 143,485,483B. Current Liabilities &Provisions 36,427,286 78,995,574Net Current Assets (A)-(B) 81,313,804 69,420,199
Particulars Year ended Year endedMarch 31, 2010 March 31, 2009
INCOMETurnover 279,590,877 269,186,069Other Income 7,983,376 5,737,410Total Income 287,574,253 274,923,479EXPENDITUREManufacturing &Administrative Expenses 191,232,640 175,809,060Personnel Expenses 45,922,053 40,530,528Interest & Finance Expenses 686,167 289,382Selling & Distribution 22,584,060 23,761,359ExpensesTotal Expenditure 260,424,920 240,390,329
Particulars 31/03/2010 31/03/2009Investment made 168,068,998 168,068,998Loan given 108,833,850 108,833,850Interest accrued onabove loan 7,275,470 7,275,470Total 284,178,318 284,178,318
Particulars 2009-10 2008-09Current service cost # 14,593,863 13,648,636Interest cost on benefit obligation 7,586,182 6,643,369Expected return on plan assets (4,067,849) (2,770,184)Net actuarial (gain)/lossrecognized in the year on accountof return on plan assets (8,967,491) (4,275,782)Net benefit expense*(Refer note below) 12,574,991 13,246,040Actual return on plan assets (4,711,712) (3,452,434)
Balance Sheet:Details of Provision for Gratuity:Particulars 2009-10 2008-09Defined benefit obligation 111,101,184 100,695,065Fair value of plan assets 62,347,398 43,638,111
48,753,786 57,056,954Less: Unrecognized past servicecost Plan (liability) (48,753,786) (57,056,954)
Changes in the present value of the defined benefit obligationare as follows:Particulars 2009-10 2008-09Opening defined benefit obligation 100,695,065 87,922,995Interest cost 7,586,182 6,643,369Current service cost 14,593,863 13,648,636Benefits paid (3,640,181) (4,025,152)Actuarial losses on obligation (8,133,745) (3,494,783)Closing defined benefit obligation 111,101,184 100,695,065
Changes in the fair value of plan assets are as follows:Particulars 2009-10 2008-09Opening fair value of plan assets 43,638,111 30,002,106Expected return 4,067,849 2,770,184Contributions by employer 17,844,701 14,109,975Benefits paid (3,640,181) (4,025,152)Actuarial Gain /(losses) 436,918 780,999Closing fair value of plan assets 62,347,398 43,638,111
12. a) Details of Company’s share in Joint Venture included inthe Consolidated Financial Statements are as follows:

150
The Company has since contributed Rs.17,844,701 to the gratuity fund.
The overall expected rate of return on assets is determined basedon the market prices prevailing on that date, applicable to theperiod over which the obligation is to be settled. There has beensignificant change in expected rate of return on assets due to theimproved debt market scenario.
The estimates of future salary increases, considered in actuarialvaluation, take account of inflation, seniority, promotion and otherrelevant factors, such as supply and demand in the employmentmarket.
*The revised accounting standard AS-15 – Employee Benefits whichprovides for Acturial Valuation of Gratuity Liability was adopted inthe year 2006-07. In the earlier years, acturial valuation was done inaccordance with the pre-revised Accounting Standard, AS-15.Accordingly, comparative numbers of one year earlier than the year2006-07 have not been furnished.
The Company expects to contribute Rs.16,100,000 to gratuityfund in the year 2010-11.
Note: During the year some employees of the Company havebeen transferred to its Associate Company PanEra Biotec Pvt.Ltd. As per the agreed terms, the tenure of the service forcomputation for post employment benefits would be taken incomputation of period served with the Company. Accordingly,the liability of Rs.3,430,285 for Gratuity and Rs.2,375,986 forLeave Encashment in respect of transferred employees as atthe date of transfer has also been transferred to PanEra BiotecPvt. Ltd. The process of transferring the gratuity amount lyingin the Company’s gratuity fund is in progress.
14. The Company has incurred expenditure on Pre-ClinicalDevelopment studies amounting to Rs.32,125,547 during theyear (Previous Year Rs.123,978,449) and Rs.479,497,285 as ofMarch 31, 2010 (Rs.426,493,761 as of March 31, 2009). Thisexpenditure relates to studies carried out by Clinical ResearchOrganization (CRO) towards obtaining registration ofCompany's products in US and / or Europe. The expenditureincurred has been capitalized and carried in Capital Work inProgress. Management believes that it is in the nature ofdevelopment expenditure and meets the capitalizationcriteria set out in Accounting Standard 26 on IntangibleAssets notified by the Companies Accounting Standard Rules,2006 due to the following reasons:
• The expenditure is not towards basic research andtherefore no new chemical entity comes into being. Thisexpenditure relates to the developmental workperformed through external agencies (CROs). Safetyprofile of the basic molecule is well established in severalcountries in Europe and in India and the products arebeing marketed successfully in several countries underdifferent brand names.
• There is no experience to suggest that the studiesconducted by CROs on behalf of the Company wouldlead to or make it difficult for the Company to obtainregulatory approvals in US and / or Europe.
The management believes that these products would becommercially viable and there is no reason to believe thatthere is any uncertainty that may lead to not securingregistration for the products from regulatory authorities in USand / or Europe.
15. In accordance with Accounting Standard 9 on ‘RevenueRecognition’ notified by the Companies Accounting StandardRules, 2006, Excise Duty on turnover amounting toRs.7,969,727 (Previous year Rs.18,845,112) has been reducedfrom turnover in Profit & Loss Account and differential ExciseDuty on opening and closing stock of finished goodsamounting to Rs.Nil (Previous year Rs.Nil) has been adjustedfrom Raw Materials, Finished Goods, Work in Progress and JobProcessing charges in Schedule XIV.
The major categories of plan assets as a percentage of the fair valueof total plan assets are as follows:
Particulars 2009-10 2008-09% %
Investments with insurer 100 100
The principal assumptions used in determining gratuity obligationsfor the Company’s plans are shown below:
Particulars 2009-10 2008-09Discount rate 7.25 % to 6.50%
8.50% to 7.50%Expected rate of return on plan assets 8.00% to 8.00% to
9.25% 9.25%Increase in compensation cost 5.00% to 5.00% to
10.00% 12.00%Employee turnoverupto 30 years 10% to 25% 10%above 30 years but upto 44 years 5% 5%above 44 years 1% 1%
Defined Contribution Plan: 2009-10 2008-09Contribution to Provident FundCharged to Profit and Loss Account 33,346,537 31,045,359
Gratuity amounts for the current and previous periods are asfollows:
Particulars 2009-10 2008-09 2007-08 2006-07Defined benefitobligation 111,101,184 100,695,065 87,922,995 54,165,505Plan assets 62,347,398 43,638,111 30,002,106 21,981,664Deficit 48,753,786 57,056,954 57,920,889 32,183,841Experienceadjustments onplan liabilities-(Gain)/Loss (7,724,979) (3,286,351) (236,689) (21,981)Experienceadjustments onplan assets-(Gain)/Loss (851,562) (743,588) (238,939) (7,984)

151
Panacea Biotec|Annual Report 2009-10
16. The Company had exercised the option as per the Companies(Accounting Standard) Amendment Rules, 2009 in the financialyear 2008-09. As per the option exchange differences related tolong term foreign currency monetary items so far as they relateto the acquisition of a depreciable capital assets are capitalizedand depreciated the same over the useful life of the assets. Inother cases, have transferred to Foreign Currency MonetaryItem Translation Difference Account and amortized over thebalance period of such long term assets/liabilities but notbeyond accounting period ending on or before 31st March2011. The unamortized balance in this account isRs.16,773,412 (liability) (Previous year Rs.95,961,134 (asset)).
17. Owing to recoveries, during the year, the Company has writtenback the provision for bad and doubtful advances of Rs.135,532,654 created during earlier years on account of oldrecoverable from PanEra Biotec Pvt. Ltd., an associate company.The same has been shown as other income during the year.
18. The Company has appointed independent consultants forconducting a Transfer Pricing study to determine whether thetransactions with associated enterprises were undertaken at“arms length basis”. The management confirms that allinternational transactions with associated enterprises areundertaken at negotiated contracted prices on usualcommercial terms. Further there has been no change in theterms of such international transactions till March 31, 2010.
19. Details of Loans and advances to Associates and Parties in whichdirectors are interested (as required by clause 32 of listingagreement) to the extent of the share of balances outside group:
Particulars 31/03/2010 31/03/2009Dues from associates
- PanEra Biotec Pvt. Ltd.Balance Recoverable - 97,543,624(including Rs.48,469,087 on accountof sale of raw material grouped assundry debtors under Schedule VIII)Maximum amount due at any time 97,543,624 97,543,624during the year
As per our attached report of even dateS.R. Batliboi & Co. For and on behalf of the BoardFirm registration number: 301003EChartered Accountants Ravinder Jain
Managing Director
Per Rajiv Goyal I.K. Sharma Dr. Rajesh JainPartner D.G.M. (Accounts & Finance) Joint Managing DirectorMembership No. 94549Place : New Delhi Vinod GoelDated : May 7, 2010 G.M. Legal & Company Secretary
20. In the current year, Company has received a capital subsidy ofRs.3,000,000 under the Central Investment Subsidy Scheme,2003 based on investment in plant & machinery as itsmanufacturing unit at Baddi, Himachal Pradesh which is in thenature of promoters’ contribution. As per the scheme, theCompany has to maintain such investment for a minimumperiod of five years. This has been treated as capital reserve inbooks of account.
21. The Company has received a soft loan from President of Indiaacting through Department of Biotechnology, Ministry ofScience & Technology, Government of India underBiotechnology Industrial Partnership Programme (BIPP) for itsH1N1 project. Repayment of the loan shall be in 10 equal half-yearly installments and repayment would commence oneyear after the completion of the said project.
22. Previous year’s figures have been rearranged and reclassifiedwherever necessary to make them comparable with thecurrent year's figures.

152
(Amount in Rs.)
As per our attached report of even dateS.R. Batliboi & Co. For and on behalf of the BoardFirm registration number: 301003EChartered Accountants Ravinder Jain
Managing Director
Per Rajiv Goyal I.K. Sharma Dr. Rajesh JainPartner D.G.M. (Accounts & Finance) Joint Managing DirectorMembership No. 94549Place : New Delhi Vinod GoelDated : May 7, 2010 G.M. Legal & Company Secretary
A. Cash flow from operating activities:Net operating profit before tax 1,127,708,189 (866,663,960)Adjustments for:Depreciation 675,553,871 714,198,042Interest Expenses 384,718,770 321,543,582Provison for Doubtful Debts & Advances (131,055,425) 422,105Interest Income (46,626,961) (179,781,777)Loss/ (Profit) on sale of Fixed Assets (Net) 14,157,409 (6,937,487Intangibles written off - (46,263,349)Provision for Impairment & Doubtful Loans - 284,178,318Unrealized foreign exchange loss/(gain) (net) (1,322,905,087) 1,689,589,699Dividend Income (33,184)Amortised exchange differences Charge/(Credit) (16,773,412) 47,980,567Product Development Expenses written off 19,395,518Deferred Revenue Expenditure written off during the year 2,190,116 1,306,690
(421,378,385) 2,826,236,390Operating profit before working capital changes 706,329,804 1,959,572,430(Increase) / Decrease in Trade and Other Receivables 201,562,825 74,223,324(Increase)/Decrease in Inventories (63,679,847) (2,367,283,704)Increase / (Decrease) in Current Liabilities & Provisions (95,533,131) 527,604,285
42,349,847 (1,765,456,095)Cash generated from operations 748,679,651 194,116,335Net Income Taxes Paid (126,970,207) (262,488,116)Net cash from operating activities 621,709,444 (68,371,781)B. Cash flow from investing activities:Purchase of Fixed Assets (1,220,405,727) (2,025,133,881)Proceeds of deposits matured(with maturity more than three months) (4,257,877) 1,250,968,300Deposits (with maturity more than three months) - (70,376,198)Sale of Fixed Assets 5,424,274 52,261,957Interest Received 47,563,305 182,155,836Dividend Received 33,184 -Invetsment made (166,880) (691,734,460)Invetsments sold - 149,108,804Net cash used in investing activities (1,171,809,721) (1,152,749,642)Net cash from operating and investing activities (550,100,277) (1,221,121,423)C. Cash flow from financing activities:Issue of Equity Share Capital (incl premium) 29,910,726 -Capital Subsidy received 3,000,000 -Net increase / (decrease) in Working Capital Borrowings 602,186,740 1,292,036,897Long Term Borrowings raised 30,000,000 837,914,977Fixed Deposits received 320,500,000 300,500,000Fixed Deposits repaid (300,500,000) (436,110,000)Inter-Company loans repaid (27,000,000)Long Term Borrowings repaid (163,121) (243,100)Interest paid (382,304,713) (313,814,246)Dividend & Tax on Dividend paid (38,824) (81,149,949)Net Cash from Financing activities 275,590,808 1,599,134,579Net cash from operating, investing &financing activities (274,509,469) 378,013,156Net increase/ (decrease) in Cash & Cash equivalent (274,509,469) 378,013,156Opening balance of Cash & Cash equivalent 678,046,532 295,835,044Add/Less: Effect of Exchange Differences onCash and Cash Equivalents held in foreign currency (7,722,250) 4,198,332Closing balance of Cash & Cash equivalent 395,814,813 678,046,532Components of cash and cash equivalentsi) Cash Balance on Hand 426,053 9,243,607ii) Balance with Scheduled Banks :a) In Cash Credit Accounts 108,977,118 -b) In Current Accounts 80,187,846 100,130,657c) In Unpaid Dividend Accounts* 1,392,070 1,583,956d) In Fixed Deposits 74,634,075 140,844,041e) In Exchange Earner Foreign CurrencyCurrent Accouns 204,831,726 496,620,469Cash & Bank Balances as per Schedule VIII 470,448,888 748,422,730Less: Fixed deposits for maturity period more than 3 months 74,634,075 70,376,198Cash & Cash Equivalents in Cash Flow Statement 395,814,813 678,046,532* Theses balances are not available for use by the Company as they represent corresponding unpaid dividend liabilities.
CASH FLOW STATEMENT ANNEXED TO CONSOLIDATED BALANCE SHEET FOR THE YEAR ENDED 31ST MARCH, 2010For the year ended For the year ended31st March 2010 31st March 2009


A W
YA
TT
SO
LUT
ION
(in
fo@
wya
tt.c
o.i
n)
Related Documents