I: *Abstract* his experiment have has conducted to measure Setting Time (which is the term used to describe the stiffening of the cement paste), we found just the Initial Setting Time (The time at which the concrete can no longer be properly mixed, finished or compacted), according to ASTM C191-82 procedure. T Before that, we prepared the sample in Normal Consistency (A standard measure of plasticity of a cement paste) procedure according to ASTM C187-86, but the result of 10mm diameter plunger gave 6mm penetration, which is out of the range of (10 ∓ 1)mm specified by ASTM. However we continued using this sample, and we found the Initial Setting Time to be: t= 154min, whereas Group (1) sample gave t=177min. We found finally that although this results are higher than the minimum value specified by ASTM t=60min, We can’t insure that this values are true since Normal consistency condition didn’t reached.

exp2
Dec 24, 2015
experiment of initial setting time in cement
Welcome message from author
This document is posted to help you gain knowledge. Please leave a comment to let me know what you think about it! Share it to your friends and learn new things together.
Transcript

I:*Abstract*
his experiment have has conducted to measure Setting Time (which is the term used to describe the stiffening of the cement paste), we found just the Initial Setting Time (The time at which the concrete
can no longer be properly mixed, finished or compacted), according to ASTM C191-82 procedure.
TBefore that, we prepared the sample in Normal Consistency (A
standard measure of plasticity of a cement paste) procedure according to ASTM C187-86, but the result of 10mm diameter plunger gave 6mm penetration, which is out of the range of (10∓1)mm specified by ASTM. However we continued using this sample, and we found the Initial Setting Time to be: t= 154min, whereas Group (1) sample gave t=177min.
We found finally that although this results are higher than the minimum value specified by ASTM t=60min, We can’t insure that this values are true since Normal consistency condition didn’t reached.

II:*Introduction*
How do we know when cement holds its shape?
When the forms can be removed?
In order to regulate the answers ASTM specified Setting Time
experiment which is conducted on a sample with specified condition of moisture and plasticity called Normal Consistency.
So in order to measure setting time we should know the amount of water needed to prepare the sample of normal consistency, and that is the procedure we are going to adopt in our experiment, First to prepare the sample that is a normal consistency experiment, then a Second one to answer those questions above by conducting Setting time experiment and measuring initial &final setting times.
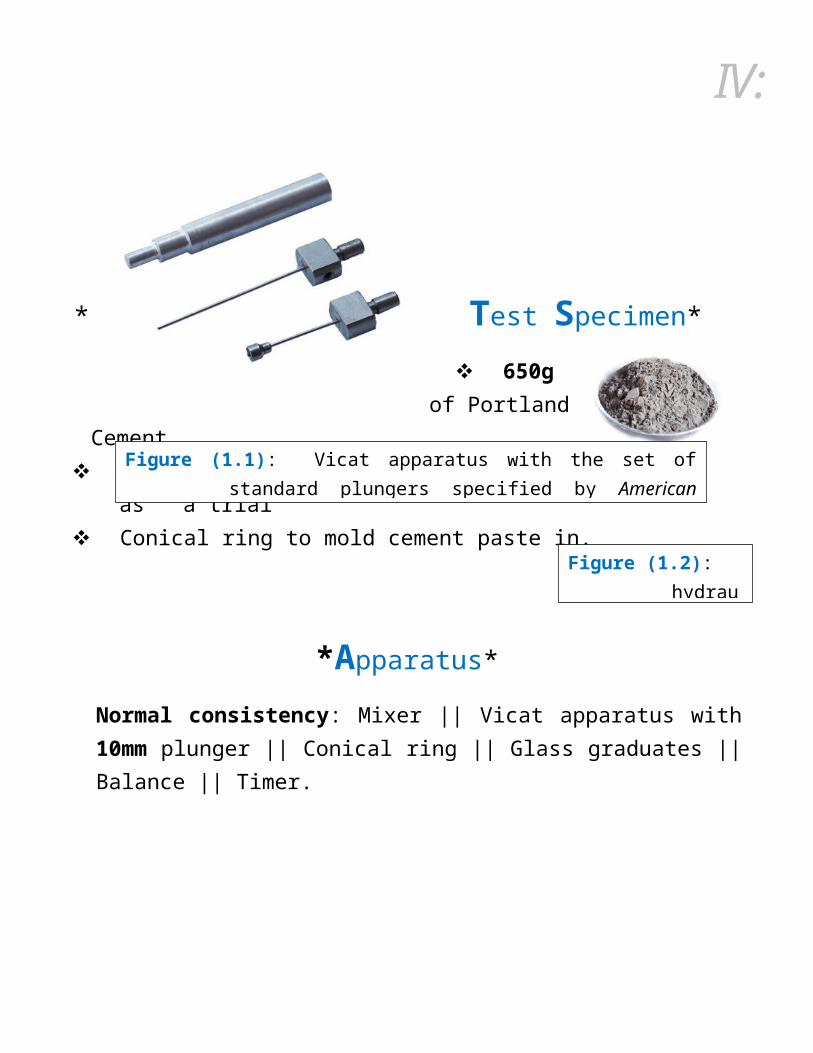
*Test Specimen*Figure (1.1): Vicat apparatus with the set of standard plungers specified by American society of testing and materials (ASTM).

III: 650g of Portland Cement distilled water 28% by weight of cement =182g as a trial Conical ring to mold cement paste in.
*Apparatus*
Normal consistency: Mixer || Vicat apparatus with 10mm plunger || Conical ring || Glass graduates || Balance || Timer.
Setting time: Vicat apparatus with 1mm plunger || Conical ring || Timer.
*Methodology*
Normal Consistency:
Figure (1.2): hydraulic Cement
Figure (1.3): Vicat apparatus assembly diagram showing the parts of it, and also the three different standard ASTM plungers
IV: Mixing of Cement Paste :
Place all the mixing water in the bowl. Add the cement to the water and allow 30s for the absorption
of the water. Mix at slow speed (140 ± 5 r/min.) for 30s. Stop the mixer and wait for 15s, during this time scrap down
into batch any paste that may have collected on sides of the bowl.
Mix at high speed (285 ± 10 r/min.) for 1minute. Molding Test Specimen:
Mold cement paste into shape of a ball. With gloved hands, toss ball six times through a free path of about six inches from one hand to another.
Press ball into larger end of Vicat ring and completely fill ring with paste.
Remove excessive paste without compressing samples and locate ring under plunger of Vicat apparatus.
Consistency Determination: Place plunger in contact with top of paste and lock, and Set
indicator on the scale to zero. Release plunger and record settlement of plunger in mm after
30s. Repeat process with trial paste with varying percentages of
water until normal consistency is observed.
Setting Time: Mix 650 g of cement with the percentage of water required
for normal consistency as described previous.

Table(1.1): Final results of Initial Setting Time experiment
Group (1) Group (2)
Initial setting time (min)
154 min 177 min
V: After molding cement paste into the test ring, place
specimen in moist room for 30 minutes. Place specimen ring under Vicat apparatus and lock needle
on surface of paste. Set indicator scale to zero. Release weighted needles and record the penetration in mm
after 30s. Repeat process every fifteen minutes until initial set is
achieved. Repeat processes every hour until final set is achieved.
*Result and Data analysis:
Raw Data: after conducting this experiment we obtained Data listed in Table (A.1.1) & Table (A.1.2) {refer to appendix}
Final Results: We {Group (2)} drew Figure (1.4), from which we obtained initial setting time to be: Initial Setting Time=154 min = 2.5 hours.
Or by interpolation between (24,165) & (26,150) from which: Initial Setting Time=157 min = 2.5 hours.
NOTE: Group(1) results will be mentioned in the discussion.

VI:

VII:
*Discussions*
Figure (1.4): Results of experiment for Group(2) shows the variation of Penetration [mm] with Time [min], also shows the procedure for obtaining Initial Setting Time correspond to penetration=25mm

VIII:We conducted this experiment to measure setting time of a sample of
cement, Setting Time is the time it takes to the transition of cement from the liquid, viscous, Moldable form, to a solid form, that keeps its shape, this transition is forced by hydration reactions of early reactive compounds in cement (C3A,C4AF,C3S).
Setting time is of two stages, First , Initial Setting Time which is the time it takes the cement to become hardly to be remolded, then, Final Setting Time which is the the gaining of some strength to keep the shape and carry some load, this stages are shown in Figure(1.5).
After conducing this experiment lets discuss the obtained resultsfirst let’s take a single value to represent setting time, as we can see setting time calculated through interpolation or through the equation of best fit line is almost the same because they both numerically based on 1st linear approximation, however let’s take the value t=154 min because the best fit line based on every point in the line so it gives the minimum error for approximation, whereas the interpolation is based just on the nearest two points .
Figure (1.5): the variation of the Rate of heat emission [watt/gram] with Time during the hydration process of cement, this Figure presents the growth chart of Cement during its life, from its mixing with water until the end of its hydration processes.

IX:Now let’s discuss the accuracy of this value, comparing it to the
minimum value specified by ASTM of 60min, or BS of 45min, we see that our obtained value is significantly higher, that’s because our sample was Too dry and it wasn’t in Normal consistency, the 10mm plunger penetrates our sample just 6mm, whereas for a Normal Consistency the plunger must penetrates (10±1) mm.
Also there is some factors contribute to this slow setting of our cement:1-Cold weather: hydration reactions and the formation of C-S-H gel is a very temperature dependent processes, the rate (speed) of the hydration decrease highly with the decrease in temperature {this is shown in figure(1.6) the curve on the left most (zero% retarder)}.
Figure (1.6): the variation of Initial Setting Time in [min] with
Temperature in [Co] for different retarder dosages [%percent of weight of cement]

X:2-Cement age and Ambient influence: fresh cement with high reactivity compounds compositions (C3A, C3S, CŜH2: gypsum) when subjected to the ambient, these compounds will start to lose their reactivity under the effect of long term partial reactions with the moisture carried by the ambient, so when we prepare our sample we with this old lower reactive cement, more time is needed for initial setting.
3-Humain errors: in balancing the cement & water, cement portion increase or water portion decrease will slow setting process and vice versa; also human error may be in recording time in both preparing sample & in measuring time for each penetration; also in choosing the point of ring for the next penetration, because overlap will be happened between the area of influence of penetrated points, because cement in a point of penetration is somewhat hardened and its vicinity is somewhat compacted, so ASTM mentioned that no penetration test shall be closer than 6.4mm from a previous penetration, and no penetration test shall be closer than 9.5mm from inside of the ring; some other errors such as shaking of the apparatus &table is of lower importance because it can be prevented.
Finally, comparing this value with the value found by Group(1) {we are Group(2)}, their value of Initial Setting Time≈177min {be best fit line equation shown in Figure(1.7)}, this value Is somewhat different, this difference may be because the preceding listed errors.

XI:
*Conclusion*
After conducting this experiment we conclude that for the given cement Initial Setting time is t=154min this value can be accepted, but for better results a more qualified experiments, with repetition and averaging will improve the accuracy and precision.
APPENDIX
Figure (1.7): Results of experiment for Group(1) shows the variation of Penetration [mm] with Time [min], also shows the procedure for obtaining Initial Setting Time correspond to penetration=25mm
Done

XII:
Readings
Weight of Cement (g) 650
Weight of Water (g) 182
Penetration (mm) 6
Elapsed Time (min)
Needle Penetration Using Needle (D= 1mm) (mm)
Group (1) Group(2) 0(30 min waiting) 40 40
15 40 40 30 40 40 45 40 37 60 38 36 75 36 33 90 34 29 102 32 27 120 30 26 135 28 24 150 26 21 165 23 17 180 21 16 210 17 11 240 11 10 270 6 6
Table (A.1.1): Normal Consistency Sample & results
Table (A.1.2): Initial Setting Time results
Related Documents


![aula3-exp2.ppt [Modo de Compatibilidade]cardoso/ie344b2008s2/aula3-exp2.pdf · ComL@b – Laboratório de Comunicações Digitais Objetivo do Experimento Familiarização com o ISE](https://static.cupdf.com/doc/110x72/5ffc2f735aefee010753401f/aula3-exp2ppt-modo-de-compatibilidade-cardosoie344b2008s2aula3-exp2pdf-comlb.jpg)