FREIE UNIVERSITÄT BERLIN CUMULATIVE DOCTORAL THESIS EXHUMATION MECHANISMS OF MIDDLE AND LOWER CRUST IN THE WESTERN TAUERN WINDOW, EASTERN ALPS Author: Susanne SCHNEIDER Supervisors: Prof. Dr. Claudio L. ROSENBERG Dr. Konrad HAMMERSCHMIDT A thesis in fulfilment of the requirements for the degree of Doctor of Natural Sciences in the Department of Earth Sciences, Institute of Geological Sciences June, 2014

Welcome message from author
This document is posted to help you gain knowledge. Please leave a comment to let me know what you think about it! Share it to your friends and learn new things together.
Transcript
FREIE UNIVERSITÄT BERLIN
CUMULATIVE DOCTORAL THESIS
EXHUMATION MECHANISMS OF MIDDLE
AND LOWER CRUST IN THE WESTERN
TAUERN WINDOW, EASTERN ALPS
Author:
Susanne SCHNEIDER
Supervisors:
Prof. Dr. Claudio L. ROSENBERG
Dr. Konrad HAMMERSCHMIDT
A thesis in fulfilment of the requirements for the degree of Doctor of Natural Sciences
in the
Department of Earth Sciences,
Institute of Geological Sciences
June, 2014


i
Declaration of Authorship
I, Susanne Schneider, declare that this thesis, ‘EXHUMATION MECHANISMS OF MIDDLE
AND LOWER CRUST IN THE WESTERN TAUERN WINDOW, EASTERN ALPS’ and the
work presented in it are my own. I confirm that:
This work was done wholly or mainly while in candidature for a research degree at the Freie
Universität Berlin.
Where any part of this thesis has previously been submitted for a degree or any other qualification
at the Freie Universität Berlin or any other institution, this has been clearly stated.
Where I have consulted the published work of others, this is always clearly attributed.
Where I have quoted from the work of others, the source is always given. With the exception of
such quotations, this thesis is entirely my own work.
I have acknowledged all main sources of help.
Where the thesis is based on work done by myself jointly with others, I have made clear exactly in
the section ‘organization of the thesis’ what was done by others and what I have contributed myself.
This work has been approved by the Doctoral Committee of the Department of Earth Sciences of
the Freie Universistät Berlin. The Doctoral Committee allowed me to write this thesis in English
language.
Primary Reviewer: Prof. Dr. Claudio L. Rosenberg (Université Pierre et Marie Curie Paris)
Secondary Reviewer: Prof. Dr. Harry Becker (Freie Universität Berlin)
Date of disputation: September 25, 2014, 2 pm
Place of disputation: Freie Universität Berlin, Malteserstraße 74-100, 12249 Berlin, Building C,
lecture hall
Signed:
Date:
Place:
ii
…Feeling and passion are best painted in, and roused by, ornamental and figurative language; but
the reason and the understanding are best addressed in the simplest and most unvarnished phrase.
Pure reason and dispassionate truth would be perfectly ridiculous in verse, as we may judge by
versifying one of Euclid's demonstrations. This will be found true of all dispassionate reasoning
whatever, and all reasoning that requires comprehensive views and enlarged combinations. It is
only the more tangible points of morality, those which command assent at once, those which have
a mirror in every mind, and in which the severity of reason is warmed and rendered palatable by
being mixed up with feeling and imagination, that are applicable even to what is called moral
poetry: and as the sciences of morals and of mind advance towards perfection, as they become more
enlarged and comprehensive in their views, as reason gains the ascendancy in them over
imagination and feeling, poetry can no longer accompany them in their progress, but drops into the
back ground, and leaves them to advance alone. Thus the empire of thought is withdrawn from
poetry…
Thomas Love Peacock, ‘The four ages of poetry’ 1820

iii
Acknowledgements
Before getting to the core, there were many experienced and successful scientists that contributed
with their fruitful discussions and impartial view to the subjects of this thesis. Many thanks to Prof.
Harry Becker for accepting the invitation of becoming the secondary reviewer of this thesis. Special
thanks to Prof. Lothar Ratschbacher for waiting patiently until the completion of this thesis and for
including me into his team. Many thanks to Prof. Stefan Schmid who, although having a different
opinion on important aspects of the thesis, carefully commented two of the manuscripts in a very
final stage. Many thanks to Prof. Ralf Schuster, Dr. Hannah Pomella, Dr. Matthias Konrad-
Schmolke who all took their precious time to correct manuscripts or parts of it constructively.
During seminars and discussions several colleagues helped to look from other points of view to the
subjects or to better carve out the implications of the results, special thanks to Dr. Ekkehard
Scheuber, Prof. Christoph Heubeck and Prof. Mark R. Handy. This thesis presents new analytical
data measured in various laboratories. Thanks to Dr. Ralf Milke, Dr. Masafumi Sudo, Dr. Axel
Gerdes and Dr. Dirk Frei who spend their precious time in installation, maintenance and
improvement of the used measuring instruments. The technical staff provided the infrastructure to
do proper science. Thanks to Martina Grundmann computer facilities were maintained and
constantly improved. Thanks to Anna Giribaldi, Christiane Behr and Christine Fischer beautiful
thin sections and sample mounts were fabricated. Special thanks to Monika Feth for improving my
clean-lab skills and for helping me to install a mineral separation laboratory. For field
accommodation, for no board to pay, for sharing good knowledge of places and for transporting
sometimes heavy samples I am grateful to family Fankhauser, especially Georg Fankhauser and
family Schwärzer, especially Markus Schwärzer.
This study has been designed under the supervision of Claudio L. Rosenberg and Konrad
Hammerschmidt. Both supervisors supported my field work on-site that took in summary twelve
months. They introduced me to the problems of structural geology and geochronology in the
working area and they both helped me fundamentally with the interpretation of key outcrops. Each
of them in his own way taught me how to collect not only good but geological meaningful samples
in both senses, geochronologically and structurally. Both of them had a very special, intuitive and
polite way to ask the right questions, to search for the right rocks and outcrops and by that to enthuse
me for the Tauern Window. Claudio L. Rosenberg deeply participated in all aspects concerning
structural geology, microtectonics and metamorphic petrology. He gave many useful advices and
also thoroughly reviewed all manuscripts over and over. He involved several MSc-, PhD-students
and Post-Docs into the project enlarging the Tauern-team not only by staff but also by content. His
additional scientific contributions published in the last years were indispensable and considerably
facilitated the scientific discussion in this study. I gained advanced knowledge in structural
mapping, fieldwork in general, micro-tectonics and scientific writing. Konrad Hammerschmidt was
deeply involved in all aspects concerning geochronology, microtectonics and metamorphic
petrology. He accompanied me on several measuring instruments, taught me technical
understanding and took my anxiety of these black boxes. His wholesome skepticism and his sharp
analytical understanding delivered the fundament to most of the analytical data presented. Not till
he thoroughly reviewed, re-calculated and statistically tested the data they became robust and
meaningful. I gained advanced knowledge in data treatment, instrumental handling and clean-lab
skills. Not only in the field but also in the office, behind the microscope, in the laboratories, at
measuring instruments, during discussions, at conferences or even while being afar in different
cities and countries Konrad Hammerschmidt and Claudio L. Rosenberg tried to understand me,
supported me, taught me and last but not least they were both the most kindest persons around.
Now, when it is almost done, I can state that missing only one of them I would have quit but thanks
iv
to their enduring believe in this study I finally became a structural geologist as well as a
geochronologist. So, this is for you Konrad and Claudio!
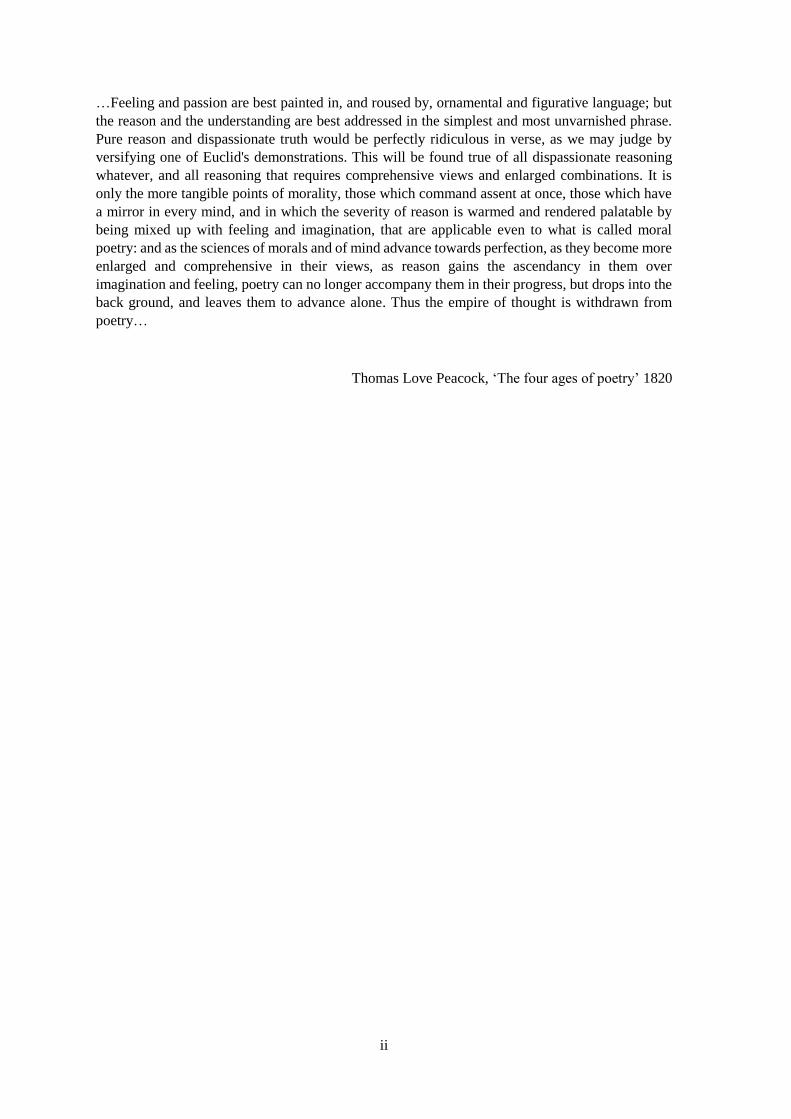
First field session, valley head of the Krimmler-Ache, Tyrol, Austria, left: Claudio L. Rosenberg, right:
Konrad Hammerschmidt
I am pleased to get to know very special people (PhD-, MSc-students and Post-Docs) at the FU
Berlin. Many thanks for unforgettable times, fruitful discussions, constructive controversies and
debugging trash-talks to Alessandro Airo, Audrey Bertrand, Nadin Bungies, Paola Crupi, Silvia
Favaro, Olga Frisch, Franziska Frütsch, Sebastian Garcia, Peter Gipper, Phillip Groß, Mario
Fischer-Gödde, Friedrich Hawemann, Fabian Hecht, Simon Hohl, Martin Homann, Cornelia M.
Kitzig, Moritz Liesegang, Ralf Milke, Kai Rankenburg, Sami Nabhan, Manuel Quiring, Andreas
Scharf, Katharina Schmidt, Marina Spanka, Xiaojuan Sun, Kamil Ustaszewski, Clemens Ullmann,
David van Aacken, Christina von Nicolai, Monique Wanner, Uwe Wichert, Marc Weynell, Sandra
Wollnik, Frank Wombacher and Corinna Wutzke.
v
Kurzfassung
Die vorliegende kumulative Dissertation mit dem Titel „EXHUMATION MECHANISMS OF
MIDDLE AND LOWER CRUST IN THE WESTERN TAUERN WINDOW, EASTERN ALPS“
wurde von mir, Susanne Schneider, am Fachbereich Geowissenschaften, Institut für Geologische
Wissenschaften der Freien Universität Berlin unter Leitung von Prof. Dr. Claudio L. Rosenberg
und Dr. Konrad Hammerschmidt in englischer Sprache verfasst. Es handelt sich dabei um eine
interdisziplinäre Arbeit die in den beiden Arbeitsbereichen (1) Tektonik, gehörend zur Fachrichtung
Tektonik und Sedimentäre Geologie, und (2) Geochemie, gehörend zur Fachrichtung Geochemie,
Hydrogeologie und Mineralogie, anzusiedeln ist. Die beiden Gutachter der Arbeit sind Prof. Dr.
Claudio L. Rosenberg (Erstgutachter) und Prof. Dr. Harry Becker (Zweitgutachter).
Das Tauernfenster, ein tektonisches Fensters, ist seit über einem Jahrhundert Gegenstand
geowissenschaftlicher Forschung. Im westlichen Tauernfenster wurden während des Känozoikums
Gesteine der europäischen Unterkruste, die einst bis in eine Tiefe von >35 km versenkt wurden,
durch tektonische Prozesse an die Erdoberfläche gebracht. Trotz eingehender Studien existiert eine
lebendige Debatte darüber welche geologischen Prozesse welchen Beitrag zur Hebung und
Exhumierung geleistet haben auch darüber wann und in welcher Reihenfolge die geologischen
Ereignisse stattfanden. Das Tauernfenster nimmt eine Schlüsselrolle ein, von der die Tektonik der
Ostalpen maßgeblich abhängt.
Diese Arbeit leistet einen strukturgeologischen und einen geochronologischen Beitrag zu dieser
Debatte. Umfangreiche strukturgeologische Messungen wurden durchgeführt um die dominanten
tektonischen Strukturen zu erfassen. Systematisch wurden stark und möglichst wenig verformte
Proben genommen um mikrostrukturelle, petrologische und geochronologische Untersuchungen
durchzuführen. Die stark verformten Proben wurden mit der 40Ar/39Ar in situ Methode datiert um
das Alter der Verformung zu erfahren. Die wenig verformten Proben wurden mit Hilfe des U-Pb
Apatit Geochronometers datiert um die Abkühlung der Gesteine der lokalisierten Verformung
zeitlich gegenüberzustellen.
Die Ergebnisse dieser Studie zeigen, dass das westliche Tauernfenster durch einen transpressiven
Gürtel aus aufrechten Falten und sinistralen Scherzonen im orogenen Maßstab verformt würde. Es
bildet eine blockierende Krümmung bestehend aus einem Krustenstapel zwischen zwei alpinen
Hauptstörungssystemen. Das Abkühlmuster der U-Pb Apatit Alter wiederspiegelt eine Domstrutur
im Einklang mit früheren Studien. Neu ist, dass ein frühes Stadium der Abkühlung im Unteren
Oligozän datiert wurde. Damit wird die Dauer der Abkühlung, folglich auch die der verursachenden
Prozesse, erheblich verlängern. Die Langlebigkeit der sinistralen Scherzonen umfasst für alle
vi
datierten Strukturen mehrere Millionen Jahre. Ihr Ende konnte in einigen Fällen genau erfasst
werden. Lokalisierte Verformung entlang der sinistralen Scherzonen beginnt im gesamten
westlichen Sub-dom zeitgleich mit der oben beschriebenen Abkühlung. Sie dauert bis ins Obere
Miozän an und folgt dabei zeitlich der Abkühlung des Doms vom Rand zum Zentrum. Die
sinistralen Scherzonen und damit der gesamte transpressive Gürtel des westlichen Tauernfensters
dominieren dessen Heraushebung.
Abstract
The present cumulative dissertation titled “EXHUMATION MECHANISMS OF MIDDLE AND
LOWER CRUST IN THE WESTERN TAUERN WINDOW, EASTERN ALPS” was written in
English language by me, Susanne Schneider, under supervision of Prof. Dr. Claudio Rosenberg and
Dr. Konrad Hammerschmidt at the Department of Earth Sciences, Institute of Geological Sciences
of the Freie Universität Berlin. This work is interdisciplinary connecting the two fields of studies
(1) Tectonics, belonging to the branch of study Tectonics and Sedimentary Geology, and (2)
Geochemistry, belonging to the branch of study Geochemistry, Hydrogeology and Mineralogy.
Reviewers of this thesis are Prof. Dr. Claudio L. Rosenberg (primary reviewer) and Prof. Dr. Harry
Becker (secondary reviewer).
The Tauern Window, a tectonic window, is subject to research in earth sciences for more than a
century. European lower crustal rocks of the western Tauern Window, once buried below 35 km,
were uplifted and exhumed to surface level during Cenozoic times. Although it has been studied
exhaustively there is a vital discussion which geological processes contributed in which amount to
uplift and exhumation and also when and in which temporal succession these processes occurred.
The Tauern Window plays a key role and is significantly involved into Eastern Alps tectonics.
This work supplies contributions in structural geology and geochronology to this discussion.
Comprehensive structural field measurements were performed to determine the dominant structural
features. A systematic sampling strategy was performed where highly and almost not deformed
samples were collected for microstructural, petrological and geochronological investigations. The
highly deformed samples were analyzed with the 40Ar/39Ar in situ technique to obtain deformation
ages. The almost not deformed samples were analyzed with the U-Pb apatite geochronometer to
contrast the cooling history of the rocks with the timing of localized deformation.
The results of this study show that the western Tauern Window was deformed by a transpressive
belt consisting of upright folds and sinistral shear zones that has the scale of an orogen. It forms a
restraining bend by crustal buckling between two major Alpine fault systems. The obtained cooling
vii
pattern from the U-Pb apatite ages indicates a dome structure in agreement with earlier studies. The
novel aspect is that an early stage of this cooling event in the Lower Oligocene epoch was dated.
Hence, the duration of cooling and the driving processes causing it were substantially extended.
The longevity of sinistral shear zones comprises for all dated structures several million years. The
termination of those structures was precisely figured out in some cases. Localized deformation
initiated within the entire western sub-dome contemporaneously to the cooling mentioned above. It
continued until the Upper Miocene and followed the cooling of the dome from the margins to the
center. The sinistral shear zones and for this reason the entire transpressive belt dominated the uplift
and exhumation of the western Tauern Window.


ix
Organization of the thesis and contributions of the authors and co-
workers
This thesis is a “cumulative dissertation” and consists of six chapters where three of them are
complete manuscripts either published, in review or submitted to international journals. These latter
three chapters 2, 3, and 4 form the heart of the thesis. The following paragraph clarifies the
contributions of the involved authors and indispensable co-workers. The remaining three chapters
are enveloping text strings connecting the manuscript chapters and unify them to this complete
works. The first chapter gives a short but general introduction, an overview of the aim of the thesis
and the driving scientific questions. A comprehensive or chronological review of previously
published literature was avoided. In the end a closing chapter summarized the complete works and
carves out the main conclusions of this thesis. The last chapter gives an outlook and ideas for future
research tying this thesis to either methodological, regional-geological or global projects.
Chapter 1: The western Tauern Window a natural laboratory, refining geology after more
than a century of research
By Susanne Schneider
Chapter 2: Dating the longevity of ductile shear zones: Insight from 40Ar/39Ar in situ
analyses
By Susanne Schneider, Konrad Hammerschmidt, Claudio L. Rosenberg
Published in Earth and Planetary Science Letters, 2013, 369. 43-58.
The first author did the field work and collected the samples analyzed in this study. She performed
preparation of the samples together with the competent assistance of the staff preparators Christiane
Behr (Freie Universität Berlin) and Christine Fischer (Universität Potsdam). The first author
examined the samples by microscopy and performed electron microprobe analyses with the
competent assistance of the lecture and research associate PD Dr. Ralf Milke (Freie Universität
Berlin). The first author performed in situ 40Ar/39Ar analyses with the competent assistance of the
research associate Dr. Massafumi Sudo (Universität Potsdam). The first author evaluated the
results, documented and visualized them in the tables and figures with the competent assistance of
the second author lecture and research associate (Akademischer Oberrat) Dr. phil. nat. Konrad
Hammerschmidt (Freie Universität Berlin). The first author wrote and revised the text for the
manuscript together with the aid of careful and constructive reviews of the third author Prof. Dr.
habil. Claudio L. Rosenberg (Université Pierre et Marie Curie Paris) and the second author Dr.
Konrad Hammerschmidt. The manuscript was peer-reviewed in a very final stage by the research
associate Dr. Matthias Konrad-Schmolke (Universität Potsdam) and by Prof. Dr. Stefan Schmid
(ETH Zürich, emerit. Prof. University of Basel).
Chapter 3: Translation of indentation into lateral extrusion across a restraining bend: The
western Tauern Window, Eastern Alps
By Susanne Schneider, Claudio L. Rosenberg, Andreas Scharf, Konrad Hammerschmidt
Submitted to Tectonics and under review since 11th March 2014
The first author did the field work and collected the structural measurements presented in this study.
The field work was supported by the expert knowledge of the second author Prof. Claudio L.

x
Rosenberg and of the forth author Dr. Konrad Hammerschmidt. The first author evaluated the
results, documented and visualized them in the tables and figures together with the aid of careful
and constructive reviews of the second author Prof. Claudio L. Rosenberg and the fourth author Dr.
Konrad Hammerschmidt. The first author performed a comprehensive literature compilation of
structural data for the western and central Tauern Window. This picture was completed by a
comprehensive literature compilation of structural data from the eastern Tauern Window performed
by the third author Dr. Andreas Scharf (Freie Universität Berlin). The first author wrote and revised
the text for the manuscript together with the aid of careful and constructive reviews of the second
author Prof. Claudio L. Rosenberg, the third author Dr. Andreas Scharf and the forth author Dr.
Konrad Hammerschmidt. The manuscript was peer-reviewed in a very final stage by the lecture
associate Dr. Hannah Pomella (Universität Innsbruck) and by Prof. Stefan Schmid. The first figure
was peer-reviewed in a very final stage by the research associate Prof. Dr. Ralf Schuster
(Geologische Bundesanstalt Österreich).
Chapter 4: U-Pb ages of apatite in the western Tauern Window (Eastern Alps): Tracing the
onset of collision-related exhumation in the European plate
By Susanne Schneider, Axel Gerdes, Konrad Hammerschmidt, Claudio L. Rosenberg, Dirk Frei,
Audrey Bertrand
Published in Earth and Planetary Science Letters, 2015, 418. 53-65.
The first author did the field work and collected the samples analyzed in this study. The first author
installed a laboratory for mineral separation at the Institute of Geological Sciences, Freie
Universität Berlin and trained three scientific assistants (Moritz Liesegang, Peter Gipper and Sandra
Wollnik). Together the first author and the tree scientific assistants separated the heavy minerals
that were analyzed in this study. The first author prepared the sample mounts with the competent
assistance of staff preparator Christine Fischer and the aid of the scientific assistant Manuel Quiring
(Freie Universität Berlin). The first author and the second author research associate Dr. Axel Gerdes
(Goethe-Universität Frankfurt) performed analyses of apatites in Frankfurt. The second author Dr.
Axel Gerdes evaluated, documented and visualized the apatite results in tables and figures. The first
and the third author Dr. Konrad Hammerschmidt revised the apatite results, figures and tables
carefully and constructively. The third author Dr. Konrad Hammerschmidt and the first author
performed the statistical tests of the apatite results. The fifth author research associate Dr. Dirk Frei
(Central Analytical Facility at Stellenbosch University) performed analyses of zircons in
Stellenbosch, South Africa. The fifth author Dr. Dirk Frei evaluated, documented and visualized
the zircon results in tables and figures. The first and the third author Dr. Konrad Hammerschmidt
revised the zircon results, figures and tables carefully and constructively. The sixth author Dr.
Audrey Bertrand (National Football Center, Paris) performed fission track dating of six of the
samples used in this study. These results are published elsewhere but the results were used to
calculate cooling rates by the first author. The first author wrote and revised the text for the
manuscript together with the careful and constructive reviews of the fifth author Prof. Claudio L.
Rosenberg and the third author Dr. Konrad Hammerschmidt.
Chapter 5: The dynamic evolution of the Tauern Window: A crustal scale expression of
upper mantle dynamics
By Susanne Schneider
Chapter 6: What will be next?
By Susanne Schneider

xi
Table of content
Declaration of Authorship ________________________________________________________ i
Acknowledgements ____________________________________________________________ iii
Kurzfassung __________________________________________________________________ v
Abstract _____________________________________________________________________ vi
Organization of the thesis and contributions of the authors and co-workers _________________ ix
1. The western Tauern Window a natural laboratory, refining the geodynamics after more than
a century of research ____________________________________________________________ 1
2. Dating the longevity of ductile shear zones: Insight from 40Ar/39Ar in situ analyses _______ 3
2.1 Highlights and article information ____________________________________________ 3
2.2 Keywords _______________________________________________________________ 3
2.3 Abstract ________________________________________________________________ 3
2.4 Introduction _____________________________________________________________ 4
2.5 Geological setting _________________________________________________________ 5
2.6 40Ar/39Ar methodology _____________________________________________________ 7
2.7 Results _________________________________________________________________ 9
2.7.1 Mineral reactions ____________________________________________________ 10
2.7.2 Isotopic data ________________________________________________________ 10
2.7.3 Isochron calculations _________________________________________________ 10
2.7.4 Extraneous argon ____________________________________________________ 13
2.7.5 Syn- and post-kinematic minerals ________________________________________ 14
2.7.5.1 Ahorn Shear Zone samples __________________________________________ 14
2.7.5.2 Tuxer Shear Zones samples _________________________________________ 16
2.7.5.3 Greiner Shear Zone samples _________________________________________ 18
2.8 Discussion _____________________________________________________________ 20
2.8.1 Errors _____________________________________________________________ 20
2.8.1.1. Analytical errors _________________________________________________ 20
2.8.1.2 Geological errors _________________________________________________ 21
2.8.2 Dating deformation ___________________________________________________ 21
2.8.3 Comparison with age results of previous studies ____________________________ 22
2.9 Conclusion _____________________________________________________________ 23
2.10 Acknowledgment _______________________________________________________ 24
2.11 References ____________________________________________________________ 24
2.12 Supplementary material __________________________________________________ 28

xii
2.12.1 Extraneous argon ____________________________________________________ 28
2.12.2 Example ST0730 of the Tuxer Shear Zones ________________________________ 28
2.12.3 Pre-kinematic minerals _______________________________________________ 30
2.12.3.1 Muscovite ______________________________________________________ 30
2.12.3.2 Biotite _________________________________________________________ 31
2.12.3.3. K-feldspar _____________________________________________________ 31
2.12.4 Rb/Sr methodology ___________________________________________________ 31
2.13 Supplement references ___________________________________________________ 32
3. Translation of indentation into lateral extrusion across a restraining bend: The western
Tauern Window, Eastern Alps ___________________________________________________ 33
3.1 Keywords ______________________________________________________________ 33
3.2 Abstract ________________________________________________________________ 33
3.3 Introduction _____________________________________________________________ 33
3.4 Geological setting of the western Tauern Window _______________________________ 34
3.4.1 Tectonometamorphic frame _____________________________________________ 34
3.4.2 Structural frame ______________________________________________________ 36
3.4.3 Timing of sinistral and extensional shear __________________________________ 37
3.4.4. Cooling history ______________________________________________________ 38
3.4.5. Surrounding faults____________________________________________________ 38
3.4.5.1 Giudicarie Belt and Meran-Mauls basement _____________________________ 38
3.4.5.2. Salzach-Ennstal-Mariazell-Puchberg (SEMP) Fault ______________________ 39
3.4.5.3 Pustertal-Gailtal Fault ______________________________________________ 39
3.4.5.4 Defereggen-Antholz-Vals (DAV) and Speikboden faults __________________ 40
3.4.5.5 Brenner Fault ____________________________________________________ 40
3.5 Results _________________________________________________________________ 40
3.5.1 Deformation fabrics ___________________________________________________ 40
3.5.2. Shear zones of the western Tauern Window ________________________________ 42
3.5.2.1 Ahorn Shear Zone _________________________________________________ 42
3.5.2.2. Tuxer Shear Zones ________________________________________________ 44
3.5.2.3 Greiner Shear Zone ________________________________________________ 44
3.5.2.4 Olperer Shear Zone ________________________________________________ 44
3.5.2.5. Ahrntal Shear Zone _______________________________________________ 44
3.5.2.6 Meran-Mauls basement and Jaufen Fault _______________________________ 45
3.5.3 Structures of the western Tauern Window __________________________________ 46
3.5.3.1 S1 foliation_______________________________________________________ 46
3.5.3.2 F2 fold axes and axial planes _________________________________________ 46

xiii
3.5.3.3 S2 foliations and L2 stretching lineations _______________________________ 46
3.5.3.4 Shear zones ______________________________________________________ 48
3.5.4 Periphery of the western sub-dome _______________________________________ 50
3.5.4.1 Domain D _______________________________________________________ 50
3.5.4.2 Domain E _______________________________________________________ 50
3.5.5 Shear bands _________________________________________________________ 53
3.5.6 Structural summary ___________________________________________________ 53
3.5.7 Shortening accommodated by upright folding _______________________________ 53
3.6 Discussion _____________________________________________________________ 54
3.6.1 Comparison with earlier studies _________________________________________ 54
3.6.2 Corner effect of the Dolomites Indenter ___________________________________ 54
3.6.3 Deformation fabrics and crustal level _____________________________________ 54
3.6.4 From upright folding to localized shearing _________________________________ 55
3.6.5 The western Tauern Window: a restraining bend ____________________________ 56
3.6.6. Age of doming in the Tauern Window ____________________________________ 56
3.6.7 Decoupling along the western margin_____________________________________ 57
3.6.8 Decoupling to the east, transition to lateral extrusion ________________________ 58
3.6.9 Estimates of shortening, displacement and extension _________________________ 59
3.7 Conclusion _____________________________________________________________ 62
3.8 Acknowledgement _______________________________________________________ 63
3.9 References _____________________________________________________________ 63
3.10 Supplementary material __________________________________________________ 71
4. U-Pb ages of apatite in the western Tauern Window (Eastern Alps): Tracing the onset of
collision-related exhumation in the European plate __________________________________ 104
4.1 Highlights and article information __________________________________________ 104
4.2 Keywords _____________________________________________________________ 104
4.3 Abstract ______________________________________________________________ 104
4.4 Introduction ___________________________________________________________ 105
4.5 Geological setting _______________________________________________________ 107
4.6 Sample description ______________________________________________________ 111
4.7 Methods ______________________________________________________________ 114
4.8 Theory and Calculations __________________________________________________ 114
4.9 Results and Discussion ___________________________________________________ 115
4.9.1 Analytical and geological errors ________________________________________ 120
4.9.2 Formation or cooling ages ____________________________________________ 122
4.9.3 Comparison to other geochronometers ___________________________________ 123

xiv
4.9.4 Tectono-metamorphic implications ______________________________________ 124
4.10 Conclusion ___________________________________________________________ 125
4.11 Acknowledgement _____________________________________________________ 126
4.12 References ____________________________________________________________ 126
4.13 Supplementary material _______________________________________________ 133
5. The dynamic evolution of the Tauern Window: a crustal scale expression of upper mantle
dynamics ___________________________________________________________________ 147
5.1 Methodological conclusions _______________________________________________ 147
5.2 Geological conclusions ___________________________________________________ 147
5.3 Geodynamic implications _________________________________________________ 148
6. What will be next? _______________________________________________________ 151
6.1 Methodological focus ____________________________________________________ 151
6.1.1 How can we improve the 40Ar/39Ar geochronometer? ________________________ 151
6.1.2 Can we use other noble gases to understand orogenic processes? ______________ 151
6.2 Microstructural focus ____________________________________________________ 152
6.2.1 How can we better understand major-element mass-transfer? _________________ 152
6.2.2 What tell us trace element distributions? __________________________________ 152
6.2.3 Do structural elements act the same or are there fundamental differences? _______ 152
6.3 Focus on Regional Geology _______________________________________________ 153

1
1. The western Tauern Window a natural laboratory, refining
the geodynamics after more than a century of research
The linkage of structural geology and geochronology is a powerful tool to understand the tectonic
evolution during orogeny. Both localized and distributed deformation may cause differential
movement of crustal blocks and rearrange them in space and time. Two fundamentally different
geochronological approaches exist to decipher the dynamics of mountain belts. The first approach
is the determination of cooling ages. It is based on empirical studies where systematic age variations
of geochronometers were observed depending on the crustal level they were exhumed from. It is
formulated by the concept of the closure temperature (Dodsen, 1973), which describes the
accumulation of radiogenic nuclides within a given mineral depending mainly on the surrounding
temperature but also on cooling rate, crystal geometry, and grain size. Below a critical temperature
the so-called closure temperature radiogenic nuclides cannot escape the crystal diffusively and
homogenize with the surroundings, they start to accumulate within the crystal and the isotopic clock
starts to tick. The second approach is the determination of formation ages. Minerals may form even
below their closure temperature due to fluid infiltration, metamorphic breakdown reactions or
recrystallization (Villa, 1988). If mineral formation is syn-kinematic to localized deformation the
isotopic age of a mineral may date one instant of the deformation event. The decision whether an
isotopic age is a cooling or a formation age requires additional information about metamorphism,
petrology, mineral chemistry and microstructure. It is not a priori straightforward.
The second Chapter presents in situ 40Ar/39Ar ages obtained by texturally-controlled laser ablation
and Rb/Sr ages (microsampling) of pre-, syn-, and post-kinematic minerals of sinistral mylonites
and their undeformed host rocks from the western Tauern Window. The major syn-kinematic
mineral is phengite which formed due to the breakdown of K-feldspar and it is absent in the host
rocks. The Tauern Window over the years has risen to the status of a natural laboratory where
various novel approaches have been tested. By using the laser ablation approach dating carefully
characterized micro-fabrics we demonstrate the viability of a whole new concept of targeting micro-
fabric for selective dating, and by this approach we tread new ground in the geochronology of
metamorphic processes. The longevity of ductile shear zones is deduced from the age range of syn-
kinematic minerals that show systematic spatial age variations. The cessation of these ductile shear
zones is dated by post-kinematic blasts. The youngest syn-kinematic minerals and the post-
kinematic blasts overlap within error suggesting that the post-kinematic blasts grew immediately
after differential stress has released.
The third chapter presents a comprehensive structural analyses of the western Tauern Window
which experienced in parts a different tectonic evolution compared to the central and eastern Tauern
Window. Nearly 7,000 structural measurements of thirteen fabric elements were summarized and
grouped into five domains. Three of these domains form a connected transpressive system of tight
upright folds and sinistral shear zones. To the southwest this transpressive system connects with
the sinistral transpressive Giudicarie Belt, towards the northeast it enters the sinistral transpressive-
transtensive SEMP Fault and forms a restraining bend between them. The map-scale restraining
bend translates Dolomites indentation (Rosenberg et al., 2004) into lateral extrusion (Ratschbacher
et al., 1991) and decouples the central and eastern Tauern Window. The faults and shear zones in
and around the western Tauern Window play a major key in palinspastic restoration of the Eastern
Alps. Amounts of shortening, extension and displacement were calculated using the mean values
of the structural fabrics obtained in this study and assuming simplified geometric relations. Upright
folding accommodated two third of the shortening caused by Dolomites indentation and sinistral
shear zones translated the remaining one third of the shortening into east-west extrusion.
The forth chapter presents U-Pb ages of apatites and zircons obtained by laser ablation analyses
from three sections crossing the western Tauern Window. Zircon analyses yield concordant
crystallization ages whereas apatite analyses show two age clusters. A considerable number of
apatite analyses for each sample reflect a relatively uniform cluster of younger age values. We
2
applied an age extractor algorithm (Ludwig and Mundil, 2002) to all apatite analyses of each sample
to calculate median ages from the younger age cluster and asymmetric 2σ errors as their
uncertainties. The median ages were interpreted as cooling ages. A second cluster reveals age values
scattering between the zircon crystallization ages and the apatite cooling ages and were interpreted
to reflect partly reset age values. The unconventional U-Pb apatite chronometer (Harrison et al.,
2002) has a closure temperature of 450 °C (Chamberlain and Bowring, 2000) and therefore, it is
appropriate to date the mid-range cooling history of the Tauern Window. Although various mid-
range geochronometers like 40Ar/39Ar and Rb/Sr of white mica exist, scattering over a wide age
range, their interpretation as cooling or formation age remains ambivalent. The spatial distribution
of the mid-range cooling ages obtained in this study shows two younging trends that were observed
in previous studies for geochronometers having lower closure temperatures (Luth and
Willingshofer, 2008). Additionally, cooling rates were calculated uncovering a rather uniform
cooling history of the western Tauern Window. By extrapolating the cooling rates until the thermal
climax that the samples experienced (Bousquet et al., 2012) the timing of Barrovian metamorphism
could be obtained. New time constraints on the cooling and exhumation history challenges earlier
interpretations of fast exhumation and rapid cooling and may shed more light on the temporality of
high-pressure and Barrovian metamorphism of neighboring rock units in the Tauern Window.
The fifth chapter summarizes the main results of the thesis. A holistic conclusion combining all
three studies will be presented. They will be linked to recent geophysical findings that might give
a hint of the driving forces for the structures of the western Tauern Window and Eastern Alps
tectonics.
The closing sixth chapter gives an outlook based on the results of this study. Possible future research
studies will be proposed.

3
2. Dating the longevity of ductile shear zones: Insight from 40Ar/39Ar in situ analyses
2.1 Highlights and article information
We analyzed two undeformed host rocks and eight mylonites at sub-millimeter-scale.
We examined pre-, syn- and post-kinematic minerals with the 40Ar/39Ar in situ technique.
We defined ablation modes obtaining either high spatial resolution or high precision.
We deduced the longevity of ductile shear by dating syn-kinematic minerals.
We determined the end of ductile deformation by dating post-kinematic minerals.
Article history: Received 16 August 2012
Received in revised form 28 February 2013
Accepted 1 March 2013
Editor: T.M. Harrison
doi:10.1016/j.epsl.2013.03.002
2.2 Keywords
deformation dating; duration and termination of ductile shear; Ar/Ar in-situ analyses; pre-, syn- and
post-kinematic mineral growth
2.3 Abstract
We attempt to improve temporal constraints on the longevity and the termination of ductile shear
zones by performing texturally-controlled in situ 40Ar/39Ar analyses of pre-kinematic muscovite,
biotite and K-feldspars, of syn-kinematic phengite and K-feldspar, and of post-kinematic phengite
within the same samples of sinistral shear zones from the western Tauern Window (Eastern Alps).
Additionally two samples were dated by the Rb/Sr method (microsampling). Relative sequences of
mineral formation based on microstructural, cross-cutting relationships were confirmed by in situ 40Ar/39Ar analyses, showing that syn-kinematic minerals are, in general, younger than pre-kinematic
minerals and older or of equal age than the post-kinematic minerals of the same sample.
From the rim to the core of the western Tauern Window syn-kinematic phengite and K-feldspar
reveal a set of formation ages varying between 33 and 15 Ma for the northernmost and peripheral
shear zone (Ahorn Shear Zone), between 24 and 12 Ma for the intermediate shear zone network
(Tuxer Shear Zones), and between 20 and 7 Ma for the southernmost and central shear zone
(Greiner Shear Zone). The age variation of syn-kinematic phengite and K-feldspar analyses is larger
than the analytical error of each age obtained. In addition, isochron calculations of the syn-
kinematic minerals reveal atmospheric-like 40Ar/36Ar intercepts. Therefore, the obtained age values
of the syn-kinematic minerals are interpreted as formation ages which date increments of a long
lasting deformation period. The time range of deformation of each shear zone system is bracketed
by the oldest and youngest formation ages of syn-kinematic phengite and K-feldspar.
4
Post-kinematic phengite laths show the youngest formation ages and overlap with the youngest syn-
kinematic formation ages. This relationship indicates that post-kinematic growth occurred
immediately after syn-kinematic mineral formation at the end of ductile sinistral shear. Hence, the
termination of deformation is dated by the ages of these post-kinematic phengite blasts.
Pre-kinematic minerals are characterized by breakdown and exsolution reactions and their age
values are heterogeneous and often affected by the presence of extraneous Ar. These age values are
usually older than, but sometimes overlapping with, ages of the syn-kinematic minerals.
Using the temporal constraints obtained by the ages of pre-, syn-, and post-kinematic minerals, we
could assess partly overlapping time intervals of syn-kinematic mineral formation of 19 Myr (33–
15 Ma) in the Ahorn Shear Zone, 13 Myr (24–12 Ma) in the Tuxer Shear Zones and 14 Myr (20–7
Ma) in the Greiner Shear Zone. This indicates successive localization and propagation of ductile
shear zones in the western Tauern Window from lower metamorphic sites at the rim towards higher
metamorphic sites in the center.
2.4 Introduction
Deformation within mountain belts is largely accommodated within fault systems which decouple
coherent crustal blocks and rearrange them in space and time. Constraining the duration of
deformation within these fault systems is a prerequisite to determine rates of shortening and orogen-
parallel extension. Crosscutting relations were used to obtain maximum ages of ductile deformation
by dating magmatic rocks which are overprinted by shear zones (e.g. Crawford et al., 1987 and
Davidson et al., 1992) or to obtain minimum ages of ductile deformation by dating magmatic rocks
which overprint shear zones (e.g. Paterson and Tobisch, 1988). Alternatively, comparison of
cooling ages on either side of faults (e.g. Hurford et al., 1989) was used to detect and date
differential cooling, hence differential exhumation. However, the latter approach cannot be applied
to strike-slip faults because horizontal displacements do not offset horizontal isotherms, and
therefore, cooling-age patterns in adjacent blocks may not be different. In these cases metamorphic
fabrics need to be dated, which display tectonic phases (e.g. Steiger, 1964). Accessory minerals like
monazite, titanite, xenotime, and zircon from deformational fabrics may be dated with high
analytical precision and high spatial resolution (e.g. Oberli et al., 2004, Resor et al., 1996 and
Rubatto, 2002). However, attributing dated compositional domains of the metamorphic texture
within such accessory minerals to given tectonic phases remains difficult (Getty and Gromet, 1992,
Resor et al., 1996 and Williams et al., 1999). Garnets commonly form porphyroblasts in
metamorphic rocks and due to their high strength garnets might exhibit helicitic structures that
formed syn-kinematically during ductile shear whose segments can be dated applying
microsampling techniques (e.g. Christensen et al., 1994, Pollington and Baxter, 2010; 2011). In
contrast to heavy minerals, micas within mylonites are commonly deformed, well suited as
kinematic and petrologic indicators, and present in most crustal rocks deformed under greenschist
and amphibolite facies conditions (e.g. Freeman et al., 1997, Kligfield et al., 1986, Massonne and
Kopp, 2005 and Rolland et al., 2008). Isotopic analyses of several generations of micas of multi-
stage deformed rocks may date different stages of deformation, but may also result in mixing ages
if classical mineral separation techniques were applied (e.g. Beltrando et al., 2009; Hunziker and
Zingg, 1980). Microstructural and chemical characterization of the minerals prior to isotopic
analyses may help to discriminate age groups (e.g. Beltrando et al., 2009).
Regional metamorphism is a prerequisite for recrystallization of minerals, that can reset their
isotopic ages, but the sufficient condition for age resetting is intense fluid–rock interaction and
complete removal of pre-metamorphic radiogenic Ar. However, in blueschist-facies rocks
metamorphic minerals may form out of pre-metamorphic ones and can be affected by extraneous
Ar caught within crystals or along grain boundaries that was not effectively discharged during
metamorphism (e.g. Warren et al., 2012). Shear zones are suitable pathways for fluid flow to
remove pre-kinematic radiogenic Ar (McCaig, 1997) and syn-kinematic mineral reactions. In most

5
shear zones where pre-kinematic micas are affected by grain size reduction, age values may vary
as a function of the grains analyzed, becoming younger for smaller grain fractions (e.g. West and
Lux, 1993). This effect can be ignored where white mica grew syn-kinematically within mylonites
that formed from white mica-free protoliths (e.g. Dunlap, 1997 and Rolland et al., 2008). However,
no matter how precisely single grains or mineral aggregates are dated, classical isotope techniques
provide only one age value for a shear zone that may persist over tens of million years (e.g. Phillips
et al., 2004). This limitation was partly overcome by the use of in situ dating techniques (Cliff and
Meffan-Main, 2003 and Kelley et al., 1994), which allow selective dating of minerals embedded in
their textural and petrological context (Mulch et al., 2005, Müller et al., 2000 and Wells et al., 2008)
and by that provide spatial age resolution. Segments of strain fringes formed around pyrite clasts
were dated and integrated to a continuous time interval of deformation, suggesting that their
formation during deformation lasted 31 Ma (Müller et al., 2000). Decreasing intra-grain formation
ages from core to rim of syn-kinematic white mica (Mulch et al., 2005) and garnet (Christensen et
al., 1994, Pollington and Baxter, 2010; 2011) were interpreted as dating the duration of ductile
deformation. These studies give minimum ages for deformation initiation and maximum ages for
its termination, hence minimum durations of the deformation phase. The difference between this
geochronologically-defined minimum time interval and the longer real time of deformation activity
largely depends on the stability of the dated mineral during the shear zone longevity.
In order to refine the age resolution on the initiation and termination of deformation activity we
present in situ 40Ar/39Ar data of mylonites whose fabrics are characterized by syn-kinematic
phengite and K-feldspar but also by preserved pre-kinematic clasts of K-feldspar, biotite, and by
post-kinematic phengite blasts. Dating the syn- and post-kinematic minerals within the same sample
allowed us to constrain the duration and the termination of deformation activity. Using 40Ar/36Ar
intercepts we were able to identify or exclude extraneous Ar, hence making these mylonites an
excellent natural example to refine deformation dating. In two cases we additionally performed
Rb/Sr in situ analyses using a microscope-stage mounted micro mill gadget for mineral preparation
(Supplement), which confirmed the 40Ar/39Ar ages.
2.5 Geological setting
The Tauern Window is the largest tectonic window in the Eastern Alps, consisting of an E–W
elongate metamorphic and structural dome, bordered by normal faults at its eastern and western
ends and by strike-slip faults along its northern and southern boundaries (Fig. 1). The deeper
structural units of the Tauern Window consist of Late Variscan granites and granodiorites, intruded
into Paleozoic country rocks (Schmid et al., 2013). This basement was overprinted by several
metamorphic events in Cenozoic, during Alpine subduction and collision (Schmid et al., 2013).
Exhumation of the Tauern Window took place in Miocene (e.g. Luth and Willingshofer, 2008 and
Rosenberg and Berger, 2009) by a combination of extensional unroofing (e.g. Selverstone, 1988)
and folding and erosion (e.g. Rosenberg and Garcia, 2011).
6
Figure 1: Tectonic map of the Eastern Alps modified after Schmid et al., (2004). The major Cenozoic
structures within and around the Tauern Window and the Dolomites Indenter are highlighted.
The window is subdivided into an eastern WNW-striking and a western ENE-striking sub-dome
(Fig. 2); the western sub-dome consists of three elongate upright antiforms which fold the nappe-
contacts and the dominant Early-Alpine foliation. Locally a second sub-vertical axial plane foliation
formed along steep limbs and within tight synclines of the upright folds. This foliation is co-genetic
with large-scale and small-scale sinistral shear zones which are sub-parallel to the axial planes of
the upright folds (Rosenberg and Schneider, 2008). The Early-Alpine foliation formed during north-
vergent nappe stacking in Eocene (Kurz et al., 2008 and Schmid et al., 2004); whereas the second
foliation resulted from folding and shearing of the nappe stack (Rosenberg and Schneider, 2008) in
Oligocene and Miocene (Barnes et al., 2004, Glodny et al., 2008 and Selverstone et al., 1991). This
second foliation within sinistral shear zones, contains phengite which is absent in the protolith, that
are coarse grained and weakly foliated granites and granodiorites. The granites consist of K-
fsp+bt+plg+qtz±gnt and sometimes muscovite forming 3–5 cm large clusters. The granodiorites
consist of plg+K-fsp+qtz+bt±zo and are associated with 10–30 cm large mafic enclaves of biotite
and amphibole.
In addition to four sinistral, ENE-striking, map-scale shear zones (Fig. 2), termed from N to S Ahorn
Shear Zone, Olperer Shear Zone, Greiner Shear Zone, and Ahrntal Shear Zone, a large number of
outcrop-scale sinistral shear zones occur in the central area of the western sub-dome suggesting the
existence of an interconnected network that we term the Tuxer Shear Zones (Fig. 2). To the ENE
all these shear zones merge into the sinistral SEMP fault (Fig. 2, Cole et al., 2007; Linzer et al.,
2002; Rosenberg and Schneider, 2008), which accommodates lateral extrusion of the Eastern Alps
(Ratschbacher et al., 1991). Given the parallelism between upright folds and sinistral shear zones,
we consider that they formed in response to the same tectonic process, namely N–S shortening and
orogen-parallel extension during late-stage collision. Both the cooling ages and the metamorphic
isogrades of the western Tauern Window reflect an elongate, concentric pattern (Hoernes and
Friedrichsen, 1974 and Luth and Willingshofer, 2008), whose longest axis coincides with the axial
plane of the upright folds and with the slip planes of the sinistral shear zones. The Ahorn Shear
Zone (Fig. 2), along the northern margin of the dome, formed under greenschist facies conditions
(Cole et al., 2007 and Rosenberg and Schneider, 2008), the Tuxer Shear Zones under greenschist
to amphibolite facies conditions, and the Greiner Shear Zone, located in the axial zone of the sub-
dome, under amphibolite facies conditions (Selverstone et al., 1983 and Selverstone et al., 1991).
7
Figure 2: Tectonic map of the Tauern window, simplified after Bigi et al., (1990) modified after Schmid et
al., (2013) showing the major Cenozoic faults and folds and the internal shear zone network of the western
Tauern Window. Sample locations are marked with yellow dots and are also available as KML-file via Google
Earth. Numbers correspond to the following samples: ST0559 (1), ST0505 (2), ST0732b and ST0734 (3),
ST0730 (4), ST0727 and ST0728 (5), FT0728 (6), ST0706a (7) and FT0719 (8). Shear Zones are ordered
according their mapped thickness 1st order ≥1 km, 2nd = 1000 to 100 m, 3rd order =100 – 10 m, 4th order ≤10
m.
Previous Rb/Sr- and 40Ar/39Ar-dating of micas of the sinistral shear zones resulted in ages varying
between 35 and 15 Ma (Blanckenburg et al., 1989, Glodny et al., 2008 and Urbanek et al., 2002).
Segments of one garnet porphyroblast, which was formed syn-kinematically within the Greiner
Shear Zone (Selverstone et al., 1991), dated by the Sm/Nd method, cover the time interval of 28–
20 Ma (Pollington and Baxter, 2010; 2011). This interval coincides with the age of cooling from
higher than 550 °C (Most, 2003) to below 300 °C (Luth and Willingshofer, 2008) in the western
Tauern Window. Therefore, most mineral ages, irrespective whether they derive from shear zones
or host rocks, are expected to fall within this time interval. Therefore, establishing whether these
ages date ductile deformation can only be successful by obtaining texturally-controlled ages
(Müller, 2003).
2.6 40Ar/39Ar methodology
The current investigation combined microstructural studies, in situ 40Ar/39Ar UV (ultra violet) LA
(laser ablation) isotope analyses (Kelley et al., 1994, McDougall and Harrison, 1999 and Merrihue
and Turner, 1966) and Rb/Sr in situ analyses. Numerous texturally-controlled in situ 40Ar/39Ar
analyses were performed within 10 samples from the Ahorn Shear Zone, the Tuxer Shear Zones,
the Greiner Shear Zone, and from their protoliths. The drilling locations of polished sections of 2
mm thickness, fixed on slides with thermoplastic glue, were chosen using a reflecting light

8
binocular. EMPA (electron microprobe analyses) were performed at each location using a JEOL
JXA 8200 superprobe, results and technical explanations are summarized in Table 1.
Disc-shaped samples of ∅=1 cm were drilled with a gouge bit and detached from glass slides at 60
°C. Sample discs were cleaned from carbon coating by repeated polishing and from glue residues
by solution in acetone for 24 h. After drying the sample discs were packed in aluminum foil, Cd-
shielded, stacked in an Al N5 irradiation can, and irradiated with fast neutrons (neutron flux of
1×10¹² n/cm2/s) in Geestacht Neutron Facility for 97 h (e.g. Willner et al., 2009).
Samples were analyzed using the Ar isotope analytical facility system at the University of Potsdam.
Suitable 6 mJ UV phase laser (wavelength 266 nm, frequency quadrupled) of a New Wave Gantry
Dual Wave laser ablation system with an output rate of 80 % was used for sublimation of all
minerals. Sample gas was cleaned within an ultrahigh vacuum purification line with a SAES getters
and a cold trap. The gas was injected and analyzed in a Micromass 5400 noble gas mass
spectrometer.
From each sample disc gas fractions of ablated phengite, biotite, K-feldspar, and/or sericitized albite
were measured. Altogether 235 analyses were performed within the measuring session of 17 days,
whereas blanks (B) were measured after three sample measurements (M) for background correction.
For example: B1–M1–M2–M3–B2–M4–M5–M6–B3, whereat M1 was corrected with B1, M2 with the
mean value ½(B1+B2) and M3 and M4 were corrected with B2 using a Microsoft Excel spread sheet
of M. Sudo, University of Potsdam. The measured ion intensities of the samples were always higher
than those of the respective blanks, therefore, the corrected beam intensities, especially 36Ar, were
sometimes low but always positive. In particular, absolute 40Ar contents of all blanks used for
background correction vary between 2.5 and 37.3×10⁻¹² cm3 STP, and had an atmospheric-like 40Ar/36Ar, whereas absolute 40Ar contents of the samples vary between 7.6 and 581.2×10⁻¹² cm3
STP (Table 2). However, due to small spot sizes and/or young age values the fraction of radiogenic
Ar (40Ar*) is sometimes <10 %; these 23 out of 142 results are given in brackets in Table 2. Since
most of these analyses show ages which are similar to the ones of adjacent minerals with 40Ar*>10%, they are also presented but their meaning will be discussed with caution.
Depending on the ablation mode used either a high precision or a high spatial resolution of the
obtained age values was aspired. Four different ablation modes were carried out:
(a) Laser ablation along lines, raster (400–3000 µm length) or large spots (∅≥100 µm) crossing
grain aggregates were performed to obtain relative precise, integrated age values, however,
with low spatial resolution.
(b) Small single spot analyses (∅=30–50 µm) within syn-kinematic crystals performed with
constant operating conditions were carried out to obtain age values with high spatial
resolution. Special care was taken to locate the spots within individual crystals, avoiding
grain boundaries, impurities, inclusions, and irregularities generated during sample
preparation. Several measurements along sections within the same microstructural site were
carried out to assess the repeatability and variance of the analyses.
(c) Large surface ablation (raster, large spots, curved lines) of or within single crystals was
performed to maximize the ablation volume, hence to obtain age values with high precision.
(d) Ablations of several single spots within the same crystal were carried out to display
intragrain variations of Ar isotopic composition with high spatial resolution (Mulch et al.,
2005).
Four standards of Fish Canyon Tuff sanidine (fixed age of 27.5 Ma; Uto et al., 1997), used as
neutron monitor, were stacked together with the sample discs vertically, upon each other in the
irradiation can and analyzed by total fusion. The J-values for each sample were obtained by
interpolation of these neutron monitors. The radial neutron fluence variation amounts to 2.6 %. The
radial neutron fluence variation was estimated to be ∼1 % according to the pile geometry and
additional eleven neutron monitors distributed in the irradiation can. For age comparison age
9
standards were analyzed before sample analyses. Four total fusion analyses of HDB-1 biotite yield
a mean age of 25.0±1.4 Ma which agrees with 25.3±0.8 Ma (Fuhrmann et al., 1987). Four total
fusion analyses of SORI93 biotite yield a mean age of 93.4±2.7 Ma which agrees with 92.6±0.6 Ma
(Sudo et al., 1998).
2.7 Results
Table 1. Mean values and errors of Electron Microprobe Analyseselement oxides n K
2O Na
2O CaO Al
2O
3SiO
2FeO MgO MnO TiO
2Total
mean 15 10.78 0.373 0.007 34.14 44.70 2.78 0.744 0.023 0.428 93.97
0.13 0.082 0.013 0.42 0.34 0.15 0.072 0.013 0.068 0.44
mean 80 10.90 0.299 0.011 31.44 46.78 2.65 1.611 0.016 0.306 94.02
0.18 0.062 0.020 0.40 0.32 0.18 0.090 0.015 0.038 0.44
mean 52 15.83 0.85 0.021 18.67 63.38 0.016 0.0050 0.010 0.007 98.79
0.31 0.16 0.062 0.18 0.52 0.016 0.0063 0.012 0.011 0.53
mean 60 15.70 0.94 0.0130 18.32 63.40 0.013 0.0043 0.0059 0.012 98.40
0.16 0.10 0.0093 0.12 0.38 0.016 0.0073 0.0074 0.014 0.41
mean 8 9.94 0.093 0.20 21.4 40.5 12.9 7.5 0.094 0.81 93.4
0.83 0.035 0.24 3.4 2.5 3.7 2.0 0.039 0.22 1.4
mean 16 9.57 0.058 0.23 18.25 35.06 24.60 4.62 0.408 2.67 95.47
0.29 0.039 0.55 0.29 0.68 0.65 0.13 0.033 0.23 0.93
mean 6 7.57 0.084 0.018 16.41 28.01 25.48 6.39 0.185 3.92 88.07
0.10 0.032 0.024 0.18 0.35 0.31 0.18 0.021 0.42 0.27
mean 12 9.81 0.110 0.06 18.00 35.88 19.84 8.14 0.265 2.39 94.49
0.41 0.042 0.14 0.17 0.41 0.21 0.18 0.031 0.12 0.91
atoms per formula n K Na Ca Al Si Fe Mg Mn Ti Total
Sample ST0732b, pre-kinematic muscovite
mean 15 0.939 0.049 0.0005 2.747 3.052 0.1586 0.0758 0.0013 0.0220 7.046
0.015 0.011 0.0010 0.027 0.014 0.0090 0.0074 0.0007 0.0035 0.011
mean 80 0.947 0.0395 0.0008 2.524 3.186 0.151 0.1636 0.00092 0.0157 7.029
0.015 0.0081 0.0015 0.031 0.016 0.010 0.0092 0.00086 0.0019 0.013
mean 52 0.947 0.077 0.0011 1.031 2.969 0.0006 0.00036 0.00039 0.00025 5.027
0.040 0.028 0.0063 0.017 0.015 0.0012 0.00088 0.00093 0.00080 0.015
mean 60 0.941 0.085 0.00065 1.015 2.981 0.0005 0.0003 0.00023 0.00042 5.025
0.023 0.018 0.00093 0.014 0.012 0.0013 0.0010 0.00059 0.00097 0.014
mean 8 0.937 0.0134 0.016 1.86 2.993 0.81 0.83 0.0060 0.045 7.51
0.058 0.0052 0.019 0.24 0.086 0.25 0.25 0.0026 0.013 0.18
mean 16 0.955 0.0088 0.020 1.682 2.743 1.609 0.538 0.0270 0.157 7.741
0.021 0.0058 0.048 0.024 0.029 0.034 0.011 0.0022 0.015 0.013
mean 6 0.837 0.0142 0.0016 1.677 2.429 1.848 0.827 0.0136 0.256 7.903
0.011 0.0055 0.0022 0.018 0.025 0.020 0.023 0.0016 0.027 0.016
mean 12 0.966 0.0165 0.005 1.637 2.768 1.280 0.937 0.0173 0.1385 7.765
0.034 0.0063 0.012 0.012 0.014 0.016 0.018 0.0021 0.0070 0.020
Notes: tungsten filament, beam current = 15 nA, acceleration voltage = 15 kV
natural standards of the FU Berlin were used for calibration:
sanidine (Al, K, Si), albite (Na), andesine (Ca), rutile (Ti), olivin (Fe, Mg), spessatite (Mn)
Sample ST0732b, pre-kinematic biotite
Sample FT0728, pre-kinematic biotite
Sample ST0706a, syn-kinematic biotite
Sample FT0728, pre-kinematic biotite
Sample ST0706a, syn-kinematic biotite
Sample ST0734, syn-kinematic phengite
Sample ST0730, pre-kinematic K-feldspar I
Sample ST0730, syn-kinematic K-feldspar II
Sample ST0559, pre-kinematic biotite
Sample ST0732b, pre-kinematic muscovite
Sample ST0734, syn-kinematic phengite
Sample ST0730, pre-kinematic K-feldspar I
Sample ST0730, syn-kinematic K-feldspar II
Sample ST0559, pre-kinematic biotite
Sample ST0732b, pre-kinematic biotite

10
We use the term microstructural site, to define areas ≤1 cm2 chosen for numerous 40Ar/39Ar
analyses. These sites are characterized by a specific fabric element, which could be a clast with
recrystallized grains in its pressure shadows, a shear band, a strain cap, or a post-kinematic blast.
2.7.1 Mineral reactions
Depending on the metamorphic facies of the investigated shear zones, we observed different
mineral assemblages that we describe below. Syn-kinematic white micas within sheared samples
consist of phengites that formed during the breakdown of biotite and K-feldspar according to the
following reaction:
(1) K-fsp+bt+qtz+fluid=phe+ab
Muscovite, if any, is very rare and only occurs within the protolith. K-feldspar clasts (K-fsp I)
selectively neo-/recrystallized into smaller K-feldspar grains (K-fsp II) of different major element
compositions (Table 1, Fig. 10, Supplement).
2.7.2 Isotopic data
The results are presented as measured 40Ar gas volumes, isotopic ratios, 40Ar*, and calculated ages
with their corresponding σ errors in Table 2. The J-value for each sample is given together with the
sample identifier in the headings of each data set (Table 2). The amount of Ar released was corrected
for blank, for interfering nuclides produced during irradiation, and for time elapsed after irradiation
in a Microsoft Excel spread sheet programed by M. Sudo, University of Potsdam. All absolute
errors are quoted at σ (confidence level=68.3 %). Numbers in the first left column of Table 2 relate
the isotopic data to their analyzed microstructural sites in the corresponding sample figures (Figs.
3, 4, 5, 6, 7, 8). Analyses marked in the column “mineral” with the superscript suffix “iso” were
used to calculate isochrons with the Isoplot add-in 3.41 ( Ludwig, 2008). The 40Ar/36Ar intercepts
are also shown in the respective sample headings (Table 2).
2.7.3 Isochron calculations
The main focus applying isochron calculation in this study was shifted from yielding new, reliable
age information of the dated minerals, since there is no substantial gain in this age information, to
rather testing whether the individual age values were affected by extraneous Ar. We considered the
isochron age performed with age data of minerals from the same microstructural site as reliable if
this isochron age agrees with the single age data used and if the 40Ar/36Ar intercept defined by the
isochron reflects an atmospheric-like Ar composition. For this reason we selected those age values
for isochron calculation which overlap within error and therefore, have similar 40Ar*/39ArK values.
The 40Ar/36Ar intercept of the isochron enables us to test for the presence of extraneous Ar (Kelley,
2002). If the 40Ar/36Ar intercept reflects an atmospheric-like Ar composition, we assume that the
same was true for the remaining syn-kinematic minerals of the same microstructural site that were
not taken into account for isochron calculation because of their different 40Ar*/39ArK ratio.
11
Table 2. Results of40
Ar/39
Ar In-Situ Laser Probe Analysis
No MineralMode, Ø and
~length (µm)40
Ar × 10-12
(cm3)
40Ar
/39Ar ±
38Ar/
39Ar ±
37Ar/
39Ar ±
36Ar/
39Ar ±
40Ar* (%)
40Ar*/
39ArK ± Age ± (Ma)
Sample ST0730 (J = 0.001729)
1 bt cL, 40, ~250 61.4 50.5 ± 0.4 0.040 ± 0.003 3.2 ± 2.6 0.117 ± 0.005 31.5 15.9 ± 1.5 48.9 ± 4.6
2 bt cL, 20, ~350 40.6 21.3 ± 0.2 0.025 ± 0.002 1.5 ± 2.1 0.056 ± 0.004 22.8 4.9 ± 1.2 15.1 ± 3.6
3 bt L, 40, ~100 28.5 52.0 ± 1.3 0.138 ± 0.009 7.2 ± 10.2 0.070 ± 0.012 56.0 31.2 ± 3.6 95 ± 11
5 bt L, 40, ~400 50.1 21.4 ± 0.1 0.027 ± 0.001 2.1 ± 0.7 0.039 ± 0.000 46.0 9.9 ± 0.1 30.5 ± 0.4
6 bt Ls, 35, ~400 37.5 28.5 ± 0.2 0.019 ± 0.005 0.0 ± 3.0 0.059 ± 0.004 39.1 11.1 ± 1.1 34.4 ± 3.4
7 bt L, 50, ~350 65.3 25.5 ± 0.1 0.029 ± 0.001 1.2 ± 0.3 0.059 ± 0.002 31.5 8.0 ± 0.4 24.9 ± 1.4
8 bt L, 40, ~450 54.2 25.4 ± 0.2 0.031 ± 0.002 0.0 ± 1.6 0.056 ± 0.002 34.3 8.7 ± 0.6 27.0 ± 2.0
9 bt Ls, 20, ~250 66.7 66.4 ± 0.3 0.038 ± 0.006 0.9 ± 3.2 0.133 ± 0.005 40.8 27.1 ± 1.4 82.7 ± 4.2
10 k-fsp cL, 40, ~300 45.3 21.6 ± 0.2 0.025 ± 0.003 2.2 ± 1.0 0.038 ± 0.003 48.6 10.5 ± 0.8 32.5 ± 2.5
11 k-fsp cL, 75, ~300 56.7 9.4 ± 0.0 0.020 ± 0.000 0.5 ± 0.3 0.012 ± 0.001 62.0 5.8 ± 0.2 18.0 ± 0.7
12 k-fsp cL, 40, ~550 78.8 11.9 ± 0.0 0.019 ± 0.000 0.2 ± 0.2 0.016 ± 0.000 59.8 7.1 ± 0.1 22.1 ± 0.4
13 k-fsp cL, 40, ~250 52.3 15.6 ± 0.1 0.018 ± 0.001 0.4 ± 0.6 0.018 ± 0.001 66.3 10.3 ± 0.4 31.9 ± 1.3
14 k-fsp cL, 50, ~500 94.7 12.3 ± 0.0 0.019 ± 0.000 0.0 ± 0.3 0.015 ± 0.000 62.9 7.7 ± 0.1 23.9 ± 0.3
15 k-fsp R, 40, ~1200 58.2 16.8 ± 0.1 0.023 ± 0.001 0.2 ± 0.5 0.020 ± 0.001 64.7 10.9 ± 0.3 33.5 ± 1.0
16 k-fsp R, 70, ~720 72.1 23.1 ± 0.1 0.023 ± 0.002 0.0 ± 0.6 0.026 ± 0.001 66.8 15.4 ± 0.3 47.4 ± 1.0
17 k-fsp S, 75 49.5 24.9 ± 0.2 0.019 ± 0.002 0.0 ± 1.1 0.030 ± 0.003 64.6 16.1 ± 0.9 49.4 ± 2.6
Sample ST0505 (J = 0.001723), btiso 40
Ar/36
Ar intercept = 298.9 ± 9.4, isochron age = 25.2 ± 8.8 Ma
1 bt S, 50 52.6 41.2 ± 0.3 0.038 ± 0.003 0.0 ± 2.2 0.106 ± 0.003 23.8 9.8 ± 1.0 30.2 ± 3.0
2 bt S, 50 33.9 32.4 ± 0.3 0.031 ± 0.002 0.0 ± 2.3 0.060 ± 0.003 44.9 14.5 ± 0.9 44.6 ± 2.6
3 bt S, 50 22.7 51.7 ± 1.0 0.026 ± 0.010 0.1 ± 6.7 0.121 ± 0.016 30.6 15.8 ± 4.8 46 ± 15
(4) (btiso
) (S, 50) (145.6) (144.6 ± 0.8) (0.106 ± 0.003) (0.0 ± 1.5) (0.453 ± 0.005) (7.5) (10.8 ± 1.3) (33.2 ± 4.1)
(5) (btiso
) (S, 50) (98.4) (98.6 ± 1.0) (0.076 ± 0.003) (1.6 ± 1.5) (0.304 ± 0.004) (8.8) (8.7 ± 0.8) (26.8 ± 2.4)
6 btiso
S, 50 37.0 41.2 ± 0.2 0.043 ± 0.003 2.5 ± 2.4 0.111 ± 0.006 20.0 8.2 ± 1.7 25.4 ± 5.1
7 btiso
S, 50 50.8 89.5 ± 1.1 0.066 ± 0.004 7.5 ± 3.7 0.272 ± 0.011 10.3 9.2 ± 3.0 28.4 ± 9.2
8 btiso
S, 50 33.5 26.2 ± 0.2 0.025 ± 0.003 1.6 ± 1.8 0.056 ± 0.005 36.6 9.6 ± 1.4 29.6 ± 4.3
9 bt S, 50 39.6 19.6 ± 0.1 0.017 ± 0.001 0.0 ± 1.1 0.016 ± 0.002 75.8 14.8 ± 0.7 45.6 ± 2.0
10 bt S, 50 33.9 21.2 ± 0.1 0.029 ± 0.001 0.0 ± 2.2 0.031 ± 0.003 56.3 11.9 ± 1.0 36.7 ± 2.9
11 bt S, 50 49.5 21.3 ± 0.1 0.024 ± 0.001 0.0 ± 1.4 0.027 ± 0.002 62.8 13.4 ± 0.6 41.0 ± 1.9
12 phe S, 40 38.4 39.4 ± 0.3 0.034 ± 0.003 0.0 ± 2.1 0.099 ± 0.003 25.7 10.1 ± 1.0 31.3 ± 3.1
13 phe S, 40 31.7 13.5 ± 0.1 0.019 ± 0.002 0.0 ± 1.3 0.019 ± 0.001 58.2 7.9 ± 0.4 24.3 ± 1.2
14 phe S, 40 23.4 9.7 ± 0.1 0.015 ± 0.001 0.0 ± 1.1 0.010 ± 0.001 70.1 6.8 ± 0.4 21.0 ± 1.3
15 phe S, 40 27.3 11.0 ± 0.1 0.020 ± 0.002 0.0 ± 0.9 0.015 ± 0.003 59.6 6.6 ± 1.0 20.3 ± 3.0
16 phe S, 40 26.8 10.6 ± 0.1 0.020 ± 0.002 0.6 ± 1.2 0.014 ± 0.003 60.3 6.4 ± 0.9 19.7 ± 2.9
17 phe S, 40 38.8 16.1 ± 0.1 0.020 ± 0.001 0.0 ± 0.8 0.019 ± 0.002 65.5 10.6 ± 0.7 32.6 ± 2.2
19 phe S, 100 39.6 17.6 ± 0.1 0.025 ± 0.001 0.0 ± 1.0 0.031 ± 0.002 48.8 8.6 ± 0.6 26.6 ± 2.0
Sample ST0559 (J = 0.001722), pheiso 40
Ar/36
Ar intercept = 296 ± 23, isochron age = 19.9 ± 7.1 Ma
1 phe S, 35 50.2 32.2 ± 0.5 0.027 ± 0.008 0.0 ± 2.8 0.092 ± 0.010 15.9 5.1 ± 3.0 15.9 ± 9.3
2 phe L, 40, ~300 64.0 12.2 ± 0.1 0.022 ± 0.001 0.0 ± 0.5 0.031 ± 0.001 26.2 3.2 ± 0.5 9.9 ± 1.4
3 k-fsp S, 40 92.2 29.3 ± 0.3 0.020 ± 0.002 1.3 ± 0.7 0.040 ± 0.003 60.0 17.6 ± 0.8 53.9 ± 2.4
4 phe L, 35, ~220 58.8 31.5 ± 0.3 0.033 ± 0.003 0.4 ± 1.7 0.092 ± 0.004 13.8 4.3 ± 1.1 13.4 ± 3.5
5 k-fsp L, 100, ~500 125.8 39.4 ± 0.3 0.032 ± 0.002 0.1 ± 0.6 0.085 ± 0.003 36.2 14.3 ± 0.9 43.8 ± 2.9
(6) (ab) (S, 50) (83.4) (60.7 ± 0.7) (0.062 ± 0.006) (0.0 ± 1.3) (0.195 ± 0.006) (5.3) (3.2 ± 1.6) (10.0 ± 4.9)
(7) (phe) (L, 35, ~260) (77.8) (48.3 ± 0.3) (0.044 ± 0.005) (0.3 ± 1.2) (0.155 ± 0.003) (5.1) (2.5 ± 0.8) (7.7 ± 2.6)
8 k-fsp S, 35 56.7 47.7 ± 0.5 0.042 ± 0.009 0.0 ± 2.6 0.137 ± 0.004 15.2 7.3 ± 1.2 22.4 ± 3.8
(9) (phe) (S, 35) (109.5) (104.3 ± 0.5) (0.079 ± 0.007) (0.6 ± 1.7) (0.336 ± 0.006) (4.9) (5.1 ± 1.9) (15.7 ± 5.8)
(11) (pheiso
) (S, 30) (71.3) (89.3 ± 1.1) (0.073 ± 0.006) (0.0 ± 2.5) (0.276 ± 0.012) (8.6) (7.7 ± 3.5) (24 ± 11)
12 pheiso
S, 30 63.3 58.2 ± 0.4 0.053 ± 0.006 2.7 ± 2.1 0.173 ± 0.006 12.0 7.0 ± 1.8 21.5 ± 5.6
13 pheiso
S, 30 46.2 31.4 ± 0.4 0.038 ± 0.006 3.3 ± 2.1 0.080 ± 0.007 24.8 7.8 ± 1.9 24.0 ± 5.9
14 pheiso
S, 30 36.3 16.7 ± 0.2 0.026 ± 0.006 1.7 ± 2.1 0.030 ± 0.005 47.2 7.9 ± 1.6 24.3 ± 4.8
15 pheiso
S, 30 41.0 23.2 ± 0.3 0.042 ± 0.005 0.0 ± 1.7 0.056 ± 0.004 28.3 6.5 ± 1.3 20.2 ± 4.1
16 pheiso
S, 30 44.6 22.3 ± 0.3 0.019 ± 0.003 0.0 ± 1.9 0.056 ± 0.006 26.1 5.8 ± 1.9 18.1 ± 5.9
17 pheiso
S, 30 47.6 30.5 ± 0.7 0.028 ± 0.004 0.0 ± 2.7 0.081 ± 0.006 21.6 6.6 ± 1.7 20.3 ± 5.3
18 pheiso
S, 30 46.6 40.0 ± 0.5 0.050 ± 0.005 1.4 ± 3.2 0.119 ± 0.006 12.3 4.9 ± 1.8 15.2 ± 5.4
19 pheiso
S, 30 34.3 20.1 ± 0.3 0.023 ± 0.006 0.6 ± 2.7 0.047 ± 0.005 30.9 6.2 ± 1.6 19.1 ± 4.8
20 phe S, 30 34.8 23.1 ± 0.3 0.035 ± 0.005 0.4 ± 3.0 0.048 ± 0.007 38.6 8.9 ± 2.1 27.5 ± 6.4
22 bt S, 30 36.9 24.6 ± 0.3 0.030 ± 0.006 0.0 ± 3.2 0.050 ± 0.006 39.6 9.7 ± 1.8 30.0 ± 5.5
23 bt S, 50 36.8 22.4 ± 0.3 0.027 ± 0.005 6.7 ± 2.7 0.046 ± 0.005 39.2 8.8 ± 1.6 27.1 ± 5.0
24 bt L, 20, ~150 46.6 33.1 ± 0.3 0.031 ± 0.005 0.0 ± 2.1 0.070 ± 0.005 37.3 12.4 ± 1.5 38.0 ± 4.5

12
No MineralMode, Ø and
length (µm)40
Ar × 10-12
(cm3)
40Ar
/39Ar ±
38Ar/
39Ar ±
37Ar/
39Ar ±
36Ar/
39Ar ±
40Ar* (%)
40Ar*/
39ArK ± Age ± (Ma)
Sample ST0734 (J = 0.001724), pheiso 40
Ar/36
Ar intercept = 296 ± 36, isochron age = 12.3 ± 4.3 Ma
1 pheiso
R, 50, ~2200 85.8 17.5 ± 0.2 0.024 ± 0.001 0.5 ± 0.4 0.046 ± 0.001 22.7 4.0 ± 0.3 12.4 ± 1.0
2 phe L, 75, ~900 77.8 9.0 ± 0.1 0.022 ± 0.001 0.3 ± 0.2 0.014 ± 0.001 54.8 4.9 ± 0.2 15.2 ± 0.7
3 phe S, 50 35.4 8.0 ± 0.2 0.027 ± 0.001 1.7 ± 1.1 0.004 ± 0.002 86.7 7.0 ± 0.6 21.5 ± 1.7
4 pheiso
S, 50 28.5 6.3 ± 0.4 0.010 ± 0.002 0.1 ± 1.4 0.007 ± 0.003 66.1 4.2 ± 0.9 12.9 ± 2.8
5 pheiso
S, 50 27.5 5.8 ± 0.5 0.020 ± 0.003 1.4 ± 1.6 0.007 ± 0.002 65.6 3.8 ± 0.9 11.8 ± 2.7
6 pheiso
S, 50 28.4 6.3 ± 0.4 0.013 ± 0.003 0.8 ± 1.8 0.008 ± 0.003 61.3 3.9 ± 1.0 12.0 ± 3.0
7 pheiso
S, 50 45.2 11.8 ± 0.3 0.016 ± 0.002 1.0 ± 1.0 0.026 ± 0.002 34.9 4.1 ± 0.6 12.7 ± 1.9
8 phe S, 50 44.9 13.8 ± 0.3 0.029 ± 0.001 0.3 ± 1.3 0.027 ± 0.002 43.0 5.9 ± 0.6 18.3 ± 1.8
9 phe R, 40, ~1400 60.7 12.8 ± 0.1 0.015 ± 0.002 0.4 ± 0.7 0.018 ± 0.001 58.4 7.5 ± 0.4 23.1 ± 1.2
10 phe L, 100, ~1000 59.5 17.4 ± 0.3 0.023 ± 0.001 0.5 ± 1.1 0.039 ± 0.003 33.3 5.8 ± 0.9 17.9 ± 2.7
11 bt L, 50, ~400 46.5 12.7 ± 0.1 0.024 ± 0.001 0.0 ± 0.7 0.025 ± 0.002 41.1 5.2 ± 0.4 16.1 ± 1.4
12 bt L, 40, ~60 27.8 37.2 ± 0.7 0.020 ± 0.004 5.0 ± 4.7 0.090 ± 0.008 28.6 10.7 ± 2.3 32.8 ± 7.0
13 bt Ls, 20, ~150 60.4 68.3 ± 0.6 0.047 ± 0.005 2.1 ± 2.9 0.155 ± 0.005 32.8 22.4 ± 1.6 68.5 ± 4.8
15 ab R, 50, ~3000 43.8 65.7 ± 1.1 0.043 ± 0.007 0.0 ± 3.4 0.199 ± 0.006 10.4 6.8 ± 1.7 21.1 ± 5.2
Sample ST0732b (J = 0.001726)
1 ms cL, 35, ~200 57.1 20.7 ± 0.1 0.022 ± 0.002 0.4 ± 0.6 0.042 ± 0.001 40.0 8.3 ± 0.4 25.5 ± 1.4
2 bt cL, 50, ~400 114.6 24.1 ± 0.1 0.038 ± 0.001 0.2 ± 0.4 0.064 ± 0.001 21.9 5.3 ± 0.2 16.4 ± 0.6
3 k-fsp cL, 50, ~300 106.0 34.0 ± 0.3 0.023 ± 0.002 0.1 ± 0.5 0.035 ± 0.001 70.0 23.8 ± 0.5 72.6 ± 1.4
4 k-fsp cL, 50, ~250 52.6 12.3 ± 0.0 0.019 ± 0.001 0.1 ± 0.5 0.020 ± 0.001 51.4 6.3 ± 0.4 19.6 ± 1.2
5 bt cL, 40, ~900 83.4 15.5 ± 0.0 0.029 ± 0.001 1.1 ± 1.0 0.030 ± 0.001 43.2 6.7 ± 0.3 20.8 ± 0.8
6 ms cL, 40, ~800 58.5 10.7 ± 0.1 0.018 ± 0.002 0.2 ± 0.6 0.012 ± 0.001 66.3 7.1 ± 0.4 21.9 ± 1.2
7 bt R, 40, ~1200 180.1 35.1 ± 0.2 0.042 ± 0.001 0.0 ± 0.4 0.104 ± 0.001 12.7 4.5 ± 0.2 13.8 ± 0.8
8 ms R, 30, ~600 77.1 18.5 ± 0.1 0.029 ± 0.001 1.0 ± 0.7 0.035 ± 0.001 44.6 8.3 ± 0.3 25.6 ± 0.8
9 k-fsp cL, 40, ~450 89.4 35.4 ± 0.3 0.025 ± 0.002 0.0 ± 0.7 0.035 ± 0.001 71.2 25.2 ± 0.5 76.9 ± 1.4
10 k-fsp S, 35 37.7 32.7 ± 0.3 0.020 ± 0.005 0.0 ± 2.8 0.032 ± 0.004 71.1 23.3 ± 1.3 71.1 ± 4.0
11 k-fsp S, 200 87.5 191.6 ± 2.8 0.099 ± 0.006 0.0 ± 3.3 0.436 ± 0.012 32.7 62.7 ± 3.1 185.3 ± 8.7
13 bt cL, 40, ~550 71.6 25.3 ± 0.1 0.032 ± 0.003 0.3 ± 0.8 0.065 ± 0.002 24.7 6.3 ± 0.7 19.4 ± 2.2
14 ms cL, 50, ~500 76.9 15.1 ± 0.1 0.020 ± 0.002 0.0 ± 0.3 0.014 ± 0.001 72.5 11.0 ± 0.3 33.8 ± 1.0
Sample FT0728 (J = 0.001728), pheiso 40
Ar/36
Ar intercept = 295 ± 25, isochron age = 15.1 ± 2.4 Ma
(1) (phe) (S, 50) (92.2) (42.4 ± 0.3) (0.045 ± 0.002) (1.7 ± 1.3) (0.131 ± 0.005) (8.8) (3.7 ± 1.4) (11.6 ± 4.2)
2 pheiso
S, 50 72.2 31.3 ± 0.3 0.033 ± 0.002 0.3 ± 1.4 0.090 ± 0.003 15.4 4.8 ± 0.9 14.9 ± 2.7
3 phe S, 50 42.6 10.2 ± 0.1 0.019 ± 0.002 0.0 ± 1.1 0.008 ± 0.002 77.1 7.8 ± 0.6 24.2 ± 1.8
4 phe S, 50 41.1 14.0 ± 0.1 0.018 ± 0.002 1.3 ± 1.6 0.024 ± 0.003 48.9 6.9 ± 0.9 21.2 ± 2.6
5 pheiso
S, 50 29.3 10.9 ± 0.1 0.019 ± 0.004 0.7 ± 1.7 0.021 ± 0.003 44.2 4.8 ± 0.9 15.0 ± 2.9
6 pheiso
S, 50 37.1 10.9 ± 0.2 0.015 ± 0.001 0.0 ± 0.8 0.020 ± 0.002 46.8 5.1 ± 0.5 15.8 ± 1.6
7 pheiso
S, 50 33.7 8.2 ± 0.1 0.005 ± 0.001 0.0 ± 1.2 0.010 ± 0.002 64.4 5.3 ± 0.5 16.5 ± 1.5
8 phe S, 150 33.7 7.9 ± 0.2 0.016 ± 0.003 0.0 ± 1.0 0.017 ± 0.002 37.7 3.0 ± 0.5 9.3 ± 1.7
9 bt cL, 40, ~500 49.5 16.2 ± 0.2 0.031 ± 0.003 0.0 ± 1.1 0.047 ± 0.003 13.6 2.2 ± 0.8 6.9 ± 2.6
10 bt cL, 50, ~800 69.0 30.7 ± 0.2 0.037 ± 0.001 0.0 ± 1.1 0.093 ± 0.002 10.3 3.2 ± 0.7 9.8 ± 2.2
11 bt cL, 50, ~300 74.0 17.2 ± 0.1 0.028 ± 0.001 0.0 ± 0.4 0.047 ± 0.001 19.6 3.4 ± 0.3 10.5 ± 0.9
12 pheiso
L, 75, ~850 69.2 10.6 ± 0.0 0.017 ± 0.001 0.0 ± 0.3 0.020 ± 0.001 43.1 4.6 ± 0.3 14.1 ± 0.9
13 bt R, 40, ~400 85.4 27.5 ± 0.2 0.038 ± 0.002 0.0 ± 0.5 0.076 ± 0.002 17.9 4.9 ± 0.5 15.2 ± 1.5
16 k-fsp R, 50, ~400 78.0 10.4 ± 0.1 0.022 ± 0.001 0.0 ± 0.2 0.019 ± 0.001 45.5 4.7 ± 0.2 14.7 ± 0.8
18 pheiso
L, 50, ~200 47.4 12.3 ± 0.1 0.018 ± 0.002 0.0 ± 1.0 0.022 ± 0.002 46.1 5.7 ± 0.5 17.5 ± 1.6
Sample ST0727 (J = 0.001727)
(1) (bt) (L, 75, ~350) (403.8) (126.7 ± 0.5) (0.098 ± 0.001) (0.1 ± 0.6) (0.409 ± 0.002) (4.7) (5.9 ± 0.5) (18.4 ± 1.5)
(2) (bt) (L, 75, ~250) (259.3) (153.9 ± 0.6) (0.112 ± 0.002) (0.0 ± 0.8) (0.496 ± 0.003) (4.7) (7.2 ± 0.7) (22.3 ± 2.2)
3 bt S, 40 54.1 133.6 ± 1.7 0.103 ± 0.008 2.3 ± 5.9 0.375 ± 0.011 17.0 22.8 ± 3.0 69.6 ± 9.0
(4) (btiso
) (S, 40) (76.0) (247.6 ± 4.0) (0.158 ± 0.009) (10.4 ± 7.9) (0.797 ± 0.021) (4.8) (12.0 ± 4.9) (37.1 ± 15.1)
(5) (btiso
) (S, 40) (85.0) (157.1 ± 1.5) (0.118 ± 0.007) (6.3 ± 3.6) (0.489 ± 0.009) (8.0) (12.6 ± 2.2) (38.9 ± 6.7)
(6) (btiso
) (S, 40) (118.6) (304.6 ± 4.7) (0.217 ± 0.009) (3.3 ± 4.2) (0.982 ± 0.020) (4.7) (14.3 ± 3.9) (44.0 ± 11.8)
(7) (btiso
) (S, 40) (67.7) (144.6 ± 2.7) (0.111 ± 0.009) (0.9 ± 2.9) (0.451 ± 0.011) (7.8) (11.3 ± 2.1) (34.9 ± 6.4)
(8) (bt) (S, 40) (21.9) (210.7 ± 5.7) (0.112 ± 0.024) (0.4 ± 16.8) (0.696 ± 0.041) (2.4) (5.0 ± 10.9) (15.6 ± 33.6)
9 bt S, 40 68.9 203.6 ± 2.5 0.159 ± 0.009 0.1 ± 7.2 0.586 ± 0.013 15.0 30.5 ± 3.4 92.6 ± 10.1
10 bt S, 40 37.4 202.6 ± 7.5 0.124 ± 0.017 26.6 ± 31.4 0.590 ± 0.038 13.9 28.1 ± 9.1 85.6 ± 27.2
Sample ST0728 (J = 0.001726)
1 bt cL, 50, ~400 129.6 33.5 ± 0.1 0.041 ± 0.001 0.0 ± 0.6 0.092 ± 0.001 19.0 6.4 ± 0.3 19.7 ± 1.1
(2) (bt) (cL, 50, ~350) (295.6) (59.7 ± 0.1) (0.057 ± 0.001) (0.0 ± 0.3) (0.187 ± 0.001) (7.7) (4.6 ± 0.4) (14.3 ± 1.3)
(3) (bt) (cL, 75, ~250) (306.8) (57.0 ± 0.2) (0.053 ± 0.001) (0.0 ± 0.4) (0.180 ± 0.001) (6.6) (3.8 ± 0.3) (11.7 ± 0.9)
5 bt L, 30, ~300 34.6 27.0 ± 0.2 0.035 ± 0.003 0.0 ± 1.5 0.057 ± 0.002 38.2 10.3 ± 0.5 31.8 ± 1.6
(6) (bt) (L, 75, ~300) (581.2) (85.3 ± 0.2) (0.074 ± 0.001) (0.0 ± 0.3) (0.276 ± 0.001) (4.4) (3.8 ± 0.3) (11.7 ± 0.8)
(7) (bt) (L, 50, ~200) (313.1) (111.4 ± 0.2) (0.090 ± 0.001) (0.0 ± 0.5) (0.369 ± 0.002) (2.1) (2.3 ± 0.7) (7.3 ± 2.1)
8 bt S, 30 58.5 80.7 ± 0.8 0.066 ± 0.005 0.0 ± 2.8 0.227 ± 0.007 17.0 13.7 ± 2.1 42.1 ± 6.2
9 bt L, 30, ~100 27.4 38.9 ± 0.6 0.039 ± 0.005 34.7 ± 6.6 0.080 ± 0.009 39.4 15.3 ± 2.6 47.1 ± 7.8
10 bt L, 30, ~100 72.4 79.8 ± 0.6 0.074 ± 0.004 0.3 ± 2.3 0.237 ± 0.007 12.2 9.7 ± 1.9 30.1 ± 5.9

13
2.7.4 Extraneous argon
40Ar/36Ar intercepts of non-atmospheric-like composition as well as significant scatter of age values
within single microstructural sites that cannot be explained by microstructural differences in the
fabric are indicators of extraneous Ar, as discussed in detail for sample ST0730 (4 Fig. 2) from the
Tuxer Shear Zones (Supplement). In addition, the results of the pre-kinematic minerals, which were
No MineralMode, Ø and
length (µm)40
Ar × 10-12
(cm3)
40Ar
/39Ar ±
38Ar/
39Ar ±
37Ar/
39Ar ±
36Ar/
39Ar ±
40Ar* (%)
40Ar*/
39ArK ± Age ± (Ma)
Sample ST0706a (J = 0.001724), btiso 40
Ar/36
Ar intercept = 289 ± 14, isochron age = 11.0 ± 3.8 Ma
1 phe L, 35, ~300 50.7 11.6 ± 0.1 0.020 ± 0.001 0.0 ± 0.4 0.021 ± 0.001 47.8 5.6 ± 0.3 17.2 ± 0.9
2 phe S, 35 31.9 16.6 ± 0.2 0.027 ± 0.003 0.0 ± 1.7 0.034 ± 0.002 39.5 6.6 ± 0.7 20.3 ± 2.0
3 phe L, 20, ~300 67.9 14.3 ± 0.1 0.022 ± 0.002 0.0 ± 0.6 0.035 ± 0.001 28.1 4.0 ± 0.3 12.5 ± 0.8
4 phe L, 20, ~500 69.1 11.5 ± 0.1 0.022 ± 0.001 0.0 ± 0.5 0.022 ± 0.001 42.8 4.9 ± 0.2 15.3 ± 0.6
5 btiso
L, 50, ~300 96.0 20.7 ± 0.1 0.037 ± 0.001 0.5 ± 0.6 0.060 ± 0.001 15.0 3.1 ± 0.3 9.6 ± 0.8
(6) (btiso
) (cL, 40, ~400) (110.9) (40.8 ± 0.1) (0.045 ± 0.001) (2.3 ± 0.7) (0.130 ± 0.002) (6.2) (2.5 ± 0.6) (7.9 ± 1.8)
7 bt cL, 50, ~550 203.8 28.2 ± 0.1 0.030 ± 0.000 0.3 ± 0.1 0.082 ± 0.000 13.7 3.9 ± 0.1 12.0 ± 0.3
(8) (btiso
) (L, 100, ~600) (214.9) (32.3 ± 0.1) (0.032 ± 0.001) (0.0 ± 0.3) (0.100 ± 0.001) (8.9) (2.9 ± 0.2) (8.9 ± 0.7)
9 bt L, 35, ~300 39.6 15.6 ± 0.7 0.034 ± 0.002 0.4 ± 1.1 0.035 ± 0.002 32.7 5.1 ± 0.8 15.8 ± 2.4
10 phe cL, 35, ~600 65.0 11.0 ± 0.3 0.021 ± 0.001 0.6 ± 0.3 0.020 ± 0.001 46.3 5.1 ± 0.3 15.8 ± 1.0
11 bt L, 30, ~250 36.8 25.5 ± 0.5 0.015 ± 0.005 1.0 ± 3.1 0.061 ± 0.006 29.6 7.6 ± 1.7 23.3 ± 5.1
Sample FT0719 (J = 0.001919), k-fspiso 40
Ar/36
Ar intercept = 262 ± 65, isochron age = 10.1 ± 3.1 Ma
4 bt cL, 50, ~1300 59.5 18.1 ± 0.2 0.027 ± 0.001 0.3 ± 1.3 0.053 ± 0.001 12.7 2.3 ± 0.3 8.0 ± 1.0
(5) (bt) (cL, 50, ~850) (31.7) (13.4 ± 0.2) (0.027 ± 0.002) (0.7 ± 2.2) (0.041 ± 0.002) (9.5) (1.3 ± 0.6) (4.4 ± 2.1)
(6) (bt) (L, 50, ~1000) (105.4) (70.9 ± 0.6) (0.062 ± 0.003) (0.4 ± 2.4) (0.226 ± 0.005) (5.7) (4.0 ± 1.5) (13.9 ± 5.2)
(8) (bt) (L, 50, ~750) (53.3) (37.8 ± 0.2) (0.042 ± 0.002) (0.5 ± 2.5) (0.123 ± 0.002) (4.1) (1.5 ± 0.7) (5.3 ± 2.4)
10 bt cL, 50, ~850 13.8 14.2 ± 0.2 0.026 ± 0.002 1.0 ± 4.8 0.039 ± 0.003 18.9 2.7 ± 0.8 9.2 ± 2.8
11 k-fsp cL, 50, ~1000 13.0 6.6 ± 0.1 0.015 ± 0.002 0.5 ± 1.7 0.011 ± 0.001 51.9 3.4 ± 0.3 11.9 ± 1.1
12 k-fspiso
cL, 50, ~1000 18.6 6.6 ± 0.0 0.018 ± 0.001 0.3 ± 0.7 0.014 ± 0.001 36.7 2.4 ± 0.3 8.3 ± 0.9
13 k-fspiso
cL, 50, ~1000 17.5 7.9 ± 0.1 0.022 ± 0.002 0.4 ± 1.7 0.018 ± 0.001 31.1 2.5 ± 0.4 8.5 ± 1.5
14 k-fspiso
cL, 50, ~1000 8.8 4.4 ± 0.1 0.019 ± 0.001 0.4 ± 1.7 0.006 ± 0.001 61.7 2.7 ± 0.3 9.4 ± 1.1
15 k-fsp cL, 50, ~850 16.4 6.6 ± 0.0 0.021 ± 0.001 0.2 ± 1.2 0.012 ± 0.001 47.0 3.1 ± 0.3 10.8 ± 1.1
16 k-fspiso
cL, 50, ~1000 7.6 8.9 ± 0.2 0.019 ± 0.003 1.3 ± 3.6 0.023 ± 0.003 23.7 2.1 ± 0.8 7.3 ± 2.7
17 k-fspiso
L, 50, ~500 7.9 4.3 ± 0.1 0.018 ± 0.002 0.6 ± 2.7 0.005 ± 0.001 65.1 2.8 ± 0.4 9.7 ± 1.4
19 k-fsp cL, 50, ~1500 25.4 6.1 ± 0.0 0.020 ± 0.001 0.9 ± 1.0 0.010 ± 0.001 53.7 3.3 ± 0.2 11.4 ± 0.6
Notes: ab = albite; bt = biotite; k-fsp = k-feldspar; ms = muscovite; phe = phengite
L = line ablation (Ls = Lines); cL = curved line ablation; R = raster ablation; S = spot ablation;40
Ar* = percentage of radiogenic40
Ariso
indicates analyses used for isochron calculation
() indicates analyses where 40
Ar* ≤10 %
all errors of the isotopic ratios, of the calculated40
Ar/36
Ar intercepts and of the isochron ages are quoted as
isochron calculation was performed using the Microsoft Excel Add-In 3.41 (Ludwig, 2008)
14
2.7.5 Syn- and post-kinematic minerals
2.7.5.1 Ahorn Shear Zone samples
Figure 3a: Photo of thick section of mylonite sample ST0505 (Ahorn Shear Zone). Yellow arrows indicate C-
C’-fabric. Red square marks the drilling locality shown in Fig. 3b. b: Back scattered electron (BSE) images
of sample ST0505 and 40Ar/39Ar age results. The size of the spot symbols approximately corresponds to the
diameter of the laser ablation area. Biotites show titanite exsolution. K-feldspar clasts show albitized rims.
Mylonites of the Ahorn Shear Zone (1, 2 Fig. 2, Fig. 3 and Fig. 4a) exhibit sinistral C–C′ fabrics
and consist of K-feldspar clasts (0.5–1 cm) embedded in a matrix of fine-grained phengite, albite,
quartz, calcite, and relics of magmatic biotite. The grain size of syn-kinematic phengite varies
between 10 and 100 µm. Phengite preferentially grew along shear bands and within strain caps. K-
feldspar clasts show remnants of magmatic zoning, perthitic exsolution, albitized rims and quartz-
or calcite-filled fractures (Figs. 3 and 4b). Quartz show patchy, undulose extinction, healed cracks,
incipient grain boundary migration and bulging with sub-grains of ∼10 µm. Biotite show frayed
grain boundaries, low [Ti] (Table 1) and exsolution of titanite (Figs. 3 and 4b). Biotite is intercalated
with chlorite which is absent in the protolith. Quartz microstructures and biotite breakdown indicate
that deformation temperatures of the Ahorn Shear Zone samples were at most 300 °C (Rosenberg
and Schneider, 2008).
Single spot analyses of sample ST0505 (12–17 Fig. 3a) of syn-kinematic phengites across a shear
band yield ages varying between 32.6 and 19.7 Ma, with older ages located at both rims of the shear
band. One integrated age obtained by large surface ablation (19 Fig. 3b) yields 26.6±2.0 Ma (Table
2). Rb/Sr in situ analyses of this sample yield three albite–phengite isochrons varying between 21.1
and 24.4 Ma (Supplement), which are consistent with the 40Ar/39Ar ages.
15
Figure 4a: Photo of thick section of mylonite sample ST0559 (Ahorn Shear Zone). Yellow arrows indicate C-
C’-fabric, red square marks the drilling locality imaged in Fig. 4b. b: BSE image of sample ST0559 and 40Ar/39Ar age results. Nine spot analyses crossing the phengite aggregate are located along a section. The
length of the colored lines corresponds approximately to the track length of line ablation. K-feldspar show
patchy albitization and remnants of magmatic zoning. Red squares mark detail figures 4c and d. c: BSE detail
of Fig. 4b (left red square) shows obliquely oriented cluster of phengite at the rim of the K-feldspar clast.
White dots in the phengite aggregate are titanite. d: BSE detail of Fig. 4b (right red square) showing
recrystallized K-feldspar in the pressure shadow of an albite clast within the phengite shear band.
A similar age range of 27.5–15.2 Ma is observed in phengites of sample ST0559, where single spot
analyses across a shear band (11–20 Fig. 4b) were performed. Isochron calculation yields an age of
19.9±7.1 Ma and an 40Ar/36Ar intercept of 296±23 (Table 2). Single grain ablation analyses (1, 9
Fig. 4b) yield 15.9±9.3 and 15.7±5.8 Ma, whereas line ablation analyses (2, 4, 7 Fig. 4b) within the
shear band reveal slightly younger ages ranging between 7.7 and 13.4 Ma. Due to the ablation mode
used, crossing aggregates of small grains and grain boundaries, we suggest that Ar loss which is
more effective at grain boundaries influenced the age values of the line ablations (see discussion on
Geological errors). Analysis of a phengite grain (9 Fig. 4b), out of a cluster grown into a K-feldspar
clast, yields 15.7±5.8 Ma. These phengites are undeformed, obliquely oriented to the shear band,
suggesting a post-kinematic formation with respect to sinistral shearing (Fig. 4c). Spot analysis (8
Fig. 4b) of a recrystallized K-feldspar in the pressure shadow of an albite clast (Fig. 4d) yields an
age of 22.4±3.8 Ma.
The large scatter of age values is influenced by low 40Ar* (2, 7, 9, 11 Table 2) and probably by an
only locally achieved chemical equilibrium of the mineral assemblage due to low deformation
temperature (Rosenberg and Schneider, 2008). However, the majority of phengite analyses yield
ages which are consistent with the Rb/Sr and 40Ar/39Ar results of sample ST0505. Therefore, the
ages of syn-kinematic phengite of the Ahorn Shear Zone bracket a time interval of 19 Myr (33–15
16
Ma). The age of 15.7±5.8 Ma of the post-kinematic blast leaves some doubts because of its low 40Ar*. However, it is consistent with the remaining two young phengite ages obtained by spot
analyses (1, 18 Fig. 4b).
2.7.5.2 Tuxer Shear Zones samples
Figure 5a: Photo of thick section of ultramylonite sample ST0734 (Tuxer Shear Zones). Yellow arrows
indicate S-C-fabric; red square marks the drilling locality imaged in Fig. 5b. b: BSE image of sample ST0734
and 40Ar/39Ar age results. Phengite aggregate is surrounded by albite clasts which are sericitized. Angular
lines indicate the tracks of raster ablation. Red square marks detail figure 5c. c: BSE detail of Fig. 5b, post-
kinematic blast in the center of the phengite aggregate. The syn-kinematic phengite aggregate strikes from
the upper left to the lower right corner, whereas the cleavage of the post-kinematic phengite is oblique,
running from the upper right to the lower left corner. d: BSE image of the protolith sample ST0732b, from
the same outcrop than sample ST0734. Note that white mica consists of pre-kinematic, randomly oriented
muscovite blasts. Length of the curved lines images the track length of laser ablation.
Proto- and ultramylonites of the Tuxer Shear Zones (Figs. 5a and 6a) are characterized by S–C
fabrics and the presence of syn-kinematic phengite. Compared to the mylonites of the Ahorn Shear
Zone the grain sizes of syn-kinematic phengite and recrystallized K-feldspar are larger (100–500
µm), and biotite is more abundant with higher [Ti] (Table 1). Feldspar is dynamically recrystallized
(Supplement) and quartz recrystallized by sub-grain rotation. Syn-kinematic phengite occurs within
strain caps, along S- and C-planes, and in pressure shadows of partly albitized K-feldspar clasts.
These microstructures indicate deformation temperatures of 450–500 °C (Rosenberg and
Schneider, 2008).

17
Line ablation across a syn-kinematic phengite aggregate (10 Fig. 5b) of the ultramylonite sample
ST0734 (3 Fig. 2) yields an integrated age of 17.9±2.7 Ma. Rb/Sr in situ analyses of phengite and
albite of the same sample yield an isochron of 16.28±0.62 Ma (Supplement), hence confirming the
integrated 40Ar/39Ar age. Spot analyses of neighboring phengites (3–8 Fig. 5b) vary systematically
between 21.5 and 11.8 Ma, whereas four central phengites yield an isochron age of 12.3±4.3 Ma
and an 40Ar/36Ar intercept of 296±36 (Table 2). Phengites at the rim of the syn-kinematic aggregate
(3, 8 Fig. 5b) yield older ages of 18.3±1.3 Ma and 21.5±1.7 Ma. In the center of the aggregate, an
undeformed phengite lath, oriented oblique to the foliation, overgrew the syn-kinematic phengites
(Fig. 5c). Large surface ablation of this post-kinematic blast yields an age of 12.4±1.0 Ma (1 Fig.
5b), which is consistent with, but more precise than the isochron age of the youngest syn-kinematic
phengites.
Line ablation (12 Fig. 6b) in the protomylonite sample FT0728 (6 Fig. 2) across a syn-kinematic
phengite aggregate at the strain cap of a K-feldspar clast yields an age of 14.1±0.9 Ma. Seven single
spot ages across this aggregate (1–7 Fig. 6b) vary between 11.6 Ma and 24.2 Ma, showing younger
ages at the rim. Four analyses (2, 5–7 Fig. 6b) of this section yield an isochron age of 15.1±2.4 Ma
and an 40Ar/36Ar intercept of 295±25 (Table 2). At both margins of this aggregate undeformed
phengites are oblique to the foliation of the syn-kinematic phengites (Fig. 6c and d) indicating a
post-kinematic growth. Large surface ablation of one post-kinematic phengite (8 Fig. 6b) yields
9.3±1.7 Ma, which is the youngest phengite age of the sample.
The dated age range of syn-kinematic phengite of the Tuxer Shear Zone samples lies between 24–
12 Ma. The end of this time interval of 13 Myr, coincides with the older age of 12 Ma of the two
dated post-kinematic phengite blasts.

18
Figure 6a: Photo of thick section of protomylonite sample FT0728 (Tuxer Shear Zones). Yellow arrows
indicate S-C-fabric; red square marks the drilling locality imaged in Fig. 6b. b: BSE image of protomylonite
sample FT0728 and 40Ar/39Ar age results. Single spot analyses of phengite across a syn-kinematic aggregate
formed at a strain cap of a K-feldspar clast shows higher age variability than the neighboring line ablation.
Red squares mark post-kinematic blasts shown in detail figures 6c and d. c: BSE detail of Fig. 6b (left red
square) shows blasts of post-kinematic phengite which are located at the albitized rim of the K-feldspar clast.
Their orientation is oblique to the direction of the syn-kinematic aggregate at the strain cap. d: BSE detail of
Fig. 6b (right red square) shows one post-kinematic phengite which is oblique to the orientation of the biotite
aggregate. This phengite blast is also obliquely oriented to the alignment of the phengite aggregate at the K-
feldspar strain cap.
2.7.5.3 Greiner Shear Zone samples
Granitic mylonites of the Greiner Shear Zone (7, 8 Fig. 2) are fine-grained and tightly foliated
showing sinistral S–C fabrics (Figs. 7a, 8a). Syn-kinematic zoisite and biotite are stable during
ductile shear and the latter shows higher [Fe], [Mg] and [Ti] than biotite of the Ahorn Shear Zone
(Table 1). Feldspar is dynamically neo-/recrystallized, whereat syn-kinematic albite aggregates
show an inverse [Ca] zonation. Syn-kinematic phengite has grain sizes of 50–600 µm (Fig. 7b).
Quartz recrystallized by sub-grain rotation with grain sizes of 100–500 µm. The mineral
paragenesis of bt+ab+qtz+zo±K-fsp±phe of the Greiner Shear Zone mylonites indicates
metamorphic temperatures of at least 500 °C (Selverstone et al., 1983).
Sample ST0706a (7 Fig. 2) shows a saussuritized plagioclase clast with biotite inclusions (Fig. 7b).
Large surface ablations (1–4, 10 Fig. 7b) of syn-kinematic and foliation-parallel phengite that

19
formed along the margin of this clast yield ages between 20.3 Ma and 12.5 Ma (Table 2). Large
surface ablations of biotite aligned parallel to the mylonitic foliation vary between 12.0 and 7.9 Ma.
Three of these biotite analyses yield an isochron age of 11.0±3.8 Ma (5, 6, 8 Fig. 7a, Table 2) with
an 40Ar/36Ar intercept of 289±14.
Figure 7a: Photo of thick section of mylonite sample ST0706a (Greiner Shear Zone). Yellow arrows indicate
S-C-fabric; red square marks the drilling locality imaged in Fig. 7b. b: BSE image of sample ST0706a and 40Ar/39Ar age results. Large surface ablations of phengite, located at strain cap of a pre-kinematic
saussuritized plagioclase clast, are indicated by the spot and curved lines. Two analyses of biotite inclusions
within the plagioclase are indicated by lines.
K-feldspar clasts of FT0719 (8 Fig. 2) are dynamically recrystallized into xenomorphic albite and
K-feldspar of ∅=300–800 µm grain size (Fig. 8a and b) forming ribbons. Single grain analyses of
these recrystallized K-feldspars vary between 11.9 and 7.3 Ma, whereas five of them (12–14, 16,
17 Fig. 8b) yield an isochron age of 11.9±3.1 Ma and an 40Ar/36Ar intercept of 262±65 (Table 2).
Biotite analyses of ST0706a and the K-feldspar analyses of FT0719 yield ages in the same range,
i.e. 12–7 Ma, which overlap with the youngest ages of syn-kinematic phengite of sample ST0706a.
Half of these biotite results are characterized by low 40Ar* (Table 2), hence they will not be
considered further.
In summary, ages of syn-kinematic phengite and dynamically recrystallized K-feldspar in the
Greiner Shear Zone range between 20 and 7 Ma. The time interval of 14 Myr bracketed by syn-
kinematic mineral formation overlaps largely with the time interval of the Tuxer Shear Zones.
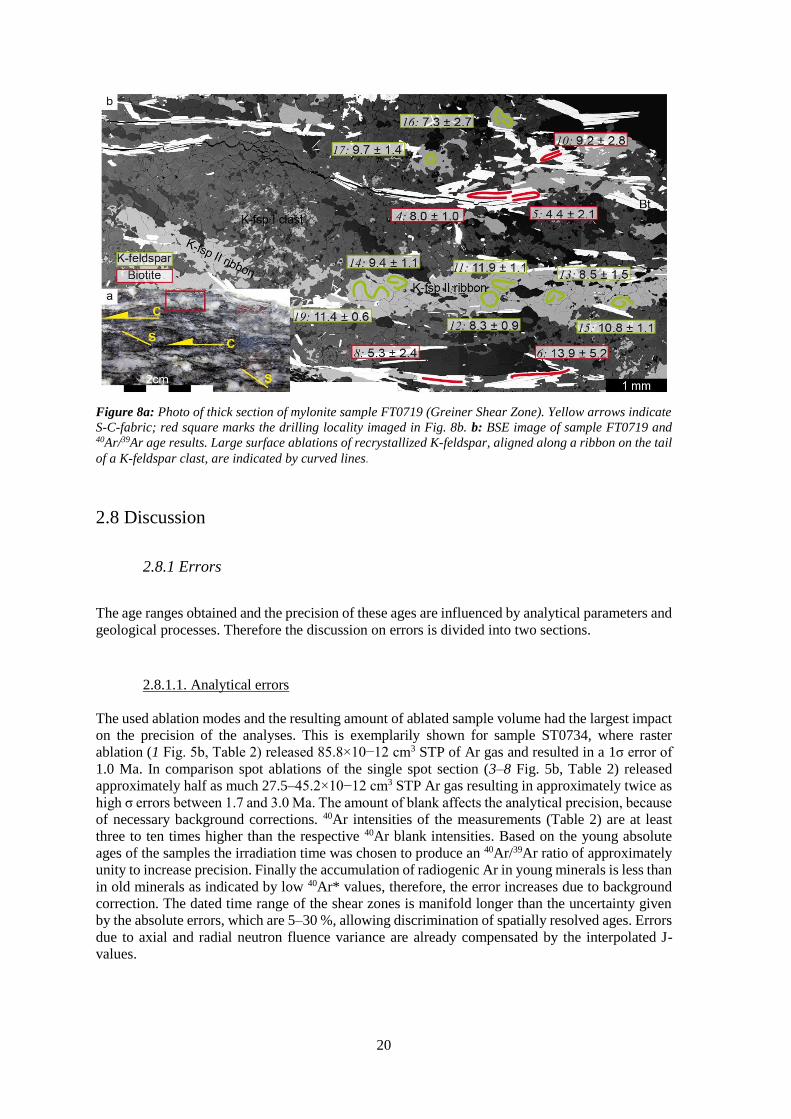
20
Figure 8a: Photo of thick section of mylonite sample FT0719 (Greiner Shear Zone). Yellow arrows indicate
S-C-fabric; red square marks the drilling locality imaged in Fig. 8b. b: BSE image of sample FT0719 and 40Ar/39Ar age results. Large surface ablations of recrystallized K-feldspar, aligned along a ribbon on the tail
of a K-feldspar clast, are indicated by curved lines.
2.8 Discussion
2.8.1 Errors
The age ranges obtained and the precision of these ages are influenced by analytical parameters and
geological processes. Therefore the discussion on errors is divided into two sections.
2.8.1.1. Analytical errors
The used ablation modes and the resulting amount of ablated sample volume had the largest impact
on the precision of the analyses. This is exemplarily shown for sample ST0734, where raster
ablation (1 Fig. 5b, Table 2) released 85.8×10⁻¹² cm3 STP of Ar gas and resulted in a 1σ error of
1.0 Ma. In comparison spot ablations of the single spot section (3–8 Fig. 5b, Table 2) released
approximately half as much 27.5–45.2×10⁻¹² cm3 STP Ar gas resulting in approximately twice as
high σ errors between 1.7 and 3.0 Ma. The amount of blank affects the analytical precision, because
of necessary background corrections. 40Ar intensities of the measurements (Table 2) are at least
three to ten times higher than the respective 40Ar blank intensities. Based on the young absolute
ages of the samples the irradiation time was chosen to produce an 40Ar/39Ar ratio of approximately
unity to increase precision. Finally the accumulation of radiogenic Ar in young minerals is less than
in old minerals as indicated by low 40Ar* values, therefore, the error increases due to background
correction. The dated time range of the shear zones is manifold longer than the uncertainty given
by the absolute errors, which are 5–30 %, allowing discrimination of spatially resolved ages. Errors
due to axial and radial neutron fluence variance are already compensated by the interpolated J-
values.
21
2.8.1.2 Geological errors
The systematic age variation of the syn-kinematic minerals and the large scatter of the pre-kinematic
minerals cannot be exclusively explained by analytical errors. These age variations are influenced
by several geological processes (Müller et al., 2000). The time scale of ductile deformation of major
shear zone is in the range of tens of million years (e.g. Phillips et al., 2004). Therefore, the time
window for syn-kinematic mineral growth might also last tens of million years if metamorphic
conditions are maintained for this time range. Subtle isotopic disequilibria inherited from pre-
kinematic minerals can be excluded for the syn-kinematic minerals, since isochron calculation
yielded atmospheric-like 40Ar/36Ar intercepts, but it might explain the large age scatter of the pre-
kinematic minerals (Warren et al., 2012, Supplement). The grain boundaries of the syn-kinematic
minerals might be affected by Ar loss, which becomes vital in sample ST0559, where line ablation
yield slightly younger age values than spot ablations. Since the difference between the youngest
intragrain ages (15.9±9.3, 15.7±5.8, 15.2±5.4, 1, 9, 18, Fig. 4b) and the ages obtained by ablation
of grain aggregates (9.9±1.4, 13.4±3.5, 7.7±2.6, 2, 4, 7, Fig. 4b) are not significant, we neglect
drastic Ar loss. Two examples (Figs. 3b and 6b) show that pre-kinematic biotites spatially close to
the syn-kinematic phengites have younger age values than pre-kinematic biotites afar from syn-
kinematic phengites. This age difference of pre-kinematic minerals might be caused by sub-
millimeter length scale of diffusion under greenschist to amphibolite facies conditions. Post-
kinematic mineral ages overlap only with the youngest syn-kinematic minerals whose grain size is
the same as that of the older syn-kinematic minerals. Therefore static crystallization or alteration
phenomena with respect to grain size can be excluded.
2.8.2 Dating deformation
The large age scatter of biotite (95–4.4 Ma) indicates that its isotopic composition was only partly
reset during mylonitization, even sometimes affected by excess Ar (Supplement). Pre-kinematic
(Figs. 3b and 4b) and armored (Fig. 7b) biotites, which are unstable on the base of microstructural
observations, have older ages than recrystallized biotites in the Greiner Shear Zone, where the
metamorphic temperature were higher and biotite are inferred to be stable constituents of the
mylonitic paragenesis. Interestingly, biotite and syn-kinematic K-feldspar in the Greiner Shear
Zone give consistent age results. Analyses of K-feldspar clasts in samples of the Ahorn Shear Zone
and the Tuxer Shear Zones (3, 5 Fig. 4a, Supplement) yield systematically older age values than
analyses of recrystallized K-feldspars (8 Fig. 4a, Supplement). The only analysis yielding a younger
age (14.7±0.8 Ma) is located in a clast showing perthitic exsolution (Fig. 6b). K-feldspar clasts in
the protolith of the Tuxer Shear Zones (ST0732b, 3 Fig. 2, 3, 9–11 Fig. 5d) are even older than K-
feldspar clasts in the mylonites. Therefore, we argue that K-feldspar clasts were affected by partial
resetting during mylonitization. Recrystallized K-feldspar of the Greiner Shear Zone vary between
11.9 and 7.3 Ma and yield an atmospheric-like 40Ar/36Ar intercept, therefore, these ages are
interpreted as formation ages. Age data of syn-kinematic phengite and recrystallized K-feldspar,
33–15 Ma (Ahorn Shear Zone), 24–12 Ma (Tuxer Shear Zones) and 20–7 Ma (Greiner Shear Zone),
are more consistent, not affected by extraneous Ar and in two cases the ages of syn-kinematic
phengite were confirmed by Rb/Sr analyses (Supplement). Therefore, these ages are interpreted as
formation ages and the interpretation as cooling ages can be refused since these two chronometers
have different closure temperatures for white mica.
Formation ages of syn-kinematic phengites across shear bands or strain caps show systematic
spatial distributions indicating in two cases a younging trend from the rims to the center (Figs. 3b
and 5b) and in one case a younging trend from the center to the rims (Fig. 6b). These different age
trends suggest that the ages of syn-kinematic minerals depends on mineral formation in selected
microstructural sites rather than on diffusional processes. If these age patterns arose from diffusion
similar age trends within all the phengite aggregates would be expected. In addition, spatial age
variations are not associated to changes in major and minor element composition across the

22
phengite aggregates (Supplement). These texturally-controlled age differences would not be
preserved if minerals were affected by alteration or post-crystallization phenomena. Considering
that the scatter of syn-kinematic minerals ages is larger than the analytical error of every formation
age obtained (Figs. 3, 4a, 5b, 6b, 7b, and 8b), we conclude that each age value dates an increment
of a long lasting deformation period (e.g. Christensen et al., 1994, Müller et al., 2000, Pollington
and Baxter, 2010; 2011). Hence the interval bracketed between the youngest and the oldest syn-
kinematic mineral ages represents the longevity of the respective shear zones.
In all cases analyzed post-kinematic phengites show the youngest ages of their microstructural site
and are indistinguishable from the youngest ages of the adjacent syn-kinematic phengites (Figs. 5b,
6b and 7b). The temporal coincidence between youngest syn-kinematic formation ages and the age
of post-kinematic blasts indicate that the latter immediately date the termination of ductile
deformation.
The presence of pre-kinematic minerals in the protolith enables us to set some temporal constraints
on the onset of deformation. The age values of pre-kinematic muscovites (33.8–21.9 Ma, 1, 6, 8,
14 Fig. 5d) of the protolith are older than but they overlap with the oldest ages of syn-kinematic
phengites (24.2±1.8 Ma, 3 Fig. 6b) of the mylonites. This is constrained for the Tuxer Shear Zones,
where muscovites might pre-date ductile deformation at 21.9±1.2 Ma.
The initiation of deformation cannot be constrained precisely, because of time possibly lacking
between the onset of deformation and syn-kinematic mineral formation or a continuous
recrystallization associated with age resetting during ongoing deformation. However, based on
large scale considerations and on independent geochronological data (Glodny et al., 2008; Kurz et
al., 2008) the onset of sinistral deformation cannot be older than our oldest age of 33 Ma for syn-
kinematic phengites of the Ahorn Shear Zone, because sinistral shear zones of this study overprint
a schistosity formed under high pressure metamorphism at 31 Ma (Glodny et al., 2008) or 38 Ma
(Kurz et al., 2008). The oldest ages of syn-kinematic phengites in the Tuxer Shear Zones and in the
Greiner Shear Zone are younger (24.2±1.8 Ma and 20.3±2.0 Ma, respectively) than the oldest syn-
kinematic ages of the Ahorn Shear Zone. This relation is also true for the youngest ages of syn-
kinematic minerals in the Greiner and Tuxer Shear Zones compared to the Ahorn Shear Zone. In
summary, shear zone longevities of 19 Myr (33–15 Ma, Ahorn Shear Zone), 13 Myr (24–12 Ma,
Tuxer Shear Zones), and 14 Myr (20–7 Ma, Greiner Shear Zone) appears to be partly coeval, but
also show a southward shift of ductile shearing from the Ahorn Shear Zone to the Greiner Shear
Zone.
2.8.3 Comparison with age results of previous studies
Age determinations on syn-kinematic white mica of the SEMP fault (Fig. 1) using 40Ar/39Ar step
heating yield an age range of 35–28 Ma (Urbanek et al., 2002). These ages overlap with our results
of the Ahorn Shear Zone (33–15 Ma), which is inferred to be the deep-seated, ductile continuation
of the SEMP Fault (Rosenberg and Schneider, 2008).
Classical Rb/Sr and K/Ar analyses of “…strongly mylonitic shear zones …” (Blanckenburg et al.,
1989) in the area of the Tuxer Shear Zone yield 20–14 Ma for phengite and 17–13 Ma for biotite,
which are consistent with our results of the Tuxer Shear Zones (24–12 Ma).
Segments of syn-kinematic garnet of the Greiner Shear Zone dated with the Rb/Sr method yield
ages of 35 Ma for the core and 30 Ma for the rim (Christensen et al., 1994). More recent Sm/Nd
analyses of similar garnet segments span a formation age range between 28 and 20 Ma (Pollington
and Baxter, 2010; 2011). Indeed, their youngest ages correspond to termination of garnet growth,
but there is no independent evidence to infer that this coincided with termination of deformation.
This limitation persists when dating syn-kinematic minerals only. Minerals can only be used to date
the time of their stability, which does not necessarily coincide with the time of deformation activity.

23
Our study shows that syn-kinematic mineral formation continued until 7.3±2.7 Ma in the Greiner
Shear Zone, under metamorphic conditions that did not permit the growth of garnet anymore.
Combining the results of Pollington and Baxter, 2010; 2011 with ours, longevity of 22 Myr for the
Greiner Shear Zone (28–7 Ma) can be inferred.
Dextral shear zones crosscutting the Greiner Shear Zone were dated at 29–20 Ma by in situ EMPA
of monazites (Barnes et al., 2004). Monazites, inferred to have formed during dextral shear by fluid
influx due to serpentinization and devolatilization, are “…individual grains, anhedral and embayed,
suggesting that incipient breakdown of monazite occurred following the initial metasomatism…”
(Barnes et al., 2004) but they lack of microstructural evidences to be certainly associated with
dextral shear. In contrast, our results for the Greiner Shear Zone indicate that phengites were formed
during sinistral shear between 20–13 Ma, in addition to K-feldspars and biotites that dynamically
recrystallized until 7 Ma.
A comprehensive study, dating shear zones in the entire Tauern Window with the “Rb-Sr internal
mineral isochron approach” (Glodny et al., 2008) suggested that sinistral shearing in the western
Tauern Window was active between 31 and 15 Ma. The time of activity of sinistral shear zones
proposed by this study (31–15 Ma) overlaps with our results (33–7 Ma). However, the implications
of our results are fundamentally different assessing the textural and therefore, the geologic
significance of these ages. The age span between 35 and 15 Ma corresponds to the age of collision
and Barrovian-type metamorphism in the Eastern Alps. Therefore, metamorphic mineral ages and
syn-kinematic formation ages of sinistral shear zones in the western Tauern Window fall in the
same age interval, no matter whether they were deformed or undeformed. Since, the clear textural
discrimination of the dated minerals is missing we abstain from evaluating the geologic significance
of these earlier published Rb/Sr ages.
Assessing that sinistral displacement in the western Tauern Window took place between 33 and 7
Ma has some important implications for the tectonics of the Eastern Alps. Some models suggested
that sinistral deformation in the Tertiary Eastern Alps terminated at 30 Ma and was overprinted by
dextral deformation (e.g. Mancktelow et al., 2001, Neubauer et al., 1999 and Polinski and
Eisbacher, 1992), whereas others suggested a contemporaneous activity of dextral and sinistral
shear zones, forming a conjugate system that accommodated N–S shortening and E–W extension
(e.g. Rosenberg et al., 2004, 2007). The continuation of sinistral deformation until 7.3±2.7 Ma,
hence coeval with dextral displacements along the Pustertal Fault (Müller et al., 2001), implies a
substantial support of the latter interpretation.
2.9 Conclusion
In situ dating of microstructurally defined pre-, syn-, and post-kinematic minerals confirms the
relative age sequence assessed by textural arguments and allows us to attribute absolute ages to
sinistral ductile shear in the western Tauern Window. Although pre-kinematic minerals appear to
be affected by extraneous Ar, syn-kinematic and post-kinematic minerals yield reliable formation
ages. Age differences of syn-kinematic minerals indicate different increments of a long lasting
deformation history. Therefore, these ages can be interpreted to define longevities of ductile shear
zones.
Since post-kinematic phengite ages coincide with the youngest syn-kinematic formation ages of the
same microstructural site in one sample, the termination of ductile deformation is interpreted to be
identical with the age of post-kinematic phengites. The initiation of deformation cannot be
constrained as precisely as its termination but our results suggest that the three large-scale shear
zones investigated were partly coeval each of them acting for time intervals of 19 Myr, 13 Myr and
22 Myr, respectively. The northernmost Ahorn Shear Zone was active under greenschist-facies
conditions between 33 and 15 Ma and might have terminated at 15.7±5.8 Ma. The Tuxer Shear
Zones were active under greenschist to amphibolite facies conditions between 24 and 12 Ma and
24
terminated at 12.4±1.0 Ma. The Greiner Shear Zone was active under amphibolite facies conditions
between 28 and 7 Ma (Pollington and Baxter, 2010; 2011, this study). This result is a first step to
assess how and when orogen-scale shear zone networking was active, hence to understand how
deformation is accommodated and partitioned in space and time.
2.10 Acknowledgment
This work was funded by a grant of the Deutsche Forschungsgemeinschaft (Ro2177/4). We
acknowledge Georg Fankhauser for field support and accommodation. For sample preparation we
thank Christiane Behr (Freie Universität of Berlin) and Christine Fischer (University of Potsdam).
Ralf Milke supported us at the EMPA facilities at the Freie Universität of Berlin. Masafumi Sudo
introduced and supported us at the Ar isotopic analytical system at University of Potsdam and he
provided a Microsoft Excel spread sheet for data evaluation and reduction. For helpful discussions
we thank Audrey Bertrand, Sebastian Garcia, Andreas Scharf, Silvia Favaro, and Mark Handy. For
critical and constructive reviews we thank Matthias Konrad-Schmolke, Stefan Schmid and two
anonymous journal reviewers.
2.11 References
Barnes, J.D., Selverstone, J., Sharp, Z.D., 2004. Interaction between serpentinite devolatization,
metasomatism and strike-slip strain localization during deep-crustal shearing in the Eastern Alps,
J. Metamorph. Geol. 22, pp. 283–300.
Blanckenburg, F.v., Villa, I.M., Baur, H., Morteani, G., Steiger, R.H., 1989. Time calibration of a
PT-path from the Western Tauern Window, Eastern Alps: the problem of closure temperatures,
Contrib. Mineral. Petr. 101, pp. 1–11.
Christensen, J.N., Selverstone, J., Rosenfeld, J.L., DePaolo, D.J., 1994. Correlation by Rb-Sr
geochronology of garnet growth histories from different structural levels within the Tauern
Window, Eastern Alps. Contrib. Mineral. Petr. 118, pp. 1–18.
Cliff, R.A., Meffan-Main, S., 2003. Evidence from Rb-Sr microsampling geochronology for the
timing of Alpine deformation in the Sonnblick Dome, SE Tauern Window, Austria, in: Linking the
Isotopic Record with Petrology and Textures. Geol. Soc. London Spec. Publ. 220, pp. 93–117.
Cole, J., Hacker, B., Ratscbacher, L., Dolan, J., Seward, G., Frost, E., Frank, W., 2007. Localized
ductile shear below the seismogenic zone: Structural analysis of an exhumed strike-slip fault,
Austrian Alps, J. Geophys. Res. 112, doi:10.1029/2007JB004975.
Crawford, M.L., Hollister, L.S., Woodsworth, G.J., 1987. Crustal deformation and regional
metamorphism across a terrane boundary, Coast Plutonic Complex, British Columbia, Tectonics 6,
343-361.
Davidson, C., Hollister, L.S., Schmid, S.M., 1992. Role of melt in the formation of a deep-crustal
compressive shear zone: the MaClaren Glacier metamorphic belt, south central Alaska, Tectonics
11, pp. 348–359.
Dunlap, W.J. Neocrystallization or cooling? 40Ar/39Ar ages of white micas from low-grade
mylonites, 1997. Chem. Geol. 143, pp. 181–203.
Finger, F., Roberts, M.P., Haunschmid, B., Schermaier, A., Steyrer, H.P., 1993. Variscan granitoids
of central Europe: their typology, potential sources and tectonothermal relations. Miner. Petrol. 61,
pp. 67-96.

25
Freeman, S.R., Inger, S., Butler, R.W.H., Cliff, R. A., 1997. Dating deformation using Rb-Sr in
white mica: Greenschist facies deformation ages from the Entrelor shear zone, Italian Alps.
Tectonics 16, pp. 57–76.
Getty, S.R. and Gromet, L.P., 1992. Geochronological constraints on ductile deformation, crustal
extension, and doming about a basement-cover boundary, New England Appalachians. Am. J. Sci.
292, pp. 359–397.
Giogris D., Cosca, M., Li, S., 2000. Distribution and significance of extraneous argon in UHP
eclogite (Sulu terrain, China): insight from in situ 40Ar/39Ar UV-laser ablation analysis, Earth
Planet. Sc. Lett. 181 (2000) 605–615.
Glodny, J., Ring, U., Kühn, A., 2008. Coeval high-pressure metamorphism, thrusting, strike-slip,
and extensional shearing in the Tauern Window, Eastern Alps. Tectonics 27, TC4004,
doi:10.1029/2007TC002193.
Hoernes, S., Friedrichsen, H., 1974. Oxygen isotope studies on metamorphic rocks of the Western
Hohe Tauern area (Austria). Schweiz. Mineral. Petrol. Mitt. 54, pp. 769–788.
Hunziker, J.C., Zingg, A., 1980. Lower Paleozoic amphibolite to granulite facies metamorphism in
the Ivrea zone (Southern Alps, Northern Italy). Schweiz. Miner. Petrog. 62, pp. 181–213.
Hurford, A.J., Flisch, M., Jäger, E., 1989. Unraveling the thermo-tectonic evolution of the Alps: a
contribution from fission track analysis and mica dating, in: Coward, M.P., Dietrich, D., Park, R.G.
(Eds.), Alpine Tectonics. Geol. Soc. London Spec. Publ., 45 pp. 369–398.
Kelley, S., 2002. Excess argon in K–Ar and Ar–Ar geochronology, Chem. Geol. 188, pp. 1–22.
Kelley, S.P., Arnaud, N.O., Turner, S.P., 1994. High spatial resolution 40Ar/39Ar investigations
using an ultra-violet laser probe extraction technique, Geochim. Cosmochim. Ac. 58, pp. 3519–
3525.
Kligfield, R., Hunziker, J., Dallmeyer, R.D., Schamel, S., 1986. Dating of deformation phases using
K-Ar and 40Ar/39Ar techniques: results from the Northern Apennines, J. Struct. Geol. 8, No. 7, pp.
781–798.
Kurz, W., Handler, R., Bertoldi, C., 2008. Tracing the exhumation of the Eclogite Zone (Tauern
Window, Easter Alps) by 40Ar/39Ar dating of white mica in eclogites, Swiss J. Geosci. 3, pp. 1–16.
Linzer, H.G., Decker, K., Peresson, H., Dell’Mour, R., Frisch, W., 2002, Tectonophysics 354, pp.
211–237.
Luth, S.W., Willingshofer, E., 2008. Mapping of the Post-Collisional Cooling History of the Eastern
Alps, Swiss J. Geosci. 101, pp. 207–223.
Ludwig, K., 2008. A Geochronological Toolkit for Microsoft Excel Berkeley Geochronology
Center Spec. Publ. 4, pp. 1–84.
Mancktelow, N.S., Stöckli, D.F., Grollimung, B., Müller, W., Fügenschuh, B., Viola, G., Seward,
D., Villa, I.M., 2001. The DAV and Periadriatic fault system in the Eastern Alps south of the Tauern
window. Int. J. Earth Sci. 90, pp. 593–622.
Massonne, H.J., and Kopp, J., 2005. A low-variance mineral assemblage with talc and phengite in
an eclogite from the Saxonian Erzgebirge, central Europe, and its P-T evolution, J. Petrol. 46, pp.
355–375.
McCaig, A.M., 1997. The geochemistry of volatile fluid flow in shear zones, In: Holness M.B. (Ed)
Deformation-enhanced Fluid Transport in the Earth’s Crust and Mantle, Chapman & Hall, London.
ISBN: 0412752905, pp. 227–239.
26
McDougall, I., Harrison, M.T., 1999. Geochronology and Thermochronology by the 40Ar/39Ar
Method, Oxford University Press, Oxford, 269 p.
Merrihue, C., Turner, G., 1966. Potassium-Argon Dating by Activation with Fast Neutrons, J.
Geophys. Res. 71, pp. 2852–2857.
Most, P., 2003. Late Alpine cooling histories of tectonic blocks along the central part of the
Transalp-Traverse (Inntal – Gadertal): constraints from geochronology, PhD-thesis Eberhardt-
Karls-Universität Tübingen, pp. 1–151.
Müller, W., Aerden, D., Halliday, A.N., 2000. Isotopic Dating of Strain Fringe Increments:
Duration and Rates of Deformation in Shear Zones, Science 288, pp. 2195–2198.
Müller, W., Prosser, G., Mancktelow, N.S., Villa, I.M., Kelley, S.P., Viola, G., Oberli, F., 2001.
Geochronological constraints on the evolution of the Periadriatic Fault System (Alps), Int. J. Earth
Sci. 90, pp. 623–653.
Müller, W., 2003. Strengthening the link between geochronology, textures and petrology, Earth
Planet. Sc. Lett. 206, pp. 237–251.
Mulch, A., Cosca, M.A., Andresen, A., Fiebig, J., 2005. Time scales of deformation and
exhumation in extensional detachment systems determined by high-spatial resolution in situ UV-
laser 40Ar/39Ar dating, Earth Planet. Sc. Lett. 233, pp. 275–390.
Neubauer F. Genser, J., Kurz, W., Wang, X., 1999. Exhumation of the Tauern Window, Eastern
Alps, Phys. Chem. Earth 24, No. 8, pp. 675–680.
Oberli, F., Rosenberg, C.L., Berger, A., Meier, M.G., 2004. U-Th-Pb and 230Th/238U disequilibrium
isotope systematics: Precise accessory mineral chronology and melt evolution tracing in the Alpine
Bergell intrusion. Geochim. Cosmochim. Ac. 11, pp. 2543–2560.
Paterson, S.R., Tobisch, O.T., 1988. Using pluton ages to date regional deformations: problems
with commonly used criteria. Geology 16, 1108–1111.
Phillips R. J., Parrish, R.R., Searle, M.P., 2004. Age constraints on ductile deformation and long-
term slip rates along the Karakoram fault zone, Ladakh, Earth Planet. Sc. Lett. 226, pp. 305–319
Polinski R.K., Eisbacher, G.H., 1992. Deformation partitioning during polyphase oblique
convergence in the Karawanken Mountains, southeastern Alps, J. Struc. Geol. 14, No. 10, pp. 1203–
1213.
Pollington, A.D., Baxter, E.F., 2010. High resolution Sm-Nd garnet geochronology reveals the
uneven pace of tectonometamorphic processes, Earth Planet. Sc. Lett. 293, pp. 63–71.
Pollington, A.D., Baxter, E.F., 2011. High precision microsampling and preparation of zoned garnet
porphyroblasts for Sm-Nd geochronology, Chem. Geol. 281, pp. 270–282.
Ratschbacher, L., Frisch, W., Linzer, H.G., Merle, O., 1991. Lateral extrusion in the Eastern Alps,
Part 2: Structural Analysis, Tectonics 10, pp. 257–271.
Resor, P.G., Chamberlain, K.R., Frost, C.D., Snoke, A.W., Frost, B.R., 1996. Direct dating of
deformation: U-Pb age of syndeformational sphene growth in the Proterozoic Laramie Peak shear
zone. Geology 24, pp. 623–626.
Rolland, Y., Rossi, M., Cox, S.F., Corsini, M., Mancktelow, N., Pennacchioni, G., Fornari, M.,
Boullier, A.M., 2008. 40Ar/39Ar dating of synkinematic white mica: insights from fluid–rock
reaction in low-grade shear zones (Mont Blanc Massif) and constraints on timing of deformation in
the NW external Alps. In: Wibberley, C. A. J., Kurz, W., Imber, J., Holdsworth, R. E., Collettini,
C. (Eds) The Internal Structure of Fault Zones: Implications for Mechanical and Fluid-Flow
Properties, Geol. Soc., London, Spec. Publ., doi: 10.1144/SP299.18.
27
Rosenberg, C.L., Brun, J.P. Cagnard, F., Gapais D. 1997. Oblique indentation in the Eastern Alps:
Insights from laboratory experiments, Tectonics 26, doi:10.1029/2006TC001960.
Rosenberg, C.L., Brun, J.-P., and Gapais, D., 2004. An indentation model of the Eastern Alps and
the origin of the Tauern Window. Geology 32, pp. 997–1000.
Rosenberg, C.L., Berger, A., 2009. On the causes and modes of exhumation and lateral growth of
the Alps, Tectonics 28, doi:10.1029/2008TC002442
Rosenberg, C.L., Garcia, S., 2011. Estimating displacement along the Brenner Fault and orogen-
parallel extension in the Eastern Alps, Int. J. Earth Sci. 100, pp. 1129–1145.
Rosenberg, C.L., Schneider, S., 2008. The western termination of the SEMP Fault (eastern Alps)
and its bearing on the exhumation of the Tauern Window, In: Siegesmund, S., Fügenschuh, B.,
Froitzheim, N. (Eds) Tectonic Aspects of the Alpine-Dinaride-Carpathian System, Geol. Soc.
London Spec. Publ. 298, pp. 197–218.
Rubatto, D., 2002. Zircon trace element geochemistry: partitioning with garnet and the link between
U–Pb ages and metamorphism, Chem. Geol. 184, pp. 123–138.
Schmid, S.M., Fügenschuh, B., Kissling, E., Schuster, R., 2004. Tectonic map and overall
architecture of the Alpine orogen, Eclogae Geol. Helv. 97, pp. 93–117¬¬.
Schmid, S.M., Scharf, A., Handy, M.R., Rosenberg, C.L., 2013. The Tauern Window (Eastern Alps.
Austria): a new tectonic map, with cross-sections and a tectonometamorphic synthesis, Swiss J.
Geosci. 106, pp. 1–32.
Selverstone, J., 1988. Evidence for East-West crustal extension in the Eastern Alps: implications
for the unroofing history of the Tauern Window, Tectonics 7, pp. 87–105.
Selverstone, J., Spear, F., Franz, G., Morteani, G., 1983. High-Pressure Metamorphism in the SW
Tauern Window, Austria: P-T Paths from Hornblende-Kyanite-Staurolite Schists, J. Petrol. 25, pp.
501–531.
Selverstone, J., Morteani, G., Staude, J.M., 1991. Fluid channeling during ductile shearing:
transformation of granodiorite into aluminous schist in the Tauern Window, Eastern Alps, J.
Metamorph. Geol. 9, 419–431.
Singer, B. S., Wijbrans, J. R., Nelson, S. T., Pringle, M. S., Feeley, T. C., Dungan, M., 1998.
Inherited argon in a Pleistocene andesite lava: 40Ar/39Ar incremental-heating and laser-fusion
analyses of plagioclase, Geology 26, 427–430.
Steiger, R.H., 1964. Dating of orogenic phases in the central Alps by K-Ar ages of hornblende, J.
Geophys. Res. 69, pp. 5407–5421. doi:10.1029/JZ069i024p05407.
Sudo M., Uto, K., Anno, K., Ishizuka, O., and Uchiumi, S., 1998. SORI93 biotite: A new mineral
standard for K-Ar dating. Geochem. J. 32, pp. 49–58.
Urbanek, C., Frank, W., Grasemann, B., Decker, K., 2002. Eoalpine versus Tertiary deformation:
Dating of heterogeneously partitioned strain (Tauern Window, Austria). PanGeo Austria 2002,
abstract volume.
Uto, K., Ishizuka, O., Matsumoto, A., Kamioka, H. and Togashi, S., 1997. Laser-heating 40Ar/39Ar
dating system of the Geological Survey of Japan: System Outline and Preliminary Results. Bull.
Geol. Surv. Jpn. 48, 23–46.
Warren, C.L., Smye, A.J., Kelley, S.P., 2012. Using white mica 40Ar/39Ar data as a tracer for fluid
flow and permeability under high-P conditions: Tauern Window, Eastern Alps. J. Metamorph. Geol.
30, pp. 63–80. doi: 10.1111/j.1525-1314.2011.00956.x

28
Wells, M.L., Spell, T.L., Hoisch, T.D., Arriola, T., Zanetti, K.A., 2008. Laser-probe 40Ar/39Ar
dating of strain fringes: Mid-Cretaceous synconvergent orogen-parallel extension in the interior of
the Sevier orogen, Tectonics 27, doi: 10.1029/2007TC002153.
West, D.P. Jr., Lux, D. R., 1993. Dating mylonitic deformation by the 40Ar-39Ar method: An
example from the Norumbega Fault Zone, Maine. Earth Planet. Sc. Lett. 120, pp. 221–237.
Williams, M.L., Jercinovic, M.J., Terry, M.P., 1999. Age mapping and dating of monazite on the
electron microprobe: Deconvoluting multistage tectonic histories. Geology 27, pp. 1023–1026.
Willner, A.P., Sepúlveda, F.A., Hervé, F., Massonne, H.J., Sudo, M., 2009. Conditions and Timing
of Pumpellyite–Actinolite-facies Metamorphism in the Early Mesozoic Frontal Accretionary Prism
of the Madre de Dios Archipelago (Latitude 508200S; Southern Chile), J. Petrol. 50, pp. 2127–
2155.
2.12 Supplementary material
2.12.1 Extraneous argon
Two types of extraneous Ar can be distinguished: First, excess Ar, which is the component of
radiogenic 40Ar apart from atmospheric 40Ar that was brought into minerals by processes not related
to the in situ decay of 40K, e.g. incorporation of excess Ar, derived from incomplete degasing of
clasts or from Ar diffused out of a fluid or out of pre-kinematic mineral into neighboring newly
formed minerals. The presence of excess Ar is best shown by 40Ar/36Ar values >295.5 (McDougall
and Harrison, 1999). The second type is inherited Ar, which might be incorporated into or trapped
within minerals during their formation. This may happen by incomplete diffusional resetting of
minerals, which are overprinted by geologic events (e.g. metamorphism) after their formation
without complete isotopic homogenization during this event. The resulting ages are termed partly
reset ages (Giogris et al., 2000; McDougall and Harrison, 1999; Mulch et al., 2005; Singer et al.,
1998). Another example might be the incorporation of inherited Ar during pseudomorphism, e.g.
chlorite after biotite where chlorite exhibits unreasonable high ages and an atmospheric-like 40Ar/36Ar value. Since, in this case the 40Ar/36Ar values are preserved, only the apparent age might
uncover the presence of inherited Ar.
2.12.2 Example ST0730 of the Tuxer Shear Zones
Sample ST0730 (Fig. 9) from the Tuxer Shear Zones shows age values affected by excess Ar and
partial resetting. The asymmetric, sigmoidal K-feldspar clast (K-fsp I, ca. 3 mm) has albite- and K-
feldspar domains within its core. The K-feldspar domain is characterized by lower [Al], remnants
of perthite and cracks (Tab. 1, Figs. 9, 10a). The asymmetric tail of the sigma clast consists of
recrystallized elongate K-feldspar grains (K-fsp II, ca. 100–200 µm) with higher [Al] and without
cracks and perthite exsolution (Tab. 1, Figs. 9, 10a). Three (15–17 Fig. 9) out of eight analyses of
K-feldspar are located within the K-feldspar clast and yield 33.5±1.0 Ma, 47.4±1.0 Ma and 49.4±2.6
Ma. Isochron calculation using analyses 16 and 17 (Fig. 9) yield a non-atmospheric-like 40Ar/36Ar
value. Therefore, we argue that the isotopic composition of this K-feldspar clast is affected by
excess Ar. Since the age range between 33.5 and 49.4 Ma of the protomylonite sample ST0730 of
the Tuxer Shear Zones is even lower than most ages of K-feldspar clasts of 71.1–76.9 Ma observed
in the protolith sample ST0732b the age values of sample ST0730 are probably affected by partial
resetting. The remaining five analyses (10–14 Fig. 9) of recrystallized K-feldspar vary between
32.5 and 18.0 Ma, whereat three analyses (11, 12, 14 Fig. 9) overlap with the ages of syn-kinematic
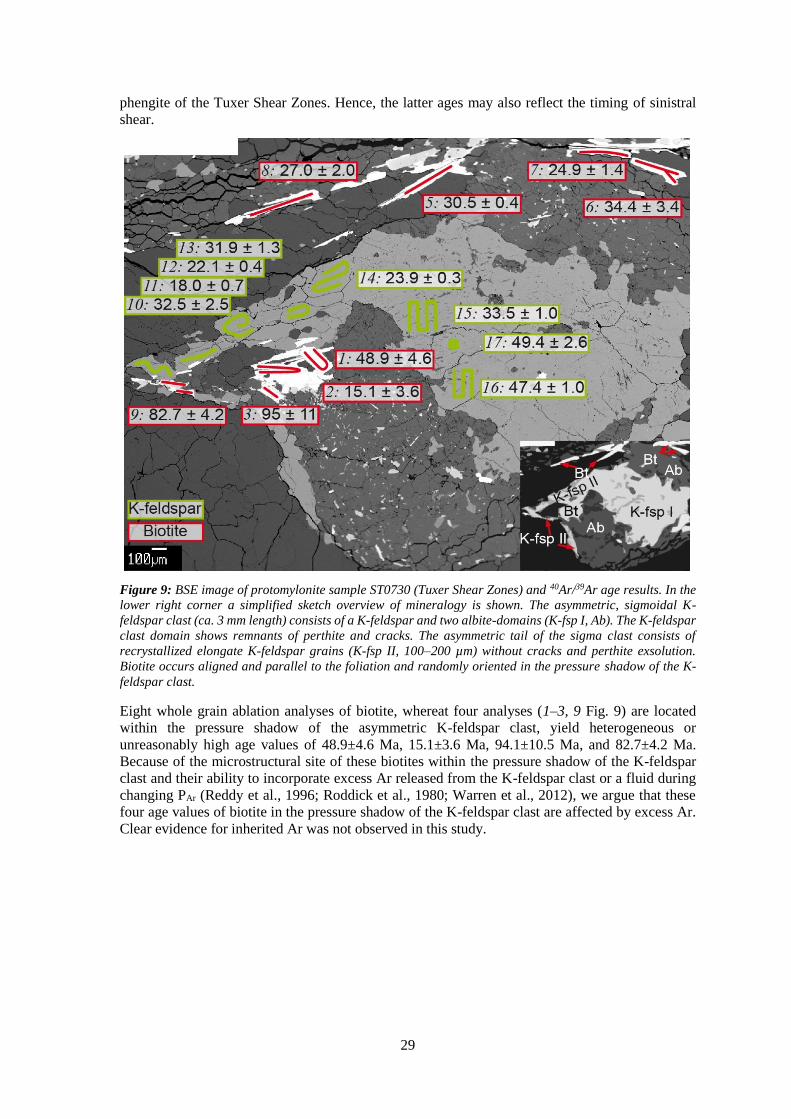
29
phengite of the Tuxer Shear Zones. Hence, the latter ages may also reflect the timing of sinistral
shear.
Figure 9: BSE image of protomylonite sample ST0730 (Tuxer Shear Zones) and 40Ar/39Ar age results. In the
lower right corner a simplified sketch overview of mineralogy is shown. The asymmetric, sigmoidal K-
feldspar clast (ca. 3 mm length) consists of a K-feldspar and two albite-domains (K-fsp I, Ab). The K-feldspar
clast domain shows remnants of perthite and cracks. The asymmetric tail of the sigma clast consists of
recrystallized elongate K-feldspar grains (K-fsp II, 100–200 µm) without cracks and perthite exsolution.
Biotite occurs aligned and parallel to the foliation and randomly oriented in the pressure shadow of the K-
feldspar clast.
Eight whole grain ablation analyses of biotite, whereat four analyses (1–3, 9 Fig. 9) are located
within the pressure shadow of the asymmetric K-feldspar clast, yield heterogeneous or
unreasonably high age values of 48.9±4.6 Ma, 15.1±3.6 Ma, 94.1±10.5 Ma, and 82.7±4.2 Ma.
Because of the microstructural site of these biotites within the pressure shadow of the K-feldspar
clast and their ability to incorporate excess Ar released from the K-feldspar clast or a fluid during
changing PAr (Reddy et al., 1996; Roddick et al., 1980; Warren et al., 2012), we argue that these
four age values of biotite in the pressure shadow of the K-feldspar clast are affected by excess Ar.
Clear evidence for inherited Ar was not observed in this study.

30
Figure 10a: Diagram of Si versus Al atoms per formula unit [apfu] of K-feldspar clasts (K-fsp I=black
diamonds) and recrystallized K-feldspar (K-fsp II=white diamonds) of sample ST0730 (Tuxer Shear Zones).
Mean values and variability of the chemical composition are given as standard deviation (black bars=K-fsp
I, white bars K-fsp II). Note the chemical difference between the two K-feldspar generations. b: Diagram of
Al versus Si atoms per formula unit [apfu] of the syn-kinematic (white diamonds) and post-kinematic (black
diamonds) phengites of ultramylonite sample ST0734 (Tuxer Shear Zones). Mean values and variability of
the chemical composition are given as standard deviation (white bars=syn-kinematic phe, black bars=post-
kinematic phe). Note the chemical similarity of syn- and post-kinematic phengites. Inlet in the upper right
corner shows the data along a tie-line of phengite between the two end-members muscovite (ms; Al=3 and
Si=3) and celadonite (cel; Al=1 and Si=4). In the lower right corner the chemical composition of muscovite
of the protolith ST0732b are also shown as blue triangles.
2.12.3 Pre-kinematic minerals
2.12.3.1 Muscovite
Large surface ablation performed on muscovite blasts of the protolith ST0732b (3 Fig. 2) yield age
values between 33.8 and 21.9 Ma (1, 6, 8, 14 Fig. 5d). These age values are slightly older than the
ages obtained from syn-kinematic phengite of the ultramylonite ST0734 (3 Fig. 2) of the Tuxer
Shear Zones. The muscovite blasts are clearly crosscut by and completely consumed in the
ultramylonite which was observed in the outcrop of samples ST0732b and ST0734. Therefore, the
muscovite reflects pre-kinematic age values which might indicate that ductile shear initiated after
21.9±1.2 Ma.

31
2.12.3.2 Biotite
Biotite analyses reveal scattering and ambiguous age values. Biotites of the Ahorn Shear Zone
(ST0505, 2 Fig. 2) vary between 45.6 and 25.4 Ma, whereas biotites that are spatially closest to the
phengite shear band (4–8 Fig. 3b) yield age values overlapping with the phengite ages. The isochron
of the latter biotites shows an atmospheric-like 40Ar/36Ar intercept (Tab. 2). A comparable spatial
age younging of biotites was observed in the Tuxer Shear Zone sample FT0728 (6 Fig. 2; 9–11, 13
Fig. 6c). Biotite ages pass from 15.2 to 6.9 Ma, when approaching syn-kinematic phengites.
Analyses of biotite from a deformed amphibolite dyke of the Tuxer Shear Zones (ST0727, 5 Fig.
2) and from an undeformed mafic enclave of the same outcrop (ST0728, 5 Fig. 2) show large scatter
of age values of 92.6 to 7.3 Ma (Tab. 2). These data lack any systematic trend and repeatability and
are affected by extraneous Ar.
Biotite inclusions (7 Fig. 2) within an plagioclase clast of sample ST0706a yield 23.1±5.1 Ma and
15.8±2.4 Ma, overlapping with the syn-kinematic phengite ages, but the foliation-parallel biotites
of this sample (Fig. 7b, Tab. 2) yield scattering and young age values varying from 15.8 to 7.9 Ma
(Fig. 7b, Tab. 2). In the Greiner Shear Zone sample FT0719 (8 Fig. 2, Fig. 8b) comparable biotite
age values of 13.9–4.4 Ma were observed. The small-scale age variation of these young biotites
proscribes their interpretation as cooling ages. Since they overlap with ages of recrystallized K-
feldspar they reflect rather formation ages.
2.12.3.3. K-feldspar
Analyses of a K-feldspar clasts yield ages of 53.9±4.5 Ma and 43.8±2.9 Ma (3, 5 Fig. 4b) for the
Ahorn Shear Zone, and they vary between 49.4 and 33.5 Ma (15–17 Fig. 9) for the Tuxer Shear
Zones. In contrast, analysis of recrystallized K-feldspar of the Tuxer Shear Zones results in 22.4±3.8
Ma (8 Fig. 4b) and in an age range of 32.5 to 18.0 Ma (10–14 Fig. 9), which overlaps with the ages
of the syn-kinematic phengite of from samples of the same shear zone. K-feldspar analyses of the
protolith sample ST0732b (Fig. 5d) yield scattering age values between 185.3 and 19.6 Ma (Tab.
2). Therefore, analyses of K-feldspar clasts in the protolith and the mylonites are interpreted as
reflect partial resetting.
2.12.4 Rb/Sr methodology
Rb/Sr analyses of two samples (ST0505 and ST0734, Fig. 2) were carried out at the Freie
Universität Berlin. Microsampling was performed using a microscope stage mounted micro mill
gadget (Müller et al., 2000). Mono-mineral cores of albite and phengite (Ø=100–600 µm) were
drilled out of 200 µm thick sections. Masses of the cores were calculated using the volume equation
of a cylinder, the section thickness, the measured radii and typical mineral densities of albite and
phengite. Enriched 87Rb and 84Sr spike solutions were added to the mineral cores and solved in a
mixture (1:4) of concentrated nitric acid and hydrofluoric acid. The rubidium and strontium ions
were separated in 2.5 M HCl chemistry using ion-chromatographic columns. Rb and Sr were loaded
on double Re-filaments. Sample ST0505 was measured on a Finnigan MAT 261, where 87Sr/86Sr
ratio of the measured standard NBS 987 yield 0.710246±30 (2 SE; standard error). Sample ST0734
was measured on a Thermo Scientific TRITON, where 87Sr/86Sr ratio of the measured standard NBS
987 yield 0.710245±10 (2 SE; standard error). The results of the Rb/Sr analyses are given in Table
3 (supplement).
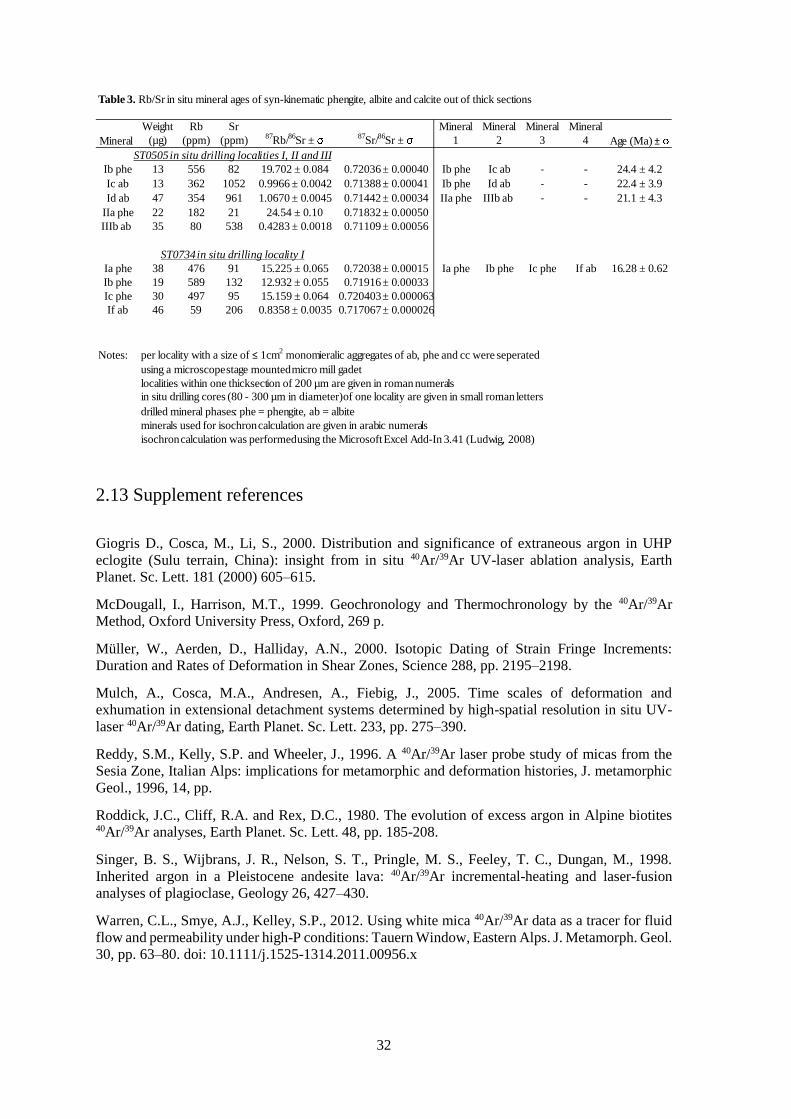
32
2.13 Supplement references
Giogris D., Cosca, M., Li, S., 2000. Distribution and significance of extraneous argon in UHP
eclogite (Sulu terrain, China): insight from in situ 40Ar/39Ar UV-laser ablation analysis, Earth
Planet. Sc. Lett. 181 (2000) 605–615.
McDougall, I., Harrison, M.T., 1999. Geochronology and Thermochronology by the 40Ar/39Ar
Method, Oxford University Press, Oxford, 269 p.
Müller, W., Aerden, D., Halliday, A.N., 2000. Isotopic Dating of Strain Fringe Increments:
Duration and Rates of Deformation in Shear Zones, Science 288, pp. 2195–2198.
Mulch, A., Cosca, M.A., Andresen, A., Fiebig, J., 2005. Time scales of deformation and
exhumation in extensional detachment systems determined by high-spatial resolution in situ UV-
laser 40Ar/39Ar dating, Earth Planet. Sc. Lett. 233, pp. 275–390.
Reddy, S.M., Kelly, S.P. and Wheeler, J., 1996. A 40Ar/39Ar laser probe study of micas from the
Sesia Zone, Italian Alps: implications for metamorphic and deformation histories, J. metamorphic
Geol., 1996, 14, pp.
Roddick, J.C., Cliff, R.A. and Rex, D.C., 1980. The evolution of excess argon in Alpine biotites 40Ar/39Ar analyses, Earth Planet. Sc. Lett. 48, pp. 185-208.
Singer, B. S., Wijbrans, J. R., Nelson, S. T., Pringle, M. S., Feeley, T. C., Dungan, M., 1998.
Inherited argon in a Pleistocene andesite lava: 40Ar/39Ar incremental-heating and laser-fusion
analyses of plagioclase, Geology 26, 427–430.
Warren, C.L., Smye, A.J., Kelley, S.P., 2012. Using white mica 40Ar/39Ar data as a tracer for fluid
flow and permeability under high-P conditions: Tauern Window, Eastern Alps. J. Metamorph. Geol.
30, pp. 63–80. doi: 10.1111/j.1525-1314.2011.00956.x
Table 3. Rb/Sr in situ mineral ages of syn-kinematic phengite, albite and calcite out of thick sections
Mineral
Weight
(µg)
Rb
(ppm)
Sr
(ppm)87
Rb/86
Sr ±87
Sr/86
Sr ±
Mineral
1
Mineral
2
Mineral
3
Mineral
4 Age (Ma) ±
ST0505in situ drilling localities I, II and III
Ib phe 13 556 82 19.702 ± 0.084 0.72036± 0.00040 Ib phe Ic ab - - 24.4 ± 4.2
Ic ab 13 362 1052 0.9966 ± 0.0042 0.71388± 0.00041 Ib phe Id ab - - 22.4 ± 3.9
Id ab 47 354 961 1.0670 ± 0.0045 0.71442± 0.00034 IIa phe IIIb ab - - 21.1 ± 4.3
IIa phe 22 182 21 24.54 ± 0.10 0.71832± 0.00050
IIIb ab 35 80 538 0.4283 ± 0.0018 0.71109± 0.00056
ST0734in situ drilling locality I
Ia phe 38 476 91 15.225 ± 0.065 0.72038± 0.00015 Ia phe Ib phe Ic phe If ab 16.28 ± 0.62
Ib phe 19 589 132 12.932 ± 0.055 0.71916± 0.00033
Ic phe 30 497 95 15.159 ± 0.064 0.720403± 0.000063
If ab 46 59 206 0.8358 ± 0.0035 0.717067± 0.000026
Notes: per locality with a size of ≤ 1cm2
monomieralic aggregates of ab, phe and cc were seperated
using a microscopestage mountedmicro mill gadet
localities within one thicksection of 200 µm are given in roman numerals
in situ drilling cores (80 - 300 µm in diameter)of one locality are given in small roman letters
drilled mineral phases: phe = phengite, ab = albite
minerals used for isochroncalculation are given in arabic numerals
isochroncalculation was performedusing the MicrosoftExcel Add-In 3.41 (Ludwig, 2008)
33
3. Translation of indentation into lateral extrusion across a
restraining bend: The western Tauern Window, Eastern Alps
3.1 Keywords
Eastern Alps; Tauern Window; Dolomites indentation; lateral extrusion; transpression; restraining
bend
3.2 Abstract
The western Tauern Window accommodated shortening comparable to a crumble zone generated
by convergence between the Dolomites indenter and the European foreland in the Oligo-Miocene
time and translated this deformation into lateral extrusion. Our structural results point to a zone of
localized deformation on the scale of the orogen consisting of tight, upright folds associated with a
network of sinistral shear zones striking from southwest of the Indenter tip through the western
Tauern Window and finally terminating in the SEMP Fault. Hence, the western Tauern Window
links the sinistral NNE-striking Giudicarie Belt with the sinistral east-striking SEMP Fault, forming
a large-scale restraining bend between them. The relationship between folds, shear zones and
fabrics of the western Tauern Window (fold axial planes (AP2), axial-plane foliations (S2), and
sinistral shear zones (Csin)) indicate an overall transpressional strain field.
North-directed Dolomites indentation of 58 km resulted in upright ENE-striking folds
accommodating 38 km of shortening and a spatially associated, coeval network of sinistral shear
zones accommodating the remaining 20 km of shortening, causing 26–31 km sinistral
displacement. The kinematic continuity of the SEMP Fault with the Giudicarie Belt reinforces the
idea that extensional displacement along the Brenner Fault is modest, hence exhumation of the
western Tauern Window occurred mainly by folding and erosion, and extensional unroofing was of
minor importance.
3.3 Introduction
The Tauern Window (Figure 1a) is the largest tectonic window of the Eastern Alps, where lower
plate rocks once buried to depths >35 km were exhumed to ground level in Cenozoic time (e.g.,
Selverstone and Spear, 1985; Spear and Franz, 1986; Kurz et al., 2008). This east-west elongate
window is a structural and metamorphic dome, whose arcuate axis coincides with the areas of
Cenozoic, high-grade Barrovian metamorphism (Grundmann and Morteani, 1985; Selverstone,
1985) and with the youngest cooling ages (Most, 2003; Luth and Willingshofer, 2008; Rosenberg
and Berger, 2009; Bertrand, 2013). The Tauern Window can be subdivided into an eastern and a
western sub-dome, both characterized by elongate, concentric, metamorphic isograds (Grundmann
and Morteani, 1985) and by intersecting and bordering shear zones (e.g., Neubauer et al., 1999;
Linzer et al., 2002; Rosenberg et al., 2004; Scharf et al., 2013; Schneider et al., 2013). The central
area between the two sub-domes is devoid of shear zones and characterized by the presence of
higher tectonostratigraphic nappes that are mainly eroded within the adjacent sub-domes (Bousquet
et al., 2012a; Schmid et al., 2013). The current debate on the exhumation mechanisms of the Tauern
Window can be illustrated by two opposite models. One emphasizes orogen-parallel, large-scale
extension, exhuming the eastern and western margins of the Tauern Window along low-angle
34
normal faults (e.g., Neubauer et al., 1999; Frisch et al., 2000). The other model emphasizes upright
folding associated with erosional denudation (e.g., Cornelius, 1940; Laubscher, 1990). In spite of
these differences, most authors agree on two points. First, exhumation of the Tauern Window is
mainly caused by the northward displacement of the Dolomites Indenter (Figure 1a) (e.g.,
Cornelius, 1940). Second, Dolomites indentation caused an eastward, lateral extrusion of the
Eastern Alps, associated with orogen-parallel extension (Figure 1a) (Ratschbacher et al., 1991a).
However, the timing of Dolomites indentation, the absolute amounts of shortening, displacement
and extension remain controversial (Neubauer et al., 1999; Frisch et al., 2000; Linzer et al., 2002;
Rosenberg and Berger, 2009; Pomella et al., 2011, 2012; Rosenberg and Garcia, 2011, 2012;
Fügenschuh et al., 2012; Luth et al., 2013; Scharf et al., 2013; Schmid et al., 2013).
We present new structural data from the western Tauern Window that we combine with a
compilation of existing foliation data from the Tauern Window (Figure 2) (Angel and Staber, 1950;
Exner, 1956; 1962a; 1962b; 1979; 1980; 1983; 1989; Karl et al., 1979; Frank et al., 1987; Becker,
1993; Höck et al., 1994; Giese, 2004; Lichtenheld, 2004; Moser, 2006; Frank and Pestal, 2008;
Rockenschaub et al., 2009; 2011) to highlight the structural differences between the eastern and
western sub-domes. We discuss these differences with respect to the kinematics of the Eastern Alps,
and show that they reflect a large-scale transition from indentation to lateral extrusion that is
consistent with our re-estimates of the amounts of shortening, displacement and extension in the
western Tauern Window.
3.4 Geological setting of the western Tauern Window
3.4.1 Tectonometamorphic frame
The deepest structural units of the Tauern Window (Figure 1a) consist of Variscan basement,
Permo-Carboniferous intrusives and their parautochtoneous host rocks covered by Post-Variscan
meta-sediments, all forming the Venediger Duplex (Schmid et al., 2013). Rock units of the
European distal Margin, the Matreier Zone (Piemont-Liguria Ocean), and the Glockner Nappe
(Valais Ocean) were thrust on top of the Venediger Duplex (Figure 1a) (Schmid et al., 2013). The
Austroalpine nappes surrounding the Tauern Window (Figure 1a) are Adria-derived and were thrust
over Europe in the Cretaceous (Schmid et al., 2013).
The European distal margin consists of felsic and carbonate rocks, Triassic and Jurassic marbles
(e.g. Hochstegenkalk) and bodies of Cenozoic eclogites (Schmid et al., 2013). The Matreier Zone
is considered as a fossil accretionary prism formed during the subduction of the Piemont-Liguria
Ocean in the Late Cretaceous (Schmid et al., 2013). It consists of an imbrication or mélange zone
with m- to km-scale blocks of sedimentary to metamorphic rocks (Schmid et al., 2013) embedded
in calcareous micaschists and subordinate ophiolitic lithologies.
The Glockner Nappe (Valais Ocean) consists mainly of calcareous micaschists and meta-pelites of
Cretaceous age (Höck et al., 2006). It underwent the main stage of Barrovian metamorphism in the
upper greenschist to amphibolite facies (0.53 GPa, 530 °C), with an early, poorly preserved
blueschist and eclogite stage and prior to the amphibolite-facies metamorphism (Dachs and Proyer,
2001).
The timing of high-P (blueschist-facies) metamorphism is controversially debated. Some authors
argue for Eocene (36 Ma, Zimmermann et al., 1994; 42-39 Ma, Ratschbacher et al., 2004; 39-38
Ma, Kurz et al., 2008) others for Oligocene (32 Ma, Glodny et al., 2005; 33 Ma, Smye et al., 2011;
33 Ma, Nagel et al., 2013). Kurz et al., (2008) argue for deformation-induces resetting during
eclogite-facies metamorphism at 32 Ma. All units inside the Tauern Window were affected by
Barrovian metamorphism (amphibolite-facies) subsequent ore coeval to the high-P event eclogite
zone (Frank et al., 1987; Selverstone, 1993), in the Oligocene (32 Ma, von Blanckenburg et al.,

35
1989; 30-28, Inger and Cliff, 1994; ca. 30 Ma, Smye et al., 2011). The isograds of the Barrow
metamorphism are concentric, cross-cut the nappe contacts and are sub-parallel to the upright folds
that fold the nappes (e.g., Rosenberg and Garcia, 2011).
Figure 1a: Simplified tectonostratigraphic map of the Tauern Window and surrounding units, modified after
(Bousquet et al., 2012b). Highlighted are the discussed fault systems active in Cenozoic time. AhSZ=Ahrntal
Shear Zone, ASZ=Ahorn Shear Zone, BF=Brenner Fault, DAV=Defereggen-Antholz-Vals Fault,
GSZ=Greiner Shear Zone, JF=Jaufen Fault, KLT=Königssee-Lammertal-Traunsee Fault, KF=Katschberg
Fault, MM=Meran-Mauls Fault, MMB=Meran-Mauls Basement, NFG=North Giudicarie Fault,
OSZ=Olperer Shear Zone, PF=Passeier Fault, PGF=Pustertal-Gailtal Fault, SEMP=Salzach-Ennstal-
Mariazell-Puchberg Fault, SGF=South Giudicarie Fault, TF=Tonale Fault. Fold structures are AA=Ahorn
Antiform, GS=Greiner Synform, HD=Hochalm Dome, MS=Mallnitz Synform, SD=Sonnblick Dome,
TA=Tuxer Antiform, ZA=Zillertaler Antiform b: Structural section crossing the western Tauern Window,
simplified after Schmid et al. (2013). c: Structural section crossing the eastern Tauern Window, simplified
after Schmid et al. (2013).

36
The Austroalpine Units south of the Tauern Window are delimited by the Southern Alps. Because
the latter were shortened less than the orogenic wedge described above, they are considered to have
acted as indenters during collision (Ratschbacher et al., 1991; Rosenberg et al., 2004).
3.4.2 Structural frame
The western sub-dome consists of three upright antiforms (Ahorn-, Tuxer-, and Zillertaler
Antiform; Figure 1a) that refold Early Alpine foliations generated by north-vergent nappe stacking
during Adria-Europe collision (Schmid et al., 2013). Two-dimensional line-length balancing of the
upright folds in the western sub-dome yields shortening amounts of 49 km for the entire dome
structure (Rosenberg and Berger, 2009), or 32 km Schmid et al. (2013), for the Venediger Duplex
above the present see-level. The upright folds are tight, strike ENE, have sub-horizontal doubly
plunging fold axes, sub-vertical axial planes often associated with axial-plane foliations. The
projected top of the antiform has a height of 17 km (Figure 1b), from which an amplitude >20 km
was inferred. In contrast, in the central and eastern Tauern Window upright folds strike east to ESE,
have a lower top of the antiform (10 km, Figure 1c), and no axial-plane foliation (Figure 2). These
differences point to an eastward, along strike decrease in the amount of shortening.
Figure 2: Foliation map of the Tauern Window shows the main foliation (undifferentiated). Compiled
literature data and own data (see paragraph 3.3 Introduction for references).
The western margin of the Tauern Window is overprinted by the extensional Brenner Fault
(Behrmann, 1988; Selverstone, 1988); the northern and southern margins of the western sub-dome
and the tight, central Greiner Synform (Figure 1a) are overprinted by sinistral shear zones, striking
sub-parallel to the axial planes of the upright folds. The major shear zones from north to south are
the Ahorn (e.g., Rosenberg and Schneider, 2008), the Greiner (e.g., Steffen et al., 2001) and the
Ahrntal shear zones (e.g., Reicherter et al., 1993), each of them being 1-3 km wide and several tens
of kilometers long (Figure 1a). In addition, several small-scale sinistral shear zones in the range of
10s to 100s of meters width occur in and around the western Tauern Window (Figure 1a, and see
paragraph 3.5.2 Shear zones of the western Tauern Window).

37
3.4.3 Timing of sinistral and extensional shear
Dating of fabric forming minerals of the major shear zones (Ahorn, Greiner, and Ahrntal shear
zones) points to the inception of sinistral shear in the Lower Oligocene (33 Ma) that continued
until Upper Miocene time (Figure 3) (Barnes et al., 2004; Cole et al., 2007; Glodny et al., 2008;
Schneider and Hammerschmidt, 2009; Kurz et al., 2008; Kitzig, 2010; Pollington and Baxter, 2010;
Schneider et al., 2013). Miocene deformation ages also resulted from dating of minor shear zones
in and around the western Tauern Window (Rinderkar, Tuxer, Olperer, Speikboden shear zones and
Jaufen Fault) (Mancktelow et al., 2001, Müller et al., 2001; Cole et al., 2007; Frisch, 2010;
Schneider et al., 2013). Sinistral shear terminated at 12-10 Ma inside the western Tauern Window
(Schneider et al., 2013) and at 15-19 at the northern and southern margins (Schneider et al., 2013,
Schneider et al., (in prep.)). Age data of fabric forming minerals and zircon fission tack (ZFT)
cooling ages of the folded footwall of the Brenner Fault suggest a longevitiy of 15 Myr (21-7 Ma,
Figure 3) (Fügenschuh et al., 1997; Glodny et al., 2008).
Figure 3: Time ranges of cooling ages from the western Tauern Window (upper third). Rb/Sr white mica
(Satir, 1975; Satir and Morteani, 1982; von Blanckenburg et al., 1989); K/Ar white mica (Satir, 1975; Raith
et al., 1978; Thöni, 1980; von Blanckenburg et al., 1989); K/Ar biotite (Satir, 1975; Raith et al., 1978; von
Blanckenburg et al., 1989; Most, 2003); Rb/Sr biotite (Satir, 1975; Borsi et al., 1978; von Blanckenburg et
al., 1989); ZFT (Fügenschuh et al., 1997; Most, 2003; Bertrand, 2013); AFT (Grundmann and Morteani,
1985; Fügenschuh et al., 1997; Most, 2003; Bertrand, 2013). Longevities of ductile shear zones inside and
transpressive faults outside the western Tauern Window (lower two third). North Giudicarie Fault (Müller et
al., 2001); Jaufen Fault (Müller et al., 2001; Viola et al., 2001; Pomella et al., 2012; Bertrand, 2013
Schneider et al., (in prep.)); Brenner Fault (Fügenschuh et al., 1997; Glodny et al., 2008); Ahrntal Shear
Zone (Cole et al., 2007; Glodny et al., 2008; Schneider and Hammerschmidt, 2009; Kitzig, 2010); Greiner
Shear Zone (Barnes et al., 2004; Cole et al., 2007; Glodny et al., 2008; Pollington and Baxter, 2010;
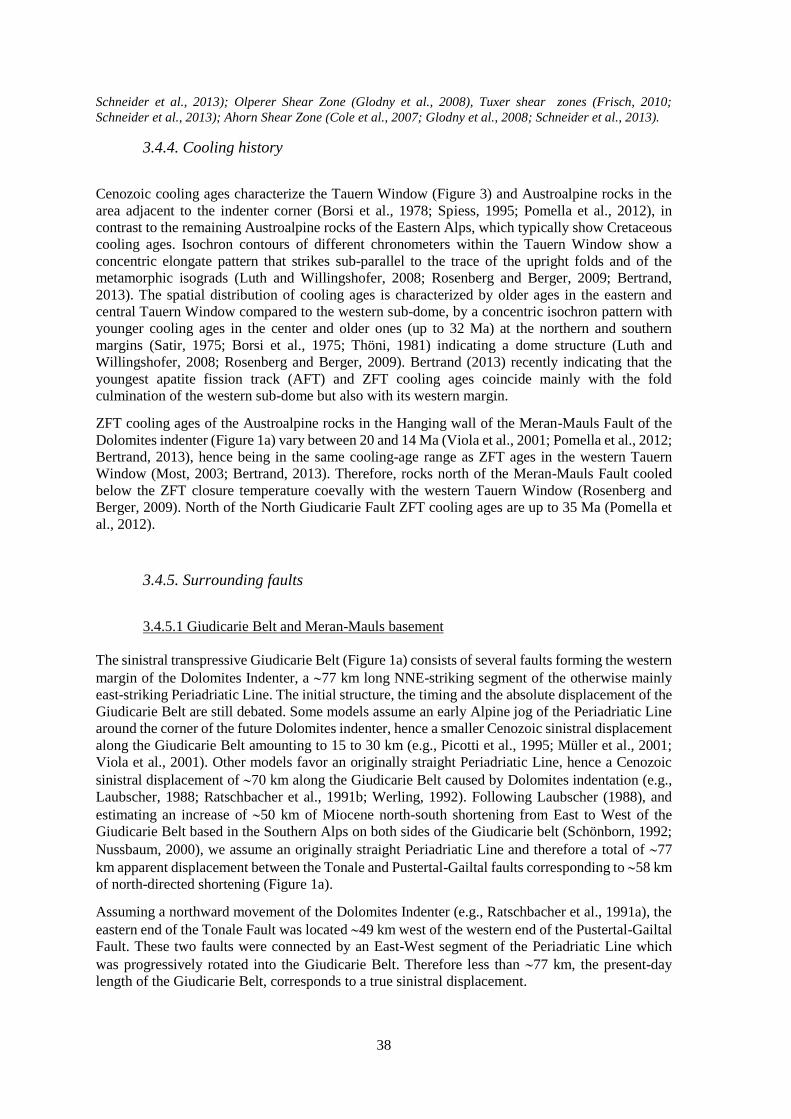
38
Schneider et al., 2013); Olperer Shear Zone (Glodny et al., 2008), Tuxer shear zones (Frisch, 2010;
Schneider et al., 2013); Ahorn Shear Zone (Cole et al., 2007; Glodny et al., 2008; Schneider et al., 2013).
3.4.4. Cooling history
Cenozoic cooling ages characterize the Tauern Window (Figure 3) and Austroalpine rocks in the
area adjacent to the indenter corner (Borsi et al., 1978; Spiess, 1995; Pomella et al., 2012), in
contrast to the remaining Austroalpine rocks of the Eastern Alps, which typically show Cretaceous
cooling ages. Isochron contours of different chronometers within the Tauern Window show a
concentric elongate pattern that strikes sub-parallel to the trace of the upright folds and of the
metamorphic isograds (Luth and Willingshofer, 2008; Rosenberg and Berger, 2009; Bertrand,
2013). The spatial distribution of cooling ages is characterized by older ages in the eastern and
central Tauern Window compared to the western sub-dome, by a concentric isochron pattern with
younger cooling ages in the center and older ones (up to 32 Ma) at the northern and southern
margins (Satir, 1975; Borsi et al., 1975; Thöni, 1981) indicating a dome structure (Luth and
Willingshofer, 2008; Rosenberg and Berger, 2009). Bertrand (2013) recently indicating that the
youngest apatite fission track (AFT) and ZFT cooling ages coincide mainly with the fold
culmination of the western sub-dome but also with its western margin.
ZFT cooling ages of the Austroalpine rocks in the Hanging wall of the Meran-Mauls Fault of the
Dolomites indenter (Figure 1a) vary between 20 and 14 Ma (Viola et al., 2001; Pomella et al., 2012;
Bertrand, 2013), hence being in the same cooling-age range as ZFT ages in the western Tauern
Window (Most, 2003; Bertrand, 2013). Therefore, rocks north of the Meran-Mauls Fault cooled
below the ZFT closure temperature coevally with the western Tauern Window (Rosenberg and
Berger, 2009). North of the North Giudicarie Fault ZFT cooling ages are up to 35 Ma (Pomella et
al., 2012).
3.4.5. Surrounding faults
3.4.5.1 Giudicarie Belt and Meran-Mauls basement
The sinistral transpressive Giudicarie Belt (Figure 1a) consists of several faults forming the western
margin of the Dolomites Indenter, a 77 km long NNE-striking segment of the otherwise mainly
east-striking Periadriatic Line. The initial structure, the timing and the absolute displacement of the
Giudicarie Belt are still debated. Some models assume an early Alpine jog of the Periadriatic Line
around the corner of the future Dolomites indenter, hence a smaller Cenozoic sinistral displacement
along the Giudicarie Belt amounting to 15 to 30 km (e.g., Picotti et al., 1995; Müller et al., 2001;
Viola et al., 2001). Other models favor an originally straight Periadriatic Line, hence a Cenozoic
sinistral displacement of 70 km along the Giudicarie Belt caused by Dolomites indentation (e.g.,
Laubscher, 1988; Ratschbacher et al., 1991b; Werling, 1992). Following Laubscher (1988), and
estimating an increase of 50 km of Miocene north-south shortening from East to West of the
Giudicarie Belt based in the Southern Alps on both sides of the Giudicarie belt (Schönborn, 1992;
Nussbaum, 2000), we assume an originally straight Periadriatic Line and therefore a total of 77
km apparent displacement between the Tonale and Pustertal-Gailtal faults corresponding to 58 km
of north-directed shortening (Figure 1a).
Assuming a northward movement of the Dolomites Indenter (e.g., Ratschbacher et al., 1991a), the
eastern end of the Tonale Fault was located 49 km west of the western end of the Pustertal-Gailtal
Fault. These two faults were connected by an East-West segment of the Periadriatic Line which
was progressively rotated into the Giudicarie Belt. Therefore less than 77 km, the present-day
length of the Giudicarie Belt, corresponds to a true sinistral displacement.

39
To the north, the Giudicarie Belt terminates in the Jaufen, the Meran-Mauls, and the Passeier faults,
that together with the southwestern corner of the Tauern Window delimit the so-called Meran-
Mauls basement (Figure 1a) (Pomella et al., 2011, 2012). The Passeier Fault is a late-stage structure
of the Giudicarie Belt, since it crosscuts and postdates the Jaufen and the Meran-Mauls fault (Müller
et al., 2001; Pomella et al., 2011).
Deformation age data of faults from the Giudicarie Belt cover the Oligo-Miocene time range.
Thrust-related mylonites and pseudotachylites along the North Giudicarie and Meran-Mauls faults
reveal Oligocene deformation ages (32-29 Ma and 26.9±0.8 Ma, respectively) (Müller et al., 2001).
Pre-kinematic zircons of sinistrally and dextrally sheared dykes along the Jaufen Fault predated
shearing at 32-30 Ma (Müller et al., 2001), whereas pseudotachylites and syn-kinematic minerals
of mylonites from the Jaufen Fault reveal Oligo-Miocene deformation ages (21-17 Ma and 24-14
Ma, respectively) (Müller et al., 2001; Schneider et al., (in prep.)). Analyses of a pseudotachylite
from the Passeier Fault revealed Miocene deformation age of 17.3±1.1 Ma (Müller et al., 2001).
Pomella et al. (2011, 2012), based on paleomagnetic and magnetic fabric, and on geochronological
and structural data suggested that the activity of the Giudicarie Belt including the Meran-Mauls
Fault started in Late Oligocene after emplacement of the Periadriatic intrusions (42-30 Ma). The
first phase of the sinistral Giudicarie Belt bent the Periadriatic Line and terminated in the thrust of
the Meran-Mauls Fault (Figures, 1a and 3), where deformation continued along the Naif Fault
(Pomella et al., 2011). A second phase, during ongoing indentation, led to the formation of the
Passeier- and the North Giudicarie faults, crosscutting the Meran-Mauls and Jaufen faults in their
later stager, and to the exhumation of the Meran-Mauls basement at 17 Ma (Figures, 1a and 3).
Scharf et al. (2013) and Schmid et al. (2013) argue for initiation of Dolomites indentation not earlier
than in Miocene time using local stratigraphic age constraints from the Monte Brione formation
(Luciani and Silvestrina, 1996; Sciunnach, 2010), located close to the South Giudicarie Fault and
from “thermal modelling” of the exhumation of the western Tauern Window (Fügenschuh et al.,
1997), (see paragraph 5.5 for discussion).
3.4.5.2. Salzach-Ennstal-Mariazell-Puchberg (SEMP) Fault
The sinistral transpressive SEMP Fault (Figure 1a) strikes ENE, starting from the northern central
margin of the Tauern Window, along 400 km until the Vienna Basin (Frost et al., 2009). This fault
was active in the Oligo-Miocene, as suggested from 40Ar/39Ar ages of syn-kinematic white micas
(Urbanek, 2002) and by deformed Miocene sediments in the Hieflau and Vienna basins (Peresson
and Decker, 1997). Deformation of quaternary stalactites suggests that the SEMP Fault is still active
at least along its eastern segment (Plan et al., 2010). Balancing the displacement accommodated by
the SEMP Fault yield 60 km of left-lateral motion (Linzer et al., 2002). Analogue models
(Ratschbacher et al., 1991a; Rosenberg et al., 2004; 2007) designed to simulate indentation into the
Eastern Alps suggest that the activation of sinistral analogue faults forming the northern boundary
of the extruding wedge, as the SEMP Fault, may initiate in the earliest stages of indentation being
approximately parallel to the western indenter margin, and rotate clockwise towards the northern
margin of the Dolomites indenter.
3.4.5.3 Pustertal-Gailtal Fault
The Pustertal-Gailtal Fault (Figure 1a) formed along a segment of the pre-existing Periadriatic Line
that has a prolonged tectonic history starting in Cretaceous (Schmid et al., 2013). Estimates on the
Oligo-Miocene displacement are missing (Bistacchi et al., 2010). K/Ar formation ages of illite
fractions of the brittle Sprechenstein-Mauls fault gouge, the westernmost segment of the Pustertal-
Gailtal Fault vary between 13 and 16 Ma (Zwingmann and Mancktelow, 2004).

40
3.4.5.4 Defereggen-Antholz-Vals (DAV) and Speikboden faults
The 90 km long DAV Fault within the Austroalpine rocks (Figure 1a) coincides with the southern
limit of Alpine metamorphism (Hoinkes et al., 1999) separating Cenozoic and partly reset Rb/Sr
biotite cooling ages in the north from pre-Alpine Rb/Sr biotite cooling ages in the south (Borsi et
al., 1973, 1978). 40Ar/39Ar dating of pseudotachylites from the DAV Fault yield 25.5±0.9 Ma,
whereas a pseudotachylite from the Speikboden shear zone yields an apparent age of 20 Ma
(Mancktelow et al., 2001; Müller et al., 2001). Syn-kinematic micas of sinistral mylonites (Rb/Sr
microsampling), and zircons (U/Pb) from sinistrally deformed dykes, yield, deformation and
intrusion ages of 30 Ma suggesting that sinistral shear terminated at 30 Ma (Müller et al., 2000).
The Speikboden Fault (Figure 4d) was interpreted as antithetic Riedel to the Pustertal-Gailtal Fault
(Mancktelow et al., 2001; Müller et al., 2001). Considering its parallel orientation to some of the
sinistral shear zones inside of the western Tauern Window (Figure 4d), and its Miocene deformation
age (Mancktelow et al., 2001), we suggest that this and other NE-directed sinistral shear zones in
the Austroalpine are related to the sinistral shear zones inside the western Tauern Window, which
also have Miocene deformation ages (Glodny et al., 2008; Pollington and Baxter, 2010; Schneider
et al., 2013).
3.4.5.5 Brenner Fault
First estimates on the amount of east-west extension vary between 9 and 14 km (Behrmann, 1988),
or “several to tens” of kilometers (Selverstone, 1988). Recent estimates vary between 70 km
(Fügenschuh et al., 1997), 4-12 km (Rosenberg and Garcia, 2011, 2012) and 44 km (Fügenschuh et
al., 2012). The vertical offset (stratigraphic omission) of the Brenner Fault varies continuously
along strike (Rosenberg and Garcia, 2011, 2012) and attains a maximum of 17 km in the area of
the Brenner Pass, along the hinge of the Tuxer Antiform (Figure 1a), where the Brenner Mylonites
have their maximum thickness (Behrmann, 1988; Selverstone, 1988; Axen et al., 1995).
Recent re-assessment (Rosenberg and Garcia, 2011, 2012; Fügenschuh et al., 2012) showed that
east-west extension along the Brenner Fault was overestimated in previous studies (Axen et al.,
1995; Selverstone et al., 1995; Fügenschuh et al., 1997) because vertical displacements from both
normal faulting and upright folding was entirely attributed to normal faulting. Following the
structural arguments of (Rosenberg and Garcia, 2011, 2012) and using the average dip angle of the
Brenner Mylonites obtained in this study we estimate that east-west extension accommodated by
the Brenner Fault is ≤10 km.
3.5 Results
3.5.1 Deformation fabrics
Based on their orientation and shear sense, we subdivided all structural data into five distinct
structural domains (Figure 4a) and three main foliations. Foliations that formed prior to upright
folding were summarized as S1 foliations (Figure 4b), although they may not have the same age. In
the Austroalpine rocks S1 foliations are Cretaceous (Bousquet et al., 2012b). In the European distal
Margin and ocean-derived units, S1 foliations formed during nappe-stacking and/or high-pressure
metamorphism in the Eocene (Bousquet et al., 2012b). In the Venediger Duplex S1 foliations
formed during north-vergent imbrication in the Eocene/Oligocene (Schmid et al., 2013) or in the
Oligocene (Glodny et al., 2005; Nagel et al., 2013). In addition, pre-alpine foliations e.g. of igneous
rocks or migmatites, do exist in the Venediger Duplex and in the Austroalpine rocks.

41

42
Figure 4: Different close up’s of the western Tauern Window based on (Bigi et al., 1994) showing a: the
outcrop distribution of this study and the five domains (A-E) in which the structural data were grouped. In
domain C the trace of the structural section between Rosskopf and Onsberg (Figure 5) is given; b: the
interpreted traces of the D2 upright folds and the abbreviations of the tectonostratigraphic units; c: the
interpreted traces of the S2a axial-plane foliation; d: the traces of the macro-scale sinistral shear zones and
their names are shown. In domains C and E top-to-the-west extensional displacement occurs along the
Brenner Mylonites and in minor shear zones. In domains A and D minor dextral displacement is associated
with sinistral one. Localities of the different Jaufen Fault branches: G=Gasteig, E=Elzenbaum.
Upright F2 folds with steep to vertical axial planes and sub-horizontal fold axes overprinted and
folded the S1 foliations (Figure 4c). Widespread axial-plane foliations (S2a) of the tight, upright F2
folds crosscut the folded nappe contacts. Along the western margin, where the hinge of the western
sub-dome plunges consistently west, doming caused moderately to gently westward dipping S2b
extensional foliations overprinting the pre-existing S1 foliations (Figure 4c). Both S2 foliations are
related to doming but spatially separated and further eastwards e.g., along the tight Greiner
Synform, afar from the westward plunging hinge of the sub-dome, the S2b extensional foliations
progressively turn into the S2a axial-plane foliations (Figure 2).
Locally a third, mylonitic foliation formed (Figure 4d) along major NNE- to ENE-striking, sinistral
(Csin) and minor ESE- to ENE-striking, dextral (Cdex) shear zones (Reicherter et al., 1993; Lammerer
and Weger, 1998; Cole et al., 2007; Rosenberg and Schneider, 2008; Schneider et al., 2013). West-
dipping foliations related to predominant top-to-the-west and minor top-to-the-east normal shear
zones (Cnor) along the western margin of the Tauern Window, the Brenner Mylonites, (Figure 4d)
(Behrmann, 1988; Selverstone, 1988) are interpreted to be contemporaneous with the transcurrent
shear zones. All shear foliations are tight, penetrative, mylonitic foliations, showing higher mica
contents (Selverstone, 1993), smaller grain sizes compared to the S2 foliations, and are associated
with shear indicators.
3.5.2. Shear zones of the western Tauern Window
Previous mapping and descriptions of map-scale sinistral shear zones of the western Tauern
Window differ significantly between each other e.g., (Figure 2, Behrmann and Frisch, 1990),
(Figures 1 and 2, Selverstone, 1985), (Figure 1, Selverstone et al., 1991), (Figures 1 and 2,
Reicherter et al., 1993), (Figure 3a, Lammerer and Weger, 1996), (Figure 1, Linzer et al., 2002),
(Figure 1, Rosenberg et al., 2004), (Figure 1, Rosenberg et al., 2007), (Figures 2 and 3, Glodny et
al., 2008), (Figure 1, Schmid et al., 2013). In the following we present a short kinematic and
petrologic summary and a new map (Figure 4) of the major ductile shear zones of the western
Tauern Window and its adjacent Austroalpine rocks, based on our new mapping of these structures.
A simplified structural section is draw crossing the Meran-Mauls basement (Figure 5).
3.5.2.1 Ahorn Shear Zone
The Ahorn Shear Zone is a 2.5 km wide and 50 km long transpressive mylonitic belt located at
the northern limb of the western sub-dome, showing sinistral and south-side-up kinematic indicators
(Figure 4d) (Rosenberg and Schneider, 2008). It strikes ENE and dips sub-vertically. The transition
from the brittle SEMP Fault to the easternmost Ahorn Shear Zone occurs in the area of Mittersill
and Krimml (Figure 4a) where overall sinistral brittle-ductile and ductile faults of the Rinderkar
Shear Zone strike nearly north and turn suddenly into the eastward striking SEMP Fault (Figure 4d)
(Cole et al., 2007).

43
Figure 5: SE trending structural cross section running from Rosskopf to Onsberg (see Figure 4a for map view). Lithological units were taken from the GK50 175 Sterzing.
Jaufen-, Fartleis- and Meran-Mauls faults are indicated.

44
3.5.2.2. Tuxer Shear Zones
A large number of outcrop-scale sinistral shear zones (1 to 10 m thickness) formed under lower
amphibolite-facies conditions affected the central area of the western sub-dome suggesting the
existence of an interconnected network that was termed Tuxer Shear Zones (Figure 4d) (Schneider
et al., 2013). These shear zones strike NE- to east and dip sub-vertically to steeply south. To the
ENE all these shear zones merge into the SEMP Fault (Figure 4d).
3.5.2.3 Greiner Shear Zone
The Greiner Shear Zone is situated within a first order tight syncline (Greiner Synform) between
two large-scale antiforms (Tuxer and Zillertaler antiforms) in the center of the western sub-dome
(Figures 1a and 4d) and affects all tectonostratigraphic units of the western Tauern Window
(Selverstone, 1993; Steffen et al., 2001). It strikes east to ENE, dips steeply south, and was formed
under amphibolite-facies conditions (e.g., Selverstone and Spear, 1985). Kinematic indicators show
both sinistral (De Vecchi and Baggio, 1982; Behrmann and Frisch, 1990) and dextral (Barnes et al.,
2004) senses of shear. Deformation temperatures increase eastwards and P estimates from syn-
kinematic garnet at the eastern end of the Greiner Shear Zone (Figure 4d) suggest that deformation
occurred at depths 35-40 km (Selverstone et al., 1991; Selverstone, 1993).
3.5.2.4 Olperer Shear Zone
Two sinistral shear zones (Lammerer and Weger, 1998, their Figure 3a), each of >40 km length,
were inferred to connect and enter the SEMP Fault near Krimml (Figure 4a). Own investigations
show that these structures are rather 10 to 15 km long (Figure 4d), strike NNE- to north and dip
moderately to sub-vertically WNW to west. Deformation occurred within a 300 m thick zone under
amphibolite-facies conditions, by combined sinistral and top-to-the-west extensional shear at the
western end of the Olperer Shear Zone (Ebner et al., 2004).
3.5.2.5. Ahrntal Shear Zone
The Ahrntal Shear Zone (Figure 4d) is a 1.7 km wide and 70 km long (Schneider et al., 2009)
transpressive mylonitic zone with predominant sinistral, minor dextral and north-side-up shear
sense indicators, which strikes NE- to ENE and dips steeply to sub-vertically south. The Ahrntal
Shear Zone formed under lower amphibolite- to greenschist-facies conditions (Kitzig, 2010;
Wollnik, 2012). Key outcrops from north to south in the Vals Valley show south-directed and
progressive transition from upright, tight folds (Figure 6a) in the north, to isoclinal folds with an
axial-plane foliation (S2; Figure 6b), finally overprinted by sinistral shear zones, also showing
north-side-up kinematic indicators in the south (Figures 6c and 6d).
45
Figure 6: Field photographs along the Vals valley from north to south. a: folded S1 upright tight folds, b:
tightly folded S1 foliations, rootless folds, and newly formed sub-vertical S2a axial-plane foliations, c: sub-
vertical S2a axial-plane foliations and localized sinistral shear zones Csin having an additional north-side-up
component, d. top view on sub-vertical S2a axial-plane foliations and localized sinistral shear bands C’sin.
3.5.2.6 Meran-Mauls basement and Jaufen Fault
Our new structural data show that the Meran-Mauls basement between the Jaufen and the Meran-
Mauls faults is folded by upright folds (F2) that are continuous with those of the western Tauern
Window (Figures 4b, 4c, and 5). Since its first descriptions, the formation of the Jaufen Fault
(Figure 4d) was related to the motion of the Dolomites Indenter (Spiess, 1995, 2001). Similar to the
Olperer Shear Zone, field observations along the Jaufen Fault indicate that there are at least two
branches of the Jaufen Fault. One branch accommodating top-to-the-west extensional shear in the
area of Gasteig SW of Sterzing (Figure 4d) (Viola et al., 2001) and another branch affected by
upright folding and mainly sinistral shear outcropping on the road to Pensenjoch NW of Elzenbaum
(Figures 4d and 5) (Müller et al., 2001).

46
3.5.3 Structures of the western Tauern Window
3.5.3.1 S1 foliation
In domains A, B and C (Figure 4a) folded S1 foliations strike ENE and dip moderately to steeply
NNW but also SSE indicating a south-vergence of the sub-dome (Figures 7a, 7b, and 7c). The sub-
vertical pi-circle of domain A indicates a sub-horizontal WSW-ENE oriented fold axis (Figure 7a).
The pi-circles indicate gently ENE-ward plunging fold axis (Figure 7b) in domain B, and WSW-
ward plunging in domain C (Figure 7c). Along the northern and southern margins as well as in the
tight synclines of the western Tauern Window, S1 and S2 form a composite foliation. On the outcrop
scale regularly distributed crenulation cleavages and the occurrence of two distinct schistosities,
corresponding to folded S1 foliations crosscut by S2a axial-plane foliations are observed (Figure 4b).
3.5.3.2 F2 fold axes and axial planes
F2 fold axes (FA2) of domain A are sub-horizontal and oriented ENE-WSW (Figures 7a and 7f).
The corresponding sub-vertical F2 axial planes (AP2) strike ENE (Figure 7k). In domain B the
majority of the F2 fold axes plunge moderately ENE-ward (Figure 7b), whereas in domain C they
plunge SW-ward (Figure 7c). This change in plunge direction goes together with a similar change
in orientation of the sub-vertical F2 axial planes (Figures 7k, 7l, and 7m). The mean values of
domain A and B strike consistently ENE, in contrast to the one of domain C, which strikes sub-
parallel to the Meran-Mauls Fault and to the northwestern margin of the Dolomites Indenter
(Figures 1a, 4b, and 4d).
3.5.3.3 S2 foliations and L2 stretching lineations
In domain A the sub-vertical S2a axial-plane foliations strike consistently ENE (Figure 8a), slightly
more northward than the corresponding F2 axial planes (Figure 7k). The associated L2 lineations
plunge gently to sub-horizontally WSW, but also ENE. In domain B and C the mean values of the
steep to sub-vertical S2a axial-plane foliations strike ENE to NE (Figures 8b and 8c), which are
slightly more northward directed than in domain A. The mean value of domain B predominantly
dips SE-wards opposite to the one of domain C. The associated L2 lineations are oriented sub-
horizontally in domain B (Figure 8b) and plunge shallowly WSW in domain C (Figure 8c), hence
L2 lineations show a monotonous increase in plunge angle from NE to SW along strike (Figures 8a,
8b, and 8c). In domain E and at its transition to domain A shallowly, WNW-ward dipping S2b
extensional foliations dominate the structural grain. These foliations are composite foliations of the
folded and westward-dipping S1 foliations and top-to-the-west extensional shear planes.
Figure 7: Stereo32 version 0.9 was used to plot Schmidt nets (Röller and Trepmann, 2008). All plots are
equal area, lower hemisphere plots. Contouring using a cosine exponential equation was applied when the
data show a preferred orientation and their absolute number was higher than fifteen, in the remaining few
cases the raw data are shown. Mean values were deduced graphically in Stereo32 by the maxima of data
culminations. a, b, c, d, e: Stereoplots of contoured S1 foliations measurements in domains A-E. Great circles
indicate pi-circles. Number of data, contouring intervals and parameters, and pi-circle value are given in the
respective left columns. f, g, h, i, j: Stereoplots of contoured F2 fold axes (FA2) measurements in domains A-
E. Number of data, contouring intervals and parameters, and mean values are given in the respective left
columns. k, l, m, n, o: Stereoplots of contoured F2 axial planes (AP2) measurements in domains A-E. Great
circles indicate AP2 mean values. Number of data, contouring intervals and parameters, and mean values
are given in the respective left columns.

47

48
3.5.3.4 Shear zones
Where the steep to sub-vertical NE- to ENE-ward striking S2a axial-plane foliations are continuous
and tightly spaced, shear zones (Csin and Cdex) often occur, suggesting a control of deformation
localization by the pre-existing S2a axial-plane foliations. S2a axial-plane foliations together with
majoritarian sinistral shear zones form S-C-fabrics from cm- to km-scale. Similarly, extensional
shear zones (Cnor) occur predominantly along that part of the Brenner Fault (domain E, Figure 4a),
where the pre-existing S2b extensional foliations follow the arcuate strike of the westward plunging
hinge of the Tuxer Antiform (Figures 2 and 4c). S2b extensional foliations together with extensional
shear zones form S-C-fabrics of the Brenner Mylonites.
Transcurrent shear zones In domain A the sub-vertical sinistral shear zones (Csin) strike ENE
similar to, but slightly more northward than the corresponding S2a axial-plane foliations (Figures
8a and 8f). The associated Lsin lineations are sub-horizontal to gently NE-plunging (Figure 8f).
Some dextral shear zones inferred to be conjugated to the above mentioned sinistral ones, strike
east and are associated with variously plunging lineations (Ldex, Figure 9a). In domain B, sinistral
shear zones (Csin) strike NE and mainly dip steeply SE (Figure 8g). Sub-horizontal Lsin lineations
of these shear zones are NE-ward oriented (Figure 8g) but dips towards the NW. In domain C sub-
vertical sinistral shear zones (Csin) strike NE (Figure 8h), as in domain B (Figure 8g). The Lsin
lineations plunge moderately SW to WNW opposite to those on domain B. The strike of the dextral
shear zones within domain C is random (Figure 9e). In both domains B and C the mean values of
the Csin shear zones (Figures 8b and 8c) show a characteristic angle of 15 ° to the S2a axial-plane
foliation (Figures 8g and 8h).
Extensional shear zones In the area of the Olperer Shear Zone and the Jaufen Fault (Figure
4d) outcrop-scale shear zones show sinistral and top-to-the-west normal sense of shear, therefore
they are interpreted as transtensive structures connecting the Brenner Mylonites with the sinistral
shear zones of the western Tauern Window. The Cnor shear zones dip moderately NW in domain A
(Figure 9c) and gently NNE in domain C, where they are associated with shallowly NW plunging
Lnor lineations (Figure 9g).
Figure 8: Stereo32 version 0.9 was used to plot Schmidt nets (Röller and Trepmann, 2008). All plots are
equal area, lower hemisphere plots. Contouring using a cosine exponential equation was applied when the
data show a preferred orientation and their absolute number was higher than twenty, in the remaining few
cases the raw data are shown. If lineation and foliations are shown together in one plot, only foliations are
contoured. Mean values were deduced graphically in Stereo32 by the maxima of data culminations. a, b, c,
d, e: Stereoplots of contoured S2a axial-plane foliations measurements and L2 lineation measurements in the
domains A-E. Great circles indicate S2a mean values. Number of data, contouring intervals and parameters,
and mean values are given in the respective left columns and the lower right corners. f, g, h, i, j: Stereoplots
of contoured sinistral shear zones (Csin) measurements and Lsin lineation measurements in domains A-E.
Great circles indicate Csin mean values. Number of data, contouring intervals and parameters, and mean
values are given in the respective left columns and the lower right corners. k, l, m, n, o: Stereoplots of
contoured sinistral shear zones (C’sin) measurements in domains A-E. Great circles indicate C’sin mean
values. Number of data, contouring intervals and parameters, and mean values are given in the respective
left columns.

49
50
3.5.4 Periphery of the western sub-dome
3.5.4.1 Domain D
In contrast to domains A, B and C (Figure 4d) the structural elements in domain D, strike
predominantly east, and D2 structures like S2 foliations and shear zones are less developed. The
most common structural feature of this domain are folded S1 foliations, which strike east and
predominantly dip gently to steeply south (Figure 7d), hence the opposite direction compared to
domains A, B and C (Figures 7a, 7b, and 7c). The F2 fold axes are sub-horizontally east-west
oriented (Figures 7d and 7i). F2 axial planes are sub-vertical and strike east (Figure 7n). Towards
the west F2 folds tighten and S2a axial-plane foliations become more common.
The rarely observed sub-vertical S2a axial-plane foliations of domain D strike east and the related
L2 lineations consistently plunge gently east (Figure 8d), i.e., in the opposite direction of L2 in
domain C (Figure 8c). Sub-vertical sinistral shear zones (Csin) strike ENE showing gently westward
plunging Lsin lineations (Figure 8i) and sub-vertical dextral shear zones strike east (Figure 9j), both
being more eastward oriented than the ones in domains A, B, and C.
3.5.4.2 Domain E
The major difference between domain E and the remaining domains is that none of the D2 structural
elements AP2, S2a, Csin, and Cdex are sub-vertical. All these elements dip NW to NE indicating a
south-vergent fold (Brandner et al., 2008; Rosenberg and Garcia, 2011). The folded S1 foliations of
domain E strike NE to east and the F2 fold axes plunge gently west (Figures 7e and 7j). The F2 axial
planes (AP2) dip moderately north (Figure 7o), similar to those of domain D (Figure 7n). The S2a
axial-plane foliations strike ENE and mainly dip moderately NNW (Figure 8e), whereas the S2b
extensional foliations, following the westward plunging hinge, strike consistently NNE and dip
gently WNW (Figure 8o). Since the S2b extensional foliations are spatially restricted to the area NW
of the Indenter tip, we suggest that the oblique geometry of the indenter caused the S2b extensional
foliations. The associated L2 lineations plunge gently west (Figure 8e), as in domain C (Figure 8c).
Only few NE-striking sinistral (Figure 8j) and ESE-striking dextral shear zones (Figure 9k) were
observed. Numerous, top-to-the-west normal shear zones (Cnor), the Brenner Mylonites, occur (e.g.,
Axen et al., 1995). The gently SW-ward dipping extensional shear zones strike SE and the related
Lnor consistently plunge gently WSW (Figure 9m).
A key outcrop, where overprinting relations can be assessed is located at the main road in St. Jodok
(Figure 4a), where rocks of the Glockner nappe (Figure 10a) show northward dipping extensional
shear zones (Cnor, Figures 10a and 10c) overprinting tight north-vergent folds along their limbs and
synforms. Cnor are associated with collapse folds (F3) (Froitzheim, 1992) that refold the F2 folds and
have flat axial planes (AP3) with similar orientation to the Cnor planes (Figures 10a, 10b and 10c),
and vertical, NW-SE opening tension gashes (Figure 10d).
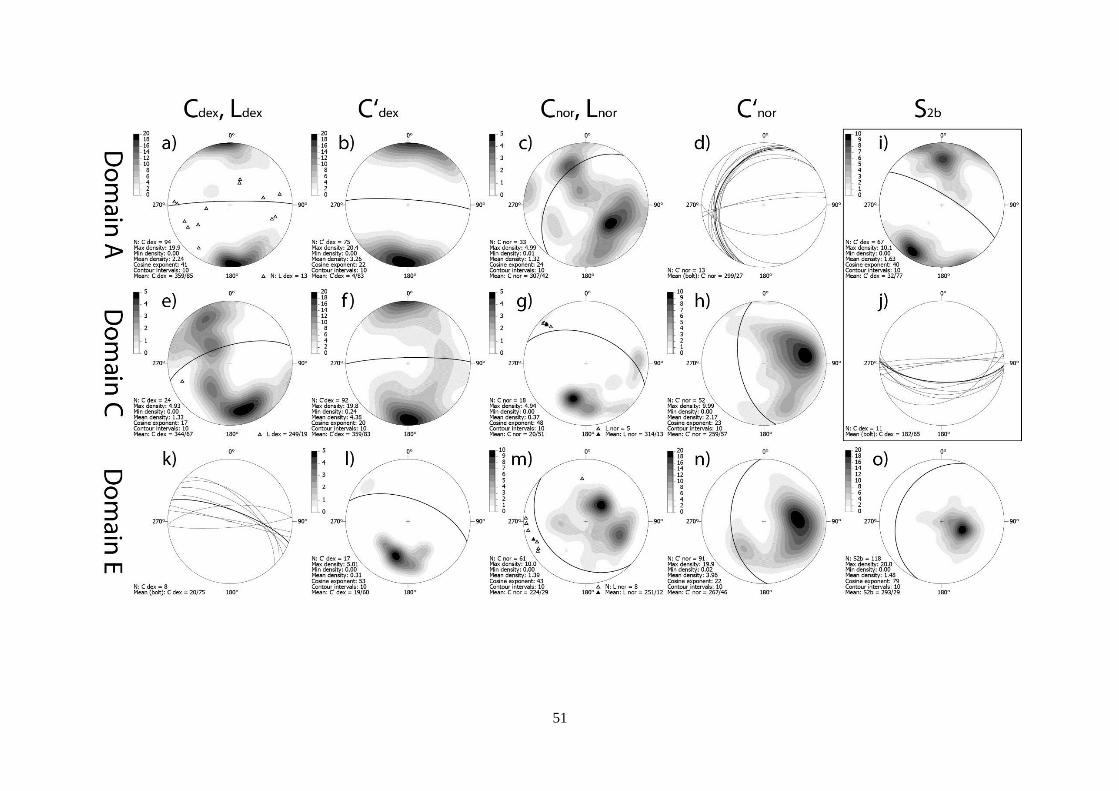
51
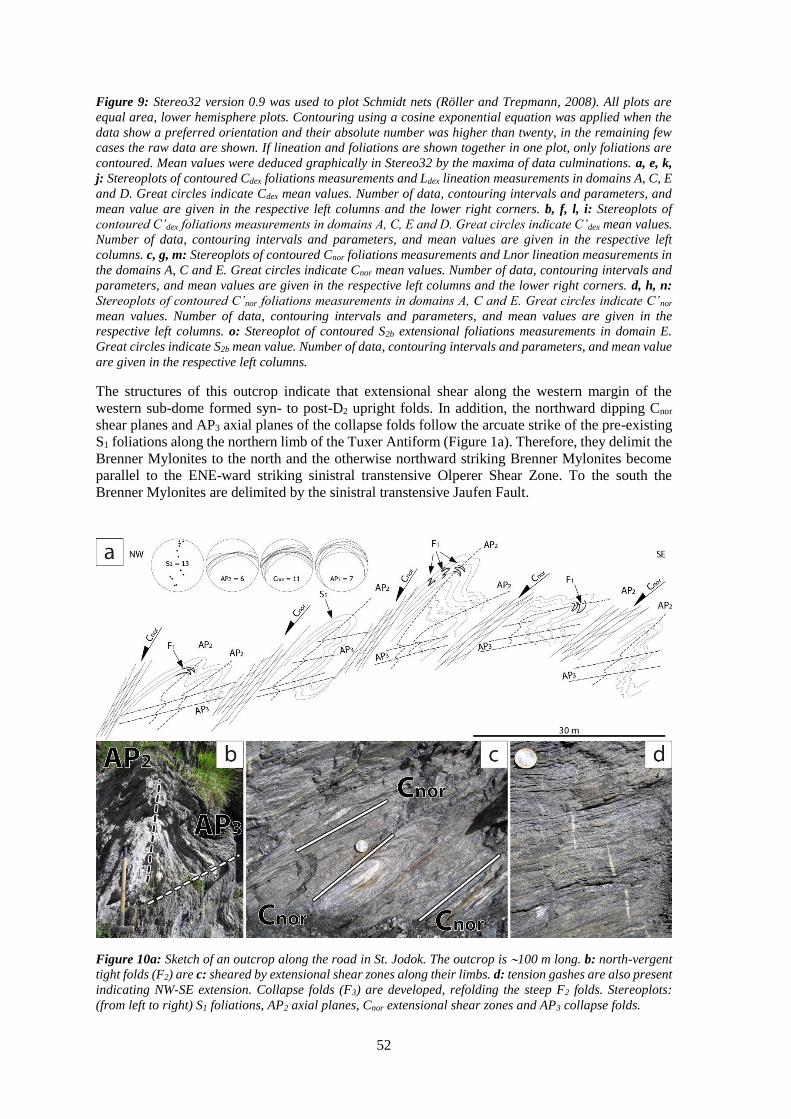
52
Figure 9: Stereo32 version 0.9 was used to plot Schmidt nets (Röller and Trepmann, 2008). All plots are
equal area, lower hemisphere plots. Contouring using a cosine exponential equation was applied when the
data show a preferred orientation and their absolute number was higher than twenty, in the remaining few
cases the raw data are shown. If lineation and foliations are shown together in one plot, only foliations are
contoured. Mean values were deduced graphically in Stereo32 by the maxima of data culminations. a, e, k,
j: Stereoplots of contoured Cdex foliations measurements and Ldex lineation measurements in domains A, C, E
and D. Great circles indicate Cdex mean values. Number of data, contouring intervals and parameters, and
mean value are given in the respective left columns and the lower right corners. b, f, l, i: Stereoplots of
contoured C’dex foliations measurements in domains A, C, E and D. Great circles indicate C’dex mean values.
Number of data, contouring intervals and parameters, and mean values are given in the respective left
columns. c, g, m: Stereoplots of contoured Cnor foliations measurements and Lnor lineation measurements in
the domains A, C and E. Great circles indicate Cnor mean values. Number of data, contouring intervals and
parameters, and mean values are given in the respective left columns and the lower right corners. d, h, n:
Stereoplots of contoured C’nor foliations measurements in domains A, C and E. Great circles indicate C’nor
mean values. Number of data, contouring intervals and parameters, and mean values are given in the
respective left columns. o: Stereoplot of contoured S2b extensional foliations measurements in domain E.
Great circles indicate S2b mean value. Number of data, contouring intervals and parameters, and mean value
are given in the respective left columns.
The structures of this outcrop indicate that extensional shear along the western margin of the
western sub-dome formed syn- to post-D2 upright folds. In addition, the northward dipping Cnor
shear planes and AP3 axial planes of the collapse folds follow the arcuate strike of the pre-existing
S1 foliations along the northern limb of the Tuxer Antiform (Figure 1a). Therefore, they delimit the
Brenner Mylonites to the north and the otherwise northward striking Brenner Mylonites become
parallel to the ENE-ward striking sinistral transtensive Olperer Shear Zone. To the south the
Brenner Mylonites are delimited by the sinistral transtensive Jaufen Fault.
Figure 10a: Sketch of an outcrop along the road in St. Jodok. The outcrop is 100 m long. b: north-vergent
tight folds (F2) are c: sheared by extensional shear zones along their limbs. d: tension gashes are also present
indicating NW-SE extension. Collapse folds (F3) are developed, refolding the steep F2 folds. Stereoplots:
(from left to right) S1 foliations, AP2 axial planes, Cnor extensional shear zones and AP3 collapse folds.
53
3.5.5 Shear bands
The mean values of sinistral shear bands (C’sin) within all five domains show remarkably similar
orientations. All mean values strike NE to NNE and are sub-vertical (Figures 8k, 8l, 8m, 8n, and
8o), or steeply NW dipping in domain E. The dextral shear bands C’dex in the domains A and C
strike east (Figures 9b and 9f), unlike in the peripheral domains D and E where the dextral shear
bands C’dex strike ESE (Figures 9i and 9l). Moderately westward dipping extensional shear bands
C’nor are a common feature of domain E and C and are related to the Cnor extensional shear zones
(Figures 9d, 9h and 9n) but are rarely observed in domain A (Figure 9d).
3.5.6 Structural summary
The structures of domains A, B, and C are similar with respect to the orientations of upright folds
and sinistral shear zones. In general, the mean values of the axial-plane foliations (S2a, Figures 8a,
8b, and 8c) show orientations that are slightly more north-directed than those of the axial planes
(AP2, Figures 7k, 7l, and 7m). The mean values of the sinistral shear zones (Csin, Figures 8f, 8g, and
8h) show orientations that are slightly more north-directed than the mean values of the axial-plane
foliations (S2a, Figures 8a, 8b, and 8c) of those domains. Hence, a successive formation of these
structures within an overall left-lateral system can be inferred. Along strike from the northeastern
to the southwestern termination the mean values of S2a, Csin and C’sin planes indicate a change in
dip direction from steeply NW-dipping in domain B (Figures 8b, 8g, and 8l) to sub-vertical in
domain A (Figures 8a, 8f, and 8k) to steeply SE-dipping in domain C (Figures 8c, 8h, and 8m). In
addition, the structural planes show an along strike change in strike direction from NE-striking in
domain B (Figures 8b, 8g, and 8l) to ENE-striking in domain A (Figures 8a, 8f, and 8k) and again
to NE-striking in domain C (Figures 8c, 8h, and 8m). These trends point to a large-scale sigmoidal
structure centered within domain A having its northeastern and southwestern terminations in
domains B and C.
3.5.7 Shortening accommodated by upright folding
To compare the amounts of shortening accommodated in the western and eastern sub-domes, we
performed line-length balancing of the base of the Austroalpine assuming a horizontal orientation
before upright folding (Figures 1b and 1c). Well aware of the fact that this can only be an first-order
estimate due the fact that orogen-parallel extension occurred perpendicular to the section and that
folding under high-temperature conditions may have lengthen the folded surface, we note that these
two effects may partly balance each other. The result suggest 38 km of shortening for the
westernmost part of the dome on the base of structural sections of Schmid et al. (2013). This
shortening amount is larger than the one estimated by Schmid et al. (2013) because it also includes
the Austroalpine units, which are folded together with the ones of the Tauern Window. Therefore,
20 km of the 58 km of indentation estimated above must have been accommodated by other
processes than folding. In the eastern part of the Tauern Window 20 km of shortening are
estimated by line-length balancing. This eastward decrease of shortening points to a clockwise
rotation of the Southern Alps, during indentation, or it might indicate the eastward decreasing
differential shortening by the obliquity of the Dolomites indenter.
54
3.6 Discussion
3.6.1 Comparison with earlier studies
Conceptual models claiming exhumation of the western Tauern Window by extensional unroofing,
require, that extensional displacements along the Brenner Fault are transferred to transcurrent
strike-slip faults located at the northern and southern terminations of the Brenner Fault (Fügenschuh
et al., 1997; Scharf et al., 2013; Schmid et al., 2013). Our fieldwork (Figure 4d) shows that neither
a sinistral strike-slip fault at the northern termination, nor a km-scale, dextral strike-slip fault at the
southern termination of the Brenner Fault are present. In spite of the widespread occurrence of
sinistral shear zones throughout the western Tauern Window and its surrounding area (Figures 4d,
8f, 8g, 8h, and 8i), the northern part of the Brenner Mylonites is devoid of such structures (Figures
4d, and 8j). The northwestern margin of the Tauern Window is characterized by south-vergent F2
folds and S1 foliations (Figures 7e, 7j, 7o), reactivated by both S2 foliations (Figures 8e and 9o).
North of the locality St. Jodok (Figure 4a) no ductile shear zone affecting the northwestern margin
was found. The transtensive Olperer Shear Zone (Lammerer and Wegner, 1998; Ebner et al., 2004)
and the transtensive Jaufen Fault (Müller et al., 2001; Viola et al., 2001) are the only structure that
could have transferred sinistral strike-slip into top-to-the-west extensional displacement along the
Brenner Fault. However, these structures are connected to the southernmost part of the Brenner
Fault, hence they cannot have accommodated the amount of extension that affected most of the
Brenner Fault, in contrast to previous interpretations (Axen et al., 1995; Fügenschuh et al., 1997,
2011). A similar contradiction is shown by our structural data in the southwestern margin of the
Tauern Window, where extensional unroofing models claim a transition from the Brenner
Mylonites into the dextral Pustertal-Gailtal Fault. We observed that the Austroalpine and ocean-
derived units in Domain C, are largely overprinted by sinistral (Figures 5, 8c, 8h, 8m) and only
minor dextral and extensional shear zones (Figures 9e, 9f, 9g, and 9h). Therefore, from a kinematic
point of view, tectonic unroofing models are in conflict with the structural evidence of the western
sub-dome.
3.6.2 Corner effect of the Dolomites Indenter
Upright folding affected all units of the Tauern Window and the Austroalpine nappes north of the
Dolomites Indenter (Figures 1b and 1c) (Schmid et al., 2013). The structures in domains C and E
form a bow tie around its northernmost tip. The traces of the folded S1 foliations, the axial planes,
and axial-plane foliations in domains C and E in the west and the corresponding traces in domains
A and D in the east converge to each other (Figures 7a, 7c, 7d, 7e, 7k, 7m, 7n, 7o, 8a, 8c, 8d, and
8e). The knot of this bow tie lies north of Mauls (Figure 4a) and coincides with the indenter tip,
where the Brenner Mylonites separate the two areas. Therefore, this structural bow tie is suggested
to result from indentation.
3.6.3 Deformation fabrics and crustal level
The style of deformation appears to be correlated to the structural level of the nappe stack exposed
at the surface. Domains C and D consist of Austroalpine rocks) that show predominantly open to
tight F2 folds with well-preserved S1 foliations (Figures 7c and 9d) rotated into a nearly parallel
orientation to the respective indenter margins. S2a axial-plane foliations or transcurrent shear zones
are rare (Figures 8c and 9d) and, if present, they only occur on the small scale, whereas, brittle
deformation is widespread in these rocks (Viola et al., 2001; Bertrand, 2013). On the contrary, rocks
of the Venediger Duplex, European distal Margin, and the ocean-derived units of domains A and
55
E, which represent the deeper structural level, are characterized by tight F2 folds and the widespread
occurrence of S2a axial-plane foliations (Figures 8a and 9d). Numerous meso- and macro-scale Csin
shear zones, or top-to-the-west extensional Cnor shear zones (domain E) are common in domains A
and E (Figures 8f, 8i, 9a, 9c, 9k, and 9m). Although the domains C and D are adjacent to the margins
of the Dolomites Indenter, these domains show less intense ductile deformation, except for the area
of Mauls north of the indenter tip, compared to domains A and E. These observations show that
metamorphic temperature, which reached greenschist- to amphibolite-facies conditions in the lower
plate during Cenozoic time, enhanced the localization of ductile deformation in these areas. On the
other hand, the higher content of carbonates and sheet silicates in the European distal Margin and
the ocean-derived units probably promoted the localization of ductile deformation inside the Tauern
Window. These observations suggest that the difference in the style of deformation between the
Austroalpine units in domain C and those inside the Tauern Window, are not in conflict with the
observed continuity and parallelism of the structures between these domains. These differences
merely reflect the transition from a lower to a higher crustal level, both affected by the same
shortening event.
3.6.4 From upright folding to localized shearing
Sinistral shear zones in the western sub-dome preferentially occur along the steep limbs and within
the tight synclines of F2 folds (Figure 4d), nucleating sub-parallel to the S2a axial-plane foliations
(Figure 4b), e.g., the Ahorn, Greiner and Ahrntal shear zones. Similarly extensional and transtensive
shear zones as the Jaufen Fault, the Brenner Mylonites, the Olperer Shear Zone, or outcrop-scale
shear zones in St. Jodok (Figure 10), occur along the south-vergent limbs, marked by arcuate-
striking pre-existing S1, overprinted by S2b extensional foliations, of the westward-plunging hinge
of the Tuxer Antiform (Figures 3 and 4c).
A succession from broad doming, to tight folding with axial-plane foliation development, to
localized shear can be inferred from the following arguments. The eastern sub-dome, which is not
shortened as much as the western one, consists of folds of larger wavelength and smaller amplitude,
and does not show the formation of an axial-plane foliation, nor of widespread strike-slip shear
zones (Figure 2). Therefore, the structure of the eastern sub-dome may be considered to reflect a
state of shortening of the western sub-dome in an earlier stage of its evolution. Another argument
is based on the observed spatial succession of open fold without axial-plane foliation to tight and
isoclinal folds with incipient axial-plane foliation, and finally to rootless folds with intense axial-
plane foliation and sub-parallel sinistral shear zones. This structural, spatial evolution was observed
at the southern (Figure 5) and northern (Rosenberg and Schneider, 2008) boundaries of the
Venediger Duplex. The presence of sinistral shear zones where the shortening gradient attains a
maximum, suggests a temporal evolution from open to tight folds and from tight folds to isoclinal
ones associated with sinistral shear zones. In addition, the orientation of the fabrics (from AP2, to
S2a, to Csin) of the western sub-dome commonly nucleated along pre-existing structures that form
suitable anisotropies. The angles between the mean values of the distinct structures (AP2, S2a, Csin,
and C’sin) in domains A, B, and C are low, (6-20 °), mostly 15 ° (Figures 7k, 7l, 7m, 8a, 8b, 8c, 8f,
8g, 8h, 8k, 8l, and 8m), which are characteristic for strike-slip regimes (Woodcock and Fischer,
1986; Dewey et al., 1998). By analogy with indentation experiments, designed to simulate
shortening in the Eastern Alps, it can be assumed, that the main fabric orientation rotates towards
parallelism with the northern indenter margin although the convergence direction remains constant
(Ratschbacher et al., 1991a, 1991b; Rosenberg et al., 2004, 2007). The strike of the C’sin mean
values (024-040 °) is remarkably consistent in all five domains, sub-parallel to the strike of the
North Giudicarie Fault (Martin et al., 1993), suggesting it to be the overall shear plane.
56
3.6.5 The western Tauern Window: a restraining bend
Upright folds, accommodating 38 km of north-oriented shortening, dominate the structural grain
of the western Tauern Window (Figures 1b and 1c). Clear crosscutting relationships between
structural elements (AP2, S2a, Csin, and C’sin) are rare, however, the systematic low angles (mostly
15 °) between the mean strike directions of sinistral shear zones, axial-plane foliations and axial
planes of upright folds, suggests that these structures all formed within the same deformation field
characterized by a N-oriented maximum shortening direction. This orientation is also compatible
with the orientation of the dextral shear zones. Therefore, we suggest that upright folds and shear
zones are coeval. The overwhelming majority of shear zones both on the outcrop- as on the map-
scale is sinistral, which indicates that deformation took place in a sinistral transpressional field.
This result is in agreement with the map-scale pattern of folds and shear zones, showing that the
NNE-striking, sinistral Giudicarie Belt turns into the NNE- to ENE-striking folds and sinistral shear
zone network of the western Tauern Window, before entering the sinistral SEMP Fault. Hence, the
latter orientation corresponds to that of a restraining bend.
The mean orientation of the structural elements show two along-strike trends passing the domains
C, A, and B from SW to NE (Figures 4b, 4c, and 4d). First, the foliations strike NE at the
terminations of the western sub-dome (domains B and C) and ENE in its center (domain A, Figures
7k, 7l, 7m, 8a, 8b, 8c, 8f, 8g, and 8h). The fold axes are doubly plunging at the terminations
(domains B and C, Figures 7b, 7c, 7g, and 7h) and sub-horizontal in the center (domain A, Figures
7a and 7f). This sigmoidal pattern resembles the foliation pattern of transpressive areas e.g. positive
flower structure (Sanderson and Marchini, 1984; Dewey et al., 1998), strike-slip duplexes
(Woodcock and Fischer, 1986). Second, all foliations show an inward steepening of the average dip
angle from the terminations (domain B and C), to the center (domain A) of the restraining bend
(Figures 7k, 7l, 7m, 8a, 8b, 8c, 8f, 8g, and 8h). This trend indicates a vortex of the foliations located
in the central domain A.
3.6.6. Age of doming in the Tauern Window
From a geochronological point of view, the concentric, elliptical distribution of cooling ages of
several chronometers (see compilations of Most, 2003; Luth and Willingshofer, 2008; Rosenberg
and Berger, 2009; Bertrand, 2013) in the western sub-dome, passing from ≥32 Ma (Rb/Sr and K/Ar
of white mica) in the outer regions (Satir, 1975; Borsi et al., 1975; Thöni, 1981) to ≥5 Ma (AFT) in
the center of the Tauern Window (Grundmann and Morteani, 1985; Fügenschuh et al., 1997; Most,
2003; Bertrand, 2013), is a strong argument in favor of an Oligocene age for the initiation of folding
(doming), hence of indentation.
Structures in the Meran-Mauls basement (domain C) resemble those of the western Tauern
Window, since these rocks are deformed by upright folds striking sub-parallel to the northwestern
margin of the Dolomites Indenter (Figures 4, 6, 7c, 7h, and 7m), which are associated in their late
stage with steep to sub-vertical, sinistral transtensive, NE-striking faults (Figure 4d; e.g., Jaufen
and Fartleis faults). The Meran-Mauls Fault may have acted as “snowplow” accommodating first
dextral and later on reverse displacements (Prosser, 1998; Viola et al., 2001; Pomella et al., 2011;
Luth et al., 2013). The Miocene cooling ages of the Austroalpine units within the Meran-Mauls
basement, contrasting with the otherwise Cretaceous cooling ages shows that Miocene exhumation
occurred everywhere around the Dolomites indenter, inferring that shortening was accommodated
by upright folds, hence by doming. Therefore, from a structural and temporal point of view the
Meran-Mauls basement can be treated as part of the western Tauern Window (Rosenberg and
Berger, 2009; Pomella et al., 2012), which links the sinistral the Passeier and North Giudicarie
faults with the restraining bend in the western Tauern Window.

57
Following the unanimously accepted interpretation that doming of the Tauern Window is related to
the convergent displacement of the Dolomites Indenter (Cornelius, 1940), bordered by the
Giudicarie Fault along its western margin, the age of activity of the Giudicarie Fault is the key to
assess the age of doming of the Tauern Window. Recent interpretations (Schmid et al., 2013) argued
that Dolomites indentation initiated not before Miocene (23-21 Ma). The first argument supporting
this conclusion are stratigraphic constraints based on the observation that pelagic sediments were
being deposited until 21.5 Ma, close to the South Giudicarie Fault (Luciani and Silvestrina, 1996).
However, cross sections perpendicular to the Giudicarie Belt (Leloup et al., 1988) show that
shortening was modest, probably insufficient to severely modify the regional depth of the
submarine surface in the realm of the Giudicarie Belt. Moreover, several pre-Miocene hiati were
observed and interpreted as possible “transgressive onlaps” in Monte Brione formation, to argue
for sea level changes, although it was conceded that “a tectonic component (causing those hiati)
cannot be excluded” (Luciani, 1989). Deformation age data of the North Giudicarie and the Meran-
Mauls faults point to Lower Oligocene and Upper Oligocene activity, respectively (Müller et al.,
2001) whereas ZFT data point to Miocene activation of the North Giudicarie Fault (Pomella et al.,
2011, 2012).
The second argument claiming inception of Dolomites indentation not earlier than 23-21 Ma
(Schmid et al., 2013) is a thermal model (Fügenschuh et al., 1997), which determines the onset of
“rapid exhumation” in the footwall of the Brenner Fault at 20 Ma (Scharf et al., 2013; Schmid et
al., 2013). However samples used to construct the T-t path stem from areas with different structural
and metamorphic history, being situated either in the high-metamorphic site of the tight Greiner
Synform (footwall of the Brenner Fault) (Christensen et al., 1994) or within the low-metamorphic
site of the Brenner Mylonites (Fügenschuh et al., 1997). Both these major structural elements,
normal faulting and upright folding, affected the isotherms, having different a priori metamorphic
grades, participated in exhumation of the western sub-dome, but were not differentiated in the
thermal model of Fügenschuh et al. (1997) and Scharf et al. (2013), making the T-t path
questionable.
3.6.7 Decoupling along the western margin
Sinistral shear zones of the restraining bend (domains A, B, and C) described in this study clearly
shows a southward rotation in strike direction in domains C and E (Figures 8h, and 8j) where the
belt enters the Meran-Mauls basement (Figure 4d). The transtensive Olperer Shear Zone (Ebner et
al., 2004) as well as the transtensive Jaufen Fault (Müller et al., 2001; Viola et al., 2001), are suitable
structures to translate sinistral displacement of the western Tauern Window into top-to-the-west
extension along the Brenner Fault (Figure 4d). In domain E all structural planes dip gently to steeply
north to WSW (Figures 7o, 8e, 8j, 9k, 9m, and 9o) and no sub-vertical, ductile structures occur.
Upright folding (Figures 7e and 7o) enabled the formation of S2a axial-plane foliation (Figure 8e)
and S2b extensional foliations (Figure 9o) which formed around the westward plunging hinge of the
Tuxer Antiform. The S2b extensional foliations on their part are associated with top-to-the-west
extensional shear zones and the Brenner Mylonites (Cnor).
The structures found at St. Jodok (Figures 4d and 10) demonstrate two main points. First,
extensional shear zones in the area of Steinach (Figure 4a) strike east, dip north, and indicate an
arcuate strike of the Brenner Mylonites as proposed by Fügenschuh et al., (1997) and Töchterle et
al. (2011) further south. Therefore, the eastward striking extensional shear zones in the area of St.
Jodok, following the arcuate-strike of S1 foliations around the hinge of the Tuxer Antiform, mark
the northern termination of the Brenner Mylonites which separate the thick occurrences of
extensional mylonites southward and their absence in the north, as described earlier (Behrmann,
1988; Selverstone, 1988; Axen et al., 1995). Second, since the extensional shear zones Cnor
associated with the formation of F3 collapse folds overprint the steep limbs, tight synclines and
axial planes of the F2 folds (Figure 10), the onset of the Brenner Fault postdates, at least locally, the

58
upright folds related to doming. However, because the Brenner Mylonites are folded themselves by
open folds (Rosenberg and Garcia, 2011) the Brenner Fault must have been active during D2, in
agreement with its Miocene deformation age data (Figure 3).
Domain E marks a structural boundary between the western Tauern Window that was shortened
due to Dolomites indentation and the flat-lying Mesozoic cover of the uppermost Austroalpine
nappes, the Ötztal basement, which was unaffected by indentation. The reason for such a sharp
boundary is the geometry of the Dolomites Indenter. Rocks north of the Meran-Mauls basement,
were shortened less due to a more oblique convergence of the Dolomites Indenter that was strongly
partitioned into top-to-the-west extensional shear. In contrast, north of the Pustertal-Gailtal Fault
(Figure 1a) the more perpendicular convergence was mainly accommodated by folding and by
sinistral shear within the Tauern Window. Hence, in domain E a lateral change of the amount of
vertical displacement occurred (Selverstone, 1988; Selverstone et al., 1991) by several processes.
First, material paths were vertically stretched to attain their present structural level in the folded
area (western Tauern Window), compared to their initial level before folding below the
Austroalpine, the Ötztal basement (Figure 2) (Rosenberg and Garcia, 2011; 2012). Second, a
clockwise rotation of the Dolomites indenter would cause an eastward component of motion, which
results in maximum east-west extension in front of the tip of Dolomites Indenter i.e., the Brenner
Fault. Third, partitioning of deformation into strike-slip and shortening, respectively parallel and
perpendicular to the indenter margins, causes a divergence of material paths away from the indenter
tip, resulting in an east-west extensional component (e.g. Reiter et al., 2011). Fourth, the western
margin of the western sub-dome is marked by first order westward plunging fold axes of the Tuxer
and Zillertaler antiforms, causing a progressive eastward increase of exhumation.
3.6.8 Decoupling to the east, transition to lateral extrusion
The central Tauern Window was neither affected by transcurrent shear zones nor by folds of high-
amplitude (Figures 2 and 4d). Accordingly, the level of exhumation is less deep and large areas are
still covered by rocks of the European distal Margin and ocean-derived units. Therefore,
exhumation of the central Tauern Window differs from that of the western Tauern Window.
During the second phase of Dolomites indentation (Pomella et al., 2011; 2012) the transpressive
motion of the western Tauern Window was transferred out of it along the sinistral shear zones in
the realm of Mittersill that yield Miocene deformation ages (e.g., Rinderkar Shear Zone: Cole et
al., 2007; Schneider et al., 2013). Hence, north-south shortening was largely translated into E-
directed strike-slip motion along the transpressive to transtensive SEMP Fault (Peresson and
Decker, 1997; Linzer et al., 2002). The sinistral transpressive belt (domains A, B, and C) described
in this study shows a major northward rotation in strike direction of all structural elements in domain
B (Figures 8b, 8g and 8l) where the belt turns into the SEMP Fault (Figure 4d) (Cole et al., 2007;
Rosenberg and Schneider, 2008). South and SW of this area, numerous sinistral shear zones with a
NNE-strike crosscut the Venediger Duplex (Figures 1a and 4) and delimit the sinistral transpressive
belt to the west from an area to the east, devoid of sub-vertical foliations (Figure 2) and delimited
to the north by the SEMP Fault. Hence, this NNE-striking belt, forms the boundary between an area
to the east that is translated eastward by the SEMP and an area to the west that is intensely shortened,
sheared, and uplifted.
Two conceptual models may explain the change from tight folding and distributed sinistral shear
zone networks in the western Tauern Window to open folds and localized strike-slip faults (SEMP
Fault) in the central Tauern Window. F2 folds north of the indenter tip are tight, nearly isoclinal
(Rosenberg and Garcia, 2011, their Figure 4), hence accommodation of additional shortening may
have needed a processes other than folding, i.e. sinistral strike-slip. Crustal thickening due to
upright folds of the western sub-dome was larger than in the central and eastern Tauern Window
(Figures 1b and 1c), in agreement with earlier termination of cooling in the central and eastern
Tauern Window (compilation by Luth and Willingshofer, 2008; Rosenberg and Berger, 2009;
59
Bertrand, 2013; Scharf et al., 2013). Therefore, this model, favoring the onset of sinistral strike-slip
in a late-stage of folding, would explain the presence of numerous strike-slip shear zones in the
west, but not in the east. However, the SEMP Fault existed already at 35-28 Ma (Figure 3) (Urbanek
et al., 2002), and could have accommodated sinistral strike-slip of the western Tauern Window
(Cole et al., 2007; Rosenberg and Schneider, 2008). As a consequence, the kinematic continuity
between the Giudicarie and the SEMP Fault may have existed since the inception of doming,
decoupling the central and eastern Tauern Window from the western and enabling their escape
eastward (Ratschbacher et al., 1991b).
3.6.9 Estimates of shortening, displacement and extension
Several investigations proposed to link indentation and exhumation of the Tauern Window, relating
displacements of the major Faults surrounding the Tauern Window (Fig. 11). Neubauer et al. (1999)
proposed an exhumation model by extension of a previously thickened crust within a pull-apart
structure (Figure 11a) during orogen-parallel strike-slip and oblique convergence. Linzer et al.
(2002) described the along-strike changes of the SEMP Fault from predominantly transpressive in
the west to predominant transtensive in the east, suggesting that the western Tauern Window formed
a restraining bend connecting to the SEMP Fault during orogen-parallel extension of 120 km in the
central Eastern Alps (Figure 11b). On the other hand they interpreted the SEMP Fault as the lateral
ramp of the Brenner normal Fault, suggesting a kinematic link between these structures, and stating
that exhumation of the Tauern Window occurred along the Brenner and Katschberg faults (Figure
1a). Fügenschuh et al., (2012) considered that 44 km of extension along the Brenner normal fault
were transformed into the “Tauern North Boundary Fault” (Töchterle et al., 2011) and the dextral
Periadriatic Fault, at the northern and southern ends of the Brenner Fault, respectively. Hence, the
largest part of the western Tauern Window would be exhumed by extensional unroofing, laterally
accommodated by strike-slip faulting. Scharf et al. (2013) interpreted exhumation of the western
Tauern Window in terms of stretching faults accommodating 70 km of extension along the
“Brenner Shear Zone System” (Figure 11c).
In spite of some differences in the way faults are linked, the left-lateral displacement of the SEMP
Fault in all these models is absorbed along the Brenner Fault, resulting in very significant
extensional denudation of its footwall (Fügenschuh et al., 1997, 2012; Neubauer et al., 1999; Scharf
et al., 2013). As a consequence, Dolomites indentation needs to be accommodated by structures
other than the SEMP and the Brenner faults, being kinematically unrelated to indentation; it would
be entirely accommodated by upright folds in the western Tauern Window. Hence, exhumation of
the western Tauern Window would result from 70 km of east-west extension in addition to erosion
of upright folds of >20 km amplitude. If 44 km of extension explain exhumation of the footwall
from 17 km depth (Fügenschuh et al., 2012) and upright folds explain a differential uplift and
exhumation of 10 km, adjacent to the Brenner Fault, where the fold amplitude plunge west, the
combined activity of folding and extension in the western Tauern Window would lead to an amount
of exhumation corresponding to >27 km exceeding by far the one inferred from both stratigraphic
(Schmid et al., 2013) and petrologic (Selverstone, 1993) constraints.
None of the models above presented structural data from the western Tauern Window, in order to
assess the kinematic and temporal links between the faults accommodating collision. Therefore,
different conceptual kinematic models were suggested, showing different links and even different
traces of the major faults in map view. Some studies consider the SEMP Fault to be the lateral ramp
of the Brenner Fault (Fügenschuh et al., 1997; Neubauer et al., 1999; Linzer et al., 2002; Scharf et
al., 2013). Although Linzer et al. (2002) showed the splitting of the SEMP Fault into several sinistral
splays terminating in the western Tauern Window, they proposed a kinematic continuity between
the SEMP and the Giudicarie Faults. Other investigations (Rosenberg and Schneider, 2008) pointed
out that the major left-lateral shear zones of the western Tauern Window show an “en échelon”
pattern, which transfers sinistral displacements from SW to NE. The structural data and

60
interpretations presented in this work allow us to discriminate between these models. Sinistral shear
zones of the western Tauern Window, do not terminate in the northern Brenner Fault, but strike
across the southwestern end of the Tauern Window, from where they continue into the Meran-
Mauls basement (Figures 2 and 4d). Hence, the boundary between Tauern Window and
Austroalpine Units here does not represent a structural boundary, but the transition from a deeper
to a higher structural level, both affected by the same structures and deformation events. These are
manifested by the upright folds and sinistral shear zones accommodating vertical and lateral
extension, respectively.
Figure 11: Sketch of tectonic models of the western Tauern Window: BF=Brenner Fault, BSZS=Brenner
Shear Zone System, GB=Giudicarie Belt, KLT=Königsee-Lammertal-Traunsee Fault, SEMP=Salzach-
Ennstal-Mariazell-Puchberg Fault, wTW=western Tauern Window. a: Simplified model after Neubauer et
al. (1999), exhumation of the Tauern Window in two stages, first stage (red lines) is a sinistral extensive step-
over structure (pull-apart) under NW directed shortening, second stage (blue lines) is a dextral transpressive
system under NE directed shortening b: Simplified model after Linzer et al. (2002) shows a connection
between the SEMP Fault and the Giudicarie Belt via the sinistral shear zones of the western Tauern Window.
The SEMP Fault was interpreted as lateral ramp of the Brenner Fault c: Exhumation model after Scharf et
al. (2013) shows that sinistral displacement of 66 km along the SEMP and the KTL faults is entirely
accommodated in the western Tauern Window by 70 km of lateral stretching that decreases to zero
displacement westwards. Along the Brenner Shear Zone System, that envelopes the western Tauern Window,
a similar amount of east-west extension of 70 km was discussed. These three regions (BSZS, wTW,
SEMP+KLT) are balanced out in east-west direction. As a consequence shortening caused by Dolomites
indentation would be solely accommodated by upright folding in the western Tauern Window. d: 58 km of
shortening caused by the Dolomites Indenter was accommodated by upright folds (38 km) and partly
translated into sinistral shear zones casing a displacement of 26-31 km. These three regions (GB, wTW,
SEMP) are interconnected and Dolomites indentation would be the driving force for lateral extrusion and
the transpression inside the western Tauern Window.

61
62
Using the known amounts of displacement accommodated by the first-order structures in the area,
we estimate orogen-perpendicular shortening, and orogen-parallel extension to test if the field-
based kinematic links inferred above offer a plausible model to explain the kinematics and
exhumation in front of the Dolomites indenter. In order to do so, we summarize the known amounts
of displacement related to the first order structures discussed above (Figure 11d). If a northward
convergence is assumed (Rosenberg et al., 2007, for discussion) the Dolomites indenter was
displaced northward by 58 km along the NE-striking, 77 km long Giudicarie belt. Shortening
accommodated by upright folds in the western Tauern Window, including the Austroalpine
basement to the south amounts to 38 km, based on line-length balancing of the antiformal
structure. Hence, the remaining 20 km of shortening must be accommodated by left-lateral
displacements along the Ahorn, Tuxer, Greiner, Olperer, and Ahrntal shear zones (Figure 4d).
Taking the present-day orientation of these shear zones as a reference, using their mean strike
directions of domains A, B, and C, their left-lateral displacement necessary to accommodate 20
km of north-south shortening corresponds to 26-31 km. These shear zones contribute 14-26 km
to east-west lateral extrusion. Left-lateral displacement along the SEMP Fault is inferred to be 60
km (Linzer et al., 2002) having an east-west extrusion component of 58 km. It is important to note
that the amount of extension of the Brenner Fault does not affect directly the estimates above,
because north-south shortening cannot be accommodated by north-south striking normal faults.
However the degree of kinematic linkage between the SEMP and the Brenner Fault is important, in
that it connects or disconnects the Giudicarie Belt from the SEMP faults. Displacement markers
for the sinistral shear zones in the western Tauern Window are missing, however, the values above
are qualitatively consistent, with the structural data, showing that both folding and sinistral strike-
slip continue west of the indenter corner and do not connect to the Brenner Fault.
Therefore, we conclude that the majority of the displacement of the SEMP Fault is not transformed
into extension along the Brenner Fault (Figures 1a, 4d, and 11d) but rather to the Giudicarie Belt.
This structural link is also consistent with the time constraints from deformation age data.
3.7 Conclusion
Based on new structural mapping of the western Tauern Window and on a structural compilation
covering the entire window, we reassessed the position and the links between Cenozoic faults and
shear zones, to discriminate between different kinematic models and to propose a new one.
The western Tauern Window shows a different structural evolution compared to the central and
eastern Tauern Window. In the former, the widespread association of high-amplitude, tight upright
folds and sinistral shear zones, testifies a larger amount of orogen-perpendicular shortening and a
peculiar position linking the Giudicarie Belt, hence indentation to the SEMP Fault, hence lateral
extrusion.
Against previous interpretations suggesting that exhumation of the western Tauern Window results
from tectonic unroofing, emphasizing extensional tectonics, we showed that the fault pattern and
the relative displacements on the faults required by such models do not match with the structures
of the western Tauern Window. In contrast this fault pattern and the inferred displacements are
consistent with exhumation dominated by erosional denudation during upright folding.
The western Tauern Window forms a restraining bend linking the sinistral, transpressive Giudicarie
Belt, with the sinistral SEMP Fault. 58 km of north-directed shortening caused by the Dolomites
Indenter were accommodated by upright folds (38 km) and partly by sinistral shear zones attaining
26-31 km of bulk sinistral displacement, i.e. 16-24 km east-west extrusion. North-south
shortening in the central area decreases, as seen from the lower amplitude of folds, the absence of
interconnected networks of shear zones, and preserved, higher tectonostratigraphic units. These
63
observations are consistent with the larger exposure of Austroalpine Units south of the Tauern
Window and the more southerly position of the indenter margin.
3.8 Acknowledgement
Data supporting Figures 7, 8, and 9 are available as in Supplementary material Table S1. This study
was funded by the DFG grant Ro2177/4. We acknowledge family Schwärzer, especially M.
Schwärzer, G. Fankhauser and R. Emberger for field support and accommodation. For helpful
discussions we thank A. Bertrand, S. Favaro, S. Garcia, M.R. Handy, L. Ratschbacher, D. Rutte,
and R. Schuster. For critical and constructive reviews of the manuscript in a very final stage we
thank H. Pomella and S.M. Schmid and finally we thank C. Teyssier and one anonymous journal
reviewers for improving the manuscript substantially.
3.9 References
Angel F., and R. Staber (1950), Geologische Karte des Ankogel-Hochalm-Gebiets, 1:50.000. In:
Angel, F., and R. Staber, Wien (Freytag & Berndt).
Axen, G. J., J. M. Bartley, and J. Selverstone (1995), Structural expression of a rolling hinge in the
footwall of the Brenner Line normal fault, eastern Alps, Tectonics, 14(6), 1380–1392,
doi:10.1029/95TC02406.
Axen, G.J., J. Selverstone, T. Byrne, and J.M. Fletcher (1998), If the strong crust leads, will the
weak crust follow, GSA today, 8(12), 1–8.
Barnes, J.D., J. Selverstone, Z.D. and Sharp (2004), Interaction between serpentinite devolatization,
metasomatism and strike-slip strain localization during deep-crustal shearing in the Eastern Alps,
J. Metamorph. Geol., 22, 283–300.
Becker, B. (1993), The structural evolution of the Radstadt Thrust System, Eastern Alps, Austria –
Kinematics, Thrust Geometries, Strain Analysis -, Tübinger Geowissenschaftliche Arbeiten, 14.
Behrmann, J.H. (1988), Crustal scale extension in a convergent orogen: The Sterzing-Steinach
mylonite zone in the eastern Alps, Geodinamica Acta, 2, 63–73.
Behrmann, J.H., and W. Frisch (1990), Sinistral Ductile Shearing Associated with Metamorphic
Decompression in the Tauern Window, Eastern Alps, Jb. Geol. B.-A., 133 (2), 135–146.
Bertrand, A., (2013), Chapter II: Cooling history and late exhumation of the Tauern Window
(Eastern Alps) inferred from apatite and zircon fission track thermochronology, PhD thesis, Freie
Universität Berlin, p. 196.
Bigi, G., D. Cosentino, M. Parotto, and R. Sartori (1992), Structural model of Italy, 1:500000, CNR,
Progetto Finalizzato Geodinamica.
Bistacchi, A., M. Massiron, and L. Menegon (2010). Three-dimensional characterization of a
crustal-scale fault zone: The Pusteria and Sprechenstein fault system (Eastern Alps), J. Struc. Geol.,
32(12), 2022–2041.
Borsi, S., A. Del Morro, F.P. Sassi, and G. Zirpoli (1973), Metamorphic evolution of the Austridic
rocks to the south of the Tauern Window (Eastern Alps): radiometric and geopetrologic data, Mem.
Soc. geol. ital. (Pisa), 12, 549–571.
Borsi, S., A. Del Moro, F.P. Sassi, A. Zanferrari, and G. Zirpoli (1978), New geopetrologic and
radiometric data on the alpine history of the Austridic continental margin south of the Tauern
Window, Mem. Sci. Geol. (Padova), 32, 1–17.

64
Bousquet, R., S.M. Schmid, G. Zeilinger, R. Oberhänsli, C.L. Rosenberg, G. Molli, C. Robert, M.
Wiederkehr, and P. Rossi (2012a), Tectonic framework of the Alps, CCGM/CGMW
Bousquet, R., R. Oberhänsli, S.M. Schmid, A. Berger, M. Wiederkehr, C. Robert, C.L. Rosenberg,
F. Koller, G. Molli, and G. Zeilinger (2012b), Metamorphic framework of the Alps,
CCGM/CGMW
Brandner, R., A. Töchterle, and F. Reiter (2008), Überblick zu den Ergebnissen der geologischen
Vorerkundung für den Brenner-Basistunnel, Geo. Alp, 5, 165–174.
Christensen, J. N., J. Selverstone, J.L. Rosenfeld, and D.J. DePaolo (1994), Correlation by Rb-Sr
geochronology of garnet growth histories from different structural levels within the Tauern
Window, Eastern Alps, Contrib. Mineral. Petr., 118(1), 1–12.
Cole, J., B. Hacker, L. Ratschbacher, J. Dolan, G. Seward, E. Frost, and W. Frank (2007), Localized
ductile shear below the seismogenic zone: Structural analysis of an exhumed strike-slip fault,
Austrian Alps, J. Geophys. Res., 112, doi:10.1029/2007JB004975.
Cornelius, H.P. (1940), Zur Auffassung der Ostalpen im Sinne der Deckenlehre, Ger. J. Geosci.,
92, 271–312.
Dachs, E. and A. Proyer (2001), Relics of high-pressure metamorphism from the Grossglockner
region, Hohe Tauern, Austria: paragenetic evolution and PT-paths of retrogressed eclogites, Eur. J.
Mineral., 13, 67–86.
Davis, J.H., and F. von Blanckenburg (1994), Slab breakoff: A model of lithosphere detachment
and its test in the magmatism and deformation of collisional orogens, Earth Panet. Sc. Lett. 129,
85–102
De Vecchi, G., and P. Baggio (1982), The Pennine zone of the Vizze region in the western Tauern
Window (Italian Eastern Alps). - Boll. Soc. Geol. ital., 101, 89–116.
Dewey, J.F., R.E. Holdsworth, and R.A. Strachan (1998), Transpression and transtension zones,
Geol. Soc. (London) Spec. Publ., 135, 1–14, doi: 10.1144/GSL.SP.1998.135.01.01.
Ebner, M., K. Decker, and B. Grasemann (2004), Normal versus Strike-Slip Faulting–Deformation
Mechanisms During Exhumation in the Footwall of the Brenner Normal Fault (Tyrol, Austria),
ISSN 1608–8166, PanGeo Austria 2004, abstract volume.
Exner, C. (1956). Geologische Karte der Umgebung von Gastein, 1:50.000, Wien: Geol. B–A.
Exner, C. (1962a), Sonnblicklamelle und Mölltallinie, Jb. Geol. B–A., 105, 272–286.
Exner, C. (1962b), Geologische Karte der Sonnblickgruppe, 1:50.000, Geologische Bundesanstalt,
Wien.
Exner, C. (1979), Geologische Karte des Salzachtales zwischen Taxenbach und Lend, 1:25.000. In:
Exner, C., Geologie des Salzachtales zwischen Taxenbach und Lend, Jb. Geol. B–A., 122, p. 73.
Exner, C. (1980), Geologie der Hohen Tauern bei Gmünd in Kärnten, Jb. Geol. B–A., 123, 343–
410.
Exner, C. (1983), Geologische Karte der Hafnergruppe, 1:25.000. Mitt. D. Ges. Geol. U.
Bergbaustudenten in Österreich, 29, 1983.
Exner, C. (1989), Geologie des mittleren Lungaus, Jb. Geol. B–A., 132, 7–103.
Frank, W. and G. Pestal (2008), Geologische Karte – Umgebung von Wagrain, Nachrug auf C.
Exner, 1:25.000. Jb. Geol. B–A., p. 148.

65
Frank, W., C. Miller, G. Pestal, H.P. Cornelius, G. Fuchs, G. Grundmann, L. Hoke, G. Malecki, F.
Popp, O. Schmidegg, H.P. Steyrer (1987), Geological map sheet 152 Matrei 1:50.000. Wien: Geol.
B–A.
Frisch, W., I. Dunkl, and J. Kuhlemann (2000), Postcollisional orogen-parallel large-scale
extension in the Eastern Alps, Tectonophysics, 327, 239–265.
Frisch, O. (2010), Altersbestimmungen an Hellglimmer und Biotit aus dem Tuxer Gneiskerns,
westliches Tauernfenster, Ostalpen: Ein methodischer Vergleich zur Datierung von Scherzonen,
Diploma-Thesis, Freie Universität Berlin, p. 74.
Froitzheim, N. (1992), Formation of recumbent folds during synorogenic crustal extension
(Austroalpine nappes, Switzerland), Geology, 20, 923–926, doi:10.1130/0091-7613.
Frost, E., J. Dolan, C. Sammis, B. Hacker, J. Cole, and L. Ratschbacher (2009), Progressive strain
localization in a major strike-slip fault exhumed from midseismogenic depths: Structural
observations from the Salzach-Ennstal-Mariazell-Puchberg fault system, Austria, J. Geophys. Res.,
114, B04406, doi:10.1029/2008JB005763.
Fügenschuh, B., D. Seward, and N.S. Mancktelow (1997), Exhumation in a convergent orogen: the
western Tauern Window, Terra Nova, 9, 213–217.
Fügenschuh B., N.S. Mancktelow, and S.M. Schmid (2012), Comment on ‘‘Estimating
displacement along the Brenner Fault and orogenparallel extension in the Eastern Alps’’ by
Rosenberg and Garcia. Int. J. Earth. Sci., 101, 1451–1455, doi: 10.1007/s00531-011-0725-4
Giese, J. (2004), Geologie der südwestlichen Grenze des Tauernfensters (Mühlwalder Kamm,
Italien) und die Analyse von Quarztexturen und Mikrogefügen in L-Tektoniten, Diploma-Thesis,
Freie Universität Berlin, p. 134.
Glodny, J., U. Ring, A. Kühn, P. Gleissner, and G. Franz (2005), Crystallization and very rapid
exhumation of the youngest Alpine eclogites (Tauern Window, Eastern Alps) from Rb/Sr mineral
assemblage analysis, Contrib. Mineral. Petr., 149(6), 699–712.
Glodny, J., U. Ring, and A. Kühn (2008), Coeval high-pressure metamorphism, thrusting, strike-
slip, and extensional shearing in the Tauern Window, Eastern Alps, Tectonics 27, TC4004,
doi:10.1029/2007TC002193.
Grundmann, G. and G. Morteani (1985), The young uplift and thermal history of the central Eastern
Alps (Austria/Italy), evidence from apatite fission track ages, Jb. Geol. B–A., 128, 197–216.
Hoernes, S. and H. Friedrichsen (1974), Oxygen isotope studies on metamorphic rocks of the
Western Hohe Tauern area (Austria). Schweiz. Mineral. Petrog., 54, 769–788.
Höck, V., G. Pestal, P. Brandmeier, E. Clar, H.P. Cornelius, W. Frank, H. Matl, P. Neumayr, K.
Petrakakis, T. Stadlmann, und H.P. Steyrer (1994), Geological map sheet 153 Großglockner
1:50.000. Wien: Geol. B–A.
Höck, V., A. Slaczka, and, A. Uchmann (2006), New biostratigraphic and palaeoenvironmental
data on metamorphosed limestones from the northern margin of the Tauern Window (Eastern Alps,
Austria). Austrian J. Earth Sci., 99, 42–56.
Hoinkes, G., F. Koller, G. Rantitsch, E. Dachs, V. Hock, F. Neubauer, and R. Schuster (1999),
Alpine metamorphism of the Eastern Alps, Schweiz. Mineral. Petrog., 79 (1), 155–181.l
Inger, S., and R.A. Cliff (1994), Timing of metamorphism in the Tauern Window, Eastern Alps:
Rb‐Sr ages and fabric formation, J. Metamorph. Geol., 12(5), 695–707.
Karl, F., O. Schmidegg, H.P. Cornelius, A. Bianchi, and G.V. Dal Piaz (1979), Geological map
sheet 151 Krimml 1:50.000. Wien: Geol. B.–A.
66
Kitzig, C.M. (2010), Structural analyses and dating of deformation of the Ahrntal fault, Diploma-
Thesis, Freie Universität Berlin, p. 114.
Kurz, W., R. Handler, and C. Bertoldi (2008), Tracing the exhumation of the Eclogite Zone (Tauern
Window, Eastern Alps) by 40Ar/39Ar dating of white mica in eclogites, Swiss J. Geosci.,
doi:10.1007/s00015-008-1281-1.
Lammerer, B. and M. Weger (1998), Footwall uplift in an orogenic wedge: the Tauern Window in
the Eastern Alps of Europe, Tectonophysics, 285, 213–230.
Laubscher, H. (1988), Material balance in Alpine orogeny, Geol. Soc. Am. Bull., 100(9), 1313–
1328.
Laubscher, H.P. (1990), The problem of the deep structure of the Southern Alps: 3-D material
balance considerations and regional consequences, Tectonophysics, 176, 103–121.
Lichtenheld, T. (2004), Diplomkartierung zwischen Nevesstausee und Weissenbachtal Südtirol,
Italien, Diploma-Mapping, Freie Universität Berlin, p. 75.
Linzer, H.G., K. Decker, H. Peresson, R. Dell’Mour, and W. Frisch (2002), Balancing lateral
orogenic float of the Eastern Alps, Tectonophysics, 354(3), 211–237.
Luciani, V. (1989), Stratigrafia Sequenziale del Terziaro Nelle Catena del Monte Baldo (Provincie
di Verona a Trento), Mem. Sci. Geol. (Padova), 41, 263–351.
Luciani, V., & Silvestrini, A. (1996), Planktonic foraminiferal biostratigraphy and
paleoclimatology of the Oligocene/Miocene transition from the Monte Brione Formation (Northern
Italy, Lake Garda), Memorie di Scienze Geologiche, 48, 155–169.
Luth, S., E. Willingshofer, M. ter Borgh, D. Sokoutis, J. van Otterloo, and A. Versteeg (2013),
Kinematic analysis and analogue modelling of the Passeier-and Jaufen faults: implications for
crustal indentation in the Eastern Alps, Int. J. Earth Sci., 1–20.
Luth, S.W. and E. Willingshofer (2008), Mapping of the Post-Collisional Cooling History of the
Eastern Alps, Swiss J. Geosci., 101, 207–223.
Mancktelow, N.S., D.F. Stöckli, B. Grollimung, W. Müller, B. Fügenschuh, G. Viola, D. Seward,
I.M. Villa (2001), The DAV and Periadriatic fault system in the Eastern Alps south of the Tauern
window. Int. J. Earth Sci., 90, 593–622.
Martin, S., G. Bigazzi, M. Zattin, G. Viola, and M.L. Balestrieri (1998), Neogene kinematics of the
Giudicarie fault (Central‐Eastern Alps, Italy): new apatite fission‐track data, Terra Nova, 10(4),
217–221.
Moser, M. (2006), Geological map sheet 177 St. Jacob in Defereggen 1:50.000. Wien: Geol. B–A.
Most, P. (2003), Late Alpine cooling histories of tectonic blocks along the central part of the
Transalp-Traverse (Inntal – Gadertal): constraints from geochronology, PhD-thesis Eberhardt-
Karls-Universität Tübingen, 151.
Müller, W., N.S. Mancktelow, and M. Meier (2000), Rb–Sr microchrons of synkinematic mica in
mylonites: an example from the DAV fault of the Eastern Alps, Earth Panet. Sc. Lett., 180, 385–
397.
Müller, W., G. Prosser, N.S. Mancktelow, I.M. Villa, S.P. Kelley, G. Viola, and F. Oberli (2001),
Geochronological constraints on the evolution of the Periadriatic Fault System (Alps), Int. J. Earth
Sci., 90, 623–653.
Nagel, T.J., D. Herwartz, S. Rexroth, C. Münker, N. Froitzheim, and W. Kurz (2013). Lu-Hf dating,
petrography, and tectonic implications of the youngest Alpine eclogites (Tauern Window, Austria),
Lithos, 170-171, 179–190.

67
Neubauer F., J. Genser, W. Kurz, and X. Wang (1999), Exhumation of the Tauern Window, Eastern
Alps, Phys. Chem. Earth 24, No. 8, 675–680.
Nussbaum, C. 2000, Neogene Tectonics and Thermal Maturity of Sediments of the Easternmost
Southern Alps (Friuli Area, Italy), PhD Thesis, Institut de Géologie Université de Neuchâtel
Peresson, H. and K. Decker (1997), The Tertiary dynamics of the northern Eastern Alps (Austria):
changing palaeostresses in a collisional plate boundary, Tectonophysics, 272(2), 125–157.
Picotti, V., G. Prosser, A. Castellarin (1995), Structures and kinematics of the Giudicarie–Val
Trompia fold and thrust belt (Central Southern Alps Northern Italy), Mem. Sc. Geol., 47, 95–109.
Plan, L., B. Grasemann, C. Spötl, K. Decker, R. Boch, and J. Kramers (2010), Neotectonic extrusion
of the Eastern Alps: Constraints from U/Th dating of tectonically damaged speleothems, Geology,
38(6), 483–486.
Pollington, A.D. and E.F. Baxter (2010), High resolution Sm-Nd garnet geochronology reveals the
uneven pace of tectonometamorphic processes, Earth Planet. Sc. Lett., 293, 63–71.
Pomella, H., U. Klötzli, R. Scholger, M. Stipp, and B. Fügenschuh (2011), The Northern Giudicarie
and the Meran-Mauls fault (Alps, Northern Italy) in the light of new paleomagnetic and
geochronological data from boudinaged Eo-/Oligocene tonalities, Int. J. Earth Sci., 100(8), 1827–
1850.
Pomella, H., M. Stipp, and B. Fügenschuh (2012), Thermochronological record of thrusting and
strike-slip faulting along the Giudicarie fault system (Alps, Northern Italy), Tectonophysics, 579,
118–130.
Prosser, G. (1998), Strike‐slip movements and thrusting along a transpressive fault zone: The North
Giudicarie line (Insubric line, northern Italy), Tectonics, 17(6), 921-937.
Raith, M., P. Raase, H. Kreuzer, and P. Müller (1978), The age of the Alpidic metamorphism in the
western Tauern Window. Austrian Alps, according to radiometric dating, In: Closs, H, D. Röder,
and K. Schmidt, Alps, Apennines, Hellenides; Inter-Union Commission on Geodynamics,
Schweizerbart'sche Verlagsbuchhandlung (Stuttgart), Scientific Report No. 38, p. 140–148.
Ratschbacher, L., O. Merle, P. Davy, and P. Cobbold (1991a), Lateral extrusion in the eastern Alps:
Part 1. Boundary conditions and experiments scaled for gravity, Tectonics 10, 245–256.
Ratschbacher, L., W. Frisch, H.G. Linzer, and O. Merle (1991b), Lateral extrusion in the Eastern
Alps, part 2: structural analysis, Tectonics, 10(2), 257–271.
Ratschbacher, L., C. Dingeldey, C. Miller, B.R. Hacker, and M.O. McWilliams (2004), Formation,
subduction, and exhumation of Penninic oceanic crust in the Eastern Alps: time constraints from 40Ar/39Ar geochronology, Tectonophysics, 394, 155–170.
Reicherter, K., R. Fimmel, and W. Frisch (1993), Sinistral strike-slip faults in the central Tauern
window (Eastern Alps, Austria) Jb. Geol. B–A., 136, 495–502.
Reiter, K., N. Kukowski, and L. Ratschbacher (2011), The interaction of two indenters in analogue
experiments and implications for curved fold-and-thrust belts, Earth Planet. Sc. Lett., 302(1), 132-
146.
Röller, K. and C. Trepmann (2008), Stereo32 Version 0.09. http://www.ruhr-uni-
bochum.de/hardrock/downloads.htm2008.
Rockenschaub, M., A. Nowotny, K. Decker, J. Feijth, D. Frieling, W. Frisch, A. Gruber, B.
Kolenprat, J. Magiera, G. Poscher, F. Reiter, F. Riedl, T. Scheibner, und J. Zasadny (2009),
Geological map sheet 149 Brenner 1:50.000. Wien: Geol. B–A.
68
Rockenschaub, M., A. Nowotny, R. Brandner, V. Fenti, W. Frisch, C. Friz, P. Frizzo, B. Kolenprat,
J. Magiera, C. Prager, M. Reiser, T. Scheiber, A. Bistacchi, G.V. Dal Piaz, G. Dal Piaz, M.
Massironi, B. Monoppoli, A. Schiavo, and G. Toffolon (2011), Geological map sheet 175 Sterzing
1:50.000. Wien: Geol. B–A.
Rosenberg, C.L. and A. Berger (2009), On the causes and modes of exhumation and lateral growth
of the Alps, Tectonics 28, doi:10.1029/2008TC002442
Rosenberg, C.L. and S. Garcia (2011), Estimating displacement along the Brenner Fault and
orogen-parallel extension in the Eastern Alps, Int. J. Earth Sci., 100, 1129–1145.
Rosenberg, C.L. and S. Garcia (2012), Reply to the comment of Fügenschuh et al. on the paper
‘Estimating displacement along the Brenner Fault and orogen-parallel extension in the Eastern
Alps’ by Rosenberg and Garcia, Int J Earth Sci (Geol Rundsch) (2011) 100:1129–1145, Int. J. Earth
Sci. 101:1457–1464, doi:10.1007/s00531-011-0726-3.
Rosenberg, C.L. and S. Schneider (2008), The western termination of the SEMP Fault (eastern
Alps) and its bearing on the exhumation of the Tauern Window, In: Siegesmund, S., Fügenschuh,
B., Froitzheim, N. (Eds) Tectonic Aspects of the Alpine-Dinaride-Carpathian System, Geol. Soc.
(London) Spec. Publ., 298, 197–218.
Rosenberg, C.L., J.-P. Brun, and D. Gapais (2004), An indentation model of the Eastern Alps and
the origin of the Tauern Window, Geology, 32, 997–1000.
Rosenberg, C.L., J.P. Brun, F. Cagnard, and D. Gapais (2007), Oblique indentation in the Eastern
Alps: Insights from laboratory experiments, Tectonics, 26, doi:10.1029/2006TC001960.
Sanderson, D.J. and W.R.D. Marchini (1984), Transpression, J. Struct. Geol., 6, 449–458.
Satir, M. (1975), Die Entwicklungsgeschichte der westlichen Höhen Tauern und der südlichen
Ötztalmasse aufgrund radiometrischer Altersbestimmungen, Mem. Ist. Geol. Mineral. Univ.
(Padova), No. 31, p. 85.
Satir, M. and G. Morteani (1982), Petrological study and radiometric age determination of the
migmatites in the Penninic rocks of the Zillertaler Alpen (Tyrol/Austria), Tscher. Miner. Petrogr.,
30(1), 59–75.
Scharf, A., M.R. Handy, S. Favaro, S.M. Schmid, and A. Bertrand (2013), Modes of orogen-parallel
stretching and extensional exhumation in response to microplate indentation and roll- back
subduction (Tauern Window, Eastern Alps), Int. J. Earth Sci., doi:10.1007/s00531-013-0894-4.
Schmid, S.M., A. Scharf, M.R. Handy, and C.L. Rosenberg (2013), The Tauern Window (Eastern
Alps. Austria): a new tectonic map, with cross-sections and a tectonometamorphic synthesis, Swiss
J. Geosci. 106(1), 1–32.
Schneider, S. and K. Hammerschmidt (2009), K-Ar dating of sinistral deformation in the upper
Schieferhülle, south-western Tauern Window (Eastern Alps), In EGU General Assembly
Conference Abstracts, 11, 13813.
Schneider, S., N. Bungies, F. Frütsch, C.M. Kitzig, C.L. Rosenberg, M. Spanka, C. von Nicolai,
and M. Wanner, (2009), Extent and significance of sinistral shear along the southwestern border of
the Tauern Window, Eastern Alps (Italy/Austria), In EGU General Assembly Conference Abstracts,
11, 11429.
Schneider, S., K. Hammerschmidt, and C.L. Rosenberg (2013), Dating the longevity of ductile
shear zones: Insight from 40Ar/39Ar in situ analyses, Earth Planet. Sc. Lett., (369–370), 43–58.
Schneider, S., C.M. Kitzig, S. Wollnik, M. Spanka, K. Hammerschmidt, and C.L. Rosenberg (in
prep.), Timing and kinematics of the Ahrntal shear zone, the southern border of the sinistral

69
transpressive belt localized in the western Tauern Window, Eastern Alps, In: Ductile Shear Zones:
from Micro- to Meso-scales (Blackwell Publishers) edited by S. Mukherjee and K. Mulchrone
Schönborn, G. (1992), Alpine tectonics and kinematic models of the central Southern Alps, Mem.
Sci. Geol., 44, 229–393.
Sciunnach, D., G. Scardia, F. Tremolada, and I.P. Silva (2010), The Monte Orfano Conglomerate
revisited: stratigraphic constraints on Cenozoic tectonic uplift of the Southern Alps (Lombardy,
northern Italy), Int. J. Earth Sci. 99, 1335–1355, doi:10.1007/s00531-009-0452-2.
Selverstone, J. (1985), Petrologic constraints on imbrication, metamorphism, and uplift in the SW
Tauern Window, Eastern Alps, Tectonics, 4(7), 687–704.
Selverstone, J. (1988), Evidence for E-W crustal extension in the Eastern Alps: implications for the
unroofing history of the Tauern Window, Tectonics, 7, 87–105.
Selverstone, J. (1993), Micro- to macroscale interactions between deformational and metamorphic
processes, Tauern Window, Eastern Alps, Schweiz. Miner. Petrog. 73, 229–239.
Selverstone, J. and F.S. Spear (1985), Metamorphic P–T Paths from pelitic schists and greenstones
from the south‐west Tauern Window, Eastern Alps, J. Metamorp. Geol., 3(4), 439–465.
Selverstone, J., G. Morteani, and J.M. Staude (1991), Fluid channeling during ductile shearing:
transformation of granodiorite into aluminous schist in the Tauern Window, Eastern Alps, J.
Metamorph. Geol., 9, 419–431.
Selverstone, J., G.J. Axen, and J.M. Bartley (1995), Fluid inclusion constraints on the kinematics
of footwall uplift beneath the Brenner Line normal fault, eastern Alps, Tectonics, 14(2), 264–278.
Smye, A.J., M.J. Bickle, T.J.B. Holland, R.R. Parrish, and D.J. Condon (2011), Rapid formation
and exhumation of the youngest Alpine eclogites: A thermal conundrum to Barrovian
metamorphism, Earth Planet. Sc. Lett., (306), 193–204.
Spear F.S. and G. Franz (1986), PT evolution of metasediments from the Eclogite Zone, south-
central Tauern Window, Austria. Lithos, 19(3), 219–234.
Spiess, R. (1995), The Passeier- Jaufen Line: A tectonic boundary between Variscan and an eo-
Alpine Meran-Mauls basement, Schweiz. Mineral. Petrog., 75, 413–425.
Spiess R., M. Marini, W. Frank, B. Marcolongo, and G. Cavazzini (2001), The kinematics of the
Southern Passeier fault: radiometric and petrographic constraints, Schweiz. Mineral. Petrog., 81,
197–212.
Steffen, K., J. Selverstone, and A. Brearley (2001), Episodic weakening and strengthening during
synmetamorphic deformation in a deep crustal shear zone in the Alps, Geol. Soc. (London) Spec.
Publ., 186, 141–156.
Thöni, M. (1980), Distribution of pre-Alpine and Alpine metamorphism of the southern Ötztal Mass
and the Scarl Unit, based on K/Ar age determinations, Mitt. österr. geol. G., 71(72), 139–165.
Töchterle, A., R. Brandner, and F. Reiter (2011), Strain partitioning on major fault zones in the
northwestern Tauern Window—insights from the investigations of the Brenner base tunnel.
Austrian J. Earth Sci., 104, 15–35.
Urbanek, C., W. Frank, B. Grasemann, and K. Decker (2002), Eoalpine versus Tertiary
deformation: Dating of heterogeneously partitioned strain (Tauern Window, Austria), PanGeo
Austria 2002, abstract volume.
Viola, G., N.S. Mancktelow, and D. Seward (2001), Late Oligocene-Neogene evolution of Europe-
Adria collision: New structural and geochronological evidence from the Giudicarie fault system
(Italian Eastern Alps), Tectonics, 20(6), 999–1020, doi:10.1029/2001TC900021.
70
von Blanckenburg, F., I.M. Villa, H. Baur, G. Morteani, and R.H. Steiger (1989), Time calibration
of a PT-path from the Western Tauern Window, Eastern Alps: the problem of closure temperatures,
Contrib. Mineral. Petr., 101, 1–11.
Werling, E. (1992), Tonale-, Pejo- und Judicarienlinie. Kinematik, Mikrostrukturen und
Metamorphose von Tektoniten aus räumlich interferierenden aber verschiedenaltrigen
Verwerfungszonen, PhD Thesis, ETH Zürich, p. 276.
Woodcock, N.H, and M. Fischer (1986), Strike-slip duplexes, J. Struct. Geol., 8, 725–735.
Wollnik, S. (2012), Änderungen der Mikrostrukturen und der Zusammensetzung entlang eines
Verformungsgradienten in Gneisen aus dem Ahrntal (Tauernfenster), mit besonderem Augenmerk
auf Granulares Fließen, Diploma-Thesis, Freie Universistät Berlin, p. 66.
Zimmermann, R., K. Hammerschmidt, G. Franz (1994), Eocene high pressure metamorphism in
the Penninic units of the Tauern Window (Eastern Alps): evidence from 40Ar-39Ar dating and
petrological investigations, Contrib. Mineral. Petr., 117, 175–186.
Zwingmann, H. and N.S. Mancktelow (2004), Timing of Alpine fault gouges, Earth Planet. Sc.
Lett., 223(3), 415–425.

71
3.10 Supplementary material
Supporting Table 1: raw data of structural measurements
Domain A Domain B Domain C Domain D Domain E
338 64 S1 350 30 S1 161 58 S1 350 42 S1 49 55 S0
165 75 S1 352 36 S1 132 70 S1 357 43 S1 62 64 S0
249 46 S1 303 54 S1 153 60 S1 342 44 S1 43 51 S0
315 65 S1 304 57 S1 163 65 S1 326 24 S1 186 88 S1
0 53 S1 330 60 S1 337 81 S1 120 78 S1 238 22 S1
353 30 S1 322 54 S1 343 70 S1 124 81 S1 243 37 S1
346 35 S1 39 34 S1 345 70 S1 144 54 S1 326 45 S1
325 36 S1 173 20 S1 347 35 S1 142 45 S1 174 19 S1
350 42 S1 338 13 S1 323 60 S1 142 44 S1 357 45 S1
11 48 S1 336 41 S1 319 60 S1 151 60 S1 180 48 S1
359 58 S1 188 39 S1 335 63 S1 143 64 S1 169 63 S1
0 54 S1 21 56 S1 327 62 S1 150 84 S1 169 58 S1
347 64 S1 16 55 S1 311 54 S1 124 38 S1 192 74 S1
169 35 S1 25 38 S1 306 69 S1 119 36 S1 181 60 S1
162 84 S1 20 42 S1 329 57 S1 229 35 S1 349 74 S1
143 39 S1 24 54 S1 355 52 S1 116 33 S1 351 79 S1
107 14 S1 22 52 S1 343 47 S1 127 57 S1 191 40 S1
241 70 S1 146 66 S1 359 39 S1 357 49 S1 186 44 S1
183 78 S1 124 61 S1 359 39 S1 152 10 S1 320 47 S1
181 62 S1 133 24 S1 346 53 S1 147 39 S1 315 64 S1
178 57 S1 183 24 S1 242 54 S1 68 44 S1 315 40 S1
352 88 S1 192 26 S1 317 68 S1 75 44 S1 344 57 S1
151 75 S1 173 88 S1 315 64 S1 32 48 S1 330 45 S1
171 69 S1 351 87 S1 336 64 S1 38 42 S1 334 71 S1
182 65 S1 157 72 S1 331 46 S1 115 9 S1 330 64 S1
181 71 S1 136 36 S1 148 64 S1 116 4 S1 324 67 S1
170 71 S1 154 30 S1 141 51 S1 45 72 S1 50 6 S1
339 67 S1 134 84 S1 129 50 S1 63 48 S1 355 79 S1
327 52 S1 152 55 S1 139 50 S1 34 66 S1 45 30 S1
168 79 S1 313 66 S1 288 50 S1 3 38 S1 277 47 S1
193 35 S1 19 74 S1 281 59 S1 9 23 S1 336 38 S1
352 62 S1 21 74 S1 275 74 S1 256 76 S1 338 49 S1
330 70 S1 198 78 S1 355 30 S1 288 77 S1 332 25 S1
340 60 S1 38 87 S1 331 27 S1 281 67 S1 315 33 S1
351 89 S1 33 53 S1 105 75 S1 284 60 S1 316 30 S1
177 87 S1 4 58 S1 332 74 S1 130 56 S1 335 64 S1
325 73 S1 21 75 S1 326 48 S1 112 57 S1 335 63 S1
347 87 S1 17 74 S1 302 38 S1 115 57 S1 337 76 S1
343 79 S1 349 69 S1 265 21 S1 144 63 S1 328 68 S1
318 65 S1 11 73 S1 260 21 S1 124 35 S1 336 32 S1
310 61 S1 29 28 S1 268 67 S1 163 41 S1 335 35 S1
165 78 S1 1 36 S1 305 35 S1 139 37 S1 300 19 S1
331 45 S1 24 45 S1 297 43 S1 130 76 S1 57 9 S1
148 57 S1 25 43 S1 323 68 S1 144 44 S1 359 20 S1
321 55 S1 20 70 S1 320 68 S1 142 48 S1 355 54 S1
325 37 S1 8 48 S1 325 70 S1 153 44 S1 330 56 S1
320 56 S1 341 74 S1 136 52 S1 148 48 S1 334 60 S1
337 80 S1 22 40 S1 123 63 S1 98 36 S1 328 52 S1
330 40 S1 10 51 S1 322 58 S1 163 25 S1 332 48 S1

72
Supporting Table 1: raw data of structural measurements
Domain A Domain B Domain C Domain D Domain E
355 61 S1 30 40 S1 322 55 S1 139 64 S1 333 49 S1
339 34 S1 24 51 S1 321 46 S1 85 32 S1 280 33 S1
351 74 S1 21 45 S1 322 53 S1 129 85 S1 284 33 S1
172 65 S1 11 55 S1 342 34 S1 356 42 S1 315 46 S1
2 75 S1 181 33 S1 2 32 S1 3 45 S1 309 41 S1
158 72 S1 194 45 S1 356 34 S1 168 54 S1 297 35 S1
166 76 S1 209 45 S1 324 72 S1 185 64 S1 257 33 S1
155 57 S1 196 42 S1 338 60 S1 187 51 S1 290 35 S1
154 50 S1 142 52 S1 312 47 S1 181 59 S1 288 35 S1
316 62 S1 353 62 S1 313 41 S1 184 65 S1 56 48 S1
153 73 S1 168 68 S1 328 49 S1 156 65 S1 62 57 S1
334 65 S1 131 72 S1 321 54 S1 163 60 S1 57 49 S1
315 72 S1 340 32 S1 328 44 S1 160 45 S1 79 49 S1
331 64 S1 114 15 S1 316 38 S1 181 40 S1 72 53 S1
34 36 S1 11 13 S1 342 53 S1 171 85 S1 106 62 S1
11 44 S1 304 30 S1 334 57 S1 185 76 S1 120 67 S1
4 50 S1 329 22 S1 359 28 S1 181 71 S1 58 60 S1
159 81 S1 331 54 S1 359 25 S1 156 86 S1 85 61 S1
158 71 S1 2 65 S1 325 65 S1 347 88 S1 101 68 S1
168 67 S1 143 68 S1 332 49 S1 170 79 S1 97 68 S1
167 68 S1 129 67 S1 296 39 S1 27 65 S1 157 75 S1
351 86 S1 153 55 S1 316 33 S1 22 65 S1 157 62 S1
175 79 S1 157 56 S1 82 20 S1 14 76 S1 120 24 S1
175 81 S1 137 79 S1 194 28 S1 0 56 S1 149 75 S1
172 90 S1 132 80 S1 223 28 S1 2 74 S1 170 52 S1
346 79 S1 129 76 S1 348 35 S1 9 74 S1 162 86 S1
325 69 S1 130 77 S1 346 38 S1 165 78 S1 264 59 S1
341 80 S1 129 69 S1 344 48 S1 165 85 S1 247 75 S1
180 40 S1 30 19 S1 5 30 S1 140 82 S1 191 88 S1
168 83 S1 42 30 S1 345 35 S1 135 79 S1 218 43 S1
168 60 S1 30 22 S1 335 32 S1 154 84 S1 283 45 S1
175 41 S1 48 23 S1 348 35 S1 163 83 S1 176 85 S1
170 71 S1 31 40 S1 340 44 S1 350 83 S1 211 36 S1
170 65 S1 33 36 S1 338 61 S1 350 81 S1 198 73 S1
160 35 S1 59 37 S1 167 64 S1 334 65 S1 235 49 S1
148 35 S1 58 34 S1 177 40 S1 334 73 S1 184 79 S1
145 55 S1 48 29 S1 191 28 S1 320 54 S1 168 76 S1
230 34 S1 52 35 S1 211 27 S1 355 45 S1 164 41 S1
150 38 S1 64 48 S1 264 33 S1 315 49 S1 175 55 S1
150 56 S1 59 29 S1 303 68 S1 352 39 S1 198 41 S1
175 67 S1 85 23 S1 288 87 S1 10 49 S1 188 35 S1
73 35 S1 73 27 S1 277 74 S1 358 45 S1 104 87 S1
252 62 S1 96 26 S1 324 50 S1 353 42 S1 9 63 S1
315 34 S1 28 43 S1 21 25 S1 334 52 S1 19 70 S1
346 59 S1 71 39 S1 19 23 S1 354 79 S1 350 52 S1
322 48 S1 288 68 S1 25 25 S1 355 78 S1 17 58 S1
325 60 S1 300 48 S1 58 15 S1 16 48 S1 281 32 S1
342 75 S1 148 26 S1 267 4 S1 342 44 S1 317 42 S1
351 40 S1 338 81 S1 292 35 S1 11 66 S1 309 33 S1

73
Supporting Table 1: raw data of structural measurements
Domain A Domain B Domain C Domain D Domain E
358 58 S1 39 35 S1 273 42 S1 338 56 S1 175 82 S1
328 62 S1 20 38 S1 7 20 S1 349 70 S1 173 88 S1
332 55 S1 142 26 S1 97 53 S1 351 81 S1 173 79 S1
340 60 S1 339 21 S1 289 38 S1 11 83 S1 176 37 S1
340 72 S1 316 24 S1 247 47 S1 359 84 S1 348 24 S1
340 84 S1 106 55 S1 277 47 S1 338 63 S1 347 31 S1
342 70 S1 108 61 S1 310 63 S1 320 70 S1 206 60 S1
170 89 S1 64 35 S1 272 52 S1 9 35 S1 240 35 S1
254 32 S1 75 39 S1 251 64 S1 62 45 S1 228 38 S1
336 38 S1 329 82 S2 270 19 S1 46 39 S1 339 60 S1
342 38 S1 330 67 S2 113 87 S1 33 34 S1 351 86 S1
159 75 S1 178 62 S2 272 67 S1 47 32 S1 191 69 S1
150 60 S1 216 65 S2 279 37 S1 24 43 S1 325 31 S1
335 38 S1 185 75 S2 291 69 S1 45 37 S1 167 72 S1
328 37 S1 192 33 S2 268 45 S1 44 34 S1 338 22 S1
1 58 S1 180 56 S2 266 45 S1 5 42 S1 350 47 S1
357 54 S1 184 77 S2 304 58 S1 69 34 S1 170 85 S1
346 53 S1 189 80 S2 282 40 S1 24 43 S1 336 55 S1
326 45 S1 216 56 S2 306 52 S1 179 49 S1 198 42 S1
340 35 S1 3 82 S2 312 53 S1 165 50 S1 190 88 S1
339 69 S1 10 84 S2 337 65 S1 225 66 S1 0 52 S1
331 35 S1 220 80 S2 311 82 S1 168 66 S1 215 45 S1
147 42 S1 211 86 S2 286 79 S1 164 30 S1 216 49 S1
165 59 S1 135 86 S2 321 65 S1 135 24 S1 246 25 S1
165 59 S1 325 68 S2 326 85 S1 175 48 S1 203 33 S1
322 48 S1 312 69 S2 321 56 S1 189 27 S1 202 39 S1
328 46 S1 359 79 S2 0 55 S1 177 42 S1 204 29 S1
340 46 S1 186 88 S2 321 41 S1 20 8 S1 247 22 S1
350 49 S1 346 85 S2 328 48 S1 208 33 S1 250 28 S1
325 68 S1 346 86 S2 348 57 S1 225 32 S1 197 14 S1
18 89 S1 351 85 S2 348 66 S1 346 18 S1 202 26 S1
10 61 S1 151 60 S2 331 82 S1 354 38 S1 246 18 S1
171 85 S1 159 63 S2 65 53 S1 220 36 S1 232 28 S1
162 83 S1 148 62 S2 354 64 S1 194 52 S1 235 29 S1
10 61 S1 155 67 S2 349 54 S1 177 28 S1 251 22 S1
11 41 S1 157 65 S2 348 49 S1 207 43 S1 263 28 S1
5 48 S1 153 67 S2 14 47 S1 214 27 S1 257 41 S1
31 17 S1 355 74 S2 342 80 S1 192 77 S1 240 35 S1
344 57 S1 360 73 S2 347 65 S1 207 77 S1 253 49 S1
355 69 S1 138 80 S2 162 59 S1 3 74 S1 266 59 S1
332 67 S1 150 72 S2 162 49 S1 167 44 S1 310 48 S1
336 79 S1 135 73 S2 308 48 S1 193 60 S1 316 52 S1
335 88 S1 168 78 S2 304 45 S1 159 52 S1 293 47 S1
157 64 S1 157 84 S2 34 28 S1 168 64 S1 265 35 S1
155 62 S1 329 83 S2 48 30 S1 171 66 S1 317 30 S1
155 62 S1 329 89 S2 123 66 S1 351 53 S1 335 33 S1
162 46 S1 317 84 S2 137 67 S1 305 55 S1 274 25 S1
166 52 S1 318 82 S2 120 11 S1 311 20 S1 267 27 S1
170 52 S1 122 79 S2 356 28 S1 340 42 S1 239 15 S1

74
Supporting Table 1: raw data of structural measurements
Domain A Domain B Domain C Domain D Domain E
120 49 S1 131 70 S2 179 10 S1 347 45 S1 205 24 S1
144 35 S1 131 72 S2 348 45 S1 188 86 S1 191 28 S1
131 43 S1 145 62 S2 11 26 S1 3 88 S1 191 21 S1
165 82 S1 346 74 S2 32 25 S1 0 84 S1 208 9 S1
45 19 S1 348 71 S2 341 40 S1 342 43 S1 172 25 S1
35 23 S1 344 71 S2 345 35 S1 359 81 S1 202 19 S1
340 35 S1 342 75 S2 353 45 S1 174 65 S1 229 21 S1
176 82 S1 339 65 S2 356 38 S1 183 75 S1 219 30 S1
115 82 S1 339 72 S2 351 30 S1 151 34 S1 335 20 S1
191 5 S1 353 68 S2 324 28 S1 172 58 S1 326 32 S1
240 10 S1 355 68 S2 302 35 S1 158 30 S1 329 18 S1
342 72 S1 358 68 S2 106 25 S1 174 46 S1 195 63 S1
348 78 S1 6 72 S2 120 51 S1 169 70 S1 184 81 S1
166 78 S1 1 77 S2 233 83 S1 168 67 S1 329 34 S1
324 83 S1 346 85 S2 264 28 S1 174 64 S1 186 27 S1
177 64 S1 342 81 S2 325 30 S1 178 80 S1 13 89 S1
152 69 S1 350 84 S2 344 22 S1 170 64 S1 22 46 S1
185 87 S1 160 65 S2 296 31 S1 170 67 S1 4 64 S1
264 34 S1 322 83 S2 334 81 S1 165 43 S1 33 43 S1
284 45 S1 151 68 S2 246 77 S1 154 55 S1 9 67 S1
153 75 S1 336 64 S2 263 63 S1 162 57 S1 182 72 S1
152 88 S1 174 48 S2 277 82 S1 168 55 S1 178 46 S1
350 87 S1 168 50 S2 278 81 S1 171 61 S1 186 72 S1
336 90 S1 188 58 S2 186 28 S1 166 67 S1 330 55 S1
336 90 S1 181 47 S2 154 62 S1 180 56 S1 337 47 S1
355 38 S1 112 60 S2 172 47 S1 172 70 S1 169 39 S1
347 60 S1 114 57 S2 322 52 S1 142 15 S1 220 34 S1
349 87 S1 94 30 S2 324 50 S1 175 65 S1 344 36 S1
355 85 S1 97 63 S2 304 440 S1 161 41 S1 320 22 S1
6 56 S1 105 70 S2 336 87 S1 172 40 S1 15 25 S1
2 55 S1 259 37 S2 353 85 S1 155 24 S1 354 35 S1
355 76 S1 285 51 S2 315 48 S1 135 19 S1 337 44 S1
5 84 S1 125 46 S2 334 62 S1 175 35 S1 24 28 S1
172 87 S1 91 45 S2 297 34 S1 170 38 S1 5 40 S1
145 62 S1 316 65 S2 304 25 S1 165 68 S1 334 59 S1
116 46 S1 109 63 S2 329 48 S1 164 67 S1 330 21 S1
349 58 S1 119 63 S2 356 45 S1 164 63 S1 334 28 S1
33 27 S1 119 67 S2 345 47 S1 167 72 S1 355 81 S2
112 24 S1 128 80 S2 323 60 S1 172 78 S1 343 90 S2
21 29 S1 132 71 S2 321 48 S1 205 33 S1 342 88 S2
340 70 S1 131 80 S2 328 62 S1 206 30 S1 342 87 S2
332 70 S1 139 72 S2 303 60 S1 190 37 S1 357 78 S2
354 86 S1 133 72 S2 308 56 S1 190 45 S1 353 75 S2
357 72 S1 132 69 S2 300 85 S1 161 34 S1 359 60 S2
349 88 S1 137 84 S2 309 70 S1 174 45 S1 345 46 S2
346 65 S1 136 86 S2 269 58 S1 166 35 S1 144 80 S2
8 57 S1 138 74 S2 328 60 S1 173 35 S1 155 72 S2
324 43 S1 133 80 S2 314 59 S1 188 40 S1 325 86 S2
329 9 S1 150 90 S2 309 26 S1 196 37 S1 309 73 S2

75
Supporting Table 1: raw data of structural measurements
Domain A Domain B Domain C Domain D Domain E
312 42 S1 158 87 S2 325 37 S1 19 24 S1 333 85 S2
145 81 S1 148 76 S2 332 48 S1 14 30 S1 318 83 S2
153 88 S1 142 78 S2 331 49 S1 10 20 S1 16 69 S2
5 86 S1 148 78 S2 272 22 S1 106 27 S1 15 79 S2
165 35 S1 158 68 S2 247 21 S1 13 67 S1 21 80 S2
146 27 S1 150 82 S2 303 51 S1 357 59 S1 22 76 S2
146 20 S1 146 84 S2 316 54 S1 18 80 S1 348 63 S2
347 53 S1 150 82 S2 331 39 S1 11 81 S1 349 74 S2
335 69 S1 142 82 S2 327 38 S1 167 36 S1 358 67 S2
329 65 S1 288 58 S2 339 55 S1 162 22 S1 344 46 S2
338 57 S1 290 73 S2 340 54 S1 180 54 S1 351 59 S2
335 50 S1 134 71 S2 292 75 S1 199 56 S1 353 70 S2
280 32 S1 293 76 S2 304 86 S1 210 45 S1 332 79 S2
344 54 S1 121 90 S2 251 37 S1 191 45 S1 345 71 S2
351 64 S1 310 67 S2 259 39 S1 224 38 S1 330 45 S2
334 55 S1 133 80 S2 152 26 S1 134 23 S1 334 71 S2
340 60 S1 129 63 S2 161 24 S1 121 24 S1 330 64 S2
342 72 S1 120 64 S2 98 35 S1 194 38 S1 324 67 S2
332 65 S1 162 82 S2 93 31 S1 203 53 S1 330 64 S2
341 72 S1 153 75 S2 130 83 S1 200 58 S1 330 64 S2
12 55 S1 162 82 S2 134 64 S1 136 78 S1 319 67 S2
10 58 S1 153 75 S2 291 48 S1 150 58 S1 330 69 S2
5 64 S1 356 39 S2 291 40 S1 147 63 S1 323 63 S2
253 8 S1 334 62 S2 301 46 S1 144 69 S1 319 81 S2
215 18 S1 45 30 S2 240 34 S1 160 67 S1 342 40 S2
160 65 S1 33 33 S2 256 35 S1 203 55 S1 332 35 S2
170 90 S1 347 46 S2 155 72 S1 192 64 S1 332 49 S2
156 60 S1 333 37 S2 141 45 S1 216 35 S1 333 53 S2
150 80 S1 150 80 S2 157 54 S1 170 65 S1 352 37 S2
334 74 S1 161 85 S2 308 50 S1 186 55 S1 342 48 S2
173 25 S1 145 88 S2 306 54 S1 196 37 S1 345 49 S2
115 3 S1 161 78 S2 306 46 S1 296 39 S1 352 52 S2
80 42 S1 149 62 S2 341 67 S1 186 73 S1 354 52 S2
350 84 S1 332 82 S2 331 58 S1 214 51 S1 359 52 S2
145 45 S1 326 86 S2 333 61 S1 198 13 S1 6 45 S2
120 52 S1 345 77 S2 331 50 S1 196 14 S1 328 52 S2
348 57 S1 28 73 S2 322 72 S1 2 40 S1 340 73 S2
194 83 S1 30 88 S2 318 48 S1 58 45 S1 44 54 S2
40 72 S1 271 20 S2 176 65 S1 290 15 S1 355 46 S2
7 61 S1 159 30 S2 188 69 S1 113 18 S1 343 48 S2
347 67 S1 135 36 S2 299 56 S1 172 63 S1 331 50 S2
347 37 S1 258 85 dex C 304 56 S1 179 43 S1 358 51 S2
356 39 S1 38 77 dex C 302 60 S1 182 80 S1 325 40 S2
172 55 S1 22 72 dex C 338 47 S1 168 46 S1 5 61 S2
184 57 S1 356 39 rev C 333 45 S1 174 53 S1 324 65 S2
358 70 S1 352 45 rev C 310 41 S1 172 65 S1 10 43 S2
344 65 S1 11 66 rev C 228 21 S1 186 71 S1 342 84 S2
350 55 S1 194 74 rev C 300 6 S1 189 80 S1 333 57 S2
355 68 S1 131 73 sin C 301 50 S1 343 46 S1 152 70 S2

76
Supporting Table 1: raw data of structural measurements
Domain A Domain B Domain C Domain D Domain E
6 45 S1 124 72 sin C 288 58 S1 0 52 S1 168 71 S2
2 37 S1 140 70 sin C 280 43 S1 145 35 S1 332 85 S2
332 34 S1 296 75 sin C 174 21 S1 32 22 S1 143 80 S2
337 37 S1 304 85 sin C 325 25 S1 172 33 S1 308 88 S2
346 67 S1 112 82 sin C 269 18 S1 121 42 S1 343 66 S2
334 54 S1 210 78 sin C 177 23 S1 139 28 S1 343 52 S2
172 84 S1 11 63 sin C 291 37 S1 182 24 S1 244 90 S2
355 86 S1 39 78 sin C 200 24 S1 146 36 S1 244 90 S2
334 35 S1 5 65 sin C 281 49 S1 172 54 S1 337 72 S2
341 54 S1 186 80 sin C 273 48 S1 178 43 S1 348 87 S2
342 50 S1 17 86 sin C 333 54 S1 149 38 S1 331 70 S2
352 60 S1 139 79 sin C 325 42 S1 206 46 S1 334 86 S2
356 72 S1 135 85 sin C 303 33 S1 178 87 S1 329 42 S2
348 70 S1 129 72 sin C 16 29 S1 187 82 S1 327 54 S2
324 27 S1 323 86 sin C 309 49 S1 9 68 S1 343 53 S2
329 26 S1 125 60 sin C 19 90 S1 359 62 S1 340 57 S2
331 44 S1 152 61 sin C 2 70 S1 342 72 S1 318 51 S2
349 59 S1 162 70 sin C 318 52 S1 341 42 S1 176 40 S2
342 70 S1 126 74 sin C 343 74 S1 327 60 S1 156 68 S2
345 55 S1 128 79 sin C 314 56 S1 280 34 S1 170 47 S2
340 56 S1 126 82 sin C 344 38 S1 10 66 S1 292 90 S2
346 35 S1 137 90 sin C 276 48 S1 37 30 S1 140 80 S2
344 50 S1 135 84 sin C 326 46 S1 353 78 S1 134 80 S2
345 23 S1 137 75 sin C 317 48 S1 339 84 S1 300 82 S2
149 37 S1 122 78 sin C 334 81 S1 338 49 S1 334 36 S2
5 71 S1 118 70 sin C 353 81 S1 118 18 S1 339 21 S2
338 40 S1 122 70 sin C 5 67 S1 146 54 S1 264 79 S2
310 62 S1 330 85 sin C 24 77 S1 158 82 S1 273 76 S2
345 60 S1 335 88 sin C 343 54 S1 152 65 S1 167 85 S2
331 73 S1 350 87 sin C 189 46 S1 163 68 S1 166 78 S2
320 75 S1 348 85 sin C 289 29 S1 328 86 S1 357 67 S2
350 81 S1 126 60 sin C 202 58 S1 156 80 S1 11 64 S2
295 45 S1 311 78 sin C 231 32 S1 156 32 S1 285 10 S3
338 55 S1 296 75 sin C 207 20 S1 158 30 S1 220 28 S3
353 80 S1 304 85 sin C 258 52 S1 140 24 S1 306 7 S3
153 76 S1 112 82 sin C 340 52 S1 121 20 S1 353 19 S3
130 68 S1 291 65 sin C 2 44 S1 144 23 S1 100 36 S3
143 62 S1 164 66 sin C 173 5 S1 188 23 S1 319 16 S3
136 70 S1 298 68 sin C 67 29 S1 337 85 S1 289 45 S3
144 75 S1 320 85 sin C 305 21 S1 357 82 S1 248 46 S3
138 66 S1 178 82 sin C 173 15 S1 1 84 S1 277 53 S3
140 74 S1 191 78 sin C 81 54 S1 168 30 S1 197 30 S3
142 79 S1 181 74 sin C 214 35 S1 137 28 S1 308 59 S3
137 40 S1 192 84 sin C 44 20 S1 168 35 S1 226 19 S3
161 51 S1 30 53 sin C 24 16 S1 178 42 S1 253 32 S3
154 69 S1 321 78 sin C 4 20 S1 190 56 S1 263 30 S3
316 33 S1 317 90 sin C 26 56 S1 175 62 S1 315 28 S3
144 84 S1 322 82 sin C 48 31 S1 174 30 S1 300 30 S3
140 75 S1 157 51 dex C 78 79 S1 112 36 S1 339 60 S3
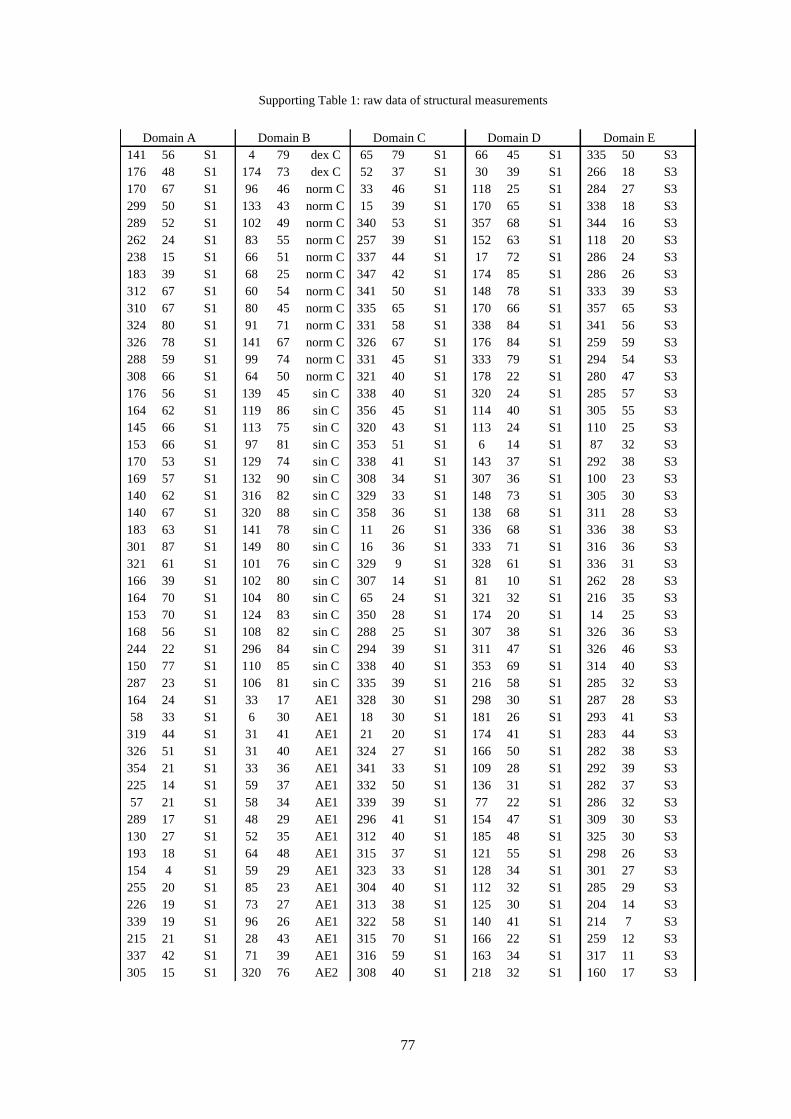
77
Supporting Table 1: raw data of structural measurements
Domain A Domain B Domain C Domain D Domain E
141 56 S1 4 79 dex C 65 79 S1 66 45 S1 335 50 S3
176 48 S1 174 73 dex C 52 37 S1 30 39 S1 266 18 S3
170 67 S1 96 46 norm C 33 46 S1 118 25 S1 284 27 S3
299 50 S1 133 43 norm C 15 39 S1 170 65 S1 338 18 S3
289 52 S1 102 49 norm C 340 53 S1 357 68 S1 344 16 S3
262 24 S1 83 55 norm C 257 39 S1 152 63 S1 118 20 S3
238 15 S1 66 51 norm C 337 44 S1 17 72 S1 286 24 S3
183 39 S1 68 25 norm C 347 42 S1 174 85 S1 286 26 S3
312 67 S1 60 54 norm C 341 50 S1 148 78 S1 333 39 S3
310 67 S1 80 45 norm C 335 65 S1 170 66 S1 357 65 S3
324 80 S1 91 71 norm C 331 58 S1 338 84 S1 341 56 S3
326 78 S1 141 67 norm C 326 67 S1 176 84 S1 259 59 S3
288 59 S1 99 74 norm C 331 45 S1 333 79 S1 294 54 S3
308 66 S1 64 50 norm C 321 40 S1 178 22 S1 280 47 S3
176 56 S1 139 45 sin C 338 40 S1 320 24 S1 285 57 S3
164 62 S1 119 86 sin C 356 45 S1 114 40 S1 305 55 S3
145 66 S1 113 75 sin C 320 43 S1 113 24 S1 110 25 S3
153 66 S1 97 81 sin C 353 51 S1 6 14 S1 87 32 S3
170 53 S1 129 74 sin C 338 41 S1 143 37 S1 292 38 S3
169 57 S1 132 90 sin C 308 34 S1 307 36 S1 100 23 S3
140 62 S1 316 82 sin C 329 33 S1 148 73 S1 305 30 S3
140 67 S1 320 88 sin C 358 36 S1 138 68 S1 311 28 S3
183 63 S1 141 78 sin C 11 26 S1 336 68 S1 336 38 S3
301 87 S1 149 80 sin C 16 36 S1 333 71 S1 316 36 S3
321 61 S1 101 76 sin C 329 9 S1 328 61 S1 336 31 S3
166 39 S1 102 80 sin C 307 14 S1 81 10 S1 262 28 S3
164 70 S1 104 80 sin C 65 24 S1 321 32 S1 216 35 S3
153 70 S1 124 83 sin C 350 28 S1 174 20 S1 14 25 S3
168 56 S1 108 82 sin C 288 25 S1 307 38 S1 326 36 S3
244 22 S1 296 84 sin C 294 39 S1 311 47 S1 326 46 S3
150 77 S1 110 85 sin C 338 40 S1 353 69 S1 314 40 S3
287 23 S1 106 81 sin C 335 39 S1 216 58 S1 285 32 S3
164 24 S1 33 17 AE1 328 30 S1 298 30 S1 287 28 S3
58 33 S1 6 30 AE1 18 30 S1 181 26 S1 293 41 S3
319 44 S1 31 41 AE1 21 20 S1 174 41 S1 283 44 S3
326 51 S1 31 40 AE1 324 27 S1 166 50 S1 282 38 S3
354 21 S1 33 36 AE1 341 33 S1 109 28 S1 292 39 S3
225 14 S1 59 37 AE1 332 50 S1 136 31 S1 282 37 S3
57 21 S1 58 34 AE1 339 39 S1 77 22 S1 286 32 S3
289 17 S1 48 29 AE1 296 41 S1 154 47 S1 309 30 S3
130 27 S1 52 35 AE1 312 40 S1 185 48 S1 325 30 S3
193 18 S1 64 48 AE1 315 37 S1 121 55 S1 298 26 S3
154 4 S1 59 29 AE1 323 33 S1 128 34 S1 301 27 S3
255 20 S1 85 23 AE1 304 40 S1 112 32 S1 285 29 S3
226 19 S1 73 27 AE1 313 38 S1 125 30 S1 204 14 S3
339 19 S1 96 26 AE1 322 58 S1 140 41 S1 214 7 S3
215 21 S1 28 43 AE1 315 70 S1 166 22 S1 259 12 S3
337 42 S1 71 39 AE1 316 59 S1 163 34 S1 317 11 S3
305 15 S1 320 76 AE2 308 40 S1 218 32 S1 160 17 S3
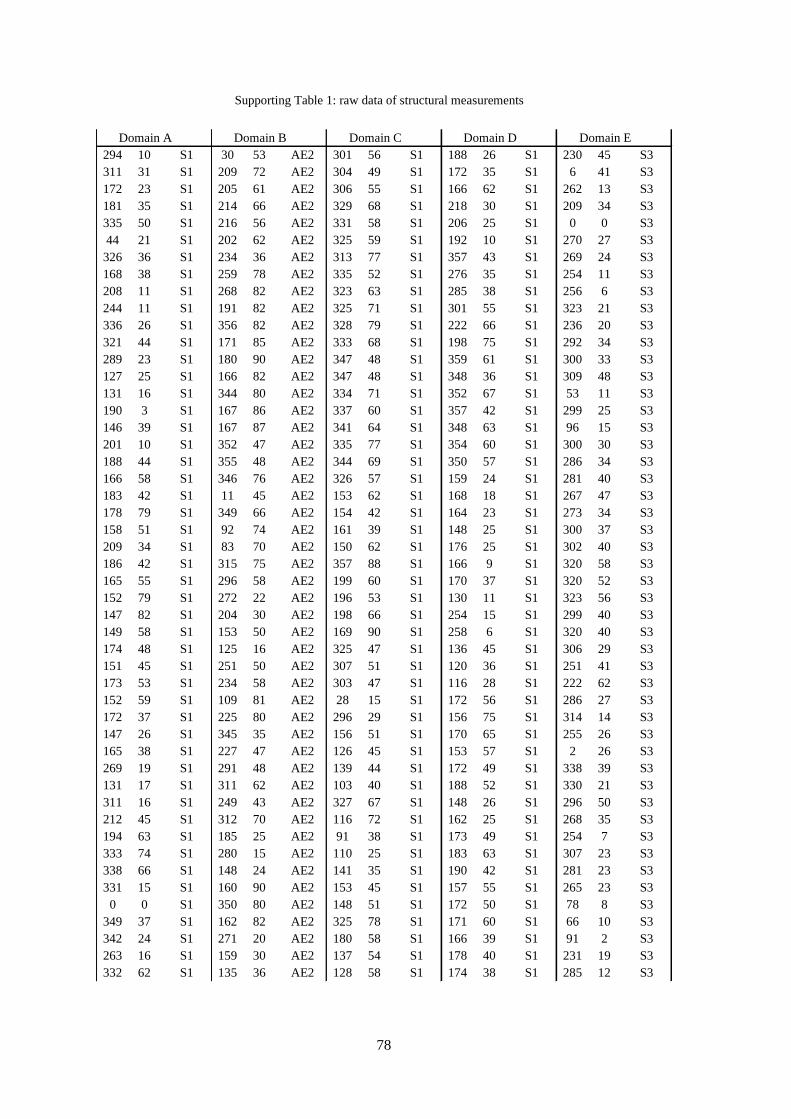
78
Supporting Table 1: raw data of structural measurements
Domain A Domain B Domain C Domain D Domain E
294 10 S1 30 53 AE2 301 56 S1 188 26 S1 230 45 S3
311 31 S1 209 72 AE2 304 49 S1 172 35 S1 6 41 S3
172 23 S1 205 61 AE2 306 55 S1 166 62 S1 262 13 S3
181 35 S1 214 66 AE2 329 68 S1 218 30 S1 209 34 S3
335 50 S1 216 56 AE2 331 58 S1 206 25 S1 0 0 S3
44 21 S1 202 62 AE2 325 59 S1 192 10 S1 270 27 S3
326 36 S1 234 36 AE2 313 77 S1 357 43 S1 269 24 S3
168 38 S1 259 78 AE2 335 52 S1 276 35 S1 254 11 S3
208 11 S1 268 82 AE2 323 63 S1 285 38 S1 256 6 S3
244 11 S1 191 82 AE2 325 71 S1 301 55 S1 323 21 S3
336 26 S1 356 82 AE2 328 79 S1 222 66 S1 236 20 S3
321 44 S1 171 85 AE2 333 68 S1 198 75 S1 292 34 S3
289 23 S1 180 90 AE2 347 48 S1 359 61 S1 300 33 S3
127 25 S1 166 82 AE2 347 48 S1 348 36 S1 309 48 S3
131 16 S1 344 80 AE2 334 71 S1 352 67 S1 53 11 S3
190 3 S1 167 86 AE2 337 60 S1 357 42 S1 299 25 S3
146 39 S1 167 87 AE2 341 64 S1 348 63 S1 96 15 S3
201 10 S1 352 47 AE2 335 77 S1 354 60 S1 300 30 S3
188 44 S1 355 48 AE2 344 69 S1 350 57 S1 286 34 S3
166 58 S1 346 76 AE2 326 57 S1 159 24 S1 281 40 S3
183 42 S1 11 45 AE2 153 62 S1 168 18 S1 267 47 S3
178 79 S1 349 66 AE2 154 42 S1 164 23 S1 273 34 S3
158 51 S1 92 74 AE2 161 39 S1 148 25 S1 300 37 S3
209 34 S1 83 70 AE2 150 62 S1 176 25 S1 302 40 S3
186 42 S1 315 75 AE2 357 88 S1 166 9 S1 320 58 S3
165 55 S1 296 58 AE2 199 60 S1 170 37 S1 320 52 S3
152 79 S1 272 22 AE2 196 53 S1 130 11 S1 323 56 S3
147 82 S1 204 30 AE2 198 66 S1 254 15 S1 299 40 S3
149 58 S1 153 50 AE2 169 90 S1 258 6 S1 320 40 S3
174 48 S1 125 16 AE2 325 47 S1 136 45 S1 306 29 S3
151 45 S1 251 50 AE2 307 51 S1 120 36 S1 251 41 S3
173 53 S1 234 58 AE2 303 47 S1 116 28 S1 222 62 S3
152 59 S1 109 81 AE2 28 15 S1 172 56 S1 286 27 S3
172 37 S1 225 80 AE2 296 29 S1 156 75 S1 314 14 S3
147 26 S1 345 35 AE2 156 51 S1 170 65 S1 255 26 S3
165 38 S1 227 47 AE2 126 45 S1 153 57 S1 2 26 S3
269 19 S1 291 48 AE2 139 44 S1 172 49 S1 338 39 S3
131 17 S1 311 62 AE2 103 40 S1 188 52 S1 330 21 S3
311 16 S1 249 43 AE2 327 67 S1 148 26 S1 296 50 S3
212 45 S1 312 70 AE2 116 72 S1 162 25 S1 268 35 S3
194 63 S1 185 25 AE2 91 38 S1 173 49 S1 254 7 S3
333 74 S1 280 15 AE2 110 25 S1 183 63 S1 307 23 S3
338 66 S1 148 24 AE2 141 35 S1 190 42 S1 281 23 S3
331 15 S1 160 90 AE2 153 45 S1 157 55 S1 265 23 S3
0 0 S1 350 80 AE2 148 51 S1 172 50 S1 78 8 S3
349 37 S1 162 82 AE2 325 78 S1 171 60 S1 66 10 S3
342 24 S1 271 20 AE2 180 58 S1 166 39 S1 91 2 S3
263 16 S1 159 30 AE2 137 54 S1 178 40 S1 231 19 S3
332 62 S1 135 36 AE2 128 58 S1 174 38 S1 285 12 S3

79
Supporting Table 1: raw data of structural measurements
Domain A Domain B Domain C Domain D Domain E
347 45 S1 28 73 AE2 129 33 S1 211 27 S1 288 22 S3
317 30 S1 30 88 AE2 101 41 S1 185 19 S1 2 67 AE1
312 63 S1 152 68 AE2 250 27 S1 203 44 S1 6 64 AE1
316 63 S1 163 82 AE2 247 16 S1 183 63 S1 17 67 AE1
302 57 S1 159 51 AE2 50 52 S1 200 67 S1 62 22 AE1
117 30 S1 332 82 AE2 72 55 S1 194 22 S1 188 40 AE1
156 55 S1 326 86 AE2 331 15 S1 323 33 S1 220 14 AE1
146 65 S1 345 77 AE2 266 24 S1 302 21 S1 244 18 AE1
194 25 S1 100 9 FA1 265 35 S1 273 23 S1 256 25 AE1
300 29 S1 132 3 FA1 355 25 S1 158 30 S1 280 28 AE1
324 42 S1 328 22 FA1 47 26 S1 168 27 S1 291 24 AE1
244 8 S1 124 4 FA1 69 22 S1 243 21 S1 300 30 AE1
324 58 S1 312 3 FA1 52 24 S1 165 44 S1 320 45 AE1
323 54 S1 310 3 FA1 69 32 S1 203 17 S1 321 57 AE1
289 40 S1 272 42 FA2 63 13 S1 230 13 S1 332 40 AE1
304 45 S1 262 24 FA2 359 49 S1 212 58 S1 335 38 AE1
334 80 S1 280 23 FA2 328 54 S1 207 68 S1 336 34 AE1
342 82 S1 278 22 FA2 337 54 S1 200 83 S1 337 45 AE1
319 72 S1 288 12 FA2 340 46 S1 238 64 S1 354 40 AE1
342 35 S1 288 8 FA2 341 38 S1 234 62 S1 357 67 AE1
327 50 S1 320 30 FA2 341 58 S1 211 70 S1 357 59 AE1
315 36 S1 283 2 FA2 336 64 S1 216 76 S1 341 78 AE2
340 52 S1 72 40 FA2 328 68 S1 200 81 S1 342 84 AE2
332 56 S1 85 19 FA2 99 66 S1 210 70 S1 0 25 AE2
334 46 S1 83 22 FA2 101 67 S1 222 68 S1 0 63 AE2
190 21 S1 53 42 FA2 115 66 S1 217 68 S1 2 76 AE2
307 37 S1 83 47 FA2 54 87 S1 222 76 S1 2 88 AE2
328 48 S1 73 32 FA2 232 75 S1 210 65 S1 2 79 AE2
352 62 S1 53 24 FA2 11 67 S1 198 66 S1 2 67 AE2
349 60 S1 67 40 FA2 32 69 S1 168 50 S1 2 67 AE2
354 61 S1 74 42 FA2 23 65 S1 167 71 S1 3 67 AE2
346 56 S1 55 45 FA2 16 62 S1 172 84 S1 3 50 AE2
346 60 S1 349 43 FA2 44 60 S1 169 62 S1 5 55 AE2
193 14 S1 359 37 FA2 34 65 S1 188 73 S1 5 77 AE2
188 16 S1 36 33 FA2 37 58 S1 180 78 S1 5 44 AE2
191 13 S1 21 39 FA2 297 72 S1 171 66 S1 6 44 AE2
335 67 S1 114 20 FA2 344 66 S1 202 75 S1 6 56 AE2
335 77 S1 121 20 FA2 322 82 S1 188 64 S1 7 87 AE2
330 88 S1 125 16 FA2 288 42 S1 189 54 S1 7 58 AE2
2 33 S1 44 44 FA2 309 47 S1 192 64 S1 8 59 AE2
32 17 S1 22 0 FA2 304 74 S1 204 80 S1 8 18 AE2
30 14 S1 235 60 FA2 310 45 S1 217 81 S1 10 54 AE2
6 44 S1 225 15 FA2 319 50 S1 16 78 S1 10 64 AE2
256 36 S1 202 10 FA2 334 50 S1 45 72 S1 11 53 AE2
12 45 S1 208 5 FA2 326 47 S1 158 14 S1 12 34 AE2
11 66 S1 256 17 FA2 348 60 S1 162 57 S1 12 33 AE2
9 48 S1 71 70 FA2 314 58 S1 173 62 S1 12 65 AE2
316 40 S1 210 48 FA2 337 68 S1 182 59 S1 13 48 AE2
313 38 S1 240 20 FA2 150 82 S1 121 88 S1 14 45 AE2
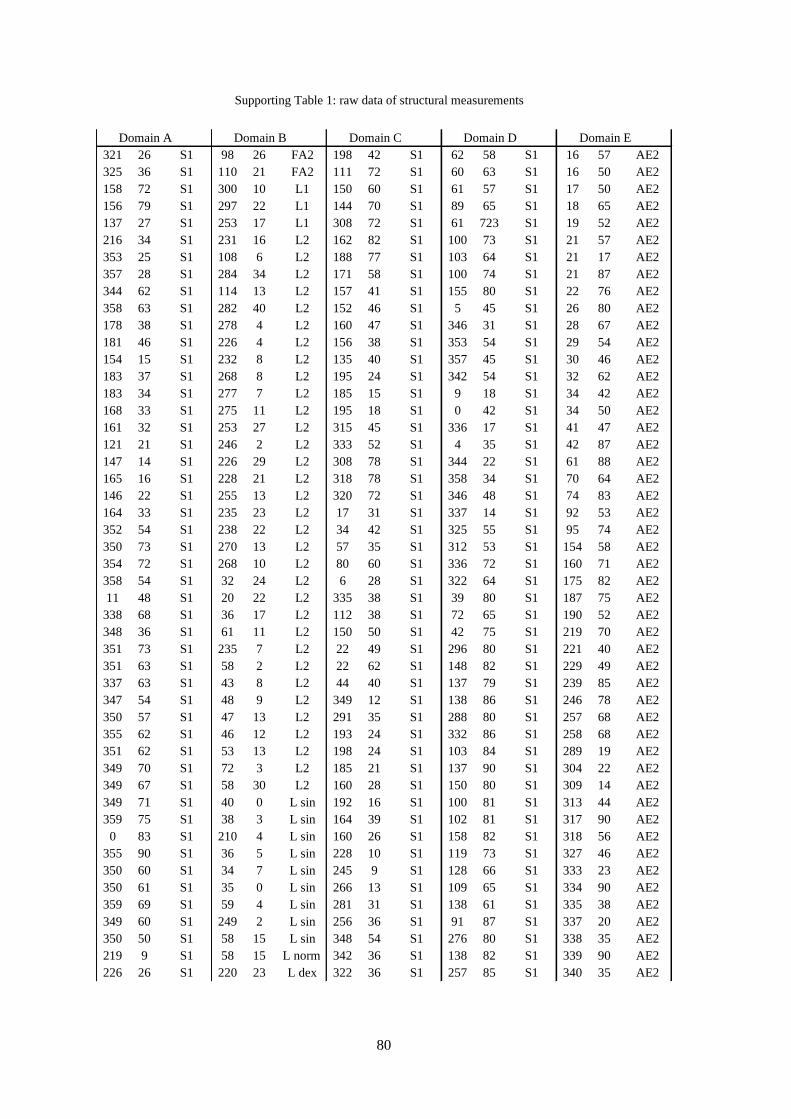
80
Supporting Table 1: raw data of structural measurements
Domain A Domain B Domain C Domain D Domain E
321 26 S1 98 26 FA2 198 42 S1 62 58 S1 16 57 AE2
325 36 S1 110 21 FA2 111 72 S1 60 63 S1 16 50 AE2
158 72 S1 300 10 L1 150 60 S1 61 57 S1 17 50 AE2
156 79 S1 297 22 L1 144 70 S1 89 65 S1 18 65 AE2
137 27 S1 253 17 L1 308 72 S1 61 723 S1 19 52 AE2
216 34 S1 231 16 L2 162 82 S1 100 73 S1 21 57 AE2
353 25 S1 108 6 L2 188 77 S1 103 64 S1 21 17 AE2
357 28 S1 284 34 L2 171 58 S1 100 74 S1 21 87 AE2
344 62 S1 114 13 L2 157 41 S1 155 80 S1 22 76 AE2
358 63 S1 282 40 L2 152 46 S1 5 45 S1 26 80 AE2
178 38 S1 278 4 L2 160 47 S1 346 31 S1 28 67 AE2
181 46 S1 226 4 L2 156 38 S1 353 54 S1 29 54 AE2
154 15 S1 232 8 L2 135 40 S1 357 45 S1 30 46 AE2
183 37 S1 268 8 L2 195 24 S1 342 54 S1 32 62 AE2
183 34 S1 277 7 L2 185 15 S1 9 18 S1 34 42 AE2
168 33 S1 275 11 L2 195 18 S1 0 42 S1 34 50 AE2
161 32 S1 253 27 L2 315 45 S1 336 17 S1 41 47 AE2
121 21 S1 246 2 L2 333 52 S1 4 35 S1 42 87 AE2
147 14 S1 226 29 L2 308 78 S1 344 22 S1 61 88 AE2
165 16 S1 228 21 L2 318 78 S1 358 34 S1 70 64 AE2
146 22 S1 255 13 L2 320 72 S1 346 48 S1 74 83 AE2
164 33 S1 235 23 L2 17 31 S1 337 14 S1 92 53 AE2
352 54 S1 238 22 L2 34 42 S1 325 55 S1 95 74 AE2
350 73 S1 270 13 L2 57 35 S1 312 53 S1 154 58 AE2
354 72 S1 268 10 L2 80 60 S1 336 72 S1 160 71 AE2
358 54 S1 32 24 L2 6 28 S1 322 64 S1 175 82 AE2
11 48 S1 20 22 L2 335 38 S1 39 80 S1 187 75 AE2
338 68 S1 36 17 L2 112 38 S1 72 65 S1 190 52 AE2
348 36 S1 61 11 L2 150 50 S1 42 75 S1 219 70 AE2
351 73 S1 235 7 L2 22 49 S1 296 80 S1 221 40 AE2
351 63 S1 58 2 L2 22 62 S1 148 82 S1 229 49 AE2
337 63 S1 43 8 L2 44 40 S1 137 79 S1 239 85 AE2
347 54 S1 48 9 L2 349 12 S1 138 86 S1 246 78 AE2
350 57 S1 47 13 L2 291 35 S1 288 80 S1 257 68 AE2
355 62 S1 46 12 L2 193 24 S1 332 86 S1 258 68 AE2
351 62 S1 53 13 L2 198 24 S1 103 84 S1 289 19 AE2
349 70 S1 72 3 L2 185 21 S1 137 90 S1 304 22 AE2
349 67 S1 58 30 L2 160 28 S1 150 80 S1 309 14 AE2
349 71 S1 40 0 L sin 192 16 S1 100 81 S1 313 44 AE2
359 75 S1 38 3 L sin 164 39 S1 102 81 S1 317 90 AE2
0 83 S1 210 4 L sin 160 26 S1 158 82 S1 318 56 AE2
355 90 S1 36 5 L sin 228 10 S1 119 73 S1 327 46 AE2
350 60 S1 34 7 L sin 245 9 S1 128 66 S1 333 23 AE2
350 61 S1 35 0 L sin 266 13 S1 109 65 S1 334 90 AE2
359 69 S1 59 4 L sin 281 31 S1 138 61 S1 335 38 AE2
349 60 S1 249 2 L sin 256 36 S1 91 87 S1 337 20 AE2
350 50 S1 58 15 L sin 348 54 S1 276 80 S1 338 35 AE2
219 9 S1 58 15 L norm 342 36 S1 138 82 S1 339 90 AE2
226 26 S1 220 23 L dex 322 36 S1 257 85 S1 340 35 AE2
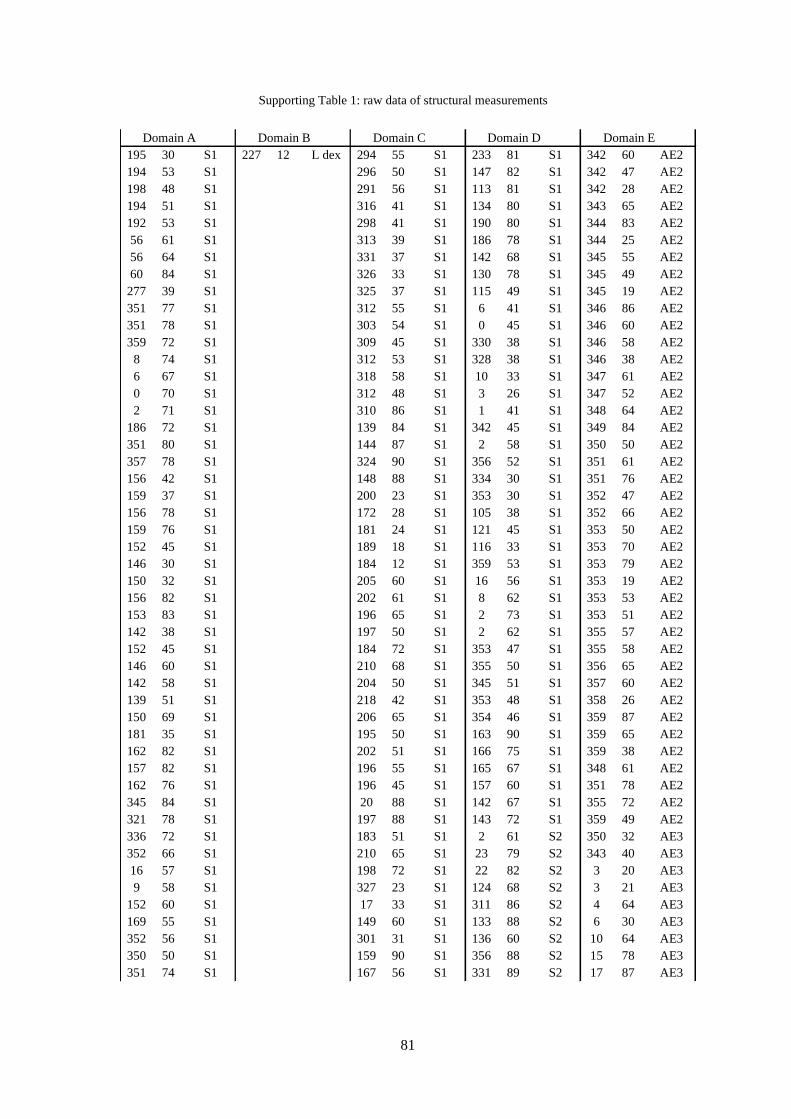
81
Supporting Table 1: raw data of structural measurements
Domain A Domain B Domain C Domain D Domain E
195 30 S1 227 12 L dex 294 55 S1 233 81 S1 342 60 AE2
194 53 S1 296 50 S1 147 82 S1 342 47 AE2
198 48 S1 291 56 S1 113 81 S1 342 28 AE2
194 51 S1 316 41 S1 134 80 S1 343 65 AE2
192 53 S1 298 41 S1 190 80 S1 344 83 AE2
56 61 S1 313 39 S1 186 78 S1 344 25 AE2
56 64 S1 331 37 S1 142 68 S1 345 55 AE2
60 84 S1 326 33 S1 130 78 S1 345 49 AE2
277 39 S1 325 37 S1 115 49 S1 345 19 AE2
351 77 S1 312 55 S1 6 41 S1 346 86 AE2
351 78 S1 303 54 S1 0 45 S1 346 60 AE2
359 72 S1 309 45 S1 330 38 S1 346 58 AE2
8 74 S1 312 53 S1 328 38 S1 346 38 AE2
6 67 S1 318 58 S1 10 33 S1 347 61 AE2
0 70 S1 312 48 S1 3 26 S1 347 52 AE2
2 71 S1 310 86 S1 1 41 S1 348 64 AE2
186 72 S1 139 84 S1 342 45 S1 349 84 AE2
351 80 S1 144 87 S1 2 58 S1 350 50 AE2
357 78 S1 324 90 S1 356 52 S1 351 61 AE2
156 42 S1 148 88 S1 334 30 S1 351 76 AE2
159 37 S1 200 23 S1 353 30 S1 352 47 AE2
156 78 S1 172 28 S1 105 38 S1 352 66 AE2
159 76 S1 181 24 S1 121 45 S1 353 50 AE2
152 45 S1 189 18 S1 116 33 S1 353 70 AE2
146 30 S1 184 12 S1 359 53 S1 353 79 AE2
150 32 S1 205 60 S1 16 56 S1 353 19 AE2
156 82 S1 202 61 S1 8 62 S1 353 53 AE2
153 83 S1 196 65 S1 2 73 S1 353 51 AE2
142 38 S1 197 50 S1 2 62 S1 355 57 AE2
152 45 S1 184 72 S1 353 47 S1 355 58 AE2
146 60 S1 210 68 S1 355 50 S1 356 65 AE2
142 58 S1 204 50 S1 345 51 S1 357 60 AE2
139 51 S1 218 42 S1 353 48 S1 358 26 AE2
150 69 S1 206 65 S1 354 46 S1 359 87 AE2
181 35 S1 195 50 S1 163 90 S1 359 65 AE2
162 82 S1 202 51 S1 166 75 S1 359 38 AE2
157 82 S1 196 55 S1 165 67 S1 348 61 AE2
162 76 S1 196 45 S1 157 60 S1 351 78 AE2
345 84 S1 20 88 S1 142 67 S1 355 72 AE2
321 78 S1 197 88 S1 143 72 S1 359 49 AE2
336 72 S1 183 51 S1 2 61 S2 350 32 AE3
352 66 S1 210 65 S1 23 79 S2 343 40 AE3
16 57 S1 198 72 S1 22 82 S2 3 20 AE3
9 58 S1 327 23 S1 124 68 S2 3 21 AE3
152 60 S1 17 33 S1 311 86 S2 4 64 AE3
169 55 S1 149 60 S1 133 88 S2 6 30 AE3
352 56 S1 301 31 S1 136 60 S2 10 64 AE3
350 50 S1 159 90 S1 356 88 S2 15 78 AE3
351 74 S1 167 56 S1 331 89 S2 17 87 AE3

82
Supporting Table 1: raw data of structural measurements
Domain A Domain A Domain C Domain D Domain E
345 75 S1 164 90 S2 194 39 S1 166 52 S2 21 20 AE3
347 67 S1 338 77 S2 198 54 S1 177 70 S2 28 38 AE3
338 54 S1 138 62 S2 202 23 S1 173 59 S2 34 85 AE3
341 65 S1 139 65 S2 192 35 S1 178 62 S2 34 31 AE3
341 52 S1 346 65 S2 308 30 S1 194 70 S2 56 23 AE3
340 55 S1 342 68 S2 341 46 S1 192 77 S2 70 90 AE3
331 74 S1 8 74 S2 343 45 S1 196 80 S2 164 53 AE3
345 85 S1 317 75 S2 342 45 S1 194 84 S2 166 75 AE3
352 66 S1 320 72 S2 157 45 S1 188 83 S2 172 67 AE3
336 62 S1 102 52 S2 347 60 S1 188 85 S2 179 72 AE3
342 50 S1 128 75 S2 348 60 S1 186 89 S2 191 70 AE3
233 36 S1 319 82 S2 351 54 S1 188 82 S2 195 8 AE3
154 65 S1 342 90 S2 219 40 S1 180 74 S2 196 82 AE3
153 50 S1 342 72 S2 235 33 S1 172 78 S2 200 80 AE3
56 25 S1 357 78 S2 220 46 S1 170 75 S2 207 71 AE3
74 45 S1 189 63 S2 239 18 S1 174 80 S2 213 4 AE3
30 34 S1 173 53 S2 208 30 S1 191 64 S2 218 57 AE3
98 25 S1 199 52 S2 234 11 S1 207 66 S2 222 62 AE3
88 41 S1 9 73 S2 218 18 S1 202 63 S2 229 28 AE3
312 35 S1 352 71 S2 27 60 S1 212 72 S2 236 76 AE3
316 41 S1 351 57 S2 219 37 S1 176 60 S2 251 18 AE3
329 75 S1 354 61 S2 191 18 S1 205 55 S2 256 88 AE3
324 69 S1 345 80 S2 153 25 S1 194 62 S2 257 72 AE3
212 24 S1 324 83 S2 198 23 S1 185 54 S2 264 24 AE3
165 38 S1 139 82 S2 181 26 S1 188 63 S2 281 25 AE3
328 54 S1 156 60 S2 309 25 S1 161 73 S2 284 26 AE3
332 54 S1 159 80 S2 288 74 S1 175 82 S2 303 20 AE3
329 76 S1 13 50 S2 268 78 S1 170 84 S2 313 23 AE3
334 64 S1 22 52 S2 108 82 S1 343 85 S2 337 34 AE3
330 61 S1 11 43 S2 280 71 S1 149 88 S2 351 54 AE3
351 50 S1 351 50 S2 122 86 S1 157 83 S2 353 13 AE3
355 51 S1 331 48 S2 109 75 S1 328 86 S2 1 57 AES3
331 59 S1 342 58 S2 113 72 S1 340 82 S2 351 55 AES3
328 56 S1 347 58 S2 114 69 S1 159 81 S2 353 49 AES3
328 70 S1 345 45 S2 261 41 S1 162 71 S2 355 56 AES3
341 45 S1 34 63 S2 240 20 S1 147 90 S2 207 16 AE3
342 49 S1 342 80 S2 254 31 S1 145 80 S2 345 64 AE3
316 80 S1 356 87 S2 298 17 S1 149 75 S2 240 29 norm C
326 74 S1 176 85 S2 357 36 S1 5 62 S2 236 34 norm C
321 81 S1 174 81 S2 307 12 S1 38 48 S2 299 58 norm C
197 41 S1 168 81 S2 3 19 S1 15 52 S2 290 55 norm C
195 30 S1 176 84 S2 22 21 S1 38 46 S2 313 55 norm C
169 24 S1 6 83 S2 10 26 S1 9 39 S2 304 56 norm C
171 27 S1 355 86 S2 19 21 S1 16 46 S2 283 49 norm C
151 75 S1 359 86 S2 41 29 S1 338 39 S2 276 44 norm C
151 73 S1 178 88 S2 346 32 S1 18 62 S2 211 32 norm C
170 90 S1 170 84 S2 330 24 S1 344 51 S2 221 36 norm C
169 89 S1 176 86 S2 334 32 S1 345 56 S2 205 48 norm C
157 63 S1 182 77 S2 304 66 S1 14 52 S2 235 38 norm C

83
Supporting Table 1: raw data of structural measurements
Domain A Domain A Domain C Domain D Domain E
149 75 S1 180 77 S2 94 78 S1 19 49 S2 207 22 norm C
177 34 S1 178 69 S2 301 65 S1 49 30 S2 213 25 norm C
157 60 S1 173 88 S2 297 67 S1 325 53 S2 169 43 norm C
169 38 S1 347 87 S2 319 59 S1 10 57 S2 192 24 norm C
179 39 S1 350 90 S2 316 64 S1 330 45 S2 177 38 norm C
168 64 S1 13 87 S2 316 65 S1 10 46 S2 57 29 norm C
164 65 S1 359 87 S2 294 45 S1 30 51 S2 82 48 norm C
166 69 S1 180 89 S2 285 47 S1 330 69 S2 244 18 norm C
292 27 S1 1 86 S2 275 52 S1 353 75 S2 1 53 norm C
315 42 S1 179 89 S2 281 48 S1 25 50 S2 25 16 norm C
317 37 S1 5 87 S2 291 62 S1 326 55 S2 348 38 norm C
326 42 S1 190 88 S2 332 61 S1 339 81 S2 81 36 norm C
328 67 S1 7 87 S2 332 68 S1 30 69 S2 108 27 norm C
336 64 S1 359 86 S2 328 67 S1 16 63 S2 84 30 norm C
137 48 S1 5 86 S2 310 65 S1 27 70 S2 98 42 norm C
119 64 S1 3 88 S2 311 42 S1 179 78 S2 140 32 norm C
140 62 S1 0 83 S2 310 54 S1 19 70 S2 176 22 norm C
174 75 S1 186 83 S2 314 65 S1 4 75 S2 188 17 norm C
166 84 S1 181 86 S2 337 77 S1 186 86 S2 56 19 norm C
136 58 S1 352 86 S2 299 61 S1 355 79 S2 291 42 norm C
196 84 S1 355 83 S2 316 78 S1 352 90 S2 290 40 norm C
27 89 S1 1 85 S2 322 55 S1 180 87 S2 171 13 norm C
151 69 S1 358 82 S2 324 61 S1 18 76 S2 300 34 norm C
134 66 S1 356 87 S2 308 54 S1 159 35 S2 259 34 norm C
177 50 S1 5 88 S2 313 37 S1 170 49 S2 296 52 norm C
169 67 S1 173 88 S2 321 62 S1 177 35 S2 271 61 norm C
164 47 S1 180 90 S2 311 56 S1 158 38 S2 307 42 norm C
159 61 S1 2 87 S2 321 59 S1 134 24 S2 354 68 norm C
356 80 S1 151 85 S2 307 62 S1 128 38 S2 325 72 norm C
23 44 S1 149 86 S2 315 40 S1 43 43 S2 290 58 norm C
40 46 S1 151 88 S2 303 39 S1 36 36 S2 319 26 norm C
321 66 S1 142 75 S2 291 49 S1 38 35 S2 331 20 norm C
329 70 S1 148 64 S2 307 59 S1 23 44 S2 265 58 norm C
273 22 S1 150 70 S2 299 52 S1 189 54 dex C 264 65 norm C
302 20 S1 1 78 S2 306 72 S1 185 43 dex C 283 31 norm C
188 39 S1 159 82 S2 307 70 S1 182 48 dex C 294 48 norm C
196 40 S1 160 75 S2 318 43 S1 185 63 dex C 226 27 norm C
198 40 S1 168 65 S2 337 47 S1 183 65 dex C 217 38 norm C
195 48 S1 134 73 S2 308 41 S1 356 88 dex C 226 33 norm C
222 26 S1 152 90 S2 315 48 S1 174 90 dex C 226 28 norm C
195 36 S1 338 80 S2 281 64 S1 349 88 dex C 209 38 norm C
168 38 S1 165 84 S2 54 64 S1 0 84 dex C 274 52 norm C
330 47 S1 311 13 S3 319 54 S1 171 58 dex C 278 16 norm C
332 54 S1 339 59 S3 317 50 S1 152 40 dex C 320 50 norm C
332 50 S1 339 59 S3 329 45 S1 31 58 norm C 337 43 norm C
356 40 S1 324 28 S3 315 53 S1 20 58 norm C 231 28 norm C
8 40 S1 322 30 S3 313 55 S1 7 35 norm C 34 48 norm C
330 57 S1 347 48 S3 334 65 S1 286 65 norm C 330 21 norm C
345 54 S1 357 67 dex C 332 41 S1 321 42 rev C 269 14 norm C

84
Supporting Table 1: raw data of structural measurements
Domain A Domain A Domain C Domain D Domain E
11 42 S1 333 85 dex C 326 53 S1 331 33 rev C 343 74 sin C
329 30 S1 350 85 dex C 334 36 S1 38 46 rev C 339 79 sin C
344 39 S1 183 88 dex C 239 11 S1 358 71 sin C 346 74 sin C
4 32 S1 130 90 dex C 1 26 S1 163 77 sin C 337 88 sin C
355 32 S1 341 85 dex C 353 15 S1 161 90 sin C 8 48 sin C
12 24 S1 161 81 dex C 274 29 S1 169 80 sin C 3 40 sin C
342 49 S1 161 78 dex C 290 61 S1 160 80 sin C 10 56 sin C
0 77 S1 188 58 dex C 296 55 S1 335 83 sin C 353 50 sin C
351 70 S1 196 63 dex C 220 70 S1 157 75 sin C 353 48 sin C
353 82 S1 8 76 dex C 229 68 S1 145 82 sin C 356 64 sin C
0 75 S1 12 60 dex C 226 60 S1 327 82 sin C 330 60 sin C
9 52 S1 11 83 dex C 316 37 S1 328 80 sin C 322 32 sin C
346 67 S1 7 78 dex C 315 36 S1 318 73 sin C 325 41 sin C
333 86 S1 22 88 dex C 321 81 S1 319 66 sin C 347 38 sin C
334 54 S1 185 87 dex C 314 81 S1 329 77 sin C 278 75 sin C
353 75 S1 188 65 dex C 321 89 S1 327 67 sin C 201 42 sin C
333 47 S1 195 73 dex C 156 85 S1 328 83 sin C 199 45 sin C
329 54 S1 199 69 dex C 119 68 S1 164 76 sin C 308 45 sin C
147 31 S1 182 63 dex C 115 65 S1 351 88 sin C 297 58 sin C
3 77 S1 333 76 dex C 107 74 S1 333 77 sin C 317 77 sin C
145 75 S1 174 67 dex C 138 67 S1 346 85 sin C 301 55 sin C
180 72 S1 5 74 dex C 119 62 S1 130 89 sin C 349 46 sin C
161 73 S1 102 58 dex C 160 70 S1 55 27 sin C 100 36 sin C
121 73 S1 1 78 dex C 195 10 S1 340 34 sin C 111 52 sin C
340 60 S1 1 83 dex C 164 17 S1 324 48 sin C 90 61 sin C
129 68 S1 341 79 dex C 224 14 S1 335 50 sin C 281 61 sin C
129 67 S1 4 88 dex C 184 86 S1 340 54 sin C 15 90 dex C
322 54 S1 355 87 dex C 15 72 S1 352 34 sin C 10 88 dex C
322 44 S1 7 77 dex C 162 45 S1 13 26 sin C 38 54 dex C
336 75 S1 183 87 dex C 331 57 S1 26 32 sin C 45 59 dex C
330 86 S1 339 63 dex C 324 51 S1 356 67 sin C 32 65 dex C
345 43 S1 343 55 dex C 204 87 S1 351 58 sin C 357 69 dex C
351 60 S1 162 82 dex C 203 83 S1 2 57 sin C 25 75 dex C
150 75 S1 354 83 dex C 201 88 S1 352 84 sin C 176 82 dex C
152 75 S1 321 57 dex C 170 88 S1 174 88 sin C 305 80 norm C
152 74 S1 329 69 dex C 160 80 S1 350 87 sin C 293 31 norm C
299 50 S1 9 67 dex C 149 83 S1 336 87 sin C 359 60 norm C
280 44 S1 356 72 dex C 359 76 S2 162 87 sin C 356 58 norm C
295 40 S1 182 80 dex C 345 70 S2 358 45 sin C 338 57 norm C
307 42 S1 192 72 dex C 349 87 S2 12 50 sin C 337 55 norm C
200 62 S1 182 85 dex C 352 72 S2 336 68 sin C 333 55 norm C
213 61 S1 330 68 dex C 352 58 S2 333 65 sin C 314 57 norm C
201 55 S1 5 76 dex C 335 55 S2 340 75 sin C 303 68 norm C
206 58 S1 182 83 dex C 257 70 S2 340 68 sin C 281 71 norm C
355 88 S1 305 69 dex C 233 78 S2 38 46 sin C 278 75 norm C
202 70 S1 136 88 dex C 228 78 S2 166 77 sin C 344 61 norm C
208 64 S1 131 87 dex C 211 84 S2 175 77 sin C 312 83 norm C
330 33 S1 247 52 dex C 208 86 S2 42 68 dex C 305 54 norm C
144 64 S1 4 34 dex C 184 86 S2 36 28 dex C 304 49 norm C

85
Supporting Table 1: raw data of structural measurements
Domain A Domain A Domain C Domain D Domain E
168 69 S1 314 65 dex C 77 72 S2 22 65 dex C 299 70 norm C
218 41 S1 321 62 dex C 49 55 S2 333 88 dex C 298 58 norm C
133 74 S1 339 76 dex C 47 54 S2 173 77 dex C 291 45 norm C
21 34 S1 337 57 dex C 23 86 S2 154 86 dex C 283 55 norm C
31 40 S1 4 66 dex C 16 87 S2 336 85 dex C 276 43 norm C
159 39 S1 12 62 dex C 15 58 S2 337 79 dex C 273 40 norm C
161 38 S1 32 30 dex C 15 70 S2 165 85 dex C 267 44 norm C
11 72 S1 112 40 dex C 15 80 S2 175 67 dex C 233 23 norm C
358 76 S1 357 86 dex C 14 50 S2 191 69 dex C 322 50 norm C
156 58 S1 167 83 dex C 13 75 S2 5 90 dex C 318 32 norm C
332 90 S1 8 76 dex C 12 65 S2 352 72 dex C 317 29 norm C
4 65 S1 350 82 dex C 10 54 S2 12 54 dex C 311 64 norm C
191 51 S1 334 77 dex C 10 81 S2 148 64 dex C 299 55 norm C
62 3 S1 345 79 dex C 6 66 S2 157 54 dex C 295 46 norm C
350 75 S1 340 84 dex C 2 86 S2 149 54 dex C 289 68 norm C
8 54 S1 355 83 dex C 165 52 S2 41 84 dex C 284 75 norm C
1 54 S1 350 85 dex C 165 88 S2 28 84 dex C 284 55 norm C
16 77 S1 142 90 dex C 167 76 S2 80 45 dex C 282 41 norm C
165 90 S1 172 88 dex C 170 77 S2 20 52 dex C 282 61 norm C
342 67 S1 359 74 dex C 176 83 S2 50 67 dex C 280 65 norm C
330 83 S1 324 71 dex C 246 25 S2 46 53 dex C 276 64 norm C
163 81 S1 326 75 dex C 239 29 S2 70 84 dex C 274 78 norm C
176 87 S1 165 88 dex C 226 24 S2 50 75 dex C 270 64 norm C
183 83 S1 174 80 dex C 226 25 S2 163 88 dex C 268 58 norm C
187 87 S1 180 88 dex C 210 20 S2 165 84 dex C 266 38 norm C
342 67 S1 178 82 dex C 203 29 S2 188 85 dex C 266 46 norm C
333 78 S1 338 90 dex C 199 42 S2 163 89 dex C 265 38 norm C
325 42 S1 340 88 dex C 193 29 S2 172 87 dex C 264 46 norm C
163 63 S1 215 74 dex C 191 49 S2 174 64 dex C 264 29 norm C
172 85 S1 216 81 dex C 11 48 S2 178 60 dex C 264 65 norm C
176 84 S1 215 52 dex C 317 46 S2 177 56 dex C 263 44 norm C
351 85 S1 180 50 dex C 297 46 S2 175 64 dex C 260 42 norm C
349 82 S1 133 24 dex C 295 40 S2 185 67 dex C 260 68 norm C
165 87 S1 126 30 dex C 302 38 S2 195 70 dex C 259 61 norm C
325 84 S1 132 32 dex C 349 59 S2 202 68 dex C 259 82 norm C
166 64 S1 229 68 dex C 349 65 S2 39 69 dex C 256 28 norm C
145 80 S1 214 82 dex C 341 67 S2 40 77 dex C 250 38 norm C
318 75 S2 302 73 dex C 338 66 S2 24 72 dex C 250 43 norm C
330 76 S2 337 74 dex C 334 64 S2 212 86 dex C 250 42 norm C
357 87 S2 168 86 dex C 333 50 S2 187 90 dex C 250 46 norm C
359 90 S2 5 75 dex C 332 54 S2 6 81 dex C 246 41 norm C
170 88 S2 5 83 dex C 331 60 S2 16 75 dex C 244 55 norm C
331 68 S2 10 87 dex C 321 55 S2 29 84 dex C 238 35 norm C
356 79 S2 335 90 dex C 294 76 S2 31 74 dex C 235 54 norm C
356 82 S2 27 72 dex C 292 21 S2 192 43 dex C 216 48 norm C
330 84 S2 32 66 dex C 291 51 S2 196 49 dex C 212 44 norm C
343 76 S2 158 78 dex C 290 48 S2 234 33 dex C 211 58 norm C
188 82 S2 159 76 dex C 290 75 S2 247 33 dex C 201 64 norm C
344 84 S2 14 75 dex C 289 55 S2 263 25 dex C 116 24 norm C
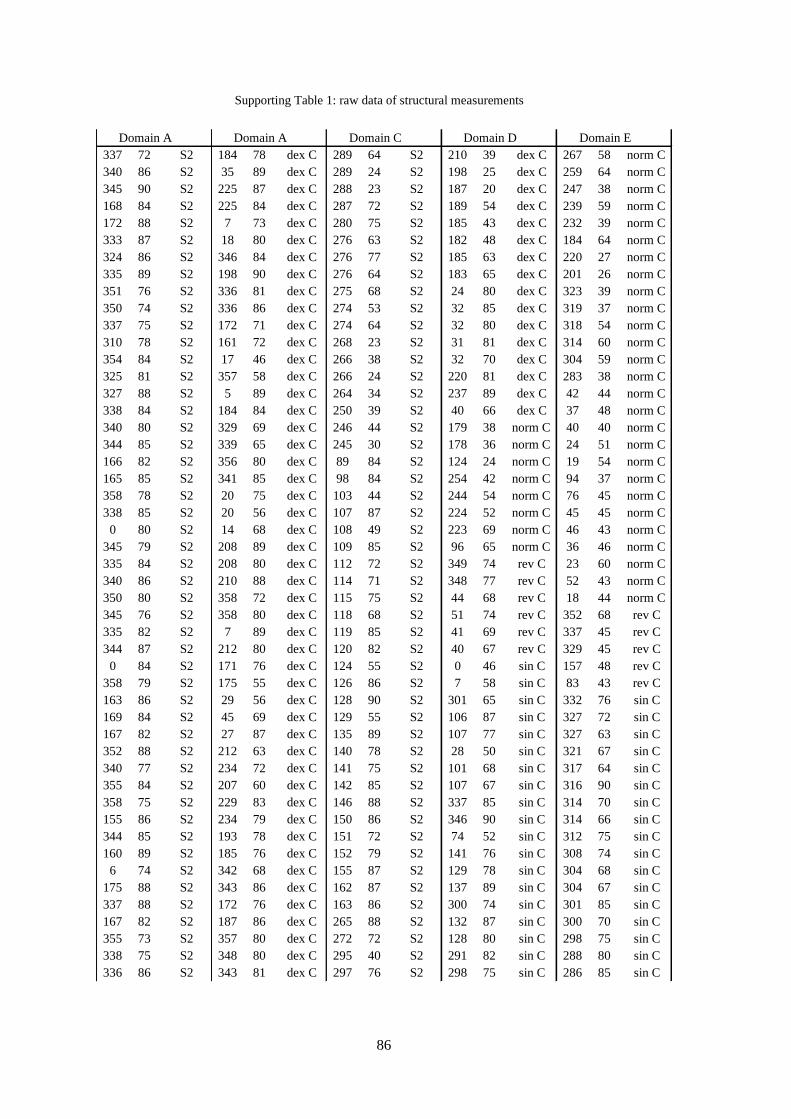
86
Supporting Table 1: raw data of structural measurements
Domain A Domain A Domain C Domain D Domain E
337 72 S2 184 78 dex C 289 64 S2 210 39 dex C 267 58 norm C
340 86 S2 35 89 dex C 289 24 S2 198 25 dex C 259 64 norm C
345 90 S2 225 87 dex C 288 23 S2 187 20 dex C 247 38 norm C
168 84 S2 225 84 dex C 287 72 S2 189 54 dex C 239 59 norm C
172 88 S2 7 73 dex C 280 75 S2 185 43 dex C 232 39 norm C
333 87 S2 18 80 dex C 276 63 S2 182 48 dex C 184 64 norm C
324 86 S2 346 84 dex C 276 77 S2 185 63 dex C 220 27 norm C
335 89 S2 198 90 dex C 276 64 S2 183 65 dex C 201 26 norm C
351 76 S2 336 81 dex C 275 68 S2 24 80 dex C 323 39 norm C
350 74 S2 336 86 dex C 274 53 S2 32 85 dex C 319 37 norm C
337 75 S2 172 71 dex C 274 64 S2 32 80 dex C 318 54 norm C
310 78 S2 161 72 dex C 268 23 S2 31 81 dex C 314 60 norm C
354 84 S2 17 46 dex C 266 38 S2 32 70 dex C 304 59 norm C
325 81 S2 357 58 dex C 266 24 S2 220 81 dex C 283 38 norm C
327 88 S2 5 89 dex C 264 34 S2 237 89 dex C 42 44 norm C
338 84 S2 184 84 dex C 250 39 S2 40 66 dex C 37 48 norm C
340 80 S2 329 69 dex C 246 44 S2 179 38 norm C 40 40 norm C
344 85 S2 339 65 dex C 245 30 S2 178 36 norm C 24 51 norm C
166 82 S2 356 80 dex C 89 84 S2 124 24 norm C 19 54 norm C
165 85 S2 341 85 dex C 98 84 S2 254 42 norm C 94 37 norm C
358 78 S2 20 75 dex C 103 44 S2 244 54 norm C 76 45 norm C
338 85 S2 20 56 dex C 107 87 S2 224 52 norm C 45 45 norm C
0 80 S2 14 68 dex C 108 49 S2 223 69 norm C 46 43 norm C
345 79 S2 208 89 dex C 109 85 S2 96 65 norm C 36 46 norm C
335 84 S2 208 80 dex C 112 72 S2 349 74 rev C 23 60 norm C
340 86 S2 210 88 dex C 114 71 S2 348 77 rev C 52 43 norm C
350 80 S2 358 72 dex C 115 75 S2 44 68 rev C 18 44 norm C
345 76 S2 358 80 dex C 118 68 S2 51 74 rev C 352 68 rev C
335 82 S2 7 89 dex C 119 85 S2 41 69 rev C 337 45 rev C
344 87 S2 212 80 dex C 120 82 S2 40 67 rev C 329 45 rev C
0 84 S2 171 76 dex C 124 55 S2 0 46 sin C 157 48 rev C
358 79 S2 175 55 dex C 126 86 S2 7 58 sin C 83 43 rev C
163 86 S2 29 56 dex C 128 90 S2 301 65 sin C 332 76 sin C
169 84 S2 45 69 dex C 129 55 S2 106 87 sin C 327 72 sin C
167 82 S2 27 87 dex C 135 89 S2 107 77 sin C 327 63 sin C
352 88 S2 212 63 dex C 140 78 S2 28 50 sin C 321 67 sin C
340 77 S2 234 72 dex C 141 75 S2 101 68 sin C 317 64 sin C
355 84 S2 207 60 dex C 142 85 S2 107 67 sin C 316 90 sin C
358 75 S2 229 83 dex C 146 88 S2 337 85 sin C 314 70 sin C
155 86 S2 234 79 dex C 150 86 S2 346 90 sin C 314 66 sin C
344 85 S2 193 78 dex C 151 72 S2 74 52 sin C 312 75 sin C
160 89 S2 185 76 dex C 152 79 S2 141 76 sin C 308 74 sin C
6 74 S2 342 68 dex C 155 87 S2 129 78 sin C 304 68 sin C
175 88 S2 343 86 dex C 162 87 S2 137 89 sin C 304 67 sin C
337 88 S2 172 76 dex C 163 86 S2 300 74 sin C 301 85 sin C
167 82 S2 187 86 dex C 265 88 S2 132 87 sin C 300 70 sin C
355 73 S2 357 80 dex C 272 72 S2 128 80 sin C 298 75 sin C
338 75 S2 348 80 dex C 295 40 S2 291 82 sin C 288 80 sin C
336 86 S2 343 81 dex C 297 76 S2 298 75 sin C 286 85 sin C

87
Supporting Table 1: raw data of structural measurements
Domain A Domain A Domain C Domain D Domain E
345 81 S2 220 78 dex C 297 46 S2 283 53 sin C 286 81 sin C
2 82 S2 13 74 dex C 299 85 S2 284 64 sin C 178 52 sin C
335 72 S2 14 70 dex C 300 64 S2 308 90 sin C 175 57 sin C
342 65 S2 141 84 dex C 302 38 S2 309 87 sin C 174 82 sin C
341 82 S2 172 88 dex C 306 83 S2 127 88 sin C 165 55 sin C
351 81 S2 8 55 dex C 306 80 S2 131 89 sin C 147 87 sin C
349 66 S2 9 67 dex C 308 73 S2 133 86 sin C 139 72 sin C
346 77 S2 18 63 dex C 308 34 S2 302 78 sin C 139 70 sin C
358 88 S2 12 90 dex C 308 81 S2 303 90 sin C 135 57 sin C
342 80 S2 180 77 dex C 308 70 S2 342 85 sin C 118 78 sin C
134 86 S2 4 81 dex C 308 80 S2 2 86 sin C 114 81 sin C
0 82 S2 343 85 dex C 309 88 S2 346 79 sin C 105 75 sin C
347 89 S2 2 86 dex C 310 66 S2 148 89 sin C 96 84 sin C
355 83 S2 198 76 dex C 310 86 S2 76 43 sin C 87 77 sin C
3 90 S2 2 82 dex C 310 78 S2 317 55 sin C 40 82 sin C
334 84 S2 205 84 dex C 311 88 S2 327 81 sin C 32 75 sin C
341 76 S2 41 81 dex C 312 72 S2 341 82 sin C 5 63 sin C
315 65 S2 29 74 dex C 312 86 S2 326 76 sin C 2 67 sin C
357 72 S2 31 70 dex C 313 72 S2 305 72 sin C 46 43 dex C
335 82 S2 3 78 dex C 317 52 S2 298 87 sin C 36 46 dex C
166 86 S2 358 70 dex C 317 46 S2 144 87 sin C 23 60 dex C
167 89 S2 326 42 norm C 318 62 S2 148 90 sin C 52 43 dex C
351 82 S2 308 34 norm C 318 74 S2 139 74 sin C 18 44 dex C
175 89 S2 307 41 norm C 321 71 S2 288 90 sin C 352 68 dex C
162 85 S2 305 37 norm C 321 80 S2 125 80 sin C 337 45 dex C
337 90 S2 161 61 norm C 322 73 S2 103 90 sin C 329 45 dex C
166 87 S2 161 65 norm C 323 78 S2 136 72 sin C 357 50 dex C
336 75 S2 105 88 norm C 325 78 S2 137 68 sin C 349 61 dex C
162 82 S2 322 72 norm C 325 78 S2 126 78 sin C 131 75 dex C
170 82 S2 100 81 norm C 325 71 S2 305 83 sin C 21 52 dex C
355 75 S2 155 49 norm C 326 77 S2 307 88 sin C 21 47 dex C
358 77 S2 245 14 norm C 326 86 S2 304 84 sin C 17 42 dex C
342 82 S2 224 35 norm C 326 88 S2 326 62 sin C 15 54 dex C
324 86 S2 294 64 norm C 326 75 S2 318 56 sin C 10 64 dex C
337 83 S2 268 41 norm C 326 86 S2 302 75 sin C 2 60 dex C
156 83 S2 70 49 norm C 328 80 S2 310 77 sin C 273 17 L1
166 87 S2 44 55 norm C 329 85 S2 288 75 sin C 93 6 L1
342 89 S2 276 72 norm C 329 54 S2 307 70 sin C 236 9 L1
345 80 S2 296 57 norm C 330 90 S2 274 38 sin C 62 5 L1
343 75 S2 279 53 norm C 330 86 S2 295 31 sin C 50 3 L1
350 90 S2 263 53 norm C 330 84 S2 292 31 sin C 73 35 L1
348 84 S2 254 65 norm C 330 89 S2 291 34 sin C 222 32 L1
162 85 S2 140 15 norm C 332 69 S2 286 25 sin C 235 43 L1
334 78 S2 152 19 norm C 332 84 S2 294 30 sin C 254 35 L1
155 83 S2 164 31 norm C 334 69 S2 296 32 sin C 253 37 L1
350 88 S2 310 42 norm C 334 82 S2 320 57 sin C 233 47 L1
175 84 S2 354 46 norm C 335 82 S2 312 57 sin C 230 46 L1
165 83 S2 333 61 norm C 335 79 S2 330 73 sin C 289 3 L1
341 90 S2 6 79 norm C 337 74 S2 139 89 sin C 264 24 L1

88
Supporting Table 1: raw data of structural measurements
Domain A Domain A Domain C Domain D Domain E
343 75 S2 160 55 norm C 342 74 S2 309 80 sin C 253 34 L1
155 85 S2 140 58 norm C 342 87 S2 328 86 sin C 254 45 L1
0 90 S2 346 66 norm C 150 75 C dex 309 88 sin C 236 18 L1
151 88 S2 175 85 norm C 153 71 C dex 308 90 sin C 245 24 L1
152 85 S2 345 76 norm C 178 68 C dex 344 77 AE1 239 15 L1
358 86 S2 349 80 norm C 156 68 C dex 12 55 AE1 229 21 L1
358 90 S2 353 84 norm C 355 70 C dex 39 45 AE1 219 30 L1
0 79 S2 292 33 norm C 338 68 C dex 32 22 AE1 279 7 L1
330 84 S2 304 27 norm C 131 67 C dex 245 46 AE1 109 7 L1
334 81 S2 294 28 norm C 123 52 C dex 222 50 AE1 285 47 L1
334 81 S2 288 32 norm C 138 30 C dex 322 28 AE1 97 24 L1
350 83 S2 288 21 norm C 141 28 C dex 27 15 AE1 282 11 L1
354 89 S2 327 25 norm C 135 34 C dex 39 22 AE1 262 12 L1
150 79 S2 288 30 norm C 105 76 C dex 42 25 AE1 252 19 L1
325 90 S2 302 20 norm C 288 86 C dex 164 30 AE1 263 6 L1
170 84 S2 323 35 norm C 324 68 C dex 134 39 AE1 277 39 L1
154 88 S2 248 24 norm C 326 60 C dex 341 29 AE1 274 19 L1
342 75 S2 181 50 norm C 319 58 C dex 32 75 AE2 271 23 L1
325 88 S2 343 34 rev C 345 70 C dex 38 73 AE2 268 10 L1
170 71 S2 347 47 rev C 353 73 C dex 175 82 AE2 285 25 L1
349 87 S2 357 38 rev C 36 36 C dex 356 82 AE2 329 27 L1
178 77 S2 326 87 rev C 76 25 C dex 132 78 AE2 87 1 L1
157 87 S2 337 85 rev C 5 65 C dex 148 60 AE2 252 25 L2
349 80 S2 335 81 rev C 16 53 C dex 298 70 AE2 269 7 L2
342 88 S2 138 98 rev C 50 42 C dex 319 32 AE2 102 20 L2
346 84 S2 142 81 rev C 34 48 C dex 106 88 AE2 72 4 L2
166 84 S2 320 85 rev C 289 70 C norm 105 81 AE2 84 7 L2
158 85 S2 349 85 rev C 1 64 C norm 124 84 AE2 276 23 L2
175 84 S2 351 85 rev C 359 69 C norm 309 87 AE2 271 34 L2
175 56 S2 346 71 rev C 22 55 C norm 146 77 AE2 201 53 L2
333 84 S2 334 65 rev C 18 45 C norm 145 42 AE2 184 59 L2
2 83 S2 135 48 rev C 19 54 C norm 319 78 AE2 203 59 L2
353 80 S2 153 36 rev C 22 66 C norm 7 47 AE2 235 22 L2
315 66 S2 326 81 rev C 329 75 C norm 15 27 AE2 238 29 L2
348 78 S2 355 85 rev C 317 86 C norm 347 64 AE2 78 18 L2
320 71 S2 353 72 rev C 30 53 C norm 168 85 AE2 274 1 L2
356 89 S2 337 72 rev C 20 45 C norm 166 62 AE2 260 48 L2
358 85 S2 335 75 rev C 305 45 C norm 328 70 AE2 254 36 L2
315 64 S2 304 67 rev C 267 72 C norm 335 78 AE2 262 18 L sin
8 89 S2 311 45 rev C 265 75 C norm 157 89 AE2 254 19 L sin
350 74 S2 314 45 rev C 13 48 C norm 343 83 AE2 260 30 L sin
164 85 S2 334 51 rev C 347 37 C norm 7 84 AE2 252 44 L sin
337 89 S2 334 52 rev C 348 65 C norm 171 76 AE2 212 32 L sin
5 89 S2 302 55 rev C 350 55 C norm 344 90 AE2 261 7 L norm
359 80 S2 303 52 rev C 138 83 C rev 346 81 AE2 247 16 L norm
180 80 S2 9 67 rev C 355 77 C rev 194 76 AE2 240 13 L norm
348 83 S2 12 63 rev C 108 88 C rev 11 89 AE2 247 16 L norm
345 80 S2 18 53 rev C 296 86 C rev 219 85 AE2 238 10 L norm
165 80 S2 157 70 sin C 223 73 C rev 203 73 AE2 268 5 L norm
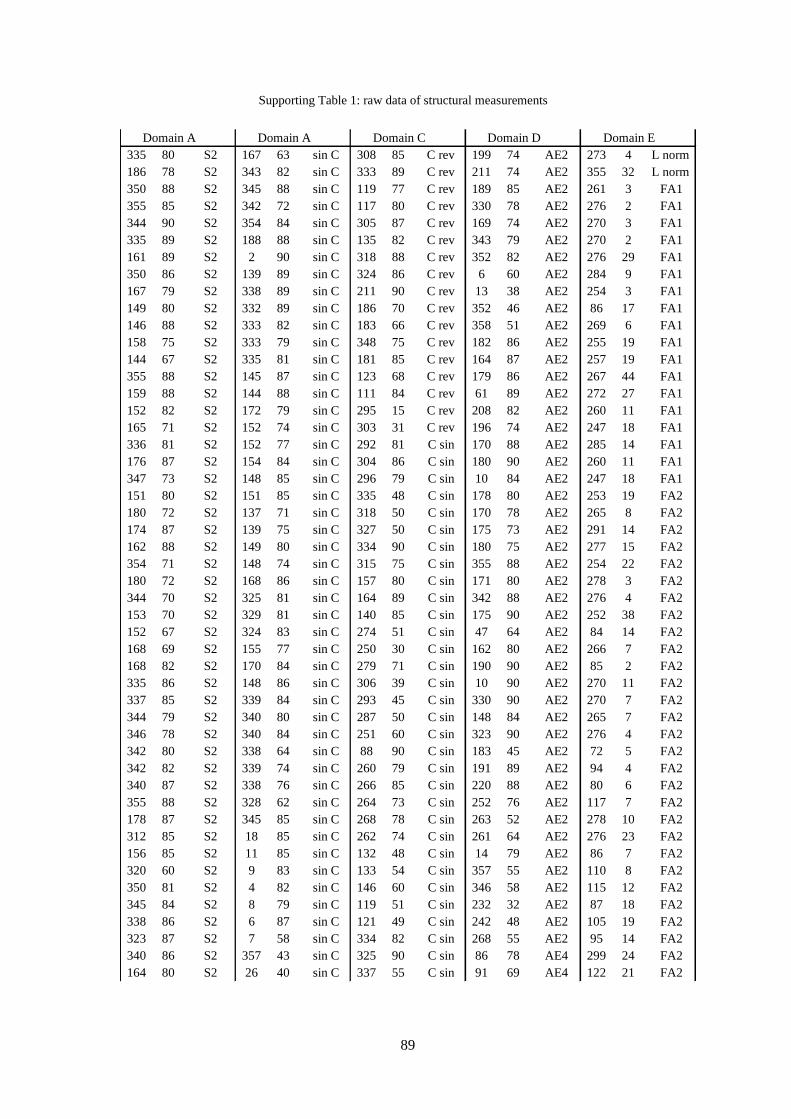
89
Supporting Table 1: raw data of structural measurements
Domain A Domain A Domain C Domain D Domain E
335 80 S2 167 63 sin C 308 85 C rev 199 74 AE2 273 4 L norm
186 78 S2 343 82 sin C 333 89 C rev 211 74 AE2 355 32 L norm
350 88 S2 345 88 sin C 119 77 C rev 189 85 AE2 261 3 FA1
355 85 S2 342 72 sin C 117 80 C rev 330 78 AE2 276 2 FA1
344 90 S2 354 84 sin C 305 87 C rev 169 74 AE2 270 3 FA1
335 89 S2 188 88 sin C 135 82 C rev 343 79 AE2 270 2 FA1
161 89 S2 2 90 sin C 318 88 C rev 352 82 AE2 276 29 FA1
350 86 S2 139 89 sin C 324 86 C rev 6 60 AE2 284 9 FA1
167 79 S2 338 89 sin C 211 90 C rev 13 38 AE2 254 3 FA1
149 80 S2 332 89 sin C 186 70 C rev 352 46 AE2 86 17 FA1
146 88 S2 333 82 sin C 183 66 C rev 358 51 AE2 269 6 FA1
158 75 S2 333 79 sin C 348 75 C rev 182 86 AE2 255 19 FA1
144 67 S2 335 81 sin C 181 85 C rev 164 87 AE2 257 19 FA1
355 88 S2 145 87 sin C 123 68 C rev 179 86 AE2 267 44 FA1
159 88 S2 144 88 sin C 111 84 C rev 61 89 AE2 272 27 FA1
152 82 S2 172 79 sin C 295 15 C rev 208 82 AE2 260 11 FA1
165 71 S2 152 74 sin C 303 31 C rev 196 74 AE2 247 18 FA1
336 81 S2 152 77 sin C 292 81 C sin 170 88 AE2 285 14 FA1
176 87 S2 154 84 sin C 304 86 C sin 180 90 AE2 260 11 FA1
347 73 S2 148 85 sin C 296 79 C sin 10 84 AE2 247 18 FA1
151 80 S2 151 85 sin C 335 48 C sin 178 80 AE2 253 19 FA2
180 72 S2 137 71 sin C 318 50 C sin 170 78 AE2 265 8 FA2
174 87 S2 139 75 sin C 327 50 C sin 175 73 AE2 291 14 FA2
162 88 S2 149 80 sin C 334 90 C sin 180 75 AE2 277 15 FA2
354 71 S2 148 74 sin C 315 75 C sin 355 88 AE2 254 22 FA2
180 72 S2 168 86 sin C 157 80 C sin 171 80 AE2 278 3 FA2
344 70 S2 325 81 sin C 164 89 C sin 342 88 AE2 276 4 FA2
153 70 S2 329 81 sin C 140 85 C sin 175 90 AE2 252 38 FA2
152 67 S2 324 83 sin C 274 51 C sin 47 64 AE2 84 14 FA2
168 69 S2 155 77 sin C 250 30 C sin 162 80 AE2 266 7 FA2
168 82 S2 170 84 sin C 279 71 C sin 190 90 AE2 85 2 FA2
335 86 S2 148 86 sin C 306 39 C sin 10 90 AE2 270 11 FA2
337 85 S2 339 84 sin C 293 45 C sin 330 90 AE2 270 7 FA2
344 79 S2 340 80 sin C 287 50 C sin 148 84 AE2 265 7 FA2
346 78 S2 340 84 sin C 251 60 C sin 323 90 AE2 276 4 FA2
342 80 S2 338 64 sin C 88 90 C sin 183 45 AE2 72 5 FA2
342 82 S2 339 74 sin C 260 79 C sin 191 89 AE2 94 4 FA2
340 87 S2 338 76 sin C 266 85 C sin 220 88 AE2 80 6 FA2
355 88 S2 328 62 sin C 264 73 C sin 252 76 AE2 117 7 FA2
178 87 S2 345 85 sin C 268 78 C sin 263 52 AE2 278 10 FA2
312 85 S2 18 85 sin C 262 74 C sin 261 64 AE2 276 23 FA2
156 85 S2 11 85 sin C 132 48 C sin 14 79 AE2 86 7 FA2
320 60 S2 9 83 sin C 133 54 C sin 357 55 AE2 110 8 FA2
350 81 S2 4 82 sin C 146 60 C sin 346 58 AE2 115 12 FA2
345 84 S2 8 79 sin C 119 51 C sin 232 32 AE2 87 18 FA2
338 86 S2 6 87 sin C 121 49 C sin 242 48 AE2 105 19 FA2
323 87 S2 7 58 sin C 334 82 C sin 268 55 AE2 95 14 FA2
340 86 S2 357 43 sin C 325 90 C sin 86 78 AE4 299 24 FA2
164 80 S2 26 40 sin C 337 55 C sin 91 69 AE4 122 21 FA2

90
Supporting Table 1: raw data of structural measurements
Domain A Domain A Domain C Domain D Domain E
142 75 S2 345 55 sin C 346 76 C sin 281 90 AE4 301 27 FA2
165 90 S2 338 46 sin C 331 72 C sin 94 82 AE4 91 2 FA2
358 83 S2 339 69 sin C 342 76 C sin 92 79 AE4 262 11 FA2
302 75 S2 323 68 sin C 334 80 C sin 308 84 AE4 267 12 FA2
160 90 S2 326 42 sin C 158 88 C sin 132 82 AE4 277 13 FA2
331 70 S2 308 34 sin C 311 86 C sin 158 77 AE4 274 18 FA2
338 80 S2 307 41 sin C 326 73 C sin 231 58 AE4 266 18 FA2
341 85 S2 305 37 sin C 314 72 C sin 108 74 AE4 272 7 FA2
333 55 S2 152 80 sin C 318 58 C sin 79 82 AE4 108 13 FA2
332 50 S2 156 80 sin C 155 77 C sin 252 74 AE4 101 23 FA2
337 65 S2 322 90 sin C 130 72 C sin 111 78 AE4 245 35 FA2
357 88 S2 148 84 sin C 142 69 C sin 93 85 AE4 97 9 FA2
158 90 S2 158 81 sin C 266 74 C sin 112 90 AE4 94 6 FA2
334 89 S2 140 80 sin C 260 75 C sin 126 83 AE4 323 30 FA2
338 83 S2 150 70 sin C 274 80 C sin 116 88 AE4 321 25 FA2
0 85 S2 330 88 sin C 114 71 C sin 133 88 AE4 78 23 FA2
155 86 S2 338 70 sin C 125 78 C sin 142 84 AE4 113 17 FA2
152 87 S2 340 90 sin C 117 84 C sin 324 65 AE4 250 5 FA2
154 90 S2 340 75 sin C 100 86 C sin 103 82 AE4 260 28 FA2
171 69 S2 161 82 sin C 79 89 C sin 130 32 FA1 320 52 FA2
167 65 S2 148 87 sin C 303 62 C sin 103 32 FA1 279 22 FA2
136 81 S2 311 73 sin C 298 68 C sin 335 38 FA1 2 9 FA2
332 86 S2 168 68 sin C 312 77 C sin 349 36 FA1 279 21 FA2
337 87 S2 154 67 sin C 312 77 C sin 71 14 FA1 280 21 FA2
344 68 S2 154 72 sin C 298 82 C sin 65 11 FA1 307 43 FA2
171 56 S2 155 73 sin C 332 59 C sin 74 20 FA1 307 18 FA2
160 61 S2 154 78 sin C 322 38 C sin 100 20 FA1 301 26 FA2
172 69 S2 144 80 sin C 293 70 C sin 124 1 FA2 306 33 FA2
328 82 S2 134 88 sin C 303 77 C sin 303 7 FA2 300 38 FA2
333 82 S2 139 87 sin C 324 76 C sin 91 46 FA2 292 16 FA2
340 82 S2 133 77 sin C 320 75 C sin 88 50 FA2 294 30 FA2
180 90 S2 176 77 sin C 316 84 C sin 226 1 FA2 285 17 FA2
135 88 S2 169 82 sin C 300 85 C sin 225 2 FA2 296 17 FA2
142 56 S2 164 75 sin C 272 84 C sin 48 25 FA2 307 22 FA2
139 74 S2 156 73 sin C 318 83 C sin 110 29 FA2 298 26 FA2
161 76 S2 322 86 sin C 316 85 C sin 56 18 FA2 357 28 FA2
155 71 S2 172 90 sin C 108 90 C sin 38 21 FA2 4 9 FA2
153 62 S2 140 81 sin C 296 86 C sin 74 28 FA2 278 17 FA2
168 68 S2 132 80 sin C 5 52 C' dex 264 5 FA2 269 24 FA2
153 83 S2 165 85 sin C 29 45 C' dex 254 3 FA2 271 18 FA2
349 72 S2 137 75 sin C 37 60 C' dex 252 7 FA2 233 44 FA2
169 82 S2 311 85 sin C 57 53 C' dex 79 8 FA2 274 42 FA2
358 90 S2 137 68 sin C 226 77 C' dex 167 22 FA2 269 53 FA2
1 88 S2 149 72 sin C 17 83 C' dex 62 73 FA2 256 9 FA2
155 89 S2 138 73 sin C 216 63 C' dex 84 74 FA2 256 33 FA2
351 87 S2 153 62 sin C 195 64 C' dex 281 37 FA2 240 47 FA2
347 79 S2 150 49 sin C 0 80 C' dex 270 38 FA2 254 35 FA2
351 83 S2 140 76 sin C 357 85 C' dex 135 74 FA2 244 39 FA2
350 80 S2 131 77 sin C 349 48 C' dex 146 66 FA2 206 43 FA2

91
Supporting Table 1: raw data of structural measurements
Domain A Domain A Domain C Domain D Domain E
355 85 S2 142 84 sin C 41 55 C' dex 132 74 FA2 85 12 FA2
188 58 S2 142 77 sin C 22 55 C' dex 188 77 FA2 286 4 FA2
346 87 S2 142 75 sin C 258 48 C' dex 260 7 FA2 294 27 FA2
355 75 S2 154 83 sin C 183 78 C' dex 86 10 FA2 304 22 FA2
353 79 S2 148 83 sin C 176 76 C' dex 287 14 FA2 267 41 FA2
352 80 S2 135 72 sin C 208 68 C' dex 118 0 FA2 263 28 FA2
3 69 S2 135 65 sin C 191 70 C' dex 270 10 FA2 272 13 FA2
357 75 S2 147 90 sin C 14 65 C' dex 275 7 FA2 280 6 FA2
4 67 S2 331 88 sin C 7 72 C' dex 265 30 FA2 287 11 FA2
3 74 S2 335 70 sin C 139 74 C' dex 262 27 FA2 269 5 FA2
6 81 S2 339 74 sin C 146 81 C' dex 267 20 FA2 288 32 FA2
357 71 S2 326 80 sin C 294 53 C' dex 223 31 FA2 276 13 FA2
357 77 S2 148 85 sin C 292 47 C' dex 247 10 FA2 270 19 FA2
353 77 S2 336 87 sin C 299 45 C' dex 240 15 FA2 286 6 FA2
355 80 S2 159 77 sin C 25 15 C' dex 145 8 FA2 288 19 FA2
3 78 S2 174 74 sin C 345 45 C' dex 244 32 FA2 276 8 FA2
356 77 S2 159 72 sin C 167 69 C' dex 106 16 FA2 290 5 FA2
6 64 S2 354 74 sin C 99 54 C' dex 93 0 FA2 228 20 FA2
7 90 S2 345 75 sin C 151 55 C' dex 100 20 FA2 283 22 FA2
7 81 S2 185 85 sin C 170 53 C' dex 287 14 FA2 319 55 FA2
166 88 S2 0 74 sin C 181 34 C' dex 127 74 FA2 94 6 FA2
357 88 S2 2 72 sin C 182 32 C' dex 132 54 FA2 269 30 FA2
358 88 S2 4 82 sin C 139 68 C' dex 144 64 FA2 282 25 FA2
178 84 S2 164 87 sin C 6 64 C' dex 153 48 FA2 277 24 FA2
3 89 S2 151 87 sin C 350 75 C' dex 96 42 FA2 244 3 FA3
161 75 S2 149 73 sin C 329 77 C' dex 275 22 FA2 325 10 FA3
182 84 S2 151 90 sin C 340 72 C' dex 272 12 FA2 80 3 FA3
191 78 S2 144 86 sin C 4 82 C' dex 262 29 FA2 259 15 FA3
176 69 S2 325 82 sin C 7 88 C' dex 275 10 FA2 284 7 FA3
343 74 S2 330 85 sin C 172 76 C' dex 285 14 FA2 267 4 FA3
188 85 S2 331 85 sin C 350 89 C' dex 87 12 FA2 244 22 FA3
194 88 S2 349 81 sin C 0 65 C' dex 112 7 FA2 114 14 FA3
199 72 S2 324 85 sin C 21 69 C' dex 94 18 FA2 285 24 FA3
336 87 S2 342 70 sin C 354 73 C' dex 99 15 FA2 274 5 FA3
152 84 S2 341 77 sin C 3 67 C' dex 88 10 FA2 274 13 FA3
150 80 S2 336 76 sin C 356 64 C' dex 279 28 FA2 272 13 FA3
332 89 S2 343 84 sin C 347 88 C' dex 250 20 FA2 282 17 FA3
140 84 S2 165 86 sin C 343 78 C' dex 75 25 FA2 122 12 FA3
314 80 S2 331 82 sin C 319 55 C' dex 266 9 FA2 270 8 FA3
331 87 S2 322 74 sin C 320 61 C' dex 285 27 FA2 260 1 FA3
142 84 S2 320 72 sin C 24 27 C' dex 242 51 FA2 273 24 FA3
321 78 S2 345 72 sin C 31 36 C' dex 151 60 FA4 263 31 FA3
351 85 S2 344 77 sin C 45 36 C' dex 69 56 FA4 267 23 FA3
353 82 S2 157 83 sin C 222 58 C' dex 260 87 FA4 341 28 FA3
173 89 S2 153 90 sin C 203 71 C' dex 80 81 FA4 285 32 FA3
358 84 S2 334 83 sin C 325 43 C' dex 76 76 FA4 319 31 FA3
355 85 S2 155 83 sin C 256 44 C' dex 240 54 FA4 299 30 FA3
161 86 S2 152 90 sin C 230 50 C' dex 72 76 FA4 290 20 FA3
6 85 S2 156 77 sin C 200 37 C' dex 214 77 FA4 321 15 FA3
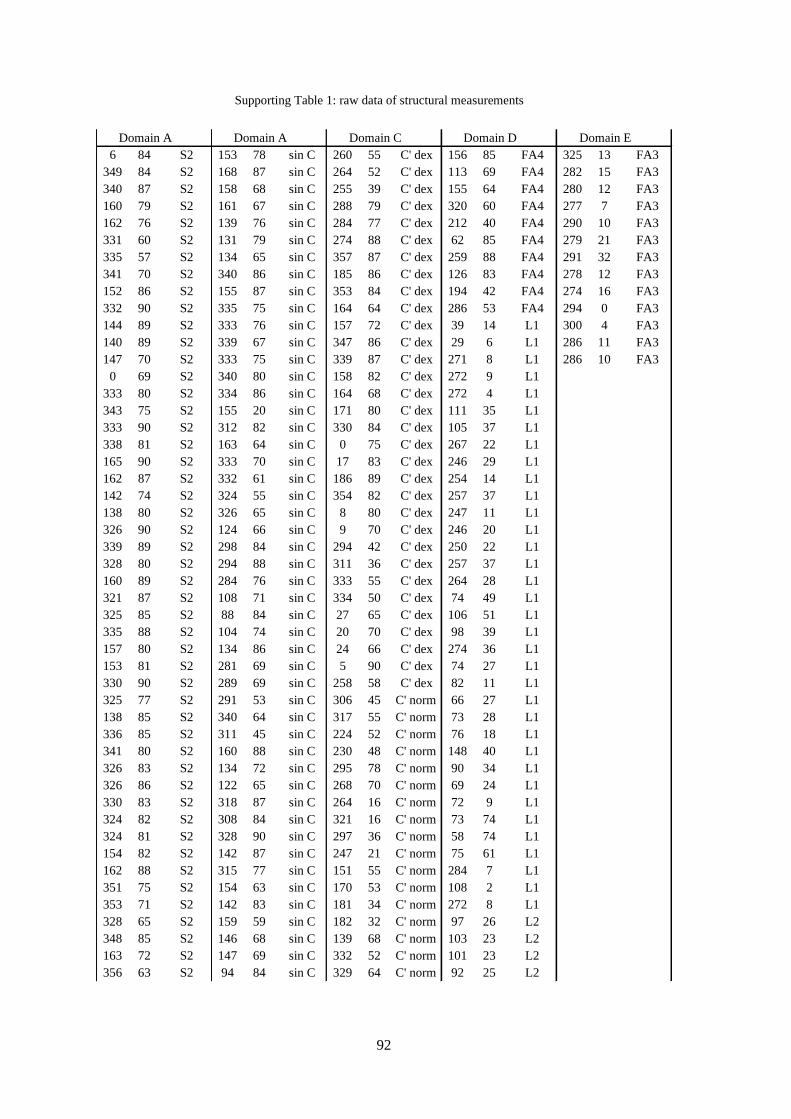
92
Supporting Table 1: raw data of structural measurements
Domain A Domain A Domain C Domain D Domain E
6 84 S2 153 78 sin C 260 55 C' dex 156 85 FA4 325 13 FA3
349 84 S2 168 87 sin C 264 52 C' dex 113 69 FA4 282 15 FA3
340 87 S2 158 68 sin C 255 39 C' dex 155 64 FA4 280 12 FA3
160 79 S2 161 67 sin C 288 79 C' dex 320 60 FA4 277 7 FA3
162 76 S2 139 76 sin C 284 77 C' dex 212 40 FA4 290 10 FA3
331 60 S2 131 79 sin C 274 88 C' dex 62 85 FA4 279 21 FA3
335 57 S2 134 65 sin C 357 87 C' dex 259 88 FA4 291 32 FA3
341 70 S2 340 86 sin C 185 86 C' dex 126 83 FA4 278 12 FA3
152 86 S2 155 87 sin C 353 84 C' dex 194 42 FA4 274 16 FA3
332 90 S2 335 75 sin C 164 64 C' dex 286 53 FA4 294 0 FA3
144 89 S2 333 76 sin C 157 72 C' dex 39 14 L1 300 4 FA3
140 89 S2 339 67 sin C 347 86 C' dex 29 6 L1 286 11 FA3
147 70 S2 333 75 sin C 339 87 C' dex 271 8 L1 286 10 FA3
0 69 S2 340 80 sin C 158 82 C' dex 272 9 L1
333 80 S2 334 86 sin C 164 68 C' dex 272 4 L1
343 75 S2 155 20 sin C 171 80 C' dex 111 35 L1
333 90 S2 312 82 sin C 330 84 C' dex 105 37 L1
338 81 S2 163 64 sin C 0 75 C' dex 267 22 L1
165 90 S2 333 70 sin C 17 83 C' dex 246 29 L1
162 87 S2 332 61 sin C 186 89 C' dex 254 14 L1
142 74 S2 324 55 sin C 354 82 C' dex 257 37 L1
138 80 S2 326 65 sin C 8 80 C' dex 247 11 L1
326 90 S2 124 66 sin C 9 70 C' dex 246 20 L1
339 89 S2 298 84 sin C 294 42 C' dex 250 22 L1
328 80 S2 294 88 sin C 311 36 C' dex 257 37 L1
160 89 S2 284 76 sin C 333 55 C' dex 264 28 L1
321 87 S2 108 71 sin C 334 50 C' dex 74 49 L1
325 85 S2 88 84 sin C 27 65 C' dex 106 51 L1
335 88 S2 104 74 sin C 20 70 C' dex 98 39 L1
157 80 S2 134 86 sin C 24 66 C' dex 274 36 L1
153 81 S2 281 69 sin C 5 90 C' dex 74 27 L1
330 90 S2 289 69 sin C 258 58 C' dex 82 11 L1
325 77 S2 291 53 sin C 306 45 C' norm 66 27 L1
138 85 S2 340 64 sin C 317 55 C' norm 73 28 L1
336 85 S2 311 45 sin C 224 52 C' norm 76 18 L1
341 80 S2 160 88 sin C 230 48 C' norm 148 40 L1
326 83 S2 134 72 sin C 295 78 C' norm 90 34 L1
326 86 S2 122 65 sin C 268 70 C' norm 69 24 L1
330 83 S2 318 87 sin C 264 16 C' norm 72 9 L1
324 82 S2 308 84 sin C 321 16 C' norm 73 74 L1
324 81 S2 328 90 sin C 297 36 C' norm 58 74 L1
154 82 S2 142 87 sin C 247 21 C' norm 75 61 L1
162 88 S2 315 77 sin C 151 55 C' norm 284 7 L1
351 75 S2 154 63 sin C 170 53 C' norm 108 2 L1
353 71 S2 142 83 sin C 181 34 C' norm 272 8 L1
328 65 S2 159 59 sin C 182 32 C' norm 97 26 L2
348 85 S2 146 68 sin C 139 68 C' norm 103 23 L2
163 72 S2 147 69 sin C 332 52 C' norm 101 23 L2
356 63 S2 94 84 sin C 329 64 C' norm 92 25 L2

93
Supporting Table 1: raw data of structural measurements
Domain A Domain A Domain C Domain D Domain A
181 40 S2 76 65 sin C 198 43 C' norm 94 28 L2 318 32 AE3
183 43 S2 246 79 sin C 216 36 C' norm 103 32 L2 300 22 AE3
161 88 S2 286 56 sin C 4 21 C' norm 94 18 L2 314 29 AE3
175 73 S2 147 72 sin C 293 53 C' norm 107 37 L2 285 45 AE3
171 79 S2 333 83 sin C 273 43 C' norm 110 11 L2 288 33 AE3
163 45 S2 326 81 sin C 276 45 C' norm 126 12 L2 246 52 AE3
335 80 S2 307 85 sin C 226 22 C' norm 132 34 L2 272 45 AE3
152 50 S2 347 43 sin C 244 28 C' norm 135 28 L2 283 41 AE3
150 89 S2 351 85 sin C 252 43 C' norm 3 45 L2 92 60 AE3
147 77 S2 271 49 sin C 334 80 C' norm 281 19 L sin 268 69 AE3
150 86 S2 303 56 sin C 332 78 C' norm 284 60 L sin 253 65 AE3
146 71 S2 280 88 sin C 270 57 C' norm 235 34 L sin 274 72 AE3
350 75 S2 101 77 sin C 260 70 C' norm 256 28 L sin 89 87 AE3
337 63 S2 116 80 sin C 208 40 C' norm 251 34 L sin 310 24 AE3
341 62 S2 18 82 sin C 219 53 C' norm 312 24 AE3
189 79 S2 17 74 sin C 228 53 C' norm 241 28 AE3
349 81 S2 337 47 sin C 344 70 C' norm 236 44 AE3
337 61 S2 331 52 sin C 333 66 C' norm 222 49 AE3
353 68 S2 314 49 sin C 283 64 C' norm 321 17 AE3
329 50 S2 321 36 sin C 263 38 C' norm 314 15 AE3
322 68 S2 300 50 sin C 248 54 C' norm 342 25 AE3
351 49 S2 295 66 sin C 250 63 C' norm 338 35 AE3
335 55 S2 287 68 sin C 271 38 C' norm 302 10 AE3
322 45 S2 298 72 sin C 239 45 C' norm 37 30 FA1
326 70 S2 288 70 sin C 264 74 C' norm 51 22 FA1
134 87 S2 278 69 sin C 9 70 C' norm 78 37 FA1
326 83 S2 280 58 sin C 305 65 C' norm 86 24 FA1
333 74 S2 307 77 sin C 239 75 C' norm 242 7 FA1
154 88 S2 294 74 sin C 247 63 C' norm 224 31 FA1
144 67 S2 299 73 sin C 267 67 C' norm 242 28 FA1
329 70 S2 299 72 sin C 266 61 C' norm 224 31 FA1
331 85 S2 286 78 sin C 257 61 C' norm 250 10 FA1
162 85 S2 278 67 sin C 24 66 C' norm 254 14 FA1
330 80 S2 110 67 sin C 5 90 C' norm 274 2 FA1
344 66 S2 118 67 sin C 258 58 C' norm 277 11 FA1
331 90 S2 84 75 sin C 117 72 C' rev 71 4 FA1
338 86 S2 133 90 sin C 118 69 C' rev 245 5 FA1
149 84 S2 149 82 sin C 72 42 C' rev 85 7 FA1
334 89 S2 153 73 sin C 67 42 C' rev 74 4 FA1
160 85 S2 155 82 sin C 301 60 C' rev 96 7 FA1
150 81 S2 154 76 sin C 307 57 C' rev 92 5 FA1
332 69 S2 148 80 sin C 303 50 C' rev 254 7 FA1
349 84 S2 110 77 sin C 320 30 C' rev 259 0 FA1
347 82 S2 126 84 sin C 325 75 C' rev 110 24 FA1
166 85 S2 312 85 sin C 304 70 C' rev 102 18 FA1
173 83 S2 304 83 sin C 292 65 C' rev 100 15 FA1
351 68 S2 141 75 sin C 271 51 C' rev 69 7 FA2
166 86 S2 141 76 sin C 68 77 C' rev 251 3 FA2
350 88 S2 149 84 sin C 58 64 C' rev 227 26 FA2
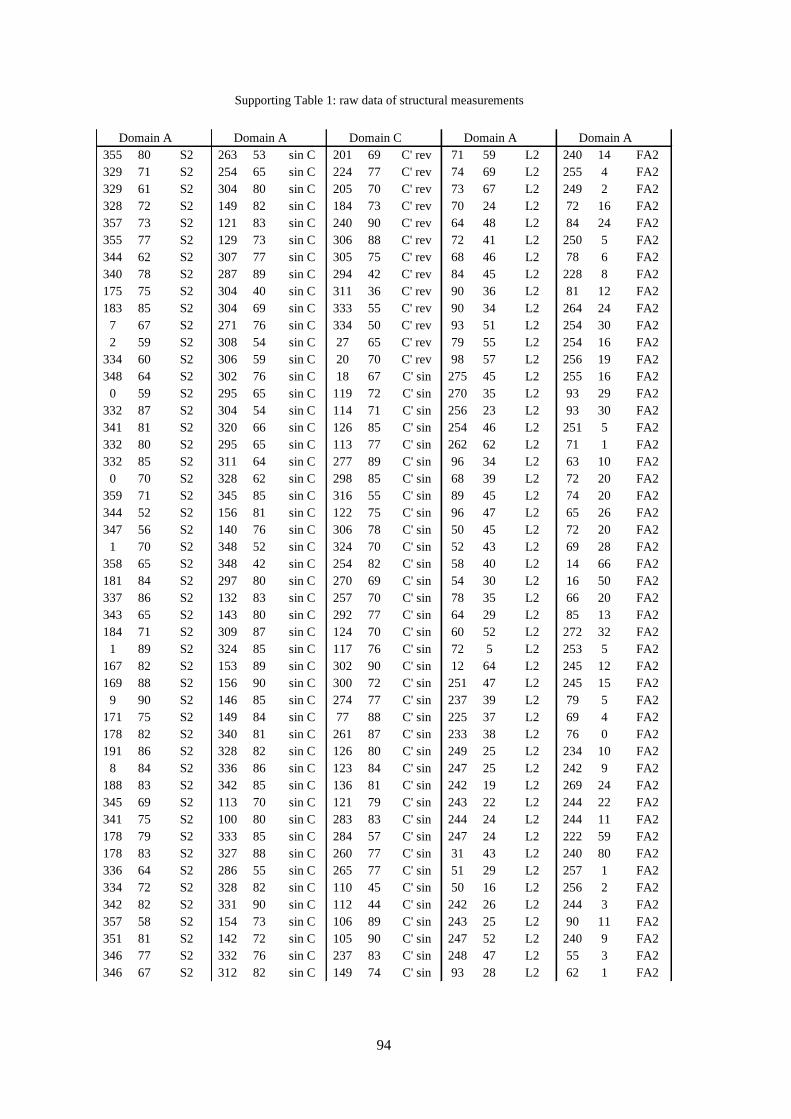
94
Supporting Table 1: raw data of structural measurements
Domain A Domain A Domain C Domain A Domain A
355 80 S2 263 53 sin C 201 69 C' rev 71 59 L2 240 14 FA2
329 71 S2 254 65 sin C 224 77 C' rev 74 69 L2 255 4 FA2
329 61 S2 304 80 sin C 205 70 C' rev 73 67 L2 249 2 FA2
328 72 S2 149 82 sin C 184 73 C' rev 70 24 L2 72 16 FA2
357 73 S2 121 83 sin C 240 90 C' rev 64 48 L2 84 24 FA2
355 77 S2 129 73 sin C 306 88 C' rev 72 41 L2 250 5 FA2
344 62 S2 307 77 sin C 305 75 C' rev 68 46 L2 78 6 FA2
340 78 S2 287 89 sin C 294 42 C' rev 84 45 L2 228 8 FA2
175 75 S2 304 40 sin C 311 36 C' rev 90 36 L2 81 12 FA2
183 85 S2 304 69 sin C 333 55 C' rev 90 34 L2 264 24 FA2
7 67 S2 271 76 sin C 334 50 C' rev 93 51 L2 254 30 FA2
2 59 S2 308 54 sin C 27 65 C' rev 79 55 L2 254 16 FA2
334 60 S2 306 59 sin C 20 70 C' rev 98 57 L2 256 19 FA2
348 64 S2 302 76 sin C 18 67 C' sin 275 45 L2 255 16 FA2
0 59 S2 295 65 sin C 119 72 C' sin 270 35 L2 93 29 FA2
332 87 S2 304 54 sin C 114 71 C' sin 256 23 L2 93 30 FA2
341 81 S2 320 66 sin C 126 85 C' sin 254 46 L2 251 5 FA2
332 80 S2 295 65 sin C 113 77 C' sin 262 62 L2 71 1 FA2
332 85 S2 311 64 sin C 277 89 C' sin 96 34 L2 63 10 FA2
0 70 S2 328 62 sin C 298 85 C' sin 68 39 L2 72 20 FA2
359 71 S2 345 85 sin C 316 55 C' sin 89 45 L2 74 20 FA2
344 52 S2 156 81 sin C 122 75 C' sin 96 47 L2 65 26 FA2
347 56 S2 140 76 sin C 306 78 C' sin 50 45 L2 72 20 FA2
1 70 S2 348 52 sin C 324 70 C' sin 52 43 L2 69 28 FA2
358 65 S2 348 42 sin C 254 82 C' sin 58 40 L2 14 66 FA2
181 84 S2 297 80 sin C 270 69 C' sin 54 30 L2 16 50 FA2
337 86 S2 132 83 sin C 257 70 C' sin 78 35 L2 66 20 FA2
343 65 S2 143 80 sin C 292 77 C' sin 64 29 L2 85 13 FA2
184 71 S2 309 87 sin C 124 70 C' sin 60 52 L2 272 32 FA2
1 89 S2 324 85 sin C 117 76 C' sin 72 5 L2 253 5 FA2
167 82 S2 153 89 sin C 302 90 C' sin 12 64 L2 245 12 FA2
169 88 S2 156 90 sin C 300 72 C' sin 251 47 L2 245 15 FA2
9 90 S2 146 85 sin C 274 77 C' sin 237 39 L2 79 5 FA2
171 75 S2 149 84 sin C 77 88 C' sin 225 37 L2 69 4 FA2
178 82 S2 340 81 sin C 261 87 C' sin 233 38 L2 76 0 FA2
191 86 S2 328 82 sin C 126 80 C' sin 249 25 L2 234 10 FA2
8 84 S2 336 86 sin C 123 84 C' sin 247 25 L2 242 9 FA2
188 83 S2 342 85 sin C 136 81 C' sin 242 19 L2 269 24 FA2
345 69 S2 113 70 sin C 121 79 C' sin 243 22 L2 244 22 FA2
341 75 S2 100 80 sin C 283 83 C' sin 244 24 L2 244 11 FA2
178 79 S2 333 85 sin C 284 57 C' sin 247 24 L2 222 59 FA2
178 83 S2 327 88 sin C 260 77 C' sin 31 43 L2 240 80 FA2
336 64 S2 286 55 sin C 265 77 C' sin 51 29 L2 257 1 FA2
334 72 S2 328 82 sin C 110 45 C' sin 50 16 L2 256 2 FA2
342 82 S2 331 90 sin C 112 44 C' sin 242 26 L2 244 3 FA2
357 58 S2 154 73 sin C 106 89 C' sin 243 25 L2 90 11 FA2
351 81 S2 142 72 sin C 105 90 C' sin 247 52 L2 240 9 FA2
346 77 S2 332 76 sin C 237 83 C' sin 248 47 L2 55 3 FA2
346 67 S2 312 82 sin C 149 74 C' sin 93 28 L2 62 1 FA2
95
Supporting Table 1: raw data of structural measurements
Domain A Domain A Domain C Domain A Domain A
335 90 S2 313 84 sin C 105 76 C' sin 97 27 L2 40 14 FA2
334 90 S2 148 65 sin C 108 75 C' sin 98 38 L2 219 11 FA2
334 78 S2 139 58 sin C 107 74 C' sin 234 38 L2 218 19 FA2
333 76 S2 163 72 sin C 100 86 C' sin 231 46 L2 225 26 FA2
339 80 S2 166 65 sin C 301 84 C' sin 237 18 L2 70 15 FA2
349 73 S2 343 86 sin C 277 65 C' sin 234 20 L2 70 21 FA2
342 55 S2 158 80 sin C 275 72 C' sin 235 17 L2 239 22 FA2
349 80 S2 346 89 sin C 90 85 C' sin 39 15 L2 75 16 FA2
334 50 S2 167 88 sin C 86 73 C' sin 55 10 L2 56 1 FA2
345 69 S2 339 86 sin C 306 68 C' sin 62 3 L2 237 5 FA2
324 78 S2 345 86 sin C 306 80 C' sin 61 9 L2 265 20 FA2
161 78 S2 139 80 sin C 233 90 C' sin 81 34 L2 254 5 FA2
335 88 S2 148 70 sin C 42 89 C' sin 67 22 L2 266 2 FA2
159 82 S2 130 67 sin C 246 85 C' sin 74 22 L2 265 4 FA2
159 74 S2 146 55 sin C 225 78 C' sin 88 23 L2 257 17 FA2
339 87 S2 152 75 sin C 306 82 C' sin 94 38 L2 264 21 FA2
333 80 S2 155 87 sin C 309 90 C' sin 152 74 L2 260 7 FA2
342 72 S2 147 74 sin C 129 86 C' sin 86 59 L2 263 11 FA2
339 71 S2 313 77 sin C 280 58 C' sin 55 27 L2 281 54 FA2
344 79 S2 310 74 sin C 271 68 C' sin 87 27 L2 285 3 FA2
349 89 S2 314 72 sin C 106 81 C' sin 56 36 L2 84 26 FA2
334 69 S2 304 90 sin C 116 84 C' sin 62 32 L2 95 17 FA2
338 74 S2 301 80 sin C 114 81 C' sin 88 25 L2 88 32 FA2
336 85 S2 289 89 sin C 99 75 C' sin 84 28 L2 89 31 FA2
329 80 S2 111 88 sin C 115 77 C' sin 83 48 L2 90 35 FA2
330 85 S2 334 81 sin C 298 88 C' sin 77 33 L2 90 12 FA2
299 69 S2 331 77 sin C 310 80 C' sin 85 12 L2 89 18 FA2
332 76 S2 161 86 sin C 118 85 C' sin 82 8 L2 263 33 FA2
332 77 S2 316 90 sin C 305 87 C' sin 168 77 L2 245 20 FA2
346 88 S2 315 84 sin C 141 78 C' sin 222 58 L2 112 5 FA2
336 88 S2 321 66 sin C 82 68 C' sin 232 42 L2 111 1 FA2
152 70 S2 122 78 sin C 93 80 C' sin 107 63 L2 102 32 FA2
153 81 S2 315 86 sin C 289 70 C' sin 73 53 L2 94 23 FA2
160 81 S2 150 90 sin C 98 86 C' sin 81 31 L2 84 18 FA2
150 83 S2 140 84 sin C 90 89 C' sin 83 28 L2 86 22 FA2
156 80 S2 321 83 sin C 96 80 C' sin 84 46 L2 281 5 FA2
156 81 S2 305 78 sin C 291 81 C' sin 89 44 L2 340 14 FA2
146 82 S2 304 77 sin C 286 87 C' sin 246 42 L2 330 24 FA2
322 88 S2 349 67 sin C 315 77 C' sin 243 58 L2 329 32 FA2
333 80 S2 352 62 sin C 308 82 C' sin 240 52 L2 285 10 FA2
3387 80 S2 145 75 sin C 319 87 C' sin 246 56 L2 270 1 FA2
159 75 S2 140 77 sin C 274 77 C' sin 235 52 L2 71 10 FA2
160 74 S2 310 42 sin C 283 79 C' sin 250 49 L2 70 16 FA2
325 84 S2 295 72 sin C 247 63 C' sin 252 55 L2 94 23 FA2
326 87 S2 139 84 sin C 267 67 C' sin 263 56 L2 89 29 FA2
157 79 S2 329 84 sin C 266 61 C' sin 253 56 L2 77 34 FA2
157 66 S2 332 85 sin C 257 61 C' sin 262 55 L2 287 8 FA2
295 65 S2 332 89 sin C 306 88 C' sin 237 55 L2 284 2 FA2
298 67 S2 246 78 sin C 305 75 C' sin 239 54 L2 91 5 FA2

96
Supporting Table 1: raw data of structural measurements
Domain A Domain A Domain C Domain A Domain A
144 83 S2 264 85 sin C 147 20 AE1 247 36 L2 96 15 FA2
331 90 S2 312 62 sin C 195 56 AE1 242 47 L2 78 4 FA2
335 90 S2 347 66 sin C 204 54 AE1 269 75 L2 79 9 FA2
144 69 S2 349 63 sin C 286 44 AE1 248 63 L2 268 6 FA2
146 76 S2 110 74 sin C 305 34 AE1 241 61 L2 92 32 FA2
327 87 S2 307 88 sin C 306 38 AE1 75 37 L2 45 45 FA2
149 88 S2 303 78 sin C 37 67 AE1 91 42 L2 89 22 FA2
142 88 S2 91 72 sin C 123 27 AE1 75 52 L2 65 34 FA2
153 89 S2 320 75 sin C 172 45 AE1 75 28 L2 230 39 FA2
144 90 S2 305 90 sin C 210 29 AE1 252 4 L2 236 18 FA2
148 90 S2 308 87 sin C 153 30 AE1 251 19 L2 275 62 FA2
151 90 S2 342 68 sin C 140 63 AE1 250 27 L2 64 17 FA2
142 90 S2 141 88 sin C 97 14 AE1 68 13 L2 72 8 FA2
330 85 S2 332 84 sin C 73 52 AE1 65 15 L2 53 12 FA2
336 80 S2 167 88 sin C 70 50 AE1 53 9 L2 52 29 FA2
154 86 S2 329 84 sin C 291 16 AE1 59 20 L2 95 12 FA2
141 84 S2 335 82 sin C 265 18 AE1 59 11 L2 99 22 FA2
155 87 S2 129 83 sin C 303 10 AE1 47 20 L2 59 32 FA2
330 70 S2 134 85 sin C 216 23 AE1 15 38 L2 92 4 FA2
332 78 S2 167 86 sin C 197 45 AE1 40 27 L2 248 13 FA3
153 80 S2 171 86 sin C 89 0 AE1 34 28 L2 250 13 FA3
149 85 S2 134 40 sin C 228 14 AE1 81 28 L2 253 2 FA3
336 83 S2 132 60 sin C 279 28 AE1 81 20 L2 243 54 FA3
334 75 S2 155 75 sin C 274 54 AE1 89 10 L2 251 32 FA3
333 75 S2 325 79 sin C 22 26 AE1 68 24 L2 256 42 FA3
333 75 S2 149 83 sin C 33 29 AE1 78 14 L2 252 12 FA3
335 84 S2 328 86 sin C 334 36 AE1 75 25 L2 85 36 FA3
336 75 S2 149 86 sin C 239 11 AE1 85 24 L2 266 35 FA3
336 85 S2 313 81 sin C 1 26 AE1 77 19 L2 264 28 FA3
156 87 S2 165 82 sin C 353 15 AE1 68 24 L2 242 43 FA3
161 89 S2 356 88 sin C 274 29 AE1 71 20 L2 235 31 FA3
157 87 S2 166 70 sin C 308 85 AE2 69 27 L2 25 35 FA3
331 90 S2 165 71 sin C 300 86 AE2 71 29 L2 82 47 FA3
334 86 S2 345 82 sin C 351 48 AE2 80 23 L2 212 52 FA3
335 86 S2 346 78 sin C 24 64 AE2 67 32 L2 217 60 FA3
333 88 S2 350 87 sin C 323 67 AE2 78 18 L2 231 59 FA3
336 89 S2 343 73 sin C 341 82 AE2 76 33 L2 153 85 FA3
325 70 S2 353 80 sin C 144 52 AE2 76 22 L2 271 17 FA3
339 82 S2 0 80 sin C 130 57 AE2 256 15 L2 274 15 FA3
339 82 S2 181 89 sin C 90 90 AE2 257 8 L2 298 18 FA3
161 88 S2 170 86 sin C 329 65 AE2 248 4 L2 252 4 FA3
357 79 S2 161 68 sin C 326 84 AE2 256 21 L2 258 11 FA3
126 47 S2 116 64 sin C 312 73 AE2 266 22 L2 267 8 FA3
135 58 S2 127 78 sin C 302 72 AE2 252 39 L2 82 11 L1
160 69 S2 119 52 sin C 309 65 AE2 253 14 L2 285 7 L1
156 73 S2 285 82 sin C 204 73 AE2 261 33 L2 272 3 L1
135 50 S2 125 62 sin C 166 69 AE2 253 11 L2 258 18 L1
150 57 S2 112 65 sin C 171 69 AE2 254 18 L2 259 20 L1
137 78 S2 314 80 sin C 17 9 AE2 242 8 L2 265 13 L1

97
Supporting Table 1: raw data of structural measurements
Domain A Domain A Domain C Domain A Domain A
139 76 S2 318 67 sin C 330 15 AE2 263 5 L2 263 20 L1
144 64 S2 306 66 sin C 95 37 AE2 220 30 L2 65 4 L1
145 57 S2 331 71 sin C 68 22 AE2 232 10 L2 252 8 L1
132 51 S2 333 84 sin C 110 74 AE2 237 20 L2 261 11 L1
142 55 S2 343 88 sin C 93 85 AE2 249 27 L2 239 34 L1
133 68 S2 324 84 sin C 280 75 AE2 234 4 L2 255 21 L1
137 64 S2 336 83 sin C 258 86 AE2 229 15 L2 255 32 L1
157 77 S2 324 80 sin C 266 83 AE2 230 20 L2 260 32 L1
156 72 S2 330 60 sin C 294 79 AE2 241 8 L2 248 21 L1
344 58 S2 310 90 sin C 299 72 AE2 243 5 L2 262 19 L1
328 52 S2 286 89 sin C 284 64 AE2 250 21 L2 261 6 L1
160 88 S2 138 88 sin C 282 67 AE2 236 17 L2 249 21 L1
336 88 S2 330 52 sin C 277 45 AE2 229 29 L2 246 2 L1
332 86 S2 316 56 sin C 317 50 AE2 42 18 L2 254 15 L1
148 86 S2 313 67 sin C 320 70 AE2 52 10 L2 249 46 L1
0 72 S2 123 55 sin C 333 52 AE2 232 10 L2 235 41 L1
345 85 S2 267 83 sin C 333 69 AE2 224 8 L2 221 24 L1
352 64 S2 295 81 sin C 325 82 AE2 60 7 L2 55 8 L1
21 65 S2 330 51 sin C 343 90 AE2 51 5 L2 60 4 L1
10 68 S2 332 84 sin C 131 37 AE2 250 14 L2 254 4 L1
172 60 S2 330 82 sin C 133 34 AE2 242 9 L2 235 18 L1
173 60 S2 308 60 sin C 117 60 AE2 236 12 L2 232 11 L1
315 80 S2 309 66 sin C 243 72 AE2 228 4 L2 83 20 L1
323 73 S2 314 51 sin C 270 88 AE2 238 6 L2 88 21 L1
326 90 S2 335 62 sin C 276 76 AE2 90 13 L2 245 6 L1
137 90 S2 318 58 sin C 90 70 AE2 275 5 L2 255 14 L1
158 84 S2 326 64 sin C 80 70 AE2 82 16 L2 257 12 L1
160 82 S2 358 46 sin C 91 70 AE2 82 5 L2 232 2 L1
157 82 S2 334 39 sin C 345 73 AE2 267 5 L2 208 52 L1
162 87 S2 319 81 sin C 345 73 AE2 246 46 L3 226 25 L1
159 82 S2 297 69 sin C 326 87 AE2 242 44 L3 232 24 L1
185 83 S2 142 78 sin C 324 82 AE2 242 39 L3 236 24 L1
340 90 S2 132 86 sin C 329 80 AE2 235 44 L3 236 28 L1
349 86 S2 154 78 sin C 146 84 AE2 273 3 L3 264 19 L1
339 86 S2 151 77 sin C 330 78 AE2 250 23 L dex 264 22 L1
340 87 S2 128 72 sin C 93 80 AE2 271 16 L dex 273 32 L1
344 89 S2 132 76 sin C 321 88 AE2 261 58 L dex 251 19 L1
159 83 S2 139 72 sin C 145 89 AE2 109 30 L dex 255 17 L1
340 82 S2 124 60 sin C 146 87 AE2 242 24 L dex 62 4 L1
337 84 S2 121 79 sin C 37 76 AE2 216 15 L dex 241 17 L1
171 80 S2 115 80 sin C 312 45 AE2 238 39 L dex 250 14 L1
169 86 S2 127 77 sin C 345 52 AE2 78 45 L dex 246 10 L1
169 88 S2 118 70 sin C 260 86 AE2 78 20 L dex 248 19 L1
172 85 S2 303 85 sin C 311 74 AE2 105 26 L dex 57 4 L1
164 87 S2 307 90 sin C 312 72 AE2 273 11 L dex 262 20 L1
166 86 S2 312 90 sin C 308 70 AE2 21 54 L dex 89 20 L1
335 84 S2 309 78 sin C 316 75 AE2 23 59 L dex 218 10 L1
338 65 S2 313 83 sin C 356 86 AE2 262 30 L rev 85 28 L1
335 58 S2 337 67 sin C 180 34 AE2 268 35 L rev 265 23 L1
98
Supporting Table 1: raw data of structural measurements
Domain A Domain A Domain C Domain A Domain A
317 63 S2 344 70 sin C 167 26 AE2 66 6 L rev 109 11 L1
326 70 S2 356 74 sin C 305 78 AE2 230 25 L rev 271 5 L1
343 82 S2 107 61 sin C 321 85 AE2 49 5 L rev 76 5 L1
335 80 S2 300 78 sin C 357 76 AE2 48 14 L rev 251 9 L1
332 79 S2 304 85 sin C 352 62 AE2 245 10 L rev 82 8 L1
324 78 S2 332 67 sin C 218 58 AE2 265 19 L sin 264 1 L1
168 66 S2 322 67 sin C 252 82 AE2 259 14 L sin 272 5 L1
161 63 S2 319 55 sin C 269 73 AE2 264 17 L sin 106 3 L1
154 70 S2 321 71 sin C 267 72 AE2 260 28 L sin 72 4 L1
145 65 S2 323 67 sin C 246 88 AE2 265 20 L sin 82 5 L1
180 70 S2 168 72 sin C 245 90 AE2 163 64 L sin 261 7 L1
176 78 S2 324 48 sin C 75 83 AE2 247 32 L sin 258 8 L1
162 86 S2 309 35 sin C 83 68 AE2 243 32 L sin 76 4 L1
323 83 S2 336 60 sin C 72 73 AE2 234 17 L sin 243 3 L1
345 87 S2 338 65 sin C 284 36 AE2 236 8 L sin 70 1 L1
140 87 S2 342 45 sin C 293 44 AE2 226 10 L sin 72 4 L1
133 88 S2 355 78 sin C 290 40 AE2 223 3 L sin 261 21 L1
131 84 S2 349 82 sin C 353 70 AE2 252 17 L sin 267 24 L1
0 82 S2 353 85 sin C 150 76 AE2 251 21 L sin 243 8 L1
153 74 S2 349 84 sin C 357 68 AE2 228 18 L sin 224 14 L1
152 67 S2 339 86 sin C 12 53 AE2 231 15 L sin 59 8 L1
355 80 S2 353 85 sin C 282 50 AE2 228 27 L sin 38 24 L1
331 86 S2 354 87 sin C 273 46 AE2 228 22 L sin 232 1 L1
340 80 S2 343 84 sin C 213 60 AE2 230 21 L sin 248 5 L1
350 80 S2 342 77 sin C 208 56 AE2 222 22 L sin 270 14 L1
159 90 S2 325 63 sin C 337 28 AE2 236 12 L sin 218 38 L1
148 89 S2 326 57 sin C 23 46 AE2 233 37 L sin 160 67 L1
335 81 S2 339 50 sin C 2 85 AE2 234 37 L sin 220 49 L1
343 74 S2 342 77 sin C 346 77 AE2 244 12 L sin 215 13 L1
336 89 S2 329 66 sin C 111 33 AE2 243 17 L sin 219 21 L1
339 78 S2 294 80 sin C 233 56 AE2 240 18 L sin 233 20 L1
152 84 S2 300 68 sin C 223 78 AE2 232 8 L sin 234 12 L1
173 78 S2 286 62 sin C 194 71 AE2 232 8 L sin 250 38 L1
142 83 S2 292 60 sin C 298 84 AE2 233 9 L sin 256 12 L1
314 85 S2 320 87 sin C 139 78 AE2 230 10 L sin 76 11 L1
330 69 S2 145 86 sin C 299 75 AE2 235 14 L sin 250 9 L1
341 37 S2 346 84 sin C 129 65 AE2 226 12 L sin 222 3 L1
331 67 S2 308 86 sin C 117 75 AE2 251 7 L sin 266 7 L1
339 62 S2 351 82 sin C 104 72 AE2 260 24 L sin 260 6 L1
341 54 S2 156 90 sin C 171 42 AE2 77 14 L sin 248 18 L1
298 65 S2 321 86 sin C 343 51 AE2 42 1 L sin 226 4 L1
346 62 S2 331 89 sin C 338 49 AE2 42 15 L sin 269 14 L1
323 74 S2 312 83 sin C 32 55 AE2 229 29 L sin 248 17 L1
320 77 S2 310 80 sin C 45 61 AE2 222 24 L sin 329 22 L1
312 81 S2 316 83 sin C 279 10 AE2 239 16 L sin 240 22 L1
323 85 S2 301 77 sin C 279 32 AE2 217 26 L sin 330 24 L1
319 70 S2 306 79 sin C 338 28 AE2 203 7 L sin 264 10 L1
324 73 S2 317 77 sin C 332 32 AE2 262 28 L sin 261 3 L1
321 60 S2 309 85 sin C 340 22 AE2 244 24 L sin 82 2 L1
99
Supporting Table 1: raw data of structural measurements
Domain A Domain A Domain C Domain A Domain A
323 78 S2 317 86 sin C 326 40 AE2 262 21 L sin 81 24 L1
169 72 S2 313 80 sin C 131 78 AE2 42 37 L sin 96 28 L1
141 90 S2 317 76 sin C 111 75 AE2 249 12 L sin 85 32 L1
149 84 S2 318 70 sin C 133 74 AE2 253 5 L sin 76 36 L1
141 89 S2 288 88 sin C 116 67 AE2 256 11 L sin 43 20 L1
313 74 S2 303 86 sin C 101 90 AE2 58 2 L sin 44 17 L1
327 63 S2 306 88 sin C 310 90 AE2 79 19 L sin 64 7 L1
332 63 S2 304 86 sin C 319 90 AE2 82 22 L sin 58 4 L1
325 68 S2 301 85 sin C 151 68 AE2 261 15 L sin 252 24 L1
319 65 S2 301 90 sin C 150 76 AE2 256 17 L sin 248 22 L1
306 61 S2 125 85 sin C 326 46 AE2 66 6 L sin 252 12 L1
267 74 S2 114 88 sin C 349 39 AE2 230 25 L sin 275 22 L1
295 65 S2 321 90 sin C 175 45 AE2 49 5 L sin 275 26 L1
302 67 S2 140 78 sin C 181 61 AE2 48 14 L sin 264 17 L1
294 66 S2 106 80 sin C 175 59 AE2 245 10 L sin 256 4 L1
305 53 S2 114 69 sin C 202 84 AE2 69 32 L sin 260 3 L1
314 73 S2 124 90 sin C 340 82 AE2 86 30 L sin 259 8 L1
288 50 S2 136 87 sin C 359 70 AE2 83 31 L sin 256 12 L1
310 62 S2 305 78 sin C 5 87 AE2 254 24 L sin 240 45 L1
137 62 S2 317 75 sin C 5 72 AE2 46 38 L sin 238 32 L1
143 63 S2 149 84 sin C 348 69 AE2 29 58 L sin 222 52 L1
137 54 S2 150 84 sin C 200 32 AE2 247 37 L sin 242 40 L1
141 55 S2 145 80 sin C 220 32 AE2 242 37 L sin 228 38 L1
143 50 S2 144 78 sin C 210 88 AE2 93 29 L sin 241 20 L1
149 74 S2 130 61 sin C 197 5 AE2 234 12 L sin 239 21 L1
141 68 S2 94 64 sin C 11 64 AE2 26 44 L sin 240 28 L1
121 90 S2 114 72 sin C 13 66 AE2 37 36 L sin 107 11 L1
149 61 S2 117 70 sin C 24 48 AE2 41 35 L sin 267 13 L1
138 70 S2 129 68 sin C 21 65 AE2 40 25 L sin 267 7 L1
155 67 S2 108 54 sin C 29 86 AE2 33 37 L sin 100 29 L1
151 75 S2 115 64 sin C 323 87 AE2 71 34 L sin 105 8 L1
142 75 S2 136 82 sin C 340 84 AE2 72 56 L sin 0 76 L1
145 80 S2 130 75 sin C 304 40 AE2 75 14 L sin 72 7 L1
142 80 S2 140 80 sin C 77 75 AE3 77 31 L sin 232 18 L1
150 54 S2 148 90 sin C 88 81 AE3 264 13 L sin 4 90 L1
129 53 S2 135 79 sin C 86 77 AE3 277 3 L sin 209 40 L1
81 50 S2 133 75 sin C 90 90 AE3 287 33 L sin 257 10 L1
337 75 S2 325 89 sin C 80 79 AE3 255 24 L2
347 88 S2 330 87 sin C 95 78 AE3 252 16 L2
342 82 S2 150 89 sin C 251 49 L1 254 12 L2
353 86 S2 338 64 sin C 263 48 L1 259 6 L2
341 88 S2 277 90 sin C 290 41 L1 214 15 L2
347 87 S2 122 82 sin C 345 17 L1 239 12 L2
321 84 S2 292 83 sin C 341 39 L1 265 3 L2
172 90 S2 282 72 sin C 8 47 L1 260 7 L2
333 75 S2 276 67 sin C 357 43 L1 255 13 L2
3 82 S2 275 70 sin C 320 58 L1 260 6 L2
336 84 S2 130 72 sin C 232 24 L1 262 3 L2
357 80 S2 135 70 sin C 42 1 L1 80 18 L2
100
Supporting Table 1: raw data of structural measurements
Domain A Domain A Domain C Domain A
339 84 S2 132 85 sin C 25 17 L1 254 4 L2
171 84 S2 297 83 sin C 29 32 L1 265 1 L2
171 87 S2 299 80 sin C 36 27 L1 260 26 L2
167 86 S2 304 82 sin C 10 16 L1 254 23 L2
354 86 S2 113 80 sin C 240 6 L1 276 24 L2
170 86 S2 133 71 sin C 56 20 L1 251 14 L2
155 81 S2 306 74 sin C 58 13 L1 251 16 L2
161 75 S2 104 87 sin C 63 2 L1 64 6 L2
162 75 S2 289 74 sin C 62 13 L1 264 21 L2
150 73 S2 296 84 sin C 112 40 L1 241 13 L2
151 73 S2 297 68 sin C 109 14 L1 256 5 L2
159 76 S2 319 85 sin C 108 24 L1 258 1 L2
163 82 S2 139 82 sin C 268 35 L1 262 17 L2
149 74 S2 305 72 sin C 279 24 L1 102 6 L2
152 72 S2 127 81 sin C 289 28 L1 258 23 L2
165 84 S2 294 89 sin C 195 36 L1 240 16 L2
162 83 S2 241 71 sin C 196 31 L1 258 19 L2
171 79 S2 106 69 sin C 3 9 L1 256 17 L2
163 81 S2 150 83 sin C 18 25 L1 260 7 L2
158 81 S2 144 90 sin C 355 9 L1 251 8 L2
176 85 S2 118 72 sin C 248 22 L2 60 11 L2
168 83 S2 135 83 sin C 248 10 L2 276 6 L2
180 81 S2 136 82 sin C 243 37 L2 269 3 L2
178 79 S2 314 88 sin C 252 32 L2 231 17 L2
191 75 S2 143 78 sin C 251 5 L2 254 29 L2
310 75 S2 143 89 sin C 245 21 L2 252 14 L2
320 81 S2 308 84 sin C 250 22 L2 262 10 L2
320 76 S2 137 82 sin C 244 25 L2 240 6 L2
176 67 S2 78 37 AE1 255 23 L2 261 5 L2
170 87 S2 359 64 AE1 231 23 L2 252 4 L2
168 86 S2 22 70 AE1 241 24 L2 75 2 L2
156 90 S2 131 36 AE1 299 72 L2 253 24 L2
152 83 S2 45 26 AE1 292 72 L2 258 24 L2
152 87 S2 104 42 AE1 240 25 L2 81 24 L2
156 81 S2 155 43 AE1 244 22 L2 249 9 L2
158 82 S2 146 34 AE1 238 45 L2 238 16 L2
144 87 S2 73 56 AE1 260 64 L2 258 13 L2
152 71 S2 83 29 AE1 266 58 L2 250 8 L2
159 74 S2 10 54 AE1 260 61 L2 264 22 L2
149 72 S2 353 61 AE1 266 56 L2 264 16 L2
336 84 S2 277 32 AE1 304 60 L2 253 11 L2
335 88 S2 198 58 AE1 300 64 L2 75 1 L2
169 83 S2 177 44 AE1 306 64 L2 79 14 L2
159 83 S2 173 82 AE1 262 50 L2 64 12 L2
149 88 S2 166 72 AE1 262 24 L2 272 55 L2
346 85 S2 351 56 AE1 250 28 L2 252 25 L2
328 85 S2 328 24 AE1 253 29 L2 253 30 L2
156 81 S2 327 28 AE1 262 26 L2 260 41 L2
148 85 S2 298 24 AE1 249 25 L2 266 43 L2

101
Supporting Table 1: raw data of structural measurements
Domain A Domain A Domain C Domain A
340 75 S2 166 15 AE1 257 31 L2 226 35 L2
340 78 S2 12 33 AE1 232 36 L2 244 20 L2
326 84 S2 321 45 AE1 274 17 L2 253 16 L2
315 80 S2 335 45 AE1 262 3 L2 228 22 L2
351 72 S2 146 9 AE1 250 7 L2 253 28 L2
343 84 S2 173 33 AE1 34 39 L2 51 9 L2
146 84 S2 165 43 AE1 13 45 L2 256 9 L2
150 87 S2 188 38 AE1 31 46 L2 251 6 L2
323 85 S2 169 28 AE1 46 44 L2 245 5 L2
168 76 S2 153 60 AE1 37 49 L2 246 2 L2
158 80 S2 168 64 AE1 247 3 L2 242 0 L2
163 77 S2 170 37 AE1 253 16 L2 247 4 L2
170 80 S2 22 71 AE1 263 9 L2 249 19 L2
152 78 S2 133 18 AE1 292 18 L2 255 20 L2
148 75 S2 338 72 AE2 288 9 L2 248 6 L2
152 75 S2 332 74 AE2 289 11 L2 254 14 L2
140 90 S2 344 80 AE2 249 19 L dex 260 18 L2
148 90 S2 335 89 AE2 266 0 L dex 252 14 L2
146 90 S2 346 83 AE2 313 7 L norm 246 8 L2
314 49 S2 169 89 AE2 315 12 L norm 243 7 L2
328 47 S2 11 69 AE2 314 8 L norm 242 11 L2
330 46 S2 11 60 AE2 316 20 L norm 233 37 L2
340 84 S2 153 80 AE2 310 16 L norm 258 4 L2
161 90 S2 160 82 AE2 240 30 L sin 261 11 L2
337 65 S2 331 70 AE2 246 26 L sin 90 29 L2
344 73 S2 338 65 AE2 306 45 L sin 92 22 L2
129 76 S2 344 80 AE2 292 44 L sin 279 2 L2
145 78 S2 335 79 AE2 310 48 L sin 87 11 L2
177 81 S2 6 77 AE2 283 46 L sin 266 4 L2
151 71 S2 354 83 AE2 225 26 L sin 175 2 L2
160 69 S2 160 88 AE2 287 39 L sin 85 3 L2
163 80 S2 342 65 AE2 285 52 L sin 94 0 L2
152 75 S2 157 68 AE2 305 52 L sin 269 4 L2
165 84 S2 165 72 AE2 271 65 L sin 275 6 L2
163 81 S2 345 84 AE2 269 39 L sin 270 4 L2
153 77 S2 340 75 AE2 259 27 L sin 266 5 L2
160 86 S2 325 86 AE2 266 3 FA1 268 4 L2
157 85 S2 339 77 AE2 275 19 FA1 265 4 L2
150 75 S2 332 71 AE2 343 10 FA1 88 28 L2
348 74 S2 190 71 AE2 33 16 FA1 90 44 L2
343 67 S2 335 90 AE2 37 11 FA1 91 32 L2
346 69 S2 156 75 AE2 130 12 FA1 91 25 L2
339 79 S2 164 78 AE2 108 22 FA1 83 22 L2
343 76 S2 337 81 AE2 107 26 FA1 94 34 L2
341 80 S2 187 50 AE2 195 23 FA1 100 27 L2
350 75 S2 167 82 AE2 68 24 FA1 92 21 L2
356 77 S2 339 80 AE2 125 54 FA1 67 27 L2
354 75 S2 131 88 AE2 175 7 FA1 278 6 L2
348 90 S2 135 80 AE2 293 8 FA1 62 12 L2
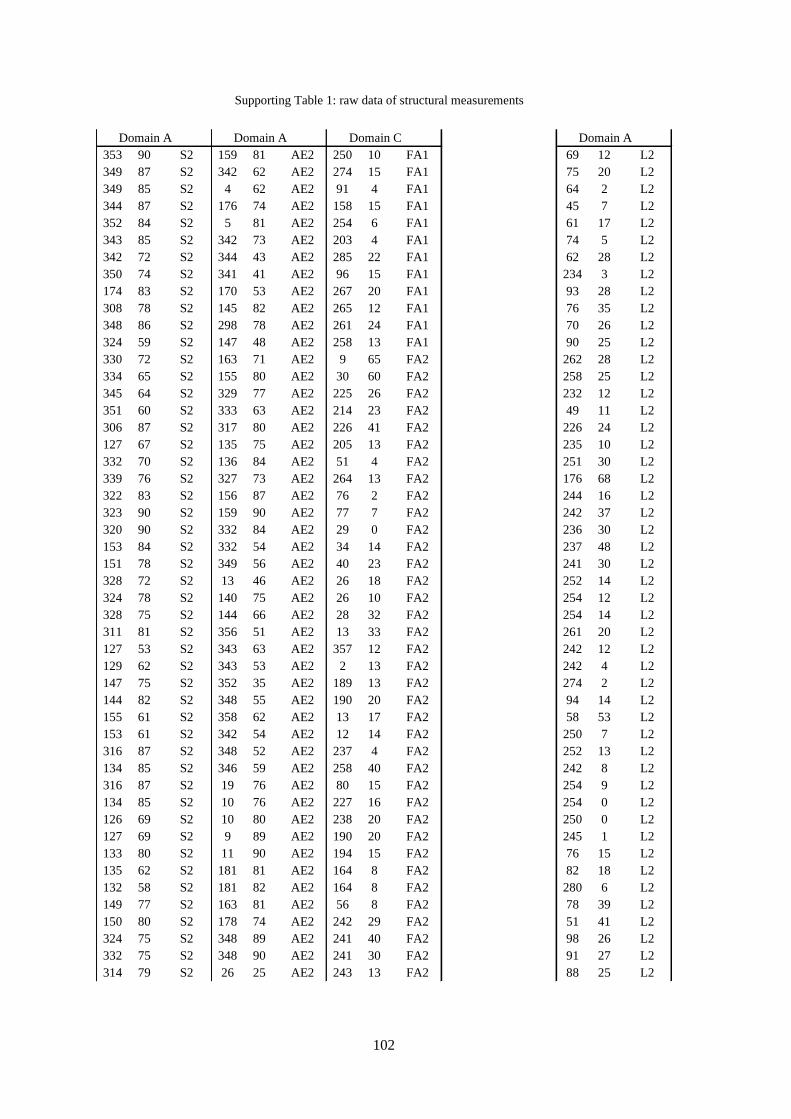
102
Supporting Table 1: raw data of structural measurements
Domain A Domain A Domain C Domain A
353 90 S2 159 81 AE2 250 10 FA1 69 12 L2
349 87 S2 342 62 AE2 274 15 FA1 75 20 L2
349 85 S2 4 62 AE2 91 4 FA1 64 2 L2
344 87 S2 176 74 AE2 158 15 FA1 45 7 L2
352 84 S2 5 81 AE2 254 6 FA1 61 17 L2
343 85 S2 342 73 AE2 203 4 FA1 74 5 L2
342 72 S2 344 43 AE2 285 22 FA1 62 28 L2
350 74 S2 341 41 AE2 96 15 FA1 234 3 L2
174 83 S2 170 53 AE2 267 20 FA1 93 28 L2
308 78 S2 145 82 AE2 265 12 FA1 76 35 L2
348 86 S2 298 78 AE2 261 24 FA1 70 26 L2
324 59 S2 147 48 AE2 258 13 FA1 90 25 L2
330 72 S2 163 71 AE2 9 65 FA2 262 28 L2
334 65 S2 155 80 AE2 30 60 FA2 258 25 L2
345 64 S2 329 77 AE2 225 26 FA2 232 12 L2
351 60 S2 333 63 AE2 214 23 FA2 49 11 L2
306 87 S2 317 80 AE2 226 41 FA2 226 24 L2
127 67 S2 135 75 AE2 205 13 FA2 235 10 L2
332 70 S2 136 84 AE2 51 4 FA2 251 30 L2
339 76 S2 327 73 AE2 264 13 FA2 176 68 L2
322 83 S2 156 87 AE2 76 2 FA2 244 16 L2
323 90 S2 159 90 AE2 77 7 FA2 242 37 L2
320 90 S2 332 84 AE2 29 0 FA2 236 30 L2
153 84 S2 332 54 AE2 34 14 FA2 237 48 L2
151 78 S2 349 56 AE2 40 23 FA2 241 30 L2
328 72 S2 13 46 AE2 26 18 FA2 252 14 L2
324 78 S2 140 75 AE2 26 10 FA2 254 12 L2
328 75 S2 144 66 AE2 28 32 FA2 254 14 L2
311 81 S2 356 51 AE2 13 33 FA2 261 20 L2
127 53 S2 343 63 AE2 357 12 FA2 242 12 L2
129 62 S2 343 53 AE2 2 13 FA2 242 4 L2
147 75 S2 352 35 AE2 189 13 FA2 274 2 L2
144 82 S2 348 55 AE2 190 20 FA2 94 14 L2
155 61 S2 358 62 AE2 13 17 FA2 58 53 L2
153 61 S2 342 54 AE2 12 14 FA2 250 7 L2
316 87 S2 348 52 AE2 237 4 FA2 252 13 L2
134 85 S2 346 59 AE2 258 40 FA2 242 8 L2
316 87 S2 19 76 AE2 80 15 FA2 254 9 L2
134 85 S2 10 76 AE2 227 16 FA2 254 0 L2
126 69 S2 10 80 AE2 238 20 FA2 250 0 L2
127 69 S2 9 89 AE2 190 20 FA2 245 1 L2
133 80 S2 11 90 AE2 194 15 FA2 76 15 L2
135 62 S2 181 81 AE2 164 8 FA2 82 18 L2
132 58 S2 181 82 AE2 164 8 FA2 280 6 L2
149 77 S2 163 81 AE2 56 8 FA2 78 39 L2
150 80 S2 178 74 AE2 242 29 FA2 51 41 L2
324 75 S2 348 89 AE2 241 40 FA2 98 26 L2
332 75 S2 348 90 AE2 241 30 FA2 91 27 L2
314 79 S2 26 25 AE2 243 13 FA2 88 25 L2
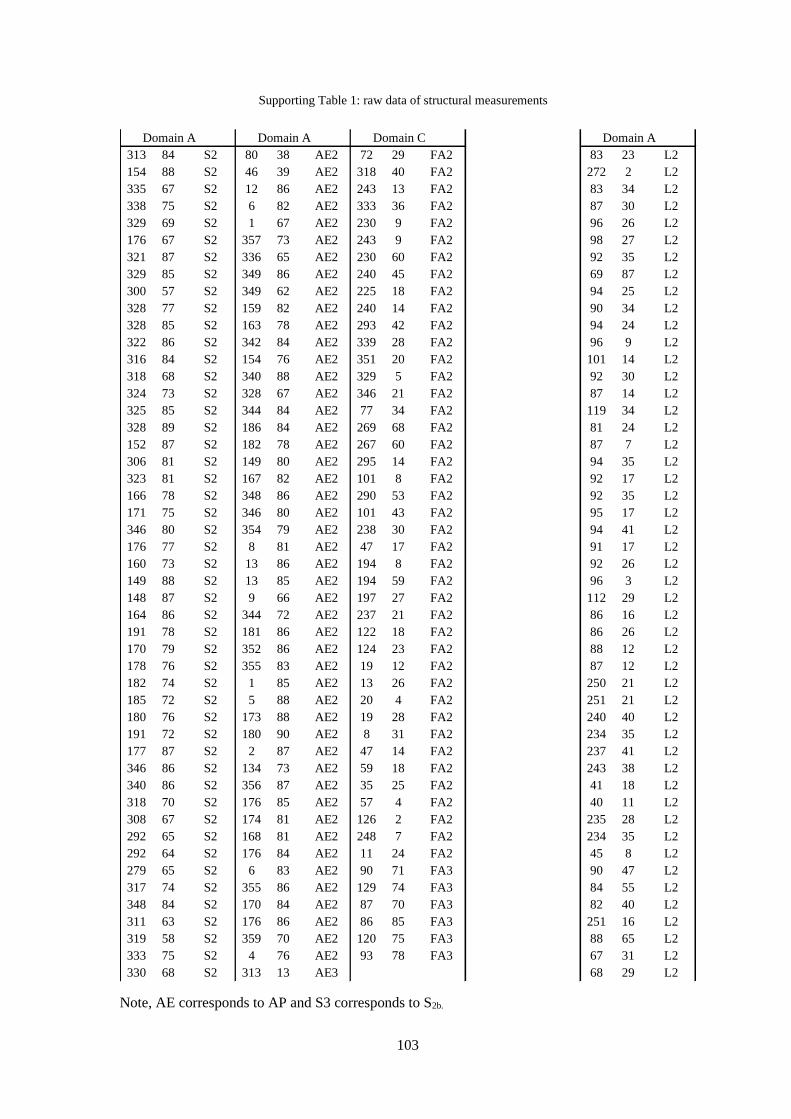
103
Note, AE corresponds to AP and S3 corresponds to S2b.
Supporting Table 1: raw data of structural measurements
Domain A Domain A Domain C Domain A
313 84 S2 80 38 AE2 72 29 FA2 83 23 L2
154 88 S2 46 39 AE2 318 40 FA2 272 2 L2
335 67 S2 12 86 AE2 243 13 FA2 83 34 L2
338 75 S2 6 82 AE2 333 36 FA2 87 30 L2
329 69 S2 1 67 AE2 230 9 FA2 96 26 L2
176 67 S2 357 73 AE2 243 9 FA2 98 27 L2
321 87 S2 336 65 AE2 230 60 FA2 92 35 L2
329 85 S2 349 86 AE2 240 45 FA2 69 87 L2
300 57 S2 349 62 AE2 225 18 FA2 94 25 L2
328 77 S2 159 82 AE2 240 14 FA2 90 34 L2
328 85 S2 163 78 AE2 293 42 FA2 94 24 L2
322 86 S2 342 84 AE2 339 28 FA2 96 9 L2
316 84 S2 154 76 AE2 351 20 FA2 101 14 L2
318 68 S2 340 88 AE2 329 5 FA2 92 30 L2
324 73 S2 328 67 AE2 346 21 FA2 87 14 L2
325 85 S2 344 84 AE2 77 34 FA2 119 34 L2
328 89 S2 186 84 AE2 269 68 FA2 81 24 L2
152 87 S2 182 78 AE2 267 60 FA2 87 7 L2
306 81 S2 149 80 AE2 295 14 FA2 94 35 L2
323 81 S2 167 82 AE2 101 8 FA2 92 17 L2
166 78 S2 348 86 AE2 290 53 FA2 92 35 L2
171 75 S2 346 80 AE2 101 43 FA2 95 17 L2
346 80 S2 354 79 AE2 238 30 FA2 94 41 L2
176 77 S2 8 81 AE2 47 17 FA2 91 17 L2
160 73 S2 13 86 AE2 194 8 FA2 92 26 L2
149 88 S2 13 85 AE2 194 59 FA2 96 3 L2
148 87 S2 9 66 AE2 197 27 FA2 112 29 L2
164 86 S2 344 72 AE2 237 21 FA2 86 16 L2
191 78 S2 181 86 AE2 122 18 FA2 86 26 L2
170 79 S2 352 86 AE2 124 23 FA2 88 12 L2
178 76 S2 355 83 AE2 19 12 FA2 87 12 L2
182 74 S2 1 85 AE2 13 26 FA2 250 21 L2
185 72 S2 5 88 AE2 20 4 FA2 251 21 L2
180 76 S2 173 88 AE2 19 28 FA2 240 40 L2
191 72 S2 180 90 AE2 8 31 FA2 234 35 L2
177 87 S2 2 87 AE2 47 14 FA2 237 41 L2
346 86 S2 134 73 AE2 59 18 FA2 243 38 L2
340 86 S2 356 87 AE2 35 25 FA2 41 18 L2
318 70 S2 176 85 AE2 57 4 FA2 40 11 L2
308 67 S2 174 81 AE2 126 2 FA2 235 28 L2
292 65 S2 168 81 AE2 248 7 FA2 234 35 L2
292 64 S2 176 84 AE2 11 24 FA2 45 8 L2
279 65 S2 6 83 AE2 90 71 FA3 90 47 L2
317 74 S2 355 86 AE2 129 74 FA3 84 55 L2
348 84 S2 170 84 AE2 87 70 FA3 82 40 L2
311 63 S2 176 86 AE2 86 85 FA3 251 16 L2
319 58 S2 359 70 AE2 120 75 FA3 88 65 L2
333 75 S2 4 76 AE2 93 78 FA3 67 31 L2
330 68 S2 313 13 AE3 68 29 L2

104
4. U-Pb ages of apatite in the western Tauern Window (Eastern
Alps): Tracing the onset of collision-related exhumation in
the European plate
4.1 Highlights and article information
First U–Pb cooling ages of apatite obtained in the European Alps.
Elongate concentric cooling pattern indicates exhumation by folding and erosion.
Cooling pattern resembles those of geochronometers having lower closure temperatures.
Sample-specific cooling-rates yield 15.3±1.9 K/Myr in the western Tauern Window.
Thermal climax of the Barrovian metamorphism is inferred to occur between 37 and 34 Ma.
Article history: Received 20 November 2014
Received in revised form 2 February 2015
Accepted 12 February 2015
Available online 13 February 2015
Editor: A. Yin
doi:10.1016/j.epsl.2015.02.020
4.2 Keywords
LA-ICP-MS; U-Pb dating of apatite; median ages; student-t test; Tauerncrystallization
4.3 Abstract
We performed U-Pb analyses of zircons and apatites from eighteen samples distributed along three
sections crossing the western Tauern Window (Eastern Alps). Zircon analyses yield concordant
ages of 295 Ma dating the Variscan emplacement of the Zentralgneiss batholith. Apatite analyses
scatter over a wide age range and show two age clusters. A considerable number of apatite analyses
for each sample reflect a relatively uniform cluster of age values varying between 40-20 Ma. A
second cluster reveals age values scattering between 300-40 Ma. We applied an age extractor
algorithm to all apatite analyses of each sample to calculate median ages from the younger age
cluster and asymmetric 2σ errors as their uncertainties, which are mostly in the range of 10 %.

105
These median ages are interpreted to date cooling below 450-500 °C during Alpine orogeny after
the thermal climax of the western Tauern Window. The cooling ages give a consistent picture over
the study area of 31-29 Ma. Along each section younger cooling ages were obtained in the center
compared to the margins. In addition, the eastern section shows older cooling ages of 36-34 Ma
whereas the western section younger cooling ages of 26-25 Ma. Both age trends, (1) younging
towards the centers of the sections and (2) younging towards the west across all three section are
confirmed by six independent two-sample student-t-tests. Spatially the age pattern resembles those
observed from geochronometers having lower closure temperatures (375-110 °C), that are largely
related to doming after Dolomites indentation. Cooling rates of five samples, where additional
fission track ages are available, yield uniform result and could be averaged to 15.2±1.5 K/Myr (2σ).
By linear extrapolation using the specific cooling rates and the estimated maximum temperature
(Tmax) we obtained a time range of 38 to 34 Ma, interpreted to date the thermal climax of the
Barrovian metamorphism in the western Tauern Window.
4.4 Introduction
Phosphorus is moderately incompatible and generally present in nature as the oxyanion PO43-,
which forms the common mineral apatite (Ca5(PO4)3(OH,F,Cl)). Fluorapatite compared to Chlor-
or Hydroxylapatite, is by far the most common member of the apatite family found as accessory
phase in many rock types. In most igneous rocks it is a minor but ubiquitous mineral, where it might
reach high concentrations in enclaves or cumulates (White, 2005). The presence of apatite in most
rocks is due to its low solubility in naturally occurring melts and fluids, and to the restricted ability
of common rock-forming minerals to incorporate the amount phosphorus that is present in most
rocks into their crystal structure (Piccoli and Candela, 2002).
Apatite crystallization takes place over a wide temperature range in most felsic metaluminous
magmatic systems because apatite saturation is achieved relatively early compared to other minerals
and its reaction to other phosphate-bearing minerals is sluggish (Wolf and London, 1995).
However, most igneous apatites crystallize over a restricted temperature interval of 60-100 °C
around the apatite saturation temperature that is usually >680 °C in felsic rocks (Piccoli and
Candela, 1994, 2002). The apatite crystal habitus might give some hints of its formation process.
According to Höche et al., (2001) needles result from surface-controlled growth at high
supersaturation whereas stubby crystals grow at lower degrees of supersaturation under conditions
where growth is diffusion-controlled. Apatite needles can precipitate from experiments without a
rapid quench, but the proportion of acicular to stubby apatite increases with increasing cooling rate
(Wyllie et al., 1962).
Apatites contain a moderately high concentration of lattice-bound U (5 to 50 ppm), hence they are
suitable for U-Th-Pb chronology (e.g., Harrison et al., 2002; Willigers et al., 2002). Generally
apatites show no compositional zoning, sometimes micro-inclusions are common, but the U-Pb
systematics do not appear to be influenced significantly by these micro-inclusions (Chamberlain
and Bowring, 2000).
Apatite is stable at epidote-amphibolite-facies conditions during metamorphism, i.e. at
temperatures that are typically higher than the apatite closure temperature for Pb diffusion
(Cherniak et al., 1991; Krogstad and Walker, 1994). During cooling apatite is inert to
recrystallization and growth before Pb isotopic exchange by thermally enhanced diffusion has
ceased. Therefore, apatite U-Pb systematics are controlled by diffusion rather than growth or
recrystallization (Willigers et al., 2001). Closure temperatures for Pb diffusion in apatite are 400
106
°C to 500 °C for typical diffusive diameters and cooling rates based on both experimental and
empirical estimates and are valid for both, rapidly and slow cooling regions (Willigers et al., 2001,
2002 and references therein). In hydrothermal systems, apatite growth can occur below its closure
temperatures and apatite U-Pb ages may be used to date the timing of fluid flow directly (e.g., Corfu
and Stone, 1998).
Willigers et al. (2001) showed that the formerly assumed closure temperature of 620 °C for U-Pb
apatite was overestimated, because K/Ar hornblende ages of the same samples and areas are
consistently older. The authors calculated a closure temperature of 500 °C for U-Pb apatite.
Chamberlain and Bowring (2000) showed that apatite is a reliable, mid-range (450 °C), diffusion-
controlled system, suitable for constraining cooling and exhumation histories from both igneous
and metamorphic rocks.
Large metamorphic sites, like orogenic domes and ranges, might be affected by poly-phase
metamorphism and/or additional poly-phase localized deformation causing map-scale 3D-
variations of the cooling pattern. Nowadays dating of metamorphic cooling is ideally achieved by
applying multiple geochronometers covering a wide range of closure temperatures to a single
sample (e.g., Willigers et al., 2002). If then multi-dating is applied to several samples covering the
area of interest a refined picture of the cooling history might be obtained, from whose differential
cooling- and exhumation rates might be calculated and structures like folds, shear zones and faults
might be detected (e.g., Borsi et al., 1973). The major advantage of this multi-dating approach is to
minimize the possibly complex cooling history to the dimension of the hand specimen and,
therefore, to calculate sample-specific vertical cooling paths. Spatial corrections of horizontal
temperature gradients might be avoided by this approach. Absolute closure temperatures of
geochronometers, having large errors (10-20 %), are still debated, depending also on geological
factors like fluid infiltration, grain size and cooling rates of the dated sample (Dodsen, 1973). On
the contrary, the relative succession of different geochronometers seems to be uniform (e.g. U-Pb
zircon, U-Pb monazite, U-Pb titanite, K/Ar amphibole, U-Pb apatite, Rb/Sr white mica, K/Ar white
mica, K/Ar biotite, Rb/Sr biotite, K/Ar K-feldspar, ZFT, TFT, AFT). Hence, the relative closure
temperatures seem to be consistent and robust (Villa, 1998; Willigers et al., 2001). This strongly
suggests that there are consistent systematic differences in the rates at which volume diffusion of
radiogenic nuclides occurs through specific mineral phases. In multi-approach studies where
cooling from the high temperature range (>400 °C) was sustained, U-Pb cooling ages of monazites
are followed by U-Pb cooling ages of apatites and K/Ar cooling ages of hornblendes (Willigers et
al., 2001), therefore, the latter geochronometers are appropriate to date the onset of cooling from a
Barrovian metamorphism.
There have been many studies dating U-Pb ages of apatite, e.g. based on the conventional TIMS
analysis after chemical dissolution (e.g., Oosthuyzen and Burger, 1973), on ion-microprobe using
SHRIMP (e.g., Kennedy and Dante, 1997), on non-destructive in situ dating using SIMS where the
textural control matters (e.g., Sano et al., 1999), or by LA-ICPMS analyses (e.g., Thomson et al.,
2012). These studies have exemplarily shown that U-Pb apatite cooling ages can be obtained by
different analytical approaches. The present study applies the unconventional U-Pb apatite
geochronometer, used for the first time in the Eastern Alps, to the western Tauern Window. Since
the closure temperature of U-Pb apatite is generally higher compared to available cooling ages of
the working area (cf. compilation of Luth and Willingshofer, 2008; Rosenberg and Berger, 2009;
Bertrand et al., 2014) they might yield new time constraints for the reconstruction of the tectono-
metamorphic evolution of the western Tauern Window.
107
4.5 Geological setting
The Tauern Window is a tectonic window exposing lower plate (European- and ocean-derived)
units of the Alpine orogen surrounded by upper plate (Adria-derived) rocks (Fig. 1a). The
European-derived rocks (Fig. 1a, Venediger Duplex) consist of granites to tonalities that are
summarized as Zentralgneiss batholith (Finger et al., 1993, 1997) and its pre-magmatic country
rocks. The formation, the shape and the structure of the Tauern Window is largely controlled by
Dolomites indentation (Cornelius, 1940). The window coincides with an arcuate dome structure
that can be subdivided into a western, a central and an eastern sub-dome (Schmid et al., 2013).
These sub-domes have a common i.e., doming, and a different i.e., tight folding and shear zone
localization, exhumation history. The central and eastern sub-domes are characterized by broad and
open folds that refold an early Alpine foliation caused by nappe stacking (Schmid et al., 2013).
There, the main foliations strike concentrically and are rather gently dipping (Schneider et al.,
2014). Localized mylonitic deformation is rare in the eastern and central sub-domes and if present
it only occurs marginally (Scharf et al., 2013). The western sub-dome is characterized by a NE-
striking transpressive belt of tight, upright folds associated with a network of sinistral shear zones
(Fig. 1a, Schneider et al., 2014). These structures connect two major Alpine fault systems, the
Giudicarie Belt and the SEMP Fault, translating Dolomites indentation (Rosenberg et al., 2004)
into lateral extrusion (Ratschbacher et al., 1991). Therefore, the western sub-dome was affected
longer and more intensely by shortening compared to the eastern and central sub-domes which were
decoupled by the restraining bend and escaped tectonically eastward (Schneider et al., 2014).

108
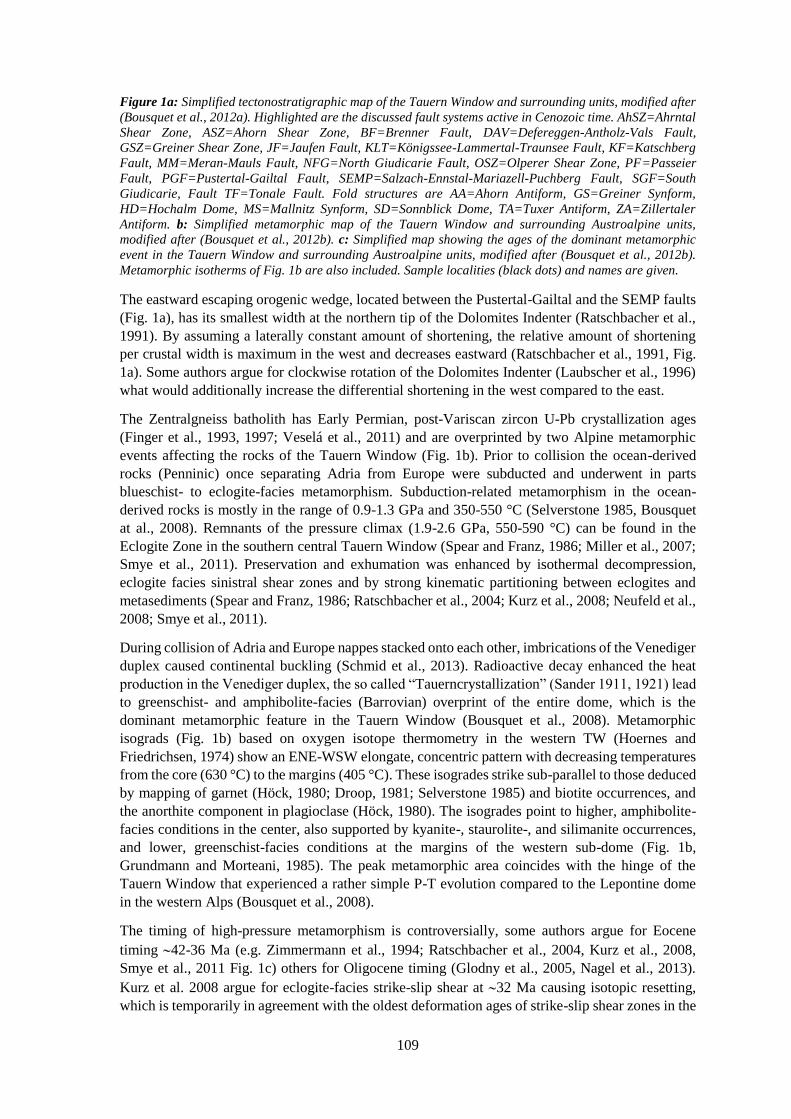
109
Figure 1a: Simplified tectonostratigraphic map of the Tauern Window and surrounding units, modified after
(Bousquet et al., 2012a). Highlighted are the discussed fault systems active in Cenozoic time. AhSZ=Ahrntal
Shear Zone, ASZ=Ahorn Shear Zone, BF=Brenner Fault, DAV=Defereggen-Antholz-Vals Fault,
GSZ=Greiner Shear Zone, JF=Jaufen Fault, KLT=Königssee-Lammertal-Traunsee Fault, KF=Katschberg
Fault, MM=Meran-Mauls Fault, NFG=North Giudicarie Fault, OSZ=Olperer Shear Zone, PF=Passeier
Fault, PGF=Pustertal-Gailtal Fault, SEMP=Salzach-Ennstal-Mariazell-Puchberg Fault, SGF=South
Giudicarie, Fault TF=Tonale Fault. Fold structures are AA=Ahorn Antiform, GS=Greiner Synform,
HD=Hochalm Dome, MS=Mallnitz Synform, SD=Sonnblick Dome, TA=Tuxer Antiform, ZA=Zillertaler
Antiform. b: Simplified metamorphic map of the Tauern Window and surrounding Austroalpine units,
modified after (Bousquet et al., 2012b). c: Simplified map showing the ages of the dominant metamorphic
event in the Tauern Window and surrounding Austroalpine units, modified after (Bousquet et al., 2012b).
Metamorphic isotherms of Fig. 1b are also included. Sample localities (black dots) and names are given.
The eastward escaping orogenic wedge, located between the Pustertal-Gailtal and the SEMP faults
(Fig. 1a), has its smallest width at the northern tip of the Dolomites Indenter (Ratschbacher et al.,
1991). By assuming a laterally constant amount of shortening, the relative amount of shortening
per crustal width is maximum in the west and decreases eastward (Ratschbacher et al., 1991, Fig.
1a). Some authors argue for clockwise rotation of the Dolomites Indenter (Laubscher et al., 1996)
what would additionally increase the differential shortening in the west compared to the east.
The Zentralgneiss batholith has Early Permian, post-Variscan zircon U-Pb crystallization ages
(Finger et al., 1993, 1997; Veselá et al., 2011) and are overprinted by two Alpine metamorphic
events affecting the rocks of the Tauern Window (Fig. 1b). Prior to collision the ocean-derived
rocks (Penninic) once separating Adria from Europe were subducted and underwent in parts
blueschist- to eclogite-facies metamorphism. Subduction-related metamorphism in the ocean-
derived rocks is mostly in the range of 0.9-1.3 GPa and 350-550 °C (Selverstone 1985, Bousquet
at al., 2008). Remnants of the pressure climax (1.9-2.6 GPa, 550-590 °C) can be found in the
Eclogite Zone in the southern central Tauern Window (Spear and Franz, 1986; Miller et al., 2007;
Smye et al., 2011). Preservation and exhumation was enhanced by isothermal decompression,
eclogite facies sinistral shear zones and by strong kinematic partitioning between eclogites and
metasediments (Spear and Franz, 1986; Ratschbacher et al., 2004; Kurz et al., 2008; Neufeld et al.,
2008; Smye et al., 2011).
During collision of Adria and Europe nappes stacked onto each other, imbrications of the Venediger
duplex caused continental buckling (Schmid et al., 2013). Radioactive decay enhanced the heat
production in the Venediger duplex, the so called “Tauerncrystallization” (Sander 1911, 1921) lead
to greenschist- and amphibolite-facies (Barrovian) overprint of the entire dome, which is the
dominant metamorphic feature in the Tauern Window (Bousquet et al., 2008). Metamorphic
isograds (Fig. 1b) based on oxygen isotope thermometry in the western TW (Hoernes and
Friedrichsen, 1974) show an ENE-WSW elongate, concentric pattern with decreasing temperatures
from the core (630 °C) to the margins (405 °C). These isogrades strike sub-parallel to those deduced
by mapping of garnet (Höck, 1980; Droop, 1981; Selverstone 1985) and biotite occurrences, and
the anorthite component in plagioclase (Höck, 1980). The isogrades point to higher, amphibolite-
facies conditions in the center, also supported by kyanite-, staurolite-, and silimanite occurrences,
and lower, greenschist-facies conditions at the margins of the western sub-dome (Fig. 1b,
Grundmann and Morteani, 1985). The peak metamorphic area coincides with the hinge of the
Tauern Window that experienced a rather simple P-T evolution compared to the Lepontine dome
in the western Alps (Bousquet et al., 2008).
The timing of high-pressure metamorphism is controversially, some authors argue for Eocene
timing 42-36 Ma (e.g. Zimmermann et al., 1994; Ratschbacher et al., 2004, Kurz et al., 2008,
Smye et al., 2011 Fig. 1c) others for Oligocene timing (Glodny et al., 2005, Nagel et al., 2013).
Kurz et al. 2008 argue for eclogite-facies strike-slip shear at 32 Ma causing isotopic resetting,
which is temporarily in agreement with the oldest deformation ages of strike-slip shear zones in the
110
western Tauern Window (Glodny et al., 2008; Pollington and Baxter, 2010; Schneider et al., 2013).
The timing of Barrovian overprint is also debated, some authors argue for thermal climax at 35
Ma (Lambert, 1970; Selverstone, 1985; Ratschbacher et al., 2004) others at 32-27 Ma (Cliff et al.,
1985; Grundmann and Morteani, 1985; von Blanckenburg and Villa, 1988; von Blanckenburg et
al., 1989; Christensen et al., 1994; Inger and Cliff, 1994; Zimmermann et al., 1994; Glodny et al.,
2005; Gleißner et al., 2007). Several age data are available pointing to mineral formation (e.g. white
mica, garnet, amphibole) at 35 Ma (Lambert et al., 1970; Raith et al., 1987; von Blanckenburg
and Villa 1988, Christensen et al., 1994; Dingledey et al., 1997) at different localities in the ocean-
derived rocks, but the assignment of these age data to either high-pressure metamorphism or thermal
climax of Barrovian metamorphism remains difficult for several reasons (e.g. excess argon,
deformational resetting, formation vs. cooling ages). One phenomenological contradiction
originates from P-T-t evolutions in the gneiss domes of the western Alps, where the high-pressure
metamorphism can be temporarily differentiated from the thermal climax of the Barrovian
metamorphism (cf. Bousquet at al., 2008). This differentiation is less pronounced in the Eastern
Alps where the high-pressure metamorphism in the Eclogite zone might be contemporaneous to the
thermal climax of the Barrovian metamorphism in the Venediger duplex (Bousquet at al., 2008;
Glodny et al., 2008; Smye et al., 2011).
Timing of Dolomites indentation is based on deformation age data of faults from the Giudicarie
Belt in Oligo-Miocene (32-14 Ma) time. Deformation ages were obtained of thrust-related
mylonites and pseudotachylites along the North Giudicarie and Meran-Mauls faults, of pre-
kinematic zircons of sinistrally and dextrally sheared dykes along the Jaufen Fault predated
shearing, of pseudotachylites and syn-kinematic minerals of mylonites from the Jaufen Fault, and
of a pseudotachylite from the Passeier Fault (Müller et al., 2001). The longevity of sinistral shear
zones forming a restraining bend in the western Tauern Window (Schneider et al., 2014) yield also
Oligo-Miocene (33-7 Ma) deformation ages from syn-kinematic minerals (Glodny et al., 2008;
Pollington and Baxter, 2010; Schneider et al., 2013). The SEMP Fault as a main fault
accommodating the lateral extrusion was also active in Oligo-Miocene time (35-17 Ma)
constrained by syn-kinematic mineral ages (Urbanek et al., 2002; Cole et al., 2007) and syn-tectonic
sediments in the Hieflau basin (Peresson and Decker, 1997).
Oligo-Miocene cooling ages of the Tauern Window indicate high spatial variability for several
geochronometers. Rb/Sr white mica ages vary between 32 and 16 Ma (Satir, 1975; Satir and
Morteani, 1982; von Blanckenburg et al., 1989). K/Ar white mica ages vary between 32 and 14 Ma
(Satir, 1975; Raith et al., 1978; Thöni, 1980; Satir and Friedrichsen, 1986; von Blanckenburg et al.,
1989). K/Ar biotite ages vary between 22 and 14 Ma (Satir, 1975; Raith et al., 1978; von
Blanckenburg et al., 1989; Most, 2003). Rb/Sr biotite ages vary between 17 and 12 Ma (Satir, 1975;
Borsi et al., 1978; von Blanckenburg et al., 1989). ZFT ages vary between 22 and 6 Ma (Fügenschuh
et al., 1997; Most, 2003; Bertrand et al., 2014). AFT ages vary between 14 and 5 Ma (Grundmann
and Morteani, 1985; Fügenschuh et al., 1997; Most, 2003; Bertrand et al., 2014).
Cooling ages of the Tauern Window show isochron contours with similar trends as the metamorphic
isograds, i.e. an ENE to SE striking, elongate concentric cooling pattern (see compilations of Luth
and Willingshofer, 2008; Rosenberg and Berger, 2009; Bertrand et al., 2014). These data show that
the eastern sub-dome cooled below 375 °C earlier than the western sub-dome, the isochrons of the
eastern and western sub-domes follow a concentric, elongate trend, sub-parallel and symmetric
about the hinge of the dome, respectively. All chronometers, indicate younger ages towards the
hinge of the dome. Additionally, the western Tauern Window shows a westward younging trend of
cooling ages. (Luth and Willingshofer, 2008). Recent, more data-rich studies indicate that for the
low-temperature geochronometers (ZFT and AFT) a general westward younging trend affecting the
entire western sub-dome is controversial (Bertrand et al., 2014). Instead the authors point to a

111
marginally younging along the extensional shear zones, the Brenner Fault, at the western and
eastern ends of the Tauern Window.
The relationship between tectonic structures and age pattern for the higher temperature (>375 °C)
history of the dome is more difficult to constrain because the too sparse age data derived from
higher temperature geochronometers (e.g. Ar/Ar of amphibole ages, von Blanckenburg et al., 1989)
do not allow the construction of isochrons and had to be corrected for excess argon, significantly.
In addition, the interpretation of white mica ages is still controversial, recrystallization of white
micas can occur even below its closure temperature (K/Ar and Rb/Sr). Numerous K/Ar and Rb/Sr
white mica ages in the western sub-dome are younger than nearby K/Ar and Rb/Sr biotite ages,
although the closure temperature of the former is generally regarded as higher (Raith et al. 1978).
The map-scale restraining bend within the western sub-dome (Fig. 1a, Schneider et al., 2014) caused
axial-plane foliations and shear zones that consist of phengite, whereas the undeformed
Zentralgneiss is usually free of white mica (Schneider et al., 2013). Therefore, white mica cooling
ages should be interpreted with caution. Hence, the high temperature history between the thermal
climax (630 °C, Hoernes and Friedrichsen, 1974) and the closure temperature (375 °C) of the
K/Ar muscovite and 40Ar/39Ar biotite chronometers is only punctually constrained yet (von
Blanckenburg et al., 1989; Zimmermann et al., 1994; Ratschbacher et al., 2004; Kurz et al., 2008).
4.6 Sample description
Figure 2a: Field photo of the granodioritic Zentralgneiss batholiths shows the typical magmatic paragenesis
of qtz, K-fps, plg and bt also a small autolite is cognizable at the lower right corner. The rocks are not or
weakly foliated. Coin for scale. b: Field photo of the Zentralgneiss batholiths shows parts of the magmatic
inventory centimeter- to meter-scale xenolites are a common feature of the granodioritic gneisses. Hammer
for scale.
We collected eighteen gneiss-samples that were almost undeformed with respect to Alpine folding
and shearing (Figs. 2a and b) for U-Th-Pb dating of apatites (e.g., Thomson et al., 2012) and zircons
(e.g., Frei and Gerdes, 2009). Sixteen samples are orthogneisses, sample GT0803 is a paragneiss
and GT0804 is an aplitic dike crosscutting these paragneisses. The Barrovian overprint of the
Tauerncrystallization in these samples is manifested by amphibolite- to greenschist-facies mineral
reactions and high-grade deformation fabrics (Figs. 3a-l). Observed amphibolite-facies minerals are
staurolite, garnet, and epidote (Figs. 3a, h, i, j, k, and l). Common amphibolite- and greenschist-
facies mineral reactions are saussuritization of plagioclase, sericitization of K-feldspar, plagioclase
breakdown to clinozoizite, allanite breakdown to epidote, titanite formation along kinks and rims

112
of biotite, and biotite breakdown to chlorite (Figs. 3a, b, d, e, g, j, and l). Fabrics like chessboard
sub-grains in quartz (Kruhl, 1996), myrmekite formation along rims of K-feldspar, and core-and-
mantle-structures of K-feldspar (Figs. 3b, c, and f) point to high-grade deformation. Thin sections
show that the apatites are mostly located within biotites (Figs. 4a, b, d, g, h, j, k, and l), within the
matrix (Figs. 4c, e, and i) but also within plagioclase (Fig. 4f). In most cases the crystals are stubby
(Figs. 4a, b, c, d, e, f, g, h, i, j, k, and l) and rarely acicular (Figs. 4a and l). In some cases the
euhedral hexagonal shape of the crystals is cognizable (Figs. 4b, d, and i), but mostly apatites are
subhedral and round having axial ratios of 1:1 to 1:3 (Figs. 4a, b, c, d, e, f, g, h, j, k, and l) sometimes
forming clusters (Fig. 4c). Therefore, we argue apatites are magmatic minerals formed during
Variscan pluton emplacement.
Figure 3: Microscope photos showing different minerals and parageneses indicating amphibolite- and
greenschist-facies metamorphism of some samples. Cross-polarized light if not indicated differently. a: In the
center a stramineous staurolite grain having a poicilitic texture is shown. Also visible are sericitized K-
feldspar, muscovite, and biotite. b: Three larger and one smaller saussuritized plagioclase grains are shown
in the center. At the lower right and lower left margin large quartz grains show chess board structures. c:
Dynamically recrystallized K-feldspar forming large myrmekites d: Plane-polarized light. Aggregate of
biotite with titanite formed along its rims and fractures. e: Breakdown reaction of K-feldspar to sericite and

113
muscovite is shown. f: Large K-feldspar grains show sub-grain rotation recrystallization along their margins
forming core-and-mantle-structures. g: Plane-polarized light. Aggregate of biotite intercalated with chlorite,
also with titanite formed along its rims and fractures. h: Plane-polarized light. Aggregate of euhedral light
pink garnet grains are shown that have inclusions in their cores. i: Paragenesis of biotite, epidote, and garnet
is shown. j: Remnant of plagioclase grain that was replaced by clinozoizite is cognizable. k: Paragenesis of
biotite, epidote, and garnet is shown. l: Large magmatic allanite grain that is partly replaced by biotite and
epidote is shown.
Figure 4: Microscope photos showing plane-polarized light if not indicated differently, a: Rounded apatite
inclusion in biotite with titanite crystals at the rim. Note acicular crystal in the center. b, d, g, h, j, k, l.:
Stubby apatite crystals within biotite. a, j, l: Note acicular crystals. c: Aggregate of stubby apatite grains
within quartz matrix. e: Stubby apatite grains within quartz matrix. f: Crossed-polarized light. Stubby apatite
within K-feldspar crystal. i: Euhedral apatite crystal within titanite aggregate.

114
4.7 Methods
Apatites and zircons were extracted from fresh and crushed 2 to 4 kg gneiss-samples by means of
standard grain-size, magnetic and density separation. Heavy minerals from the grain-size fraction
50-125 µm were concentrated using two heavy liquids (bromoform and diiodomethane). Suitable
grains (zircons and apatites) for U-Th-Pb dating were cleaned, hand-picked, mounted in epoxy resin
and polished for laser treatment.
Uranium, thorium and lead isotope analyses of zircons were performed by laser ablation (LA) at
Central Analytical Facilities (CAF), Stellenbosch, South Africa using a New Wave ® 213 nm ultra-
violet (UV) phase laser connected to a ThermoFischer Scientific ® Element 2 high-resolution
sector-field inductively-coupled-plasma mass-spectrometer (HR-SF-ICP-MS). Uranium, thorium
and lead isotope analyses of apatites were carried out at the Goethe University of Frankfurt,
Germany (cf. Millionig et al., 2012). The LA-analyses were performed with a ThermoFischer
Scientific ® Element 2 SF-ICP-MS coupled to a Resolution M-50 (Resonetics ®) 193 nm ArF
excimer laser (ComprexPro 102, Coherent) system. Laser spot sizes for zircons, apatites, and for
standard grains were kept relatively constant in the range of 50-80 µm to enhance comparability of
the analyzed grains. Zircon data were acquired on five subsequent days and are listed in
supplementary table 1. Apatite data were acquired on three subsequent days and are listed in
supplementary table 2.
4.8 Theory and Calculations
We applied accurate and precise U–Pb age dating of zircons by LA-SF-ICP-MS following the
method of Frei and Gerdes (2009), which involves: matrix-matched external standardization by
standard-sample bracketing using the GJ-1 zircon reference standard (Jackson et al., 2004); careful
matching of ablation conditions between standards and samples (e.g., Tiepolo, 2003); application
of a purpose build low-volume ablation cell; use of He as carrier gas in order to stabilize the ablation
signal and suppress U-Pb fractionation during ablation (e.g., Jackson et al., 2004); correction of the
time-dependent within-analysis U-Pb fraction using the intercept method (e.g., Sylvester and
Ghaderi, 1997; Košler and Sylvester, 2003).
To verify accuracy and reproducibility of zircon analyses we performed twenty-five analyses of the
Plesovice standard, that yield a concordia age of 339.3±2.3 Ma, MSWD=0.057 and a
probability=0.81 of concordance. Zircon U-Pb data are majoritarian concordant, therefore the
metric applied in this study is the conventional 2D 206Pb/238U vs. 207Pb/235U Wetherill concordia
using ISOPLOT (Ludwig, 1998) and the uncertainties of 235U and 238U decay constants (Steiger and
Jäger, 1977) are acknowledged.
The raw data of the apatite analyses were corrected offline for background signal, common Pb,
laser-induced element fractionation, instrument mass discrimination, and time-dependent elemental
fractionation of Pb-U using an in-house MS Excel spreadsheet (Gerdes and Zeh, 2006, 2009). A
common-Pb correction based on the interference and background-corrected 204Pb signal and a
model Pb composition (Stacy and Kramers, 1975) was carried out. The 204Pb content for each ratio
was determined in three different ways. Wherever possible it was estimated by subtracting the
average mass 204 signal of the background, which mostly results from 204Hg in the carrier gas (ca.
1000–1500 cps), from the mass 204 signal during sample ablation. Due to the high Hg background
this method results in rather high detection limits (e.g., about 200 cps) for the 204Pb and yields
unsatisfactory results for analyses with lower radiogenic Pb (e.g., 206Pb <4×10⁵ cps). For analysis

115
with Th/U <0.5 we therefore used the 208Pb signal to determine the 204Pb content by subtracting the
radiogenic 208Pb, estimated from the Th signal, and the 206Pb/238U age of the analysis. For minerals
<100 Ma with high Th/U (>3) the 204Pb content is estimated from the non-radiogenic 207Pb,
calculated from the 206Pb/238U (or 208Pb/232Th) age and the 206Pb signal assuming concordance of the
U–Th–Pb system.
One in-house (Griedel) and two international (Plesovice and 91500) zircon age standards were
analyzed during apatite analyses. Fifteen analyses of the Pleisovice standard yield a concordia age
of 339.4±1.7 Ma, MSWD=2.0 (of concordance) and probability=0.16 (of concordance). Fifteen
analyses of the Griedel standard yield a concordia age of 26.21±0.29 Ma, MSWD=2.5 (of
concordance) and probability=0.11 (of concordance). Sixteen analyses of standard 91500 yield a
concordia age of 1061.9±4.1 Ma, MSWD=4.9 (of concordance) and probability=0.027 (of
concordance). Reported uncertainties (2σ) of the 206Pb/238U ratio during apatite analyses were
propagated by quadratic addition of the external reproducibility (2 SE; standard error) obtained
from the standard zircon GJ-1 (n=12; 2σ 2.8 %) during the analytical session and the within-run
precision of each analysis (2σ).
Apatite U-Pb data have commonly low U concentrations, in our samples too low to calculate proper 207Pb/235U ages and therefore concordia ages. Hence, the metric applied in this study is the TuffZirc
age extractor, an ISOPLOT algorithm (originally based on the TuffZirc algorithm by Ludwig and
Mundil, 2002). This algorithm implements a mathematically based approach on the loss and
inheritance of Pb to reject age values affected by isotopic disturbance. It calculates a median age of
the extracted age cluster that is characterized by a high-frequency age value, interpreted as true age,
and its relatively conservative and asymmetric error as age uncertainty (Ludwig, 2009). It is
suggested by Ludwig (2009) to include 10 or more grains within the process. This ISOPLOT
algorithm is also applicable for minerals that show age variability influenced by Pb-loss and age
resetting due to geological processes.
4.9 Results and Discussion
U-Pb results of zircons of sixteen samples are presented as eleven concordia age plots and five
discordia plots in (Figs. 5a-p). Zircon ages are shown as light grey, open error ellipses and the
calculated concordia ages are given as black and filled (dark gray) error ellipses. The sample names,
the numbers of analyzed zircons and the numbers of analyses used for concordia age calculation
are given in the upper left boxes of the diagrams (Figs. 5b, c, d, e, f, h, I, j, k, l, n, and o). The
concordia ages, the MSWD and probabilities of concordance are given in the lower right boxes.
The obtained discordiae were anchored to the origin since in all cases the discordia lower intercepts
coincide with it. The age of the discordia upper intercepts and the MSWD are given in the lower
right boxes (Figs. 5a, g, h, m, and p).
The concentrations of U (ppm), Pb (ppm), the element ratio Th/U, the percentage of common Pb
on the base of 206Pb, the isotopic ratios 207Pb/235U, 206Pb/238U, 207Pb/206Pb, their percentage 2σ errors,
the 207Pb/235U-206Pb/238U error correlation (rho), the 207Pb/206Pb ratio, its percentage error, and the 207Pb/235U, 206Pb/238U, 207Pb/206Pb ages plus their absolute 2σ error of each zircon analysis are given
in supplementary table 1. For each rock sample several analyses (14-25) were performed that are
given in one block and ordered in ascending 206Pb/238U age values. Those age values that were taken
into account for concordia age calculation are indicated with an asterisk (*) in the supplementary
table 2. For each sample block the calculated concordia age (or discordia upper intercept), its 2σ
error, the MSWD and the probability of concordance for the coherent group is given in the heading.
The 206Pb/238U and the 207Pb/235U ratios yield similar precisions of 4.7 % in average (1.3-26.0 %).
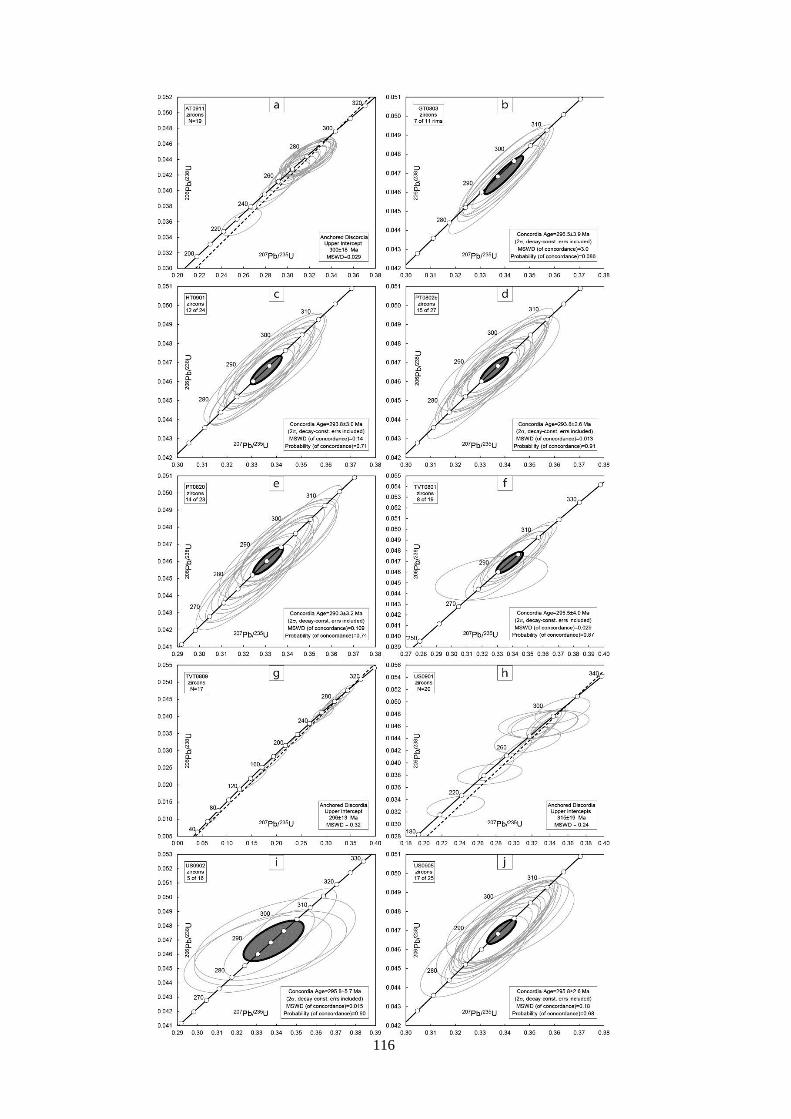
116

117
Figure 5a, g, h, m, p: 206Pb/238U vs. 207Pb/235U discordia plots of zircon analyses showing the upper intercept,
the lower intercept is anchored to the origin. Sample names and number of analyses are given in the upper
left boxes. Discordia ages of the upper intercept and the MSWD are given in the lower right boxes. b, c, d, e,
f, h, i, j, k, l, n, o: 206Pb/238U vs. 207Pb/235U concordia plots of zircon analyses, light grey and open circles
indicate single measurements and dark grey filled circles indicate concordia ages. In the upper left box the
names, the number of performed analyses, and the number of analyses used for the concordia plot is given.
Excluded from concordia plots are analyses of zircon cores, analyses yielding inherited concordant age
values or discordant age values. All the excluded analyses are listed in supplementary table 1. Concordia
age together with its 2σ errors, the MSWDs and probabilities of concordance are given in the lower right
boxes.
U-Pb results of apatites of sixteen samples are presented as median age plots in (Figs. 6a-p). The
vertical bars represent the 2σ errors of the apatite analyses ordered in descending age values. The
black colored analyses were taken into account for median age calculation. Light gray and dark
gray colored analyses were excluded by the ISOPLOT algorithm because of their large errors and
the low frequency of their age values, respectively. In two cases (TVT0801 and ZG0804) the
median age of the younger cluster was obtained in a second iterative stage. For both samples the
five oldest apparent ages of single analyses were excluded during age calculation. Note that for
sample PT0802b only the youngest age value was interpreted in the context of the two neighboring
samples TVT0809 and ZT0902 to be representative (Fig. 6e). Therefore it is marked with an asterisk
(*) in the text.

118
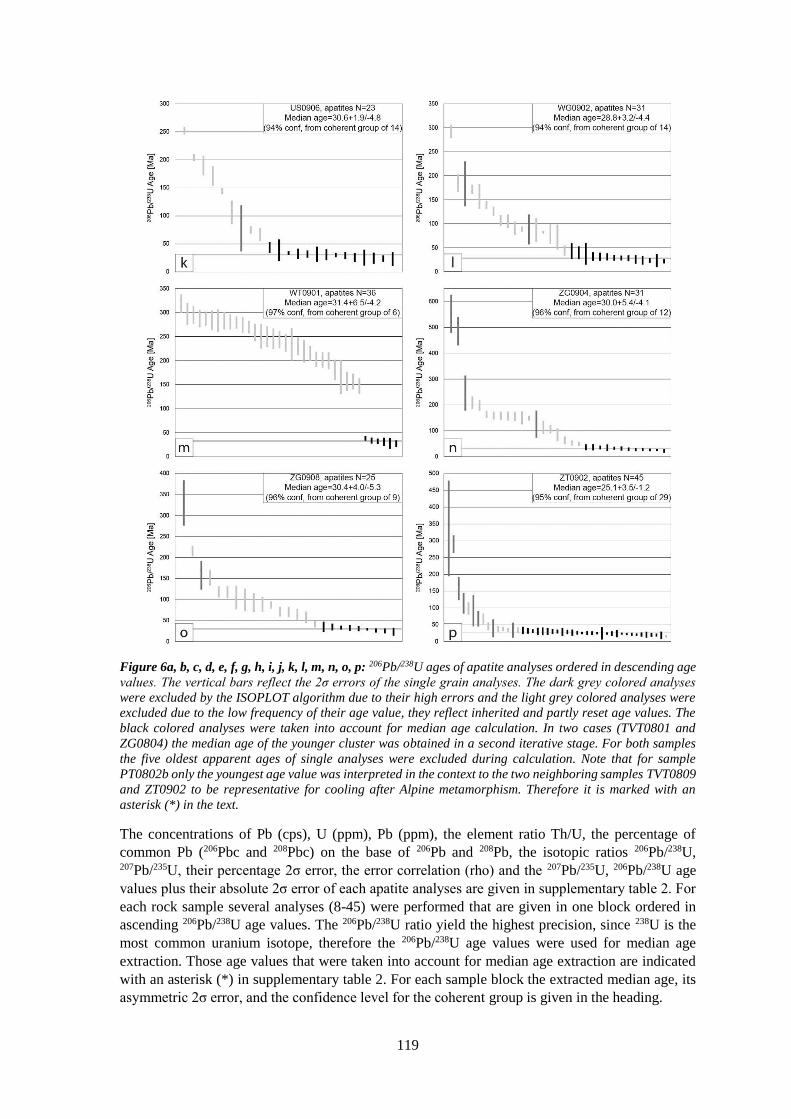
119
Figure 6a, b, c, d, e, f, g, h, i, j, k, l, m, n, o, p: 206Pb/238U ages of apatite analyses ordered in descending age
values. The vertical bars reflect the 2σ errors of the single grain analyses. The dark grey colored analyses
were excluded by the ISOPLOT algorithm due to their high errors and the light grey colored analyses were
excluded due to the low frequency of their age value, they reflect inherited and partly reset age values. The
black colored analyses were taken into account for median age calculation. In two cases (TVT0801 and
ZG0804) the median age of the younger cluster was obtained in a second iterative stage. For both samples
the five oldest apparent ages of single analyses were excluded during calculation. Note that for sample
PT0802b only the youngest age value was interpreted in the context to the two neighboring samples TVT0809
and ZT0902 to be representative for cooling after Alpine metamorphism. Therefore it is marked with an
asterisk (*) in the text.
The concentrations of Pb (cps), U (ppm), Pb (ppm), the element ratio Th/U, the percentage of
common Pb (206Pbc and 208Pbc) on the base of 206Pb and 208Pb, the isotopic ratios 206Pb/238U, 207Pb/235U, their percentage 2σ error, the error correlation (rho) and the 207Pb/235U, 206Pb/238U age
values plus their absolute 2σ error of each apatite analyses are given in supplementary table 2. For
each rock sample several analyses (8-45) were performed that are given in one block ordered in
ascending 206Pb/238U age values. The 206Pb/238U ratio yield the highest precision, since 238U is the
most common uranium isotope, therefore the 206Pb/238U age values were used for median age
extraction. Those age values that were taken into account for median age extraction are indicated
with an asterisk (*) in supplementary table 2. For each sample block the extracted median age, its
asymmetric 2σ error, and the confidence level for the coherent group is given in the heading.
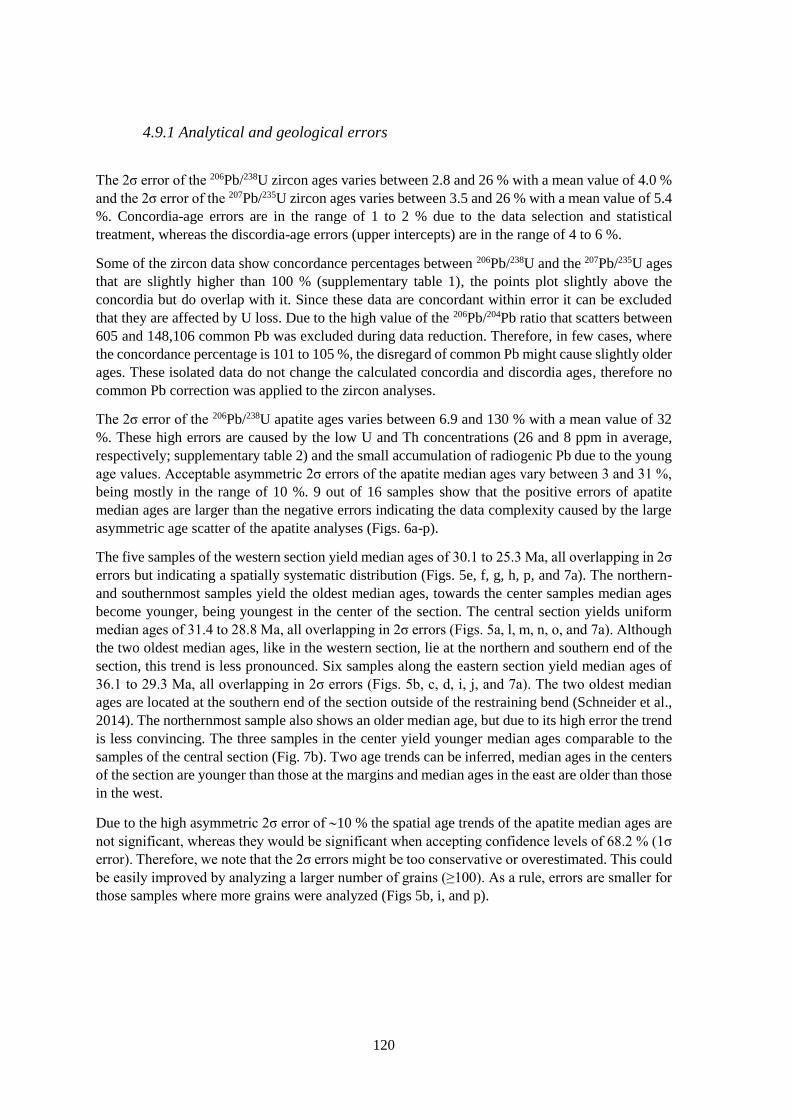
120
4.9.1 Analytical and geological errors
The 2σ error of the 206Pb/238U zircon ages varies between 2.8 and 26 % with a mean value of 4.0 %
and the 2σ error of the 207Pb/235U zircon ages varies between 3.5 and 26 % with a mean value of 5.4
%. Concordia-age errors are in the range of 1 to 2 % due to the data selection and statistical
treatment, whereas the discordia-age errors (upper intercepts) are in the range of 4 to 6 %.
Some of the zircon data show concordance percentages between 206Pb/238U and the 207Pb/235U ages
that are slightly higher than 100 % (supplementary table 1), the points plot slightly above the
concordia but do overlap with it. Since these data are concordant within error it can be excluded
that they are affected by U loss. Due to the high value of the 206Pb/204Pb ratio that scatters between
605 and 148,106 common Pb was excluded during data reduction. Therefore, in few cases, where
the concordance percentage is 101 to 105 %, the disregard of common Pb might cause slightly older
ages. These isolated data do not change the calculated concordia and discordia ages, therefore no
common Pb correction was applied to the zircon analyses.
The 2σ error of the 206Pb/238U apatite ages varies between 6.9 and 130 % with a mean value of 32
%. These high errors are caused by the low U and Th concentrations (26 and 8 ppm in average,
respectively; supplementary table 2) and the small accumulation of radiogenic Pb due to the young
age values. Acceptable asymmetric 2σ errors of the apatite median ages vary between 3 and 31 %,
being mostly in the range of 10 %. 9 out of 16 samples show that the positive errors of apatite
median ages are larger than the negative errors indicating the data complexity caused by the large
asymmetric age scatter of the apatite analyses (Figs. 6a-p).
The five samples of the western section yield median ages of 30.1 to 25.3 Ma, all overlapping in 2σ
errors but indicating a spatially systematic distribution (Figs. 5e, f, g, h, p, and 7a). The northern-
and southernmost samples yield the oldest median ages, towards the center samples median ages
become younger, being youngest in the center of the section. The central section yields uniform
median ages of 31.4 to 28.8 Ma, all overlapping in 2σ errors (Figs. 5a, l, m, n, o, and 7a). Although
the two oldest median ages, like in the western section, lie at the northern and southern end of the
section, this trend is less pronounced. Six samples along the eastern section yield median ages of
36.1 to 29.3 Ma, all overlapping in 2σ errors (Figs. 5b, c, d, i, j, and 7a). The two oldest median
ages are located at the southern end of the section outside of the restraining bend (Schneider et al.,
2014). The northernmost sample also shows an older median age, but due to its high error the trend
is less convincing. The three samples in the center yield younger median ages comparable to the
samples of the central section (Fig. 7b). Two age trends can be inferred, median ages in the centers
of the section are younger than those at the margins and median ages in the east are older than those
in the west.
Due to the high asymmetric 2σ error of 10 % the spatial age trends of the apatite median ages are
not significant, whereas they would be significant when accepting confidence levels of 68.2 % (1σ
error). Therefore, we note that the 2σ errors might be too conservative or overestimated. This could
be easily improved by analyzing a larger number of grains (≥100). As a rule, errors are smaller for
those samples where more grains were analyzed (Figs 5b, i, and p).
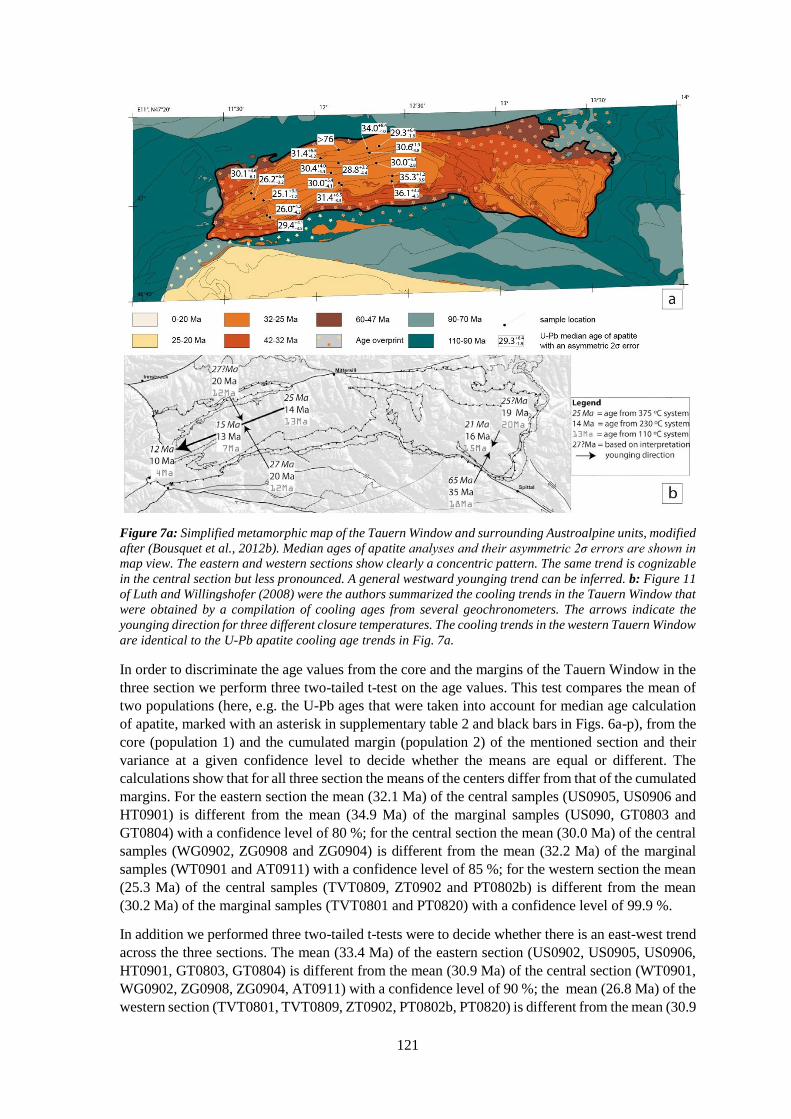
121
Figure 7a: Simplified metamorphic map of the Tauern Window and surrounding Austroalpine units, modified
after (Bousquet et al., 2012b). Median ages of apatite analyses and their asymmetric 2σ errors are shown in
map view. The eastern and western sections show clearly a concentric pattern. The same trend is cognizable
in the central section but less pronounced. A general westward younging trend can be inferred. b: Figure 11
of Luth and Willingshofer (2008) were the authors summarized the cooling trends in the Tauern Window that
were obtained by a compilation of cooling ages from several geochronometers. The arrows indicate the
younging direction for three different closure temperatures. The cooling trends in the western Tauern Window
are identical to the U-Pb apatite cooling age trends in Fig. 7a.
In order to discriminate the age values from the core and the margins of the Tauern Window in the
three section we perform three two-tailed t-test on the age values. This test compares the mean of
two populations (here, e.g. the U-Pb ages that were taken into account for median age calculation
of apatite, marked with an asterisk in supplementary table 2 and black bars in Figs. 6a-p), from the
core (population 1) and the cumulated margin (population 2) of the mentioned section and their
variance at a given confidence level to decide whether the means are equal or different. The
calculations show that for all three section the means of the centers differ from that of the cumulated
margins. For the eastern section the mean (32.1 Ma) of the central samples (US0905, US0906 and
HT0901) is different from the mean (34.9 Ma) of the marginal samples (US090, GT0803 and
GT0804) with a confidence level of 80 %; for the central section the mean (30.0 Ma) of the central
samples (WG0902, ZG0908 and ZG0904) is different from the mean (32.2 Ma) of the marginal
samples (WT0901 and AT0911) with a confidence level of 85 %; for the western section the mean
(25.3 Ma) of the central samples (TVT0809, ZT0902 and PT0802b) is different from the mean
(30.2 Ma) of the marginal samples (TVT0801 and PT0820) with a confidence level of 99.9 %.
In addition we performed three two-tailed t-tests were to decide whether there is an east-west trend
across the three sections. The mean (33.4 Ma) of the eastern section (US0902, US0905, US0906,
HT0901, GT0803, GT0804) is different from the mean (30.9 Ma) of the central section (WT0901,
WG0902, ZG0908, ZG0904, AT0911) with a confidence level of 90 %; the mean (26.8 Ma) of the
western section (TVT0801, TVT0809, ZT0902, PT0802b, PT0820) is different from the mean (30.9
122
Ma) of the central section with a confidence level of 99.9 %; the mean (33.4 Ma) of the eastern
section is different from the mean (26.8 Ma) of the western section with a confidence level of 99.999
%. Therefore we argue that both age trends, younging towards the centers of the sections and
younging towards the west across all sections are geological meaningful.
4.9.2 Formation or cooling ages
Generally radiometric ages can be interpreted as either formation age, dating the time of magmatic,
metamorphic, diagenetic, deformational or hydrothermal mineral formation, or as cooling age from
a magmatic or metamorphic event, dating the time when volume diffusion of radiogenic nuclides
out of the mineral has ceased mainly due to undercutting the closure temperature of a given isotope
system (Dodsen, 1973). Microscopic petrography, mineral chemistry and thermobarometric
estimations, with respect to the specific closure temperatures, are the main criterions for age
interpretations. The age spectra itself might also give some hints, but it depends also on the tectono-
metamorphic setting. Rather similar ages would be expected if the isotopic systematics were
controlled by a discrete formation or recrystallization event, although syn-kinematic mineral
formation might be possible over a prolonged interval if localized deformation is long-lasting (e.g.
Pollington and Baxter, 2011; Schneider et al., 2013). Fast cooling from high temperatures (e.g.
upper amphibolite-facies) would cause relatively uniform cooling ages. On the contrary, an
observed age spread from a single hand specimen or a restricted working area could point to the
progressive closing of an isotopic system, during slow cooling, which could be caused by the
development of diffusion gradients of radiogenic nuclides across the effective diffusion domain of
a given geochronometer (Willigers et al., 2001). In addition, if isotopic signatures of earlier events,
e.g. magmatic formation are still preserved, interpretation as cooling ages is likely.
The zircon concordia ages vary between 290.3 and 296.5 Ma, all overlapping within their 2σ errors,
and the zircon discordia (upper intercept) ages vary between 296 and 315 Ma, also overlapping
within their 2σ errors. In agreement to previous studies (Vavra and Hansen 1991; von Quadt, 1992;
Finger et al., 1993, 1997; Cesare et al., 2002; Veselá et al., 2008) presenting magmatic
crystallization ages from the Zentralgneiss batholith, the zircon U-Pb ages above are interpreted as
formation ages dating the emplacement of the Zentralgneiss batholith.
The paragneiss-sample GT0803 shows zircon cores having 206Pb/238U ages of 338 and 653 Ma
that are concordant (supplementary table 1). Two orthogneiss-samples US0905 and US0906 show
each one zircon core having 206Pb/238U ages of 529±20 and 581±23 Ma, respectively, that are
concordant (supplementary table 1). These few Carboniferous to Precambrian ages of the zircon
cores are interpreted to reflect detrital zircons from the country rocks of the Zentralgneiss or from
crustal fragments brought into the Zentralgneiss batholith by melt assimilation during pluton
emplacement. The aplitic dike-sample GT0804 shows scattering 206Pb/238U zircon ages between
239 and 595 Ma that are partly concordant and partly discordant, having a larger cluster of
concordant ages at 340 Ma (supplementary table 1). These ages might also reflect inherited ages
from geological events preceding emplacement of the Zentralgneiss or they represent isotopically
disturbed ages that we will not considered any further for the geological interpretation.
Apatite analyses scatter over a wide range and show two age clusters. A considerable number of
apatite analyses of each sample reflect a relatively uniform age cluster varying between 40-20 Ma.
These age values define a plateau as reliable ages and are separated from the older age cluster by
either a kink in the age-value trend (Figs. 6a, b, c, and k), by a logarithmic approximation (Pareto
distribution, Figs. 6f, j, l, n, o, and p), or by a discrete offset in age value (Fig. 6d, g, h, i, and m).
The ISOPLOT algorithm extracted median ages from this cluster due to their relatively low error
123
and their high frequency. The obtained apatite median ages of all samples vary between 36.1 and
25.3 Ma, whereat the majority (10 of 16 samples) vary between 29 and 31 Ma (Fig. 7a). Three
samples located in the center of the western section (ZT0902, PT0802b, and TVT0809) show
younger median ages of 25 and 26 Ma. Three samples (US0902, GT0803 and GT0804) of the
eastern section, located at the margins or even outside of the transpressive belt (Fig. 1a) of the
western Tauern Window, show older median ages of 34 and 36 Ma. The median ages overlap with
the time interval of Barrovian metamorphism in the Eastern Alps, suggesting a tectono-
metamorphic relation (Lambert, 1970; Cliff et al., 1985; Selverstone, 1985; Grundmann and
Morteani, 1985; von Blanckenburg and Villa, 1988; von Blanckenburg et al., 1989; Christensen et
al., 1994; Inger and Cliff, 1994; Ratschbacher et al., 2004). The thermal climax of the Barrovian
metamorphism of the analyzed samples was majoritarian >450 °C, therefore we interpret the
median ages as cooling ages. However, in all cases the median ages reflect the youngest age values
of the samples with relatively low scatter, no drop to younger age values from the median-age
plateau is observed (Figs. 6a-p), therefore we exclude that the apatites are affected by remarkable
Pb loss, either diffusional or due to fluid-mineral interactions, after isotopic resetting.
Samples WG0904 shows apatite age values that are >76 Ma, no median age could be extracted.
Apatite analyses of sample US0902 show a young age cluster but the asymmetric error of the
median age is maximal (31 %). Both these samples hail from locations where the thermal climax
of the Barrovian overprint is ≤450 °C, suggesting that during metamorphism the samples were not
heated completely through and therefore, not isotopically reset.
The second age cluster in all samples reveals age values scattering between 300-40 Ma. The time
span between pluton emplacement indicated by the zircon crystallization ages, and the younger age
cluster is often covered by several age values of the apatite analyses (Figs. 6a-p), that are interpreted
as partly reset. Four samples (HT0901, TVT0801, TVT0809 and WT0902) show a discrete jump
between the partly reset age values (≥108 Ma) and the younger age cluster. The oldest apatite age
values, if not excluded due to their high error by the ISOPLOT algorithm, overlap with the zircon
crystallization ages from the same samples. The preservation of the age signal of the magmatic
emplacement is an additional argument, that the apatites are affected by diffusional Pb loss during
Alpine Barrovian metamorphism (Tauerncrystallization) rather than by recrystallization. Otherwise
in case of metamorphic apatite growth this age signal would have been completely overprinted or
not manifested at all.
4.9.3 Comparison to other geochronometers
The spatial age trends of the obtained cooling ages show remarkable accordance with the spatial
age patterns of geochronometers (K/Ar biotite, Rb/Sr biotite, ZFT, and AFT) having lower closure
temperatures (see compilation of Luth and Willingshofer, 2008). For six out of eighteen samples
additional cooling ages (ZFT and/or AFT) were performed and are published elsewhere (Fig. 8,
Bertrand et al., 2014). We calculated cooling rates (Fig. 8) for these six sample assuming closure
temperatures of 450±50 °C for apatite U-Pb (Chamberlain and Bowring, 2000), of 230±20 °C for
ZFT and of 120±20 °C for AFT (Reiners and Brandon, 2006). The sample GT0804 from outside
the restraining bend yield a cooling rate of 10.4 K/Myr. The remaining five samples from the
western sub-dome yield uniform cooling rates between 14.4 and 16.3 K/Myr, with a mean cooling
rate of 15.2±1.5 K/Myr (2σ). Although the age spread of the U-Pb apatite cooling ages and the ZFT
ages is relatively large (> 5 Myr), the specific cooling trends are remarkable uniform. The linear
cooling trend overlaps with published cooling age ranges of biotite and muscovite (K/Ar and Rb/Sr,
Fig. 8). We estimated the thermal climax of the Barrovian metamorphism for each sample

124
graphically from the sample location (Fig. 1b, Bousquet et al., 2012b). Using the specific cooling
rates we calculated the specific timing of the thermal climax for each sample that resulted in an age
range between 38 to 34 Ma (Fig. 8).
Figure 8: Time-temperature diagram solid circles indicate the dated samples, open circles indicate the
calculated time range of the thermal climax t(Tmax), solid lines indicate the cooling rates of samples inside
the western Tauern Window, dashed line indicates apparent cooling rate of a sample from the central Tauern
Window, formulas show the specific cooling rates, colored semitransparent squares give the age ranges of
different geochronometers (errors are not included), assumed closure temperatures: muscovite Rb/Sr 500±50
°C (Jäger et al., 1996), muscovite K/Ar 400±30 °C (Kirschner et al., 1996), apatite U-Pb 450±50 °C
(Chamberlain and Bowring, 2000), biotite K/Ar 350±50 °C (Grove and Harrison, 1996); biotite Rb/Sr
300±50 °C (Jäger et al., 1969); ZFT 230±20 °C (Reiners and Brandon, 2006); AFT 120±20 °C (Reiners and
Brandon, 2006), dashed box indicates thermal climax based on Bousquet et al., 2012b and extrapolated age
data.
4.9.4 Tectono-metamorphic implications
The timing of the Tauerncrystallization compared to the timing of the high-pressure metamorphism
in the Eclogite Zone is one of the fundamental constrains for the tectono-metamorphic evolution of
the Eastern Alps. Smye et al. (2011) argued for fast exhumation of the Eclogite Zones within 10
Myr (38-28 Ma) enhanced by mantle heat input. Our results indicate that simultaneously the thermal
climax within the Tauern Window occurred at 38-34 Ma. A possible source for this heat input might
by slab breakoff (Davies and von Blanckenburg, 1994) at 35 Ma (Ratschbacher et al., 2004). The
Periadriatic plutonism is discussed to be a manifestation of this heat input and lower crustal melting,
recent U-Pb zircon ages point to magmatic emplacement at 42-30 Ma (Pomella et al., 2011 and
references therein) overlapping with the timing of the thermal climax estimated in this study.
The U-Pb apatite cooling age distribution in map view shows two spatial trends. Along each of the
three sections ages become younger towards the central area. This effect is most clearly seen in the
western and eastern sections. Additionally a lateral, westward younging trend also exists. The age
pattern in map view appears to be mirror-symmetric about a central plane striking ENE, but also
the westward younging trend correlates with the differential shortening of the Dolomites indenter
being highest in the west and decreasing eastward (Fig. 1a). This pattern resembles those of

125
geochronometers having lower closure temperatures (Fig. 7b, Luth and Willingshofer, 2008;
Bertrand et al., 2014). The orientation and the location of this symmetry plane is almost identical
to the hinge of the western Tauern dome (Schneider et al., 2014). Hence, erosional denudation after
upright folding seems to explain cooling below 450 °C, and this exhumation continued until the
partial annealing zone (PAZ) for AFT is attained (Bertrand et al., 2014).
Younging of cooling ages towards the hinge of an antiform has been observed in thermal (Bertrand,
2013) and thermo-mechanical (Batt and Braun, 1997) numerical models, but also in other, natural
examples of orogen-scale folding (Brandon et al., 1998). This age variation results from the
combined effect of higher uplift and erosion rates in the hinge region compared to the limbs and to
successive upward-bending of the isotherms in the hinge region during doming (Bertrand, 2013).
The first process reduces the time needed for material particles in the hinge region to reach the
Earth surface from the PAZ. The second process reduces the distance between the PAZ and the
Earth surface. However, the cooling rates of the western Tauern Window obtained in this study are
uniform, therefore the upward bending of the isotherms seems to dominate the exhumation process.
However, this interpretation is preliminary base on five specific cooling rates. As shown by
numerical, thermal models of a lithosphere undergoing shortening by folding and erosion, the oldest
ages at the margins of the fold can be taken to date the initiation of folding. This suggests that the
Tauern dome may have started to be exhumed already at 36-35 Ma, hence much earlier than
previously thought and possibly linked to the slab breakoff at 35 Ma (Ratschbacher et al., 2004).
All samples that are located within the restraining bend (Schneider et al., 2014) of the western sub-
dome yield Oligocene cooling ages, whereas two sample (GT0803 and GT0804) outside this
restraining bend yield Eocene cooling ages. This age jump in cooling ages across the restaining
bend might date the onset of Dolomites Indentation to 31-29 Ma that would be in agreement with
deformation age data of the Giudicarie Belt (Müller et al., 2001) of the restraining bend in the
western Tauern Window (Glodny et al., 2008; Pollington and Baxter, 2011; Schneider et al., 2013)
and the SEMP Fault accommodating lateral extrusion (Peresson and Decker, 1997; Urbanek et al.,
2002; Cole et al., 2007).
4.10 Conclusion
The ISOPLOT algorithm TuffZirc age extractor (Ludwig and Mundil, 2002) is a promising tool to
decipher crystallization, partly reset and cooling ages of apatites that underwent amphibolite-facies
metamorphism. Cooling ages dating the mid-range metamorphism (400-500 °C) can be obtained
from apatites due to their diffusion controlled Pb loss and their inert behavior to recrystallization.
Differentiation of the apatite age spectra into crystallization, partly reset and cooling ages was
supported by the U-Pb crystallization ages of zircons from the same samples and by combining the
apatite U-Pb age data to a large data set that existed already in the literature (compilation by Luth
and Willingshofer, 2008). Both age trends that were observed for cooling ages of geochronometers
having lower closure temperatures (Luth and Willingshofer, 2008) could be positively confirmed
by applying the unconventional U-Pb apatite geochronometer the first time in the Eastern Alps. In
future studies analyses of larger amounts of grains (≥100) might achieve a higher significance level
of the apatite median ages and therefore could better constrain the timing of isotopic closure.
Formation of the Tauern Window is largely related to doming caused by Adria-Europe collision
causing Barrovian metamorphism in the Zentralgneiss batholith. The timing of the thermal climax
in the Zentralgneiss batholith occurred at 38-34 Ma contemporaneously to high-pressure
metamorphism in the eclogite zone and might be related to mantle-derived heat influx after slab
breakoff at 35 Ma. Ongoing shortening and detached upper crust might have promoted Dolomites
126
Indentation causing strain localization such as the restaining bend in the western Tauern Window
and additional rock uplift starting at 33 Ma. The remarkable coincidence of U-Pb apatite ages with
the spatial distribution of geochronometers having lower closure temperatures indicate that from
31-29 Ma on the western Tauern Window cooled with a cooling rate of 15.2±1.5 K/Myr due to
erosional denudation. Samples that are outside of the restraining bend, cooled at 36-35 Ma, whereas
samples that are inside of the restaining bend started to cool at 31-29 Ma below 450 °C. Therefore
we argue that the onset of Dolomites indentation might have occurred at 31-29 Ma.
4.11 Acknowledgement
This study was funded by the DFG grant Ro2177/4. We acknowledge family Schwärzer, especially
M. Schwärzer, G. Fankhauser and R. Emberger for field support and accommodation. For helpful
discussions we thank A. Bertrand, S. Favaro, S. Garcia, M.R. Handy, L. Ratschbacher, D. Rutte,
and M. Tichomirowa.
4.12 References
Batt, G., Braun, J., 1997. On the thermomechanical evolution of compressional orogens. Geophys.
J. Int. 128, 364-382.
Bertrand, A., 2013 Chapter IV. 2D-thermal modelling of a structural and thermal dome based on a
natural example, the Tauern Window (Eastern Alps), 123–158.
Bertrand, A., Rosenberg, C., Fügenschuh B., 2014. Exhumation mechanisms of the Tauern Window
(Eastern Alps) inferred from Apatite and Zircon fission track thermochronology. Tectonics, (in
review).
Blanckenburg, F.v., Villa, I.M., 1988. Argon retentivity and argon excess in amphiboles from the
garbenschists of the Western Tauern Window, Eastern Alps. Contrib. Mineral. Petrol. 100, 1¬–11.
Blanckenburg, F.v., Villa, I.M., Baur, H., Morteani, G., Steiger, R.H., 1989. Time calibration of a
PT path from the Western Tauern Window, Eastern Alps: the problem of closure temperatures.
Contrib. Mineral. Petrol. 101, 1–11.
Borsi, S., Del Moro, A., Sassi, F.P., Zirpoli, G., 1973. Metamorphic evolution of the Austridic rocks
to the south of the Tauern Window (Eastern Alps): radiometric and geopetrologic data. Mem. Soc.
Geol. It., 12, 549– 571.
Borsi, S., Del Morro, A., Sassi, F., Zanferrari, A., Zirpoli, G. 1978. New geopetrologic and
radiometric data on the alpine history of the Austridic continental margin South of the Tauern
window (Eastern Alps). Memorie dell’Istituto della Regia Universitá di Padova 32, 1–20.
Bousquet, R., Oberhänsli, R., Goffé, B., Wiederkehr, M., Koller, F., Schmid, S. M., Martinotti, G.
2008. Metamorphism of metasediments at the scale of an orogen: a key to the Tertiary geodynamic
evolution of the Alps*. Geol. Soc. Spec. Pub. 298, 393–411.
Bousquet, R., Schmid, S.M., Zeilinger, G., Oberhänsli, R., Rosenberg, C.L., Molli, G., Robert, C.,
Wiederkehr, M., Rossi, P., 2012a, Tectonic framework of the Alps, CCGM/CGMW

127
Bousquet, R., Oberhänsli, R., Schmid, S.M., Berger, A., Wiederkehr, M., Robert, C., Rosenberg,
C.L., Koller, F., Molli, G., Zeilinger, G., 2012b, Metamorphic framework of the Alps,
CCGM/CGMW
Brandon M.T., Roden-Tice, M.K., Garver, J.I., 1998. Late Cenozoic exhumation of the Cascadia
accretionary wedge in the Olympic Mountains, northwest Washington State. GSA Bulletin 110,
985–1009.
Cesare, B., Rubatto, D., Hermann, J., Barzi, L., 2002. Evidence for Late Carboniferous subduction-
type magmatism in ultra-mafic cumulates of the SW Tauern window (Eastern Alps), Contrib.
Mineral. Petrol. 142, 449–464.
Chamberlain, K.R., Bowring, S.A., 2000. Apatite–feldspar U–Pb thermochronometer: a reliable,
mid-range (450°C), diffusion-controlled system. Chem. Geol. 172, 173–200.
Cherniak, D.J., Lanford, W.A., Ryerson, F.J., 1991. Lead diffusion in apatite and zircon using ion
implantation and Rutherford backscattering techniques. Geochim. Cosmochim. Acta 55, 1663–
1673.
Christensen, J.N., Selverstone, J., Rosenfeld, J.L., De Paolo, D.J., 1994. Correlation by Rb–Sr
geochronology of garnet growth histories from different structural levels within the Tauern
Window, Eastern Alps. Contrib. Mineral. Petrol. 118, 1–18.
Cliff, R.A., Droop, G.T.R., Rex, D.C., 1985. Alpine metamorphism in the south-east Tauern
Window, Austria: 2. Rates of heating, cooling and uplift. J. metamorphic Geol. 3, 403–415.
Cole, J., Hacker, B., Ratschbacher, L., Dolan, J., Seward, G., Frost, E., Frank, W., 2007. Localized
ductile shear below the seismogenic zone: Structural analysis of an exhumed strike‐slip fault,
Austrian Alps. J. Geophys Res. Sol. Ea., 1978–2012.
Corfu, F., Stone, D., 1998. The significance of titanite and apatite U-Pb ages: Constraints for the
post-magmatic thermal-hydrothermal evolution of a batholithic complex, Berens River area,
northwestern Superior Province, Canada. Geochim. Cosmochim. Acta, 62, 2979–2995.
Cornelius, H.P., 1940. Zur Auffassung der Ostalpen im Sinne der Deckenlehre. Z. Deutsch. Geol.
Ges. 92, 271–312.
Davies, H.J., Blanckenburg, F.v., 1995. Slab breakoff: a model of lithosphere detachment and its
test in the magmatism and deformation of collisional orogens. Earth Planet. Sci. Lett., 129, 85–102.
Dingledey, C., Dallmeyer, R.D., Koller, F., Massonne, H.-J., 1997. P-T-t history of the Lower
Austroalpine Nappe Complex in the “Tarntaler Berge” NW of the Tauern Window: implications
for the geotectonic evolution of the central Eastern Alps. Contrib. Mineral. Petr. 129, 1–19.
Dodson, M.H., 1973. Closure temperature in cooling geochronological and petrological systems.
Contrib. Mineral. Petr., 40, 259–274.
Droop. G.T.R., 1981. Alpine metamorphism of pelitic schists in the south-east Tauern Window.
Austria. Schweiz. Miner. Petrog. 61, 237–273.
Finger, F., Frasl, G., Haunschmid, B., Lettner, H., Quadt, A.v., Schermaier, A., Schindlmayr, A.O.,
Steyrer, H.P., 1993. The Zentralgneise of the Tauern Window (Eastern Alps): insight into an intra-
alpine Variscan Batholith. In J.F. von Raumer and F. Neubauer (Eds.): Pre-Mesozoic Geology in
the Alps, 375–391. Berlin: Springer.
128
Finger, F., Roberts, M.P., Haunschmid, B., Schermaier, A., Steyrer, H.P., 1997. Variscan granitoids
of central Europe: their typology, potential sources and tectonothermal relations. Mineralogy and
Petrology 61, 67–96.
Frei, D., Gerdes, A., 2009. Precise and accurate in situ U–Pb dating of zircon with high sample
throughput by automated LA-SF-ICP-MS. Chem. Geol. 261, 261–270.
Fügenschuh, B., Seward, D., Mancktelow, N.S., 1997. Exhumation in a convergent orogen: the
western Tauern Window. Terra Nova 9, 213–217.
Gerdes, A., Zeh, A., 2006. Combined U–Pb and Hf isotope LA-(MC)-ICP-MS analyses of detrital
zircons: comparison with SHRIMP and new constraints for the provenance and age of an Armorican
metasediment in Central Germany. Earth Planet. Sci. Lett. 249, 47–61.
Gerdes, A., Zeh, A., 2009. Zircon formation versus zircon alteration—new insights from combined
U–Pb and Lu–Hf in-situ La-ICP-MS analyses of Archean zircons from the Limpopo Belt. Chem.
Geol. 261, 228–241. doi:10.1016/j. chemgeo.2008.03.005.
Gleißner, P., Glodny, J., Franz, G., 2007. Rb–Sr isotopic dating of pseudomorphs after lawsonite
in metabasalts from the Glockner nappe, Tauern Window, Eastern Alps. Eur. J. Mineral. 19, 723–
734.
Glodny, J., Ring, U., Kühn, A., Gleissner, P., Franz, G., 2005. Crystallization and very rapid
exhumation of the youngest Alpine eclogites (Tauern Window, Eastern Alps) from Rb/Sr mineral
assemblage analysis. Contrib. Mineral. Petrol. 149, 699–712.
Glodny, J., Ring, U., Kühn, A., 2008. Coeval high-pressure metamorphism, thrusting, strike-slip,
and extensional shearing in the Tauern Window, Eastern Alps. Tectonics 27, TC4004.
http://dx.doi.org/10.1029/2007TC002193.
Grove, M., Harrison, M.T., 1996. Ar diffusion in Fe-rich biotite. Am. Mineral. 81, 940–951.
Grundmann, G., Morteani, G., 1985. The Young Uplift and Thermal History of the Central Eastern
Alps (Austria/Italy), Evidence from Apatite Fission Track Ages. Jb. Geol. B.-A. 128, 197–216.
Harrison, M.T., Cathlos, E.J., Montel, J.-M., 2002. U-Th-Pb Dating of Phosphate Minerals. Rev.
Minerl. Geochem. 48, 524–558.
Hoernes, S., Friedrichsen, H., 1974. Oxygen isotope studies on metamorphic rocks of the Western
Hohe Tauern area (Austria). Schweiz. Mineral. Petrogr. 54, 769–788.
Höche. T., Moisescu, C, Avramov, I., Rüssel, C., 2001. Microstructures of SiO2-Al2O3-CaO-P2O5-
K2O-F- Glass Ceramics. 1. Needlelike versus Isometric Morphology of Apatite Crystalls. Chem.
Mater. 13, 1312–1319.
Höck, V., 1980. Distribution maps of minerals of the Alpine metamorphism in the Penninic Tauern
window, Austria. Mitt. Österr. Geol. Ges. 71/72, 119–127.
Inger, S., Cliff, R.A., 1994. Timing of metamorphism in the Tauern Window, Eastern Alps: Rb-Sr
ages and fabric formation. J. metamorphic Geol. 12, 695–707.
Jackson, S., Pearson, N.J., Griffin, W.L., Belousova, E.A., 2004. The application of laser ablation
– inductively coupled plasma – mass spectrometry to in situ U–Pb zircon geochronology. Chem.
Geol. 211,
129
Jäger, E., Karl, F., Schmidegg, O., 1969. Rubidium-Strontium-Altersbestimmungen an Biotit-
Muskowit-Granitgneisen (Typus Augen- und Flasergneise) aus dem nördlichen
Großvenedigerbereich (Hohe Tauern). Miner. Petrol., 13, 251–272.
Kennedy, A.K., Dante, K., 1997. SHRIMP measurement of U–Th–Pb ages of apatite from the
Acropolis find ore prospect, South Australia. Joint Annual Meeting of the Geological Association
of Canada and the Mineralogical Association of Canada (GAC-MAC), Abstract, A-77.
Kirschner, D., Cosca, M., Masson, H. Hunziker, J. 1996. Staircase 40Ar/39Ar spectra of fine-grained
white mica; timing and duration of deformation and empirical constraints on argon diffusion.
Geology 24(8), 747–750.
Košler, J., Sylvester, P.J., 2003. Present trends and the future of zircon in geochronology: laser
ablation ICPMS. Rev. Mineral. Geochem. 53, 243–275.
Krogstad, E.J., Walker, R.J., 1994. High closure temperatures of the U–Pb system in large apatites
from the Tin Mountain Pegmatite, Black Hills, South Dakota, USA. Geochim. Cosmochim. Acta
58, 3845–3853.
Kruhl, J.H., 1996. Prism- and basal-plane parallel subgrain boundaries in quartz: a microstructural
geothermobarometer, J. metamorphic Geol. 14, 581–589.
Kurz, W., Handler, R., Bertoldi, C., 2008. Tracing the exhumation of the Eclogite Zone (Tauern
Window, Easter Alps) by 40Ar/39Ar dating of white mica in eclogites. Swiss J. Geosci. 3, 1–16.
Laubscher, H., 1996. Shallow and deep rotations in the Miocene Alps. Tectonics, 15, 1022–1035.
Lambert, S. 1970. A Potassium-Argon Study of the Margin of the Tauernfenster at Döllach, Austria.
Eclogae Geol. Helv. 63, 197–205.
Ludwig, K.R., 1998. On the treatment of concordant uranium-lead ages: Geochim. Cosmochim.
Acta 62, 665–676.
Ludwig, K.R., 2009. User’s Manual for ISOPLOT 3.70 A Geochronological Toolkit for Microsoft
Excel, Berkeley Geochronology Center Special Publication No. 4, 1-78.
Ludwig K.R., Mundil, R., 2002. Extracting reliable U-Pb ages and errors from complex populations
of zircons from Phanerozoic tuffs. J. Conf. Abstr. 12th Goldschmidt Conf. 2002.
Luth, S.W., Willingshofer, E., 2008. Mapping of the post-collisional cooling history of the Eastern
Alps. Swiss J. Geosci. 101, 207–223.
Miller, C., Konzett, J., Tiepolo, M., Armstrong, R., Thöni, M., 2007. Jadeite-gneiss from the
Eclogite Zone, Tauern Window, Eastern Alps, Austria: metamorphic, geochemical and zircon
record of a sedimentary protolith. Lithos 93, 68–88.
Millionig, L.J., Gerdes, A., Groat, L.A., 2012. The effect of amphibolite facies metamorphism on
the U–Th–Pb geochronology of accessory minerals from meta-carbonatites and associated meta-
alkaline rocks. Chem. Geol. 353, 199–209.
Most, P., 2003. Late Alpine Cooling Histories of Tectonic Blocks along the Central Part of the
Transalp-Traverse (Inntal–Gadertal): Constraints from Geochronology. Ph.D.-thesis. Eberhardt-
Karls-Universität Tübingen, 1–151.
Müller, W., Prosser, G., Mancktelow, N.S., Villa, I.M., Kelley, S.P., Viola, G., Oberli, F., 2001.
Geochronological constraints on the evolution of the Periadriatic Fault System (Alps). Int. J. Earth
Sci., 90, 623–653.

130
Nagel, T.J., Herwartz, D., Rexroth, S., Münker, C., Froitzheim, N., Kurz, W., 2013. Lu–Hf dating,
petrography, and tectonic implications of the youngest Alpine eclogites (Tauern Window, Austria).
Lithos 170–171, 179–190.
Neufeld, K., Ring, U., Heidelbach, F., Dietrich, S., Neuser, R.D., 2008. Omphacite textures in
eclogites of the Tauern Window: implications for the exhumation of the Eclogite Zone, Eastern
Alps. J. Struct. Geol., 30, 976–992.
Oosthuyzen, E.J., Burger, A.J., 1973. The suitability of apatite as an age indicator by the uranium–
lead isotope method. Earth Planet. Sci. Lett. 18, 29–36.
Peresson, H., Decker, K., 1997. The Tertiary dynamics of the northern Eastern Alps (Austria):
changing palaeostresses in a collisional plate boundary. Tectonophysics, 272, 125–157.
Piccoli, P.M., Candela, P.A., 1994. Apatite in felsic rocks; a model for the estimation of initial
halogen concentrations in the Bishop Tuff (Long Valley) and Tuolumne Intrusive Suite (Sierra
Nevada Batholith) magmas. Am. J. Sci. 294, 92–135.
Piccoli, P.M., Candela, P.A., 2002. Apatite in Igneous Systems. Rev. Minerl. Geochem. 48, 255–
292.
Pollington, A.D., Baxter, E.F., 2010. High resolution Sm–Nd garnet geochronology reveals the
uneven pace of tectonometamorphic processes. Earth Planet. Sci. Lett. 293, 63–71.
Quadt, A.v., 1992. U-Pb zircon and Sm-Nd geochronology of mafic and ultramafic rocks from the
central part of the Tauern Window (eastern Alps). Contrib. Mineral. Petrol 110, 57–67.
Raith, M., Raase, P., Kreuzer, P., Müller, P. 1978. The age of the Alpidic metamorphism in the
Western Tauern Window, Austrian Alps, according to radiometric dating In: Cloos, H., Roeder, D.
& Schmid, K. (Eds): Alps, Apennines, Hellenides, Inter-Union Commission on Geodynamics, 140–
148.
Ratschbacher, L., Frisch, W., Linzer, H.-G., Merle, O., 1991. Lateral extrusion in the Eastern Alps,
Part2: structural analysis. Tectonics 10, 257–271.
Ratschbacher, L., Dingeldey, C., Miller, C., Hacker, B.R., McWilliams, M.O., 2004. Formation,
subduction, and exhumation of Penninic oceanic crust in the Eastern Alps: time constraints from 40Ar/39Ar geochronology. Tectonophysics 394, 155–170.
Reiners, P.W., Brandon, M.T., 2006. Using thermochronology to understand orogenic erosion.
Annu. Rev. Earth Planet. Sci. 34, 419–66.
Rosenberg, C.L., Berger, A., 2009. On the causes and modes of exhumation and lateral growth of
the Alps. Tectonics 28, pp. 1–16 http://dx.doi.org/10.1029/2008TC002442.
Rosenberg, C.L., Brun, J.-P., Gapais, D., 2004. An indentation model of the Eastern Alps and the
origin of the Tauern Window. Geology 32, 997–1000.
Sander, B., 1911. Geologische Studien am Westende der Hohen Tauern (1. Bericht) Denkschr.
Akad. Wiss. Wien, math. nat. Kl., 82, 257–319.
Sander, B., 1921 Geologische Studien am Westende der Hohen Tauern (2. Bericht) Jahrb. Geol.
St.-A. Wien, 70, 273–296.
Sano, Y., Oyama, T., Terada, K., Hidaka, H., 1999. Ion micro-probe U–Pb dating of apatite. Chem.
Geol. 153, 249–258.
131
Satir, M., 1975. Die Entwicklungsgeschichte der westlichen Hohen Tauern und der südlichen
Ötztalmasse auf Grund radiometrischer Altersbestimmungen. PhD.-thesis, Società cooperativa
tipografica, Padova, 1–84.
Satir, M., Friedrichsen, H., 1986. The origin and evolution of the Menderes Massif, W-Turkey: a
rubidium/strontium and oxygen isotope study. Int. J. Earth Sci. 75, 703–714.
Satir, M., Morteani, G., 1982. Petrological study and radiometric age determination of the
migmatites in the Penninic rocks of the Zillertaler Alpen (Tyrol/Austria). Tscher. Miner. Petrog.
30, 59-75.
Scharf, A., Handy, M.R., Favaro, S., Schmid, S.M., Bertrand, A., 2013. Modes of orogen-parallel
stretching and extensional exhumation in response to microplate indentation and roll-back
subduction (Tauern Window, Eastern Alps). Int. J. Earth Sci. 106, 1627–1654.
Schmid, S.M., Scharf, A., Handy, M.R., Rosenberg, C.L., 2013. The Tauern Window (Eastern Alps,
Austria): a new tectonic map, with cross-sections and a tectonometamorphic synthesis. Swiss J.
Geosci. 106, 1–32.
Schneider, S., Hammerschmidt, K., Rosenberg, C.L., 2013. Dating the longevity of ductile shear
zones: Insight from 40Ar/39Ar in situ analyses. Earth Planet. Sci. Lett. 369, 43–58.
Schneider, S., Rosenberg, C.L., Scharf, A., Hammerschmidt, K., 2014. Translation of indentation
into lateral extrusion across a restraining bend: The western Tauern Window, Eastern Alps,
Tectonics (in review).
Selverstone, J., 1985. Petrologic constraints on imbrication, metamorphism, and uplift in the SW
Tauern Window, Eastern Alps. Tectonics, 4, 687–704.
Smye, A.J., Bickle, M.J., Holland, T.J., Parrish, R.R., Condon, D.J., 2011. Rapid formation and
exhumation of the youngest Alpine eclogites: a thermal conundrum to Barrovian metamorphism.
Earth Planet. Sci. Lett., 306, 193–204.
Spear, F. S., Franz, G., 1986. PT evolution of metasediments from the Eclogite Zone, south-central
Tauern Window, Austria. Lithos, 19, 219–234.
Stacey, J.S., Kramers, J.D., 1975. Approximation of terrestrial lead isotope evolution by a two-
stage model. Earth Planet. Sci. Lett. 26, 207–221.
Steiger, R., Jäger, E., 1977. Subcommission on geochronology: convention on the use of decay
constants in geo-and cosmochronology. Earth Planet. Sci. Lett., 36, 359–362.
Sylvester, P.J., Ghaderi, M., 1997. Trace element analysis of scheelite by excimer laser ablation
inductively coupled plasma mass spectrometry (ELA-ICP-MS) using a synthetic glass standard.
Chem. Geol. 141, 49–65.
Thomson, S.N., Gehrels, G.E., Ruiz, J., Buchwaldt. R., 2012. Routine low-damage apatite U-Pb
dating using laser ablation–multicollector–ICPMS, Geochem. Geophy. Geosy. 13, Q0AA21,
doi:10.1029/2011GC003928.
Thöni, M., 1980. Distribution of pre-Alpine and Alpine metamorphism of the southern Ötztal Mass
and the Scarl Unit, based on K/Ar age determinations. Mitt. österr. geol. G., 71, 139–165.
Tiepolo, M., 2003. In situ Pb geochronology of zircon with laser ablation-inductively coupled
plasma-sector field mass spectrometry. Chem. Geol. 199, 159–177.

132
Urbanek, C., Frank, W., Grasemann, B., Decker, K., 2002. Eoalpine Versus Tertiary Deformation:
Dating of Heterogeneously Partitioned Strain (Tauern Window, Austria).PanGeo Austria 2002,
abstract volume.
Vavra, G., Hansen, B.T., 1991. Cathodoluminescence studies and U/Pb dating of zircons in pre-
Mesozoic gneisses of the Tauern Window implications for the Penninic basement evolution. Int. J.
Earth Sci. 80, 703–715.
Veselá, P., Söllner, F., Finger, F., Gerdes, A., 2010. Magmato-sedimentary Carboniferous to
Jurassic evolution of the western Tauern window, Eastern Alps (constraints from U-Pb zircon
dating and geochemistry). Int. J. Earth Sci. 100, 993–1027.
Villa, I.M. 1998. Isotopic closure. Terra Nova 10, 42–47.
White, W.M., 2005. Geochemistry. Chapter 7: Trace Elements in Igneous Processes. 1–55.
Willigers, B.J.A., Krogstad, E.J., Wijbrans, J.R., 2001. Comparison of thermochronometers in a
slowly cooled granulite terrain: Nagssugtoqidian Orogen, West Greenland. J. Petrol. 42, 1729 –
1749.
Willigers, B.J.A., Baker, J.A., Krogstad, E.J., Peate, D.W., 2002. Precise and accurate in situ Pb-
Pb dating of apatite, monazite, and sphene by laser ablation multiple-collector ICP-MS. Geochim.
Cosmochi. Acta, 66, 1051–1066.
Wolf, M.B., London, D. 1995. Incongruent dissolution of REE-and Sr-rich apatite in peraluminous
granitic liquids: Differential apatite, monazite, and xenotime solubilities during anatexis. Am.
Mineral. 80, 765-775.
Wyllie, P.J., Cox, K.G., Biggar, G.M., 1962. The habit of apatite in synthetic systems and igneous
rocks. J. Petrol. 3, 238–243.
Zimmermann, R., Hammerschmidt, K., Franz, G., 1994. Eocene high pressure metamorphism in
the Penninic units of the Tauern Window (Eastern Alps): evidence from 40Ar−39Ar dating and
petrological investigations. Contrib. Mineral. Petrol. 117, 175–186.

133
4.13 Supplementary material
Table 1: LA-ICP-MS results of zircons
Conc.
Analysis U (ppm)a
Pb (ppm)a
Th/Ua 207
Pb/235
Ub c 206
Pb/238
Ub c
rhod 207
Pb/206
Pbe c 207
Pb/235
U206
Pb/238
U207
Pb/206
Pb (%)
zcn 08 176 6.4 0.29 0.26 5.7 0.036 3.9 0.68 0.052 4.2 233 13 227.4 8.8 293 48 97
zcn 15 560 22 0.35 0.29 5.0 0.040 4.5 0.89 0.053 2.3 258 13 252 11 312 26 81
zcn 07 266 11 0.44 0.29 4.4 0.040 3.5 0.78 0.052 2.8 258 11 254.4 8.8 295 32 98
zcn 20 301 14 0.60 0.30 4.9 0.042 3.7 0.76 0.052 3.1 268 13 264.3 9.8 298 36 89
zcn 16 168 7.3 0.39 0.30 5.1 0.042 4.1 0.80 0.052 3.0 268 14 265 11 288 34 92
zcn 22 211 9.3 0.43 0.31 4.9 0.043 3.5 0.72 0.052 3.4 272 13 268.9 9.5 301 39 89
zcn 14 292 13 0.41 0.31 5.4 0.043 4.0 0.73 0.052 3.7 274 15 270 11 301 42 90
zcn 24 245 11 0.53 0.31 4.5 0.043 3.7 0.81 0.052 2.6 275 12 272 10 300 30 91
zcn 21 264 12 0.47 0.31 4.6 0.043 3.7 0.80 0.052 2.8 276 13 274 10 292 31 94
zcn 11 198 9.0 0.48 0.32 6.2 0.044 3.7 0.59 0.053 5.1 279 17 276 10 309 58 89
zcn 23 246 12 0.62 0.32 4.8 0.044 3.6 0.76 0.052 3.1 280 13 277 10 301 35 92
zcn 13 113 5.2 0.51 0.32 6.1 0.044 4.2 0.68 0.052 4.5 280 17 278 12 299 51 93
zcn 29 191 8.7 0.41 0.32 5.8 0.044 4.0 0.69 0.052 4.2 282 16 279 11 305 48 91
zcn 25 247 11 0.52 0.32 5.3 0.044 4.0 0.76 0.052 3.4 281 15 279 11 297 39 94
zcn 27 95 4.3 0.39 0.32 6.4 0.044 4.3 0.67 0.052 4.7 282 18 279 12 303 54 92
zcn 28 190 9.0 0.55 0.32 5.8 0.044 3.9 0.68 0.052 4.3 283 16 280 11 301 49 93
zcn 12 307 14 0.33 0.32 5.1 0.044 3.9 0.77 0.052 3.3 283 15 281 11 305 38 92
zcn 10 203 9.0 0.31 0.32 5.4 0.045 3.9 0.72 0.052 3.8 284 15 282 11 301 43 99
zcn 26 204 9.2 0.37 0.32 5.1 0.045 4.1 0.79 0.052 3.1 283 15 282 11 295 36 95
zcn 09 260 15 0.43 0.42 4.8 0.055 3.9 0.81 0.056 2.8 357 17 344 13 442 31 96
zcn 20, core 1677 52 0.86 0.23 4.4 0.032 4.3 0.96 0.052 1.3 212.9 9.5 205.1 8.7 301 15 68
zcn 36, rim 1221 50 0.85 0.32 6.1 0.043 3.7 0.61 0.053 4.9 279 17 274 10 320 55 86
zcn 07, rim 1152 48 0.11 0.32 4.0 0.044 3.4 0.86 0.054 2.0 285 11 276.5 9.5 353 23 97
zcn 16, rim 1666 69 0.35 0.32 4.1 0.044 3.7 0.91 0.052 1.7 280 11 277 10 306 19 90
zcn 12, rim 1194 50 0.68 0.33 3.8 0.045 3.5 0.92 0.053 1.5 289 11 287 10 311 17 92
zcn 10*, rim 1481 64 0.66 0.34 4.5 0.046 4.1 0.92 0.053 1.7 294 13 291 12 318 19 99
zcn 27*, rim 1011 44 1.3 0.34 4.2 0.047 3.9 0.92 0.053 1.7 296 13 294 11 311 19 95
zcn 14*, rim 1215 53 1.7 0.34 4.0 0.047 3.6 0.89 0.053 1.8 297 12 295 11 312 21 94
zcn 34*, rim 1465 64 1.0 0.34 3.8 0.047 3.6 0.96 0.052 1.1 296 11 295 11 304 13 97
zcn 25*, rim 934 41 0.74 0.34 4.6 0.047 4.1 0.90 0.052 2.0 298 14 297 12 301 22 99
zcn 23*, rim 1619 72 0.49 0.34 3.7 0.047 3.6 0.95 0.053 1.1 299 11 297 11 312 13 95
zcn 21*, rim 1123 49 0.80 0.34 3.8 0.047 3.4 0.90 0.052 1.7 298 11 298 10 292 19 102
zcn 29, rim 1124 50 1.1 0.35 4.1 0.048 3.5 0.86 0.053 2.1 305 12 302 11 328 24 92
zcn 09, core 283 17 0.42 0.40 4.2 0.054 3.6 0.85 0.054 2.2 341 14 338 12 364 25 99
zcn 24, core 902 62 2.5 0.52 4.1 0.067 3.7 0.90 0.056 1.8 424 17 417 15 459 20 91
zcn 26, core 511 39 0.88 0.55 4.0 0.071 3.5 0.87 0.056 2.0 445 18 444 16 450 22 99
zcn 22, core 429 30 2.1 0.58 4.8 0.074 3.7 0.76 0.056 3.1 463 22 462 17 468 35 99
zcn 08, core 368 28 0.60 0.59 4.2 0.076 3.6 0.87 0.056 2.1 469 20 474 17 448 23 101
zcn 15, core 376 29 1.2 0.61 4.5 0.077 3.9 0.87 0.057 2.2 481 21 480 19 483 25 99
zcn 13, core 264 22 0.97 0.73 4.9 0.082 4.3 0.87 0.064 2.4 555 27 507 22 755 25 67
zcn 37, core 327 28 1.3 0.72 4.9 0.089 3.8 0.77 0.059 3.1 551 27 547 21 565 33 97
zcn 11, core 300 32 0.99 0.76 4.4 0.094 3.7 0.85 0.059 2.3 577 25 577 21 575 25 100
zcn 28, core 379 42 0.29 0.80 4.3 0.096 3.7 0.86 0.061 2.2 598 26 591 22 626 23 94
zcn 33, core 119 13 0.86 0.90 5.8 0.11 3.5 0.59 0.061 4.7 652 38 651 22 655 50 99
zcn 35, core 463 55 0.35 0.91 5.2 0.11 3.9 0.76 0.062 3.3 658 34 653 26 673 36 97
zcn 035 1781 64 0.043 0.27 6.3 0.038 4.7 0.74 0.052 4.2 244 15 239 11 293 48 81
zcn 008 406 18 0.47 0.31 4.8 0.044 3.9 0.82 0.052 2.8 278 13 275 11 300 32 92
zcn 029 980 50 0.70 0.33 8.3 0.045 4.2 0.51 0.052 7.1 288 24 286 12 301 81 95
zcn 028 312 16 0.13 0.42 5.3 0.052 4.2 0.81 0.059 3.1 358 19 329 14 552 34 60
zcn 033 650 34 0.030 0.41 7.8 0.055 4.6 0.59 0.054 6.3 349 27 347 16 357 71 97
zcn 020 1097 62 0.17 0.45 5.0 0.060 4.0 0.79 0.054 3.1 375 19 375 15 375 35 100
zcn 007 365 22 0.20 0.50 5.2 0.062 4.1 0.78 0.058 3.2 410 21 387 16 546 35 71
zcn 024 365 25 0.36 0.52 5.4 0.067 4.4 0.83 0.056 3.0 423 23 415 18 465 33 89
zcn 015 642 41 0.14 0.55 4.3 0.068 3.9 0.93 0.059 1.6 444 19 423 17 552 17 77
zcn 013 488 33 0.22 0.52 4.5 0.068 4.2 0.93 0.056 1.6 428 19 426 18 437 18 97
zcn 027 404 28 0.27 0.53 5.0 0.069 4.1 0.82 0.056 2.9 431 22 428 18 446 32 96
zcn 021 560 36 0.084 0.52 5.0 0.069 4.5 0.90 0.055 2.2 428 22 430 19 415 25 103
zcn 016 564 37 0.14 0.54 4.7 0.070 4.3 0.91 0.056 2.0 437 21 434 18 454 22 96
zcn 012 432 29 0.13 0.53 4.4 0.070 3.9 0.90 0.055 1.9 434 19 434 17 430 22 101
zcn 014 209 15 0.30 0.55 5.0 0.070 4.1 0.83 0.057 2.8 444 22 435 18 493 31 88
zcn 011 376 27 0.33 0.53 5.1 0.070 4.3 0.85 0.055 2.7 432 22 437 19 407 30 108
zcn 009 177 13 0.50 0.54 5.8 0.070 4.2 0.73 0.056 3.9 440 25 438 18 452 44 97
zcn 010 998 82 1.1 0.59 4.6 0.072 3.9 0.85 0.060 2.4 472 22 445 17 601 26 74
zcn 038 346 25 0.37 0.55 5.2 0.072 4.2 0.81 0.056 3.1 447 23 449 19 438 34 102
zcn 023 282 21 0.21 0.61 8.7 0.073 4.3 0.49 0.060 7.6 485 42 456 20 621 82 73
zcn 025 318 23 0.27 0.61 4.9 0.074 4.2 0.84 0.060 2.6 486 24 458 19 618 28 74
zcn 026 152 11 0.22 0.62 5.6 0.076 4.2 0.74 0.059 3.7 489 27 470 20 580 41 81
zcn 022 1335 117 0.15 0.76 4.3 0.092 4.1 0.96 0.060 1.2 572 24 566 23 595 13 95
zcn 037 679 77 1.1 0.79 7.2 0.095 4.1 0.57 0.060 5.9 591 43 587 24 604 64 97
zcn 036 382 36 0.20 0.80 4.7 0.096 4.1 0.87 0.061 2.3 597 28 590 24 622 24 95
zcn 034 150 16 0.78 0.79 5.7 0.097 4.4 0.77 0.060 3.6 594 34 595 26 590 39 101
GT0804, inherited ages
GT0803, Concordia age=296.5±3.9 Ma, MSWD=3.0, Probability=0.086
AT0911 , anchored Discordia, upper intercept=300±18 Ma, MSWD=0.029
Ratios Ages (Ma)Concentrations
134
Table 1: LA-ICP-MS results of zircons
Conc.
Analysis U (ppm)a
Pb (ppm)a
Th/Ua 207
Pb/235
Ub c 206
Pb/238
Ub c
rhod 207
Pb/206
Pbe c 207
Pb/235
U206
Pb/238
U207
Pb/206
Pb (%)
zcn 25 2323 56 0.29 0.18 4.0 0.025 3.8 0.95 0.052 1.2 166.0 6.6 156 .9 5.9 298 14 53
zcn 13 521 20 0.32 0.28 8.1 0.038 3.9 0.48 0.052 7.1 247 20 240 .5 9.4 307 81 78
zcn 29 949 38 0.33 0.29 7.8 0.040 3.7 0.48 0.052 6.8 259 20 254.9 9.5 292 78 87
zcn 15 647 27 0.55 0.29 6.8 0.040 3.7 0.55 0.052 5.6 260 18 255 .3 9.5 298 64 86
zcn 10 1182 48 0.26 0.30 5.9 0.041 4.1 0.69 0.052 4.3 263 16 259 11 292 49 99
zcn 38 298 12 0.18 0.30 4.6 0.041 3.9 0.84 0.052 2.5 264 12 260 10 299 28 87
zcn 14 1673 68 0.27 0.30 4.0 0.042 3.8 0.93 0.053 1.4 270 11 265 10 312 16 85
zcn 28 350 15 0.31 0.31 4.6 0.043 3.7 0.81 0.052 2.7 273 12 270 10 298 30 91
zcn 23 476 21 0.32 0.32 4.8 0.045 3.8 0.79 0.052 3.0 283 14 281 11 300 34 94
zcn 07 593 26 0.31 0.32 4.5 0.045 3.9 0.87 0.052 2.2 283 13 282 11 296 25 99
zcn 20* 342 16 0.37 0.33 4.5 0.046 3.5 0.78 0.052 2.8 289 13 288 10 291 32 99
zcn 11* 852 39 0.31 0.33 4.3 0.046 3.8 0.88 0.052 2.0 290 12 289 11 295 23 98
zcn 27* 323 16 0.62 0.33 4.5 0.046 3.9 0.87 0.052 2.3 291 13 289 11 302 26 96
zcn 34* 569 27 0.53 0.33 4.2 0.046 3.8 0.91 0.052 1.7 292 12 291 11 299 20 97
zcn 33* 443 22 0.64 0.34 4.3 0.047 3.5 0.82 0.052 2.4 294 13 293 10 301 28 98
zcn 08 175 8 0.28 0.34 5.7 0.047 3.6 0.63 0.053 4.4 296 17 294 11 310 51 99
zcn 22* 267 13 0.51 0.34 4.7 0.047 3.6 0.78 0.052 2.9 294 14 294 11 288 33 102
zcn 36* 583 28 0.57 0.34 4.3 0.047 3.8 0.88 0.052 2.0 295 13 294 11 303 23 97
zcn 37 333 16 0.51 0.34 4.5 0.047 3.7 0.81 0.052 2.6 294 13 295 11 289 30 102
zcn 09* 957 44 0.27 0.34 4.4 0.047 4.1 0.93 0.052 1.6 295 13 295 12 294 18 100
zcn 21* 407 20 0.50 0.34 4.7 0.047 3.5 0.75 0.052 3.1 296 14 295 10 303 36 97
zcn 39* 750 35 0.37 0.34 3.9 0.047 3.4 0.88 0.052 1.8 297 11 297 10 295 21 101
zcn 26* 276 13 0.35 0.34 4.4 0.047 3.7 0.85 0.052 2.3 298 13 298 11 295 26 101
zcn 35* 440 21 0.41 0.34 4.5 0.047 3.7 0.81 0.052 2.7 298 13 299 11 291 30 103
zcn 38 1742 49 1.2 0.15 6.4 0.021 3.7 0.57 0.052 5.3 141 .5 9.1 132 .2 4.9 301 60 44
zcn 07 1946 42 0.27 0.16 4.3 0.022 3.9 0.91 0.052 1.8 146.7 6.3 137 .2 5.3 304 21 93
zcn 16 2101 75 0.65 0.17 7.0 0.024 5.1 0.74 0.052 4.7 163 11 154 .4 8.0 294 54 52
zcn 12 1456 41 0.26 0.21 5.2 0.028 4.7 0.89 0.053 2.4 190 .0 9.9 179 .7 8.4 321 27 56
zcn 33 1076 42 0.46 0.28 4.7 0.039 3.9 0.83 0.052 2.6 249 12 244.0 9.6 298 30 82
zcn 29 1068 41 0.32 0.28 4.0 0.039 3.4 0.85 0.052 2.1 253 10 249 .3 8.4 291 24 86
zcn 35 690 29 0.38 0.30 4.2 0.042 3.6 0.87 0.052 2.1 268 11 265 .8 9.6 285 24 93
zcn 39 807 38 0.94 0.31 4.5 0.042 3.6 0.80 0.053 2.7 272 12 267 .1 9.5 318 31 84
zcn 08 1157 49 0.32 0.31 4.1 0.043 3.3 0.79 0.053 2.5 275 11 271.1 8.9 310 29 99
zcn 09 1213 54 0.37 0.32 4.1 0.044 3.7 0.90 0.052 1.8 281 11 279 10 292 20 99
zcn 11* 957 42 0.30 0.33 4.9 0.045 4.4 0.91 0.052 2.0 288 14 287 13 302 23 95
zcn 22* 557 24 0.21 0.33 4.1 0.046 3.4 0.82 0.052 2.4 288 12 287.8 9.8 294 27 98
zcn 21* 739 34 0.31 0.33 4.1 0.046 3.6 0.88 0.052 2.0 289 12 289 10 294 23 98
zcn 24* 637 29 0.30 0.33 4.2 0.046 3.6 0.86 0.052 2.1 290 12 290 10 293 24 99
zcn 28* 342 16 0.36 0.33 4.9 0.046 3.3 0.69 0.052 3.5 292 14 292 .0 9.7 288 40 102
zcn 23* 557 25 0.21 0.33 4.1 0.046 3.4 0.82 0.052 2.4 292 12 292.1 9.9 294 27 99
zcn 37* 781 36 0.35 0.33 4.0 0.046 3.5 0.87 0.052 2.0 293 12 292 10 299 23 98
zcn 15* 950 44 0.34 0.34 4.6 0.047 4.2 0.90 0.052 2.0 296 14 296 12 296 23 100
zcn 25 1178 56 0.50 0.34 4.2 0.047 3.8 0.89 0.053 2.0 300 13 296 11 330 22 89
zcn 27* 820 38 0.33 0.34 4.1 0.047 3.5 0.85 0.052 2.2 297 12 296 10 300 25 99
zcn 34* 717 33 0.33 0.34 4.1 0.047 3.5 0.85 0.052 2.2 296 12 297 10 294 25 101
zcn 14* 649 30 0.26 0.34 4.3 0.047 3.4 0.78 0.052 2.7 296 13 297 10 291 30 102
zcn 13* 854 39 0.28 0.34 5.1 0.047 4.6 0.91 0.052 2.1 296 15 297 14 287 24 104
zcn 36* 173 9 0.68 0.34 5.1 0.047 3.7 0.73 0.052 3.5 298 15 298 11 295 40 101
zcn 10* 866 41 0.37 0.34 3.9 0.047 3.3 0.84 0.052 2.1 298 12 298 .1 9.9 298 24 100
zcn 20* 899 42 0.33 0.34 3.9 0.047 3.5 0.90 0.052 1.7 298 12 299 10 291 19 103
zcn 36 3292 16 0.059 0.034 14 0.0047 3.9 0.28 0.052 13 33.6 4.7 30.1 1.2 285 154 11
zcn 09 4922 69 0.27 0.10 7.5 0.013 4.2 0.56 0.052 6.2 93.6 7.1 86.4 3.7 281 71 92
zcn 34 4317 65 0.26 0.11 6.2 0.015 4.4 0.71 0.052 4.4 104.4 6.5 96.0 4.2 300 50 32
zcn 35 1853 39 0.28 0.15 5.0 0.021 4.8 0.94 0.053 1.7 143.5 7.2 133 .3 6.3 315 19 42
zcn 10 2075 65 0.21 0.24 5.0 0.032 4.7 0.93 0.053 1.8 216 11 205.8 9.7 332 20 95
zcn 29 1040 36 0.50 0.23 5.9 0.032 5.6 0.94 0.052 2.0 213 13 206 12 295 23 70
zcn 08 963 41 0.62 0.28 8.5 0.039 4.0 0.47 0.052 7.5 248 21 243 .8 9.8 287 86 98
zcn 28 539 23 0.38 0.31 5.3 0.043 4.6 0.87 0.053 2.6 277 15 271 13 323 30 84
zcn 11 271 12 0.40 0.32 5.3 0.044 4.2 0.78 0.052 3.4 279 15 276 11 307 38 90
zcn 24* 316 14 0.33 0.32 5.0 0.044 4.1 0.82 0.052 2.9 280 14 279 11 292 33 96
zcn 26* 366 16 0.38 0.32 5.5 0.045 4.2 0.76 0.052 3.6 283 16 282 12 291 41 97
zcn 12* 629 31 0.68 0.32 5.3 0.045 4.6 0.88 0.052 2.5 285 15 284 13 288 28 99
zcn 20* 567 27 0.64 0.33 5.1 0.045 4.1 0.81 0.052 3.0 286 15 285 12 295 34 97
zcn 23* 337 16 0.57 0.33 5.3 0.046 4.6 0.87 0.052 2.6 289 15 288 13 297 30 97
zcn 27* 731 33 0.39 0.33 4.9 0.046 4.5 0.93 0.052 1.8 290 14 290 13 291 21 99
zcn 22* 324 15 0.39 0.33 5.3 0.046 3.9 0.74 0.052 3.6 290 15 290 11 285 41 102
zcn 16* 580 27 0.45 0.33 4.9 0.046 4.3 0.88 0.052 2.3 291 14 291 13 288 27 101
zcn 14* 411 19 0.38 0.33 5.0 0.046 4.3 0.85 0.052 2.6 292 15 292 12 298 30 98
zcn 33* 443 21 0.49 0.34 4.8 0.047 4.1 0.85 0.052 2.5 295 14 295 12 292 29 101
zcn 21* 388 19 0.45 0.34 5.6 0.047 4.2 0.75 0.052 3.7 297 17 296 12 300 43 99
zcn 07* 343 16 0.40 0.34 5.2 0.047 4.1 0.79 0.052 3.2 297 15 297 12 297 37 100
zcn 13* 249 12 0.50 0.34 5.3 0.047 4.2 0.80 0.052 3.2 298 16 298 13 301 37 99
zcn 25* 830 40 0.50 0.34 5.4 0.048 5.0 0.93 0.052 1.9 299 16 299 15 294 22 102
Concentrations Ratios Ages (Ma)
HT0901, Concordia age=293.6±3.0 Ma, MSWD=0.14, Probability=0.71
PT0820, Concordia age=290.3±3.2 Ma, MSWD=0.109, Probability=0.74
PT0802b , Concordia age=293.6±2.6 Ma, MSWD=0.013, Probability=0.91
135
Table 1: LA-ICP-MS results of zircons
Conc.
Analysis U (ppm)a
Pb (ppm)a
Th/Ua 207
Pb/235
Ub c 206
Pb/238
Ub c
rhod 207
Pb/206
Pbe c 207
Pb/235
U206
Pb/238
U207
Pb/206
Pb (%)
zcn 15 1175 24 0.29 0.15 5.1 0.020 4.2 0.83 0.053 2.8 138.2 7.0 128 .2 5.4 314 32 41
zcn 23 2672 56 0.32 0.15 4.8 0.021 3.9 0.80 0.052 2.9 146 .0 7.0 136 .4 5.3 306 33 45
zcn 22 1028 24 0.37 0.16 6.6 0.022 4.0 0.61 0.052 5.3 152 10 143 .2 5.8 290 60 49
zcn 21 662 19 0.25 0.20 6.2 0.028 4.8 0.76 0.052 4.0 185 12 175.5 8.4 303 46 58
zcn 13 1351 41 0.24 0.22 5.8 0.031 5.5 0.95 0.052 1.9 203 12 195 11 306 21 64
zcn 25 2968 89 0.27 0.23 4.5 0.031 4.1 0.91 0.053 1.8 208 .0 9.3 199 .2 8.2 309 21 65
zcn 27 2424 78 0.27 0.24 5.3 0.033 5.2 0.97 0.052 1.3 216 12 208 11 297 15 70
zcn 12 1642 55 0.30 0.25 4.5 0.034 4.3 0.95 0.052 1.3 222.6 9.9 214 .9 9.2 305 15 71
zcn 16 1143 48 0.73 0.27 4.3 0.038 3.9 0.90 0.052 1.9 244 11 239.1 9.3 294 22 81
zcn 07 1111 43 0.30 0.28 5.1 0.039 4.6 0.91 0.052 2.1 251 13 246 11 303 24 98
zcn 24 488 22 0.40 0.32 5.4 0.044 4.2 0.78 0.052 3.4 278 15 276 11 297 39 93
zcn 10* 505 26 1.00 0.33 9.3 0.045 3.7 0.40 0.052 8.5 287 27 287 11 287 97 100
zcn 14* 414 19 0.41 0.33 4.8 0.045 3.6 0.75 0.052 3.2 288 14 287 10 300 36 95
zcn 20* 463 22 0.45 0.34 4.6 0.047 3.5 0.77 0.052 3.0 297 14 297 10 297 34 100
zcn 28* 367 17 0.34 0.34 6.2 0.047 5.5 0.88 0.052 3.0 297 19 297 16 296 34 100
zcn 29* 708 33 0.34 0.34 4.9 0.047 4.5 0.91 0.052 2.0 297 15 298 13 294 23 101
zcn 33* 303 15 0.55 0.34 5.4 0.047 4.3 0.80 0.052 3.2 298 16 298 13 300 37 99
zcn 09* 979 45 0.22 0.34 4.6 0.048 3.8 0.83 0.052 2.6 299 14 300 11 294 30 100
zcn 08* 485 23 0.27 0.35 4.3 0.049 3.6 0.85 0.052 2.2 305 13 306 11 304 25 100
zcn 09 9077 86 0.087 0.071 7.6 0.0099 6.7 0.88 0.052 3.7 69.3 5.3 63.3 4.2 284 42 91
zcn 22 3104 60 0.22 0.14 4.4 0.020 4.1 0.93 0.053 1.6 137 .5 6.0 127 .2 5.2 319 18 40
zcn 10 2096 45 0.16 0.16 8.3 0.022 7.8 0.94 0.053 2.9 153 13 141 11 348 32 92
zcn 21 5960 135 0.18 0.17 4.0 0.024 3.8 0.95 0.052 1.2 159 .2 6.4 150 .3 5.7 294 14 51
zcn 12 1105 30 0.27 0.20 9.5 0.027 9.0 0.95 0.052 2.9 183 17 175 16 296 34 59
zcn 08 3336 108 0.22 0.24 4.5 0.033 4.0 0.89 0.052 2.1 219 .6 9.9 212 .3 8.5 298 24 97
zcn 23 993 36 0.36 0.26 4.1 0.036 3.6 0.88 0.052 2.0 232.4 9.6 227 .1 8.3 287 22 79
zcn 24 1939 73 0.27 0.28 4.2 0.039 3.9 0.93 0.052 1.6 248 10 244 .0 9.4 285 18 86
zcn 28 536 20 0.20 0.28 4.6 0.040 3.7 0.79 0.052 2.8 254 12 250 .3 9.2 289 32 87
zcn 11 774 32 0.34 0.29 4.6 0.041 4.0 0.85 0.052 2.4 261 12 257 10 301 27 85
zcn 07 358 15 0.34 0.29 5.8 0.041 4.1 0.70 0.052 4.1 262 15 259 11 292 47 99
zcn 27 493 21 0.44 0.30 4.7 0.042 4.1 0.88 0.052 2.2 266 12 263 11 291 25 90
zcn 25 403 17 0.33 0.31 4.8 0.043 4.0 0.82 0.052 2.7 273 13 271 11 292 31 93
zcn 16 421 20 0.70 0.31 4.7 0.044 3.6 0.77 0.052 3.0 276 13 274 .8 9.9 287 34 96
zcn 14 1001 43 0.23 0.32 4.1 0.044 3.6 0.88 0.052 1.9 280 12 279 10 290 22 96
zcn 29 155 6.9 0.36 0.32 5.1 0.045 4.0 0.79 0.052 3.1 284 14 283 11 289 36 98
zcn 20 394 19 0.59 0.34 4.5 0.047 3.7 0.82 0.052 2.6 296 13 296 11 290 30 102
zcn 16 1088 38 0.51 0.24 11 0.033 4.3 0.39 0.052 10 215 24 208.4 9.0 282 117 74
zcn 08 536 21 0.68 0.27 11 0.038 3.6 0.33 0.052 10 245 26 241.4 8.7 281 116 98
zcn 07 601 26 0.61 0.28 5.7 0.039 4.2 0.73 0.052 3.9 251 14 247 10 284 45 99
zcn 26 702 30 0.36 0.30 4.9 0.042 4.2 0.86 0.052 2.5 268 13 264 11 302 29 87
zcn 35 489 23 0.47 0.32 9.5 0.044 4.0 0.42 0.052 8.7 278 27 276 11 297 99 93
zcn 22 1105 48 0.34 0.32 4.1 0.044 3.8 0.93 0.053 1.5 283 12 277 11 330 17 84
zcn 15 1184 53 0.29 0.33 4.5 0.045 4.0 0.89 0.053 2.0 290 13 285 11 329 23 87
zcn 13 665 31 0.53 0.33 4.1 0.046 3.6 0.87 0.053 2.1 291 12 288 10 319 23 90
zcn 38 734 37 0.61 0.33 9.0 0.046 3.9 0.44 0.052 8.1 293 26 291 11 302 92 97
zcn 20 605 40 1.3 0.33 9.6 0.046 4.0 0.41 0.052 8.8 291 28 292 12 289 100 101
zcn 11 728 39 0.39 0.33 12 0.046 3.9 0.31 0.052 12 292 36 292 11 287 134 102
zcn 09 170 7.9 0.34 0.33 4.8 0.046 3.8 0.80 0.052 2.9 292 14 293 11 286 33 100
zcn 10 327 16 0.51 0.34 4.7 0.047 3.8 0.81 0.052 2.7 296 14 295 11 305 31 100
zcn 34 413 22 0.30 0.35 7.1 0.049 3.6 0.51 0.053 6.1 308 22 306 11 323 69 95
zcn 47 3551 39 0.17 0.07 18 0.010 4.6 0.26 0.052 17 73 13 66.2 3.0 298 195 22
zcn 54 4326 56 0.10 0.078 26 0.011 25 0.98 0.053 5.4 77 20 69 18 311 61 22
zcn 50 2462 47 0.22 0.13 9.9 0.017 4.6 0.47 0.053 8.7 121 12 111 .2 5.2 321 99 35
zcn 46 1140 30 1.2 0.14 13 0.020 4.8 0.38 0.052 12 137 17 128 .3 6.1 291 134 44
zcn 62 1727 41 0.59 0.15 12 0.021 5.6 0.47 0.052 11 143 17 134.7 7.6 283 122 48
zcn 53 2221 50 0.43 0.16 9.7 0.022 6.3 0.65 0.052 7.3 147 14 137 .9 8.7 292 84 47
zcn 49 1187 33 0.79 0.17 15 0.024 7.5 0.49 0.052 13 161 24 152 11 288 151 53
zcn 68 1349 44 0.30 0.19 12 0.026 4.5 0.37 0.052 11 176 21 166 .7 7.5 303 127 55
zcn 60 2213 65 0.25 0.22 7.8 0.030 4.5 0.57 0.052 6.4 200 16 191.7 8.6 296 73 65
zcn 51 1797 59 0.35 0.23 7.7 0.032 4.0 0.52 0.052 6.6 212 16 206 .2 8.3 280 75 74
zcn 63 1830 83 0.27 0.26 11 0.036 6.7 0.60 0.052 9.1 234 26 228 15 296 103 77
zcn 48* 801 39 0.72 0.33 9.2 0.046 4.9 0.53 0.052 7.8 290 27 290 14 289 90 100
zcn 65* 1613 72 0.23 0.34 9.3 0.046 4.6 0.49 0.053 8.1 295 28 292 13 314 92 93
zcn 66* 437 21 0.46 0.34 5.6 0.047 4.1 0.73 0.052 3.8 294 16 295 12 292 43 101
zcn 52* 1724 97 0.78 0.34 9.8 0.047 5.0 0.51 0.052 8.4 297 29 296 15 298 96 99
zcn 61* 610 28 0.18 0.35 5.2 0.048 4.1 0.79 0.052 3.2 303 16 303 12 303 36 100
Concentrations Ratios Ages (Ma)
US0902, Concordia age=295.8±5.7 Ma, MSWD=0.015, Probab ility=0.90
TVT0801, Concordia age=295.5±4.0 Ma, MSWD=0.029, Probab ility=0.87
TVT0809, anchored Discordia, upper intercept 296±13 Ma, MSWD=0.32
US0901, anchored Discordia, upper intercept 315±13 Ma, MSWD=0.24

136
Table 1: LA-ICP-MS results of zircons
Conc.
Analysis U (ppm)a
Pb (ppm)a
Th/Ua 207
Pb/235
Ub c 206
Pb/238
Ub c
rhod 207
Pb/206
Pbe c 207
Pb/235
U206
Pb/238
U207
Pb/206
Pb (%)
zcn 07 1624 70 0.50 0.29 4.1 0.041 3.8 0.93 0.052 1.4 261 11 257 .1 9.8 300 16 98
zcn 22, core 724 31 0.28 0.31 3.8 0.043 3.5 0.92 0.052 1.5 272 10 268 .9 9.4 296 17 91
zcn 08, core 744 37 0.97 0.32 5.4 0.044 5.0 0.92 0.053 2.2 282 15 279 14 309 25 99
zcn 36 240 11 0.39 0.32 4.8 0.044 3.6 0.75 0.052 3.2 282 13 279.2 9.9 301 36 93
zcn 38 239 11 0.41 0.32 4.8 0.045 3.4 0.72 0.052 3.3 283 13 280 .9 9.7 297 38 95
zcn 23, rim 291 13 0.34 0.32 5.3 0.045 3.6 0.68 0.052 3.9 282 15 281 10 291 45 97
zcn 09, rim 687 33 0.48 0.33 4.5 0.045 3.7 0.82 0.052 2.6 286 13 284 10 297 30 100
zcn 37 602 30 0.60 0.33 4.2 0.045 3.7 0.88 0.052 2.0 287 12 285 10 305 22 93
zcn 39* 630 31 0.62 0.33 5.4 0.046 3.8 0.70 0.052 3.9 288 16 288 11 288 44 100
zcn 16* 575 29 0.59 0.33 4.3 0.046 3.5 0.82 0.052 2.5 292 13 291 10 299 28 98
zcn 21* 376 18 0.46 0.33 4.8 0.046 3.9 0.82 0.052 2.8 292 14 291 12 301 31 97
zcn 15* 263 13 0.43 0.33 5.2 0.046 3.5 0.67 0.052 3.9 292 15 293 10 289 44 101
zcn 34* 298 14 0.41 0.34 4.5 0.047 3.6 0.80 0.052 2.7 294 13 294 11 294 31 100
zcn 11* 259 12 0.38 0.34 4.5 0.047 3.5 0.78 0.052 2.8 295 13 295 10 299 32 98
zcn 35* 246 12 0.37 0.34 4.8 0.047 3.8 0.79 0.052 2.9 296 14 296 11 296 33 100
zcn 10* 493 23 0.34 0.34 4.9 0.047 4.1 0.82 0.052 2.8 296 15 296 12 296 32 100
zcn 20* 569 28 0.50 0.34 4.3 0.047 3.6 0.82 0.052 2.4 297 13 296 11 306 28 97
zcn 12* 249 12 0.41 0.34 4.7 0.047 3.6 0.77 0.052 3.0 298 14 298 11 300 34 99
zcn 27* 300 14 0.38 0.34 4.8 0.047 3.9 0.82 0.052 2.8 297 14 298 12 289 32 103
zcn 13* 625 31 0.48 0.34 4.7 0.047 4.0 0.85 0.052 2.4 298 14 298 12 293 28 102
zcn 14* 159 8 0.45 0.34 6.2 0.047 3.6 0.58 0.052 5.0 299 18 299 11 300 57 100
zcn 28* 338 17 0.44 0.34 4.8 0.047 3.7 0.78 0.052 3.0 299 14 299 11 303 34 98
zcn 26* 625 31 0.51 0.34 4.2 0.047 3.7 0.90 0.053 1.8 300 12 299 11 309 21 97
zcn 25*, rim 316 15 0.38 0.34 5.5 0.048 4.0 0.73 0.052 3.7 299 16 299 12 300 43 100
zcn 33* 417 20 0.41 0.34 4.4 0.048 3.7 0.84 0.052 2.4 300 13 299 11 301 27 99
zcn 24, core 419 34 0.17 0.70 4.6 0.086 3.7 0.81 0.059 2.7 538 25 529 20 579 29 91
zcn 047 3076 48 0.24 0.11 7.8 0.016 5.3 0.69 0.052 5.7 108 .0 8.4 99.5 5.3 299 65 92
zcn 048 1856 45 0.32 0.17 11 0.024 3.9 0.37 0.052 10 161 17 151.8 6.0 300 114 94
zcn 063, rim 2058 55 0.28 0.20 6.9 0.027 4.1 0.60 0.053 5.5 184 13 174 .2 7.2 313 62 95
zcn 049 1139 39 0.61 0.25 5.1 0.034 4.5 0.89 0.053 2.3 226 12 218 .5 9.9 309 27 97
zcn 062, rim 1463 50 0.22 0.25 4.8 0.035 4.2 0.88 0.052 2.2 228 11 221.3 9.3 296 26 97
zcn 060 1414 54 0.47 0.27 5.1 0.037 4.7 0.92 0.053 2.0 239 12 232 11 314 22 97
zcn 050 1866 75 0.31 0.30 4.1 0.041 3.8 0.91 0.052 1.7 263 11 258 .1 9.7 302 19 98
zcn 066 474 19 0.34 0.29 5.0 0.041 4.2 0.85 0.052 2.6 262 13 259 11 292 30 99
zcn 064 1367 58 0.29 0.31 4.7 0.043 4.1 0.87 0.053 2.3 276 13 271 11 318 26 98
zcn 046 1293 55 0.23 0.32 4.9 0.044 4.3 0.88 0.052 2.3 280 14 277 12 302 26 99
zcn 067* 1349 60 0.22 0.33 4.2 0.046 3.8 0.90 0.052 1.8 290 12 288 11 302 21 99
zcn 053 855 41 0.56 0.34 4.9 0.046 4.2 0.85 0.053 2.6 296 15 291 12 342 29 98
zcn 059 1642 74 0.26 0.34 4.2 0.046 3.8 0.90 0.053 1.8 296 12 292 11 331 20 99
zcn 068* 881 41 0.31 0.33 4.5 0.046 3.9 0.86 0.052 2.3 293 13 292 11 294 26 100
zcn 054* 633 29 0.32 0.34 5.3 0.046 4.1 0.77 0.052 3.4 294 16 293 12 303 39 100
zcn 051* 832 40 0.43 0.34 4.7 0.047 3.9 0.84 0.053 2.5 298 14 297 12 308 29 100
zcn 055* 628 29 0.23 0.34 4.7 0.047 4.0 0.86 0.052 2.4 297 14 297 12 291 27 100
zcn 065* 1221 56 0.22 0.34 4.2 0.047 3.8 0.91 0.052 1.8 298 12 298 11 304 20 100
zcn 052* 1030 47 0.24 0.34 4.5 0.047 4.0 0.90 0.052 1.9 299 13 299 12 305 22 100
zcn 061, core 280 25 0.17 0.78 4.7 0.094 3.9 0.83 0.060 2.6 586 27 581 23 605 28 99
zcn 62 1856 50 0.23 0.19 4.8 0.027 3.4 0.71 0.053 3.4 179 .1 8.6 169 .5 5.8 308 39 55
zcn 66 1067 31 0.29 0.21 5.0 0.029 4.2 0.84 0.052 2.7 193 10 184 .5 7.8 300 31 61
zcn 59 2549 73 0.26 0.21 5.5 0.029 5.2 0.95 0.053 1.8 194 11 185 10 312 20 59
zcn 55 1976 62 0.24 0.23 6.5 0.032 3.7 0.57 0.052 5.4 209 14 201.3 7.5 296 61 68
zcn 76 2371 75 0.27 0.23 5.0 0.032 3.5 0.70 0.052 3.5 213 11 205 .2 7.1 300 40 68
zcn 46 2069 69 0.51 0.23 7.3 0.032 3.3 0.46 0.052 6.5 213 16 205 .3 6.8 302 74 96
zcn 51 1475 49 0.22 0.23 5.9 0.033 3.5 0.59 0.052 4.8 214 13 206 .5 7.2 301 55 69
zcn 50 1291 48 0.32 0.27 4.8 0.037 4.5 0.93 0.052 1.8 241 12 234 10 304 20 77
zcn 79 1311 51 0.30 0.28 5.8 0.038 3.3 0.58 0.052 4.7 248 14 242.8 8.1 299 54 81
zcn 68 1533 59 0.24 0.28 3.8 0.040 3.5 0.92 0.052 1.4 253 .3 9.5 250 .5 8.7 280 16 90
zcn 77 1465 60 0.35 0.30 4.0 0.041 3.4 0.84 0.052 2.2 263 11 259 .5 8.8 291 25 89
zcn 52 1253 51 0.25 0.30 4.2 0.042 3.6 0.86 0.052 2.1 268 11 264 10 301 24 88
zcn 63 1118 47 0.37 0.30 3.9 0.042 3.2 0.82 0.052 2.3 269 11 264.7 8.5 304 26 87
zcn 48 343 15 0.32 0.31 4.4 0.043 3.2 0.72 0.053 3.0 277 12 273 .0 8.6 311 34 99
zcn 74 714 31 0.24 0.32 3.6 0.044 3.1 0.85 0.052 1.9 281 10 279 .4 8.6 296 22 94
zcn 60 1359 61 0.38 0.32 4.8 0.045 3.1 0.64 0.052 3.7 283 14 281.1 8.7 300 42 94
zcn 75 1754 77 0.32 0.32 4.5 0.045 3.9 0.86 0.053 2.3 284 13 281 11 308 26 91
zcn 54 1347 60 0.32 0.33 4.2 0.045 3.5 0.83 0.053 2.4 289 12 287 10 313 27 92
zcn 49* 736 33 0.21 0.33 4.5 0.046 3.5 0.78 0.053 2.8 293 13 291 10 308 32 99
zcn 47* 654 30 0.26 0.34 4.3 0.047 3.4 0.78 0.052 2.7 295 13 294.4 9.9 296 31 100
zcn 73* 521 24 0.25 0.34 4.4 0.047 3.6 0.81 0.052 2.6 294 13 295 11 288 29 102
zcn 67* 1083 50 0.31 0.34 3.8 0.047 3.2 0.85 0.052 2.0 296 11 295 .2 9.6 306 22 97
zcn 53* 1343 61 0.24 0.34 3.8 0.047 3.4 0.89 0.052 1.7 296 11 296 10 297 20 100
zcn 64* 475 25 0.56 0.35 4.3 0.048 3.5 0.80 0.052 2.6 304 13 304 11 302 30 100
Concentrations Ratios Ages (Ma)
WG0902, Concordia age=295.8±4.0 Ma, MSWD=0.114, Probability=0.74
US0906, Concordia age=295.1±4.2 Ma, MSWD=0.46, Probab ility=0.50
US0905, Concordia age=295.8±2.6 Ma, MSWD=0.018, Probab ility=0.68
137
Table 1: LA-ICP-MS results of zircons
Conc.
Analysis U (ppm)a
Pb (ppm)a
Th/Ua 207
Pb/235
Ub c 206
Pb/238
Ub c
rhod 207
Pb/206
Pbe c 207
Pb/235
U206
Pb/238
U207
Pb/206
Pb (%)
zcn 59 3473 39 0.24 0.077 7.1 0.011 4.1 0.59 0.052 5.7 75.4 5.3 68.5 2.8 302 65 23
zcn 52 2505 41 0.28 0.12 5.8 0.016 4.0 0.68 0.052 4.3 110 .7 6.5 102 .4 4.0 291 49 35
zcn 55 1715 54 0.28 0.23 5.3 0.032 3.5 0.66 0.052 4.0 210 11 202.5 7.1 295 46 69
zcn 66 1838 64 0.28 0.24 6.8 0.033 3.2 0.46 0.052 6.0 215 15 208 .3 6.6 294 69 71
zcn 53 983 34 0.28 0.25 5.1 0.035 4.5 0.88 0.053 2.4 228 12 220 .3 9.8 309 27 71
zcn 61 968 40 0.27 0.30 3.6 0.041 3.1 0.85 0.053 1.9 268 10 261 .6 8.0 326 21 80
zcn 67 1090 44 0.23 0.30 3.8 0.042 3.2 0.83 0.053 2.1 268 10 262.3 8.3 313 24 84
zcn 51 759 34 0.48 0.30 3.8 0.042 3.0 0.79 0.052 2.3 267 10 263 .9 7.9 291 26 91
zcn 62 772 34 0.32 0.32 4.0 0.044 3.3 0.81 0.052 2.3 282 11 279 .6 9.1 303 27 92
zcn 48 675 30 0.38 0.32 4.6 0.044 3.1 0.68 0.053 3.4 284 13 279.7 8.8 322 38 87
zcn 68 960 45 0.48 0.32 4.1 0.045 3.3 0.82 0.052 2.4 281 12 280 .7 9.4 286 27 98
zcn 63 142 6.4 0.35 0.32 5.7 0.045 3.5 0.60 0.052 4.6 285 16 285 .7 9.9 282 52 101
zcn 46 842 38 0.27 0.33 4.1 0.046 3.1 0.76 0.052 2.7 289 12 287 .6 8.8 299 30 96
zcn 54 615 29 0.24 0.34 5.9 0.047 4.8 0.81 0.052 3.4 298 18 299 14 292 39 103
zcn 53 6136 152 0.18 0.18 10 0.025 9.8 0.96 0.052 2.9 168 17 159 16 298 33 53
zcn 73 3225 125 0.14 0.24 3.7 0.032 3.2 0.85 0.053 2.0 215 .4 8.1 203 .7 6.5 345 22 59
zcn 66 6131 272 0.16 0.25 4.5 0.034 4.3 0.94 0.053 1.6 223 10 213 .6 9.1 329 18 65
zcn 50 4455 165 0.24 0.27 4.2 0.037 3.7 0.87 0.052 2.1 243 10 237.3 8.7 298 24 80
zcn 60 4431 186 0.24 0.30 3.5 0.042 3.3 0.92 0.052 1.4 265 .8 9.4 262 .6 8.6 294 16 89
zcn 59 1475 66 0.43 0.32 4.0 0.044 3.4 0.85 0.053 2.1 280 11 275 .6 9.5 321 24 86
zcn 48 445 21 0.48 0.33 4.0 0.046 3.0 0.75 0.053 2.7 290 12 287 .4 8.7 310 30 93
zcn 47* 1531 71 0.41 0.33 3.9 0.046 3.0 0.77 0.052 2.5 291 11 290.8 8.9 293 28 99
zcn 61* 820 38 0.33 0.33 4.0 0.046 3.4 0.86 0.052 2.0 292 12 290 .8 9.9 304 23 96
zcn 72* 1335 61 0.30 0.33 3.8 0.046 3.3 0.86 0.052 1.9 291 11 291 .7 9.5 287 22 102
zcn 46* 600 28 0.38 0.34 4.1 0.047 3.1 0.74 0.052 2.8 295 12 294.5 9.0 298 32 99
zcn 49* 585 28 0.45 0.34 4.8 0.047 3.4 0.72 0.052 3.3 295 14 295 10 297 38 99
zcn 52* 407 19 0.22 0.34 3.9 0.047 2.8 0.70 0.052 2.8 294 12 296 .1 8.2 282 32 105
zcn 51* 668 30 0.21 0.34 3.8 0.047 3.3 0.86 0.052 2.0 297 11 297 10 298 22 100
zcn 65* 1008 52 0.74 0.34 4.1 0.047 3.2 0.79 0.052 2.5 296 12 296.8 9.5 292 29 101
zcn 63* 739 36 0.50 0.34 3.9 0.047 3.2 0.82 0.052 2.2 297 12 297 .7 9.6 291 26 102
zcn 64* 773 36 0.24 0.35 3.9 0.048 3.1 0.80 0.053 2.3 302 12 300 .9 9.3 310 26 97
zcn 74 501 24 0.27 0.35 4.5 0.048 2.8 0.63 0.052 3.5 304 14 305 .2 8.6 295 40 103
zcn 50 9999 122 0.063 0.079 17 0.011 16 0.96 0.052 4.5 77 13 71 11 282 52 25
zcn 73 5956 160 0.19 0.20 3.5 0.027 3.3 0.93 0.053 1.3 182 .9 6.5 173 .1 5.7 312 15 56
zcn 54 2749 86 0.28 0.23 3.8 0.032 3.5 0.91 0.052 1.6 210.5 8.1 203 .3 7.1 292 18 70
zcn 76 4887 167 0.25 0.25 4.0 0.035 3.7 0.93 0.052 1.5 227 .4 9.1 220 .3 8.2 302 17 73
zcn 60 2499 95 0.23 0.28 3.7 0.039 3.3 0.90 0.052 1.6 250 .5 9.2 245 .1 8.0 301 19 81
zcn 49 669 29 0.62 0.28 8.7 0.039 3.7 0.43 0.052 7.9 251 22 248 .4 9.2 281 90 88
zcn 74 702 30 0.26 0.31 3.8 0.043 2.9 0.77 0.052 2.4 274 10 270.7 7.9 300 27 90
zcn 64 977 44 0.45 0.31 4.1 0.044 3.4 0.82 0.052 2.3 276 11 274 .5 9.3 293 27 94
zcn 75 1468 63 0.24 0.31 3.6 0.044 3.2 0.88 0.052 1.7 277 10 274 .7 8.7 296 20 93
zcn 51 1046 45 0.28 0.31 3.7 0.044 3.0 0.79 0.052 2.3 277 10 274.7 8.1 297 26 92
zcn 66 458 20 0.29 0.32 4.2 0.044 2.9 0.70 0.052 3.0 280 12 277.6 8.1 301 34 92
zcn 68 1344 65 0.65 0.32 3.5 0.044 3.0 0.84 0.053 1.9 282 10 277 .9 8.2 314 22 89
zcn 72* 926 42 0.34 0.32 4.3 0.045 3.4 0.77 0.052 2.7 284 12 282 .4 9.5 293 31 96
zcn 53* 271 12 0.29 0.33 4.4 0.046 2.8 0.65 0.052 3.3 289 13 288.2 8.2 294 38 98
zcn 46* 747 35 0.39 0.33 4.1 0.046 3.1 0.77 0.052 2.6 292 12 291 .2 9.1 296 30 98
zcn 48* 422 20 0.36 0.33 4.4 0.046 3.3 0.75 0.052 2.9 292 13 291 .7 9.7 295 33 99
zcn 47* 1074 49 0.33 0.33 4.1 0.046 3.3 0.80 0.052 2.5 293 12 292 .2 9.6 300 28 97
zcn 63* 1333 66 0.55 0.33 4.4 0.046 3.6 0.82 0.052 2.5 293 13 293 10 292 29 100
zcn 59* 1471 68 0.30 0.34 3.9 0.047 3.6 0.92 0.052 1.6 294 12 294 11 298 18 99
zcn 62* 514 25 0.51 0.34 4.1 0.047 2.9 0.71 0.052 2.9 295 12 293 .7 8.5 303 32 97
zcn 65* 1502 73 0.52 0.34 3.5 0.047 3.0 0.85 0.052 1.8 296 10 295.9 8.8 296 21 100
zcn 61* 617 30 0.42 0.34 4.1 0.047 3.4 0.83 0.052 2.3 297 12 298 10 291 26 102
zcn 51 7147 40 0.36 0.036 10.1 0.006 5.5 0.55 0.047 8.4 35.7 3.6 35.4 2.0 60 100 59
zcn 62 3339 37 0.07 0.076 7.6 0.012 3.9 0.51 0.047 6.5 74.5 5.7 75.1 2.9 54 78 139
zcn 55 1409 30 0.41 0.16 6.9 0.022 6.6 0.95 0.052 2.1 148 10 138.7 9.1 296 24 47
zcn 66 3579 85 0.19 0.18 6.7 0.025 6.5 0.96 0.053 1.8 168 11 158 10 309 21 51
zcn 59 5575 141 0.25 0.19 4.3 0.026 4.0 0.92 0.052 1.7 174 .9 7.6 165 .4 6.6 305 19 54
zcn 52 807 30 0.24 0.27 5.2 0.037 4.1 0.80 0.053 3.1 242 13 235 10 312 36 75
zcn 47 1686 61 0.28 0.27 3.6 0.038 3.0 0.84 0.053 2.0 245.0 8.9 237 .4 7.2 319 23 74
zcn 63 925 34 0.38 0.27 4.3 0.038 3.7 0.88 0.052 2.0 245 10 239 .1 8.9 299 23 80
zcn 68 1832 68 0.22 0.27 4.2 0.038 3.7 0.88 0.053 2.0 247 10 239 .8 8.9 312 23 77
zcn 46 745 28 0.25 0.28 5.5 0.038 4.9 0.89 0.052 2.5 248 14 243 12 298 28 81
zcn 65 2178 83 0.22 0.28 4.0 0.039 3.6 0.89 0.052 1.8 249 10 244.1 8.8 299 21 82
zcn 67 758 30 0.45 0.28 4.3 0.039 3.7 0.85 0.053 2.3 253 11 247 .5 9.1 307 26 81
zcn 53 1047 43 0.37 0.30 5.5 0.041 5.3 0.95 0.053 1.7 264 15 259 14 314 20 83
zcn 54 500 21 0.20 0.30 4.1 0.042 3.2 0.80 0.052 2.5 269 11 266.6 8.6 294 28 91
zcn 60 896 39 0.29 0.31 4.2 0.044 3.1 0.75 0.052 2.8 278 12 275 .3 8.7 300 32 92
zcn 49 3672 161 0.28 0.32 3.7 0.044 3.5 0.94 0.052 1.3 281 11 280 10 292 15 96
zcn 61 1220 54 0.30 0.33 3.9 0.045 3.5 0.89 0.053 1.7 290 11 284 10 332 20 86
zcn 64 1878 85 0.32 0.33 3.6 0.046 3.1 0.86 0.052 1.8 289 10 288 .1 9.0 292 21 99
zcn 48 972 44 0.24 0.33 4.2 0.046 3.6 0.86 0.052 2.1 293 12 292 11 304 24 96
zcn 50 97 4.7 0.47 0.35 7.7 0.048 4.6 0.60 0.052 6.2 302 23 304 14 287 71 106
Concentrations Ratios Ages (Ma)
ZT0902, anchored Discordia, upper intercept 305±11 Ma, MSWD=0.27
ZG090, Concordia age=291.2±2.9 Ma, MSWD=0.23, Probability=0.63
ZG0904, Concordia age=295.1±2.9 Ma, MSWD=0.012, Probability=0.97
WG0904, anchored Discordia, upper intercept 304±17 Ma, MSWD=0.19

138
Table 1: LA-ICP-MS results of zircons
Conc.
Analysis U (ppm)a
Pb (ppm)a
Th/Ua 207
Pb/235
Ub c 206
Pb/238
Ub c
rhod 207
Pb/206
Pbe c 207
Pb/235
U206
Pb/238
U207
Pb/206
Pb (%)
Peisovicef
999 52 0.16 0.40 0.0090 0.054 0.0011 0.78 0.053 0.00038 339.2 6.5 339 .3 6.7 339 16 100
aU and Pb concentrations and Th/U ratios are calculated relative to GJ-1 reference zcn
bCorrected for background and within-run Pb/U fractionation and normalised to reference zcn GJ-1 (ID-TIMS values/measured value);
207Pb/
235U calculated using (
207Pb/
206Pb)/(
238U/
206Pb * 1/137.88)
cQuadratic addition of within-run errors (2 SD) and daily reproducibility of GJ-1 (2 SD)
dRho is the error correlation defined as the quotient of the propagated errors of the
206Pb/
238U and the
207/235
U ratioe
Corrected for mass-bias by normalising to GJ-1 reference zcn (~0.6 per atomic mass unit) and common Pb using the model Pb composition of Stacey & Kramers (1975)fAccuracy and reproducibilty was checked by repeated analyses (n = 25) of reference zcn Plesovice, Griedel, and 91500 ;
data given as mean with 2 standard deviation uncertainties
Conc. = Concordance of of the206
Pb/238
U and the207
/235
U ages
Concentrations Ratios Ages (Ma)
Age-standard
139
Table 2: LA-ICP-MS results of apatites
Analysis 206Pb (cps)
aU (ppm)
bPb (ppm)
bTh/U
b 206Pbc (%)
c 208Pbc (%)
c 206Pb/
238U
d d 207Pb/
235U
d drho
e 207Pb/
235U
206Pb/
238U
ap 112* 15139 4.9 1.6 0.62 94 100 0.0032 101 0.028 112 0.91 28 31 20 21
ap 105* 24440 0.89 2.7 0.027 94 100 0.0037 54 0.053 72 0.74 53 38 24 13
ap 90* 14238 14 1.5 0.21 88 100 0.0038 24 0.035 91 0.27 35 32 24.6 6.0
ap 83* 18034 4.4 2.0 1.6 89 100 0.0041 50 0.061 72 0.70 60 43 27 13
ap 101* 17977 12 1.9 1.3 90 99 0.0043 51 0.028 99 0.52 28 27 28 14
ap 106* 22011 79 2.1 1.5 78 92 0.0046 6.9 0.033 69 0.10 33 22 29.4 2.0
ap 87* 18624 9.3 2.0 1.3 84 99 0.0047 68 0.050 102 0.66 50 51 30 20
ap 98* 16923 24 1.8 0.75 90 99 0.0047 26 0.047 110 0.24 47 52 30.5 8.0
ap 92* 16521 13 1.9 1.2 92 99 0.0048 33 0.039 95 0.35 38 37 31 10
ap 108* 18972 23 2.0 0.48 88 99 0.0049 14 0.024 84 0.17 24 20 31.7 4.6
ap 97* 18859 8.0 2.0 0.47 90 100 0.0050 37 0.045 96 0.38 44 43 32 12
ap 99* 15376 6.2 1.6 0.73 88 100 0.0057 38 0.035 62 0.61 35 21 37 14
ap 84* 15384 20 1.7 0.52 80 99 0.0058 21 0.056 49 0.42 56 27 37.1 7.7
ap 109* 14373 13 1.5 1.3 89 98 0.0059 15 0.067 93 0.17 66 61 38.0 5.9
ap 111* 15985 3.8 1.7 1.7 93 99 0.0060 71 0.029 111 0.64 29 32 39 28
ap 107* 18050 10 1.9 1.7 91 99 0.0061 32 0.041 99 0.33 41 41 39 13
ap 91* 19164 13 1.9 1.3 82 98 0.0066 29 0.055 98 0.30 55 54 42 12
ap 104* 15619 3.5 1.7 0.41 93 100 0.0071 55 0.12 92 0.60 113 103 45 25
ap 82 17176 8.1 1.8 1.7 83 98 0.010 10 0.098 95 0.10 95 90 66.5 6.4
ap 113 44088 47 2.5 0.26 55 98 0.014 7.7 0.083 26 0.30 81 20 89.9 6.9
ap 86 20597 18 2.2 0.91 77 96 0.016 4.7 0.10 89 0.053 98 86 105.0 4.9
ap 96 19324 8.9 2.1 1.9 82 96 0.017 18 0.09 98 0.18 86 83 112 20
ap 89 19887 7.0 2.1 1.7 82 97 0.021 20 0.16 79 0.25 155 120 133 26
ap 93 17884 11 1.9 1.3 76 95 0.023 12 0.18 63 0.20 170 103 147 18
ap 95 41513 15 1.7 1.1 63 92 0.024 5.8 0.17 77 0.075 159 120 153.7 8.8
ap 88 18993 12 2.0 1.5 71 92 0.028 7.9 0.30 63 0.13 270 161 179 14
ap 94 19416 8.7 2.2 1.8 83 94 0.028 11 0.12 53 0.21 119 62 181 20
ap 102 20659 9.3 2.4 2.5 74 91 0.030 7.2 0.35 81 0.090 304 238 190 14
ap 85 20747 11 2.3 1.6 72 90 0.039 4.0 0.18 60 0.067 167 97 244.4 9.6
ap 100 21931 8.3 2.3 1.8 68 90 0.048 7.7 0.45 72 0.11 376 254 305 23
ap 64* 38729 25 3.8 0.026 73 100 0.0048 14 0.029 40 0.35 29 11 30.7 4.3
ap 50* 50899 9.4 2.7 0.68 90 100 0.0049 27 0.045 85 0.32 45 38 31.3 8.4
ap 57* 32743 65 3.2 0.022 70 100 0.0052 11 0.034 48 0.23 34 16 33.1 3.7
ap 72* 33525 15 3.6 1.4 85 99 0.0054 8.2 0.035 88 0.093 35 30 34.5 2.8
ap 63* 20584 9.4 2.3 0.83 89 100 0.0055 17 0.034 132 0.13 34 45 35.2 5.9
ap 81* 29824 25 3.1 0.16 83 100 0.0056 15 0.033 107 0.14 33 35 35.9 5.2
ap 53* 24717 13 2.5 0.43 72 100 0.0056 22 0.037 44 0.49 37 16 36.0 7.8
ap 46* 60199 38 2.9 0.021 81 100 0.0057 8.2 0.034 57 0.14 34 19 36.4 3.0
ap 78* 22124 9.6 2.1 1.0 86 99 0.0060 24 0.040 50 0.48 40 20 38.8 9.4
ap 51 62788 24 2.8 0.022 80 100 0.0091 8.2 0.057 44 0.18 56 24 58.6 4.8
ap 56 36459 33 3.2 0.45 75 99 0.010 3.3 0.069 30 0.11 68 20 65.8 2.2
ap 73 33377 12 3.5 0.038 78 100 0.011 13 0.079 76 0.17 77 58 72.9 9.3
ap 77 23781 14 2.2 0.47 78 99 0.013 6.0 0.085 50 0.12 82 40 80.1 4.8
ap 60 40163 21 4.3 0.32 80 99 0.017 5.3 0.11 54 0.10 104 55 106.0 5.6
ap 48 54906 22 2.5 0.29 65 98 0.019 5.4 0.13 25 0.21 127 30 124.0 6.6
ap 62 32747 20 3.1 0.15 69 99 0.020 3.6 0.13 35 0.10 127 42 128.9 4.6
ap 58 19697 11 2.0 0.087 74 100 0.020 6.5 0.13 68 0.097 128 85 130.2 8.4
ap 74 24038 13 2.2 0.28 65 99 0.026 3.8 0.18 35 0.11 167 56 168.2 6.3
ap 55 26554 18 2.6 0.49 64 97 0.026 3.9 0.18 25 0.15 168 40 168.5 6.5
ap 76 30936 17 3.2 0.53 62 98 0.029 11 0.25 130 0.081 224 303 184 19
ap 49 43962 9.6 2.2 0.64 70 98 0.030 5.5 0.15 249 0.022 146 410 193 11
ap 79 35502 28 2.8 0.41 53 95 0.033 3.2 0.23 17 0.18 212 34 209.3 6.6
ap 75 26785 18 2.4 0.14 54 99 0.034 4.0 0.24 24 0.17 218 48 214.6 8.5
ap 66 22095 11 2.2 0.38 66 98 0.038 3.2 0.28 48 0.067 247 110 238.3 7.5
ap 47 61783 20 2.8 0.71 54 93 0.040 3.1 0.28 31 0.098 249 71 253.1 7.6
ap 80 100523 126 7.0 0.82 6.6 48 0.042 2.4 0.30 4.1 0.58 263.2 9.6 263.7 6.2
ap 52 148006 187 10 0.35 10 74 0.042 2.4 0.31 3.3 0.70 272.1 8.0 266.6 6.1
ap 61 75729 93 4.6 0.077 8.0 90 0.044 2.4 0.32 4.1 0.59 278 10 279.2 6.6
ap 54 54844 64 4.0 0.22 10 87 0.045 2.5 0.33 6.1 0.40 288 15 284.1 6.9
ap 65 33942 25 3.0 0.39 46 94 0.045 2.9 0.33 14 0.21 287 36 286.4 8.2
Concentrations Ratios Ages (Ma)
GT0803,Median Age=35.3+1.2/-3.9 Ma, 96 % confidence from coherent group of 9
AT0911,Median Age=31.4+6.5/-3.3 Ma, 97 % confidence from coherent group of 18

140
Table 2: LA-ICP-MS results of apatites
Analysis 20 6Pb (cps)
aU (ppm)
bPb (ppm)
bTh/U
b 206Pbc (%)
c 208Pbc (%)
c 206Pb/
238U
d d 20 7Pb/
23 5U
d drho
e 207Pb/
235U
206Pb/
238U
ap 38* 38716 8.6 4.4 0.13 88 100 0.0046 31 0.035 93 0.33 35 32 29.8 9.2
ap 12* 39751 11 4.8 0.11 89 100 0.0049 28 0.028 56 0.50 28 15 31.3 8.7
ap 32* 31505 5.0 3.8 0.10 87 100 0.0049 22 0.028 51 0.43 28 14 31.8 6.9
ap 10* 41657 10 5.2 0.06 91 100 0.0051 39 0.031 141 0.27 31 43 33 13
ap 16* 85675 7.8 4.8 0.12 93 100 0.0055 30 0.048 69 0.43 48 33 35 10
ap 06* 31990 5.1 4.0 0.20 89 100 0.0056 23 0.055 64 0.36 54 34 36.1 8.3
ap 11* 49367 44 6.0 0.08 89 100 0.0057 12 0.041 100 0.12 41 41 36.6 4.5
ap 09* 35533 54 4.3 0.08 78 100 0.0060 7.0 0.051 36 0.20 51 18 38.3 2.7
ap 27* 100138 4.4 5.7 0.23 86 100 0.0061 22 0.040 299 0.073 40 125 39.2 8.5
ap 40* 85795 27 11 0.15 85 100 0.0061 23 0.014 787 0.029 14 116 39.4 9.0
ap 20* 52248 13 6.2 0.05 88 100 0.0069 24 0.049 106 0.23 48 51 45 11
ap 14 149393 46 7.2 <0.01 77 100 0.010 7.1 0.065 29 0.24 64 18 66.3 4.7
ap 18 60424 5.7 3.3 <0.01 88 100 0.014 19 0.089 72 0.26 87 62 87 16
ap 29 87283 11 4.6 0.088 87 100 0.015 6.5 0.11 63 0.10 103 64 93.1 6.0
ap 31 40151 14 4.7 0.073 75 100 0.017 8.0 0.10 77 0.10 100 76 107.0 8.5
ap 19 56031 41 5.7 0.070 65 100 0.017 3.3 0.11 24 0.14 106 25 107.5 3.6
ap 07 49408 21 5.8 0.16 77 100 0.019 6.0 0.13 46 0.13 123 55 123.7 7.3
ap 28 94637 5.8 5.2 0.21 88 100 0.022 15 0.21 74 0.21 190 137 137 21
ap 23 97024 6.7 5.4 0.29 89 100 0.024 10 0.16 59 0.17 147 84 150 15
ap 24 39591 14 4.7 0.12 67 100 0.029 6.7 0.19 39 0.17 173 63 186 12
ap 30 28406 8.6 3.3 0.27 85 99 0.031 7.1 0.19 86 0.083 174 147 199 14
ap 25 50965 23 5.6 0.13 55 99 0.033 5.6 0.20 44 0.13 184 76 212 12
ap 13 39014 4.4 5.1 0.48 88 100 0.037 16 0.26 50 0.33 237 110 232 37
ap 17 57988 27 6.3 0.058 69 100 0.039 4.2 0.25 37 0.11 224 78 248 10
ap 08 64559 36 7.0 0.052 56 100 0.039 3.5 0.28 24 0.14 252 56 248.3 8.6
ap 21 70850 40 7.7 0.050 56 100 0.042 2.9 0.29 21 0.14 258 48 263.0 7.6
ap 184* 16098 4.4 1.9 2.2 90 99 0.0043 45 0.023 60 0.74 23 14 27 12
ap 179* 23841 28 2.8 1.5 88 98 0.0045 43 0.020 60 0.71 20 12 29 13
ap 186* 21094 15 2.4 1.3 89 99 0.0055 14 0.044 172 0.08 44 76 35.6 5.0
ap 183 25743 19 2.7 1.6 67 92 0.022 3.9 0.14 23 0.17 136 30 137.4 5.3
ap 160 15501 5.9 2.0 1.2 82 97 0.024 7.4 0.18 22 0.34 165 34 155 11
ap 185 16127 5.1 1.9 1.7 72 96 0.030 6.7 0.33 46 0.15 291 122 193 13
ap 171 19598 6.9 2.4 1.6 79 95 0.032 7.6 0.25 64 0.12 230 141 200 15
ap 180 487471 33 6.5 0.84 54 93 0.037 2.6 0.28 3.1 0.85 249.1 6.9 236.2 6.1
ap 182 18487 4.8 2.4 1.9 79 96 0.039 23 0.38 57 0.41 330 175 247 57
ap 173 17648 5.4 2.1 1.5 76 95 0.042 5.2 0.44 57 0.09 367 193 263 13
ap 165 22284 14 2.4 0.54 58 95 0.044 3.5 0.36 23 0.15 310 64 277.1 9.4
ap 89* 215730 102 26 0.033 95 100 0.0040 16 0.039 108 0.15 39 42 26.0 4.2
ap 76 880314 21 108 0.036 96 100 0.0072 102 0.074 112 0.92 72 81 46 48
ap 88 758932 9.8 93 0.051 97 100 0.019 138 0.24 147 0.94 220 343 122 169
ap 107 400937 10 48 0.007 96 100 0.031 28 0.35 71 0.40 302 205 199 55
ap 108 664367 24 81 0.019 96 100 0.034 16 0.24 49 0.33 220 102 213 34
ap 75 629712 20 78 0.42 94 100 0.039 35 0.20 94 0.37 182 171 246 84
ap 78 484031 16 60 0.12 95 100 0.039 17 0.22 54 0.31 205 105 248 41
ap 86 654092 7.6 80 0.20 96 100 0.041 54 0.84 82 0.66 621 478 256 138
ap 92 542264 22 67 0.091 96 100 0.047 16 0.41 37 0.42 352 117 294 45
ap 83 675471 23 83 0.029 95 100 0.047 13 0.66 43 0.31 515 190 295 39
ap 93 656844 20 81 0.010 96 100 0.052 16 0.54 68 0.23 436 276 324 50
ap 79 766015 20 95 0.021 93 100 0.053 16 0.66 73 0.22 512 346 335 53
ap 228* 20950 11 1.4 0.31 85 100 0.0040 26 0.032 37 0.68 32 12 25.8 6.6
ap 212* 24479 4.1 3.1 0.52 92 100 0.0040 35 0.021 46 0.76 21 10 25.9 9.1
ap 225* 21264 13 1.7 0.74 83 99 0.0042 25 0.018 52 0.47 18 10 27.3 6.7
ap 218* 41256 29 1.9 0.37 78 99 0.0044 14 0.034 57 0.24 34 19 28.4 3.9
ap 214* 43806 10 3.1 0.70 92 100 0.0045 28 0.035 54 0.52 35 19 28.8 8.0
ap 230* 18739 18 2.1 0.61 87 99 0.0047 34 0.032 52 0.67 32 17 30 10
ap 207* 26234 8.5 2.2 0.39 88 100 0.0047 19 0.031 34 0.55 31 10 30.4 5.7
ap 215* 19175 5.0 1.4 2.0 89 99 0.0051 23 0.032 52 0.45 32 17 32.8 7.6
ap 235* 18906 11 1.4 0.065 80 100 0.0052 25 0.044 60 0.42 44 26 33.6 8.4
ap 202* 59497 12 2.8 0.15 88 100 0.0062 19 0.046 47 0.42 46 21 40.0 7.8
ap 226 45247 7.9 2.1 1.1 86 99 0.0082 24 0.028 50 0.47 28 14 53 12
ap 221 22000 5.2 1.6 0.72 89 99 0.0083 44 0.13 64 0.68 124 78 53 23
ap 211 21201 6.5 0.94 1.2 83 98 0.0090 16 0.057 33 0.47 56 18 57.6 9.0
ap 232 22082 12 2.3 0.97 86 98 0.011 23 0.13 60 0.39 126 74 72 17
ap 227 50012 11 2.3 1.1 85 98 0.012 14 0.080 42 0.34 78 32 79 11
ap 223 41086 5.8 2.0 0.84 88 99 0.013 28 0.17 44 0.63 158 67 83 23
ap 217 57526 15 2.6 0.61 74 97 0.023 9.1 0.18 29 0.32 169 46 146 13
ap 204 716316 15 36 0.57 92 100 0.025 36 0.14 70 0.52 133 92 161 58
ap 224 104583 69 3.0 0.20 37 92 0.026 4.6 0.19 19 0.25 177 31 168.1 7.6
ap 234 41690 6.5 2.1 1.2 76 97 0.027 9.1 0.20 52 0.18 186 91 171 15
ap 216 45863 5.2 2.2 1.8 83 96 0.027 11 0.13 59 0.19 123 70 171 19
ap 208 48349 5.3 2.4 1.2 80 98 0.030 13 0.17 60 0.22 156 91 188 25
ap 222 26514 2.8 1.4 0.0033 81 100 0.032 68 0.46 90 0.76 383 336 203 137
ap 229 20310 5.7 2.1 1.5 64 94 0.042 10 0.44 36 0.28 368 118 266 26
ap 233 64629 5.8 3.2 0.84 76 98 0.047 13 0.53 52 0.26 429 200 294 39
ap 219 25813 0.42 1.3 0.012 94 100 0.068 44 0.79 54 0.81 590 274 423 181
PT0820,Median Age=29.4+4.1/-3.5 Ma, 98 % confidence from coherent group of 10
HT0901,Median Age=29.2+6.4/-1.8 Ma, 75 % confidence from coherent group of 3
PT0802b,No useful Median Age, one analyses=26.0±4.2
Concentrations
GT0804,Median Age=36.1+3.2/-4.3 Ma, 94% confidence from coherent group of 11
Ratios Ages (Ma)
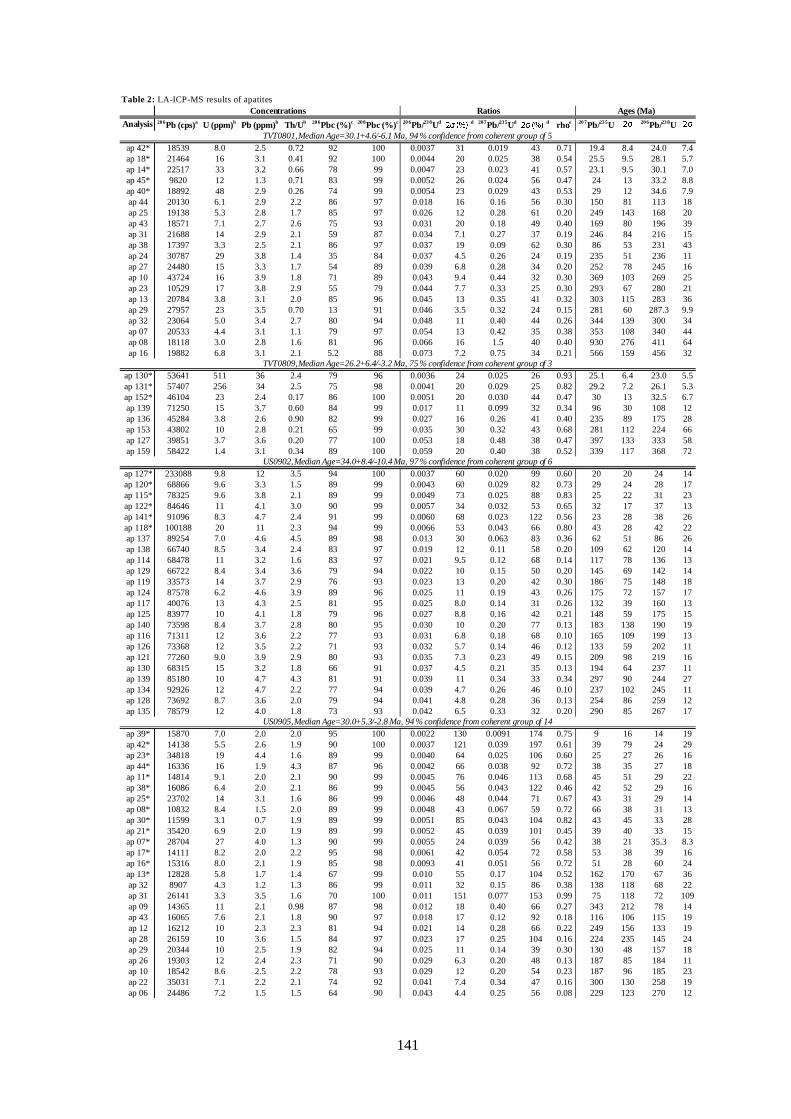
141
Table 2: LA-ICP-MS results of apatites
Analysis 20 6Pb (cps)
aU (ppm)
bPb (ppm)
bTh/U
b 206Pbc (%)
c 208Pbc (%)
c 206Pb/
238U
d d 20 7Pb/
23 5U
d drho
e 207Pb/
235U
206Pb/
238U
ap 42* 18539 8.0 2.5 0.72 92 100 0.0037 31 0.019 43 0.71 19.4 8.4 24.0 7.4
ap 18* 21464 16 3.1 0.41 92 100 0.0044 20 0.025 38 0.54 25.5 9.5 28.1 5.7
ap 14* 22517 33 3.2 0.66 78 99 0.0047 23 0.023 41 0.57 23.1 9.5 30.1 7.0
ap 45* 9820 12 1.3 0.71 83 99 0.0052 26 0.024 56 0.47 24 13 33.2 8.8
ap 40* 18892 48 2.9 0.26 74 99 0.0054 23 0.029 43 0.53 29 12 34.6 7.9
ap 44 20130 6.1 2.9 2.2 86 97 0.018 16 0.16 56 0.30 150 81 113 18
ap 25 19138 5.3 2.8 1.7 85 97 0.026 12 0.28 61 0.20 249 143 168 20
ap 43 18571 7.1 2.7 2.6 75 93 0.031 20 0.18 49 0.40 169 80 196 39
ap 31 21688 14 2.9 2.1 59 87 0.034 7.1 0.27 37 0.19 246 84 216 15
ap 38 17397 3.3 2.5 2.1 86 97 0.037 19 0.09 62 0.30 86 53 231 43
ap 24 30787 29 3.8 1.4 35 84 0.037 4.5 0.26 24 0.19 235 51 236 11
ap 27 24480 15 3.3 1.7 54 89 0.039 6.8 0.28 34 0.20 252 78 245 16
ap 10 43724 16 3.9 1.8 71 89 0.043 9.4 0.44 32 0.30 369 103 269 25
ap 23 10529 17 3.8 2.9 55 79 0.044 7.7 0.33 25 0.30 293 67 280 21
ap 13 20784 3.8 3.1 2.0 85 96 0.045 13 0.35 41 0.32 303 115 283 36
ap 29 27957 23 3.5 0.70 13 91 0.046 3.5 0.32 24 0.15 281 60 287.3 9.9
ap 32 23064 5.0 3.4 2.7 80 94 0.048 11 0.40 44 0.26 344 139 300 34
ap 07 20533 4.4 3.1 1.1 79 97 0.054 13 0.42 35 0.38 353 108 340 44
ap 08 18118 3.0 2.8 1.6 81 96 0.066 16 1.5 40 0.40 930 276 411 64
ap 16 19882 6.8 3.1 2.1 5.2 88 0.073 7.2 0.75 34 0.21 566 159 456 32
ap 130* 53641 511 36 2.4 79 96 0.0036 24 0.025 26 0.93 25.1 6.4 23.0 5.5
ap 131* 57407 256 34 2.5 75 98 0.0041 20 0.029 25 0.82 29.2 7.2 26.1 5.3
ap 152* 46104 23 2.4 0.17 86 100 0.0051 20 0.030 44 0.47 30 13 32.5 6.7
ap 139 71250 15 3.7 0.60 84 99 0.017 11 0.099 32 0.34 96 30 108 12
ap 136 45284 3.8 2.6 0.90 82 99 0.027 16 0.26 41 0.40 235 89 175 28
ap 153 43802 10 2.8 0.21 65 99 0.035 30 0.32 43 0.68 281 112 224 66
ap 127 39851 3.7 3.6 0.20 77 100 0.053 18 0.48 38 0.47 397 133 333 58
ap 159 58422 1.4 3.1 0.34 89 100 0.059 20 0.40 38 0.52 339 117 368 72
ap 127* 233088 9.8 12 3.5 94 100 0.0037 60 0.020 99 0.60 20 20 24 14
ap 120* 68866 9.6 3.3 1.5 89 99 0.0043 60 0.029 82 0.73 29 24 28 17
ap 115* 78325 9.6 3.8 2.1 89 99 0.0049 73 0.025 88 0.83 25 22 31 23
ap 122* 84646 11 4.1 3.0 90 99 0.0057 34 0.032 53 0.65 32 17 37 13
ap 141* 91096 8.3 4.7 2.4 91 99 0.0060 68 0.023 122 0.56 23 28 38 26
ap 118* 100188 20 11 2.3 94 99 0.0066 53 0.043 66 0.80 43 28 42 22
ap 137 89254 7.0 4.6 4.5 89 98 0.013 30 0.063 83 0.36 62 51 86 26
ap 138 66740 8.5 3.4 2.4 83 97 0.019 12 0.11 58 0.20 109 62 120 14
ap 114 68478 11 3.2 1.6 83 97 0.021 9.5 0.12 68 0.14 117 78 136 13
ap 129 66722 8.4 3.4 3.6 79 94 0.022 10 0.15 50 0.20 145 69 142 14
ap 119 33573 14 3.7 2.9 76 93 0.023 13 0.20 42 0.30 186 75 148 18
ap 124 87578 6.2 4.6 3.9 89 96 0.025 11 0.19 43 0.26 175 72 157 17
ap 117 40076 13 4.3 2.5 81 95 0.025 8.0 0.14 31 0.26 132 39 160 13
ap 125 83977 10 4.1 1.8 79 96 0.027 8.8 0.16 42 0.21 148 59 175 15
ap 140 73598 8.4 3.7 2.8 80 95 0.030 10 0.20 77 0.13 183 138 190 19
ap 116 71311 12 3.6 2.2 77 93 0.031 6.8 0.18 68 0.10 165 109 199 13
ap 126 73368 12 3.5 2.2 71 93 0.032 5.7 0.14 46 0.12 133 59 202 11
ap 121 77260 9.0 3.9 2.9 80 93 0.035 7.3 0.23 49 0.15 209 98 219 16
ap 130 68315 15 3.2 1.8 66 91 0.037 4.5 0.21 35 0.13 194 64 237 11
ap 139 85180 10 4.7 4.3 81 91 0.039 11 0.34 33 0.34 297 90 244 27
ap 134 92926 12 4.7 2.2 77 94 0.039 4.7 0.26 46 0.10 237 102 245 11
ap 128 73692 8.7 3.6 2.0 79 94 0.041 4.8 0.28 36 0.13 254 86 259 12
ap 135 78579 12 4.0 1.8 73 93 0.042 6.5 0.33 32 0.20 290 85 267 17
ap 39* 15870 7.0 2.0 2.0 95 100 0.0022 130 0.0091 174 0.75 9 16 14 19
ap 42* 14138 5.5 2.6 1.9 90 100 0.0037 121 0.039 197 0.61 39 79 24 29
ap 23* 34818 19 4.4 1.6 89 99 0.0040 64 0.025 106 0.60 25 27 26 16
ap 44* 16336 16 1.9 4.3 87 96 0.0042 66 0.038 92 0.72 38 35 27 18
ap 11* 14814 9.1 2.0 2.1 90 99 0.0045 76 0.046 113 0.68 45 51 29 22
ap 38* 16086 6.4 2.0 2.1 86 99 0.0045 56 0.043 122 0.46 42 52 29 16
ap 25* 23702 14 3.1 1.6 86 99 0.0046 48 0.044 71 0.67 43 31 29 14
ap 08* 10832 8.4 1.5 2.0 89 99 0.0048 43 0.067 59 0.72 66 38 31 13
ap 30* 11599 3.1 0.7 1.9 89 99 0.0051 85 0.043 104 0.82 43 45 33 28
ap 21* 35420 6.9 2.0 1.9 89 99 0.0052 45 0.039 101 0.45 39 40 33 15
ap 07* 28704 27 4.0 1.3 90 99 0.0055 24 0.039 56 0.42 38 21 35.3 8.3
ap 17* 14111 8.2 2.0 2.2 95 98 0.0061 42 0.054 72 0.58 53 38 39 16
ap 16* 15316 8.0 2.1 1.9 85 98 0.0093 41 0.051 56 0.72 51 28 60 24
ap 13* 12828 5.8 1.7 1.4 67 99 0.010 55 0.17 104 0.52 162 170 67 36
ap 32 8907 4.3 1.2 1.3 86 99 0.011 32 0.15 86 0.38 138 118 68 22
ap 31 26141 3.3 3.5 1.6 70 100 0.011 151 0.077 153 0.99 75 118 72 109
ap 09 14365 11 2.1 0.98 87 98 0.012 18 0.40 66 0.27 343 212 78 14
ap 43 16065 7.6 2.1 1.8 90 97 0.018 17 0.12 92 0.18 116 106 115 19
ap 12 16212 10 2.3 2.3 81 94 0.021 14 0.28 66 0.22 249 156 133 19
ap 28 26159 10 3.6 1.5 84 97 0.023 17 0.25 104 0.16 224 235 145 24
ap 29 20344 10 2.5 1.9 82 94 0.025 11 0.14 39 0.30 130 48 157 18
ap 26 19303 12 2.4 2.3 71 90 0.029 6.3 0.20 48 0.13 187 85 184 11
ap 10 18542 8.6 2.5 2.2 78 93 0.029 12 0.20 54 0.23 187 96 185 23
ap 22 35031 7.1 2.2 2.1 74 92 0.041 7.4 0.34 47 0.16 300 130 258 19
ap 06 24486 7.2 1.5 1.5 64 90 0.043 4.4 0.25 56 0.08 229 123 270 12
US0905,Median Age=30.0+5.3/-2.8 Ma, 94 % confidence from coherent group of 14
TVT0801,Median Age=30.1+4.6/-6.1 Ma, 94 % confidence from coherent group of 5
TVT0809,Median Age=26.2+6.4/-3.2 Ma, 75 % confidence from coherent group of 3
US0902,Median Age=34.0+8.4/-10.4 Ma, 97 % confidence from coherent group of 6
Concentrations Ratios Ages (Ma)

142
Table 2: LA-ICP-MS results of apatites
Analysis 206Pb (cps)
aU (ppm)
bPb (ppm)
bTh/U
b 206Pbc (%)
c 208Pbc (%)
c 206Pb/
238U
d d 207Pb/
235U
d drho
e 207Pb/
235U
206Pb/
238U
ap 54* 398884 38 50 1.0 90 100 0.0036 54 0.040 89 0.61 40 35 23 12
ap 46* 249904 20 31 0.19 89 100 0.0037 23 0.026 51 0.46 26 13 24.0 5.6
ap 41* 24023 11 2.9 0.086 91 100 0.0038 40 0.024 68 0.60 24 16 24.6 9.9
ap 60* 294044 8.0 37 1.7 93 100 0.0040 55 0.027 61 0.89 27 16 26 14
ap 49* 286925 12 37 1.1 93 100 0.0040 32 0.040 66 0.49 40 26 25.8 8.3
ap 63* 30349 14 3.6 1.1 89 99 0.0046 22 0.047 62 0.36 46 29 29.4 6.5
ap 56* 26776 14 3.3 1.0 91 99 0.0047 13 0.042 61 0.21 42 25 30.3 3.9
ap 47* 183073 20 23 0.42 86 100 0.0048 32 0.028 69 0.46 28 19 30.8 9.8
ap 66* 156338 7.5 20 0.28 90 100 0.0049 43 0.024 72 0.59 24 17 32 14
ap 45* 27434 14 3.4 1.0 91 99 0.0050 20 0.036 75 0.27 36 27 32.1 6.4
ap 53* 179673 32 25 2.0 92 99 0.0051 29 0.031 55 0.53 31 17 32.5 9.3
ap 72* 149004 192 18 1.9 84 97 0.0053 9.8 0.039 45 0.22 39 17 33.9 3.3
ap 64* 304566 8.8 38 0.20 90 100 0.0060 50 0.032 182 0.28 32 59 39 19
ap 55* 16350 7.2 2.0 1.3 90 99 0.0069 23 0.072 58 0.39 70 41 44.1 9.9
ap 48 147415 4.9 19 0.11 88 100 0.010 17 0.058 48 0.36 58 27 67 12
ap 62 41360 42 4.7 1.0 74 97 0.012 8.9 0.057 71 0.13 56 39 75.0 6.6
ap 65 164377 7.5 20 0.045 89 100 0.012 53 0.099 143 0.37 96 140 78 41
ap 74 186797 9.5 23 0.33 88 100 0.017 20 0.36 68 0.29 312 203 107 21
ap 43 21172 27 1.4 0.16 39 97 0.023 4.0 0.14 17 0.24 135 21 144.3 5.8
ap 59 521627 34 66 0.26 68 100 0.027 10 0.21 63 0.16 194 118 171 17
ap 42 126035 4.2 16 0.066 83 100 0.030 9.3 0.20 52 0.18 189 94 190 17
ap 73 78334 78 6.6 0.34 57 94 0.032 3.0 0.22 18 0.16 201 34 204.1 6.1
ap 52 25083 34 1.6 0.39 36 57 0.040 2.7 0.28 7.2 0.37 254 16 252.0 6.6
ap 136* 23606 29 2.7 1.1 84 99 0.0034 20 0.022 48 0.42 22 11 22.1 4.4
ap 154* 24103 12 3.3 1.9 90 99 0.0037 58 0.029 64 0.92 29 19 23 14
ap 129* 22013 11 2.4 1.4 94 99 0.0037 21 0.017 53 0.40 17.0 9.0 23.5 5.0
ap 159* 20953 6.8 2.6 1.5 90 100 0.0037 38 0.026 44 0.87 26 11 24.1 9.2
ap 157* 17757 24 2.1 0.59 84 99 0.0040 35 0.058 149 0.23 58 87 25.6 9.0
ap 149* 19226 5.5 2.3 1.3 90 100 0.0044 22 0.034 49 0.45 34 16 28.1 6.1
ap 151* 17198 9.0 2.0 1.8 86 99 0.0045 18 0.026 42 0.42 26 11 28.6 5.1
ap 125* 20009 11 2.3 1.1 89 99 0.0045 20 0.024 38 0.54 24.5 9.1 28.9 5.8
ap 127* 21355 5.5 2.5 1.6 82 100 0.0048 24 0.029 43 0.56 29 12 31.1 7.5
ap 135* 20268 9.9 2.3 1.5 86 99 0.0049 27 0.032 42 0.63 32 13 31.4 8.4
ap 138* 20806 17 2.4 1.5 86 98 0.0050 28 0.026 44 0.63 26 11 31.9 8.9
ap 155* 21094 15 2.3 1.3 87 99 0.0058 61 0.053 182 0.33 52 98 37 23
ap 140* 16572 9.2 2.0 1.3 86 99 0.0062 34 0.046 45 0.76 46 20 40 13
ap 156* 17097 5.7 2.1 0.78 90 100 0.0067 39 0.14 129 0.30 129 171 43 17
ap 123 23464 59 2.6 0.78 71 96 0.0069 24 0.050 45 0.54 50 22 44 11
ap 132 23024 26 2.5 0.14 73 99 0.011 36 0.047 61 0.59 46 28 72 26
ap 128 16145 12 2.0 0.90 83 98 0.012 26 0.18 48 0.55 165 75 79 20
ap 142 40907 65 4.5 0.86 66 95 0.013 3.5 0.074 36 0.10 72 26 82.2 2.9
ap 124 24285 17 2.8 1.2 77 97 0.014 29 0.11 67 0.43 102 67 87 25
ap 148 19831 6.6 2.3 1.6 81 98 0.014 36 0.15 61 0.59 143 84 88 31
ap 152 7166 8.4 0.96 1.7 62 93 0.014 6.2 0.093 6.9 0.89 90.0 5.9 88.9 5.4
ap 130 19561 7.9 2.3 1.2 84 98 0.014 16 0.096 43 0.37 93 39 90 14
ap 150 17711 7.2 2.1 0.34 85 99 0.016 14 0.13 178 0.08 126 236 105 14
ap 122 21204 8.5 2.5 1.4 87 98 0.017 10 0.12 85 0.12 112 94 107 11
ap 134 21832 12 2.5 1.1 71 97 0.020 7.5 0.10 44 0.17 94 41 126.1 9.4
ap 141 21537 9.8 2.5 1.2 73 97 0.022 6.2 0.19 34 0.18 174 56 139.3 8.5
ap 139 23565 24 2.9 0.74 67 95 0.025 17 0.26 61 0.27 238 139 157 26
ap 131 25321 9.6 3.1 1.6 82 96 0.027 5.8 0.16 64 0.09 154 96 171.6 9.8
ap 153 24602 7.1 3.0 1.2 82 98 0.029 26 0.47 152 0.17 392 677 183 47
ap 133 21170 4.3 2.6 2.2 86 97 0.029 10 0.21 76 0.13 197 145 185 18
ap 158 22438 7.9 2.9 1.4 76 94 0.046 4.9 1.4 15 0.34 903 91 292 14
ap 113 101785 4.0 12 1.1 83 100 0.012 183 0.11 208 0.88 103 228 76 139
ap 114 24798 11 2.6 0.82 71 98 0.023 8.7 0.20 34 0.26 183 58 147 13
ap 110 64636 51 6.1 0.76 63 93 0.029 3.8 0.20 43 0.088 185 76 186.6 7.0
ap 111 33670 24 3.1 0.13 43 99 0.032 3.7 0.25 26 0.14 227 54 205.0 7.4
ap 112 35426 26 3.4 1.0 61 91 0.033 4.6 0.24 21 0.22 214 42 207.7 9.5
ap 117 36974 28 3.7 0.87 57 91 0.038 3.1 0.30 17 0.18 266 40 241.3 7.3
WG0902,Median Age=28.8+3.2/-4.4 Ma, 94 % confidence from coherent group of 14
WG0904,No useful Median Age
US0906,Median Age=30.6+1.9/-4.8 Ma, 94 % confidence from coherent group of 14
Concentrations Ratios Ages (Ma)
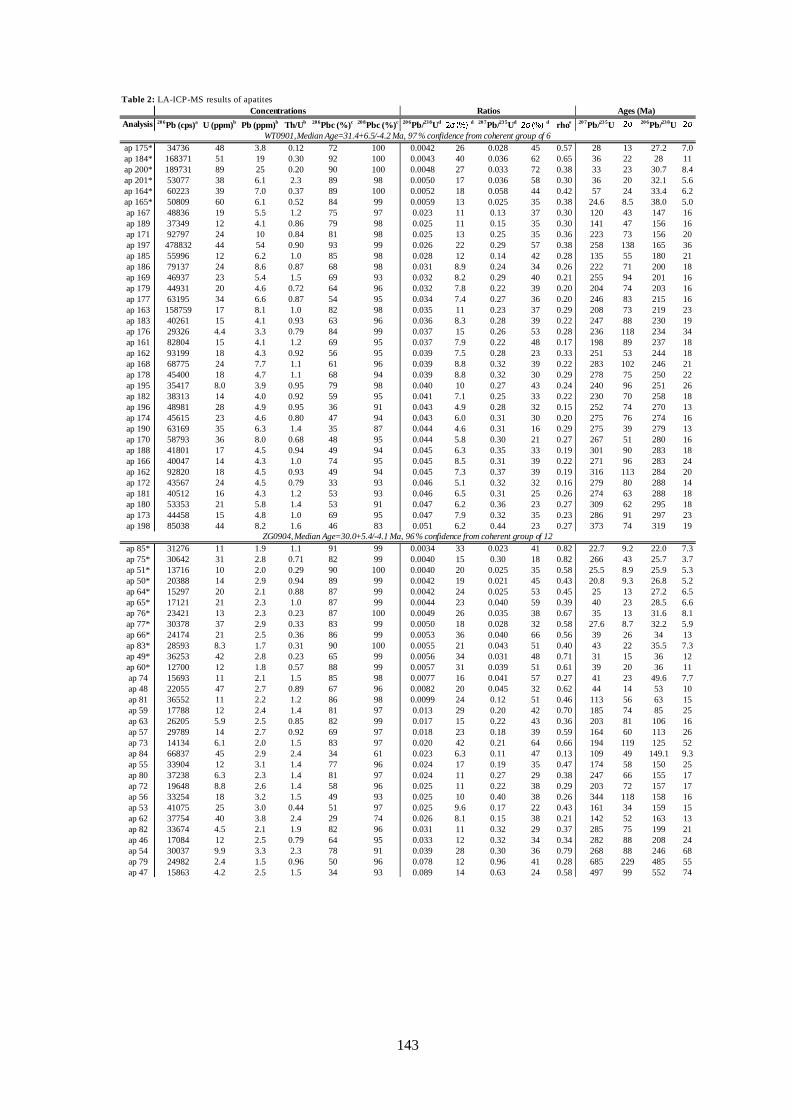
143
Table 2: LA-ICP-MS results of apatites
Analysis 206Pb (cps)
aU (ppm)
bPb (ppm)
bTh/U
b 206Pbc (%)
c 208Pbc (%)
c 206Pb/
238U
d d 207Pb/
235U
d drho
e 207Pb/
235U
206Pb/
238U
ap 175* 34736 48 3.8 0.12 72 100 0.0042 26 0.028 45 0.57 28 13 27.2 7.0
ap 184* 168371 51 19 0.30 92 100 0.0043 40 0.036 62 0.65 36 22 28 11
ap 200* 189731 89 25 0.20 90 100 0.0048 27 0.033 72 0.38 33 23 30.7 8.4
ap 201* 53077 38 6.1 2.3 89 98 0.0050 17 0.036 58 0.30 36 20 32.1 5.6
ap 164* 60223 39 7.0 0.37 89 100 0.0052 18 0.058 44 0.42 57 24 33.4 6.2
ap 165* 50809 60 6.1 0.52 84 99 0.0059 13 0.025 35 0.38 24.6 8.5 38.0 5.0
ap 167 48836 19 5.5 1.2 75 97 0.023 11 0.13 37 0.30 120 43 147 16
ap 189 37349 12 4.1 0.86 79 98 0.025 11 0.15 35 0.30 141 47 156 16
ap 171 92797 24 10 0.84 81 98 0.025 13 0.25 35 0.36 223 73 156 20
ap 197 478832 44 54 0.90 93 99 0.026 22 0.29 57 0.38 258 138 165 36
ap 185 55996 12 6.2 1.0 85 98 0.028 12 0.14 42 0.28 135 55 180 21
ap 186 79137 24 8.6 0.87 68 98 0.031 8.9 0.24 34 0.26 222 71 200 18
ap 169 46937 23 5.4 1.5 69 93 0.032 8.2 0.29 40 0.21 255 94 201 16
ap 179 44931 20 4.6 0.72 64 96 0.032 7.8 0.22 39 0.20 204 74 203 16
ap 177 63195 34 6.6 0.87 54 95 0.034 7.4 0.27 36 0.20 246 83 215 16
ap 163 158759 17 8.1 1.0 82 98 0.035 11 0.23 37 0.29 208 73 219 23
ap 183 40261 15 4.1 0.93 63 96 0.036 8.3 0.28 39 0.22 247 88 230 19
ap 176 29326 4.4 3.3 0.79 84 99 0.037 15 0.26 53 0.28 236 118 234 34
ap 161 82804 15 4.1 1.2 69 95 0.037 7.9 0.22 48 0.17 198 89 237 18
ap 162 93199 18 4.3 0.92 56 95 0.039 7.5 0.28 23 0.33 251 53 244 18
ap 168 68775 24 7.7 1.1 61 96 0.039 8.8 0.32 39 0.22 283 102 246 21
ap 178 45400 18 4.7 1.1 68 94 0.039 8.8 0.32 30 0.29 278 75 250 22
ap 195 35417 8.0 3.9 0.95 79 98 0.040 10 0.27 43 0.24 240 96 251 26
ap 182 38313 14 4.0 0.92 59 95 0.041 7.1 0.25 33 0.22 230 70 258 18
ap 196 48981 28 4.9 0.95 36 91 0.043 4.9 0.28 32 0.15 252 74 270 13
ap 174 45615 23 4.6 0.80 47 94 0.043 6.0 0.31 30 0.20 275 76 274 16
ap 190 63169 35 6.3 1.4 35 87 0.044 4.6 0.31 16 0.29 275 39 279 13
ap 170 58793 36 8.0 0.68 48 95 0.044 5.8 0.30 21 0.27 267 51 280 16
ap 188 41801 17 4.5 0.94 49 94 0.045 6.3 0.35 33 0.19 301 90 283 18
ap 166 40047 14 4.3 1.0 74 95 0.045 8.5 0.31 39 0.22 271 96 283 24
ap 162 92820 18 4.5 0.93 49 94 0.045 7.3 0.37 39 0.19 316 113 284 20
ap 172 43567 24 4.5 0.79 33 93 0.046 5.1 0.32 32 0.16 279 80 288 14
ap 181 40512 16 4.3 1.2 53 93 0.046 6.5 0.31 25 0.26 274 63 288 18
ap 180 53353 21 5.8 1.4 53 91 0.047 6.2 0.36 23 0.27 309 62 295 18
ap 173 44458 15 4.8 1.0 69 95 0.047 7.9 0.32 35 0.23 286 91 297 23
ap 198 85038 44 8.2 1.6 46 83 0.051 6.2 0.44 23 0.27 373 74 319 19
ap 85* 31276 11 1.9 1.1 91 99 0.0034 33 0.023 41 0.82 22.7 9.2 22.0 7.3
ap 75* 30642 31 2.8 0.71 82 99 0.0040 15 0.30 18 0.82 266 43 25.7 3.7
ap 51* 13716 10 2.0 0.29 90 100 0.0040 20 0.025 35 0.58 25.5 8.9 25.9 5.3
ap 50* 20388 14 2.9 0.94 89 99 0.0042 19 0.021 45 0.43 20.8 9.3 26.8 5.2
ap 64* 15297 20 2.1 0.88 87 99 0.0042 24 0.025 53 0.45 25 13 27.2 6.5
ap 65* 17121 21 2.3 1.0 87 99 0.0044 23 0.040 59 0.39 40 23 28.5 6.6
ap 76* 23421 13 2.3 0.23 87 100 0.0049 26 0.035 38 0.67 35 13 31.6 8.1
ap 77* 30378 37 2.9 0.33 83 99 0.0050 18 0.028 32 0.58 27.6 8.7 32.2 5.9
ap 66* 24174 21 2.5 0.36 86 99 0.0053 36 0.040 66 0.56 39 26 34 13
ap 83* 28593 8.3 1.7 0.31 90 100 0.0055 21 0.043 51 0.40 43 22 35.5 7.3
ap 49* 36253 42 2.8 0.23 65 99 0.0056 34 0.031 48 0.71 31 15 36 12
ap 60* 12700 12 1.8 0.57 88 99 0.0057 31 0.039 51 0.61 39 20 36 11
ap 74 15693 11 2.1 1.5 85 98 0.0077 16 0.041 57 0.27 41 23 49.6 7.7
ap 48 22055 47 2.7 0.89 67 96 0.0082 20 0.045 32 0.62 44 14 53 10
ap 81 36552 11 2.2 1.2 86 98 0.0099 24 0.12 51 0.46 113 56 63 15
ap 59 17788 12 2.4 1.4 81 97 0.013 29 0.20 42 0.70 185 74 85 25
ap 63 26205 5.9 2.5 0.85 82 99 0.017 15 0.22 43 0.36 203 81 106 16
ap 57 29789 14 2.7 0.92 69 97 0.018 23 0.18 39 0.59 164 60 113 26
ap 73 14134 6.1 2.0 1.5 83 97 0.020 42 0.21 64 0.66 194 119 125 52
ap 84 66837 45 2.9 2.4 34 61 0.023 6.3 0.11 47 0.13 109 49 149.1 9.3
ap 55 33904 12 3.1 1.4 77 96 0.024 17 0.19 35 0.47 174 58 150 25
ap 80 37238 6.3 2.3 1.4 81 97 0.024 11 0.27 29 0.38 247 66 155 17
ap 72 19648 8.8 2.6 1.4 58 96 0.025 11 0.22 38 0.29 203 72 157 17
ap 56 33254 18 3.2 1.5 49 93 0.025 10 0.40 38 0.26 344 118 158 16
ap 53 41075 25 3.0 0.44 51 97 0.025 9.6 0.17 22 0.43 161 34 159 15
ap 62 37754 40 3.8 2.4 29 74 0.026 8.1 0.15 38 0.21 142 52 163 13
ap 82 33674 4.5 2.1 1.9 82 96 0.031 11 0.32 29 0.37 285 75 199 21
ap 46 17084 12 2.5 0.79 64 95 0.033 12 0.32 34 0.34 282 88 208 24
ap 54 30037 9.9 3.3 2.3 78 91 0.039 28 0.30 36 0.79 268 88 246 68
ap 79 24982 2.4 1.5 0.96 50 96 0.078 12 0.96 41 0.28 685 229 485 55
ap 47 15863 4.2 2.5 1.5 34 93 0.089 14 0.63 24 0.58 497 99 552 74
Ages (Ma)
WT0901,Median Age=31.4+6.5/-4.2 Ma, 97 % confidence from coherent group of 6
ZG0904,Median Age=30.0+5.4/-4.1 Ma, 96% confidence from coherent group of 12
Concentrations Ratios

144
Table 2: LA-ICP-MS results of apatites
Analysis 206Pb (cps)
aU (ppm)
bPb (ppm)
bTh/U
b 20 6Pbc (%)
c 20 8Pbc (%)
c 20 6Pb/
238U
d d 207Pb/
235U
d drho
e 207Pb/
235U
20 6Pb/
238U
ap 121* 16018 34 2.1 0.36 83 99 0.0036 40 0.037 47 0.84 37 17 23.3 9.2
ap 95* 34589 35 4.5 0.37 88 100 0.0039 23 0.058 61 0.38 57 35 25.1 5.8
ap 123* 10239 16 1.2 0.25 80 100 0.0041 19 0.057 33 0.58 56 18 26.1 4.9
ap 116* 34478 62 1.8 0.78 55 96 0.0045 10 0.027 42 0.25 27 11 28.8 3.0
ap 091* 15883 13 1.9 0.68 88 99 0.0047 20 0.034 47 0.42 34 16 30.4 6.0
ap 98* 25437 8.7 1.5 0.64 90 99 0.0050 21 0.028 42 0.51 28 12 32.3 6.9
ap 93* 18218 71 2.2 0.82 65 95 0.0052 14 0.060 43 0.33 59 25 33.3 4.7
ap 122* 14300 9.1 1.7 0.91 88 99 0.0054 23 0.033 39 0.59 33 13 34.4 7.9
ap 111* 15951 14 1.9 0.74 87 99 0.0054 36 0.059 53 0.68 58 30 35 12
ap 101 24407 18 2.2 0.59 81 99 0.0064 18 0.044 38 0.48 43 16 41.0 7.5
ap 108 11909 5.0 1.5 1.7 89 98 0.0089 24 0.163 60 0.40 153 89 57 14
ap 112 14013 6.1 1.7 2.1 88 98 0.010 22 0.137 46 0.47 130 58 64 14
ap 96 12615 6.0 1.6 1.4 90 98 0.011 18 0.091 44 0.40 89 38 70 12
ap 100 24806 9.1 2.1 1.0 88 98 0.011 16 0.096 51 0.32 93 46 71 12
ap 94 19833 19 2.3 1.3 78 95 0.014 10 0.059 52 0.19 58 30 86.6 8.6
ap 115 33328 7.7 1.8 1.6 82 97 0.014 20 0.095 52 0.39 92 47 88 18
ap 97 23770 3.5 1.3 1.6 88 98 0.014 24 0.12 45 0.53 112 50 93 22
ap 99 14809 3.8 1.9 1.8 87 98 0.015 27 0.15 54 0.50 145 75 99 27
ap 92 16826 4.2 2.2 1.3 89 99 0.016 27 0.12 36 0.74 117 41 105 28
ap 118 19295 15 2.4 1.7 67 93 0.018 13 0.094 60 0.21 91 54 117 15
ap 90 29580 5.8 1.7 1.2 83 98 0.018 11 0.14 48 0.24 133 61 118 13
ap 87 18549 7.2 2.4 2.0 86 95 0.024 12 0.24 44 0.28 217 90 151 18
ap 117 17959 7.0 2.2 2.0 79 95 0.025 22 0.26 44 0.50 233 96 157 34
ap 114 52524 22 2.3 0.22 48 97 0.034 5.7 0.22 24 0.23 200 45 215 12
ap 110 15442 4.6 2.2 1.8 66 93 0.052 17 0.36 29 0.58 314 82 330 54
ap 25* 58946 84 7.4 2.6 86 97 0.0024 25 0.019 160 0.16 19 30 15.7 4.0
ap 30* 53855 52 8.0 2.1 94 99 0.0029 59 0.030 100 0.60 30 30 19 11
ap 15* 101004 104 6.0 2.3 81 96 0.0030 23 0.019 113 0.20 19 22 19.5 4.4
ap 56* 70754 66 8.5 1.9 92 99 0.0031 30 0.018 310 0.098 18 57 20.2 6.1
ap 18* 105831 57 14 1.4 95 99 0.0032 43 0.025 96 0.45 25 24 20.6 8.9
ap 53* 96561 64 12 1.8 94 99 0.0033 29 0.032 189 0.15 32 62 21.0 6.2
ap 44* 49502 54 6.5 5.1 90 90 0.0033 16 0.046 82 0.20 46 37 21.1 3.4
ap 55* 81140 50 9.5 1.6 90 98 0.0034 20 0.030 216 0.09 30 65 22.1 4.5
ap 74* 69356 124 7.6 1.3 89 98 0.0035 15 0.027 178 0.09 27 49 22.5 3.4
ap 43* 60449 113 6.8 0.20 83 99 0.0037 13 0.028 65 0.20 28 18 23.7 3.1
ap 52* 82308 68 10 4.2 94 97 0.0037 45 0.033 255 0.18 33 88 24 11
ap 63* 74032 75 9.3 3.3 92 97 0.0037 27 0.033 279 0.098 33 95 24.1 6.6
ap 12* 136445 106 8.3 3.3 88 95 0.0038 14 0.018 121 0.12 18 22 24.2 3.4
ap 41* 29221 26 3.4 1.3 96 99 0.0038 75 0.040 151 0.50 40 61 25 18
ap 65* 69483 69 8.0 1.7 80 96 0.0039 15 0.025 50 0.30 25 13 24.9 3.8
ap 48* 59318 72 9.0 2.2 92 98 0.0039 22 0.034 142 0.15 34 48 25.1 5.4
ap 60* 87420 64 10 2.9 94 98 0.0039 24 0.026 165 0.14 26 42 25.3 5.9
ap 31* 55144 45 7.1 3.4 74 94 0.0040 14 0.020 76 0.19 20 15 25.5 3.7
ap 64* 49225 92 5.7 3.5 89 93 0.0041 22 0.035 62 0.35 35 22 26.2 5.7
ap 23* 73001 82 9.6 3.3 85 96 0.0042 33 0.037 95 0.35 37 35 26.9 9.0
ap 58* 47204 50 5.5 1.8 91 98 0.0044 22 0.038 192 0.12 38 75 28.5 6.3
ap 73* 67829 31 7.6 1.3 91 99 0.0046 39 0.027 90 0.44 27 24 29 11
ap 08* 83383 89 12 4.4 92 95 0.0047 19 0.033 197 0.096 33 66 30.0 5.7
ap 72* 61068 41 6.8 1.0 93 99 0.0047 24 0.031 311 0.08 31 101 30.1 7.3
ap 19* 360445 53 56 4.1 91 99 0.0047 35 0.021 77 0.45 21 16 30 10
ap 57* 33610 26 4.9 0.80 91 99 0.0047 38 6.6 39 0.96 2058 424 30 12
ap 47* 21471 30 2.7 5.1 83 92 0.0048 33 0.098 121 0.28 95 116 31 10
ap 20* 67931 60 9.8 0.68 84 99 0.0048 19 0.032 101 0.19 32 32 31.1 5.8
ap 13* 98053 47 6.4 0.91 90 99 0.0049 26 0.028 69 0.37 28 19 31.6 8.1
ap 54 136749 59 18 3.4 94 96 0.0052 33 0.082 126 0.26 80 102 33 11
ap 29 66101 53 8.6 4.9 91 95 0.0052 25 0.086 122 0.21 84 103 33.7 8.4
ap 27 93653 16 12 0.55 95 100 0.0053 66 0.074 138 0.48 72 101 34 22
ap 49 71123 66 9.1 2.2 89 97 0.0054 17 0.044 119 0.14 44 53 35.0 5.9
ap 38 40924 56 5.4 3.0 91 94 0.0058 17 0.053 164 0.11 53 88 37.2 6.5
ap 07 66557 48 9.9 1.0 93 99 0.0059 23 0.063 131 0.18 62 82 37.9 8.7
ap 51 20059 8.7 2.4 3.4 93 98 0.0061 68 0.013 995 0.068 13 136 40 27
ap 45 110458 77 15 1.9 87 98 0.0071 25 0.19 59 0.43 173 99 45 12
ap 21 50022 70 7.0 2.7 84 91 0.011 25 0.079 71 0.35 77 54 67 17
ap 62 173334 107 23 2.1 89 97 0.011 33 0.075 50 0.66 73 36 68 22
ap 14 75495 17 10 2.2 92 98 0.014 50 0.13 151 0.33 125 195 92 46
ap 28 139281 48 18 2.0 92 98 0.015 19 0.15 213 0.088 145 339 99 18
ap 24 24998 17 3.4 1.1 88 97 0.018 27 0.15 96 0.28 139 133 114 30
ap 32 114420 30 15 0.81 91 99 0.025 22 0.57 271 0.080 460 4373 158 34
ap 66 442856 117 57 0.31 0 54 0.046 9.4 0.33 10 0.99 288 24 290 27
ap 11 30112 3.0 4.3 2.0 88 98 0.054 43 1.4 81 0.53 870 634 337 142
Pleisovicef
73330 676 35 0.11 0.88 29 0.394 0.0 0.05 0.0 0.59 337.5 8.4 339.4 5.8
Griedelf
5811 48 0.46 1.1 17 41 0.0263 0.0 0.004 0 0.35 26.3 2.8 26.4 1.3
91500f
177146 56 10 0.35 0.53 8.3 1.85 0.0 0.2 0.0 0.76 1064 15 1060 17
Concentrations Ratios Ages (Ma)
ZT0902,Median Age=25.1+3.5/-1.2 Ma, 95 % confidence from coherent group of 29
ZG0908,Median Age=30.4+4.0/-5.3 Ma, 96 % confidence from coherent group of 9
Age-standards

145
Notes:
Spot size = 50 to 75 µm; depth of crater ~15µm.20 6
Pb/23 8
U error is the quadratic additions of the within run precision (2 SE)
and the external reproducibility (2 SD) of the reference zircon.20 7
Pb/20 6
Pb error propagation (20 7
Pb signal dependent) following Gerdes & Zeh (2009).20 7
Pb /23 5
U error is the quadratic addition of the20 7
Pb/20 6
Pb and20 6
Pb /23 8
U uncertainty.a
Within run background-corrected mean20 7
Pb signal in cps (counts per second).b
U and Pb content and Th/U ratio were calculated relative to GJ-1 reference zircon.c percentage of the common Pb on the
20 6Pb. b.d. = below dectection limit.
d corrected for background, within-run Pb/U fractionation (in case of
20 6Pb/
23 8U) and common Pb using Stacy and Kramers (1975) model Pb and
subsequently normalised to GJ-1 (ID-TIMS value/measured value);20 7
Pb /23 5
U calculated using20 7
Pb/20 6
Pb/(23 8
U/20 6
Pb *1/137.88).e
rho is the20 6
Pb/23 8
U/20 7
Pb/23 5
U error correlation coefficient.fAccuracy and reproducibilty was checked by repeated analyses (n = 16) of reference zircon Plesovice, Griedel, and 91500;
data given as mean with 2 standard deviation uncertainties

147
5. The dynamic evolution of the Tauern Window: a crustal scale
expression of upper mantle dynamics
5.1 Methodological conclusions
Based on comprehensive and detailed structural mapping of the western Tauern Window and on a
structural compilation covering the entire window, we reassessed the position and the links between
Cenozoic faults systems and shear zones, to discriminate between different kinematic models and
to propose a new one. The compilation of main foliations covering the entire Tauern Window
visualize the first order differences between the western, central and eastern Tauern Window that
are also manifested by first order geochronological differences.
The ISOPLOT algorithm TuffZirc age extractor (Ludwig and Mundil, 2002) is a promising tool to
decipher crystallization, partly reset and cooling ages of apatites that underwent amphibolite-facies
metamorphism. Cooling ages dating the mid-range metamorphism (450 °C) can be obtained from
apatites due to their diffusion controlled Pb loss and their inert behavior to recrystallization.
Differentiation of the apatite age spectra into crystallization, partly reset and cooling ages was
supported by the U-Pb crystallization ages of zircons from the same samples. In future studies
analyses of larger amounts of grains (≥100) might achieve a higher significance level of the apatite
median ages and therefore, could better constrain the timing of isotopic closure.
In situ dating of microstructurally defined pre-, syn-, and post-kinematic minerals confirms the
relative age sequence assessed by textural arguments and allows us to attribute absolute ages to
ductile shear. Although pre-kinematic minerals appear to be affected by extraneous Ar, syn-
kinematic and post-kinematic minerals yield reliable formation ages. Age differences of syn-
kinematic minerals indicate different increments of a long lasting deformation history. Therefore,
these ages can be interpreted to define longevities of ductile shear zones. Since post-kinematic
phengite ages coincide with the youngest syn-kinematic formation ages of the same microstructural
site in one sample, the termination of ductile deformation is interpreted to be identical with the age
of post-kinematic phengites. The initiation of deformation cannot be constrained as precisely as its
termination. This result is a first step to assess how and when orogen-scale shear zone networking
was active, hence to understand how deformation is accommodated and partitioned in space and
time.
5.2 Geological conclusions
The results of this study show that the western Tauern Window was deformed by a transpressive
belt consisting of upright folds and sinistral shear zones that has the scale of an orogen. It forms a
restraining bend by crustal buckling linking the sinistral, transpressive Giudicarie Belt, with the
sinistral SEMP Fault. 58 km of north-directed shortening caused by the Dolomites Indenter were
accommodated by upright folds (38 km) and partly by sinistral shear zones attaining 26-31 km
of bulk sinistral displacement, i.e. 16-24 km east-west extension. The SEMP Fault as major strike-
slip fault north of the central sub-dome accommodated ~60 km of sinistral displacement
contributing ~58 km to lateral extrusion. North-south shortening in the central Tauern Window
decreases, as seen from the lower amplitude of folds, the absence of interconnected networks of
shear zones, and preserved, higher tectonostratigraphic units. These observations are consistent
with the larger exposure of Austroalpine Units south of the Tauern Window and the more southerly
position of the indenter margin.
148
The obtained cooling pattern from the U-Pb apatite ages indicates a dome structure in agreement
with earlier studies. The novel aspect is that an early stage of this cooling event in the Lower
Oligocene epoch was dated. Hence, the duration of cooling and the driving processes causing it
were substantially extended. The remarkable coincidence of U-Pb apatite ages with the spatial
distribution of geochronometers having lower closure temperatures indicate that from 31-29 Ma
on the western Tauern Window cooled with a cooling rate of 15.2±1.5 K/Myr due to erosional
denudation. Samples that are outside of the restraining bend, cooled at 36-35 Ma, whereas samples
that are inside of the restaining bend started to cool at 31-29 Ma below 450 °C. Therefore we argue
that the onset of Dolomites Indentation might have occurred at 31-29 Ma.
The longevity of sinistral shear zones comprises for all dated structures several million years. The
termination of those structures was precisely figured out in some cases. Localized deformation
initiated within the entire western sub-dome contemporaneously to the cooling mentioned above.
Our results suggest that the three large-scale shear zones investigated were partly coeval each of
them acting for time intervals of 19 Myr, 13 Myr and 22 Myr, respectively. The northernmost Ahorn
Shear Zone was active under greenschist-facies conditions between 33 and 15 Ma and might have
terminated at 15.7±5.8 Ma. The Tuxer Shear Zones were active under greenschist to amphibolite
facies conditions between 24 and 12 Ma and terminated at 12.4±1.0 Ma. The Greiner Shear Zone
was active under amphibolite facies conditions between 28 and 7 Ma (Pollington and Baxter, 2010;
Schneider et al., 2013). Localized deformation continued until the Upper Miocene and followed the
cooling of the dome from the margins to the center. The sinistral shear zones and for this reason the
entire transpressive belt dominated the uplift and exhumation of the western Tauern Window.
5.3 Geodynamic implications
Upright folding in the western Tauern Window is the surface expression of an extraordinary
localized process of crustal buckling. In contrast to all other parts of the Alpine Chain, the site of
accretion of new nappes of European basement did not shift towards the foreland, hence erosion
eliminated more than 30 km of a crustal column in the hinge area of this antiformal stack, allowing
for the exhumation of deep crust. This process was coeval with orogen-parallel extrusion, which
localized along normal faults forming the western and eastern margins of the Tauern Window and
a network of sinistral shear zones in the western sub-dome, decoupling it from central and eastern
sub-domes.
Therefore, the western sub-dome experienced a different structural evolution compared to the
central and eastern ones. In the former, the widespread association of high-amplitude, tight upright
folds and sinistral shear zones, testifies a larger amount of orogen-perpendicular shortening and a
peculiar position linking the Giudicarie Belt, hence indentation to the SEMP Fault, hence lateral
extrusion. Against previous interpretations suggesting that exhumation of the western Tauern
Window results from tectonic unroofing, emphasizing extensional tectonics, we showed that the
fault pattern and the relative displacements on the faults required by such models do not match with
the structures of the western Tauern Window. In contrast this fault pattern and the inferred
displacements are consistent with exhumation dominated by erosional denudation during upright
folding and sinistral shearing.
Formation of the Tauern Window is largely related to doming caused by Adria-Europe collision
causing Barrovian metamorphism in the Zentralgneiss batholith. The timing of the thermal climax
in the Zentralgneiss batholith occurred at 38-34 Ma contemporaneously to high-pressure
metamorphism in the eclogite zone and might be related to mantle-derived heat influx after slab
breakoff at 35 Ma (Ratschbacher et al., 2004), which coincides with the main phase of Periadriatic
plutonism 34 Ma (42-30 Ma, cf. Pomella et al., 2011). Ongoing shortening and detached upper
crust might have promoted Dolomites Indentation causing strain localization such as the restaining
bend in the western Tauern Window and additional rock uplift starting at 33 Ma, confirmed by the

149
oldest deformation ages obtained in this study and in agreement with eclogite-facies ductile shear
at 32 Ma (Kurz et al., 2008).
Recent findings of upper mantle anisotropy beneath the Eastern Alps measured by fast orientations
of shear-wave splitting parameters indicate the presence of a more-or-less mountain chain-parallel
seismic anisotropy in the upper mantle under the Western and Central Alps (Bokelmann et al.,
2013). However, in the Eastern Alps, fast orientations jump by about 45° across the Tauern
Window. For the easternmost stations yet record a shear-wave splitting of similar size, Bokelmann
et al. (2013) found that fast directions agree closely with those predicted by the relative motion of
the surface (GPS) with respect to the Central Alps. This suggests that the authors may have observed
a mantle deformation signal of the eastward extrusion. In that case, the entire lithosphere takes part
in the lateral escape toward the Pannonian basin. The restaining bend in the western Tauern Window
and the decoupling of the central and eastern Tauern Window coinciding with this deep seismic
signal may be the surface expression of this crustal-scale flip.

151
6. What will be next?
When I visited one of my new colleagues in Freiberg for some administrative questions, I read a
very interesting proverb stuck to the monitor of his computer. At first I forgot it, but later on it came
back into my mind and I really started to like it. It says: “The solution to a problem is half completed
when the question to it is carefully worded” Therefore I will ask some question that might be
interesting on the base of this thesis.
6.1 Methodological focus
6.1.1 How can we improve the 40Ar/39Ar geochronometer?
There are some set screws to refine in situ 40Ar/39Ar geochronology. First of all the quality of all
isotopic measurements is directly proportional to the blank analyses. Thanks to Dr. Jörg Pfänder
(Technische Universität Bergakademie Freiberg) the ARGUS VI mass spectrometer has a very low
volume of the central unit and therefore internal instrument surfaces where blank gas can be
attached to or released from is very low. In addition, a high percentage of the ablated gas enters the
mass spectrometer yielding good intensities even from small ablation volumes. Therefore, the
conditions for high-precision noble gas measurements with high spatial resolution are unrivaled in
Freiberg. Another factor that directly influences the quality of 40Ar/39Ar data is the J-value, a
parameter describing the neutron fluence that a given sample was exposed to during rotational
neutron irradiation. The axial variability of this value is already described in the literature, but the
radial variability is believed to be minor or negligible. On the contrary, new findings of PhD-student
Daniel Rutte (Technische Universität Bergakademie Freiberg) showed that radial variability of the
J-value might have been underestimated in the past. By better monitoring this value or better
adjustment of the samples holder geometry the control of this variable could be improved. Maybe
the biggest weakness 40Ar/39Ar geochronology or the laser ablation approach in general is that
scientists have no direct measure of the isotopic concentrations since the ablated volume is hard to
constrain and depends on several parameters like mineral phase, crystal structure, laser power and
chosen ablation mode. The methodological improvement of direct excess to the Ar concentrations
of the in situ analyses could facilitate microtectonic or geochemical interpretations in terms of mass-
transfer, excess Ar, Ar loss or composition of metamorphic fluids.
6.1.2 Can we use other noble gases to understand orogenic processes?
Noble gases such as Helium, Neon, Argon and Xenon have been used to understand early
differentiation processes of volatile accretion in the Earth’s mantle. It has been shown that the noble
gas signature of OIBs is less radiogenic compared to the one of MORBs. There is an ongoing
discussion whether atmospheric Xenon was recycled to the mantle by subduction or whether there
exists a relatively undegassed primitive deep-mantle reservoir. What exactly is happening to the
noble gases during subduction is less understood and the data are ambivalent. A systematic
comparison of the isotopic composition of noble gas in ophiolites and eclogites compared to present
day MORB signatures might give a hint of which fraction of noble gases is recycled to the mantle
during subduction, exhumation and/or eclogite formation.
152
6.2 Microstructural focus
6.2.1 How can we better understand major-element mass-transfer?
Breakdown and formation of minerals within shear and fault zones are the manifestation of
differential stress and rock failure under certain PT conditions. Usually metamorphic fluids are
involved in mineral reactions during deformation. The Ar concentration of metamorphic fluids is
highly divers and the Ar isotope composition of such fluids is poorly understood. However, the
presence and mobility of fluids a directly linked to the porosity and permeability of the rocks.
Recent findings by Dr. Florian Fusseis (University of Edinburgh) showed that in mylonites a
significant volume of porosity is present. He and his colleagues showed in analogue models that
this porosity is formed syn-kinematically. Systematic sampling across fault and shear zone for
analyses of K and Ar concentration, for Ar isotopic composition in contrast to porosity and
permeability might give new insights to metamorphic fluids, their composition and distribution
during deformation.
6.2.2 What tell us trace element distributions?
Several elements are consumed or released during metamorphic mineral reactions. Especially trace
elements are highly mobile and might indicate fluid rock interactions. Recent findings of Dr.
Matthias Konrad-Schmolke (University of Potsdam) showed that Li and B budgets are fluid-
controlled in eclogite-facies rocks that suffered a deformation induced overprint, thus acting as
tracers for fluid–rock interaction processes. On the contrary, other trace elements e.g. Sr and Pb
were controlled by breakdown reactions of epidote. Looking at trace element distributions
greenschist- to amphibolite-facies shear zones in combination to the above mentioned approaches
might strengthen the link between metamorphic fluid infiltration and syn-kinematic mineral
formation.
6.2.3 Do structural elements act the same or are there fundamental differences?
Mylonitic shear zones are mainly expressions of rock failure and stress release. Other structures
more related to compression are folds. During folding recrystallization and syn-kinematic mineral
formation also occurs. First results during this study that were not presented in this thesis due to
their preliminary character show that there are also systematic age distribution in samples that are
folded. In dependence on the second chapter presented in this study where the longevity of ductile
shear zones was dated, the formation and longevity of folds might also be analyzed. Especially in
transpressional or transtensional regimes where shear zones are linked to folds systematic analyses
of both structural elements might reveals a more complete structural evolution of the area of interest.
153
6.3 Focus on Regional Geology
This study in agreement with earlier published literature showed that ductile shear zones might be
active over millions of years and might evolve in space and time, especially if they are km-scale
structures. This major result opens up the possibility to study the temporal evolution of major shear
zones in the European Alps, in the Pamir Mountains, or in the Himalayas from the perspective of
kinematic endurance and propagation of localized ductile deformation. A complication to this
approach is the common field observation, that usually strain across a given shear zone system does
not increase or decrease monotonous into one direction. Shear zones are webbed into networks,
they interact and overprint themselves; and strain might be distributed or localized. Systematic
sampling strategies for in situ 40Ar/39Ar dating across well- or un-known major fault and shear zones
might illuminate tectonic processes and might also improve spatial plate restoration.
U-Pb ages of apatite were performed for the first time in the Eastern Alps. The results show
remarkably consistent median ages and makes the U-Pb apatite geochronometer a promising tool.
The precision could be improved by analyzing more grains which would not be extraordinary time-
consuming. To better understand the thermal history of the entire Tauern Window, similar analyses
could be performed in the central and eastern Tauern Window. The discussion of white mica cooling
age vs. formation age could be circumvent by this approach since apatite U-Pb in the western
Tauern Window are certainly cooling ages which is also likely for the central and eastern Tauern
Window.
Related Documents