EXHIBIT J – PART 2 Case 5:14-cv-00117-cr Document 63-11 Filed 11/14/14 Page 1 of 312

Welcome message from author
This document is posted to help you gain knowledge. Please leave a comment to let me know what you think about it! Share it to your friends and learn new things together.
Transcript

EXHIBIT J – PART 2
Case 5:14-cv-00117-cr Document 63-11 Filed 11/14/14 Page 1 of 312

Why We Need Labeling ofGenetically Engineered Food
Consumers International, April 1998
Researched and written by Jean Halloran and Michael Hansen, Ph.D.Consumer Policy Institute/Consumers Union, USA.
Overview
Food is different from other consumer products. It’s something we literally take inside ourselves, it’s necessary on adaily basis for growth and life, and bound up in our cultures and traditions, so we care about it intensely. Consumers,therefore, have a fundamental right to know what they are eating, and that it is safe. Most developed countries haveadopted laws that reflect this view, requiring labelling, to show ingredients (e.g. broccoli, beef), processing (e.g.frozen, homogenized, irradiated), conformance to standards of identity (e.g. peanut butter must be made from peanuts),and additives (e.g. sulfites, preservatives). Some countries require fat, protein, carbohydrate and vitamin content offood to be labeled as well.
All of this labelling serves the consumer's right to know, and is above and beyond underlying national programs toassure the safety of food from such things as hazardous pesticides residues and additives, and disease-causing bacteria.
Consumers want to know what they are eating both as a matter of taste and preference, and for many health-relatedreasons. They may want to eat fish to improve their chances of avoiding heart disease, or avoid fish because they areconcerned about depletion of certain species in the oceans or about mercury contamination. They may seek outcarbohydrates because they are training for a marathon, or avoid them because they want to lose weight. They may eatbananas because they want a good source of potassium, or may avoid bananas because even one bite causes them to gointo anaphylactic shock (as is the case with some people with severe food allergies). Body builders may want red meat,vegetarians will avoid it, and Muslims will avoid pork but not lamb. A mother may look for apple juice for her childbecause it is a natural drink, or avoid it because it gives the child a stomach ache. Every day, millions of consumersworld-wide read millions of food labels and make millions of decisions like this for themselves and their families.
Consumers also have a right to know if food is genetically engineered. In this case too, it may be for taste andpreference, or for important health related reasons. Some food producers claim that genetically engineered food isbasically the same (‘substantially equivalent’ is the description used) as conventionally produced food. But this is notthe case; some individuals can have unpredictable mild to severe allergic reactions; it can have unanticipated toxiceffects; and it can change the nutrition in food. In addition consumers express a wide variety of religious, ethical andenvironmental preferences in their food choices, and they cannot do this without comprehensive labelling.
The countries of the European Union have recognized this, and have introduced regulations requiring labelling of allgenetically engineered food. In the United States, where genetically engineered corn, soybeans and potatoes are beinggrown commercially, repeated public opinion surveys show consumers overwhelmingly want labelling, but thus far thegovernment has failed to require it. In 1997, a survey sponsored by Novartis found that more than 90 per cent of
EXHIBIT J - Page 284
Case 5:14-cv-00117-cr Document 63-11 Filed 11/14/14 Page 2 of 312

Americans want labelling (Feder, 1997). Most countries have not considered the issue yet. Of the largechemical/biotechnology companies that are developing these foods, some, like Novartis, support labelling, but most,like Monsanto and other major developers, oppose it.
The Codex Alimentarius Commission, an agency of the United Nations World Health Organization and Food andAgriculture Organization, has been considering whether to adopt a guideline recommending that all countries requirelabelling of genetically engineered food. Codex guidelines are not binding, but are often adopted by developingcountries and can be used to settle trade disputes (if a country adopts a Codex standard, that standard cannot bechallenged as protectionist). Consumers International is urging the Codex Alimentarius to recommend full mandatorylabelling of all genetically engineered foods. This paper discusses eight important reasons why.
1. Genetically Engineered Food is Different
A strawberry can be given a flounder gene that makes it frost resistant, a bacterial gene that confers antibioticresistance, and a virus gene that "turns on" the other added genes. Under normal circumstances, a strawberry can onlyacquire genetic material from other strawberries--that is, plants of the same or closely related species. With geneticengineering, however, scientists can give strawberries genetic material from trees, bacteria, fish, pigs, even humans ifthey chose to. Consumers International believes that any plant or animal food to which genes have been added from asource other than the species to which the food belongs, should be required to be labeled, to tell the consumer that thishas been done.
Some people, mostly scientists and corporations involved in the development of genetically engineered food, argue thatthe strawberry with the foreign genes is not really different but "substantially equivalent" in the language Codex andinternational regulation and therefore needs no label.
Consumers, however, through their organizations, through comments to regulators, and through opinion surveys, haverepeatedly expressed the view that this strawberry, and all other genetically engineered foods, are not "substantiallyequivalent," but sufficiently different that, like irradiated foods, and foods containing additives, they should be labeled.Since labelling laws are created to meet consumer needs, consumer opinion should be respected.
2. Genetically Engineered Food Can Cause Toxic Effects
The fact that genetic engineering can go seriously wrong was shown by one of the very first products introduced intothe market. An amino acid (a protein building block) called tryptophan is sold in a number of countries including theUnited States as a dietary supplement. In the late 1980s, the Showa Denko company of Japan began makingtryptophan by a new process, using genetically engineered bacteria, and selling it in the United States.
Within months thousands of people who had taken the supplement began to suffer from eosinophilia myalgiasyndrome, which included neurological problems. Eventually at least 1500 were permanently disabled and 37 died(Mayeno and Gleich, 1994).
As doctors encountered this syndrome, they gradually noticed that it seemed linked to patients taking tryptophanproduced by Showa Denko. However, it took months before this was taken off the market. Had it been labeled asgenetically engineered, it might have accelerated the identification of the source of the problem.
Showa Denko refused to cooperate in any U.S. government efforts to investigate the cause of the problem. However,the tryptophan that caused the problem was determined to contain a toxic contaminant which appears to have been aby-product of the increased tryptophan production of the genetically engineered bacteria (Mayeno and Gleich, 1994).
There are many ways besides this in which genetic engineering could go awry and result in hazardous toxins in food.Many common plant foods such as tomatoes and potatoes produce highly toxic chemicals in their leaves, for example.Any responsible company working with such plants would check for changes in toxin levels. But not all companies areequally responsible, and as the Showa Denko example shows, and a serious hazard can be missed.
Government agencies cannot be counted on to prevent unexpected problems. World-wide, government premarketEXHIBIT J - Page 285
Case 5:14-cv-00117-cr Document 63-11 Filed 11/14/14 Page 3 of 312

safety reviews of genetically engineered products range from relatively thorough in the European Union to no reviewat all in much of the world. In the United States, premarket safety reviews are voluntary.
We can expect that in the future genetically engineered food will be developed and grown in many countries with nopremarket safety reviews. Unless all such products are labeled, it will be difficult to determine the source of any toxinproblems originating in such food.
3. Genetically Engineered Food Can Cause Allergic Reactions
In the United States, about a quarter of all people report that they have an adverse reaction to some food (Sloan andPowers, 1986). Studies have shown that 2 percent of adults and 8 percent of children have true food allergies,mediated by immunoglobin E (IgE) (Bock, 1987; Sampson et al., 1992).
People with IgE mediated allergies have an immediate reaction to certain proteins, ranging from itching to potentiallyfatal anaphylactic shock. The most common allergies are to peanuts, other nuts and shellfish.
Genetic engineering can transfer allergies from foods to which people know they are allergic, to foods that they thinkis safe. In March 1996, researchers at the University of Nebraska in the United States confirmed that an allergen fromBrazil nuts had been transferred into soybeans. The Pioneer Hi-Bred International seed company had put a Brazil nutgene into soybeans to improve their protein content for animal feed. In an in-vitro and a skin prick test, the engineeredsoybeans reacted with the IgE of individuals with a Brazil nut allergy in a way that indicated that the individualswould have had an adverse, potentially fatal reaction to the soybeans (Nordlee et al., 1996).
This case has a happy ending. As Marion Nestle, the head of the Nutrition Department at New York Universitysummarized in an editorial in the respected New England Journal of Medicine "In the special case of transgenicsoybeans, the donor species was known to be allergenic, serum samples from persons allergic to the donor specieswere available for testing and the product was withdrawn" (Nestle, 1996: 726). However, for virtually every food,there is someone allergic to it. Proteins are what cause allergic reactions, and virtually every gene transfer in cropsresults in some protein production. Proteins will be coming into food crops not just from known sources of commonallergens, like peanuts, shellfish and dairy, but from plants of all kinds, bacteria and viruses, whose potentialallergenicity is uncommon or unknown. Furthermore, there are no fool-proof ways to determine whether a givenprotein will be an allergen, except tests involving serum from individuals allergic to the given protein. Nestlecontinues, "The next case could be less ideal, and the public less fortunate. It is in everyone’s best interest to developregulatory policies for transgenic foods that include premarketing notification and labelling" (Nestle, 1996: 727).
To protect consumer health from the effects of unrecognized or uncommon allergens, all genetically engineered foodmust be labeled. Otherwise there will be no way for sensitive individuals to distinguish foods that cause them problemsfrom ones that do not. This need is particularly urgent, since one of the potential consequences is sudden death, andchildren are the part of the population most at risk.
4. Genetic Engineering Can Increase Antibiotic Resistance
Despite the precise sound of its name, genetic engineering, is actually a messy process, and most attempts end infailure. While the gene to be transferred can be identified fairly precisely, the process of inserting it in the new hostcan be very imprecise. Genes are often moved with something that is the molecular equivalent of a shotgun. Scientistscoat tiny particles with genetic material and then "shoot" these into thousands of cells in a petri dish before they getone where the desired trait "takes" and is expressed.
Because the transferred trait, such as ability to produce an insecticide in the leaves of the plant, is often notimmediately apparent, scientists generally also insert a "marker gene" along with the desired gene into the new plant.The most commonly used marker is a bacterial gene for antibiotic resistance. Most genetically engineered plant foodcontains such a gene.
Widespread use of antibiotic resistance marker genes could contribute to the problem of antibiotic resistance. Thegenes may move from a crop into bacteria in the environment, and since bacteria readily exchange antibiotic resistance
EXHIBIT J - Page 286
Case 5:14-cv-00117-cr Document 63-11 Filed 11/14/14 Page 4 of 312

genes, move into disease-causing bacteria and make them resistant too. Antibiotic resistance genes could even betransferred in the digestive tract to bacteria. An example of this is the genetically engineered Bt maize plant fromNovartis which includes an ampicillin-resistance gene. Ampicillin is a valuable antibiotic used to treat a variety ofinfections in people and animals. A number of European countries, including Britain, have refused to permit theNovartis Bt corn to be grown, because of concern that the ampicillin resistance gene could move from the corn intobacteria in the food chain, making ampicillin a less effective weapon against bacterial infections.
But there are already foods in the market made using plants with antibiotic resistance marker genes. Without labelling,consumers cannot choose not to buy them.
5. Genetic Engineering Can Alter Nutritional Value
Genetic engineering can alter nutritional value of foods in positive ways. For example, canola oil has been engineeredto have a different profile of fatty acids, so that they contain less of the fat molecules that tend to build up in people'sarteries. Scientists are also working on increasing the vitamin C content in some foods. However, it is also possible thatnutritional content could be reduced as an unexpected side effect of some other genetic engineering. Labelling isneeded to make sure consumers are properly informed.
6. Genetically Engineered Food Can Create Environmental Risk
The most widely grown genetically engineered crops, accounting for 99 percent of the land under transgeniccultivation world-wide, are engineered for herbicide tolerance, insect resistance, and virus resistance (James, 1997).Each of these poses environmental risks.
Herbicide-tolerant crops are varieties on which herbicides can be used to kill weeds, without killing the crop itself.These varieties encourage farmers to use more herbicides, which frequently pollute groundwater and can cause variousother forms of ecological damage.
Insect-resistant crops almost all contain a gene from the bacterium Bacillus thuringiensis (Bt) which causes the plant toproduce an endotoxin throughout the plant, including leaves and fruit. Bt corn, cotton, potatoes tomatoes and rice areall being grown in various parts of the world.
While Bt crops at first glance appear to be ecologically sound, because they need less chemical pesticides, they haveserious drawbacks. Crops that continuously produce Bt endotoxin quickly speed up the process of the spread ofresistance to the Bt endotoxin among the pests feeding on the crops.
A recent computer model developed by a scientist at the University of Illinois in the U.S. predicted that if all U.S.farmers grew Bt corn, resistance would develop in a single year! Scientists at the University of North Carolina in theU.S. have already found Bt resistance genes in wild populations of a moth pest that feeds on corn. (Gloud et. al, 1997)
The Bt endotoxin, produced by the Bt bacteria, is a staple of organic farming since it is a relatively harmless naturalpesticide. It is also widely used by conventional farmers who use integrated pest management to minimize the use ofmore toxic chemicals. Scientists predict that Bt will become less and less useful, however, within a few years ofwidespread planting of Bt crops.
The Bt crops may also be toxic to beneficial insects. Researchers from Swiss Federal Research Station forAgroecology and Agriculture found, for example, over 60% mortality of green lacewings, that ate moth larvae that hadfed on Bt corn.
Virus-resistant crops almost all contain genes that can mix with genes from other viruses that naturally infect the plantto create new gene combinations, some of which can give rise to new or deadlier viruses. US and Canadian work hasshown that wild viruses can hijack genes from engineered crops at rates far higher than previously suspected. Theconcern was great enough that the U.S. Department of Agriculture held a meeting in October, 1997 to discuss possiblerestrictions aimed at reducing the risk of creating harmful new plant viruses due to the use of virus-resistant crops(Kleiner, 1997).
EXHIBIT J - Page 287
Case 5:14-cv-00117-cr Document 63-11 Filed 11/14/14 Page 5 of 312

Another serious concern is "gene pollution". If the gene for herbicide tolerance escapes into wild relatives of cropplants that are weeds, it could result in a new generation of herbicide-tolerant superweeds. In fact, researchers in bothNorway (Jorgensen and Andersen, 1995) and the United States (Hileman, 1995) have already demonstrated that thegene for herbicide tolerance moved from cultivated canola to close relatives in nearby fields, such as wild mustard.
If the gene for the production of the Bt endotoxin moves into wild plants, they could become resistant to butterfly,moth and beetle pests, just like the Bt crops. This could upset established ecological balances by either causing thewild plant to flourish excessively and become a plant pest, or by reducing the butterfly or moth population thatpreviously fed on the newly toxic plant.
Gene pollution would be especially problematic in many developing countries where the center of origin for manycrops is.
In these areas, traditional crop varieties could become "polluted" with genes from the genetically engineered crops andbiological diversity will suffer. The rate of gene flow between genetically engineered plants and their wild relativesmay be higher than previously thought. Researchers in the southern United States demonstrated that more than 50% ofthe wild strawberries growing within 50 meters of a strawberry field contained marker genes from the cultivatedstrawberries.
Researchers in central U.S. found that after ten years more than a quarter of the wild sunflowers growing near fields ofcultivated sunflowers had a marker gene from the cultivated sunflowers. (Kling, 1996)
These problems illustrate the need for great caution in introducing and using genetically modified plants. But evenwith this, consumers have a right to know about the environmental impact of the foods they buy so that, if they wishthey can exercise their own preferences and avoid - or choose to buy - food that has been produced in a particular way.
7. Genetic Engineering Can Affect Dietary Preferences
Consumers make decisions about what they eat for a wide variety of religious, ethical, philosophical and emotionalreasons. Most major world religions have some rules or traditions as to food. Jews and Muslims do not eat pork;Christians often avoid meat on Fridays or during Lent, many Buddhists are vegetarians.
Many other individuals have food preferences that are not related to an organized religion but which reflect deeplyheld personal beliefs, such as wanting to protect the environment.
Consumers International supports labelling of genetically engineered food in order to allow consumers the opportunityto exercise their religious and ethical preferences. For example, some people will want to avoid lamb which containspig genes (a product which is not yet on the market, but is well within the current capabilities of science). For this,labelling would be essential.
8. Science is Fallible
When a new technology of food production emerges, all the problems it may cause may not be foreseen. Whenpesticides were first synthesized and used widely in the 1950s, they were heralded as a miracle cure for pest problems.Only later did we discover that some of them could also cause birds to lay eggs with shells that collapsed, humans toget cancer, and insects to become resistant to them.
Genetic engineering is shuffling the deck of genes in ways that are entirely new, and creating living things that havenever before existed. Consumers International believes consumers have a right to be cautious about using these, if theywish. The right to choose can be exercised only if proper information is provided — on labels or the food itself.
References
Bock, S.A. 1987. Prospective appraisal of complaints of adverse reactions to foods in children during the first 3years of life. Pediatrics, 79: 683-688.
EXHIBIT J - Page 288
Case 5:14-cv-00117-cr Document 63-11 Filed 11/14/14 Page 6 of 312
Feder, B.J. 1997. Biotech firm to advocate labels on genetically altered products. New York Times, February 24.Gould, F., Anderson, A., Jones, A., Sumerford, D., Heckel, D.G., Lopez, J., Micinski, S., Leonard, R. and M.Laster. 1997. Initial frequency of alleles for resistance to Bacillus Rhuringiensis toxins in field populations ofHeliothis Virescens. Proceedings of the National Academy of Sciences, USA, 94: 3519-3523.Green, A.E. and R.F. Alison. 1994. Recombination between viral RNA and transgenic plant transcripts. Science,263: 1423-1425.Hileman, B. 1995. Views differ sharply over benefits, risks of agricultural biotechnology. Chemical andEngineering News, August 21, 1995.James, C. 1997. Global Status of Transgenic Crops in 1997. ISAAA Briefs No. 5. The International Service forthe Acquisition of Agri-biotech Applications (ISAAA): Ithaca,NY. 31 pp.Jorgensen, R. and B. Andersen. 1995. Spontaneous hybridization between oilseed rape (Brassica napus) andweed Brassica campestris: a risk of growing genetically engineered modified oilseed rape. American Journal ofBotany, 81: 1620-1626.Kleiner, K. 1997. Fields of genes. New scientist. August 16.Kling, J. 1996. Could transgenic supercrops one day breed superweeds? Science, 274: 180-181.Mayeno, A.N. and G.J. Gleich. 1994. Eosinophilia myalgia syndrome and tryptophan production: a cautionarytale. TIBTECH, 12: 346-352.Nestle, M. 1996. Allergies to transgenic foods Questions of policy. The New England Journal of Medicine ,334(11): 726-727.Nordlee, J.A., Taylor, S.L., Townsend, J.A., Thomas, L.A. and R.K. Bush. 1996. Identification of a brazil-nutallergen in transgenic soybeans. The New England Journal of Medicine , 334(11): 688-692.Sampson, H.A., Mendelson, L. and J.P. Rosen. 1992. Fatal and near-fatal anaphylactic reactions to food inchildren and adolescents. The New England Journal of Medicine , 327: 380-384.Sloan, A.E. and M.E. Powers. 1986. A perspective on popular perspections of adverse reactions to foods. Journalof Allergy and Clinical Immunology, 78: 127-133.
[ Health ] [ Finance ] [ Food ] [ Product ] [ Other ][ About CU ] [ News ] [ Tips ]
[ Home ]
Please contact us at: http://www.consunion.org/contact.htmAll information ©1998 Consumers Union
EXHIBIT J - Page 289
Case 5:14-cv-00117-cr Document 63-11 Filed 11/14/14 Page 7 of 312

Institute for Responsible Technology P.O. Box 469 Fairfield, IA 52556 USA +1.641.209.1761 [email protected] www.responsibletechnology.org
STATE-OF-THE-SCIENCE ON THE HEALTH RISKS OF GM FOODS
v2.15.10
e all know stories of tobacco, asbestos, and DDT. Originally declared safe, they caused widespread death and disease. Although their impact was vast, most of the population was spared. The same cannot be said for sweeping changes in the food supply. Everyone eats; everyone is affected. The increase in several diseases in North America may be due to the profound changes in our diet. The most radical change occurred a little over a decade ago when genetically
modified (GM) crops were introduced. Their influence on health has been largely ignored, but recent studies show serious problems. Genetically modified organisms (GMOs) have been linked to thousands of toxic or allergic-type reactions, thousands of sick, sterile, and dead livestock, and damage to virtually every organ and system studied in lab animals.1 Nearly every independent animal feeding safety study shows adverse or unexplained effects.
GM foods were made possible by a technology developed in the 1970s whereby genes from one species are forced into the DNA of other species. Genes produce proteins, which in turn can generate characteristics or traits. The promised traits associated with GMOs have been sky high—vegetables growing in the desert, vitamin fortified grains, and highly productive crops feeding the starving millions. None of these are available. In fact, the only two traits that are found in nearly all commericialized GM plants are herbicide tolerance and/or pesticide production.
Herbicide tolerant soy, corn, cotton, and canola plants are engineered with bacterial genes that allow them to survive otherwise deadly doses of herbicides. This gives farmers more flexibility in weeding and gives the GM seed company lots more profit. When farmers buy GM seeds, they sign a contract to buy only that seed producer’s brand of herbicide. Herbicide tolerant crops comprise about 80% of all GM plants. The other 20% are corn and cotton varieties that produce a pesticide in every cell. This is accomplished due to a gene from a soil bacterium called Bacillus thuringiensis or Bt, which produces a natural insect-killing poison called Bt-toxin. In addition to these two traits, there are also disease resistant GM Hawaiian papaya, zucchini and crook neck squash, which comprise well under 1% of GMO acreage.
THE FDA’S “NON-REGULATION” OF GM FOODS
Rhetoric from the United States government since the early 1990s proclaims that GM foods are no different from their natural counterparts that have existed for centuries. The Food and Drug Administration (FDA) has labeled them “Generally Recognized as Safe,” or GRAS. This status allows a product to be commercialized without any additional testing. According to US law, to be considered GRAS the substance must be the subject of a substantial amount of peer-reviewed published studies (or equivalent) and there must be overwhelming consensus among the scientific community that the product is safe. GM foods had neither. Nonetheless, in a precedent-setting move in 1992 that some experts contend was illegal, the FDA declared that GM crops are GRAS as long as their producers say they are. Thus, the FDA does not require any safety evaluations or labeling of GMOs. A company can even introduce a GM food to the market without telling the agency.
W
EXHIBIT J - Page 290
Case 5:14-cv-00117-cr Document 63-11 Filed 11/14/14 Page 8 of 312

Such a lenient approach was largely the result of the influence of large agricultural corporations According to Henry Miller, who had a leading role in biotechnology issues at the FDA from 1979 to 1994, “In this area, the US government agencies have done exactly what big agribusiness has asked them to do and told them to do.” The Ag biotech company with the greatest influence was clearly Monsanto. According to the New York Times, “What Monsanto wished for from Washington, Monsanto and, by extension, the biotechnology industry got. . . . When the company abruptly decided that it needed to throw off the regulations and speed its foods to market, the White House quickly ushered through an unusually generous policy of self-policing.”
This policy was heralded by Vice President Dan Quayle on May 26, 1992. He chaired the Council on Competitiveness, which had identified GM crops as an industry that could boost US exports. To take advantage, Quayle announced “reforms” to “speed up and simplify the process of bringing” GM products to market without “being hampered by unnecessary regulation.”2 Three days later, the FDA policy on non-regulation was unveiled.
The person who oversaw its development was the FDA’s Deputy Commissioner for Policy, Michael Taylor, whose position had been created especially for him in 1991. Prior to that, Taylor was an outside attorney for both Monsanto and the Food Biotechnology Council. After working at the FDA, he became Monsanto’s vice president. The Obama administration has put Talyor back into the FDA as the US Food Safety Czar.
THE FDA COVERS UP HEALTH RISKS
Taylor’s GMO policy needed to create the impression that unintended effects from GM crops were not an issue. Otherwise their GRAS status would be undermined and they would need the extensive testing and labels that are normally required for food additives. But internal memos made public from a lawsuit showed that the overwhelming consensus among the agency scientists was that GM crops can have unpredictable, hard-to-detect side effects. Various departments and experts spelled these out in detail, listing allergies, toxins, nutritional effects, and new diseases as potential dangers. They urged superiors to require long-term safety studies.3 In spite of the warnings, according to public interest attorney Steven Druker who studied the FDA’s internal files, “References to the unintended negative effects of bioengineering were progressively deleted from drafts of the policy statement (over the protests of agency scientists).”4
FDA microbiologist Louis Pribyl, PhD, wrote about the policy, “What has happened to the scientific elements of this document? Without a sound scientific base to rest on, this becomes a broad, general, ‘What do I have to do to avoid trouble’-type document. . . . It will look like and probably be just a political document. . . . It reads very pro-industry, especially in the area of unintended effects.”5
The scientists’ concerns were not only ignored, their very existence was denied. The official FDA policy stated, “The agency is not aware of any information showing that foods derived by these new methods differ from other foods in any meaningful or uniform way.”6 In sharp contrast, an internal FDA report stated, “The processes of genetic engineering and traditional breeding are different and according to the technical experts in the agency, they lead to different risks.”7 The FDA’s deceptive notion of no difference was coined “substantial equivalence” and formed the basis of the US government position on GMOs.
Many scientists and organizations have criticized the US position. The National Academy of Sciences and even the pro-GM Royal Society of London8 describe the US system as inadequate and flawed. The editor of the prestigious journal Lancet said, “It is astounding that the US Food and Drug Administration has not changed their stance on genetically modified food adopted in 1992. . . . The policy is that genetically modified crops will receive the same consideration for potential health risks as any other new crop plant. This stance is taken despite good reasons to believe that specific risks may exist. . . . Governments should never have allowed these products into the food chain without insisting on rigorous testing for effects on health.”9 The Royal Society of Canada described substantial equivalence as “scientifically unjustifiable and inconsistent with precautionary regulation of the technology.”
10
EXHIBIT J - Page 291
Case 5:14-cv-00117-cr Document 63-11 Filed 11/14/14 Page 9 of 312

GMOS ARE INHERENTLY UNSAFE
There are several reasons why GM plants present unique dangers. The first is that the process of genetic engineering itself creates unpredicted alterations, irrespective of which gene is transferred. The gene insertion process, for example, is accomplished by either shooting genes from a “gene gun” into a plate of cells, or using bacteria to infect the cell with foreign DNA. Both create mutations in and around the insertion site and elsewhere.11 The “transformed” cell is then cloned into a plant through a process called tissue culture, which results in additional hundreds or thousands of mutations throughout the plants’ genome. In the end, the GM plant’s DNA can be a staggering 2-4% different from its natural parent.12 Native genes can be mutated, deleted, or permanently turned on or off. In addition, the insertion process causes holistic and not-well-understood changes among large numbers of native genes. One study revealed that up to 5% of the natural genes altered their levels of protein expression as a result of a single insertion.
The Royal Society of Canada acknowledged that “the default prediction” for GM crops would include “a range of collateral changes in expression of other genes, changes in the pattern of proteins produced and/or changes in metabolic activities.”13 Although the FDA scientists evaluating GMOs in 1992 were unaware of the extent to which GM DNA is damaged or changed, they too described the potential consequences. They reported, “The possibility of unexpected, accidental changes in genetically engineered plants” might produce “unexpected high concentrations of plant toxicants.”14 GM crops, they said, might have “increased levels of known naturally occurring toxins,” and the “appearance of new, not previously identified” toxins.15 The same mechanism can also produce allergens, carcinogens, or substances that inhibit assimilation of nutrients.
Most of these problems would pass unnoticed through safety assessments on GM foods, which are largely designed on the false premise that genes are like Legos that cleanly snap into place. But even if we disregard unexpected changes in the DNA for the moment, a proper functioning inserted gene still carries significant risk. Its newly created GM protein, such as the Bt-toxin, may be dangerous for human health (see below). Moreover, even if that protein is safe in its natural organism, once it is transferred into a new species it may be processed differently. A harmless protein may be transformed into a dangerous or deadly version. This happened with at least one GM food crop under development, GM peas, which were destroyed before being commercialized.
FDA scientists were also quite concerned about the possibility of inserted genes spontaneously transferring into the DNA of bacteria inside our digestive tract. They were particularly alarmed at the possibility of antibiotic resistant marker (ARM) genes transferring. ARM genes are employed during gene insertion to help scientists identify which cells successfully integrated the foreign gene. These ARM genes, however, remain in the cell and are cloned into the DNA of all the GM plants produced from that cell. One FDA report wrote in all capital letters that ARM genes would be “A SERIOUS HEALTH HAZARD,” due to the possibility of that they might transfer to bacteria and create super diseases, untreatable with antibiotics.
Although the biotech industry confidently asserted that gene transfer from GM foods was not possible, the only human feeding
study on GM foods later proved that it does take place. The genetic material in soybeans that make them herbicide tolerant
transferred into the DNA of human gut bacteria and continued to function16
. That means that long after we stop eating a GM
crop, its foreign GM proteins may be produced inside our intestines. It is also possible that the foreign genes might end up inside our own DNA, within the cells of our own organs and tissues.
Another worry expressed by FDA scientists was that GM plants might gather “toxic substances from the environment” such as “pesticides or heavy metals,”17 or that toxic substances in GM animal feed might bioaccumulate into milk and meat products. While no studies have looked at the bioaccumulation issue, herbicide tolerant crops certainly have higher levels of herbicide residues. In fact, many countries had to increase their legally allowable levels—by up to 50 times—in order to accommodate the introduction of GM crops.
The overuse of the herbicides due to GM crops has resulted in the development of herbicide resistant weeds. USDA statistics show that herbicide use is rapidly accelerating. Its use was up by 383 million pounds in the first 13 years of GM crops.18 But the rate of application is accelerating due in large part to the emergence of herbicide tolerant weeds. According to a study by Charles Benbrook, “Crop years 2007 and 2008 accounted for 46% of the increase in herbicide use over 13 years across the three HT [herbicide tolerant] crops. Herbicide use on HT crops rose a remarkable 31.4% from 2007 to 2008.” And as Roundup becomes less effective, farmers are now using more toxic herbicides, such as 2-4D, which increased by 237% from 2004 to2006.19
EXHIBIT J - Page 292
Case 5:14-cv-00117-cr Document 63-11 Filed 11/14/14 Page 10 of 312

All of the above risks associated with GM foods are magnified for high-risk groups, such as pregnant women, children, the sick, and the elderly. The following section highlights some of the problems that have been identified.
GM DIET SHOWS TOXIC REACTIONS IN THE DIGESTIVE TRACT
The very first crop submitted to the FDA’s voluntary consultation process, the FlavrSavr tomato, showed evidence of toxins. Out of 20 female rats fed the GM tomato, 7 developed stomach lesions.20 The director of FDA’s Office of Special Research Skills wrote that the tomatoes did not demonstrate a “reasonable certainty of no harm,”21 which is their normal standard of safety. The Additives Evaluation Branch agreed that “unresolved questions still remain.”22 The political appointees, however, did not require that the tomato be withdrawn.1
According to Arpad Pusztai, PhD, one of the world’s leading experts in GM food safety assessments, the type of stomach lesions linked to the tomatoes “could lead to life-endangering hemorrhage, particularly in the elderly who use aspirin to prevent [blood clots].”23 Dr. Pusztai believes that the digestive tract, which is the first and largest point of contact with foods, can reveal various reactions to toxins and should be the first target of GM food risk assessment. He was alarmed, however, to discover that studies on the FlavrSavr never looked passed the stomach to the intestines. Other studies that did look found problems.
Mice fed potatoes engineered to produce the Bt-toxin developed abnormal and damaged cells, as well as proliferative cell growth in the lower part of their small intestines (ileum).24 Rats fed potatoes engineered to produce a different type of insecticide (GNA lectin from the snowdrop plant) also showed proliferative cell growth in both the stomach and intestinal walls (see photos).25 Although the guts of rats fed GM peas were not examined for cell growth, the intestines were mysteriously heavier; possibly as a result of such growth.26 Cell proliferation can be a precursor to cancer and is of special concern.
GM DIETS CAUSE LIVER DAMAGE
1
EXHIBIT J - Page 293
Case 5:14-cv-00117-cr Document 63-11 Filed 11/14/14 Page 11 of 312

The state of the liver—a main detoxifier for the body—is another indicator of toxins.
• Rats fed the GNA lectin potatoes described above had smaller and partially atrophied livers.27
• Rats fed Monsanto’s Mon 863 corn, engineered to produce Bt-toxin, had liver lesions and other indications of toxicity.28
• Rabbits fed GM soy showed altered enzyme production in their livers as well as higher metabolic activity.29
• The livers of rats fed Roundup Ready canola were 12%–16% heavier, possibly due to liver disease or inflammation.30
• Microscopic analysis of the livers of mice fed Roundup Ready soybeans revealed altered gene expression and structural and functional changes (see photos).31 Many of these changes reversed after the mice diet was switched to non-GM soy, indicating that GM soy was the culprit. The findings, according to molecular geneticist Michael Antoniou, PhD, “are not random and must reflect some ‘insult’ on the liver by the GM soy.” Antoniou, who does human gene therapy research in King’s College London, said that although the long-term consequences of the GM soy diet are not known, it “could lead to liver damage and consequently general toxemia.”32
• Rats fed Roundup Ready soybeans also showed structural changes in their livers. 33
EXHIBIT J - Page 294
Case 5:14-cv-00117-cr Document 63-11 Filed 11/14/14 Page 12 of 312

GM FED ANIMALS HAD HIGHER DEATH RATES AND ORGAN DAMAGE
In the FlavrSavr tomato study, a note in the appendix indicated that 7 of 40 rats died within two weeks and were replaced.34 In another study, chickens fed the herbicide tolerant “Liberty Link” corn died at twice the rate of those fed natural corn.35 But in these two industry-funded studies, the deaths were dismissed without adequate explanation or follow-up.
In addition, the cells in the pancreas of mice fed Roundup Ready soy had profound changes and produced significantly less digestive enzymes;36 in rats fed a GM potato, the pancreas was enlarged.37 In various analyses of kidneys, GM-fed animals showed lesions, toxicity, altered enzyme production or inflammation.38,39 Enzyme production in the hearts of mice was altered by GM soy.40 And GM potatoes caused slower growth in the brain of rats.41 A team of independent scientists re-analyzed the raw data in three Monsanto 90-day rat feeding studies and saw signs of toxicity in the liver and kidneys, as well as effects in the heart, adrenal glands, spleen, and blood.42
REPRODUCTIVE FAILURES AND INFANT MORTALITY
The testicles of both mice and rats fed Roundup Ready soybeans showed dramatic changes. In rats, the organs were dark blue instead of pink (see photos on next page).43 In mice, young sperm cells were altered.44 Embryos of GM soy-fed mice also showed temporary changes in their DNA function, compared to those whose parents were fed non-GM soy.45
EXHIBIT J - Page 295
Case 5:14-cv-00117-cr Document 63-11 Filed 11/14/14 Page 13 of 312

An Austrian government study showed that mice fed GM corn (Bt and Roundup Ready) had fewer babies and smaller babies.46 More dramatic results were discovered by a leading scientist at the Russian National Academy of sciences. Female rats were fed GM soy, starting two weeks before they were mated.
• Over a series of three experiments, 51.6 percent of the offspring from the GM-fed group died within the first three weeks, compared to 10 percent from the non-GM soy group, and 8.1 percent for non-soy controls.
• “High pup mortality was characteristic of every litter from mothers fed the GM soy flour.”47
• The average size and weight of the GM-fed offspring was quite a bit smaller (see photo on next page).48
• In a preliminary study, the GM-fed offspring were unable to conceive.49
After the three feeding trials, the supplier of rat food used at the Russian laboratory began using GM soy in their formulation. Since all the rats housed at the facility were now eating GM soy, no non-GM fed controls were available for subsequent GM feeding trials; follow-up studies were canceled. After two months on the GM soy diet, however, the infant mortality rate of rats throughout
the facility had skyrocketed to 55.3 percent (99 of 179).50
EXHIBIT J - Page 296
Case 5:14-cv-00117-cr Document 63-11 Filed 11/14/14 Page 14 of 312

FARMERS REPORT LIVESTOCK STERILITY AND DEATHS
About two dozen farmers reported that their pigs had reproductive problems when fed certain varieties of Bt corn. Pigs were sterile, had false pregnancies, or gave birth to bags of water. Cows and bulls also became sterile. Bt corn was also implicated by farmers in the deaths of cows, horses, water buffaloes, and chickens.51
When Indian shepherds let their sheep graze continuously on Bt cotton plants, within 5-7 days, one out of four sheep died. There was an estimated 10,000 sheep deaths in the region in 2006, with more reported in 2007. Post mortems on the sheep showed severe irritation and black patches in both intestines and liver (as well as enlarged bile ducts). Investigators said preliminary evidence “strongly suggests that the sheep mortality was due to a toxin. . . . most probably Bt-toxin.”52 In a small feeding study, 100% of sheep fed Bt cotton died within 30 days. Those fed natural plants had no symptoms.
Buffalo that grazed on natural cotton plants for years without incident react to the Bt variety. In one village in Andhra Pradesh, for example, 13 buffalo grazed on Bt cotton plants for a single day. All died within 3 days.53 Investigators in the state of Haryana, India, report that most buffalo that ate GM cottonseed had reproductive complications such as premature deliveries, abortions, infertility, and prolapsed uteruses. Many young calves and adult buffaloes died.
GM CROPS TRIGGER IMMUNE REACTIONS AND MAY CAUSE ALLERGIES
Allergic reactions occur when the immune system interprets something as foreign, different, and offensive, and reacts accordingly. All GM foods, by definition, have something foreign and different. And several studies show that they provoke reactions. Rats fed Monsanto’s GM corn, for example, had a significant increase in blood cells related to the immune system.54 GM potatoes caused the immune system of rats to respond more slowly.55 And GM peas provoked an inflammatory response in mice, suggesting that it might cause deadly allergic reactions in people.56
It might be difficult to identify whether GM foods were triggering allergic responses in the population, since very few countries conduct regular studies or keep careful records. One country that does have an annual evaluation is the UK. Soon after GM soy was introduced into the British diet, researchers at the York Laboratory reported that allergies to soy had skyrocketed by 50% in a single year.57 Although no follow-up studies were conducted to see if GM soy was the cause, there is evidence showing several ways in which it might have contributed to the rising incidence of allergies:
• The only significant variety of GM soy is Monsanto’s “Roundup Ready” variety, planted in 89% of US soy acres. A foreign gene from bacteria (with parts of virus and petunia DNA) is inserted, which allows the plant to withstand Roundup herbicide. The protein produced by the bacterial gene has never been part of the human food supply. Because people aren’t usually allergic to a food until they have eaten it several times, it would be difficult to know in advance if the protein was an allergen. Without a surefire method to identify allergenic GM crops, the World Health Organization (WHO) and others recommend examining the properties of the protein to see if they share characteristics with known allergens. One method is to compare the amino acid sequence of the novel protein with a database of allergens. If there is a match, according to the WHO, the GM crop should either not be commercialized or additional testing should be done. Sections of the protein produced in GM soy are identical to shrimp and dust mite allergens,58 but the soybean was introduced before WHO criteria were established and the recommended additional tests were not conducted. If the protein does trigger reactions, the danger is compounded by the finding that the Roundup Ready gene transfers into the DNA of human gut bacteria and may continuously produce the protein from within our intestines.59
• In addition to the herbicide tolerant protein, GM soybeans contain a unique, unexpected protein, which likely came about from the changes incurred during the genetic engineering process. Scientists found that this new protein was able to bind with IgE antibodies, suggesting that it may provoke dangerous allergic reactions. The same study revealed that one human subject showed a skin prick immune response only to GM soy, but not to natural soy.60 These results must be considered preliminary,
EXHIBIT J - Page 297
Case 5:14-cv-00117-cr Document 63-11 Filed 11/14/14 Page 15 of 312

as the non-GM soy was a wild type and not necessarily comparible to the GM variety. Another study showed that the levels of one known soy allergen, called trypsin inhibitor, were as much as seven times higher in cooked GM soy compared to a non-GM control.61 This was Monsanto’s own study, and did use comparable controls.
• GM soy also produces an unpredicted side effect in the pancreas of mice—the amount of digestive enzymes produced is dramatically reduced.62 If a shortage of enzymes caused food proteins to breakdown more slowly, then they have more time to trigger allergic reactions. Thus, digestive problems from GM soy might promote allergies to a wide range of proteins, not just soy.
• The higher amount of Roundup herbicide residues on GM soy might create reactions in consumers. In fact, many of the symptoms identified in the UK soy allergy study are among those related to glyphosate exposure. [The allergy study identified irritable bowel syndrome, digestion problems, chronic fatigue, headaches, lethargy, and skin complaints, including acne and eczema, all related to soy consumption. Symptoms of glyphosate exposure include nausea, headaches, lethargy, skin rashes, and burning or itchy skin. It is also possible that glyphosate’s breakdown product AMPA, which accumulates in GM soybeans after each spray, might contribute to allergies.]
It is interesting to note that in the five years immediately after GM soy was introduced, US peanut allergies doubled. It is known that a protein in natural soybeans cross-reacts with peanut allergies, i.e. soy may trigger reactions in some people who are allergic to peanuts.63 Given the startling increase in peanut allergies, scientists should investigate whether this cross-reactivity has been amplified in GM soy.
BT-TOXIN, PRODUCED IN GM CORN AND COTTON, MAY CAUSE ALLERGIES
For years, organic farmers and others have sprayed crops with solutions containing natural Bt bacteria as a method of insect control. The toxin creates holes in their stomach and kills them. Genetic engineers take the gene that produces the toxin in bacteria and insert it into the DNA of crops so that the plant does the work, not the farmer. The fact that we consume that toxic pesticide in every bite of Bt corn is hardly appetizing.
Biotech companies claim that Bt-toxin has a history of safe use, is quickly destroyed in our stomach, and wouldn’t react with humans or mammals in any event. Studies verify, however, that natural Bt-toxin is not fully destroyed during digestion and does react with mammals. Mice fed Bt-toxin, for example, showed an immune response as potent as cholera toxin, 64, became immune sensitive to formerly harmless compounds,65 and had damaged and altered cells in their small intestines.66 A 2008 Italian government study found that Bt corn provoked immune responses in mice.67 Moreover, when natural Bt was sprayed over areas around Vancouver and Washington State to fight gypsy moths, about 500 people reported reactions—mostly allergy or flu-like symptoms.68,69 Farm workers and others also report serious reactions7071727374 and authorities have long acknowledged that “people with compromised immune systems or preexisting allergies may be particularly susceptible to the effects of Bt.”75
The Bt-toxin produced in GM crops is “vastly different from the bacterial [Bt-toxins] used in organic and traditional farming and forestry.”76 The plant produced version is designed to be more toxic than natural varieties,77 and is about 3,000-5,000 times more concentrated than the spray form. And just like the GM soy protein, the Bt protein in GM corn varieties has a section of its amino acid sequence identical to a known allergen (egg yolk). The Bt protein also fails other allergen criteria recommended by the WHO, i.e. the protein is too resistant to break down during digestion and heat.
If Bt-toxin causes allergies, then gene transfer carries serious ramifications. If Bt genes relocate to human gut bacteria, our
intestinal flora may be converted into living pesticide factories, possibly producing Bt-toxin inside of us year after year. The UK Joint Food Safety and Standards Group also described gene transfer from a different route. They warned that genes from inhaled pollen might transfer into the DNA of bacteria in the respiratory system.78 Although no study has looked into that possibility, pollen from a Bt cornfield appears to have been responsible for allergic-type reactions.
In 2003, during the time when an adjacent Bt cornfield was pollinating, virtually an entire Filipino village of about 100 people was stricken by mysterious skin, respiratory, and intestinal reactions.79 The symptoms started with those living closest to the field and spread to those further away. Blood samples from 39 individuals showed antibodies in response to Bt-toxin, supporting—but not
EXHIBIT J - Page 298
Case 5:14-cv-00117-cr Document 63-11 Filed 11/14/14 Page 16 of 312
proving—a link. When the same corn was planted in four other villages the following year, however, the symptoms returned in all four areas—only during the time of pollination.80
Bt-toxin might also trigger reactions by skin contact. In 2005, a medical team reported that hundreds of agricultural workers in India are developing allergic symptoms when exposed to Bt cotton, but not when axposed to natural varieties.81 They say reactions come from picking the cotton, cleaning it in factories, loading it onto trucks, or even leaning against it. Their symptoms are virtually identical to those described by the 500 people in Vancouver and Washington who were sprayed with Bt.
GOVERNMENT EVALUATIONS MISS MOST HEALTH PROBLEMS
Although the number of safety studies on GM foods is quite small, it has validated the concerns expressed by FDA scientists and others. Unfortunately, government safety assessments worldwide are not competent to even identify most of the potential health problems described above, let alone protect its citizens from the effects.82
A 2000 review of approved GM crops in Canada by professor E. Ann Clark, PhD, for example, reveals that 70% (28 of 40) “of the currently available GM crops . . . have not been subjected to any actual lab or animal toxicity testing, either as refined oils for direct human consumption or indirectly as feedstuffs for livestock. The same finding pertains to all three GM tomato decisions, the only GM flax, and to five GM corn crops.” In the remaining 30% (12) of the other crops tested, animals were not fed the whole GM feed. They were given just the isolated GM protein that the plant was engineered to produce. But even this protein was not extracted from the actual GM plant. Rather, it was manufactured in genetically engineered bacteria. This method of testing would never identify problems associated with collateral damage to GM plant DNA, unpredicted changes in the GM protein, transfer of genes to bacteria or human cells, excessive herbicide residues, or accumulation of toxins in the food chain, among others. Clark asks, “Where are the trials showing lack of harm to fed livestock, or that meat and milk from livestock fed on GM feedstuffs are safe?”83
Epidemiologist and GM safety expert Judy Carman, PhD, MPH, shows that assessments by Food Safety Australia New Zealand (FSANZ) also overlook serious potential problems, including cancer, birth defects, or long-term effects of nutritional deficiencies. 84
“A review of twelve reports covering twenty-eight GM crops - four soy, three corn, ten potatoes, eight canola, one sugar beet and two cotton—revealed no feeding trials on people. In addition, one of the GM corn varieties had gone untested on animals. Some seventeen foods involved testing with only a single oral gavage (a type of forced-feeding), with observation for seven to fourteen days, and only of the substance that had been genetically engineered to appear [the GM protein], not the whole food. Such testing assumes that the only new substance that will appear in the food is the one genetically engineered to appear, that the GM plant-produced substance will act in the same manner as the tested substance that was obtained from another source [GM bacteria], and that the substance will create disease within a few days. All are untested hypotheses and make a mockery of GM proponents’ claims that the risk assessment of GM foods is based on sound science. Furthermore, where the whole food was given to animals to eat, sample sizes were often very low—for example, five to six cows per group for Roundup Ready soy—and they were fed for only four weeks.”85
Dr. Carman points out that GM “experiments used some very unusual animal models for human health, such as chickens, cows, and trout. Some of the measurements taken from these animals are also unusual measures of human health, such as abdominal fat pad weight, total de-boned breast meat yield, and milk production.” In her examination of the full range of submittals to authorities in Australia and New Zealand, she says that there was no proper evaluation of “biochemistry, immunology, tissue pathology, and gut, liver, and kidney function.”86 Writing on behalf of the Public Health Association of Australia, Dr. Carman says, “The effects of feeding people high concentrations of the new protein over tens of years cannot be determined by feeding 20 mice a single oral gavage of a given high concentration of the protein and taking very basic data for 13-14 days.”87
EXHIBIT J - Page 299
Case 5:14-cv-00117-cr Document 63-11 Filed 11/14/14 Page 17 of 312

THE FDA’S FAKE SAFETY ASSESSMENTS
Submissions to the US Food and Drug Administraion (FDA) may be worse than in other countries, since the agency doesn’t actually require any data. Their policy says that biotech companies can determine if their own foods are safe. Anything submitted is voluntary and, according to former Environmental Protection Agency scientist Doug Gurian-Sherman, PhD, “often lack[s] sufficient detail, such as necessary statistical analyses needed for an adequate safety evaluation.” Using Freedom of Information Requests, Dr. Gurian-Sherman analyzed more than a fourth of the data summaries (14 of 53) of GM crops reviewed by the FDA. He says, “The FDA consultation process does not allow the agency to require submission of data, misses obvious errors in company-submitted data summaries, provides insufficient testing guidance, and does not require sufficiently detailed data to enable the FDA to assure that GE crops are safe to eat.”88 Similarly, a Friends of the Earth review of company and FDA documents concluded:
“If industry chooses to submit faulty, unpublishable studies, it does so without consequence. If it should respond to an agency request with deficient data, it does so without reprimand or follow-up. . . . If a company finds it disadvantageous to characterize its product, then its properties remain uncertain or unknown. If a corporation chooses to ignore scientifically sound testing standards . . . then faulty tests are conducted instead, and the results are considered legitimate. In the area of genetically engineered food regulation, the ‘competent’ agencies rarely if ever (know how to) conduct independent research to verify or supplement industry findings.”89
At the end of the consultation, the FDA doesn’t actually approve the crops. Rather, they issue a letter that includes a statement such as the following:
“Based on the safety and nutritional assessment you have conducted, it is our understanding that Monsanto has concluded that corn products derived from this new variety are not materially different in composition, safety, and other relevant parameters from corn currently on the market, and that the genetically modified corn does not raise issues that would require premarket review or approval by FDA. . . . As you are aware, it is Monsanto’s responsibility to ensure that foods marketed by the firm are safe, wholesome and in compliance with all applicable legal and regulatory requirements.”90
COMPANY RESEARCH IS SECRET, INADEQUATE, AND FLAWED
The unpublished industry studies submitted to regulators are typically kept secret based on the claim that it is “confidential business information.” The Royal Society of Canada is one of many organizations that condemn this practice. They wrote:
“In the judgment of the Expert Panel, the more regulatory agencies limit free access to the data upon which their decisions are based, the more compromised becomes the claim that the regulatory process is ‘science based.’ This is due to a simple but well-understood requirement of the scientific method itself—that it be an open, completely transparent enterprise in which any and all aspects of scientific research are open to full review by scientific peers. Peer review and independent corroboration of research findings are axioms of the scientific method, and part of the very meaning of the objectivity and neutrality of science.”91
Whenever private submissions are made public through lawsuits or Freedom of Information Act Requests, it becomes clear why companies benefit from secrecy. The quality of their research is often miserable, incompetent, and unacceptable for peer-review. In 2000, for example, after the potentially allergenic StarLink corn was found to have contaminated the food supply, the corn’s producer, Aventis CropScience, presented wholly inadequate safety data to the EPA’s scientific advisory panel. One frustrated panel member, Dean Metcalfe, MD,—the government’s top allergist—said during a hearing, “Most of us review for a lot of journals. And if this were presented for publication in the journals that I review for, it would be sent back to the authors with all of these questions. It would be rejected.”92
EXHIBIT J - Page 300
Case 5:14-cv-00117-cr Document 63-11 Filed 11/14/14 Page 18 of 312

UNSCIENTIFIC ASSUMPTIONS ARE THE BASIS OF APPROVALS
Professor Clark, who analyzed submissions to Canadian regulators, concluded, “Most or all of the conclusions of food safety for individual GM crops are based on inferences and assumptions, rather than on actual testing.” For example, rather than actually testing to see if the amino acid sequence produced by their inserted gene is correct, “the standard practice,” according to research analyst William Freese, “is to sequence just 5 to 25 amino acids,”93 even if the protein has more than 600 in total. If the short sample matches what is expected, they assume that the rest are also fine. If they are wrong, however, a rearranged protein could be quite dangerous.
Monsanto’s submission to Australian regulators on their high lysine GM corn provides an excellent example of overly optimistic assumptions used in place of science. The gene inserted into the corn produces a protein that is naturally found in soil. Monsanto claimed that since people consume small residues of soil on fruits and vegetables, the protein has a history of safe consumption. Based on the amount of GM corn protein an average US citizen would consume (if all their corn were Monsanto’s variety), they would eat up to 4 trillion times the amount normally consumed through soil. In other words, “for equivalent exposure” of the protein from soil “people would have to eat . . . nearly as much as 10,000kg [22,000 pounds, every] second 24 hours a day seven days a week.”94
STUDIES ARE RIGGED TO AVOID FINDING PROBLEMS
In addition, to relying on untested assumptions, industry-funded research is often designed specifically to force a conclusion of safety. In the high lysine corn described above, for example, the levels of certain nutritional components (i.e. protein content, total dietary fiber, acid detergent fiber, and neutral detergent fiber) were far outside the normal range for corn. Instead of comparing their corn to normal controls, which would reveal this disparity, Monsanto compared it to obscure corn varieties that were also substantially outside the normal range on precisely these values. Thus, their study found no statistical differences by design.
When independent researchers published a study in July 1999 showing that GM soy contains 12%-14% less cancer-fighting phytoestrogens, Monsanto responded with its own study, concluding that soy’s phytoestrogen levels vary too much to even carry out a statistical analysis. Researchers failed to disclose, however, that they had instructed the laboratory to use an obsolete method of detection—one that had been prone to highly variable results.95
When Aventis prepared samples to see if the potential allergen in StarLink corn remained intact after cooking, instead of using the standard 30-minute treatment, they heated corn for two hours.96
To show that pasteurization destroyed bovine growth hormone in milk from cows treated with rbGH, scientists pasteurized the milk 120 times longer than normal. Unable to destroy more than 19%, they then spiked the milk with a huge amount of the hormone and repeated the long pasteurization, destroying 90%.97 (The FDA reported that pasteurization destroys 90% of the hormone.98)
To demonstrate that injections of rbGH did not interfere with cow’s fertility, Monsanto apparently added cows to the study that were pregnant prior to injection.99
And in order to prove that the protein from their GM crops breaks down quickly during simulated digestion, biotech companies used thousands of times the amount of digestive enzymes and a much stronger acid compared to that recommended by the World Health Organization.100
Other methods used to hide problems are varied and plentiful. For example, researchers:
• Use highly variable animal starting weights to hinder detection of food-related changes
• Keep feeding studies short to miss long-term impacts
EXHIBIT J - Page 301
Case 5:14-cv-00117-cr Document 63-11 Filed 11/14/14 Page 19 of 312

• Test effects of Roundup Ready soybeans that have not been sprayed with Roundup
• Avoid feeding animals the actual GM crop, but give them instead a single dose of the GM protein that was produced inside GM bacteria
• Use too few subjects to derive statistically significant results
• Use poor statistical methods or simply leave out essential methods, data, or statistics
• Use irrelevant control groups, and employ insensitive evaluation techniques
ROUNDUP READY SOYBEANS: CASE STUDY OF FLAWED RESEARCH
Monsanto’s 1996 Journal of Nutrition studies on Roundup Ready soybeans101,102 provide plenty of examples of scientific transgressions. Although the study has been used often by the industry as validation for safety claims, experts working in the field were not impressed. For example, Dr. Arpad Pusztai was commissioned at the time by the UK government to lead a 20 member consortium in three institutions to develop rigorous testing protocols on GM foods—protocols that were never implemented. Dr. Pusztai, who had published several studies in that same nutrition journal, said the Monsanto paper was not “up to the normal journal standards.” He said, “It was obvious that the study had been designed to avoid finding any problems. Everybody in our consortium knew this.” Some of the flaws include:
• Researchers tested GM soy on mature animals, not young ones. Young animals use protein to build their muscles, tissues, and organs. Problems with GM food could therefore show up in organ and body weight. But adult animals use the protein for tissue renewal and energy. “With a nutritional study on mature animals,” says Dr. Pusztai, “you would never see any difference in organ weights even if the food turned out to be anti-nutritional. The animals would have to be emaciated or poisoned to show anything.”
• If there were an organ development problem, the study wouldn’t have picked it up since the researchers didn’t even weigh the organs.
• In one of the trials, researchers substituted only one tenth of the natural protein with GM soy protein. In two others, they diluted their GM soy six- and twelve-fold. 103 Scientists Ian Pryme, PhD, of Norway and Rolf Lembcke, PhD, of Denmark wrote, the “level of the GM soy was too low, and would probably ensure that any possible undesirable GM effects did not occur.”
• Pryme and Lembcke, who published a paper in Nutrition and Health that analyzed all published peer-reviewed feeding studies on GM foods (10 as of 2003), also pointed out that the percentage of protein in the feed used in the Roundup Ready study was “artificially too high.” This “would almost certainly mask, or at least effectively reduce, any possible effect of the [GM soy].” They said it was “highly likely that all GM effects would have been diluted out.” 104
• Proper compositional studies filter out effects of weather or geography by comparing plants grown at the same time in the same location. Monsanto, however, pooled data from several locations, which makes it difficult for differences to be statistically significant. Nonetheless, the data revealed significant differences in the ash, fat, and carbohydrate content. Roundup Ready soy meal also contained 27% more trypsin inhibitor, a potential allergen. Also, cows fed GM soy produced milk with a higher fat content, demonstrating another disparity between the two types of soy.
• One field trial, however, did grow GM and non-GM plants next to each other, but this data was not included in the paper. Years after the study appeared, medical writer Barbara Keeler recovered the data that had been omitted. It showed that Monsanto’s GM soy had significantly lower levels of protein, a fatty acid, and phenylalanine, an essential amino acid. Also, toasted GM soy meal contained nearly twice the amount of a lectin—a substance that may interfere with the body’s ability to assimilate other nutrients. And the amount of trypsin inhibitor in cooked GM soy was as much as seven times higher than in a cooked non-GM control.
EXHIBIT J - Page 302
Case 5:14-cv-00117-cr Document 63-11 Filed 11/14/14 Page 20 of 312

• The study also omitted many details normally required for a published paper. According to Pryme and Lembcke, “No data were given for most of the parameters.”
• And when researchers tested the effects of Roundup Ready protein on animals, they didn’t extract the protein from the soybeans. Instead, they derived it from GM bacteria, claiming the two forms of protein were equivalent. There are numerous ways, however, in which the protein in the soy may be different. In fact, nine years after this study was published, another study showed that the gene inserted into the soybeans produced unintended aberrant RNA strands, meaning that the protein may be quite different than what was intended.105
In Pryme and Lembcke’s analysis, it came as no surprise that this Monsanto study, along with the other four peer-reviewed animal feeding studies that were “performed more or less in collaboration with private companies,” reported no negative effects of the GM diet. “On the other hand,” they wrote, “adverse effects were reported (but not explained) in [the five] independent studies.” They added, “It is remarkable that these effects have all been observed after feeding for only 10–14 days.”106
TOXIC GM FOODS COULD HAVE BEEN APPROVED
Two GM foods whose commercialization was stopped because of negative test results give a chilling example of what may be getting through. Rats fed GM potatoes had potentially precancerous cell growth in the stomach and intestines, less developed brains, livers, and testicles, partial atrophy of the liver, and damaged immune systems.107 GM peas provoked an inflammatory response in mice, suggesting that the peas might trigger a deadly anaphylactic shock in allergic humans.108 Both of these dangerous crops, however, could easily have been approved. The problems were only discovered because the researchers used advanced tests that were never applied to GM crops already on the market. Both would have passed the normal tests that companies typically use to get their products approved.
Ironically, when Monsanto was asked to comment on the pea study, their spokesperson said it demonstrated that the regulatory system works. He failed to disclose that none of his company’s GM crops had been put through such rigorous tests.
RAMPANT, UNRELENTING INDUSTRY BIAS
Industry-funded research that favors the funders is not new. Bias has been identified across several industries. In pharmaceuticals, for example, positive results are four times more likely if the drug’s manufacturer funds the study.109 When companies pay for the economic analyses of their own cancer drugs, the results are eight times more likely to be favorable.110 Compared to drug research, the potential for industry manipulation in GM crop studies is considerably higher. Unlike pharmaceutical testing, GM research has no standardized procedures dictated by regulators. GM studies are not usually published in peer-reviewed journals and are typically kept secret by companies and governments. There is little money available for rigorous independent research, so company evidence usually goes unchallenged and unverified. Most importantly, whereas drugs can show serious side-effects and still be approved, GM food cannot. There is no tolerance for adverse reactions; feeding trials must show no problems.
Thus, when industry studies show problems (in spite of their efforts to avoid them), serious adverse reactions and even deaths among GM-fed animals are ignored or dismissed as “not biologically significant” or due to “natural variations.” In the critical arena of food safety research, the biotech industry is without accountability, standards, or peer-review. They’ve got bad science down to a science.
EXHIBIT J - Page 303
Case 5:14-cv-00117-cr Document 63-11 Filed 11/14/14 Page 21 of 312

PROMOTING AND REGULATING DON’T MIX
While such self-serving behavior may be expected from corporations, how come government bodies let such blatant scientific contortions pass without comment? One reason is that several regulatory agencies are also charged with promoting the interests of biotechnology. This is the official position of the FDA and other US government bodies, for example. Suzanne Wuerthele, PhD, a US EPA toxicologist, says, “This technology is being promoted, in the face of concerns by respectable scientists and in the face of data to the contrary, by the very agencies which are supposed to be protecting human health and the environment. The bottom line in my view is that we are confronted with the most powerful technology the world has ever known, and it is being rapidly deployed with almost no thought whatsoever to its consequences.”
Canadian regulators are similarly conflicted. The Royal Society of Canada reported that, “In meetings with senior managers from the various Canadian regulatory departments . . . their responses uniformly stressed the importance of maintaining a favorable climate for the biotechnology industry to develop new products and submit them for approval on the Canadian market. . . . The conflict of interest involved in both promoting and regulating an industry or technology . . . is also a factor in the issue of maintaining the transparency, and therefore the scientific integrity, of the regulatory process. In effect, the public interest in a regulatory system that is ‘science based’. . . is significantly compromised when that openness is negotiated away by regulators in exchange for cordial and supportive relationships with the industries being regulated.”111
Many scientists on the European Food Safety Authority (EFSA) GMO Panel are personally aligned with biotech interests. According to Friends of the Earth (FOE), “One member has direct financial links with the biotech industry and others have indirect links, such as close involvement with major conferences organized by the biotech industry. Two members have even appeared in promotional videos produced by the biotech industry. . . . Several members of the Panel, including the chair Professor Kuiper, have been involved with the EU-funded ENTRANSFOOD project. The aim of this project was to agree [to] safety assessment, risk management, and risk communication procedures that would ‘facilitate market introduction of GMOs in Europe, and therefore bring the European industry in a competitive position.’ Professor Kuiper, who coordinated the ENTRANSFOOD project, sat on a working group that also included staff from Monsanto, Bayer CropScience, and Syngenta.” In a statement reminiscent of the deceptive policy statement by the FDA, the FOE report concludes that EFSA is “being used to create a false impression of scientific agreement when the real situation is one of intense and continuing debate and uncertainty.”112
The pro-GM European Commission repeats the same ruse. According to leaked documents obtained by FOE, while they privately appreciate “the uncertainties and gaps in knowledge that exist in relation to the safety of GM crops, . . . the Commission normally keeps this uncertainty concealed from the public whilst presenting its decisions about the safety of GM crops and foods as being certain and scientifically based.” For example, the Commission privately condemned the submission information for one crop as “mixed, scarce, delivered consecutively all over years, and not convincing.” They said there is “No sufficient experimental evidence to assess the safety.”113
With an agenda to promote GM foods, regulators regularly violate their own laws. In Europe, the law requires that when EFSA and member states have different opinions, they “are obliged to co-operate with a view to either resolving the divergence or preparing a joint document clarifying the contentious scientific issues and identifying the relevant uncertainties in the data.”114 According to FOE, in the case of all GM crop reviews, none of these legal obligations were followed.115 The declaration of GRAS status by the FDA also deviated from the Food and Cosmetic Act and years of legal precedent. Some violations are more blatant. In India, one official tampered with the report on Bt cotton to increase the yield figures to favor Monsanto.116 In Mexico, a senior government official allegedly threatened a University of California professor, implying “We know where your children go to school,” trying to get him not to publish incriminating evidence that would delay GM approvals.117 In Indonesia, Monsanto gave bribes and questionable payments to at least 140 officials, attempting to get their genetically modified (GM) cotton approved.118
EXHIBIT J - Page 304
Case 5:14-cv-00117-cr Document 63-11 Filed 11/14/14 Page 22 of 312

MANIPULATION OF PUBLIC OPINION
When governments fail in their duty to keep corporations in check, the “protector” role should shift to the media, which acts as a watchdog to expose public dangers and governmental shortcomings. But mainstream media around the world has largely overlooked the serious problems associated with GM crops and their regulation. The reason for this oversight is varied and includes contributions from an aggressive public relations and disinformation campaign by the biotech industry, legal threats by biotech companies, and in some cases, the fear of losing advertising accounts. This last reason is particularly prevalent among the farm press, which receives much of its income from the biotech industry.
Threatening letters from Monsanto’s attorneys have resulted in the cancellation of a five-part news series on their genetically engineered bovine growth hormone scheduled for a Fox TV station in Florida, as well as the cancellation of a book critical of Monsanto’s GMO products. A printer also shredded 14,000 copies of the Ecologist magazine issue entitled “The Monsanto Files,” due to fear of a Monsanto lawsuit. (See the chapter “Muscling the Media” in Seeds of Deception
119 for more examples.)
The methods that biotech advocates use to manipulate public opinion research has become an art form. Consumer surveys by the International Food Information Council (IFIC), for example,whose supporters include the major biotech seed companies, offers conclusions such as “A growing majority of Americans support the benefits of food biotechnology as well as the US Food and Drug Administration’s (FDA) labeling policy.” But communications professor James Beniger, who was past president of the American Association for Public Opinion Research, described the surveys as “so biased with leading questions favoring positive responses that any results are meaningless.”120 The 2003 survey, for example, included gems such as:
“All things being equal, how likely would you be to buy a variety of produce, like tomatoes or potatoes, if it had been modified by biotechnology to taste better or fresher?” and
“Biotechnology has also been used to enhance plants that yield foods like cooking oils. If cooking oil with reduced saturated fat made from these new plants was available, what effect would the use of biotechnology have on your decision to buy this cooking oil?”121
A similar tactic was used at a December 11, 2007 focus group in Columbus, Ohio “designed” to show that consumers wanted to make it illegal for dairies to label their milk as free from Monsanto’s genetically engineered bovine hormone rBST. The facilitator said, “All milk contains hormones. There is no such thing as hormone-free milk. The composition of both types of milk is the same in all aspects. Now what do you think of a label that says ‘no added hormones?’ Don’t you think it is deceiving and inappropriate to put ‘rBST-free’ on labels?” Not only was the facilitator “leading the witness,” he presented false information. Milk from cows treated with rBST has substantially higher levels of Insulin-like Growth Factor-1,122 which has been linked to higher risk of cancer,123 and higher incidence of fraternal twins.124 It also has higher levels of bovine growth hormone, pus, and in some cases, antibiotics.
Another example of manipulated consumer opinion was found in a 2004 article in the British Food Journal, authored by four advocates of genetically modified (GM) foods.125 According to the peer-reviewed paper, when shoppers in a Canadian farm store were confronted with an informed and unbiased choice between GM corn and non-GM corn, most purchased the GM variety. This finding flew in the face of worldwide consumer resistance to GM foods, which had shut markets in Europe, Japan, and elsewhere. It also challenged studies that showed that the more information on genetically modified organisms (GMOs) consumers have, the less they trust them.126 The study, which was funded by the biotech-industry front group, Council for Biotechnology Information and the industry’s trade association, the Crop Protection Institute of Canada (now Croplife Canada), was given the Journal’s prestigious Award for Excellence for the Most Outstanding Paper of 2004 and has been cited often by biotech advocates.
Stuart Laidlaw, a reporter from Canada’s Toronto Star, visited the farm store several times during the study and described the scenario in his book Secret Ingredients. Far from offering unbiased choices, key elements appeared rigged to favor GM corn purchases. The consumer education fact sheets were entirely pro-GMO, and Doug Powell, the lead researcher, enthusiastically demonstrated to Laidlaw how he could convince shoppers to buy the GM varieties. He confronted a farmer who had already
EXHIBIT J - Page 305
Case 5:14-cv-00117-cr Document 63-11 Filed 11/14/14 Page 23 of 312

purchased non-GM corn. After pitching his case for GMOs, Powell proudly had the farmer tell Laidlaw that he had changed his opinion and would buy GM corn in his next shopping trip.
Powell’s interference with shoppers’ “unbiased” choices was nothing compared to the effect of the signs placed over the corn bins. The sign above the non-GM corn read, “Would you eat wormy sweet corn?” It further listed the chemicals that were sprayed during the season. By contrast, the sign above the GM corn stated, “Here’s What Went into Producing Quality Sweet Corn.” It is no wonder that 60% of shoppers avoided the “wormy corn.” In fact, it may be a testament to people’s distrust of GMOs that 40% still went for the “wormy” option.
Powell and his colleagues did not mention the controversial signage in their study. They claimed that the corn bins in the farm store were “fully labelled”—either “genetically engineered Bt sweet corn” or “Regular sweet-corn.” When Laidlaw’s book came out, however, Powell’s “wormy” sign was featured in a photograph,127 exposing what was later described by Cambridge University’s Dr. Richard Jennings as “flagrant fraud.” Jennings, who is a leading researcher on scientific ethics, says, “It was a sin of omission by failing to divulge information which quite clearly should have been disclosed.”128
In his defence, Powell claimed that his signs merely used the language of consumers and was “not intended to manipulate consumer purchasing patterns.” He also claimed that the “wormy” corn sign was only there for the first week of the trial and was then replaced by other educational messages. But eye witnesses and photographs demonstrate the presence of the sign long after Powell’s suggested date of replacement.129
Several scientists and outraged citizens say the paper should be withdrawn, but the Journal refused. In fact, the Journal’s editor has not even agreed to reconsider its Award for Excellence. A blatant propaganda exercise still stands validated as exemplary science.
CRITICS AND INDEPENDENT SCIENTISTS ARE ATTACKED
One of the most troubling aspects of the biotech debate is the attack strategy used on GMO critics and independent scientists. Not only are adverse findings by independent scientists often suppressed, ignored, or denied, researchers that discover problems from GM foods have been fired, stripped of responsibilities, deprived of tenure, and even threatened. Consider Dr. Pusztai, the world’s leading scientist in his field, who inadvertently discovered in 1998 that unpredictable changes in GM crops caused massive damage in rats. He went public with his concerns, was a hero at his prestigious institute for two days, and then, after the director received two phone calls allegedly from the UK Prime Minister’s office, was fired after 35 years and silenced with threats of a lawsuit. False statements were circulated to trash his reputation, which are recited by GMO advocates today.
After University of California Professor Ignacio Chapela, PhD, published evidence that GM corn contaminated Mexico’s indigenous varieties, two fictitious internet characters created by Monsanto’s PR firm, the Bivings Group, initiated a brutal internet smear campaign, lying about Dr. Chapela and his research.
Irina Ermakova, PhD, a leading scientist at the Russian National Academy of Sciences, fed female rats GM soy and was stunned to discover that more than half their offspring died within three weeks—compared to only 10% from mothers fed non-GM soy. Without funding to extend her analysis, she labeled her work “preliminary,” published it in a Russian journal, and implored the scientific community to repeat the study. Two years later, no one has repeated it, but advocates use false or irrelevant arguments to divert attention from the shocking results and have tried to vilify Dr. Ermakova.
A New Zealand MP testified at the 2001 Royal Commission of Inquiry on Genetic Modification, “I have been contacted by telephone and e-mail by a number of scientists who have serious concerns . . . but who are convinced that if they express these fears publicly. . . or even if they asked the awkward and difficult questions, they will be eased out of their institution.” Indeed this year, after Professor Christian Velot, PhD, raised the difficult questions on GMOs at public conferences, his 2008 research funds were confiscated, his student assistants were re-assigned, and his position at the University of Paris-Sud faces early termination.
EXHIBIT J - Page 306
Case 5:14-cv-00117-cr Document 63-11 Filed 11/14/14 Page 24 of 312

WE’RE THE GUINEA PIGS
Since GM foods are not properly tested before they enter the market, consumers are the guinea pigs. But this doesn’t even qualify as an experiment. There are no controls and no monitoring. Given the mounting of evidence of harm, it is likely that GM foods are contributing to the deterioration of health in the United States, Canada, and other countries where it is consumed. But without post-marketing surveillance, the chances of tracing health problems to GM food are low. The incidence of a disease would have to increase dramatically before it was noticed, meaning that millions may have to get sick before a change is investigated. Tracking the impact of GM foods is even more difficult in North America, where the foods are not labeled.
Regulators at Health Canada announced in 2002 that they would monitor Canadians for health problems from eating GM foods. A spokesperson said, “I think it’s just prudent and what the public expects, that we will keep a careful eye on the health of Canadians.” But according to CBC TV news, Health Canada “abandoned that research less than a year later saying it was ‘too difficult to put an effective surveillance system in place.’” The news anchor added, “So at this point, there is little research into the health effects of genetically modified food. So will we ever know for sure if it’s safe?”130
Not with the biotech companies in charge. Consider the following statement in a report submitted to county officials in California by pro-GM members of a task force. “[It is] generally agreed that long-term monitoring of the human health risks of GM food through epidemiological studies is not necessary because there is no scientific evidence suggesting any long-term harm from these foods.”131 Note the circular logic: Because no long-term epidemiological studies are in place, we have no evidence showing long-term harm. And since we don’t have any evidence of long-term harm, we don’t need studies to look for it.
What are these people thinking? Insight into the pro-GM mindset was provided by Dan Glickman, the US Secretary of Agriculture under President Clinton.
“What I saw generically on the pro-biotech side was the attitude that the technology was good, and that it was almost immoral to say that it wasn’t good, because it was going to solve the problems of the human race and feed the hungry and clothe the naked. . . . And there was a lot of money that had been invested in this, and if you’re against it, you’re Luddites, you’re stupid. That, frankly, was the side our government was on. Without thinking, we had basically taken this issue as a trade issue and they, whoever ‘they’ were, wanted to keep our product out of their market. And they were foolish, or stupid, and didn’t have an effective regulatory system. There was rhetoric like that even here in this department. You felt like you were almost an alien, disloyal, by trying to present an open-minded view on some of the issues being raised. So I pretty much spouted the rhetoric that everybody else around here spouted; it was written into my speeches.”132
Fortunately, not everyone feels that questioning GM foods is disloyal. On the contrary, millions of people around the world are unwilling to participate in this uncontrolled experiment. They refuse to eat GM foods. Manufacturers in Europe and Japan have committed to avoid using GM ingredients. And the US natural foods industry, not waiting for the government to test or label GMOs, is now engaged in removing all remaining GM ingredients from their sector using a third party verification system. The Campaign for Healthier Eating in America will circulate non-GMO shopping guides in stores nationwide so that consumers have clear, healthy non-GMO choices. With no governmental regulation of biotech corporations, it is left to consumers to protect ourselves.
For a guide to avoiding GMOs, go to www.NonGMOShoppingGuide.com.
EXHIBIT J - Page 307
Case 5:14-cv-00117-cr Document 63-11 Filed 11/14/14 Page 25 of 312

Endnotes
1 Jeffrey M. Smith, Genetic Roulette: The Documented Health Risks of Genetically Engineered Foods, Yes! Books, Fairfield, IA USA 2007 2 Dan Quayle, “Speech in the Indian Treaty Room of the Old Executive Office Building,” May 26, 1992. 3 For copies of FDA memos, see The Alliance for Bio-Integrity, www.biointegrity.org 4 Steven M. Druker, “How the US Food and Drug Administration approved genetically engineered foods despite the deaths one had caused and the warnings of its own scientists about their unique risks,” Alliance for Bio-Integrity, http://www.biointegrity.org/ext-summary.html 5 Louis J. Pribyl, “Biotechnology Draft Document, 2/27/92,” March 6, 1992, www.biointegrity.org http://www.biointegrity.org/FDAdocs/04/view1.html 6 “Statement of Policy: Foods Derived from New Plant Varieties,” Federal Register 57, no. 104 (May 29, 1992): 22991. 7 Linda Kahl, Memo to James Maryanski about Federal Register Document “Statement of Policy: Foods from Genetically Modified Plants,” Alliance for Bio-Integrity(January 8, 1992) http://www.biointegrity.org 8 See for example, “Good Enough To Eat?” New Scientist (February 9, 2002), 7. 9 “Health risks of genetically modified foods,” editorial, Lancet, 29 May 1999. 10 “Elements of Precaution: Recommendations for the Regulation of Food Biotechnology in Canada; An Expert Panel Report on the Future of Food Biotechnology prepared by The Royal Society of Canada at the request of Health Canada Canadian Food Inspection Agency and Environment Canada” The Royal Society of Canada, January 2001. 11 J. R. Latham, et al., “The Mutational Consequences of Plant Transformation,” The Journal of Biomedicine and Biotechnology 2006, Article ID 25376: 1-7; see also Allison Wilson, et. al., “Transformation-induced mutations in transgenic plants: Analysis and biosafety implications,” Biotechnology and Genetic Engineering Reviews – Vol. 23, December 2006. 12 P. H. Bao, S. Granata, S. Castiglione, G. Wang, C. Giordani, E. Cuzzoni, G. Damiani, C. Bandi, S. K. Datta, K. Datta, I. Potrykus, A. Callegarin and F. Sala, "Evidence for genomic changes in transgenic rice (Oryza sativa L.) recovered from protoplasts" Transgen Res 5 (1996): 97-103.; M. Labra, C. Savini, M. Bracale, N. Pelucchi, L. Colombo, M. Bardini and F. Sala, "Genomic changes in transgenic rice (Oryza sativa L.) plants produced by infecting calli with Agrobacterium tumefaciens," Plant Cell Rep 20 (2001): 325-330. 13 “Elements of Precaution: Recommendations for the Regulation of Food Biotechnology in Canada; An Expert Panel Report on the Future of Food Biotechnology prepared by The Royal Society of Canada at the request of Health Canada Canadian Food Inspection Agency and Environment Canada” The Royal Society of Canada, January 2001. 14 Edwin J. Mathews, Ph.D., in a memorandum to the Toxicology Section of the Biotechnology Working Group. Subject: Analysis of the Major Plant Toxicants. Dated October 28, 1991 15 Division of Food Chemistry and Technology and Division of Contaminants Chemistry, “Points to Consider for Safety Evaluation of Genetically Modified Foods: Supplemental Information,” November 1, 1991, www.biointegrity.org 16 Netherwood et al, “Assessing the survival of transgenic plant DNA in the human gastrointestinal tract,” Nature Biotechnology 22 (2004): 2. 17 Division of Food Chemistry and Technology and Division of Contaminants Chemistry, “Points to Consider for Safety Evaluation of Genetically Modified Foods: Supplemental Information,” November 1, 1991, www.biointegrity.org 18 Charles Benbrook, “Impacts of Genetically Engineered Crops on Pesticide Use: The First Thirteen Years,” November 2009, The Organic Center, http://www.organic-center.org/science.latest.php?action=view&report_id=159 19 Comments for AC21 Ag Biotech Committee Meeting, Center for Food Safety, August 1, 2007 20 Department of Veterinary Medicine, FDA, correspondence June 16, 1993. As quoted in Fred A. Hines, Memo to Dr. Linda Kahl. “Flavr Savr Tomato: . . . Pathology Branch’s Evaluation of Rats with Stomach Lesions From Three Four-Week Oral (Gavage) Toxicity Studies . . . and an Expert Panel’s Report,” Alliance for Bio-Integrity (June 16, 1993) http://www.biointegrity.org/FDAdocs/17/view1.html 21 Robert J. Scheuplein, Memo to the FDA Biotechnology Coordinator and others, “Response to Calgene Amended Petition,” Alliance for Bio-Integrity (October 27, 1993) www.biointegrity.org 22 Carl B. Johnson to Linda Kahl and others, “Flavr Savr™ Tomato: Significance of Pending DHEE Question,” Alliance for Bio-Integrity (December 7, 1993) www.biointegrity.org 23 Arpad Pusztai, “Genetically Modified Foods: Are They a Risk to Human/Animal Health?” June 2001 Action Bioscience www.actionbioscience.org/biotech/pusztai.html 24 Nagui H. Fares, Adel K. El-Sayed, “Fine Structural Changes in the Ileum of Mice Fed on Endotoxin Treated Potatoes and Transgenic Potatoes,” Natural Toxins 6, no. 6 (1998): 219–233. 25 Stanley W. B. Ewen and Arpad Pusztai, “Effect of diets containing genetically modified potatoes expressing Galanthus nivalis lectin on rat small intestine,” Lancet, 1999 Oct 16; 354 (9187): 1353-4. 26 Arpad Pusztai, “Facts Behind the GM Pea Controversy: Epigenetics, Transgenic Plants & Risk Assessment,” Proceedings of the Conference, December 1st 2005 (Frankfurtam Main, Germany: Literaturhaus, 2005).
EXHIBIT J - Page 308
Case 5:14-cv-00117-cr Document 63-11 Filed 11/14/14 Page 26 of 312

27 Arpad Pusztai, “Can science give us the tools for recognizing possible health risks of GM food,” Nutrition and Health, 2002, Vol 16 Pp 73-84. 28 John M. Burns, “13-Week Dietary Subchronic Comparison Study with MON 863 Corn in Rats Preceded by a 1-Week Baseline Food Consumption Determination with PMI Certified Rodent Diet #5002,” December 17, 2002 http://www.monsanto.com/pdf/products/fullratstudy863.pdf 29 R. Tudisco, P. Lombardi, F. Bovera, D. d’Angelo, M. I. Cutrignelli, V. Mastellone, V. Terzi, L. Avallone, F. Infascelli, “Genetically Modified Soya Bean in Rabbit Feeding: Detection of DNA Fragments and Evaluation of Metabolic Effects by Enzymatic Analysis,” Animal Science 82 (2006): 193–199. 30 Comments to ANZFA about Applications A346, A362 and A363 from the Food Legislation and Regulation Advisory Group (FLRAG) of the Public Health Association of Australia (PHAA) on behalf of the PHAA, “Food produced from glyphosate-tolerant canola line GT73,” www.iher.org.au/ 31 M. Malatesta, C. Caporaloni, S. Gavaudan, M. B. Rocchi, S. Serafini, C. Tiberi, G. Gazzanelli, “Ultrastructural Morphometrical and Immunocytochemical Analyses of Hepatocyte Nuclei from Mice Fed on Genetically Modified Soybean,” Cell Struct Funct. 27 (2002): 173–180 32 Jeffrey M. Smith, Genetic Roulette: The Documented Health Risks of Genetically Engineered Foods, Yes! Books, Fairfield, IA USA 2007 33 Irina Ermakova, “Experimental Evidence of GMO Hazards,” Presentation at Scientists for a GM Free Europe, EU Parliament, Brussels, June 12, 2007 34 Arpad Pusztai, “Can Science Give Us the Tools for Recognizing Possible Health Risks for GM Food?” Nutrition and Health 16 (2002): 73–84. 35 S. Leeson, “The Effect of Glufosinate Resistant Corn on Growth of Male Broiler Chickens,” Department of Animal and Poultry Sciences, University of Guelph, Report No. A56379, July 12, 1996. 36 Malatesta, et al, “Ultrastructural Analysis of Pancreatic Acinar Cells from Mice Fed on Genetically modified Soybean,” J Anat. 2002 November; 201(5): 409–415; see also M. Malatesta, M. Biggiogera, E. Manuali, M. B. L. Rocchi, B. Baldelli, G. Gazzanelli, “Fine Structural Analyses of Pancreatic Acinar Cell Nuclei from Mice Fed on GM Soybean,” Eur J Histochem 47 (2003): 385–388. 37 Arpad Pusztai, “Can science give us the tools for recognizing possible health risks of GM food,” Nutrition and Health, 2002, Vol 16 Pp 73-84 38 R. Tudisco, P. Lombardi, F. Bovera, D. d’Angelo, M. I. Cutrignelli, V. Mastellone, V. Terzi, L. Avallone, F. Infascelli, “Genetically Modified Soya Bean in Rabbit Feeding: Detection of DNA Fragments and Evaluation of Metabolic Effects by Enzymatic Analysis,” Animal Science 82 (2006): 193–199. 39 John M. Burns, “13-Week Dietary Subchronic Comparison Study with MON 863 Corn in Rats Preceded by a 1-Week Baseline Food Consumption Determination with PMI Certified Rodent Diet #5002,” December 17, 2002 http://www.monsanto.com/pdf/products/fullratstudy863.pdf 40 R. Tudisco, P. Lombardi, F. Bovera, D. d’Angelo, M. I. Cutrignelli, V. Mastellone, V. Terzi, L. Avallone, F. Infascelli, “Genetically Modified Soya Bean in Rabbit Feeding: Detection of DNA Fragments and Evaluation of Metabolic Effects by Enzymatic Analysis,” Animal Science 82 (2006): 193–199. 41 Arpad Pusztai, “Can science give us the tools for recognizing possible health risks of GM food,” Nutrition and Health, 2002, Vol 16 Pp 73-84 42 de Vendômois JS, Roullier F, Cellier D, Séralini GE. A Comparison of the Effects of Three GM Corn Varieties on Mammalian Health. Int J Biol Sci 2009; 5:706-726. Available from http://www.biolsci.org/v05p0706.htm 43 Irina Ermakova, “Experimental Evidence of GMO Hazards,” Presentation at Scientists for a GM Free Europe, EU Parliament, Brussels, June 12, 2007 44 L. Vecchio et al, “Ultrastructural Analysis of Testes from Mice Fed on Genetically Modified Soybean,” European Journal of Histochemistry 48, no. 4 (Oct–Dec 2004):449–454. 45 Oliveri et al., “Temporary Depression of Transcription in Mouse Pre-implantion Embryos from Mice Fed on Genetically Modified Soybean,” 48th Symposium of the Society for Histochemistry, Lake Maggiore (Italy), September 7–10, 2006. 46 Alberta Velimirov and Claudia Binter, “Biological effects of transgenic maize NK603xMON810 fed in long term reproduction studies in mice,” Forschungsberichte der Sektion IV, Band 3/2008 47 I.V.Ermakova, “Genetically Modified Organisms and Biological Risks,” Proceedings of International Disaster Reduction Conference (IDRC) Davos, Switzerland August 27th – September 1st, 2006: 168–172. 48 Irina Ermakova, “Genetically modified soy leads to the decrease of weight and high mortality of rat pups of the first generation. Preliminary studies,” Ecosinform 1 (2006): 4–9. 49 Irina Ermakova, “Experimental Evidence of GMO Hazards,” Presentation at Scientists for a GM Free Europe, EU Parliament, Brussels, June 12, 2007 50 I.V.Ermakova “GMO: Life itself intervened into the experiments,” Letter, EcosInform N2 (2006): 3–4. 51 Jeffrey M. Smith, Genetic Roulette: The Documented Health Risks of Genetically Engineered Foods, Yes! Books, Fairfield, IA USA 2007 52 “Mortality in Sheep Flocks after Grazing on Bt Cotton Fields—Warangal District, Andhra Pradesh” Report of the Preliminary Assessment, April 2006, http://www.gmwatch.org/archive2.asp?arcid=6494
EXHIBIT J - Page 309
Case 5:14-cv-00117-cr Document 63-11 Filed 11/14/14 Page 27 of 312

53 Personal communication and visit, January 2009. 54 John M. Burns, “13-Week Dietary Subchronic Comparison Study with MON 863 Corn in Rats Preceded by a 1-Week Baseline Food Consumption Determination with PMI Certified Rodent Diet #5002,” December 17, 2002 http://www.monsanto.com/monsanto/content/sci_tech/prod_safety/fullratstudy.pdf, see also Stéphane Foucart, “Controversy Surrounds a GMO,” Le Monde, 14 December 2004; and Jeffrey M. Smith, “Genetically Modified Corn Study Reveals Health Damage and Cover-up,” Spilling the Beans, June 2005, http://www.seedsofdeception.com/Public/Newsletter/June05GMCornHealthDangerExposed/index.cfm 55 Arpad Pusztai, “Can science give us the tools for recognizing possible health risks of GM food,” Nutrition and Health, 2002, Vol 16 Pp 73-84 56 V. E. Prescott, et al, “Transgenic Expression of Bean r-Amylase Inhibitor in Peas Results in Altered Structure and Immunogenicity,” Journal of Agricultural Food Chemistry (2005): 53. 57 Yearly food sensitivity assessment of York Laboratory, as reported in Mark Townsend, “Why soya is a hidden destroyer,” Daily Express, March 12, 1999. 58 G. A. Kleter and A. A. C. M. Peijnenburg, “Screening of transgenic proteins expressed in transgenic food crops for the presence of short amino acid sequences indentical to potential, IgE-binding linear epitopes of allergens,” BMC Structural Biology 2 (2002): 8–19. 59 Netherwood et al, “Assessing the survival of transgenic plant DNA in the human gastrointestinal tract,” Nature Biotechnology 22 (2004): 2. 60 Hye-Yung Yum, Soo-Young Lee, Kyung-Eun Lee, Myung-Hyun Sohn, Kyu-Earn Kim, “Genetically Modified and Wild Soybeans: An immunologic comparison,” Allergy and Asthma Proceedings 26, no. 3 (May–June 2005): 210-216(7). 61 Stephen R. Padgette et al, “The Composition of Glyphosate-Tolerant Soybean Seeds Is Equivalent to That of Conventional Soybeans,” The Journal of Nutrition 126, no. 4, (April 1996); including data in the journal archives from the same study; see also A. Pusztai and S. Bardocz, “GMO in animal nutrition: potential benefits and risks,” Chapter 17, Biology of Nutrition in Growing Animals (Elsevier, 2005). 62 Manuela Malatesta, et al, “Ultrastructural Analysis of Pancreatic Acinar Cells from Mice Fed on Genetically modified Soybean,” Journal of Anatomy 201, no. 5 (November 2002): 409; see also M. Malatesta, M. Biggiogera, E. Manuali, M. B. L. Rocchi, B. Baldelli, G. Gazzanelli, “Fine Structural Analyses of Pancreatic Acinar Cell Nuclei from Mice Fed on GM Soybean,” Eur J Histochem 47 (2003): 385–388. 63 See for example, Scott H. Sicherer et al., “Prevalence of peanut and tree nut allergy in the United States determined by means of a random digit dial telephone survey: A 5-year follow-up study,” Journal of allergy and clinical immunology, March 2003, vol. 112, n 6, 1203-1207); and Ricki Helm et al., “Hypoallergenic Foods—Soybeans and Peanuts,” Information Systems for Biotechnology News Report, October 1, 2002. 64 Vazquez et al, "Intragastric and intraperitoneal administration of Cry1Ac protoxin from Bacillus thuringiensis induces systemic and mucosal antibody responses in mice," Life Sciences, 64, no. 21 (1999): 1897–1912; Vazquez et al, “Characterization of the mucosal and systemic immune response induced by Cry1Ac protein from Bacillus thuringiensis HD 73 in mice,” Brazilian Journal of Medical and Biological Research 33 (2000): 147–155. 65 Vazquez et al, “Bacillus thuringiensis Cry1Ac protoxin is a potent systemic and mucosal adjuvant,” Scandanavian Journal of Immunology 49 (1999): 578–584. See also Vazquez-Padron et al., 147 (2000b). 66 Nagui H. Fares, Adel K. El-Sayed, “Fine Structural Changes in the Ileum of Mice Fed on Endotoxin Treated Potatoes and Transgenic Potatoes,” Natural Toxins 6, no. 6 (1998): 219–233. 67 Alberto Finamore, et al, “Intestinal and Peripheral Immune Response to MON810 Maize Ingestion in Weaning and Old Mice,” J. Agric. Food Chem., 2008, 56 (23), pp 11533–11539, November 14, 2008 68 Washington State Department of Health, “Report of health surveillance activities: Asian gypsy moth control program,” (Olympia, WA: Washington State Dept. of Health, 1993). 69 M. Green, et al., “Public health implications of the microbial pesticide Bacillus thuringiensis: An epidemiological study, Oregon, 1985-86,” Amer. J. Public Health 80, no. 7(1990): 848–852. 70 M.A. Noble, P.D. Riben, and G. J. Cook, “Microbiological and epidemiological surveillance program to monitor the health effects of Foray 48B BTK spray” (Vancouver, B.C.: Ministry of Forests, Province of British Columbi, Sep. 30, 1992). 71 A. Edamura, MD, “Affidavit of the Federal Court of Canada, Trial Division. Dale Edwards and Citizens Against Aerial Spraying vs. Her Majesty the Queen, Represented by the Minister of Agriculture,” (May 6, 1993); as reported in Carrie Swadener, “Bacillus thuringiensis (B.t.),” Journal of Pesticide Reform, 14, no, 3 (Fall 1994). 72 J. R. Samples, and H. Buettner, “Ocular infection caused by a biological insecticide,” J. Infectious Dis. 148, no. 3 (1983): 614; as reported in Carrie Swadener, “Bacillus thuringiensis (B.t.)”, Journal of Pesticide Reform 14, no. 3 (Fall 1994) 73 M. Green, et al., “Public health implications of the microbial pesticide Bacillus thuringiensis: An epidemiological study, Oregon, 1985-86,” Amer. J. Public Health, 80, no. 7 (1990): 848–852. 74 A. Edamura, MD, “Affidavit of the Federal Court of Canada, Trial Division. Dale Edwards and Citizens Against Aerial Spraying vs. Her Majesty the Queen, Represented by the Minister of Agriculture,” (May 6, 1993); as reported in Carrie Swadener, “Bacillus thuringiensis (B.t.),” Journal of Pesticide Reform, 14, no, 3 (Fall 1994). 75 Carrie Swadener, “Bacillus thuringiensis (B.t.),” Journal of Pesticide Reform 14, no. 3 (Fall 1994).
EXHIBIT J - Page 310
Case 5:14-cv-00117-cr Document 63-11 Filed 11/14/14 Page 28 of 312

76 Terje Traavik and Jack Heinemann, “Genetic Engineering and Omitted Health Research: Still No Answers to Ageing Questions, 2006. Cited in their quote was: G. Stotzky, “Release, persistence, and biological activity in soil of insecticidal proteins from Bacillus thuringiensis,” found in Deborah K. Letourneau and Beth E. Burrows, Genetically Engineered Organisms. Assessing Environmental and Human Health Effects (cBoca Raton, FL: CRC Press LLC, 2002), 187–222. 77 See for example, A. Dutton, H. Klein, J. Romeis, and F. Bigler, “Uptake of Bt-toxin by herbivores feeding on transgenic maize and consequences for the predator Chrysoperia carnea,” Ecological Entomology 27 (2002): 441–7; and J. Romeis, A. Dutton, and F. Bigler, “Bacillus thuringiensis toxin (Cry1Ab) has no direct effect on larvae of the green lacewing Chrysoperla carnea (Stephens) (Neuroptera: Chrysopidae),” Journal of Insect Physiology 50, no. 2–3 (2004): 175–183. 78 N. Tomlinson of UK MAFF's Joint Food Safety and Standards Group 4, December 1998 letter to the U.S. FDA, commenting on its draft document, “Guidance for Industry: Use of Antibiotic Resistance Marker Genes in Transgenic Plants,” http://www.food.gov.uk/multimedia/pdfs/acnfp1998.pdf; (see pages 64–68). 79 Jeffrey M. Smith, “Bt-maize (corn) during pollination, may trigger disease in people living near the cornfield,” Press Release, February 2004, http://www.seedsofdeception.com/Public/AboutGeneticallyModifiedFoods/InhaledGMMaizePollenMayCauseDiseas/index.cfm; and Allen V. Estabillo, “Farmer's group urges ban on planting Bt corn; says it could be cause of illnesses,” Mindanews, October 19, 2004 http://www.seedsofdeception.com/utility/showArticle/?objectID=75 80 Mae-Wan Ho, “GM Ban Long Overdue, Dozens Ill & Five Deaths in the Philippines,” ISIS Press Release, June 2, 2006. 81 Ashish Gupta et. al., “Impact of Bt Cotton on Farmers’ Health (in Barwani and Dhar District of Madhya Pradesh),” Investigation Report, Oct–Dec 2005. 82 Jeffrey M. Smith, Genetic Roulette: The Documented Health Risks of Genetically Engineered Foods, Yes! Books, Fairfield, IA USA 2007 83 E. Ann Clark, “Food Safety of GM Crops in Canada: toxicity and allergenicity,” GE Alert, 2000. 84 FLRAG of the PHAA of behalf of the PHAA, “Comments to ANZFA about Applications A372, A375, A378 and A379.” 85 Judy Carman, “Is GM Food Safe to Eat?” in R. Hindmarsh, G. Lawrence, eds., Recoding Nature Critical Perspectives on Genetic Engineering (Sydney: UNSW Press, 2004): 82–93. 86 Judy Carman, “Is GM Food Safe to Eat?” in R. Hindmarsh, G. Lawrence, eds., Recoding Nature Critical Perspectives on Genetic Engineering (Sydney: UNSW Press, 2004): 82–93. 87 FLRAG, “Comments to ANZFA about Applications A346, A362 and A363,” http://www.iher.org.au/ 88 Doug Gurian-Sherman, “Holes in the Biotech Safety Net, FDA Policy Does Not Assure the Safety of Genetically Engineered Foods,” Center for Science in the Public Interest, http://www.cspinet.org/new/pdf/fda_report__final.pdf 89 Bill Freese, “The StarLink Affair, Submission by Friends of the Earth to the FIFRA Scientific Advisory Panel considering Assessment of Additional Scientific Information Concerning StarLink Corn,” July 17–19, 2001. 90 FDA Letter, Letter from Alan M. Rulis, Office of Premarket Approval, Center for Food Safety and Applied Nutrition, FDA to Dr. Kent Croon, Regulatory Affairs Manager, Monsanto Company, Sept 25, 1996. See Letter for BNF No. 34 at http://www.cfsan.fda.gov/~lrd/biocon.html 91 “Elements of Precaution: Recommendations for the Regulation of Food Biotechnology in Canada; An Expert Panel Report on the Future of Food Biotechnology prepared by The Royal Society of Canada at the request of Health Canada Canadian Food Inspection Agency and Environment Canada” The Royal Society of Canada, January 2001. 92 FIFRA Scientific Advisory Panel (SAP), Open Meeting, July 17, 2001. 93 Bill Freese, Crop testing, New Scientist, Letter to the Editor, issue 2530, December 17, 2005 94 M. Cretenet, J. Goven, J. A. Heinemann, B. Moore, and C. Rodriguez-Beltran, “Submission on the DAR for application A549 Food Derived from High-Lysine Corn LY038: to permit the use in food of high-lysine corn, 2006, www.inbi.canterbury.ac.nz 95 Marc Lappé and Britt Bailey, “ASA Response,” June 25, 1999, http://cetos.org/articles/asaresponse.html 96 Bill Freese, “The StarLink Affair, Submission by Friends of the Earth to the FIFRA Scientific Advisory Panel considering Assessment of Additional Scientific Information Concerning StarLink Corn,” July 17-19, 2001 97 Paul P. Groenewegen, Brian W. McBride, John H. Burton, Theodore H. Elsasser. "Bioactivity of Milk from bST-Treated Cows." J. Nutrition 120, 1990, pp. 514-519 98 Judith C. Juskevich and C. Greg Guyer. "Bovine Growth Hormone: Human Food Safety Evaluation." Science, vol. 249. August 24, 1990, pp. 875-884 99 Pete Hardin, “rbGH: Appropriate Studies Haven’t Been Done,” The Milkweed, July 2000 100 See for example, Doug Gurian-Sherman, “Holes in the Biotech Safety Net, FDA Policy Does Not Assure the Safety of Genetically Engineered Foods,” Center for Science in the Public Interest, http://www.cspinet.org/new/pdf/fda_report__final.pdf 101 S. R. Padgette, N. B.Taylor, D. L. Nida, M. R. Bailey, J. MacDonald, L. R. Holden, R. L. Fuchs, “The composition of glyphosate-tolerant soybean seeds is equivalent to that of conventional soybeans,” J. Nutr. 126 (1996):702–716.
EXHIBIT J - Page 311
Case 5:14-cv-00117-cr Document 63-11 Filed 11/14/14 Page 29 of 312

102 B. G. Hammond, J. L. Vicini, G. F. Hartnell, M. W. Naylor, C. D. Knight, E. H. Robinson, R. L. Fuchs, and S. R. Padgette, “The feeding value of soybeans fed to rats, chickens, catfish, and dairy cattle is not altered by genetic incorporation of glyphosate tolerance,” J. Nutr. 126 (1996): 717–727. 103 A. Pusztai and S. Bardocz, “GMO in animal nutrition: potential benefits and risks,” Chapter 17, Biology of Nutrition in Growing Animals (Elsevier, October 2005). earlier 104 Ian F. Pryme and Rolf Lembcke, “In Vivo Studies on Possible Health Consequences of Genetically Modified Food and Feed—with Particular Regard to Ingredients Consisting of Genetically Modified Plan Materials,” Nutrition and Health 17(2003): 1–8. 105 Andreas Rang, et al, “Detection of RNA variants transcribed from the transgene in Roundup Ready soybean,” Eur Food Res Technol 220 (2005): 438–443. 106 Ian F. Pryme and Rolf Lembcke, “In Vivo Studies on Possible Health Consequences of Genetically Modified Food and Feed—with Particular Regard to Ingredients Consisting of Genetically Modified Plan Materials,” Nutrition and Health 17(2003): 1–8. 107 Arpad Pusztai, “Can science give us the tools for recognizing possible health risks of GM food,” Nutrition and Health, 2002, Vol 16 Pp 73-84; Stanley W. B. Ewen and Arpad Pusztai, “Effect of diets containing genetically modified potatoes expressing Galanthus nivalis lectin on rat small intestine,” Lancet, 1999 Oct 16; 354 (9187): 1353-4; Arpad Pusztai, “Genetically Modified Foods: Are They a Risk to Human/Animal Health?” June 2001 Action Bioscience http://www.actionbioscience.org/biotech/pusztai.html; and A. Pusztai and S. Bardocz, “GMO in animal nutrition: potential benefits and risks,” Chapter 17, Biology of Nutrition in Growing Animals, R. Mosenthin, J. Zentek and T. Zebrowska (Eds.) Elsevier, October 2005 108 V. E. Prescott, et al, “Transgenic Expression of Bean r-Amylase Inhibitor in Peas Results in Altered Structure and Immunogenicity,” Journal of Agricultural Food Chemistry (2005): 53. 109 J. Lexchin, L. A. Bero, B. Djulbegovic, and O. Clark, “Pharmaceutical industry sponsorship and research outcome and quality: systematic review,” BMJ 326 (2003):1167–1176. 110 Mark Friedberg, et al, “Evaluation of Conflict of Interest in Economic Analyses of New Drugs Used in Oncology,” JAMA 282 (1999):1453–1457. 111 “Elements of Precaution,” The Royal Society of Canada, January 2001. 112 Friends of the Earth Europe, “Throwing Caution to the Wind: A review of the European Food Safety Authority and its work on genetically modified foods and crops,” November 2004. 113 European Communities submission to World Trade Organization dispute panel, 28 January 2005. 114 EU Regulation 178/2002 (Article 30) 115 Friends of the Earth Europe, “Throwing Caution to the Wind: A review of the European Food Safety Authority and its work on genetically modified foods and crops,” November 2004. 116 “Greenpeace exposes Government-Monsanto nexus to cheat Indian farmers: calls on GEAC to revoke BT cotton permission,” Press release, March 3, 2005, http://www.greenpeace.org/india_en/news/details?item_id=771071 117 Jeffrey M. Smith, Seeds of Deception, (Iowa: Yes! Books, 2003), 224. 118 “Monsanto Bribery Charges in Indonesia by DoJ and USSEC,” Third World Network, Malaysia, Jan 27, 2005, http://www.mindfully.org/GE/2005/Monsanto-Indonesia-Bribery27jan05.htm 119 Jeffrey M. Smith, Seeds of Deception, Yes! Books, Fairfield, Iowa 2003 120 Karen Charman, The Professor Who Can Read Your Mind, PR Watch Newsletter Fourth Quarter 1999, Volume 6, No. 4 121 http://www.gmwatch.org/archive2.asp?arcid=4387 122 Estimates of increased IGF-1 levels vary considerably. In Mepham et al, “Safety of milk from cows treated with bovine somatotropin,” The Lancet 2 (1994):197, IGF-1 levels were up to 10 times higher. The methods used may also underestimate IGF-1 levels considerably. See Samuel S. Epstein, “Unlabeled Milk From Cows Treated With Biosynthetic Growth Hormones: A Case of Regulatory Abdication,” International Journal of Health Services 26(1996): 173–185; and Samuel S. Epstein, What’s In Your Milk? (Victoria, British Columbia, Canada:Trafford Publishing, 2006), 197–204. 123 For a review of literature linking elevated levels of IGF-1 with increased risks of breast, colon and prostate cancers, see Samuel S. Epstein, What’s In Your Milk?, 197–204. 124 Gary Steinman, “Mechanisms of Twinning VII. Effect of Diet and Heredity on the Human Twinning Rate,” Journal of Reproductive Medicine, May 2006; S.E. Echternkamp et al, “Ovarian Follicular Development in Cattle Selected for Twin Ovulations and Births,” Journal of Animal Science 82 no. 2 (2004): 459–471; and S. E. Echternkamp et al, “Concentrations of insulin-like growth factor-I in blood and ovarian follicular fluid of cattle selected for twins,” Biology of Reproduction, 43(1990): 8–14. 125 Powell D.A.; Blaine K.; Morris S.; Wilson J., Agronomic and consumer considerations for Bt and conventional sweet-corn, British Food Journal, Volume: 105, Issue: 10, Page: 700-713 (Nov 2003) 126 GM Nation? The findings of the public debate, http://www.gmnation.org.uk/ut_09/ut_9_6.htm#summary
EXHIBIT J - Page 312
Case 5:14-cv-00117-cr Document 63-11 Filed 11/14/14 Page 30 of 312

127 To see the Toronto Star photo in Laidlaw’s book, go to http://www.gmwatch.org/p1temp.asp?pid=72&page=1 128 Corn Fakes, Private Eye, No. 1194, 28 September-11 October 2007 http://www.gmwatch.org/archive2.asp?arcid=8314 129 Tim Lambert, Would you eat wormy corn?, September 7 2007 http://scienceblogs.com/deltoid/2007/09/would_you_eat_wormy_sweet_corn.php 130 “Genetically modified foods, who knows how safe they are?” CBC News and Current Affairs, September 25, 2006. 131 Mike Zelina, et al., The Health Effects of Genetically Engineered Crops on San Luis Obispo County,” A Citizen Response to the SLO Health Commission GMO Task Force Report, 2006. 132 Bill Lambrecht, Dinner at the New Gene Café, St. Martin's Press, September 2001, pg 139 Photos 132 Stanley W. B. Ewen and Arpad Pusztai, “Effect of diets containing genetically modified potatoes expressing Galanthus nivalis lectin on rat small intestine,” Lancet, 1999 Oct 16; 354 (9187): 1353-4. 132 M. Malatesta, C. Caporaloni, S. Gavaudan, M. B. Rocchi, S. Serafini, C. Tiberi, G. Gazzanelli, “Ultrastructural Morphometrical and Immunocytochemical Analyses of Hepatocyte Nuclei from Mice Fed on Genetically Modified Soybean,” Cell Struct Funct. 27 (2002): 173–180 132 Irina Ermakova, “Experimental Evidence of GMO Hazards,” Presentation at Scientists for a GM Free Europe, EU Parliament, Brussels, June 12, 2007 132 Irina Ermakova, “Genetically modified soy leads to the decrease of weight and high mortality of rat pups of the first generation. Preliminary studies,” Ecosinform 1 (2006): 4–9.
EXHIBIT J - Page 313
Case 5:14-cv-00117-cr Document 63-11 Filed 11/14/14 Page 31 of 312

A three generation study with genetically modified Bt corn inrats: Biochemical and histopathological investigation
Aysun Kılıc� *, M. Turan Akay
Department of Biology, Faculty of Science, Hacettepe University, Beytepe Campus, 06800 Ankara, Turkiye
Received 30 April 2007; accepted 21 November 2007
Abstract
For the last ten years, in accordance with the increased use of genetically modified (GM) foods for human and livestocks, a largenumber of feeding studies have been carried out. However, the evidence is still far from proving whether the long-term consumptionof GM foods posses a possible danger for human or animal health. Therefore, this study was designed to evaluate the effects of transgeniccorn on the rats that were fed through three generations with either GM corn or its conventional counterpart. Tissue samples of stomach,duodenum, liver and kidney were obtained for histopathological examinations. The average diameter of glomeruli, thickness of renalcortex and glomerular volume were calculated and number of affected animals/number of examined animals for liver and kidney histo-pathology were determined. Amounts of urea, urea nitrogen, creatinine, uric acid, total protein, albumin and globulin were determined;enzyme activities of aspartate aminotransferase, alanine aminotransferase, alkaline phosphatase, gamma glutamyltransferase, creatinekinase and amylase were measured in serum samples. No statistically significant differences were found in relative organ weights of ratswithin groups but there were some minimal histopathological changes in liver and kidney. Changes in creatinine, total protein and glob-ulin levels were also determined in biochemical analysis.� 2007 Elsevier Ltd. All rights reserved.
Keywords: Transgenic Bt corn; Three generation study; Histopathology; Biochemical analysis; Wistar albino rat
1. Introduction
The global area of approved genetically modified (GM)crops such as soybean, corn, cotton, rice, canola, tomatohave risen from 1.7 million hectares in 1996 to 102.0 mil-lion hectares in 2006 and the number of countries plantingGM crops increased to 22. GM corn is the second principalbiotech crop occupying 25.2 million hectares, after the GMsoybean (James, 2006). The views endorsing the develop-ment of GM crops created with recombinant DNA tech-nology, are based on improving the yield and quality ofcrops, solving the famine that would be a dangerous riskin the next 25 years, founding renewable sources for vac-
cines, drugs and bioplastics (Coghlan, 1995). Meanwhile,this technology poses scientific, technological, environmen-tal, social, ethical, economical and political issues as well ashealth risks (Jones, 1999). In order to assess the potentialrisks of transgenic organisms, International Food Biotech-nology Council (IFBC) has initially reported the safetyevaluation of GMOs and then Organisation for EconomicCooperation and Development (OECD), Food and Agri-culture Organisation of the United Nations (FAO), WorldHealth Organisation (WHO) and International Life Sci-ence Institute (ILSI) have established safety assessmentguidelines. OECD, developed the concept of substantialequivalence defined as comparison between GM organismand its traditional counterpart and used the data for futuresafety assessments (Kuiper et al., 2001).
European corn borer (Ostrinia nubilalis) and Southwest-ern corn borer (Diatraea grandiosella) have caused signifi-cant yield losses in corn (Zea mays L.) agriculture
0278-6915/$ - see front matter � 2007 Elsevier Ltd. All rights reserved.doi:10.1016/j.fct.2007.11.016
Abbreviations: Bt, Bacillus thuringiensis; Cry, crystal protein; GM,genetically modified.
* Corresponding author. Tel.: +90 312 297 6124; fax: +90 312 299 2028.E-mail address: [email protected] (A. Kılıc�).
www.elsevier.com/locate/foodchemtox
Available online at www.sciencedirect.com
Food and Chemical Toxicology 46 (2008) 1164–1170
EXHIBIT J - Page 314
Case 5:14-cv-00117-cr Document 63-11 Filed 11/14/14 Page 32 of 312

(MacKenzie et al., 2007; Williams et al., 2005). Therefore,for over 40 years an insecticidal spray that includes a mix-ture of spores and associated protein crystals belonging toa Gram (–) bacterium Bacillus thuringiensis (Bt) has beenbeing worldwide used (Nester et al., 2002). Intracellularcrystal inclusions produced during sporulation of Bt arecalled parasporal crystals (crystal protein) which haveinsecticidal activity on insects midgut epithelium. Afterapplications of recombinant DNA technology, more directand controlled ways have been employed, namely geneti-cally modified Bt crops, to fight with the aforesaid pests.Bt toxin encoded by bacterial cry gene, transferred to cropsand expressed in their specific tissues. During the process ofobtaining Bt protein from cultures in order to reach suffi-cient amounts, unwanted processes may cause toxicity indifferent organisms (Kuiper et al., 2001). Various nutri-tional analysis and short term feeding studies have beenperformed to demonstrate the possible effects of GM Btcorn on human and animal health (Brake and Evenson,2004; Hammond et al., 2006; El Sanhoty et al., 2004; Neth-erwood et al., 2004). However, no reports on the possiblehealth effects of GM crops through multigeneration in ratswere obtained. Therefore, this three generation study inwhich rats fed with transgenic Bt corn was designed to clar-ify and enlighten the safety of long-term Bt cornconsumption.
2. Materials and methods
2.1. Animals and housing
Eighteen female and nine male Wistar albino rats, obtained fromExperimental Animals Production Center of Bas�kent University, inAnkara, Turkiye were 10 weeks of age at the beginning of the study. Thestudy conforms the National Research Council guidelines for animalexperimentation (National Research Council, 1996). The rats were allowedto acclimate to the housing conditions for 1 week during which they kepton basal diet. All rats were provided with tap water ad libitum through thestudy and were housed singly in polycarbonate cages with stainless steelcover. Laboratory conditions were maintained 12 h light/dark schedule, attemperature of 23 ± 3 �C and a relative humidity of 47 ± 5. Animals wereobserved two times daily for general wholesomeness and care.
2.2. Experimental diets
Bt corn that has insect resistance trait for the most invasive corn borersand its reference (same genetic and breeding background but lack of the Bt
transgene) were obtained by the agency of Turkish Ministry of Agricultureand Rural Affairs. Besides, standard rat diet were purchased from DokuzTug Yem A.S�., Ankara, Turkiye. Composition list of experimental dietsare given at Table 1. Rats in Group I were fed only with standard diet,
those in Group II with standard diet containing 20% reference corn andthe ones in Group III with standard diet containing 20% transgenic Btcorn. These percentages were chosen in order to maintain a balancedrodent diet in this long-term feeding study. Corn grains and standard foodwere ground weekly to have a homogenous-mixed diet. Experimental dietswere kept at 4 �C to preserve their protein content. Mixing ratios ofstandard and experimental diets are given at Table 2. The amount ofdam’s diet was 25 g/rat/day during gestation and lactation on the otherhand offspring’s diet was 20 g/rat/day from the beginning of 1.5 monthsafter the birth.
2.3. Experimental design and treatment
Animals were randomly assigned to three groups, depending on theirbody weight means. Eighteen female Wistar albino rats (6 rats/each group)were mated with 9 male rats (one male for two female rats) overnight.Vaginal lavages were examined on light microscopy and the day that spermwas detected was considered to be the first day of pregnancy. Then, preg-nant rats (F0) were started to feed with either the diet containing 20%transgenic corn or 20% reference corn or standard rat diet depending ontheir groups. Dams and their offsprings were fed with the diets during theperiods of mating, gestation, lactation, offspring care and pubescence. Theoffsprings of different dams in a group of each generation were matedamong themselves throughout three generations. F1, F2 and F3 generationswere acquired by the same procedures described above. F3 rats were alsofed with either standard diet or experimental diets until they reached to 3.5months age. The male rats that were used in mating were out of study. Maleand female gender ratio of F1, F2, F3 rats were compared.
2.4. Processing of tissues for histopathology
All F3 rats were weighed and sacrificed by cervical dislocation at theend of the treatment. Their tissues of stomach (corpus), small intestine(duodenum), liver and kidney were removed, weighed and immediatelyfixed in Bouin’s fixative for 8 h or 10% formaldehyde for 10 h. After theroutine procedure, the fixed tissues were embedded in paraffin and 5 lmthick tissue sections were stained with routine haemotoxylin and eosin(H&E) or periodic acid schiff (PAS) in order to examine under lightmicroscopy. All tissue sections were observed; only liver and kidney tissueswere photographed. For histopathological changes ‘‘affected number ofanimals/examined number of animals” of liver and kidney, and theirpercentages were calculated. Forty glomeruli for each kidney specimenwere selected and the maximum diameter and the thickness of cortex ofselected glomeruli in serial sections was measured by Bs200prop programin Olympus BX51 system light microscope. The diameters were calculatedas the mean of the longest and shortest diameters (Yamashita et al., 2002).The glomerular volume was calculated from the mean glomerular diam-eter, d(G), using the formula: 4p(d(G)/2)3/3 (Sugimoto et al., 1998).
2.5. Biochemical analysis
Blood samples were taken from heart of F3 rats under ether anaes-thesia at the end of the study. After centrifugation at 3000 rpm for 15 min,serum was separated. Serum samples were analysed for determination ofthe amounts of urea, urea nitrogen (BUN), creatinine, uric acid, totalprotein, albumin and globulin and for the measurement of enzymeactivities of aspartate aminotransferase (AST), alanine aminotransferase
Table 1Composition of experimental diets for rats (%)
Ingredients Bt corn Non-Bt corn
Water 11.00 11.50Dry nutrient 89.00 88.50Crude protein 9.28 9.37Crude fat 3.39 3.10Starch 60.70 54.20Sugar 2.33 2.10
Table 2Ratios of standard and experimental diets (%)
Groups Diets (%)
Transgenic corn Reference corn Standard diet
Group I 0 0 100Group II 0 20 80Group III 20 0 80
A. Kılıc�, M.T. Akay / Food and Chemical Toxicology 46 (2008) 1164–1170 1165
EXHIBIT J - Page 315
Case 5:14-cv-00117-cr Document 63-11 Filed 11/14/14 Page 33 of 312

(ALT), alkaline phosphatase (ALP), gamma-glutamyltransferase (GGT),creatine kinase (CK) and amylase by closed system of Olympus Auautoanalyser in Olc�um Tıp Laboratory in Ankara, Turkiye.
2.6. Statistical analysis
Statistical analysis were performed using a SPSS 11.5 program forWindows. Data were expressed as mean ± standard error (SE) and sta-tistical significance was assigned at the p 6 0.05 level. The homogeneity ofvariance and normal distribution between groups was evaluated by Gen-eral Linear Model procedure and Kolmogorov–Smirnov nonparametric
test. Serum parameters were analysed by two-way ANOVA in male andfemale rats separately. To identify the sources of significant main effect,post hoc comparisons (Games–Howell, Tukey) were used. Body and rel-ative organ weights were examined by one-way ANOVA and Games–Howell post hoc test (Sokal and Rohlf, 1995). Besides, histopathologicalfindings were compared by using Fisher’s exact test as described by Gadand Weil (1989).
3. Results
3.1. Clinical observations, number of offspring, body and
relative organ weights
No signs of adverse effects were seen in clinical appear-ance of new borns in all three generation. The dams gave fer-tile progeny and successfully continued their strips. Numberof offsprings in F1, F2, F3 generations are shown in Table 3.
The final body weights, relative kidney and liver weightsof female and male F3 rats are given at Table 4. There wereno significant differences in final body weights of rats in allgroups whereas relative liver weights of female rats inGroups II and III and also relative kidney weights inGroup II showed decreases. A statistically significantdecrease was determined in the relative kidney weight ofmale rats in Group II.
3.2. Histopathology
3.2.1. Stomach and duodenum
No histopathological finding was observed in the stom-ach and duodenum of Bt rats in Group III. Gastric glands,surface epithelium preserved their structure in stomach.Villi and microvilli were continuous and there were nodeformations in lacteals and goblet cells in duodenum.
3.2.2. Liver
Different levels of minimal granular degeneration wereseen in all groups. The degrees and percentages of granular
degeneration among groups are shown in Fig. 1. Granulardegeneration level in 10% of examined sections was maxi-mum (level 4) in Group III while no degeneration wasobserved at level 4 in Groups I and II. Additionally, degen-eration level 3 was seen in 6.6% of Group II. Besides, focalmononuclear cell infiltration, congestion and nuclear bor-der changes were determined locally in some ratios amonggroups and some of them were statistically significant(Table 5; Fig. 2B and C).
3.2.3. Kidney
Enlargements in parietal layer of Bowman’s capsule andminimal tubular degenerations were observed at differentratios in groups (Table 5; Fig. 2E and F). The decreasesin average short and long diameter of glomeruli andglomerular volume in Groups II and III were statisticallydifferent from controls while changes in the thickness ofcortex was not significant among groups (Table 6).
Table 3Number of female and male offsprings in Groups I–III for threegeneration
Generations
Groups F0 F1 F2 F3
$ $ # Total $ # Total $ # Total
Group I 6 10 16 26 8 14 22 5 14 19Group II 6 12 10 22 15 22 37 10 22 32Group III 6 18 6 24 18 16 34 14 16 30
Table 4Final body weights, relative liver and kidney weights of F3 rats
Groups
Group I Group II Group III
n 5 10 14
Females
Body weight (g) 204.30 ± 4.35 246.15 ± 1.69 251.33 ± 6.43Liver (g � 10�3) 33.46 ± 0.65 6.70 ± 0.78a 25.11 ± 0.34a
Kidney (g � 10�3) 3.36 ± 0.075 2.68 ± 0.053a 2.84 ± 0.002
n 14 22 16
Males
Body weight (g) 294.20 ± 6.22 289.12 ± 6.30 299.89 ± 4.76Liver (g � 10�3) 28.43 ± 0.25 30.10 ± 0.42 29.13 ± 0.53Kidney (g � 10�3) 3.04 ± 0.04 2.97 ± 0.06a 2.99 ± 0.10
Each value is mean ± SE.n: number of rats.
a Significantly different from control group, P 6 0.05.
0
10
20
30
40
50
60
70
%
Group I Group II Group III
Groups
0
1
2
3
4
Cumulative severity score on a 4-point scale: 0, no lesions; 1, slight severity;2, minimal severity; 3, moderate severity; 4, marked severity.
Fig. 1. Levels and percentages of granular degenerations in liver of rats incontrol, reference and Bt group.
1166 A. Kılıc�, M.T. Akay / Food and Chemical Toxicology 46 (2008) 1164–1170
EXHIBIT J - Page 316
Case 5:14-cv-00117-cr Document 63-11 Filed 11/14/14 Page 34 of 312

Table 5Incidence of histopathological changes observed in liver and kidney of rats in control and experimental groups
Tissue Finding Groups
Female Male
Group I Group II Group III Group I Group II Group III
Liver Focal infiltration 1/5 2/10 7/14 2/16 3/20 8/16b
Congestion 0/5 2/10 10/14a,b 2/16 4/20 7/16Granular degeneration 1/5 2/10 9/14 3/16 6/20 13/16a,b
Nuclear border change 0/5 3/10 10/14a 3/16 6/20 13/16a,b
Kidney Enlargement in parietal layer of Bowman’s capsule 0/5 1/10 6/14 2/14 1/15 5/11a,b
Tubular degeneration 0/5 3/10 13/14a,b 2/14 4/15 9/11a,b
Data are expressed as number of affected/number of examined animals. Each value is mean ± SE.a Significantly different from Group I (control) group, P 6 0.05 (Fisher’s exact test).b Significantly different from Group II (reference) group, P 6 0.05 (Fisher’s exact test).
Fig. 2. Photomicrographs of liver (A–C) and kidney (D–F) tissues of rats stained with H&E. A and D are of control groups; B, C, E and F are of Bt corngroups. In liver, minor granular degeneration (arrows), nuclear border changes (B) (arrow heads) and (C) focal mononuclear cell infiltration (arrows) areshown. In kidney, (E) minimal tubular degeneration (arrows), (F) enlargements in parietal layers of Bowman’s capsule (arrow heads) (magnification: A,100�; B–F, 200�).
A. Kılıc�, M.T. Akay / Food and Chemical Toxicology 46 (2008) 1164–1170 1167
EXHIBIT J - Page 317
Case 5:14-cv-00117-cr Document 63-11 Filed 11/14/14 Page 35 of 312

3.3. Biochemical analysis
Results of biochemical analysis for female and male ratsare presented in Tables 7 and 8. Alterations in the amountsof creatinine, globulin and total protein were statisticallysignificant in treatment groups. Creatinine level differeddepending on the group and also on gender. There wereincreases in the amount of creatinine in Group II females,on the other hand decreases in Group III males. Amountsof globulin and total protein were statistically differ-ent from controls in Group II but not in Group III. Nostatistically significant differences were noted for otherparameters.
4. Discussion
GM technology have the advantage of improvement inproductivity and quality of crops which express 0.01–0.1% protein of host’s total protein (first generation-trans-genic foods) and also prevention of various disease such asdiabetes, hypertension, hypercholesterolemia and corpu-lence with novel crop (second generation-transgenic foods)having more than 1–10% expressing level (Hashimotoet al., 1999). Maize is one of the most widely used crop pro-ducing high-fructose corn syrup, glycose, dextrose, starch,oil, flour and meal. By means of transferring insecticidaltrait to maize (Bt corn) it is possible to combat with demol-ishing pests that cause 7% loss of maize products (Kuiperet al., 2001).
The results of sub-chronic feeding studies on ratsshowed no histopathological, and biochemical effects butcaused some minor changes observed suggesting long-termstudies (Akay et al., 2003; Seralini, 2005). The reports onlong-term feeding studies and comprehensive analysis withtransgenic Bt corn are rare so this current study wasplanned in which rats fed with 20% Bt or reference corn(below the safety margin 33%) containing diets in orderto restrain from one way and unbalanced feeding.
In our study, final body weights were not considered tobe significant and decreases in relative weights of liver andkidney appeared randomly among all groups and sex, sodifferences were diet independent. Likewise no differenceswere observed in body weights and weights of kidney andliver in a recently published 90-day feeding study with Bt(Cry1Ab protein) corn in rats (Schrøder et al., 2007).
Table 6Measurements of glomerular diameter, glomerular volume and thickness of cortex of rats in control and experimental groups
Groups Diameter of glomerulus Glomerular volume (104 lm3) Thickness of cortex (lm)
x-axis y-axis
Group I 193.73 ± 38.88 187.96 ± 24.96 360 389.53 ± 27.50Group II 172.89 ± 27.67a 184.89 ± 30.04 299 370.89 ± 41.04Group III 168.19 ± 29.15a 164.73 ± 30.65 a,b 241 370.38 ± 44.70
Each value is mean ± SE.a Significantly different from Group I (control) group, P 6 0.05.b Significantly different from Group II (reference) group, P 6 0.05.
Table 7Serum analysis values of female rats in control and experimental groups
Parameter Groups
Group I Group II Group III
Urea (mg/dl) 38.50 ± 4.50 36.00 ± 3.00 36.25 ± 1.31Urea nitrogen
(mg/dl)18.00 ± 2.10 16.73 ± 1.43 16.95 ± 0.61
Creatinine(mg/dl)
0.47 ± 0.005 0.54 ± 0.003a 0.50 ± 0.01
Uric acid (mg/dl) 1.69 ± 0.60 1.75 ± 0.14 1.63 ± 0.10Total protein
(g/dl)6.07 ± 0.07 6.86 ± 0.15a 6.25 ± 0.13b
Albumin (g/dl) 3.15 ± 0.07 3.31 ± 0.008 3.42 ± 0.14Globulin (g/dl) 2.92 ± 0.14 3.55 ± 0.16a 2.98 ± 0.14b
AST (U/L) 250.70 ± 53.20 152.50 ± 12.71 285 ± 22.98ALT (U/L) 80.55 ± 17.55 50.06 ± 3.88 61.00 ± 5.54ALP (U/L) 105.80 ± 12.62 63.98 ± 9.00 86.88 ± 14.75GGT (U/L) 2.65 ± 0.15 1.76 ± 0.27 4.35 ± 0.91Creatine kinase
(U/L)1368.00 ± 144.0 833.33 ± 90.87 1560.00 ± 100.51
Amylase (U/L) 443.5 ± 23.50 355.0 ± 7.09 369.2 ± 5.64
Each value is mean ± SE and each group consists of five rats.a Significantly different from Group I (control) group, P 6 0.05.b Significantly different from Group II (reference) group, P 6 0.05
Table 8Serum analysis values of male rats in control and experimental groups
Parameter Groups
Group I Group II Group III
Urea (mg/dl) 40.80 ± 2.63 39.00 ± 1.63 34.33 ± 2.18Urea nitrogen
(mg/dl)19.06 ± 1.23 18.22 ± 0.75 16.03 ± 1.02
Creatinine(mg/dl)
0.47 ± 0.005 0.49 ± 0.017 0.41 ± 0.006a
Uric acid (mg/dl) 1.76 ± 0.14 2.05 ± 0.34 1.33 ± 0.05Total protein
(g/dl)6.09 ± 0.19 6.62 ± 0.18a 6.37 ± 0.05b
Albumin (g/dl) 3.10 ± 0.09 3.19 ± 0.04 3.27 ± 0.07Globulin (g/dl) 2.98 ± 0.10 3.42 ± 0.14a 3.10 ± 0.12b
AST (U/L) 299.12 ± 63.20 240.35 ± 23.02 547.03 ± 35.43ALT (U/L) 81.52 ± 9.28 76.80 ± 8.32 122.10 ± 35.20ALP (U/L) 115.21 ± 15.71 99.53 ± 16.02 120.99 ± 7.47GGT (U/L) 3.56 ± 0.65 2.65 ± 0.32 2.00 ± 0.05Creatine kinase
(U/L)1296.20 ± 200.51 1329.50 ± 167.7 823.33 ± 89.09
Amylase (U/L) 521.60 ± 31.46 559 ± 34.84 632.33 ± 84.33
Each value is mean ± SE and each group consists of five rats.a Significantly different from Group I (control) group, P 6 0.05.b Significantly different from Group II (reference) group, P 6 0.05.
1168 A. Kılıc�, M.T. Akay / Food and Chemical Toxicology 46 (2008) 1164–1170
EXHIBIT J - Page 318
Case 5:14-cv-00117-cr Document 63-11 Filed 11/14/14 Page 36 of 312

Results of a 13 week feeding study in rats with 11% or 33%Roundup Ready corn containing diets showed fewincreases in weight gain of males (Hammond et al., 2004)and no statistically significant differences were found inbody or organ weights in a 90-day feeding study in ratswith 11% or 33% MON 810 corn containing diets (Ham-mond et al., 2006). Similar body weights and increase inrelative weight of small intestine and adrenal were foundin another 90-day safety study with Galanthus nivalis
expressing GM rice in rats (Poulsen et al., 2007).Throughout our study, no adverse behavioural or clini-
cal effects on F1, F2, F3 generation animals were observed.Besides, birthrate and survival of the offsprings did notchange among groups demonstrating successful reproduc-tion. Polat (2005), reported no apparent differences werefound in histopathological examinations in male andfemale rat reproductive system that were fed with trans-genic Bt corn throughout two generation. Conversely, highlevel of mortality (55.6%) and decreases in weights of off-springs were reported in GM soybean feeding study inwhich female rats were fed before mating, during matingand pregnancy (Ermakova, 2005).
Our histopathological examinations in stomach andduodenum pointed out that Bt toxin did not cause defor-mations in gastrointestinal system. A 105-day feeding studysupporting our findings was with Brown Norway rats andmice in which they fed with GM soybean and no histopa-thological abnormalities in mucosa of small intestine weredetected (Teshima et al., 2000). In the only reported studyon humans, seven volunteers fed with meal containing GMsoybean and low levels of transgene survival were detectedin small intestine only in three ileostomists with usingmolecular biology techniques (Netherwood et al., 2004).On the other hand, increase in hyperplastic cell wasobserved in the ileum of mice fed with Bacillus thuringiensis
var. kurstaki delta-endoxin treated potatoes through 14days (Fares and El Sayed, 1998).
The changes in the liver, as a site responsible for bio-transformation and detoxification, suggest alterations inthe metabolic processes. Markedly severity level of granu-lar degeneration was seen in Bt diet containing groups inour study but not in control and reference groups. Hepato-cyte nuclear size change related to both age and food(Schmucker, 1990). Therefore diets containing Bt maycause excess fatty supply for animals. But, we also observedgranular degeneration at lower levels in rats of control andreference groups not showing health problems. Granulardegeneration was statistically significant only in male ratsin Group III. Additionally, nuclear border changes foundstatistically significant in female and male rats in GroupIII. Malatesta et al. (2002) observed irregular shaped hepa-tocyte nuclei and increase in number of nuclear pore atelectron microscopy in offspring’s of GM soybean fed preg-nant mice. Thirty-five-day feeding study with GM corn inporcine showed the presence of transgene Cry1A(b) in tis-sues of liver, spleen, kidney and in blood but not in muscle(Mazza et al., 2005).
One of the most important processes in kidneys is excre-tion of toxic metabolic waste products by glomerular andtubular filtration so we examined parietal layer of Bow-man’s capsule and tubular changes. These findings werestatistically different in males and females in Group IIIfrom control and reference groups in our study. Glomeru-lar diameters and volume reflecting renal functionsdecreased in experimental groups. Decreases in short glo-merular diameter in Group II also short and long diameterin Group III were statistically significant. These alterationswere minor changes and parallel to the enlargements inparietal layers. The thickness of renal cortex did notchanged significantly among groups. Besides, thickness inBowman’s capsule, basal membrane and glomerular mes-angium were not seen at PAS stained sections. In a shortterm safety assessment in rats fed with GM potato showedneither pathological nor histopathological finding in liverand kidney (Hashimoto et al., 1999). Another feeding studyin rats with MON 863 Bt corn demonstrated inflammationin kidney and lesions in liver and kidney (Smith, 2005). Ser-alini (2005) observed decreases in weight of kidney, tubularchanges and inflammation in male rats fed with 33% MON863 Bt corn in a 90-day study.
According to the results of biochemical analysis, sex-dependent creatinine levels were detected. Significant lowerplasma level of creatinine in Group III may refer to anom-aly in working of muscles but we did not encounter anyabnormal situation during the study (Vural et al., 1986).Creatinine levels of female serum samples in Group II sig-nificantly increased from Groups I and III, depending onindividual alterations and diets. Significant differences wereobserved in amounts of globulin and total protein in refer-ence groups besides, findings in Group III were statisticallysignificant from Group II. Other parameters like AST,ALT, ALP reflecting liver function and like urea, ureanitrogen, uric acid reflecting renal function did not change.Histopathological changes in liver and kidney were inaccordance with our biochemical results, showing damageswere minor but not critical on animal health. Parallel toour findings, Poulsen et al. (2007) pointed out lower creat-inine levels but increased in plasma activity of ALT infemale rats fed on GM rice. Slight reduction of albumin/globulin ratio was observed in male rats fed with 33%MON 810 GM corn through 90 day but individually albu-min and globulin were not different from control groups(Hammond et al., 2006). In another 90-day study, higherconcentration of urea and reduction in concentration ofprotein was reported in male rats fed with Bt rice (Schrøderet al., 2007).
In conclusion, although the results obtained from thisstudy showed minor histopathological and biochemicaleffects in rats fed with Bt corn, long-term consumption oftransgenic Bt corn throughout three generation did notcause severe health concerns on rats. Therefore, long-termfeeding studies with GM crops should be performed onother species collaboration with new improving technolo-gies in order to assure their safety.
A. Kılıc�, M.T. Akay / Food and Chemical Toxicology 46 (2008) 1164–1170 1169
EXHIBIT J - Page 319
Case 5:14-cv-00117-cr Document 63-11 Filed 11/14/14 Page 37 of 312

Acknowledgement
This study is a part of Master’s Thesis of Aysun Kılıc�submitted to Hacettepe University.
References
Akay, M.T., Koc�kaya, E.A., Selmanoglu, G., Erdogan,. Y., Cabuk, S.,2003, Transgenik Bt mısırın Sıc�anlar Uzerine Etkilerinin Aras�tırılması,Proje No: F.B_I. P90. Ankara, s:22–25.
Brake, D.G., Evenson, D.P., 2004. A generational study of glyphosate-tolerant soybeans on mouse fetal, postnatal, pubertal and adulttesticular development. Food Chem. Toxicol. 42, 29–36.
Coghlan, A., 1995. Grow your own vaccines. New Scientist (Jan), 21–23.
El Sanhoty, R., Rahman, A.A.A., Bogl, K.W., 2004. Quality and safetyevaluation of genetically modified potatoes Spunta with Cry V gene:Compositional analysis, determination of some toxins, antinutrientscompounds and feeding study in rats. Nahrung/Food 48 (1), 13–18.
Ermakova, I.V., 2005. Influence of genetically modified soya on the birth-weight and survival of rat pups: preliminary study. Institute of HigherNervous Activity and Neurophysicology Russian Academy of Science.
Fares, N.H., El Sayed, A.K., 1998. Fine structural changes in the ileum ofmice fed on delta-endotoxin-treated potatoes and transgenic potatoes.Nat. Toxins 6, 219–233.
Gad, S.C., Weil, C.S., 1989. Statistics for toxicologists. In: Hayes, A.W.(Ed.), Principles and Methods of Toxicology, second ed. Raven Press,New York, pp. 435–483.
Hammond, B., Dudek, R., Lemen, J., Nemeth, M., 2004. Result of a 13week safety assurance study with rats fed grain from glyphosatetolerant corn. Food Chem. Toxicol. 42, 1003–1014.
Hammond, B.G., Dudek, R., Lemen, J.K., Nemeth, M.A., 2006. Resultsof a 90-day safety assurance study with rats fed grain from corn borer-protected corn. Food Chem. Toxicol. 44, 1092–1099.
Hashimoto, W., Momma, K., Katsube, T., Ohkawa, Y., Ishige, T., Kito,M., Utsumi, S., Murata, K., 1999. Safety assessment of geneticallyengineered potatoes with designed soybean glycinin: compositionalanalyses of potato tubers and digestibility of the newly expressedprotein in transgenic potatoes. J. Sci. Food Agric. 79, 1607–1612.
James, C., 2006. Executive Summary Global Status of CommercializedBiotech/GM Crops: 2006 ISAAA Brief 35.
Jones, L., 1999. Science, medicine, and the future, genetically modifiedfoods. BMJ 581–584 (February).
Kuiper, H.A., Kleter, G.A., Noteborn, H.P.J.M., Kok, E.J., 2001.Assessment of food safety issues related to genetically modified foods.Plant J. 27 (6), 503–528.
MacKenzie, S.A., Lamb, I., Schmidt, J., Deege, L., Morrisey, M.J.,Harper, M., Layton, R.J., Prochaska, L.M., Sanders, C., Locke, M.,Mattsson, J.L., Fuentes, A., Delaney, B., 2007. Thirteen week feedingstudy with transgenic maize grain containing event DAS-Ø15Ø7-1 inSprague–Dawley rats. Food Chem. Toxicol. 45 (4), 551–562.
Malatesta, M., Caporaloni, C., Gavaudan, S., Rocchi, M.B., Serafini, S.,Tiber, C., Gazzanelli, G., 2002. Ultrastructural morphometrical andimmunocytochemical analysis of hepatocyte nuclei from mice fed ongenetically modified soybean. Cell Struct. Funct. 27, 173–180.
Mazza, R., Soave, M., Morlacchini, M., Piva, G., Marocco, A., 2005.Assessing the transfer of genetically modified DNA from feed toanimal tissues. Trans. Res. Oct. 14 (5), 775–784.
National Research Council, 1996. Guide for the Care and Use ofLaboratory Animals. National Academy, Washington, DC.
Nester, E.W., Thomashow, L.S., Metz, M., Gordon, M., 2002. 100 Yearsof Bt A Critical Scientific Assessment. American Academy ofMicrobiology.
Netherwood, T., Martın-Orue, M.S., O’Donnell, G.A., Gockling, S.,Graham, J., Mathers, J.C., Gilbert, H.J., 2004. Assessing the survivalof transgenic plant DNA in the human gastrointestinal tract. Nat.Biotechnol. 22 (2), 204–209.
Polat, S., 2005. Transgenik Bt mısırın Sıc�anların Prenatal ve PostnatalGelis�imi Uzerine Etkileri Yuksek Lisans Tezi (The Effects of Trans-genic Bt Corn on Prenatal and Postnatal Development of The Rats:Master Thesis) Hacettepe Universitesi, pp. 46–75.
Poulsen, M., Kroghsbo, S., Schrøder, M., Wilcks, A., Jacobsen, H.,Miller, A., Frenzel, T., Danier, J., Rychlik, M., Shu, Q., Emami, K.,Sudhakar, D., Gatehouse, A., Engel, K.H., Knudsen, I., 2007. A 90-day safety study in Wistar rats fed genetically modified rice expressingsnowdrop lectin Galanthus nivalis (GNA). Food Chem. Toxicol. 45,350–363.
Schrøder, M., Poulsen, M., Wilcks, A., Kroghsbo, S., Miller, A., Frenzel,T., Danier, J., Rychlik, M., Emami, K., Gatehouse, A., Shu, Q., Engel,K.H., Altosaar, I., Knudsen, I., 2007. A 90-day safety study ofgenetically modified rice expressing Cry1Ab protein (Bacillus thurin-
giensis toxin) in Wistar rats. Food Chem. Toxicol. 45, 339–349.Schmucker, D.L., 1990. Hepatocyte fine structure during maturation and
senescence. J. Electron Microsc. Tech. 14, 106–125.Seralini, G.E., 2005. Report on MON 863 GM maize produced by
MONSANTO Company. Controversial Effects on Health Reportedafter subchronic toxicity test: a confidential rat 90 day feeding study,June.
Smith, J.M., 2005. Most offspring died when mother rats ate geneticallyengineered soy spilling. The Beans Newsletter (October), 1–4.
Sokal, R., Rohlf, F.J., 1995. Biometry, third ed. W.H. Freeman andCompany, NY (Section 9).
Sugimoto, H., Shikata, K., Matsuda, M., Makino, H., 1998. Increasedexpression of endothelial cell nitric oxide synthase (ecNOS) in afferentand glomerular endothelial cells is involved in glomerular hyperfiltra-tion of diabetic nephropathy. Diabetologia 41, 1426–1434.
Teshima, R., Akiyama, H., Okunuki, H., Sakushima, H., Takahashi, M.,Matsuda, T., Fujimura, T., 2000. Effect of GM and non-GM soybeanson immune system of BN rats and B10 mice. J. Food Hyg. Soc. Jpn.41, 188–193.
Vural, S., Cetin, E.T., Tuzlacı, U., 1986. Klinik tes�histe laboratuvar._Istanbul. s.75.
Williams, W.P., Windham, G.L., Buckley, P.M., Perkins, J.M., 2005.Southwestern corn borer damage and aflatoxin accumulation inconventional and transgenic corn hybrids. Field Crops Res. 91 (2-3),329–336.
Yamashita, T., Shikata, K., Matsuda, M., Okada, S., Ogawa, D.,Sugimoto, H., Wada, J., Makino, H., 2002. Beraprost sodium,prostacyclin analogue, attenuates glomerular hyperfiltration andglomerular macrophage infiltration by modulating ecNOS expressionin diabetic rats. Diab. Res. Clin. Practice 57, 149–161.
1170 A. Kılıc�, M.T. Akay / Food and Chemical Toxicology 46 (2008) 1164–1170
EXHIBIT J - Page 320
Case 5:14-cv-00117-cr Document 63-11 Filed 11/14/14 Page 38 of 312

Induction of Mortality and Malformation in Scinax nasicusTadpoles Exposed to Glyphosate Formulations
R. C. Lajmanovich,1,2 M. T. Sandoval,3 P. M. Peltzer1
1 National Institute of Limnology (INALI-CONICET), Jose Macias 1933 (3016), SantoTome (Santa Fe) Argentina2 High School of Health, Faculty of Biochemistry and Biological Sciences (UNL),Ciudad Universitaria (3000), Santa Fe, Argentina3 Faculty of Natural Sciences and Land Surveying, Av. Libertad 5470 (3500),Corrientes, Argentina
Received: 15 February 2002/Accepted: 19 October 2002
Correspondence to: R. C. Lajmanovich
Bull. Environ. Contam. Toxicol. (2003) 70:612–618© 2003 Springer-Verlag New York Inc.DOI: 10.1007/s00128-003-0029-x B
ulle
tin
of EnvironmentalContaminationand Toxicology
612 EXHIBIT J - Page 321
Case 5:14-cv-00117-cr Document 63-11 Filed 11/14/14 Page 39 of 312
613 EXHIBIT J - Page 322
Case 5:14-cv-00117-cr Document 63-11 Filed 11/14/14 Page 40 of 312

614 EXHIBIT J - Page 323
Case 5:14-cv-00117-cr Document 63-11 Filed 11/14/14 Page 41 of 312

615 EXHIBIT J - Page 324
Case 5:14-cv-00117-cr Document 63-11 Filed 11/14/14 Page 42 of 312

616 EXHIBIT J - Page 325
Case 5:14-cv-00117-cr Document 63-11 Filed 11/14/14 Page 43 of 312

617 EXHIBIT J - Page 326
Case 5:14-cv-00117-cr Document 63-11 Filed 11/14/14 Page 44 of 312

618 EXHIBIT J - Page 327
Case 5:14-cv-00117-cr Document 63-11 Filed 11/14/14 Page 45 of 312

Histochem Cell Biol (2008) 130:967–977DOI 10.1007/s00418-008-0476-x
123
ORIGINAL PAPER
A long-term study on female mice fed on a genetically modiWed soybean: eVects on liver ageing
Manuela Malatesta · Federica Boraldi · Giulia Annovi · Beatrice Baldelli · SeraWna Battistelli · Marco Biggiogera · Daniela Quaglino
Accepted: 1 July 2008 / Published online: 22 July 2008© Springer-Verlag 2008
Abstract Liver represents a suitable model for monitor-ing the eVects of a diet, due to its key role in controlling thewhole metabolism. Although no direct evidence has beenreported so far that genetically modiWed (GM) food mayaVect health, previous studies on hepatocytes from youngfemale mice fed on GM soybean demonstrated nuclearmodiWcations involving transcription and splicing path-ways. In this study, the eVects of this diet were studied onliver of old female mice in order to elucidate possible inter-ference with ageing. The morpho-functional characteristicsof the liver of 24-month-old mice, fed from weaning oncontrol or GM soybean, were investigated by combining aproteomic approach with ultrastructural, morphometricaland immunoelectron microscopical analyses. Several pro-teins belonging to hepatocyte metabolism, stress response,calcium signalling and mitochondria were diVerentiallyexpressed in GM-fed mice, indicating a more markedexpression of senescence markers in comparison to controls.
Moreover, hepatocytes of GM-fed mice showed mitochon-drial and nuclear modiWcations indicative of reducedmetabolic rate. This study demonstrates that GM soybeanintake can inXuence some liver features during ageing and,although the mechanisms remain unknown, underlines theimportance to investigate the long-term consequences ofGM-diets and the potential synergistic eVects with ageing,xenobiotics and/or stress conditions.
Keywords Ageing · Cell nucleus · Genetically modiWed soybean · Liver · Mitochondria
Introduction
Diet is considered one of the most important environmentalfactors aVecting lifespan. Genetically modiWed (GM) crops,in which new genes have been inserted into the originalgenome, are nowadays distributed all over the world, thusfrequently becoming part of human and animal diets (San-vido et al. 2007). The fact that GM food may aVect human oranimal health is debated: actually, no consensus exists nei-ther on the test designs nor on the criteria to be assumed forassessing the presence of possible pathological signs (Doullet al. 2007; Séralini et al. 2007). However, it cannot beignored that some scientiWc reports have described struc-tural and molecular modiWcations in diVerent organs andtissues of GM-fed animals (e.g. Ewen and Pustzai 1999;Malatesta et al. 2002a, b, 2003a, 2005, Vecchio et al. 2004;Tudisco et al. 2006; Trabalza-Marinucci et al. 2008). Theseobservations suggest that the risk of genetically modiWedcrops cannot be ignored and deserves further investigationsin order to identify possible long-term eVects, if any, ofGM food consumption that might help in the post marketsurveillance (Kuiper et al. 2004).
M. Malatesta (&)Dipartimento di Scienze Morfologico-Biomediche, Sezione di Anatomia e Istologia, University of Verona, strada Le Grazie 8, 37134 Verona, Italye-mail: [email protected]
F. Boraldi · G. Annovi · D. QuaglinoDepartment of Biomedical Sciences, University of Modena e Reggio Emilia, 41100 Modena, Italy
B. Baldelli · S. BattistelliIstituto di Istologia e Analisi di Laboratorio, University of Urbino, 61029 Urbino (PU), Italy
M. BiggiogeraDipartimento di Biologia Animale, Laboratorio di Biologia Cellulare e Neurobiologia, University of Pavia, 27100 Pavia, Italy
EXHIBIT J - Page 328
Case 5:14-cv-00117-cr Document 63-11 Filed 11/14/14 Page 46 of 312

968 Histochem Cell Biol (2008) 130:967–977
123
Within this context, it seems of prime importance toelucidate whether a GM-containing diet may interfere withthe ageing process, since senescence is characterized byprogressive changes in several cellular functions that even-tually result in disease and/or the loss of the ability tosuccessfully respond to stress and xenobiotics (Jameson2004). In fact, to test GMO-related eVects on laboratorymammals, experiments have usually been performed forsome months only, thus making impossible to detectlong-term consequences (Séralini et al. 2007).
Liver represents an especially suitable model for moni-toring the eVects of a diet, since it is a multifunctionalorgan exerting a key role in controlling the whole metabo-lism and in detoxifying toxic compounds. It is known thatliver sensitivity to xenobiotics is gender-related, manydetoxiWcation pathways being hormone-regulated (e.g.Voss et al. 2003); for this reason, our studies were carriedout only on female animals, which seem to be more capableto cope with exogenous stress conditions (e.g. Lin et al.2003; Dai et al. 2006; Patel et al. 2008).
In previous studies on hepatocytes from young and adult(2–8 months of age) female mice fed on GM soybean wedemonstrated nuclear modiWcations involving structuralconstituents of the transcription and splicing processingpathways (Malatesta et al. 2002a).
In the present study, we have investigated the morpho-functional characteristics of the liver of 24-month-oldfemale mice, fed from weaning on control or GM soybean,by combining a proteomic approach with ultrastructural,morphometrical and immunocytochemical analyses.
Materials and methods
Animals and treatments
Ten female Swiss mice were fed on a laboratory chow(Malatesta et al. 2002a) containing 14% GM soybean, apercentage corresponding to that usually present in thestandard diet of this mouse strain and also included inthe range (11–33%, Séralini et al. 2007) generally used inthe regulatory tests for GMOs. This GM soybean has beenobtained by insertion of the bacterial CP4 EPSPS (5-eno-lpyruvylshikimate-3-phosphate synthase) gene conferring ahigh level of tolerance to glyphosate, the active ingredientof the herbicide Roundup (GTS 40-3-2; Padgette et al.1995). In parallel, ten female mice were fed on the samediet with commercial, non-GM soybean (controls). Bothanimal groups started their respective diets at weaning andwere grown in standard cages under constant environmen-tal conditions (21 § 1°C, 50 § 5% moisture, 12L:12D day-light cycle) until 24 months of age. During treatment, micewere weighed every 2 months. After death by cervical
dislocation, liver was quickly removed, weighed and theright lobe of the organ was partly processed for microsco-pical analyses, and partly stored in liquid nitrogen forproteome analysis.
All animals received humane care and this study proto-cols comply with the institution’s guidelines.
Proteome analysis
Sample preparation Liver samples were obtained fromthree mice for each experimental condition and were keptseparate during all experiments. The tissue was homo-genized and immediately resuspended in lysis buVer (8 Murea, 2% CHAPS, 65 mM dithioerythritol, 2% pharmalytepH 3–10 and trace amount of bromophenol blue). Proteinconcentration was determined according to Bradford(1976).
2-DE 2-DE was performed in two independent assays,where samples from all animals were run in triplicate. Sam-ples containing 60 �g (analytical gels) or 1 mg (preparativegels) of protein underwent 2-DE using the Immobiline/polyacrylamide system (Bjellqvist et al. 1993). Isoelectricfocusing was performed on IPGphor system (GE-Health-care, Uppsala, Sweden) at 16°C using two diVerent proto-cols. For analytical gels: passive rehydration for 16 h,500 V for 1 h, 500–2,000 V for 1 h, 3,500 V for 3 h,5,000 V for 30 min and 8,000 V for 12 h. For preparativegels a preliminary step at 200 V constant for 12 h wasadded. Thereafter, immobilized pH gradient strips werereduced (2% dithioerythritol) and alkylated (2.5% iodoace-tamide) in equilibration buVer (6 M urea, 50 mM Tris–HCl,pH 6.8, 30% glycerol, 2% SDS). Subsequently, strips wereloaded onto 12% acrylamide vertical gels using an EttanDALTsix electrophoresis unit (GE-Healthcare, Uppsala,Sweden). Analytical gels were stained with ammoniacal sil-ver nitrate (Hochstrasser et al. 1988), whereas preparativegels for mass spectrometric analysis were silver-stained(Shevchenko et al. 1996).
Data acquisition and analysis To detect signiWcantdiVerences in protein abundance between the two experi-mental conditions, all silver-stained gel images weredigitalized at 400 dpi resolution using ImageScanner(GE-Healthcare, Uppsala, Sweden) and analysed usingMelanie 3.0 software (GE-Healthcare, Uppsala, Sweden).After background subtraction, protein spots were auto-matically deWned and quantiWed with the feature detectionalgorithm (Hochstrasser et al. 1988). Spot intensities wereexpressed as percentages (vol %) of relative volumes byintegrating the optical density (OD) of each pixel in thespot area (vol) and dividing with the sum of volumes ofall spots detected in the gel. Only those spots, within thesame experimental condition, exhibited the same trend of
EXHIBIT J - Page 329
Case 5:14-cv-00117-cr Document 63-11 Filed 11/14/14 Page 47 of 312

Histochem Cell Biol (2008) 130:967–977 969
123
expression in all gels underwent further quantitative ana-lysis. Mean values, standard deviations and coeYcients ofvariation were calculated. Statistical data were obtainedusing GraphPad software (San Diego, CA, USA) andcompared by the unpaired t test. DiVerences betweentreatments were considered signiWcant at P < 0.05. ForMS analysis only those spots whose expression appearedsigniWcantly changed upon GM soybean treatment havebeen selected.
In-gel destaining and digestion of protein samples Spotsof interest were manually excised from preparative silver-stained 2-DE gels. Silver-stained gel pieces were destainedas described by Gharahdaghi et al. (1999). All excised spotswere incubated with 12.5 ng/�l sequencing grade trypsin(Roche Molecular Biochemicals, Basel, Switzerland) in25 mM AmBic overnight at 37°C. Peptide extraction wascarried out twice using 50% ACN, 1% TFA and then 100%ACN. All extracts were pooled, and the volume wasreduced by SpeedVac.
Mass spectrometry
Peptides were resuspended in aqueous 5% formic acidand subsequently eluted onto a 150 mm £ 75 �m Atlan-tis C18 column analytical (Waters, Milford, MA, USA)and separated with an increasing ACN gradient from 10to 85% in 30 min using a Waters CapLC system. Theanalytical column (estimated Xow approximately 200 nL/min) was directly coupled, through a nanoES ion source,to a Q-TOF Ultima Global mass spectrometer (Waters,Milford, MA, USA). Multicharged ions (charge states 2,3 and 4) were selected for fragmentation and the acquiredMS/MS spectra were searched against the SWISS-PROT/TrEMBL non-redundant protein and NCBI databaseusing the Mascot (www.matrixscience.com) MS/MSsearch engine. Initial search parameters were the follows:enzyme, trypsin; maximum number of missed cleavages,1; Wxed modiWcation, carbamidomethylation of cyste-ines; variable modiWcation parameters, oxidation Met;peptide tolerance, 0.5 Da; MS/MS tolerance, 0.3 Da;charge state, 2, 3, or 4. We basically selected the candi-date peptides with probability-based MOWSE scores thatexceeded its threshold, indicating a signiWcant (or exten-sive) homology (P < 0.05), and referred to them as“hits”. The criteria were based on the manufacturer’sdeWnitions (Matrix Science, Boston, MA, USA) (Honoreet al. 2004). Proteins identiWed with at least two peptideswere validated without any manual processing, whenscore higher than 40, whereas were systematicallychecked and/or interpreted manually to conWrm or cancelMASCOT suggestions, when score was lower than 40 buthigher than 20.
Light microscopy
For conventional histological observations, liver sampleswere Wxed by immersion in 4% paraformaldehyde in 0.1 Mphosphate buVer, pH 7.4, for 6 h at 4°C, then dehydratedwith ethanol and embedded in paraYn. Five-�m-thick sec-tions were stained with either haematoxylin–eosin or Mal-lory’s connective tissue stain. Samples were observed in anOlympus BX51 light microscope.
Electron microscopy
For conventional ultrastructural morphology and mitochon-dria morphometrical evaluations, liver samples were Wxedwith 2.5% glutaraldehyde and 2% paraformaldehyde in0.1 M Sörensen phosphate buVer, pH 7.4 for 3 h, washed,post-Wxed with 1% OsO4 at 4°C for 1 h, dehydrated andembedded in Epon.
For morphometrical and immunocytochemical studieson cell nuclei, samples were Wxed with 4% paraformalde-hyde in 0.1 M Sörensen buVer at 4°C for 2 h, dehydratedand embedded in LRWhite resin.
Epon-embedded ultrathin sections were conventionallycontrasted with uranyl acetate and lead citrate, whileLRWhite-embedded sections were stained with the EDTAmethod (Bernhard 1969). This procedure entails threesteps: Wrst, the sections are contrasted with uranyl acetate,then they are exposed to EDTA to bleach condensed chro-matin, whose contrast generally masks the ribonucleopro-tein (RNP) constituents involved in RNA processing, and,Wnally, lead citrate is brieXy applied to increase RNP con-trast. Specimens were observed in a Philips Morgagni TEMequipped with a Megaview II camera for digital imageacquisition.
Morphometry
Morphometrical analyses were carried out by using theAnalySIS Image processing software (Soft Imaging Sys-tem GmbH, Germany). Cellular and nuclear areas weremeasured (440£) on 30 hepatocytes/animal; then, thenucleus/cytoplasm (N/C) ratio was calculated. Furthermorphometrical evaluations (11,000£) were made on tenhepatocyte nuclei/animal: nucleolar areas, percentages ofWbrillar centres (FCs), dense Wbrillar component (DFC)and granular component (GC) per nucleolus, FC area,index of nuclear shape irregularity (the ratio between themeasured perimeter and the circumference of the equiva-lent circle), percentage of nuclear area occupied by con-densed chromatin, perichromatin granule density (PG/�m2
of nucleoplasm) and nuclear pore frequency (NP/�m ofperimeter) were considered. Finally, the sectional area aswell as inner and outer membrane proWle length were
EXHIBIT J - Page 330
Case 5:14-cv-00117-cr Document 63-11 Filed 11/14/14 Page 48 of 312

970 Histochem Cell Biol (2008) 130:967–977
123
measured (18,000£) in 20 mitochondria/animal, then theinner/outer membrane length ratio was calculated in orderto estimate the inner membrane length independently frommitochondrial size.
Immunoelectron microscopy
For immunocytochemical analyses, mouse monoclonalantibodies directed against phosphorylated polymerase II(Research Diagnostics Inc., Flanders, NJ, USA) and thesplicing factor SC-35 (Sigma-Aldrich, Buchs, Switzerland)were used and revealed by secondary gold-conjugatedprobes (Malatesta et al. 2002a, b). Labelling density (num-ber of gold grains/�m2) over nucleoplasm and nucleoluswas evaluated on ten nuclei/animal (18,000£). Areas ofinterest were measured as described above and gold grainscounted manually.
Data for each variable were pooled according to theexperimental group and expressed as mean § standarderror (SE). Statistical comparisons were performed by theone-way ANOVA test (P · 0.05).
Results
Mice body weight was quite similar in all animals during thewhole experiment. At sacriWce, animal’s weight varied from21 to 29 g, whereas liver’s weight ranged from 0.6 to 1.5 g,without signiWcant diVerences between control and GM soy-
bean-fed animals. No macroscopic alterations or pathologiclesions were observed in any organ of all animals.
Proteomics
The total protein content of the liver did not reveal any sig-niWcant diVerence between control and GM-fed mice, asevaluated by the Bradford assay. Similarly, the number ofproteins separated by 2-DE was approximately of 1,400from each sample, independently from the experimentalcondition.
In order to exclude the inXuence of possible high intra-sample variability, the coeYcient of variation (CV) (stan-dard deviation of normalized spot volume divided by mean)was evaluated for each sample from triplicate parallel prepa-rations.
As reported (Molloy et al. 2003), we considered for furtheranalysis spots with CV values of normalized volumes lowerthan 30%. Consistently with the observation that the greatmajority of proteins gave reproducible results in terms of sam-ple preparation, extraction procedures and 2-DE, CV values ofnormalized volumes higher than 30% were only obtained forvery faint spots and for spots located close to the gel edges.
In the liver of GM-fed mice we demonstrated signiWcantchanges in the expression of 49 spots, as indicated by labelson two representative gels obtained from control (Fig. 1a)and GM-fed animals (Fig. 1b). In particular, 39 proteinsappeared signiWcantly more expressed in GM-fed mice,whereas 10 proteins were signiWcantly decreased.
Fig. 1 Representative silver-stained 2-D electropherograms of liver from control (a) and GM-fed mice (b). DiVerentially expressed proteins areindicated by arrows and symbol name when identiWed, or by open circles when unidentiWed
EXHIBIT J - Page 331
Case 5:14-cv-00117-cr Document 63-11 Filed 11/14/14 Page 49 of 312

Histochem Cell Biol (2008) 130:967–977 971
123
By mass spectrometry we identiWed 20 diVerentiallyexpressed proteins in the whole tissue lysate (Table 1). Theremaining proteins were either in insuYcient amount to beanalysed by MS or MS/MS or the MS-compatible stainingprocedure failed to reveal them.
Protein distribution into functional categories indicatesthat the majority of diVerentially expressed proteinsidentiWed by MS belong to hepatocyte metabolism (namely,nitrogen, carbohydrate and lipid metabolism), stressresponse and calcium signalling pathways, as well as tomitochondria.
Morphology
The general structure of the liver parenchyma showed simi-lar organization of hepatocytes, blood vessels, bile ducts,and extracellular matrix in the periportal areas in controland GM soybean-fed mice.
Accordingly, hepatocyte cytoplasmic organelles showedsimilar features in all animals: abundant rough and smoothendoplasmic reticulum, well-developed Golgi apparatus,ovoid mitochondria with transversal cristae, glycogendeposits, lipid droplets and some residual bodies (notshown).
Conversely, hepatocyte nuclei of GM-fed mice showedsome morphological diVerences in comparison to controls(Fig. 2a, b). Hepatocyte nuclei from control mice showed aroundish shape characterized by little irregularities appearingas a Wne waving and contained clumps of condensed chroma-tin distributed both at the periphery and inside the nucleus. Inthe nucleoplasm, perichromatin Wbrils (PF) and perichroma-tin granules (PG) were distributed along the borders of thecondensed chromatin, while interchromatin granules (IG)occurred as clusters in the interchromatin space (Fakan2004). Nucleoli exhibited easily recognizable, intermingled,dense Wbrillar (DFC) and granular components (GC),whereas Wbrillar centres (FC) were not prominent (Fig. 2a)(nucleolar nomenclature in Schwarzacher and Wachtler1993). Hepatocyte nuclei from GM-fed mice diVered fromcontrols because of more regular contour, large clumps ofcondensed chromatin, high number of PG, and smaller andcompact nucleoli rich in GC (Fig. 2b). Interestingly, manyPG were observed inside the condensed chromatin areas.
Morphometry
Cellular and nuclear areas were generally smaller in GM-fed than in control mice, without modifying the N/C ratio.
Table 1 DiVerentially expressed proteins identiWed in the liver of GM-fed mice compared to controls
a Symbols correspond to the entry name of the sequence and are reported on gels in Fig. 1b Data represent the mean fold change variation (“+” increase and “¡“decrease) in GM-fed mice versus control animals. * P < 0.05, ** P < 0.01
Symbola Protein name and accession number Theoretical MW(kDa)/pI
Fold-change§ SDb
IdentiWcation method, % coverage, no. matched peptides
ARGI1 Arginase-1 (EC 3.5.3.1) (Q61176) 34.8/6.52 +2.1 § 0.5* MS/MS, 49%, 10
ARGI1 Arginase-1 (EC 3.5.3.1) (Q61176) 34.8/6.52 +1.6 § 0.3* MS/MS, 38%, 8
C1TC C-1-tetrahydrofolate synthase, cytoplasmic (EC 1.5.1.5) (Q922D8) 101.2/6.68 +3.6 § 1.0* MS/MS, 10%, 9
C1TC C-1-tetrahydrofolate synthase, cytoplasmic (EC 1.5.1.5) (Q922D8) 101.2/6.68 ¡1.8 § 0.4* MS/MS, 2%, 3
C1TC C-1-tetrahydrofolate synthase, cytoplasmic (EC 1.5.1.5) (Q922D8) 101.2/6.68 ¡3.4 § 1.1* MS/MS, 5%, 5
C1TC C-1-tetrahydrofolate synthase, cytoplasmic (EC 1.5.1.5) (Q922D8) 101.2/6.68 ¡4.4 § 1.3** MS/MS, 5%, 5
CH_60 60 kDa heat shock protein, mitochondrial (P63038) 60.9/5.91 ¡2.0 § 0.5* MS/MS, 34%, 13
CH_60 60 kDa heat shock protein, mitochondrial (P63038) 60.9/5.91 +1.9 § 0.3* MS/MS, 43%, 15
CPSM Carbamoyl-phosphate synthase (EC 6.3.4.16) (Q8C196) 164.6/6.48 + 3.1 § 1.1** MS/MS, 17%, 21
CPSM Carbamoyl-phosphate synthase (EC 6.3.4.16) (Q8C196) 164.6/6.48 +2.1 § 0.7* MS/MS, 6%, 2
CPSM Carbamoyl-phosphate synthase (EC 6.3.4.16) (Q8C196) 164.6/6.48 +2.6 § 1.0* MS/MS, 11%, 16
ETFA Electron transfer Xavoprotein subunit alpha, mitochondrial (Q99LC5) 35/8.62 ¡2.0 § 0.3* MS/MS, 18%, 4
ETFA Electron transfer Xavoprotein subunit alpha, mitochondrial (Q99LC5) 35/8.62 ¡2.2 § 0.5* MS/MS, 5%, 1
ENPL Endoplasmin (P08113) 92.4/4.74 ¡2.0 § 0.6* MS/MS, 7%, 6
ECHM Enoyl-CoA hydratase, mitochondrial (E C 4.2.1.17) (Q8BH95) 31.5/8.76 +1.9 § 0.2* MS/MS, 4%, 1
HBB1 Haemoglobin subunit beta-1 (P02088) 15.8/7.13 +2.0 § 0.6* MS/MS, 29%, 4
INMT Indolethylamine N-methyl-transferase (EC 2.1.1.49) (P40936) 29.5/6 +2.1 § 0.9* MS/MS, 5%, 1
OTC Ornithine carbamoyl-transferase, mitochondrial (EC 2.1.3.3) (P11725) 39.8/8.81 ¡3.2 § 1.1** MS/MS, 29%, 9
RGN Regucalcin (Q64374) 33.4/5.16 ¡2.3 § 0.6* MS/MS, 38%, 9
TPIS Triosephosphate isomerase (EC 5.3.1.1) (P17751) 26.7/6.9 ¡2.2 § 0.9* MS/MS, 40%, 5
EXHIBIT J - Page 332
Case 5:14-cv-00117-cr Document 63-11 Filed 11/14/14 Page 50 of 312

972 Histochem Cell Biol (2008) 130:967–977
123
In GM-fed mice, shape index, nuclear pore frequency andnucleolar area decreased, while condensed chromatin per-centage, PG density and GC percentage signiWcantlyincreased (Table 2).
In mitochondria of GM-fed mice, a signiWcant decrease inthe inner/outer membrane length ratio (2.35 § 0.05 vs.3.19 § 0.04, respectively, P < 0.001) was observed, althoughthe mitochondrial area remained unchanged (0.23 § 0.01 �m2
vs. 0.27 § 0.01 �m2, respectively, P = 0.199).
Immunoelectron microscopy
No diVerence in the localization of polymerase II andSC-35 was found between GM-fed and control mice. Asexpected, polymerase II was mainly associated with PF
(Fig. 2e), while SC-35 speciWcally occurred on PF andIG (Fig. 2f). By contrast, quantitative evaluation ofimmunolabelling revealed a signiWcantly weaker label-ling for polymerase II and SC-35 in GM-fed mice(Table 3).
Discussion
The present study was performed to investigate the eVectson female mouse liver of a 2-year-long diet containing 14%GM soybean and its potential impact on the physiologicalageing process; this is, to our knowledge, the longest test sofar performed on laboratory mammals fed on a commer-cially available GMO.
Fig. 2 Hepatocyte nuclei from a control mouse (a, c) and from a GM-fed mouse (b, d); LRWhite-embedded EDTA-stained sam-ples. The general aspect of the nucleus is similar; however, in GM-fed mice the condensed chromatin (c) is quite abundant, PGs (arrowheads) are very numerous and occur also inside condensed chromatin areas, the nucleoli (Nu) appear smaller and more compact. Asterisks: DFC; squares: GC; IG: interchromatin granules. Bars: 1 �m. e Immu-nolabelling with anti-polymer-ase II antibody; the signal is speciWcally located on pericrom-atin Wbrils (arrows), whereas PG (arrowheads) are devoid of labelling. f Immunolabelling with anti-SC-35 antibody; the gold grains occur on perichrom-atin Wbrils (arrows) and on inte-chromatin granules (IG). The arrowhead indicates an unla-belled PG. Bars: 0.2 �m. The gold grain contrast was digitally enhanced using Adobe Photo-shop
EXHIBIT J - Page 333
Case 5:14-cv-00117-cr Document 63-11 Filed 11/14/14 Page 51 of 312

Histochem Cell Biol (2008) 130:967–977 973
123
The eVect of gender on hepatic metabolism has beenextensively examined for a number of drugs and xenobio-tics, and female rats seem to be less sensitive to many xeno-biotic treatments as demonstrated for DCPT (Patel et al.2008), APAP (Dai et al. 2006, 2008), or clivorine (Daiet al. 2006, 2003, 2008). Gender-associated variations maybe related to diVerences in the hepatic transport (Torres1996), in the Xuidity of the liver sinusoidal membranes (i.e.phosphatidylethanolamine to phosphatidylcholine ratio),and in higher levels of total mdr gene products in female ratlivers compared to males (Morris et al. 2003). It has alsobeen suggested that diVerences in the hepatic antioxidantdefence mechanisms could be responsible for the higherresistance of females to some hepatotoxicants (Sverko et al.2004; Justo et al. 2005). Other gender diVerences are hor-mone-dependent: i.e. the arginine metabolism (Kumar andKalyankar 1984; Tipton 2001) and the expression of heatshock proteins (HSPs) (Voss et al. 2003) are related to theestrogen availability. By considering these all, we carriedout our experiments only on female mice.
We performed a complementary interdisciplinaryapproach which allowed us to reveal changes in liver pro-tein proWle as well as in structural cellular components thatmay suggest morpho-functional changes in the organ.
The macroscopical analysis did not reveal evident diVer-ences between control and GM-fed mice; moreover, no sig-niWcant diVerence in the mortality rate was observedbetween the two animal groups. The liver weight reductionobserved, independently from treatment, in old animalscompared to young and adult mice (Malatesta et al. 2002a)is a well-known phenomenon occurring during ageing(Schmucker 1990; Anantharaju et al. 2002).
Proteome analysis demonstrated in GM-fed mice adiVerential expression of a number of proteins mostlyrelated to metabolic pathways (i.e. lipid and carbohydrate)and to the urea cycle. In particular, as for the urea cycle,arginase and carbamoyl-phosphate synthetase were signiW-cantly increased, whereas ornithine transcarbamoylase wasmarkedly downregulated. Arginase is a cytosolic enzymeresponsible for the cleavage of arginine, an amino acid par-ticularly required during growth, stress and injury acting,and also involved in the metabolism of biologically activecompounds (Tong and Barbul 2004). Arginine cleavagegenerates urea and ornithine, the latter being necessary fortissue repair processes (Witte and Barbul 2003; Duranteet al. 2007) as well as for citrullin production in the mito-chondrial matrix, where ornithine transcarbamoylase cata-lyzes the condensation of ornithine with carbamoylphosphate.
Since nitric oxide (NO) synthase and arginase competefor arginine, it could be speculated that increased expres-sion of arginase might be associated to a decrease in NOsynthase activity, thus inXuencing the redox grading whichT
able
2M
ean§
SE v
alue
s of
var
iabl
es c
onsi
dere
d in
hep
atoc
ytes
of
the
two
grou
ps o
f an
imal
s
DF
C d
ense
Wbr
illar
com
pone
nt; F
C W
bril
lar
cent
re; G
C g
ranu
lar
com
pone
nt; N
/C n
ucle
us/c
ytop
lasm
; PG
per
ichr
omat
in g
ranu
le
Cel
l are
aN
ucle
ar a
rea
N/C
rat
ioS
hape
inde
xC
onde
nsed
ch
rom
atin
(%
)PG
den
sity
Pore
fr
eque
ncy
Nuc
leol
ar
area
FC
are
aFC
(%
)D
FC (
%)
GC
(%
)
Con
trol
405.
77§
13.8
6*45
.14§
1.95
*0.
11§
0.00
11.
38§
0.07
*27
.55§
1.44
*0.
76§
0.04
*0.
69§
0.03
*2.
25§
0.13
*0.
05§
0.01
6.92
§0.
7129
.65§
1.35
63.4
8§
1.28
*
GM
-fed
291.
26§
9.42
*36
.95§
1.42
*0.
13§
0.00
61.
19§
0.02
*41
.05§
1.06
*1.
73§
0.06
*0.
55§
0.02
*1.
70§
0.10
*0.
05§
0.01
5.40
§0.
9025
.63§
0.98
68.9
7§
1.41
*
P v
alue
s<
0.00
10.
050.
071
0.02
<0.
001
<0.
001
0.00
20.
007
0.87
70.
285
0.06
00.
022
EXHIBIT J - Page 334
Case 5:14-cv-00117-cr Document 63-11 Filed 11/14/14 Page 52 of 312

974 Histochem Cell Biol (2008) 130:967–977
123
contributes to dual activation of proliferating and proapop-totic cascades (Carreras and Poderoso 2007), ultimatelymodulating senescence (Gilca et al. 2007). Consistently, itis known that NO synthase activity undergoes reductionwith increasing age (Valdez et al. 2004; Numao et al.2007). Interestingly, NO synthase also occurs in the innermitochondrial membrane, functioning as a regulatory factorof respiration (Kato and Giulivi 2006), and reduced mito-chondrial inner membrane as well as decreased expressionof some respiratory enzymes have been found in GM-fedmice.
In GM-fed mice, we also found a signiWcant downregu-lation of the senescent marker regucalcin. Regucalcin playsa regulatory role in intracellular signalling systems (Yam-aguchi 2005) maintaining intracellular Ca(2+) homeostasisthrough activation of Ca(2+) pump enzymes in plasmamembrane, endoplasmic reticulum and mitochondria,beside its activatory eVect on SOD in the liver cytosol(Fukaya and Yamaguchi 2004). A reduced expression ofregucalcin could imply an impaired ratio between pro-oxi-dant and anti-oxidant molecules. It is known that regucalcinlevels signiWcantly decrease in aged rats, thus favouring theage-dependent deterioration of liver (Tobisawa et al. 2003;Fujita 1999). It seems therefore that senescence pathwaysare signiWcantly activated in GM-fed mice.
Furthermore, proteome analysis revealed a downregula-tion of several HSPs in GM-fed animals. HSPs areexpressed in response to a wide variety of physiologicaland environmental insults, acting as molecular chaperonesfor nascent and stress-accumulated misfolded proteins, ormediating immunological functions, thus exerting a protec-tive function (MulthoV 2006; Schmitt et al. 2007). How-ever, it is known that during ageing a reduction in theexpression of HSPs occurs (e.g. Rea et al. 2001; Zhanget al. 2002), thus contributing to the lower capability of eld-erly to cope against xenobiotics and stress conditions.Again, hepatocytes of GM-fed animals seem to be charac-terized by a more pronounced senescence than controls.
Several Wndings also suggest a lower metabolic activityin hepatocytes from GM-fed mice in comparison to con-trols. First, smaller cellular and nuclear areas, without alter-ation of the N/C ratio, generally indicate decreasedmetabolic rate (Hildebrand 1980). When compared to pre-vious data (Malatesta et al. 2002a, 2005), cellular and
nuclear areas from both control and GM-fed old mice showdimensions more similar to young than adult animals,according to previous data demonstrating an increase insize during development and maturation and a decline dur-ing ageing (Schmucker 1990). Nucleoli also decrease insize and show prominent GC, suggesting a downregulationof ribosomal RNA transcription/processing and export rate(Schwarzacher and Wachtler 1993). In addition, more regu-lar nuclear contour and lower nuclear pore frequency implyreduced nucleus–cytoplasmic molecular traYcking (e.g.Malatesta et al. 1998); weaker labelling for RNA polymer-ase II and SC-35, and higher amounts of condensed chro-matin indicate reduced transcriptional activity; higherdensities of PG, site of intranuclear storage and transport ofalready spliced (pre)-mRNA (Fakan 2004), suggest alteredpre-mRNA processing and/or impaired intranuclear ornucleus–cytoplasmic transport (e.g. Lafarga et al. 1993).
Interestingly, most of these Wndings represent a peculiarresponse of aged GM-fed animals; in fact, until the 12thmonth of age, hepatocyte nuclei of GM-fed mice show fea-tures typical of high metabolic rate (Malatesta et al. 2002a,2005). It is known that a general decrease in transcriptionand splicing factors (Frasca et al. 2003; Malatesta et al.2003b, 2004), in nucleocytoplasmic transport factors (Pujolet al. 2002) and in nuclear pore number (Galy et al. 2000)occur in hepatocyte nuclei during ageing, together with aPG accumulation (Malatesta et al. 2003b). However, in oldmice fed on GM soybean these age-related alterationsappear to be more pronounced than in controls. It could behypothesized that the high metabolic rate observed inyounger mice fed on GM soybean may accelerate the age-ing process, possibly favouring the accumulation of reac-tive oxygen species (ROS) (e.g. Hallen 2002; Roijkindet al. 2002), thus contributing to the expression of senes-cent markers.
At present, we do not know which could be the factor(s)present in the GM soybean capable of inducing such modi-Wcations. The changes of regucalcin as well as of otherdiVerentially expressed liver proteins observed in the pres-ent study are comparable to that reported after exposure ofseveral xenobiotics (Yamaguchi et al. 2002; Pastorelli et al.2006; Wei et al. 2008), thus suggesting the involvement ofsimilar pathways activated in response to diVerent toxiccompounds. The soybean used in this study has been
Table 3 Mean § SE values of labelling densities obtained with anti-RNA polymerase II, and anti-SC35 antibodies on hepatocyte nuclei of thetwo animal groups. Background: 0.14 § 0.01 gold grains/�m2
Anti-pol II nucleoplasm Anti-pol II nucleolus Anti-SC35 nucleoplasm Anti-SC35 nucleolus
Control 1.15 § 0.10 0.31 § 0.08 2.52 § 0.10 0.31 § 0.08
GM-fed 0.74 § 0.06 0.24 § 0.06 2.01 § 0.08 0.28 § 0.07
P values <0.001 0.576 <0.001 0.815
EXHIBIT J - Page 335
Case 5:14-cv-00117-cr Document 63-11 Filed 11/14/14 Page 53 of 312

Histochem Cell Biol (2008) 130:967–977 975
123
treated in the Weld with the herbicide Roundup; althoughthe treatment conditions used were not speciWed by themanufacturer, it is worth considering the possible presencein the chow of traces of glyphosate (Granby et al. 2003),i.e. the active ingredient of the herbicide Roundup to whichthe soybean has been rendered tolerant (Padgette et al.1995). It has been demonstrated that Roundup slows downtranscription (Marc et al. 2005), interferes with estrogensynthesis (Richard et al. 2005) and depresses respiratoryactivity (Peixoto 2005), inducing alterations of the mito-chondria inner membrane (Szarek et al. 2000). Althoughthe respiratory activity of mitochondria declines duringageing (Schmucker 1990), in GM-fed old mice such adecrease appeared to be signiWcantly more pronounced thanin controls. Again, this phenomenon becomes evident onlyin aged animals: in fact, measurements performed on 8 and12-month-old mice revealed no modiWcation of mitochon-drial membrane length (unpublished results).
At present, no data are available on the eVects of thisGM-containing diet on old male mice, but microscopicalobservations on livers of 3-month-old male mice (unpub-lished results) revealed a situation comparable to that foundin females of the same age (Malatesta et al. 2002a), thussuggesting a limited inXuence of the gender on the eVectsof this GM soybean. On the other hand, the comparison ofthe features of hepatocytes from young and old GM-fedfemale mice seems indicate the occurrence of cumulativelong-term eVects: GM soybean would Wrst enhance livermetabolism, and this prolonged activation may then accel-erate the ageing process with increased expression of senes-cent markers.
In conclusion, the present work demonstrate that GMsoybean intake can inXuence the liver morpho-functionalfeatures during the physiological process of ageing and,although the mechanisms responsible for such alterationsare still unknown and some data have been discussed on aspeculative basis, there are several Wndings underlining theimportance to further investigate the long-term conse-quences of a GM-diet and the potential synergistic eVectswith ageing, xenobiotics and/or stress conditions.
Acknowledgments We thank M. Storaci of the Istituto ZooproWlat-tico Sperimentale dell’Umbria e delle Marche for his assistancein mouse breeding. This work was supported by the Agenzia ServiziSettore Agroalimentare delle Marche, Italy.
References
Anantharaju A, Feller A, Chedid A (2002) Aging liver. Gerontology48:343–353
Bernhard W (1969) A new staining procedure for electron microscopicalcytology. J Ultrastruct Res 27:250–265
Bjellqvist B, Pasquali C, Ravier F, Sanchez JC, Hochstrasser D (1993) Anonlinear wide-range immobilized pH gradient for two-dimensional
electrophoresis and its deWnition in a relevant pH scale. Electro-phoresis 14:1357–1365
Bradford MM (1976) A rapid and sensitive method for the quantitationof microgram quantities of protein utilizing the principle of pro-tein-dye binding. Anal Biochem 72:248–254
Carreras MC, Poderoso JJ (2007) Mitochondrial nitric oxide in the sig-naling of cell integrated responses. Am J Physiol Cell Physiol292:C1569–1580
Dai G, He L, Chou N, Wan YJ (2006) Acetaminophen metabolismdoes not contribute to gender diVerence in its hepatotoxicity inmouse. Toxicol Sci 92:33–41
Doull J, Gaylor D, Greim HA, Lovell DP, Lynch B, Munro IC (2007)Report of an Expert Panel on the reanalysis by Séralini of a 90-day study conducted by Monsanto in support of the safety of agenetically modiWed corn variety (MON 863). Food Chem Toxi-col 45:2073–2085
Durante W, Johnson FK, Johnson RA (2007) Arginase: a critical reg-ulator of nitric oxide synthesis and vascular function. Clin ExpPharmacol Physiol 34:906–911
Ewen SW, Pustzai A (1999) EVects of diets containing geneticallymodiWed potatoes expressing Galanthus nivalis lecitin on ratsmall intestine. Lancet 354:1353–1354
Fakan S (2004) Ultrastructural cytochemical analyses of nuclear func-tional architecture. Eur J Histochem 48:5–14
Frasca D, Nguyen D, Riley RL, Blomberg BB (2003) Decreased E12and/or E47 transcription factor activity in the bone marrow aswell as in the spleen of aged mice. J Immunol 170:719–726
Fujita T (1999) Senescence marker protein-30 (SMP30): structure andbiological function. Biochem Biophys Res Commun 254:1–4
Fukaya Y, Yamaguchi M (2004) Regucalcin increases superoxide dis-mutase activity in rat liver cytosol. Biol Pharm Bull 27:1444–1446
Galy V, Olivo-Marin JC, Scherthan H, Doye V, Rascalou N, NehrbassU (2000) Nuclear pore complexes in the organization of silenttelomeric chromatin. Nature 403:108–112
Gharahdaghi F, Weinberg CR, Meagher DA, Imai BS, Mische SM(1999) Mass spectrometric identiWcation of proteins from silver-stained polyacrylamide gel: a method for the removal of silverions to enhance sensitivity. Electrophoresis 20:601–605
Gilca M, Stoian I, Atanasiu V, Virgolici B (2007) The oxidativehypothesis of senescence. J Postgrad Med 53:207–213
Granby K, Johannesen S, Vahl M (2003) Analysis of glyphosate resi-dues in cereals using liquid chromatography–mass spectrometry.Food Addit Contam 20:692–698
Hallen A (2002) Accumulation of insoluble protein and ageing. Bio-gerontology 3:307–315
Hildebrand R (1980) Nuclear volume and cellular metabolism. AdvAnat Embryol Cell Biol 60:1–54
Hochstrasser DF, Patchornik A, Merril CR (1988) Development ofpolyacrylamide gels that improve the separation of proteins andtheir detection by silver staining. Anal Biochem 173:412–423
Honore B, Ostergaard M, Vorum H (2004) Functional genomics stud-ied by proteomics. Bioessays 26:901–915
Jameson CW (2004) Towards a uniWed and interdisciplinary model ofageing. Med Hypotheses 63:83–86
Justo R, Boada J, Frontera M, Oliver J, Bermúdez J, Gianotti M (2005)Gender dimorphism in rat liver mitochondrial oxidative metabo-lism and biogenesis. Am J Physiol Cell Physiol 289:C372–378
Kato K, Giulivi C (2006) Critical overview of mitochondrial nitric-oxide synthase. Front Biosci 11:2725–2738
Kuiper HA, König A, Kleter GA, Hammes WP, Knudsen I, EuropeanNetwork on Safety Assessment of Genetically ModiWed FoodCrops (ENTRANSFOOD) (2004) Safety assessment, detectionand traceability, and societal aspects of genetically modiWedfoods. European Network on Safety Assessment of GeneticallyModiWed Food Crops (ENTRANSFOOD). Food Chem Toxicol42:1195–1202
EXHIBIT J - Page 336
Case 5:14-cv-00117-cr Document 63-11 Filed 11/14/14 Page 54 of 312

976 Histochem Cell Biol (2008) 130:967–977
123
Kumar AN, Kalyankar GD (1984) EVect of steroid hormones on agedependent changes in rat arginase isoenzymes. Exp Gerontol19:191–198
Lafarga M, Berciano MT, Andres MA (1993) Protein-synthesis inhibi-tion induces perichromatin granule accumulation and intranuclearrodlet formation in osmotically stimulated supraoptic neurons.Anat Embryol 187:363–369
Lin G, Cui YY, Liu XQ (2003) Gender diVerences in microsomal met-abolic activation of hepatotoxic clivorine in rat. Chem Res Toxi-col 16:768–774
Malatesta M, Bertoni-Freddari C, Fattoretti P, Baldelli B, Fakan S, Gaz-zanelli G (2004) Aging and vitamin E deWciency are responsible foraltered RNA pathways. Ann N Y Acad Sci 1019:379–382
Malatesta M, Bertoni-Freddari C, Fattoretti P, Caporaloni C, Fakan S,Gazzanelli G (2003a) Altered RNA structural constituents inaging and vitamin E deWciency. Mech Ageing Dev 124:175–181
Malatesta M, Biggiogera M, Manuali E, Rocchi MBL, Baldelli B,Gazzanelli G (2003b) Fine structural analyses of pancreatic aci-nar cell nuclei from mice fed on GM soybean. Eur J Histochem47:385–388
Malatesta M, Caporaloni C, Gavaudan S, Rocchi MBL, Tiberi C, Gaz-zanelli G (2002a) Ultrastructural morphometrical and immunocy-tochemical analyses of hepatocyte nuclei from mice fed ongenetically modiWed soybean. Cell Struct Funct 27:173–180
Malatesta M, Caporaloni C, Rossi L, Battistelli S, Rocchi MBL, Ton-ucci F, Gazzanelli G (2002b) Ultrastructural analysis of pancre-atic acinar cells from mice fed on genetically modiWed soybean.J Anat 201:409–416
Malatesta M, Mannello F, Sebastiani M, Cardinali A, Marcheggiani F,Renò F, Gazzanelli G (1998) Ultrastructural characterization andbiochemical proWle of human gross cystic breast disease. BreastCancer Res Treat 48:211–219
Malatesta M, Tiberi C, Baldelli B, Battistelli S, Manuali E, BiggiogeraB (2005) Reversibility of hepatocyte nuclear modiWcations inmice fed on genetically modiWed soybean. Eur J Histochem49:237–242
Marc J, Le Breton M, Cormier P, Morales J, Belle R, Mulner-LorillonO (2005) A glyphosate-based pesticide impinges on transcription.Toxicol Appl Pharmacol 203:1–8
Molloy MP, Brzezinski EE, Hang J, McDowell MT, VanBogelen RA(2003) Overcoming technical variation and biological variation inquantitative proteomics. Proteomics 3:1912–1919
Morris ME, Lee HJ, Predko LM (2003) Gender diVerences in the mem-brane transport of endogenous and exogenous compounds. Phar-macol Rev 55:229–240
MulthoV G (2006) Heat shock proteins in immunity. Handb Exp Phar-macol 172:279–304
Numao N, Masuda H, Sakai Y, Okada Y, Kihara K, Azuma H (2007)Roles of attenuated neuronal nitric-oxide synthase protein expres-sion and accelerated arginase activity in impairing neurogenicrelaxation of corpus cavernosum in aged rabbits. BJU Int99:1495–1499
Padgette SR, Kolacz KH, Delannay X, Re DB, LaVallee BJ, TiniusCN, Rhodes WK, Otero YI, Barry GF, Eichholtz DA, PeschkeVM, Nida DL, Taylor NB, Kishore GM (1995) Development,identiWcation and characterization of a glyphosate-tolerant soy-bean line. Crop Sci 35:1451–1461
Pastorelli R, Carpi D, Campagna R, Airoldi L, Pohjanvirta R, Viluks-ela M, Hakansson H, Boutros PC, MoVat ID, Okey AB, Fanelli R(2006) DiVerential expression proWling of the hepatic proteome ina rat model of dioxin resistance: correlation with genomic andtranscriptomic analyses. Mol Cell Proteomics 5:882–894
Patel NN, Crincoli CM, Kennedy EL, Frederick DM, Tchao R, Harvi-son PJ (2008) EVect of gender, dose, and time on 3-(3,5-dichloro-phenyl)-2,4-thiazolidinedione (DCPT)-induced hepatotoxicity inFischer 344 rats. Xenobiotica 38:435–449
Peixoto F (2005) Comparative eVects of the Roundup and glyphosateon mitochondrial oxidative phosphorylation. Chemosphere61:1115–1122
Pujol G, Soderqvist H, Radu A (2002) Age-associated reduction of nu-clear protein import in human Wbroblast. Biochem Biophys ResComm 274:354–358
Rea IM, McNerlan S, Pockley AG (2001) Serum heat shock proteinand anti-heat shock protein antibody levels in aging. Exp Geron-tol 36:341–352
Richard S, Moslemi S, Sipahutar H, Benachour N, Seralini GE (2005)DiVerential eVects of glyphosate and roundup on human placentalcells and aromatase. Environ Health Perspect 113:716–720
Roijkind M, Dominguez-Rosales JA, Nieto N, Greenweld P (2002)Role of hydrogen peroxide and oxidative stress in healing re-sponses. Cell Mol Life Sci 59:1872–1891
Sanvido O, Romeis J, Bigler F (2007) Ecological impacts of geneti-cally modiWed crops: ten years of Weld research and commercialcultivation. Adv Biochem Eng Biotechnol 107:235–278
Schmitt E, Gehrmann M, Brunet M, MulthoV G, Garrido C (2007)Intracellular and extracellular functions of heat shock proteins:repercussions in cancer therapy. J Leukoc Biol 81:15–27
Schmucker DL (1990) Hepatocyte Wne structure during maturation andsenescence. J Electron Microsc Tech 14:106–125
Schwarzacher HG, Wachtler F (1993) The nucleolus. Anat Embryol188:515–536
Séralini GE, Cellier D, Spiroux de Vendomois J (2007) New analysisof a rat feeding study with a genetically modiWed maize revealssigns of hepatorenal toxicity. Arch Environ Contam Toxicol52:596–602
Shevchenko A, Wilm M, Vorm O, Mann M (1996) Mass spectrometricsequencing of proteins silver-stained polyacrylamide gels. AnalChem 68:850–858
Sverko V, Sobocanec S, Balog T, Marotti T (2004) Age and genderdiVerences in antioxidant enzyme activity: potential relation-ship to liver carcinogenesis in male mice. Biogerontology5:235–242
Szarek J, Siwicki A, Andrzejewska A, Terech-Majewska E, Banas-zkiewicz T (2000) EVects of the herbicide Roundup on the ultra-structural pattern of hepatocytes in carp (Cyprinus carpio). MarEnviron Res 50:263–266
Tobisawa M, Tsurusaki Y, Yamaguchi M (2003) Decrease in regucal-cin level and enhancement of protein tyrosine phosphatase activ-ity in rat brain microsomes with increasing age. Int J Mol Med12:577–580
Tong BC, Barbul A (2004) Cellular and physiological eVects of argi-nine. Mini Rev Med Chem 4:823–832
Torres AM (1996) Gender-diVerential liver plasma membrane aYni-ties in hepatic tetrabromosulfonephthalein (TBS) uptake. Bio-chem Pharmacol 51:1117–1122
Trabalza-Marinucci M, Brandi G, Rondini C, Avellini L, GiammariniC, Costarelli S, Acuti G, Orlandi C, Filippini G, Chiaradia E, Mal-atesta M, Crotti S, Antonini C, Amagliani G, Manuali E, Mastro-giacomo AR, Moscati L, Haouet MN, Gaiti A, Magnani M (2008)A three year longitudinal study on the eVects of a diet containinggenetically modiWed Bt176 maize on the health status and perfor-mance on sheep. Livestock Sci 113:178–190
Tipton KD (2001) Gender diVerences in protein metabolism. CurrOpin Clin Nutr Metab Care 4:493–498
Tudisco R, Lombardi P, Bovera F, d’Angelo D, Cutrignelli MI, Ma-stellone V, Terzi V, Avallone L, Infascelli F (2006) GeneticallymodiWed soya bean in rabbit feeding: detection of DNA fragmentsand evaluation of metabolic eVects by enzymatic analysis. AnimSci 82:193–199
Valdez LB, Zaobornyj T, Alvarez S, Bustamante J, Costa LE, BoverisA (2004) Heart mitochondrial nitric oxide synthase. EVects ofhypoxia and aging. Mol Aspects Med 25:49–59
EXHIBIT J - Page 337
Case 5:14-cv-00117-cr Document 63-11 Filed 11/14/14 Page 55 of 312

Histochem Cell Biol (2008) 130:967–977 977
123
Vecchio L, Cisterna B, Malatesta M, Martin TE, Biggiogera M (2004)Ultrastructural analysis of testes from mice fed on geneticallymodiWed soybean. Eur J Histochem 48:449–453
Voss MR, Stallone JN, Li M, Cornelussen RN, Knuefermann P,Knowlton AA (2003) Gender diVerences in the expression of heatshock proteins: the eVect of estrogen. Am J Physiol Heart CircPhysiol 285:H687–H692
Wei Y, Chan LL, Wang D, Zhang H, Wang J, Dai J (2008) Proteomicanalysis of hepatic protein proWles in rare minnow (Gobiocyprisrarus) exposed to perXuorooctanoic acid. J Proteome Res7:1729–1739
Witte MB, Barbul A (2003) Arginine physiology and its implicationfor wound healing. Wound Repair Regen 11:419–423
Yamaguchi M (2005) Role of regucalcin in maintaining cell homeosta-sis and function. Int J Mol Med 15:371–389
Yamaguchi M, Tsurusaki Y, Misawa H, Inagaki S, Ma ZJ, TakahashiH (2002) Potential role of regucalcin as a speciWc biochemicalmarker of chronic liver injury with carbon tetrachloride adminis-tration in rats. Mol Cell Biochem 241:61–67
Zhang HJ, Drake VJ, Morrison JP, Oberley LW, Kregel KC (2002) Se-lected contribution: diVerential expression of stress-related geneswith aging and hyperthermia. J Appl Physiol 92:1762–1769
EXHIBIT J - Page 338
Case 5:14-cv-00117-cr Document 63-11 Filed 11/14/14 Page 56 of 312

EXHIBIT J - Page 339
Case 5:14-cv-00117-cr Document 63-11 Filed 11/14/14 Page 57 of 312

EXHIBIT J - Page 340
Case 5:14-cv-00117-cr Document 63-11 Filed 11/14/14 Page 58 of 312

Journal of Hematology & Thromboembolic Diseases
Research Article Open Access
Volume 1 • Issue 1 • 1000104
Hematotoxicity of Bacillus thuringiensis as Spore-crystal Strains Cry1Aa, Cry1Ab, Cry1Ac or Cry2Aa in Swiss Albino Mice Bélin Poletto Mezzomo, Ana Luisa Miranda-Vilela*, Ingrid de Souza Freire, Lilian Carla Pereira Barbosa, Flávia Arruda Portilho, Zulmira Guerrero Marques Lacava and Cesar Koppe Grisolia*Department of Genetics and Morphology, Institute of Biological Sciences, University of Brasilia, Brasilia/DF, Brazil
AbstractFormulated and sporulated cultures of Bacillus thuringiensis (Bt) have been widely used against insect pests, but
after the advent of genetically modified plants expressing δ-endotoxins, the bioavailability of Cry proteins has been increased. For biosafety reasons their adverse effects should be studied, mainly for non-target organisms. Thus, we evaluated, in Swiss albino mice, the hematotoxicity and genotoxicity of four Bt spore-crystals genetically modified to express individually Cry1Aa, Cry1Ab, Cry1Ac or Cry2A, administered alone by gavage with a single dose of 27 mg/Kg, 136 mg/Kg or 270 mg/Kg, 24 h, 72 h or 7 days before euthanasia. Binary combinations of these four spore-crystal proteins were also assayed at 270 mg/Kg with a single administration 24 h before euthanasia. Control mice received filtered water or cyclophosphamide at 27 mg/kg. For hematotoxicity evaluations, blood samples were drawn by cardiac puncture and processed in a multiple automated hematology analyzer; for genotoxicity analyses, micronucleus test was carried out in mice bone marrow cells. Spore-crystal administrations provoked selective hematotoxicity for the 3 exposure times, particularly for erythroid lineage. A significant reduction in bone marrow cell proliferation demonstrated cytotoxic but not genotoxic effects. These effects persisted for all exposure times, becoming more evident at 7 days. Similar results were observed for binary combinations at 24 h, suggesting that further studies are required to clarify the mechanism involved in the hematotoxicity found in mice, and to establish the toxicological risks to non-target organisms, especially mammals, before concluding that these microbiological control agents are safe for mammals.
*Corresponding author: Miranda-Vilela AL, University of Brasilia, Institute of Biological Sciences, Department of Genetics and Morphology, Brasília, 70.910-900, Brazil, Tel: 55 61 3107-3085; Fax: 55 61 3107-2923; E-mail: [email protected]
Grisolia CK, University of Brasilia, Institute of Biological Sciences, Department of Genetics and Morphology, Brasília, 70.910-900, Brazil, Tel: 55 61 3107-3085; Fax: 55 61 3107-2923; E-mail: [email protected]
Received February 04, 2013; Accepted March 12, 2013; Published March 16, 2013
Copyright: © 2013 Mezzomo BP, et al. This is an open-access article distributed under the terms of the Creative Commons Attribution License, which permits unrestricted use, distribution, and reproduction in any medium, provided the original author and source are credited.
Keywords: Bacillus thuringiensis, δ-endotoxins, Cry, Biosafety, Non-target organisms, Bioinsecticide
IntroductionAgricultural production has been boosted by continued and
indiscriminate applications of pesticides, mainly from the 1940s to the 1960s [1]. Unfortunately, this pest control management resulted in harmful outcomes such as the selection of resistant populations of insect pests, compromising the efficiency of control and forcing farmers to use increasingly high doses of pesticides [2-4]. Moreover, these chemical insecticides have harmful effects on human health and wildlife, leaving residues in food and the environment [2,3].
Among the viable alternatives for the replacement of these synthetic pesticides, entomopathogenic biological agents show potential for use in biological control programs and integrated production, because they leave few human side effects and have low impact on natural enemies and the environment [3,5,6]. In this context, Bacillus thuringiensis (Bt), a gram-positive, rod-shaped, spore-forming bacterium, is the most important biopesticide sold worldwide [7,8], having been used for over 40 years by organic farmers who spray it as a foliar insecticide [7,9].
Bt is a microbial control agent (MCA) that produces a range of entomopathogenic toxins [10,11]. The most prominent feature of Bt is that during sporulation it synthesizes δ-endotoxins or insecticidal crystal proteins (ICPs), which are parasporal crystalline protein inclusions containing crystal proteins (Cry proteins or Cry toxins) as their major constituent [12–15]. These are toxic to larvae of susceptible insects and small invertebrates [1,16], and their use in combating predators from the Hymenoptera, Homoptera, Orthoptera, Coleoptera, Diptera and Lepdoptera Orders, the main cause of damage to agriculture, has been effective [7,17].
Apart from the wide use of formulated and sporulated cultures of Bt as foliar sprays, forming part of integrated pest management strategies against insect pests of agricultural crops [11,18], advances in biotechnology have allowed the development of many genetically modified plants expressing Bt δ-endotoxins [8,19,20]. Consequently, this gene has been widely cloned in different crops and then large
amounts of such toxins are released into the environment. However, its adverse effects on non-target organisms are poorly understood [7,9,20].
The primary threat to the effectiveness of long-term use of Bt toxins is the evolution of resistance by pests [21], and one of the strategies to delay the emergence of resistant pests is the combined use of Cry toxins that are effective for the same target species. The simultaneous expression of binary combinations of Cry toxins minimizes the chance of insect resistance to Bt-plants [22]. In addition to the binary combinations, advances in genetic engineering promise the expression of multiple Cry toxins in Bt-plants, known as gene pyramiding [23]. Therefore, studies on non-target species are requirements of international protocols to verify the adverse effects of these toxins, ensuring human and environmental biosafety [8].
Due to its growing use in agricultural activities, Bt presence has already been detected in different environmental compartments such as soil and water [8]. Consequently, the bioavailability of Cry proteins has increased, and for biosafety reasons their adverse effects might be studied, mainly for non-target organisms. Studies are therefore needed to evaluate (i) Bt toxicity to non-target organisms [7,9]; (ii) the
Mezzomo et al., J Hematol Thromb Dis 2013, 1:1http://dx.doi.org/10.4172/2329-8790.1000104
Citation: Mezzomo BP, Miranda-Vilela AL, Freire IdS, Barbosa LCP, Portilho FA, et al. (2013) Hematotoxicity of Bacillus thuringiensis as Spore-crystal Strains Cry1Aa, Cry1Ab, Cry1Ac or Cry2Aa in Swiss Albino Mice. J Hematol Thromb Dis 1: 104. doi: 10.4172/2329-8790.1000104
J Hematol Thromb DisISSN: 2329-8790 JHTD, an open access journal EXHIBIT J - Page 341
Case 5:14-cv-00117-cr Document 63-11 Filed 11/14/14 Page 59 of 312

Page 2 of 9
Volume 1 • Issue 1 • 1000104
persistence of Bt toxin and its stability in aquatic environments [24]; and (iii) the risks to humans and animals exposed to potentially toxic levels of Bt through their diet [25].
Thus, we aimed to evaluate, in Swiss albino mice, the hematotoxicity and genotoxicity of four Bt spore-crystals genetically modified to express individually Cry1Aa, Cry1Ab, Cry1Ac or Cry2A, administered alone by gavage with a single dose of 27 mg/Kg, 136 mg/Kg or 270 mg/Kg, 24 h, 72 h or 7 days before euthanasia, as well as their Cry binary combinations at 270 mg/Kg with a single administration 24 h before euthanasia.
Materials and MethodsBt spore-crystal toxins
The spore-crystals Cry1Aa, Cry1Ab, Cry1Ac and Cry2Aa from B. thuringiensis var. kurstaki were obtained in lyophilized form from the Germplasm Bank of the Brazilian Agricultural Research Corporation (Embrapa) through its National Genetic Resource and Biotechnology Research Center (Cenargen), Brasilia/DF, Brazil. These strains were genetically modified to express individually Cry1Aa, Cry1Ab, Cry1Ac or Cry2A, and bioassays using the purified proteins from these genetically modified (GM) Bt spore-crystals have been published [26].
Animals and experimental design
Swiss albino mice of both genders obtained from the animal facilities of the Faculty of the University of São Paulo (Ribeirão Preto/SP, Brazil) were kept in the animal facility of the Laboratory of Genetics of the University of Brasilia (Brasília/Brazil), housed in plastic cages at room temperature (22°C ± 2°C) in a 12 h light/dark cycle with lights on at 6 a.m., and with free access to food and water. The period of acclimatization of the animals was at least seven days. Because quantitative differences in micronucleus induction have been identified between the sexes, but no qualitative differences have been described [27], and hematology reference values for mice in the veterinary therapeutic guidelines do not differentiate sexes [28], a sample size (N) of 6 mice aged approximately three months, 50% male and 50% female, was used.
Four strains of lyophilized Bt spore-crystals, Cry1Aa, Cry1Ab, Cry1Ac and Cry2Aa, were resuspended in distilled water at 37°C, agitated for 10 minutes and administered orally by gavage, with a single dose of 27 mg/Kg, 136 mg/Kg or 270 mg/Kg, 24 h, 72 h or 7 days before euthanasia. Cry binary combinations (Cry1Aa+1Ab, Cry1Aa+1Ac, Cry1Aa+2Aa, Cry1Ab+1Ac, Cry1Ab+2Aa, Cry1Ac+2Aa) were also assayed at 270 mg/Kg with a single administration 24 h before euthanasia. Control mice received filtered water (negative control) or cyclophosphamide (CP, positive control) at 27 mg/kg. The minimum dose of Bt spore-crystal toxins was of 27 mg/Kg; the maximum dose (270 mg/Kg) was 10 times greater than the minimum dose, while the intermediate dose (136 mg/Kg) was equivalent to about half the maximum dose. In our previous experiments, exposures greater than 270 mg/Kg had caused signs of toxicity and death, so this concentration was considered the maximum tolerated.
The animals were anesthetized by an intraperitoneal administration of ketamine (80 mg/kg) plus xylazine (10 mg/kg). Blood samples collected by cardiac puncture (400 μL), using an insulin syringe containing EDTA as anticoagulant, were used to carry out hemogram in a multiple automated hematologic analyzer for veterinary use, Sysmex pocH-100iV Diff (Curitiba/Paraná, Brazil) calibrated for mice. Blood smear slides were also prepared and stained with Giemsa for visual assessments of anisocytosis (variation in size), poikilocytosis (change in
shape of red blood cells - RBC), polychromasia (variation in erythrocyte coloration related to the maturation of RBC), hemagglutination and erythrocyte rouleaux. After euthanasia by cervical dislocation, bone marrow cells were surgically removed and the slides for the micronucleus (MN) test were prepared according to a standard method [29]. The genotoxic potential of spore-crystal toxins was assessed by quantification of MN in polychromatic erythrocytes (PCE) and normochromatic erythrocytes (NCE), and their possible cytotoxicity was evaluated by calculating the percentage of PCE. A total of 4000 cells was analyzed in light microscopy (1000X magnification), using a Zeiss Axioskop 2 microscope. For the 24-hour exposure, circulating blood and bone marrow of the mice were collected; for the 72-hour and 7-day exposure, only circulating blood was collected.
All procedures were reviewed and approved by the institutional Ethics Committee for Animal Research (Institute of Biological Science, University of Brasília), number 32942/2009.
Colony Forming Units (CFU)
In order to quantify the number of viable Bt spore-crystals, the colony forming units test (CFU) was performed according to Alves and Moraes (1998) [30]. For this, 0.1 g of each lyophilized spore-crystal was diluted and homogenized with a vortex in 10 mL of sterile distilled water. Thenceforward, five successive dilutions were made, using in each one 0.1 mL of previous dilution to 9.9 mL of sterile distilled water. Then, 0.1 mL of each one of the last three dilutions was plated in three replicates on a conventional culture medium (NYSM) and placed in an incubator at 30°C for 14 hours. The colonies of each replicate were counted and the average was calculated, with the result given in cells/mL (Table 5).
Statistical analysis
Statistical analysis was carried out using SPSS (Statistical Package for the Social Sciences) version 15.0. Data were expressed as mean ± SEM (standard error of mean) and values of p<0.05 were considered statistically significant. The continuous variables were tested for normal distribution with Shapiro-Wilk. Possible differences among the groups analyzed were investigated through Kruskal-Wallis test, since the data were not normally distributed. For significant Kruskal-Wallis results, Mann-Whitney U test was performed to verify differences between the treatments (2-to-2 comparisons). P-values with statistical significance (p<0.05) were only considered when they also presented biological significance, according to the following criteria: (1) group C (negative control) compared to all groups; (2) group CP (positive control) compared to the treatments with the same exposure time or between CP of different exposure times; (3) the same toxins compared in the same exposure time but in different doses (dose-effect) or at 270 mg/Kg in different exposure times (24 h, 72 h, 7 days); (4) different toxins compared to each other at 270 mg/Kg in the 24 h, 72 h and 7-day exposure; (5) binary combinations compared to single doses of those Cry present in the combinations at 270 mg/Kg, at 24 h of exposure; (6) binary combinations compared to each other.
ResultsErythrogram (Table 1)
24 hours of exposure: Oral administrations of single doses of Cry1Ab 136 mg/Kg (p=0.006), Cry1Ac 270 mg/Kg (p=0.011) and Cry2Aa 27 mg/Kg (p=0.006) significantly reduced MCH values, while Cry1Aa 27 mg/Kg (p=0.034) increased MCHC values. All Bt spore-crystals promoted significant reductions in MCV values (p=0.004 for Cry1Aa 27 mg/Kg, p=0.003 for Cry1Ac 27 mg/Kg, and p=0.000 for the
J Hematol Thromb DisISSN: 2329-8790 JHTD, an open access journal
Citation: Mezzomo BP, Miranda-Vilela AL, Freire IdS, Barbosa LCP, Portilho FA, et al. (2013) Hematotoxicity of Bacillus thuringiensis as Spore-crystal Strains Cry1Aa, Cry1Ab, Cry1Ac or Cry2Aa in Swiss Albino Mice. J Hematol Thromb Dis 1: 104. doi: 10.4172/2329-8790.1000104
EXHIBIT J - Page 342
Case 5:14-cv-00117-cr Document 63-11 Filed 11/14/14 Page 60 of 312

Page 3 of 9
Volume 1 • Issue 1 • 1000104
others). For the visually assessed slides, microcytosis and hypochromia particularly increased for the treatments with Cry1Ab at 27 and 136 mg/Kg, with hypochromia being more severe for the dose of 136 mg/Kg; spherocytes were also very prevalent in these slides. Microcytosis with spherocyte presence was also observed in slides of Cry2Aa 270 mg/Kg. Significantly decreased RDW were also observed for most Cry treatments, except for Cry1Ac at 27 and 270 mg/Kg (p=0.041 for Cry1Ab and Cry1Ac at 136 mg/Kg, p=0.002 for the other treatments). In the dose-effect evaluations, values for RDW were significantly higher for Cry1Aa at 270 mg/Kg than at 136 mg/Kg (p=0.004). Binary combinations containing Cry1Ab+Cry2Aa (p=0.004) and Cry1Ac+Cry2Aa (p=0.000) caused significant reductions in MCH values, and all Cry combinations promoted significant reductions in VCM and RDW. For the visually assessed slides, a higher hypochromia to Cry1Ac+2Aa was observed. Among different binary combinations, Cry1Ac+Cry2Aa showed a higher RDW compared to Cry1Aa+Cry1Ab
and Cry1Aa+Cry1Ac (p=0.041), which also occurred with Cry1Aa in respect to Cry1Aa+Cry1Ab (p=0.041).
72 hours of exposure: Compared to negative control, Cry1Ac 270 mg/Kg continued to significantly reduce MHC values (p=0.040), while MCV and RDW were significantly reduced after treatment with CP, Cry1Ab, Cry1Ac and Cry2Aa. Among toxins, Cry1Aa showed a significant reduction in RBC (p=0.030), HGB (p=0.041) and HCT (p=0.015) values compared to Cry2Aa, and increased MCV compared to Cry2Aa (p=0.009) and Cry1Ac (p=0.026).
7 days of exposure: Cry1Ab 270 mg/Kg resulted in significantly reduced HGB (p=0.009) and HCT (p=0.002) values, while all Cry administrations significantly reduced MCH and MCV; the same occurred with MCV after CP treatment and with RDW after CP and all Cry administrations, except the Cry1Ab. For the visually assessed slides
G Treatment RBC(x 106/µL)
HGB(g/dL)
HCT(%)
MCH(pg)
MCHC(g/dL)
MCV(fL)
RDW(%)
1 Filtered water, 7.53 ± 0.28 11.90 ± 0.44 30.38 ± 1.02 15.83 ± 0.09 39.12 ± 0.41 40.40 ± 0.40 17.83 ± 0.412 CP 27 mg/Kg, 24 h 7.60 ± 0.12 12.05 ± 0.26 30.57 ± 0.66 15.85 ± 0.16 39.45 ± 0.75 40.22 ± 0.46 16.80 ± 0.603 Cry1Aa 27 mg/Kg, 24 h 8.25 ± 0.13 12.78 ± 0.21 30.90 ± 0.36 15.50 ± 0.25 41.36 ± 0.38* 37.50 ± 0.43**.● 14.94 ± 0.54**.●
4 Cry1Aa 136 mg/Kg, 24 h 7.92 ± 0.14 12.19 ± 0.31 29.84 ± 0.68 15.37 ± 0.19 40.81 ± 0.32 37.64 ± 0.28**.● 14.16 ± 0.38**.●
5 Cry1Aa 270 mg/Kg, 24 h 8.35 ± 0.20 12.40 ± 0.29 31.08 ± 0.71 14.85 ± 0.16 39.88 ± 0.34 37.22 ± 0.12**.● 15.38 ± 0.21**.‡
6 Cry1Ab 27 mg/Kg, 24 h 8.17 ± 0.22 12.55 ± 0.42 31.13 ± 0.89 15.35 ± 0.22 40.30 ± 0.38 38.12 ± 0.21**.● 15.35 ± 0.31*
7 Cry1Ab 136 mg/Kg, 24 h 7.69 ± 0.09 11.23 ± 0.25 28.55 ± 0.62 14.62 ± 0.21**.● 39.35 ± 0.26 37.12 ± 0.42**.● 16.65 ± 0.56**
8 Cry1Ab 270 mg/Kg, 24 h 8.19 ± 0.16 12.63 ± 0.20 30.77 ± 0.53 15.45 ± 0.18 41.07 ± 0.33 37.60 ± 0.17**.● 15.70 ± 0.36**
9 Cry1Ac 27 mg/Kg, 24 h 7.98 ± 0.12 12.25 ± 0.24 30.42 ± 0.56 15.33 ± 0.20 40.28 ± 0.56 38.08 ± 0.22**.● 16.93 ± 0.3610 Cry1Ac 136 mg/Kg, 24 h 8.11 ± 0.32 12.12 ± 0.40 29.92 ± 1.02 14.98 ± 0.22 40.53 ± 0.47 36.93 ± 0.23**.● 16.18 ± 0.67*
11 Cry1Ac 270 mg/Kg, 24 h 8.17 ± 0.35 11.98 ± 0.39 29.68 ± 1.07 14.67 ± 0.21* 40.42 ± 0.32 36.37 ± 0.35**.● 16.17 ± 0.6712 Cry2Aa 27 mg/Kg, 24 h 8.24 ± 0.18 12.02 ± 0.15 29.95 ± 0.53 14.62 ± 0.22**.● 40.15 ± 0.35 36.40 ± 0.36**.● 15.02 ± 0.52**
13 Cry2Aa 136 mg/Kg, 24 h 7.86 ± 0.23 11.68 ± 0.33 29.05 ± 0.77 14.87 ± 0.10 40.22 ± 0.18 36.97 ± 0.31**.● 15.47 ± 0.30**
14 Cry2Aa 270 mg/Kg, 24 hk 7.75 ± 0.27 11.82 ± 0.37 28.97 ± 0.89 15.27 ± 0.17 40.82 ± 0.42 37.42 ± 0.29**.● 15.62 ± 0.34**
15 Cry1Aa+1Ab 270 mg/Kg, 24 h 8.30 ± 0.18 12.45 ± 0.30 31.15 ± 0.78 15.00 ± 0.10 ● 40.00 ± 0.23 37.53 ± 0.28**.● 14.87 ± 0.12**.●.a
16 Cry1Aa+1Ac 270 mg/Kg, 24 h 8.47 ± 0.42 12.93 ± 0.63 31.78 ± 1.25 15.30 ± 0.13 40.60 ± 0.48 37.63 ± 0.39**.● 14.85 ± 0.46**.●
17 Cry1Aa+2Aa 270 mg/Kg, 24 h 8.46 ± 0.14 12.70 ± 0.09 31.77 ± 0.24 15.03 ± 0.19 39.98 ± 0.27 37.57 ± 0.47**.● 14.95 ± 0.32**.●
18 Cry1Ab+1Ac 270 mg/Kg, 24 h 8.03 ± 0.15 12.17 ± 0.29 29.63 ± 0.78 15.15 ± 0.21 41.08 ± 0.28 36.88 ± 0.47**.● 15.48 ± 0.39**
19 Cry1Ab+2Aa 270 mg/Kg, 24 h 8.20 ± 0.16 11.95 ± 0.10 29.83 ± 0.35 14.58 ± 0.23** 40.07 ± 0.24 36.42 ± 0.48**.● 15.38 ± 0.43**
20 Cry1Ac+2Aa 270 mg/Kg, 24 h 8.33 ± 0.17 11.95 ± 0.21 30.50 ± 0.47 14.37 ± 0.33**.● 39.18 ± 0.48 36.70 ± 0.53**.● 15.82 ± 0.37**
P-values 24 h 0,075 0.072 0.179 0.000 0.002 0.000 0.00021 CP 27 mg/Kg, 72 h 7.72 ± 0.28 11.65 ± 0.28 29.30 ± 0.76 15.13 ± 0.34 39.75 ± 0.27 38.03 ± 0.60*.● 15.02 ± 0.22**.●
22 Cry1Aa 270 mg/Kg, 72 h 6.86 ± 0.47a 10.77 ± 0.65a 26.73 ± 1.59a 15.77 ± 0.29 40.28 ± 0.45 39.15 ± 0.54 16.57 ± 0.6723 Cry1Ab 270 mg/Kg, 72 h 7.92 ± 0.29 11.87 ± 0.26b 29.83 ± 0.81 15.02 ± 0.31 39.82 ± 0.44 37.75 ± 0.47** 15.40 ± 0.62**
24 Cry1Ac 270 mg/Kg, 72 h 8.17 ± 0.19 11.97 ± 0.44 30.28 ± 0.88 14.63 ± 0.27* 39.48 ± 0.46 37.07 ± 0.56** 16.40 ± 0.36*.○
25 Cry2Aa 270 mg/Kg, 72 h 8.30 ± 0.22 12.38 ± 0.31 30.67 ± 0.78 14.92 ± 0.16 40.38 ± 0.22 36.95 ± 0.52** 15.82 ± 0.10**.○
P-values 72 h 0,027 0.300 0.213 0.014 0.211 0.002 0.00426 CP 27 mg/Kg, 7 days 8.10 ± 0.28 12.25 ± 0.34 30.82 ± 0.87 15.15 ± 0.13 39.75 ± 0.25 38.13 ± 0.41*.● 16.32 ± 0.59*
27 Cry1Aa 270 mg/Kg, 7 days 7.12 ± 0.30 10.77 ± 0.44a 26.88 ± 0.99a 15.13 ± 0.26 40.00 ± 0.25 37.80 ± 0.57** 16.38 ± 0.46*.a
28 Cry1Ab 270 mg/Kg, 7 days 6.53 ± 0.38b 9.68 ± 0.58**.b.b’ 24.55 ± 1.36**.b.b' 14.83 ± 0.15** 39.38 ± 0.40 37.63 ± 0.37** 17.02 ± 0.5429 Cry1Ac 270 mg/Kg, 7 days 8.16 ± 0.10 12.17 ± 0.26 30.38 ± 0.48 14.92 ± 0.26* 40.03 ± 0.31 37.27 ± 0.47** 16.03 ± 0.33**
30 Cry2Aa 270 mg/Kg, 7 days 7.99 ± 0.20 11.90 ± 0.31 30.25 ± 0.77 14.88 ± 0.09* 39.33 ± 0.34 37.85 ± 0.28** 15.92 ± 0.41**
P-values 7 days 0.001 0.000 0.000 0.004 0.293 0.000 0.059Total p-values 0.000 0.002 0.007 0.000 0.001 0.000 0.000
The data correspond to the means and to the standard error of mean (SEM). RBC=Red Blood Cells; HGB=Hemoglobin; HCT=Hematocrit; MCV=Mean Corpuscular volume; MCH=Mean Corpuscular hemoglobin; MCHC=Mean corpuscular hemoglobin concentration; RDW=Red cell distribution width (represents an indication of the amount of variation − anisocytosis − in cell size); g/dL=grams per deciliter; fL=fentoliters; pg=picograms. P-values were generated by the Kruskall-Wallis test. Asterisks indicate significant (p<0.05) and highly significant (p<0.01) differences detected by the Mann Whitney U test in the comparisons with the negative control. The following symbols represent significant differences in respect to: ●=CP 24 h; ○=CP 72 h; †= dose-effect for the dose of 27 mg/Kg; ‡=dose-effect for the dose of 136 mg/Kg; a= Cry1Aa 270 mg/Kg, 24 h; b=Cry1Ab 270 mg/Kg, 24 h; b’=Cry1Ab 270 mg/Kg, 72 hTable 1: Results of erythrogram of Swiss albino mice treated with Bt spore-crystal Cry1Aa, Cry1Ab, Cry1Ac and Cry2Aa administered orally (per os, p.o.) 24 h, 72 h and 7 days before euthanasia. Control mice received filtered water (negative control) or cyclophosphamide (CP – positive control) at 27 mg/Kg.
J Hematol Thromb DisISSN: 2329-8790 JHTD, an open access journal
Citation: Mezzomo BP, Miranda-Vilela AL, Freire IdS, Barbosa LCP, Portilho FA, et al. (2013) Hematotoxicity of Bacillus thuringiensis as Spore-crystal Strains Cry1Aa, Cry1Ab, Cry1Ac or Cry2Aa in Swiss Albino Mice. J Hematol Thromb Dis 1: 104. doi: 10.4172/2329-8790.1000104
EXHIBIT J - Page 343
Case 5:14-cv-00117-cr Document 63-11 Filed 11/14/14 Page 61 of 312

Page 4 of 9
Volume 1 • Issue 1 • 1000104
a higher hypochromia was observed for Cry1Aa, Cry1Ac, and Cry2Aa, more pronounced in the two first treatments.
Comparing toxins, RBC, HGB and HCT were significantly lower for Cry1Ab than for Cry1Ac and Cry2Aa.
Leukogram (Table 2)
24 hours of exposure: In single doses only Cry1Ab 27 mg/Kg promoted a significant increase in lymphocyte frequency in comparison to the negative control (p=0.041). Cry1Ab significantly increased total leukocytes (white blood cells or WBC) and lymphocytes for the dose of 27 mg/Kg in respect to the doses of 136 mg/Kg (p=0.015 for WBC, p=0.002 for lymphocytes) and 270 mg/Kg (p=0.026 for total WBC, p=0.015 for lymphocytes), and increased neutrophils+monocytes for 136 mg/Kg in respect to 270 mg/Kg (p=0.009).
72 hours of exposure: Compared to negative control, only Cry1Aa
caused significantly increased neutrophils+monocytes (p=0.003). Cry1Aa also showed increased WBC compared to Cry1Ab (p=0.015) and Cry1Ac (p=0.009), as well as neutrophils+monocytes in respect to Cry1Ab (p=0.016), Cry1Ac (p=0.004) and Cry2Aa (p=0.002).
7 days of exposure: Compared to the negative control, CP (p=0.026), Cry1Ac and Cry2Aa (p=0.041 for both) promoted a significant increase in WBC, and this result was related to increased neutrophils+monocytes (p=0.004 for CP; p=0.026 for Cry1Ac and Cry2Aa). Cry1Ab (p=0.002) caused a significant reduction in lymphocytes, while Cry2Aa (p=0.026) resulted in a significant increase in their number. Also, Cry1Aa (p=0.041) and Cry1Ab (p=0.026) caused a significant increase in eosinophils. Cry1A (p=0.009) and Cry1Ab (p=0.015) also showed significantly increased eosinophils compared to Cry2Aa. WBC and lymphocytes were also significantly reduced for Cry1Ab in respect to Cry1Ac and Cry2Aa.
G Treatment WBC(× 103/µL)
Lymphocytes(× 103/µL)
Neutrophils + Monocytes (× 103/µL)
Eosinophils (× 103/µL)
1 Filtered water 4.63 ± 0.74 3.35 ± 0.55 1.22 ± 0.20 0.07 ± 0.052 CP 27 mg/Kg, 24 h 5.37 ± 0.77 3.73 ± 0.53 1.58 ± 0.34 0.05 ± 0.033 Cry1Aa 27 mg/Kg, 24 h 6.32 ± 0.85 4.94 ± 0.73 1.38 ± 0.14 0.00 ± 0.004 Cry1Aa 136 mg/Kg, 24 h 5.53 ± 0.52 4.20 ± 0.45 1.27 ± 0.11 0.06 ± 0.045 Cry1Aa 270 mg/Kg, 24 h 5.47 ± 0.77 3.93 ± 0.77 1.47 ± 0.31 0.07 ± 0.036 Cry1Ab 27 mg/Kg, 24 h 6.82 ± 0.62 5.13 ± 0.33* 1.68 ± 0.33 0.00 ± 0.007 Cry1Ab 136 mg/Kg, 24 h 4.60 ± 0.49† 2.60 ± 0.42† 1.92 ± 0.45 0.08 ± 0.038 Cry1Ab 270 mg/Kg, 24 h 4.60 ± 0.47† 3.53 ± 0.43† 0.98 ± 0.10‡ 0.08 ± 0.049 Cry1Ac 27 mg/Kg, 24 h 6.90 ± 0.89 4.25 ± 0.45 2.52 ± 0.66 0.13 ± 0.1010 Cry1Ac 136 mg/Kg, 24 h 6.78 ± 1.66 4.00 ± 0.97 2.48 ± 0.56 0.30 ± 0.2411 Cry1Ac 270 mg/Kg, 24 h 5.17 ± 0.66 3.55 ± 0.66 1.60 ± 0.37 0.02 ± 0.0212 Cry2Aa 27 mg/Kg, 24 h 4.38 ± 0.63 2.43 ± 0.36 1.90 ± 0.53 0.05 ± 0.0213 Cry2Aa 136 mg/Kg, 24 h 4.68 ± 1.06 3.05 ± 0.91 1.50 ± 0.32 0.13 ± 0.0614 Cry2Aa 270 mg/Kg, 24 h 5.03 ± 0.78 2.98 ± 0.28 2.02 ± 0.73 0.03 ± 0.0215 Cry1Aa+1Ab 270 mg/Kg, 24 h 5.97 ± 0.52 4.28 ± 0.54 1.67 ± 0.08b 0.02 ± 0.0216 Cry1Aa+1Ac 270 mg/Kg, 24 h 4.10 ± 0.69 2.85 ± 0.58 1.20 ± 0.28 0.05 ± 0.0217 Cry1Aa+2Aa 270 mg/Kg, 24 h 4.92 ± 0.84 3.38 ± 0.84 1.43 ± 0.52 0.10 ± 0.0518 Cry1Ab+1Ac 270 mg/Kg, 24 h 4.72 ± 0.59 3.18 ± 0.51 1.42 ± 0.13b 0.12 ± 0.0819 Cry1Ab+2Aa 270 mg/Kg, 24 h 4.78 ± 0.54 3.47 ± 0.48 1.28 ± 0.24 0.03 ± 0.0220 Cry1Ac+2Aa 270 mg/Kg, 24 h 4.63 ± 0.70 3.13 ± 0.51 1.48 ± 0.40 0.02 ± 0.02
P-values 24 hours 0.454 0.095 0.758 0.486
21 CP 27 mg/Kg, 72 h 3.37 ± 0.78 2.40 ± 0.46 0.95 ± 0.41 0.02 ± 0.0222 Cry1Aa 270 mg/Kg, 72 h 6.53 ± 0.82○ 3.42 ± 0.41 2.98 ± 0.43**.○.a 0.13 ± 0.0823 Cry1Ab 270 mg/Kg, 72 h 4.27 ± 0.36 2.72 ± 0.16 1.48 ± 0.29 0.07 ± 0.0324 Cry1Ac 270 mg/Kg, 72 h 3.72 ± 0.35 2.37 ± 0.35 1.25 ± 0.13 0.10 ± 0.0625 Cry2Aa 270 mg/Kg, 72 h 4.80 ± 0.57 3.58 ± 0.46 1.18 ± 0.15 0.03 ± 0.02
P-values 72 hours 0.059 0.331 0.000 0.557
26 CP 27 mg/Kg, 7 days 7.22 ± 0.68*.○ 4.33 ± 0.40○ 2.82 ± 0.35**.●.○ 0.07 ± 0.0327 Cry1Aa 270 mg/Kg, 7 days 6.70 ± 1.83 3.30 ± 0.77 3.15 ± 1.20 0.25 ± 0.08*.◊.a
28 Cry1Ab 270 mg/Kg, 7 days 3.90 ± 0.58◊ 1.85 ± 0.10**.◊.b.b’ 1.77 ± 0.42 0.28 ± 0.08*
29 Cry1Ac 270 mg/Kg, 7 days 6.58 ± 0.50*.c’ 3.85 ± 0.62 2.63 ± 0.60* 0.10 ± 0.0430 Cry2Aa 270 mg/Kg, 7 days 7.85 ± 1.37* 5.33 ± 0.89*.d 2.48 ± 0.55*.d’ 0.03 ± 0.02
P-values 7 days 0.034 0.006 0.092 0.015
Total P-values 0.015 0.004 0.034 0.024
G= group. WBC= White Blood Cells. The data correspond to the means and to the standard error of mean (SEM). P-values were generated by the Kruskall-Wallis test. Asterisks indicate significant (p<0.05) and highly significant (p<0.01) differences detected by the Mann Whitney U test in the comparisons with the negative control. The following symbols represent significant differences in respect to: ●=CP 24 h; ○=CP 72 h; ◊=CP 7 days; †=dose-effect for the dose of 27 mg/Kg; ‡=dose-effect for the dose of 136 mg/Kg; a=Cry1Aa 270 mg/Kg, 24 h; b=Cry1Ab 270 mg/Kg, 24 h; b’=Cry1Ab 270 mg/Kg, 72 h; c=Cry1Ac 270 mg/Kg, 24 h; c’=Cry1Ac 270 mg/Kg, 72h; d=Cry2Aa 270 mg/Kg, 24 h; d’=Cry2Aa 270 mg/Kg, 72 h.Table 2: Results of leukogram of Swiss albino mice treated with Bt spore-crystal Cry1Aa, Cry1Ab, Cry1Ac and Cry2Aa administered orally (per os, p.o.) 24 h, 72 h, and 7 days before euthanasia. Control mice received filtered water (negative control) or cyclophosphamide (CP – positive control) at 27 mg/Kg.
J Hematol Thromb DisISSN: 2329-8790 JHTD, an open access journal
Citation: Mezzomo BP, Miranda-Vilela AL, Freire IdS, Barbosa LCP, Portilho FA, et al. (2013) Hematotoxicity of Bacillus thuringiensis as Spore-crystal Strains Cry1Aa, Cry1Ab, Cry1Ac or Cry2Aa in Swiss Albino Mice. J Hematol Thromb Dis 1: 104. doi: 10.4172/2329-8790.1000104
EXHIBIT J - Page 344
Case 5:14-cv-00117-cr Document 63-11 Filed 11/14/14 Page 62 of 312

Page 5 of 9
Volume 1 • Issue 1 • 1000104
Plateletgram (Table 3)
24 hours of exposure: In comparison with negative control, CP promoted a significant fall in platelet number (PLT, p=0.026), while a single dose of Cry1Aa 27 mg/Kg significantly increased PLT (p=0.009), decreased mean platelet volume (MPV, p=0.015) and platelet large cell ratio (P-LCR, p=0.026); the same decreased P-LCR occurring at 136 mg/Kg (p=0.041). Cry1Ac 136 mg/Kg significantly increased MPV (p=0.019) and P-LCR (p=0.038), while Cry2Aa at 270 mg/Kg significantly decreased platelet distribution width (PDW, p=0.026). Regarding dose-effect, Cry1Aa at 136 mg/Kg showed reduced PLT (p=0.015) compared to 27 mg/Kg and reduced PDW (p=0.009) compared to 270 mg/Kg. Significantly increased values of MPV, P-LCR and PDW were verified for Cry1Ac at 136 mg/Kg compared to 27 mg/Kg and 270 mg/Kg (at 27 mg/Kg, p=0.010; at 270 mg/Kg, p=0.029). Cry1Ac at 136 mg/Kg also showed a significantly increased PDW in
respect to the dose of 270 mg/Kg (p=0.038). Among toxins, at 270 mg/Kg, PLT was significantly higher after treatment with Cry1Aa compared to Cry2Aa (p=0.041), while PDW was significantly higher for Cry1Ab than for Cry1A (p=0.041).
As regards the negative control, binary combinations significantly reduced levels as follows: Cry1Aa+Cry2Aa for PLT (p=0.002), Cry1Ab+Cry2Aa for MPV (p=0.024), and Cry1Ab+Cry1Ac for PDW (p= 0.030). Between combinations, Cry1Aa+Cry2Aa showed a lower PLT compared to Cry1Ab+Cry1Ac (p=0.015), and Cry1Aa+Cry2Aa presented higher MPV and RDW (p=0.036) in comparison with Cry1Ab+Cry2Aa.
Cry1Aa+Cry2Aa showed significantly reduced PLT (p=0.009) and increased PDW (p=0.009) compared to Cry1Aa, which also presented lower PDW compared to Cry1Aa+Cry1Ab and Cry1Aa+Cry1Ac (p=0.015 for both), and Cry1Ab showed significantly higher PDW
Group Treatment PLT(× 103/µL)
MPV(fl)
P-LCR(%)
PDW(fl)
1 Filtered water 1219.00 ± 56.64 6.93 ± 0.10 10.88 ± 0.81 6.95 ± 0.112 CP 27 mg/Kg, 24 h 978.67 ± 93.57* 7.10 ± 0.30 11.23 ± 2.33 7.25 ± 0.243 Cry1Aa 27 mg/Kg, 24 h 1431.60 ± 27.40**.● 6.38 ± 0.15*.● 7.32 ± 1.15* 6.74 ± 0.05●
4 Cry1Aa 136 mg/Kg, 24 h 1243.57 ± 113.56† 6.56 ± 0.14 7.91 ± 1.14* 6.77 ± 0.075 Cry1Aa 270 mg/Kg, 24 h 1292.00 ± 74.24● 6.75 ± 0.15 11.15 ± 1.68 6.53 ± 0.07●.‡
6 Cry1Ab 27 mg/Kg, 24 h 1168.00 ± 73.22 6.62 ± 0.17 9.93 ± 1.10 6.63 ± 0.10●
7 Cry1Ab 136 mg/Kg, 24 h 1076.00 ± 148.54 6.85 ± 0.22 10.73 ± 1.74 6.75 ± 0.168 Cry1Ab 270 mg/Kg, 24 h 1020.50 ± 113.38 7.05 ± 0.16 12.33 ± 1.35 6.87 ± 0.119 Cry1Ac 27 mg/Kg, 24 h 1224.67 ± 58.93● 6.90 ± 0.09 9.63 ± 0.88 7.03 ± 0.1010 Cry1Ac 136 mg/Kg, 24 h 955.83 ± 183.68 7.48 ± 0.10*.† 15.35 ± 0.80*.† 7.13 ± 0.09†
11 Cry1Ac 270 mg/Kg, 24 h 1213.50 ± 133.20 6.83 ± 0.16‡ 10.78 ± 0.78‡ 6.63 ± 0.08●.‡
12 Cry2Aa 27 mg/Kg, 24 h 1282.33 ± 110.10● 6.90 ± 0.16 10.24 ± 0.87 6.92 ± 0.1413 Cry2Aa 136 mg/Kg, 24 h 1146.83 ± 62.99 6.97 ± 0.09 11.13 ± 0.94 6.9 ± 0.0714 Cry2Aa 270 mg/Kg, 24 h 1057.50 ± 65.31 7.00 ± 0.10 11.78 ± 0.42 6.80 ± 0.13*
15 Cry1Aa+1Ab 270 mg/Kg, 24 h 1090.33 ± 69.82 6.80 ± 0.09 10.22 ± 0.61 6.83 ± 0.08a
16 Cry1Aa+1Ac 270 mg/Kg, 24 h 1187.33 ± 156.68 6.77 ± 0.13 9.78 ± 1.04 6.80 ± 0.06a
17 Cry1Aa+2Aa 270 mg/Kg, 24 h 942.67 ± 44.98**.a 7.00 ± 0.11 11.78 ± 1.17 6.88 ± 0.07a
18 Cry1Ab+1Ac 270 mg/Kg, 24 h 1171.67 ± 60.58 6.78 ± 0.16 11.16 ± 1.45 6.54 ± 0.10*
19 Cry1Ab+2Aa 270 mg/Kg, 24 h 1110.50 ± 69.8 6.57 ± 0.03*.b 9.23 ± 0.38b.d 6.57 ± 0.0920 Cry1Ac+2Aa 270 mg/Kg, 24 h 1164.67 ± 105.33 7.00 ± 0.16 12.35 ± 1.34 6.75 ± 0.18
P-values 24 hours 0.048 0.015 0.044 0.005
21 CP 27 mg/Kg, 72 h 1112.17 ± 178.48 6.58 ± 0.15 8.14 ± 1.19 6.78 ± 0.1222 Cry1Aa 270 mg/Kg, 72 h 1152.33 ± 96.43 6.65 ± 0.10* 7.67 ± 0.43** 6.78 ± 0.1523 Cry1Ab 270 mg/Kg, 72 h 928.67 ± 92.55 6.93 ± 0.22 11.83 ± 1.55 6.58 ± 0.1624 Cry1Ac 270 mg/Kg, 72 h 1095.50 ± 96.69 7.13 ± 0.23 12.80 ± 1.39 7.00 ± 0.1625 Cry2Aa 270 mg/Kg, 72 h 1196.00 ± 67.53 7.16 ± 0.21 12.28 ± 2.12 7.04 ± 0.18
P-values 72 hours 0.454 0.077 0.010 0.316
26 CP 27 mg/Kg, 7 dias 1345.50 ± 158.38 6.67 ± 0.10 8.80 ± 0.81* 6.72 ± 0.0927 Cry1Aa 270 mg/Kg, 7 dias 1002.50 ± 101.89a 7.23 ± 0.18a’ 12.07 ± 0.96a’ 7.05 ± 0.2228 Cry1Ab 270 mg/Kg, 7 dias 589.50 ± 92.13b.b’ 7.47 ± 0.34 15.03 ± 2.23* 6.93 ± 0.2929 Cry1Ac 270 mg/Kg, 7 dias 1289.00 ± 97.91 6.72 ± 0.10 9.85 ± 0.44 6.68 ± 0.0930 Cry2Aa 270 mg/Kg, 7 dias 1205.33 ± 88.27 6.92 ± 0.09 9.98 ± 0.82 6.95 ± 0.10
P-values 7 days 0.000 0.006 0.034 0.388
Total P-values 0.005 0.002 0.002 0.020
The data correspond to the means and to the standard error of mean (SEM). Platelet indices: platelet count (PLT), mean platelet volume (MPV), platelet large cell ratio (P-LCR) and platelet distribution width (PDW); fl=fentoliters. P-values were generated by the Kruskall-Wallis test. Asterisks indicate significant (p<0.05) and highly significant (p<0.01) differences detected by the Mann Whitney U test in the comparisons with the negative control. The following symbols represent significant differences in respect to: ●=CP 24 h; ○=CP 72 h; †=dose-effect for the dose of 27 mg/Kg; ‡=dose-effect for the dose of 136 mg/Kg; a=Cry1Aa 270 mg/Kg, 24 h; a’=Cry1Aa 270 mg/Kg, 72 h; b=Cry1Ab 270 mg/Kg, 24 h; b’=Cry1Ab 270 mg/Kg, 72 h; d=Cry2Aa 270 mg/Kg, 24 h
Table 3: Results of platelet gram of Swiss albino mice treated with Bt spore-crystal Cry1Aa, Cry1Ab, Cry1Ac and Cry2Aa administered orally (per os, p.o.) 24 h, 72 h and 7 days before euthanasia. Control mice received filtered water (negative control) or cyclophosphamide (CP – positive control) at 27 mg/Kg.
J Hematol Thromb DisISSN: 2329-8790 JHTD, an open access journal
Citation: Mezzomo BP, Miranda-Vilela AL, Freire IdS, Barbosa LCP, Portilho FA, et al. (2013) Hematotoxicity of Bacillus thuringiensis as Spore-crystal Strains Cry1Aa, Cry1Ab, Cry1Ac or Cry2Aa in Swiss Albino Mice. J Hematol Thromb Dis 1: 104. doi: 10.4172/2329-8790.1000104
EXHIBIT J - Page 345
Case 5:14-cv-00117-cr Document 63-11 Filed 11/14/14 Page 63 of 312

Page 6 of 9
Volume 1 • Issue 1 • 1000104
compared to Cry1Ab+Cry2Aa (p=0.024). Similar results were observed for P-LCR, whose values were significantly higher for Cry1Ab (p=0.048) and Cry2Aa (p=0.024) in comparison to the binary combination Cry1Ab+Cry2Aa.
72 hours of exposure: Cry1Aa promoted significantly decreased MPV (p=0.026) and P-LCR (p=0.002) compared to negative control; for the latter, values presented for Cry1Aa were also lower in respect to those presented for treatments with Cry1Ab, Cry1Ac (p=0.010) and Cry2Aa (p=0.017).
7 days of exposure: Compared to negative control, CP caused a significant reduction in P-LCR (p=0.041), while Cry1Ab promoted a significant increase in its values (p=0.048). Cry1Ab also presented a reduced PLT number compared to Cry1Ac (p=0.001) and Cry2Aa (p=0.003), and increased MVP compared to Cry1Ac (p=0.036).
Micronucleus (MN) test (Table 4)
None of the tested Bt-toxins induced MN. Single doses of Cry1Aa 136 mg/Kg (p=0.041), Cry1Ab at 27 (p=0.009) and 136 mg/Kg (p=0.026), Cry1Ac 136 mg/Kg and Cry2Aa 27 mg/Kg (p=0.009 for both) significantly decreased cell proliferation in mice bone marrow (%PCE) compared with negative control. Binary combinations of Cry1Aa+Cry2Aa, Cry1Ab+Cry2Aa and Cry1Ac+Cry2Aa (p=0.026 for all) also decreased the %PCE index.
Colony Forming Units (CFU) (Table 5)
CFU varied with Bt strain. Thus, although animals received Cry1Aa, Cry1Ab, Cry1Ac or Cry2Aa at 27 mg/Kg, 136 mg/Kg or 270 mg/Kg, the number of viable Bt spore-crystals ingested by animals varied according to Bt strain.
DiscussionSince the late 1960’s, spore-crystals from B. thuringiensis have been
an important ally in combating insect pests in agriculture, against insect vectors of human diseases and in biological pest control, through their use as a foliar insecticide [1,31] and, more recently, by inserting δ-endotoxin genes in transgenic Bt-plants [5]. A major environmental advantage of microbial Bt preparations and of genetically engineered insect-resistant plants expressing genes encoding δ-endotoxins is the greater specificity of δ-endotoxins to target species, compared with use of many synthetic chemical insecticides. However, despite their more targeted specificity, there may still be insects and other non-target organisms potentially affected by the δ-endotoxins, and extended exposure might affect their populations [8]. Thus, the Brazilian Collegiate Board of Directors of the National Sanitary Surveillance Agency (ANVISA) Nº 194/02 advocates evaluations of toxicity and pathogenicity of microbiological control agents (MCAs), given that little is known about their toxicological potential [32].
Group Treatment MN-NCEPolychromatic erythrocytes (PCE)
MN-PCE Cellular proliferation index (%PCE)1 Filtered water 2.00 ± 1.44 2.50 ± 1.43 52.61 ± 1.012 CP 27 mg/Kg 2.17 ± 0.48 3.50 ± 0.62 45.97 ± 1.21**
3 Cry1Aa 27 mg/Kg 0.40 ± 0.25● 3.00 ± 0.55 48.55 ± 1.544 Cry1Aa 136 mg/Kg 0.43 ± 0.20● 2.29 ± 0.36 49.28 ± 1.36*
5 Cry1Aa 270 mg/Kg 1.00 ± 0.37 3.67 ± 0.56 52.90 ± 1.57●
6 Cry1Ab 27 mg/Kg 1.67 ± 0.49 4.67 ± 0.88 45.92 ± 1.54**
7 Cry1Ab 136 mg/Kg 1.50 ± 0.43 3.33 ± 0.33 47.78 ± 1.28*
8 Cry1Ab 270 mg/Kg 1.00 ± 0.37 2.17 ± 0.95 52.91 ± 1.55●.†.‡
9 Cry1Ac 27 mg/Kg 1.33 ± 0.21 3.33 ± 0.76 49.49 ± 2.1410 Cry1Ac 136 mg/Kg 2.50 ± 0.96 5.17 ± 0.98 44.92 ± 1.87**
11 Cry1Ac 270 mg/Kg 2.17 ± 0.40 4.00 ± 0.73 48.69 ± 1.7312 Cry2Aa 27 mg/Kg 1.00 ± 0.52 0.83 ± 0.31● 47.06 ± 1.25**
13 Cry2Aa 136 mg/Kg 0.50 ± 0.22● 2.00 ± 0.45 47.93 ± 1.8914 Cry2Aa 270 mg/Kg 0.17 ± 0.17● 0.50 ± 0.22●.‡ 48.63 ± 1.3915 Cry1Aa+1Ab 270 mg/Kg 0.50 ± 0.22● 0.67 ± 0.33 45.02 ± 2.27a
16 Cry1Aa+1Ac 270 mg/Kg 0.33 ± 0.21●.c 0.83 ± 0.31●.a.c 46.72 ± 2.1017 Cry1Aa+2Aa 270 mg/Kg 0.17 ± 0.17● 0.83 ± 0.31●.a 48.88 ± 0.56*
18 Cry1Ab+1Ac 270 mg/Kg 0.50 ± 0.22●.c 1.50 ± 0.43●.c 51.46 ± 1.43●
19 Cry1Ab+2Aa 270 mg/Kg 1.00 ± 0.45 2.83 ± 0.48d 46.50 ± 2.50*
20 Cry1Ac+2Aa 270 mg/Kg 0.50 ± 0.34●.c 1.83 ± 0.48c.d 46.51 ± 2.08*
P-values 0.001 0.000 0.026
The data correspond to the means and to the standard error of mean (SEM). MN-NCE and MN-PCE = micronucleus test results for normochromatic erythrocytes (NCE) and polychromatic erythrocytes (PCE), respectively. P-values were generated by the Kruskall-Wallis test. Asterisks indicate significant (p<0.05) and highly significant (p<0.01) differences detected by the Mann Whitney U test in the comparisons with the negative control. The following symbols represent significant differences in respect to: ●= CP; †=dose-effect for the dose of 27 mg/Kg; ‡=dose-effect for the dose of 136 mg/Kg; a=Cry1Aa 270 mg/Kg; c=Cry1Ac 27 mg/Kg; d=Cry2Aa 270 mg/Kg.Table 4: Micronucleus evaluation of bone marrow cells from Swiss white mice treated with Bt spore-crystal Cry1Aa, Cry1Ab, Cry1Ac and Cry2Aa administered orally (per os, p.o.) 24 h before euthanasia. Control mice received filtered water (negative control) or cyclophosphamide (CP – positive control) at 27 mg/Kg.
Cry1Aa Cry1Ab Cry1Ac Cry2Aa
at 27 mg/Kg (cells/mL) 2 × 10⁷ 3 × 10⁷ 4 ×10⁷ 2 × 10⁷
at 136 mg/Kg (cells/mL) 1 × 10⁸ 1 × 10⁸ 2 × 10⁸ 1 × 10⁸
at 270 mg/Kg (cells/mL) 2 × 10⁸ 3 × 10⁸ 4 × 10⁸ 2 × 10⁸
Table 5: Results of Colony Forming Units (CFU) for Cry1Aa, Cry1Ab, Cr1Ac and Cry2Aa and quantification of the viable Bt spore-crystals ingested by the animals at the different concentrations used (27 mg/Kg, 136 mg/Kg and 270 mg/Kg).
J Hematol Thromb DisISSN: 2329-8790 JHTD, an open access journal
Citation: Mezzomo BP, Miranda-Vilela AL, Freire IdS, Barbosa LCP, Portilho FA, et al. (2013) Hematotoxicity of Bacillus thuringiensis as Spore-crystal Strains Cry1Aa, Cry1Ab, Cry1Ac or Cry2Aa in Swiss Albino Mice. J Hematol Thromb Dis 1: 104. doi: 10.4172/2329-8790.1000104
EXHIBIT J - Page 346
Case 5:14-cv-00117-cr Document 63-11 Filed 11/14/14 Page 64 of 312

Page 7 of 9
Volume 1 • Issue 1 • 1000104
It has been reported that Cry toxins exert their toxicity when activated at alkaline pH of the digestive tract of susceptible larvae, and, because the physiology of the mammalian digestive system does not allow their activation, and no known specific receptors in mammalian intestinal cells have been reported, the toxicity these MCAs to mammals would negligible [8,22,23]. However, our study demonstrated that Bt spore-crystals genetically modified to express individually Cry1Aa, Cry1Ab, Cry1Ac or Cry2A induced hematotoxicity, particularly to the erythroid lineage. This finding corroborates literature that demonstrated that alkali-solubilized Bt spore-crystals caused in vitro hemolysis in cell lines of rat, mouse, sheep, horse, and human erythrocytes and suggested that the plasma membrane of susceptible cells (erythrocytes, in this case) may be the primary target for these toxins [33].
It has been reported that strains of Cry toxins can be solubilized by alkaline buffer or a combination of alkaline buffer and reducing conditions, and that, although intravenous and subcutaneous administrations of 15-30 µg per gram body weight (0.4-0.9 mg per animal) of these alkali-soluble crystal proteins in Balb-C mice resulted in death, there were no toxic effects when orally administered [33]. In our study, lyophilized Bt spore-crystals resuspended in distilled water (and not in alkaline and/or reducing conditions) and orally administered at higher doses than the foregoing ones presented cytotoxic effects, particularly to the erythroid lineage of mice. Considering the increased risk of human and animal exposures to significant levels of these toxins, especially through diet, our results suggest that further evaluations are needed, with longer exposure of mammals to these diets, and involving clinical observations, before concluding that these microbiological control agents are safe to mammals. Cry1Ab induced microcytic hypochromic anemia in mice, even at the lowest tested dose of 27 mg/Kg, and this toxin has been detected in blood of non-pregnant women, pregnant women and their fetuses in Canada, supposedly exposed through diet [34]. These data, as well as increased bioavailability of these MCA in the environment, reinforce the need for more research, especially given that little is known about spore crystals’ adverse effects on non-target species.
Because of its high mitotic index, hematopoietic tissue becomes the target of the adverse effects of many chemical substances entering the body. Some substances that act on bone marrow may have a selective effect, that is, they may be toxic to a given cell line [35]. Our study found selective cytotoxicity for the erythroid lineage and showed differences in the dose response curves of Bt spore-crystals genetically modified to express individually Cry1Aa, Cry1Ab, Cry1Ac or Cry2A. After 24 hours of exposure, Cry1Ac and Cry2Aa showed a non-monotonic dose response curve, where Cry2Aa presented a U-shaped dose response curve, with high responses at both low and high levels of contamination, while the Cry1Ac response curve was shaped like an inverted U with the greatest response in intermediate ranges. On the other hand, Cry1Ab seemed to have an effect similar to hormesis, where lower toxin doses (such as 27 and 136 mg/Kg) increased the body’s tolerance for greater toxicity (such as 270 mg/Kg), while Cry1Aa seemed to maintain almost the same behavior, regardless of the dose. These differences among Cry toxins were already somewhat expected, since they have a defined spectrum of insecticidal activity, each of which is specific for some species belonging to a particular order of insects, according to their affinities for specific receptors on their target organisms [10,36]. Additionally, although results of CFU showed fewer viable spores/mL for Cry2Aa and Cry1Aa than for Cry1Ab and Cry1Ac, at 270 mg/mL the cytotoxic effects of Cry2Aa and Cry1Aa seemed higher compared to Cry1Ab and Cry1Ac.
Knowledge of the genotoxic potential of chemical industrial agents
or those naturally present in the environment is essential information for regulatory agencies, regarding the establishment of risk for humans [37]. Since micronuclei in interphase cells result from chromosomal breaks or chromosomal lagging, the MN test is most widely used for the detection of clastogenic and aneugenic agents [29,38,39]. For the fish species Danio rerio, it has been reported that Cry1Aa significantly increased the frequency of micronuclei in peripheral blood of erythrocytes, while Cry1Ab, Cry1Ac, and Cry2A did not present genotoxicity [40]. In our study, all evaluated spore-crystals in single or binary combinations were hematotoxic and cytotoxic to the mice bone marrow, but not genotoxic, and this could indicate differences among vertebrates.
In the biological control of pests, a combination of different mixtures of Bt spore-crystal strains is also used. Also, a second generation of Bt-plants expressing two different Cry toxins has been developed to avoid insect resistance. There are several examples of transgenic plants with dual Bt gene insertion, such as Bollgard® II RR Flex cotton (Cry1Ac+Cry2Ab) and maize (Cry1Ac+Cry2Ab) [41]. Consequently, various interactive processes may occur, such as additivity, synergism, potentiation or antagonism [41,42]. However, to date, there are few studies on the cytotoxicity of conjugated Bt toxins for different organisms, and no studies were found in the literature evaluating the potential toxic and genotoxic effects of binary combinations of Cry toxins for non-target organisms. Our results demonstrated that the binary combinations of Cry1Ac+Cry2Aa and Cry1Ab+Cry2Aa were also hematotoxic to the erythroid lineage in particular. Furthermore, these binary combinations and also Cry1Aa+Cry2Aa were cytotoxic to the bone marrow cells in that they reduced the %PCE.
Literature has shown that Bt toxins are generally nontoxic and do not bioaccumulate in fatty tissue or persist in the environment [23], but our study demonstrated that all Cry at 270 mg/Kg showed a more pronounced cytotoxic effect on the erythroid lineage from 72 hours of exposure onwards, and that these effects were more pronounced after 7 days of exposure. After 7 days of exposure, Cry1Ab was toxic showing alterations in the hematological parameters of the exposed mice. It is well known that processes or substances that cause damage in the hematopoietic stem cell or bone marrow stroma of mice can also cause a decrease in WBC count [43]. Indeed, Cry1Ab significantly decreased MCH, MCV, and RDW and also decreased the number of PLT, which was non-significant in relation to the negative control but was substantially lower than the reference values for mice (900-1600 × 103/μL) [43], as well as significantly increased P-LCR and decreased lymphocyte number. The profile of observed cytotoxic effects of these Cry toxins can be related to their high concentrations and the exposure time. Such exposures at these high concentrations are not commonly found in the environment.
In mice, the inflammatory response is often associated with both increased lymphocytes and neutrophils, and small changes in the number of neutrophils may be biologically significant and reflected in the total leukocyte count [43]. In this context, our study showed a higher inflammatory response for Cry1Aa 270 mg/Kg after 72 hours of exposure and for Cry1Ac and Cry2Aa at 270 mg/Kg after 7 days of exposure. Immunophenotypic changes have been demonstrated in the intestine and peripheral sites of young and old mice after ingestion of Bt corn MON810 encoding the active form of Cry1Ab [44], and intragastric administration of Cry1Ac prototoxin has induced secretion of mucosal antibodies in mice [45]. Our results corroborate these findings for Cry1Ac and also demonstrate leukogenic activity for other spore-crystals not yet reported in the literature.
J Hematol Thromb DisISSN: 2329-8790 JHTD, an open access journal
Citation: Mezzomo BP, Miranda-Vilela AL, Freire IdS, Barbosa LCP, Portilho FA, et al. (2013) Hematotoxicity of Bacillus thuringiensis as Spore-crystal Strains Cry1Aa, Cry1Ab, Cry1Ac or Cry2Aa in Swiss Albino Mice. J Hematol Thromb Dis 1: 104. doi: 10.4172/2329-8790.1000104
EXHIBIT J - Page 347
Case 5:14-cv-00117-cr Document 63-11 Filed 11/14/14 Page 65 of 312

Page 8 of 9
Volume 1 • Issue 1 • 1000104
In conclusion, results showed that the Bt spore-crystals genetically modified to express individually Cry1Aa, Cry1Ab, Cry1Ac or Cry2A can cause some hematological risks to vertebrates, increasing their toxic effects with long-term exposure. Taking into account the increased risk of human and animal exposures to significant levels of these toxins, especially through diet, our results suggest that further studies are required to clarify the mechanism involved in the hematotoxicity found in mice, and to establish the toxicological risks to non-target organisms, especially mammals, before concluding that these microbiological control agents are safe for mammals.
AcknowledgmentsResearch supported by the University of Brasília (UnB), the Brazilian National
Council for Technological and Scientific Development (CNPq) and the Coordination for Further Training of Graduate Staff (CAPES). We are grateful to the Brazilian Agricultural Research Corporation (EMBRAPA/CENARGEN) for providing samples of Bt spore crystals.
References
1. Federici BA (2005) Insecticidal bacteria: an overwhelming success for invertebrate pathology. J Invertebr Pathol 89: 30-38.
2. Barros R, Degrande PE, Ribeiro JF, Rodrigues ALL, Nogueira RF, et al. (2006) Flutuação populacional de insetos predadores associados a pragas do algodoeiro. Arq Inst Biol 73: 57-64.
3. Monnerat RG, Bordat D, Castelo Branco M, França FH (2000) Efeito de Bacillus thuringiensis Berliner e Inseticidas Químicos Sobre a Traça-das-crucíferas, Plutella xylostella (L.) (Lepidoptera:Yponomeutidae) e Seus Parasitóides. An Soc Entomol Bras 29: 723-730.
4. Monteiro LB, Souza A (2010) Controle de tortricídeos em macieira com duas formulações de Bacillus thuringiensis var. Kustaki em Fraiburgo-SC. Rev Bras Frutic 32: 423-428.
5. Bravo A, Gill SS, Soberón M (2007) Mode of action of Bacillus thuringiensis Cry and Cyt toxins and their potential for insect control. Toxicon 49: 423-435.
6. Kleter GA, Bhula R, Bodnaruk K, Carazo E, Felsot AS, et al. (2007) Altered pesticide use on transgenic crops and the associated general impact from an environmental perspective. Pest Manag Sci 63: 1107-1115.
7. Glare RT, O’Callaghan M (1998) Environmental and health impacts of Bacillus thuringiensis israelensis. Report for the Ministry of Health. Biocontrol & Biodiversity, Grasslands Division, AgResearch,Lincoln.
8. OECD (2007) Consensus Document on Safety information on transgenic plants expressing Bacillus thuringiensis – derived insect control proteins. Organisation for Economic Co-operation and Development (OECD), 1-109.
9. Grisolia CK (2005) Agrotóxicos: mutações, câncer e reprodução. Editora da Universidade de Brasília, Brasília.
10. de Maagd RA, Bravo A, Crickmore N (2001) How Bacillus thuringiensis has evolved specific toxins to colonize the insect world. Trends Genet 17: 193-199.
11. Schnepf E, Crickmore N, Van Rie J, Lereclus D, Baum J, et al. (1998) Bacillus thuringiensis and its pesticidal crystal proteins. Microbiol Mol Biol Rev 62: 775-806.
12. Pigott CR, King MS, Ellar DJ (2008) Investigating the properties of Bacillus thuringiensis Cry proteins with novel loop replacements created using combinatorial molecular biology. Appl Environ Microbiol 74: 3497-3511.
13. Bobrowski VL, Fiuza LM, Pasquali G, Bodanese-Zanettini MH (2003) Genes de Bacillus thuringiensis: uma estratégia para conferir resistência a insetos plantas. Cienc Rural 34: 843-850.
14. Whiteley HR, Schnepf HE (1986) The molecular biology of parasporal crystal body formation in Bacillus thuringiensis. Annu Rev Microbiol 40: 549-576.
15. Yamamoto T (1983) Identification of Entomological Toxins of Bacillus thuringiensis by high Performance Liquid chromatography. J Gen Microbiol 129: 2595-2603.
16. Praça LB, Batista AC, Martins ES, Siqueira CB, Dias DGS, et al. (2004) Estirpes de Bacillus thuringiensis efetivas contra insetos das ordens Lepidoptera, Coleoptera e Diptera. Pesq Agropec Bras 39: 11-16.
17. Aronson AI, Beckman W, Dunn P (1986) Bacillus thuringiensis and related insect pathogens. Microbiol Rev 50: 1-24.
18. Lacey LA, Frutos R, Kaya HK, Vail P (2001) Insect pathogens as biological control agents: do they have a future? Biol Cont 21: 230-248.
19. Fischhoff DA, Bowdish KS, Perlak FJ, Marrone PG, McCormick SM, et al. (1987) Insect tolerant transgenic tomato plants. Nature Biotechnol 5: 807-813.
20. Ramiro ZA, Faria AM (2006) Levantamento de insetos predadores nos cultivares de algodão Bollgard DP90 e Convencinal Delta Pine Acala 90. Arq Inst Biol 73: 119-121.
21. Soberón M, Pardo-López L, López I, Gómez I, Tabashnik BE, et al. (2007) Engineering modified Bt toxins to counter insect resistance. Science 318: 1640-1642.
22. Höfte H, Whiteley HR (1989) Insecticidal crystal proteins of Bacillus thuringiensis. Microbiol Rev 53: 242-255.
23. Betz FS, Hammond BG, Fuchs RL (2000) Safety and advantages of Bacillus thuringiensis-protected plants to control insect pests. Regul Toxicol Pharmacol 32: 156-173.
24. Douville M, Gagné F, Blaise C, André C (2007) Occurrence and persistence of Bacillus thuringiensis (Bt) and transgenic Bt corn cry1Ab gene from an aquatic environment. Ecotoxicol Environ Saf 66: 195-203.
25. Séralini GE, Cellier D, de Vendomois JS (2007) New analysis of a rat feeding study with a genetically modified maize reveals signs of hepatorenal toxicity. Arch Environ Contam Toxicol 52: 596-602.
26. Santos KB, Neves P, Meneguim AM, Santos RB, Santos WJ, et al. (2009) Selection and characterization of the Bacillus thuringiensis strains toxic to Spodoptera eridania (Cramer), Spodoptera cosmioides (Walker) and Spodoptera frugiperda (Smith) (Lepidoptera: Noctuidae). Biol Control 50: 157-163.
27. Guideline for Industry: Specific Aspects of Regulatory Genotoxicity Tests for Pharmaceuticals (1996).
28. Viana FAB (2007) Guia Terapêutico Veterinário, 2ª ed. Gráfica e Editora CEM, Lagoa Santa.
29. Schmid W (1975) The micronucleus test. Mutat Res 31: 9-15.
30. Alves SB, Moraes SB (1998) Quantificação de inoculo de patógenos de insetos. In: Alves SB (Editor), Controle Microbiano de Insetos, 2nd ed. FEALQ, Piracicaba, pp. 765-778.
31. Pigott CR, Ellar DJ (2007) Role of receptors in Bacillus thuringiensis crystal toxin activity. Microbiol Mol Biol Rev 71: 255-281.
32. Oliveira-Filho EC (2005) Segurança de Agentes Microbiológicos para o Controle de Pragas: Avaliação Toxicológica, Regulamentação e Situação Atual. Rev Bras Toxicol 18: 71-75.
33. Thomas WE, Ellar DJ (1983) Bacillus thuringiensis var israelensis crystal delta-endotoxin: effects on insect and mammalian cells in vitro and in vivo. J Cell Sci 60: 181-197.
34. Aris A, Leblanc S (2011) Maternal and fetal exposure to pesticides associated to genetically modi?ed foods in Eastern Townships of Quebec, Canada. Reprod Toxicol 31: 528-533.
35. Beamonte A, Goldfain-Blanc F, Casadevall N, Bazot D, Bertheux H, et al. (2005) A case of drug-induced hematotoxicity: from in vivo to in vitro assessment. Comp Clin Pathol 14: 61-65.
36. Gómez I, Arenas I, Benitez I, Miranda-Ríos J, Becerril B, et al. (2006) Specific epitopes of domains II and III of Bacillus thuringiensis Cry1Ab toxin involved in the sequential interaction with cadherin and aminopeptidase-N receptors in Manduca sexta. J Biol Chem 281: 34032-34039.
37. Ribeiro LR (2003) Teste do micronúcleo em medula óssea de roedores in vivo. In: Ribeiro LR, Salvadori DMF, Marques EK (Editors), Mutagênese Ambiental. ULBRA, Canoas, pp. 173-178.
38. FDA (U.S. Food and Drug Administration) (2000) Toxicological Principles for the Safety Assessment of Food Ingredients. Redbook 2000: IV.C.1.d. Mammalian Erythrocyte Micronucleus Test.
39. Natarajan AT, Obe G (1982) Mutagenicity testing with cultured mammalian cells: cytogenetic assays. In: Heddle JA (Editor), Mutagenicity. New Horizons in Genetic Toxicology. Academic Press, New York, pp 171-212.
40. Grisolia CK, Oliveira R, Domingues I, Oliveira-Filho EC, Monerat RG, et al. (2009) Genotoxic evaluation of different delta-endotoxins from Bacillus thuringiensis on zebrafish adults and development in early life stages. Mutat Res 672: 119-123.
J Hematol Thromb DisISSN: 2329-8790 JHTD, an open access journal
Citation: Mezzomo BP, Miranda-Vilela AL, Freire IdS, Barbosa LCP, Portilho FA, et al. (2013) Hematotoxicity of Bacillus thuringiensis as Spore-crystal Strains Cry1Aa, Cry1Ab, Cry1Ac or Cry2Aa in Swiss Albino Mice. J Hematol Thromb Dis 1: 104. doi: 10.4172/2329-8790.1000104
EXHIBIT J - Page 348
Case 5:14-cv-00117-cr Document 63-11 Filed 11/14/14 Page 66 of 312

Page 9 of 9
Volume 1 • Issue 1 • 1000104
41. Manyangarirwa W, Turnbull M, McCutcheon GS, Smith JP (2006) Gene pyramiding as a Bt resistance management strategy: How sustainable is this strategy? Afr J Biotechnol 5: 781-785.
42. Cedergreen N, Streibig JC (2005) Can the choice of endpoint lead to contradictory results of mixture-toxicity experiments? Environ Toxicol Chem 24: 1676-1683.
43. Everds E (2007) Hematology of the laboratory mouse. In: Fox JG, Barthold SW, Davison MT, Newcomer CE, Quimby FW, Smith AL (Editors), The mouse in
Biomedical research – Normative Biology, Husbandry, and Models, (2ndedn). Academic Press, California 3:133-170.
44. Finamore A, Roselli M, Britti S, Monastra G, Ambra R, et al. (2008) Intestinal and peripheral immune response to MON810 maize ingestion in weaning and old mice. J Agric Food Chem 56: 11533-11539.
45. Vázquez-Padrón RI, Moreno-Fierros L, Neri-Bazán L, de la Riva GA, López-Revilla R (1999) Intragastric and intraperitoneal administration of Cry1Ac protoxin from Bacillus thuringiensis induces systemic and mucosal antibody responses in mice. Life Sci 64: 1897-1912.
Submit your next manuscript and get advantages of OMICS Group submissionsUnique features:
• Userfriendly/feasiblewebsite-translationofyourpaperto50world’sleadinglanguages• AudioVersionofpublishedpaper• Digitalarticlestoshareandexplore
Special features:
• 250OpenAccessJournals• 20,000editorialteam• 21daysrapidreviewprocess• Qualityandquickeditorial,reviewandpublicationprocessing• IndexingatPubMed(partial),Scopus,DOAJ,EBSCO,IndexCopernicusandGoogleScholaretc• SharingOption:SocialNetworkingEnabled• Authors,ReviewersandEditorsrewardedwithonlineScientificCredits• Betterdiscountforyoursubsequentarticles
Submityourmanuscriptat:http://www.omicsonline.org/submission/
J Hematol Thromb DisISSN: 2329-8790 JHTD, an open access journal
Citation: Mezzomo BP, Miranda-Vilela AL, Freire IdS, Barbosa LCP, Portilho FA, et al. (2013) Hematotoxicity of Bacillus thuringiensis as Spore-crystal Strains Cry1Aa, Cry1Ab, Cry1Ac or Cry2Aa in Swiss Albino Mice. J Hematol Thromb Dis 1: 104. doi: 10.4172/2329-8790.1000104
Citation: Mezzomo BP, Miranda-Vilela AL, Freire IdS, Barbosa LCP, Portilho FA, et al. (2013) Hematotoxicity of Bacillus thuringiensis as Spore-crystal Strains Cry1Aa, Cry1Ab, Cry1Ac or Cry2Aa in Swiss Albino Mice. J Hematol Thromb Dis 1: 104. doi: 10.4172/2329-8790.1000104
EXHIBIT J - Page 349
Case 5:14-cv-00117-cr Document 63-11 Filed 11/14/14 Page 67 of 312

EXHIBIT J - Page 350
Case 5:14-cv-00117-cr Document 63-11 Filed 11/14/14 Page 68 of 312

EXHIBIT J - Page 351
Case 5:14-cv-00117-cr Document 63-11 Filed 11/14/14 Page 69 of 312

EXHIBIT J - Page 352
Case 5:14-cv-00117-cr Document 63-11 Filed 11/14/14 Page 70 of 312

EXHIBIT J - Page 353
Case 5:14-cv-00117-cr Document 63-11 Filed 11/14/14 Page 71 of 312

EXHIBIT J - Page 354
Case 5:14-cv-00117-cr Document 63-11 Filed 11/14/14 Page 72 of 312

EXHIBIT J - Page 355
Case 5:14-cv-00117-cr Document 63-11 Filed 11/14/14 Page 73 of 312

EXHIBIT J - Page 356
Case 5:14-cv-00117-cr Document 63-11 Filed 11/14/14 Page 74 of 312

EXHIBIT J - Page 357
Case 5:14-cv-00117-cr Document 63-11 Filed 11/14/14 Page 75 of 312

EXHIBIT J - Page 358
Case 5:14-cv-00117-cr Document 63-11 Filed 11/14/14 Page 76 of 312

EXHIBIT J - Page 359
Case 5:14-cv-00117-cr Document 63-11 Filed 11/14/14 Page 77 of 312

EXHIBIT J - Page 360
Case 5:14-cv-00117-cr Document 63-11 Filed 11/14/14 Page 78 of 312

EXHIBIT J - Page 361
Case 5:14-cv-00117-cr Document 63-11 Filed 11/14/14 Page 79 of 312

Che111. Res. To.ricol. XXXX, .r.r.r. 000
Glyphosate-Based Herbicides Produce Teratogenic Effects on Vertebrates by Impairing Retinoic Acid Signaling
Alejandra Paganelli. Victoria Gnazzo, Helena Acost:1, Silvia L. Lc)pez, and Andres E. Carrasco'''
Lohoratorio de E111hriologft1 Moll'rnlar, CONICET-UBA, Farnlwd di' Medi61w, IJ11i1•ersidwl de Buenos Aires, Paraguay 2155. 3° pirn (I 121 ). Ciudad A111<!110111a de H11e110.1· Aires. Arge11ti11a
Recei11ed Mm· 20, 2010
The bro;1d SJK'clrt1111 hnbicitle glyphosalc is widely used i11 ;1gric11ILUre worldwide. Tlwre has been
ongoing conln>l'LTsy regarding the possible advcr~c cl"kcts 01· glyphos;1tc on the envirnnmcnl and on
human health . Rcpnrts or ncural tkkcts and craninfacial 111;tlrorn1atio11~ rrnm rL·gio11s where glyrhosale
baseJ herbicides (Gl31 IJ arc w;cd ktl u~ [(1 untlntah.L· ~111 L'inhryulngictl appr(lach [(1 explore till' L'lkcls
or low doses 11f glyphosate in Lil'Vl:lupllll'lll. Xenopus loc1ii.1· emhrvus ll'L'rl' innibatL:d with 1/5000 dilutions
or a l'lllllmercial (Jl3l I. The treated embryo~ wcre hi12hly ;1h11111111al with fll<irh.L'.d alkrations in cephalic
and neural lTL'Sl development and shortening or LhL: a11tni11r-pDslcrio1 (i\-P) a.\ is. Altcrntiuns 1111 neural
LTL'st 111arkcr' were latl'r currl'lated with defor111itiL'S i11 thL· L·rnnial L·artilages al tadpulc stages. Ernhryl\s
injected with pure glyphosatc sliowL·d ve1 y similar phcn1itypL'S . iVhireuvc1. GL\11 produn:tl similar l'l'fects
in chicken L'n1hryos. showing a gradual loss of rh(l111h1111wrc domains, rl'lluction of the optic vesicles. and
111icroccphaly. This suggests that glyphosalL' itself was rc'p'1nsihlc ror lhL' phc110type' ohscrwtl, rather
than a surfactant Or othL'.r complllll'.nt oi' till' l'llllllllL'rL'ial i'orn1ul;1tio11. i\ ll'J1!lrH:I gClll' a.'>say rL'.\'l'aJcd lhal GL3l I treatment inLTL'.ascd L'ntl())..'Cllous l'L'Linoic acid (Ri\) al·ti1·i1y in Xe11op11s L'n1hryos and c<>lrcalmcnl
with a KJ\ antagonist resc:ucd the teratogenic L'ffL'l"l.s uf the CIL31 I. ThcrL·fnn:. WL' cl\ndudL: that the
phenotypes pr,1ducctl hy GUI I arc mainly a c<1nseqL1L'.ncc or the increase ol c11dogc1\llu., rdinoid activity.
This is consisknt with thl'. lkCrl'asc or Sonic hcdgL·hog I Shh) signaling frnm the cmh1 yonil' dorsal midi inc.
with the inhihitio11 or otx2 L'.\Jm:ssion anti with lhL' di.sruption ()r L'l•plrnlil' lll'.UJ"al crest dewloprnrnl. The
direct l'ffL'L'l Of glyphosa!C Oil early lllCciWlliSlllS or lllOq1hll!,'.l'llCSis in Vl'rtd1ratl'. embryos opens l'Ollt'erns
about the clinical lindings from human offspring in populations exposed to GBH in agricultural lit~lds.
Introduction
The hroatl-spcctrum glyphnsalc hasetl hl'rhicidcs !CiBHsJ arc widely used in agrirnltural practice . particularly in a'soeiation with genetically modilictl organisms (GMO) engineered to be glyphn,atc rc,istant such as soy crops. Considering the wide u'e of GJ3H/GMO ag1 iculturc. studieo; nf the pns,ibk~ i111pach of GB!-1 on L'nvirnnmc111al and human health :ire~ timely ~111d
important. ()iven the intL'll'ivc t"l' nf thi ;, teclrnnlogical package in South Amcril·a. 'tudies or thl' j)O>'>ihk illlpat'ls tln environ· mcnt and human health arc absolutely necessary . togL' lhcr \I ilh adequate epidemiological >tudics. The need for iDfnrrnation about the dcvclnp111c11tal i111pact of GBH is reinforced hy a variety of adverse health clfrcls on peopk living in areas whcrL' CiBH is extensively used , particularly sinL·e there i.s :1 pnucity of data regarding chltlllic exposu1e tn suhlethal doses during embryonic dcvelnprncnl.
It is irnpo1tanl lil note th<n the hulk of the data provided during the evaluation stage~ of Cif3H/CiMO sal"ety were p1lll'idcd hy the industry. (iivcn the recent history o1 the cnducri11c disruptor field with low dose effects observed in numerous academic laboratories but not in i1uJu, 11y-fundc'd sllldie.\ I/, 2). it is L·lear that a reasonable corpus or independent studies is ncLT~sary w fully evaluate the dfcL·ts of ;1grod1emic;tls on human health. This is particularly impor1anl when significant economic i ntereqs arc cnnccr ned.
• Corrcs1x111<li11g author, Phone: +541 l 5950 9500 ext. 22 t 6. Fax: +541 t 5950 9626. E-mail: acam1srn@rmc<l.utrn .ar.
There is growing cviclcncc rni~i ng concerns about the effects ol Cil3H nn people living in areas where herbicides are i nlL'. nsi vcl y used. Women ex posed during pregnancy to herbicides de livered tilT.,pring with cungcnital malformations. including rnil'lncephaly. anenccphaly. and crnnial malfoi matinns (3).
Rcl c.vant co11trihutirn1s lo the subject wc1c made hy Scralini's gn1up. among others (-/). They showed that a GBH acts as an cnducrillL' disruptor in cultu1es nf JECi:l placental cells, decreasi11g the rnRNA levels of the enzyme CYPl9 (an essential component of cytochrnmc p.:150 arnmata,c) and inhibiting its aL·til'ity . CYP 19 i~ responsible for the irreversible. conversion ni' antlrogc.n.s into estrogens. The GRH Roundup is ahlc to disrupt aro111at:1se activity. Importantly, the active principle glyphosalc interacts with the active site of the purified enzyme and its cl"frL·ts in cell cultu1cs, and micrnsomes arc facilitated hy other components in lhL~ Roundup formulation that presumably inl'l"ease the hin<1vi1ilability of glyphosatc (4). Glyphosate penetration thrnugh the cell membrane and subsequent intracellular al'lion is greatly facililalL~d by adjuvants such as surfaL' lants (5, 6).
In addition , hnth glyphosatc and the comrncrcial herbicide sel'crL·ly affcl'l embryonic and placental cells, producing rnitochontlrial d;unagc. necrnsis, and programmed cell death hy the activation or caspases J/7 in cell culture within 2.:1 h with doses far hdow tho.sc u . .;ed in agricultui c. Other effects observed incl udc' L')'lntux ic i ty and gcnotox ici ty. endocri nc disruption of th.: androgen and estrogen receptors . and DNA d:rniage in cell lines r7. 8).
10.102 l ftx 1001749 (~.1 XXXX American Chemical Society
EXHIBIT J - Page 362
Case 5:14-cv-00117-cr Document 63-11 Filed 11/14/14 Page 80 of 312

B Chem. Res. Toxicol .. \lo/ . .r.r.r, No. rx, XXXX
J\1ore recently, rats kd with a glyphnsatc-1csislant genetil·ally
modified corn showed functional alterations in two dctoxifkanls organs: kidney and liver, and the hc:11t :ind the he11wlDpnictic
system t 9). Another line uf evickncc ,uppo1 ting ;1dver.-;c dkcl> nl
glyphosarc was provided hy Bclk's group . They suggcs1cd lhal glypl10,ate and its prinL·ipal mctahulite. AMPA. alter cell cycle
ched:pninls hy interfering with the physinlogical DNA repair 11iachinc1y. Several GBfls w.-:rc ~1s.,ayccl. and they indt1CL'd CL'iicycle dysfunction fro111 the flrst cell divisinn in sea urchin c•111hryos ( /0, I/). The tlm:shold L'Oncc1llrnlion l"or this cl'kct is
500- lo 4000-fold lower than that sprayed on crnps in the licld. Eight milli111nlar glyplws•llc induces a delay in the kinetics of the first cell cleavage of sea urchins, altering the enlry inlo S-phase by inlerfcring with lhc ac1iva1ion of the' CDK l/cyclin B cnmplc>x ({j, /2). This i"ailu1e ni' cclkyl·le chccJ..p11i11ls i,
known to k•ad w genoinic i11.'1ahility ;l!ld the pus.'>ihle dcvelnpmelll of cancer. In agreement wilh these lindings, gcnotox icily \Ludie' ril" glyphnsall" 111 ih mctahnlitc, ,q1ggc·st that lhe
irrc\cr:-ihle damagi.: in rile DNA may inc1easc till' ri<.k "" carL·inogcnesis I 13, /4l.
A-,idl' from tile J11 eviou,Jy repn1 Led lt:'l at11geniL· el rc~L'h 111"
glyphosatc-ha:-.cd !'nrmulatioth rn1 L'c•phalic suuc·tu1cs i11 a111pllibia11s I /5). there is alm(l.'>I nP in!'or111a1ion available ahnur the
molecular 111cdiani:-.1m a'sllL'iatcd \\ ith CiBH nr glyphn~;tll'
teratngcncsi<,. Rcpn11s or lh'llral delcc·h <llld L'.J'alli1)facial mal
for111a1in11' f"rnm regions where CiBHs arc u'ed he;1vily lc'd u., t<• a11 c·111hrynlngical approach Ill l'.\plor.: Ille cfli..•l"I;, 111. loll' doses
or glyplin:-.atc in Xcil0/11/,\ and chiL:kcll l'lllhryngcncsis. We show hcJL~ lhat sublctlrnl doses i11L' surficient In induce
1 cp1 nducihk nwlfo1 mati011' in Xe1101111s uml chicke11 L'1nh1 y11s trl'all.'d with a 1/5000 dilutiC111 o1 a CJBH l111111ulation 1equivalc11I
to 4:10 ,urvt of glyphosalc) m in frog L'l1lhryos injected with glyphusate alone (hclwecn 8 and 12,ui\1 per injl.'ctcd cell). (jfHJ trealed m glyphnsale injected frog embryos showed very simila1
phennlypc•;, including shortening of 1hc trunk. ccphaliL' rc'.ductinn, mil'l"OjlhthaJJ11)', l')'CJnpia, 1edUL0 liOJ1 llf the 11L'LlraJ L'l"eSl
ten itory at ncurula stages. and crnn infacial 111alfo1 matinn~ al 1adpolc stages. Thesc dck'Ch suggested a link with lhc retinoic
acid <RAJ signaling pa1hway. Rcpurtcr gene as.,ays using a R,•\dcpendcnt rcporler reveakd that GBH trl'atmcnt increa:-.e.1;
endogenous RA activity. Strikingly, we dcmonslrnlc thal Rn 41-525~ (Ro). an antagoni .'-l or RA (16, /7), rescues thc
phenotype prnduccd by GBH. We p1oposc lhat at least some nl' the teratogenic effects of CJBl-l arc mediated hy inL'1cascd endogenous RA activity in Ilic embryos. This is nrnsi:-.tc111 with thl' vcry well-known syndri>mc prnduced hy an cH·css of RA,
as dcscrihed by 1hc cpick~miolngical :-.ludy or Lammer ct <ti. in human' (18) and in vc11cb1ate cmbryos ( /C)-25).
Experimental Procedures
Embryo Cultun and Trratnll'nts. Xe11op11.1 liw1•i.v emhryos wen~ obtained by in vitro ft:.rLilizaLinn, incubaled in 0.1 x modified Barlh's saline (MBS) (26) ;md stagt:J al"Cordi11g lo Nieuwkoop and faher (27). The GBH used was Roundup Classic (f\fonsanlol. containing 48'1o w/v ol a glyphosate s;ilt. Treaune1Hs were perfonned from the 2-cel I slage with Ci B H di luliuns of 11."'000, 1/4000, ;md 1/.'iOOO prcparc>d in ll. Ix MBS. For rescue e.xperiment,, 0.5 or I pl'vl Ro-415253 was added al stage 9. Cyclopamine !Sigma C4 I I 6) was used at ) t)O /IM rnncl'ntralion in 0.1 x fVIBS and was applied from the 2-ccll stage until fixation. Embryos were fixl'd in ME!v!FA (2<'1J when sibling conLmls reached the de,ired stagL'·
Xenopus Embryo lnjcctions, Whole Mount in Situ Hybridization and Cartilage Staining. E111hryns were injected with 360 or 5(XJ pg ot glyplwsatc lN-(phosphtrnomt'Lhyl) glycine (Sigma
1'11ga11e//i <'/ al.
3.~7757) !X'r cell into l'ne nr both cells at the 2-cell stage. Glyphosale wa, rninjeclcd with I 0 ng of Dcxtran Oregon Green (DOG, /vlokcular Prohcs) lo identify the injected side as previously dl'scrihcd 1?9l. Embryos were cultured in 0.1 x MBS and rixcd in ME~lfA when sibling controls reached the desired stage. WholenH>llnl in situ hyhriJi1.a1ion (WMISI I) with digoxigenin-labeled antiscnse RN A probe-, was perfurn1ed as previously described (30) except 1hat the prnreinase K step was omitted. For cartilage visualizalion, embryos were rixed in MEMFA at stages 45-47, washed \\'ilh PBS, and stained overnight in ().(}4% Alcian blue, 20% acetic acid, and XIJCA:, ctlianol. After cxle.mivc washing with ethanol and hkaching with 2</c KOH. embryos were washed with 20% glyccrnl and 2% KOH. and dehydrated through a glycerol/2% KOH series until KO'lc1 glyct•rol was n:ached.
Dl!tection of RA Adh•ity. Emhryos were injected into one cell al the 2-cell stage with 320 pg of the plasmid RAREhplacZ (RAREZ) (3/. 32) and plal·ed immedia!dy in l/30!XJ, 1/4000, and 1/5000 CJHJ-1 dilutions. Basal luminiscence was detected in uninjected and untreated embryos. The endogenous RA activity was measured in ernhryos injected with RAREZ and left untreated. As positive Clllllrnls, embryos were injected with the RAREZ plasmid and incuba1cd al late hlastula slagc with 0.5 m 5 11M all-trnnsretinoic acid (RA, Sigma R2625). For rescue experiments, cmbryos injected with the rcpmter plasmid were incubat.:d in a 1/4000 dilutiun or GBH tr(Hll the 2-cell stage. and when they reached the hlastula stage. I 11M or Ro 41-5253 was added. Finally, when sibling rnntrnls readwd the neurula stages (14, 15), all emhryos were processed for cht:miluminiscenl quantitalion of the reporter activity hy using the /J-gal reporter gene assay (Roche). Protdn e~lr•JCts and enzymatic reactions were performt:d as previously reponed (_I.I). Luminiscence was me.asured on duplicale samples in FlexSlaLion J equipmenl (Molet:ular Devices), and values were normalized by protein conlent (32). A two-tailed r test was employed to analyze the -;ignifkance in the difference of the means. Thi: nperimenl \\•as repeated three limes.
TrC'atments or Chickl'n Embryos. Alier opening a small wind"w in the shell, fertilized chicken eggs (White Leghorn strain) were injected above the air chamber in the inner membrane with 20 11L or 1/3500 or 1/4500 dilutions of GBH. Control embryos we.n: injcrtet..I unly with 20 pl of H~O. After injection, the window was scaled wilh transparenl adhesive Lape, and eggs were plact:d with their blunl end up at room tempernlllre for 30 min. Then, eggs wert' inrnhated in darkness al 38 "C in a humidified incubator (56-58% humidity) and rotated ut regular intervals. After appropriate. incubation times, embryos were isolaled and staged according lo Hamburger and Hamilton (34).
Wholr-1\lount lnmunonuorescrnce and WMISH or Chicken Embryos. Emhryos were fixed 2-4 h in freshly prepared 4% paraformaldehydc, rinsed, and proces~ed for analysis. For immu· nofiuorescencr, embryos were hlocked overnight al 4 "C in block.ing solution (5\·c normal goat serum. 0.3% Triton X-100, 0.01 % NaN3, and Tris huffer saline <TBS) at pH 7.4). Then, they were incubated \\'ilh a 1150 dilulion of a nmust: anti-Pax6 monoclonal primary anlihody (De\'elopmenlal Hyhridoma Bank) in TBS at pH 7.4 and (U% Triton X-100 for 48 h al 4 °C. Embryos were washed three times with TBS and i11t:ub•11ed at 4 °C with the secondary antibody (1/1000 fiuorescein-conjugated (FITC) antimousc lgG. Jackson l111rnu110Rescarch) in TBS at pH 7.4, 0.3% Triton X-100. and 3%
normal goat serum for at least 12 h. Finally, embryos were washed with TBS, placed in a glass culture dish with 80% v/v of glycerol in wate.r, and photographed. WMISH was perfonned as describe{] for Xe11op11s embryos, using a c-shh probe.
Results
GBH and (;Jyphosak Alter Ncurnl Crest Markers, Rhom· homerk Patterning, and Primary Neuron Differentiation. In order Lo examine whether GBH trcalment can affect neural crc'1 de\'elopment, rhnmbo111eric patterning, and neuronal dilTC'r.::ntialion, 2-cell slage Xe11op11s laeui.1· embryos were
EXHIBIT J - Page 363
Case 5:14-cv-00117-cr Document 63-11 Filed 11/14/14 Page 81 of 312

Tat1toge11ic E.ffr>c·t.1· 1!( Glypho.wlle
CONTROL GB ·t·TREATED
GLYPHOSATE-INJECTED
slug I krox-20 slug N-rubulin
Figur~ 1. Gl3Jl anu glyphosate di.o;turb neural crest formation. 1 hombomcric patterning anu primary neuron diffr1'cntiatin11. (A-Gl Embryo:, were analyzed at ncurula stage hy WM ISi I with different markers. All arc dorsal views (anterior is up) . (A,C> Control embryos. (B.Dl Embryos treated with J/5000 dilution of GUii. (13) Impairment of neural c1c.,t rormation as revealed hy the ,pccilic marker slug (arrnwsl. Notice. the down-regulation of the kmx-20 domain in the 1J rhornbomcre. Slug and kro r-20 were down-regulated in S7'i( of treated cmhl)'OS (11 "" ,,ll J (Dl Suppression of primary neuron formation as seen with the differentiation marker N-11il111/i11 The number of pri 111ary nctiron' was decreased in SYk of t1catcd embryos (11 = JO). (E-G) Emhryos unilaterally injected with 500 P!! of !!lyphosatc pct cell plus DOG a' the tracer. The injected side is dc111an:;i1cd by the green lluorcsccncc in the insets and i<> oric11te<.l lo the left. JS, injc<.:tcd sick NIS, no11injc-cted side. (E,F) Abolishment of s/11g cxprcssio;1 in the cranial neurai c1cst domains (arrow: 77'7<., 11 =· ~1 t) and Jimi11utio11 nf kroi-20 cxp1cssion in r3 and r5 (arrowheads: 71'.'f,,11 = 21) 1\11 the IS. rCi) Rcduc1ion of N-111b11/i11 expression on the JS (81 '.;., /1 = I hl. r.1. is the third rbomhonw1c: r5 . fiflh rhornhontcrc . m. i. and ' · a1c primary motor neurons, i11tc111curons, and scnsnry 11cu1ons, respccti1 cly . :-.ICS, 1 ICS. and BCS, a1c mandibular nc,1 scgmcnl, ltyuiJ c1c<.t ,;cgn1c1tC. anJ htanchial crc\t :,cgrncnl, 1cspcc1ivcly.
cxpn;..eJ 10 (iBIL a' dcSL'I ibed in ExpL't i111c11tal l'1"L·cdurc;.. , and
a~sayed by whole 111ounl in 'itu hyh1idizatin11 i\VIVJISl-11 .ii the 11cwula ~tagc (stage 14-15). ·1 he neural crc.:·<.t nrnr~c·r .1/11g hcgin,,
ih cxp1e.-;sio11 early. wh(·1-.:· ueurnl c.:·rest i11ducti"t1 l;1kc;.. pl:1cc.
Al neutula stage, it ii, c.\pres,ed in the neural L'lt' .'-t 1c1ri1.,ry
(Figu1.:· IA. arrows) 135L TrL·at.::d emhrym ;;h"w an important duwn-rcgulatiPn nf.l'/11g in !Ill' 1reural cre;..l territ111y (Fig11JL' IB.
arro\l''J in L'nmparison witl1 th:1t ol 'ibling n111trnk To ;..tudy lhe effcch on hindhrain p<1lte1 ning. we a11;tlyZL·d the· cxprc,,inn
nl' krox-20. This zinc finger (ranscription factnt is expressed in
rhombnt11crcs rJ and r5 trigu1c I/\) and ha.'> been shown to
play an i111po1 tan! rnle in Cllntnilling rho111hn111e1\' identity (36).
The r3 stripe was lost in CiBH-lrc'<lted c·mhry"s {Pigure I B).
This resembles the prngres,i\c loss from anterior lo p\lslcrior
rhnmhomcrC'.s associated with incrca.-;ing L'OllCL'lllralions or RA treatments in Xe11op11s and n1ousc embryos 137, 38).
Then we investigated pl'imary neurogcnc,is al the neural plate
slage. At this time . N-111/n1/i11 is normally e.,1ircsscd in dir
fcretllialcd primary ncun1ns organized in lhrce lnngiludinal
domains in the pustcrior neural plate: medial. irnermcdiale. and
lateral. whieh corrcspot1d to motor neuruns (111). internc·urons (iJ. and sen,nry neurons ts), respel'tivl?ly (Figu1·c IC) (39).
Cht•m. Res. Toxico/., \lo/ . . n-x, No. xx, XXXX C
Treated embryos showed a down-regulation in tlu; three stripes
or primary rH'ltrllllS (figure ID).
To corrohorale if the effect is spccilically due to lhe active principle of the llL'I bicidc ittld llOt [O adjuvants present in fonnulations , glypho.,are wa.-; injceled into one cell al the 2-cell
stage and slug. kmx-20, anu N-111/mli11 were revealed al stages l·~-1.'i , as hcfurc. The<.c e111h1yos slmwed an i111po11at1t down
rL'gulatinn nr slug (figure IE. arrmv). 1esi:.111bling the clfocts of Ci Bl I on 1hi .-; marker at this Stage or development. Although l\mx-20 did 11111 completely di,,appcar from rJ ;is in GIJH-lrcated embryos. the c.xprcs.<.ion clearly decreased in this rhomhomcre
a~ ll'ell ;1., in r'i. indica1i11g 1hal glyphosale also alters rho111holllL?ric paUerning t figure IE: arrnwhcadsJ.
N1>1mally. al .,1agc 18. the 11curnl cresl has formed three prcmigratorv blocks from \\'hich three diffcrcnl segments SL'grc·gatc: mandibul:1r crest segment. hyuid crest segment, at1d lw,u1cl1ial CIL'SI segment (lv!CS, llCS. and BCS: rigure I PJ. The
lirst segment contributes lo the Meckel, quadrnle, and cthmoidt1ahecular· cartilages: the hyllid crcq segmenl to lhe ceratohyal
L'artilagc. aml thc h1anchial scgmcn1 lo the cartilages nf lhe gills (40). (i!yph11sale-injL•c1ed embryos showed thal the segregation
process clearly ;11Tectcd the injected side (Figure IF. arrow). suggcs1ii1g thal the dcrivcd rnrtilagcs may he atrech:d at later
slagcs during development. When hybridized wilh N-111b11/i11, lhcsc:: cmhryos showed a clec1casc in the number or primary
neurons in tlw three stripes corresponding to motor neurons, interncurnns. ;rncl -,cnsnry neurons (Figure I CJ. arrows), rescm
hl ing the ellccls or ( i Bl-I treatmen(s, although wi(h milder consequences for· this markc'r'.
In rnnclusion. lhc effet:ts nr GBH-lreated and glyphosatcinjcl'ted embryos rl'prescnl equivalent phenotypes despite the
fact 1hat they arc 1w1 identical. ThL' adjuvant p1esenl in the L·om111c1°L·ial fo1111ulatint1 may explain the Jifft'rcnces. Taken
t"gether. tht'SC re.,ults indicate (lrnl hoth GBl-I and glyphosale impair IJCllll!ll<ll ciil krcntiatillll, rho111bnn1eric fonnaliun, and the
paltL'rn nr the neural L'!'cst during indUL'tion and segregation.
GlHI and Clyphosalc Produce Head Defects and Impair lhe Expression of Dorsal Midlinc and Cephalic Markers. lkcau.,c c1:1niot.;1cial dckc·h 11'<:'1\' nh;..c1ved i11 lnrnrn11' residing
i11 ;irea' chrt1r1ically cxpo,ed to GfHI. we decided to e.\plorc \\ hetl1er gcnes i11volved in head devc:lopn1c111 are altered as a
n111sl·qucr1L·c .. r1rc:11111l'nt willi GBH 01 injection nl glyphosate. Shh ach as a 111orphngen c1>11lrolli11g 111ultiplc developmental
JllllL'L'S,es . During e;1rly 1 L'rlellt'ale cmh1yugcnesis, shh expressed in rnidlinc 't1uctu1e' 'uch a.-; the notnchnrd, prechordal mesodcrm. and f1onr plalc conlrols left-right a.-,ymlllL'try, neuron idcntily, t1cural survival. and dnrsn-venlral palternit1g nf the
nL'llntl tuhc 141. 421. :vtnrcm'CI'. Shh »ec1cted hy the prechnrdal rncsoderm i~ re,p1111sihk for 1esolving the brain and the retina
licld into two separale hemispheres and eyes, preventing cyclopia (./3).
Shh cxpl'es~ion was dramatically reduced in the dorsal 111idline at nc'.l11ula stages. cspccially in the prcchordal mcsoclerm in CiBl-1-trcatL·d cmh1yn~. The anterior li111il or the shh c.xpression domain i' rno\'ed caudally in treated embryos. in relation to the ptn-6 domain (L'tllllparc green arrowheads, Figure 2A-C).
Pox6 is cssenl iu I for eye f'nnnalion in a wide range of species.
It is expressed in the eye prirnordia nl' vertebrates such as the n1ou.-,e. d1id .. cn. Xe11op11s, zehrafish, and humans, as well as in
in\'l'!'tehratcs .\uch as Dro.rnphila (44-47), Embryos incubated with CJBI t showed ;i di\tinct down-regulation of the pax6
territory (cn1npa1c. white arrllwheads: Pigurc 2A-C). Moreover, in trt?<ilcd embryos. thc pax6 domain is not divided in the t>ye tield (lighl blue arrowheads; Figure 28,C). These results suggest
EXHIBIT J - Page 364
Case 5:14-cv-00117-cr Document 63-11 Filed 11/14/14 Page 82 of 312

D Chem. Res. Toxico/., Vol . . nx, No. xx, XXXX
BH· fREAn::o
CONTROL
0
GBH-TREATEO
F
olx2/ ahh
CONTROL GLYPHOSATE~NJECTED
Figure 2. GBH and glyphosatc produce A-P truncations and impair the expression of dorsal midline and neural crest markers. (A - 1) WMfSH analysis at ncurula (1\-C) and tailhud (0-1) stages. (Al Control embryo hybridized with .1/r/i (arrow) and p1n6 (white arrowheads). (B-CJ Embryos exposed to 1/5000 dilution of GUI!. Notice the dramatic reduction of slrlr expression in the embryonic doisal midi inc (armws) and the caudal displacement of the anterior limit (green arrowheads) (85%·, 11 = '.l:I). The expression of prl.l6 is reduced, and the domain is not properly resolved in the eye field (light blue arrowheads) (H5'i'<" 11 = 33). (O,fo) Control cmhryos. (D) Normal expression of J/J/r in the nolochord (n). floor plal<' (fp'i. and prcchnrdal mcsoderm (pm) and nf mx2 in the eye (e J, forehrain (111), and midhrain (mh). The spa..-e lictwccn bars indil'atcs Lhe size of tl1c brain. (E) Normal expression of .mx9 in tl1e pharyngeal arches (pa). otic plncode (op), eye (e). genital ridge (gr), and notnchnrd (n). (F,G) l/SOOO GB II-treated emhryos. (FJ Reduced expression of J/i/r and or.r2 (Q2%, /1 = 2..\) in dorsal midline cells lslrh, arrow), prcchordal llll'Soderm (.1/rh. hlack arrowheaclJ. eye (otx2. yellow arrowhead). and brnin structures (01.r:?, space between bars!. lG) Diminution of .10.19 expression in the nntochord (black arrow), genital ridge (green arrow!, and eyes (yellow arrowhead) (87%, /1 = 30). Notice the delay in the migration of neural crest c:dls toward the pharyngeal arches (red arrowheads). Treated embryos rF and G) showed microphtalmy, micnX'cphaly (c:ompare the space between hars in D-G). and a shonened A-P a.xis (89'~ .. /1 = 54). (1!.ll EmhT)'OS hybridized with shh and 11tx:!. (11) Control cmhl)'o showing the same structures as those in 0. <I) E111h1yo bilatt•rally injected with 360 pg of glyphosatc per cell at the 2-ccl I stage plus DOG a.~ tracer (green fluorescence in th,, insetJ. Similar to that in GBHtrcatcd embryos, shh and ot.r2 expression was reduced (62%, 11 =- 16), and this was accompanied by micr<X'Cphaly (compare spa..-e between bars) and rnicrophtnlmy tycllow arrowhead).
that a down-regulation ol' shh expression in th!? p1 l'd1ordal mesodenn together with a diminution of pax6 exprl'ssin11 may underlie the defects in the resolution of the retina 11cld and the brain hemispheres in embryos treated with GBH.
To test whether thl'se molecular alterations were associated with defects at later stages. \W analyzed the e.xpression of slihJ otx2 (rigurc 20,F) and sox9 (J<igure 2E.G) in embryos treated with GBH as before hut fixed at tailbud stages. Otx2 is a homcohox-containing gene expressed in retinal ancl lcn; co111-po11e11ts of the eye and telcncL~phal ic. dicncephal ic . and mcsencephalic regions and plays an impnt tant role in specifying antainr structures (48, 49). Exposed embryos showed a decrease of anterior shh expression with concomita11t 111icrophtal111y cllHl microccphaly. as revealed by the 1eduction of the otx2 domain
Paganelli et al.
(Figurc. 2. compare the spacc between bars in the colllrol cmhl)'o in [)with the treati?d embryo in F). Also. there is a pronounced shortening of the A-I' axis (compare cn11trol 1?mb1yos in Figure 2D.E with treated embryo:-; in F,CI). In control embryos, the t1anscription factor .wx9 is cxp1esscd in the cranial neural crest cc.lls as thL')' populate the pharyngeal arches, the otic placode, thl' clcvclnping L')'C. the genital ridges. and also the notochord (Figure 2El (50). Embryos trl'ated with CIBH showed reduced eyes and genital ridges. and developed abnormal pharyngeal arches . The migration nf' neural crest cells to these struclllres was delayed. as revealed by a more dorsal position (compare
Figure 2G with EJ.
To analyze the d'fects of glyphosate alone on dorsal midline development. we perfo1 med bilateral injections at the 2-cell
stage. EmbJ)'OS \•."ere fixed when sibling controls reached stage 2X-30, ;111d the expression nf shh was amllyzed. To helter
undl'r:-.tand L'epltaliL· defect,. the pattern or otx2 was also c><aminl'd. Simil~1r to L'mhryos treated with GBl-I, we observed 1,~Lluced p11?chnrdal .l'hh l' xp1\'~sion acco111panied by strong 111ic1m:l'phalic a11d micwphtalrnic phenotypes. This is likely due to a dcn<·a~e nl' midline-derived signals (Figure 2H,ll. Taken togt'thcr, all ol these. 1esult~ indkate that GBH as well as glypho,atc aln1w cause cephalic del'ccts that probably r.::sult from a rc.dudi<111 nl' shh ctnd otx2 .::xprcs.,ion in anterior structures.
ThL' delay in the migration of cranial neural crest ce.Jls in the lailhud stage cmhryns tog..-ther with the inhibitiou of slug c~pr<·,si1rn at rarli<·r stage.s led LI» to nexc e:rnmine whether craniufacial develt'Jp1nt:nl would he impaired in older embryos.
<aU-l 11nd (;lyphosate Disrupt the Development of the Craniof'acial Skeleton. The pattern nf neural crest derivatives in the c1anial sk.::lctn11 of' the Xe11op11s .::mbryo was previou~ly c.,tahlished (40). Briclly, in the firsl pharyngeal arch, neural crest cells C(lnt1ihute to the upper (quad rate. Qu) and lower (Mcckcl's. Mel jaws: in the second arch. they contribute lo the ccralhoyal rnnilage (Cc). while in th!? third and J'ourth arches, neural crest cdls contribute to the anterior and posterior regions of the hrnnchial/gills c;11tilage (Br). 1espcctively (Figure 3C).
To add1ess if the effects seen at neurula and tailhud stages arc correlated with craniol'acial malformations, embryos treaced with GBH and embryos unilaterally or bilaterally injected with glyphnsale at the 2-cell stage were allowed to develop up to stage 47 and pwcessed with Alcia11 Blue staining for skeletal analysis. The gross morphology of GBH-treated embryos 1cvealed an overall reduction of cranial strucw1es and mic1 ophthalmy (compare f'igurc :IA,C with B,0). All affected ernhryo, displayed a reduction of the. quadrate and Meckel's cartilages (asterisks. Figure JDJ, while the branehial and ccrnthoyal cartilagL'~ Wl're mildly affected.
Unilateral glyphos:1tc i11j,·ctinns re~ulted in a general decrease of Alcia11 blue staining and in a reduction of the Mcckcl's and quadratl' ca1tilagcs on the injccteLI side (;1sterisks. f'igure 3E,F). In some embryos, the eye practically disappeared from the injcc1ed side (arrow. J<igure JH). Moreover, bilalerally injected embryos c.>.hibited cyclopia (f'igure JI, arrow), consistent with the loss of Shh signaling from the prechordal mcsoderm ob.<.crved al earlier st:1ges. Similar results were obtained in frog embryos treated with cyclopamine (Figure JJ), a known inhibitor or the Hedgehog pathway which leads to developmental malfo11natinns and holoprnscncephaly-like abnormalities, including cyl'iopia in the most severe cases (51-53). Unilateral injcccions of cyclopamine produced cartilage alterations similar lo those obtained with glyphosate inj.::ctions (not shown).
In su111111a1y. our results are compatible with the malformations obserVL'd in the offspring of women chronically exposed
EXHIBIT J - Page 365
Case 5:14-cv-00117-cr Document 63-11 Filed 11/14/14 Page 83 of 312

Tera/ogenic E.fj('c/.1· 1!( (f/ypho.rate
E
IS
G
• ~i
°'itilrol
B
..... ' •' !.:•"
NIS IS Qiy-mj
H ~ . 'r. • ' .\ c _,. ...
'
Gl)'-IOJ NtS
CBH-treotcd
NIS ,,., " .
a111ne
Figure 3. GBH trcatmcnr and glyphosatc injection rc~ult in cephalic malformations and ahnormal dcvdopmcnr of thr naniofacial skckrnn. (i\-0) 1/.5000 GUii-treated embryos analyzrd at swgc 45·-.n . (t\,l.l) Gross morphology. (A) Conlrol rmhryn: eyes (arrows}: head size (space hclwccn yellow bars). (Il) Embryo rxposed to GBll showing rc•duccd eyes (arrows) and head structures (89</f,, 11 '=' :18) (comparr the space between yellow bars in A and Bl. (C',0) Embryos stained with 1\kian blue. CC) Control embryo. showing facial canilages: Meckel (/Viel.
ccratohyal (Cc), infrarrostral (I), quadraro (Qu), and hranchial fUr). (0) Reduction of 1\-k anu Qu cartilages 1asicrisks) in GUii-exposed embryos (77'lt, 11 = 19L <E- 1) Embryos injected wich )(i() pg of glyplrnsatc per «ell in one or both cells at the 2-cdl stage and analyzed at stage 47 by i\h:ian hlue staining ( E.l'i or gross nmrphology (Ill 1.
which was compared with that of sihli11g controls (GJ. (E.1'1 Unilaterally i11jectcd emhryos showing reduced Aldan hlue staining and smaller Qu and Mc cartilages (asterisks) on the IS (."i(i<i;, 11-oc l6L 1,Ci) Control embryo. ArTows indicate rhc position of the ryc.s. (11 I Notil'c the reduction of the eye in the lS (arrow) (."i4'k, 11 = 11). rll UilatL'.raliy injected embryo exhibiting cyclopia (arrow I ( 38'J;,, 11 = 8). (J l Cyclopaminc-trcatrcl embryo. Observr the proximity of both eyes (arrows), due tn midlinc defects (compare with the conlrnl embryo in G). IS. injected sidr. NIS, noninjrctcd siclc. Cly-i11j. embryo injected with glyphosntc.
tn GBH during pregmllll')' (,ee Di~cu~si(l11l. These 111alfl1rmations ~uggcst the ln~s ot rnidlinc sig11ali11g. acl'orrtpa11icd by defel'ls i11 neural crest migration (or irrcrca-.cd apoptnsi~d with
aberrant Llc>velop111ent nf 111anLlibula1 and ma.\illary 'tructun::,.
Phenotype induced hy (;UH Is at Least Mediated hy
Changes in RA Signaling. It \Vil~ previously reprnted lh;rt increasing concentration~ or RA cau,cd progressi\'e 1runc;1tinn of anterior and posterior structure' in Xe1101111s lc1e1;is (20, 21 l. The most severely aflel·tcd embryos l~rd.ed eyes. na,al pits. forehrain. rnidhrain, and otic vcsil'ics. and displayed tnrncalion.'> of Llt..: lail. The phcrmtypt•s pmduccd hy (;BH and glyphosale resemble the tcracngcnic effects ol' embryos treated with RA; therefore .. we theorized Lhat the RA pathway Clluld he associatl'd with rhc rnnrphngcnctic ctfects of glyphnsatc during early cmhryogcncsi,.;.
The RA signal is transduccd 1hruugh nuclear retinnic acid receptors (RA Rs), which control 1he e.\prcssinn or target gene.-. involved in vcrtc.hrate pattern tonnatinn , organogcne1-.is. anLI li%ue hn111costasis (54). Ro .+J-52.'i.~ <Ro) is an antagonist or the RA Ra receptor. which is expressed during early dc\·clop-111cnt in Xe11op11s ( 16, 17. 55, 56). Ro wa.s previously used as a
Che111. Res. Toxico/., Vol .. ux, No . . n-, XXXX E
tool to hluck 1·ctir1oid-rncdiatcd 1-.ignaling, producing a variety ur mnrplwlogical changes in the !'mg crnhryn. The most severe phenotype' showed anterior and posterior truncations, a reduction or loss of eyes and otic vc,iclcs. and a general disorganization or h1 anchial arches (22). Moreover, maternal insufficiency (If vitamin ;\ (thl'· prccmsor or RAJ nr RA in excess in vcl'lehrates cause a wide range ofteratologic effects (/8, 57, 58). All this evidence demonstrates that vertebrates require a precisely regulatL·d .wpply of retinnids during emhryogenesis.
Considering that the phenotypes obtained in our analysis predominantly 1 esernhlc thllse nl' RA excess, we wondered if Ci Bl I trL'atmcnts are able to increase endogenous RA activity. To answer this qUt:,tilln. we measured the levels of RA signaling hy tal\ing advantage nr the reporter plasmiLI RAREZ (32). as
dc~'-nihed in the Experimental Procedures section. Figure 4A shows that GBH treatment significanely increased the level of RA sigrwling in the embryo in a concentration-dependent manner. Importantly. the RA receptor antagonist Ro rescued the cl l'cl't ol' Gl3H .<.incc the level or 1hc RA output, as measured by the reporter assay, was not significantly different from that in RAREZ-injcl·tcd , untreated controls ffigurc 4f\). Together, these obscrvati1H1s strnngly suggest that GBH increases endog
cnnu.-. rctinoid activity.
If an increase of RA signaling underlies Lhe phcnolype pruduced hy CiBH trca1rncnls. antagonizing the RA palhway should re,cue the effect or GBH. To examine this hypothesis, crnhryo' were incuh::ilcd at !he 2-ccll stage with GIJH alone or with CiBH together with 0.5 or I pM Ro added when sibling cnntrols reached ~tagc l) (22). f<rng embryo.'> were analyzed by thci r nwrphnlogical aspect and also were hybridiz.ed with shh and orx2 probes.
Control embryos ~howcd an cxpn::ssion of otx2 in the rorchrain, 111idbrai11, and optic vesicle. while shh transcripts are di,lrihuted alnrrg the crnhryunic clrnsal midline (Figure 48). Ernh1·yo~ treatl'd l·nntinuously with CIBH showed a downrcguL11io11 ul shh and olr2, redUl'Cd head structures, and 'hnrtc.ned .r\-1' a.xi~ 1 figure. 4CL Sirnil:u results were obtained alter trearing lr"g L'lllhryr" 11 ith 0.1 nr I 11i'vf RA c2!, 59, 60). ;.\, previously n:pnrleJ (22). embryos incubated with 0.5 or I ,11:vt Jfo alrn1c abo di-;playcd ;1 l'01lCl'lllratioir-Lle1l<'11dent shnr1cn
ing ni' the A-P a.'i' and reduction or head structure,, which was l'Olllinncd by a rcdui.:tion or the ot.x2 domain l Figure 40,E; l'Dlllparc the 'pace hctwccn bars wilh BJ. We also observed a mon.' diffuse wiining or shh, mainly in the prechnrdal rnesoderni. in cornparisnn with that nr 'ihling l'nrllrnls (Figure 40.E; arn111,J. When 0.5 or I pM Rn W<ls added at stage 9 to embryos l'ot1Linunu,1y l'.\pusL'd In 1/5000 dilutinn nl CiBH. tire elongation nl the A-I' axi .-. w:h rn:nvcrcd as well a;; the normal e..v.prcssion pattern or on2 and .flih tPigurc -ff.(;). We concludt' that the <1hili1y of Ro 1rcatrncn1 to rescue the teratogenic effect of the CIBI I suppnrls the idea that RA activity is elevated in GBHlr ea led cmhryu.-..
GBH Produces Similar Teratogenic Effects in Chick Embryos. To te~t whether the teratogenic cffrcls of GBH are reproducible in an amniote l'e11chrate, we chose the chick model. Embryos were incubated with 113500 or 1/4500 dilutions of GBH and analyzed i1t !he HI-I stage 9 (8 somile~J by immunofluorcsccncc with an anti-Pax6 antibody and by WM I SH with a c:-slrlr probe (6/ J. As was previously demonstrated for Pax6 mRNA (62J . the rax6 prolcin is norrnally distribulcd in the optic vesicle: in the' distinctive comet-like shape in the ectoclerm, pnsll'rinr tn tile region nf the optic vesicle; in the hindhrain in 1 hnrnhornerc.-; rJ and r.'i and along the spinal i.:nrd (Figure 5A,D). CiBH treatments produced a co11centratin11-depcndcnt reduction
EXHIBIT J - Page 366
Case 5:14-cv-00117-cr Document 63-11 Filed 11/14/14 Page 84 of 312

F Chem. Re.1'. Toxico/., Vol . . ux, No. xx, XXXX
A 600.
. ·~
Figure 4. Phenotype induced hy GIHJ is mediated hy an increase of RA signaling (A). Analysis of RA activity with the reporter plasmid RAREZ. All embryos were injected with the reponer plasmid RAREZ. except for uninjectcd controls. and left untreated or were treated as indicated in the figure until stage 14-15. when they were processed. Results arc expressed as arbitrary luminisccncc units per pg of protein. A two-tailed I lest wa~ empluyed lo analyze. the sig11illcance in the difference of the means. ** p < (J.01; **~ p < ilOOOL (B-(j) WMTSll for shit and otx2 at tailbud stages. (B) Control embryo. Notochord (nJ: floor plate (rp): brain (space between bars), eye (arrowhead). (C) Embryo treated with l/5000 GBH manitcsting microccphaly (space bcrwecn bars), reduced eyes (mrnwhcadl. diminished Shh signaling from the prcchordal mesodenn (arrow), and shonencd A-P axis (78%, 11 = 9). CD.El Embryos inl'Ubatcd with 0.5 and 1 /tM RA antagonist Ro 41-5253, displaying a rc.duction in tllc mx2 domain al·companicd by microccphaly (bars) and micropht:llmy (arrowhead), and more diffuse expression of shh (arrows) (80%·, 11 = 15 for 0.5 JIM Ro; 87%, 11 = 15 for I 11M Ro). <F.G) Embryos treated with I/5000 Gl3H at rhc 2-ccll stage; 0.5 pM Ro (Fl or I 11M Ro (G l was added at stage 9, and phenotypes were analyZl'd at the tailbud stage. Notice that Ro reverts the phenotype produced by Gl3H, rescuing the A-P axis elongation and the expression of shh and otx2 (compare with the control ernhryn in B) (RR%. 11 = 17 for 0.5 JIM Ro. which gives the best rescue effect since the effect of the retinoid antagonist begins to prevail with l pM Ro). All embryos arc oriented with the anterior end toward the right.
of the optic vesicles , as revealed by a reduction of the
corresponding Pax6 domain. and this was accompanied by
microcephaly (compare the space between bars in Pigure 58,C
with A). We also observed a gradual Joss of the r3 and r5
domains in embryos treated with GBH (compare Pigure. 5E.r with D). which resembles the results observed in frog embryos
in the krox-20 domains (Figures I B and 2EJ. Hybridization with
the c-shh probe showed that , as in Xe11op11s , the prl'chordal
mesoderm domain is preferentially Inst in GBH-lrcatcd chick
embryos (compare Figure .'iG with H.I). As the GBH concentra
tion increases, the expression along the embryonic dorsal mid line
also gradually disappears (Figure .'iH,IJ.
CONTROL GDll 114500
Paganelli et C1l.
GDll 1/3500
c ---
r
' I
. . ____ ...
shh
Figure 5. Tcrncogcnic effects of GBH in chicken embryos. (A-C) Whole-mount inmunonuorcscence analysis of Pax6 al 8 somites. (A,D) Control embryo showing Pax6 expression in the optic vesicles (arrowheads in A) and in rhombomcrcs r3 and rS (blue arrows in D). (13,E and C,FJ graded reduction of Pax6 expression in embryos treated with 1/4500 and 1/3500 dilutions of GBH, respectively. Notice the progressive microccphaly (compare space between bars with D) and the loss of Pax.6 expression corresponding to rhombomercs r3 and r5 (red arrows). The remaining fluorescence corresponds to specific Pax6 expression that is normally found in the spinal cord but is out of focus in the control embryo in D. (G-1) WMISH with c-shh. (G) Control embryo. Sil/I transcripts arc seen in dorsal midlinc cells (block arrow) and in the prcchordal mcsodcrm (green arrow). (H,I) Embryos treated with 114500 and 1/3500 dilutions of GOH, respectively. Notice the abolishment of sllll expression in the prcchordal mesoderm (dotted green arrow) and the progressive decrease of shlr expression in the midline cells in a conccnt1 ation-dcpcndent manner (dotted black arrows).
Therefore .. our experiments with chick embryos fu1ther extend
conclu~ions from studies about the teratogenic effects of GBH
in amphibians to other vertebrate species.
Discussion
The results presented above argue that both GBH rmd
glyphosate itself interfore with key molecular mechanisms
rt'gulating early development in hoth Xenopus and chicken
embryos. leading to congenital malformations. Sublethal doses
of the herbicide (430 /tM n1 glyphosale in 1/5000 dilutions of
GBH) and injections leading lo a final concentration of8 to 12
pM of glyphosale in the injected side of the embryo were
sufficient lo induce serious disturbances in the expression of
slug, otx2, and shh. These molecular phenotypes were correlated
with a di~ruption of dewlopmental mechanisms involving the
neural crest. embryonic dorsal midline formation, and cephalic
patterning. Because glyphosate penetration through the cell
membrane ~quires facilitation by adjuvants present in com
mercial formulations (5, 6), we tested the effects of glyphosate
alonl' hy dircetly rnicroinjecting ir into Xe11opu~· embryos. The
similarity of the phenotypes obtained in both situations suggests
that they are allributable to the active principle ot' GBH and
not Lo the acljuvams .
We will discuss our results in the following wnlext: (I) the
correlation of our phenotypes with those observed in animal
models with an impainnent or RA signaling or deficits in the
expression or critical genes that control embryonic development;
(2) the probable mechanisms underlying the phenotypes induced
by GBH and glyphosate ; (3) possible correlations with clinical
cases of human offspring exhibiting malformations in zones
exposed to GBH. Misregulation of RA, shh, and otx2 Are Involved in
Cephalic Malformations and Neural Crest-Derived Phenotypes Reminiscent of the EfTect.'i of GBH and Glyphosate. The phenotypes obtained after GBH treotments or injections of
glyphosate alone are strikingly reminiscent of those observed
as a consequence of an excess of RA signaling in vertebrates
and humans. Acute or chronic increase of RA levels leads to
teratogenic effects during human pregnancy and in experimental
EXHIBIT J - Page 367
Case 5:14-cv-00117-cr Document 63-11 Filed 11/14/14 Page 85 of 312

Teratoge11ic Effi'c/s 1if' G/yp/10.rnte
models. The characteristic fcaturcs displayed hy RA cmhryopathy in humans include brain abnnrnialilics such us microcephaly, microphlhalmia, and impairment of hindhrnin development; abnormal external and middle cars 1 microtia or ano1ia): mandibular and midl"acial underdevelopment; and cleft pali1te. r-.fony craniofacial 111alror111aliu11" can be a1t1ilH11cd lo dl'fel"ls in cranial neural crest cells (19, 24).
This spcclrum is consi.-;tcnl with the phcnutypcs obtained in rodent models exposed to RA. When administc1cd during gaslrulation in min:, RA severely impairs lhe tk1 clopmenl or the anterior neural plate, resulting in ocular, brain, and r~1ciiil
malfornrntions. Exposure al critical stagcs of 1wural cr(~,l cell migration induces craniofocial mall'n1 ma1iuns L'lrnlparahh:: to those seen in Di-Cieorge syndrome. LalL'I' expo'<tJl"e, when the epibranchial pl11cndes <11-.: active. J'L'Slllls in mnndihuloracial dysuslo.-;is-li[..c sy1Hlrom.:s I /91. Tiles.: au1h"1" sugge\t tlwl L'Xccssivc cell death i11 n:gillllS wh.:1e. apnptnsis nu1111ally lake> place may underlie• a f'_C11eral mc·cha11i,111 fur craniol·al·iul 11wlfo1matinns assnciatcd with tcratug.:11-,.
An c.\ccss of f{;\ signaling is <lbk tn dnwn-r.:gulate shh cxpr.:,sinn in the cmh1 y1111il' dorsal midline in Xe11np11s (60, 63 ). Shh cleticicncy is associated wilh holoprosenccphaly syndrome (HPE1, a CNS mall"u1rnatinn wilh a f1cquc11cy ol' 112.'i() nl pregnancies ~rnd JI I (}()(I() or Ii l'C births. IH'E j, ~I dckct generated by the dct1ciency of the embryonic dorsal midlinc. leading to a failure in lhe divbiun 111' the b1ain hc111isphc1es. This result-. in unilnhar brain. cyclnpia, am.I defects in the cloo;urc nf the dnr,al neural tu he, accompanied h~, othe1-dck'l"IS including micrclL~ephaly. <li1normally dccre•1scd distance hL't ll'L'l'll the eyt'' (hypotelrnism), prnhnscb. and c.:hoccplialy (a simple 1Hlse) (5/-53). Morl'oh~r. Shh ,ignaling i-. 11cc.:s.,a1) ln1 th.: development of the cianial neural cr.:sl derivatives. In the nwusc, specific removal or Shh responsiveness in the neural crest cells that give rise 111 skeleton and conn.:ctive tissue in lhc h.:i1d inc1·eases apoptrn,i~ and Jecrcas.:s pmlifcrntion in th.: lm1nchial arches. leading to facial truncations (64). In zebrafish, the cranial neural crest requires Shh .~ignaling emanating l"rom 1hc e1nhryonic dorsal midlinc and the oral tXtnLkrm 10 achil'vc correcl migration and drnnclrog.:ncsis (65). In chicken embryos. dcVl'lopmcnt nl" the lower.jaw skeleton requires Shh signaling fnnn the foregut cndodenn to prevent apllplnsis lll" lh.: neural nesl cells that migrate to the first branchial arch (66). Shh 'ignaling from the ventral mid line is necessary. as an antiapoptotic agcnl, for the survival or the neural cpilhclium. and it is abo essential for the rapid and extensive cxpan.,ion ol 1hc .:arly vesicles or lhe developing midhrain and rorcbrnin (67-69).
An excess or RA signaling also down-regulates otx2 expr.:ssion in Xenop11s, chicken, and mouse .:mbryos 124). KnocKmll mice for otx2 lacK all the brain slnJL'lLll'es rnll.:riur lo rhombo111ere J. Interestingly, heterozygous mutants showed crnnioraL"ial malformations including the loss or th.: eyes and lower jaw (agnathia). These phenotypes arc re111inisccnl of otoc.:phaly reported in humans and other animals and suggest that otx2 plays an essential role in the development ol' cranial skeleton'> of rncscnccphalic neural crest origi11 (70-72).
Otx2, in turn. is necessary !"or thl' .:xpr.:ssion of shh in the ventral midhrain (73). All this evidence indicates that RA signaling, otx2. and shh arc part of a generic cascade critical for the dcvelopmenl of the hrnin and crnniol"arial sKclelun 11r neural crest migin. Cilyphosatc inhibits the anlcriur cxpr.:s.,ion ol shh, reduces the domain or OIX2. prcvcnls lhc subdivision or the eye field, and impairs craniofacial devclopmcnl, resembling aspects of 1he hnloprcnsen:plwlic and olOccplrnlic syndnrn1cs.
Ch1!111. Res. Toxicr>/., Vol. xxx, No. _u, XXXX G
This prompted us lo investigate whether an increase of RA signaling could be mediating the effects or GBH treatments.
(;BH Increases the Activity of the Morphogen RA, Leading to Teratogenic Effects. In Xenopu.1· embryos, the endogenous activity of 1etinoicls gradually increases during early embryDgenesis and is finely regulated in space. Al late gastrula, a ro-,1ral-u1mlal gradient from ().()I lo 0.16 pM RA is e\lahlishcd, with lhc highest levels at the pnsterior end of the emhryu. The grndi.:nt persists al the early neurula stage (stage 13-1..J). Synthesis and degradation or RA seem lo be the 111cchanis111~ 1ha1 lead lo this unev.:n distribution (74). This gradient explains why low doses or applied RA primarily affect the cephalic region and increasing the doses begins to affect the t1 uni.. (20, 21 ). Mo1eover. maintaining a normal endogenous distrihu1ion of RA is important r·or axes patterning and organogcncsis not unly in Xe1wp11.1· (7{ 22, 38) hut also in other Ycrlchralcs such as zehrafish (75-77), chicken (78-80), and nHH1sc cmhryns (8/ i.
In this study, (JBH lrcallncnts or glyplmsate injections mostly reproduce the morphological phenotype obtained after treatments or Xenopus embryos with RA concentrations from O.J tn 10 ,u M (2 I). The fal:t I hat GB II treatments increase endogenous RA aL·tivity. w, measured by the RAREZ reporter, and that the C!B H-induccd phL·nolypcs arc rescued by the antirelinoid Ro strongly suggest that augmented RA activity is a major cause of the molc~ular and morphological phenotypes described in lhis work .
GBHs arc considered endocrine disruptors because of their ability tll impair the synthesis of steroid hormones (82).
Cilyphnsalc inhibit.\ the aclivily of arnmatase. a member of the rytochromc f'450 family crucial for sex steroid hormone synthesis 14). Rctinuid actil'ity ii> regulated hy degradation of RA hv the CYP2() cn1ymes, which arc members of the l'yluchrnmL: f'..J)() family and arc prcs.:nt in all vertebrates from c;1r\y stag.:s nr emhryngcncsis. Transcription or CYP26 is developmentally and spatially regulated. Deficiencies of this enzym.: produrc serious malformations in different ve11ehrate 1nodd' L't111sistcnt with an important increase in RA signaling. The~c phenotypes include cephalic defects, ahnrn malities of the C)C and the rnrchrain, agnathia, <11KI caudal truncations (83-90).
111 this context, ii will he inter.:sti11g tn elucidate in the future ii" the innt'aSL' ,1t RA 1>ignali11g inJucccl hy CillH rnulcl be a l"llllSCLJLICnl'l' nr inhibiting the aclivily of CYP26 enzymes 1csponsible l"or maintaining a normal RA distribution by specific tcrl"iln1 ial dcg1 adati1 Hl.
In Xe11op11s laeuis. RA ravnr,, the ditlerentialion of primary neun1ns (39, 60. 91 ). SinCL' GBll increases retinoid signaling, tli.: 1cdur1iun i11 th.: number of p1imary neurons in GBH-trealed and glyphosa1c-i11jcclcd embryos is paradoxical. Olht:r biochemical rncchanisms could be triggering the inhibition of nL'llrogenesis. h1r example, we cannot rule out that apoptosis of neural precursors could be involved in this process since GBH and glyphosate haw a toxic effect rn1 mitochondrial membranes <llld activate caspascsJ/7 (7). Bolh CiBH and glyphosate inhibit shh exp1essinn, and the Shh protein is known to have an anliapoplnti.: function. necessary for the survival of the. neuroepithclium 1_67. 68). Abnormal induction of cell Jealh is one or lhc~ crncial mechanisms or mall"ormations associated with di IT.:rcnl teratogenic agents such as ethanol. RA, hypoxia, and chemicals h.:rhicidcs (/9, 92).
A.-,suming a linear 1espnnse of the luminescence system with thl' RAREZ 1cpo1·ter used In measure RA signaling, we estimate that lhc c11dogc110us cnnccnlrntion of RA available for activity in Xe1111pu1· embryos i., around 0.2 ,uM (Figure 4A, compare
EXHIBIT J - Page 368
Case 5:14-cv-00117-cr Document 63-11 Filed 11/14/14 Page 86 of 312

H Chem. Res. Toxicol., \lo/. x.u, No. xx, XXXX
RA bar~ with the RAREZ bar). Thi., is very similar lo the average conccnlration or 0.1.'i ,uM previuusly n1castll'ed hy HPLC (20). !1npnrlanlly. liealments with I /50()1) dilution \ll' GBH do not show a significant increase or RA activity when compared to that ur u1Hrca1cd controls, as llh?asut\.:d hy the repo1ter sy.<;tc111 (Figure 4A). Ho\w1·cr. this dilution L:k:1rly produces cephalic and trunk phenotypes and aaniofacial malformations, as shown throughnut this work, which arc re.-;cued by Rn Ltcat111e1Hs. Therefore, the RAREZ reporter docs not seem tn he sensitive enough in dctcct 111inimal v:1riations in the lcvds or RA activity. This reinforces the importance of using ver'lehrnte cmbt'yos as hinsen,ors for testing possible? tcratogcns.
Moreover, it has been reccmly rcporll'.d that Triadimefon. a systemic fungicide with teratogenic effec1s in rodent nrndels. produces craniofacial malformations in Xe11op11s /ae1iis by altering endogenous R.i\ sigrwling l 93J. Arsenic. an(llher endoc1inc di~rupto1. also increase-, RA signaling at lnw. noncytnloxic dn.'>c.,. in human emhryPnic NT.2 cell;, ( 94). R;\ signaling i~ one Llf the !lnest pathways to lune up gene regulation during developlllL'llL and ~ill thi' evidence rai,es the pns,ihility that disturbances in RA dist1 ibutio11 may lw a nwre general llleChanbm lliHJerJying lhC tc1atngc11il' eflcCh oJ" XL'ilOIJiolics ill vcnehrates. Since meclrnnisrns ul dc\'clupn11•nt ~11"; highly cnnser ved in evolution an1011g \'Cl'tcbratcs ( 95). we would I ikc to >.tress thal Lh<''Y cuuld he u.,cl'ul as very se11si1i1·c hiuscnsnr., to detect The undesirable ctfrcts nf new molecules.
Clinical Approaches. In Argentina. the' C.\Le11siPn ol SPil devoted to transgenic sny rL'ached I lJ milli\111 hc·ctares . Two hundred million liters of glypho~ate-hased herbicide is used for a prnduL'tiun nf .'iO n1illinr1tons111' sny bean' per year (96, 97). The intcnsi1·e and extensive agricultural mndels based n11 the CiMO technological package arc currently applied without critic;il C\ alua1ion. r·igornus rcgulati11n,. a11d adequate i nlur matinn cdmut the impact of suhiel lrnl dnses Oil human health UllCI
the environment, leading to a conflicting situation. In this work. we focused on suhlethal dw;cs ol CiBH to •HTilc' :it The thrcslinkb for teratogenic phenotypes instead or lethality.
In lhe last 10 ye<u·s. several L'ountric.> in Lati11 Amnica hal'L' initiated studies about the environmental consequences or tl1e use or herbicides am] pesticide.-,. ]11 r.1raguay, <Ill epide1niulogical study in the nfl\p1i11g of womc·n c·xposl.'d duri11g pregnancy to herbicides 'ilmwcd :i1 cases nf 1nalrl•rn1a1ions t3). which strikingly resemble the wide spectrum phenol) [K'S resulting lrn111 a dysfunctional RA nr Shh signaling pathway. Jn Argentina. an inncase in the incidence ul congenital 111alto1111ations began to be rcponed in the lasl few years tDr. Hugo Lucc10. Urtill'I sidad Nacional Jct Nnrdestc, Chacu: pc1 sonal communication). In Crirdoha. several cases ui' rnali'ormallnns togethc:r \I ith repeated spontanenu' ahonions were ddected in Liie village 111 ltuzaing1'1, which is surrounded by GMO-based agriculture. ll1cse llndings were concentrated in families living a kw meters from whL'Ie the herbicides a1e regularly sprayed. All of thi.s information i' extremely worrying because the risk of cnvironmentally-imluced disruptions in human development is highest during the nitical period of gestation (1 lo 8 weeks) ( 981. Moreover. th.: mature human placenta has been shown to he penneahlc to glyphosatc. After 2.5 h or perfusion. IY:f of administered glyplmsate b transferred tn the ktal cnrnpanmenl ( 99).
All of the evidence reported in the scientific literature and the clinical observations in the field were not sufficient, however, lo activate the precautionary principle or the envirnruncntal legislation in order to realize the depth of the impact on human health produced hy herbicides in Cil'>'IO-based <1griculture. To our knowledge, the rcsulis prc·scrlled in this work show fpr the
Paga11e//i er al.
first time that at least some of the malformations produced by CJ BH in vc11chratc embryos arc due to an increase of endogenous RA <ll'tivity. cunsistent with the well-known syndrome produced by an e.\CL'.Ss of RA.
Acknowledgment. We acknowledge the following researchers J'or providing us with the constructs for making probes: David Wilkinson for krox-20. Michael Sargent for slug. Nancy Papalopulu for N-t11buli11, Ira Blitz for otx2, Jean-Pierre Saint Jeanne! ror rnx9, Thomas Hollcmann for {J(Lt6, and Cliff Tabin I'm c-shh. V./e nre <ilso gratcl'ul lo Abraham Painsod for the RAREZ plasmid. Dr. M. Klaus for providing Ro 41-52.53, and Bruce Blumhe1·g for useful discussions. We thank Ana Adamo for material support, Hugo Rios. Ezequiel Varela, and Ernesto CJ01m\lez t'or helping us with cl1id.:en experiments. and members or our lab !Cecilia Aguirre, Sabrina Murgan, and Diego Rcvinski) ror hl'iping with embryos and reagent preparations. We ahm thank Carlns Davin and Sandra Verstractcn for assistance in lu111i11L1;cence dewrmination. A.E.C. is paiticularly indebted w Bar de Cao. ;\ .R.P. and A.E.C. arc J'rorn Consejo Nacional de lnvestigaciones Cicntfficas y Tccnicas (CONICET) and Universidad de Buenos Aires. V.G. was supported by a fellowship 1'10111 ANPCyT, and H.A was supported hy a fellowship from llniversidad de Buenos Aires. S.L.L. is from CONJC'[T. Thi.-, work and th.: auth(lrs arc completely independent from industry. The authors declare no competing financial and com1ncrcial interests.
References
( J l vom Saal, F., antl Hughes, C. (2005) An extensive new literature concerning low-Jose clfrcts or bisphcnol A shows the need for a new risk a.ss''"111~1H. E111>ir011. Ht·alth P..r.1p~ct. 113, 926-9:13.
(2) Myers, J., Z11cller, R ., and vom Saal, F. (2CXl9) A clash or old and llL~W scicntilic com:cpls in to:dcily. with imponant implications for puhli.: hc·allh. E11uiw11. ffralth Pt•r.>pect. 117, 1652-1655.
(J) Bl'nftc1. Lciic. s .. Macd1i, l\'I. A .. antl Acosta, M. (2009) Malfomiacionl's Con!!Cnilus a~ociuda~ a :.igrolUxicos_ A1ch. Pediatr. /Jru1: 80, 237-247.
14) Ridmrd. S .. :V1uslemi, S. Sipahurar, H .. Bcnachour, N., antl Scralini, G. Ii. 1200.~J Dilkrcn1ial clkcls of glyphm.atc and roundup on human place11tal cl'lls a11tl arrnnatasc_ E1111inm ffra/th PaJpcct I 13, 716-720.
15) Hal'I,, R., Sch111i11.-Eihergl'r. M., Mainx, H. G., Mille)slaedl, W., and Noga, G. (2002) Stutlics on a new group of biodegradable surfactanL~ for glyphll,atc. Pe.11. Mwwg. Sci. 5li, 825-833.
(6) l\fan:, J .. Mul11cr-Lorillon, 0., Boulbcn, S., Hureau, D., Durand, G., and Bdle, R. 12002) PcsrkiJe Roundup provokes cell division dy,functio11 al lhc lcvd of CDK l/cyclin B aclivation. Chem. Re.f. Tmkol. 15, J26-JJ l.
(7 l Be11achour, N ,, a11d Saalini, G. E. 12009) Glyphosatc fon11ulations induce apoptosis antl necrosis i11 human umbilical, embryonic, and placen1al cells. C/i,.,,, R1·.1. To_iicol. 2~, 97-105.
(81 Gm.nier, C .. Du111onl. C., Benachour. N., Clair, E., Chagnon, M. C., ancJ Scrali11i, G. E. 12009) Glyphosale-basetl hcrhicidL•s arc toxic and cntlocri11e di,rurtn" in human cell line~. Toxicolo1;y 162, 184-19 I.
(9) Spirou.\ tlc Ventlom{iis, J., Roullicr, F., Ccllicr, D., and Scralini, G. E. (2009) A rnmparison of the effects of three GM com varieties on mammalian hcal1h . Int. J. Biol. Sci. 5, 706-726.
( 10) Marc, J.. Mulner-Lllrillon, 0 ., ;md Belle, R. (2004) Glyphosale-hascd pesticides affect cell cydc regulation. Biol. Cell 96, 245-249.
t 11) Bell~, R., Le, B. R., l\foralcs, J., Cossrn1, B., Conni er, P., and MulnerLorillon, 0. (2007) Sea urchin cmhryo, DNA-damaged cell cycle checkpoint :mt.I the mechanisms initiating c:mcer development. J. Soc. Biol. 201, 317-327.
( l 2) Marc, J., Belle, R., Morales, J .. Conni er, P., and Mulncr-Lorillon, 0. 2CXl4b FonnulaiccJ glyphosate activates the DNA-response checkpoint or the cell cyck leading to the prevention of G2/M lransilion. Toxicnl. Sd. 82, 4.16-442.
(13) Malias. F, Peraha, L., Ravi1ilo, J., Garcia, 0. H., Weyers, A., Ugnia, L., Gon£ale£. C. M., Lanipa, !., antl Gorla, N. 2009a Gcnotoxicity of /\MPA, the environmental metabolite of glyrhosate, assessed by the Co111ct as,ay antl cytogcnelic tests. Ecotoxicol. Eni>irm1. Saf 72, 834-837.
EXHIBIT J - Page 369
Case 5:14-cv-00117-cr Document 63-11 Filed 11/14/14 Page 87 of 312

Teratogenic Ejjects nf Glypho.1·ate
( 14) Manas. F., Peralta, L .. Raviolo. J., Garcia. 0. H .. Weyers, 1\., Ugnia, L., GonzalcL, C. ~L Lllrripa, I., aml Gorla, N. 2009h Gcnotoxicity oi' glyphosatc asse:>scd hy the comet a.,say and cytoi:;enctic tests. F.111-irrm. To.rim/. Plrarm"':ol. 2/i. 3 7-41 .
(15) Laj111;u11ivich. R. C .. Sandoval. M. T., and Peltzer, P. M. (200.l) Induction of mortulity aml 111alfon11atinn in Scinax nasirus tadpoles exposed to glyphusatc f'ormulatinns. 8111/. F.1111in111. Co111t1m. To.ricol. 70, 612-618.
(16) Apfel, C.. Bauer. F., Crcttaz. M .. Forni, L.. Kamber, M., Daurmann, F., LcMottc, P .. Pbnn, M., and Klaus, M. ( 1992) i\ rNinoic acid receptor;\ antagonist sclc<.:tivcly rnunteracts rctinoiL· acid effects. Pmc. Natl Acad. Sci. U.S.A. li!J, 7129-7 LU
(17) Moroni, M .. Viµano. M., and Mavilin, F. (199.li Regulation of the hulllan HOXD4 gene by rctinoids. Mcclr. Dcu. ·/.I. Ll'l - l.'i4.
(18) Lalllmer. E. J., Chen, D. T .. Hoar, R. M .. Agnish, N. D, Benke. P. J .. Braun, J. T., Curry, C. J,, Fernlwff, P. f\·I., Jr., Loll. I. T .. ct al. 1198.'i) Rctinoic acill emhrynpathy. N. Engl. J. ,\,fed. 313. 8.17- 841.
(19) Sulik. K. K., Cook, C. S .. mu.I Webster, W. S. (1988) Terato)!L'lls and craniofacial 111nlfon11ations; relationships to cell cfeal11 . D1•t:rlop11w11t 10./ !Suppl.). 211-DI.
(20) Du" con, i\. J., Tin1111en11ans, J. P .. Ha)!L', W. J .. Hcridrik,. H. F .. de Vries, N. J.. He.idcveltl, M .. and Nicuwk1•>p. P. D. ( 1989) Rdinnic aci<l i.:au~s m1 <mternpl'•sll'rio1 tra11s!'on11ati1111 in the dcvl'.lnrinµ l'l!lllral
ncrq>us system. N111111·e 3./0. 140-J 44.
(21) L6pl'L, S. L.. anll Carra.,co, A. E. (i9'l2) Retinuic acid i11dUL'L'' changes in the Jocali:1.atior1 of ht1rncoho,'(. pn>lciU!-. i11 Ilic a11h..·10-posrerior a_,j:-, or x'""'f'll.\' 1a.·1•i.1· L'lllhl)•(JS. f.frc/r. ne1 •. 36, 15.1-164.
(22) L6pcz. S. L, Dono. R., Zdkr, R., and C:t1Tasco, /\. E. ( \ 995) Differential effoct' of rdi11niL- acid a11<J a rc'linoid a11ta~onist 011 the spatial distribution of tlw honwop1otcin Hn.\h-7 iri Vl'rtL·h~atc embr\'OS. Dr/.'. D.1·11. ](!4, 457-n I. .
(23) Clolma11, F .. van Maclc-Fahry, G .. and Picard, J. J. (1~97) RdinniLacid induce\ ;i tissuc-Spl'L'ilit' llek!ion in th(' c.~pr"ssion dom:1in 111 Ocx2. Ne11rotoxi1·0/. Tt•mtol. 19, I 6~-169.
(24) Clmman. F., van Mack-Fabry, G., Chu-\Vu, L .. a11ll Pirnrd, J . .I. (1998) StructtirJI and )!L'nC exprc,sion ahnormalitic' indt1ccJ hy rctinok acid in the fori:hrnin. R<·prod. Tod,·ol 12, 169-176.
(2.'i) Padmanabhan. R ( 1998) Retinoic acid-inducci.1 caudal rq~n"si1111
sy11dromc in th~ mouse r,·111s. ffrpwd l'r1.ri.-ol. l'l. I J'J--1.51.
(:!ti) Gurdnn, 1. (1976) l11je..:tc<l 1111dci in frn)! nocytc" fate. cnlM)!L'llll'lll, ani.1 d1ro111atin dispersal. ./. Emhrwi E1p. Mnrplwl . .16, 52.1-.'i40.
(27) Nieuwkoor. P .. Fabl'r. J. 11994) Nor11111! Tahlc of .'frm.>11111· fo<'l'i.1· (Dmu/in), Garlani.I Puhlishing, Inc ., New Yurk.
(28) Harland, R. ( 1991) In ~ilt1 hybridization: an improved whok n1ount method l'or X1•1101J11.1· embryo,, M"rhod' Cd/ Biol 36, 6K.'i--69.~.
(29) Revinski. D. R .. Paganelli. A. R .. Carrasrn, A. E, :ind L6pez, S. L (2010) Delta-Notch siiinaling is in1 nlved in the segrc)!ation of the three germ lay~rs in Xt·1rop11J lae1•i.1-. fJl'1• Biol. 339, 477--492.
(30) Pi1ard, A., Hara111is, A, C'arni.,co, A. E. Franrn, P .. Lt\pct., S., ;u1d Paganelli, A. (2CX~J Whole-Mount in Situ Hybridi1.ation and Detc<:lion ol' RNAs in Yc11ebrnte En>hl)'"' a11ll lrnlated Or)!<u1s. in C11rrn11 Pm1ocol.1 i11 Molernlw lliology (1\usuhcl, F M., Eds.) pp l~.9. 1-14.9.24, Wiley, New Y<>rk.
0 I) Rns-.11tt. J., Zimgibl. R., Callo. D .. Sh:t)!o. M .. <lllll Gi)!Ut'fl', V. ( 1991) Exprcs~ion of a reti11oic acid response dcn1c111-h,placZ tra11sgcnc defines spccilic dL>mains of transcriptional activity during mou''' embl)•ogen..,si~. c;,.,,,._1· D1·1>. 5. I J.B-134~.
(.U) Kot-Lcihovich. H., anll FaillsOLi, A. (2009) Etlmnnl imluee' embryonic malfon11ation' by cmnpcling for retinaldchyde dchydrngenase a~tivity during vcrtd>rate gastrulatinn. Dis. MPdel Ml'l'il. 2, 295-305.
(33) loWI)' , 0. H .. Rosl'brnugh. N. J.. Farr, A. L.. anll Ranllall. R. J . ( 19.511 Protein JllcasL1rcmcn1 with the Folin ph,'nol n:av.cnt. J. Biol. Clre111. 193, 265-275.
(34) Hamburger, V., and Hamilton, H. L. ( 1951) A series or nonnal stages in the development of the chick crnhryu. I. !1<lorf'lrol. 118, 49·-92.
05) Mayor, R., Morgan, R., und Sarg..,nt, M. G. ( 1995) lnduclin11 or the pro.1pcctivc neural crest ol' Xenopus. D··1•..to1m1t•111 121, 76 7-777.
(36) Bradley, L. C .. Snape, A .. Blwll, S .. anLi Wilkinson, D. G. ( 1993) The structure and expression of the .'fr1101111s Krox-20 gene: cunscrvcll and diwrgcnt patlcms or c.~prc"ion in rhomhomeres and ncurnl crest. Mec:lr. De1'. 40, 73-84.
(37) Murphy, P .. Davidson, D. R., Hill, R. E., anll Morriss-Kay, G. /vi. ( 1992) Rctinoid-Induced /\llcn1tion' lll' Segmelltal Organization and Gene Exrrcssinn in the !\·louse Hindbrain, in Rt•ti11oids i11 Nr1mwl Dcl'1·!01mw11t 1111tl Terorogn1t'.1·iJ tMorri"-Kay. G .. Ell.), pp 229-240, Oxford University Press. Oxford, lJ K.
(38) Got.lsavc, S. F., Koster, C. H .. Gctahu11, /\., 1'·1uthu, M., Houivclll, M., van Lier Wees, J., HcnLi1iks, J., and Durston. /\ . .I. ( 1998) Graded retinoid responses in the developing hint.lhrain. D«1<. Dy11. 213, .l9-49.
Chem. R.eJ. To.ricol .. Vol. x.u, No .. \X, XXXX I
1~'11 Papalopulu, N .. a11d Ki11lncr, C. ( 1996) A poslcriorising factor, rctinoic acid. rcYca1' that anleroposterior pallaning controls U1e timing of neuronal diffcrc111ia1ion in Xe11op11.1· ncurocctoderrr. De1,elop111e111 122, .1409-:1418.
140) Sall<11!hia11i, B., and lliichaud. C.H. ( 1987) Ncur.il crest development i11 tli~ X1·11t1/J111· la1·ui.1· cmhryo, studied tiy inlcrspccilic transplantation aml "·a11ni11i; ckctron micro,cop)'. De11. Biol. 124, 91-110.
t41) L1\pc1. S., a11ll Carrasco, A. E. (2CXJ51 Sonic Hellgehog Signalling in Dofoal Midli11c De\'cloplllL'lll, i11 Shh 011d Gli Si1111aling a11d Dei1elop"'""' (Htiwic. S., anll Fislwr. C' .. Eds .. i Chapter I, p 111. LanLies Bio~ci~11Lt.', r\u~ci11, TX_
t42J Varjll,alo, :'vi, and Taipalt.'. J. (2008) Hcllgehog: functions and mcchanisin,. Ge11i:s D<'I'. 22, 2454-.!472.
1.-iJJ Li. H .. Tiernc), C., Wc11. L.. Wu, J. Y .. and Rao, Y. ( 1997) A slnglt: 111orphug.,'l1c1ic licld g.iv,'s rise tn two retina primordia under \he innucncc of tile prcclrnrdal plate. D~1·elop11u·11/ 12./, 603--015.
(-14) Walther. C .. anu Gru,s. P. t I 991) Pax-6, a murinc paired hox gene, is C.\prc."':d in Uw dcvduping CNS. D1·udop111e111 113, 1435-1449.
(45) Krnuss, S., Jnhan,;on, T .. Korth, Y .. anll Fjose, /\. il991) Expression p:1llctn of lrh1alish p:ix gcn<?s suggrsl a roil'. in early brain regionali1.ation. N11111ff 353. 2to7-270.
146) PUsd1d. A. W., Gruss. P .. ant.I Wcs1erlicld, M. (1992) Sequence and e.\11r,·ssion pallern or 1.111.r-6 arc highly rnnserved belwCl'n 1.ebraflsh anll lllicc. Ocl'l'i1111111<·111 11./, 64.l-651.
(47) CihL~cr, T., Jcpeal , L., Edwards, J. G., Young, S. R., Favor, J., and Ma:L,, R. L. ( 1994 J Pmr, gene dosage ~ff~cl in a family with congenital t-:H:1ra«h. aniridia, <111ophthalmia a11ll C«nlrul nervous system defe.ct. Nar. Gt'ne/. 7. -16.~ -471.
(481 Pan11csc, M .. Polo, C., i\11dreazzoli, M., Vignali, R., Kablar, B., Barsacehi, G .. and Bnncinclli, E ( 199.'i) The Xe1101m.1· homologue of Otx2 is a maternal homcobnx gene \hat demarcates and specifies anleriur body regions. De1•clop111rnt 121. 707-720.
149) Zygar, C. A .. Cmk. T. L., and Grainger. R. M. ( 1998) Gene activation during curly stages or lens i11ductio11 in Xe11op11.1-. De1•t:lop111ent. 125, .1)09-.~5 I 9.
(.'i()) Spokony. R. F .. Aoki, Y., Saint-Germain. N., Magner-Fink, E., and Saint-Jeanne!, l. P. t 2002) 111e tran"·1iplion factor Sox9 is required for cranial neural crest dcwloprne.nt in Xe11op11s. De1~·lorm1e111 I 29, 42 l-B2.
(.'ii) Chi:mg. C., Litin!,!lung, Y., Lee, E .. Young, K. E .. Corden, J. L. Westphal. H., and Beachy. P.A. ( 19%) Cyclopia and defective axial paltemi11g in r11icc lacking Sonic hellgc.IHig gene function. Nar11rt' 383, 407--413.
1.5~) Rcx's'lcr, E .. Bclloni, E, Gauden1, K., Jay, P .. Berta, P .. Scherer, S. W., Tsui, L. C., and Mucnkc, M. ( 1996) Mutalions in the human Sonic hcdg,·110µ gene cause holoproscnecphaly. Nm. Ge11e1. 14, 357-360.
1)3) Che11, J. K .. Taipale, J., Coo1,.,r, M. K .. and Beachy, P. A. (2002) lnhibilinn nf Hellgchog signaling hy direct binding ol' cyelopamine lo Smoolhcncd. Ge11«.r Dn'. /fJ, 2743-2748.
t54) Mark, M. Ghyscli11ck. N. B., and Chamhnn, P. (2006) Function of' rctinoid nuclear re.:eptor,; lessons from genetic and phannacological c.lisscctions or the rctinoic acid signaling pathway during mouse c1nhryogcncsis. t\111111. Reu. Plramlllco/. To.ricol . ./6, 451-480.
15:'\J Blumberg. B., Mar1gclsdorf', D. J .. Dyck, J. A., BitlllL•r, D. A., Evans, R. M .. anll De Rohcrtis, E. M. ( 1992) Multiple rctinoid-rcsponsive receptors in a ,;inglc cell: families or rctinoid "X" rcc~ptors and retinoic at•id receptors in the Xe11op111 <'·!!ll· Pmc. Nari. Ac"'/. Sci. U.S.A. 89, 2321-2325.
151i) Sharpe. C. R. ( 1992) Two i><Jfonns of rctinoic acid receptor alpha c'prL·sscd durinv XL'1wp11s dcvdopmenl respond lo rclinoic acid. Mech. !),., .. _l'i, 81-9-1.
t:'7l La1111nc.r, E. J .. and /\nn~trong, D. L. (1992) Malfom1aLions of Hindbrnin Structures am on)! Humans Exposed to Isntrctinoin ( IJ-d.rRL'linoic Acid) during Early Embryogcncsis, in Retirwid., i11 Nonna/ D .. udo1m1,·1111111d frratoi.:t•11c.l'is (Morri,;s-Kay, G., &!.) pp 281-295, Oxl'ord University Press, Oxforll, U.K.
(58) Ross, S. A .. McCaffery, P. J., Drager, U. C., anll Dt: Luca, L. M. (2000) RL•tinoids in L'mhryonal llevelopmcnt. Phy.rio/. Reu. liO, 1021-1054.
(59) 1\ndreauoli, M .. Pannes..,, M., anll Bondnclli, E. ( 1997) Activating :uid rcprcs:>ing signals in head devclop111cnl: the role of XoLX l and Xot.x2. Dt'1odop111en/. 124, 17.B-174J.
tliO) Franco. P. CJ., Paganelli. A. R., L<ipcz, S. L., and Carrasco, A. E. (I 999) Functional as~ocialion or retinoic acid and hedgehog signaling in Xc1101111s pri111ary ncurogcncsis. Dci•dorm1enl 126, 4257--4265.
(nl) Riddle, R. D., Johnson, R. L., Laufer, E., <Ind Tahin, C. (1993) Sonic hcdgdiog mediates the polarizing activity or the ZPA. Cell 75, 1401-1416.
(62) Li, H. s .. Yang, J. M., Jacobson. R. D., Pasko, D., and Sundin, 0. ( 1994) P;ix-6 is first expressed in a rc!_?ion or cclndcrm anterior to !he early neural plate: implications for stepwise t.lelermination of the lens. JJ,.,._ Biol. 162, 181-194.
EXHIBIT J - Page 370
Case 5:14-cv-00117-cr Document 63-11 Filed 11/14/14 Page 88 of 312

J Chem. Res. Toxirnl.. Vol. x.rx, No . . tx. XX.XX
(63) Shaqlc, C .. and Gol<i.htonc, K. (2000) Rctinoi<.1 sig11alli11g a,·1s duri11µ
the gastru1:1 stagL'.I lo promote pri111ary neurogcne;is. Int J. fJt'u. Biul. .u. 463-470.
f64) Jeong, J .. Mao, l., Tcn1.e11, T .. Kou111an11, A H. , and McMalllln, A. P (200-1) Hedgehog signaling i11 the 11cural cr,•sL cl'lls r,·µula1c1 1he paltcming an<.I growth Ill facial ptimordia r.n1<'.1 D.:1<. IS. 9.17-9) I.
(65) Wm.la, N .. fovidan, Y .. Ncbon, S .. Camey. T. J .. Kel,h, R. N .. and Schilli11g. T. F. 12005) Hcdgd10~ signaling is l\:<juired for cr.mial neural crest morphogenesis mid chondrogcnl'sis al the rnidlin<> in lhl' zchrafish
skull. Dt·i·elop111i:111 IJ:!, 3977-3988. (66) Brito, J. :'vi .. Tcillet, M. A .. and Le Douarin. N M. (2006) An early
role for "rnic hedgehog from forcgltl cndt1dcrm in jaw dcvdopmcnt:
cn,uring neural crest cell sun il'al. Prue. Natl. 1\rnd. Sci. US A. 103, 11607-11612.
(67) Le Dnuarin, N. M .. ~u1d Halpern. M. E. 12t)()()) Di,cu";inn point. Origi11
and sp.xilkation of the neural tul>c. ll<'<>r plate: insights lrom th<' chkk and lCbral\sh. Curr, 011i11. Nt'1m1hiol. JO, D-30.
(68) Charrier, J. B .. bpoinlc, F, Le Douarin, N. M., and Teilkt, M. /\. (2001) Anti-apoptotic mle or Sonic l1cdgehoµ protein al the early '!ages of' nerV1)lls system organogcnt>sis. 01•vt.'!opmrnr 128. -l01 l-I020.
169) Brillo, J., Ta1111ahill, D., and Keynes, R. I 2002) A cr1tical role for sonic hedgch11g signaling in the ,·arly expansion or the ucvclopin)! hrain. Nat Nt'uro.w·i. 5, I 03-1111.
(70) Matsuo, I.. Kuratani. S .. Kimum, C., Tal..eda, N .. and Aizawa. S. ( 1995) Mou-<e Otx2 fu11ctio11s in the formation anu p<llkmini,: of n'>'tral head. r.ell<'.t Det'. 9, 2646-2658.
t71) Kimura. C ., Takc•da. N., Sutuki, M .. (hhi111ur:1, M .. Ai1.awa, S., and Mat.<uo, I. ( 1997) Cis-actin~ clcincnts consen ~d hdwccn mriuse and
pull'erli.~h Otx2 genes go1·e~n the exprcssinn in mcscnccphalk llL'llml crest cdls. Dn•t•lopmml 12.J, 3':!29-.W.t I.
(72) Erlich, M. S., Cu1111infha1n. 1\-1. L. , and Hudµi11s. L. (20ll0) Transrni;.
sinn of ihc dysgnathia '"m1plex I nuri rnulhcr to 1bu,>!hlcr. :\111 .I. M1:tl. Gt'111·1. 95, 269-274.
(73) Jin, 0., Harpal. K .. Ang. S. L.. and Rn"""'· .1 . 1_2001) Otx2 and
HNF3hcta genetically inh~racl in anterior palkming. l11t. J. Dt'I'. Biol. .J5, 357--365.
(74) Cheu. Y .. Huang. L .. and Sulursh, M. (1994) A '"""·cntralion !!radicnl nf rctinoius in the early Xmop11.1 lr1t·uis crnhryo D~'" Biol. /(j/. 70-76.
(75) Marsh-Annstrun)!, N .. McCafft•ry, P .. Hyau. G ., Alonso, L .. Dl)wling. J. E .. Gilhcrt, W., and Drager, U. C. (1995) Rctinoic· acid in the antcmposlcrior p:1llcrning of the zebratish trunk. Ro11x'.1· Affir. Dl'1 '. Biol. 205. I 03-1 I J .
176) Grw1dd, H .. Lun. K .. Rauch. G . J .. Rhinn, M .. Piotrowski, T., Houan. C .. Sordino, P .. Kuehler. A. M .. Schulle-J\·krhr, S .. Gciskr, R., ct al.
(2002) Rctinoic acid signalling in the zehralish crntiryo is lll'<'cssary during pre-segmentation stage' tu pancrn the antcrinr-p<"terior axi'
oflhe CNS and lo induce a pcctor:il 1111 bud. De1Y''"'"""111 129, 2851-2865.
(77) Dohhs-McAuliffc, B .. Zhao, Q .. and Linney, E. (2004) Fcedhilck
mcdrnnisrns regulate n:linoic acid production and degradation in the zcllraftsh embryo. Mel'lr. Dev. 121, .\39-350.
(78) Maden. M. (2000) TI1c rok of rctinoic acid in emhryonk and P"'t
ernbryonic dcvcloprncnl. Proc. N1111 . Soc. 59, 65-73. 179) Bcri;grt'n, K .. MrCaffory, P .. Drai,:cr. U .• and Forehand. C. J. ( 1999)
Dilfrrcntial Jistrihution or rel inoic acid 'Ynthcsi' in the chicken
crnhryo as dctennincd hy immu11olncali1ation of the rc.tinoic acid synthetic cnlymc. RALDH-2. Dt•11. Biol. 2 JO, 288-30-k
(1!0) Chen, Y., Huang. L. Russo, A. F .. a11d Solursh. 1\1. 1199.!I Rctinoic acid is cnricheu in Hensen·, no<lc and is Jcvelnp111entally rcgulalcd iu the early chicken e111hryo Proc. Natl. ;\rnd. Sci. Cl.SJ\. 89, J[)(l5f>
J 0059. (81) Ang, H. L, Dcltour. L., HayamiLu. T. F .. Zgomhic-Knight, M., and
Ducslcr, G. ( 1996) Rcti11oic aciJ synthesis in mouse e111bry11' Jurin)!
gastrulation anu craniol'acial del'l'lnp111c111 linked lo cla" IV akolml dchydrogcn<1M! gene expn:"ion. J. Hiol. c1r .. ,,,. 271' 9)26-9.~.1.t.
182)
(83)
(84)
(85)
(86)
(87)
(88)
189)
190)
191)
(92)
t9J)
19.:1)
(9.'i)
(961
197)
198)
199)
Paganelli et al.
Walsh, L. P .. McConnick, C., Martin, C .. aud Stocco, D. M. (2000)
Roundup inhibits slcroidogcncsis by disrupting stcroillogenic acute regulatory (St/\Ri protein expression. E111.'iro11. Health PerJpect. 108, 769--776. de Roos, K., S11n11cvcld, E., Compa:m, B., Len, B. D., Durston, A. J., and vm1 c.Jcr Saag, P. T. ( 1999) Expression of relinoic acid +hydroxy
bsc (CYP26J during mouse and Xc11op11.1· laet1i.1· embryogenesis. Mech. o .. u. 82, 205- 211.
Maden, J\·1., Sormcvcld, E., van dcr Saag, P. T., and Gale, E. (1998) The distrihutinn or cncJogcnDus rctinoic acid in the chick embryo:
implications for dcvclopmcnllll inechm1is111s. Daelopme111125, 4133-4144. Sakai. Y .. Meno. C., Fujii, H .. Nishirw. J .. Shiratori, H., Saijoh, Y., RDssant, J., anu Hamada, H. (200 I) TI1c rclinoic acid-inactivating cn1.y111c CYP26 is essential i'<>r cslahlishing an uneven distribution of
rctinoic add along th!' m1tcrio-poslerior axis within the mou~ embryo. Gou·.1· Dt•1.•. 15, 213-215. Gongal, P. A .. and Waskiewicz, A. J. (2008) Z.Cbrafish model or
holoproscnccphaly demonstrates a key role. for TGIF in regulating rctinoic add 111etaholis111. ff11m. Mo/. Genet. 17, 525-538.
Hcmfouc1 , R. E .. Putzkc, t\. P .. Myers, J. P .. Margaretha. L., and
Mucns. C B. (20071 Cyp26 cnzy111cs generate the rclinoic acid rcspo11se patwrn 11cccssary t'or hinubrain development. De1•e/opme111 I.I~. 177-1 X7. Rcij11\je" S .. Ro<laway, 1\., a11d Maden. !\·I. (2007) TI1c retinoic acid metabolising gene, CYP2613 f, pallL•rns the cartilaginous cranial neural
crest in zchralish. Int. J. Del'. Biol. 51, 351 - 360.
Ducsk'r, G. 12(Kl8) Rcli11oic ai.'iu sytllhcsis and signaling during early
or);!anog,·11csis. Cd/. 134, 921--931.
Niedcrrcither, K .. and DoM, P. (2008) Retirroit: acid in development:
towards a11 intcgratcu view. Nat. Rei'. Gt•11,·1. 9, 54 I ·-553.
Blu111llt:rg, B .. Jr .. Morc110. T . A .. Kintner. C., Evans, R. M., and
Papalopulu, N. ( 1997) i\11 essential role for retinoiu signaling in :u1tcropostcrior neural pallcrning. Dcl'<'io11111e11t 12.J, 373-379.
Ahlg1\.'11. S. C .. Thakur, V., aml Bronner-Fraser, M. (2002) Sonic hcdgl'11og rc,cucs cranial neural crcM from cell death induced by
ethanol cxpnsun:. f'mc. Nut/. Arnd. Sci. IJ.S.A. 99, 10476-10481.
Papb. E .. Bernardini. G., Gomati, R., Menegola. E .. and Prati, M.
12007) Gene t!Xpn:ssion in Xe11op11s /acuis embryos after TriadimeFon c .\posurc . r,,.,,., Erp. Pa11em.r 7, 137-142.
Davey. J. C., Nrnnikos, A. P .. Wungjiranirun, M .. Shemian, J. R., lngrnm, L., Batki, C.. Lariviere. J. P., and Hamilton, J. W. (2008)
Arsenic "' an endocrine di~ruplor: arsenic disrupts retinoic atiu
receptor-and lhyruid horn1onc rcceptor-111cdialcd gene regulation and thyroi<l honno11,·-111cdiatcd a111phihian tail metamorphosis. Ent1im1L lfr11/tli ?aspect I J(i, 165-172. Siem, C. (2005) G1rnrulatim1: From Cells w Emhrvo (Stern, C. D., Ed.) Cold Spring H:lfhnr Laboratory Press, New y,)rk.
Tc11hal . M .. Dnmrnguez, D., Sabatino, P. (2005). Transfomiaciones aw<1rias c11 la argcnti11a. Agrit:uhurn i11Juslrial y ~istema agroalimen
tario. In: El u1111po argl'l1ti110 en la e11cr11cijada. E.rtrategiti.t y l'C'si.1t<·11ci1n sociale.1·, <'l'os ;•11 /11 ciudad. (ed. Giarracca, N. Teubal,
M.1. pp 37-78. Buenos Aires: Alia111.a Ed.ial.
Teubal. !\·I. (2009) fapansi1)11 dcl modelo sojcro en la Argentina. De
la production de alimc11tos a los commodities. in La pa.n'.rlenda de/ rn111pe.,i11wlo "" America Lt.11i1111 (Lizarraga, P .. and Vacallores, C .. fab.) pp 161-197, Comunidad dt• Estudios JAINA. Tarija.
Gilbc.rt, S. (2003) In Dei•elopmnrla/ Biology, 7th ed., Sinauer A"ociates, Inc., Su11dcrla11d, MA.
Poubcn, M. S .. Rytting. E .. Mn,c, T .. a11d Knudsen, L. E. (2009) Moddi11g placental Lran,port: rnrrclation of in vitro BcWo cell
pcnncahilily a11J c.\ vivo human placental perfusion. Toxicol. i11 Vitro 23, I 380.- 13XA.
TX1001749
EXHIBIT J - Page 371
Case 5:14-cv-00117-cr Document 63-11 Filed 11/14/14 Page 89 of 312

Evaluation of DNA damage in an Ecuadorian population exposedto glyphosate
César Paz-y-Miño1,2, María Eugenia Sánchez1,2, Melissa Arévalo1, María José Muñoz1, Tania Witte1,
Gabriela Oleas De-la-Carrera1 and Paola E. Leone1,2
1Laboratorio de Genética Molecular y Citogenética Humana, Escuela de Biología,
Pontificia Universidad Católica del Ecuador, Quito, Ecuador.2Unidad de Genética, Facultad de Medicina, Pontificia Universidad Católica del Ecuador, Quito, Ecuador.
Abstract
We analyzed the consequences of aerial spraying with glyphosate added to a surfactant solution in the northern partof Ecuador. A total of 24 exposed and 21 unexposed control individuals were investigated using the comet assay.The results showed a higher degree of DNA damage in the exposed group (comet length = 35.5 µm) compared to thecontrol group (comet length = 25.94 µm). These results suggest that in the formulation used during aerial sprayingglyphosate had a genotoxic effect on the exposed individuals.
Key words: comet assay, DNA damage, Ecuador, genotoxicity, glyphosate.
Received: May 24, 2006; Accepted: November 7, 2006.
Glyphosate is a non-selective herbicide which is the
main chemical component in many systemic herbicides
used to control most annual and perennial plants. It controls
weeds by inhibiting the synthesis of aromatic amino acids
necessary for protein formation, which link primary and
secondary metabolism in susceptible plants (Carlisle and
Trevors, 1988; U.S. Forest Service, 1997).
According to some reports glyphosate shows no ad-
verse effects on soil microorganisms, it is relatively non-
toxic to fish (U.S. Forest Service, 1997) and is of relatively
low toxicity to birds and mammals, including humans (Batt
et al., 1980; Evans and Batty, Williams et al., 2000;
Goldstein et al., 2002). However, Lioi et al., (1998) re-
ported de induction of oxidative stress and mutagenic ef-
fects for some pesticides, including glyphosate, in bovines
and Paz-y-Miño et al., (2002a) reported that some pesti-
cides were associated with genetic damage in human popu-
lations subjected to high pesticide exposure levels due
intensive use, misuse or failure of control measures.
Since January 2001, the northern area of Ecuador
(mainly Sucumbíos district) has been subjected to aerial
spraying by the Colombian Government with Roundup-
Ultra, a herbicide formulation containing glyphosate, poly-
ethoxylated tallowamine surfactant (POEA) and the
adjuvant Cosmoflux 411F which is a propriety Colombian
component probably included to aid the adherence or ab-
sorption of the herbicide (Ministerio de Relaciones Exte-
riores, Ecuador (MREE), 2003). According to the National
Narcotic Council for air spraying of illicit cultures the load
of the airplane was 1137 to 1705 liters and the effective un-
loading with Roundup Ultra (43.9% of glyphosate) was
23.4 liters ha-1 equivalent to 10.3 L ha-1 of glyphosate
(Acción Ecológica, 2003, Nivia, 2001). The main purpose
of spraying glyphosate in this formulation is to eradicate il-
licit crops grown in this area, and several research projects
have been carried out to investigate the consequences of the
use of this formulation in Ecuador (MRE, Ecuador, 2003;
Acción Ecológica, 2003).
The comet assay can be used to evaluate DNA dam-
age and provides a useful tool for estimating the genetic
risk from exposure to complex mixtures of chemicals
(Paz-y-Miño et al., 2002b), this assay having been widely
applied in genotoxicity studies of factors such as X-rays
and pesticides (Singh et al., 1988; Tice et al., 1990; Scar-
pato et al., 1996; Slamenová et al., 1999; Blasiak et al;
1999; Garaj-Vrhovac and Zeljezic, 2000; Paz-y-Miño et
al., 2002a; Paz-y-Miño et al., 2002b; Acción Ecológica,
2003).
The aim of the study described in this paper was to de-
termine the possible influence of the formulation of
Genetics and Molecular Biology, 30, 2, 456-460 (2007)
Copyright by the Brazilian Society of Genetics. Printed in Brazil
www.sbg.org.br
Send correspondence to César Paz-y-Miño. Laboratorio de Gené-tica Molecular y Citogenética Humana, Escuela de Biología, Facul-tad de Ciencias Exactas y Naturales, Pontificia UniversidadCatólica del Ecuador, P.O. Box 17-01-2184 Quito, Ecuador. E-mail:[email protected]
Short Communication
EXHIBIT J - Page 372
Case 5:14-cv-00117-cr Document 63-11 Filed 11/14/14 Page 90 of 312

glyphosate used during aerial spraying in northern Ecuador
on the genetic material of exposed individuals.
The exposed (E) group consisted of 24 randomly se-
lected individuals (Table 1) who lived 3 km or less from an
area on the border between Ecuador and Colombia where
aerial spraying with a glyphosate-based herbicide had oc-
curred continuously during three days between December
2000 and March 2001, sporadic aerial spraying continuing
for three weeks following continuous spraying (MREE,
2003, Acción Ecológica 2004). Exposed group individuals
manifested symptoms of toxicity after several exposures to
aerial spraying, with half of the individuals in this group
having received spraying directly over their houses and the
other half living within 200m to 3 km from the sprayed ar-
eas.
A clinical history was completed for each of the ex-
posed individuals and a wide-range of reactions were
noted, including intestinal pain and vomiting, diarrhea, fe-
ver, heart palpitations, headaches, dizziness, numbness, in-
somnia, sadness, burning of eyes or skin, blurred vision,
difficulty in breathing and blisters or rash (MREE, 2003;
Acción Ecológica 2003).
Venous blood (5 mL) was taken from the exposed in-
dividuals between two weeks and two months after their
exposure to aerial spraying and processed immediately af-
ter collection.
The blood samples analyzed in this study were pro-
vided by Dr. Adolfo Maldonado, a specialist in tropical
medicine and a member of the Ecological Action founda-
tion and part of the group of investigators of the Interna-
tional Commission on the Impact on Ecuadorian Territory
of Aerial Fumigations in Colombia. This study was ap-
proved by the Bioethics Committee of the Pontifical Catho-
lic University of Ecuador, according to the international
guidelines. Each individual completed a personal and bio-
medical survey and gave their informed consent to be part
of this study. In the case of the adolescents involved in the
study (14-17 year-olds) their legal guardians, as well as
themselves, gave their informed consent.
All of the individuals included in this study combine
their activities mainly in the house and sometimes cultivat-
ing and harvesting. This persons neither used herbicides,
pesticides nor similar substances in the named activities
(Acción Ecológica, 2004).
Paz-y-Miño et al. 457
Table 1 - DNA damage assessed by the comet assay in individuals exposed (E) to glyphosate and unexposed (U) control individuals. Note that the same
numbers (1, 2, 3 etc.) for the individuals does not indicate that the exposed and control individuals were matched.
Exposed to glyphosate Unexposed controls
Individual
(gender,
age)a
Number of cells scored in each group DNA migration (µm) Individual
(gender,
age)a
Number of cells scored in each group DNA migration (µm)
A B C D E Mean Median A B C D E Mean Median
1E (F, 53) 2 120 76 5 3 39.5 32.5 1U (F, 17) 150 59 3 0 0 26.2 25.0
2E (F, 37) 13 92 82 14 0 44.1 32.5 2U (F, 40) 164 43 4 0 0 25.4 25.0
3E (F, 40) 2 64 62 77 4 56.6 52.5 3U (F, 26) 165 40 2 0 0 25.7 25.0
4E (M, 27) 8 75 64 47 8 49.2 37.5 4U (M, 14) 111 96 6 0 0 27.3 26.5
5E (F, 44) 9 138 63 3 0 34.6 30.0 5U (M, 32) 165 38 3 0 0 25.9 25.0
6E (F, 50) 51 113 30 3 0 30.8 27.5 6U (M, 21) 171 35 1 0 0 25.7 25.0
7E (F, 38) 21 139 48 3 0 33.2 30.0 7U (M, 16) 177 25 6 0 0 25.8 25.0
8E (F, 46) 21 116 72 4 0 35.2 30.0 8U (F, 47) 176 25 3 0 0 25.7 25.0
9E (F, 55) 26 100 84 1 0 32.8 30.0 9U (F, 15) 190 14 1 0 0 25.2 25.0
10E (F, 50) 26 100 84 1 0 34.2 30.0 10U (F, 36) 179 25 1 0 0 25.4 25.0
11E (F, 22) 28 123 60 0 0 32.0 27.5 11U (F, 21) 150 46 9 0 0 26.3 25.0
12E (F, 27) 11 130 63 6 0 33.7 30.0 12U (F, 43) 148 49 15 0 0 26.8 25.0
13E (F, 28) 40 132 40 2 0 31.0 30.0 13U (F, 53) 161 27 10 0 0 26.1 25.0
14E (F, 59) 10 96 99 1 0 36.4 32.5 14U (F, 35) 164 23 21 0 0 27.0 25.0
15E (F, 55) 35 110 62 1 0 32.7 30.0 15U (F, 38) 169 28 11 0 0 26.4 25.0
16E (F, 17) 60 101 44 1 0 31.3 37.5 16U (F, 22) 183 15 8 0 0 25.1 25.0
17E (F, 34) 7 114 57 2 0 33.4 30.0 17U (F, 71) 191 8 5 0 0 25.0 25.0
18E (F, 45) 10 150 50 4 0 33.0 30.0 18U (F, 39) 195 13 6 0 0 25.5 25.0
19E (F, 28) 13 160 44 0 0 31.1 27.5 19U (F, 21) 179 20 8 0 0 25.9 25.0
20E (F, 21) 1 153 47 3 0 33.2 30.0 20U (F, 50) 190 14 2 0 0 25.3 25.0
21E (F, 34) 2 130 25 1 0 31.8 30.0 21U (F, 43) 150 56 9 0 0 26.4 25.0
22E (F, 23) 0 29 173 2 0 39.3 37.5
23E (F, 34) 2 88 115 1 0 35.5 37.5
24E (F, 42) 93 103 9 0 0 27.6 27.5
Mean age = 38 ± 12.2b 35.5 ± 6.4c 30 ± 5.4d Mean age = 33 + 15 b 25.94 ± 0.6c 25 ± 0.3d
aF = female; M = male, b,cMean ± standard deviation (SD), dMean median value ± SD.
EXHIBIT J - Page 373
Case 5:14-cv-00117-cr Document 63-11 Filed 11/14/14 Page 91 of 312

The unexposed (U) control group consisted of 21 un-
related healthy individuals living 80 km away from the
spraying area. They were similar to the exposed group re-
garding their demographic characteristics and occupation
but were not matched controls. Blood samples were col-
lected and processed as for the exposed group, but not con-
comitantly.
None of the individuals analyzed in this study (nei-
ther the exposed group nor the control group) smoked to-
bacco, drank alcohol, took non-prescription drugs or had
been exposed to pesticides during the course of their nor-
mal daily lives. All of the individuals included in this study
mainly worked at home, sometimes cultivating and har-
vesting crops without the use of herbicides, pesticides or
similar substances in the named activities and their win-
dowed houses did not contain asbestos in the ceilings or
roofs (Acción Ecológica, 2004).
The Comet assay is a rapid and sensitive method for
the detection of DNA damage induced in vivo (Singh et al.,
1988, McKelvey-Martin et al., 1993, Monroy et al., 2005)
or after environmental and occupational exposures (Alber-
tini et al., 1996, Leroy et al., 1996).
The blood samples were assayed using the alkaline
comet assay as described by Singh et al., (Singh et al.,
1988) with the modifications implemented in our labora-
tory (Paz-y-Miño et al., 2002). The comet assay slides were
analyzed at 400x magnification using a Zeiss fluorescence
microscope equipped with a calibrated ocular micrometer
and a 50 W mercury lamp with and excitation filter of
515-560nm and a 590nm barrier filter.
Cells were visually allocated to classified one o five
predefined categories (A-E) according to the amount of
DNA in the comet’s tail, tail and a rank-number of from 0
(A) to 400 (E) was assigned to quantify the damage in each
cell and calculate a mean of the amount of DNA damage
(Anderson et al., 1994).
To measure the head-to-tail comet length randomly-
selected cells from the center of the gel were measured us-
ing a calibrated scale and DNA migration was determined
by measuring the nuclear DNA and the migrating DNA
(Singh et al., 1988).
An average of 200 cells per individual was scored and
the mean and median comet length from each individual
was used for statistical analysis by the Mann-Whitney U
test, which was applied to determine the differences be-
tween exposed and control group in the comet assay.
We found that individuals in the group which had
been exposed to spraying with the glyphosate-containing
herbicide showed higher DNA migration levels than con-
trols (p < 0.001), the exposed group having a mean total mi-
gration level of 35.50 µm as compared with 25.94 µm for
the control group (Table 1). Comet types D and E were not
observed in the control group (Table 1).
This work reports the results of the cytogenetic moni-
toring and DNA damage assessment of individuals exposed
to aerial spraying of glyphosate in the northern part of Ec-
uador. A study of the genotoxicity of chemicals, such as
glyphosate is important because of their possible conse-
quences on human health and their association with cancer,
as has been published in similar studies with pesticides
(Paz-y-Miño et al., 2002a). The Alaska Community Action
on Toxics (ACAT, 1998) factshhet, other studies like
Arbuckle et al., (2001) and Richard et al., (2005) reported
that when people ingest or absorb glyphosate through their
skin or bathe or drink in water contaminated with this herbi-
cide a wide range of symptoms can occur, such as head-
aches or reactions which affect the eyes, skin, lungs, heart,
blood cells and genitals and gonads. Ecuadorian govern-
mental data confirms the existence of health problems asso-
ciate with such symptoms in the spraying zone (MREE,
2003).
Published data showed that chromosomal damage in-
duced by pesticides appears to be transient transient in
acute or discontinuous exposure but cumulative in continu-
ous exposure to complex agrochemical mixtures (Bolog-
nesi, 2003).
Formulated herbicides containing glyphosate are
more potent mutagens to animals and humans than pure
glyphosate, most probably due to the concomitant effects of
additional toxic components, such as surfactants (ACAT,
1998). The aerial spraying on the border between Ecuador
and Colombia used 44% of Roundup-Ultra (see above) but
the recommended application rate of this formulation in the
USA is 1.6% to 7.7% up to a maximum concentration of
29% (MREE, 2003) and according to Acción Ecológica
(2003) the application rate of the formulated product must
not exceed 0.95 L ha-1. In the area of our study the applica-
tion rate was 23.4 L ha-1 (10.3 L ha-1 with respect to
glyphosate) and therefore more than 20 times the maximum
recommended application rate for the formulated product,
which may explain our comet assay results (Table 1)
(Acción Ecológica, 2003, Nivia, 2001).
The analysis of genes implicated in the process of
DNA detoxification, would be useful to understand the ge-
netic influence of some chemicals like glyphosate. In our
study factors such us age and DNA damage were not found
to be related and because most members of the exposed and
control groups were female we cannot conclude anything
regarding the influence of sex on the results of the comet as-
say. Similar results have been reported in other investiga-
tions, which report that in general terms sex and age seem
to have little, if any, effect in pesticide exposed populations
(Carbonell et al., 1993, Steenland et al., 1986).
However, we did find a higher degree of DNA dam-
age in the exposed group compared to the control group
(Table 1). The significant increase in DNA damage levels
observed seem to reflect a general response to the formula-
tion used during aerial spraying, since none of the individu-
als in the exposed group smoked tobacco or drank alcohol
458 Glyphosate related DNA damage
EXHIBIT J - Page 374
Case 5:14-cv-00117-cr Document 63-11 Filed 11/14/14 Page 92 of 312

or had been exposed to other pesticides when the samples
were taken.
Our findings suggest the existence of a genotoxic risk
for glyphosate exposure in the formulation used during the
aerial sprayings and indicate the need for further studies on
individuals exposed to glyphosate to determine its possible
influence on genetic material.
Acknowledgments
We are grateful to Dr. Adolfo Maldonado, specialized
in tropical medicine, for providing us the blood samples an-
alyzed in this study. He is member of Ecological Action
Foundation and part of the group of investigators of the “In-
ternational Commission of Impact over Ecuadorian
territory of Aerial Fumigations in Colombia” FUNDACYT-
PUCE PIC 015 Project.
References
Albertini RJ, Nicklas JA and O`Neill JP (1996) Future research
directions for evaluating human genetic and cancer risk
from environmental exposures. Environ Health Perspect
104:503-510.
Anderson D, Yu TW, Phillips BJ and Schmezer P (1994) The ef-
fects of various antioxidants and other modifying agents on
oxygen-radical-generated DNA damage in human lympho-
cytes in the comet assay. Mutat Res 307:261-271.
Arbuckle TE, Lin Z and Mery LS (2001) An exploratory analysis
of the effect of pesticide exposure on the risk of spontaneous
abortion in an Ontario farm population. Environ Health
Perspect 109:851-857.
Batt BD, Black JA and Cowan WF (1980) The effects of glypho-
sate herbicide on chicken egg hatchability. Can J Zool
58:1940-1942.
Blasiak J, Jaloszynski P, Trzeciak A and Szyfter K (1999) In vitro
studies on the genotoxicity of the organophosphorus insecti-
cide malathion and its two analogues. Mutat Res 445:275-
283.
Bolognesi C (2003) Genotoxicity of pesticides: A review of hu-
man biomonitoring studies. Mutat Res 543:251-272.
Carbonell E, Xamena N, Creus A and Marcos R (1993) Cyto-
genetic biomonitoring in a Spanish group of agricultural
workers exposed to pesticides. Mutagenesis 8:511-517.
Carlisle SM and Trevors JT (1988) Glyphosate in the environ-
ment. Water Air Soil Pollut 39:409-420.
Evans DD and Batty MJ (1986) Effects of high dietary concentra-
tions of glyphosate on a species of bird, marsupial and ro-
dent indigenous to Australia. Environ Toxicol Chem
5:399-401.
Garaj-Vrhovac V and Zeljezic D (2000) Evaluation of DNA dam-
age in workers occupationally exposed to pesticides using
single-cell gel electrophoresis (SCGE) assay. Pesticide ge-
notoxicity revealed by comet assay. Mutat Res 469:279-285.
Goldstein DA, Acquavella JF, Mannion RM and Farmer DR
(2002) An analysis of glyphosate data from the California
Environmental Protection Agency Pesticide Illness Surveil-
lance Program [Abstract]. J Toxicol Clin Toxicol 40:885-
892.
Leroy T, van Hummelen P, Anard D, Castelain P, Kirsh-Volders
M, Lauwerys R and Lison D (1996) Evaluation of three
methods for the detection of DNA single-strand breaks in
human lymphocytes: Alkaline elution, nick translation, and
single-cell gel electrophoreis. J Toxicol Environ Health
47:409-422.
Lioi MB, Scarfi MR, Santoro A, Barbieri R, Zeni O, Di Berardino
D and Ursini MD (1998) Genotoxicity and oxidative stress
induced by pesticide exposure in bovine lymphocyte cul-
tures in vitro. Mutat Res 403:13-20.
McKelvey-Martin VJ, Green MHL, Schmezer P, Pool-Zobel B.,
De Méo MP and Collins A (1993) The single cell gel electro-
phoresis assay (Comet assay): A European review. Mutat
Res 288:47-63.
Monroy CM, Cortes AC, Sicard DM and de Restrepo HG (2006)
Cytotoxixity and genotoxicity of human cells exponed in vi-
tro to glyphosate. Biomedica 25:335-45.
Paz-y-Miño C, Bustamante G, Sánchez ME and Leone PE
(2002a) Cytogenetic monitoring in a population occupation-
ally exposed to pesticides in Ecuador. Environ Health
Perspect 110:1077-1080.
Paz-y-Miño C, Dávalos MV, Sánchez ME, Arévalo M and Leone
PE (2002b) Should gaps be included in chromosomal aber-
ration analysis? Evidence based on the comet assay. Mutat
Res 516:57-61.
Richard S, Moslemi S, Sipahuta H, Benachour N and Seralini GE
(2005) Differential effects of glyphosate and Roundup on
human placental cells and aromatase. Environ Health
Perspect 113:716-720.
Scarpato R, Migliore L, Angotzi G, Fedi A, Miligi L and Loprieno
N (1996) Cytogenetic monitoring of a group of Italian flori-
culturists: No evidence of DNA damage related to pesticide
exposure. Mutat Res 367:73-82.
Slamenová D, Gábelová A, Chalupa I, Szabová E, Mikuláová M,
Horváthová E, Ruzekova L, et al. (1999) Cytotoxic and
genotoxic effect of inhibitor of vulcanisation N-cyclohexyl-
thiophthalimide in a battery of in vitro assays. Mutat Res
446:35-48.
Singh NP, McCoy MT, Tice RR and Schneider EL (1988) A sim-
ple technique for quantitation of low levels of DNA damage
in individual cells. Exp Cell Res 175:184-191.
Steenland K, Carrano A, Ratcliffe J, Clapp D, Ashworth L and
Meinhardt T (1986) A cytogenetic study of papaya workers
exposed to ethylene dibromide. Mutat Res 170:151-160.
Tice RR, Andrews PW and Singh NP (1990) The single cell gel
assay: A sensitive technique for evaluating intercellular dif-
ferences in DNA damage and repair. Basic Life Sci 53:291-
301.
U.S. Forest Service (1997) Glyphosate: Herbicide Information
Profile. Pacific Northwest Region, United Stated Drug Ad-
ministration (bulletin), Washington, pp 25.
Williams GM, Kroes R and Munro IC (2000) Safety evaluation
and risk assessment of the herbicide Roundup and its active
ingredient, glyphosate, for humans. Regul Toxicol Pharm
31:117-165.
Internet Resources
Alaska Community Action on Toxics (ACAT) (1998). Facts
About Glyphosate Roundup, Rodeo, Accord, http://www.
Paz-y-Miño et al. 459
EXHIBIT J - Page 375
Case 5:14-cv-00117-cr Document 63-11 Filed 11/14/14 Page 93 of 312

akaction.net/REPORTS/glyphosate_fact_sheet.pdf (June
13th, 2005).
Acción Ecológica (2003) Impacto de las Fumigaciones del Plan
Colombia en la Frontera Ecuatoriana. La guerra oculta con-
tra las comunidades. Acción Ecológica, Quito:85 1-52,
http://www.accionecologica.org (June 8th, 2005).
Acción Ecológica (2004) Frontera: Daños genéticos por las fumi-
gaciones del Plan Colombia. Acción Ecológica, Quito,
pp 1-48, http://www.accionecologica.org (June 8th, 2005).
Ministerio de Relaciones Exteriores (2003) Misión de Verifica-
ción. Impactos en el Ecuador de las fumigaciones realizadas
en el Departamento del Putumayo dentro del Plan Colombia.
Ministerio de Relaciones Exteriores: Ecuador. Informe téc-
nico [in Spanish], http://www.accionecologica.org/webae/
images/docs/fumigaciones/Informe%20Fumigaciones%20
Julio%202003-espa_ol.pdf (October 26th, 2006).
Nivia E (2001) Aerial spraying of illicit crops is dangerous- some
approximations. Paper presented in Spanish to the confer-
ence Wars in Colombia: Drugs, Guns and Oil, University of
California, Davis, 17-19 May 2001.
http://www.nadir.org/nadir/initiativ/agp/campecuador/spanish/
doc/fumigacion.htm (October 26th, 2006).
Associate Editor: Catarina S. Takahashi
460 Glyphosate related DNA damage
EXHIBIT J - Page 376
Case 5:14-cv-00117-cr Document 63-11 Filed 11/14/14 Page 94 of 312

A 90-day safety study in Wistar rats fed genetically modifiedrice expressing snowdrop lectin Galanthus nivalis (GNA)
Morten Poulsen a,*, Stine Kroghsbo a, Malene Schrøder a, Andrea Wilcks b,Helene Jacobsen a, Andreas Miller c, Thomas Frenzel c, Jurgen Danier d, Michael Rychlik e,
Qingyao Shu f, Kaveh Emami g, Duraialagraja Sudhakar h, Angharad Gatehouse g,Karl-Heinz Engel c, Ib Knudsen a
a Department of Toxicology and Risk Assessment, Danish Institute for Food and Veterinary Research, Mørkhøj Bygade 19, DK-2860 Søborg, Denmarkb Department of Microbiological Food Safety, Danish Institute for Food and Veterinary Research, Mørkhøj Bygade 19, DK-2860 Søborg, Denmark
c Lehrstuhl fur Allgemeine Lebensmitteltechnologie, Technical University Munich, Am Forum 2, D-85350 Freising-Weihenstephan, Germanyd Bioanalytik Weihenstephan, Alte Akademie 10, D-85350, Freising-Weihenstephan, Germany
e Lehrstuhl fur Lebensmittelchemie, Technical University Munich, Lichtenbergstr. 4, D-85748 Garching, Germanyf Institute of Nuclear Agricultural Sciences, Zhejiang University, Hangzhou 310029, China
g School of Biology, Institute for Research on Environment and Sustainability, University of Newcastle, Newcastle upon Tyne NE1 7RU, UKh Tamil Nadu Agricultural University, Coimbatore 648 003, Tamil Nadu, India
Received 14 October 2005; accepted 1 September 2006
Abstract
Genetically modified plants expressing insecticidal traits offer a new strategy for crop protection, but at the same time present a chal-lenge in terms of food safety assessment. The present 90-day feeding study was designed to assess the safety of a rice variety expressingthe snowdrop Galanthus nivalis lectin (GNA lectin), and forms part of a EU-funded project where the objective has been to develop andvalidate sensitive and specific methods to assess the safety of genetically modified foods. Male and female Wistar rats were given a puri-fied diet containing either 60% genetically modified or parental rice for 90 days. This corresponds to a mean daily GNA lectin intake ofapproximately 58 and 67 mg/kg body weight for males and females, respectively. Prior to the animal study comprehensive analyticalcharacterization of both rice materials was performed. The chemical analyses showed a number of statistically significant differences,with the majority being within the ranges reported in the literature. In the animal study a range of clinical, biological, immunological,microbiological and pathological parameters were examined. A number of significant differences were seen between groups fed the twodiets, but none of them were considered to be adverse. In conclusion, the design of the present animal study did not enable us to concludeon the safety of the GM food. Additional group(s) where the expressed gene products have been spiked to the diet should be included inorder to be able to distinguish whether the observed effects were due to the GNA lectin per se or to secondary changes in the GM rice.� 2006 Elsevier Ltd. All rights reserved.
Keywords: Genetically modified rice; Safety assessment; Animal study; GNA lectin; SAFOTEST
1. Introduction
Rice (Oryza sativa L.) is one of the most important cer-eal crops in the world. Worldwide it comprises approxi-
mately 23% of all calories consumed; in some countriesmore than 60% of the dietary calories are derived from thiscereal (Khush, 2003).
The ever-increasing demands on yield are responsiblefor the development of many different high yielding varie-ties of rice. However, whilst the extensive cultivation ofmodern high yielding varieties has on the one hand resulted
0278-6915/$ - see front matter � 2006 Elsevier Ltd. All rights reserved.doi:10.1016/j.fct.2006.09.002
* Corresponding author. Tel.: +45 7234 7540; fax: +45 7234 7699.E-mail address: [email protected] (M. Poulsen).
www.elsevier.com/locate/foodchemtox
Food and Chemical Toxicology 45 (2007) 350–363
EXHIBIT J - Page 377
Case 5:14-cv-00117-cr Document 63-11 Filed 11/14/14 Page 95 of 312

in a significant increase in yield of most food crops, includ-ing rice, on the other hand it has augmented the develop-ment towards monocultures, which often favour a drasticincrease in the insects that feed upon these crops(Gatehouse and Gatehouse, 1998). Despite the extensiveuse of pesticides it has been estimated that 37% of all cropproduction is lost worldwide to pests and diseases, with atleast 13% directly to insects (Gatehouse and Gatehouse,1998). Thus, better and more sophisticated forms of cropprotection are sought to ensure a stable food supply tomeet the demands from an ever-increasing global popula-tion. During the past decade genetic transformation hasresulted in a number of crop varieties expressing trans-gene(s) from related or unrelated taxa, as a novel, andoften more effective, way of crop protection to ensurehigher yields.
Genetically modified (GM) crops represent a challengein terms of food safety assessment. In general, the safetyof food for human consumption is based on the conceptthat there should be a reasonable certainty that no harmwill result from intended uses under the anticipated condi-tions of food consumption (OECD, 1993). In Europe, theplacing on the market of genetically modified foods isgoverned by Regulation (EC) 1829/2003 on geneticallymodified food and feed, and before that by the so-callednovel food regulation (258/97 of January 1997). Docu-ments giving guidance on the safety assessment of GMfoods have been developed (SCF, 1996; FAO/WHO,2000; EFSA, 2005). However, for issues concerning thesafety no specific instructions on how to perform therequested investigations are given.
The present study forms part of a EU-funded researchproject ‘New methods for the safety testing of transgenicfood’ (SAFOTEST), where the objective has been todevelop and validate sensitive and specific methods toassess the safety of genetically modified foods. A ricevariety with a novel gene inserted expressing the snowdropGalanthus nivalis lectin (GNA lectin) was selected as one ofthe model crops to be tested in a 90-day feeding study inrats. GNA is a promising candidate as an inserted trait inGM-food since it is toxic to several species of insect pestsdue to its binding capacity to their gut epithelia (Powellet al., 1998), whilst at the same time considered non-toxicto mammals, due to the low binding capacity in the jeju-num. A gene encoding GNA has now been inserted andexpressed in a number of different food plants includingrice, wheat, potato and sugarcane (Sudhakar et al., 1998;Rao et al., 1998; Stoger et al., 1999; Birch et al., 1999; Seta-mou et al., 2002) so as to increase the inherent resistance ofthese crops to insect pests.
Transgenic GNA rice and its parental control (ASD16)were assessed in a subchronic 90-day feeding study in rats;this duration is considered to be sufficient to provide datafor use in evaluating safety or determining whether furtherstudies are required (Howlett et al., 2003). To our know-ledge, this is the first time a transgenic rice variety express-ing GNA lectin has been subject to a safety assessment
study in experimental mammals. Prior to the 90-day feed-ing study the two rice lines were subjected to a comprehen-sive analytical characterization. The compositionalanalyses measured a total of more than 50 parametersincluding major constituents and amino acids, fatty acids,minerals, vitamins, steryl ferulates and phytic acid. In addi-tion the material was screened for contaminants (heavymetals, pesticides), and the microbiological quality wascontrolled through screening for mycotoxins and by bacte-rial/fungal counts. On the basis of these data, similaritiesand differences between the parental and the GM ricematerial used for the feeding study should be demon-strated. The results were also expected to assist in the inter-pretation of effects detected in the subchronic 90-day study.
The aim of the 90-day feeding study was to compare thesafety of a novel insect-resistant rice variety expressing thesnowdrop G. nivalis lectin (GNA lectin) to its parental vari-ety. Furthermore, the outcome of the study and the overallexperience gained should provide valuable lessons for thefuture safety assessment of genetically modified food crops.
2. Materials and methods
2.1. Production and characterization of transgenic rice seed
Transgenic rice (O. sativa L.) expressing the snowdrop lectin (G.
nivalis; GNA) was generated by particle bombardment of immature riceembryos (cultivar ASD16) as previously described (Sudhakar et al., 1998).Transgene expression levels in mature seeds were estimated by immuno-assay using Western blots (Gatehouse et al., 1997). The average GNAlectin content of mature seeds from the transgenic line was estimated to be1.25% of the total soluble protein (unpublished data). Southern blotanalysis of the selected transgenic line revealed the presence of a singlecopy of the transformation construct in the rice genome (unpublisheddata). Using inverse PCR and similarity studies (Altschul et al., 1997) ofthe cloned PCR product sequence, the transgene was shown to haveintegrated into a non-protein coding region of the rice genome.
Rice seeds of the transgenic (T6 generation) and parental line used inthe animal studies were bulked up at the Experimental Farm of ZhejiangUniversity at Jiande County, Zhejiang Province of China. Rice seeds ofboth transgenic and parent were sown concurrently in the same field, and30 days after sowing, seedlings were transplanted in adjacent fields. Reg-ular practice of field management, fertilizer application and pest controlwere applied. A pesticide with Triazophos as the major active componentwas used to control stem borer damage at the vegetative (2 weeks aftertransplantation), the booting and the heading stages. Rice seeds wereharvested in about 4 weeks after heading. The rice seeds were later sentfrom China to the Danish Institute for Food and Veterinary Research(DFVF), Denmark as whole rough rice. After arrival the rice was dehulledusing a testing husker THU 35B (Sakate Corporation, Japan) and milledwith a hammer mill SB-89 (United Milling Systems, Denmark). Theresulting flour from the brown rice was kept at �20 �C until use.
2.2. Compositional analysis
Proximates (moisture, starch, fiber, sugars, protein, fat, and ash),amino acids, fatty acid distribution and minerals were determined usingvalidated standard protocols (VDLUFA, 1996, 1997). The content ofprotein was calculated using a nitrogen to protein conversion factor of5.95. Vitamin B1 was measured by the AOAC method (AOAC, 2000).Extraction and HPLC analysis of vitamin B6 were performed according toReitzer-Bergaentzle et al. (1993). To measure total vitamin B6 contentsincluding pyridoxol glucosides, extracts were treated with b-glucosidase
M. Poulsen et al. / Food and Chemical Toxicology 45 (2007) 350–363 351
EXHIBIT J - Page 378
Case 5:14-cv-00117-cr Document 63-11 Filed 11/14/14 Page 96 of 312
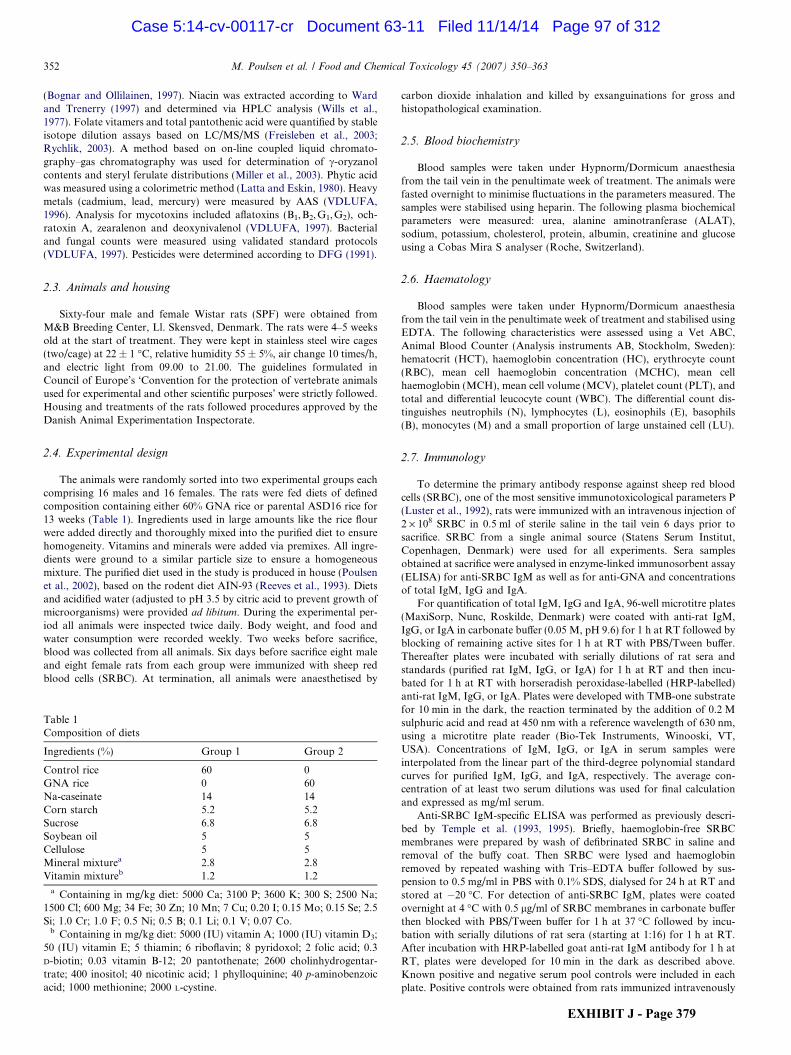
(Bognar and Ollilainen, 1997). Niacin was extracted according to Wardand Trenerry (1997) and determined via HPLC analysis (Wills et al.,1977). Folate vitamers and total pantothenic acid were quantified by stableisotope dilution assays based on LC/MS/MS (Freisleben et al., 2003;Rychlik, 2003). A method based on on-line coupled liquid chromato-graphy–gas chromatography was used for determination of c-oryzanolcontents and steryl ferulate distributions (Miller et al., 2003). Phytic acidwas measured using a colorimetric method (Latta and Eskin, 1980). Heavymetals (cadmium, lead, mercury) were measured by AAS (VDLUFA,1996). Analysis for mycotoxins included aflatoxins (B1,B2,G1,G2), och-ratoxin A, zearalenon and deoxynivalenol (VDLUFA, 1997). Bacterialand fungal counts were measured using validated standard protocols(VDLUFA, 1997). Pesticides were determined according to DFG (1991).
2.3. Animals and housing
Sixty-four male and female Wistar rats (SPF) were obtained fromM&B Breeding Center, Ll. Skensved, Denmark. The rats were 4–5 weeksold at the start of treatment. They were kept in stainless steel wire cages(two/cage) at 22 ± 1 �C, relative humidity 55 ± 5%, air change 10 times/h,and electric light from 09.00 to 21.00. The guidelines formulated inCouncil of Europe’s ‘Convention for the protection of vertebrate animalsused for experimental and other scientific purposes’ were strictly followed.Housing and treatments of the rats followed procedures approved by theDanish Animal Experimentation Inspectorate.
2.4. Experimental design
The animals were randomly sorted into two experimental groups eachcomprising 16 males and 16 females. The rats were fed diets of definedcomposition containing either 60% GNA rice or parental ASD16 rice for13 weeks (Table 1). Ingredients used in large amounts like the rice flourwere added directly and thoroughly mixed into the purified diet to ensurehomogeneity. Vitamins and minerals were added via premixes. All ingre-dients were ground to a similar particle size to ensure a homogeneousmixture. The purified diet used in the study is produced in house (Poulsenet al., 2002), based on the rodent diet AIN-93 (Reeves et al., 1993). Dietsand acidified water (adjusted to pH 3.5 by citric acid to prevent growth ofmicroorganisms) were provided ad libitum. During the experimental per-iod all animals were inspected twice daily. Body weight, and food andwater consumption were recorded weekly. Two weeks before sacrifice,blood was collected from all animals. Six days before sacrifice eight maleand eight female rats from each group were immunized with sheep redblood cells (SRBC). At termination, all animals were anaesthetised by
carbon dioxide inhalation and killed by exsanguinations for gross andhistopathological examination.
2.5. Blood biochemistry
Blood samples were taken under Hypnorm/Dormicum anaesthesiafrom the tail vein in the penultimate week of treatment. The animals werefasted overnight to minimise fluctuations in the parameters measured. Thesamples were stabilised using heparin. The following plasma biochemicalparameters were measured: urea, alanine aminotranferase (ALAT),sodium, potassium, cholesterol, protein, albumin, creatinine and glucoseusing a Cobas Mira S analyser (Roche, Switzerland).
2.6. Haematology
Blood samples were taken under Hypnorm/Dormicum anaesthesiafrom the tail vein in the penultimate week of treatment and stabilised usingEDTA. The following characteristics were assessed using a Vet ABC,Animal Blood Counter (Analysis instruments AB, Stockholm, Sweden):hematocrit (HCT), haemoglobin concentration (HC), erythrocyte count(RBC), mean cell haemoglobin concentration (MCHC), mean cellhaemoglobin (MCH), mean cell volume (MCV), platelet count (PLT), andtotal and differential leucocyte count (WBC). The differential count dis-tinguishes neutrophils (N), lymphocytes (L), eosinophils (E), basophils(B), monocytes (M) and a small proportion of large unstained cell (LU).
2.7. Immunology
To determine the primary antibody response against sheep red bloodcells (SRBC), one of the most sensitive immunotoxicological parameters P(Luster et al., 1992), rats were immunized with an intravenous injection of2 · 108 SRBC in 0.5 ml of sterile saline in the tail vein 6 days prior tosacrifice. SRBC from a single animal source (Statens Serum Institut,Copenhagen, Denmark) were used for all experiments. Sera samplesobtained at sacrifice were analysed in enzyme-linked immunosorbent assay(ELISA) for anti-SRBC IgM as well as for anti-GNA and concentrationsof total IgM, IgG and IgA.
For quantification of total IgM, IgG and IgA, 96-well microtitre plates(MaxiSorp, Nunc, Roskilde, Denmark) were coated with anti-rat IgM,IgG, or IgA in carbonate buffer (0.05 M, pH 9.6) for 1 h at RT followed byblocking of remaining active sites for 1 h at RT with PBS/Tween buffer.Thereafter plates were incubated with serially dilutions of rat sera andstandards (purified rat IgM, IgG, or IgA) for 1 h at RT and then incu-bated for 1 h at RT with horseradish peroxidase-labelled (HRP-labelled)anti-rat IgM, IgG, or IgA. Plates were developed with TMB-one substratefor 10 min in the dark, the reaction terminated by the addition of 0.2 Msulphuric acid and read at 450 nm with a reference wavelength of 630 nm,using a microtitre plate reader (Bio-Tek Instruments, Winooski, VT,USA). Concentrations of IgM, IgG, or IgA in serum samples wereinterpolated from the linear part of the third-degree polynomial standardcurves for purified IgM, IgG, and IgA, respectively. The average con-centration of at least two serum dilutions was used for final calculationand expressed as mg/ml serum.
Anti-SRBC IgM-specific ELISA was performed as previously descri-bed by Temple et al. (1993, 1995). Briefly, haemoglobin-free SRBCmembranes were prepared by wash of defibrinated SRBC in saline andremoval of the buffy coat. Then SRBC were lysed and haemoglobinremoved by repeated washing with Tris–EDTA buffer followed by sus-pension to 0.5 mg/ml in PBS with 0.1% SDS, dialysed for 24 h at RT andstored at �20 �C. For detection of anti-SRBC IgM, plates were coatedovernight at 4 �C with 0.5 lg/ml of SRBC membranes in carbonate bufferthen blocked with PBS/Tween buffer for 1 h at 37 �C followed by incu-bation with serially dilutions of rat sera (starting at 1:16) for 1 h at RT.After incubation with HRP-labelled goat anti-rat IgM antibody for 1 h atRT, plates were developed for 10 min in the dark as described above.Known positive and negative serum pool controls were included in eachplate. Positive controls were obtained from rats immunized intravenously
Table 1Composition of diets
Ingredients (%) Group 1 Group 2
Control rice 60 0GNA rice 0 60Na-caseinate 14 14Corn starch 5.2 5.2Sucrose 6.8 6.8Soybean oil 5 5Cellulose 5 5Mineral mixturea 2.8 2.8Vitamin mixtureb 1.2 1.2
a Containing in mg/kg diet: 5000 Ca; 3100 P; 3600 K; 300 S; 2500 Na;1500 Cl; 600 Mg; 34 Fe; 30 Zn; 10 Mn; 7 Cu; 0.20 I; 0.15 Mo; 0.15 Se; 2.5Si; 1.0 Cr; 1.0 F; 0.5 Ni; 0.5 B; 0.1 Li; 0.1 V; 0.07 Co.
b Containing in mg/kg diet: 5000 (IU) vitamin A; 1000 (IU) vitamin D3;50 (IU) vitamin E; 5 thiamin; 6 riboflavin; 8 pyridoxol; 2 folic acid; 0.3D-biotin; 0.03 vitamin B-12; 20 pantothenate; 2600 cholinhydrogentar-trate; 400 inositol; 40 nicotinic acid; 1 phylloquinine; 40 p-aminobenzoicacid; 1000 methionine; 2000 L-cystine.
352 M. Poulsen et al. / Food and Chemical Toxicology 45 (2007) 350–363
EXHIBIT J - Page 379
Case 5:14-cv-00117-cr Document 63-11 Filed 11/14/14 Page 97 of 312

(2 · 108 SRBC/rat) six days before blood sampling. Serum from untreatedrats was used as negative control. The antibody titres were expressed aslog2 titres and defined as the interpolated dilution of a serum sampleleading to an absorbance of 0.5.
For detection of GNA-specific IgG1, IgG2a and IgA, plates werecoated for 2–3 days at 4 �C with 2 lg/ml of GNA lectin in carbonatebuffer, blocked for 1 h at 37 �C and then incubated with serial dilutions ofrat sera (starting at 1:4) for 1 h at RT. Thereafter plates were incubatedwith HRP-labelled anti-rat IgG1, IgG2a or IgA antibodies for 1 h at RTand then developed for 10 min in the dark as described above. Knownpositive and negative serum pool controls were included in each plate.Positive controls were obtained from rats immunized intraperitoneallywith 100 lg/0.5 ml/rat of GNA lectin absorbed on 12 mg Al(OH)3 at day 1and with 10 lg/0.5 ml/rat of GNA lectin at day 21, 35 and 49. Serum fromuntreated rats was used as the negative control. The antibody titres wereexpressed as log2 titres, defined as the interpolated dilution (3-parameteranalysis) of a serum sample leading to an absorbance of 0.2.
To prepare the spleen cells, spleens were aseptically removed andweighed and transferred into sterile 50 ml tubes with Hank’s balanced saltsolution and kept on ice until preparation. Single-cell suspensions ofsplenocytes from each rat were prepared and suspended in culture medium(RPMI 1640 with phenol red supplemented with 2 mM L-glutamine 10%heat-inactivated FBS, 100 lg/ml of penicillin and 100 IU/ml of strepto-mycin). Cell numbers were determined for each splenocyte suspension andviability was verified by eosin exclusion.
A modified non-radioactive assay was used for T-cell dependentproliferation as previously described (Ahmed et al., 1994; Zhi-Jun et al.,1997). Spleen lymphocytes were cultured in quadruplicates in a 96-wellblack flat-bottomed tissue culture plate with 0 (basal proliferation), 0.04,0.2 or 0.4 lg/well of concanavalin A (Con A) or phytohemagglutinin(PHA-L, Sigma). The plates were incubated at 37 �C in a 5% humidifiedatmosphere of CO2. After 48 h of culture, the non-radioactive fluorescentdye alamarBlue (BioSource International, Camarillo, CA, USA) wereadded to each well and 24 h later plates were read on a fluorometer withexcitation at 530 and emission at 590 nm. The mitogenic responsivenesswas calculated as the average of the absolute fluorescence units (FLU) ofreplicates with mitogen minus the average of FLU of replicates withoutmitogen (DFLU ± SD).
2.8. Bacteriological quantification
During the experimental period, fresh faecal samples were taken from10 animals (5 males and 5 females) from each of the two groups byprovoked defaecation for microbial analysis at day 0, 30 and 60, and attermination of the study. Furthermore, at sacrifice, samples from ileumand duodenum were taken from the same 10 animals from each group.The faecal and intestinal samples were homogenized in saline supple-mented with 0.1% peptone to 10�1 dilution. Ten-fold serial dilutions wereprepared in the same buffer and samples were applied to appropriateselective media. The total aerobic and anaerobic populations were enu-merated on RCA plates (Reinforced Clostridial Agar, Oxoid), and incu-bated for 72 h aerobically and anaerobically, respectively. Rogosa agarplates (Oxoid) were used to determine the number of Lactobacillus in thesamples. Bifidobacteria were counted on RCA plates containing supple-ment according to Munoa and Pares (1988). Lactobacillus and Bifido-bacteria were counted after anaerobic growth for 72 h. MacConkey(MacConkey Agar no. 3, Oxoid) and Slanetz (Slanetz & Bartley Medium,Oxoid) were used for the detection of Enterobacteria and Enterococci,respectively. The plates were incubated aerobically for 24 and 48 h,respectively. On the MacConkey plates all intense violet–red colonies werecounted. On the Slanetz plates all red or maroon colonies were counted.All plates were incubated at 37 �C.
2.9. Organ weights, gross necropsy and histopathology
A thorough necropsy was performed and the following organs wereexcised and weighed: testes, epididymis, ovaries, uterus, small intestine,
liver, kidneys, adrenals, pancreas, spleen, mesenterial lymph nodes, heart,thyroid, brain. Tissues from these organs and macroscopically evidentlesions were fixed in 4% buffered formaldehyde for histological processing.Tissue samples were embedded in paraffin and sections, 4–6 lm thick,stained with standard hematoxylin–eosin for light microscopy. In addi-tion, the intact small intestines were flushed with a 0.09% NaCl solutionand the length measured.
2.10. Statistical analysis
Compositional data are presented as means ± confidence intervals(p < 0.05). Means are considered as statistically significantly different iftheir confidence intervals are not overlapping. Data obtained from theanimal studies were analysed separately for each sex and presented asmean ± SD where appropriate. The homogeneity of variance betweengroups was evaluated by judgement of standard residual plots (GeneralLinear Model procedure). Statistical comparisons of body weight, foodand water consumption, bacterial counts, clinical biochemistry, haema-tology, immunology and organ weights between control rats and GNA fedrats were performed by one-way analysis of variance and if significant at-test was performed. Data not showing homogeneity of variance andnormal distribution was transformed and the analysis of variance proce-dure was repeated. If the homogeneity of variance still not was obtained,data was subjected to a Kruskall–Wallis test followed by Wilcoxons testfor pair-wise comparisons if significant. Differences were consideredsignificant at p < 0.05. All statistical analyses were carried out using SASrelease 8.1 (SAS Institute Inc., Cary, NC).
3. Results
3.1. Agronomic parameters
The number of days from sowing to heading of thetransgenic rice is about three weeks shorter than its parent,and the former was also shorter in plant height and less inbiomass than the parent. However, the parent had a lowerseed-set (<50%) compared to GNA rice, probably becauseit experienced a period of high temperature (higher than35 �C) before heading.
3.2. Compositional analysis
Transgenic (GNA) and parental (ASD16) brown ricetested in the 90-day study were subjected to comprehensiveanalytical characterization. Compositional data were com-pared to data reported for brown rice (Latta and Eskin,1980; Juliano, 1985; Scherz and Senser, 2000; Mølleret al., 2002; USDA, 2004; OECD, 2004) and differencesbetween the lines were assessed for statistical significance(p < 0.050).
Contents of proximates are presented in Table 2. Nostatistically significant differences between transgenic andparental rice were observed for moisture and fat content.However, GNA rice exhibited statistically significanthigher contents of fiber (+29%), sugars (+100%), protein(+19%) and ash (+35%), and a statistically significantlower starch content (�8%). Compared to data presentedin the literature (Juliano, 1985; Scherz and Senser, 2000;Møller et al., 2002; USDA, 2004; OECD, 2004) both linesexhibited high contents of protein, fat and ash.
M. Poulsen et al. / Food and Chemical Toxicology 45 (2007) 350–363 353
EXHIBIT J - Page 380
Case 5:14-cv-00117-cr Document 63-11 Filed 11/14/14 Page 98 of 312

The difference in protein content was also reflected in theamino acid levels (Table 3). GNA rice exhibited statisticallysignificant higher contents of almost all amino acids. Inparticular the content of proline was very high in GNA ricecompared to the parental rice (+111%). Except for isoleu-cine, threonine and valine, data for GNA rice exceed datareported in the literature (Scherz and Senser, 2000; USDA,2004).
Fatty acid distributions of the two lines were similar(Table 4). Minor but statistically significant differences weredetected for proportions of myristic acid (+33%) and stearicacid (+26%). Patterns of both lines were in agreement todata reported in literature (Scherz and Senser, 2000; USDA,2004; OECD, 2004; Kitta et al., 2005).
Mineral compositions are presented in Table 5. No sta-tistically significant differences were observed for contentsof calcium, magnesium, molybdenum and zinc. However,
GNA rice exhibited statistically significant higher contentsof iron (+144%), manganese (+15%), phosphorous (+19%)and potassium (+31%), and a statistically significant lowercopper content (�19%). Given the very large variation pre-viously reported for mineral levels in brown rice (Juliano,1985; Scherz and Senser, 2000; Møller et al., 2002; USDA,2004), these differences observed between GNA andASD16 were considered as low.
Statistically significant differences were found for impor-tant vitamins of the B-complex (Table 6). GNA rice exhib-ited higher contents of vitamin B1 (+28%) and B6 (+50%).No statistically significant difference was observed for theniacin content. Whereas the content of total pantothenicacid was higher in GNA rice (+52%), the content of totalfolic acid was higher in the parental rice (+129%). In bothlines 5-methyl-H4 folate was the major folate vitamer. Vita-min contents for both lines were in agreement with datareported for brown rice (Juliano, 1985; Scherz and Senser,2000; Møller et al., 2002; USDA, 2004).
c-Oryzanol comprises a mixture of steryl ferulates foundin rice (Xu and Godber, 1999). They exhibit antioxidative(Xu et al., 2001) and cholesterol-lowering properties (Ronget al., 1997). No statistically significant difference wasobserved for the c-oryzanol contents (Table 7). Data from
Table 2Proximate composition of brown rice material from transgenic line GNAand its corresponding parental line ASD16 (mean ± confidence interval,n = 4, p < 0.05)
Component (%) GNA ASD16 Literature dataa
Moisture 12.9 ± 0.2 12.8 ± 0.3 9.1–14.1Starch 63.9 ± 0.7b 69.3 ± 1.8 57–77Fiber 1.8 ± 0.1b 1.4 ± 0.3 0.5–3.5Sugars 0.6 ± 0.1b 0.3 ± 0.1 0.6–1.3Protein 12.6 ± 0.2b 10.5 ± 0.3 6.1–9.5Fat 3.23 ± 0.44 3.47 ± 0.10 1.4–2.9Ash 2.01 ± 0.03b 1.49 ± 0.03 0.9–1.5
a Ranges from minimum to maximum reported values (Juliano, 1985;Scherz and Senser, 2000; Møller et al., 2002; USDA, 2004; OECD, 2004).
b Statistically significant different from parental line (p < 0.05).
Table 3Amino acid levels in brown rice material from transgenic line GNA and itscorresponding parental line ASD16 (g/100 g; mean ± confidence interval,n = 3, p < 0.05)
Amino acid GNA ASD16 Literature dataa
Alanine 0.75 ± 0.09b 0.57 ± 0.05 0.46–0.58Arginine 1.03 ± 0.04b 0.88 ± 0.07 0.44–0.91Aspartic acid 1.55 ± 0.04b 1.39 ± 0.10 0.74–0.87Cystine 0.33 ± 0.02 0.31 ± 0.01 0.06–0.19Glutamic acid 2.28 ± 0.21b 1.77 ± 0.16 1.52–1.76Glycine 0.64 ± 0.07 0.60 ± 0.03 0.39–0.49Histidine 0.50 ± 0.07b 0.38 ± 0.04 0.12–0.27Isoleucine 0.55 ± 0.04b 0.44 ± 0.05 0.26–0.57Leucine 1.06 ± 0.09b 0.88 ± 0.02 0.50–0.93Lysine 0.63 ± 0.05b 0.46 ± 0.04 0.10–0.42Methionine 0.38 ± 0.03 0.35 ± 0.05 0.05–0.31Phenylalanine 0.77 ± 0.15 0.58 ± 0.07 0.30–0.55Proline 0.95 ± 0.04b 0.45 ± 0.01 0.37–0.40Serine 0.63 ± 0.05b 0.51 ± 0.05 0.41–0.50Threonine 0.47 ± 0.05b 0.35 ± 0.07 0.19–0.62Tryptophan 0.16 ± 0.00b 0.13 ± 0.01 0.03–0.11Tyrosine 0.72 ± 0.08 0.62 ± 0.15 0.21–0.47Valine 0.78 ± 0.03b 0.67 ± 0.05 0.40–0.76
a Ranges from minimum to maximum reported values (Scherz andSenser, 2000; USDA, 2004).
b Statistically significant different from parental line (p < 0.05).
Table 4Fatty acid distribution in brown rice material from transgenic line GNAand its corresponding parental line ASD16 (mean ± confidence interval,n = 4, p < 0.05)a
Fatty acid GNA ASD16 Literature datab
Myristic acid 0.4 ± 0.0c 0.3 ± 0.0 0.4–3.0Palmitic acid 20.2 ± 0.2 19.9 ± 0.1 18–31Stearic acid 2.4 ± 0.0c 1.9 ± 0.0 1.6–2.6Oleic acid 39.0 ± 0.1 39.4 ± 0.1 27–41Linoleic acid 33.2 ± 0.2 33.2 ± 0.1 31–40Linolenic acid 1.4 ± 0.0 1.4 ± 0.0 0.9–1.7
a Proportions of total fatty acids (%).b Ranges from minimum to maximum reported values (Scherz and
Senser, 2000; USDA, 2004; OECD, 2004; Kitta et al., 2005).c Statistically significant different from parental line (p < 0.05).
Table 5Contents of minerals in brown rice material from transgenic line GNA andits corresponding parental line ASD16 (mean ± confidence interval, n = 4,p < 0.05)
Mineral GNA ASD16 Literature dataa
Calcium (g/kg) 0.3 ± 0.0 0.2 ± 0.0 0.1–0.5Copper (mg/kg) 2.5 ± 0.2b 3.1 ± 0.1 1–6Iron (mg/kg) 44 ± 4b 18 ± 2 2–52Magnesium (g/kg) 1.6 ± 0.0 1.5 ± 0.0 0.2–1.7Manganese (mg/kg) 24.6 ± 0.3b 21.4 ± 0.3 2–37Molybdenum (mg/kg) 1.3 ± 0.1 1.2 ± 0.1 0.3–1.0Phosphorous (g/kg) 4.3 ± 0.0b 3.6 ± 0.0 1.7–4.4Potassium (g/kg) 3.4 ± 0.1b 2.6 ± 0.1 0.6–2.8Zinc (mg/kg) 24.5 ± 11.2 28.0 ± 0.3 6–28
a Ranges from minimum to maximum reported values (Juliano, 1985;Scherz and Senser, 2000; Møller et al., 2002; USDA, 2004).
b Statistically significant different from parental line (p < 0.05).
354 M. Poulsen et al. / Food and Chemical Toxicology 45 (2007) 350–363
EXHIBIT J - Page 381
Case 5:14-cv-00117-cr Document 63-11 Filed 11/14/14 Page 99 of 312

the present study were within the range reported in the lit-erature (Miller et al., 2003). Apart from minor, althoughstatistically significant differences, both lines exhibitedsimilar steryl ferulate distributions. Compared to datapresented in the literature, both lines exhibited low pro-portions of cyclartenyl ferulate but high proportions of24-methylenecycloartanyl ferulate.
Phytic acid is known to be an anti-nutritient of rice, andhas been shown to limit the bioavailability of minerals(Saha et al., 1994). Both transgenic rice and parental riceexhibited similar contents of phytic acid (0.88% and0.87%, respectively; n = 2) and were in agreement withthe literature (0.6–1.6%; Latta and Eskin, 1980).
To evaluate the microbiological quality of the rice mate-rial, bacterial and fungal counts were measured and thematerial screened for the presence of mycotoxins. Bothmaterials exhibited similarly low bacterial (<0.3 · 106/g)and fungal counts (<5.4 · 103/g). No mycotoxins weredetected in the material.
As regards contaminants, no lead was detected in eitherof the lines (<0.05 mg/kg) although low levels of mercurywere found in both GNA rice (0.019 ± 0.001 mg/kg,n = 4) and parental rice (0.027 ± 0.001 mg/kg). Whilst thetransgenic rice line only exhibited a low cadmium content(0.02 ± 0.01 mg/kg), the parental line contained high levels
of cadmium (0.17 ± 0.01 mg/kg). However, for both linesthe cadmium levels were below the limit set for rice byCommission Regulation (EG) 466/2001.
The pesticide Triazophos was detected in both the GNArice (0.12 ± 0.07 mg/kg) and the control rice (0.41 ±0.11 mg/kg). The contents of all other pesticides analysedwere below the detection limit of the method applied.
3.3. Clinical observations, body weight and food and
water intake
During the course of the experiment no treatment-related signs of adverse effects in clinical appearance ofthe animals were observed. The body weights of male ratswere comparable throughout the study period, whereasfemale rats given the GNA rice tended to have a lowerbody weight (p = 0.065) compared to rats in the controlgroup (Fig. 1). The reduction in body weight seen in week12 was due to the blood sampling procedure and fasting of
Table 6Contents of vitamins in brown rice material from transgenic line GNAand its corresponding parental line ASD16 (mg/kg; mean ± confidenceinterval, p < 0.05)
Vitamin GNA ASD16 Literature dataa
B1b 4.1 ± 0.5c 3.2 ± 0.2 2.9–6.1
B6b 1.8 ± 0.2c 1.2 ± 0.3 2–10
Niacinb 51 ± 2 57 ± 10 35–58Total pantothenic acidd 13.7 9.0 9–17Total folic acid d 0.14 0.32 0.1–0.55-Methyl-H4 folated,e 0.12 0.295-Formyl-H4 folated,e 0.02 0.03
a Ranges from minimum to maximum reported values (Juliano, 1985;Scherz and Senser, 2000; Møller et al., 2002; USDA, 2004).
b n = 3.c Statistically significant different from parental line (p < 0.05).d n = 2.e Calculated as folic acid.
Table 7c-Oryzanol (steryl ferulates) in brown rice material from transgenic line GNA and its corresponding parental line ASD16 (mean ± confidence interval,n = 3, p < 0.05)
GNA ASD16 Literature dataa
c-Oryzanol (mg/100 g) 32 ± 3 28 ± 4 31–63Steryl ferulate distributionb
Campesteryl ferulate 13.5 ± 0.2c 15.5 ± 0.4 7–19Campestanyl ferulate 5.9 ± 0.2c 7.2 ± 0.3 6–13b-Sitosteryl ferulate 7.3 ± 0.2c 8.8 ± 0.3 5–10Cycloartenyl ferulate 20.6 ± 0.4c 25.0 ± 0.4 33–4724-Methylenecycloartanyl ferulate 52.8 ± 0.9c 43.7 ± 0.6 27–36
a Ranges from minimum to maximum values reported in Miller et al. (2003).b Proportions of total c-oryzanol content (%).c Statistically significant different from parental line (p < 0.05).
100
150
200
250
300
350
400
450
1 2 3 4 5 6 7 8 9 10 11 12 13Duration of study (weeks)
Bod
y w
eigh
t (g)
Control males
GNA males
Control females
GNA females
Fig. 1. Growth curves based on weekly measurements of body weightduring the study. The curves show group means based on 16 rats/sex/group. SE bars not shown for clarity.
M. Poulsen et al. / Food and Chemical Toxicology 45 (2007) 350–363 355
EXHIBIT J - Page 382
Case 5:14-cv-00117-cr Document 63-11 Filed 11/14/14 Page 100 of 312

the animals. There was no statistically significant differencein food consumption between groups, although consump-tion was slightly lower in females fed the diet containingGNA rice (Table 8). However, a marked significantlyhigher relative water intake was seen in both males andfemales given GNA rice (Figs. 2 and 3). The absolute water
intake was significantly higher for males, but not females,fed GNA rice.
3.4. Blood biochemistry
Data on blood biochemistry are presented in Table 9.Male rats given GNA rice had a significantly lower plasmaconcentration of potassium, and levels of protein and albu-min were significantly lower in both males and femalesgiven GNA rice. Levels of creatinine were significantlylower in female rats fed GNA rice. Furthermore, signifi-cantly higher plasma activities of alanine aminotransferasewere seen in female rats fed the GNA rice.
3.5. Haematology
Only a few statistically significant differences occurred inthe haematological parameters between rats fed GNA riceand the parental control (Table 10). In male rats the plate-let count (PLT) was slightly higher in the group fed GNArice, whereas the mean cell haemoglobin concentration(MCHC) was slightly lower compared to the controlgroup. Female rats given GNA rice had a lower numberof large unstained cells (LU) compared to the female con-trol group.
3.6. Immunological parameters
No statistical differences in the basal level of total IgM,IgG and IgA nor the anti-SRBC IgM response wereobserved between groups within the same sex (Table 11).
Immunization with SRBC statistically increased theconcentration of total IgM in male and female rats(p 6 0.001 and p 6 0.05, respectively), total IgG in femalerats (p 6 0.01), and total IgA in male rats (p 6 0.01) inthe control group. In addition, immunization with SRBCgenerally increased the concentration of total IgM, IgG,and IgA in rats fed GNA rice although this was only foundto be statistically different for the total IgM concentrationin females (data not shown). Feeding rats with GNA ricedid not induce a detectable GNA-specific antibodyresponse for any of the tested antibody isotypes IgG1,IgG2a and IgA (data not shown).
GNA rice statistically reduced the mitogen-inducedproliferative response at optimal concentrations of Con Ain female rats, whereas a tendency to an increased responsewas found in male rats at the same concentrations (Table11). Generally, the group fed GNA rice did not statisticallydiffer in PHA lectin-induced proliferative response fromthe control group, although a statistical increase at the sub-optimal concentration of PHA lectin was found in femalerats (Table 11).
3.7. Bacteriological quantification of faecal samples
For the faecal samples no significant difference could bedetected between the group fed GNA rice and the control
Table 8Food consumption – group mean values ± SD
Group Week 2–7(g/animal/week)
Week 8–13(g/animal/week)
1M 130 ± 9 135 ± 142M 132 ± 13 134 ± 181F 94 ± 7 97 ± 132F 89 ± 8 93 ± 14
1M: control rice-males, 2M: GNA rice-males, 1F: control rice-females, 2F:GNA rice-females.
40
50
60
70
80
90
100
110
120
130
140
2 3 4 5 6 7 8 9 10 11 12 13Duration of study (weeks)
g w
ater
/kg
body
wei
ght/d
ay Control
GNA
¤
¤
¤
¤¤
§
§
¤¤
¤ ¤¤
Fig. 2. Mean relative water intake of male rats. SE bars not shown forclarity. (§) and ( ) indicate significantly different from control group at p <0.01 and p < 0.001, respectively. n = 16.
60
70
80
90
100
110
120
130
140
150
2 3 4 5 6 7 8 9 10 11 12 13Duration of study (weeks)
g w
ater
/kg
body
wei
ght/d
ay
Control
GNA
**
§
§
**
*§
Fig. 3. Mean relative water intake of female rats. SE bars not shown forclarity. (*) and (§) indicate significantly different from control group atp < 0.05 and p < 0.01, respectively. n = 16.
356 M. Poulsen et al. / Food and Chemical Toxicology 45 (2007) 350–363
EXHIBIT J - Page 383
Case 5:14-cv-00117-cr Document 63-11 Filed 11/14/14 Page 101 of 312

Table 9Blood biochemistry – group mean values ± SD
Group N Urea (mmol/l) ALAT (U/l) Sodium(mmol/l)
Potassium(mmol/l)
Cholesterol(mmol/l)
Protein (g/l) Albumin (g/l) Creatinine(lmol/l)
Glucose (mmol/l)
1M 15 5.2 ± 0.6 28.6 ± 7.3 146.7 ± 16.2 4.8 ± 0.7 1.4 ± 0.2 61.0 ± 2.1 39.0 ± 0.9 32.4 ± 8.9 7.8 ± 0.92M 16 5.6 ± 0.6 31.4 ± 7.5 146.0 ± 17.5 4.2a ± 0.5 1.3 ± 0.3 59.4a ± 1.8 37.9a ± 1.3 36.3 ± 6.4 8.4 ± 1.7
1F 16 7.2 ± 0.9 20.8 ± 4.6 139.1 ± 23.8 4.1 ± 1.0 1.2 ± 0.3 65.5 ± 4.2 45.6 ± 3.7 52.1 ± 9.6 7.8 ± 1.22F 16 6.7 ± 1.1 24.8a ± 3.4 142.6 ± 10.7 4.0 ± 0.5 1.1 ± 0.2 62.2a ± 3.2 42.7a ± 2.4 44.1a ± 10.1 7.4 ± 1.0
1M: control rice-males, 2M: GNA rice-males, 1F: control rice-females, 2F: GNA rice-females.a Statistically significantly different from control group within same sex when a Students t-test was performed (p 6 0.05).
Table 10Haematology – group mean values ± SD
Group N RBC1012/L
PLT(109/l)
HC(mmol/l)
HCT(%)
MCVFL
MCH (fmol) MCHC(mmol/l)
Total(109/l)
L (%) N (%) WBC
M (%) E (%) B (%) LU (%)
1M 15 8.64 ± 0.4 527 ± 135 15.5 ± 0.5 45.8 ± 1.3 53 ± 2 17.9 ± 0.7 33.7 ± 0.7 4.1 ± 1.2 75.5 ± 10.2 20.4 ± 9.3 2.8 ± 1.3 1.1 ± 0.8 0.0 ± 0.1 0.1 ± 0.22M 16 8.70 ± 0.3 617a,1 ± 83 15.4 ± 0.6 46.5 ± 1.6 53 ± 2 17.6 ± 0.6 33.0a,1 ± 0.3 4.1 ± 1.4 80.8 ± 5.5 16.0 ± 4.8 1.7 ± 1.6 1.2 ± 0.6 0 ± 0 0.1 ± 0.2
1F 16 8.12 ± 0.4 611 ± 142 14.8 ± 0.6 43.6 ± 1.6 54 ± 1 18.2 ± .0.6 33.8 ± 0.4 2.7 ± 1.0 78.2 ± 6.8 19.2 ± 6.6 1.2 ± 1.0 1.3 ± 0.8 0 ± 0 0.2 ± 0.22F 16 8.00 ± 0.3 566 ± 147 14.6 ± 0.5 43.6 ± 1.4 55 ± 2 18.3 ± 0.6 33.6 ± 0.6 2.1 ± 0.5 82.1 ± 8.2 15.5 ± 8.0 0.8 ± 0.5 1.6 ± 1.5 0 ± 0 0a,2 ± 0
1M: Control rice-males, 2M: GNA rice-males, 1F: control rice-females, 2F: GNA rice-females.a Statistically significantly different from control group within same sex (p < 0.05). Statistical analysis; 1: t-test, 2: Wilcoxon two-sample test.
M.
Po
ulsen
eta
l./
Fo
od
an
dC
hem
ical
To
xico
logy
45
(2
00
7)
35
0–
36
3357
EXHIBIT J - Page 384
Case 5:14-cv-00117-cr Document 63-11 Filed 11/14/14 Page 102 of 312

group (Table 12). However, in samples from the duodenuma statistically significant increase in the total anaerob, theLactococcal and the Enterococcal population was observedin the GNA group compared to the control group (Table13). This was not observed in the ileal samples, where adecrease in Enterobacteria was observed in the GNA groupcompared to the control group (P < 0.005).
3.8. Organ weights, gross necropsy and histopathology
The absolute and relative mean organ weights arepresented in Table 14. A statistically significant increasein the relative weight of the small intestine (+10%) wasobserved in female rats fed on GNA rice, as well as anincrease in absolute and relative weight of the adrenals
Table 12Bacterial counts – faecal samples – means log10 cfu g�1 faeces ± SD
Group Total aerob Total anaerob Lactobacilli Bifidobacteria Enterobacteria Enterococci
Bacterial counts – day 0
1 8.35 ± 0.59 (8)a 8.91 ± 0.44 (8) 7.05 ± 0.65 8.3 ± 0.4 7.93 ± 0.5 7.84 ± 0.552 8.46 ± 0.63 (9) 9.48 ± 0.42 (9) 7.44 ± 0.24 8.45 ± 0.48 (9) 8.02 ± 0.64 7.75 ± 0.64
Bacterial counts – day 30
1 9.59 ± 0.39 (9) 9.5 ± 0.41 (7) 7.66 ± 1.01 8.91 ± 0.11 9.12 ± 0.53 (7) 8.52 ± 0.182 9.36 ± 0.7 (9) 9.46 ± 0.59 7.06 ± 0.68 8.83 ± 0.36 8.78 ± 1.13 (8) 8.54 ± 0.4
Bacterial counts – day 60
1 7.96 ± 0.6 (7) 8.08 ± 0.52 (8) 7.73 ± 0.66 7.99 ± 0.55 (9) 7.33 ± 0.75 7.74 ± 0.82 7.94 ± 0.52 8.17 ± 0.89 (3) 7.67 ± 0.63 8.16 ± 0.62 7.39 ± 0.61 7.54 ± 0.58
Bacterial counts – day 90
1 8.41 ± 0.41 (2) 8.31 ± 0.48 (8) 8.02 ± 0.89 (8) 8.02 ± 0.45 (8) 6.79 ± 0.69 (8) 7.49 ± 0.57 (3)2 7.65 ± 0.27 (3) 8.5 ± 0.5 (7) 8.19 ± 0.46 (7) 8.17 ± 0.24 (7) 7.08 ± 0.53 (7) 8.25 ± 1.2 (5)
Group 1: Control rice, Group 2: GNA rice.a The numbers in brackets indicate the number of animals, no number means 10 animals.
Table 13Bacterial counts – intestinal samples – means log10 cfu g�1 intestinal content ± SD
Group Total aerob Total anaerob Lactobacilli Bifidobacteria Enterobacteria Enterococci
Bacterial counts – duodenum
1 7.02 ± 0.22 (4)a 4.48 ± 0.39 (6) 6.71 ± 0.55 (7) 4.42 ± 0.49 (7) 3.8 ± 0.55 (8) 3.78 ± 0.28 (4)2 6.6 ± 1.27 (4) 5.09 ± 0.71b (7) 7.22 ± 0.36b (8) 4.97 ± 0.76 (9) 3.88 ± 0.9 (6) 4.28 ± 0.34b (6)
Bacterial counts – ileum
1 7.31 (1) 6.81 ± 0.78 (6) 7.46 ± 0.4 (4) 6.76 ± 0.55 (9) 6.69 ± 0.79 6.44 ± 0.75 (8)2 6.34 ± 0.8 (6) 6.63 ± 0.45 (9) 7.41 ± 0.14 (3) 6.33 ± 0.62 (8) 5.72 ± 0.62b (10) 5.93 ± 0.68 (9)
Group 1: Control rice, Group 2: GNA rice.a The numbers in brackets indicate the number of animals, no number means 10 animals.b Statistically significant different from the control group (p 6 0.05).
Table 11Immunological parameters – group mean values ± SD
Analysis Group
1M 2M 1F 2F
Total IgMa 0.225 ± 0.06 0.282 ± 0.07 0.265 ± 0.09 0.282 ± 0.09Total IgGa 1.977 ± 0.67 2.232 ± 0.63 2.991 ± 0.73 3.493 ± 1.12Total IgAa 0.029 ± 0.01 0.038 ± 0.01 0.028 ± 0.01 0.032 ± 0.01Anti-SRBC IgMb 8.98 ± 0.76 7.98 ± 1.79 8.65 ± 2.07 8.28 ± 0.79Con A (0.04 lg/well)c 22.4 ± 12.5 17.3 ± 12.7 29.8 ± 10.5 21.7 ± 11.4Con A (0.2 lg/well)c 42.8 ± 17.7 55.6 ± 12.5 60.2 ± 3.8 53.7 ± 3.9d
Con A (0.4 lg/well)c 52.9 ± 17.4 70.1 ± 15.0 75.9 ± 7.9 64.1 ± 6.0d
PHA (0.04 lg/well)c 11.2 ± 6.6 10.1 ± 3.9 4.9 ± 4.1 11.0 ± 6.4d
PHA (0.2 lg/well)c 26.2 ± 7.7 26.5 ± 7.1 19.6 ± 3.3 20.5 ± 3.2PHA (0.4 lg/well)c 29.1 ± 5.0 30.4 ± 4.4 26.1 ± 5.8 25.1 ± 3.1
a Concentrations of total IgM, IgG and IgA are expressed as mg/ml.b The anti-SRBC IgM response was measured as log2 titres.c The proliferative responsiveness of splenocytes to Con A and PHA, respectively, is expressed as DFLU · 103 (see materials and methods).d Statistically significant different from the control group (p 6 0.05).
358 M. Poulsen et al. / Food and Chemical Toxicology 45 (2007) 350–363
EXHIBIT J - Page 385
Case 5:14-cv-00117-cr Document 63-11 Filed 11/14/14 Page 103 of 312

(+14% and +20%, respectively). Furthermore, this grouphad a significantly reduced absolute (�30%) and relative(�26%) weight of the mesenterial lymph node comparedwith the female control group. No macroscopic or histo-logical findings were observed.
4. Discussion
Even though the two rice varieties were grown underalmost identical environmental conditions, chemical analy-ses revealed a number of statistically significant differencesbetween transgenic and parental rice. Differences weredetected for proximates (starch, fiber, sugars, protein,and ash), amino acids, minerals (copper, iron, manganese,phosphorous, and potassium) and vitamins (B1, B6, panto-thenic acid, folic acid). Minor, but statistically significantdifferences were also observed for distributions of fattyacids and steryl ferulates. Additional field trials would benecessary to determine whether the differences detected
are due to the genetic modification or due to biological var-iability in the field.
The compositional data for transgenic rice were withinthe ranges reported in the literature except for protein,amino acids, ash and potassium. One has to keep in mindthat existing food composition databases do not necessarilyreflect the complete natural variation (Burlingame, 2004).In the present case, for example, protein contents exceedliterature data for both the transgenic and the parental line.To assess the overall relevance of statistically significantdifferences in the light of natural variability within species,more comprehensive databases for the different plant spe-cies are necessary, which include samples with differentgenetic and/or environmental backgrounds. Recently, theInternational Life Science Institute released a comprehen-sive crop composition database that provides informationon the natural variability in compositions of maize, soy-bean and cotton (Ridley et al., 2004). The intended exten-sion of the database to other crops including rice will assist
Table 14Absolute and relative organ weights for rats fed on GNA rice diet and control rice diet
Males Females
GNA rice Control GNA rice Control
Absolute weight
Body weight 422 ± 33 417 ± 40 244 ± 22 257 ± 16Adrenals 0.0576 ± 0.007 0.0600 ± 0.012 0.0759 ± 0.015a 0.0666 ± 0.008Brains 2.02 ± 0.07 2.00 ± 0.09 1.88 ± 0.08 1.86 ± 0.10Epididymis 1.176 ± 0.10 1.178 ± 0.16 – –Heart 1.14 ± 0.11 1.12 ± 0.09 0.805 ± 0.07 0.818 ± 0.08Kidneys 2.40 ± 0.28 2.32 ± 0.25 1.52 ± 0.16 1.57 ± 0.16Liver 12.7 ± 1.4 12.7 ± 1.7 7.54 ± 0.88 7.78 ± 0.72Mesenterial ln. 0.109 ± 0.03 0.108 ± 0.03 0.092 ± 0.03b 0.131 ± 0.04Ovaries – – 0.133 ± 0.03 0.122 ± 0.03Pancreas 1.370 ± 0.43 1.284 ± 0.36 1.050 ± 0.23 1.047 ± 0.14Small intestine 8.05 ± 1.05 8.07 ± 1.03 6.14 ± 0.84 5.91 ± 0.59Spleen 0.776 ± 0.07 0.762 ± 0.10 0.555 ± 0.079 0.552 ± 0.051Testes 3.91 ± 0.34 3.92 ± 0.34 – –Thymus 0.393 ± 0.08 0.385 ± 0.06 0.334 ± 0.078 0.365 ± 0.075Uterus – – 0.500 ± 0.12 0.482 ± 0.14Length small int. 112.8 ± 7.2 111.5 ± 8.0 100.8 ± 4.4 100.8 ± 3.1
Relative weight
Adrenals 0.0137 ± 0.002 0.0145 ± 0.003 0.0313 ± 0.006a 0.0261 ± 0.003Brains 0.481 ± 0.03 0.491 ± 0.04 0.777 ± 0.06 0.727 ± 0.04Epididymidis 0.280 ± 0.02 0.284 ± 0.05 – –Heart 0.270 ± 0.02 0.269 ± 0.02 0.331 ± 0.02 0.319 ± 0.03Kidneys 0.569 ± 0.04 0.557 ± 0.03 0.625 ± 0.04 0.614 ± 0.06Liver 3.00 ± 0.19 3.04 ± 0.22 3.09 ± 0.26 3.04 ± 0.30Mesenterial ln. 0.0258 ± 0.006 0.0260 ± 0.009 0.0379 ± 0.011b 0.0509 ± 0.013Ovaries – – 0.0547 ± 0.013 0.0478 ± 0.011Pancreas 0.324 ± 0.10 0.310 ± 0.09 0.433 ± 0.09 0.410 ± 0.06Small intestine 1.95 ± 0.28 1.91 ± 0.26 2.52 ± 0.34a 2.30 ± 0.20Spleen 0.185 ± 0.02 0.183 ± 0.02 0.228 ± 0.027 0.215 ± 0.019Testis 0.931 ± 0.09 0.945 ± 0.10 – –Thymus 0.093 ± 0.02 0.093 ± 0.01 0.137 ± 0.028 0.142 ± 0.024Uterus – – 0.206 ± 0.05 0.189 ± 0.05Length small int. 0.269 ± 0.018 0.259 ± 0.023 0.416 ± 0.036 0.395 ± 0.026
Relative organ weights expressed as g/100 g body weight. Small intestinal length and relative length is expressed in cm and cm/g body weight. Data ispresented as group mean values ± SD.
a Statistically significant different from control group (p < 0.05).b Statistically significant different from control group (p < 0.01).
M. Poulsen et al. / Food and Chemical Toxicology 45 (2007) 350–363 359
EXHIBIT J - Page 386
Case 5:14-cv-00117-cr Document 63-11 Filed 11/14/14 Page 104 of 312

in the assessment of compositional data like those gener-ated in the present study. Further experiments are neededto ascertain the actual reasons for lower concentrationsof cadmium and Triazophos in GNA rice compared tothe control. These effects might be partially explained bythe more vigorous vegetative growth, but lower seed-set,of the control: the more vigorous the vegetative growthof the plants the more cadmium might be taken up fromthe soil, and the more pesticide might be accumulated;however, it might also be argued that the lower the seed-set, the greater the concentrations of these contaminantsin the seeds. The level of Triazophos in the control rice dietwas below the no-observed-adverse-effect level (NOAEL)found in a study where rats were given Triazophos in thediet for 104 weeks (WHO, 2003). However, the levels foundin the parental and the GM rice were above the maximumresidue level of 0.02 mg/kg.
The rice tested in the 90-day feeding study was given tothe animals as raw brown ground rice. To test the rice in astandardised way it was decided to use raw rice becausecooking may affect the activity of many proteins, includingthe expressed lectin; furthermore, cooking recipes differmarkedly. The inclusion level of 60% was found to be fullyacceptable to the rat after testing different inclusion levelsof rice meal in a preliminary 28-day study (data not pub-lished). The inclusion level of 60% GNA rice in the dietcorresponds to a mean daily GNA lectin intake of approx-imately 58 and 67 mg/kg body weight for males andfemales, respectively.
To take into account the inclusion of rice at a level of60%, the diet in the present study was balanced to ensurean adequate supply of macro- and micro-components(Table 1). It can be argued as to whether to balance theanimal diet within an individual study where both theintended effects, as well as unintended effects resulting fromthe genetic modification, are being evaluated. In the pres-ent study no adjustments were made to balance differencesbetween parental and GNA rice as identified in the courseof the chemical analyses. Despite the fact that the chemicalcharacterization revealed markedly significant differencesin the levels of some macro- and micro-nutrients betweenparental and GNA rice, the differences of these compoundsin the final diet were below 10%, with the exception of iron,which was 35% higher in feed containing the GNA rice.However, the iron level of 60 mg/kg diet in the GNA ricediet is still lower than the 75 mg/kg diet which is the levelrecommended for rats during pregnancy and lactation(NRC, 1995).
The similar body weights and similar levels of feedintake throughout the study of rats given control orGNA rice, and the absence of observed clinical effects,demonstrated the nutritional adequacy within and betweendiets. The significantly increased water intake of both maleand female rats fed GNA rice could be explained by theGNA lectin present in the diet, however the underlyingmechanism for this observation is not known. One possiblehypothesis could be that the higher iron content in the
GNA rice diet could have increased the water intake ofthe rats in order to excrete the excess iron. However, nofurther measurements of the urine were taken in order toelucidate this.
The significantly lower plasma concentrations of potas-sium and protein in the GNA-fed male and female ratscould not be explained by the levels in the diet. In as muchas the concentration of plasma albumin represents a frac-tion of the protein fraction, the decrease in plasma albuminappears to be responsible for the observed decrease inplasma protein. The decreased plasma albumin concentra-tion seen in males and females fed GNA rice as well as thedecreased potassium concentration in males fed GNA ricecould be due to a dilution effect resulting from the signifi-cantly higher water intake of these animals. However, nodecreases in concentrations were observed for the otherplasma solutes. The minor but significantly higher levelof ALAT seen in females fed GNA rice could indicate somekind of effect on the liver (Hoffmann et al., 1989; Moss andHenderson, 1994). However, no effect on liver weight andno histopathological findings in the liver were observed,and accordingly, the increased ALAT activity was not con-sidered adverse. Although renal diseases often result in anelevated plasma concentration of creatinine (Wheltonet al., 1994), the observed change in the level of creatininebetween female rats in the two groups was not consideredas an adverse finding, but could rather be related to theincreased water consumption of the rats fed GNA rice.Enlargement of the lymph nodes could be indicative ofan immune toxic response (Haschek and Rousseaux,1998). The decreased weight of the mesenteric lymph nodesseen in rats given a diet based on GNA rice is therefore notconsidered as an adverse effect. Furthermore, no differenceswere observed in the histopathological examinations ofthese organs. The few significant differences in the otherimmunological parameters measured were considered ofonly minor biological importance and the feeding ofGNA rice was considered to cause no adverse immunolo-gical response in the present study.
Haematology data from the present study were withinthe normal range for this rat strain and the few statisticallysignificant findings seen, in one sex only, were consideredto be of negligible biological importance.
The absolute and relative increase in adrenal weightafter intake of GNA rice was seen in females only. In asmuch as no differences were observed by the histopatho-logical examination we do not consider the effect to beadverse. It cannot be excluded that the higher content ofcadmium in the control diet could have affected the adrenalweight as observed earlier (Selypes et al., 1986), however, inthis study cadmium was given i.p. to female mice at rela-tively high doses.
Female rats fed GNA rice had an increased relative, butnot absolute, weight of the small intestine, which couldresult from an effect of GNA lectin. As no effect was seenon the small intestine at the macroscopic and histopathol-ogical examination the increased relative weight was not
360 M. Poulsen et al. / Food and Chemical Toxicology 45 (2007) 350–363
EXHIBIT J - Page 387
Case 5:14-cv-00117-cr Document 63-11 Filed 11/14/14 Page 105 of 312

considered as an adverse effect. Pusztai et al. (1990) foundno increase in the relative weight of the jejunum after 10days exposure to GNA, despite an observed strong bindingof the GNA to the epithelial surface of the small intestine.
An effect of GNA on bacterial counts was only observedin samples taken from the small intestine. An increase intotal anaerob bacteria, Lactobacilli and Enterococci inthe duodenum was observed for the group fed GNA rice.However, corresponding increases were not detected inthe ileum samples where reduced numbers of Enterobacte-ria were found in the GNA group. Pusztai et al. observedthat feeding rats with 42 mg GNA for six days had no effecton the number of lactose fermenters, non-lactose ferment-ers or lactobacilli (Pusztai et al., 1993). In contrast, GNAwas able to block the PHA-induced Escherichia coli over-growth probably because of mannose-specific binding ofGNA, which is in keeping with the decrease in enterobac-teria in the ileum samples observed in our study.
The present 90-day feeding study was designed to detectboth intended and unintended effects of the genetic modifi-cation of the rice. However, it can be argued as to whetherthe animal model selected was sufficiently sensitive to detectthese effects and distinguish between them. One way todemonstrate the sensitivity and specificity of the animalmodel could be to include additional groups, which receivedthe parental or genetically modified rice spiked with thetransgene product from the inserted trait in a concentrationknown to induce effects within the test animals. Anotherway could be to include groups, which received a mixtureof the GM rice and the parental rice to obtain a dose–response relationship. In the present study, the increasedwater intake of the GNA fed rats appeared to be a key find-ing which could account for the observed differences inother parameters investigated; a urine analysis might haveexplained some of these observed differences.
The results of the study demonstrated that the combina-tion of a thorough chemical analysis of the rice with thein vivo testing of the same rice enables us to better evaluatewhether significant effects observed in the animal studywere due to biological variation of the animals, or differ-ences in the rice varieties resulting from the geneticmodification.
In the present study, several significant differences wereobserved between rats fed diets with genetically modifiedand parental rice. Most of these differences appeared tobe related to the increased water intake of the rats fedGM rice, which probably relates to the GNA lectin con-tent, but none of the effects were considered to be adverse.The lesson from this study is that a 90-day study with thepresent design of one control group and one group giventhe GM food is not sufficient enough for the safety assess-ment of this GM food crop. The addition of groups givenparental or genetically modified rice spiked with theexpressed gene product could have elucidated whether theobserved findings were caused by GNA lectin per se orby secondary changes in the GM rice due to the geneticmodification and could thereby have improved the com-
parative safety assessment of parental rice and the GMrice.
Acknowledgements
This work was financially supported by the EuropeanCommission (Contract no. QLK1-1999-00651, New meth-ods for the safety testing of transgenic food). The authorsthank Margareta Bertram, Dagmar Fottner, Joan Frand-sen, Dorte Hansen, Merete Lykkegaard, Nehad Moradian,Amer Mujezinovic, Henrik Ottesen, Karen Roswall, DitteSørensen and Gillian Davison, for their excellent technicalassistance.
References
Ahmed, S.A., Gogal, R.M., Walsh, J.E., 1994. A new rapid and simplenon-radioactive assay to monitor and determine the proliferation oflymphocytes: an alternative to [3H]thymidine incorporation assay.Journal of Immunological Methods 170, 211–224.
Altschul, S.F., Madden, T.L., Schaffer, A.A., Zhang, J., Zhang, Z., Miller,W., Lipman, D.J., 1997. Gapped BLAST and PSI-BLAST: a newgeneration of protein database search programs. Nucleic AcidsResearch 25, 3389–3402.
AOAC, 2000. Thiamine (vitamin B1) in human and pet food. AOACOfficial Methods 45, 6–7.
Birch, A.N.E., Geoghegan, I.E., Majerus, M.E.N., McNicol, J.W.,Hackett, C.A., Gatehouse, A.M.R., Gatehouse, J.A., 1999. Tri-trophicinteractions involving pest aphids, predatory 2-spot ladybirds andtransgenic potatoes expressing snowdrop lectin for aphid resistance.Molecular Breeding 5, 75–83.
Bognar, A., Ollilainen, V., 1997. Influence of extraction on the determi-nation of vitamin B6 in food by HPLC. Zeitschrift fur Lebensmittel-Untersuchung und Forschung A 204, 327–335.
Burlingame, B., 2004. Fostering quality data in food compositiondatabases: visions for the future. Journal of Food Composition andAnalysis 17, 251–258.
Commission Regulation (EC) No 466/2001 of 8 March 2001. Settingmaximum levels for certain contaminants in foodstuffs. Official JournalL 077, 16/03/2001 P.0001–0013.
DFG (Deutsche Forschungsgemeinschaft), 1991. Ruckstandsanalytikvon Pflanzenschutzmitteln. VCH, Verlagsgesellschaft, Weinheim,Germany.
EFSA (European Food Safety Authority), 2005. Guidance document ofthe scientific panel on genetically modified organisms for the riskassessment of genetically modified plants and derived food and feed.The EFSA Journal 2004 99, 1–94.
FAO/WHO, 2000. Safety aspects of genetically modified foods of plantorigin. Report of a Joint FAO/WHO Expert Consultation on FoodsDerived from Biotechnology, Geneva, Switzerland, 29 May–2 June2000. Food and Agriculture Organisation of the United Nations,Rome. ftp://ftp.fao.org/es/esn/food/gmreport.pdf.
Freisleben, A., Schieberle, P., Rychlik, M., 2003. Specific and sensitivequantification of folate vitamers in foods by stable isotope dilutionassays using high-performance liquid chromatography–tandem massspectrometry. Analytical and Bioanalytical Chemistry 376, 149–156.
Gatehouse, A.M.R., Gatehouse, J.A., 1998. Identifying proteins withinsecticidal activity: use of encoding genes to produce insect-resistanttransgenic crops. Pesticide Science 52, 165–175.
Gatehouse, A.M.R., Davison, G.M., Newell, C.A., Merryweather, A.,Hamilton, W.D.O., Burgess, E.P.J., Gilbert, R.J.C., Gatehouse, J.A.,1997. Transgenic potato plants with enhanced resistance to thetomatomoth Lacanobia oleracea: growthroom trials. Molecular Breed-ing 3, 49–63.
M. Poulsen et al. / Food and Chemical Toxicology 45 (2007) 350–363 361
EXHIBIT J - Page 388
Case 5:14-cv-00117-cr Document 63-11 Filed 11/14/14 Page 106 of 312

Haschek, W.M., Rousseaux, C.G., 1998. Fundamentals of toxicologicpathology. Academic Press, London.
Hoffmann, W.E., Kramer, J., Main, A.R., Torres, J.L., 1989. Clinicalenzymology. In: Loeb, W.F., Quimby, F.W. (Eds.), The ClinicalChemistry of Laboratory Animals. Pergamon Press, Oxford, pp. 237–278.
Howlett, J., Edwards, DJ., Cockburn, A., Hepburn, P., Kleiner, J., Knorr,D., Kozianowski, G., Muller, D., Peijnenburg, A., Perrin, I., Poulsen,M., Walker, R., 2003. The safety assessment of novel foods andconcepts to determine their safety in use. International Journal ofFood Science and Nutrition 54 (Suppl. 1), 1–32.
Juliano, B.O., 1985. Rice: Chemistry and Technology. The AmericanAssociation of Cereal Chemists, Inc., St. Paul, MN, USA.
Khush, G., 2003. Productivity improvements in rice. Nutrition Reviews(II), S114–S116.
Kitta, K., Ebihara, M., Iizuka, T., Yoshikawa, R., Isshiki, K., Kawamoto,S., 2005. Variations in lipid content and fatty acid composition ofmajor non-glutinous rice cultivars in Japan. Journal of Food Com-position and Analysis 18, 269–278.
Latta, M., Eskin, M., 1980. A simple and rapid colorimetric method forphytate determination. Journal of Agricultural and Food Chemistry28, 1313–1315.
Luster, M.I., Portier, C., Pait, D.G., White, K.L., Gennings, C., Munson,A.E., Rosenthal, G.J., 1992. Risk assessment in immunotoxicology I.Sensitivity and predictability of immune tests. Fundamental andApplied Toxicology 18, 200–210.
Miller, A., Frenzel, T., Schmarr, H.-G., Engel, K.-H., 2003. Coupledliquid chromatography–gas chromatography for the rapid analysis ofc-oryzanol in rice lipids. Journal of Chromatography A 985, 403–410.
Møller, A., Saxholt, E., Christensen, A.T., Hartkopp, H.B., 2002. DanishFood Composition Databank, revision 5.0. Food Informatics, Insti-tute of Food Safety and Nutrition, Danish Veterinary and FoodAdministration. Website: http://www.foodcomp.dk.
Moss, D.W., Henderson, A.R., 1994. Enzymes. In: Burtis, C.A.,Ashwood, E.R. (Eds.), Tietz Textbook of Clinical Chemistry, seconded. W.B. Saunders Company, Pennsylvania, pp. 735–896.
Munoa, F.J., Pares, R., 1988. Selective medium for isolation andenumeration of Bifidobacterium spp. Applied Environmental Microbi-ology 54, 1715–1718.
NRC (National Research Council), 1995. Nutrient Requirements ofLaboratory Animals, fourth revised ed. National Academy Press,Washington, DC.
OECD, 1993. Safety Evaluation of Foods Derived by Modern Biotech-nology, Concepts and Principles. Organisation for Economic Cooper-ation and Development, Paris. http://www.oecd.org/pdf/m00033000/m00033002.pdf.
OECD, 2004. Series on the safety of novel foods and feeds, no. 10.Consensus document on compositional considerations for new vari-eties of rice (Oryza sativa): key food and feed nutrients and anti-nutrients. OECD, Paris, France.
Poulsen, M., Mølck, A.M., Jacobsen, B.L., 2002. Different effects of short-and long-chained fructans on large intestinal physiology and carcin-ogen-induced aberrant crypt foci in rats. Nutrition and Cancer 42 (2),194–205.
Powell, K.S., Spence, J., Bharathi, M., Gatehouse, J.A., Gatehouse,A.M.R., 1998. Immunohistochemical and developmental studies toelucidate the mechanism of action of the snowdrop lectin on the ricebrown planthopper, Nilaparvata lugens (Stal). Journal Insect Physiol-ogy 44, 529–539.
Pusztai, A., Ewen, S.W.B., Grant, G., Peumans, W.J., van Damme,E.J.M., Rubio, L., Bardocz, S., 1990. Relationship between survivaland binding of plant lectins during small intestinal passage and theireffectiveness as growth factors. Digestion 46 (Suppl. 2), 308–316.
Pusztai, A., Grant, G., Spencer, R.J., Duguid, T.J., Brown, D.S., Ewen,S.W., Peumans, W.J., Van Damme, E.J., Bardocz, S., 1993. Kidneybean lectin-induced Escherichia coli overgrowth in the small intestineis blocked by GNA, a mannose-specific lectin. Journal of AppliedBacteriology 75, 360–368.
Rao, K.V., Rathore, K.S., Hodges, T.K., Fu, X.D., Stoger, E., Sudhakar,D., Williams, S., Christou, P., Bown, D.P., Powell, K.S., Spence, J.,Bharathi, M., Gatehouse, A.M.R., Gatehouse, J.A., 1998. Expressionof snowdrop lectin (GNA) in the phloem of transgenic rice plantsconfers resistance to rice brown planthopper. The Plant Journal 14,469–477.
Reeves, P.G., Nielsen, F.H., Fahey Jr., G.C., 1993. AIN-93 purified dietsfor laboratory rodents: final report of the American Institute ofNutrition ad hoc writing committee on the reformulation of the AIN-76A rodent diet. Journal of Nutrition 123, 1939–1951.
Reitzer-Bergaentzle, M., Marchioni, E., Hasselmann, C., 1993. HPLCdetermination of vitamin B6 in foods after pre-column derivatizationof free and phosphorylated vitamers into pyridoxol. Food Chemistry48, 321–324.
Ridley, W.P., Shillito, R.D., Coats, I., Steiner, H.-Y., Shawgo, M.,Phillips, A., Dussold, P., Kurtyka, L., 2004. Development of theInternational Life Sciences Institute crop composition database.Journal of Food Composition and Analysis 17, 423–438.
Rong, N., Ausman, L.M., Nicolosi, R.J., 1997. Oryzanol decreasescholesterol absorption and aortic fatty streaks in hamsters. Lipids 32,303–309.
Rychlik, M., 2003. Pantothenic acid quantification by a stable isotopedilution assay based on liquid chromatography–tandem massspectrometry. The Analyst 128, 832–837.
Saha, P.R., Weaver, C.M., Mason, A.C., 1994. Mineral bioavailability inrats from intrinsically labeled whole wheat flour of various phytatelevels. Journal of Agricultural and Food Chemistry 42, 2531–2535.
SCF, 1996. SCF opinions on the assessment of novel foods Part I.Recommendations concerning scientific aspects of information neces-sary to support an application for placing on the market of novel foodsand novel food ingredients (expressed on 7 June 1996). http://europa.eu.int/comm/food/fs/sc/scf/reports_en.html.
Scherz, H., Senser, F. (Eds.), 2000. Souci-Fachmann-Kraut. FoodComposition and Nutrition Tables, sixth ed. Medpharm ScientificPublication, Stuttgart, Germany.
Selypes, A., Lorencz, R., Serenyi, P., 1986. The preventive effect ofprednisolone on the adrenal toxicity of cadmium. Journal of AppliedToxicology 6, 377–378.
Setamou, M., Bernal, J.S., Legaspi, J.C., Mirkov, T.E., 2002. Parasitismand location of sugarcane borer (Lepidoptera: Pyralidae) by Cotesiaflavipes (Hymenoptera: Braconidae) on transgenic and conventionalsugarcane. Environmental Entomology 31, 1219–1225.
Stoger, E., Williams, S., Christou, P., Down, R.E., Gatehouse, J.A., 1999.Expression of the insecticidal lectin from snowdrop (Glanthus nivalisagglutinin; GNA) in transgenic wheat plants: effects on predationby bythe grain aphid Sitobion avenae. Molecular Breeding 5, 65–73.
Sudhakar, D., Fu, X., Stoger, E., Williams, S., Spence, J., Brown, D.P.,Bharathi, M., Gatehouse, J.A., Christou, P., 1998. Expression andimmunolocalisation of the Snowdrop Lectin, GNA in Transgenic RicePlants. Transgenic Research 7, 371–378.
Temple, L., Kawabata, T.T., Munson, A.E., White, K.L., 1993. Com-parison of ELISA and plaque-forming cell assays for measuring thehumoral immune response to SRBC in rats and mice treated withbenzo[a]pyrene or cyclophosphamide. Fundamental and AppliedToxicology 21, 412–419.
Temple, L., Butterworth, L., Kawabata, T.T., Munson, A.E., White,K.L., 1995. ELISA to measure SRBC specific serum IgM: method anddata evaluation. In: Burleson, B.R., Dean, J.H., Munson, A.E. (Eds.),Methods in Immunotoxicology. Wiley-Liss, New York, pp. 137–157.
USDA, Agricultural Research Service, 2004. USDA Nutrient Databasefor Standard Reference, Release 16-1. Nutrient Data LaboratoryHome Page, http://www.nal.usda.gov/fnic/foodcomp.
VDLUFA, 1996. Methodenbuch, VII – Umweltanalytik. Verband Deut-scher Landwirtschaftlicher Untersuchungs- und Forschungsanstalten,Bonn, Germany.
VDLUFA, 1997. Methodenbuch, III – Untersuchung von Futtermitteln.Verband Deutscher Landwirtschaftlicher Untersuchungs- und Fors-chungsanstalten, Bonn, Germany.
362 M. Poulsen et al. / Food and Chemical Toxicology 45 (2007) 350–363
EXHIBIT J - Page 389
Case 5:14-cv-00117-cr Document 63-11 Filed 11/14/14 Page 107 of 312

Ward, C.M., Trenerry, C., 1997. The determination of niacin in cereals,meat and selected food by capillary electrophoresis and HPLC. FoodChemistry 60, 667–674.
Whelton, A., Watson, A.J., Rock, R.C., 1994. Nitrogen metabolites andrenal function. In: Burtis, C.A., Ashwood, E.R. (Eds.), Tietz Textbookof Clinical Chemistry, second ed. W.B Saunders Company, Pennsyl-vania, pp. 1513–1575.
WHO (World Health Organisation), 2003. Pesticide residues in food. JointFAO/WHO meeting on pesticide residues. Evaluations 2002. Part II –Toxicological.
Wills, R.B., Shaw, C.G., Day, W.R., 1977. Analysis of water solublevitamins by HPLC. Journal of Chromatographic Science 15, 262–266.
Xu, Z., Godber, J.S., 1999. Purification and identification of componentsof c-oryzanol in rice bran oil. Journal of Agricultural and FoodChemistry 47, 2724–2728.
Xu, Z., Hua, N., Godber, J.S., 2001. Antioxidative activity of tocopherols,tocotrienols, and c-oryzanol components from rice bran againstcholesterol oxidation accelerated by 2,20-azobis(2-methylpropionami-dine) dihydrochloride. Journal of Agricultural and Food Chemistry 49,2077–2081.
Zhi-Jun, Y., Sriranganathan, N., Vaught, T., Arastu, S.K., Ahmed, A.,1997. A dye-based lymphocyte proliferation assay that permitsmultiple immunological analyses: mRNA, cytogenetic, apoptosis,and immunophenotyping studies. Journal of Immunological Methods210, 25–39.
M. Poulsen et al. / Food and Chemical Toxicology 45 (2007) 350–363 363
EXHIBIT J - Page 390
Case 5:14-cv-00117-cr Document 63-11 Filed 11/14/14 Page 108 of 312

Transgenic Expression of Bean r-Amylase Inhibitor in PeasResults in Altered Structure and Immunogenicity
VANESSA E. PRESCOTT,† PETER M. CAMPBELL,§ ANDREW MOORE,|
JOERG MATTES,† MARC E. ROTHENBERG,‡ PAUL S. FOSTER,†
T. J. V. HIGGINS,| AND SIMON P. HOGAN* ,†
Division of Molecular Bioscience, The John Curtin School of Medical Research, Australian NationalUniversity, Canberra, ACT, Australia, Division of Allergy and Immunology, Department of Pediatrics,
Cincinnati Children’s Hospital Medical Center, University of Cincinnati College of Medicine,Cincinnati, Ohio 45229, and Divisions of Entomology and Plant Industry, Commonwealth Scientific
and Industrial Research Organization, Canberra, ACT, Australia
The development of modern gene technologies allows for the expression of recombinant proteins innon-native hosts. Diversity in translational and post-translational modification pathways betweenspecies could potentially lead to discrete changes in the molecular architecture of the expressedprotein and subsequent cellular function and antigenicity. Here, we show that transgenic expressionof a plant protein (R-amylase inhibitor-1 from the common bean (Phaseolus vulgaris L. cv.Tendergreen)) in a non-native host (transgenic pea (Pisum sativum L.)) led to the synthesis of astructurally modified form of this inhibitor. Employing models of inflammation, we demonstrated inmice that consumption of the modified RAI and not the native form predisposed to antigen-specificCD4+ Th2-type inflammation. Furthermore, consumption of the modified RAI concurrently with otherheterogeneous proteins promoted immunological cross priming, which then elicited specific immuno-reactivity of these proteins. Thus, transgenic expression of non-native proteins in plants may lead tothe synthesis of structural variants possessing altered immunogenicity.
KEYWORDS: r-Amylase inhibitor; transgenic plant; animal model; Th2 inflammation; mass spectro-
photometry
INTRODUCTION
Genetically modified (GM) plants are designed to enhanceagronomic productivity or product quality and are beingincreasingly employed in both agricultural and livestock indus-tries (1, 2). Recently, peas (Pisum satiVumL.) expressing a genefor R-amylase inhibitor-1 (RAI) from the common bean(Phaseolusvulgaris L. cv. Tendergreen) were generated toprotect the seeds from damage by inhibiting theR-amylaseenzyme in old world bruchids (pea, cowpea, and azuki beanweevils) and are currently undergoing risk assessments (3-6).
The present study was initiated to (1) characterize theproteolytic processing and glycopeptide structures ofRAI whentransgenically expressed in peas (pea-RAI) and (2) evaluate inan in vivo model system the immunological consequence oforal consumption of pea-RAI. We demonstrate that expression
of RAI in pea leads to a structurally modified form of thisinhibitor. Employing experimental models, we show that thestructural modification can lead to altered antigenicity. Theseinvestigations reveal that expression of proteins in non-nativehosts can lead to the synthesis of a protein variant with alteredimmunogenicity.
MATERIALS AND METHODS
Nontransgenic and Transgenic Plants.Seed meal was obtainedfrom nontransgenic peas, genetically modified peas expressing beanR-amylase inhibitor-1 (RAI) (5), genetically modified narrow leaf lupin(Lupinus angustifoliusL.) expressing sunflower seed albumin protein(SSA) in the seeds (SSA-lupin) (7), and from nontransgenic Pinto bean.Seeds were ground into fine flour in liquid N2 using a mortar and pestle.This seed meal was then suspended in PBS (0.166 g meal/mL),homogenized, sieved through a 70µm mesh, and stored at-70 °C. Insome experiments, seed meal homogenates were cooked at 100°C for30 min before administration to mice (indicated in text).
Purification of SSA from Transgenic Lupin and rAI fromCommon Beans and from Transgenic Peas.RAI was purified fromthe common beans (Pinto and Tendergreen) and transgenic peas andSSA from genetically modified narrow leafed lupin (SSA-lupin) aspreviously described (7, 8). Purified proteins were analyzed by sodiumdodecyl sulfate polyacrylamide gel electrophoresis (SDS-PAGE, 15-
* Author to whom correspondence should be addressed [telephone (513)636-6620; fax (513) 636-3310; e-mail [email protected]].
† Australian National University.§ Division of Entomology, Commonwealth Scientific and Industrial
Research Organization.| Division of Plant Industry, Commonwealth Scientific and Industrial
Research Organization.‡ University of Cincinnati College of Medicine.
J. Agric. Food Chem. 2005, 53, 9023−9030 9023
10.1021/jf050594v CCC: $30.25 © 2005 American Chemical SocietyPublished on Web 10/15/2005
EXHIBIT J - Page 391
Case 5:14-cv-00117-cr Document 63-11 Filed 11/14/14 Page 109 of 312

25% gradient, 1 mm thick, mini-gel format) and MALDI-TOF massspectrometry.
Western Immunoblot Analysis.RAI polypeptide composition wasdetermined in protein extracts from common bean and transgenic peasas previously described (3). Protein was extracted from seeds with 0.5M NaCl, 1 mM EDTA, and 0.1 MN-tris(hydroxymethyl)methylamino-ethanesulfonic acid at pH 7.8. Aliquots of reduced protein (20µg byBradford assay) were fractionated by SDS-PAGE and electroblottedonto nitrocellulose membrane.RAI polypeptides were detected withan RAI antiserum from rabbit and goat anti-rabbit IgG conjugated toalkaline phosphatase (3). The concentration ofRAI in transgenic peaswas determined as 4% of total protein as previously described (3).
Structural Analysis of Purified rAI from the Pinto and Ten-dergreen Beans and from Transgenic Peas.Purified RAI from thecommon beans, Pinto and Tendergreen, and from transgenic peas wereanalyzed by matrix-assisted laser desorption/ionization-time-of-flight-mass spectrometry (MALDI-TOF-MS). The proteins were dissolvedin water (approximately 1µg/µL), and then 1µL was mixed with 1µL of matrix solution (saturated sinapinic acid in 50% acetonitrile/0.1% trifluoroacetic acid) on the sample plate of a Voyager EliteMALDI-TOF mass spectrometer (Perseptive Biosystems) and allowedto dry. Spectra were collected in linear mode with myoglobin used forclose external calibration (Sigma, Cat. No. M-1882, 16952.6 [M+H]+, 8476.8 [M+ 2H]2+).
Mice and Intragastric Administration of Seed Meal fromNontransgenic and Transgenic Plants.BALB/c mice were obtainedfrom specific pathogen-free facilities at the Australian NationalUniversity. Mice were intragastrically administered 250µL of seedmeal suspension (∼100 mg/mL) containing either transgenic peas,nontransgenic peas, SSA-lupin, or Pinto bean twice a week for 4 weeks.In some experiments, serum was taken from the mice at the start ofthe third and fifth weeks during feeding. The serum antibody titerswere determined as previously described (9).
Mice and Delayed Type Hypersensitivity Responses.BALB/cmice were administered seed meal as described above. Seven daysfollowing the final intra-gastric challenge, mice were subcutaneouslyinjected with 25µL of the appropriate antigen [Tendergreen-RAI, peaR-AI, or lupin SSA (1 mg/mL in PBS)] into the footpad. The positivecontrol [(+) control] is mice immunized by i.p. injection of 200µLcontaining 50µg of Tendergreen-RAI dissolved in PBS with Alum(1 mg/mL) and subsequently receiving 25µL of purified Tendergreen-RAI (1 mg/mL PBS). The negative control [(-) control] is miceimmunized by i.p. injection of 200µL containing 50µg of Tendergreen-RAI dissolved in PBS with Alum (1 mg/mL) and subsequently receiving25µL of PBS. DTH responses were assessed by measuring the specificincrease in footpad thickness using a digmatic calliper (Mitutoyo,Kawasaki, Japan) 24 h following the challenge. Serum was collectedon day 14, and antibody titers were determined as previously described(9).
Murine Model of CD4+ Th2 Cell-Mediated Inflammation.BALB/c WT mice were administered seed meal as indicated in thetext. Seven and nine days following the final intra-gastric challenge,mice were anesthetized with an intravenous injection of 100µL ofSaffan solution (1:4 diluted in PBS). Mice were intubated with a 22gauge catheter needle, through which purifiedRAI from Tendergreenbean or transgenic pea (1 mg/mL PBS), or vehicle control (PBS), wasinstilled. Airway responsiveness (AHR), mucus production, andeosinophilia were measured 24 h following the final intra-trachealchallenge. AHR to methacholine was assessed in conscious, unrestrainedmice by barometric plethysmography, using apparatus and softwaresupplied by Buxco (Troy, NY) as previously described (9). This systemyields a dimensionless parameter known as enhanced pause (Penh),reflecting changes in waveform of the pressure signal from theplethysmography chamber combined with a timing comparison of earlyand late expiration, which can be used to empirically monitor airwayfunction. Measurements were performed as previously described (9).Lung tissue representing the central (bronchi-bronchiole) and peripheral(alveoli) airways was fixed, processed, and stained with Alcian Blue-PAS for enumeration of mucin-secreting cells or Charbol’s chromo-trope-Haematoxylin for identification of eosinophils as previouslydescribed (9).
Intragastric Administration of Purified rAI and OVA. Mice wereadministered 200µL of affinity purified Tendergreen- or transgenicpea-RAI (5 µg) with ovalbumin (OVA, 1 mg/mL) in a PBS suspensionthree times a week for 2 weeks. One week following feeding, the micewere intubated with a 22 gauge catheter needle, through which 25µLof OVA (1 mg/mL PBS), or vehicle control (PBS), was instilled andthe CD4+ Th2-inflammation indices determined as described above.Serum was taken from the mice 1 day after the final intra-trachealchallenge, and serum antibody titers were determined as described (9).
Antigen Specific CD4+ T-Cell Response.Peribronchial lymphnodes (PBLN) were subjected to pea-RAI or RCD3/RCD28 stimulationas previously described (9). In brief, 5× 10⁵ PBLN cells/mL werecultured withRAI (50 µg/mL) or RCD3 (5µg/mL)/RCD28 (1µg/mL)for 96 h. IL-4, IL-5, IFNγ levels were determined in supernatants fromstimulated PBLN homogenates by using the OptEIA Mouse IL-4, IL-5, and IFNγkits (Pharmingen).
Statistical Analysis. The significance of differences betweenexperimental groups was analyzed using Student’s unpairedt-test.Values are reported as the mean( SEM. Differences in means wereconsidered significant ifp < 0.05.
RESULTS
MALDI-TOF-MS Analysis of rAI. To assess the conse-quences of transgenic expression of the beanRAI in peas, weinitially performed a structural analysis of the transgenicallyexpressed protein (pea-RAI). Pea-RAI was compared by Westernblot analysis and MALDI-TOF-MS with natively expressedRAIfrom the common beans, cvs. Pinto (Pinto-RAI) and Tender-green (Tendergreen-RAI) (collectively termed bean-RAI). Previ-ous studies have shown that bean-RAI is synthesized as a pre-pro-RAI polypeptide that is cleaved following Asn77 to formtwo peptide chains (Randâ), both of which are glycosylatedand have one or more amino acid residue(s) removed from theirC-termini (8). This post-translational processing results in majorforms of theR andâ chains with masses of 11 646 and 17 319,respectively, and minor forms containing alternative glycans(10-12). Western immunoblot analysis of Tendergreen-RAI andpea-RAI revealed immunoreactive bands in the 11 000-18 000mass range consistent with the reported structure (10-13).Detailed comparison of Tendergreen-RAI with pea-RAI revealeddifferences in the banding profile, suggesting possible differ-ences in the molecular structure of natively and transgenicallyexpressedRaI (Figure 1A).
To better resolve the differences between pea-RAI and bean-RAI, affinity purified RAI was analyzed by MALDI-TOF-MS(Figure 1B). The mass spectra of Tendergreen-RAI and Pinto-RAI closely matched a previously published spectrum (10) ofa bean-RAI (PhaseolusVulgarisL. cv. Greensleeves) confirmingthat both Tendergreen- and Pinto-RAI possess similar well-characterized post-translational modifications and very similarrelative abundance of minor processing variants (10, 11).Alignment of our spectra with the previously published data(10) allowed identification of peaks in the pea-, Tendergreen-,and Pinto-RAI spectra. The major form of theR-chain (11 646Da) of bean-RAI contains residues 1-76 by cleavage of thepro-protein following Asn77, removal of Asn77, and the additionof sugar residues (Man6GlcNAc2 at Asn12 and Man9GlcNAc2
at Asn65). Minor forms of theR-chain of bean-RAI differed byhaving one to three fewer mannose residues resulting in a seriesof peaks in the MALDI-TOF spectrum that differ by 162 massunits. In contrast, less heavily glycosylated forms dominatedfor theR-chain of pea-RAI. In particular, anR-chain with twofewer mannose residues (11 322 Da) was the most abundantfor pea-RAI but the least abundant for Tendergreen-RAI (Figure1C(i)). A further difference in the pea-RAI spectrum was a seriesof minor peaks differing from the mainR-chain peaks by either
9024 J. Agric. Food Chem., Vol. 53, No. 23, 2005 Prescott et al.
EXHIBIT J - Page 392
Case 5:14-cv-00117-cr Document 63-11 Filed 11/14/14 Page 110 of 312

+98 or-64 mass units, indicating another modification of someof the pea-RAIR-chains (Figure 1C(i)).
The major form of theâ-chain of Greensleeves-RAI (16527Da) contains residues 78-216 by cleavage of the pro-proteinfollowing Asn77, the removal of the seven C-terminal residuesfollowing Asn216, and the addition of sugar residues (Man3-GlcNAc2Xyl1 at Asn140) (10-13). Theâ-chain region of theTendergreen-RAI spectrum closely aligned with that of Green-sleeves-RAI (Figure 1C). Theâ-chain region of the Pinto-RAI
spectrum also closely resembled that of Greensleeves-RAIexcept that both major and minor peaks of Pinto-RAI wereshifted by approximately+104 mass units. This mass discrep-ancy is consistent with five amino acid residue differencesbetween theâ-chains of Tendergreen-RAI and Pinto-RAI aspredicted by gene sequence comparison (see Supporting Infor-mation Figure 1). Further, there are also three predicted residuedifferences between the Tendergreen-RAI and Pinto-RAI R-chainsthat result in a difference of+1 mass unit, which would not be
Figure 1. Western immunoblot and MALDI-TOF-MS analysis of common bean-derived-RAIs and RAI from transgenic peas. (A) Western blot analysisof RAI protein in extracts of transgenic peas and the Tendergreen variety of common bean. The masses of standard proteins are indicated. (B) AlignedMALDI-TOF mass spectra of purified RAI from transgenic pea and the common beans, Tendergreen and Pinto. (C) Detail from the spectra in panel Bshowing the regions of the R-chain (i) and the â-chain (ii).
Bean R-Amylase Inhibitor and Immunogenicity J. Agric. Food Chem., Vol. 53, No. 23, 2005 9025
EXHIBIT J - Page 393
Case 5:14-cv-00117-cr Document 63-11 Filed 11/14/14 Page 111 of 312

detected by our methods. These sequence differences areconsistent with previous reports ofRAI polymorphisms amongbean cultivars (12,13). The pea-RAI spectrum showed majorpeaks corresponding to the two major and minor forms of theâ-chain found in Tendergreen-RAI; however, the pea-RAIspectrum also showed a number of other peaks (Figure 1C(ii)).DNA sequencing of the transgene in pea and comparison withthe published sequence (14) confirmed that the nucleotidesequences were identical, establishing that the observed furtherforms of the pea-RAI are related by variations in post-translational modifications including glycosylation (Figure1C(ii)).
Analysis of the spectra of pea- and bean-RAI also revealedseveral other differences. First, a number of peaks at∼8-9000and 5824 mass units and below were observed in the bean-RAIspectrum, which are consistent with a previously reported proteinthat copurifies with bean-RAI (10) and doubly charged ((MH2)2+)forms of theR-chain, respectively. Further, a peak at 4223 massunits was detected in the pea-RAI spectrum, which has not beenpreviously reported. While this peak is barely detected in thebean-RAI spectrum presented here, the peak was observed in anumber of other bean-RAI preparations (results not shown). Themass of this peak is consistent with the first 39 residues of theâ-chain, which could be obtained by cleavage following an Asnresidue, the same protease specificity that provides the reportedprocessing ofRAI at Asn77. Consistent with this hypothesis, asmall peak was detected in some preparations at about 12 304mass units that could correspond to the remainder of theâ-chain.
While pea-RAI has not yet been characterized as thoroughlyas the bean-RAI, it is clear that the transgenic expression ofthe beanRAI gene in the pea led to differences of glycosylationand possibly other differences in both theR- and theâ-chains.
Immunological Consequence of Oral Consumption ofBeans. Peas are used as a feed component in the livestockindustry and also in human diets. Generally, dietary proteinantigens undergo gastric digestion leading to the formation ofnonimmunogenic peptides and the induction of a state of specificimmunological unresponsiveness termed oral tolerance (15,16).However, the demonstration of structural differences betweenthe transgenicRAI in pea and the natively expressed bean formsraised the concern that the tolerance mechanism may beperturbed, possibly leading to enhanced immunoreactivity.
The induction of oral tolerance results in the failure of theimmune system to elicit an active immune response to subse-quent exposure to the same antigen in the skin (delayed typehypersensitivity [DTH] response) or lung (CD4+ T-helper [Th2]cell-mediated inflammation). To examine potential differencesin immunological responsiveness following oral consumption,mice were fed Pinto bean, which expresses a native form ofRAI and subsequently received purified Tendergreen-RAI in theskin and lung. Most varieties of common beans such as RedKidney or Tendergreen contain high levels of phytohemagglu-tinin (PHA), an anti-nutritional factor that induces dietarytoxicity in rodents and birds. We therefore used the Pinto varietythat contains very low levels of PHA (17,18) as the appropriatecontrol for oral exposure. Oral consumption of native uncookedPinto bean seed flour followed by intra-tracheal (i.t.) challengewith Tendergreen-RAI or phosphate buffered saline (PBS) failedto induce anRAI-specific IgG1 antibody response (Figure 2A).Similarly, sub-cutaneous (s.c.) challenge of the footpad or i.t.challenge of Pinto bean-fed mice with Tendergreen-RAI alsofailed to promote a DTH response (results not shown) or apulmonary Th2-inflammatory response [pulmonary eosinophilia,mucus hypersecretion, and enhanced AHR to a bronchocon-
strictive agents], respectively (Figure 2B-D). While the levelof AHR in the Pinto bean-fedRAI-challenged mice was higherthan PBS-challenged mice, the level of responsiveness is notsignificantly different from that of naıve mice i.t. challengedwith Tendergreen-RAI (Figure 2D). As a positive control, micewere sensitized by intra-peritoneal (i.p.) injection and subse-quently challenged via the airways with bean-derivedRAI toinduce immunological responsiveness (Figure 2A-D). Col-lectively, these data showed that oral consumption of the nativebean form ofRAI followed by respiratory exposure to bean-RAI did not promote immunological responsiveness or inflam-mation.
Immunological Consequence of Oral Consumption ofTransgenic Peas.To determine whether oral consumption ofthe transgenicRAI (from pea) elicited an immunologicalresponse, mice were orally administered transgenic pea seedmeal andRAI; serum antibody titers and DTH responses wereexamined. Interestingly, in mice that were fed transgenic pea,but not nontransgenic pea,RAI-specific IgG1 was detected at 2weeks and at significant levels after 4 weeks of oral exposure(Figure 3A). Consistent with the antibody findings, mice fednontransgenic pea seed meal did not develop DTH responsesfollowing footpad challenge with purified pea-RAI (Figure 3B).In contrast, mice fed transgenic pea seed meal exhibited asignificant DTH response as compared to the nontransgenic peaexposed group when purified pea-RAI was injected into thefootpad (Figure 3B). As a control for any general effect ofgenetic modification, we repeated the experiment with materialfrom two other genetically modified plants, lupin (LupinusangustifoliusL.) expressing sunflower seed albumin (SSA)[transgenic lupin] (9) and chickpeas (Cicer arietinum L.)expressing bean derivedRAI. Mice were orally administeredlupin or transgenic lupin or chickpea or transgenic chickpeaseed meal and subsequently footpad challenged with SSA orRAI and DTH responses were examined. In contrast to trans-genic pea, mice fed transgenic lupin or chickpea did not develop
Figure 2. Experimental consumption of bean (cv. Pinto) seed meal doesnot predispose to inflammation. (A) RAI-specific IgG1 in serum and (B)mucus-secreting cell numbers and (C) eosinophil levels in lung tissuefrom Pinto bean-fed mice i.t. challenged with PBS or Tendergreen-RAI.(D) AHR in Pinto bean-fed mice i.t. challenged with PBS or Tendergreen-RAI. Data are expressed as the (A−D and F) mean ± SEM and (E)mean O.D. of the serum dilution 1/10 ± SEM from 4 to 6 mice per groupfrom duplicate experiments. (A−D) * p < 0.05 as compared to Pinto bean-fed i.t. RAI.
9026 J. Agric. Food Chem., Vol. 53, No. 23, 2005 Prescott et al.
EXHIBIT J - Page 394
Case 5:14-cv-00117-cr Document 63-11 Filed 11/14/14 Page 112 of 312

DTH responses following footpad challenge with the transgeni-cally expressed and purified SSA orRAI protein (Figure 3B;results not shown). Thus, consumption of transgenic peacontainingRAI promotedRAI-specific immunological respon-siveness.
To characterize the type of immune response elicited againstpea-RAI following oral consumption of transgenic pea, weemployed a well-characterized murine model of CD4+ Th2 cell-
mediated inflammation (19). Mice were orally administeredtransgenic pea seed meal and subsequently i.t. challenged withpurified pea-RAI, and key features of Th2-inflammation [pul-monary eosinophilia, mucus hypersecretion, and AHR] wereexamined. I.t. challenge of nontransgenic pea-fed mice withpurified pea-RAI failed to induce features of Th2-inflammation(Figure 4A-G). Furthermore, airways responsiveness to thecholinergic spasmogen, methacholine, was not induced in these
Figure 3. Experimental consumption of transgenic pea seed meal predisposed to antigen-specific IgG1 and DTH responses. (A) Antigen-specific IgG1
and (B) DTH responses in pea nontransgenic and pea transgenic-fed mice. Data are expressed as the (F) mean ± SEM and (E) mean O.D. of the serumdilution 1/10 ± SEM from 4 to 6 mice per group from duplicate experiments. (A−C) * p < 0.05 as compared to nontransgenic pea or transgenic lupinfed mice i.t. RAI.
Figure 4. Consumption of transgenic pea seed meal predisposed to CD4+ Th2-type inflammatory response. Eosinophil accumulation in bronchoaveolarlavage fluid (BAL) (A), tissue (B), and mucus-secreting cell numbers (C) in lung tissue from nontransgenic and transgenic pea-fed mice i.t. challengedwith RAI purified from pea. (D−G) Representative photomicrographs of eosinophil accumulation in lung of (D) nontransgenic and (E) pea transgenic-fedmice and mucus-secreting cell numbers in lung tissue of (F) nontransgenic and (G) pea transgenic-fed mice i.t. challenged with RAI from pea. (H)Airways hyperresponsiveness (AHR) in nontransgenic and pea transgenic-fed mice i.t. challenged with RAI from pea. Data are expressed as the mean± SEM from 3 to 6 mice per group from duplicate experiments. Statistical significance of differences (p < 0.05) was determined using Student’s unpairedt-test. (D−G) ×400 magnification.
Bean R-Amylase Inhibitor and Immunogenicity J. Agric. Food Chem., Vol. 53, No. 23, 2005 9027
EXHIBIT J - Page 395
Case 5:14-cv-00117-cr Document 63-11 Filed 11/14/14 Page 113 of 312

mice (Figure 4H). However, instillation of pea-RAI into thelungs of mice fed transgenic pea induced key features of Th2-type inflammation including pulmonary eosinophilia, mucushypersecretion, and AHR (Figure 4A-H).
Pulmonary eosinophilia, mucus hypersecretion, and AHR arecritically linked to the effector function of the Th2 cytokines(20). To examine whether consumption of transgenic peapromoted aRAI-specific CD4+ Th2-type T-cell response, CD4+
T-cells in peribronchial lymph node (PBLN) cultures from micefed nontransgenic pea or transgenic pea seeds challenged withpea-RAI were stimulated with pea-RAI and cytokine profilesdetermined. Stimulation of CD4+ T-cells in peribronchial lymphnode (PBLN) cultures from nontransgenic pea-fed mice chal-lenged with pea-RAI did not elicit Th2 (interleukin (IL)-4 andIL-5)- or Th1-type (gamma interferon, IFNγ) cytokine produc-tion in response to pea-RAI stimulation (Figure 5A-C). Bycontrast, stimulation of PBLN cultures with pea-RAI from i.t.challenged mice fed transgenic pea resulted in the significantproduction of Th2 cytokines (Figure 5A-C). Thus, oralexposure of mice to transgenic pea, but not nontransgenic seedmeal, predisposed to systemic immunological responsivenesscharacterized by a Th2-type immune profile.
Pea-rAI Promotes Immune Responses to Other OralAntigens.Previous investigations have demonstrated that vari-ous plant-derived proteins such as tomatine possess immuno-modulatory activity and potentiate and polarize immune re-sponses (21-23). We have demonstrated that consumption oftransgenic pea in the presence of a large number of potentialdietary antigens in the gastrointestinal tract induces an activesystemic Th2-immune response against pea-RAI. In light of thesefindings, we were next interested in determining whetherconsumed pea-RAI possessed immunomodulatory activity forTh2 immune responses and could sensitize mice to heteroge-neous nongenetically modified food antigens. Thus, we intra-gastrically (i.g.) administered purified Tendergreen- or pea-RAIwith the well-characterized dietary antigen, chicken egg whiteprotein OVA, or OVA alone and subsequently i.t. challengedmice with OVA. I.g. administration of OVA alone did notsystemically sensitize mice to OVA (Figure 6A). Further,subsequent OVA challenge in the airways did not promote Th2-inflammation (mucus hypersecretion, pulmonary eosinophilia,or AHR). Similarly, i.g. administration of bean-RAI and OVAdid not systemically sensitize mice or predispose to Th2-inflammatory processes. However, consumption of pea-RAI andOVA promoted a strong OVA-specific Th2-type antibody
response (Figure 6A) and predisposed mice to OVA-inducedTh2-inflammation (Figure 6B-D). To support this observation,we examined serum levels of antigen-specific IgG1 against peaseed proteins (pea globulins, lectin, and vicilin-4) in transgenicpea and nontransgenic pea-fed mice. Interestingly, levels ofantigen-specific IgG1 against pea globulins, lectin, and vicilin-4in serum of transgenic pea fed mice were significantly higherthan those of nontransgenic pea-fed mice, suggesting a height-ened immune responsiveness to dietary proteins due to pea-RAI (Figure 7). Thus, these studies demonstrate that modifiedRAI possesses immunodulatory activity and that consumption
Figure 5. Consumption of transgenic pea seed meal predisposed to CD4+
T-cell derived Th2-type cytokine production. IL-4 (A), IL-5 (B), and IFNγ(C) levels in supernatants from RCD3/RCD28 or pea-RAI or media alonestimulated PBLN cells from nontransgenic and transgenic pea-fed micei.t. challenged with RAI from pea. Data are expressed as the mean ±SEM from 3 to 6 mice per group from duplicate experiments. Statisticalsignificance of differences (p < 0.05) was determined using Student’sunpaired t-test.
Figure 6. Intra-gastric administration of RAI from pea induces cross-priming of heterogeneous food antigens. OVA-specific IgG1 levels (A)and the Th2-inflammation phenotype (mucus hypersecretion) (B), pulmo-nary eosinophilia (C), and airways hyperreactivity (D) in mice that werefed (i.g. challenged) ovalbumin (OVA) alone (the control) or in combinationwith natively expressed Tendergreen bean-RAI or transgenically expressed(pea) RAI and subsequently intra-tracheal challenged with purified OVA.Data are expressed as the mean ± SEM from 4 to 6 mice per group. *p < 0.05 as compared to OVA and bean RAI/OVA.
Figure 7. RAI from pea induces cross-priming of pea proteins. Peaglobulin-, vicilin-4, and lectin-specific IgG1 levels in serum from mice thatwere intragastrically administered 250 µL (∼100 mg/mL) of eithernontransgenic or transgenic pea seed meal twice a week for 4 weeks.Data are expressed as mean ± SEM from 4 to 5 mice per group. * p <0.05 as compared to nontransgenic pea.
9028 J. Agric. Food Chem., Vol. 53, No. 23, 2005 Prescott et al.
EXHIBIT J - Page 396
Case 5:14-cv-00117-cr Document 63-11 Filed 11/14/14 Page 114 of 312

of the modifiedRAI concurrently with heterogeneous proteinscan promote immunological cross priming, which predisposesto specific immunoreactivity to these proteins.
DISCUSSION
Recently, peas expressing a gene forRAI from the commonbean were generated for protection against field and storage pests(3-6). Characterization ofRAI by structural analysis hasdemonstrated that transgenic expression of this protein in peasled to the synthesis of a modified form ofRAI. Further, weshow that the modified form ofRAI possessed altered antigenicproperties and consumption of this protein by mice predisposedto RAI-specific CD4+ Th2-type inflammation and elicitedimmunoreactivity to concurrently consumed heterogeneous foodantigens.
Bean-RAI undergoes significant post-translational modifica-tion including variable glycosylation and proteolytic processingleading to the synthesis of a mature functional protein (8, 11).We demonstrate that differences in glycosylation and/or othermodifications of the pea-RAI lead to altered antigenicity.Consistent with our observations, investigators have previouslydemonstrated that differential glycosylation of subunits of acerealR-amylase-inhibitor family (unrelated to legumeRAIs)enhances IgE-binding capacity (24). Moreover, glycosylatedcerealRAI subunits have been shown to possess significantlyenhanced IgE-binding affinity when compared to the unglyco-sylated forms (24). These cereal proteins possess identical aminoacid sequences and only differ in their carbohydrate moieties,indicating that glycosylation can confer IgE-binding capacityand Th2-inflammation. In particular, recent investigations havedemonstrated that glycan side chains linked to high mannose-type N-glycans on plant-derived glycoproteins can conferimmunogenicity and are IgE binding determinants (25, 26).Moreover, R(1,3)-fucose andâ(1,2)-xylose linkage to highmannose-type N-glycans (Man5GlcNAc2-Man9GlcNAc2) pro-mote immunogenicity and IgE binding. Theâ-chain of pea-RAI possessesâ(1,2)-xylose linked high mannose-type N-gly-cans, and other complex glycoforms and theR-chain maypossess an as yet undefined glycoform variant, and it remainsto be determined how these modifications alter pea-RAIimmunogenicity.
Functional and structural properties of pea-RAI may con-tribute to its ability to circumvent immune tolerance and elicitinflammatory responses. Bean-RAI is a potent inhibitor ofhuman R-amylase activity and can induce gastrointestinaldysfunction (27). Comparison of bean- and pea-derivedRAIactivity revealed no difference in enzymatic activity betweenthe two proteins (results not shown). Furthermore, we examinedthe gastrointestinal tract of pea and transgenic pea-fed mice andobserved no histological abnormalities to the gastrointestinaltissue in either group (results not shown). Bean-RAI is also aheat-stable protein and partially resistant to proteolytic degrada-tion (28, 29). Extensive boiling (100°C for 20 min), whilesignificantly reducingR-amylase inhibitory activity, failed toalter the ability of the transgenic pea to prime for Th2-inflammation when challenged in the lung [results not shown:see Supporting Information Figure 2]. These findings areconsistent with previous demonstrations that cooking of plantmaterial such as lentils and peanuts does not diminish theallergenic potential of certain proteins (30,31). Furthermore,these studies suggest that the altered immunogenicity ofRAI isunrelated to its properties as an amylase inhibitor.
We demonstrate that the immune response elicited againstpea-RAI following oral consumption of transgenic pea is
characterized by CD4+ Th2 cell-mediated inflammation, inparticular, the presence of IL-4 and IL-5. To examine whetherthe immune response was dependent on IL-5 and eosinophils,we employed IL-5 and eotaxin-deficient mice. IL-5/eotaxin-deficient mice were i.g. administered nontransgenic and trans-genic seed meal and subsequently i.t. challenged with purifiedRAI. We show that i.t. challenge of transgenic pea fed IL-5/eotaxin-deficient mice induced Th2-inflammation that wassignificantly elevated over nontransgenic fed mice (32). Theseinvestigations suggest that the immune response elicited againstpea-RAI following oral consumption of transgenic pea is notdependent on IL-5 and eosinophils.
In this study, we have demonstrated that transgenic expressionof RAI in a pea can lead to the synthesis of a modified form ofthe protein with altered antigenic properties. Furthermore, weshow that concomitant exposure of the gastrointestinal tract tomodified RAI and heterogeneous food antigens cross primesand elicits immunogenicity. Currently, we do not know thefrequency at which alterations in structure and immunogenicityof transgenically expressed proteins occur or whether this isunique to transgenically expressedRAI. These investigations,however, demonstrate that transgenic expression of non-nativeproteins in plants may lead to the synthesis of structural variantswith altered immunogenicity.
ABBREVIATIONS USED
RAI, R-amylase inhibitor-1; pea (Pisum satiVumL.), trans-genic pea;PhaseolusVulgaris L. cv. Tendergreen,PisumsatiVumL. expressingR-amylase inhibitor-1 from the commonbean; MALDI-TOF-MS, matrix-assisted laser desorption/ioniza-tion-time-of-flight-mass spectrometry.
ACKNOWLEDGMENT
We thank Aulikki Koskinen and Anne Prins for excellenttechnical assistance and David Tremethick, Ian Young, andKlaus Matthaei for their helpful discussions and preparation ofthe manuscript. GenBank accession number for common beancv. Pinto is AY603476.
Supporting Information Available: Amino acid sequenceof RA1 from common bean and consumption of pea seed mealpredisposed to Th2-type inflammation. This material is availablefree of charge via the Internet at http://pubs.acs.org.
LITERATURE CITED
(1) Daniell, H.; Streatfield, S. J.; Wycoff, K. Medical molecularfarming: production of antibodies, biophmaceuticals and ediblevaccines in plants.Trends Plant Sci.2001,6, 219-226.
(2) Brandt, P. Overview of the current status of genetically modifiedplants in Europe as compared to the USA.J. Plant. Physiol.2003,160, 735-742.
(3) Schroeder, H. E.; Gollasch, S.; Moore, A. E.; Tabe, L. M.; Craig,S.; Hardie, D. C.; Chrispeels, M. J.; Spencer, D.; Higgins, T. J.V. BeanR-amylase inhibitor confers resistance to the pea weevil(Bruchus pisorum) in transgenic peas (Pisum satiVum L.).PlantPhysiol.1995,107, 1233-1239.
(4) Ishimoto, M. Bruchid resistance of transgenic azuki beanexpressing seedR-amylase inhibitor of common bean.Entomol.Exp. Appl.1996, 309-315.
(5) Shade, R. E.; Schroeder, H. E.; Pueyo, J. J.; Tabe, L. M.;Murdock, L. L.; Higgins, T. J. V.; Chrispeels, M. J. Transgenicpea seeds expressing theR-amylase inhibitor of the commonbean are resistant to bruchid beetles.Biotechnology1994,12,793-796.
Bean R-Amylase Inhibitor and Immunogenicity J. Agric. Food Chem., Vol. 53, No. 23, 2005 9029
EXHIBIT J - Page 397
Case 5:14-cv-00117-cr Document 63-11 Filed 11/14/14 Page 115 of 312

(6) Morton, R. L.; Schroeder, H. E.; Bateman, K. S.; Chrispeels,M. J.; Armstrong, E.; Higgins, T. J. V. BeanR-amylase inhibitor1 in transgenic peas (Pisum satiVum) provides complete protec-tion from pea weevil (Bruchus pisorum) under field conditions.Proc. Natl. Acad. Sci. U.S.A.2000,97, 3820-3825.
(7) Molvig, L.; Tabe, L. M.; Eggum, B. O.; Moore, A. E.; Carig,S.; Spencer, D.; Higgins, T. J. V. Enhanced methionine levelsand increase nutritive value of seeds of transgenic lupins (LupinsangustifoliusL.) expressing a sunflower seed albumin gene.Proc.Natl. Acad. Sci. U.S.A.1997,94, 8393-8398.
(8) Moreno, J.; Chrispeels, M. J. A lectin gene encodes theR-amylase inhibitor of the common bean.Proc. Natl. Acad. Sci.U.S.A.1989,86, 7885-7889.
(9) Smart, V.; Foster, P. S.; Rothenberg, M. E.; Higgins, T. J.;Hogan, S. P. A plant-based allergy vaccine suppresses experi-mental asthma via an IFN-gamma and CD4+CD45RBlow T cell-dependent mechanism.J. Immunol.2003,171, 2116-2126.
(10) Martin Young, N.; Thibault, P.; Watson, D. C.; Chrispeels, M.J. Post-translational processing of twoR-amylase inhibitors andan arcelin from the common bean,PhaseolusVulgaris. FEBSLett. 1999,446, 203-206.
(11) Yamaguchi, H.; Funaoka, H.; Iwamoto, H. Structures of sugarchains of the subunits of an alpha-amylase inhibitor fromPhaseolusVulgaris white kidney beans.J. Biochem. (Tokyo)1992,111, 388-395.
(12) Sawada, S.; Takeda, Y.; Tashiro, M. primary structures of alpha-and beta-subunits of alpha-amylase inhibitors from seeds of threecultivars of phaseolus beans.J. Protein Chem.2002,21, 9-17.
(13) Ishimoto, M.; Suzuki, K.; Iwanaga, M.; Kikuchi, F.; Kitamura,I. Variation of seedR-amylase inhibitors in the common bean.Theor. Appl. Genet.1995,90, 425-429.
(14) Hoffman, L. M.; Ma, Y.; Barker, R. F. Molecular cloning ofPhaseolus vulgaris lectin mRNA and use of cDNA as a probeto estimate lectin transcript levels in various tissues.NucleicAcids Res.1982,10, 7819-7828.
(15) Mowat, A. M. I. Anatomical basis of tolerance and immunity tointestinal anitgens.Nat. ReV. Immunol.2003,3, 331-341.
(16) Michael, J. G. The role of digestive enzymes in orally inducedimmune tolerance.Immunol. InVest.1989,18, 1049-1054.
(17) Pusztai, A.; G., G.; Stewart, J. C. A new type ofPhaseolusVulgaris (cv. Pinto III) seed lectin: isolation and characterization.Biochim. Biophys. Acta1981,671, 146-154.
(18) Banwell, J. G.; Abramowsky, C. R.; Weber, F.; Howard, R.;Boldt, D. H. Phytohemagglutinin-induced diarrheal disease.Dig.Dis. Sci.1984,29, 921-929.
(19) Wills-Karp, M. Murine models of asthma in understandingimmune dysregulation in human asthma.Immunopharmacology2000,48, 263-268.
(20) Wills-Karp, M. Immunologic basis of antigen-induced airwayhyperresponsiveness.Annu. ReV. Immunol. 1999, 17, 255-281.
(21) Rajananthanan, P.; Attard, G. S.; Sheikh, N. A.; Morrow, W. J.Novel aggregate structure adjuvants modulate lymphocyteproliferation and Th1 and Th2 cytokine profiles in ovalbuminimmunized mice.Vaccine1999,18, 140-152.
(22) Rajananthanan, P.; Attard, G. S.; Sheikh, N. A.; Morrow, W. J.Evaluation of novel aggregate structures as adjuvants: composi-tion, toxicity studies and humoral responses.Vaccine1999,17,715-730.
(23) Morrow, W. J. W.; Wang, Y. W.; Sheikh, N. A. Immunobiologyof the tomatine adjuvant.Vaccine2004,22, 2380-2384.
(24) Sanchez-Monge, R.; Gomez, L.; Barber, D.; Lopez-OTIN, C.;Armentia, A.; Salcedo, G. Wheat and barley allergens associatedwith bakers asthma.Biochem. J.1992,281, 401-405.
(25) Faye, L.; Gomord, V.; Fitchette-Laine, A. C.; Chrispeels, M. J.Affinity purification of antibodies specific for Asn-linked glycanscontaining a1-3 fucose or b1-2 xylose.Anal. Biochem.1993,209, 104-108.
(26) Van Ree, R.; Cabanes-Macheteau, M.; Akkerdaas, J.; Milazzo,J.; Loutelier-Bourhis, C.; Rayon, C.; Villalba, M.; Koppelman,S.; Aalberse, R.; Rodriguez, R.; Faye, L.; Lerouge, P. b(1,2)-xylose and a(1,3)-fucose residues have a string contribution inIgE binding to plant glycoallergens.J. Biol. Chem.2000,275,11451-11458.
(27) Layer, P.; Carlson, G. L.; DiMagno, E. P. Partially purifiedamylase inhibitor reduces starch digestion in vitro and inactivatesintraduodenal amylase in humans.Gastoenterology1985, 88,1895-1902.
(28) Marshall, J. J.; Lauda, C. M. Purification and properties ofphaseolamin, an inhibitor ofR-amylase, from the kidney bean,PhaseolusVulgaris. J. Biol. Chem.1975,250, 8030-8037.
(29) Yoshikawa, H.; Kotaru, M.; Tanaka, C.; Ikeuchi, T.; Kawabata,M. Characterization of Kintoki bean (PhaseolusVulgaris) alpha-amylase inhibitor: inhibitory activities against human salivaryand procine pancreatic alpha-amylases and activity changes byprteolytic digestion.J. Nutr. Sci. Vitaminol.1999, 45, 797-802.
(30) Ibanez Sandin, D.; MArtinez San Ireneo, M.; Maranon Lizana,F.; Fernandez-Caldas, E.; Alonso Lebrero, E.; Laso Borrego, T.Specific IgE determinations to crude and boiled lentil (Lensculinaris) extracts in lentil-sensitive children and controls.Allergy1999,54, 1209-1214.
(31) Beyer, K.; Morrow, E.; Li, X.; Bardina, L.; Bannon, G. A.; Burks,A. W.; Sampson, H. Effects of cooking methods on peanutallergenicity.J. Allergy Clin. Immunol.2001,107, 1077-1081.
(32) Prescott, V.; Foster, P. S.; Matthaei, K. I.; Hogan, S. P.Mechanistic analysis of food allergy-induced skin and pulmonaryinflammation.J. Allergy Clin. Immunol.2005,115(2 Suppl), S1-360.
Received for review March 16, 2005. Revised manuscript receivedAugust 26, 2005. Accepted September 6, 2005. This work was supportedin part by National Health Medical Research Council (Australia)Program Grant 224207.
JF050594V
9030 J. Agric. Food Chem., Vol. 53, No. 23, 2005 Prescott et al.
EXHIBIT J - Page 398
Case 5:14-cv-00117-cr Document 63-11 Filed 11/14/14 Page 116 of 312

EXHIBIT J - Page 399
Case 5:14-cv-00117-cr Document 63-11 Filed 11/14/14 Page 117 of 312

EXHIBIT J - Page 400
Case 5:14-cv-00117-cr Document 63-11 Filed 11/14/14 Page 118 of 312

EXHIBIT J - Page 401
Case 5:14-cv-00117-cr Document 63-11 Filed 11/14/14 Page 119 of 312

EXHIBIT J - Page 402
Case 5:14-cv-00117-cr Document 63-11 Filed 11/14/14 Page 120 of 312

EXHIBIT J - Page 403
Case 5:14-cv-00117-cr Document 63-11 Filed 11/14/14 Page 121 of 312

EXHIBIT J - Page 404
Case 5:14-cv-00117-cr Document 63-11 Filed 11/14/14 Page 122 of 312

EXHIBIT J - Page 405
Case 5:14-cv-00117-cr Document 63-11 Filed 11/14/14 Page 123 of 312

EXHIBIT J - Page 406
Case 5:14-cv-00117-cr Document 63-11 Filed 11/14/14 Page 124 of 312

EXHIBIT J - Page 407
Case 5:14-cv-00117-cr Document 63-11 Filed 11/14/14 Page 125 of 312

EXHIBIT J - Page 408
Case 5:14-cv-00117-cr Document 63-11 Filed 11/14/14 Page 126 of 312

EXHIBIT J - Page 409
Case 5:14-cv-00117-cr Document 63-11 Filed 11/14/14 Page 127 of 312

EXHIBIT J - Page 410
Case 5:14-cv-00117-cr Document 63-11 Filed 11/14/14 Page 128 of 312

Cytotoxicity on human cells of Cry1Ab andCry1Ac Bt insecticidal toxins alone or with aglyphosate-based herbicideR. Mesnage,a,b E. Clair,a,b S. Gress,a,b C. Then,c A. Székácsd andG.-E. Séralinia,b*
ABSTRACT: The study of combined effects of pesticides represents a challenge for toxicology. In the case of the new growinggeneration of genetically modified (GM) plants with stacked traits, glyphosate-based herbicides (like Roundup) residues arepresent in the Roundup-tolerant edible plants (especially corns) and mixed with modified Bt insecticidal toxins that are pro-duced by the GM plants themselves. The potential side effects of these combined pesticides on human cells are investigatedin this work. Here we have tested for the very first time Cry1Ab and Cry1Ac Bt toxins (10ppb to 100ppm) on the humanembryonic kidney cell line 293, as well as their combined actions with Roundup, within 24h, on three biomarkers of cell death:measurements of mitochondrial succinate dehydrogenase, adenylate kinase release by membrane alterations and caspase 3/7inductions. Cry1Ab caused cell death from 100ppm. For Cry1Ac, under such conditions, no effects were detected. The Rounduptested alone from 1 to 20 000ppm is necrotic and apoptotic from 50ppm, far below agricultural dilutions (50% lethal concen-tration 57.5ppm). The only measured significant combined effect was that Cry1Ab and Cry1Ac reduced caspases 3/7 activationsinduced by Roundup; this could delay the activation of apoptosis. There was the same tendency for the other markers. In theseresults, we argue that modified Bt toxins are not inert on nontarget human cells, and that they can present combined side-effects with other residues of pesticides specific to GM plants. Copyright © 2012 John Wiley & Sons, Ltd.
Keywords: Roundup; Bt toxins; Cry1Ab; Cry1Ac; GMOs; mixtures; glyphosate; human cells
INTRODUCTIONThe real effects of mixtures of chemical pollutants are a majorconcern for public health (Monosson, 2005). Humans areexposed to hundreds of compounds on a daily basis. The com-mercialized combinations could be a first matter of concern.Agricultural genetically modified organisms (GMOs) are steadilyincreasing worldwide, and they need to be carefully assessed(Séralini et al., 2009, 2011; Spiroux de Vendômois et al., 2010).Nowadays 99.9% of GMOs can be described as pesticide plants,designed for herbicide tolerance and/or modified insecticideproduction (James, 2010). Thus pesticides residues co-occur inthe plant, synthesized by the plant itself, by the expression ofthe inserted transgene (modified Bt from Bacillus thuringiensis)or through external pesticide treatment facilitated by the trans-gene-dependent tolerance to herbicides (Roundup in mostinstances). In turn, such residues exert their effects upon con-sumption or release into the environment (Arregui et al, 2004;Tank et al., 2010). Owing to their key role in intensive agriculture,potential side effects of such combined pesticides residuesshould be assessed. In vitro tests are frequently recommendedas a first step to replace animal models in toxicity studies. Here,we have tested for the first time the effects of Cry1Ab andCry1Ac alone and combined with Roundup on human cells.
Modified toxins from Bt are Cry proteins forming pores ininsect cell membranes (Then, 2010); they account for 39% ofedible plant GMOsworldwide (James, 2010). Since natural Bt toxinshave long been used, their modified counterparts are often com-pared with them. However, the latter derivatives are truncated,
adapted and modified synthetic sequences; consequently theiractivity is possibly quite different from the natural ones (Séraliniet al., 2011). Also, Bt toxins are claimed and believed to be safe.Yet prions, hormones and venoms are also proteins, and are farfrom being innocuous. To date, Bt toxins have not been tested onhuman cells. However, Bt corns are regularly consumed by humansin America and their residues have even been found in maternaland fetal cord serum at around 0.2 ppb (Aris and Leblanc, 2011),which does not take into account the tissue levels. Nontarget toxic-ity of natural Bt toxins has been detected in mammals, for instanceat a 50% lethal concentration (LC50) from around 10 to 520ppb (Itoet al., 2004; Nagamatsu et al., 2010; Rani and Balaraman, 1996).Roundup formulations are mixtures of glyphosate and adju-
vants such as ammonium sulfate, benzisothiazolone, glycerine,isobutane, isopropylamine, polyethoxylated alkylamines and
*Correspondence to: G.-E. Séralini, University of Caen, Risk Pole MRSH-CNRS,Laboratory of Biochemistry EA2608, Esplanade de la Paix, 14032 Caen cedex, France.E-mail: [email protected]
aUniversity of Caen, Risk Pole MRSH-CNRS, Laboratory of Biochemistry EA2608,Esplanade de la Paix, 14032 Caen cedex, France
bCRIIGEN, 40 rue de Monceau, 75008 Paris, France
cTestbiotech e.V., Frohschammerstr. 14, 80807 München, Germany
dPlant Protection Institute, Hungarian Academy of Sciences, H-1525, Budapest,POB 102, Hungary
J. Appl. Toxicol. 2012 Copyright © 2012 John Wiley & Sons, Ltd.
Short Communication
Received: 5 May 2011, Revised: 15 November 2011, Accepted: 19 November 2011 Published online in Wiley Online Library
(wileyonlinelibrary.com) DOI 10.1002/jat.2712
EXHIBIT J - Page 411
Case 5:14-cv-00117-cr Document 63-11 Filed 11/14/14 Page 129 of 312

sorbic acid (Cox, 2004). Glyphosate-based herbicides are theobject of an increasing number of studies, which reveal, incombination with adjuvants, endocrine-disrupting effects, andtumor-promoting or teratogenic effects on numerous nontargetspecies (Gasnier et al., 2009; George et al., 2010; Paganelli et al.,2010), for instance from 0.5 ppm on androgen receptors. Wehave used human embryonic kidney cell line HEK293 as a sensi-tive model (Benachour and Séralini, 2009). The kidney modelwas used also because a body of evidence suggests kidney dys-functions as endpoints of GMO diet effects (Séralini et al., 2011),and thus kidney cells could be a target for GMOs. We first mea-sured the mitochondrial respiration level, by succinate dehydro-genase (SD) activity assessment in order to test cytotoxicity.Then, as Bt proteins act as pore forming toxins (Then, 2010),we determined adenylate kinase (AK) activity when released inthe medium, revealing possible membrane alterations. In associ-ation, we assayed caspase 3 and 7 activities in order to separatethe apoptotic and necrotic actions involved in cytotoxic effects.Moreover, human cell lines allow the study of unintended sideeffects on nontarget species of GMO-associated pesticides.
MATERIALS AND METHODS
Chemicals
Cry1Ab and Cry1Ac were prepared as described previously bytwo different laboratories (Székács et al, 2010; Pusztai-Careyet al., 1994). The glyphosate-based herbicide tested was com-mercially available RoundupW GT Plus formulation, approvalno. 2020448 (Monsanto, Anvers, Belgium). It contains 450 g l!1
glyphosate acid (N-phosphonomethyl-glycine). Successive dilu-tions were prepared in Eagle’s modified minimum essentialmedium (EMEM; Abcys, Paris, France). 3-(4,5-Dimethyl-thiazol-2-yl)-2,5-diphenyl-tetrazolium bromide (MTT) and all other compoundswere obtained from Sigma-Aldrich (Saint-Quentin Fallavier, France),unless specified. MTT was prepared as a 5mgml!1 stock solution inphosphate-buffered saline, filtered through a 0.22mm filter beforeuse, and diluted to 1mgml!1 in EMEM.
Toxin Preparations
The Cry1Ab and Cry1Ac toxins are cloned from the naturalBacillus thuringiensis subspecies kurstaki HD-1 strain andexpressed in Escherichia coli as single gene products. The inclu-sion bodies, containing the protoxins, were solubilized at pH10.5 in the presence of b-mercaptoethanol and treated withcommercial bovine trypsin (Sigma, USA). The 65 kDa activatedtoxins were isolated by ion exchange HPLC and the pure toxinfractions were desalted and lyophilized and stored at !80 "C.After storage, toxins were diluted in a 50mM Na-carbonate–HClbuffer at 1mgml!1 (pH 9.5), and then diluted in EMEM.
Cell Lines
The human embryonic kidney 293 cell line (ECACC 85120602)was provided by Sigma-Aldrich (Saint-Quentin Fallavier, France).Cells were grown in phenol red-free EMEM (Abcys, Paris, France)containing 2mM glutamine, 1% nonessential amino acid,100 U ml!1 of antibiotics (a mixture of penicillin, streptomycinand fungizone; Lonza, Saint Beauzire, France), 10mgml!1 of liquidkanamycin (Dominique Dutscher, Brumath, France) and 10% fetalbovine serum (PAA, les Mureaux, France). Cells were grown at
37 "C (5% CO2, 95% air) during 24h to 80% confluence, washedwith serum-free EMEM and then exposed to various chemicals,since the serum delayed the cell necrosis by about 48 h in thepresence of toxic compounds (Benachour et al., 2007). Thecontrol cells grow normally in serum-free medium up to 96h.
Cell Treatments and Cytotoxicity Biomarkers
Cells at 80% confluence in 48- or 96-well plates (DominiqueDutscher, Brumath, France) were washed with serum-free EMEM,in order to avoid other combined effects, and then exposed tovarious concentrations of Bt toxins or Roundup GT Plus in EMEMserum-free medium for 24 h. Bt toxins were used from 10ppb to100ppm (in the range of GM plant production). ConcerningRoundup, 50% lethal concentrations (LC50) were assessed from1 to 20 000ppm (the latter is the agricultural dilution). Combinedeffects were measured by mixing LC50 of Roundup with threedoses of each Bt toxin. After treatments, the following tests wereapplied: mitochondrial respiration assay (MTT) through the succi-nate dehydrogenase activity measurement (Mosmann, 1983).The optical density was measured at 570 nm using a Mithras LB940 luminometer (Berthold, Thoiry, France). The bioluminescentToxiLight bioassay (Lonza, Saint Beauzire, France) was applied forthe membrane degradation assessment, by the intracellular AKrelease in the medium; this is described as a necrosis marker(Crouch et al., 1993). Finally, the apoptotic cell death was evaluatedwith the Caspase-Glo 3/7 assay (Promega, Paris, France). Lumines-cencewasmeasured using aMithras LB 940 luminometer (Berthold,Thoiry, France). These methods were previously described by ourgroup (Benachour and Séralini, 2009).
Statistical Analysis
The experiments were repeated at least three times in differentweeks on three independent cultures (n= 9). LC50 values werecalculated by a nonlinear regression using a sigmoid (five-parameter) equation with the GraphPad Prism 5 software. All datawere presented as the means# standard errors (SEs). Statisticaldifferences were determined by Student t-test using significancelevels at P< 0.01 (**) and P< 0.05 (*).
RESULTSWe measured for the first time cytotoxic effects of Bt toxins,alone or in combination with a glyphosate-based herbicide, onHEK293 cells. First of all, we confirmed that the buffer was notcytototoxic for the cells. The mitochondrial succinate dehydro-genase activity of treated cells significantly decreased at100 ppm of Cry1Ab alone (by 11%, Fig. 1A). Even if it was limited,this phenomenon was undetected for Cry1Ac. Lower doses weretested from 10ppb to 10 ppm, but significant effects were notobserved. We obtained similar effects with a Cry1Ab toxin pro-vided by another laboratory that was prepared and stored inde-pendently (Fig. 1A). We measured AK activity after its release inthe medium in order to evaluate plasma membrane integrity.A concentration of Cry1Ab of 100 ppm increased AK leakage inthe medium 2-fold, revealing plasma membrane alterations. Thiswas performed for the two Cry1Ab toxins. Apoptotic effects ofCry1Ab and Cry1Ac by means of caspase 3/7 activities were stud-ied; no effects on HEK293 cells were visible. We can thereforeconfirm that Cry1Ab can induce cytotoxic effects via a necroticmechanism in these conditions at 100ppm.
R. Mesnage et al.
J. Appl. Toxicol. 2012Copyright © 2012 John Wiley & Sons, Ltd.wileyonlinelibrary.com/journal/jatEXHIBIT J - Page 412
Case 5:14-cv-00117-cr Document 63-11 Filed 11/14/14 Page 130 of 312

Closer to the reality of exposure, we then tested combinedeffects of Bt toxins with Roundup (Fig 2). According to ourprevious results, Roundup is cytotoxic by inhibition of mito-chondrial respiration activity, far below agricultural dilutions(around 200 times less) with an LC50 of 57.5 ppm (Fig. 2A).At this concentration, Roundup also induced necrosisevidenced by a 15-fold increase of an AK release. Apoptosisinduction was measured by a 6.7-fold caspase 3/7 activitiesenhancement (Fig. 2B). However, concerning combined effectswe observed significant effects on apoptosis; both Bt toxinsfrom 10ppm reduced caspase 3/7 activities (by around 50%)when they were induced in Roundup at its LC50 (Fig. 2B).Similarly, there was a non significant tendency for both toxins(data not shown) to reduce AK leakage and mitochondrial respi-ration inhibition induced by Roundup.
DISCUSSIONFew studies have been performed on nontarget effects of Bttoxins, and none with modified Bt toxins extracted from plants,or together with Roundup residues, even in regulatory files. Fornatural Bt toxins, their mechanisms of action and insect resis-tance are not fully understood (Singh and Sivaprasad, 2009),and the metabolism of these proteins in mammals is unknown(Séralini et al., 2011; Chowdhury et al., 2003). They may eveninteract with extrinsic factors (Then, 2010). Billions of peopleand wildlife could be exposed to modified Bt toxins; thereforeunderstanding their potential side effects is crucial.
On two biomarkers of cell death, Cry1Ab exposure led torespiration inhibition and plasma membrane alterations, by con-trast to Cry1Ac. This could be consistent with the fact that theconsumption of MON810 maize producing Cry1Ab (in the ppmrange) induced signs of hepatorenal alterations in a subchronicfeeding study on rats (Spiroux de Vendômois et al., 2009). It isknown that both toxins differ significantly in their domain IIIstructure (Karim and Dean, 2000), which is the only one to beinvolved at the same time in ion channel function, receptorbinding and insertion into the membrane (Dean et al., 1996).This occurred at relatively high concentrations (100 ppm)in comparison to the concentrations produced in GM plants(1–20 ppm, Székács et al., 2010). The content can differ greatlyaccording to the GM variety and environmental conditions(Then and Lorch, 2008). The exposure during consumption canappear low enough to avoid side effects, and whether thisoccurs in vivo remains to be checked. However, the bioaccumu-lation in tissues, or bioaccumulative or long-term effects, has tobe taken into account since Bt residues were recently claimed tobe measured in pregnant women’s serum at around 0.2 ppb (Arisand Leblanc, 2011). In addition, high quantities of Bt crops canbe consumed by mammals. The procedure for GMO marketauthorizations for crops such as MON810 (EFSA, 2009) doesnot require in vitro tests on human cells of Bt toxins, nor on itscombinatorial effects, thus our results are raising new questionsabout the safety of these toxins and the Bt crops in general.Although in vitro studies suggest degradation in human gastric
Figure 1. Cytotoxic effects of modified Bt toxins Cry1Ac and Cry1Ab onHEK293 cell line. (A) Cell death has been measured on mitochondrialsuccinate dehydrogenase after 24 h exposure to two Cry1Ab toxins upto 100 ppm prepared from different sources (A, black curves with circlesand squares) and Cry1Ac (grey curve). (B) Cell membrane degradationwas measured by adenylate kinase release (RU, relative units) provokedby Cry1Ab and Cry1Ac toxins (1–100ppm) in comparison to control (C).No effect was detected on caspase 3/7 activities; therefore results arenot displayed. Standard errors of the mean are indicated in all instances(n=9; * P< 0.05).
Figure 2. Effects of Roundup alone and with modified Bt toxins Cry1Aband Cry1Ac on HEK293 cell line. (A) Cells were treated with Roundup(1–20 000ppm) and the mitochondrial respiration was measuredthrough succinate dehydrogenase activity (left). The LC50 for Roundupwas determined as 57.5 ppm by nonlinear regression (arrow). On theright, the adenylate kinase release showing membrane alterations byRoundup alone at its LC50 in comparison to control. (B) Combined effectsof Roundup at its LC50 with Bt toxins measured on caspase 3/7 activities(%). The same tendency for the combined effects but with no significantresults was detected on adenylate kinase release and succinate dehydro-genase; results not shown. Standards errors of the mean are indicated inall instances (n=9). Significance of the effects (* P< 0.05; ** P< 0.01) istested against the negative control C (medium alone) or the positiveRoundup control (R).
Cytotoxicity of Cry1Ab and Cry1Ac Bt insecticidal toxins
J. Appl. Toxicol. 2012 Copyright © 2012 John Wiley & Sons, Ltd. wileyonlinelibrary.com/journal/jatEXHIBIT J - Page 413
Case 5:14-cv-00117-cr Document 63-11 Filed 11/14/14 Page 131 of 312

secretions, digestion is never a complete process and insecticidetoxins cannot be fully degraded in vivo (Paul et al., 2010). This isknown to be the case for Cry1Ab (Chowdhury et al., 2003). Itmust be underlined that the insecticidal proteins produced bythe GM plants are in soluble forms, and thus already biochemi-cally activated, unlike those produced by the microorganismBt, secreted as inactive precursors or protoxins (Hilbeck andSchmidt, 2006). The importance of Bt toxin activation has beendemonstrated in relation to in vitro membrane damages of hu-man erythrocytes, by solubilized Bt toxins, but not by the intactform (Rani and Balaraman, 1996). Cellular response to Bt toxinsdoes not elicit apoptosis; it induces necrotic effects via a plasmamembrane disruption for Cry1Ab within only 24 h. This may bedue to pore formation like in insect cells owing to binding tospecific receptors or membrane lipid rafts (Then, 2010; Soberónet al., 2009).
We also demonstrated that Cry1Ab and Cry1Ac exposuresslightly reduced caspase 3/7 activations induced by Roundup.This could be related at least in part to the properties ofRoundup compounds, especially adjuvants. We observed pre-viously, in our group, that serum delayed the cytotoxic effectsinduced by Roundup. This was probably due to serum bindingproteins (Benachour et al., 2007). Here we can assume that phy-sico-chemical properties of proteins may give them the abilityto bind and form complexes with Roundup adjuvants that havetendencies to form vesicles, buffering their bioavailability tocells. Similarly, a nonsignificant tendency of reduction of thecytotoxic effects of Roundup was observed on mitochondrialrespiration and membrane degradation when the toxins wereadded. The apoptosis induction appeared to be the mostsensitive impact of combined effects. This does not excludeother intracellular targets such as endocrine disruption, sinceRoundup is antiandrogenic from 0.5 ppm, below toxic levelsand close to human serum levels (0.1–0.2 ppm in Acquavellaet al., 2004).
Here we documented that modified Bt toxins are not inert onhuman cells, but can exert toxicity, at least under certain in vitroconditions. In vivo implications should be now assessed. Ourresults raise new questions in the risk assessment of food andfeed derived from genetically engineered plants.
Acknowledgments
We are grateful to Testbiotech and the GEKKO Foundation, theassociation Denis Guichard, CRIIGEN and the Conseil Regionalof Basse-Normandie for their support. R.M. and E.C. are recipientsof fellowships from CRIIGEN and the Conseil Regional of Basse-Normandie. We would also like to thank Marianne Pusztai-Careyfor one of the toxin preparations.
REFERENCESAcquavella JF, Alexander BH, Mandel JS, Gustin C, Baker B, Chapman P,
Bleeke M. 2004. Glyphosate biomonitoring for farmers and their fam-ilies: results from the Farm Family Exposure Study. Environ. HealthPerspect. 112(3): 321–326.
Aris A, Leblanc S. 2011. Maternal and fetal exposure to pesticides associ-ated to genetically modified foods in Eastern Townships of Quebec,Canada. Reprod. Toxicol. 31(4): 528–533.
Arregui MC, Lenardon A, Sanchez D, Maitre MI, Scotta R, Enrique S. 2004.Monitoring glyphosate residues in transgenic glyphosate-resistantsoybean. Pest Manag. Sci. 60: 163–166.
Benachour N, Séralini GE. 2009. Glyphosate formulations induce apopto-sis and necrosis in human umbilical, embryonic, and placental cells.Chem. Res. Toxicol. 22: 97–105.
Benachour N, Sipahutar H, Moslemi S, Gasnier C, Travert C, Séralini GE.2007. Time- and dose-dependent effects of roundup on humanembryonic and placental cells. Arch. Environ. Contam. Toxicol. 53:126–133.
Chowdhury EH, Shimada N, Murata H, Mikami O, Sultana P, Miyazaki S,Yoshioka M, Yamanaka N, Hirai N, Nakajima Y. 2003. Detection ofCry1Ab protein in gastrointestinal contents but not visceral organsof genetically modified Bt11-fed calves. Vet. Hum. Toxicol. 45: 72–75.
Cox C. 2004. Glyphosate. J. Pest. Reform. 24: 10–15.Crouch SP, Kozlowski R, Slater KJ, Fletcher J. 1993. The use of ATP biolu-
minescence as a measure of cell proliferation and cytotoxicity. J.Immunol. Meth. 160: 81–88.
Dean DH, Rajamohan F, Lee MK, Wu SJ, Chen XJ, Alcantara E, Hussain SR.1996. Probing the mechanism of action of Bacillus thuringiensis in-secticidal proteins by site-directed mutagenesis – a minireview. Gene179(1): 111–117.
EFSA. 2009. Scientific opinion on genetically modified organismMON810. The EFSA J. 1149: 1–84.
Gasnier C, Dumont C, Benachour N, Clair E, Chagnon MC, Seralini GE.2009. Glyphosate-based herbicides are toxic and endocrine disrup-tors in human cell lines. Toxicology 262: 184–191.
George J, Prasad S, Mahmood Z, Shukla Y. 2010. Studies on glyphosate-induced carcinogenicity in mouse skin: a proteomic approach. J. Pro-teom. 73: 951–964.
Hilbeck A, Schmidt JEU. 2006. Another view on Bt proteins – how specificare they and what else might they do? Biopest. Int. 2(1): 1–50.
Ito A, Sasaguri Y, Kitada S, Kusaka Y, Kuwano K, Masutomi K, Mizuki E,Akao T, Ohba M. 2004. A Bacillus thuringiensis crystal protein with se-lective cytocidal action to human cells. J. Biol. Chem. 279: 21282–21286.
James C. 2010. Global status of commercialized biotech/GM crops: 2010ISAAA Brief 42.
Karim S, Dean DH. 2000. Pesticidal and receptor binding properties of Ba-cillus thuringiensis Cry1Ab and Cry1Ac delta-endotoxin mutants toPectinophora gossypiella and Helicoverpa zea. Curr. Microbiol. 41(6):430–440.
Monosson E. 2005. Chemical mixtures: considering the evolution oftoxicology and chemical assessment. Environ. Health. Perspect.113: 383–390.
Mosmann T. 1983. Rapid colorimetric assay for cellular growth and sur-vival: application to proliferation and cytotoxicity assays. J. Immunol.Meth. 65: 55–63.
Nagamatsu Y, Okamura S, Saitou H, Akao T, Mizuki E. 2010. Three Cry tox-ins in two types from Bacillus thuringiensis strain M019 preferentiallykill human hepatocyte cancer and uterus cervix cancer cells. Biosci.Biotechnol. Biochem. 74: 494–498.
Paganelli A, Gnazzo V, Acosta H, Lopez SL, Carrasco AE. 2010. Glyphosate-based herbicides produce teratogenic effects on vertebrates byimpairing retinoic acid signaling. Chem. Res. Toxicol. 23: 1586–1595.
Paul V, Guertler P, Wiedemann S, Meyer HH. 2010. Degradation ofCry1Ab protein from genetically modified maize (MON810) in rela-tion to total dietary feed proteins in dairy cow digestion. TransgenicRes. 19: 683–689.
Pusztai-Carey M, Carey P, Lessard T, Yaguchi M. 1994. Isolation, quantita-tion and purification of insecticidal proteins from Bacillus thuringien-sis. US patent 5,356,788.
Rani SS, Balaraman K. 1996. Effect of insecticidal crystal proteins of Bacil-lus thuringiensis on human erythrocytes in vitro. Indian J. Exp. Biol. 34:1241–1244.
Séralini GE, Spiroux de Vendômois J, Cellier D, Sultan C, Buiatti M, GallagherL, Antoniou M, Dronamraju KR. 2009. How subchronic and chronichealth effects can be neglected for GMOs, pesticides or chemicals.Int. J. Biol. Sci. 5: 438–443.
Séralini GE, Mesnage R, Clair E, Gress S, Cellier D, Spiroux de Vendômois J.2011. Genetically modified crops safety assessments: present limitsand possible improvements. Environ. Sci. Eur. 23: 10.
Singh A, Sivaprasad CV. 2009. Functional interpretation of APNreceptor from M. sexta using a molecular model. Bioinformation3: 321–325.
Soberón M, Gill SS, Bravo A. 2009. Signaling versus punching hole: howdo Bacillus thuringiensis toxins kill insect midgut cells. Cell Mol. LifeSci. 66: 1337–1349.
Spiroux de Vendômois J, Roullier F, Cellier D, Séralini GE. 2009. A compar-ison of the effects of three GM corn varieties on mammalian health.Int. J. Biol. Sci. 5: 706–726.
R. Mesnage et al.
J. Appl. Toxicol. 2012Copyright © 2012 John Wiley & Sons, Ltd.wileyonlinelibrary.com/journal/jatEXHIBIT J - Page 414
Case 5:14-cv-00117-cr Document 63-11 Filed 11/14/14 Page 132 of 312

Spiroux de Vendômois J, Cellier D, Vélot C, Clair E, Mesnage R, Séralini GE.2010. Debate on GMOs health risks after statistical findings in regula-tory tests. Int. J. Biol. Sci. 6: 590–598.
Székács A, Lauber E, Juracsek J, Darvas B. 2010. Cry1Ab toxin produc-tion of MON 810 transgenic maize. Environ. Toxicol. Chem. 29:182–190.
Tank JL, Rosi-Marshall EJ, Royer TV, Whiles MR, Griffiths NA, FrauendorfTC, Treering DJ. 2010. Occurrence of maize detritus and a transgenic
insecticidal protein (Cry1Ab) within the stream network of an agricul-tural landscape. Proc. Natl Acad. Sci. USA 107: 17645–17650.
Then C. 2010. Risk assessment of toxins derived from Bacillus thuringiensis –synergism, efficacy, and selectivity. Environ. Sci. Pollut. Res. Int.17: 791–797.
Then C, Lorch A. 2008. A simple question in a complex environment:How much Bt toxin do genetically engineered MON810 maize plantsactually produce? Theor. Ökol. 14: 1–5.
Cytotoxicity of Cry1Ab and Cry1Ac Bt insecticidal toxins
J. Appl. Toxicol. 2012 Copyright © 2012 John Wiley & Sons, Ltd. wileyonlinelibrary.com/journal/jatEXHIBIT J - Page 415
Case 5:14-cv-00117-cr Document 63-11 Filed 11/14/14 Page 133 of 312

A 90-day safety study of genetically modified rice expressingCry1Ab protein (Bacillus thuringiensis toxin) in Wistar rats
Malene Schrøder a, Morten Poulsen a,*, Andrea Wilcks b, Stine Kroghsbo a, Andreas Miller c,Thomas Frenzel c, Jurgen Danier d, Michael Rychlik e, Kaveh Emami f,
Angharad Gatehouse f, Qingyao Shu g, Karl-Heinz Engel c, Illimar Altosaar h, Ib Knudsen a
a Department of Toxicology and Risk Assessment, Danish Institute for Food and Veterinary Research, Mørkhøj Bygade 19, DK-2860 Søborg, Denmarkb Department of Microbiological Food Safety, Danish Institute for Food and Veterinary Research, Mørkhøj Bygade 19, DK-2860 Søborg, Denmark
c Lehrstuhl fur Allgemeine Lebensmitteltechnologie, Technical University Munich, Am Forum 2, D-85350 Freising-Weihenstephan, Germanyd Bioanalytik Weihenstephan, Alte Akademie 10, D-85350 Freising-Weihenstephan, Germany
e Lehrstuhl fur Lebensmittelchemie, Technical University Munich, Lichtenbergstr. 4, D-85748 Garching, Germanyf School of Biology, Institute for Research on Environment and Sustainability, University of Newcastle, Newcastle upon Tyne, NE1 7RU, UK
g Institute of Nuclear Agricultural Sciences, Zhejiang University, Hangzhou 310029, Chinah Department of Biochemistry, Microbiology and Immunology, University of Ottawa, Ont., Canada K1H 8M5
Received 14 October 2005; accepted 1 September 2006
Abstract
An animal model for safety assessment of genetically modified foods was tested as part of the SAFOTEST project. In a 90-day feedingstudy on Wistar rats, the transgenic KMD1 rice expressing Cry1Ab protein was compared to its non-transgenic parental wild type, Xiu-shui 11. The KMD1 rice contained 15 mg Bt toxin/kg and based on the average feed consumption the daily intake was 0.54 mg Bt toxin/kg body weight.
No adverse effects on animal behaviour or weight gain were observed during the study. Blood samples collected one week prior tosacrifice were analyzed and compared for standard haematological and biochemical parameters. A few parameters were significantlydifferent, but all within the normal reference intervals for rats of this breed and age and not in relation to any other findings, thusnot considered treatment related. Upon sacrifice a large number of organs were weighed, macroscopic and histopathological examina-tions were performed with only minor changes to report.
The aim of the study was to use a known animal model in performance of safety assessment of a GM crop, in this case KMD1 rice.The results show no adverse or toxic effects of KMD1 rice when tested in the design used in this 90-day study. Nevertheless the expe-riences from this study lead to the overall conclusion that safety assessment for unintended effects of a GM crop cannot be done withoutadditional test group(s).� 2006 Elsevier Ltd. All rights reserved.
Keywords: Genetically modified rice; Bacillus thuringiensis; Cry1Ab protein; Animal study; Wistar rats; SAFOTEST; Food safety; Feeding trial
1. Introduction
Bt rice is rice that has been genetically modified toexpress insecticidal genes (cry genes) from Bacillus thuringi-
ensis (Bt). The transgenic rice is resistant to major lepidop-
teran insect pests of rice and thus has the potential tosignificantly decrease yield losses, reduce the use ofbroad-spectrum chemical insecticides, and furthermorereduce levels of mycotoxins, one of the unexpected benefitsof reducing larval attacks (Cheng et al., 1998; Papst et al.,2005). The Bt rice line, KMD1, since its development in1998 has been characterized thoroughly at the molecularlevel, and in numerous field trials has shown evidence of
0278-6915/$ - see front matter � 2006 Elsevier Ltd. All rights reserved.doi:10.1016/j.fct.2006.09.001
* Corresponding author. Tel.: +45 7234 7540; fax: +45 7234 7699.E-mail address: [email protected] (M. Poulsen).
www.elsevier.com/locate/foodchemtox
Food and Chemical Toxicology 45 (2007) 339–349
EXHIBIT J - Page 416
Case 5:14-cv-00117-cr Document 63-11 Filed 11/14/14 Page 134 of 312

affording the farmer a high level of resistance against atleast eight different insect pest species (Shu et al., 2000;Ye et al., 2001, 2003).
In spite of the extensive research that has been con-ducted in developing this pest resistant rice, as summarizedby High et al. (2004), Bt rice is not yet grown commercially.Other Bt crops, expressing a range of different cry genes,are commercially grown in many parts of the world includ-ing Bt corn, Bt cotton, Bt canola and Bt potatoes. Bt toxins(Cry proteins) have been used as microbial pesticides formany years and have a long history of safe use (Mendel-sohn et al., 2003; Betz et al., 2000).
Cry proteins show highly species-specific toxicity againstcertain insects and only a few insect species are affected byeach of the Cry proteins. The mode of action in the insect isthrough specific receptors in the gut, which is highly alka-line, with binding of the toxin resulting in pore-formation,osmotic imbalance, cell lysis and subsequently death of theinsect (Betz et al., 2000).
The Cry proteins are regarded harmless or nontoxic tomammals, including humans, probably due to acidifiedgut pepsinolysis and the lack of Cry protein binding-siteson mammalian gut epithelial cells. Numerous data fromtoxicity studies show no significant adverse effects of theCry proteins on body weight gain or clinical observations.Furthermore, no signs of pathogenicity to mammals,including humans, have been reported (McClintock et al.,1995).
Investigations on the effects of the Cry1Ab protein onmammalian cells have revealed no significant effect onbovine hepatocyte morphology or on albumin secretionin vitro (Shimada et al., 2003). In animal studies no signif-icant differences were observed in general health or growthrate in pigs fed a Bt corn diet (Chowdhury et al., 2003),although in 1998 Fares and El Sayed observed fine struc-tural microscopic changes in the ileum of mice fed Cry1potato diet. Bt toxin released by the crop root or fromthe biomass of Bt corn has been found nontoxic to soil bac-teria (Saxena and Stotzky, 2001).
This study is part of the EU-project SAFOTEST,designed to develop scientific methodologies for assessingthe safety of genetically modified (GM) crops. The aim ofthe present 90-day study in Wistar rats was to perform acomparative safety assessment study of the geneticallymodified Bt rice, KMD1, expressing Cry1Ab in an animalmodel, when compared to the parental wild-type rice, Xiu-shui 11, and to furthermore monitor changes in major aer-obe and facultative anaerobe bacterial populations in theintestines of the rats.
The study design includes two test groups given compa-rable diets containing 60% raw brown rice flour fromparental and transgenic rice, respectively, to be tested ina directly comparative 90-day feeding study without spik-ing of the recombinant protein.
The objective was to have identical cohorts of male andfemale rats in a sub-chronic 90-day exposure to 60% ricediets, which contained realistic and meaningful levels of
the transgene-expressed Cry protein, Cry1Ab. The focuswas first and foremost on the tissues and organs in initialcontact with the diets. These are the digestive tract andrelated organs, including a detailed veterinarian and path-ological assessment of the whole animals’ well-being andbehaviour.
The rice materials tested in the 90-day toxicity studywere subjected to comprehensive analytical characteriza-tion before the study so that the compositional data couldprovide the basis for the interpretation of any possibleeffects detected in the feeding studies. Every effort wasmade to provide a consistent and well-characterizedGMO diet to the test animals, in a universally adoptableand approvable manner, for a study based on the OECDGuideline no. 408 (OECD, 1995).
2. Materials and methods
2.1. Test material
Bt rice KMD1 and the corresponding parental rice Xiushui 11, wereaccessed from University of Ottawa (Canada) and Zhejiang University(China), respectively. Seeds of KMD1 and its parental line, Xiushui 11,were produced in the late season of 2000 in Hangzhou, China. Wu et al.(2001) have described generation and selection of the transformant rice.During multiplication of rice seeds, the performance of these materials wasconsistent with previous years’ observations. Neither leaf folders nor stemborers damaged plants of KMD1, while Xiushui 11 was infested by both,leading to curled leaves (caused by leaf folders), dead-hearts and white-heads (by stem borers at vegetative and heading stage, respectively) in thefield. All shipping and handling was conducted to protect the freshnessand quality of the rice grains. On arrival by air courier at the DanishInstitute for Food and Veterinary Research (DFVF, Søborg, Denmark)the rice was stored at 5 �C, before dehulling, grinding and subsequentstorage at �18 �C until use. Samples of intact rice grains representative forthe bulk material were shipped to Technical University Munich(Germany).
2.2. Characterization of test material
Rice plants were generated by Agrobacterium-mediated transformationand positive transformants selected on the basis of hygromycin resistance(Wu et al., 2001). The presence of the Cry1Ab transformation cassette wasconfirmed by PCR and Southern blot analysis using standard protocols(Sambrook and Russell, 2002). Transgene expression of Cry1Ab in matureseeds of line KMD1 was verified by immunological assay (Western blot-ting after analysis of total protein by SDS-PAGE) using rabbit polyclonalantibodies raised against Cry1Ab as the primary antibody, with HRP-conjugated goat anti-rabbit IgG (Bio-Rad) as the secondary antibody. Theprotein was visualized using ECL (chemiluminescence) detection (Amer-sham) as previously described (Gatehouse et al., 1997) and quantified bydensitometric scanning using Bio-Rad Molecular Analyst software. Thefinal concentration of Cry1Ab in the animal diet was also determined byimmunoassay.
2.3. Compositional analyses of test material
Intact rice grains were manually dehulled by means of a wooden ricedehuller and ground using a cyclone mill equipped with a 500-lm sieve.The rice flour obtained was immediately frozen and stored at �20 �C untilanalysis.
Proximates (moisture, starch, fibre, sugars, protein, fat, ash), aminoacids, fatty acid distribution and minerals were determined using validatedstandard protocols (VDLUFA, 1996; VDLUFA, 1997). The content of
340 M. Schrøder et al. / Food and Chemical Toxicology 45 (2007) 339–349
EXHIBIT J - Page 417
Case 5:14-cv-00117-cr Document 63-11 Filed 11/14/14 Page 135 of 312

protein was calculated using nitrogen to protein conversion factor of 5.95.Vitamin B1 was measured by the AOAC method (AOAC, 2000). Extrac-tion and HPLC analysis of vitamin B6 were performed according toReitzer-Bergaentzle et al. (1993). To measure total vitamin B6 contentsincluding pyridoxol glucosides, extracts were treated with b-glucosidase(Bognar and Ollilainen, 1997). Niacin was extracted according to Wardand Trenerry (1997) and determined via HPLC analysis (Wills et al.,1977). Folate vitamers and total pantothenic acid were quantified by stableisotope dilution assays based on LC/MS/MS (Freisleben et al., 2003;Rychlik, 2003). A method using on-line coupled liquid chromatography–gas chromatography was used for determination of c-oryzanol contentsand steryl ferulate distributions (Miller et al., 2003). Phytic acid wasmeasured using a colorimetric method (Latta and Eskin, 1980). Heavymetals (cadmium, lead, mercury) were measured by AAS (VDLUFA,1996). Analysis for mycotoxins included aflatoxins (B1, B2, G1, G2),ochratoxin A, zearalenon and deoxynivalenol (VDLUFA, 1997). Bacterialand fungal counts were measured using validated standard protocols(VDLUFA, 1997). Pesticides were determined according to DFG, 1991.
2.4. Animals and housing
Sixty-four SPF Wistar rats [mol:Wist] (32 male and 32 female) wereobtained from M&B Breeding Center, Ll. Skensved, Denmark. The ratswere 6–7 weeks old at the initiation of the study. The animals were housedpair wise in stainless steel wire cages at 22 ± 1 �C, relative humidity55 ± 5%, air change 10 times/h and electric light from 09.00 to 21.00.Animal experiments and housing procedures were performed in accor-dance to the Danish Animal Experimentation act on a license granted bythe Ministry of Legal Affairs and the Convention ETS 123 of the Councilof Europe and the Danish Animal Experimental Inspectorate approvedthe study.
2.5. Diet formulation and feeding
The purified, or semi-synthetic, rat diet used in the study is produced inhouse (Poulsen et al., 2002), based on the rodent diet AIN-93 (Reeveset al., 1993). The purified diet is based on cornstarch and does not containrice. In this study, both test diets contained 60% ground rice flour, eitherXiushui 11 for the controls or KMD1 expressing Cry1Ab protein from thecry1Ab gene. Mixing procedures were performed as described by Poulsenet al. (2006); see Table 1 for diet composition.
Both diets were adjusted identically to assure an adequate supply ofmacronutrients and vitamins after substitution with 60% rice, but noadjustments were made to outbalance the differences in the constitution of
the rice, observed by the compositional/chemical analyses. The rats wereallowed free access to both food and water.
2.6. Experimental design
Animals were randomly assigned to two experimental groups of 16males and females, based on body weight means. The animals wereobserved twice daily; body weight, food and water consumption weremeasured once weekly. During the last week of treatment, blood sampleswere taken from the tail vein and collected in EDTA and heparin coatedtubes for hematology and blood biochemistry, respectively. Blood sampleswere taken under Hypnorm–Dormicum anaesthesia and the animals werefasted overnight to minimize fluctuations in the parameters measured.
At terminal sacrifice, the animals were anaesthetized by CO2 inhalationand killed by decapitation and exsanguination followed by examinationfor gross and histopathological changes.
2.7. Blood biochemistry and haematology
Following biochemical parameters were measured in plasma: urea(BUN), alanine aminotransferase (ALAT), sodium, potassium, choles-terol, protein, albumin, creatinine and glucose. All analyses on bloodplasma were performed on a Cobas Mira S analyzer (Roche DiagnosticSystems, Switzerland) using the relevant kits for each parameter.
Haematology characteristics were assessed using a Twincounter 187Hematology Analyser (Analysis Instruments AB, Stockholm, Sweden) onthe following parameters: White blood cells (WBC), red blood cells(RBC), platelets (PLT), haemoglobin (HGB), haematocrit (HCT), meancorpuscular volume (MCV), mean corpuscular haemoglobin (MCH), andmean corpuscular hemoglobin concentration (MCHC). The differentialcount was performed manually on blood smears for neutrophilic, eosin-ophilic and basophilic granulocytes, lymphocytes, monocytes and largeunstained cells (LU). The smears were stained with May-Grunwald andGiemsa and two times 100 cells were counted.
2.8. Bacterial counts
During the experimental period, fresh faecal samples were taken formicrobial analysis from ten animals (5 males and 5 females) of each of thetwo groups by provoked defecation at day 30 and 60 of the experiment,and at termination of the study. Furthermore, at terminal sacrifice samplesfrom ileum and duodenum were taken from the same ten animals of eachgroup. The faecal and intestinal samples were treated as described byPoulsen et al. (2006).
2.9. Gross necropsy and histopathology
A complete necropsy was performed and the following organs wereexcised and weighed: adrenals, brains, epididymis, heart, kidneys, liver,mesenterial lymph nodes, ovaries, pancreas, small intestine, spleen,stomach, testes, thyroid gland and uterus. Paired organs (adrenals, epi-didymides, kidneys, ovaries and testis) were weighed as a total of left andright. Sections from the above organs including the axillary lymph nodes,skin with mammary glands, bones, spine and other organs and tissues withmacroscopically visible lesions were fixed for a minimum of 24 h in 4%buffered formaldehyde before histological processing. Tissue samples wereembedded in paraffin and sections, 4–6 lm thick, were then stained rou-tinely with hematoxylin–eosin (H&E) for light microscopy.
The main focus of the histopathological examination was on theintestinal tract and the related organs. From a total of 10 males andfemales per group the following tissues were selected for histologicalexamination: forestomach, glandular stomach, duodenum, jejunum andileum of the small intestine, cecum, colon, rectum, the mesenteriallymph node, liver (sections from both right and left lateral lobes),pancreas (exocrine and endocrine), adrenal cortex and medulla, kidneys,axillary lymph node, heart, skeletal muscle (m. biceps femoris), spleen, andthymus.
Table 1Composition of diets
Ingredients (%) Group 1 Group 2
Control rice (Xiushui 11) 60 0Bt rice (KMD1) 0 60Corn starch 5.2 5.2Sucrose 6.8 6.8Soybean oil 5 5Cellulose 5 5Mineral mixturea 2.8 2.8Vitamin mixtureb 1.2 1.2
a In mg/kg diet: Ca: 5000, P: 3100, K: 3600, S: 300, Na: 2500, Cl: 1500,Mg: 600, Fe: 34, Zn: 30, Mn: 10, Cu: 7, I: 0.20, Mo: 0.15, Se: 0.15, Si: 2.5,Cr: 1.0, F: 1.0, Ni: 0.5, B: 0.5, Li: 0.1, V: 0.1, Co: 0.07.
b In mg/kg diet: Vit. A.: 5000 (IU); Vit. D3.: 1000 (IU); Vit. E.: 50 (IU);Thiamin: 5; Riboflavin: 6; Pyridoxol: 8; Folic acid: 2; D-biotin: 0.3; Vit.B12.: 0.03; Panthothenate: 20; Cholinhydrogentartrat: 2600; Inositol: 400;Nicotinic acid: 40; Phylloquinine: 1; p-aminobenzoic acid: 40; Methionine:1000; L-cystine: 2000.
M. Schrøder et al. / Food and Chemical Toxicology 45 (2007) 339–349 341
EXHIBIT J - Page 418
Case 5:14-cv-00117-cr Document 63-11 Filed 11/14/14 Page 136 of 312

2.10. Statistical analysis
Compositional data are presented as means ± confidence intervals(p < 0.05). Means are considered as statistically significantly different iftheir confidence intervals are not overlapping. All statistical calculationson data obtained from the feeding study were carried out using SASrelease 8.1 (SAS Institute Inc., Cary, NC). Homogeneity of varianceamong groups and normality distribution were investigated. Two-wayanalysis of variance with repeated measures on one factor was used toanalyze food and water consumption, body weight and faecal and intes-tinal microflora. A Least Significant Difference test, or Duncan multiple-range test if significant, followed the analyses. Organ weights, data onhematology and blood biochemistry were analyzed by ANOVA (generallinear model), and where the overall F-test was significant, least squaremeans was used to compare the exposed group to the control group.
In cases where data was not normally distributed a non-parametricaltest was performed, using Kruskal–Wallis test followed by Wilcoxon Two-Sample test. P 6 0.05 was in all cases considered significant, data on malesand females were always analyzed separately. Data is mainly presented asgroup mean values ± SEM (standard error of the mean).
3. Results
3.1. Compositional analysis
Bt (KMD1) brown rice and parental (Xiushui 11) brownrice tested in the 90-day feeding study were subjected tocomprehensive analytical characterization. More than fiftyrice constituents were measured including proximates,amino acids, fatty acids, minerals, vitamins, steryl ferulatesand phytic acid. In addition the material was screened forcontaminants (heavy metals, pesticides), and the microbio-logical quality was evaluated by screening for mycotoxinsand bacterial/fungal counts. Compositional data werecompared to data reported for brown rice (Juliano, 1985;Latta and Eskin, 1980; Scherz and Senser, 2000; Mølleret al., 2002; USDA, 2004; OECD, 2004; Kitta et al.,2005) and differences between the lines were assessed forstatistical significance (p < 0.05).
Contents of proximates are presented in Table 2. Com-pared to the parental rice, KMD1 exhibited a statisticallysignificantly higher protein content (+8%) and a statisti-cally significantly lower fat content (�18%). However, datafor both lines are within literature range (Juliano, 1985;Scherz and Senser, 2000; Møller et al., 2002; USDA,
2004; OECD, 2004). No statistically significant differencebetween the lines was detected for contents of moisture,starch, fibre, sugars, and ash.
The difference between KMD1 and Xiushui 11 in pro-tein content is also reflected in the amino acid levels (Table3). The transgenic rice exhibited statistically significantlyhigher contents of all amino acids except cystine and pro-line. In particular, levels of arginine and histidine were veryhigh in KMD1 compared to Xiushui 11 (+98% and+123%, respectively). Whereas the level of arginine inKMD1 is within the data range reported in the literature(Scherz and Senser, 2000; USDA, 2004), the level of histi-dine in KMD1 significantly exceeds the data rangereported for brown rice.
Statistically significant differences were observed for thefatty acid distribution (Table 4). A statistically significantlyhigher proportion of linoleic acid was found for the trans-genic rice (+13%), whereas the parental rice exhibited a sta-tistically significant higher proportion of oleic and stearicacid (+9% and +38%, respectively). For stearic acid theamount in KMD1 was below the minimum value reportedin literature. For myristic and palmitic acid the proportionsin both parental and GM material were slightly below theminima described in literature whereas for oleic acid theamount in the parental line was slightly above the maxi-mum reported. Despite these minor differences, the overallfatty acid patterns of both lines with in agreement with thedata reported for rice in the literature (Scherz and Senser,2000; USDA, 2004; OECD, 2004; Kitta et al., 2005).
Contents of minerals are presented in Table 5. No statis-tically significant difference between the transgenic and theparental rice was observed for contents of calcium, magne-
Table 2Proximate composition of brown rice material from transgenic KMD1and its corresponding parental line Xiushui 11 (mean ± confidenceinterval, n = 4, p < 0.05)
Component (%) Xiushui 11 KMD1 Literature dataa
Moisture 12.5 ± 0.1 12.5 ± 0.4 9.1–14.1Starch 72.5 ± 0.4 72.7 ± 0.2 57–77Fibre 1.1 ± 0.2 1.2 ± 0.3 0.5–3.5Sugars 0.6 ± 0.2 0.5 ± 0.1 0.6–1.3Protein 8.7 ± 0.1 9.4 ± 0.1b 6.1–9.5Fat 2.99 ± 0.05 2.46 ± 0.08b 1.4–2.9Ash 1.30 ± 0.05 1.25 ± 0.03 0.9–1.5
a Ranges from minimum to maximum reported values (Juliano, 1985;Møller et al., 2002; Scherz and Senser, 2000; USDA, 2004; OECD, 2004).
b Statistically significantly different from parental line (p < 0.05).
Table 3Amino acid levels in brown rice material from transgenic KMD1 and itscorresponding parental line Xiushui 11 (g/100 g; mean ± confidenceinterval, n = 3, p < 0.05)
Amino acid Xiushui 11 KMD1 Literature dataa
Alanine 0.48 ± 0.02 0.60 ± 0.02b 0.46–0.58Arginine 0.44 ± 0.05 0.87 ± 0.02b 0.44–0.91Aspartic acid 0.81 ± 0.04 1.00 ± 0.01b 0.74–0.87Cystine 0.20 ± 0.01 0.22 ± 0.07 0.06–0.19Glutamic acid 1.40 ± 0.03 1.76 ± 0.00b 1.52–1.76Glycine 0.40 ± 0.00 0.47 ± 0.01b 0.39–0.49Histidine 0.26 ± 0.01 0.58 ± 0.07b 0.12–0.27Isoleucine 0.33 ± 0.03 0.39 ± 0.01b 0.26–0.57Leucine 0.70 ± 0.01 0.85 ± 0.00b 0.50–0.93Lysine 0.30 ± 0.01 0.35 ± 0.01b 0.10–0.42Methionine 0.19 ± 0.01 0.27 ± 0.01b 0.05–0.31Phenylalanine 0.44 ± 0.01 0.56 ± 0.02b 0.30–0.55Proline 0.46 ± 0.02 0.50 ± 0.05 0.37–0.40Serine 0.37 ± 0.01 0.44 ± 0.00b 0.41–0.50Threonine 0.23 ± 0.00 0.32 ± 0.01b 0.19–0.62Tryptophan 0.10 ± 0.00 0.12 ± 0.00b 0.03–0.11Tyrosine 0.42 ± 0.02 0.56 ± 0.01b 0.21–0.47Valine 0.48 ± 0.00 0.63 ± 0.01b 0.40–0.76
a Ranges from minimum to maximum reported values (Scherz andSenser, 2000; USDA, 2004).
b Statistically significantly different from parental line (p < 0.05).
342 M. Schrøder et al. / Food and Chemical Toxicology 45 (2007) 339–349
EXHIBIT J - Page 419
Case 5:14-cv-00117-cr Document 63-11 Filed 11/14/14 Page 137 of 312

sium, phosphorous and potassium. However, the trans-genic rice exhibited statistically significantly lower contentsof copper (�57%), iron (�27%), manganese (�38%),molybdenum (�33%), and zinc (�30%). For both linescontents of minerals were in agreement with literature data(Juliano, 1985; Møller et al., 2002; Scherz and Senser, 2000;USDA, 2004).
Table 6 presents contents of important rice vitamins,which were in agreement with literature data (Juliano,1985; Møller et al., 2002; Scherz and Senser, 2000; USDA,2004).
Rice contains a mixture of steryl ferulic acid estersnamed c-oryzanol (Xu and Godber, 1999). c-Oryzanolwas shown to exhibit antioxidative (Xu et al., 2001) andcholesterol-lowering properties (Rong et al., 1997). Nostatistically significant difference between transgenic andparental rice was observed for contents of total c-oryzanol(Table 7). Data were within the range reported in literature(Miller et al., 2003). Despite minor but statistically signifi-cant differences, steryl ferulate distributions were similar inboth lines. Except for the proportion of 24-methylenecyclo-artanyl ferulate in the transgenic rice, steryl ferulate distri-butions were in agreement with literature data (Milleret al., 2003).
Phytic acid is known as an anti-nutritive rice constitu-ent. It has been shown to limit bioavailability of minerals(Saha et al., 1994). No statistically significant differencewas detected between phytic acid content of the transgenic(0.90 ± 0.03%, mean ± confidence interval, p < 0.05, n = 4)and the parental rice (0.88 ± 0.04%). Data were in agree-ment with literature data (0.6–1.6%; Latta and Eskin,1980).
To evaluate the microbiological quality of the rice mate-rial bacterial and fungal counts were measured and thematerials were screened for mycotoxins. Analyses followedstandard methods with limits of detection of 0.0003 mg/kgfor aflatoxins (B1, B2, G1, G2), 0.00025 mg/kg for ochra-toxin A, 0.0025 mg/kg for zearalenon and 0.025 mg/kgfor deoxynivalenol (VDLUFA, 1997). No mycotoxins weredetected in the material. Both materials exhibited similarlylow bacterial (<0.07 · 106/g) and fungal counts (<0.1 ·103/g).
As regards contaminants, 149 pesticides from differentclasses were analyzed in each line following standard meth-ods. They were shown to be below their respective detec-tion limits ranging from 0.0025 mg/kg for PCBs (7) andchlorinated hydrocarbons (13) to 0.5 mg/kg for cymoxanil,pyridaben and thiobendazol; for the majority of the pesti-cides the detection limits were 0.005 mg/kg (59) and0.05 mg/kg (42), respectively. Levels of heavy metals (lead,cadmium and mercury) were low. Contents of lead andcadmium were below limits set for rice by the CommissionRegulation (EG) 466/2001 (Table 8).
The level of transgene expression of Cry1Ab in matureKMD1 rice seeds was shown to be 0.015–0.018% of thetotal soluble protein, while no Cry1Ab protein wasdetected in the parental control rice.
3.2. Clinical observation, body weight and food and water
intake
Throughout the study, no adverse effects on animalbehaviour were observed. The animals were observed twice
Table 4Fatty acid distribution in brown rice material from transgenic KMD1 andits corresponding parental line Xiushui 11 (mean ± confidence interval,n = 4, p < 0.05)a
Fatty acid (%) Xiushui 11 KMD1 Literature datab
Myristic acid 0.3 ± 0.1 0.3 ± 0.1 0.4–3.0Palmitic acid 16.9 ± 0.2 16.2 ± 0.6 18–31Stearic acid 1.8 ± 0.1 1.3 ± 0.1c 1.6–2.6Oleic acid 42.2 ± 0.1 38.4 ± 0.5c 27–41Linoleic acid 35.5 ± 0.1 40.1 ± 0.3c 31–40Linolenic acid 1.5 ± 0.1 1.7 ± 0.1 0.9–1.7
a Proportions of total fatty acids (%).b Ranges from minimum to maximum reported values (Scherz and
Senser, 2000; USDA, 2004; OECD, 2004; Kitta et al., 2005).c Statistically significantly different from parental line (p < 0.05).
Table 5Contents of minerals in brown rice material from transgenic KMD1 andits corresponding parental line Xiushui 11 (mean ± confidence interval,n = 4, p < 0.05)
Mineral Xiushui 11 KMD1 Literature dataa
Calcium (g/kg) 0.2 ± 0.0 0.5 ± 0.3 0.1–0.5Copper (mg/kg) 5.1 ± 0.1 2.2 ± 0.3b 1–6Iron (mg/kg) 22 ± 2 16 ± 1b 2–52Magnesium (g/kg) 1.2 ± 0.1 1.2 ± 0.1 0.2–1.7Manganese (mg/kg) 35.0 ± 0.4 21.6 ± 0.2b 2–37Molybdenum (mg/kg) 0.6 ± 0.1 0.4 ± 0.1b 0.3–1.0Phosphorous (g/kg) 3.0 ± 0.1 3.0 ± 0.1 1.7–4.4Potassium (g/kg) 2.3 ± 0.1 2.4 ± 0.1 0.6–2.8Zinc (mg/kg) 22.4 ± 0.3 15.7 ± 0.7b 6–28
a Ranges from minimum to maximum reported values (Juliano, 1985;Møller et al., 2002; Scherz and Senser, 2000; USDA, 2004).
b Statistically significantly different from parental line (p < 0.05).
Table 6Contents of vitamins in brown rice material from transgenic KMD1 andits corresponding parental line Xiushui 11 (mg/kg; mean ± confidenceinterval, p < 0.05)
Vitamin Xiushui 11 KMD1 Literature dataa
B1b 3.4 ± 0.4 3.8 ± 0.9 2.9–6.1
B6c 1.1 ± 0.2 1.1 ± 0.1 2–10
Niacinb 54 ± 2 57 ± 3 35–58Total pantothenic acidd 8.0 9.6 9–17Total folic acida 0.15 0.13 0.1–0.55-Methyl-H4folatea,e 0.09 0.065-Formyl-H4folatea,e 0.06 0.07
a Ranges from minimum to maximum reported values (Juliano, 1985;Møller et al., 2002; Scherz and Senser, 2000; USDA, 2004).
b n = 3.c n = 5.d n = 2.e Calculated as folic acid.
M. Schrøder et al. / Food and Chemical Toxicology 45 (2007) 339–349 343
EXHIBIT J - Page 420
Case 5:14-cv-00117-cr Document 63-11 Filed 11/14/14 Page 138 of 312

daily for well-being. Body weight, food and water con-sumption was measured weekly and the relative foodconsumption calculated. Statistically significant differenceswere seen on the food consumption in single weeks for themales, where the rats fed KMD1 had a slightly lower foodintake, but no overall effect was seen when comparing thetwo groups (Table 9). There were no differences observedon water consumption (data not shown).
Growth curves are included for males and females inFig. 1. They illustrate normal and similar growth patternswithin and between the two groups. The slight reductionin body weight at week 12 in both groups was due to anovernight fasting period prior to blood sampling and pos-sibly also stress, related to the blood sampling procedure.
3.3. Blood biochemistry and haematology
Male rats fed KMD1 had a significantly higher plasmaconcentration of urea (+10%; p < 0.05) and glucose(+13%, p < 0.05), whereas the concentration of proteinwas significantly reduced by 5% (p < 0.05) compared tothe control group. For female rats fed KMD1, the onlystatistically significant observation was a 1% increase in
plasma concentration of sodium (p < 0.05). See Table 10for details on group values.
Regarding haematology only a few differences wereobserved between the two groups. In male rats statisticallysignificant differences were observed on MCH, which was3.5% lower in males fed on KMD1 (p < 0.05) and on theWBC, which was reduced by 17% in the same group(p < 0.05). See Table 11 for details about hematologicalmeasurements.
3.4. Microbiology
For the faecal samples no significant differences in thebacterial micro flora could be found between the twogroups (p < 0.05) (data not shown). Results of the signifi-cant microbiological findings in the small intestines aresummarized in Table 12. In the samples from the duode-num a 13% decrease in the Bifidobacterial populationwas observed in the dosed group compared to the controlgroup (p < 0.05). In samples from ileum an increase wasobserved in the coliform population, which was 23% higherin the KMD1 group (p < 0.05).
3.5. Organ weights
Only few significant differences in organ weights wereobserved in this study, namely on adrenal, testis and uterusweight. A statistically significantly reduced absolute weightof the adrenals (�15%) (p < 0.05) was detected in male ratsfed the KMD1. The absolute weight of the testis from malerats fed the KMD1 was increased (+10%) (p < 0.05), as wasthe relative weight (+12%) (p < 0.01). The absolute weightof the uterus in KMD1 fed females was increased (+19%)(p < 0.05). There was no statistical difference in the relativeweight of the uterus. Details regarding organ weights andminimum and maximum weight for relevant organs aresummarized in Table 13.
3.6. Gross necropsy and histopathology
During the necropsy there were no gross pathologicalfindings, nor did the histopathological examination reveal
Table 7c-Oryzanol (steryl ferulates) in brown rice material from transgenic KMD1 and its corresponding parental line Xiushui 11 (mean ± confidence interval,n = 3, p < 0.05)
Xiushui 11 KMD1 Literature dataa
c-Oryzanol (mg/100 g) 31 ± 1 32 ± 3 31–63
Steryl ferulate distributionb
Campesteryl ferulate 19.3 ± 0.3 21.1 ± 1.4c 7–19Campestanyl ferulate 6.8 ± 0.2 6.0 ± 0.2a 6–13b-Sitosteryl ferulate 9.5 ± 0.3 10.5 ± 0.2a 5–10Cycloartenyl ferulate 37.7 ± 0.6 44.2 ± 0.6a 33–4724-Methylenecycloartanyl ferulate 26.6 ± 0.6 18.3 ± 0.4a 27–36
a Ranges from minimum to maximum values reported in Miller et al. (2003).b Proportions of total c-oryzanol content (%).c Statistically significantly different from parental line (p < 0.05).
Table 8Contents of heavy metals in brown rice material from transgenic KMD1and its corresponding parental line Xiushui 11 (mg/kg; mean ± confidenceinterval, n = 4, p < 0.05)
Heavy metal Xiushui 11 KMD1 Limita
Lead 0.15 ± 0.09 0.14 ± 0.05 0.2Cadmium 0.03 ± 0.02 0.02 ± 0.01 0.2Mercury 0.006 ± 0.001 0.006 ± 0.001 –
a Commission Regulation (EG) 466/2001.
Table 9Food consumption (in g/animal/week) presented as group meanvalues ± SD
Males Females
Xiushui 11 KMD1 Xiushui 11 KMD1
Weeks 2–7 134 ± 13 134 ± 12 95 ± 5 97 ± 5Weeks 8–13 141 ± 14 137 ± 8 102 ± 10 100 ± 9
344 M. Schrøder et al. / Food and Chemical Toxicology 45 (2007) 339–349
EXHIBIT J - Page 421
Case 5:14-cv-00117-cr Document 63-11 Filed 11/14/14 Page 139 of 312

any dose-related changes in the intestinal tract or therelated organs; in general no pathologically relevantchanges were found to explain the identified differences inorgan weights between the two groups.
Due to the observed difference in the weight of the testisa thorough histological examination was performed reveal-
ing unilateral testicular degeneration in different stages inboth groups.
Macroscopically the testis were more or less swelled oratrophied which was directly related to the observed differ-ent stages of degeneration in the seminiferous tubules; 2of 16 control males had mainly atrophic degeneration,
Table 10Blood biochemical findings in rats fed on Xiushui 11 (control) diet and KMD1 diet
Males Females
Xiushui 11 KMD1 Xiushui 11 KMD1
BUN (lmol/l) 5.4 ± 0.6 6.0 ± 0.5a 6.6 ± 0.7 6.7 ± 1.1ALAT (U/l) 35.3 ± 4.7 32.4 ± 5.4 24.3 ± 8.1 25.3 ± 3.4CREA (lmol/l) 33.5 ± 7.4 33.9 ± 6.8 40.1 ± 7.7 37.9 ± 7.5CHOL (mmol/l) 1.7 ± 0.3 1.5 ± 0.3 1.3 ± 0.3 1.2 ± 0.3PROT (g/l) 64.4 ± 2.2 61.2 ± 2.4a 63.9 ± 3.1 63.9 ± 3.5ALB (g/l) 40.8 ± 1.5 39.9 ± 1.6 45.5 ± 3.2 45.2 ± 3.0GLUC (mmol/l) 7.5 ± 0.8 8.6 ± 1.7a 10.5 ± 13.5 6.8 ± 0.6Na+ (mmol/l) 145.1 ± 1.3 145.9 ± 1.1 143.9 ± 1.3 145.5 ± 1.1a
K+ (mmol/l) 4.3 ± 0.3 4.2 ± 0.3 4.1 ± 0.4 4.2 ± 0.5
The number of animals was 16 rats/sex/group; data is presented as group mean values ± SD.a p < 0.05.
Males
100
150
200
250
300
350
400
450
Rand. 1 2 3 4 5 6 7 8 9 10 11 12 13Duration of study (weeks)
body
wei
ght (
g)
Control rice group
Bt rice group
Females
100
125
150
175
200
225
250
275
body
wei
ght (
g)
Control rice group Bt rice group
Rand. 1 2 3 4 5 6 7 8 9 10 11 12 13
Duration of study (weeks)
Fig. 1. Growth curves based on weekly measurements of body weight during the study. The curves show group means based on 16 rats/sex/group.
M. Schrøder et al. / Food and Chemical Toxicology 45 (2007) 339–349 345
EXHIBIT J - Page 422
Case 5:14-cv-00117-cr Document 63-11 Filed 11/14/14 Page 140 of 312

whereas 3 of 16 males in the KMD1 group has morepronounced swelling associated with the degeneration.
4. Discussion
Compositional analysis of KMD1 and the parental riceXiushui 11 tested in the feeding studies revealed statisticallysignificant differences between the two. These significantdifferences were observed for contents of protein, fat, andminerals (copper, iron, manganese, molybdenum, zinc).The higher protein content in KMD1 was also reflected inhigher levels of amino acids. Minor, although statistically
significant differences were detected for the distribution offatty acids and steryl ferulates. Compositional data onGM rice KMD1 and its parental rice Xiushui 11 has beenpublished previously (Wang et al., 2002). The materialinvestigated in that study had also been grown in Hangzhou(China), however at a different site and in another year. Thespectrum of the constituents analyzed was more limitedthan in the present study and for some of the parametersinvestigated, the results were different from those found inthe study presented here. However, Wang et al. (2002)reported no statistically significant differences between theGM and parental rice in their study. This indicates thatthe differences detected between KMD1 and Xiushui 11 inour study might be due to biological variability rather thanto the genetic modification. Additional field trials would benecessary to confirm this conclusion, and field trial permis-sion must be sought well enough in advance to have all therequisite rice lines grown in randomized block design in thesame filed station sector in one optimal rice growing season(sow April–October harvest).
The concentration of Bt toxin present in mature rice seedswas estimated to 0.0165% of total soluble protein in theKMD1, which equates to approx. 15 mg Bt toxin/kg rice.With an estimated daily feed consumption of 15 g/rat/dayand a mean body weight of 250 g, the daily feed consumptionis approx. 60 g/kg body weight. In the 60% rice diet the Bttoxin concentration was 9 mg/kg feed giving a mean dailydosage of Bt toxin of 0.54 mg/kg body weight. For compar-ison sub-chronic oral toxicity studies have shown a NOEL(no-observed-effect-level) of up to 8400 mg Bt product/kgbody weight/day when feeding Bt microbial toxins to rats(Betz et al., 2000). This means that possible toxicologicalfindings in the present study with 0.54 mg/kg body weight/day most likely will derive from unintended changes intro-duced in the GM rice and not from toxicity of Bt toxin.
Table 11Haematological findings in rats fed on Xiushui 11 (control) diet and KMD1 diet
Males Females
Xiushui 11 KMD1 Xiushui 11 KMD1
WBC (109/l) 5.5 ± 0.2 4.7 ± 0.2a 3.0 ± 0.2 2.7 ± 0.2RBC (1012/l) 8.4 ± 0.1 8.7 ± 0.1 7.9 ± 0.1 7.8 ± 0.07PLT (109/l) 640 ± 24 642 ± 19 663 ± 11 709 ± 32HGB (mmol/l) 15.1 ± 0.1 15.1 ± 0.2 14.4 ± 0.2 14.0 ± 0.09HCT (%) 45.5 ± 0.5 46.2 ± 0.6 43.5 ± 0.6 42.5 ± 0.3MCV (fL) 53.9 ± 0.5 53.1 ± 0.4 54.9 ± 0.3 54.8 ± 0.5MCH (fmol) 17.9 ± 0.2 17.3 ± 0.2b 18.2 ± 0.2 18.0 ± 0.2MCHC (mmol/l) 33.1 ± 0.2 32.7 ± 0.2 33.2 ± 0.2 32.9 ± 0.2
Differential count
Lymphocytes (%) 79.5 ± 1.5 79.1 ± 1.9 81.8 ± 1.5 77.6 ± 2.0Neutrophils (%) 17.8 ± 1.6 17.3 ± 1.8 14.7 ± 1.4 18.8 ± 1.9Eosinophils (%) 1.4 ± 0.3 1.5 ± 0.2 1.7 ± 0.3 1.5 ± 0.3Basophils (%) 0 ± 0 0 ± 0 0 ± 0 0 ± 0Monocytes (%) 1.4 ± 0.2 1.4 ± 0.2 1.4 ± 0.2 1.7 ± 0.2Other cells (%) 0.4 ± 0.2 0.2 ± 0.06 0.4 ± 0.09 0.5 ± 0.1
The number of animals was 16 rats/sex/group; data is presented as group mean values ± SEM.a F-value: 5.71, p = 0.024.b v2 = 3.92, p = 0.048 (non-par).
Table 12Bacterial counts in the small intestine of rats (top: duodenum, bottom:ileum) fed Xiushui 11 (control) diet and KMD1 diet
Xuishui 11 KMD1
Bacterial counts in duodenum (log10 cfu/g intestinal content)
Total aerobe 5.75 ± 1.16 (9) 5.9 ± 1.05 (9)Total anaerobe 6.18 ± 0.85 (9) 5.52 ± 1.34Lactobacilli 6.87 ± 1.44 (8) 6.31 ± 0.66 (9)Bifidobacteria 6.49 ± 0.87a (9) 5.72 ± 0.57b (9)Coliforms 3.39 ± 0.69 (6) 2.85 ± 0.21 (2)Enterococci 4.35 ± 1.15 (9) 4.45 ± 1.27 (8)
Bacterial counts in ileum (log10 cfu/g intestinal content)
Total aerobe 6.78 ± 1.0 (9) 7.01 ± 0.78 (8)Total anaerobe 7.53 ± 0.69 7.15 ± 0.59Lactobacilli 7.55 ± 1.39 (9) 7.58 ± 1.25Bifidobacteria 7.01 ± 0.96 7.02 ± 0.81Coliforms 5.73 ± 0.93a 7.03 ± 0.59b
Enterococci 6.43 ± 0.98 6.04 ± 0.58 (9)
Data are presented as group mean values ± SEM for 10 animals; figures inbrackets indicate the number of animals, if different from 10. Differentsuperscripts in a row indicate significant difference in the bacterial countsbetween the two groups (p < 0.05).
346 M. Schrøder et al. / Food and Chemical Toxicology 45 (2007) 339–349
EXHIBIT J - Page 423
Case 5:14-cv-00117-cr Document 63-11 Filed 11/14/14 Page 141 of 312

On analysis of hematological parameters a significantlyreduced amount of white blood cells was observed in themale rats of the group fed with KMD1. This could beindicative of immuno-suppression, but neither the differen-tial count nor other significant findings on clinical observa-tions, organ weights or pathology of the immune organs(thymus and spleen) support this possibility. With respectto blood biochemistry the observed differences in glucose,urea, protein and sodium were minor and the measuredvalues were all within the normal reference intervals forrats of this breed and age. The observed differences arenot related to other clinical or pathological findings, andwere thus considered insignificant.
Only minor effects were recognized in samples takenfrom the small intestine for bacteriological quantificationin the dosed group. The faecal samples did not reveal anydifferences in bacterial counts in the animals fed KMD1compared to animals fed the wild type rice. A recently pub-
lished study investigated bacterial changes in the rumen ofcattle fed Bt corn, where no significant influence of Bt corncould be found on the composition of the microbial popu-lation (Einspanier et al., 2004). In the current studyreduced amounts of Bifidobacteria in the duodenum andincreased amounts of coliforms in the ileum were observedin the KMD1 group. The mechanisms behind thesechanges are unknown, and further studies are required toclarify whether these findings are biologically significant.
The adrenal weight was significantly reduced in theKMD1 group, but due to the lack of histopathologicalchanges in the organ, this was considered an insignificantfinding. As to the observed testicular degeneration, thedifference in testis weight was explained by the finding ofdifferent stages of degeneration in the seminiferous tubules.The incidence of these findings is not significantly higher inthe KMD1 group and thus found not to be related to theGM rice. The conclusion from the present study suggesting
Table 13Absolute and relative organ weights for rats fed on Xiushui 11 (control) diet and KMD1 diet
Males Females
Xiushui 11 KMD1 Xiushui 11 KMD1
Absolute weight (g)Body weight 419 ± 13 408 ± 7 249 ± 4 250 ± 6Adrenals 0.0694 ± 0.003 0.0602 ± 0.002a 0.0611 ± 0.002 0.0673 ± 0.003Brains 1.97 ± 0.03 1.87 ± 0.11 1.84 ± 0.02 1.89 ± 0.03Epididymides 1.13 ± 0.03 1.15 ± 0.01Heart 1.15 ± 0.03 1.16 ± 0.02 0.813 ± 0.01 0.831 ± 0.03Kidneys 2.27 ± 0.07 2.25 ± 0.04 1.53 ± 0.05 1.51 ± 0.03Liver 13.04 ± 0.50 12.59 ± 0.25 8.18 ± 0.14 8.20 ± 0.25Mesenterial ln. 0.222 ± 0.016 0.189 ± 0.017 0.183 ± 0.015 0.167 ± 0.014Ovaries 0.0967 ± 0.007 0.1071 ± 0.007Pancreas 1.43 ± 0.07 1.38 ± 0.05 1.06 ± 0.18 1.01 ± 0.26Small intestine 7.79 ± 0.21 7.73 ± 0.18 6.16 ± 0.82 6.04 ± 0.94Spleen 0.744 ± 0.03 0.714 ± 0.02 0.589 ± 0.105 0.532 ± 0.080Testis 3.57 ± 0.09 3.94 ± 0.10b
Thymus 0.435 ± 0.04 0.413 ± 0.02 0.414 ± 0.067 0.392 ± 0.101Uterus 0.437 ± 0.05 0.519 ± 0.04d
Length small int. 107.5 ± 1.4 109.4 ± 1.1 99.3 ± 1.1 99.3 ± 1.9
Relative weight (g/100 g BW)
Adrenals 0.0167 ± 0.001 0.0148 ± 0.001 0.0248 ± 0.001 0.0270 ± 0.001Brains 0.473 ± 0.01 0.461 ± 0.03 0.740 ± 0.01 0.760 ± 0.02Epididymides 0.271 ± 0.01 0.283 ± 0.005Heart 0.275 ± 0.005 0.286 ± 0.015 0.327 ± 0.005 0.333 ± 0.010Kidneys 0.542 ± 0.009 0.553 ± 0.023 0.612 ± 0.014 0.607 ± 0.012Liver 3.10 ± 0.05 3.09 ± 0.05 3.29 ± 0.06 3.28 ± 0.08Mesenterial ln. 0.054 ± 0.005 0.046 ± 0.004 0.073 ± 0.006 0.067 ± 0.006Ovaries 0.0390 ± 0.003 0.0425 ± 0.002Pancreas 0.342 ± 0.01 0.340 ± 0.01 0.429 ± 0.02 0.405 ± 0.03Small intestine 1.87 ± 0.06 1.90 ± 0.04 2.48 ± 0.09 2.41 ± 0.08Spleen 0.177 ± 0.003 0.176 ± 0.005 0.236 ± 0.009 0.213 ± 0.008Testis 0.860 ± 0.03 0.967 ± 0.02c
Thymus 0.102 ± 0.009 0.101 ± 0.004 0.167 ± 0.006 0.158 ± 0.011Uterus 0.177 ± 0.021 0.212 ± 0.021Length small int. 25.9 ± 0.6 26.9 ± 0.4 40.4 ± 1.0 39.9 ± 1.0
Small intestinal length and relative length is expressed in cm and cm/100 g BW. Data is presented as group mean values ± SEM.a Adrenals: F-value: 5.89, p = 0.0216 � reduced absolute weight. Xiushui 11: min. 0.055 g, max. 0.103 g; KMD1: min. 0.043 g, max. 0.073 g.b Testis: F-value: 7.43, p = 0.011 � increased absolute weight. Xiushui 11: min. 2.76 g, max. 4.18 g; KMD1: min. 3.44 g, max. 5.27 g.c Testis: F-value: 8.94, p = 0.006 � increased relative weight. Xiushui 11: min. 0.585 g/100 g BW, max. 0.999; KMD1: min. 0.878, max. 1.18.d Uterus: F-value: 7.09, p = 0.013 � increased absolute weight. Xiushui 11: min. 0.24 g, max. 1.14 g; KMD1: min. 0.32 g, max. 0.82 g.
M. Schrøder et al. / Food and Chemical Toxicology 45 (2007) 339–349 347
EXHIBIT J - Page 424
Case 5:14-cv-00117-cr Document 63-11 Filed 11/14/14 Page 142 of 312

that expression of Cry 1Ab in transgenic rice was notresponsible for the observed changes in the testis are sup-ported by Wang et al. (2002) who carried out a comparablefeeding study on Sprague–Dawley rats without anyobserved changes in the testis. In addition, Brake et al.(2004) evaluated the effects of Bt corn on mouse testiculardevelopment and with special emphasis on the effect of Bttoxins on the germ cell population, neither short-term normultigenerational studies showed any apparent toxic effectson the reproductive system.
The inclusion of an additional test group to the presentstudy, where the rats were fed on a diet spiked with purerecombinant protein Cry1Ab would have been desirableand probably the most suitable model for testing the safetyof the GM crop, since this would have enabled a morecomprehensive assessment of the observed differences inorgan weights and the minute pathological changes in thereproductive organs of the male rats. An additional groupspiked with Cry1Ab could have increased the specificity ofthe study to detect specific compound-related effects inorder to furthermore ascertain whether the pathologicalfindings and increased organ weights were indeed insignif-icant or related to either the Bt toxin in the rice or unin-tended changes in the rice genome. As tested in thispresent 90-day study the genetically modified Bt rice,KMD1, exhibited no toxicological effects on Wistar ratswhen fed as 60% of the diet, in comparison with the wildtype parental rice, Xiushui 11.
The design may be limited in its ability to detect unin-tended toxic or nutritional effects of the genetic modifi-cation but in large measure this 90-day feeding trialwith male and female rats proved that such a model isfeasible and successful for safety assessment purposeswhen the incoming GMO grain diet contains a verifiablelevel of Cry1Ab in mature KMD1 rice at 0.015–0.018%of the total soluble protein, with no Cry1Ab proteindetected in the Xiushui 11 parental control. There wereno adverse findings that led to the conclusion that Bt riceis not safe to eat, but nevertheless greater certainty couldhave been obtained by the inclusion of an additional testgroup.
In the actual situation where recombinant protein wasnot available in 100 g quantities sufficient to perform nei-ther a 28-day toxicity study nor to add a spiked group tothe 90-day study it is relevant to discuss different possibil-ities for addition of a group to the study. Additionalgroups with different levels of KMD1 rice would have beenhelpful to assess the observed differences between thegroups that were found.
It is important to keep in mind that the original aim ofthis study was not to perform a safety assessment study onKMD1 per se, but to test the suitability of the well-known90-day study for safety assessment of GM crops. Based onthe results of this study as presented here, the conclusion tobe drawn concerning the model is that in order to thor-oughly assess the safety of the GM crop an additionalgroup is desirable, not to say necessary.
Acknowledgements
The work was financially supported by the EuropeanCommission (Contract no. QLK1-1999-00651, New meth-ods for the safety testing of transgenic food). The authorsespecially wish to thank Mohsin A. Zaidi for help withBt control clones, Merete Lykkegaard, Ditte M. Sørensen,Karen Roswall, Dorte Hansen, Margareta Bertram,Dagmar Fottner, Joan Frandsen, Henrik Ottesen and theanimal technicians for their excellent technical assistance. I.Altosaar and Q.Y. Shu are grateful to The Rockefeller Foun-dation and NSERC for grants in-aid-of research on grains.
References
AOAC, 2000. Thiamine (vitamin B1) in human and pet food. AOACOfficial Methods 45, 6–7.
Betz, F.S., Hammond, B.G., Fuchs, R.L., 2000. Safety and advantages ofBacillus thuringiensis-protected plants to control insect pests. Regula-tory Toxicology and Pharmacology 32, 156–173.
Bognar, A., Ollilainen, V., 1997. Influence of extraction on the determi-nation of vitamin B6 in food by HPLC. Zeitschrift fur Lebensmittel-Untersuchung und Forschung A 204, 327–335.
Brake, D.G., Thaler, R., Evenson, D.P., 2004. Evaluation of Bt (Bacillus
thuringiensis) corn on mouse testicular development by dual parameterflow cytometry. Journal of Agricultural and Food Chemistry 52, 2097–2102.
Cheng, X., Kaplan, R., Sardana, H., Altosaar, I., 1998. Agrobacterium-transformed rice plants expressing synthetic CryIA(b) and CryIA(c)
genes are highly toxic to yellow stem borer and striped stem borer.Proceedings of the National Academy of Sciences USA 95, 2767–2772.
Chowdhury, E.H., Kuribara, H., Hino, A., Sultana, P., Mikami, O.,Shimada, N., Guruge, K.S., Saito, M., Nakajima, Y., 2003. Detectionof corn intrinsic and recombinant DNA fragments and Cry1Abprotein in the gastrointestinal contents of pigs fed genetically modifiedcorn Bt11. Journal of Animal Science 81, 2546–2551.
Commission Regulation (EC) No 466/2001 of 8 March 2001. Settingmaximum levels for certain contaminants in foodstuffs. Official JournalL 077, 16/03/2001 P.0001–0013.
DFG (Deutsche Forschungsgemeinschaft), 1991. Ruckstandsanalytik vonPflanzenschutzmitteln. VCH Verlagsgesellschaft, Weinheim, Germany.
Einspanier, R., Lutz, B., Rief, S., Berezina, O., Zverlov, V., Schwarz, W.,Mayer, J., 2004. Tracing residual recombinant feed molecules duringdigestion and rumen bacterial diversity in cattle fed transgene maize.European Food Research and Technology 218, 269–273.
Fares, N.H., El Sayed, A.K., 1998. Fine structural changes in the ileum ofmice fed on delta-endotoxin-treated potatoes and transgenic potatoes.Natural Toxins 6, 219–233.
Freisleben, A., Schieberle, P., Rychlik, M., 2003. Specific and sensitivequantification of folate vitamers in foods by stable isotope dilutionassays using high-performance liquid chromatography-tandem massspectrometry. Analytical and Bioanalytical Chemistry 376, 149–156.
Gatehouse, A.M.R., Davison, G.M., Newell, C.A., Merryweather, A.,Hamilton, W.D.O., Burgess, E.P.J., Gilbert, R.J.C., Gatehouse, J.A.,1997. Transgenic potato plants with enhanced resistance to the tomatomoth Lacanobia oleracea: Growthroom trials. Molecular Breeding 3,49–63.
High, S.M., Cohen, M.B., Shu, Q.Y., Altosaar, I., 2004. Achievingsuccessful deployment of Bt rice. Trends in Plant Science 9, 286–292.
Juliano, B.O., 1985. Rice: Chemistry and Technology. The AmericanAssociation of Cereal Chemists, Inc. St. Paul, Minnesota, USA.
Kitta, K., Ebihara, M., Iizuka, T., Yoshikawa, R., Isshiki, K., Kawamoto,S., 2005. Variations in lipid content and fatty acid composition ofmajor non-glutinous rice cultivars in Japan. Journal of Food Com-position and Analysis 18, 269–278.
348 M. Schrøder et al. / Food and Chemical Toxicology 45 (2007) 339–349
EXHIBIT J - Page 425
Case 5:14-cv-00117-cr Document 63-11 Filed 11/14/14 Page 143 of 312

Latta, M., Eskin, M., 1980. A simple and rapid colorimetric method forphytate determination. Journal of Agricultural and Food Chemistry28, 1313–1315.
McClintock, J.T., Schaffer, C.R., Sjoblad, R.D., 1995. A comparativereview of mammalian toxicity of Bacillus thuringiensis-based pesticides.Pesticide Science 45, 95–105.
Mendelsohn, M., Kough, J., Vaituzis, Z., Matthews, K., 2003. Are Btcrops safe? Nature Biotechnology 21 (9), 1003–1009.
Miller, A., Frenzel, Th., Schmarr, H.-G., Engel, K.-H., 2003. Coupledliquid chromatography–gas chromatography for the rapid analysis ofc-oryzanol in rice lipids. Journal of Chromatography A 985, 403–410.
Møller, A., Saxholt, E., Christensen, A.T., Hartkopp, H.B., 2002. DanishFood Composition Databank, revision 5.0. Food Informatics, Insti-tute of Food Safety and Nutrition, Danish Veterinary and FoodAdministration. <http://www.foodcomp.dk> (accessed 03.09.05).
OECD, 1995. Guidelines for the testing of chemicals. Organisation forEconomic Cooperation and Development, Paris, France.
OECD, 2004. Series on the safety of novel foods and feeds, no. 10.Consensus document on compositional considerations for new vari-eties of rice (Oryza sativa): key food and feed nutrients and anti-nutrients. Organisation for Economic Cooperation and Development,Paris, France.
Papst, C., Utz, H.F., Melchinger, A.E., Eder, J., Magg, T., Klein, D.,Bohn, M., 2005. Mycotoxins produced by Fusarium spp. in isogenic Btvs. non-Bt maize hybrids under European corn borer pressure.Agronomy Journal 97 (1), 219–224.
Poulsen, M., Mølck, A.M., Jacobsen, B.L., 2002. Different effects of short-and long-chained fructans on large intestinal physiology and carcin-ogen-induced aberrant crypt foci in rats. Nutrition and Cancer 42 (2),194–205.
Poulsen, M., Schrøder, M., Wilcks, A., Kroghsbo, S., Lindecrona, R.H.,Miller, A., Frenzel, T., Danier, J., Rychlik, M., Shu, Q., Emami, K.,Taylor, M., Gatehouse, A., Engel, K.-H., Knudsen, I., 2006. Safetytesting of GM-rice expressing PHA-E lectin using a new animal testdesign. Food and Chemical Toxicology, in press.
Reeves, P.G., Nielsen, F.H., Fahey Jr., G.C., 1993. AIN-93 purified dietsfor laboratory rodents: final report of the American Institute ofNutrition ad hoc writing committee on the reformulation of the AIN-76A rodent diet. Journal of Nutrition 123, 1939–1951.
Reitzer-Bergaentzle, M., Marchioni, E., Hasselmann, C., 1993. HPLCdetermination of vitamin B6 in foods after pre-column derivatizationof free and phosphorylated vitamers into pyridoxol. Food Chemistry48, 321–324.
Rong, N., Ausman, L.M., Nicolosi, R.J., 1997. Oryzanol decreasescholesterol absorption and aortic fatty streaks in hamsters. Lipids 32,303–309.
Rychlik, M., 2003. Pantothenic acid quantification by a stable isotopedilution assay based on liquid chromatography-tandem mass spec-trometry. The Analyst 128, 832–837.
Saha, P.R., Weaver, C.M., Mason, A.C., 1994. Mineral bioavailability inrats from intrinsically labeled whole-wheat flour of various phytatelevels. Journal of Agricultural and Food Chemistry 42, 2531–2535.
Sambrook, J., Russell, D.W., 2002. Molecular Cloning a LaboratoryManual. Cold Spring Harbor laboratory Press, Cold Spring Harbor,New York.
Saxena, D., Stotzky, G., 2001. Bacillus thuringiensis (Bt) toxin releasedfrom root exudates and biomass of Bt corn has no apparent effect onearthworms, nematodes, protozoa, bacteria, and fungi in soil. SoilBiology & Biochemistry 33, 1225–1230.
Scherz, H., Senser, F. (Eds.), 2000. Souci-Fachmann-Kraut Food Com-position and Nutrition Tables, sixth ed. Medpharm Scientific Publi-cation, Stuttgart, Germany.
Shimada, N., Kim, Y.S., Miyamoto, K., Yoshioka, M., Murata, H., 2003.Effects of Bacillus thuringiensis Cry1Ab toxin on mammalian cells.Journal of Veterinary Science 65 (2), 187–191.
Shu, Q.Y., Ye, G., Cui, H.R., Cheng, X., Xiang, Y., Wu, D., Gao, M.W.,Xia, Y.W., Hu, C., Sardana, R., Altosaar, I., 2000. Transgenic riceplants with a synthetic cry1Ab gene from Bacillus thuringiensis werehighly resistant to eight lepidopteran rice pest species. MolecularBreeding 6 (4), 433–439.
USDA, Agricultural Research Service, 2004. USDA Nutrient Databasefor Standard Reference, Release 16-1. Nutrient Data LaboratoryHome Page, <http://www.nal.usda.gov/fnic/foodcomp>.
VDLUFA, 1996. Methodenbuch, VII – Umweltanalytik. Verband Deut-scher Landwirtschaftlicher Untersuchungs- und Forschungsanstalten,Bonn, Germany.
VDLUFA, 1997. Methodenbuch, III – Untersuchung von Futtermitteln.Verband Deutscher Landwirtschaftlicher Untersuchungs- und Fors-chungsanstalten, Bonn, Germany.
Wang, Z.H., Wang, Y., Cui, H.R., Xia, Y.W., Altosaar, I., Shu, Q.Y.,2002. Toxicological evaluation of transgenic rice flour with a syntheticcry1Ab gene from Bacillus thuringiensis. Journal of the Science ofFood and Agriculture 82, 738–744.
Ward, C.M., Trenerry, C., 1997. The determination of niacin in cereals,meat and selected foods by capillary electrophoresis and HPLC. FoodChemistry 60, 667–674.
Wills, R.B., Shaw, C.G., Day, W.R., 1977. Analysis of water solublevitamins by HPLC. Journal of Chromatographic Science 15, 262–266.
Wu, G., Cui, H., Ye, G., Xia, Y., Sardana, R., Cheng, X., Li, Y., Altosaar,I., Shu, Q., 2001. Inheritance and expression of the cry1Ab gene in Bt(Bacillus thuringiensis) transgenic rice. Theoretical and AppliedGenetics 104 (4), 727–734.
Xu, Z., Godber, J.S., 1999. Purification and identification of componentsof c-oryzanol in rice bran oil. Journal of Agricultural and FoodChemistry 47, 2724–2728.
Xu, Z., Hua, N., Godber, J.S., 2001. Antioxidative activity of tocopherols,tocotrienols, and c-oryzanol components from rice bran againstcholesterol oxidation accelerated by 2,20-azobis(2-methylpropionami-dine) dihydrochloride. Journal of Agricultural and Food Chemistry 49,2077–2081.
Ye, G.Y., Shu, Q.Y., Yao, H.W., Cui, H.R., Cheng, X.Y., Hu, C., Xia,Y.W., Gao, M.W., Altosaar, I., 2001. Field evaluation of resistance oftransgenic rice containing a synthetic cry1Ab gene from Bacillus
thuringiensis Berliner to two stem borers. Journal of EconomicEntomology (USA) 94 (1), 271–276.
Ye, G.Y., Yao, H.W., Shu, Q.Y., Cheng, X.Y., Hu, C., Xia, Y.W., Gao,M.W., Altosaar, I., 2003. High levels of stable resistance in transgenicrice with a cry1Ab gene from Bacillus thuringiensis Berliner to riceleaffolder, Cnaphalocrocis medinalis (Guenee) under field conditions.Crop Protection 22 (1), 171–178.
M. Schrøder et al. / Food and Chemical Toxicology 45 (2007) 339–349 349
EXHIBIT J - Page 426
Case 5:14-cv-00117-cr Document 63-11 Filed 11/14/14 Page 144 of 312

New Analysis of a Rat Feeding Study with a Genetically Modified Maize RevealsSigns of Hepatorenal Toxicity
Gilles-Eric S�ralini,1,2 Dominique Cellier,1,3 Jo�l Spiroux de Vendomois1
1 Committee for Independent information and Research on Genetic Engineering CRIIGEN, Paris, France2 Laboratory of Biochemistry, Institute of Biology, University of Caen, Caen, France3 Laboratory LITIS, University of Rouen, Mont-Saint-Aignan, France
Received: 18 July 2006 /Accepted: 20 November 2006
Abstract. Health risk assessment of genetically modifiedorganisms (GMOs) cultivated for food or feed is under debatethroughout the world, and very little data have been publishedon mid- or long-term toxicological studies with mammals. Oneof these studies performed under the responsibility ofMonsanto Company with a transgenic corn MON863 has beensubjected to questions from regulatory reviewers in Europe,where it was finally approved in 2005. This necessitated a newassessment of kidney pathological findings, and the resultsremained controversial. An Appeal Court action in Germany(M�nster) allowed public access in June 2005 to all the crudedata from this 90-day rat-feeding study. We independentlyre-analyzed these data. Appropriate statistics were added, suchas a multivariate analysis of the growth curves, and forbiochemical parameters comparisons between GMO-treatedrats and the controls fed with an equivalent normal diet, andseparately with six reference diets with different compositions.We observed that after the consumption of MON863, ratsshowed slight but dose-related significant variations in growthfor both sexes, resulting in 3.3% decrease in weight for malesand 3.7% increase for females. Chemistry measurementsreveal signs of hepatorenal toxicity, marked also by differen-tial sensitivities in males and females. Triglycerides increasedby 24–40% in females (either at week 14, dose 11% or at week5, dose 33%, respectively); urine phosphorus and sodiumexcretions diminished in males by 31–35% (week 14, dose33%) for the most important results significantly linked to thetreatment in comparison to seven diets tested. Longer experi-ments are essential in order to indicate the real nature andextent of the possible pathology; with the present data it cannotbe concluded that GM corn MON863 is a safe product.
Very little data have been published on mid- or long-termfeeding studies with genetically modified plants, approved andcommercialized, in equilibrated diets, given to mammals, with
numerous blood and organs parameters measured (Domingo2000; Meningaud et al. 2001) and only one study with theMON 863 maize in such conditions. It has been performedunder the responsibility of Monsanto Company and wasrecently published after the authorities� assessment (Hammondet al. 2006). The crude data at first kept confidential weresubjected to questions from regulatory reviewers in Europe,where it was finally approved in 2005. This necessitated, inparticular, a new assessment of kidney pathological findings,and because the study was claimed afterwards to provide anassurance of safety (Hammond et al. 2006), we independentlyre-analyzed these data here obtained after a Court action. Thewhole approval was based on the statement that all thesignificant differences were not biologically meaningful. Toassess this hypothesis, we wanted to link the statistical dif-ferences per organ and to apply new methods of analysis. Thistransgenic maize was modified to produce in its cells a newartificial insecticidal and modified toxin Cry3Bb1 (49-97 lg/g) that was exempted from subchronic toxicity in vivostudies (Hammond et al. 2006), and its mechanism of action isnot known in mammals, because it was not tested, and thetarget receptor has not been characterized precisely in insects.Most, if not all, of the commercialized genetically modified
organisms (GMOs) in open fields contain pesticide residuesthat they tolerate and/or produce (Clive 2006). Regulatoryrules do not require 3-month tests with three mammalianspecies, then with a mammal for 1 year and yet another for 2years, such as those employed for the testing of pesticides ordrugs. This is why it appears crucial to analyze carefully thelongest toxicity tests available only in one mammalian species,where numerous parameters have been measured for 400 rats,according to Organisation for Economic Co-operation andDevelopment (OECD) standards during only 90 days. Otherindependent studies over 8 months with mice fed a GMRoundup tolerant soy were very detailed but only at an ul-trastructural level, and showed nuclear transcription abnor-malities in hepatocytes during the feeding (Malatesta et al.2002), in pancreas (Malatesta et al. 2003), and testes (Vecchioet al. 2004), and hypothesized that these changes might be dueto Roundup herbicide (Monsanto) toxic effects, similar tothose observed on mammalian cells (Richard et al. 2005), butCorrespondence to: Gilles-Eric S�ralini; email: [email protected]
Arch. Environ. Contam. Toxicol. (2007)DOI: 10.1007/s00244-006-0149-5
EXHIBIT J - Page 427
Case 5:14-cv-00117-cr Document 63-11 Filed 11/14/14 Page 145 of 312

the parameters measured in these longest toxicity tests pub-lished on GMOs did not concern almost all organs and bloodand urine chemistry, as in the present experiment.
Materials and Methods
Biological Context: The In Vivo Protocol of Monsanto
All OECD standards were claimed to be followed by the MonsantoCompany: individual cages, animal randomly distributed in eachgroup after a 1-week stabilization period, standard and validatedmeasurement methods, and so on. This feeding study served toauthorize the MON863 maize by the European and Americanauthorities. It included young adult Sprague-Dawley-derived rats(Crl:CD�(SD)IGS BR, Charles River laboratories, NY), approxi-mately 6 weeks old separated in 10 groups of 20 males and 10 of 20females analyzed in details (organ weights and histology), but thebiochemical parameters were measured only for half of these at weeks5 and 14. For each sex, two groups were fed with GMOs, one with11% and the second with 33% of MON 863 in the equilibrated diet,and two with the closest control line and regimen, grown in the samelocation (Hawaii), called control herein, indicated to be substantiallyequivalent (Hammond et al. 2006), in similar proportions. The closestcontrol plant possible will then be the equivalent isogenic or parentalnontransformed line, grown in similar conditions. In this article, thecontrol is called the LH82 · A634 line. The six other groups weregiven diets without GMOs but that did not have the same finalchemical composition, even if these diets also met PMI specificationsfor Certified 5002 Rodent Diet. They contained 33% of conventionaldifferent maize lines (MON 847 Repl, Asgrow RX-770, LH235 ·LH185, LH200 · LH172, B73Ht · LH82, Burrus BX-86). These werenot grown in the same locations (Illinois or other places in Hawaii),and were not demonstrated to be substantially equivalent to the GMOand control diet, but were supposed to mimic the variability of regularreference regimens, called reference herein, and other details havebeen described (Hammond et al. 2006).
The genetic modification in the maize tested here was inserted bychance by particle bombardment in the plant genome of immaturecells. This may cause insertional mutagenesis effects, which may notbe directly visible by compositional analysis; the latter can then beonly partially compared for a nonexhaustive list of substances toconventionally bred lines, for instance, to test ‘‘substantial equiv-alence.’’ The genetic construction itself comprises a transgenewith an ubiquitous adapted 35S promoter encoding a modifiedtoxin directed against the coleopteran insect Diabrotica. Thisdangerous parasite was probably introduced several times byairplane in Europe from the late 1990s (Miller et al. 2005). Theproblem apparently has been anticipated by the first trials ofMON 863 or similar GMOs in Europe. This maize also containsa neomycin phosphotransferase II marker gene, coding forantibiotic resistance, to facilitate the selection of the transformedplants.
Statistical Methods
The present feeding experiment was designed and statisticallyassessed by Monsanto Company (St. Louis, MO), but animals wereanalyzed by Covance Laboratory (Vienna, VA). We first repeated thesame statistical analysis as that of Monsanto to verify descriptivestatistics (sample size, means, standard deviations) and one-wayanalysis of variance (ANOVA) by sex and by variable. For that, thenormality of the residues was tested using the Shapiro test and the
homoscedasticity (homogeneity of the variances) using the Bartletttest. In the case where the Shapiro and Bartlett tests were nonsignif-icant (*p > 0.05 and **p > 0.01, respectively) we performed anANOVA, and in the case of heteroscedasticity the approximate Welchmethod was used. In the case where the Shapiro test was significant,we performed the Kruskal-Wallis rank sum test.
In addition, we undertook a multivariate analysis of the growthcurves and the consumption of the rats. For the weight growth curveof the rats, after linear regression, the weekly relative increase rate canbe considered proportional to the logarithm of the weight, and thus weused a Gompertz model (Ratkowsky 1990; Huet et al. 2004),Y = a.exp(-exp(-b(X-c))). The parameter a represents the top of thecurve, b is related to the growth rate, and c is a position parameterwith the X axis. These parameters were estimated by nonlinearregression. In order to see whether the growth curves are significantlydifferent, we compared the models by testing the null hypothesis(which would give the same curves with identical parameters for bothgroups) against the alternative (different curves). For that, we used theF test to compare the sum of square errors under the two hypotheses.The Akaike�s Information Criteria (AIC, Akaike 1974) was also usedto evaluate the probability of differences.
We then analyzed the GMO effects for each sex and each diet bypairwise comparisons of the parameters of GMO-fed rats to thecontrol groups and after to the reference groups. In order to select theappropriate two-tailed comparison test (Crawley 2005), we againstudied first normality (Shapiro test) and variance equality (F test).According to the results, we performed the adapted test, i.e., an un-paired t test, a Welch corrected t test or a Mann-Whitney test (which isgenerally more appropriate with a sample size of 10).
We used the R language (Crawley 1995) version 2.2.1 for statisticalcomputations (Comprehensive R Archive Network, CRAN - http://cran.r-project.org), except for the weight growth curves statisticalstudy, for which nonlinear regressions were performed using Graph-Pad Prism (version 4.02 for Windows, GraphPad Software, SanDiego, CA, www.graphpad.com).
Results
We first checked all the crude data, and we noticed aconcordance for descriptive statistics (sample size, means,standard deviations) and one-way ANOVA by sex and byvariable between our calculated values and those published byHammond et al. (2006) from Monsanto Company.
Body Weights
Our study consisted of a multivariate analysis of the growthcurve and the consumption of the rats for the four groupsreceiving GMOs or equivalent diets. If the animal con-sumption was not noticeably changed, it appeared for thegrowth curves that the variations for the two controls foreach sex are superimposed, whereas the GMO feeding trialsprovoked different growths (Fig. 1). The 11% GMO groupswere always under the 33% groups for both sexes. All themales are growing less than the controls from week 2, andall the females more. This sex- and dose-related effect re-sulted in the fact that the growth variations of the 11%GMO males are highly statistically lower than their controls,and 33%-GM fed females higher (Table 1). All p values ofdifferent groups versus controls are <0.01. This results in3.3% decrease in weight for males and 3.7% increase forfemales.
2 G.-E. S�ralini et al.
EXHIBIT J - Page 428
Case 5:14-cv-00117-cr Document 63-11 Filed 11/14/14 Page 146 of 312

Other Parameters
We then studied first the GMO effects in comparison to theisogenic, nontransgenic, equivalent maize (control) in Table 2,then the effects of different nonequivalent maize compositionson rat physiology (six different reference groups versuscontrols. Finally, we studied the GMO effects versus all dif-ferent diets (double frame, Table 2). In total, 58 biochemicalparameters reflecting most physiological functions weremeasured two times (week 5 and 14), in particular throughserum and urine chemistry, and hematology. Organ weights
and relative ratios were added. We thus performed 494 com-parisons: 40 differences (8%) were statistically significant (*p< 0.05); 25 would have been expected under the global nullhypothesis of no differences between GMO and control dieteffects. Among the 40 significant differences, we retained onlythe 33 with a relatively ‡€5% difference to the mean;this most probably also excluded potential incidental differ-ences, if any. Table 2 summarizes only the list of significantlydisturbed parameters at least for one sex or one treatment,and also shows the percentage of variations of the means.The same Table 2 is obtained if we systematically use the
Fig. 1. Body weight growth for males(A, C) and females (B, D) over a periodof 14 weeks. The experimental (A, B)and corresponding theoretical curvesaccording to Gompertz models (C, D) arepresented. The most important effects ineach sex are in bold lines and statisticallydifferent from controls (see Materials andMethods)
Table 1. Statistical differences between weight curves
a
Gompertz models for males
Par. Control 11% GMO 11% One model
a 533.6 524.6 528.8b 0.2240 0.2011 0.2126c 0.1251 )0.0939 0.0185
Gompertz models for females
Control 33% GMO 33% One modela 286.1 300.1 292.9b 0.2272 0.2016 0.2142c )1.185 )1.376 )1.282
b
Sex F test AIC
Males p < 0.0001 Prob. > 99.99%F = 11.73 Diff. 28.34
Females P = 0.0032 Prob. = 98.04%F = 4.66 Diff. 7.83
The parameter estimates for Gompertz models have been calculated (a) for parameters (Par.) a, b and c and tested for statistical differences(b, F test column 2) with p values and the F ratio. The Akaike�s Information Criteria (AIC) and the probabilities (Prob.) for differences (Diff.) incurves are precised (b, column 3).
Rat Feeding Study with GMO Maize 3
EXHIBIT J - Page 429
Case 5:14-cv-00117-cr Document 63-11 Filed 11/14/14 Page 147 of 312

Mann-Whitney test for all the biological parameters, except foralbumin–14–f11%, urine phosphorus–5-m33%, and ureanitrogen–14-f11%; the p values in this case are comprisedbetween 6.3% and 10.6%; these were not considered below.Table 3 corresponds to physiological values of the signifi-cantly disturbed parameters in GMO-fed rats in comparison totheir corresponding controls. It emphasizes the impressivequantity of abnormalities.Table 2 indicates that GMO-linked variations in comparison
to controls were concentrated mostly on five male and ninefemale liver parameters, and nine and four kidney parameters
for males and females, respectively, on all organs studied. Wethen measured the significant variations between the six ref-erence groups and controls (isogenic to GMO), which allowedus to study the potential effects of the diet composition alone.The parameters that were also disturbed in this case werededucted from the first ones, and still three and five liverparameters and seven and one kidney parameters at leastappeared to be specifically linked to the GMO diet. We con-secutively compared the parameters of GMO-fed rats to the sixreference groups given other diets, focusing on the GMOeffects as being more important than any other diet effects, and
Week m 11% m 3 % f 11% f 33%Liver parameters Albumin/globulin ratio 5 11* -3 -9 4 Albumin/globulin ratio 14 6 -2 -18** 7 Albumin 5 -3 -2 -2 5* Albumin 14 -2 3 -6* 5 Globulin 5 -12* 2 9* 1 Globulin 14 -8 7 15* -2 Alanine aminotransferase 14 -30* -8 37 4 Total protein 14 -5* 5* 1 3 Triglycerides 5 22 -2 -11 40** Triglycerides 14 15 -1 24* 6 Liver weight 14 -1 -2 7** 6 Liver/brain ratio 14 -1 -3 6* 4 Kidney parameters Creatinin 14 -7 13* 13* -2 Urine sodium 14 -23 -25* 11 -26 Urine sodium excretion 14 3 -35* 35 -24 Urine chloride excretion 5 35 3 50* 67* Urine potassium 5 35* -20 -3 -13 Urine phosphorus 5 3 -35* 24 -15 Urine phosphorus 14 -34 -31* 12 -8 Urea nitrogen 14 -8 4 17* -1 Kidney weight 14 -3 -7* 3 2 Kidney/brain ratio 14 -3 -7* 1 1 Kidney % body weight 14 -1 -5* -1 -1 Pancreas Glucose 14 -4 9 9* 10**Bone marrow Neutrophils 5 5 22* -14 3 Eosniophils 14 32 54* 20 0 Reticulocytes 14 15 -17 -35 -52* Reticulocytes % RBC 14 16 -16 -36 -55*
Table 2. Differences between GMO)fed rats and controls
Study of the GMO effects indicated by mean differences (%) for each parameter with the corresponding control group per sex and per dose. Thesignificant differences versus controls (*p < 0.05, **p < 0.01), for all the parameters measured in the subchronic feeding tests, are presented. Theparameters were grouped by organs according to the sites of synthesis or classical indicators of dysfunction. They were indicated for all groupsonly if they showed at least for one sex or one diet a significant and relatively ‡ € 5% difference to the mean. The animals were male (m) orfemale (f) young adult rats fed during 5 or 14 weeks with GMO (MON 863, 11 or 33% in the diet) and compared with controls fed with a‘‘substantially equivalent’’ isogenic maize line (LH82 · A634) grown in the same location (Hawa�). The parameters were measured for 10 rats,except for the organ weights (20 rats), obtained only at the end of the experiment. In single)boxed numbers, we indicate the statistical differencesbetween GMO)fed rats and controls, which are not found between the mean of the six reference groups and controls. A difference betweenreference and control groups could indicate an effect of the diet per se. In double)boxed numbers, among the effects due to the GMO, areindicated the statistical differences between the GMO groups and the mean of the six reference groups (which have not even eaten the samecomposition as the control and the GMO treated groups).
4 G.-E. S�ralini et al.
EXHIBIT J - Page 430
Case 5:14-cv-00117-cr Document 63-11 Filed 11/14/14 Page 148 of 312

always for males and females, respectively, four and zerokidney parameters and one and two liver parameters remainedsignificantly different in all cases.The significant liver changes in the 11% GMO-fed male rats
that had the lowest growth rate was a total serum proteindecrease (5%), possibly linked to a globulin decrease (12%). Infemales, the triglycerides were specifically enhanced in theanimals that had liver and body weight increases abovenormal. In fact, triglycerides increased by 24–40% in females(either at week 14, dose 11% or at week 5, dose 33%,respectively).At the kidney level, phenomena corresponding to urine
phosphorus and sodium excretions diminished in males by31–35% (week 14, dose 33%) for the most important resultssignificantly linked to the treatment in comparison to sevendiets tested, whereas other diets enhanced sodium excretion insome instances (data not shown).
Moreover, for males, none of these significantly changedparameters were similar to the variations due to the compo-sition of the diet. The effect of the GMO diet was concomitantwith a kidney weight decrease.Other sporadic effects on serum glucose, urine chloride
excretion, or reticulocytes, depending on the sex or the dose,are apparent.
Discussion
The statistical analysis used in the conclusion of Hammondet al. (2006) was only carried out for this experiment by theMonsanto statistics center. The goal of this experiment is tostudy the possible toxicological effects of introducing thegenetic construction producing an insecticide into the maize;thus, it should be guaranteed that the only variability sources in
Table 3. Effects of GMO treatments classified by organs
Parameters Week Sex DoseControl GMO
Unitsmean € sem mean € sem
Liver parametersAlbumin / Globulin Ratio 5 m 11% 1.782 € 0.053 1.974 € 0.043 RatioAlbumin / Globulin Ratio 14 f 11% 2.334 € 0.085 1.914 € 0.083 RatioAlbumin 5 f 33% 4.600 € 0.054 4.850 € 0.056 g/dlAlbumin 14 f 11% 5.130 € 0.104 4.830 € 0.091 g/dlGlobulin 5 m 11% 2.450 € 0.090 2.150 € 0.072 g/dlGlobulin 5 f 11% 2.110 € 0.041 2.300 € 0.080 g/dlGlobulin 14 f 11% 2.220 € 0.080 2.560 € 0.097 g/dlAlanine aminotransferase 14 m 11% 67.100 € 11.078 47.300 € 1.422 u/lTotal protein 14 m 11% 7.140 € 0.092 6.810 € 0.099 g/dlTotal protein 14 m 33% 6.860 € 0.090 7.1778 € 0.112 g/dlTriglycerides 5 f 33% 39.300 € 1.578 54.900 € 3.743 mg/dlTriglycerides 14 f 11% 40.900 € 3.889 50.900 € 2.479 mg/dlLiver weight 14 f 11% 7.250 € 0.116 7.789 € 0.163 gLiver / brain ratio 14 f 11% 3.664 € 0.059 3.890 € 0.085 Ratio
Kidney parametersCreatinin 14 m 33% 0.520 € 0.013 0.589 € 0.031 mg/dlCreatinin 14 f 11% 0.560 € 0.016 0.630 € 0.021 mg/dlUrine sodium 14 m 33% 26.980 € 3.487 20.122 € 5.699 meq/lUrine sodium excretion 14 m 33% 0.290 € 0.028 0.189 € 0.020 meq/timeUrine chloride excretion 5 f 11% 0.220 € 0.025 0.330 € 0.042 meq/timeUrine chloride excretion 5 f 33% 0.150 € 0.022 0.250 € 0.037 meq/timeUrine potassium 5 m 11% 112.210 € 13.860 151.000 € 10.039 meq/lUrine phosphorus 5 m 33% 166.970 € 24.719 108.310 € 7.922 mg/dlUrine phosphorus 14 m 33% 119.120 € 13.479 81.822 € 10.468 mg/dlUrea nitrogen 14 f 11% 13.200 € 0.742 15.500 € 0.792 mg/dlKidney weight 14 m 33% 3.446 € 0.070 3.201 € 0.078 gKidney / brain ratio 14 m 33% 1.600 € 0.030 1.483 € 0.034 RatioKidney % body weight 14 m 33% 0.705 € 0.015 0.667 € 0.009 %
PancreasGlucose 14 f 11% 103.300 € 2.495 112.600 € 3.497 mg/dlGlucose 14 f 33% 105.300 € 2.432 115.800 € 2.476 mg/dl
Bone marrowNeutrophils 5 m 33% 0.860 € 0.058 1.050 € 0.054 ·103/llEosinophils 14 m 33% 0.130 € 0.015 0.200 € 0.024 ·103/llReticulocytes 14 f 33% 0.085 € 0.015 0.041 € 0.008 ·106/llReticulocytes % RBC 14 f 33% 1.040 € 0.201 0.470 € 0.092 %
Based on Table 2, all the parameters significantly different between GMO-fed rats and corresponding controls are represented by their crudemeans € SEM in exactly corresponding units. The differences were always p < 0.05 or <0.01 to controls according to one or two asterisks inTable 2. The controls are submitted to a substantially equivalent isogenic maize with the same diet, with all other conditions (genetic,temperature, light, space of caging, and so on) are identical. The time of exposure (weeks 5 and 14 corresponding, respectively, to 4 and 13 weeksof GMO diet), the sexes (males: m, females: f), and the dose (11 or 33% of GM Bt maize MON 863 in the equilibrated diet) are indicated.
Rat Feeding Study with GMO Maize 5
EXHIBIT J - Page 431
Case 5:14-cv-00117-cr Document 63-11 Filed 11/14/14 Page 149 of 312

the results are related to the presence, or not, of this transgeneapart from purely random effects. In a sense, the presence ofthe 6 reference groups fed with other commercial varieties ofcorn, which are not substantially equivalent (with more or lesssalts or sugars), introduces the simultaneous study of otherparameters. Moreover, the reference groups representing 60rats per sex, measured for their biological parameters, havebeen compared to 10 rats fed with 33% GMO, by Monsanto.We think that this difference in size favors the uncertainties.We thus preferred to separate the analysis first between theGMO groups and the control ones, and then between GMOgroups and the reference groups, in contrast to Monsantoanalysis.Moreover, a study with 20 animals per group already has a
limited power of discrimination. Consequently, we couldconsider possible toxic effects if several parameters aredisturbed for the same organ in a non-negligible manner.Unfortunately, besides controls and references, only 40 rats persex in a total of 400 animals have been given GMOs in thisstudy, and only half of those have been analyzed for bio-chemical parameters, i.e., 10 per dose and per sex after 5 and14 weeks, as indicated.The body weight growth variations, usually hardly modi-
fied by a normal diet with very little quantities of toxin,represent an important factor to follow. This study wasabsent from the statistical report of Monsanto. The significantvariations were not tested by Hammond et al. (2006),although the 11% GMO males form the lowest curve afterweek 2. However, we clearly proved very significant differ-ences in weight growths for both males and females, with alower effect with the 11% diet in comparison to 33% andcontrols. This increase was over controls in females with the33% diet, and under controls for the 11% diet given to males.This may be not only an indication of the dysfunction ofseveral organs as shown in Table 3, but also a sex-dependenteffect related to endocrine disruption and/or hormonalmetabolism differences. Surprisingly, sexual hormones werenot measured in these regulatory tests. This could have ex-plained some of these observations. In fact, the results ofTable 2 concur with signs of possible hepatorenal toxicitywith a greater kidney sensitivity in males and liver sensitivityin females. A differential sensitivity for toxicants amongsexes is usual, the hepatic detoxification being hormone-dependent, for instance.The differences were significant even if the reference diets
had specific effects between them, such as 8–23% differencesin liver alkaline phosphatase, alanine or aspartate amino-transferase activities, or small different sodium chlorideexchanges and urine volume, probably due to different lipid orsalt contents in the diets (data not shown).The GMO-linked differences are illustrated at an hepatic
level by a protein or triglyceride metabolism disruption. It isknown that some hepatotoxics, such as the drug metabolitehydrazine, may cause liver necrosis and steatosis withhypertriglyceridemia in the blood (Sarich et al. 1996). Thesechanges may have differential thresholds according to the sexor hormonal status, as with classical reactions to hepatocar-cinogens (Castelli et al. 1986; Pitot et al. 1989). Moreover,nothing in the protocol allowed the conclusion that the 11% or33% GMO proportions chosen in the diets were in the linearportion of a dose–response curve, after intoxication by the Bt
protein, for instance. Some Bt toxins may cause humanhepatotoxicity by a nonapoptotic mechanism (Ito et al. 2004),or hepatic lipid peroxidation in rats (Shaban et al. 2003).However, it should be emphasized that a pleiotropic metaboliceffect due to insertional mutagenesis and independent of thenew insecticide produced in the GMO cannot be excluded.To interpret the kidney data, although we did not have access
to the kidney slices after the Appeal Court, Hammond et al.(2006) from Monsanto published that there were small in-creases of focal inflammation, and tubular regenerative chan-ges in this group, in comparison to controls. They commentedon a small decrease of serum chloride. After questions from theregulators in Europe, two board-certified pathology experts,proposed by Monsanto and who re-examined the slides, con-cluded that a classic chronic progressive nephropathy, forwhich male rats are sensitive (Hard and Khan 2004), had anincidence of 18/20 in the MON863 male group, higher than incontrols (14/20), even if this was not considered as relevant byHammond et al. (2006). If all the data are taken together, andoverall in regard to the specifically disturbed urine chemistryparameters at weeks 5 and 14 (Table 2), which were not indi-cated by Hammond et al. (2006), it could be concluded that aGM-linked male renal toxicity is observed in this work.To explain the sporadic results observed in the blood, we have
little data. However, it is known in some instances that Bt toxinsmay also perforate blood cells (Rani and Balaraman 1996).In conclusion, the two main organs of detoxification, liver
and kidney, have been disturbed in this study. It appears thatthe statistical methods used by Monsanto were not detailedenough to see disruptions in biochemical parameters, in orderto evidence possible signs of pathology within only 14 weeks.Moreover, the experimental design could have been performedmore efficiently to study subchronic toxicity, in particular withmore rats given GMOs in comparison to other groups.Considering that the human and animal populations could beexposed at comparable levels to this kind of food or feed thathas been authorized in several countries, and that these are thebest mammalian toxicity tests available, we strongly recom-mend a new assessment and longer exposure of mammals tothese diets, with cautious clinical observations, beforeconcluding that MON863 is safe to eat.
Acknowledgments. We thank Anne-Laure Afchain for her help instatistical analyses, and the CRIIGEN scientific and administrativecouncils for expertise, and initiating judiciary actions by the formerFrench minister of environment, Corinne Lepage, to obtain the data.We also thank Frederique Baudoin for secretarial assistance, andDr. Brian John and Ian Panton for advising on the English revision ofthe manuscript. This work was supported by Greenpeace Germanywho, in June 2005, won the Appeal Court action against Monsanto,who wanted to keep the data confidential. We acknowledge theFrench Ministry of Research and the member of Parliament FranÅoisGrosdidier for a contract to study health assessments of GMOs, aswell as the support of Carrefour Group, Quality, Responsibility andRisk Management.
References
Akaike H (1974) A new look at the statistical model identification.IEEE Trans Automat Control 19:716–723
6 G.-E. S�ralini et al.
EXHIBIT J - Page 432
Case 5:14-cv-00117-cr Document 63-11 Filed 11/14/14 Page 150 of 312

Castelli D, Seralini GE, Lafaurie M, Stora C (1986) Ovarian functionduring aflatoxin B1-induced hepatocarcinogenesis in the rat. ResCommun Chem Pathol Pharmacol 53:183–194
Clive J (2006) Global status of biotech/GM crops. ISAAA Briefs 35:1Crawley MJ (2005) Statistics an introduction using R. Wiley, LondonDomingo JL (2000) Health risks of GM foods: many opinions but few
data. Science 288:1748–1749Hammond B, Lemen J, Dudek R, Ward D, Jiang C, Nemeth M,
Burns J (2006) Results of a 90-day safety assurance study withrats fed grain from corn rootworm-protected corn. Food ChemToxicol 44:147–160
Hard GC, Khan KN (2004) A contemporary overview of chronicprogressive nephropathy in the laboratory rat, and its significancefor human risk assessment. Toxicol Pathol 32:171–180
Huet S, Bouvier A, Poursat MA, Jolivet E (2004) Statistical tools fornonlinear regression. Springer-Verlag, New York
Ito A, Sasaguri Y, Kitada S, Kusaka Y, Kuwano K, Masutomi K,Mizuki E, Akao T, Ohba M (2004) Bacillus thuringiensis crystalprotein with selective cytocidal action to human cells. J BiolChem 279:21282–21286
Malatesta M, Biggiogera M, Manuali F, Rocchi MB, Baldelli B,Gazzanelli G (2003) Fine structural analyses of pancreatic acinarcell nuclei from mice fed on genetically modified soybean. Eur JHistochem 47:385–388
Malatesta M, Caporaloni C, Gavaudan S, Rocchi MB, Serafini S,Tiberi C, Gazzanelli G (2002) Ultrastructural morphometrical andimmunocytochemical analyses of hepatocyte nuclei from micefed on genetically modified soybean. Cell Struct Function27:173–180
Meningaud JP, Moutel G, Herve C (2001) Ethical acceptability, healthpolicy and foods biotechnology based foods: is there a third way
between the precaution principle and on overly enthusiasticdissemination of GMO? Med Law 20:133–141
Miller N, Estoup A, Toepfer S, Bourguet D, Lapchin L, Derridj S,Kim KS, Reynaud P, Furlan L, Guillemaud T (2005) Multipletransatlantic introductions of the western corn rootworm. Science310:992
Pitot HC, Campbell HA, Maronpot R, Bawa N, Rizvi TA, Xu YH,Sargent L, Dragan Y, Pyron M (1989) Critical parameters in thequantitation of the stages of initiation, promotion, and progressionin one model of hepatocarcinogenesis in the rat. Toxicol Pathol17:594–612
Rani SS, Balaraman K (1996) Effect of insecticidal crystal proteins ofBacillus thuringiensis on human erythrocytes in vitro. Indian JExp Biol 34:1241–1244
Ratkowsky DA (1990) Handbook of non linear regression modelsDekker, New York
Richard S, Moslemi S, Sipahutar H, Benachour N, Seralini GE(2005) Differential effects of glyphosate and Roundup on hu-man placental cells and aromatase. Environ Health Perspect113:716–720
Sarich TC, Youssefi M, Zhou T, Adams SP, Wall RA, Wright JM(1996) Role of hydrazine in the mechanism of isoniazid hepato-toxicity in rabbits. Arch Toxicol 70:835–840
Shaban NZ, Helmy MH, El-Kersh MA, Mahmoud BF (2003) Effectsof Bacillus thuringiensis toxin on hepatic lipid peroxidation andfree-radical scavengers in rats given alpha-tocopherol or acetyl-salicylate. Comp Biochem Physiol C Toxicol Pharmacol135:405–414
Vecchio L, Cisterna B, Malatesta M, Martin TE, Biggiogera M (2004)Ultrastructural analysis of testes from mice fed on geneticallymodified soybean. Eur J Histochem 48:449–454
Rat Feeding Study with GMO Maize 7
EXHIBIT J - Page 433
Case 5:14-cv-00117-cr Document 63-11 Filed 11/14/14 Page 151 of 312

REVIEW Open Access
Genetically modified crops safety assessments:present limits and possible improvementsGilles-Eric Séralini1*, Robin Mesnage1, Emilie Clair1, Steeve Gress1, Joël Spiroux de Vendômois2, Dominique Cellier3
Abstract
Purpose: We reviewed 19 studies of mammals fed with commercialized genetically modified soybean and maizewhich represent, per trait and plant, more than 80% of all environmental genetically modified organisms (GMOs)cultivated on a large scale, after they were modified to tolerate or produce a pesticide. We have also obtained theraw data of 90-day-long rat tests following court actions or official requests. The data obtained include biochemicalblood and urine parameters of mammals eating GMOs with numerous organ weights and histopathology findings.
Methods: We have thoroughly reviewed these tests from a statistical and a biological point of view. Some ofthese tests used controversial protocols which are discussed and statistically significant results that were consideredas not being biologically meaningful by regulatory authorities, thus raising the question of their interpretations.
Results: Several convergent data appear to indicate liver and kidney problems as end points of GMO diet effectsin the above-mentioned experiments. This was confirmed by our meta-analysis of all the in vivo studies published,which revealed that the kidneys were particularly affected, concentrating 43.5% of all disrupted parameters inmales, whereas the liver was more specifically disrupted in females (30.8% of all disrupted parameters).
Conclusions: The 90-day-long tests are insufficient to evaluate chronic toxicity, and the signs highlighted in thekidneys and livers could be the onset of chronic diseases. However, no minimal length for the tests is yetobligatory for any of the GMOs cultivated on a large scale, and this is socially unacceptable in terms of consumerhealth protection. We are suggesting that the studies should be improved and prolonged, as well as being madecompulsory, and that the sexual hormones should be assessed too, and moreover, reproductive andmultigenerational studies ought to be conducted too.
Background, aim, and scopeRecently, an ongoing debate on international regulationhas been taking place on the capacity to predict andavoid adverse effects on health and the environment fornew products and novel food/feed (GMOs, chemicals,pesticides, nanoparticles, etc.). The health risk assess-ments are often, but not always, based on the study ofblood analyses of mammals eating these products in sub-chronic tests, and more rarely in chronic tests. In particu-lar, in the case of GMOs, the number and nature ofparameters assessed, the length of the necessary tests, thestatistics used and their interpretations are the subject ofcontroversies, especially in the application of Organiza-tion of Economic Cooperation and Development (OECD)
norms. Confusion is perceived even in regulatory agen-cies, as in the European Food Safety Authority (EFSA)GMO panel working group and its guidelines. Doubt hasarisen on the role and necessity of animal feeding trialsin safety and nutritional assessments of GM plants andderived food and feed [1]. Based on the literature data,EFSA first admitted (p. S33) that for other tests thanGMOs: “For 70% (57 of 81) of the studies evaluated,all toxicological findings in the 2-year tests were seen inor predicted by the 3-month subchronic tests”. Moreover,they also indicated (p. S60) that “to detect effects onreproduction or development [...] testing of the wholefood and feed beyond a 90-day rodent feeding study maybe needed.” We fully agree with these assumptions. Thisis why we think that in order to protect large populationsfrom unintended effects of novel food or feed, importedor cultivated crops on a large scale, chronic 2-yearand reproductive and developmental tests are crucial.
* Correspondence: [email protected] of Biochemistry - IBFA, University of Caen, Esplanade de la Paix,14032 Caen, Cedex, FranceFull list of author information is available at the end of the article
Séralini et al. Environmental Sciences Europe 2011, 23:10http://www.enveurope.com/content/23/1/10
© 2011 Séralini et al; licensee Springer. This is an Open Access article distributed under the terms of the Creative Commons AttributionLicense (http://creativecommons.org/licenses/by/2.0), which permits unrestricted use, distribution, and reproduction in any medium,provided the original work is properly cited.
EXHIBIT J - Page 434
Case 5:14-cv-00117-cr Document 63-11 Filed 11/14/14 Page 152 of 312

However, they have never been requested by EFSA forcommercial edible crops. We therefore wish to underlinethat in contrast with the statements of EFSA, all com-mercialized GMOs have indeed been released withoutsuch tests being carried out, and as it was the caserecently with maize stacked events without 90-day invivo mammalian tests being conducted. GM stackedevents have the cumulated characteristics of first genera-tion of GMOs (herbicide tolerance and insecticide pro-duction), which are mostly obtained by hybridization. Forinstance, Smarstax maize contains two genes for herbi-cide tolerance and six genes for insecticide production.In fact, this contradictory possibility was already high-lighted in the same review by EFSA (p. S60), when sub-stantial equivalence studies and other analyses wereperformed: “animal feeding trials with rodents [...] addslittle if anything [...], and is not recommended.” This iswhy, in this work we will analyze and review deficienciesin GMO safety assessments, not only performed by bio-tech companies, but also by regulatory agencies.We will focus on the results of available 90-day feed-
ing trials (or more) with commercialized GMOs, in thelight of modern scientific knowledge. We also suggesthere an alternative to conventional feeding trials, tounderstand the biological significance of statistical dif-ferences. This approach will make it possible to avoidboth false negative and false positive results in order toimprove safety assessments of agricultural GMOs beforetheir commercialization for cultivation and food/feeduse and imports.
Overview of the safety studies of GMOs performed onmammalsOur experience in scientific committees for the assess-ment of environmental and health risks of GMOs andin biological, biostatistical research, and medicine, aswell as in the research relative to side effects [2-6]allowed us to review and criticize mammalian feedingtrials with GMOs and make new proposals. Mammalianfeeding trials have been usually but not always per-formed for regulatory purposes in order to obtainauthorizations or commercialization for GM plant-derived foods or feed. They may have been published inthe scientific literature afterwards; however, withoutpublic access to the raw data.We have obtained, following court actions or official
requests, the raw data of several 28- or 90-day-long safetytests carried out on rats. The thing we did was to thor-oughly review the longest tests from both a biostatisticaland a biological point of view. Such studies often analyzethe biochemical blood and urine parameters of mammalseating GMOs, together with numerous organ weightsand histopathology. We have focused our review on com-mercialized GMOs which have been cultivated in
significant amounts throughout the world since 1994(Table 1). We observe and emphasize that all the eventsin Table 1 correspond to soybean and maize which con-stitute 83% of the commercialized GMOs, whilst otherGMOs not displayed in the table, but still commercia-lized, are canola or cotton. However, they are not usuallydirectly consumed [7]. Only Sakamoto’s and Malatesta’sstudies have been more than 90 days long (104 weeksand 240 days with blood analyses in Japanese for the firstone). Moreover, such tests are not obligatory yet for allGMOs. No detailed blood analysis is available for Mala-testa’s study, as it mostly includes histochemistry at theultrastructural level; moreover, the latter tests have notbeen used to obtain the commercial release by the firm.However, this work has been performed by researchersindependent from the GMO industry; it is an importantelement to take into account for an objective interpreta-tion of the facts, as pointed out in the case of the riskassessments conducted by regulatory agencies withBisphenol A. For instance in the latter case, it wasobserved that none of the industry-funded studiesshowed adverse effects of Bisphenol A, whereas 90% ofgovernment-funded studies showed hazards at variouslevels and various doses [8]. However, regulatory agenciesstill continue to refer only to industry-funded studiesbecause they are supposed to follow OECD norms, evenif such standards are not always appropriate for thedetection of environmental hazards [9]. In this paper,Myers et al. showed that hundreds of laboratory animalsand cell culture studies were rejected by regulatoryauthorities because they did not follow the Good Labora-tory Practices (GLP). The Food and Drug Administrationand EFSA have based their final decision on two indus-try-funded studies, claiming that they were superior tothe others because they followed GLP. Yet, GLP arebased on ancient paradigms. They have serious concep-tual and methodological flaws, and do not take intoaccount the latest knowledge in environmental sciences.For example, in the case of Bisphenol A assessment, theanimal models used are known to be insensitive to estro-gen (CD-1 mouse). Also, assays and protocols in someOECD guidelines are out of date and insensitive. It isobvious that new product assessments should be basedon adapted studies using state-of-the-art experiments.The significant gap between scientific knowledge andregulations should be filled also in the case of GMOs [9].Therefore, some tests presented here show controversialresults or statistically significant results that were notconsidered as biologically significant by EFSA, raising thequestion of their interpretation.First of all, the data indicating no biological signifi-
cance of statistical effects in comparison to controlshave been published mostly by companies from 2004onwards, and at least 10 years after these GMOs were
Séralini et al. Environmental Sciences Europe 2011, 23:10http://www.enveurope.com/content/23/1/10
Page 2 of 10
EXHIBIT J - Page 435
Case 5:14-cv-00117-cr Document 63-11 Filed 11/14/14 Page 153 of 312

first commercialized round the world. This is a matterof grave concern. Moreover, only three events weretested for more than 90-days in feeding experiments oron more than one generation. This method was not per-formed by industries which conducted 90-day tests (withblood and organ analyses), but it was in some casesonly. However, a 90-day period is considered as insuffi-cient to evaluate chronic toxicity [1,5]. All these com-mercialized cultivated GMOs have been modified tocontain pesticides, either through herbicide tolerance orby producing insecticides, or both, and could thereforebe considered as “pesticide plants.” Almost all GMOsonly encode these two traits despite claims of numerousother traits. For instance, Roundup ready crops havebeen modified in order to become insensitive to glypho-sate. This chemical together with adjuvants in formula-tions constitutes a potent herbicide. It has been used formany years as a weed killer by blocking aromatic aminoacid synthesis by inhibition of 5-enolpyruvylshikimate-3-phosphate synthase (EPSPS). Most Roundup readyplants have been modified thanks to the insertion of amutated EPSPS gene coding for a mutated enzyme,which is not inhibited by glyphosate. Therefore, GMplants exposed to glyphosate-based herbicides such asRoundup do not specifically degrade glyphosate. Theycan even accumulate Roundup residues throughouttheir life, even if they excrete most of such residues.Glyphosate and its main metabolite AMPA (with itsown toxicity) are found in GMOs on a regular and
regulatory basis [10,11]. Therefore, such residues areabsorbed by people eating most GM plants (as around80% of these plants are Roundup tolerant). On the otherhand, about 20% of the other GMOs do synthesize newinsecticide proteins through the insertion of mutatedgenes derived from Bacillus thuringiensis (Bt).Usually, pesticides are tested over a period of 2 years
on a mammal, and this quite often highlights sideeffects. Additionally, unintended effects of the geneticmodification itself cannot be excluded, as direct orindirect consequences of insertional mutagenesis, creat-ing possible unintended metabolic effects. For instance,in the MON810 maize, the insertion of the transgene inthe ubiquitine ligase gene caused a complex recombina-tion event, leading to the synthesis of new RNA pro-ducts encoding unknown proteins [12]. Thus, geneticmodifications can induce global changes in the genomic,transcriptomic, proteomic, or metabolomic profiles ofthe host. The frequency of such events in comparison toclassical hybridization is by nature unpredictable. Inaddition, in a plant producing a Cry1Ab-modified toxin,a metabolomic study [13] revealed that the transgeneintroduced indirectly 50% changes in osmolytes andbranched amino acids.
Review of statistical effects after GMO consumptionSome GMOs (Roundup tolerant and MON863) affectthe body weight increase at least in one sex [2,14]. It isa parameter considered as a very good predictor of side
Table 1 Review of the longest chronic or subchronic toxicity studies in mammals fed with commercialized GMsoybean and maize representing more than 80% of edible GMOs (2010)
References Plant Pesticide contained Name ofevent
Species Duration Main observations
[17,38,39,19,15] Soybean Roundup herbicide mCP4 EPSPS Mouse 240 days Ultrastructural histochemistrydisturbed
[14] Soybean Roundup herbicide mCP4 EPSPS Rat 91 days Weight problems
[40] Soybean Roundup herbicide Optimum GATDP-356Ø43-5
Rat 93 days Statistical differencesa
[41] Soybean Roundup herbicide Not precise Rat 104 weeks Statistical differencesa
[42] Maize Roundup herbicide Optimum GATDP-Ø9814Ø-6
Rat 91 days Statistical differencesa
[43,5] Maize Roundup herbicide NK603 Rat 90 days Controversial results
[44,5] Maize mCry1Ab insecticide MON810 Rat 90 days Controversial results
[25,2,4,5] Maize mCry3Bb1 insecticide MON863 Rat 90 days Controversial results
[16] Maize mBt insecticide not indicated Rat Multi-generational
(F3)
Histopathological,biochemical, organ weights
alterations
[45] Maize mCry1F insecticide - glufosinate ammonium-based herbicide
DAS-Ø15Ø7-1 Rat 91 days Statistical differencesa
[46,47] Maize mCry34Ab1, mCry35Ab1 insecticides -glufosinate ammonium-based herbicide
DAS-59122-7 Rat 90 days Statistical differencesa
[48] Maize mCry1F, mCry34Ab1, mCry35Ab1 insecticides- glufosinate ammonium-based herbicide
DAS-Ø15Ø7-1× DAS-59122-7
Rat 92 days Statistical differencesa
aStatistical differences are not biologically meaningful for the authors; however, this can be debated. Oilseed rape and cotton have been excluded because theyare not directly edible and not primarily grown for feed. This table includes authorized events for food and feed at least in the European Union and America.
Séralini et al. Environmental Sciences Europe 2011, 23:10http://www.enveurope.com/content/23/1/10
Page 3 of 10
EXHIBIT J - Page 436
Case 5:14-cv-00117-cr Document 63-11 Filed 11/14/14 Page 154 of 312

effects in various organs. Several convergent factorsappear to indicate liver and kidney problems as endpoints of GMO diet effects in these experiments[2,5,15,16]. This was confirmed by our meta-analysis ofall in vivo studies published on this particular topic(Table 2). The kidneys are particularly affected, concen-trating 42% of all parameters disrupted in males. How-ever, other organs may be affected too, such as theheart and spleen, or blood cells [5].
Liver parametersFor one of the longest independent tests performed, aGM herbicide-tolerant soybean available on the marketwas used to feed mice. It caused the development ofirregular hepatocyte nuclei, more nuclear pores, numer-ous small fibrillar centers, and abundant dense fibrillarcomponents, indicating increased metabolic rates [17]. Itwas hypothesized that the herbicide residues could beresponsible for that because this particular GM plantcan absorb the chemicals to which it was rendered tol-erant. Such chemicals may be involved in the above-mentioned pathological features. This became evenclearer when Roundup residues provoked similar fea-tures in rat hepatic cells directly in vitro [18]. Thereversibility observed in some instances for these para-meters in vivo [19] might be explained by the heteroge-neity of the herbicide residues in the feed [20]. Anyway,these are specific parameters of ultrastructural dysfunc-tion, and the relevance is clear. The liver is reacting.The Roundup residues have been also shown to be toxicfor human placental, embryonic, and umbilical cordcells [21-23]. This was also the case for hepatic humancell lines in a comparable manner, inducing nuclei andmembrane changes, apoptosis and necrosis [24].The other major GMO trait has to do with the
mutated (mBt) insecticidal peptidic toxins produced bytransgenes in plants. In this case, some studies withmaize confirmed histopathological changes in the liverand the kidneys of rats after GM feed consumption.Such changes consist in congestion, cell nucleus borderchanges, and severe granular degeneration in the liver
[16]. Similarly, in the MON810 studies, a significantlylower albumin/globulin ratio indicated a change inhepatic metabolism of 33% of GM-fed male rats(according to EFSA opinion on MON810 and [5]).Taken together, the results indicate potential adverseeffects in hepatic metabolism. The insecticide producedby MON810 could also induce liver reactions, like manyother pesticides. Of course, the mCry1Ab and othermBt (mutated Bt toxins derived from native Bacillusthuringiensis toxins) in GMOs are proteic toxins; how-ever, these are modified at the level of their amino acidsequence by biotechnologies and introduced by artificialvectors, thus these could be considered as xenobiotics(i.e., a molecule foreign to life). The liver together withthe kidneys are the major reactive organs in case offood chronic intoxication.
Kidney parametersIn the NK603 study, statistically significant strong urineionic disturbances and kidney markers could beexplained by renal leakage [5], which is well correlatedwith the effects of glyphosate-based herbicides (likeRoundup) observed on embryonic kidney cells [23]. Thisdoes not exclude metabolic effects indirectly due toinsertional mutagenesis linked to the plant transforma-tion. Roundup adjuvants even stabilize glyphosate andallow its penetration into cells, which in turn inhibitestrogen synthesis as a side effect, cytochrome P450 aro-matase inhibition [21]. This phenomenon changes theandrogen/estrogen ratio and may at least, in part,explain differential impacts in both sexes.Kidney dysfunctions are observed with mBt maize
producing mutated insecticides such as in MON863. Forinstance, we quote the initial EFSA report: “Individualkidney weights of male rats fed with the 33% MON863diet were statistically significantly lower compared tothose of animals on control diets”, “small increases inthe incidences of focal inflammation and tubular regen-erative changes in the kidneys of 33% MON863 males.”This was confirmed by the company tests [25] andanother counter analysis revealed disrupted biochemical
Table 2 Meta-analysis of statistical differences with appropriate controls in feeding trials
All parameters measured in vivo in GMO toxicity studies Measured by organ(%)/Total (694-698)
Disturbed in each organ (%)/Total disruptedparameters (approximately 9%)
Females Males Females Males
Liver 22.9 22.9 30.8 26.1
Kidney 23.7 23.7 26.4 43.5
Bone marrow 29.5 29.5 29.7 22.8
Total for 3 tissues 76.1 76.1 86.9 92.4
Commercialized soybean and maize GMOs were fed to rats and their blood analyses were obtained. The different parameters are classified according to thetissue [2] to which they are related (e.g., liver, kidney, bone marrow). Of the total parameters measured 76.1% are related to these three organs. The percentagesof significantly different parameters to the controls are called “disrupted parameters.” There are in total 9% of disrupted parameters and, for instance, 43.5% ofthese are concentrated in kidneys in males. The bold values are significantly over the parameters measured per organ.
Séralini et al. Environmental Sciences Europe 2011, 23:10http://www.enveurope.com/content/23/1/10
Page 4 of 10
EXHIBIT J - Page 437
Case 5:14-cv-00117-cr Document 63-11 Filed 11/14/14 Page 155 of 312

markers typical of kidney filtration or function problems[2]. The first effects were not always but sometimesgreater than the ones with non-isogenic maize (calledreference lines), which contain different salts, lipids, orsugars. Moreover, both results described are differentbetween males and females; this is quite usual in liveror kidney pesticide reactions. These facts do not excludethat such effects can be considered as treatment-related.Other studies also confirmed effects on kidneys. Tubulardegeneration and not statistically significant enlargementin parietal layer of Bowman’s capsules were alsoobserved with GM maize fed rats [16].Last but not least, a total of around 9% of parameters
were disrupted in a meta-analysis (Table 2). This istwice as much as what could be obtained by chanceonly (generally considered as 5%). Surprisingly, 43.5% ofsignificant different parameters were concentrated inmale kidneys for all commercialized GMOs, even if onlyaround 25% of the total parameters measured were kid-ney-related. If the differences had been distributed bychance in the organs, not significantly more than 25%differences would have been found in the kidney. Evenif our own counter analysis is removed from the calcula-tion, showing numerous kidney dysfunctions [2], around32% of disturbances are still noticed in kidneys.
DiscussionNeed for chronic tests and other testsChronic toxicity tests (both with males and females) andreproductive tests with pregnant females and then withthe developing progeny over several generations (noneof these steps exist at present) are called as a whole theToxotest approach (or Risk management test, see“Details on the new suggested Toxotest approach”). Thiscould address the long-term physiological or pathologi-cal relevance of the previous observations. The physiolo-gical interpretations of 90-day-based effects areotherwise somewhat limited. These studies should becomplementary to the present regulations or the Safot-est and the sentinel test suggested by EFSA [1]. TheToxotest could provide evidence of carcinogenic, devel-opmental, hormonal, neural, and reproductive potentialdysfunctions, as it does for pesticides or drugs. Addi-tionally, it is obvious that the 90-day-long trials onmature animals performed today cannot scientificallyreplace the sensitivity of developmental tests on neo-nates. A good example is the gene imprinting by drugsthat will be revealed only at maturity; this is an impor-tant subject of current research, and many findings havebeen reported for some chemicals such as bisphenol A[26,27]. Even transgenerational effects occur after epige-netic imprinting by a pesticide [28]. These effects cannotbe detected by classical 90-day feeding trials and will bevisible after many decades by epidemiology in humans if
any, as illustrated in the case of diethylstilbestrol, whichinduced female genital cancers among other problemsin the second generation [29]. The F3 multigenerationalstudy for a GMO (Table 1) was too rarely performed.This is why, because of the number of parameters dis-rupted in adult mammals within 90 days, the newexperiments should be systematically performed to pro-tect the health of billions of people that could consumedirectly or indirectly these transformed products.The acute toxicity approach (less than a month of
investigations on rodents with high doses) may giveeffects which are more proportional to the dose, as itmight correspond to a rapid poisoning of the animals,generally with force-fed experiments. However, formany pesticide studies in the scientific literature, somelong-term side effects of pesticides at environmentaldoses are described, which are not apparent in short-term experiments [30]. Classical toxicology is quiteoften based on the concept of revealing linear dose-responses as defined by Paracelsus, which generally failsto evidence U or J curves observed after hormonal sex-specific disruptions. Moreover, the effects of mixturesare also neglected in long-term studies, when supposedactive principles of pesticides are not assessed with theiradjuvants, which also are present as residues in GMOs.Such pesticides may have the capacity to disrupt the“cell web”, i.e., to interfere with a signaling pathway, andthis could be unspecific. For instance Roundup isknown to disrupt the EPSPS in plants, but is alsoknown to interact with the mammalian ubiquist reduc-tase [21] common and essential to cytochromes P450, awide class of detoxification enzymes. The so-calledRoundup active principle, glyphosate, acts in combina-tion with adjuvants to increase glyphosate-mediatedtoxicity [21,31], and this may apply to other environ-mental pollutants [22]. Moreover, all new metabolites inedible Roundup ready GMOs, as acetyl-glyphosate forthe new GAT GMOs, have not been assessed for theirchronic toxicity [11], and we consider this as a majoroversight in the present regulations.Therefore, as xenobiotic effects are complex, the
determination of their toxic effects cannot be deter-mined using a single method, but rather convergingpieces of evidence. In GMO risk assessment, the proto-cols must be optimized to detect side effects, in particu-lar for herbicide-treated GM plants. These cannot bereduced to GM assessment on one side and herbicideresidues with any diet on the other side, but unfortu-nately this has been the case, and this approach hasbeen promoted up to now by regulatory authorities.In fact, it is impossible, within only 13 weeks, to con-
clude about the kind of pathology that could be inducedby pesticide GMOs and whether it is a major pathologyor a minor one. It is therefore necessary to prolong the
Séralini et al. Environmental Sciences Europe 2011, 23:10http://www.enveurope.com/content/23/1/10
Page 5 of 10
EXHIBIT J - Page 438
Case 5:14-cv-00117-cr Document 63-11 Filed 11/14/14 Page 156 of 312

tests, as suggested by EFSA, since at least one third ofchronic effects visible with chemicals are usually new incomparison to the ones highlighted in subchronic stu-dies [1]. The so-called Toxotests, which are supposed toinclude the studies of chronic pathologies in particular,should be performed on three mammalian species, withat least one non-rodent, similar to the type of rodentsused for pesticides and drugs. However, the chronicfeeding tests for GMOs cannot be based on the noobserved adverse effect level, nor on the lowest observedadverse effect level approach, as in classical toxicology.There are several reasons for that. There is not only onechemical, but also several unknown metabolites andcomponents, in Roundup tolerant varieties for instance,and therefore toxicity is enhanced thanks to the factthat they are mixed together. There is also no possibilityof increasing the doses of GMOs in an equilibrated dietover an acceptable level. The diets should be ratherrepresentative of an equilibrated diet with GMOs like itcould be the case in a real population in America. Toprolong 90-day subchronic tests with three normaldoses of GM in the diet (11%, 22%, 33% for instance) isthe solution.
Sex- or dose-specific pathological effects are commonWhen there is a low or environmental dose impregna-tion of the feed (with a pesticide GM plant for instance),the chronic effects could be more differentiated accord-ing to the sex, the physiological status, the age, or thenumber of intakes over such and such a period of timein the case of a drug. These parameters (chronic intake,age of exposure, etc.) are more decisive for pathologieslike cancers, than the actual quantity of toxin ingestedin one intake. This is in part because the liver, kidney,and other cytochrome P450-rich organs are concernedfor long-term metabolism and detoxification, and thisphenomenon is hormone dependent. It is also due tothe process of carcinogenesis or hormone-sensitive pro-gramming of cells [32]. The liver for instance is a sexdifferentiated organ as far as its enzymatic equipment isconcerned [4]. An effect in subchronic or chronic testscannot be disregarded on the rationale that it is not lin-ear to the dose (or dose-related) or not comparable ingenders. This would not be scientifically acceptable.However, this reasoning was adopted both by companiesand EFSA for several GMOs, as underlined by Doullet al. [33]. Indeed, most xenobiotics or pollutants mayhave non-linear effects, and/or may have sex- and age-specific impacts.One of the pivotal requirements for regulators nowa-
days, in order to interpret a significant difference as bio-logically relevant, is to observe a linear dose-response.This allows them to deduce a causality. However, this
dose-response cannot be studied with only two points,which is nonetheless the case for all major commercialGMOs today, which are given in the diet in 11% and33% concentrations only, in subchronic tests. This istrue overall if no preliminary data has been obtained tochoose the given doses, which is the case in regulatoryfiles. As we have already emphasized, most of pathologi-cal and endocrine effects in environmental health arenot directly proportional to the dose, and they have adifferential threshold of sensitivity in both sexes [34].This is, for instance, the case with carcinogenesis andendocrine disruption.
Improving the knowledge on impacts of modified BttoxinsOne of the interpretations of the side effects observed(Tables 1 and 2) would be that the insecticide toxins inmaize lines may have more pleiotropic or specific actionsthan originally supposed. The toxins could generate parti-cular metabolites, either in the GM plant or in the animalsfed with it. The Bt toxins in GMOs are new and modified,truncated, or chimerical in order to change their activities/solubility in comparison to wild Bt. For instance, there isat least a 40% difference between the toxin in Bt176 andits wild counterpart [10]. None of the modified Bt toxinshave been authorized separately for food or feed, neitherhas the wild Bt, and neither have they been tested bythemselves on animal or human health to date. Even ifsome studies were performed, the receptors have not beencloned and the signaling pathways have not been identifiedas yet, nor required for authorizations, and the metabolismof these proteins in mammals are unknown [35]. Thus, theargument about “safe use history” of the wild Bt protein(not designed for direct consumption, in contrast to sev-eral GMOs) cannot, on a sound scientific basis, be usedfor direct authorizations of the above-cited GM corns,overall without in vivo chronic toxicity tests (or Toxotestapproach), as it is requested for a pesticide. Someimprovements may even be included with regard to pesti-cide legislation, since these human modified toxins consid-ered as xenobiotics are continuously produced by theplants devoted to consumption.The proteins usually compared (modified Bt toxins
and wild ones) are not identical, and the tests onhuman cells of Bt proteins are not performed nor arethey requested by authorities. Their stability has beenassessed in vitro, and GM insecticide toxins are neverfully digested in vivo [36]. If some consumers sufferfrom stomach problems or ulcers, the new toxins willpossibly act differently; the digestion in children couldbe affected too; however, these GMOs could be eatenanywhere and all proteins are never fully decomposed inamino acids by the digestive tract.
Séralini et al. Environmental Sciences Europe 2011, 23:10http://www.enveurope.com/content/23/1/10
Page 6 of 10
EXHIBIT J - Page 439
Case 5:14-cv-00117-cr Document 63-11 Filed 11/14/14 Page 157 of 312

Details on the new suggested Toxotest approachThe suggested Toxotest would basically include anextension of the existing 90-day tests, but with at leastthree doses plus controls (0%, 11%, 22%, 33% GMOs forinstance; today the equilibrated diets tested contain 0%,11%, and 33% GMOs in the best regulatory tests). Thepurpose would be to characterize scientifically the dose-response approach. The latter cannot be taken seriouslywith only two GM doses. The final goal is the besthealth protection for the population without really pos-sible clinical trials, in our case for practical and ethicalreasons. There is also no epidemiological follow-up forlack of traceability and labeling in GM-producing Amer-ican countries. In addition, the fact that the Toxotestincludes the best possible toxicological approach willalso be in favor of the biotechnology economy and theEuropean Community because it is more expensive toaddress an issue concerning a whole population after-wards, rather than to work with laboratory animalsbeforehand; it is also more ethical to work on rats andother mammalian experiments, in order to get the rele-vant information, rather than to give pesticide plantsdirectly to humans on a long-term basis.As previously underlined, the health effects such as
those suggested in Table 2 (if any, are revealed byadapted studies, such as Safotests or Toxotests), couldonly be due to two possibilities:Firstly, the side effects may be directly or indirectly
due to a pesticide residue and/or its metabolites. Thedirect effect is about the pesticide effect on the consu-mer, and the indirect one is about a metabolism disrup-tion that it has provoked within the plant first. Thiscould not be visible by a detailed compositional analysis,such as the one performed to be assessed by a substan-tial equivalence study. This concept is not a well-definedone (how many cultivations of crops, over how manyyears, under which climate, and to measure what preciseparameters).Secondly, the pathological signs may be due to the
genetic transformation itself, its method provokingeither insertional mutagenesis or a new metabolism bygenetic interference. This is the reason why separatingintended effects (the direct genetic trait consequenceitself) from unintended effects (linked to biotechnology,e.g., insertional mutagenesis), such as spiking the controldiet with the purified toxin in the Toxotest approach, isclearly inadequate. It could work in the case of a directaction of the toxin in mammals, but conversely onecould not conclude, between an insertional mutagenesisand a specific metabolic action in the plant due to thetoxin. However, this is more a research question aboutthe mode of genesis of an effect on health, and newresearch avenues could be, for instance, to compare theGM diet with or without herbicide treatment in long-
term tests with the isogenic control diet including herbi-cide residues added. This is only necessary for theunderstanding of the potential signs of toxicity and notfor a conclusion of the Safotest or the Toxotest, whichwould rather suggest, if positive, excluding immediatelythe corresponding GMO from food and feed.
Improvement of statistical analysisA serious experimental design is based on a properchoice of the groups, with only one question studied perexperiment if possible, and balanced sample sizes. Inseveral authorized GMOs, the sample sizes appearinadequate in 90 days: ten animals per group for themeasurement of biochemical parameters out of 20, asperformed by the major stakeholders, and accepted byEFSA for MON863, MON810, or NK603 for instance.This is too limited a size to ensure that parametric sta-tistical methods used by the company are reliable.Moreover, an important discrepancy between GMO-treated rats (40 measured out of 80) and the totalnumber of animals (400) renders more difficult the evi-dencing of relevant effects, and confusion factors arebrought in at the same time with six different referencediets in addition to the two normal control groups asperformed in three commercialized GMOs at least [5,6].This introduces new uncontrolled sources of variabilityabout the effects of the diets and new unnecessary ques-tions not relevant to the GMO safety. The representa-tion of a standard diet with multiple sources could havebeen studied with only one control group of the samesize than the GMO group, eating a mix of six differentregular non-GM diets.Several questions have been raised by companies and
authorities as well as comments on statistically signifi-cant effects that would supposedly not be biologicallymeaningful. A subjective part is introduced at this levelbecause it is necessary to take into account the contextand the general and detailed knowledge of toxicologyand endocrine disruption, as EFSA underlines. Thismight be highly expert dependent. This is why, to avoidor prevent any misunderstanding, we suggest, in addi-tion to a new statistical approach based on classicalmethods, to analyze the 90-day tests, even with controland reference diets called the “SSC method” (accordingto the initials of the authors in [2]).Briefly, following the necessity to model and analyze
the growth curves, multivariate data analysis and datamining of all parameters can be used to correlate, clus-ter, and select meaningful variables. This kind ofapproach is not performed at all today. Thereafter, thedetailed comparison between GM-treated and controlgroups, fed with the near isogenic line (because the realisogenic line does not often exists anymore), will neces-sarily be followed by the study of specific diet effects,
Séralini et al. Environmental Sciences Europe 2011, 23:10http://www.enveurope.com/content/23/1/10
Page 7 of 10
EXHIBIT J - Page 440
Case 5:14-cv-00117-cr Document 63-11 Filed 11/14/14 Page 158 of 312

when there are non-substantially equivalent diets forreference groups. For that purpose, the controls will befirst compared using multivariate inference with refer-ence groups, and thereafter, similarly GMO-treatedgroups with reference groups. The significant differenceslinked to the GMO and/or the composition of the dietwill be classified according to organ and function. Theresults will appear more clearly than with the simplestatistics accepted today by the authorities (that is, com-parison of the highest GM dose group with the meanvalue of all six control groups), and will reveal in addi-tion new information, as it can be demonstrated.As recommended by EFSA, an appropriate and rele-
vant statistical analysis is crucial. It should follow thefollowing series of steps, allowing the use of severalmethods depending on the questions raised:
• Obtaining and modeling the growth curves and feedconsumption, assessed by non-linear regression, vali-dation, and statistical comparisons in order to test ifthe curves are significantly different, thus taking intoaccount individual variability. This necessitates theuse of time series analysis, selection models, and non-parametric tests, Akaike Information Criteria andrelated methods. Water consumption should also bean important factor to follow-up and therefore betterunderstand kidney and urine data.• The study of dose-response predictions using non-linear regression should be the goal, but the onlytwo doses generally used in these tests do not makeit possible to evidence linearity as we indicated.Moreover, in the cases where there are not dose-related trends or relationships using the two dosesmentioned, the absence of linear dose-responsecurves cannot be a reason to neglect the effects. Forinstance, as previously cited, U or J curves may becharacteristic of endocrine effects [37], and spikyirregular curves may be detected in carcinogenesis.• Simultaneous analysis of all observed variables:multivariate data analysis, principal component ana-lysis, correlations analysis, factorial analysis andclustering• Multivariate comparisons of the different variables:hypothesis testing, multiple ways ANOVA, MAN-OVA, and others to determinate if the groups differrelative to the different questions: specific GMOeffect or diet effect per se. To evidence a detail,when comparing two mean values, SEM should becalculated to determine confidence intervals; how-ever, SD have been used up to now by the companyfor MON863 and NK603 files for instance.
Apart from empirical curves in some instances,ANOVA and univariate hypothesis testing only the
GMO effect, none of the other statistical approaches iscurrently used nor requested by the authorities.
Human tests and post-market monitoringFor the record, it must be said that very few tests onhumans have been carried out up to now. Moreover,epidemiological studies are not feasible in America,since there is no organized traceability of GMOs any-where on the continent, where, by far, most of edibleGMOs are cultivated (97%). As a consequence, a post-market monitoring (PMM) is offered to the population.The Cartagena Biosafety Protocol identifying GMOs atthe borders of a country has now been signed by over150 countries, including the member states of the Eur-opean Union. PMM may have some value in detectingunexpected adverse effects. It could therefore be consid-ered as a routine need. This approach makes it possibleto collect information related to risk management. Itcan be relied upon as a technique for monitoringadverse events or other health outcomes related to theconsumption of GM plant-derived foods, provided thatthe Toxotest approach, together with the SSC method,should have already been applied. The PMM should belinked with the possibility of detecting allergenicity reac-tions to GMOs in routine medicine, thanks to the verysame routine cutaneous tests that should be developedprior to large-scale commercialization. A screening ofserum banks of patients with allergies could be also putforward in order to search for antibodies against themain GMOs and not only their transgenic proteins,since they may induce secondary allergenic metabolitesin the plant not visible in the substantial equivalencestudy.The traceability of products from animals fed on
GMOs is also crucial. The reason for this is becausethey can develop chronic diseases which are not utterlyknown today. Such possible diseases could be linked tothe hepatorenal toxicity observed in some GMO-relatedcases (Table 1).Moreover, labeling animals fed on GMOs is therefore
necessary because some pesticide residues linked toGMOs could pass into the food chain and also becausenobody would want to eat disabled or physiologicallymodified animals after long-term GMOs ingestion, evenif pesticides residues or DNA fragments are not toxicnor transmitted by themselves.
ConclusionTranscriptomics, proteomics and other related methodsare not ready yet for routine use in the laboratories, andmoreover they may be inappropriate for studying toxi-city in animals, and could not in any way replace in vivostudies with all the physiological and biochemical para-meters that are measured with organs weight,
Séralini et al. Environmental Sciences Europe 2011, 23:10http://www.enveurope.com/content/23/1/10
Page 8 of 10
EXHIBIT J - Page 441
Case 5:14-cv-00117-cr Document 63-11 Filed 11/14/14 Page 159 of 312

appearance, and histology. By contrast, afterwards, newapproaches could well help to explain pathologicalresults or action mechanisms of pesticides present inthe GM plants or GM-fed animals, if found.To obtain the transparency of raw data (including rat
blood analyses) for toxicological tests, maintained illeg-ally confidential, is crucial. It has also become crucial toapply objective criteria of interpretation like the criteriadescribed here: sex-specific side effects or non-linearones. Such data can be put online on the EFSA websitewith a view to provide a fuller review to the wider scienti-fic community, and in order to better inform the citizento make biotechnologies more socially acceptable. Sincefundamental research is published on a regular basis, itshould be the same for this kind of applied research onlong-term health effects, as suggested by the CE/2001/18and the corresponding 1829/2003 regulations.We can conclude, from the regulatory tests performed
today, that it is unacceptable to submit 500 million Eur-opeans and several billions of consumers worldwide tothe new pesticide GM-derived foods or feed, this beingdone without more controls (if any) than the only3-month-long toxicological tests and using only onemammalian species, especially since there is growingevidence of concern (Tables 1 and 2). This is why wepropose to improve the protocol of the 90-day studiesto 2-year studies with mature rats, using the Toxotestapproach, which should be rendered obligatory, andincluding sexual hormones assessment too. The repro-ductive, developmental, and transgenerational studiesshould also be performed. The new SSC statisticalmethod of analysis is proposed in addition. This shouldnot be optional if the plant is designed to contain a pes-ticide (as it is the case for more than 99% of cultivatedcommercialized GMOs), whilst for others, depending onthe inserted trait, a case-by-case approach in the methodto study toxicity will be necessary.
AcknowledgementsWe thank the CRIIGEN scientific committee for helpful discussions andstructural support, as well as the Risk Pole (MRSH-CNRS, University of Caen,France). We acknowledge the French Ministry of Research for financialsupport and the Regional Council of Basse-Normandie. We are grateful toHerrade Hemmerdinger for the English revision of this manuscript.
Author details1Laboratory of Biochemistry - IBFA, University of Caen, Esplanade de la Paix,14032 Caen, Cedex, France 2CRIIGEN, Paris, France 3University of Rouen LITISEA 4108, 76821 Mont-Saint-Aignan, France
Authors’ contributionsGES designed and coordinated the review. RM participated in the drafting ofthe manuscript and final version. EC, SG, JSV and DC helped the writing,compiling the literature, revising in details and proofreading the manuscript.All authors read and approved the final manuscript.
Competing interestsThe authors declare that they have no competing interests.
Received: 17 January 2011 Accepted: 1 March 2011Published: 1 March 2011
References1. EFSA: Safety and nutritional assessment of GM plants and derived food
and feed: the role of animal feeding trials. Food Chem Toxicol 2008, 46:S2-70.
2. Séralini GE, Cellier D, Spiroux J: New analysis of a rat feeding study with agenetically modified maize reveals signs of hepatorenal toxicity. ArchEnviron Contam Toxicol 2007, 52:596-602.
3. Séralini G-E: Comment on Transgenic aubergines put on ice. Naturenews 2009.4. Séralini GE, Spiroux J, Cellier D, Sultan C, Buiatti M, Gallagher L, Antoniou M,
Dronamraju KR: How subchronic and chronic health effects can beneglected for GMOs, pesticides or chemicals. Int J Biol Sci 2009, 5:438-443.
5. Spiroux J, Roullier F, Cellier D, Séralini GE: A comparison of the effects ofthree GM corn varieties on mammalian health. Int J Biol Sci 2009,5:706-726.
6. Spiroux J, Cellier D, Vélot C, Clair E, Mesnage R, Séralini GE: Debate onGMOs health risks after statistical findings in regulatory tests. Int J BiolSci 2010, 6:590-598.
7. James C: Global Status of Commercialized Biotech/GM Crops. ISAAA Brief41 2009.
8. Vom Saal FS, Hughes C: An extensive new literature concerning low-doseeffects of bisphenol A shows the need for a new risk assessment.Environ Health Perspect 2005, 113:926-933.
9. Myers JP, vom Saal FS, Akingbemi BT, Arizono K, Belcher S, Colborn T,Chahoud I, Crain DA, Farabollini F, Guillette LJ Jr, Hassold T, Ho SM,Hunt PA, Iguchi T, Jobling S, Kanno J, Laufer H, Marcus M, McLachlan JA,Nadal A, Oehlmann J, Olea N, Palanza P, Parmigiani S, Rubin BS,Schoenfelder G, Sonnenschein C, Soto AM, Talsness CE, Taylor JA,Vandenberg LN, Vandenbergh JG, Vogel S, Watson CS, Welshons WV,Zoeller RT: Why public health agencies cannot depend on goodlaboratory practices as a criterion for selecting data: the case ofbisphenol A. Environ Health Perspect 2009, 117:309-315.
10. Séralini G-E: Ces OGM qui changent le monde France: Flammarion; 2004.11. EFSA: Modification of the residue definition of glyphosate in genetically
modified maize grain and soybeans, and in products of animal origin onrequest from the European Commission. EFSA Journal 2009, 7:42.
12. Rosati A, Bogani P, Santarlasci A, Buiatti M: Characterisation of 3’transgene insertion site and derived mRNAs in MON810 YieldGardmaize. Plant Mol Biol 2008, 67:271-81.
13. Manetti C, Bianchetti C, Casciani L, Castro C, Di Cocco ME, Miccheli A,Motto M, Conti F: A metabonomic study of transgenic maize (Zea mays)seeds revealed variations in osmolytes and branched amino acids. J ExpBot 2006, 57:2613-2625.
14. Zhu Y, Li D, Wang F, Yin J, Jin H: Nutritional assessment and fate of DNAof soybean meal from roundup ready or conventional soybeans usingrats. Arch Anim Nutr 2004, 58:295-310.
15. Vecchio L, Cisterna B, Malatesta M, Martin TE, Biggiogera M: Ultrastructuralanalysis of testes from mice fed on genetically modified soybean. Eur JHistochem 2004, 48:448-454.
16. Kilic A, Akay MT: A three generation study with genetically modified Btcorn in rats: biochemical and histopathological investigation. Food ChemToxicol 2008, 46:1164-1170.
17. Malatesta M, Caporaloni C, Gavaudan S, Rocchi MB, Serafini S, Tiberi C,Gazzanelli G: Ultrastructural morphometrical and immunocytochemicalanalyses of hepatocyte nuclei from mice fed on genetically modifiedsoybean. Cell Struct Funct 2002, 27:173-180.
18. Malatesta M, Perdoni F, Santin G, Battistelli S, Muller S, Biggiogera M:Hepatoma tissue culture (HTC) cells as a model for investigating theeffects of low concentrations of herbicide on cell structure and function.Toxicol In Vitro 2008, 22:1853-1860.
19. Malatesta M, Tiberi C, Baldelli B, Battistelli S, Manuali E, Biggiogera M:Reversibility of hepatocyte nuclear modifications in mice fed ongenetically modified soybean. Eur J Histochem 2005, 49:237-242.
20. Arregui MC, Lenardon A, Sanchez D, Maitre MI, Scotta R, Enrique S:Monitoring glyphosate residues in transgenic glyphosate-resistantsoybean. Pest Manag Sci 2004, 60:163-166.
21. Richard S, Moslemi S, Sipahutar H, Benachour N, Séralini GE: Differentialeffects of glyphosate and roundup on human placental cells andaromatase. Environ Health Perspect 2005, 113:716-720.
Séralini et al. Environmental Sciences Europe 2011, 23:10http://www.enveurope.com/content/23/1/10
Page 9 of 10
EXHIBIT J - Page 442
Case 5:14-cv-00117-cr Document 63-11 Filed 11/14/14 Page 160 of 312

22. Benachour N, Sipahutar H, Moslemi S, Gasnier C, Travert C, Séralini GE:Time- and dose-dependent effects of roundup on human embryonicand placental cells. Arch Environ Contam Toxicol 2007, 53:126-133.
23. Benachour N, Séralini GE: Glyphosate formulations induce apoptosis andnecrosis in human umbilical, embryonic, and placental cells. Chem ResToxicol 2009, 22:97-105.
24. Gasnier C, Dumont C, Benachour N, Clair E, Chagnon MC, Séralini GE:Glyphosate-based herbicides are toxic and endocrine disruptors inhuman cell lines. Toxicology 2009, 262:184-191.
25. Hammond B, Lemen J, Dudek R, Ward D, Jiang C, Nemeth M, Burns J:Results of a 90-day safety assurance study with rats fed grain from cornrootworm-protected corn. Food Chem Toxicol 2006, 44:147-160.
26. Braniste V, Jouault A, Gaultier E, Polizzi A, Buisson-Brenac C, Leveque M,Martin PG, Theodorou V, Fioramonti J, Houdeau E: Impact of oralbisphenol A at reference doses on intestinal barrier function and sexdifferences after perinatal exposure in rats. Proc Natl Acad Sci USA 2009,107:448-453.
27. Braun JM, Yolton K, Dietrich KN, Hornung R, Ye X, Calafat AM, Lanphear BP:Prenatal bisphenol A exposure and early childhood behavior. EnvironHealth Perspect 2009, 117:1945-1952.
28. Anway MD, Cupp AS, Uzumcu M, Skinner MK: Epigenetictransgenerational actions of endocrine disruptors and male fertility.Science 2005, 308:1466-1469.
29. Wise LA, Palmer JR, Rowlings K, Kaufman RH, Herbst AL, Noller KL, Titus-Ernstoff L, Troisi R, Hatch EE, Robboy SJ: Risk of benign gynecologictumors in relation to prenatal diethylstilbestrol exposure. Obstet Gynecol2005, 105:167-173.
30. Hernandez AF, Casado I, Pena G, Gil F, Villanueva E, Pla A: Low level ofexposure to pesticides leads to lung dysfunction in occupationallyexposed subjects. Inhal Toxicol 2008, 20:839-849.
31. Benachour N, Moslemi S, Sipahutar H, Séralini GE: Cytotoxic effects andaromatase inhibition by xenobiotic endocrine disrupters alone and incombination. Toxicol Appl Pharmacol 2007, 222:129-140.
32. Melnick R, Lucier G, Wolfe M, Hall R, Stancel G, Prins G, Gallo M, Reuhl K,Ho SM, Brown T, Moore J, Leakey J, Haseman J, Kohn M: Summary of theNational Toxicology Program’s report of the endocrine disruptors low-dose peer review. Environ Health Perspect 2002, 110:427-431.
33. Doull J, Gaylor D, Greim HA, Lovell DP, Lynch B, Munro IC: Report of anExpert Panel on the reanalysis by of a 90-day study conducted byMonsanto in support of the safety of a genetically modified corn variety(MON 863). Food Chem Toxicol 2007, 45(11):2073-85.
34. Goldsmith JR, Kordysh E: Why dose-response relationships are often non-linear and some consequences. J Expo Anal Environ Epidemiol 1993,3:259-276.
35. Then C: Risk assessment of toxins derived from Bacillus thuringiensis-synergism, efficacy, and selectivity. Environ Sci Pollut Res Int 2010,17:791-797.
36. Paul V, Guertler P, Wiedemann S, Meyer HH: Degradation of Cry1Abprotein from genetically modified maize (MON810) in relation to totaldietary feed proteins in dairy cow digestion. Transgenic Res 2010,19(4):683-689.
37. Andrade AJ, Grande SW, Talsness CE, Grote K, Chahoud I: A dose-responsestudy following in utero and lactational exposure to di-(2-ethylhexyl)-phthalate (DEHP): non-monotonic dose-response and low dose effectson rat brain aromatase activity. Toxicology 2006, 227:185-192.
38. Malatesta M, Caporaloni C, Rossi L, Battistelli S, Rocchi MB, Tonucci F,Gazzanelli G: Ultrastructural analysis of pancreatic acinar cells from micefed on genetically modified soybean. J Anat 2002, 201:409-415.
39. Malatesta M, Biggiogera M, Manuali E, Rocchi MB, Baldelli B, Gazzanelli G:Fine structural analyses of pancreatic acinar cell nuclei from mice fed ongenetically modified soybean. Eur J Histochem 2003, 47:385-388.
40. Appenzeller LM, Munley SM, Hoban D, Sykes GP, Malley LA, Delaney B:Subchronic feeding study of herbicide-tolerant soybean DP-356O43-5 inSprague-Dawley rats. Food Chem Toxicol 2008, 46:2201-2213.
41. Sakamoto Y, Tada Y, Fukumori N, Tayama K, Ando H, Takahashi H, Kubo Y,Nagasawa A, Yano N, Yuzawa K, Ogata A: A 104-week feeding study ofgenetically modified soybeans in f344 rats. Shokuhin Eiseigaku Zasshi2008, 49:272-282.
42. Appenzeller LM, Munley SM, Hoban D, Sykes GP, Malley LA, Delaney B:Subchronic feeding study of grain from herbicide-tolerant maize DP-O9814O-6 in Sprague-Dawley rats. Food Chem Toxicol 2009, 47:2269-2280.
43. Hammond B, Dudek R, Lemen J, Nemeth M: Results of a 13 week safetyassurance study with rats fed grain from glyphosate tolerant corn. FoodChem Toxicol 2004, 42:1003-1014.
44. Hammond BG, Dudek R, Lemen JK, Nemeth MA: Results of a 90-day safetyassurance study with rats fed grain from corn borer-protected corn.Food Chem Toxicol 2006, 44:1092-1099.
45. MacKenzie SA, Lamb I, Schmidt J, Deege L, Morrisey MJ, Harper M,Layton RJ, Prochaska LM, Sanders C, Locke M, Mattsson JL, Fuentes A,Delaney B: Thirteen week feeding study with transgenic maize graincontaining event DAS-O15O7-1 in Sprague-Dawley rats. Food ChemToxicol 2007, 45:551-562.
46. He XY, Huang KL, Li X, Qin W, Delaney B, Luo YB: Comparison of grainfrom corn rootworm resistant transgenic DAS-59122-7 maize with non-transgenic maize grain in a 90-day feeding study in Sprague-Dawleyrats. Food Chem Toxicol 2008, 46:1994-2002.
47. Malley LA, Everds NE, Reynolds J, Mann PC, Lamb I, Rood T, Schmidt J,Layton RJ, Prochaska LM, Hinds M, Locke M, Chui CF, Claussen F,Mattsson JL, Delaney B: Subchronic feeding study of DAS-59122-7 maizegrain in Sprague-Dawley rats. Food Chem Toxicol 2007, 45:1277-1292.
48. Appenzeller LM, Malley L, Mackenzie SA, Hoban D, Delaney B: Subchronicfeeding study with genetically modified stacked trait lepidopteran andcoleopteran resistant (DAS-O15O7-1xDAS-59122-7) maize grain inSprague-Dawley rats. Food Chem Toxicol 2009, 47:1512-1520.
doi:10.1186/2190-4715-23-10Cite this article as: Séralini et al.: Genetically modified crops safetyassessments: present limits and possible improvements. EnvironmentalSciences Europe 2011 23:10.
Submit your manuscript to a journal and benefi t from:
7 Convenient online submission
7 Rigorous peer review
7 Immediate publication on acceptance
7 Open access: articles freely available online
7 High visibility within the fi eld
7 Retaining the copyright to your article
Submit your next manuscript at 7 springeropen.com
Séralini et al. Environmental Sciences Europe 2011, 23:10http://www.enveurope.com/content/23/1/10
Page 10 of 10
EXHIBIT J - Page 443
Case 5:14-cv-00117-cr Document 63-11 Filed 11/14/14 Page 161 of 312

Long term toxicity of a Roundup herbicide and a Roundup-tolerantgenetically modified maize
Gilles-Eric Séralini a,⇑, Emilie Clair a, Robin Mesnage a, Steeve Gress a, Nicolas Defarge a,Manuela Malatesta b, Didier Hennequin c, Joël Spiroux de Vendômois a
a University of Caen, Institute of Biology, CRIIGEN and Risk Pole, MRSH-CNRS, EA 2608, Esplanade de la Paix, Caen Cedex 14032, Franceb University of Verona, Department of Neurological, Neuropsychological, Morphological and Motor Sciences, Verona 37134, Italyc University of Caen, UR ABTE, EA 4651, Bd Maréchal Juin, Caen Cedex 14032, France
a r t i c l e i n f o
Article history:Received 11 April 2012Accepted 2 August 2012Available online 19 September 2012
Keywords:GMORoundupNK603RatGlyphosate-based herbicidesEndocrine disrupting effects
a b s t r a c t
The health effects of a Roundup-tolerant genetically modified maize (from 11% in the diet), cultivatedwith or without Roundup, and Roundup alone (from 0.1 ppb in water), were studied 2 years in rats. Infemales, all treated groups died 2–3 times more than controls, and more rapidly. This difference was vis-ible in 3 male groups fed GMOs. All results were hormone and sex dependent, and the pathological pro-files were comparable. Females developed large mammary tumors almost always more often than andbefore controls, the pituitary was the second most disabled organ; the sex hormonal balance was mod-ified by GMO and Roundup treatments. In treated males, liver congestions and necrosis were 2.5–5.5times higher. This pathology was confirmed by optic and transmission electron microscopy. Markedand severe kidney nephropathies were also generally 1.3–2.3 greater. Males presented 4 times more largepalpable tumors than controls which occurred up to 600 days earlier. Biochemistry data confirmed verysignificant kidney chronic deficiencies; for all treatments and both sexes, 76% of the altered parameterswere kidney related. These results can be explained by the non linear endocrine-disrupting effects ofRoundup, but also by the overexpression of the transgene in the GMO and its metabolic consequences.
� 2012 Elsevier Ltd. All rights reserved.
1. Introduction
There is an ongoing international debate as to the necessarylength of mammalian toxicity studies in relation to the consump-tion of genetically modified (GM) plants including regular meta-bolic analyses (Séralini et al., 2011). Currently, no regulatoryauthority requests mandatory chronic animal feeding studies tobe performed for edible GMOs and formulated pesticides. How-ever, several studies consisting of 90 day rat feeding trials havebeen conducted by the biotech industry. These investigationsmostly concern GM soy and maize that are rendered either herbi-
cide tolerant (to Roundup (R) in 80% of cases), or engineered toproduce a modified Bt toxin insecticide, or both. As a result theseGM crops contain new pesticide residues for which new maximalresidual levels (MRL) have been established in some countries.
If the petitioners conclude in general that there is no majorchange in genetically modified organism (GMO) subchronic toxic-ity studies (Domingo and Giné Bordonaba, 2011; Hammond et al.,2004, 2006a,b), significant disturbances have been found andmay be interpreted differently (Séralini et al., 2009; Spiroux deVendômois et al., 2010). Detailed analyses have revealed altera-tions in kidney and liver functions that may be the signs of earlychronic diet intoxication, possibly explained at least in part bypesticide residues in the GM feed (Séralini et al., 2007; Spirouxde Vendômois et al., 2009). Indeed, it has been demonstrated thatR concentrations in the range of 103 times below the MRL inducedendocrine disturbances in human cells (Gasnier et al., 2009) andtoxic effects thereafter (Benachour and Seralini, 2009), includingin vivo (Romano et al., 2012). After several months of consumptionof an R-tolerant soy, the liver and pancreas of mice were affected,as highlighted by disturbances in sub-nuclear structure (Malatestaet al., 2008a, 2002a,b). Furthermore, this toxic effect was repro-duced by the application of R herbicide directly to hepatocytes inculture (Malatesta et al., 2008b).
0278-6915/$ - see front matter � 2012 Elsevier Ltd. All rights reserved.http://dx.doi.org/10.1016/j.fct.2012.08.005
Abbreviations: GM, genetically modified; R, Roundup; MRL, maximal residuallevels; GMO, genetically modified organism; OECD, Organization for Economic Co-operation and Development; GT, glutamyl-transferase; PCA, principal componentanalysis; PLS, partial least-squares; OPLS, orthogonal partial least-squares; NIPALS,Nonlinear Iterative Partial Least Squares; OPLS-DA, Orthogonal Partial Least SquaresDiscriminant Analysis; G, glycogen; L, lipid droplet; N, nucleus; R, rough endoplas-mic reticulum (on microscopy pictures only); U, urinary; UEx, excreted in urineduring 24 h; APPT, Activated Partial Thromboplastin Time; MCV, Mean CorpuscularVolume; PT, Prothrombine Time; RBC, Red Blood Cells; ALT, alanine aminotrans-ferase; MCHC, Mean Corpuscular Hemoglobin Concentration; A/G, Albumin/Glob-ulin ratio; WBC, White Blood Cells; AST, aspartate aminotransferase.⇑ Corresponding author. Tel.: +33 (0)231565684; fax: +33 (0)231565320.
E-mail address: [email protected] (G.-E. Séralini).
Food and Chemical Toxicology 50 (2012) 4221–4231
Contents lists available at SciVerse ScienceDirect
Food and Chemical Toxicology
journal homepage: www.elsevier .com/locate / foodchemtox
EXHIBIT J - Page 444
Case 5:14-cv-00117-cr Document 63-11 Filed 11/14/14 Page 162 of 312

Since then, long-term and multi-generational animal feedingtrials have been performed with some possibly providing evidenceof safety, while others conclude on the necessity of further investi-gations because of metabolic modifications (Snell et al., 2011).However, none of these studies have included a detailed follow-up of the animals with up to 11 blood and urine samples over2 years, and none has investigated the NK603 R-tolerant maize.
Furthermore, toxicity evaluation of herbicides is generally per-formed on mammalian physiology through the long-term studyof only their active principle, rather than the formulation used inagriculture, as was the case for glyphosate (Williams et al., 2000),the active herbicide constituent of R. It is important to note thatglyphosate is only able to efficiently penetrate target plant organ-isms with the help of adjuvants present in the various commer-cially used R formulations (Cox, 2004). When R residues arefound in tap water, food or feed, they arise from the total herbicideformulation, which is the most commonly used mixture in agricul-ture; indeed many authors in the field have strongly emphasizedthe necessity of studying the potential toxic effects of total chem-ical mixtures rather than single components (Cox and Surgan,2006; Mesnage et al., 2010; Monosson, 2005). Even adjuvantsand not only glyphosate or other active ingredients are found inground water (Krogh et al., 2002), and thus an exposure to the di-luted whole formulation is more representative of an environmen-tal pollution than the exposure to glyphosate alone in order tostudy health effects.
With a view to address this lack of information, we have per-formed a 2 year detailed rat feeding study. The actual guideline408 of the Organization for Economic Co-operation and Develop-ment (OECD) was followed by some manufacturers for GMOs evenif it was not designed for that purpose. We have explored moreparameters and more frequently than recommended in this stan-dard (Table 1) in a long-term experiment. This allowed us to followin details potential health effects and their possible origins due tothe direct or indirect consequences of the genetic modification it-self in GMOs, or due to the formulated herbicide mixture used onGMOs (and not glyphosate alone), or both. Because of recent re-
views on GMOs (Domingo and Giné Bordonaba, 2011; Snell et al.,2011) we had no reason to settle at first for a carcinogenesis pro-tocol using 50 rats per group. However we have prolonged the bio-chemical and hematological measurements or disease statusrecommended in combined chronic studies using 10 rats per group(up to 12 months in OECD 453). This remains the highest numberof rats regularly measured in a standard GMO diet study. We havetested also for the first time 3 doses (rather than two in the usual90 day long protocols) of the R-tolerant NK603 GM maize alone,the GM maize treated with R, and R alone at very low environmen-tally relevant doses starting below the range of levels permitted byregulatory authorities in drinking water and in GM feed.
2. Materials and methods
2.1. Ethics
The experimental protocol was conducted in accordance with the regulations ofour ethics in an animal care unit authorized by the French Ministries of Agricultureand Research (Agreement Number A35-288-1). Animal experiments were per-formed according to ethical guidelines of animal experimentations (CEE 86/609 reg-ulation). Concerning field studies of plant species, no specific permits wererequired, nor for the locations/activities. The maize grown (MON-00603-6 com-monly named NK603) was authorized for unconfined release into the environmentand use as a livestock feed by the Canadian Food Inspection Agency (Decision Doc-ument 2002-35). We confirm that the location is not privately-owned or protectedin any way and that the field studies did not involve endangered or protected spe-cies. The GM maize was authorized for import into the European Union (CE 258/97regulation).
2.2. Plants, diets and chemicals
The varieties of maize used in this study were the R-tolerant NK603 (MonsantoCorp., USA), and its nearest isogenic non-transgenic control. These two types ofmaize were grown under similar normal conditions, in the same location, spacedat a sufficient distance to avoid cross-contamination. The genetic nature, as wellas the purity of the GM seeds and harvested material, was confirmed by qPCR anal-ysis of DNA samples. One field of NK603 was treated with R at 3 L ha�1 (Weather-MAX, 540 g/L of glyphosate, EPA Reg. 524-537), and another field of NK603 was nottreated with R. Corns were harvested when the moisture content was less than 30%and were dried at a temperature below 30 �C. From these three cultivations of
Table 1Protocol used and comparison to existing assessment, and to non-mandatory regulatory tests.
Treatments and analyses In this work Hammond et al., 2004 Regulatory tests
Treatments + controls GMO NK603, GMO NK603 +Roundup, Roundup, andclosest isogenic maize
GMO NK603 + Roundup, closest isogenicmaize, and six other maize lines nonsubstantially equivalent
GMOs or chemicals(in standard diet or water)
Doses by treatment 3 2 At least 3Duration in months 24 (chronic) 3 (subchronic: 13 weeks) 3Animals measured/group/sex 10/10 SD rats (200 rats measured) 10/20 SD rats (200 rats measured/total
400)At least 10 rodents
Animals by cage (same sex) 1–2 1 1 or moreMonitoring/week 2 1 1 or moreFeed and water consumptions Measured For feed only At least feedOrgans and tissues studied For high dose and controlsHistology/animal 34 17/36 At least 30Organs weighted 10 7 At least 8Electronic microscopy Yes No NoBehavioral studies (times) 2 1 (no protocol given) 1Ophtalmology (times) 2 0 2Number of blood samples/
animal11, each month (0–3) then every 3 months 2, weeks 4 and 13 1, at the end
Blood parameters 31 (11 times for most) 31 (2 times) At least 25 (at least 2 times)Plasma sex steroids Testosterone, estradiol No No, except if endocrine effects suspectedLiver tissue parameters 6 0 0Number of urine samples 11 2 Optional, last weekUrine parameters studied 16 18 7 if performedMicrobiology in feces or urine Yes Yes NoRoundup residues in tissues Studied Not studied Not mandatoryTransgene in tissues Studied Not studied Not studied
The protocol used in this work was compared to the regulatory assessment of NK603 maize by the company (Hammond et al., 2004), and to non mandatory regulatory in vivotests for GMOs, or mandatory for chemicals (OECD 408). Most relevant results are shown in this paper.
4222 G.-E. Séralini et al. / Food and Chemical Toxicology 50 (2012) 4221–4231
EXHIBIT J - Page 445
Case 5:14-cv-00117-cr Document 63-11 Filed 11/14/14 Page 163 of 312

maize, laboratory rat chow was made based on the standard diet A04 (Safe, France).The dry rat feed was made to contain 11, 22 or 33% of GM maize, cultivated eitherwith or without R, or 33% of the non-transgenic control line. The concentrations ofthe transgene were confirmed in the three doses of each diet by qPCR. All feed for-mulations consisted in balanced diets, chemically measured as substantially equiv-alent except for the transgene, with no contaminating pesticides over standardlimits. All secondary metabolites cannot be known and measured in the composi-tion. However we have measured isoflavones and phenolic acids including ferulicacid by standard HPLC-UV. All reagents used were of analytical grade. The herbicidediluted in the drinking water was the commercial formulation of R (GT Plus, 450 g/Lof glyphosate, approval 2020448, Monsanto, Belgium). Herbicides levels were as-sessed by glyphosate measurements in the different dilutions by massspectrometry.
2.3. Animals and treatments
Virgin albino Sprague-Dawley rats at 5 weeks of age were obtained from Harlan(Gannat, France). All animals were kept in polycarbonate cages (820 cm2, Genestil,France) with two animals of the same sex per cage. The litter (Toplit classic, Safe,France) was replaced twice weekly. The animals were maintained at 22 ± 3 �C undercontrolled humidity (45–65%) and air purity with a 12 h-light/dark cycle, with freeaccess to food and water. The location of each cage within the experimental roomwas regularly moved. This 2 year life-long experiment was conducted in a GPL envi-ronment according to OECD guidelines. After 20 days of acclimatization, 100 maleand 100 female animals were randomly assigned on a weight basis into 10 equiv-alent groups. For each sex, one control group had access to plain water and standarddiet from the closest isogenic non-transgenic maize control; six groups were fedwith 11, 22 and 33% of GM NK603 maize either treated or not with R. The final threegroups were fed with the control diet and had access to water supplemented withrespectively 1.1 � 10�8% of R (0.1 ppb of R or 50 ng/L of glyphosate, the contaminat-ing level of some regular tap waters), 0.09% of R (400 mg/kg, US MRL of glyphosatein some GM feed) and 0.5% of R (2.25 g/L, half of the minimal agricultural workingdilution). This was changed weekly. Twice weekly monitoring allowed carefulobservation and palpation of animals, recording of clinical signs, measurement ofany tumors that may arise, food and water consumption, and individual bodyweights.
2.4. Biochemical analyses
Blood samples were collected from the tail vein of each rat under short isoflu-rane anesthesia before treatment and after 1, 2, 3, 6, 9, 12, 15, 18, 21 and24 months: 11 measurements were obtained for each animal alive at 2-years. Itwas first demonstrated that anesthesia did not impact animal health. Two aliquotsof plasma and serum were prepared and stored at �80� C. Then 31 parameters wereassessed (Table 1) according to standard methods including hematology and coag-ulation parameters, albumin, globulin, total protein concentration, creatinine, urea,calcium, sodium, potassium, chloride, inorganic phosphorus, triglycerides, glucose,total cholesterol, alanine aminotransferase, aspartate aminotransferase, gammaglutamyl-transferase (GT), estradiol, testosterone. In addition, at months 12 and24 the C-reactive protein was assayed. Urine samples were collected similarly 11times, over 24 h in individual metabolic cages, and 16 parameters were quantifiedincluding creatinine, phosphorus, potassium, chloride, sodium, calcium, pH andclairance. Liver samples at the end made it possible to perform assays of CYP1A1,1A2, 3A4, 2C9 activities in S9 fractions, with glutathione S- transferase and gam-ma-GT.
2.5. Anatomopathology
Animals were sacrificed during the course of the study only if necessary becauseof suffering according to ethical rules (such as 25% body weight loss, tumors over25% body weight, hemorrhagic bleeding, or prostration), and at the end of the studyby exsanguination under isoflurane anesthesia. In each case, the following organswere collected: brain, colon, heart, kidneys, liver, lungs, ovaries, spleen, testes, adre-nals, epididymis, prostate, thymus, uterus, aorta, bladder, bone, duodenum, esoph-agus, eyes, ileum, jejunum, lymph nodes, lymphoreticular system, mammaryglands, pancreas, parathyroid glands, Peyer’s patches, pituitary, salivary glands, sci-atic nerve, skin, spinal cord, stomach, thyroid and trachea. The first 14 organs (atleast 10 per animal depending on the sex, Table 1) were weighted, plus any tumorthat arose. The first nine organs were divided into two parts and one half wasimmediately frozen in liquid nitrogen/carbonic ice. The remaining parts includingother organs were rinsed in PBS and stored in 4% formalin before anatomopatholog-ical study. These samples were used for further paraffin-embedding, slides and HEShistological staining. For transmission electron microscopy, kidneys, livers and tu-mors were cut into 1 mm3 fragments. Samples were fixed in pre-chilled 2% parafor-maldehyde/2.5% glutaraldehyde in 0.1 M PBS pH 7.4 at 4 �C for 3 h and processed aspreviously described (Malatesta et al., 2002a).
2.6. Statistical analysis
Biochemical data were treated by multivariate analysis with the SIMCA-P (V12)software (UMETRICS AB Umea, Sweden). The use of chemometrics tools, for exam-ple, principal component analysis (PCA), partial least-squares to latent structures(PLS), and orthogonal PLS (OPLS), are robust methods for modeling, analyzing andinterpreting complex chemical and biological data. OPLS is a recent modificationof the PLS method. PLS is a regression method used in order to find the relationshipbetween two data tables referred to as X and Y. PLS regression (Eriksson et al.,2006b) analysis consists in calculating by means of successive iterations, linearcombinations of the measured X-variables (predictor variables). These linear com-binations of X-variables give PLS components (score vectors t). A PLS componentcan be thought of as a new variable – a latent variable – reflecting the informationin the original X-variables that is of relevance for modeling and predicting the re-sponse Y-variable by means of the maximization of the square of covariance(Max cov2(X,Y)). The number of components is determined by cross validation. SIM-CA software uses the Nonlinear Iterative Partial Least Squares algorithm (NIPALS)for the PLS regression. Orthogonal Partial Least Squares Discriminant Analysis(OPLS-DA) was used in this study (Weljie et al., 2011; Wiklund et al., 2008). Thepurpose of Discriminant Analysis is to find a model that separates groups of obser-vations on the basis of their X variables. The X matrix consists of the biochemicaldata. The Y matrix contains dummy variables which describe the group member-ship of each observation. Binary variables are used in order to encode a group iden-tity. Discriminant analysis finds a discriminant plan in which the projectedobservations are well separated according to each group. The objective of OPLS isto divide the systematic variation in the X-block into two model parts, one linearlyrelated to Y (in the case of a discriminant analysis, the group membership), and theother one unrelated (orthogonal) to Y. Components related to Y are called predic-tive, and those unrelated to Y are called orthogonal. This partitioning of the X dataresults in improved model transparency and interpretability (Eriksson et al., 2006a).Prior to analysis, variables were mean-centered and unit variance scaled.
3. Results
3.1. Mortality
Control male animals survived on average 624 ± 21 days, whilstfemales lived for 701 ± 20, during the experiment, plus in each case5 weeks of age at the beginning and 3 weeks of stabilization period.After mean survival time had elapsed, any deaths that occurredwere considered to be largely due to aging. Before this period,30% control males (three in total) and 20% females (only two) diedspontaneously, while up to 50% males and 70% females died insome groups on diets containing the GM maize (Fig. 1). However,the rate of mortality was not proportional to the treatment dose,reaching a threshold at the lowest (11%) or intermediate (22%)amounts of GM maize in the equilibrated diet, with or withoutthe R application on the plant. It is noteworthy that the first twomale rats that died in both GM treated groups had to be euthanizeddue to kidney Wilm’s tumors that were over 25% of body weight.This was at approximately a year before the first control animaldied. The first female death occurred in the 22% GM maize feedinggroup and resulted from a mammary fibroadenoma 246 days be-fore the first control. The maximum difference in males was 5times more deaths occurring during the 17th month in the groupconsuming 11% GM maize, and in females 6 times greater mortal-ity during the 21st month on the 22% GM maize diet with andwithout R. In the female cohorts, there were 2–3 times moredeaths in all treated groups compared to controls by the end ofthe experiment and earlier in general. Females were more sensitiveto the presence of R in drinking water than males, as evidenced bya shorter lifespan. The general causes of death represented in his-togram format (Fig. 1) are linked mostly to large mammary tumorsin females, and other organic problems in males.
3.2. Anatomopathological observations
All rats were carefully monitored for behavior, appearance, pal-pable tumors, infections, during the experiment, and at least 10 or-gans per animal were weighted and up to 34 analyzed postmortem, at the macroscopic and/or microscopic levels (Table 1).
G.-E. Séralini et al. / Food and Chemical Toxicology 50 (2012) 4221–4231 4223
EXHIBIT J - Page 446
Case 5:14-cv-00117-cr Document 63-11 Filed 11/14/14 Page 164 of 312

All data cannot be shown in one report, and the most relevant aredescribed here. There was no rejection by the animals of the dietwith or without GMOs, nor any major difference in the bodyweight.
The largest palpable growths (above a diameter of 17.5 mm infemales and 20 mm in males) were found to be in 95% of casesnon-regressive tumors, and were not infectious nodules. Thesegrowths progressively increased in size and number, but not pro-portionally to the treatment dose over the course of the experi-ment (Fig. 2). As in the case of rates of mortality, this suggeststhat a threshold in effect was reached at the lowest doses. Theywere rarely equal but almost always more frequent than in con-trols for all treated groups, often 2–3 times more in both sexes. Tu-mors began to reach a large size on average 94 days before intreated females, and up to 600 days earlier in 2 male groups eatingthe GM maize (11 and 22% with or without R).
In female animals, the largest tumors were in total 5 times morefrequent than in males after 2 years, with 93% being mammary tu-mors. Adenomas, fibroadenomas and carcinomas were deleteriousto health due to a very large size, rather than the grade of thetumor itself. Large tumor size caused impediments to eitherbreathing or nutrition and digestion because of their thoracic or
abdominal location and also resulted in hemorrhaging. In addition,one metastatic ovarian cystadenocarcinoma and two skin tumorswere identified. Metastases were observed in only 2 cases; one ina group fed with 11% GM maize, and another in the highest doseof R treatment group.
Up to 14 months, no animals in the control groups showed anysigns of tumors whilst 10–30% of treated females per group devel-oped tumors, with the exception of one group (33% GMO + R). Bythe beginning of the 24th month, 50–80% of female animals haddeveloped tumors in all treated groups, with up to 3 tumors peranimal, whereas only 30% of controls were affected. The R treat-ment groups showed the greatest rates of tumor incidence with80% of animals affected with up to 3 tumors for one female, in eachgroup. A summary of all mammary tumors at the end of the exper-iment, independent of the size, is presented in Table 2. The sametrend was observed in the groups receiving R in their drinkingwater; all females except one (with metastatic ovarian carcinoma)presented, in addition mammary hypertrophies and in some caseshyperplasia with atypia (Table 2).
The second most affected organ in females was the pituitarygland, in general around 2 times more than in controls for mosttreatments (Table 2). At this level again, adenomas and/or hyper-
Fig. 1. Mortality of rats fed GMO treated or not with Roundup, and effects of Roundup alone. Rats were fed with NK603 GM maize (with or without application of Roundup) atthree different doses (11, 22, 33% in their diet: thin, medium and bold lines, respectively) compared to the substantially equivalent closest isogenic non-GM maize (control,dotted line). Roundup was administrated in drinking water at 3 increasing doses, same symbols (environmental (A), MRL in agricultural GMOs (B) and half of minimalagricultural levels (C), see Section 2). Lifespan during the experiment for the control group is represented by the vertical bar ± SEM (grey area). In bar histograms, the causes ofmortality before the grey area are detailed in comparison to the controls (0). In black are represented the necessary euthanasia because of suffering in accordance with ethicalrules (tumors over 25% body weight, more than 25% weight loss, hemorrhagic bleeding, etc.); and in hatched areas, spontaneous mortality.
4224 G.-E. Séralini et al. / Food and Chemical Toxicology 50 (2012) 4221–4231
EXHIBIT J - Page 447
Case 5:14-cv-00117-cr Document 63-11 Filed 11/14/14 Page 165 of 312

plasias and hypertrophies were noticed. For all R treatment groups,70–80% of animals presented 1.4–2.4 times more abnormalitiesthan controls in this gland.
The big palpable tumors in males (in kidney, and mostly skin)were by the end of the experimental period on average twice asfrequent as in controls, in which one skin fibroma appeared duringthe 23rd month. At the end of the experiment, internal non-palpa-ble tumors were added, and their sums were lower in males than
in females. They were not really different from controls, althoughslightly above in females (Histograms Fig. 2).
The most affected organs in males were the liver, together withthe hepatodigestive tract and kidneys (Table 2 and Fig. 3). Hepaticcongestions, macroscopic and microscopic necrotic foci were 2.5–5.5 times more frequent in all treatments than in control groups.Gamma GT hepatic activity was increased in particular for GMO + Rgroups (up to 5.4 times), this being probably due to a liver disorder.
Fig. 2. Largest non-regressive tumors in rats fed GMO treated or not by Roundup, and effects of Roundup alone. The symbols of curves and treatments are explained in thecaption of Fig. 1. The largest tumors were palpable during the experiment and numbered from 20 mm in diameter for males and 17.5 mm for females. Above this size, 95% ofgrowths were non-regressive tumors. Summary of all tumors are shown in the bar histograms: black, non regressive largest tumors; white, small internal tumors; grey,metastases.
Table 2Summary of the most frequent anatomical pathologies observed.
Organs and associated pathologies Controls GMO 11% GMO 22% GMO 33% GMO 11% + R GMO 22% + R GMO 33% + R R (A) R (B) R (C)
Males, in liver 2 (2) 5 (4) 11 (7) 8 (6) 5 (4) 7 (4) 6 (5) 11 (5) 9 (7) 6 (5)In hepatodigestive tract 6 (5) 10 (6) 13 (7) 9 (6) 9 (6) 13 (6) 11 (7) 23 (9) 16 (8) 9 (5)Kidneys, CPN 3 (3) 4 (4) 5 (5) 7 (7) 5 (5) 4 (4) 4 (4) 6 (6) 5 (5) 3 (3)Females, mammary tumors 8 (5) 15 (7) 10 (7) 15 (8) 10 (6) 11 (7) 13 (9) 20 (9) 16 (10) 12 (9)In mammary glands 10 (5) 22 (8) 10 (7) 16 (8) 17 (8) 16 (8) 15 (9) 26 (10) 20 (10) 18 (9)Pituitary 9 (6) 23 (9) 20 (8) 8 (5) 19 (9) 9 (4) 19 (7) 22 (8) 16 (7) 13 (7)
After the number of pathological abnormalities, the number of rats reached is indicated in parentheses. In male animals pathological signs are liver congestions, macroscopicspots and microscopic necrotic foci. Hepatodigestive pathological signs concern the liver, stomach and small intestine (duodenum, ileum or jejunum). Only marked or severechronic progressive nephropathies (CPN) are listed, excluding two nephroblastomas in groups consuming GMO 11% and GMO 22% + Roundup. In females, mammaryfibroadenomas and adenocarcinomas are the major tumors detected; galactoceles and hyperplasias with atypia are also found and added in mammary glands pathologicalsigns. Pituitary dysfunctions include adenomas, hyperplasias and hypertrophies. For details of the various treatment groups see Fig. 1.
G.-E. Séralini et al. / Food and Chemical Toxicology 50 (2012) 4221–4231 4225
EXHIBIT J - Page 448
Case 5:14-cv-00117-cr Document 63-11 Filed 11/14/14 Page 166 of 312

In addition, cytochrome activities also generally increased in thepresence of R (in drinking water or GM diet) according to the doseup to 5.7 times at the highest dose. Transmission electron micro-scopic observations of liver samples confirmed changes for all trea-ted groups in relation to glycogen dispersion or appearance inlakes, increase of residual bodies and enlargement of cristae in
mitochondria (Fig. 4). The GM maize fed groups either with orwithout R application (in plants) showed a reduced transcriptionin mRNA and rRNA because of higher heterochromatin content,and decreased nucleolar dense fibrillar components. In theGMO + R group (at the highest dose) the smooth endoplasmicreticulum was drastically increased and nucleoli decreased in size,
Fig. 3. Anatomopathological observations in rats fed GMO treated or not by Roundup, and effects of Roundup alone. Macroscopic and microscopic photographs show malelivers (A–E) and left kidneys (F–I0), female mammary glands (J–P) and pituitaries (Q–T), according to Table 2. The number of each animal and its treatment is specified.Macroscopic pale spots (D) and microscopic necrotic foci in liver (C clear-cell focus, E basophilic focus with atypia), and marked or severe chronic progressive nephropathies,are illustrated. In females, mammary tumors (J,J0 ,N adenocarcinoma and K,K0 ,L,L0 ,O,P fibroadenomas) and pituitary adenomas (R–T) are shown and compared to controls (Cafter the rat number).
4226 G.-E. Séralini et al. / Food and Chemical Toxicology 50 (2012) 4221–4231
EXHIBIT J - Page 449
Case 5:14-cv-00117-cr Document 63-11 Filed 11/14/14 Page 167 of 312

becoming more compact. For R treatment alone similar trendswere observed, with a partial resumption of nucleolar activity atthe highest dose.
Degenerating kidneys with turgid inflammatory areas demon-strate the increased incidence of marked and severe chronic pro-gressive nephropathies, which were up to 2-fold higher in the33% GM maize or lowest dose R treatment groups (Table 2 andFig. 3).
3.3. Biochemical analyses
For the different corns and diets, the study of the standard chem-ical composition revealed no particular difference; this is why theywere classified as substantially equivalent, except for transgeneDNA quantification. For instance, there was no difference betweentotal isoflavones. In addition, other specific compounds not alwaysrequested for substantial equivalence establishment were assayed.Among phenolic acids, the only consistent and significant (p < 0.01)results concerned ferulic acid that was decreased in both GM andGM + R diets by 16–30% in comparison to the control diet(889 ± 107, 735 ± 89 respectively vs control 1057 ± 127 mg/kg)and caffeic acid by 21–53% (17.5 ± 2.1, 10.3 ± 1.3 vs control22.1 ± 2.6 mg/kg).
For biochemical measurements in rats, statistical analysis wasperformed on the results obtained from samples taken at the15th month time point, as this was the last sampling time when
most animals were still alive (in treated groups 90% males, 94% fe-males, and 100% controls). OPLS-DA 2-class models were built be-tween each treated group per sex and controls. Only models withan explained variance R2(Y) P 80%, and a cross-validated predic-tive ability Q2(Y) P 60%, were used for selection of the discrimi-nant variables (Fig. 5A), when their regression coefficients weresignificant at 99% confidence level. Thus, in treated females, kidneyfailures appeared at the biochemical level (82% of the total dis-rupted parameters). Ions (Na, Cl) or urea increased in urine.Accordingly, the same ions decreased in serum (Fig. 5B) as didthe levels of P, K and Ca. Creatinine or clairance decreased in urinefor all treatment groups in comparison to female controls (Table 3).In GM maize treated males (with or without R), 87% of discrimi-nant variables were kidney related, but the disrupted profiles wereless obvious because of advanced chronic nephropathies anddeaths. In summary, for all treatments and both sexes, 76% of thediscriminant variables versus controls were kidney related.
Moreover, in females (Table 3) the androgen/estrogen balancein serum was modified by GM maize and R treatments (at least95% confidence level, Fig. 5B), and for male animals at the highestR-treatment dose, levels of estrogens were more than doubled.
4. Discussion
This report describes the first life-long rodent (rat) feedingstudy investigating possible toxic effects rising from an R-tolerant
Fig. 4. Ultrastructure of hepatocytes in male rats from groups presenting the greatest degree of liver pathology. (1) Typical control rat hepatocyte (Bar 2 lm except in 4). (2)Effects with Roundup at the lowest dose. Glycogen (G) is dispersed in the cytoplasm. L, lipid droplet; N, nucleus; R rough endoplasmic reticulum. (3) Hepatocytes of animalfed GM maize (GMO) at 22% of total diet. Large lakes of glycogen occur in the cytoplasm. M, mitochondria. (4) Details of treatment effects with 22% dietary GMO (Bar 1 lm).(a) Cluster of residual bodies (asterisks). (b) Mitochondria show many enlarged cristae (arrows).
G.-E. Séralini et al. / Food and Chemical Toxicology 50 (2012) 4221–4231 4227
EXHIBIT J - Page 450
Case 5:14-cv-00117-cr Document 63-11 Filed 11/14/14 Page 168 of 312

GM maize (NK603) and a complete commercial formulation of R-herbicide.
Our data show that, as is often the case for hormonal diseases,most observed effects in this study were not proportional to thedose of the treatment (GM maize with and without R application;R alone), non-monotonic and with a threshold effect (Vandenberget al., 2012). Similar degrees of pathological symptoms were no-ticed in this study to occur from the lowest to the highest dosessuggesting a threshold effect. This corresponds to levels likely to
arise from consumption or environmental exposure, such as either11% GM maize in food, or 50 ng/L of glyphosate in R-formulation ascan be found in some contaminated drinking tap waters, andwhich fall within authorized limits.
The lifespan of the control group of animals corresponded to themean rat lifespan, but as is frequently the case with most mam-mals including humans (WHO, 2012), males on average died beforefemales, except for some female treatment groups. All treatmentsin both sexes enhanced large tumor incidence by 2–3-fold in com-
Fig. 5. Orthogonal Partial Least Squares-Discriminant Analysis (OPLS-DA) for biochemical data (females fed 33% GMO versus controls). (A) OPLS-DA regression coefficients forpredictive component, with jack-knifed confidence intervals at 99% confidence level, indicate discriminant parameters versus controls at month 15 (Abbreviations: U Urinary,UEx Excreted in urine during 24 h, APPT Activated Partial Thromboplastin Time, MCV Mean Corpuscular Volume, PT Prothrombine Time, RBC Red Blood Cells, ALT ALanineaminoTransferase, MCHC Mean Corpuscular Hemoglobin Concentration, A/G Albumin/Globulin ratio, WBC White Blood Cells, AST aspartate aminotransferase). (B) In thiscase, detailed examples of significant discriminant variables distribution between females fed 33% GMO (bold line) and controls (dotted line). On x axis: animals; on y axis:serum or urine biochemical values for Na, Cl, estradiol, testosterone. Profiles evidence kidney ion leakages and sex hormonal imbalance versus controls.
4228 G.-E. Séralini et al. / Food and Chemical Toxicology 50 (2012) 4221–4231
EXHIBIT J - Page 451
Case 5:14-cv-00117-cr Document 63-11 Filed 11/14/14 Page 169 of 312

parison to our controls but also for the number of mammary tu-mors in comparison to the same Harlan Sprague Dawley strain(Brix et al., 2005), and overall around 3-fold in comparison to thelargest study with 1329 Sprague Dawley female rats (Chandraet al., 1992). In our study the tumors also developed considerablyfaster than the controls, even though the majority of tumors wereobserved after 18 months. The first large detectable tumors oc-curred at 4 and 7 months into the study in males and femalesrespectively, underlining the inadequacy of the standard 90 dayfeeding trials for evaluating GM crop and food toxicity (Séraliniet al., 2011).
Suffering inducing euthanasia and deaths corresponded mostlyin females to the development of large mammary tumors. Theseappeared to be clearly related to the various treatments whencompared to the control groups. These tumors are generally knownto be mostly estrogen-dependent (Harvell et al., 2000). We ob-served a strikingly marked induction of mammary tumors by Ralone, a major formulated pesticide, even at the very lowest doseadministered. R has been shown to disrupt aromatase which syn-thesizes estrogens (Richard et al., 2005), but to also interfere withestrogen and androgen receptors in cells (Gasnier et al., 2009). Inaddition, R appears to be a sex endocrine disruptor in vivo, alsoin males (Romano et al., 2010). Sex steroids are also modified intreated rats. These hormone-dependent phenomena are confirmedby enhanced pituitary dysfunction in treated females. An estrogenmodified feedback mechanism may act at this level (Popovics et al.,2011; Walf and Frye, 2010). The similar pathological profiles pro-voked by the GM maize containing R residues may thus be ex-plained at least by R residues themselves, knowing that themedium dose of the R treatment corresponds to acceptable levelsof this pesticide residues in GMOs.
Interestingly, in the groups of animals fed with the NK603 with-out R application, similar effects with respect to enhanced tumorincidence and mortality rates were observed. A possible explana-tion for this finding is the production of specific compound(s) inthe GM feed that are either directly toxic and/or cause the inhibi-tion of pathways that in turn generate chronic toxic effects. This isdespite the fact that the variety of GM maize used is this study wasjudged by industry and regulators as being substantially equivalentto the corresponding non-GM closest isogenic line. As the totalchemical composition of the GM maize cannot be measured in de-tails, the use of substantial equivalence is insufficient to highlightpotential unknown toxins and therefore cannot replace long-termanimal feeding trials for GMOs. A cause of the effects of the effectscould be that the NK603 GM maize used in this study is engineered
to overexpress a modified version of the Agrobacterium tumefaciens5-enolpyruvylshikimate-3-phosphate synthase (EPSPS) (Ham-mond et al., 2004) allowing the R tolerance. The modified EPSPSis not inhibited by glyphosate by contrast to the wild enzyme. Thisenzyme is known to drive the first step of aromatic amino acid bio-synthesis in the plant shikimate pathway; in addition estrogenicisoflavones and their glycosides are also products of this pathway(Duke et al., 2003). They were not disturbed in our study. By con-trast, the levels of caffeic and ferulic acids in the GM diets, whichare also secondary metabolites from this pathway, but not alwaysmeasured in regulatory tests, are significantly reduced. This maylower their protective effects against carcinogenesis and evenmammalian tumors (Kuenzig et al., 1984; Baskaran et al., 2010).Moreover, these phenolic acids and in particular ferulic acid maymodulate estrogen receptors or the estrogenic pathway in mam-malian cells (Chang et al., 2006). This does not exclude the actionof other unknown metabolites. This explanation also correspondsto the fact that the observed effects of NK603 and R are not addi-tive and reached a threshold. This implies that both the NK603maize and R may cause hormonal disturbances in the samebiochemical and physiological pathway.
As expected, mammary tumors in males occurred far less fre-quently than in females. Death in male rats was mostly due tothe development of severe hepatorenal insufficiencies, confirmingthe first signs of toxicity observed in 90 day feeding trials withNK603 maize (Spiroux de Vendômois et al., 2009). In females, kid-ney ion leakages were evidenced at the biochemical levels atmonth 15, when severe nephropathies were evidenced in deadmale animals afterwards, at the anatomopathological level. Earlysigns of toxicity at month 3 in kidney and liver were also observedfor 19 edible GM crops containing pesticide residues (Séralini et al.,2011). As a matter of fact, only elderly male rats are sensitive tochronic progressive nephropathies (Hard and Khan, 2004). The dis-turbed kidney parameters may have been induced by the reductionof phenolic acids in our study, since caffeic and ferulic acids arebeneficial in the kidney as they prevent oxidative stress (Srinivasanet al., 2005; U Rehman and Sultana, 2011). Accordingly, we previ-ously demonstrated that plant extracts containing ferulic and caf-feic acids were able to promote detoxification of embryonic kidneycells after R contamination (Gasnier et al., 2011). It is thus possiblethat NK603 consumption by reducing these compounds may wellprovoke an early aging of kidney physiology in this study, like Rby oxidative stress.
Disturbances that we found to occur in the male liver arecharacteristic of a chronic intoxication, confirmed by alterations
Table 3Percentage variation of parameters indicating kidney failures of female animals.
Discriminant variables GMO 11% + R GMO 22% + R GMO 33% + R GMO 11% GMO 22% GMO 33% R (A) R (B) R (C)
Urinary decrease Clairance �4 �11 �20 �20 �20 �19 �20 �24 �40Creatinine �5 �32 �37 �19 �37 �36 �43 �23 �1Creatinine ex �5 �11 �19 �18 �17 �21 �21 �22 �39
Urinary increase Urea 12 18 15 15 12 �1 0 13 32Na 25 33 30 52 �2 95 62 65 91Na ex 24 50 68 50 24 125 108 51 7Cl 14 35 28 46 5 101 67 56 94Cl ex 20 63 70 51 31 138 121 48 13
Serum decrease Na 2 1 1 �1 �4 �6 �7 0 �3Cl �1 �2 �2 �5 �7 �6 �8 �1 �4P �6 �11 �13 �17 �18 �20 �32 �9 �13K 4 5 10 2 �4 0 �4 8 �5Ca 4 3 3 2 �2 �5 �6 3 �6
Gonads Estradiol 8 �1 2 5 �2 �25 �26 �73 39Testosterone 5 �9 27 56 17 81 97 �72 10
OPLS-DA was performed on 48 variables at month 15. Here we showed mean differences (%) of variables (discriminant at 99% confidence level, in bold character) indicatingkidney parameters of female animals, together with sex hormones. Male kidney pathologies are already illustrated in Table 2.
G.-E. Séralini et al. / Food and Chemical Toxicology 50 (2012) 4221–4231 4229
EXHIBIT J - Page 452
Case 5:14-cv-00117-cr Document 63-11 Filed 11/14/14 Page 170 of 312

in biochemical liver and kidney function parameters. The observa-tion that liver function in female animals is less affected may bedue to their physiology being better adapted to estrogen metabo-lism. Furthermore, liver enzymes have been clearly demonstratedas sex-specific in their expression patterns, including in a 90-dayrat feeding trial of NK603 maize (Spiroux de Vendômois et al.,2009). However, in a long-term study, evidence of early liver agingwas observed in female mice fed with R-tolerant GM soy (Malates-ta et al., 2008a). In the present investigation, deeper analysis at anultrastructural level revealed evidence of impediments in tran-scription and other defects in cell nuclear structure that were com-parable in both sexes, and dose-dependent in hepatocytes in alltreatments. This is consistent with the well-documented toxic ef-fect of very low dilutions of R on apoptosis, mitochondrial function,and cell membrane degradation inducing necrosis of hepatocytes,and other cell lines (Benachour and Seralini, 2009; Benachouret al., 2007; Gasnier et al., 2010; Peixoto, 2005).
The disruptions of at least the estrogen-related pathways and/or enhancement of oxidative stress by all treatments need furtherinvestigations. This can be addressed through the application oftranscriptomic, proteomic and metabolomic methods to analyzethe molecular profiles of kidneys and livers, as well as the GMNK603 maize (Jiao et al., 2010; Zhou et al., 2009; Zolla et al.,2008). Other possible causes of observed pathogenic effects maybe due to disturbed gene expression resulting from the transgeneinsertional, general mutagenic or metabolic effects (Latham et al.,2006; Wilson et al., 2006) as has been shown for MON810 GMmaize (Rosati et al., 2008). A consequent disruption of generalmetabolism in the GMO cannot be excluded, which could lead,for example, to the production of other potentially active com-pounds such as miRNAs (Zhang et al., 2012) or leukotoxin diols(Markaverich et al., 2005).
In conclusion, it was previously known that glyphosate con-sumption in water above authorized limits may provoke hepaticand kidney failures (EPA). The results of the study presented hereclearly demonstrate that lower levels of complete agricultural gly-phosate herbicide formulations, at concentrations well below offi-cially set safety limits, induce severe hormone-dependentmammary, hepatic and kidney disturbances. Similarly, disruptionof biosynthetic pathways that may result from overexpression ofthe EPSPS transgene in the GM NK603 maize can give rise to com-parable pathologies that may be linked to abnormal or unbalancedphenolic acids metabolites, or related compounds. Other muta-genic and metabolic effects of the edible GMO cannot be excluded.This will be the subject of future studies, including transgene andglyphosate presence in rat tissues. Reproductive and multigenera-tional studies will also provide novel insights into these problems.This study represents the first detailed documentation of long-term deleterious effects arising from the consumption of a GM R-tolerant maize and of R, the most used herbicide worldwide.
Altogether, the significant biochemical disturbances and physi-ological failures documented in this work confirm the pathologicaleffects of these GMO and R treatments in both sexes, with differentamplitudes. We propose that agricultural edible GMOs and formu-lated pesticides must be evaluated very carefully by long termstudies to measure their potential toxic effects.
Conflict of Interest
The authors declare that there are no conflicts of interest.
Acknowledgments
We thank Michael Antoniou for English assistance and con-structive comments on the manuscript, as well as Herrade Hem-
merdinger for proofreading. We gratefully acknowledge theAssociation CERES, the Foundation ‘‘Charles Leopold Mayer pourle Progrès de l’Homme’’, the French Ministry of Research, and CRI-IGEN for their major support.
References
Baskaran, N., Manoharan, S., Balakrishnan, S., Pugalendhi, P., 2010.Chemopreventive potential of ferulic acid in 7,12-dimethylbenz[a]anthracene-induced mammary carcinogenesis in Sprague-Dawley rats. Eur. J. Pharmacol.637, 22–29.
Benachour, N., Seralini, G.E., 2009. Glyphosate formulations induce apoptosis andnecrosis in human umbilical, embryonic, and placental cells. Chem. Res. Toxicol.22, 97–105.
Benachour, N., Sipahutar, H., Moslemi, S., Gasnier, C., Travert, C., Seralini, G.E., 2007.Time- and dose-dependent effects of Roundup on human embryonic andplacental cells. Arch. Environ. Contam. Toxicol. 53, 126–133.
Brix, A.E., Nyska, A., Haseman, J.K., Sells, D.M., Jokinen, M.P., Walker, N.J., 2005.Incidences of selected lesions in control female Harlan Sprague-Dawley ratsfrom two-year studies performed by the National Toxicology Program. Toxicol.Pathol. 33, 477–483.
Chandra, M., Riley, M.G., Johnson, D.E., 1992. Spontaneous neoplasms in agedSprague-Dawley rats. Arch. Toxicol. 66, 496–502.
Chang, C.J., Chiu, J.H., Tseng, L.M., Chang, C.H., Chien, T.M., Wu, C.W., Lui, W.Y., 2006.Modulation of HER2 expression by ferulic acid on human breast cancer MCF7cells. Eur. J. Clin. Invest. 36, 588–596.
Cox, C., 2004. Herbicide factsheet – Glyphosate. J. pestic. reform 24, 10–15.Cox, C., Surgan, M., 2006. Unidentified inert ingredients in pesticides: implications
for human and environmental health. Environ. Health Perspect. 114, 1803–1806.
Domingo, J.L., Giné Bordonaba, J., 2011. A literature review on the safety assessmentof genetically modified plants. Environ. Int. 37, 734–742.
Duke, S.O., Rimando, A.M., Pace, P.F., Reddy, K.N., Smeda, R.J., 2003. Isoflavone,glyphosate, and aminomethylphosphonic acid levels in seeds of glyphosate-treated, glyphosate-resistant soybean. J. Agric. Food. Chem. 51, 340–344.
EPA, 2012. Basic Information about Glyphosate in Drinking Water. <http://water.epa.gov/drink/contaminants/basicinformation/glyphosate.cfm> (Lastaccess June).
Eriksson, L., Johansson, E., Kettaneh-Wold, N., Trygg, J., Wikström, C., Wold, S.,2006a. Multi- and Megavariate Data Analysis Part II Advanced Applications andMethod Extensions. Umetrics, Umea, Sweden.
Eriksson, L., Johansson, E., kettaneh-Wold, N., Wold, S., 2006b. Multi andMegavariate Data Analysis Part I – Principles and Applications. Umetrics AB,Umea, Sweden.
Gasnier, C., Benachour, N., Clair, E., Travert, C., Langlois, F., Laurant, C., Decroix-Laporte, C., Séralini, G.-E., 2010. Dig1 protects against cell death provoked byglyphosate-based herbicides in human liver cell lines. J. Occup. Med. Toxicol. 5,29.
Gasnier, C., Dumont, C., Benachour, N., Clair, E., Chagnon, M.C., Seralini, G.E., 2009.Glyphosate-based herbicides are toxic and endocrine disruptors in human celllines. Toxicology 262, 184–191.
Gasnier, C., Laurant, C., Decroix-Laporte, C., Mesnage, R., Clair, E., Travert, C., Séralini,G.E., 2011. Defined plant extracts can protect human cells against combinedxenobiotic effects. J. Occup. Med. Toxicol. 6, 3.
Hammond, B., Dudek, R., Lemen, J., Nemeth, M., 2004. Results of a 13 week safetyassurance study with rats fed grain from glyphosate tolerant corn. Food Chem.Toxicol. 42, 1003–1014.
Hammond, B., Lemen, J., Dudek, R., Ward, D., Jiang, C., Nemeth, M., Burns, J., 2006a.Results of a 90 day safety assurance study with rats fed grain from cornrootworm-protected corn. Food Chem. Toxicol. 44, 147–160.
Hammond, B.G., Dudek, R., Lemen, J.K., Nemeth, M.A., 2006b. Results of a 90 daysafety assurance study with rats fed grain from corn borer-protected corn. FoodChem. Toxicol. 44, 1092–1099.
Hard, G.C., Khan, K.N., 2004. A contemporary overview of chronic progressivenephropathy in the laboratory rat, and its significance for human riskassessment. Toxicol. Pathol. 32, 171–180.
Harvell, D.M., Strecker, T.E., Tochacek, M., Xie, B., Pennington, K.L., McComb, R.D.,Roy, S.K., Shull, J.D., 2000. Rat strain-specific actions of 17beta-estradiol in themammary gland: correlation between estrogen-induced lobuloalveolarhyperplasia and susceptibility to estrogen-induced mammary cancers. Proc.Natl. Acad. Sci. USA 97, 2779–2784.
Jiao, Z., Si, X.X., Li, G.K., Zhang, Z.M., Xu, X.P., 2010. Unintended compositionalchanges in transgenic rice seeds (Oryza sativa L.) studied by spectral andchromatographic analysis coupled with chemometrics methods. J. Agric. Food.Chem. 58, 1746–1754.
Krogh, K.A., Vejrup, K.V., Mogensen, B.B., Halling-Sørensen, B., 2002. Liquidchromatography-mass spectrometry method to determine alcohol ethoxylatesand alkylamine ethoxylates in soil interstitial water, ground water and surfacewater samples. J. Chromatogr. A 957, 45–57.
Kuenzig, W., Chau, J., Norkus, E., Holowaschenko, H., Newmark, H., Mergens, W.,Conney, A.H., 1984. Caffeic and ferulic acid as blockers of nitrosamineformation. Carcinogenesis 5, 309–313.
Latham, J.R., Wilson, A.K., Steinbrecher, R.A., 2006. The mutational consequences ofplant transformation. J. Biomed. Biotechnol. 2006, 25376.
4230 G.-E. Séralini et al. / Food and Chemical Toxicology 50 (2012) 4221–4231
EXHIBIT J - Page 453
Case 5:14-cv-00117-cr Document 63-11 Filed 11/14/14 Page 171 of 312

Malatesta, M., Boraldi, F., Annovi, G., Baldelli, B., Battistelli, S., Biggiogera, M.,Quaglino, D., 2008a. A long-term study on female mice fed on a geneticallymodified soybean: effects on liver ageing. Histochem. Cell Biol. 130, 967–977.
Malatesta, M., Caporaloni, C., Gavaudan, S., Rocchi, M.B., Serafini, S., Tiberi, C.,Gazzanelli, G., 2002a. Ultrastructural morphometrical andimmunocytochemical analyses of hepatocyte nuclei from mice fed ongenetically modified soybean. Cell Struct. Funct. 27, 173–180.
Malatesta, M., Caporaloni, C., Rossi, L., Battistelli, S., Rocchi, M.B., Tonucci, F.,Gazzanelli, G., 2002b. Ultrastructural analysis of pancreatic acinar cells frommice fed on genetically modified soybean. J. Anat. 201, 409–415.
Malatesta, M., Perdoni, F., Santin, G., Battistelli, S., Muller, S., Biggiogera, M., 2008b.Hepatoma tissue culture (HTC) cells as a model for investigating the effects oflow concentrations of herbicide on cell structure and function. Toxicol. In Vitro22, 1853–1860.
Markaverich, B.M., Crowley, J.R., Alejandro, M.A., Shoulars, K., Casajuna, N., Mani, S.,Reyna, A., Sharp, J., 2005. Leukotoxin diols from ground corncob bedding disruptestrous cyclicity in rats and stimulate MCF-7 breast cancer cell proliferation.Environ. Health Perspect. 113, 1698–1704.
Mesnage, R., Clair, E., Séralini, G.-E., 2010. Roundup in Genetically modifiedcrops: Regulation and toxicity in mammals. Theorie in der Ökologie 16,31–33.
Monosson, E., 2005. Chemical mixtures: considering the evolution of toxicology andchemical assessment. Environ. Health Perspect. 113, 383–390.
Peixoto, F., 2005. Comparative effects of the Roundup and glyphosate onmitochondrial oxidative phosphorylation. Chemosphere 61, 1115–1122.
Popovics, P., Rekasi, Z., Stewart, A.J., Kovacs, M., 2011. Regulation of pituitaryinhibin/activin subunits and follistatin gene expression by GnRH in female rats.J. Endocrinol. 210, 71–79.
Richard, S., Moslemi, S., Sipahutar, H., Benachour, N., Seralini, G.E., 2005. Differentialeffects of glyphosate and roundup on human placental cells and aromatase.Environ. Health Perspect. 113, 716–720.
Romano, M.A., Romano, R.M., Santos, L.D., Wisniewski, P., Campos, D.A., de Souza,P.B., Viau, P., Bernardi, M.M., Nunes, M.T., de Oliveira, C.A., 2012. Glyphosateimpairs male offspring reproductive development by disrupting gonadotropinexpression. Arch. Toxicol. 86, 663–673.
Romano, R.M., Romano, M.A., Bernardi, M.M., Furtado, P.V., Oliveira, C.A., 2010.Prepubertal exposure to commercial formulation of the herbicide glyphosatealters testosterone levels and testicular morphology. Arch. Toxicol. 84, 309–317.
Rosati, A., Bogani, P., Santarlasci, A., Buiatti, M., 2008. Characterisation of 30
transgene insertion site and derived mRNAs in MON810 YieldGard maize. PlantMol. Biol. 67, 271–281.
Séralini, G.-E., Cellier, D., de Vendomois, J.S., 2007. New analysis of a rat feedingstudy with a genetically modified maize reveals signs of hepatorenal toxicity.Arch. Environ. Contam. Toxicol. 52, 596–602.
Séralini, G.-E., Mesnage, R., Clair, E., Gress, S., Spiroux De Vendomois, J., Cellier, D.,2011. Genetically modified crops safety assessments: present limits andpossible improvements. Environ. Sci. Eur., 23.
Séralini, G.E., Spiroux de Vendomois, J., Cellier, D., Sultan, C., Buiatti, M., Gallagher,L., Antoniou, M., Dronamraju, K.R., 2009. How subchronic and chronic healtheffects can be neglected for GMOs, pesticides or chemicals. Int. J. Biol. Sci. 5,438–443.
Snell, C., Bernheim, A., Bergé, J.-B., Kuntz, M., Pascal, G., Paris, A., Ricroch, A.E., 2011.Assessment of the health impact of GM plant diets in long-term andmultigenerational animal feeding trials: a literature review. Food Chem.Toxicol. 50, 1134–1148.
Spiroux de Vendômois, J., Cellier, D., Velot, C., Clair, E., Mesnage, R., Seralini, G.E.,2010. Debate on GMOs health risks after statistical findings in regulatory tests.Int. J. Biol. Sci. 6, 590–598.
Spiroux de Vendômois, J., Roullier, F., Cellier, D., Seralini, G.E., 2009. A comparison ofthe effects of three GM corn varieties on mammalian health. Int. J. Biol. Sci. 5,706–726.
Srinivasan, M., Rukkumani, R., Ram Sudheer, A., Menon, V.P., 2005. Ferulic acid, anatural protector against carbon tetrachloride-induced toxicity. Fundam. Clin.Pharmacol. 19, 491–496.
U Rehman, M., Sultana, S., 2011. Attenuation of oxidative stress, inflammation andearly markers of tumor promotion by caffeic acid in Fe-NTA exposed kidneys ofWistar rats. Mol. Cell. Biochem. 357, 115–124.
Vandenberg, L.N., Colborn, T., Hayes, T.B., Heindel, J.J., Jacobs Jr., D.R., Lee, D.H.,Shioda, T., Soto, A.M., Vom Saal, F.S., Welshons, W.V., Zoeller, R.T., Myers, J.P.,2012. Hormones and endocrine-disrupting chemicals: low-dose effects andnonmonotonic dose responses. Endocr. Rev. 33, 378–455.
Walf, A.A., Frye, C.A., 2010. Raloxifene and/or estradiol decrease anxiety-like anddepressive-like behavior, whereas only estradiol increases carcinogen-inducedtumorigenesis and uterine proliferation among ovariectomized rats. Behav.Pharmacol. 21, 231–240.
Weljie, A.M., Bondareva, A., Zang, P., Jirik, F.R., 2011. 1H NMR metabolomicsidentification of markers of hypoxia-induced metabolic shifts in a breast cancermodel system. J. Biomol. NMR 49, 185–193.
WHO, 2012. World Health Statistics. WHO Press. <http://who.int> (Last accessAugust).
Wiklund, S., Johansson, E., Sjostrom, L., Mellerowicz, E.J., Edlund, U., Shockcor, J.P.,Gottfries, J., Moritz, T., Trygg, J., 2008. Visualization of GC/TOF-MS-basedmetabolomics data for identification of biochemically interesting compoundsusing OPLS class models. Anal. Chem. 80, 115–122.
Williams, G.M., Kroes, R., Munro, I.C., 2000. Safety evaluation and risk assessment ofthe herbicide Roundup and its active ingredient, glyphosate, for humans. Regul.Toxicol. Pharmacol. 31, 117–165.
Wilson, A.K., Latham, J.R., Steinbrecher, R.A., 2006. Transformation-inducedmutations in transgenic plants: analysis and biosafety implications.Biotechnol. Genet. Eng. Rev. 23, 209–237.
Zhang, L., Hou, D., Chen, X., Li, D., Zhu, L., Zhang, Y., Li, J., Bian, Z., Liang, X., Cai, X.,Yin, Y., Wang, C., Zhang, T., Zhu, D., Zhang, D., Xu, J., Chen, Q., Ba, Y., Liu, J., Wang,Q., Chen, J., Wang, J., Wang, M., Zhang, Q., Zhang, J., Zen, K., Zhang, C.Y., 2012.Exogenous plant MIR168a specifically targets mammalian LDLRAP1: evidenceof cross-kingdom regulation by microRNA. Cell Res. 22, 107–126.
Zhou, J., Ma, C., Xu, H., Yuan, K., Lu, X., Zhu, Z., Wu, Y., Xu, G., 2009. Metabolicprofiling of transgenic rice with cryIAc and sck genes: an evaluation ofunintended effects at metabolic level by using GC-FID and GC-MS. J.Chromatogr. B. Analyt. Technol. Biomed. Life Sci. 877, 725–732.
Zolla, L., Rinalducci, S., Antonioli, P., Righetti, P.G., 2008. Proteomics as acomplementary tool for identifying unintended side effects occurring intransgenic maize seeds as a result of genetic modifications. J. Proteome Res.7, 1850–1861.
G.-E. Séralini et al. / Food and Chemical Toxicology 50 (2012) 4221–4231 4231
EXHIBIT J - Page 454
Case 5:14-cv-00117-cr Document 63-11 Filed 11/14/14 Page 172 of 312

Reply to letters to the editor
Answers to critics: Why there is a long term toxicity due to a Roundup-tolerant genetically modified maize and to a Roundup herbicide
Gilles-Eric Séralini a,⇑, Robin Mesnage a, Nicolas Defarge a, Steeve Gress a, Didier Hennequin c, Emilie Clair a,Manuela Malatesta b, Joël Spiroux de Vendômois a
a University of Caen, Institute of Biology, EA2608 and CRIIGEN and Network on Risks, MRSH-CNRS, Esplanade de la Paix, 14032 Caen Cedex, Franceb University of Verona, Department of Neurological, Neuropsychological, Morphological and Motor Sciences, 37134 Verona, Italyc University of Caen, Network on Risks, MRSH-CNRS, Bd Maréchal Juin, 14032 Caen Cedex, France
a r t i c l e i n f o
Article history:Available online xxxx
Keywords:GMORoundupNK603RatGlyphosate-based herbicidesEndocrine disrupting effectsAnswers to critics
a b s t r a c t
Our recent work (Séralini et al., 2012) remains to date the most detailed study involving the life-long con-sumption of an agricultural genetically modified organism (GMO). This is true especially for NK603 maizefor which only a 90-day test for commercial release was previously conducted using the same rat strain(Hammond et al., 2004). It is also the first long term detailed research on mammals exposed to a highlydiluted pesticide in its total formulation with adjuvants. This may explain why 75% of our first criticismsarising within a week, among publishing authors, come from plant biologists, some developing patentson GMOs, even if it was a toxicological paper on mammals, and from Monsanto Company who owns boththe NK603 GM maize and Roundup herbicide (R). Our study has limits like any one, and here we carefullyanswer to all criticisms from agencies, consultants and scientists, that were sent to the Editor or to our-selves. At this level, a full debate is biased if the toxicity tests on mammals of NK603 and R obtained byMonsanto Company remain confidential and thus unavailable in an electronic format for the whole sci-entific community to conduct independent scrutiny of the raw data. In our article, the conclusions oflong-term NK603 and Roundup toxicities came from the statistically highly discriminant findings atthe biochemical level in treated groups in comparison to controls, because these findings do correspondin an blinded analysis to the pathologies observed in organs, that were in turn linked to the deaths byanatomopathologists. GM NK603 and R cannot be regarded as safe to date.
� 2012 Elsevier Ltd. All rights reserved.
1. Introduction
Our recent publication of research evaluating the long term tox-icity of a NK603 Roundup-tolerant genetically modified (GM)maize and of a Roundup (R) herbicide (Séralini et al., 2012) hasprovoked numerous positive and negative reactions throughoutthe world. This is the way science moves forward and here we pro-vide a response to this intense debate. Our work is the most de-tailed study involving the life-long consumption of anagricultural genetically modified organism (GMO), and especiallyon NK603 for which only a 90-day safety test was previously con-ducted and using the same rat strain (Hammond et al., 2004). It isalso the first long term detailed research on mammals exposed to ahighly diluted pesticide in its total formulation with adjuvants.These adjuvants help to stabilize the active principles of pesticides,and promote a better penetration into organisms, and thus moreside-effects. R is the most widely used herbicide in the world,
which we tested from levels arising in tap water. Indeed in ourstudy, its active principle glyphosate (G) was not studied alone,contrasting with the long term experiments conducted by themanufacturer as part of its application for regulatory approval.As such, the debate in question here is at the cornerstone of scienceand regulatory issues on this topic. This fact has major economicramifications for the development of such products, which can ex-plain the severe comments posted within hours of our publicationbecoming available online. This may explain why 75% of our firstcriticisms arising within a week, among publishing authors, comefrom plant biologists, some developing patents on GMOs, even ifit was a toxicological paper on mammals, and from MonsantoCompany who owns both the NK603 GM maize and R herbicide.
We must firstly focus on science. Our work is a research study;it has not a direct regulatory purpose and should not be consideredas a final point in knowing the toxicological effects of NK603 and R.This is a first step in the iterative investigation of the long-termhealth effects on mammals of these commercial products thatshould be replicated independently, as well as on developingmammals. It has limits like any study, and here we carefully an-swer to all criticisms from agencies, consultants and scientists, that
0278-6915/$ - see front matter � 2012 Elsevier Ltd. All rights reserved.http://dx.doi.org/10.1016/j.fct.2012.11.007
DOI of original article: http://dx.doi.org/10.1016/j.fct.2012.10.057⇑ Corresponding author.
E-mail address: [email protected] (G.-E. Séralini).
Food and Chemical Toxicology xxx (2012) xxx–xxx
Contents lists available at SciVerse ScienceDirect
Food and Chemical Toxicology
journal homepage: www.elsevier .com/locate / foodchemtox
Please cite this article in press as: Séralini, G.-E., et al. Answers to critics: Why there is a long term toxicity due to a Roundup- tolerant genetically modifiedmaize and to a Roundup herbicide. Food Chem. Toxicol. (2012), http://dx.doi.org/10.1016/j.fct.2012.11.007
EXHIBIT J - Page 455
Case 5:14-cv-00117-cr Document 63-11 Filed 11/14/14 Page 173 of 312

were sent to the Editor of Food & Chemical Toxicology or to our-selves. These challenged our results and the validity of our proto-col, some letters even requested the withdrawal of thepublication from the journal. All remarks and answers are summa-rized in Table 1 and with some explanatory details given below.
At this level, a full debate is biased if the toxicity tests on mam-mals of NK603 and R obtained by Monsanto Company remain con-fidential and thus unavailable for the scientific community toconduct independent scrutiny of their raw data. This is why, afterseveral exchanges, we requested again from the European FoodSafety Agency (EFSA) on September 20th and October 18th 2012the release on a public website of the raw data on health risks onthe basis of which commercialization of these products wasgranted, in particular results from the longest study of NK603and Roundup on mammals (Hammond et al., 2004). We ask for afree and transparent exchange of scientific findings, mainly whenthese are related to public health and environmental risks (Schre-ider et al., 2010). Examination of industry raw data previously evi-denced divergence of regulatory decisions from scientific evidenceunderestimating toxicological features of G (Antoniou et al., 2012).We recall that the tests on rats are usually considered as a modelfor mammalian health before clinical trials (for example for phar-maceuticals) or for a direct market release (for novel food and feed,pesticides or chemicals). Moreover, tests on rats are also models forenvironmental risk assessment, since they are models for otherwildlife mammals. The public release of these raw data will revealif significant differences observed between test and control groupsin both studies are coherent and if the statistics are of sufficientpower in both cases, thereby allowing the design of appropriatefollow-up experiments by others, perhaps through a publically dis-cussed and agreed protocol.
2. Relevance of the scientific context
Some remarks emphasize a lack of context, claiming that thestudy was performed for non-scientific reasons. The establishmentof this protocol was however the consequence of an intense debateabout the biological relevance of numerous statistically significantdifferences compared to controls revealed and admitted to in 90-day feeding studies with agricultural GMOs (Spiroux de Vendomoiset al., 2010). This is highly controversial, with companies and reg-ulatory agencies having refuted findings, which were validated bya peer reviewed process in international journals (EFSA, 2007;Séralini et al., 2007). Indeed, regulatory agencies such as EFSA ap-pear to have their own criteria to judge the biological relevance ofresearch findings (Doull et al., 2007), which is markedly at oddswith some recent knowledge. This includes cases of sex specificnon-linear endocrine disruptions, which were not admitted to asvalid at a regulatory level although accepted at a scientific researchlevel (Myers et al., 2009b). In order to overcome the divergence inbiological interpretation of early signs of toxicity in blood bio-chemistry for GMOs, one solution was to prolong 90-day feedingtests to chronic periods. We therefore chose the R tolerantNK603 GM maize because R tolerance is the trait present inapproximately 80% of agricultural GMOs (James, 2011) and be-cause statistical differences in the 90-day feeding trial with thismaize were admitted to by both the petitioner and regulatoryagencies (EFSA, 2009).
3. Originality and limits of the experimental design
Due to the economic and regulatory issues of this topic, it is notsurprising that our research study was confounded with pre-com-mercial regulatory assessments. This is why the most commoncriticism questions the following of Organization for Economic
Co-operation and Development (OECD) guidelines. However, noguidelines exist for GMO toxicity studies in vivo, which are stillnot mandatory. Published reviews have confirmed that most ofthe studies conducted to date did not follow specific guidelinesor were contradictory (Domingo, 2007; Domingo and Giné Bordon-aba, 2011). We compared our design (Table 1 of Séralini et al.,2012) to Hammond et al. (2004) inspired from OECD guideline408 for chemicals. We have replicated, extended and thus im-proved the experiments conducted by Hammond and colleagues(Hammond et al., 2004) by measuring outcomes from 3 insteadof 2 feed doses and more crucially for a period 8 times longer induration (90-days vs 2 years), with 11 blood and urine measuresof around 50 parameters, 34 organs instead of 17, etc., in orderto ascertain if the statistical findings (observed at 90 days; Ham-mond et al., 2004), were biologically relevant or not in the longterm. We thus biochemically measured 10 rats per sex per groupas performed by Monsanto. Even for a study of up to two years,we had no reason to monitor biochemical effects on more than10 animals per sex per group as this is the number recommendedin OECD guideline 452 for chronic toxicity testing (OECD 1981 wasin application when the study started in 2008), even if 20 animalsper group or more are possible.
The purpose of the addition of R treated groups was not to as-sess R long term carcinogenesis, which needs to follow OECD 453guideline with at least 50 rats per sex per group (even if 10 ratsare then still measured at a biochemical level). The aim of ourstudy was to test R under similar conditions to the GM maize in or-der to try and understand if residues of R in the feed could explainthe possible pathologies that may arise. There were two main po-tential sources of harm tested in our study: (i) effects from the GMmaize itself, treated or not with R, and (ii) herbicide residues alonein drinking water, using 3 doses for each treatment. We recall thatthe initial investigation published by Hammond and colleagues(Hammond et al., 2004) used 2 doses for each treatment group de-spite that fact that 3 doses are recommended by OECD guideline408, which they reported to have followed.
In addition, one of the criteria for biological relevance employedby Monsanto and other critics of our study is the linearity or lackthereof in response to the dose. Such a dose–response relationshipcannot be claimed from a trial using only 2 doses of test material asemployed in the initial NK603 assessment (Hammond et al., 2004).We therefore find it surprising that the relevance of Monsanto’sand the agencies’ conclusion of safety was not challenged due tosuch protocol insufficiencies. A recent review of the literature is of-ten cited as a proof of the safety of GMO consumption on a long-term basis (Snell et al., 2012). However, of the 24 studies they eval-uated, only 2 are long-term on rodents, since a 2 year feeding per-iod with pigs or cows do not constitute a life-long experiments. The2 rodent studies quoted by Snell and colleagues are from Sakamotoet al. (2008) where not all rats fed transgenic soy were analyzed,and Malatesta et al. (2008a) in mice fed again GM soy, whichshowed at an electronic microscopy level effects of this producton hepatic function. Moreover, of the 24 studies cited, 16 did notmention the use of the closest isogenic non-GM line as a control,many did not describe the methods in detail, and contained addi-tional deficiencies (Snell et al., 2012). However, all these studieswere accepted as proof of safety regardless of the inadequacieshighlighted here. It would appear that conclusions of safety seemto need fewer requirements than conclusions of toxicity. However,scientifically it is easier to conclude an outcome of toxicity thansafety. This was not the first time regulatory agencies used suchdouble standards to minimize independent research findings in re-gard to industry findings (Hilbeck et al., 2012; Myers et al., 2009a).Our control groups were also questioned and this needs some clar-ification. Some claimed that controls are lacking for all 4 testgroups (GMO+R and GMO alone at 11% and 22%). We compared
2 G.-E. Séralini et al. / Food and Chemical Toxicology xxx (2012) xxx–xxx
Please cite this article in press as: Séralini, G.-E., et al. Answers to critics: Why there is a long term toxicity due to a Roundup- tolerant genetically modifiedmaize and to a Roundup herbicide. Food Chem. Toxicol. (2012), http://dx.doi.org/10.1016/j.fct.2012.11.007
EXHIBIT J - Page 456
Case 5:14-cv-00117-cr Document 63-11 Filed 11/14/14 Page 174 of 312

Table 1Summary of criticisms and responses on Séralini et al. long-term NK603 GM maize and Roundup toxicity rat study.
Criticisms Answers
Relevance of the scientific contextNo scientific context This study addresses biological interpretations of early signs of toxicity in
biochemistry after 90-day feeding trials (Spiroux de Vendomois et al., 2010)OECD guidelines not respected No guidelines exist for GMO animal studies. Protocol based and adapted from
OECD 408 and 452Protocol not adapted to tumor findings This is not a carcinogenesis study, but a long term full toxicological studyGLP violation because of amendments Research protocols not adapted to GLP agreement because of amendments. The
experiment was conducted under a GLP environment and conditionsHistory of flaw by the authors which are not toxicologists. Previous studies of the
group rejectedMore than 26 international scientific peer reviewed papers by the team with thelead author on the topic in the last 5 years, and 11 in toxicological journals on thesame period only in PubMed. One author, Malatesta, has also published on GMO/pesticide health risks. None of the papers was considered as flawed by thescientific community. Regulatory agencies or Monsanto are not scientific peerreviewed journal systems
Lack of signs in 90 days Statistical differences in biochemical parameters of liver and kidney functionrecognized by both industry and agencies
Not the first long term study First chronic investigation with NK603 GM maize; others of two years in farmanimals are not over the entire lifespan; the most detailed study for all agriculturalGMOs and a formulated pesticide
Originality and limits of the experimental designChoice of the rat strain (sensitivity to mammary tumors and nephropathies in
males)Necessity to have sensitive strains, recommended by the US National ToxicologyProgram (King-Herbert et al. 2010). Rats and mice have been preferredexperimental models because of their susceptibility to tumor induction (OECDguidelines) Relevant comparisons to controls in this work
Number of rats per group OECD 408 (90-day toxicity study) 10 animals per group OECD 452 (Chronictoxicity study) 20 animals per group but at least 10 animals per group are studiedfor hematological and clinical biochemical function
Missing data: diet composition and process, PCR analysis of batches, contaminants(mycotoxins, pesticides), storage (R in water, BPA, feed), isogenic line, cultureconditions
Normally included in GLP environment studies. No possibility to detail all thesedata in this scientific study in this journal – in process of publication. Dietequilibrated for substantial equivalence between GMO and the closest isogenicline and other compounds. Other points detailed in the text
No blinding, not the knowledge to interpret tumors, no morphometric analyses, nouse of PETO codes, no classification
Independent and blinded analysis by GLP performed by professional regulatoryanatomopathologists. Nature of most frequent tumors in Fig. 3 legend and results.A professional report for each rat indicates the cause of mortality
R formulations are different Depends on the countryControls not sufficient (number of rats per group, 4 groups 11 and 22%, no drinking
water control group)Number of rats approved in guidelines, best in the world at this level of details forthese products. All the animals have eaten 33% of maize and substantiallyequivalent diets. Only R treated rats had received R in water
No reference groups, no lab historical data Reference groups add irrelevant variability with non-substantially equivalentdiets; historical data contain diets not controlled for pesticides and GMOs, thusnot relevant
Ad Libitum feeding In accordance to guidelines and usual practicesDiurnal variations All samplings were taken at the same time
Focus on statisticsNot enough statistical power
No Kaplan Meier’s curvesVariability expected by chanceOnly raw data in Figs. 1–3 and Table 2
Statistics do not tell the truth, but may help in understanding results. Thebiological interpretations and the crossing of methodologies are the key. Enoughand high statistical power for OPLS-DA, and this is why raw data only werepresented in Figs. 1 and 2 and Table 2; no statistical power of Kaplan Meier’sanalyses for a conclusion demonstrating effects or no effects.
No means and standard deviations in Table 3 OPLS-DA is not a method to compare mean differences which were presented forunderstanding of biochemical measurements with highly discriminant parametersin bold
Pertinence of the resultsMissing data (Behavioral studies, ophthalmology, microbiology in feces and in
infectious nodules, G in tissues, body and organ weights, feed and waterconsumptions, transgene in tissues, time effects)
All measures cannot be presented in one paper and will be the subject of otherpublications. The other analyses are not relevant for the conclusions presented
No isoflavones in maize Testing the diets for phytoestrogens is relevant because the equilibrated diet (non-GM) contains other components
Phenolic acids in the normal range Used as biomarkers indicative of change in the metabolism of the GMO. This doesnot exclude the presence of unknown toxic compounds
No incidence / severity Lack of histopathology data Taken into account as indicated in the legend of Table 2 which consists in asummary of the most relevant data
Endocrine disruption not sufficiently supported Convergent body of evidence stemming from mammary tumors, pituitarydysfunctions, histopathology and sex hormone biochemistry
Wilm’s tumors are only of genetic origin Promotion by pesticide exposure is plausible and as evidenced by gestationalexposure described in the literature
Feeding state explains glycogen in electron microscopy No difference in feed consumption; experience in the domain by M. MalatestaPictures of control rat not shown Rats representative of each group shown, controls do not present tumors in
majority during the experiment, pictures non necessary
Discussion: findings in regard with the contradictory hypothesesR is not a sex endocrine disruptor This is still true at a regulatory but not at a scientific research level. R endocrine
disrupting properties are described in vivo and in vitro (references in the text).
(continued on next page)
G.-E. Séralini et al. / Food and Chemical Toxicology xxx (2012) xxx–xxx 3
Please cite this article in press as: Séralini, G.-E., et al. Answers to critics: Why there is a long term toxicity due to a Roundup- tolerant genetically modifiedmaize and to a Roundup herbicide. Food Chem. Toxicol. (2012), http://dx.doi.org/10.1016/j.fct.2012.11.007
EXHIBIT J - Page 457
Case 5:14-cv-00117-cr Document 63-11 Filed 11/14/14 Page 175 of 312

all treated groups to the control group containing 33% of the clos-est available isogenic maize, as all diets were equilibrated to 33%maize; that is, for example the 11% GM maize diet was supple-mented with non-GM control maize to reach 33%. More accuratelythe closest available isogenic line was the DKC2675 variety com-pared to the DKC2978 GM maize (NK603). Regulatory agencies alsoquestioned the conditions under which the maize was grown. OneR treatment was applied 4 months before harvest. Fungicides wereapplied similarly. We were unable to use the same R formulation inthe field (Canada) and in the drinking water of the rats (France) be-cause authorized formulations vary between nations. The diet wasnutritionally equilibrated from substantially equivalent maize andwas then checked by PCR for GMO content. A major concern wasthe potential presence of mycotoxins. Fumonisin B1 and B2, zearal-enone, deoxynivalenol (DON), nivalenol, 3-acetyl-DON, 15-acetyl-DON, fusarenone X, T2 toxin, HT2 toxin and diacetoxyscirpenolwere all under recommended limits in food/feed used in this study.We did not present details of each of these substances when noparticular changes affecting the understanding of the results werenoticed.
As a research protocol, Good Laboratory Practice (GLP, OECD,1997; 2004/10/EC regulation) was followed, meaning that housingconditions, manufacturing process, diet composition and storage,stability of solutions and dietary contaminants were assessed byapproved laboratories. Anatomopathology was performed in ablind manner (without knowing the treatments) by professionalanatomopathologists approved for regulatory purposes. An elec-tronic chip was inserted in each rat for identification. However,the technicians employed for the care and sampling of the animalsdid not know either the nature of the diets or the drinking waterprepared independently, or which was the control group. The cageshousing the animals were moved within holding rooms regularlyand similarly for all animals. The blood (1 mL) and urine sampleswere coded and the measurement of biochemical parameters alsoblind, as were the decisions of euthanasia to avoid suffering inaccordance with precise regulatory ethical rules (hemorrhages,impossibility to drink and eat, large tumors over 25% body weightbecause they provoke mortality). All the animals were monitored
during the experiment by professional veterinarians. The statisticalanalysis was also undertaken on coded groups. However, we havemade research amendments adding additional analyses (tissue andbiochemical parameters) adapted to the findings in order to im-prove the understanding of the pathologies, thus we are only in aGLP environment. Generally, it is standard practice that a regula-tory agency does not take note of research studies because theyare not conducted under GLP conditions (Myers et al., 2009a). Byits very nature, a research protocol is rarely compatible with GLPagreements. GLP agreement is a good tool to normalize regulatoryassessment but research studies need a greater degree of freedom,in test protocols, models, etc.
4. Rat strain
We would like to explain the choice of the strain of rat. This isanother redundant remark made by critics of our study design. Werecall that OECD norms (408, 452 and 453) are not prescriptive forthe strain of rat to be used. Sprague Dawley (SD) rats are subject tospontaneous neoplasms and this property is supposed to invalidatethem being used as a model for carcinogenesis. However, on thecontrary, the fact that the SD strain develops tumors, hence hasled to it is preferentially used by some agencies such as for the Na-tional Toxicology Program using it for 2-year carcinogenicity andother long-term studies (King-Herbert et al., 2010). Indeed, itwould be a non-sense to study pathologies in a strain insensitiveto tumor formation. Long-term OECD guideline 452 even statesthat rats and mice have been preferred as experimental model sys-tems because of their susceptibility to tumor induction. The samereasoning is used for chronic progressive nephropathies (CPN)developed by SD rats. The fact that the strain developed spontane-ous CPN with age (Hard and Khan, 2004) does not invalidate themodel as we looked at the difference in the chronology, age, num-ber and severity of CPN in comparison to controls.
To assess the biological relevance of results, many authors makecomparisons with historical data of control rats, either within thelaboratory or the breeding company from which animals are
Table 1 (continued)
Criticisms Answers
Regulatory classification should be in processG is not toxic in two-year tests G is never used alone in agriculture, but in formulations with G far more toxic than
G alone; G tests are not relevant, we used RG is close in structure to amino acids and surfactant exposure is as soap exposure This is not supported by the scientific literature; the structural and activity
comparisons are not scientifically relevant to predict with certainty toxicologicaleffects or safety
No effects on farm animals and in human population of the USA No epidemiology, no life-long experimental studies; farms animals are generallykilled too young to show development of long term diseases. No traceability andlabeling of GMOs in USA, no epidemiological survey can be performed
Sakamoto et al. 2008 not reported This study does not use the same GMO (soy vs maize) and neither the same strainof rat. No effect for GM soy in F344 rats is claimed but does not imply the same forNK603 GM maize in SD rats
Raw data expected for our study Raw data also expected for regulatory accepted tests for this GMO and thispesticide to scientifically discuss details
Ethical issues and deontologyMaize illicitly grown Not at all; grown and imported with appropriate authorizationsAnimal welfare problems, a veterinarian would not authorize such tumor
developmentThe work follows GLP conditions. All rats followed by veterinarians on the site,applying the rules of the ethical committee and guidelines
Conflicts of interests No conflict for us. Conflicts of interests for companies testing their own productsRole of funders See acknowledgments, funders identified. No interference in study or results;
confidential up to the embargoPublication released before for journalists Everything was released on the same day (September 19th), in accordance with
the conditions set by the FCT editorial board.Confidentiality agreement unusual The confidentiality of the work is a usual practice before embargoThe authors should alert agencies from the end of experiment instead of waiting
for a publicationThe publication and reviewing of the work is the guarantee of quality with nointerference
4 G.-E. Séralini et al. / Food and Chemical Toxicology xxx (2012) xxx–xxx
Please cite this article in press as: Séralini, G.-E., et al. Answers to critics: Why there is a long term toxicity due to a Roundup- tolerant genetically modifiedmaize and to a Roundup herbicide. Food Chem. Toxicol. (2012), http://dx.doi.org/10.1016/j.fct.2012.11.007
EXHIBIT J - Page 458
Case 5:14-cv-00117-cr Document 63-11 Filed 11/14/14 Page 176 of 312

sourced. However, this clearly greatly enhances control variabilityand heightens the risk of false negative findings (Cuffe, 2011). It isnow established that this concept should be used with caution.There are several reasons for this. Control diets for rats are gener-ally not monitored, neither for pesticides (Hayes, 2004), nor forchemicals leaching from cages or other environmental sources(Howdeshell et al., 2003). This artificially enhances background ef-fects. The supplier even recognizes that their historical data comefrom rats potentially fed GMOs since this was not controlled for(Harlan communication), except in our experiment. Thus, it wasnot appropriate for us to use historical control data. This is alsothe reason why we did not use reference groups fed differentnon-substantially equivalent diets, as they increase the standarddeviation of the control groups, hiding differential effects due totreatments.
Many non-relevant remarks have also been noticed. Amongothers, some criticized the use of ad libitum feed to explain the in-crease of tumor incidence. Guidelines on the design and conduct ofchronic toxicity studies state that rodents should be fed and wa-tered ad libitum (OECD, Guidance Document No. 116). The hor-monal imbalances were criticized to be due to diurnal or cyclicvariations. However, sampling was performed at the same timeeach day in the morning.
5. Focus on statistical analytical methods and outcomes
Statistics do not tell the truth, but may assist in our understand-ing of experimental outcomes. The biological interpretations andthe crossing of methodologies are the key (Cooper and Kavlock,1997). We have applied the most modern statistical methods(OPLS-DA, see below) for multivariate data analysis of approxi-mately 50 parameters measured 11 times for 200 rats. This al-lowed, in a blinded manner, to obtain results significantlydiscriminant at 99% confidence levels. These discriminant bio-chemical markers were, for example in the case of sexual hor-mones (at 95% for females at month 15), when the differences inhormone-dependent tumor incidence with the control group be-gan. Disability in pituitary function was characteristic of this sec-ond most affected organ as certified independently by thepathologists in a blinded manner in treated female groups in com-parison to controls. Such a disturbance in hormonal function isknown to elicit mammary tumors in rats with the pituitary beinga target of endocrine disrupting chemicals (Wozniak et al., 2005).The pathologists employed in our study explained that most ofthe mortality in females resulted from tumors, which led to eutha-nasia independently of the grade of cancer. This is why we did notdetail the grade of tumors in our research but with the cancerousnature of the major tumor growths described in our study (Fig. 3legend and results section (Par. 3.2)). These observations togetherwith microscopic analysis reinforced our conclusions.
We believe all this was more pertinent than the study of statis-tically non-powerful Kaplan–Meiers’ curves on survival (because ofthe groups of 10 animals per sex dying progressively) that cannotallow any conclusion on mortality linked or not to the treatment.Taking into account these limits, we decided to be simply factualin our presentation and thus describe the chronology and inci-dence of tumors and deaths. In comparison, statisticians fromagencies could evaluate the power of the statistical analyses ofthe tests conducted by Hammond et al. (2004), which gave a scoreof safety, and that were used for market release. For us, the powerof statistics used in Hammond et al. (2004) is extremely low toconclude to safety.
In our study, case PLS-regression (Projections to Latent Struc-tures by means of partial least squares) is of particular relevancebecause, unlike conventional multivariate data analytical methods,
it can analyze data sets with variables more numerous than obser-vations, which can be strongly correlated (Wold et al., 2001). In thecase of Orthogonal Partial Least Squares Discriminant Analysis(OPLS-DA) there is separation between the inter-group variation(represented on the predictive component) and the intra-groupvariation (variability of the samples, represented on the first Y-orthogonal components). OPLS-DA is thus not an appropriatemethod with which to compare mean differences. However, forproviding biochemical understanding, we have presented andhighlighted those in Table 3 of our study, with highly discriminantparameters in bold text. OPLS-DA renders it possible to identifywhich variables are responsible for the separation of the groups.For instance, we also indicate in Fig. 5B that estradiol and testoster-one are significantly discriminant at 95% confidence levels in somegroups (not at 99% like other parameters presented).
Moreover, the SIMCA-P (V12) software (UMETRICS AB Umea,Sweden) for the multivariate analysis of biochemical data uses amethod of validation of models, which is a k-fold cross-validation.The Q2(Y) parameter which measures the predictive ability of themodels is calculated according to this cross-validation method.Only valid models with a satisfactory predictive quality Q2 indexwere retained for the selection of the discriminant variables (boldin figures, Table 3). Furthermore, all models retained are significant(CV-ANOVA test with p-value <5%). One of the authors of our paper(D.H.) previously used this method and published their results ininternational peer-reviewed journals (Ledauphin et al., 2010;Malzert-Freon et al., 2010a; Malzert-Freon et al., 2010b).
6. Pertinence of the results
The first major criticisms that were raised concerned the resultsand their format of presentation. A scientific publication is bynecessity limited in figures/tables and only shows the data neces-sary to understand and discuss the conclusions. This is why behav-ioral studies, ophthalmology, microbiology in feces and ininfectious nodules, G in tissues, body and organ weights, feedand water consumptions, transgene in tissues, time effects willbe the subject of future publications. The inclusion of these dataat this stage would neither add to the main message nor wouldit improve the understanding of this first publication. Indeed, thepeer review process has controlled the logic of the body of datapresented. Additional sets of results were included in the revisionof the manuscript in response to issues raised by the reviewersprior to publication.
The second major criticism of the results is that we attached toomuch importance to findings related to mortality and tumor rela-tive to their scientific significance. We are aware of the limitationsof these findings as discussed above in relation to the statisticalanalysis undertaken. The body of evidence for our conclusionscomes from the converging methodologies and data (see Focuson Statistics). The variability in rates of mortality can indeed, iflooked at in isolation, arise in principle by chance. However, statis-tical analysis for Figs. 1 and 2 is not of sufficient power to concludethat this is the case or the contrary. This is why we have presentedthe raw data for these sets of observations. For instance, males pre-sented up to 4 times (2 times of the mean) more large palpable tu-mors than controls, similarly to that observed in female animals.As these observations may represent a potential risk for the humanpopulation, this cannot simply be disregarded so rapidly with non-potent statistics. This is also why we emphasized statistically dis-criminant biochemical effects at the 15th month, when most ofanimals were still alive (in treated groups 90% males, 94% females,and 100% controls). The significantly discriminant biochemicalmarkers disrupted do correspond to the organic markers linkedto the pathologies in a blinded analysis for the pathologists, who
G.-E. Séralini et al. / Food and Chemical Toxicology xxx (2012) xxx–xxx 5
Please cite this article in press as: Séralini, G.-E., et al. Answers to critics: Why there is a long term toxicity due to a Roundup- tolerant genetically modifiedmaize and to a Roundup herbicide. Food Chem. Toxicol. (2012), http://dx.doi.org/10.1016/j.fct.2012.11.007
EXHIBIT J - Page 459
Case 5:14-cv-00117-cr Document 63-11 Filed 11/14/14 Page 177 of 312

in turn linked that to the deaths. The two nephroblastomas in GMOfed groups linked to premature deaths was criticized for bringingconfusion to the results, because these tumors are often of embry-onic and/or genetic origin. However, these tumors are also knownto be promoted by pesticide exposure (Fear et al., 1998).
The summary of the major histopathological findings in Table 2was subject to the same criticisms. In fact, we indicated the sever-ities of the CPN and only marked or severe CPN were shown. In-deed, elderly rats are subject to CPN and taking into account allCPN could hide interesting and important differences. The powerof statistics may be discussed as for Figs. 1 and 2. However, allthese data need to be seen in the context of all the significant re-sults presented in the paper, as previously underlined.
For the findings obtained from the electron microscopy analy-sis, it is important to compare our results with those reported pre-viously. Several studies have shown ultrastructural abnormalitiesin the liver of mice fed with GM soy (Malatesta et al., 2002) andthat this structural disturbance was reproduced by adding the her-bicide R directly to rat hepatocytes (Malatesta et al., 2008b). Wethus wanted to test if the same disruptions can be seen in the liverof the rats in our experiment. This was indeed the case, and fur-thermore these observations conform with ours and others pub-lished in vitro effects of R (Gasnier et al., 2010, 2011). Glycogendispersion or appearance in lakes found by electron microscopywas attributed to the feeding state by some critics. However, dif-ferences in feed consumption were not observed during the courseof our study. Not only appearance of glycogen in lakes was noticed,but also a reduced rate of transcription of mRNA and rRNA, whichis not normally known to be due to the feeding state, but rather toa toxic insult. Ultrastructural patterns revealed by of electronmicroscopy were coherent with an increase in detoxifying activityin liver, and this is corroborated by differences in cytochrome en-zyme activities.
A major gap in some toxicological assessments is the lack ofmeasurements investigating endocrine disrupting effects (Birn-baum, 2012). As noted previously, the central dogma in toxicologyis that effects vary linearly to dose. This is true for standard poisonintoxication. However, toxins with endocrine disruptive propertiescan give response curves that are U, inverted U or J in shape and arefrequently observed in the case of exposure to environmental pol-lutants (Vandenberg et al., 2012). Endocrine disturbance is sup-ported by observations in human (Gasnier et al., 2009) and rattesticular cells for R residues (Clair et al., 2012). In our study it isdemonstrated by statistically significant sex hormone imbalancesand disabled pituitary function. Moreover, doses varied from50 ng/L to 2.5 g/L of glyphosate in R; that is, a factor 50 million,from which we cannot expect linear effects with such a wide rangeof doses tested, characteristic of the range of different kinds ofenvironmental exposures (tap water, GM food and feed, dilutedagricultural use). The kidneys and liver are also sensitive to endo-crine disruptors. As the two major detoxifying organs, containingcytochrome P450 or other enzymes involved in xenobiotic or sexsteroid metabolism, they often react with steroid sex hormoneand related compounds (Pascussi et al., 2008).
Last but not least, we have identified phenolic acids as potentialbiomarkers of metabolic disturbances in the GM diet. We have alsomeasured isoflavones in the diet even though maize does not pro-duce these compounds. Rats indeed did not eat only maize but alsoother plants in an equilibrated diet. Even OECD 452 guidelines onchronic toxicity ask for testing phytoestrogen content of the diet.Importantly, decrease in phenolic acids is a good indicator ofchange in the metabolism of the GMO that could in turn lead toa reduced protection against the pathologies observed in the ani-mals fed the NK603 GM maize. However, this does not excludethe possibility of other toxic effects of the GMO alone, which havenot been identified in the experiment.
7. Discussion
7.1. Findings in regard with the contradictory hypotheses
Critics have claimed that no argument exists for R to be a sexhormone endocrine disruptor, which is based on a review by Wil-liams et al. (2000), where most of the studies cover G effects aloneand not R. We wish to draw attention again to the fact that G isnever used as such, but in formulations with other substancesallowing toxicity, both of target and non-target species. This isextensively described for G-based herbicides, but also for otherpesticides (Eddleston et al., 2012). This is why, in our opinion, alldiscussion of our study referring to testing of G alone is not rele-vant. Furthermore, we find it incomprehensible that non-scientificassertions justify R innocuousness by the structural homology of Gwith non-toxic amino acids. In addition adjuvants in the R formu-lation cannot be judged harmless by a comparison of their activityto soap. There is no scientific basis to use these assertions to pre-dict with certainty toxicological effects or safety. The fact that Galone is neither a carcinogen nor an endocrine disruptor in regula-tory tests is not a proof of the safety of whole R formulations, espe-cially when some formulations contained toxic compounds (Cox,2004). The unexpected finding of new active principles with hu-man cell toxicity capabilities in G-based herbicides has challengedthe relevance of testing G alone as the active principle in R (Mes-nage et al., 2012). R has already been demonstrated to be an endo-crine disruptor in vivo (Dallegrave et al., 2007; Oliveira et al., 2007;Romano et al., 2010, 2012) with the underlying mechanism under-stood in vitro.
Several studies have shown significant endocrine disrupting ef-fects of R, such as decrease in progesterone production, decreasedlevels of Steroidogenic Acute Regulatory (StAR) mRNA productionin MA-10 mouse Leydig cells (Walsh et al., 2000), decrease in aro-matase mRNA and activity levels in JEG3 cells and placental andequine testicular microsomes (Richard et al., 2005; Benachouret al., 2007), inhibition of transcriptional activities of androgensand of both a- and b-estrogen receptors in cells (Gasnier et al.,2009), and a decrease in testosterone production in rat Leydig cells(Clair et al., 2012). All these studies reinforce the biological rele-vance of our findings.
Some critics have emphasized that no adverse effects have beenreported on either farm animals or in the human population of theUSA who have consumed an unknown mixture GMO crop derivedfood. Such claims are scientifically unsound for the following rea-sons. First, it is important to note that there have been neither epi-demiological studies of the human population nor monitoring offarm animals in an attempt to correlate any ill-health observedwith the consumption of a given GM crop. Second, it should be re-called that farm animals are not reared to live for the entire dura-tion of their natural lifespan, and thus usually do not live longenough to develop long-term chronic diseases, which contrastswith the rats in our life-long experiment. If any studies in lactatingcows are conducted, biological analyses performed are far lesscomplete than those done in regulatory tests using rodents includ-ing in our study. Third, as there is no labeling of GMO food and feedin the USA, the amount consumed is unknown, and no ‘‘controlgroup’’ exists. Thus, without a clear traceability or labeling, no epi-demiological survey can be performed.
7.2. Ethical issues
Many critics argue against our refusal to release all the raw datagenerated in our study. This is a very unusual request when weclearly stated that we plan several other papers out of this dataset. Our study was not performed for regulatory purposes. How-
6 G.-E. Séralini et al. / Food and Chemical Toxicology xxx (2012) xxx–xxx
Please cite this article in press as: Séralini, G.-E., et al. Answers to critics: Why there is a long term toxicity due to a Roundup- tolerant genetically modifiedmaize and to a Roundup herbicide. Food Chem. Toxicol. (2012), http://dx.doi.org/10.1016/j.fct.2012.11.007
EXHIBIT J - Page 460
Case 5:14-cv-00117-cr Document 63-11 Filed 11/14/14 Page 178 of 312

ever, due to the social impact and for full scientific understandingof the potential risks associated NK603 GM maize and R, we willrelease our raw data if the regulatory agencies that have takenindustry data into account in their approval of their products alsorelease the data pertinent for environmental and health riskassessments, in particular their longest toxicological tests on mam-mals, as we have indicated in our correspondence with EFSA. As afirst step to this end, we have communicated the raw data under-lying the data presented in Figs. 1 and 2 to the French food safetyagency (ANSES), and answered their questions on experimental de-sign and results, including analysis of food composition and myco-toxin content, etc.
Most of the criticisms on the topic of ethical conduct relate toanimal welfare, some thinking that we overpassed the thresholdin size of tumors above which animals should be euthanized, withthe purpose of taking shocking photographs. However, it should berecalled that in a GLP environment, animal welfare is of major con-cern and that we fully respected the threshold in tumor size beforeeuthanasia. Pictures of every animal and organ were taken. Wepresented those related to the most observed pathologies, includ-ing those of a microscopic nature, for illustrative purposes inFig. 3, with rats representative of each group.
Some critics raised concerns about the role of the funders of thiswork, and possible conflicts of interest. Of course, the funders nei-ther played a role in the design and conduct of the experiment, andnor in its interpretation. The data remained confidential to thefunders. We recall that in the regulatory assessment of GMOs,chemicals and medicines, tests are conducted by the applying com-panies themselves, often in their own laboratories. As a result, con-flicts of interest exist in these cases. These are even not claimed byauthors from the company defending the safety of the tested prod-ucts (Hammond et al., 2012). Our study does not aim to requestcommercialization of a new product. In contrast, we wanted toestimate the health risk of these products. It is the most detailedtest conducted to date that is also independent from biotechnologyand pesticide companies. We encourage others to replicate suchchronic experiments, with greater statistical power. What is nowurgently required is for the burden of proof to be obtained exper-imentally by studies conducted independent from industry. Thiswas recommended by regulatory agencies in France that have as-sessed our work, even though their objective is more to regulateproducts than to review research. GM NK603 and R cannot be re-garded as safe to date.
Conflict of Interest
The authors declare that there are no conflicts of interest.
Acknowledgments
We would like to acknowledge again our funders as already sta-ted in our original publication (FPH, CERES, Ministry of Research,CRIIGEN structural help). We warmly thank also fellowships forS.G. (Léa Nature, Nature Vivante), and all supports, constructiveand positive comments coming from almost 300 scientists frommore than 33 countries from 5 continents (November 2012).
References
Antoniou, M., Habib, M.E.M., Howard, C.V., Jennings, R.C., Leifert, C., Nodari, R.O.,Robinson, C.J., Fagan, J., 2012. Teratogenic effects of glyphosate-basedherbicides: divergence of regulatory decisions from scientific evidence. J.Environ. Anal. Toxicol. S4:006. http://dx.doi.org/10.4172/2161-0525.S4-006.
Benachour, N., Sipahutar, H., Moslemi, S., Gasnier, C., Travert, C., Seralini, G.E., 2007.Time- and dose-dependent effects of roundup on human embryonic andplacental cells. Arch. Environ. Contam. Toxicol. 53, 126–133.
Birnbaum, L.S., 2012. Environmental chemicals: evaluating low-dose effects.Environ. Health Perspect. 120 (4), a143–a144.
Clair, E., Mesnage, R., Travert, C., Seralini, G.E., 2012. A glyphosate-based herbicideinduces necrosis and apoptosis in mature rat testicular cells in vitro andtestosterone decrease at lower levels. Toxicol. In Vitro 26 (2), 269–279.
Cooper, R.L., Kavlock, R.J., 1997. Endocrine disruptors and reproductivedevelopment: a weight-of-evidence overview. J. Endocrinol. 152, 159–166.
Cox, C., 2004. Herbicide factsheet – glyphosate. J. Pestic. Reform 24, 10–15.Cuffe, R.L., 2011. The inclusion of historical control data may reduce the power of a
confirmatory study. Stat. Med. 30, 1329–1338.Dallegrave, E., Mantese, F.D., Oliveira, R.T., Andrade, A.J., Dalsenter, P.R., Langeloh, A.,
2007. Pre- and postnatal toxicity of the commercial glyphosate formulation inWistar rats. Arch. Toxicol. 81, 665–673.
Domingo, J.L., 2007. Toxicity studies of genetically modified plants: a review of thepublished literature. Crit. Rev. Food Sci. Nutr. 47, 721–733.
Domingo, J.L., Giné Bordonaba, J., 2011. A literature review on the safety assessmentof genetically modified plants. Environ. Int. 37, 734–742.
Doull, J., Gaylor, D., Greim, H.A., Lovell, D.P., Lynch, B., Munro, I.C., 2007. Report of anExpert Panel on the reanalysis by of a 90-day study conducted by Monsanto insupport of the safety of a genetically modified corn variety (MON 863). FoodChem. Toxicol. 45, 2073–2085.
Eddleston, M., Street, J.M., Self, I., Thompson, A., King, T., Williams, N., Naredo, G.,Dissanayake, K., Yu, L.M., Worek, F., John, H., Smith, S., Thiermann, H., Harris,J.B., Eddie Clutton, R., 2012. A role for solvents in the toxicity of agriculturalorganophosphorus pesticides. Toxicology 294, 94–103.
EFSA, 2007. EFSA review of statistical analyses conducted for the assessment of theMON 863 90-day rat feeding study.
EFSA, 2009. Applications (references EFSA-GMO-NL-2005-22, EFSA-GMO-RX-NK603) for the placing on the market of the genetically modified glyphosatetolerant maize NK603 (. . .) under Regulation (EC) No 1829/2003 fromMonsanto. EFSA J. 1137, 16–50.
Fear, N.T., Roman, E., Reeves, G., Pannett, B., 1998. Childhood cancer and paternalemployment in agriculture: the role of pesticides. Br. J. Cancer 77, 825–829.
Gasnier, C., Dumont, C., Benachour, N., Clair, E., Chagnon, M.C., Seralini, G.E., 2009.Glyphosate-based herbicides are toxic and endocrine disruptors in human celllines. Toxicology 262, 184–191.
Gasnier, C., Benachour, N., Clair, E., Travert, C., Langlois, F., Laurant, C., Decroix-Laporte, C., Séralini, G.E., 2010. Dig1 protects against cell death provoked byglyphosate-based herbicides in human liver cell lines. J. Occup. Med. Toxicol. 5,29.
Gasnier, C., Laurant, C., Decroix-Laporte, C., Mesnage, R., Clair, E., Travert, C., Séralini,G.E., 2011. Defined plant extracts can protect human cells against combinedxenobiotic effects. J. Occup. Med. Toxicol. 6 (1), 3.
Hammond, B., Dudek, R., Lemen, J., Nemeth, M., 2004. Results of a 13 week safetyassurance study with rats fed grain from glyphosate tolerant corn. Food Chem.Toxicol. 42, 1003–1014.
Hammond, B., Goldstein, D.A., Saltmiras, A., 2012. Letter to the editor. Food Chem.Toxicol. http://dx.doi.org/10.1016/j.fct.2012.10.044.
Hard, G.C., Khan, K.N., 2004. A contemporary overview of chronic progressivenephropathy in the laboratory rat, and its significance for human riskassessment. Toxicol. Pathol. 32, 171–180.
Hayes, T.B., 2004. There is no denying this: defusing the confusion about atrazine.Biosciences 54, 1139–1149.
Hilbeck, A., Meier, M., Trtikova, M., 2012. Underlying reasons of the controversyover adverse effects of Bt toxins on lady beetle and lacewing larvae. Environ. Sci.Eur. 24, 9.
Howdeshell, K.L., Peterman, P.H., Judy, B.M., Taylor, J.A., Orazio, C.E., Ruhlen, R.L.,Vom Saal, F.S., Welshons, W.V., 2003. Bisphenol A is released from usedpolycarbonate animal cages into water at room temperature. Environ. HealthPerspect. 111, 1180–1187.
James, C., 2011. Global status of commercialized biotech/GM crops: 2011. ISAAABrief, 43.
King-Herbert, A.P., Sills, R.C., Bucher, J.R., 2010. Commentary: update on animalmodels for NTP studies. Toxicol. Pathol. 38, 180–181.
Ledauphin, J., Lemilbeau, C., Barillier, D., Hennequin, D., 2010. Differences in thevolatile compositions of French labeled brandies using GC-MS and PLS-DA. J.Agric. Food Chem. 58, 7782–7793.
Malatesta, M., Caporaloni, C., Gavaudan, S., Rocchi, M.B., Serafini, S., Tiberi, C.,Gazzanelli, G., 2002. Ultrastructural morphometrical and immunocytochemicalanalyses of hepatocyte nuclei from mice fed on genetically modified soybean.Cell Struct. Funct. 27, 173–180.
Malatesta, M., Boraldi, F., Annovi, G., Baldelli, B., Battistelli, S., Biggiogera, M.,Quaglino, D., 2008a. A long-term study on female mice fed on a geneticallymodified soybean: effects on liver ageing. Histochem. Cell Biol. 130, 967–977.
Malatesta, M., Perdoni, F., Santin, G., Battistelli, S., Muller, S., Biggiogera, M., 2008b.Hepatoma tissue culture (HTC) cells as a model for investigating the effects oflow concentrations of herbicide on cell structure and function. Toxicol. In Vitro22, 1853–1860.
Malzert-Freon, A., Hennequin, D., Rault, S., 2010a. Partial least squares analysis andmixture design for the study of the influence of composition variables on lipidicnanoparticle characteristics. J. Pharm. Sci. 99, 4603–4615.
Malzert-Freon, A., Saint-Lorant, G., Hennequin, D., Gauduchon, P., Poulain, L., Rault,S., 2010b. Influence of the introduction of a solubility enhancer on theformulation of lipidic nanoparticles with improved drug loading rates. Eur. J.Pharm. Biopharm. 75, 117–127.
G.-E. Séralini et al. / Food and Chemical Toxicology xxx (2012) xxx–xxx 7
Please cite this article in press as: Séralini, G.-E., et al. Answers to critics: Why there is a long term toxicity due to a Roundup- tolerant genetically modifiedmaize and to a Roundup herbicide. Food Chem. Toxicol. (2012), http://dx.doi.org/10.1016/j.fct.2012.11.007
EXHIBIT J - Page 461
Case 5:14-cv-00117-cr Document 63-11 Filed 11/14/14 Page 179 of 312

Mesnage, R., Bernay, B., Seralini, G.E., 2012. Ethoxylated adjuvants of glyphosate-based herbicides are active principles of human cell toxicity. Toxicology. http://dx.doi.org/10.1016/j.tox.2012.09.006.
Myers, J.P., vom Saal, F.S., Akingbemi, B.T., Arizono, K., Belcher, S., Colborn, T.,Chahoud, I., et al., 2009a. Why public health agencies cannot depend on goodlaboratory practices as a criterion for selecting data: the case of bisphenol A.Environ. Health Perspect. 117, 309–315.
Myers, J.P., Zoeller, R.T., vom Saal, F.S., 2009b. A clash of old and new scientificconcepts in toxicity, with important implications for public health. Environ.Health Perspect. 117, 1652–1655.
OECD, 1997. OECD series on principles of good laboratory practice and compliancemonitoring. ENV/MC/CHEM (98), 17.
Oliveira, A.G., Telles, L.F., Hess, R.A., Mahecha, G.A., Oliveira, C.A., 2007. Effects of theherbicide Roundup on the epididymal region of drakes Anas platyrhynchos.Reprod. Toxicol. 23, 182–191.
Pascussi, J.M., Gerbal-Chaloin, S., Duret, C., Daujat-Chavanieu, M., Vilarem, M.J.,Maurel, P., 2008. The tangle of nuclear receptors that controls xenobioticmetabolism and transport: crosstalk and consequences. Annu. Rev. Pharmacol.Toxicol. 48, 1–32.
Richard, S., Moslemi, S., Sipahutar, H., Benachour, N., Seralini, G.E., 2005. Differentialeffects of glyphosate and roundup on human placental cells and aromatase.Environ. Health Perspect. 113, 716–720.
Romano, M.A., Romano, R.M., Santos, L.D., Wisniewski, P., Campos, D.A., de Souza,P.B., Viau, P., Bernardi, M.M., Nunes, M.T., de Oliveira, C.A., 2012. Glyphosateimpairs male offspring reproductive development by disrupting gonadotropinexpression. Arch. Toxicol. 86 (4), 663–673.
Romano, R.M., Romano, M.A., Bernardi, M.M., Furtado, P.V., Oliveira, C.A., 2010.Prepubertal exposure to commercial formulation of the herbicide glyphosatealters testosterone levels and testicular morphology. Arch. Toxicol. 84 (4), 309–317.
Sakamoto, Y., Tada, Y., Fukumori, N., Tayama, K., Ando, H., Takahashi, H., Kubo, Y.,Nagasawa, A., Yano, N., Yuzawa, K., Ogata, A., 2008. A 104-week feeding study ofgenetically modified soybeans in F344 rats. Shokuhin Eiseigaku Zasshi. 49, 272–282.
Schreider, J., Barrow, C., Birchfield, N., Dearfield, K., Devlin, D., Henry, S., Kramer, M.,Schappelle, S., Solomon, K., Weed, D.L., Embry, M.R., 2010. Enhancing thecredibility of decisions based on scientific conclusions: transparency isimperative. Toxicol. Sci. 116 (1), 5–7.
Séralini, G.E., Cellier, D., de Vendomois, J.S., 2007. New analysis of a rat feedingstudy with a genetically modified maize reveals signs of hepatorenal toxicity.Arch. Environ. Contam. Toxicol. 52, 596–602.
Séralini, G.E., Clair, E., Mesnage, R., Gress, S., Defarge, N., Malatesta, M., Hennequin,D., de Vendomois, J.S., 2012. Long term toxicity of a Roundup herbicide and aRoundup-tolerant genetically modified maize. Food Chem. Toxicol. 50, 4221–4231.
Snell, C., Bernheim, A., Berge, J.B., Kuntz, M., Pascal, G., Paris, A., Ricroch, A.E., 2012.Assessment of the health impact of GM plant diets in long-term andmultigenerational animal feeding trials: a literature review. Food Chem.Toxicol. 50, 1134–1148.
Spiroux de Vendomois, J., Cellier, D., Velot, C., Clair, E., Mesnage, R., Séralini, G.E.,2010. Debate on GMOs health risks after statistical findings in regulatory tests.Int. J. Biol. Sci. 6, 590–598.
Vandenberg, L.N., Colborn, T., Hayes, T.B., Heindel, J.J., Jacobs Jr., D.R., Lee, D.H.,Shioda, T., Soto, A.M., Vom Saal, F.S., Welshons, W.V., Zoeller, R.T., Myers, J.P.,2012. Hormones and endocrine-disrupting chemicals: low-dose effects andnonmonotonic dose responses. Endocr. Rev. 33, 378–455.
Walsh, L.P., McCormick, C., Martin, C., Stocco, D.M., 2000. Roundup inhibitssteroidogenesis by disrupting steroidogenic acute regulatory (StAR) proteinexpression. Environ. Health Perspect. 108, 769–776.
Williams, G.M., Kroes, R., Munro, I.C., 2000. Safety evaluation and risk assessment ofthe herbicide Roundup and its active ingredient, glyphosate, for humans. Regul.Toxicol. Pharmacol. 31, 117–165.
Wold, S., Sjöström, M., Eriksson, L., 2001. PLS-regression: a basic tool ofchemometrics. Chemom. Intell. Lab. Syst. 58, 109–130.
Wozniak, A.L., Bulayeva, N.N., Watson, C.S., 2005. Xenoestrogens at picomolar tonanomolar concentrations trigger membrane estrogen receptor-alpha-mediated Ca2+ fluxes and prolactin release in GH3/B6 pituitary tumor cells.Environ. Health Perspect. 113, 431–439.
8 G.-E. Séralini et al. / Food and Chemical Toxicology xxx (2012) xxx–xxx
Please cite this article in press as: Séralini, G.-E., et al. Answers to critics: Why there is a long term toxicity due to a Roundup- tolerant genetically modifiedmaize and to a Roundup herbicide. Food Chem. Toxicol. (2012), http://dx.doi.org/10.1016/j.fct.2012.11.007
EXHIBIT J - Page 462
Case 5:14-cv-00117-cr Document 63-11 Filed 11/14/14 Page 180 of 312

Resources How To
KEYWORDS:
Food Chem Toxicol. 2013 Sep;59:129-36. doi: 10.1016/j.fct.2013.05.057. Epub 2013 Jun 10.
Glyphosate induces human breast cancer cells growth via estrogenreceptors.
Thongprakaisang S, Thiantanawat A, Rangkadilok N, Suriyo T, Satayavivad J.Environmental Toxicology Program, Chulabhorn Graduate Institute, Laksi, Bangkok 10210, Thailand.
Abstract
Glyphosate is an active ingredient of the most widely used herbicide and it is believed to be lesstoxic than other pesticides. However, several recent studies showed its potential adverse healtheffects to humans as it may be an endocrine disruptor. This study focuses on the effects of pureglyphosate on estrogen receptors (ERs) mediated transcriptional activity and their expressions.Glyphosate exerted proliferative effects only in human hormone-dependent breast cancer, T47Dcells, but not in hormone-independent breast cancer, MDA-MB231 cells, at 10(-12) to 10(-6)M inestrogen withdrawal condition. The proliferative concentrations of glyphosate that induced theactivation of estrogen response element (ERE) transcription activity were 5-13 fold of control inT47D-KBluc cells and this activation was inhibited by an estrogen antagonist, ICI 182780,indicating that the estrogenic activity of glyphosate was mediated via ERs. Furthermore,glyphosate also altered both ERα and β expression. These results indicated that low andenvironmentally relevant concentrations of glyphosate possessed estrogenic activity. Glyphosate-based herbicides are widely used for soybean cultivation, and our results also found that therewas an additive estrogenic effect between glyphosate and genistein, a phytoestrogen insoybeans. However, these additive effects of glyphosate contamination in soybeans need furtheranimal study.
Copyright © 2013 Elsevier Ltd. All rights reserved.
Estrogenic effect, Genistein, Glyphosate, Human breast cancer, T47D, T47D-KBluc
PMID: 23756170 [PubMed - in process]
GETTING STARTED
NCBI Education
NCBI Help Manual
RESOURCES
Chemicals & Bioassays
Data & Software
POPULAR
PubMed
Bookshelf
FEATURED
Genetic Testing Registry
PubMed Health
NCBI INFORMATION
About NCBI
Research at NCBI
Sign in to NCBI
Display Settings: Abstract Send to:
LinkOut - more resources
Save items
Add to Favorites
Related citations inPubMed
See reviews...
See all...
Quantitative proteomics andtranscriptomics addressing the[Mol Cell Proteomics. 2011]
Lycopene and other carotenoidsinhibit estrogenic activity of[Breast Cancer Res Treat. 2007]
Transcriptional regulation ofvascular endothelial growth[Cancer Res. 2002]
Review EM-652 (SCH 57068),a third generation SERM acting Steroid Biochem Mol Biol. 1999]
Review Safety evaluation andrisk assessment of the herbicide[Regul Toxicol Pharmacol. 2000]
Related information
Related Citations
MedGen
Recent Activity
See more...
ClearTurn Off
Related Citations forPubMed (Select 23756170)PubMed
Glyphosate induces humanbreast cancer cells growthPubMed
You are here: NCBI > Literature > PubMed Write to the Help Desk
Search
Advanced
US National Library of MedicineNational Institutes of Health
PubMed
Help
EXHIBIT J - Page 463
Case 5:14-cv-00117-cr Document 63-11 Filed 11/14/14 Page 181 of 312

Copyright | Disclaimer | Privacy | Browsers | Accessibility | Contact
National Center for Biotechnology Information, U.S. National Library of Medicine8600 Rockville Pike, Bethesda MD, 20894 USA
NCBI Handbook
Training & Tutorials
DNA & RNA
Domains & Structures
Genes & Expression
Genetics & Medicine
Genomes & Maps
Homology
Literature
Proteins
Sequence Analysis
Taxonomy
Training & Tutorials
Variation
PubMed Central
PubMed Health
BLAST
Nucleotide
Genome
SNP
Gene
Protein
PubChem
GenBank
Reference Sequences
Gene Expression Omnibus
Map Viewer
Human Genome
Mouse Genome
Influenza Virus
Primer-BLAST
Sequence Read Archive
NCBI News
NCBI FTP Site
NCBI on Facebook
NCBI on Twitter
NCBI on YouTube
EXHIBIT J - Page 464
Case 5:14-cv-00117-cr Document 63-11 Filed 11/14/14 Page 182 of 312

A three-year longitudinal study on the effects of a diet containinggenetically modified Bt176 maize on the health status and
performance of sheep
Massimo Trabalza-Marinucci a,⁎, Giorgio Brandi b,c, Cristina Rondini d, Luca Avellini a,Camilla Giammarini b, Silva Costarelli d, Gabriele Acuti a, Chiara Orlandi e,
Giovanni Filippini d, Elisabetta Chiaradia a, Manuela Malatesta f, Silvia Crotti d,Chiara Antonini a, Giulia Amagliani b,c, Elisabetta Manuali d, Anna Rita Mastrogiacomo b,
Livia Moscati d, Mohamed Naceur Haouet d, Alberto Gaiti a, Mauro Magnani b,e
a Dipartimento di Patologia, Diagnostica e Clinica Veterinaria, Università degli Studi di Perugia, Italyb Centro di Biotecnologie in Fano, Università degli Studi di Urbino “Carlo Bo”, Italy
c Istituto di Igiene, Università degli Studi di Urbino “Carlo Bo”, Italyd Istituto Zooprofilattico Sperimentale dell'Umbria e delle Marche, Perugia, Italy
e Istituto di Biochimica “G. Fornaini”, Università degli Studi di Urbino “Carlo Bo”, Italyf Istituto di Istologia, Università degli Studi di Urbino “Carlo Bo”, Italy
Received 20 October 2006; received in revised form 16 March 2007; accepted 19 March 2007
Abstract
This study shows that a diet including insect-resistant Bt176 maize, fed to 53 ewes and their progeny for 3 years, did not haveadverse effects on their health or performance and that no horizontal gene transfer to ruminal microorganisms or animal tissues wasdetected. No differences were observed regarding performance, reproductive traits, haematological parameters, antioxidantdefences, lymphocyte proliferative capacity, phagocytosis and intracellular killing of macrophages, and ruminal microbialpopulation characteristics between control and genetically modified (GM) maize-fed animals. Immune response to Salmonellaabortus ovis vaccination was more efficient in GM maize fed sheep. No modifications of histological features of tissues werefound; however, cytochemical analyses of ruminal epithelium by Ki67 staining provided evidence of proliferative activation ofbasal cells in all GM maize-fed ewes. Preliminary electron microscopy analyses of the liver and pancreas revealed smaller cellnuclei containing increased amounts of heterochromatin and perichromatin granules in GM maize-fed lambs. Meat protein contentand water loss by cooking were slightly affected by the dietary treatment. No transgenic DNA was detected in tissues, blood, andruminal fluid or ruminal bacteria. Longitudinal studies should be included in evaluation of food safety whenever possible and sheepmay be a useful animal model for toxicological assessment.© 2007 Elsevier B.V. All rights reserved.
Keywords: Bt176 maize; Sheep; Health status; Transgene detection
Available online at www.sciencedirect.com
Livestock Science 113 (2008) 178–190www.elsevier.com/locate/livsci
⁎ Corresponding author. Tel.: +39 075 5857707; fax: +39 075 5857764.E-mail address: [email protected] (M. Trabalza-Marinucci).
1871-1413/$ - see front matter © 2007 Elsevier B.V. All rights reserved.doi:10.1016/j.livsci.2007.03.009
EXHIBIT J - Page 465
Case 5:14-cv-00117-cr Document 63-11 Filed 11/14/14 Page 183 of 312

1. Introduction
Genetically modified (GM) plants, as well as feedand food derived from these plants, have to undergo arisk assessment prior to market authorization in the EU.The particular requirements for risk assessment havebeen and still are particularly contested issues and onlyrecently attempts have begun to specify requirements ingreater detail (Kleter and Kuiper, 2002; König et al.,2004; Jank et al., 2005). A recent review of a number ofapplications that have been submitted and approved atthe European level (Spök et al., 2005), suggests thatthere are shortcomings in the risk assessment approach,in particular with issues revolving around the concept ofsubstantial equivalence.
The agronomic improvements afforded by geneticmodification of crops have resulted in a dramatic increasein their use. Thus, as adoption of GM crops continues toincrease, so will their consumption by animals reared forfood. However, despite rigorous approval standards fortransgenic plants, little is known about the fate of re-combinant DNA following ingestion of GM crops byanimals and exposure of the plant DNA to microorgan-isms within the digestive tract (Duggan et al., 2003;Einspanier et al., 2004). Scientific knowledge on hori-zontal gene transfer from plant cells to mammalian orbacterial cells is still incomplete (van den Eede et al.,2004). The ruminal microbial population is consideredone of the most likely targets for natural transformation,when the diet contains GM organisms (GMO). There is alack of long-term studies, performed on a high number ofanimals over several generations, aimed at evaluating theeffects of genetically modified (GM) feeds on livestockspecies.
In this context, a 3-year longitudinal study was carriedout to evaluate possible effects of a diet containing GMO(Bt176 maize) on a group of meat sheep and their prog-eny. The study was aimed at assessing: (a) animal welfareand health status through periodic evaluation ofmetabolicand haemato-chemical profiles as well as immune re-sponse following vaccination; (b) performance and repro-ductive traits; (c) nutritional and organoleptic properties ofmeat; (d) the presence of transgenes in ruminal micro-organisms and animal tissues.
2. Material and methods
2.1. Animals and feeds
One hundred and six Bergamasca×Appenninicaewes, aged approximately 10 months, were divided in2 groups, treated (T) and control (C), balanced for body
weight (BW: 36.9 (±0.9) vs. 37.1 (±1.2) kg) and bodycondition score (BCS: 1.9 (±0.03) vs. 1.9 (±0.04))(Russel et al., 1969). During the first 8 months of thetrial, animals were fed a diet based on non-GM mixedhay (crude protein 115.5 (±5.3) g/kg; crude fibre 323.0(±6.1) g/kg), non-GM maize grains and a non-GMmineral-vitamin supplement (“PRE” period). For thefollowing 36 months of the experiment, starting in May2002 (“EXP” period), group T had the non-GM maizereplaced with the maize hybrid NK COMPA CB (eventBt176). The amount of hay and maize varied accordingto physiological state (hay: 1700 to 2500 g/day; maize:100 to 600 g/day, for dry period and lactation, respec-tively) (NRC, 1981). The animals had free access towater. Compositional analyses were conducted to mea-sure proximate, fibre andmineral content (AOAC, 2000)of the maize (Table 1). Rumen degradability parameters(Ørskov and McDonald, 1979; McDonald, 1981) wereassessed using 2 ruminal cannulated ewes (Table 1).
The sheep were subjected to natural mating in June2002, November 2003 and August 2004 and presented
Table 1Composition of maize lines (as-fed basis) used in the experiment
Item Non-GMmaize
SEM GMmaize
SEM P-value
Chemicalcomposition (g/kg)Dry matter 877.8 1.6 879.6 1.8 0.50Ether extract 28.4 4.5 40.7 1.1 0.07Ash 10.3 1.3 10.9 0.1 6.5Crude protein 74.3 1.0 75.1 1.1 0.63Neutral detergentfibre
97.4 0.4 82.7 2.2 b0.01
Acid detergentfibre
18.1 1.4 13.7 0.8 0.06
Acid detergentlignin
4.8 0.5 4.0 0.4 0.31
Starch 630.2 1.8 644.6 3.1 0.06Minerals (μg/g)
Calcium 383.80 118.63 157.25 91.05 0.18Phosphorus 2352.10 208.20 2833.30 185.60 0.04Magnesium 1088.30 26.83 1056.77 23.43 0.42Zinc 19.92 1.42 16.89 0.81 0.09Copper 3.74 0.21 2.69 0.20 b0.01Iron 24.75 2.40 19.47 0.55 0.06Manganese 7.80 0.55 7.03 0.62 0.37
Rumen dry matterdegradationparametersED (%) 80.50 1.66 81.12 1.66 0.80Degradation rate(h−1)
0.06 0.006 0.06 0.006 0.65
ED: effective degradability at k=0.02 h−1 (where k=rate of outflowfrom the rumen).
179M. Trabalza-Marinucci et al. / Livestock Science 113 (2008) 178–190
EXHIBIT J - Page 466
Case 5:14-cv-00117-cr Document 63-11 Filed 11/14/14 Page 184 of 312

normal pregnancies and deliveries. Fertility and twinrate, the lambs' BW at birth, the lambs' mortality anddaily weight gain up to weaning (90 days of age) wereevaluated.
Sheep BW and BCS were assessed at 180 dayintervals. The lambs' diet before weaning was supple-mented with a commercial mixture of non-GM steam-rolled cereals and faba bean (crude protein: 210.3 g/kg;crude fibre 57.6 g/kg), which progressively increasedfrom 50 (30 days of age) to 300 g/day (60 days of age).
At weaning, 46 ewes and their lambs (14, 20 and 12after the first, second and third lambing, respectively),equally distributed between the 2 experimental groups,were slaughtered approximately 12 h after feeding. Sam-ples of ruminal contents, venous blood, gastrointestinalorgans and muscles were collected and processed forchemical analyses and recombinant DNA fragmentdetection.
The present study was carried out in accordance withthe guidelines of animal care and experimentation of theIstituto Zooprofilattico Sperimentale dell'Umbria e delleMarche.
2.2. Welfare status
Animals were periodically subjected to clinical ex-aminations to assess cardiorespiratory and reproductivefunctions aswell asmotory, sensory and/or reflex changes.
Haematological analyses were conducted at 4-monthintervals, starting 4 months before the end of the PREperiod. Blood samples were taken inK3EDTAvacutainertubes to analyse the common haematological profile by asemi-automatic electric impedance analyser (Hemacomp10, SEAC, Florence, Italy). Leukogram was determinedthrough microscopic observation of blood smears stainedusing the May-Grunwald Giemsa technique. For thedetermination of biochemistry parameters, blood wascollected in heparinized tubes. Plasma samples werestored at −20 °C prior to the following analyses: totalprotein, aspartate aminotransferase, alanine amino trans-ferase, gamma glutamyltransferase, alkaline phosphatase,albumin, bilirubin, creatinkinase, glucose, calcium, chlo-ride, potassium, sodium, urea nitrogen, creatinine, iron,magnesium, and phosphorus. Analyses were performedusing standard enzymatic methods (Boehringer Man-nheim GmbH, Mannheim, Germany) with a fully auto-mated Hitachi 704 analyser (Hitachi Ltd., Tokyo, Japan).
Analyses for oxidative stress markers were con-ducted, as for haematological indexes, at 4-monthintervals. Blood samples were taken in EDTA vacutai-ner tubes. The malonildialdeide content, end product oflipid peroxidation, was assayed in plasma by separating
the malondialdehyde/thiobarbituric acid adduct byreverse-phase HPLC and quantified by using fluores-cence detection (Draper et al., 1993). Total scav-enger capacity of plasma was evaluated by ABTS(2,2′-azinobis-3-ethyl-benzothiazoline-6-sulphonicacid) test according to Rice-Evans and Miller (1994).Antioxidant defences were assessed in vitro by treatingerythrocytes with 2 mmol/l tert-butyl-hydroperoxideincubation; BHT (0.1 mmol/l) was used to interrupt theperoxidative chain reaction at 1, 2, 5, and 10min and thepercentage of methaemoglobin, as haemoglobin oxida-tive product, was calculated (Winterbourn, 1990).
2.3. Immune response
The immunological response to vaccination againstClostridium spp. and Salmonella abortus ovis was eval-uated by an optimized indirect ELISA assay. Twovaccine preparations without adjuvants were used. Thefirst was composed of formaldehyde-inactivated (0.05%v/v) C. perfringens Type A, B, C and D, C. septicum,C. chauvoei, and C. novy A, at a total concentration of3×109 CFU/ml with 20 LD50 mouse/ml toxins ofC. perfringens and 2000 LD50 Guinea pig/ml toxins ofC. septicum. The second one consisted of S. abortusovis bacteria inactivated with formaldehyde (0.05% v/v)at a concentration of 1.8×10⁹ CFU/ml. The time sched-ule of the experiment is reported in Fig. 1.
Blood samples were collected at 4-month periodsfrom 7 animals per experimental group for cell-mediatedimmunity evaluation (Fig. 1). Peripheral blood mono-nuclear cells (PBMC) were obtained from EDTA bloodby separating cells on Histopaque (Sigma, St. Louis,MO, USA). Monocytes were separated from lympho-cytes by adherence overnight to plastic dishes anddistributed into 24-well plates (10×106/well) for killingassessment or in trak tubes (5×10⁶/tube) for phagocy-tosis study and cultured at 37 °C in 5% CO2 for 10 days,at the end of which the monocytes had matured intomacrophages (M/M). Phagocytic activity of M/M wasassessed by using both latex fluorescent microparticles(Molecular Probes, Inc., Eugene, USA) and bacterialsuspensions of S. abortus ovis (Antonelli et al., 1997).Latex beads and bacterial cells were pre-opsonized inRPMI medium, 10%-supplemented with a pool of sheepsera, by incubation at 37 °C for 30 min. Bacteria andbeads were sonicated to disperse clumps and added tocellular monolayers, maintaining a 1:50 effector/tar-get ratio. After 1 h incubation at 37 °C, 5% CO2, thecultures were washed 3 times with HBSS to removeany extracellular nonphagocytosed microorganism orparticle. Phagocytosis and the phagocytic index were
180 M. Trabalza-Marinucci et al. / Livestock Science 113 (2008) 178–190
EXHIBIT J - Page 467
Case 5:14-cv-00117-cr Document 63-11 Filed 11/14/14 Page 185 of 312

evaluated as previously reported (Miliotis, 1991; Roilideset al., 1990).
Intracellular killing was performed with S. abortusovis grown under starvation conditions, preopsonized asdescribed for phagocytosis tests and added to cellularmonolayers at a 1/50 ratio. After 30 min incubation, toallow bacterial internalization by macrophages, the cul-tures were washed three times to eliminate extracellularmicroorganisms and processed as reported elsewhere(Roilides et al., 1990). The bactericidal activity wascalculated as the percentage of killed intracellular bac-teria after 60 min, with respect to time zero.
The proliferation capacity of lymphocytes was as-sessed by monitoring the incorporation of [3H]thymi-dine into newly synthesized DNA after concanavalin A,phytohaemagglutinin, and pokeweed stimulation(Chiaradia et al., 2002).
2.4. Ruminal metabolism and microbial population
Samples obtained from the slaughtered ewes (n=46)were used. Immediately after slaughter, whole ruminalcontents were mixed, the pH was measured and com-posite samples were collected for microbiological andchemical analyses. A sub-sample of ruminal contents(50 g) was anaerobically processed for total, amylolyticand cellulolytic bacterial numbers evaluation accordingto the MPN procedure (Dehority, 1969; Dehority et al.,1989). The amylolytic and cellulolytic sub-populationswere chosen because adherent to feed particles and morelikely to get in close proximity with the plant DNA. Asecond sub-sample of ruminal contents (50 ml) was
processed for generic counts of protozoa (Dehority,1984). A further sub-sample of ruminal contents wasfiltered through 4 layers of cheesecloth and then pro-cessed for chemical analyses as follows:
(a) Volatile fatty acids (VFA)—A gas chromatograph(Carlo Erba GC 6000 Vega Series 2, Milan, Italy),equippedwith a flame ionization detector, was used.After filtration and acidic precipitation, sampleswere centrifuged and the liquid fraction was anal-ysed in a 2 m×2 mm glass column i.d. packed withCarbograph 1 80–120 mesh, AL acid washed +4%Carbowax 20 M (Laboratori Analitici di RicercaAssociati, Rome, Italy).
b) NH3-N—After filtration of ruminal contents andprecipitationwith 1N cloridric acid, NH3-N contentwas evaluated in the supernatant fluid using acolorimetric assay (Beecher and Whitten, 1970).
c) Lactate—Filtered ruminal contents were mixedwith 8% perchloric acid in a 5:1 ratio and cen-trifuged at 2000×g for 15 min at 4 °C. Analyses onthe supernatant fluid were carried out following acolorimetric method (L-Lactate PAP, RandoxLaboratories Ltd., Co Antrim, UK).
2.5. Histological analyses
Twenty-six (13 C+13 T) ewes and 32 (16 C+16 T)lambs, distributed between first and second lambing,were used. Samples of liver, spleen, pancreas, duode-num, cecal appendix, mesenteric lymph nodes, rumenand abomasum were fixed in a 10% neutral buffered
Fig. 1. Time schedule for the accomplishment of the different events of the experiment, referred as months of the year. Vaccination for Clostridiumspp. and Salmonella abortus ovis are indicated with elevated lines, while sera samplings are indicated with arrowheads. PRE period=pre-experimental period, EXP period=experimental period with animals divided in 2 groups (control and GM-maize fed), A=I immunization – firstdose, B=I immunization – booster dose, C=II immunization.
181M. Trabalza-Marinucci et al. / Livestock Science 113 (2008) 178–190
EXHIBIT J - Page 468
Case 5:14-cv-00117-cr Document 63-11 Filed 11/14/14 Page 186 of 312

formalin solution and routinely embedded in paraffin wax.For histological evaluations, 4 μm-thick sections werestained with haematoxylin–eosin and observed with anOlympus BX51 (Hamburg, Germany) light microscope.
In addition, the ewes' ruminal epithelium from thedorsal sac was submitted to immunohistochemical pro-cedures using a monoclonal antibody against the Ki-67nuclear protein, a proliferating marker (Gerdes et al.,1984). Four μm-thick tissue sections were deparaffinised,rehydrated, treated with 0.3% H2O2–methanol (v/v) andthen microwaved in 10 mmol/l citrate buffer. The antibodyfor Ki-67 protein (Clone MIBI, Dakocytomation, Den-mark) was incubated with the sections overnight at 4 °C.Detection of immunoreactive staining was carried out bystreptavidin–biotinilated–peroxidase complex using theLSAB kit (Dako, Copenhagen, Denmark). Finally, 3.3diaminobenzidinewas used as the chromogen andMayer'shaematoxylin for counterstaining. Positive controls con-sisted of normal lymph node tissue, while negative controlswere obtained by omitting the primary antibody. Scoringof immuno-reactivity was assessed by counting the totalnumber of positively stained basal cell nuclei (40×) in 5randomly selected sections per sample and values wereexpressed as the number of labelled cells/mm2.
For transmission electron microscopy, samples ofliver and pancreas from the lambs and ewes were pro-cessed (Malatesta et al., 2003). Ultrathin sections werestained with the EDTA technique (Bernhard, 1969) tovisualize the ribonucleoprotein structural constituentsand observed in a Zeiss EM 902 (Thornwood, NY,USA) electron microscope.
2.6. Meat quality
Samples of meat from 20 sheep (10 T and 10 C) and14 lambs (7 T and 7 C), distributed between first andsecond lambing, were analysed 24 h following slaugh-tering. One hundred and fifty gram portions of Longis-simus dorsi between the 10th and the 15th rib andBiceps femoris of each carcass were sampled andchilled for 24 h before analysis. Analyses for moisture,fat, protein and ash content (AOAC, 2000) and for pH,water loss by cooking and tenderness (AMSA, 1995)were carried out for each muscle sample.
2.7. Transgene detection
Transgene detection was performed on: (a) bloodcollected periodically from 20 ewes, at 4-month intervals,beginning 18 months after the start of the EXP period;(b) blood, liver, spleen, pancreas, jejunum and rumensampled at slaughter from 12 ewes; (c) ruminal fluid
collected from 24 ewes at slaughter and ruminal bacteriagrown in liquid anaerobic media as described above.Samples were equally distributed between the group Tand C and between first and second lambing.
a) Animal tissues—Tissue samples and blood withEDTA were quick-frozen and stored at −20 °C untilanalysis. Total DNAwas extracted using a commercialkit for tissue and blood extraction (QIAamp® DNAMini Kit, QIAGEN, Valencia, CA, USA) according tothemanufacturer's instructions. The yield and purity ofthe extracted DNA were determined following mea-surement of UV absorption at 260 and 280 nm. DNAextraction was shown using primers for amelogeningene amplification. During each extraction procedurean extraction control (duplicate) was also carried outusing only the same buffers/reagents. A pair of primerswas used in PCR detection of transgene sequences:Cry03 (5′-CTCTCGCCGTTCATGTCCGT-3′) andCry04 (5′-GGTCAGGCTCAGGCTGATGT-3′)(GenBank accession no. I41419). These primers am-plify the last 73 bp region of the CDPK promoter andthe first 138 bp of the N-terminus of the CryIA(b)(Hupfer et al., 1998). When assembling each PCRplate, a positive (5 μl of Bt176 maize) and a negativecontrol (5 μl of water) were routinely set up. PCR wasperformed with a Thermal Mastercycler (Eppendorf)in a 25 μl final volume. Five microliters of each DNAsample were added to 20 μl containing 1× PCR re-action buffer, 1.5 mmol/l MgCl2, 200 μmol/l dNTP(each), 0.6 μmol/l of each primer and 1 unit ofAmpliTAQ Gold DNA Polymerase (Applied Biosys-tems, Foster, CA, USA). The amplification for trans-gene sequences was carried out under the followingcycling conditions: 30 s at 95 °C, 30 s at 63 °C, and 30 sat 72 °C for 38 cycles and a final extension at 72 °C for6 min. Amplification products (25 μl) were electro-phoresed in 2% (w/v) Tris-borate-EDTA agarose gelstained with ethidium bromide.
b) Ruminal fluid and bacteria—Total DNA wasextracted from the ruminal fluid as well as from themicroorganisms grown in liquid media for total,amylolitic and cellulolytic bacterial species usingDynabeads®DNADIRECT™ (Dynal Biotech, Oslo,Norway), following the manufacturer's instruction.PCR analyses were performed to reveal the presenceor absence of two different fragments of the delta-endotoxin CryIA(b) using 2 pairs of primers: Cry1(5′-ACCATCAACAGCCGCTACAACGACC-3′)and Cry2 (5′-TGGGGAACAGGCTCACGATGTC-CAG-3′), designed to amplify a 184 bp fragment oftransgene sequence (Hurst et al., 1995), and the
182 M. Trabalza-Marinucci et al. / Livestock Science 113 (2008) 178–190
EXHIBIT J - Page 469
Case 5:14-cv-00117-cr Document 63-11 Filed 11/14/14 Page 187 of 312

Cry03/Cry04 described above (Hupfer et al., 1998). Toexclude false positive results, 2 intrinsic maize geneswere assayed as a control for maize DNA contamina-tion in the samples, using the primer pair IVR1/2(IVR1 5′-CCGCTGTATCACAAGGGCTGGTACC-3′; IVR2 5′-GGAGCCCGTGTAGAGCATGAC-GATC-3′) as primer for the maize invertase gene(Chiter et al., 2000) and the F1/B1 (F1 5′-TACGGCAACAAGAAGTTCGAGAC-3′; B1 5′-AACATGGGCAGCTTCCACTGG-3′) designed to amplify a200 bp fragment of the ribulose-1,5-bisphosphatecarboxylase/oxygenase (Rubisco) small subunit,which is normally present in plant DNA (Hurstet al., 1995). The universal bacterial primer set 27f(5′-AGAGTTTGATCMTGGCTCAG-3′) and 1525r(5′-AAGGAGGTGWTCCARCC-3′) were used forthe amplification of a 1500 bp of the bacterial 16SrDNA to ensure the quality and suitability of the DNAextracts for PCR.
All PCR were performed with a GeneAmp PCRsystem 2700 thermocycler (Applied Biosystems, Foster,CA, USA) in a 25 μl final volume. Four microliters ofeachDNA sample was added to 21 μl containing 1× PCRreaction buffer, 2.5 mmol/l MgCl2, 200 μmol/l (each)dNTP, 400 nmol/l of each primer, bovine serum albumin200 ng/μl, and 0.625 U/reaction of Hot-Rescue DNAPolymerase (DIATHEVA s.r.l, Fano, Italy). The ampli-fications for transgene sequences and maize endogenousgenes were carried out under the same cycling condi-tions: after 1 cycle at 95 °C for 10 min a 3-step PCRprocedure, consisting of 20 s at 95 °C, 15 s at 64 °C and20 s at 68 °C for 50 cycles and a final extension at 68 °Cfor 5 min, was used. Finally, 1/5 of the PCR mixture was
subjected to an ulterior 50 PCR cycles. For the bacterial16S rDNA amplification, the temperature programconsisted of denaturation at 95 °C for 10 min, followedby 35 cycles consisting of 95 °C for 20 s, annealing at60 °C for 15 s, and extension at 68 °C for 80 s and a finalextension at 72 °C for 7 min. For each amplification, 10-fold dilutions (1:8 and 1:80 from extracted DNA) weretested to ensure the absence of PCR-inhibiting con-taminants in the samples.
When assembling each PCR plate, a positive control(GMmaize standard) and a negative control (water) wereroutinely set up. Amplification products (25 μl) wereelectrophoresed in 2% (w/v) Tris-borate-EDTA agarosegel stained with ethidium bromide. All the PCR productswere cloned into the pCR 2.1 plasmid vector (Invitrogen,San Diego, CA), following the manufacturer's instruc-tions and directly sequenced. The limit of detection ofthe PCR assay established, using negative control DNA,spiked with known quantities of plasmids containing thetransgene or endogenous maize sequences, was 2molecules (Fig. 2).
2.8. Statistical analysis
Statistical analyses were performed using the Statisti-cal Analysis Systems statistical software package version8.2 (SAS, 2001). Performance, reproductive traits andruminal characteristics were evaluated by ANOVA usingthe GLM procedure. The main independent factors weredietary treatment (C and T), year of birth and samplingperiod. Bacterial numbers were log-transformed prior toanalysis to satisfy the requirement for constant variance.For BW and BCS data of the adult animals, valuesobtained during the PRE period were used as a covariate.
Fig. 2. Sensitivity assay. Negative control DNA was spiked with known quantities of each plasmid and subjected to PCR analyses. INV=maizeinvertase gene, Cry=Bt176 maize transgene sequences.
183M. Trabalza-Marinucci et al. / Livestock Science 113 (2008) 178–190
EXHIBIT J - Page 470
Case 5:14-cv-00117-cr Document 63-11 Filed 11/14/14 Page 188 of 312

The lambs'BWwas analysed by taking into considerationsex, dietary treatment (C and T) and year as fixed factorsand BW at birth as a covariate. Interactions betweenfactors were included if found significant at ANOVA.
A repeated measures design with sheep within diet asthe error term, and diet and period as main effects, wascarried out to assess the dietary effect on haematologicalparameters and oxidative stress markers. Multiple com-parisons among treatments were by the Tukey test ifsignificance had been indicated by the analysis ofvariance. As for the immune response to vaccination,absorbance values obtained for 1:100 serum dilution forClostridium spp. ELISA assay and 1:500 for S. abortusovis assay were used in an ANOVA model for repeatedmeasures. Post hoc comparisons were performed usingthe Tukey least significant difference test. Cell-mediatedimmunity data were statistically analysed by the t test incase of equal variance assumption.
The histological data were analysed by an ANOVAmodel which included animal category (ewe and lamb)and dietary treatment (C and T) as main factors.
Factors considered in the ANOVA model for meatquality traits were dietary treatment (C and T), type ofmuscle (L. dorsi and B. femoris) and animal category(ewe and lamb). Interactions between factors were notincluded in the model because they were found notsignificant at ANOVA.
3. Results
3.1. Animals and feeds
The data in Table 1 indicate that the chemical com-position and the ruminal degradability of the 2 maizehybrids were similar. Minor differences between lineswere related to neutral detergent fibre, ether extracts,
Table 2Effect of dietary treatment and sampling period on haematological parameters in ewes
Item Dietary treatment P-value
GM SEM Control SEM Dietary treatment SP INT
Albumin (mmol/l) 36.53 0.51 35.64 0.54 0.239 b0.001 0.006Alk phos (U/l) 242.66 10.16 230.64 11.03 0.428 b0.001 0.629ALT (U/l) 30.10 0.68 28.98 0.75 0.053 b0.001 0.040AST (U/l) 111.72 2.45 107.05 2.64 0.202 b0.001 0.676Bilirubin (μmol/l) 3.04 0.16 3.22 0.16 0.431 b0.001 0.177Glucose (mmol/l) 2.47 0.05 2.42 0.05 0.545 b0.001 0.640Urea nitrogen (mmol/l) 6.36 0.17 6.43 0.18 0.794 b0.001 b0.001Creatinine (μmol/l) 90.54 1.24 91.16 1.36 0.735 b0.001 0.973Total protein (g/l) 59.59 0.60 59.07 0.64 0.557 b0.001 0.211GGT (U/l) 44.49 0.91 40.19 0.98 0.003 b0.001 0.440Calcium (mmol/l) 2.46 0.03 2.42 0.03 0.307 b0.001 0.399Chloride (mmol/l) 104.07 0.66 103.11 0.70 0.324 b0.001 0.028Potassium (mmol/l) 5.98a 0.18 6.68b 0.20 0.012 b0.001 0.074Sodium (mmol/l) 154.47 1.48 153.31 1.67 0.605 b0.001 b0.001Iron (mmol/l) 24.49 0.39 23.79 0.42 0.236 b0.001 0.203Magnesium (mmol/l) 0.91a 0.03 0.76 b 0.03 b0.001 b0.001 b0.001Phosphorus (mmol/l) 1.73 0.04 1.75 0.05 0.848 b0.001 0.260Haematocrit (%) 31.38 0.25 31.00 0.26 0.290 b0.001 0.023Haemoglobin (g/dl) 10.92a 0.11 10.46b 0.11 0.005 b0.001 0.067MCH (pg) 9.57 0.10 9.47 0.11 0.518 b0.001 0.084MCHC (%) 30.89 0.19 31.16 0.19 0.323 b0.001 0.179MCV (fl) 31.54 0.23 30.96 0.24 0.090 b0.001 b0.001Platelet (103/μl) 195.44 5.77 179.08 6.18 0.060 b0.001 0.575Basophil (%) 0.10 0.03 0.10 0.03 0.980 0.119 0.185Eosinophil (%) 3.95 0.17 4.15 0.17 0.412 b0.001 0.067Lymphocyte (%) 52.25 0.44 51.60 0.46 0.313 b0.001 0.030Monocyte (%) 4.74 0.18 4.60 0.19 0.597 b0.001 0.322Neutrophil (%) 41.95 0.54 40.56 0.57 0.085 b0.001 b0.001RBC (106/ml) 11.33 0.12 11.22 0.13 0.564 b0.001 0.352WBC (103/μl) 12.91 0.35 13.89 0.36 0.056 b0.001 0.002
SP=sampling period; INT=interaction between treatment and SP; Alk phos: alkaline phosphatase; ALT: alanine aminotransferase; AST: aspartateaminotransferase; GGT: gamma glutamyltransferase; MCH: mean corpuscular haemoglobin; MCHC: mean corpuscular haemoglobin concentration;MCV: mean corpuscular volume; RBC: red blood cells; WBC: white blood cells.a,bMeans values (n=327) within a row with unlike superscript letters were significantly different (Pb0.05).
184 M. Trabalza-Marinucci et al. / Livestock Science 113 (2008) 178–190
EXHIBIT J - Page 471
Case 5:14-cv-00117-cr Document 63-11 Filed 11/14/14 Page 189 of 312

copper and iron contents. No differences were detectedbetween the two groups of ewes, in all generationsstudied, as far as BW, BCS, fertility, and twin rate wereconcerned (62 (±1.0) vs. 62 (±1.0) kg, 2.8 (±0.04) vs. 2.8(±0.05), 79 (±1.6) vs. 72 (±1.9) %, and 25 (±1.2) vs. 24(±1.1) % for T and C ewes, respectively). The lambs'BW at birth, mortality and daily weight gain up toweaning (5 (±0.1) vs. 5 (±0.1) kg, 4 (±0.4) vs. 4 (±0.5)%,and 288 (±5.3) vs. 293 (±4.8) g, for T and C lambs,respectively) were not affected by dietary treatment.
3.2. Welfare status
Clinical examinations did not detect any alterationsof cardiorespiratory and reproductive functions, orchanges in motory, sensory and/or reflex behaviour,associated to dietary treatment.
Analysis of variance carried out on haematologicalfindings and least square means of dietary treatments arepresented in Table 2. All values, except for the per-centage of basophil, were affected by the samplingperiod. Four (gamma glutamyltransferase, potassium,magnesium, and haemoglobin) of the 30 haematologicaltraits evaluated were affected by diet.
Values recorded for malondialdehyde and in vitrooxidative stress did not show any significant effect due todietary treatment. The sampling period was able to affectthe oxidation of Hb to MetHb by t-BuOOH. Valuesobtained during lactation (second sampling period) werelower than those recorded at the end of the experiment.
3.3. Immune response
A low titer of anti-Clostridium spp. and anti-S.abortus ovis antibodies was detected by ELISA assaysin the pre-immune sera (t=0) of sheep from both groupsT and C. The statistical analysis showed that the dietarytreatment played a highly significant role in the vari-ations of anti-S. abortus ovis titer following vaccination(P=0.008). With respect to the anti-Clostridium spp.titer, a quasi-significant role of the dietary treatment(P=0.077) was detected. For both types of investiga-tions, the mean absorbance values were higher in Tanimals in every phase of the study. In spite of this, theconfidence intervals for differences of means showedsignificant differences only in t=1 sampling for clos-tridiosis and in t=3 and t=4 sampling for salmonellosisvaccination (Table 3).
As for cell-mediated immunity, M/M yields obtainedat the established periods (4th, 8th, 12th and 16thmonth) from peripheral blood of both groups C and Twere 2.20 (±0.3) % of the total mononucleated bloodcells (Knoll, 2000). The number of phagocytosed bac-teria per cell ranged from 3.29 (±1.68) to 5.67 (±0.11)for C sheep and from 3.83 (±2.58) to 6.07 (±0.56) for Tsheep. Phagocytosis of latex beads resulted to be in arange from 5.82 (±1.78) to 10.9 (±3.3) particles for Cand from 5.79 (±1.13) to 10.8 (±5.63) for T samples.Intracellular killing of S. abortus ovis resulted to be18.53% in C sheep vs. 19.6% in T. However, when thedata of the phagocytic index and killing obtained from C
Table 3Statistical analysis of ELISA absorbance values
Phase ofanalysis⁎
Clostridium spp. Salmonella abortusovis
Mean SEM Mean SEM
t=0 C 0.274 0.022 0.07809 0.014GM 0.285 0.019 0.07508 0.013
t=1 C 0.955a 0.068 –GM 1.151b 0.059 –
t=2 C 0.938 0.055 1.38 0.053GM 1.007 0.048 1.517 0.046
t=3 C 0.714 0.053 0.525a 0.054GM 0.839 0.046 0.729b 0.047
t=4 C 1.074 0.066 0.466a 0.045GM 1.119 0.058 0.639b 0.039
C: Control ewes; GM: GM maize-fed ewes.a,bWithin a phase of analysis, means values (n=70) in a column withunlike superscript letters were significantly different (Pb0.01).⁎Phases of analysis are: t=0, 3 months before immunization; t=1, firstimmunization against Clostridium spp.; t=2, immunization againstSalmonella abortus ovis; t=3, second immunization against Clostri-dium spp.; t=4, 4 months after t=3.
Table 4Rumen microbial numbers and metabolism as affected by dietarytreatment
Control GM SEM
Bacteria (n/ml, log)Total 9.03 9.05 0.08Amylolytic 8.76 8.96 0.11Cellulolytic 7.75 8.04 0.11
ProtozoaTotal (n/ml×104) 16.06 14.65 1.70Entodinium (%) 84.72 84.55 1.64Diplodiniinae (%) 8.45 8.50 0.82Isotricha (%) 1.87 2.17 0.40Dasytricha (%) 3.08 2.58 0.62Ophryoscolex (%) 1.88 2.20 0.72
pH 6.57 6.54 0.14NH3-N (mg/dl) 14.96 13.48 1.15Lactate (mmol/l) 0.32 0.45 0.05Volatile fatty acids
Acetate (%) 58 57 0.9Propionate (%) 23 24 1.0Butyrate (%) 19 19 1.3
Values are means of 46 measurements. GM: GM maize-fed ewes.
185M. Trabalza-Marinucci et al. / Livestock Science 113 (2008) 178–190
EXHIBIT J - Page 472
Case 5:14-cv-00117-cr Document 63-11 Filed 11/14/14 Page 190 of 312

and T samples at any sampling time were compared, thedifferences resulted to be not significant (PN0.05).
The response of T and B peripheral lymphocytes to66 h of stimulation with ConA, PKW, or PHA wasunaffected by diet (5 animals per group) and nodifferences were observed among the periods consid-ered. The percentage of proliferation of the stimulatedvs. resting (without mitogen) cells was extremelyvariable, ranging from 500 to up to 2000.
3.4. Ruminal metabolism and microbial population
Total, amylolytic and cellulolytic bacterial concentra-tions, as well as protozoal numbers and composition,did not differ between groups (Table 4). The ruminalmetabolism indicators taken into consideration (pH, VFA,NH3-N, and lactate) were not affected by dietary treatment.
3.5. Histological analyses
Light microscopy observations of liver, spleen, pan-creas, duodenum, cecal appendix, mesenteric lymph
nodes, rumen and abomasum sections did not revealhistological differences between groups C and T, forboth sheep and lambs.
Immunocytochemical analyses of ruminal epitheliumby Ki-67 staining provided evidence of the proliferativeactivation of basal cells in Tewes: the values of anti-Ki-67labelled cells/mm2 of ruminal epithelium were sig-nificantly higher in T animals than in the controls at allages (Pb0.001) (Fig. 3). Moreover, preliminary EManalyses of hepatocytes and pancreatic acinar cells re-vealed smaller, irregularly shaped cell nuclei containingincreased amounts of heterochromatin and perichromatingranules (ribonucleoprotein structural components in-volved in transport and/or storage of already spliced pre-mRNA) (Fakan et al., 1984) in T lambs (Fig. 3).
3.6. Meat quality
Except for protein content (C: 20.3 (±0.2); T: 19.7(±0.2); Pb0.05) and water loss by cooking (C: 37.9(±0.8); T: 40.3 (±0.7);Pb0.05), the parameters examinedwere not affected by the dietary treatment. Other factors
Fig. 3. Top: immunocytochemical detection of Ki-67 protein on control (a) and GM maize-fed (b) ewes. The number of immunolabelled cell nuclei(arrows) is markedly higher in the samples from GM maize-fed animals; bar=10 μm. Bottom: ultrastructural features of pancreatic acinar cell nucleifrom control (a) and GM maize-fed (b) 3 month-old lambs. The cell nuclei from GM-fed animals show smaller size and larger amounts ofheterochromatin (C) and perichromatin granules (arrows). Nu=nucleolus, bar=1 μm.
186 M. Trabalza-Marinucci et al. / Livestock Science 113 (2008) 178–190
EXHIBIT J - Page 473
Case 5:14-cv-00117-cr Document 63-11 Filed 11/14/14 Page 191 of 312

such as type of muscle (L. dorsi/B. femoris) and animalcategory (ewe/lamb) were found to be significant atANOVA (data not shown).
3.7. Transgene detection
No transgenic DNAwas detected in any of the tissueand blood samples taken from both C and T groups.While bacterial DNA was detected in all ruminal fluidand bacterial culture samples at all time points, neithertransgenic maize nor intrinsic maize fragments weredetected.
4. Discussion
The differences among the maize hybrids used in thestudy were so minor that they are unlikely to be of anybiological significance. Trace mineral content of the twomaize lines was possibly influenced by agronomic traitsand geographical origin (Ipharraguerre et al., 2003). Therelative lack of chemical composition differences be-tween the Bt and non-Bt hybrid agrees with literaturedata (Sidhu et al., 2000; Folmer et al., 2002). On thecontrary, the crude protein content of the Rh208 maizehybrid was found to be higher than that of its nearisogenic line (Rh289) in a study where maize silagecomposition was examined (Barrière et al., 2001).
In this study, the animals' BW and BCS were notaffected by treatment in all generations studied and weresimilar to that indicated in the literature for animals ofthe same genotype (Valusso et al., 1998) or physiolog-ical state (Bocquier et al., 1988). Other authors haveshown the nutritional equivalence of transgenic maizefed to monogastric and poligastric animals, but there is alack of information concerning the ovine species. More-over, no multi-generational studies have been publishedso far. The absence of differences between transgenicmaize Bt176 (Rh208Bt) and its near isogenic hybrid(Rh208), fed as silage to Texel ewes, was demonstratedas far as neutral detergent fibre, crude fibre and organicmatter digestibility was concerned (Barrière et al.,2001). Similarly, no differences in either digestibilityor energy content between Bt-maize and its conven-tional counterpart, used in a series of trials with poultry,pigs and wethers, were found (Aulrich et al., 2001).
Most of the haematological indexes examined in thisstudy fell within the range normally observed in healthyewes of similar age (Kaneko, 1989). At present, there isno plausible explanation for the differences found be-tween the groups regarding gamma glutamyltransferase,potassium, magnesium, and haemoglobin. Other authorshave reported no differences between the haematologi-
cal and clinical serum parameters of rats fed with GMglyphosate-tolerant soybean meal and controls (Zhuet al., 2004). No effects on haematology and bloodbiochemical indexes between rats or mice, fed eitherGM sweet pepper or tomato diets, were found whencompared with those fed the non-GM diets (Zhang-Liang et al., 2003). With reference to malondialdehydeand oxidative stress in vitro, results are indicative of alack of effect by dietary treatment on the antioxidantdefences of the animals. No data are available in theliterature on this subject. Data from the immune re-sponse study indicated that GM maize did not impairtwo important functions of M/M, such as phagocytosisand intracellular killing. These findings are in agreementwith the results obtained regarding the lymphocyte pro-liferative capacity. The immune response against S.abortus-ovis was more efficient in T animals; however,more extensive research is needed in order to reachdefinite conclusions on this aspect.
Values recorded for ruminal pH, VFA, NH3-N, andlactate in samples obtained from both C and T groupswere within the physiological ranges and compatible withthe diet being fed at slaughter (third month of lactation,characterized by moderate supplementation with maizegrain, i.e. 27% of total DM intake). Similar results wereobtained with dairy cows fed glyphosate-tolerant soybean(Hammond et al., 1996). The lack of differences observedin protozoal and bacterial populations is in agreementwith results indicated in previous studies (Einspanier etal., 2004). In a 4-week feeding experiment, during whichBt176 maize was fed to cows, no significant variations inthemicrobial population sampled from different organs ofthe gastrointestinal tract were reported.
The diet containing GM maize did not seem to affectthe histological features of the examined tissues. How-ever, cytochemical analyses revealed that functionalmodifications took place without inducing evident his-tological alterations. In fact, the basal cells of the ru-minal epithelium of T ewes showed a higher expressionof Ki-67 in comparison to controls. It is known thatsheep rumen is sensitive to age and diet (Lane et al.,2000). The higher expression of Ki-67 in the ruminalcells was possibly induced by some components of theGM maize; it has been reported that Cry1 is able to bindthe intestinal mucosal surface, influencing some epithe-lial cell functions (Vazquez-Padron et al., 2000).
The cell nuclear modifications observed in the pan-creatic acinar cells and hepatocytes could also be due tosome direct or indirect effect of Bt 176 maize. Thechanges in chromatin arrangement and ribonucleopro-tein constituents observed in T animals are suggestive offunctional modifications concerning transcriptional/
187M. Trabalza-Marinucci et al. / Livestock Science 113 (2008) 178–190
EXHIBIT J - Page 474
Case 5:14-cv-00117-cr Document 63-11 Filed 11/14/14 Page 192 of 312

post-transcriptional events. However, the significance ofthis phenomenon is unclear and is presently underinvestigation. Fine structural modifications of cellularcomponents in relation to GM feed intake have alreadybeen described, although without any consequences onorgan functions or animal health (Fares and El-Sayed,1998; Malatesta et al., 2002).
There are no available explanations that could sup-port the effects of diet on the meat chemical traits ob-served in the present study and no data concerning theeffects of GM maize on sheep meat quality traits areavailable in the scientific literature. Stanford et al.(2003), in a study involving Arcott lambs slaughtered at45 kg BW, did not observe changes in carcass com-position and characteristics except for the moisturecontent of loin tissue, which was higher in the group fedglyphosate-tolerant (Roundup Ready®) rapeseed com-pared to the controls. As for studies conducted withmonogastrics, Hyun et al. (2004) compared glyphosate-tolerant Roundup Ready® (event NK603) corn with itsnontransgenic genetically similar control corn (RX670)in an experiment carried out with barrows and gilts andfound no differences in muscle quality traits, composi-tion measurements and L. dorsi colour and marblingscores. In a 38-d feeding trial with broiler chickens, inwhich Bt176 maize was compared with a non-Bt coun-terpart, minor differences on feed conversion ratio,breast skin, and Pectoralis minor yield, not directlyassociated to dietary treatment, were reported (Brakeand Vlachos, 1998).
The present transgene detection study only focused onthe presence or absence of the amplicon resulting from thelast 73 bp of the CDPK promoter and the first 138 bp ofthe N-terminus of the CryIA(b) gene. These results are inagreement with most data from the literature, that do notreport the presence of transgenic DNA fragments intissues of either mono- and poligastric animals. In con-trast, Mazza et al. (2005) detected a small fragment of theCryIA(b) gene in blood, liver, spleen and kidney of pigletsfed for 35 day with a diet containing GM (MON810)maize. Sharma et al. (2006) reported the presence offragments of the cp4 epsps transgene in the gastrointes-tinal tissues of sheep and pigs fed Roundup Ready®rapeseed. It has been assumed that, when compared withnon-GM plant DNA, the exposure to DNA of GMOmaterial is negligible. Most plant DNA is likely to bedegraded by DNase activity within the gastrointestinaltract. Furthermore, low pH conditions of the abomasumcontribute to denaturize most adenine and guanine basesfrom naked DNA fragments (Beever and Kemp, 2000).
Although it is not possible to conclusively prove thattransgene sequences were not transferred to the ruminal
bacterial species, uptake of transgenic DNA fragmentsis probably precluded or time-limited by rapid degra-dation of plant DNA upon plant cell lysis (Sharma et al.,2004). Plasmid DNA exposed to ovine saliva in vitrowas able to transform competent Escherichia coli cellsto ampycillin resistance even after 24 h (Duggan et al.,2000). In contrast, free maize chromosomal DNA wasrapidly destroyed within 1 min of incubation in ruminalfluid or silage effluent (Duggan et al., 2000). Stability ofDNA fragments in the gastrointestinal tract can be af-fected by the type of feed being used, with processedfeedstuffs being more degradable than the untreatedgrains (Chiter et al., 2000). Fragments of the Rubiscogene were found in bovine digesta samples obtainedfrom the rumen and duodenum and from faeces andmilk,but single-copy genes such as cp4epsps and Cry1A(b),from GM-soybean and maize, were only detected in thesolid phase of ruminal and duodenal digesta (Phippset al., 2003). These data are consistent with the resultsobtained in the current study, where no transgenic DNAwas detected in rumen fluid. To our knowledge, the onlyevidence of gene transfer from GM-soya to gut micro-organisms was reported in mixed cultures of humanintestinal bacteria (Netherwood et al., 2005).
5. Conclusions
Overall welfare status indexes could confirm sub-stantial equivalence with conventional hybrid as far asnutritional and safety characteristics are concerned.These results were partly expected, considering the ge-netic transformation involved, and in agreement withprevious studies conducted in other monogastric andpoligastric species (Aumaitre et al., 2002).
Our findings confirm that transgenes from maize areunlikely to survive in the ruminant prestomachs for 12 hor longer and provide a source of transforming DNAfragments for microorganisms. No transgenic DNAwasfound in the animals' tissues, which supports the opin-ion that intact genes from foods are unlikely to beabsorbed through the gastrointestinal tract and integrat-ed into the DNA of eukaryotic cells (Schubbert et al.,1997, 1998; Hohlweg and Doerfler, 2001; Einspanieret al., 2001).
However, more extensive research is needed to clarifysome of the metabolic aspects under investigation, toimprove safety assessments for GM organisms used forfeed and food. In particular, the cytochemical modifica-tions of the gastrointestinal organs and the immuneresponse mechanisms that take place in GM-fed animalsshould deserve special emphasis and priority in futureinvestigations.
188 M. Trabalza-Marinucci et al. / Livestock Science 113 (2008) 178–190
EXHIBIT J - Page 475
Case 5:14-cv-00117-cr Document 63-11 Filed 11/14/14 Page 193 of 312

Acknowledgements
This research was conducted with financial supportfrom the Italian Ministry of Health (project IZS-UM-01/2000). The authors would like to thank A. Casabianca,G. Gazzanelli, F. Tonelli, L. Mughetti, L. Terracina,E. Merati and E. Cassetta for technical help in laboratoryanalyses and C. Pieramati, M.B.L. Rocchi andV. Montebelli for assistance with the statistical tests. Theskilful assistance and help in animal care of C. Cavalletti,G. Tenerini and L. Burani are kindly acknowledged.
References
AMSA, American Meat Science Association, 1995. Research Guide-lines for Cookery, Sensory Evaluation and Instrumental Tender-ness Measurements of Fresh Meat. National Live Stock and MeatBoard, Chicago, IL, USA.
Antonelli, A., Brandi, G., Casabianca, A., Magnani, M., 1997. 2′,3′-Dideoxycytidine cytotoxicity in human macrophages. Biochim.Biophys. Acta 1358, 39–45.
AOAC, 2000. Official Methods of Analysis of AOAC International,17th Edition. AOAC International, Arlington, VA, USA.
Aulrich, K., Böhme, H., Daenicke, R., Halle, I., Flachowsky, G., 2001.Genetically modified feeds in animal nutrition. 1st Communica-tion: Bacillus thuringiensis (Bt) corn in poultry, pig and ruminantnutrition. Arch. Anim. Nutr. 54, 183–195.
Aumaitre, A., Aulrich, K., Chesson, A., Flachowsky, G., Piva,G., 2002. New feeds from genetically modified plants: sub-stantial equivalence, nutritional equivalence, digestibility, andsafety for animals and the food chain. Livest. Prod. Sci. 74,223–238.
Barrière, Y., Vérité, R., Brunschwig, P., Surault, F., Emile, J.C., 2001.Feeding value of corn silage estimated with sheep and dairy cowsis not altered by genetic incorporation of Bt176 resistance to Os-trinia nubilalis. J. Dairy Sci. 84, 1863–1871.
Beecher, G.R., Whitten, B.K., 1970. Ammonia determination: reagentmodification and interfering compounds. Anal. Biochem. 36,243–246.
Beever, D.E., Kemp, C.F., 2000. Safety issues associated with the DNAin animal feed derived from genetically modified crops. A review ofscientific and regulatory procedures. Nutr. Abstr. Rev. Ser. B. Livest.Feeds Feed. 70, 175–182.
Bernhard, W., 1969. A new staining procedure for electronmicroscopical cytology. J. Ultrastruct. Res. 27, 250–265.
Bocquier, F., Theriez, M., Prache, S., Brelurut, A., 1988. Alimentationdes ovins. In: INRA (Ed), Alimentation des Bovins, Ovins etCaprins. INRA, Paris, pp. 249–280.
Brake, J., Vlachos, D., 1998. Evaluation of transgenic event 176 “Bt”corn in broiler chickens. Poult. Sci. 77, 648–653.
Chiaradia, E., Gaiti, A., Scaringi, L., Cornacchione, P., Marconi,P., Avellini, L., 2002. Antioxidant systems and lymphocyteproliferation in the horse, sheep and dog. Vet. Res. 33,661–668.
Chiter, A., Forbes, J.M., Blair, G.E., 2000. DNA stability in plant tissues:implication for the possible transfer of genes from geneticallymodified food. FEBS Lett. 481, 164–168.
Dehority, B.A., 1969. Pectin-fermenting bacteria isolated from thebovine rumen. J. Bacteriol. 99 (1), 89–96.
Dehority, B.A., 1984. Evaluation of subsampling and fixationprocedures used for counting rumen protozoa. Appl. Environ.Microbiol. 48, 182–185.
Dehority, B.A., Tirabasso, P.A., Grifo, A.P., 1989. MPN procedures forenumerating ruminal bacteria, including the simultaneous estimationof total and cellulolytic numbers in one medium. Appl. Environ.Microbiol. 55, 2789–2792.
Draper, H.H., Squire, E.J., Mahmoody, H., Wu, J., Agarwal, S.,Hadley, M.A., 1993. Comparative evaluation of thiobarbituric acidmethods for the determination of malondialdehyde in biologicalmaterials. Free Radic. Biol. Med. 15, 353–363.
Duggan, P.S., Chambers, P.A., Heritage, J., Forbes, J.M., 2000. Survivalof free DNA encoding antibiotic resistance from transgenic maizeand the transformation activity of DNA in ovine saliva, ovine rumenfluid and silage effluent. FEMS Microbiol. Lett. 191, 71–77.
Duggan, P.S., Chambers, P.A., Heritage, J., Forbes, J.M., 2003. Fate ofgenetically modified maize DNA in the oral cavity and rumen ofsheep. Br. J. Nutr. 89, 159–166.
Einspanier, R., Klotz, A., Kraft, J., Aulrich, K., Poser, R., Schwägele,F., Jahreis, G., Flachowsky, G., 2001. The fate of forage plantDNA in farm animals: a collaborative case-study investigatingcattle and chicken fed recombinant plant material. Eur. Food Res.Technol. 212, 129–134.
Einspanier, R., Lutz, B., Rief, S., Berezina, O., Zverlov, V., Schwarz,W., Mayer, J., 2004. Tracing residual recombinant feed moleculesduring digestion and rumen bacterial diversity in cattle fedtransgene maize. Eur. Food Res. Technol. 218, 269–273.
Fakan, S., Leser, G., Martin, T.E., 1984. Ultrastructural distribution ofnuclear ribonucleoproteins as visualized by immunocytochemistryon thin sections. J. Cell Biol. 98, 358–363.
Fares, N.H., El-Sayed, A.K., 1998. Fine structural changes in the ileumof mice fed on delta-edotoxin-treated potatoes and transgenicpotatoes. Nat. Toxins 6, 219–233.
Folmer, J.D., Grant, R.J., Milton, C.T., Beck, J., 2002. Utilization of Btcorn residues by grazing beef steers and Bt corn silage and grain bygrowing beef cattle and lactating dairy cows. J. Anim. Sci. 80,1352–1361.
Gerdes, J., Lemke, H., Bousch, H., Wacker, H.H., Schwab, U., Stein,H., 1984. Cell cycle analyses of a cell proliferation-associatedhuman nuclear antigen defined by the monoclonal antibody Ki-67.J. Immunol. 133, 1710–1715.
Hammond, B.G., Vicini, J.L., Hartnell, G.F., Naylor,M.W., Knight, C.D.,Robinson, E.H., Fuchs, R.L., Padgette, S.R., 1996. The feeding valueof soybean fed too rats, chickens, catfish and dairy cattle is not alteredby genetic incorporation of glyphosate tolerance. J. Nutr. 126 (3),717–727.
Hohlweg, U., Doerfler, W., 2001. On the fate of plant or other foreigngenes upon the uptake in food or after intramuscular injection inmice. Mol. Genet. Genomics 265, 225–233.
Hupfer, C., Hotzel, H., Sachse, K., Engel, K.H., 1998. Detection of thegenetic modification in heat-treated products of Bt maize bypolymerase chain reaction. Z. Lebensm.-Unters. -Forsch., A Eur.Food Res. Technol. 206, 203–207.
Hurst, C.D., Knight, A., Bruce, I.J., 1995. PCR detection of geneticallymodified soya and maize in foodstuffs. Mol. Breed. 5, 579–586.
Hyun, Y., Bressner, G.E., Ellis, M., Lewis, A.J., Fischer, R.,Stanisiewski, E.P., Hartnell, G.F., 2004. Performance of grow-ing-finishing pigs fed diets containing Roundup Ready corn (eventNK603), a non transgenic genetically similar corn, or conventionalcorn lines. J. Anim. Sci. 82, 571–580.
Ipharraguerre, I.R., Younker, R.S., Clark, J.H., Stanisiewski, E.P.,Hartnell, G.F., 2003. Performance of lactating dairy cows fed corn
189M. Trabalza-Marinucci et al. / Livestock Science 113 (2008) 178–190
EXHIBIT J - Page 476
Case 5:14-cv-00117-cr Document 63-11 Filed 11/14/14 Page 194 of 312

as whole plant silage and grain produced from a glyphosate-tolerant hybrid (event NK603). J. Dairy Sci. 86, 1734–1741.
Jank, B., Rath, J., Spök, A., 2005. Genetically modified organisms andthe EU. Trends Biotechnol. 23 (5), 222–224.
Kaneko, J.J., 1989. In: Clinical Biochemistry of Domestic Animals,third ed. (Academic Press editor). New York, USA.
Kleter, G.A., Kuiper, H.A., 2002. Considerations for the assessment ofthe safety of genetically modified animals used for human food oranimal feed. Livest. Prod. Sci. 74, 275–285.
Knoll, J.S., 2000. Clinical automated haematology systems, In:Feldman, B.F., Zinkl, J.G., Jain, N.C. (Eds.), Schalm's VeterinaryHaematology, 5th ed. Lippincott, Philadelphia, USA, pp. 3–11.
König, A., Cockburn, A., Crevel, R.W.R., Debruyne, E., Grafstroem, R.,Hammerling, U., Kimber, I., Knudsen, I., Kuiper, H.A., Peijnenburg,A.A.C.M., Penninks, A.H., Poulsen, M., Schauzu, M., Wal, J.M.,2004. Assessment of the safety of foods derived from geneticallymodified (GM) crops. Food Chem. Toxicol. 42, 1047–1088.
Lane, M.A., Baldwin, V.R.L., Jesse, B.W., 2000. Sheep rumenmetabolic development in response to age and dietary treatments.J. Anim. Sci. 78, 1990–1996.
Malatesta, M., Caporaloni, C., Gavaudan, S., Rocchi, M.B.L., Tiberi,C., Gazzanelli, G., 2002. Ultrastructural morphometrical andimmunocytochemical analyses of hepatocyte nuclei from mice fedon genetically modified soybean. Cell Struct. Funct. 27, 173–180.
Malatesta, M., Biggiogera, M., Manuali, E., Rocchi, M.B.L., Baldelli,B., Gazzanelli, G., 2003. Fine structural analyses of pancreaticacinar cell nuclei frommice fed on GM soybean. Eur. J. Histochem.47, 385–388.
Mazza, R., Soave, M., Morlacchini, M., Piva, G., Marocco, A., 2005.Assessing the transfer of genetically modified DNA from feed toanimal tissues. Transgenic Res. 14, 775–784.
McDonald, I., 1981. A revised model for the estimation of proteindegradability in the rumen. J. Agric. Sci. (Camb.) 96, 251–252.
Miliotis, M.D., 1991. Acridine orange stain for determining intra-cellular enteropathogens in HeLa cells. J. Clin. Microbiol. 29,830–831.
Netherwood, T., Martìn-Orùe, S.M., O'Donnell, A.G., Gockling, S.,Graham, J., Mathers, J.C., Gilbert, H.J., 2005. Assessing the sur-vival of transgenic plant DNA in the human gastrointestinal tract.Nat. Biotechnol. 22 (2), 204–209.
NRC, 1981. In: Nutrient Requirements of Domestic Animals (NationalAcademy Press editor). Washington, DC (USA).
Ørskov, E.R., McDonald, I., 1979. The estimation of proteindegradability in the rumen from incubationmeasurementsweightedaccording to rate of passage. J. Agric. Sci. (Camb.) 92, 499–503.
Phipps, R.H., Deaville, E.R., Maddison, B.C., 2003. Detection oftransgenic and endogenous plant DNA in rumen fluid, duodenaldigesta, milk, blood and feces of lactating dairy cows. J. Dairy Sci.86, 4070–4078.
Rice-Evans, C., Miller, N.J., 1994. Total antioxidant status in plasmaand body fluids. Methods Enzymol. 234 (24), 279–293.
Roilides, E., Venzon, D., Pizzo, P.A., Rubin, M., 1990. Effects ofantiretroviral dideoxynucleosides on polymorphonuclear leuko-cyte function. Antimicrob. Agents Chemother. 34, 1672–1677.
Russel, A., Gunn, R.G., Doney, J.M., 1969. Subjective assessment ofbody fat in live sheep. J. Agric. Sci. (Camb.) 72, 451–454.
SAS, 2001. Version 8.2. SAS Institute, Inc., Cary, NC, USA.Schubbert, R., Renz, D., Schmitz, B., Doerfler, W., 1997. Foreign (M13)
DNA ingested by mice reaches peripheral leukocytes, spleen, andliver via the intestinal wall mucosa and can be covalently linked tomouse DNA. Proc. Natl. Acad. Sci. U. S. A. 94, 961–966.
Schubbert, R., Hohlweg, U., Renz, D., Doerfler, W., 1998. On the fate oforally ingested foreign DNA in mice: chromosomal association andplacental transmission to the fetus. Mol. Gen. Genet. 259, 569–576.
Sharma, R., Alexander, T.W., John, S.J., Forster, R.J., McAllister, T.A.,2004. Relative stability of transgene DNA fragments from GMrapeseed in mixed ruminal cultures. Br. J. Nutr. 91 (5), 673–681.
Sharma, R., Damgaard, D., Alexander, T.W., Dugan, M.E.R., Aalhus,J.L., Stanford, K., McAllister, T.A., 2006. Detection of transgenicand endogenous plant DNA in digesta and tissues of sheep andpigs fed Roundup Ready canola meal. J. Agric. Food Chem. 54,1699–1709.
Sidhu, R.S., Hammond, B.G., Fuchs, R.L., Mutz, J.L., Golden, L.R.,Gorge, B., Olson, T., 2000. Glyphosate-tolerant corn: the composi-tion and feeding value of grain from glyphosate-tolerant corn isequivalent to that of conventional corn (Zea mays L.). J. Agric. FoodChem. 48, 2305–2312.
Spök, A., Gaugitsch, H., Laffer, S., Pauli, G., Saito, H., Sampson, H.,Sibanda, E., Thomas, W., van Hage, M., Valenta, R., 2005. Sug-gestions for the assessment of the allergenic potential of geneticallymodified organisms. Int. Arch. Allergy Immunol. 137, 167–180.
Stanford, K., Aalhus, J.L., Dugan, M.E.R., Wallins, G.L., Sharma, R.,McAllister, T.A., 2003. Effects of feeding transgenic canola onapparent digestibility, growth performance and carcass character-istics of lambs. Can. J. Anim. Sci. 83, 299–305.
Valusso, R., Mills, C.R., Bovolenta, S., Piasentier, E., 1998. Qualitàdella carcassa del castrato Bergamasco e dell'agnello leggeroAppenninico. Atti XIII Congr. Naz. SIPAOC, pp. 203–207.
van den Eede, G., Aarts, H., Buhk, H.J., Corthier, G., Flint, H.J.,Hammes, W., Jacobsen, B., Midtvedt, T., van der Vossen, J., vonWright, A., Wackernagel, W., Wilcks, A., 2004. The relevance ofgene transfer to the safety of food and feed derived from geneticallymodified (GM) plants. Food Chem. Toxicol. 42, 1127–1156.
Vazquez-Padron, R.I., Gonzales-Cabrera, J., Garcia-Tovar, C., Neri-Bazan, L., Lopez-Revilla, R., Hernandez, M., Moreno-Fierro, L.,de la Riva, G.A., 2000. Cry1Ac protoxin fromBacillus thuringensissp. Kurstaki HD73 binds to surface proteins in the mouse smallintestine. Biochem. Biophys. Res. Commun. 271, 54–58.
Winterbourn, C.C., 1990. Oxidative reactions of haemoglobin. In:Packer, L., Glazer, A.N. (Eds.), Methods in Enzymology. NewYork Academic Press, NY, USA, pp. 265–272.
Zhang-Liang, C., Hongya, G., Yi, L., Yilan, S., Ping, W., Zhicheng, J.,Xiaotian, M., Jinhua, T., Naisui, P., Li-Jia, Q., 2003. Safetyassessment for genetically modified sweet pepper and tomato.Toxicology 188, 297–307.
Zhu, Y., Li, D.,Wang, F., Yin, J., Jin, H., 2004.Nutritional assessment andfate of DNA of soybean meal from roundup ready or conventionalsoybeans using rats. Arch. Anim. Nutr. 58 (4), 295–310.
190 M. Trabalza-Marinucci et al. / Livestock Science 113 (2008) 178–190
EXHIBIT J - Page 477
Case 5:14-cv-00117-cr Document 63-11 Filed 11/14/14 Page 195 of 312

Genetically modified soya bean in rabbit feeding: detection of DNAfragments and evaluation of metabolic effects by enzymatic analysis
R. Tudisco1, P. Lombardi2, F. Bovera1, D. d’Angelo2, M. I. Cutrignelli1, V. Mastellone2, V. Terzi3, L. Avallone2 andF. Infascelli1†
1Dipartimento di Scienze Zootecniche e Ispezione degli Alimenti, sez. B. Ferrara, Universita di Napoli Federico II, Italy2Dipartimento di Strutture, Funzioni e Tecnologie Biologiche, Universita di Napoli Federico II, Italy3Istituto Sperimentale per la Cerealicoltura, Fiorenzuola d’Arda (Piacenza), Italy
†Corresponding author. E-mail: [email protected]
Abstract
The presence of DNA fragments in tissues from rabbits given genetically modified (GM) soya-bean meal (solvent
extracted) was investigated by using the polymerase chain reaction (PCR) approach. Moreover, the possible effects on
cell metabolism were evaluated by determination of several specific enzymes in serum, heart, skeletal muscle, liver and
kidney. The chloroplast sequence for tRNA Leu by using the Clor1/Clor2 primers designed on chloroplast trnL
sequence was clearly detected. On the contrary, two couples of species specific primers for conventional (Le1-5/Le 1-3
which amplifies the soya bean lectin gene) and genetically modified (35S1/35S2 which amplifies the 35S CMV promoter
that is present in the genomic structure of GM soya bean) soya bean were not found in all samples. No differences in
enzyme levels were detected in serum, but a significant increase of lactic dehydrogenase, mainly concerning the LDH1
isoenzyme was found in particular in kidney and heart but not in the muscle, thus suggesting a potential alteration in
the local production of the enzyme. Finally, no significant differences were detected concerning body weight, fresh
organ weights and no sexual differences were detected.
Keywords: genetic modification, polymerase chain reaction, rabbits, soya-bean oil meal.
IntroductionSeveral genetically modified (GM) plants have been pro-duced and approved by regulatory agencies worldwide forcultivation and commercialization. The insertion of newgenes or the repression of endogenous gene expressioncan be in fact an useful tool to obtain specific characteristicwhich can lead to an improvement of agronomically relevanttraits or food quality. Resistance to insects and tolerance toherbicides are the most recurrent agronomic traits modifiedin GM crops approved for feeding.
Nowadays, a number of GM plants have been approved foranimal and human consumption but concerns over safetypersist in the public. Allergenicity and toxicity, which can berelated to novel foods are a major concern (HINO, 2002).Potential toxicological risks of a GM plant as whole food areevaluated on laboratory and target animals according to theclassical methods used for drugs: blood and urine chem-istry, organ weight and gross histo-pathological examination(Food and Agriculture Organisation-World Health Organis-ation, 2000; Organisation for Economic Co-operation andDevelopment, 2003, novel foods OECD no. 9; EuropeanFood Safety Authority, 2004). It has also suggestedfinding specific biomarkers of early effects in order to
increase diagnostic value and sensitivity of toxicity tests onfood.
Animal nutritionists have evaluated in several studies thenutritional equivalence and the efficacy of the new feeds, incomparison with near isogenic or conventional varieties ofplants (Aumaitre et al., 2002; Cromwell et al., 2002) and nodirect evidence that GM plants may represent a possibledanger for animal health has been reported so far (for areview, see Aumaitre (2004)). Another aspects that hasbeen studied is the fate and integrity of forage plant DNA inthe gastro-intestinal tract (GIT) of various animal models.Some authors have shown that highly fragmented plantDNA can be isolated from animal organs and tissues, thussuggesting that plant DNA is not completely degradedduring animal digestion (Chowdhury et al., 2003; Dugganet al., 2003; Einspanier et al., 2004).
The aims of this research have been the evaluation, bythe polymerase chain reaction (PCR) approach, of thepresence of plant DNA fragments in rabbit tissues to fol-low the fate of plant fed and the possible health effectsof a GM diet by studying the activity of organ specificenzymes in rabbits.
Animal Science 2006, 82: 193–199
Q 2006 British Society of Animal Science
ISSN 1357-7298
DOI: 10.1079/ASC200530
193
EXHIBIT J - Page 478
Case 5:14-cv-00117-cr Document 63-11 Filed 11/14/14 Page 196 of 312

Material and methodsAnimal and dietsTwenty weaned 30-day-old New Zealand rabbits (10 malesand 10 females) individually caged were equally assigned tocontrol (C) and treated (T) groups. The animals were given(130 g/day) a diet constituted per kg of 800 g pelleted con-centrate (165 g crude protein and 155 g crude fibre, as fed;dehydrated lucerne meal, sunflower meal, wheat, carob,soft wheat middlings, sugar-beet pulp, barley) and 200 gsoya-bean meal (solved extracted) (SBM) which was fromconventional or genetically modified (Roundup Readyw)beans, for group C and T, respectively. Roundup Readyw
(RR) is tolerant to the glyphosate family of herbicidesby expressing transgenic DNA from the CP4 strain of Agro-bacterium tumefaciens, encoding 5-enolpyruvilshikimate-3-phosphate synthase protein (cp4 epsps).
The proximate composition of conventional and GM SBMwas determined according to Association of Official Analyti-cal Chemists (1990); the fibre fraction was analysed assuggested by Van Soest et al. (1991).
Water was given ad libitum. The rabbits were slaughtered at70 ^ 5 days of age (2 ^ 0·2 kg live weight), food was avail-able until 12 h before slaughtering. Body weights weretaken before the onset of the experiment and immediatelybefore slaughtering, organ weights were taken soon afterslaughtering.
SamplingBlood was withdrawn just before slaughtering and put in twodifferent plastic tubes, with or without sodium citrate 9:1.Small pieces of liver, muscle, kidney and heart werewashed in saline. All samples were stored at 2208C. Ascontrols, conventional and transgenic SBM were used.
DNA extractionPlant samples were extracted according to the Wizardextraction method (Promega, Madison, Wisconsin). Onehundred milligrams of SBM were resuspended by carefulvortexing in 860ml of extraction buffer (10 mmol/l Tris HCl(pH 8·0), 150 mmol/l NaCl, 2 mmol/l EDTA, 1% (w/v) SDS),100ml guanidine hydrochloride (5 mol/l) and 40ml of protein-ase K (20 mg/ml). Samples were then incubated at 588C forat least 3 h on a shaking incubator and then centrifuged at20 000g for 10 min. Five hundred microlitres of the super-natant were incubated with 5ml RNase (10 mg/ml) at 378Cfor 10 min. One millilitre of Wizard DNA Purification Resin
(Promega) was added to the supernatant and mixed bygently inversion. A 2-ml syringe was mounted on the columnand the mixture was pushed with the plunger through the col-umn. The DNA-resin mixture was washed with 2 ml 80%(v/v) isopropyl alcohol following by centrifugation at 20 000gfor 1 min. After drying at 708C for 10 min, the DNA was elutedwith 50ml of 708C elution buffer (10 mmol/l tris HCl (pH 9·0),0·1 mmol/l EDTA) and centrifuged at 20 000g for 1 min.
Tissue (25 mg) and blood (200ml) samples were extractedby using the ‘nucleo-spin tissue’ and ‘blood-spin tissue’(Macherey-Nagel, Duren, Germany), respectively, accordingto users’ manual. Briefly, 25 mg of ground tissue were incu-bated with 180ml buffer T1 and 25ml proteinase K solutionat 568C for at least 3 h on a shaking incubator. After diges-tion, the lysates were again incubated with 200ml buffer B3at 708C for 10 min. About the blood samples, they wereslowly defrosted (in ice-water bath) and then 200ml ofwhole blood were incubated with 25ml proteinase K solutionand 200ml lysis buffer B3 at 708C for 15 min on a shakingincubator. To both samples (tissue and blood) were added210ml ethanol (96 to 100%), and all of the precipitate wasloaded on the column placing into a 2 ml collecting tube andthen centrifuged at 11 000g for 1 min. The silica membranewas washed with 500ml buffer BW and 600ml buffer B5 fol-lowing by centrifugation at 11 000g for 1 min. After dryingby centrifugation at 11 000g for 1 min, the DNA was elutedwith 100ml pre-warmed elution buffer BE (708C), incubatingfor 1 min, and centrifuged the column at 11 000g for 1 min.
The DNA concentration was determined by measuring theUV absorption at 260 nm, then its quality was checked from260/280 nm UV absorption ratios. All extracted DNA wasstored at 2208C until used.
PrimersThe quality of DNAs extracted has been checked in a PCRreaction with UNIV P/UNIV Q primers to amplify a con-served portion of animal mtDNA 16S rRNA gene (Sawyeret al., 2003). Therefore, samples have been monitored forthe presence of the chloroplast sequence for tRNA Leu byusing the Clor1/Clor2 primers designed on chloroplast trnLsequence (Terzi et al., 2004). Finally, two couples ofspecies specific primers for conventional and GM soyabean were used: Le1-5/Le 1-3 which amplifies the soya-bean lectin gene (Kuribara et al., 2002) and 35S1/35S2which amplifies the 35S CMV promoter that is present inthe genomic structure of GM soya bean (Lipp et al., 1999).The sequence of all the primers is shown in Table 1.
Table 1 Sequence, annealing temperature and amplicon size (bp) of primer pairs used in the study
Primers Sequence (50 to 30) Annealing temperature(8C) Amplicon size (bp) Reference
Clor1 TTCCAGGGTTTCTCTGAATTTG 60 100 Terzi et al. (2004)Clor2 TATGGCGAAATCGGTAGACGUNIV P GGTTTACGACCTCGATGTT 55 104 Sawyer et al. (2004)UNIV Q CCGGTCTGAACTCAGATCACLe1-5 GCCCTCTACTCCACCCCCA 59 118 Kuribara et al. (2002)Le1-3 GCCCATCTGCAAGCCTTTTT35S-1 GCTCCTACAAATGCCATCA 54 195 Lipp et al. (1999)35S-2 GATAGTGGGATTGTGCGTCA
Tudisco, Lombardi, Bovera, d’Angelo, Cutrignelli, Mastellone, Terzi, Avallone and Infascelli
194
EXHIBIT J - Page 479
Case 5:14-cv-00117-cr Document 63-11 Filed 11/14/14 Page 197 of 312

The primer pairs have been selected among those reportedin literature (Jennings et al., 2003) with the aim of obtainingshort amplicons (118 bp), compatible with highly fragmentedDNA samples.
PCR analysisPCR reactions were performed in 20ml reaction volumescontaining 20 mmol/l Tris HCl pH 8·4, 1·5 mmol/l MgCl2,50 mmol/l KCl, 100 mmol/l of each dNTPs, 900 nmol/l for-ward and reverse primers (see Table 1), 100 ng of geno-mic DNA templates, and 1U of Taq polymerase(Invitrogen, Carlsbad, CA). Amplifications were performedusing an Applied Biosystems Gene Amp PCR System2400 programmed as follows: one step of 5 min at 948C;35 cycles of 30 s at 948C, 30 s at annealing temperature(see Table 1), 1 min at 728C; and one step of 3 min at728C. The PCR products were separated on 2·5% agar-ose gels in TBE buffer.
Enzyme assayAspartate aminotransferase (AST), alanine aminotransferase(ALT), creatine kinase (CK), lactic dehydrogenase (LDH),gamma glutamyltransferase (GGT) and alkaline phosphatase(ALP) were assayed in serum and in homogenates fromliver, kidney, heart and skeletal muscle. Briefly, one gram oftissue was put into an ice-cold homogenization buffer (inmmol/l): 280 mannitol, 10 KCl 1 MgCl2, 0·2 pefabloc SC, 10hepes, pH 7·0 adjusted with tris. Samples were homogen-ized by an Ultra-Turrax homogenizer and then centrifuged ina Beckman L7 ultracentrifuge at 10 000g for 10 min, theupper layer was used for analysis.
Enzyme activity was determined spectrophotometrically byusing reagents from Spinreact SA, Sant Esteve de Bas,Spain. Since significant differences were found for LDHbetween control and treated groups, in order to assess theisoenzymatic distribution of LDH, electrophoretic separationwas performed on each sample. Briefly, 20ml of samplewere applied on cellulose acetate membranes and electro-phoresis was performed under undenaturing conditions at200 V for 50 min in barbital buffer. Following electrophor-esis, the membranes were stained to reveal the LDH isoen-zymes by using the ISO-LAD commercial kits (ChemetronChimica S.p.A., Milan, Italy). Quantification of isoenzymesfractions was done by using a densitometer (CGA, Flor-ence, Italy). The relative distribution of the isoenzymes inthe samples was expressed as a percentage of total enzy-matic activity.
StatisticsResults were expressed as mean ^ standard deviation.Differences in enzyme levels between groups were ana-lysed by the Student t test (Statistical Packages for theSocial Sciences (SPSS), 1999). Diet and sexual differenceswithin groups were analysed by analysis of variance(ANOVA) using the model: yijk ¼ m þ Di þ Sj þ D £ Sij þ 1ijk,where y ¼ single observation; m ¼ general mean; D ¼ dieteffect (i ¼ control or treated); S ¼ sex effect ( j ¼ male orfemale); D £ S ¼ interaction between diet and sex effects;1 ¼ error (SPSS, 1999).
ResultsDetection of DNA fragmentsThe chemical compositions of conventional and GM SBMwere superimposable (Table 2), in agreement with theresults summarized by Aumaitre (2004).
Figure 1 shows the DNA amplification in one rabbit fromeach group by using the UNIV P/UNIV Q primers; as seen,a 104 base pair (bp) band was detected in all the samplesthus showing the good quality of extracted DNA.
A similar representative example is reported in Figure 2 forClor1/Clor2 primers, where a 100 bp band was found inmany tissues thus showing the presence of chloroplastDNA in tissues and blood from both control and treatedgroups. The Clor1/Clor2 primers were not detected in allsamples, in particular, percentages of positive sampleswere: 50% (blood), 70% (muscle), 80% (heart), 70% (liver)and 80% (kidney).
In Figure 3 a representative example obtained by usingLe1-5/Le1-3 soya-bean specific primers shows how the sig-nal could not be detected in all samples and the band(118 bp) was seen only in the plant sample.
A similar aspect can be seen in Figure 4 where also the35S1/35S2 primers gave undetectable results (195 bp) in allsamples except for the GM soya bean.
Table 3 shows body weight before and after the end of theexperiment and the organ weights in control and treated
Table 2 Composition (g/kg dry matter) of conventional and geneti-cally modified (GM) soya-bean meal (SBM)
Component†
CP EE CF Ash NDF ADF ADL
Conventional SBM 544 250 41 71 157 140 20GM SBM 536 248 43 69 152 125 38
† CP: crude protein; EE: ether extract; CF: crude fibre; NDF: neutraldetergent fibre; ADF: acid detergent fibre; ADL: acid detergentlignin.
600 bp
200 bp
100 bp
M
Blo
od
Mus
cle
Live
r
Hea
rt
Kid
ney
Mus
cle
Live
r
Hea
rt
Kid
ney
Blo
od
Control Treated
Figure 1 Electrophoretic analysis of DNA amplification in one rabbit
from each group by using the UNIV P/UNIV Q primers. M ¼ 100 bp
DNA ladder.
Genetically modified soya bean in rabbit feeding
195
EXHIBIT J - Page 480
Case 5:14-cv-00117-cr Document 63-11 Filed 11/14/14 Page 198 of 312

animals, no statistical difference was detected. Finally, nostatistical differences were found between sexes.
Enzyme activityFigure 5 shows the differences in enzyme activity in heart,skeletal muscle, kidney, liver and serum. Statistical differ-ences (P , 0·05) were detected in kidney for ALT, GGTand LDH whereas in the heart such result was seen only forLDH. No statistical differences were found for serum, liver
and skeletal muscle. No statistical differences were foundbetween sexes (data not shown).
Table 4 shows the relative distribution of LDH isoenzymesin serum and in tissues. Significant differences (P , 0·05)between control and treated animals were detected forheart LDH1 and LDH2 and for kidney LDH1, thus confirmingthe significant increase of the enzyme in these tissues.Moreover, despite no significant differences were found forLDH total activity in liver, a significant increase (LDH1) anddecrease (LDH4) were found also in this organ.
DiscussionDNAOur findings confirm that, despite chloroplastic plant DNAcan be fragmented by technological processes for foodpreparation and by digestion, multicopy gene can be foundin rabbit tissues by using the Clor1/Clor2 primers.
The persistence of short DNA sequences from planttissues offered has been shown in the GIT of ruminants,from the oral cavity of sheep to rumen and abomasumingesta of cattle, differing in the case of maize silage andgrain (Duggan et al., 2003; Einspanier et al., 2004).The high level of degradation of ubiquitous plant chloro-plast DNA in the last section of cattle GIT (jejunum andcolon) has been demonstrated by Einspanier et al. (2004).In the GIT of monogastrics, plant DNA is detectable inpigs (Klotz et al., 2002; Chowdury et al., 2003; Reuterand Aulrich, 2003), in chickens (Chambers et al., 2002)and in humans (Martın-Orue et al., 2002; Netherwoodet al., 2004).
In blood, muscular tissues and organs the presence ofresidual plant DNA has been demonstrated in poultrybut not in pig (Klotz et al., 2002; Jennings et al., 2003;Reuter and Aulrich, 2003). Contrasting results have beenreported also for ruminants, such as cattle and sheep(Einspanier et al., 2001; Duggan et al., 2003; Phippset al., 2003).
Also concerning the research of specific DNA fragments thedata in the literature are controversial. Indeed, the fragmentof invertase gene (ivr, 226 bp) from corn was found in theliver, spleen and muscle of poultry by Aeschbacher et al.(2002) but not by Tony et al. (2003). In the pigs, whileChowdhury et al. (2003) detected fragments of zeina(242 bp), ivr (226 bp) and cry1A(b) (110–437 bp) gene fromconventional and GM maize in the gastric and intestinalcontents, Jennings et al. (2003) did not find fragments(198 bp) of le1 gene for soybean lectin in the muscle. In thepresent trial, by using the same gene sequence (gi170005/gbK00821·1) of Jennings et al. (2003) in the same samplewhere we found the chloroplast fragment it was not possibleto detect neither a shorter fragment (118 bp) of the lectingene nor the 35S promoter thus confirming that plant low-abundance genes are not detectable in animal tissues.
This finding agrees with the results obtained by Phipps et al.(2003) in cow blood and milk, confirming that single copy
100 bp
Control Treated
M
Blo
od
Mu
scle
Live
r
Live
r
Hea
rt
Hea
rt
Kid
ney
Kid
ney
Neg
ativ
e ct
rl
So
yab
ean
f.e.
Blo
od
Mu
scle
Figure 2 Electrophoretic analysis of DNA amplification in one rabbit
from each group by using the Clor1/Clor2 primers. M ¼ 100 bp DNA
ladder.
M
Blo
od
Mu
scle
Live
r
Live
r
Hea
rt
Hea
rt
Kid
ney
Kid
ney
Neg
ativ
e ct
rl
So
yab
ean
f.e.
Blo
od
Mu
scle
Control Treated
118 bp
Figure 3 Electrophoretic analysis of DNA amplification in one rabbit
from each group by using the Le1-5/Le1-3 conventional soya bean
specific primers. M ¼ 100 bp DNA ladder.
M
Blo
od
Mu
scle
Live
r
Live
r
Hea
rt
Hea
rt
Kid
ney
Kid
ney
Neg
ativ
e ct
rl
So
yab
ean
f.e.
Blo
od
Mu
scle
Control Treated
195 bp
Figure 4 Electrophoretic analysis of DNA amplification in one rabbit
from each group by using the 35S-1/35S-2 GM soya bean specific
primers. M ¼ 100 bp DNA ladder.
Tudisco, Lombardi, Bovera, d’Angelo, Cutrignelli, Mastellone, Terzi, Avallone and Infascelli
196
EXHIBIT J - Page 481
Case 5:14-cv-00117-cr Document 63-11 Filed 11/14/14 Page 199 of 312

gene are difficult to identify (Artim et al., 2001). However, ina previous trial we found the single copy gene of barley(data not yet published) in the tissues and organs of rabbits.
Our negative results in detecting single copy gene fromSBM could be affected by its processing. Indeed, according
to Forbes et al. (1998) and Chiter et al. (2000), the oilextraction or the heat treatment can cause fragmentation offood DNA.
The persistence of transgenic proteins in the GIT and tissuesof animal models have been evaluated in monogastrics.
Figure 5 Levels of aspartate aminotransferase (AST), alanine aminotransferase (ALT), creatine kinase (CK), lactic dehydrogenase (LDH),
gamma glutamyltransferase (GGT) and alkaline phosphatase (ALP) in serum and in homogenates from heart, skeletal muscle, kidney and
liver from control (p) and treated ( ) rabbits.
Table 3 Organ fresh weights and body weights in control and treated animals
Weight (g)†
Liver Kidney Muscle Heart Body
No. Mean s.d. Mean s.d. Mean s.d. Mean s.d Mean s.d.
DietControl 10 89·0 5·2 14·7 1·2 127·0 12·6 8·7 0·7 2063·1 114·9Treated 10 86·9 7·2 14·5 1·5 125·5 10·0 8·8 0·7 2040·0 203·5
SexMales 10 87·0 7·2 14·2 1·6 124·2 11·7 8·5 0·7 2070·3 135·0Females 10 88·9 5·2 15·0 0·9 128·3 10·7 9·0 0·7 2030·4 191·0
† Two-way ANOVA: main effects diet, sex and interaction between diet and sex, revealed no significant differences (P . 0·05).
Genetically modified soya bean in rabbit feeding
197
EXHIBIT J - Page 482
Case 5:14-cv-00117-cr Document 63-11 Filed 11/14/14 Page 200 of 312

Yonemochi et al. (2002) for example evaluated transgenicevent CBH 351 (StarLink) corn in broiler chicks feeding, find-ing that both cry9C gene and cry9C protein were notdetected in blood, liver and muscle.
EnzymesAnother interesting aspect of our results concerns theenzyme activity in serum and organs. The levels of theenzyme tested in serum did not show significant differ-ences thus suggesting that no adverse effects wereinduced by GM soya bean in treated animals. Such resultis in agreement with Yonemochi et al. (2003), who foundno effects of maize GM on serum LDH levels in dairycows. By contrast, the analysis of enzyme relative activi-ties in tissues gave a different picture. As depicted inFigure 5, significant differences in enzyme levels con-cerned mainly the kidney, showing higher levels of LDH,ALT and GGT in treated animals. Such a result seems toindicate that some alteration occurred in kidney even ifserum levels were not affected. Moreover, LDH was sig-nificantly increased also in the heart thus showing that thelocal production of LDH altered in two of the most import-ant organs of the body. The relative distribution of LDHisoenzymes confirms this hypothesis showing significantdifferences for heart LDH1 and LDH2 and for kidneyLDH1. LDH1 was the dominant isoenzyme in both organsand, additionally, a significant increase of this isoenzymeand a decrease of LDH4 were also shown in the liver,despite no significant differences were found for total LDHactivity in this organ. Such a result means that, sinceLDH is a tetrameric enzyme made up of M and H sub-units, a different combination of H and M subunitsoccurred in the liver (LDH-H4 . LDH-H1M3). The reasonfor that shift is not clear, substrate specificity is greaterfor pyruvate than for alpha-hydroxybutyrate, but a higheramount of H subunit is thought to mean a higher speci-ficity for the reduction of alpha-hydroxybutyrate to alpha-oxobutyrate. Anyway, such shift supports the hypothesisthat some metabolic changes occurred in the liver. There-fore, an increased activity of LDH1 occurred in threeorgans from GM-fed rabbits. The reason for such increaseis not fully understood and confirmed but such resultsuggests that even slight modifications occurred inthe local production of the LDH1 isoenzyme in GM-fed
rabbits. Moreover, it is known that serum enzyme activi-ties are a reflection of the relative contribution of each tis-sue to the serum pool. From the lactate dehydrogenaseisoenzymatic pattern of the serum and in comparison tothe various tissue patterns, it seems that most lactatedehydrogenase activity in the rabbit serum originates fromthe skeletal muscle which is the major mass componentof the body. It is also known that the dominant isoenzymein muscle is the LDH5 and, for these reasons, it is poss-ible that the LDH1 increase was not detected in serum.Moreover, since LDH1 is known to be involved in cellmetabolism by favouring the reaction of lactate to pyru-vate (Van Hall, 2000), our results should indicate a gen-eral increase of cell metabolism. Such hypothesis is inagreement with other authors who showed significantmodifications of some nuclear features in GM-fed micesuggesting a high metabolic rate and an intense moleculartrafficking (Malatesta et al., 2002). Anyway, since no dis-eases were detected in treated animals and serum activi-ties of all the enzymes showed similar levels between thegroups, it should be overspeculative to assess that theGM diet is responsible for that but it is a fact that the syn-thesis of LDH changed in more than one organ and suchresults should be taken into account for future research.
In any event, our results suggest that an accurate enzymaticanalysis can be useful to detect the effects of the diet on cellmetabolism even in absence of clinical and biochemicalsigns. Since the techniques for enzyme assay are well estab-lished, enzymes can represent an additional tool to evaluatethe risks of GM feeding for animal and human health.
ReferencesAeschbacher, K., Meile, L., Messikommer, R. and Wenk, C.2002. Influence of genetically modified maize on performance andproduct quality of chickens. Proceedings Society Nutrition Physi-ology 11: 196.
Artim, L., Charlton, S., Dana, G., Faust, M., Glenn, K., Hartnell, G.,Hunst, P., Jennings, J. and Shillito, R. 2001. Animal performancetrials with bt crops. Biotechnology of Bacillus thuringiensis and itsenvironmental impact. Australian National University of Canberra S61(abstr.).
Association of Official Analytical Chemists. 1990. Official methodsof analysis, 15th edition, Washington, DC.
Table 4 Relative distribution of lactic dehydrogenase (LDH) isoenzymes in serum and in homogenates from heart, skeletal muscle, kidney andliver from control and treated rabbits
Relative distribution of LDH isoenzyme (U/g)
Total LDH activity LDH-1 LDH-2 LDH-3 LDH-4 LDH-5
Tissue Group† Mean s.d. Mean s.d. Mean s.d. Mean s.d. Mean s.d. Mean s.d.
Serum (U/I) C 614·8 204·2 15·6 6·4 31·8 10·3 37·8 10·8 139·0 33·2 390·6 146·4T 646·8 189·6 27·3 4·3 34·9 12·6 40·2 11·0 154·9 42·6 399·5 122·8
Heart (U/g) C 129·9 34·6 122·5 31·9 3·9 2·1 1·5 1·1 0·9 0·5 1·1 0·5T 168·8* 19·2 153·5* 18·0 6·6* 1·4 2·7 1·6 1·9 2·2 1·9 1·7
Skeletal muscle (U/g) C 385·3 127·3T 398·9 107·1
Kidney (U/g) C 57·5 6·8 34·4 4·0 13·4 1·2 6·1 0·9 1·6 0·9 1·6 0·9T 65·2* 7·3 41·4* 4·6 15·1 2·3 5·0 1·6 1·3 0·5 1·3 0·5
Liver (U/g) C 107·5 12·6 54·9 5·9 20·4 2·5 13·1 3·5 9·9 3·9 9·3 3·9T 110·5 19·8 63·7* 10·3 19·6 4·6 12·5 3·3 5·3* 3·5 7·4 4·1
† C ¼ control; T ¼ treated. *Significant differences are indicated for T v. C groups (P , 0·05).
Tudisco, Lombardi, Bovera, d’Angelo, Cutrignelli, Mastellone, Terzi, Avallone and Infascelli
198
EXHIBIT J - Page 483
Case 5:14-cv-00117-cr Document 63-11 Filed 11/14/14 Page 201 of 312

Aumaitre, A. 2004. Safety assessment and feeding value for pigs,poultry and ruminant animals of pest protected (Bt) plants, herbicidetolerant (glyphosate, gluphosinate) plants: interpretation of exper-imental results observed worldwide on GM plants. Italian Journal ofAnimal Science 2: 107-121.
Aumaitre, A., Aulrich, K., Chesson, A., Flachowsky, G. andPiva, G. 2002. New feeds from genetically modified plants: sub-stantial equivalence, nutritional equivalence, digestibility, and safetyfor animals and the food chain. Livestock Production Science 74:223-238.
Chambers, P. A., Duggan, P. S., Heritage, J. and Forbes, J. M.2002. The fate of antibiotic resistance marker genes in transgenicplant feed material fed to chickens. Journal of AntimicrobialChemotherapy 49: 161-164.
Chiter, A., Forbes, J. M. and Blair, G. E. 2000. DNA stability inplant tissues: implications for the possible transfer of genes fromgenetically modified food. FEBS Letters 481: 164-168.
Chowdhury, E. H., Kuribara, H., Hino, A., Sultana, P., Mikami, O.,Shimada, N., Guruge, K. S., Saito, M. and Nakajiama, Y. 2003.Detection of corn intrinsic and recombinant DNA fragments andCry1Ab protein in the gastrointestinal contents of pigs fed geneticallymodified corn Bt11. Journal of Animal Science 81: 2546-2551.
Cromwell, G. L., Lindemann, M. D., Randolph, J. H., Parker, G. R.,Coffey, R. D., Laurent, K. M., Armstrong, C. L., Mikel, W. B.,Stanisiewski, E. P. and Hartnell, G. F. 2002. Soybean mealfrom Roundup Ready or conventional soybeans in diets for growing-finishing swine. Journal of Animal Science 80: 708-715.
Duggan, P. S., Cambers, P. A., Heritage, J. and Forbes, J. M.2003. Fate of genetically modified maize DNA in the oral cavity andrumen of sheep. British Journal of Nutrition 89: 159-166.
European Food Safety Authority. 2004. Guidance document ofthe scientific panel on genetically modified organisms for the riskassessment of genetically modified plants and derived food andfeed. The EFSA Journal 99: 1-94.
Einspanier, R., Klotz, A., Kraft, J., Aulrich, K., Poser, R.,Schwagele, F., Jahreis, G. and Flachowsky, G. 2001. The fate offorage plant DNA in farm animals: a collaborative case-study inves-tigating cattle and chicken fed recombinant plant material. Euro-pean Food Research Technologies 212: 129-134.
Einspanier, R., Lutz, B., Rief, S., Berezina, O., Zverlov, V.,Scwarz, W. and Mayer, J. 2004. Tracing residual recombinantfeed molecules during digestion and rumen bacterial diversity incattle fed transgene maize. European Food Research Technology218: 269-273.
Food and Agriculture Organisation/World Health Organisation.2000. Safety aspects of genetically modified foods of plant origin.Report of a joint FAO/WHO expert consultation on foods derivedfrom biotechnology, Geneva, Switzerland, 2000, Food and Agricul-ture Organisation of the United Nations, Rome.
Forbes, J. M., Blair, G. E., Chiter, A. and Perks, S. 1998. Effectof feed processing conditions on DNA fragmentation. UK MAFFReport CS0116. Her Majesty’s Stationery Office, London.
Hino, A. 2002. Safety assessment and public concerns for geneti-cally modified food products: the Japanese experience. Toxicologyand Pathology 30: 126-128.
Jennings, J. C., Kolwyck, D. C., Kats, S. B., Whetsell, A. J.,Surber, J. B., Cromwell, G. L., Lirette, R. P. and Glenn, K. C. 2003.Determining whether transgenic and endogenous plant DNA andtransgenic protein are detectable in muscle from swine fed RoundupReady soybean meal. Journal Animal Science 81: 1447-1455.
Klotz, A., Mayer, J. and Einspanier, R. 2002. Degradation andpossible carry over of feed DNA monitored in pigs ad poultry.European Food Research Technology 214: 271-275.
Kuribara, H., Shindo, Y., Matsuoka, T., Takubo, K., Futo, S., Aoki,N., Hirao, T., Ariyama, H., Goda, Y., Toyoda, M. and Hino, A. 2002.
Novel reference molecules for quantitation of geneticallymodified maize and soybean. Journal of AOAC International 85:1077-1089.
Lipp, M., Brodmann, P., Pietsch, K., Pauwels, J. and Anklam, E.1999. IUPAC collaborative study of a method to detect geneticallymodified soybean and maize in dried powder. Journal of AOAC Inter-national 82: 923-929.
Malatesta, M., Caporaloni, C., Gavaudan, S., Rocchi, M. B., Ser-afini, S., Tiberi, C. and Gazzanelli, G. 2002. Ultrastructural mor-phometrical and immunocytochemical analyses of hepatocytenuclei from mice fed on genetically modified soybean. Cell Structureand Function 27: 173-180.
Martın-Orue, S. M., O’Donnell, A. G., Arino, J., Netherwood, T.,Gilbert, H. J. and Mathers, J. C. 2002. Degradation of transgenicDNA from genetically modified soya and maize in human intestinalsimulations. British Journal of Nutrition 87: 533-542.
Netherwood, T., Martın-Orue, S. M., O’Donnell, A. G., Gockling, S.,Graham, J., Mathers, J. C. and Gilbert, H. J. 2004. Assessing thesurvival of transgenic plant DNA in the human gastrointestinal tract.Nature Biotechnology 22: 1-6.
Organisation for Economic Co-operation and Development.2003. Considerations for the safety assessment of animal feed-stuffs derived from genetically modified plants. Series on the Safetyof Novel Foods and Feeds, no. 9. OECD, Paris.
Phipps, R. H., Deaville, E. R. and Maddison, B. C. 2003. Detec-tion of transgenic and endogenous plant DANN in rumen fluid, duo-denal digesta, milk, blood, and feces of lactating dairy cows.Journal of Dairy Science 86: 4070-4078.
Reuter, T. and Aulrich, K. 2003. Investigations on geneticallymodified maize (Bt-maize) in pig nutrition: fate of feed-ingestedforeign DNA in pig bodies. European Food Research Technology216: 185-192.
Sawyer, J., Wood, C., Shanahan, D., Gout, S. and McDowell, D.2003. Real-time PCR for quantitative meat species testing. FoodControl 14: 579-583.
Statistical Packages for the Social Sciences. 1999. SPSS forWindows. SPSS Inc., Chicago.
Terzi, V., Infascelli, F., Tudisco, R., Russo, G., Stanca, A. M.and Faccioli, P. 2004. Quantitative detection of Secale cereale byreal-time PCR amplification. Lebensmittel Wissenschaft und Tech-nologie 37: 239-246.
Tony, M. A., Butschke, A., Broll, H., Grohmann, L., Zagon, J.,Halle, I., Danicke, S., Schauzu, M., Hafez, H. M. andFlachowsky, G. 2003. Safety assessment of Bt 176 maize inbroiler nutrition: degradation of maize-DNA and its metabolic fate.Archive of Animal Nutrition 57: 235-252.
Van Hall, G. 2000. Lactate as a fuel for mitochondrial respiration.Acta Physiologica Scandinavica 168: 643-656.
Van Soest, P. J., Robertson, J. B. and Lewis, B. A. 1991.Methods for dietary fiber, neutral detergent fiber, and nonstarchpolysaccharides in relation to animal nutrition. Journal of DairyScience 74: 3583-3597.
Yonemochi, C., Fujisaki, H., Harada, C., Kusama, T. andHanazumi, M. 2002. Evaluation of transgenic event CBH 351(StarLink) corn in broiler chicks. Animal Science Journal 73:221-228.
Yonemochi, C., Ikeda, T., Harada, C., Kusama, T. andHanazumi, M. 2003. Influence of transgenic corn (CBH 351,named Starlink) on health condition of dairy cows and transferof Cry9C protein and cry9C gene to milk, blood, liver and muscle.Animal Science Journal 74: 81-88.
(Received 18 July 2005—Accepted 1 December 2005)
Genetically modified soya bean in rabbit feeding
199
EXHIBIT J - Page 484
Case 5:14-cv-00117-cr Document 63-11 Filed 11/14/14 Page 202 of 312

Biochemical and Biophysical Research Communications 271, 54-58 (2000)
doi: 10.1006/bbrc.2000.2584, available online at http://www.idealibrary.com on IDE ~l ®
Cry1 Ac Protoxin from Bacillus thuringiensis sp. kurstaki HD73 Binds to Surface Proteins in the Mouse Small Intestine
Roberto I. Vazquez-Padron,*·' Joel Gonzales-Cabrera,* Carlos Garcia-Tovar,t Leticia Neri-Bazan.*
Ruben Lopez-Revilla,+ Manuel Hernandez.+ Leticia Moreno-Fierro,§ and Gustavo A. de la Riva*
*Center for Genetic Engineering and Biotechnology (CIGB), P.O. Box 6162, Havana 10600, Cuba; tCuautitJan UNAM,
Mexico; +Department of Cell Biology, CINVESTAV-IPN. P.O. Box 14-740, 07000 Mexico D.F.; and
§ENEP-IZTACALA-UNAM, P.O. Box 314, Tlalnepantla, EDO Mexico, Mexico
Received March 23, 2000
Bacillus thuringiensis (Bt), considered a safe insecticide, produces insecticidal proteins named Cry during sporulation, which possess exceptional immunological properties. In this work using an immunohistochemical test we demonstrated that CrylAc protoxin (pCrylAc) binds to the mucosal surface of the mouse small intestine. Ligand blot assay allowed us to detect, under denaturing conditions, six pCrylAcbinding polypeptides present in brush border membrane vesicles isolated from the small intestine. Moreover, this protein induced in situ temporal changes in the electrophysiological properties of the mouse jejunum. The data obtained indicate a possible interaction in vivo of Cry proteins with the animal bowel which could induce changes in the physiological status of the intestine. © ZOOO Academic Press
Bacillus thuringiensis produces inclusion bodies during sporulation, which are formed by proteins toxic to a group of important pests. These are called Cry proteins. The biochemical properties of Cry proteins are very peculiar: they have a high molecular weight, are resistant to proteolysis and are soluble at alkaline pH (1). Little is known about the physiological or immunological effects of Cry proteins on vertebrate organisms, despite the proven homology of Bt with the pathogenic Bacillus cereus species (2).
The few studies related with the immunological properties of Cry proteins have been limited to the protoxin. In previous reports, Prasad et al. suggested that these proteins have antitumoral activity against Yoshida ascites sarcoma in rats (3), and that they enhance the immune response to sheep red blood cells
' To whom correspondence should be addressed. Fax: (53-7) 336008. E-mail: [email protected].
0006-291X/OO $35.00 54 Copyright © 2000 by Academic Press All rlghts of reproduction in any form reserved
( 4). Recently, we demonstrated that recombinant CrylAc protoxin (pCrylAc) administered to mice by intraperitoneal or intragastric route induces systemic and mucosa! antibody responses similar to those obtained with cholera toxin (5). Moreover, in adjuvanticity studies, pCrylAc elicited serum antibodies to hepatitis B surface antigen and BSA when these antigens were co-administered via intragastric, and IgG antibodies in the intestinal fluid when administered by the intraperitoneal route (6) .
Transgenic maize containing Cry proteins is being used in food elaboration (7). In this way, animals and man will be in contact with these toxins at the intestinal epithelium; however, we do not know if CrylAc produces any physiological effect on the mammalian bowels. In this report, we show that pCrylAc from Bt HD73 binds in situ to the intestinal epithelium of mice and induces a transient hyperpolarization of the mucosa! tissue.
MATERIALS AND METHODS
Organisms and culture conditions. Dr. Donald H. Dean from Ohio State University, Columbus, gently provided Escherichia coli JM103 [p0S9300] strain. The recombinant strain was grown In LB medium containing 50 µ,g of ampicillin per ml, and the induction of CrylAc protein production was performed using isopropyl-/3-Dthlogalactopyranoside (IPTG) (8).
Purification of CrylAc protein. Recombinant CrylAc protoxin was purified from IPTG-induced E. coli JM103 [p0S9300] cultures (8). The cell pellet harvested by centrifugation was resuspended In TE buffer (50 mM Tris-HCI, pH 8, 50 mM EDTA) and sonicated (Fisher Sonic Dismembrator Model 300, U.S.A.) three times for 5 min on ice. Inclusion bodies were collected by centrifugation at 10,000g for 10 min. The pellets were washed twice with TE buffer and pCry!Ac was solubilized In CBP buffer (O.l M Na,C03 pH 9.6, I% 2-mercaptoethanol. 1 mM PMSF). The particulate material was discarded by centrifugation at 10,000g for 10 min. Purified protoxln was examined by SOS-PAGE (9) and protein concentration was determined using the method of Bradford (10).
EXHIBIT J - Page 485
Case 5:14-cv-00117-cr Document 63-11 Filed 11/14/14 Page 203 of 312
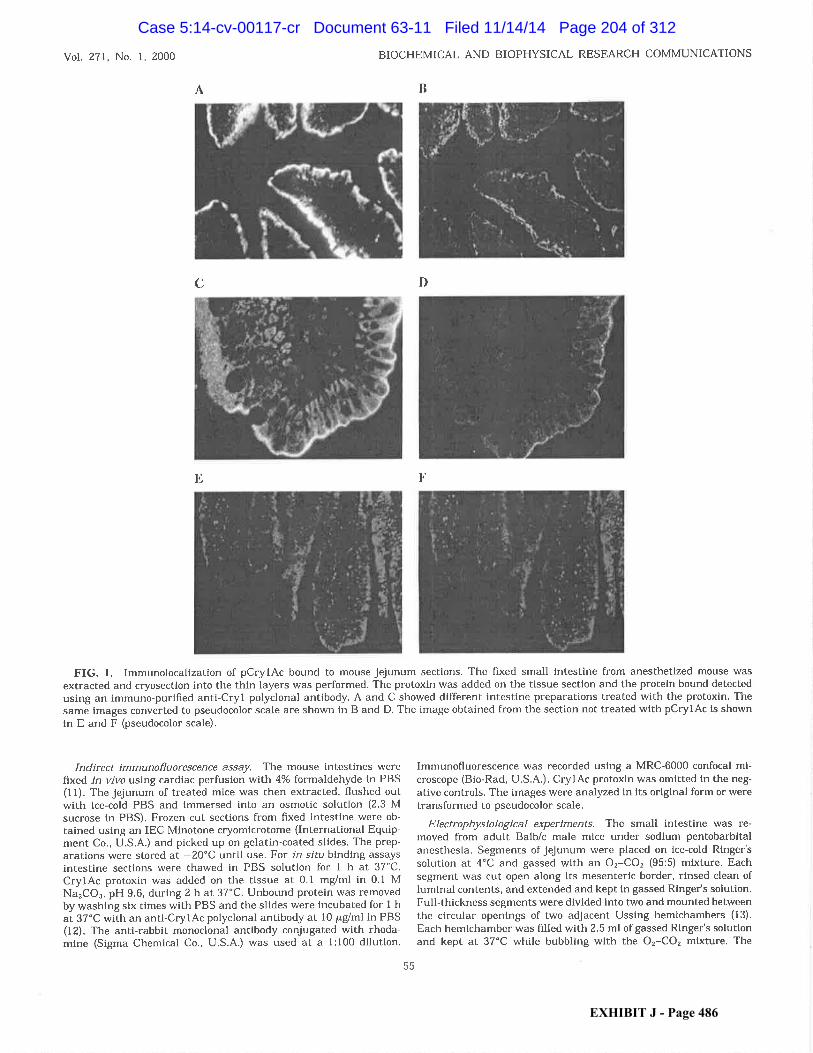
Vol. 271, No. 1, 2000 BIOCHEMICAL AND BIOPHYSICAL RESEARCH COMMUNICATIONS
A n
c D
E F
FIG. I. Immunolocalization of pCrylAc bound to mouse jejunum sections. The fixed small intestine from anesthetized mouse was
extracted and cryosectlon into the thin layers was performed. The protoxln was added on the tissue section and the protein bound detected
using an immuno-purified antl-Cryl polyclonal antibody. A and C showed different Intestine preparations treated with the protoxln. The
same Images converted to pseudocolor scale are shown in Band D. The image obtained from the section not treated with pCrylAc Is shown
In E and F (pseudocolor scale).
Indirect Jmmunofluorescence assay. The mouse Intestines were fixed in vivo using cardiac perfusion with 4% formaldehyde in PBS (11). The jejunum of treated mice was then extracted, flushed out with lee-cold PBS and Immersed into an osmotic solution (2.3 M sucrose in PBS). Frozen cut sections from fixed Intestine were obtained using an IEC Minotone cryomlcrotome (International Equipment Co., U.S.A.) and picked up on gelatin-coated slides. The preparations were stored at -20°C until use. For in situ binding assays intestine sections were thawed In PBS solution for 1 h at 37°C. CrylAc protoxin was added on the tissue at 0.1 mg/ml in 0.1 M Na2CO" pH 9.6, during 2 h at 37°C. Unbound protein was removed by washing six times with PBS and the slides were incubated for 1 h at 37°C with an anti-CrylAc polyclonal antibody at 10 µ,g/ml in PBS (12). The anti-rabbit monoclonal antibody conjugated with rhodamlne (Sigma Chemical Co., U.S.A.) was used at a 1:100 dilution.
55
Immunofluorescence was recorded using a MRC-6000 confocal microscope (Bio-Rad, U.S.A.). CrylAc protoxln was omitted In the negative controls. The Images were analyzed In Its original form or were transformed to pseudocolor scale.
Electrophysiological experiments. The small Intestine was removed from adult Balb/c male mice under sodium pentobarbltal anesthesia. Segments of jejunum were placed on Ice-cold Ringer's solution at 4°C and gassed with an 0 2-C02 (95:5) mixture. Each segment was cut open along Its mesenterlc border, rinsed clean of lumlnal contents, and extended and kept in gassed Ringer's solution. Full-thickness segments were divided into two and mounted between the circular openings of two adjacent Ussing hemichambers (13). Each hemlchamber was filled with 2.5 ml of gassed Ringer's solution and kept at 37°C while bubbling with the 0 2-CO, mixture. The
EXHIBIT J - Page 486
Case 5:14-cv-00117-cr Document 63-11 Filed 11/14/14 Page 204 of 312

Vol. 271. No. 1, 2000 BIOCHEMICAL AND BIOPHYSICAL RESEARCH COMMUNICATIONS
protoxin (7.5 µg) was applied on the mucosa! side of the preparation that had been mounted ten minutes before, and the transmural potential difference (PD) and short-circuit currents (Isc) were recorded each minute for sixteen minutes. Transmural resistance (R) values were obtained from PD/Isc ratios at each time point (13). Decay rates were calculated by regression analysis of the corresponding PD and Isc values.
Brush border membrane vesicles (BBMV) purification. Mouse intestinal BBMVs were prepared according the methodology reported by Biber et al. (1980) with some modifications (14). Briefly, small intestine from five anesthetized mice was extracted, rinsed with PBS and cut to small pieces. Intestinal fragments were immersed in 15 ml of ice-cold BBMV isolation buffer (300 mM D-mannitol, 5 mM EGTA. 12 mM Trls-HCI, pH 7.4) and homogenized at 4°C using a potter (B . Braund, Germany). The homogenate was mixed with 21 ml of icecold water and MgCl 2 was added to 12 mM. The mixture was incubated 15 min on ice and part of the precipitate was discarded by centrifugation at 4500g. The BBMVs suspended in the supernatant were then collected by centrifugation at 16,000g during 15 min at 4°C and stored at -70°C. The quality of BBMVs was tested by measuring the activity of alkaline phosphatase and J3-glucoronidase enzymes (14). Protein concentration was determined by Bradford's method (10).
Ligand blot assay. Ligand blot assays were performed following the protocol reported by Hoffman et al. (15) for insect BBMVs (15). Different amounts (5, 10, 15, 20 µg) of mouse BBMV were dissolved in sample buffer (1% 2-mercaptoethanol, 1% SOS, 10% glycerol, 100 mM Tris-HCI pH 8) and applied on SOS-PAGE (9). The resolved proteins were immobilized onto Hybond C+ (Amersham, UK) using a submarine transfer (Bio-Rad, USA) . Membranes were blocked with 5% dry milk in PBS for 1 h at 37°C, and incubated under similar conditions with 10 µg of pCrylAc alone or with 10 mM of glucose, mannose, N-acetyl-galactosamine, or biotin. CrylAc protein binding to the membrane was detected using an anti-CrylAc polyclonal antibody (12). The immune complexes were revealed with an ECL Western blot kit (Amersham, UK).
RESULTS
Immunohistochemical detection of CrylAc binding after in situ exposure. CrylAc protoxin under alkaline conditions bound to the jejunum epithelium, being more intensive the binding to enterocytes. The processing of confocal images with pseudocolor scale showed that the protoxin binds mainly to the apical surface, including the brush border. The tissue sections to which pCrylAc was not added did not emit intense red fluorescence (Fig. 1).
Study of Cry I Ac interaction with BBMV proteins from mouse small intestine. BBMVs isolated from the small intestine were separated and immobilized onto a nitrocellulose membrane. Six polypeptides with molecular weights of 102, 87, 62, 55, 51, and 39 kDa bound pCrylAc in ligand blot assays (Fig. 2). The signal was saturated with more than 10 µg of BBMVs per lane. The assay performed with no protoxin did not show signal, which evidences the lack of antibody immunoreactivity with the membrane proteins.
A second experiment was performed to characterize the binding of pCrylAc to intestinal surface proteins. The presence of biotin, glucose, mannose and N-acetylglucosamine in the reaction buffer of ligand blot assay
56
2 3 4 5 6 7 8 g r 200 kDa
..... ~
116 kDa
66 kDa
••-4 •·· ·- ~ , ·-... .. .. I 42 kOa
FIG. 2. Ligand blotting assay performed with BBMVs isolated from mouse small intestine. (Left) Amounts of BBMV proteins of 5 (I), 10 (2), 15 (3), and 20 µg (4) were loaded onto a SOS-PAGE and blotted to a nitrocellulose membrane. The membrane was incubated with 10 µg of pCrylAc and the bound protoxin was detected using a polyclonal antibodies. (Right) Strips of nitrocellulose membrane, contained 15 µg of resolved proteins from mouse BBMVs, were incubated with pCrylAc mixed with glucose (6), mannose (7), N-acetylgalactosamine (8). or biotin (9). Line 5 was treatment without pCrylAc and was used as a negative control.
did not inhibit the protoxin interaction with the BBMV proteins (Fig. 2).
CrylAc effect on electric properties of mouse small intestine. The PD and Isc values of full-thickness jejunum fragments mounted in the Ussing chamber decayed very slow with a rate of -0.015 mV min- 1 and -0.016 µA cm 2 min - 1
, respectively (Fig. 3). The R values of this tissue in Ringer's solution were constant during the experiments. Treatment of mice jejunum with pCry 1 Ac raised Msc in 3 7% and 6.PD in 31 % during the first 5 min, with the increased rates of 0.092 µA cm 2 min- 1 and 0.096 mV min - 1
, respectively. Seven minutes later, these electrical parameters decayed with a rate of -0.040 µA cm 2 min- 1 and -0.020 mV min -i. The resistance of treated jejunum did not change during the experiments (Fig. 3).
DISCUSSION
CrylAc protoxin induced a high immune response in mice by both oral and intraperitoneal route (5), and had an immunostimulant effect when coadministered with other antigen (6). In this study, we demonstrate that a Cry binding protein exists in mice, which could be related with an efficient capture and processing of Cry proteins by the antigen presenting cells in the mucosal tissue. Ligand blot and immunohistochemical assays allowed us to detect six CrylAc binding proteins probably placed in the apical membrane of the small intestine. The data obtained by us do not discard the possibility that CrylAc protein could bind to another molecule in the intestine mucosal surface. Other bacterial toxins with exceptional immunological properties like cholera toxin and E. coli labile enterotoxin from E. coli (LT), bind to gangliosides presents on the intestinal surface of vertebrates (16).
EXHIBIT J - Page 487
Case 5:14-cv-00117-cr Document 63-11 Filed 11/14/14 Page 205 of 312

Vol. 271, No. 1, 2000 BIOCHEMICAL AND BIOPHYSICAL RESEARCH COMMUNICATIONS
0 1 .5 -c a.. a a..
0 c.J Cll
::::::: c.J
.!!!
0 0::: D2
1 ' 0 -
0 . 5
1 .5 -
0 .5
1 ,5
1 .0
0.5
0
pCry1Ac Ringer's solution
•
-----------· -·------.-~.____._
5 1 0 1 5 20 0 5 1 0 1 5 20
Time (min) Time (min)
FIG. 3. Effects of pCrylAc pro toxin on the electrophysiological properties of mouse jejunum preparation. Both hemlchambers contained Ringer's solution gassed with 95% 0 2-5% CO,, and 15 min later 7.5 µ.g of protoxin were added to each preparation on the mucosa! side. The symbols represent the average normalized values of PD/PD0 , Isc/Isc0 , and R/R0 ratios, i.e., (value for each tlme)/{initial values) . Each point represents the mean of four experiments.
Putative Et toxin receptors have been found in the apical membrane of the columnar cells present in the insect midgut, and have been identified in many cases as either 100- or 120-kDa N-aminopeptidases (17) or 200- to 220-kDa E-cadherine-like proteins (18) . Similar proteins are present in vertebrate bowel playing important roles in nutrient absorption (19) and cellular adhesion (20). In contrast with the data reported for insect EEMVs, the interaction of Cry binding protein with the protoxin is not mediated neither by sugars nor biotin, thus electrostatic interactions involving other structures may occur (17, 18) .
CrylAc not only binds to the intestinal surfaces, but also induces a temporal hyperpolarization of the intestine without apparent tissue damage. This phenomenon could be explained by supposing that pCrylAc, or a locally produced toxin, form cationic channels like it happens in the insect midgut (21). In this way, a net ion flux could be generated across the enterocytes in-
57
creasing the positive charges on the intestinal serose side. Many substances, from simple organic molecules to complex proteins, induce changes on the electric parameters of animal intestine (22). In contrast with LT and ciguatoxins, which produce hyperpolarization on the intestinal tissue, pCrylAc does not induce electrolyte secretions (23, 24).
For many years, Et-based formulations containing high concentrations of Cry proteins have been used as an example of totally safe insecticides. This idea is based on three important facts: (i) Et-based insecticides have been used for many years with no reports of consistent hypersensitivity or toxicity (25); (ii) the toxicological tests performed to support registration of Et-based insecticides show that several strains of this microorganism are innocuous when administered to animals and man by systemic and mucosal routes (26); and (iii) Et strains isolated from food and human infected wounds are unable to produce illness in animals
EXHIBIT J - Page 488
Case 5:14-cv-00117-cr Document 63-11 Filed 11/14/14 Page 206 of 312

Vol. 271, No. 1, 2000 BIOCHEMICAL AND BIOPHYSICAL RESEARCH COMMUNICATIONS
(27, 28). However, there are no histopathological or immunotoxicological assays probing the absence of a microscopic effect on animal physiology.
The results obtained by us indicate that pCrylAc could induce temporal changes in the intestinal membrane of mice without affecting the macroscopic physiological signals, perhaps due to the existence of a mechanism that eliminates or inhibits the toxin effect. We think that previous to commercialization of food elaborated with self-insecticide transgenic plants it is necessary to perform toxicological tests to demonstrate the safety of CrylA proteins for the mucosa! tissue and for the immunological system of animals. If pCrylAc is a totally harmless protein that binds to the intestinal surface of animals it could be now used as a carrier of vaccinal antigens for oral immunization.
ACKNOWLEDGMENTS
We are grateful to Q. F. B. Lourdes Alaran from Biophysics, Physiology, and Neuroscience Department, CINVESTAV-MEXICO, for her technical assistance with the confocal microscopy and to Lie. Ariel F. Martinez-Gil (Editorial Elfos Scientiae. Center for Genetic Engineering and Biotechnology, Havana, Cuba) for revision of the manuscript.
REFERENCES
1. Hiifte, H., and Whiteley, H. (1989) Microbial. Rev. 53, 242-255.
2. Carlson, C. R., Caugant, D. A., and Kolsto, A.-B. (1994) Environ. Microbial. 60, 1719-1725.
3. Prasad, S.S. S. V., and Shethna , Y. I. {1976) Indian J. Exp. Biol. 14, 285-290.
4. Prasad, S. S. S. V .. and Shethna, Y. I. (1975) Biochem. Biophys. Res. Commun. 62, 517-521.
5. Vazquez-Padron, R. I.. Moreno-Fierros, L .. Neri-Bazan, L., de la Riva, G. A., and Lopez-Revilla, R. (1999) Life Sci. 64, 1897-1912.
6. Vazquez-Padron, R. I .. Moreno-Fierros, L .. Neri-Bazan. L .. de la Riva, G. A. , and Lopez-Revilla, R. (1999) Scand. J. Immunol. 46, 578-584.
7. James, C. (1998) Global review of commercialized transgenic crops: 1998. ISAAA Briefs 8, U.S .A.
58
8. Ge, A. z .. Pfister, R. M., and Dean, D. H. (1990) Gene 93, 49-54.
9. Laemmll, U . K. (1970) Nature 227, 680-685.
10. Bradford, M. M. (1976) Anal. Biochem. 72, 248-254.
11. Cote, S . L., Ribeiro da Sliva, A., and Cuello, A. C. (1993) in Current Protocols for Light Microscopy, Immunocytochemistry and Immunohistochemistry II (Cuello, A. C., Ed.), pp. 147-168, Wiley, England .
12. Vazquez, R., Prieto, D., de la Riva, G. A., and Selman-Houseln,
G. (1996) J. Immunol. Methods 196, 33-39.
13. Navarro-Garcia, F .. Lopez-Revilla, R., Tsutsumi, V .. and Reyes J. L. (1993) Exp. Parasitol. 77, 162- 169.
14. Biber, J., Stieger, B., Haase, W., and Murer, H. (1981) Biochim. Biophys. Acta 647, 169 - 176.
15. Hoffman, H., Vanderbruggen, H., Hofte , H .. Van Rle, J., Jansen, S .. and Van Mellaert, H. (1988) Proc. Natl. Acad. Sci. USA 85, 7844 -7848.
16. Williams, N. A., Hirst, T. R .. and Nashar, T. 0. (1999) Immunol. Today 20, 95- 101.
17. Knight. P. J . K., Crickmore, N., and Ellar, D. J . (1994) Mol. Microbial. II, 429-436.
18. Vadlamudi, R. K., Ji, T. H., and Bulla, L.A. (1993) J. Biol. Chem. 268, 12334-12340.
19. Kenny, A. J ., Stephenson, S. L.. and Turner A. J . (1987) in Mammalian Ectoenzymes (Kenny, A. J .. and Turner, A. J., Eds.), pp. 169-190, Elsevier, Amsterdam.
20. Takeichi, M. (1991) Science 251, 1451-1455.
21. Knowles, B. (1994) Adv. Insect. Physiol. 24, 275-307.
22. Navarro-Garcia. F .. Lopez-Revilla, R., and Tsutsumi, V. (1994) Arch. Med. Res. 25, 253-263.
23. Fasano, A., Hokama, Y., Russell, R .. and Morris , J. G. (1991) Gastroenterology 100, 471-476.
24. Savarino, J. S., Fasano, A., Donald, C. R., and Levine, M. M. {1991) J. Clin. Invest. 87, 1450-1457.
25. Drobniewski, F. A. (1994) J. Appl. Bacterial. 76, 101-109.
26. McClintock, J . T., Schaffer, C. R., and Sjoblad, R. D. {1995) Pestic. Sci. 45, 95-105.
27. Damgaard, P . H .. Granum, P. E., Bresciani, J., Torregrossa, M. V., Eilenberg, J .. and Valentino L. (1997) FEMS Immunol. Med. Microbial. 18, 47-1852.
28. Hernandez, E., Ramisse, F., Ducoureau, J. P ., Cruel, T., and Cavallo, J. D. (1998) J. Clin. Microbial. 36, 2138-2144.
EXHIBIT J - Page 489
Case 5:14-cv-00117-cr Document 63-11 Filed 11/14/14 Page 207 of 312

Biological effects
of transgenic maize NK603xMON810 fed
in long term reproduction studies in mice
11. November 2008
Dr. A. Velimirov, Dr. C. Binter, Univ. Prof. Dr. J. Zentek
Scientific contribution (alphabetical order): N. Cyran, Dr. C. Gülly, Dr. S. Handl, G. Hofstätter, F. Meyer,
Dr. M. Skalicky, Prof. Dr. R. Steinborn
EXHIBIT J - Page 490
Case 5:14-cv-00117-cr Document 63-11 Filed 11/14/14 Page 208 of 312

Biological effects of transgenic maize NK603xMON810 fed in long term reproduction studies in mice
Page 2 of 105
Department/Universitätsklinik für Nutztiere und öffentliches Gesundheitswesen in der Veterinärmedizin I n s t i t u t f ü r E r n ä h r u n g Univ. Prof. Dr. med. vet. Jürgen Zentek Dr. med. vet. Claudia Binter A- 1210 Wien, Veterinärplatz 1 Tel. +43 1 25077/3201, Fax: +43 1 25077/3290 www.vu-wien.ac.at/i124
Forschungsinstitut für biologischen Landbau – FiBL Österreich Dr. Alberta Velimirov A -1040 Wien, Theresianumgasse 11/1 Tel. +43 1 9076313, Fax. 01 4037050191 [email protected] www.fibl.org
EXHIBIT J - Page 491
Case 5:14-cv-00117-cr Document 63-11 Filed 11/14/14 Page 209 of 312

Biological effects of transgenic maize NK603xMON810 fed in long term reproduction studies in mice
Page 3 of 105
Contents
ABSTRACT............................................................................................................................................. 3
1.INTRODUCTION .................................................................................................................................. 3
2. MATERIAL AND METHODS .............................................................................................................. 3
2.1. CROP PRODUCTION AND CHOICE OF COMPARATORS ......................................................................... 3 2.2. DIET ............................................................................................................................................... 3
2.2.1. Diet composition .................................................................................................................. 3 2.2.2. Analyses of corn and diets ................................................................................................. 3
2.3. ANIMALS AND HOUSING ................................................................................................................... 3 2.4. MULTIGENERATION STUDY (MGS) ................................................................................................... 3
2.4.1. Performance and reproduction data .................................................................................. 3 2.4.2. Organ weights ...................................................................................................................... 3 2.4.3. Histology ............................................................................................................................... 3 2.4.4. Immunohistochemistry........................................................................................................ 3 2.4.5. Ultrastructural investigations ............................................................................................. 3 2.4.6. Microarray analyses............................................................................................................. 3 2.4.7. q-RT-PCR .............................................................................................................................. 3 2.4.8. miRNA analyses ................................................................................................................... 3
2.5. LIFE TERM STUDY (LTS) .................................................................................................................. 3 2.5.1. Feed intake and body mass survey.................................................................................... 3 2.5.2. Survival ................................................................................................................................. 3
2.6. REPRODUCTIVE ASSESSMENT BY CONTINUOUS BREEDING (RACB).................................................. 3 2.6.1. Performance and reproduction........................................................................................... 3 2.6.2. q-RT-PCR .............................................................................................................................. 3
3. RESULTS............................................................................................................................................ 3
3.1. DIET ............................................................................................................................................... 3 3.1.1. Harvest in 2005 (diets for MGS and LTS)........................................................................... 3 3.1.2. Harvest in 2007 (diets for RACB)........................................................................................ 3
3.2. MULTI GENERATION STUDY (MGS).................................................................................................. 3 3.2.1. Performance and reproduction........................................................................................... 3 3.2.2. Organ weights ...................................................................................................................... 3 3.2.3. Histology ............................................................................................................................... 3 3.2.4. Immunohistochemistry........................................................................................................ 3 3.2.5. Ultrastructural investigation ............................................................................................... 3 3.2.6. Microarray analyses............................................................................................................. 3 3.2.7. q-RT-PCR .............................................................................................................................. 3 3.2.8. miRNA profiling.................................................................................................................... 3
3.3. LIFE TERM STUDY (LTS) .................................................................................................................. 3 3.4. REPRODUCTIVE ASSESSMENT BY CONTINUOUS BREEDING (RACB).................................................. 3
3.4.1. Performance and reproduction........................................................................................... 3 3.4.2. q-RT-PCR .............................................................................................................................. 3
4. DISCUSSION ...................................................................................................................................... 3
5. CONCLUSION .................................................................................................................................... 3
6. DISKUSSION ...................................................................................................................................... 3
7. SCHLUSSFOLGERUNG .................................................................................................................... 3
8. OVERVIEW OF TABLES.................................................................................................................... 3
9. OVERVIEW OF FIGURES .................................................................................................................. 3
10. REFERENCE LIST............................................................................................................................ 3
EXHIBIT J - Page 492
Case 5:14-cv-00117-cr Document 63-11 Filed 11/14/14 Page 210 of 312

Biological effects of transgenic maize NK603xMON810 fed in long term reproduction studies in mice
Page 4 of 105
Abstract The aim of the study was to examine effects of the stacked GM crop NK603 x MON810 in different models of long term feeding studies. So far no negative ef-fects of GM corn varieties have been reported in peer-reviewed publications. But the hypothesis, that effects after long term exposure might become evident in multi-generation studies has rarely been investigated. In this study three designs were used, including a multi-generation study (MGS), a reproductive assessment by continuous breeding (RACB) and a life-term feed-ing study (LTS), all performed with laboratory mice (strain OF1). The test diets differed only as to the inclusion of 33% NK603 x MON810 corn (GM) versus non-GM corn of a near isogenic line (ISO), both grown under identical conditions in Canada. The MGS also included one group with a non GM corn cultivated in Aus-tria (A REF). All corn varieties used in the MGS and LTS were harvested in 2005, the transgenic and isogenic corn for the RACB were harvested in Canada in 2007. No Austrian corn was used in this case. In the MGS microscopic and ultra-structural investigations were performed to detect changes at the organ and cell level. Gene expression patterns were compared by micro array expression pro-files of the intestine as feed-animal interface and by real time PCR. The results of the MGS showed no statistically significant differences concerning parental body mass. The number of females without litters decreased with time in the GM and ISO group, especially in the 4th generation. In the group fed with A REF corn fewer females were without litters, and accordingly more pups were weaned. The production parameters average litter size and weight as well as number of weaned pups were in favour of the ISO group. These differences were also seen in the RACB design and were statistically significant in the 3rd and 4th litters. In addition, the inter-individual variability was higher in the GM group as compared to the other groups. The LTS showed no statistically significant differences in the survival of 3 groups of mice fed the different maize varieties. In the MGS the continuative investigations revealed differences between the GM and ISO groups. The comparison of organ weights did not indicate directed die-tary effects, except for kidneys. The electron histological investigation of the cell nuclei revealed differences as to fibrillar centres, dense fibrillar components and the pore density in hepatocytes. This could point to an effect of the GM crop on metabolic parameters. Immunohistochemistry revealed no systematic differences in CD3, CD20 positive cells and macrophages in gut tissue. The microarrays showed differences between the feeding groups. When the data of both non-GM feeding groups from MGS were combined and compared to the GM feeding group, the discrimination became more evident. Analyses of metabolic pathways indicated, that the groups differed regarding some important pathways, including interleukin signalling pathway, cholesterol biosynthesis and protein metabolism. Summarizing the findings of this study it can be concluded, that multi-generation studies, especially based on the RACB design are well suited to reveal differences between feeds. The RACB trial showed time related negative reproductive effects of the GM maize under the given experimental conditions. The RACB trial with its specific design with the repeated use of the parental generation is a demanding biological factor for the maternal organism. Compared to the findings in the RACB trials it can be assumed that the physiological stress was considerably lower in the MGS trial. The trial design of using “new” parental generations in-stead of continuous breeding with the same generation has to be considered as being obviously less demanding. This might have masked the impact of dietary
EXHIBIT J - Page 493
Case 5:14-cv-00117-cr Document 63-11 Filed 11/14/14 Page 211 of 312

Biological effects of transgenic maize NK603xMON810 fed in long term reproduction studies in mice
Page 5 of 105
factors on reproductive performance. However, this part of the experiment is valuable as such because it underlines the need for different experimental de-signs for the assessment of dietary effects that have an unknown impact on ani-mals. The outcome of this study suggests that future studies on the safety of GM feed and food should include reproduction studies. Physiological and genomic traits and depending on the nature of the genetic modification proteomic and metabolomic methods might be taken into consideration as additional tools to the tests performed in this study.
EXHIBIT J - Page 494
Case 5:14-cv-00117-cr Document 63-11 Filed 11/14/14 Page 212 of 312

Biological effects of transgenic maize NK603xMON810 fed in long term reproduction studies in mice
Page 6 of 105
1. Introduction Transgenic crops are playing an increasing role in the EU. It is often, but arbi-trarily distinguished between the 1st generation of transgenic plants, with the characteristics of pest or insect resistance, the 2nd generation that has modified nutritional quality and the 3rd generation plants that are used for plant made pharmaceuticals, vaccines, or plant made industrials. Today, the 1st generation is used in animal nutrition either as source of feed protein, such as soy, or as energy source, such as corn. The demand especially for high value protein feed-stuffs for the nutrition of food producing animals is high but the perception of transgenic crops in the public is quite controversial (Finucane 2002; Schiermeier 2004). Discussions on food and feed safety, precaution measures and ethical as-pects have been conducted since many years and there seems to be no clear di-rection. One important aspect is the potential impact of transgenic feed on the metabo-lism of animals. The effects on digestion, metabolism and health in farm animals have been addressed in many studies. Most feeding experiments have been short term feeding trials using conventional designs such as digestibility experiments or growth trials until slaughter. Adverse effects of GM crops have not been re-ported in peer-reviewed publications related to animal feed. Compositional analyses have demonstrated substantial equivalence, feeding trials could show that the 1st generation of transgenic crops is nutritionally equivalent to conven-tional feedstuffs (Flachowsky et al. 2005; Flachowsky et al. 2007). A certain variability of nutrient composition has been described in almost every study comparing trans- with the isogenic substrates. However, these fluctuations have also been well known for conventional plants because seasonal, environmental and agricultural factors can have severe impact on the nutritional properties of crops. Nutrients in transgenic plants have always been described to be within the variation of the reference lines, representing the “normal range of agronomic variability” (Kuiper et al. 1999; Aulrich et al. 2001; Aumaitre et al. 2002). The variability of feed composition may affect the utilization of feedstuffs by farm animals. In conventional feedstuffs considerable variation of nutrient concentra-tion occurs and has been shown to affect apparent digestibility of the organic matter in several domestic animals. Comparisons have been made for iso- and transgenic maize in monogastric animals as pigs or poultry and ruminants. A cer-tain variability of feed utilization was obvious in some studies, but the experi-ment-related variability has to be taken into account when discussing the poten-tial impact of the newly introduced events on animal performance. In all, the published data do not give clear indications for a systematic effect of genetic en-gineering on nutrient digestibility so far. Nutritional and anti-nutritional proper-ties of transgenic crops depend on the geographical position, the growth condi-tions, soil and fertilization and climate variations, as in isogenic feedstuffs. Only few studies have been conducted to assess “toxicity” and “long term ef-fects” of transgenic crops in warm blooded animals. An advanced safety evalua-tion process has to address several important issues and should include genomic and postgenomic technologies, DNA microarrays, proteomics and advanced methods of metabolic profiling (Kuiper et al. 1999; Kleter and Kuiper 2002). In vitro studies using rumen epithelia could not demonstrate an impact by Cry1Ab toxin (Bondzio et al. 2008). But Vasquez-Padron et al. (2000) demonstrated that Cry1Ac protoxin binds to the mucosal surface of the mouse intestine and induces
EXHIBIT J - Page 495
Case 5:14-cv-00117-cr Document 63-11 Filed 11/14/14 Page 213 of 312

Biological effects of transgenic maize NK603xMON810 fed in long term reproduction studies in mice
Page 7 of 105
in situ temporal changes in the electrophysiological properties of the mouse jeju-num thus, indicating potential changes in the physiological status of the intes-tine. The risk of allergenicity seems to be limited in farm animals in comparison to the situation in humans. The effects on reproduction are important because breeding and growing animals should have a higher susceptibility to adverse effects if pre-sent compared to animals with lower performance. There are only few long-term chronic or multigenerational studies in laboratory or domestic animals. Up to now, no negative effects were described in peer-reviewed publications on repro-duction and testicular development in mice or rats (Brake and Evenson 2004; Brake et al. 2004; Rhee et al. 2005; Kilic and Akay 2008), or on animal health, feed intake, feed efficiency, laying performance, or hatchability, DNA-transfer and quality of meat and eggs of 10 generations of quails compared with the isogenic counterparts (Flachowsky et al. 2005). The outcome of one study in rats was discussed controversially because of differing interpretations of the effects of the transgenic maize MON 863 (Hammond et al. 2006; Doull et al. 2007; Seralini et al. 2007). Whether there is a risk under specific conditions, for instance disorders of the digestive tract, has not been widely studied. Rats did not show adverse reaction when gastrointestinal injury was induced and purified Bt protein Cry1Ab from B. thuringiensis var. Kurustaki HD-1 was applied orally (Onose et al. 2008). The comprehensive characterization of novel transgenic plants will be most im-portant for the future evaluation process. The biological response of animals has to be described in the best possible way according to the scientific state of the art. Traditional feeding and digestive trials appear in many regards less suitable for a well-founded risk evaluation. This should be defined based on the analysis of the physiological reaction of the body, the modification of the intestinal micro-flora, the interactions with the immune system, the fate of DNA and protein in the organism and the potential appearance in animal products. Reproductive function and efficiency might be considered as important research area. The present study in mice uses advanced approaches to assess biological effects of the transgenic maize NK603 x MON810 in a multigenerational study in mice. Two different designs have been applied to assess the impact of different maize varieties on reproduction traits, a Reproductive Assessment by Continuous Breeding design and a Multigeneration Reproductive Trial have been used. Data related to the reproductive function were analyzed and the interaction with the animal organism was studied in relation to intestinal gene expression, and histo-logical studies. In addition a life term study was performed with a limited number of animals.
EXHIBIT J - Page 496
Case 5:14-cv-00117-cr Document 63-11 Filed 11/14/14 Page 214 of 312

Biological effects of transgenic maize NK603xMON810 fed in long term reproduction studies in mice
Page 8 of 105
2. Material and Methods
2.1. Crop production and choice of comparators
Crop Production The crop production for all feeding studies was carried out by the Organic Agri-culture Centre of Canada (Prof. R. Martin, Organic Agriculture Centre of Canada, Nova Scotia Agricultural College, P.O. Box 550, Truro, NS B2N 5E3, Tel: 902-893-7256; Fax: 902-896-7095). Both test crops, GM and control, were grown on loamy soil in Canada, Nova Scotia, in 2005 and 2007. Corn production sites 2005: The comparators were grown on 4 locations, two for each variant. The distance between the fields in Plumdale (non-GM corn) and Interval (GM corn) was 2 km and between Masstown (non-GM corn) and Hamilton-Onslow (GM corn) 10 km. There were 20 km between the two test field layouts. Corn production sites 2007: The second feed lot was grown on two locations in the Marsh region, Nova Sco-tia, Canada. The treatments were arranged in a manner to reduce the possibility of cross contamination of GM with non-GM corn by planting according to prevail-ing wind direction and growing a 75 m buffer zone of non-GM corn between the two test variants. Soil samples were taken from all fields and analysed in the state laboratory of the Nova Scotia Department of Agriculture and Fisheries to compare soil qualities and determine the fertilisation management. The fertility management differed between 2005 and 2007 insofar as liquid dairy manure was used additionally to the mineral fertilizers in 2007 only. In both cul-tivation years the same herbicides containing the active ingredients dicamba, atrazine and s-metalochlor for the non-GM variant and glyphosate for the GM corn, were used. The corn was hand harvested when the moisture content was less than 30%. After shelling in a small threshing machine designed for this purpose the corn was dried to < 14% moisture in separate bulk drying bins at a low temperature (<30°C) to ensure good feeding quality. The corn was shipped in 25 kg bags on treated pallets. Choice of comparators Since it was not possible to obtain a genetically modified test crop plus parental line from the agro-business companies, two comparators where chosen according to availability on the Canadian market. The trade names are DKC 26-79, geneti-cally modified corn hybrid, and DKC 26-75, NK 603-near isogenic line. The test corn represents the stacked event NK 603 x MON 810 and contains three gene cassettes, conveying herbicide tolerance and insect resistance. The hybrid was produced by traditional breeding of the two genetically modified parental inbred lines derived from maize transformation events NK 603 and MON 810. The two parental lines were modified using the particle acceleration method.
EXHIBIT J - Page 497
Case 5:14-cv-00117-cr Document 63-11 Filed 11/14/14 Page 215 of 312

Biological effects of transgenic maize NK603xMON810 fed in long term reproduction studies in mice
Page 9 of 105
Description of the test corn NK 603 x MON 810
NK 603 has been modified to tolerate the broad spectrum herbicide glyphosate (N-phosphonomethyl-glycine) by introducing two gene cassettes containing the CP4 EPSPS (5-enolpyruvyl-shikimate-3-phosphate synthase) gene derived from Agrobacterium tumefaciens, strain CP 4 (Table 1 and Table 2). Table 1: 1st cp4 EPSPS gene cassette genetic element derived from size function P-ract1/ ract1 in-tron
Oryza sativa 1.4 kb promotor, transcription start site, 1st intron
ctp 2 Arabidopsis thaliana
0.2 kb chloroplast transit peptide
cp4-epsps Agrobacterium sp. 1.4 kb glyphosate tolerant CP4 EPSPS enzyme NOS 3` Agrobacterium
tumefaciens 0.3 kb ends transcription and directs polyade-
nylation of the mRNA Table 2: 2nd cp4 EPSPS gene cassette genetic element derived from size function e35S Cauliflower mosaic vi-
rus 0.6 kb promotor
Zmhsp70 Zea mais L. 0.8 kb stabilizes level of gene transcription ctp 2 Arabidopsis thaliana 02 kb chloroplast transit peptide cp4-epsps l214p Agrobacterium sp 1.4 kb glyphosate tolerant CP4 EPSPS
L214P enzyme NOS 3` Agrobacterium tumefa-
ciens 0.3 kb ends transcription, and directs
polyadenylation of the mRNA The transgenic EPSPS enzyme is not inhibited by glyphosate and can therefore substitute the sensitive plant-derived EPSPS enzyme in the shikimic acid pathway for the biosynthesis of aromatic amino acids. Thus the continued function of the aromatic amino acid pathways is ensured, even in the presence of glyphosate. MON 810 contains one gene cassette (Table 3) to import insect resistance by producing the Cry1Ab protein, which targets specific lepidopteran insect pests including the European Corn Borer (Ostrinia nubilalis) and pink borers (Sesamia spp.). After activation by proteolytic processing in the target insect´s gut the toxin binds to receptors on the surface of midgut epithelial cells generating pores in the membrane. Resulting electrolyte imbalance and pH changes paralyze the gut, which entails the insect to stop eating and die (Sacchi et al. 1986). Table 3: Gene cassette of MON 810 genetic element derived from size function e35S Cauliflower mosaic
virus 0.32 kb
promotor
Zmhsp70 Zea mais L. 0.8 kb stabilizes level of gene tran-scription
Cry1Ab Bacillus thuringiensis 3.5 kb Cry1Ab protein
EXHIBIT J - Page 498
Case 5:14-cv-00117-cr Document 63-11 Filed 11/14/14 Page 216 of 312

Biological effects of transgenic maize NK603xMON810 fed in long term reproduction studies in mice
Page 10 of 105
By means of traditional breeding methods NK 603 and MON 810 inbred lines, homozygous for the respective insert, were produced and crossed to obtain the stacked event NK 603 x MON 810, now containing both traits of the parental lines. A slight GM contamination of the isoline of harvest 2005 was detected and there-fore a further reference group (A REF) was introduced. This corn was grown in Austria under conventional conditions. Since it was not possible to obtain the same variety, a substantially equivalent cultivar (Sarastro) was chosen.
2.2. Diet
2.2.1. Diet composition A purified diet with 33.0% maize content was chosen as a common level of maize in commercial rodent diets (Table 4). For all diets a standardized diet for laboratory mice in reproduction in accordance with Nutrient Requirements of Laboratory Animals (National Research Council, NRC, 1995) was used (Table 5). All three diets were produced by Ssniff Spezialdiaeten GmbH, Ferdinand-Gabriel-Weg 16, D-59494 Soest. Table 4: Overview about diets used Abbrevia-tion
Diet
GM group test diet with 33.0% of the transgenic corn (NK603 x MON810)
ISO group control diet with the 33.0% isoline A REF group reference diet with 33.0% GM free Austrian corn
EXHIBIT J - Page 499
Case 5:14-cv-00117-cr Document 63-11 Filed 11/14/14 Page 217 of 312

Biological effects of transgenic maize NK603xMON810 fed in long term reproduction studies in mice
Page 11 of 105
Table 5: Diet composition according to Ssniff Ingredient % Corn (according to group) 33.0 Potato protein vD (No1) 17.0 Caseinacid, ssniff (Na- poor) 86% XP 5.0 Barm vD (No 9006) 1.0 Dry whey, suss VD (1009; kaasweip.) 5.0 Saccharose 3.5 Cellulose (Arbocell) ssniff 6.0 Tarwevoerbloem (wheat sort) (No. 92) Okt.05 18 (H) CaCO3 vanDijck (No. 23) 0.6 (H) MCP (Aliphos) vanDijck (No. 228) 1.0 (H) NaCl, salt (Zout) vanDijck (N0. 351) 0.2 (H) Magnesiumoxid, MgO van Dijck (No. 28) 0.1 (H) Cholinchlorid (50%) van Dijck (No. 1015) 0.3 (H) Ca-Propionate 1.0 (H) DL-Methionin 99 % van Dijck (No. 36) 0.2 (H) L-Tryptophan van Dijck (Nr. 702) 0.1 Ssniff EF 1/0 Vitamin-VM 1.0 Ssniff EF 1/0 Mineralstoff-VM 3.0 Sunflower oil 4.0 100
2.2.2. Analyses of corn and diets 2.2.2.1. Test on the genetic modification Test at protein level For the determination of Cry1Ab and EPSPS the ELISA technique was used. Corn was tested with a Roundup Ready® Cry1Ab and Roundup Ready® CP4 EPSPS (Ag-dia Incorporated, Indiana, USA) ELISA system according to the manufacturers protocol. Test at DNA level Corn was first screened on the presence of the 35S-promoter and nos-terminator using PCR (Oesterreichische Agentur fuer Gesundheit und Ernaehrungssicherheit GmbH, AGES, 1226 Vienna, Spargelfeldstrasse 191) and if positive analysed for the event specific region. 2.2.2.2. Crude nutrients and gross energy Corn and diets were analysed according to Weende (Institut fuer Tierernaehrung, Freie Universitaet Berlin, Bruemmerstrasse 34, 14195 Berlin, Germany) for dry matter (DM), crude protein (XP), crude fat (EE), crude fibre (XF) and crude ash (XA). Nitrogen free extracts (NfE) which include α-glycosidic polysaccharides, soluble sugars and soluble parts of cellulose, lignins and pectins, were calculated: NfE = DM - (XA+XF+EE+XP); (VDLUFA Methodenbuch, Bd. III – Futtermittel, Untersuchung von Futtermitteln, VDLUFA-Verlag Darmstadt). Gross energy (GE) was calculated: GE (MJ/ kg)= 0.0239 XP + 0.0398 EE + 0.0201 XF + 0.0175 NfE.
EXHIBIT J - Page 500
Case 5:14-cv-00117-cr Document 63-11 Filed 11/14/14 Page 218 of 312

Biological effects of transgenic maize NK603xMON810 fed in long term reproduction studies in mice
Page 12 of 105
2.2.2.3. Minerals and trace elements Atom absorption spectrometry (AAS) was used for the quantification of calcium (Ca), sodium (Na), manganese (Mg), copper (Cu), zinc (Zn) and iron (Fe). Phos-phorus (P) was determined photometrically in corn and diets (Institut fuer Tier-ernaehrung, Freie Universitaet Berlin). 2.2.2.4. Vitamins Vitamin A, β-Carotene and Vitamin E were investigated as they play a major role in reproduction. Samples were analyzed with high liquid chromatography (HPLC, Institut fuer Physiologische Chemie, Stiftung Tieraerztliche Hochschule Hannover, Buenteweg 17, 30559 Hanover, Germany). 2.2.2.5. Fatty acids For the determination of fatty acids gas-chromatography was performed (Institut fuer Tierernaehrung, Freie Universitaet Berlin, Germany). 2.2.2.6. Amino acids Amino acids were determined by ion exchange chromatography after acid hy-drolysis. 2.2.2.7. Hygienic evaluation Total microbial count, yeasts and moulds were determined by cultivation tech-niques (VDL LUFA, Methodenbuch). HPLC-mass spectrometry (MS/MS) was used for the investigation of deoxynivalenol (DON) and zearalenon (ZON) (LUFA-ITL GmbH, Dr.-Hell-Str. 6, 24107 Kiel, Germany). 2.2.2.8. Herbicides Glyphosate and its derivative aminomethylphosphonic acid (AMPA) were deter-mined by liquid chromatography (LC)-MS/MS (LUFA Nord-West, Jaegerstraße 23-27, 26121 Oldenburg, Germany). Dicamba, S-Metolachlor, Atrazin were deter-mined by the QuEChERS method which is a rapid multiresidue method that is established for herbicide analysis. 2.2.3. Diet processing The feed was offered in feeding troughs (Tecniplast, Hohenpreißenberg, Ger-many) as meal diet to avoid structural changes in the proteins by the pelleting process, where high temperature and pressure are applied. It has been shown that delta- endotoxins are heat instable (EPA 2003).
EXHIBIT J - Page 501
Case 5:14-cv-00117-cr Document 63-11 Filed 11/14/14 Page 219 of 312

Biological effects of transgenic maize NK603xMON810 fed in long term reproduction studies in mice
Page 13 of 105
2.3. Animals and housing The animal trials were conducted at the Institute of Nutrition, University of Vet-erinary Medicine Vienna, and were approved by the ethics committee of the Uni-versity of Veterinary Medicine of Vienna and the national ethics committee for animal experiments (GZ: 68.205/0042 – BrGT/2006). In risk assessment feeding studies, both, inbred and outbred mouse strains have been used. In some cases the possibility is addressed that a less fertile strain should be the strain of choice for testing potential effects on reproduction, since strains with low fertility are more susceptible to potential effects on reproduction. On the other hand a good breeding performance is necessary especially for the RACB design to ensure enough offspring for data collection and for continuing multigeneration studies. Therefore the fertile outbred mouse strain OF1/SPF was chosen to ensure good breeding success and provide a diverse genetic back-ground for potential feed impacts beyond fertility parameters. For the Life Term Study the same strain was used. The mice were kept in macrolon cages III in an animal experimental unit of the Institute of Nutrition, University of Veterinary Medicine, Vienna. Average room temperature was 23°C. A light program was installed for a 12 hour day/night cycle. Health status of mice was checked daily by a veterinarian.
EXHIBIT J - Page 502
Case 5:14-cv-00117-cr Document 63-11 Filed 11/14/14 Page 220 of 312

Biological effects of transgenic maize NK603xMON810 fed in long term reproduction studies in mice
Page 14 of 105
2.4. Multigeneration study (MGS)
2.4.1. Performance and reproduction data
2.4.1.1. Data collection The parental generation (F0) was fed since birth with either 33% genetically modified diet or the 33% isogenic maize variety and 4 generations were bred (Table 6). Eighteen -24 pairs from these groups were randomly paired at the age of 7 weeks. After one week of mating the males were sacrificed. The offspring stayed with the parents and were weaned after 3 weeks. Then male and female pups were separated and raised until sexual maturity. Again random allotment of pairs and mating occurred at the age of 7 weeks. Feed was given ad libitum throughout the study. The collected data were divided into parental data (Table 7) and data from offspring (Table 8) The animals were weighed on a high precision analytical balance with animal weighing modus (AND GF 300EC, Ehret, Tulln, Austria). Table 6: Overview of succession of generations
Table 7: Data collection of parental mice per generation
Performance data Reproduction data
Feed intake [g] Deliveries/group
Females body mass [g] at birth
mating Litter size distribution
1 week after mating Number of pups
delivery at birth/pair
1 week after delivery at birth/group
2 weeks after delivery at weaning/ pair
3 weeks after delivery at weaning/ group
Males body mass [g] Pup losses/group
mating birth to weaning
1 week after mating Pup losses/group [%]
Birth to weaning
F0 parents F1 offspring F1 parents F2 offspring F2 parents F3 offspring F3 parents F4 offspring
EXHIBIT J - Page 503
Case 5:14-cv-00117-cr Document 63-11 Filed 11/14/14 Page 221 of 312

Biological effects of transgenic maize NK603xMON810 fed in long term reproduction studies in mice
Page 15 of 105
Table 8: Data collection of the offspring per generation
Performance data
Litter mass [g]
birth
1/2/3/4/5/6 d after birth
7/14/21 d after birth
Individual pup mass [g]
Birth
7/14/21 d after birth
Individual female pup mass [g]
4/5 week after birth
Individual male pup mass [g]
4/5 week after birth
Weight gain [g]
Birth to weaning
2.4.1.2. Statistics Normal distribution was tested with Kolmogorov-Smirnov-test and t test was per-formed for feed intake, individual body mass, litter mass, number of pups, pup losses and weight gain comparison. Frequencies of deliveries per group were as-sessed using χ²-test. The homogeneity of variances was evaluated by the Levene test. Further comparison of intra-group performance over the generations was done by two way analysis of variance and Duncan’s post hoc test. A difference was considered statistical significant at p < 0.05. Statistical signifi-cance was tested between the groups GM versus ISO and ISO versus A REF.
2.4.2. Organ weights 2.4.2.1. Data collection Five male and 5 female pups of the F2, F3 and F4 generation were randomly chosen at the age of approximately 5 weeks and sacrificed for organ weight. Thus the mice were 3 weeks suckling to the dam and 2-3 weeks consuming the test diet. After fasting for 2 hours mice body weights were recorded and they were killed by vertebral dislocation. Liver, spleen, kidneys and testes were carefully re-moved, connective tissue dissected and organs immediately weighed on a high precision analytical balance (measures masses to within 0.0001 g) (AND GF 300EC, Ehret, Tulln, Austria). Absolute organ weight was recorded and relative organ weight was calculated: Relative organ weight [%] = (absolute organ weight/ body weight) * 100
EXHIBIT J - Page 504
Case 5:14-cv-00117-cr Document 63-11 Filed 11/14/14 Page 222 of 312

Biological effects of transgenic maize NK603xMON810 fed in long term reproduction studies in mice
Page 16 of 105
2.4.2.2. Statistics Normal distribution was tested with Kolmogorov-Smirnov-test and t test was used for group comparison. A difference was considered statistically significant at p < 0.05. Statistical signifi-cance was tested between the groups GM versus ISO and ISO versus A REF.
2.4.3. Histology 2.4.3.1. Data collection Sample collection The organs for histological investigation included the intestine, kidneys, liver, pancreas, spleen, lung and testes of 5 males and females per group from ran-domly chosen mice of the F3 generations at the age of 7 weeks. Fixation and staining method The tissues were processed in 4 steps to obtain microscopic sections. Immedi-ately after removal from the body the organs were fixed in formalin (Sigma-Aldrich, Steinheim, Germany) to prevent autolysis. The tissue is fixed by cross-linkages formed in the proteins without harming the structure of proteins, so that antigenicity is not lost and the same tissue preparations can also be used for immune histochemistry. To remove the water the tissues were placed in a series of alcohols (70% to 95% to 100%). The dehydrant was then substituted by li-molene, which is miscible with the embedding medium paraffin. The dehydration steps were done in an automated tissue processor. The tissues that came off the tissue processor were still in the cassettes and had to be put manually into the blocks by picking them out of the cassette and pouring molten paraffin over them. Now the tissues could be aligned properly in the paraffin block. After cool-ing the paraffin blocks were ready for sectioning. On a microtome (Mikrom HM 400, Mikrom, Heidelberg, Germany) with disposable knives the tissues were cut into sections (3 µm) which were floated in a warm water bath to remove wrin-kles. The slices were picked up and placed on slides. The slides were placed over night in a 37°C warm oven to dry and help the sec-tions adhere to the slides. The embedding process had to be reversed to remove the paraffin and allow water soluble dyes to penetrate the section. Therefore be-fore staining was done the slides were deparaffinised by running them through limolene to alcohols to water. The routine stain of haematoxylin and eosin (H and E) was used. Haematoxylin is a basic dye and has an affinity to the nucleic acids of the cell nucleus. Eosin is an acidic dye with an affinity to cytoplasmic compo-nents of the cell. Nuclei appear blue, the cytoplasm pale red, muscle fibres and erythrocytes red. The stained slide was again taken through a series of alcohol solutions to remove the water and through clearing agents before covered with a thin glass cover slip. Pieces of the gut tissues were snap frozen in liquid nitrogen. Histological evaluation Slides were investigated with light microscope (Reichert-Jung Polyvar, Nussloch, Germany) and traits investigated are shown in table 9.
EXHIBIT J - Page 505
Case 5:14-cv-00117-cr Document 63-11 Filed 11/14/14 Page 223 of 312

Biological effects of transgenic maize NK603xMON810 fed in long term reproduction studies in mice
Page 17 of 105
Table 9: Histological evaluation of the different anatomical sides Intestine Villus, crypt structure and enterocytes Infiltration of leukocytes Pathological changes (ulceration, oedema, fibrosis, hyperplasia) Kidneys Epithelia of tubuli Mineralisation Infiltration of leukocytes Pathological changes (ulceration, oedema, fibrosis, hyperplasia) Liver Hepatocytes Glycogen accumulation Bile ducts Infiltration of leukocytes Pathological changes (necrosis, oedema, fibrosis, hyperplasia) Spleen Pathological changes (necrosis, oedema, fibrosis, hyperplasia) Pancreas Pathological changes (necrosis, oedema, fibrosis, hyperplasia) Lung Pathological changes (necrosis, oedema, fibrosis, hyperplasia) Testes Pathological changes (necrosis, oedema, fibrosis, hyperplasia)
2.4.4. Immunohistochemistry 2.4.4.1. Data collection For the investigation of the intestinal immune system, immunohistochemical staining of CD3+ lymphocytes (representing the T cell line) was performed. Sample collection Same mice used for microscopic evaluation were used for immunohistochemical evaluation. Samples were taken immediately after slaughter. The small intestine (duodenum and jejunum, excl. Ileum) was dissected and divided into four seg-ments of the same length. From each angular point a 1 cm segment was placed in 4% paraformaldehyde. Fixation and staining method CD3 The tissue samples of the small intestine were embedded in paraffin wax and cut with a slide microtome (Mikrom HM 400, Mikrom, Heidelberg, Germany) into slices of 2 µm and mounted on coated slides (Superfrost®, Menzel, Braun-schweig, Germany). After deparaffinisation with NeoClear (Merck, Darmstadt, Germany) and ethanol (Sigma-Aldrich, Steinheim, Germany) antigen retrieval was performed by placing the slides in a microwave oven (2 x 5 min at 750 W) submerged in a sodium citrate buffer (0.01 M, pH 6, Sigma-Aldrich). After wash-ing with phosphate buffered saline (PBS, Sigma-Aldrich) the endogen peroxidase was blocked by immersion in 1.5 % H2O2 in methanol (both Sigma-Aldrich) for 30 min. After the application of the normal serum (Normal goat serum, Vector, Burlingame, USA), diluted 1:10, the samples were left in a humidified chamber at room temperature for 45 min. The serum was then removed and the primary antibody (polyclonal rabbit anti-human T cell CD3, Code No. A 452, DakoCy-
EXHIBIT J - Page 506
Case 5:14-cv-00117-cr Document 63-11 Filed 11/14/14 Page 224 of 312
Biological effects of transgenic maize NK603xMON810 fed in long term reproduction studies in mice
Page 18 of 105
tomation, Glostrup, Denmark) was applied (dilution 1:200). Incubation was done overnight in a humidified chamber at 4 °C. On the next day the slides were washed with PBS and then incubated with the secondary antibody (biotinylated goat anti rabbit IgG, Vector, Burlingame, USA) diluted 1:200. After 30 min the streptavidin-peroxidase (Vectastain ABC Kit, Vec-tor, Burlingame, USA) was applied and the slides were left in the humidified chamber at room temperature for 60 min. For detection of bound antibodies, a diaminobenzidine (DAB) kit was used (Vector, Burlingame, USA). Slides were counterstained with Mayer’s haemalaun (Merck), dehydrated with ethanol (Sigma-Aldrich) and NeoClear (Merck), dried and sealed with a cover slip. CD20 Preparation and staining were performed as described for CD3. The blocking se-rum was obtained from goat (Normal goat serum, Vector, Burlingame, USA). As primary antibody the polyclonal goat anti mouse CD20 (M-20): sc-7735 (Santa Cruz Biotechnology, Inc., Santa Cruz, USA) was used in a dilution of 1:100, as the secondary antibody a biotinylated rabbit anti goat IgG (DakoCytomation, Glostrup, Denmark), diluted 1:200, was used. Macrophages Preparation of slides was done as described for CD3. For antigen retrieval, sam-ples were incubated with 1 mg Protease (Sigma-Aldrich, Steinheim, Germany P5147) /ml PBS* for 20 min at room temperature. For staining, MAC387 was used as the anti- macrophage antibody (Thermo Fisher Scientific, Fremont, CA, USA: diluted 1:75). After incubation with the secondary antibody, 100 µl ABC Elite working solution (Vector, Burlingame, USA) were ap-plied and left for 30 min. For development of staining, diaminobenzidine (DAB) was used. Samples were counterstained with haemalaun, dehydrated and sealed with a cover slip. Analysis The stained samples were checked microscopically (Reichert-Jung Polyvar, Nus-sloch, Germany). Digital pictures of all specimens were taken with a Nikon DN 100 Digital Net Camera with control unit (Nikon Corporation, Chiyoda-ku, Tokyo, Japan) using the program EclipseNet, version 1.16.3 (Laboratory Imaging, Praha, Czech Republic). Analysis was performed with Ellipse 2.0.6.1 (ViDiTo Systems, Kosice, Slovakia) using stereological counting rules. 2.4.4.2. Statistics Normal distribution was tested with Kolmogorov-Smirnov-test. Statistical signifi-cance was tested with t test between the group GM versus ISO and ISO versus A REF. Further comparison of intra-group performance over the different anatomical in-testinal sites was done by two way analysis and Duncan’s post hoc test. A differ-ence was considered statistical significant at p < 0.05.
EXHIBIT J - Page 507
Case 5:14-cv-00117-cr Document 63-11 Filed 11/14/14 Page 225 of 312

Biological effects of transgenic maize NK603xMON810 fed in long term reproduction studies in mice
Page 19 of 105
2.4.5. Ultrastructural investigations 2.4.5.1. Data collection Liver, pancreas and spleen were taken from 5 male and 5 female mice of the F3 generation to perform ultrastructural comparisons. For the morphometric analy-ses of the nuclear components liver, pancreas and spleen were cut in 0.5 mm pieces. The samples were immersed in 2.5% glutaraldehyde and 2% paraformal-dehyde with 0.1 M Soerensen phosphate buffer (pH 7.4) at 4°C for 3 h, washed in buffer solution, postfixed with 1% osmium-tetroxide and 1.5% potassium-ferrocyanide at 4°C for 1 h, dehydrated in a graded series of ethanol and em-bedded in Epon. Ultrathin sections (60-80 nm) were mounted on cupper slot grids coated with formvar in dioxane, stained with uranyle acetate and lead cit-rate (Reynolds 1963) and examined in a TEM Zeiss EM 902. Morphometrical measurements were carried out on 270 micrographs of nuclei (3 per animal and organ) using the image analysis program ImageJ 1.38X. Area and perimeter of the nuclei were measured and opposed to the circumference of the equivalent circle to calculate the nuclear shape irregularity (the radius r of the equivalent circle is given by r = √A/π, where A is the measured area; the nuclear shape irregularity I follows from I = P/2 πr, where P is the observed pe-rimeter). Areas of nucleoli and nucleolar components - fibrillar centres (FCs), dense fibrillar component (DFC) and granular component (GC) - where measured to calculate the percentages of FC, DFC, GC per nucleolus. Moreover the nuclear pores where counted and the pore density (pores per µm membrane length) was assessed. 2.4.5.2. Statistics Normal distribution was tested with Kolmogorov-Smirnov-test. Statistical signifi-cance was tested with t test between the group GM versus ISO and ISO versus A REF. A difference was considered statistical significant at p < 0.05.
2.4.6. Microarray analyses These analyses were conducted in collaboration with Dr. Christian Guelly, Core Facility Molecular Biology, Medical University of Graz and with the scientific advi-sory of Prof. Ralf Steinborn, Vetomics Core Facility, University of Veterinary Medicine, Vienna. 2.4.6.1. Data collection Sample collection Twelve males per group of the F3 generation were randomly at the age of 7 weeks. Males were preferred to females to minimize hormonal influences. Mice were fasted for 3 hours and then sacrificed by vertebral dislocation. The small intestine (beginning from the pylorus to the ileocaecal junction) was dissected immediately and parted into 2 fragments of the same length. To avoid any pancreatic tissue, approximately 4 cm distal the pyloric edge, a 2 cm seg-ment of the intestine was dissected, representing the duodenal/proximal jejunal section. A 2 cm segment was also dissected 1 cm proximal and 1 cm distal of the angular point representing the distal jejunum. Finally a 2 cm sample 2 cm proxi-mal to the ileo-caeco-colic junction comprised the ileum. These tissues include a
EXHIBIT J - Page 508
Case 5:14-cv-00117-cr Document 63-11 Filed 11/14/14 Page 226 of 312

Biological effects of transgenic maize NK603xMON810 fed in long term reproduction studies in mice
Page 20 of 105
variety of cell lineages (epithelial, immune, endothelial, etc.) and were already described in ABC transporter expression analyses along the intestinal tract (Mutch et al. 2004). Every tissue sample was immediately shock frozen in methyl-butane (Merck, Darmstadt, Germany) on liquid nitrogen. Then the samples were stored in cryo tubes (Bertoni, Vienna, Austria) at liquid nitrogen until further analyses. Simulta-neously intestinal samples close to the sampling side were taken for microscopic reassurance and fixed in 4 % paraformaldehyde. mRNA and miRNA purification Prior to RNA purification, 50mg intestinal tissue samples were homogenised in 700µL Qiazol Lysis Reagent (Qiagen, Hilden, Germany) with ceramic beads (Magna Lyser Green Beats, Roche, Basel, Switzerland) for 20 s in a Magna Lyser (Roche). Intermittent storage of the homogenate was done in a deep-freezer at -80 °C. The extraction of mRNA and miRNA occurred in one step by using a column-based RNA isolation kit (miRNEasy Kit, Qiagen) according to the manufacturer’s instructions. Briefly, after storage 700 µL frozen homogenized lysates were incu-bated at 37°C for 2 min in a water bath (Julabo, Seelbach, Germany) so that lys-ates were completely thawed and salts dissolved. After adding 140 µL chloroform (Merck) to the lysate, the tube was shaken vigorously for 15 s and incubated for 2 min at room temperature. Next the tubes were centrifuged for 15 min at 12.000 x g at 4 °C (Centrifuge 5417 R, Eppendorf, Hamburg, Germany). The up-per aqueous phase containing the RNA was carefully transferred into a new col-lection tube. Then the purification of RNA was automated on the QIAcube (Qiagen). Sample preparation using the QIAcube follows the same steps as the manual procedure (i.e., lyse, bind, wash, and elute). Total RNA including miRNA was finally diluted in 40 µL RNAse free water. RNA concentrations were determined in a BioPhotometer (Eppendorf) and yields ranged from 0.5- 2 µg/µL. Only samples with an extraction value of ratio 260/280 at 1.9 were accepted. Subsequently, samples were examined for RNA integrity with an Agilent Bioanalyzer (Agilent Technologies, Santa Clara, USA) as previously described. Three biological-technical replicates per group from distal jejunum were selected with similar RIN between the groups ranging from 8.5 to 10 for the microarrays. cDNA synthesis DIG-labelled cDNA probes were generated by reverse transcription of 40µg total RNA using the chemiluminescent RT-Labelling kit (Applied Biosystems, Foster City, CA, US) as described by the protocol. Array hybridization, chemilumines-cence detection, image acquisition and analysis were performed using Applied Biosystems Chemiluminescence Detection Kit and Applied Biosystems 1700 Chemiluminescence Microarray Analyzer following the manufacturer’s instruc-tions. Array hybridisation Briefly, each microarray was first pre-hybridized at 55°C for 1hr in hybridization buffer with blocking reagent. Oligo-dT-primed, DIG-labelled cDNA targets were fragmented mixed with internal control target and then hybridized to the equili-brated microarrays in a volume of 1.5ml at 55°C for 16 hrs. After hybridization, the arrays were washed with hybridization wash buffer and chemiluminescence rinse buffer. Enhanced chemiluminescent signals were generated by incubating
EXHIBIT J - Page 509
Case 5:14-cv-00117-cr Document 63-11 Filed 11/14/14 Page 227 of 312

Biological effects of transgenic maize NK603xMON810 fed in long term reproduction studies in mice
Page 21 of 105
arrays with Alkaline Phosphatase conjugated anti-digoxigenin antibody followed by incubation with chemiluminescence Enhancing Solution and a final addition of chemiluminescence substrate. Four images were collected for each microarray using the ABI 1700 Chemiluminescent Microarray Analyzer. Images were auto-gridded and the chemiluminescence signals were quantified, corrected for back-ground and spot and spatially normalized. Data Analysis Data analysis was performed using GeneSpring 7.3.1 software (Agilent Tech-nologies). Normalization and data transformation: Per Chip normalization was done to the 50th percentile followed by median Per Gene normalization. Only if a certain gene tag was found to be expressed in all 3 biological replicates of a group (Signal to Noise >3 in 3 of 3 experiments) the gene was considered as “expressed” in the referred group. The final gene set used for statistical analysis contained the combined “expressed” gene sets derived from both of the treat-ment groups. Groups were compared pair wise using Welch t-test. The following pair wise comparisons were performed: GM vs ISO and A REF vs ISO. A p-value <0.05 was considered significant. Additionally, a minimum fold-change filtering with a cut-off value of 2 was applied. Comparisons drawn were: 1. GM vs ISO 2. ISO vs A REF 3. GM vs. ISO and A REF. This is regarded as a pilot study and is justified by the criteria that both, ISO and A REF do not contain the genetic modification. Para-metric test was performed with variances not assumed to be equal (Welch t-test) with a p-value of 0.05 and without multiple testing correction. Default Interpreta-tion - Genes from SN>3_QCd with statistically significant differences among the following groups based on values of 'Experiment Type': ISO (“ISO+A REF”=> n=6), GM. 2.4.6.2. Statistics Further analysis in PANTHER For further analyses, the gene list with the differentially expressed genes (p < 0.05) was compared in the PANTHER database (http://www.pantherdb.org) and genes were allocated to biological processes and pathways. The first column contains the name of the PANTHER classification category. The second column contains the number of genes in the reference list (Mouse AB 1700 genes) that map to this particular PANTHER classification category. The third column contains the number of genes in the uploaded list that map to this PANTHER classification category. The fourth column contains the expected value, which is the number of genes expected in the list for this PANTHER category, based on the reference list. The fifth column has either a + or -. A plus sign indicates over-representation of this category in the experiment: more genes are observed than expected based on the reference list (for this category, the number of genes in the list is greater than the expected value). Conversely, a negative sign indicates under-representation. The sixth column is the p-value as determined by the binomial statistic. This is the probability that the number of genes observed in this cate-gory occurred by chance (randomly), as determined by the reference list. A low p-value indicates that the number observed is significant and potentially interest-ing. A cut-off of 0.05 was used as a starting point.
EXHIBIT J - Page 510
Case 5:14-cv-00117-cr Document 63-11 Filed 11/14/14 Page 228 of 312

Biological effects of transgenic maize NK603xMON810 fed in long term reproduction studies in mice
Page 22 of 105
2.4.7. q-RT-PCR Gene expression was analysed with custom TaqMan low density arrays (TLDA) (Applied Biosystems). The genes (p<0.05) for the TLDAs were selected according to higher fold changes (cut off 2) and for a possible group classification. Out of those genes 17 genes could be clustered to the Protein Metabolism and Modifica-tion and 3 genes to the signal transduction, further selected genes belonged to not specified pathways (Table 10). Endogenous controls were Hprt1, Tbp and 18s-rRNA. The same gene setup was used for the RACB intestinal samples. Table 10: Genes on the TLDA fulfilling with a 2-fold deregulation (p<0.05) be-tween ISO vs GM groups Biological process Deregulated genes Protein Metabolism & Modification 1810064L21Rik, Ntrk2, Gga1, Pum1, Sgta, Clk3,
2610529C04Rik, Eef1b2, Gsk3b, Herc3, Rpl22, Eef2k, Gspt2, Prkcn, Dnajc1, Trim47, Fkbp5
Signal Transduction Ramp1, Ift140, Nphp1 Other diverse pathways (not specified)
Igtp, Adpn, Itga5, Bcar3,Elmo2, Gpr39, Shc1, Socs1, LOC433259|,Csf3r, Irs1, Aatf, Cd40, Bmyc, Per3, Stat5b, Mapk10, Sntb2, Fbxw7, Cd68, Hmg20a, Ccnh, Btla, Foxq1, Kif3c, Rgs6
Samples (n=6, only male mice) with a RNA Integrity Number (RIN) > 7 were used for qRT-PCR. The RNA was diluted in water to a concentration of 0.2μg/μl. The cDNA was synthesised using the High-Capacity cDNA reverse Transcription Kit (Applied Biosystems) according to the manufacturer’s protocol. The samples were incubated at 25 °C for 10 min followed by 120 min at 37 °C. The reaction was stopped by exposing the samples to 85 °C for 5 s. For validation of the reverse transcription a qPCR targeting HPRT was performed using the fluorescent dye EvaGreen (Biotium, Hayward, USA), to determine whether the reverse transcription worked or not. A ∆Ct range of two was chosen as an arbitrary quality cut-off. 2 µl of cDNA was mixed with 3.5 mM MgCl2, 200 nM of each primer 0.4 x EvaGreen, 1 U Hot Firepol® DNA polymerase (Solis Bio-dyne, Tartu, Estonia), 0.2 mM dNTP mix and 0.08 M Tris-HCl, 0.02 M (NH4)2SO4, 0.02% w/v Tween-20. Thermocycling was done on a RotorGene 6000 (Corbett Life Science, Sydney, Australia). After a hot start phase of 15 min at 95 °C, 37 cycles of 95 °C for 10 s, 60 °C for 40 s and 70 °C for 15 s were run. After thermocycling a melting curve was measured starting at 65 °C and using the parameters given by the Rotor-Gene-6000-Series-Software 1.7. The sample cDNA was amplified in duplicate, the minus reverse transcription control was run in unicate. The ct values of all samples lay within 1.78 cycles. cDNA samples were diluted to 100 ng/μl in nuclease-free water. 50μl of the di-luted cDNA was mixed with 50μl of TaqMan Gene Expression Master Mix (Applied Biosystems) and transferred into the fill-ports of the TLDA (1 sample/ port). The micro fluidic cards were then centrifuged for one minute at 331 x g twice in a Heraeus Multifuge 3S-R Centrifuge (DJB Labcare Ltd, Newport Pagnell, England). TLDA were run on an ABI 7900HT Sequence Detection System (Applied Biosys-tems). The conditions of the qRT-PCR were given by the supplied run-template file. 2 min at 50°C were followed by10 min at 94.5°C. This hot start was followed by 45 cycles of 30 s at 97°C and 1 min at 59.7°C.
EXHIBIT J - Page 511
Case 5:14-cv-00117-cr Document 63-11 Filed 11/14/14 Page 229 of 312
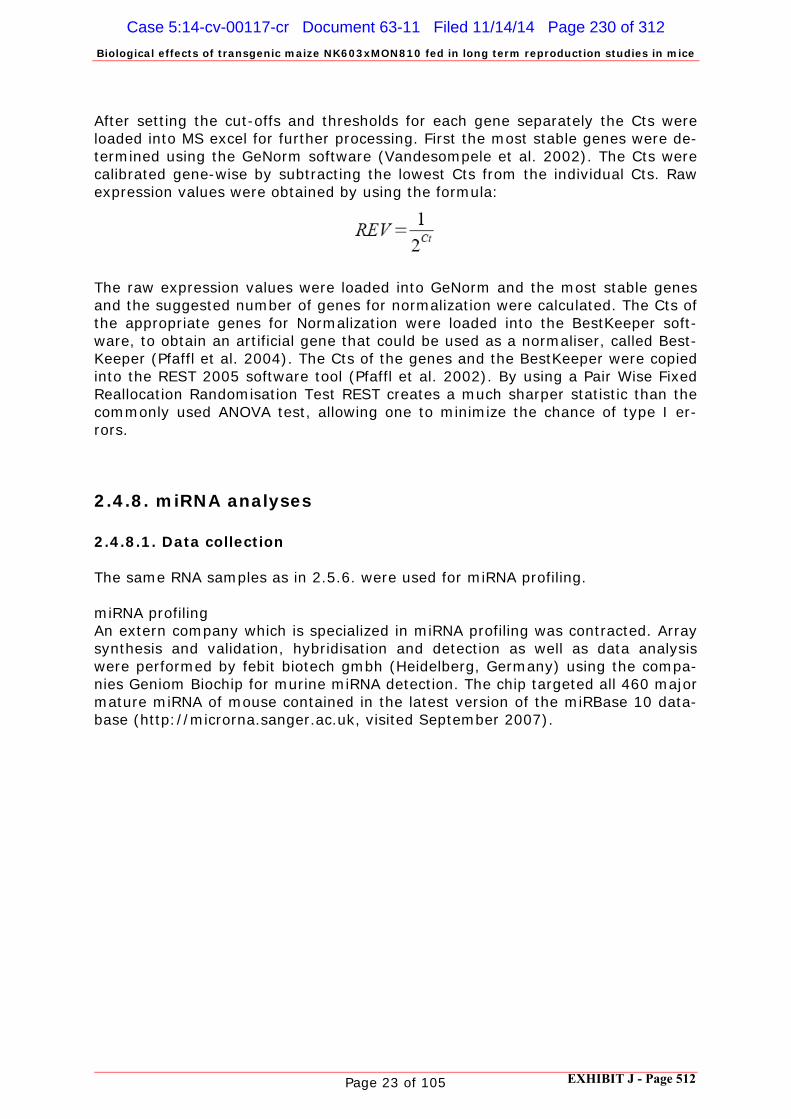
Biological effects of transgenic maize NK603xMON810 fed in long term reproduction studies in mice
Page 23 of 105
After setting the cut-offs and thresholds for each gene separately the Cts were loaded into MS excel for further processing. First the most stable genes were de-termined using the GeNorm software (Vandesompele et al. 2002). The Cts were calibrated gene-wise by subtracting the lowest Cts from the individual Cts. Raw expression values were obtained by using the formula:
The raw expression values were loaded into GeNorm and the most stable genes and the suggested number of genes for normalization were calculated. The Cts of the appropriate genes for Normalization were loaded into the BestKeeper soft-ware, to obtain an artificial gene that could be used as a normaliser, called Best-Keeper (Pfaffl et al. 2004). The Cts of the genes and the BestKeeper were copied into the REST 2005 software tool (Pfaffl et al. 2002). By using a Pair Wise Fixed Reallocation Randomisation Test REST creates a much sharper statistic than the commonly used ANOVA test, allowing one to minimize the chance of type I er-rors.
2.4.8. miRNA analyses 2.4.8.1. Data collection The same RNA samples as in 2.5.6. were used for miRNA profiling. miRNA profiling An extern company which is specialized in miRNA profiling was contracted. Array synthesis and validation, hybridisation and detection as well as data analysis were performed by febit biotech gmbh (Heidelberg, Germany) using the compa-nies Geniom Biochip for murine miRNA detection. The chip targeted all 460 major mature miRNA of mouse contained in the latest version of the miRBase 10 data-base (http://microrna.sanger.ac.uk, visited September 2007).
EXHIBIT J - Page 512
Case 5:14-cv-00117-cr Document 63-11 Filed 11/14/14 Page 230 of 312

Biological effects of transgenic maize NK603xMON810 fed in long term reproduction studies in mice
Page 24 of 105
2.5. Life term study (LTS)
2.5.1. Feed intake and body mass survey 2.5.1.1. Data collection 10 female mice per group were randomly allotted from the F1 generation, thus being already born from dams that were fed either 33% genetically modified corn or transgenic corn in the diet from the onset of pregnancy. Feed intake was re-corded weekly and body mass was measured biweekly. 2.5.1.2. Statistics Normal distribution was tested with Kolmogorov-Smirnov-test and t test was used for inter group comparison. A difference was considered statistically signifi-cant at a p < 0.05. Statistical significance was tested between the groups GM versus ISO and ISO versus A REF.
2.5.2. Survival 2.5.2.1. Data collection Death was noted per group and cross necropsy as well as histopathology was performed by a pathologist from the Institute of Pathology and Forensic Veteri-nary Medicine, University of Veterinary Medicine Vienna. 2.5.2.2. Statistics Descriptive statistics and Kaplan-Meier survival test were performed.
EXHIBIT J - Page 513
Case 5:14-cv-00117-cr Document 63-11 Filed 11/14/14 Page 231 of 312

Biological effects of transgenic maize NK603xMON810 fed in long term reproduction studies in mice
Page 25 of 105
2.6. Reproductive Assessment by Continuous Breeding (RACB)
2.6.1. Performance and reproduction 2.6.1.1. Data collection Data from Reproductive Assessment by Continuous Breeding (RACB) studies are used for risk assessment processes. The RACB design has been used for instance by the US National Toxicology Program (NTP) since 15 years, so far to establish any possible adverse effects of chemical compounds on the reproductive per-formance of the test animals. In these cases a short dose-finding-range study is performed in advance. According to the Environmental Protection Agency (EPA), risk assessments of the plant pesticide Bt delta-endotoxin needed no threshold regulation, since it revealed no toxic effects in acute toxicity testing and its expo-sure level is very low. Therefore no dose-related diets have been tested. For the RACB test in this study 24 breeding pairs of mice per group were chosen at random. Exposure started 1 week prior to cohabitation to allow for diet adap-tion. Then the animals were housed as breeding pairs until the end of the ex-periment after 20 weeks. During this time 4 litters (Table 10) were bred ap-proximately 3-4 weeks apart, which were left with the parents until weaning af-ter 3 weeks. This approach differs from the established RACB, where all new-borns are killed immediately after birth except for the last litter. The pups of all litters were kept alive in this study to obtain more data on pup development dur-ing lactation. These data present valuable information since the susceptibility of growing organisms to potentially adverse dietary effects is known to be much higher than in adults. Data collected were divided into parental data (Table 11) and offspring data (Ta-ble 12). Weighing was done using a high precision analytical balance with animal weigh-ing modus (AND GF 300EC, Ehret, Tulln, Austria). Table 11: Succession of generation in the RACB
F0 parents 1. litter 2. litter 3. litter 4. litter
EXHIBIT J - Page 514
Case 5:14-cv-00117-cr Document 63-11 Filed 11/14/14 Page 232 of 312

Biological effects of transgenic maize NK603xMON810 fed in long term reproduction studies in mice
Page 26 of 105
Table 12: Data of parental mice collected in the RACB
Performance data Reproduction data
Feed intake [g] Deliveries/group
Females body mass [g] at birth
mating Litter size distribution
1 week after mating Number of pups
delivery at birth/pair
1 week after delivery at birth/group
2 weeks after delivery at weaning/ pair
3 weeks after delivery at weaning/ group
Males body mass [g] Pup losses/group
mating birth to weaning
1 week after mating Pup losses/group [%]
Delivery of female Birth to weaning
1 week after delivery of female Birth interval
2 weeks after delivery of female Period from one delivery to the next
3 weeks after delivery of female
Table 13: Data of offspring collected in the RACB
Performance data
Litter mass [g]
birth
1/2/3/4/5/6 d after birth
7/14/21 d after birth
Individual pup mass [g]
Birth/7/14/21 d after birth
Weight gain [g]
Birth to weaning
2.6.1.2. Statistics Normal distribution was tested with Kolmogorov-Smirnov-test and for inter group comparison of feed intake, individual body mass, litter mass, number of pups, pup losses and weight gain the t -test was used. Frequencies of deliveries per group were assessed using χ²-test. Homogeneity of variances was investigated with Levene test. Further comparison of intra group performance over the generations was done by two way analysis of variance and Duncan’s post hoc test. A difference was considered statistical significant at p < 0.05. Statistical signifi-cance was tested between the groups GM versus ISO.
EXHIBIT J - Page 515
Case 5:14-cv-00117-cr Document 63-11 Filed 11/14/14 Page 233 of 312

Biological effects of transgenic maize NK603xMON810 fed in long term reproduction studies in mice
Page 27 of 105
2.6.2. q-RT-PCR The RACB intestinal samples were investigated by q-PCR technique. The same protocols as described in part 2.4.7. were applied. For q-RT-PCR samples from male and female mice of the distal section of jejunum were used.
EXHIBIT J - Page 516
Case 5:14-cv-00117-cr Document 63-11 Filed 11/14/14 Page 234 of 312

Biological effects of transgenic maize NK603xMON810 fed in long term reproduction studies in mice
Page 28 of 105
3. Results
3.1. Diet
3.1.1. Harvest in 2005 (diets for MGS and LTS)
3.1.1.1. Test on the genetic modification Test at protein level The transgenic corn was positive for the genetic modifications whereas the con-trol and reference corn were negative. Quantification was difficult as the ELISA was not designed for quantitative approach. Semiquantitative analysis revealed 0.11-0.24 µg Cry1Ab / g corn (fresh weight). Test at DNA level The NK603 x MON810 maize was tested positive on the presence of 35S and nos in the screening. The positive sequences were specific for the maize line NK603 and MON810. Furthermore the control maize was slightly positive for 35S. The A REF corn was tested negative (Table 14). Table 14: Test on genetic modification with PCR sequence corn ISO GM A REF 35S-Promotor 0.25% pos. 100% pos. neg. 3.1.1.2. Crude nutrients and gross energy There was no difference in the content of crude nutrients and energy (Table 15 and 16). Additionally, the analyses of the diets meet the nutritional standards for mice in reproduction and crude nutrients are in accordance to the manufacturers’ declaration. Table 15: Crude nutrients and gross energy in the corn corn % ISO GM A REF
DM 90.4 89.8 88.9 XA 1.4 1.2 0.9 EE 3.6 3.7 3.9 XP 9.4 9.9 9.3 XF 3.4 3.4 3.3 NfE 72.6 71.6 71.5 GE/kg 17.0 17.0 17.0
EXHIBIT J - Page 517
Case 5:14-cv-00117-cr Document 63-11 Filed 11/14/14 Page 235 of 312

Biological effects of transgenic maize NK603xMON810 fed in long term reproduction studies in mice
Page 29 of 105
Table 16: Crude nutrients and gross energy in the diets diet % ISO GM A REF
DM 90.5 90.6 90.3 XA 6.8 6.4 5.8 EE 5.0 5.1 5.1 XP 25.8 23.4 24.5 XF 6.0 5.8 6.3 NfE 46.9 50 48.6 GE/kg 17.5 17.5 17.7 3.1.1.3. Minerals and trace elements Minerals and Trace elements are shown in table 17 and table 18. Table 17: Minerals and trace elements in the corn corn
Unit ISO GM A REF
Ca % 0.02 0.03 0.04
P % 0.23 0.21 0.28
Na % 0.07 0.08 0.12
Mg % 0.10 0.11 0.10
Zn mg/kg 15.0 16.7 26.9
Cu mg/kg 2.5 2.9 not invest.
Fe mg/kg 28.5 29 55.3
Table 18: Minerals and trace elements in the diets diet
Unit ISO GM A REF
Ca % 1.17 1.13 1.04 P % 0.93 0.98 0.91 Na % 0.46 0.37 0.34 Mg % 0.21 0.24 0.20 Zn mg/kg 37.90 44.40 44.2 Cu mg/kg 12.90 9.50 not invest. Fe mg/kg 102.20 90.60 137.5
EXHIBIT J - Page 518
Case 5:14-cv-00117-cr Document 63-11 Filed 11/14/14 Page 236 of 312

Biological effects of transgenic maize NK603xMON810 fed in long term reproduction studies in mice
Page 30 of 105
3.1.1.4. ß-Carotene, Vitamins A and E Carotene and vitamin analyses are shown in table 19 and table 20. Table 19: Carotene and vitamin analyses in the corn Corn Unit ISO GM A REF ß-Carotene mg/kg 1.8 1.7 1.3 Vit. E mg/kg 1.9 1.2 2.4 Table 20: Vitamin analyses in the diets diet unit ISO GM A REF Vit. A IU/kg 7049.0 9857.0 17773.0 Vit. E mg/kg 114.2 91.2 140 3.1.1.5. Fatty acids Fatty acid analyses of the corn are shown in table 21. Table 21: Fatty acid profile of corn (g 100g-1 total fatty acids)
corn
Fatty acid ISO GM A REF
C 16:0 11.26 10.03 7.66 C 18:0 2.68 1.62 1.45 C 18:1 n-9 23.40 24.50 17.16 C 18:2 n-6 48.52 48.14 45.67 C 18:3 n-3 1.00 0.98 1.04
EXHIBIT J - Page 519
Case 5:14-cv-00117-cr Document 63-11 Filed 11/14/14 Page 237 of 312

Biological effects of transgenic maize NK603xMON810 fed in long term reproduction studies in mice
Page 31 of 105
3.1.1.6. Amino acids Amino acids are shown in table 22. Table 22: Amino acids of the diet diet % ISO GM A REF Aspartic acid 19.05 20.18 20.28 Threonine 9.75 10.29 10.63 Serine 11.07 11.62 11.67 Glutamic acid 26.14 28.92 28.74 Glycine 7.70 8.21 8.43 Alanine 9.01 9.49 9.58 Cystine 3.70 3.68 3.66 Valine 10.44 11.31 11.70 Methionine 7.44 8.02 8.32 Isoleucine 8.86 9.39 9.84 Leucine 17.87 19.31 19.33 Tyrosine 8.43 9.19 9.03 Phenylalanine 10.99 11.56 11.81 Histidine 5.59 5.95 5.88 Lysine 12.42 13.16 13.39 Arginine 7.49 7.48 8.18 Proline 13.36 14.05 14.21 Sum 189.3 201.8 204.7
3.1.1.7. Hygienic evaluation Total microbial counts, yeast and moulds (Table 23 and Table 24) were within limits according to the standards for mixed feed of the VDLUFA (Bucher, 2003). The mycotoxins deoxynivalenol and zearalenone were within acceptable limits for animal feed and there were no concerns of adverse effects according to guide-lines for the quality-assured production of laboratory animal diets of the Society for Laboratory Animal Science (GV-SOLAS, 2002). Table 23: Investigation of feed hygiene corn unit ISO GM A REF Total microbial count
CFU*/g 2.200.000 1.000.000 2.300
Yeasts CFU/g 16.000 35.000 <200 Moulds CFU/g 36.000 18.000 1.300 Deoxynivalenol mg/kg <0.05 0.23 <0.05 Zearalenone mg/kg <0.005 <0.005 <0.005 *colony forming units
EXHIBIT J - Page 520
Case 5:14-cv-00117-cr Document 63-11 Filed 11/14/14 Page 238 of 312

Biological effects of transgenic maize NK603xMON810 fed in long term reproduction studies in mice
Page 32 of 105
Table 24: Investigation of feed hygiene diet unit ISO GM A REF Total microbial count
CFU*/g 23.000 160.000 < 2000
Yeasts CFU/g 2.400 1.600 <200 Moulds CFU/g 3.600 36.000 <200 Deoxynivalenol mg/kg <0.05 0.18 <0.05 Zearalenone mg/kg 0.01 0.01 <0.011 *colony forming units 3.1.1.8. Herbicides No residual levels of herbicides were found in the diets, analytical procedures were targeted to the herbicides that were actually used in the production process (Table 25). Table 25: Evaluation of herbicide levels in the diet diet unit ISO GM A REF Glyphosate mg/kg Not tested <0.010 Not tested AMPA mg/kg Not tested <0.010 Not tested Dicamba mg/kg <0.01 Not tested Not tested S-Metolachlor mg/kg <0.01 Not tested <0.01 Atrazine mg/kg <0.01 Not tested Not tested Terbuthylazin mg/kg Not tested Not tested <0.01
3.1.2. Harvest in 2007 (diets for RACB) 3.1.2.1. Test on genetic modification Test at protein level The transgenic corn was tested positive for the genetic modifications whereas the control corn was negative. Quantification was difficult as the ELISA was not de-signed for quantitative approach. Semiquantitative analysis revealed 0.13-0.26 µg Cry1Ab / g corn (fresh weight). Test at DNA level The MON810 x NK603 maize was tested positive on the presence of 35S and nos. Furthermore the control maize was positive for 35S which was slightly above the detection limit of 0.02% and limit of quantification 0.01% (Table 26). The posi-tive sequences were characteristic for the maize line NK603 and MON810 in the declared transgenic and for MON810 in the isogenic corn. Since the isogenic corn showed insignificant traces of obviously cross polluted transgenic corn a second control group was not necessary.
EXHIBIT J - Page 521
Case 5:14-cv-00117-cr Document 63-11 Filed 11/14/14 Page 239 of 312

Biological effects of transgenic maize NK603xMON810 fed in long term reproduction studies in mice
Page 33 of 105
Table 26: Test on genetic modification with PCR corn sequences ISO GM 35S-Promotor <0.02% pos. 100% pos.
3.1.2.2. Crude nutrients and gross energy There was no difference in the content of crude nutrients and energy between isogenic and transgenic corn and diet (Table 27). Table 27: Crude nutrients and gross energy in the corn and diets corn diet % ISO GM ISO GM
DM 86.1 84.7 90.1 89.1 XA 1.5 1.3 6.7 6.3 EE 3.7 3.3 5.5 4.8 XP 8.1 8.5 25.0 24.9 XF 6.8 6.1 7.8 7.3 NfE 70.3 70.6 45.5 47.4 GE/kg 17.0 16.9 17.6 17.6 3.1.2.3. Minerals and trace elements Minerals and trace elements are shown in table 28. Table 28: Minerals and trace elements in the corn and diets corn diet unit ISO GM ISO GM
Ca % 0.1 0.2 1.2 1.2 P % 0.35 0.30 0.92 0.84 Na % 0.014 0.012 0.34 0.33 Mg % 0.13 0.12 0.24 0.21 Zn mg/kg 19.70 18.9 66.1 50.8 Cu mg/kg 3.0 2.9 12.8 16.5 Fe mg/kg 30.2 31.6 147.0 134.0 3.1.2.4. ß-Carotene, Vitamins A and E Carotene and vitamin levels are shown in table 29. Table 29: Carotene and vitamins in the corn and diets corn diet unit ISO GM ISO GM ß-Carotene mg/kg 1.2 1.4 - - Vit. A IU/kg - - 9.365.0 13.198.0 Vit. E mg/kg 7.4 7.8 125.0 127.0
EXHIBIT J - Page 522
Case 5:14-cv-00117-cr Document 63-11 Filed 11/14/14 Page 240 of 312

Biological effects of transgenic maize NK603xMON810 fed in long term reproduction studies in mice
Page 34 of 105
3.1.2.5. Fatty acids No difference of fatty acid levels was seen between the two corn lines (Table 30). Table 30: Fatty acid profile of corn (g 100g-1 total fatty acids)
Fatty acid ISO GM
C 16:0 10.89 10.85 C 18:0 3.61 3.62 C 18:1 n-9 24.79 24.17 C 18:2 n-6 59.38 59.82 C 18:3 n-3 0.45 0.62 3.1.2.6. Amino acids Table 31 shows the amino acids of the diet. Table 31: Amino acids of the diet diet % ISO GM Aspartic acid 2.4 2.5 Threonine 1.2 1.2 Serine 1.3 1.3 Glutamic acid 3.6 3.7 Glycine 0.9 1.0 Alanine 1.1 1.2 Cystine 0.3 0.3 Valine 1.4 1.4 Methionine 0.8 0.7 Isoleucine 1.2 1.2 Leucine 2.4 2.4 Tyrosine 1.2 1.2 Phenylalanine 1.4 1.4 Histidine 0.7 0.6 Lysine 1.7 1.7 Arginine 1.0 1.0 Proline 1.7 1.8 Sum 24.2 24.8 3.1.2.7. Hygienic evaluation Total microbial count, yeast and mould were within acceptable limits according to the guidance levels for mixed feed of the VDLUFA (Bucher 2003). Zearalenone concentrations were within limits for animal feed and there were no concerns of adverse effects according to guidelines for the quality-assured production of laboratory animal diets of the Society for Laboratory Animal Science (GV-Solas 2002)(Table 32).
EXHIBIT J - Page 523
Case 5:14-cv-00117-cr Document 63-11 Filed 11/14/14 Page 241 of 312

Biological effects of transgenic maize NK603xMON810 fed in long term reproduction studies in mice
Page 35 of 105
Table 32: Investigation of feed hygiene ISO GM unit corn diet corn diet Total microbial count
CFU*/g 11.000.000 10.000.000 140.000 1.300.000
Yeast CFU/g 250.000 220.000 25.000 14.000 Mould CFU/g 150.000 50.000 24.000 3.800 Deoxynivalenol mg/kg 0.87 0.25 0.64 0.42 Zearalenone mg/kg 0.03 <0.005 0.048 0.02 *CFU colony forming units 3.1.2.8. Herbicides No residual levels of herbicides were found in the diets (Table 33). Table 33: Evaluation of herbicide residues in the diet diet unit ISO GM Glyphosate mg/kg - <0.010 AMPA mg/kg - <0.010 Dicamba mg/kg <0.01 Not tested S-Metolachlor mg/kg <0.01 Not tested Atrazine mg/kg <0.01 Not tested
EXHIBIT J - Page 524
Case 5:14-cv-00117-cr Document 63-11 Filed 11/14/14 Page 242 of 312

Biological effects of transgenic maize NK603xMON810 fed in long term reproduction studies in mice
Page 36 of 105
3.2. Multi Generation Study
3.2.1. Performance and reproduction The trial was conducted from November 2006 to July 2007 (Table 34). Table 34: Overview of succession of generation and season when performed
3.2.1.1. GM versus ISO
Parental performance
From the F1 parents 1 female of the ISO group and 3 females of the GM group died and in the F2 parents 1 female of the ISO group died before delivery for un-known reasons. No difference in feed intake was seen between the two groups. The feed intake differed significantly between the generations, being highest in the F1 generation and lowest in the F3 generation (Figure 1).
Generation pairs/group date F0 parents n= 18 November 2006 F1 offspring December 2006/January 2007 F1 parents n= 24 January 2007 F2 offspring February/March 2007 F2 parents n= 24 March 2007 F3 offspring April/May 2007 F3 parents n= 22 Mai 2007 F4 offspring June/July 2007
Figure 1: Feed intake of adult mice fed 33% isogenic (ISO) or genetically modified (GM) corn in their diet in several genera-tions
feed intake
F1 F2 F30
20
40
60
80
100ISOGM
generation
feed
[g]/
wee
k
EXHIBIT J - Page 525
Case 5:14-cv-00117-cr Document 63-11 Filed 11/14/14 Page 243 of 312

Biological effects of transgenic maize NK603xMON810 fed in long term reproduction studies in mice
Page 37 of 105
No differences were seen in performance of the parental mice in all generations (Table 35). In the ISO group body mass of females and males at mating (F1 < F3, F2 < F0), females at delivery (F1, F3 < F0, F2) and 3 weeks after delivery (F1, F3 < F3, F2, F0) differed significantly over several generations. A similar pattern was seen in the GM group with a significant influence of generations on female body mass at mating (F1 < F0, F2, F3), at delivery (F0, F3 < F0, F1, F2) and male body mass at mating (F1, F2, F3 < F0).
Parental reproduction
No statistically significant differences were seen in reproduction data between the two feeding groups (Table 36), but litter size was influenced by generation (Figure 2). More litters with n> 8 were seen in the ISO compared to the GM group. Within the ISO group F3 delivered significantly smaller litters than F0 and within the GM group significantly more pups were delivered in the F0 and F2 than in the F3 generation. The number of pups at birth (except in F2 generation) and at weaning (all gen-erations) were always lower and pup losses were always higher in the GM group but not on a significantly different level. All data showed high variations. Over all generations about twice as many pups were lost in the GM group as compared to the ISO group (14.59% vs 7.4%).
EXHIBIT J - Page 526
Case 5:14-cv-00117-cr Document 63-11 Filed 11/14/14 Page 244 of 312

Biological effects of transgenic maize NK603xMON810 fed in long term reproduction studies in mice
Page 38 of 105
Table 35: Performance of mice fed 33% isogenic (ISO) or genetically modified (GM) corn in their diet over several generations
Parental performance
F0 F1 F2 F3
Traits ISO GM ISO GM ISO GM ISO GM
Females body mass [g]
Mating 27.21 26.42 20.26 21.47 25.87 26.04 25.77 25.47
± 0.452 ± 0.469 ± 0.572 ± 0.590 ± 0.345 ± 0.494 ± 0.433 ± 0.465
1 week after mating 29.74 29.14 26.92 27.25 - - 27.85 26.73
± 0.431 ± 0.462 ± 0.451 ± 0.468 - - ± 0.418 ± 0.428
Delivery 35.86 34.62 33.27 36.02 35.65 35.64 33.54 32.10
± 0.571 ± 0.749 ± 0.533 ± 1.332 ± 0.642 ± 0.577 ± 0.699 ± 0.977
1 week after delivery 37.00 38.00 36.62 36.94 38.55 38.01 36.66 34.88
± 0.919 ± 0.782 ± 0.675 ± 0.659 ± 0.699 ± 0.746 ± 0.724 ± 1.671
2 weeks after delivery 37.31 37.88 37.24 38.06 37.35 38.80 36.83 35.59
± 1.207 ± 1.360 ± 0.993 ± 0.683 ± 0.974 ± 0.635 ± 0.578 ± 0.676
3 weeks after delivery 36.77 35.61 33.77 35.07 36.55 36.80 34.47a 36.36
± 1.134 ± 0.791 ± 0.789 ± 0.720 ± 0.592 ± 0.727 ± 0.893 ± 0.733
Males body mass [g]
Mating 34.02 34.52 29.02 29.73 31.13 30.36 32.27 31.77
± 0.741 ± 0.703 ± 0.535 ± 0.565 ± 0.474 ± 0.694 ± 0.435 ± 0.552
1 week after mating 33.31 33.59 30.74 31.36 - - 31.74 30.40
± 0.533 ± 0.573 ± 0.514 ± 0.499 - - ± 0.297 ± 0.661
Values represent means and standard error
EXHIBIT J - Page 527
Case 5:14-cv-00117-cr Document 63-11 Filed 11/14/14 Page 245 of 312

Biological effects of transgenic maize NK603xMON810 fed in long term reproduction studies in mice
Page 39 of 105
Table 36: Reproduction data of mice fed 33% isogenic (ISO) or genetically modified (GM) corn in their diet over several gen-erations
Parental reproduction
F0 F1 F2 F3
traits ISO GM ISO GM ISO GM ISO GM
Pairs/group 18 18 24 24 24 24 22 22
Deliveries/group 17 18 23 22 19 21 16 14
Non deliveries/group 5.6% 0.0% 4.2% 8.3% 20.8% 12.5% 27.3% 36.4%
Number of pups at birth/pair
10.28 ± 0.980
10.22 ± 0.629
8.25 ± 0.778
7.88 ± 0.779
8.42 ± 1.025
8.92 ± 0.875
6.59 ± 1.046
5.68 ± 1.10
Sum of pups at birth/group
185 184 198 189 202 208 145 125
Number of pups at weaning/ pair
8.39 ± 0.936
7.67 ± 0.792
8.00 ± 0.766
6.96 ± 0.786
7.96 ± 0.928
7.63 ± 0.850
6.45
± 1.040 5.23
± 1.03
Sum of pups at weaning/ group
151 138 192 167 191 183 142 115
Sum of pup losses/group 34 46 6 22 11 25 3 10
Pup losses/group 2.06 ± 0.683
2.61 ± 0.837
0.26 ± 0.157
1.00 ± 0.510
0.58 ± 0.289
2.95 ± 0.631
0.19 ± 0.136
0.71 ± 0.322
Values represent means and standard error, means that do not share a common superscript are significantly different (p < 0.05)
EXHIBIT J - Page 528
Case 5:14-cv-00117-cr Document 63-11 Filed 11/14/14 Page 246 of 312

Biological effects of transgenic maize NK603xMON810 fed in long term reproduction studies in mice
Page 40 of 105
#
Offspring performance
Although the average mass of whole litters was always lower in the GM group as compared to the ISO group, no statistically significant difference could be regis-tered (Figure 3 a-c). The individual pup weights remained not significantly differ-ent (Figure 3 a’-3c’) but when clustered to litter size n ≤ 8 and n > 8, significant differences were found in the individual pup mass of the small litters. Differences were inconsistent in the generations. In the F1 generation the individual pup mass at 7d was higher (p= 0.024) in the GM group, whereas in the second gen-eration the pup weight at birth and 7d lower (p=0.027) in the GM group. Further significant differences in individual pup mass of litters n ≤ 8 were seen in the F4 generation 1, 2 and 3 weeks after birth. The average individual pup weight was lower (p= 0.055, p=0.003 and p=0.015, respectively) in the ISO than in the GM group (Table 37). Litters > 8 pups did not differ in individual pup mass except of the F3 generation at birth with the individual pup mass being significantly higher (p=0.038) in the ISO group. No differences were seen in individual pup mass after weaning (Table 38).
F4
n≤ 8 n>80
5
10
15
20ISOGM
pups/litter
freq
uenc
y
Figure 2: Distribution of litter size at delivery from females fed 33% isogenic (ISO) or genetically modified (GM) corn in their diet in sev-eral generations
F1
n≤ 8 n>80
5
10
15
20
pups/litter
freq
uenc
y
F2
n≤ 8 n>80
5
10
15
20ISOGM
pups/litter
freq
uenc
y
F3
n≤ 8 n>80
5
10
15
20
pups/litter
freq
uenc
y
F3
F0 F1
F2
EXHIBIT J - Page 529
Case 5:14-cv-00117-cr Document 63-11 Filed 11/14/14 Page 247 of 312

Biological effects of transgenic maize NK603xMON810 fed in long term reproduction studies in mice
Page 41 of 105
F1
F2
F 1
birth 1 2 3 4 5 6 7 14 21 280
25
50
100
150
200
ISOGM
days after birth
mas
s of
who
le li
tter
[g]
F1
birth 7 14 21 280
5
10
15
20
25ISOGM
days after birth
indi
vidu
al p
up w
eihg
t [g]
Figure 3 a-b and 3 a’-b’: Mass of whole litter [g] and individual pup weight [g] at several timepoints of the F1 and F2 generation after birth of offspring from parental mice fed 33% isogenic (ISO) or genetically modified (GM) corn in their diet
F2
birth 1 2 3 4 5 6 7 14 21 280
1020304050
100
150
200
ISOGM
days after birth
mas
s of
who
le li
tter
[g]
F2
birth 7 14 21 280
5
10
15
20
25
ISOGM
days after birthin
divi
dual
pup
wei
hgt [
g]
EXHIBIT J - Page 530
Case 5:14-cv-00117-cr Document 63-11 Filed 11/14/14 Page 248 of 312

Biological effects of transgenic maize NK603xMON810 fed in long term reproduction studies in mice
Page 42 of 105
F3
birth 7 14 21 280
5
10
15
20
25
ISOGM
days after birth
indi
vidu
al p
up w
eihg
t [g]
F4
birth 7 14 21 280
5
10
15
20
25
ISOGM
days after birthin
divi
dual
pup
wei
hgt [
g]
F3
birth 1 2 3 4 5 6 7 14 21 280
20
40
100
150
200
250
ISOGM
days after birth
mas
s of
who
le li
tter
[g]
F4
birth 1 2 3 4 5 6 7 14 21 280
1020304050
100
150
200
ISOGM
days after birth
mas
s of
who
le li
tter
[g]
Figure 3 c-d and 3 c’-d’: Mass of whole litter [g] and individual pup weight [g] at several timepoints of the F3 and F4 generation after birth of offspring from parental mice fed 33% isogenic (ISO) or genetically modified (GM) corn in their diet
F3
F4
EXHIBIT J - Page 531
Case 5:14-cv-00117-cr Document 63-11 Filed 11/14/14 Page 249 of 312

Biological effects of transgenic maize NK603xMON810 fed in long term reproduction studies in mice
Page 43 of 105
Table 37: Individual pup mass [g] per group at birth, 7, 14, 21 and 28 days after birth from parents with 33% of near isogenic (ISO) or transgenic(GM) corn in their diet
group ISO n≤ 8 GM n≤ 8 ISO n> 8 GM n> 8
F1 generation Birth 2.13a ± 0.113 2.09a ± 0.046 1.87a ± 0.059 1.88a ± 0.063
7d 5.21a ± 0.277 5.94b ± 0.104 4.54a ± 0.175 4.38a ± 0.208
14 d 7.48a ± 0.678 8.77a ± 0.702 6.51a ± 0.399 6.51a ± 0.301
21 d 12.16a ± 1.084 13.20a ± 1.275 9.50a ± 0.688 9.85a ± 0.512
28 d 19.95a ± 1.506 21.33a ± 0.928 15.70a ± 0.970 15.62a ± 0.940
F2 generation Birth 2.27a ± 0.114 1.96b ± 0.059 1.81a ± 0.036 1.81a ± 0.051
7d 6.70a ± 0.431 5.59b ± 0.183 4.69a ± 0.140 4.80a ± 0.241
14 d 10.67a ± 1.002 9.75a ± 0.738 7.04a ± 0.275 6.99a ± 0.430
21 d 14.88a ± 0.878 14.08a ± 1.162 10.44a ± 0.619 10.88a ± 0.717
28 d 22.17a ± 1.261 20.54a ± 1.376 16.51a ± 1.048 17.42a ± 1.024
F3 generation Birth 1.84a ± 0.101 1.92a ± 0.045 1.82a ± 0.039 1.70 b ± 0.034
7d 5.89a ± 0.468 5.41a ± 0.236 4.67a ± 0.188 4.65a ± 0.165
14 d 9.66a ± 0.822 8.75a ± 0.258 6.90 a ± 0.222 7.28a ± 0.287
21 d 14.44a ± 1.077 13.66a ± 0.508 11.06a ± 0.387 11.09a ± 0.491
28 d 19.15 ± 0.763 20.37 ± 0.620 18.88a ± 0.506 19.60a ± 0.838
F4 generation Birth 2.19a ± 0.097 2.13a ± 0.104 1.93a ± 0.045 1.85a ± 0.079
7d 5.14a ± 0.495 6.44b ± 0.298 4.75a ± 0.152 4.49a ± 0.108
14 d 8.91a ± 0.325 10.61b ± 0.257 7.20a ± 0.279 6.57a ± 0.185
21 d 13.40a ± 0.738 15.77b ± 0.201 11.30a ± 0.525 10.34a ± 0.293
28 d 22.44a ± 0.497 24.05a ± 0.584 19.37a ± 0.757 18.88a ± 0.467
Values represent means and standard error, a,b means that have a superscript are significantly different (p < 0.05)
EXHIBIT J - Page 532
Case 5:14-cv-00117-cr Document 63-11 Filed 11/14/14 Page 250 of 312

Biological effects of transgenic maize NK603xMON810 fed in long term reproduction studies in mice
Page 44 of 105
Table 38: Individual pup mass [g] per group 5 and 6 weeks after birth from par-ents with 33% of near isogenic (ISO) or transgenic (GM) corn in their diet
Weeks after birth F1 generation 5 w ISO GM Males & Females 22.07 ± 0.636 22.86 ± 0.727
F2 generation
ISO GM
5 w
Females 20.36 ± 0.768 21.92 ± 0.758
Males 24.01 ± 0.742 23.98 ± 0.789
6 w
Females 26.93 ± 1.554 24.97 ± 0.564
Males a 28.73 ± 0.561 28.51 ± 0.803
F3 generation
ISO GM
5 w Females 22.92 ± 0.440 23.30 ± 0.475
Males 26.38 ± 0.551 25.39 ± 0.980
6 w
Females 25.21 ± 0.525 24.88 ± 0.537
Males a 30.26 ± 0.427 30.35 ± 0.948
F4 generation
ISO GM
5 w Females 22.58 ± 0.429 22.91 ± 0.512
Males 25.50 ± 0.588 24.75 ± 2.004
6 w
Females 24.58 ± 0.630 23.93 ± 0.495
Males 28.45 ± 0.685 27.36 ± 0.823
3.2.1.2. ISO versus A REF
Parental performance
One female died in the F1 generation in the ISO and A REF group and in the F2 generation 1 female from the ISO group before delivery for unknown reasons. In the F1 generation the A REF group had a lower (p=0.001) feed intake than the ISO group (Figure 4). Further feed intake was significantly different (p<0.001) between the generations but similar in succession (F1>F2>F3).
EXHIBIT J - Page 533
Case 5:14-cv-00117-cr Document 63-11 Filed 11/14/14 Page 251 of 312

Biological effects of transgenic maize NK603xMON810 fed in long term reproduction studies in mice
Page 45 of 105
Differences in performance (Table 39) were seen in body mass of females at de-livery in the F1 and F3 generation where females from the ISO group were sig-nificantly lighter than females from the A REF group (p= 0.000 and p=0.004, respectively). In the aforementioned generations also the body mass of females 3 weeks after delivery was significantly different and again females from the ISO group were significantly lighter than females from the A REF group (p= 0.016 and p=0.019, respectively). Differences in body mass of males was seen in the F2 generation and males from the ISO group were significantly (p= 0.01) lighter than males from the A REF group. In the ISO group body mass of females and males at mating (F1 < F3, F2 < F0), females at delivery (F1, F3 < F0, F2) and 3 weeks after delivery (F1, F3 < F3, F2, F0) differed significantly over several generations. In the A REF body mass differed significantly at mating in the F2 > F1 in females and F3>F1 in males.
Parental reproduction
In general the breeding success of the A REF group defined by number of deliv-eries, number of pups and average litter weight was lower in the first two and higher in the last two generations as compared to the ISO group (Table 40). The number of deliveries per group decreased in the succession of generations in the ISO group but remained constant in the A REF group. Accordingly in the ISO group the number of weaned pups in the 4th generation was 14% lower. Except for the first generation the loss of pups until weaning was higher in the A REF group but all findings were not at a significant level. So was the frequency of number of pups per litter n ≤ 8 that was always lower in the ISO group (Figure 5).
feed intake
F1 F2 F30
20
40
60
80
100ISOA REF
generation
feed
[g]/
wee
k
Figure 4: Feed intake of adult mice fed 33% isogenic (ISO) or Austrian reference (A REF) corn in their diet in several generations
p=0.001
EXHIBIT J - Page 534
Case 5:14-cv-00117-cr Document 63-11 Filed 11/14/14 Page 252 of 312

Biological effects of transgenic maize NK603xMON810 fed in long term reproduction studies in mice
Page 46 of 105
Offspring performance
No differences were seen in litter weight (Figure 6 a-c) and individual pup weight (Figure 6 a’-c’ and table 41). Except on a single time point in the F3 generation the A REF pups in the small litters were significantly (p=0.011) heavier (Table 41). At the age of 5 weeks the A REF male and female pups were significantly heavier in the F1 (p=0.021) and F2 (p=0.06 and p=0.01, respectively) genera-tion as compared to the ISO group (Table 42). There was no weight difference at the age of 6 weeks.
F3
n≤ 8 n>80
5
10
15
20ISOA REF
pups/litter
freq
uenc
y
F2
n≤ 8 n>80
5
10
15
20
pups/litter
freq
uenc
y
F1
n≤8 n>80
5
10
15
20ISOA REF
pups/litter
freq
uenc
y
F0
n≤ 8 n>80
5
10
15
20
pups/litter
freq
uenc
y
Figure 5: Distribution of litter size at delivery from females fed 33% isogenic (ISO) or Austrian reference corn in their diet in several generations
EXHIBIT J - Page 535
Case 5:14-cv-00117-cr Document 63-11 Filed 11/14/14 Page 253 of 312

Biological effects of transgenic maize NK603xMON810 fed in long term reproduction studies in mice
Page 47 of 105
Table 39: Performance of mice fed 33% isogenic (ISO) or Austrian reference (A REF) corn in their diet over several generations
Parental performance
F0 F1 F2 F3
Traits ISO A REF ISO A REF ISO A REF ISO A REF
Females body mass [g]
mating 27.21 26.25 20.26 24.44 25.87 28.75 25.77 26.37
± 0.452 ± 0.312 ± 0.572 ± 0.644 ± 0.345 ± 1.408 ± 0.433 ± 0.489
1 week after mating 29.74 28.98 26.92 27.91 - - 27.85 27.79
± 0.431 ± 0.324 ± 0.451 ± 0.465 - - ± 0.418 ± 0.507
delivery 35.86 35.01 33.27a 34.45b 35.65 36.00 33.54a 36.44b
± 0.571 ± 0.587 ± 0.533 ± 0.490 ± 0.642 ± 0.562 ± 0.699 ± 0.658
1 week after delivery 37.00 36.58 36.62 37.93 38.55 37.93 36.66 38.01
± 0.919 ± 0.892 ± 0.675 ± 0.534 ± 0.699 ± 0.754 ± 0.724 ± 0.626
2 weeks after delivery 37.31 36.61 37.24 38.53 37.35a 40.14b 36.83 38.08b
± 1.207 ± 0.913 ± 0.993 ± 0.649 ± 0.974 ± 0.671 ± 0.578 ± 0.495
3 weeks after delivery 36.77 36.52 33.77a 36.37b 36.55 38.14 34.47a 37.27b
± 1.134 ± 0.573 ± 0.789 ± 0.683 ± 0.592 ± 0.530 ± 0.893 ± 0.720
Males body mass [g]
mating 34.02 35.01 29.02 29.21 31.13a 33.37b 32.27 33.09
± 0.741 ± 0.635 ± 0.535 ± 0.709 ± 0.474 ± 0.677 ± 0.435 ± 0.559
1 week after mating 33.31 33.71 30.74 30.93 - - 31.74 31.91
± 0.533 ± 0.679 ± 0.514 ± 0.407 - - ± 0.297 ± 0.425
Values represent means and standard error, a,b means that have a superscript are significantly different (p < 0.05)
EXHIBIT J - Page 536
Case 5:14-cv-00117-cr Document 63-11 Filed 11/14/14 Page 254 of 312

Biological effects of transgenic maize NK603xMON810 fed in long term reproduction studies in mice
Page 48 of 105
Table 40: Reproduction data of mice fed 33% isogenic (ISO) or genetically modified (GM) corn in their diet over several gen-erations
Parental reproduction
F0 F1 F2 F3
traits ISO A REF ISO A REF ISO A REF ISO A REF
Pairs/group 18 18 24 24 24 24 22 22
Deliveries/group 17 16 23 21 19 22 16 20
Non deliveries/group 5.6% 11.1% 4.2% 12.5% 20.8% 8.0% 27.3% 9.1%
Number of pups at birth/pair 10.28
± 0.980 7.67
± 1.042 8.25
± 0.778 7.46
± 0.736 8.42
± 1.025 9.20
± 0.735 6.59
± 1.046 9.05
± 0.774
Sum of pups at birth/group
185 138 198 194 202 230 145 199
Number of pups at weaning/ pair 8.39
± 0.936 6.72
± 0.928 8.00
± 0.766 6.77
± 0.705 7.96
± 0.928 8.36
± 0.709 6.45
± 1.040 8.59
± 0.732
Sum of pups at weaning/ group
151 121 192 176 191 209 142 189
Sum of pup losses/group 34 17 6 18 11 21 3 10
Pup losses/group 2.06 ± 0.683
1.06 ± 0.322
0.26 ± 0.157
0.78 ± 0.281
0.58 ± 0.289
0.91 ± 0.266
0.19 ± 0.136
0.50 ± 0.212
Values represent means and standard error, a,b means that have a superscript are significantly different (p < 0.05)
EXHIBIT J - Page 537
Case 5:14-cv-00117-cr Document 63-11 Filed 11/14/14 Page 255 of 312

Biological effects of transgenic maize NK603xMON810 fed in long term reproduction studies in mice
Page 49 of 105
F1
birth 7 14 21 280
5
10
15
20
25ISOA REF
days after birth
indi
vidu
al p
up w
eihg
t [g]
F1
birth 1 2 3 4 5 6 7 14 21 280
25
50
100
150
200
ISOA REF
days after birth
mas
s of
who
le li
tter
[g]
F2
birth 7 14 21 280
5
10
15
20
25ISOA REF
days after birth
indi
vidu
al p
up w
eihg
t [g]
F2
birth 1 2 3 4 5 6 7 14 21 280
25
50
100
150
200
ISOA REF
days after birth
mas
s of
who
le li
tter
[g]
Figure 6 a-b and 6 a’-b’: Mass of whole litter [g] and individual pup weight [g] at several timepoints of the F1 and F2 generation after birth of offspring from parental mice fed 33% isogenic (ISO) or Austrian reference(A REF) corn in their diet
F1
F2
EXHIBIT J - Page 538
Case 5:14-cv-00117-cr Document 63-11 Filed 11/14/14 Page 256 of 312

Biological effects of transgenic maize NK603xMON810 fed in long term reproduction studies in mice
Page 50 of 105
F3
Figures 6 c-d and 6 c’-d’: Mass of whole litter [g] and individual pup weight [g] at several timepoints of the F3 and F4 generation after birth of offspring from parental mice fed 33% isogenic (ISO) or Austrian reference (A REF) corn in their diet
F4
birth 1 2 3 4 5 6 7 14 21 280
25
50
100
150
200
ISOA REF
days after birth
mas
s of
who
le li
tter
[g]
F4
birth 7 14 21 280
5
10
15
20
25ISOA REF
days after birth
indi
vidu
al p
up w
eihg
t [g]
F4
F3
birth 1 2 3 4 5 6 7 14 21 280
25
50
100
150
200
ISOA REF
days after birth
mas
s of
who
le li
tter
[g]
F3
birth 7 14 21 280
5
10
15
20
25ISOA REF
days after birth
indi
vidu
al p
up w
eihg
t [g]
EXHIBIT J - Page 539
Case 5:14-cv-00117-cr Document 63-11 Filed 11/14/14 Page 257 of 312

Biological effects of transgenic maize NK603xMON810 fed in long term reproduction studies in mice
Page 51 of 105
Table 41: Individual pup mass [g] per group at birth, 7, 14, 21 and 28 days after birth from parents with 33% of near isogenic (ISO) or Austrian reference (A REF) corn in their diet
group ISO n≤ 8 A REF n≤ 8 ISO n> 8 A REF n> 8
F1 generation Birth 2.14a ± 0.114 2.03a ± 0.066 1.84 ± 0.054 1.74 ± 0.065
7d 5.33a ± 0.323 5.65a ± 0.253 4.54 ± 0.192 4.60 ± 0.242
14 d 7.52a ± 0.873 8.87a ± 0.494 6.75 ± 0.359 7.06 ± 0.271
21 d 12.23a ± 1.397 13.50a ± 0.701 9.50 ± 0.688 10.27 ± 0.536
28 d 20.64a ± 1.731 20.96a ± 0.553 15.70 ± 0.970 16.24 ± 0.734
F2 generation Birth 2.28a ± 0.114 2.17a ± 0.089 1.81 ± 0.036 1.91 ± 0.052
7d 6.70a ± 0.431 5.67a ± 0.305 4.69 ± 0.141 5.12 ± 0.242
14 d 10.67a ± 1.002 8.92a ± 0.445 7.04 ± 0.276 7.59 ± 0.298
21 d 14.88a ± 0.878 14.62a ± 0.983 10.44 ± 0.619 11.56 ± 0.556
28 d 22.17a ± 1.261 23.05a ± 1.188 16.51 ± 1.048 19.35 ± 1.174
F3 generation Birth 1.84 a ± 0.101 2.00a ± 0.099 1.82 ± 0.039 1.83 ± 0.044
7d 5.89a ± 0.468 5.68a ± 0.377 4.67 ± 0.188 4.85 ± 0.183
14 d 9.66a ± 0.822 9.67a ± 0.512 6.90 ± 0.222 7.29 ± 0.245
21 d 14.44a ± 1.077 13.89a ± 0.856 11.06 ± 0.387 11.32 ± 0.478
28 d 19.15a ± 0.763 21.86b ± 0.691 18.88 ± 0.506 18.37 ± 1.137
F4 generation Birth 2.19a ± 0.097 2.09a ± 0.086 1.93 ± 0.045 1.85 ± 0.030
7d 5.14a ± 0.495 5.65a ± 0.323 4.75 ± 0.152 4.64 ± 0.164
14 d 8.91a ± 0.325 9.17a ± 0.523 7.20 ± 0.279 6.76 ± 0.246
21 d 13.40a ± 0.738 13.83a ± 0.630 11.30 ± 0.525 9.95 ± 0.443
28 d 22.44a ± 0.497 22.62a ± 0.731 19.37 ± 0.757 17.30 ± 0.708
Values represent means and standard error, a,b means that have a superscript are significantly different (p < 0.05
EXHIBIT J - Page 540
Case 5:14-cv-00117-cr Document 63-11 Filed 11/14/14 Page 258 of 312

Biological effects of transgenic maize NK603xMON810 fed in long term reproduction studies in mice
Page 52 of 105
Table 42: Individual pup mass [g] per group 5 and 6 weeks after birth from par-ents with 33% of near isogenic (ISO) or Austrian reference (A REF) corn in their diet Weeks after birth F1 generation 5 w ISO A REF Males & Females 22.07a ± 0.636 24.18b ± 0.584
F2 generation
5 w
Females 20.36a ± 0.768 23.66b ± 0.488
Males 24.01a ± 0.742 27.16b ± 0.773
6 w
Females 26.93 ± 1.554 25.82 ± 0.518
Males 28.73 ± 0.561 29.83 ± 0.762
F3 generation
5 w Females 22.92 ± 0.440 23.64 ± 0.491
Males 26.38 ± 0.551 27.08 ± 0.612
6 w
Females 25.21 ± 0.525 25.74 ± 0.428
Males 30.26 ± 0.427 31.00 ± 0.566
F4 generation
5 w Females 22.58 ± 0.429 22.41 ± 0.428
Males 25.50 ± 0.588 25.14 ± 0.684
6 w
Females 24.58 ± 0.630 24.36 ± 0.559
Males 28.45 ± 0.685 27.09 ± 0.627
Values represent means and standard error, a,b means that have a superscript are significantly different (p < 0.05)
EXHIBIT J - Page 541
Case 5:14-cv-00117-cr Document 63-11 Filed 11/14/14 Page 259 of 312
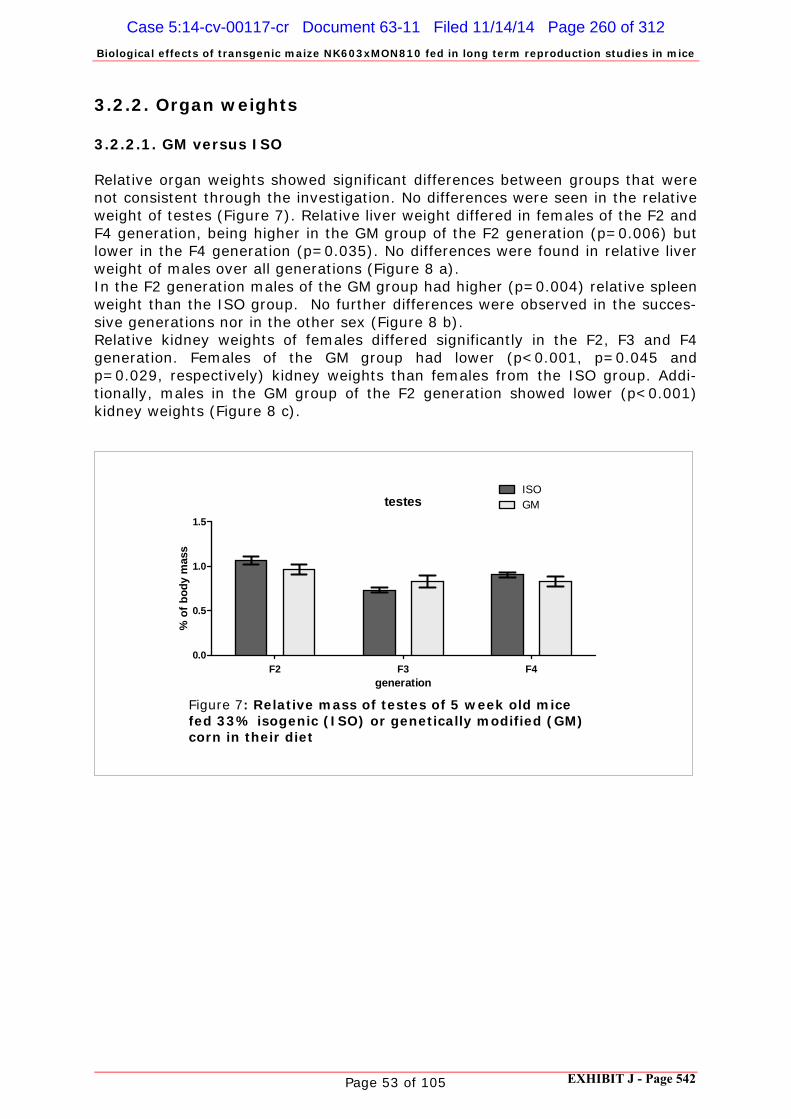
Biological effects of transgenic maize NK603xMON810 fed in long term reproduction studies in mice
Page 53 of 105
3.2.2. Organ weights
3.2.2.1. GM versus ISO Relative organ weights showed significant differences between groups that were not consistent through the investigation. No differences were seen in the relative weight of testes (Figure 7). Relative liver weight differed in females of the F2 and F4 generation, being higher in the GM group of the F2 generation (p=0.006) but lower in the F4 generation (p=0.035). No differences were found in relative liver weight of males over all generations (Figure 8 a). In the F2 generation males of the GM group had higher (p=0.004) relative spleen weight than the ISO group. No further differences were observed in the succes-sive generations nor in the other sex (Figure 8 b). Relative kidney weights of females differed significantly in the F2, F3 and F4 generation. Females of the GM group had lower (p<0.001, p=0.045 and p=0.029, respectively) kidney weights than females from the ISO group. Addi-tionally, males in the GM group of the F2 generation showed lower (p<0.001) kidney weights (Figure 8 c).
Figure 7: Relative mass of testes of 5 week old mice fed 33% isogenic (ISO) or genetically modified (GM) corn in their diet
testes
F2 F3 F40.0
0.5
1.0
1.5
ISOGM
generation
% o
f bod
y m
ass
EXHIBIT J - Page 542
Case 5:14-cv-00117-cr Document 63-11 Filed 11/14/14 Page 260 of 312

Biological effects of transgenic maize NK603xMON810 fed in long term reproduction studies in mice
Page 54 of 105
Figure 8: Relative mass of liver (a), spleen (b) and kidneys(c) of 5 week old mice fed 33% isogenic (ISO) or genetically modified (GM) corn in their diet
relative mass of liver
females
F2 F3 F40
2
4
6
8
generations
% o
f bod
y m
ass
males
F2 F3 F40
2
4
6
8
ISOGM
generation
% o
f bod
y m
ass
relative mass of kidneys
females
F2 F3 F40.0
0.5
1.0
1.5
2.0
2.5
generation
% o
f bod
y m
ass
males
F2 F3 F40.0
0.5
1.0
1.5
2.0
2.5
ISOGM
generation
% o
f bod
y m
ass
a)
b)
c)
p=0.006
p=0.004
p<0.001 p=0.045 p=0.029
p<0.001
relative mass of spleen
females
F2 F3 F40.0
0.2
0.4
0.6
0.8
generation
% o
f bod
y m
ass
males
F2 F3 F40.0
0.2
0.4
0.6
0.8
ISOGM
generation
% o
f bod
y m
ass
EXHIBIT J - Page 543
Case 5:14-cv-00117-cr Document 63-11 Filed 11/14/14 Page 261 of 312

Biological effects of transgenic maize NK603xMON810 fed in long term reproduction studies in mice
Page 55 of 105
3.2.2.2. ISO versus A REF Differences were seen in several organs of different generations. Males showed significant differences (p=0.015 and p=0.005) of the relative organ weight of testes in the F3 and F4 generation (Figure 9). These were inconsistent insofar as the ISO males had lower relative testes weight in the F3 and higher relative tes-tes weight in F4 than the A REF group. In the F3 generation the ISO mice of both sexes had significantly higher relative liver weights (p= 0.021 for females and p=0.034 for males, Figure 10 a). The males of the A REF group showed a significantly (p=0.018) higher relative spleen weights in the F2 generation only (Figure 10 b) Finally a further single statistically significant difference was seen for kidney weight of females (p=0.016) in the F4 generation (Figure 10 c) being higher in the ISO group.
testes
F2 F3 F40.0
0.5
1.0
1.5
ISOA REF
generation
% o
f bod
y m
ass
Figure 9: Relative mass of testes of 5 week old mice fed 33% isogenic (ISO) or Austrian reference (A REF) corn in their diet
p=0.015 p=0.005
EXHIBIT J - Page 544
Case 5:14-cv-00117-cr Document 63-11 Filed 11/14/14 Page 262 of 312

Biological effects of transgenic maize NK603xMON810 fed in long term reproduction studies in mice
Page 56 of 105
p=0.021 p=0.034
p=0.018
p=0.016
Figure 10: Relative mass of liver (a), spleen (b) and kidneys (c) of 5 week old mice fed 33% isogenic (ISO) or Austrian reference (A REF) corn in their diet
males
F2 F3 F40
2
4
6
8
10
ISOA REF
generation
% o
f bod
y m
ass
females
F2 F3 F40
2
4
6
8
10
generation
% o
f bod
y m
ass
Relative mass of liver
females
F2 F3 F40.0
0.2
0.4
0.6
0.8
generation
% o
f bod
y m
ass
males
F2 F3 F40.0
0.2
0.4
0.6
0.8
ISOA REF
generation
% o
f bod
y m
ass
Relative mass of spleen
females
F2 F3 F40.0
0.5
1.0
1.5
2.0
2.5
generation
% o
f bod
y m
ass
males
F2 F3 F40.0
0.5
1.0
1.5
2.0
2.5
ISOA REF
generation
% o
f bod
y m
ass
Relative mass of kidneys
a)
b)
c)
EXHIBIT J - Page 545
Case 5:14-cv-00117-cr Document 63-11 Filed 11/14/14 Page 263 of 312

Biological effects of transgenic maize NK603xMON810 fed in long term reproduction studies in mice
Page 57 of 105
3.2.3. Histology
The histological comparison included the gastrointestinal tract, liver, pancreas, kidney, spleen, lung and testes of 5 male and 5 female test mice of the F3 gen-eration of the multigeneration study at the age of 7 weeks. The organs were examined for pathological changes such as necrosis, oedema, fibrosis, hyperplasia and ulceration. Although a number of significant differences concerning relative organ weights had been found, these differences could not be corroborated by the microscopic comparisons between the feeding groups in any of the above mentioned organs.
▪ Gastrointestinal Tract The comparison of villi and crypt structure showed no difference between the feeding groups. There was no infiltration of lymphocytes seen on any of the investigated slides. The test mouse strain is prone to develop ulcers, but in this case the animals were probably too young for this pathological change to occur. ▪ Liver Although size differences in hepatocytes were observed these were randomly distributed among all samples and therefore not feed dependent. There were also slight differences in the accumulation of glycogen in the liver cells. But glycogen aggregates vary depending on the feed uptake shortly before the animal is sacrificed. The bile duct epithelia did not show any pathological changes in all groups and no infiltration of leucocytes was observed. ▪ Pancreas No acute pancreatitis or infiltration of leucocytes was seen in any of the slides. No necrosis of adipose tissue associated with pancreatic damage was found. The accumulation of zymogen granula in the acinus cells was low and comparable between the groups indicating a similar feed intake, since zymo-gen granula point at the nutritional status of the animal. ▪ Kidney No differences were seen by histological comparisons. Renal tubules (deposi-tion of calcium phosphate) were not mineralized and the epithelia were with-out pathological findings. ▪ Spleen No lymphocyte accumulation was seen in the white pulpa of the compared spleens. All spleen samples showed dense accumulations of megacaryocytes that is known for young animals. ▪ Lungs No accumulation of eosinophilic granulocytes representing control mechanisms associated with allergy and asthma was found in any of the lung samples and no other abnormality was detected. ▪ Testes The developmental state of the testes was comparable between the groups, since mature spermatozoa were found equally in the seminiferous tubules. The testes of all groups were without any pathological findings.
In conclusion, there was no evidence of diet related changes in the tissues of the gastrointestinal tract, liver, pancreas, kidneys, spleen, lungs and testes.
EXHIBIT J - Page 546
Case 5:14-cv-00117-cr Document 63-11 Filed 11/14/14 Page 264 of 312

Biological effects of transgenic maize NK603xMON810 fed in long term reproduction studies in mice
Page 58 of 105
3.2.4. Immunohistochemistry
CD3+ T-lymphocytes
In general, the highest density of CD3+ intraepithelial lymphocytes was seen in the two proximal segments of the small intestine and in the rectum, the lowest in the colon. Statistically significant differences were found between the ISO and the GM group in the 2nd intestinal segment of the male mice (p=0.021) and in the 3rd intestinal segment of the female mice (p=0.009) with contradictory re-sults (table 43). GM females showed higher but GM males lower CD3+ density. In the A REF less (p=0.003) CD3+ cells were seen than in the ISO males. The differences are inconsistent between the two sexes and were not found in all segments. For the CD3+ immune population the impact of feed seems rather low. Table 43: CD3+ Intraepithelial lymphocytes in the gut tissue (per 0.1 mm2) Group ISO GM A REF Male small intest_1 0.68 ± 0.199 0.16 ± 0.165 0.44 ± 0.093 small intest_2 1.13a ± 0.070 0.67bb ± 0.068 0.30bb ± 0.106 small intest_3 0.37 ± 0.096 0.46 ± 0.051 0.15 . small intest_4 0.36 ± 0.146 0.56 ± 0.256 0.21 ± 0.068 caecum 0.48 ± 0.156 0.22 ± 0.053 0.16 ± 0.034 colon 0.08 ± 0.015 0.20 ± 0.107 0.05 ± 0.001 rectum 1.08 ± 0.416 0.37 ± 0.023 0.07 ± 0.035 Female small intest_1 1.26 1.00 ± 0.144 1.05 ± 0.050 small intest_2 0.90 ± 0.162 0.81 ± 0.070 0.51 ± 0.123 small intest_3 0.57a ± 0.056 1.25bb ± 0.031 0.75 ± 0.009 small intest_4 0.60 0.76 0.51 ± 0.169 caecum 0.23 0.12 0.13 ± 0.080 colon 0.30 0.29 ± 0.095 0.10 ± 0.013 rectum 0.85 0.12 0.36 . a,b means that have a superscript are significantly different (p < 0.05)
CD20 + B-lymphocytes
In the male animals, the highest density of CD20+ cells (> 1.1/0.1 mm2) was seen in the most distal segment of the small intestine. In the female mice, distri-bution of CD20+ cells was more inhomogeneous and ranged from 0.63 to 2.23 CD20+ cells/0.1 mm2. Due to a high inter-individual variability of the results, statistically significant dif-ferences between the feeding groups could not be found (Table 44).
EXHIBIT J - Page 547
Case 5:14-cv-00117-cr Document 63-11 Filed 11/14/14 Page 265 of 312

Biological effects of transgenic maize NK603xMON810 fed in long term reproduction studies in mice
Page 59 of 105
Table 44: CD20+ cells in the lamina propria of the small intestine (per 0.1 mm2) Group ISO GM A REF Male small intest_1 0.59 ± 0.094 0.92 ± 0.479 1.16 ± 0.354 small intest_2 0.60 ± 0.182 0.58 ± 0.047 1.05 ± 0.572 small intest_3 0.51 ± 0.149 0.37 ± 0.124 0.87 ± 0.266 small intest_4 1.99 ± 0.802 1.10 ± 0.395 2.15 ± 0.621 Female small intest_1 0.99 ± 0.357 0.95 ± 0.113 1.60 ± 0.113 small intest_2 2.23 ± 0.819 0.82 ± 0.206 1.40 ± 0.206 small intest_3 1.46 ± 0.482 0.63 ± 0.185 0.81 ± 0.185 small intest_4 1.10 ± 0.802 1.50 ± 0.718 1.16 ± 0.718
Macrophages
With the available antibody against macrophage clone MAC387 only the samples from the female mice could be stained. The density of macrophages in the lamina propria of the small intestine ranged from 1.44 to 3.7 cells/0.1 mm2. No statisti-cally significant differences were seen between the groups (Table 45).
Table 45: Macrophages in the lamina propria of the small intestine of female mice (per 0.1 mm2) group ISO GM A REF small intest_1 2.44 ± 0.762 3.28 ± 0.671 2.67 ± 0.477 small intest_2 3.50 ± 0.901 2.47 ± 0.613 1.71 ± 0.477 small intest_3 2.65 ± 0.425 2.87 ± 0.777 1.50 ± 0.246 small intest_4 1.44 ± 0.460 1.56 ± 0.460 3.70 ± 0.951
3.2.5. Ultrastructural investigation
3.2.5.1. ISO versus GM The ultrastructural observations showed comparable nuclear shape irregularity in the ISO and the GM group in hepatocytes, lymphocytes and pancreas acinar cells. Fibrillar centres (FC) and dense fibrillar components (DFC) of hepatocytes were significantly lower in females (p=0.027 and p= 0.041) and DFC in males (p=0.017) in the GM group in contrast to the ISO group (Figure 11 a). FC was also lower in males but not at a significant level. No differences were seen in characteristics of spleen lymphocytes. In pancreatic acinar cells DFC were significantly less abundant in females (p=0.01) but not in males of the GM group (Figure 11 c). FC of both females and males were higher in the GM group but not at a significant level.
EXHIBIT J - Page 548
Case 5:14-cv-00117-cr Document 63-11 Filed 11/14/14 Page 266 of 312

Biological effects of transgenic maize NK603xMON810 fed in long term reproduction studies in mice
Page 60 of 105
a) b) c) The pore density of hepatocyte nuclei was significantly lower in females (p=0.031) and males (p=0.000) in the GM group than in the ISO group.
males
FC DFC0
5
10
15ISOGM
nucleolar components%
females
FC DFC0
5
10
15
nucleolar components
%liver
females
FC DFC0
2
4
6
nucleolar components
%
males
FC DFC0
2
4
6ISOGM
nucleolar components
%
spleen
females
FC DFC0
2
4
6
nucleolar components
%
males
FC DFC0
2
4
6ISOGM
nucleolar components
%
pancreas
Figure 11: Fibrillar centres (FC) and dense fibrillar components (DFC) of liver (a) (hepatocytes), spleen (b) (lymphocytes) and pancreatic acinar cells (c) from the F3 generation of mice fed 33% genetically modified (GM) or isog-enic (ISO) corn.
p=0.027
p=0.041
p=0.017
p=0.01
EXHIBIT J - Page 549
Case 5:14-cv-00117-cr Document 63-11 Filed 11/14/14 Page 267 of 312

Biological effects of transgenic maize NK603xMON810 fed in long term reproduction studies in mice
Page 61 of 105
Differences were seen in the pore density of hepatocytes of males (p<0.001) but not of females.
Table 46: Pore density (pores/µm nuclear membrane length) from different tis-sue of mice fed 33% genetically modified (GM) or isogenic (ISO) corn
No significant divergences could be found in the spleen and pancreatic cells.
3.2.5.2. ISO versus A REF A significant variation regarding the nuclear shape irregularity was only ascer-tained in liver cells of female mice, which was lower (p=0.025) in the A REF group in comparison to the ISO group (Table 47). Table 47: Nuclear shape irregularity of different anatomical sites from mice fed 33% isogenic (ISO) or Austrian reference (A REF) corn
ISO A REF Liver females 1.04a ± 0.008 1.08b ± 0.016 males 1.05a ± 0.016 1.04a ± 0.017 Spleen females 1.13a ± 0.021 1.09a ± 0.015 males 1.18a ± 0.031 1.16a ± 0.026 Pancreas females 1.09a ± 0.018 1.09a ± 0.018 males 1.07a ± 0.010 1.08a ± 0.028
Dense fibrillar components (DFC) but not fibrillar centers (FC) of hepatocytes were significantly lower in males (p= 0.026) in the A REF group than in the ISO group, values of females where comparable in both groups (Fig. 12 a). Calculations of nucleolar components made on spleen and pancreas tissue gave no significant results (Figure 12 b-c).
ISO GM Liver females 0.74a ± 0.068 0.54b ± 0.051 males 0.68a ± 0.045 0.36b ± 0.038 Spleen females 0.35a ± 0.043 0.37a ± 0.029 males 0.36a ± 0.035 0.24b ± 0.035 Pancreas females 0.51a ± 0.043 0.62a ± 0.056 males 0.49a ± 0.039 0.50a ± 0.039
EXHIBIT J - Page 550
Case 5:14-cv-00117-cr Document 63-11 Filed 11/14/14 Page 268 of 312

Biological effects of transgenic maize NK603xMON810 fed in long term reproduction studies in mice
Page 62 of 105
a)
females
FC DFC0
2
4
6
8
10
nucleolar components
%
males
FC DFC0
5
10
15ISOA REF
nucleolar components%
females
FC DFC0
1
2
3
4
5
nucleolar components
%
males
FC DFC0
2
4
6ISOA REF
nucleolar components
%
pancreas
females
FC DFC0
1
2
3
4
nucleolar components
%
males
FC DFC0
1
2
3
4ISOA REF
nucleolar components
%spleen
liver
Figure 12 a-c: Fibrillar centres (FC) and dense fibrillar components (DFC) of liver (a), spleen (b) and pancreatic acinar cells (c) from the F3 generation of mice fed 33% isogenic (ISO) or Austrian Reference (A REF) corn.
b)
c)
p=0.026
EXHIBIT J - Page 551
Case 5:14-cv-00117-cr Document 63-11 Filed 11/14/14 Page 269 of 312

Biological effects of transgenic maize NK603xMON810 fed in long term reproduction studies in mice
Page 63 of 105
The pore density of lymphocyte nuclei in the spleen was significantly lower in males (p=0.026) in the A REF group than in the ISO Group. The other values were not significant (Table 48). Table 48: Pore density (pores/µm nuclear membrane length) of different ana-tomical sites of mice fed 33% isogenic (ISO) or Austrian reference (A REF) corn
ISO A REF Liver females 0.74a ± 0.068 0.91a ± 0.059
males 0.68a ± 0.045 0.56a ± 0.050 Spleen females 0.35a ± 0.043 0.39a ± 0.042
males 0.36a ± 0.035 0.24b ± 0.031 Pancreas females 0.51a ± 0.043 0.62a ± 0.058
males 0.49a ± 0.039 0.50a ± 0.039
EXHIBIT J - Page 552
Case 5:14-cv-00117-cr Document 63-11 Filed 11/14/14 Page 270 of 312

Biological effects of transgenic maize NK603xMON810 fed in long term reproduction studies in mice
Page 64 of 105
3.2.6. Microarray analyses
ISO versus GM In total 439 genes were found to be expressed differentially (p<0.05) using the t test approach for gene expression of mice fed transgenic versus isogenic corn. The minimum fold-change with a cut-off value of 2 revealed 43 genes being up-regulated and 98 down-regulated. Gene Set Enrichment Analysis (GSEA) using PANTHER database tool was per-formed to extract biological information from the data set. Annotation and classi-fication of the differentially expressed genes due to their biological context re-vealed significant alterations between the following biological processes: protein biosynthesis (p=2.4*10-15), G-protein mediated signalling (p=1.6*10-04) and pro-tein metabolism and modification (p=2.3*10-04). The biological processes ranking on top of the classification (p-values<1.4*10-02) are listed in table 49. Table 49: GSEA of deregulated genes (2fold change) between GM and ISO groups describing biological processes‡
Biological Process Genes on Mouse AB 1700 genes
Number of genes
Expected by chance
over/under represented
P-value
Protein biosynthesis 446 38 7.80 + 2.4*10-15
G-protein mediated signalling 1251 7 21.88 - 1.6*10-04
Protein metabolism and modification
2720 72 47.56 + 2.3*10-04
Ion transport 574 3 10.04 - 9.4*10-03
Sensory perception 873 7 15.27 - 1.4*10-02
Cation transport 442 2 7.73 - 1.6*10-02
Other receptor mediated signalling pathway
200 8 3.50 + 2.6*10-02
Proteolysis 924 9 16.16 - 3.7*10-02
Translational regulation 71 4 1.24 + 3.7*10-02
Exocytosis 141 6 2.47 + 3.9*10-02 ‡ see 2.4.6.2. for further explanation
Biological processes involved in protein biosynthesis reflect the most significantly affected set of genes differentially expressed in the distal jejunum from male mice in the 3rd generation fed either 33% genetically modified or isogenic corn. Furthermore, pathway analysis revealed interleukin signalling pathway, choles-terol biosynthesis and insulin/IGF pathway-protein kinase B signalling cascade as prominent differentiators of the two groups (see table 50).
EXHIBIT J - Page 553
Case 5:14-cv-00117-cr Document 63-11 Filed 11/14/14 Page 271 of 312

Biological effects of transgenic maize NK603xMON810 fed in long term reproduction studies in mice
Page 65 of 105
Table 50: GSEA of deregulated genes (2fold change) between GM and ISO groups describing pathways‡
Pathway Genes on Mouse AB 1700 genes
Number of genes
Expected by chance
over/under represented
P-value
Interleukin signalling pathway 157 5 0.87 + 1.9*10-03
Cholesterol biosynthesis 12 2 0.07 + 2.1*10-03
Insulin/IGF pathway-protein kinase B signalling cascade
84 3 0.46 + 1.2*10-02
PI3 kinase pathway 110 3 0.61 + 2.4*10-02
Notch signalling pathway 49 2 0.27 + 3.0*10-02
Integrin signalling pathway 212 4 1.17 + 3.1*10-02
TGF-beta signalling pathway 146 2 0.81 + 2.0*10-01
Synaptic_vesicle_trafficking 42 1 0.23 + 2.1*10-01
Insulin/IGF pathway-mitogen activated protein kinase /MAP kinase cascade
42 1 0.23 + 2.1*10-01
Integrin signalling pathway 212 6 0.96 + 1.7*10-01 ‡ see 2.4.6.2 for further explanation
ISO versus A REF In total, 1016 genes were found to be differentially expressed (p<0.05) using the t test approach for gene expression of mice fed 33% isogenic (ISO) versus Aus-trian reference (A REF) corn. Out of these genes 186 were greater than 2-fold down regulated (182 genes) or up regulated (4 genes). The gene list containing all the 1016 differentially expressed genes was selected for Gene Set Enrichment Analysis using the PANTHER database (p<0.05). Genes were allocated according to their biological processes and pathways. This ap-proach identified biological process like G-protein signalling pathway, the cell surface receptor mediated signal transduction and the signal transduction (Table 51) processes as significantly altered between the study groups. Furthermore pathway analyses with gene tags deregulated at least two fold indicated differ-ences in genes of the circadian clock system, the T cell activation and the FAS signalling pathway (Table 52).
EXHIBIT J - Page 554
Case 5:14-cv-00117-cr Document 63-11 Filed 11/14/14 Page 272 of 312

Biological effects of transgenic maize NK603xMON810 fed in long term reproduction studies in mice
Page 66 of 105
Table 51: GSEA of deregulated genes (2fold change) between ISO and A REF groups describing biological processes‡
Biological Process Mouse AB
1700 genes genes.txt expected over/under P-value
G-protein mediated signalling 1251 14 54.05 - 3.9*10-11
Sensory perception 873 8 37.72 - 3.3*10-09
Cell surface receptor mediated Signalling transduction
1978 41 85.46 - 2.3*10-08
Chemosensory perception 463 1 20.00 - 3.6*10-08
Signal transduction 3590 100 155.11 - 2.3*10-07
Protein biosynthesis 446 43 19.27 + 1.7*10-06
Intracellular protein traffic 878 66 37.94 + 1.5*10-05
Tricarboxylic acid pathway 28 8 1.21 + 3.8*10-05 ‡ see 2.4.6.2 for further explanation
Table 52: GSEA of deregulated genes (2fold change) between ISO and A REF groups describing pathways‡
Pathway Mouse AB
1700 genes genes.txt expected over/under P-value
Circadian clock system 15 4 0.11 + 6.4*10-06
T cell activation 115 5 0.88 + 2.1*10-03
FAS signalling pathway 36 3 0.28 + 2.8*10-03
Histamine H1 receptor mediated signalling pathway
40 3 0.31 + 3.8*10-03
Oxytocin receptor mediated signalling pathway
57 3 0.44 + 9.9*10-03
Wnt signalling pathway 315 7 1.41 + 1.1*10-02
Thyrotropin-releasing hormone receptor signalling pathway
60 3 0.46 + 1.1*10-02
Phenylalanine biosynthesis 2 1 0.02 + 1.5*10-02
5HT2 type receptor mediated signalling pathway
67 3 0.51 + 1.5*10-02
Apoptosis signalling pathway 132 4 0.01 + 1.9*10-02 ‡ see 2.4.6.2 for further explanation
EXHIBIT J - Page 555
Case 5:14-cv-00117-cr Document 63-11 Filed 11/14/14 Page 273 of 312

Biological effects of transgenic maize NK603xMON810 fed in long term reproduction studies in mice
Page 67 of 105
ISO & A REF versus GM When the mRNA gene expression data of mice fed genetically modified corn with the Cry1Ab and CP4 EPSPS event was compared to gene expression data without any Cry1Ab and CP4 EPSPS exposure 2,374 genes were significantly (p<0.05) deregulated and 421 out of these had a fold change of at least 2 (Figure 13). In total 13,034 genes were expressed in the distal jejunum.
For further analyses, the 2374 differentially expressed gene tags (p<0.05) were functionally classified using the PANTHER database and were allocated to biologi-cal processes and pathways (Table 53 and 54). Expression data became even more pronounced and the level of significance increased in protein biosynthesis from p= 2.30*-15 to p=1.26*-148 and protein metabolism and modification from p= 2.35*-04 to p=5.34*-61.
Figure 13: Venn diagram depicting the number of deregulated genes in the F3 generation of mice fed 33% genetically modified (GM) corn. Isogenic (ISO) and Austrian reference (A REF) corn were used as controls
EXHIBIT J - Page 556
Case 5:14-cv-00117-cr Document 63-11 Filed 11/14/14 Page 274 of 312

Biological effects of transgenic maize NK603xMON810 fed in long term reproduction studies in mice
Page 68 of 105
Table 53: GSEA of deregulated genes between GM and ISO+A REF groups de-scribing biological processes ‡
Biological Process Genes on Mouse AB 1700 genes
Number of genes
Expected by chance
over/under represented
P-value
Protein biosynthesis 446 301 44.09 + 1.3*10-148
Protein metabolism and modification
2720 552 268.88 + 5.3*10-61
Nucleoside, nucleotide and nucleic acid metabolism
2779 397 274.71 + 5.3*10-14
G-protein mediated signalling 1251 56 123.67 - 2.5*10-12
Signal transduction 3590 248 354.88 - 5.9*10-11
Sensory perception 873 37 86.30 - 1.0*10-09
Cell surface receptor mediated signal transduction
1978 123 195.53 - 4.7*10-09
Transport 1203 63 118.92 - 6.2*10-09
mRNA transcription 1569 227 155.10 + 1.1*10-08
Olfaction 457 13 45.18 - 1.4*10-08 ‡ see 2.4.6.2 for further explanation
Table 54: GSEA of deregulated genes between GM and ISO+A REF groups de-scribing pathways‡
Pathway Genes on Mouse AB 1700 genes
Number of genes
Expected by chance
over/under represented
P-value
Circadian clock system 15 3 0.25 + 2.0*10-03
Cholesterol biosynthesis 12 2 0.20 + 1.7*10-02
Hypoxia response via HIF activation
33 3 0.54 + 1.7*10-02
Carnitine metabolism 2 1 0.03 + 3.2*10-02
Carnitine and CoA metabolism 2 1 0.03 + 3.2*10-02
Interleukin signalling pathway 157 6 2.56 + 4.6*10-02
PDGF signalling pathway 173 6 2.83 + 6.7*10-02
Salvage pyrimidine deoxyribonucleotides
5 1 0.08 + 7.8*10-02
PI3 kinase pathway 110 4 1.80 + 1.1*10-01 ‡ see 2.4.6.2 for further explanation
EXHIBIT J - Page 557
Case 5:14-cv-00117-cr Document 63-11 Filed 11/14/14 Page 275 of 312

Biological effects of transgenic maize NK603xMON810 fed in long term reproduction studies in mice
Page 69 of 105
3.2.7. q-RT-PCR
From 45 genes that were identified as deregulated by microarray screening, some could be confirmed by q-RT-PCR (Table 55) using a larger cohort. With t test 19 genes were proofed to be significantly deregulated (p<0.05) in the MGS and 11 genes (p<0.05) in the RACB. By using REST procedure, a pair wise fixed reallocation randomisation test providing a much sharper statistical evaluation, 9 (p<0.05) and 3 (p<0.01) genes were found to be deregulated depending on study design, sex and anatomical site (Table 55).
Table 55: Fold changes of deregulated genes confirmed by q-RT-PCR in the MGS and the RACB MGS RACB GM vs. ISO GM vs. ISO Gene symbol prox. Jejunum dist. Jejunum dist. Jejunum male male female male Fkbp5 4.7a 2.9a 0.9 0.9 Foxq1 1.3 1.3 2.1 0.6a
Gspt2 0.7a 1.0 1.5b 1.0 Hmg20a 1.0 0.9 1.2b 0.9 Igtp 0.6 0.3a 1.2 2.2 Mapk10 1.0 0.8 1.5a 1.0 Per3 1.8 1.7 1.3 4.9a
Pnpla3 1.6 0.2a 1.8 0.6 Socs1 0.9 0.5a 1.2 1.2 Trim47 1.2 1.0 1.0 0.7b
ap < 0.05, bp < 0.1 Increasing the sample size by pooling the data of MGS and RACB, sexes as well as sampling sites indicated statistically significant differences (p < 0.05) in 3 genes (Table 56).
Table 56: Fold changes of deregulated genes confirmed by q-RT-PCR of the indi-vidual and pooled studies (GM versus ISO) MGS RACB Pooled Gene Symbol prox. Jejunum dist. Jejunum dist. Jejunum male male female male Fkbp5 4.7b 2.9a 0.9 0.9 1.9a Per 3 1.8 1.7 1.3 4.9a 2.4a Pnpla3 1.6 0.2a 1.8 0.6 0.4a ap<0.05
The deregulated genes can be allotted to different pathways. Fkbp5 is a member of the Immunophilin family and functions as a peptidyl-prolyl-isomerase. It acts in the AR-signal transduction pathway and it works as a cochaperone for Hsp90. High Fkbp-levels block activation of NFATc and therefore inhibit T-cell activation (Magee et al. 2006). Socs-1 acts in the feedback inhibition of the Jak-Stat signal transduction pathway by ubiquitination of NFκB. It is also thought to inhibit insulin receptors. By block-ing Irs it can mediate type II diabetes (Chung et al. 2007; Gagnon et al. 2007). Igtp is thought to be mainly produced by activated macrophages and limits bac-terial growth. Its detailed function is unknown. It might be involved in the traf-
EXHIBIT J - Page 558
Case 5:14-cv-00117-cr Document 63-11 Filed 11/14/14 Page 276 of 312

Biological effects of transgenic maize NK603xMON810 fed in long term reproduction studies in mice
Page 70 of 105
ficking and processing of immunological active proteins, and might mediate cell survival (Lapaque et al. 2006; Zhang et al. 2003). Pnpla3 also known as adiponutrin is induced during adipogenesis and is highly enriched in adipose tissue. Adiponutrin may participate primarily in triglyc-eride/NEFA recycling rather than in net lipolysis making its function different from human adiponutrin (Kershaw et al. 2006). Gspt2 is involved in cell proliferation and in the termination of protein synthesis (Royland and Kodavanti 2008). Mapk10 is a member of the MAP kinase family and is thought to activate apoptosis in neurons (Bruckner et al. 2001). Per3 as member of the Period gene family is part of the circadian clock system. It only exhibits a DBPE one of three transcriptional factors found in circadian clock genes, while other genes exhibit up to all three transcriptional factors. The combination of expressed transcription factors is thought to control the functions of the circadian rhythm (Yamamoto et al. 2004). Until now, no general conclusion can be drawn in aspects of molecular analyses of intestinal mRNA. Differences between ISO and GM fed mice detected by mi-croarray analysis were observed in several pathways. Within the chosen set of deregulated genes selected from the initial microarray screen and further ana-lyzed by the use of TLDA, several genes could be confirmed by RT-PCR, which is considered the gold standard for mRNA quantification. But it still has to be investigated whether the quantitative changes seen at ge-netic level are also seen at protein level. Proteins represent the functionally ac-tive substances in the host metabolism.
EXHIBIT J - Page 559
Case 5:14-cv-00117-cr Document 63-11 Filed 11/14/14 Page 277 of 312

Biological effects of transgenic maize NK603xMON810 fed in long term reproduction studies in mice
Page 71 of 105
3.2.8. miRNA profiling
ISO versus GM
No significantly different expression of miRNAs was seen in the array profiling when using a p-value cut-off as high as 0.2 (Figure 14). These data do not indi-cate differential miRNA expression between the groups fed either the transgenic or isogenic corn.
ISO versus A REF No significantly different expression of miRNAs was seen in the array profiling even when a cut-off as high as p=0.2 was used (Figure 15). This data set does not indicate differential miRNA expression between the groups fed either the isogenic corn or the A REF corn.
Figure 15: Bar graphs of normalized data of jejunal miRNAs (each bar represents one miRNA) of the 3rd generation (F3) from mice fed 33% isogenic(ISO) or Aus-trian reference corn (A REF)
A REF ISO
Figure 14: Bar graphs of normalized data of jejunal miRNAs (each bar represents one miRNA) of the 3rd generation (F3) from mice fed 33% isogenic(ISO) or transgenic(GM) corn
ISO GM
EXHIBIT J - Page 560
Case 5:14-cv-00117-cr Document 63-11 Filed 11/14/14 Page 278 of 312

Biological effects of transgenic maize NK603xMON810 fed in long term reproduction studies in mice
Page 72 of 105
3.3. Life term study
The test period was terminated after almost 22 months, when 2 mice of each group were still alive. 3.3.1. Feed intake and body mass investigation No significant difference concerning feed intake were seen. The feed consumed within the investigated period was approx. 23kg in the ISO, 22kg in the GM and 21,5kg in the A REF group. Body mass development was not statistically calculated as the clinical manifest cancer form biased the investigation. In times without any obvious clinical dis-ease the body mass was not undergoing considerable fluctuations. 3.3.2. Survival rate The average life time of mice was 16.3 month in the ISO, 15.7 month in the A REF and 17.0 month in the GM group but was not significantly different (Figure 16).
The common causes of death were cancer (leucosis) that is considered to be triggered by the activation of a murine retrovirus inherent in the genome of the test mice. Typical pathological findings were cachexia, spleno- and hepatomegaly with diffuse or local infiltration with abnormal leukocytes. No differences were found in the inter group comparison. Long term studies may have limitations as the majority of outbred or inbred strains develop different forms of cancer. Thus diet related differences could be masked and not really assessed.
Figure 16: Test on survival by Kaplan-Meyer from female mice fed 33 % isogenic (ISO), Austrian reference (A REF) or ge-netically modified (GM) corn
ISO
A REF GM
Surv
ival
[%
]
Exitus [month]
EXHIBIT J - Page 561
Case 5:14-cv-00117-cr Document 63-11 Filed 11/14/14 Page 279 of 312

Biological effects of transgenic maize NK603xMON810 fed in long term reproduction studies in mice
Page 73 of 105
3.4. Reproductive Assessment by Continuous Breeding (RACB)
3.4.1. Performance and reproduction The RACB was performed with 24 breeding pairs per feeding group and lasted for 20 weeks. During this time 4 litters were produced and weaned at the end of the test (Table 57).
Table 57: Overview of litters in the RACB
Parental performance
No statistically significant differences were seen in the prefeeding period and feed intake of breeding pairs within the first weeks of the RACB (Figure 17).
At mating the F0 breeding pairs did not differ in weight. All females and males gained weight throughout the test. But no statistically significant differences be-tween the two groups were seen in body mass of females or males (Table 58).
Generation pairs/group date F0 parents n= 24
1. litter February 2008 2. litter March 2008 3. litter April/May 2008 4. litter May/June 2008
feed intake
week 1 week 2 week 30
50
100
150ISOGM
generation
feed
[g]
Figure 17: Feed intake within the first 2 weeks of the RACB of the mating pairs fed 33% isogenic (ISO) or genetically modified (GM) corn in their diet
EXHIBIT J - Page 562
Case 5:14-cv-00117-cr Document 63-11 Filed 11/14/14 Page 280 of 312

Biological effects of transgenic maize NK603xMON810 fed in long term reproduction studies in mice
Page 74 of 105
Parental reproduction
During the 20 week period of the RACB 4 litters were bred. From 24 pairs as-signed to the ISO and GM group, all females of the ISO group (100%) delivered 4 litters (Table 59). In the GM group the number of deliveries declined with time. In the 4th litter only 20 deliveries occurred (p=0.055). The average number of pups born was always lower in the GM group but not significant before the 3rd delivery. There were significantly fewer pups born in the GM group in the 3rd (p= 0.011) and 4th (p=0.010) delivery and weaned in the 4th litter (p=0.025). Regarding all deliveries per group more pups were born in the ISO than in the GM group (1035 versus 844). Furthermore females of the GM group always had smaller litters (n≤ 8) as compared to females of the ISO group (Figure 18). At weaning the GM group had significantly fewer pups weaned in the 4th litter, though less pups were lost during weaning in all generations (only significantly in the 3rd litter p=0.025). Litters with a high number of pups tended to lose more pups. No difference was seen in the birth interval of 1st, 2nd and 3rd litters (data not shown). Inter-litter comparison within the ISO group showed significantly less pups born in the 1st than in the other three litters and in the GM group significantly less pups were born in the 1st and 4th litters.
EXHIBIT J - Page 563
Case 5:14-cv-00117-cr Document 63-11 Filed 11/14/14 Page 281 of 312

Biological effects of transgenic maize NK603xMON810 fed in long term reproduction studies in mice
Page 75 of 105
Table 58: Performance of mice fed 33% isogenic (ISO) or genetically modified (GM) corn in their diet over several deliveries Parental performance
1st litter 2nd litter 3rd litter 4th litter
ISO GM ISO GM ISO GM ISO GM
body mass [g] female
delivery 33.11 ± 0.440 32.86 ± 0.548 36.09 ± 0.455 36.17 ± 0.604 38.37 ± 0.572 37.36 ± 0.607 39.97 ± 0.797 38.39 ± 0.751
1 week after delivery 34.97 ± 0.526 34.67 ± 0.600 36.76 ± 0.504 35.91 ± 0.685 38.65 ± 0.427 38.67 ± 0.606 40.47 ± 1.801 41.60 ± 0.963
2 week after delivery 36.94 ± 0.698 35.98 ± 0.706 39.47 ± 0.798 38.59 ± 0.887 42.37 ± 0.696 42.05 ± 0.849 42.36 ± 0.508 41.55 ± 0.957
3 week after delivery 43.42 ± 2.113 47.29 ± 2.417 50.92 ± 1.675 47.43 ± 2.178 53.66 ± 1.481 54.73 ± 1.702 38.38 ± 0.601 40.99 ± 2.207
body mass [g] male
delivery 32.80 ± 0.436 32.78 ± 0.603 34.54 ± 0.481 34.90 ± 0.649 34.96 ± 0.439 35.64 ± 0.721 - -
1 week after delivery 33.41 ± 0.469 34.15 ± 0.600 34.53 ± 0.426 35.30 ± 0.581 35.56 ± 0.526 35.91 ± 0.738 - -
2 week after delivery 34.31 ± 0.475 34.79 ± 0.765 35.65 ± 0.439 36.12 ± 0.682 37.02 ± 0.805 36.35 ± 0.873 - -
3 week after delivery 34.67 ± 0.432 34.74 ± 0.683 35.96 ± 0.474 36.77 ± 0.745 37.49 ± 0.703 37.30 ± 0.893 - -
Values represent means and standard error
EXHIBIT J - Page 564
Case 5:14-cv-00117-cr Document 63-11 Filed 11/14/14 Page 282 of 312

Biological effects of transgenic maize NK603xMON810 fed in long term reproduction studies in mice
Page 76 of 105
1. F1
n≤ 8 n>80
5
10
15
20
25
pups/litter
freq
uenc
y
2. F1
n≤ 8 n>80
5
10
15
20
25ISOGM
pups/litter
freq
uenc
y
Figure 18: Distribution of litter size at delivery from females fed 33% isogenic (ISO) or genetically modified (GM) corn in their diet over 4 litters
3. F1
n≤ 8 n>80
5
10
15
20
25
pups/litter
freq
uenc
y
4. F1
n≤ 8 n>80
5
10
15
20
25
pups/litter
freq
uenc
y
EXHIBIT J - Page 565
Case 5:14-cv-00117-cr Document 63-11 Filed 11/14/14 Page 283 of 312

Biological effects of transgenic maize NK603xMON810 fed in long term reproduction studies in mice
Page 77 of 105
Table 59: Reproduction data of mice fed 33% isogenic (ISO) or genetically modified (GM) corn in their diet over several gen-erations
Parental reproduction
1st litter 2nd litter 3rd litter 4th litter
traits ISO GM ISO GM ISO GM ISO GM
Pairs/group 24 24 24 24 24 24 24 24
Deliveries/group 24 23 24 23 24 22 24 20
Non deliveries/group 0 1 0 1 0 2 0 4
Weaned litters/group 24 23 24 23 24 17 24 19
Number of pups at birth/pair
9.00 ± 0.614
8.22 ± 0.590
10.83 ± 0.473
10.65 ± 0.649
11.92a
± 0.496 9.68b
± 0.688 11.38a
± 0.462 8.21b
± 1.077
Sum of pups at birth/group 216 189 260 245 286 213 273 197
Number of pups at weaning/ pair
8.33 ± 0.560
8.13 ± 0.560
10.04 ± 0.480
9.83 ± 0.550
10.58 ± 0.454
9.06 ± 0.820
9.79a
± 0.525 7.21b
± 0.985 Sum of pups at weaning/ group
200 187 241 226 254 207 235 173
Pup losses/group 0.67 ± 0.305
0.09 ± 0.060
0.79 ± 0.289
0.83 ± 0.375
1.33a
± 0.433 0.12b
± 0.081 1.58
± 0.371 1.00
± 0.376 Sum of pup losses/group 16 2 19 19 32 2 38 24
Values represent means and standard error, means that do not share a common superscript are significantly different (p < 0.05)
EXHIBIT J - Page 566
Case 5:14-cv-00117-cr Document 63-11 Filed 11/14/14 Page 284 of 312

Offspring performance
In the first two litters no significant differences were found between the groups. In the third litters the average litter weights were statistically significantly lower in the GM group at birth and on the second day (at birth p=0.026; 2 d p=0.040) as well as at weaning (p=0.031). In the fourth litter the average litter weight was significantly lower in the GM group (p=0.05), but all the consecutive aver-age litter weights failed to meet the level of significance by a small margin (2 d p=0.053; 3 d p=0.070; 4 d p=0.080; 5 d p=0.082; 6 d p=0.064; 7 d 0.088 and 14 d p= 0.088). The individual pup masses in litters with a high number of pups are commonly lower. In the ISO group the average individual pup mass of the small litters (n≤ 8) was once significantly (p=0.043) lighter as compared to GM pups in the 4th litter (Table 60). The average individual pup weights were not higher in the GM group, although this group had significantly smaller litter sizes (p<0.001).
Data in figure 19 a-d and 19 a’-d’ and table 60.
EXHIBIT J - Page 567
Case 5:14-cv-00117-cr Document 63-11 Filed 11/14/14 Page 285 of 312

Biological effects of transgenic maize NK603xMON810 fed in long term reproduction studies in mice
Page 79 of 105
p=0.028
2. F1
1. F1 1. F 1
birth 1 2 3 4 5 6 7 14 210
25
50
100
150
200
250
ISOGM
days after birth
mas
s of
who
le li
tter
[g]
2. F1
birth 1 2 3 4 5 6 7 14 210
20
40
100
150
200
250
ISOGM
days after birth
mas
s of
who
le li
tter
[g]
1.F1
birth 7 14 210
5
10
15ISOGM
days after birth
indi
vidu
al p
up w
eihg
t [g]
2. F1
birth 7 14 210
5
10
15
ISOGM
days after birth
indi
vidu
al p
up w
eihg
t [g]
Figure 19 a-b and 19 a’-b’: Mass of whole litter [g] and individual pup weight [g] at several time-points of the 1st and 2nd F1 generation after birth of offspring from parental mice fed 33% isogenic (ISO) or genetically modified (GM) corn in their diet
a) a´)
b) b´)
EXHIBIT J - Page 568
Case 5:14-cv-00117-cr Document 63-11 Filed 11/14/14 Page 286 of 312

Biological effects of transgenic maize NK603xMON810 fed in long term reproduction studies in mice
Page 80 of 105
3. F1
Figures 19 c-d and 19 c’-d’: Mass of whole litter [g] and individual pup weight [g] at several timepoints of the 3rd and 4th F1 generation after birth of offspring from parental mice fed 33% isogenic (ISO) or genetically modified (GM) corn in their diet
p= p= 0.026 0.04
p= 0.05
4. F1
birth 1 2 3 4 5 6 7 14 210
20
40
60
100
150
200
250
ISOGM
days after birth
mas
s of
who
le li
tter
[g]
4. F1
birth 7 14 210
5
10
15
ISOGM
days after birth
indi
vidu
al p
up w
eihg
t [g]
4. F1
p<0.08
p<0.09
p= 0.031
c) c´)
d) d´)
3. F1
birth 1 2 3 4 5 6 7 14 210
20
40
60
100
150
200
250
ISOGM
days after birth
mas
s of
who
le li
tter
[g]
birth 7 14 210
5
10
15
ISOGM
days after birth
indi
vidu
al p
up w
eihg
t [g]
EXHIBIT J - Page 569
Case 5:14-cv-00117-cr Document 63-11 Filed 11/14/14 Page 287 of 312

Biological effects of transgenic maize NK603xMON810 fed in long term reproduction studies in mice
Page 81 of 105
Table 60: Individual pup mass [g] per group at birth, 7, 14 and 21 days after birth from parents with 33% of near isogenic (ISO) or transgenic (GM) corn in their diet
generation ISO n≤ 8 GM n≤ 8 ISO n> 8 GM n> 8
1. F1 Birth 2.08 ± 0.060 2.21 ± 0.083 1.77 ± 0.051 1.89 ± 0.078
7d 6.36 ± 0.326 6.44 ± 0.372 4.95 ± 0.124 5.38 ± 0.221
14 d 9.92 ± 0.624 9.87 ± 0.493 7.48 ± 0.209 7.68 ± 0.263
21 d 14.03 ± 0.588 14.23 ± 0.505 11.47 ± 0.346 10.82 ± 0.445
2. F1 Birth 1.99 ± 0.102 2.17 ± 0.057 1.81 ± 0.044 1.75 ± 0.027
7d 5.55 ± 0.240 6.16 ± 0.255 4.93 ± 0.141 4.73 ± 0.209
14 d 9.63 ± 0.314 9.54 ± 0.457 7.83 ± 0.251 7.17 ± 0.293
21 d 13.62 ± 0.343 13.96 ± 0.321 11.44 ± 0.385 10.38 ± 0.536
3. F1 Birth 2.21 ± 0.308 2.20 ± 0.121 1.83 ± 0.050 1.87 ± 0.064
7d 5.66 ± 0.555 6.26 ± 0.226 5.00 ± 0.132 4.60 ± 0.360
14 d 9.696 ± 0.563 9.95 ± 0.874 7.83 ± 0.183 7.57 ± 0.242
21 d 13.72 ± 0.973 14.48 ± 0.928 11.62 ± 0.280 11.02 ± 0.650
4. F1
Birth 1.94a ± 0.033 2.15a ± 0.178 1.87 ± 0.037 1.82 ± 0.058
7d 5.4a ± 0.305 6.49b ± 0.330 4.89 ± 0.134 4.83 ± 0.185
14 d 9.31a ± 0.246 10.30a ± 0.643 7.65 ± 0.192 7.34 ± 0.279
21 d 14.36a ± 0.356 15.93b ± 0.629 12.00 ± 0.321 11.71 ± 0.391
Values represent means and standard error, means that do not share a common superscript are significantly different (p < 0.05)
EXHIBIT J - Page 570
Case 5:14-cv-00117-cr Document 63-11 Filed 11/14/14 Page 288 of 312

Biological effects of transgenic maize NK603xMON810 fed in long term reproduction studies in mice
Page 82 of 105
3.4.2. q-RT-PCR See point 3.2.7.
EXHIBIT J - Page 571
Case 5:14-cv-00117-cr Document 63-11 Filed 11/14/14 Page 289 of 312

Biological effects of transgenic maize NK603xMON810 fed in long term reproduction studies in mice
Page 83 of 105
4. Discussion
Aim of the study
The aim of the study was to examine chronic feed effects of the stacked GM maize NK603 x MON810 in mice. A short term broiler study showing no effects had been conducted with the event in question, but no rodent feeding study was performed, since both parental GM lines had been declared safe and the new event was obtained by conventional breeding. No further transgene has been introduced. Toxicological risks of GM plants are currently assessed by 90 day feeding studies with rodents. A 90 day study is considered as sufficient to detect adverse effects and the duration is considered as long enough by the EFSA GMO Panel. However, chronic effects might only become evident in longer lasting multi-generation studies, since reproduction and lactation as well as growth and survival rate of the offspring are very sensitive parameters. Furthermore almost all present GM crops are used for the nutrition of breeding animals. Therefore the impact of dietary factors on fertility needs to be investigated in more detail. This is the first study investigating a stacked event in a multigenera-tion study focussing on mice in reproduction and development. Additionally mi-croscopic investigations (histology, electron microscopy and immunohistochemis-try) were performed to investigate possible effects of transgene maize at cellular level and microarray analyses for possible impacts at molecular level.
Methods
In this project two breeding designs were applied for the evaluation of the stacked event NK603 x MON 810 to highlight and compare the suitability of dif-ferent study designs for risk assessment. The first experimental design was a multigeneration study (MGS) with 4 generations of mice. The second breeding scheme was a reproductive assessment by continuous breeding including 4 litters (RACB). Traits investigated were body mass development of parents and off-spring as well as the fertility parameters litter size and survival rate until wean-ing. To corroborate the results of the feeding studies additional investigations have been included in the MGS. Organ weights, histological and electron microscopic ultrastructural investigations were performed to detect changes at the organ and cellular level. Focus was laid on the intestine as a primary indicator of feed-animal interface. Immunohistochemistry was applied for the investigation of im-mune cells in the small intestine and finally gene expression profiles of the jeju-num were performed by microarray analyses and q-RT-PCR. Finally a life term study was performed with focus on mortality of mice allotted to the feeding groups. This design turned out to be less suitable for risk assessment studies. For all trial designs, animals from an outbred mouse strain were chosen. The re-sults obtained from an outbred strain can be considered as basis with a wider
EXHIBIT J - Page 572
Case 5:14-cv-00117-cr Document 63-11 Filed 11/14/14 Page 290 of 312

Biological effects of transgenic maize NK603xMON810 fed in long term reproduction studies in mice
Page 84 of 105
range of various mouse genotypes. The alternative would have been to use in-bred mice strains. Due to a lower genetic variability the results might have been less variable. However, the disadvantages of such an approach are also obvious. Inbred lines may be more or less susceptible to certain external stimuli and may therefore give a biased insight into the nutrition host interaction. This might hap-pen in both directions, making the assessment of nutritional factors more compli-cated. The results presented in the study provide a wide range of differences between the feeding groups that appear higher than natural variations normally expected. The total spectrum of methods is broad and should allow a valid conclusion about the potential impact of the different corn varieties on the animal. However, even with such a broad approach subtle effects might have been missed. On the other hand, some methods would need to be explored in more detail in future studies to evaluate the background and the variability under varying dietary conditions and with a broader spectrum of different mice strains or animal species, ideally covering several nutritional types (omnivorous, herbivorous, carnivorous).
Corn used for the feeding trials
In the MGS three feeding groups were established with diets containing the stacked corn NK603 x MON810 (GM group), the near isogenic line (ISO group) grown in Canada and an additional Austrian GM free reference corn (A REF). The addition of A REF corn was prompted by a slight contamination of the ISO corn and fulfilled the criteria of substantial equivalence. All different varieties were harvested in 2005. The RACB investigation included only the GM and ISO corn from a second harvest in Canada in 2007. All corn varieties were substantially equivalent in both harvests. The diets were offered as meal instead of pellets in order to avoid potential changes of feed components due to the application of heat and pressure. This is an important fact because for GMO crops the heat sensibility and in general the susceptibility to feed and food processing methods has hardly been addressed up to now.
Reproduction and performance- MGS
The MGS over 4 generations did not show significant differences between the feeding groups ISO and GM. The number of pups weaned, the average litter size and weight at weaning tended to be lower in the GM group as compared to the ISO group. At the same time the pup losses were higher in the GM group. These differences were consistent over the generations, but not significant, since the intra-group variability was very high. It might be speculated that not all mice were compromised by the GM feed be-cause of the high genetic variation between the test animals. The effects on litter size and weight became more notable in the 4th generation. In terms of produc-tion profit the ISO group had more weaned pups, 9% more females with litters (64% vs 73%) and slightly higher average litter weights at weaning in the ISO group (92.6 g vs 102.1 g).
EXHIBIT J - Page 573
Case 5:14-cv-00117-cr Document 63-11 Filed 11/14/14 Page 291 of 312

Biological effects of transgenic maize NK603xMON810 fed in long term reproduction studies in mice
Page 85 of 105
The additional A REF group excelled in number of females with litters (91%) and accordingly more pups weaned as well as a 35% higher body mass production as compared to the GM group. Within four generations bred in the MGS no adverse effects on overall health and reproduction as well as performance were seen. Feed intake, fertility rate and number of pups born and weaned as well as body weight gain showed no statistically significant (p<0.05) differences.
Reproduction and performance- RACB
The 1st litters in the RACB displayed no differences between the GM and ISO feeding groups. Comparing the 2nd litters a very slight tendency towards smaller litter size and accordingly lower average litter weight in the GM group could be observed. In the 3rd and 4th litters the aforementioned traits became significant (p<0.05). Apart from a decline of deliveries, in the 3rd and 4th litters signifi-cantly fewer pups were born and in the 4th litter also significantly fewer pups were weaned in the GM group. The average litter weights were in favour of the ISO group with significant results in the 3rd litters at birth and weaning as well as in the 4th litters at birth. But in contrast to the MGS the loss of pups was higher in the ISO group. These results substantiate the assumption that long term feeding studies with more generations are useful in studying chronic diet related effects. According to our data the RACB design was better suited than the MGS, since the differences between the feeding groups were at significant levels. The biological phenomenon observed in the RACB trial cannot be explained by different nutrient intakes, because both diets were covering the energy and nu-trient requirements and fulfilled the prerequisite of nutritional equivalence. Lower reproduction performance can be considered as indicator for a dietary effect. It can be speculated, that this effect was caused by a factor beyond nutrient sup-ply. Whether this can be related to one of the two genetic modifications in the transgenic material or whether this is an unintended effect in the strict sense re-lated to the stacked events has to be further evaluated. Compared to the findings in the RACB trials it can be assumed that the physio-logical stress was considerably lower in the MGS trial. The trial design of using “new” parental generations instead of continuous breeding with the same gen-eration has to be considered as being obviously less demanding. This might have masked the impact of dietary factors on reproductive performance. However, this part of the experiment is valuable as such because it underlines the need for dif-ferent experimental designs for the assessment of dietary effects that have an unknown impact on animals. The genomic work that was performed in the gut tissue of the mice of both groups is not indicative. However, the high number of deregulated genes that has been identified as difference between both groups could indicate a complex nutrition-host-interaction. This has to be further evaluated and gene expression profiles need to be considered in other organs and especially in the reproductive system. To date, trials have not been performed on that issue in feeding studies with genetically modified corn to our best knowledge.
EXHIBIT J - Page 574
Case 5:14-cv-00117-cr Document 63-11 Filed 11/14/14 Page 292 of 312

Biological effects of transgenic maize NK603xMON810 fed in long term reproduction studies in mice
Page 86 of 105
Reproduction and performance in other trials
It is surprising that despite the long use of Bt corn since 1996 and the many con-troversial discussions about its safety, partly fuelled by anecdotal evidence, only few peer-reviewed multi-generation studies investigating potential effects of delta endotoxins on rodents have been conducted so far. Brake et al. (2004) used mouse testes as a sensitive indicator of potential toxic effects of diets con-taining Bt corn. The type of delta-endotoxin was not mentioned nor the condi-tions under which the diet was processed. This is an essential point when com-paring different studies. When heat is applied during feed processing (e.g. pellet-ing), the danger of denaturing the transprotein is high and the outcome might be completely different compared to the raw material. In the aforementioned Brake-study different mouse strains were used and crossed. For a short term study the mice were obtained at the age of 5 weeks and kept for 3 weeks on a conventional mouse chow. Only at the time of breed-ing the test diets were given. For the long term study with four generations 16 randomly chosen males and females (2 of each sex and strain for each diet) were used at the start and fed the test diets before mating. To produce the 2nd and 3rd generation 6 females and 3 males were paired for each strain and diet. No diet related differences in the sperm development were found in this study. Significant differences occurring during the spermatogenesis were attributed to age differences. The progeny born within the same 24 hours was considered the same age. The authors also mentioned effects on litter sizes and weights. In the 4th generation they found significant differences in body weight comparing 3 animals / treatment at day 26 in favour of the GM diet (p=0.001) and on day 63 in favour of the conventional diet (p=0.005). It is also stated that litter sizes were similar in both feeding studies, suggesting that the Bt diet is not a factor impairing reproductive performance. The results are not corroborated by the pre-sent study. Data cannot be directly compared to the present results since inbred mouse strains have smaller litters and often have lower body weights. A three generation study with Bt corn was also conducted with laboratory rats. Apart from some significant histopathological changes in liver and kidney no dif-ferences were found between the feeding groups (Kilic and Akay 2008). No dif-ferences concerning developmental performance were reported. But the number of offspring was generally very low in this 3 generation study, 4-5 pups / dam, whereas 10-12 pups / dam can be expected from Wistar Albino rats. Many short term feed conversion studies with GM crops conducted with farm animals showed no negative effects (Aumaitre 2002; Flachowsky et al. 2005). The number of feeding studies with rodents is small, and inconsistent differences make it difficult to draw an overall conclusion on the tested GM feed (Hammond et al. 2006). Thus the safety of NK603 x MON810 is based on one poultry study performed by the applicant with the parental lines including 90 day rodent stud-ies, and one poultry study with the stacked event (ACRE 2004). The GMO Panel of EFSA considers it unlikely that NK603 x MON810 maize will have any adverse effect on human and animal health (Opinion of GM Panel, 2005) Regarding the weight development of the parental mice in the present study the short term feeding results can be corroborated, since the weight differences ob-served were very small and inconsistent. Chronic effects are difficult to measure and cannot be assessed by feeding trials in non performing animals. To ascertain that no chronic health impacts are caused by GM feed components the animal homeostatic system has to be challenged, since health is defined by the ability to
EXHIBIT J - Page 575
Case 5:14-cv-00117-cr Document 63-11 Filed 11/14/14 Page 293 of 312

Biological effects of transgenic maize NK603xMON810 fed in long term reproduction studies in mice
Page 87 of 105
handle and overcome challenges, e.g. infections or stress, successfully. In the present study reproduction was chosen as a high performance status in a long-term feeding study encompassing several generations (MGS) and continuous re-production of several litters (RACB). The RACB test design is normally applied for testing xenobiotic substances such as pesticides to define safety limits and has never been used before in connection with GM assessment to our knowledge. Since in toxicity tests, the LD50 for Cry1Ab showed no dose related deaths at an amount of 4000mg/kg (oral), the EPA has established the rule of an exemption from the requirement of a tolerance for residues of the plant pesticide active in-gredients Bacillus thuringiensis Cry1Ab delta-endotoxin and the genetic material necessary for its production in all plants (EPA, 2001). But no multigenerational studies with the toxins have been performed to exclude any possible chronic ef-fects. The present RACB has been designed as whole feed study. The interpretation poses difficulties since it does not concern one single compound in different con-centrations, but whole feed effects. On the other hand realistic conditions are reflected. Further studies are needed comparing GM corn producing the Bt toxin with non-GM corn spiked with corresponding amounts of Bt toxin to investigate whether the method of GM and/or the toxin are responsible for the outcome.
Organ weights and microscopic investigations (histology, immunohistochemistry, ultra-structural investigations)
Organ weights were recorded as potential indicator of a dietary effect on the or-ganism. Liver and kidneys are central metabolic organs and are important for metabolic and excretory processes and are therefore often regarded as indicator organs for toxic effects. Therefore differences in liver and kidney weights are considered as sensitive risk parameters. Kilic and Akay (2008) also referred to significant differences in these organs. Significantly lower relative kidney weights were found in GM females (F2, F3, F4) and in GM males (F3). Hammond et al. (2006) also mentioned lower relative kid-ney weights for MON863 (Cry3Bb1) fed males compared to the controls, but not at a statistically significant level. Microscopic pathological changes were de-scribed earlier in kidneys from rats from a 90day feeding trial, but they were not considered being feed related. A revision of these data indicated the possibility of GM-linked renal toxicity in male animals (Séralini et al. 2007), however, these results were critically discussed by several other authors including EFSA. In-creased liver weights in females fed a GM diet were discussed as potential risk indicator (Séralini et al. 2007). In the present study liver weights were different between feeding groups in GM females, however, this was not unidirectional and therefore not interpretable. No differences in liver weight were seen in males. The spleen is an important immunological organ and thus may also reflect die-tary impacts. In the present study the relative spleen weights were significantly higher in the GM males of the F2 generation, in the other trial periods no such differences were found. No histological changes were seen in these organs. The investigation of T- and B- lymphocytes as well as macrophages by immuno-histochemistry did not reveal differences between the groups. The ultrastructural investigation revealed some statistically significant differences between the groups. The fibrillar centres (FC) and dense fibrillar components (DFC) and the pore density are linked to the metabolic rate of cells. Increasing
EXHIBIT J - Page 576
Case 5:14-cv-00117-cr Document 63-11 Filed 11/14/14 Page 294 of 312

Biological effects of transgenic maize NK603xMON810 fed in long term reproduction studies in mice
Page 88 of 105
metabolic rate leads to higher values of these parameters (Schwarzacher and Wachtler 1993; Dzidziguri et al. 1994). The nuclear shape irregularity, a way to detect enlarged surface areas, sometimes appears with rapid nucleus activity enhancement (Malatesta et al. 1998). Regarding the main test groups ISO and GM some differences were found. The lower nuclear pore density and the lower quantity of the nucleolar components FC and DFC in both females and males, found in hepatocytes of GM mice, indicate a lower liver metabolic rate in animals fed the GM feed. Similar findings were reported previously (Malatesta 2002). Since hepatocytes are involved in numerous metabolic activities, the cause of these observations is not clear. The spleen lymphocytes in male mice showed higher DFC values in the GM group compared to the ISO group, suggesting an increased activity. Females seemed not to be affected. The DFC in pancreatic cells was decreased in males of the GM group, the FC was slightly increased. Therefore, a generalizing conclusion about cell activities is not possible. The comparison of the ISO group to the REF A group showed only few differences. Only the decreased FC and DFC values in hepatocytes of male mice in the A REF group as compared to the ISO group were significant. The other findings showed comparable values. Although the ISO and A REF diets were based on different corn varieties, the ul-trastructural data of these two groups are closer together than those obtained from comparing the ISO and the GM group. Possibly, these parameters are less influenced by the maize variety than by the genetic modification.
Molecular analyses- Microarray and q-RT-PCR
Differences in gene expression in the intestinal tissue were seen in a number of biological processes when the different groups were compared. The corn might have contributed to that because the substantial equivalence was given, how-ever, minor differences might have acted as extrinsic factors. The inter-individual differences generated by the outbred strain (intrinsic factors) may have amplified noise of the expression data. Microarray data display phenotypic variability through noise from intrinsic or extrinsic sources and can make those data diffi-cult to interpret (Raser and O’Shea 2005). When ISO and A REF were pooled to one group and compared to the GM group, the expression data from ISO and GM comparison became more pronounced and the level of significance increased in the pathways protein biosynthesis as well as protein metabolism and modifica-tion. In addition to difficult data interpretation through noise the majority of dif-ferences found in the array data were under a fold change of 2 which is rather low and near detection limit of microarray analyses. Moreover, the dynamic range/sensitivity of microarrays limits their use in detecting changes in mRNA levels of those genes expressed at low abundance (Lord et al. 2006). Clustering into biological processes and pathways was used in our study to overcome this limitation. Influence of the variety but also of the genetic modification were observed in mi-croarray analyses of jejunal tissue. The intestine is considered as “feed-host in-terface” and until now no effects of Cry1Ab on mammalian intestinal cells were reported (Bondzio et al. 2008). As there are no previous pathways identified whole transcriptome microarray analyses covering the whole murine genomic
EXHIBIT J - Page 577
Case 5:14-cv-00117-cr Document 63-11 Filed 11/14/14 Page 295 of 312

Biological effects of transgenic maize NK603xMON810 fed in long term reproduction studies in mice
Page 89 of 105
profile were used as a pre-screening tool. Significant (p<0.001) differences in gene expression were identified in a number of biological processes and path-ways between the GM and non-genetically modified diets. Q-RT PCR, the gold standard for gene expression analysis, was done with a set of 45 out of 400 deregulated genes previously identified by microarray analyses. From the 45 genes investigated on the TLDA, 9 (p<0.05) genes were classified as deregulated with influences by the trial, but also by sex and anatomical site. Differences between ISO and GM fed mice detected by microarray analysis were observed in several pathways. Clearly more work needs to be done on those analyses to get further insights into natural variation of gene expression and po-tential impact of dietary modifications. In a next step more work is necessary regarding the normalization of expression data and extending set of target genes that can contribute to the list of deregulated genes by GMO food. The networks around the marker genes identified are a promising issue of further research. Further the sampling strategy has to be improved to circumvent high intra-group variability. Variability trough noise is coming from extrinsic e.g. the corn varieties and in-trinsic, e.g. outbred strain sources that make array data difficult to interpret (Raser and O’Shea 2005). Further work is necessary to confirm and identify the full set of deregulated genes, identify involved pathways and especially to proof the deregulation at protein level. So far the genes detected represent only a proof of principle that differences can be seen between the ISO and GM group but no statement about the meaning of those genes can be discussed. Due to the high technical demands and costs of such trials it will be difficult to set up these approaches in the future regarding the high number of new applica-tions for the import of transgenic foods and feeds into the EU that are expected to come. However, based on the experience of this study it seems to be feasible to establish new test models that would increase consumer safety in this impor-tant area of risk assessment at least in selected GM feed and food materials.
EXHIBIT J - Page 578
Case 5:14-cv-00117-cr Document 63-11 Filed 11/14/14 Page 296 of 312

Biological effects of transgenic maize NK603xMON810 fed in long term reproduction studies in mice
Page 90 of 105
5. Conclusion
Feeding mice with diets containing the transgenic corn NK603 x MON810 in dif-ferent models of multi-generation studies indicated that the RACB trial design was sensitive and could therefore be better suited compared to the MGS model for the evaluation of reproductive traits. Reproductive traits were not statistically different over 4 generations in the MGS, but in differences between the groups became obvious in the 3rd and 4th litters of the RACB. RNA microarrays and q-RT-PCR indicated differences between the groups. The findings were weak and need confirmation. However, a dietary impact on gene expression cannot be excluded. The high intra group variance could be due to different sensitivity of genotypes within the outbred mouse strain OF1 used in this study. For further investigation an RACB including several inbred strains could be useful. Some data obtained from the assessment of selected traits in organs by electron microscopy indicate a diet-host interaction that should be fur-ther evaluated. The trial indicates that dietary interactions with the host organism have to be further evaluated. Regarding the sensitivity of the topic, studies are needed to extend the database using standardized feeding trials with clear endpoints such as reproductive performance and a backup by genomic, proteomic and me-tabolomic traits. Summarising the study, the maize with the stacked event NK603 x MON810 af-fected the reproduction of mice in the RACB trial. Whether similar findings could be expected for other animals, needs to be evaluated in studies including repro-ductive traits. Future studies are necessary to determine the impact of normal and transgenic dietary ingredients on the organism.
EXHIBIT J - Page 579
Case 5:14-cv-00117-cr Document 63-11 Filed 11/14/14 Page 297 of 312

Biological effects of transgenic maize NK603xMON810 fed in long term reproduction studies in mice
Page 91 of 105
6. Diskussion
Ziel der Untersuchung
Das Ziel der Untersuchung war die Überprüfung von möglichen Effekten der gen-technisch veränderten Maissorte NK603 x MON810 auf Reproduktionsparameter in Fütterungsversuchen bei Mäusen. Ein Kurzzeitfütterungsversuch mit Hühnern zeigte keine nachteiligen Effekte. Fütterungsstudien mit Nagern sind nicht durch-geführt worden. Beide Elternlinien des untersuchten stacked event Produkts sind als sicher eingestuft worden. Toxikologische Risiken gentechnisch veränderter Pflanzen werden derzeit mittels 90-Tage Fütterungsversuchen mit Nagern bewertet. Eine 90-Tage Studie wird als ausreichend eingestuft, um nachteilige Effekte zu erfassen. Es stellt sich aber die Frage, inwieweit länger dauernde Multigenerationenversuche in diesem Zusam-menhang sinnvoll sein können. Reproduktion und Laktation sowie Wachstum und Überlebensrate der Nachkommen stellen sensible Parameter dar. Weiters werden fast alle derzeit vermarkteten gentechnisch veränderten Pflanzen für landwirt-schaftliche Nutztiere eingesetzt, die Reproduktionsleistungen erbringen müssen. Daher erschien es notwendig, den Einfluss der Futtermittel auf die Zucht detail-liert zu untersuchen. Die vorliegende Studie untersucht einen stacked event in einem Multigeneratio-nenversuch mit den Schwerpunkten Reproduktion und Jungtierentwicklung bei Mäusen. Zusätzlich wurden mikroskopische Untersuchungen von Darm und Orga-nen (Histologie, Elektronenmikroskopie und Immunhistochemie) und in Darmge-webe Microarrayanalysen durchgeführt, um mögliche Effekte des transgenen Mai-ses weitergehend zu untersuchen.
Methoden
In diesem Projekt wurden für die Evaluierung des stacked events NK603 x MON810 zwei Versuchsdesigns angewendet, um die Eignung verschiedener An-sätze für die Risikoforschung zu beleuchten und zu vergleichen. Das erste Ver-suchsdesign war eine Multigenerationenstudie (MGS) mit vier Mäusegeneratio-nen. Das zweite Versuchsdesign war die Methode der fortlaufenden Zucht (Re-productive Assessment by Continuous Breeding; RACB) mit vier Würfen. Unter-suchte phänotypische Parameter waren die Gewichtsentwicklung der Eltern und Nachkommen sowie Wurfgröße und Überlebensrate bis zum Absetztermin. In der Multigenerationenstudie wurden neben der phänotypischen Erfassung der Leistungen ergänzende Untersuchungen durchgeführt. Diese umfassten die Erhe-bung der Organgewichte sowie histologische und elektronenmikroskopische Un-tersuchungen. Der Fokus lag dabei auf dem Darm im Sinne eines Grenzflächen-organs zwischen Nahrung und Tier. Immunhistochemische Methoden wurden für die Untersuchung von Lymphozytenpopulationen im Dünndarm angewendet und Genexpressionsprofile des Jejunums wurden mittels Microarrayanalysen und an-schließender q-RT-PCR erstellt. Eine Lebensdauerstudie stellte den dritten Ver-suchsansatz dar, um mögliche Einflüsse der untersuchten Maisvarianten zu erfas-sen. Für alle Versuchsdesigns wurden Mäuse eines Auszuchtstamms (OF 1) verwen-det. Die Verwendung eines Auszuchtstamms bedingt eine tierexperimentelle Ba-
EXHIBIT J - Page 580
Case 5:14-cv-00117-cr Document 63-11 Filed 11/14/14 Page 298 of 312

Biological effects of transgenic maize NK603xMON810 fed in long term reproduction studies in mice
Page 92 of 105
sis mit relativ heterogenen Mausgenotypen. Als Alternative hätte ein Inzucht-stamm verwendet werden können, der möglicherweise den Vorteil einheitlicherer Ergebnisse gehabt hätte. Nachteil dieses Ansatzes sind nicht vorhersehbare un-terschiedliche Sensitivitäten des jeweiligen Testkollektivs, die das Risiko einer gerichteten, positiven oder negativen Beeinflussung der Ergebnisse erhöht hätte. Die Ergebnisse dieser Studie zeigen einige Unterschiede zwischen den Fütte-rungsgruppen an, die zum Teil statistisch abzusichern waren. Das Methoden-spektrum war so gewählt, dass eine Erfassung potentieller Interaktionen zwi-schen den verfütterten Maisvarianten und dem Organismus möglich war. Die ge-wählten Methoden sollten in zukünftigen Studien weiter evaluiert werden, um deren Sensitivität und die Variabilität in Abhängigkeit von Fütterungsbedingun-gen, Mausstämmen oder anderen Tierarten zu überprüfen. Die Einbeziehung an-derer Ernährungstypen (omnivor, herbivor, karnivor) wäre sinnvoll.
Maisvarianten der Fütterungsstudien
Für die MGS wurden drei Fütterungsgruppen verwendet. Die drei entsprechenden Diäten enthielten entweder 33% NK603 x MON810 (GM Gruppe), eine isogene Maislinie (ISO Gruppe) – beide angebaut unter kontrollierten Bedingungen in Ka-nada – und Mais aus Österreich (A REF Gruppe). Die Diät mit österreichischem Mais wurde auf Grund einer leichten Verunreinigung der aus Kanada bezogenen isogenen Maisvariante eingeführt. Der Mais für die MGS und den Lebensdauer-versuch wurde 2005 geerntet. Für den RACB Versuch wurden nur die beiden ka-nadischen Testsorten (GM und ISO) aus einer Ernte von 2007 verwendet. Alle Maissorten waren weitgehend substanziell äquivalent. Die Diäten wurden in Schrotform, nicht pelletiert und nicht thermisch behandelt angeboten, um mögli-che Veränderungen der Futterkomponenten durch die Einwirkung von Druck und Hitze, wie es beim Pelletieren der Fall ist, zu vermeiden. Eine Temperatursensiti-vität der Deltaendotoxine ist nach Literaturangaben vorhanden.
Reproduktion und Leistung - MGS
Die MGS zeigte über 4 Generationen keine statistisch signifikanten Unterschiede zwischen den Fütterungsgruppen GM und ISO. Die Anzahl abgesetzter Junge, die durchschnittliche Wurfgröße und das durchschnittliche Wurfgewicht waren im Vergleich zur ISO Gruppe in der GM Gruppe geringfügig niedriger, während der Verlust an Jungen in dieser Gruppe etwas höher war. Diese Unterschiede waren konsistent in den Generationen, aber nicht auf einem signifikanten Niveau. Tierindividuelle Reaktionen sind nicht auszuschließen, da nicht alle Mäuse durch die GM Diät beeinträchtigt waren und vermutlich eine hohe genetische Variation zwischen den Mäusen bestand. Die Einflüsse auf Wurfgröße und –masse wurden in der vierten Generation deutlicher. Im Hinblick auf die Produktion erbrachte die ISO Gruppe eine 20% höhere Gesamtleistung als die GM Gruppe, was auf das Zusammentreffen mehrerer Faktoren zurückzuführen war. Die ISO Gruppe hatte mehr abgesetzte Junge, 9% mehr Weibchen mit Würfen und ein geringfügig hö-heres Durchschnittsgewicht bei den abgesetzten Würfen. Die zusätzliche A REF Gruppe übertraf die beiden anderen Gruppen sowohl be-züglich der Weibchen mit Würfen und dementsprechend höheren Anzahl ange-
EXHIBIT J - Page 581
Case 5:14-cv-00117-cr Document 63-11 Filed 11/14/14 Page 299 of 312

Biological effects of transgenic maize NK603xMON810 fed in long term reproduction studies in mice
Page 93 of 105
setzter Junge als auch einer 35% höheren Gesamtproduktionsleistung verglichen mit der GM Gruppe. Während der vier Generationen wurde kein Einfluss auf die Gesundheit beobach-tet. Die Futteraufnahme, die Fruchtbarkeitsrate sowie die Anzahl an Jungen und deren Gewichtszunahme zeigten keine statistisch signifikanten Unterschiede.
Reproduktion und Leistung - RACB
Die ersten Würfe in dem RACB Versuch zeigten keine Unterschiede zwischen den Fütterungsgruppen. Während des zweiten Wurfes konnte eine geringfügige Ver-änderung zu kleineren Würfen und niedrigeren durchschnittlichen Wurfgewichten in der GM Gruppe beobachtet werden. Die Ergebnisse des dritten und vierten Wurfes ergaben deutlichere Unterschiede (p<0,05). Neben der Abnahme an Wür-fen pro Gruppe (im vierten Wurf nahe der Signifikanzgrenze, p=0,055), wurden in der GM Gruppe bei den dritten und vierten Würfen weniger Welpen geboren und bei den vierten Würfen auch weniger Jungtiere abgesetzt. Die durchschnittli-chen Wurfgewichte waren in der ISO Gruppe in den dritten Würfen bei Geburt und Absetzen abgesichert höher, bei den vierten Würfen bei der Geburt. Im Un-terschied zu der MGS war der Verlust an Jungtieren in der ISO Gruppe gegenüber der GM Gruppe höher. Diese Ergebnisse unterstützen die Annahme, dass Langzeitfütterungsversuche für die Erfassung von ernährungsbedingten Effekten geeignet sind. Entsprechend unserer Ergebnisse war das RACB Versuchsdesign offenbar sensitiver als das MGS Design und zeigte abzusichernde Unterschiede. Die unterschiedlichen Re-produktionsdaten im RACB Versuch können nicht plausibel durch unterschiedliche Nährstoffaufnahmen erklärt werden, da beide Diäten den Energie- und Nährstoff-bedarf der Tiere abdeckten und den Anforderungen an Äquivalenz sehr weitge-hend entsprachen. Eine geringere Reproduktionsleistung kann als Indikator für diätetische Effekte angesehen werden. Es ist nicht auszuschließen, dass diese Effekte auf Einfluss-faktoren außerhalb der Nährstoffversorgung beruhen. Ob diese Beobachtung auf die genetische Modifikation oder auf einen unbeabsichtigten Effekt des geprüften Produkts zurückzuführen ist, sollte in künftigen Arbeiten untersucht werden. Die genomischen Untersuchungen des Darmgewebes der Mäuse beider Gruppen kön-nen die Ursache der Veränderungen in den Reproduktionsparametern nicht erklä-ren. Aber die große Zahl an deregulierten Genen, die als Unterschied zwischen den beiden Gruppen identifiziert wurden, könnte auf eine komplexe Interaktion von Nahrungsfaktoren mit dem Organismus hindeuten. Diese Analysen wären zu erweitern und sollten auf andere Körpersysteme, besonders solche mit Relevanz für die Reproduktion, ausgedehnt werden. Bis heute gibt es nach unserem Wis-sen keine solchen Untersuchungen im Zusammenhang mit gentechnisch verän-dertem Mais. Der direkte Vergleich der Ergebnisse des RACB Versuches mit denen des MGS legt die Hypothese nahe, dass die physiologische Stressbelastung in der MGS im Vergleich zum RACB erheblich geringer war. Das Versuchsdesign, bei welchem für jede Generation „neue“ Eltern aus den Nachkommen der vorherigen Genera-tion herangezogen werden anstatt dieselben Eltern in mehreren konsekutiven Phasen zu verwenden, ist offensichtlich für den Organismus weniger fordernd und belastend. Diese Tatsache könnte den Futtereinfluss auf die Reproduktion in der MGS maskiert haben. Das MGS Design stellt trotzdem einen wichtigen Beitrag in der Diskussion um die Bewertung von genetisch modifizierten Futtermitteln dar,
EXHIBIT J - Page 582
Case 5:14-cv-00117-cr Document 63-11 Filed 11/14/14 Page 300 of 312

Biological effects of transgenic maize NK603xMON810 fed in long term reproduction studies in mice
Page 94 of 105
da es die Notwendigkeit der vergleichenden Prüfung verschiedener Versuchsde-signs bei der Beurteilung von unbekannten Diätfaktoren verdeutlicht.
Reproduktion und Leistung in anderen Untersuchungen
Es ist festzustellen, dass trotz der langjährigen Anwendung von Bt Mais seit 1996 und vieler kontroversieller Sicherheitsdiskussionen, die teilweise ohne wissen-schaftlich belegte Aussagen geführt werden, bisher kaum Multigenerationenstu-dien zu möglichen Effekten von Deltaendotoxinen bei Nagern durchgeführt wur-den. Brake et al. (2004) verwendeten Hoden von Mäusen für die Evaluierung po-tenziell Ernährungseffekte von Bt Mais. Weder die Art des Endotoxins noch die Futterzubereitung wurden explizit dargestellt. Diese Informationen sind für den Vergleich verschiedener Studien von grundlegender Bedeutung. Bei Hitzeanwen-dung, z. B. beim Pelletieren, besteht die Gefahr der Denaturierung von Proteinen. Es ist daher nicht auszuschließen, dass Ergebnisse anders ausfallen als bei Roh-produkten. In der zitierten Studie wurden verschiedene Mauszuchtlinien verwen-det und gekreuzt. Für einen Kurzzeitversuch wurden fünf Wochen alte Mäuse über einen Zeitraum von drei Wochen mit kommerziellem Mischfutter ernährt. Erst zur Paarungszeit wurde die Testdiät verabreicht. Für die Langzeitstudie mit vier Generationen wurden nach dem Zufallsprinzip 16 Weibchen und Männchen (jeweils zwei Tiere je Geschlechts und Zuchtlinie / Testdiät) ausgewählt und be-reits vor der Paarung mit der Testdiät gefüttert. Für die Produktion der zweiten und dritten Generation wurden für jede Zuchtlinie und Diät jeweils sechs Weib-chen mit drei Männchen gepaart. In dieser Studie wurden keine Unterschiede in der Spermatogenese gefunden. Signifikante Unterschiede, die während der Spermatogenese auftraten, wurden auf das differierende Alter der Tiere zurück-geführt. Die innerhalb von 24 Stunden geborenen Nachkommen waren als gleich-altrig eingestuft worden. Die Autoren erwähnen auch Wurfgrößen und –gewichte. In der vierten Generation am 26. Tag waren die Tiere der GM Gruppe signifikant schwerer (p = 0,001), während am 63. Tag das Ergebnis umgekehrt war (p = 0,005). Allerdings wurden jeweils nur drei Tiere für die Gewichtsbestimmung he-rangezogen. Die Wurfgrößen waren ähnlich, so dass die Bt Diät keine negativen Einflüsse auf die Reproduktion hatte. Diese Ergebnisse können mit der hier prä-sentierten Untersuchung nicht direkt verglichen werden, da sich Inzuchtlinien durch kleinere Würfe und geringere Körpermassezunahmen auszeichnen und auch die Futtervarianten unterschiedlich waren. Eine weitere Studie mit Laborratten und Bt Mais wurde über drei Generationen durchgeführt. Abgesehen von histopathologischen Unterschieden in Leber und Niere wurden keine Effekte gefunden, auch nicht in der Reproduktionsleistung (Kilic und Akay 2008). Die Anzahl an Nachkommen war in dieser Generationen-studie sehr niedrig, 3-4 Junge pro Weibchen, während 10-12 Junge pro Weibchen bei dieser Zuchtlinie (Wistar Albino Ratten) normalerweise hätten erwartet wer-den können. Publizierte Kurzzeitfütterungsversuche mit genetisch modifiziertem Mais an Nutz-tieren zeigten keine negativen Einflüsse der Bt Produkte (z.B. Aumaitre 2002; Flachowsky et al. 2005). Die Anzahl der Fütterungsversuche mit Nagern ist zu gering und inkonsistente Ergebnisse erschweren eine allgemeine Schlussfolge-rung über mögliche Effekte der Testfutter (Hammond et al. 2006). Die Sicherheitsbewertung von NK603 x MON810 beruht auf den Ergebnissen ei-ner Fütterungsstudie mit Hühnern und einer 90-Tagesstudie mit Laborratten mit den Elternlinien der stacked event Maissorte sowie einer Untersuchung mit dem kombinierten Mais an Hühnern, die von den Antragsstellern durchgeführt wurden.
EXHIBIT J - Page 583
Case 5:14-cv-00117-cr Document 63-11 Filed 11/14/14 Page 301 of 312

Biological effects of transgenic maize NK603xMON810 fed in long term reproduction studies in mice
Page 95 of 105
Das GMO Panel der EFSA betrachtet es daher als unwahrscheinlich, dass NK603 x MON810 negative Effekte auf die Gesundheit von Mensch und Tier haben wird (Opinion of GMO Panel 2005). In der hier präsentierten Studie können die Ergebnisse der Kurzzeitversuche bes-tätigt werden, so weit es die Gewichtsentwicklung der Elterntiere betrifft, da die Gewichtsunterschiede sehr gering und inkonsistent waren. Mögliche chronische Effekte sind schwerer erfassbar, vermutlich erlauben reproduzierende Tiere eine genauere Erfassung. Langfristige Gesundheitseffekte erscheinen unter dem As-pekt einer Belastung des homöostatischen Systems von Interesse, da Gesundheit auch durch die Fähigkeit, mit Herausforderungen wie z.B. Infektionen oder Stress erfolgreich umzugehen und diese zu bewältigen, definiert wird. In der vorliegen-den Studie wurde diesem Aspekt in Langzeitversuchen zur Reproduktion Rech-nung getragen, wobei mehrere reproduzierende Generationen (MGS) bzw. meh-rere Würfe einer Elterngeneration (RACB) eingeschlossen waren. Das RACB Versuchsdesign wird bei der Sicherheitsbewertung von xenobiotischen Substanzen wie Pestiziden angewendet und wurde nach unserem Wissen nie zur Überprüfung von GM Produkten benützt. Da toxikologische Untersuchungen zur Bestimmung des LD50 Wertes für Cry1Ab bis zu einer Menge von 4000mg/kg keine dosisabhängigen Effekte (Todesfälle) ergaben, wurden in den USA von der zuständigen Behörde (Environmental Protection Agency) die Deltaendotoxine so-wie alle Pflanzen, die solche exprimieren, von der Notwendigkeit einer Grenz-wertbestimmung ausgenommen (EPA 2001). Mit den Toxinen wurden allerdings keine Mehrgenerationenstudien durchgeführt, um mögliche chronische Effekte auszuschließen. In dem vorliegenden RACB Versuch wurden Maiskörner und nicht das isolierte Endotoxin als Testprodukt gewählt. Die Interpretation solcher Versu-che ist naturgemäß schwierig, da nicht ein Einzelstoff in verschiedenen Konzent-rationen untersucht werden kann, sondern die Effekte des Testprodukts insge-samt erfasst werden. Im Sinne der Verwendung als Futtermittel werden dadurch aber realistische Bedingungen reflektiert. Weitere Studien mit genetisch modifi-ziertem und mit isogenem Mais, der mit einer äquivalenten Menge an Deltaendo-toxin versetzt wurde, könnten für die Differenzierung von möglichen Effekten der genetischen Modifikation bzw. der Toxine hilfreich sein.
Organgewichte sowie mikroskopische Untersuchungen (Histologie, Immunhistochemie und ultrastrukturelle Untersuchungen)
Als mögliche Indikatoren für diätetische Effekte wurden die Organgewichte erho-ben. Leber und Niere werden als mögliche Indikatoren angesehen, da sie für die Metabolisierung und Ausscheidung zahlreicher Substanzen verantwortlich sind. Daher werden Unterschiede im Leber- und Nierengewicht als empfindliche Risiko-parameter gewertet. Kilic und Akay (2008) erwähnten signifikante Unterschiede bei diesen Organen zwischen den Fütterungsgruppen. In der vorliegenden Studie wurden bei den Weibchen (F2, F3, F4) und Männchen (F3) der GM Gruppe signifikant niedrigere relative Nierengewichte nachgewiesen. Hammond et al. (2006) erwähnten ebenfalls niedrigere relative Nierengewichte bei Männchen, die mit einer MON863 Diät (Cry3Bb1) gefüttert wurden, aber nicht auf signifikantem Niveau. Auch histopathologische Veränderungen in Nieren von Laborratten in einem 90-Tage Fütterungsversuch wurden beschrieben, aber als biologisch bedeutungslos eingestuft. Eine Evaluierung dieser Daten indizierte die Möglichkeit einer nierentoxischen Wirkung der GV Fütterung in männlichen La-borratten (Séralini et al., 2007), diese Interpretation wurde allerdings von ande-ren Autoren einschließlich der EFSA kritisch hinterfragt. Auch erhöhte Leberge-
EXHIBIT J - Page 584
Case 5:14-cv-00117-cr Document 63-11 Filed 11/14/14 Page 302 of 312

Biological effects of transgenic maize NK603xMON810 fed in long term reproduction studies in mice
Page 96 of 105
wichte bei Rattenweibchen wurden als mögliche Indikatoren für toxische Wirkun-gen diskutiert (Séralini et al. 2007). In der vorliegenden Studie waren die Leber-gewichte bei den Weibchen unterschiedlich zwischen den Fütterungsgruppen, die-se Unterschiede waren jedoch nicht gleich gerichtet und sind daher nicht inter-pretierbar. In den Lebergewichten der Männchen wurden keine Unterschiede ge-funden. Die Milz hat neben anderen auch immunologische Funktionen und könnte daher ebenfalls Diäteinflüsse reflektieren. In der vorliegenden Studie war das relative Milzgewicht bei den Männchen der F2 Generation der GM Gruppe signifikant hö-her, in den anderen Generationen wurde das wiederum nicht bestätigt. Die ultrastrukturellen Untersuchungen zeigten einige Unterschiede zwischen den Gruppen. Die Fibrillarzentren (FC) und die dichten Fibrillarkomponenten (DFC) sowie die Porendichte werden mit der metabolischen Aktivität der Zelle in Zu-sammenhang gebracht, wobei eine zunehmende Aktivität zu höheren Werten die-ser Parameter führen soll (Schwarzacher und Wachtler, 1993; Dzidziguri et al., 1994). Eine Unregelmäßigkeit der Kernform mit vergrößerter Oberfläche wurde ebenfalls mit einer Aktivitätszunahme in Zusammenhang gebracht (Malatesta et al., 1998). Zwischen den Haupttestgruppen GM und ISO wurden einige Unter-schiede gefunden. Die niedrigere Porendichte und geringere Ausprägung der FC und DFC in den Leberzellen bei Männchen und Weibchen deutet auf eine geringe-re Stoffwechselaktivität in der GM Gruppe hin. Ähnliche Ergebnisse wurden auch in einer früheren Studie berichtet (Malatesta, 2002). Da Leberzellen in viele me-tabolische Aktivitäten involviert sind, ist der Grund für diese Veränderungen al-lerdings nicht klar. Die Milzlymphozyten der männlichen Mäuse zeigten hohe DFC Werte in der GM Gruppe, was demnach eine erhöhte Aktivität andeuten könnte. Die Weibchen zeigten keine Unterschiede. Die DFC Werte in den Pankreaszellen waren bei den Männchen der GM Gruppe niedriger, während die FC Werte leicht erhöht waren. Daher kann eine Schlussfolgerung über Zellaktivitäten im Zusammenhang mit GM Futter auf Basis der Ergebnisse nicht erfolgen. Der Vergleich zwischen der ISO und AREF Gruppe zeigte geringere Unterschiede. Nur FC und DFC Werte in den Leberzellen der Männchen der A REF Gruppe im Vergleich zur ISO Gruppe ergaben signifikante Daten. Obwohl die ISO und AREF Diäten verschiedene Maissorten enthielten, waren die ultrastrukturellen Daten dieser beiden Gruppen ähnlicher zueinander verglichen mit den Daten der GM Gruppe.
Molekularbiologische Analysen – Microarray und q-RT-PCR
In den Genexpressionsuntersuchungen am Darmgewebe ergaben sich in Abhän-gigkeit von den Gruppen Unterschiede. Die substantielle Äquivalenz konnte in den Nährstoffuntersuchungen bestätigt werden, trotzdem scheint die Maislinie als extrinsischer Faktor in die Daten einzufließen. Auch intrinsische Faktoren wie die interindividuelle Variabilität in dem Auszuchtstamm führen zu biologischem Rau-schen. Die Summe dieser Faktoren erhöht die Variabilität in derartigen Experi-menten und kann zu Schwierigkeiten in der Datenanalyse führen (Raser and O´Shea 2005). Wenn die beiden nicht transgenen Maislinien (ISO und A REF) zusammengefasst und gegen die transgene Linie verglichen wurden, konnten Un-terschiede zur GM Gruppe im Rahmen der biologischen Prozesse ebenfalls und sogar deutlicher bestätigt werden. Die Daten zeigen eine Erhöhung der Anzahl an deregulierten Genen im Rahmen von Prozessen der Proteinbiosynthese sowie des Proteinmetabolismus bzw. der –modifikation. Eine Schwierigkeit stellen die gerin-
EXHIBIT J - Page 585
Case 5:14-cv-00117-cr Document 63-11 Filed 11/14/14 Page 303 of 312

Biological effects of transgenic maize NK603xMON810 fed in long term reproduction studies in mice
Page 97 of 105
gen Expressionsunterschiede dar. Nur wenige Gene über wurden oberhalb des Faktors zwei differentiell exprimiert. Für die Detektion von geringen Expressions-unterschieden sind Arrays auf Grund einer geringeren Sensitivität und eines ge-ringeren dynamischen Bereichs eingeschränkt geeignet (Lord et al. 2006). In die-ser Studie wurden die Microarrayanalysen durchgeführt, um eine Vorauswahl an Genen zu treffen, die in weiterer Folge durch Clusteranalysen und q-RT-PCR un-tersucht wurden. Unterschiede in der Genexpression im Dünndarmgewebe konnten der Maissorte und der gentechnischen Veränderung zugeordnet werden. An Darmzellen von Mäusen wurden solche Untersuchungen nicht durchgeführt bzw. es wurden keine Effekte von Cry1Ab beobachtet (Bondzio et al. 2006). In der vorliegenden Studie ergaben sich zwischen den Fütterungsgruppen Hinweise auf Unterschiede in ver-schiedenen biologischen Prozessen. In einem folgenden Schritt wurden 45 vorselektierte Gene aus mehreren Stoff-wechselwegen mittels q-RT-PCR als „Referenzmethode“ für Expressionsanalysen untersucht. Von diesen selektierten Genen konnten 9 (p<0.05) als unterschied-lich zwischen ISO und GM in Abhängigkeit von Versuchsdesign, Geschlecht und anatomischer Lokalisation bestätigt werden. Angesichts fehlender Vergleichsstu-dien zu diätetischen Einflüssen von GMOs auf die Genexpression ist eine breitere Datenbasis in diesem Bereich erforderlich. Methodisch konnten die geringen Un-terschiede in der Genexpression dargestellt werden, in weiteren Schritten sollte die Methode noch dahingehend optimiert werden, bessere Normalisierungsstrate-gien zu finden und somit potentielle Kandidatengene mit höherer Wahrscheinlich-keit auffinden und bestätigen zu können. Die Variabilität von extrinsischen Faktoren, z.B. der Maissorte, und intrinsischen Faktoren, z.B. dem verwendeten Auszuchtstamm, erschwert die Datenanalyse. Weitere Arbeiten scheinen notwendig um die betroffene biologische Prozesse und Gene mit höherer Sicherheit zu identifizieren, auch unter Einbeziehung der Prote-inebene. Im Moment können die aufgezeigten Unterschiede zeigen, dass die In-teraktionen zwischen Futter und Darm zwischen GM und ISO unterschiedlich sind, die Bedeutung ist jedoch weiter abzuklären. Auf Grund der hohen technischen Ansprüche und damit verbundenen Kosten wird die Anwendung der Methode auf die zahlreichen GMO Produkte mit Vorbehalt ge-sehen. Anhand dieser Studie konnte gezeigt werden, dass die Etablierung neuer Methoden sinnvoll wäre, zumindest bei ausgewählten GM Produkten, um den Verbraucherschutz zu erhöhen.
EXHIBIT J - Page 586
Case 5:14-cv-00117-cr Document 63-11 Filed 11/14/14 Page 304 of 312

Biological effects of transgenic maize NK603xMON810 fed in long term reproduction studies in mice
Page 98 of 105
7. Schlussfolgerung Die Fütterung von Labormäusen mit dem GV Mais NK603 x MON810 in zwei Mehrgenerationenstudien mit unterschiedlichen Ansätzen, MGS und RACB, zeigte, dass der RACB Versuch die sensiblere Methode darstellt und daher besser geeig-net erscheint, potenzielle Effekte von genetisch modifizierten Produkten zu über-prüfen. Die Reproduktionsparameter waren nicht signifikant unterschiedlich in vier Generationen im Rahmen der MGS, zeigten aber signifikant negative Effekte der GV Diät im dritten und vierten Wurf des RACB. Die Genexpressionsanalyse und q-RT-PCR deuten ebenfalls Unterschiede zwi-schen den Gruppen an. Die Differenzen bedürfen der weiteren Bestätigung, Effek-te der GV Diät können nicht ausgeschlossen werden. Die hohe interindividuelle Variabilität könnte auf unterschiedlich sensitive Genotypen bei den Versuchsmäu-sen des Auszuchtstamms OF1 hinweisen. Weitere Untersuchungen mit Inzucht-stämmen könnten hier Aufschluss geben. Einige Ergebnisse der elektronenmikro-skopischen Untersuchungen geben Hinweise auf eine Interaktion der Futterzu-sammensetzung mit dem Organismus.
Zusammenfassend weisen die Ergebnisse dieser Studie darauf hin, dass Interak-tionen zwischen den Testtieren und den verwendeten Maissorten bestehen, bei Verwendung des stacked event NK603 x MON810 zeigten sich geringere Repro-duktionsleistungen im Verlaufe des RACB. Ob ähnliche Befunde für andere Stäm-me oder auch Spezies reproduzierbar sind, muss in entsprechenden Ansätzen un-tersucht werden. Diese sollten Reproduktionsparameter und eine weitergehende Untersuchung der möglichen Wirkmechanismen umfassen.
EXHIBIT J - Page 587
Case 5:14-cv-00117-cr Document 63-11 Filed 11/14/14 Page 305 of 312

Biological effects of transgenic maize NK603xMON810 fed in long term reproduction studies in mice
Page 99 of 105
8. Overview of tables Table 1: 1st cp4 EPSPS gene cassette ..................................................................... 3 Table 2: 2nd cp4 EPSPS gene cassette .................................................................... 3 Table 3: Gene cassette of MON 810 ....................................................................... 3 Table 4: Overview about diets used ....................................................................... 3 Table 5: Diet composition according to Sniff............................................................ 3 Table 6: Overview of succession of generations ....................................................... 3 Table 7: Data collection of parental mice per generation ........................................... 3 Table 8: Data collection of the offspring per generation ............................................ 3 Table 9: Histological evaluation of the different anatomical sides................................ 3 Table 10: Genes on the TLDA fulfilling with a 2-fold deregulation (p<0.05) between ISO
vs GM groups ................................................................................................. 3 Table 11: Succession of generation in the RACB ...................................................... 3 Table 12: Data of parental mice collected in the RACB.............................................. 3 Table 13: Data of offspring collected in the RACB..................................................... 3 Table 14: Test on genetic modification with PCR ...................................................... 3 Table 15: Crude nutrients and gross energy in the corn ............................................ 3 Table 16: Crude nutrients and gross energy in the diets ........................................... 3 Table 17: Minerals and trace elements in the corn ................................................... 3 Table 18: Minerals and trace elements in the diets................................................... 3 Table 19: Carotene and vitamin analyses in the corn................................................ 3 Table 20: Carotene and vitamin analyses in the diets ............................................... 3 Table 21: Fatty acid profile of corn (g 100g-1 total fatty acids) ................................... 3 Table 22: Amino acids of the diet .......................................................................... 3 Table 23: Investigation of feed hygiene.................................................................. 3 Table 24: Investigation of feed hygiene.................................................................. 3 Table 25: Evaluation of herbicide levels in the diet ................................................... 3 Table 26: Test on genetic modification with PCR ...................................................... 3 Table 27: Crude nutrients and gross energy in the corn and diets .............................. 3 Table 28: Minerals and trace elements in the corn and diets...................................... 3 Table 29: Carotene and Vitamins in the corn and diets ............................................. 3 Table 30: Fatty acid profile of corn (g 100g-1 total fatty acids) ................................... 3 Table 31: Amino acids of the diet .......................................................................... 3 Table 32: Investigation of feed hygiene.................................................................. 3 Table 33: Evaluation of herbicide residues in the diet ............................................... 3 Table 34: Overview of succession of generation and season when performed............... 3 Table 35: Performance of mice fed 33% isogenic (ISO) or genetically modified (GM) corn
in their diet over several generations................................................................. 3 Table 36: Reproduction data of mice fed 33% isogenic (ISO) or genetically modified
(GM) corn in their diet over several generations .................................................. 3 Table 37: Individual pup mass [g] per group at birth, 7, 14, 21 and 28 days after birth
from parents with 33% of near isogenic (ISO) or transgenic(GM) corn in their diet... 3 Table 38: Individual pup mass [g] per group 5 and 6 weeks after birth from parents with
33% of near isogenic (ISO) or transgenic (GM) corn in their diet ........................... 3 Table 39: Performance of mice fed 33% isogenic (ISO) or Austrian reference (A REF)
corn in their diet over several generations .......................................................... 3 Table 40: Reproduction data of mice fed 33% isogenic (ISO) or genetically modified
(GM) corn in their diet over several generations .................................................. 3 Table 41: Individual pup mass [g] per group at birth, 7, 14, 21 and 28 days after birth
from parents with 33% of near isogenic (ISO) or Austrian reference (A REF) corn in their diet ....................................................................................................... 3
Table 42: Individual pup mass [g] per group 5 and 6 weeks after birth from parents with 33% of near isogenic (ISO) or Austrian reference (A REF) corn in their diet............. 3
Table 43: CD3+ Intraepithelial lymphocytes in the gut tissue ( per 0.1 mm2) ............... 3 Table 44: CD20+ cells in the lamina propria of the small intestine ( per 0.1 mm2 .......... 3
EXHIBIT J - Page 588
Case 5:14-cv-00117-cr Document 63-11 Filed 11/14/14 Page 306 of 312

Biological effects of transgenic maize NK603xMON810 fed in long term reproduction studies in mice
Page 100 of 105
Table 45: Macrophages in the lamina propria of the small intestine of female mice ( per 0.1 mm2)....................................................................................................... 3
Table 46: Pore density (pores/µm nuclear membrane length) from different tissue of mice fed 33% genetically modified (GM) or isogenic (ISO) corn ............................. 3
Table 47: Nuclear shape irregularity of different anatomical sites from mice fed 33% isogenic (ISO) or Austrian reference (A REF) corn................................................ 3
Table 48: Pore density (pores/µm nuclear membrane length) of different anatomical sites of mice fed 33% isogenic (ISO) or Austrian reference (A REF) corn................. 3
Table 49: GSEA of deregulated genes (p<0.05 and 2fold change) between GM and ISO groups describing biological processes‡ .............................................................. 3
Table 50: GSEA of deregulated genes (p<0.05 and 2fold change) between GM and ISO groups describing pathways‡ ............................................................................ 3
Table 51: GSEA of deregulated genes (p<0.05 and 2fold change) between ISO and A REF groups describing biological processes‡ ........................................................ 3
Table 52: GSEA of deregulated genes (p<0.05 and 2fold change) between ISO and A REF groups describing pathways‡ ...................................................................... 3
Table 53: GSEA of deregulated genes (p<0.05 and 2fold change) between GM and ISO+A REF groups describing biological processes ‡ ............................................. 3
Table 54: GSEA of deregulated genes (p<0.05 and 2fold change) between GM and ISO+A REF groups describing pathways‡............................................................ 3
Table 55: Fold changes of deregulated genes confirmed by q-RT-PCR in the MGS and the RACB ............................................................................................................ 3
Table 56: Fold changes of deregulated genes confirmed by q-RT-PCR of the individual and pooled studies.......................................................................................... 3
Table 57: Overview of litters in the RACB ............................................................... 3 Table 58: Performance of mice fed 33% isogenic (ISO) or genetically modified (GM) corn
in their diet over several deliveries .................................................................... 3 Table 59: Reproduction data of mice fed 33% isogenic (ISO) or genetically modified
(GM) corn in their diet over several generations .................................................. 3 Table 60: Individual pup mass [g] per group at birth, 7, 14 and 21 days after birth from
parents with 33% of near isogenic (ISO) or transgenic(GM) corn in their diet .......... 3
EXHIBIT J - Page 589
Case 5:14-cv-00117-cr Document 63-11 Filed 11/14/14 Page 307 of 312

Biological effects of transgenic maize NK603xMON810 fed in long term reproduction studies in mice
Page 101 of 105
9. Overview of figures
Figure 1: Feed intake of adult mice fed 33% isogenic (ISO) or genetically modified (GM) corn in their diet in several generations…………………………………………………………………..……...36 Figure 2: Distribution of litter size at delivery from females fed 33% isogenic (ISO) or genetically modified (GM) corn in their diet in several generations ..40 Figure 3 a-b and 3 a’-b’: Mass of whole litter [g] and individual pup weight [g] at sev-eral time points of the F1 and F2 generation after birth of offspring from parental mice fed 33% isogenic (ISO) or genetically modified (GM) corn in their diet……………………………………………………………………………………………………………………………………..41 Figure 3 c-d and 3 c’-d’: Mass of whole litter [g] and individual pup weight [g] at sev-eral time points of the F1 and F2 generation after birth of offspring from parental mice fed 33% isogenic (ISO) or genetically modified (GM) corn in their diet……………………………………………………………………………………………………………………………………..42 Figure 4: Feed intake of adult mice fed 33% isogenic (ISO) or Austrian reference (A
REF) corn in their diet in several generations……………………………………………..…………..……….45
Figure 5: Distribution of litter size at delivery from females fed 33% isogenic (ISO) or Austrian reference corn in their diet in several generations……………………………..………….….46 Figure 6 a-b and 6 a’-b’: Mass of whole litter [g] and individual pup weight [g] at sev-eral time points of the F1 and F2 generation after birth of offspring from parental mice fed 33% isogenic (ISO) or Austrian reference(A REF) corn in their diet………………………………………………………………………………………………………………………………………49 Figures 6 c-d and 6 c’-d’: Mass of whole litter [g] and individual pup weight [g] at sev-eral time points of the F3 and F4 generation after birth of offspring from parental mice fed 33% isogenic (ISO) or Austrian reference (A REF) corn in their diet………………………………………………………………………………………………………………………………………50 Figure 7: Relative mass of testes of 5 week old mice fed 33% isogenic (ISO) or geneti-cally modified (GM) corn in their diet ………………………………………………………..…………………….53 Figure 8: Relative mass of liver (a), spleen (b) and kidneys(c) of 5 week old mice fed 33% isogenic (ISO) or genetically modified (GM) corn in their diet …………………………….…54 Figure 9: Relative mass of testes of 5 week old mice fed 33% isogenic (ISO) or Austrian reference (A REF) corn in their diet …………………………………………………………….……………………55 Figure 10: Relative mass of liver (a), spleen (b) and kidneys (c) of 5 week old mice fed 33% isogenic (ISO) or Austrian reference (A REF) corn in their diet…56 Figure 11: Fibrillar centres (FC) and dense fibrillar components (DFC) of liver (a) (hepa-tocytes), spleen (b) (lymphocytes) and pancreatic acinar cells (c) from the F3 generation of mice fed 33% genetically modified (GM) or isogenic (ISO) corn………………………….………………………………………………………………………………………………………….60 Figure 12a-c: Fibrillar centres (FC) and dense fibrillar components (DFC) of liver (a), spleen (b) and pancreatic acinar cells (c) from the F3 generation of mice fed 33% isog-enic (ISO) or Austrian Reference (A REF) corn……………………………………………………………..….62 Figure 13: Venn diagram depicting the number of deregulated genes in the F3 genera-tion of mice fed 33% genetically modified (GM) corn. Isogenic (ISO) and Austrian refer-ence (A REF) corn were used as controls………………………………..………………………………..67 Figure 14: Bar graphs of normalized data of jejunal miRNAs (each bar represents one miRNA) of the 3rd generation (F3) from mice fed 33% isogenic(ISO) or transgenic(GM) corn………………………………………………………………………………….…………………………..…………………….71 Figure 15: Bar graphs of normalized data of jejunal miRNAs (each bar represents one miRNA) of the 3rd generation (F3) from mice fed 33% isogenic(ISO) or Austrian reference corn (A REF)………………………………………………………………………………………………………….…………….71 Figure 16: Test on survival by Kaplan-Meyer from female mice fed 33 % isogenic (ISO),
Austrian reference (A REF) or genetically modified (GM) corn…………………………..…………...72
Figure 17: Feed intake within the first 2 weeks of the RACB of the mating pairs fed 33%
isogenic (ISO) or genetically modified (GM) corn in their diet………………………………..73
EXHIBIT J - Page 590
Case 5:14-cv-00117-cr Document 63-11 Filed 11/14/14 Page 308 of 312

Biological effects of transgenic maize NK603xMON810 fed in long term reproduction studies in mice
Page 102 of 105
Figure 18: Distribution of litter size at delivery from females fed 33% isogenic (ISO) or genetically modified (GM) corn in their diet over 4 litters………………………………………….…….76 Figure 19 a-b and 19 a’-b’: Mass of whole litter [g] and individual pup weight [g] at several time points of the 1st and 2nd F1 generation after birth of offspring from parental mice fed 33% isogenic (ISO) or genetically modified (GM) corn in their diet……………………………………………………………………………..……………………………………………………….79 Figure 19 c-d and 19 c’-d’: Mass of whole litter [g] and individual pup weight [g] at several time points of the 1st and 2nd F1 generation after birth of offspring from parental mice fed 33% isogenic (ISO) or genetically modified (GM) corn in their diet…………………………………………………………………………………………..………………………………………….80
EXHIBIT J - Page 591
Case 5:14-cv-00117-cr Document 63-11 Filed 11/14/14 Page 309 of 312

Biological effects of transgenic maize NK603xMON810 fed in long term reproduction studies in mice
Page 103 of 105
10. Reference List
ACRE (ADVISORY COMMITTEE ON RELEASES TO THE ENVIRONMENT): Advice on a notifi-
cation for marketing of herbicide tolerant and insect resistant GM hybrid maize (30 January 2004). www.defra.gov.uk/environment/acre/advice/pdf/acre_advice70.pdf
Applied Biosystems (2006). White paper taqman® gene expression assays. http://www3.appliedbiosystems.com/cms/groups/mcb_marketing/documents/generaldocuments/cms_040198.pdf
Aulrich, K., G. Flachowsky, R. Daenicke and I. Halle (2001). Bt-maize in animal nutrition. Ernährungsforschung 46(1): 13-20.
Aumaitre, A., K. Aulrich, A. Chesson, G. Flachowsky and G. Piva (2002). New feeds from genetically modified plants: substantial equivalence, nutritional equivalence, di-gestibility, and safety for animals and the food chain. Livestock Prod. Sci. 74(3): 223-238.
Becker, A. (2002): GV-SOLAS, Guidelines for the Quality Assured Production of Labora-tory Animal Diets. EN A06-2002.
Bondzio, A., Stumpff, F., Schon, J., Martens, H. and R. Einspanier (2008). Impact of Ba-cillus thuringiensis toxin Cry1A(b) on rumen epithelial cells (REC) - A new in vitro model for safety assessment of recombinant food compounds. Food Chem. Toxicol. 46(6): 1976-1984.
Brake, D. G. and D. P. Evenson (2004). A generational study of glyphosate-tolerant soy-beans on mouse fetal, postnatal, pubertal and adult testicular development. Food Chem. Toxicol. 42(1): 29-36.
Brake, D. G., Thaler, R. and D. P. Evenson (2004). Evaluation of Bt (Bacillus thuringien-sis) corn on mouse testicular development by dual parameter flow cytometry. J. Ag-ric. Food Chem. 52(7): 2097-2102.
Bruckner, S.R., Tammariello, S.P., Kuan, C.Y., Flavell, R.A., Rakic, P. and S. Estus (2001). Jnk3 contributes to c-jun activation and apoptosis but not oxidative stress in nerve growth factor-deprived sympathetic neurons. J. Neurochem. 78: 298-303.
Bucher, E. (2003): Verfahrensanweisung zur mikrobiologischen Qualitätsbeurteilung von Futtermitteln. Methodenbuch Band III, VDLUFA-Verlag, Bonn
Chapin, R. E. and R.A. Sloane (1996): Reproductive Assessment by Continous Breeding: Evolving Study Design and Summaries of Eighty-Eight Studies. Environm. Health Persp. 104, Suppl. 2: 1 – 7.
Chung, C., Chen, Y., Grutkoski, P.S., Doughty, L. and A. Ayala (2007). Socs-1 is a cen-tral mediator of steroid-increased thymocyte apoptosis and decreased survival fol-lowing sepsis. Apoptosis 7: 1143-1153.
Doull, J., Gaylor, D., Greim, H.A., Lovell, D.P., Lynch, B. and I. C. Munro (2007). Report of an Expert Panel on the reanalysis by of a 90-day study conducted by Monsanto in support of the safety of a genetically modified corn variety (MON 863). Food. Chem Toxicol. 45(11): 2073-2085.
Dzidziguri, D.V., Chelidze, P.V., Zarandia, M.A., Cherkezia, E.C. and G.D. Tumanishvili 1994. Transcriptional activity and ultrastructure of morphologically different types of nucleoli isolated from hepatocytes of normal and hepatectomized rats. Epith. Cell Biol. 3: 54-60.
EFSA (2005). Opinion of the Scientific Panel on Genetically Modified Organisms on an application (Reference EFSA-GMO-UK-2004-01) for the placing on the market of glyphosate-tolerant and insect resistant genetically modified maize NK603 x MON810, for food and feed uses under Regulation (EC) No 1829/2003 from Mon-santo1 (Question No EFSA-Q-2004-086). Opinion adopted on 13 October 2005. http://www.efsa.europa.eu/cs/BlobServer/DocumentSet/gmo_op_ej309_maizenk603xmon810_en1.pdf?ssbinary=true; Accessed 18/10/2008.
EPA (2001). Bacillus Thuringiensis CryIA(b) Delta-Endotoxin and the Genetic Material Necessary for Its Production in All Plants; Exemption from Requirement of a Toler-ance [Federal Register: August 2, 1996 (Volume 61, Number 150)]
EXHIBIT J - Page 592
Case 5:14-cv-00117-cr Document 63-11 Filed 11/14/14 Page 310 of 312

Biological effects of transgenic maize NK603xMON810 fed in long term reproduction studies in mice
Page 104 of 105
http://www.epa.gov/EPA-PEST/1996/August/Day-02/pr-838.html; Accessed 18/10/2008
EPA (2003). Cry3Bb1 Final Exec Summary Event MON863 Bt Cry3Bb1 Corn Biopesticide Registration Action Document April 2003 BIOPESTICIDES REGISTRATION ACTION DOCUMENT Event MON863 Bacillus thuringiensis Cry3Bb1 Corn U.S http://www.epa.gov/pesticides/biopesticides/ingredients/tech_docs/cry3
Fares, N.H. and A.K. El-Sayed (1998). Fine structural changes in the ileum of mice fed on delta-endotoxin-treated potatoes and transgenic potatoes. Nat. Tox. 6, 219-233.
Finucane, M. L. (2002). Mad cows, mad corn and mad communities: the role of socio-cultural factors in the perceived risk of genetically-modified food. Proc. Nutr. Soc. 61(1): 31-37.
Flachowsky, G., Halle, I, and K. Aulrich (2005). Long term feeding of Bt-corn-a ten-generation study with quails. Arch. Anim. Nutr. 59(6): 449-451.
Flachowsky, G., Aulrich, K. and A. Chesson (2005). Animal nutrition with feeds from ge-netically modified plants. Arch. Anim. Nutr. 59: 1-40.
Flachowsky, G., Aulrich, K., Bohme, H. and I. Halle (2007). Studies on feeds from geneti-cally modified plants (GMP) - contributions to nutritional and safety assessment. Anim. Feed Sci. Techn. 133(1/2): 2-30.
Gagnon, J., Ramanathan, S., Leblanc, C. and S. Ilangumaran (2007). Regulation of il-21 signalling by suppressor of cytokine signalling-1 (socs1) in cd8(+) t lymphocytes. Cell Signal. 4: 806-816.
GV-SOLAS, guidelines for the quality-assured production of laboratory animal diets; EN A-06-2002
Hammond, B., Lemen, J., Dudek, R., Ward, D., Jiang, C., Nemeth, M. and J. Burns (2006). Results of a 90-day safety assurance study with rats fed grain from corn rootworm-protected corn. Food Chem. Toxicol. 44(2): 147-160.
Kershaw, E.E, Hamm, J.K., Verhagen, L.A.W., Peroni, O., Katic, M. and J.S. Flier (2006). Adipose triglyceride lipase: function, regulation by insulin, and comparison with adi-ponutrin. Diabetes 1: 148-157.
Kilic, A. and M. T. Akay (2008). A three generation study with genetically modified Bt corn in rats: Biochemical and histopathological investigation. Food Chem. Toxicol. 46(3): 1164-1170.
Kleter, G. A. and H. A. Kuiper (2002). Considerations for the assessment of the safety of genetically modified animals used for human food or animal feed. Livestock Prod. Sci. 74(3): 275-285.
Kuiper, H.A., Noteborn, H. P. M. J. and A. A. C. M. Peijnenburg (1999). Adequacy of methods for testing the safety of genetically modified foods. Lancet 354: 1315-1316.
Lapaque, N., Takeuchi, O., Corrales, F., Akira, S., Moriyon, I., Howard, J.C. and J. Gorvel (2006). Differential inductions of tnf-alpha and igtp, iigp by structurally diverse classic and non-classic lipopolysaccharides. Cell. Microbiol. 3: 401-413.
Lord, P. G., Nie, A., and M. McMillian. 2006. Application of Genomics in Preclinical Drug Safety Evaluation. Basic Clin. Pharm. Toxic. 98:537-546.
Magee, J.A., Chang, L., Stormo, G.D. and J. Milbrandt (2006). Direct, androgen receptor-mediated regulation of the fkbp5 gene via a distal enhancer element. Endocrinol. 147: 590-598.
Malatesta, M., Capolaroni, C., Gavaudan, S., Rocchi, M.B., Serafini, S., Tiberi, C. and G. Gazzanelli (2002a): Ultrastructural morphometrical and immunocytochemical analyses of hepatocyte nuclei from mice fed on genetically modified soybean. Cell. Struct. Funct. 27 (4): 173-180.
Malatesta, M., Capolaroni C., Rossi L., Battistelli, S., Rocchi, M.B., Tonucci F. And G. Gazzanelli (2002b): Ultrastructural analyses of pancreatic acinar cells from mice fed on genetically modified soybean. J. Anat. 201 (5): 409-415
Mutch, D. M., Anderle, P., Fiaux, M., Mansourian, R., Vidal, K., Wahli, W., Williamson, G. and M. A. Roberts. 2004. Regional variations in ABC transporter expression along the mouse intestinal tract. Physiol. Genomics 17:11-20.
OECD Environment Directorate (2002): Consensus Document on compositional consid-erations for new varieties of Maize (Zea Mays): Key Food and Feed nutrients, anti-
EXHIBIT J - Page 593
Case 5:14-cv-00117-cr Document 63-11 Filed 11/14/14 Page 311 of 312

Biological effects of transgenic maize NK603xMON810 fed in long term reproduction studies in mice
Page 105 of 105
nutrients and secondary plant metabolites. http://www.olis.oecd.org/olis/2002doc.nsf/LinkTo/env-jm-mono(2002)25
Onose, J. I., Imai, T., Hasumura, M., Ueda, M., Ozeki, Y. and M. Hirose (2008). Evalua-tion of subchronic toxicity of dietary administered Cry1A(b) protein from Bacillus thuringiensis var. Kurustaki HD-1 in F344 male rats with chemically induced gastro-intestinal impairment. Food Chem. Toxicol. 46: 2184-2189.
Panel on Genetically Modified Organisms (2008). Safety and nutritional assessment of GM plants and derived food and feed: The role of animal feeding trials. Food. Chem. Toxicol. 46S1: S2-S70.
Pfaffl, M.W., Horgan, G.W. and L. Dempfle (2002). Relative expression software tool (rest) for group-wise comparison and statistical analysis of relative expression re-sults in real-time PCR. Nucleic Acids Res. 9: e36.
Pfaffl, M.W., Tichopad, A., Prgomet, C. and T.P. Neuvians (2004). Determination of stable housekeeping genes, differentially regulated target genes and sample integrity: bestkeeper--excel-based tool using pair-wise correlations. Biotechnol. Lett. 6: 509-515.
Pusztai, A., Grant, G., Bardocz, S., Alonso, R., Chrispeels, M.J., Schroeder, H.E., Tabe, L.M. and T.J.V. Higgins (1999). Expression of the insecticidal bean alpha-amylase inhibitor transgene has minimal detrimental effect on the nutritional value of peas fed to rats at 30% of the diet. J. Nutr. 129: 1597-1603.
Raser, J. M. and E. K. O'Shea (2005). Noise in Gene Expression: Origins, Consequences, and Control. Science 309: 2010-2013.
Rhee, G. S., Cho, D.H., Won,Y.H., Seok, J.H., Kim, S.S., Kwack, S.J., Lee, R.D., Chae, S.Y., Kim, JU.W., Lee, B.M., Park, K.L. and K. S. Choi (2005). Multigeneration re-productive and developmental toxicity study of bar gene inserted into genetically modified potato on rats. J. Toxicol. Environ. Health A 68: 2263-2276.
Royland, J.E. and P.R.S. Kodavanti (2008). Gene expression profiles following exposure to a developmental neurotoxicant, aroclor 1254: pathway analysis for possible mode(s) of action. Toxicol. Appl. Pharmacol. 231: 179-196.
Schiermeier, Q. (2004). Europe urged to move on transgenic crop imports. Nature 427: 474.
Seralini, G. E., Cellier, D. and J. S. de Vendomois (2007). New analysis of a rat feeding study with a genetically modified maize reveals signs of hepatorenal toxicity. Arch. Environ. Contam. Toxicol. 52(4): 596-602.
Vandesompele, J., De Preter, K., Pattyn, F., Poppe, B., Van Roy, N., De Paepe, A. and F. Speleman (2002). Accurate normalization of real-time quantitative rt-pcr data by geometric averaging of multiple internal control genes. Gen. Biol. 7: re-search0034.1-research0034.11.
Vazquez-Padron, R.I., Gonzales-Cabrera, J., Garcia-Tovar, C., Neri-Bazan, L., Lopes-Revilla, R., Hernandez, M., Moreno-Fierro, L. and G.A. de la Riva (2000): CRY1Ac protoxin from Bacillus thuringiensis sp. kurstaki HD73 binds to surface proteins in the mouse small intestine. Biochem. Biophys. Res. Commun. 271: 54-58
Vecchio, L., Cisterna, B., Malatesta, M., Martin, T. E. and M. Briggiogera (2004): Ultra-structural analysis of testes from mice fed on genetically modified soybean. Europ. J. Histochem. 48: 449-454.
Yamamoto, T., Nakahata, Y., Soma, H., Akashi, M., Mamine, T. and T. Takumi (2004). Transcriptional oscillation of canonical clock genes in mouse peripheral tissues. BMC Mol. Biol.: 18-27.
Zhang, H.M., Yuan, J., Cheung, P., Luo, H., Yanagawa, B., Chau, D., Stephan-Tozy, N., Wong, B.W., Zhang, J., Wilson, J.E., McManus. B.M. and D. Yang (2003). Overex-pression of interferon-gamma-inducible gtpase inhibits coxsackievirus b3-induced apoptosis through the activation of the phosphatidylinositol 3-kinase/akt pathway and inhibition of viral replication. J. Biol. Chem. 278: 33011-33019.
EXHIBIT J - Page 594
Case 5:14-cv-00117-cr Document 63-11 Filed 11/14/14 Page 312 of 312
Related Documents