Exergy-method analysis of a two-stage vapour- compression refrigeration-plants performance C. Nikolaidis a, *, D. Probert b a Panagiotechniki, P.O. Box 468, Plagiari-Epanomis, 575 00 Thessaloniki, Greece b Applied Energy Department, Cranfield University, Bedford MK43 OAL, UK Abstract The behaviour of two-stage compound compression-cycle, with flash intercooling, using refrigerant R22, has been investigated by the exergy method. The condenser’s saturation- temperature was varied from 298 to 308 K and the evaporator’s saturation-temperature from 238 to 228 K. The eects of temperature changes in the condenser and evaporator on the plant’s irreversibility rate were determined. The greater the temperature dierence between either (i) the condenser and the environment, or (ii) the evaporator and the cold room, the higher the irreversibility rate. Any reduction in the irreversibility rate of the condenser gives approximately 2.40 times greater reduction in the irreversibility rate for the whole plant, and any reduction in the evaporator’s irreversibility rate gives a 2.87 times greater mean reduction in the irreversibility rate of the whole plant. Because the changes in the temperatures in the condenser and the evaporator contribute so significantly to the plant’s overall irreversibility, there is considerable scope for optimising the conditions imposed upon the condenser and evaporator. # 1998 Elsevier Science Ltd. All rights reserved. Keywords: Compound compression-cycle; Exergy method; Coecient of structural bond; Refrigeration cycle Notation A s Area (m 2 ) c Constant E 0 Energy rate, (kW) E 0 Q Thermal exergy rate, (kW) Applied Energy 60 (1998) 241–256 0306-2619/98/$—see front matter # 1998 Elsevier Science Ltd. All rights reserved. PII: S0306-2619(98)00030-0 * Corresponding author.

Welcome message from author
This document is posted to help you gain knowledge. Please leave a comment to let me know what you think about it! Share it to your friends and learn new things together.
Transcript
Exergy-method analysis of a two-stage vapour-compression refrigeration-plants performance
C. Nikolaidis a,*, D. Probert b
aPanagiotechniki, P.O. Box 468, Plagiari-Epanomis, 575 00 Thessaloniki, GreecebApplied Energy Department, Cran®eld University, Bedford MK43 OAL, UK
Abstract
The behaviour of two-stage compound compression-cycle, with ¯ash intercooling, using
refrigerant R22, has been investigated by the exergy method. The condenser's saturation-temperature was varied from 298 to 308 K and the evaporator's saturation-temperature from238 to 228 K. The e�ects of temperature changes in the condenser and evaporator on theplant's irreversibility rate were determined. The greater the temperature di�erence between
either (i) the condenser and the environment, or (ii) the evaporator and the cold room, thehigher the irreversibility rate. Any reduction in the irreversibility rate of the condenser givesapproximately 2.40 times greater reduction in the irreversibility rate for the whole plant, and
any reduction in the evaporator's irreversibility rate gives a 2.87 times greater mean reductionin the irreversibility rate of the whole plant. Because the changes in the temperatures in thecondenser and the evaporator contribute so signi®cantly to the plant's overall irreversibility,
there is considerable scope for optimising the conditions imposed upon the condenser andevaporator. # 1998 Elsevier Science Ltd. All rights reserved.
Keywords: Compound compression-cycle; Exergy method; Coe�cient of structural bond; Refrigeration
cycle
Notation
As Area (m2)c ConstantE0
Energy rate, (kW)E0Q Thermal exergy rate, (kW)
Applied Energy 60 (1998) 241±256
0306-2619/98/$Ðsee front matter # 1998 Elsevier Science Ltd. All rights reserved.
PII: S0306-2619(98)00030-0
* Corresponding author.
f Fluid Stateg Gas stateh Speci®c enthalpy, (kJ/kg)I Irreversibility rate, (kW)IR; It Component and total irreversibility rates respectively, (kW)m Mass ¯ow rate, (kg/s)P Pressure, (bar)Pi Interstage pressure, (bar)Qc Cold-room cooling load, (kW)Qo Rate of heat-transfer to the environment, (kW)r Compression ratior0 Overall pressure ratios Speci®c entropy, (kJ/kg K)Ti Intermediate temperature, (K)T0 Environmental temperature, (K)Tcoro Cold-room temperature, (K)Tref Reference temperature, (K)U Heat-transfer coe�cient, (kW/m2K)W Power input (kW)x Dryness fractionI,II At stages I and II respectively
Greek Symbols (all dimensionless)
Temperature di�erence, (K)�i E�ciency defect of the i-th sub-region�e Electrical e�ciency�is Isentropic e�ciency�m Mechanical E�ciency�k;i Coe�cient of structural bonds
Rational e�ciency
Abbreviations
COMP CompressorCOND CondenserCOP Coe�cient of PerformanceCSB Coe�cient of structural bondEVAP EvaporatorFT Flash TankHPC High-pressure compressorHPV High-pressure valveLPC Low-pressure compressorLPV Low-pressure valvet total
242 C. Nikolaidis, D, Probert / Applied Energy 60 (1998) 241±256
1. Introduction
The purpose of this investigation is to help improve (i) our understanding ofrefrigeration cycles and (ii) hence their e�ciencies. The challenge is to use lessenergy, i.e. for the refrigerator to be more e�cient. The requirement is to obtainquantitative information that will lead to a better understanding of the processirreversibilities and their distribution among the plant's components. By determin-ing the sources and magnitudes of the exergy losses, and minimising them, an opti-mal refrigeration cycle can emerge [1,2].The scope of this paper encompasses two-stage vapour-compression with ¯ash inter-
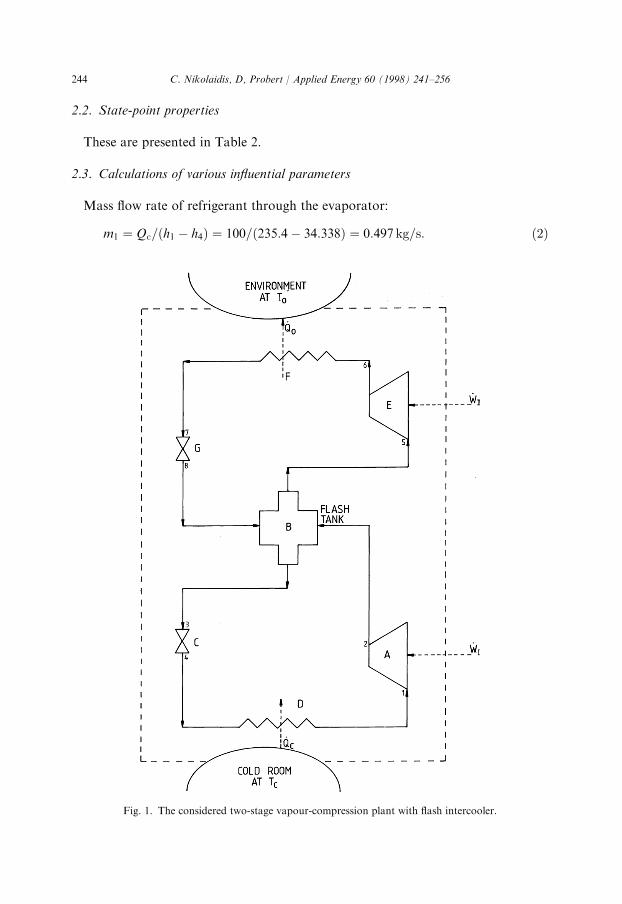
cooling. Removal of the ¯ash gas at an intermediate pressure Pi and recompressing it tothe condenser pressure Pcond results in saving compressor power, i.e. ¯ash intercoolingreduces the power requirement for the compressors. Also, staging of compressors isnecessary to prevent an excessive discharge temperature from the compressor.A schematic diagram of the equipment, for the two-stage (designated I and II)
system with an open-¯ash intercooler, is shown in Fig. 1 the corresponding tem-perature versus entropy diagram appears as Fig. 2.
2. A worked example
The cold room considered was for storing frozen meat, requiring preservation at atemperature of 243 K, i.e. as recommended by the Intervention Board for Agri-cultural Products in the United Kingdom and Eire. The temperature di�erencebetween the cold room and the evaporator is assumed to be 5 K and the evapor-ator's steady-state temperature is ®xed, initially at 238 K, and then varied to become236, 234, 232, 230 and 228 K successively.The ambient temperature is assumed to be 293 K and the saturation temperature
of the condenser is ®xed at 298 K, and then altered by 2 K increments as follows:- to300, 302, 304, 306 and eventually 308 K.A sample hand-calculation for the 2-stage vapour-compression cycle (Table 1) is
carried out below to indicate how the exergy method can be applied. Subsequently acomputer program is used to predict values for the varied condenser's and evapor-ator's temperatures.
2.1. Plant's input data
Optimal interstage pressure between the condenser and the evaporator is given by
Pi � �PIII�1=2 � �10:39� 1:31�1=2 � 3:69 bar: �1�
First-stage pressure-ratio is rI � Pi=PI � 3:69=1:31 � 2:816 Second-stage pressure-ratio is rII � PII=Pi � 10:39=3:69 � 2:816 Overall pressure-ratio is r0 � PII=Pi � 7:93:
C. Nikolaidis, D, Probert / Applied Energy 60 (1998) 241±256 243
2.2. State-point properties
These are presented in Table 2.
2.3. Calculations of various in¯uential parameters
Mass ¯ow rate of refrigerant through the evaporator:
m1 � Qc=�h1 ÿ h4� � 100=�235:4ÿ 34:338� � 0:497 kg=s: �2�
Fig. 1. The considered two-stage vapour-compression plant with ¯ash intercooler.
244 C. Nikolaidis, D, Probert / Applied Energy 60 (1998) 241±256
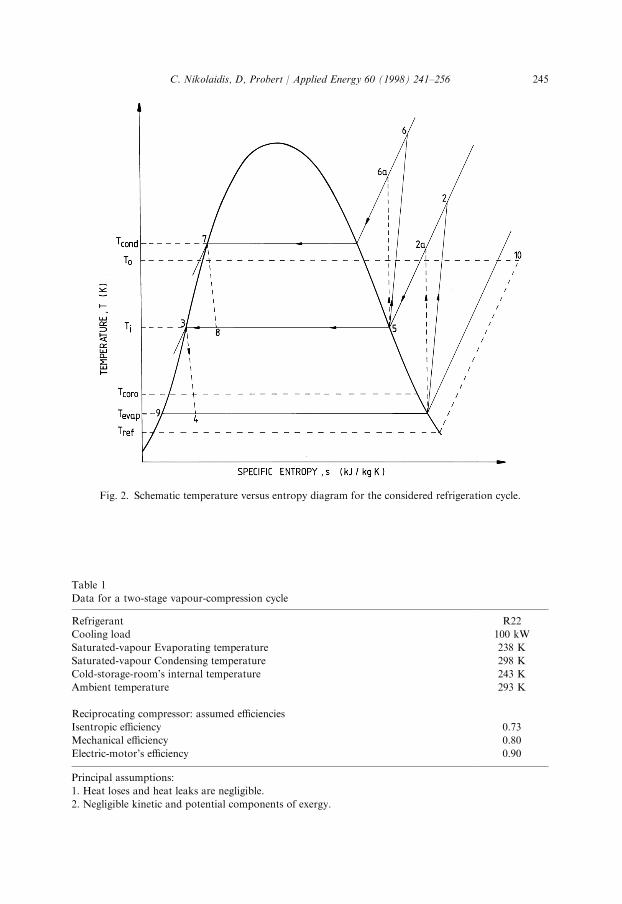
Table 1
Data for a two-stage vapour-compression cycle
Refrigerant R22
Cooling load 100 kW
Saturated-vapour Evaporating temperature 238 K
Saturated-vapour Condensing temperature 298 K
Cold-storage-room's internal temperature 243 K
Ambient temperature 293 K
Reciprocating compressor: assumed e�ciencies
Isentropic e�ciency 0.73
Mechanical e�ciency 0.80
Electric-motor's e�ciency 0.90
Principal assumptions:
1. Heat loses and heat leaks are negligible.
2. Negligible kinetic and potential components of exergy.
Fig. 2. Schematic temperature versus entropy diagram for the considered refrigeration cycle.
C. Nikolaidis, D, Probert / Applied Energy 60 (1998) 241±256 245
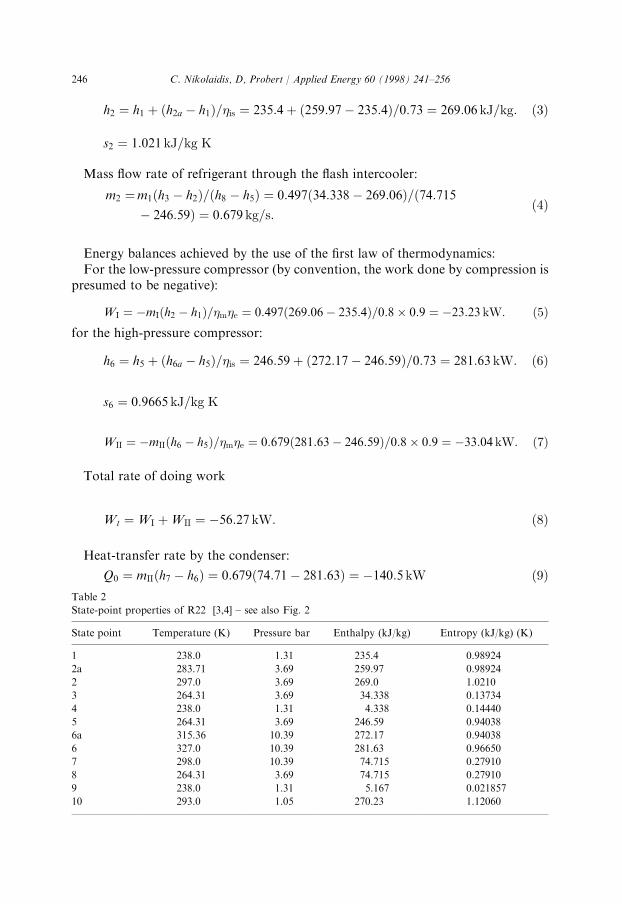
h2 � h1 � �h2a ÿ h1�=�is � 235:4� �259:97ÿ 235:4�=0:73 � 269:06 kJ=kg: �3�
s2 � 1:021 kJ=kg K
Mass ¯ow rate of refrigerant through the ¯ash intercooler:
m2 �m1�h3 ÿ h2�=�h8 ÿ h5� � 0:497�34:338ÿ 269:06�=�74:715ÿ 246:59� � 0:679 kg=s:
�4�
Energy balances achieved by the use of the ®rst law of thermodynamics:For the low-pressure compressor (by convention, the work done by compression is
presumed to be negative):
WI � ÿmI�h2 ÿ h1�=�m�e � 0:497�269:06ÿ 235:4�=0:8� 0:9 � ÿ23:23 kW: �5�for the high-pressure compressor:
h6 � h5 � �h6a ÿ h5�=�is � 246:59� �272:17ÿ 246:59�=0:73 � 281:63 kW: �6�
s6 � 0:9665 kJ=kg K
WII � ÿmII�h6 ÿ h5�=�m�e � 0:679�281:63ÿ 246:59�=0:8� 0:9 � ÿ33:04 kW: �7�
Total rate of doing work
Wt �WI �WII � ÿ56:27 kW: �8�
Heat-transfer rate by the condenser:
Q0 � mII�h7 ÿ h6� � 0:679�74:71ÿ 281:63� � ÿ140:5 kW �9�Table 2
State-point properties of R22 [3,4] ± see also Fig. 2
State point Temperature (K) Pressure bar Enthalpy (kJ/kg) Entropy (kJ/kg) (K)
1 238.0 1.31 235.4 0.98924
2a 283.71 3.69 259.97 0.98924
2 297.0 3.69 269.0 1.0210
3 264.31 3.69 34.338 0.13734
4 238.0 1.31 4.338 0.14440
5 264.31 3.69 246.59 0.94038
6a 315.36 10.39 272.17 0.94038
6 327.0 10.39 281.63 0.96650
7 298.0 10.39 74.715 0.27910
8 264.31 3.69 74.715 0.27910
9 238.0 1.31 5.167 0.021857
10 293.0 1.05 270.23 1.12060
246 C. Nikolaidis, D, Probert / Applied Energy 60 (1998) 241±256
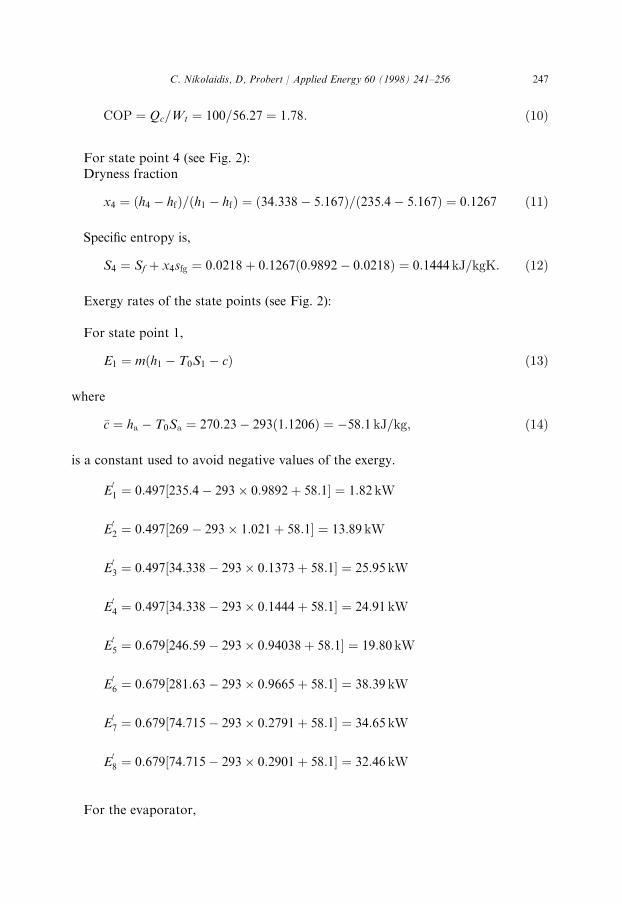
COP � Qc=Wt � 100=56:27 � 1:78: �10�
For state point 4 (see Fig. 2):Dryness fraction
x4 � �h4 ÿ hf�=�h1 ÿ hf� � �34:338ÿ 5:167�=�235:4ÿ 5:167� � 0:1267 �11�
Speci®c entropy is,
S4 � Sf � x4sfg � 0:0218� 0:1267�0:9892ÿ 0:0218� � 0:1444 kJ=kgK: �12�
Exergy rates of the state points (see Fig. 2):
For state point 1,
E1 � m�h1 ÿ T0S1 ÿ c� �13�
where
�c � ha ÿ T0Sa � 270:23ÿ 293�1:1206� � ÿ58:1 kJ=kg; �14�
is a constant used to avoid negative values of the exergy.
E01 � 0:497�235:4ÿ 293� 0:9892� 58:1� � 1:82 kW
E02 � 0:497�269ÿ 293� 1:021� 58:1� � 13:89 kW
E03 � 0:497�34:338ÿ 293� 0:1373� 58:1� � 25:95 kW
E04 � 0:497�34:338ÿ 293� 0:1444� 58:1� � 24:91 kW
E05 � 0:679�246:59ÿ 293� 0:94038� 58:1� � 19:80 kW
E06 � 0:679�281:63ÿ 293� 0:9665� 58:1� � 38:39 kW
E07 � 0:679�74:715ÿ 293� 0:2791� 58:1� � 34:65 kW
E08 � 0:679�74:715ÿ 293� 0:2901� 58:1� � 32:46 kW
For the evaporator,
C. Nikolaidis, D, Probert / Applied Energy 60 (1998) 241±256 247
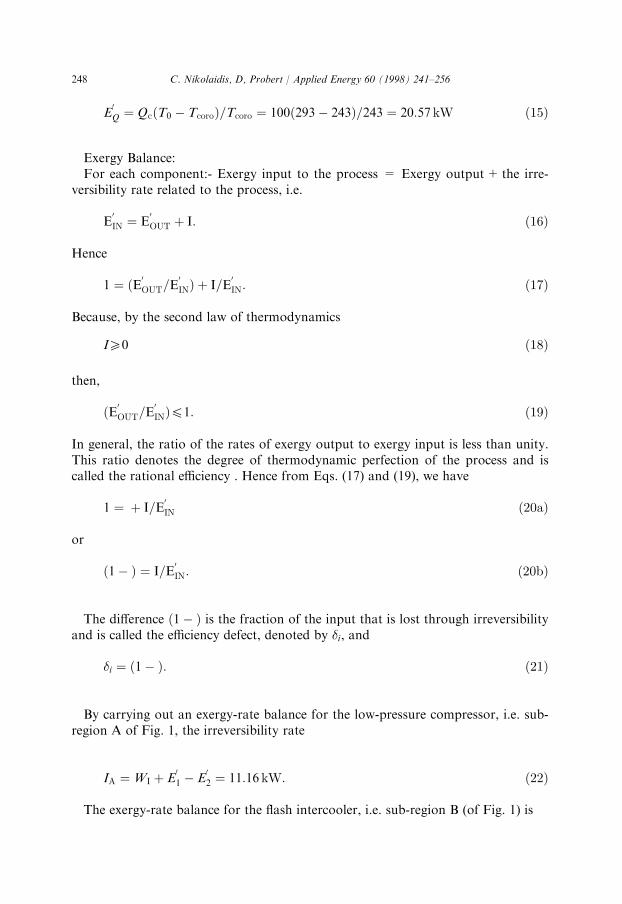
E0Q � Qc�T0 ÿ Tcoro�=Tcoro � 100�293ÿ 243�=243 � 20:57 kW �15�
Exergy Balance:For each component:- Exergy input to the process = Exergy output+ the irre-
versibility rate related to the process, i.e.
E0IN � E
0OUT � I: �16�
Hence
1 � �E0OUT=E0IN� � I=E
0IN: �17�
Because, by the second law of thermodynamics
I50 �18�
then,
�E0OUT=E0IN�41: �19�
In general, the ratio of the rates of exergy output to exergy input is less than unity.This ratio denotes the degree of thermodynamic perfection of the process and iscalled the rational e�ciency . Hence from Eqs. (17) and (19), we have
1 � � I=E0IN �20a�
or
�1ÿ � � I=E0IN: �20b�
The di�erence �1ÿ � is the fraction of the input that is lost through irreversibilityand is called the e�ciency defect, denoted by �i, and
�i � �1ÿ �: �21�
By carrying out an exergy-rate balance for the low-pressure compressor, i.e. sub-region A of Fig. 1, the irreversibility rate
IA �WI � E01 ÿ E
02 � 11:16 kW: �22�
The exergy-rate balance for the ¯ash intercooler, i.e. sub-region B (of Fig. 1) is
248 C. Nikolaidis, D, Probert / Applied Energy 60 (1998) 241±256
IB � �E02 ÿ E03� � �E
08 ÿ E
05� � 0:6 kW: �23�
The exergy-rate balance for the low-pressure valve, i.e. sub-region C (of Fig. 1) is
IC � E05 ÿ E
04 � 1:04 kW: �24�
The exergy-rate balance for the evaporator, i.e. sub-region D (of Fig. 1) is
ID � E04 ÿ E
01 ÿ E
QD � 2:52 kW: �25�
For the high-pressure compressor
IE � E05 ÿ E
06 �WII � 14:45 kW: �26�
The exergy-rate balance for the condenser, i.e. sub-region F (of Fig. 1) is
IF � E06 ÿ E
07 � 3:74 kW: �27�
The exergy-rate balance in the high-pressure throttling valve, i.e. sub-region G (ofFig. 1) is
IG � E7 ÿ E8 � 2:19 kW: �28�
The total plant's irreversibility-rate It � 35:7 kW.
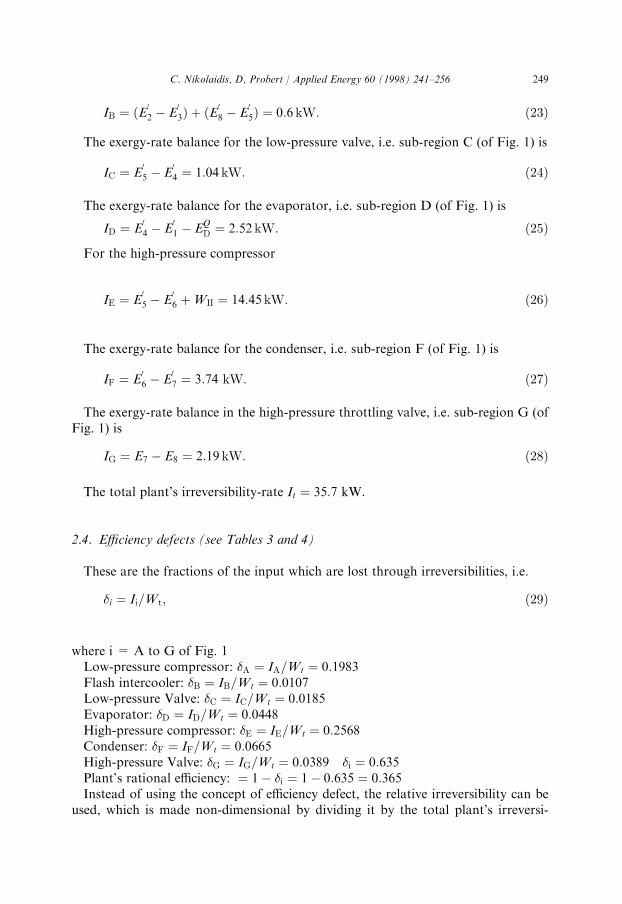
2.4. E�ciency defects (see Tables 3 and 4)
These are the fractions of the input which are lost through irreversibilities, i.e.
�i � Ii=Wt; �29�
where i = A to G of Fig. 1Low-pressure compressor: �A � IA=Wt � 0:1983Flash intercooler: �B � IB=Wt � 0:0107Low-pressure Valve: �C � IC=Wt � 0:0185Evaporator: �D � ID=Wt � 0:0448High-pressure compressor: �E � IE=Wt � 0:2568Condenser: �F � IF=Wt � 0:0665High-pressure Valve: �G � IG=Wt � 0:0389 �i � 0:635Plant's rational e�ciency: � 1ÿ �i � 1ÿ 0:635 � 0:365Instead of using the concept of e�ciency defect, the relative irreversibility can be
used, which is made non-dimensional by dividing it by the total plant's irreversi-
C. Nikolaidis, D, Probert / Applied Energy 60 (1998) 241±256 249
bility. This is a convenient form for examining the relative contributions di�erentplant components make to the total irreversibility:
IHPC=It � IFT=It � ILPC=It � IEVAP=It
� IHPC=It � ICOND=It � IHPV=It � 31:26%� 1:68%� 2:92%
� 7:06%� 40:47%� 10:48%� 6:13% � 100%
�30�
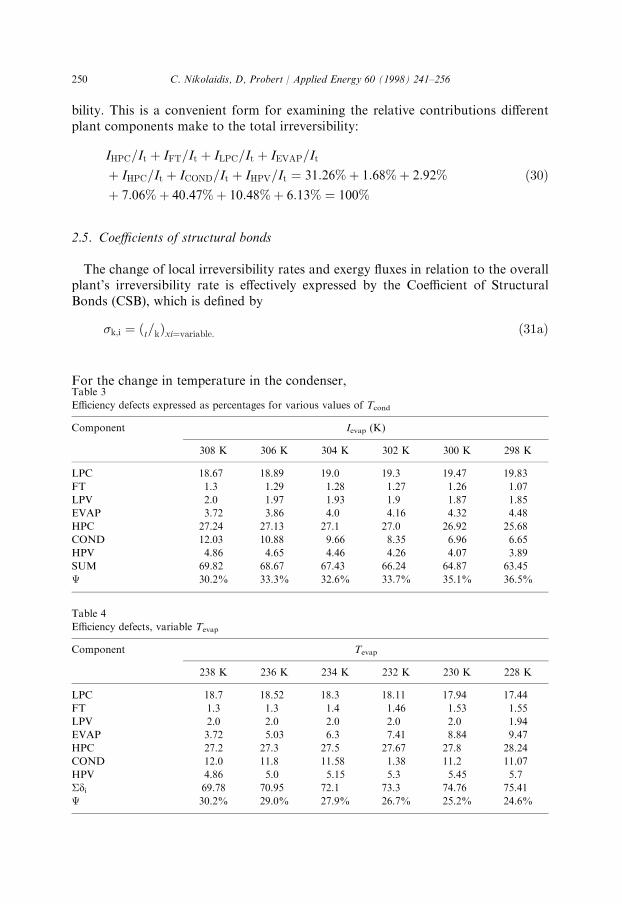
2.5. Coe�cients of structural bonds
The change of local irreversibility rates and exergy ¯uxes in relation to the overallplant's irreversibility rate is e�ectively expressed by the Coe�cient of StructuralBonds (CSB), which is de®ned by
�k;i � �t=k�xi�variable: �31a�
For the change in temperature in the condenser,Table 3
E�ciency defects expressed as percentages for various values of Tcond
Component Ievap (K)
308 K 306 K 304 K 302 K 300 K 298 K
LPC 18.67 18.89 19.0 19.3 19.47 19.83
FT 1.3 1.29 1.28 1.27 1.26 1.07
LPV 2.0 1.97 1.93 1.9 1.87 1.85
EVAP 3.72 3.86 4.0 4.16 4.32 4.48
HPC 27.24 27.13 27.1 27.0 26.92 25.68
COND 12.03 10.88 9.66 8.35 6.96 6.65
HPV 4.86 4.65 4.46 4.26 4.07 3.89
SUM 69.82 68.67 67.43 66.24 64.87 63.45
30.2% 33.3% 32.6% 33.7% 35.1% 36.5%
Table 4
E�ciency defects, variable Tevap
Component Tevap
238 K 236 K 234 K 232 K 230 K 228 K
LPC 18.7 18.52 18.3 18.11 17.94 17.44
FT 1.3 1.3 1.4 1.46 1.53 1.55
LPV 2.0 2.0 2.0 2.0 2.0 1.94
EVAP 3.72 5.03 6.3 7.41 8.84 9.47
HPC 27.2 27.3 27.5 27.67 27.8 28.24
COND 12.0 11.8 11.58 1.38 11.2 11.07
HPV 4.86 5.0 5.15 5.3 5.45 5.7
�di 69.78 70.95 72.1 73.3 74.76 75.41
30.2% 29.0% 27.9% 26.7% 25.2% 24.6%
250 C. Nikolaidis, D, Probert / Applied Energy 60 (1998) 241±256
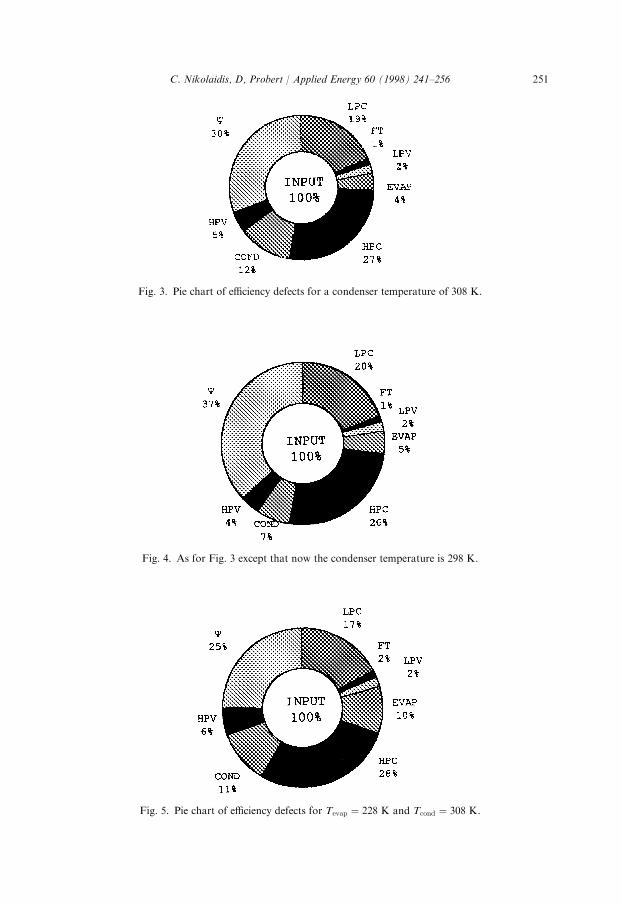
Fig. 3. Pie chart of e�ciency defects for a condenser temperature of 308 K.
Fig. 4. As for Fig. 3 except that now the condenser temperature is 298 K.
Fig. 5. Pie chart of e�ciency defects for Tevap � 228 K and Tcond � 308 K.
C. Nikolaidis, D, Probert / Applied Energy 60 (1998) 241±256 251
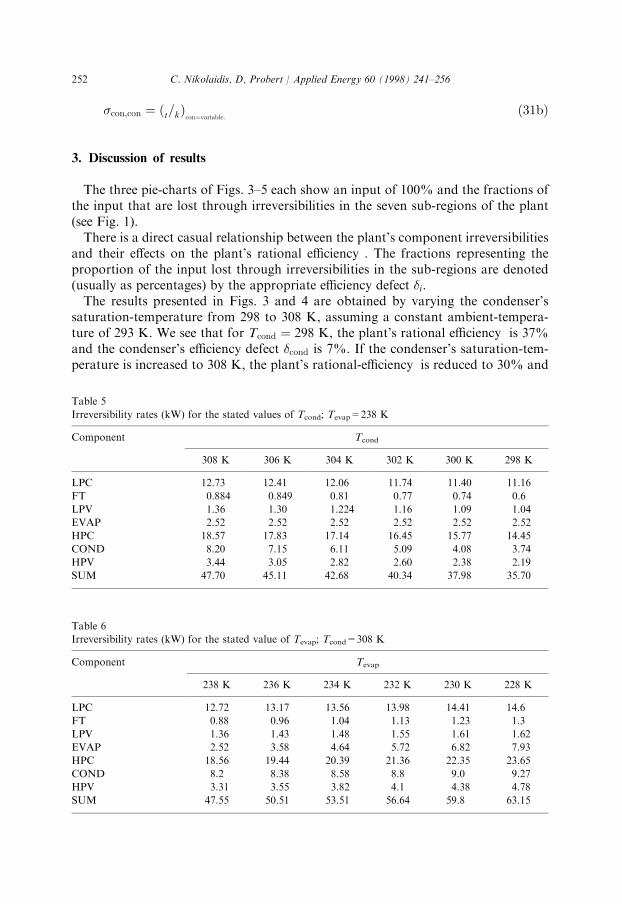
�con;con � �t=k�con�variable:�31b�
3. Discussion of results
The three pie-charts of Figs. 3±5 each show an input of 100% and the fractions ofthe input that are lost through irreversibilities in the seven sub-regions of the plant(see Fig. 1).There is a direct casual relationship between the plant's component irreversibilities
and their e�ects on the plant's rational e�ciency . The fractions representing theproportion of the input lost through irreversibilities in the sub-regions are denoted(usually as percentages) by the appropriate e�ciency defect �i.The results presented in Figs. 3 and 4 are obtained by varying the condenser's
saturation-temperature from 298 to 308 K, assuming a constant ambient-tempera-ture of 293 K. We see that for Tcond � 298 K, the plant's rational e�ciency is 37%and the condenser's e�ciency defect �cond is 7%. If the condenser's saturation-tem-perature is increased to 308 K, the plant's rational-e�ciency is reduced to 30% and
Table 5
Irreversibility rates (kW) for the stated values of Tcond; Tevap=238 K
Component Tcond
308 K 306 K 304 K 302 K 300 K 298 K
LPC 12.73 12.41 12.06 11.74 11.40 11.16
FT 0.884 0.849 0.81 0.77 0.74 0.6
LPV 1.36 1.30 1.224 1.16 1.09 1.04
EVAP 2.52 2.52 2.52 2.52 2.52 2.52
HPC 18.57 17.83 17.14 16.45 15.77 14.45
COND 8.20 7.15 6.11 5.09 4.08 3.74
HPV 3.44 3.05 2.82 2.60 2.38 2.19
SUM 47.70 45.11 42.68 40.34 37.98 35.70
Table 6
Irreversibility rates (kW) for the stated value of Tevap; Tcond=308 K
Component Tevap
238 K 236 K 234 K 232 K 230 K 228 K
LPC 12.72 13.17 13.56 13.98 14.41 14.6
FT 0.88 0.96 1.04 1.13 1.23 1.3
LPV 1.36 1.43 1.48 1.55 1.61 1.62
EVAP 2.52 3.58 4.64 5.72 6.82 7.93
HPC 18.56 19.44 20.39 21.36 22.35 23.65
COND 8.2 8.38 8.58 8.8 9.0 9.27
HPV 3.31 3.55 3.82 4.1 4.38 4.78
SUM 47.55 50.51 53.51 56.64 59.8 63.15
252 C. Nikolaidis, D, Probert / Applied Energy 60 (1998) 241±256

Table 7
Irreversibilities and plant's rational e�ciencies for the stated values of Tcond; Tevap=238 K
Condenser
temperature (K)
Total plant's irreversibility
rate (kW)
Condenser's irreversibility
rate (kW)
Plant's rational
e�ciency (%)
298 35.7 3.74 36.6
300 37.98 4.08 35.1
302 40.34 5.09 33.8
304 42.68 6.11 32.5
306 45.11 7.15 31.3
308 47.70 8.20 30.2
Table 8
Irreversibilities and plant's rational e�ciencies for the stated values of Tevap; Tcond=308 K
Evaporator temperature,
(K)
Total plant's irreversibility
rate, (kW)
Evaporator's irreversibility
rate, (kW)
Plant's rational
e�ciency (%)
238 47.6 2.52 30.2
236 50.5 3.58 28.95
234 53.52 4.64 27.77
232 56.62 5.72 26.65
230 59.81 6.82 25.60
228 63.15 7.93 24.57
Fig. 6. Plot for determining the CSB of the condenser with Tcond as a variable and Tevap � 238 K.
C. Nikolaidis, D, Probert / Applied Energy 60 (1998) 241±256 253
the condenser's e�ciency-defect �cond to 12%.The results seen in Fig. 5 are obtained by reducing the evaporator's saturation-tem-
perature from 238 to 228 K, assuming a constant cold-room temperature of 243 K.For Tevap � 238 K, the plant's rational e�ciency is 37% and the evaporator's
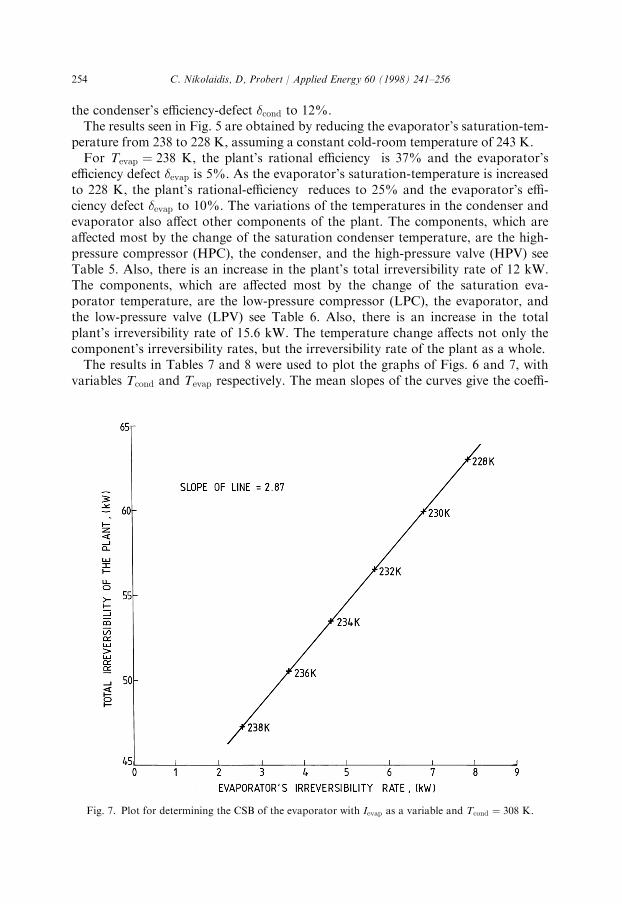
e�ciency defect �evap is 5%. As the evaporator's saturation-temperature is increasedto 228 K, the plant's rational-e�ciency reduces to 25% and the evaporator's e�-ciency defect �evap to 10%. The variations of the temperatures in the condenser andevaporator also a�ect other components of the plant. The components, which area�ected most by the change of the saturation condenser temperature, are the high-pressure compressor (HPC), the condenser, and the high-pressure valve (HPV) seeTable 5. Also, there is an increase in the plant's total irreversibility rate of 12 kW.The components, which are a�ected most by the change of the saturation eva-porator temperature, are the low-pressure compressor (LPC), the evaporator, andthe low-pressure valve (LPV) see Table 6. Also, there is an increase in the totalplant's irreversibility rate of 15.6 kW. The temperature change a�ects not only thecomponent's irreversibility rates, but the irreversibility rate of the plant as a whole.The results in Tables 7 and 8 were used to plot the graphs of Figs. 6 and 7, with
variables Tcond and Tevap respectively. The mean slopes of the curves give the coe�-
Fig. 7. Plot for determining the CSB of the evaporator with Ievap as a variable and Tcond � 308 K.
254 C. Nikolaidis, D, Probert / Applied Energy 60 (1998) 241±256
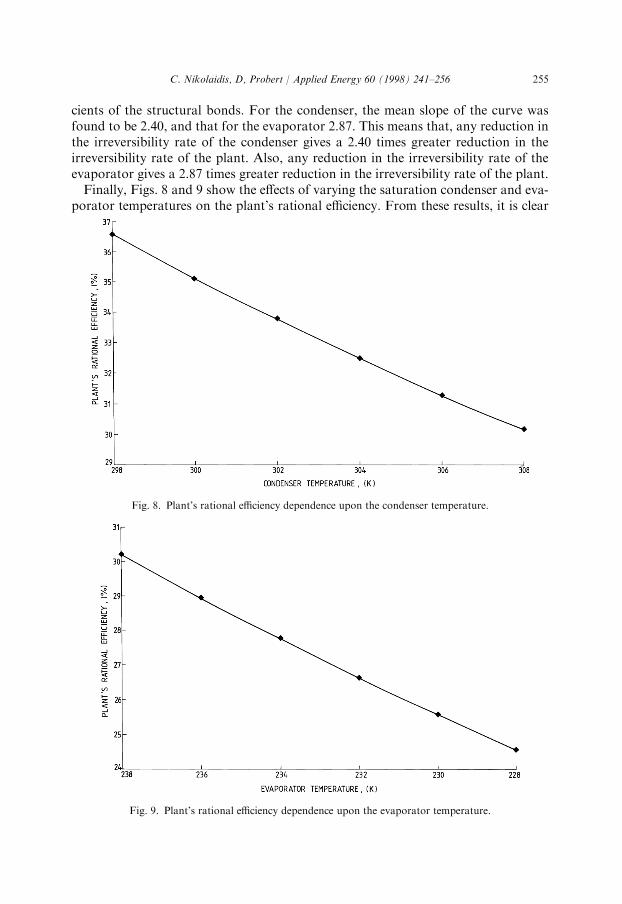
cients of the structural bonds. For the condenser, the mean slope of the curve wasfound to be 2.40, and that for the evaporator 2.87. This means that, any reduction inthe irreversibility rate of the condenser gives a 2.40 times greater reduction in theirreversibility rate of the plant. Also, any reduction in the irreversibility rate of theevaporator gives a 2.87 times greater reduction in the irreversibility rate of the plant.Finally, Figs. 8 and 9 show the e�ects of varying the saturation condenser and eva-
porator temperatures on the plant's rational e�ciency. From these results, it is clear
Fig. 8. Plant's rational e�ciency dependence upon the condenser temperature.
Fig. 9. Plant's rational e�ciency dependence upon the evaporator temperature.
C. Nikolaidis, D, Probert / Applied Energy 60 (1998) 241±256 255
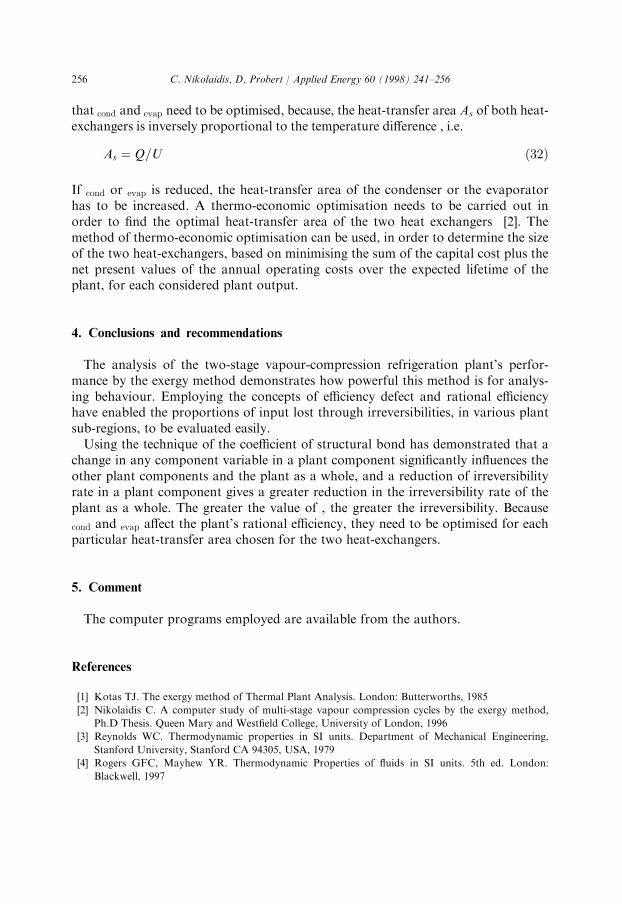
that cond and evap need to be optimised, because, the heat-transfer area As of both heat-exchangers is inversely proportional to the temperature di�erence , i.e.
As � Q=U �32�
If cond or evap is reduced, the heat-transfer area of the condenser or the evaporatorhas to be increased. A thermo-economic optimisation needs to be carried out inorder to ®nd the optimal heat-transfer area of the two heat exchangers [2]. Themethod of thermo-economic optimisation can be used, in order to determine the sizeof the two heat-exchangers, based on minimising the sum of the capital cost plus thenet present values of the annual operating costs over the expected lifetime of theplant, for each considered plant output.
4. Conclusions and recommendations
The analysis of the two-stage vapour-compression refrigeration plant's perfor-mance by the exergy method demonstrates how powerful this method is for analys-ing behaviour. Employing the concepts of e�ciency defect and rational e�ciencyhave enabled the proportions of input lost through irreversibilities, in various plantsub-regions, to be evaluated easily.Using the technique of the coe�cient of structural bond has demonstrated that a
change in any component variable in a plant component signi®cantly in¯uences theother plant components and the plant as a whole, and a reduction of irreversibilityrate in a plant component gives a greater reduction in the irreversibility rate of theplant as a whole. The greater the value of , the greater the irreversibility. Because
cond and evap a�ect the plant's rational e�ciency, they need to be optimised for eachparticular heat-transfer area chosen for the two heat-exchangers.
5. Comment
The computer programs employed are available from the authors.
References
[1] Kotas TJ. The exergy method of Thermal Plant Analysis. London: Butterworths, 1985
[2] Nikolaidis C. A computer study of multi-stage vapour compression cycles by the exergy method,
Ph.D Thesis. Queen Mary and West®eld College, University of London, 1996
[3] Reynolds WC. Thermodynamic properties in SI units. Department of Mechanical Engineering,
Stanford University, Stanford CA 94305, USA, 1979
[4] Rogers GFC, Mayhew YR. Thermodynamic Properties of ¯uids in SI units. 5th ed. London:
Blackwell, 1997
256 C. Nikolaidis, D, Probert / Applied Energy 60 (1998) 241±256
Related Documents