http://nnr.sagepub.com/ Repair Neurorehabilitation and Neural http://nnr.sagepub.com/content/early/2012/04/26/1545968312441711 The online version of this article can be found at: DOI: 10.1177/1545968312441711 published online 27 April 2012 Neurorehabil Neural Repair Barker, Catherine Kirkham and Sandra O'Rourke Catherine M. Dean, Chris Rissel, Catherine Sherrington, Michelle Sharkey, Robert G. Cumming, Stephen R. Lord, Ruth N. Trial Exercise to Enhance Mobility and Prevent Falls After Stroke: The Community Stroke Club Randomized Published by: http://www.sagepublications.com On behalf of: American Society of Neurorehabilitation can be found at: Neurorehabilitation and Neural Repair Additional services and information for http://nnr.sagepub.com/cgi/alerts Email Alerts: http://nnr.sagepub.com/subscriptions Subscriptions: http://www.sagepub.com/journalsReprints.nav Reprints: http://www.sagepub.com/journalsPermissions.nav Permissions: What is This? - Apr 27, 2012 OnlineFirst Version of Record >> at Macquarie University Library on May 6, 2012 nnr.sagepub.com Downloaded from

Welcome message from author
This document is posted to help you gain knowledge. Please leave a comment to let me know what you think about it! Share it to your friends and learn new things together.
Transcript
http://nnr.sagepub.com/Repair
Neurorehabilitation and Neural
http://nnr.sagepub.com/content/early/2012/04/26/1545968312441711The online version of this article can be found at:
DOI: 10.1177/1545968312441711
published online 27 April 2012Neurorehabil Neural RepairBarker, Catherine Kirkham and Sandra O'Rourke
Catherine M. Dean, Chris Rissel, Catherine Sherrington, Michelle Sharkey, Robert G. Cumming, Stephen R. Lord, Ruth N.Trial
Exercise to Enhance Mobility and Prevent Falls After Stroke: The Community Stroke Club Randomized
Published by:
http://www.sagepublications.com
On behalf of:
American Society of Neurorehabilitation
can be found at:Neurorehabilitation and Neural RepairAdditional services and information for
http://nnr.sagepub.com/cgi/alertsEmail Alerts:
http://nnr.sagepub.com/subscriptionsSubscriptions:
http://www.sagepub.com/journalsReprints.navReprints:
http://www.sagepub.com/journalsPermissions.navPermissions:
What is This?
- Apr 27, 2012OnlineFirst Version of Record >>
at Macquarie University Library on May 6, 2012nnr.sagepub.comDownloaded from

Neurorehabilitation and Neural RepairXX(X) 1 –12© The Author(s) 2012Reprints and permission: http://www. sagepub.com/journalsPermissions.navDOI: 10.1177/1545968312441711http://nnr.sagepub.com
Poor mobility and falls are major contributors to stroke-related disability. Stroke is a major risk factor for falls.1 More than 70% of stroke survivors fall within 6 months of discharge from hospital,2 and nearly 50% of community-dwelling female stroke survivors continue to fall each year.3 After a stroke, individuals are up to 4 times more likely to suffer a hip fracture than other community dwellers.4 Gait and balance problems are important risk factors for falls.3,5
Well-designed exercise programs can enhance function after stroke.6-8 Exercise can prevent falls in older people,9,10 but it is not known whether exercise can prevent falls after stroke.11 The objective of this trial was to establish and eval-uate a community-based mobility enhancement and fall prevention exercise program for people after stroke. The program evaluated was the weight-bearing exercises for better balance (WEBB) program.12 The WEBB was devel-oped by Australian physiotherapy researchers (including CMD and CS) and clinicians to assist physiotherapists in individually prescribing progressive exercises that chal-lenge balance. The development of the program was based on existing evidence,6-11 our previous research,8,10,13,14 and clinical experience. The efficacy of the WEBB program is
currently being evaluated in randomized trials for people recently discharged from hospital,15 people with Parkinson’s disease,16 and as part of a multifaceted intervention for people with frailty.17
MethodsTrial Design
A prospective, multicenter, parallel, randomized trial was undertaken. The study protocol was approved by Sydney
441711 NNRXXX10.1177/1545968312441711Dean et alNeurorehabilitation and Neural Repair© The Author(s) 2010
Reprints and permission: http://www.sagepub.com/journalsPermissions.nav
1Macquarie University, North Ryde, Australia2The University of Sydney, Sydney, Australia3The George Institute for Global Health, Sydney, Australia4Stroke Recovery Association of NSW, Putney, Australia5Neuroscience Research Australia, Randwick, Australia6University of New South Wales, Sydney, Australia7James Cook University, Townsville, Australia
Corresponding Author:Catherine Dean, Macquarie University, Blg F10A ASAM, Macquarie University, North Ryde, 2109, Australia Email: [email protected]
Exercise to Enhance Mobility and Prevent Falls After Stroke: The Community Stroke Club Randomized Trial
Catherine M. Dean, PhD1,2, Chris Rissel, PhD2, Catherine Sherrington, PhD2,3, Michelle Sharkey4, Robert G. Cumming, PhD2, Stephen R. Lord, PhD,DSc5,6, Ruth N. Barker, PhD7, Catherine Kirkham4, and Sandra O’Rourke5
Abstract
Background. Exercise interventions can enhance mobility after stroke as well as prevent falls in elderly persons. Objective. Investigate whether an exercise intervention can enhance mobility, prevent falls, and increase physical activity among community-dwelling people after stroke. Method. A randomized trial with blinding of physical outcome assessment was conducted through local stroke clubs. Both groups, on average 5.9 years poststroke, received exercise classes, advice, and a home program for 12 months. The experimental group (EG) program (n = 76) aimed to improve walking, prevent falls and increase physical activity. The control group (CG) program (n = 75) aimed to improve upper-limb and cognitive functions. The primary outcomes were walking capacity, walking speed measured before and after the intervention, and fall rates monitored monthly. Results. At 12 months, the EG walked 34 m further in 6 minutes (95% confidence interval [CI] = 19-50; P < .001) and 0.07 m/s faster over 10 m (95% CI = 0.01-0.14; P = .03) than the CG. The EG had 129 falls, and the CG had 133. There were no differences in proportion of fallers (relative risk = 1.22; 95% CI = 0.91-1.62; P = .19) or the rate of falls between groups (incidence rate ratio = 0.96; 95% CI = 0.59-1.51; P = .88). Conclusion. The experimental intervention delivered through stroke clubs enhanced aspects of mobility but had no effect on falls.
Keywords
stroke, mobility limitation, accidental falls, clinical trial, exercise
at Macquarie University Library on May 6, 2012nnr.sagepub.comDownloaded from

2 Neurorehabilitation and Neural Repair XX(X)
South West Area Health Service Ethics Committee (Clearance No: X06-0039) and The University of Sydney Human Research Ethics Committee (HREC Number 07/2006/9031), and written informed consent was obtained from all par-ticipants. The protocol for this study was registered with the Australian New Zealand Clinical Trials Registry (ACTRN12606000479505) and is outlined in full else-where.18
Participants, Therapists, and Stroke ClubsParticipants were invited to participate if they had suffered 1 or more strokes, were able to walk 10 m independently with or without a mobility aid, gained medical clearance, were willing to join the NSW Stroke Recovery Association and commit to a weekly exercise class and home program for 12 months, and were able to give informed consent. Participants were excluded if they had a Folstein Mini–Mental State Examination19 score of less than 20, insufficient language skills to participate in assessment and intervention, and a medical condition preclud-ing exercise, such as unstable cardiovascular disease or other uncontrolled chronic conditions20 that would interfere with training and testing protocols. Age, side of stroke, time since stoke, and comorbidities were recorded.
Therapists were included if they were registered physio-therapists and were able to deliver interventions per trial protocol. Stroke clubs were included if club members and the individual club’s committee agreed to participate in the trial and have exercise classes delivered at the club or a nearby venue weekly. The number of participants recruited at each of the stroke clubs was recorded.
Randomization ProcedureCommunity-dwelling people after stroke were screened for eligibility by a physiotherapist. After medical clearance and the initial assessment were completed, eligible participants were randomly allocated within each stroke club to an experimental group (EG) or a control group (CG), using random permuted blocks of 2 to 6 participants. The alloca-tion sequence was computer generated before commence-ment of the study, and a set of consecutively numbered, sealed opaque envelopes containing the allocation was centrally generated for each stroke club.
InterventionBoth the EG and CG participated in exercise classes planned to be delivered weekly for 40 weeks over a 1-year period and were given a home exercise program to be completed at least 3 times per week. Interventions were tailored to the participant’s functional ability. The nature and difficulty of the exercises were progressed regularly to ensure that the intervention remained challenging. The
exercise classes were delivered by a physiotherapist who also designed individual home programs, which were reviewed and modified monthly. Each class and home pro-gram session was designed to take 45 to 60 minutes.
The EG received an exercise intervention designed to enhance mobility, prevent falls, and increase physical activity—the WEBB program.12 The program involved “task-related” training with progressive balance and strength-ening exercises as well as walking and stair climbing. Typical exercises included calf raisers while standing, sit-stand, step-ups, standing with reduced base of support, graded reaching activities in standing and forward, back-ward, and sideways stepping and walking. The intervention was delivered in a weekly circuit-style group exercise class and a home exercise program, and advice to increase walk-ing was given. The CG exercise class was designed to improve upper-limb function, manage upper-limb contrac-ture with task-related strength and coordination training, and improve cognition with matching, sorting and sequencing tasks. The CG was also prescribed a home program aimed to make them use their affected arm and keep their mind occu-pied with cognitive leisure tasks such as word and number puzzles. Further information about the intervention pro-grams can be found in the trial protocol.18 The experimental and control classes were held in different areas of the stroke club and at different times to minimize the risk of “contami-nation” between the groups.
Outcome MeasuresThe primary outcome measures were mobility and falls. Two aspects of mobility, walking capacity and speed, were assessed. Walking capacity was measured by quantifying the distance walked (m) from a 6-minute Walk Test.21 Walking speed (m/s) was measured using the 10-m Walk Test at the participant’s comfortable and fastest speed over the middle 10 m of a level, 14-m walking track.
Falls were monitored for 1 year with monthly fall calen-dars. A fall was defined according to the Kellogg definition “as an incident in which the body unintentionally comes to rest on the ground or other lower level which is not as a result of a violent blow, loss of consciousness, sudden onset of paralysis as in a stroke or an epileptic seizure”22 (p 1). All participants received monthly calendars on entry to the study, with instructions to record the number of falls. Participants were asked to return the completed calendar monthly at their weekly exercise class. If calendars were not returned after therapist reminders, further contact was made by telephone. Details of falls, including how and where the fall occurred, injuries suffered, medical intervention required, and limita-tions to activity as a result, were verified.
Secondary outcomes were falls risk score, habitual phys-ical activity, quality of life, community participation, and health system contact. Falls risk (score 0-7) was assessed
at Macquarie University Library on May 6, 2012nnr.sagepub.comDownloaded from

Dean et al. 3
using the Short-form Physiological Profile Assessment.23 Physical activity (steps/d) was measured by averaging the number of steps taken each day for 7 consecutive days, recorded using a Digimax pedometer. Health-related qual-ity of life was measured using the SF (Short Form)-12 Version 2.24 The physical composite and mental composite scores (0-100) were reported.24 Community participation was measured using the Adelaide Activities Profile.25 The questions reflect performance on activities in 4 domains: domestic chores (0-24 points), household maintenance (0-21 points), service to others (0-15 points), and social activities (0-12 points) over the past 3 months. Community participation was reported in the 4 domains separately.26 Health system contact was recorded on the falls calendars. Participants were required to indicate when they had seen a doctor or health worker and if they were hospitalized.
Several additional impairment and activity measures were collected to provide insight into the mechanisms underlying any of the changes in outcomes. Dexterity was evaluated by measuring choice stepping reaction time.27 Choice stepping reaction time was measured as the time to complete a stan-dardized stepping routine. Isometric muscle strength was evaluated by measuring knee extensor strength while seated with hip and knee flexed to 90°. Strength was measured in both legs. This test is part of the short-form Physiological Profile Assessment.23 Strength (kg) was recorded as the best score from 3 attempts for each leg. Balance was measured by maximal balance range,28 coordinated stability,28 and single-leg stance time.29 Activity limitation was measured by sit-to-stand ability as time (s) to complete 5 stands from a 45-cm chair,30 the Timed Up and Go Test,31 and the Step Test using the affected and unaffected legs.32
BlindingThe participants and therapists delivering the intervention could not be blinded to intervention group allocation. Falls were recorded from self-report calendars. All other out-come measures were collected by an assessor who was blinded to group allocation. Blinding was ensured using several strategies. Participants were asked not to reveal details of their program to the assessors, and assessments were collected outside the times for exercise classes.
Sample SizeWe undertook an a priori power calculation to determine sample size. A sample size of 350 participants (175 per group) was needed for the trial to have 80% power to detect as significant at the 5% level a 34% reduction in the rate of falling (ie, an incidence rate ratio [IRR] of 0.66 using negative binomial regression analysis) in the 12-month follow-up period. This sample size would allow for a 15%
loss to follow-up that could result from death or withdrawal from the trial. By powering for the falls outcome, we also had sufficient power to detect meaningful between-group differences for walking capacity.7,8 A sample size of 126 participants (63 per group) was needed to have 80% power to detect a 50-m between-group difference in the 6-minute walk distance.
Statistical AnalysesAll analyses were by intention to treat. Analyses were con-ducted using the SPSS and Stata software packages. Missing data for individual variables were imputed using regression, where possible. Overall missing data amounted to less than 10%. The number of falls during the trial period was compared between groups using negative binomial regression to estimate the difference in fall rates. The pro-portion of fallers in each group was compared using the relative risk (RR) statistic (95% confidence interval [CI]). Between-group comparisons for the post intervention evaluation for the continuously scored outcome measures were made using general linear models (ANCOVA) con-trolling for baseline values. When distributions were highly skewed, change scores were compared using linear regres-sions. Categorical data were dichotomized, and between-group differences were compared using logistic regression models. The level of significance was set as P < .05, and the mean differences (95% CI) between the groups were reported for all outcome measures.
Post hoc analyses were undertaken to assess whether there was a differential effect of the intervention on the pri-mary outcomes and physical activity levels based on base-line walking speed. Statistically, this effect was quantified using interaction terms (group allocation by baseline fast walking speed as a continuous variable) in linear regression models. However, for ease of interpretation and presenta-tion of these analyses, we divided the sample into 2 sub-groups: Participants with a baseline fast walking speed greater than 0.8 m/s were classified as faster walkers, and those with speeds less than or equal to 0.8 m/s were classi-fied as slower walkers.
ResultsThe flow of participants through the trial is summarized in Figure 1. A total of 151 participants (73 female, 78 male), with an average age of 67 (standard deviation [SD] = 12) years and an average time since stroke of 5.9 (SD = 6.1) years were recruited to the study between November 2006 and January 2009. Among them, 76 participants were allo-cated to the EG and 75 to the CG. At baseline, the groups were similar in terms of demographic characteristics and other comorbidities (Table 1).
at Macquarie University Library on May 6, 2012nnr.sagepub.comDownloaded from

4 Neurorehabilitation and Neural Repair XX(X)
A total of 8 physiotherapists, on average 28 (SD = 13) years since graduating, provided the intervention; 6 of them had relevant postgraduate qualifications, and 7 had research experience. All therapists provided both experimental and control interventions at the nominated stroke club. One therapist provided intervention at 4 clubs. In all, 11 stroke clubs participated. The number of participants recruited at each club ranged from 6 (club E) to 27 (club D); however, the number of participants in each group was similar at each club (Table 2). One club (club B) withdrew involvement after 1 month because of clashes with club activities, but 3 participants from this club who wished to continue were offered monthly home visits to review their exercise pro-grams and were given regular phone encouragement.
Compliance
On average, the EG had access to 32 (SD = 8) classes and the CG to 31 (SD = 9) classes. Attendance records kept by the therapists indicated that only 6 participants (experi-mental = 1; control = 5) did not attend a single class. On average, the EG attended 20 (SD = 10; 63%) of the avail-able classes and the CG, 19 (SD = 12; 62%). The home program of at least 3 sessions per week was reviewed monthly by the therapist who managed the exercise classes. For experimental participants, therapists recorded the number of sessions prescribed per week, and adher-ence to the home program was rated by therapists at 3, 6, and 12 months on a scale from 0 to 3 with 0 = nil, 1 = low,
Control GroupUpper limb and cognitive exercises40 × 45 min classes over 12Home programAdvice
Stroke survivors screened by telephone (n = 309)
Excluded (n = 158)Declined (n = 69)Classes not suitable location or time (n = 50)Diagnosis not stroke (n = 10)Unable to walk (n = 9)Poor cognition (n = 5)Aphasia (n = 4)Continuing Rehab (n = 4)Unknown (n = 3)No GP Consent (n = 2)Other medical conditions (n = 2)
Measured mobility, falls risk, physical activity, quality of life, community participation, impairments and activity limitations
Randomized (n = 151) n = 76 n = 75
Month 0
Experimental GroupLower limb exercises40 × 45 min classes over 12Home programAdvice
Month 12
Lost to Month 12follow-up
incontinence (n = 1)moved (n = 2)carer illness (n = 2)illness (n = 6)
Lost to Month 12 follow-up
died (n = 3)illness (n = 2)refused classes/ reassessment (n = 2)
(n = 65) (n = 68)Measured falls (n=151), mobility, falls risk, physical activity, quality of life, community
participation, impairments and activity limitations.
Figure 1. Flow of participants through the trial
at Macquarie University Library on May 6, 2012nnr.sagepub.comDownloaded from
Dean et al. 5
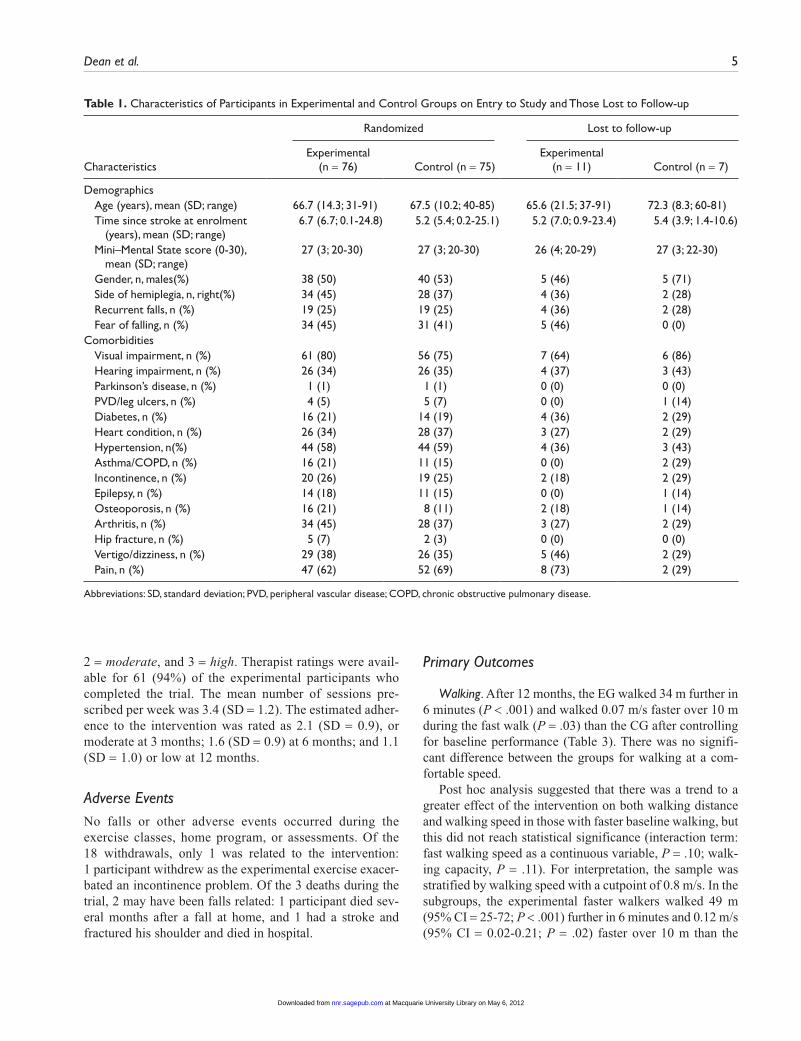
2 = moderate, and 3 = high. Therapist ratings were avail-able for 61 (94%) of the experimental participants who completed the trial. The mean number of sessions pre-scribed per week was 3.4 (SD = 1.2). The estimated adher-ence to the intervention was rated as 2.1 (SD = 0.9), or moderate at 3 months; 1.6 (SD = 0.9) at 6 months; and 1.1 (SD = 1.0) or low at 12 months.
Adverse EventsNo falls or other adverse events occurred during the exercise classes, home program, or assessments. Of the 18 withdrawals, only 1 was related to the intervention: 1 participant withdrew as the experimental exercise exacer-bated an incontinence problem. Of the 3 deaths during the trial, 2 may have been falls related: 1 participant died sev-eral months after a fall at home, and 1 had a stroke and fractured his shoulder and died in hospital.
Primary Outcomes
Walking. After 12 months, the EG walked 34 m further in 6 minutes (P < .001) and walked 0.07 m/s faster over 10 m during the fast walk (P = .03) than the CG after controlling for baseline performance (Table 3). There was no signifi-cant difference between the groups for walking at a com-fortable speed.
Post hoc analysis suggested that there was a trend to a greater effect of the intervention on both walking distance and walking speed in those with faster baseline walking, but this did not reach statistical significance (interaction term: fast walking speed as a continuous variable, P = .10; walk-ing capacity, P = .11). For interpretation, the sample was stratified by walking speed with a cutpoint of 0.8 m/s. In the subgroups, the experimental faster walkers walked 49 m (95% CI = 25-72; P < .001) further in 6 minutes and 0.12 m/s (95% CI = 0.02-0.21; P = .02) faster over 10 m than the
Table 1. Characteristics of Participants in Experimental and Control Groups on Entry to Study and Those Lost to Follow-up
Randomized Lost to follow-up
CharacteristicsExperimental
(n = 76) Control (n = 75)Experimental
(n = 11) Control (n = 7)
DemographicsAge (years), mean (SD; range) 66.7 (14.3; 31-91) 67.5 (10.2; 40-85) 65.6 (21.5; 37-91) 72.3 (8.3; 60-81)Time since stroke at enrolment
(years), mean (SD; range)6.7 (6.7; 0.1-24.8) 5.2 (5.4; 0.2-25.1) 5.2 (7.0; 0.9-23.4) 5.4 (3.9; 1.4-10.6)
Mini–Mental State score (0-30), mean (SD; range)
27 (3; 20-30) 27 (3; 20-30) 26 (4; 20-29) 27 (3; 22-30)
Gender, n, males(%) 38 (50) 40 (53) 5 (46) 5 (71)Side of hemiplegia, n, right(%) 34 (45) 28 (37) 4 (36) 2 (28)Recurrent falls, n (%) 19 (25) 19 (25) 4 (36) 2 (28)Fear of falling, n (%) 34 (45) 31 (41) 5 (46) 0 (0)
ComorbiditiesVisual impairment, n (%) 61 (80) 56 (75) 7 (64) 6 (86)Hearing impairment, n (%) 26 (34) 26 (35) 4 (37) 3 (43)Parkinson’s disease, n (%) 1 (1) 1 (1) 0 (0) 0 (0)PVD/leg ulcers, n (%) 4 (5) 5 (7) 0 (0) 1 (14)Diabetes, n (%) 16 (21) 14 (19) 4 (36) 2 (29)Heart condition, n (%) 26 (34) 28 (37) 3 (27) 2 (29)Hypertension, n(%) 44 (58) 44 (59) 4 (36) 3 (43)Asthma/COPD, n (%) 16 (21) 11 (15) 0 (0) 2 (29)Incontinence, n (%) 20 (26) 19 (25) 2 (18) 2 (29)Epilepsy, n (%) 14 (18) 11 (15) 0 (0) 1 (14)Osteoporosis, n (%) 16 (21) 8 (11) 2 (18) 1 (14)Arthritis, n (%) 34 (45) 28 (37) 3 (27) 2 (29)Hip fracture, n (%) 5 (7) 2 (3) 0 (0) 0 (0)Vertigo/dizziness, n (%) 29 (38) 26 (35) 5 (46) 2 (29)Pain, n (%) 47 (62) 52 (69) 8 (73) 2 (29)
Abbreviations: SD, standard deviation; PVD, peripheral vascular disease; COPD, chronic obstructive pulmonary disease.
at Macquarie University Library on May 6, 2012nnr.sagepub.comDownloaded from
6 Neurorehabilitation and Neural Repair XX(X)
control faster walkers, after controlling for baseline perfor-mance (Table 4).
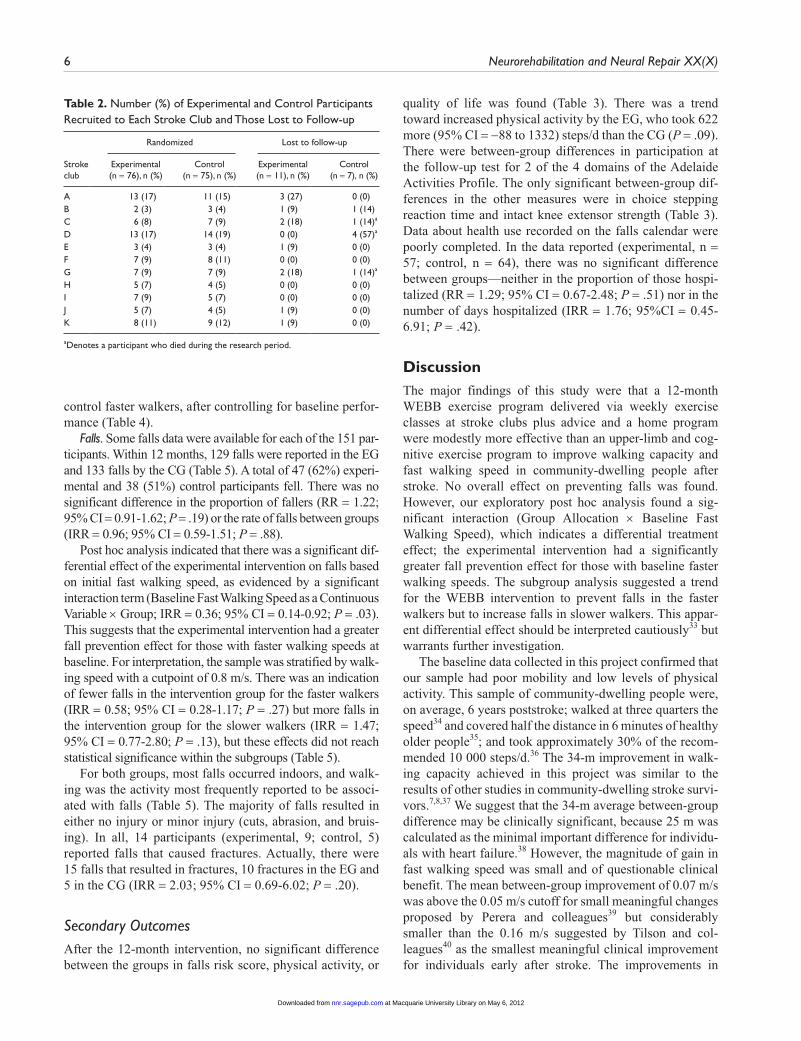
Falls. Some falls data were available for each of the 151 par-ticipants. Within 12 months, 129 falls were reported in the EG and 133 falls by the CG (Table 5). A total of 47 (62%) experi-mental and 38 (51%) control participants fell. There was no significant difference in the proportion of fallers (RR = 1.22; 95% CI = 0.91-1.62; P = .19) or the rate of falls between groups (IRR = 0.96; 95% CI = 0.59-1.51; P = .88).
Post hoc analysis indicated that there was a significant dif-ferential effect of the experimental intervention on falls based on initial fast walking speed, as evidenced by a significant interaction term (Baseline Fast Walking Speed as a Continuous Variable × Group; IRR = 0.36; 95% CI = 0.14-0.92; P = .03). This suggests that the experimental intervention had a greater fall prevention effect for those with faster walking speeds at baseline. For interpretation, the sample was stratified by walk-ing speed with a cutpoint of 0.8 m/s. There was an indication of fewer falls in the intervention group for the faster walkers (IRR = 0.58; 95% CI = 0.28-1.17; P = .27) but more falls in the intervention group for the slower walkers (IRR = 1.47; 95% CI = 0.77-2.80; P = .13), but these effects did not reach statistical significance within the subgroups (Table 5).
For both groups, most falls occurred indoors, and walk-ing was the activity most frequently reported to be associ-ated with falls (Table 5). The majority of falls resulted in either no injury or minor injury (cuts, abrasion, and bruis-ing). In all, 14 participants (experimental, 9; control, 5) reported falls that caused fractures. Actually, there were 15 falls that resulted in fractures, 10 fractures in the EG and 5 in the CG (IRR = 2.03; 95% CI = 0.69-6.02; P = .20).
Secondary OutcomesAfter the 12-month intervention, no significant difference between the groups in falls risk score, physical activity, or
quality of life was found (Table 3). There was a trend toward increased physical activity by the EG, who took 622 more (95% CI = −88 to 1332) steps/d than the CG (P = .09). There were between-group differences in participation at the follow-up test for 2 of the 4 domains of the Adelaide Activities Profile. The only significant between-group dif-ferences in the other measures were in choice stepping reaction time and intact knee extensor strength (Table 3). Data about health use recorded on the falls calendar were poorly completed. In the data reported (experimental, n = 57; control, n = 64), there was no significant difference between groups—neither in the proportion of those hospi-talized (RR = 1.29; 95% CI = 0.67-2.48; P = .51) nor in the number of days hospitalized (IRR = 1.76; 95%CI = 0.45-6.91; P = .42).
DiscussionThe major findings of this study were that a 12-month WEBB exercise program delivered via weekly exercise classes at stroke clubs plus advice and a home program were modestly more effective than an upper-limb and cog-nitive exercise program to improve walking capacity and fast walking speed in community-dwelling people after stroke. No overall effect on preventing falls was found. However, our exploratory post hoc analysis found a sig-nificant interaction (Group Allocation × Baseline Fast Walking Speed), which indicates a differential treatment effect; the experimental intervention had a significantly greater fall prevention effect for those with baseline faster walking speeds. The subgroup analysis suggested a trend for the WEBB intervention to prevent falls in the faster walkers but to increase falls in slower walkers. This appar-ent differential effect should be interpreted cautiously33 but warrants further investigation.
The baseline data collected in this project confirmed that our sample had poor mobility and low levels of physical activity. This sample of community-dwelling people were, on average, 6 years poststroke; walked at three quarters the speed34 and covered half the distance in 6 minutes of healthy older people35; and took approximately 30% of the recom-mended 10 000 steps/d.36 The 34-m improvement in walk-ing capacity achieved in this project was similar to the results of other studies in community-dwelling stroke survi-vors.7,8,37 We suggest that the 34-m average between-group difference may be clinically significant, because 25 m was calculated as the minimal important difference for individu-als with heart failure.38 However, the magnitude of gain in fast walking speed was small and of questionable clinical benefit. The mean between-group improvement of 0.07 m/s was above the 0.05 m/s cutoff for small meaningful changes proposed by Perera and colleagues39 but considerably smaller than the 0.16 m/s suggested by Tilson and col-leagues40 as the smallest meaningful clinical improvement for individuals early after stroke. The improvements in
Table 2. Number (%) of Experimental and Control Participants Recruited to Each Stroke Club and Those Lost to Follow-up
Randomized Lost to follow-up
Stroke club
Experimental (n = 76), n (%)
Control (n = 75), n (%)
Experimental (n = 11), n (%)
Control (n = 7), n (%)
A 13 (17) 11 (15) 3 (27) 0 (0)B 2 (3) 3 (4) 1 (9) 1 (14)C 6 (8) 7 (9) 2 (18) 1 (14)a
D 13 (17) 14 (19) 0 (0) 4 (57)a
E 3 (4) 3 (4) 1 (9) 0 (0)F 7 (9) 8 (11) 0 (0) 0 (0)G 7 (9) 7 (9) 2 (18) 1 (14)a
H 5 (7) 4 (5) 0 (0) 0 (0)I 7 (9) 5 (7) 0 (0) 0 (0)J 5 (7) 4 (5) 1 (9) 0 (0)K 8 (11) 9 (12) 1 (9) 0 (0)
aDenotes a participant who died during the research period.
at Macquarie University Library on May 6, 2012nnr.sagepub.comDownloaded from

7
Tabl
e 3.
Mea
n (S
D)
of E
xper
imen
tal a
nd C
ontr
ol G
roup
s, M
ean
(SD
) D
iffer
ence
With
in G
roup
s, an
d M
ean
(95%
CI)
Diff
eren
ce B
etw
een
Gro
ups
for
Prim
ary
(Sha
ded)
and
Se
cond
ary
Out
com
es a
nd A
dditi
onal
Impa
irm
ent
and
Act
ivity
Mea
sure
s
Gro
ups
Diff
eren
ce w
ithin
gro
ups
Diff
eren
ce b
etw
een
grou
ps
M
onth
0M
onth
12
Mon
th 1
2 −
Mon
th 0
Mon
th 1
2 ad
just
ed fo
r M
onth
0
Out
com
esEx
peri
men
tal
(n =
76)
Con
trol
(n
= 7
5)Ex
peri
men
tal
(n =
65)
Con
trol
(n
= 6
8)Ex
peri
men
tal
(n =
65)
Con
trol
(n
= 6
8)Ex
peri
men
tal −
Con
trol
Wal
king
Com
fort
able
spe
ed (
m/s
)0.
72 (
0.36
)0.
67 (
0.38
)0.
74 (
0.39
)0.
67 (
0.37
)0.
01 (
0.17
)−0
.01
(0.1
5)0.
03 (
−0.0
3 to
0.0
8, P
= .3
5)Fa
st s
peed
(m
/s)
0.87
(0.
46)
0.84
(0.
52)
0.89
(0.
49)
0.80
(0.
48)
0.01
(0.
20)
−0.0
6 (0
.18)
0.07
(0.
01 t
o 0.
14, P
= .0
3)C
apac
ity (
m)
233
(124
)22
0 (1
31)
273
(133
)22
4 (1
35)
32 (
37)
−2 (
50)
34 (
19 t
o 50
, P <
.001
)Fa
lls r
isk
Phys
iolo
gica
l pro
file
asse
ssm
ent
(sco
re 0
-7)
3.1
(1.3
)2.
8 (1
.2)
3.0
(1.6
)2.
9 (1
.4)
0.0
(1.1
)0.
1 (1
.2)
−0.0
2 (−
0.4
to 0
.4, P
= .9
3)
Phys
ical
act
ivity
7-da
y pe
dom
eter
cou
nt
(ste
ps/d
)34
17 (
2702
)32
84 (
3325
)43
65 (
3350
), n
= 64
3357
(32
56),
n =
6273
8 (2
056)
, n =
64
148
(196
3), n
= 6
262
2 (−
88 t
o 13
32, P
= .0
9)
Qua
lity
of li
feSF
12, v
2 Ph
ysic
al C
ompo
site
(0
-100
)37
(10
)33
(9)
37 (
9)35
(10
)0
(9)
2 (9
)0
(−3
to 3
, P =
.98)
SF12
, v2
Men
tal C
ompo
site
(0
-100
)50
(11
) 5
0 (1
2)50
(10
)50
(11
)0
(11)
0 (1
2)0
(−3
to 3
, P =
.96)
Part
icip
atio
n: A
AP
dom
ains
AA
P D
omes
tic C
hore
s (0
-24)
12.0
(6.
9), n
= 7
010
.8 (
7.3)
, n =
68
12.7
(7.
8), n
= 6
210
.4 (
7.3)
, n =
67
−0.1
(4.
3), n
= 5
8−0
.4 (
4.1)
, n =
61
0.4
(−1.
1 to
1.9
, P =
.63)
AA
P H
ouse
hold
Mai
nten
ance
(0
-21)
7.5
(5.1
), n
= 69
7.7
(5.1
), n
= 69
8.3
(5.1
), n
= 61
7.1
(5.1
), n
= 65
0.4
(3.6
), n
= 56
−0.8
(4.
3), n
= 6
01.
2 (−
0.2
to 2
.5, P
= .0
9)
AA
P Se
rvic
e to
Oth
ers
(0-1
5)4.
5 (2
.9),
n =
694.
7 (3
.3),
n =
685.
5 (3
.1),
n =
624.
5 (2
.5),
n =
640.
5 (2
.7),
n =
57−0
.4 (
2.6)
, n =
59
0.9
(0 t
o 1.
7, P
= .0
4)A
AP
Soci
al A
ctiv
ities
(0-
12)
5.1
(1.6
), n
= 67
4.8
(2.0
), n
= 69
5.0
(2.1
), n
= 62
5.5
(2.2
), n
= 66
−0.3
(2.
2), n
= 5
50.
6 (2
.4),
n =
61−0
.8 (
−1.6
to
−0.1
, P =
.04)
Cho
ice
step
ping
rea
ctio
n tim
e (s
)63
.5 (
30.8
)61
.0 (
29.4
)58
.7 (
31.4
)67
.7 (
34.6
)−4
.4 (
28.9
)6.
6 (3
3.5)
−10.
3 (−
20.0
to
−0.5
, P =
.04)
Affe
cted
kne
e st
reng
th (
kg)
19.9
(10
.2)
18.3
(8.
7)20
.5 (
8.4)
, n =
64
18.6
(8.
4), n
= 6
60.
4 (7
.7),
n =
640.
1 (6
.9),
n =
660.
95 (
−1.2
to
3.1,
P =
.38)
Inta
ct k
nee
stre
ngth
(kg
)25
.0 (
10.7
)23
.9 (
10.1
)26
.6 (
8.5)
, n =
64
23.0
(10
.6),
n =
661.
2 (7
.3),
n =
64−1
.3 (
9.5)
, n =
66
3.0
(0.4
to
5.5,
P =
.03)
Max
imum
bal
ance
ran
ge (
mm
)11
4 (5
7)11
7 (6
1)12
3 (7
0)11
8 (6
7)9.
3 (6
0.7)
2.7
(61.
0)6
(−13
to
26, P
= .5
3)C
oord
inat
ed s
tabi
lity
(err
or)
211
(197
)20
1 (1
93)
194
(208
)23
3 (2
23)
−12
(12)
26 (
151)
−38
(−91
to
15, P
= .1
6)Si
ngle
-leg
stan
ce, i
ntac
t (s
)5.
0 (8
.0)
5.5
(8.6
)6.
2 (8
.9)
6.5
(13.
5)1.
2 (1
0.0)
0.9
(8.4
)0.
1 (−
3.0
to 3
.3, P
= .9
3)Si
ngle
-leg
stan
ce, a
ffect
ed (
s)1.
5 (2
.4)
1.8
(4.5
)3.
1 (6
.6)
2.2
(6.2
)1.
5 (5
.5)
0.3
(2.8
)1.
3 (−
0.1
to 2
.8, P
= .0
8)T
imed
5 S
TS
(s)
23.7
(14
.3)
24.2
(13
.9)
20.4
(12
.6)
23.4
(15
.9)
−1.9
(6.
0)−1
.2 (
12.9
)−1
.1 (
−4.5
to
2.4,
P =
.54)
Tim
ed U
p an
d G
o (s
)25
.0 (
28.3
)30
.2 (
32.9
)26
.3 (
34.7
)28
.6 (
28.3
)4.
2 (2
7.1)
−1.2
(18
.3)
5.1
(−2.
9 to
13.
1, P
= .2
1)St
ep t
est,
inta
ct (
num
ber)
5.7
(4.5
)5.
9 (4
.4)
6.3
(5.1
)6.
0 (6
.0)
0.6
(2.9
)0.
1 (3
.5)
0.5
(−0.
6 to
1.6
, P =
.37)
Step
tes
t, af
fect
ed (
num
ber)
5.4
(4.0
)5.
2 (4
.1)
5.8
(4.5
)5.
4 (5
.3)
0.4
(2.8
)0.
2 (3
.2)
0.3
(−0.
8 to
1.3
, P =
.60)
Abb
revi
atio
ns: S
D, s
tand
ard
devi
atio
n; S
F-12
, v2,
Sho
rt F
orm
12,
Ver
sion
2; A
AP,
Ade
laid
e A
ctiv
ities
Pro
file;
ST
S, si
t-to
-sta
nd.
at Macquarie University Library on May 6, 2012nnr.sagepub.comDownloaded from

8
Tabl
e 4.
Mea
n (S
D)
of E
xper
imen
tal a
nd C
ontr
ol G
roup
s, M
ean
(SD
) D
iffer
ence
With
in G
roup
s, an
d M
ean
(95%
CI)
Diff
eren
ce B
etw
een
Gro
ups
for
Slow
er (
Base
line
Fast
Spe
ed
≤0.8
m/s
) an
d Fa
ster
(Ba
selin
e Fa
st S
peed
>0.
8 m
/s)
Wal
kers
for
Fast
Wal
king
Spe
ed, W
alki
ng C
apac
ity, a
nd P
hysi
cal A
ctiv
ity
Gro
ups
Diff
eren
ce w
ithin
gro
ups
Diff
eren
ce b
etw
een
grou
ps
M
onth
0M
onth
12
Mon
th 1
2 −
Mon
th 0
Mon
th 1
2 ad
just
ed fo
r M
onth
0
Subg
roup
Ana
lyse
sEx
peri
men
tal
Con
trol
Expe
rim
enta
lC
ontr
olEx
peri
men
tal
Con
trol
Expe
rim
enta
l − C
ontr
ol
Fast
wal
king
: 10-
m s
peed
Sl
ower
wal
kers
(m
/s),
m
ean
(SD
)0.
46 (
0.22
), n
= 35
0.42
(0.
21),
n =
380.
50 (
0.30
), n
= 30
0.42
(0.
25),
n =
320.
02 (
0.21
), n
= 30
0.01
(0.
12),
n =
320.
01 (
−0.0
7 to
0.1
, P =
.75)
Fa
ster
wal
kers
(m
/s),
m
ean
(SD
)1.
21 (
0.30
), n
= 41
1.27
(0.
37),
n =
371.
23 (
0.35
), n
= 35
1.1
(0.3
6), n
= 3
60.
01 (
0.21
), n
= 35
−0.1
1 (0
.21)
, n =
36
0.12
(0.
02 t
o 0.
21, P
= .0
2)
Wal
king
cap
acity
, 6-m
inut
e di
stan
ce
Slow
er w
alke
rs (
m),
m
ean
(SD
)12
8 (7
9), n
= 3
512
1 (6
0), n
= 3
815
8 (8
1), n
= 3
012
4 (7
9), n
= 3
225
(35
), n
= 30
6 (3
7), n
= 3
217
(−1
to
36, P
= .0
7)
Fa
ster
wal
kers
(m
),
mea
n (S
D)
324
(74)
, n =
41
321
(105
), n
= 37
372
(74)
, n =
35
312
(111
), n
= 36
38 (
39),
n =
35−1
0 (5
9), n
= 3
649
(25
to
72, P
< .0
01)
Phys
ical
act
ivity
, 7-d
ay p
edom
eter
Sl
ower
wal
kers
(
step
s/d)
, mea
n (S
D)
2039
(16
39),
n =
3516
94 (
1881
), n
= 38
2578
(19
96),
n =
2919
48 (
1929
), n
= 29
383
(193
3), n
= 2
911
9 (1
608)
, n =
29
413
(−44
0 to
126
5, P
= .3
4)
Fa
ster
wal
kers
(
step
s/d)
, mea
n (S
D)
4594
(28
85),
n =
4149
16 (
3699
), n
= 37
5844
(35
40),
n =
3545
94 (
3685
), n
= 33
1033
(21
35),
n =
2917
4 (2
254)
, n =
29
873
(−19
9 to
194
5, P
= .1
1)
Abb
revi
atio
n: S
D, s
tand
ard
devi
atio
n.
at Macquarie University Library on May 6, 2012nnr.sagepub.comDownloaded from

Dean et al. 9
walking capacity and speed were larger for faster walkers compared with slower walkers.
There were also statistically significant between-group differences for several of the secondary outcome measures. At posttest, the EG performed better in choice stepping reaction time, strength of the intact knee extensor muscle, and the “service to others” domain of the Adelaide Activities Profile. There were also trends favoring the experimental intervention for physical activity and single-leg stance time on the affected leg. However, formal accuracy testing of the pedometers with all participants was not carried out prior to their use, which may have led to some inaccuracies. In gen-eral, significant between-group differences were a result of small improvements by the EG and small deteriorations in performance by the CG.
This study was conducted in partnership with the NSW Stroke Recovery Association and sought to use the Association’s
stroke club network as a means of establishing sustainable exer-cise opportunities for long-term stroke survivors. Recruitment of stroke clubs to the project was more difficult than antici-pated. The most common barriers to stroke club participation were irregular meetings, insufficient members to make the proj-ect viable, transport issues, and an unwillingness to disrupt or change the current meeting program. Despite these challenges, exercise classes were established in 11 stroke clubs, and only 1 club withdrew from the project. One club continues to provide ongoing exercise classes on a participant-funded basis.
The positive findings reported in this study were achieved with a modest dose of exercise. The intended dose of the program was 40 exercise classes and a home program completed at least 3 times a week over 12 months. However, on average, only 31 classes were offered to each participant, and on average, experimental participants attended only 20 classes. The concordance with the home program also
Table 5. Falls Data for Experimental and Control Groups and Between-Group Differences as RR (95% CI) and IRR (95% CI); Fall Rates by Location and Activitya
Group Difference between groups
Falls Experimental, n = 76 Control, n = 75 Experimental relative to control
Overall Falls follow-up (days), mean (SD) 339 (80) 351 (54) Total number of falls 129 133 Fallers, n (%) 47 (62) 38 (51) RR = 1.22 (0.91-1.62, P = .19) 1 Fall 18 (24) 19 (25) 2 Falls 15 (20) 2 (3) ≥3 14 (18) 17 (23) Fall rates (falls/person), mean
(SD; range)1.7 (2.5; 0-15) 1.8 (3.6; 0-22) IRR = 0.96 (0.59-1.51, P = .88)
Slower walkers (falls/person), mean (SD)
2.4 (3.2) 1.6 (2.9) IRR = 1.47 (0.77-2.80, P = .27)b
Faster walkers (falls/person), mean (SD)
1.1 (1.3) 1.9 (4.2) IRR = 0.58 (0.28-1.17, P = .13)b
Location Inside (falls/person), mean (SD;
range)1.2 (1.9; 0-9) 1.1 (2.1; 0-9)
Outside (falls/person), mean (SD; range)
0.5 (1.1; 0-6) 0.7 (1.9; 0-14)
Activity Walking (falls/person), mean (SD;
range)0.7 (1.2; 0-5) 0.9 (2.1; 0-10)
Transferring bed/chair (falls/person), mean (SD; range)
0.2 (0.9; 0-7) 0.1 (0.3; 0-1)
Sit-to-stand (falls/person), mean (SD; range)
0.3 (1.2; 0-5) 0.2 (0.7; 0-4)
Abbreviations: SD, standard deviation; RR, relative risk; IRR, incidence rate ratio.aThe latter are presented for descriptive purposes.bThere was a significant differential effect of the experimental intervention based on baseline fast walking speed, as evidenced by a significant interac-tion term (Walking Speed × Group); IRR = 0.36 (0.14-0.92, P = .03). The sample has been stratified into slower (baseline fast speed ≤ 0.8 m/s) and faster walkers (baseline fast speed > 0.8 m/s) for ease of interpretation and presentation.
at Macquarie University Library on May 6, 2012nnr.sagepub.comDownloaded from

10 Neurorehabilitation and Neural Repair XX(X)
deteriorated progressively over the 12 months. The low adherence rates and decreased concordance with the home program, effectively reducing the dose of intervention, were not surprising given the presence of a large number of comor-bidities and reliance of many participants on family members and carers to access classes and assist with home programs. Future research needs to develop strategies to minimize the gap between actual and intended dose of intervention. Provision of additional classes and assistance with transporta-tion may be useful strategies.
The results of this trial confirm that falls continue to be a common problem in community-dwelling people after stroke. In total, participants recorded 262 falls over the 12-month period, and there were 15 fall-related fractures. There are few stroke-specific falls prevention trials with which to compare our findings. A 2010 systematic review11 concluded that further research was needed because the only intervention shown to be effective in reducing falls after stroke was vitamin D supplementation for women in an institutional setting. The significant heterogeneity of the intervention effect based on baseline fast walking speed suggests that the WEBB program (or a similar program) and advice to increase walking as delivered in this trial may be a promising falls prevention intervention for people after stroke without markedly slowed walking and warrants fur-ther research. Further research is also required to establish the effect of exercise on fall rates among people after stroke with greater mobility limitation. Lower-limb weight-bearing exercises that challenge strength and balance may still be an effective intervention for slower walkers, but issues around dosage and amount and nature of supervision are avenues worthy of further research. Alternatively, other falls preven-tion strategies, such as home modifications, education, and carer training, may be more beneficial. Given that almost 6% of the falls reported resulted in a fracture, we also rec-ommend that all future studies report fracture rates, so that meta-analyses can be undertaken.
The strengths of our study are its generalizability to ambulatory people living in the community well after a stroke and adherence to quality trial design and processes. However, we acknowledge that there are several limitations to our study. First, our failure to meet our recruitment target of 350 resulted in the study being underpowered for both falls and injurious falls. Despite this, there was no indication of an effect on falls for the entire sample, so it is unlikely that a larger study would have shown an effect on falls. Second, as in most clinical trials of complex interventions, therapists and participants cannot be blinded to group allocation and are therefore potential sources of bias. Third, as the individu-als were recruited from the community, we do not have information on neurological deficits and the location of the stroke. Fourth, the high levels of disability and comorbidi-ties resulted in variable adherence to the program.
Conclusion
This project found that delivery of exercise classes through a stroke club network was possible but more difficult than anticipated. Nonetheless, this project showed that the WEBB program and advice to increase walking improved mobility. Although there was no overall effect on preventing falls, exploratory post hoc analysis revealed a differential effect of the intervention according to baseline walking speed with a greater fall prevention effect in the faster walkers.
Acknowledgments
The research team thanks the following people and organizations and their staff for assistance with the project: Sydney South West Area Health Service Health Promotion Unit; The Stroke Recovery Association of NSW; volunteers and members of the NSW Stroke Recovery Association’s Stroke Clubs who participated in and/or supported the project; physiotherapists who provided intervention (Catherine Kirkham, Fran Moran, Heidi Janssen, Monte Elissa, Doris Lee, Enid Schafer, Meredith Schwilk, and Jan Macphail); physiotherapists who completed assessments (Catherine Kirkham, Sharon Czerniec, and Rachelle Love); and Ming Lin, Beverly Lloyd, Clare Monger, and Andrew Milat from NSW Health and Colleen Canning from the University of Sydney who provided advice to the research team.
Authors’ Note
Professor Stephen Lord developed The Physiological Profile Assessment (FallScreen), which is commercially available through Neuroscience Research Australia.
Declaration of Conflicting Interests
The authors declared no potential conflicts of interest with respect to the research, authorship, and/or publication of this article.
Funding
The authors disclosed receipt of the following financial support for the research, authorship, and/or publication of this article: The project was funded by NSW Health through the NSW Health Promotion Demonstration Research Grants Scheme and con-ducted by the University of Sydney, Stroke Recovery Association of NSW, and Health Promotion Service of Sydney South West Area Health Service. A complete project report, required by the funding source, can be accessed at http://www.health.nsw.gov.au/pubs/2011/exercise_intervention_to_.html.
References
1. National Institute for Clinical Excellence. Clinical Practice Guideline for the Assessment and Prevention of Falls in Older people. United Kingdom: National Institute for Clini-cal Excellence; 2004.
2. Forster A, Young J. Incidence and consequences of falls due to stroke: a systematic inquiry. BMJ. 1995;311:83-86.
at Macquarie University Library on May 6, 2012nnr.sagepub.comDownloaded from

Dean et al. 11
3. Lamb SE, Ferrucci L, Volapto S, et al. Risk factors for fall-ing in home-dwelling older women with stroke: the Women’s Health and Aging Study. Stroke. 2003;34:494-501.
4. Ramnemark A, Nyberg L, Borssén B, et al. Fractures after stroke. Osteoporos Int. 1998;8:92-95.
5. Stolze H, Klebe S, Zechlin C, et al. Falls in frequent neu-rological diseases: prevalence, risk factors and aetiology. J Neurol. 2004;51:79-84.
6. Outpatient Service Trialists. Rehabilitation therapy services for stroke patients living at home: systematic review of ran-domised trials. Lancet. 2004;363:352-356.
7. Duncan P, Studenski S, Richards L, et al. Randomized clini-cal trial of therapeutic exercise in subacute stroke. Stroke. 2003;34:2173-2180.
8. Ada L, Dean CM, Hall JM, et al. A treadmill and overground walking program improves walking in persons residing in the community after stroke: a placebo-controlled, randomized trial. Arch Phys Med Rehabil. 2003;84:1486-1491.
9. Gillespie LD, Robertson MC, Gillespie WJ, et al. Interven-tions for preventing falls in older people living in the com-munity. Cochrane Database Syst Rev. 2009;(2):CD007146.
10. Sherrington C, Whitney J, Lord S, et al. Effective exercise for the prevention of falls; a systematic review and meta-analysis. J Am Geriatr Soc. 2008;56:2234-2243.
11. Batchelor F, Hill K, Mackintosh S, et al. What works in falls prevention after stroke? A systematic review and meta analy-sis. Stroke. 2010;41:1715-1722.
12. Sherrington C, Canning C, Dean C, et al. Weight-Bearing Exer-cise for Better Balance: A Challenging, Safe, Evidence-Based Physiotherapy Program for Older People. Sydney, Australia: The George Institute for Global Health and The University of Sydney; 2008. http://www.WEBB.org.au. Accessed October 11, 2010.
13. Sherrington C, Pamphlett PI, Jacka JA, et al. Group exercise can improve participants’ mobility in an outpatient rehabili-tation setting: a randomized controlled trial. Clin Rehabil. 2008;22:493-502.
14. Dean CM, Richards CL, Malouin F. Task-related circuit training improves performance of locomotor tasks in chronic stroke: a randomized, controlled pilot trial. Arch Phys Med Rehabil. 2000;81:409-417.
15. Sherrington C, Lord SR, Vogler CM, et al. Minimising dis-ability and falls in older people through a post-hospital exer-cise program: a protocol for a randomised controlled trial and economic evaluation. BMC Geriatr. 2009;9:8.
16. Canning CG, Sherrington C, Lord SR, et al. Exercise therapy for prevention of falls in people with Parkinson’s disease: a protocol for a randomised controlled trial and economic eval-uation. BMC Neurol. 2009;9:4.
17. Fairhall N, Aggar C, Kurrle SE, et al. Frailty Intervention Trial (FIT). BMC Geriatr. 2008;8:27.
18. Dean CM, Rissel C, Sharkey M, et al. Exercise intervention to prevent falls and enhance mobility in community dwellers
after stroke: a protocol for a randomised controlled trial. BMC Neurol. 2009;9:38.
19. Folstein MF, Folstein SE, McHugh PR. “Mini–Mental State”: a practical method for grading the cognitive status of patients for the clinician. J Psychiatr Res. 1975;12:189-198.
20. American College of Sports Medicine Position Stand: Exer-cise and physical activity for older adults. Med Sci Sports Exerc. 1998;30:992-1008.
21. Lipkin DP, Scriven AJ, Crake T, et al. Six-minute walking test for assessing exercise capacity in chronic heart failure. Br Med J (Clin Res Ed). 1986;292:633-635.
22. Gibson MJ, Andres RO, Isaacs B, et al. The prevention of falls in later life: a report of the Kellogg International Work Group on the Prevention of Falls by the Elderly. Dan Med Bull. 1987;34(suppl 4):1-24.
23. Lord SR, Menz HB, Tiedemann A. A physiological profile approach to falls risk assessment and prevention. Phys Ther. 2003;83:237-252.
24. Ware JE, Kosinski M, Keller SD. SF-12: How to Score the SF-12 Physical and Mental Health Summary Scales. 3rd ed. Lincoln, RI: Quality Metric Incorporated; 1998.
25. Clark MJ, Bond MS. The Adelaide activities profile: a mea-sure of the lifestyle activities of elderly people. Aging Clin Exp Res. 1995;7:174-184.
26. Bond MS, Clark MJ. Clinical applications of Adelaide Activ-ities Profile. Clin Rehabil. 1998;12:228-237.
27. Lord SR, Fitzpatrick RC. Choice stepping reaction time: a composite measure of falls risk in older people. J Gerontol A Biol Sci Med Sci. 2001;56:M627-M632.
28. Lord SR, Ward JA, Williams P. Exercise effect on dynamic stability in older women: a randomized controlled trial. Arch Phys Med Rehabil. 1996;77:232-236.
29. Ekdahl C, Jarnlo GB, Andersson SI. Standing balance in healthy subjects: evaluation of a quantitative test battery on a force platform. Scand J Rehabil Med. 1989;21:187-195.
30. McCarthy EK, Horvat MA, Holtsberg PA, et al. Repeated chair stands as a measure of lower limb strength in sexagenarian women. J Gerontol A Biol Sci Med Sci. 2004;59:1207-1212.
31. Podsiadlo D, Richardson S. The timed “up and go”: a test of basic functional mobility for frail elderly persons. J Am Geriatr Soc. 1991;39:142-148.
32. Hill K, Bernhardt J, McGann A, et al. A new test of dynamic standing balance for stroke patients: reliability and compari-son with healthy elderly. Physiother Can. 1996;48:257-262.
33. Sun X, Briel M, Walter SD, et al. Is a subgroup effect believ-able? Updating criteria to evaluate the credibility of subgroup analyses. BMJ. 2010;340:c117.
34. Bohannon RW. Comfortable and maximum walking speed of adults aged 20-79 years: reference values and determinants. Age Ageing. 1997;26:15-19.
35. Enright PL, Sherrill D. Reference equations for the six-minute walk in healthy adults. Am J Respir Crit Care Med. 1998;158:1384-1387.
at Macquarie University Library on May 6, 2012nnr.sagepub.comDownloaded from

12 Neurorehabilitation and Neural Repair XX(X)
36. Tudor-Locke C, Bassett DR. How many steps/day are enough? Preliminary pedometer indices for public health. Sports Med. 2004;34:1-8.
37. Pang MY, Eng JJ, Dawson AS, et al. A community based fitness and mobility exercise program for older adults with chronic stroke: a randomized controlled trial. J Am Geriatr Soc. 2005;53:1667-1674.
38. Holland AE, Hill CJ, Rasekaba T, et al. Updating the minimal important difference for six-minute walk distance in patients
with chronic obstructive pulmonary disease. Arch Phys Med Rehabil. 2010;91:221-225.
39. Perera S, Mody SH, Woodman RC, et al. Meaningful change and responsiveness in common physical perfor-mance measures in older adults. J Am Geriatr Soc. 2006;54: 743-749.
40. Tilson JK, Sullivan KJ, Cen SY, et al. Meaningful gait speed improvement during first 60 days post stroke: minimally clin-ically important difference. Phys Ther. 2010;90:196-208.
at Macquarie University Library on May 6, 2012nnr.sagepub.comDownloaded from
Related Documents