Exercise loading and cortical bone distribution at the tibial shaft T. Rantalainen a,b,c, ⁎, R. Nikander d,e,f , R.M. Daly e,g , A. Heinonen c , H. Sievänen f,h a Department of Mechanical Engineering, Lappeenranta University of Technology, Finland b Neuromuscular Research Center, Department of Biology of Physical Activity, University of Jyväskylä, Finland c Department of Health Sciences, University of Jyväskylä, Finland d Helsinki Metropolia University of Applied Sciences, Helsinki, Finland e Centre for Physical Activity and Nutrition Research, School of Exercise and Nutrition Sciences, Deakin University, Melbourne, Victoria, Australia f Pirkanmaa Hospital District, Science Center, Tampere, Finland g Department of Medicine (RMH/WH), Western Hospital, University of Melbourne, Melbourne, Victoria, Australia h Bone Research Group, UKK Institute, Tampere, Finland abstract article info Article history: Received 19 July 2010 Revised 18 November 2010 Accepted 20 November 2010 Available online 30 November 2010 Edited by: David Fyhrie Keywords: Adaptation Bone density Bone strength Physical activity pQCT Cortical bone is not a uniform tissue, and its apparent density [cortical volumetric density (vBMD)] varies around the bone cross-section as well as along the axial length of the bone. It is not yet known, whether the varying vBMD distribution is attributable to modulation in the predominant loads affecting bone. The aim of the present study was to compare the cortical bone mass distribution through the bone cortex (radial distribution) and around the center of mass (polar distribution) among 221 premenopausal women aged 17– 40 years representing athletes involved in high impact, odd impact, high magnitude, repetitive low impact, repetitive non-impact sports and leisure time physical activity (referent controls). Bone cross-sections at the tibial mid-diaphysis were assessed with pQCT. Radial and polar vBMD distributions were analyzed in three concentric cortical divisions within the cortical envelope and in four cortical sectors originating from the center of the bone cross-section. MANCOVA, including age as a covariate, revealed no significant group by division/sector interaction in either radial or polar distribution, but the mean vBMD values differed between groups (P b 0.001). The high and odd-impact groups had 1.2 to 2.6% (P b 0.05) lower cortical vBMD than referents, in all analyzed sectors/divisions. The repetitive, low-impact group had 0.4 to 1.0% lower (P b 0.05) vBMD at the mid and outer cortical regions and at the anterior sector of the tibia. The high magnitude group had 1.2% lower BMD at the lateral sector (P b 0.05). The present results generate a hypothesis that the radial and polar cortical bone vBMD distributions within the tibial mid-shaft are not modulated by exercise loading but the mean vBMD level is slightly affected. © 2010 Elsevier Inc. All rights reserved. Introduction The strength of a whole bone is an important predictor of fracture risk, and is determined by the material and architectural properties of bone [1–3]. It is well known that bones adapt to prevalent imposed loads and muscle forces mostly via changing their mineral mass and architecture, rather than altering the material properties [4,5]. Currently there are a number of X-ray based bone imaging techniques that permit a reasonable estimation of the apparent volumetric BMD (vBMD) of the cortex, which reflects both the porosity of bone tissue, mineralization and other bone material properties [6–8]. Further, it has been reported that about 70% of the age-related reduction in cortical vBMD is attributable to increased porosity [6], which suggests that apparent vBMD of the cortex would provide an adequate surrogate of cortical porosity [9]. It is well established that cortical vBMD within long bones is not uniform, and that there are differences between individuals both around the bone cross-section [10–16] and along its axial length [13– 15]. These differences observed in the distribution of cortical vBMD between different sectors around the center of mass or neutral axis (polar distribution), and within the circumferential layers within the cortex (radial distribution), during growth [10,11,17], and aging [12,13,16] have raised an important question as to whether loading plays an important role in modulating the distribution of cortical bone density [10,11]. To date, such changes have been observed in a single randomized controlled trial (RCT) investigating both the polar and radial distribution in response to exercise and hormone replacement therapy in postmenopausal women [18]. In our previous analyses of athletes' bone data, the long-term specific exercise loading was clearly associated with direction-specific structural adaptations at the tibial midshaft [19–22]. To extend this geometric analysis to apparent material properties of cortical bone, the present study was carried out to evaluate whether cortical vBMD distribution within the cortical envelope (i.e. radial distribution) or in Bone 48 (2011) 786–791 ⁎ Corresponding author. University of Jyväskylä, P.O. Box 35, 40014 Jyväskylä, Finland. Fax: +358 14 260 2071. E-mail address: timo.j.rantalainen@jyu.fi (T. Rantalainen). 8756-3282/$ – see front matter © 2010 Elsevier Inc. All rights reserved. doi:10.1016/j.bone.2010.11.013 Contents lists available at ScienceDirect Bone journal homepage: www.elsevier.com/locate/bone

Welcome message from author
This document is posted to help you gain knowledge. Please leave a comment to let me know what you think about it! Share it to your friends and learn new things together.
Transcript
Bone 48 (2011) 786–791
Contents lists available at ScienceDirect
Bone
j ourna l homepage: www.e lsev ie r.com/ locate /bone
Exercise loading and cortical bone distribution at the tibial shaft
T. Rantalainen a,b,c,⁎, R. Nikander d,e,f, R.M. Daly e,g, A. Heinonen c, H. Sievänen f,h
a Department of Mechanical Engineering, Lappeenranta University of Technology, Finlandb Neuromuscular Research Center, Department of Biology of Physical Activity, University of Jyväskylä, Finlandc Department of Health Sciences, University of Jyväskylä, Finlandd Helsinki Metropolia University of Applied Sciences, Helsinki, Finlande Centre for Physical Activity and Nutrition Research, School of Exercise and Nutrition Sciences, Deakin University, Melbourne, Victoria, Australiaf Pirkanmaa Hospital District, Science Center, Tampere, Finlandg Department of Medicine (RMH/WH), Western Hospital, University of Melbourne, Melbourne, Victoria, Australiah Bone Research Group, UKK Institute, Tampere, Finland
⁎ Corresponding author. University of Jyväskylä, PFinland. Fax: +358 14 260 2071.
E-mail address: [email protected] (T. Rantala
8756-3282/$ – see front matter © 2010 Elsevier Inc. Aldoi:10.1016/j.bone.2010.11.013
a b s t r a c t
a r t i c l e i n f oArticle history:Received 19 July 2010Revised 18 November 2010Accepted 20 November 2010Available online 30 November 2010
Edited by: David Fyhrie
Keywords:AdaptationBone densityBone strengthPhysical activitypQCT
Cortical bone is not a uniform tissue, and its apparent density [cortical volumetric density (vBMD)] variesaround the bone cross-section as well as along the axial length of the bone. It is not yet known, whether thevarying vBMD distribution is attributable to modulation in the predominant loads affecting bone. The aim ofthe present study was to compare the cortical bone mass distribution through the bone cortex (radialdistribution) and around the center of mass (polar distribution) among 221 premenopausal women aged 17–40 years representing athletes involved in high impact, odd impact, high magnitude, repetitive low impact,repetitive non-impact sports and leisure time physical activity (referent controls). Bone cross-sections at thetibial mid-diaphysis were assessed with pQCT. Radial and polar vBMD distributions were analyzed in threeconcentric cortical divisions within the cortical envelope and in four cortical sectors originating from thecenter of the bone cross-section. MANCOVA, including age as a covariate, revealed no significant group bydivision/sector interaction in either radial or polar distribution, but the mean vBMD values differed betweengroups (Pb0.001). The high and odd-impact groups had 1.2 to 2.6% (Pb0.05) lower cortical vBMD thanreferents, in all analyzed sectors/divisions. The repetitive, low-impact group had 0.4 to 1.0% lower (Pb0.05)vBMD at the mid and outer cortical regions and at the anterior sector of the tibia. The high magnitude grouphad 1.2% lower BMD at the lateral sector (Pb0.05). The present results generate a hypothesis that the radialand polar cortical bone vBMD distributions within the tibial mid-shaft are not modulated by exercise loadingbut the mean vBMD level is slightly affected.
.O. Box 35, 40014 Jyväskylä,
inen).
l rights reserved.
© 2010 Elsevier Inc. All rights reserved.
Introduction
The strength of a whole bone is an important predictor of fracturerisk, and is determined by the material and architectural properties ofbone [1–3]. It is well known that bones adapt to prevalent imposedloads and muscle forces mostly via changing their mineral mass andarchitecture, rather than altering the material properties [4,5].Currently there are a number of X-ray based bone imaging techniquesthat permit a reasonable estimation of the apparent volumetric BMD(vBMD) of the cortex, which reflects both the porosity of bone tissue,mineralization and other bone material properties [6–8]. Further, ithas been reported that about 70% of the age-related reduction incortical vBMD is attributable to increased porosity [6], which suggeststhat apparent vBMD of the cortex would provide an adequatesurrogate of cortical porosity [9].
It is well established that cortical vBMD within long bones is notuniform, and that there are differences between individuals botharound the bone cross-section [10–16] and along its axial length [13–15]. These differences observed in the distribution of cortical vBMDbetween different sectors around the center of mass or neutral axis(polar distribution), and within the circumferential layers within thecortex (radial distribution), during growth [10,11,17], and aging[12,13,16] have raised an important question as to whether loadingplays an important role in modulating the distribution of cortical bonedensity [10,11]. To date, such changes have been observed in a singlerandomized controlled trial (RCT) investigating both the polar andradial distribution in response to exercise and hormone replacementtherapy in postmenopausal women [18].
In our previous analyses of athletes' bone data, the long-termspecific exercise loading was clearly associated with direction-specificstructural adaptations at the tibial midshaft [19–22]. To extend thisgeometric analysis to apparent material properties of cortical bone,the present study was carried out to evaluate whether cortical vBMDdistribution within the cortical envelope (i.e. radial distribution) or in
787T. Rantalainen et al. / Bone 48 (2011) 786–791
different anatomic directions around the cortex (i.e. polar distribu-tion) is associated with long-term exercise loading, and whether theyare related to specific loading patterns in athletes involved in a diverserange of sporting activities.
Methods
A convenience sample of data from 180 premenopausal womenrepresenting athletes with a long history of participation in differentsports and 41 physically active, non-athletic referents (Table 1) wasused in the present study [19,21–23]. The age at which the athletesstarted their competitive career in sports was obtained from aquestionnaire. Based on each athlete's sport, they were divided intofive near-distinct types of exercise loading as previously reported([19,21,23]): 1) high-impact (triple- and high-jumpers, hurdlers), 2)odd-impact (soccer and squash players), 3) high-magnitude (power-lifters), 4) repetitive low-impact (endurance runners), and 5)repetitive non-impact (swimmers). The athletes were recruitedthrough national sports associations and local athletics clubs, andthe physically active reference subjects were mainly students fromthe Pirkanmaa University of Applied Sciences. The study wasconducted in agreement with the Helsinki declaration with theapproval of the ethics committee of The Pirkanmaa Hospital District.Written informed consent was obtained from all participants.
Radial and polar vBMD distribution
Bone cross-section at the tibial midshaft was assessed withperipheral quantitative computed tomography (pQCT, XCT 3000,Stratec Medizintechnik GmbH, Pforzheim, Germany) according to ourstandard procedures [24]. The pQCT scan (in-plane pixel size 0.5 mm,slice thickness 2.5 mm) was taken from the dominant side. Athreshold value of 690 mg/cm3 was used to differentiate the corticalbone tissue from surrounding soft tissues, bone marrow andsubcortical bone [25].
The outermost and innermost rows of cortical pixels wereexcluded from the analysis to eliminate partial volume effects [17].The cortical cross-section was then divided into four polar 90° sectorsand three cortical radial divisions (Fig. 1). Mean cortical polarvolumetric bone mineral density (vBMD, mg/cm3) was calculated inall three radial divisions and within each 90° sector with 0.05 mm (i.e.1/10th of the planar resolution) increments of radius (r) from thebone marrow area center of gravity and 1° increments of angle asfollows:
vBMDk;l =∑90
i=1∑nij=1vBMDi;j
∑90i=1ni
Table 1Descriptive characteristics (mean (SD), range) of the exercise loading and reference groups
Exercise loadinggroups
Age Height Body mass BMI[years] [cm] [kg] [kg/m2]
High impact 21.2 (3.1) 174 (7) 65.2 (8.7) 21.4 (2.3(N=60) 17–32 160–190 55.0–95.0 16.7–30.Odd impact 23.3 (4.5) 167 (7) 63 (9) 22.5 (2.2(N=47) 18–35 155–188 45.9–97.9 18.3–30.High magnitude 27.3 (6.6) 159 (3) 64.2 (13.9) 25.3 (4.5(N=15) 18–40 153–167 47.9–106 19.7–38.Repetitive, low impact 29.5 (5.5) 168 (5) 53.5 (3.4) 19 (1.1)(N=16) 20–39 158–176 44.0–58.3 16.7–20.Repetitive, non-impact 20.3 (2.7) 170 (5) 63 (6.7) 21.7 (2.1(N=42) 17–28 178 48.9–78.3 16.7–26.Reference 24.1 (3.6) 165 (5) 60.4 (7.8) 22.1 (2.4(N=41) 20–33 150–175 44.2–80.4 17.2–28.
Differences in age, height, body mass and body mass index between the groups were not t
where k = index of radial division (from 1 to 3), l = index of polarsector (from 1 to 4), i = index of 1° angle, n = number of 0.05 mmincrements of radius needed to reach the next radial division from theprevious radial divisionwithin the ith 1° sector, j = the index of radiusincrement, and vBMDi,j = volumetric bone mineral density of thepixel where the distal end of radius after the jth increment resides in.
Thereafter, the mean kth radial division vBMD was calculated as
vBMDk =∑4
l=1vBMDk;l
4:
Similarly, the mean lth polar sector vBMD for cortical bone wascalculated as
vBMDl =∑3
k=1vBMDk;l
3:
For anatomically proper comparison of bone cross-sectionsbetween individuals and exercise loading groups, the cross-sectionalmoments of inertia for the two orthogonal axes (i.e., the horizontaland vertical axes of the original pQCT image) were first calculated asfollows:
Ix = ∑n
i=1y2i dA
where x= axis of interest, (horizontal or vertical axis), n= number ofpixels, i = index of pixel, y= the perpendicular distance from the axisof interest and dA = area of pixel.
Then to determine the rotation angle needed for the calculation ofmaximal andminimal cross-sectional moments of inertia, the productmoment of area was calculated as:
Ixy = ∑n
i=1xiyidA
where n = number of pixels, i = index of pixel, x = horizontalcoordinate of the pixel (in mm) in relation to the area center of mass(the value may be negative), y = vertical coordinate of the pixel (inmm) in relation to the area center of mass (the value may benegative), and dA = area of pixel.
Finally, the rotation angle needed for rotating the originalhorizontal and vertical image axes to correspond to maximal andminimal bending axes was obtained as:
α =
tan−1 2IxyIx−Iy
!
2:
.
Age started competitive training Proportion of oral contraceptive use[years] [%]
) 11.6 (3.0) 474 5–19) 13.5 (4.2) 493 6–27) 19.1 (4.1) 603 15–28
15.9 (6.6) 386 7–28) 10.2 (2.7) 559 5–16) N.A. 560
ested.
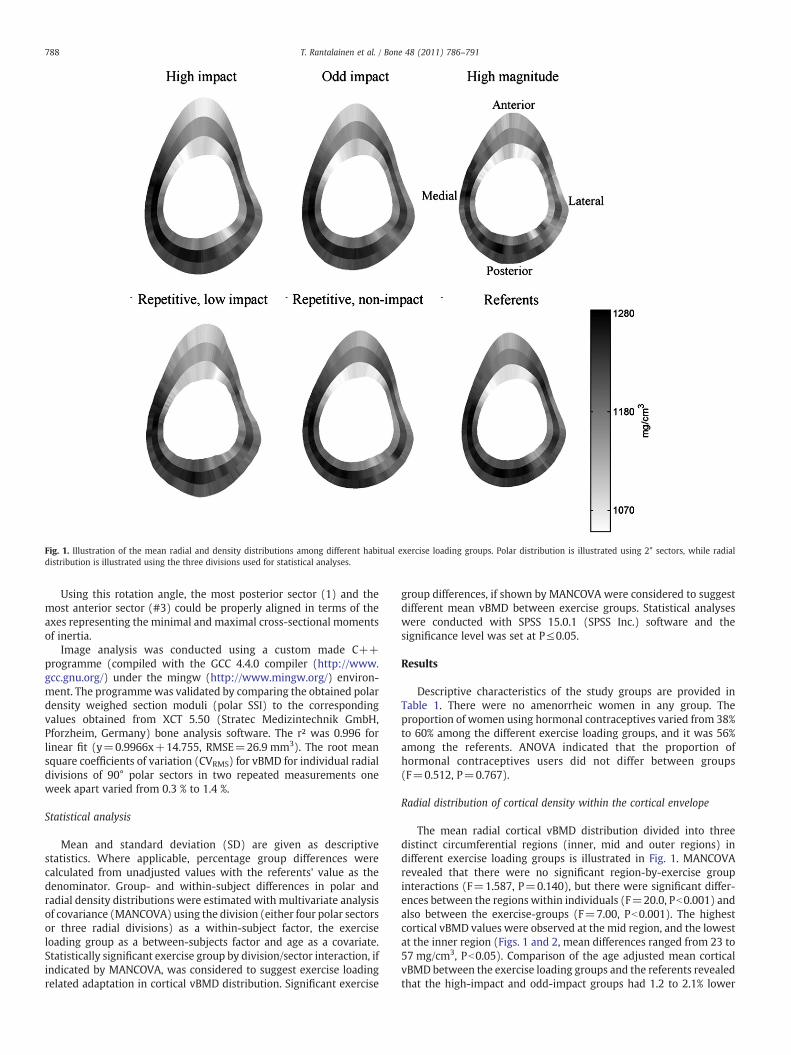
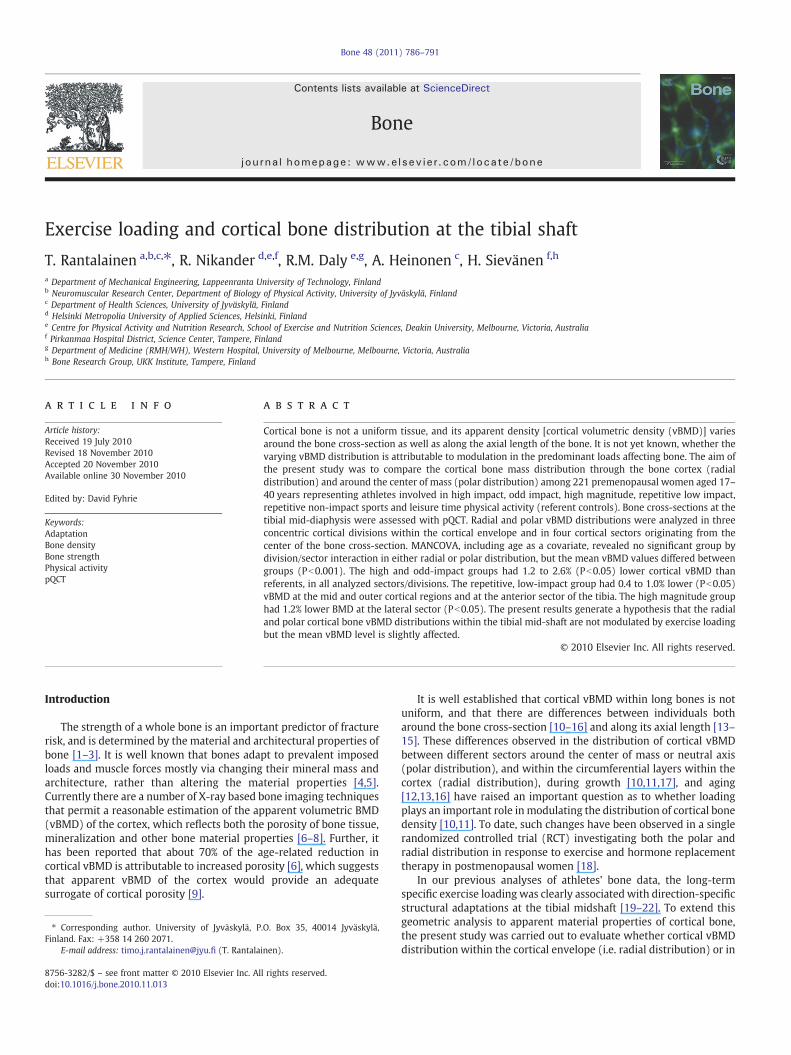
Fig. 1. Illustration of the mean radial and density distributions among different habitual exercise loading groups. Polar distribution is illustrated using 2° sectors, while radialdistribution is illustrated using the three divisions used for statistical analyses.
788 T. Rantalainen et al. / Bone 48 (2011) 786–791
Using this rotation angle, the most posterior sector (1) and themost anterior sector (#3) could be properly aligned in terms of theaxes representing the minimal and maximal cross-sectional momentsof inertia.
Image analysis was conducted using a custom made C++programme (compiled with the GCC 4.4.0 compiler (http://www.gcc.gnu.org/) under the mingw (http://www.mingw.org/) environ-ment. The programmewas validated by comparing the obtained polardensity weighed section moduli (polar SSI) to the correspondingvalues obtained from XCT 5.50 (Stratec Medizintechnik GmbH,Pforzheim, Germany) bone analysis software. The r² was 0.996 forlinear fit (y=0.9966x+14.755, RMSE=26.9 mm3). The root meansquare coefficients of variation (CVRMS) for vBMD for individual radialdivisions of 90° polar sectors in two repeated measurements oneweek apart varied from 0.3 % to 1.4 %.
Statistical analysis
Mean and standard deviation (SD) are given as descriptivestatistics. Where applicable, percentage group differences werecalculated from unadjusted values with the referents' value as thedenominator. Group- and within-subject differences in polar andradial density distributions were estimated with multivariate analysisof covariance (MANCOVA) using the division (either four polar sectorsor three radial divisions) as a within-subject factor, the exerciseloading group as a between-subjects factor and age as a covariate.Statistically significant exercise group by division/sector interaction, ifindicated by MANCOVA, was considered to suggest exercise loadingrelated adaptation in cortical vBMD distribution. Significant exercise
group differences, if shown by MANCOVA were considered to suggestdifferent mean vBMD between exercise groups. Statistical analyseswere conducted with SPSS 15.0.1 (SPSS Inc.) software and thesignificance level was set at P≤0.05.
Results
Descriptive characteristics of the study groups are provided inTable 1. There were no amenorrheic women in any group. Theproportion of women using hormonal contraceptives varied from 38%to 60% among the different exercise loading groups, and it was 56%among the referents. ANOVA indicated that the proportion ofhormonal contraceptives users did not differ between groups(F=0.512, P=0.767).
Radial distribution of cortical density within the cortical envelope
The mean radial cortical vBMD distribution divided into threedistinct circumferential regions (inner, mid and outer regions) indifferent exercise loading groups is illustrated in Fig. 1. MANCOVArevealed that there were no significant region-by-exercise groupinteractions (F=1.587, P=0.140), but there were significant differ-ences between the regions within individuals (F=20.0, Pb0.001) andalso between the exercise-groups (F=7.00, Pb0.001). The highestcortical vBMD values were observed at the mid region, and the lowestat the inner region (Figs. 1 and 2, mean differences ranged from 23 to57 mg/cm3, Pb0.05). Comparison of the age adjusted mean corticalvBMD between the exercise loading groups and the referents revealedthat the high-impact and odd-impact groups had 1.2 to 2.1% lower
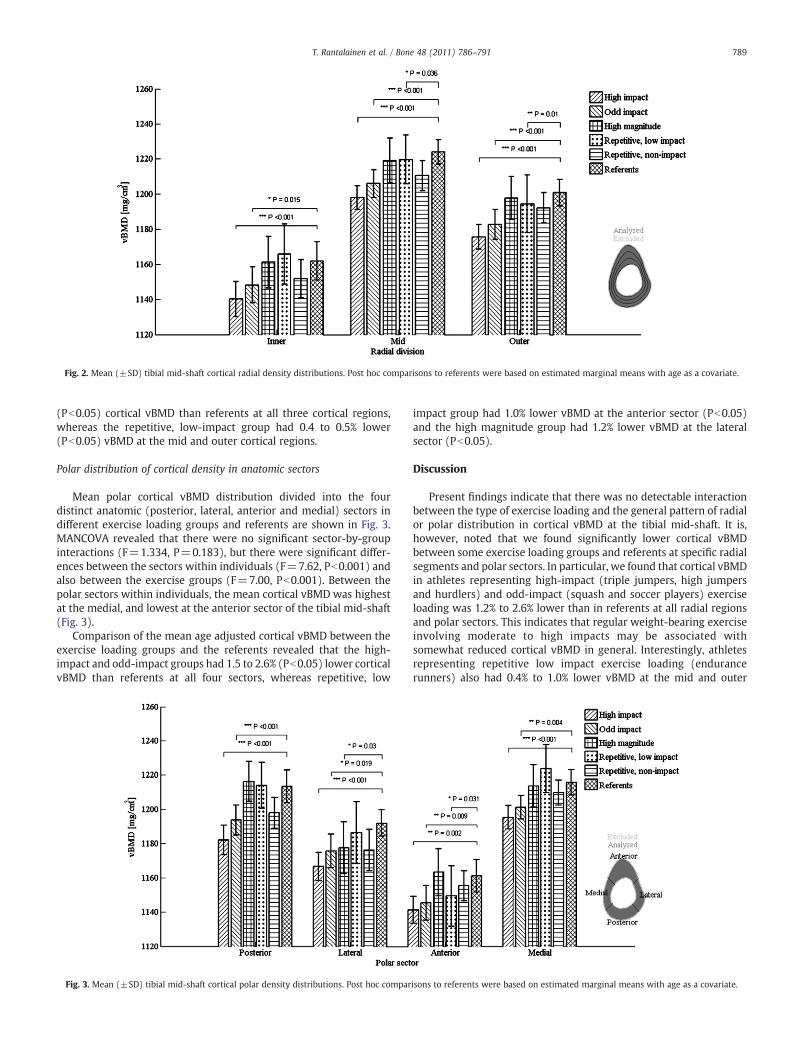
Fig. 2. Mean (±SD) tibial mid-shaft cortical radial density distributions. Post hoc comparisons to referents were based on estimated marginal means with age as a covariate.
789T. Rantalainen et al. / Bone 48 (2011) 786–791
(Pb0.05) cortical vBMD than referents at all three cortical regions,whereas the repetitive, low-impact group had 0.4 to 0.5% lower(Pb0.05) vBMD at the mid and outer cortical regions.
Polar distribution of cortical density in anatomic sectors
Mean polar cortical vBMD distribution divided into the fourdistinct anatomic (posterior, lateral, anterior and medial) sectors indifferent exercise loading groups and referents are shown in Fig. 3.MANCOVA revealed that there were no significant sector-by-groupinteractions (F=1.334, P=0.183), but there were significant differ-ences between the sectors within individuals (F=7.62, Pb0.001) andalso between the exercise groups (F=7.00, Pb0.001). Between thepolar sectors within individuals, the mean cortical vBMD was highestat the medial, and lowest at the anterior sector of the tibial mid-shaft(Fig. 3).
Comparison of the mean age adjusted cortical vBMD between theexercise loading groups and the referents revealed that the high-impact and odd-impact groups had 1.5 to 2.6% (Pb0.05) lower corticalvBMD than referents at all four sectors, whereas repetitive, low
Fig. 3. Mean (±SD) tibial mid-shaft cortical polar density distributions. Post hoc compar
impact group had 1.0% lower vBMD at the anterior sector (Pb0.05)and the high magnitude group had 1.2% lower vBMD at the lateralsector (Pb0.05).
Discussion
Present findings indicate that there was no detectable interactionbetween the type of exercise loading and the general pattern of radialor polar distribution in cortical vBMD at the tibial mid-shaft. It is,however, noted that we found significantly lower cortical vBMDbetween some exercise loading groups and referents at specific radialsegments and polar sectors. In particular, we found that cortical vBMDin athletes representing high-impact (triple jumpers, high jumpersand hurdlers) and odd-impact (squash and soccer players) exerciseloading was 1.2% to 2.6% lower than in referents at all radial regionsand polar sectors. This indicates that regular weight-bearing exerciseinvolving moderate to high impacts may be associated withsomewhat reduced cortical vBMD in general. Interestingly, athletesrepresenting repetitive low impact exercise loading (endurancerunners) also had 0.4% to 1.0% lower vBMD at the mid and outer
isons to referents were based on estimated marginal means with age as a covariate.
790 T. Rantalainen et al. / Bone 48 (2011) 786–791
regions and at the anterior sector than the referent controls, while thehigh magnitude group (power lifters) had 1.2% lower vBMD in thelateral sector. We previously observed that body mass, height and ageadjusted bone strength indices derived from mid tibia cross-sectionalgeometry among the same high-impact, odd impact and repetitive,low impact groups were 20–30% greater, while the high magnitudegroup did not differ from the referents [19,21–23]. Based on thesefindings, it seems that regular weight-bearing exercises improvecortical bone strength largely through enlarging the bone cross-section rather than through apparent material properties (vBMD).
The finding that cortical vBMD was lower in some of the athleticgroups is in line with previous literature reporting lower vBMD at thetibial diaphysis in late middle aged/elderly race-walkers and runnerscompared to sedentary referents [26] as well as decreased mid tibiavBMD in female swimmers and jumpers compared to controls [27].Low cortical vBMD values could be explained by the observation thatendurance athletes have greater risk for amenorrhea which isassociated with lower bone gains ensuing exercise loading [28].However, the athletes in the present study were not amenorrheic.Further, an interesting observation in our study was that corticalvBMD within different sectors and circumferential layers of the tibialdiaphysis were not significantly reduced in all athletic groups. In thehigh-impact and odd-impact athletes, cortical vBMD was uniformlylower across all regions of the mid-tibia relative to referents, whereasin the endurance runners, representing repetitive low impact exerciseloading, cortical density was similar to referents at the inner corticaldivision and at posterior, lateral and medial sectors. It has beensuggested that an exercise-related decrease in cortical vBMD may berelated to increasedmicrodamage leading to targeted remodeling andthus increased intracortical porosity [26]. Since microdamage in boneacts as a stimulus for bone remodeling, we speculate that the lowercortical vBMD among athletes involved in weight-bearing impactsports is likely to reflect higher rates of bone remodeling, whichwould lead to increased intracortical porosity and/or incompletesecondary mineralization.
Also in line with previous literature [6,10–16], significant within-subject variation in radial and polar distribution of cortical vBMD wasobserved in the present study. Likewise, the cortical vBMD valuesseemed to be higher at the posterior than anterior sectors of the tibialmid-shaft, a finding previously observed in postmenopausal women[11]. Previously it has been speculated that the observed variation incortical vBMD distribution was related to the prevalent loadingpattern [11], whereas we would like to highlight an alternativehypotheses. During typical locomotive activities such as running, thetibial diaphysis is primarily subjected to bending [29,30]. It has beensuggested that the curvature of bones serves to ensure loadingpredictability. Long bones are curved, which is not optimal for rigidity,but it is desirable if loads need to be predictable [31,32]. The polardensity distribution observed in the present study is similar to the oneseen in equine metacarpus [32]. As suggested by Les et al. this kind ofdensity distribution would help in redirecting the loading into sagittalplane bending further enhancing load predictability [32]. Further, ifcortical vBMD was evenly distributed, then the bending inducedstrains at the anterior aspect would be lower than at the posterioraspect. According to Sverdlova and Witzel [33], minimization ofbending makes physiologically sense, since compressive loadingwould provide relatively similar strain values regardless of the spatiallocation within the bone cross-section. However, the primary loadingmode of tibial diaphysis is bending [29–31], and then appropriatevariation in polar vBMD distribution could serve to smooth thedifferences in bone strains during normal locomotion, thus providinga more similar strain environment around the bone cross-section.Therefore, it seems logical to speculate that the similar pattern ofpolar density distribution of cortical density in all exercise loadinggroups has evolved during evolutionary process of the lower bodyskeleton.
The radial density distribution results, i.e. the highest densities atmid-cortical region, are in line with what has been observed atfemoral mid-shaft [16]. It makes sense that the inner region is lessdense since it provides little resistance to bending. When bone isloaded in bending, the inner regions of the cortical wall receive lessstrain stimulus than the outer regions. Following the same line ofthought one would have expected the outer region to be the densest,which appeared not to be case. However, it may well be that radialdensity distribution provides a measure of bone metabolism ratherthan reflects a direct result of mechanically controlled adaptation. It ispossible that the mid cortical region in young adults contains thehighest proportion of primary, fully mineralized lamellar bonecompared to the oldest inner region or the newest outer region [34].
There are some limitations that need to be considered wheninterpreting the present findings. First, the cross-sectional design ofthe present study is neither free from potential selection bias nor ableto show causal effects. Rather, the present findings generatehypotheses that may be tested in prospective controlled trials or inreanalyses of existing prospective data. The age at onset ofcompetitive career, menstrual status and use of oral contraceptivesare subject to possible recall bias. The use of oral contraceptives canalso affect vBMD [35], but the groups did not differ in terms of use oforal contraceptives. The cortical vBMD analysis in the present studywas limited by the resolution of the pQCT system and therefore wecan only speculate whether the differences observed in vBMDdistributions were related to local mineralization or porosity. Neitherdoes the resolution of pQCT used in the present study allowseparation of cortical remnants or trabecularized cortex just belowthe chosen 690 mg/cm3 threshold as recently indicated by Zebaze etal. [36]. However, this issue was taken into account by peeling out theinnermost and outermost pixel rowswhich was expected tominimizethe potential confounding effect of trabecularization and partialvolume effect. Further, since pQCT employs continuous X-ray energyspectrum, the beam hardening effect on density results cannot beruled out [23]. According to our recent phantom experiments withpQCT system used in this study (unpublished data), doubling the softtissue diameter decreased themeasured density by ~5%. However, themean soft tissue thickness around the tibial diaphysis was similar inall study groups but the low impact group, which had ~10% thinnersoft tissue compared to other groups (data not shown). As the groupdifferences remained relatively small, it is hardly likely that the beamhardening effect would have modulated the present results toconsiderable extent. Nevertheless, the potential effect of beamhardening should not be ignored when analyzing the pQCT data.The apparent strengths of this study were that several differentexercise loading groups were assessed and the partial volume effect ofpQCT measurement was minimized by excluding the inner and outercortical pixels and the bone geometries were carefully aligned.
In conclusion, the present results generate a hypothesis that polarand radial distributions of cortical density at the tibial midshaft arenot greatly modulated by exercise loading. However, there is someevidence that weight-bearing impact and high magnitude loadingmay influence mean tibial vBMD. The present findings also supportthe common notion that the whole bone strength is primarily adaptedto loading through changes in bone mineral mass and geometryrather than its apparent material properties.
Acknowledgments
This study was financially supported by Competitive ResearchFunding of the Pirkanmaa Hospital District, Tampere UniversityHospital (Grant 9K121), the Finnish Ministry of Education and thePäivikki and Sakari Sohlberg Foundation. Associate Professor RobinDaly is supported by a National Health and Medical Research Council(NHMRC) Career Development Award (ID 425849).
791T. Rantalainen et al. / Bone 48 (2011) 786–791
References
[1] van der Meulen MC, Jepsen KJ, Mikic B. Understanding bone strength: size isn'teverything. Bone 2001;29:101–4.
[2] Myburgh KH, Charette S, Zhou L, Steele CR, Arnaud S, Marcus R. Influence ofrecreational activity and muscle strength on ulnar bending stiffness in men. MedSci Sports Exerc 1993;25:592–6.
[3] Turner CH, Robling AG. Designing exercise regimens to increase bone strength.Exerc Sport Sci Rev 2003;31:45–50.
[4] Currey JD. The many adaptations of bone. J Biomech 2003;36:1487–95.[5] Zebaze RM, Jones A, Knackstedt M, Maalouf G, Seeman E. Construction of the
femoral neck during growth determines its strength in old age. J Bone Miner Res2007;22:1055–61.
[6] Bousson V, Bergot C, Meunier A, et al. CT of the middiaphyseal femur: cortical bonemineral density and relation to porosity. Radiology 2000;217:179–87.
[7] Basillais A, Bensamoun S, Chappard C, et al. Three-dimensional characterization ofcortical bone microstructure by microcomputed tomography: validation withultrasonic and microscopic measurements. J Orthop Sci 2007;12:141–8.
[8] Martin RB. Determinants of the mechanical properties of bones. J Biomech1991;24(Suppl 1):79–88.
[9] Seeman E. Growth in bone mass and size—are racial and gender differences inbone mineral density more apparent than real? J Clin Endocrinol Metab 1998;83:1414–9.
[10] Cooper DM, Ahamed Y, Macdonald HM, McKay HA. Characterising cortical densityin the mid-tibia: intra-individual variation in adolescent girls and boys. Br J SportsMed 2008;42:690–5.
[11] Lai YM, Qin L, Hung VW, Chan KM. Regional differences in cortical bone mineraldensity in the weight-bearing long bone shaft—a pQCT study. Bone 2005;36:465–71.
[12] Bell KL, Loveridge N, Power J, Garrahan N, Meggitt BF, Reeve J. Regional differencesin cortical porosity in the fractured femoral neck. Bone 1999;24:57–64.
[13] Atkinson PJ, Weatherell JA. Variation in the density of the femoral diaphysis withage. J Bone Joint Surg Br 1967;49:781–8.
[14] Espinoza Orias AA, Deuerling JM, Landrigan MD, Renaud JE, Roeder RK. Anatomicvariation in the elastic anisotropy of cortical bone tissue in the human femur. JMech Behav Biomed Mater 2009;2:255–63.
[15] Bensamoun S, Ho Ba Tho MC, Luu S, Gherbezza JM, de Belleval JF. Spatialdistribution of acoustic and elastic properties of human femoral cortical bone. JBiomech 2004;37:503–10.
[16] Goldman HM, Bromage TG, Boyde A, Thomas CD, Clement JG. Intrapopulationvariability in mineralization density at the human femoral mid-shaft. J Anat2003;203:243–55.
[17] Kontulainen SA, Macdonald HM, McKay HA. Change in cortical bone density andits distribution differs between boys and girls during puberty. J Clin EndocrinolMetab 2006;91:2555–61.
[18] Cheng S, Sipila S, Taaffe DR, Puolakka J, Suominen H. Change in bone massdistribution induced by hormone replacement therapy and high-impact physicalexercise in post-menopausal women. Bone 2002;31:126–35.
[19] Nikander R, Sievänen H, Uusi-Rasi K, Heinonen A, Kannus P. Loading modalitiesand bone structures at nonweight-bearing upper extremity and weight-bearinglower extremity: a pQCT study of adult female athletes. Bone 2006;39:886–94.
[20] Nikander R, Kannus P, Rantalainen T, Uusi-Rasi K, Heinonen A, Sievanen H. Cross-sectional geometry of weight-bearing tibia in female athletes subjected todifferent exercise loadings. Osteoporos Int 2010;21:1687–94.
[21] Nikander R, Kannus P, Dastidar P, et al. Targeted exercises against hip fragility.Osteoporos Int 2009;20:1321–8.
[22] Rantalainen T, Nikander R, Heinonen A, Suominen H, Sievanen H. Direction-specific diaphyseal geometry and mineral mass distribution of tibia and fibula: apQCT study of female athletes representing different exercise loading types. CalcifTissue Int 2010;86:447–54.
[23] NikanderR, SievänenH,HeinonenA,KannusP. Femoralneck structure inadult femaleathletes subjected to different loading modalities. J Bone Miner Res 2005;20:520–8.
[24] Sievänen H, Koskue V, Rauhio A, Kannus P, Heinonen A, Vuori I. Peripheralquantitative computed tomography in human long bones: evaluation of in vitroand in vivo precision. J Bone Miner Res 1998;13:871–82.
[25] Kontulainen S, Liu D, Manske S, Jamieson M, Sievänen H, McKay H. Analyzingcortical bone cross-sectional geometry by peripheral QCT: comparison with bonehistomorphometry. J Clin Densitom 2007;10:86–92.
[26] Wilks DC, Winwood K, Gilliver SF, et al. Bone mass and geometry of the tibia andthe radius of master sprinters, middle and long distance runners, race-walkers andsedentary control participants: a pQCT study. Bone 2009;45:91–7.
[27] Liu L, Maruno R, Mashimo T, et al. Effects of physical training on cortical bone atmidtibia assessed by peripheral QCT. J Appl Physiol 2003;95:219–24.
[28] Ducher G, Eser P, Hill B, Bass S. History of amenorrhoea compromises some of theexercise-induced benefits in cortical and trabecular bone in the peripheral andaxial skeleton: a study in retired elite gymnasts. Bone 2009;45:760–7.
[29] Biewener AA. Musculoskeletal design in relation to body size. J Biomech 1991;24(Suppl 1):19–29.
[30] Garcia GJ, da Silva JK. On the scaling of mammalian long bones. J Exp Biol2004;207:1577–84.
[31] Bertram JE, Biewener AA. Bone curvature: sacrificing strength for load predict-ability? J Theor Biol 1988;131:75–92.
[32] Les CM, Stover SM, Keyak JH, Taylor KT, Willits NH. The distribution of materialproperties in the equine third metacarpal bone serves to enhance sagittal bending.J Biomech 1997;30:355–61.
[33] Sverdlova NS, Witzel U. Principles of determination and verification of muscleforces in the human musculoskeletal system: muscle forces to minimise bendingstress. J Biomech 2010;43:387–96.
[34] Martin RB, Burr DB. Structure, function, and adaptation of compact bone. NewYork: Raven Press; 1989.
[35] Hartard M, Kleinmond C, Wiseman M, Weissenbacher ER, Felsenberg D, Erben RG.Detrimental effect of oral contraceptives on parameters of bone mass andgeometry in a cohort of 248 young women. Bone 2007;40:444–50.
[36] Zebaze RM, Ghasem-Zadeh A, Bohte A, et al. Intracortical remodelling and porosityin the distal radius and post-mortem femurs of women: a cross-sectional study.Lancet 2010;375:1729–36.
Related Documents


![Adaptations in tibial cortical thickness and total volumetric bone …epubs.surrey.ac.uk/805890/7/4BonepQQTpaperR2FINALCOPY.pdf · 2014-08-12 · with Caucasian women [10, 11]. However,](https://static.cupdf.com/doc/110x72/5fa58913779a7455a0482204/adaptations-in-tibial-cortical-thickness-and-total-volumetric-bone-epubs-2014-08-12.jpg)