Roberts et al. Cardiovasc Diabetol (2018) 17:44 https://doi.org/10.1186/s12933-018-0688-x ORIGINAL INVESTIGATION Exercise capacity in diabetes mellitus is predicted by activity status and cardiac size rather than cardiac function: a case control study Timothy J. Roberts 1,2 , Andrew T. Burns 1,2 , Richard J. MacIsaac 2,3 , Andrew I. MacIsaac 1,2 , David L. Prior 1,2 and André La Gerche 1,2,4,5* Abstract Background: The reasons for reduced exercise capacity in diabetes mellitus (DM) remains incompletely understood, although diastolic dysfunction and diabetic cardiomyopathy are often favored explanations. However, there is a paucity of literature detailing cardiac function and reserve during incremental exercise to evaluate its significance and contribution. We sought to determine associations between comprehensive measures of cardiac function during exercise and maximal oxygen consumption ( ˙ VO 2 peak), with the hypothesis that the reduction in exercise capacity and cardiac function would be associated with co-morbidities and sedentary behavior rather than diabetes itself. Methods: This case–control study involved 60 subjects [20 with type 1 DM (T1DM), 20 T2DM, and 10 healthy controls age/sex-matched to each diabetes subtype] performing cardiopulmonary exercise testing and bicycle ergometer echocardiography studies. Measures of biventricular function were assessed during incremental exercise to maximal intensity. Results: T2DM subjects were middle-aged (52 ± 11 years) with a mean T2DM diagnosis of 12 ± 7 years and modest glycemic control (HbA 1c 57 ± 12 mmol/mol). T1DM participants were younger (35 ± 8 years), with a 19 ± 10 year his- tory of T1DM and suboptimal glycemic control (HbA 1c 65 ± 16 mmol/mol). Participants with T2DM were heavier than their controls (body mass index 29.3 ± 3.4 kg/m 2 vs. 24.7 ± 2.9, P = 0.001), performed less exercise (10 ± 12 vs. 28 ± 30 MET hours/week, P = 0.031) and had lower exercise capacity ( ˙ VO 2 peak = 26 ± 6 vs. 38 ± 8 ml/min/kg, P < 0.0001). These differences were not associated with biventricular systolic or left ventricular (LV) diastolic dysfunction at rest or during exercise. There was no difference in weight, exercise participation or ˙ VO 2 peak in T1DM subjects as compared to their controls. After accounting for age, sex and body surface area in a multivariate analysis, significant positive predictors of ˙ VO 2 peak were cardiac size (LV end-diastolic volume, LVEDV) and estimated MET-hours, while T2DM was a negative predictor. These combined factors accounted for 80% of the variance in ˙ VO 2 peak (P < 0.0001). Conclusions: Exercise capacity is reduced in T2DM subjects relative to matched controls, whereas exercise capacity is preserved in T1DM. There was no evidence of sub-clinical cardiac dysfunction but, rather, there was an association between impaired exercise capacity, small LV volumes and sedentary behavior. Keywords: Diabetes, Exercise capacity, ˙ VO 2 peak, Exercise echocardiography, Diabetic cardiomyopathy, Diastolic dysfunction © The Author(s) 2018. This article is distributed under the terms of the Creative Commons Attribution 4.0 International License (http://creativecommons.org/licenses/by/4.0/), which permits unrestricted use, distribution, and reproduction in any medium, provided you give appropriate credit to the original author(s) and the source, provide a link to the Creative Commons license, and indicate if changes were made. The Creative Commons Public Domain Dedication waiver (http://creativecommons.org/ publicdomain/zero/1.0/) applies to the data made available in this article, unless otherwise stated. Open Access Cardiovascular Diabetology *Correspondence: [email protected] 5 Head, Exercise and Physical Activity Domain, Baker Heart and Diabetes Institute, 75 Commercial Rd, Melbourne, VIC 3004, Australia Full list of author information is available at the end of the article

Welcome message from author
This document is posted to help you gain knowledge. Please leave a comment to let me know what you think about it! Share it to your friends and learn new things together.
Transcript

Roberts et al. Cardiovasc Diabetol (2018) 17:44 https://doi.org/10.1186/s12933-018-0688-x
ORIGINAL INVESTIGATION
Exercise capacity in diabetes mellitus is predicted by activity status and cardiac size rather than cardiac function: a case control studyTimothy J. Roberts1,2, Andrew T. Burns1,2, Richard J. MacIsaac2,3, Andrew I. MacIsaac1,2, David L. Prior1,2 and André La Gerche1,2,4,5*
Abstract
Background: The reasons for reduced exercise capacity in diabetes mellitus (DM) remains incompletely understood, although diastolic dysfunction and diabetic cardiomyopathy are often favored explanations. However, there is a paucity of literature detailing cardiac function and reserve during incremental exercise to evaluate its significance and contribution. We sought to determine associations between comprehensive measures of cardiac function during exercise and maximal oxygen consumption (V̇O2peak), with the hypothesis that the reduction in exercise capacity and cardiac function would be associated with co-morbidities and sedentary behavior rather than diabetes itself.
Methods: This case–control study involved 60 subjects [20 with type 1 DM (T1DM), 20 T2DM, and 10 healthy controls age/sex-matched to each diabetes subtype] performing cardiopulmonary exercise testing and bicycle ergometer echocardiography studies. Measures of biventricular function were assessed during incremental exercise to maximal intensity.
Results: T2DM subjects were middle-aged (52 ± 11 years) with a mean T2DM diagnosis of 12 ± 7 years and modest glycemic control (HbA1c 57 ± 12 mmol/mol). T1DM participants were younger (35 ± 8 years), with a 19 ± 10 year his-tory of T1DM and suboptimal glycemic control (HbA1c 65 ± 16 mmol/mol). Participants with T2DM were heavier than their controls (body mass index 29.3 ± 3.4 kg/m2 vs. 24.7 ± 2.9, P = 0.001), performed less exercise (10 ± 12 vs. 28 ± 30 MET hours/week, P = 0.031) and had lower exercise capacity (V̇O2peak = 26 ± 6 vs. 38 ± 8 ml/min/kg, P < 0.0001). These differences were not associated with biventricular systolic or left ventricular (LV) diastolic dysfunction at rest or during exercise. There was no difference in weight, exercise participation or V̇O2peak in T1DM subjects as compared to their controls. After accounting for age, sex and body surface area in a multivariate analysis, significant positive predictors of V̇O2peak were cardiac size (LV end-diastolic volume, LVEDV) and estimated MET-hours, while T2DM was a negative predictor. These combined factors accounted for 80% of the variance in V̇O2peak (P < 0.0001).
Conclusions: Exercise capacity is reduced in T2DM subjects relative to matched controls, whereas exercise capacity is preserved in T1DM. There was no evidence of sub-clinical cardiac dysfunction but, rather, there was an association between impaired exercise capacity, small LV volumes and sedentary behavior.
Keywords: Diabetes, Exercise capacity, V̇O2peak, Exercise echocardiography, Diabetic cardiomyopathy, Diastolic dysfunction
© The Author(s) 2018. This article is distributed under the terms of the Creative Commons Attribution 4.0 International License (http://creativecommons.org/licenses/by/4.0/), which permits unrestricted use, distribution, and reproduction in any medium, provided you give appropriate credit to the original author(s) and the source, provide a link to the Creative Commons license, and indicate if changes were made. The Creative Commons Public Domain Dedication waiver (http://creativecommons.org/publicdomain/zero/1.0/) applies to the data made available in this article, unless otherwise stated.
Open Access
Cardiovascular Diabetology
*Correspondence: [email protected] 5 Head, Exercise and Physical Activity Domain, Baker Heart and Diabetes Institute, 75 Commercial Rd, Melbourne, VIC 3004, AustraliaFull list of author information is available at the end of the article

Page 2 of 14Roberts et al. Cardiovasc Diabetol (2018) 17:44
IntroductionExercise capacity is frequently reduced in people with diabetes mellitus (DM)—universally in those with type 2 diabetes mellitus (T2DM) but less consistently in peo-ple with type 1 DM (T1DM). Diabetic cardiomyopathy, described as cardiac dysfunction in the absence of coro-nary artery disease and cardiovascular risk factors such as hypertension [1, 2], has gained mainstream traction over the years as a unique pathophysiological entity affecting people with DM that may contribute to impaired exercise performance. A direct association between hyperglyce-mia, myocardial dysfunction and resulting congestive heart failure (CHF) has been reported [3] although this association seems to be much stronger for T2DM than for T1DM [4, 5]. These inconsistencies have led to some doubting the entity of diabetic cardiomyopathy alto-gether [6]. Indeed, there is overlap between risk factors for exercise intolerance and T2DM including sedentary behavior, obesity and resulting metabolic derangements. Rather than having a causal relationship, collinearity in risk factors may explain the association between diabe-tes and exercise intolerance, particularly in people with T2DM.
We sought to quantify exercise capacity in people with DM compared to healthy controls and establish the relative contribution of cardiac dysfunction using com-prehensive measures of left ventricular (LV) and right ventricular (RV) function at rest and during exercise. Rel-ative to healthy controls, we hypothesized that exercise capacity would be normal in T1DM and reduced in the T2DM sub-group, implying that metabolic comorbidities may provide an alternative explanation for reductions in exercise impairment and cardiac function.
Research design and methodsSubject recruitmentSubjects with T1DM and T2DM attending specialist hos-pital diabetes outpatient clinics were recruited via pro-motional leaflets and approval of their treating doctor. An equal number of those with- and without microvascular complications formed each group, defined by diabetic retinopathy, nephropathy and/or neuropathy according to current guidelines [7]. Inclusion criteria consisted of confirmed diabetes diagnosis, age 18–70 years, and suffi-cient physical capacity to perform low-intensity exercise.
A group of healthy controls were age- and sex- matched to each diabetes subgroup in a 2:1 ratio to balance demo-graphic differences between the DM subgroups and allow inferences to be made when considering results for T1DM and T2DM groups. For both diabetes and con-trol subjects, exclusion criteria included known coronary artery disease, resting LV systolic dysfunction (defined as LV ejection fraction < 40%), significant nephropathy
(eGFR < 30 ml/min/1.73 m2), and chronic obstructive air-ways disease. Subjects were also excluded if echocardio-graphic images were non-diagnostic.
A detailed baseline assessment of microvascular and cardiovascular disease was performed in all subjects, including serum creatinine, urinalysis, retinal imaging for diabetic retinopathy grading, 24-h blood pressure monitoring, and echocardiography. History of diabetic neuropathy was assessed by review of each participant’s hospital medical record and diabetes outpatient clinic charts. A detailed diary of exercise habits over the 4 weeks prior to the study were recorded and the prod-uct of weekly exercise (hours) and intensity were used to quantify the metabolic equivalent (MET) hours.
Exercise studiesCardiopulmonary exercise testing was performed on an upright bicycle (Excaliber Sport, Lode, The Netherlands) using an individualized continuous incremental ramp protocol until exhaustion. Peak exercise capacity (V̇O2
peak) was aimed to be reached within 10 min of exercise. Continuous 12-lead electrocardiography (ECG) moni-tored heart rate (HR), ST-segment changes and arrhyth-mia throughout exercise (Norav Medical, Israel) whilst blood pressure was recorded using an automated ECG-gated auscultatory device (Tango M2, SunTech Medical, USA). Breath-by-breath analysis of oxygen consump-tion and carbon dioxide production (JLab, CareFusion, Germany) was averaged over five breaths. Respiratory exchange ratio (RER), ventilatory threshold (VT) and ventilatory efficiency (V̇E/V̇CO2) were calculated by standard measures [8].
Exercise echocardiography was completed on a semi-supine bicycle ergometer with lateral tilt (Lode, The Netherlands) over four exercise stages at increasing power calculated according to an individual’s V̇O2peak. We have demonstrated previously that 66% of maximal power obtained on an upright ergometer is equivalent to near-maximal intensity on a semi-supine ergometer [9]. Thus low, medium, high and maximal intensity exer-cise was prescribed as 15, 25, 50 and 66% of V̇O2peak respectively. After 1 min of commencing each exercise stage, image acquisition began with the aim to collect all images within 3 min. Breath holding was required in only a minority of studies predominantly in the lat-ter stages of exercise to improve image quality, although a preference to extend the number of cardiac cycles recorded was favored. At rest and during each stage of exercise, apical four- and two-chamber, and parasternal long- and short-axis transthoracic images were collected to calculate comprehensive measures of biventricular systolic function according to guideline recommenda-tions for performing exercise echocardiography [10].

Page 3 of 14Roberts et al. Cardiovasc Diabetol (2018) 17:44
Non-invasively derived central hemodynamic parame-ters including stroke volume (SV), cardiac output (CO), and pulmonary artery systolic pressure (PASP) were also calculated by standard measures [11]. The Doppler envelope of tricuspid regurgitation (TR) peak veloc-ity was optimized by injection of 1–2 ml of an agitated colloid contrast to calculate PASP. Measurements of chamber volume, SV and CO were indexed to body sur-face area (BSA). Three to five beat loops were recorded for each 2D window while continuous wave (CW) and pulse wave (PW) Doppler recordings were extended to allow measurement and averaging of three beats. The highest recorded TR peak velocity was used for PASP at each level of exercise. Heart rate reserve was the differ-ence of peak exercise and resting heart rate. All other measures of cardiac reserve were defined as the dif-ference between peak exercise and resting measures as a percentage. Global longitudinal strain (GLS) was measured at rest using 2-dimensional speckle-tracking methods as described in detail previously [12]. Dias-tolic function was assessed at rest, and in early recovery after sufficient separation of the early (E) and late (A) diastolic mitral inflow waves. A single experienced car-diac sonographer conducted all studies using a Vivid E9 cardiac ultrasound machine (GE Healthcare), while one cardiologist with expertise in echocardiography ana-lyzed all images offline using EchoPAC software (Ver-sion 113, GE Healthcare).
StatisticsData was analyzed using IBM SPSS Version 22 (SPSS Inc., Chicago, USA). Analysis of data normality was determined by the Shapiro–Wilk test. Continuous data was expressed as the mean value ± standard devia-tion (SD). A P < 0.05 was considered statistically signifi-cant. Differences between groups were assessed using unpaired t tests and Chi square Fisher’s exact test. Pearson’s coefficient evaluated univariate correlations. Two-way repeated measure ANOVA was used to assess the effect of diabetes and exercise stage on echocardio-graphic measures with changes during exercise analyzed as a within subjects factor and comparisons between groups as between subjects factors. A forward stepwise multiple linear regression was used to assess predictors of exercise capacity (V̇O2peak). Age, gender and BSA were included in the multiple regression as they are well described determinants of V̇O2peak. In addition, the strongest univariate predictors of V̇O2peak were included in the regression after excluding those variables demon-strating significant collinearity. Collinearity was consid-ered significant when two factors were closely associated (R > 0.7). The number of variables entered into the model
was restricted to 7, selected as a balance between includ-ing variables relevant to the study hypothesis whilst maintaining a reasonable balance for the cohort size.
ResultsSixty-four subjects were recruited; three were excluded due to suboptimal echocardiography image quality (two with T1DM; one control) and one subject withdrew dur-ing the study. In total, 20 people with T1DM, 20 with T2DM, and 20 healthy age/sex-matched controls (10 matched to T1DM, 10 to T2DM) were included in the final analysis (Table 1).
The mean age of T1DM participants was 35 ± 8 years, predominantly male (n = 13, [65%]) and slightly over-weight (BMI 25.7 ± 3.2 kg/m2), with a 19 ± 10-year his-tory of T1DM and suboptimal glycemic control (HbA1c 65 ± 16 mmol/mol). All T1DM subjects with microvas-cular complications had retinopathy, of which one had additional microalbuminuria, and two had microalbumi-nuria and neuropathy.
T2DM subjects were middle-aged (52 ± 11 years), male (n = 16, [80%]) and overweight (body mass index [BMI] 29.3 ± 3.4 kg/m2). The diagnosis of T2DM was made 12 ± 7 years previously, and current glycemic control was modest (HbA1c 57 ± 12 mmol/mol). Microvascular com-plications comprised of isolated retinopathy in two (20%), isolated microalbuminuria in five (50%), retinopathy and microalbuminuria in two (20%) and combined retinopa-thy, microalbuminuria and neuropathy in one (10%).
While control groups were matched for age and sex, T2DM subjects were heavier than their controls (BMI 29.3 ± 3.4 vs. 24.7 ± 2.9 kg/m2, P = 0.001) with greater waist circumference (13 vs. 2% above normal upper limit reference for sex, P = 0.016), and performed less exercise (10 ± 12 vs. 28 ± 30 MET hours/week, P = 0.031). Similar differences were not present amongst T1DM and their controls.
Cardiopulmonary exercise testingV̇O2peak was significantly lower in T2DM subjects com-pared to their controls (Table 1 and Fig. 1). In contrast, those with T1DM had above-average fitness (power: 120 ± 33% predicted) and no significant difference in exercise capacity compared to their controls.
Baseline echocardiographyBoth DM groups had normal resting measures of biven-tricular systolic function and pulmonary pressures (Table 2). There was greater concentric remodeling amongst the T2DM cohort relative to their controls (55% vs. 10%; χ2 P = 0.024), because of lower LV end-diastolic volume (LVEDV) and a tendency to greater LV mass.

Page 4 of 14Roberts et al. Cardiovasc Diabetol (2018) 17:44
There were no differences in cardiac structure (LV rela-tive wall thickness, LV mass, LVEDV and left atrial vol-ume) in T1DM subjects and their controls.
The diastolic E/A ratio was lower and E/e’ ratio higher in T2DM subjects compared to their controls, while
counter-intuitively left atrial volume index (LAVI) was lower. The prevalence of LV diastolic dysfunction accord-ing to current diagnostic guidelines was not different (20% of T2DM and control subjects alike; χ2 P = 1.0). No subject with T1DM had evidence of diastolic dysfunction.
Table 1 Patient demographics
Statistically significant differences are highlighted in italic
BMI body mass index, BSA body surface area, HbA1c glycated hemoglobin, eGFR estimated glomerular filtration rate, ACR albumin-creatinine ratio, GLP1 glucagon-like peptide-1 receptor agonist, DPP4-I dipeptidyl peptidase-4 inhibitor, SGLT2-I sodium-glucose co-transporter-2 inhibitor, ACE-I angiotensin converting enzyme inhibitor, ARB angiotensin II receptor blocker, BP blood pressure, MET metabolic equivalent, HR heart rate, V̇O2 volume of oxygen, V̇O2peak peak oxygen consumption, V̇E/V̇CO2 minute ventilation/volume of carbon dioxide, RER respiratory exchange ratio
T1DM T2DM
T1DM (n = 20) Control to T1DM (n = 10) P T2DM (n = 20) Control to T2DM (n = 10) P
Age 35 ± 8 35 ± 9 0.99 52 ± 11 51 ± 13 0.8
Male (%) 13 (65) 6 (60) 0.74 16 (80) 7 (70) 0.66
Waist circumference (cm) 89 ± 13 84 ± 7 0.25 103 ± 10 91 ± 9 0.005
BMI (kg/m2) 25.7 ± 3.2 24.7 ± 3.4 0.44 29.3 ± 3.4 24.7 ± 2.9 0.001
BSA (m2) 1.9 ± 0.2 1.9 ± 0.2 0.8 2.1 ± 0.2 2.0 ± 0.2 0.25
HbA1c mmol/mol (%) 65 ± 16 (8.1 ± 3.9) 33 ± 2 (5.1 ± 0.2) < 0.0001 57 ± 12 (7.4 ± 1.1) 36 ± 3 (5.4 ± 0.2) < 0.0001
eGFR (ml/min/1.73 m2) 89 ± 4 88 ± 5 0.54 78 ± 17 87 ± 6 0.15
Urine ACR (mg/mmol) 1.4 ± 2.4 2.7 ± 4 0.30 9.7 ± 18.1 0.8 ± 0.6 0.13
Complications (%) 10 (50) 10 (50)
Microalbuminuria (%) 3 (15) 0 (0) 8 (40) 0 (0)
Retinopathy (%) 10 (50) 0 (0) 5 (25) 0 (0)
Neuropathy (%) 2 (10) 1 (5)
Diabetes duration (years) 19 ± 10 12 ± 7
Diabetes therapy
Insulin (%) 20 (100) 11 (55)
Metformin (%) 0 (0) 19 (95)
Sulfonylurea (%) 0 (0) 5 (25)
GLP1/DPP4-I 0 (0) 7 (35)
SGLT2-I 0 (0) 2 (10)
ACE-I/ARB 4 (20) 11 (55)
Statin 3 (15) 1 (10) 1.0 14 (70) 2 (20) 0.019
24 h average BP
Systolic (mmHg) 121 ± 10 116 ± 11 0.21 130 ± 10 127 ± 12 0.53
Diastolic (mmHg) 74 ± 4 72 ± 6 0.33 79 ± 6 82 ± 9 0.27
Hypertension (%) 3 (15) 0 (0) 0.23 10 (50) 1 (10) 0.049
Smoker 0 (0) 0 (0) 3 (15) 0 (0) 0.06
MET hours 34.1 ± 30.5 40.2 ± 51.8 0.69 10.5 ± 12.1 27.8 ± 30.0 0.031
Cardiopulmonary test
Maximum power (W) 236 ± 100 258 ± 89 0.57 158 ± 46 230 ± 49 < 0.0001
Power (% predicted) 120 ± 33 122 ± 26 0.87 85 ± 18 115 ± 19 < 0.0001
Maximum HR (bpm) 170 ± 15 179 ± 13 0.13 154 ± 21 165 ± 15 0.17
HR (% predicted) 92 ± 7 97 ± 5 0.07 92 ± 11 98 ± 8 0.15
V̇O2 (ml/min) 2886 ± 877 3238 ± 867 0.31 2341 ± 601 2959 ± 521 0.01
V̇O2peak (ml/min/kg) 38 ± 9 43 ± 13 0.20 26 ± 6 38 ± 8 < 0.0001
V̇O2peak (% predicted) 99 ± 20 112 ± 31 0.16 88 ± 18 126 ± 33 < 0.0001
V̇E/V̇CO223 ± 3 22 ± 4 0.43 26 ± 3 23 ± 4 0.06
RER 1.23 ± 0.10 1.29 ± 0.11 0.17 1.20 ± 0.09 1.23 ± 0.08 0.44

Page 5 of 14Roberts et al. Cardiovasc Diabetol (2018) 17:44
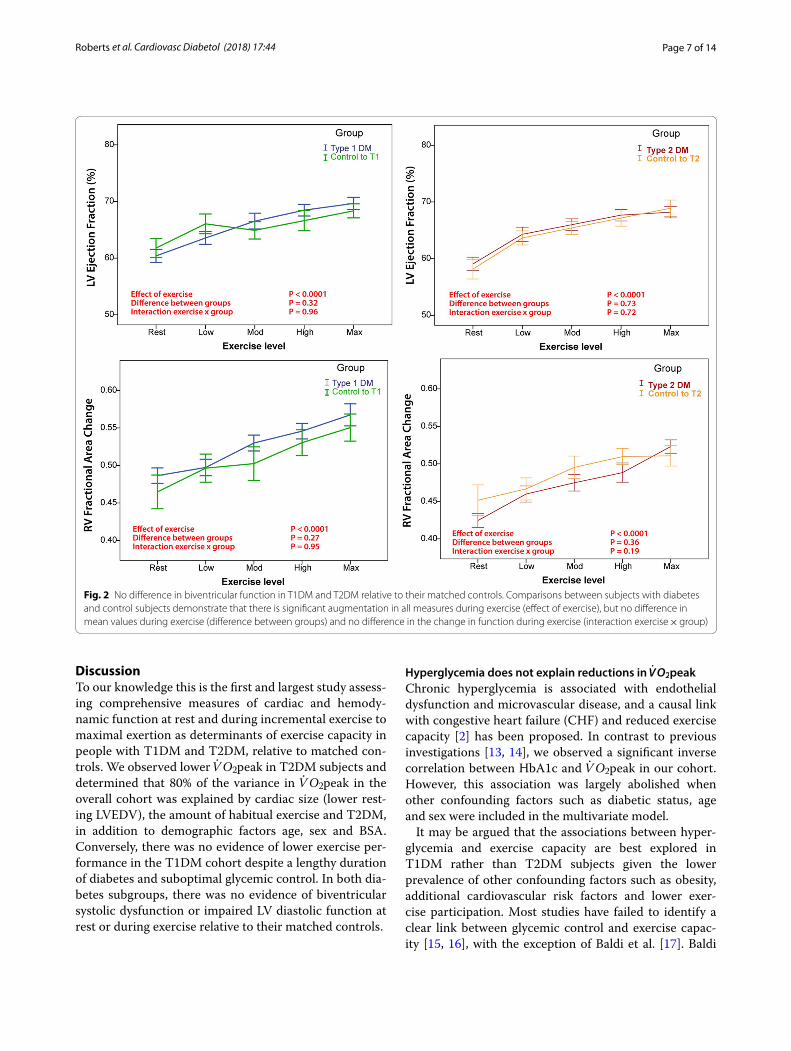
Exercise echocardiographyAll measures of biventricular systolic function and hemo-dynamic parameters augmented significantly from rest-ing to maximal exercise intensity in both DM groups
(Table 3a, b and Fig. 2). No subject had evidence of inducible regional wall motion abnormalities on echocar-diography or significant ischemic ECG changes.
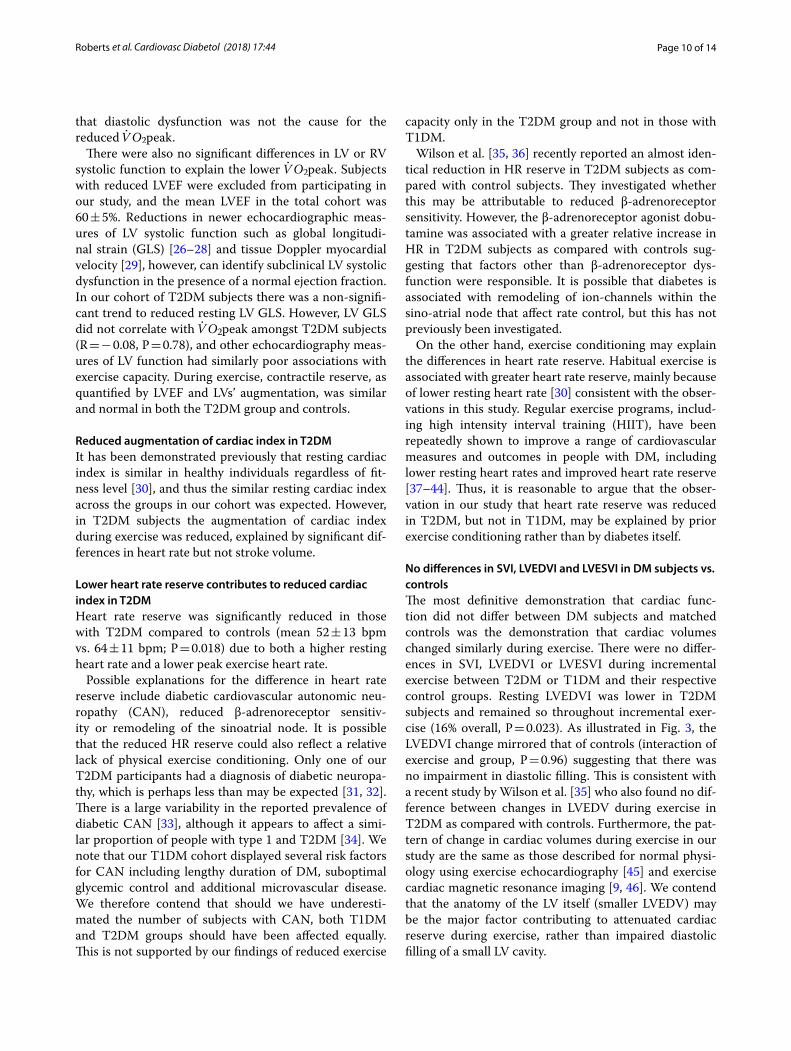
Cardiac function during incremental exercise stagesT1DMLVEF augmentation with exercise was similar in T1DM and control subjects (Table 3a, Fig. 2). LV septal myocar-dial systolic velocity (LVs’) was lower in T1DM through-out exercise (mean LVs’: 8.5 ± 0.2 vs. 9.4 ± 0.3 cm/s; P = 0.029), but the rate of increase during exercise stages was similar. Throughout exercise, T1DM subjects had 13% lower stroke volume index (SVI) and 16% cardiac index throughout exercise (P = 0.04 and P = 0.005 respec-tively) but the degree of augmentation with exercise was similar (P = 0.37 and P = 0.44 for the interaction respec-tively), see Fig. 3. There was no significant difference in the pattern of LVEDV-index (LVEDVI) reduction during exercise compared to their controls.
T2DMAugmentation of cardiac index was greater in matched controls than T2DM subjects (P = 0.005 for interaction), due to a significantly greater heart rate reserve in controls
Fig. 1 Lower V̇O2peak in subjects with T2DM relative to controls. Box plot graphs signifying the median, interquartile range (box) and mini-mum/maximum values (whiskers) for the comparison between T1DM and T2DM subjects relative to age and sex matched controls
Table 2 Resting echocardiography measurements
Statistically significant differences are highlighted in italic
LVMI left ventricular mass index, RWT relative wall thickness, LVEDVI left ventricular end diastolic volume index, LVEF left ventricular ejection fraction, LVs’ LV tissue Doppler septal peak systolic velocity, LV GLS left ventricular global longitudinal strain, LAVI left atrial volume index, RVs’ RV tissue Doppler free wall peak systolic velocity, RVFAC right ventricular fractional area change, RV GLS RV global longitudinal strain, PASP pulmonary artery systolic pressure, E early mitral inflow velocity, A late mitral inflow velocity, DT deceleration time, e’sep tissue Doppler septal mitral annular early diastolic velocity, E/e’sep ratio of early mitral inflow velocity to tissue Doppler septal mitral annular early diastolic velocity
T1DM T2DM
T1DM (n = 20) Control to T1DM (n = 10) P T2DM (n = 20) Control to T2DM (n = 10) P
LVMI (g/m2) 78 ± 8 83 ± 13 0.19 78 ± 9 68 ± 18 0.07
RWT 0.38 ± 0.07 0.35 ± 0.06 0.35 0.44 ± 0.07 0.36 ± 0.05 0.002
LVEDVI (ml/m2) 50 ± 13 56 ± 19 0.28 42 ± 10 54 ± 13 0.008
LVEF (%) 60 ± 4 60 ± 5 0.93 59 ± 6 59 ± 5 0.91
LVs’ (cm/s) 6.5 ± 0.9 7.1 ± 1.1 0.11 5.8 ± 1.2 5.7 ± 1.0 0.76
LV GLS (%) − 18.9 ± 2.4 − 19.9 ± 2.0 0.29 − 18.1 ± 2.1 − 19.8 ± 2.4 0.055
LV strain rate − 1.1 ± 0.2 − 1.1 ± 0.1 0.45 − 1.1 ± 0.2 − 1.1 ± 0.2 0.93
LAVI (ml/m2) 34 ± 11 41 ± 10 0.13 33 ± 6 39 ± 7 0.03
RVs’ (cm/s) 10.5 ± 1.7 11.1 ± 1.5 0.33 10.0 ± 1.7 10.3 ± 1.2 0.56
RVFAC (%) 49 ± 5 46 ± 7 0.32 42 ± 4 45 ± 6 0.18
RV GLS (%) − 29.2 ± 5.8 − 27.0 ± 4.3 0.31 − 24.9 ± 4.6 − 20.4 ± 13.4 0.19
PASP (mmHg) 24 ± 5 26 ± 4 0.45 29 ± 6 27 ± 4 0.33
E (m/s) 0.81 ± 0.16 0.77 ± 0.19 0.50 0.72 ± 0.13 0.66 ± 0.24 0.38
A (m/s) 0.49 ± 0.18 0.46 ± 0.12 0.63 0.66 ± 0.15 0.45 ± 0.11 0.001
E/A 1.8 ± 0.6 1.7 ± 0.6 0.77 1.1 ± 0.3 1.6 ± 0.9 0.046
DT (ms) 189 ± 22 192 ± 25 0.70 199 ± 28 200 ± 21 0.95
e’sep (cm/s) 9.2 ± 1.8 9.3 ± 1.8 0.85 5.8 ± 1.6 6.9 ± 2.0 0.13
E/e’sep (rest) 9 ± 3 9 ± 3 0.60 13 ± 4 10 ± 2 0.02
E/e’sep (peak) 9 ± 2 8 ± 4 0.37 11 ± 2 10 ± 2 0.16

Page 6 of 14Roberts et al. Cardiovasc Diabetol (2018) 17:44
(P = 0.006), Fig. 3. There were no differences in measures of LV or RV systolic function to contribute to this obser-vation (see Fig. 2). Resting LVEDVI tended to be lower in the T2DM group (49 ± 10 vs. 58 ± 16, P = 0.07) and was overall 16% lower throughout exercise in T2DM as compared with controls (P = 0.023). However, the change in LVEDVI was similar in both groups during exercise (interaction between LVEDVI and exercise, P = 0.96). There were no differences in systemic blood pressure and pulmonary artery pressure augmentation between groups.
Diastolic stress testE/e′ post exercise was surprisingly normal in all four sub-jects identified to have LV diastolic dysfunction at rest. Only one subject in the study cohort—with T2DM—met criteria (E/e′ > 15) for LV diastolic dysfunction at peak exercise.
Predictors of exercise performanceSignificant univariate correlates of V̇O2peak are pre-sented in Table 4. The strongest univariate associations with V̇O2peak were LVEDV (accounting for 44% of vari-ance, see Fig. 4), RV end-diastolic area (RVEDA), MET-hours of physical activity and cardiac index reserve.
A multivariate analysis was performed to predict V̇O2
peak from a selection of the significant univariate corre-lates. Age, sex and BSA accounted for 49% of the variance in V̇O2peak (Table 5a). After adjustment for the above three factors, significant positive predictors of V̇O2peak were LVEDV and estimated MET-hours of physical activ-ity, whilst T2DM was a negative predictor (Table 5b). The combined model accounted for 80% of the variance in V̇O2peak (R2 = 0.80; P < 0.0001).
Table 3 Repeated measures factorial ANOVA assessing cardiac reserve in type 1 (a) and type 2 (b) DM subjects
Values are mean ± SD
Statistically significant differences between DM and control groups are highlighted in italic
LVEF left ventricular ejection fraction, LVs’ LV tissue Doppler septal peak systolic velocity, LVEDVI LV end diastolic volume index, RVFAC right ventricular fractional area change, RVs’ RV tissue Doppler free wall peak systolic velocity, PASP pulmonary artery systolic pressure, CI cardiac index, HR heart rate, SVI stroke volume index
* P value represents the comparison between regressions of multiple measures during exercise with slope coefficients compared between diabetes and control subjects† P < 0.0001 for peak exercise vs. baseline for individual groups
Rest Peak
T1DM Control to T1DM P value, baseline Type 1 diabetes Control to T1DM P value*, interaction with exercise
(a) Type 1 DM subjects
LVEF (%) 60 ± 5 62 ± 5 0.50 70 ± 5† 68 ± 4† 0.32
LVs’ (cm/s) 6.5 ± 0.9 7.1 ± 1.1 0.11 10.6 ± 1.8† 11.5 ± 1.9† 0.12
LVEDVI (ml/m2) 52 ± 12 61 ± 14 0.11 46 ± 13† 56 ± 15 0.10
RVFAC (%) 49 ± 5 46 ± 7 0.32 57 ± 7† 55 ± 6† 0.86
RVs’ (cm/s) 10.5 ± 1.8 11.1 ± 1.5 0.33 17.1 ± 2.3† 18.3 ± 1.8† 0.55
PASP (mmHg) 24 ± 5 26 ± 4 0.45 53 ± 11† 53 ± 5† 0.27
CI (l/min/m2) 2.1 ± 0.3 2.5 ± 0.6 0.024 5.2 ± 1.0† 6.2 ± 1.3† 0.43
HR (bpm) 67 ± 11 66 ± 12 0.93 140 ± 17† 145 ± 9† 0.57
SVI (ml/m2) 32 ± 6 38 ± 7 0.021 38 ± 8† 43 ± 9† 0.43
Rest Peak
T2DM Control to T2DM P value, baseline T2DM Control to T2DM P value*, interaction with exercise
(b) Type 1 DM subjects
LVEF (%) 59 ± 5 58 ± 6 0.66 68 ± 5† 69 ± 4† 0.73
LVs’ (cm/s) 5.8 ± 1.2 5.7 ± 1.0 0.76 8.6 ± 1.5† 9.6 ± 2.1† 0.08
LVEDVI (ml/m2) 49 ± 10 58 ± 16 0.07 46 ± 8† 55 ± 14 0.96
RVFAC (%) 42 ± 4 45 ± 6 0.18 52 ± 4† 51 ± 4† 0.28
RVs’ (cm/s) 10.0 ± 1.7 10.3 ± 1.2 0.56 16.1 ± 2.8† 16.7 ± 1.8† 0.66
PASP (mmHg) 29 ± 6 27 ± 4 0.33 57 ± 10† 54 ± 7† 0.23
CI (l/min/m2) 2.3 ± 0.5 2.3 ± 0.5 0.94 4.9 ± 1.0† 5.9 ± 1.4† 0.001
HR (bpm) 73 ± 13 65 ± 9 0.11 125 ± 18† 130 ± 14† 0.001
SVI (ml/m2) 32 ± 6 35 ± 4 0.19 40 ± 7† 45 ± 8† 0.60
Page 7 of 14Roberts et al. Cardiovasc Diabetol (2018) 17:44
DiscussionTo our knowledge this is the first and largest study assess-ing comprehensive measures of cardiac and hemody-namic function at rest and during incremental exercise to maximal exertion as determinants of exercise capacity in people with T1DM and T2DM, relative to matched con-trols. We observed lower V̇O2peak in T2DM subjects and determined that 80% of the variance in V̇O2peak in the overall cohort was explained by cardiac size (lower rest-ing LVEDV), the amount of habitual exercise and T2DM, in addition to demographic factors age, sex and BSA. Conversely, there was no evidence of lower exercise per-formance in the T1DM cohort despite a lengthy duration of diabetes and suboptimal glycemic control. In both dia-betes subgroups, there was no evidence of biventricular systolic dysfunction or impaired LV diastolic function at rest or during exercise relative to their matched controls.
Hyperglycemia does not explain reductions in V̇O2peakChronic hyperglycemia is associated with endothelial dysfunction and microvascular disease, and a causal link with congestive heart failure (CHF) and reduced exercise capacity [2] has been proposed. In contrast to previous investigations [13, 14], we observed a significant inverse correlation between HbA1c and V̇O2peak in our cohort. However, this association was largely abolished when other confounding factors such as diabetic status, age and sex were included in the multivariate model.
It may be argued that the associations between hyper-glycemia and exercise capacity are best explored in T1DM rather than T2DM subjects given the lower prevalence of other confounding factors such as obesity, additional cardiovascular risk factors and lower exer-cise participation. Most studies have failed to identify a clear link between glycemic control and exercise capac-ity [15, 16], with the exception of Baldi et al. [17]. Baldi
Fig. 2 No difference in biventricular function in T1DM and T2DM relative to their matched controls. Comparisons between subjects with diabetes and control subjects demonstrate that there is significant augmentation in all measures during exercise (effect of exercise), but no difference in mean values during exercise (difference between groups) and no difference in the change in function during exercise (interaction exercise × group)

Page 8 of 14Roberts et al. Cardiovasc Diabetol (2018) 17:44
Fig. 3 Differences in cardiac index, heart rate, stroke volume and end-diastolic volume in diabetic and control groups. In T1DM subjects there was a slightly lower stroke volume index and cardiac index as compared with matched controls, but the augmentation of these measures was similar between groups (interaction exercise × group, P > 0.05). As compared with matched controls, the increase in cardiac index was less in T2DM (inter-action exercise × group, P = 0.005) due to a lesser increase in heart rate (interaction exercise × group, P = 0.006)

Page 9 of 14Roberts et al. Cardiovasc Diabetol (2018) 17:44
compared a group of 12 T1DM endurance triathletes with matched controls and whilst there was no difference in exercise capacity, the 6 T1DM athletes with worse gly-cemic control (mean HbA1c = 62 mmol/mol) had 15% lower V̇O2peak than the six athletes with better control (mean HbA1c = 48 mmol/mol). The degree to which
these differences can be accounted for by hyperglycemia as opposed to confounding behavioral and health factors is difficult to quantify. The data presented here suggests that once multiple factors are considered, the influence of glycemic control on exercise capacity is, at most, modest.
An absence of subclinical cardiac dysfunctionA higher incidence of congestive heart failure (CHF) has been observed in diabetes subjects [18, 19], leading to the concept of a diabetes-specific cardiomyopathy [2]. Dia-betic cardiomyopathy has evolved into a specific clinical entity with two distinct phenotypes proposed: heart fail-ure with preserved ejection fraction (HFpEF) and heart failure with reduced ejection fraction (HFrEF) [2]. Fur-thermore, Widya et al. [20] have reported changes in the right ventricle that parallel those seen in the left ventri-cle in T2DM subjects. On the other hand, the entity of diabetic cardiomyopathy remains contentious amongst some given the dependence of small animal and molecu-lar models rather than prospective human data [6, 21].
A high prevalence of LV diastolic dysfunction has been observed in T2DM [22, 23] and its association with impaired exercise capacity has been suggested to repre-sent a subclinical phase of diabetic cardiomyopathy [24, 25]. In the present study, we found no difference in the prevalence of diastolic dysfunction between the T2DM group and their controls. Interestingly, the four T2DM subjects identified to have diastolic dysfunction at rest had normal diastolic stress test results. Similarly, there were no differences in the change of LVEDV during exer-cise when DM subjects were compared with matched controls (Fig. 3). These findings strengthen the argument
Table 4 Univariate correlates of V̇O2peak (ml/min)
HbA1c glycated hemoglobin, hsCRP high sensitivity C-reactive protein, LVEDV left ventricular end diastolic volume, RVEDA right ventricular end diastolic area, CI-reserve cardiac index reserve, HR-reserve heart rate reserve, LVs’-reserve LV tissue Doppler septal peak systolic velocity reserve, BSA body surface area, RVFAC right ventricular fractional area change
Variable r P
Female sex − 0.45 < 0.0001
T2DM − 0.39 0.002
HbA1c (mmol/mol) − 0.37 0.004
hsCRP (mg/l) − 0.32 0.013
Age − 0.30 0.021
LVEDV (ml) 0.67 < 0.0001
RVEDA (cm2) 0.58 < 0.0001
MET-hour equivalents 0.57 < 0.0001
CI-reserve (%) 0.55 < 0.0001
LV mass (g) 0.43 0.001
HR-reserve (bpm) 0.40 0.002
LVs’-reserve (%) 0.38 0.003
Hemoglobin (g/l) 0.35 0.006
BSA (m2) 0.32 0.013
RVFAC reserve (%) 0.30 0.022
Fig. 4 Correlation between cardiac volumes and exercise capacity. The scatter graph and Pearson’s correlation demonstrate a moder-ately strong correlation in which LV end-diastolic volume accounts for 44% of the variance in V̇O2 peak
Table 5 Multivariate predictors of VO2 (ml/min)—model 1 and 2
B unstandardized regression coefficient, SE standard error of the coefficient, Standardized B standardized coefficient, 95% CI 95% confidence interval, BSA body surface area, LVEDV LV end diastolic volume
Variable Coefficient (B) SE 95% CI P
(a) Model 1
Intercept 1623.1 931.6
Age − 34.6 7.0 − 48.8 to − 20.5 < 0.0001
Sex (female) − 846.4 189.3 − 1226.3 to − 466.5 < 0.0001
BSA 1494.1 486.1 518.6 to 2469.6 0.003
(b) Model 2
Intercept − 258.6 647.6
Age − 18.7 5.5 − 29.8 to − 7.7 0.001
Sex (female) − 532.3 130.3 − 794.1 to − 270.5 < 0.0001
BSA 1719.6 354.2 1007.9 to 2431.3 < 0.0001
MET hours 8.0 2.0 4.1 to 12.0 < 0.0001
T2DM − 471.2 133.4 − 739.4 to − 203.0 0.001
LVEDV 6.2 2.3 1.7 to 10.8 0.008
Page 10 of 14Roberts et al. Cardiovasc Diabetol (2018) 17:44
that diastolic dysfunction was not the cause for the reduced V̇O2peak.
There were also no significant differences in LV or RV systolic function to explain the lower V̇O2peak. Subjects with reduced LVEF were excluded from participating in our study, and the mean LVEF in the total cohort was 60 ± 5%. Reductions in newer echocardiographic meas-ures of LV systolic function such as global longitudi-nal strain (GLS) [26–28] and tissue Doppler myocardial velocity [29], however, can identify subclinical LV systolic dysfunction in the presence of a normal ejection fraction. In our cohort of T2DM subjects there was a non-signifi-cant trend to reduced resting LV GLS. However, LV GLS did not correlate with V̇O2peak amongst T2DM subjects (R = − 0.08, P = 0.78), and other echocardiography meas-ures of LV function had similarly poor associations with exercise capacity. During exercise, contractile reserve, as quantified by LVEF and LVs’ augmentation, was similar and normal in both the T2DM group and controls.
Reduced augmentation of cardiac index in T2DMIt has been demonstrated previously that resting cardiac index is similar in healthy individuals regardless of fit-ness level [30], and thus the similar resting cardiac index across the groups in our cohort was expected. However, in T2DM subjects the augmentation of cardiac index during exercise was reduced, explained by significant dif-ferences in heart rate but not stroke volume.
Lower heart rate reserve contributes to reduced cardiac index in T2DMHeart rate reserve was significantly reduced in those with T2DM compared to controls (mean 52 ± 13 bpm vs. 64 ± 11 bpm; P = 0.018) due to both a higher resting heart rate and a lower peak exercise heart rate.
Possible explanations for the difference in heart rate reserve include diabetic cardiovascular autonomic neu-ropathy (CAN), reduced β-adrenoreceptor sensitiv-ity or remodeling of the sinoatrial node. It is possible that the reduced HR reserve could also reflect a relative lack of physical exercise conditioning. Only one of our T2DM participants had a diagnosis of diabetic neuropa-thy, which is perhaps less than may be expected [31, 32]. There is a large variability in the reported prevalence of diabetic CAN [33], although it appears to affect a simi-lar proportion of people with type 1 and T2DM [34]. We note that our T1DM cohort displayed several risk factors for CAN including lengthy duration of DM, suboptimal glycemic control and additional microvascular disease. We therefore contend that should we have underesti-mated the number of subjects with CAN, both T1DM and T2DM groups should have been affected equally. This is not supported by our findings of reduced exercise
capacity only in the T2DM group and not in those with T1DM.
Wilson et al. [35, 36] recently reported an almost iden-tical reduction in HR reserve in T2DM subjects as com-pared with control subjects. They investigated whether this may be attributable to reduced β-adrenoreceptor sensitivity. However, the β-adrenoreceptor agonist dobu-tamine was associated with a greater relative increase in HR in T2DM subjects as compared with controls sug-gesting that factors other than β-adrenoreceptor dys-function were responsible. It is possible that diabetes is associated with remodeling of ion-channels within the sino-atrial node that affect rate control, but this has not previously been investigated.
On the other hand, exercise conditioning may explain the differences in heart rate reserve. Habitual exercise is associated with greater heart rate reserve, mainly because of lower resting heart rate [30] consistent with the obser-vations in this study. Regular exercise programs, includ-ing high intensity interval training (HIIT), have been repeatedly shown to improve a range of cardiovascular measures and outcomes in people with DM, including lower resting heart rates and improved heart rate reserve [37–44]. Thus, it is reasonable to argue that the obser-vation in our study that heart rate reserve was reduced in T2DM, but not in T1DM, may be explained by prior exercise conditioning rather than by diabetes itself.
No differences in SVI, LVEDVI and LVESVI in DM subjects vs. controlsThe most definitive demonstration that cardiac func-tion did not differ between DM subjects and matched controls was the demonstration that cardiac volumes changed similarly during exercise. There were no differ-ences in SVI, LVEDVI or LVESVI during incremental exercise between T2DM or T1DM and their respective control groups. Resting LVEDVI was lower in T2DM subjects and remained so throughout incremental exer-cise (16% overall, P = 0.023). As illustrated in Fig. 3, the LVEDVI change mirrored that of controls (interaction of exercise and group, P = 0.96) suggesting that there was no impairment in diastolic filling. This is consistent with a recent study by Wilson et al. [35] who also found no dif-ference between changes in LVEDV during exercise in T2DM as compared with controls. Furthermore, the pat-tern of change in cardiac volumes during exercise in our study are the same as those described for normal physi-ology using exercise echocardiography [45] and exercise cardiac magnetic resonance imaging [9, 46]. We contend that the anatomy of the LV itself (smaller LVEDV) may be the major factor contributing to attenuated cardiac reserve during exercise, rather than impaired diastolic filling of a small LV cavity.

Page 11 of 14Roberts et al. Cardiovasc Diabetol (2018) 17:44
Increased LV volume predicts greater exercise capacityIt has been well demonstrated that exercise capacity cor-relates strongly with cardiac size (LV volumes, LV mass or whole heart volumes), both in athletic and non-athletic populations [30, 47, 48]. We previously demonstrated that in the absence of overt contractile dysfunction, dif-ferences in cardiac function during exercise were modest and thus the major determinant of stroke volume dur-ing intense exercise was stroke volume at rest [30]. In the current study, we found no evidence of LV systolic or diastolic dysfunction and, like the experience in ath-letes, found strong correlations between resting cardiac geometry measures (LV mass, LVEDV and RVEDA) and V̇O2peak. LVEDV was most strongly associated with V̇O2
peak in the entire cohort and remained a significant inde-pendent predictor on multivariate analysis after adjusting for age, sex and BSA. Most literature to date has focused on measures of cardiac function to explain exercise capacity in diabetes. We could not identify differences in function despite comprehensive resting and exercise measures. On the other hand, we identified differences in cardiac size (LVEDV) and we found a robust correlation between LVEDV and V̇O2peak. This is perhaps not sur-prising given that cardiac output is a major determinant of exercise capacity and, in the absence of differences in cardiac function, the major determinant of stroke volume is cardiac size.
It is notable, however, that we did not find a strong relationship between LVEDV and V̇O2peak in all sub-groups. Whilst the association in the combined group of T1DM, T2DM and controls was strong, the correlation was diminished when comparing T2DM and controls or T1DM and controls (R = 0.51, P = 0.004 and R = 0.79, P < 0.0001, respectively). These comparisons are chal-lenged by the limitations of sample size and also by the
influence of covariates. Simple correlations do not con-sider the important confounders of age, gender and BSA, all of which influence V̇O2peak. Thus, the more robust analysis is the multivariate analysis in which LVEDV remained a significant independent predictor of V̇O2
peak.
Limited activity may explain exercise performanceIt is generally reported that levels of physical activity in people with T2DM are less than that of the general non-diabetic population [49, 50] and this was also true in our comparison between T2DM subjects and controls according to estimated MET-hours. More importantly, weekly exercise participation was a significant independ-ent predictor of V̇O2peak on multivariate analysis.
The question arises as to how V̇O2peak could dimin-ish in the setting of preserved cardiac function and how this could relate to reduced physical activity? Haykowsky et al. elegantly demonstrated that sedentary behavior was associated with reductions in V̇O2peak that was related to fatty infiltration and atrophy of peripheral muscle, thereby compromising peripheral O2 diffusive metabo-lism [51]. Similarly, Russell et al. [52] attributed differ-ences in exercise capacity between T2DM and controls to changes in the peripheral vasculature and muscle inter-face. We can only hypothesize by inference from our data as we did not assess the quality of peripheral muscle gas exchange.
T2DM is most prevalent in older adults, and aging is associated with a linear decline in exercise capacity, accel-erating after age 50 [53]. Physical inactivity compounds this age-related decline in V̇O2peak and increases the risk of cardiovascular mortality in people with T2DM [54]. The Dallas Bed Rest and Exercise Study [55] eloquently described a loss of cardiorespiratory fitness, cardiac mass and ventricular volumes that occurred following 3 weeks of bed rest. This extreme intervention resulted in cardio-vascular changes equivalent to 30 years of aging. It has also been reported that one of the strongest predictors of heart failure in older adults is their level of fitness two decades earlier [56], and thus chronic inactivity could result in cardiac atrophy and reductions in functional capacity whilst also increasing insulin resistance and dia-betes risk. As summarized in Fig. 5, our observed asso-ciation between less physical activity, smaller cardiac volumes and T2DM, lends weight to the premise that inactivity could be the common underlying factor caus-ing both diabetes and exercise intolerance.
Clinical implicationsIt has been suggested that cardiac limitation in diabe-tes relates to increased fibrosis and stiffness of the myo-cardium [2]. Typical heart failure treatments have not
Fig. 5 Collinearity between exercise capacity, heart size and T2DM. The lack of relationship between reduced exercise capacity and T1DM as well as the strong association with sedentary behavior and T2DM suggests that sedentary behavior may be the common link between T2DM and reduced exercise capacity

Page 12 of 14Roberts et al. Cardiovasc Diabetol (2018) 17:44
proved efficacious and novel therapies have primarily targeted anti-fibrotic pathways. Such treatments may continue to prove fruitless if the cause of exercise limita-tion in diabetes is predominantly due to relative cardiac atrophy (or lack of physiological hypertrophy) associated with a sedentary lifestyle. Exercise is one of the few effica-cious treatments in heart failure with preserved ejection fraction [57] and this may be because it directly addresses the causative mechanisms. Our data identifies a strong association between sedentary behavior and reduced functional capacity implying that exercise may prove the best therapy for the prevention and treatment of exercise intolerance in patients with diabetes.
LimitationsThe risk of recruitment bias is challenging to avoid in an exercise study given the tendency for healthier subjects to volunteer for a study that includes exercise assessment. However, DM subjects were recruited from special-ist outpatient clinics where patients tend to have higher rates of co-morbidities than direct community recruit-ment. Patient demographics, glycemic control and medi-cation use were similar to those described in previous DM cohorts suggesting that a healthy cohort bias does not explain the lack of cardiac dysfunction identified in the study. DM subjects were not excluded if known to have hypertension, which is a confounder to the diag-nosis of diabetic cardiomyopathy. Given that half of the T2DM group had a pre-existing diagnosis of hyperten-sion, we contend that the normal measures of cardiac reserve strengthen our finding that myocardial dysfunc-tion and therefore diabetic cardiomyopathy was not the cause of reduced exercise capacity.
Although our DM group was equally split into T1DM and T2DM, we elected not to perform direct compari-sons between these DM subtypes other than to per-form univariate and multivariable analyses of the entire cohort. In our institution, it would not have been feasible to match T1DM and T2DM participants for age with-out significantly altering disease duration and the pres-ence and severity of diabetic complications between the two groups, based on the demographics of our institu-tion’s DM clinic patients. However, we believe the use of smaller healthy control groups to each DM subtype allows indirect comparisons to be drawn, in addition to collating all subject data for multivariable analyses.
We relied on hospital records to determine the pres-ence of diabetic neuropathy and did not perform cardio-vascular autonomic reflex tests. This may have led to an underestimation of the number of DM subjects affected by mild diabetic neuropathy and CAN. However, our DM subjects had relatively mild severity of microvascu-lar complications despite longstanding diabetes, and had
no difference in resting heart rate or sinus tachycardia to suggest significant CAN.
Invasive measurements of central hemodynamics were not performed and beyond the scope of the current study design. Nonetheless it has previously been demonstrated that Doppler echocardiography-derived estimates of CO and PASP allow for accurate measurements with moder-ate precision [58].
Finally, we did not quantify the degree of hyper-insu-linemia and its effect on cardiovascular or peripheral vascular function. Insulin resistance is associated with reduced exercise capacity in heart failure populations with [59, 60] and without [61] diabetes. However, as hyper-insulinemia is also present in obesity and meta-bolic syndrome, the ability to discern the relative contri-bution of obesity and diabetes is difficult and we do not think would alter the interpretation of our findings.
ConclusionsIn our cohort of DM subjects, T2DM was associated with reduced exercise capacity whereas active subjects with T1DM had preserved exercise capacity relative to healthy controls. Reduced physical activity and smaller LV volumes, rather than subclinical cardiac dysfunction, were associated with impaired exercise capacity. These findings suggest that physical inactivity may be a stronger predictor of exercise intolerance than hyperglycemia or myocardial dysfunction, and a powerful reminder to encourage exercise prescription to people with T2DM.
AbbreviationsBSA: body surface area; CAN: cardiovascular autonomic neuropathy; CHF: congestive heart failure; CO: cardiac output; CW: continuous wave; DM: dia-betes mellitus; ECG: electrocardiography; HFpEF: heart failure with preserved ejection fraction; HFrEF: heart failure with reduced ejection fraction; HIIT: high intensity interval training; HR: heart rate; LAVI: left atrial volume index; LV: left ventricle; LVEDV: left ventricular end-diastolic volume; LVEF: left ventricular ejection fraction; LVESV: left ventricular end-systolic volume; LV GLS: left ventricular global longitudinal strain; PASP: pulmonary artery systolic pressure; PW: pulse wave; RVEDA: right ventricular end-diastolic area; SV: stroke volume; T1DM: type 1 diabetes mellitus; T2DM: type 2 diabetes mellitus; V̇O2peak: oxygen consumption at peak exercise.
Authors’ contributionsTJR and ALG are guarantors for the study data and results. TJR contributed to the study design, recruitment, data acquisition and analysis, and writing of the manuscript. ATB, AIM and DLP contributed to manuscript editing. RJM contributed to recruitment and manuscript editing. ALG contributed to the study concept and design, recruitment, data analysis, writing and manuscript editing. All authors read and approved the final manuscript.
Author details1 Department of Cardiology, St Vincent’s Hospital Melbourne, Fitzroy, Australia. 2 St Vincent’s Department of Medicine, University of Melbourne, Fitzroy, Australia. 3 Department of Endocrinology & Diabetes, St Vincent’s Hospital Melbourne, Fitzroy, Australia. 4 Department of Cardiovascular Medicine, Uni-versity Hospitals Leuven, Leuven, Belgium. 5 Head, Exercise and Physical Activ-ity Domain, Baker Heart and Diabetes Institute, 75 Commercial Rd, Melbourne, VIC 3004, Australia.

Page 13 of 14Roberts et al. Cardiovasc Diabetol (2018) 17:44
AcknowledgementsWe wish to thank the Statistical Consulting Centre at The University of Melbourne for overseeing the statistical methodology chosen to analyze the data presented in this manuscript. We sincerely thank DJ Mooney (BSc) of St Vincent’s Hospital Melbourne for performing all echocardiography studies; N Cohen (MBBS) of Baker IDI Heart & Diabetes Institute, A Jenkins (MBBS) of The University of Sydney, D O’Neal (MBBS) of The University of Melbourne, and G Ward (MBBS) of The University of Melbourne for subject recruitment; DJ Campbell (MBBS) of St Vincent’s Institute of Medical Research for study design support; and the assistance of J Barros (BSc) of The University of Melbourne during exercise studies.
Competing interestsThe authors declare that they have no competing interests.
Availability of data and materialsThe datasets analyzed during the current study are available from the cor-responding author on reasonable request.
Consent for publicationNot applicable.
Ethics approval and consent to participateThe study was approved by the human research ethics committee at St Vin-cent’s Hospital Melbourne. All subjects provided written informed consent.
FundingThis study was funded by the National Heart Foundation of Australia (Grant-In-Aid G 12 M 6396). A/Prof La Gerche is supported by a Career Development Fellowship from the National Health and Medical Research Council (NHMRC 1089039) and a Future Leaders Fellowship from the National Heart Foundation (NHF 100409) of Australia.
Publisher’s NoteSpringer Nature remains neutral with regard to jurisdictional claims in pub-lished maps and institutional affiliations.
Received: 26 September 2017 Accepted: 17 March 2018
References 1. Boudina S, Abel ED. Diabetic cardiomyopathy revisited. Circulation.
2007;115(25):3213–23. 2. Seferovic PM, Paulus WJ. Clinical diabetic cardiomyopathy: a two-
faced disease with restrictive and dilated phenotypes. Eur Heart J. 2015;36(27):1718–1727, 1727a–1727c.
3. Iribarren C, Karter AJ, Go AS, Ferrara A, Liu JY, Sidney S, Selby JV. Glycemic control and heart failure among adult patients with diabetes. Circulation. 2001;103(22):2668–73.
4. Diabetes Control and Complications Trial. Intensive diabetes treatment and cardiovascular outcomes in type 1 diabetes: the DCCT/EDIC study 30-year follow-up. Diabetes Care. 2016;39:686–93.
5. Konduracka E, Gackowski A, Rostoff P, Galicka-Latala D, Frasik W, Piwowar-ska W. Diabetes-specific cardiomyopathy in type 1 diabetes mellitus: no evidence for its occurrence in the era of intensive insulin therapy. Eur Heart J. 2007;28(20):2465–71.
6. Litwin SE. Diabetes and the heart: is there objective evidence of a human diabetic cardiomyopathy? Diabetes. 2013;62(10):3329–30.
7. Cefalu WT. Standards of medical care in diabetes—2016. Diabetes Care. 2016;39(1):S4–5.
8. Balady GJ, Arena R, Sietsema K, Myers J, Coke L, Fletcher GF, Forman D, Franklin B, Guazzi M, Gulati M, et al. Clinician’s guide to cardiopulmonary exercise testing in adults: a scientific statement from the American Heart Association. Circulation. 2010;122(2):191–225.
9. La Gerche A, Claessen G, Van de Bruaene A, Pattyn N, Van Cleemput J, Gewillig M, Bogaert J, Dymarkowski S, Claus P, Heidbuchel H. Cardiac MRI:
a new gold standard for ventricular volume quantification during high-intensity exercise. Circ Cardiovasc Imaging. 2013;6(2):329–38.
10. Pellikka PA, Nagueh SF, Elhendy AA, Kuehl CA, Sawada SG, American Soci-ety of E. American Society of Echocardiography recommendations for performance, interpretation, and application of stress echocardiography. J Am Soc Echocardiogr. 2007;20(9):1021–41.
11. Quiñones MA, Otto CM, Stoddard M, Waggoner A, Zoghbi WA. Recom-mendations for quantification of Doppler echocardiography: a report from the Doppler quantification task force of the nomenclature and standards committee of the American Society of Echocardiography. J Am Soc Echocardiogr. 2002;15(2):167–84.
12. Burns AT, La Gerche A, D’Hooge J, MacIsaac AI, Prior DL. Left ventricular strain and strain rate: characterization of the effect of load in human subjects. Eur J Echocardiogr. 2010;11(3):283–9.
13. Bacchi E, Negri C, Tarperi C, Baraldo A, Faccioli N, Milanese C, Zanolin ME, Lanza M, Cevese A, Bonora E, et al. Relationships between cardiorespira-tory fitness, metabolic control, and fat distribution in type 2 diabetes subjects. Acta Diabetol. 2014;51(3):369–75.
14. Regensteiner JG, Sippel J, McFarling ET, Wolfel EE, Hiatt WR. Effects of non-insulin-dependent diabetes on oxygen consumption during tread-mill exercise. Med Sci Sports Exerc. 1995;27(5):661–7.
15. Veves A, Saouaf R, Donaghue VM, Mullooly CA, Kistler JA, Giurini JM, Horton ES, Fielding RA. Aerobic exercise capacity remains normal despite impaired endothelial function in the micro- and macrocirculation of physically active IDDM patients. Diabetes. 1997;46(11):1846–52.
16. Niranjan V, McBrayer DG, Ramirez LC, Raskin P, Hsia CC. Glycemic control and cardiopulmonary function in patients with insulin-dependent diabe-tes mellitus. Ame J Med. 1997;103(6):504–13.
17. Baldi JC, Cassuto NA, Foxx-Lupo WT, Wheatley CM, Snyder EM. Glycemic status affects cardiopulmonary exercise response in athletes with type I diabetes. Med Sci Sports Exerc. 2010;42(8):1454–9.
18. Kannel WB, Hjortland M, Castelli WP. Role of diabetes in congestive heart failure: the Framingham study. Am J Cardiol. 1974;34(1):29–34.
19. Sarma S, Mentz RJ, Kwasny MJ, Fought AJ, Huffman M, Subacius H, Nodari S, Konstam M, Swedberg K, Maggioni AP, et al. Association between diabetes mellitus and post-discharge outcomes in patients hospital-ized with heart failure: findings from the EVEREST trial. Eur J Heart Fail. 2013;15(2):194–202.
20. Widya RL, van der Meer RW, Smit JW, Rijzewijk LJ, Diamant M, Bax JJ, de Roos A, Lamb HJ. Right ventricular involvement in diabetic cardiomyopa-thy. Diabetes Care. 2013;36(2):457–62.
21. Seferovic PM, Milinkovic I, Ristic AD, Mitrovic JPS, Lalic K, Jotic A, Kanjuh V, Lalic N, Maisch B. Diabetic cardiomyopathy: ongoing controversies in 2012. Herz. 2012;37(8):880–6.
22. Nicolino A, Longobardi G, Furgi G, Rossi M, Zoccolillo N, Ferrara N, Rengo F. Left ventricular diastolic filling in diabetes mellitus with and without hypertension. Am J Hypertens. 1995;8(4):382–9.
23. Dandamudi S, Slusser J, Mahoney DW, Redfield MM, Rodeheffer RJ, Chen HH. The prevalence of diabetic cardiomyopathy: a population-based study in Olmsted County, Minnesota. J Card Fail. 2014;20(5):304–9.
24. Poirier P, Garneau C, Bogaty P, Nadeau A, Marois L, Brochu C, Gingras C, Fortin C, Jobin J, Dumesnil J-G. Impact of left ventricular diastolic dysfunction on maximal treadmill performance in normotensive subjects with well-controlled type 2 diabetes mellitus. Am J Cardiol. 2000;85(4):473–7.
25. Fang ZY, Sharman J, Prins JB, Marwick TH. Determinants of exercise capac-ity in patients with type 2 diabetes. Diabetes Care. 2005;28(7):1643–8.
26. Jensen MT, Sogaard P, Andersen HU, Bech J, Fritz Hansen T, Biering-Sorensen T, Jorgensen PG, Galatius S, Madsen JK, Rossing P, et al. Global longitudinal strain is not impaired in type 1 diabetes patients with-out albuminuria: the Thousand & 1 study. JACC Cardiovasc Imaging. 2015;8(4):400–10.
27. Zoroufian A, Razmi T, Taghavi-Shavazi M, Lotfi-Tokaldany M, Jalali A. Evaluation of subclinical left ventricular dysfunction in diabetic patients: longitudinal strain velocities and left ventricular dyssynchrony by two-dimensional speckle tracking echocardiography study. Echocardiogra-phy. 2014;31(4):456–63.
28. Scholte AJ, Nucifora G, Delgado V, Djaberi R, Boogers MJ, Schuijf JD, Kharagjitsingh AV, Jukema JW, van der Wall EE, Kroft LJ, et al. Subclinical left ventricular dysfunction and coronary atherosclerosis in asymptomatic patients with type 2 diabetes. Eur J Echocardiogr. 2011;12(2):148–55.

Page 14 of 14Roberts et al. Cardiovasc Diabetol (2018) 17:44
• We accept pre-submission inquiries
• Our selector tool helps you to find the most relevant journal
• We provide round the clock customer support
• Convenient online submission
• Thorough peer review
• Inclusion in PubMed and all major indexing services
• Maximum visibility for your research
Submit your manuscript atwww.biomedcentral.com/submit
Submit your next manuscript to BioMed Central and we will help you at every step:
29. Weytjens C, Cosyns B, D’Hooge J, Droogmans S, Lahoutte T, Garbar C, Roossens B, Van Camp G. Evaluation of contractile function and inotropic reserve with tissue velocity, strain and strain rate imaging in streptozo-tocin-induced diabetes. Eur J Echocardiogr. 2010;11(7):622–9.
30. La Gerche A, Burns AT, Taylor AJ, Macisaac AI, Heidbuchel H, Prior DL. Maximal oxygen consumption is best predicted by measures of cardiac size rather than function in healthy adults. Eur J Appl Physiol. 2012;112(6):2139–47.
31. Spallone V, Ziegler D, Freeman R, Bernardi L, Frontoni S, Pop-Busui R, Stevens M, Kempler P, Hilsted J, Tesfaye S, et al. Cardiovascular autonomic neuropathy in diabetes: clinical impact, assessment, diagnosis, and man-agement. Diabetes Metab Res Rev. 2011;27(7):639–53.
32. Vinik AI, Erbas T, Casellini CM. Diabetic cardiac autonomic neuropathy, inflammation and cardiovascular disease. J Diab Investig. 2013;4(1):4–18.
33. Vinik A, Maser R, Mitchell B, Freeman R. Diabetic autonomic neuropathy. Diabetes Care. 2003;26(5):1553–79.
34. Stephenson J, Fuller JH, EUROBIAB IDDM Complications Study Group. Microvascular and acute complications in IDDM patients: the EURODIAB IDDM complications study. Diabetologia. 1994;37(3):278–85.
35. Wilson GA, Wilkins GT, Cotter JD, Lamberts RR, Lal S, Baldi JC. Impaired ventricular filling limits cardiac reserve during submaximal exercise in people with type 2 diabetes. Cardiovasc Diabetol. 2017;16(1):160.
36. Wilson GA, Wilson LC, Lamberts RR, Majeed K, Lal S, Wilkins GT, Baldi JC. beta-Adrenergic responsiveness in the type 2 diabetic heart: effects on cardiac reserve. Med Sci Sports Exerc. 2017;49(5):907–14.
37. Sigal RJ, Kenny GP, Wasserman DH, Castaneda-Sceppa C, White RD. Physi-cal activity/exercise and type 2 diabetes: a consensus statement from the American Diabetes Association. Diabetes Care. 2006;29(6):1433–8.
38. Jelleyman C, Yates T, O’Donovan G, Gray LJ, King JA, Khunti K, Davies MJ. The effects of high-intensity interval training on glucose regulation and insulin resistance: a meta-analysis. Obes Rev. 2015;16(11):942–61.
39. Gusso S, Pinto T, Baldi JC, Derraik JGB, Cutfield WS, Hornung T, Hofman PL. Exercise training improves but does not normalize left ventricular systolic and diastolic function in adolescents with type 1 diabetes. Diabetes Care. 2017;40(9):1264–72.
40. St Clair M, Mehta H, Sacrinty M, Johnson D, Robinson K. Effects of cardiac rehabilitation in diabetic patients: both cardiac and noncar-diac factors determine improvement in exercise capacity. Clin Cardiol. 2014;37(4):233–8.
41. Revdal A, Hollekim-Strand SM, Ingul CB. Can time efficient exercise improve cardiometabolic risk factors in type 2 diabetes? A Pilot study. J Sports Sci Med. 2016;15(2):308–13.
42. Grace A, Chan E, Giallauria F, Graham PL, Smart NA. Clinical outcomes and glycaemic responses to different aerobic exercise training intensities in type II diabetes: a systematic review and meta-analysis. Cardiovasc Diabetol. 2017;16(1):37.
43. Ostman C, Smart NA, Morcos D, Duller A, Ridley W, Jewiss D. The effect of exercise training on clinical outcomes in patients with the metabolic syndrome: a systematic review and meta-analysis. Cardiovasc Diabetol. 2017;16(1):110.
44. Byrkjeland R, Stensaeth KH, Anderssen S, Njerve IU, Arnesen H, Seljeflot I, Solheim S. Effects of exercise training on carotid intima-media thickness in patients with type 2 diabetes and coronary artery disease. Influence of carotid plaques. Cardiovasc Diabetol. 2016;15:13.
45. Haykowsky MJ, Brubaker PH, John JM, Stewart KP, Morgan TM, Kitzman DW. Determinants of exercise intolerance in elderly heart failure patients with preserved ejection fraction. J Am Coll Cardiol. 2011;58(3):265–74.
46. Claessen G, La Gerche A, Wielandts JY, Bogaert J, Van Cleemput J, Wuyts W, Claus P, Delcroix M, Heidbuchel H. Exercise pathophysiology and silde-nafil effects in chronic thromboembolic pulmonary hypertension. Heart (British Cardiac Society). 2015;101(8):637–44.
47. Steding K, Engblom H, Buhre T, Carlsson M, Mosen H, Wohlfart B, Arheden H. Relation between cardiac dimensions and peak oxygen uptake. J Cardiovasc Magn Reson. 2010;12(1):8.
48. Scharhag J, Schneider G, Urhausen A, Rochette V, Kramann B, Kinder-mann W. Athlete’s heart: right and left ventricular mass and function in male endurance athletes and untrained individuals determined by magnetic resonance imaging. J Am Coll Cardiol. 2002;40(10):1856–63.
49. Ford ES, Herman WH. Leisure-time physical activity patterns in the US diabetic population: findings from the 1990 National Health Interview Survey—Health Promotion and Disease Prevention Supplement. Diabe-tes Care. 1995;18(1):27–33.
50. Huebschmann AG, Kohrt WM, Regensteiner JG. Exercise attenuates the premature cardiovascular aging effects of type 2 diabetes mellitus. Vasc Med. 2011;16(5):378–90.
51. Kitzman DW, Brubaker P, Morgan T, Haykowsky M, Hundley G, Kraus WE, Eggebeen J, Nicklas BJ. Effect of caloric restriction or aerobic exercise training on peak oxygen consumption and quality of life in obese older patients with heart failure with preserved ejection fraction: a randomized clinical trial. JAMA. 2016;315(1):36–46.
52. Russell RD, Hu D, Greenaway T, Blackwood SJ, Dwyer RM, Sharman JE, Jones G, Squibb KA, Brown AA, Otahal P, et al. Skeletal muscle microvas-cular-linked improvements in glycemic control from resistance training in individuals with type 2 diabetes. Diabetes Care. 2017;40(9):1256–63.
53. Fleg JL, Morrell CH, Bos AG, Brant LJ, Talbot LA, Wright JG, Lakatta EG. Accelerated longitudinal decline of aerobic capacity in healthy older adults. Circulation. 2005;112(5):674–82.
54. Moe B, Augestad LB, Nilsen TI. Diabetes severity and the role of leisure time physical exercise on cardiovascular mortality: the Nord-Trondelag Health study (HUNT), Norway. Cardiovasc Diabetol. 2013;12:83.
55. McGuire DK, Levine BD, Williamson JW, Snell PG, Blomqvist CG, Saltin B, Mitchell JH. A 30-year follow-up of the Dallas Bed Rest and Training Study: I. Effect of age on the cardiovascular response to exercise. Circula-tion. 2001;104(12):1350–7.
56. Pandey A, Allen NB, Ayers C, Reis JP, Moreira HT, Sidney S, Rana JS, Jacobs DR Jr, Chow LS, de Lemos JA, et al. Fitness in young adulthood and long-term cardiac structure and function: the CARDIA study. JACC Heart Fail. 2017;5(5):347–55.
57. Pandey A, Parashar A, Kumbhani DJ, Agarwal S, Garg J, Kitzman D, Levine BD, Drazner M, Berry JD. Exercise training in patients with heart failure and preserved ejection fraction: meta-analysis of randomized control trials. Circ Heart Fail. 2015;8(1):33–40.
58. D’Alto M, Romeo E, Argiento P, D’Andrea A, Vanderpool R, Correra A, Bossone E, Sarubbi B, Calabro R, Russo MG, et al. Accuracy and precision of echocardiography versus right heart catheterization for the assess-ment of pulmonary hypertension. Int J Cardiol. 2013;168(4):4058–62.
59. Suskin N, McKelvie RS, Burns RJ, Latini R, Pericak D, Probstfield J, Rouleau JL, Sigouin C, Solymoss CB, Tsuyuki R, et al. Glucose and insulin abnor-malities relate to functional capacity in patients with congestive heart failure. Eur Heart J. 2000;21(16):1368–75.
60. Snoer M, Monk-Hansen T, Olsen RH, Pedersen LR, Simonsen L, Rasmusen H, Dela F, Prescott E. Insulin resistance and exercise tolerance in heart failure patients: linkage to coronary flow reserve and peripheral vascular function. Cardiovasc Diabetol. 2012;11:97.
61. AlZadjali MA, Godfrey V, Khan F, Choy A, Doney AS, Wong AK, Petrie JR, Struthers AD, Lang CC. Insulin resistance is highly prevalent and is associ-ated with reduced exercise tolerance in nondiabetic patients with heart failure. J Am Coll Cardiol. 2009;53(9):747–53.
Related Documents