Advanced Webinar: Techniques for Wildfire Detection and Monitoring July 12 & 19, 2018 http://arset.gsfc.nasa.gov/ 1 Exercise 2: The Global Wildfire Information System (GWIS) Objectives • Understand how to use the GWIS Current Situation Viewer • Learn how to compare various fire danger indices • Learn how to conduct an assessment of active fires in comparison with fire emissions • Learn how to use the GWIS system for monitoring global wildfire patterns and specific fire events Overview of Topics • Explore GWIS functions • Examine various fire danger indices • Conduct a rapid fire assessment on an example fire Tools Needed • Web browser with internet connection Introduction For this exercise we will explore the Global Wildfire Information System (GWIS) website. GWIS is a joint initiative of the Group on Earth Observations (GEO) and the Copernicus Work Program that is supported by NASA’s Applied Sciences Program. GEO is a global network of government and academic institutions, private businesses, data providers, and experts that aim to create innovative solutions to solve global challenges, particularly those related to environmental management. Copernicus is the European Union’s Earth Observation Programme that provides both satellite and in-situ environmental data. GWIS is used operationally by the Emergency Response Coordinating Centre (ERCC) of the European Commission. The ERCC coordinates disaster relief worldwide on behave of the European Commission. GWIS provides data for the Fire Danger Forecast a day in advance, which is provided to incident managers. GWIS aims to provide a comprehensive view of fire effects and fire regimes at a global level. The GWIS Current Situation Viewer provides data on fire danger forecasts, actively burning fires, and fire emissions.

Welcome message from author
This document is posted to help you gain knowledge. Please leave a comment to let me know what you think about it! Share it to your friends and learn new things together.
Transcript

Advanced Webinar: Techniques for Wildfire Detection and Monitoring
July 12 & 19, 2018
http://arset.gsfc.nasa.gov/ 1
Exercise 2: The Global Wildfire Information System
(GWIS)
Objectives
• Understand how to use the GWIS Current Situation Viewer
• Learn how to compare various fire danger indices
• Learn how to conduct an assessment of active fires in comparison with fire
emissions
• Learn how to use the GWIS system for monitoring global wildfire patterns and
specific fire events
Overview of Topics
• Explore GWIS functions
• Examine various fire danger indices
• Conduct a rapid fire assessment on an example fire
Tools Needed
• Web browser with internet connection
Introduction
For this exercise we will explore the Global Wildfire Information System (GWIS) website. GWIS is a joint initiative of the Group on Earth Observations (GEO) and the Copernicus Work Program that is supported by NASA’s Applied Sciences Program. GEO is a global network of government and academic institutions, private businesses, data providers, and experts that aim to create innovative solutions to solve global challenges, particularly those related to environmental management. Copernicus is the European Union’s Earth Observation Programme that provides both satellite and in-situ environmental data. GWIS is used operationally by the Emergency Response Coordinating Centre (ERCC) of the European Commission. The ERCC coordinates disaster relief worldwide on behave of the European Commission. GWIS provides data for the Fire Danger Forecast a day in advance, which is provided to incident managers. GWIS aims to provide a comprehensive view of fire effects and fire regimes at a global level. The GWIS Current Situation Viewer provides data on fire danger forecasts, actively burning fires, and fire emissions.

Advanced Webinar: Techniques for Wildfire Detection and Monitoring
July 12 & 19, 2018
http://arset.gsfc.nasa.gov/ 2
Part 1: Exploring the GWIS Current Situation Viewer
1. Go to the Global Wildfire Information System (GWIS) website here:
http://gwis.jrc.ec.europa.eu/
2. Click on Current Situation Viewer on the right side of the page under
Applications.
3. Let’s first explore the viewer functions on the right side.

Advanced Webinar: Techniques for Wildfire Detection and Monitoring
July 12 & 19, 2018
http://arset.gsfc.nasa.gov/ 3
a. The Open/close layers sidebar function will turn on or off
the layer options on the left hand side of the viewer.
b. The Search function allows the user to input a location and be taken
directly to that region on the map.
c. The Home function will return the zoom level to the standard (the one
pictured above).
d. The plus and minus signs will allow you to zoom in and out. You can also
do this with your mouse.
e. The Zoom to specific area function allows the user to draw a
rectangle on the map to zoom to that region.
f. The Full Screen function will display the map at full screen.
g. The Show me where I am function will point the user to where they
are currently located in the world.
h. The Switch Base Layer function will allow the user to select from a
different GoogleMap or OpenMap layer.
i. The Show Legend function displays the Fire Danger Forecast
levels on the right. These are the colors represented in the standard map
function, and range from Very Low Danger to Extreme Danger.
4. Now let’s examine the data layers on the left side. To turn on the country
boundaries click on COUNTRY BOUNDARIES under Map Options.
Advanced Webinar: Techniques for Wildfire Detection and Monitoring
July 12 & 19, 2018
http://arset.gsfc.nasa.gov/ 4
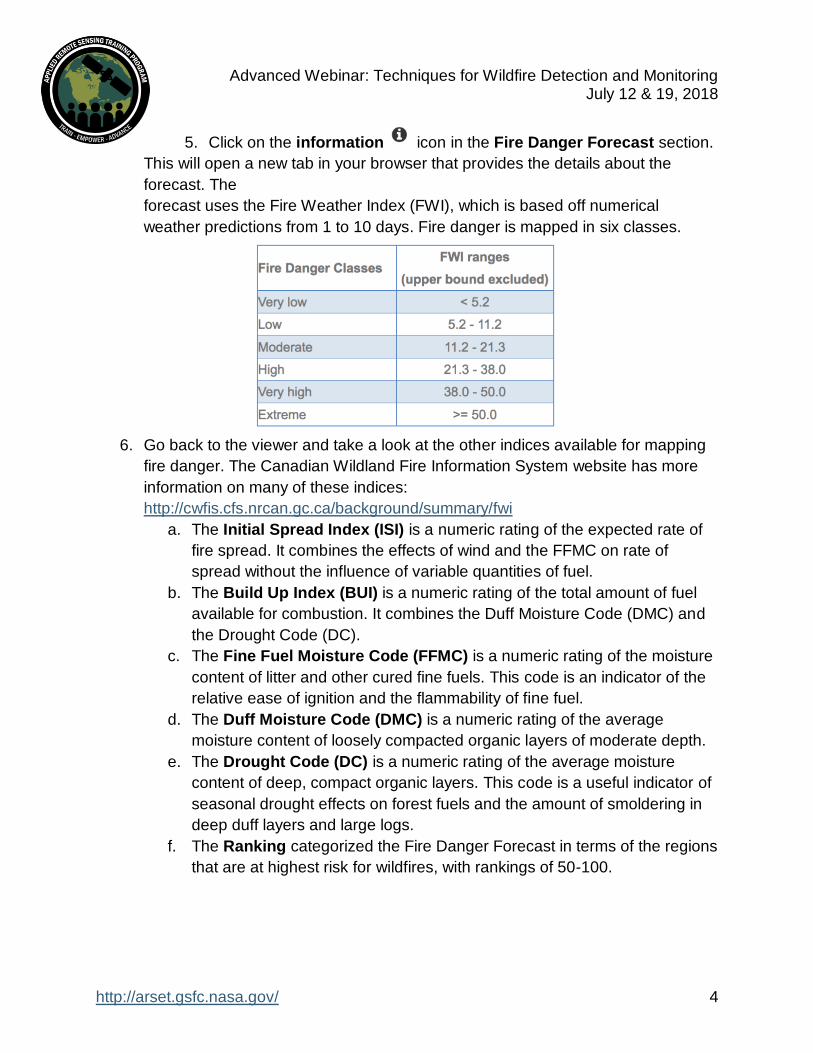
5. Click on the information icon in the Fire Danger Forecast section.
This will open a new tab in your browser that provides the details about the
forecast. The
forecast uses the Fire Weather Index (FWI), which is based off numerical
weather predictions from 1 to 10 days. Fire danger is mapped in six classes.
6. Go back to the viewer and take a look at the other indices available for mapping
fire danger. The Canadian Wildland Fire Information System website has more
information on many of these indices:
http://cwfis.cfs.nrcan.gc.ca/background/summary/fwi
a. The Initial Spread Index (ISI) is a numeric rating of the expected rate of
fire spread. It combines the effects of wind and the FFMC on rate of
spread without the influence of variable quantities of fuel.
b. The Build Up Index (BUI) is a numeric rating of the total amount of fuel
available for combustion. It combines the Duff Moisture Code (DMC) and
the Drought Code (DC).
c. The Fine Fuel Moisture Code (FFMC) is a numeric rating of the moisture
content of litter and other cured fine fuels. This code is an indicator of the
relative ease of ignition and the flammability of fine fuel.
d. The Duff Moisture Code (DMC) is a numeric rating of the average
moisture content of loosely compacted organic layers of moderate depth.
e. The Drought Code (DC) is a numeric rating of the average moisture
content of deep, compact organic layers. This code is a useful indicator of
seasonal drought effects on forest fuels and the amount of smoldering in
deep duff layers and large logs.
f. The Ranking categorized the Fire Danger Forecast in terms of the regions
that are at highest risk for wildfires, with rankings of 50-100.

Advanced Webinar: Techniques for Wildfire Detection and Monitoring
July 12 & 19, 2018
http://arset.gsfc.nasa.gov/ 5
g. The Anomaly shows the deviation from normal fire danger globally, with
negative anomalies indicating less than normal fire danger and positive
values indicating higher than normal fire danger.
7. Notice the date selections along the bottom portion of the Fire Danger Forecast
Panel, where you can view model predictions up to 8 days in advance.
The Rapid Damage Assessment panel allows you analyze near real-time data such as actively burning fires, burnt areas, and aerosols information. 8. For the Date Range you can select the last 7, 30, or 90 days, select the fire
season, or a specific date range.
9. Active Fires are available via MODIS and VIIRS. Click on the information
icon under Active Fires and read the overview description about these data.
10. The Burnt Areas are calculated using MODIS data. Click on the information
icon next to BURNT AREAS (MODIS) and read the overview description
about these data.

Advanced Webinar: Techniques for Wildfire Detection and Monitoring
July 12 & 19, 2018
http://arset.gsfc.nasa.gov/ 6
11. The Fire Emissions panel provides data on a variety of aerosols like
carbon dioxide and particulate matter. Click on the information icon next to
FIRE EMISSIONS and read the overview description about these data. You can
also visit this website for more detailed information: http://www.gmes-
atmosphere.eu/about/project_structure/input_data/d_fire/
12. The FUELS panel provide an image of the first global fuel map, containing the
inputs for the Fuel Characteristic Classification System (FCCS). This is based on
satellite products and fuel databases. Click on the information icon next to
FUELS and you will be directed to a website that has a link to the paper that this
layer was based on.
Part 2: Examining Fire Danger
1. In the GWIS viewer, set the map to the original extent using the Reset Map icon.
2. Turn off all layers, and turn on the COUNTRY BOUNDARIES and FIRE
DANGER FORECAST layers.
3. Each day GWIS has a different range of dates for fire forecasts, with a lead time
of up to 8-days in advance. Select any day you would like, and choose the Fire
Weather Index (FWI) as the Source.
4. Move your mouse around the globe.
a. What are the regions of the world that are at highest risk for wildfires?
5. Zoom into the southwestern United States. This is a region experiencing extreme
drought, and is also prone to wildfires. Recently, parts of Colorado have been
experiencing wildfires.

Advanced Webinar: Techniques for Wildfire Detection and Monitoring
July 12 & 19, 2018
http://arset.gsfc.nasa.gov/ 7
6. Click on the Show Legend icon. Now toggle the map view between the FWI and
the BUI.
a. What differences do you notice between these two indices? Why do you
think the BUI fire danger is less severe in some regions?

Advanced Webinar: Techniques for Wildfire Detection and Monitoring
July 12 & 19, 2018
http://arset.gsfc.nasa.gov/ 8
7. In the drop down menu next to Index, turn on the Fire Danger Ranking layer
and notice that much of the region is in the highest ranked category (98-100).
Fire managers in this region can be expected to be on high alert for active fires
this summer.
8. With the Fire Danger Ranking category still turned on, zoom back out to the full
extent of the global map. You can use the Reset Map icon to do this.
a. What other part of the world appears to be at high risk for fire?

Advanced Webinar: Techniques for Wildfire Detection and Monitoring
July 12 & 19, 2018
http://arset.gsfc.nasa.gov/ 9
9. Zoom into Finland, and notice that the southern region of the country is
also at high risk for wildfires. Note, that due to the rapidly changing conditions, at
the time you complete this exercise, some of these patterns will be different than
the images and categories outlined below.
10. Under the Rapid Damage Assessment panel, turn on the MODIS and VIIRS
ACTIVE FIRES buttons.
11. Select the Last 30 dd. date range.
a. Do you see any actives fires in this region?
Finland just experienced the warmest May in over 30 years, coupled with a considerable dry spell, and the risk for fires is particularly high. While there may not be many fires yet in this region, the risk is currently high. Feel free to explore other regions of interest that appear to have a high fire risk, such as central Africa or northwestern Australia.
Part 3: Rapid Fire Assessment Example
Let’s use GWIS now to examine a particular set of fires burning in Siberia. Dry, warm weather in the region sparked wildfires in the countryside in early May 2018. NASA and ESA satellites imaged and analyzed these fires. On May 9th, a fire blazed near Komsomolsk-on-Amur, a city in Russia with over 260,000 people. Below is an image taken from the Sentinel-2 satellite on May 9, 2018.

Advanced Webinar: Techniques for Wildfire Detection and Monitoring
July 12 & 19, 2018
http://arset.gsfc.nasa.gov/ 10
Here is an article about this fire and image:
https://sentinels.copernicus.eu/web/sentinel/news/-/article/copernicus-sentinels-work-together-to-monitor-wildfires
1. In the GWIS viewer, set the map to the original extent using the Reset Map icon.
2. Turn off the Danger Forecast layer.
3. Turn on the Country Boundaries layer.
4. Click on the Select a custom date range icon under the Rapid
Damage Assessment panel.
a. Select April 26th, 2018 as the start date and May 25th, 2018 as the end
date.
5. Turn on the MODIS and VIIRS Active Fires layers.
6. Turn on the FIRE EMISSIONS and the Particulate Matter buttons.
7. Scroll over to the southeastern portion of Russia (see map below) and zoom into
the region with the clustering of blue and red dots.

Advanced Webinar: Techniques for Wildfire Detection and Monitoring
July 12 & 19, 2018
http://arset.gsfc.nasa.gov/ 11
8. Zoom in a bit farther and turn on the legend by clicking on the Show Legend
icon on the bottom right of the page.

Advanced Webinar: Techniques for Wildfire Detection and Monitoring
July 12 & 19, 2018
http://arset.gsfc.nasa.gov/ 12
Now you can see levels of PM2.5 that are elevated and overlapping active fires
identified by MODIS and VIIRS.
9. Click on some of the other options in the FIRE EMISSIONS panel. Examine the
differences between different types of pollutants.
10. Turn on the FUELS layer.
a. What types of vegetation are predominant in this region?
Conclusion
GWIS allows users to visualize fire danger, actively burning fires, and fire emissions. These types of data assist in the visualization of fire properties and can provide an overview of an active fire area and emissions. As a first approach, GWIS provides insight on where to examine active fires and what other types of information you might need to monitor fires on the ground. In this exercise you:
1. explored GWIS functions
2. examined various fire danger indices
3. conducted a rapid fire assessment on an example fire from Siberia

Advanced Webinar: Techniques for Wildfire Detection and Monitoring
July 12 & 19, 2018
http://arset.gsfc.nasa.gov/ 13
Additional Online Resources
• The Group on Earth Observations (GEO):
http://www.earthobservations.org/geoss_wp.php
• Copernicus Emergency Management System:
http://www.earthobservations.org/geoss_wp.php
• The European Forest Fire Information System (EFFIS):
http://effis.jrc.ec.europa.eu/
• The Global Terrestrial Observing System (GTOS) Global Observation of Forest
Cover- Global Observation of Land Dynamics (GOFC-GOLD) Fire
Implementation Team (GOFC-Fire IT):http://gofc-fire.umd.edu/
Related Documents