17/03/2015 1 Exemplifying the Mixing of Research Methods: Triangulating on student drawings. Presentation to the Faculty of Education, Hong Kong University March 2015 Gavin Brown, PhD [email protected] Method effects How you collect and analyse data shapes and determines the results you get Every method is imperfect and so you get method effects Results may be due to the method you use Data may cluster because of how it is collected not what it actually measures

Welcome message from author
This document is posted to help you gain knowledge. Please leave a comment to let me know what you think about it! Share it to your friends and learn new things together.
Transcript

17/03/2015
1
Exemplifying the Mixing of Research Methods: Triangulating
on student drawings.
Presentation to the Faculty of Education, Hong Kong University
March 2015
Gavin Brown, PhD
Method effects
How you collect and analyse data shapes and determines the results you get
Every method is imperfect and so you get method effects
Results may be due to the method you use Data may cluster because of how it is collected
not what it actually measures

17/03/2015
2
Triangulation: Multiple & Mixed Methods
Find location of unknown object by approaching it in different ways from known sites
Metaphor for multiple and mixed methods research Multiple approaches to
examine common phenomenon
Method Effects in Quantitative Research
NOT new in Quantitative Research Need to check or control for method effects
by using multiple methods Validation tools Multi-trait, multi-method analysis Multi-battery factor analysis
The common traits should stand out regardless of method used

17/03/2015
3
Triangulation Method
1
Method
2
Method
3
Strength M1
Strength M2
Weakness M1
Weakness M3 Weakness M2
Goal: non-overlapping weaknesses
Convergence likelyProbably complementary
Random chance?
Multi-Trait, Multi-Method Analysis
Method 1 Method 2
Trait A Trait B Trait A Trait B
Method 1
Trait A (reliability)
Trait B MonoM
HeteroT
(reliability)
Method 2
Trait A HeteroM
MonoT
HeteroM
HeteroT
(reliability)
Trait B HeteroM
Hetero T
HeteroM
MonoT
MonoM
HeteroT
(reliability)
Campbell, D. T. & Fiske, D. W. (1959). Convergent and discriminant validation by the multitrait-multimethod matrix. Psychological Bulletin 56, 81-105.
If traits exist across methods then HeteroM+MonoTshould be stronger than other correlations

17/03/2015
4
MTMM Analysis: Self-Rating, Teacher-Rating, & Ability
Monotrait Heteromethod
Heterotrait Monomethod
Heterotrait Heteromethod
Measure 1 2 3 1 2 3 1 2 3 1. SILSER .26 .22 .50 .25 .21 2. Teacher Rating of Independence
.09 .73 .36
3. ESA:IS Test Performance na
Brown, G. T. L. (2005). Student information literacy: Psychometric validation of a self-efficacy report. Psychological Reports, 96, 1044-1048.
These are Average Correlations.
What Conclusions can you draw?
Multi-Battery Factor Analysis
Joint Factor Analysis Multi-battery Factor
Analysis Scales I II III IV I II III IV
18. Student Accountability .66 .35 -.04 -.08 .19 .50 .01 .02 14. Describe .63 -.44 -.15 .04 -.32 .35 -.04 .17 13. Valid .56 -.41 .17 -.14 -.31 .35 .10 -.03 17. School Accountability .56 -.13 .09 -.26 -.13 .43 .20 .00 20. Academic .47 .05 -.20 -.24 .04 .48 .08 .28 7. Surface .45 .09 -.12 -.10 -.01 .50 .04 -.00 21. Technological .42 -.15 -.31 -.01 -.11 .35 -.07 .29 9. Internal .40 .07 -.06 -.21 .02 .24 .13 .05 10. Bad .13 .79 -.02 .01 .77 .11 .00 .01 11. Ignore -.03 .72 -.02 -.09 .83 .04 .08 .28 16. Improve Learning .39 -.60 -.13 -.09 -.43 .14 .11 .17 15. Improve Teaching .38 -.53 -.30 .08 -.34 .18 -.03 .17 12. Inaccurate -.11 .40 -.31 -.09 .49 .04 .08 .28 8. External .20 .36 .13 .04 .23 .17 -.00 -.17 1. Nurturing -.10 -.07 -.67 -.20 .00 -.07 .07 .39 6. Deep .02 -.05 -.64 -.10 .00 -.02 .05 .37 22. Humanistic .24 .05 -.51 .16 .04 .15 -.12 .38 2. Apprenticeship .09 -.10 -.39 -.35 -.05 .09 .16 .27 4. Social Reform -.04 .03 -.02 -.78 .06 .00 .72 .09 5. Development -.06 -.11 -.29 -.67 -.02 .04 .27 .29 19. Social Reconstruction .20 .11 .09 -.55 .03 .12 .59 -.07 3. Transmission .36 .07 .09 -.53 -.01 .46 .20 -.15
Same Method
Method Effect Trait Effect
Brown, Gavin T L (2007). An introduction to multi-battery factor analysis: Overcoming method artefacts. Practical Assessment Research & Evaluation, 12(7). Available online: http://tinyurl.com/2bt7fl
Same Trait

17/03/2015
5
Mixing Methods
More than using multiple methods Multiple methods within quantitative reduces error
and increases validity
Mixing methods means using both qualitative and quantitative appropriately mixed depending on multi-faceted nature of problem
Mixing Methods Rationale
When you want to ask a question that has rarely been asked or has been asked with questionable results.
When you want the strength of multiple methods for triangulation.
When some, and only some, of your variables are easily quantifiable at this stage of inquiry.

17/03/2015
6
To think about
Is your problem or interest… Quantities or qualities Take place in a naturally occurring or artificial
setting Focused on meanings or behaviours Amenable to an inductive or deductive approach Generalised to cultural contexts or universe of all
populations
If both then need mixing methods design If problem contains both then need both
Otherwise use multiple methods that don’t mix paradigm
Mixing Methods Research
Mixing methods moderates the competition between methodological paradigms
Simply adding a second method to a study does not make it good research
What makes good research is having a rationale for mixing methods and a rigorous implementation technique How will you overcome method effects so as to be
able to integrate results?
17/03/2015
7
Mixing Methods Designs
Mixed Methods Designs
Johnson & Onwuegbuzie, 2004, p. 21 Figure 1
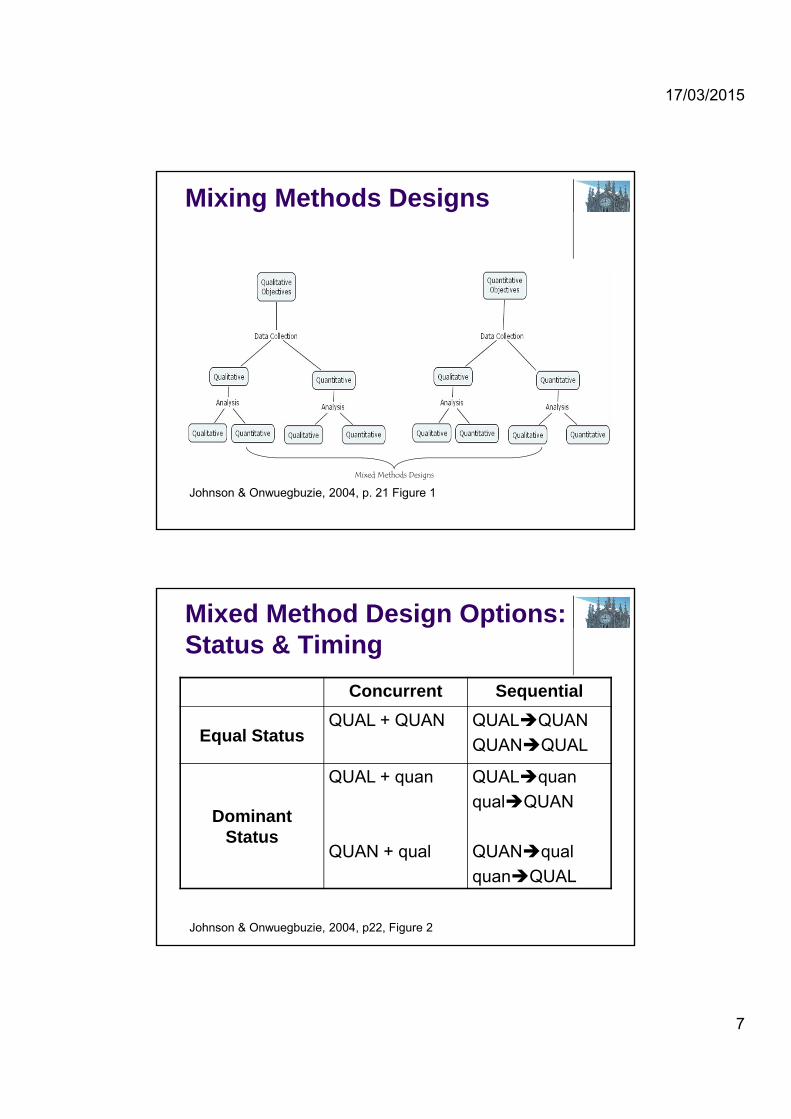
Mixed Method Design Options: Status & Timing
Concurrent Sequential
Equal StatusQUAL + QUAN QUALQUAN
QUANQUAL
Dominant Status
QUAL + quan
QUAN + qual
QUALquan
qualQUAN
QUANqual
quanQUAL
Johnson & Onwuegbuzie, 2004, p22, Figure 2
17/03/2015
8
Advantages of Mixing Methods
Reduce bias in the study.
Help to understand complex issues.
Addresses the objectivity-subjectivity continuum.
Allows researcher to move back and forth between paradigms to fully understand situation.
Disadvantages of Mixing Methods
Conflict of paradigms - purist perspective. Can you really work and write using two
contrasting paradigms and be close to the truth?
Works well if you work in a team - one qualitatively grounded, one quantitatively grounded.
But results from one method may not align with another method

17/03/2015
9
26 Teachers completed questionnaires and then interviewed in open-ended, phenomenographic fashion 4 factor scores created for each teacher by questionnaire
Interview results reduced to 3 point scale for same factors
Level of agreement poor 57% of ratings the same;
kappa coefficients=-.13; .14; .13; -.11 (around chance)
Inference: complementary, not consistent results Not corroboration
Data alignment across methods
Harris, L. R., & Brown, G. T. L. (2010). Mixing interview and questionnaire methods: Practical problems in
aligning data. Practical Assessment Research & Evaluation, 15(1). Available online: http://pareonline.net/pdf/v15n1.pdf.
Investigating the implicit
How do we find out about the thinking, beliefs, attitudes, opinions, or ideas that people have when: They may never have thought about the topic before
(i.e., they don’t know what they think)?
They don’t have language skills sufficient to express their ideas?
They are reluctant to tell you their personal thinking (e.g., cultural respect for authority)?
They are too shy or too young to express themselves?

17/03/2015
10
Traditionally
Interview or Survey But both depend on good metacognitive
awareness, linguistic skills
May result in reflexive results (i.e., responses are a function of the stimulus not really what they think)
Clever Hans the horse was supposedly able to do arithmetic. In 1907, it was found that the horse was watching the reaction of his human observers and stopping his counting when their physical reactions changed.
Observer-expectancy effect
Projective techniques
Methods that allow a person reveal hidden emotions and internal conflicts.
Responses content analyzed for meaning. From psychoanalytic psychology, which argues
that humans have conscious and unconscious attitudes
and motivations that are beyond or hidden from conscious awareness.
Projective techniques exposed those unconscious elements
Better called a FREE RESPONSE MEASURE

17/03/2015
11
Strengths
Diem-Wille pictures, drawings, and metaphors show a
person’s emotional state of mind much better than verbal definitions or descriptors (p. 119) Diem-Wille, G. (2001). A therapeutic perspective: The use of drawings in child
psychoanalysis and social science. In T. V. Leeuwen & C. Jewitt (Eds.), Handbook of visual analysis (pp. 119-133). London: Sage.
Strengths
drawings can be used to identify nuances and ambivalences within a person’s belief system
Clarebout, G., Depaepe, F., Elen, J., & Briell, J. (2007). The use of drawings to assess students‘ epistemological beliefs. Paper presented at the Biannual Conference of the European Association for Research on Learning and Instruction, Budapest.
Clarebout, G., Elen, J., Leonard, R., & Lowyck, J. (2007). Assessing instructional conceptions: A task-based approach. Educational Research and Evaluation, 13(2), 109 -125.

17/03/2015
12
Strengths
drawing pictures seems to help children recall and express more detail about events they depicted.
children are generally receptive to drawing, making it a useful ‘icebreaking’ activity and a potential way of mediating student shyness
Strengths
Students with low literacy, English language learners, and pupils with certain special needs (e.g. intellectual impairment, speech-language impairment) may particularly benefit from expressing their viewpoints through drawings
Wheelock, A., Bebell, D., & Haney, W. (2000a). Student self-portraits as test-takers: Variations, contextual differences, and assumptions about motivation. Teachers College Record, ID Number: 10635.
Wheelock, A., Bebell, D., & Haney, W. (2000b). What can student drawings tell us about highstakes testing in Massachusetts? Teachers College Record, ID Number: 10634.
17/03/2015
13
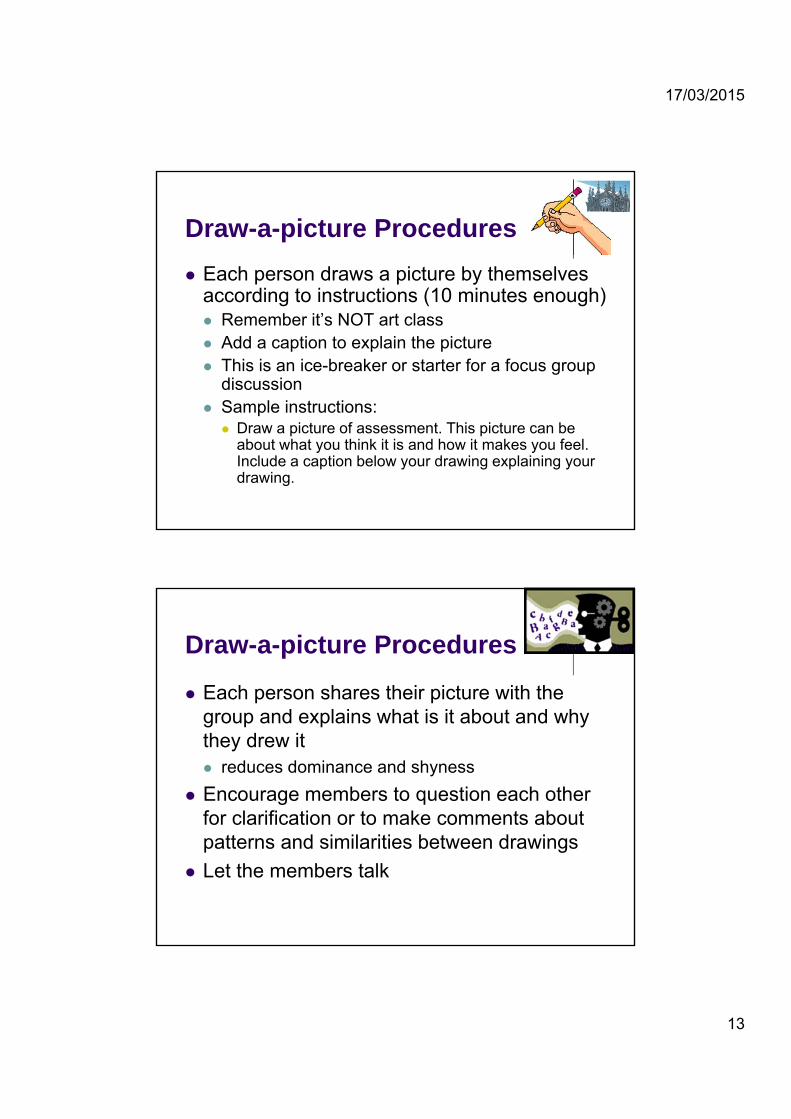
Draw-a-picture Procedures
Each person draws a picture by themselves according to instructions (10 minutes enough) Remember it’s NOT art class Add a caption to explain the picture This is an ice-breaker or starter for a focus group
discussion Sample instructions: Draw a picture of assessment. This picture can be
about what you think it is and how it makes you feel. Include a caption below your drawing explaining your drawing.
Draw-a-picture Procedures
Each person shares their picture with the group and explains what is it about and why they drew it reduces dominance and shyness
Encourage members to question each other for clarification or to make comments about patterns and similarities between drawings
Let the members talk
17/03/2015
14
Preparation for Analysis of Drawings and Discussions
Transcribe discussions Give identification code to each
participant Code & scan pictures digitally
Make sure codes match! Use high resolution 300dpi
Decide on approach to content analysis A priori theoretically derived categories (scientific
approach) Emergent empirically derived categories (grounded
theory approach)
Content Analysis
An empirical (observational) and objective procedure for quantifying recorded ‘audio-visual’ (including verbal) representation using reliable, explicitly defined categories Bell, 2001 p. 13
Frequency gives some insight into importance & scale SCoA example
Establish the frequencies of words and images within the drawings thought to convey meaning about the students’ conceptions of assessment and its purposes…to identify important trends
17/03/2015
15
A priori Analysis of Drawings and Discussions Define categories of interest based on prior research
questions, literature review, and theories. Look for those things. Human behaviour is a function of intentions, purposes, and
beliefsLook for causal reasons & effects Practices usually have multiple purposesLook for goals Processes have personal, affective, and social
consequencesLook for effects at multiple levels Processes interact with other processes in an
environmentLook for connections to other meaningful & important processes
If you know your field you should know already what is important to look for
Emergent Analysis of Drawings and Discussions
Develop categories from content present in the data (emergent analytic) Drawings—objects drawn or thematic elements
across multiple pictures Discussions—words, phrases, ideas that are said
across multiple participants Focus is on content patterns across the
participants Phenomenographic analysis of variations in
categories Weakness: if it isn’t in the data that you have does
that mean it doesn’t exist?

17/03/2015
16
Coding procedure
Split data into two halves and assign each to an independent analyst or
Do ½ and use 2nd ½ for validation of schema Create a list of all the objects, symbols, and key
words visible in the pictures as possible ‘sub-categories’.
Create the least number of subcategories needed to account for all items. For example, rather than having separate sub-categories for
all drawn school supplies (e.g., pen, pencil, ruler, eraser), group into one because of similarities in their function and content (i.e., stationery).
Coding procedure
Group sub-categories into higher order grouping categories. For example, ‘sub-categories’ of school supplies,
desks, blackboards, computers, and other similar objects common category of ‘physical environment artefacts’.
Minimise number of categories with fewer than 5 members in them
Develop codebook of categories Code 2nd half or get another analyst to
independently code the drawings

17/03/2015
17
Sample Student Drawing of Assessment
What do you see in the drawing? Type of
assessment
Physical artefacts
Teacher
Emotions
Outcomes
Estimating Similarity of Coding
Cohen’s (1960) kappa (κ) coefficient determines the degree of similarity between raters taking into account possibility of agreeing by chance Kappa values <.00 = agreement is less than
would occur purely by chance .00 kappa = consensus rates are equal to chance, Kappa up to .40 = slightly better than chance, Kappa.41 to .60 = moderately better than chance, Kappa >.60 = stronger than chance.

17/03/2015
18
Calculating Cohen’s Kappa for 2 raters
Teachers Experts Level 2 Level 3 Level 4 Total
Level 2 14 0 0 14 Level 3 2 13 0 15 Level 4 1 2 2 5 Total 17 15 2 34
κ = Po − Pc 1− Pc
Po (Probability of Observed) = Sum of agreement cells N
Pc (Probability of chance) = Sum of Products of matching columns and rows N squared
N = 34; N2=1156 Po=(14+13+2)/34 = .85 [NB. This is exact consensus %; >70%=good] Pc=(14*17)+(15*15)+(5*2)/1156 = (238+225+10)/1156 = .41 κ = (.85 - .41)/(1-.41) = .44/.59 = .746 ≈.75
If agreement is high, then systematic observation technique leads to robust result…..but are the results only a function of the coding?
Checking Drawings with Surveys: More triangulation
A study with 3 techniques Feedback practices checklist. Factor analysis
of a list of 15 different practices that are ticked to indicate YES
Fixed response survey--Student conceptions of feedback. Factor analysis of 42 items
Draw a picture of feedback. Content analysis of student drawings
Harris, L. R., Brown, G. T. L., & Harnett, J. (2014). Understanding classroom feedback practices: A study of New Zealand student experiences, perceptions, and emotional responses. Educational Assessment, Evaluation and Accountability, 26(2), 107-133. doi: 10.1007/s11092-013-9187-5

17/03/2015
19
Quantitative Results Conceptions of Feedback 3 factors Comments for Improvement (13 items),
Interpersonal Feedback (7 items), and
Negative Feedback (8 items)
fit good: χ2 = 617.96, df = 347, χ2/df = 1.78, p = .18; CFI = .87; gamma hat = .91; RMSEA = .064, 90% CI = 0.056-0.072, SRMR = .076
Practices of Feedback
3 factors Teacher Evaluation (4 items),
Teacher Help (6 items), and
Interpersonal (4 items)
fit good: χ2 = 133.38, df = 74, χ2/df = 1.80, p = .18; CFI = .94; gamma hat = .96; RMSEA = .067, 90% CI = 0.048-0.085, SRMR = .069
Drawing Category Aggregation
Categories CharacteristicsForm of Feedback
Teacher Feedback Written feedback from teacher Spoken or nonverbal feedback from teacher
Student-led Feedback Spoken or non-verbal from self Spoken or non-verbal feedback from peer Written feedback from peer Written feedback from self
Spoken Feedback Spoken or nonverbal feedback from teacher Spoken or nonverbal feedback from self Spoken or nonverbal feedback from peer Feedback from parents
Written Feedback Written feedback from teacher Written feedback from peer Written feedback from self Written feedback source ambiguous Grades, results, scores, outcomes, reports Ticks and crosses Smiley face, stickers, stamps, rewards, certificates
Content of FeedbackTask Feedback Describing or comparing performance
Suggestions for improvement, feed-forward Surface learning features (spelling, grammar, basic facts, recall) Presentation (neatness, layout, speed) Deep learning (understanding, explaining, extending, clarifying)
Self Feedback Praise and encouragement Effort and identifying improvement Behaviour
Emotional Impact
Positive Smiling student Smiling teacher Positive symbols
Negative Sad, angry, or upset student Sad, angry or upset teacher Negative symbols
Student Response to FeedbackAccepts Student accepts feedbackRejects Student rejects feedbackShares Student shares feedback results with peers
Student shares feedback results with parentsActs on Student action or intention to act on feedback from others
Student reflects, compares results, and/or proposes own action

17/03/2015
20
Drawing content analysis quality check
Agreement statisticCategory Consensus Pearson (r) Kappa (κ)Form of Feedback 97% 0.89 0.83Content of Feedback 94% 0.82 0.85Emotional Impact 96% 0.86 0.87Student Response to Feedback
96% 0.86 0.88
Table 1. Inter-rater Reliability Statistics for Classifying Drawings by Four Major Categories
Triangulating MethodsTable 11. Inter-Correlations of Drawing Traits to Feedback Practices and Conceptions Feedback Practicesa Conceptions of Feedbackb Drawing Categories
Negative Teacher Evaluation
Interpersonal Teacher Help
Comments for Improvement
Interpersonal
Teacher Feedback
-0.08 -0.15* -0.09 0.12 0.21** 0.04
Student-led Feedback
0.33** 0.23** -0.22** -0.46** -0.29** -0.19**
Spoken Feedback
0.14 0.19** -0.02 -0.24** -0.08 -0.02
Written Feedback
0.04 -0.07 -0.20** -0.13 -0.14 -0.10
Task Feedback 0.25** 0.06 -0.13 -0.07 -0.01 0.12 Self-Feedback -0.14 -0.18* -0.06 0.10 0.07 -0.09 Positive Affect -0.23** -0.19* -0.20** 0.12 0.01 -0.10 Shares Feedback
-0.09 -0.17* -0.17* 0.07 0.02 -0.02
Note. an=182, bn=192 *p<0.05, **p<0.01
Look how many correlations = zero; the methods don’t relate for lots of stuff.Red=inverse; bold=positive
Looking across helps interpret the drawings….what do you see?
17/03/2015
21
Concluding thoughts
method effects result from instrument design, participant responses, and analytical processes and can cause data to say different things.
Differences should be considered not so much as confirmatory or divergent, but rather as complementary
Analyse data separately using methods suitable to each
then compare results to see if any common messages resonate from both methods
To finish
“triangulation attempts to confirm inferences made from the findings of several research methods and approaches. However, triangulation is less a method than a troublesome metaphor”. (p. 465) Smith, M. L. (2006). Multiple methodology in education research.
In J. L. Green, G. Camilli, & P. B. Elmore (Eds.), Handbook of complementary methods in education research (pp. 457-475). Mahwah, NJ: LEA.
17/03/2015
22
References
Brannen, J. (Ed.). (1992). Mixing methods: Qualitative and quantitative research. Aldershot, UK: AveburyAshgate Publishing.
Ercikan, K., & Roth, W.-M. (2006). What good is polarizing research into qualitative and quantitative? Educational Researcher, 35(4), 14-23.
Johnson, R. B., & Onwuegbuzie, A. J. (2004). Mixed methods research: A research paradigm whose time has come. Educational Researcher, 33(7), 14-26.
Brewer, J., & Hunter, A. (1989). Multimethod Research: A Synthesis of Styles. Newbury Park, CA: SAGE.
Related Documents