EXECUTIVE SUMMARY Conspecific Attraction as a Management Tool for Endangered and At-risk Species on Military Lands ESTCP Project RC-201615 JULY 2019 Distribution Statement A This document has been cleared for public release

Welcome message from author
This document is posted to help you gain knowledge. Please leave a comment to let me know what you think about it! Share it to your friends and learn new things together.
Transcript
EXECUTIVE SUMMARY
Conspecific Attraction as a Management Tool for Endangered and At-risk Species on Military Lands
ESTCP Project RC-201615
JULY 2019
Distribution Statement A
This document has been cleared for public release

Page Intentionally Left Blank

This report was prepared under contract to the Department of Defense Environmental Security Technology Certification Program (ESTCP). The publication of this report does not indicate endorsement by the Department of Defense, nor should the contents be construed as reflecting the official policy or position of the Department of Defense. Reference herein to any specific commercial product, process, or service by trade name, trademark, manufacturer, or otherwise, does not necessarily constitute or imply its endorsement, recommendation, or favoring by the Department of Defense.

Page Intentionally Left Blank

i
EXECUTIVE SUMMARY Project: #RC-201615
TABLE OF CONTENTS
Page
1.0 INTRODUCTION ................................................................................................................. 1
2.0 OBJECTIVES ........................................................................................................................ 3
3.0 TECHNOLOGY DESCRIPTION ......................................................................................... 5
4.0 PERFORMANCE ASSESSMENT ....................................................................................... 7 4.1 CONSPECIFIC ATTRACTION OF BIRDS................................................................ 7 4.2 CONSPECIFIC ATTRACTION OF FROGS .............................................................. 9
5.0 COST ASSESSMENT ......................................................................................................... 13
6.0 IMPLEMENTATION ISSUES ........................................................................................... 15
ii
LIST OF FIGURES
Page
Figure 1. Call Box, Timer and Battery Used to Broadcast Calls for Conspecific Attraction. ..... 5 Figure 2. Grasshopper Sparrow (Ammodramus savannarum) Detections per Point Count in
Treatment (Playback) and Control (No Playback) Plots at Fort McCoy, WI. .............. 8 Figure 3. Proportion of Northern Bobwhite (Colinus virginianus) Counts in Control (No
Playback) and Treatment (with Playback) Plots from 2016–18. .................................. 8 Figure 4. Example Experimental Pond and Treatment/Control Pond Arrangement for Amphibian
Conspecific Attraction (Buxton et al. 2015). .............................................................. 10 Figure 5. Proportion of Treatment and Control Ponds Colonized by Eastern Grey Tree Frogs
(Hyla versicolor) at Fort McCoy, WI. ........................................................................ 10 Figure 6. Proportion of Treatment and Control Ponds Colonized by Wood Frogs (Lithobates
sylvaticus) at Fort McCoy, WI. ................................................................................... 11 Figure 7. Timeline of Conspecific Attraction Studies by Taxonomic Group from 1960-2017. 16 Figure 8. Percentage of Species Showing Attraction, Repulsion, or No Response (Neutral) to
Conspecific Cues Grouped by Taxa. .......................................................................... 16
1
1.0 INTRODUCTION
The movements of wildlife species and associated colonization of habitats is often unpredictable. In the case of federally listed or at-risk species on military installations, this unpredictability can lead to ineffective management and/or interference with military training. Habitat restoration for wildlife management on military lands is a common, yet expensive, response to federal conservation (e.g., Endangered Species Act) and mitigation (e.g., Clean Water Act Section 404) mandates, yet viable wildlife populations often fail to become established on restored habitat. As such, managers are tasked with encouraging animals to colonize restored habitats, and methods for achieving this goal range from no active management (e.g., build it and they will come) to translocation of adults or eggs/young (Scott et al. 2001). These methods are often ineffective and/or expensive. Conspecific attraction, using the tendency for individuals of the same species to settle near one another (Stamps 1988), provides an alternative tool that can be a cost-effective means of attracting animals to newly created or restored habitats.
For species that communicate via auditory signaling, conspecific attraction can be used as a management tool by attracting individuals to suitable yet unoccupied or underutilized habitat by broadcasting prerecorded conspecific vocalizations (Ward and Schlossberg 2004). Although most previous work on conspecific attraction has been done with birds (e.g., Ward and Schlossberg 2004, Ward et al. 2011, Hahn and Silverman 2006), a recent study has shown that broadcasting conspecific calls can also be used to attract pond breeding amphibians to newly created ponds (Buxton et al. 2015). This suggests that conspecific attraction is not only a viable option for managing and restoring bird populations, but also for restoring amphibian communities to wetlands, a previously difficult outcome to achieve.
Compared to currently available methods, conspecific attraction can be a very effective means of attracting focal species to restored habitats. With minimal financial and time investment, conspecific attraction can be used as a management tool to not only lure at-risk species to target habitats but to establish long-term viable populations. Because this is a passive means of moving animals, risks associated with more invasive methods (e.g. decreased survival associated with translocation) are minimized. Establishing viable populations in restored or mitigated habitats is often a requirement of federal mandates (e.g., Endangered Species Act, Clean Water Act) and the Department of Defense spends considerable funding and effort restoring habitats for species of conservation concern. Conspecific attraction could be used to attract species both within an installation to established conservation areas or to partner lands away from conflict with military training.

2
Page Intentionally Left Blank
3
2.0 OBJECTIVES
Our work had two primary objectives: 1) demonstrate the use of conspecific attraction as a cost-effective management tool for encouraging colonization of restored habitats by target at-risk bird and amphibian species; and 2) test the use of conspecific attraction to establish populations following cessation of the broadcast calls. Our demonstration sites of Fort McCoy, WI and Fort Polk, LA encompass a variety of species, habitats, and restoration strategies. At Fort McCoy, we targeted grassland and shrubland restoration sites and associated focal species likely to use such habitats, including grasshopper sparrow (Ammodramus savannarum), savannah sparrow (Passerculus sandwichensis), golden-winged warbler (Vermivora chrysoptera), upland sandpiper (Bartramia longicauda), and a suite of amphibian species including American toad (Anaxyrus americanus), eastern grey tree frog (Hyla versicolor), and wood frog (Lithobates sylvaticus). At Fort Polk, we targeted recently clear-cut lands that were a target for longleaf pine restoration. We focused on shrub associated species that were likely to use these habitats including prairie warbler (Setophaga discolor), eastern towhee (Pipilo erythrophthalmus), northern bobwhite (Colinus virginianus), blue grosbeak (Passerina caerulea), brown thrasher (Toxostoma rufum), painted bunting (Passerina ciris), Cope’s grey tree frog (Hyla chrysoscelis), and eastern narrow-mouthed toad (Gastrophryne carolinensis). Grassland and shrubland species have experienced precipitous declines across the continent (Brennan and Kuvlesky 2005) and use of novel management tools such as conspecific attraction could provide effective strategies for military land managers. Preference was given to species that were present on/near restoration sites and that presumably occur in low to moderate abundances.

4
Page Intentionally Left Blank
5
3.0 TECHNOLOGY DESCRIPTION
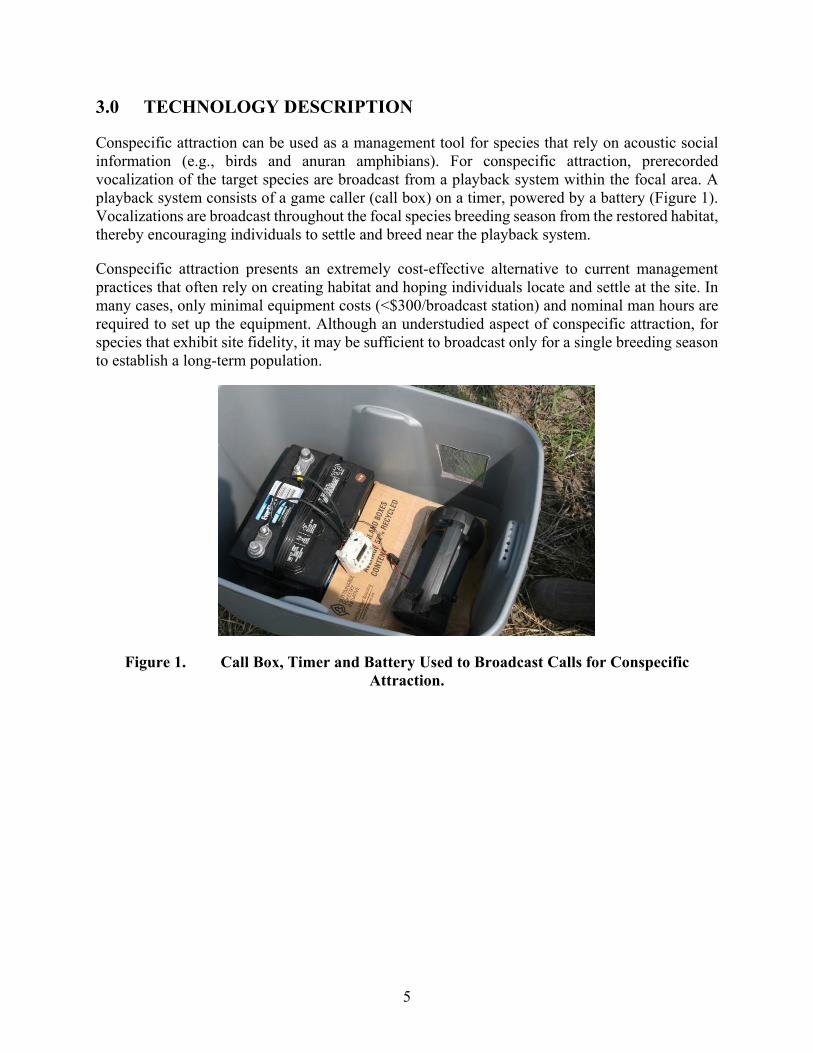
Conspecific attraction can be used as a management tool for species that rely on acoustic social information (e.g., birds and anuran amphibians). For conspecific attraction, prerecorded vocalization of the target species are broadcast from a playback system within the focal area. A playback system consists of a game caller (call box) on a timer, powered by a battery (Figure 1). Vocalizations are broadcast throughout the focal species breeding season from the restored habitat, thereby encouraging individuals to settle and breed near the playback system.
Conspecific attraction presents an extremely cost-effective alternative to current management practices that often rely on creating habitat and hoping individuals locate and settle at the site. In many cases, only minimal equipment costs (<$300/broadcast station) and nominal man hours are required to set up the equipment. Although an understudied aspect of conspecific attraction, for species that exhibit site fidelity, it may be sufficient to broadcast only for a single breeding season to establish a long-term population.
Figure 1. Call Box, Timer and Battery Used to Broadcast Calls for Conspecific Attraction.

6
Page Intentionally Left Blank
7
4.0 PERFORMANCE ASSESSMENT
4.1 CONSPECIFIC ATTRACTION OF BIRDS
For avian species, we established a minimum of 12 demonstration plots per installation. Half of the plots were randomly assigned to a treatment group where conspecific calls were broadcast and half were silent controls. Vocalizations were broadcast in year 2 at all treatment plots (birds) and ponds (amphibians). In year 3, we switched treatment and control plots for the species that demonstrated a response to playback in year 2 (northern bobwhites and grasshopper sparrows). Plot size was based on the territory sizes of the focal species and the extent of appropriate habitat. For most bird species, the plots included areas large enough to accommodate 3 to 8 breeding pairs and range from 3 to 10 hectares (ha). Plots were placed a minimum of 500 meters (m) apart to avoid overlapping of territories and noise contamination. For birds, our playback methods mimicked those successfully used in Ward and Schlossberg (2004) and Hahn and Silverman (2006). Vocalizations were broadcast from an hour before sunrise until 1030 am at volumes reflecting natural levels (80–90 decibels [db], as measured with a sound level meter). Songs were broadcast daily from the early settlement period through the breeding season (March–August). Broadcast tracks included ~70 minutes of bird songs (rotating through focal species) followed by 10 minutes of silence. Because each focal species had unique call types and combinations (e.g., golden-winged warbler type 1 and 2 songs), broadcast calls included numerous song types from each species. Exemplars used were from at least 5 unique individuals. Calls used for treatment were recorded in year 1 using a parabolic microphone (Wildtronics, LLC) and recorder. Abundance was estimated using point count data and territory monitoring. To assure that habitat variables did not differ among treatment and control plots, we measured a variety of habitat features known to be important to avian breeding including canopy cover, shrub cover and ground cover. We did not find any differences between treatment and control plots for any of these variables (MANOVA Wilk’s Lambda, F = 0.78, P = 0.67). Avian abundance was compared among treatment and control plots, as well as year, if applicable, using generalized linear models in R 3.1.3 (R Core Team 2015). We monitored avian productivity by documenting the fates of nests (i.e., until eggs hatched or a nest failed due to predation, parental abandonment, or was destroyed by weather).
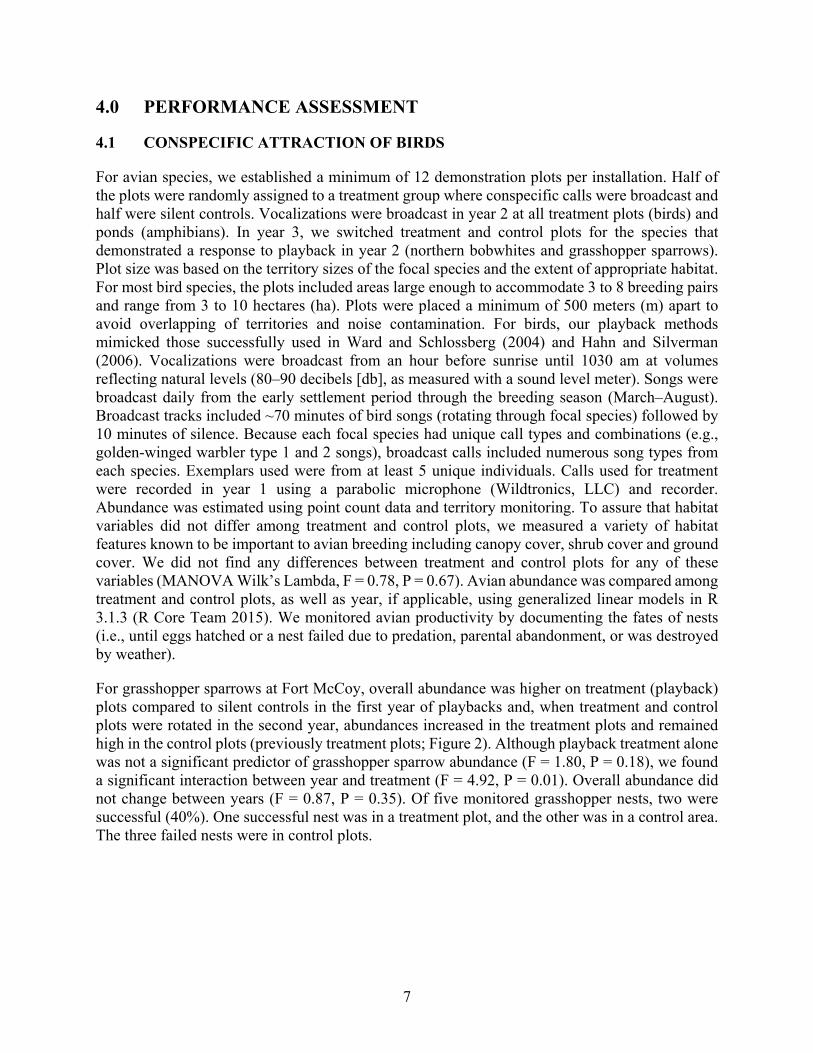
For grasshopper sparrows at Fort McCoy, overall abundance was higher on treatment (playback) plots compared to silent controls in the first year of playbacks and, when treatment and control plots were rotated in the second year, abundances increased in the treatment plots and remained high in the control plots (previously treatment plots; Figure 2). Although playback treatment alone was not a significant predictor of grasshopper sparrow abundance (F = 1.80, P = 0.18), we found a significant interaction between year and treatment (F = 4.92, P = 0.01). Overall abundance did not change between years (F = 0.87, P = 0.35). Of five monitored grasshopper nests, two were successful (40%). One successful nest was in a treatment plot, and the other was in a control area. The three failed nests were in control plots.
8
Figure 2. Grasshopper Sparrow (Ammodramus savannarum) Detections per Point Count in Treatment (Playback) and Control (No Playback) Plots at Fort McCoy, WI.
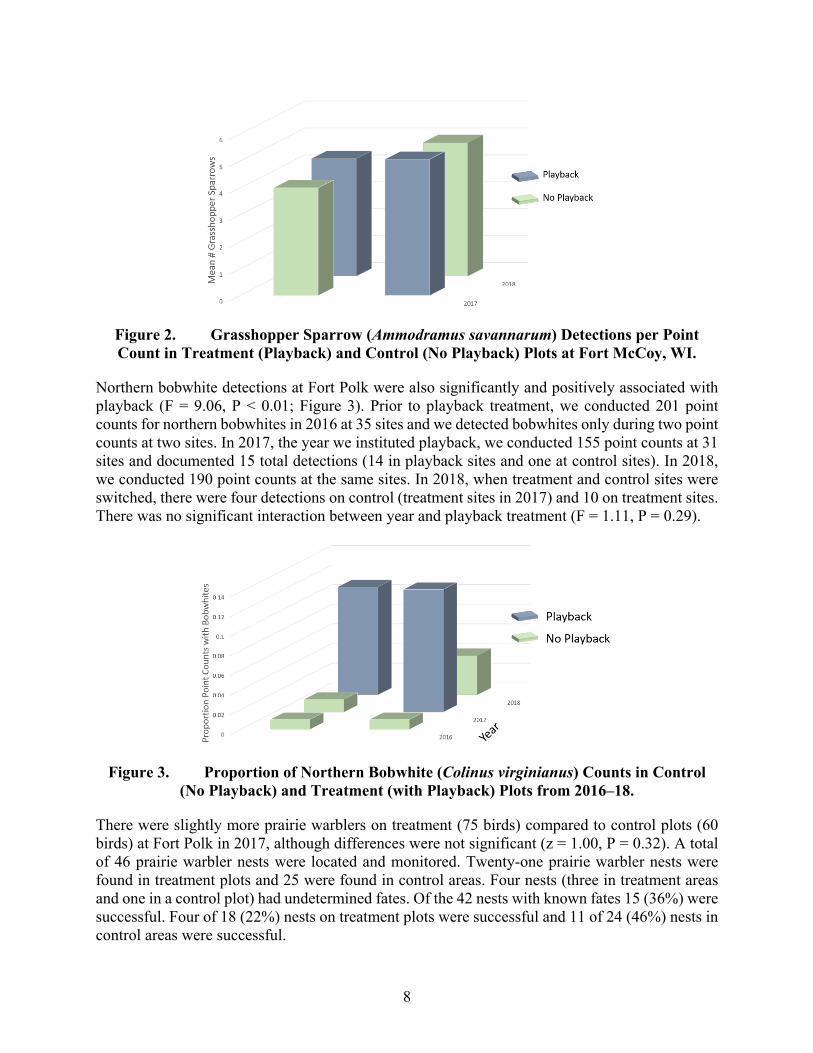
Northern bobwhite detections at Fort Polk were also significantly and positively associated with playback (F = 9.06, P < 0.01; Figure 3). Prior to playback treatment, we conducted 201 point counts for northern bobwhites in 2016 at 35 sites and we detected bobwhites only during two point counts at two sites. In 2017, the year we instituted playback, we conducted 155 point counts at 31 sites and documented 15 total detections (14 in playback sites and one at control sites). In 2018, we conducted 190 point counts at the same sites. In 2018, when treatment and control sites were switched, there were four detections on control (treatment sites in 2017) and 10 on treatment sites. There was no significant interaction between year and playback treatment (F = 1.11, P = 0.29).
Figure 3. Proportion of Northern Bobwhite (Colinus virginianus) Counts in Control (No Playback) and Treatment (with Playback) Plots from 2016–18.
There were slightly more prairie warblers on treatment (75 birds) compared to control plots (60 birds) at Fort Polk in 2017, although differences were not significant (z = 1.00, P = 0.32). A total of 46 prairie warbler nests were located and monitored. Twenty-one prairie warbler nests were found in treatment plots and 25 were found in control areas. Four nests (three in treatment areas and one in a control plot) had undetermined fates. Of the 42 nests with known fates 15 (36%) were successful. Four of 18 (22%) nests on treatment plots were successful and 11 of 24 (46%) nests in control areas were successful.
9
We did not document a response to playback for any of the other bird species we tested. Abundances of golden-winged warblers, upland sandpipers, blue grosbeaks, and brown thrashers all were unaffected by playback treatment (all P > 0.37). Although eastern towhees were detected in lower abundances on control compared to treatment plots (47 towhee detections in control plots and 31 detections in treatment plots; z = -2.08, P = 0.04), there was no change in the number of birds on either the treatment or control plots when comparing before and during treatments (all P > 0.90), indicating that there was not an effect of treatment but, rather, higher number of birds on the control plots initially. No painted buntings were detected in any of the study plots (control or treatment). We did not find enough nests of any of these species to evaluate productivity.
4.2 CONSPECIFIC ATTRACTION OF FROGS
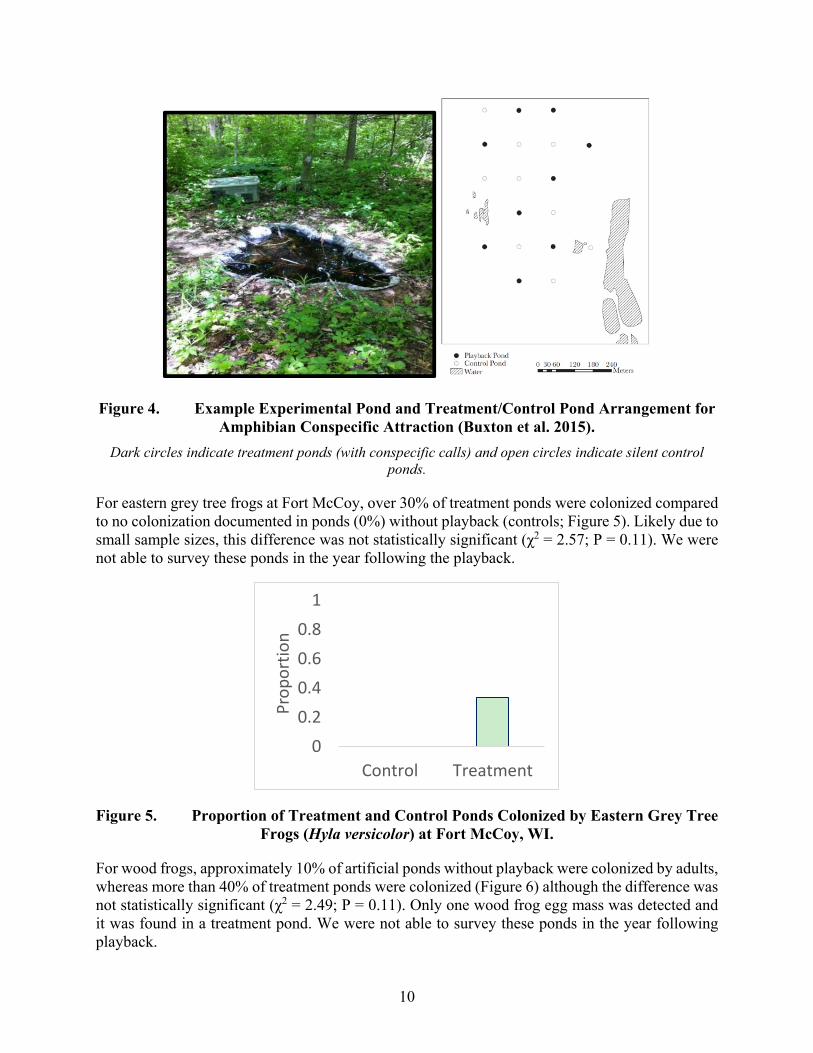
For amphibian species, we installed a minimum of 18 small artificial garden ponds (approximately 1.7 m x 1.2 m, 91-gallon capacity) in a grid throughout the demonstration area on each installation (Figure 4). The demonstration area was positioned near (< 500 m) already occurring water bodies. Ponds were dug into the ground so that the lip of the pond was flush with the ground surface. Ponds were placed a minimum of 150 meters apart to avoid overlapping of territories and noise contamination. Ponds were filled with water from nearby water bodies and leaf litter and branches were placed in the ponds to provide structural support for egg masses and to facilitate growth of algae as a food source for tadpoles. Many of the existing small ephemeral pools which our experimental ponds simulate have a similar substrate of leaf litter with little to no emergent vegetation. We measured canopy cover over the ponds, as an index of habitat structure, and we found no differences between treatment and control ponds (t = -0.07; P = 0.95). Although future application of this technology would likely be in association with natural or created ponds or wetlands, the limited availability of newly created or uncolonized ponds would make a robust demonstration infeasible. However, we felt a demonstration of the technology using artificial ponds allowed a controlled, replicated experiment and the results should be applicable to naturally occurring breeding ponds. All of our target amphibian species (or closely related species) have been documented breeding in shallow ephemeral pools, including artificial pools (Buxton et al. 2015), thus the size and characteristics of our artificial ponds is unlikely to deter oviposition.
For frogs, our playback methods mimicked those successfully used in Buxton et al. (2015). Vocalizations were broadcast daily from an hour before sunset until midnight at volumes reflecting natural levels (measured using a sound level meter), with 15 minutes of silence after 60 minutes of calling to prevent habituation to playbacks. Vocalization tracks consisted of 5 different exemplars obtained from recordings downloaded from the Macauley Library (www.macauleylibrary.org). Exemplars contained calls of individuals and calls of a chorus but did not contain heterospecific calls. Each exemplar was clipped to two minutes and repeated 6 times on a 60-minute track. Abundance for amphibian species was estimated based on categorical frog call surveys and number of egg masses present in ponds. The proportion of colonized treatment and control ponds was compared using Fisher’s exact tests. To evaluate productivity for frogs, we counted egg masses in ponds and compared the number of egg masses between treatment and control ponds using t-tests. In 2017, we broadcast playback for Cope’s grey tree frogs at Fort Polk and American toads at Fort McCoy. Because we did not detect any toads in 2017, we switched species in 2018 (the final year of the demonstration) to broadcast playback for wood frogs and eastern grey tree frogs at Fort McCoy. Although we were able to compare treatment and control plots for these two species, we were not able to determine abundances in the year following treatment.
10
Figure 4. Example Experimental Pond and Treatment/Control Pond Arrangement for Amphibian Conspecific Attraction (Buxton et al. 2015).
Dark circles indicate treatment ponds (with conspecific calls) and open circles indicate silent control ponds.
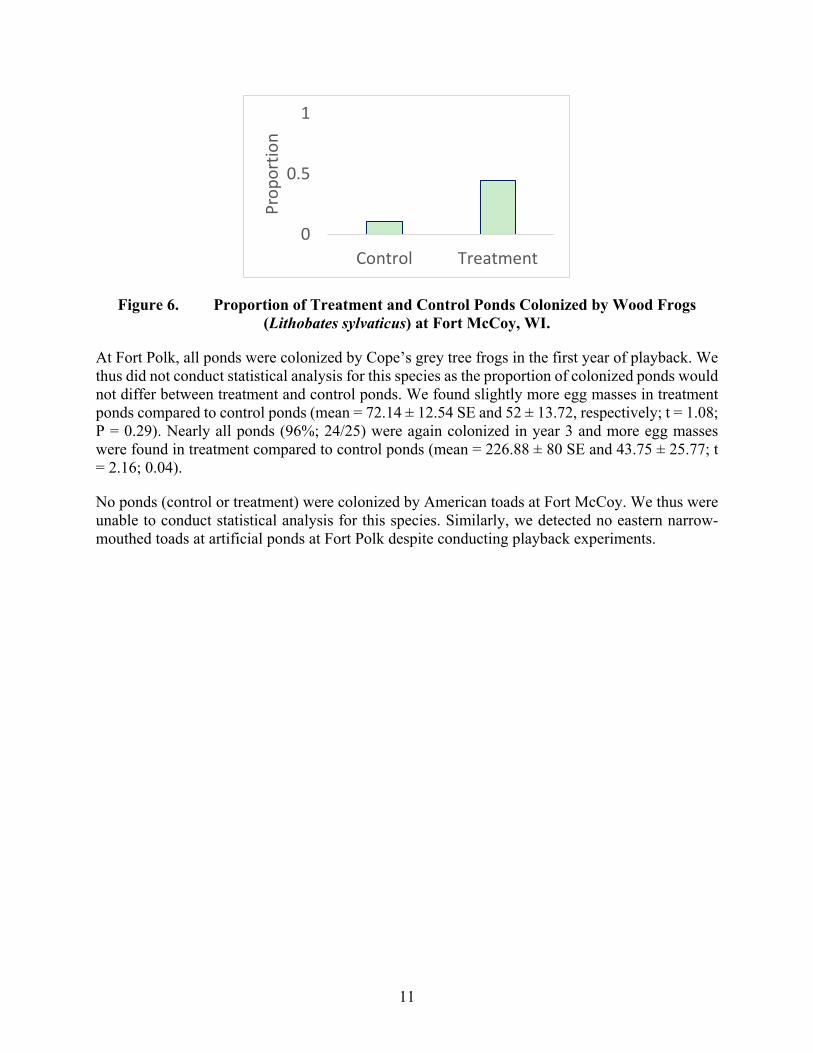
For eastern grey tree frogs at Fort McCoy, over 30% of treatment ponds were colonized compared to no colonization documented in ponds (0%) without playback (controls; Figure 5). Likely due to small sample sizes, this difference was not statistically significant (χ2 = 2.57; P = 0.11). We were not able to survey these ponds in the year following the playback.
Figure 5. Proportion of Treatment and Control Ponds Colonized by Eastern Grey Tree Frogs (Hyla versicolor) at Fort McCoy, WI.
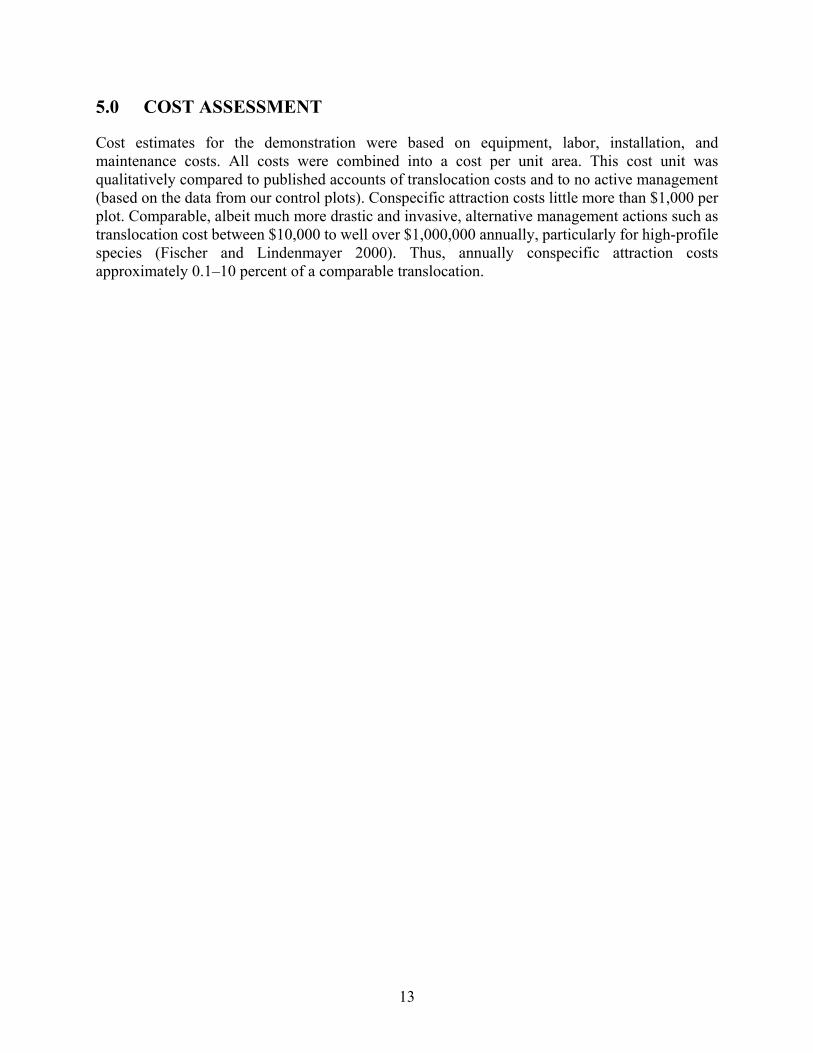
For wood frogs, approximately 10% of artificial ponds without playback were colonized by adults, whereas more than 40% of treatment ponds were colonized (Figure 6) although the difference was not statistically significant (χ2 = 2.49; P = 0.11). Only one wood frog egg mass was detected and it was found in a treatment pond. We were not able to survey these ponds in the year following playback.
00.20.40.60.8
1
Control Treatment
Prop
ortio
n
11
Figure 6. Proportion of Treatment and Control Ponds Colonized by Wood Frogs (Lithobates sylvaticus) at Fort McCoy, WI.
At Fort Polk, all ponds were colonized by Cope’s grey tree frogs in the first year of playback. We thus did not conduct statistical analysis for this species as the proportion of colonized ponds would not differ between treatment and control ponds. We found slightly more egg masses in treatment ponds compared to control ponds (mean = 72.14 ± 12.54 SE and 52 ± 13.72, respectively; t = 1.08; P = 0.29). Nearly all ponds (96%; 24/25) were again colonized in year 3 and more egg masses were found in treatment compared to control ponds (mean = 226.88 ± 80 SE and 43.75 ± 25.77; t = 2.16; 0.04).
No ponds (control or treatment) were colonized by American toads at Fort McCoy. We thus were unable to conduct statistical analysis for this species. Similarly, we detected no eastern narrow-mouthed toads at artificial ponds at Fort Polk despite conducting playback experiments.
0
0.5
1
Control TreatmentPr
opor
tion

12
Page Intentionally Left Blank
13
5.0 COST ASSESSMENT
Cost estimates for the demonstration were based on equipment, labor, installation, and maintenance costs. All costs were combined into a cost per unit area. This cost unit was qualitatively compared to published accounts of translocation costs and to no active management (based on the data from our control plots). Conspecific attraction costs little more than $1,000 per plot. Comparable, albeit much more drastic and invasive, alternative management actions such as translocation cost between $10,000 to well over $1,000,000 annually, particularly for high-profile species (Fischer and Lindenmayer 2000). Thus, annually conspecific attraction costs approximately 0.1–10 percent of a comparable translocation.

14
Page Intentionally Left Blank
15
6.0 IMPLEMENTATION ISSUES
Conspecific attraction, as a wildlife management tool, was relatively straight-forward to employ. The equipment is all commercially available and the calls can either be recorded on site or acquired through publically available sources (e.g., Macaulay library). Required maintenance was minimal and was limited primarily to battery replacement (every 3 weeks). Total costs were little more than $1,000 per demonstration plot, far below costs associated with alternative management techniques such as translocation (Fischer and Lindenmayer 2000).
The primary implementation issue encountered was the variation in effectiveness across the numerous species tested. We demonstrated clear success in attracting some bird and frog species into our target areas. In particular, northern bobwhite detections increased dramatically on our treatment plots and remained relatively high following cessation of calls. Similarly, the number of ponds colonized by wood frogs was much higher for ponds with calls (40% of ponds) compared to silent controls (10% of ponds). We also found trends of higher use of treatment plots for grasshopper sparrows and eastern grey tree frogs. Species that are at low or moderate abundances appear to be more likely to respond to playback.
However, other species did not show responses to playback, particularly those that were very rare near our sites. Painted buntings and eastern narrowmouth toads were in the general area but did not colonize either treatment or control plots during our demonstration. In contrast, Cope’s grey tree frogs were very abundant at Fort Polk and colonized all available ponds, regardless if playback was conducted. American toads, although present near our sites, may have shown no response because they generally rely on permanent water bodies for breeding and thus may have limited behavioral plasticity for selecting alternate breeding sites (Buxton et al. 2015). Species-specific life history and abundances should be considered when evaluating this technique.
We did not find enough nests to conduct a robust analyses of productivity but we found that overall nest survival estimates were similar to previously published accounts. We found that prairie warbler nest survival was lower on treatment plots but, given that we did not see a response to playback, it is unlikely that reproductive success was linked to treatments. More work is needed to evaluate any possible effects of playback on productivity.
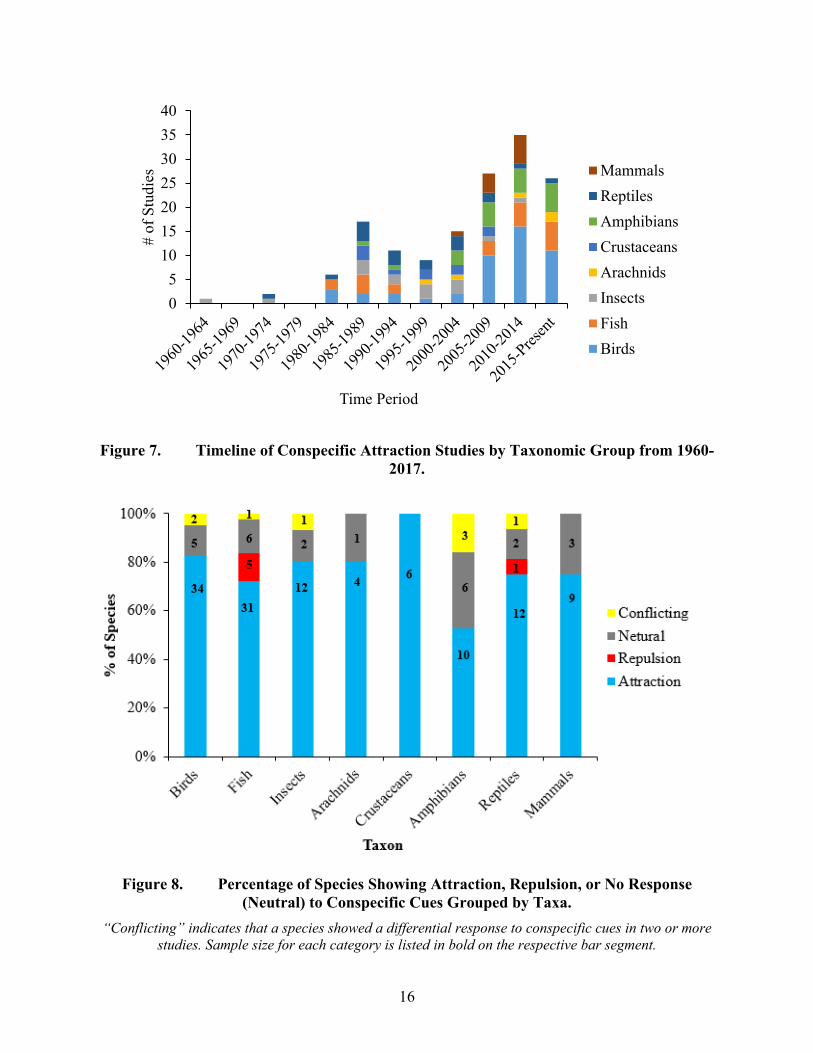
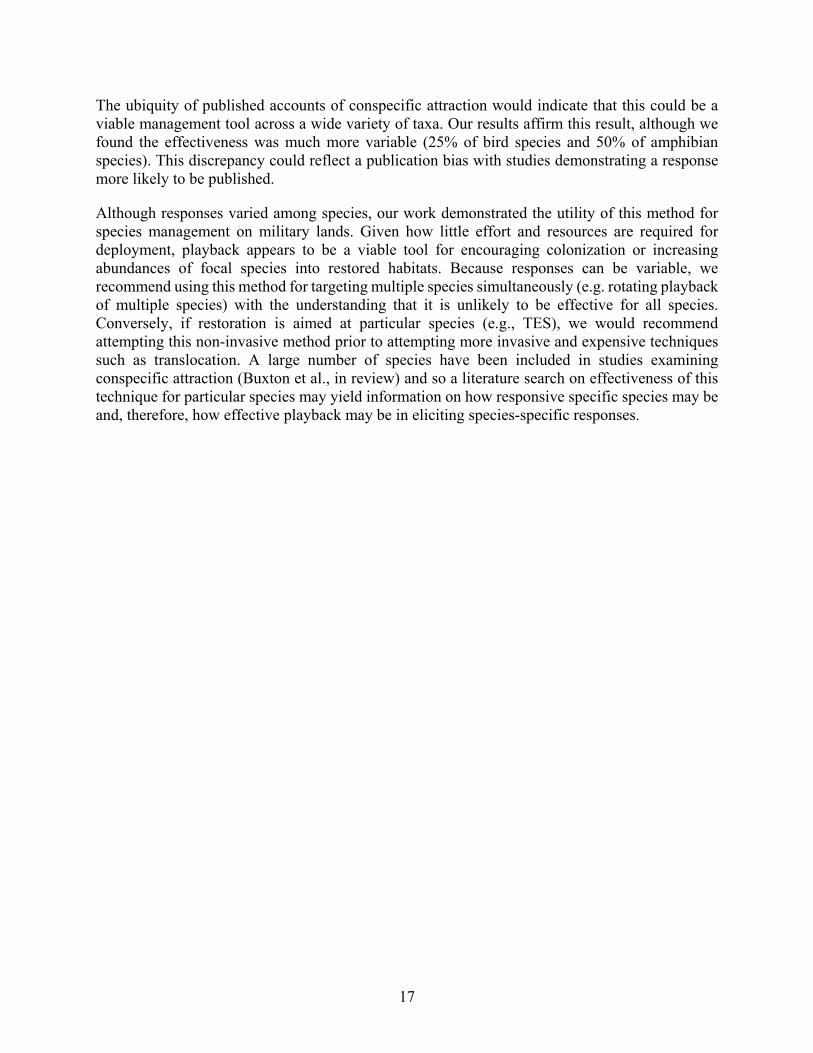
In an attempt to understand the disparity in responses, we complied results from all published work examining conspecific attraction for habitat selection (Buxton et al. In Review). We conducted a review of the literature and found 149 studies investigating conspecific attraction across eight taxa (Figure 7). We found that conspecific attraction is widespread, with between 50 – 80% of studies documenting positive associations, depending on taxa (Figure 8). This included studies that used a wide range of cue types including acoustic cues (similar to our demonstration here) and chemical cues.
16
Figure 7. Timeline of Conspecific Attraction Studies by Taxonomic Group from 1960-2017.
Figure 8. Percentage of Species Showing Attraction, Repulsion, or No Response (Neutral) to Conspecific Cues Grouped by Taxa.
“Conflicting” indicates that a species showed a differential response to conspecific cues in two or more studies. Sample size for each category is listed in bold on the respective bar segment.
05
10152025303540
# of
Stu
dies
Time Period
MammalsReptilesAmphibiansCrustaceansArachnidsInsectsFishBirds
17
The ubiquity of published accounts of conspecific attraction would indicate that this could be a viable management tool across a wide variety of taxa. Our results affirm this result, although we found the effectiveness was much more variable (25% of bird species and 50% of amphibian species). This discrepancy could reflect a publication bias with studies demonstrating a response more likely to be published.
Although responses varied among species, our work demonstrated the utility of this method for species management on military lands. Given how little effort and resources are required for deployment, playback appears to be a viable tool for encouraging colonization or increasing abundances of focal species into restored habitats. Because responses can be variable, we recommend using this method for targeting multiple species simultaneously (e.g. rotating playback of multiple species) with the understanding that it is unlikely to be effective for all species. Conversely, if restoration is aimed at particular species (e.g., TES), we would recommend attempting this non-invasive method prior to attempting more invasive and expensive techniques such as translocation. A large number of species have been included in studies examining conspecific attraction (Buxton et al., in review) and so a literature search on effectiveness of this technique for particular species may yield information on how responsive specific species may be and, therefore, how effective playback may be in eliciting species-specific responses.
Related Documents