Executive Summary Report GIS Maintenance and Resource Allocation Visualization For the Alabama Department of Transportation By David P. Hale, Ph.D. Joanne E. Hale, Ph.D. Area of MIS Enterprise Integration Lab The University of Alabama Tuscaloosa, Alabama Published by UTCA University Transportation Center for Alabama The University of Alabama, The University of Alabama in Birmingham, and The University of Alabama at Huntsville UTCA Report 02114 May 2003

Welcome message from author
This document is posted to help you gain knowledge. Please leave a comment to let me know what you think about it! Share it to your friends and learn new things together.
Transcript

Executive Summary Report GIS Maintenance and Resource Allocation Visualization
For the Alabama Department of Transportation
By
David P. Hale, Ph.D. Joanne E. Hale, Ph.D.
Area of MIS Enterprise Integration Lab The University of Alabama
Tuscaloosa, Alabama
Published by
UTCA University Transportation Center for Alabama
The University of Alabama, The University of Alabama in Birmingham, and The University of Alabama at Huntsville
UTCA Report 02114
May 2003

Technical Report Documentation Page
1. Report No
2. Government Accession No. 3. Recipient Catalog No.
5. Report Date May 2003
4. Title and Subtitle Executive Summary Report: GIS Maintenance and Resource Allocation Visualization
6. Performing Organization Code
7. Authors Drs. David Hale and Joanne Hale
8. Performing Organization Report No. UTCA Report 02114 10. Work Unit No.
9. Performing Organization Name and Address Enterprise Integration Lab Area of MIS The University of Alabama Box 870226 Tuscaloosa, Alabama 35487-0226
11. Contract or Grant No. DTSR0023424 13. Type of Report and Period Covered Final Report: January 2, 2002 – December 31, 2002.
12. Sponsoring Agency Name and Address University Transportation Center for Alabama Box 870205, 271 H M Comer Mineral Industries Building Tuscaloosa, Alabama 35487-0205 14. Sponsoring Agency Code 15. Supplementary Notes 16. Abstract Highway systems throughout the United States are showing their age. Consequently, transportation agencies across the country are increasingly faced with the dilemma of allocating resources to new construction to increase capacity or allocating resources to maintain existing roadways. The allocation process includes economic, safety, engineering and political concerns. Therefore, it is vital for planners and policymakers to view and understand multi-criteria decision models. Moreover, they must be able to effectively depict their decisions to stakeholders and constituents. This research project prototyped multi-criteria decision models, using geographic information systems (GIS) based on statistical analysis and data mining techniques. Although these techniques are effectively used in the private sector, their use is rare by transportation agencies to allocate resources. The project combined work by Alabama Department of Transportation staff and University of Alabama researchers to specify, design, build, test, and evaluate a multi-criteria GIS visualization resource allocation support prototype system. 17. Key Words Asset Management, Management Information Systems, Cost Effectiveness, Geographic Information Systems, Information Resource System, Resource Allocation
18. Distribution Statement
19. Security Class (of report) Unclassified
20. Security Class. (Of page) 21. No of Pages
22. Price
ii

Contents Contents …………………………………………………………………………………… iii List of Tables ……………………………………………………………………………… List of Figures ……………………………………………………………………………..
iv iv
Executive Summary ………………………………………………………………………. vi 1.0 Introduction ………………………………………………………………………….. 1 2.0 Methodology………………………………. ………………………………………….. 2 3.0 Results…………………………………………………...…………………………….. 3 3.1 Prioritized Requirements…………………………………………………………... 4 3.2 Proofs of Concept / Discovery Prototyping with MapPoint……………………….. 7 3.3 GIS Tool Evaluation ………………….…………………………………………… 13 3.4 Discovery Prototyping with GeoMedia …………………………………………… 14 4.0 Next Steps …….……………………………………………………………………….. 24 5.0 Training Manual……………………………………………………………………………………… 25 6.0 Conclusion………………………………………………………………………. …… 26 7.0 Appendix …………………………………………………..………………………….. 27 Appendix A:Visualization Tool Cost Comparison Report…………………………….. 27 Appendix B:GeoMedia Active X Controls……………………………………………… 30 Appendix C:GeoMedia GIS Procedures Manual..…………………………………….… 32 Glossary 72
iii
List of Tables Number Page 1-1 Project work plan…………………………………………………………… 1 3-1 Prioritized requirements……………………………………………………… 6 3-2 Visualization tool comparison checklist……………………………………… 13 3-3 Software availability………………………………………………………….. 13 3-4 GeoMedia-MapPoint comparison……………………………………………. 14 A-1 Visualization tool cost and features summary……………………………….. 29
List of Figures Number Page 2-1 Methodology…………………………………………………………………………. 2 3-1 Territory analysis example…………………………………………………………… 7 3-2 Importing data………………………………………………………………………... 8 3-3 Type specification……………………………………………………………………. 8 3-4 Push pin example…………………………………………………………………….. 9 3-5 Push pin with underlying roads removed……………………………………………. 9 3-6 Data message box……………………………………………………………………. 10 3-7 AADT data example…………………………………………………………………. 10 3-8 Pavement condition rating county example………………………………………….. 11 3-9 Division template…………………………………………………………………….. 12 3-10 GeoMedia’s mapping of pavement condition rating…………………………………. 15 3-11 GeoMedia’s Active X controls……………………………………………………… 15 3-12 ALDOT Division map using GeoMedia…………………………………………….. 16 3-13 County thematic using GeoMedia…………………………………………………… 17 3-14 Roads by route type………………………………………………………………….. 19 3-15 Data plotted by Alabama County……………………………………………………. 20 3-16 Data plotted by ALDOT Division…………………………………………………… 20 3-17 Data plotted by political district……………………………………………………… 21 3-18 Data plotted by political district with statistics shown………………………………. 21 3-19 Senate District 10 with data extracted for a specific point…………………………... 22 3-20 Mapping roads and segments by political district……………………………………. 22 3-21 Comparison of multiple attributes……………………………………………………. 23 3-22 METDC 96 and Roadstatenetwork…………………………………………………... 23
iv

Executive Summary Highway systems throughout the United States are showing their age. Consequently, transportation agencies across the country are increasingly faced with the dilemma of allocating resources to new construction to increase capacity, or allocating resources to maintain existing roadways. The allocation process includes economic, safety, engineering and political concerns. Therefore, it is vital for planners and policymakers to view and understand multi-criteria decision models. Moreover, they must be able to effectively depict their decisions to stakeholders and constituents. This research project prototyped multi-criteria decision models, using geographic information systems (GIS) based on statistical analysis and data mining techniques. Although these techniques are effectively used in the private sector, their use is rare by transportation agencies to allocate resources. The project combined work by Alabama Department of Transportation staff and University of Alabama researchers to specify, design, build, test, and evaluate a multi-criteria GIS visualization resource allocation support prototype system. Based on the results of this project, the ALDOT Transportation Planning Bureau is pursuing a full study in the use of GIS to aid in “needs analysis,” and the ALDOT Bureau of Materials and Tests is working to produce statewide pavement condition maps.
v

1.0 Introduction
To effectively manage a state’s highway systems, planners must allocate resources to build new roadways and to maintain existing routes. The decisions about which segments to expand, which segments to recondition, and which to sustain require input from multiple sources and must comply with multiplr goals. Needs-based analysis often required that goals be derived from social, economic, environmental, safety, as well as, asset preservation criteria. Compounding the difficulty in performing needs-based analysis is the aging of the United States road system and governmental budget deficits at all levels. Consequently, transportation agencies across the country are increasingly faced with the dilemma of allocating resources to new construction to increase capacity, or allocating resources to maintain existing roadways. State highway agency planners and policymakers must utilize a form of multi-faceted decision making to depict these often complex and competing goals. In addition, they must also effectively convey intricate details without leaving gaps, bottlenecks, or dangerous conditions and provide the foundation for an effective allocation process that includes economic, safety, social, economic, engineering and political concerns. This research project prototyped multi-criteria decision models using geographic information systems (GIS) to integrate data from the Alabama Bridge Information Management System (ABIMS), ALBRIDGE, ALDOT’s Intergraph GIS, and the Pavement Management System (PMS). The project combined work by ALDOT staff and University of Alabama researchers to specify, design, build, test, and evaluate a multi-criteria GIS visualization resource allocation support prototype system. Table 1-1. Project Work Plan, details the steps in the research initiative.
Table 1-1. Project Work Plan Task Activities Milestone Start Analyze Existing Materials
Examined existing ADLOT GISs; met and interviewed ALDOT staff regarding existing materials, and needs
A comprehensive visualization tool checklist
1/7/02
Benchmarking Studied and analyzed similar visualization and planning systems currently being employed by other state transportation agencies or relevant industries
Comparative Analysis of available visualization and GIS application tools
2/22/02
Proof of Concept using MapPoint
Developed requirement prototypes to show case concepts & potential features; developed prioritized list of system requirements for the visualization system; met with ALDOT personnel to validate prototype and requirements
Distress rating prototypes and System Requirements
4/1/02
Determine Appropriate GIS Tool
Determined system integration for existing requirements in terms of processes, data, and timing interchange; Met with ALDOT personnel to validate integration requirements
Integration requirements 6/3/02
Proof of Concept using GeoMedia
Developed and tested prototypes Construct and test prototype 7/1/02
Next Steps Working with ALDOT staff to determine extensions and potential overlays of additional data; and expanding time coverage of data
Test the sensitivity of the optimization program to changes in various input variables
9/9/02
Training Material
Worked with ALDOT staff to load associated Pavement Condition Management System databases
Develop Training material and conduct initial training seminars for ALDOT staff
10/1/02
Prepare Reports
Summaries of presentations and internal project reports have been organized into a working repository.
Prepare Final report 11/9/02
1

2.0 Methodology Along with interviews of ALDOT personnel and evaluation of existing visualization and GIS materials internal to ALDOT, the project team conducted a benchmarking process with other state departments of transportation. The team became familiar with ALDOT needs, business requirements, and the general scope of the project. The benchmarking aided in establishing project direction and identifying topics that would potentially benefit from data visualization. It also helped in identifying leading tools, techniques and methodologies used for implementing and maintaining GIS. Using the results from benchmarking and a previous UA evaluation of the current system, the project team formulated initial business requirements. These requirements served as a framework for the GIS visualization tool evaluation and prototype development. Over the initial four months, the visualization team was able to document the mapping capabilities of data and to address the process for breaking out ALDOT data into useful datasets necessary to continue the process of visualizing data to ALDOT constituents. Thus, this phase of the project laid the foundation for achieving the long-term goals of visualizing information. During the spring of 2002, the project team conducted the first of several iterations needed to complete the project. In this iteration, the team developed several Proofs-of-Concept that demonstrated many capabilities of Intergraph’s GeoMedia suite of products and compared these results with Microsoft’s Mappoint application software. The creation of the Visualization Component involved the use of an iterative approach to development during the final phases of the project. Figure 2-1 summaries the approach the team used.
• Acceptance Testing • Match System Features
with Requirements • Develop Additional Requirements
• Design Proof of Concepts
• Construct and Test
Figure 2-1. Methodology
2

This iterative approach was used to identify requirements, develop hypotheses utilized in developing proofs-of-concept, code, and evaluate the prototypes against the requirements for the iteration. In the early stages of the project, acceptance testing was used to generate requirements for the next iteration. Several iterations were necessary to capture and develop the desired look-and-feel and identified necessary visualization functionality. Likewise, the Construction and Delivery phases become iterative as it was learned that the most practical way to create the Visualization Component was to create smaller pieces of functionality and add them to the project as they become available. This process resulted in several versions of the component being released as new pieces of the program were added and existing ones were refined. Through use of the iterative approach, the team migrated from the initial proof of concept tool, MapPoint, to the project development tool GeoMedia, a prevalent mapping tool currently being utilized in other GIS projects within ALDOT. Moving to GeoMedia allowed increased mapping functionality and, in particular, gave the team a tool with which to address one critical business requirement: the mapping of data by political district.
3

3.0 Results 3.1 Prioritized Requirements The primary stakeholders for the visualization component of the ALDOT team were initially identified as:
1. Materials and Tests Bureau 2. Finance Department 3. Transportation Planning Bureau
The Preliminary Business Requirements were identified as the following:
1. Provide information related to pavement deficiency/condition across the state a. Based on deficiency/condition rating b. Color coded
i. Green – good ii. Blue – satisfactory (minor maintenance needed)
iii. Red – needs maintenance/major rework c. Be able to specify filtering criteria
i. Example: all roads with a condition rating below 90 d. Provide historical information
2. Provide information related to pavement friction data across the state. 3. Provide traffic flow information
a. Annual average daily traffic (AADT) information b. Color coded
4. Financial/Planning information a. What will happen to roads/system if nothing is done to it? b. If $x.xx is spent (overall), how will the system look?
i. Based on some criteria ii. Would it be more beneficial to allocated funds to a road needing more
repair while letting another road go another year or so? iii. Spend $x here, $y there, how will system look?
c. What will the transportation system look like (based on 3-year plan) in: i. 1 year?
ii. 2 years? iii. 3 years?
d. Based on optimal resource allocation for pavement maintenance, what will the system look like?
5. Provide population information across the state 6. Provide a map detailing Governmental Accounting Standards Board policy 34 (GASBY
34) condition ratings across the state a. Broken down by:
i. Interstate ii. National Highway System
iii. Non-national highway system
4

b. Be able to specify filtering criteria i. Example: all roads with a condition rating below 90
7. Provide information based on political boundaries a. What type of information?
8. Provide information on current and future resurfacing projects 9. Provide a visual companion to the Preliminary Prioritization Report 10. Provide information on the correlation between asphalt mix types and resurfacing
frequency 11. Display the projected condition, traffic, and friction numbers for any given road segment
a. Based on GPS data 12. Provide information related to pavement and the construction company that
constructed/resurfaced it 13. Historical comparison (aging of maps)
Proofs-of-concept were constructed using Microsoft MapPoint and Visual Basic. The purpose of these prototypes was to validate the feasibility of the requirements defined in the Study Phase. Attempts were made using MapPoint to do preliminary mapping of latitude/longitude coordinates as well as define some "territories" in which to map various sets data points derived from ALDOT data. Examples of these proofs of concept follow at the end of this section. Next, the proofs-of-concept and Preliminary Business Requirements generated in the Study Phase were presented to the primary stakeholders of the system. The stakeholders reviewed the preliminary requirements and provided feedback in terms of relevance and errors and omissions. After the meeting, the Visualization team met to draft the final version of the prioritized requirements based on the interview results. The team then revised any steps in the project that were affected by the prioritized requirements. The Project Plan was then updated to reflect these changes. Table 3-1details the priorities of the stakeholders.
5

Table 3-1 Prioritized requirements
Report Topic
Div
isio
n
Cou
nty/
Dis
trict
Polit
ical
Dis
trict
Rou
te T
ype
Rou
te
Segm
ent
Rou
te T
ype
One
Dire
ctio
n
Rou
te O
ne D
irect
ion
Segm
ent O
ne D
irect
ion
Deficiency Rating X X x X X X X X X ADT X X x X X X X X X Friction (Internal Use Only) X X X X X X X X Projected Average Deficiency Rating X X x X X X X X X Average age of Route segments X X x X X X X Total Distance (lane miles and by center lane miles) X X x X X X X Vehicle Mile traveled X X x X X X X X Cost per vehicle mile X X x X X X X X Total number of Projects (number and location) X X x X X Most Frequently Used Mix Type (w/condition, age, truck traffic….) X X X X X X X X GASB Rating X X X X
Pavement budget allocated X X x X X X X X X Pavement budget spent X X x X X X X X X Yearly budget comparison X X x X X X X X X
On the horizontal axis are the various datasets available either from Pavement Management System or some other ALDOT source. On the vertical axis are the different categories to which the datasets can be mapped. The intersections marked by X’s are those “views” of the data that ALDOT would like to see in the Visualization Tool. In the table, priority is shown by italics “X’s (also shown in red color). During this portion of the project, ALDOT established its top priority as Political Districts, for budget allocated/spent and yearly budget comparison. Then the priority fell to District, Division, and, lastly, by route and segment. The UA research team identified several other topics to consider:
1. Financial “what if scenarios” from cost data 2. Information from Preliminary Prioritization report 3. Information broken down into route and segment info by one direction or lane mile 4. Information by District (dependant on identifying information broken into ALDOT
Districts) 5. Five-year plan, 20-year plan (including deficiency, projected average rating, and budget
numbers)
6

3.2 Proofs-of-Concept/Discovery Prototyping with MapPoint The following screenshots detail some proofs-of-concept that were prepared using Microsoft MapPoint and its associated ActiveX control in Visual Basic. In the first set, territories were defined based on Alabama counties, and a set of LAT/LONG coordinates was mapped (representing points on a road) and using MapPoint’s "Import Data" feature.
Figure 3-1. Territory analysis example
Figure 3-1 is the original county template (each county has been designated as its own territory within MapPoint) before any data has been imported.
7

Figure 3-2. Importing data This screen shown in Figure 3-2 appears when the Import Data command button is clicked. It allows you the user to choose a data file to be imported into the MapPoint Control.
Figure 3-3. Type specification
Figure 3-3 is a screen that allows users to confirm or specify the parameters for importing data.
8

Figure 3-4. Push pin example Figure 3-4 shows the data after import. Each record is represented as a pushpin, created using its lat/long coordinates (format DD:MM:SS).
Figure 3-5. Push pin with underlying roads removed Figure 3-5 is the same map as shown in Figure 3-4 with one difference, the roads have been removed leaving only the Pushpins. The idea here is to show that MapPoint should have the functionality to draw roads using the data (and hence not relying on MapPoint's built-in road data). This provides greater freedom because, if this feature were not available, the user would be limited to the level of correctness provided in the MapPoint Map(s).
9
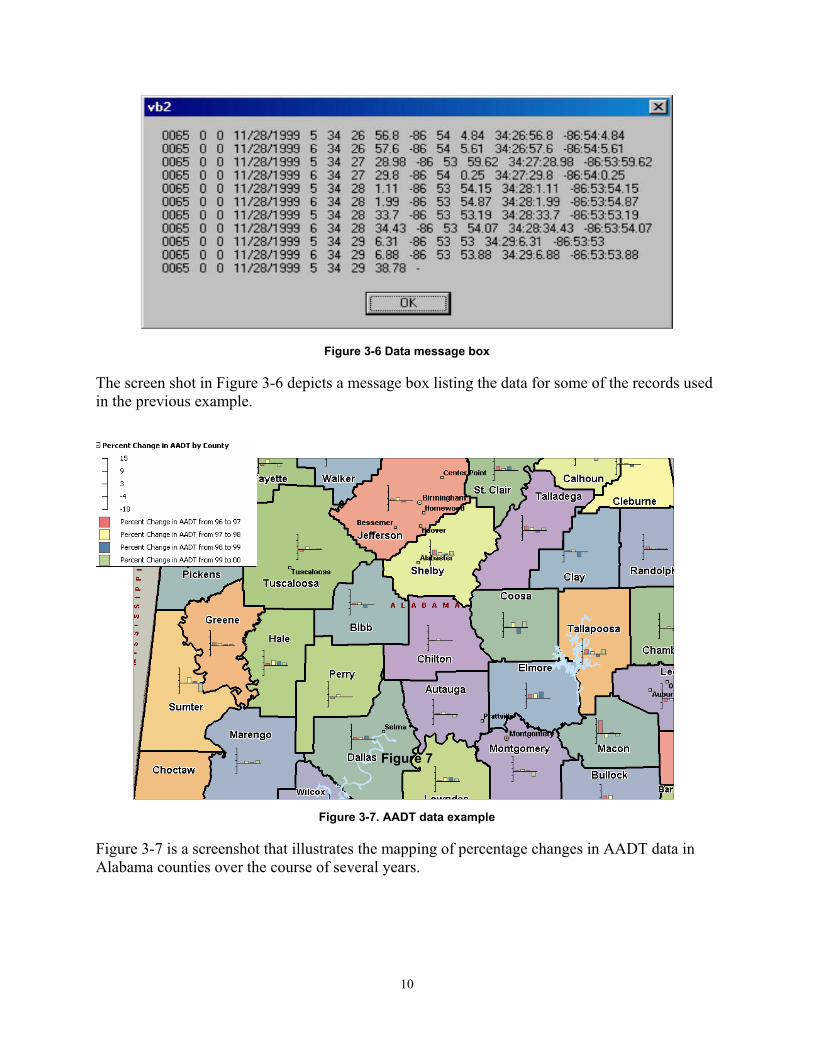
Figure 3-6 Data message box
The screen shot in Figure 3-6 depicts a message box listing the data for some of the records used in the previous example.
Figure 7
Figure 3-7. AADT data example
Figure 3-7 is a screenshot that illustrates the mapping of percentage changes in AADT data in Alabama counties over the course of several years.
10

Figure 3-8. Pavement condition rating by county example
Figure 3-8 breaks down average pavement deficiency rating by county. Range of rating is color coded from blue to red, with those counties having acceptable ratings being dark blue and those having marginal ratings coded as dark red. Fair ratings fell in between and are coded as white.
11
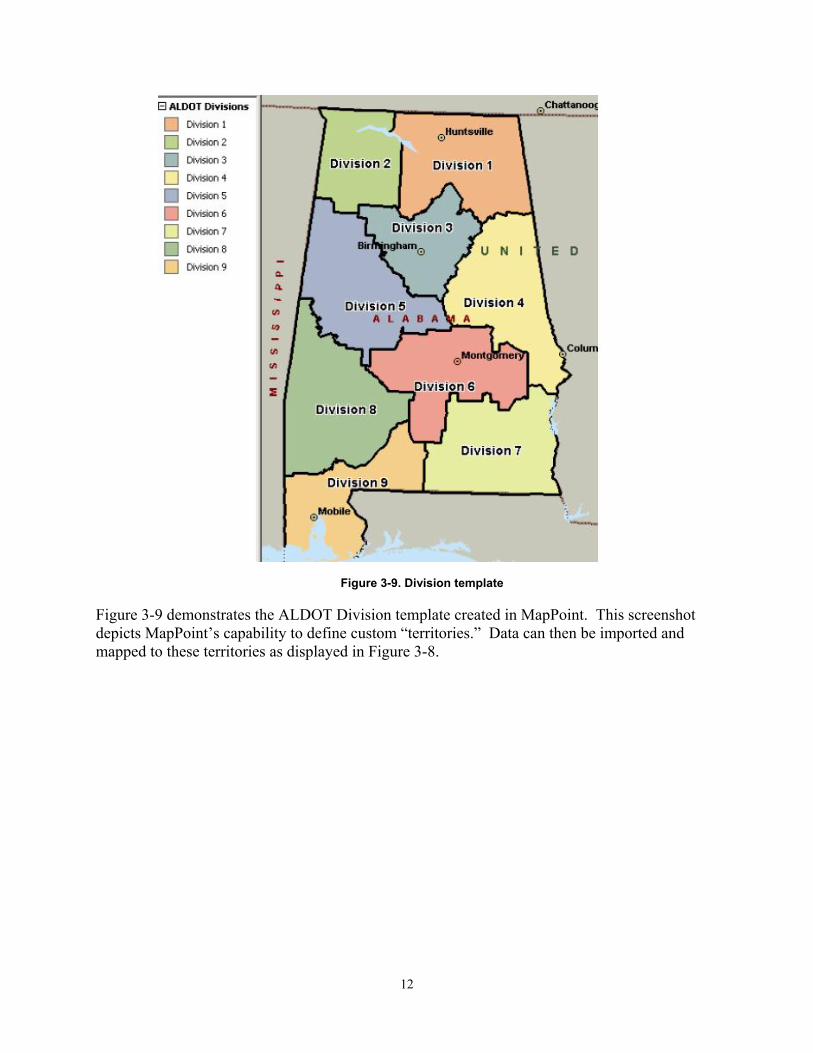
Figure 3-9. Division template Figure 3-9 demonstrates the ALDOT Division template created in MapPoint. This screenshot depicts MapPoint’s capability to define custom “territories.” Data can then be imported and mapped to these territories as displayed in Figure 3-8.
12
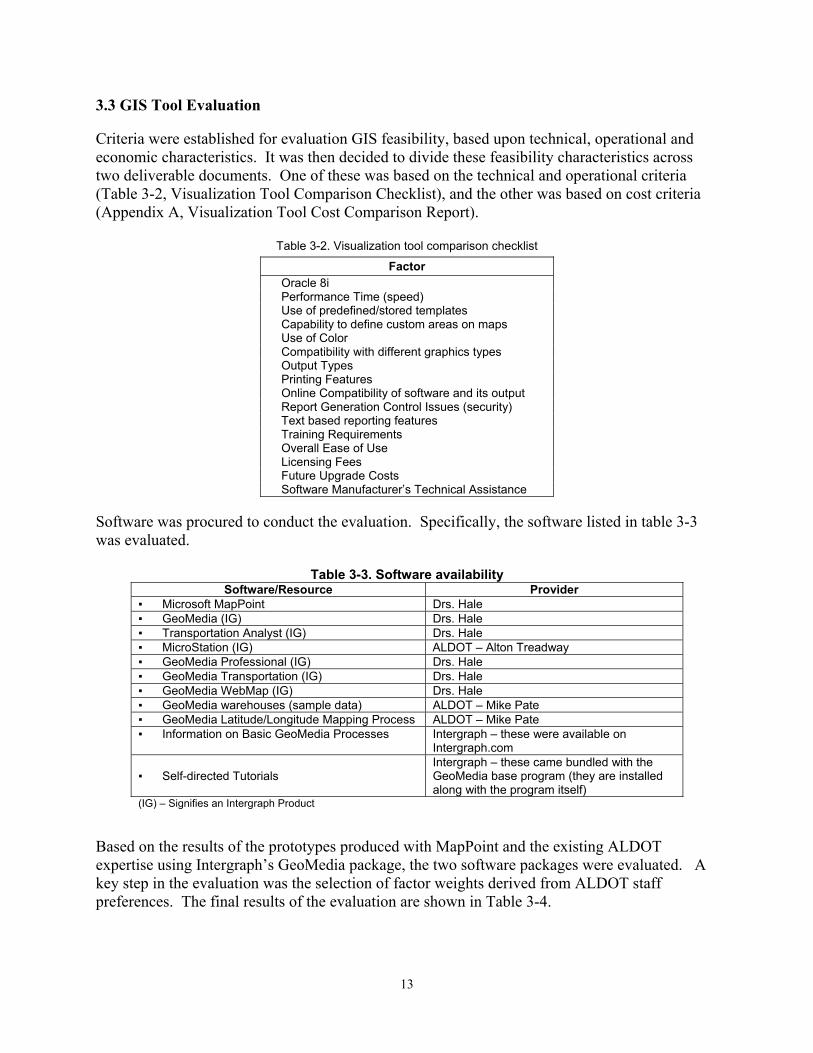
3.3 GIS Tool Evaluation Criteria were established for evaluation GIS feasibility, based upon technical, operational and economic characteristics. It was then decided to divide these feasibility characteristics across two deliverable documents. One of these was based on the technical and operational criteria (Table 3-2, Visualization Tool Comparison Checklist), and the other was based on cost criteria (Appendix A, Visualization Tool Cost Comparison Report).
Table 3-2. Visualization tool comparison checklist
Factor Oracle 8i Performance Time (speed) Use of predefined/stored templates Capability to define custom areas on maps Use of Color Compatibility with different graphics types Output Types Printing Features Online Compatibility of software and its output Report Generation Control Issues (security) Text based reporting features Training Requirements Overall Ease of Use Licensing Fees Future Upgrade Costs Software Manufacturer’s Technical Assistance
Software was procured to conduct the evaluation. Specifically, the software listed in table 3-3 was evaluated.
Table 3-3. Software availability
Software/Resource Provider ▪ Microsoft MapPoint Drs. Hale ▪ GeoMedia (IG) Drs. Hale ▪ Transportation Analyst (IG) Drs. Hale ▪ MicroStation (IG) ALDOT – Alton Treadway ▪ GeoMedia Professional (IG) Drs. Hale ▪ GeoMedia Transportation (IG) Drs. Hale ▪ GeoMedia WebMap (IG) Drs. Hale ▪ GeoMedia warehouses (sample data) ALDOT – Mike Pate ▪ GeoMedia Latitude/Longitude Mapping Process ALDOT – Mike Pate ▪ Information on Basic GeoMedia Processes
Intergraph – these were available on Intergraph.com
▪ Self-directed Tutorials Intergraph – these came bundled with the GeoMedia base program (they are installed along with the program itself)
(IG) – Signifies an Intergraph Product Based on the results of the prototypes produced with MapPoint and the existing ALDOT expertise using Intergraph’s GeoMedia package, the two software packages were evaluated. A key step in the evaluation was the selection of factor weights derived from ALDOT staff preferences. The final results of the evaluation are shown in Table 3-4.
13
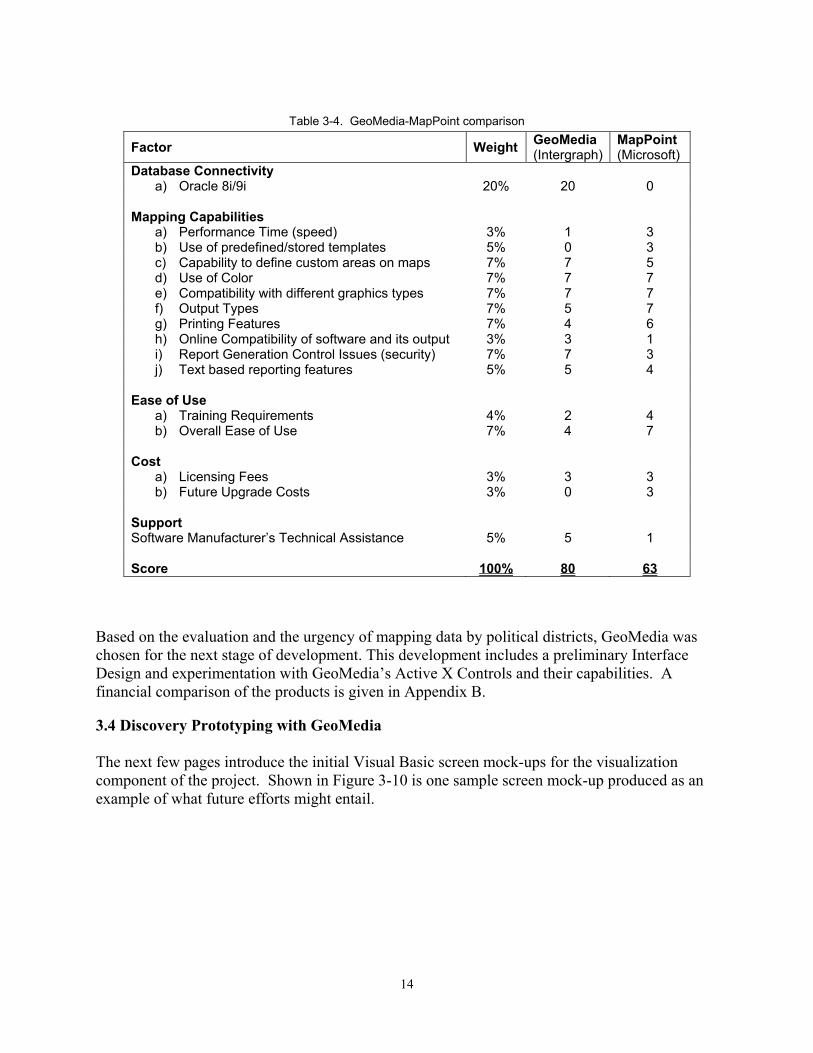
Table 3-4. GeoMedia-MapPoint comparison
Factor Weight GeoMedia (Intergraph)
MapPoint (Microsoft)
Database Connectivity a) Oracle 8i/9i 20% 20 0
Mapping Capabilities
a) Performance Time (speed) 3% 1 3 b) Use of predefined/stored templates 5% 0 3 c) Capability to define custom areas on maps 7% 7 5 d) Use of Color 7% 7 7 e) Compatibility with different graphics types 7% 7 7 f) Output Types 7% 5 7 g) Printing Features 7% 4 6 h) Online Compatibility of software and its output 3% 3 1 i) Report Generation Control Issues (security) 7% 7 3 j) Text based reporting features 5% 5 4
Ease of Use
a) Training Requirements 4% 2 4 b) Overall Ease of Use 7% 4 7
Cost
a) Licensing Fees 3% 3 3 b) Future Upgrade Costs 3% 0 3
Support Software Manufacturer’s Technical Assistance 5% 5 1 Score 100% 80 63
Based on the evaluation and the urgency of mapping data by political districts, GeoMedia was chosen for the next stage of development. This development includes a preliminary Interface Design and experimentation with GeoMedia’s Active X Controls and their capabilities. A financial comparison of the products is given in Appendix B. 3.4 Discovery Prototyping with GeoMedia The next few pages introduce the initial Visual Basic screen mock-ups for the visualization component of the project. Shown in Figure 3-10 is one sample screen mock-up produced as an example of what future efforts might entail.
14

Figure 3-10. GeoMedia mapping of pavement condition rating After initial mapping was complete, the project demonstrated GeoMedia’s Active X Controls and its’ capabilities (Figure 3-11). A description of these controls appears in Appendix B.
Figure 3-11. GeoMe
dia’s Active X controls
15

The following proofs of concept demonstrate the various capabilities of GeoMedia to manipulate and visually display ALDOT data.
Figure 3-12 ALDOT Division map using GeoMedia
16
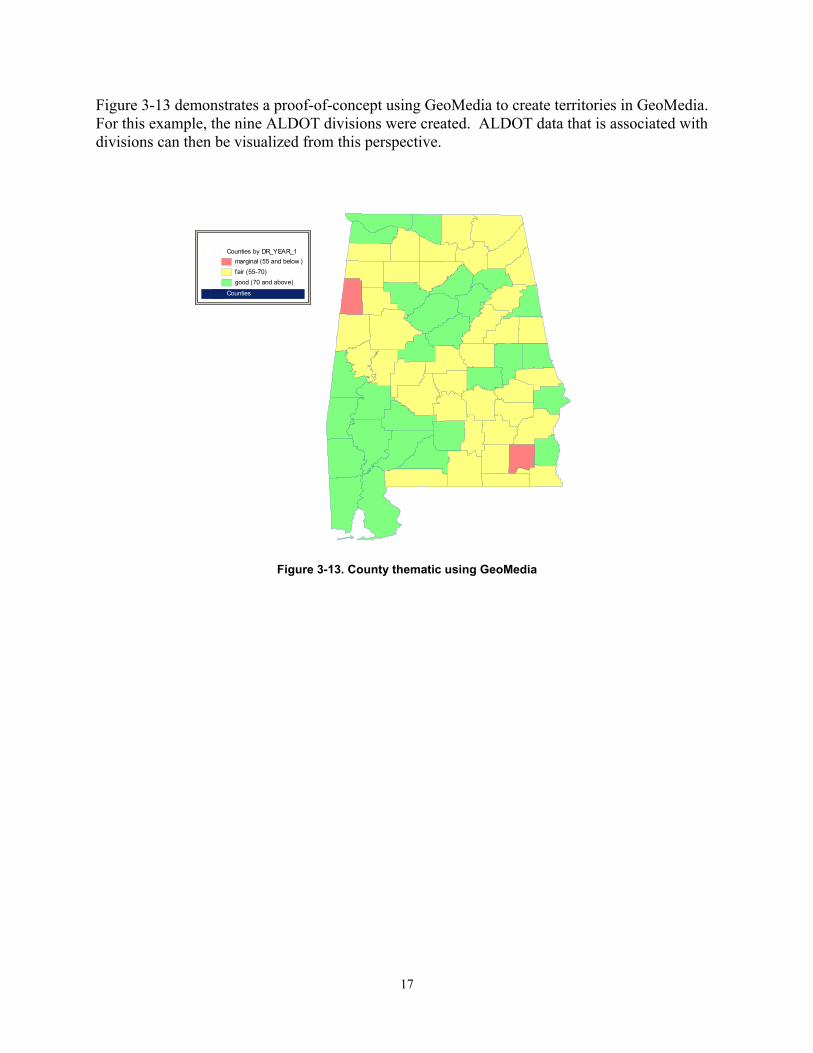
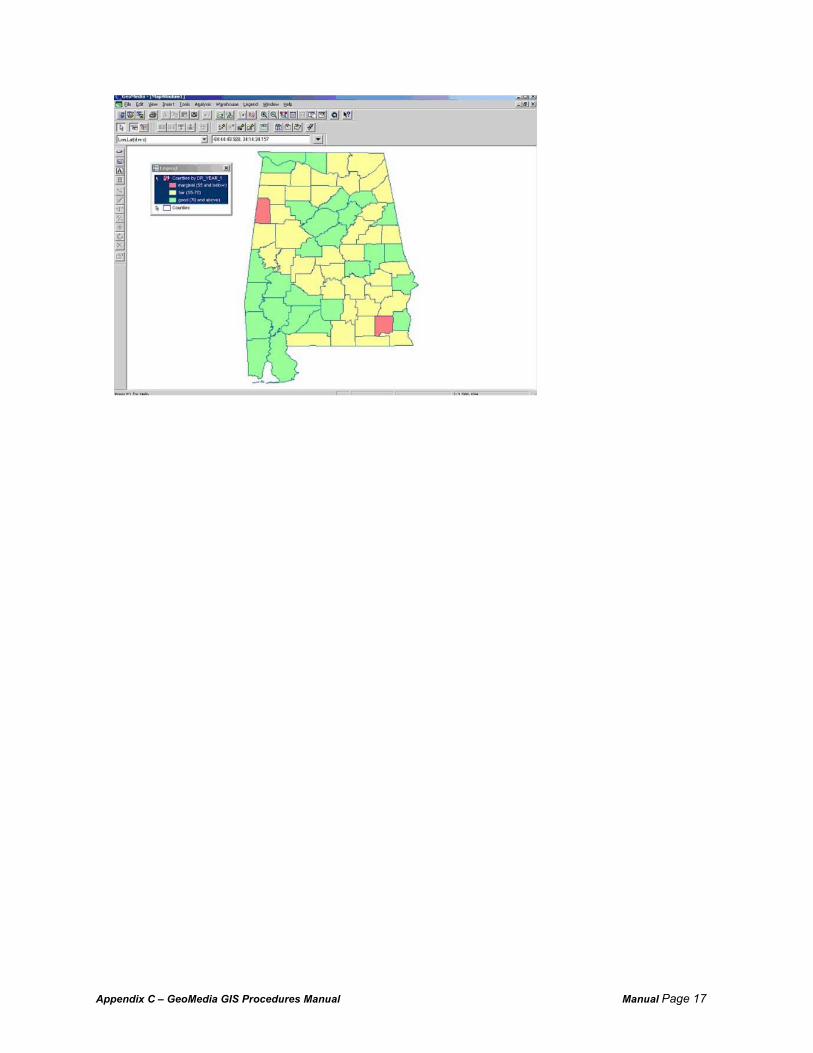
Figure 3-13 demonstrates a proof-of-concept using GeoMedia to create territories in GeoMedia. For this example, the nine ALDOT divisions were created. ALDOT data that is associated with divisions can then be visualized from this perspective.
Counties
good (70 and above)fair (55-70)marginal (55 and below )
Counties by DR_YEAR_1
Figure 3-13. County thematic using GeoMedia
17

Figure 3-14. Roads by route type Figure 3-14 illustrates the proof-of-concept of accounting for roads. Simultaneously, it color coded them based on their reporting category.
18

METDC99_dataMETDC99_data_w ithin_SenDist1METDC99_data_w ithin_JeffersonCoCountyShape
RF
METDC99_data_w ithin_JeffersonCo by PVMT_TYPE
Figure 3-15. Data plotted by Alabama county Figure 3-15 illustrates the proof of concept of plotting data points attributed to latitude and longitude coordinates and simultaneously displaying only those points within a certain boundary. For this example, points were plotted for a specific county.
Figure 3-16. Data Plotted by ALDOT Division Figure 3-16 illustrates the same proof-of-concept as Figure 3-15, but this proof-of-concept shows data points plotted by a specific ALDOT division. In addition, a thematic was created color-coding the data points according to those points falling within ranges specified by ALDOT.
19
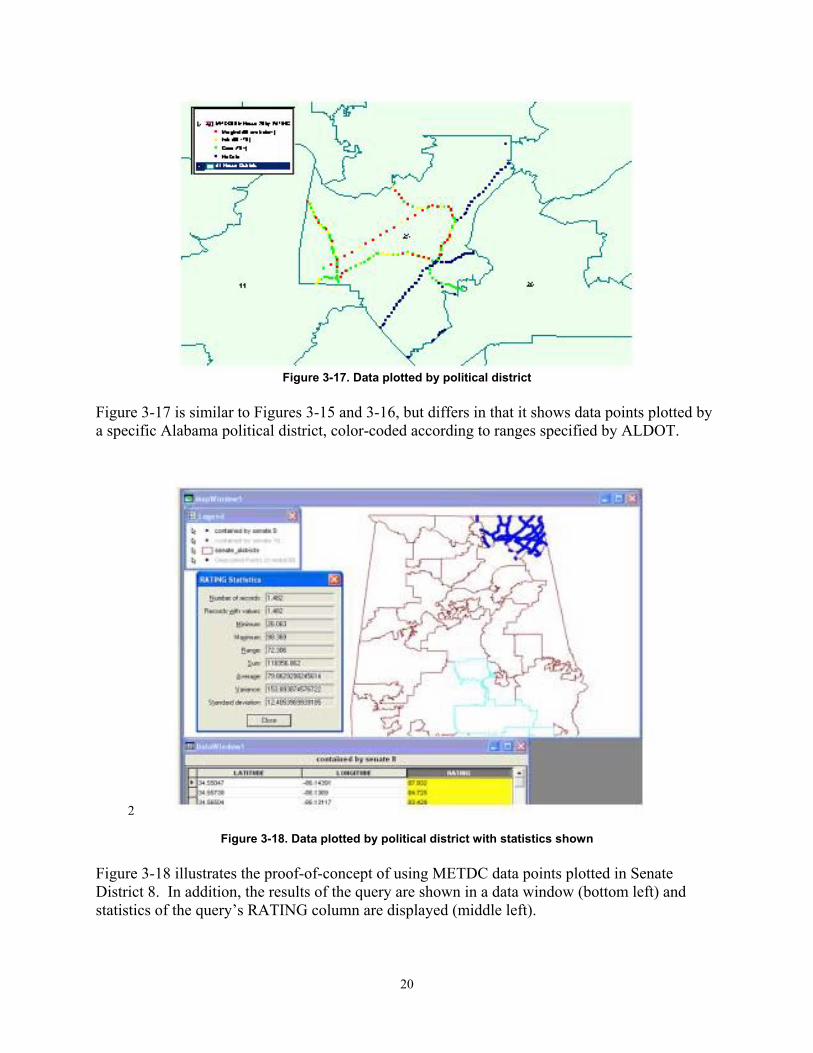
Figure 3-17. Data plotted by political district
Figure 3-17 is similar to Figures 3-15 and 3-16, but differs in that it shows data points plotted by a specific Alabama political district, color-coded according to ranges specified by ALDOT.
2
Figure 3-18. Data plotted by political district with statistics shown Figure 3-18 illustrates the proof-of-concept of using METDC data points plotted in Senate District 8. In addition, the results of the query are shown in a data window (bottom left) and statistics of the query’s RATING column are displayed (middle left).
20
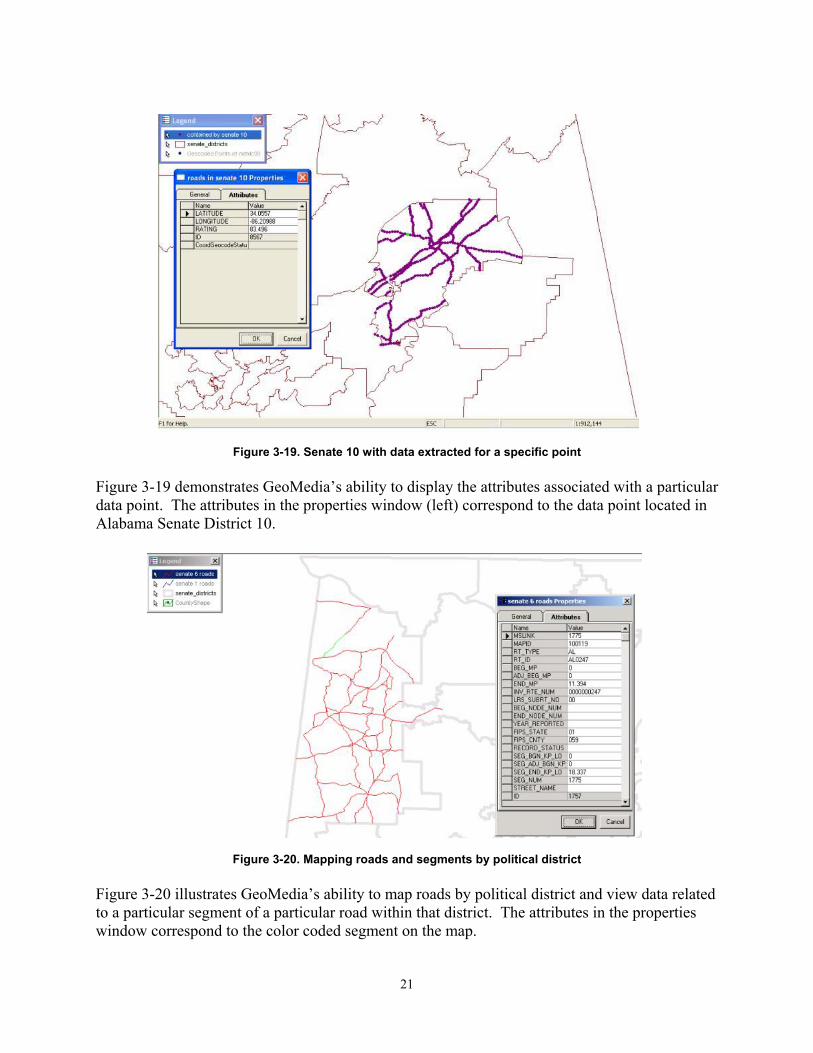
Figure 3-19. Senate 10 with data extracted for a specific point Figure 3-19 demonstrates GeoMedia’s ability to display the attributes associated with a particular data point. The attributes in the properties window (left) correspond to the data point located in Alabama Senate District 10.
Figure 3-20. Mapping roads and segments by political district Figure 3-20 illustrates GeoMedia’s ability to map roads by political district and view data related to a particular segment of a particular road within that district. The attributes in the properties window correspond to the color coded segment on the map.
21
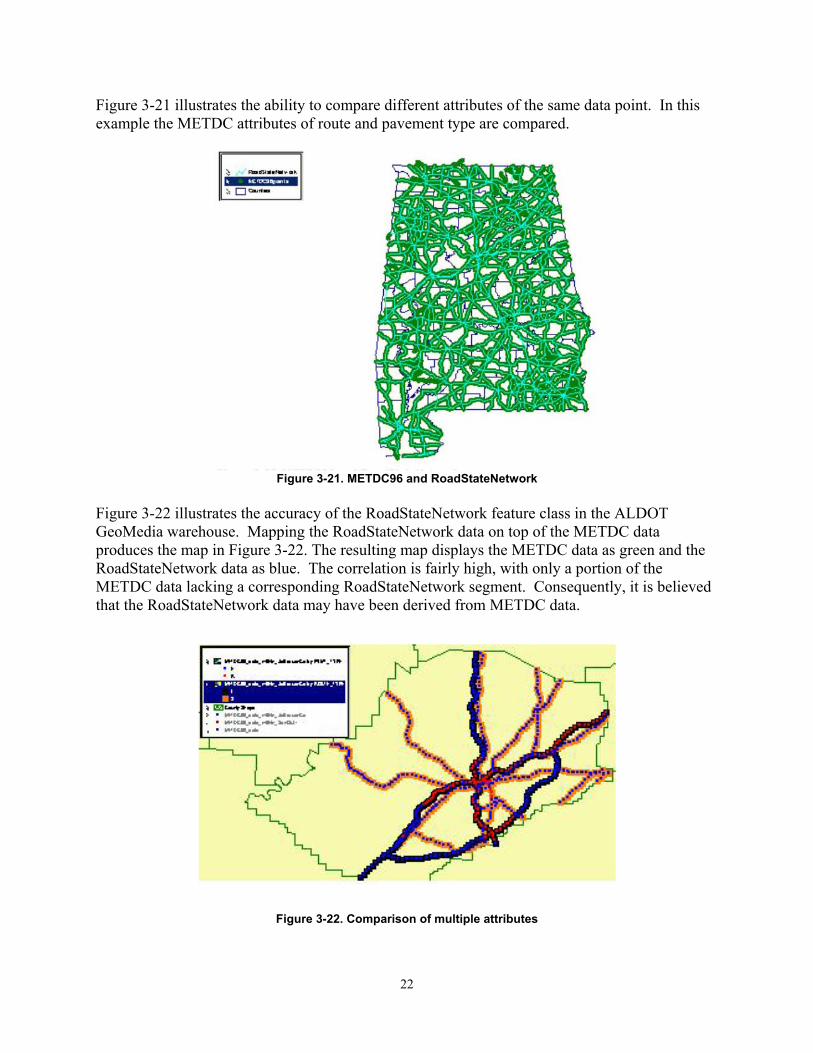
Figure 3-21 illustrates the ability to compare different attributes of the same data point. In this example the METDC attributes of route and pavement type are compared.
Figure 3-21. METDC96 and RoadStateNetwork
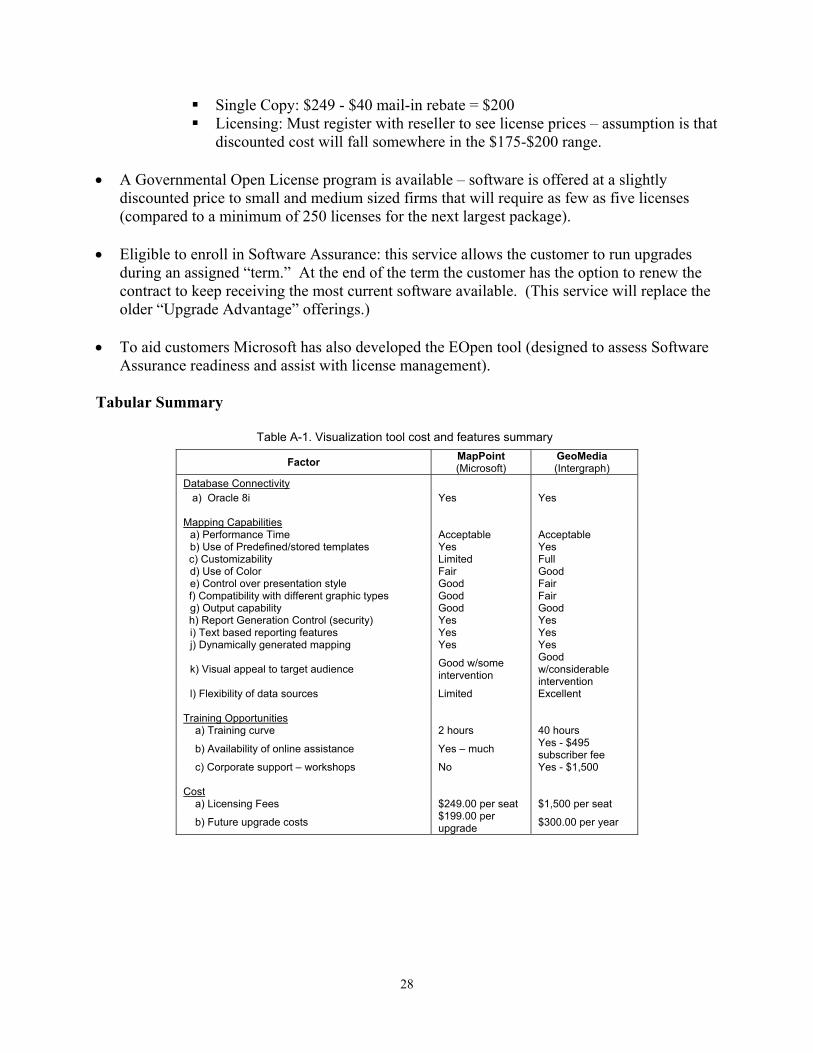
Figure 3-22 illustrates the accuracy of the RoadStateNetwork feature class in the ALDOT GeoMedia warehouse. Mapping the RoadStateNetwork data on top of the METDC data produces the map in Figure 3-22. The resulting map displays the METDC data as green and the RoadStateNetwork data as blue. The correlation is fairly high, with only a portion of the METDC data lacking a corresponding RoadStateNetwork segment. Consequently, it is believed that the RoadStateNetwork data may have been derived from METDC data.
Figure 3-22. Comparison of multiple attributes
22

4.0 Next Steps
This project has spawned a new ALDOT project entitled “Transportation Network Planning: Data Gathering, Analysis Methodology Development, and Visualization.” The new project will bring together:
•
• • •
•
•
The University of Alabama’s Enterprise Integration Lab (EIL) to establish preservation levels associated with alternative condition targets and to estimate the spending levels necessary to achieve those targets, Day Wilburn Associates, Inc. (DWA) to develop a long-term statewide plan, ALDOT’s information system group to extend GIS, and ALDOT’s Bureau of Transportation Planning to refine its “needs analysis.”
Integrating these initiatives will document the analysis of transportation data needed to objectively support new projects and will provide improved communication capabilities with external stakeholders.
This project is grounded on the:
Established capabilities of ALDOT’s Comprehensive Project Management System (CPMS), which provides access to extensive project and financial information, and Growing capability in visualizing current and future asset conditions through GIS.
This project provides a data compilation, analysis methodology and visualization methodology for the current state of network (system-wide) ALDOT assets, which will form the basis for analyzing and visualizing network needs to meet future economic development and growth challenges. The project will be composed of nine tasks building on one another to establish data sources, formats, access, GIS capabilities, decision-maker needs; and to collect required data and forecast future conditions of roadways and other modes offered in the ALDOT system. All of this will be used for an analysis to develop the methodology to determine future transportation needs.
23

5.0 Training Manual
Appendix C contains the GeoMedia GIS Procedures Manual. The manual was provided to help shorten the length of the learning curve associated with GeoMedia, 4.0 by documenting the procedures for the program’s various uses with ALDOT data sets. It is recommended to first proceed through the user tutorial supplied with GeoMedia before beginning the training manual. The tutorial is located in the HELP menu of GeoMedia. This manual is meant to be followed sequentially, even though the tutorials do not build on the previous sections. Data sources should not be turned off. All data that is displayed in the map area, except for the Alabama shape, should not be turned off before moving to the next tutorial unless specifically told otherwise. In cases were the tutorial specifies turning off data, failure to close data sources will result in the new data overlaying the old data. This will cause confusion in viewing the results of the tutorial. The manual contains details on how to load GeoMedia, how to utilize the Pavement Condition Management Systems (Hydra) from GeoMedia, use of X controls, point and click examples, and the format of ALDOT pavement management systems tables.
24

6.0 Conclusions Based partially on this research initiative, ALDOT is pursuing formal needs-based analysis for GIS. It is beyond the scope of this study to definitively conclude that GIS provide the ultimate answer to multifaceted needs-based decision making. However, the needs-based mapping of GIS holds promise that planners and policymakers may view and understand multi-criteria decision models in a more comprehensive manner than looking at tabular data or statewide metrics. Based on the results of this project, the ALDOT Transportation Planning Bureau is pursuing a full study in the use of GIS to aid in needs analysis, and the Bureau of Materials and Tests is working to produce statewide pavement condition maps.
25

7.0 Appendices
Appendix A Visualization Tool Cost Comparison Report
This appendix reports on a comparison of two software visualization tools that might be used by ALDOT as part of its asset management system. The following narrative discusses GeoMedia 4.0 and MapPoint 2002, and terminates with a comparative tabulation of key characteristics in Table A-1. GeoMedia 4.0 by Intergraph • Base price summary
o Single Copy: $1,500 o 25 Copies: approx. $30,000 (quantity discounts are applied on a case by case basis)
• Intergraph does not differentiate between Government and Non-Government accounts.
However, with many states and the federal government Intergraph maintains "contracts" with pre-negotiated prices and rates for software and services. These prices vary, dependant on contract vehicle, quantity and customer history.
• The cost to maintain GeoMedia 4.0 is $300 per year for the first copy and $216 per year for subsequent copies. Maintenance consists of free through “1-800” phone support and software upgrades.
• Intergraph offers GeoMedia objects that provide only the functionality required for use on a users desktop. The entire suite of GeoMedia products is OLE/COM based and is “easily customized" using VB, Visual C++, etc.
• Intergraph offers site wide licenses for universities that range from $15K to free per year.
• Team GeoMedia Subscriber – Any firm or individual with at least one license of any GeoMedia product under a regular maintenance contract may become a member of the Team GeoMedia Subscriber program. The Subscriber Program provides members access to sample code, technical papers, sample applications and more. More details are provided in the following Q & A description.
o Who can join the Team GeoMedia Subscriber Program?
GeoMedia customers, either companies or individuals Education facilities studying GeoMedia Research labs using GeoMedia
26

o What are the benefits of the Subscriber Program? Team GeoMedia TechNet access Discounted e-mail support Standard development training courses at cost Subscriber identity kit with logo usage
o What are the requirements of becoming a Subscriber?
At least one GeoMedia product license Current maintenance contract
o How much does it cost to join the Subscriber Program?
There is an annual fee of U.S. $495 Training Opportunities – Courses are taught in Huntsville, AL or at a
company’s site if certain requirements are met. Information on three sample courses is shown below.
o GeoMedia User Training Version 4.0
Length – 4 days Cost - $1,500 per enrollment, or $8,800 on-site (plus instructor expenses) Material Covered – Basic concepts such as coordinate systems and feature
classes
o GeoMedia Professional Version 4.0 Length – Not specified Cost - $1,875 per enrollment, or $11,500 on-site (plus instructor expenses) Material Covered – More advanced topics including geometry principles,
database update procedures, and image placement.
o Developing Desktop Solutions with GeoMedia Technology Length – 3.5 days, with PCs, completed examples, and other materials
provided Cost - $1,600 per enrollment, or $10,000 per enrollment on-site (plus
instructor expenses) Material Covered – Programming applications in Visual Basic using
GeoMedia’s built-in functionality Microsoft MapPoint 2002 (North America) • Base Price Summary (source www.microsoft.com)
o New user price (one copy): $249 o Upgrade price: $199 o Rebates offered: $50 mail-in, limited to users of previous MapPoint versions or
Office XP owners.
• Online ordering thru a reseller o Example: Amazon.com
27
Single Copy: $249 - $40 mail-in rebate = $200 Licensing: Must register with reseller to see license prices – assumption is that
discounted cost will fall somewhere in the $175-$200 range.
• A Governmental Open License program is available – software is offered at a slightly discounted price to small and medium sized firms that will require as few as five licenses (compared to a minimum of 250 licenses for the next largest package).
• Eligible to enroll in Software Assurance: this service allows the customer to run upgrades during an assigned “term.” At the end of the term the customer has the option to renew the contract to keep receiving the most current software available. (This service will replace the older “Upgrade Advantage” offerings.)
• To aid customers Microsoft has also developed the EOpen tool (designed to assess Software Assurance readiness and assist with license management).
Tabular Summary
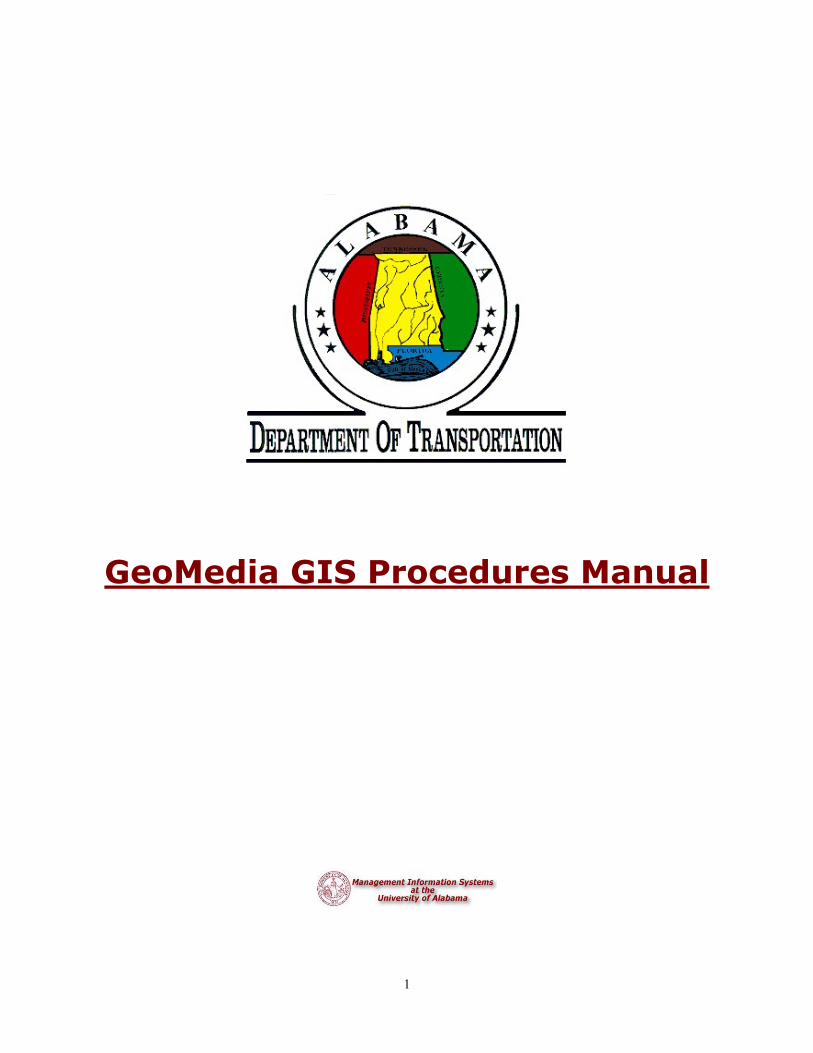
Table A-1. Visualization tool cost and features summary
Factor MapPoint (Microsoft)
GeoMedia (Intergraph)
Database Connectivity a) Oracle 8i Yes Yes Mapping Capabilities
a) Performance Time Acceptable Acceptable b) Use of Predefined/stored templates Yes Yes c) Customizability Limited Full d) Use of Color Fair Good e) Control over presentation style Good Fair f) Compatibility with different graphic types Good Fair g) Output capability Good Good h) Report Generation Control (security) Yes Yes i) Text based reporting features Yes Yes j) Dynamically generated mapping Yes Yes
k) Visual appeal to target audience Good w/some intervention
Good w/considerable intervention
l) Flexibility of data sources Limited Excellent Training Opportunities a) Training curve 2 hours 40 hours
b) Availability of online assistance Yes – much Yes - $495 subscriber fee
c) Corporate support – workshops No Yes - $1,500 Cost a) Licensing Fees $249.00 per seat $1,500 per seat
b) Future upgrade costs $199.00 per upgrade $300.00 per year
28

Appendix B
GeoMedia’s Active X Controls This appendix provides a brief, categorical review of the Active X Controls that an ALDOT user might be expected to employ while conducting a GIS visualization session to examine decision data. View Controls GMDataView is an ActiveX control that provides a formatted view of the non-graphic attributes of features, divided vertically by columns and horizontally by rows. GMMapView is an ActiveX control that is the primary display control for GeoMedia map features. It provides a view of feature geometries, images, labels, North arrow, scale bar, and legend. GMEventControl is an OLE control that fires events from the MapView. GMNorthArrow is an ActiveX control that can be displayed in a MapView to indicate the current North direction. It consists of an icon that indicates the direction on a map to the geographic North Pole. GMScaleBar is an ActiveX control that can be displayed in a MapView to indicate the current scale of the map feature display. It consists of a moveable bar that is marked at intervals to indicate the relationship between the distance on a map and the corresponding actual distances. Pipe Controls GMFeatureComboboxInput is an OLE control that generates a recordset based on the feature class or query selected in the combobox. GMFeatureListboxInput is an OLE control that generates a recordset based on the feature class or query selected in the listbox. GMQueryStorage is an OLE control that creates and populates a new query from an input recordset using data entered in the control. GMTableStorage is an OLE control that creates and populates a new feature class from an input recordset using data entered in the control. GMLegendEntryOutput is an OLE control that creates a legend entry in a mapview from an input recordset and a style selected in the control. GMDataWindowOutput is an OLE control that populates a new or existing data window from an input recordset.
29

Data Capture Controls GMProperties is an OLE control that displays a feature instance (db record) in a grid. This control requires a valid license of DBGrid in order to run correctly. GMPrecisionCoordinate is an OLE control that displays the current coordinates of the cursor in the mapview. Other Controls GMFeatureCombobox is an OLE control used to display feature classes and queries on custom forms as a combobox. GMFeatureListbox is an OLE control used to display feature classes and queries on custom forms as a listbox. GMDefCoordSystem is an OLE control which contains a dialog that supports the interactive definition of a coordinate system. Dialogs PickQuickDialog is a dialog that can be displayed to choose the specific feature instance in the mapview when more than one feature is in the LocatedObjectsCollection. GeoMathUtilities General is a part of GeoMathUtilities function library. BasicMath is a part of GeoMathUtilities function library. GeometyInfo is a part of GeoMathUtilities function library. GeometryMath is a part of GeoMathUtilities function library. Other Components MapViewListeners manages commands that are listening to events in the Mapviews. EventServer allows events from multiple map windows to be handled by a single event control.
30

Appendix C
GeoMedia GIS Procedures Manual Prepared and published by UA Management Information Systems during this project,
and reformatted for this report. (Page numbers restart from 1 on next page)
31
GeoMedia GIS Procedures Manual
1

Table of Contents Table of Contents............................................................................................................................................ 2 Introduction .................................................................................................................................................... 3 Important note about this manual ................................................................................................................... 3 Installing Oracle Client 9i............................................................................................................................... 3 Installing GeoMedia 4.0* ............................................................................................................................... 4 Connecting to an Oracle Warehouse .............................................................................................................. 5 Connecting to a non-Oracle Warehouse ......................................................................................................... 5 Creating an Alabama map and displaying feature class boundaries ............................................................... 6 Plotting data within a specific boundary......................................................................................................... 9 Plotting a specific road by route number in a specific boundary.................................................................. 11 Plotting roads by type (NHS, AL, or IN)...................................................................................................... 11 Plotting data based on latitude and longitude ............................................................................................... 12 Creating a thematic of condition by county.................................................................................................. 14 Creating a thematic of condition by division................................................................................................ 16 Creating a condition point rating thematic by senate district *and* displaying condition statistics for that district...................................................................................................................................................................... 18 Loading GIS data files into a GeoMedia Warehouse ................................................................................... 23 Updating and Adding GIS Information to an Oracle Warehouse ................................................................. 25 Best Practices................................................................................................................................................ 25 Dynamic Segmentation................................................................................................................................. 26 Political District Backfill .............................................................................................................................. 29 Hydra Scheme .............................................................................................................................................. 33 GIS Table Names and Summary Tables....................................................................................................... 34 Glossary........................................................................................................................................................ 35
Appendix C – GeoMedia GIS Procedures Manual Manual Page 2

Introduction The purpose of this document is to shorten the length of the learning curve associated with GeoMedia 4.0 by documenting the procedures for the program’s various uses with ALDOT data sets. It is recommended to first proceed through the user tutorial supplied with GeoMedia. The tutorial is located in the HELP menu of GeoMedia.
Important note about this manual This manual is meant to be followed sequentially, even though the tutorials do not build on the previous sections. Please turn off or close any data source that is displayed in the map area, except the Alabama Shape, before moving to the next tutorial unless specifically told otherwise. Failure to close data sources will result in the new data overlaying the old data. This will cause confusion in view the results of the tutorial.
Installing Oracle Client 9i
• Note: Oracle must be installed before GeoMedia. If GeoMedia is already installed on the machine and Oracle is not, then
1. GeoMedia must be removed 2. Oracle must be installed 3. GeoMedia reinstalled.
1. Insert Oracle 9i installation CD A. If the CD does not auto-run, select run from the start menu and browse to the CD drive letter,
selecting setup.exe B. If auto-run, click Install / De-install Products, and click Next
2. Make sure that OraHome91 is the destination name and c:\oracle\Ora91 is the path, and click Next 3. Select Runtime Radial button, and click Next 4. Click Install 5. Click No, I will create net service names myself radial button and click Next 6. Select Oracle 8i or later database radial button, and click Next 7. Type “hydra” into the service name text box and click Next 8. Select TCP from list box and click Next 9. Type "Appropriate Address” (example 130.160.86.116) and click Next 10. Select Yes, Perform Test radial button and click Next 11. Advance to Finish 12. Click Finish 13. Click Exit
Appendix C – GeoMedia GIS Procedures Manual Manual Page 3

Installing GeoMedia 4.0*
1. Insert the installation CD 2. The GeoMedia splash screen will appear; Click “Install GeoMedia 4.0”, 3. Click Next on the GeoMedia Setup Screen 4. Click Yes to the Software License 5. Fill in the necessary information on User Information, and click Next 6. Confirm your user information and click Yes 7. Click Next to the destination directory 8. Click Yes to confirm directory 9. Click Next to create the Geoworkspaces directory 10. Click Next to create the warehouse directory 11. Confirm the Typical button is selected and click Next 12. Click Next to create an icon in Program Files 13. Click Next to confirm current settings; the install process will begin. 14. Click OK and disregard the warning regarding MDAC 2.5 15. Click Finish
First Step Before running through this document it is highly recommended that you complete the GeoMedia 4.0 tutorial contained within of the application. Here’s how to begin the tutorial:
1. Start GeoMedia 2. On the Welcome splash image click on the button beside “Create New GeoWorkspace” 3. Click New on the next window 4. Select Help > Learning GeoMedia * may take a few seconds to load
* These instructions are specific to the Microsoft Windows 2000 operating system
Appendix C – GeoMedia GIS Procedures Manual Manual Page 4

Connecting to an Oracle Warehouse Purpose: You display feature geometries and attribute data in GeoMedia
through connections to warehouses (i.e. database) where the data are stored.
1. Select Warehouse > New Connection 2. Select Oracle Relational Model Read-Only from the list box and click Next
• Note: If Oracle Relational Model Read-Only choice not present, then Oracle Client is not installed (see "Installing Oracle 9i" section )
3. Enter “hydra” for connection name 4. Enter "hydragis" for user name 5. Enter "aldothydra" for password 6. Enter "hydra" for host and, click Next 7. Click Finish
Connecting to a non-Oracle Warehouse Purpose: You display feature geometries and attribute data in GeoMedia
through connections to warehouses (i.e. database) where the data are stored.
1. Start GeoMedia (Start > Programs > GeoMedia > GeoMedia) 2. Click the button next to “Create New GeoWorkspace” 3. Click New to use normal.gwt 4. Select Warehouse > New Connection 5. Select the Connection Type (i.e. Access, ArcView shapefile) and click Next 6. Name the connection 7. Fill in a description if you wish 8. Click Browse to locate desired file 9. Select Desired File, and click Open 10. Determine feature connectivity and click Next 11. Make sure the radial button labeled “Let the wizard open the connection as read/write” is
selected if available, and click Finish 12. You are now connected to the warehouse
Appendix C – GeoMedia GIS Procedures Manual Manual Page 5

Creating an Alabama map and displaying feature class boundaries
Purpose: To display a feature class on which to
graphically view data.
1. Select Legend > Add Feature Class 2. On the connection dropdown menu select the HYDRA
warehouse connection 3. Select the GIS_COUNTIES feature class, and click OK
4. You can extract information (i.e. county name, FIPS number, e
specific county.
Appendix C – GeoMedia GIS Procedures Manual
Feature Classes include: GIS_ALABAMALABEL GIS_ALABAMASHAPE GIS_ALHOUSEDIS GIS_ALHOUSELAB GIS_ALSENATEDIS GIS_ALSENATELAB GIS_BRIDGES GIS_COUNTIES GIS_COUNTYLAB GIS_DIVISIONLAB GIS_DIVISIONS GIS_ROADSTNETWORK GIS_USCONGDIS GIS_USCONGLAB
tc.) on each county by double clicking on a
Manual Page 6
Altering a feature class (i.e. changing boundary line):
1. Make the county boundary lines thicker by double clicking the legend entry labeled GIS_COUNTIES 2. Double click the Style icon for GIS_COUNTIES 3. Select the Area Boundary Tab 4. Change the Weight for the primary line to 2.00 and click OK 5. Click OK to view the change
You can also display multiple feature classes at the same time:
1. Select Legend > Add Feature Class 2. Select RoadSTNetwork, and click OK 3. The ALDOT road network appears as follows:
You can control which feature classes are visible by turning them on and off via the Legend:
1. Right click the legend entry for GIS_ROADSTNETWORK 2. Select Display Off 3. The roads disappear; to make them reappear right click the legend entry again and select Display On
Appendix C – GeoMedia GIS Procedures Manual Manual Page 7

NOTE: If you attempt to display the political district feature classes but are having difficulty making them show up on the map, complete the following steps:
1. Select View > GeoWorkspace Coordinate System 2. Make sure Geographic is specified as the base storage type, and click OK 3. Select File > Save GeoWorkspace
Appendix C – GeoMedia GIS Procedures Manual Manual Page 8

Plotting data within a specific boundary Purpose: GIS_ROADSTNETWORK, and other features can be viewed statewide or “boundary-wide.”
For example, GeoMedia can show only those roads contained in Tuscaloosa County, a specific division, or political district. The following steps outline the procedures for doing this.
For example, to display all the roads in senate district 8:
1. Select Analysis > New Query 2. In the Select Features In dropdown menu, select GIS_ROADSTNETWORK from the "HYDRA"
warehouse connection 3. Click the Spatial >> button 4. In the dropdown menu labeled “That” select “are contained by” 5. In the Features In dropdown menu, select GIS_ALSENATEDIS1996 from the "HYDRA" warehouse
connection;
6. Click the Filter button on the right-hand side of the New Query window (just under the selection from step 6)
Appendix C – GeoMedia GIS Procedures Manual Manual Page 9

7. In the left-hand window double click on Name 8. Click the equals (=) operator 9. Click Show Values (above right-hand window), and click Yes 10. Double click on '8'; the Filter window should now read Name = ‘8’
Note: The query you have created through these steps reads: SELECT Features IN RoadStateNetwork THAT ARE CONTAINED BY senate_district = ‘8’
11. Name the query “Roads for Senate 8”, and click OK 12. The roads in Senate district 8 are now shown on the map
Appendix C – GeoMedia GIS Procedures Manual Manual Page 10

Plotting a specific road by route number in a specific boundary Purpose: GeoMedia can also map ALDOT data from a query constructed with the results from another
query. For this example we will use the results from the query created in the previous tutorial to create and display another query. In this tutorial you will display a single route and only display that portion that is in Senate District 8. Take the following steps to do so:
Continuing on from Plotting data within a specific boundary,
1. Select Analysis > New Query 2. In the Select Features In dropdown menu select the query 'Roads for Senate 8' 3. Once selected, click the Filter button 4. Double click on the attribute named RT_ID 5. Click the “=” button under the list of available operators 6. Click Show Values (right hand side of window) and click Yes 7. Double click on AL0002 and click OK 8. Name the query “AL Route 2 for Senate 8” and click OK 9. In the legend right click the item labeled "Roads for Senate 8" and set the display to Off 10. You will now see "AL Route 2 for Senate 8" only 11. Double click on the legend entry labeled "AL Route 2 for Senate 8" 12. Double click on the style icon for "AL Route 2 Senate 8" 13. Change the color to red and the weight to 2.50 and click OK 14. Click OK
Plotting roads by type (NHS, AL, or IN) Select Analysis > New Query
1. In the Select Features In dropdown menu select the GIS_ROADSTNETWORK 2. Once selected, click the Filter button 3. Double click on the attribute named RT_TYPE 4. Click the “=” button under the list of available operators 5. Click Show Values (right hand side of window) and click Yes 6. Double click on ‘AL’, ‘NS’, or ‘US’ and click OK 7. Name the query “[respective route type] Routes” (i.e. AL Routes) and click OK
Appendix C – GeoMedia GIS Procedures Manual Manual Page 11

Plotting data based on latitude and longitude Purpose: This tutorial outlines the procedures for plotting the data in that Hydra Condition table and is a
model that can be used to map other sources of data tied to lat/long coordinates. Preparing the data If not already done, the Lat/Long values in the Hydra Condition table must be modified for use in GeoMedia. To change the format of the latitude and longitude (degrees, minutes, seconds) which are assigned to separate fields, one of two things must be done.
1. Add two additional fields to the database (Latitude and Longitude) and for each respective new field/column combine the degrees, minutes, and seconds in DD:MM:SS.ss format. (positive = N latitude, negative = W longitude), or
2. Add two additional fields to the database (Latitude and Longitude) and for each respective new
field/column calculate decimal degrees from the separate degrees, minutes, seconds fields. For this tutorial we will use option 2. The formula for converting Lat/Long coordinates from degrees, minutes, seconds to decimal degrees is:
Degrees + (minutes/60) + (seconds/3600) We have now added the lat/long coordinates for all condition points to their respective fields in the table of concern in the database. With the Counties feature class from the master ALDOT warehouse displayed do the following:
1. Select Analysis > Geocode Coordinates 2. In the "Geocode Coordinates In" dropdown menu, select the table of concern 3. Click the "Units and Format" button 4. Adjust settings as follows:
• Geographic: d:m:s • Height: m • Geographic quadrant: N, S, E, W suffix • Coordinate Order: Latitude/Longitude
5. Click OK 6. In the "Latitude (d:m:s):" dropdown menu, select LAT_DEC (the name you gave the latitude
field you previously created) 7. In the "Longitude (d:m:s):" dropdown menu, select LNG_DEC (the name you gave the
longitude field you previously created) 8. In the "Height (m)" dropdown menu, make sure <None> is selected 9. In the "Query name:" text box, give your query a name or keep the default 10. Click OK; the points then appear in the Map window
Appendix C – GeoMedia GIS Procedures Manual Manual Page 12

Appendix C – GeoMedia GIS Procedures Manual Manual Page 13
Creating a thematic of condition by county
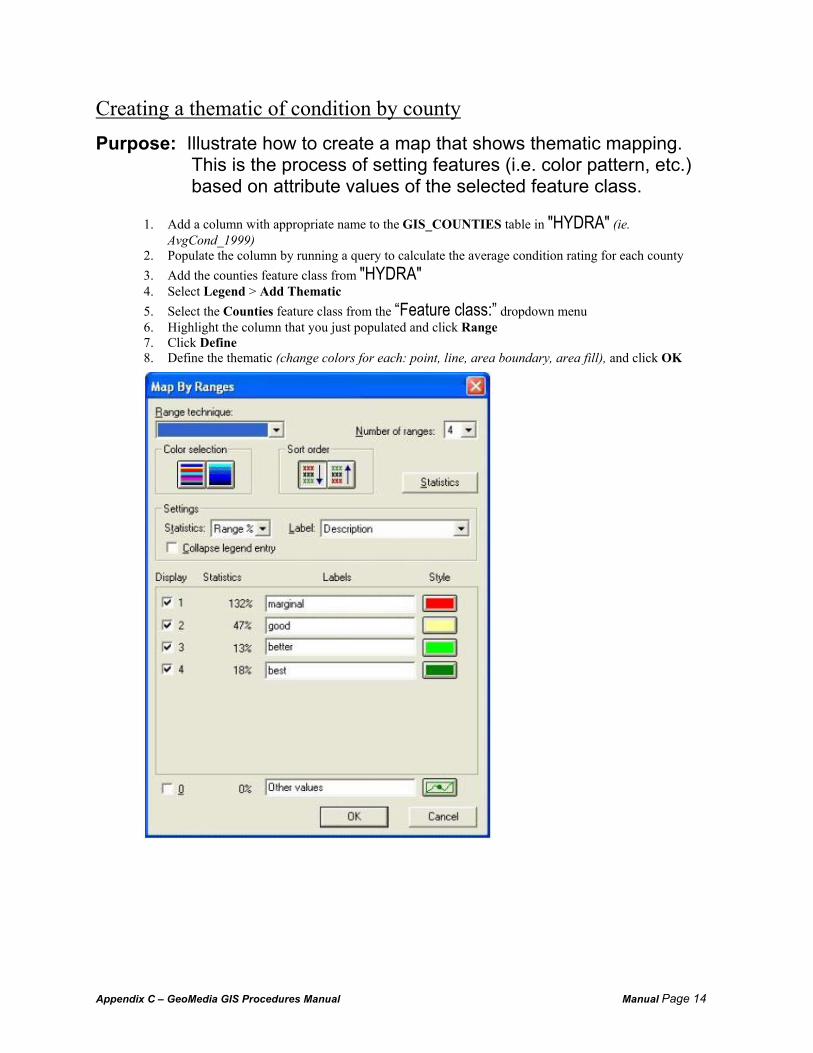
Purpose: Illustrate how to create a map that shows thematic mapping. This is the process of setting features (i.e. color pattern, etc.) based on attribute values of the selected feature class.
1. Add a column with appropriate name to the GIS_COUNTIES table in "HYDRA" (ie.
AvgCond_1999) 2. Populate the column by running a query to calculate the average condition rating for each county 3. Add the counties feature class from "HYDRA" 4. Select Legend > Add Thematic 5. Select the Counties feature class from the “Feature class:” dropdown menu 6. Highlight the column that you just populated and click Range 7. Click Define 8. Define the thematic (change colors for each: point, line, area boundary, area fill), and click OK
Appendix C – GeoMedia GIS Procedures Manual Manual Page 14

9. Click OK 10. On the legend, click, hold, and drag Counties to the first position in the legend
Appendix C – GeoMedia GIS Procedures Manual Manual Page 15
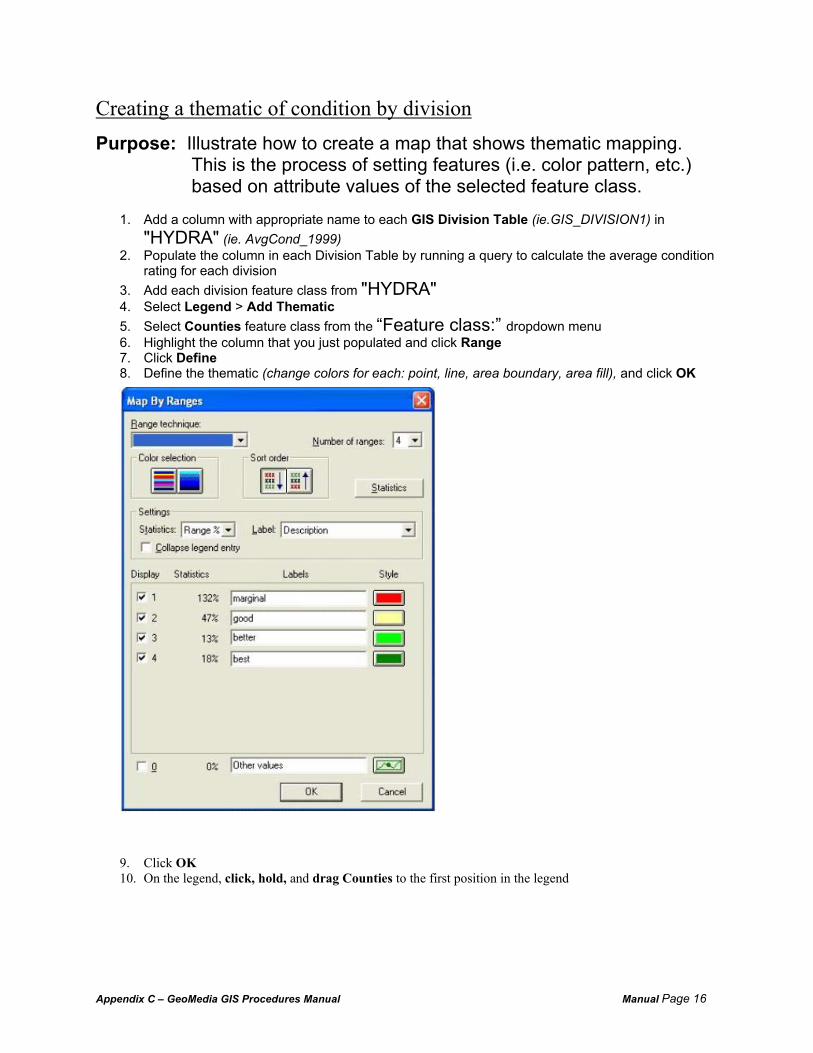
Creating a thematic of condition by division Purpose: Illustrate how to create a map that shows thematic mapping.
This is the process of setting features (i.e. color pattern, etc.) based on attribute values of the selected feature class.
1. Add a column with appropriate name to each GIS Division Table (ie.GIS_DIVISION1) in
"HYDRA" (ie. AvgCond_1999) 2. Populate the column in each Division Table by running a query to calculate the average condition
rating for each division 3. Add each division feature class from "HYDRA" 4. Select Legend > Add Thematic 5. Select Counties feature class from the “Feature class:” dropdown menu 6. Highlight the column that you just populated and click Range 7. Click Define 8. Define the thematic (change colors for each: point, line, area boundary, area fill), and click OK
9. Click OK 10. On the legend, click, hold, and drag Counties to the first position in the legend
Appendix C – GeoMedia GIS Procedures Manual Manual Page 16
Appendix C – GeoMedia GIS Procedures Manual Manual Page 17
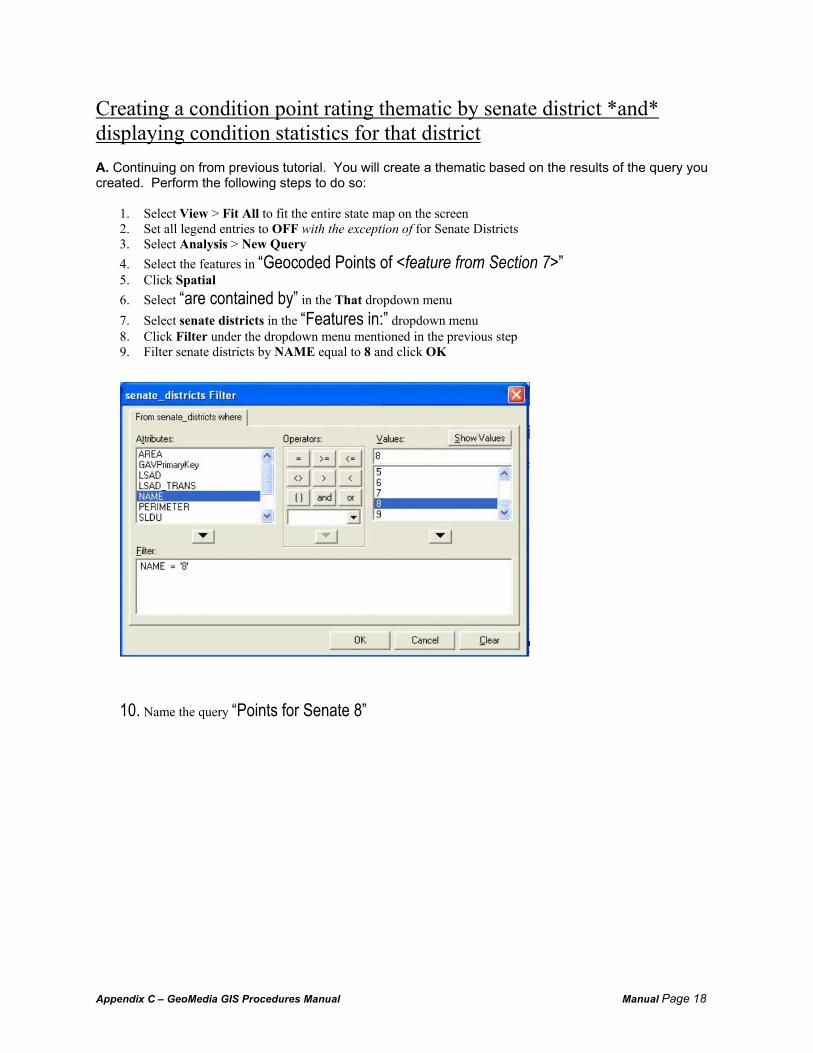
Creating a condition point rating thematic by senate district *and* displaying condition statistics for that district A. Continuing on from previous tutorial. You will create a thematic based on the results of the query you created. Perform the following steps to do so:
1. Select View > Fit All to fit the entire state map on the screen 2. Set all legend entries to OFF with the exception of for Senate Districts 3. Select Analysis > New Query 4. Select the features in “Geocoded Points of <feature from Section 7>” 5. Click Spatial 6. Select “are contained by” in the That dropdown menu 7. Select senate districts in the “Features in:” dropdown menu 8. Click Filter under the dropdown menu mentioned in the previous step 9. Filter senate districts by NAME equal to 8 and click OK
10. Name the query “Points for Senate 8”
Appendix C – GeoMedia GIS Procedures Manual Manual Page 18
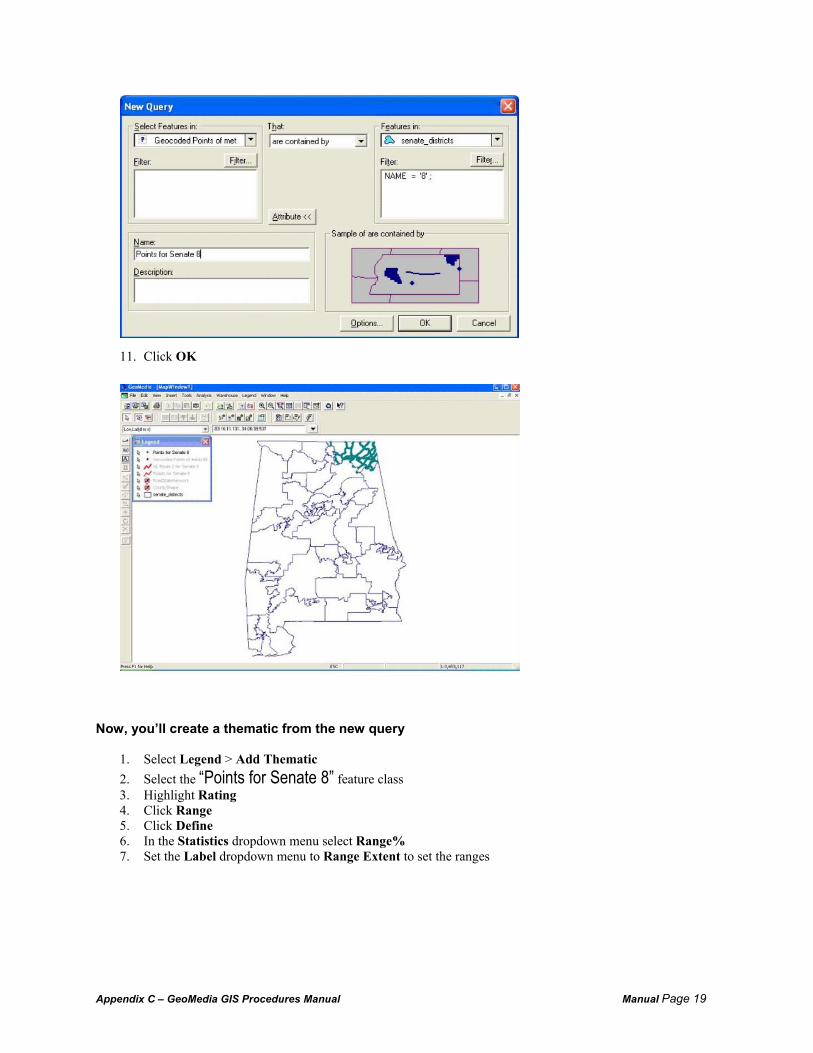
11. Click OK
Now, you’ll create a thematic from the new query
1. Select Legend > Add Thematic 2. Select the “Points for Senate 8” feature class 3. Highlight Rating 4. Click Range 5. Click Define 6. In the Statistics dropdown menu select Range% 7. Set the Label dropdown menu to Range Extent to set the ranges
Appendix C – GeoMedia GIS Procedures Manual Manual Page 19

8. Set the Labels 9. Set the Label dropdown menu to Description to edit the legend label
10. Edit the description 11. Click the Style button next to each range to set the color to be displayed by that range, and click OK 12. Click OK; The map now shows the points color-coded according to the ranges specified in step 8 and the
legend now has a new entry labeled according to the descriptions from step 10
Appendix C – GeoMedia GIS Procedures Manual Manual Page 20

B. You can also display query results in a data window and edit the results:
1. Select Analysis > Queries 2. Select the “Points for Senate 8” query, and click Display 3. Uncheck Display query in map window 4. Check Display data in data window, and click OK 5. Click Close; You can now edit the results of the query (*for illustration purposes only; don’t change
anything for this example Changes to the data may effect the tutorials that follow)
Appendix C – GeoMedia GIS Procedures Manual Manual Page 21

C. You can also display the statistics of the results by doing the following:
8. Highlight the RATING column by clicking the column title 9. Select Data > Column Statistics 10. The statistics for the RATING column will be shown
11. Select File > Save GeoWorkspace
Appendix C – GeoMedia GIS Procedures Manual Manual Page 22
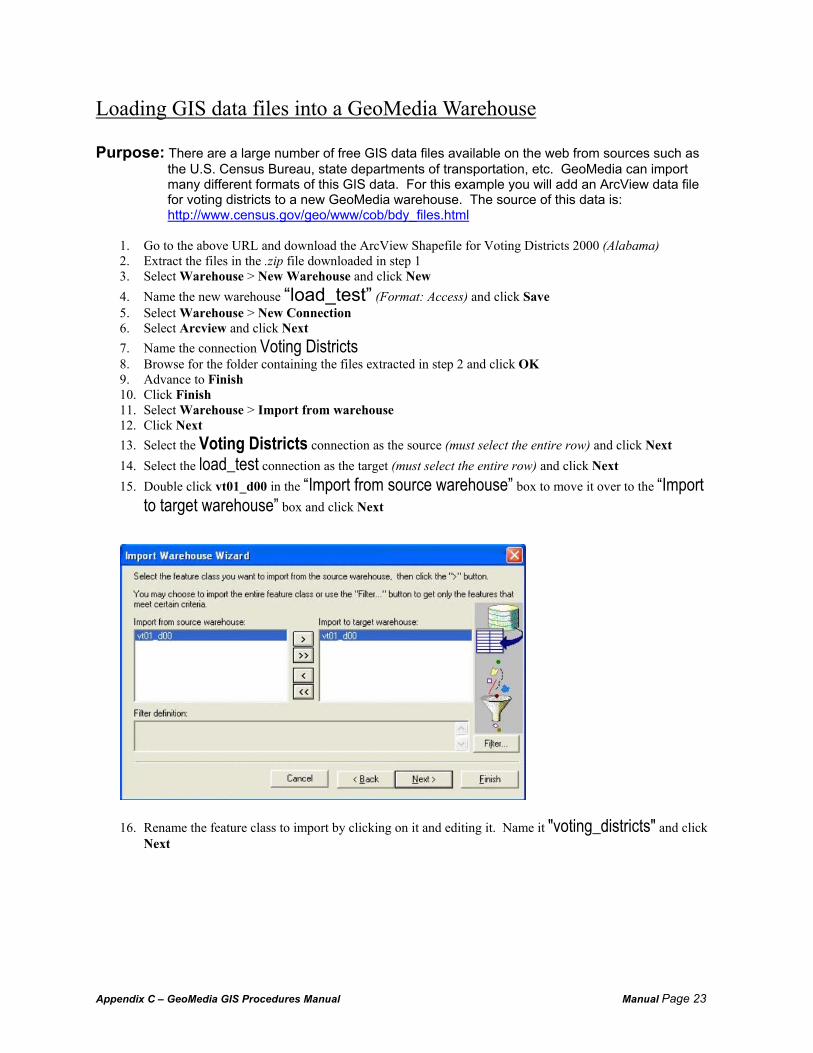
Loading GIS data files into a GeoMedia Warehouse Purpose: There are a large number of free GIS data files available on the web from sources such as
the U.S. Census Bureau, state departments of transportation, etc. GeoMedia can import many different formats of this GIS data. For this example you will add an ArcView data file for voting districts to a new GeoMedia warehouse. The source of this data is: http://www.census.gov/geo/www/cob/bdy_files.html
1. Go to the above URL and download the ArcView Shapefile for Voting Districts 2000 (Alabama) 2. Extract the files in the .zip file downloaded in step 1 3. Select Warehouse > New Warehouse and click New 4. Name the new warehouse “load_test” (Format: Access) and click Save 5. Select Warehouse > New Connection 6. Select Arcview and click Next 7. Name the connection Voting Districts 8. Browse for the folder containing the files extracted in step 2 and click OK 9. Advance to Finish 10. Click Finish 11. Select Warehouse > Import from warehouse 12. Click Next 13. Select the Voting Districts connection as the source (must select the entire row) and click Next 14. Select the load_test connection as the target (must select the entire row) and click Next 15. Double click vt01_d00 in the “Import from source warehouse” box to move it over to the “Import
to target warehouse” box and click Next
16. Rename the feature class to import by clicking on it and editing it. Name it "voting_districts" and click Next
Appendix C – GeoMedia GIS Procedures Manual Manual Page 23

17. Select “Do not create new legend entries" and click Next 18. Click Finish; the import will begin 19. Click Close when import is complete 20. Turn off all legend displays 21. Select Legend > Add feature class 22. From the "load_test" connection select "voting_districts" and click OK 32. Select View > Fit All
33. Select File > Save GeoWorkspace
Appendix C – GeoMedia GIS Procedures Manual Manual Page 24

Updating and Adding GIS Information to an Oracle Warehouse Purpose: This will be necessary when new political district files are received, ALDOT Districts change,
etc., or when GIS data that was not before present needs to be added.
1. If updating GIS info start with step 2, otherwise start with step 5 2. Search Oracle Database for existing table name (ie.GIS_ALSenateDis1996) 3. Record name for future use 4. Delete all tables beginning with this name (ie.GIS_ALSenateDis1996[…] 5. Select Warehouse > Output to feature class… 6. In the Select features to output drop down menu select the feature class you wish to output 7. In the Connection drop down menu select the Warehouse Connection you wish to output to (probably
"HYDRA") 8. In the Feature class drop down menu type in the new name of the feature class you are outputting (ie.
GIS_ALSenateDis2002) 9. Click OK 10. This process can take some time (up to 20 minutes)
Best Practices Format of Latitude and Longitude data: decimal degrees This format was chosen as best practice in order to standardize the way coordinates were fed into the system. In addition, it was found much to be simpler to handle from a data/programming point of view. The common format of degrees, minutes, seconds Lat/Long coordinates is DD:MM:SS.ssH. DD: degrees MM: minutes SS.ss: seconds H: hemisphere (e.g. N, S, E, W) As one can see, reading the various parts involves traversing the coordinates to extract the needed components in between each colon. Using decimal degrees resolves this issue and implements the coordinate as one number with hemisphere indicated by that number being positive or negative (e.g. -85.12354 is 85.12354 degrees WEST longitude; had the number been positive it would be EAST. The same applies for latitude coordinates.) Formula for converting Lat/Long coordinates from degrees, minutes, seconds to decimal degrees: Degrees + (minutes/60) + (seconds/3600) Note: When performing the above calculation make certain that all longitude parts are negative (e.g. degrees: -85 minutes: -32 seconds: -2.53)
Appendix C – GeoMedia GIS Procedures Manual Manual Page 25

Dynamic Segmentation Purpose: Dynamic segmentation provides the ability for a user to divide the road state network
template map into overlays so that project level analysis can occur.
1. Select the Transportation menu 2. Select Dynamic Segmentation 3. Select LRS Measure from the LRS Model Dropdown Box 4. Select GIS_ROADSTNETWORK for LRS Feature 5.
6. Select the LRS Feature Properties Button 7. Select RT_TYPE for Primary 8. Select RT_ID for Secondary 9. Select BEG_MP for Begin Measure 10. Select END_MP for End Measure 11. Select mi for LRS Unit 12. Push the OK Button
Appendix C – GeoMedia GIS Procedures Manual Manual Page 26

13. Select respective OVERLAY table from HYDRA for Event Feature 14. Select the Event Feature Attributes button 15. Deselect the Attributes that you do not wish to carry over, if any 16. Push the OK Button 17. Push the Event Feature Properties Button 18. Select ROUTE_TYPE for Primary 19. Select ROUTE_NUM for Secondary 20. Select the Linear Radial button for Event Type 21. Select Measure for Event reference type 22. Select OVERLAY_BEGIN_MILEPOST from the Start Measure Dropdown Box 23. Select OVERLAY_END_MILEPOST from the End Measure Dropdown Box 24. Select mi from the Measure Dropdown Box in the Units Section 25. Press OK
Appendix C – GeoMedia GIS Procedures Manual Manual Page 27

26. Deselect the Display in Map Window and the Display in Data Window check boxes, as you will not need to actually display the dynamic segmentation
27. Join the Dynamic Segmentation created in the prior steps to the respective table containing the average condition rating by overlay (you should join on the Overlay_ID field)
28. Add a thematic of this join for OVERLAY_RATING (see page 21) Issues: Need a template map with accurate begin and end milepost for each route. If the route is a single record, must have correct begin and end milepost. If the route is many records, it must be continuous, with no overlapping and have a correct begin milepost in the first record and end milepost in the last record. Make sure that the overlay table being used is clean. (ie. Continuous overlays)
Appendix C – GeoMedia GIS Procedures Manual Manual Page 28

Political District Backfill Purpose: This procedure details how to update the Hydra database with new political district numbers.
This procedure will be used in the event there is a change in the layout of a political district in the State of Alabama. In order for procedure to perform properly one must have administrator privileges, at least GeoMedia 5 Professional, and Access.
NOTE 1: The procedures hereafter are designed for application in GeoMedia 5 Professional NOTE 2: Due to the large numbers of records it is suggested that the condition table and the
political district feature classes be copied in to Access to speed up the process Access Create Table
1. Create a blank database 2. Under the file menu select Get External Data 3. Select link tables 4. In the file type menu bow select ODBC Databases 5. On the select data source window, click the Machine Data Source tab 6. Highlight HydraGIS and click Ok 7. Type in the appropriate password 8. On the link table window, 9. Select the most recent condition table
i. Example: Hydra.Condition_1999 10. Select the query tab in the database window 11. Click on the Create table in design view 12. Select the condition table in the show table window 13. In the Query menu on the file bar, select the Make Table Query 14. In the table name box type Condition 15. Click and drag the ‘*’ into the first field row 16. Close the window and save the query 17. Run the query 18. Select Yes to the message box 19. Select the table tab 20. Delete the link to Hydra.Condition_1999 21. Save the database to the warehouse folder on your hard drive
Open GeoMedia 5 Pro Select a blank workspace Connect to HydraGis
1. Under Warehouse, Select New Connection 2. Select Oracle Relational Model Read/Write for the connection type 3. Name the Connection
a. Example: HydraGis b. User Name: hydragis c. Password: aldothydra d. Host: hydra
Appendix C – GeoMedia GIS Procedures Manual Manual Page 29

Connect to the Access database
1. Under Warehouse, Select New Connection 2. Select Access for the connection type 3. Name the Connection
a. Example: PoliticalBackFill 4. Click browse 5. Select the Access database with the condition table in it 6. Click next until the window closes
Output the Political Districts to Access database
1. Under Warehouse, Select Import from Warehouse 2. Click Next 3. Select source warehouse (Hydra) 4. Select target warehouse (Access Database) 5. Select the feature classes to import (AL Senate and House Districts and US Congressional Districts) 6. Click Next 7. Select “Do not create New Legend Entries” 8. Click Finish 9. Close the connection to HydraGis
GeoCode Condition Points
1. Under Analysis Menu, Select Geocode Coordinates 2. Geocode attributes in: Condition_1999 3. Coordinate attributes
a. Latitude: Cond_Lat_Dec b. Longitude: Cond_Long_Dec
4. Deselect display in map window and data window
Appendix C – GeoMedia GIS Procedures Manual Manual Page 30

Aggregate Condition and Political Districts
1. Under Analysis Menu, Select Aggregation 2. Select the Geocoded Condition points for the aggregate to summary features 3. Select the appropriate political district map (AL House, Senate or Congressional) 4. Click the Spatial Aggregation tab 5. Select ‘are contained by’ in the drop down box
6. Click the Output tab 7. Type a name for the functional attribute
a. Example: For AL House Districts type AL_House_Num 8. Click First under the Functions menu 9. Click Detail.District under the Attribute menu 10. Click Add 11. Click Close
12. Deselect display in map and data window 13. Click Ok
Appendix C – GeoMedia GIS Procedures Manual Manual Page 31

Output to Feature Class
1. Select features to Output: Aggregation of Geocoded condition points and political district 2. Select output feature class
a. Connection: Condition b. Feature Class: Type in the specific Political district
i. Example: Condition_USCongDist_2002 3. Do not display in map or data window 4. Click Ok
NOTE 3: The table is created with the new political district number and is located in the Access
database. Repeat the Aggregation of Condition and Political Districts and Output to Feature Class for all Political Districts.
Moving the New Political District Number into Hydra
1. Open your access database 2. Connect to Hydra 3. See Access create table instructions 2-8 4. Link the table:
a. HYDRAGISRPT.Political_disrticts b. HYDRA.BASE_COND_DETAIL
5. Go to the query menu 6. Click Make query in design view 7. Highlight
a. HYDRAGISRPT.Political_disrticts 8. Click Ok 9. Click Close 10. Change the query type to Delete Query 11. In the first column 12. Place the * in the Field column 13. Run the query 14. This cleans all the existing records form the table 15. Close the Delete Query 16. Create a table (Political District) with the following attributes
a. COND_ID b. AL_SENATE c. AL_HOUSE d. US_CONG e. BASE_ID
17. Click Make query in design view 18. Highlight
a. One of the Political district tables b. Newly created Political District table
19. Write an Append query copy the cond_id and the district number in to the new table 20. Run the query 21. Create a new query to update the remaining two political district fields with the appropriate information 22. Run the query 23. Write another update query to copy the base_id from the base condition detail table where condition id is
equal 24. Run the query 25. Now that all the fields are populated in the table, verify that the table is correct 26. If the table is correct INSERT the political district table into the Oracle HYDRAGISRPT.Political_District
table
Appendix C – GeoMedia GIS Procedures Manual Manual Page 32
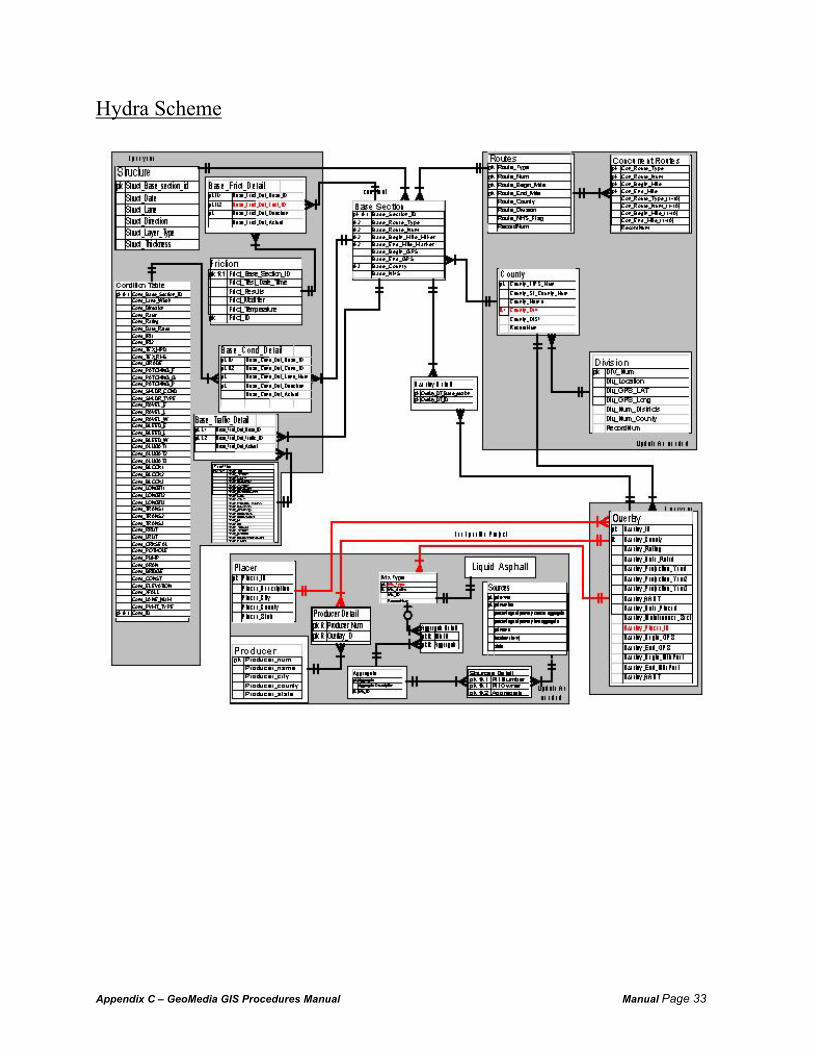
Hydra Scheme
Appendix C – GeoMedia GIS Procedures Manual Manual Page 33

GIS Table Names and Summary Tables
GIS Tables: GIS_ALABAMALABEL GIS_COUNTIES GIS_ALABAMASHAPE GIS_COUNTYLAB GIS_ALHOUSEDIS GIS_DIVISIONLAB GIS_ALHOUSELAB GIS_DIVISIONS GIS_ALSENATEDIS GIS_ROADSTNETWORK GIS_ALSENATELAB GIS_USCONGDIS GIS_BRIDGES GIS_USCONGLAB
Predefined Summary Tables Average Condition Rating By: AV_COND_RATING_CO AV_COND_RATING_DIV AV_COND_RATING_RT1D AV_COND_RATING_RTTYPE AV_COND_RATING_RT AV_COND_RATING_SEG1D AV_COND_RATING_SEG Average Friction Rating By: AV_FRICT_CO AV_FRICT_DIV AV_FRICT_RT1D AV_FRICT_RTTYPE AV_FRICT_RT AV_FRICT_SEG1D AV_FRICT_SEG Average Segment Age By: AV_SEG_AGE_CO AV_SEG_AGE_DIV AV_SEG_AGE_RT AV_SEG_AGE_RT_DIR AV_SEG_AGE_RT_TYPE Average GASB Rating By: GASB_RATE_CO GASB_RATE_DIV GASB_RATE_RTTYPE GASB_RATE_RTYPE_ONEDIR Total Distance (Center Lane) By: TOTAL_DIST_CO TOTAL_DIST_DIV TOTAL_DIST_RT TOTAL_DIST_RT_DIR TOTAL_DIST_RT_TYPE
Appendix C – GeoMedia GIS Procedures Manual Manual Page 34

8.0 Glossary Boundary: a geographically represented area (i.e. county, division, state, etc.) Feature Class: is represented in a map window by geometry and is further defined by non-graphic attributes in the database Thematic: A map that uses colors and patterns to portray the spatial characteristics and distribution of features in the map window.
Appendix C – GeoMedia GIS Procedures Manual Manual Page 35

Appendix C – GeoMedia GIS Procedures Manual Manual Page 72
Related Documents