Executive Summary of Affirmative Action & Diversity Plan Workforce as of 8/31/09 Activities from 9/1/08 to 8/31/09

Executive Summary of Affirmative Action & Diversity Plan Workforce as of 8/31/09 Activities from 9/1/08 to 8/31/09.
Dec 21, 2015
Welcome message from author
This document is posted to help you gain knowledge. Please leave a comment to let me know what you think about it! Share it to your friends and learn new things together.
Transcript

Executive Summary of Affirmative Action& Diversity Plan
Workforce as of 8/31/09Activities from 9/1/08 to 8/31/09

GVSU WORKFORCEChange By Race & Gender
Minorities FemalesDate Total # % # %Fall, 2005 1668 224 13% 907 54%Fall, 2006 1746 252 14% 956 55%Fall, 2007 1811 259 14% 985 54%Fall, 2008 1898 282 15% 1025 54%Fall, 2009 1973 291 15% 1070 54%Note: Regular, full & part time; not seasonal or temporarySince 2005: +305 employees, +18% overall growthMinorities: +67 minority employeesFemales: +163 female employees

TOTAL WORKFORCE: By Race & Ethnicity Fall 2005 to Fall 2009
Number
Date White Black HispanicAsian Amer
Native Amer
Fall, 2005 1444 111 50 55 8Fall, 2006 1494 122 53 69 8Fall, 2007 1552 120 55 75 9Fall, 2008 1616 134 58 81 9Fall, 2009 1682 129 63 89 10
Percentage
Date White Black HispanicAsian Amer
Native Amer
Fall, 2005 86.6% 6.7% 3.0% 3.3% 0.5%Fall, 2006 85.6% 7.0% 3.0% 4.0% 0.5%Fall, 2007 85.7% 6.6% 3.0% 4.1% 0.5%Fall, 2008 85.1% 7.1% 3.1% 4.3% 0.5%Fall, 2009 85.3% 6.5% 3.2% 4.5% 0.5%Note: Regular, full & part time; not seasonal or temporary
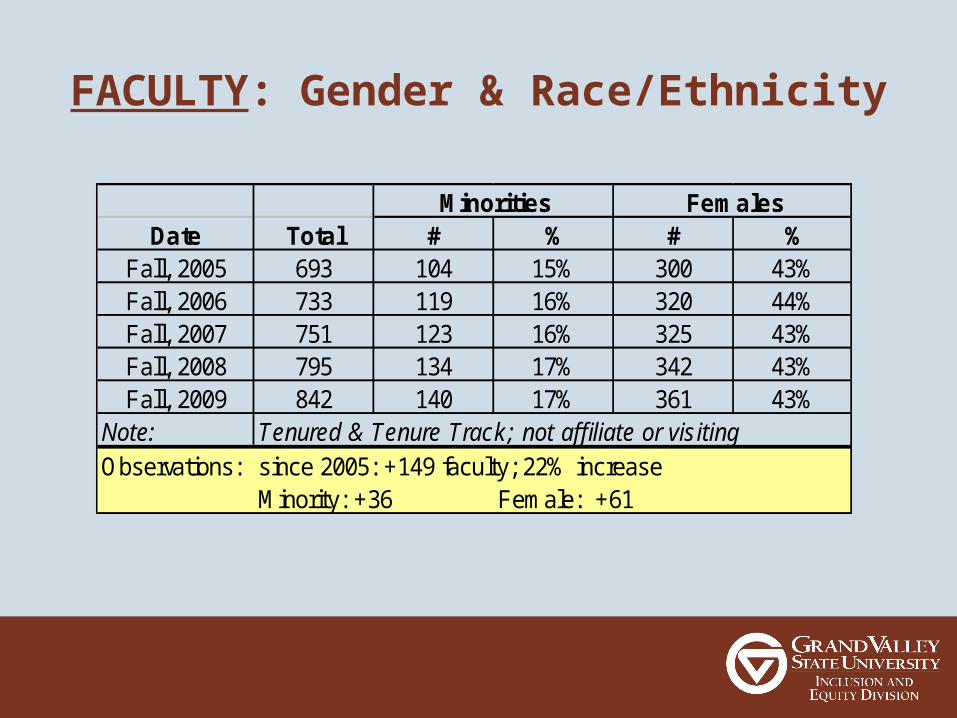
FACULTY: Gender & Race/Ethnicity
Minorities FemalesDate Total # % # %
Fall, 2005 693 104 15% 300 43%Fall, 2006 733 119 16% 320 44%Fall, 2007 751 123 16% 325 43%Fall, 2008 795 134 17% 342 43%Fall, 2009 842 140 17% 361 43%
Note: Tenured & Tenure Track; not affiliate or visitingObservations: since 2005: +149 faculty; 22% increase
Minority: +36 Female: +61
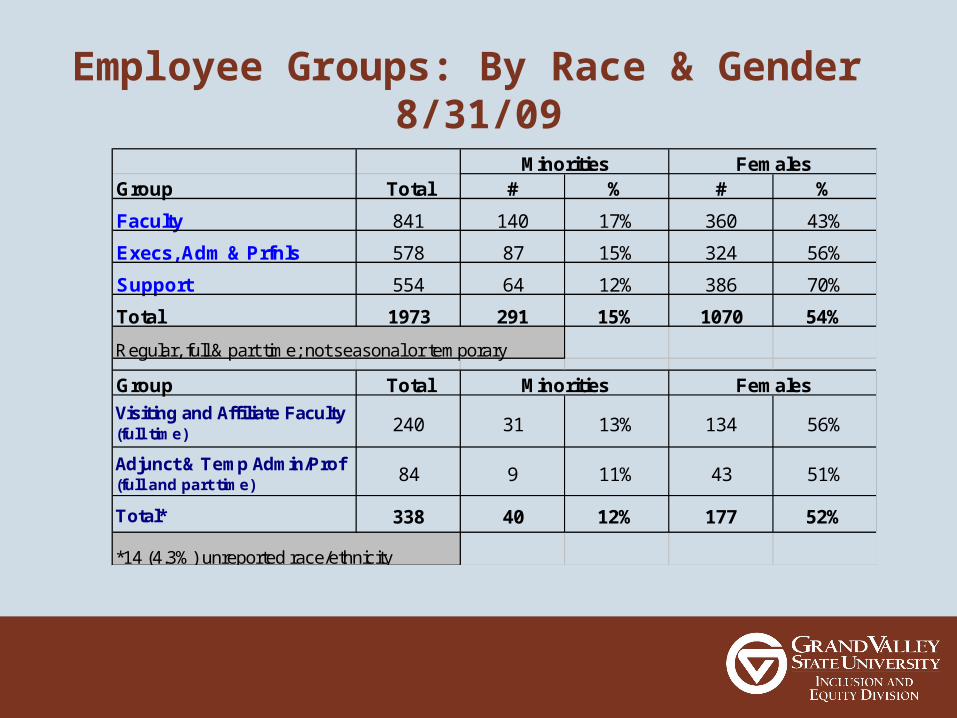
Employee Groups: By Race & Gender 8/31/09
Minorities FemalesGroup Total # % # %
Faculty 841 140 17% 360 43%
Execs, Adm & Prfnls 578 87 15% 324 56%
Support 554 64 12% 386 70%
Total 1973 291 15% 1070 54%
Regular, full & part time; not seasonal or temporary
Group Total Minorities Females
Visiting and Affiliate Faculty (full time) 240 31 13% 134 56%
Adjunct & Temp Admin/Prof (full and part time)
84 9 11% 43 51%
Total* 338 40 12% 177 52%
*14 (4.3%) unreported race/ethnicity

Applicants v. Hires – Minority & Non-minority 9/1/08 – 8/31/09
NUMBERS Total* Minorities Non-minoritiesGroup Applicants** Hires Applicants** Hires Applicants** Hires
Faculty 2,034 65 641 10 1,393 55Execs, Adm & Prof 3,312 57 604 9 2,708 48Support Staff 4,482 37 559 5 3,923 32TOTAL 9,828 159 1,804 24 8,024 135
PERCENTS Total* Minorities Non-minoritiesGroup Applicants** Hires Applicants** Hires Applicants** Hires
Faculty 2,034 65 32% 15% 68% 85%Execs, Adm & Prof 3,312 57 18% 16% 82% 84%Support Staff 4,482 37 12% 14% 88% 86%TOTAL 9,828 159 18% 15% 82% 85%* Total: Regular, full & part time; not seasonal or temporary**Applicants:Total =10,594; 93% self-ID rate; includes only applicants who met minimum qualifications
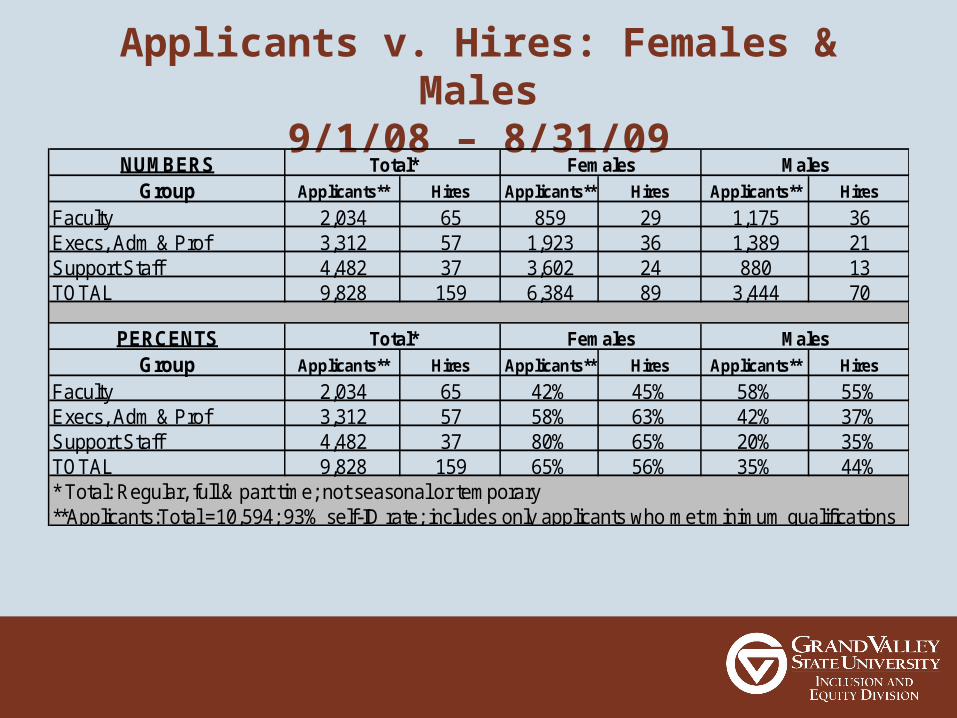
Applicants v. Hires: Females & Males9/1/08 – 8/31/09
NUMBERS Total* Females MalesGroup Applicants** Hires Applicants** Hires Applicants** Hires
Faculty 2,034 65 859 29 1,175 36Execs, Adm & Prof 3,312 57 1,923 36 1,389 21Support Staff 4,482 37 3,602 24 880 13TOTAL 9,828 159 6,384 89 3,444 70
PERCENTS Total* Females MalesGroup Applicants** Hires Applicants** Hires Applicants** Hires
Faculty 2,034 65 42% 45% 58% 55%Execs, Adm & Prof 3,312 57 58% 63% 42% 37%Support Staff 4,482 37 80% 65% 20% 35%TOTAL 9,828 159 65% 56% 35% 44%* Total: Regular, full & part time; not seasonal or temporary**Applicants:Total =10,594; 93% self-ID rate; includes only applicants who met minimum qualifications
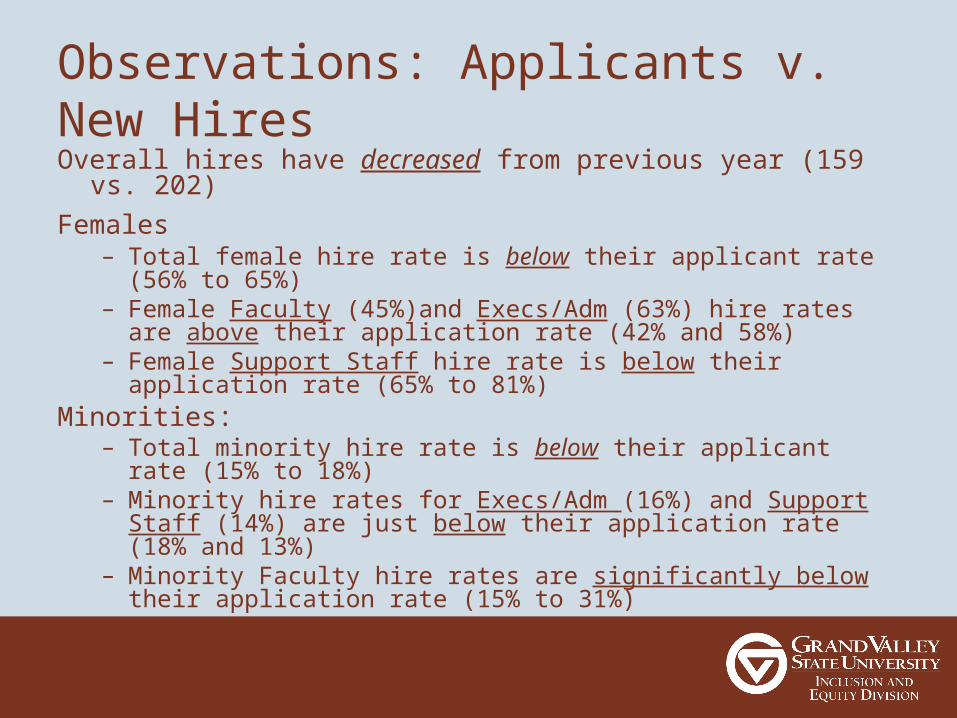
Observations: Applicants v. New HiresOverall hires have decreased from previous year (159 vs. 202)
Females – Total female hire rate is below their applicant rate (56% to 65%)– Female Faculty (45%)and Execs/Adm (63%) hire rates are
above their application rate (42% and 58%) – Female Support Staff hire rate is below their application rate
(65% to 81%)Minorities:
– Total minority hire rate is below their applicant rate (15% to 18%)– Minority hire rates for Execs/Adm (16%) and Support Staff (14%)
are just below their application rate (18% and 13%)– Minority Faculty hire rates are significantly below their
application rate (15% to 31%)

Hires v. Separations: Race and Gender2005 TO 2009
Numbers Total Minorities FemalesActivity Year Hires Separations Hires Separations Hires Separations
08/31/04 to 08/30/05 125 84 26 20 70 4508/31/05 to 08/31/06 156 80 35 10 92 4609/01/06 to 08/31/07 152 93 18 13 82 5509/01/07 to 08/31/08 202 118 41 20 105 6609/01/08 TO 08/31/09 159 88 24 14 89 46
TOTAL 1150 628 218 117 619 344
Percents Total Minorities FemalesActivity Year Hires Separations Hire Rate Sep Rate Hire Rate Sep Rate
08/31/04 to 08/30/05 125 84 21% 24% 56% 54%08/31/05 to 08/31/06 156 80 22% 13% 59% 58%09/01/06 to 08/31/07 152 93 12% 14% 54% 59%09/01/07 to 08/31/08 202 118 20% 17% 52% 56%09/01/08 TO 08/31/09 159 88 15% 16% 56% 52%
TOTAL 1150 628 19% 19% 54% 55%

Hires v. Separations: Employee Groups 9/1/08 – 8/31/09
Numbers Total Minorities FemalesGroup Hires Separations Hires Separations Hires Separations
Faculty 65 30 10 5 29 14Execs & Admin 57 37 9 5 36 17Support 37 21 5 4 24 15Total 159 88 24 14 89 46
Percents Total Minorities FemalesGroup Hires Separations Hires Separations Hires Separations
Faculty 65 30 15% 17% 45% 47%Execs & Admin 57 37 16% 14% 63% 46%Support 37 21 14% 19% 65% 71%Total 159 88 15% 16% 56% 52%Note: Minority Faculty & Support groups separation rate are higher than their hire rate Note: Female Faculty & Support separation rate are higher than their hire rate

Observations: Hires v. Separations
Females – Female separation rates decreased from previous year (56% to
52%)– Female Exec/Adm hire rate above their separation rate (63% v
46%) – Female Faculty hire rate is just below their separation rate (45%
v 47%)
Minorities– Minority separation rates decreased from previous year (17% to
16%)– Minority total hire rate is below their separation rate by 1% (15%
v 16%)– Minority hire rate is below their separation rate in all 3 employee
groups

Promotions Rates v. Employment Rates 9/1/08 – 8/31/09
Numbers Total Minorities FemalesGroup Promotions Employed* Promotions Employed* Promotions Employed*
Faculty 27 842 6 140 17 361Execs & Admin 68 578 13 87 34 385Support 49 553 3 64 39 324Total 144 1973 22 291 90 1070
Percents Total Minorities FemalesGroup Promotions Employed* Promotions Employed* Promotions Employed*
Faculty 27 842 22% 17% 63% 43%Execs & Admin 68 578 19% 15% 50% 67%Support 49 553 6% 12% 80% 59%Total 144 1973 15% 15% 63% 54%Promotion rate 7.3% (based on total employed at beginning of year: 8/31/09)
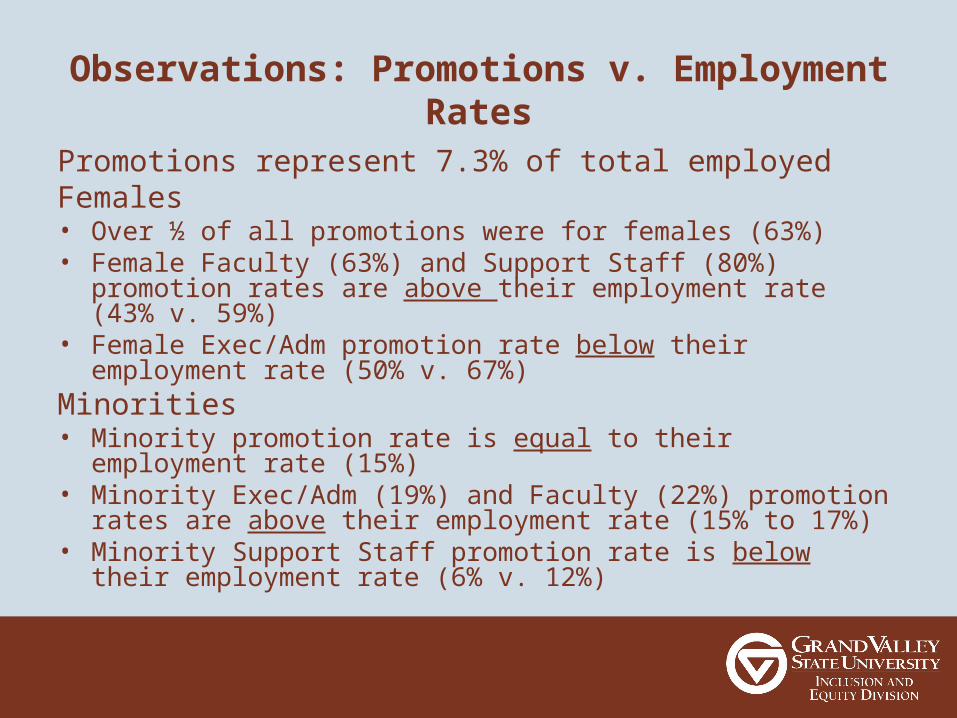
Observations: Promotions v. Employment Rates
Promotions represent 7.3% of total employedFemales• Over ½ of all promotions were for females (63%)• Female Faculty (63%) and Support Staff (80%) promotion rates
are above their employment rate (43% v. 59%)• Female Exec/Adm promotion rate below their employment rate
(50% v. 67%)Minorities• Minority promotion rate is equal to their employment rate (15%)• Minority Exec/Adm (19%) and Faculty (22%) promotion rates are
above their employment rate (15% to 17%)• Minority Support Staff promotion rate is below their employment
rate (6% v. 12%)

Minority Students: Enrollment & Degrees
Minority Student DataGVSU Fall '09
Mich 2006
US 2006
Minority Undergrads Students Enrolled 12% 18% 28%Minority Undergrad Degrees Awarded 10% 15% 23%
Minority Graduate Students Enrolled 10% 19% 24%Minority Graduate Degrees Awarded 10% 19% 22%Source: IPEDS 2006

Workforce Force Comparisons: Gender
Total WkfcTotal
Females
Total GVSU 8/31/09 1,973 54%LABOR FORCE STATISTICS
GR MSA (Kent, Muskegon, Ottawa counties) (2000 Cens)
566,389 46%
United States (2000 Census) 1,080,625 46%
Employed at 4-yr Public Universities in United States 2007 (National Center for Education Statistics)
1,743,935 53%
Employed at 4-yr Public Universities in Michigan 2007 (IPEDS)
69,036 53%
* GVSU employed females are slightly above females employed at Michigan 4-yr Public Universities
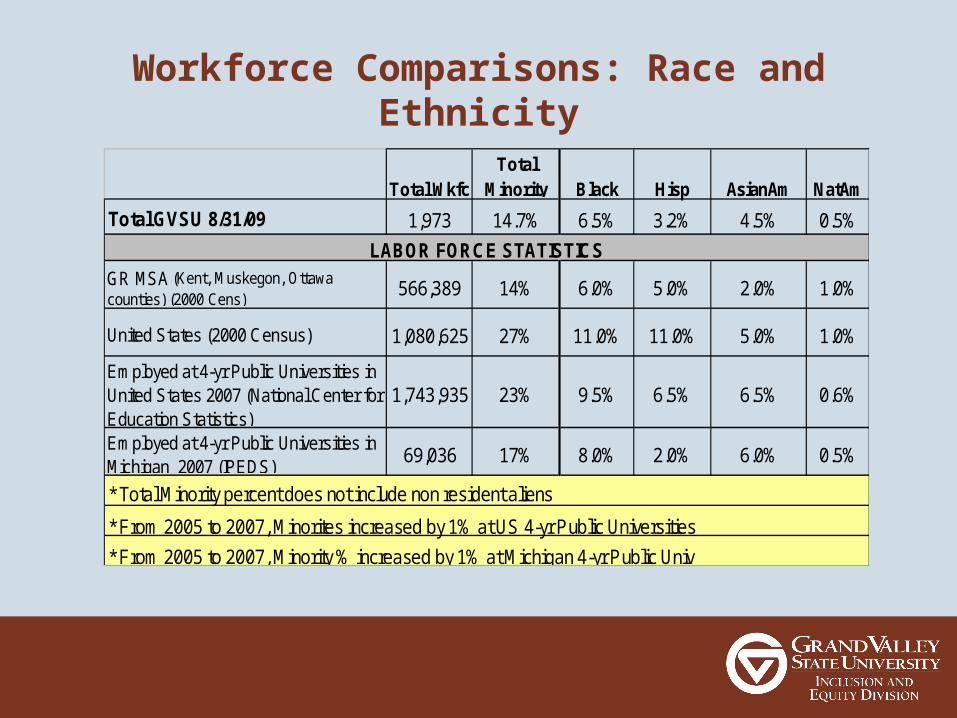
Workforce Comparisons: Race and Ethnicity
Total WkfcTotal
Minority Black Hisp AsianAm NatAm
Total GVSU 8/31/09 1,973 14.7% 6.5% 3.2% 4.5% 0.5%
LABOR FORCE STATISTICSGR MSA (Kent, Muskegon, Ottawa counties) (2000 Cens)
566,389 14% 6.0% 5.0% 2.0% 1.0%
United States (2000 Census) 1,080,625 27% 11.0% 11.0% 5.0% 1.0%
Employed at 4-yr Public Universities in United States 2007 (National Center for Education Statistics)
1,743,935 23% 9.5% 6.5% 6.5% 0.6%
Employed at 4-yr Public Universities in Michigan 2007 (IPEDS)
69,036 17% 8.0% 2.0% 6.0% 0.5%
* Total Minority percent does not include non resident aliens
* From 2005 to 2007, Minorites increased by 1% at US 4-yr Public Universities
* From 2005 to 2007, Minority % increased by 1% at Michigan 4-yr Public Univ

Doctorates Awarded 2004, 2005, & 2006
2004 2005 2006# % # % # %
Total Doctorates 42,155 100% 43,354 100% 45,596 100%Doctorates to minorities 7,638 18% 5,467 13% 6,077 13%Doctorate to females 19,098 45% 19,564 45% 20,539 45%Doctorates to foreign nationals 11,585 27% 14,424 33% 15,947 35%
Source: National Survey of Earned Doctorates, National Science Foundation
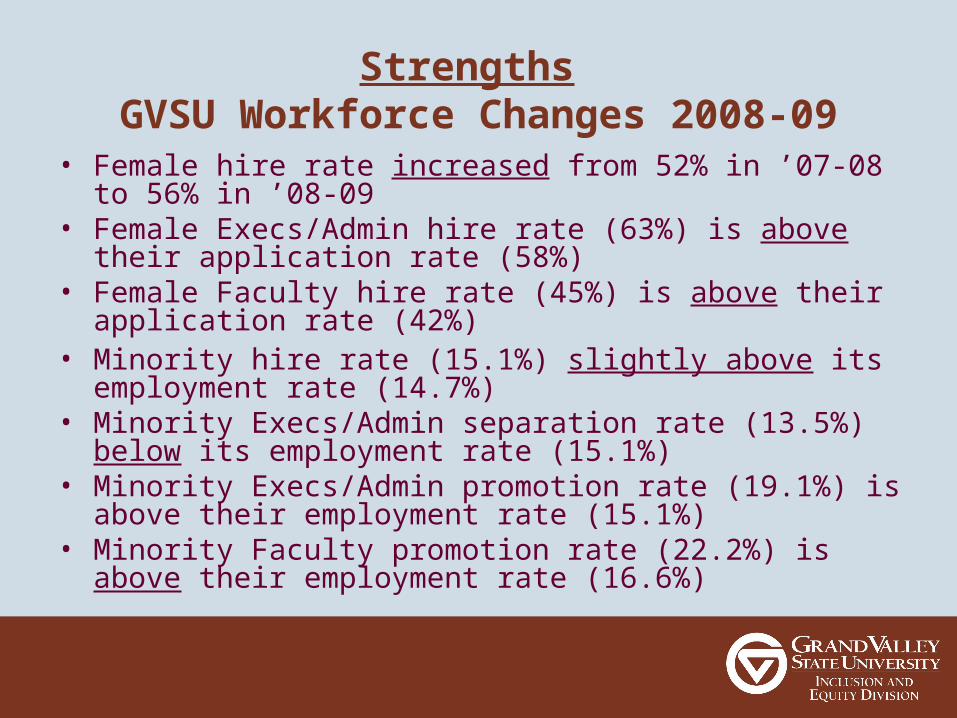
Strengths GVSU Workforce Changes 2008-09
• Female hire rate increased from 52% in ’07-08 to 56% in ’08-09• Female Execs/Admin hire rate (63%) is above their application
rate (58%)• Female Faculty hire rate (45%) is above their application rate
(42%)• Minority hire rate (15.1%) slightly above its employment rate
(14.7%)• Minority Execs/Admin separation rate (13.5%) below its
employment rate (15.1%)• Minority Execs/Admin promotion rate (19.1%) is above their
employment rate (15.1%)• Minority Faculty promotion rate (22.2%) is above their
employment rate (16.6%)

Challenges … based on most recent workforce changes
• Female Faculty separation rate (47%) is above their hire rate (45%)
• Female Support separation rate (71%) is above their hire rates (65%)
• Female Faculty separation rate (47%) is above their employment rate (43%)
• Total Minority hire rates are below their application rates (15% to 18%)
• Minority Faculty hire rate is only half of their application rate (15% to 31%)
• Minority Faculty separation rate (17%) is above their hire rate• Minority Support separation rate (19%) is above their hire rate
(14%)

GVSU Annual Report on Affirmative Action & Diversity

The following slides have been used in previous years. They have not been updated.

Diversity in Higher Education*???
Diversity improves teaching and learning, in and out of the classroom FOR ALL STUDENTS
Students are exposed to multiple perspectives on a range of issues
Students’ existing perspectives are challenged Students’ critical thinking and problem solving
skills are strengthened
From Coleman, Arthur, “Diversity in Higher Education: A Continuing Agenda” Citizens’ Commission on Civil Rights

Benchmarks -???
4 year public colleges & universities - employed– United States– Michigan
Student enrollment and graduation demographics– United States– Michigan
Labor force statistics (Census) – Local (GR MSA)– National (US)
Applicant, hire, separation, promotion rate comparisonsUtilization analysis compared to availability %’s (local,
state, national) (census, degrees awarded)GVSU diversity studies
Utilization Analysis and Employment Activities
Inclusion Advocate Program for search committees
Patterns based on utilization & employment activities:– Application rates v. hire rates– Hire v. separation rates– Multi-year Patterns – Employment rates v. availability percents
Academic Affairs Division Strategic Planning, includes diversity considerations (Deans)
HR provides ‘FYI’ data to search committees
?? Another Benchmark2005 GVSU Diversity Study
Climate of Acceptance: People of color, GLBT, and disabled are less likely to feel accepted
Prevalence of Disparaging Remarks: Most occur in informal conversations, mostly spoken by students, mostly about politics or religion although race, sexual orientation, gender, and English-speaking skill are also disparaged
Negative Treatment: People of color, GLBT, and disabled disproportionately experience this
Commitment to Diversity: People of color and GLBT are less likely to believe GVSU is committed to diversity

??Diversity Study: Follow-up
CONVERSATIONS held with representatives from the groups who indicated they were less likely to feel accepted at GVSU
Predominant themes from these conversations were ACCESS and ACCOUNTABILITY
Next steps:– DIVERSITY DIRECTORY for 1st year students– BIAS INCIDENT PROTOCOL now in place

GVSU Strategic Planning

Race and Gender Conscious? Race and Gender Neutral?
Michigan’s proposition 2 requires race and gender neutral processes
Federal affirmative action regulations require race and gender based objectives

Valuing Diversity
Conversations about race or gender… … while there may always be disagreement on the best way to achieve greater diversity, coming to agreement that diversity in higher education is both an educational and economic imperative is critical
Demographic– Majority of new entrants to the labor force will be people of
color, women and immigrants
Business & human interests– Compelling to everyone– CQI – a quality initiative– Tangible gains for everyone

Valuing Diversity: Pitfalls
Don’t dummy down – valuing diversity does not mean compromising quality or standards
Use your workforce demographics to have honest and genuine discussions about troubling patterns
Don’t just react; save time, energy and $$ by being proactive rather than reactive
Related Documents