MSC certification of Guyana’s industrial seabob fishery Report 1: Guyana commercial sampling scheme and stock assessment on three key commercial species Centre for Environment, Fisheries and United Kingdom Hydrographic Office (UKHO) National Oceanography Centre (NOC) Aquaculture Science (Cefas) Admiralty Way, Taunton, Somerset, TA1 2DN European Way, Southampton, Hampshire, Pakefield Road, Lowestoft, Suffolk, NR33 0HT SO14 3ZH www.cefas.co.uk www.gov.uk/ukho www.noc.ac.uk

Welcome message from author
This document is posted to help you gain knowledge. Please leave a comment to let me know what you think about it! Share it to your friends and learn new things together.
Transcript

MSC certification of Guyana’s industrial seabob
fishery
Report 1: Guyana commercial sampling scheme and stock
assessment on three key commercial species
Sustainable Fisheries
Centre for Environment, Fisheries and United Kingdom Hydrographic Office (UKHO) National Oceanography Centre (NOC)Aquaculture Science (Cefas) Admiralty Way, Taunton, Somerset, TA1 2DN European Way, Southampton, Hampshire, Pakefield Road, Lowestoft, Suffolk, NR33 0HT SO14 3ZHwww.cefas.co.uk www.gov.uk/ukho www.noc.ac.uk

Cefas Document Control
Submitted to: Ed McManus
Date submitted: 30/04/2018
Project Manager: Lyn Elvin
Report compiled by: Ana Ribeiro Santos, Nicola Walker, Jose de Oliveira and Stephen Mangi
Quality control by: Stephen Mangi, Bryony Townhill
Approved by and date: Ed McManus 30/04/2018
Version: 5
Version Control HistoryAuthor Date Comment Version
Ana Ribeiro Santos 27/02/18 Initial version 1Nicola Walker and Jose de Oliveira
02/03/2018 Stock assessment section
2
Ana Ribeiro Santos, Nicola Walker, Jose de Oliveira
06/03/2018 Edits from S Mangi
3
Ana Ribeiro Santos, Nicola Walker, Jose de Oliveira and Stephen Mangi
25/04/2018 Edits from Bryony Townhill
4
Ed McManus 30/04/2018 Ed McManus 5
2

Executive SummaryFor a fishery to achieve Marine Stewardship Council (MSC) certification, it needs to be underpinned by rigorous and scientifically credible data and information. Local stakeholders in Guyana have requested technical support from Cefas towards completing specific analyses and producing reports on stock assessment, habitat and ecosystem impacts, and training in the setting up and running of an observer programme. The Seabob Working Group (our main local stakeholder group/research partner) has indicated that it intends to include these reports in their application for MSC certification. Report 1 (this report) presents exploratory analyses on the sampling scheme, quality of the data collected and carries out length-based stock assessment for three primary species: Bangamary (Macrodon ancylodon), Sea trout (Cynoscion virescens) and Butterfish (Nebris microps). It is based on on-shore sampling data collected between 2002 and 2015 by Guyana’s Fisheries Department. The three species assessed are the target species for the artisanal fisheries using gillnets, seines (Chinese pin) and cadell lines. They are caught as by-catch by the industrial trawlers targeting Atlantic seabob (Xiphopenaeus kroyeri). As data limited stocks, length-based stock assessment should be applied for these three species. Findings show that the current on-shore sampling scheme is representative of most of the landings in Guyana's ports, with most of the samples being collected from the major ports and gear types, but also covering areas, ports and gears with fewer landings. Towards stock assessment, three key recommendations are made. These include: i) the need for reliable life history parameters as only one species had an estimate, which appears far too low; ii) the need for data on total catch (i.e. landings plus discards) as only landings data were available; and iii) reliable length frequencies for single years to allow a check on the stability of estimates over time. Here length frequencies from several years (2002-2015) were combined to obtain a single length-frequency distribution. Given that sampling across years has been uneven and inconsistent, doing so assumes that conditions in the fishery and stocks have not changed for a long period of time.
3

Contents
EXECUTIVE SUMMARY.........................................................................31. SCOPE............................................................................................52. THE MARINE STEWARDSHIP COUNCIL (MSC) CERTIFICATION PROCESS.........................................................................................................63. GUYANA’S COMMERCIAL SAMPLING PROGRAMME.............................93.1 Sampling programme......................................................................................93.2 Stock assessment............................................................................................94. DATA...........................................................................................105. ASSESSING THE SPATIAL AND TECHNICAL REPRESENTATIVENESS OF THE SAMPLING PROGRAMME.............................................................135.1 Spatial sampling............................................................................................145.2 Sampling by gear...........................................................................................166. LENGTH FREQUENCY.....................................................................186.1 Bangamary....................................................................................................196.2 Butterfish.......................................................................................................196.3 Sea trout........................................................................................................206.4 Length frequency analyses............................................................................216.5 Length frequency plots..................................................................................226.6 Mean length between 2002 and 2015...........................................................267. CATCH PER UNIT EFFORT (KG/DAY)................................................268. STOCK ASSESSMENT.....................................................................298.1 Method...........................................................................................................298.2 Analysis.........................................................................................................309. FINAL CONSIDERATIONS................................................................339.1 Data...............................................................................................................339.2 Sampling scheme..........................................................................................349.3 Stock Assessment..........................................................................................3410. NEXT STEPS................................................................................35REFERENCES....................................................................................35
1. ScopeSeabob, a short-lived shallow water shrimp found in the western central Atlantic, is
4

Guyana’s most valuable seafood export and ranks fifth among exports overall. Almost all seabob harvested by the industrial fishery is exported to the US with a value of ~ US$45 million annually. Increasingly, customers of Guyana’s seabob are demanding Marine Stewardship Council (MSC) certification. The MSC is an international non-profit organisation established to address the problem of unsustainable fishing and safeguard seafood supplies for the future. It runs a certification and eco-labelling program for wild-capture fisheries. For a fishery to attain MSC certification, it must meet the MSC Fisheries Standard, which is based upon the United Nations Food and Agriculture Organization (FAO) Code of Conduct for Responsible Fisheries.
In Year I of the Commonwealth Marine Economies (CME) Programme, Cefas i) provided an expert external review of key documents required for MSC certification; ii) reviewed existing data for key by-catch species and habitats (for both by-catch species and seabob) and their suitability for stock assessment; and iii) provided general and specialist training to Fisheries Department personnel in stock assessment, habitat mapping and other key science areas in fisheries management. Building on this initial assessment, reviews and training, work in Year II focused on completing specific analyses and producing reports on stock assessment, habitat and ecosystem impacts, and training in the setting up and running of an observer programme. The Seabob Working Group (our main local stakeholder group/research partner) has indicated that it intends to include these in their application for MSC certification.
The main objective of this work is to provide expert technical support to Guyana towards attaining MSC certification for the seabob trawl fishery and in the process build the Fisheries Department’s capacity for more efficient independent future progress on the ongoing fisheries improvement project (FIP) and in fisheries management.Specifically, the project focuses on three main areas:
Ecosystems and habitat mapping. Technical support is being provided towards vessel monitoring system (VMS) data analysis and habitat mapping of seabed within the seabob trawl zone along with sampling of seabed communities and their structure in trawled and less trawled areas.
Stock assessment. Length-based stock assessment (suitable for data poor stocks) is being carried out on the key bycatch species (Bangamary, Seatrout and Butterfish) using datasets that Cefas helped the Fisheries Department clean, sort and prepare last year.
Observer programme. To support the Fisheries Department (FD) in Guyana develop and run an observer programme for trawlers targeting seabob to demonstrate awareness of impacts of their fishery on ecosystems including levels of by-catch/discards. This information is needed to achieve MSC certification of the Industrial Seabob Fishery.
5

2. The Marine Stewardship Council (MSC) certification processEcolabels (seals of approval) are a growing feature of international fish trade and marketing. They are recognised by consumers, producers and suppliers who use them to indicate that they are purchasing / selling a seafood product that originates from a sustainable source. A range of ecolabelling and certification schemes exists in the fisheries sector, with each scheme having its own criteria, assessment processes, levels of transparency and sponsors. For instance, the
Dolphin Safe was developed by the Non-Governmental Organisation (NGO) Earth Island Institute in 1990 and is concerned mainly with Dolphin bycatch.
Friend of the Sea (FoS), was also developed by the Earth Island Institute in 2006. It covers both wild and farmed fish and its criteria also include requirements related to carbon footprint and “social accountability”.
The MSC was set up by the World Wild Fund for Nature (WWF) and Unilever in 1997 but is independent of them now. The MSC is arguably the most comprehensive fisheries certification scheme in that it covers a range of species and deals with all aspects of the management of a fishery (Sainsbury, 2010). It is an international non-profit organisation established to address the problem of unsustainable fishing and safeguard seafood supplies for the future. For a fishery to attain MSC certification, it must meet the MSC Fisheries Standard which is based upon the Food and Agriculture Organization (FAO) Code of Conduct for Responsible Fisheries. The MSC Fisheries Standard has three core principles: sustainable fish stocks; minimising environmental impact; and effective management, (Table 1). MSC therefore, certifies the fishery as being both sustainable and sustainably managed.
Table 1: Principles that make up the MSC Fisheries StandardPrinciple 1 Sustainable fish
stocks
Fisheries must operate in a way that allows fishing to
continue indefinitely, without over exploiting the resources
Principle 2 Minimising
environmental
impacts
Fishing operations need to be managed to maintain the
structure, productivity, function and diversity of the
ecosystem upon which the fishery depends, including other
species and habitats.
Principle 3 Effective
management
All fisheries need to meet all local, national and international
laws and have an effective management system in place.
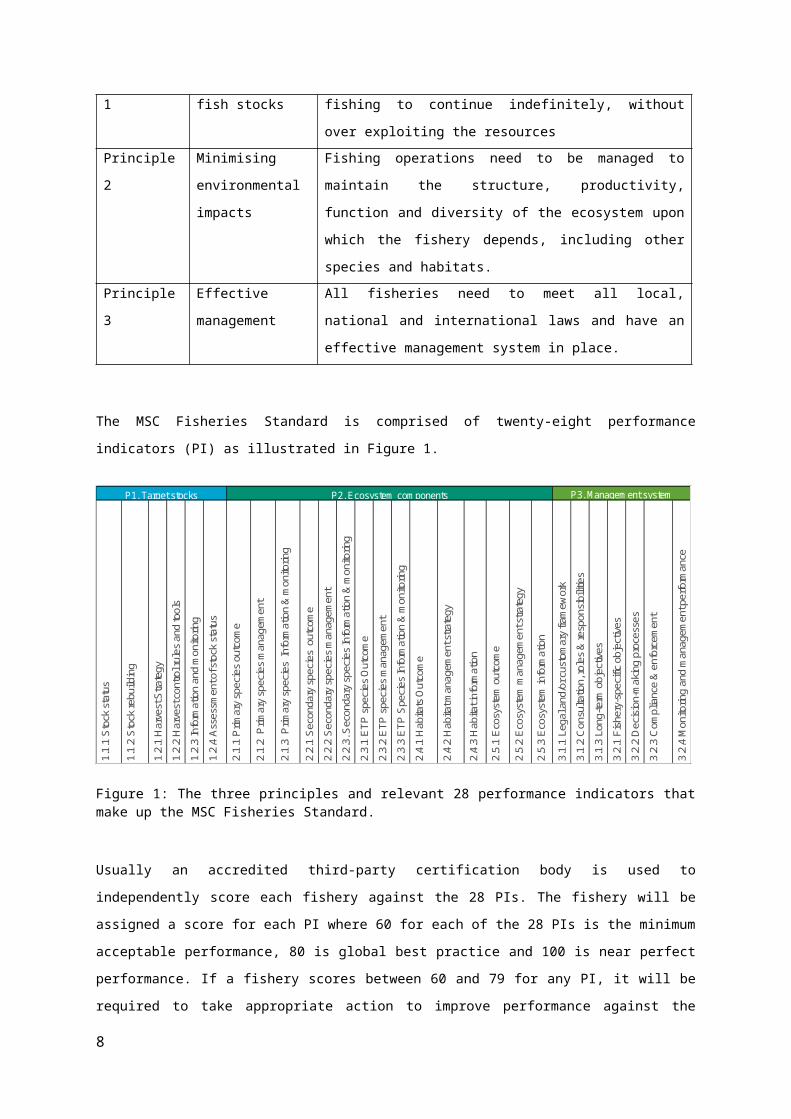
The MSC Fisheries Standard is comprised of twenty-eight performance indicators (PI) as illustrated in Figure 1.
6

1.1.1
Stoc
k stat
us
1.1.2
Stoc
k reb
uildin
g
1.2.1
Harve
st St
rateg
y1.2
.2 Ha
rvest
contr
ol ru
les an
d too
ls1.2
.3 Inf
orma
tion a
nd m
onito
ring
1.2.4
Asse
ssme
nt of
stock
statu
s
2.1.1
Prim
ary s
pecie
s outc
ome
2.1.2
Prim
ary s
pecie
s man
agem
ent
2.1.3
Prim
ary s
pecie
s Inf
orma
tion &
mon
itorin
g
2.2.1
Seco
ndar
y spe
cies
outco
me2.2
.2 Se
cond
ary s
pecie
s man
agem
ent
2.2.3.
Sec
onda
ry sp
ecies
Infor
matio
n & m
onito
ring
2.3.1
ETP
spec
ies O
utcom
e2.3
.2 ET
P sp
ecies
man
agem
ent
2.3.3
ETP
Spec
ies In
forma
tion &
mon
itorin
g2.4
.1 Ha
bitats
Outc
ome
2.4.2
Habit
at ma
nage
ment
strate
gy
2.4.3
Habit
at inf
orma
tion
2.5.1
Ecos
ystem
outco
me
2.5.2
Ecos
ystem
man
agem
ent s
trateg
y
2.5.3
Ecos
ystem
infor
matio
n 3.1
.1 Le
gal a
nd/or
custo
mary
frame
work
3.1.2
Cons
ultati
on, ro
les &
resp
onsib
ilities
3.1.3
Long
-term
objec
tives
3.2.1
Fish
ery-s
pecifi
c obje
ctive
s3.2
.2 De
cision
-mak
ing pr
oces
ses
3.2.3
Comp
lianc
e & en
force
ment
3.2.4
Monit
oring
and m
anag
emen
t per
forma
nce
evalu
ation
P3. Management systemP2. Ecosystem componentsP1. Target stocks
Figure 1: The three principles and relevant 28 performance indicators that make up the MSC Fisheries Standard.
Usually an accredited third-party certification body is used to independently score each fishery against the 28 PIs. The fishery will be assigned a score for each PI where 60 for each of the 28 PIs is the minimum acceptable performance, 80 is global best practice and 100 is near perfect performance. If a fishery scores between 60 and 79 for any PI, it will be required to take appropriate action to improve performance against the indicator so that it scores 80 or above within a predetermined timeframe (typically five years).
The following key steps are used:1. Deciding on the Unit of Assessment (UoA) The UoA defines what is being assessed during the certification process and includes:
Target stock(s); Fishing method or gear; The fleets, vessels, individual fishing operators and other eligible fishers pursuing
that stock.
The UoA could cover anything from a handful of local vessels to a full national fleet. Once it has been defined, only seafood from that specific unit will later be able to carry the MSC ecolabel in the marketplace.2. Preparing the informationA fishery assessment is based on expert analysis of information. This information can take many forms, including:
Data on fish stocks; Data on landings; Interviews with stakeholders;
7
Scientific papers and reports.
Without this information the assessment team will not be able to make a thorough evaluation of the fishery. If the fishery is data limited, the assessment team could use the MSC’s Risk-Based Framework, which is built into the MSC fisheries certification requirements.
3. Gaining the support of stakeholdersIn the MSC assessment process, the burden of proof is on the fishery. The assessment team may only consider information that is also available to the public and it is the fishery stakeholder’s (fishing industry, the Government and fisheries scientists) responsibility to assemble an information package for the assessment team. The MSC assessment process is also a public process where the public is invited to engage in contributing to the assessment. Relevant stakeholders therefore need to be made aware at the very beginning of the assessment process to build trust, reduce the likelihood of any unforeseen setbacks and help make sure the assessment goes smoothly. Input and involvement of stakeholders is used to ensure that the assessment is fair, credible and robust.
There is an objections procedure, in case an objection is raised during the 15-working day period of ‘intent to object’ after the final report is published. This provides a mechanism for any disagreement with the assessment of the fishery to be resolved by an independent adjudicator. Following appropriate consultations, the adjudicator will decide on whether the objection should be upheld.
3. Guyana’s commercial sampling programme3.1 Sampling programmeThe description of the Guyana’s sampling progammes is based on personal communications from Guyana’s Fisheries Institure staff and CRFM (2007) report.
8

The current market (on-shore) sampling programme is a stratified random sampling. The stratification is done by vessel/gear type and each month the number of vessels to be sampled for each gear is pre-defined. At the beginning of every month, sampling schedules are prepared in three regions for data collection. A total of 82 vessels are chosen. These vessels are randomly selected from landing sites in the regions. They comprise 20 Chinese seine, 17 gillnet nylon, 4 cadell, 15 gillnet (outboard), 6 gillnet (inboard), 4 pin seine, for the artisanal fishery; 3 handlines and 2 traps for semi-industrial fisheries; and 6 seabob and 5 prawns for the industrial fishery. The vessels sampled in Region 3-5 are all the industrial vessels, five semi-industrial (3 handlines and 2 traps)and thirty nine artisanal. In Regions, six and two the number of vessels sampled is 13 and 14 respectively. The number of vessels being targeted for data collection has been reduced due to limited resources. Only 65 vessels are being sampled per month. Sampling is done five days per week (Monday to Friday) and at least two trips are scheduled per day. The number of vessels targeted/sampled per trip would depend on the landing site being targeted, the number of data collectors and the number of vessels at the site. Catch and effort and biological data are collected from the vessels selected randomly at the landing sites.
3.2 Stock assessmentThe 2007 Caribbean Regional Fisheries Mechanism (CRFM) annual scientific meeting report analysed data from different fisheries and stocks in the Caribbean. In their report, they carried out stock assessment for Sea trout and Bangamary. For Sea trout an assessment was completed to determine changes in the stock status based on three types of analyses: (a) estimation of total mortality rate using information on mean length (Gedamke and Hoenig 2006 - in CRFM 2007); (b) estimation of total mortality using length-converted catch-curve analyses; and (c) estimation of trends in abundance based on standardized catch per unit effort (CPUE) information. For Bangamary, catch and effort and length frequencies for the period 1995 to 2006 from industrial trawlers, artisanal gillnets and Chinese seine were used. A preliminary assessment was conducted to determine trends in the fishery from standardized CPUE indices generated using the general linear model (GLM). For butterfish no assessment was performed, as this species was not previously included in the list of species to be assessed. However, catch and effort and length frequencies for the period 1995 to 2006 were available from industrial trawlers, artisanal gillnets and Chinese seine. Gedamke and Hoenig (2006) estimated the total mortality rate (Z) using a length-converted linearized catch curve. Their estimates of mortality are derived using the growth parameters from previous assessment (K=0.3, Linf=90). They also evaluated changes in stock and total mortality (Z) based on changes in mean length and size frequency composition through Beverton and Holt (1956, 1957) mean length mortality estimator and the Gedamke and Honing (2006) method.
9
PFO, 04/23/18,
? Inshore for artisanal and off shore for industrial
Ana Ribeiro Santos (Cefas), 04/29/18,
See comment above. If changes occur in the sampling programme, this needs input from the Guyana’s fisheries institute.
Admin, 03/07/18,
Capacity has increased since and sampling is done Monday to Friday
Ana Ribeiro Santos (Cefas), 04/25/18,
As far as I know, there is only on-shore (market) sampling and there isn’t off-shore sampling, i.e. fisheries observer on-board the vessels for sampling. If there is, this information should be added by the Guyana’s Fisheries department.

4. DataThe data used for this exploratory analysis were provided by the Guyana Fisheries Department. These data encompass length data from the Guyana on-shore sampling programme from each trip sampled, total catches and sampled weight per species, and days at sea collected between 2002 and 2015. According to the Gaudian draft report (2008), there are length data collected for these species since 1996. However, these data were not received and are therefore not used in this report.
Data checks (output using R software)The following section runs various checks in the data: on dates, ports sampled, and species length range. The data checks were carried out in software R. The r code is readily available to be passed and used routinely by Guyana’s Fisheries Depatment staff.
Check if the dates of arrival are after dates of departure. Arrivals before departures?
## All Ok
Dates range## [1] "2002-01-16" "2015-12-10"
## [1] "2002-01-16" "2015-12-14"
Checks needed: There are dates that need correction: there are dates starting in 1900. Identify those dates and correct. Fish numbers with wrong dates ranged between 1446, 2741. The dates were 00/01/1900
Ports and regions sampledList of landing regions and fishing areas:
In total, there were 335 areas fished, and 5 landing regions between 2002 and 2015.
List of site points (ports):
Between 2002 and 2015, 73 ports were sampled.
## [1] "08/12/1901" "204" "205" "206" "208"
## [6] "209" "210" "211" "212" "213"
## [11] "214" "215" "216" "220" "223"
10

## [16] "224" "225" "226" "307" "310"
## [21] "311" "404" "407" "408" "411"
## [26] "413" "416" "418" "419" "420"
## [31] "421" "422" "427" "429" "430"
## [36] "431" "432" "433" "501" "502"
## [41] "503" "504" "505" "506" "507"
## [46] "508" "509" "511" "513" "520"
## [51] "522" "601" "603" "604" "607"
## [56] "613" "614" "615" "629" "630"
## [61] "701" "702" "703" "704" "705"
## [66] "707" "709" "710" "711" "712"
## [71] "714" "Gt. Seafood" "Jibb"
Checks needed: There are port names with date format. These need correcting.
Table 1 Number of trips sampled by port and landing region, between 2002 and 2015
Port /Region 2 3 4 5 6
08/12/1901 0 0 0 0 1
204 59 0 0 0 0
205 19 0 0 0 0
206 3 0 0 0 0
208 3 0 0 0 0
209 3 0 0 0 0
210 7 0 0 0 0
211 1 0 0 0 0
212 22 0 0 0 0
213 8 0 0 0 0
214 30 0 0 0 0
215 15 0 0 0 0
216 5 0 0 0 0
220 6 0 0 0 0
223 107 0 0 0 0
224 2 0 0 0 0
225 23 0 0 0 0
226 8 0 0 0 0
11

307 0 7 0 0 0
310 0 5 0 0 0
311 0 9 0 0 0
404 0 0 1217 0 0
407 0 0 1 0 0
408 0 0 34 0 0
411 0 0 5 0 0
413 0 0 88 0 0
416 0 0 3 0 0
418 0 0 32 0 0
419 0 0 45 0 0
420 0 0 41 0 0
421 0 0 23 0 0
422 0 0 4 0 0
427 0 0 20 0 0
429 0 0 26 0 0
430 0 0 28 0 0
431 0 0 3 0 0
432 0 0 1 0 0
433 0 0 33 0 0
501 0 0 0 17 0
502 0 0 0 289 0
503 0 0 0 4 0
504 0 0 0 6 0
505 0 0 0 1 0
506 0 0 0 1 0
507 0 0 0 1 0
508 0 0 0 1 0
509 0 0 0 28 0
511 0 0 0 8 0
513 0 0 0 48 0
520 0 0 0 2 0
522 0 0 0 27 0
601 0 0 0 0 3
603 0 0 0 0 102
604 0 0 0 0 1
607 0 0 0 0 4
613 0 0 0 0 108
614 0 0 0 0 6
615 0 0 0 0 31
629 0 0 0 0 1
630 0 0 0 0 2
12

701 0 0 0 0 59
702 0 0 0 0 1
703 0 0 0 0 1
704 0 0 0 0 4
705 0 0 0 0 1
707 0 0 0 0 3
709 0 0 0 0 1
710 0 0 0 0 8
711 0 0 0 0 1
712 0 0 0 0 1
714 0 0 0 0 2
Gt. Seafood 1 0 0 0 0
Jibb 2 0 0 0 0
Most of the fishing trips sampled were in Regions 4 and 5, while Regions 2 and 3 are the least sampled. No trips were sampled in Region 1. It is important to understand why these areas were not sampled, whether it is due to low fishing activity, difficulties to access the ports or the fisheries in those areas are not covered by the sampling programme.
Gears Sampled
Table 2. Gear types sampled between 2002 and 2015
Gear definition Gear type
Chinese Seine C/S
Cadell Cad
Gillnet Nylon GNN
Gillnet Polyethylene Cabin Cruiser GNPcc
Gillnet Polyethylene Inboard Engine GNPin
Pin Seine P/S
Traps Traps
Trawl (Seabob/Finfish) Trawl
5. Assessing the spatial and technical representativeness of the sampling programmeTo assess and evaluate the representativeness of the fisheries sampling programme, it is necessary to have up to date and recurring characterisation of the entire fleet (number
13

of vessels, fishing and landings patterns, fishing effort, gear used, accessibility of vessels and catches), both before and after the sampling year. The availability and completeness of these data will determine the design of appropriate sampling frames, sampling units and selection schemes for different fleet sectors and the need to separate surveys to estimate fleet composition and activity. There is need to have access to census data to understand the fleet behaviour, effort and catches. An important consideration when designing a sampling scheme is the coverage of all sampling frames. Ideally the entire population is completely covered by the frame. If only part of the population is covered, the frame has under-coverage that will lead to bias unless the variables of interest (e.g. discard rates, species and length catch composition) are the same in the parts of the population covered and not covered.
The industrial vessels (those targeting seabob) in Guyana are well documented through logbook data, making it possible to reconstruct all the vessel trips. However, for the small-scale fisheries, landing sites are often widely dispersed and therefore information on total landings and species composition is difficult to collect. This means that the use of census approaches is impractical. This imposes difficulties in the sampling scheme as there is limited knowledge of the total fleet activity at the end of the sampling year. Therefore, there is need for complementary surveys to be conducted to estimate total catch. A separate survey for human population needs conducting as well to estimate total effort.
Currently, for the Guyana fisheries, the only population information available is the fleet size, by the total number of vessels by gear type, in each administrative region (2011). As far as we are aware, there is a logbook registration system only for the seabob industrial fisheries, where they report official landings and effort. To increase precision and avoid bias, the sampling strategies need to have some stratification and that is usually done by a combination of time (month, quarter), space (rectangle, area, harbours or set of harbours) and technical (gear, fleet). However, attention should be given to the risk of over-stratification that may occur when the number of strata is large with respect to sampling effort. The following sections describe the representativeness of the trips sampled between 2002 and 2015 in the industrial (Seabob and prawn trawl fishery), semi industrial and artisanal fisheries (all other gears). We assessed the spatial (landing region) and technical (gear type) representativeness in relation to the total number of trips sampled and the number of vessels in each gear and region. However, these samples only represent the fraction of the catch that is landed, as currently no off-shore sampling programme is carried out.
According to the census in 2011, there are 1321 fishing vessels operating in Guyana.
14

5.1 Spatial samplingThe spatial coverage of the sampling scheme was analysed in terms of how the number of trips sampled relates to the number of vessels in each administrative region. The mean proportion of trips sampled and the proportion of vessels in each region were calculated and plotted.
Table 3. Summary of total number of vessels and trips sampled by region
Region
Total No. vessels per region
Percentage vessel per region
Percentage of sampled trips per region
1 30 2% 0%
2 119 9% 12%
3 209 16% 4%
4 517 39% 63%
5 178 13% 15%
6 268 20% 14%
Figure 1. Percentage of vessels and trips sampled in each landing region.
According to the data, 63% of the trips sampled are in Region 4, where most of the landings and fishing activity takes place. However, only 39% of the vessels fishing in Guyana are from this region. Nearly 20% of the vessels operate from Region 3, but only 4% of the trips are sampled from this region. This does not mean that the sampling effort
15

is miss-representing the fishing activity and catches. Region 4 is where the highest landings are, and where the industrial vessels land and operate from, so it should be where most of the sampling effort is allocated. In the remaining regions, only artisanal vessels (small-scale fisheries) operate and the sampling effort should be distributed along those regions, according to the size and diversity of the fleet (gear types), landings and catch composition.
5.2 Sampling by gearFor the technical representativeness of the sampling scheme, the mean proportion of trips sampled, proportion of vessels and the mean proportion of landings by gear was calculated.
Proportion of trips Vs Proportion of number of vessels per gear
Figure 2 . Percentage of number of vessels and trips sampled for each gear type.
Table 4. Summary of total number of vessels and trips sampled by gear type
Gear type
Total number of vessels per gear
Percentage of Vessels per gear
Percentage trips sampled per gear
C/S 307 23% 27%
Cad 87 7% 1%
GNN 448 34% 29%
GNPcc 296 22% 24%
GNPin 64 5% 14%
P/S 26 2% 2%
Tie 6 0% 0%
Trawl 87 7% 5%
Traps 0 0% 0%
16

Proportion of trips Vs proportion of landings per gear
Figure 3. Comparison between the percentage of total landings of Bangamary, Burtterfish and Sea trout and the percentage of trips sampled in each gear type.
Table 5. Summary of proportion of landings and trips sampled by gear type
Gear type Mean percentage landings per gear Mean percentage trips sampled by gear
C/S 9% 27%
Cad 0% 1%
GNN 15% 29%
GNPcc 28% 24%
GNPin 17% 14%
P/S 0% 2%
Traps 0% 0%
Trawl 32% 5%
When we compared the proportion of trips sampled with the number of vessels by gear, we verified that overall, the sampling scheme is well represented in relation to the technical coverage. The only exception is that there are very few trips sampled from Cadell lines. However, when we analysed the proportion of trips sampled with the
17

proportions of landings per gear, this gear type has very low landings in comparison to the other gears. The comparison between the proportion of trips sampled with the landings per gear, showed that the industrial trawls are responsible for 32% of the landings for these species, followed by the gillnets (GNN, GNPin and GNPcc). Data shows that the trawls might be under covered in relation to their proportion of landings, with only 5% of trips sampled from trawls. On the other hand, the gillnet nylon (GNN) and Chinese seine (C/S) might be over covered.
Table 6. Species sampled between 2002 and 2015
Species code Common name
SCIAAN Bangamary
SCIAHI Butterfish
SCIAUI Seatrout
SCIAAN Seatrout
SCIAUI Butterfish
SCIAHI Seatrout
Checks needed: The table above summarises the list of species sampled between 2012 and 2015 and the corresponding species code. Some of the species codes need correcting!
6. Length frequency
Table 7. Length range for each species between 2002 and 2015
Common name min.length.cm
max.length.cm
Bangamary 1 45
Butterfish 8 40
Seatrout 6 115
According to the available data, the length for Bangamary varied between 1 and 45 cm, for Butterfish between 8 and 40 cm and for Sea trout between 6 and 115cm. The minimum lengths for the three species seem too small.
Checks needed: The minimum length for these species, particularly for Bangamary are very small. Length data needs to be verified to confirm that these lengths are correct.
18

The following section summarizes and plots the length frequency for each species, by gear type and landing region.
6.1 Bangamary
Table 8. Number of Bangamary sampled and length range between 2002 and 2015, by gear and region
Region Gear type Total number sampled per region
and gear
Sample weight kg
Landings kg Min length
Max length
2 C/S 379 100.6 315.8 8 27
2 GNN 87 312.3 621.4 9 45
2 GNPcc 69 178.1 314.3 15 35
2 P/S 92 199.8 535.2 10 35
3 C/S 357 384.3 1356.0 7 36
4 C/S 664 1999.1 10324.1 6 39
4 GNN 1496 11079.2 138032.9 12 45
4 GNPcc 47 79.1 317.8 23 39
4 P/S 12 24.3 24.3 20 35
4 Trawl 4770 17520.6 422671.7 1 45
5 C/S 71 146.8 1160.9 10 34
5 GNN 133 296.8 3568.7 18 30
6 C/S 47 87.2 1941.6 12 41
6 GNN 1218 2430.3 9127.2 12 36
6 GNPcc 44 96.2 781.8 12 23
6 Trawl 76 204.0 1497.0 19 35
Bangamary has not been consistently sampled throughout the years. It was sampled only for 2002, 2003, 2005, 2009, 2013, 2014, 2015. Most samples are from Regions 4 and 6, and from trawls and gillnets, which corresponds with the majority of landings for this species. These data needs confirmation and inspection from the Guyana’s Fisheries Institute staff.
6.2 ButterfishTable 9. Number of butterfish sampled and length range between 2002 and 2015, by gear and region
Region
Gear type
Total number sampled per region and gear
Sample weight kg
Landings kg
Min length
Max length
2 GNN 18 54.6 54.6 11 17
19

Region
Gear type
Total number sampled per region and gear
Sample weight kg
Landings kg
Min length
Max length
2 P/S 101 184.5 458.9 11 353 C/S 12 5.4 136.2 20 294 C/S 49 70.7 93.1 9 304 GNN 454 2937.5 9600.1 13 404 P/S 5 4.5 4.5 21 304 Trawl 2368 8847.9 114802.3 8 395 GNN 259 396.7 2181.7 10 386 GNN 58 107.2 720.4 20 276 Trawl 34 92.4 544.8 22 33
Butterfish has not been consistently sampled throughout the years. It was sampled in
2002, 2003, 2005, 2011, 2012, 2013, 2014, 2015. The majority of samples are from
Region 4 by trawls and gillnets, where most of the landings are.
6.3 Sea troutTable 10. Number of sea trout sampled and length range between 2002 and 2015, by gear and region
Region Gear type
Total number sampled per region and gear
Sample weight kg
Landings kg
Min length
Max length
2 GNN 151 1109.0 2100.0 17 95
2 GNPcc 349 3170.3 5068.0 8 102
2 GNPin 234 1572.3 3538.5 54 105
2 P/S 28 163.2 272.4 42 50
2 Trawl 1 0.9 1270.1 23 23
3 C/S 3 28.5 28.5 86 88
4 C/S 58 812.6 820.7 8 90
4 Cad 1 9.1 9.1 87 87
4 GNN 616 11411.4 23510.2 18 112
4 GNPcc 2724 119029.6 380122.3 16 111
4 GNPin 1464 45201.1 161794.2 6 115
4 Trawl 733 14305.1 189202.2 11 94
5 C/S 23 92.0 116.6 41 86
5 Cad 54 629.8 629.8 26 85
5 GNN 321 3246.0 4886.1 12 102
5 GNPcc 488 17839.4 40515.3 27 94
5 Trawl 19 673.2 714.0 50 83
20

Region Gear type
Total number sampled per region and gear
Sample weight kg
Landings kg
Min length
Max length
6 GNN 45 389.3 389.3 37 91
6 GNPcc 869 25747.2 31728.6 53 99
6 Trawl 174 3164.2 55092.0 28 88Sea trout has not been consistently sampled throughout the years. It was sampled in 2002, 2003, 2004, 2005, 2009, 2010, 2011, 2012, 2013, 2014, 2015. The majority of samples are from Region 4 by trawls and gillnets.
6.4 Length frequency analysesSample data for the period 2002-2015 from all the fisheries sampled in Guyana's sampling scheme were used to obtain length frequencies for Bangamary, Butterfish and Sea trout. For Bangamary and Butterfish, the frequencies were binned into 1cm intervals while for Sea trout, they were binned into 5cm intervals.
Table 11. Yearly number of fish sampled by species
Year Common name Number sampled per year
2014 Bangamary 2630
2015 Bangamary 2306
2003 Bangamary 2180
2002 Bangamary 1491
2005 Bangamary 762
2013 Bangamary 156
2009 Bangamary 37
2015 Butterfish 994
2014 Butterfish 880
2003 Butterfish 689
2002 Butterfish 357
2005 Butterfish 183
2012 Butterfish 170
2011 Butterfish 76
2013 Butterfish 9
2014 Seatrout 2409
2004 Seatrout 1722
2003 Seatrout 1475
2002 Seatrout 971
2015 Seatrout 852
2005 Seatrout 459
2012 Seatrout 264
2009 Seatrout 92
2011 Seatrout 85
2010 Seatrout 24
2013 Seatrout 2
21

The number of fish measured varied across the years. Bangamary sample sizes ranged from 37 to 2630 fish being measured. Butterfish sample size varied between 9 and 994 fish measured and for Sea trout, sample sizes varied between 2 and 2409 measured in a year.
6.5 Length frequency plots
Figure 4. Length frequency distribution of Bangamary, Butterfish and Sea trout, across all areas and gears, between 2002 and 2015.
22

Figure 5. Length frequency distribution of Bangamary for each gear type, between 2002 and 2015.
Bangamary length frequency showed that the main gear landing this species is the trawl fishery, followed by the gillnets. The trawl fishery is landing very few small and bigger individuals, with a distinctive mode at 25-30 cm. On the other hand, the gillnets (GNN, GNPcc) exploit the same length range without a clear length mode. The Chinese seine seems to exploit the smaller individuals of the population. These length frequencies are only from the landings component. If these gears catch smaller fish and are discarded, a sampling programme for discards is required to capture the whole length range of the catches, landings and discards.
23

Figure 6. Length frequency distribution of butterfish for each gear type, between 2002 and 2015.
For butterfish, the length frequency showed a clear length class mode for trawls, between 30-35cm. For the other gears, the catches were low, and no pattern was found.
24

Figure 7. Length frequency distribution of Sea trout for each gear type, between 2002 and 2015.
An examination of the sea trout length frequency data from the fisheries of Guyana showed that the gillnets exploit the whole length range of the species, with the highest catches between 60-90cm, with few small individuals being captured. The trawl fishery, although with smaller catches, captures individuals between 30-40cm, with a gradual decline in abundance of bigger individuals.
25

6.6 Mean length between 2002 and 2015
Figure 8. Mean length of individuals sampled between 2002 and 2015, for the three species.
Annual mean lengths were calculated from all fish measured for each species. For Bangamary and Butterfsih there was no apparent trend. The Sea trout mean length decreased from 75-80 cm between 2002 and 2005 to 30-35cm in 2010 and 2011. The decrease coincides with the years with least Sea trout fish measured and all the samples were from gillnets which capture the smaller individuals. The apparent increases of the mean length in the last 3 years for all species is probably due to the increase of the sampling effort on the trawl fishery.
7. Catch per unit effort (kg/day)Catch per unit effort (CPUE, kg/day) was calculated for each trip based on the total landings and number of days fishing. Catch per day was standardized to account for unbalanced and incomplete sampling across months, regions and years, by dividing the annual CPUE for each gear type by the average for that gear.
Table 12. Average catch (kg) in each trip, by gear type, between 2002 and 2015
26

Gear type Common name Mean landings per gear
C/S Bangamary 41.39
C/S Butterfish 5.70
C/S Seatrout 14.56
Cad Seatrout 22.01
GNN Bangamary 368.20
GNN Butterfish 53.43
GNN Seatrout 41.51
GNPcc Bangamary 45.59
GNPcc Seatrout 346.99
GNPin Seatrout 300.02
P/S Bangamary 29.46
P/S Butterfish 28.97
P/S Seatrout 45.36
Trawl Bangamary 761.55
Trawl Butterfish 258.90
Trawl Seatrout 514.14
Bangamary standardized CPUE
Figure 9. Evolution of catch per unit effort for Bangamary, between 2002 and 2015.
Butterfish standardized CPUE
27

Figure 10. Evolution of catch per unit effort for Butterfish, between 2002 and 2015.
Sea trout standardized CPUE
Figure 11. Evolution of catch per unit effort for sea trout, between 2002 and 2015.
28

8. Stock Assessment 8.1 MethodIndicators of status of a stock are calculated from length-frequency distributions and compared to reference points (RPs) derived from life-history parameters and ecological theory or empirical observation, providing a snapshot assessment of status under steady state assumptions. The ICES workshop on the ‘Development of Quantitative Assessment Methodologies based on Life-history Traits, Exploitation Characteristics and other Relevant Parameters for Data-limited Stocks’ (WKLIFE V) selected a set of Length-Based Indicators (LBIs) characterising conservation of large and small individuals, yield optimisation and maximum sustainable yield (ICES, 2015). A traffic light approach is used to compare ratios of indicators and reference points to expected values where conservation, yield or MSY properties are considered achieved. This suite of LBI outputs is considered to provide an overall perception of stock status and exploitation.
Table 13. Selected indicators with the Length-Based indicators used for the assessment.
Indicator Calculation Reference point Indicator ratio
Expected value
Property
Lmax5% Mean length of largest 5%
L∞ Lmax5%/L∞ > 0.8 Conservation (large individuals)L95% 95th percentile L∞ L95%/L∞ > 0.8
Pmega Proportion of individuals above Lopt + 10%
0.3-0.4 Pmega > 0.3
L25% 25th percentile Lmat L25%/Lmat > 1 Conservation (immatures)
Lc Length at first catch (length at 50% of mode)
Lmat Lc/Lmat > 1
Lmean Mean length of individuals > Lc
Lopt=2/3L∞ * Lmean/Lopt ≈ 1 Optimal yield
Lmaxy Length class with maximum biomass in catch
Lopt=2/3L∞ * Lmaxy/Lopt ≈ 1
Lmean Mean length of individuals > Lc
LF=M=(0.75Lc+0.25L∞) *
Lmean/LF=M ≥ 1 MSY
(* = simplified equations resulting from substituting M/k = 1.5; an assumption based on the life history of teleost fish).
The method requires length frequency distributions and life history parameters. Length frequency distributions for Sea trout, Bangamary and Butterfish were combined for the years 2002–2015. Life history parameters required are length at 50% maturity (Lmat), von Bertalanffy asymptotic length (L∞), the ratio M/k and weights-at-length, which can be obtained from the relationship w=a Lb.
Table 14. Life history parameters available for Sea trout, Bangamary and Butterfish are (CRFM, 2007)
29

L/W parametersSpecies Source k L∞ M F Z a bSeatrout Charlier
(2000)0.39 95.8cm 0.56 0.66 1.22 0.0000118 3
Previous assessment
0.30 90 0.46 0.34 0.79
Bangamary Assessment using CPUE index – No biological parametersButterfish No assessment
Table 15. Biological data for the three species from Fishbase.
Species Lmat (cm) Lmax (cm) a bSeatrout ? 115Bangamary 23.7 45.0 0.00324 3.270Butterfish ? 40 0.00589 3.040
8.2 Analysis
Table 16. Traffic light indicator for each species.
Conservation Optimizing Yield FMSY/FL
max5%/L∞ L95%/L∞ Pmega L25%/Lmat Lc/Lmat
Lmean/Lopt Lmaxy/Lopt Lmean/LF=M
Reference >0.8 >0.8 >0.3 >1 >1 ≈1 ≈1 ≥1
Sea Trout 1.03 0.97 0.63 NA NA 1.29 1.31 1.05
Bangamary 0.85 0.79 0.10 0.91 0.82 0.91 1.02 1.06
Butter fish 0.94 0.89 0.62 NA NA 1.23 1.18 1.00
Sea trout: Two sets of life history parameters were available for sea trout. Given that both estimates of L∞ fall well below the maximum length observed in the length frequency data (115cm), the estimates of Charlier (2000) were used to give a more precautionary assessment (higher L∞ and lower M/k). Indicators relating to immatures could not be calculated in the absence of maturity information.
The LBI show little truncation of the length frequency distribution due to fishing, with all indicators relating to the conservation of large individuals meeting their expected values. This is not surprising given that the estimate of L∞ falls below the lengths of larger fish in the landings. Indicators relating to optimal yield suggest targeting of fish above the optimal length, which again is not surprising given the discrepancy between L∞ and Lmax.
The MSY LBI suggests sustainable fishing but should be interpreted with caution as the
30

reference point LF=M is calculated from what appears to be an inappropriate value for L∞. It is important for the analysis of LBIs that input parameters are reliable and appropriate, otherwise the analysis is likely to be compromised.
Figure 12. Length frequency distribution of Seatrout and respective length indicators.
Bangamary: In the absence of required life history parameters, estimates of Lmat and Lmax
were obtained from FishBase, where Lmax is used as a proxy for L∞. M/k was assumed to be 1.5 in the absence of growth or mortality information.
Indicators relating to the conservation of large individuals are close to the expected value of 0.8 but the proportion of mega-spawners is well below the target value of 0.3. This expectation assumes asymptotic selectivity, so may not apply to this fishery if selection is believed to be dome-shaped. Indicators relating to immatures suggest too high a proportion of small individuals being caught before being able to spawn. Targeting appears to be at the optimal length and the MSY reference point is met. As indicated above, it is important for the analysis of LBIs that input parameters are reliable and appropriate (which is questionable if the analysis relies heavily on values from FishBase), otherwise the analysis is likely to be compromised.
31

Figure 13. Length frequency distribution of bangamary and respective length indicators.
Butterfish: In the absence of required life history parameters, an Lmax obtained from FishBase was used as a proxy for L∞, M/k assumed equal to 1.5 and the exploitation status of immatures not evaluated.
Indicators relating to large individuals meet expected values. An estimate of Lmat was not provided but would need to be larger than 30.5cm for both conditions relating to immatures to be satisfied. The optimal yield indicators suggest targeting of fish greater than the optimal length, which may be a consequence of assuming Lmax ≈ L∞. The MSY LBI falls on the threshold of acceptable values. Once again, it is important for the analysis of LBIs that input parameters are reliable and appropriate (which is questionable if the analysis relies heavily on values from FishBase), otherwise the analysis is likely to be compromised.
32

Figure 14. Length frequency distribution of Butterfish and respective length indicators.
9. Final Considerations9.1 DataThis assessment used catch, effort and length data collected by Guyana’s commercial sampling programme, between 2002 and 2015. The data checked carried out highlighted errors, on the sampling dates, species code, length ranges. These data needed to be reviewed and cleared in order to be analysed fully. The current data set we had access to, still needs small revisions and clearing, particularly in the length data to confirm they are correct. Currently, Guyana's sampling scheme only covers landings. These species are known to be caught as by-catch by the industrial Seabob fishery and, although part of those catches is landed, the discarded component is unknown.
Biological data collected as part of market sampling programmes provides valuable information on the species and size ranges that are commercially landed. Although the data collected are valuable, this programme has its limitations because it does not capture all the catch components (discards) and sometimes lacks catch details such as spatial and effort information. Some of the disadvantages of on-shore fishery-dependent surveys can be overcome by using on-board observers, but inevitably only a small fraction of fishing activity can be covered in this way due to high costs. The overall objective of an off-shore catch sampling programme is to collect size and/or age data
33

from all categories of commercial catch of all fish and shellfish species, with particular focus on the discarded component. To improve the data collected for the whole catch components, it would be ideal to develop an off-shore sampling scheme that would sample all the by-catch species and biological data from discards of commercial species.
9.2 Sampling schemeOverall, it seems that the current on-shore sampling scheme is representative for most of the landings in Guyana's ports, with most of the samples being collected from the major ports and gear types, but also covering areas, ports and gears with fewer landings. However, catches and effort data need to be improved for the artisanal fisheries. The lack of information for these fleets are common and widely documented. If the vessel is the primary sampling unit (PSU), the raising factors are poorly known because there is no information on the total fleet activity at the end of the sampling year. Currently, the vessel is the PSU for each region and gear type. However, the total number of vessels active and their catches at the sampling day is unknown.
One way to overcome this is, instead of using vessel as PSU (as done currently), the PSU could be port-days. The total number of PSUs could be exactly calculated (e.g. 73 ports x 365 days). The total catch and length composition could then be estimated by taking a random sample port x day combination from all the PSUs in the frame (whether vessels landed) and record the total catch landed on each selected port-day. The length compositions for the port-day would be obtained by sampling the catches. The catches at length from the sampled port-day could then be raised to the total number of port-days in the frame.
9.3 Stock AssessmentAccording to the Gaudin report (2018), there is need to update the stock assessment carried out in 2007 (CRFM report, 2007). As data limited stocks, length-based stock assessment should be applied for these three species. Length-based stock assessment for the three species were carried out, using the length data available.
It is recommended that reliable life history parameters are obtained. Only one species had an estimate of L∞, which appears far too low, while other parameters could not be obtained or had to come from FishBase. While this method can be applied, the results should be interpreted with extreme caution until reliable life history parameters are obtained. Estimates of maturity would give a more holistic view of exploitation status while a maturity ogive (a distribution curve in which the frequencies are cumulative) would open the possibility of using LB-SPR.
34

The method used here was applied to landings data, which is not ideal as it does not account for the mortality suffered by discarded fish. Use of landings alone will likely underestimate the impacts of fishing on smaller individuals and skews estimates of central indicators such as mean length, impacting many of the LBIs.
Length frequencies from several years (2002-2015) were combined to obtain a single length-frequency distribution, given that sampling across years has been uneven and inconsistent, but doing so assumes that conditions in the fishery and stocks have not changed for a long period of time. Having reliable length frequencies for single years are several shorter time-periods would allow a check on the stability of estimates over time, and the application of methods such as Gedamke and Hoenig (2006), which relax the equilibrium assumption.
10. Next stepsTo continue to provide expert technical support to Guyana towards attaining MSC certification for their trawl industrial fishery for seabob. Project activities to focus on data collection and sampling protocols in particular:
Developing/modifying their sampling programme in light of the explanatory analyses that we have done in Year II
Environmental and socio-economic impact assessments Strategic planning and operational management of an observer programme for
the seabob fishery.
ReferencesCRFM FISHERY REPORT – 2007. Volume 1. Report of the Third Annual Scientific Meeting –
St. Vincent and the Grenadines, 17-26 July 2007Gaudin, G. 2018. Guyana Seabob fishery, P2 issues – Draft. (not publicly available).Gedamke, T., and J.M. Hoenig. 2006. Estimating Mortality from Mean Length Data in Non-
equilibrium Situations, with Application to the Assessment of Goosefish. Trans. Amer. Fish. Soc. 135:476–487.
ICES. 2015. Report of the Fifth Workshop on the Development of Quantitative Assessment Methodologies based on Life-history Traits, Exploitation Characteristics and other Relevant Parameters for Data-limited Stocks (WKLIFE V), 5–9 October 2015, Lisbon, Portugal. ICES CM 2015/ACOM:56. 157 pp.
35
Related Documents