www.pwc.com/in Revenue maximizing study in particular for non-fare box revenues with affordability studies Executive Summary Submitted to: Mumbai Railway Vikas Corporation Ltd (MRVC) March, 2014

Welcome message from author
This document is posted to help you gain knowledge. Please leave a comment to let me know what you think about it! Share it to your friends and learn new things together.
Transcript

www.pwc.com/in
Revenue maximizing study in particular for non-fare box revenues with affordability studies
Executive Summary
Submitted to: Mumbai Railway Vikas Corporation Ltd (MRVC) March, 2014

Important Message to any person Not Authorized to have access to this report
Any person who is not an addressee of this report or who has not signed and returned to PricewaterhouseCoopers
Private Limited (PricewaterhouseCoopers) a Release Letter or a Reliance Letter is not authorized to have access
to this report.
Should any unauthorized person obtain access to and read this report, by reading this report such person accepts
and agrees to the following terms:
1. The reader of this report understands that the work performed by PricewaterhouseCoopers was
performed in accordance with instructions provided by our addressee client and was performed
exclusively for our addressee client's sole benefit and use.
2. The reader of this report acknowledges that this report was prepared at the direction of our addressee
client and may not include all procedures deemed necessary for the purposes of the reader.
3. The reader agrees that PricewaterhouseCoopers, its partners, directors, principals, employees and
agents neither owe nor accept any duty or responsibility to it, whether in contract or in tort (includingwithout limitation, negligence and breach of statutory duty), and shall not be liable in respect of any
loss, damage or expense of whatsoever nature which is caused by any use the reader may choose to makeof this report, or which is otherwise consequent upon the gaining of access to the report by the reader.
Further, the reader agrees that this report is not to be referred to or quoted, in whole or in part, in anyprospectus, registration statement, offering circular, public filing, loan, other agreement or document
and not to distribute the report without PricewaterhouseCoopers' prior written consent.

Revenue maximizing study in particular for non-fare box revenues with affordability studies EXECUTIVE SUMMARY
13 PwC
Executive Summary
Background and Context
A Profile of the Mumbai’s Suburban Railway System
The city of Mumbai is the financial capital of the country, and the suburban railway network serves as the city’s life line. The network is a part of the Indian Railways (IR) under the Ministry of Railways (MOR). Two zonal divisions of IR, viz., Western Railway (WR) and Central Railway (CR), operate the railway lines in Mumbai. Mumbai’s suburban railway system is one of the most complex, densely loaded and intensively utilized system in the world. It carries over ~7.4 million passengers per day through a network over 319 km long, with a line length (track km) of over 876 km. The network operates over 2600 train services per day with a fleet of over 270 rakes (9 car equivalents which are run in 9, 12 and 15 car composition).1
The system accounts for 51% of all motorized trips in the city2. Even with this high share of commuters’ traffic, the operating revenues for the system have been declining year-on-year. Mumbai Suburban Railway’s total revenue was INR 1344 Crores in 2011-123. While the Central Railway generated revenues of ~INR 711.80 Crores from 76 suburban railway stations, the Western Railway earned ~INR 632.20 Crores from 28 suburban railway stations. Against this, their respective operating losses were INR 571.10 Cr and INR 88.54 Cr.
At current levels, fare box revenues have been insufficient to meet the challenges of managing a high-density transit system
Past studies have estimated that the suburban railway system carries an estimated 40% of Indian Railway’s (IR) daily passenger traffic (measured in terms of passengers). This represents 12% of the overall passenger traffic (measured in terms of passenger-km), and about 7% of IR’s total traffic including freight4. However, the system generates only 1.5% of IR’s total revenue, indicating a high level of cross-subsidization.
It is also observed that between 93% and 95% of the total revenues of the suburban railway system is contributed from fare-box sources, through sale of tickets. Railway fares in the city network have been one of the cheapest, while offering one of the fastest transit modes, creating significant value to commuters
Table 1: Comparison of single journey fare
Distance Slab 0 - 10 km 11 - 20 km 21 - 30 km 31 - 40 km 41 - 50 km
Suburban Rail (2nd class) 5 10 - 15 15 15 15 - 20
Suburban Rail (1st class) 45 60 - 85 85 - 110 115 - 120 120 - 130
BEST (non-AC) 6 - 15 18 - 20 22 - 25 28 - 30 35 - 40
BEST (AC) 20 -40 50 - 60 70 - 80 90 - 100 110 - 120
Auto Rickshaw 15 - 99 100 - 197 198 - 296
Taxi 19 - 124 125 - 247 248 - 371
Under construction Mumbai Metro 1 8 - 12 - - - -
Cars5 7 - 70 70 - 135 140 - 200 207 - 270 270 - 335
Source: BEST (Website), Railway fare chart, m-indicator, PwC Research & Analysis
1 Source: MRVC (Presentation "Need of Urban & Regional Rail Based Transport"; December 6, 2013) 2 Source: Comprehensive Transportation Study (CTS) for Mumbai Metropolitan Region (2008) 3 Source: WR and CR (Mumbai Division), MRVC 4 World Bank’s Project Appraisal Document for MUTP-2A 5 Assumption: Petrol price of ~INR 80 per liter and mileage of 12 km/liter.
Figure 1: Mumbai Suburban Railway Network
Revenue maximizing study in particular for non-fare box revenues with affordability studies EXECUTIVE SUMMARY
14 PwC
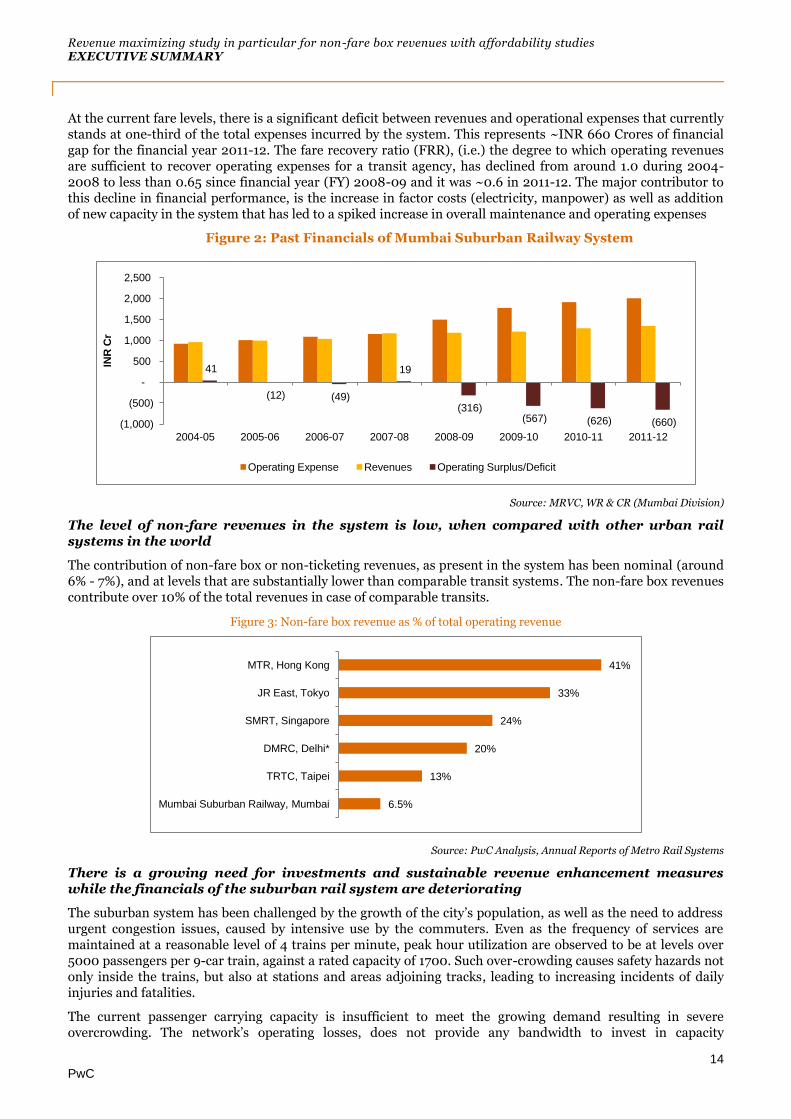
At the current fare levels, there is a significant deficit between revenues and operational expenses that currently stands at one-third of the total expenses incurred by the system. This represents ~INR 660 Crores of financial gap for the financial year 2011-12. The fare recovery ratio (FRR), (i.e.) the degree to which operating revenues are sufficient to recover operating expenses for a transit agency, has declined from around 1.0 during 2004-2008 to less than 0.65 since financial year (FY) 2008-09 and it was ~0.6 in 2011-12. The major contributor to this decline in financial performance, is the increase in factor costs (electricity, manpower) as well as addition of new capacity in the system that has led to a spiked increase in overall maintenance and operating expenses
Figure 2: Past Financials of Mumbai Suburban Railway System
Source: MRVC, WR & CR (Mumbai Division)
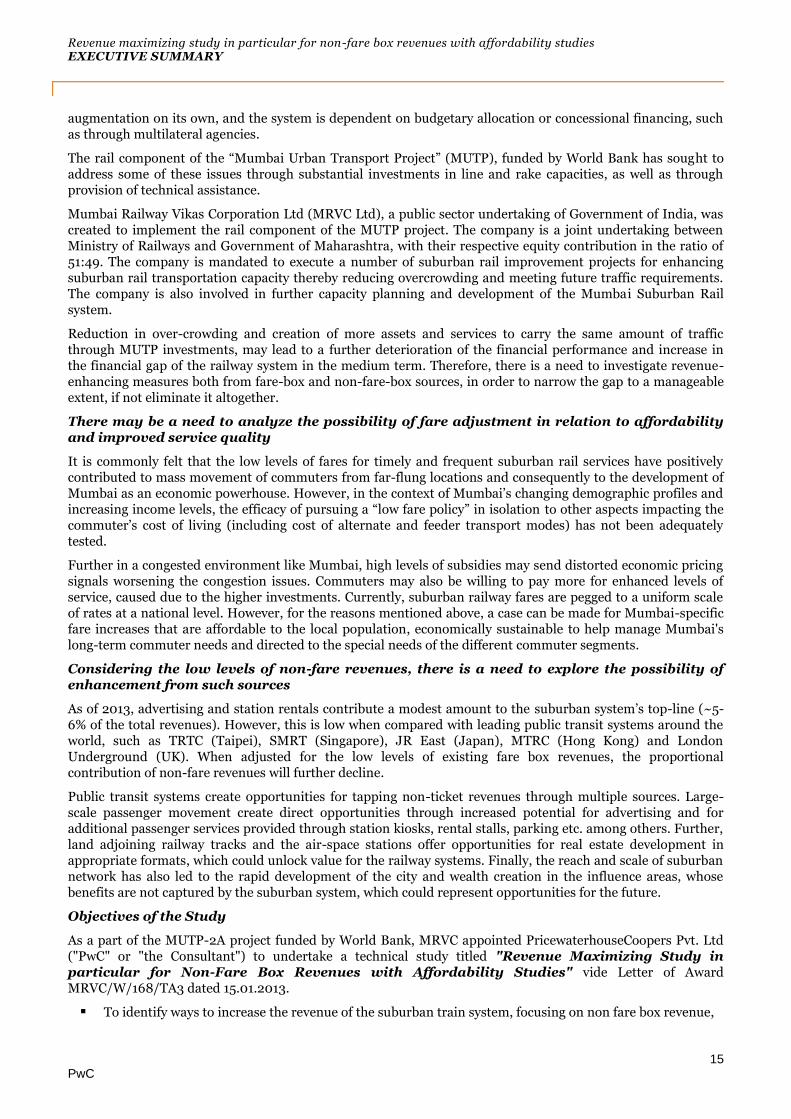
The level of non-fare revenues in the system is low, when compared with other urban rail systems in the world
The contribution of non-fare box or non-ticketing revenues, as present in the system has been nominal (around 6% - 7%), and at levels that are substantially lower than comparable transit systems. The non-fare box revenues contribute over 10% of the total revenues in case of comparable transits.
Figure 3: Non-fare box revenue as % of total operating revenue
Source: PwC Analysis, Annual Reports of Metro Rail Systems
There is a growing need for investments and sustainable revenue enhancement measures while the financials of the suburban rail system are deteriorating
The suburban system has been challenged by the growth of the city’s population, as well as the need to address urgent congestion issues, caused by intensive use by the commuters. Even as the frequency of services are maintained at a reasonable level of 4 trains per minute, peak hour utilization are observed to be at levels over 5000 passengers per 9-car train, against a rated capacity of 1700. Such over-crowding causes safety hazards not only inside the trains, but also at stations and areas adjoining tracks, leading to increasing incidents of daily injuries and fatalities.
The current passenger carrying capacity is insufficient to meet the growing demand resulting in severe overcrowding. The network’s operating losses, does not provide any bandwidth to invest in capacity
41
(12) (49)
19
(316) (567) (626) (660) (1,000)
(500)
-
500
1,000
1,500
2,000
2,500
2004-05 2005-06 2006-07 2007-08 2008-09 2009-10 2010-11 2011-12
INR
Cr
Operating Expense Revenues Operating Surplus/Deficit
6.5%
13%
20%
24%
33%
41%
Mumbai Suburban Railway, Mumbai
TRTC, Taipei
DMRC, Delhi*
SMRT, Singapore
JR East, Tokyo
MTR, Hong Kong
Revenue maximizing study in particular for non-fare box revenues with affordability studies EXECUTIVE SUMMARY
15 PwC
augmentation on its own, and the system is dependent on budgetary allocation or concessional financing, such as through multilateral agencies.
The rail component of the “Mumbai Urban Transport Project” (MUTP), funded by World Bank has sought to address some of these issues through substantial investments in line and rake capacities, as well as through provision of technical assistance.
Mumbai Railway Vikas Corporation Ltd (MRVC Ltd), a public sector undertaking of Government of India, was created to implement the rail component of the MUTP project. The company is a joint undertaking between Ministry of Railways and Government of Maharashtra, with their respective equity contribution in the ratio of 51:49. The company is mandated to execute a number of suburban rail improvement projects for enhancing suburban rail transportation capacity thereby reducing overcrowding and meeting future traffic requirements. The company is also involved in further capacity planning and development of the Mumbai Suburban Rail system.
Reduction in over-crowding and creation of more assets and services to carry the same amount of traffic through MUTP investments, may lead to a further deterioration of the financial performance and increase in the financial gap of the railway system in the medium term. Therefore, there is a need to investigate revenue-enhancing measures both from fare-box and non-fare-box sources, in order to narrow the gap to a manageable extent, if not eliminate it altogether.
There may be a need to analyze the possibility of fare adjustment in relation to affordability and improved service quality
It is commonly felt that the low levels of fares for timely and frequent suburban rail services have positively contributed to mass movement of commuters from far-flung locations and consequently to the development of Mumbai as an economic powerhouse. However, in the context of Mumbai’s changing demographic profiles and increasing income levels, the efficacy of pursuing a “low fare policy” in isolation to other aspects impacting the commuter’s cost of living (including cost of alternate and feeder transport modes) has not been adequately tested.
Further in a congested environment like Mumbai, high levels of subsidies may send distorted economic pricing signals worsening the congestion issues. Commuters may also be willing to pay more for enhanced levels of service, caused due to the higher investments. Currently, suburban railway fares are pegged to a uniform scale of rates at a national level. However, for the reasons mentioned above, a case can be made for Mumbai-specific fare increases that are affordable to the local population, economically sustainable to help manage Mumbai's long-term commuter needs and directed to the special needs of the different commuter segments.
Considering the low levels of non-fare revenues, there is a need to explore the possibility of enhancement from such sources
As of 2013, advertising and station rentals contribute a modest amount to the suburban system’s top-line (~5-6% of the total revenues). However, this is low when compared with leading public transit systems around the world, such as TRTC (Taipei), SMRT (Singapore), JR East (Japan), MTRC (Hong Kong) and London Underground (UK). When adjusted for the low levels of existing fare box revenues, the proportional contribution of non-fare revenues will further decline.
Public transit systems create opportunities for tapping non-ticket revenues through multiple sources. Large-scale passenger movement create direct opportunities through increased potential for advertising and for additional passenger services provided through station kiosks, rental stalls, parking etc. among others. Further, land adjoining railway tracks and the air-space stations offer opportunities for real estate development in appropriate formats, which could unlock value for the railway systems. Finally, the reach and scale of suburban network has also led to the rapid development of the city and wealth creation in the influence areas, whose benefits are not captured by the suburban system, which could represent opportunities for the future.
Objectives of the Study
As a part of the MUTP-2A project funded by World Bank, MRVC appointed PricewaterhouseCoopers Pvt. Ltd ("PwC" or "the Consultant") to undertake a technical study titled "Revenue Maximizing Study in particular for Non-Fare Box Revenues with Affordability Studies" vide Letter of Award MRVC/W/168/TA3 dated 15.01.2013.
To identify ways to increase the revenue of the suburban train system, focusing on non fare box revenue,
Revenue maximizing study in particular for non-fare box revenues with affordability studies EXECUTIVE SUMMARY
16 PwC
To study and review the socio-economic profile of customers and examine the justification for financial
cross-support from other economic agents as well as the potential for fare adjustment in relation to
affordability and service quality.
To help in strengthening of skills in assessing non fare box revenue, and fare affordability and knowledge
obtained through the study to MRVC, and other agencies as appropriate (such as MMRDA, Ministry of
Railways, Government of Maharashtra, Western & Central Railways)
Tasks undertaken in the Study
To achieve its objectives, the study was divided in two phases with five distinct tasks
Ideation Stage: The ideation stage was planned to develop a fact-base of the current state, with the
help of primary and secondary research through the following tasks:
o Task 1: Review of Existing Studies and Literature: PwC reviewed railway statistics,
major studies and reports in related areas carried out over the last 20 years and major acts,
guidelines and regulations, in order to familiarize itself of the existing system.
o Task 2: Extensive interactions with stakeholders, including MRVC, different arms of
Western and Central Railway Suburban Divisions, city planning agencies and local bodies
including MCGM and CIDCO, other transit agencies like BEST, several private stakeholders in
the real estate and transit advertising space, in order to generate and validate hypotheses for
revenue enhancement, through various sources
During the course of the analysis phase, several formal interactions with the State agencies including MMRDA and Urban Development Department (UDD), besides interactions with other city transit systems like Delhi Metro Railway Corporation (DMRC) were also conducted.
o Task 5: Guided Study Tour:, As a part of this study, PwC was mandated to organize a
suitable guided study tour/training for the study of the fare system and the revenues generated
in the non fare box areas and other commercial activities in leading suburban metros of the
world, with a focus on the following areas:
Study of Diversification strategy for Revenue sources, especially non-fare box sources
Revenue maximization through Transit-Oriented real estate development/suburban
railway linked real estate development & advertising potential
Systems & processes to enable steady revenue stream from non-fare box sources,
institutional building and best practices etc.
Accordingly, the key urban cities of Japan (Tokyo and Osaka city) and China (Beijing and Shanghai) were selected, and a study tour was organized between June 30, 2013 and July 13, 2013. It included meetings with the major urban rail operators as well as Ministry of Land, Infrastructure and Transport (MLIT), Japan.
Analysis and Recommendations Stage:
During this stage, revenue-enhancing targets were established based on the expected financial gap over the next 10 years, and targeted measures, both from fare and non-fare perspectives were established through the following tasks
o Task 3: Estimation of potential non-fare box revenues: During this task, PwC
investigated means of enhancing non-fare box revenues, from several sources including the
following:
Advertising, including inside and outside local trains, Platforms
Rental of commercial space at stations
Commercial development at stations or on other suburban rail land

Revenue maximizing study in particular for non-fare box revenues with affordability studies EXECUTIVE SUMMARY
17 PwC
Indirect user charges
Pay and use amenities and other measures
PwC estimated the maximum potential achievable from various sources through multiple methods, as well as the critical success factors and interventions required for realizing these objectives. Real estate development emerges as one of the most important methods for revenue enhancement.
As part of the task, PwC in consultation with MRVC has developed preliminary concept plans at 4 selected sites in the suburban network, focused on airspace development of real estate.
o Task 4: Analysis of fare optimization and affordability studies: This task was aimed
at investigating ways of optimizing the overall levels of fares (according to what the market will
bear), while protecting the ability of lower income passengers to continue to use the rail system.
In order to do this, PwC undertook a detailed survey of commuters to establish their socio-economic profiles, estimating their ability and willingness to pay. As a result of this survey, insights were generated on possible fare optimization methods and structuring recommendations, that could be affordable to the general population. Further, several possible fare trajectory scenarios were generated for consideration.

Revenue maximizing study in particular for non-fare box revenues with affordability studies EXECUTIVE SUMMARY
18 PwC
Defining the contours of the study
The network is expected to cumulatively incur operating gaps of over INR 18,000 Crores over the next 10 years, which will represent a burden on the budgetary resources
Figure 4: Financial projections for the System till 2023-24
It has been observed that till 2007-08, the suburban railway system had been operating at near break-even levels. However, increasing factor costs, including employee and electricity prices, as well as increasing asset maintenance costs due to additional capital investments have led to steep operating losses in the recent years.
To estimate future projections, it was assumed that the operational cost will continue to increase at an annual rate of 7%, as projected by economic estimates, (long term outlook on inflation6) and that the revenues will grow in-line with population growth rate, assumed as 2% p.a.7 Accounting for the onetime increase in fares during January, 2013 it is estimated that the deficit during the financial year 2013-14 may be approximately INR 791 crores
This deficit is expected to increase substantially over the next 10 years and lead to a cumulative operating gap of close to INR 18,300 Crores till 2023-24 (calculated as an arithmetic sum), which will need to be financed through budgetary sources. This would also translate to a steadily declining fare recovery ratio from the current 0.60 to 0.40 by 2023-24.
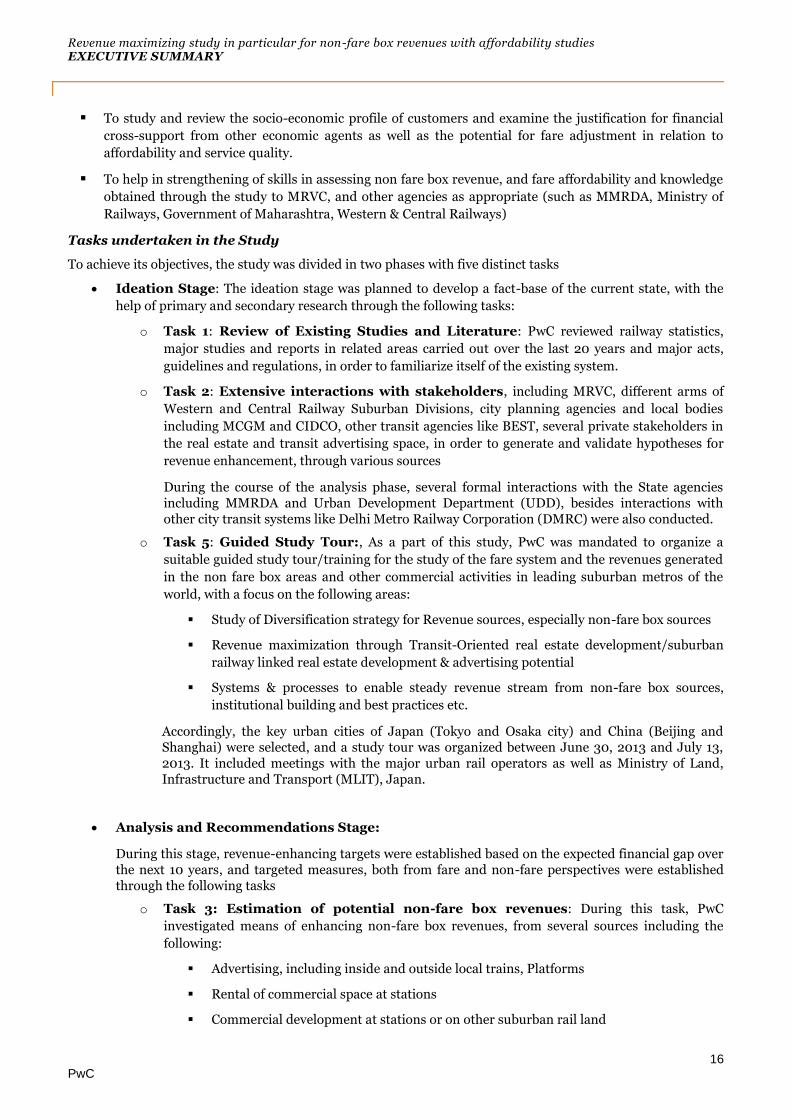
An additional INR 30,000 is required to finance fresh investments through MUTP and other programs
Many further investments beyond MUTP Phase - 1 and 2 are currently being planned. While the exact extent of the investments and their costs are yet to be estimated, conservative estimates of the projects on the anvil add up to over ~30,000 Crores, (calculated as an arithmetic sum)
Table 2: Select list of projects estimated over the next 10 years
Estimated Projects Estimated Project Costs
1. Thane-Bhiwandi and Airoli-Kalwa lines ~ INR 1500 Crores
2. Electrification of Panvel-Pen and new single line on Panvel-Alibaug ~ INR 960 Crores
3. Panvel-Khopoli/Karjat doubling ~ INR 2139 Crores
6 Source: Survey of Professional Forecasters on Macroeconomic Indicators – 25th and 26th Round (RBI) 7 Population growth in MMR region ~1.5 -2.0% (@1.8% as per Project Appraisal Report for MUTP-2A Loan, World Bank)
Revenue maximizing study in particular for non-fare box revenues with affordability studies EXECUTIVE SUMMARY
19 PwC
4. Virar-Dahanu Road Quadrupling ~ INR 3522 Crores
5. Virar-Vasai-Panvel suburban Corridor ~ INR 5,500 Crores
6. Churchgate-Virar Elevated Corridor ~ INR 22,500 Crores
7. CSTM-Panvel Corridor ~ INR 11,000 Crores
Source: RFQ document for Churchgate-Virar Elevated Corridor, PwC Research & Analysis, News articles
The Comprehensive Transportation Study (CTS) for MMR (2008), a study undertaken by World Bank and MMRDA to formulate a comprehensive transportation strategy for the metropolitan region, also outlines the need for investments in the suburban railway system worth over ~29,113 Cr (@2005-06 prices) during 2008 – 2021 and around INR 31,418 Cr (@2005-06 prices) between 2008-2031. These investments are expected to augment capacity with over 200 line km and include some of the projects listed above.
Figure 5: Estimated Capital Investment Projections over the next 10 years
While some of the above projects are planned to be financed through private investments, servicing private capital will require creating avenues for maximization of commercial revenues and/or significant viability gap funding.
Therefore in the absence of any revenue enhancement measures, the cumulative operational deficit and investment need will represent a large financial burden on the Ministry of Railways over the next 10 years, estimated currently to be close to INR 50,000 Crores (as an arithmetic sum).
Augmentation of fare-box and non-fare-box revenues will need to be seen in the context of reducing the burden of the government towards meeting the operating and financing gaps of the Mumbai Suburban Railway System. The initial part of this study was spent in assessing the current context in greater detail through a series of stakeholder interviews, data analysis, literature reviews, and passenger surveys as well as through site visits and guided study tours. As a result of this ideation phase, several insights were gained, that helped to define the framework of the core issues, as well as possible solutions at hand, which were further elaborated to assess their ease of implementation, in order to generate targeted recommendations for the future.
Revenue Enhancement Potential from non-fare box sources
Insights gained during the Ideation Stage:
As part of the ideation phase, several reports and stakeholder interviews were conducted, in order to establish the current context of non-fare box revenues in the suburban rail network.
Revenue maximizing study in particular for non-fare box revenues with affordability studies EXECUTIVE SUMMARY
20 PwC
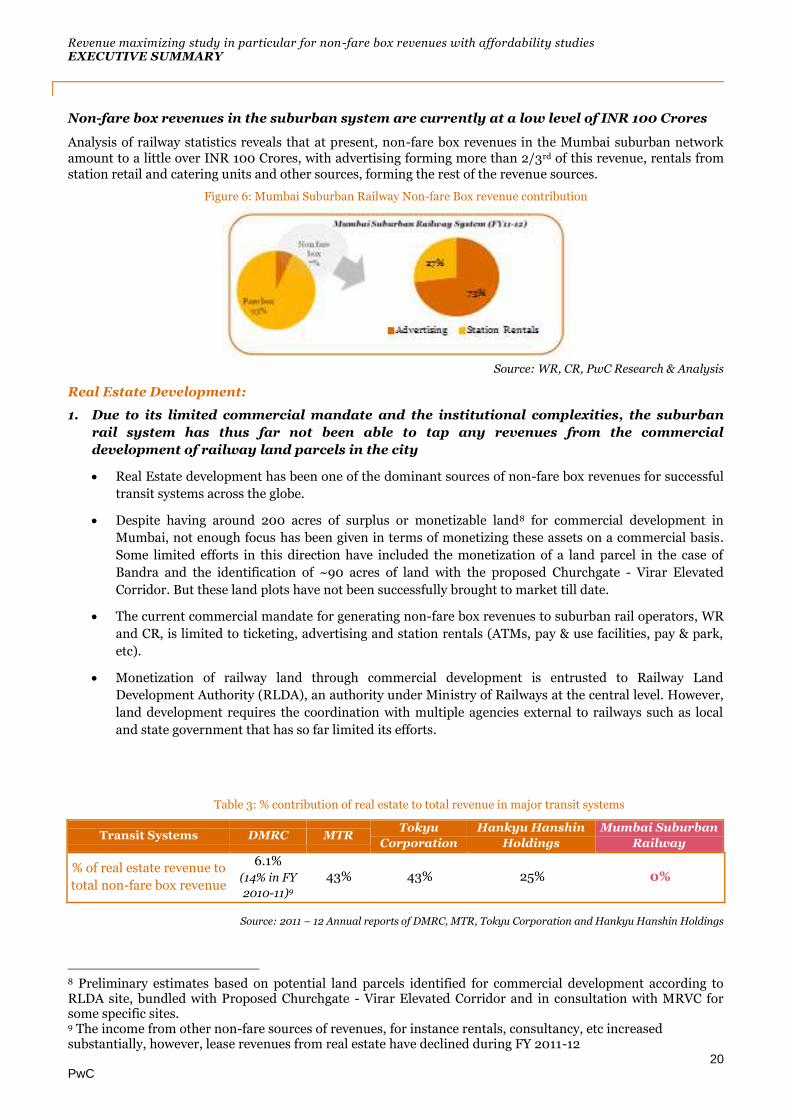
Non-fare box revenues in the suburban system are currently at a low level of INR 100 Crores
Analysis of railway statistics reveals that at present, non-fare box revenues in the Mumbai suburban network amount to a little over INR 100 Crores, with advertising forming more than 2/3rd of this revenue, rentals from station retail and catering units and other sources, forming the rest of the revenue sources.
Figure 6: Mumbai Suburban Railway Non-fare Box revenue contribution
Source: WR, CR, PwC Research & Analysis
Real Estate Development:
1. Due to its limited commercial mandate and the institutional complexities, the suburban
rail system has thus far not been able to tap any revenues from the commercial
development of railway land parcels in the city
Real Estate development has been one of the dominant sources of non-fare box revenues for successful
transit systems across the globe.
Despite having around 200 acres of surplus or monetizable land8 for commercial development in
Mumbai, not enough focus has been given in terms of monetizing these assets on a commercial basis.
Some limited efforts in this direction have included the monetization of a land parcel in the case of
Bandra and the identification of ~90 acres of land with the proposed Churchgate - Virar Elevated
Corridor. But these land plots have not been successfully brought to market till date.
The current commercial mandate for generating non-fare box revenues to suburban rail operators, WR
and CR, is limited to ticketing, advertising and station rentals (ATMs, pay & use facilities, pay & park,
etc).
Monetization of railway land through commercial development is entrusted to Railway Land
Development Authority (RLDA), an authority under Ministry of Railways at the central level. However,
land development requires the coordination with multiple agencies external to railways such as local
and state government that has so far limited its efforts.
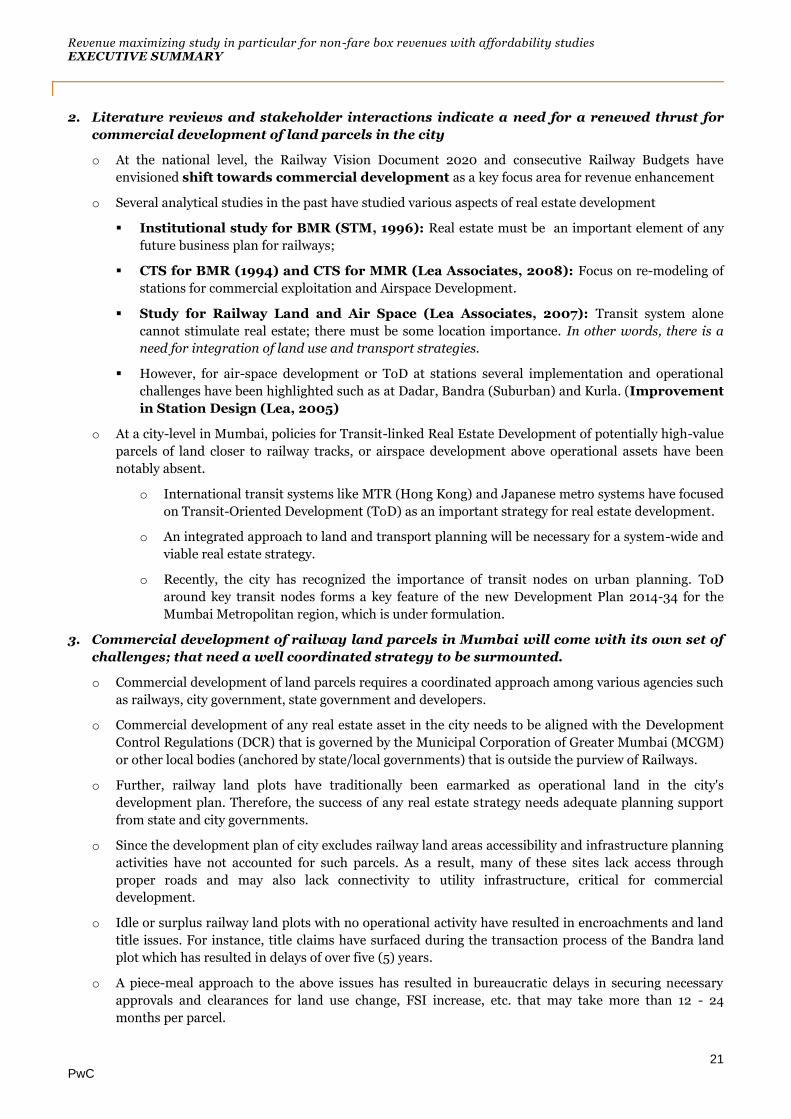
Table 3: % contribution of real estate to total revenue in major transit systems
Transit Systems DMRC MTR Tokyu
Corporation
Hankyu Hanshin
Holdings
Mumbai Suburban
Railway
% of real estate revenue to
total non-fare box revenue
6.1%
(14% in FY
2010-11)9
43% 43% 25% 0%
Source: 2011 – 12 Annual reports of DMRC, MTR, Tokyu Corporation and Hankyu Hanshin Holdings
8 Preliminary estimates based on potential land parcels identified for commercial development according to RLDA site, bundled with Proposed Churchgate - Virar Elevated Corridor and in consultation with MRVC for some specific sites. 9 The income from other non-fare sources of revenues, for instance rentals, consultancy, etc increased substantially, however, lease revenues from real estate have declined during FY 2011-12
Revenue maximizing study in particular for non-fare box revenues with affordability studies EXECUTIVE SUMMARY
21 PwC
2. Literature reviews and stakeholder interactions indicate a need for a renewed thrust for
commercial development of land parcels in the city
o At the national level, the Railway Vision Document 2020 and consecutive Railway Budgets have
envisioned shift towards commercial development as a key focus area for revenue enhancement
o Several analytical studies in the past have studied various aspects of real estate development
Institutional study for BMR (STM, 1996): Real estate must be an important element of any
future business plan for railways;
CTS for BMR (1994) and CTS for MMR (Lea Associates, 2008): Focus on re-modeling of
stations for commercial exploitation and Airspace Development.
Study for Railway Land and Air Space (Lea Associates, 2007): Transit system alone
cannot stimulate real estate; there must be some location importance. In other words, there is a
need for integration of land use and transport strategies.
However, for air-space development or ToD at stations several implementation and operational
challenges have been highlighted such as at Dadar, Bandra (Suburban) and Kurla. (Improvement
in Station Design (Lea, 2005)
o At a city-level in Mumbai, policies for Transit-linked Real Estate Development of potentially high-value
parcels of land closer to railway tracks, or airspace development above operational assets have been
notably absent.
o International transit systems like MTR (Hong Kong) and Japanese metro systems have focused
on Transit-Oriented Development (ToD) as an important strategy for real estate development.
o An integrated approach to land and transport planning will be necessary for a system-wide and
viable real estate strategy.
o Recently, the city has recognized the importance of transit nodes on urban planning. ToD
around key transit nodes forms a key feature of the new Development Plan 2014-34 for the
Mumbai Metropolitan region, which is under formulation.
3. Commercial development of railway land parcels in Mumbai will come with its own set of
challenges; that need a well coordinated strategy to be surmounted.
o Commercial development of land parcels requires a coordinated approach among various agencies such
as railways, city government, state government and developers.
o Commercial development of any real estate asset in the city needs to be aligned with the Development
Control Regulations (DCR) that is governed by the Municipal Corporation of Greater Mumbai (MCGM)
or other local bodies (anchored by state/local governments) that is outside the purview of Railways.
o Further, railway land plots have traditionally been earmarked as operational land in the city's
development plan. Therefore, the success of any real estate strategy needs adequate planning support
from state and city governments.
o Since the development plan of city excludes railway land areas accessibility and infrastructure planning
activities have not accounted for such parcels. As a result, many of these sites lack access through
proper roads and may also lack connectivity to utility infrastructure, critical for commercial
development.
o Idle or surplus railway land plots with no operational activity have resulted in encroachments and land
title issues. For instance, title claims have surfaced during the transaction process of the Bandra land
plot which has resulted in delays of over five (5) years.
o A piece-meal approach to the above issues has resulted in bureaucratic delays in securing necessary
approvals and clearances for land use change, FSI increase, etc. that may take more than 12 - 24
months per parcel.

Revenue maximizing study in particular for non-fare box revenues with affordability studies EXECUTIVE SUMMARY
22 PwC
o Railway Land Development Authority (RLDA) has the jurisdiction for commercial development of
railway lands in India. Though guidelines for Multi-Functional Complex (MFC) are available such as
concession period, commercial structuring, model concession agreement, etc.; no adequate guidelines
or mechanisms exist for commercial development of residential colonies.
4. Land use and transport integration has helped unlock the potential from commercial
development in case of successful transit agencies
o Study of Japanese Railway industry indicate successful integration of land use planning, infrastructure
and transport development at the highest level as ministry (Ministry of Land, Infrastructure &
Transport, MLIT).
o Land-use and transport integrated urban planning can be seen in the case of Navi Mumbai (for
instance, Vashi and Belapur) by CIDCO and "Railway + Property model" of JR East, Tokyo. The
agencies indicated that this approach has helped in generating revenues eradicating the need for heavy
subsidies.
5. Revenue enhancement through commercial development would need a judicious strategy
that takes into account timing and micro-market issues
o Real estate market dynamics is intrinsically volatile with variations in absorption, lease rentals, and
tenants across micro markets and over time.
o The shape of the land parcels available with railways is typically longitudinal with highly skewed length
to width ratios. This lead to height restrictions on account to limited width and closeness to tracks and
other development constraints that can lead to discounting of realizable values.
o Demarcation between commercial and operational area in railway plots will be critical for their
potential development.
o Interactions with agencies reveal that air space development above suburban stations in Mumbai will
be challenging both from construction and financial viability points of view in comparison with green-
field development (E.g. commercial development at Navi Mumbai stations).
6. Given the market dynamics and institutional limitations, agencies have expressed
preference for commercial development through public-private partnership
o From the experience of CIDCO in Navi Mumbai, which has developed properties on five (5) stations
and has preferred Public Private Partnership (PPP) route for the 6th station, it can be observed that:
o A guided approach is not seen to be suitable for a volatile industry like real estate and a market
oriented approach involving private developers is preferable
o Government entities have limited flexibility with respect to marketing, pricing and contracting
aspects that are crucial in the real estate market
o A guided approach in the case of the first five (5) stations has resulted in high level of vacancies for
a long period, especially for large properties at Vashi and Belapur stations
o Limited funds available for investments in capacity augmentation of the system, also limits the
availability of the public funds for commercial development.
o Having recognized this, RLDA guidelines provide options for self-development, joint development and
third party development and management of properties.
7. Lack of precedence in working with agencies like railways could be a deterrent for
attracting private sector participants/developers who perceive an increased degree of risk
which may require focused attention
o Land development in Mumbai has higher potential of wind fall gains, risking greater public scrutiny
and perception risks. Well-defined risk/reward sharing is necessary at the outset before involving
private developers.

Revenue maximizing study in particular for non-fare box revenues with affordability studies EXECUTIVE SUMMARY
23 PwC
o Delays and uncertainty of infrastructure projects, frequent revisions to long term development plans,
and frequent amendments of DCR especially with respect to FSI could lead to greater uncertainties in
outcomes. This requires greater investment in project preparation and co-ordination with city agencies.
o Also, the lack of agreement between various government entities on development, relating to
overlapping jurisdiction is observed to be the major cause of delays and cost overruns
E.g. L&T Seawoods project, which suffered delays in clearances and approvals due to involvement of multiple agencies such as CIDCO, Central Railway, NMMC, etc having inter-agency issues, as well as changes requested in air space development over Seawoods Darave suburban station with respect to proposed CSTM - Panvel fast suburban rail corridor several years after the award of the project.
o Private participants will expect speedy clearances and approvals which will help boost the confidence of
the investors
8. MoU between RLDA and MRVC is a step in the direction of adding commercial
development as a potential source of non-fare box revenues
o During the course of this study, RLDA & MRVC have entered into a Memorandum of Understanding
MoU (Dt. 16.07.2013)10 for commercial development of Railway Land / air space above stations in
Mumbai, wherein the commercial assets so developed shall remain under the exclusive control of and
be operated and maintained by MRVC during the entire lease period. The concession period & Equity
IRR (EIRR) are proposed as 45 years and 22.5% respectively.
o The MoU focuses largely on commercial use development, but residential colony redevelopment and
residential assets are not covered under the MoU, which will need concession period of over 65 years.
However a preliminary framework has been established to fast track commercial development in
coming years
o However, in order for MRVC to succeed in its efforts, it would be necessary to resolve some of the
aforesaid challenges through involvement of state/local government or entities.
Advertising:
1. Advertising generates over 2/3rd of the total non-fare box revenues for Mumbai Suburban
Railway System
Advertising is the single largest source of non-fare box revenues as on date. If revenues from penalties
collected from ticketless travel are excluded, the contribution is as high as 75% of the total non-fare box
sources.
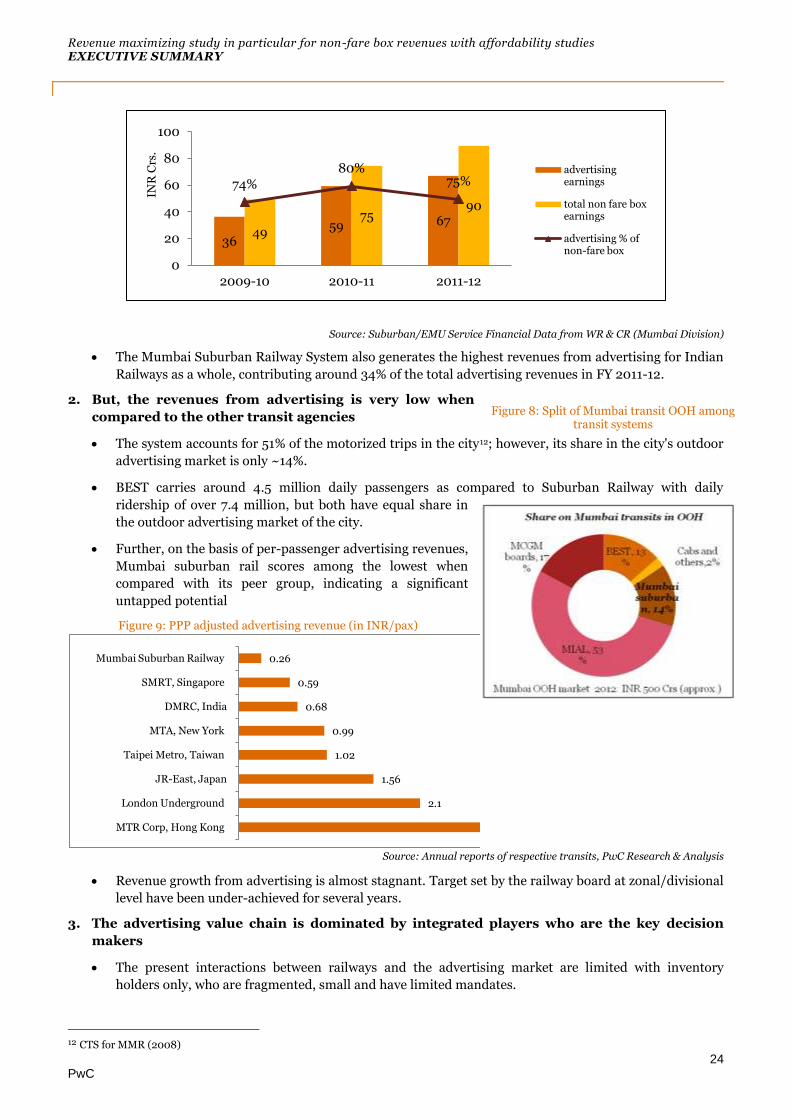
Figure 7: Revenue contribution of advertising (Mumbai Suburban Railways)11
10 Source: MRVC 11 This excludes the earnings from penalty collected against ticketless travel, and other miscellaneous sundry earnings
Revenue maximizing study in particular for non-fare box revenues with affordability studies EXECUTIVE SUMMARY
24 PwC
Source: Suburban/EMU Service Financial Data from WR & CR (Mumbai Division)
The Mumbai Suburban Railway System also generates the highest revenues from advertising for Indian
Railways as a whole, contributing around 34% of the total advertising revenues in FY 2011-12.
2. But, the revenues from advertising is very low when
compared to the other transit agencies
The system accounts for 51% of the motorized trips in the city12; however, its share in the city's outdoor
advertising market is only ~14%.
BEST carries around 4.5 million daily passengers as compared to Suburban Railway with daily
ridership of over 7.4 million, but both have equal share in
the outdoor advertising market of the city.
Further, on the basis of per-passenger advertising revenues,
Mumbai suburban rail scores among the lowest when
compared with its peer group, indicating a significant
untapped potential
Figure 9: PPP adjusted advertising revenue (in INR/pax)
Source: Annual reports of respective transits, PwC Research & Analysis
Revenue growth from advertising is almost stagnant. Target set by the railway board at zonal/divisional
level have been under-achieved for several years.
3. The advertising value chain is dominated by integrated players who are the key decision
makers
The present interactions between railways and the advertising market are limited with inventory
holders only, who are fragmented, small and have limited mandates.
12 CTS for MMR (2008)
2.1
1.56
1.02
0.99
0.68
0.59
0.26
MTR Corp, Hong Kong
London Underground
JR-East, Japan
Taipei Metro, Taiwan
MTA, New York
DMRC, India
SMRT, Singapore
Mumbai Suburban Railway
Figure 8: Split of Mumbai transit OOH among transit systems
36 59 67
49
75 90
74%
80% 75%
50%
60%
70%
80%
90%
100%
0
20
40
60
80
100
2009-10 2010-11 2011-12
INR
Crs
.
advertising earnings
total non fare box earnings
advertising % of non-fare box

Revenue maximizing study in particular for non-fare box revenues with affordability studies EXECUTIVE SUMMARY
25 PwC
Media planners and media buying agencies which are the decision makers and influencers in the
selection of the type of media and the transit modes are currently absent in the list of customers served
by suburban railways.
Figure 10: Advertising value chain
Source: PwC Research & Analysis
Interactions with transit agencies and market participants reveal the following issues:
o Large number of smaller and local players in the suburban rail advertising space, has led to
severe fragmentation of the market
o Market players with larger appetite are either absent or have minimal presence in the network.
4. Growth in conventional outdoor media is declining and being replaced by fast growing
transit and digital advertising media
The current inventory available with railways is found to
be largely conventional outdoor media comprising
billboards & hoardings, which generate ~92% of the total advertising revenues
However, review of market reports suggest declining trend in the growth of conventional OOH market,
currently growing at only 2% p.a. 13
The advertising industry is undergoing a fundamental shift towards alternate media, such as transit
media (20% YoY), digital OOH media (35% YoY), internet &
mobile based advertising (26% YoY) 14
Going by industry trends, the conventional media may lose its
importance and value and hence there is a need to tap
opportunities from alternate media for growth.
Studies in the past have recognized the need for a better
market alignment of advertising inventory:
o Railway Vision 2020: Considers the idea of
launching a separate TV channel to disseminate
information and earn revenues and explore
merchandizing opportunity.
13 Growth rates; source: Pitch-Madison media Advertising Outlook 2013, PwC M & E Advertising Outlook 2016 14 Growth rates; source: Pitch-Madison media Advertising Outlook 2013, PwC M & E Advertising Outlook 2016
Figure 11: Split of advertising revenue by different sources (Mumbai Suburban Railways)
Source - PwC Research & Analysis, CR, WR

Revenue maximizing study in particular for non-fare box revenues with affordability studies EXECUTIVE SUMMARY
26 PwC
o CTS for MMR (2008): Emphasizes advertising as one of the new source of funding for
transportation system. In other words, advertising should be pro-market and adaptive to
industry dynamics to enhance revenues.
5. Interactions with existing market participants reveal key operational issues with the current
advertising practices
Market participants acknowledge that the network offers immense “opportunities to see” (eyeball
opportunities), an essential value creator for advertising
However, they have also expressed dissatisfactions regarding based on their past experience and have
largely limited plans for business expansion in the suburban rail network
Some of the key operational issues as highlighted are:
o Lack of market orientation and flexibility in inventory, pricing, etc.
o Lack of simple and time bound clearance and approval process
o Market unfriendly payment terms
o Inadequate security for the assets and investments
o Lack of grievance redressal and arbitration processes
o Contract tenor not appropriate to risks undertaken
6. Interactions with the integrated market participants who have not yet considered railways
as a medium of choice also reveal additional aspects to be addressed to achieve market
oriented outcomes
Integrated or larger players, having presence across the industry value chain, expressed willingness to
work with railways in the city if provided adequate incentives which meet their expectations
The summary of major expectations revealed from the interactions are as follows:
o Longer contract tenor of 10-15 years and stringent qualification criteria
o Mechanisms for involvement in media planning at an early stage, so that inventory can be
realistically aligned to market needs
o Better station aesthetics and choice of locations
Station Rentals:
1. Station rentals contribute to around 1/5th of the total non-fare box revenues and comprises
of various sources
Existing sources of station rental revenues comprise of ATMs, Pay & park, pay & use facilities, catering
stalls, book stalls, STD/PCO booths, shoeshine, etc. However, ATMs, Pay & park and Catering stalls are
the largest contributor in this category.
These sources can be categorized further as
o Category A: Facilities which are necessary & complementary to train services and can cater to both
commuters and external station area population. E.g. Pay & park
o Category B: Facilities which bank on higher footfalls and capture value without adding to the
congestion at the station premises. E.g. ATMs
o Category C: Station facilities that are currently provided which may need to be rationalized
considering better passenger amenities, passenger convenience and safety. E.g. catering stalls
2. Retail rental earnings in the system is not in pace with the retail market of the city

Revenue maximizing study in particular for non-fare box revenues with affordability studies EXECUTIVE SUMMARY
27 PwC
Rentals earnings are a function of ridership and local real estate rental price indices. However, in the
case of Mumbai Suburban Railway, the rentals are not in line with growing ridership as well as the
rental indices.
Figure 12: Suburban rail ridership, real estate and station rental earning trends in Mumbai
Source: CR and WR (Mumbai Division), PwC Research & Analysis
Interaction with officials reveal that, the license fee for existing contracts especially from catering stalls
and ATMs are not market determined.
Station platforms are flanked with tea stalls and milk stalls which were mostly awarded several decades
ago. The license fees for such facilities are revised nominally without substantial price corrections and
any open tender procedure.
Over half of the existing ATMs are awarded based on a MoU between Railway Board and nationalized
banks, which are lower than the license fee received through open tenders.
3. These sources of revenues compete with operations and passenger amenities for space.
Station areas including platforms and FOBs are highly congested at most of the stations.
Past studies have also highlighted the issue of inadequate space resulting in inconvenience to
passengers:
o Mumbai Suburban Rail Passenger Survey & Analysis (Wilbur Smith Associates,
2012): The study has highlighted the various aspects with respect to stations, platforms,
FOBs/Subways and trains causing dissatisfaction and inconvenience to passengers. Congestion,
inadequate space and platform width are the key issues highlighted by the commuters.
o Improvement in Station design and engineering on Mumbai Suburban Railway
section (Lea Associates): This study also highlights the congestion on platform and difficulty in
passenger movement due to presence of hawkers, stalls on platform area.
4. Some policies such as catering policy 2010 may have resulted in fragmentation of the market
Catering policy 2010 limits the number of major stalls to a maximum of two (2) per zone per
contractor. Hence, the larger industry players with interest in bulk contracts as found in case of Delhi
Metro, as well as branded outlets are absent from the suburban stations in the city.
Indirect Benefits:
1. The city has grown linearly along the suburban rail corridor, and recent projects, including
MUTP, are influencing the spatial and outward growth of the city
Spatial growth of the city can be attributed to several factors; however connectivity remains the largest
influencer of the way city grows.
70
80
90
100
110
120
130
140
2008 2009 2010 2011 2012
Ind
exed
an
nu
al r
eta
il r
enta
ls
Island city retail rental Eastern suburbs Retail rental Western suburbs Retail rental
Ridership Station rentals
Revenue maximizing study in particular for non-fare box revenues with affordability studies EXECUTIVE SUMMARY
28 PwC
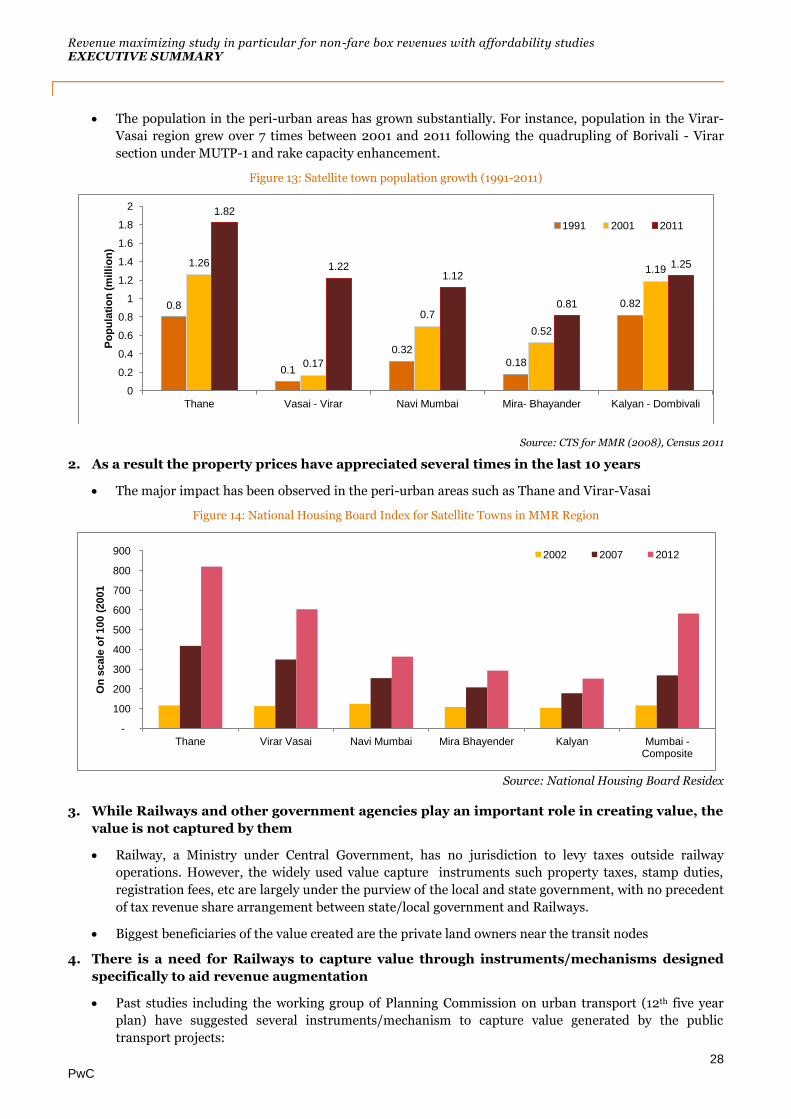
The population in the peri-urban areas has grown substantially. For instance, population in the Virar-
Vasai region grew over 7 times between 2001 and 2011 following the quadrupling of Borivali - Virar
section under MUTP-1 and rake capacity enhancement.
Figure 13: Satellite town population growth (1991-2011)
Source: CTS for MMR (2008), Census 2011
2. As a result the property prices have appreciated several times in the last 10 years
The major impact has been observed in the peri-urban areas such as Thane and Virar-Vasai
Figure 14: National Housing Board Index for Satellite Towns in MMR Region
Source: National Housing Board Residex
3. While Railways and other government agencies play an important role in creating value, the
value is not captured by them
Railway, a Ministry under Central Government, has no jurisdiction to levy taxes outside railway
operations. However, the widely used value capture instruments such property taxes, stamp duties,
registration fees, etc are largely under the purview of the local and state government, with no precedent
of tax revenue share arrangement between state/local government and Railways.
Biggest beneficiaries of the value created are the private land owners near the transit nodes
4. There is a need for Railways to capture value through instruments/mechanisms designed
specifically to aid revenue augmentation
Past studies including the working group of Planning Commission on urban transport (12th five year
plan) have suggested several instruments/mechanism to capture value generated by the public
transport projects:
0.8
0.1
0.32
0.18
0.82
1.26
0.17
0.7
0.52
1.19
1.82
1.22 1.12
0.81
1.25
0
0.2
0.4
0.6
0.8
1
1.2
1.4
1.6
1.8
2
Thane Vasai - Virar Navi Mumbai Mira- Bhayander Kalyan - Dombivali
Po
pu
lati
on
(m
illi
on
)
1991 2001 2011
-
100
200
300
400
500
600
700
800
900
Thane Virar Vasai Navi Mumbai Mira Bhayender Kalyan Mumbai - Composite
On
scale
of
100 (
2001
2002 2007 2012
Revenue maximizing study in particular for non-fare box revenues with affordability studies EXECUTIVE SUMMARY
29 PwC
o The Planning Commission working group on urban transport (12th five year plan): It proposes
green cess and urban transport tax as some of the major instruments to capture value at
central/state/city government level.
o CTS for MMR (Lea Associates, 2008) had proposed development charge or one time
betterment levy as a means of source of funding transportation project. The study estimated
resources range from INR 86,000 Cr to 172,000 Cr for period 2006-31 (assuming charges at
5% and 10% for residential and non residential development).
o In March, 2013, an 11-member panel headed by additional chief secretary (home)
recommended congestion charge for the city in its 51-point action plan submitted to the
Bombay high Court.
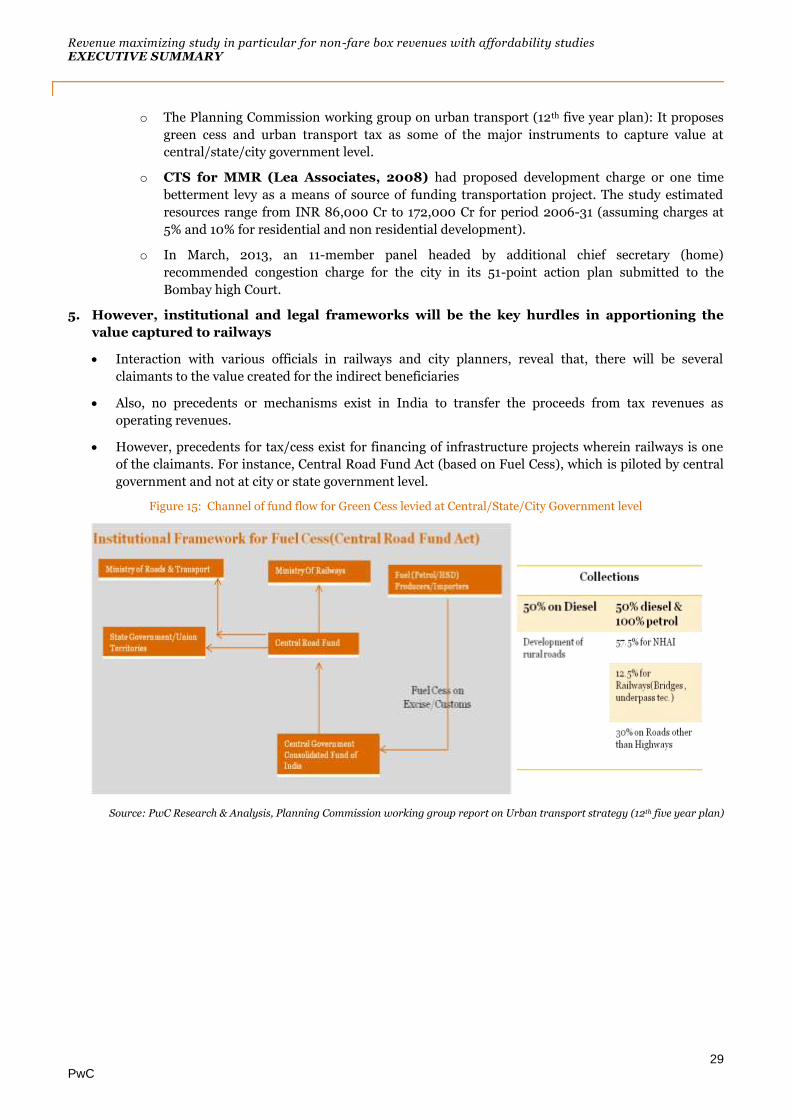
5. However, institutional and legal frameworks will be the key hurdles in apportioning the
value captured to railways
Interaction with various officials in railways and city planners, reveal that, there will be several
claimants to the value created for the indirect beneficiaries
Also, no precedents or mechanisms exist in India to transfer the proceeds from tax revenues as
operating revenues.
However, precedents for tax/cess exist for financing of infrastructure projects wherein railways is one
of the claimants. For instance, Central Road Fund Act (based on Fuel Cess), which is piloted by central
government and not at city or state government level.
Figure 15: Channel of fund flow for Green Cess levied at Central/State/City Government level
Source: PwC Research & Analysis, Planning Commission working group report on Urban transport strategy (12th five year plan)

Revenue maximizing study in particular for non-fare box revenues with affordability studies EXECUTIVE SUMMARY
30 PwC
Key Findings from Analysis Stage:
As part of the analysis phase, an assessment of current inventory, regulatory framework and market were conducted, in order to estimate the potential that can be tapped with or without regulatory changes.
Real Estate Development
A) As-is and inventory assessment
Railway is one of the largest land owners (over 2,000 acres15) in the city with most of its land holdings
concentrated in the Island City, a prime real
estate area.
However, given the vast land under operational
use, only limited proportion (~10 - 20%) of land
parcels will be available for commercial
development including air space development16
The present land holdings can be classified as:
o Stations (Over 120 suburban stations)
o Operational lands
Four (4) workshops, 2 each in CR & WR
Around 11 Carsheds in MMR
9 Goods Sheds including Wadi Bunder
2 major parcel depots at Grant Road and
Currey Road in Island City
Open plots (surplus operational land with
little or no current operational usage)
o Residential colonies - around 10,000 railway
quarters in MMR region17, with many of
residential building/structures having an age of over 40 years.
o and Offices
The market attractiveness and regulatory frameworks may vary depending on the asset being proposed for
the commercial development, for instance, air space development above station vs. air space development
above workshop or carshed. Hence, there is a need to identify right mix of assets or land parcels for
commercial development.
B) Policy and Regulatory
Commercial development of railway land will be governed by RLDA guidelines, MoU between RLDA and
MRVC as well as local laws such as Development Control Regulations (DCR) for respective municipal
jurisdiction.
Key aspects of DCR reviewed that have major impact on the commercial viability are:
o Permissible land use: At present all railway land parcels fall under operational use, and hence for
the purpose of commercial development, change of land use is required. However, current DCR
15 Land area details as obtained from MCGM Land Use maps 16 Preliminary estimates based on potential land parcels identified for commercial development according to RLDA site, bundled with Proposed Churchgate - Virar Elevated Corridor and in consultation with MRVC for some specific sites. 17 Consultation with MRVC
Figure 16: Distribution of Indian Railway's assets in the
MMR region
Source - MCGM, Interactions with MRVC

Revenue maximizing study in particular for non-fare box revenues with affordability studies EXECUTIVE SUMMARY
31 PwC
does not have provisions for mixed land use or additional land use as in the case of air space
development above operational area.
o Permissible Floor Space Index (FSI): FSI for commercial use is 1.0 in TMC and MCGM suburban
area while it is 1.33 in MCGM Island City, but higher FSI up to 4.0 is given for notified areas only
o Further, FSI is calculated on the net land area after adjusting for mandatory recreational/open
space area, for instance, net land area is 85% of the total area in case of land plot of size between
2,500 to 10,000 sq. m.
o Mandatory parking provisions is necessary to be met and it is excluded from FSI calculations.
However, additional parking will be counted as a part of permissible FSI.
Approvals for land use change and FSI relaxation are required to be obtained from Urban Development
Department (UDD), Government of Maharashtra (GOM) and respective municipal bodies. As observed in
the case of Bandra land plot, this process takes around 12 to 18 months.
RLDA guidelines allow commercial models based on upfront premium and annual payment model;
however, upfront premium should be at least 7 times the annual payment component. Hence optimal trade-
off between upfront and recurring revenue stream (or annual payment) is required for each of the land
parcel based on financial feasibility and investment priority.
C) Real Estate Market Analysis
Analysis of Real Estate market has revealed
that Sub-urban areas are the new growth centres while Island City is more or less stagnant
The major real estate market in the city
comprises of offices, retail, residential and
hospitality. The market is observed to be
volatile and cyclic.
Commercial office space real estate
market: A phenomenon of migration
among the corporate away from the island
to the suburban and peripheral business
districts has been observed leading to
spatial restructuring. In the future the
distinction between CBD & Off-CBD, BKC
and Off-BKC and Central Mumbai may
become blurred.
Residential space real estate market: Most of the new residential units are coming up in the suburbs,
extended suburbs, Navi Mumbai and Thane with only 1% of new residential units are coming up in South
Mumbai. However, capital prices are the highest in Island City/South Mumbai.
Retail space real estate market: Island city already has quality retail space and it is more or less saturated.
But it also yields the highest rentals. Almost half of the mall space addition has been observed in the
Eastern Suburban region.
D) Complexities and challenges
There are two types of complexities found with respect to commercial development of railway land parcels.
o Macro-complexities: These are largely regulatory, legal and institutional challenges. For instance,
land use conversion in the congested area, multiplicity of agencies with overlapping jurisdiction and
approving authority, etc
o Site-specific complexities:
0%
20%
40%
60%
80%
100%
1999 2001 2003 2005 2007 2009 2011 2013 2015 2017
Ma
rk
et
sh
ar
e i
n %
BKC & Off BKC CBD & Off- CBD Central Mumbai
Figure 17: Distribution trend of office market across zones
Source– Knight Frank Investment Advisory Report (2013)

Revenue maximizing study in particular for non-fare box revenues with affordability studies EXECUTIVE SUMMARY
32 PwC
o Accessibility – It was observed that several of the operational assets studied are either land
locked or have poor accessibility. Most of the operational assets are bounded by tracks and can be
approached only through access which are rendered inadequate because of various factors such as
encroachments
o Encroachments – It was observed that there are over 20 slum settlements on Railway land
parcels in the city. Generally encroachments are on the periphery of the open plots and take place
because of inadequate boundary and preventative measures.
Example – Bandra Station
Figure 18: Bandra Station
Source – Wikimapia, PwC Research & Analysis
o Congestion outside the site – Congestions are mostly observed in the vicinity of stations but
this challenge is not exclusive to station. If the site is located in a congested area getting land use
change may be difficult as the envisaged commercial development at the site will put further
pressure on already stressed infrastructure, utilities and traffic
o Size and Shape of the site – A smaller land parcel is more complex to construct compare to a
larger land parcel. Also it is desirable that the shape of the land parcel is not longitudinal
o Interference with existing operations –
Stations - With higher commuter traffic the complexities increases as the level of disruptions
caused goes up. Station like Dadar, CST and Bandra will be more complex as compared to
Byculla and Mulund
Operational Assets – Higher the intensity of operations higher is the complexity. Sites like
Parel Central Locomotive workshop, Virar Carshed, Mumbai Central carshed with high
intensity of operations will make air space development over these assets highly complex.
E) Estimation of potential
The following approach was followed in arriving at potential estimation.

Revenue maximizing study in particular for non-fare box revenues with affordability studies EXECUTIVE SUMMARY
33 PwC
Around 60 sites were identified and studied. It was estimated that if all these sites were put to market at
once, at a prevailing FSI, on an annuity model only assuming 4 - 5 years of construction period, it can
yield a maximum achievable potential of up to INR 600 Cr in the 5th year. This can be as high as INR
2,600 Cr in the 20th year.
On the other hand, if the sites were put to market at once, at a prevailing FSI, on an upfront premium
model, can yield a maximum achievable potential of up to INR 3,500 Cr. However, at an enhanced FSI up
to 4, the upfront premium can be as high as INR 8,000 Cr. Some of the sites are found to be financially
unviable to yield an EIRR of 22.5% for developer, at a prevailing FSI, which may become financially
viable at an enhanced FSI.
However, realization of revenues could be less than the potential for a number of reasons.
o It may be impractical to put all the land parcels in the market at once from the regulatory
perspective.
o Sudden increase in supply will disrupt the market dynamics leading to reduction in realisable
potential.
o Also, capability of railways/MRVC to handle over 60 real estate contracts and monitor construction
and operating activities will be another key constraint.
F) Pilot projects - Concept Plans for four stations/identified sites
PwC investigated and developed detailed concept plans for four sites located in Thane (E), Nahur (NGSM),
Bhandup store depot and Byculla (W), which are targeted to become pilot projects for commercial
development.
It is estimated that these four sites can together generate an upfront revenue of around
INR 90-100 Cr. However, the actual realization can be higher or lower depending on the approved FSI,
clearances and approvals from all authorities, timing of market entry and transaction appetite.

Revenue maximizing study in particular for non-fare box revenues with affordability studies EXECUTIVE SUMMARY
34 PwC
Summary
On mapping the four types of assets (identified) according to their revenue potential and ease of implementation based on the analysis of complexities associated, it was observed that open plots will be easier to be monetized compared to other types of assets.
Revenue maximizing study in particular for non-fare box revenues with affordability studies EXECUTIVE SUMMARY
35 PwC
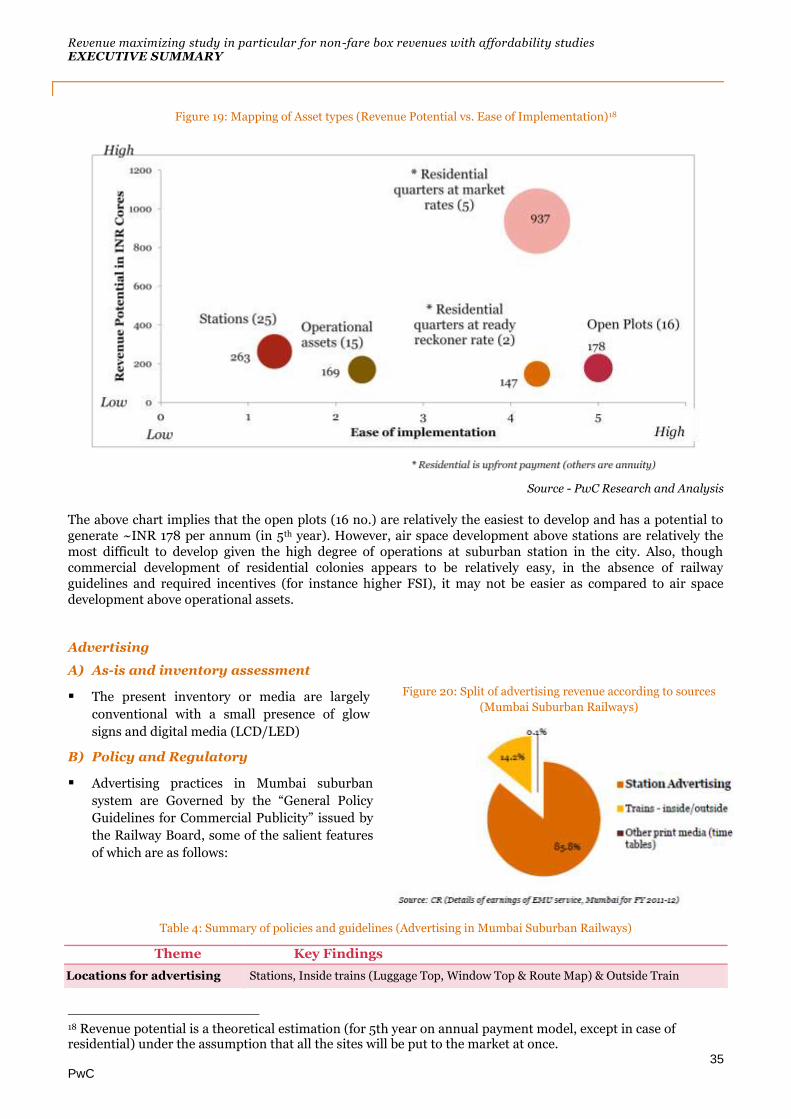
Figure 19: Mapping of Asset types (Revenue Potential vs. Ease of Implementation)18
Source - PwC Research and Analysis
The above chart implies that the open plots (16 no.) are relatively the easiest to develop and has a potential to generate ~INR 178 per annum (in 5th year). However, air space development above stations are relatively the most difficult to develop given the high degree of operations at suburban station in the city. Also, though commercial development of residential colonies appears to be relatively easy, in the absence of railway guidelines and required incentives (for instance higher FSI), it may not be easier as compared to air space development above operational assets.
Advertising
A) As-is and inventory assessment
The present inventory or media are largely
conventional with a small presence of glow
signs and digital media (LCD/LED)
B) Policy and Regulatory
Advertising practices in Mumbai suburban
system are Governed by the “General Policy
Guidelines for Commercial Publicity” issued by
the Railway Board, some of the salient features
of which are as follows:
Table 4: Summary of policies and guidelines (Advertising in Mumbai Suburban Railways)
Theme Key Findings
Locations for advertising Stations, Inside trains (Luggage Top, Window Top & Route Map) & Outside Train
18 Revenue potential is a theoretical estimation (for 5th year on annual payment model, except in case of residential) under the assumption that all the sites will be put to the market at once.
Figure 20: Split of advertising revenue according to sources
(Mumbai Suburban Railways)
Revenue maximizing study in particular for non-fare box revenues with affordability studies EXECUTIVE SUMMARY
36 PwC
Media for advertising Hoarding ,Billboards, Glow signs, Kiosks, Digital Displays, Transfers
Outside station display
criteria (Hoardings)
Hoarding Classification
o Category A: (height of hoarding + 3 m) < (nearest track distance)
o Category B: All other than in Category A
Tendering Aspects o Bidding Parameter: Annual license fees
o Criteria for Reserve Price: 1.5 times the highest annual publicity earnings for
entire division during any of three preceding financial years
Contract structuring o Contract tenure: 3-5 years
o Escalation Clause: 10% p.a.
The review of policy guidelines and commercial circulars shows mismatch between the guidelines and
actual outcome (for instance bulk advertising rights) which are mainly attributed to shorter contract tenor,
fragmented market and legacy piecemeal contracts.
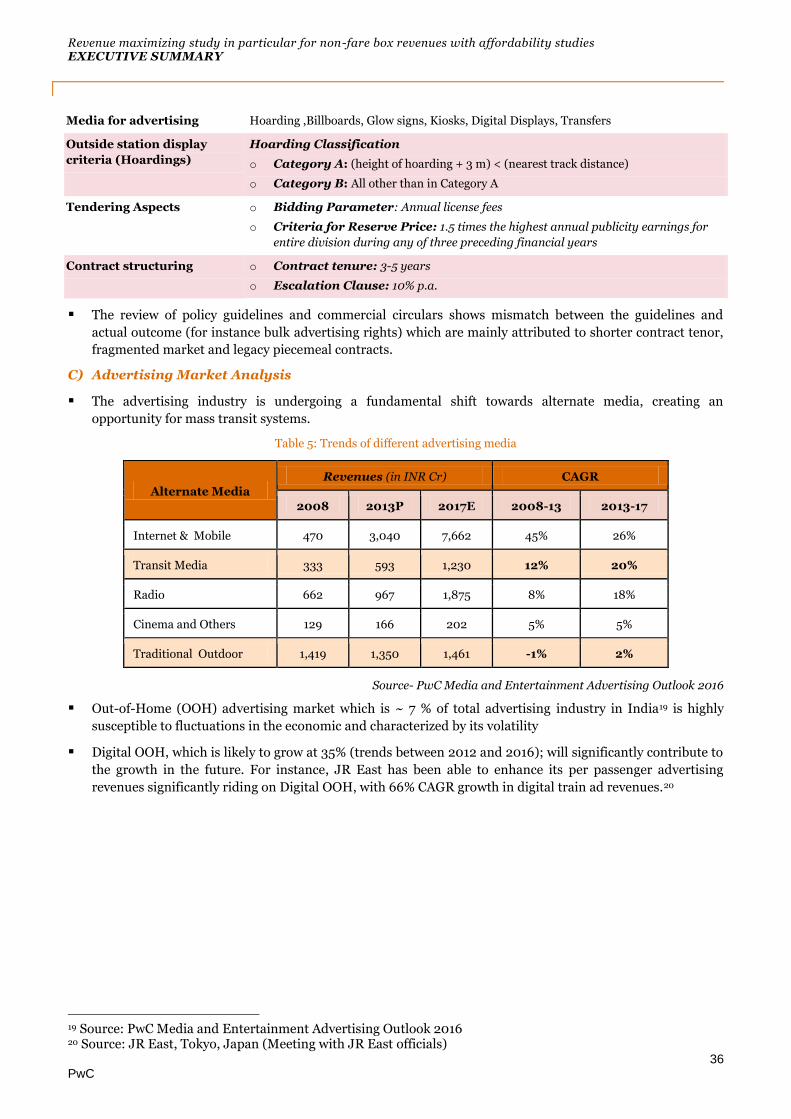
C) Advertising Market Analysis
The advertising industry is undergoing a fundamental shift towards alternate media, creating an
opportunity for mass transit systems.
Table 5: Trends of different advertising media
Alternate Media
Revenues (in INR Cr) CAGR
2008 2013P 2017E 2008-13 2013-17
Internet & Mobile 470 3,040 7,662 45% 26%
Transit Media 333 593 1,230 12% 20%
Radio 662 967 1,875 8% 18%
Cinema and Others 129 166 202 5% 5%
Traditional Outdoor 1,419 1,350 1,461 -1% 2%
Source- PwC Media and Entertainment Advertising Outlook 2016
Out-of-Home (OOH) advertising market which is ~ 7 % of total advertising industry in India19 is highly
susceptible to fluctuations in the economic and characterized by its volatility
Digital OOH, which is likely to grow at 35% (trends between 2012 and 2016); will significantly contribute to
the growth in the future. For instance, JR East has been able to enhance its per passenger advertising
revenues significantly riding on Digital OOH, with 66% CAGR growth in digital train ad revenues.20
19 Source: PwC Media and Entertainment Advertising Outlook 2016 20 Source: JR East, Tokyo, Japan (Meeting with JR East officials)

Revenue maximizing study in particular for non-fare box revenues with affordability studies EXECUTIVE SUMMARY
37 PwC
Figure 21: OOH market trends
Source: Pitch Madison Media Ad Outlook 2013
The industry is primarily driven and influenced by increasing number of agencies integrated across the
industry value chain. These players are at a better position to serve their clients thus making them more
valuable. Globally as well as at home Delhi Airport (DIAL), Mumbai Airport (MIAL), DMRC, Mumbai
Metro One, are some of the entities/companies who prefer working with such integrated players.
D) Complexities and challenges
As identified during ideation stage, there are several operational and transactional issues with respect to security, market friendly payment structure, shorter contract tenor, market fragmentation, etc. Also, several initiatives in the recent past for bulk contracts have not materialized. For instance, attempts by Mumbai Division of Western Railways and Central Railways have failed for the following reasons
Interference with the existing numerous piecemeal contracts
Existing contracts with multiple agencies resulting in a high fragmentation even at a single station
Aggressive reserve price as a fixed license fee which is to be escalated annually
E) Estimation of potential
The potential can be estimated in three ways
Based on benchmarking with global urban rail/metro systems: The network generates among the
lowest per passenger advertising revenue on purchasing power parity when compared with other transit
systems. Even if DMRC (Delhi) and SMRT (Singapore) are taken as benchmark, a potential of around INR
180 - 200 Cr can be achieved in next five years.
Based on share in OOH market: Suburban rail accounts for ~51% of the motorized trips in the city
(CTS for MMR, 2008), however, has only 14% share in the city's OOH advertising industry. As per the PwC,
Media & Entertainment Advertising Outlook 2013-17, OOH advertising market is estimated to reach USD
538 million in 2017 (~INR 3,161 Crores21) of which round 55% of the market will be shared equally between
Delhi and Mumbai. This converts to advertising revenue potential of over ~INR 200 Crores for the
suburban rail network by 2017 (E).
Bottom-up estimates: Based on proper contract management and efficient monitoring and following a
strategic road map as market aligned strategies the revenue potential of over INR 250 Crores can achieved
in the short to medium term.
21 Currency conversion rate - 1 USD = INR 58
1412 1752
1419 1848
1717 1862 1943
24%
-19%
30%
-7%
8.4%
4.4%
-30%
-20%
-10%
0%
10%
20%
30%
40%
0
500
1000
1500
2000
2500
2007 2008 2009 2010 2011 2012 2013
INR
Crs
.
OOH advertising revenues growth rate

Revenue maximizing study in particular for non-fare box revenues with affordability studies EXECUTIVE SUMMARY
38 PwC
Figure 22: Bottom-up assessment of Mumbai advertising earnings
Sources – PwC Research & Analysis
Station Rentals
A) Inventory Analysis
Catering stalls, ATMs and Pay & Park service form about 80% of total station rental earnings.
Pay & Park: Western Railways & Central Railways together has 40 parking lots at around 30 stations
mainly catering to two wheelers.
ATMs:
o Of existing 159 ATMs (as of June, 2013) in Mumbai
Suburban Railway Network, around 80% are awarded
to SBI and other six (6) nationalized banks via MoU
route and remaining 32 ATMs were installed through
open tender process at divisional railway.
o Recently in June 2013, Central Railways has called for
101 ATM’s in 38 suburban stations for the concession
period of 5 years. Of these 101 ATM’s, 84 sites have
already been awarded (by December, 2013)
successfully to Banks / Financial Institutions.
Catering stalls: The total available catering area on
suburban station is around 25,000 sq. ft. with ~84% of the available station rental area consume by tea
stalls only, however these tea stalls form only half of the total 405 stall and kiosks present in the system.
36%
44%
20% SBI as per MoU
Nat. banks as per MoU
others via open tender
Figure 23: Existing ATM break-up in Mumbai Suburban

Revenue maximizing study in particular for non-fare box revenues with affordability studies EXECUTIVE SUMMARY
39 PwC
Figure 24: Distribution of Catering Units (Unit wise and Area wise)
B) Policy & Regulations
Each of the source of rental earnings is governed by specific policy guidelines as formulated by Railway
Board and implemented by Zonal and Divisional Railway.
Cateing Policy 2010: New Catering policy was formulated under which the railways will progressively
take over the management of all catering services on platform/station (except food plazas) from IRCTC
through departmental catering in a phased mnner. The key silent features of the policy are:
o Contract tenor of five (5) years with provision for renewal after every 3 years only for minor units
o License fee fixation shall be determined based on defined set of parameters such as station
category, average number of daily passengers, number of train stoppages, type of license, unit size,
circle rates, location of the unit, etc.
o License fees are fixed by the Chief Commercial Officer for all major and minor units except for the
units under the purview of IRCTC
Pay & Park: Railway Board letter no. 95/TGI/8/P dated 15.12.1995, Commercial Circular No. 35 of 2000
and Commercial Circular No. 69 of 2006 define the policy for pay and park services, which states that the
parking facilities can be either operated by the divisions departmentally or through a third party contractor
o In case of third party contracts the contract tenure is 3 years
o Divisions empowered to fix parking charges, reserve price (Sr. DCM/DCM) with concurrence of
divisional finance and approval of DRM
o Reserve price fixation criteria - Land value, number of users, type of vehicle
ATMs: Installation of Automated Teller Machines (ATM) is primarily governed by the MoU signed on
04.08.2006 between Indian Railway (IR) and State Bank of India (SBI), and similar MoU signed on
22.11.2006 between IR and other six (6) nationalized banks. The silent features of these MoUs are:
Salient features of MoU
Contract Period 5 years
Licensee fees for category “C” stations (2006 rate) INR 45,000/sq. m. /annum
Escalation rate 5% p.a.
ATM kiosk area 6 sq. mt.
Internet Ticketing Kiosk (free of fee) 1.5 sq. mt.
Electricity connection will be provided by Railways on payment of charges by the bank

Revenue maximizing study in particular for non-fare box revenues with affordability studies EXECUTIVE SUMMARY
40 PwC
In addition to MoU, Commercial Circular No. 03 of 2001 outline the policy guidelines for the installation of
ATMs through open tender process, for the concession tenor of five (5) years with a provison for renewal for
additional five (5) years.
In addition to above, other policies governing the rental earnings from various sources include:
o STD/ISD/PCO booth allotment policy
o Policy for pay and use toilet 2006
o Shoeshine
o Management of misc. stalls/trolleys 2007
o Book stall policy 2004
C) Market Analysis
Pay and Park:
o With only one parking space for every 120 vehicles, sufficient demand for parking exists in the city22.
Also, the commuter survey show that around 4% of the commuters surveyed access station through 2-
wheelers indicating that there is a demand for as high as 2,00,000 parking space (equivalent to 2-
wheelers) if the results are extrapolated for the entire network.
o Also, the parking charges for the parking lots owned by MCGM are the highest in the city. This will
further drive the demand for parking in railway plots if sufficient space is made available.
ATMs:
o The subruban rail network of the city
carries over 1/4th of the city's
population daily, majority of whom
belong to service and business class.
However, its share in the city's ATM
coverage is less than 3%.
o Although in the last three years ATM
growth in India has been very high
(almost 100%)23, Indian has one of
the lowest penetrations of ATM.
o Concepts like White Label ATMs24
are being emphasized by RBI for
increasing the level of ATM
penetration per 100,000 population.
D) Challenges and Complexities
Pay and Park: Congestion in the station area, lack of sufficient land parcels with better connectivity,
very low parking charges, etc are the key issues making pay and park opportunity in the Greater
Mumbai area financially unviable. Of the 40 railway parking lots, only 15 lots are present in the MCGM
area, most of them are located in the suburban region.
22 Mumbai has only one parking lot for every 120 vehicles (Source: NDTV - http://www.ndtv.com/article/cities/mumbai-has-one-parking-spot-for-every-120-vehicles-207316) 23 World Bank 24 The white label ATMs (WLA) are owned and operated by non-banking companies and do not display any bank's branding. WLAs serve customers from all banks and will be interconnected with the entire ATM network in the country
125.8
50.9
45.6
4.3
129.0
60.2
49.6
8.9
Japan
Singapore
Hong Kong
India
2011
2008
Figure 25: ATM penetration per 100,000 populations
Source: World Bank Data

Revenue maximizing study in particular for non-fare box revenues with affordability studies EXECUTIVE SUMMARY
41 PwC
ATMs: The sububan railway stations already being highly congested, any addition of ATMs inside
stations may have to compete for space with passenger convenience. However, ATMs in non-paid area
such as in ticketing area, outside station platform area, will not congest the stations.
Catering stalls:
o The sububan railway stations already being highly congested, and existing stalls as found in the
previous studies are adding to passenger inconvenience.
o License fees are not reflective of market rates as existing legacy contracts are being renewed at
nominal increase in license fees without any price corrections
o The current Catering Policy which permits maximum two major stalls per zone per contractor has
failed to attract larger, branded and organized players and it has also lead to high fragmentation.
This, also, has increased contract management activity, time and costs at divisional railways level.
E) Revenue Estimation
Pay and Park:
o The revenues from pay and park can be enhanced by price correction, capacity augmentation or
combinations of the two.
o Parking charges can be enhanced still keeping it lower than the parking rates defined by MCGM. Some
of the benchmarks that can be used are parking rates charged by DMRC in Delhi or average parking
rates proposed by MCGM.
o Further capacity addition can be planned on land plots, which are surplus or having less operation
density, near transit nodes to enhance the supply.
Figure 26: Expected revenues from pay & park
ATMs:
o Preliminary estimate suggest that around 250-300 ATMs can be added to 21 stations having higher
footfalls considering the existing level of penetration in India (8 ATMs per 100,000 population) as
benchmark.
o At an average license fee of around INR 1,47,000 per sq m based on 84 ATM sites tendered by CR
during 2013, revenues from ATMs is estimated to be around INR 88 Cr by FY 2018-19.
5.5
10
17
29
Existing Revenues (FY 12)
Only pricing corrections
Only enhanced capacity (3-4 x)
Pricing corrections + capacity
enhancement
INR
Cr

Revenue maximizing study in particular for non-fare box revenues with affordability studies EXECUTIVE SUMMARY
42 PwC
Figure 27: estimated ATM earning with ATM additions
Catering stalls:
o Given the priority of passenger convenience and high congestion level in station/platform area, we did
not forecast any revenue enhancement. However, some of the ways though which the potnetial can be
enhanced are as follows:
By converting legacy contract to open tender
Through correction in license fee in accordance with the market prices or as per Catering Policy 2010
By planning space for retail during station redevelopment projects
Comparison of revenue source
When the various non-fare box revenue sources are mapped against one another on both potential and ease of implementation scale, it is seen that ATM scores high on both the scale indicating that it is low hanging fruit. The high potential can be explained by the better prospects of the ATM market
Figure 28: Revenue vs. Ease of Implementation (Advertising media vs. Station Rentals)
Source – PwC Research & Analysis
Indirect Benefits
A) Instruments of value capture
5 13
25
37
52
68
88
159
259
359
459
559
659
759
0
100
200
300
400
500
600
700
800
0
10
20
30
40
50
60
70
80
90
100
2013 2014 2015 2016 2017 2018 2019
To
tal
AT
M
INR
Cro
res
ATM annual earnings (INR Crs.) Total ATM's

Revenue maximizing study in particular for non-fare box revenues with affordability studies EXECUTIVE SUMMARY
43 PwC
Some of the most widely use value capture mechanisms used by successful transit agencies across the globe and as proposed by various entities in India such as Planning Commission are as follows
Congestion fees – Congestion charge or congestion fee is a fee payable to use traffic congested zone
Fuel taxes as carbon surcharge – Fuel tax can be levied on private vehicles
Green Cess – Green Cess is a cess levied on new and existing private vehicle users who have or will be
benefitted from the decongested roads as a result of others using suburban rail system
Urban Transport Tax – Urban Transport Tax is a cess levied on new private vehicle users who will be
benefitted from the decongested roads as a result of others using suburban rail system
Additional Property Tax – Levying of higher rate of property tax on properties in the vicinity of
Suburban Stations (As suburban stations has the potential to increase the property values in its
vicinity)
B) Policy and Regulations
In March 2013, an 11-member panel, headed by additional chief secretary (home), has recommended
congestion charge for the city in its 51-point action plan submitted in Bombay High Court. The panel
has proposed two ideas for imposing the congestion levy
o Congestion charge to restrict the number of vehicles in certain areas such as the city's central
business districts
o Congestion pricing on certain goods in select zones
From jurisdiction point of view, central government can levy the fuel taxes and the net collection can be
transferred to Ministry of Railways.
The Planning Commission working group on urban transport (12th five year plan) in its
recommendation to Government of India has
o Implementation of Green Cess
o proposed charging urban transport tax at 7.5% and 20% of the total cost of vehicle for petrol
vehicle and diesel vehicle respectively
C) Challenges and complexities
Railways do not have the right and jurisdiction to levy congestion fee, fuel tax, green cess, urban
transport tax and property tax
Pricing of fuel, especially diesel are politically sensitive and already the prices of fuels are highly
inflated with taxes and surcharge
At present there is no institutional arrangement for allocation of proceeds to Railways
D) Revenue Estimation
Congestion fees – The estimated Congestion fees collection from the city is ~ INR 750 Cr - ~INR 1000
Cr. 10% to 20% fund allocation to Railways from the proceeds will mean value capture of INR 75 Cr to
INR 200 Cr per annum.
Fuel taxes as carbon surcharge – Based on the current fuel consumption of the city levying INR 0.5 –
INR 2 per litre of petrol and diesel can generate around INR 240 Cr to INR 580Cr per annum. 10% to
20% fund allocation to Railways from the proceeds will mean value capture of INR 24 Cr to INR 100 Cr
per annum
Green Cess – The estimated Green Cess collection from the city is ~ INR 200 Cr. 10% to 20% fund
allocation to Railways from the proceeds will mean value capture of INR 20 Cr to INR 40 Cr per
annum.

Revenue maximizing study in particular for non-fare box revenues with affordability studies EXECUTIVE SUMMARY
44 PwC
Urban Transport Tax – It is estimated to generate ~ INR 850 Cr per annum. Again 10 – 20 % % fund
allocation to Railways from the proceeds will mean value capture of INR 85 Cr to INR 170 Cr per
annum
Additional Property Tax – Based on flat surcharge or varying surcharge based on transit influence
zone, it is estimated to generate INR 20 Cr to INR 100 Cr.
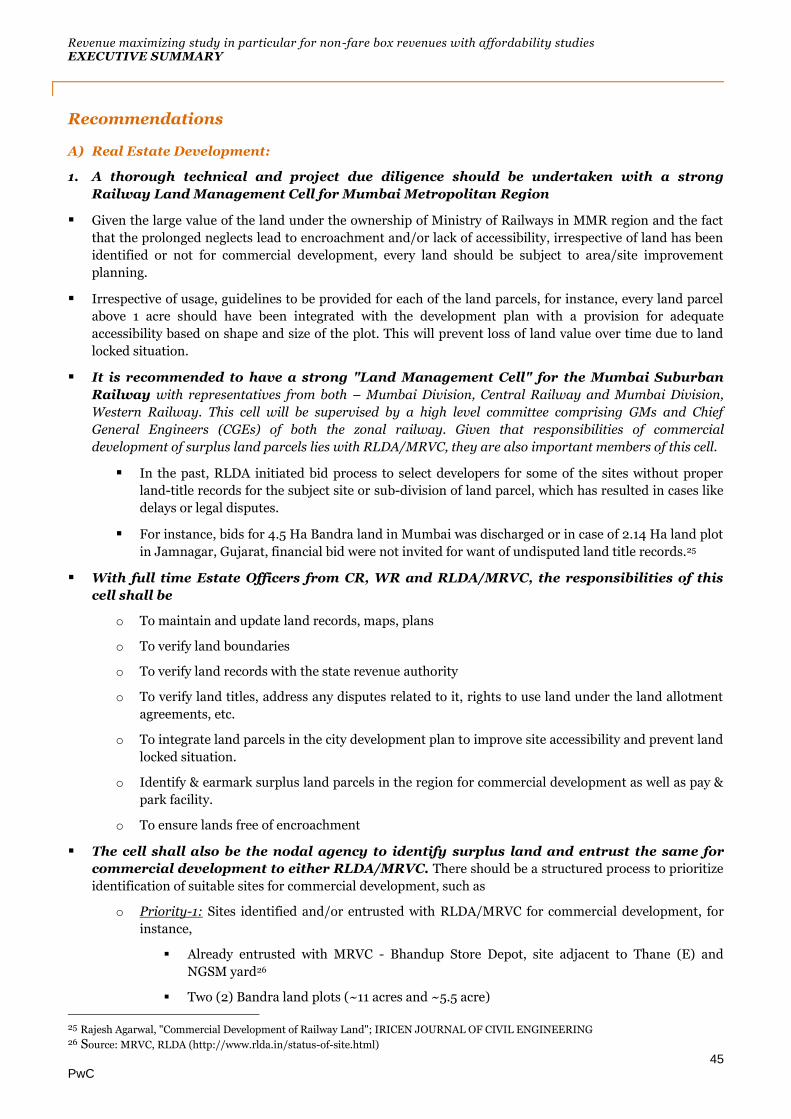
Revenue maximizing study in particular for non-fare box revenues with affordability studies EXECUTIVE SUMMARY
45 PwC
Recommendations
A) Real Estate Development:
1. A thorough technical and project due diligence should be undertaken with a strong
Railway Land Management Cell for Mumbai Metropolitan Region
Given the large value of the land under the ownership of Ministry of Railways in MMR region and the fact
that the prolonged neglects lead to encroachment and/or lack of accessibility, irrespective of land has been
identified or not for commercial development, every land should be subject to area/site improvement
planning.
Irrespective of usage, guidelines to be provided for each of the land parcels, for instance, every land parcel
above 1 acre should have been integrated with the development plan with a provision for adequate
accessibility based on shape and size of the plot. This will prevent loss of land value over time due to land
locked situation.
It is recommended to have a strong "Land Management Cell" for the Mumbai Suburban
Railway with representatives from both – Mumbai Division, Central Railway and Mumbai Division,
Western Railway. This cell will be supervised by a high level committee comprising GMs and Chief
General Engineers (CGEs) of both the zonal railway. Given that responsibilities of commercial
development of surplus land parcels lies with RLDA/MRVC, they are also important members of this cell.
In the past, RLDA initiated bid process to select developers for some of the sites without proper
land-title records for the subject site or sub-division of land parcel, which has resulted in cases like
delays or legal disputes.
For instance, bids for 4.5 Ha Bandra land in Mumbai was discharged or in case of 2.14 Ha land plot
in Jamnagar, Gujarat, financial bid were not invited for want of undisputed land title records.25
With full time Estate Officers from CR, WR and RLDA/MRVC, the responsibilities of this
cell shall be
o To maintain and update land records, maps, plans
o To verify land boundaries
o To verify land records with the state revenue authority
o To verify land titles, address any disputes related to it, rights to use land under the land allotment
agreements, etc.
o To integrate land parcels in the city development plan to improve site accessibility and prevent land
locked situation.
o Identify & earmark surplus land parcels in the region for commercial development as well as pay &
park facility.
o To ensure lands free of encroachment
The cell shall also be the nodal agency to identify surplus land and entrust the same for
commercial development to either RLDA/MRVC. There should be a structured process to prioritize
identification of suitable sites for commercial development, such as
o Priority-1: Sites identified and/or entrusted with RLDA/MRVC for commercial development, for
instance,
Already entrusted with MRVC - Bhandup Store Depot, site adjacent to Thane (E) and
NGSM yard26
Two (2) Bandra land plots (~11 acres and ~5.5 acre)
25 Rajesh Agarwal, "Commercial Development of Railway Land"; IRICEN JOURNAL OF CIVIL ENGINEERING 26 Source: MRVC, RLDA (http://www.rlda.in/status-of-site.html)
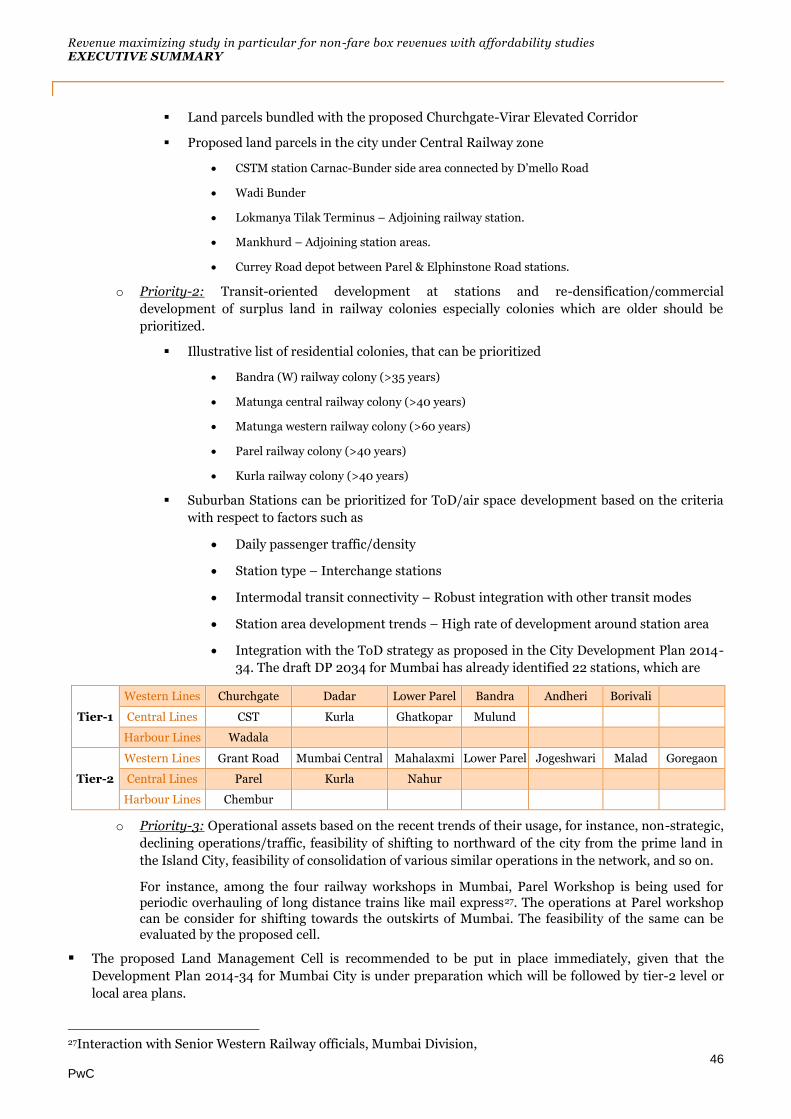
Revenue maximizing study in particular for non-fare box revenues with affordability studies EXECUTIVE SUMMARY
46 PwC
Land parcels bundled with the proposed Churchgate-Virar Elevated Corridor
Proposed land parcels in the city under Central Railway zone
CSTM station Carnac-Bunder side area connected by D’mello Road
Wadi Bunder
Lokmanya Tilak Terminus – Adjoining railway station.
Mankhurd – Adjoining station areas.
Currey Road depot between Parel & Elphinstone Road stations.
o Priority-2: Transit-oriented development at stations and re-densification/commercial
development of surplus land in railway colonies especially colonies which are older should be
prioritized.
Illustrative list of residential colonies, that can be prioritized
Bandra (W) railway colony (>35 years)
Matunga central railway colony (>40 years)
Matunga western railway colony (>60 years)
Parel railway colony (>40 years)
Kurla railway colony (>40 years)
Suburban Stations can be prioritized for ToD/air space development based on the criteria
with respect to factors such as
Daily passenger traffic/density
Station type – Interchange stations
Intermodal transit connectivity – Robust integration with other transit modes
Station area development trends – High rate of development around station area
Integration with the ToD strategy as proposed in the City Development Plan 2014-
34. The draft DP 2034 for Mumbai has already identified 22 stations, which are
Tier-1
Western Lines Churchgate Dadar Lower Parel Bandra Andheri Borivali
Central Lines CST Kurla Ghatkopar Mulund
Harbour Lines Wadala
Tier-2
Western Lines Grant Road Mumbai Central Mahalaxmi Lower Parel Jogeshwari Malad Goregaon
Central Lines Parel Kurla Nahur
Harbour Lines Chembur
o Priority-3: Operational assets based on the recent trends of their usage, for instance, non-strategic,
declining operations/traffic, feasibility of shifting to northward of the city from the prime land in
the Island City, feasibility of consolidation of various similar operations in the network, and so on.
For instance, among the four railway workshops in Mumbai, Parel Workshop is being used for periodic overhauling of long distance trains like mail express27. The operations at Parel workshop can be consider for shifting towards the outskirts of Mumbai. The feasibility of the same can be evaluated by the proposed cell.
The proposed Land Management Cell is recommended to be put in place immediately, given that the
Development Plan 2014-34 for Mumbai City is under preparation which will be followed by tier-2 level or
local area plans.
27Interaction with Senior Western Railway officials, Mumbai Division,

Revenue maximizing study in particular for non-fare box revenues with affordability studies EXECUTIVE SUMMARY
47 PwC
Also, the proposed cell should have a set target to achieve due diligence of 50% of the all land parcels within
three (2) years since its inception, with identified sites for commercial development on a priority, and
achieve 100% due diligence by 5th years of its inception.
2. Collaboration with the State and Local Governments to mutually benefit as well as to
benefit the city as a whole.
Integration with Development plan: The city needs land resources for better town planning whereas
railways need better accessibility to its land and provision for infrastructure/utilities for future
development. This can be achieved by initiating integration of railway land assets with the city's
development plan and need to partner with local authorities like MCGM to be pro-railways in deciding
appropriate land use classification, earmarking suitable connectivity provisions, etc.
Additionally a quid pro quo arrangement between the local/state government and railway can be
explored. Some of the various strategies or types arrangement can be:
1. Development in accordance with the requirement of the city development plan and not only from
commercial best use perspective, however, with adequate compensation for the opportunity lost in
terms of TDRs, etc.
i. E.g.: Pay and Park, Green Zones, Residential/office, Multi-modal transit points etc
2. Exchange of development rights to the city governments in congested areas in return for higher development rights in lesser congested areas
3. Joint development model with the city governments, wherein railways and urban bodies like MCGM can enter into commercial ventures such as parking, through joint development. MCGM can also bring in higher enforcement measures to prevent illegal parking in the area to achieve its objective of decongestion and enhance the viability of parking venture.
4. Sale/exchange of assets for better consolidation - For instance, smaller isolated land plots can be exchanged for the land parcels closer to transit nodes/corridor.
Financial arrangement: Financial arrangements between railways and state/local government under
which a commitment to reinvest a part of revenue generated from commercial development for the city's
suburban railway infrastructure, as done in case of Bandra land (~11 acres).
TOD Strategy: Since most of the railway land parcels are in the vicinity of the transit nodes, railways can
help achieve the ToD vision/strategy of the local government (MCGM) to encourage high density vehicular
free developments in the vicinity of major transit nodes.
3. From the initial stage itself, it is preferable to engage private sector constructively to build
mutual confidence and trust
It is recommended to organize workshops and marketing road shows involving private sector participants
such as developers, to engage them for the pilot projects as well as future road map.
These marketing activities will also help alienate perceived risks among the developer community to deal in
properties with railways.
The clear plans should be outlined for the role and support of railways/MRVC especially during pre-
tendering and during construction, for instance,
o Pre-tendering stage support: Land due diligence, preparatory actions such as land use change,
approved FSI, connectivity issues and construction related clearances from all the relevant railway
departments (especially in case of air space development)
o Support during construction: Single point of contact (e.g. nodal railway/MRVC officer for the
project coordination and supervision) for clearances and approvals from within railways,
adherence to construction and building plans once approved, etc.

Revenue maximizing study in particular for non-fare box revenues with affordability studies EXECUTIVE SUMMARY
48 PwC
4. Going forward, for better value capture there is a need to develop capability, resources
and flexible commercial models (joint development, revenue share model, self
development, etc.), i.e., beyond the role of just contract management.
Necessary regulatory changes:
Commercial development, since it involves large amount of involvement and coordination with internal and
external stakeholders, will required complying with various local acts and regulations. For instance, land
use change is a must to undertake commercial development which will require approvals from state and
local government.
Internal policy/regulatory changes: The following regulatory or policy changes shall be required -
o Guidelines/circular to establish MMR region specific Land Management Cell, its composition,
functions and targets to be achieved.
o Amendment to existing guidelines/policies and MoU between RLDA and MRVC (Dt. 16.07.2013)
which shall empower RLDA/MRVC to undertake re-densification/commercial development of
residential colonies with concession period up to 99 years.
External policy/regulatory changes: The following regulatory or policy changes shall be required -
o Site specific land use change and grant of FSI will be required, and accordingly DCR shall be
amended.
o Also, DCR will be required to be amended to
To permit Flexible TDR (for instance permitting use of unused FSI in the same area
irrespective of whether it is located in the northward direction of the land or not),
To permit mix-land use (for instance, transportation/railway + commercial office),
To qualify and incentivise re-densification of residential colonies (for instance, minimum
permissible FSI of 2.5 which shall be enhanced further on case-to-case basis).
Institutional Arrangement:
The key success factors of an institution will be coordination with railways, state government, local government and private sectors/developers. The required coordination can be mapped out as follows:
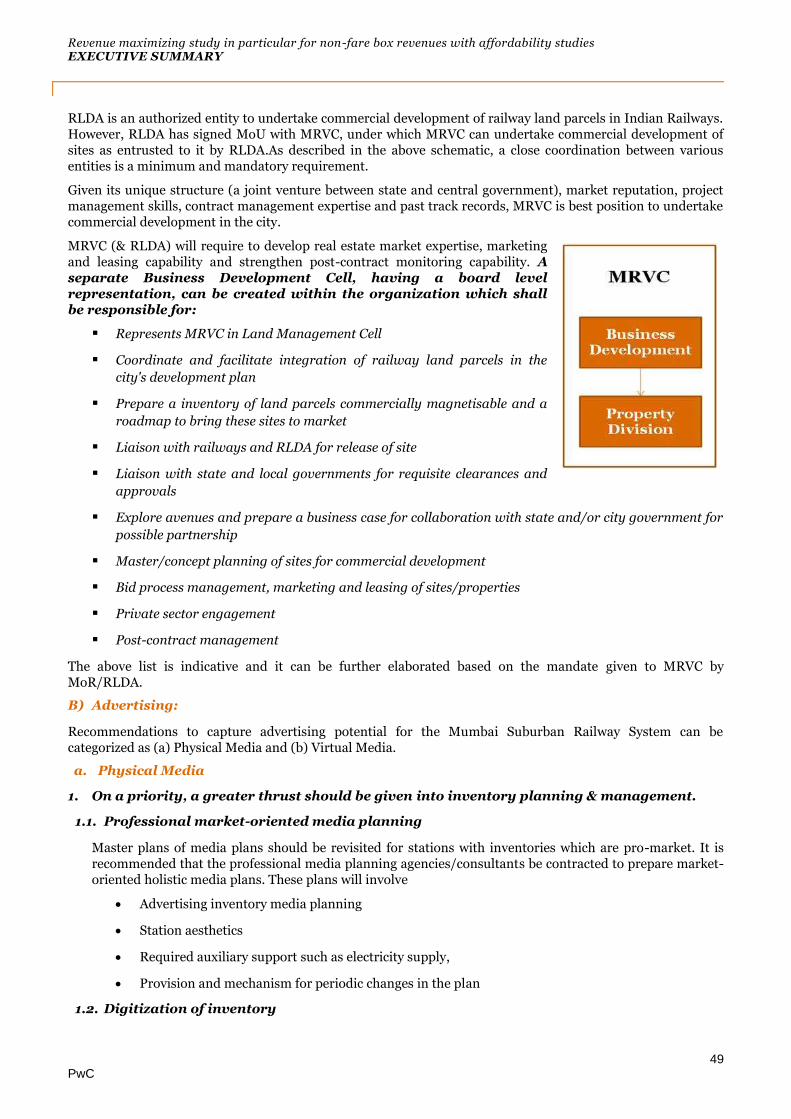
Revenue maximizing study in particular for non-fare box revenues with affordability studies EXECUTIVE SUMMARY
49 PwC
RLDA is an authorized entity to undertake commercial development of railway land parcels in Indian Railways. However, RLDA has signed MoU with MRVC, under which MRVC can undertake commercial development of sites as entrusted to it by RLDA.As described in the above schematic, a close coordination between various entities is a minimum and mandatory requirement.
Given its unique structure (a joint venture between state and central government), market reputation, project management skills, contract management expertise and past track records, MRVC is best position to undertake commercial development in the city.
MRVC (& RLDA) will require to develop real estate market expertise, marketing and leasing capability and strengthen post-contract monitoring capability. A separate Business Development Cell, having a board level representation, can be created within the organization which shall be responsible for:
Represents MRVC in Land Management Cell
Coordinate and facilitate integration of railway land parcels in the
city's development plan
Prepare a inventory of land parcels commercially magnetisable and a
roadmap to bring these sites to market
Liaison with railways and RLDA for release of site
Liaison with state and local governments for requisite clearances and
approvals
Explore avenues and prepare a business case for collaboration with state and/or city government for
possible partnership
Master/concept planning of sites for commercial development
Bid process management, marketing and leasing of sites/properties
Private sector engagement
Post-contract management
The above list is indicative and it can be further elaborated based on the mandate given to MRVC by MoR/RLDA.
B) Advertising:
Recommendations to capture advertising potential for the Mumbai Suburban Railway System can be categorized as (a) Physical Media and (b) Virtual Media.
a. Physical Media
1. On a priority, a greater thrust should be given into inventory planning & management.
1.1. Professional market-oriented media planning
Master plans of media plans should be revisited for stations with inventories which are pro-market. It is recommended that the professional media planning agencies/consultants be contracted to prepare market-oriented holistic media plans. These plans will involve
Advertising inventory media planning
Station aesthetics
Required auxiliary support such as electricity supply,
Provision and mechanism for periodic changes in the plan
1.2. Digitization of inventory

Revenue maximizing study in particular for non-fare box revenues with affordability studies EXECUTIVE SUMMARY
50 PwC
In order to capture value from future industry trends, a greater focus on digital inventory will be
required, and hence media/master plans should have mandatory digital media focus. This will
require planning for necessary electricity supply and security provisions in the media plans.
For instance, by the end of 3rd year, 30% of the total advertising space in the System should be achieved by digital media comprising LCDs, LEDs, etc.
2. Also, the horizons of interactions with advertising industry value chain needs to be
widened by involving integrated players in transit advertising
More stringent eligibility criteria, for instance,
o 5 – 10 years of transit OOH advertising experience and in transportation centres like Metro
rail stations, airports, railways, seaports, bus terminals, etc.
o The average turnover of the firm in the past three (3) financial years should be at least
equal to the reserve price
o Should have developed master plans for the transit nodes (e.g. stations) and approved by
the transit authorities
Greater involvement in the media planning stage, through appropriate tendering process
(E.g. 2-stage tendering process being followed by DMRC since 2013)
o 1-stage - Qualification Stage: At this stage advertisers will be shortlisted in accordance with
the revised eligibility criteria
o 2-stage - Bidding Stage:
At this stage, the draft media plan prepared by railways (with media consultants)
will be shared with qualified bidders who will submit revised media plans as their
technical bid. This will ensure involvement of larger players, further refinement in
the media plans in-line with the market practices.
Railway's media consultant will assist railway in evaluate this media plans. With
proper weight-age to technical and financial bid, final bidder will be selected.
3. The flexible contract structure is a prerequisite to attract value creators or integrated
large advertisers
Longer contract tenor of 10 to 15 years, in-line with market expectations and practices being
followed by other successful transits (DMRC, SMRT, etc.)
Mitigation of contract risks, preferably through revenue share model to capture upside
value whereas prevents downside risks by the provision of minimum guarantee fee.
Bulk advertising rights: The suburban railway stations can be grouped such that it attracts right
set of advertisers. The grouping can be done geographically, or based on lines, or mix of stations from
both central and western railway to enhance options. The following is the illustration of such
arrangement/options.
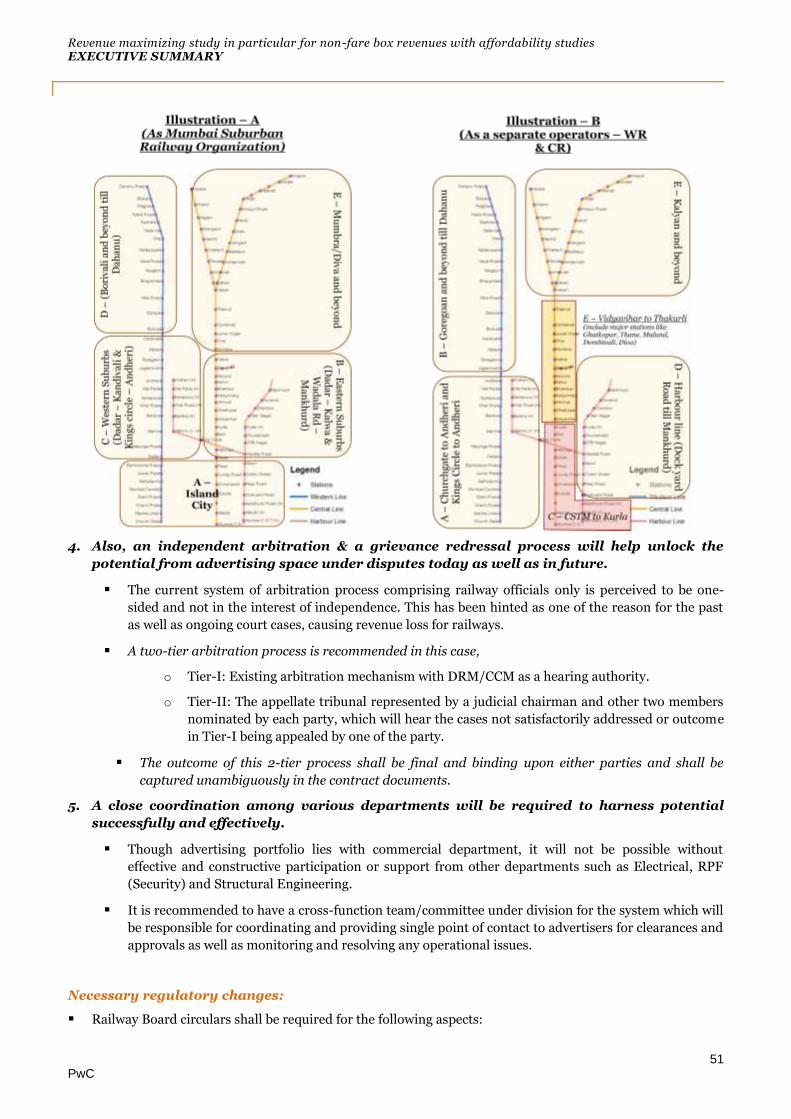
Revenue maximizing study in particular for non-fare box revenues with affordability studies EXECUTIVE SUMMARY
51 PwC
4. Also, an independent arbitration & a grievance redressal process will help unlock the
potential from advertising space under disputes today as well as in future.
The current system of arbitration process comprising railway officials only is perceived to be one-
sided and not in the interest of independence. This has been hinted as one of the reason for the past
as well as ongoing court cases, causing revenue loss for railways.
A two-tier arbitration process is recommended in this case,
o Tier-I: Existing arbitration mechanism with DRM/CCM as a hearing authority.
o Tier-II: The appellate tribunal represented by a judicial chairman and other two members
nominated by each party, which will hear the cases not satisfactorily addressed or outcome
in Tier-I being appealed by one of the party.
The outcome of this 2-tier process shall be final and binding upon either parties and shall be
captured unambiguously in the contract documents.
5. A close coordination among various departments will be required to harness potential
successfully and effectively.
Though advertising portfolio lies with commercial department, it will not be possible without
effective and constructive participation or support from other departments such as Electrical, RPF
(Security) and Structural Engineering.
It is recommended to have a cross-function team/committee under division for the system which will
be responsible for coordinating and providing single point of contact to advertisers for clearances and
approvals as well as monitoring and resolving any operational issues.
Necessary regulatory changes:
Railway Board circulars shall be required for the following aspects:
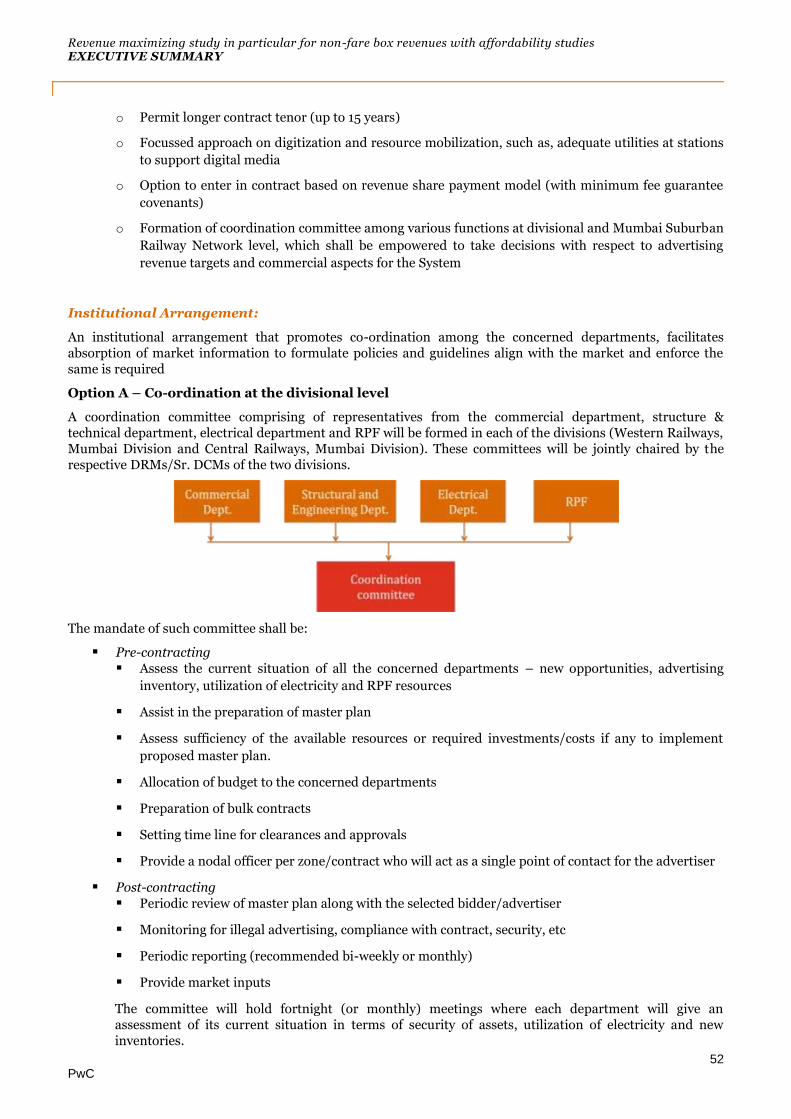
Revenue maximizing study in particular for non-fare box revenues with affordability studies EXECUTIVE SUMMARY
52 PwC
o Permit longer contract tenor (up to 15 years)
o Focussed approach on digitization and resource mobilization, such as, adequate utilities at stations
to support digital media
o Option to enter in contract based on revenue share payment model (with minimum fee guarantee
covenants)
o Formation of coordination committee among various functions at divisional and Mumbai Suburban
Railway Network level, which shall be empowered to take decisions with respect to advertising
revenue targets and commercial aspects for the System
Institutional Arrangement:
An institutional arrangement that promotes co-ordination among the concerned departments, facilitates absorption of market information to formulate policies and guidelines align with the market and enforce the same is required
Option A – Co-ordination at the divisional level
A coordination committee comprising of representatives from the commercial department, structure & technical department, electrical department and RPF will be formed in each of the divisions (Western Railways, Mumbai Division and Central Railways, Mumbai Division). These committees will be jointly chaired by the respective DRMs/Sr. DCMs of the two divisions.
The mandate of such committee shall be:
Pre-contracting
Assess the current situation of all the concerned departments – new opportunities, advertising
inventory, utilization of electricity and RPF resources
Assist in the preparation of master plan
Assess sufficiency of the available resources or required investments/costs if any to implement
proposed master plan.
Allocation of budget to the concerned departments
Preparation of bulk contracts
Setting time line for clearances and approvals
Provide a nodal officer per zone/contract who will act as a single point of contact for the advertiser
Post-contracting
Periodic review of master plan along with the selected bidder/advertiser
Monitoring for illegal advertising, compliance with contract, security, etc
Periodic reporting (recommended bi-weekly or monthly)
Provide market inputs
The committee will hold fortnight (or monthly) meetings where each department will give an assessment of its current situation in terms of security of assets, utilization of electricity and new inventories.
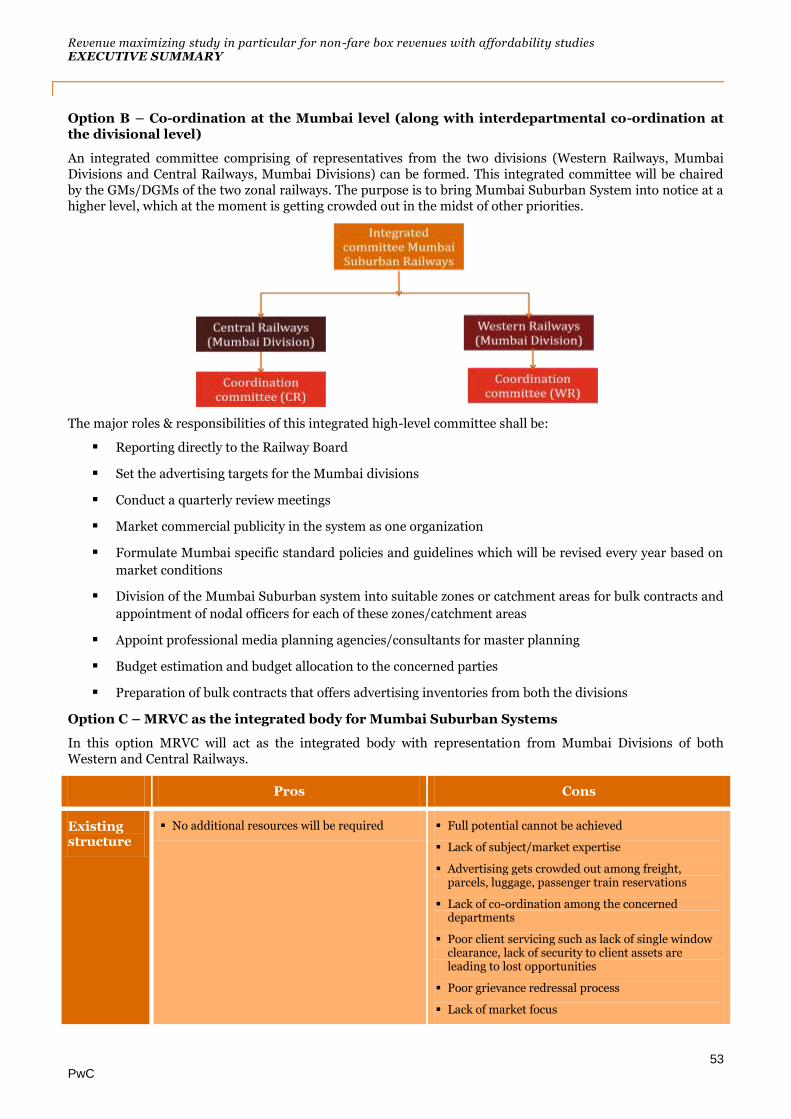
Revenue maximizing study in particular for non-fare box revenues with affordability studies EXECUTIVE SUMMARY
53 PwC
Option B – Co-ordination at the Mumbai level (along with interdepartmental co-ordination at the divisional level)
An integrated committee comprising of representatives from the two divisions (Western Railways, Mumbai Divisions and Central Railways, Mumbai Divisions) can be formed. This integrated committee will be chaired by the GMs/DGMs of the two zonal railways. The purpose is to bring Mumbai Suburban System into notice at a higher level, which at the moment is getting crowded out in the midst of other priorities.
The major roles & responsibilities of this integrated high-level committee shall be:
Reporting directly to the Railway Board
Set the advertising targets for the Mumbai divisions
Conduct a quarterly review meetings
Market commercial publicity in the system as one organization
Formulate Mumbai specific standard policies and guidelines which will be revised every year based on
market conditions
Division of the Mumbai Suburban system into suitable zones or catchment areas for bulk contracts and
appointment of nodal officers for each of these zones/catchment areas
Appoint professional media planning agencies/consultants for master planning
Budget estimation and budget allocation to the concerned parties
Preparation of bulk contracts that offers advertising inventories from both the divisions
Option C – MRVC as the integrated body for Mumbai Suburban Systems
In this option MRVC will act as the integrated body with representation from Mumbai Divisions of both Western and Central Railways.
Pros Cons
Existing structure
No additional resources will be required Full potential cannot be achieved
Lack of subject/market expertise
Advertising gets crowded out among freight, parcels, luggage, passenger train reservations
Lack of co-ordination among the concerned departments
Poor client servicing such as lack of single window clearance, lack of security to client assets are leading to lost opportunities
Poor grievance redressal process
Lack of market focus

Revenue maximizing study in particular for non-fare box revenues with affordability studies EXECUTIVE SUMMARY
54 PwC
Option-A Enhanced co-ordination among departments
Better services to clients/ advertisers
Single point of contact
Better security to assets
Pressures to continue to meet targets set by Railway Board
Lack of subject/market expertise
Less freedom in contract structuring
Inability to incur costs/ investments if not within departmental budget for instance, enhance electricity supply for digital media,
Option-B Integration at the highest level will ensure better enforcement of policies
Ability to formulate Mumbai specific policies and revenue targets
More freedom in bulk contract structuring
Ability to allocate additional budget if required as investments
Lack of subject/market expertise
Likely pressures from to meet targets set by Railway Board
Need to establish credibility to attract larger integrated players
Option-C Independent city specific organization
Contracting and post-contract management expertise
Brings in more trust among larger private players
Ability to manage long tenor contract
Better placed to bundle contracts with commercial development or station redevelopment projects to part finance capex
No control over operational assets
Difficult to manage and coordinate with field/divisional committee given no administrative authority
The above assessment of the institution options, it is recommended to have a combination of Option-B & C will be more preferable. MRVC can play a role of providing market expertise and consultative assistance to the integrated committee.
b. Virtual Media
1. Create of brand value for the System as a whole by investing in station aesthetics, adequate
signage, enhanced public information system using new technological platforms such as mobile apps,
internet, Google maps, etc.
The enhanced brand will help railways leverage it for enhancing advertising potential through
physical media as well as for merchandizing opportunity, for instance, heritage cards.
2. Capture advertising potential from virtual media such as mobile apps, internet, and social
media using real time data and passenger information
Large section of suburban rail commuters are using mobile phones or smart cell phones, and uses
apps like m-indicator which provides railway and other public time table. Railways generate and own
large real time information which it wishes to transfer to public through various public information
systems.
Platforms like mobile-apps, internet, social media which can be used as public information platforms
as well as advertising revenues.
It is recommended to outsource advertising rights along with platform creation on a fixed licensee or
revenue share model, instead of developing own apps and market the same.
A media plan should be prepared for this purpose with the help of market
experts/professionals.

Revenue maximizing study in particular for non-fare box revenues with affordability studies EXECUTIVE SUMMARY
55 PwC
3. It is recommended to establish an integrated body or leverage MRVC to represent Mumbai
Suburban Railway System as a whole for this purpose, with a close coordination/support
from railways to transfer real time information/data
Necessary regulatory changes:
Railway Board circulars shall be required to appoint MRVC/an integrated entity representing the System to
exploit virtual media. This body shall be empowered to
o Outsource or develop the virtual platforms and provide real time information
o Enter into advertising rights contract on fixed fee basis or revenue share basis or a model as
deemed appropriate
o Sell ticketing through online/virtual/mobile media
Also, Railway Board shall direct the
concerned railway zonal/divisional
administration to provide all necessary
administrative and information sharing
support to MRVC/a new entity
Institutional Arrangement:
Given that MRVC already exists, its success in creating a reputation as a body representing Mumbai Suburban Railway Network on various platforms, as well as its ability to diversify to commercial development and consultancy, it is recommended to entrust the commercial exploitation of virtual media to harness advertising potential with MRVC.
Revenue maximizing study in particular for non-fare box revenues with affordability studies EXECUTIVE SUMMARY
PwC 56
C) Station Rentals
ATMs:
1. Having low penetration, there is a need to enhance supply of spaces for ATMs
through conventional and non-conventional means
Prioritize stations with higher footfalls having daily ridership of over 1,00,000 as a candidates
for additional ATMs based on required penetration levels (E.g. 1 ATM for every 25,000 daily
ridership)
Station which are the trip generators, such as residential areas in the Northward and the
Suburban city, should be given a priority and high penetration levels
ATM format such as Point of Sales (POS) Terminals consume relatively less space and can be
accommodated in ticketing areas (for instance, Ticketing Area at concourse level in Dadar
Station)
Location of ATM’s can be chosen strategically adjacent to areas such as ticketing area,
entry/exit and concourse areas to ensure convenience without causing to congestion.
2. Prefer open tender route to generate more value than MoU route and transfer
rights to allot or lease spaces to division only.
Open tendering route yield more lease rentals and also are closer to market. This has been substantiated in the past including recent tendering of 101 ATM sites by Central Railway during June, 2013.
3. Additionally, invite White Label ATM operators such as Tata Communications
Payment Solutions, Prizm Payment Services, etc. for bulk ATM space contract (for
instance bulk contract for 10 or more ATM spaces for a station/a group of stations)
RBI has identified 17 non-bank entities to set up White Label ATMs (WLA) in India which are
expected to ad around 1.5 lakh ATMs in the next 3 years.28
Four of the well known players in this market are Tata Communications Payment Solutions
Ltd, Prizm Payment Services Pvt. Ltd, Muthoot Finance Ltd and Vakrangee Ltd
Bulk contracts will help add more number of ATMs in the system with minimum tendering
and contracting process.
Pay & Park:
1. With MCGM revising its parking rates, railways should revisit parking rates in its
land parcels to enhance viability of parking lots in the city.
According to Parking Policy 2004 (Commercial Circular No. 39 of 2004),
o Parking rates should be fixed by Sr. DCM/DCM with the concurrence of divisional
finance and the approval of DRM.
o While fixing the parking rates, a survey should be carried out for parking charges
prevailing at other prominent locations in the city/area and it should be ensured that
parking rates fixed are normally not below the parking rates prevailing at
important/prominent places in the same city/area.
o The parking charges should be reviewed before the award of new contract as per the
above procedure.
28 Moneycontrol Bureau; April 05, 2013 (http://www.moneycontrol.com/news/business/rbi-gives-17-licences-for-white-atms-tatas-to-open-soon_847904.html?utm_source=ref_article)
Revenue maximizing study in particular for non-fare box revenues with affordability studies EXECUTIVE SUMMARY
PwC 57
However, the parking rates are found to be lower than prevailing rates charged by local
municipal authorities, shopping malls etc. in the city.
It is recommended that Sr. DCM/DCM should conduct a parking rate survey once a year
and revise parking charges accordingly (for instance on annual basis).
2. Identify suitable sites and underutilized land parcels to increase new supply of
parking lots
There is a demand for parking among the railway users as well as general public. However,
the supply of parking lots is not sufficient.
Coordination between commercial and technical/operations department is necessary to
identify and transfer surplus land assets for the purpose of commercial parking. The
proposed Land Management Cell (under Real Estate) can also play an important role for
this purpose.
The land parcels near stations, which are not being used currently or are under-utilized
should be released for parking with immediate effect till these land parcels are put under
different usage (including commercial development). This will also benefit railway, for
instance:
o Generation of additional revenues
o Better utilization of land assets, especially longitudinal sites least attractive for
commercial development
o Prevention of encroachment, land boundary and title issues
o Prevention of land sites getting land locked, etc.
Supply can also be enhanced in partnership with other agencies such as local government, bus
transport corporations for joint development of parking lots or multi-level parking ventures
with commercial/retail component. However, such opportunity should be assessed on a case-
to-case basis.
Catering and other retail stalls
Catering stalls are not the major contributor to revenue. It is primarily due to highly fragmented market and existence of legacy stalls. IRCTC followed market driven strategies during 2005 - 2010, however, post-2010, the catering is entrusted to departmental catering unit. However, the revenue potential from retail stalls can be enhanced if the following recommendations are implemented:
1. Revise the license fee for the existing catering stalls not awarded by IRCTC in
accordance with the Catering Policy 2010
Ensure license fees are revised according to the latest circular on catering license fee fixation
(No. C 45/15/1). Currently thisq has not been enforced effectively and the license fees are
revised nominally without price corrections.
Need a better enforcement at divisional levels, which can be achieved by having targets in
place. The recommended targets are to achieve 100% compliance, i.e., 100% of the stalls to
be awarded through open tendering process or for the existing legacy stalls to be converted
to finite contract tenor with the nearest market rate as license fee only by end of Financial
Year 2014-15.
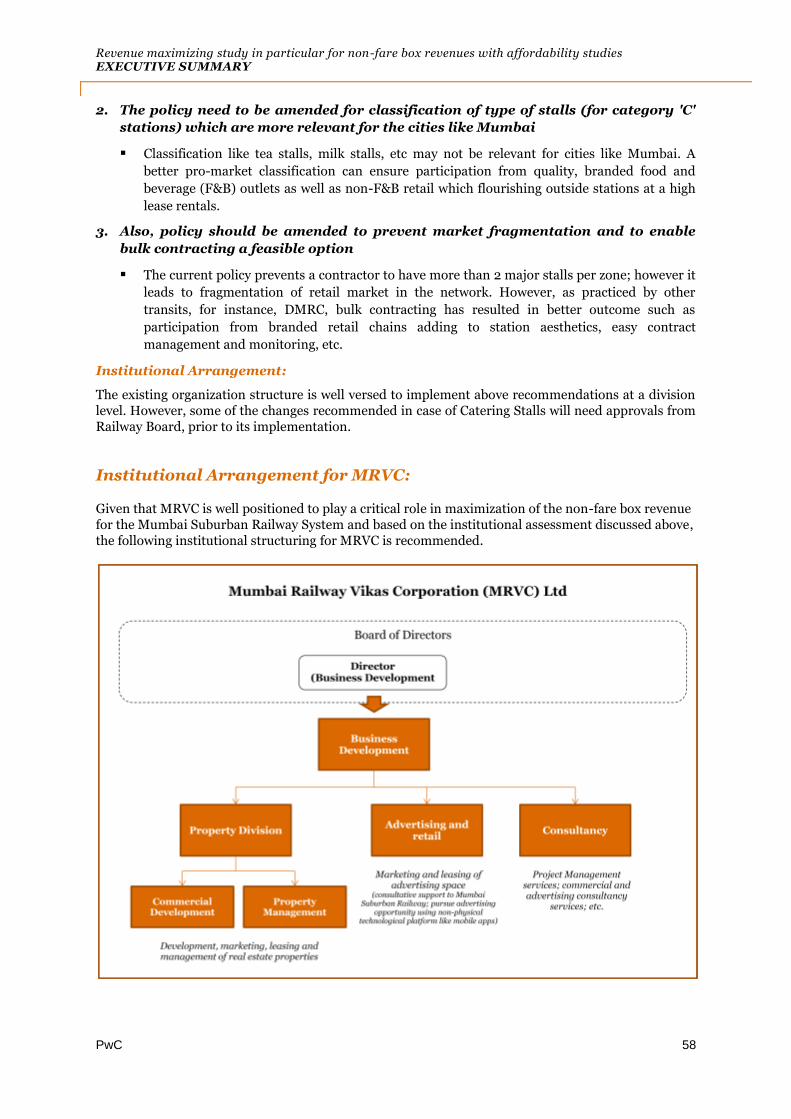
Revenue maximizing study in particular for non-fare box revenues with affordability studies EXECUTIVE SUMMARY
PwC 58
2. The policy need to be amended for classification of type of stalls (for category 'C'
stations) which are more relevant for the cities like Mumbai
Classification like tea stalls, milk stalls, etc may not be relevant for cities like Mumbai. A
better pro-market classification can ensure participation from quality, branded food and
beverage (F&B) outlets as well as non-F&B retail which flourishing outside stations at a high
lease rentals.
3. Also, policy should be amended to prevent market fragmentation and to enable
bulk contracting a feasible option
The current policy prevents a contractor to have more than 2 major stalls per zone; however it
leads to fragmentation of retail market in the network. However, as practiced by other
transits, for instance, DMRC, bulk contracting has resulted in better outcome such as
participation from branded retail chains adding to station aesthetics, easy contract
management and monitoring, etc.
Institutional Arrangement:
The existing organization structure is well versed to implement above recommendations at a division level. However, some of the changes recommended in case of Catering Stalls will need approvals from Railway Board, prior to its implementation.
Institutional Arrangement for MRVC:
Given that MRVC is well positioned to play a critical role in maximization of the non-fare box revenue for the Mumbai Suburban Railway System and based on the institutional assessment discussed above, the following institutional structuring for MRVC is recommended.

Revenue maximizing study in particular for non-fare box revenues with affordability studies EXECUTIVE SUMMARY
PwC 59
It is recommended to create a Business Development Division which shall be headed by an executive Board of Director. This will include three (3) business divisions:
A) Property Division: The property division shall be responsible for commercial development of land parcels. This division should have two sub-divisions:
o Commercial Development, which will be responsible for
Identification of new sites
Represent MRVC and coordinate with proposed Land Management Cell
Coordinate with state and local government
Site development
Concept planning
Site development through self or joint or third party development
Assist the successful bidder during construction stage for required coordination with railways
o Property Management, which will be responsible for
Real estate market research
Post-award contract management
Manage property developed through self or joint mode
Monitor activities for properties developed through third parties in accordance with the agreement
Assist commercial development team in concept planning and at various stages as required
B) Advertising and Retail Division: The primary functions of this division are to
o Liaison with the high-level integrated committee of WR & CR for Mumbai Suburban Railway System
o Create and develop for brand value for Mumbai Suburban Railway System
o Exploit merchandising opportunity
o Market research & interactions with advertising industry
o Commercial exploitation of virtual media such as online portals, mobile media, etc.
o Also, advertising and station rentals for the redeveloped stations if entrusted to MRVC, this department can fulfill the responsibility of contracting as well as post-contract management
C) Consultancy: MRVC brings in capabilities in the field of project and construction contract
management in both the Brownfield and Greenfield transit systems. Also, it is well positioned to
develop in-house capability for harnessing potential from commercial development and virtual
advertising media and can leverage such knowledge to provide consultancy services to other
transit agencies in India and also possibly to markets like Africa.
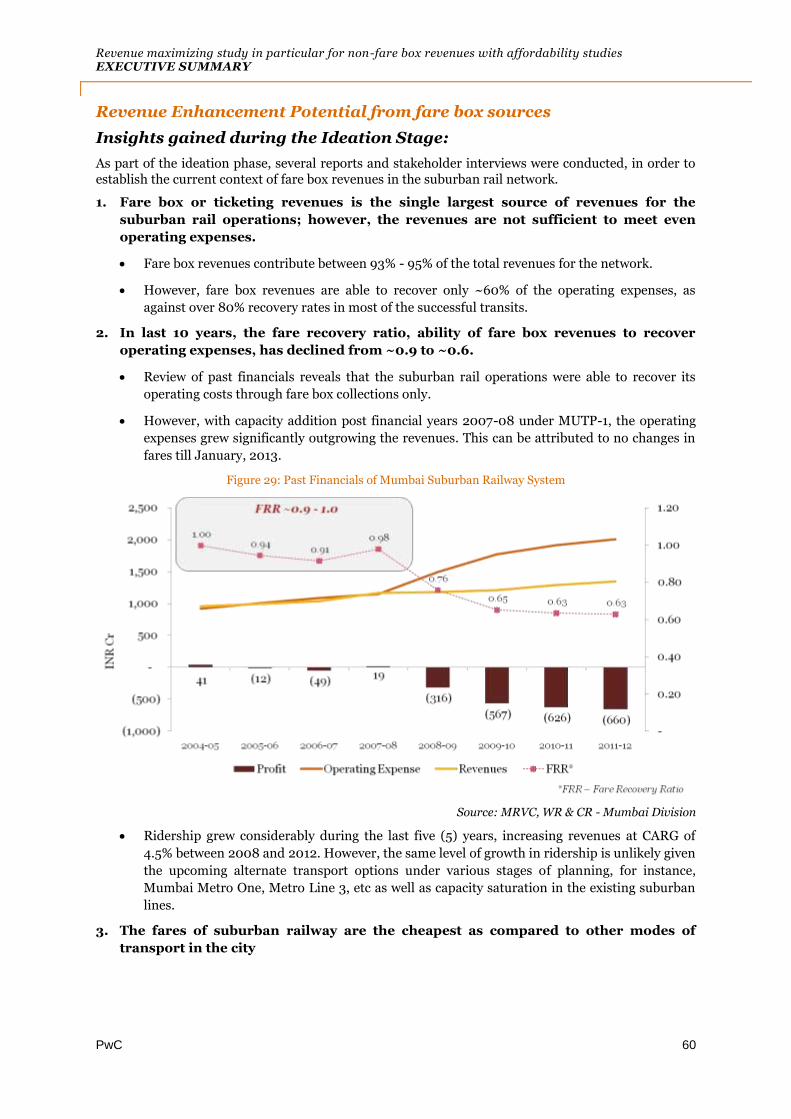
Revenue maximizing study in particular for non-fare box revenues with affordability studies EXECUTIVE SUMMARY
PwC 60
Revenue Enhancement Potential from fare box sources
Insights gained during the Ideation Stage:
As part of the ideation phase, several reports and stakeholder interviews were conducted, in order to establish the current context of fare box revenues in the suburban rail network.
1. Fare box or ticketing revenues is the single largest source of revenues for the
suburban rail operations; however, the revenues are not sufficient to meet even
operating expenses.
Fare box revenues contribute between 93% - 95% of the total revenues for the network.
However, fare box revenues are able to recover only ~60% of the operating expenses, as
against over 80% recovery rates in most of the successful transits.
2. In last 10 years, the fare recovery ratio, ability of fare box revenues to recover
operating expenses, has declined from ~0.9 to ~0.6.
Review of past financials reveals that the suburban rail operations were able to recover its
operating costs through fare box collections only.
However, with capacity addition post financial years 2007-08 under MUTP-1, the operating
expenses grew significantly outgrowing the revenues. This can be attributed to no changes in
fares till January, 2013.
Figure 29: Past Financials of Mumbai Suburban Railway System
Source: MRVC, WR & CR - Mumbai Division
Ridership grew considerably during the last five (5) years, increasing revenues at CARG of
4.5% between 2008 and 2012. However, the same level of growth in ridership is unlikely given
the upcoming alternate transport options under various stages of planning, for instance,
Mumbai Metro One, Metro Line 3, etc as well as capacity saturation in the existing suburban
lines.
3. The fares of suburban railway are the cheapest as compared to other modes of
transport in the city

Revenue maximizing study in particular for non-fare box revenues with affordability studies EXECUTIVE SUMMARY
PwC 61
Suburban rail fares are the lowest among all the public transport modes including
intermediate public transport such as auto rickshaws and taxies.
Figure 30: Comparison of single journey fares
Source: DMRC (Website), BEST (Website), PwC Research & Analysis
Even in case of season tickets, the suburban railway fares are among the lowest when
compared with transport modes within city as well as with DMRC.
Figure 31: Comparison of Season ticket fares
Source – DMRC (Website), BEST (Website), PwC Research & Analysis
4. Also, inflationary costs have forced comparable
transport modes in the city to raise fares several
times in the last few decades as compared to the
suburban rail.
Between 1993 and 2013, BEST base fares have increased
around 10 times as compared to that of 2.5 times for
suburban railway.
The fares of BEST bus have been revised five (5) times
since 2007.
Figure 32: Comparison of increase in fares (BEST vs. Mumbai Suburban Railways)

Revenue maximizing study in particular for non-fare box revenues with affordability studies EXECUTIVE SUMMARY
PwC 62
5. Survey of over 6,200 suburban rail commuters show improved socio-economic
profiles and affordability than what may be normally assumed
Review of past studies, and findings of the survey conducted under this study reveal that over
half of the commuters belong to mid-income group & high-income group category. Also, over
3/4th of the commuters belong to service and business occupation
Whereas, ~1/5th of the commuters belongs to "No Income" group which comprises of
students, housewives, retired personnel, social trips, etc.
Figure 34: Income wise distribution of suburban rail
commuters
Source: PwC - Prozeal Commuter Survey (2013)
The per capita income of the city has grown over 3 times between 2005-06 and 2011-1229,
indicating improved affordability of the population
The spending on widely used 2nd class monthly season ticket is far below the affordability
index of 5% to 10% of the monthly total income30. This combines with the fact that over 3/4th
of the commuters are the daily users of the suburban rail system who uses the system for 44 -
56 trips per month using monthly season tickets.
Access and dispersal modes of transport pattern shows that these modes account for more
than half of the average cost to passenger, but account for only ~10% of the trip distance and
trip time.
6. The review of fare structure and share of revenues indicates, the existence of the
structural anomalies, especially in the season tickets, which are also supported by
survey results
Survey results indicate that season ticket contributes to around 85% of the daily ridership,
29 Source: Planning Commission, Economic Survey for Maharashtra 30 Source: World Bank - several studies have been undertaken by World Bank on affordability and affordability index, including mapping of affordability index for 27 cities. It shows that typically 5% - 10% of the income can be considered a reasonable range for affordability index but varies widely across the world.
Single, 3.4% Return,
9.8%
Tourist Pass, 2.2%
M.S.T, 78.1%
Q.S.T, 6.4%
Most of the daily passengers travel using season tickets
Single Return Tourist Pass M.S.T Q.S.T
Figure 33: Split of commuters based on ticket type

Revenue maximizing study in particular for non-fare box revenues with affordability studies EXECUTIVE SUMMARY
PwC 63
However, review of passenger earning statements for the suburban rail operations reveals that
the contribution of season ticket is only 53% of the total fare box collections (FY 2011-12)
Table 6: Season Tickets - revenue contribution vs. share in daily ridership
OT ST
% of daily ridership 15% 85%
% share of revenues (FY12) 47% 53%
7. Given the fare revisions are the central subject and have uniform structure across
India, the city specific surcharge is being used to customized fares for the city
The existing fare structure of the Mumbai Suburban Railway includes the following
components:
o Suburban rail base fare based on distance slab, which uniform across India
o MUTP surcharge – III
o Rounding off to multiples of five (5) - Rounding off to higher multiple of 5.
This MUTP surcharge is specific to MMR region only and levied only on suburban rail
operations.
Also, CIDCO development surcharge is being levied additionally for travel on Harbour line
beyond Mankhurd.
Our interactions with officials reveal that city specific surcharge is an alternate and better
option.
8. Commuters will be willing to pay extra with increasing income as well as increased
quality of services
Past studies, such as, Comprehensive transport plan for Bombay Metropolitan
Region (Atkins), also in its consumer attitude survey, found that "as income rise, an
increased proportion of users are ready to pay for better quality services than are currently
offered."
Key Findings from Analysis Stage:
The findings of the analysis of survey results, past financials, existing fares and statistics can be summarized as structural anomalies in the present framework, willingness to pay and test for affordability
Structural anomalies in season tickets:
o Survey results shows that over 90% of the daily commuters uses rail services for 44 - 56 trips
per month. However, fare structure of monthly season tickets (MST) show high level of
discounting
o 2nd class MST fare is equivalent to 15/16 single journey tickets - discounting of ~70%
o 1st class MST fare is equivalent to 6/7 single journey tickets - discounting of ~85%
o Globally urban rail systems, including Delhi Metro, discount typically 10% - 40% on periodic
passes.

Revenue maximizing study in particular for non-fare box revenues with affordability studies EXECUTIVE SUMMARY
PwC 64
o Also, Model Concession Agreement (MCA) for Urban Rail System permits monthly pass fares
as equivalent to 40 single journey trips.
Figure 35: Structural Anomalies in Season tickets
Source: PwC - Prozeal Commuter Survey (2013)
Willingness to pay extra:
Commuters have expressed at least 10% willingness to pay (WTP) extra for the existing level of service, irrespective of their income group, trip distance, or travel class. Also, over 83% of the commuters stated that they will continue to use suburban railway even if the fares are hiked beyond 10%.
Table 7: Average WTP across income groups, travel class and distance slabs
Source: PwC Research & Analysis, Survey
Also, WTP extra increases to minimum 20% with incremental improvement in the quality of services and passenger amenities, such as security, better toilet facilities, cleanliness, etc.
Test for affordability
Globally affordability of transport expenditure is measured as an index equivalent to 5 – 10% of the monthly income. Only 4% of the total commuters with monthly income of <INR 5,000 uses suburban rail system (Commuter Survey 2013), against ~50% of the Mumbai’s households from this category (CTS for MMR, 2008), who usually walks to place of employment.
The lower & middle income group commuters prefer to travel by 2nd class using MST tickets. However, the monthly expenses are still below affordability index (refer the following chart), showing possibility of increase in MST fares without affecting the affordability of the lower income strata.
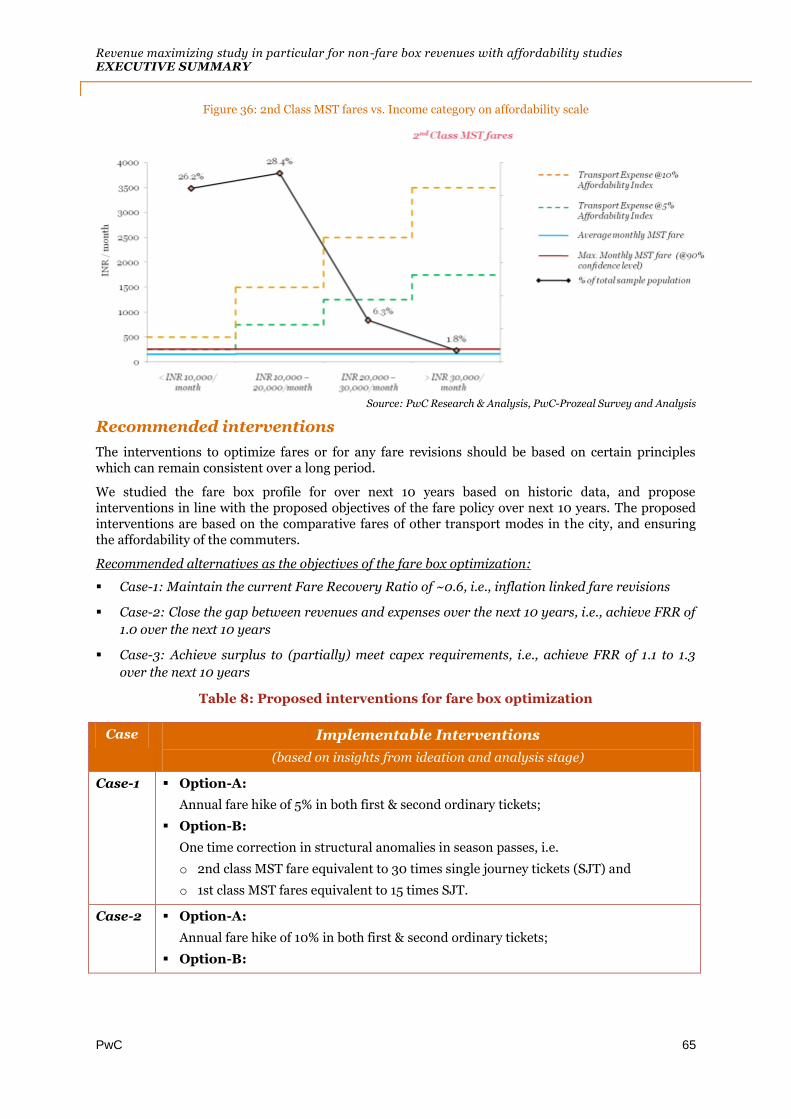
Revenue maximizing study in particular for non-fare box revenues with affordability studies EXECUTIVE SUMMARY
PwC 65
Figure 36: 2nd Class MST fares vs. Income category on affordability scale
Source: PwC Research & Analysis, PwC-Prozeal Survey and Analysis
Recommended interventions
The interventions to optimize fares or for any fare revisions should be based on certain principles which can remain consistent over a long period.
We studied the fare box profile for over next 10 years based on historic data, and propose interventions in line with the proposed objectives of the fare policy over next 10 years. The proposed interventions are based on the comparative fares of other transport modes in the city, and ensuring the affordability of the commuters.
Recommended alternatives as the objectives of the fare box optimization:
Case-1: Maintain the current Fare Recovery Ratio of ~0.6, i.e., inflation linked fare revisions
Case-2: Close the gap between revenues and expenses over the next 10 years, i.e., achieve FRR of
1.0 over the next 10 years
Case-3: Achieve surplus to (partially) meet capex requirements, i.e., achieve FRR of 1.1 to 1.3
over the next 10 years
Table 8: Proposed interventions for fare box optimization
Case Implementable Interventions
(based on insights from ideation and analysis stage)
Case-1 Option-A:
Annual fare hike of 5% in both first & second ordinary tickets;
Option-B:
One time correction in structural anomalies in season passes, i.e.
o 2nd class MST fare equivalent to 30 times single journey tickets (SJT) and
o 1st class MST fares equivalent to 15 times SJT.
Case-2 Option-A:
Annual fare hike of 10% in both first & second ordinary tickets;
Option-B:

Revenue maximizing study in particular for non-fare box revenues with affordability studies EXECUTIVE SUMMARY
PwC 66
One time correction in structural anomalies in season passes, i.e.
o 2nd class MST fare equivalent to 30 times single journey tickets (SJT) and
o 1st class MST fares equivalent to 15 times SJT.
Annual fare hike of 5% in both first and second class ordinary tickets
Case-3 Option-A:
Annual fare hike of 20% for the first 3-4 years followed by annual fare hike 10% for
the both first and second class ordinary tickets.
Option-B:
One time correction in structural anomalies in season passes, i.e.
o 2nd class MST fare equivalent to 30 times single journey tickets (SJT) and
o 1st class MST fares equivalent to 15 times SJT.
Annual fare hike of 7% (equivalent to inflation) in both first and second class
ordinary tickets.
Source: PwC Research and Analysis
The above proposed interventions can improve financials of the suburban railway operations substantially eliminating or reducing the need for operating subsidy. These funds can further be utilized towards improving passenger amenities.
Figure 37: Summary of Potential interventions and impact on operating subsidy
Source: PwC Research & Analysis
Next Steps
Ushering in a new pricing regime through a transparent process, Railway Minister Mallikarjun Khrage
on February 12, 2014 announced in the interim rail budget (2014) constitution of an independent Rail
Tariff Authority (RTA) to advise the government on fixing of fares and freight
If RTA is empowered to enforce the tariff once decided in a transparent manner and after the
consultation with the various stakeholders, it can act as authority to set fares for the Mumbai
Suburban Railway Network.
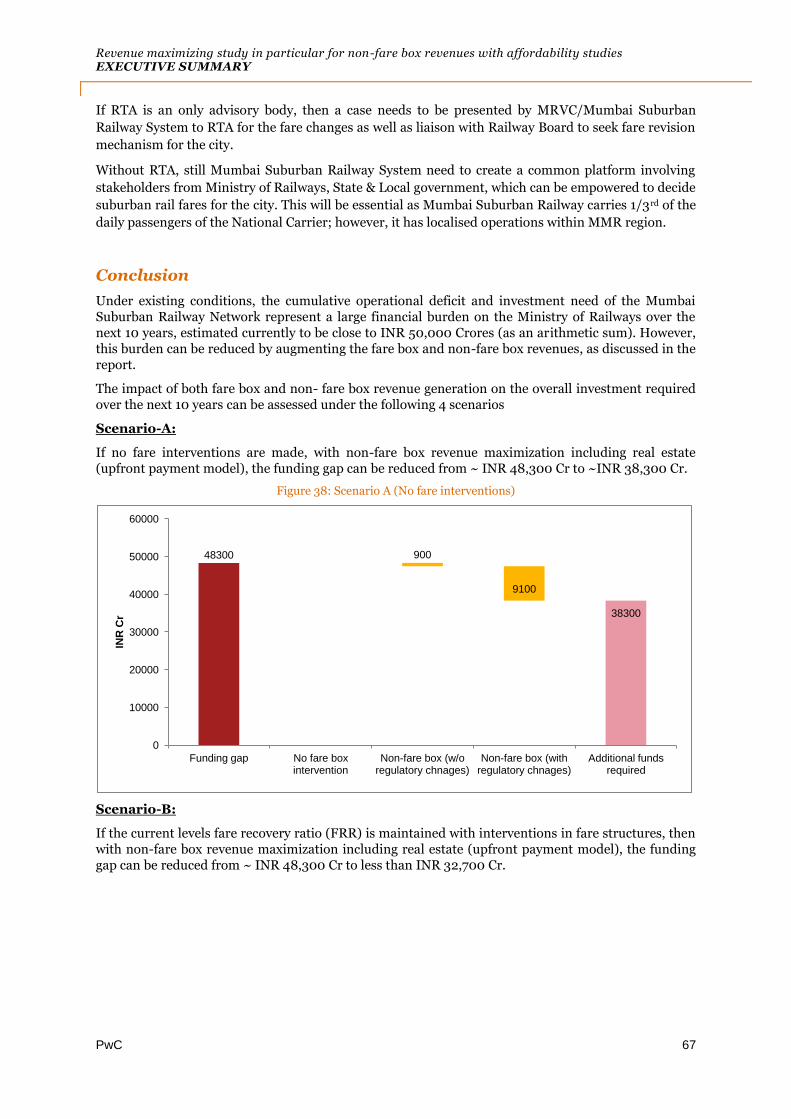
Revenue maximizing study in particular for non-fare box revenues with affordability studies EXECUTIVE SUMMARY
PwC 67
If RTA is an only advisory body, then a case needs to be presented by MRVC/Mumbai Suburban
Railway System to RTA for the fare changes as well as liaison with Railway Board to seek fare revision
mechanism for the city.
Without RTA, still Mumbai Suburban Railway System need to create a common platform involving
stakeholders from Ministry of Railways, State & Local government, which can be empowered to decide
suburban rail fares for the city. This will be essential as Mumbai Suburban Railway carries 1/3rd of the
daily passengers of the National Carrier; however, it has localised operations within MMR region.
Conclusion
Under existing conditions, the cumulative operational deficit and investment need of the Mumbai Suburban Railway Network represent a large financial burden on the Ministry of Railways over the next 10 years, estimated currently to be close to INR 50,000 Crores (as an arithmetic sum). However, this burden can be reduced by augmenting the fare box and non-fare box revenues, as discussed in the report.
The impact of both fare box and non- fare box revenue generation on the overall investment required over the next 10 years can be assessed under the following 4 scenarios
Scenario-A:
If no fare interventions are made, with non-fare box revenue maximization including real estate (upfront payment model), the funding gap can be reduced from ~ INR 48,300 Cr to ~INR 38,300 Cr.
Figure 38: Scenario A (No fare interventions)
Scenario-B:
If the current levels fare recovery ratio (FRR) is maintained with interventions in fare structures, then with non-fare box revenue maximization including real estate (upfront payment model), the funding gap can be reduced from ~ INR 48,300 Cr to less than INR 32,700 Cr.
48300
38300
900
9100
0
10000
20000
30000
40000
50000
60000
Funding gap No fare box intervention
Non-fare box (w/o regulatory chnages)
Non-fare box (with regulatory chnages)
Additional funds required
INR
Cr

Revenue maximizing study in particular for non-fare box revenues with affordability studies EXECUTIVE SUMMARY
PwC 68
Figure 39: Scenario B (Case-1: Current FRR is maintained)
Scenario-C:
If the gap between operating expenses and fare box revenues is met, i.e. in other words if FRR of 1.0 is to be achieved in the next 10 years with appropriate interventions in fare structures, then together with non-fare box revenue maximization including real estate (upfront payment model), the funding gap can be reduced from ~ INR 48,300 Cr to less than INR 25,000 Cr.
Figure 40: Scenario C (Case-2: Achieve FRR of 1.0)
Scenario-D:
If the gap between operating expenses and fare box revenues is met as well as an operating surplus is target, i.e. in other words if FRR of 1.1 to 1.3 is to be achieved in the next 10 years with appropriate interventions in fare structures, then together with non-fare box revenue maximization including real estate (upfront payment model), the funding gap can be reduced from ~ INR 48,300 Cr to less than INR 16,500 Cr. Additionally the future operating surplus can also be leveraged, which can further reduce the need for additional funds to less than INR 12,000 Cr.
48300
32700
5600 900
9100
0
10000
20000
30000
40000
50000
60000
Funding gap Fare intervention (Case 1)
Non-fare box (w/o regulatory chnages)
Non-fare box (with regulatory chnages)
Additional funds required
INR
Cr
48300
25000
13300
900 9100
0
10000
20000
30000
40000
50000
60000
Funding gap Fare intervention (Case 2)
Non-fare box (w/o regulatory chnages)
Non-fare box (with regulatory chnages)
Additional funds required
INR
Cr
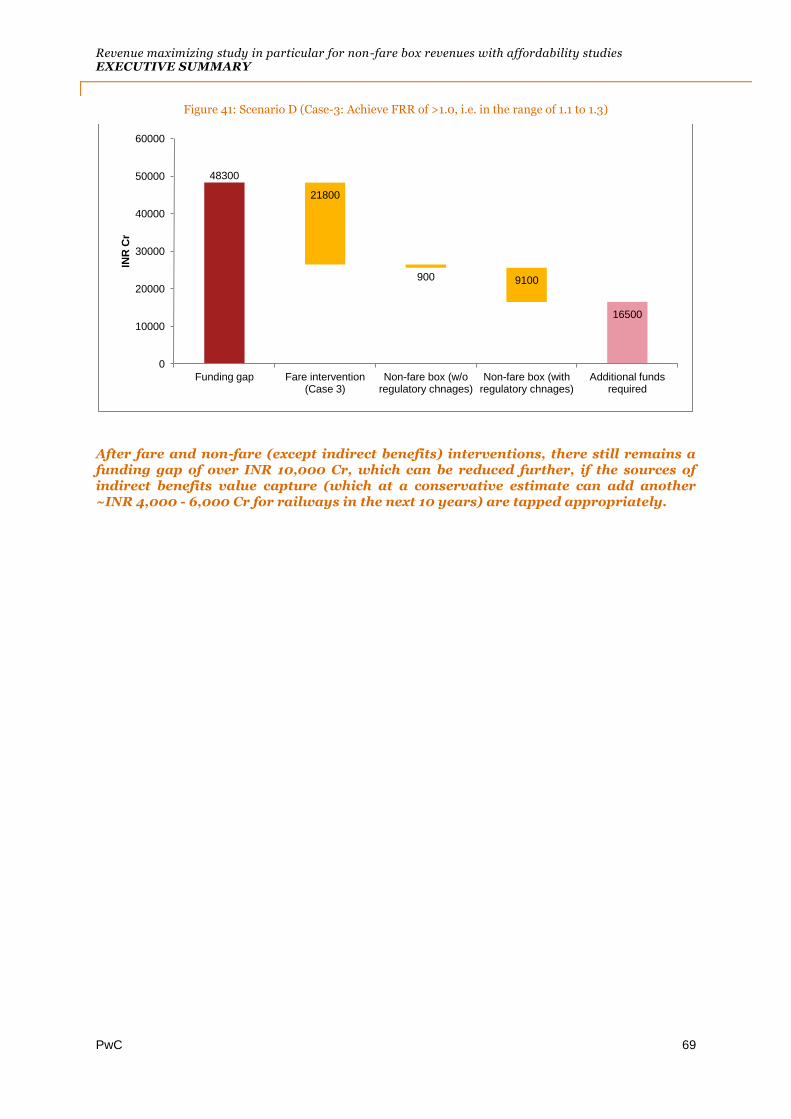
Revenue maximizing study in particular for non-fare box revenues with affordability studies EXECUTIVE SUMMARY
PwC 69
Figure 41: Scenario D (Case-3: Achieve FRR of >1.0, i.e. in the range of 1.1 to 1.3)
After fare and non-fare (except indirect benefits) interventions, there still remains a funding gap of over INR 10,000 Cr, which can be reduced further, if the sources of indirect benefits value capture (which at a conservative estimate can add another ~INR 4,000 - 6,000 Cr for railways in the next 10 years) are tapped appropriately.
48300
16500
21800
900 9100
0
10000
20000
30000
40000
50000
60000
Funding gap Fare intervention (Case 3)
Non-fare box (w/o regulatory chnages)
Non-fare box (with regulatory chnages)
Additional funds required
INR
Cr
Related Documents