Executive Compensation and Firm Leverage * Michael Albert Fisher College of Business Ohio State University November 10, 2013 ** Preliminary and Incomplete ** Abstract This work explores the role of executive compensation in determining the capital structure de- cisions of a firm. CEOs experience a large personal cost of default that interacts through the risk adjusted probability of default with their compensation contract. Since default happens in a partic- ularly costly state of the world for a CEO whose compensation contract consists primarily of pay for performance elements, i.e. a CEO who has a large personal equity stake in the firm, a large pay performance sensitivity is negatively and significantly associated with firm leverage choice. I document this effect in detail for the first time, and I show that it is both statistically robust and significant in magnitude, approximately 1% of firm value. I show that this effect is driven by the stock holdings of the CEO, not the option holdings. I provide a simple principal agent model that explains the observed negative relationship and makes additional predictions on the relationship of other firm characteristics to pay performance sensitivity and leverage. I then test and confirm these predictions empirically using a standard OLS framework and an instrumental variable approach to control for endogeneity in the compensation contract. I also look at leverage adjustment speeds and show that CEOs with higher pay performance sensitivity adjust leverage upwards towards target values more slowly and downwards more quickly than their peers, and I interpret this as direct evidence that CEOs are actively managing personal risk through firm leverage choice. * I’m very grateful to the faculties of Duke University, ITAM, and the University of Hawaii for comments, with a special mention for David Robinson, John Graham, Lukas Schmid, and Pino Lopomo. All errors are my own.

Welcome message from author
This document is posted to help you gain knowledge. Please leave a comment to let me know what you think about it! Share it to your friends and learn new things together.
Transcript
Executive Compensation and Firm Leverage ∗
Michael Albert
Fisher College of Business
Ohio State University
November 10, 2013
** Preliminary and Incomplete **
Abstract
This work explores the role of executive compensation in determining the capital structure de-
cisions of a firm. CEOs experience a large personal cost of default that interacts through the risk
adjusted probability of default with their compensation contract. Since default happens in a partic-
ularly costly state of the world for a CEO whose compensation contract consists primarily of pay
for performance elements, i.e. a CEO who has a large personal equity stake in the firm, a large
pay performance sensitivity is negatively and significantly associated with firm leverage choice. I
document this effect in detail for the first time, and I show that it is both statistically robust and
significant in magnitude, approximately 1% of firm value. I show that this effect is driven by the stock
holdings of the CEO, not the option holdings. I provide a simple principal agent model that explains
the observed negative relationship and makes additional predictions on the relationship of other firm
characteristics to pay performance sensitivity and leverage. I then test and confirm these predictions
empirically using a standard OLS framework and an instrumental variable approach to control for
endogeneity in the compensation contract. I also look at leverage adjustment speeds and show that
CEOs with higher pay performance sensitivity adjust leverage upwards towards target values more
slowly and downwards more quickly than their peers, and I interpret this as direct evidence that
CEOs are actively managing personal risk through firm leverage choice.
∗I’m very grateful to the faculties of Duke University, ITAM, and the University of Hawaii for comments, with a specialmention for David Robinson, John Graham, Lukas Schmid, and Pino Lopomo. All errors are my own.
1 Introduction
Standard theories of corporate leverage assume that the observed leverage choice is optimal for maximizing
the value of the firm. However, there is a large and growing literature that suggests that many firm choices
are driven not by considerations of firm value maximization, but instead by the idiosyncratic effect of
CEOs (e.g. Bertrand and Schoar (2003), Cadenillas et al. (2004), and Malmendier and Tate (2005)). In
addition, there is a growing literature examining the effect of executive compensation on firm financing
decisions (e.g. Brockman et al. (2010)). The importance of understanding the effect of the structure
of managerial compensation on firm choices, specifically pay for performance components, has increased
since the manner in which executive compensation is structured has changed dramatically over the past
three decades. The median exposure of executive compensation to stock price tripled from 1984 to 1994
(Hall and Liebman (1998)) and further doubled between 1994 and 2000 (Bergstressor and Phillippon
(2006)). Further, CEOs face significant negative shocks to lifetime income after being the active manager
for a firm that experiences default (Eckbo and Thorburn (2003), Eckbo et al. (2012)). While CEO fixed
effects have been shown to affect the leverage chosen by a firm (Frank and Goyal (2007)), the question
of how and why executive compensation affects the leverage choice of a firm is still open. This paper
documents in detail that pay performance sensitivity (hereafter referred to alternatingly as PPS or pay
performance sensitivity) is significantly and robustly negatively correlated with firm leverage, and it
provides a model consistent with the empirical evidence where this negative relationship comes about
through the interaction between PPS and personal corporate default risk.
The effects of executive compensation on firm choice has been studied in other contexts. Aggarwal
and Samwick (2006) show that firm performance increases in incentives. Likewise, Aggarwal and Samwick
(1999) show that incentives influence firm pricing policy. Denis et al. (1997) show that CEO incentives
affect the diversification decision of a firm. In order for executive compensation to play a role in deter-
mining the firms capital structure three things must be true. First, the executive must have the ability to
determine capital structure. Second, the executive must have an incentive to deviate from the interests
of shareholders. Third, the compensation contract must affect the incentives of the executive to deviate.
In this paper, I will show all three of these hold true for the CEO, and that there is significant empirical
evidence indicating that this does indeed occur.
The strongest evidence for executives being able to influence firm capital structure decisions comes
from survey data. Graham et al. (2013) report from a survey of executives that CEOs and CFOs claim
that one of the two areas in which they have the most influence are capital structure, with the other area
being mergers and acquisitions. Frank and Goyal (2007) provide more direct evidence by showing that
differences among CEO fixed effects account for a large percentage of variation in corporate leverage.
1
This paper provides further evidence by demonstrating that executive compensation is correlated with
the firms leverage choice in a manner consistent with the CEO managing leverage for the purposes of
personal risk management.
CEOs have a strong incentive to deviate from an optimal capital structure because default is very
costly for the current CEO. Very few CEOs survive the bankruptcy process and their outside option is
normally significantly lower than their current wage. Betker (1995) reports that 91% of CEOs in office
two years prior to a chapter 11 bankruptcy do not survive the bankruptcy process. Ayotte and Morrison
(2009) find a similar percentage. Further, CEOs earning prospects are significantly decreased after being
forced out. Eckbo and Thorburn (2003) find that in a sample of Swedish firms median income change
for a CEO resulting from bankruptcy is -47%, and in a more recent working paper Eckbo et al. (2012)
use a sample of U.S. firms undergoing bankruptcy to show that the median loss of future income due
to undergoing bankruptcy is 2.7 times present income. Therefore, bankruptcy is very costly for the
executives of the firm, substantially more costly than it is for the firm. This drives a wedge between the
optimal capital structure from the perspective of the executive and the perspective of the firm.
It is a common assumption in the literature that CEOs possess incentives other than those of share-
holder wealth maximization, such as empire building or perquisite consumption. The literature exploring
optimal compensation schemes seeks to align the incentives of CEOs with shareholders, however, in most
models, the firm is rarely able to achieve a first best solution through compensation contracts. Executive
compensation typically consists of four main components, a fixed wage, various explicit performance in-
centives, and an equity stake in the company through both direct stock ownership and indirectly through
options. In this paper, I will ignore the explicit performance incentive. I justify this by noting that
explicit performance incentives tends to be minuscule compared to the magnitude of pay performance
sensitivities due to stock and options in the data. However, the literature has ignored the presence of
personal default costs for CEOs when examining the compensation contracts. Since executives are risk
averse agents, this interaction is important.
A standard result in the compensation literature going back to Holmstrom and Milgrom (1987) is
that risk-sharing is fundamentally sub-optimal for a risk averse agent, and it’s only necessary to provide
correct incentives for effort. However, risk averse agents care not only about the amount of wealth, but
also about what state of the world the payments arrive in. For an executive with a large component of
compensation due to a pay for performance component of the contract, the state of the world under which
he realizes his large negative wealth shock due to default is also the state of the world under which his
pay for performance is very low. This means a heavy pay for performance based compensation contract
further increases the perceived cost of firm default.
2
As the cost of default increases, if the CEO has some measure of control over firm leverage, the
chosen leverage ratio decreases. This may lead to a lower than optimal leverage choice, though it’s not a
necessity. However, this interaction does lead to a chosen leverage ratio that is lower than what would
otherwise be observed in a risk neutral agent.
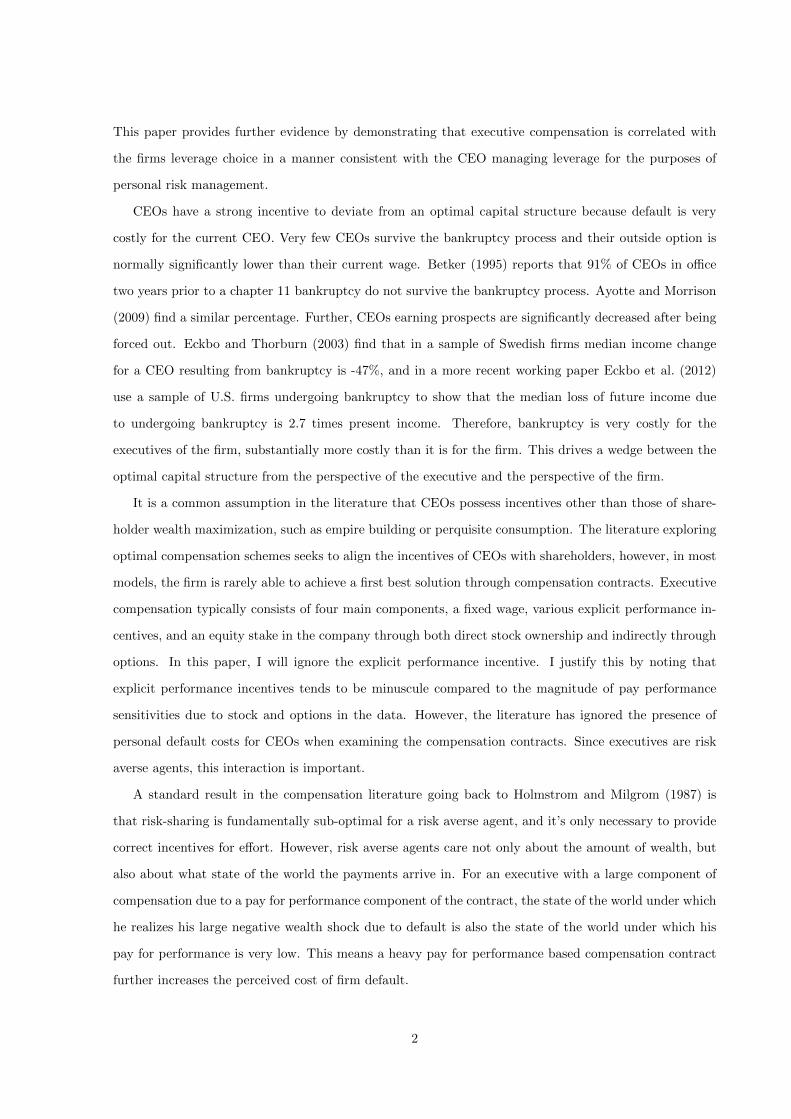
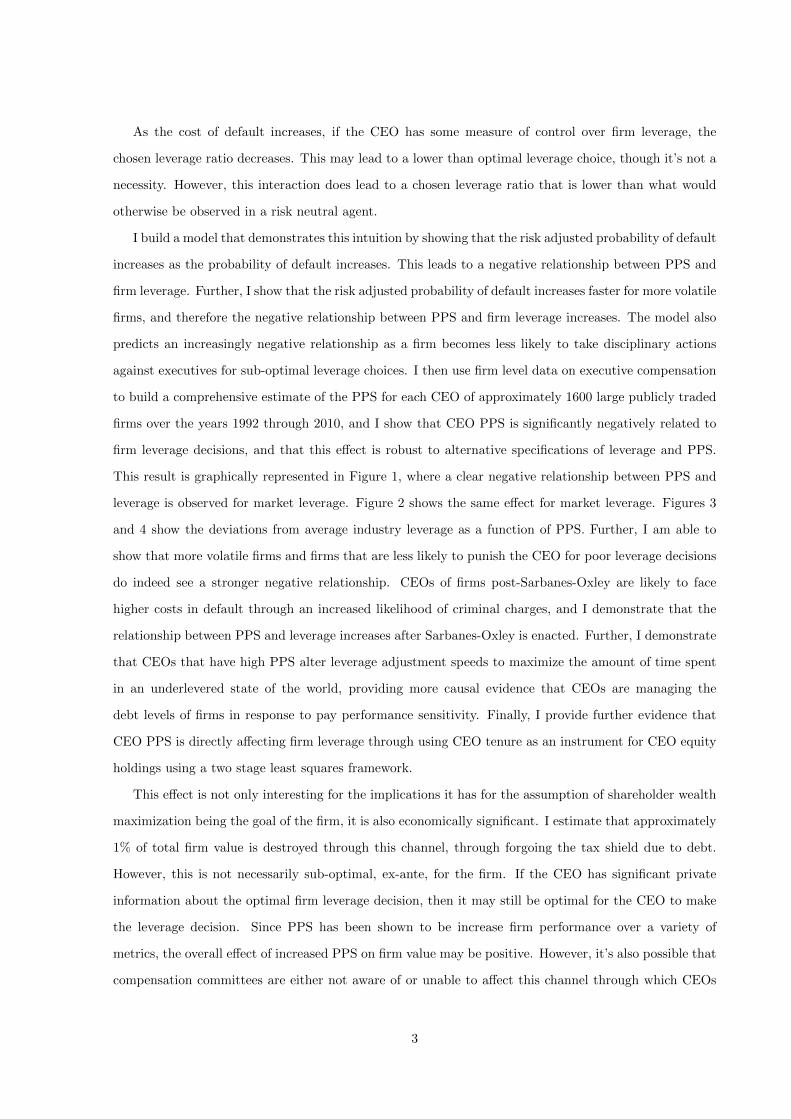
I build a model that demonstrates this intuition by showing that the risk adjusted probability of default
increases as the probability of default increases. This leads to a negative relationship between PPS and
firm leverage. Further, I show that the risk adjusted probability of default increases faster for more volatile
firms, and therefore the negative relationship between PPS and firm leverage increases. The model also
predicts an increasingly negative relationship as a firm becomes less likely to take disciplinary actions
against executives for sub-optimal leverage choices. I then use firm level data on executive compensation
to build a comprehensive estimate of the PPS for each CEO of approximately 1600 large publicly traded
firms over the years 1992 through 2010, and I show that CEO PPS is significantly negatively related to
firm leverage decisions, and that this effect is robust to alternative specifications of leverage and PPS.
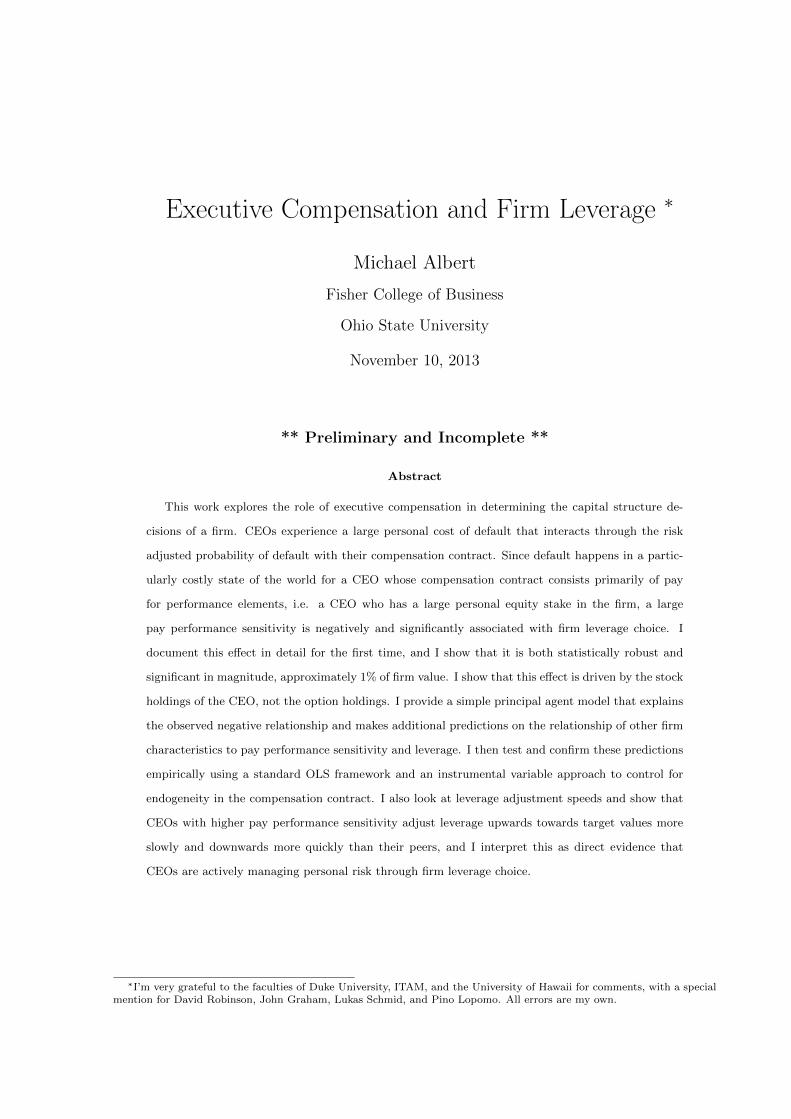
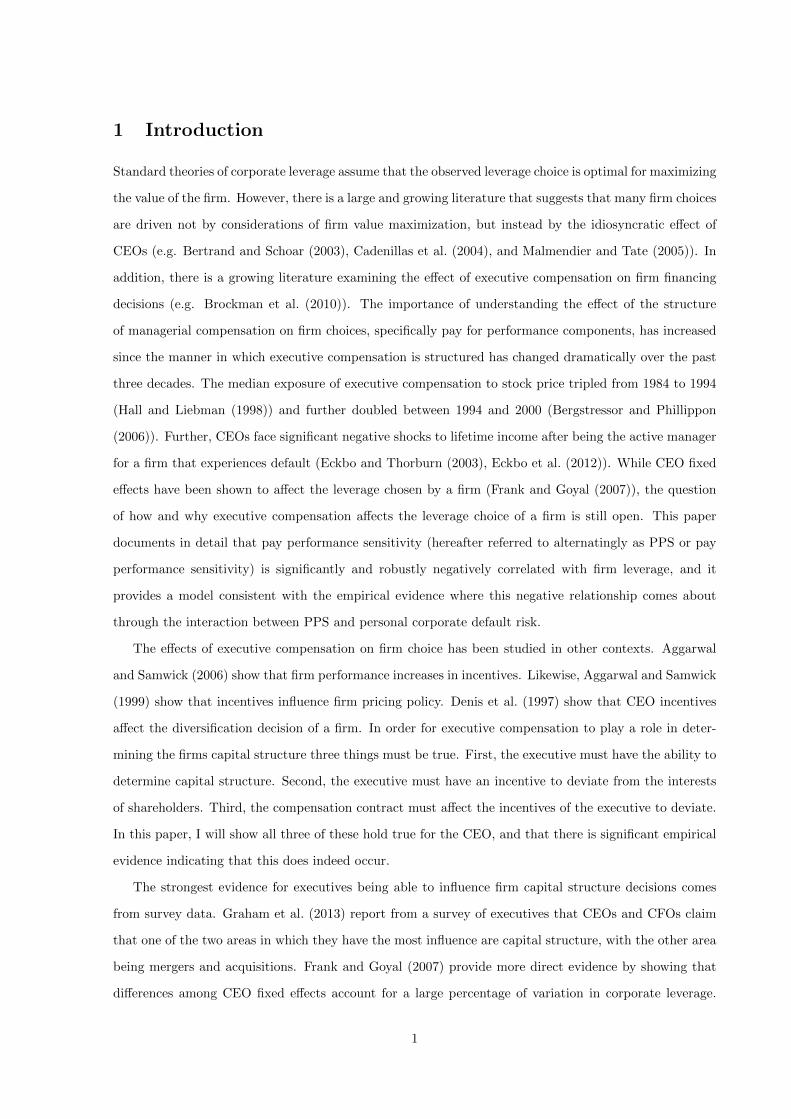
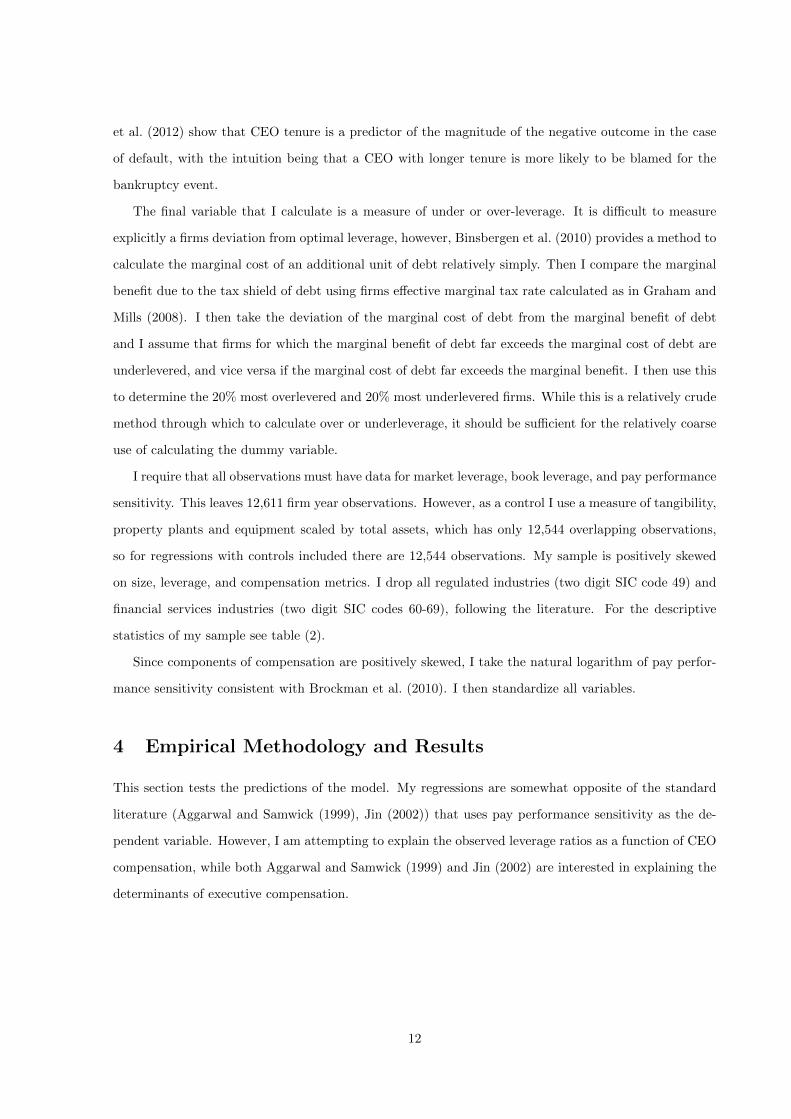
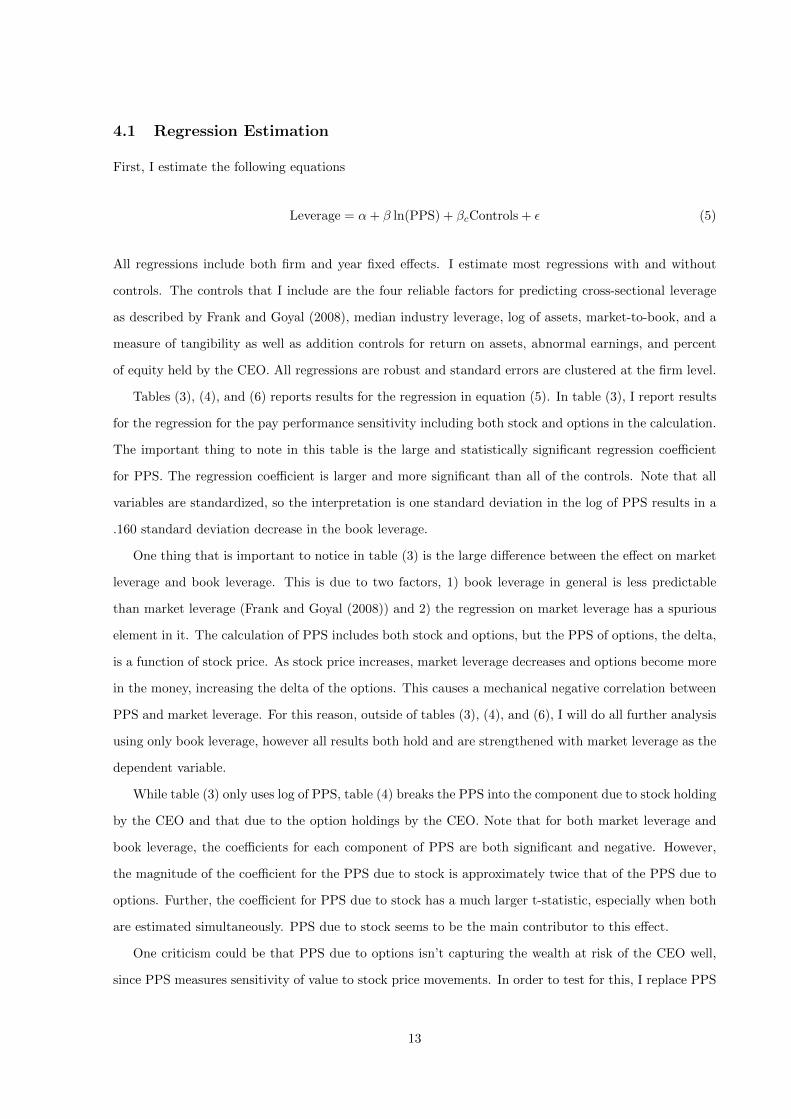
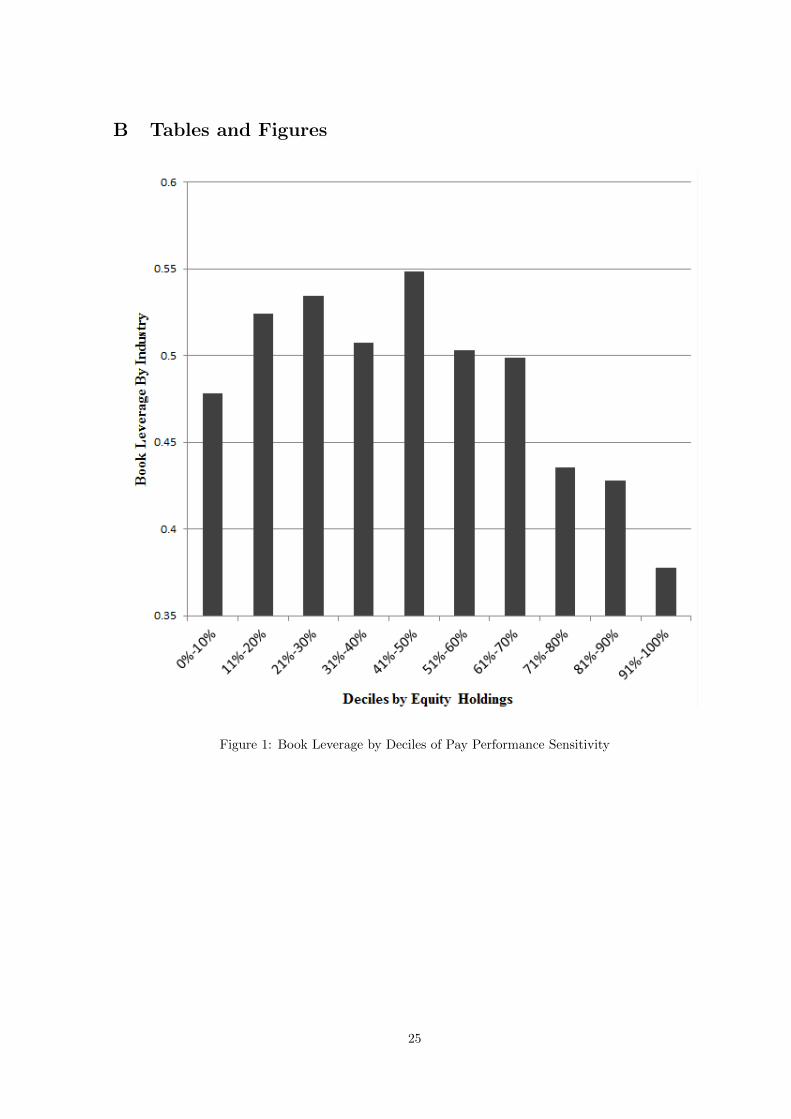
This result is graphically represented in Figure 1, where a clear negative relationship between PPS and
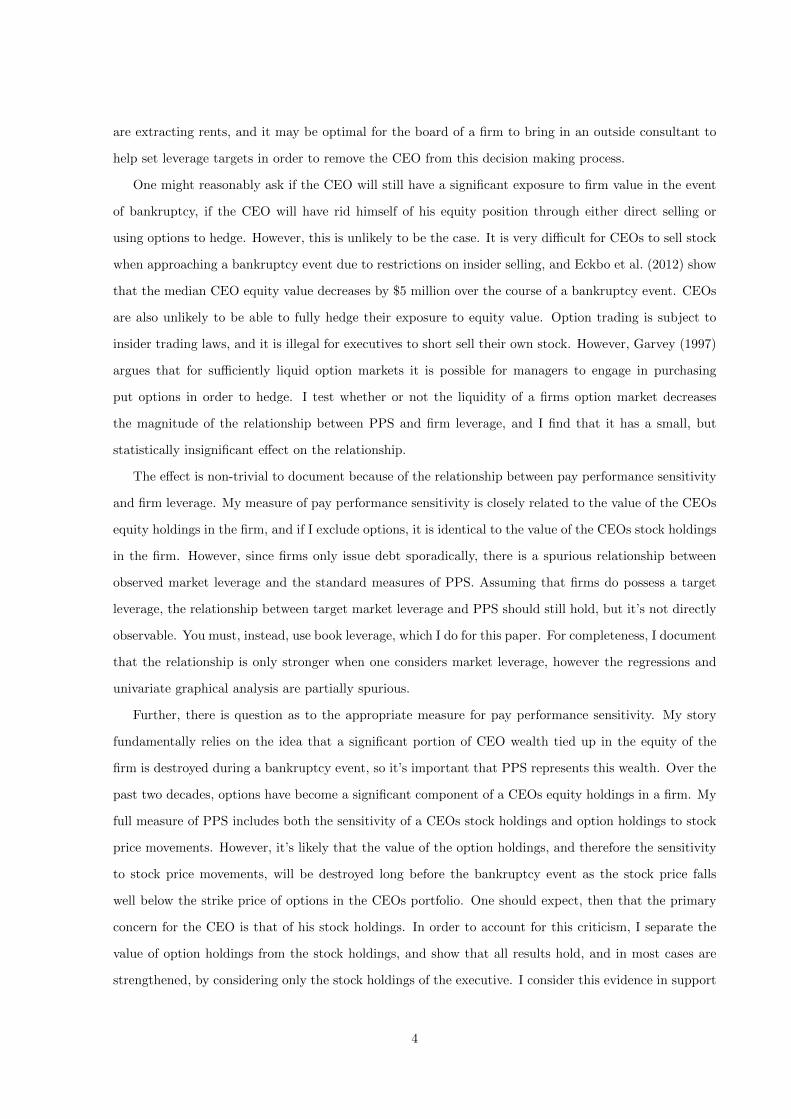
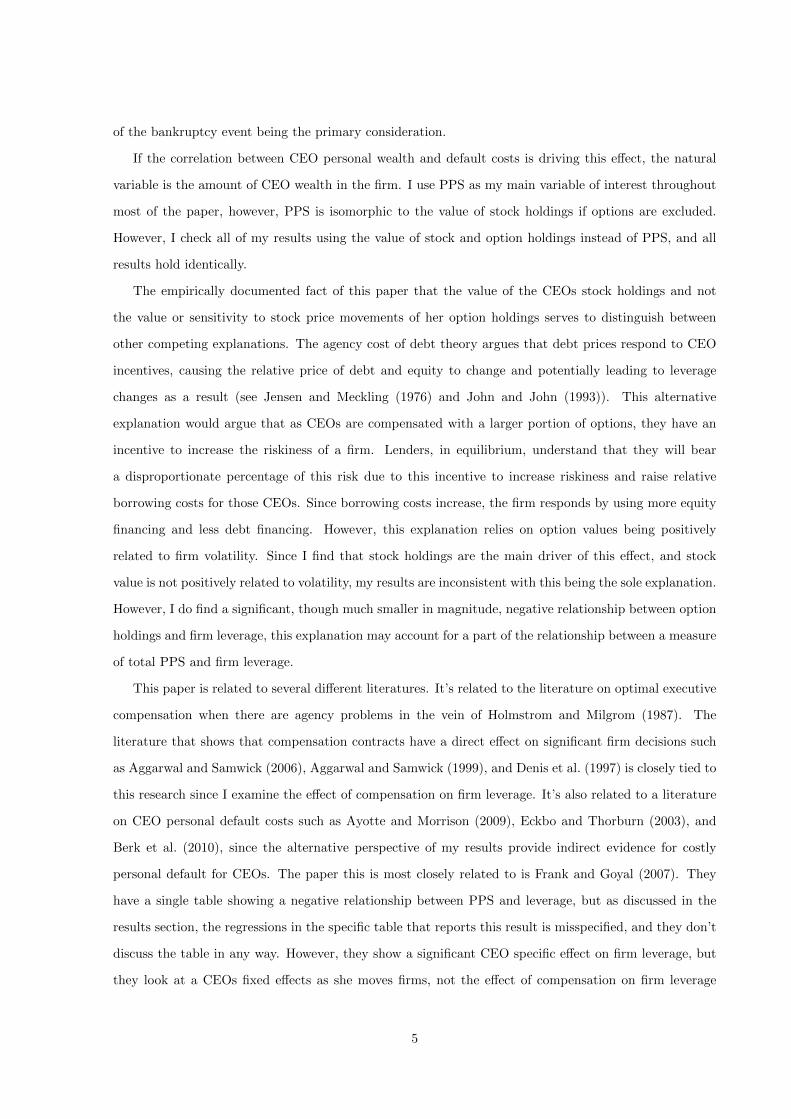
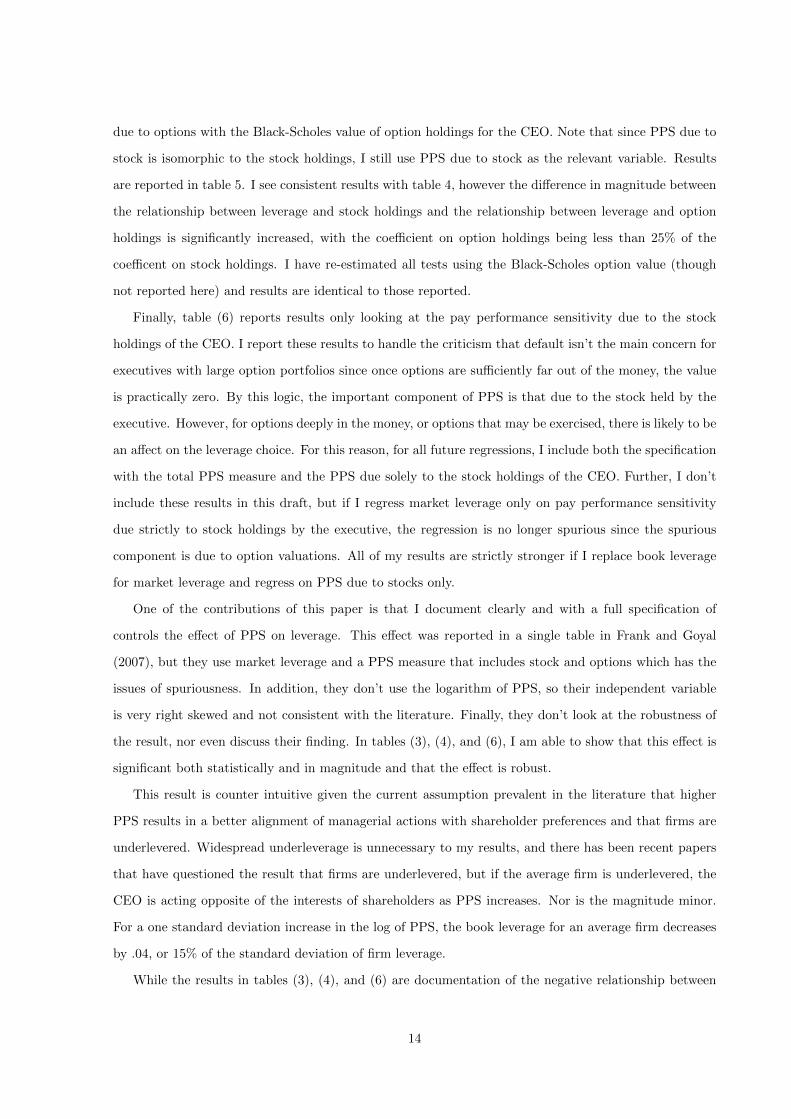
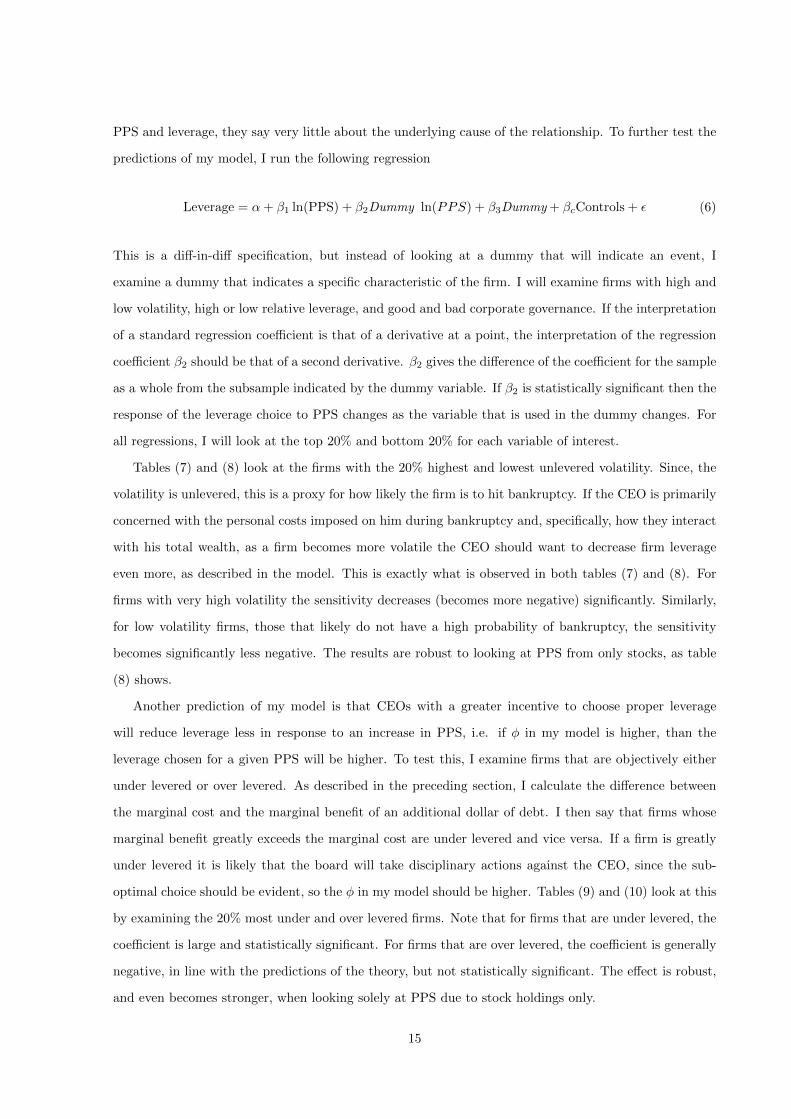
leverage is observed for market leverage. Figure 2 shows the same effect for market leverage. Figures 3
and 4 show the deviations from average industry leverage as a function of PPS. Further, I am able to
show that more volatile firms and firms that are less likely to punish the CEO for poor leverage decisions
do indeed see a stronger negative relationship. CEOs of firms post-Sarbanes-Oxley are likely to face
higher costs in default through an increased likelihood of criminal charges, and I demonstrate that the
relationship between PPS and leverage increases after Sarbanes-Oxley is enacted. Further, I demonstrate
that CEOs that have high PPS alter leverage adjustment speeds to maximize the amount of time spent
in an underlevered state of the world, providing more causal evidence that CEOs are managing the
debt levels of firms in response to pay performance sensitivity. Finally, I provide further evidence that
CEO PPS is directly affecting firm leverage through using CEO tenure as an instrument for CEO equity
holdings using a two stage least squares framework.
This effect is not only interesting for the implications it has for the assumption of shareholder wealth
maximization being the goal of the firm, it is also economically significant. I estimate that approximately
1% of total firm value is destroyed through this channel, through forgoing the tax shield due to debt.
However, this is not necessarily sub-optimal, ex-ante, for the firm. If the CEO has significant private
information about the optimal firm leverage decision, then it may still be optimal for the CEO to make
the leverage decision. Since PPS has been shown to be increase firm performance over a variety of
metrics, the overall effect of increased PPS on firm value may be positive. However, it’s also possible that
compensation committees are either not aware of or unable to affect this channel through which CEOs
3
are extracting rents, and it may be optimal for the board of a firm to bring in an outside consultant to
help set leverage targets in order to remove the CEO from this decision making process.
One might reasonably ask if the CEO will still have a significant exposure to firm value in the event
of bankruptcy, if the CEO will have rid himself of his equity position through either direct selling or
using options to hedge. However, this is unlikely to be the case. It is very difficult for CEOs to sell stock
when approaching a bankruptcy event due to restrictions on insider selling, and Eckbo et al. (2012) show
that the median CEO equity value decreases by $5 million over the course of a bankruptcy event. CEOs
are also unlikely to be able to fully hedge their exposure to equity value. Option trading is subject to
insider trading laws, and it is illegal for executives to short sell their own stock. However, Garvey (1997)
argues that for sufficiently liquid option markets it is possible for managers to engage in purchasing
put options in order to hedge. I test whether or not the liquidity of a firms option market decreases
the magnitude of the relationship between PPS and firm leverage, and I find that it has a small, but
statistically insignificant effect on the relationship.
The effect is non-trivial to document because of the relationship between pay performance sensitivity
and firm leverage. My measure of pay performance sensitivity is closely related to the value of the CEOs
equity holdings in the firm, and if I exclude options, it is identical to the value of the CEOs stock holdings
in the firm. However, since firms only issue debt sporadically, there is a spurious relationship between
observed market leverage and the standard measures of PPS. Assuming that firms do possess a target
leverage, the relationship between target market leverage and PPS should still hold, but it’s not directly
observable. You must, instead, use book leverage, which I do for this paper. For completeness, I document
that the relationship is only stronger when one considers market leverage, however the regressions and
univariate graphical analysis are partially spurious.
Further, there is question as to the appropriate measure for pay performance sensitivity. My story
fundamentally relies on the idea that a significant portion of CEO wealth tied up in the equity of the
firm is destroyed during a bankruptcy event, so it’s important that PPS represents this wealth. Over the
past two decades, options have become a significant component of a CEOs equity holdings in a firm. My
full measure of PPS includes both the sensitivity of a CEOs stock holdings and option holdings to stock
price movements. However, it’s likely that the value of the option holdings, and therefore the sensitivity
to stock price movements, will be destroyed long before the bankruptcy event as the stock price falls
well below the strike price of options in the CEOs portfolio. One should expect, then that the primary
concern for the CEO is that of his stock holdings. In order to account for this criticism, I separate the
value of option holdings from the stock holdings, and show that all results hold, and in most cases are
strengthened, by considering only the stock holdings of the executive. I consider this evidence in support
4
of the bankruptcy event being the primary consideration.
If the correlation between CEO personal wealth and default costs is driving this effect, the natural
variable is the amount of CEO wealth in the firm. I use PPS as my main variable of interest throughout
most of the paper, however, PPS is isomorphic to the value of stock holdings if options are excluded.
However, I check all of my results using the value of stock and option holdings instead of PPS, and all
results hold identically.
The empirically documented fact of this paper that the value of the CEOs stock holdings and not
the value or sensitivity to stock price movements of her option holdings serves to distinguish between
other competing explanations. The agency cost of debt theory argues that debt prices respond to CEO
incentives, causing the relative price of debt and equity to change and potentially leading to leverage
changes as a result (see Jensen and Meckling (1976) and John and John (1993)). This alternative
explanation would argue that as CEOs are compensated with a larger portion of options, they have an
incentive to increase the riskiness of a firm. Lenders, in equilibrium, understand that they will bear
a disproportionate percentage of this risk due to this incentive to increase riskiness and raise relative
borrowing costs for those CEOs. Since borrowing costs increase, the firm responds by using more equity
financing and less debt financing. However, this explanation relies on option values being positively
related to firm volatility. Since I find that stock holdings are the main driver of this effect, and stock
value is not positively related to volatility, my results are inconsistent with this being the sole explanation.
However, I do find a significant, though much smaller in magnitude, negative relationship between option
holdings and firm leverage, this explanation may account for a part of the relationship between a measure
of total PPS and firm leverage.
This paper is related to several different literatures. It’s related to the literature on optimal executive
compensation when there are agency problems in the vein of Holmstrom and Milgrom (1987). The
literature that shows that compensation contracts have a direct effect on significant firm decisions such
as Aggarwal and Samwick (2006), Aggarwal and Samwick (1999), and Denis et al. (1997) is closely tied to
this research since I examine the effect of compensation on firm leverage. It’s also related to a literature
on CEO personal default costs such as Ayotte and Morrison (2009), Eckbo and Thorburn (2003), and
Berk et al. (2010), since the alternative perspective of my results provide indirect evidence for costly
personal default for CEOs. The paper this is most closely related to is Frank and Goyal (2007). They
have a single table showing a negative relationship between PPS and leverage, but as discussed in the
results section, the regressions in the specific table that reports this result is misspecified, and they don’t
discuss the table in any way. However, they show a significant CEO specific effect on firm leverage, but
they look at a CEOs fixed effects as she moves firms, not the effect of compensation on firm leverage
5
choice.
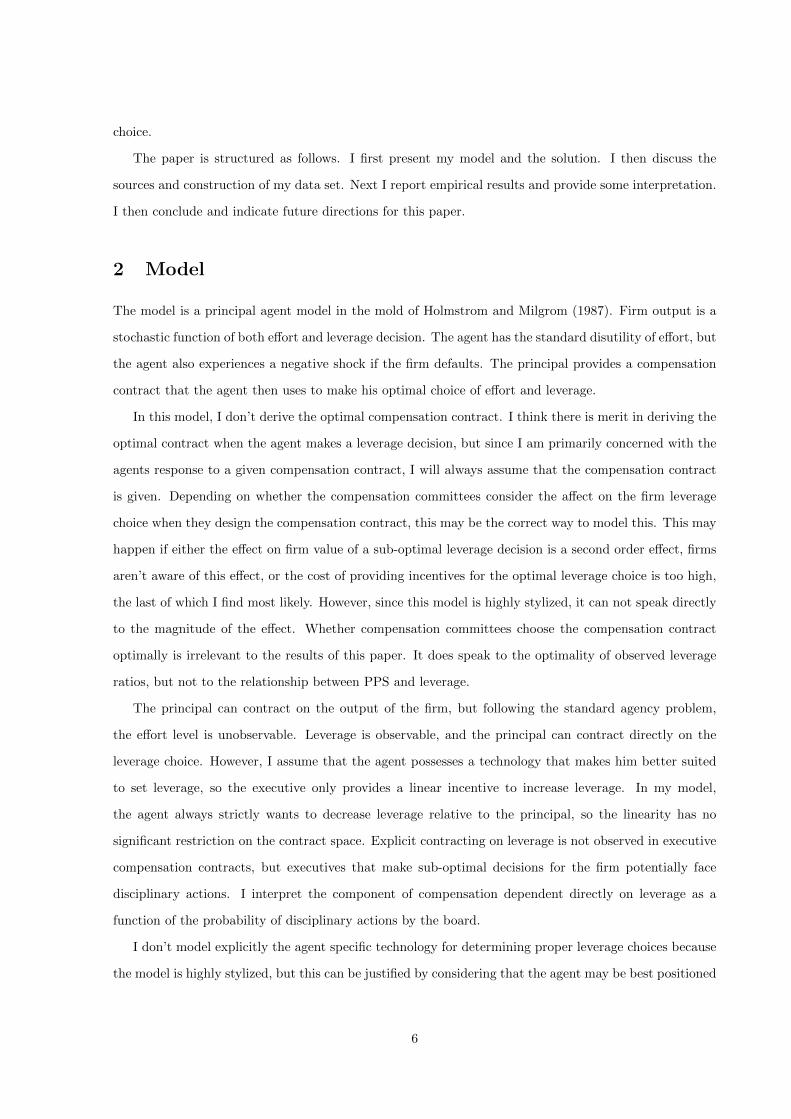
The paper is structured as follows. I first present my model and the solution. I then discuss the
sources and construction of my data set. Next I report empirical results and provide some interpretation.
I then conclude and indicate future directions for this paper.
2 Model
The model is a principal agent model in the mold of Holmstrom and Milgrom (1987). Firm output is a
stochastic function of both effort and leverage decision. The agent has the standard disutility of effort, but
the agent also experiences a negative shock if the firm defaults. The principal provides a compensation
contract that the agent then uses to make his optimal choice of effort and leverage.
In this model, I don’t derive the optimal compensation contract. I think there is merit in deriving the
optimal contract when the agent makes a leverage decision, but since I am primarily concerned with the
agents response to a given compensation contract, I will always assume that the compensation contract
is given. Depending on whether the compensation committees consider the affect on the firm leverage
choice when they design the compensation contract, this may be the correct way to model this. This may
happen if either the effect on firm value of a sub-optimal leverage decision is a second order effect, firms
aren’t aware of this effect, or the cost of providing incentives for the optimal leverage choice is too high,
the last of which I find most likely. However, since this model is highly stylized, it can not speak directly
to the magnitude of the effect. Whether compensation committees choose the compensation contract
optimally is irrelevant to the results of this paper. It does speak to the optimality of observed leverage
ratios, but not to the relationship between PPS and leverage.
The principal can contract on the output of the firm, but following the standard agency problem,
the effort level is unobservable. Leverage is observable, and the principal can contract directly on the
leverage choice. However, I assume that the agent possesses a technology that makes him better suited
to set leverage, so the executive only provides a linear incentive to increase leverage. In my model,
the agent always strictly wants to decrease leverage relative to the principal, so the linearity has no
significant restriction on the contract space. Explicit contracting on leverage is not observed in executive
compensation contracts, but executives that make sub-optimal decisions for the firm potentially face
disciplinary actions. I interpret the component of compensation dependent directly on leverage as a
function of the probability of disciplinary actions by the board.
I don’t model explicitly the agent specific technology for determining proper leverage choices because
the model is highly stylized, but this can be justified by considering that the agent may be best positioned
6
to predict the marginal tax rate that the firm is likely to experience, or he may understand better the
firm specific cost of default. If there is an asymmetry in information related to the marginal tax rate
or default costs, the optimal action for the principal to take would be to offset the agents tendency to
underlever due to agent specific costs of default and allow the agent to directly set the leverage ratio.
Again, this isn’t explicit in my model since it distracts from the primary goal of providing intuition on
the interaction between PPS and default costs.
I will make the assumption that the compensation contract is linear in firm performance. While
this is not without loss of generality, observed compensation contracts are approximately linear, and this
assumption is consistent with other papers in this literature (Holmstrom and Milgrom (1987), Holmstrom
and Milgrom (1991), and Jin (2002)).
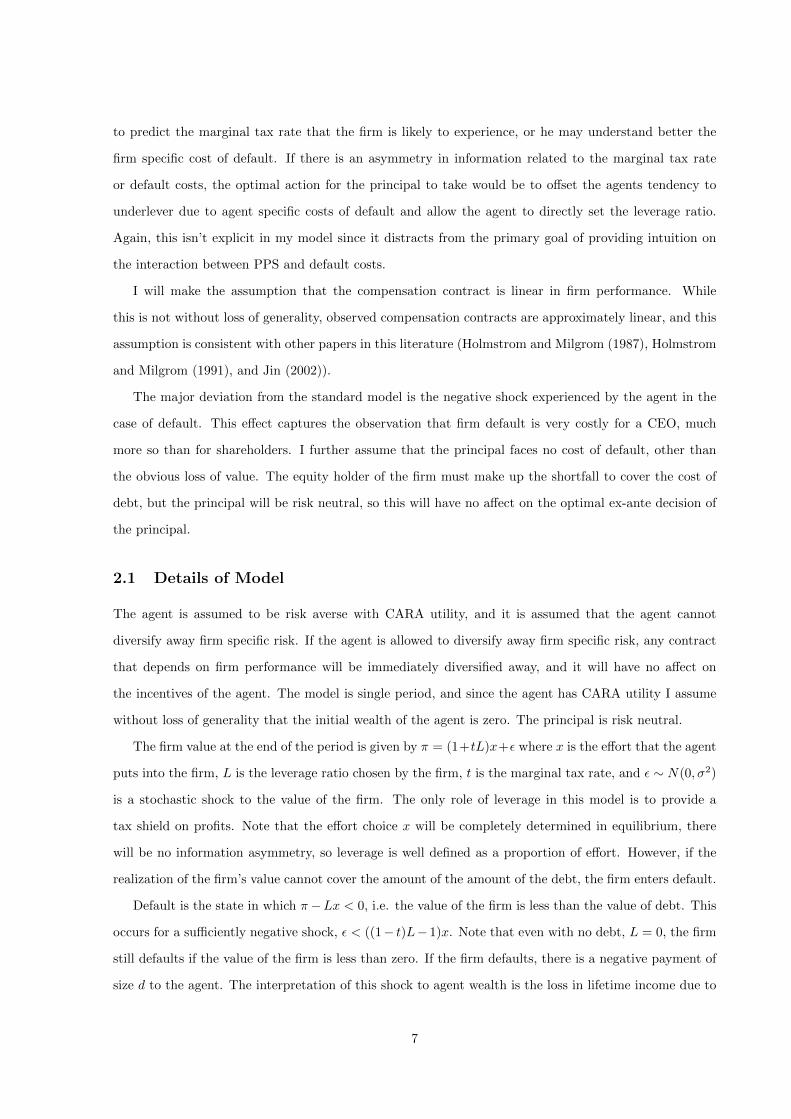
The major deviation from the standard model is the negative shock experienced by the agent in the
case of default. This effect captures the observation that firm default is very costly for a CEO, much
more so than for shareholders. I further assume that the principal faces no cost of default, other than
the obvious loss of value. The equity holder of the firm must make up the shortfall to cover the cost of
debt, but the principal will be risk neutral, so this will have no affect on the optimal ex-ante decision of
the principal.
2.1 Details of Model
The agent is assumed to be risk averse with CARA utility, and it is assumed that the agent cannot
diversify away firm specific risk. If the agent is allowed to diversify away firm specific risk, any contract
that depends on firm performance will be immediately diversified away, and it will have no affect on
the incentives of the agent. The model is single period, and since the agent has CARA utility I assume
without loss of generality that the initial wealth of the agent is zero. The principal is risk neutral.
The firm value at the end of the period is given by π = (1+tL)x+ε where x is the effort that the agent
puts into the firm, L is the leverage ratio chosen by the firm, t is the marginal tax rate, and ε ∼ N(0, σ2)
is a stochastic shock to the value of the firm. The only role of leverage in this model is to provide a
tax shield on profits. Note that the effort choice x will be completely determined in equilibrium, there
will be no information asymmetry, so leverage is well defined as a proportion of effort. However, if the
realization of the firm’s value cannot cover the amount of the amount of the debt, the firm enters default.
Default is the state in which π−Lx < 0, i.e. the value of the firm is less than the value of debt. This
occurs for a sufficiently negative shock, ε < ((1− t)L− 1)x. Note that even with no debt, L = 0, the firm
still defaults if the value of the firm is less than zero. If the firm defaults, there is a negative payment of
size d to the agent. The interpretation of this shock to agent wealth is the loss in lifetime income due to
7

lowered future employment prospects. The assumption of default breaks the linearity of the model, and
this adds considerable complexity to the solution.
The agents compensation contract is linear in the outcome of firm value and is given by w = w0 +
απ + φL. The agent receives a fixed component w0, a percentage of profits α, and a payment to provide
incentive for a higher leverage ratio at the rate φ. Though this contract is written as a positive payment
for a larger choice of the leverage ratio, it is isomorphic to a negative payment for a low leverage ratio.
As noted previously, we don’t observe explicit clauses in compensation contracts for leverage, however,
an executive that chooses a sub-optimal leverage ratio faces disciplinary actions with a probability that
is proportional to the extent of the deviation. In my model, the tendency to deviate will always be in
the negative direction, so the principal will only ever want to provide incentives for the agent to increase
the leverage ratio. The model can be extended to punish both very high and very low leverage, but
for simplicity I now assume that the principal only provides positive linear incentives for the managers
leverage ratio.
The agent has CARA utility with a risk aversion of γ. The agent has a disutility of effort equal to
kx2
2 . Further, if the firm defaults, the agent receives a negative shock to wealth of d. The total utility
function of the agent becomes
UA = eγ(w0+απ+φL− kx2
2 −dIdefault) (1)
where Idefault is a dummy variable which is one if the firm enters default. The agent has an outside option
with value U0. Then the agents problem can be rewritten as the following optimization:
maxx,L
γ(w0 + α(1 + tL)x+ φL− kx2
2− 1
2γα2σ2)− ln
(edγΦ (ε′D) + (1− Φ (ε′D))
)(2)
s.t.
γ(w0 + α(1 + tL)x+ φL− kx2
2− 1
2γα2σ2)− ln
(edγΦ (ε′D) + (1− Φ (ε′D))
)≥ u0 (3)
where
ε′D =((1− t)L− 1)x+ γασ2
σ(4)
The first term in equation (2) is exactly equivalent to a standard principal agent problem. However, the
second term is unique to my model. Φ is the cumulative distribution function for the standard normal,
and ε′D looks almost like the standardized value of ε in default, however, it’s not quite. Instead, it is the
risk adjusted probability of default for the risk averse agent. Note that if d = 0, the second term becomes
zero and this reduces exactly to a standard contracting problem. However, as it is, the problem is quite
nonlinear, and difficult to arrive at closed solutions.
8

The leverage ratio L enters in the objective function in a few different places. First, there is a positive
effect on profits through the tax benefit of debt that directly effects agents utility through the profit
sharing portion of the agents compensation contract. Second, there is a direct positive effect through
the incentive in the compensation contract for higher leverage. Third and finally, the leverage choice
directly effects the probability of default, Φ(ε′D). This last effect causes the agent to reduce his leverage
choice. His incentives are aligned with the principal to the extent that there is profit sharing, but the
additional cost of default that the agent bears that the principal doesn’t causes a wedge between the
optimal leverage choice from the perspective of the principal and the observed leverage choice by the
agent.
2.2 Solution
The introduction of non-linear default costs specific to the agent creates additional complexity to the
solution of the model because it breaks the fundamental linearity of the contract. However, it is possible
to determine some theoretical results that will provide intuition for the empirical results. As stated
previously, I am interested in how the agent responds to his compensation contract when the principal
isn’t explicitly contracting on at least one choice variable. Further, I must assume that the agent is
limited in his ability to remove the possibility of bankruptcy through effort alone. I do this through
allowing his cost of effort, k, to be large. If the cost of effort is sufficiently large, he is unwilling to exert
the effort necessary to avoid bankruptcy in all states of the world. Further, I am interested in the state
of the world in which default is very costly, so I will only prove that my results hold for situations in
which default is a very costly event. However, there is no strict lower bound on the necessary size of the
default cost, so I will restrict my attention to arbitrarily large values.
Assumption 1. Parameter values are subject to the following restrictions:
1. The personal cost of default for the agent, δ, is large.
2. The cost of effort of the agent, k, is large. Specifically, k ≥ 1(1−t)γσ2 .
3. Leverage, L, is in the set [0,∞], and parameters are such that the agent finds it optimal to choose
L > 0.
4. The agent is risk averse, i.e. γ > 0.
5. The tax rate, t, is in the set [0, 1].
Given Assumption 1, we can show the following theorems.
9
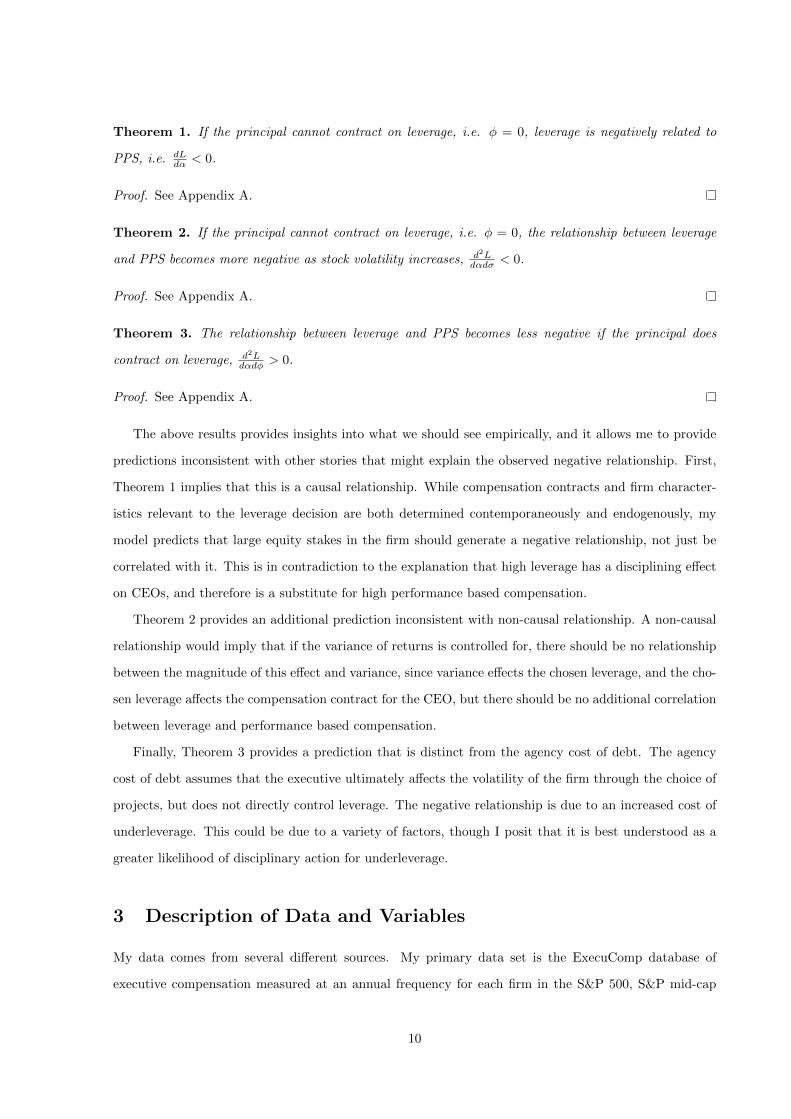
Theorem 1. If the principal cannot contract on leverage, i.e. φ = 0, leverage is negatively related to
PPS, i.e. dLdα < 0.
Proof. See Appendix A.
Theorem 2. If the principal cannot contract on leverage, i.e. φ = 0, the relationship between leverage
and PPS becomes more negative as stock volatility increases, d2Ldαdσ < 0.
Proof. See Appendix A.
Theorem 3. The relationship between leverage and PPS becomes less negative if the principal does
contract on leverage, d2Ldαdφ > 0.
Proof. See Appendix A.
The above results provides insights into what we should see empirically, and it allows me to provide
predictions inconsistent with other stories that might explain the observed negative relationship. First,
Theorem 1 implies that this is a causal relationship. While compensation contracts and firm character-
istics relevant to the leverage decision are both determined contemporaneously and endogenously, my
model predicts that large equity stakes in the firm should generate a negative relationship, not just be
correlated with it. This is in contradiction to the explanation that high leverage has a disciplining effect
on CEOs, and therefore is a substitute for high performance based compensation.
Theorem 2 provides an additional prediction inconsistent with non-causal relationship. A non-causal
relationship would imply that if the variance of returns is controlled for, there should be no relationship
between the magnitude of this effect and variance, since variance effects the chosen leverage, and the cho-
sen leverage affects the compensation contract for the CEO, but there should be no additional correlation
between leverage and performance based compensation.
Finally, Theorem 3 provides a prediction that is distinct from the agency cost of debt. The agency
cost of debt assumes that the executive ultimately affects the volatility of the firm through the choice of
projects, but does not directly control leverage. The negative relationship is due to an increased cost of
underleverage. This could be due to a variety of factors, though I posit that it is best understood as a
greater likelihood of disciplinary action for underleverage.
3 Description of Data and Variables
My data comes from several different sources. My primary data set is the ExecuComp database of
executive compensation measured at an annual frequency for each firm in the S&P 500, S&P mid-cap
10
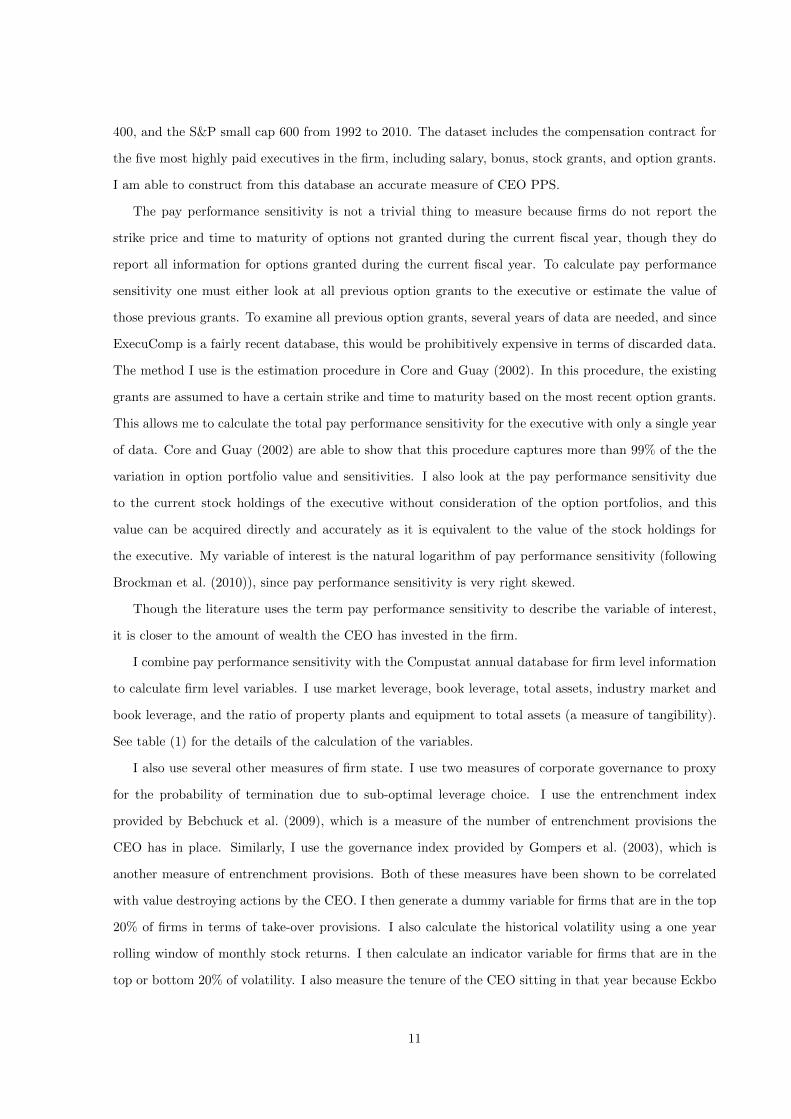
400, and the S&P small cap 600 from 1992 to 2010. The dataset includes the compensation contract for
the five most highly paid executives in the firm, including salary, bonus, stock grants, and option grants.
I am able to construct from this database an accurate measure of CEO PPS.
The pay performance sensitivity is not a trivial thing to measure because firms do not report the
strike price and time to maturity of options not granted during the current fiscal year, though they do
report all information for options granted during the current fiscal year. To calculate pay performance
sensitivity one must either look at all previous option grants to the executive or estimate the value of
those previous grants. To examine all previous option grants, several years of data are needed, and since
ExecuComp is a fairly recent database, this would be prohibitively expensive in terms of discarded data.
The method I use is the estimation procedure in Core and Guay (2002). In this procedure, the existing
grants are assumed to have a certain strike and time to maturity based on the most recent option grants.
This allows me to calculate the total pay performance sensitivity for the executive with only a single year
of data. Core and Guay (2002) are able to show that this procedure captures more than 99% of the the
variation in option portfolio value and sensitivities. I also look at the pay performance sensitivity due
to the current stock holdings of the executive without consideration of the option portfolios, and this
value can be acquired directly and accurately as it is equivalent to the value of the stock holdings for
the executive. My variable of interest is the natural logarithm of pay performance sensitivity (following
Brockman et al. (2010)), since pay performance sensitivity is very right skewed.
Though the literature uses the term pay performance sensitivity to describe the variable of interest,
it is closer to the amount of wealth the CEO has invested in the firm.
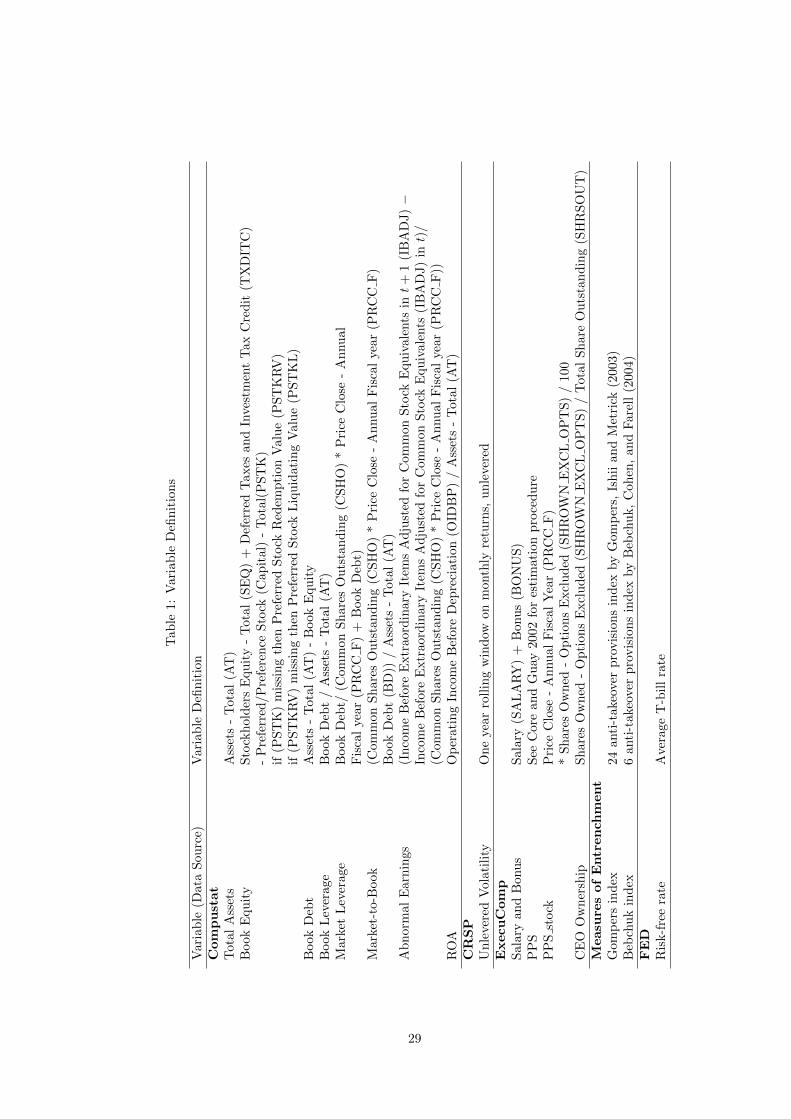
I combine pay performance sensitivity with the Compustat annual database for firm level information
to calculate firm level variables. I use market leverage, book leverage, total assets, industry market and
book leverage, and the ratio of property plants and equipment to total assets (a measure of tangibility).
See table (1) for the details of the calculation of the variables.
I also use several other measures of firm state. I use two measures of corporate governance to proxy
for the probability of termination due to sub-optimal leverage choice. I use the entrenchment index
provided by Bebchuck et al. (2009), which is a measure of the number of entrenchment provisions the
CEO has in place. Similarly, I use the governance index provided by Gompers et al. (2003), which is
another measure of entrenchment provisions. Both of these measures have been shown to be correlated
with value destroying actions by the CEO. I then generate a dummy variable for firms that are in the top
20% of firms in terms of take-over provisions. I also calculate the historical volatility using a one year
rolling window of monthly stock returns. I then calculate an indicator variable for firms that are in the
top or bottom 20% of volatility. I also measure the tenure of the CEO sitting in that year because Eckbo
11
et al. (2012) show that CEO tenure is a predictor of the magnitude of the negative outcome in the case
of default, with the intuition being that a CEO with longer tenure is more likely to be blamed for the
bankruptcy event.
The final variable that I calculate is a measure of under or over-leverage. It is difficult to measure
explicitly a firms deviation from optimal leverage, however, Binsbergen et al. (2010) provides a method to
calculate the marginal cost of an additional unit of debt relatively simply. Then I compare the marginal
benefit due to the tax shield of debt using firms effective marginal tax rate calculated as in Graham and
Mills (2008). I then take the deviation of the marginal cost of debt from the marginal benefit of debt
and I assume that firms for which the marginal benefit of debt far exceeds the marginal cost of debt are
underlevered, and vice versa if the marginal cost of debt far exceeds the marginal benefit. I then use this
to determine the 20% most overlevered and 20% most underlevered firms. While this is a relatively crude
method through which to calculate over or underleverage, it should be sufficient for the relatively coarse
use of calculating the dummy variable.
I require that all observations must have data for market leverage, book leverage, and pay performance
sensitivity. This leaves 12,611 firm year observations. However, as a control I use a measure of tangibility,
property plants and equipment scaled by total assets, which has only 12,544 overlapping observations,
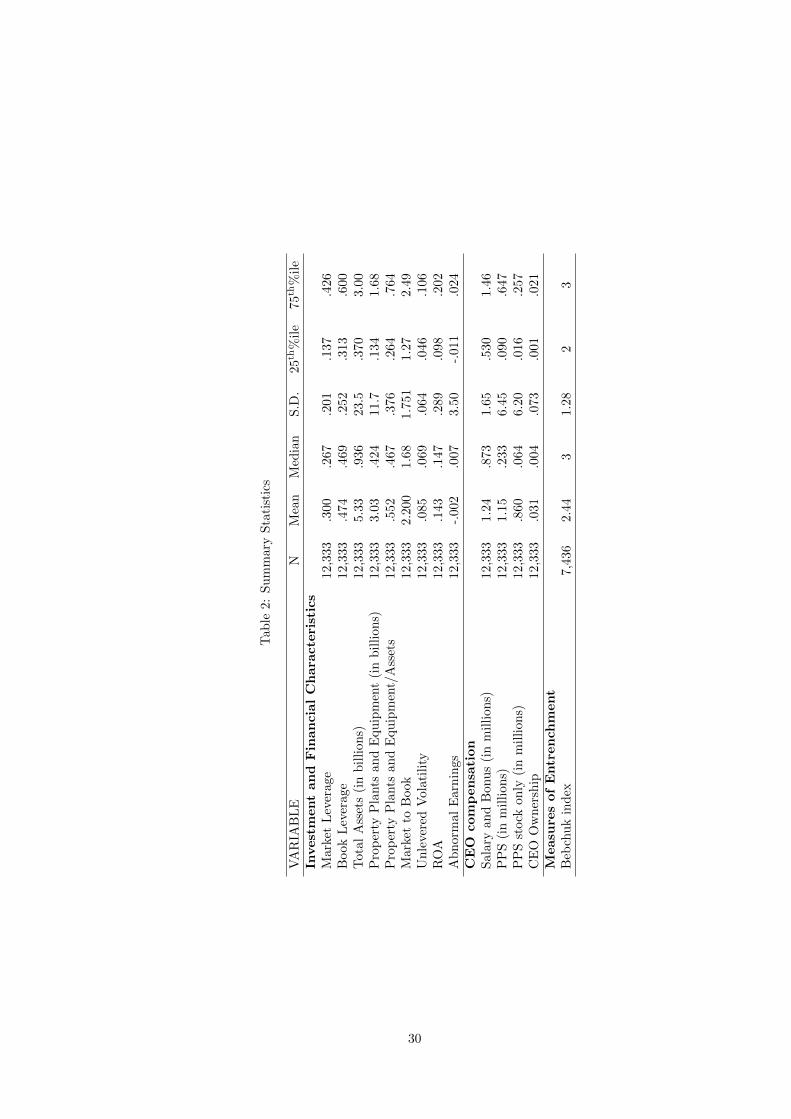
so for regressions with controls included there are 12,544 observations. My sample is positively skewed
on size, leverage, and compensation metrics. I drop all regulated industries (two digit SIC code 49) and
financial services industries (two digit SIC codes 60-69), following the literature. For the descriptive
statistics of my sample see table (2).
Since components of compensation are positively skewed, I take the natural logarithm of pay perfor-
mance sensitivity consistent with Brockman et al. (2010). I then standardize all variables.
4 Empirical Methodology and Results
This section tests the predictions of the model. My regressions are somewhat opposite of the standard
literature (Aggarwal and Samwick (1999), Jin (2002)) that uses pay performance sensitivity as the de-
pendent variable. However, I am attempting to explain the observed leverage ratios as a function of CEO
compensation, while both Aggarwal and Samwick (1999) and Jin (2002) are interested in explaining the
determinants of executive compensation.
12
4.1 Regression Estimation
First, I estimate the following equations
Leverage = α+ β ln(PPS) + βcControls + ε (5)
All regressions include both firm and year fixed effects. I estimate most regressions with and without
controls. The controls that I include are the four reliable factors for predicting cross-sectional leverage
as described by Frank and Goyal (2008), median industry leverage, log of assets, market-to-book, and a
measure of tangibility as well as addition controls for return on assets, abnormal earnings, and percent
of equity held by the CEO. All regressions are robust and standard errors are clustered at the firm level.
Tables (3), (4), and (6) reports results for the regression in equation (5). In table (3), I report results
for the regression for the pay performance sensitivity including both stock and options in the calculation.
The important thing to note in this table is the large and statistically significant regression coefficient
for PPS. The regression coefficient is larger and more significant than all of the controls. Note that all
variables are standardized, so the interpretation is one standard deviation in the log of PPS results in a
.160 standard deviation decrease in the book leverage.
One thing that is important to notice in table (3) is the large difference between the effect on market
leverage and book leverage. This is due to two factors, 1) book leverage in general is less predictable
than market leverage (Frank and Goyal (2008)) and 2) the regression on market leverage has a spurious
element in it. The calculation of PPS includes both stock and options, but the PPS of options, the delta,
is a function of stock price. As stock price increases, market leverage decreases and options become more
in the money, increasing the delta of the options. This causes a mechanical negative correlation between
PPS and market leverage. For this reason, outside of tables (3), (4), and (6), I will do all further analysis
using only book leverage, however all results both hold and are strengthened with market leverage as the
dependent variable.
While table (3) only uses log of PPS, table (4) breaks the PPS into the component due to stock holding
by the CEO and that due to the option holdings by the CEO. Note that for both market leverage and
book leverage, the coefficients for each component of PPS are both significant and negative. However,
the magnitude of the coefficient for the PPS due to stock is approximately twice that of the PPS due to
options. Further, the coefficient for PPS due to stock has a much larger t-statistic, especially when both
are estimated simultaneously. PPS due to stock seems to be the main contributor to this effect.
One criticism could be that PPS due to options isn’t capturing the wealth at risk of the CEO well,
since PPS measures sensitivity of value to stock price movements. In order to test for this, I replace PPS
13
due to options with the Black-Scholes value of option holdings for the CEO. Note that since PPS due to
stock is isomorphic to the stock holdings, I still use PPS due to stock as the relevant variable. Results
are reported in table 5. I see consistent results with table 4, however the difference in magnitude between
the relationship between leverage and stock holdings and the relationship between leverage and option
holdings is significantly increased, with the coefficient on option holdings being less than 25% of the
coefficent on stock holdings. I have re-estimated all tests using the Black-Scholes option value (though
not reported here) and results are identical to those reported.
Finally, table (6) reports results only looking at the pay performance sensitivity due to the stock
holdings of the CEO. I report these results to handle the criticism that default isn’t the main concern for
executives with large option portfolios since once options are sufficiently far out of the money, the value
is practically zero. By this logic, the important component of PPS is that due to the stock held by the
executive. However, for options deeply in the money, or options that may be exercised, there is likely to be
an affect on the leverage choice. For this reason, for all future regressions, I include both the specification
with the total PPS measure and the PPS due solely to the stock holdings of the CEO. Further, I don’t
include these results in this draft, but if I regress market leverage only on pay performance sensitivity
due strictly to stock holdings by the executive, the regression is no longer spurious since the spurious
component is due to option valuations. All of my results are strictly stronger if I replace book leverage
for market leverage and regress on PPS due to stocks only.
One of the contributions of this paper is that I document clearly and with a full specification of
controls the effect of PPS on leverage. This effect was reported in a single table in Frank and Goyal
(2007), but they use market leverage and a PPS measure that includes stock and options which has the
issues of spuriousness. In addition, they don’t use the logarithm of PPS, so their independent variable
is very right skewed and not consistent with the literature. Finally, they don’t look at the robustness of
the result, nor even discuss their finding. In tables (3), (4), and (6), I am able to show that this effect is
significant both statistically and in magnitude and that the effect is robust.
This result is counter intuitive given the current assumption prevalent in the literature that higher
PPS results in a better alignment of managerial actions with shareholder preferences and that firms are
underlevered. Widespread underleverage is unnecessary to my results, and there has been recent papers
that have questioned the result that firms are underlevered, but if the average firm is underlevered, the
CEO is acting opposite of the interests of shareholders as PPS increases. Nor is the magnitude minor.
For a one standard deviation increase in the log of PPS, the book leverage for an average firm decreases
by .04, or 15% of the standard deviation of firm leverage.
While the results in tables (3), (4), and (6) are documentation of the negative relationship between
14
PPS and leverage, they say very little about the underlying cause of the relationship. To further test the
predictions of my model, I run the following regression
Leverage = α+ β1 ln(PPS) + β2Dummy ln(PPS) + β3Dummy + βcControls + ε (6)
This is a diff-in-diff specification, but instead of looking at a dummy that will indicate an event, I
examine a dummy that indicates a specific characteristic of the firm. I will examine firms with high and
low volatility, high or low relative leverage, and good and bad corporate governance. If the interpretation
of a standard regression coefficient is that of a derivative at a point, the interpretation of the regression
coefficient β2 should be that of a second derivative. β2 gives the difference of the coefficient for the sample
as a whole from the subsample indicated by the dummy variable. If β2 is statistically significant then the
response of the leverage choice to PPS changes as the variable that is used in the dummy changes. For
all regressions, I will look at the top 20% and bottom 20% for each variable of interest.
Tables (7) and (8) look at the firms with the 20% highest and lowest unlevered volatility. Since, the
volatility is unlevered, this is a proxy for how likely the firm is to hit bankruptcy. If the CEO is primarily
concerned with the personal costs imposed on him during bankruptcy and, specifically, how they interact
with his total wealth, as a firm becomes more volatile the CEO should want to decrease firm leverage
even more, as described in the model. This is exactly what is observed in both tables (7) and (8). For
firms with very high volatility the sensitivity decreases (becomes more negative) significantly. Similarly,
for low volatility firms, those that likely do not have a high probability of bankruptcy, the sensitivity
becomes significantly less negative. The results are robust to looking at PPS from only stocks, as table
(8) shows.
Another prediction of my model is that CEOs with a greater incentive to choose proper leverage
will reduce leverage less in response to an increase in PPS, i.e. if φ in my model is higher, than the
leverage chosen for a given PPS will be higher. To test this, I examine firms that are objectively either
under levered or over levered. As described in the preceding section, I calculate the difference between
the marginal cost and the marginal benefit of an additional dollar of debt. I then say that firms whose
marginal benefit greatly exceeds the marginal cost are under levered and vice versa. If a firm is greatly
under levered it is likely that the board will take disciplinary actions against the CEO, since the sub-
optimal choice should be evident, so the φ in my model should be higher. Tables (9) and (10) look at this
by examining the 20% most under and over levered firms. Note that for firms that are under levered, the
coefficient is large and statistically significant. For firms that are over levered, the coefficient is generally
negative, in line with the predictions of the theory, but not statistically significant. The effect is robust,
and even becomes stronger, when looking solely at PPS due to stock holdings only.
15
The next table, (11), looks at how the sensitivity of leverage to CEO PPS changes as corporate
governance changes. The Bechuk, Cohen, and Farell index measures how many out of a set of 6 anti-
takeover provisions the firm has in place. As the number of entrenchment indices increase, the CEO
has less likelihood of being forced out short of bankruptcy, which typically ends in termination without
the takeover provisions being activated. The Bebchuk dummy indicates the firms in the top 20% of
anti-takeover provisions. As the number of anti-takeover provisions increase, the likelihood of the CEO
facing termination for a sub-optimal leverage choice decreases, i.e. φ in the model decreases. Therefore,
the sensitivity of leverage to PPS should become more negative. Tables (11) show that this is generally
the case, however the coefficients are not significant. Note that the sample size is much smaller for Tables
(11) due to the need to have information on the entrenchment indices, and both indices are fairly crude
measures of managerial entrenchment, so it’s not surprising that there is no statistical significance.
Table (12) attempts to control for the magnitude of the negative outcome in default by looking at CEO
tenure. Eckbo, Thorburn, and Wang (2012) show that more senior CEOs are more likely to experience
a large negative shock to lifetime earning. The explanation that they give is that more senior CEOs are
more likely to be blamed for the decisions that led the firm to bankruptcy, and therefore be blamed by
shareholders and removed during the bankruptcy event or be tainted when entering the job market again.
I create a dummy for the top 20% most senior CEOs in my sample by year and interact that with PPS.
The interaction causes the effect to become consistently more negative for every specification, however
the interaction term is not significant at the 10% level.
Table (13) examines whether CEOs that are likely to be able to hedge are significantly different than
CEOs who can’t hedge. Following Gao (2010), I consider a CEO that can hedge as one whose firm has
high option volatility. My threshold is the top 20% of firms with option volatility, though the results are
unchanged for other choices. I only report results for PPS from stock only since the option positions for
the CEO are reported, there should be no effect on the PPS measure. Table (13) shows that CEOs that
can hedge do have a smaller relationship between PPS and leverage, however it’s statistically insignificant
and a small fraction of the observed relationship. From this I conclude that CEOs do hedge, but not the
entirety of their equity exposure. This is consistent with previous literature.
If default risk is driving this relationship, the ideal test would be to look at situations of heterogeneity
in default risk. Unfortunately, there are no accepted proxies for default risk. However, Brickley (2003)
and Brickley (2006) show that top executives are significantly more likely to face criminal penalties post
the enactment of the Sarbanes-Oxley Act of 2002 (hereafter referred to as SOX) due to bankruptcy. If
an executive faces an increased risk of criminal litigation, the personal cost of default should increase. To
test for this, I interact my PPS measure with a dummy for post-SOX. I see a significant increase in the
16
magnitude of the effect post-SOX, consistent with default cost driving the relationship.
Since the effect is fundamentally driven by the probability of bankruptcy, we should expect to see
a differential in the effect for firms of various sizes. This is due to the empirical fact that large firms
rarely fail, while small firms are much more likely to fail. In order to test for this, I separate firms into
quartiles each year based on total firm value. I then run the OLS regression specified by 5 for each of
the quartiles separately. As can be seen in table 15, firms in the smallest quartile exhibit this effect to
a much higher degree. It is important to remember that all variables are standardized so coefficients
indicate the expected standard deviation in leverage for a one standard deviation change in the variable.
The t-statistic for the difference between the coefficient for firms in the lowest and largest quartiles is
-2.11, indicating that this is stronger for small firms at the 5% level.
4.2 Leverage Adjustment Speed
All of the previously discussed results serve to confirm the predictions of my model, however they do not
directly speak to the criticism that potentially firms are choosing a low leverage ratio and an executive
compensation contract with high PPS due to some underlying omitted variable. Fundamentally, the
analysis is missing a causal link. To attempt to establish direct manipulation of leverage ratios by CEOs,
I look at the leverage adjustment speed. Since CEOs with high pay performance sensitivity value an
underlevered firm, every moment that a firm is underlevered has positive value for the CEO. Therefore,
I predict that CEOs with high PPS will manage leverage adjustment actions in order to maximize time
in an underlevered state of the world.
I follow Flannery and Rangan 2006 for estimating leverage adjustment speeds. The standard equation
for estimating leverage adjustment speeds is
(Li,t+1 − Li,t) = λ(L∗i,t+1 − Li,t) + εi,t (7)
where L∗i,t+1 = βXi,t, Li,t is the leverage observed for firm i at time t, L∗i,t is the optimal leverage target
for firm i at time t, and Xi,t is a standard set of controls used for predicting optimal firm leverage (the
Frank and Goyal 2008 factors). I estimate a slightly different equation given by
(Li,t+1 − Li,t) = λ+ max(L∗i,t+1 − Li,t, 0) + λ−min(L∗i,t+1 − Li,t, 0) + εi,t (8)
which is identical except I treat the case where target leverage is above current leverage separately from
the case in which target leverage is below current leverage. λ+ is the leverage adjustment speed for when
a firm is underlevered relative to it’s target leverage, and similarly, λ− is the leverage adjustment speed
17
when a firm is overlevered relative to it’s target leverage.
If a high PPS CEO has an incentive to keep a firm underlevered due to the interaction of bankruptcy
risk with PPS, we would expect to see a lower adjustment speed when a firm is underlevered, in order
to maximize the time spent in a underlevered state, and when the firm is overlevered, we would expect
to see a faster adjustment speed in order to minimize the time spent overlevered. This is exactly the
pattern that we see in Table (16).
4.3 Instrumental Variable Approach
As discussed previously, it is highly probable that leverage and CEO compensation are jointly determined.
If so, the coefficient estimates are likely to be biased. To attack this directly, I use an instrumental
variables approach through two stage least squares. My two-equation system is given as follows:
ln(PPS) = α+ β0CEO Tenure + βc0Controls + ξ (9)
Leverage = α+ β1 ln(PPS) + βc1Controls + ε (10)
where controls are identical as to the basic regression specification, save for the additional controls
indicated below.
Identifying an instrument for pay performance sensitivity is not trivial. To my knowledge there are
not established instrumental variables for pay performance sensitivity in the existing literature. I use
CEO tenure as an instrument for CEO PPS. CEOs tend to accumulate larger equity positions the longer
they are with the company as firms have restrictions on executives selling equity. Table 17 shows the
first stage regression from equation 9, in which I regress CEO tenure on ln(PPS), ln(PPS stock), and
ln(PPS option), and I find the for both ln(PPS) and ln(PPS stock), CEO tenure is significantly and
positively related to PPS. Both statistically and in magnitude, the effect is larger for ln(PPS stock),
which should be expected, because options have fixed length expirations and should not accumulate with
CEO tenure. In accordance with expectation, I observe no relationship between CEO tenure and equity
compensation.
CEO tenure is positively related to both firm age and CEO age which may affect firm leverage. Firm
age may affect firm access to debt markets, and it has been shown that age is positively related with risk
aversion which may affect the CEO decision as to firm leverage. I control for both of these factors in
the reported regressions. While I have found nothing in the literature providing a direct link for CEO
tenure to firm leverage, Frank and Goyal 2007 do report that CEO tenure is negatively related to firm
leverage. However, they do not control for firm age, CEO age and PPS, and if CEO tenure is included in
18
the regression from equation 5, CEO tenure is not significantly related. It is my conclusion that Frank
and Goyal 2007 were misidentifying the effect. However, their paper does not provide an explanation for
the relationship, they merely document it.
In table 18, I report the results from the two stage least squared regression. Instrumenting for both
ln(PPS) and ln(PPS stock), I find identical results to those reported in the basic regression in tables 3
and 6, with a slightly larger coefficient in both instances.
One potential consideration is survivorship bias. It’s possible that a CEO is more likely to maintain
his position by reducing leverage, so in unreported results, I restrict my sample to CEOs that have been
with the firm for less than five years, in the attempt to mitigate any effect of long tenure CEOs on the
level of leverage. Results are qualitatively identical, though slightly less statistically significant, as those
reported.
4.4 Further Discussion
I’ve looked at a number of other potentially relevant variables to rule out other explanations or strengthen
my interpretation that I don’t report in this draft, but I would like to discuss them briefly. I use volatility
as a measure of likelihood of default, but this is a very indirect measure of default probability. A natural
measure to use is the Altman z-score, which measures the financial health of a firm directly. I have used
the Altman z-score in place of volatility and the results are consistent, though not significant. However,
the Altman z-score indicates firms that are already in financial distress. Once a firm enters financial
distress, the CEO is likely to already be in the process of removal, so it’s unclear what the relationship
between PPS and leverage means for a financially distressed firm.
Further, the measure I use for PPS is not scaled by total compensation, following the standard PPS
literature. This is consistent with the notion of CARA utility that I include in my model. However, for an
agent with an alternative specification of utility, the scaled measure may make more sense. The difficulty
with scaling PPS is determining the correct scaling factor since PPS is potentially an accumulation of
many years of stock and option grants. I did scale PPS by total salary and bonus for the given year and
found identical results, but it’s not clear that this is an appropriate scaling factor. I will provide those
regressions upon request.
I use a 20% threshold for all regressions for equation (6), but the results are robust to other thresholds
as well. I chose 20% to maintain a large enough number of observations captured by the dummy variable,
but I’ve looked at 5%, 10%, 30%, and 40% and the results are consistent.
A potential criticism of my explanation is that both firm leverage and executive compensation is
endogenous. To examine this, I have included executive fixed effects to my current regressions. All
19
results are essentially unchanged since executive mobility is relatively low, so firm fixed effects already
control for most of the variation. To further explore this, I restrict my sample to CEOs that have been
employed by at least two of the firms in the sample, and I then estimate equation (5) including CEO fixed
effects. This severely restricts my sample (there are only 40 executives that have worked at two or more
firms in my sample), so the results are no longer significant, but the sign is still consistent, as reported
in Table (19). I am currently working to enlarge this sample using a technique described in Graham, Li,
and Qiu 2011, but I am not able to report those results at this time.
One element of compensation that I do not include is severance payments. If termination in bankruptcy
is the primary concern for the executive, a natural way to extend the compensation contract is to ensure
a large positive payment to the executive in the case of termination due to default. There are several
difficulties with studying severance payments that make them impractical for the current iteration of this
paper. First, data is not widely reported for severance payments that are part of an explicit agreement.
Second, a large proportion of severance agreements are implicit in nature, and therefore unobservable.
Thirdly and most directly related to my work, Berk, Stanton, and Zechner (2010) argue that it is un-
likely that firms have the legal ability to commit to a severance payment in bankruptcy. If the severance
payment is not relevant to the state of the world in which default occurs, it should have no effect on my
results. Further, if severance payments are made in default, the omission from my specification should
only serve to weaken my results. However, I am currently attempting to acquire data on severance
payments to test the effect.
5 Conclusion
I am able to establish the robustness of the negative relationship between pay performance sensitivity
and leverage for the first time. This result is in contradiction to the standard result that firms are
underlevered and that greater PPS leads the CEO to strictly improve firm performance. My results
are not in contradiction to papers that claim that firm value increases as PPS increases, since I’m only
examining a single choice out of the sets of choices that the typical executive makes. Further, I don’t rely
on the necessity of widespread firm underleverage for my results to be meaningful, for the result is still
novel and significant. Nor does my interpretation of the results depend on underleverage.
I develop and partially solve a model that predicts the empirically observed negative relationship and
makes further predictions. I show that the relationship becomes more negative for high volatility firms,
and more negative for firms that are unlikely to take disciplinary actions against the current CEO. Both
of these results are entirely new to the best of my knowledge. I further demonstrate the robustness of
20
my results by examining a restricted measure of pay performance sensitivity. I also show that this affect
varies by firm size with small firms, the firms more likely to experience bankruptcy, having a significantly
stronger relationship between PPS and leverage. Since it is likely that personal default costs increase
post-SOX, I test to see if the relationship strengthens, and it does become significantly stronger post-SOX.
This effect seems to be primarily due to the stock holdings of CEOs and not the option holdings. This
in inconsistent with the agency cost of debt being the primary factor affecting this relationship. Further,
in my instrumental variable approach, I use an instrument that is unrelated to option PPS, and I still
observe a significant relationship. To the best of my knowledge, there is not another explanation that
can account for the observed empirical relationship.
I am extending the analysis currently present in this paper by examining heterogeneity in personal
costs of bankruptcy following some of the analysis in Eckbo, Thorburn, and Wang 2012. While initial
results are promising, there is more work to be done to fully examine this heterogeneity. Further, I am
working to exploit events where firms merge or split to enable me to control for corporate governance.
Finally, There is heterogeneity in the extent to which CEOs can legally hedge their own exposure to
equity risk in their own firm (Gao 2010), and I am currently gathering data to exploit this heterogeneity.
Endogeneity of the compensation contract is a significant concern. It’s entirely possible that CEOs
are selecting firms that would optimally choose lower leverage and provide greater pay performance
sensitivity to their executives. I provide evidence that this isn’t a complete story because I demonstrate
that leverage adjustment speeds are affected by PPS in a way consistent with CEOs trying to actively
manage debt downwards. Further, I provide direct evidence through instrumenting for CEO PPS using
CEO tenure. I show that with CEO tenure instrumenting for PPS, results are identical.
Though the model is currently quite simplistic, it is not trivial to solve. I am currently exploring
other modeling options to increase the analytical richness of my solution. In addition, I am exploring the
structure of optimal compensation contracts from the perspective of the firm. It may be that firms are
structuring contracts optimally, and that providing incentives for the CEOs to increase leverage is too
costly. However, I suspect that this is an area of unnecessary wealth appropriation by CEOs.
The application of this paper is that boards should potentially consider implementing direct incentives
for the executive to increase leverage. However, if there is an information asymmetry between firms
governing body and the typical executive, it may be prudent for firms to regularly have an independent
auditor examine the leverage choices of the firm and take disciplinary action against the current CEO in
the case of a sub-optimal choices.
Going forward, it seems fruitful to continue examining other unexpected, and, therefore, likely un-
intended, consequences of the current structure of executive compensation. In this paper, I show that
21

the interaction of the standard compensation contract with the well documented cost of default borne by
executives can have surprising and financially significant results. Whether this interaction drives other
firm decisions that may affect bankruptcy risk is still an open question.
22

A Proofs of Theoretical Results
Proof of Theorem 1. From equation 2, we have that the agent is trying to maximize
U(x, L) = γ(w0 + α(1 + tL)x+ φL− kx2
2− 1
2γα2σ2)− ln
(edγΦ (ε′D) + (1− Φ (ε′D))
).
Therefore, the first order conditions state that
∂U
∂x= γα(1 + tL)− γkx−
(edγ − 1
)Φ′ (ε′D)
(edγ − 1) Φ (ε′D) + 1
((1− t)L− 1
σ
)= 0 (11)
and
∂U
∂L= γαtx+ γφ−
(edγ − 1
)Φ′ (ε′D)
(edγ − 1) Φ (ε′D) + 1
((1− t)x
σ
)= 0 (12)
Equations 11 and 12 can be jointly solved for x, where
x =α+
√α2 − 4kφ((1− t)2L− (1− t))
2k(1− t)(13)
From this point onward in the proof, I will use the assumption that the principal cannot or does not
contract on leverage, i.e. φ = 0. Then equation 11 becomes
x =α
k(1− t)(14)
This implies that ε′D, given by equation 4, can be written as
ε′D =α(((1− t)L− 1) 1
(1−t)k + γσ2)
σ(15)
Notice that from equation 15 and assumption 1, ε′D > 0 and∂ε′D∂L > 0. If I further assume that d is
arbitrarily large, then equation 12 converges to
∂U
∂L= γαt− Φ′ (ε′D)
Φ (ε′D)
((1− t)σ
)= 0 (16)
or
γασt
1− t=
Φ′ (ε′D)
Φ (ε′D). (17)
This can be totally differentiated to give the following
dL
dα=
γktσ2
(1− t)2
2(Φ (ε′D))2
2Φ (ε′D) Φ′′ (ε′D)− (Φ′ (ε′D))2− γσ (18)
23
where Φ(·) is the CDF of the normal distribution. Using Properties of normal distributions, it can be
shown that 2(Φ(·))22Φ(·)Φ′′(·)−(Φ′(·))2 < 0 for any input greater than or equal to zero. Since by assumption of a
sufficiently large k and L ≥ 0, equation 15 shows that ε′D > 0. Therefore, dLdα < 0.
Proof of Theorem 2. Equation 18 says
dL
dα=
γktσ2
(1− t)2
2(Φ (ε′D))2
2Φ (ε′D) Φ′′ (ε′D)− (Φ′ (ε′D))2− γσ
and it can be further shown that 2Φ(·)Φ′′(·)−(Φ′(·))22(Φ(·))2 approaches 0 asymptotically from below, using the
properties of normal distributions, for all series starting from greater than zero and approaching positive
infinity. Therefore, as σ is increasing, ε′D is increasing. Therefore, dLdα becomes more negative. So,
d2Ldαdσ .
Proof of Theorem 3. As φ increases, the relative trade off between the personal benefits of debt (the share
in the tax shield and the personal compensation for increased leverage) becomes relatively larger, while
the personal costs of default stays constant. Therefore, a small change in the exposure to firm equity,
an increase in α, affects the risk adjusted probability of default identically to the previous case, but the
relative benefits of leverage are still larger. This leads to a smaller change in leverage, i.e. d2Ldφdα > 0.
24
B Tables and Figures
Figure 1: Book Leverage by Deciles of Pay Performance Sensitivity
25
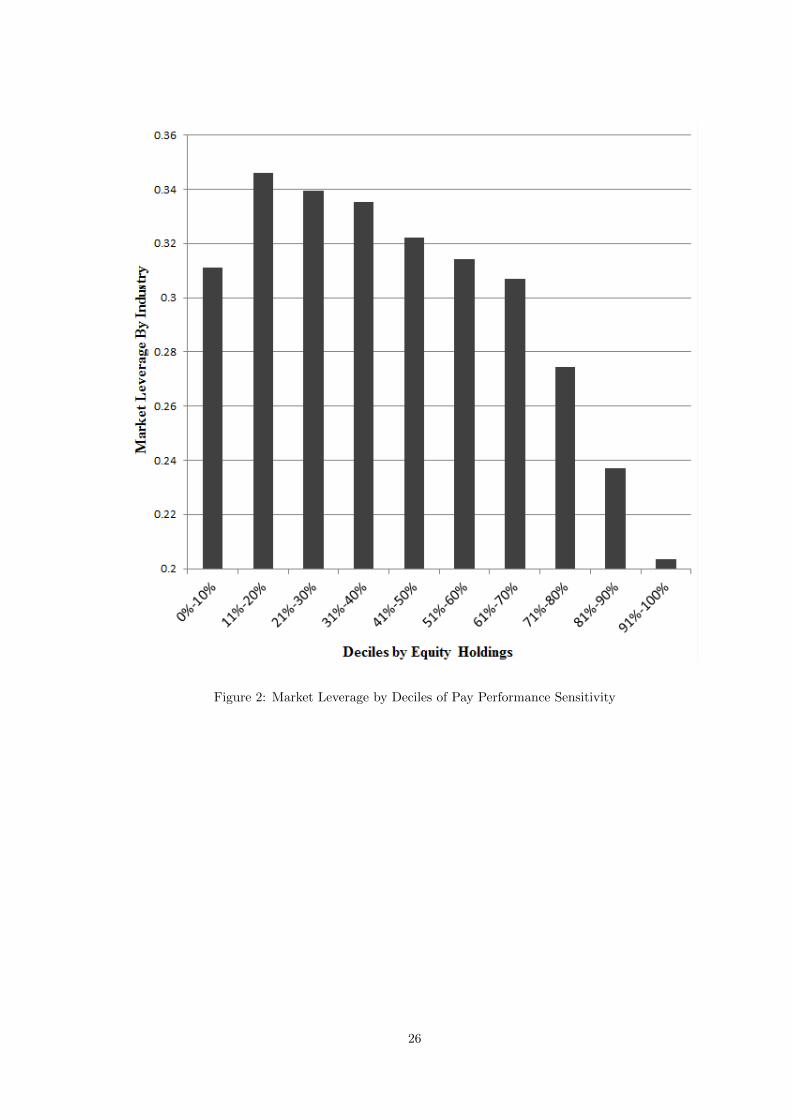
Figure 2: Market Leverage by Deciles of Pay Performance Sensitivity
26
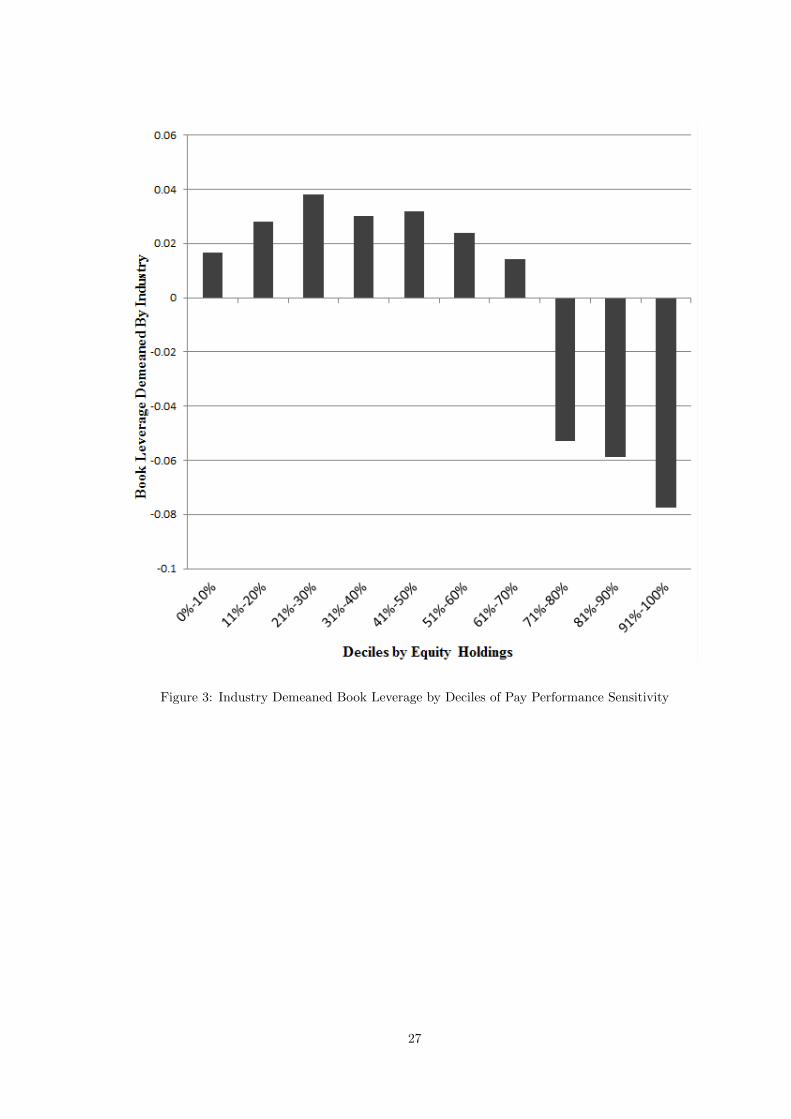
Figure 3: Industry Demeaned Book Leverage by Deciles of Pay Performance Sensitivity
27
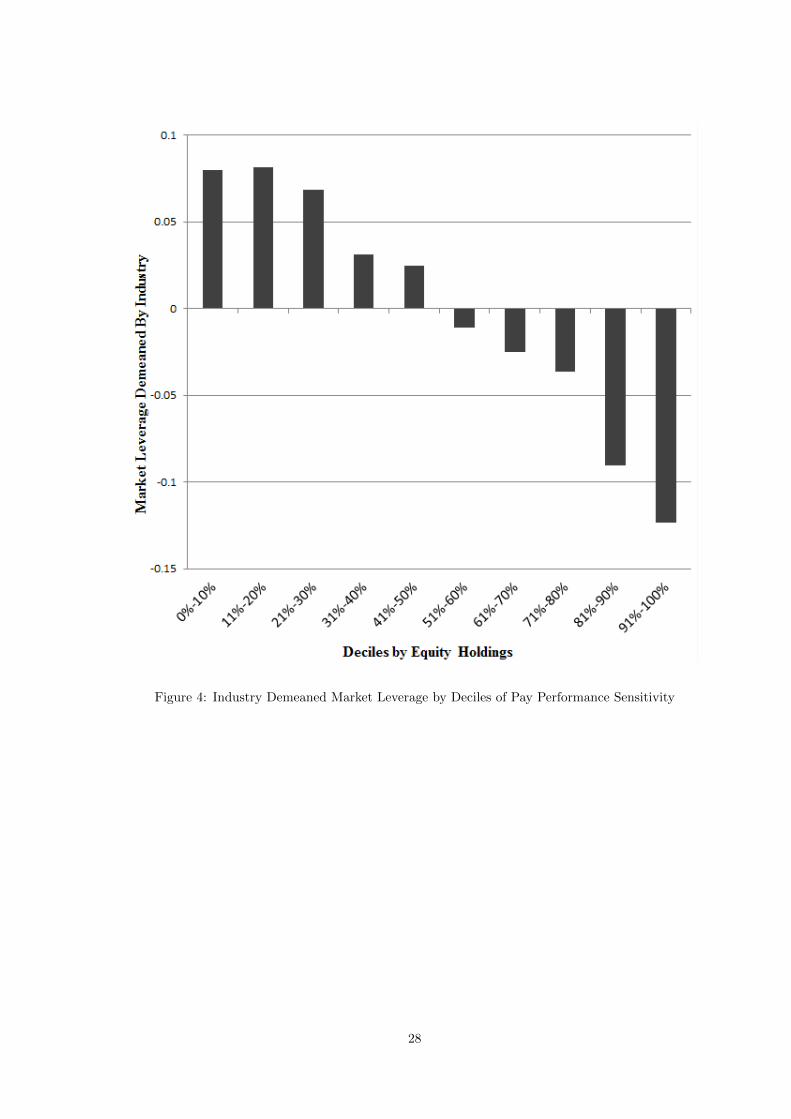
Figure 4: Industry Demeaned Market Leverage by Deciles of Pay Performance Sensitivity
28
Tab
le1:
Vari
ab
leD
efin
itio
ns
Var
iab
le(D
ata
Sou
rce)
Var
iab
leD
efin
itio
nCompustat
Tot
alA
sset
sA
sset
s-
Tot
al(A
T)
Book
Equ
ity
Sto
ckh
old
ers
Equ
ity
-T
ota
l(S
EQ
)+
Def
erre
dT
axes
an
dIn
ves
tmen
tT
ax
Cre
dit
(TX
DIT
C)
-P
refe
rred
/Pre
fere
nce
Sto
ck(C
ap
ital)
-T
ota
l(P
ST
K)
if(P
ST
K)
mis
sin
gth
enP
refe
rred
Sto
ckR
edem
pti
on
Valu
e(P
ST
KR
V)
if(P
ST
KR
V)
mis
sing
then
Pre
ferr
edS
tock
Liq
uid
ati
ng
Valu
e(P
ST
KL
)B
ook
Deb
tA
sset
s-
Tot
al(A
T)
-B
ook
Equ
ity
Book
Lev
erag
eB
ook
Deb
t/
Ass
ets
-T
ota
l(A
T)
Mar
ket
Lev
erag
eB
ook
Deb
t/(C
om
mon
Sh
are
sO
uts
tand
ing
(CS
HO
)*
Pri
ceC
lose
-A
nnu
al
Fis
cal
yea
r(P
RC
CF
)+
Book
Deb
t)M
arke
t-to
-Book
(Com
mon
Sh
ares
Ou
tsta
nd
ing
(CS
HO
)*
Pri
ceC
lose
-A
nnu
al
Fis
cal
year
(PR
CC
F)
Book
Deb
t(B
D))
/A
sset
s-
Tota
l(A
T)
Ab
nor
mal
Ear
nin
gs(I
nco
me
Bef
ore
Extr
aord
inary
Item
sA
dju
sted
for
Com
mon
Sto
ckE
qu
ivale
nts
int
+1
(IB
AD
J)−
Inco
me
Bef
ore
Extr
aord
inary
Item
sA
dju
sted
for
Com
mon
Sto
ckE
qu
ivale
nts
(IB
AD
J)
int)
/(C
omm
onS
har
esO
uts
tan
din
g(C
SH
O)
*P
rice
Clo
se-
An
nu
al
Fis
cal
yea
r(P
RC
CF
))R
OA
Op
erat
ing
Inco
me
Bef
ore
Dep
reci
ati
on
(OID
BP
)/
Ass
ets
-T
ota
l(A
T)
CRSP
Un
leve
red
Vol
atil
ity
On
eyea
rro
llin
gw
ind
owon
month
lyre
turn
s,u
nle
vere
dExecuComp
Sal
ary
and
Bon
us
Sal
ary
(SA
LA
RY
)+
Bonu
s(B
ON
US
)P
PS
See
Cor
ean
dG
uay
2002
for
esti
mati
on
pro
ced
ure
PP
Sst
ock
Pri
ceC
lose
-A
nnu
al
Fis
cal
Yea
r(P
RC
CF
)*
Sh
ares
Ow
ned
-O
pti
on
sE
xcl
uded
(SH
RO
WN
EX
CL
OP
TS
)/
100
CE
OO
wn
ersh
ipS
har
esO
wn
ed-
Op
tion
sE
xcl
ud
ed(S
HR
OW
NE
XC
LO
PT
S)
/T
ota
lS
hare
Ou
tsta
nd
ing
(SH
RS
OU
T)
Measu
resofEntrench
ment
Gom
per
sin
dex
24an
ti-t
akeo
ver
pro
vis
ion
sin
dex
by
Gom
per
s,Is
hii
an
dM
etri
ck(2
003)
Beb
chu
kin
dex
6an
ti-t
akeo
ver
pro
vis
ion
sin
dex
by
Beb
chu
k,
Coh
en,
an
dF
are
ll(2
004)
FED
Ris
k-f
ree
rate
Ave
rage
T-b
ill
rate
29
Tab
le2:
Su
mm
ary
Sta
tist
ics
VA
RIA
BL
EN
Mea
nM
edia
nS
.D.
25
th%
ile
75
th%
ile
Investmentand
FinancialChara
cteristics
Mar
ket
Lev
erag
e12,3
33
.300
.267
.201
.137
.426
Book
Lev
erag
e12,3
33
.474
.469
.252
.313
.600
Tot
alA
sset
s(i
nb
illi
ons)
12,3
33
5.3
3.9
36
23.5
.370
3.0
0P
rop
erty
Pla
nts
and
Equ
ipm
ent
(in
bil
lion
s)12,3
33
3.0
3.4
24
11.7
.134
1.6
8P
rop
erty
Pla
nts
and
Equ
ipm
ent/
Ass
ets
12,3
33
.552
.467
.376
.264
.764
Mar
ket
toB
ook
12,3
33
2.2
00
1.6
81.7
51
1.2
72.4
9U
nle
vere
dV
olat
ilit
y12,3
33
.085
.069
.064
.046
.106
RO
A12,3
33
.143
.147
.289
.098
.202
Ab
nor
mal
Ear
nin
gs12,3
33
-.002
.007
3.5
0-.
011
.024
CEO
compensa
tion
Sal
ary
and
Bon
us
(in
mil
lion
s)12,3
33
1.2
4.8
73
1.6
5.5
30
1.4
6P
PS
(in
milli
ons)
12,3
33
1.1
5.2
33
6.4
5.0
90
.647
PP
Sst
ock
only
(in
mil
lion
s)12,3
33
.860
.064
6.2
0.0
16
.257
CE
OO
wn
ersh
ip12,3
33
.031
.004
.073
.001
.021
Measu
resofEntrench
ment
Beb
chu
kin
dex
7,4
36
2.4
43
1.2
82
3
30
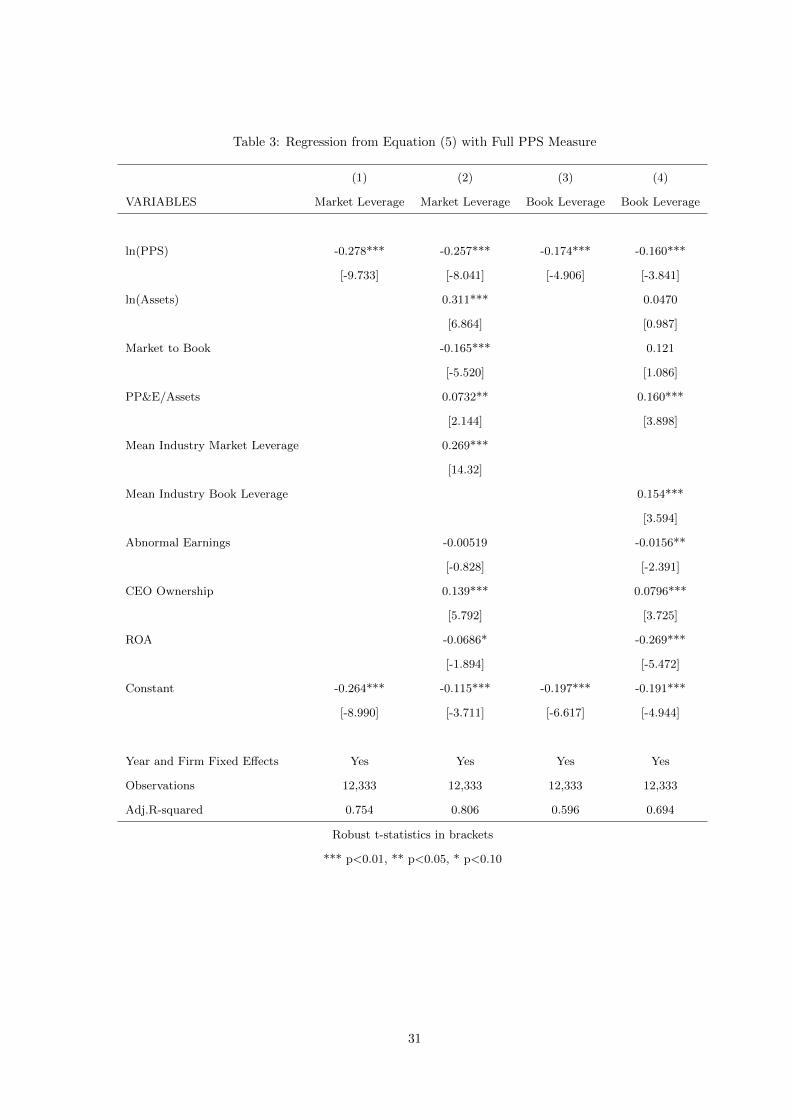
Table 3: Regression from Equation (5) with Full PPS Measure
(1) (2) (3) (4)
VARIABLES Market Leverage Market Leverage Book Leverage Book Leverage
ln(PPS) -0.278*** -0.257*** -0.174*** -0.160***
[-9.733] [-8.041] [-4.906] [-3.841]
ln(Assets) 0.311*** 0.0470
[6.864] [0.987]
Market to Book -0.165*** 0.121
[-5.520] [1.086]
PP&E/Assets 0.0732** 0.160***
[2.144] [3.898]
Mean Industry Market Leverage 0.269***
[14.32]
Mean Industry Book Leverage 0.154***
[3.594]
Abnormal Earnings -0.00519 -0.0156**
[-0.828] [-2.391]
CEO Ownership 0.139*** 0.0796***
[5.792] [3.725]
ROA -0.0686* -0.269***
[-1.894] [-5.472]
Constant -0.264*** -0.115*** -0.197*** -0.191***
[-8.990] [-3.711] [-6.617] [-4.944]
Year and Firm Fixed Effects Yes Yes Yes Yes
Observations 12,333 12,333 12,333 12,333
Adj.R-squared 0.754 0.806 0.596 0.694
Robust t-statistics in brackets
*** p<0.01, ** p<0.05, * p<0.10
31
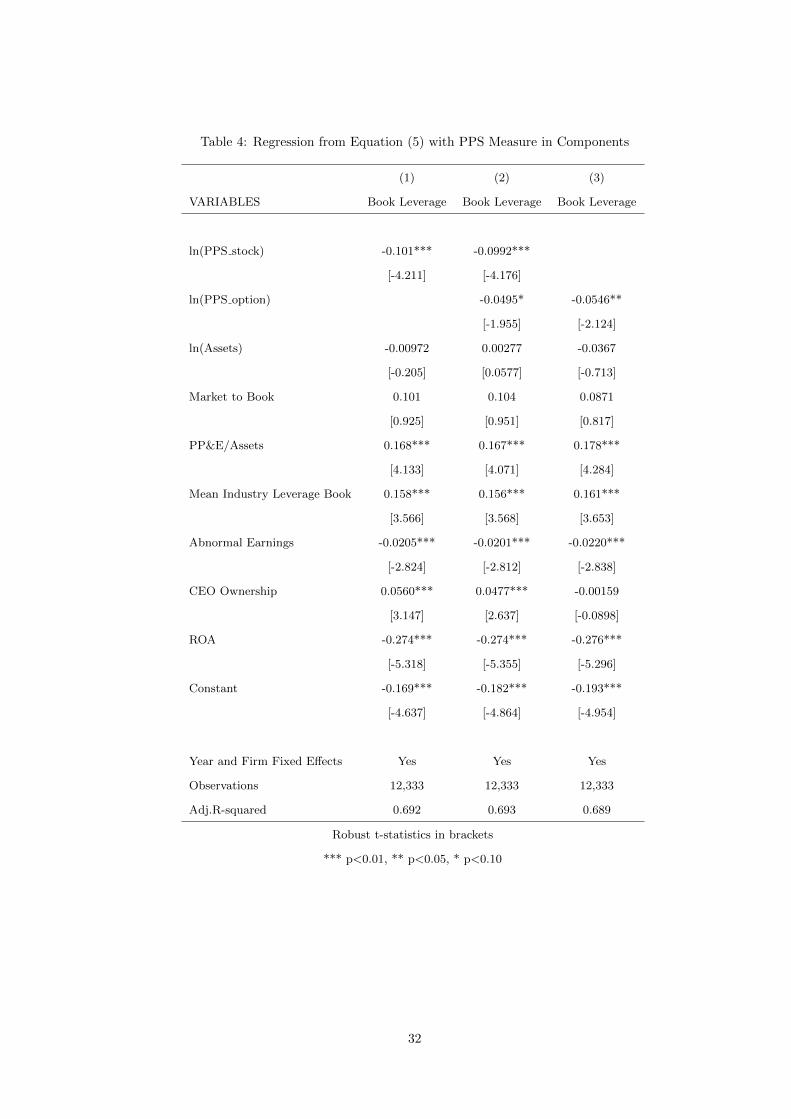
Table 4: Regression from Equation (5) with PPS Measure in Components
(1) (2) (3)
VARIABLES Book Leverage Book Leverage Book Leverage
ln(PPS stock) -0.101*** -0.0992***
[-4.211] [-4.176]
ln(PPS option) -0.0495* -0.0546**
[-1.955] [-2.124]
ln(Assets) -0.00972 0.00277 -0.0367
[-0.205] [0.0577] [-0.713]
Market to Book 0.101 0.104 0.0871
[0.925] [0.951] [0.817]
PP&E/Assets 0.168*** 0.167*** 0.178***
[4.133] [4.071] [4.284]
Mean Industry Leverage Book 0.158*** 0.156*** 0.161***
[3.566] [3.568] [3.653]
Abnormal Earnings -0.0205*** -0.0201*** -0.0220***
[-2.824] [-2.812] [-2.838]
CEO Ownership 0.0560*** 0.0477*** -0.00159
[3.147] [2.637] [-0.0898]
ROA -0.274*** -0.274*** -0.276***
[-5.318] [-5.355] [-5.296]
Constant -0.169*** -0.182*** -0.193***
[-4.637] [-4.864] [-4.954]
Year and Firm Fixed Effects Yes Yes Yes
Observations 12,333 12,333 12,333
Adj.R-squared 0.692 0.693 0.689
Robust t-statistics in brackets
*** p<0.01, ** p<0.05, * p<0.10
32
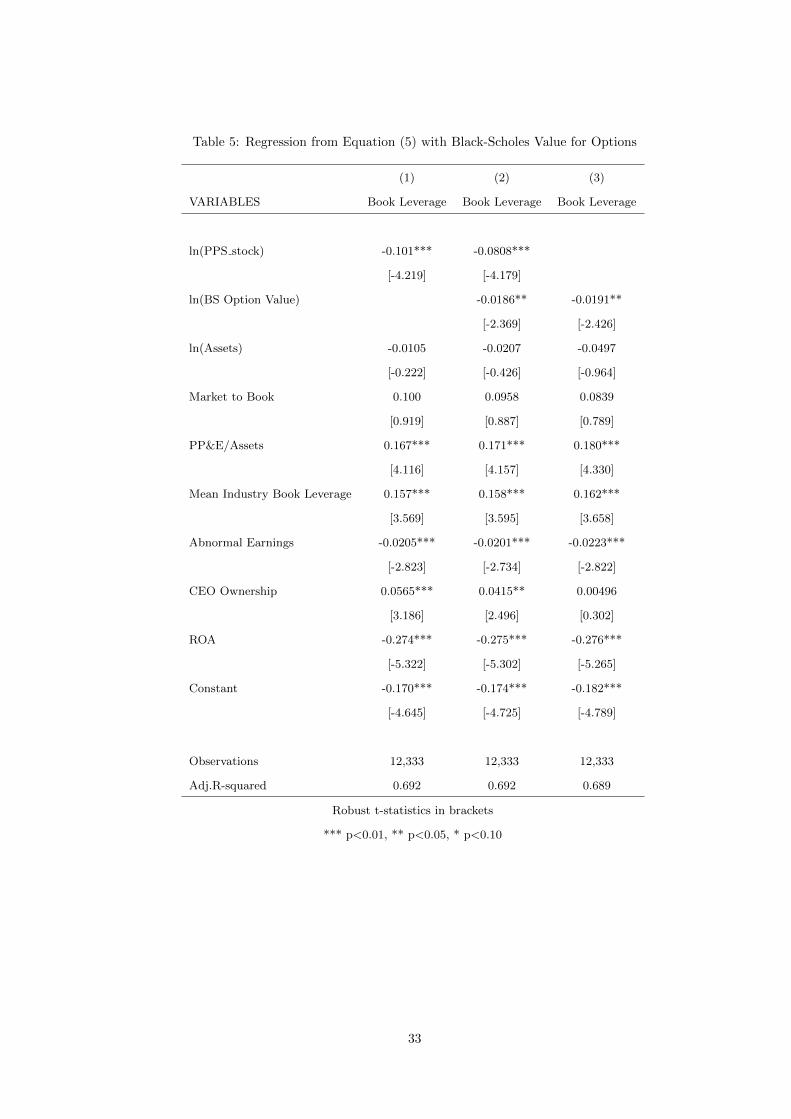
Table 5: Regression from Equation (5) with Black-Scholes Value for Options
(1) (2) (3)
VARIABLES Book Leverage Book Leverage Book Leverage
ln(PPS stock) -0.101*** -0.0808***
[-4.219] [-4.179]
ln(BS Option Value) -0.0186** -0.0191**
[-2.369] [-2.426]
ln(Assets) -0.0105 -0.0207 -0.0497
[-0.222] [-0.426] [-0.964]
Market to Book 0.100 0.0958 0.0839
[0.919] [0.887] [0.789]
PP&E/Assets 0.167*** 0.171*** 0.180***
[4.116] [4.157] [4.330]
Mean Industry Book Leverage 0.157*** 0.158*** 0.162***
[3.569] [3.595] [3.658]
Abnormal Earnings -0.0205*** -0.0201*** -0.0223***
[-2.823] [-2.734] [-2.822]
CEO Ownership 0.0565*** 0.0415** 0.00496
[3.186] [2.496] [0.302]
ROA -0.274*** -0.275*** -0.276***
[-5.322] [-5.302] [-5.265]
Constant -0.170*** -0.174*** -0.182***
[-4.645] [-4.725] [-4.789]
Observations 12,333 12,333 12,333
Adj.R-squared 0.692 0.692 0.689
Robust t-statistics in brackets
*** p<0.01, ** p<0.05, * p<0.10
33
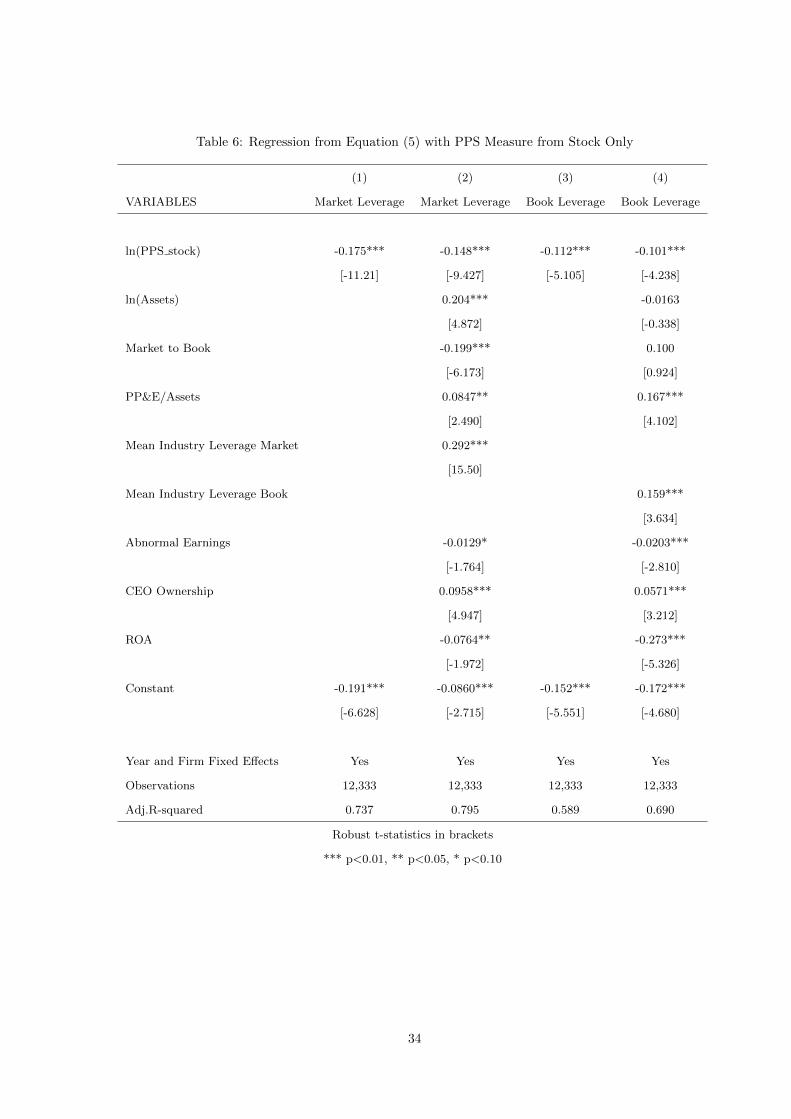
Table 6: Regression from Equation (5) with PPS Measure from Stock Only
(1) (2) (3) (4)
VARIABLES Market Leverage Market Leverage Book Leverage Book Leverage
ln(PPS stock) -0.175*** -0.148*** -0.112*** -0.101***
[-11.21] [-9.427] [-5.105] [-4.238]
ln(Assets) 0.204*** -0.0163
[4.872] [-0.338]
Market to Book -0.199*** 0.100
[-6.173] [0.924]
PP&E/Assets 0.0847** 0.167***
[2.490] [4.102]
Mean Industry Leverage Market 0.292***
[15.50]
Mean Industry Leverage Book 0.159***
[3.634]
Abnormal Earnings -0.0129* -0.0203***
[-1.764] [-2.810]
CEO Ownership 0.0958*** 0.0571***
[4.947] [3.212]
ROA -0.0764** -0.273***
[-1.972] [-5.326]
Constant -0.191*** -0.0860*** -0.152*** -0.172***
[-6.628] [-2.715] [-5.551] [-4.680]
Year and Firm Fixed Effects Yes Yes Yes Yes
Observations 12,333 12,333 12,333 12,333
Adj.R-squared 0.737 0.795 0.589 0.690
Robust t-statistics in brackets
*** p<0.01, ** p<0.05, * p<0.10
34
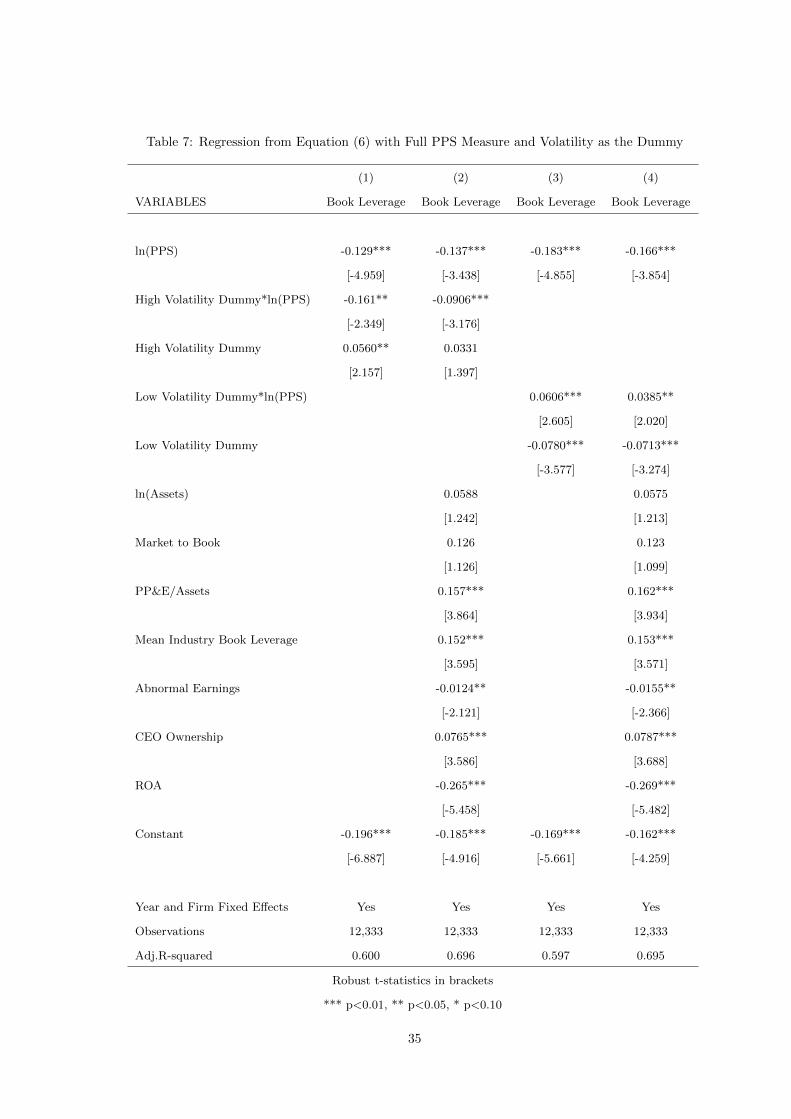
Table 7: Regression from Equation (6) with Full PPS Measure and Volatility as the Dummy
(1) (2) (3) (4)
VARIABLES Book Leverage Book Leverage Book Leverage Book Leverage
ln(PPS) -0.129*** -0.137*** -0.183*** -0.166***
[-4.959] [-3.438] [-4.855] [-3.854]
High Volatility Dummy*ln(PPS) -0.161** -0.0906***
[-2.349] [-3.176]
High Volatility Dummy 0.0560** 0.0331
[2.157] [1.397]
Low Volatility Dummy*ln(PPS) 0.0606*** 0.0385**
[2.605] [2.020]
Low Volatility Dummy -0.0780*** -0.0713***
[-3.577] [-3.274]
ln(Assets) 0.0588 0.0575
[1.242] [1.213]
Market to Book 0.126 0.123
[1.126] [1.099]
PP&E/Assets 0.157*** 0.162***
[3.864] [3.934]
Mean Industry Book Leverage 0.152*** 0.153***
[3.595] [3.571]
Abnormal Earnings -0.0124** -0.0155**
[-2.121] [-2.366]
CEO Ownership 0.0765*** 0.0787***
[3.586] [3.688]
ROA -0.265*** -0.269***
[-5.458] [-5.482]
Constant -0.196*** -0.185*** -0.169*** -0.162***
[-6.887] [-4.916] [-5.661] [-4.259]
Year and Firm Fixed Effects Yes Yes Yes Yes
Observations 12,333 12,333 12,333 12,333
Adj.R-squared 0.600 0.696 0.597 0.695
Robust t-statistics in brackets
*** p<0.01, ** p<0.05, * p<0.10
35
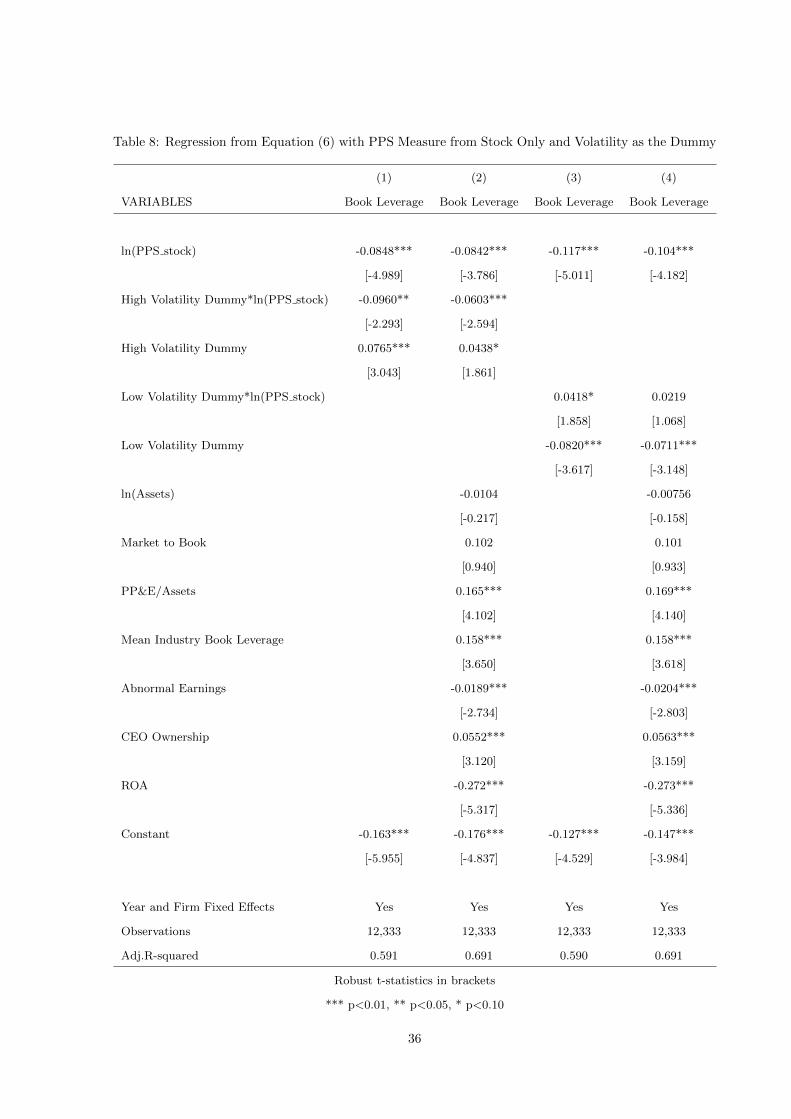
Table 8: Regression from Equation (6) with PPS Measure from Stock Only and Volatility as the Dummy
(1) (2) (3) (4)
VARIABLES Book Leverage Book Leverage Book Leverage Book Leverage
ln(PPS stock) -0.0848*** -0.0842*** -0.117*** -0.104***
[-4.989] [-3.786] [-5.011] [-4.182]
High Volatility Dummy*ln(PPS stock) -0.0960** -0.0603***
[-2.293] [-2.594]
High Volatility Dummy 0.0765*** 0.0438*
[3.043] [1.861]
Low Volatility Dummy*ln(PPS stock) 0.0418* 0.0219
[1.858] [1.068]
Low Volatility Dummy -0.0820*** -0.0711***
[-3.617] [-3.148]
ln(Assets) -0.0104 -0.00756
[-0.217] [-0.158]
Market to Book 0.102 0.101
[0.940] [0.933]
PP&E/Assets 0.165*** 0.169***
[4.102] [4.140]
Mean Industry Book Leverage 0.158*** 0.158***
[3.650] [3.618]
Abnormal Earnings -0.0189*** -0.0204***
[-2.734] [-2.803]
CEO Ownership 0.0552*** 0.0563***
[3.120] [3.159]
ROA -0.272*** -0.273***
[-5.317] [-5.336]
Constant -0.163*** -0.176*** -0.127*** -0.147***
[-5.955] [-4.837] [-4.529] [-3.984]
Year and Firm Fixed Effects Yes Yes Yes Yes
Observations 12,333 12,333 12,333 12,333
Adj.R-squared 0.591 0.691 0.590 0.691
Robust t-statistics in brackets
*** p<0.01, ** p<0.05, * p<0.10
36
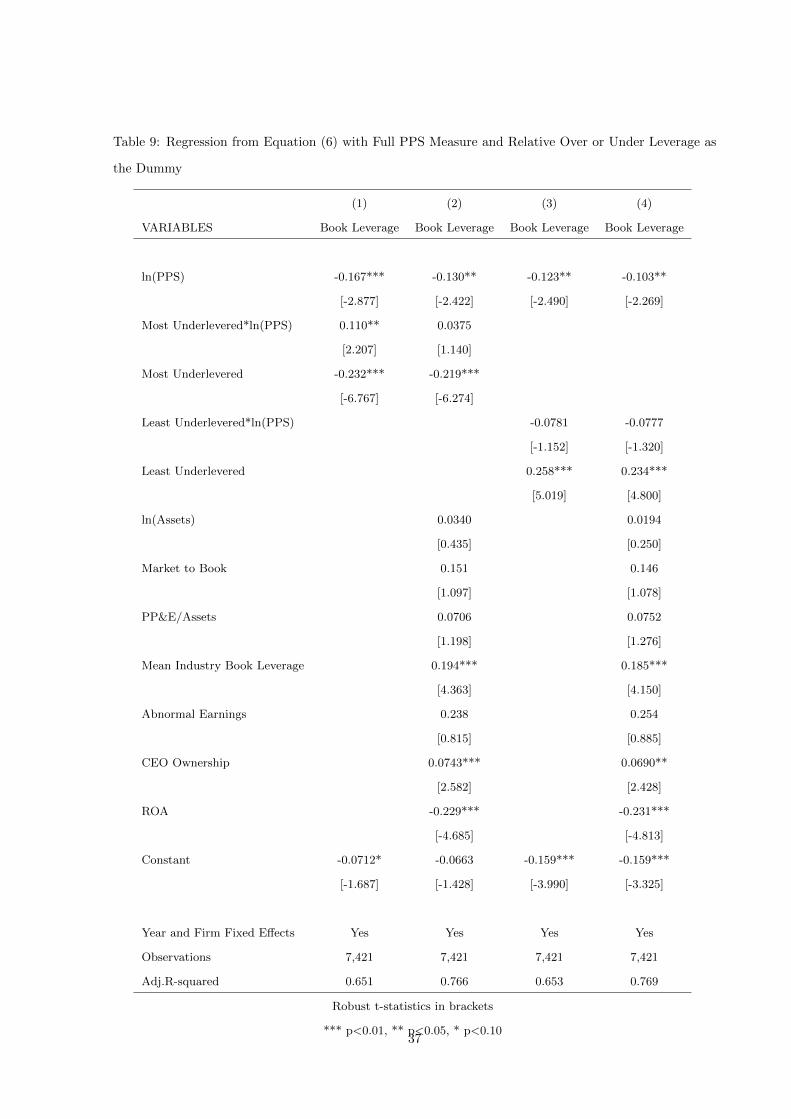
Table 9: Regression from Equation (6) with Full PPS Measure and Relative Over or Under Leverage as
the Dummy
(1) (2) (3) (4)
VARIABLES Book Leverage Book Leverage Book Leverage Book Leverage
ln(PPS) -0.167*** -0.130** -0.123** -0.103**
[-2.877] [-2.422] [-2.490] [-2.269]
Most Underlevered*ln(PPS) 0.110** 0.0375
[2.207] [1.140]
Most Underlevered -0.232*** -0.219***
[-6.767] [-6.274]
Least Underlevered*ln(PPS) -0.0781 -0.0777
[-1.152] [-1.320]
Least Underlevered 0.258*** 0.234***
[5.019] [4.800]
ln(Assets) 0.0340 0.0194
[0.435] [0.250]
Market to Book 0.151 0.146
[1.097] [1.078]
PP&E/Assets 0.0706 0.0752
[1.198] [1.276]
Mean Industry Book Leverage 0.194*** 0.185***
[4.363] [4.150]
Abnormal Earnings 0.238 0.254
[0.815] [0.885]
CEO Ownership 0.0743*** 0.0690**
[2.582] [2.428]
ROA -0.229*** -0.231***
[-4.685] [-4.813]
Constant -0.0712* -0.0663 -0.159*** -0.159***
[-1.687] [-1.428] [-3.990] [-3.325]
Year and Firm Fixed Effects Yes Yes Yes Yes
Observations 7,421 7,421 7,421 7,421
Adj.R-squared 0.651 0.766 0.653 0.769
Robust t-statistics in brackets
*** p<0.01, ** p<0.05, * p<0.1037
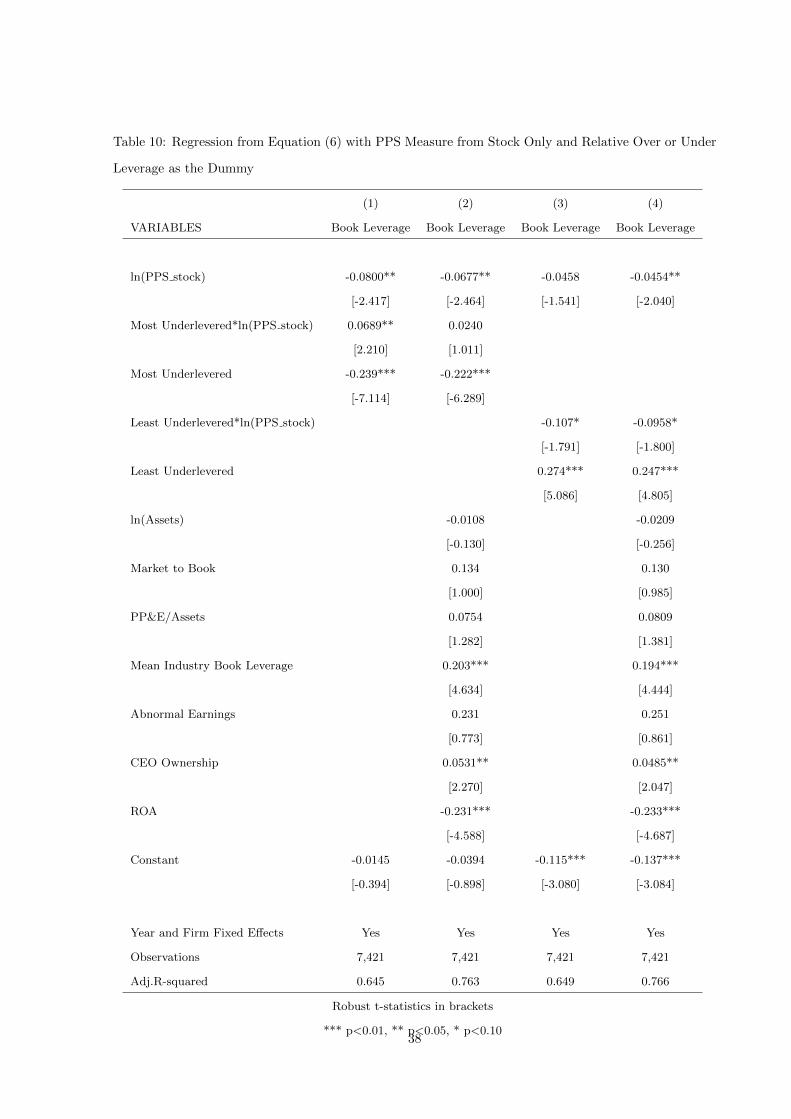
Table 10: Regression from Equation (6) with PPS Measure from Stock Only and Relative Over or Under
Leverage as the Dummy
(1) (2) (3) (4)
VARIABLES Book Leverage Book Leverage Book Leverage Book Leverage
ln(PPS stock) -0.0800** -0.0677** -0.0458 -0.0454**
[-2.417] [-2.464] [-1.541] [-2.040]
Most Underlevered*ln(PPS stock) 0.0689** 0.0240
[2.210] [1.011]
Most Underlevered -0.239*** -0.222***
[-7.114] [-6.289]
Least Underlevered*ln(PPS stock) -0.107* -0.0958*
[-1.791] [-1.800]
Least Underlevered 0.274*** 0.247***
[5.086] [4.805]
ln(Assets) -0.0108 -0.0209
[-0.130] [-0.256]
Market to Book 0.134 0.130
[1.000] [0.985]
PP&E/Assets 0.0754 0.0809
[1.282] [1.381]
Mean Industry Book Leverage 0.203*** 0.194***
[4.634] [4.444]
Abnormal Earnings 0.231 0.251
[0.773] [0.861]
CEO Ownership 0.0531** 0.0485**
[2.270] [2.047]
ROA -0.231*** -0.233***
[-4.588] [-4.687]
Constant -0.0145 -0.0394 -0.115*** -0.137***
[-0.394] [-0.898] [-3.080] [-3.084]
Year and Firm Fixed Effects Yes Yes Yes Yes
Observations 7,421 7,421 7,421 7,421
Adj.R-squared 0.645 0.763 0.649 0.766
Robust t-statistics in brackets
*** p<0.01, ** p<0.05, * p<0.1038
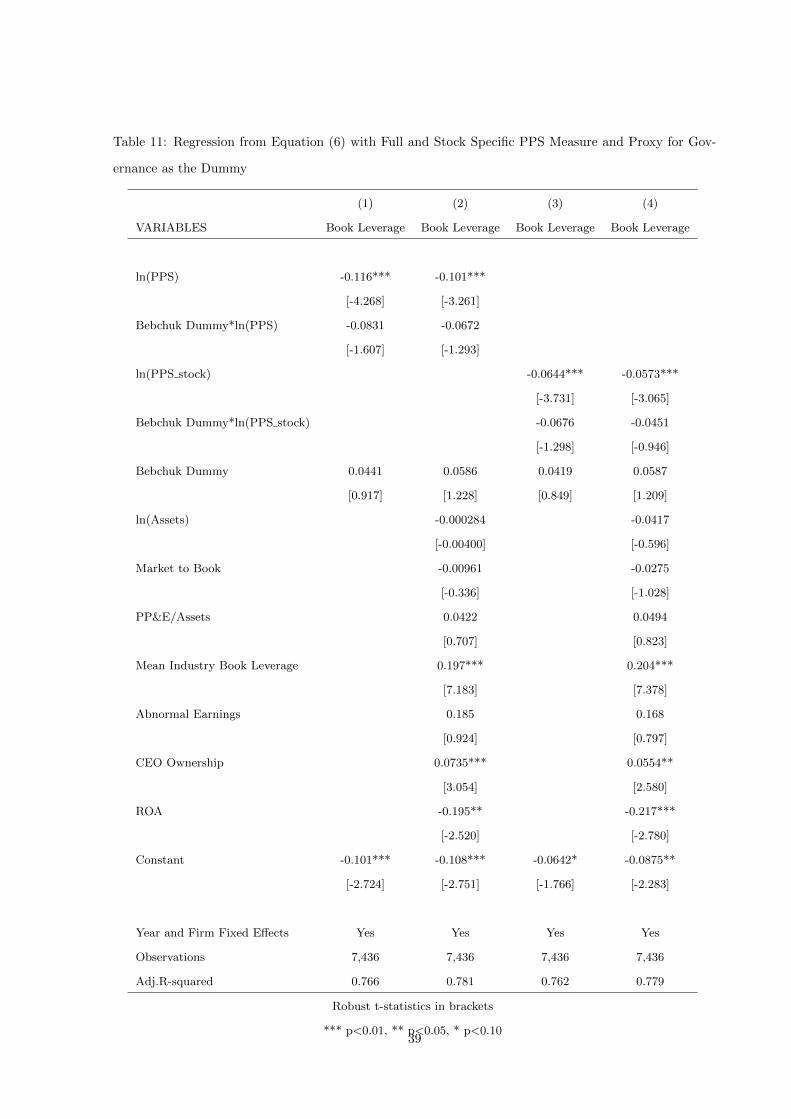
Table 11: Regression from Equation (6) with Full and Stock Specific PPS Measure and Proxy for Gov-
ernance as the Dummy
(1) (2) (3) (4)
VARIABLES Book Leverage Book Leverage Book Leverage Book Leverage
ln(PPS) -0.116*** -0.101***
[-4.268] [-3.261]
Bebchuk Dummy*ln(PPS) -0.0831 -0.0672
[-1.607] [-1.293]
ln(PPS stock) -0.0644*** -0.0573***
[-3.731] [-3.065]
Bebchuk Dummy*ln(PPS stock) -0.0676 -0.0451
[-1.298] [-0.946]
Bebchuk Dummy 0.0441 0.0586 0.0419 0.0587
[0.917] [1.228] [0.849] [1.209]
ln(Assets) -0.000284 -0.0417
[-0.00400] [-0.596]
Market to Book -0.00961 -0.0275
[-0.336] [-1.028]
PP&E/Assets 0.0422 0.0494
[0.707] [0.823]
Mean Industry Book Leverage 0.197*** 0.204***
[7.183] [7.378]
Abnormal Earnings 0.185 0.168
[0.924] [0.797]
CEO Ownership 0.0735*** 0.0554**
[3.054] [2.580]
ROA -0.195** -0.217***
[-2.520] [-2.780]
Constant -0.101*** -0.108*** -0.0642* -0.0875**
[-2.724] [-2.751] [-1.766] [-2.283]
Year and Firm Fixed Effects Yes Yes Yes Yes
Observations 7,436 7,436 7,436 7,436
Adj.R-squared 0.766 0.781 0.762 0.779
Robust t-statistics in brackets
*** p<0.01, ** p<0.05, * p<0.1039
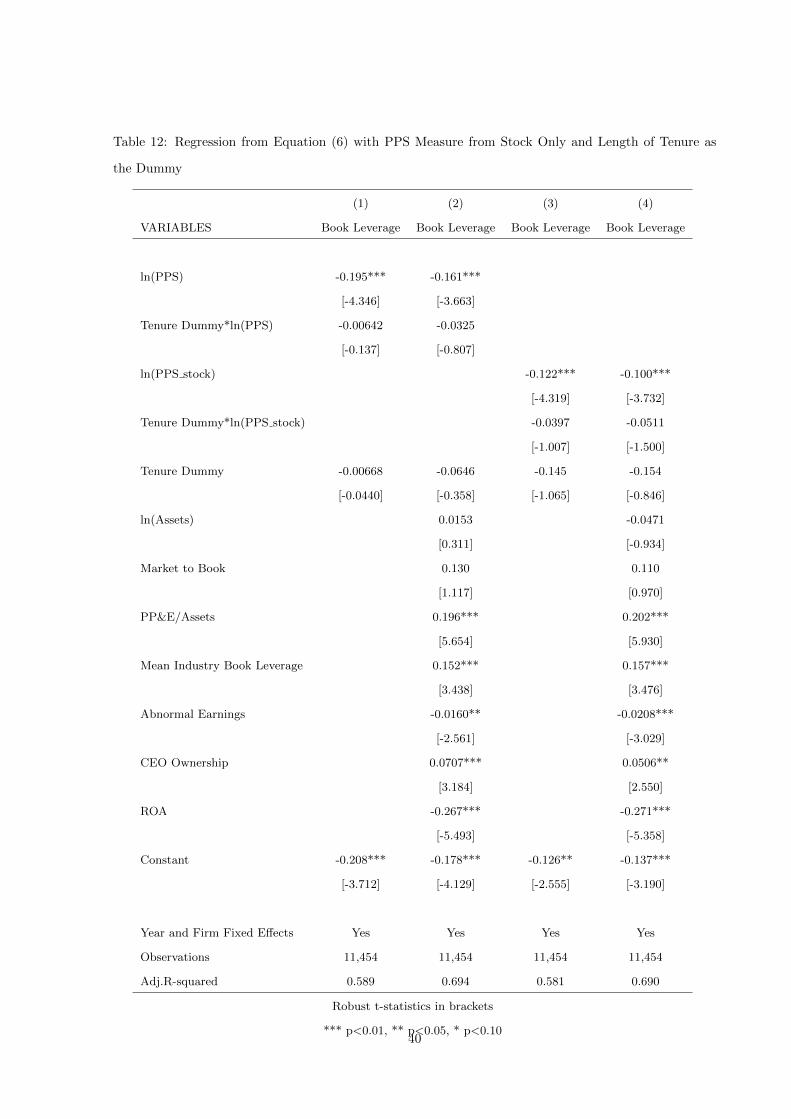
Table 12: Regression from Equation (6) with PPS Measure from Stock Only and Length of Tenure as
the Dummy
(1) (2) (3) (4)
VARIABLES Book Leverage Book Leverage Book Leverage Book Leverage
ln(PPS) -0.195*** -0.161***
[-4.346] [-3.663]
Tenure Dummy*ln(PPS) -0.00642 -0.0325
[-0.137] [-0.807]
ln(PPS stock) -0.122*** -0.100***
[-4.319] [-3.732]
Tenure Dummy*ln(PPS stock) -0.0397 -0.0511
[-1.007] [-1.500]
Tenure Dummy -0.00668 -0.0646 -0.145 -0.154
[-0.0440] [-0.358] [-1.065] [-0.846]
ln(Assets) 0.0153 -0.0471
[0.311] [-0.934]
Market to Book 0.130 0.110
[1.117] [0.970]
PP&E/Assets 0.196*** 0.202***
[5.654] [5.930]
Mean Industry Book Leverage 0.152*** 0.157***
[3.438] [3.476]
Abnormal Earnings -0.0160** -0.0208***
[-2.561] [-3.029]
CEO Ownership 0.0707*** 0.0506**
[3.184] [2.550]
ROA -0.267*** -0.271***
[-5.493] [-5.358]
Constant -0.208*** -0.178*** -0.126** -0.137***
[-3.712] [-4.129] [-2.555] [-3.190]
Year and Firm Fixed Effects Yes Yes Yes Yes
Observations 11,454 11,454 11,454 11,454
Adj.R-squared 0.589 0.694 0.581 0.690
Robust t-statistics in brackets
*** p<0.01, ** p<0.05, * p<0.1040
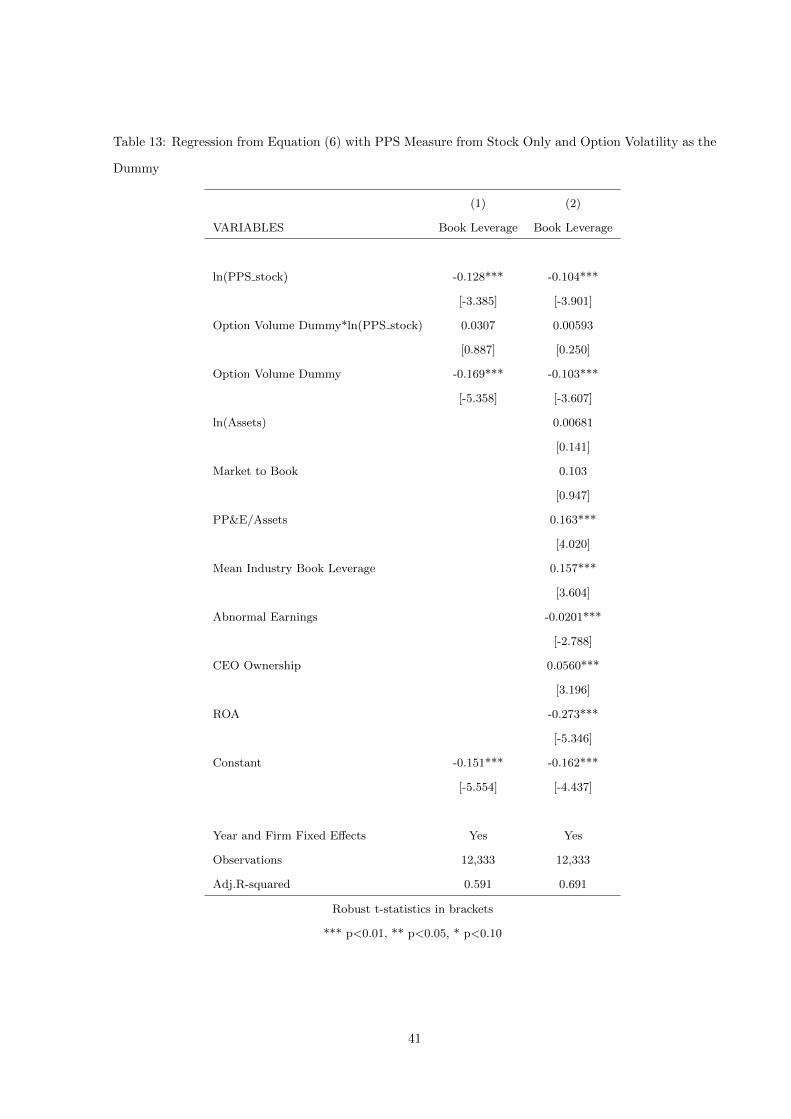
Table 13: Regression from Equation (6) with PPS Measure from Stock Only and Option Volatility as the
Dummy
(1) (2)
VARIABLES Book Leverage Book Leverage
ln(PPS stock) -0.128*** -0.104***
[-3.385] [-3.901]
Option Volume Dummy*ln(PPS stock) 0.0307 0.00593
[0.887] [0.250]
Option Volume Dummy -0.169*** -0.103***
[-5.358] [-3.607]
ln(Assets) 0.00681
[0.141]
Market to Book 0.103
[0.947]
PP&E/Assets 0.163***
[4.020]
Mean Industry Book Leverage 0.157***
[3.604]
Abnormal Earnings -0.0201***
[-2.788]
CEO Ownership 0.0560***
[3.196]
ROA -0.273***
[-5.346]
Constant -0.151*** -0.162***
[-5.554] [-4.437]
Year and Firm Fixed Effects Yes Yes
Observations 12,333 12,333
Adj.R-squared 0.591 0.691
Robust t-statistics in brackets
*** p<0.01, ** p<0.05, * p<0.10
41
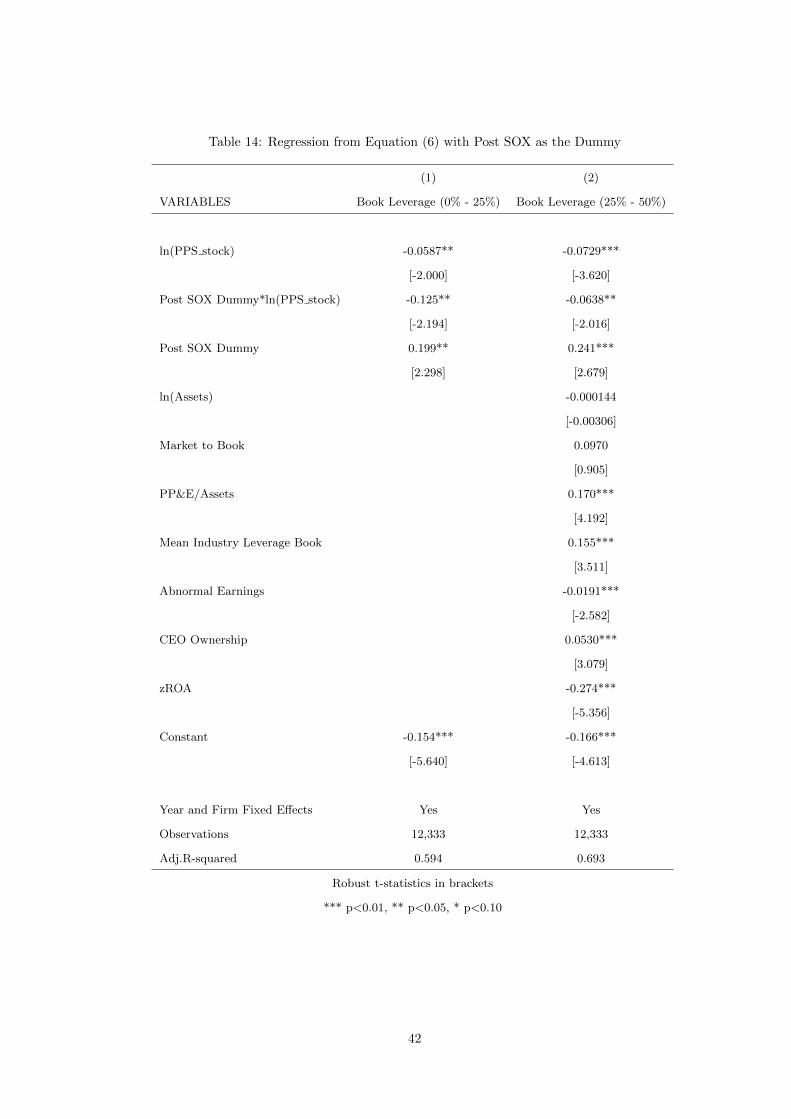
Table 14: Regression from Equation (6) with Post SOX as the Dummy
(1) (2)
VARIABLES Book Leverage (0% - 25%) Book Leverage (25% - 50%)
ln(PPS stock) -0.0587** -0.0729***
[-2.000] [-3.620]
Post SOX Dummy*ln(PPS stock) -0.125** -0.0638**
[-2.194] [-2.016]
Post SOX Dummy 0.199** 0.241***
[2.298] [2.679]
ln(Assets) -0.000144
[-0.00306]
Market to Book 0.0970
[0.905]
PP&E/Assets 0.170***
[4.192]
Mean Industry Leverage Book 0.155***
[3.511]
Abnormal Earnings -0.0191***
[-2.582]
CEO Ownership 0.0530***
[3.079]
zROA -0.274***
[-5.356]
Constant -0.154*** -0.166***
[-5.640] [-4.613]
Year and Firm Fixed Effects Yes Yes
Observations 12,333 12,333
Adj.R-squared 0.594 0.693
Robust t-statistics in brackets
*** p<0.01, ** p<0.05, * p<0.10
42
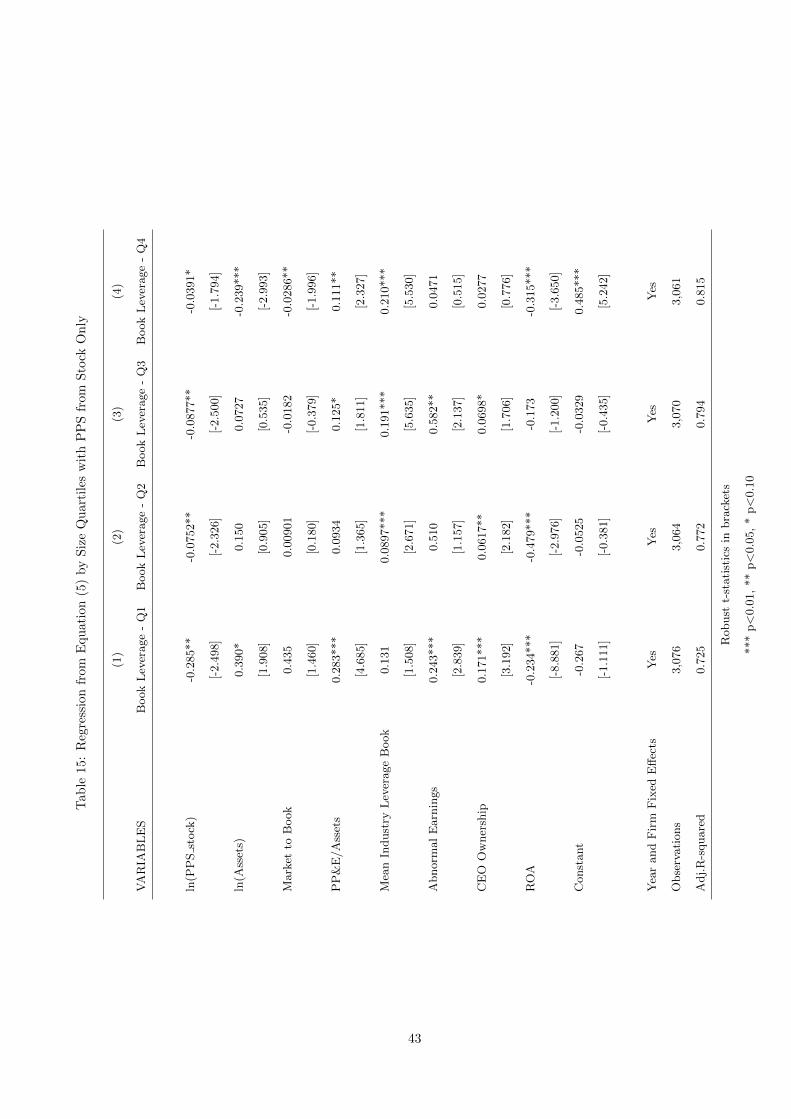
Tab
le15
:R
egre
ssio
nfr
om
Equ
ati
on
(5)
by
Siz
eQ
uart
iles
wit
hP
PS
from
Sto
ckO
nly
(1)
(2)
(3)
(4)
VA
RIA
BL
ES
Book
Lev
erage
-Q
1B
ook
Lev
erage
-Q
2B
ook
Lev
erage
-Q
3B
ook
Lev
erage
-Q
4
ln(P
PS
stock
)-0
.285**
-0.0
752**
-0.0
877**
-0.0
391*
[-2.4
98]
[-2.3
26]
[-2.5
00]
[-1.7
94]
ln(A
sset
s)0.3
90*
0.1
50
0.0
727
-0.2
39***
[1.9
08]
[0.9
05]
[0.5
35]
[-2.9
93]
Mark
etto
Book
0.4
35
0.0
0901
-0.0
182
-0.0
286**
[1.4
60]
[0.1
80]
[-0.3
79]
[-1.9
96]
PP
&E
/A
sset
s0.2
83***
0.0
934
0.1
25*
0.1
11**
[4.6
85]
[1.3
65]
[1.8
11]
[2.3
27]
Mea
nIn
dust
ryL
ever
age
Book
0.1
31
0.0
897***
0.1
91***
0.2
10***
[1.5
08]
[2.6
71]
[5.6
35]
[5.5
30]
Abnorm
al
Earn
ings
0.2
43***
0.5
10
0.5
82**
0.0
471
[2.8
39]
[1.1
57]
[2.1
37]
[0.5
15]
CE
OO
wner
ship
0.1
71***
0.0
617**
0.0
698*
0.0
277
[3.1
92]
[2.1
82]
[1.7
06]
[0.7
76]
RO
A-0
.234***
-0.4
79***
-0.1
73
-0.3
15***
[-8.8
81]
[-2.9
76]
[-1.2
00]
[-3.6
50]
Const
ant
-0.2
67
-0.0
525
-0.0
329
0.4
85***
[-1.1
11]
[-0.3
81]
[-0.4
35]
[5.2
42]
Yea
rand
Fir
mF
ixed
Eff
ects
Yes
Yes
Yes
Yes
Obse
rvati
ons
3,0
76
3,0
64
3,0
70
3,0
61
Adj.
R-s
quare
d0.7
25
0.7
72
0.7
94
0.8
15
Robust
t-st
ati
stic
sin
bra
cket
s
***
p<
0.0
1,
**
p<
0.0
5,
*p<
0.1
0
43
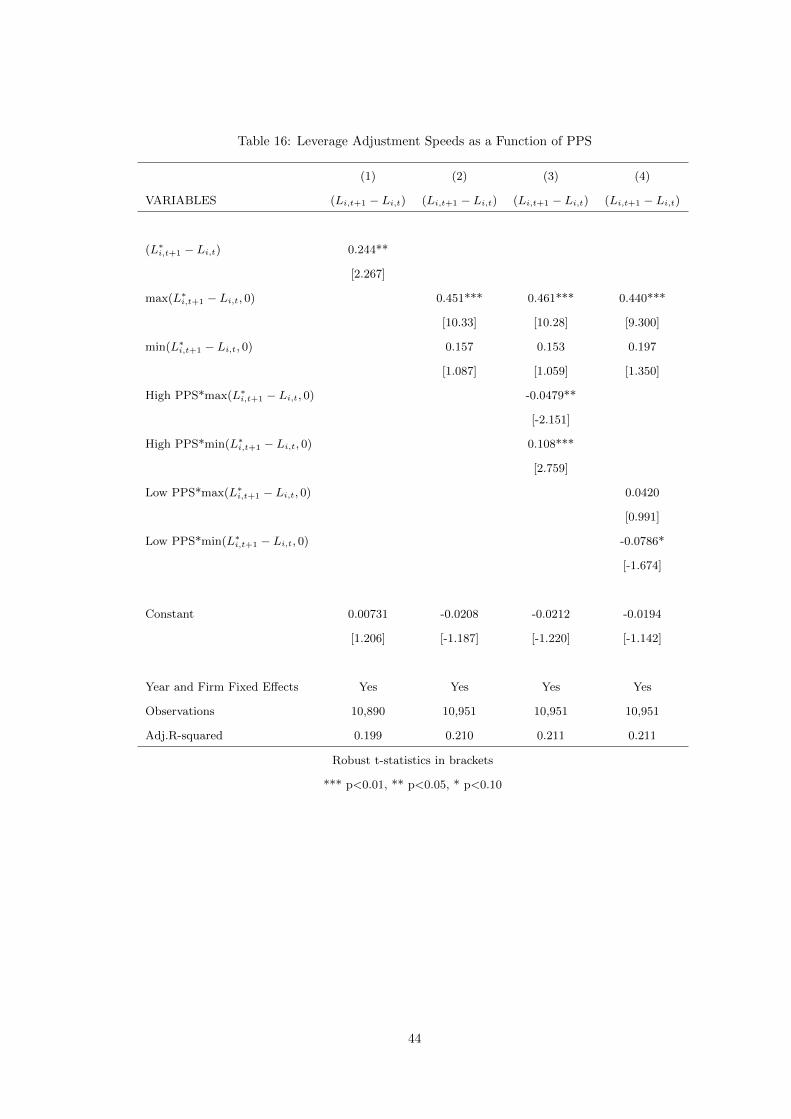
Table 16: Leverage Adjustment Speeds as a Function of PPS
(1) (2) (3) (4)
VARIABLES (Li,t+1 − Li,t) (Li,t+1 − Li,t) (Li,t+1 − Li,t) (Li,t+1 − Li,t)
(L∗i,t+1 − Li,t) 0.244**
[2.267]
max(L∗i,t+1 − Li,t, 0) 0.451*** 0.461*** 0.440***
[10.33] [10.28] [9.300]
min(L∗i,t+1 − Li,t, 0) 0.157 0.153 0.197
[1.087] [1.059] [1.350]
High PPS*max(L∗i,t+1 − Li,t, 0) -0.0479**
[-2.151]
High PPS*min(L∗i,t+1 − Li,t, 0) 0.108***
[2.759]
Low PPS*max(L∗i,t+1 − Li,t, 0) 0.0420
[0.991]
Low PPS*min(L∗i,t+1 − Li,t, 0) -0.0786*
[-1.674]
Constant 0.00731 -0.0208 -0.0212 -0.0194
[1.206] [-1.187] [-1.220] [-1.142]
Year and Firm Fixed Effects Yes Yes Yes Yes
Observations 10,890 10,951 10,951 10,951
Adj.R-squared 0.199 0.210 0.211 0.211
Robust t-statistics in brackets
*** p<0.01, ** p<0.05, * p<0.10
44
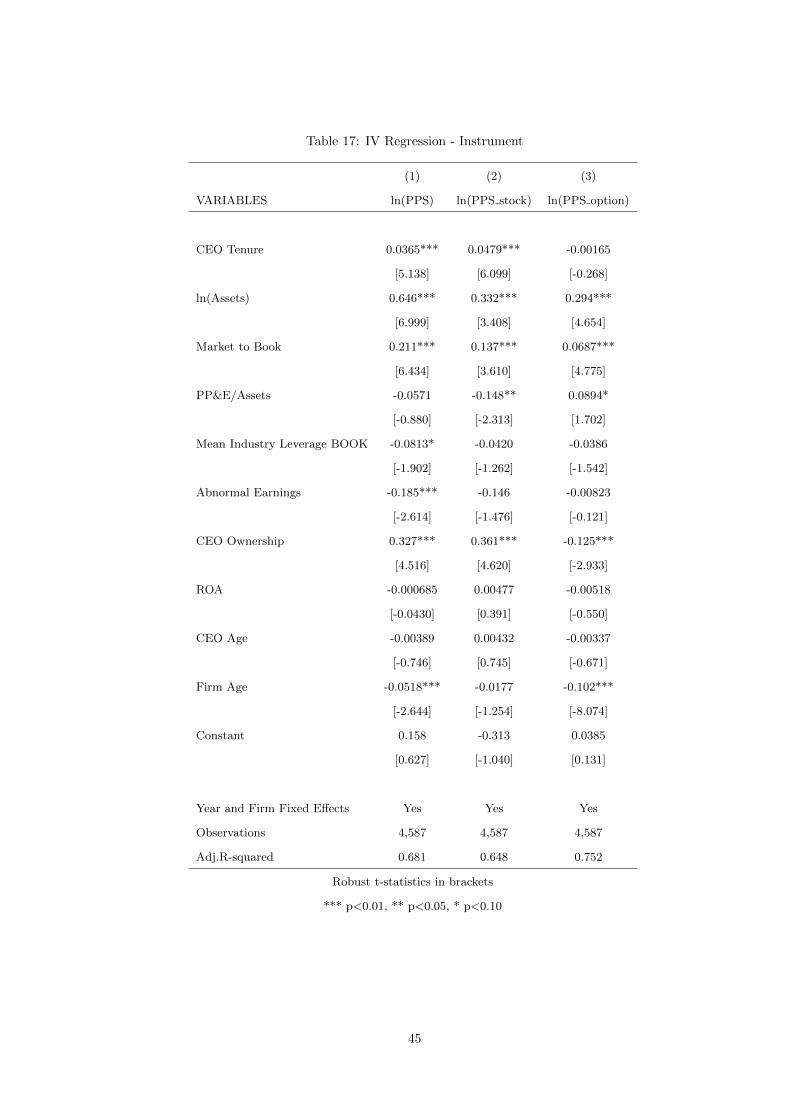
Table 17: IV Regression - Instrument
(1) (2) (3)
VARIABLES ln(PPS) ln(PPS stock) ln(PPS option)
CEO Tenure 0.0365*** 0.0479*** -0.00165
[5.138] [6.099] [-0.268]
ln(Assets) 0.646*** 0.332*** 0.294***
[6.999] [3.408] [4.654]
Market to Book 0.211*** 0.137*** 0.0687***
[6.434] [3.610] [4.775]
PP&E/Assets -0.0571 -0.148** 0.0894*
[-0.880] [-2.313] [1.702]
Mean Industry Leverage BOOK -0.0813* -0.0420 -0.0386
[-1.902] [-1.262] [-1.542]
Abnormal Earnings -0.185*** -0.146 -0.00823
[-2.614] [-1.476] [-0.121]
CEO Ownership 0.327*** 0.361*** -0.125***
[4.516] [4.620] [-2.933]
ROA -0.000685 0.00477 -0.00518
[-0.0430] [0.391] [-0.550]
CEO Age -0.00389 0.00432 -0.00337
[-0.746] [0.745] [-0.671]
Firm Age -0.0518*** -0.0177 -0.102***
[-2.644] [-1.254] [-8.074]
Constant 0.158 -0.313 0.0385
[0.627] [-1.040] [0.131]
Year and Firm Fixed Effects Yes Yes Yes
Observations 4,587 4,587 4,587
Adj.R-squared 0.681 0.648 0.752
Robust t-statistics in brackets
*** p<0.01, ** p<0.05, * p<0.10
45
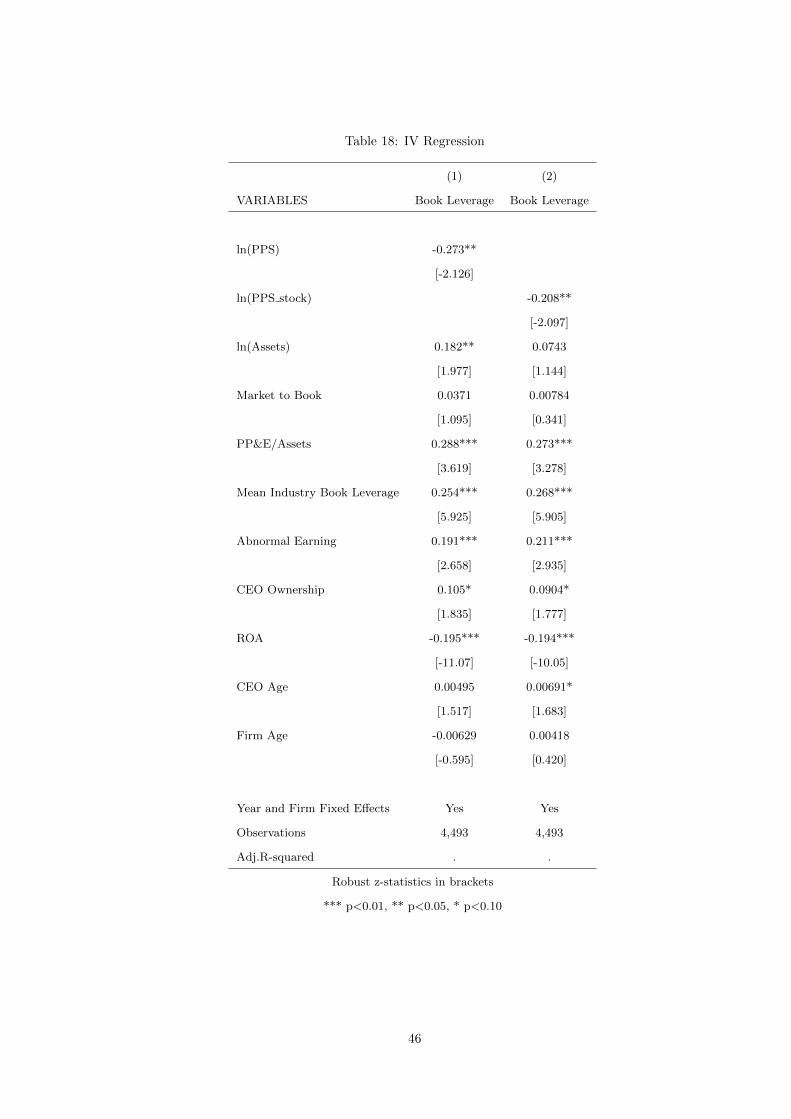
Table 18: IV Regression
(1) (2)
VARIABLES Book Leverage Book Leverage
ln(PPS) -0.273**
[-2.126]
ln(PPS stock) -0.208**
[-2.097]
ln(Assets) 0.182** 0.0743
[1.977] [1.144]
Market to Book 0.0371 0.00784
[1.095] [0.341]
PP&E/Assets 0.288*** 0.273***
[3.619] [3.278]
Mean Industry Book Leverage 0.254*** 0.268***
[5.925] [5.905]
Abnormal Earning 0.191*** 0.211***
[2.658] [2.935]
CEO Ownership 0.105* 0.0904*
[1.835] [1.777]
ROA -0.195*** -0.194***
[-11.07] [-10.05]
CEO Age 0.00495 0.00691*
[1.517] [1.683]
Firm Age -0.00629 0.00418
[-0.595] [0.420]
Year and Firm Fixed Effects Yes Yes
Observations 4,493 4,493
Adj.R-squared . .
Robust z-statistics in brackets
*** p<0.01, ** p<0.05, * p<0.10
46
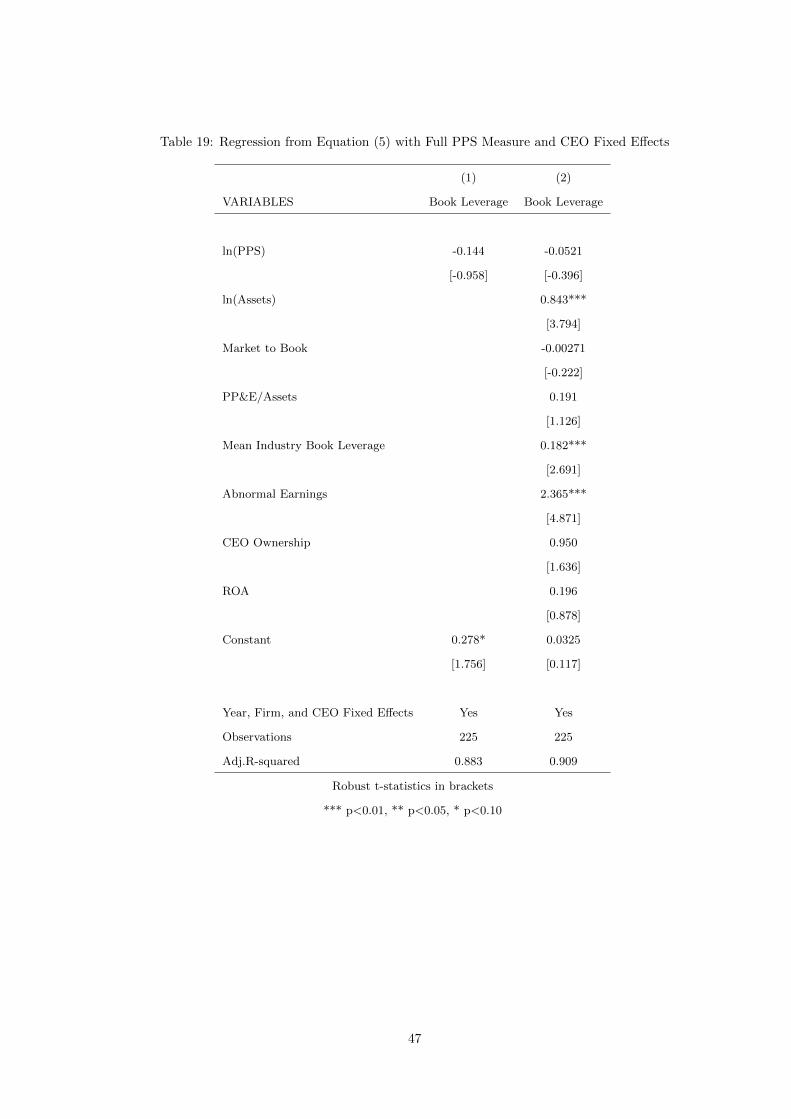
Table 19: Regression from Equation (5) with Full PPS Measure and CEO Fixed Effects
(1) (2)
VARIABLES Book Leverage Book Leverage
ln(PPS) -0.144 -0.0521
[-0.958] [-0.396]
ln(Assets) 0.843***
[3.794]
Market to Book -0.00271
[-0.222]
PP&E/Assets 0.191
[1.126]
Mean Industry Book Leverage 0.182***
[2.691]
Abnormal Earnings 2.365***
[4.871]
CEO Ownership 0.950
[1.636]
ROA 0.196
[0.878]
Constant 0.278* 0.0325
[1.756] [0.117]
Year, Firm, and CEO Fixed Effects Yes Yes
Observations 225 225
Adj.R-squared 0.883 0.909
Robust t-statistics in brackets
*** p<0.01, ** p<0.05, * p<0.10
47
References
Aggarwal, R. (2008), “Executive Compensation and Incentives,” in Handbook of Empirical Corporate
Finance, ed. E. Eckbo, vol. 2, chap. 17, pp. 497–538, North Holland.
Aggarwal, R. and Samwick, A. (1999), “Executive Compensation, Relative Performance Evaluation, and
Strategic Competition: Theory and Evidence,” Journal of Finance, 54, 1999–2043.
Aggarwal, R. and Samwick, A. (2006), “Empire-Builders and Shirkers: Investment, Firm Performance,
and Managerial Incentives,” Journal of Corporate Finance, 12, 489–515.
Ayotte, K. and Morrison, E. (2009), “Creditor Control and Conflict in Chapter 11,” Journal of Legal
Analysis, 1, 511–551.
Bebchuck, L., Cohen, A., and Ferrell, A. (2009), “What Matters in Corporate Governance?” Review of
Financial Studies, 22, 783–827.
Berger, P., Ofek, E., and Yermack, D. (1997), “Managerial Entrenchment and Capital Structure Deci-
sions,” Journal of Finance, 52, 1411–1438.
Bergstressor, D. and Phillippon, T. (2006), “CEO Incentives and Earnings Management,” Journal of
Financial Economics, 80, 511–529.
Berk, J., Stanton, R., and Zechner, J. (2010), “Human Capital, Bankruptcy, and Capital Stucture,”
Journal of Finance, 65, 891–926.
Bertrand, M. and Schoar, A. (2003), “Managing With Style: The Effect of Managers on Firm Policies,”
Quarterly Journal of Economics, 118, 1169–1208.
Betker, B. (1995), “Management’s Incentives, Equity’s Bargaining Power, abd Deviations From Absolute
Priority in Chapter 11 Bankruptcies,” Journal of Business, 68, 161–183.
Binsbergen, J. V., Graham, J., and Yang, J. (2010), “The Cost of Debt,” The Journal of Finance, 65,
2089–2136.
Brickley, K. (2003), “From Enron to WorldCom and Beyond: Life and Crime After Sarbanes-Oxley,”
Wash. U. L.Q., 81, 357–400.
Brickley, K. (2006), “In Enron’s Wake: Corporate Executives on Trial,” Journal of Criminal Law &
Criminology, 96, 396–434.
48
Brockman, P., Martin, X., and Unlu, E. (2010), “Executive Compensation and the Maturity Structure
of Corporate Debt,” Journal of Finance, 65, 1123–1161.
Cadenillas, A., Cvitanic, J., and Zapatero, F. (2004), “Leverage Decision and Manager Compensation
With Choice of Effort and Volatility,” Journal of Financial Economics, 73, 71–92.
Core, J. and Guay, W. (2002), “Estimating the Value of Employee Stock Option Portfolios and Their
Sensitivities to Price and Volatility,” Journal of Accounting Research, 40, 613–630.
Denis, D., Denis, D., and Sarin, A. (1997), “Agency Problems, Equity Ownership, and Corporate Diver-
sification,” Journal of Finance, 52, 135–160.
Eckbo, B. and Thorburn, K. (2003), “Control Benefits and CEO Discipline in Automatic Bankruptcy
Auctions,” Journal of Financial Economics, 69, 227–258.
Eckbo, B., Thorburn, K., and Wang, W. (2012), “How Costly is Corporate Bankruptcy for Top Execu-
tives?” Working Paper, Tuck School of Business.
Flannery, M. and Rangan, K. (2006), “Partial Adjustment Toward Target Capital Structures,” Journal
of Financial Economics, 79, 469–506.
Frank, M. and Goyal, V. (2007), “Corporate Leverage: How Much do Managers Really Matter?” Working
Paper, University of Minnesota.
Frank, M. and Goyal, V. (2008), “Trade-Off and Pecking Order Theories of Debt,” in Handbook of
Empirical Corporate Finance, ed. E. Eckbo, vol. 2, chap. 12, pp. 135–202, North Holland.
Gao, H. (2010), “Optimal Compensation Contracts When Managers Can Hedge,” Journal of Financial
Economics, 97, 218–238.
Garvey, G. (1997), “Marketable Incentive Contracts and Capital Structure Relevance,” Journal of Fi-
nance, 52, 353–378.
Gompers, P., Ishii, J., and Metrick, A. (2003), “Corporate Governance and Equity Prices,” Quarterly
Journal of Economics, 118, 107–155.
Graham, J. and Mills, L. (2008), “Simulating Marginal Tax Rates Using Tax Return Data,” Journal of
Accounting and Economics, 46, 366–388.
Graham, J., Li, S., and Qiu, J. (2011), “Managerial Attributes and Executive Compensation,” Review of
Financial Studies, 24, 1944–1979.
49
Graham, J., Harvey, C., and Puri, M. (2013), “Managerial Attitudes and Corporate Action,” Journal of
Financial Economics, Forthcoming.
Hall, B. and Liebman, J. (1998), “Are CEOs Really Paid Like Bureaucrats?” Quarterly Journal of
Economics, 113, 653–691.
Hennessy, C. and Whited, T. (2005), “Debt Dynamics,” Journal of Finance, 60, 1129–1165.
Hennessy, C. and Whited, T. (2007), “How Costly is External Financing? Evidence From a Structural
Estimation,” Journal of Finance, 62, 1705–1745.
Holmstrom, B. and Milgrom, P. (1987), “Aggregation and Linearity in the Provision of Intertemporal
Incentives,” Econometrica, 55, 303–328.
Holmstrom, B. and Milgrom, P. (1991), “Multitask Principal-Agent Analysis: Incentive Contracts, Asset
Ownership, and Job Design,” Journal of Law, Economics, & Organization, 7, 24–52.
Hotchkiss, E., John, K., Mooradian, R., and Thorburn, K. (2008), “Bankruptcy and the Resolution of
Financial Distress,” in Handbook of Empirical Corporate Finance, ed. E. Eckbo, vol. 2, chap. 14, North
Holland.
Jensen, M. and Meckling, W. (1976), “Theory of the Firm: Managerial Behavior, Agency Costs, and
Ownership Structure,” Journal of Financial Economics, 3, 305–360.
Jensen, M. and Murphy, K. (1990), “Performance Pay and Top-Management Incentives,” Journal of
Political Economy, 98, 225–264.
Jin, L. (2002), “CEO Compensation, Diversification, and Incentives,” Journal of Financial Economics,
66, 29–63.
John, T. A. and John, K. (1993), “Top-Management Compensation and Capital Structure,” Journal of
Finance, 48, 949–974.
Kaplan, S. N. and Minton, B. A. (2012), “How Has CEO Turnover Changed?” International Review of
Finance, 12, 57–87.
Malmendier, U. and Tate, G. (2005), “CEO Overconfidence and Corporate Investment,” Journal of
Finance, 60, 2661–2700.
Nikolov, B. and Whited, T. (2010), “Agency Conflicts and Cash: Estimates From a Structural Model,”
Working Paper, University of Rochester.
50

Tauchen, G. (1986), “Finite State Markov-Chain Approximations to Univariate and Vector Autoregres-
sions,” Economic Letters, 20, 177–181.
Tosun, O. (2012), “The Effect of the CEO’s Option Compensation on the Firm’s Capital Structure: A
Natural Experiment,” Working Paper, University of Maryland.
51
Related Documents