2019 www.kce.fgov.be KCE REPORT 314 EXCESS MORTALITY AND LIFE EXPECTANCY OF INDIVIDUALS WITH TYPE 1 DIABETES: A RAPID REVIEW

Welcome message from author
This document is posted to help you gain knowledge. Please leave a comment to let me know what you think about it! Share it to your friends and learn new things together.
Transcript

2019 www.kce.fgov.be
KCE REPORT 314
EXCESS MORTALITY AND LIFE EXPECTANCY OF INDIVIDUALS WITH TYPE 1 DIABETES: A RAPID REVIEW
2019 www.kce.fgov.be
KCE REPORT 314 HEALTH SERVICES RESEARCH
EXCESS MORTALITY AND LIFE EXPECTANCY OF INDIVIDUALS WITH TYPE 1 DIABETES: A RAPID REVIEW
PETER LOUWAGIE, CHRIS DE LAET, DOMINIQUE ROBERFROID

COLOPHON
Title: Excess mortality and life expectancy of individuals with type 1 diabetes: a rapid review
Authors: Peter Louwagie, Chris De Laet, Dominique Roberfroid
Reviewers: Pieter Gillard (UZ Leuven), Aan Kharagjitsing (UZ Brussel)
Layout: Ine Verhulst
Disclaimer: The external experts were consulted about a (preliminary) version of the scientific report. Their comments were discussed during meetings. They did not co-author the scientific report and did not necessarily agree with its content.
Subsequently, a (final) version was submitted to the validators. The validation of the report results from a consensus or a voting process between the validators. The validators did not co-author the scientific report and did not necessarily all three agree with its content.
Finally, this report has been approved by common assent by the Executive Board.
Only the KCE is responsible for errors or omissions that could persist. The policy recommendations are also under the full responsibility of the KCE.
Publication date: 16 May 2019
Domain: Health Services Research (HSR)
MeSH: Diabetes Mellitus, Type 1; Life expectancy; Mortality; Survival
NLM Classification: WK810
Language: English
Format: Adobe® PDF™ (A4)
Legal depot: D/2019/10.273/37
ISSN: 2466-6459
Copyright: KCE reports are published under a “by/nc/nd” Creative Commons Licence http://kce.fgov.be/content/about-copyrights-for-kce-publications.

How to refer to this document? Louwagie P, De Laet C, Roberfroid D. Excess mortality and life expectancy of individuals with type 1 diabetes: a rapid review. Health Services Research (HSR) Brussels: Belgian Health Care Knowledge Centre (KCE). 2019. KCE Reports 314. D/2019/10.273/37.
This document is available on the website of the Belgian Health Care Knowledge Centre.

KCE Report 314 Excess mortality and life expectancy of individuals with type 1 diabetes 1
TABLE OF CONTENTS
LIST OF TABLES ................................................................................................................................................. 4
LIST OF ABBREVIATIONS ................................................................................................................................. 5
SCIENTIFIC REPORT............................................................................................................................ 7
1 BACKGROUND ..................................................................................................................................... 7
1.1. CONTEXT .............................................................................................................................................. 7
1.2. RESEARCH QUESTION ........................................................................................................................ 7
1.3. TYPE 1 DIABETES MELLITUS .............................................................................................................. 7
1.4. GENERAL CLINICAL CONSIDERATIONS AND CONTEXT................................................................. 8
2. METHODOLOGY ................................................................................................................................... 9
2.1. IDENTIFICATION OF THE MOST RECENT HIGH QUALITY SYSTEMATIC REVIEWS ..................... 9
2.2. IDENTIFICATION OF PRIMARY STUDIES PUBLISHED AFTER THE SEARCH DATE APPLIED IN THE SYSTEMATIC REVIEWS .............................................................................................................10
3. EVIDENCE FROM THE LITERATURE ...............................................................................................10
3.1. SYSTEMATIC REVIEWS .....................................................................................................................10
3.1.1. Literature search ....................................................................................................................10
3.1.2. Evidence from the systematic review of Huxley et al. ............................................................11
3.1.3. Evidence from the systematic review of Lung et al. ...............................................................11
3.1.4. Consistency of the evidence from both systematic reviews ..................................................11
3.2. PRIMARY PAPERS REPORTING ON LIFE EXPECTANCY ..............................................................15
3.2.1. Literature search ....................................................................................................................15
3.2.2. The Scottish registry-based cohort study by Livingstone et al. .............................................15
3.2.3. The Swedish registry-based cohort study by Petrie et al.......................................................16

2 Excess mortality and life expectancy of individuals with type 1 diabetes KCE Report 314
3.2.4. The Australian registry-based cohort study by Huo et al.. .....................................................16
3.2.5. Consistency of the evidence in the Scottish, Swedish and Australian cohort studies ...........17
3.2.6. The Taiwanese longitudinal cohort study based on incident cases .......................................18
3.3. ADDITIONAL STUDIES REPORTING SMR, MORTALITY, RISK FOR MAJOR OUTCOMES OR TRENDS OVER TIME ..........................................................................................................................25
3.3.1. The Finnish Diabetic Nephropathy study (FinnDiane) ...........................................................25
3.3.2. The Pittsburgh Epidemiology of Diabetes Complications study (‘Pittsburgh EDC’ or ‘EDC study’) .....................................................................................................................................26
3.3.3. The SEARCH for diabetes in youth study (‘SEARCH’) ..........................................................27
3.3.4. The EURODIAB-Prospective Complications Study (EURODIAB-PCS) ................................27
3.3.5. A Danish study, run at the Steno Diabetes Centre, ...............................................................28
3.3.6. A Swedish cohort study .........................................................................................................28
3.3.7. A Norwegian retrospective cohort study ................................................................................29
3.3.8. A Norwegian registry-based study .........................................................................................29
3.3.9. An Australian cohort study .....................................................................................................30
3.3.10. An Australian registry-based study ........................................................................................30
3.3.11. A recent narrative overview on type 1 diabetes. ....................................................................30
4. DISCUSSION AND CONCLUSION .....................................................................................................31
4.1. EXCESS MORTALITY AND PARAMETERS THAT MODIFY THIS RISK ..........................................31
4.2. AGE AT ONSET ...................................................................................................................................32
4.3. DISEASE DURATION, CURRENT AGE ..............................................................................................32
4.4. GENDER ..............................................................................................................................................33
4.5. LEVEL OF OVERALL GLYCAEMIC (METABOLIC) CONTROL .........................................................33
4.6. RISK FACTORS FOR ACUTE LIFE-THREATENING COMPLICATIONS ..........................................34
KCE Report 314 Excess mortality and life expectancy of individuals with type 1 diabetes 3
4.7. MICRO-VASCULAR COMPLICATIONS ..............................................................................................35
4.8. MACRO-VASCULAR COMPLICATIONS ............................................................................................35
4.9. NEPHROPATHY AS A PROGNOSTIC INDICATOR ...........................................................................35
4.10. CARDIAC AUTONOMIC NEUROPATHY ............................................................................................37
4.11. WELL KNOWN RISK FACTORS REQUIRING SPECIAL ATTENTION ..............................................37
4.12. SOCIO-ECONOMIC STATUS ..............................................................................................................38
4.13. SPECIFIC FEATURES OF LONG SURVIVING PATIENTS WITH T1D ..............................................38
4.14. SECULAR TRENDS .............................................................................................................................39
4.15. CONCLUSION ......................................................................................................................................39
5. SYNTHESIS .........................................................................................................................................41
5.1. INTRODUCTION ..................................................................................................................................41
5.2. METHODS ............................................................................................................................................41
5.3. OVERALL EXCESS MORTALITY ........................................................................................................42
5.4. PARAMETERS MODULATING MORTALITY RISK ............................................................................42
5.5. LIMITATIONS .......................................................................................................................................44
5.6. FINAL CONCLUSION ..........................................................................................................................44
APPENDIX ...........................................................................................................................................45
APPENDIX 1. SEARCH FOR SYSTEMATIC REVIEWS .............................................................................46
APPENDIX 1.1. PICO AND INCLUSION / EXCLUSION CRITERIA ...............................................................46
APPENDIX 1.2. MEDLINE @ OVID ................................................................................................................47
APPENDIX 1.3. EMBASE ................................................................................................................................49
APPENDIX 1.4. COCHRANE ..........................................................................................................................51
APPENDIX 2. SEARCH STRATEGY FOR PRIMARY PAPERS .................................................................54
APPENDIX 2.1. PICO AND INCLUSION / EXCLUSION CRITERIA ...............................................................54

4 Excess mortality and life expectancy of individuals with type 1 diabetes KCE Report 314
APPENDIX 2.2. MEDLINE @ OVID ................................................................................................................54
APPENDIX 2.3. EMBASE ................................................................................................................................56
APPENDIX 2.4. COCHRANE ..........................................................................................................................58
REFERENCES .....................................................................................................................................61
LIST OF TABLES Table 1 – Study characteristics of systematic reviews .......................................................................................12
Table 2 – Summary of the main results - Systematic review and meta-analysis by Huxley at al. .....................13
Table 3 – Summary of the main results - Systematic review and meta-analysis by Lung at al. ........................14
Table 4 – Comparison of the three cohort studies ..............................................................................................18
Table 5 – Study characteristics of the primary papers .......................................................................................19
Table 6 – Summary of main results - Scottish prospective cohort study on life expectancy by Livingstone et al. ....................................................................................................................................................................21
Table 7 – Summary of main results - Swedish registry-based cohort study on life expectancy by Petrie et al. ....................................................................................................................................................................22
Table 8 – Summary of main results - Australian registry-based cohort study on live expectancy by Huo et al. ....................................................................................................................................................................23
Table 9 – Summary of main results - Taiwanese longitudinal cohort study of incident cases of type 1 diabetes evaluating live expectancy after diagnosis by Ou HT et al. ................................................................24
Table 10 – Comparison of the three cohort studiesType 1 diabetic population in: ............................................42
Table 11 – PICO and inclusion / exclusion criteria for the systematic reviews ..................................................46
Table 12 – PICO and inclusion / exclusion criteria for the primary papers .........................................................54

KCE Report 314 Excess mortality and life expectancy of individuals with type 1 diabetes 5
LIST OF ABBREVIATIONS
ABBREVIATION DEFINITION
BP Blood Pressure
BMI Body Mass Index (weight over height squared)
CAN Cardiac Autonomic Neuropathy
CKD Chronic Kidney Disease
CNS Central Nervous System
CVA Cerebrovascular Accident
CV Cardiovascular
CVD Cardiovascular disease
DKA Diabetic Keto-Acidosis
eLE estimated LE
ESM Electronic Supplementary Material
ESRD End Stage Renal Disease
eYLL estimated YLL
FU Follow-Up
(e)GFR (estimated) Glomerular Filtration Rate
HbA1c glycated Haemoglobin A1
HR Hazard ratio
IHD Ischaemic Heart Disease
LDL-c LDL cholesterol
LE Life Expectancy
M-A Meta-Analysis
MA Micro-Albuminuria
OBS Opvolgingsbureau voor tarificatie – Bureau de suivi de la tarification
6 Excess mortality and life expectancy of individuals with type 1 diabetes KCE Report 314
PAD Peripheral Artery Disease
PICO(D) Patient, Intervention, Comparator, Outcome, (Design)
PY, PYE Patient Years (of Exposure or follow-up): PY or PYE can be used interchangeably
RF Risk Factor(s)
RR Relative Risk
SMR Standardized Mortality Ratio
SR Systematic Review
T1D Type 1 Diabetes
T2D Type 2 Diabetes
y Year
YLL Years of Life Lost
KCE Report 314 Excess mortality and life expectancy of individuals with type 1 diabetes 7
SCIENTIFIC REPORT 1 BACKGROUND
1.1. Context
This report is a technical advice demanded by the Insurance Commission at the request of the Opvolgingsbureau voor tarificatie – Bureau de suivi de la tarification (OBS). The immediate reason for this request is the fact that the OBS has to decide on individual cases when subjects with type 1 diabetes mellitus (T1D), applying for a debt balance life insurance, are confronted with high additional premiums for their insurance, or even with a refusal to obtain the insurance, and seek arbitration by the OBS. KCE has a legal obligation to give advice to the Insurance Commission.
This technical advice is thus an atypical Health System Research (HSR) report. The report is limited to addressing a very specific technical question, and contains no description of the Belgian situation, no international comparison, no stakeholder consultations, and no recommendations. The draft version was reviewed by two external experts. It is published only in English.
1.2. Research question
The estimation of mortality risk with a primary focus on standardized mortality ratios (SMR), and on life expectancy (LE) as it is relevant in the context of patients with T1D applying for a debt balance life insurance. An additional request was to evaluate the parameters that are likely to increase or decrease this mortality risk in individual patients.
1.3. Type 1 diabetes mellitus
T1D mostly presents at young ages, mainly before the age of 40 years, though occasionally at older ages, and seems to be triggered by an external factor (e.g. some hypotheses points to certain viral infections), so that it essentially takes the affected individual ‘by surprise’. Exact data on the prevalence for Belgium do not exist, though according to the Belgian Diabetes Liga prevalence for T1D is estimated at 4/1000 inhabitants.1 This is in line with data from the International Diabetes Federation (data from
8 Excess mortality and life expectancy of individuals with type 1 diabetes KCE Report 314
Diabetes Altas – 2017, with extrapolation by assuming that 5 to 7.5% of all diabetic patients suffer from T1D).2
Genetic predisposition (susceptibility) is involved, though on average the genetic predisposition to develop T1D is much less prominent than is the case for Type 2 diabetes (T2D) development. Despite this genetic influence in T1D, the majority of new cases of T1D present in individuals with no known family history of the disease. In addition to these possible genetic factors, unhealthy lifestyle factors play an important and often even predominant role in the development of T2D.
It should also be noted that, given the life-threatening situation when T1D presents itself and the need to rely on insulin therapy for survival, T1D patients are diagnosed early, in contrast to T2D which is often present for several years before diagnosis.
1.4. General clinical considerations and context
It is known from clinical experience and confirmed by data and reports in literature that the excess mortality in T1D is the result of its complications.
Many factors are involved and modulate this risk such as:
1. the time-period (calendar time) analysed and linked to this the continuing progress in T1D management (e.g. innovations in therapy, introduction and implementation of new technologies, better education and self-management, monitoring….) as well as,
2. the individual patient characteristics that may largely differ like e.g.:
o age at diagnosis,
o gender,
o disease duration,
o level of glycaemic/metabolic control,
o presence and severity of complications,
o presence and severity of comorbidities,
o presence or absence of traditional risk factor control,
o socioeconomic status,
o therapeutic and self-care compliance.
When reading and interpreting data from studies and analyses reported in literature the following considerations should be made:
1. Caution is needed when extrapolating conclusions from historical data and data from different regions. This is why this technical issue paper focusses only on the most recent systematic reviews (SR) and recent primary papers. Even then medical progress and improvement of care is constantly implemented so that the current situation might already be different from what has been reported previously. The SR and papers discussed here as well as other data demonstrate that LE in T1D clearly improved over time.
2. What really matters to clinicians, patients and other stakeholders, including the insurers is the estimate of remaining life expectancy from a given age. This requires estimating the remaining LE, conditional on survival up to a given age. If a patient at a given time has long-standing disease, the relevant remaining LE should ideally be based on data from other patients with similar disease conditions and durations.
3. We should be careful when applying general conclusions from studies to individual patients who largely differ on their demographics, age of diagnosis, duration of diabetes, level of good or bad metabolic control, quality of self-care, presence or absence of complications, presence of co-morbidities, socio-economic status and other possible risk modifying factors.
4. There is no unique increased mortality risk for all T1D patients and this report aims to give an estimate of the mortality risk in these patients overall, but also provides a qualitative discussion of the effect of modifying factors.

KCE Report 314 Excess mortality and life expectancy of individuals with type 1 diabetes 9
5. Relevant to the current context, when basing judgements on relative risks of mortality, hazard ratio’s or SMR estimates, it is important to put the relative risks in balance with the still low absolute risk in a typical rather ‘young’ population applying for a debt balance insurance. Therefore, one should also look at the (crude) mortality rates for instance expressed as % / year or n / 1000 person-years of follow-up.
6. Recently the PRIME Diabetes Model was described in a publication by Valentine et al. reporting on a novel prediction model/method to estimate long-term clinical and cost outcomes in patients withT1D developed by authors affiliated with Ossian-consulting (Ossian Health Economics and Communication, Basel, Switzerland) and Eli Lilly and
Company.3 We kindly received access from the authors, but we realised that this model is essentially meant to simulate populations using individual patient modelling, rather than for making predictions for an individual.
2. METHODOLOGY
Given the nature of the information need as defined by the demander and the time frame, a rapid review approach of literature was applied (Roberfroid D, Fairon N, San Miguel L, Paulus D. Method – Rapid reviews. Methods Brussels: Belgian Health Care; document available on website of the Belgian Health Care Knowledge Centre, www.kce.fgov.be).
This consisted of two steps: the identification of the most recent high-quality systematic reviews and the identification of primary studies published after the search date applied in the systematic reviews identified in step 1.
2.1. Identification of the most recent high quality systematic reviews
The search strategy, inclusion-exclusion criteria and selection flow chart are presented in the appendix part 6.1.
The search was limited to systematic reviews published in the last five years (2013-Jan. 2018), as disease management and treatment strategies of diabetes have evolved over time, and current estimates of associated mortality risk and life expectancy must keep up as much as possible with these innovations (improved care and treatment of T1D: e.g. use of insulin analogues, increased use of insulin pumps and continuous glucose monitoring technology, implementation of more stringent therapeutic targets & targets for risk factor control, increased use of anti-hypertensive of lipid lowering drugs, improved education and self-management,…).
10 Excess mortality and life expectancy of individuals with type 1 diabetes KCE Report 314
2.2. Identification of primary studies published after the search date applied in the systematic reviews
The search strategy, inclusion-exclusion criteria and selection flow chart are presented in the appendix part 6.2.
As none of the retained SR reported specifically on life expectancy (LE) or years of life lost (YLL), the principal objective here was to identify and extract publications/studies that provide life expectancy or life table data.
An additional aim of this technical issue paper was the identification of the parameters and risk factors that are likely to influence the observed mortality risk in the overall T1D population. Here the purpose was not to do a systematic review of literature, so that several of the articles referred to were identified through ‘cascade’ referral and manual searching. The most important parameters/risk factors will be discussed in chapter 0.
The quality of the systematic review(s) was appraised with AMSTAR-2 and quality of the primary studies reporting life expectancy in Cohort studies were evaluated according to SIGN methodology.4, 5
In addition to the systematic search strategy outlined above, additional important papers were identified through reference lists and hand searching for use in the discussion. A short summary of these publications is given in section 0.
a For information: the two other SR which were not retained were excluded because:
- The SR by Morgan et al. which was limited to people with type 1 diabetes who were diagnosed < 19 y of age and was primarily meant to map situations in different geographical regions or countries (Belgium not included).6 The
3. EVIDENCE FROM THE LITERATURE
3.1. Systematic reviews
3.1.1. Literature search
Initially we retrieved 112 papers. On the basis of title and abstract, four systematic reviews (SR) seemed eligible. After full-text appraisal, two systematic reviews were selected:a
The SR by Huxley et al. was primarily focussed on the mortality risk of T1D in women vs men, but also reported on the comparison of women and men with type 1 diabetes vs. women and men without the disease.8
The SR by Lung et al. was primarily focussed on temporal changes over time in the relative risk (RR) of mortality.9
These systematic reviews also included meta-analyses and their main characteristics are summarized in Table 1.
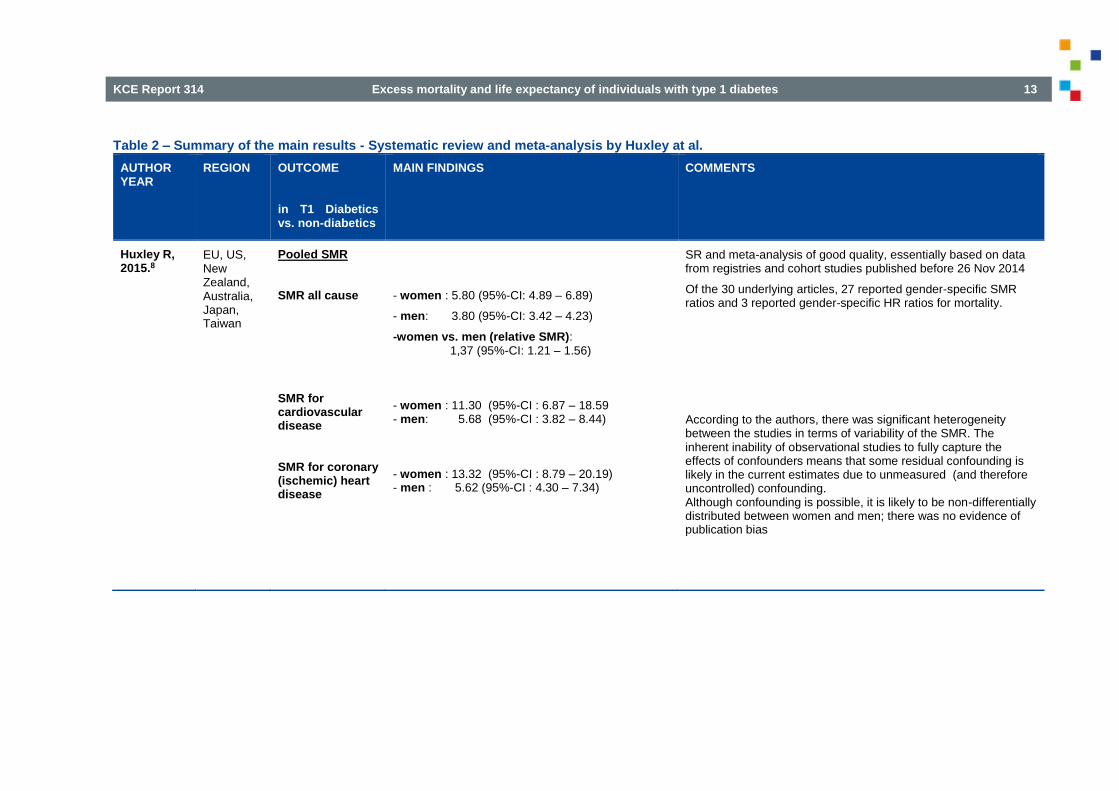
The main results of the SR by Huxley et al. are summarized in Table 2.
The main results of the SR by Lung et al. are summarized in Table 3.
main reason for exclusion is the limitation of the population to children and adolescents only and the historical nature of the data.
- The SR by Scott et al. which evaluated the effect of socio-economic status and inequalities on mortality, morbidity and diabetes management in T1D.7 As the outcome of this SR is out of scope and provide no SMR, RR of mortality or Life expectancy data, this review is not retained.
KCE Report 314 Excess mortality and life expectancy of individuals with type 1 diabetes 11
3.1.2. Evidence from the systematic review of Huxley et al.
The SR by Huxley et al. basically confirms the increased mortality in patients with T1D vs. individuals with no T1D, and this increased mortality is to a large extend driven by an increased mortality by cardiovascular disease (CVD). This study also confirms gender differences in mortality rates associated with T1D as was suggested in previous studies. The all-cause SMR was 5.80 for T1D in women (95%-CI: 4.89 – 6.89), and 3.80 for T1D in men (95%-CI: 3.42 – 4.23), with a rSMR for T1D in women vs. T1D in men of 1,37 (95%-CI 1.21 – 1.56, p<0.0001).
This study showed no increased risk of mortality from cancer, neither in women, nor in men vs. the population without T1D, and no significant between gender differences related to cancer mortality were observed in this T1D population, in contrast to the Australian registry-based cohort study by Huo et al. reported in section 3.2.4.
3.1.3. Evidence from the systematic review of Lung et al.
The SR by Lung et al. shows improvement in mortality risk over time, with most of the improvement realized before 1990. This is in line with previous reports in literature confirming that life expectancy gap vs. the general population has decreased.
This SR reports a pooled RR of mortality (men and women combined) of 3.82 (95%-CI: 3.41 – 4.29). For the pooled contributing studies that started before 1970 this was 5.8 (95%-CI: 4.20 – 8.01) and this figure went down for studies started after 1990 to 3.11 (95%-CI: 2.47 – 3.91), showing improvement over time and with the largest relative improvements occurring prior to 1990.
For the overall period covered, EU-studies provided a pooled RR of 3.56 (95%-CI: 3.16 – 4.00), compared to a larger RR of mortality of 4.63 (95%-CI: 3.28-6.55) in the pooled Non-EU studies. A separate meta-analysis in this study for women and men provided RR of mortality which were respectively 4.54 (95%-CI:3.79 – 5.45) and 3.25 (95%-CI: 2.82 – 3.73).
3.1.4. Consistency of the evidence from both systematic reviews
In general, the findings of both SRs are largely consistent. Both SRs confirm the increased mortality risk associated with T1D, as well as the higher relative mortality risk for T1D in women vs. T1D in men.
Although the absolute risk of death in men with T1D remains higher than in women with T1D, both SRs confirm that the relative mortality risk ratios are higher in women than in men when comparing the gender specific mortality risk in people with T1D compared to their counterparts without the disease.8,
9
As in other observations it seems that the so-called cardiovascular protection in women disappears in females with T1D. The exact reason for this is not well understood (see discussion in chapter 0.4).
Both SRs reported significant heterogeneity across the underlying studies. Differences in duration of studies and baseline characteristics of the T1D patients, inconsistent reporting of patient characteristics during and across studies could be at the basis of this heterogeneity. As such the influence of other confounders (e.g. diabetes specific complications, duration of diabetes, median age at diagnosis, body weight, smoking, type of insulin treatment, HbA1c levels etc.) which might be associated with heterogeneity, could not be assessed.
Improvements in type 1 diabetes treatments, technologies, care and self-care are still ongoing, and further increases in LE have been observed and still can be expected to take place. This point is relevant as the end-data applied in the search windows for the SRs by Huxley at al. and by Lung et al. were respectively November 2014 and April 2012

12 Excess mortality and life expectancy of individuals with type 1 diabetes KCE Report 314
Table 1 – Study characteristics of systematic reviews
Author, year
Time frame relied on
Region /country
Objective Trials /studies (# participants)
Type of studies included
Patient -population
Comparison Outcomes relevant for the current research Q
Study quality
Evaluation tool
Huxley et al. 2015.8
Studies/papers published < 26-Nov-2014
Multi-region
Pooled SMR all cause, and cause specific
M-A of 26 studies (n=214.114)
19 registries and 6 prospective. cohort studies, 1 UK GPRD*
T1D men and women
Men & women without T1D plus also T1D-M vs. T1D-F (= initial aim of the SR)
Pooled SMR, T1D M & F vs. counterparts without the disorder.
Moderate-to-good
AMSTAR-2
Lung et al. 2014. 9
Studies/papers published < April 2012
Multi-region
RR of all-cause mortality Focus on exploration of temporal changes over time
M-A of 26 studies from 88 observations (partial overlap with Huxley) Median number of subjects/study = 382 (ranging from 75 –
12 684/trial)
24 cohort studies, 2 RCT’s
T1D-subjects
General population
RR of mortality,
with sub-analysis according to time period, gender, age-group at diagnosis and region (Eu vs. non-Eu)
Moderate-to-good
AMSTAR-2
*UK-GPRD : UK General Practice Research Database.
As could be expected there was an overlap in the individual studies contributing to each of the two SRs. The fact that the overlap is only partial can be explained by the different time period window searched, but also might be caused by a difference in the primary focus of both studies.
KCE Report 314 Excess mortality and life expectancy of individuals with type 1 diabetes 13
Table 2 – Summary of the main results - Systematic review and meta-analysis by Huxley at al.
AUTHOR YEAR
REGION OUTCOME in T1 Diabetics vs. non-diabetics
MAIN FINDINGS COMMENTS
Huxley R, 2015.8
EU, US, New Zealand, Australia, Japan, Taiwan
Pooled SMR
SMR all cause
SMR for cardiovascular disease
SMR for coronary (ischemic) heart disease
- women : 5.80 (95%-CI: 4.89 – 6.89)
- men: 3.80 (95%-CI: 3.42 – 4.23)
-women vs. men (relative SMR): 1,37 (95%-CI: 1.21 – 1.56)
- women : 11.30 (95%-CI : 6.87 – 18.59 - men: 5.68 (95%-CI : 3.82 – 8.44)
- women : 13.32 (95%-CI : 8.79 – 20.19) - men : 5.62 (95%-CI : 4.30 – 7.34)
SR and meta-analysis of good quality, essentially based on data from registries and cohort studies published before 26 Nov 2014
Of the 30 underlying articles, 27 reported gender-specific SMR ratios and 3 reported gender-specific HR ratios for mortality.
According to the authors, there was significant heterogeneity between the studies in terms of variability of the SMR. The inherent inability of observational studies to fully capture the effects of confounders means that some residual confounding is likely in the current estimates due to unmeasured (and therefore uncontrolled) confounding. Although confounding is possible, it is likely to be non-differentially distributed between women and men; there was no evidence of publication bias

14 Excess mortality and life expectancy of individuals with type 1 diabetes KCE Report 314
Table 3 – Summary of the main results - Systematic review and meta-analysis by Lung at al.
AUTHOR YEAR
REGION OUTCOME to be predicted in T1 Diabetics vs. non-diabetics
MAIN FINDINGS COMMENTS
Lung T, 2014.9
EU, US, Australia, New Zealand, Cuba, Hong Kong, Japan
RR of all-cause mortality:
Overall
In function of time period
in observations using data
- before 1971
- 1971-80
- 1981–90
- after 1990
In Females:
In Males:
In patients diagnosed <18 y
In patients diagnosed ≥ 18 y
In European studies
In non-European studies
RR = 3.82 (95%-CI 3.41 - 3.4.29)
RR = 5.80 (95%-CI 4.20 - 8.01)
RR = 5.06 (95%-CI 3.44 - 7.45)
RR = 3.59 (95%-CI 3.15 - 4.09)
RR = 3.11 (95%-CI 2.47 - 3.91)
RR = 4.54 (95%-CI 3.79 – 5.45)
RR = 3.25 (95%-CI 2.82 – 3.73)
RR = 4.93 (95%-CI 4.13 - 5.88)
RR = 2.41 (95%-CI 1.75 - 3.32)
RR = 3.56 (95%-CI 3.16 - 4.00)
RR = 4.63 (95%-CI 3.28- 6.55)
SR and meta-analysis of good quality, based on English language
papers published before April 2012 in peer reviewed journals. SR based on 26 studies (88 observations), 24 from cohort studies, 2 from RCT.
There was significant heterogeneity across the studies, which could not be explained solely by gender differences; There are still other (unobserved) factors which could play a role. According to the authors there was no evidence of publication bias
KCE Report 314 Excess mortality and life expectancy of individuals with type 1 diabetes 15
3.2. Primary papers reporting on life expectancy
3.2.1. Literature search
After the deletion of five duplicates we identified 416 primary papers. After an initial screening on title and abstract 60 papers were considered potentially useful.
After screening those publications, four papers were selected that either reported life expectancy (LE), years of life lost (YLL) or life tables.
The Scottish prospective cohort study, the Swedish nationwide registry-based study and the Australian registry-based cohort study are based on period estimates, in other words they provide conditional LE estimates for each attained age of prevalent cases. They are based upon period estimates (relatively short periods in which the observed patients vary in disease age-of-onset, disease duration, severity, complications and comorbidities) and they describe the expected remaining LE under the assumption that mortality rates across all age strata observed at a certain moment remain constant 10-12.
Their conclusions are therefore appropriate for hypothetical individuals who are supposed to experience each of the age-specific mortality rates as observed in a relatively short observation period. Therefore it is hazardous to extrapolate these observations into the future such as the prediction of the remaining LE for an individual person affected by T1D. Moreover, they do not provide the probability that an individual at a given age will survive the next ten or twenty years.
The fourth Taiwanese study, rather than only providing an estimated conditional LE provides additional cohort LE for incident cases of people affected by T1D.13 This cohort life expectancy study also uses recent trends in LE to project further improvements in survival in the future.
The study characteristics and main results of these four papers are summarized in Table 5 to Table 9.
3.2.2. The Scottish registry-based cohort study by Livingstone et al.
The estimated LE for patients with T1D in Scotland based on data from 2008 through 2010 indicated an estimated loss of life expectancy at age 20 of approximately 11 years in men and 13 years in women, compared to the general population without T1D.11
The study also found that nephropathy (renal disease as defined by eGFR criteria) remained an important factor associated with loss in LE, though even for those with preserved renal function there was still a substantial difference in LE vs. the general population.
There are a few specific possible limitations to this study.
An important remark and limitation about the sub-analysis made on those with ‘preserved renal function’ is that the threshold used was based on an eGFR criterion (eGFR > 90 mL/min/1.73m2), without taking into account the presence or absence of (micro-) albuminuria. Micro-albuminuria (MA) is a very important marker both for nephropathy and for overall cardiovascular risk in general 14. This is a limitation and weakness to be considered when interpreting data for the group categorized as with ‘preserved renal function’. In fact a substantial proportion of the subjects in this study might well have a eGFR above the defined threshold but also have (micro-) albuminuria.
This will further be elaborated in section 4.9, as it is clear from literature that the presence or absence of nephropathy is an important prognostic indicator. Some reports in the literature even suggested that in the absence of nephropathy, mortality in T1D could be comparable to the general population or those not affected by diabetes, though the necessary caution on this assumption should be made.
The obtained LE and YLL are estimates based on a period-type LE (observation period 3 years). The calculated LE estimates describe the expected additional years of life or LE for people alive today if mortality rates across all age strata observed today would be applicable throughout their life.
16 Excess mortality and life expectancy of individuals with type 1 diabetes KCE Report 314
Regarding the analysis on the contribution of acute complications to mortality, the data did not allow to differentiate death due to severe DKA or hypoglycaemic coma.
The study did not allow including data analysis in function of the level of (good or poor) glycaemic control.
3.2.3. The Swedish registry-based cohort study by Petrie et al.
From June 2002 till November 2007 the LE at age 20 of Swedes with T1D increased by approximately 2 years for men but minimally for women (not significant).12 These changes have been driven by a decrease in cardiovascular mortality.
The strengths of this study are the large representative sample, the relatively long length of follow-up and the measurement of clinical risk factors. Data on age at diagnosis, HbA1c, presence/absence of micro-albuminuria and eGFR, BMI, blood pressure, lipids and on smoking status were available and were used for modelling for risk factor changes. A Cox proportional hazards model was applied to assess trends in overall and cause-specific mortality. In general the study confirms the well-known usual risk factors (see also Table 2 in the original article). However two parameters, Body Mass Index and Blood Pressure (BMI and BP) were in this study negatively correlated and are as such ‘counterintuitive’. Higher BMI could in some patients be a marker of good history of glycaemic control (higher insulin doses can lead to higher weight gain), or could hypothetically be explained by the positive effects of greater lean mass in overweight and obese people counterbalancing the negative effects of greater fat mass on mortality. Anyway this observation is not well understood. Another counterintuitive finding is the negative correlation between systolic BP and mortality risk, which might result from the fact that a (too) low systolic BP may be a marker for underlying poor health, particularly in people with heart failure.
The LE data obtained in this study are an estimate based on abridged period-type of life tables (total period June 2002 and November 2007) resulting in conditional LE estimates. The period covered is considerable though still limited so that the database did not allow to make reliable
additional LE estimates. This means that recent improvements in care may not show up in this kind of analysis.
3.2.4. The Australian registry-based cohort study by Huo et al..
This Australian study showed that type 1 diabetic patients had an estimated LE at birth of 68.6 years (95%-CI 68.1 – 69.1), which was 12.2 years (95%-CI 11.8 – 12.7) less than in the overall population.10
Over the 14-year follow-up (FU) period the improvement in LE at birth in 2004 – 2010 compared with 1997 – 2003 was similar for both type 1 diabetic patients (men, +1.9 years [95%-CI 0.4 – 3.3]; women, +1.5 years [95%-CI 0.0 – 3.2]) and the general population (men, +2.2 years; women, +1.4 years).
There was a slight improvement in estimated LE with increasing age at T1D diagnosis. For example, at the age of 35 years, patients diagnosed before age 15 years lived 1.6 years less compared with those diagnosed between the ages of 15 and 29 years: 32.6 years [95%-CI: 30.2 – 35.4] vs. 34.2 years [95%-CI: 32.9 – 35.9] and 2.5 fewer years than those diagnosed at age >30 years: 32.6 years [95%-CI: 30.2 – 35.4] vs. 35.1 years [95%-CI: 34.5 – 35.8]. However, these differences decreased at an attained age over 50 years.
Deaths at age less than 60 years accounted for 60% of the YLL from T1D for men and 45% for women.
The major contribution to YLL was mortality from endocrine and metabolic disease at age 10–39 years (men, 39–59%; women, 35–50%). This peaked at 10-19 years and decreased with increasing age.
The major contribution to YLL was mortality from circulatory disease at age ≥40 years (men, 43–75%; women, 34–75%). This peaked at 70-79 years.
Another important contributor to YLL was death from neoplasm between the ages of 10 and 50 y. After the age of 50 years, death from neoplasm had a much lower contribution to the total YLL. This finding is in contrast with the SR by Huxley et al. where no increased risk of mortality from cancer was found, neither in women or men vs. the general population.
KCE Report 314 Excess mortality and life expectancy of individuals with type 1 diabetes 17
In general (for all age groups combined) the order of contribution to YLL is: 1st circulatory/CV-disease, 2nd endocrine/metabolic (acute complications: like hypoglycaemic coma or severe diabetic keto acidosis (DKA)), and 3th neoplasm.
The LE obtained is an estimate based on abridged period life tables. The total period covering June 2002 and November 2007 is a considerable period though still limited so that the database did not allow cohort ‘additional’ LE estimates. In principle, the collected data would have made it possible to estimate probabilities of death within a given time period. Unfortunately, the data available (even in the electronic supplementary material) do not allow this. Efforts to contact the authors were unsuccesfull. However, figure 1 in this publication gives a good indication of the gap in life expectancy at different ages for given periods of time.
The study generally explicitly identified T1D populations based on classification by the heath practitioner at registration, however for the current study, T1D status was assigned to participants recorded as T1D who were diagnosed at age < 45 years and taking insulin. Registration date was used as a proxy for the diagnosis date because the diagnosis date was missing for a large proportion of participants (56%). Additionally those participants recorded as having type 2 diabetes (T2D) who were diagnosed under 30 years of age and were taking insulin within 1 year of diagnosis were reclassified as having T1D. This might be a minor limitation in this study.
3.2.5. Consistency of the evidence in the Scottish, Swedish and Australian cohort studies
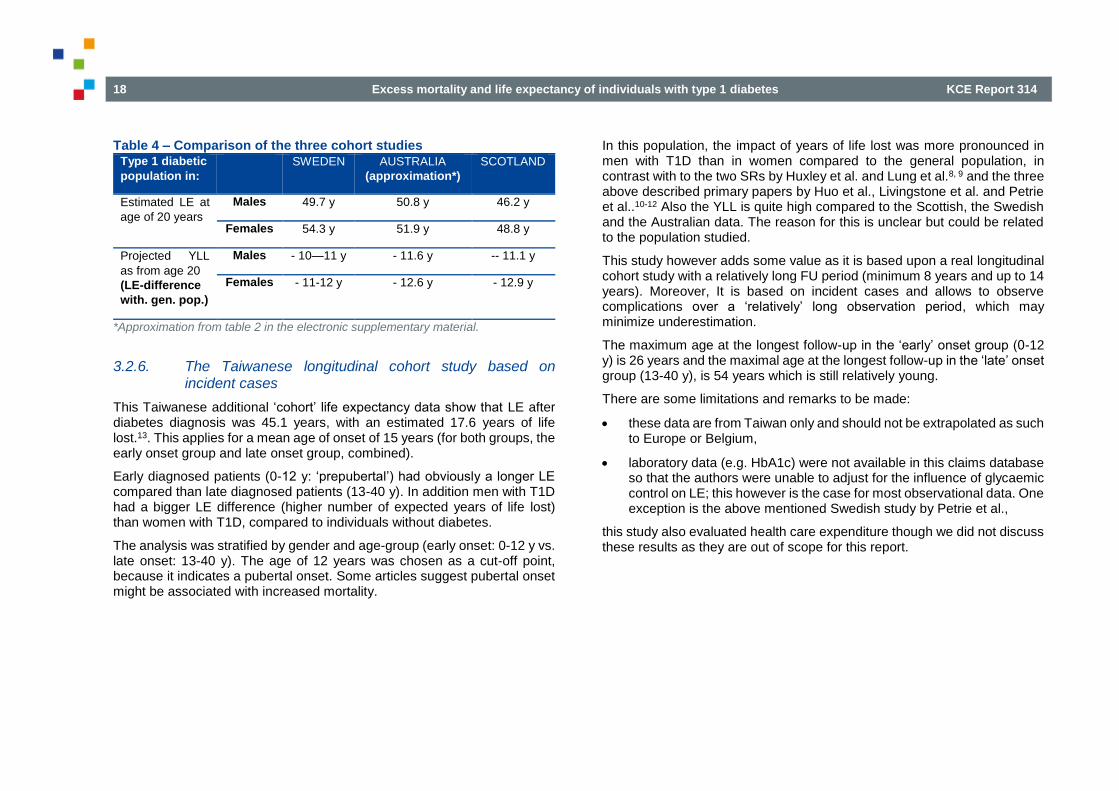
In general the large registry based cohort studies in Sweden and Australia, published respectively by Petrie et al. and Huo et al. show a similar pattern.
The study by Petrie is based on approximately 30 000 patients (about 195 000 PYE) and the study by Huo on ca. 85 000 patients (about. 902 000 PYE).10, 12
Consistency can be demonstrated by comparing the estimated LE at age 20 years and the LE difference with the general population.
These data are specifically reported for the Swedish cohort in the paper by Petrie et al. and similar data can be approximated for the Australian study by Huo et al. For this purpose one can rely on the average results for the groups 15-19 and 20-24 years based on life-tables present in article’s Electronic Supplemental Material (ESM) Table 2 to obtain LE at age 20 years and table 2 in the article itself for YLL for those at age 20 years.15
For information, similar data for the Scottish cohort study by Livingstone et al., based on ca. 23 000 patients but with a shorter observation window (2008-2010; ca. 68 000 PYE) are added. 11
However, there are some important considerations:
the outcome estimates remain assumptions for the average patient,
individual T1D patients present very different characteristics, so it is uncertain to apply an average historic estimate to the individual contemporary patients.
18 Excess mortality and life expectancy of individuals with type 1 diabetes KCE Report 314
Table 4 – Comparison of the three cohort studies Type 1 diabetic
population in:
SWEDEN AUSTRALIA
(approximation*)
SCOTLAND
Estimated LE at
age of 20 years
Males 49.7 y 50.8 y 46.2 y
Females 54.3 y 51.9 y 48.8 y
Projected YLL
as from age 20
(LE-difference
with. gen. pop.)
Males - 10—11 y - 11.6 y -- 11.1 y
Females - 11-12 y - 12.6 y - 12.9 y
*Approximation from table 2 in the electronic supplementary material.
3.2.6. The Taiwanese longitudinal cohort study based on incident cases
This Taiwanese additional ‘cohort’ life expectancy data show that LE after diabetes diagnosis was 45.1 years, with an estimated 17.6 years of life lost.13. This applies for a mean age of onset of 15 years (for both groups, the early onset group and late onset group, combined).
Early diagnosed patients (0-12 y: ‘prepubertal’) had obviously a longer LE compared than late diagnosed patients (13-40 y). In addition men with T1D had a bigger LE difference (higher number of expected years of life lost) than women with T1D, compared to individuals without diabetes.
The analysis was stratified by gender and age-group (early onset: 0-12 y vs. late onset: 13-40 y). The age of 12 years was chosen as a cut-off point, because it indicates a pubertal onset. Some articles suggest pubertal onset might be associated with increased mortality.
In this population, the impact of years of life lost was more pronounced in men with T1D than in women compared to the general population, in contrast with to the two SRs by Huxley et al. and Lung et al.8, 9 and the three above described primary papers by Huo et al., Livingstone et al. and Petrie et al..10-12 Also the YLL is quite high compared to the Scottish, the Swedish and the Australian data. The reason for this is unclear but could be related to the population studied.
This study however adds some value as it is based upon a real longitudinal cohort study with a relatively long FU period (minimum 8 years and up to 14 years). Moreover, It is based on incident cases and allows to observe complications over a ‘relatively’ long observation period, which may minimize underestimation.
The maximum age at the longest follow-up in the ‘early’ onset group (0-12 y) is 26 years and the maximal age at the longest follow-up in the ‘late’ onset group (13-40 y), is 54 years which is still relatively young.
There are some limitations and remarks to be made:
these data are from Taiwan only and should not be extrapolated as such to Europe or Belgium,
laboratory data (e.g. HbA1c) were not available in this claims database so that the authors were unable to adjust for the influence of glycaemic control on LE; this however is the case for most observational data. One exception is the above mentioned Swedish study by Petrie et al.,
this study also evaluated health care expenditure though we did not discuss these results as they are out of scope for this report.
KCE Report 314 Excess mortality and life expectancy of individuals with type 1 diabetes 19
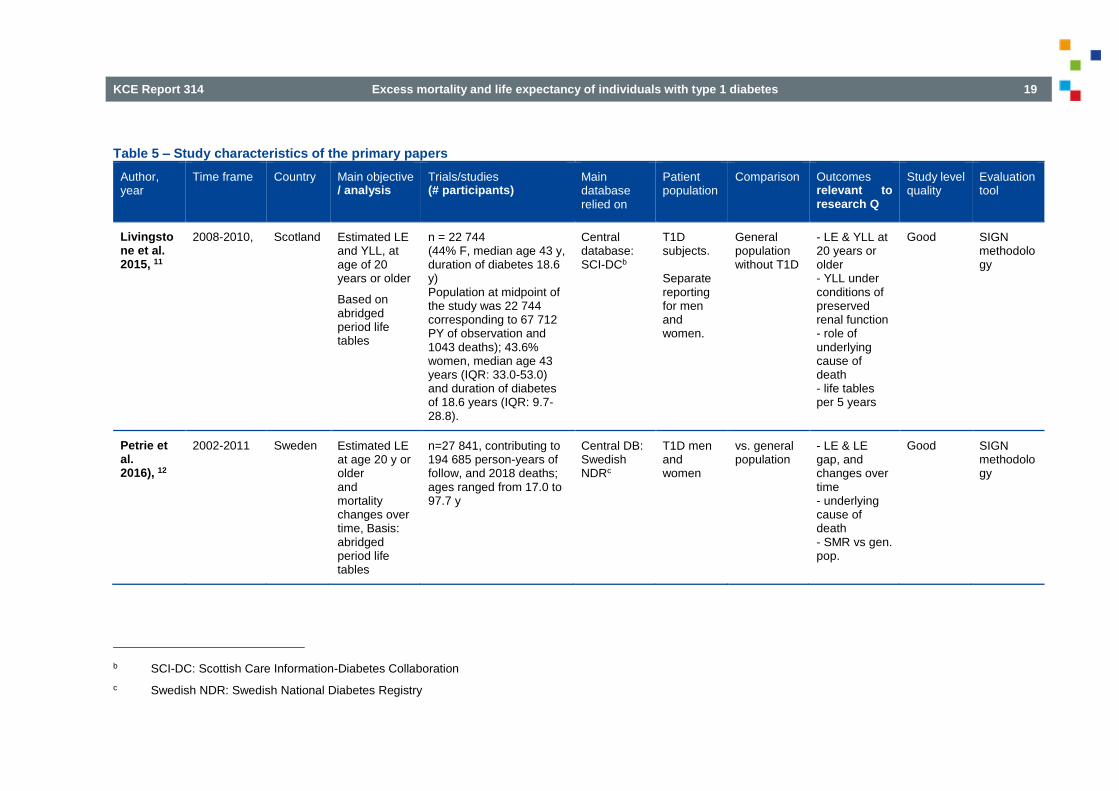
Table 5 – Study characteristics of the primary papers
Author, year
Time frame Country Main objective / analysis
Trials/studies (# participants)
Main database relied on
Patient population
Comparison Outcomes relevant to research Q
Study level quality
Evaluation tool
Livingstone et al. 2015, 11
2008-2010, Scotland Estimated LE and YLL, at age of 20 years or older
Based on abridged period life tables
n = 22 744 (44% F, median age 43 y, duration of diabetes 18.6 y) Population at midpoint of the study was 22 744 corresponding to 67 712 PY of observation and 1043 deaths); 43.6% women, median age 43 years (IQR: 33.0-53.0) and duration of diabetes of 18.6 years (IQR: 9.7-28.8).
Central database: SCI-DCb
T1D subjects. Separate reporting for men and women.
General population without T1D
- LE & YLL at 20 years or older - YLL under conditions of preserved renal function - role of underlying cause of death - life tables per 5 years
Good
SIGN methodology
Petrie et al. 2016), 12
2002-2011 Sweden Estimated LE at age 20 y or older and mortality changes over time, Basis: abridged period life tables
n=27 841, contributing to 194 685 person-years of follow, and 2018 deaths; ages ranged from 17.0 to 97.7 y
Central DB: Swedish NDRc
T1D men and women
vs. general population
- LE & LE gap, and changes over time - underlying cause of death - SMR vs gen. pop.
Good SIGN methodology
b SCI-DC: Scottish Care Information-Diabetes Collaboration
c Swedish NDR: Swedish National Diabetes Registry

20 Excess mortality and life expectancy of individuals with type 1 diabetes KCE Report 314
Huo et al. 2016, 10
1997-2010 Australia - Estimated LE at birth, - Estimated loss of LE -Improvement over time
n = 85 547 902 136 person-years of follow-up median age at diagnosis: 20.4 y (IQR 11.2-30.8); number of deaths observed : 5981
Basis = abridged period life tables
Central DB = Australian NDSSd
T1D men and women; < 45 y
vs. general population
- LE at birth, - Loss of LE - Improvement over time - Contribution of mortality at different ages & of different causes to YLL - life tables/5 y
Good SIGN methodology
Ou et al. 2016, 13
1999-2012 Taiwan Longitudinal Cohort study based on incident cases of T1D - Estimated additional LE - Estimated years lost of LE - Mortality rate
n = 2386 incident cases Basis = longitudinal cohort life-table research
Central dataset = LHDBe
T1D males and females. Analysis for age groups at diagnosis: - 0-12 y - 13 -40 y
vs. age- & gender matched general population
- estimated additional LE - estimated YLL - mortality rate for: - overall pop. - for M & F separately - according to age group.
Good SIGN methodology
d Australian NDSS: Australian Nat. Diabetes Services Scheme
e LHDB: longitudinal cohort of diabetes patients

KCE Report 314 Excess mortality and life expectancy of individuals with type 1 diabetes 21
Table 6 – Summary of main results - Scottish prospective cohort study on life expectancy by Livingstone et al.
AUTHOR YEAR
REGION OUTCOME MAIN FINDINGS COMMENTS
Livingstone S, 2015.11
Scotland Estimated LE at attained age of 20 years :
In Males In Females
Corresponding estimated YLL (vs. non-diabetics)
In Males In Females
YLL among those with preserved renal function
(eGFR≥ 90)
In Males In Females
Role of underlying cause of death:
46.2 y 48.1 y
- 11.1 y - 12.9 y
- 8.3 y - 7.9 y
The largest eYLL was related to ischemic heart disease (36% in M, 31% in F), but death from acute complications (diabetic coma or ketoacidosis) was associated with the largest estimated loss occurring before age of 50 y (29.4% in M, 21.7% in F).
The article provides additional useful graphs/tables on: - % survival curves over time (with increasing age, compared to non-diabetics) - abridged life tables for men and women, both for T1D in general (vs. general population), as well as under the conditions of preserved renal function. For copy-right reasons, we refer the reader to the article and it’s relevant online-materials / appendices.
See also useful figures and tables in the article: Figure on % survival curves (M & F, T1D vs. gen-pop.) and abridged life tables: Table 1, Table 2, Table 3, eTable 1 in online appendix to article
22 Excess mortality and life expectancy of individuals with type 1 diabetes KCE Report 314
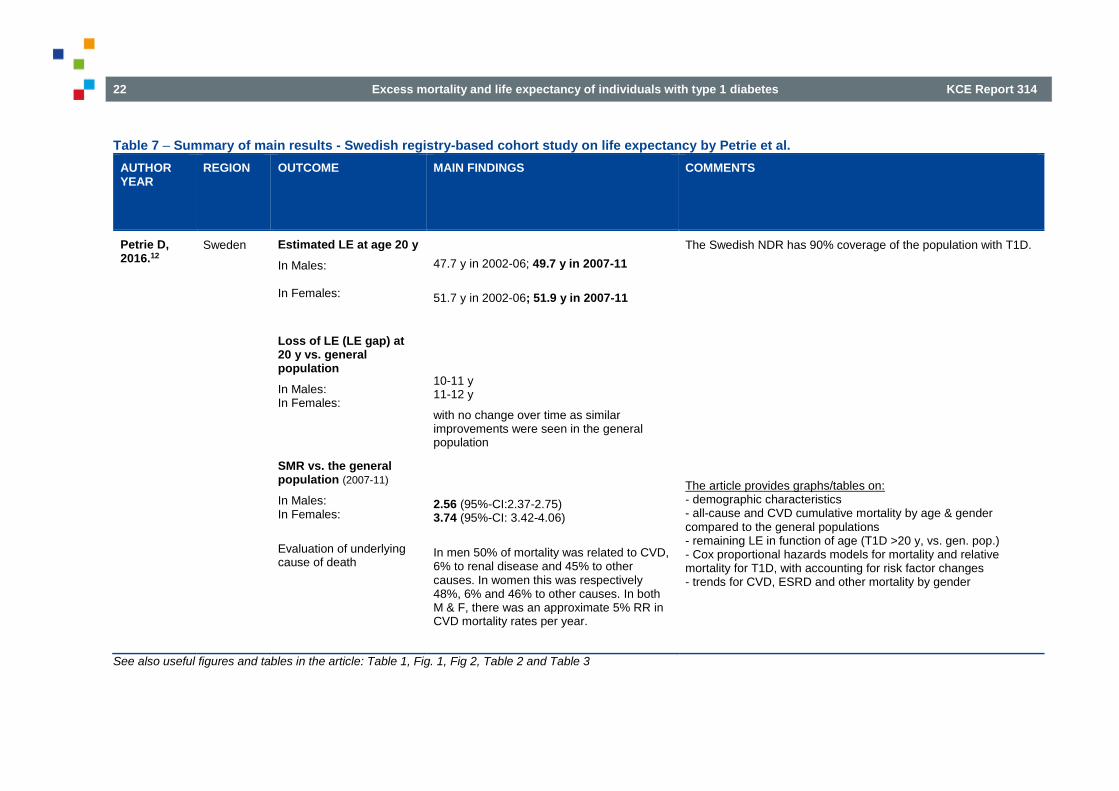
Table 7 – Summary of main results - Swedish registry-based cohort study on life expectancy by Petrie et al.
AUTHOR YEAR
REGION OUTCOME MAIN FINDINGS COMMENTS
Petrie D, 2016.12
Sweden Estimated LE at age 20 y
In Males: In Females:
Loss of LE (LE gap) at 20 y vs. general population
In Males: In Females:
SMR vs. the general population (2007-11)
In Males: In Females:
Evaluation of underlying cause of death
47.7 y in 2002-06; 49.7 y in 2007-11
51.7 y in 2002-06; 51.9 y in 2007-11
10-11 y 11-12 y
with no change over time as similar improvements were seen in the general population
2.56 (95%-CI:2.37-2.75) 3.74 (95%-CI: 3.42-4.06)
In men 50% of mortality was related to CVD, 6% to renal disease and 45% to other causes. In women this was respectively 48%, 6% and 46% to other causes. In both M & F, there was an approximate 5% RR in CVD mortality rates per year.
The Swedish NDR has 90% coverage of the population with T1D.
The article provides graphs/tables on: - demographic characteristics - all-cause and CVD cumulative mortality by age & gender compared to the general populations - remaining LE in function of age (T1D >20 y, vs. gen. pop.) - Cox proportional hazards models for mortality and relative mortality for T1D, with accounting for risk factor changes - trends for CVD, ESRD and other mortality by gender
See also useful figures and tables in the article: Table 1, Fig. 1, Fig 2, Table 2 and Table 3

KCE Report 314 Excess mortality and life expectancy of individuals with type 1 diabetes 23
Table 8 – Summary of main results - Australian registry-based cohort study on live expectancy by Huo et al.
AUTHORYEAR
REGION OUTCOME MAIN FINDINGS COMMENTS
Huo L, 2016.10
Australia Estimated LE at birth
- in Males - In Females
Estimated loss of LE vs. general pop.
Improvements in LE (YLL):
between 2004-2010 and 1997-2003 - Males T1D &. non-diab.M - Females T1D &. non-diab.F
Crude mortality rate
- Males: - Females Contribution of death < 60 y to the % of YLL due to T1D
- In Males: - In Females:
Major disease-cause factors contributing to the YLL in function of age of death
- Mortality occurring 10-39 y: - Mortality occurring ≥ 40 y:
Approximation of LE at 20 y
(estimated from life-tables presented in article-appendix ESM Table2) - In Males: - In Females:
68.6 y (95%-CI: 68.1-69.1)
66.7 y (95%-CI: 66.1-67.5) 70.5 y (95%-CI: 70.3-71.7)
- 12.2 y (95%-CI: 11.8-12.7); M: -11.6y, F: -12.5y
Comparable between T1D & general pop.
+ 1.9 y & + 2.2 y + 1.5 y & + 1.4y
0.81%/y (8.1/1,000 PY; 95%-CI:7.9-8.4) 0.51%/y (5.1/1,000 PY; 95%-CI:4.9-5.3) deaths at age < 60 account for:
60% of the YLL 45% of the YLL
Endocrine/metabolic cause: M: 39-59%, F: 35-50% Circulatory cause : M :43-75%, F : 34-75% 50.8 y 54.3 y
Australian National Diabetes Services Scheme database, with almost 100% coverage
The article provides graphs/tables on: - demographic characteristics - survival curves - abridged period life tables for M & F, T1D and general population, and by age groups of 4 y - age-specific contributions to the YLL in T1D - age distribution of causes of death - cause-specific contributions to the YLL stratified by age, for M & F with T1D - more info in appendix, eg. ESM Table 2 : abridged life table for M & F with T1D, split by calendar period : 1997-2003 vs. 2004-2010 (with gain of LE over time)
See also useful figures and tables in the article: Table 1 and 2 and Figure 1, 2, 3 and 4. Electronic Supplemental Material (ESM) Table 2 in the online appendix
24 Excess mortality and life expectancy of individuals with type 1 diabetes KCE Report 314
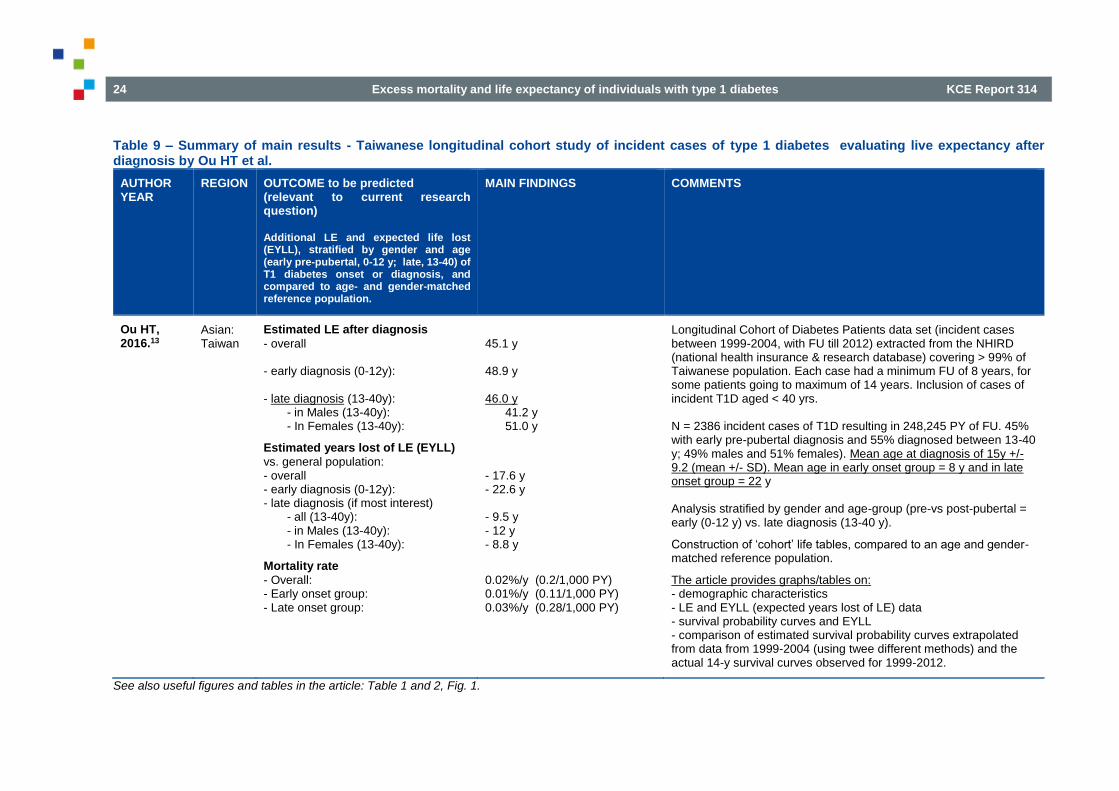
Table 9 – Summary of main results - Taiwanese longitudinal cohort study of incident cases of type 1 diabetes evaluating live expectancy after diagnosis by Ou HT et al.
AUTHOR YEAR
REGION OUTCOME to be predicted (relevant to current research question) Additional LE and expected life lost (EYLL), stratified by gender and age (early pre-pubertal, 0-12 y; late, 13-40) of T1 diabetes onset or diagnosis, and compared to age- and gender-matched reference population.
MAIN FINDINGS COMMENTS
Ou HT, 2016.13
Asian: Taiwan
Estimated LE after diagnosis
- overall - early diagnosis (0-12y): - late diagnosis (13-40y): - in Males (13-40y): - In Females (13-40y):
Estimated years lost of LE (EYLL)
vs. general population: - overall - early diagnosis (0-12y): - late diagnosis (if most interest) - all (13-40y): - in Males (13-40y): - In Females (13-40y):
Mortality rate
- Overall: - Early onset group: - Late onset group:
45.1 y 48.9 y 46.0 y 41.2 y 51.0 y
- 17.6 y - 22.6 y - 9.5 y - 12 y - 8.8 y
0.02%/y (0.2/1,000 PY) 0.01%/y (0.11/1,000 PY) 0.03%/y (0.28/1,000 PY)
Longitudinal Cohort of Diabetes Patients data set (incident cases between 1999-2004, with FU till 2012) extracted from the NHIRD (national health insurance & research database) covering > 99% of Taiwanese population. Each case had a minimum FU of 8 years, for some patients going to maximum of 14 years. Inclusion of cases of incident T1D aged < 40 yrs. N = 2386 incident cases of T1D resulting in 248,245 PY of FU. 45% with early pre-pubertal diagnosis and 55% diagnosed between 13-40 y; 49% males and 51% females). Mean age at diagnosis of 15y +/- 9.2 (mean +/- SD). Mean age in early onset group = 8 y and in late onset group = 22 y Analysis stratified by gender and age-group (pre-vs post-pubertal = early (0-12 y) vs. late diagnosis (13-40 y).
Construction of ‘cohort’ life tables, compared to an age and gender-matched reference population.
The article provides graphs/tables on: - demographic characteristics - LE and EYLL (expected years lost of LE) data - survival probability curves and EYLL - comparison of estimated survival probability curves extrapolated from data from 1999-2004 (using twee different methods) and the actual 14-y survival curves observed for 1999-2012.
See also useful figures and tables in the article: Table 1 and 2, Fig. 1.

KCE Report 314 Excess mortality and life expectancy of individuals with type 1 diabetes 25
3.3. Additional studies reporting smr, mortality, risk for major outcomes or trends over time
In addition to the systematic search which was focussed on the identification of the most recent systematic reviews and the identification of newer primary studies reporting on LE and/or life tables (see chapter 2), additional important papers were identified from reference lists and hand searching. These additional studies are referred to in the discussion and here we provide the reader with a short summary.
3.3.1. The Finnish Diabetic Nephropathy study (FinnDiane)
The FinnDiane study is an ongoing nationwide Finnish multicentre study that aims to identify genetic and environmental risk factors for diabetes complications, with special emphasis on diabetic nephropathy in patients with T1D. Baseline visits occurred between 1994 and 2008. Since then, several analyses and research questions on this population were published. 16-22.
This study clearly demonstrates that the presence or absence of chronic kidney disease (being it from micro-albuminuria only to (macro)albuminuria or severe renal impairment and end stage renal disease) is a very predominant (probably the most important) determinant of the risk of mortality, with a steep increase in the risk from CKD stage 1 (microalbuminuria only) to CKD 5.21, 23 Analysis from this FinnDiane trial also suggest that individuals with no nephropathy (thus also free of micro-albuminuria) show no excess of mortality beyond the general population.
An analysis published in 2009 and based on a median follow-up of 7 years of 4021 T1D adults demonstrated a 3.6 fold increase in SMR (95%-CI: 3.2-4.0) for the overall population. However excess mortality vs. age and sex-matched general population was only observed in individuals with CKD. 21: individuals with normoalbuminuria showed no excess mortality beyond the general population (SMR 0.8, 95%-CI: 0.5–1.1), independent of the duration of diabetes. The presence of microalbuminuria, macroalbuminuria, and end-stage kidney disease was associated with a 2.8, 9.2, and 18.3 times higher SMR, respectively. The increase in mortality across each stage of
albuminuria was equivalent to the risk conferred by pre-existing macrovascular disease. Note however that the general population includes also subjects (with type 2 or type 1) diabetes.
Another recent paper evaluated the contribution of risk factors to ‘early’ mortality (< 10 years of diagnosis in childhood onset T1D, based upon a population-based ‘Early’ T1D Cohort) as well the role of contribution of risk factors to ‘late’ mortality in T1D adults (the FinnDiane ‘Late’ Cohort), both vs. the general population.20
Data from the ‘Early’ cohort, based on 10 737 childhood onset T1D patients followed for 10 years (median age 18.3 y and median age at onset of 8.3 y), show an SMR vs. the general population of 2.57 (95%-CI: 2.07-3.18), which was higher for female than for male T1D patients (respective SMR of 3.32 and 2.25). This increase in SMR was essentially caused by acute complications (fatal severe hypoglycaemic coma and fatal severe DKA).
The ‘Late’ cohort consisted of 2544 adults with long-standing T1D (drawn from the FinnDiane population: ≥ 18 and < 40 y at age of diagnosis; median age 36.3 y, median duration of diabetes 16.2 y, median follow-up of 14 y) who had normal albuminuria excretion at baseline and who remained normo-albuminuric during follow-up.20 In other words, patients who progressed from normo-to microalbuminuria or higher levels of albuminuria were excluded in this subset analysis. This group was compared to 6655 age and sex matched controls in the general population. They concluded that the SMR in adults with long-standing diabetes was not different from the general population (1.02: 95%-CI: 0.84-1.22). One should remark that in many Western populations the prevalence of diabetes (majority with T2D) reaches up to around 7-10% of the total population. After subtracting those with T1D and T2D, the mortality ratio was 1.33 (95%-CI: 1.06-1.66). This excess mortality became only apparent after > 7 years of follow-up in the study, and the mortality ratio was significant only in women (1.59; 95%-CI: 1.10-2.30), but not in men (1.18: 95%-CI: 0.90-1.57). The most frequent cause of death in this ‘late cohort’ of adults with longstanding T1D was ischemic heart disease. The mortality ratio for ischemic heart disease was 4.34 (significant), while there remained a number of deaths due to acute complications including ketoacidosis and hypoglycaemia, most prominent in
26 Excess mortality and life expectancy of individuals with type 1 diabetes KCE Report 314
those adults with a more recent diagnosis, but still apparent in those with long-standing diabetes. Notably, deaths due to ‘risk-taking behaviour’ were lower in Finnish adults with T1D compared to matched individuals without diabetes: mortality rate of 0.42 (95%-CI: 0.22-0.79), which was largely driven by a 80% reduction in deaths due to alcohol and drugs in males with T1D.
3.3.2. The Pittsburgh Epidemiology of Diabetes Complications study (‘Pittsburgh EDC’ or ‘EDC study’)
The EDC study is a representative prospective type 1 diabetes cohort study (representative of the T1D population in the Allegheny county in Pennsylvania) of childhood-onset (<17 y) T1D that entered the study (within 1 year of diagnosis) between 1950 and 1980. A first evaluation took place from 1986 to 1988. Since participants were followed by biennial examinations for 10 years and thereafter with biennial questionnaires and further examinations at 18 and 25 years post-baseline. The study looked at complication outcomes (microvascular, macrovascular and mortality).24, 25 Since study start, several analyses and research questions were performed on the EDC population.26-32
Three of these analyse will be shortly discussed.30, 31, 33
One analysis aimed at providing a contemporary estimate of total mortality and CV disease in young adults with T1D from the EDC cohort.28. For this purpose participants who were < 45 y old during the 1996-2012 FU-period were studied, and mortality and CVD rates were calculated for those aged 30-39 and 44-44 y. Data from the background Allegheny County population were used to calculate age- and sex-matched standardized mortality (SMR) and incidence rate ratios (IRR). In both age groups, the SMR for total
mortality was ∼5 (with following 95%-CI’s : for 30–39-year-olds between 2.8
-7.2; for 40–44-year-olds between 3.4 - 7.8). CVD-mortality SMRs ranged respectively from19 (95%-CI 11-32) to 33 (95%-CI 17-59). For all outcomes, the relative risk was larger in women. Participants aged 30–39 years had 6.3% (95%-CI 3.8-9.8) absolute 10-year CVD risk, approaching the cut-off point of 7.5% (recommended by American College of Cardiology/American Heart Association) for initiation of statin therapy in older adults. The study concludes that total and CVD mortality and hospitalized CVD are all
significantly increased in this ‘contemporary’ U.S. cohort of young adults with long-standing T1D. These findings support more aggressive risk factor management in T1D, especially among women. Note however that this ‘contemporary’ estimate can now be regarded as historic as the initial inclusion period and time at diagnosis goes back to 1950-1980.
A second analysis/study looked at the research question on whether in the absence of renal disease (which is a strong risk determinant of cardiovascular disease), mortality risk indeed could come close to the general population, as suggested among others by analyses made on the FinnDiane population (cf. supra).31 This study (in a US Pennsylvania population) sought to replicate and expand the above mentioned findings to a 20 year follow-up and examine the cause of death by renal status. At baseline, mean age and duration of diabetes were respectively 28 and 19 years. Renal disease (RD) was defined in this study as an albumin excretion rate of ≥ 20 mcg/min from multiple samples and grouped as normo-albuminuria (NA), micro-albuminuria (MA), overt nephropathy (ON) or end stage renal disease (ESRD). At baseline (at mean age of 28 y and 19 y disease duration) 53% were NA, while 21% had MA, 22% ON and 4% ESRD. During a median FU of 20 years 23% died. For the overall group, mortality was 6.2 times higher than expected (95-CI: 5.2-7.2), with an SMR of 2.0 (1.2–2.8) for normo-albuminuria (NA); 6.4 (95-CI: 4.4–8.4) for MA; 12.5 (95-CI: 9.5–15.4) for ON; and 29.8 (95-CI: 16.8–42.9) for ESRD. Excluding those with NA who later progressed to RD, no significant excess mortality was observed in ‘the remaining NA’ group (= those who remained free of developing MA or more advanced RD), with an SMR of 1.2, (95-CI: 0.5–1.9). The study concludes and confirms the importance of renal disease (including persistent micro-albuminuria) as a marker of mortality risk and suggests that T1D patients without renal disease achieve long-term survival coming close to the general population.
The last EDC analysis studied improvements of life expectancy over time by comparing two sub-cohorts based on the year of their of childhood T1D diagnosis.30. The sub-cohort with year of diagnosis 1950-1964 was compared with the one with year of diagnosis 1965-1980. Mortality ascertainment was censored 31 Dec. 2009. Abridged life tables were constructed to calculate life expectancy. LE at birth for those diagnosed
KCE Report 314 Excess mortality and life expectancy of individuals with type 1 diabetes 27
1965–1980 was 15 years greater than participants diagnosed 1950–1964: 68.8 (95%-CI: 64.7–72.8) vs. 53.4 (95%-CI: 50.8–56.0) years, respectively (P , 0.0001); this difference persisted regardless of sex or pubertal status at diagnosis. The authors of the article state that ‘this improvement in life expectancy emphasizes the need for insurance companies to update analysis of the life expectancy of those with childhood onset type 1 diabetes because weighting of insurance premiums is based on outdated estimates’. This seems to be a valid remark, while in the meanwhile also this analysis of EDC is outdated as the most recent analysis relied on data that went up to end 2009.
3.3.3. The SEARCH for diabetes in youth study (‘SEARCH’)
Results from SEARCH trial were recently published. This study aimed to estimate short-term mortality rates for individuals with T1D or T2D diagnosed before the age of 20 y, based on data from health insurance plans in 6 states in the US, which were coupled with the US National Death Index trough 31 Dec. 2010. 34 Apart from assessing mortality risk in T1D, one of the main aims was to better characterize short-term mortality risk in youth onset T2D, and to put this into perspective with short-term mortality risk in the general population and in youth onset T1D. Besides crude mortality ratio’s, SMR’s were calculated based on age, sex and race for the comparable US population in the geographic area of the SEARCH study.
During 44 893 person-years (PY) of observation (median follow-up = 5.3 years), overall crude mortality rate was 91.3 deaths/100 000 PY. The expected mortality rate was 70.9 deaths/100 000 PY (general population). Specifically for T1D and T2D crude mortality rates respectively were 70.6 deaths/100 000 PY and 185.6 deaths/100 000 PY, pointing to a higher mortality risk in youth affected by T2D. Compared to the US state populations, mortality in the SEARCH study was significantly higher than expected for individuals with T2D (SMR=2.4, 95%-CI=1.3, 3.9; p=0.001) but not for individuals with T1D (SMR=1.1, 95%-CI=0.7, 1.6; p=0.84). So on the short term (mean FU of 5 y) the authors observed no excess mortality in youth onset T1D (diagnosis before <20 y of age).
3.3.4. The EURODIAB-Prospective Complications Study (EURODIAB-PCS)
The EURODIAB-PCS is a European clinic-based prospective cohort study in T1D started in the early nineties, including patients form 31 centres in 16 EU countries. On the EURODIAB-PCS cohort several sub-studies / analyses were done. Among others the objectives were to measure the impact of lifestyle, physiological and genetic factors on the onset and progression of diabetic complications and to define high-risk groups who could be targeted for interventions of risk factor modification. 35, 36
More recently a prediction model was developed based on the EURODIAB-PCS to predict the development of major outcomes. 37. Although not providing a direct estimate for mortality, the major outcomes examined and contributing to the prognostic model were coronary heart disease, end-stage renal failure, amputation, blindness and death (= a composite endpoint) with the first occurrence of any of the major outcomes being used for analysis. The model was constructed and based on the analysis of 1,973 participants with T1D who were followed for 7 years in the EURODIAB-PCS, and the
model performance was tested in 3 different prospective cohorts Pittsburgh EDC study, FinnDiane and Coronary Artery Calcification in Type 1 diabetes
study (CACTI). The prognostic indicators identified were: age, HbA1c, waist-hip ratio, albuminuria and (low) HDL cholesterol. The conclusion of the authors was that the model might be helpful in clinical practice and for risk stratification in clinical trials.37
Another publication reports the development of a predication rule (also based on EURODIAB-PCS, and also validated the same 3 above mentioned cohorts (Pittsburgh EDC, FinnDiane and CACTI) in order to predict the development of microalbuminuria after 7 years. HbA1c, level of albuminuria, waist-hip-ratio, BMI and ever smoking were found to be the most important predictors.38
Finally a recent paper estimated the CV-risk and survival in an Italian single centre T1D population.39 The authors estimated the risk of major vascular outcomes based on the EURODIAB PCS score, and determined all-cause mortality rate in 774 T1DM according to CKD phenotypes.
28 Excess mortality and life expectancy of individuals with type 1 diabetes KCE Report 314
People with type 1 diabetes were followed to compare the risk of major vascular outcomes in those with albuminuric (Alb+) and non-albuminuric (Alb−) chronic kidney disease (CKD). All T1D individuals who attended the diabetes outpatient clinic in the period from 2001 till end 2009 were screened. Of the 843 screened, 774 were eligible for inclusion (52.6% men; age 40.2 ± 11.7 years; duration of diabetes 19.4 ± 12.2 years, mean±SD).
Of study participants, 6.8% had CKD stage 1–2; 2.2% had stage ≥3 Alb− CKD and 1.6% had stage ≥3 Alb+ CKD. The remaining 89.4% had no CKD. Note that CKD stage 1-2 is characterized by kidney damage (read: micro-albuminuric) with a normal or mildly decreased eGFR).23. According to the EURODIAB PCS score, 60.2% had a low risk score or estimate for major vascular outcomes (LS), 26.5% had intermediate risk (IS) and 13.3% had high risk (HS). A high risk score (HS) was respectively present in 9.1% of subjects with no CKD, in 34.0% of CKD stages 1–2, in 64.7% of Alb−CKD, and in 91.7% of Alb+CKD patients (P < 0.0001).
Over 8.25 years of follow-up, the rate of mortality was 3.0% for those with no CKD, 15.1% for those with stage 1–2 CKD, 29.4% for those with Alb−CKD, and 50.0% for those with Alb+CKD. Compared with people with no CKD, and accounting for age and sex, the hazard ratios for mortality were 3.84 for those with CKD stages 1–2 (essentially those with (micro)-albuminuria only), 2.97 for Alb− CKD, and 7.44 for Alb+ CKD.
Adjusting for sex and the EURODIAB score, HRs for mortality compared to no CKD were: 2.57 (P = 0.027) for CKD stages 1–2; 2.77 (P = 0.058) for Alb−CKD, and 4.58 (P = 0.003) for Alb+CKD. In conclusion, mortality (over 8.3 y of follow-up) was lowest in the group with no CKD (= no albuminuria and no major impairment of eGFR), and was
highest seen in people with type 1 diabetes and Alb+CKD impaired GFR
and presence of (micro-)albuminuria. Approximately 20% of people with type 1 diabetes and CKD may be non-albuminuric. These people have a higher risk of major adverse outcomes and their mortality rate is comparable to that of individuals with CKD stage 1–2. 39
3.3.5. A Danish study, run at the Steno Diabetes Centre,
This study estimated absolute and relative mortality rates in patients with T1D relative to the general background population and also looked at time trends. 40 4,821 patients were followed from 1 January 2002 until 1 January 2011, with death from any cause as the main outcome. In this period 673 deaths occurred during 33 847 patient years of follow-up (equals 2% / year). The predominant cause of death in patients with T1D was cardiovascular disease. Mortality rates were highest among those with the lowest age at onset. The mortality rate in the diabetic population decreased over that time period by 6.6% and 4.8% per year in men and women, respectively; this was substantially greater than the decrease in mortality rates in the background population. The decline in SMR was 4.3% per year in men and 2.6% per year in women. Patients who did not develop nephropathy had only slightly elevated mortality rates compared with the background population. The authors conclude that despite advances in care, mortality rates (in the period 2002-2010) continue to be greater in patients with type 1 diabetes than in those without diabetes; however, the mortality rate in patients decreased over the study period faster than that of the background population. Nephropathy seems to be the main driver of the excess mortality. Patients who did not develop nephropathy had only slightly elevated mortality rates compared with the background population.40
3.3.6. A Swedish cohort study
This study aimed to evaluate the excess risk of mortality in subjects with type 1 diabetes. The study design and baseline characteristics as wells as the overall results of this cohort were reported by Lind et al., who described mortality risk in function of glycaemic control (HbA1c); this paper reported that death from any cause or from CV-causes was ca. twice as high as the risk for matched controls in patients with HbA1c levels ≤ 7.9%.41.
A more recent analysis by Ahlen et al. based on the same cohort aims to evaluate the excess risk of mortality in subjects with type 1 diabetes without renal complications who target goals for glycaemic control and are non-smokers.42 The authors also evaluated risk factors of death due to hypoglycaemia or ketoacidosis in young adults with type 1 diabetes. The
KCE Report 314 Excess mortality and life expectancy of individuals with type 1 diabetes 29
data are based on a cohort of 33,915 persons with T1D compared with 169,249 randomly selected controls from the general population matched on age, sex and county, followed for 8 years.
The adjusted HRs for all-cause and CVD mortality for persons with type 1 diabetes without renal complications (normoalbuminuric and with eGFR ≥ 60 ml/min) and HbA1c ≤ 6.9% compared to controls were 1.22 (95%-CI 0.98-1.52) and 1.03 (95%-CI 0.66-1.60), respectively. The HRs increased with higher updated mean HbA1c. For non-smokers in this group, the HRs for all-cause and CVD mortality were somewhat lower: 1.11 (95%-CI 0.87-1.42) and 0.89 (95%-CI 0.53-1.48) at updated mean HbA1c ≤ 6.9%.
HRs for significant predictors for deaths due to hypoglycaemia or ketoacidosis in persons < 50 years were male sex 2.40 (95%-CI 1.27-4.52), smoking 2.86 (95%-CI 1.57-5.22), lower educational level 3.01 (95%-CI 1.26-7.22), albuminuria or advanced kidney disease 2.83 (95%-CI 1.63-4.93), earlier hospital diagnosis of hypoglycaemia or ketoacidosis 2.30 (95%-CI 1.20-4.42), and earlier diagnosis of intoxication 2.53 (95%-CI 1.06-6.04).
The authors conclude that if currently recommended HbA1c targets can be reached, renal complications and smoking avoided in persons with T1D, the excess risk of mortality will likely converge substantially to that of the general population.
3.3.7. A Norwegian retrospective cohort study
This study evaluated the risk of developing End Stage Renal Disease (ESRD) and mortality risk in a T1D population diagnosed at age 15-29 y (period of diagnosis : 1978-1982).43 Subjects were followed-up until death, emigration or Sep. 2013. Number of T1D subjects = 719. During 30 years’ follow-up, 4.6% of participants developed ESRD and 20.6% (n = 148; 106 men and 42 women) died. Cumulative mortality by years since diagnosis was 6.0% (95%-CI 4.5–8.0) at 10 years, 12.2% (10.0–14.8) at 20 years, and 18.4% (15.8–21.5) at 30 years. The SMR was 4.4 (95%-CI 3.7–5.1). Mean time from diagnosis of diabetes to ESRD was 23.6 years (range 14.2–33.5). Death was caused by chronic complications (32.2%), acute complications (20.5%), violent death (19.9%), or any other cause (27.4%). Death was
related to alcohol in 15% of cases. SMR for alcohol-related death was 6.8 (95%-CI 4.5–10.3), for cardiovascular death was 7.3 (5.4–10.0), and for violent death was 3.6 (2.3–5.3). The authors concluded that the cumulative incidence of ESRD was low in this cohort with type 1 diabetes followed for 30 years. Mortality was 4.4 times that of the general population, and more than 50% of all deaths were caused by acute or chronic complications. A relatively high proportion of deaths were related to alcohol.
3.3.8. A Norwegian registry-based study
Another Norwegian study (larger and registry based) from the same research group evaluated the incidence of ESRD in childhood-onset type 1 diabetes followed for up to 42 years.44 Data were based on the nationwide population-based Norwegian Childhood Diabetes Registry and included patients with new-onset type 1 diabetes (age <15 y) who had received a diagnosis during the periods 1973–1982 and 1989–2012. Follow-up took place until the development of ESRD, death, emigration, or 30th November 2015. The authors estimated the cumulative incidence of ESRD by linking to the national renal registry. Among the 7,871 patients, representing 147,714 person-years of follow-up, ESRD developed in 1.3%. The mean time from the diagnosis of diabetes to the development of ESRD was 25.9 years (range 12.7–39.1). The cumulative incidence of ESRD was 0.7% (95%-CI 0.4–1.0) at 20 years’ diabetes duration, 2.9% (2.3–3.7) at 30 years’ duration, and 5.3% (4.3–6.5) at 40 years’ duration. The risk of the development of ESRD was lower in women than in men (hazard ratio [HR] 0.61; 95%-CI 0.41–0.91) and higher in individuals in whom diabetes had been diagnosed at 10–14 years of age compared with those in whom it was diagnosed before 10 years of age (HR 1.29; 1.06–1.56). No significant difference was identified in the risk of the development of ESRD between those in whom diabetes was diagnosed in 1973–1982 and in 1989–2012 (HR 0.80; 0.45–1.45). In conclusion, the authors reported a very low incidence of ESRD among patients with childhood-onset diabetes in Norway. The risk was lower in women compared with men and in individuals in whom diabetes was diagnosed at a younger age.44
30 Excess mortality and life expectancy of individuals with type 1 diabetes KCE Report 314
3.3.9. An Australian cohort study
This study evaluated clinical and demographic risk factors associated with mortality during early adulthood (18-38 years) in a population with childhood onset T1D.45 1309 T1D subjects were compared to an age and sex-matched comparison cohort without diabetes (n=6451). Participants were followed up until Jan. 2012. The SMR for all-cause mortality was 1.7 (95%-CI 0.7–3.3) for male and 10.1 (95%-CI 5.2–17.7) for female subjects with Type 1 diabetes (median age at end of study 25.6 years). The adjusted HR was 1.5 (95%-CI 1.1–2.1) for a 1% increase in mean paediatric HbA1c level, 3.8 (95%-CI 0.9–15.3) for four episodes of severe hypoglycaemia relative to zero episodes, and 6.21 (95%-CI 1.4–28.4) for a low-level socio-economic background relative to a high-level background. The authors conclude that people with childhood-onset Type 1 diabetes have higher mortality rates in early adulthood. At particularly high risk are women, those with a history of poor HbA1c levels, those with recurrent severe hypoglycaemia during paediatric management, and those from a low socio-economic background. The authors conclude that these groups may benefit from intensified management during transition from paediatric to adult care facilities.
3.3.10. An Australian registry-based study
This study looked at age-specific time trends in all-cause mortality in T1D and T2D (from 2000-2011). 46 A total of 1 189 079 (7.3% with T1D) Australians with diabetes registered in the National Diabetes Service Scheme between 2000 and 2011 were linked to the National Death Index. Mortality rates in the total population were age standardized to the 2001 Australian population. Mortality rates were calculated for the following age-groups: 0 to <40 years, ≥ 40 to <60 years, and ≥ 60 to ≤ 85 years. Annual mortality rates were fitted using a Poisson regression model including calendar year as a covariate and age and sex where appropriate, with Ptrend reported. For type 1 diabetes all-cause, cardiovascular disease (CVD), and diabetes age standardized mortality rates (ASMRs) decreased each year by 0.61, 0.35, and 0.14 per 1,000 person-years (PY), respectively, between 2000 and 2011, Ptrend < 0.05, while cancer mortality remained unchanged. By age, significant decreases in all-cause, CVD-, and diabetes mortality rates were observed in all age-groups, excluding diabetes mortality in age-
group 0–40 years. The authors conclude that all-cause -, CVD-, and diabetes-related ASMRs in type 1 and type 2 diabetes decreased between 2000 and 2011, while cancer ASMRs remained unchanged. However, younger populations are not benefiting from the same improvements as older populations. In addition, the absence of a decline in cancer mortality warrants further attention.46
3.3.11. A recent narrative overview on type 1 diabetes.
Finally we refer for your information to a very recent narrative overview article (Lancet ‘seminar’) on type 1 diabetes providing an overview on current understanding of the disease and potential future directions for research and care.47
KCE Report 314 Excess mortality and life expectancy of individuals with type 1 diabetes 31
4. DISCUSSION AND CONCLUSION
4.1. Excess mortality and parameters that modify this risk
The first systematic review (SR) in section 3.1 point to an overall point-estimate for the relative risk of mortality in individuals with T1D of 3.8 in men and 5.8 in women. The second SR reports similar overall relative risks of 3.25 and 4.54 in men and women respectively. This relative risk decreases over calendar time from 5.80 (men women combined) for the period before 1971 to 3.11 after 1990. Moreover the risk is higher in patients diagnosed prior to age 18 years and in non-European studies (see section 3.1 for details).
Three cohort studies in section 1.1 point to an estimated years of life lost (YLL) due to diabetes of between 10 and 12 in men and between 11 and 13 in women. The Taiwanese longitudinal cohort reports a higher YLL of 17.6 years (see section 1.1 for details) which is as could be expected since mean age (at diagnosis) was 15 years and it is a different population.
In this chapter we will mainly focus on the most important clinical factors and parameters that influence the risk of mortality.
In the first years up to a decade after the diagnosis of T1D, acute complications and in particular severe hypoglycaemic coma and severe diabetic ketoacidosis (DKA) predominate and can lead to excess mortality, while later on chronic complications (mainly cardiovascular) become the main driver of excess mortality.
This is a general pattern, though acute complications are always possible and as such need be considered as a possible constant companion, meaning that severe and potentially life-threatening hypoglycaemic coma or severe DKA later on are still possible. However, they become less important as a driver for mortality in longstanding disease. Most cases of hypoglycaemia and DKA, when treated correctly, will not results in permanent damage.
Vascular complications are classified into macro-vascular and micro-vascular complications. Macro-vascular complications mainly relate to
ischaemic heart disease (IHD), cerebrovascular disease leading to cerebrovascular accidents (CVA) and peripheral arterial disease (PAD). Micro-vascular complications typically cover diabetic retinopathy, diabetic nephropathy and diabetic neuropathy. When PAD and peripheral sensory polyneuropathy are present patients are also at higher risk to develop diabetic foot complications.
The link between glycaemic control and occurrence of complications is more prominent for micro-vascular than for macro-vascular complications. Poor glycaemic control translates more strongly and earlier in micro-vascular complications while for macro-vascular complications the link is less strong on the short and mid-term. Nonetheless it has become clear that good early metabolic (glycaemic) control still is very important, because it allows in the longer run to reduce also the risk for macro-vascular complications, which also is described as the metabolic memory or legacy effect. This is an important notion, and means that if good metabolic control can be obtained from within the first years/decade of disease this still will make a difference and translate in a clinical benefit on the long run 14.
From literature those factors or parameters (non-exhaustive) that are likely to modulate the risk:
age at onset,
disease duration and current age of the individual with T1D,
time period of diagnosis and the subsequent treatment/management changes and outcomes studied vs. contemporary T1D populations,
gender,
level of glycaemic (metabolic) control, both early and later on and in addition, but receiving less attention, the variability of glycaemic control
a history of severe or problematic hypoglycaemia, especially (recent) history of repetitive severe hypoglycaemia needing third party assistance or severe nocturnal hypoglycaemia and the presence of hypoglycaemia unawareness,
recent or repetitive severe diabetic ketoacidosis (DKA),

32 Excess mortality and life expectancy of individuals with type 1 diabetes KCE Report 314
presence and severity of chronic micro-vascular complications:
o nephropathy (decreased renal function and/or micro albuminuria or overt albuminuria): this is a very important risk determinant and possibly the most important,
o the presence of cardiac autonomic neuropathy (CAN),
o the presence of retinopathy also has a predictive value as it is often associated with the presence of nephropathy
presence and severity of chronic macro-vascular complications such as ischemic heart disease, cerebrovascular disease and peripheral arterial disease or the presence of heart failure,
presence or absence of more traditional risk factors (not at target) such as lipid control, blood pressure, obesity and inactivity, smoking etc…,
socio-economic status.
4.2. Age at onset
Most reports indicate that early age of onset increases mortality risk:
these subjects have a longer life-time ‘exposure’ to the disease,
early age of onset might increase the risk on itself; possible explanations are:
o importance of good glycaemic control from the beginning, which is often challenging during infancy, puberty and early adolescence,48
o in general, often higher HbA1c targets are applied in children, as balance needs to be found between good glycaemic control and the risk of hypoglycaemia,8
realizing that on the one hand it might be more difficult to obtain optimal glycaemic control in infants/young adolescents as from the first years, and on the other hand, having the knowledge that good glycaemic control from early on translates into long-term cardiovascular benefits (metabolic memory effect or legacy effect), may at least partially explain
why early age at onset potentially might increase the risk of mortality on the long term,48
the increased risk for IHD/CVD development seems to start early as demonstrated by certain surrogate parameters (e.g. carotid intima hyperplasia) but only clinically manifests itself later in life.49, 50
4.3. Disease duration, current age
The current age influences the estimated remaining LE as in the population in general. The current age is also related to disease duration depending on the age at onset.
Longstanding disease duration also means a longer exposure to T1D and its associated complications. This is demonstrated by two studies:
the Pittsburg Epidemiology of Diabetes Complications Study (EDC) study (patients with childhood onset T1D) that evaluated mortality rates and SMR in age group 30-39 and 40-44,28
a Norwegian study looking at SMR in patients with childhood onset T1D, and evaluating the mortality risk in function of current age, gender, age at diagnosis and diagnosis period; the study shows that SMR increases with current age (and thus also with disease duration), and is higher for females than for man; in addition a positive trend over time was observed, with SMR ratio’s decreasing for those with a more recent diagnosis, compared to those with a more historical diagnosis, which is probably explained by improvement over time in T1D care.51

KCE Report 314 Excess mortality and life expectancy of individuals with type 1 diabetes 33
4.4. Gender
The relative impact of T1D on mortality (mortality risk or SMR) is higher in women with T1D than in men, compared to individuals without T1D.
This appears to be largely due to an increase in cardiovascular risk. This is demonstrated in numerous publications and is attributed to the loss of the so-called ‘female cardiovascular protection’ in women with T1D.8, 20, 28, 52-57. The exact reason for this gender difference is not well understood, and some hypothesis/authors suggest the following possible factors could possibly play a role:8, 57:
gender differences on the level of blood glucose control and HbA1c, especially in childhood onset diabetes and during the pubertal period; this has been suggested to be attributed to greater impairment of insulin sensitivity during puberty in young women with T1D and to an increased propensity towards eating disorders and under-dosing of insulin in women with T1D compared to men with T1D,
the so-called vascular protection in females is not present in case of T1D (which might be a manifestation of reported disturbances in the hypothalamus-pituitary-ovarian axis that are associated with diabetes, including delayed age of menarche, menstrual irregularities and precocious menopause).
However, the absolute risk of death in men with T1D remains higher than in women with T1D but the relative mortality risk ratios are higher for women with T1D when comparing the gender-specific mortality risk ratios in individuals with T1D compared to individuals without the disease.57 This increased CV risk in women with T1D women appears to be more pronounced in women with early onset T1D (childhood / early adolescence).54
Improvements over time of cardiovascular mortality are observed, though these improvements appear to be more marked in men.12, 58, 59
4.5. Level of overall glycaemic (metabolic) control
It is generally known that the link between the level of metabolic or glycaemic control and occurrence of complications is stronger (more prominent) for micro-vascular than for macro-vascular complications.
Poor glycaemic control translates more strongly and earlier in micro-vascular complications (diabetic retinopathy, diabetic nephropathy and diabetic neuropathy). For macrovascular complications (e.g. myocardial infarction, CVA, PAD) the link with glycaemic control is less prominent, at least on the short- and mid-term and other risk factors play an equally important or even more important role like for instance the level of blood pressure or lipid control.35, 41, 59-61
Despite this, it is clear that good early glycaemic control still is very important, because it does allow - in the longer run to reduce the risk for macro-vascular complications, a phenomenon being described as the metabolic memory or legacy effect. So good metabolic control from early on does has an impact on the long term.48, 60, 61
The lower the HbA1c, the less the risk for micro-vascular complications.
The lower the HbA1c, the less the risk is also true for macro-vascular complications and mortality risk, though some important remarks need to be made:
the HbA1c gives a summary on the average level of glycaemic control over the last 2 -3 months,
it is an average that tells nothing about the extreme values (very high or very low values) that also contribute to the average result; in other words, the point here made relates to the magnitude of fluctuations over (the) day(s), which include both low and high glucose values,
very low glycaemic values can be dangerous in terms of the risk for hypoglycaemic coma, and rarely may even lead to acute cardiac events and life-threatening arrhythmias,
34 Excess mortality and life expectancy of individuals with type 1 diabetes KCE Report 314
apart from possible strong within-day or between-day fluctuations, some patients may demonstrate high variability in HbA1c levels (= variability over months) and this type of variability on itself may increase mortality risk as suggested by several authors,62-64,
the link between increasing HbA1c and increased CV-risk and mortality might not be completely linear and some data suggest that very low Hb1Ac targets might even increase overall risk and CV-risk,
applying very low HbA1c objectives means increasing the inherent risk
for hypoglycaemia possibly causing Central Nervous System (CNS) effects/hypoglycaemic coma or seizures but also the possibility of acute
cardiac events; this could explain why in certain observations a U-shaped relationship between HbA1c and mortality risk has been described: see Fig 2 in the article by Schoenaker et al., 2014,35 reporting the results of the EURODIAB prospective clinic-based cohort complications study analysing the link between glycaemic control and all-cause mortality in T1D; from this trial and from other work it seems that overall and cardiovascular mortality risk increases especially as from HbA1c values of ≥ 8.0%,35, 65 while on the other hand also targeting values ≤ 6 might not be desirable.
In general, for most people with T1D the target for HbA1c is set at < 7%, though individualization may be necessary, in function of age or other patient characteristics.
4.6. Risk factors for acute life-threatening complications
Often these acute complications are also described as (acute) metabolic complications. Essentially they refer to acute severe hypoglycaemia and severe diabetic keto-acidosis (DKA).
They drive the increased risk of mortality and increased SMR in the first years after diagnosis. However one should not forget that even in patients with long-standing diabetes (> 15-20 y), the risk of death due to severe hypoglycaemia or severe DKA remains a risk.
Severe hypoglycaemia can arise when there is too much active insulin in the body for the level of glycaemia to be ‘covered’. Most of the time this happens when patients are injecting too much insulin and are taking in less carbohydrates than foreseen, when they do more strenuous exercise or sport which was not sufficiently compensated by the reduction in the insulin dose injected, or when dosing mistakes are made. Some patients are more at risk for the consequences of severe hypoglycaemia, especially when (temporary or permanent) hypoglycaemia unawareness exists. Hypoglycaemia might also be triggered by the intake of alcohol.
Important clinical factors that might favour the risk of severe hypoglycaemia and thus the potential risk of hypoglycaemic coma, seizures or death are:
occurrence of ‘problematic hypoglycaemia’ characterized by:
o two or more episodes per year of severe hypoglycaemia, or
o one episode of impaired awareness of severe hypoglycaemia;
extreme glycaemic lability,
major fear and maladaptive behaviours,
frequent episodes of severe hypoglycaemia,
severe nocturnal hypoglycaemia,
inability to detect severe episodes,
presence of hypoglycaemia unawareness or absence of adrenergic and neuroglycopenic symptoms of hypoglycaemia: this may be a temporary issue (following repetitive recent episodes of severe hypoglycaemia), or a permanent issue (due to longstanding T1D with autonomic neuropathy),
poor compliance in terms of auto-control, insulin dose adjustments, insulin administration methods.
Apart from the CNS consequences, severe hypoglycaemia may also increase the risk of acute CV events (e.g. potentially serious cardiac arrhythmias, myocardial infarction).66-68
KCE Report 314 Excess mortality and life expectancy of individuals with type 1 diabetes 35
Severe diabetic ketoacidosis (DKA) can be life-threatening and arises when there is no insulin in the body or when it is below a critical level. T1D patients rely on insulin for survival. Insulin is necessary among others for the inhibition of lipolysis. When insulin levels are critically low or when insulin is absent lipolysis will no longer be inhibited, a situation that will lead to the formation of ketone-bodies. When ketone-bodies are high and no corrective measures are taken, severe (life-threatening) DKA will develop.
Precipitating factors for DKA may be:
intercurrent illnesses (leading to vomiting, dehydration, inadequate food intake) and insufficient food intake and insufficient insulin dosing,
poor therapy compliance,
administration errors,
technical defects (rare, but possible: e.g. insulin pump malfunction, or kink in or disconnection of the administration line).
Some patients might present for the first time with severe DKA at the moment they receive the diagnosis of T1D.10, 11, 20, 69
Note that in general, most of the improvements over time have been observed for the chronic complications, but not (yet) for the acute metabolic complications.70. This might well change with the ongoing implementation of continuous glucose monitoring systems (with built in alarms, and auto-suspend functions) and possibilities for self-measurement of ketone-bodies).
4.7. Micro-vascular complications
Microvascular complications especially have an impact on the quality of life due to increased co-morbidity, though they can also signal an increased risk for macro-vascular complications and increased risk of mortality.
Apart from the level of (poor) glycaemic control, other factors may also further increase the risk of development of these micro-vascular complications like poor BP control, and to a lesser extend poor lipid control.
Especially the presence of diabetic nephropathy is in important mortality risk modifier (mostly via an increase in the CV-disease risk) as is the presence of diabetic cardiac autonomic neuropathy (CAN).
The presence of diabetic retinopathy is an indirect risk factor for mortality, and as such is often accompanied by the existence of diabetic nephropathy (and vice versa).71
The role of nephropathy is discussed in 4.9.
The role of CAN is often underestimated and overlooked, though should not to be underestimated. Brief reference is made to this in 4.10.
4.8. Macro-vascular complications
Macro-vascular complications are the main driver for mortality following the first decade of T1D.
Apart from good metabolic (glycaemic) control, preferable as from in the first years after diagnosis, other risk factors play an equal or even more important role like smoking, lipid control and blood pressure control.
See also articles by Rawshani et al., 2017 and Subramanian et al.,2018.48,
49, 72
4.9. Nephropathy as a prognostic indicator
Recently the question on whether or not individuals with T1D in the absence of nephropathy could be placed at the same level of mortality risk as the general population (or non-diabetic population) received more attention in research and literature.
Nephropathy in individuals with T1D ranges from beginning nephropathy with micro-albuminuria as only indicator up to severe or even end stage renal disease (ESRD), and it is well known that severe renal insufficiency and certainly ESRD clearly increase cardiovascular and mortality risk to a very high degree.

36 Excess mortality and life expectancy of individuals with type 1 diabetes KCE Report 314
The presence of micro-albuminuria (MA) is important risk indicator for two reasons:
it is often a first indication of beginning nephropathy,
the presence of MA is also a clear marker of general cardiovascular risk or CV-burden. Micro-albuminuria can evolve to macro-albuminuria or even franc proteinuria, whether or not accompanied by a decrease in eGFR.
If MA develops it’s important that it doesn’t progress.22 In that context the use of nephroprotective agents (ACE-I or ARB) is advocated. In case of arterial hypertension strict BP management is required.
The number of patients developing ESRD is low and seems to decrease over the five past decades. 44, 73-75. However looking at diabetic nephropathy as a whole (as from albuminuria or minor renal impairment onwards) it has been estimated that diabetic nephropathy continues to affect up to 30% of persons with T1D 76
Some data in the literature suggest that in the absence of nephropathy, the cardiovascular risk and mortality risk associated with T1D would equal or approach that of the general population or non-diabetic population.11, 20, 21,
31, 40, 42
Caution however should be used regarding the interpretation of research results and literature reports as to which definition of nephropathy is used. If the definition of absence of nephropathy is solely based on an eGFR criterion (e.g. an eGFR of ≥ 60 or 90 mL/kg/1.73m2) then the possible presence of micro-albuminuria will be missed or not taken into-account. In addition one should be conscious that in the early stages of diabetes, eGFR often is even higher than normal due to hyper-filtration at the level of the nephron. For instance in the Scottish cohort study, the absence of nephropathy was solely defined by an eGFR ≥ 90 mL/kg/1.73m2 , certainly missing a lot of subjects with microalbuminuria. This study concluded that mortality risk was less in this population though still increased vs. the general population. If one would have excluded also those without micro-albuminuria the risk probably even would have been lower.
Taking several recent literature reports into consideration one could summarize the situation as follows:
The following parameters (in order of importance) certainly increase cardiovascular risk and mortality risk:
o the presence of micro-albuminuria,
o micro-albuminuria which is progressing,
o development of severe chronic kidney disease,
o development of ESRD,
The absence of micro-albuminuria (and absence of diminished renal function) definitely mitigates the risk to a much lower level,40 however, it seems that even in that case the mortality risk (and cardiovascular risk) vs. the general population or non-diabetic population still remains higher in T1D.20, 41, 77. Some authors describe the risk, if no nephropathy is present, as slightly elevated compared to the general population.22, 31,
40 A Swedish group that conducted a cohort study on 33.915 persons with T1D and 169.249 control subjects, concluded that ‘if currently recommended HbA1c targets can be reached, renal complications and smoking avoided in persons with T1D, the excess risk of mortality will likely converge substantially to that of the general population’.42. The positive impact on mortality of absence of micro-albuminuria and absence of impaired kidney function clearly and certainly is a beneficial factor and the negative predictive ‘value’ of this seems even to be more important for men than for women with T1D.59According to some authors, nephropathy (or absence of nephropathy) seems to be a better discriminator of risk in men than in women with T1D.33, 59
Determinants associated with the development of diabetic nephropathy are HbA1c and age 78. However the presence of other risk factors (not at target) like hypertension or smoking also play an important role, like does the presence of uncontrolled hypercholesterolemia. Moreover, some subjects seem to be genetically more vulnerable or susceptible to the development of nephropathy than others. An update on the renal

KCE Report 314 Excess mortality and life expectancy of individuals with type 1 diabetes 37
link and the cardiovascular complications in T1D is provided by Orchard et al.79
4.10. Cardiac autonomic neuropathy
Cardiac autonomic neuropathy (CAN) is an often overlooked but possible complication of longstanding diabetes mellitus and is, in itself, a very strong risk factor for overall and CV-mortality.80-82
CAN results from autonomic neural dysfunction induced by chronic hyperglycaemia and its downstream consequences, and is characterized by the impairment of neuro-vegetative performance.
CAN is relatively easy to evaluate by assessing normal heart rate variability in relation to (or in response to paced) breathing (cf. R-R variation on ECG), to Valsalva manoeuver and to postural changes in blood pressure. However, such formal screening seems to be underused in clinical practice.
4.11. Well known risk factors requiring special attention
Traditional well established CV risk factors (RF) that apply for the general population are even more important in the context of T1D.
These well know RF are:
smoking,
hypertension / BP not at target,
hypercholesterolemia / lipids not at target,
obesity and presence of metabolic syndrome and marked insulin resistance.
If severe obesity or presence of metabolic syndrome (insulin resistance syndrome) is present in T1D patients, this is often also called ‘double diabetes’ which means that the T1D subject in question additionally also has RF that typically play a role and modify the risk as seen in subjects with T2D.83
An important illustrative article underlines the importance of obtaining a maximum of RF at target.72. Rawshani et al. looked at five RF and their related therapeutic targets (defined according to the authors):
hypertension or treated hypertension (abnormal: systolic BP ≥ 140 or diastolic BP≥ 80),
hypercholesterolemia (abnormal: LDL-c > 115 mg/dL),
smoking,
albuminuria (abnormal: presence of micro- or macro-albuminuria),
HbA1c level ≥ 6.9%.
They found a steep-graded association between decreasing number of CV-risk factors at target and major adverse cardiac events among patients with T1D. T1D subjects with all five selected CV risk factors ‘at target’ demonstrated only a non-significant excess risk of death compared to controls. However, the risk of myocardial infarction and heart failure were still respectively 82% and 97% higher in T1D subjects having all five risk factors at target vs controls. However, the absolute risk of myocardial infarction and heart failure depends on the age, so even a 100% risk increase might relate to a very small absolute risk increase at younger ages.
Conclusion of their research is that for every incremental risk factor not at target, the excess risk of death and major CV outcomes increased in a graded fashion. They also conclude that achievement of the applied target levels for the selected risk factors markedly reduces the excess risk of CV-disease and may even eliminate the excess risk of cardiovascular mortality.
Note that the targets proposed by Rawshani et al. 2017 differ from contemporary targets most often used nowadays.72 See also table 1 (for the recommended CV-RF targets in adults with T1D) in the very recent article by Subramanian et al.48
This article by Subramanian also discusses the outcomes of the landmark ‘Diabetes Control and Complications Trial’ (DCCT) in persons with T1D and the subsequent long-term FU study ‘Epidemiology of Diabetes Interventions and Complications’ (EDIC) following the participants from DCCT.60 In DCCT
38 Excess mortality and life expectancy of individuals with type 1 diabetes KCE Report 314
the participants were randomized into a group receiving intensive treatment with a lower HbA1C target (target HbA1c close to 7%) and a group receiving conventional treatment. After the initial period of 6.5 years (DCCT) all participants were switched to or continued intensive treatment in the EDIC follow-up. This DCCT/EDIC study essentially evaluated the impact of 6.5 years of intensive treatment early-on compared to conventional less stringent treatment early-on, on long-term mortality. After the initial DCCT period of 6.5 years the intensive treatment group achieved an HbA1c of 7.2% vs. 9% in the group with conventional treatment. DCCT/EDIC was a multi-centre study in the US & Canada that started in 1983 and randomized 1441 individuals with T1D.
The main conclusion after a mean FU of 27 years, was that 6.5 years of early intensive T1D treatment was associated with a lower all-cause mortality rate when compared to the group with conventional treatment. (HR = 0.67, 95%-CI: 0.46-0.99). Higher levels of HbA1c and development of albuminuria were clearly associated with all-cause mortality. This means that the impact of early intensive treatment is still visible 20 years later. This is a clear demonstration of the metabolic memory effect (legacy effect).
Another indirect finding from this trial, when comparing the DCCT/EDIC study group with the general US population including people with and without diabetes,53 is that overall mortality in the combined DCCT/EDIC cohort (intensive and conventional treatment group during first 6.5 years) was similar to that of the general population, but was higher in the DCCT conventional treatment group than in the general population. Mortality increased significantly with increasing mean HbA1c, more so among females than males, especially for HbA1c >9%. Interestingly, mortality in the DCCT intensive treatment group was lower (not statistically significant) than that in the general U.S. population (SMR = 0.88 [95%-CI 0.67, 1.16]). The obtained HbA1c in the DCCT intensive group was lower than in most patients today.
This finding, which is in contrast to observational registry-based cohort studies, resides probably in the fact that people actively wanting and willing to participate in randomized clinical research, are on average likely to be
more health focussed and their health behaviours might well be different from the average individual with T1D.20.
This demonstrates that if care givers and patients care well, are engaged and committed, mortality risk could possibly be decreased into a range slightly higher or comparable to the general population.
4.12. Socio-economic status
Although not a clinical parameter per se, it is clear form literature that low socioeconomic status and low level of education is associated with higher levels of mortality and morbidity in adults with T1D, as it is in the general population.6, 7, 84-86
4.13. Specific features of long surviving patients with t1d
Having discussed several important risk factors that could influence the risk of diabetic complications and hence overall mortality in T1D, it might be useful to take a look from a different angle.
This reflexion is made by Distiller, 2014 in an article entitled ‘Why do some patients with type 1 diabetes live so long?’.87 Figure 4 of this article provides an easy, comprehensive and well organized scheme on the complex interactions that exist between multiple risk factors in determining the outcome in T1D subjects. In addition its table 2 provides a check list allowing to identify the most important features of long-surviving subjects with T1D. The items on the checklist (slightly adapted from the original article) are :
reasonable (not necessarily ideal) glycaemic control,
high HDL-cholesterol and low LDL cholesterol levels,
low daily insulin requirements (“insulin sensitive”, so not pointing to double diabetes),
normal body weight,
non-smoker,
lower / normal blood pressures,
KCE Report 314 Excess mortality and life expectancy of individuals with type 1 diabetes 39
micro-albuminuria negative (after 15-20 y of diabetes),
family history of longevity.
4.14. Secular trends
With time, treatment and care of diabetes improved and better technologies for (self-) monitoring have been implemented. Data from literature clearly point to improved survival over time (secular trend) as demonstrated by several studies.9, 30, 40, 46, 51
As a consequence, the data mentioned in this report might probably already be out-dated and mortality risk over-estimated, as diabetes therapies, technologies and care facilities are continuing to improve, especially in developed Western countries including Belgium with high quality diabetes care. As a consequence the average relative mortality risk might now well be lower. However, this is speculative since present data are obviously unavailable.
4.15. Conclusion
Overall, the average mortality risk in individuals with T1D is higher than in individuals without T1D. In the first decade after the diagnosis of T1D, acute complications and in particular severe hypoglycaemic coma and severe diabetic ketoacidosis predominate and can lead to excess mortality. Later on, chronic complications (mainly cardiovascular) become the main driver of this excess mortality.
Based upon historic systematic reviews and primary studies reporting life expectancy data (or tables) this increased average relative risk mortality for T1D patients overall is situated between 3.1 and 5.8, with an estimated loss of life years of between 10 and 13 years in Western Countries. However in the meanwhile these papers and their underlying data-capture periods very likely have become outdated.
The reported excess mortality is in general relatively higher in women than in men, higher for individuals with type 1 diabetes diagnosed before the age of 18, decreases over the decades due to better diabetes control and treatment, and is lower in Western countries.
However, an average risk means that some individuals are below that average while others are far above it. Of utmost importance is the fact that excess mortality is very dependent on the individual characteristics of that person with T1D. This is modulated by several important clinical risk factors, type 1 diabetes complications and other parameters and those have been enumerated in this chapter. Time since diagnosis, current age, gender, level of metabolic control, therapeutic and self-care compliance, (recent) history of severe acute metabolic complications, presence and severity of chronic complications and co-morbidities, and presence or absence of other classic risk factors for instance all influence the mortality risk.
The presence or absence of nephropathy, from persistent micro-albuminuria onwards until severe renal disease is one of most important risk indicators (probably the most important) for increased mortality from long-term cardiovascular complications.
There are indeed patients with T1D where mortality risk is high, clear and apparent (e.g. patients with overt or advanced nephropathy, or who experienced previous major cardiovascular complications, had several recent episodes of life-threatening hypoglycaemia or DKA…). But for many other patients with T1D one cannot easily conclude whether or not they have a significantly increased risk compared to the general population that also present apparent or non-apparent risk factors.
This implies that making extrapolations from average results and estimates described in literature towards contemporary populations is not straightforward and extrapolation for individual patients is very uncertain. This is the reason why a general average mortality risk figure or estimate based on an overall population of type 1 diabetes patients cannot be applied as such to an individual subject with T1D.

40 Excess mortality and life expectancy of individuals with type 1 diabetes KCE Report 314
Moreover, even if the average historical relative mortality risk would be
doubled or tripled, this still represents only a small absolute risk increase in
mortality at the typical ages where debt balance insurances are sought and
when the absolute mortality risk is low. There might be a tendency of over-
estimation of the absolute mortality risk during the period of the loan. 30
Literature reports indicate that, if care givers and patients care well and are engaged and committed, reasonably good HbA1c levels reached, renal complications and smoking avoided, and traditional CV-risk factors well controlled, mortality risk is probably much lower than the average and close to that in the general population. An easy to use checklist or shortlist is proposed in section 4.13 to make the assessment of excess mortality risk more individualized.
A reflexion on what could be a POSSIBLE WAY FORWARD (before applying data from literature to individual patients, which is anyway far from straight-forward) might include:
a focus on a positive checklist identifying the presence of features and characteristics of long-surviving T1D as proposed by Distiller et al.(see 4.13),
the development of a specific medical questionnaire/form which is adapted to type 1 diabetic patients applying for a debt-balance insurance,
o this form or tool – after agreement by the subject in question, and handed over by the subject to the endocrinologist/diabetologist – could be filled in by the treating endocrinologist/diabetologist or by another third party endocrinologist/diabetologist appointed by the concerned person,
o such a form or questionnaire could be developed by a workgroup including endocrinologists/diabetologists with a specific focus on type 1 diabetes and medical doctors working for insurance companies. The form could be based on the risk factors influencing mortality as described in chapter 0, also including a list of positive prognostic factors or features for longevity. Such a form would have
the advantage that it could be used by all insurance companies offering debt balance insurances,
o this form should lead to a semi-quantitative estimate on the level of risk of death within the period of the loan by rating the overall risk for example as: very low / low / moderate / high
This is a reflexion only, and if deemed useful, the initiative to start-up or initiate such a panel or work-group should ideally be taken by the Insurance Commission or OBS.

KCE Report 314 Excess mortality and life expectancy of individuals with type 1 diabetes 41
5. SYNTHESIS
5.1. Introduction
This report is a technical advice demanded by the Insurance Commission at the request of the Opvolgingsbureau voor tarificatie – Bureau de suivi de la tarification (OBS). KCE has a legal obligation to give advice to the Insurance Commission and as such this is an atypical Health System Research (HSR) report. The report is limited to addressing a very specific technical question, and contains no description of the Belgian situation, no international comparison, no stakeholder consultations, and no recommendations. The draft version was reviewed by two external experts. It is published only in English.
In this technical issue paper we evaluate the excess mortality risk and life expectancy of patients with type 1 diabetes.
Type 1 diabetes (T1D) mostly presents at a young age (mainly < 40 years of age; although later onset is possible), and seems to be triggered by an external factor (some hypotheses points e.g. to specific viral infections), so that it essentially takes the affected individual ‘by surprise’. Currently there are no preventive measures known.
Genetic predisposition (susceptibility) is involved, though on average the genetic predisposition to develop type 1 diabetes is much less prominent than is the case for type 2 diabetes development. For type 2 diabetes (much more prevalent than type 1), unhealthy lifestyle factors play an important and often predominant role in its development, on top of a possible genetic predisposition.
In type 1 diabetes, and despite the role of genetic susceptibility, the majority of new cases of type 1 diabetes present in individuals with no known family history of the disease. In Belgium, the estimated prevalence of type 1 diabetes is 4/1000.
Early after the diagnosis of type 1 diabetes, acute complications and in particular severe hypoglycaemic coma and severe diabetic ketoacidosis predominate and can lead to excess mortality. Although this risk for acute
complications remains, later on, chronic complications, mainly cardiovascular, become the main driver of the excess mortality.
This excess mortality is modulated by several important clinical factors and parameters and those are described in detail in chapter 4.
5.2. Methods
Our approach was a rapid review of literature. This consisted of two steps: the identification of the most recent high-quality systematic reviews and the identification of primary studies published after the search date applied in the systematic reviews identified in the first step. For this second search we focussed on papers reporting life expectancy as this information was missing in the systematic reviews.
The search strategies, inclusion-exclusion criteria and selection flow charts are presented in the appendix. The search was limited to publications published since 2013, since disease management and treatment strategies of diabetes have evolved over time, and current estimates of associated mortality risk and life expectancy must keep up as much as possible with these innovations.
After selection, two systematic reviews with meta-analysis and four primary papers were used for the assessment of the overall excess mortality. Full information on the methods and the search strategy can be found in chapter 2.
In addition we selected other recent papers reporting standardized Mortality Ratios (SMR) and/or mortality risk for major outcomes and trends over time through reference lists and hand searching. These studies are briefly discussed and summarized in section 3.3.
For the discussion on mortality risk and the parameters modifying this risk in chapter 4, further ‘ad hoc’ searches were performed.
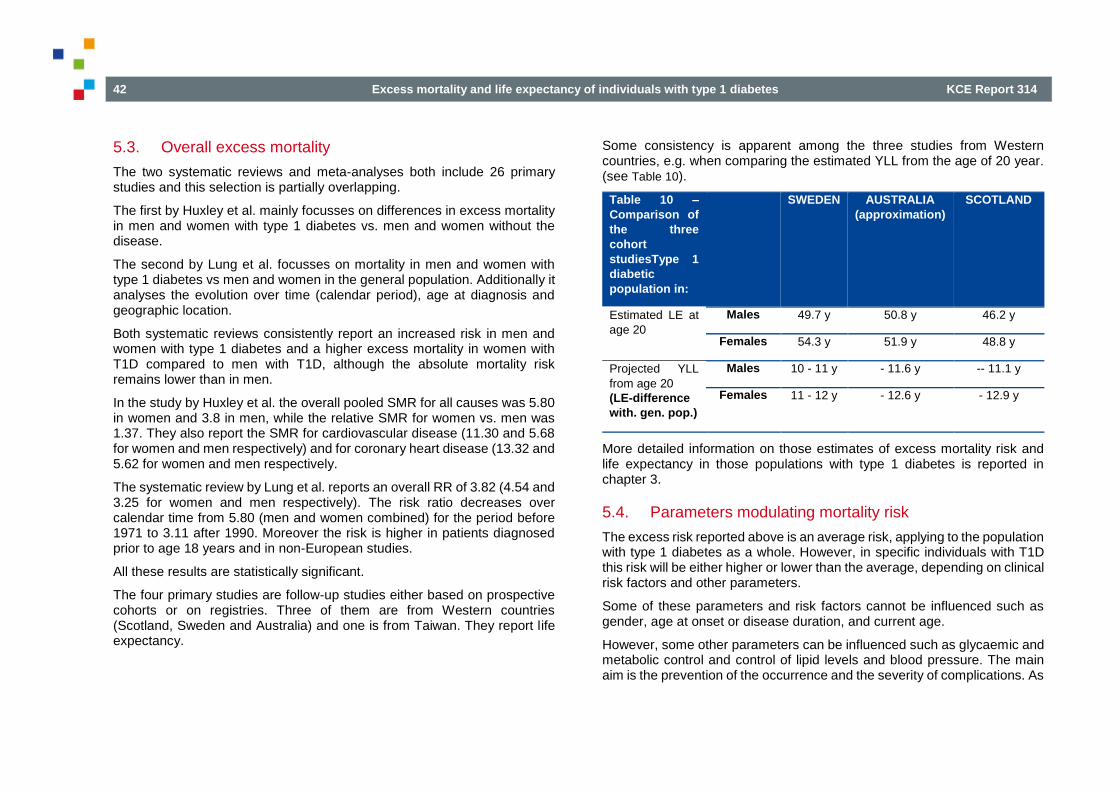
42 Excess mortality and life expectancy of individuals with type 1 diabetes KCE Report 314
5.3. Overall excess mortality
The two systematic reviews and meta-analyses both include 26 primary studies and this selection is partially overlapping.
The first by Huxley et al. mainly focusses on differences in excess mortality in men and women with type 1 diabetes vs. men and women without the disease.
The second by Lung et al. focusses on mortality in men and women with type 1 diabetes vs men and women in the general population. Additionally it analyses the evolution over time (calendar period), age at diagnosis and geographic location.
Both systematic reviews consistently report an increased risk in men and women with type 1 diabetes and a higher excess mortality in women with T1D compared to men with T1D, although the absolute mortality risk remains lower than in men.
In the study by Huxley et al. the overall pooled SMR for all causes was 5.80 in women and 3.8 in men, while the relative SMR for women vs. men was 1.37. They also report the SMR for cardiovascular disease (11.30 and 5.68 for women and men respectively) and for coronary heart disease (13.32 and 5.62 for women and men respectively.
The systematic review by Lung et al. reports an overall RR of 3.82 (4.54 and 3.25 for women and men respectively). The risk ratio decreases over calendar time from 5.80 (men and women combined) for the period before 1971 to 3.11 after 1990. Moreover the risk is higher in patients diagnosed prior to age 18 years and in non-European studies.
All these results are statistically significant.
The four primary studies are follow-up studies either based on prospective cohorts or on registries. Three of them are from Western countries (Scotland, Sweden and Australia) and one is from Taiwan. They report life expectancy.
Some consistency is apparent among the three studies from Western countries, e.g. when comparing the estimated YLL from the age of 20 year. (see Table 10).
Table 10 –
Comparison of
the three
cohort
studiesType 1
diabetic
population in:
SWEDEN AUSTRALIA
(approximation)
SCOTLAND
Estimated LE at
age 20
Males 49.7 y 50.8 y 46.2 y
Females 54.3 y 51.9 y 48.8 y
Projected YLL
from age 20
(LE-difference
with. gen. pop.)
Males 10 - 11 y - 11.6 y -- 11.1 y
Females 11 - 12 y - 12.6 y - 12.9 y
More detailed information on those estimates of excess mortality risk and life expectancy in those populations with type 1 diabetes is reported in chapter 3.
5.4. Parameters modulating mortality risk
The excess risk reported above is an average risk, applying to the population with type 1 diabetes as a whole. However, in specific individuals with T1D this risk will be either higher or lower than the average, depending on clinical risk factors and other parameters.
Some of these parameters and risk factors cannot be influenced such as gender, age at onset or disease duration, and current age.
However, some other parameters can be influenced such as glycaemic and metabolic control and control of lipid levels and blood pressure. The main aim is the prevention of the occurrence and the severity of complications. As
KCE Report 314 Excess mortality and life expectancy of individuals with type 1 diabetes 43
such lifestyle factors are also important such as no-smoking, avoidance of obesity, sufficient exercise etc.
In chapter 4 we discuss several of these parameters and the complications associated with type 1 diabetes that influence cardiovascular risk and therefore mortality risk. We also discuss the risk factors for acute life-threatening complications that mainly occur shortly after initial diagnosis.
The long-term complications of type 1 diabetes are mainly vascular:
micro-vascular disease, with nephropathy as its most important consequence and risk determinant / indicator for cardiovascular disease,
macro-vascular disease with cardiovascular disease including coronary heart disease.
For prognosis, a very important complication of type 1 diabetes is the presence of nephropathy. Nephropathy can go from the presence of micro-albuminuria only, to moderate or severe renal impairment and finally to end-stage renal disease requiring renal dialysis. The highest risk is linked to the presence of end-stage renal disease, which fortunately has become relatively rare. However, the presence of micro-albuminuria on itself is an important prognostic indicator, as it is not only an indicator of nephropathy, but also an important prognostic indicator and an established marker of general cardiovascular risk. When micro-albuminuria is present, it is important for the prognosis that it does not progress. The most important risk factor for nephropathy development seems to be age, HbA1c, the presence of hypertension (blood pressure not at target), as well as a possible genetic predisposition for developing nephropathy.
The presence or absence of nephropathy after 15 years of diabetes is probably the single most important risk determinant of increased overall and CV- mortality.
The presence of cardiac autonomic neuropathy is an often overlooked but possible complication of longstanding diabetes mellitus and by itself a strong risk factor for overall and cardiovascular mortality. Screening for the presence or absence of this complication seems to be underused.
Correct management of the traditional cardiovascular risk factors is even more important in individuals with type 1 diabetes than in the general non-diabetic population. This is demonstrated in recent research that is described in section 4.11. Overall, there is steep-graded association between the number of cardiovascular risk factors at target and the risk for cardiovascular disease and mortality.
Looking at the specific features of long surviving patients with type 1 patients a pattern can be identified and used for mortality risk estimation (see also section 4.13):
reasonable (not necessarily ideal) glycaemic control,
high HDL-cholesterol and low LDL cholesterol levels,
low daily insulin requirements (“insulin sensitive”, so not pointing to double diabetes),
normal body weight,
non-smoker,
lower / normal blood pressures,
micro-albuminuria negative (after 15-20 y of diabetes),
family history of longevity.
44 Excess mortality and life expectancy of individuals with type 1 diabetes KCE Report 314
5.5. Limitations
Ideally, we should have specific survival probability from a given (attained) age for a specific period of time (ten, twenty years), but this information is unavailable in the literature. Moreover, no specific data for Belgium are available. Therefore we had to rely on data from other countries, but we focus on data from Western countries. However, even in those countries management of type 1 diabetes might differ. Anyway, all those results should be used with caution:
all the available data are historical data from other time periods (and regions) with different procedures for type 1 diabetes management (different insulin types, often before the implementation of continuous glucose monitoring systems, …),
even if prevalence might be comparable between (Western) countries, type 1 diabetes management might differ from one country to another,
individual disease characteristics differ to a large extend from patient to patient; this should be taken into account when the (insurance) risk estimate is made; especially the absence or presence of complications should be considered, with in particular the presence or absence of CV-complications and nephropathy,
the reported average relative mortality risk estimates should be put in perspective of the low absolute mortality risk in the typically young population applying for a debt-balance insurance. When available, we provided, in chapter 3, the mortality rates expressed as absolute numbers.
5.6. Final conclusion
Overall, the mortality risk in individuals with type 1 diabetes is higher than in individuals without type 1 diabetes. In the first decade after the diagnosis of type 1 diabetes, acute complications predominate and can lead to excess mortality. Later on, chronic complications (mainly cardiovascular) become the main driver of this excess mortality.
The excess mortality risk, and especially the probability that an individual with type 1 diabetes at a given age will survive for the next ten, twenty or thirty years is difficult to estimate for the reasons given above, especially not for an individual patient. No long-term observational studies are available and therefore we have to rely on proxies such as relative mortality risks on the short term, theoretical life expectancy and years of life lost, from life tables. Moreover, the reported (average) relative risk estimates should to be put in perspective with the still low absolute risk of mortality in younger populations.
However, an average risk means that some individuals are below that average while others are far above it. Of utmost importance is the fact that excess mortality is very dependent on the individual characteristics of the person, and is modulated by several important clinical factors and parameters. Those have been enumerated in chapter 4. Diabetes type 1 duration, current age, gender, level of metabolic control, therapeutic and self-care compliance, (recent) history of severe acute metabolic complications, presence and severity of chronic complications and co-morbidities, and presence or absence of other classic risk factors for instance, they all influence the mortality risk.
The presence or absence of nephropathy, from persistent micro-albuminuria onwards to severe renal disease, is one of most important determinants (if not the most important) for increased mortality from long-term cardiovascular complications.
There are definitely patients with type 1 diabetes where mortality risk is clearly high. However, for many patients, one cannot easily evaluate whether or not there is a significantly increased risk compared to the general population.
KCE Report 314 Excess mortality and life expectancy of individuals with type 1 diabetes 45
This implies that making extrapolations from historic average mortality risk estimates described in literature towards contemporary populations is not straightforward and extrapolation to individual patients is uncertain.
We conclude that:
1. a general average mortality risk estimate based on an overall population of type 1 diabetes patients cannot be applied as such to an individual subject with the disease, because individual patients characteristics largely differ,
2. data from literature show a positive secular trend of improvement in overall survival. Therefore, one should realize that recent papers may refer to historic underlying data, while in reality diabetes therapy, care and technology is constantly improving,
3. although overall, the risk of dying is increased in patients with type 1 diabetes, evidence indicates that if – care givers and patients care well, are engaged and committed, reasonably good HbA1c levels reached, renal complications and smoking avoided, and traditional cardiovascular risk factors well controlled – then the risk of mortality approaches that of the general population.
This report was limited to addressing a specific technical question, and
contains no recommendations. However, a reflexion on a possible way
forward is made in section 4.15.
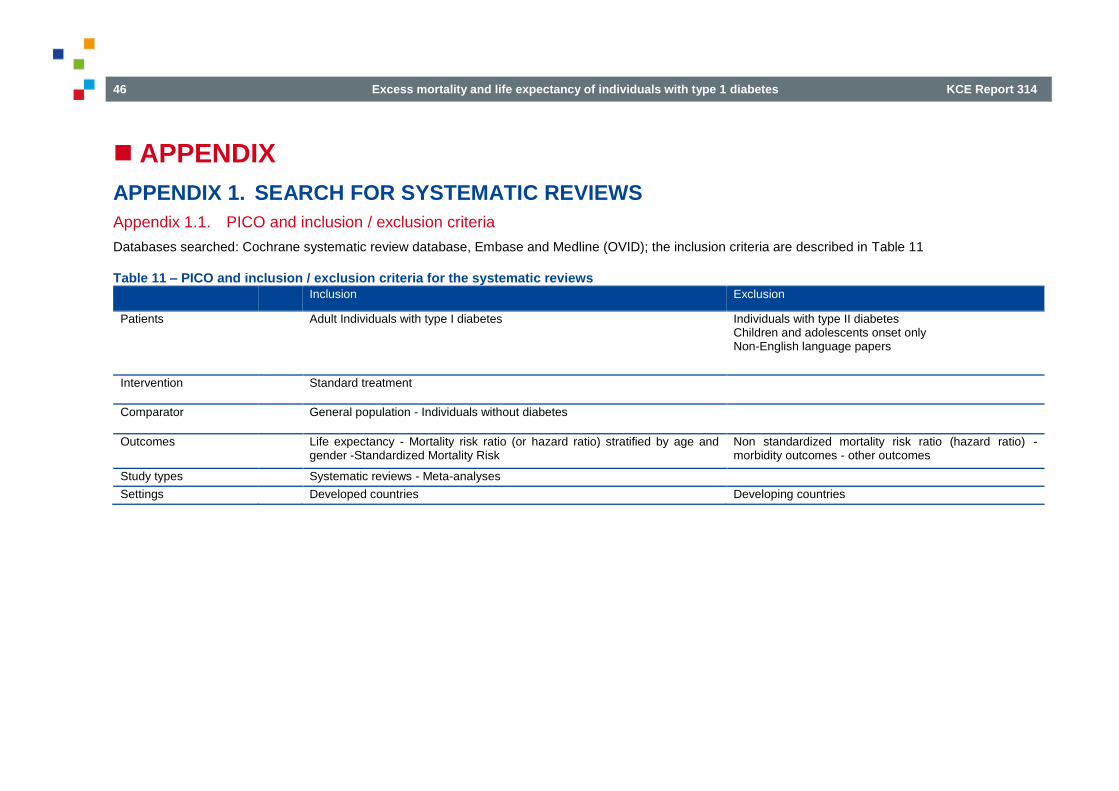
46 Excess mortality and life expectancy of individuals with type 1 diabetes KCE Report 314
APPENDIX
APPENDIX 1. SEARCH FOR SYSTEMATIC REVIEWS
Appendix 1.1. PICO and inclusion / exclusion criteria
Databases searched: Cochrane systematic review database, Embase and Medline (OVID); the inclusion criteria are described in Table 11
Table 11 – PICO and inclusion / exclusion criteria for the systematic reviews Inclusion Exclusion
Patients
Adult Individuals with type I diabetes Individuals with type II diabetes Children and adolescents onset only Non-English language papers
Intervention
Standard treatment
Comparator
General population - Individuals without diabetes
Outcomes
Life expectancy - Mortality risk ratio (or hazard ratio) stratified by age and gender -Standardized Mortality Risk
Non standardized mortality risk ratio (hazard ratio) - morbidity outcomes - other outcomes
Study types
Systematic reviews - Meta-analyses
Settings
Developed countries Developing countries

KCE Report 314 Excess mortality and life expectancy of individuals with type 1 diabetes 47
Appendix 1.2. Medline @ Ovid
Medline @Ovid
Date 06/02/2018
Database Medline via OvidSp
Segments Ovid MEDLINE(R) Epub Ahead of Print, In-Process & Other Non-Indexed Citations, Ovid MEDLINE(R) Daily, Ovid MEDLINE and Versions(R)
Search Strategy
Row Query Hits
1 exp Diabetes Mellitus, Type 1/ 69306
2 (autoimmune adj3 diabetes).ti,kw. 1691
3 (brittle adj3 diabetes mellitus).ti,kw. 15
4 (diabetes adj3 juvenile-onset).ti,kw. 204
5 (diabetes mellitus adj3 insulin-dependent).ti,kw. 5829
6 (diabetes mellitus adj3 ketosis-prone).ti,kw. 15
7 (diabetes mellitus adj3 sudden-onset).ti,kw. 2
8 (diabetes adj3 (type 1 or type i)).ti,kw. 20662
9 iddm.ti,kw. 1759
10 1 or 2 or 3 or 4 or 5 or 6 or 7 or 8 or 9 74975
11 exp Mortality/ 337014
12 exp mortality/ 337014
13 Longevity/ 18476
14 Life expectancy/ 15889
15 Life tables/ 6277
16 Vital Statistics/ 5025
17 mortality.ab,ti,kw. 630468
18 mortalities.ab,ti,kw. 8018
19 death rate?.ab,ti,kw. 19639
20 case fatality rate?.ab,ti,kw. 5735

48 Excess mortality and life expectancy of individuals with type 1 diabetes KCE Report 314
21 survival rate.ab,ti,kw. 76753
22 mean survival time.ab,ti,kw. 3910
23 life expectancy.ab,ti,kw. 26168
24 years of potential life lost.ab,ti,kw. 439
25 life table?.ab,ti,kw. 8429
26 survival.ab,ti,kw. 788037
27 exp Survival Analysis/ 247664
28 (kaplan-meier adj3 (analysis or curve? or estimate? or test? or product-limit? or method?)).ab,ti,kw. 41888
29 cox model?.ab,ti,kw. 7579
30 hazard? model?.ab,ti,kw. 28725
31 11 or 12 or 13 or 14 or 15 or 16 or 17 or 18 or 19 or 20 or 21 or 22 or 23 or 24 or 25 or 26 or 27 or 28 or 29 or 30 1577384
32 10 and 31 4669
33 limit 32 to yr="2013 -Current" 1100
34 limit 33 to systematic reviews 65
Note

KCE Report 314 Excess mortality and life expectancy of individuals with type 1 diabetes 49
Appendix 1.3. Embase
Embase @Embase.com
Date 20/02/2018
Database Embase
Search Strategy
Row Query Hits
#1 'diabetes mellitus, type 1'/exp 102841
#2 (autoimmune NEAR/3 diabetes):ti 2086
#3 (brittle NEAR/3 'diabetes mellitus'):ti 20
#4 (diabetes NEAR/3 'juvenile onset'):ti 255
#5 ('diabetes mellitus' NEAR/3 'insulin dependent'):ti 6720
#6 ('diabetes mellitus' NEAR/3 'ketosis prone'):ti 26
#7 ('diabetes mellitus' NEAR/3 'sudden onset'):ti 2
#8 ((diabetes NEAR/3 'type 1'):ti) OR ((diabetes NEAR/3 'type i'):ti) 31209
#9 iddm:ti 1978
#10 #1 OR #2 OR #3 OR #4 OR #5 OR #6 OR #7 OR #8 OR #9 109156
#11 'mortality'/exp 913166
#12 'longevity'/de 24286
#13 'life expectancy'/de 42140
#14 'life tables'/de 4181
#15 'vital statistics'/de 5903
#16 mortality:ab,ti 891156
#17 mortalities:ab,ti 10943
#18 'death rate':ab,ti OR 'death rates':ab,ti 24165
#19 'case fatality rate':ab,ti OR 'case fatality rates':ab,ti 6773
#20 'survival rate':ab,ti 106373
#21 'mean survival time':ab,ti 5196

50 Excess mortality and life expectancy of individuals with type 1 diabetes KCE Report 314
#22 'life expectancy':ab,ti 35821
#23 'years of potential life lost':ab,ti 488
#24 'life table':ab,ti OR 'life tables':ab,ti 9385
#25 survival:ab,ti 1127136
#26 'survival analysis'/exp 7922
#27 ('kaplan meier' NEAR/3 (analysis OR curve OR curves OR estimate OR estimates OR test OR tests OR 'product limit' OR 'product limits' OR method OR methods)):ab,ti
79886
#28 'cox model':ab,ti OR 'cox models':ab,ti 13251
#29 'hazard model':ab,ti OR 'hazards model':ab,ti OR 'hazard models':ab,ti OR 'hazards models':ab,ti 46013
#30 'life table method'/exp 706
#31 'proportional hazards model'/exp 80828
#32 'kaplan meier method'/exp 56096
#33 #11 OR #12 OR #13 OR #14 OR #15 OR #16 OR #17 OR #18 OR #19 OR #20 OR #21 OR #22 OR #23 OR #24 OR #25 OR #26 OR #27 OR #28 OR #29 OR #30 OR #31 OR #32
2252900
#34 #10 AND #33 8892
#35 #34 AND ('meta-analysis'/exp OR 'meta-analysis' OR 'systematic review'/exp OR 'systematic review') 346
#36 #35 AND [2013-2018]/py 183
#37 #36 NOT [medline]/lim 74
#38 #37 NOT ([conference abstract]/lim OR [conference paper]/lim OR [conference review]/lim OR [editorial]/lim) 42
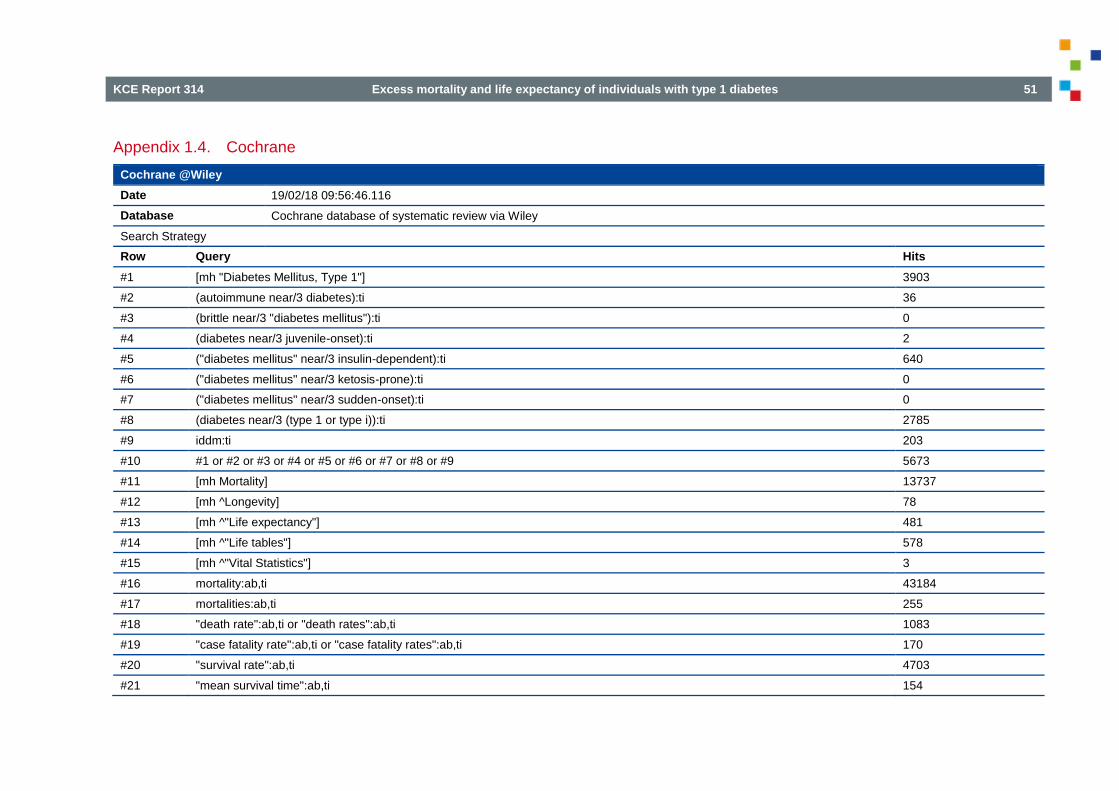
KCE Report 314 Excess mortality and life expectancy of individuals with type 1 diabetes 51
Appendix 1.4. Cochrane
Cochrane @Wiley
Date 19/02/18 09:56:46.116
Database Cochrane database of systematic review via Wiley
Search Strategy
Row Query Hits
#1 [mh "Diabetes Mellitus, Type 1"] 3903
#2 (autoimmune near/3 diabetes):ti 36
#3 (brittle near/3 "diabetes mellitus"):ti 0
#4 (diabetes near/3 juvenile-onset):ti 2
#5 ("diabetes mellitus" near/3 insulin-dependent):ti 640
#6 ("diabetes mellitus" near/3 ketosis-prone):ti 0
#7 ("diabetes mellitus" near/3 sudden-onset):ti 0
#8 (diabetes near/3 (type 1 or type i)):ti 2785
#9 iddm:ti 203
#10 #1 or #2 or #3 or #4 or #5 or #6 or #7 or #8 or #9 5673
#11 [mh Mortality] 13737
#12 [mh ^Longevity] 78
#13 [mh ^"Life expectancy"] 481
#14 [mh ^"Life tables"] 578
#15 [mh ^"Vital Statistics"] 3
#16 mortality:ab,ti 43184
#17 mortalities:ab,ti 255
#18 "death rate":ab,ti or "death rates":ab,ti 1083
#19 "case fatality rate":ab,ti or "case fatality rates":ab,ti 170
#20 "survival rate":ab,ti 4703
#21 "mean survival time":ab,ti 154

52 Excess mortality and life expectancy of individuals with type 1 diabetes KCE Report 314
#22 "life expectancy":ab,ti 1187
#23 "years of potential life lost":ab,ti 2
#24 "life table":ab,ti or "life tables":ab,ti 783
#25 survival:ab,ti 56480
#26 [mh "Survival Analysis"] 20046
#27 (kaplan-meier near/3 (analysis or curve or curves or estimate or estimates or test or tests or product-limit or product-limits or method or methods)):ab,ti
4759
#28 "cox model":ab,ti or "cox models":ab,ti 1152
#29 hazard* model*:ab,ti 7944
#30 #11 or #12 7or #13 or #14 or #15 or #16 or #17 or #18 or #19 or #20 or #21 or #22 or #23 or #24 or #25 or #26 or #27 or #28 or #29 108155
#31 #10 and #30 238
#32 #31 Publication Year from 2013 to 2018 75
Note
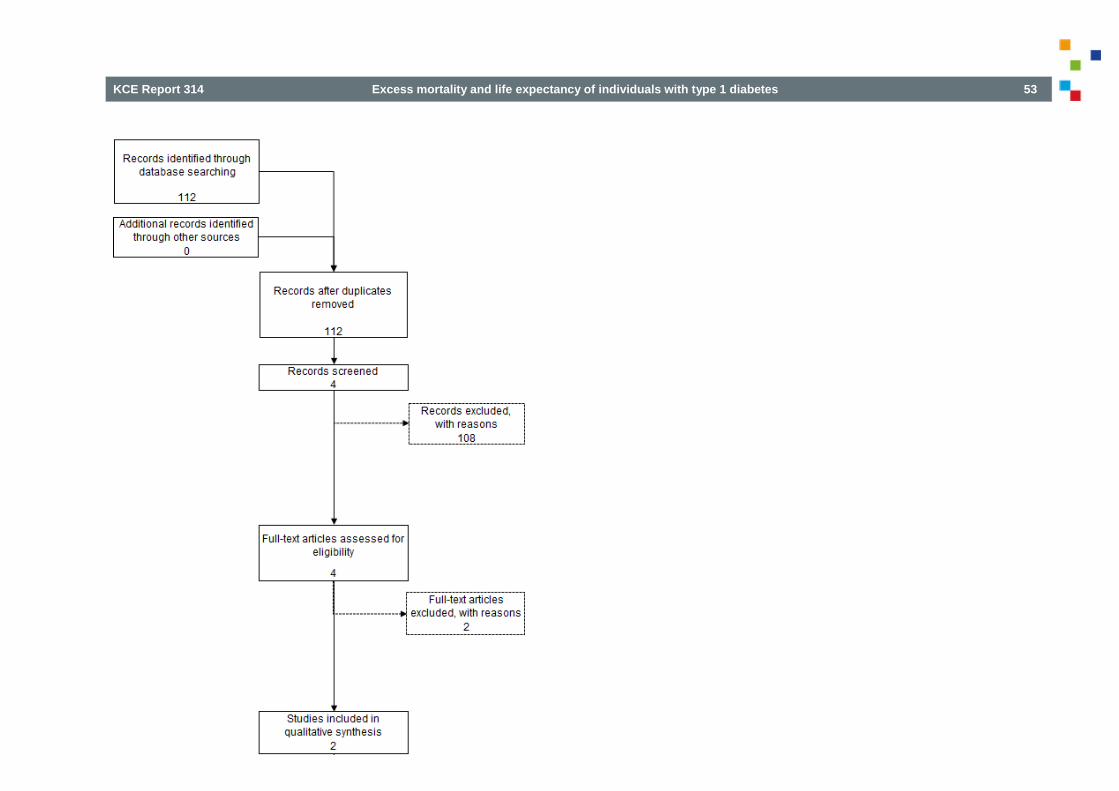
KCE Report 314 Excess mortality and life expectancy of individuals with type 1 diabetes 53

54 Excess mortality and life expectancy of individuals with type 1 diabetes KCE Report 314
APPENDIX 2. SEARCH STRATEGY FOR PRIMARY PAPERS
Appendix 2.1. PICO and inclusion / exclusion criteria
Databases searched: Cochrane systematic review database, Embase and Medline (OVID); the inclusion criteria are described in Table 12
Table 12 – PICO and inclusion / exclusion criteria for the primary papers Inclusion Exclusion
Patients
Adult Individuals with type I diabetes Individuals with type II diabetes
Children and adolescents onset only
Non-English language papers
Intervention
Standard treatment
Comparator
General population - Individuals without diabetes
Outcomes
Life expectancy - Life tables Non standardized mortality risk ratio (hazard ratio) - morbidity outcomes - other outcomes
Study types
Cohorts ) RCTs Observational studies other than cohorts
Settings
Developed countries Developing countries
A secondary and auxiliary aim of this RR technical issue paper was the identification of the potential important parameters and risk factors that are likely to influence the observed mortality risk. Here the purpose was not to do a systematic review of literature, so that several of the articles referred to in section 4 (DISCUSSION) were identified through ‘cascade’ referral and manual searching. The most important parameters/risk factors will be discussed in section 4.4.
Appendix 2.2. Medline @ Ovid
Medline @Ovid
Date 02/03/2018 13:41
Database Medline via OvidSp
Segments Ovid MEDLINE(R) Epub Ahead of Print, In-Process & Other Non-Indexed Citations, Ovid MEDLINE(R) Daily, Ovid MEDLINE and Versions(R)
Search Strategy
Row Query Hits
1 exp *Diabetes Mellitus, Type 1/ 56704
2 (autoimmune adj3 diabetes).ti,kw. 1694
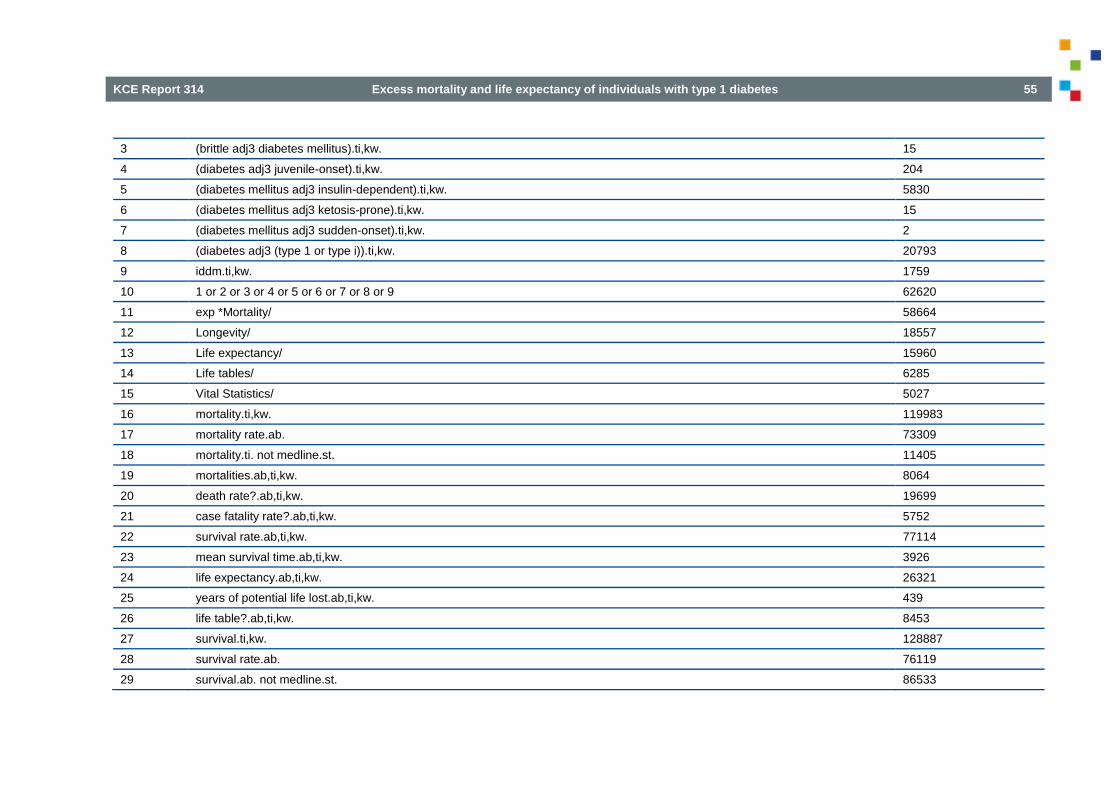
KCE Report 314 Excess mortality and life expectancy of individuals with type 1 diabetes 55
3 (brittle adj3 diabetes mellitus).ti,kw. 15
4 (diabetes adj3 juvenile-onset).ti,kw. 204
5 (diabetes mellitus adj3 insulin-dependent).ti,kw. 5830
6 (diabetes mellitus adj3 ketosis-prone).ti,kw. 15
7 (diabetes mellitus adj3 sudden-onset).ti,kw. 2
8 (diabetes adj3 (type 1 or type i)).ti,kw. 20793
9 iddm.ti,kw. 1759
10 1 or 2 or 3 or 4 or 5 or 6 or 7 or 8 or 9 62620
11 exp *Mortality/ 58664
12 Longevity/ 18557
13 Life expectancy/ 15960
14 Life tables/ 6285
15 Vital Statistics/ 5027
16 mortality.ti,kw. 119983
17 mortality rate.ab. 73309
18 mortality.ti. not medline.st. 11405
19 mortalities.ab,ti,kw. 8064
20 death rate?.ab,ti,kw. 19699
21 case fatality rate?.ab,ti,kw. 5752
22 survival rate.ab,ti,kw. 77114
23 mean survival time.ab,ti,kw. 3926
24 life expectancy.ab,ti,kw. 26321
25 years of potential life lost.ab,ti,kw. 439
26 life table?.ab,ti,kw. 8453
27 survival.ti,kw. 128887
28 survival rate.ab. 76119
29 survival.ab. not medline.st. 86533
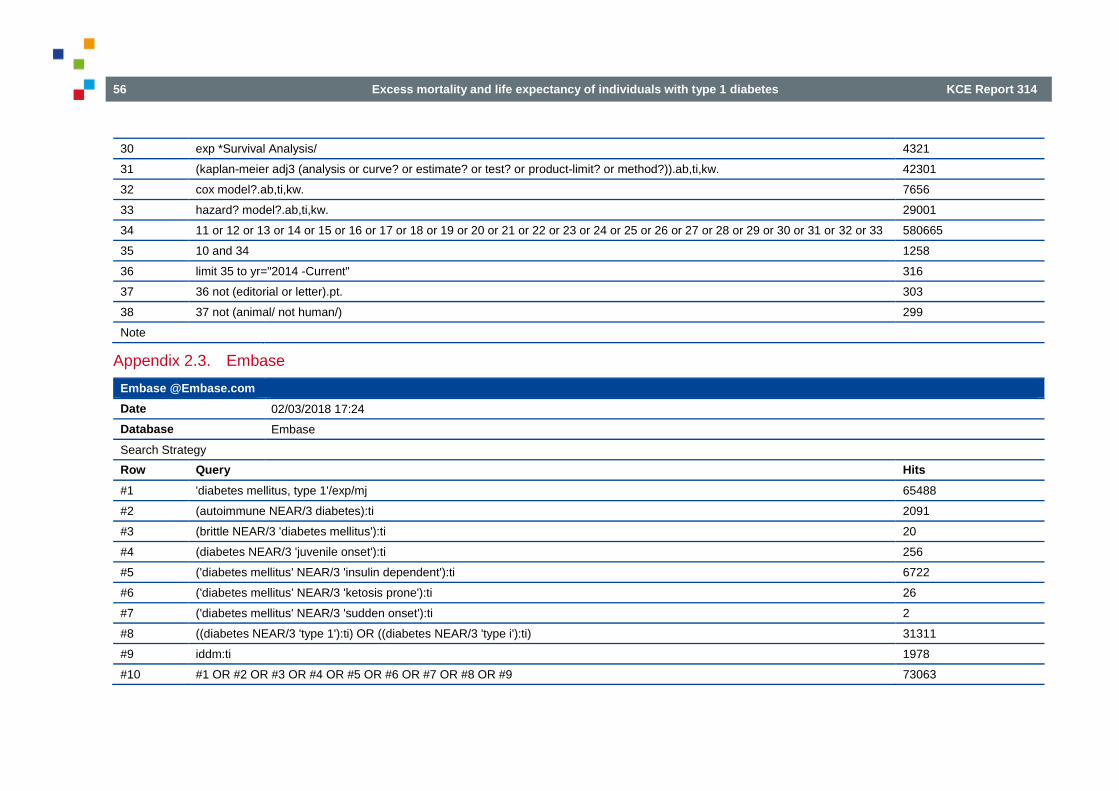
56 Excess mortality and life expectancy of individuals with type 1 diabetes KCE Report 314
30 exp *Survival Analysis/ 4321
31 (kaplan-meier adj3 (analysis or curve? or estimate? or test? or product-limit? or method?)).ab,ti,kw. 42301
32 cox model?.ab,ti,kw. 7656
33 hazard? model?.ab,ti,kw. 29001
34 11 or 12 or 13 or 14 or 15 or 16 or 17 or 18 or 19 or 20 or 21 or 22 or 23 or 24 or 25 or 26 or 27 or 28 or 29 or 30 or 31 or 32 or 33 580665
35 10 and 34 1258
36 limit 35 to yr="2014 -Current" 316
37 36 not (editorial or letter).pt. 303
38 37 not (animal/ not human/) 299
Note
Appendix 2.3. Embase
Embase @Embase.com
Date 02/03/2018 17:24
Database Embase
Search Strategy
Row Query Hits
#1 'diabetes mellitus, type 1'/exp/mj 65488
#2 (autoimmune NEAR/3 diabetes):ti 2091
#3 (brittle NEAR/3 'diabetes mellitus'):ti 20
#4 (diabetes NEAR/3 'juvenile onset'):ti 256
#5 ('diabetes mellitus' NEAR/3 'insulin dependent'):ti 6722
#6 ('diabetes mellitus' NEAR/3 'ketosis prone'):ti 26
#7 ('diabetes mellitus' NEAR/3 'sudden onset'):ti 2
#8 ((diabetes NEAR/3 'type 1'):ti) OR ((diabetes NEAR/3 'type i'):ti) 31311
#9 iddm:ti 1978
#10 #1 OR #2 OR #3 OR #4 OR #5 OR #6 OR #7 OR #8 OR #9 73063
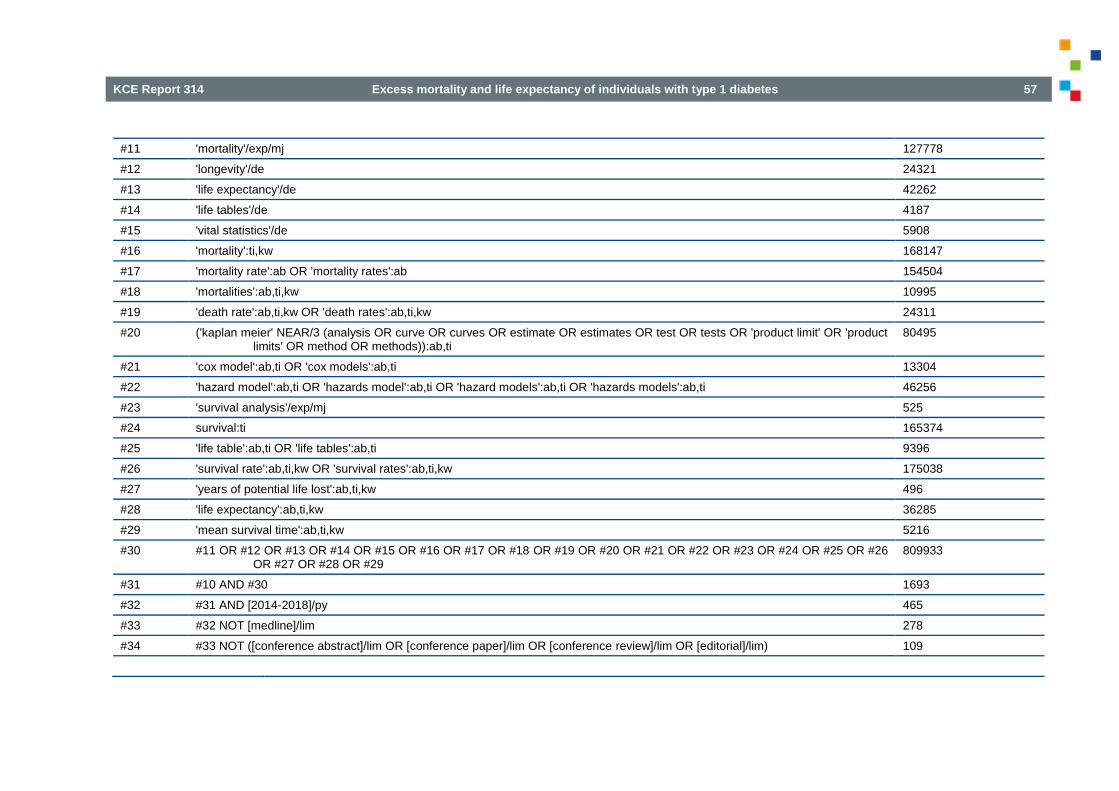
KCE Report 314 Excess mortality and life expectancy of individuals with type 1 diabetes 57
#11 'mortality'/exp/mj 127778
#12 'longevity'/de 24321
#13 'life expectancy'/de 42262
#14 'life tables'/de 4187
#15 'vital statistics'/de 5908
#16 'mortality':ti,kw 168147
#17 'mortality rate':ab OR 'mortality rates':ab 154504
#18 'mortalities':ab,ti,kw 10995
#19 'death rate':ab,ti,kw OR 'death rates':ab,ti,kw 24311
#20 ('kaplan meier' NEAR/3 (analysis OR curve OR curves OR estimate OR estimates OR test OR tests OR 'product limit' OR 'product limits' OR method OR methods)):ab,ti
80495
#21 'cox model':ab,ti OR 'cox models':ab,ti 13304
#22 'hazard model':ab,ti OR 'hazards model':ab,ti OR 'hazard models':ab,ti OR 'hazards models':ab,ti 46256
#23 'survival analysis'/exp/mj 525
#24 survival:ti 165374
#25 'life table':ab,ti OR 'life tables':ab,ti 9396
#26 'survival rate':ab,ti,kw OR 'survival rates':ab,ti,kw 175038
#27 'years of potential life lost':ab,ti,kw 496
#28 'life expectancy':ab,ti,kw 36285
#29 'mean survival time':ab,ti,kw 5216
#30 #11 OR #12 OR #13 OR #14 OR #15 OR #16 OR #17 OR #18 OR #19 OR #20 OR #21 OR #22 OR #23 OR #24 OR #25 OR #26 OR #27 OR #28 OR #29
809933
#31 #10 AND #30 1693
#32 #31 AND [2014-2018]/py 465
#33 #32 NOT [medline]/lim 278
#34 #33 NOT ([conference abstract]/lim OR [conference paper]/lim OR [conference review]/lim OR [editorial]/lim) 109

58 Excess mortality and life expectancy of individuals with type 1 diabetes KCE Report 314
Appendix 2.4. Cochrane
Cochrane @Wiley
Date 05/03/18 16:49:51.877
Database Cochrane CENTRAL @Wiley.com
Search Strategy
Row Query Hits
#1 [mh "Diabetes Mellitus, Type 1" [mj]] 607
#2 (autoimmune near/3 diabetes):ti 36
#3 (brittle near/3 diabetes mellitus):ti 0
#4 (diabetes near/3 juvenile-onset):ti 2
#5 ("diabetes mellitus" near/3 insulin-dependent):ti 640
#6 (diabetes mellitus near/3 sudden-onset):ti 0
#7 'iddm':ti 203
#8 (diabetes mellitus near/3 ketosis-prone):ti 0
#9 (diabetes near/3 (type 1 or type i)):ti 2797
#10 #1 or #2 or #3 or #4 or #5 or #6 or #7 or #8 or #9 4023
#11 [mh Mortality [mj]] 3007
#12 [mh ^Longevity] 78
#13 [mh ^"Life expectancy"] 481
#14 [mh ^"Life tables"] 578
#15 [mh ^"Vital Statistics"] 3
#16 mortality:ti 5568
#17 mortalities:ab,ti,kw 255
#18 'death rate':ab,ti,kw or 'death rates':ab,ti,kw 19961
#19 'mortality rate':ab or 'mortality rates':ab 26786
#20 ('kaplan meier' near/3 (analysis or curve or curves or estimate or estimates or test or tests or 'product limit' or 'product limits' or method or methods)):ab,ti
4751

KCE Report 314 Excess mortality and life expectancy of individuals with type 1 diabetes 59
#21 'cox model':ab,ti or 'cox models':ab,ti 6421
#22 'hazard model':ab,ti or 'hazards model':ab,ti or 'hazard models':ab,ti or 'hazards models':ab,ti 7413
#23 [mh "survival analysis" [mj]] 3991
#24 survival:ti 7813
#25 'life table':ab,ti or 'life tables':ab,ti 3200
#26 'survival rate':ab,ti,kw or 'survival rates':ab,ti,kw 39207
#27 'years of potential life lost':ab,ti,kw 198
#28 'life expectancy':ab,ti,kw 1765
#29 'mean survival time':ab,ti,kw 5186
#30 #11 or #12 or #13 or #14 or #15 or #16 or #17 or #18 or #19 or #20 or #21 or #22 or #23 or #24 or #25 or #26 or #27 or #28 or #29 84137
#31 #10 and #30 104
#32 #31 Publication Year from 2014 to 2018 42
Note Among the 42 results, 5 are from Cochrane Database of Systematic reviews and 37 from CENTRAL.
In addition a selection of other recent papers reporting SMR and/or mortality, risk for major outcomes and trends over time are briefly discussed and summarized in section 3.3.

60 Excess mortality and life expectancy of individuals with type 1 diabetes KCE Report 314

KCE Report 314 Excess mortality and life expectancy of individuals with type 1 diabetes 61
REFERENCES 1. Belgium DL-. Diabetes is helemaal niet zo zeldzaam. We zetten enkele markante gegevens op een rijtje. Hoe vaak komt diabetes voor? [Web page]. Diabetes Liga;2018 [cited May, 17th]. Available from: https://leden.diabetes.be/diabetes-cijfers
2. Federation I-ID. IDF DIABETES ATLAS, 8th Edition [Web page]. IDF;2018 [cited May, 17th]. Available from: http://diabetesatlas.org/resources/2017-atlas.html
3. Valentine WJ, Pollock RF, Saunders R, Bae J, Norrbacka K, Boye K. The Prime Diabetes Model: Novel Methods for Estimating Long-Term Clinical and Cost Outcomes in Type 1 Diabetes Mellitus. Value in Health. 2017;20(7):985-91.
4. Shea BJ, Reeves BC, Wells G, Thuku M, Hamel C, Moran J, et al. AMSTAR 2: a critical appraisal tool for systematic reviews that include randomised or non-randomised studies of healthcare interventions, or both. BMJ. 2017;358:j4008.
5. SIGN. SIGN Critical appraisal notes and checklists. http://www.sign.ac.uk/checklists-and-notes.html: Accessed on 13 May 2018.
6. Morgan E, Cardwell CR, Black CJ, McCance DR, Patterson CC. Excess mortality in Type 1 diabetes diagnosed in childhood and adolescence: a systematic review of population-based cohorts. Acta Diabetologica. 2015;52(4):801-7.
7. Scott A, Chambers D, Goyder E, O'Cathain A. Socioeconomic inequalities in mortality, morbidity and diabetes management for adults with type 1 diabetes: A systematic review. PLoS ONE [Electronic Resource]. 2017;12(5):e0177210.
8. Huxley RR, Peters SA, Mishra GD, Woodward M. Risk of all-cause mortality and vascular events in women versus men with type 1 diabetes: a systematic review and meta-analysis. The Lancet Diabetes & Endocrinology. 2015;3(3):198-206.
9. Lung TW, Hayes AJ, Herman WH, Si L, Palmer AJ, Clarke PM. A meta-analysis of the relative risk of mortality for type 1 diabetes

62 Excess mortality and life expectancy of individuals with type 1 diabetes KCE Report 314
patients compared to the general population: exploring temporal changes in relative mortality. PLoS ONE [Electronic Resource]. 2014;9(11):e113635.
10. Huo L, Harding JL, Peeters A, Shaw JE, Magliano DJ. Life expectancy of type 1 diabetic patients during 1997-2010: a national Australian registry-based cohort study. Diabetologia. 2016;59(6):1177-85.
11. Livingstone SJ, Levin D, Looker HC, Lindsay RS, Wild SH, Joss N, et al. Estimated life expectancy in a Scottish cohort with type 1 diabetes, 2008-2010. JAMA. 2015;313(1):37-44.
12. Petrie D, Lung TW, Rawshani A, Palmer AJ, Svensson AM, Eliasson B, et al. Recent trends in life expectancy for people with type 1 diabetes in Sweden. Diabetologia. 2016;59(6):1167-76.
13. Ou HT, Yang CY, Wang JD, Hwang JS, Wu JS. Life Expectancy and Lifetime Health Care Expenditures for Type 1 Diabetes: A Nationwide Longitudinal Cohort of Incident Cases Followed for 14 Years. Value in Health. 2016;19(8):976-84.
14. Walker BCNR, S.; Penman, I. Davidson's principles & practice of medicine. 22nd Edition. Churchill Livingstone - Elsevier.; 2014.
15. Stene LC. Gaps in life expectancy for people with type 1 diabetes. Diabetologia. 2016;59(6):1150-2.
16. Makinen VP, Tynkkynen T, Soininen P, Peltola T, Kangas AJ, Forsblom C, et al. Metabolic diversity of progressive kidney disease in 325 patients with type 1 diabetes (the FinnDiane Study). J Proteome Res. 2012;11(3):1782-90.
17. Thorn LM, Forsblom C, Fagerudd J, Thomas MC, Pettersson-Fernholm K, Saraheimo M, et al. Metabolic syndrome in type 1 diabetes: association with diabetic nephropathy and glycemic control (the FinnDiane study). Diabetes Care. 2005;28(8):2019-24.
18. van der Kloet FM, Tempels FW, Ismail N, van der Heijden R, Kasper PT, Rojas-Cherto M, et al. Discovery of early-stage biomarkers for
diabetic kidney disease using ms-based metabolomics (FinnDiane study). Metabolomics. 2012;8(1):109-19.
19. Waden J, Forsblom C, Thorn LM, Saraheimo M, Rosengard-Barlund M, Heikkila O, et al. Physical activity and diabetes complications in patients with type 1 diabetes: the Finnish Diabetic Nephropathy (FinnDiane) Study. Diabetes Care. 2008;31(2):230-2.
20. Groop PH, Thomas M, Feodoroff M, Forsblom C, Harjutsalo V, FinnDiane Study G. Excess Mortality in Patients With Type 1 Diabetes Without Albuminuria-Separating the Contribution of Early and Late Risks. Diabetes Care. 2018;29:29.
21. Groop PH, Thomas MC, Moran JL, Waden J, Thorn LM, Makinen VP, et al. The presence and severity of chronic kidney disease predicts all-cause mortality in type 1 diabetes. Diabetes. 2009;58(7):1651-8.
22. Jansson FJ, Forsblom C, Harjutsalo V, Thorn LM, Waden J, Elonen N, et al. Regression of albuminuria and its association with incident cardiovascular outcomes and mortality in type 1 diabetes: the FinnDiane Study. Diabetologia. 2018;08:08.
23. gLevey AS, Eckardt KU, Tsukamoto Y, Levin A, Coresh J, Rossert J, et al. Definition and classification of chronic kidney disease: a position statement from Kidney Disease: Improving Global Outcomes (KDIGO). Kidney Int. 2005;67(6):2089-100.
24. Orchard TJ, Dorman JS, Maser RE, Becker DJ, Ellis D, LaPorte RE, et al. Factors associated with avoidance of severe complications after 25 yr of IDDM. Pittsburgh Epidemiology of Diabetes Complications Study I. Diabetes Care. 1990;13(7):741-7.
25. Orchard TJ, Dorman JS, Maser RE, Becker DJ, Drash AL, Ellis D, et al. Prevalence of complications in IDDM by sex and duration. Pittsburgh Epidemiology of Diabetes Complications Study II. Diabetes. 1990;39(9):1116-24.

KCE Report 314 Excess mortality and life expectancy of individuals with type 1 diabetes 63
26. Costacou T, Orchard TJ. Cumulative kidney complication risk by 50 years of type 1 diabetes: The effects of sex, age, and calendar year at onset. Diabetes Care. 2018;41(3):426-33.
27. Costacou T. The Epidemiology of Cardiovascular Disease in Adults with Type 1 Diabetes. Current Diabetes Reviews. 2017;13(6):520-7.
28. Miller RG, Mahajan HD, Costacou T, Sekikawa A, Anderson SJ, Orchard TJ. A Contemporary Estimate of Total Mortality and Cardiovascular Disease Risk in Young Adults With Type 1 Diabetes: The Pittsburgh Epidemiology of Diabetes Complications Study. Diabetes Care. 2016;39(12):2296-303.
29. Miller RG, Secrest AM, Ellis D, Becker DJ, Orchard TJ. Changing impact of modifiable risk factors on the incidence of major outcomes of type 1 diabetes: the Pittsburgh Epidemiology of Diabetes Complications Study. Diabetes Care. 2013;36(12):3999-4006.
30. Miller RG, Secrest AM, Sharma RK, Songer TJ, Orchard TJ. Improvements in the life expectancy of type 1 diabetes: the Pittsburgh Epidemiology of Diabetes Complications study cohort. Diabetes. 2012;61(11):2987-92.
31. Orchard TJ, Secrest AM, Miller RG, Costacou T. In the absence of renal disease, 20 year mortality risk in type 1 diabetes is comparable to that of the general population: a report from the Pittsburgh Epidemiology of Diabetes Complications Study. Diabetologia. 2010;53(11):2312-9.
32. Orchard TJ, Olson JC, Erbey JR, Williams K, Forrest KY, Smithline Kinder L, et al. Insulin resistance-related factors, but not glycemia, predict coronary artery disease in type 1 diabetes: 10-year follow-up data from the Pittsburgh Epidemiology of Diabetes Complications Study. Diabetes Care. 2003;26(5):1374-9.
33. Miller RG, Anderson SJ, Costacou T, Sekikawa A, Orchard TJ. Risk stratification for 25-year cardiovascular disease incidence in type 1 diabetes: Tree-structured survival analysis of the Pittsburgh
Epidemiology of Diabetes Complications study. Diabetes & Vascular Disease Research. 2016;13(4):250-9.
34. Reynolds K, Saydah SH, Isom S, Divers J, Lawrence JM, Dabelea D, et al. Mortality in youth-onset type 1 and type 2 diabetes: The SEARCH for Diabetes in Youth study. Journal of Diabetes and its Complications. 2018;32(6):545-9.
35. Schoenaker DA, Simon D, Chaturvedi N, Fuller JH, Soedamah-Muthu SS, Group EPCS. Glycemic control and all-cause mortality risk in type 1 diabetes patients: the EURODIAB prospective complications study. Journal of Clinical Endocrinology & Metabolism. 2014;99(3):800-7.
36. Soedamah-Muthu SS, Chaturvedi N, Witte DR, Stevens LK, Porta M, Fuller JH, et al. Relationship between risk factors and mortality in type 1 diabetic patients in Europe: the EURODIAB Prospective Complications Study (PCS). Diabetes Care. 2008;31(7):1360-6.
37. Soedamah-Muthu SS, Vergouwe Y, Costacou T, Miller RG, Zgibor J, Chaturvedi N, et al. Predicting major outcomes in type 1 diabetes: a model development and validation study. Diabetologia. 2014;57(11):2304-14.
38. Vergouwe Y, Soedamah-Muthu SS, Zgibor J, Chaturvedi N, Forsblom C, Snell-Bergeon JK, et al. Progression to microalbuminuria in type 1 diabetes: development and validation of a prediction rule. Diabetologia. 2010;53(2):254-62.
39. Garofolo M, Russo E, Miccoli R, Lucchesi D, Giusti L, Sancho-Bornez V, et al. Albuminuric and non-albuminuric chronic kidney disease in type 1 diabetes: Association with major vascular outcomes risk and all-cause mortality. Journal of Diabetes and its Complications. 2018;32(6):550-7.
40. Jorgensen ME, Almdal TP, Carstensen B. Time trends in mortality rates in type 1 diabetes from 2002 to 2011. Diabetologia. 2013;56(11):2401-4.

64 Excess mortality and life expectancy of individuals with type 1 diabetes KCE Report 314
41. Lind M, Svensson AM, Kosiborod M, Gudbjornsdottir S, Pivodic A, Wedel H, et al. Glycemic control and excess mortality in type 1 diabetes. New England Journal of Medicine. 2014;371(21):1972-82.
42. Ahlen E, Pivodic A, Wedel H, Dahlqvist S, Kosiborod M, Lind M. Glycemic Control, Renal Complications, and Current Smoking in Relation to Excess Risk of Mortality in Persons With Type 1 Diabetes. Journal of Diabetes Science & Technology. 2016;10(5):1006-14.
43. Gagnum V, Stene LC, Jenssen TG, Berteussen LM, Sandvik L, Joner G, et al. Causes of death in childhood-onset Type 1 diabetes: long-term follow-up. Diabetic Medicine. 2017;34(1):56-63.
44. Gagnum V, Saeed M, Stene LC, Leivestad T, Joner G, Skrivarhaug T. Low Incidence of End-Stage Renal Disease in Childhood-Onset Type 1 Diabetes Followed for Up to 42 Years. Diabetes Care. 2018;41(3):420-5.
45. Cooper MN, de Klerk NH, Jones TW, Davis EA. Clinical and demographic risk factors associated with mortality during early adulthood in a population-based cohort of childhood-onset type 1 diabetes. Diabetic Medicine. 2014;31(12):1550-8.
46. Harding JL, Shaw JE, Peeters A, Davidson S, Magliano DJ. Age-Specific Trends From 2000-2011 in All-Cause and Cause-Specific Mortality in Type 1 and Type 2 Diabetes: A Cohort Study of More Than One Million People. Diabetes Care. 2016;39(6):1018-26.
47. DiMeglio LA, Evans-Molina C, Oram RA. Type 1 diabetes. Lancet. 2018;391(10138):2449-62.
48. Subramanian S, Hirsch IB. Intensive Diabetes Treatment and Cardiovascular Outcomes in Type 1 Diabetes Mellitus: Implications of the Diabetes Control and Complications Trial/Epidemiology of Diabetes Interventions and Complications Study 30-Year Follow-up. Endocrinology & Metabolism Clinics of North America. 2018;47(1):65-79.
49. Bjornstad P, Donaghue KC, Maahs DM. Macrovascular disease and risk factors in youth with type 1 diabetes: time to be more attentive to treatment? Lancet Diabetes Endocrinol. 2018.
50. Evans-Cheung TC, Bodansky HJ, Parslow RC, Feltbower RG. Early deaths from ischaemic heart disease in childhood-onset type 1 diabetes. Archives of Disease in Childhood. 2018;24:24.
51. Gagnum V, Stene LC, Sandvik L, Fagerland MW, Njolstad PR, Joner G, et al. All-cause mortality in a nationwide cohort of childhood-onset diabetes in Norway 1973-2013. Diabetologia. 2015;58(8):1779-86.
52. Morgan E, Black CR, Abid N, Cardwell CR, McCance DR, Patterson CC. Mortality in type 1 diabetes diagnosed in childhood in Northern Ireland during 1989-2012: A population-based cohort study. Pediatric Diabetes. 2018;19(1):166-70.
53. Diabetes C, Complications Trial /Epidemiology of Diabetes I, Complications Study Research G. Mortality in Type 1 Diabetes in the DCCT/EDIC Versus the General Population. Diabetes Care. 2016;39(8):1378-83.
54. Harjutsalo V, Maric-Bilkan C, Forsblom C, Groop PH. Impact of sex and age at onset of diabetes on mortality from ischemic heart disease in patients with type 1 diabetes. Diabetes Care. 2014;37(1):144-8.
55. Soedamah-Muthu SS, Fuller JH, Mulnier HE, Raleigh VS, Lawrenson RA, Colhoun HM. All-cause mortality rates in patients with type 1 diabetes mellitus compared with a non-diabetic population from the UK general practice research database, 1992-1999. Diabetologia. 2006;49(4):660-6.
56. Lithovius R, Toppila I, Harjutsalo V, Forsblom C, Groop P.-H, Mäkinen V.-P. Data-driven metabolic subtypes predict future adverse events in individuals with type 1 diabetes. Diabetologia. 2017;60(7):1234-43.

KCE Report 314 Excess mortality and life expectancy of individuals with type 1 diabetes 65
57. Simmons D. Excess deaths in women with type 1 diabetes: time to act. Lancet Diabetes Endocrinol. 2015;3(3):164-5.
58. Harding JL, Shaw JE, Peeters A, Guiver T, Davidson S, Magliano DJ. Mortality trends among people with type 1 and type 2 diabetes in Australia: 1997-2010.[Erratum appears in Diabetes Care. 2015 Apr;38(4):733-4; PMID: 25805865]. Diabetes Care. 2014;37(9):2579-86.
59. Matuleviciene-Anangen V, Rosengren A, Svensson AM, Pivodic A, Gudbjornsdottir S, Wedel H, et al. Glycaemic control and excess risk of major coronary events in persons with type 1 diabetes. Heart. 2017;103(21):1687-95.
60. Orchard TJ, Nathan DM, Zinman B, Cleary P, Brillon D, Backlund JY, et al. Association between 7 years of intensive treatment of type 1 diabetes and long-term mortality. Jama. 2015;313(1):45-53.
61. Sandahl K, Nielsen LB, Svensson J, Johannesen J, Pociot F, Mortensen HB, et al. Increased mortality in a Danish cohort of young people with Type 1 diabetes mellitus followed for 24 years. Diabetic Medicine. 2017;34(3):380-6.
62. Gorst C, Kwok CS, Aslam S, Buchan I, Kontopantelis E, Myint PK, et al. Long-term Glycemic Variability and Risk of Adverse Outcomes: A Systematic Review and Meta-analysis. Diabetes Care. 2015;38(12):2354-69.
63. Walker GS, Cunningham SG, Sainsbury CAR, Jones GC. HbA<sub>1c</sub> variability is associated with increased mortality and earlier hospital admission in people with Type 1 diabetes. Diabetic Medicine. 2017;34(11):1541-5.
64. Wightman SS, Sainsbury CAR, Jones GC. Visit-to-visit HbA1c variability and systolic blood pressure (SBP) variability are significantly and additively associated with mortality in individuals with type 1 diabetes: An observational study. Diabetes, Obesity & Metabolism. 2017;21:21.
65. Snell-Bergeon JK, Maahs DM. Diabetes: Elevated risk of mortality in type 1 diabetes mellitus. Nature Reviews Endocrinology. 2015;11(3):136-8.
66. Graveling A.J, Frier B.M. The risks of nocturnal hypoglycaemia in insulin-treated diabetes. Diabetes Res. Clin. Pract. 2017;133:30-9.
67. Khunti K, Davies M, Majeed A, Thorsted BL, Wolden ML, Paul SK. Hypoglycemia and risk of cardiovascular disease and all-cause mortality in insulin-treated people with type 1 and type 2 diabetes: a cohort study. Diabetes Care. 2015;38(2):316-22.
68. Sejling AS, Schouwenberg B, Faerch LH, Thorsteinsson B, de Galan BE, Pedersen-Bjergaard U. Association between hypoglycaemia and impaired hypoglycaemia awareness and mortality in people with Type 1 diabetes mellitus. Diabetic Medicine. 2016;33(1):77-83.
69. Wasag DR, Gregory JW, Dayan C, Harvey JN, Brecon G. Excess all-cause mortality before age 30 in childhood onset type 1 diabetes: data from the Brecon Group Cohort in Wales. Archives of Disease in Childhood. 2018;103(1):44-8.
70. Evans-Cheung TC, Bodansky HJ, Parslow RC, Feltbower RG. Mortality and acute complications in children and young adults diagnosed with Type 1 diabetes in Yorkshire, UK: a cohort study. Diabetic Medicine. 2018;35(1):112-20.
71. Gordin D, Harjutsalo V, Tinsley L, Fickweiler W, Sun JK, Forsblom C, et al. Differential Association of Microvascular Attributions With Cardiovascular Disease in Patients With Long Duration of Type 1 Diabetes. Diabetes Care. 2018;41(4):815-22.
72. Rawshani A, Rawshani A, Franzen S, Eliasson B, Svensson AM, Miftaraj M, et al. Range of Risk Factor Levels: Control, Mortality, and Cardiovascular Outcomes in Type 1 Diabetes Mellitus. Circulation. 2017;135(16):1522-31.
73. Gagnum V, Stene LC, Leivestad T, Joner G, Skrivarhaug T. Long-term Mortality and End-Stage Renal Disease in a Type 1 Diabetes

66 Excess mortality and life expectancy of individuals with type 1 diabetes KCE Report 314
Population Diagnosed at Age 15-29 Years in Norway. Diabetes Care. 2017;40(1):38-45.
74. Helve J, Sund R, Arffman M, Harjutsalo V, Groop PH, Gronhagen-Riska C, et al. Incidence of End-Stage Renal Disease in Patients With Type 1 Diabetes. Diabetes Care. 2018;41(3):434-9.
75. Lecaire TJ, Klein BE, Howard KP, Lee KE, Klein R. Risk for end-stage renal disease over 25 years in the population-based WESDR cohort. Diabetes Care. 2014;37(2):381-8.
76. Wise J. Type 1 diabetes still shortens life span, Scottish study finds. BMJ. 2015;350:h59.
77. Karalliedde J, Viberti G. Diabetes. Excess mortality in well-controlled T1DM without renal disease. Nature Reviews Nephrology. 2015;11(3):132-4.
78. Huang CY, Ting WH, Lo FS, Tsai JD, Sun FJ, Chan CI, et al. Factors associated with diabetic nephropathy in children, adolescents, and adults with type 1 diabetes. Journal of the Formosan Medical Association. 2017;116(12):924-32.
79. Orchard TJ, Costacou T. Cardiovascular complications of type 1 diabetes: update on the renal link. Acta Diabetologica. 2017;54(4):325-34.
80. Pop-Busui R, Braffett BH, Zinman B, Martin C, White NH, Herman WH, et al. Cardiovascular Autonomic Neuropathy and Cardiovascular Outcomes in the Diabetes Control and Complications Trial/Epidemiology of Diabetes Interventions and Complications (DCCT/EDIC) Study. Diabetes Care. 2017;40(1):94-100.
81. Lacigova S, Brozova J, Cechurova D, Tomesova J, Krcma M, Rusavy Z. The influence of cardiovascular autonomic neuropathy on mortality in type 1 diabetic patients; 10-year follow-up. Biomedical Papers of the Medical Faculty of Palacky University in Olomouc, Czech Republic. 2016;160(1):111-7.
82. Mameli C, Mazzantini S, Ben Nasr M, Fiorina P, Scaramuzza AE, Zuccotti GV. Explaining the increased mortality in type 1 diabetes. World Journal of Diabetes. 2015;6(7):889-95.
83. Cleland SJ, Fisher BM, Colhoun HM, Sattar N, Petrie JR. Insulin resistance in type 1 diabetes: what is 'double diabetes' and what are the risks? Diabetologia. 2013;56(7):1462-70.
84. Berhan YT, Eliasson M, Mollsten A, Waernbaum I, Dahlquist G, Swedish Childhood Diabetes Study G. Impact of parental socioeconomic status on excess mortality in a population-based cohort of subjects with childhood-onset type 1 diabetes. Diabetes Care. 2015;38(5):827-32.
85. Rawshani A, Svensson AM, Rosengren A, Eliasson B, Gudbjornsdottir S. Impact of Socioeconomic Status on Cardiovascular Disease and Mortality in 24,947 Individuals With Type 1 Diabetes. Diabetes Care. 2015;38(8):1518-27.
86. Rawshani A, Svensson AM, Zethelius B, Eliasson B, Rosengren A, Gudbjornsdottir S. Association Between Socioeconomic Status and Mortality, Cardiovascular Disease, and Cancer in Patients With Type 2 Diabetes. JAMA Internal Medicine. 2016;176(8):1146-54.
87. Distiller LA. Why do some patients with type 1 diabetes live so long? World Journal of Diabetes. 2014;5(3):282-7.
Related Documents