minerals Article Exceptional Preservation of Fungi as H 2 -Bearing Fluid Inclusions in an Early Quaternary Paleo-Hydrothermal System at Cape Vani, Milos, Greece Magnus Ivarsson 1,2, *, Stephanos P. Kilias 3 , Curt Broman 4 , Anna Neubeck 5 , Henrik Drake 6 , Ernest Chi Fru 7 , Stefan Bengtson 2 , Jonathan Naden 8 , Kleopatra Detsi 3 and Martin J. Whitehouse 9 1 Department of Biology, University of Southern Denmark, Campusvej 55, 5230 Odense, Denmark 2 Department of Paleobiology, Swedish Museum of Natural History, Box 50007, 10405 Stockholm, Sweden; [email protected] 3 Department of Economic Geology and Geochemistry, Faculty of Geology and Geoenvironment, National and Kapodistrian University of Athens, Panepistimiopolis, Zographou, 15784 Athens, Greece; [email protected] (S.P.K.); [email protected] (K.D.) 4 Department of Geological Sciences, Stockholm University, SE-10691 Stockholm, Sweden; [email protected] 5 Department of Earth Sciences, Uppsala University, SE-75236 Uppsala, Sweden; [email protected] 6 Department of Biology and Environmental Science, Linnæus University, 392 31 Kalmar, Sweden; [email protected] 7 School of Earth and Ocean Sciences, Institute for Geobiology and Geochemistry, Cardiff University, Park Place, Cardiff CF10 3AT, UK; chifrue@cardiff.ac.uk 8 British Geological Survey, Keyworth, Nottingham NG12 5GG, UK; [email protected] 9 Department of Geosciences, Swedish Museum of Natural History, Box 50007, SE10405 Stockholm, Sweden; [email protected] * Correspondence: [email protected] Received: 5 November 2019; Accepted: 2 December 2019; Published: 3 December 2019 Abstract: The production of H 2 in hydrothermal systems and subsurface settings is almost exclusively assumed a result of abiotic processes, particularly serpentinization of ultramafic rocks. The origin of H 2 in environments not hosted in ultramafic rocks is, as a rule, unjustifiably linked to abiotic processes. Additionally, multiple microbiological processes among both prokaryotes and eukaryotes are known to involve H 2 -production, of which anaerobic fungi have been put forward as a potential source of H 2 in subsurface environments, which is still unconfirmed. Here, we report fungal remains exceptionally preserved as fluid inclusions in hydrothermal quartz from feeder quartz-barite veins from the Cape Vani Fe-Ba-Mn ore on the Greek island of Milos. The inclusions possess filamentous or near-spheroidal morphologies interpreted as remains of fungal hyphae and spores, respectively. They were characterized by microthermometry, Raman spectroscopy, and staining of exposed inclusions with WGA-FITC under fluorescence microscopy. The spheroidal aqueous inclusions interpreted as fungal spores are unique by their coating of Mn-oxide birnessite, and gas phase H 2 . A biological origin of the H 2 resulting from anaerobic fungal respiration is suggested. We propose that biologically produced H 2 by micro-eukaryotes is an unrecognized source of H 2 in hydrothermal systems that may support communities of H 2 -dependent prokaryotes. Keywords: fungi; hydrothermal system; molecular hydrogen Minerals 2019, 9, 749; doi:10.3390/min9120749 www.mdpi.com/journal/minerals

Welcome message from author
This document is posted to help you gain knowledge. Please leave a comment to let me know what you think about it! Share it to your friends and learn new things together.
Transcript
minerals
Article
Exceptional Preservation of Fungi as H2-Bearing FluidInclusions in an Early QuaternaryPaleo-Hydrothermal System at Cape Vani,Milos, Greece
Magnus Ivarsson 1,2,*, Stephanos P. Kilias 3 , Curt Broman 4, Anna Neubeck 5, Henrik Drake 6 ,Ernest Chi Fru 7 , Stefan Bengtson 2, Jonathan Naden 8 , Kleopatra Detsi 3 andMartin J. Whitehouse 9
1 Department of Biology, University of Southern Denmark, Campusvej 55, 5230 Odense, Denmark2 Department of Paleobiology, Swedish Museum of Natural History, Box 50007, 10405 Stockholm, Sweden;
[email protected] Department of Economic Geology and Geochemistry, Faculty of Geology and Geoenvironment,
National and Kapodistrian University of Athens, Panepistimiopolis, Zographou, 15784 Athens, Greece;[email protected] (S.P.K.); [email protected] (K.D.)
4 Department of Geological Sciences, Stockholm University, SE-10691 Stockholm, Sweden;[email protected]
5 Department of Earth Sciences, Uppsala University, SE-75236 Uppsala, Sweden; [email protected] Department of Biology and Environmental Science, Linnæus University, 392 31 Kalmar, Sweden;
[email protected] School of Earth and Ocean Sciences, Institute for Geobiology and Geochemistry, Cardiff University,
Park Place, Cardiff CF10 3AT, UK; [email protected] British Geological Survey, Keyworth, Nottingham NG12 5GG, UK; [email protected] Department of Geosciences, Swedish Museum of Natural History, Box 50007, SE10405 Stockholm, Sweden;
[email protected]* Correspondence: [email protected]
Received: 5 November 2019; Accepted: 2 December 2019; Published: 3 December 2019�����������������
Abstract: The production of H2 in hydrothermal systems and subsurface settings is almost exclusivelyassumed a result of abiotic processes, particularly serpentinization of ultramafic rocks. The originof H2 in environments not hosted in ultramafic rocks is, as a rule, unjustifiably linked to abioticprocesses. Additionally, multiple microbiological processes among both prokaryotes and eukaryotesare known to involve H2-production, of which anaerobic fungi have been put forward as a potentialsource of H2 in subsurface environments, which is still unconfirmed. Here, we report fungalremains exceptionally preserved as fluid inclusions in hydrothermal quartz from feeder quartz-bariteveins from the Cape Vani Fe-Ba-Mn ore on the Greek island of Milos. The inclusions possessfilamentous or near-spheroidal morphologies interpreted as remains of fungal hyphae and spores,respectively. They were characterized by microthermometry, Raman spectroscopy, and stainingof exposed inclusions with WGA-FITC under fluorescence microscopy. The spheroidal aqueousinclusions interpreted as fungal spores are unique by their coating of Mn-oxide birnessite, and gasphase H2. A biological origin of the H2 resulting from anaerobic fungal respiration is suggested.We propose that biologically produced H2 by micro-eukaryotes is an unrecognized source of H2 inhydrothermal systems that may support communities of H2-dependent prokaryotes.
Keywords: fungi; hydrothermal system; molecular hydrogen
Minerals 2019, 9, 749; doi:10.3390/min9120749 www.mdpi.com/journal/minerals

Minerals 2019, 9, 749 2 of 33
1. Introduction
Hydrothermal systems are recognized as environments of remarkable microbiological diversityand abundance [1]. With respect to exploration of microbiological communities, most efforts havebeen on prokaryotes, whereas eukaryotes have been largely overlooked. The few studies devoted toeukaryotes indicate a notable diversity including fungi, green algae, animals, as well as alveolates, ofwhich a previously undescribed majority are representatives of early branching eukaryotic lineages [2–5].Most of the investigations have been performed either on shallow-water sediments at vent sites or onhydrothermal fluids dissipating directly from vents. Deeper in the underlying rocks, our knowledgeof the eukaryotic abundance and diversity is still poor. Fungi are so far the only eukaryotes thathave been isolated from subseafloor basalts [6]. A recently discovered fossil record in subseafloorcrust indicates that fungi are, in fact, abundant and widely distributed spatially, and with depth andage [7–9]. The presence of fungi in such deep and remote environments raises questions regardingtheir metabolism and ecological role [8,10,11]. Fungi are known from other environments, like soils, toplay a crucial role in biogeochemical cycles and symbiotic relationships with other organisms [12,13].Observations from the fossil record suggest fungi to play a similar role in the oceanic crust, where theyare involved in mineral weathering and precipitation, decomposition of organic matter, and engage insymbiotic-like relationships with chemoautotrophic prokaryotes [7,14–16].
The majority of the subseafloor environments from which eukaryotes, including fungi, havebeen detected or isolated, are anoxic or suboxic in nature. A facultative or obligate anaerobic natureis by implication inferred for the eukaryotes living in these environments, but the physiologicaland ecological implications are seldom recognized and discussed [2]. Facultative anaerobic fungioccur among all fungal phyla, but obligate anaerobic fungi are only known from the PhylumNeocallimastigomycota, which almost exclusively are known from rumens of ruminant herbivores [17,18]. A majority of fungi from deep-sea settings belong to Ascomycota or Basidiomycota or areundescribed [5], thus not belonging to the Neocallimastigomycota, and implying that there seemsto be fundamental gaps in our knowledge regarding deep fungi and their metabolism. Obligateeukaryotes, including Neocallimastigomycota, have hydrogenosomes instead of mitochondria, whichevolve H2 during respiration [17,18]. In rumens, the fungal growth is inhibited by the presence of H2;however, the fungi exist in intimate symbiosis with H2-consuming methanogens and acetogens [19,20].The fungal–prokaryotic symbiosis stimulates growth of both partners. A similar symbiotic relationshipbetween anaerobic fungi and H2-dependent prokaryotes was hypothesized to be functional and vitalin anoxic subseafloor environments [21]. The presence of fossilized fungal hyphae and syngeneticpyrite with δ34S signatures indicating bacterial sulfate reduction corroborated such a partnership instrictly anoxic fractures at >700 m depth in the Swedish crystalline basement [22]. Yet, confirmation ofH2-producing fungi in subsurface and subseafloor environments would strengthen this hypothesisand expand the ecological role of anaerobic eukaryotes in deep biosphere settings.
Molecular hydrogen is the fundamental energy source for deep-biosphere lithoautotrophiccommunities [23–26] and is assumed to be predominantly produced abiotically by mineral–fluidinteractions, radiolysis, or originate from volcanic gases [24]. The highest fluxes of H2 are found inserpentine hosted environments owing to the abiotic production of H2 during serpentinization [27].Otherwise, the rates of H2 production are low, even in basalt hosted systems [28]. It has beenquestioned whether abiotic processes in environments other than serpentine hosted systems can formH2 in sufficient amounts to sustain lithoautotrophic communities [29]. For instance, deep groundwater(down to 1000 m depth) from the Fennoscandian shield shows highly variable H2 concentrations thatare correlated neither with depth nor with residence times of the waters, which implies that radiolysisis not the sole source of the elevated H2 concentrations [22]. In addition to abiotic production ofH2, biological production may occur in anoxic to suboxic environments by bacterial fermentation [1].However, biological production of H2 is rarely regarded as an important contributor to the main H2
pool [30]. Besides, biologically produced H2 is almost always considered to be produced by bacteria [1].

Minerals 2019, 9, 749 3 of 33
Eukaryotes are rarely accounted for, but a confirmation of eukaryotic H2 production would challengethe present notion of biological H2 in natural environments.
In remote and extreme environments, like the oceanic crust and hydrothermal systems,where sampling of live specimens is difficult, fossilized material has been used as an alternative approachto study microorganisms and microbial consortia [7]. Hydrothermal environments are characterizedby rapid mineral growth, which fosters instant entombment and fossilization of microorganisms and,thus a high grade of preservation. Fossilized consortia have the advantage of usually being easierto visualize in three dimensions than live microbial communities. The spatial relationship betweenprokaryotes and eukaryotes has been visualized [14], and differentiation between prokaryotes andeukaryotes including various types of fungi has been shown by detailed morphological studies offossilized material [7].
Here we report fossilized fungi, exceptionally preserved as fluid inclusions, in a paleo-hydrothermal system associated with Mn-ore on Milos island, Greece. We combine results frombiochemical staining, fluid-inclusion microthermometry, and Raman spectroscopy with microscaleand bulk sample stable isotope analysis of the mineral phases to describe the putative fossils,related mineralogy and the environment in which the organisms lived. The fossil imprints displaycharacteristic fungal features and contain H2 as gas phase. We suggest fungi as producers of H2
in subseafloor hydrothermal environments, although the evaluation of the quantities and theirgeobiological impact remains.
Geology and Mineralization of Milos
The Milos Island is a recently emerged volcanic edifice of the Pliocene–modern Hellenic volcanicarc (HVA), Greece. It comprises Upper Pliocene submarine and Upper Pleistocene to Holocenesubmarine-to-subaerial calc-alkaline volcanic domes, lavas, and pyroclastic deposits consisting ofandesites, dacites, and rhyolites [31,32]. Volcanism was constructed on a Mesozoic basement andMiocene–Pliocene marine sediments representing a transition from shallow submarine to subaerialvolcanic environments [31,32]. Milos hosts a range of mineralization from polymetallic massivesulfides to vein-style precious metals considered as analogs for mineralization in volcanic arcs that iscontinuous across the submarine-subaerial transition [33–36].
The Cape Vani sedimentary basin (CVSB), NW Milos, is a sedimentary rift basin, flooredby dacitic–andesitic lava domes and overlain by Lower Pleistocene fossiliferous volcaniclasticsandstone/sandy tuff infill [31,32,37–39]. It hosts a fossil analog of active shallow submarinehydrothermal activity on the Milos coast [40]. The CVSB has been divided into three lithologicallyvariable, fault-bounded volcano-sedimentary sub-basins [39]: (A) Basin 1, host of microfossil-richPrecambrian banded iron formation (BIF)-type deposits (MFIF); (B) Basin 2, host of economic-gradeMn oxide ores; and, (C) Basin 3, host of non-fossiliferous BIF-type deposits (NFIF) (Figure 1). Most ofthe CVSB volcaniclastics hosting the Mn-rich deposit are foreshore to shoreface shallow submarinedeposits [37,38,41]. The BIF-type deposits are considered Earth’s youngest BIF analogs of Quaternaryage [39].
The well-preserved hydrothermal Fe-Ba-Mn deposit is hosted by unmetamorphosed fossiliferousLower Pleistocene volcaniclastic sandstones/sandy tuffs, which are underlain by submarinedacitic-andesitic lava domes (Figure 1) [31,32,37–39]. Quartz-barite (Mn oxide, chalcedony, K-feldspar)hydrothermal feeder veins cut the entire section. The Mn oxide ores typically construct texturallydiverse cements to a variety of volcaniclastic detritus and authigenic mineral grains. The Mn-oxidesconsist of pyrolusite and ramsdellite as an early generation, cryptomelane-hollandite-coronaditetogether with hydrohetaerolite as a second generation, as well as barite formed throughout the durationof Mn oxide mineralization at Cape Vani [37,38]. In the deposit, barite occurs as
(i) disseminated crystals or cement in Mn-mineralized sandstone/sandy tuff;

Minerals 2019, 9, 749 4 of 33
(ii) quartz-barite (chalcedony, Mn oxide, K-feldspar) hydrothermal veins showing epithermal textures.These occur throughout the stratigraphy, crosscutting both the dacite/andesite basement and theoverlying Mn-mineralized sediments, where they become more rich in barite and Mn-oxide;
(iii) bedding-conformable barite (±Mn oxide, silica)-rich horizons underlain by mineralogically similardiscordant pipe-like bodies; and
(iv) barite-rich white smoker-like paleo-seafloor structures [37,41–43].
These hydrothermal quartz- and barite-rich deposits are closely associated with Mn-mineralized,bedding-concordant microbial mat-related sedimentary structures [41]. The Mn deposit is interpretedas synvolcanic shallow-marine/tidal-flat seafloor and subseafloor, which exhibits a range ofseafloor-exhalative, subseafloor-replacement and infilling, stratiform and stratabound layers, as wellas structurally controlled stringer network styles [37,38,41,44].
Minerals 2019, 9, 749 4 of 34
dacite/andesite basement and the overlying Mn-mineralized sediments, where they become more rich in barite and Mn-oxide;
(iii) bedding-conformable barite (±Mn oxide, silica)-rich horizons underlain by mineralogically similar discordant pipe-like bodies; and
(iv) barite-rich white smoker-like paleo-seafloor structures [37,41–43]. These hydrothermal quartz- and barite-rich deposits are closely associated with Mn-
mineralized, bedding-concordant microbial mat-related sedimentary structures [41]. The Mn deposit is interpreted as synvolcanic shallow-marine/tidal-flat seafloor and subseafloor, which exhibits a range of seafloor-exhalative, subseafloor-replacement and infilling, stratiform and stratabound layers, as well as structurally controlled stringer network styles [37,38,41,44].
Figure 1. A generalized north-south stratigraphic map of the ~1 km long the Cape Vani sedimentary basin (CVSB) showing interpreted geology, lithology, and main faults. CIF: conglomerate-hosted iron formation; NFIF: nonfossiliferous iron formation; MFIF: microfossiliferous iron formation.
2. Materials and Methods
Our study used the geologic and stratigraphic knowledge delineated by previous studies (see Figure 1) [37–39,41–43,45]. Samples were mostly collected from Basin 2 outcrops inside the abandoned Cape Vani Mn mine, where they are either from veins (n = 7) volumetrically dominated by coarse-bladed massive barite set in an amorphous silica and crystalline quartz matrix (Figure 2A), or from cavity fillings and cement of sandstone (n = 3) (Figure 2B,C). To supplement this material, samples were also collected from stockwork veins stratigraphically below the mine; these veins have typical epithermal crustiform banded textures and consist of coarsely crystalline and zoned barite bands separated by massive, colloform, and comb quartz (Figure 2D).
The samples were prepared as doubly polished thin sections (~150 µm thick) and investigated by optical and fluorescence microscopy, microthermometry, and Raman spectroscopy to identify and characterize mineralogy, fluid inclusions, and microbial morphologies. Stable C, S, and O isotopes were analyzed for the mineral material, both for bulk sample material and microscale within individual barite crystals.
Figure 1. A generalized north-south stratigraphic map of the ~1 km long the Cape Vani sedimentarybasin (CVSB) showing interpreted geology, lithology, and main faults. CIF: conglomerate-hosted ironformation; NFIF: nonfossiliferous iron formation; MFIF: microfossiliferous iron formation.
2. Materials and Methods
Our study used the geologic and stratigraphic knowledge delineated by previous studies (seeFigure 1) [37–39,41–43,45]. Samples were mostly collected from Basin 2 outcrops inside the abandonedCape Vani Mn mine, where they are either from veins (n = 7) volumetrically dominated by coarse-bladedmassive barite set in an amorphous silica and crystalline quartz matrix (Figure 2A), or from cavityfillings and cement of sandstone (n = 3) (Figure 2B,C). To supplement this material, samples were alsocollected from stockwork veins stratigraphically below the mine; these veins have typical epithermalcrustiform banded textures and consist of coarsely crystalline and zoned barite bands separated bymassive, colloform, and comb quartz (Figure 2D).
The samples were prepared as doubly polished thin sections (~150 µm thick) and investigatedby optical and fluorescence microscopy, microthermometry, and Raman spectroscopy to identify andcharacterize mineralogy, fluid inclusions, and microbial morphologies. Stable C, S, and O isotopeswere analyzed for the mineral material, both for bulk sample material and microscale within individualbarite crystals.

Minerals 2019, 9, 749 5 of 33
Minerals 2019, 9, 749 5 of 34
Figure 2. (A) Epithermal, discordant to bedded sandstone, quartz-barite (chalcedony, Mn oxide) veins within the Cape Vani abandoned open pit Mn mine. The vein comprises, narrow margin of finely crystalline chiefly barite bands, and coarse bladed “comb” barite intergrown with quartz-chalcedony as central vein infill. Note manganese mineralization that occurs as thin layers, encrustations, and cement of sandstone (Mn). (B) Euhedral barite laths preserved in barite-rich open space filling texture, Cape Vani Mn mine. (C) Steep, bifurcating curvilinear vein swarms which project to barite(-silica)-rich white smoker-like structures (WS), and Mn encrustations (Mn) characteristic of seafloor venting. (D) Steeply dipping almost vertical stockwork veins, below the mine level, that represent fluid feeder structures to the Cape Vani basin, crosscut the underlying lavas and hyaloclastite for several tens of meters below the epiclastic/volcaniclastic sediments. These feeder veins show typical epithermal crustiform banded quartz-barite textures. Inset: Plan view of outcrop of typical epithermal crustiform–colloform veins.
2.1. Microthermometry
Representative vein samples were taken from the underlying dacitic–andesitic lavas and hyaloclastite below the mine level (Figure 2D), to the near- and sub-paleoseafloor volcaniclastic sediments, including material immediately adjacent to structures analogous to modern-day white smokers characteristic of seafloor venting (Figure 2B,C), and microbial-mat related sedimentary structures [41]. The analyses were made at the Department of Economic Geology and Geochemistry; National and Kapodistrian University of Athens (NKUA); and the Department of Geological Sciences, Stockholm University. A conventional microscope was used to get an overview of the distribution of fluid inclusions. Microthermometric measurements on fluid inclusions in barite and quartz were performed with a Linkam THM 600 stage mounted on a Nikon microscope utilizing a 40x long working-distance objective. The working range of the stage is −196 °C to +600 °C. Calibration was made using SynFlinc® synthetic fluid inclusions and well-defined natural inclusions in Alpine quartz. The reproducibility was ±0.1°C for temperatures below 40 °C and ±0.5 °C for temperatures above 40 °C.
2.2. Raman Spectroscopy
Raman spectra were collected at the Department of Geological Sciences, Stockholm University, using a confocal laser Raman spectrometer, Horiba instrument LabRAM HR 800; Horiba Jobin Yvon, equipped with a multichannel air-cooled (−70 °C) 1024 × 256 pixel CCD (charge-coupled device) detector. Acquisitions were obtained with an 1800 lines/mm grating. Excitation was provided by an
Figure 2. (A) Epithermal, discordant to bedded sandstone, quartz-barite (chalcedony, Mn oxide) veinswithin the Cape Vani abandoned open pit Mn mine. The vein comprises, narrow margin of finelycrystalline chiefly barite bands, and coarse bladed “comb” barite intergrown with quartz-chalcedony ascentral vein infill. Note manganese mineralization that occurs as thin layers, encrustations, and cementof sandstone (Mn). (B) Euhedral barite laths preserved in barite-rich open space filling texture, CapeVani Mn mine. (C) Steep, bifurcating curvilinear vein swarms which project to barite(-silica)-rich whitesmoker-like structures (WS), and Mn encrustations (Mn) characteristic of seafloor venting. (D) Steeplydipping almost vertical stockwork veins, below the mine level, that represent fluid feeder structures tothe Cape Vani basin, crosscut the underlying lavas and hyaloclastite for several tens of meters belowthe epiclastic/volcaniclastic sediments. These feeder veins show typical epithermal crustiform bandedquartz-barite textures. Inset: Plan view of outcrop of typical epithermal crustiform–colloform veins.
2.1. Microthermometry
Representative vein samples were taken from the underlying dacitic–andesitic lavas andhyaloclastite below the mine level (Figure 2D), to the near- and sub-paleoseafloor volcaniclasticsediments, including material immediately adjacent to structures analogous to modern-day whitesmokers characteristic of seafloor venting (Figure 2B,C), and microbial-mat related sedimentarystructures [41]. The analyses were made at the Department of Economic Geology and Geochemistry;National and Kapodistrian University of Athens (NKUA); and the Department of Geological Sciences,Stockholm University. A conventional microscope was used to get an overview of the distributionof fluid inclusions. Microthermometric measurements on fluid inclusions in barite and quartz wereperformed with a Linkam THM 600 stage mounted on a Nikon microscope utilizing a 40x longworking-distance objective. The working range of the stage is −196 ◦C to +600 ◦C. Calibration wasmade using SynFlinc® synthetic fluid inclusions and well-defined natural inclusions in Alpine quartz.The reproducibility was ±0.1◦C for temperatures below 40 ◦C and ±0.5 ◦C for temperatures above 40◦C.
2.2. Raman Spectroscopy
Raman spectra were collected at the Department of Geological Sciences, Stockholm University,using a confocal laser Raman spectrometer, Horiba instrument LabRAM HR 800; Horiba Jobin Yvon,equipped with a multichannel air-cooled (−70 ◦C) 1024 × 256 pixel CCD (charge-coupled device)

Minerals 2019, 9, 749 6 of 33
detector. Acquisitions were obtained with an 1800 lines/mm grating. Excitation was provided by anAr-ion laser (λ = 514 nm) source. Raman spectra were recorded in the 150–4300 cm−1 region andwere obtained under weak laser excitation power (0.1 to 1 mW) at the sample surface to alleviate anydecomposition of the samples. The sample material was placed on a glass slide on an Olympus BX41microscope coupled to the instrument. The laser beam was focused through a 100x objective to obtaina spot size of about 1 µm. Collection times for the Raman spectra are 10 accumulations of 5 s each.The accuracy of the instrument was controlled by repeated use of a silicon (Si) reference with a Ramanline at 520.7 cm−1. The Raman spectra were collected using the LabSpec 5 software.
2.3. Staining with WGA-FITC and Fluorescence Microscopy
Thin sections were stained with WGA-FITC (Sigma-Aldrich lectin from Triticum vulgarisFITC conjugate) according to the method in [46]. All samples were examined by fluorescencemicroscopy before incubation with WGA-FITC to exclude native fluorescence in the regions of interest,and controls were made to exclude the possibility of WGA-FITC binding to minerals in the thin sections.Fluid inclusions close to the thin section surface were chosen and subjected to laser excitation power(1 > mW) by Raman spectroscopy to penetrate the sample surface and expose the fluid inclusioninterior and content prior to the staining procedure. The samples were washed three times withdistilled water (10 min each wash) prior to exposure and incubation with WGA-FITC, which lasted for2 h. The concentration of the lectin in the incubation medium was 50 µg/mL in 10 mmol/L phosphatebuffer. After incubation the samples were washed three times with distilled water and examined underfluorescence microscope. A Leitz DMRBE epifluorescent microscopy equipped with a Leica DFC 280camera was used.
2.4. Stable Isotopes
Stable isotope compositions of C and S were determined on bulk quartz-barite samples that containhydrocarbon inclusions. There were no carbonates or hydrocarbons in the samples other than in thefluid inclusions. The stable isotope measurements were determined at the Stable Isotope Laboratory atthe Department of Geological Sciences, Stockholm University. The samples were hand-ground to a finepowder with a sterilized (95% ethanol) agate mortar and pestle prior to combustion with a Carlo ErbaNC2500 analyzer connected, via a split interface to reduce the gas volume, to a Finnigan MAT Deltaplus mass spectrometer. From these measurements, the reproducibility was calculated to be betterthan 0.15%� for δ13C. The relative error was <1% for all measurements.
Barite stable isotope analyses (δ34S and δ18O) were undertaken at the Scottish UniversitiesEnvironmental Research Centre using the techniques of [47,48]. For sulfate sulfur analyses, SO2 gaswas liberated by combustion with excess copper (I) oxide and silica at 1125 ◦C. Gases were analyzedon a VG Isotech SIRA II mass spectrometer, and standard corrections applied to raw δ66SO2 values toproduce true δ34S. International standards NBS-123 and IAEA-S-3, and the SUERC standard CP-1 gaveδ34S values of +17.1%�, −31%�, and −4.6%�, respectively, with 1σ reproducibility better than ±0.2%�.Data are reported in δ34S notation as per mil (%�) variations from the Vienna Cañon Diablo Troilite(V-CDT) standard. For sulfate oxygen analyses, barite was carefully cleaned by washing and rinsing inAqua Regia, and deionized water. Oxygen was extracted by heating barite and graphite to 1200 ◦Cand the evolved carbon oxides converted to CO2 and C by reduction in a Pt-electrode, high-voltage(2 kV) discharge vessel held at liquid nitrogen temperature. The CO2 was then analyzed on a VG Sira10 mass spectrometer, with all results reported in standard delta notation as %� variations relative tothe V-SMOW international standard. Replicate analyses of the NBS-127 BaSO4 standard during theseanalyses gave +9.6 ± 0.3%�.
Stable S and O isotopes in barite were also determined within single crystals using a CamecaIMS1280 secondary ion mass spectrometry (SIMS) at NordSIM facility, Stockholm, Sweden. Two to fourcrystals (mainly two) were analyzed from four samples (BD-14, 15, 16, 17), and up to ten analyses weremade for each crystal, in transects from inner growth zone to rim, with closely spaced analyses for S

Minerals 2019, 9, 749 7 of 33
and O isotopes, with a higher number of analyses for O (n = 96) than for S (n = 40). Separate analyticalroutines applied for S and O, are described briefly below, and closely follow those described in [49]for sulfur, with the exception that only 34S/32S ratios were measured here, and in [50] for oxygen.For both elements, the samples were sputtered using a Gaussian focused 133Cs+ primary beam with20 kV incident energy (10 kV primary, −10 kV secondary) and primary beam current of ~3 nA,which was rastered over a 5 µm × 5 µm area during analysis to homogenize the beam density. Theresulting analytical crater had a diameter of ~10 µm. A normal incidence electron gun was usedfor charge compensation. Analyses were performed in automated sequences, with each analysiscomprising a 40 s presputter to remove the gold coating over a rastered 15 µm × 15 µm area, centeringof the secondary beam in the field aperture to correct for small variations in surface relief, and dataacquisition in twelve four-second integration cycles. The magnetic field was locked at the beginningof the session using an NMR field sensor. Secondary ion signals (32S and 34S or 16O and 18O) weredetected simultaneously using two Faraday detectors with a common mass resolution of 4860 (M/∆M)for S and 2430 (M/∆M) for O. Data were normalized for instrumental mass fractionation using amatrix-matched standard mounted with the sample mounts and analyzed after every sixth sampleanalysis. For barite, the S0327 reference material, with a conventionally determined δ34SCDT value of22.3%� and δ34SCDT value of 11.0%� (values and standard courtesy of R.A. Stern, [51]; conventionallydetermined values have absolute uncertainties of ca. ±0.5%� for both S and O due to interlaboratorydifferences). Determinations from our two sessions are shown in Tables 1 and 2 together with thesample analyses). Typical precision on a single δ34S and δ18O values, after propagating the withinrun and external uncertainties from the standard measurements was ±0.2%� (1σ) and 0.23%� (1σ)respectively. All results are reported with respect to the V-CDT [52] and V-SMOW for oxygen [53].
Table 1. δ13C data obtained on bulk samples of the barite-quartz interface.
Sample ∆13C TOT vs PDB (%�) %C
VA0518 −26.69 0.13VA0520 −30.24 0.52VA0522 −27.79 0.25MI0344 −28.25 1.05
Table 2. δ34S and δ18O stable isotope data for barite.
Sample δ18OV-SMOW (%�) δ34SCDT (%�)
MI-45B 11.2 23.2MI-04-29 10.7 22.7
VA-19 10.5 23.5VA-21 14.3 22.2VA-01 14.7 21.9
SMO-bar 9.7 21.4MI-52 10.5 24.3VA-26 12.3 21.3
VA-05-02 11.4 22.6VA-18 10.4 22.8
3. Results
3.1. Mineralogy
The mineralogy of the veins is dominated by barite and quartz with minor amounts of goethite,hematite, X-ray amorphous hollandite-group-like minerals, and MnO2-like phases [38,54]. AdditionalK-feldspar and some galena were observed using SEM in the current study. Vein textures vary throughthe Cape Vani basement lavas and siliciclastic sediments vertical profile (Figure 1). Mineralogy andfluid inclusions are primarily studied on samples from the sediment-hosted veins. These veins are
Minerals 2019, 9, 749 8 of 33
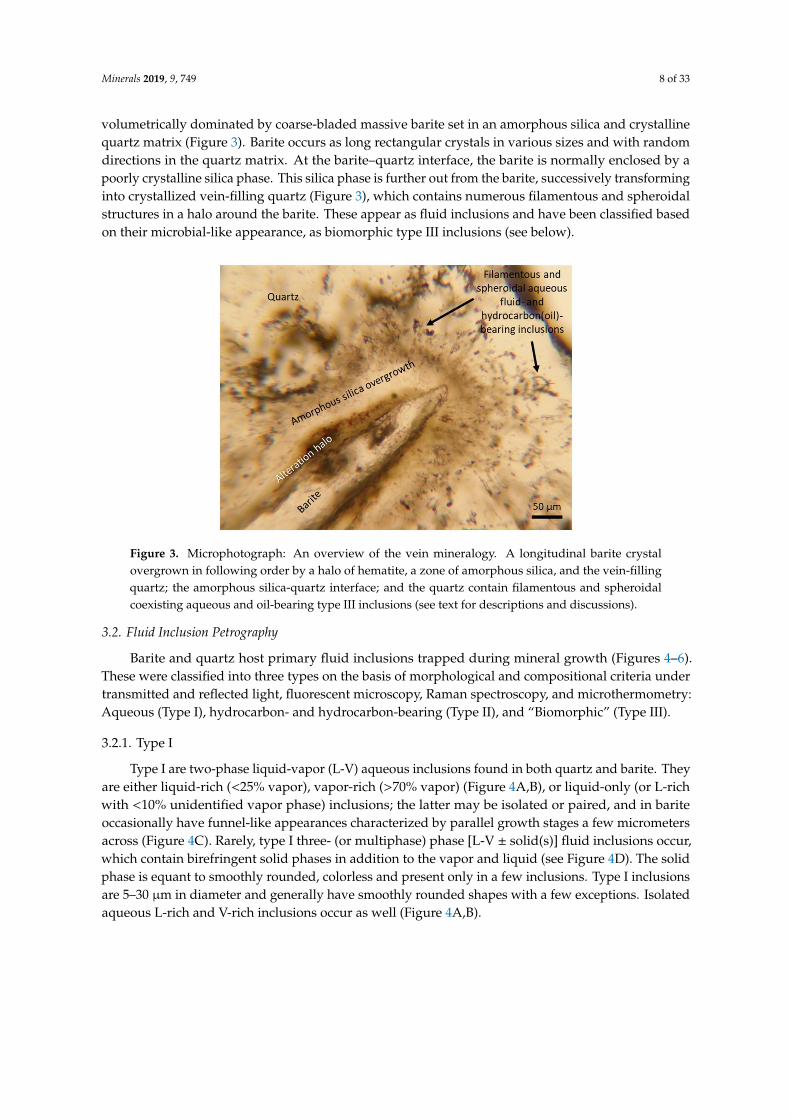
volumetrically dominated by coarse-bladed massive barite set in an amorphous silica and crystallinequartz matrix (Figure 3). Barite occurs as long rectangular crystals in various sizes and with randomdirections in the quartz matrix. At the barite–quartz interface, the barite is normally enclosed by apoorly crystalline silica phase. This silica phase is further out from the barite, successively transforminginto crystallized vein-filling quartz (Figure 3), which contains numerous filamentous and spheroidalstructures in a halo around the barite. These appear as fluid inclusions and have been classified basedon their microbial-like appearance, as biomorphic type III inclusions (see below).Minerals 2019, 9, 749 8 of 34
Figure 3. Microphotograph: An overview of the vein mineralogy. A longitudinal barite crystal overgrown in following order by a halo of hematite, a zone of amorphous silica, and the vein-filling quartz; the amorphous silica-quartz interface; and the quartz contain filamentous and spheroidal coexisting aqueous and oil-bearing type III inclusions (see text for descriptions and discussions).
3.2. Fluid Inclusion Petrography
Barite and quartz host primary fluid inclusions trapped during mineral growth (Figures 4–6). These were classified into three types on the basis of morphological and compositional criteria under transmitted and reflected light, fluorescent microscopy, Raman spectroscopy, and microthermometry: Aqueous (Type Ι), hydrocarbon- and hydrocarbon-bearing (Type ΙΙ), and “Biomorphic” (Type ΙΙΙ).
3.2.1. Type I
Type I are two-phase liquid-vapor (L-V) aqueous inclusions found in both quartz and barite. They are either liquid-rich (<25% vapor), vapor-rich (>70% vapor) (Figure 4A,B), or liquid-only (or L-rich with <10% unidentified vapor phase) inclusions; the latter may be isolated or paired, and in barite occasionally have funnel-like appearances characterized by parallel growth stages a few micrometers across (Figure 4C). Rarely, type I three- (or multiphase) phase [L-V ± solid(s)] fluid inclusions occur, which contain birefringent solid phases in addition to the vapor and liquid (see Figure 4D). The solid phase is equant to smoothly rounded, colorless and present only in a few inclusions. Type I inclusions are 5–30 µm in diameter and generally have smoothly rounded shapes with a few exceptions. Isolated aqueous L-rich and V-rich inclusions occur as well (Figure 4A,B).
Figure 3. Microphotograph: An overview of the vein mineralogy. A longitudinal barite crystalovergrown in following order by a halo of hematite, a zone of amorphous silica, and the vein-fillingquartz; the amorphous silica-quartz interface; and the quartz contain filamentous and spheroidalcoexisting aqueous and oil-bearing type III inclusions (see text for descriptions and discussions).
3.2. Fluid Inclusion Petrography
Barite and quartz host primary fluid inclusions trapped during mineral growth (Figures 4–6).These were classified into three types on the basis of morphological and compositional criteria undertransmitted and reflected light, fluorescent microscopy, Raman spectroscopy, and microthermometry:Aqueous (Type I), hydrocarbon- and hydrocarbon-bearing (Type II), and “Biomorphic” (Type III).
3.2.1. Type I
Type I are two-phase liquid-vapor (L-V) aqueous inclusions found in both quartz and barite. Theyare either liquid-rich (<25% vapor), vapor-rich (>70% vapor) (Figure 4A,B), or liquid-only (or L-richwith <10% unidentified vapor phase) inclusions; the latter may be isolated or paired, and in bariteoccasionally have funnel-like appearances characterized by parallel growth stages a few micrometersacross (Figure 4C). Rarely, type I three- (or multiphase) phase [L-V ± solid(s)] fluid inclusions occur,which contain birefringent solid phases in addition to the vapor and liquid (see Figure 4D). The solidphase is equant to smoothly rounded, colorless and present only in a few inclusions. Type I inclusionsare 5–30 µm in diameter and generally have smoothly rounded shapes with a few exceptions. Isolatedaqueous L-rich and V-rich inclusions occur as well (Figure 4A,B).

Minerals 2019, 9, 749 9 of 33Minerals 2019, 9, 749 9 of 34
Figure 4. Transmitted light photomicrographs (Nichols) of type I aqueous fluid inclusions in quartz and barite. (A) Quartz (deep-water stratigraphy). Isolated pair of primary, type I inclusions, consisting of aqueous V-rich inclusion, with a thin sheath of liquid water (black arrow) coexisting with two-phase L-rich aqueous inclusion (white arrow). Indication of boiling conditions. (B) Barite (deep-water stratigraphy). Primary, two-phase V-rich type I aqueous inclusions. (C) Barite (shallow-water stratigraphy). Funnel-shaped, colorless one-phase liquid aqueous type 1 inclusions. Note parallel growth striations. (D) Barite (shallow-water stratigraphy). Liquid-rich type I multiphase [L-V ± solid(s)] aqueous inclusion with solid phases identified as hematite (Fe2O3) by Raman Spectroscopy.
3.2.2. Type II
Type II are hydrocarbon-bearing fluid inclusions that either occur as type III inclusions (see below) or in barite as (i) one-phase (Lhydrocarbon) inclusions (Figure 5A–C); (ii) two-phase (Lhydrocarbon-Vhydrocarbon) inclusions (Figure 5D,E); and (iii) three-phase (L1-L2-V) inclusions with liquid–vapor hydrocarbon (Lhydrocarbon-Vhydrocarbon) and a small amount of aqueous liquid (LH2O), indicative of heterogeneous trapping (Figure 5F). The liquid hydrocarbon phase is mostly reddish-brown to reddish-orange, or pale yellow-orange to amber-colored, or colorless, under transmitted light (T). Hydrocarbon-bearing fluid inclusions range between 10 and 50 µm in size, have smooth appearance and, equant, spheroidal or irregular shapes (see type III below); again funnel-like appearance characterized by parallel growth stages occur in barite (Figure 5C).
Figure 4. Transmitted light photomicrographs (Nichols) of type I aqueous fluid inclusions in quartzand barite. (A) Quartz (deep-water stratigraphy). Isolated pair of primary, type I inclusions, consistingof aqueous V-rich inclusion, with a thin sheath of liquid water (black arrow) coexisting with two-phaseL-rich aqueous inclusion (white arrow). Indication of boiling conditions. (B) Barite (deep-waterstratigraphy). Primary, two-phase V-rich type I aqueous inclusions. (C) Barite (shallow-waterstratigraphy). Funnel-shaped, colorless one-phase liquid aqueous type 1 inclusions. Note parallelgrowth striations. (D) Barite (shallow-water stratigraphy). Liquid-rich type I multiphase [L-V ±solid(s)] aqueous inclusion with solid phases identified as hematite (Fe2O3) by Raman Spectroscopy.
3.2.2. Type II
Type II are hydrocarbon-bearing fluid inclusions that either occur as type III inclusions(see below) or in barite as (i) one-phase (Lhydrocarbon) inclusions (Figure 5A–C); (ii) two-phase(Lhydrocarbon-Vhydrocarbon) inclusions (Figure 5D,E); and (iii) three-phase (L1-L2-V) inclusions withliquid–vapor hydrocarbon (Lhydrocarbon-Vhydrocarbon) and a small amount of aqueous liquid (LH2O),indicative of heterogeneous trapping (Figure 5F). The liquid hydrocarbon phase is mostly reddish-brownto reddish-orange, or pale yellow-orange to amber-colored, or colorless, under transmitted light (T).Hydrocarbon-bearing fluid inclusions range between 10 and 50µm in size, have smooth appearance and,equant, spheroidal or irregular shapes (see type III below); again funnel-like appearance characterizedby parallel growth stages occur in barite (Figure 5C).
Minerals 2019, 9, 749 10 of 33Minerals 2019, 9, 749 10 of 34
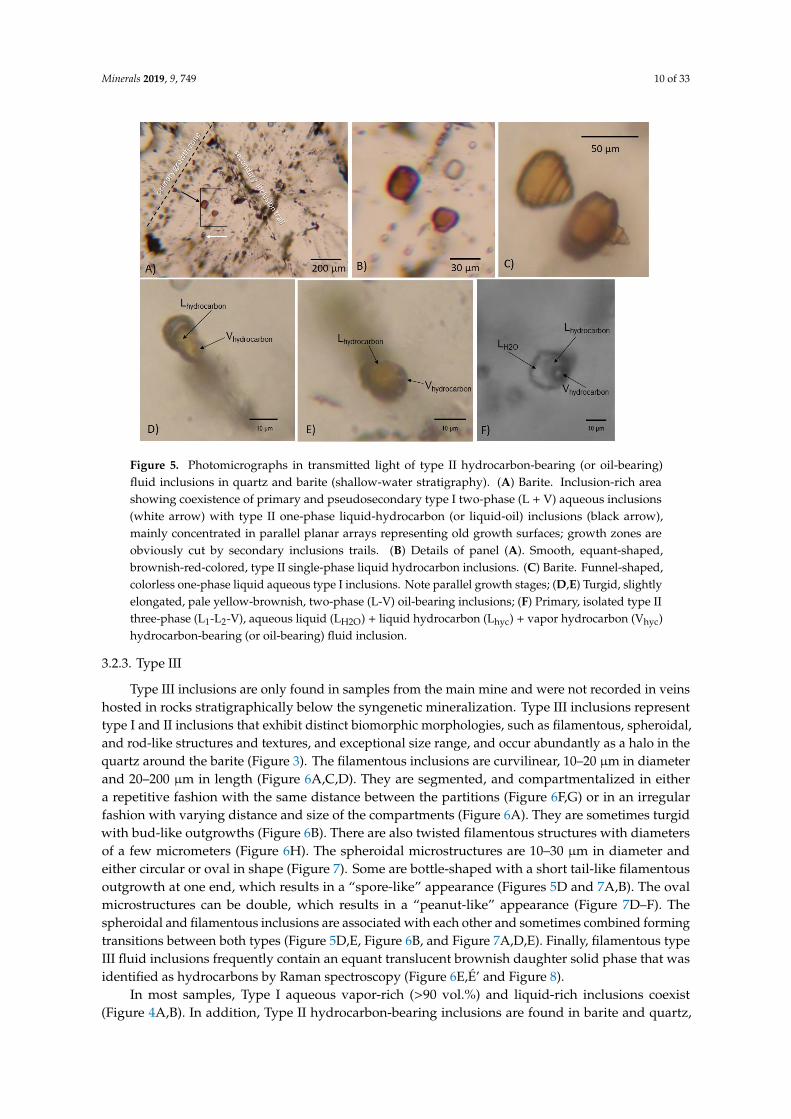
Figure 5. Photomicrographs in transmitted light of type II hydrocarbon-bearing (or oil-bearing) fluid inclusions in quartz and barite (shallow-water stratigraphy). (A) Barite. Inclusion-rich area showing coexistence of primary and pseudosecondary type I two-phase (L + V) aqueous inclusions (white arrow) with type II one-phase liquid-hydrocarbon (or liquid-oil) inclusions (black arrow), mainly concentrated in parallel planar arrays representing old growth surfaces; growth zones are obviously cut by secondary inclusions trails. (B) Details of panel (A). Smooth, equant-shaped, brownish-red-colored, type II single-phase liquid hydrocarbon inclusions. (C) Barite. Funnel-shaped, colorless one-phase liquid aqueous type I inclusions. Note parallel growth stages; (D,E) Turgid, slightly elongated, pale yellow-brownish, two-phase (L-V) oil-bearing inclusions; (F) Primary, isolated type II three-phase (L1-L2-V), aqueous liquid (LH2O) + liquid hydrocarbon (Lhyc) + vapor hydrocarbon (Vhyc) hydrocarbon-bearing (or oil-bearing) fluid inclusion.
3.2.3. Type III
Type III inclusions are only found in samples from the main mine and were not recorded in veins hosted in rocks stratigraphically below the syngenetic mineralization. Type III inclusions represent type I and II inclusions that exhibit distinct biomorphic morphologies, such as filamentous, spheroidal, and rod-like structures and textures, and exceptional size range, and occur abundantly as a halo in the quartz around the barite (Figure 3). The filamentous inclusions are curvilinear, 10–20 µm in diameter and 20–200 µm in length (Figure 6A,C,D). They are segmented, and compartmentalized in either a repetitive fashion with the same distance between the partitions (Figure 6F,G) or in an irregular fashion with varying distance and size of the compartments (Figure 6A). They are sometimes turgid with bud-like outgrowths (Figure 6B). There are also twisted filamentous structures with diameters of a few micrometers (Figure 6H). The spheroidal microstructures are 10–30 µm in diameter and either circular or oval in shape (Figure 7). Some are bottle-shaped with a short tail-like filamentous outgrowth at one end, which results in a “spore-like” appearance (Figures 5D and 7A,B). The oval microstructures can be double, which results in a “peanut-like” appearance (Figure 7D–F). The spheroidal and filamentous inclusions are associated with each other and sometimes combined forming transitions between both types (Figures 5D,E, 6B, and 7A,D,E). Finally, filamentous type III fluid inclusions frequently contain an equant translucent brownish daughter solid phase that was identified as hydrocarbons by Raman spectroscopy (Figures 6E,É’ and 8).
In most samples, Type I aqueous vapor-rich (>90 vol.%) and liquid-rich inclusions coexist (Figure 4A,B). In addition, Type II hydrocarbon-bearing inclusions are found in barite and quartz,
Figure 5. Photomicrographs in transmitted light of type II hydrocarbon-bearing (or oil-bearing)fluid inclusions in quartz and barite (shallow-water stratigraphy). (A) Barite. Inclusion-rich areashowing coexistence of primary and pseudosecondary type I two-phase (L + V) aqueous inclusions(white arrow) with type II one-phase liquid-hydrocarbon (or liquid-oil) inclusions (black arrow),mainly concentrated in parallel planar arrays representing old growth surfaces; growth zones areobviously cut by secondary inclusions trails. (B) Details of panel (A). Smooth, equant-shaped,brownish-red-colored, type II single-phase liquid hydrocarbon inclusions. (C) Barite. Funnel-shaped,colorless one-phase liquid aqueous type I inclusions. Note parallel growth stages; (D,E) Turgid, slightlyelongated, pale yellow-brownish, two-phase (L-V) oil-bearing inclusions; (F) Primary, isolated type IIthree-phase (L1-L2-V), aqueous liquid (LH2O) + liquid hydrocarbon (Lhyc) + vapor hydrocarbon (Vhyc)hydrocarbon-bearing (or oil-bearing) fluid inclusion.
3.2.3. Type III
Type III inclusions are only found in samples from the main mine and were not recorded in veinshosted in rocks stratigraphically below the syngenetic mineralization. Type III inclusions representtype I and II inclusions that exhibit distinct biomorphic morphologies, such as filamentous, spheroidal,and rod-like structures and textures, and exceptional size range, and occur abundantly as a halo in thequartz around the barite (Figure 3). The filamentous inclusions are curvilinear, 10–20 µm in diameterand 20–200 µm in length (Figure 6A,C,D). They are segmented, and compartmentalized in eithera repetitive fashion with the same distance between the partitions (Figure 6F,G) or in an irregularfashion with varying distance and size of the compartments (Figure 6A). They are sometimes turgidwith bud-like outgrowths (Figure 6B). There are also twisted filamentous structures with diametersof a few micrometers (Figure 6H). The spheroidal microstructures are 10–30 µm in diameter andeither circular or oval in shape (Figure 7). Some are bottle-shaped with a short tail-like filamentousoutgrowth at one end, which results in a “spore-like” appearance (Figures 5D and 7A,B). The ovalmicrostructures can be double, which results in a “peanut-like” appearance (Figure 7D–F). Thespheroidal and filamentous inclusions are associated with each other and sometimes combined formingtransitions between both types (Figure 5D,E, Figure 6B, and Figure 7A,D,E). Finally, filamentous typeIII fluid inclusions frequently contain an equant translucent brownish daughter solid phase that wasidentified as hydrocarbons by Raman spectroscopy (Figure 6E,É’ and Figure 8).
In most samples, Type I aqueous vapor-rich (>90 vol.%) and liquid-rich inclusions coexist(Figure 4A,B). In addition, Type II hydrocarbon-bearing inclusions are found in barite and quartz,

Minerals 2019, 9, 749 11 of 33
whereas biomorphic Type III inclusions are only found in quartz from the samples collected withinthe mine (Figure 2A–C). Moreover, barite from within the mine also contains numerous primary andpseudosecondary one- or two-phase Type I and one-phase Type II fluid inclusions, with a size of upto 50 µm, that coexist concentrated in parallel planar arrays representing old growth surfaces, alongsuccessive crystal margins (Figure 5A,B), or occur disseminated within barite. Secondary inclusionscan be differentiated from those inclusions trapped during mineral growth by their occurrence asinclusions trails that crosscut growth zones (Figure 5A).
Minerals 2019, 9, 749 11 of 34
whereas biomorphic Type III inclusions are only found in quartz from the samples collected within the mine (Figure 2A–C). Moreover, barite from within the mine also contains numerous primary and pseudosecondary one- or two-phase Type I and one-phase Type II fluid inclusions, with a size of up to 50 µm, that coexist concentrated in parallel planar arrays representing old growth surfaces, along successive crystal margins (Figure 5A,B), or occur disseminated within barite. Secondary inclusions can be differentiated from those inclusions trapped during mineral growth by their occurrence as inclusions trails that crosscut growth zones (Figure 5A).
Figure 6. Transmitted light microphotographs of type III filamentous inclusions in quartz. (A) Large (~70 µm) isolated, primary, aqueous single-phase liquid (L) inclusion with septa (black arrows). (B) Filamentous, aqueous liquid (LH2O) or liquid hydrocarbon (Lhyc) inclusions, with dark solid phase (bitumen) and no V phase. Note the knob-like outgrowths and/or associated spheroidal microstructures. (C) Filamentous and spheroidal aqueous or hydrocarbon (oil) two-phase (L + V) inclusions with transitions between both types including turgid appearance. (D–G) Large filamentous, multiphase, mixed aqueous (LH2O) and hydrocarbon (Lhyc-Vhyc-Shyc ± solids) inclusion. Note inclusion divided by septa, with an outgrowth at one end. (H) Small, twisted, filamentous aqueous multiphase (L-V-S) inclusions. (I) Filamentous, two-phase (L-V) aqueous or hydrocarbon inclusions.
Figure 6. Transmitted light microphotographs of type III filamentous inclusions in quartz. (A) Large(~70 µm) isolated, primary, aqueous single-phase liquid (L) inclusion with septa (black arrows).(B) Filamentous, aqueous liquid (LH2O) or liquid hydrocarbon (Lhyc) inclusions, with dark solid phase(bitumen) and no V phase. Note the knob-like outgrowths and/or associated spheroidal microstructures.(C) Filamentous and spheroidal aqueous or hydrocarbon (oil) two-phase (L + V) inclusions withtransitions between both types including turgid appearance. (D–G) Large filamentous, multiphase,mixed aqueous (LH2O) and hydrocarbon (Lhyc-Vhyc-Shyc ± solids) inclusion. Note inclusion dividedby septa, with an outgrowth at one end. (H) Small, twisted, filamentous aqueous multiphase (L-V-S)inclusions. (I) Filamentous, two-phase (L-V) aqueous or hydrocarbon inclusions.

Minerals 2019, 9, 749 12 of 33Minerals 2019, 9, 749 12 of 34
Figure 7. Transmitted light microphotographs of spheroidal aqueous and hydrocarbon-bearing type III fluid inclusions in quartz. (A) Spheroidal aqueous two-phase (L-V) inclusion with a “spore-like” shape and turgid appearance. (B) An oval aqueous two-phase (L-V) inclusion to the right and one “spore-like” leaked inclusion to the left. (C) Two phase aqueous inclusion with a H2-gas phase. (D–F) “peanut-like” one-phase (Lhydrocarbon or LH2O) (D), two-phase (Lhydrocarbon + Vhydrocarbon or LH2O + VH2O) (F), and mixed three-phase (LH2O-Lhyc-Vhyc), hydrocarbon-(oil-)bearing type III inclusions, coexisting with aqueous type I L-V inclusions.
Figure 7. Transmitted light microphotographs of spheroidal aqueous and hydrocarbon-bearing type IIIfluid inclusions in quartz. (A) Spheroidal aqueous two-phase (L-V) inclusion with a “spore-like” shapeand turgid appearance. (B) An oval aqueous two-phase (L-V) inclusion to the right and one “spore-like”leaked inclusion to the left. (C) Two phase aqueous inclusion with a H2-gas phase. (D–F) “peanut-like”one-phase (Lhydrocarbon or LH2O) (D), two-phase (Lhydrocarbon + Vhydrocarbon or LH2O + VH2O) (F), andmixed three-phase (LH2O-Lhyc-Vhyc), hydrocarbon-(oil-)bearing type III inclusions, coexisting withaqueous type I L-V inclusions.

Minerals 2019, 9, 749 13 of 33Minerals 2019, 9, 749 13 of 34
Figure 8. Raman spectrum of brownish phases captured in (photo A) a filamentous curvilinear multiphase, mixed aqueous (LH2O) and hydrocarbon [Lhyc-Vhyc-Shyc ± solid (s)] inclusion in quartz. The Raman spectrum is obtained at the tip of the upper arrow. Raman spectrum obtained in (photo B) funnel-like one-phase (L) hydrocarbon-bearing type II inclusions in barite, at the tip of the upper arrow. The graph in (C) shows Raman spectra in the 1000 to 3600 cm−1 range. The inset shows a magnified part in the 2750–3100 cm−1 region. The spectra are similar for inclusions in both barite and quartz. The weak intensity of spectrum (C1), identified as hydrocarbons, was obtained using a low laser power of 0.1 mW, and spectrum (C2) shows that by increasing the laser power to 1 mW on the same inclusion, the result was a laser induced photodegradation of the structures with a transformation to a poorly ordered carbonaceous matter (solid).
3.3. Fluid Inclusion Analyses
3.3.1. Microthermometry
In total, microthermometric data were obtained from 143 fluid inclusions hosted in barite and quartz. Microthermometric data were collected for two-phase (L-V) aqueous Type I and Type II fluid inclusions hosted in barite and quartz as well as biomorphic Type III inclusions in quartz. The data are presented in Figure 9, and Table S1, and described below. First, ice melting temperatures (Tfm-ice) of inclusions, where observed, occur between −42 °C and −30 °C, and suggest the possible
Figure 8. Raman spectrum of brownish phases captured in (photo A) a filamentous curvilinearmultiphase, mixed aqueous (LH2O) and hydrocarbon [Lhyc-Vhyc-Shyc ± solid (s)] inclusion in quartz.The Raman spectrum is obtained at the tip of the upper arrow. Raman spectrum obtained in (photo B)funnel-like one-phase (L) hydrocarbon-bearing type II inclusions in barite, at the tip of the upper arrow.The graph in (C) shows Raman spectra in the 1000 to 3600 cm−1 range. The inset shows a magnifiedpart in the 2750–3100 cm−1 region. The spectra are similar for inclusions in both barite and quartz. Theweak intensity of spectrum (C1), identified as hydrocarbons, was obtained using a low laser power of0.1 mW, and spectrum (C2) shows that by increasing the laser power to 1 mW on the same inclusion,the result was a laser induced photodegradation of the structures with a transformation to a poorlyordered carbonaceous matter (solid).
3.3. Fluid Inclusion Analyses
3.3.1. Microthermometry
In total, microthermometric data were obtained from 143 fluid inclusions hosted in barite andquartz. Microthermometric data were collected for two-phase (L-V) aqueous Type I and Type II fluidinclusions hosted in barite and quartz as well as biomorphic Type III inclusions in quartz. The data arepresented in Figure 9, and Table S1, and described below. First, ice melting temperatures (Tfm-ice) of

Minerals 2019, 9, 749 14 of 33
inclusions, where observed, occur between −42 ◦C and −30 ◦C, and suggest the possible presence ofdivalent cations such as magnesium. Additionally, the occurrence of hematite in colorless inclusionssuggests presence of FeCl2 in the barite-hosted fluid inclusions. Final ice melting temperatures(Tm-ice) range from −0.2 to −12.4 ◦C (median: −7.0 ◦C), which correspond to salinities between 0.3and 16.3 wt.% NaCl eq. (median: 10.6 wt.% NaCl eq.) (Figure 9a) (calculated using the methodin [55]). Homogenization temperatures (Th) vary from 95 to 297 ◦C (median: 148 ◦C) (Figure 9b).High temperatures (>200 ◦C) are exclusively recorded in barite and probably represent necked/leakedinclusions. Figure 10 shows how fluid inclusion homogenization temperatures (Th) and last ice melting(Tm-ice) co-vary with data discriminated by hosting mineral phase and location within the mine.
Minerals 2019, 9, 749 14 of 34
presence of divalent cations such as magnesium. Additionally, the occurrence of hematite in colorless inclusions suggests presence of FeCl2 in the barite-hosted fluid inclusions. Final ice melting temperatures (Tm-ice) range from −0.2 to −12.4 °C (median: −7.0 °C), which correspond to salinities between 0.3 and 16.3 wt.% NaCl eq. (median: 10.6 wt.% NaCl eq.) (Figure 9a) (calculated using the method in [55]). Homogenization temperatures (Th) vary from 95 to 297 °C (median: 148 °C) (Figure 9b). High temperatures (>200 °C) are exclusively recorded in barite and probably represent necked/leaked inclusions. Figure 10 shows how fluid inclusion homogenization temperatures (Th) and last ice melting (Tm-ice) co-vary with data discriminated by hosting mineral phase and location within the mine.
Figure 9. Histograms showing the distribution of (A) salinity and (B) homogenization temperatures for fluid inclusions discriminated by host mineral and sample stratigraphic level. Figure 9. Histograms showing the distribution of (A) salinity and (B) homogenization temperaturesfor fluid inclusions discriminated by host mineral and sample stratigraphic level.

Minerals 2019, 9, 749 15 of 33
Minerals 2019, 9, 749 15 of 34
Figure 10. Scattergram of homogenization temperature versus salinity with individual points discriminated by host mineral (see text for details).
3.3.2. Raman Spectroscopy
Raman spectroscopy analysis was undertaken on (i) filamentous and spheroidal quartz-hosted Type III fluid inclusions that contain a
translucent tabular dull-yellow phase (Figures 8A and 11) and (ii) funnel-shaped Type II inclusions in barite, that are filled with a pale yellow-amber to
yellow-brownish phase (Figure 8B). Each fluid inclusion type gave similar hydrocarbon spectra (Figure 8), even though the
hydrocarbon phase in Type III inclusions appears in optical microscopy to be solid and that in Type II a liquid. To avoid decomposition of the included material, a low laser power of 0.1 mW was initially utilized in acquiring the Raman spectrum, seen in C1 in Figure 8. The weak intensity of the spectrum using the low laser power made characterization of this spectrum difficult. The inset in Figure 8C shows a magnified part in the 2750 to 3100 cm−1 region where a complex group of bands appears: two main bands at approximately 2870 and 2920 cm−1 with shoulders at 2850 and 2960 cm−1 can be assigned to C–H stretching vibrations. The band at 1450 cm−1 is diagnostic of alkane CH2 units, and the band around 1600 cm−1 can be assigned to ring stretching vibrations of aromatic hydrocarbons [56]. With a higher laser power of 1 mW some photodegradation of the hydrocarbons was induced with resulting transformation of the hydrocarbons, both in quartz and barite. This verifies that the inclusions have a pristine hydrocarbon composition that is easily altered by the Raman laser to a material with the resulting characteristic bands (C2 in Figure 8) typical of poorly ordered carbonaceous matter. That is a first-order region that consists of five overlapping bands: one ordered band at 1590 cm−1 together with defect bands at 1250, 1350, 1460, and 1620 cm−1 [57,58], and a second-order region with overtone scattering.
In addition to the trapped aqueous phase (s) in two-phase (L-V) Type III spheroidal inclusions in quartz (Figures 11 and 7C), the walls inside these structures, are encrusted with a Mn-compound
Figure 10. Scattergram of homogenization temperature versus salinity with individual pointsdiscriminated by host mineral (see text for details).
3.3.2. Raman Spectroscopy
Raman spectroscopy analysis was undertaken on
(i) filamentous and spheroidal quartz-hosted Type III fluid inclusions that contain a translucenttabular dull-yellow phase (Figures 8A and 11) and
(ii) funnel-shaped Type II inclusions in barite, that are filled with a pale yellow-amber toyellow-brownish phase (Figure 8B).
Each fluid inclusion type gave similar hydrocarbon spectra (Figure 8), even though the hydrocarbonphase in Type III inclusions appears in optical microscopy to be solid and that in Type II a liquid. Toavoid decomposition of the included material, a low laser power of 0.1 mW was initially utilized inacquiring the Raman spectrum, seen in C1 in Figure 8. The weak intensity of the spectrum usingthe low laser power made characterization of this spectrum difficult. The inset in Figure 8C shows amagnified part in the 2750 to 3100 cm−1 region where a complex group of bands appears: two mainbands at approximately 2870 and 2920 cm−1 with shoulders at 2850 and 2960 cm−1 can be assignedto C–H stretching vibrations. The band at 1450 cm−1 is diagnostic of alkane CH2 units, and theband around 1600 cm−1 can be assigned to ring stretching vibrations of aromatic hydrocarbons [56].With a higher laser power of 1 mW some photodegradation of the hydrocarbons was induced withresulting transformation of the hydrocarbons, both in quartz and barite. This verifies that the inclusionshave a pristine hydrocarbon composition that is easily altered by the Raman laser to a material withthe resulting characteristic bands (C2 in Figure 8) typical of poorly ordered carbonaceous matter.That is a first-order region that consists of five overlapping bands: one ordered band at 1590 cm−1
Minerals 2019, 9, 749 16 of 33
together with defect bands at 1250, 1350, 1460, and 1620 cm−1 [57,58], and a second-order region withovertone scattering.
Minerals 2019, 9, 749 16 of 34
with bands at 505, 574, 625, and 645 cm−1 consistent with birnessite (Na, Ca)0.5Mn2O4∙1.5H2O, [59]). The birnessite is associated with hydrocarbons (Figure 7A–C). Hydrocarbons were only detected in birnessite, not in the rest of these inclusions.
In these spheroidal two-phase L-V inclusions, Raman spectroscopy showed that the vapor phase consists of H2 (Figure 11) with a strongest peak at 4155 cm−1 and with minor peaks at 4125, 4143, and 4160 cm−1 (reference spectrum in [60]). No other gases were found. H2 was only detected in the spheroidal Type III inclusions.
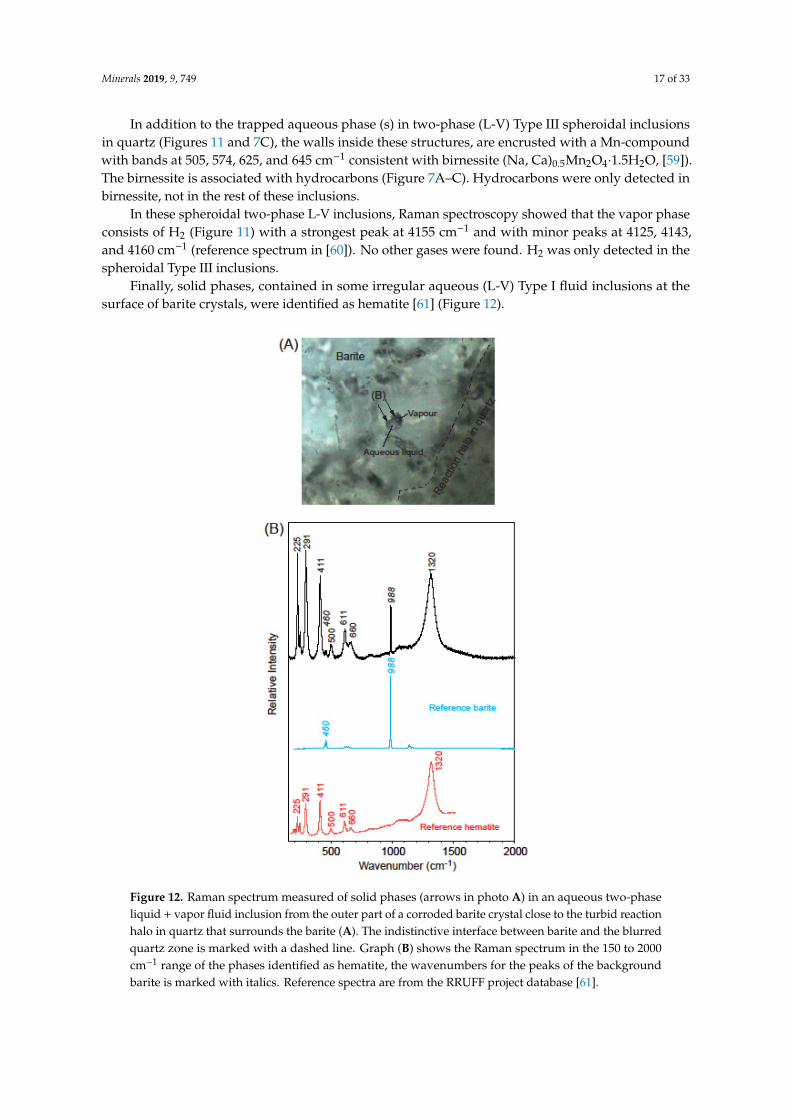
Finally, solid phases, contained in some irregular aqueous (L-V) Type I fluid inclusions at the surface of barite crystals, were identified as hematite [61] (Figure 12).
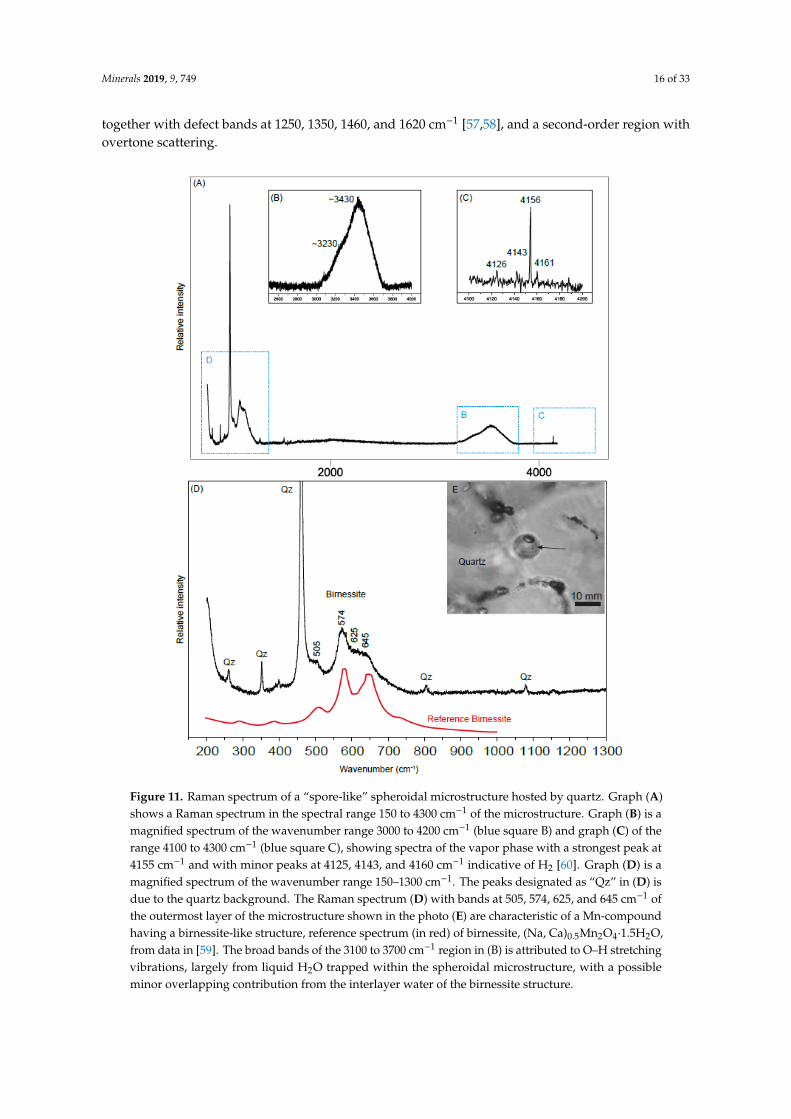
Figure 11. Raman spectrum of a “spore-like” spheroidal microstructure hosted by quartz. Graph (A) shows a Raman spectrum in the spectral range 150 to 4300 cm−1 of the microstructure. Graph (B) is a magnified spectrum of the wavenumber range 3000 to 4200 cm−1 (blue square B) and graph (C) of the range 4100 to 4300 cm−1 (blue square C), showing spectra of the vapor phase with a strongest peak at 4155 cm−1 and with minor peaks at 4125, 4143, and 4160 cm−1 indicative of H2 [60]. Graph (D) is a
Figure 11. Raman spectrum of a “spore-like” spheroidal microstructure hosted by quartz. Graph (A)shows a Raman spectrum in the spectral range 150 to 4300 cm−1 of the microstructure. Graph (B) is amagnified spectrum of the wavenumber range 3000 to 4200 cm−1 (blue square B) and graph (C) of therange 4100 to 4300 cm−1 (blue square C), showing spectra of the vapor phase with a strongest peak at4155 cm−1 and with minor peaks at 4125, 4143, and 4160 cm−1 indicative of H2 [60]. Graph (D) is amagnified spectrum of the wavenumber range 150–1300 cm−1. The peaks designated as “Qz” in (D) isdue to the quartz background. The Raman spectrum (D) with bands at 505, 574, 625, and 645 cm−1 ofthe outermost layer of the microstructure shown in the photo (E) are characteristic of a Mn-compoundhaving a birnessite-like structure, reference spectrum (in red) of birnessite, (Na, Ca)0.5Mn2O4·1.5H2O,from data in [59]. The broad bands of the 3100 to 3700 cm−1 region in (B) is attributed to O–H stretchingvibrations, largely from liquid H2O trapped within the spheroidal microstructure, with a possibleminor overlapping contribution from the interlayer water of the birnessite structure.
Minerals 2019, 9, 749 17 of 33
In addition to the trapped aqueous phase (s) in two-phase (L-V) Type III spheroidal inclusionsin quartz (Figures 11 and 7C), the walls inside these structures, are encrusted with a Mn-compoundwith bands at 505, 574, 625, and 645 cm−1 consistent with birnessite (Na, Ca)0.5Mn2O4·1.5H2O, [59]).The birnessite is associated with hydrocarbons (Figure 7A–C). Hydrocarbons were only detected inbirnessite, not in the rest of these inclusions.
In these spheroidal two-phase L-V inclusions, Raman spectroscopy showed that the vapor phaseconsists of H2 (Figure 11) with a strongest peak at 4155 cm−1 and with minor peaks at 4125, 4143,and 4160 cm−1 (reference spectrum in [60]). No other gases were found. H2 was only detected in thespheroidal Type III inclusions.
Finally, solid phases, contained in some irregular aqueous (L-V) Type I fluid inclusions at thesurface of barite crystals, were identified as hematite [61] (Figure 12).
Minerals 2019, 9, 749 17 of 34
magnified spectrum of the wavenumber range 150–1300 cm−1. The peaks designated as “Qz” in (D) is due to the quartz background. The Raman spectrum (D) with bands at 505, 574, 625, and 645 cm−1 of the outermost layer of the microstructure shown in the photo (E) are characteristic of a Mn-compound having a birnessite-like structure, reference spectrum (in red) of birnessite, (Na, Ca)0.5Mn2O4∙1.5H2O, from data in [59]. The broad bands of the 3100 to 3700 cm−1 region in (B) is attributed to O–H stretching vibrations, largely from liquid H2O trapped within the spheroidal microstructure, with a possible minor overlapping contribution from the interlayer water of the birnessite structure.
Figure 12. Raman spectrum measured of solid phases (arrows in photo A) in an aqueous two-phase liquid + vapor fluid inclusion from the outer part of a corroded barite crystal close to the turbid reaction halo in quartz that surrounds the barite (A). The indistinctive interface between barite and the blurred quartz zone is marked with a dashed line. Graph (B) shows the Raman spectrum in the 150 to 2000 cm−1 range of the phases identified as hematite, the wavenumbers for the peaks of the background barite is marked with italics. Reference spectra are from the RRUFF project database [61].
3.3.3. Staining with WGA-FITC and Fluorescence Microscopy
Using the Raman laser beam, a few of the larger hydrocarbon Type III inclusions were punctured and partly exposed. Most fluids were released when punctured, but some content on the walls
Figure 12. Raman spectrum measured of solid phases (arrows in photo A) in an aqueous two-phaseliquid + vapor fluid inclusion from the outer part of a corroded barite crystal close to the turbid reactionhalo in quartz that surrounds the barite (A). The indistinctive interface between barite and the blurredquartz zone is marked with a dashed line. Graph (B) shows the Raman spectrum in the 150 to 2000cm−1 range of the phases identified as hematite, the wavenumbers for the peaks of the backgroundbarite is marked with italics. Reference spectra are from the RRUFF project database [61].
Minerals 2019, 9, 749 18 of 33
3.3.3. Staining with WGA-FITC and Fluorescence Microscopy
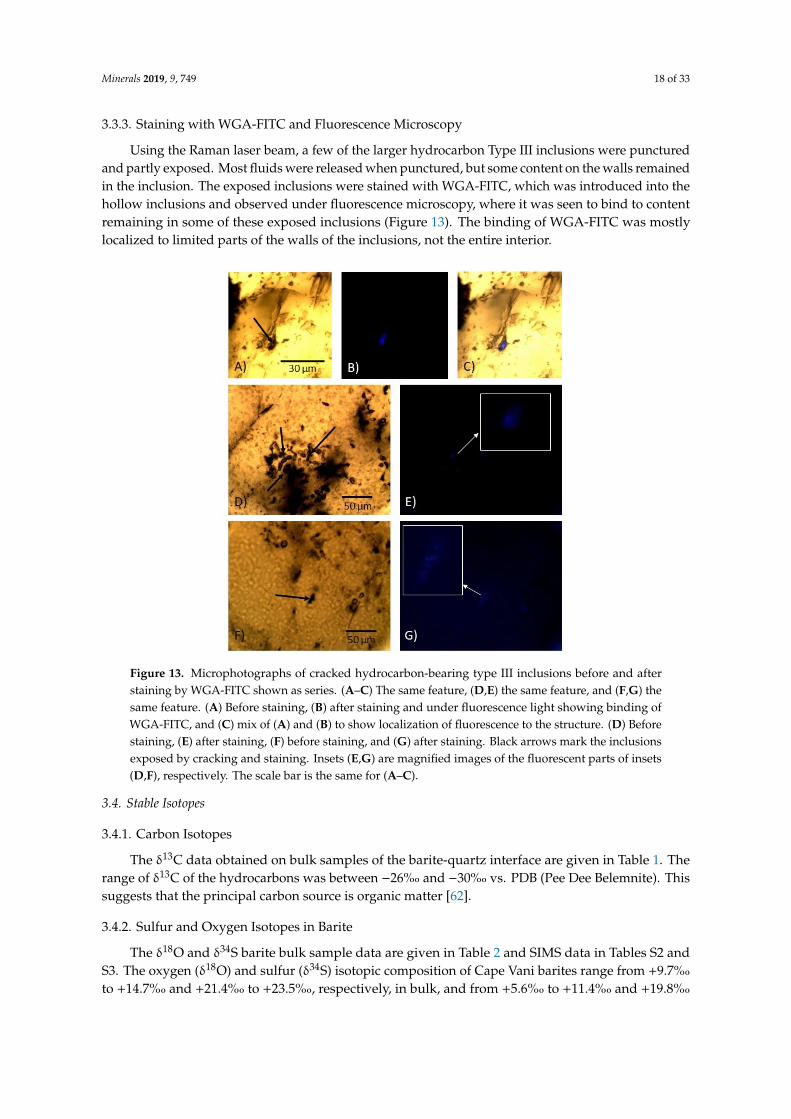
Using the Raman laser beam, a few of the larger hydrocarbon Type III inclusions were puncturedand partly exposed. Most fluids were released when punctured, but some content on the walls remainedin the inclusion. The exposed inclusions were stained with WGA-FITC, which was introduced into thehollow inclusions and observed under fluorescence microscopy, where it was seen to bind to contentremaining in some of these exposed inclusions (Figure 13). The binding of WGA-FITC was mostlylocalized to limited parts of the walls of the inclusions, not the entire interior.Minerals 2019, 9, 749 19 of 34
Figure 13. Microphotographs of cracked hydrocarbon-bearing type III inclusions before and after staining by WGA-FITC shown as series. (A–C) The same feature, (D,E) the same feature, and (F,G) the same feature. (A) Before staining, (B) after staining and under fluorescence light showing binding of WGA-FITC, and (C) mix of (A) and (B) to show localization of fluorescence to the structure. (D) Before staining, (E) after staining, (F) before staining, and (G) after staining. Black arrows mark the inclusions exposed by cracking and staining. Insets (E,G) are magnified images of the fluorescent parts of insets (D,F), respectively. The scale bar is the same for (A–C).
Figure 13. Microphotographs of cracked hydrocarbon-bearing type III inclusions before and afterstaining by WGA-FITC shown as series. (A–C) The same feature, (D,E) the same feature, and (F,G) thesame feature. (A) Before staining, (B) after staining and under fluorescence light showing binding ofWGA-FITC, and (C) mix of (A) and (B) to show localization of fluorescence to the structure. (D) Beforestaining, (E) after staining, (F) before staining, and (G) after staining. Black arrows mark the inclusionsexposed by cracking and staining. Insets (E,G) are magnified images of the fluorescent parts of insets(D,F), respectively. The scale bar is the same for (A–C).
3.4. Stable Isotopes
3.4.1. Carbon Isotopes
The δ13C data obtained on bulk samples of the barite-quartz interface are given in Table 1. Therange of δ13C of the hydrocarbons was between −26%� and −30%� vs. PDB (Pee Dee Belemnite). Thissuggests that the principal carbon source is organic matter [62].
3.4.2. Sulfur and Oxygen Isotopes in Barite
The δ18O and δ34S barite bulk sample data are given in Table 2 and SIMS data in Tables S2 andS3. The oxygen (δ18O) and sulfur (δ34S) isotopic composition of Cape Vani barites range from +9.7%�
to +14.7%� and +21.4%� to +23.5%�, respectively, in bulk, and from +5.6%� to +11.4%� and +19.8%�
Minerals 2019, 9, 749 19 of 33
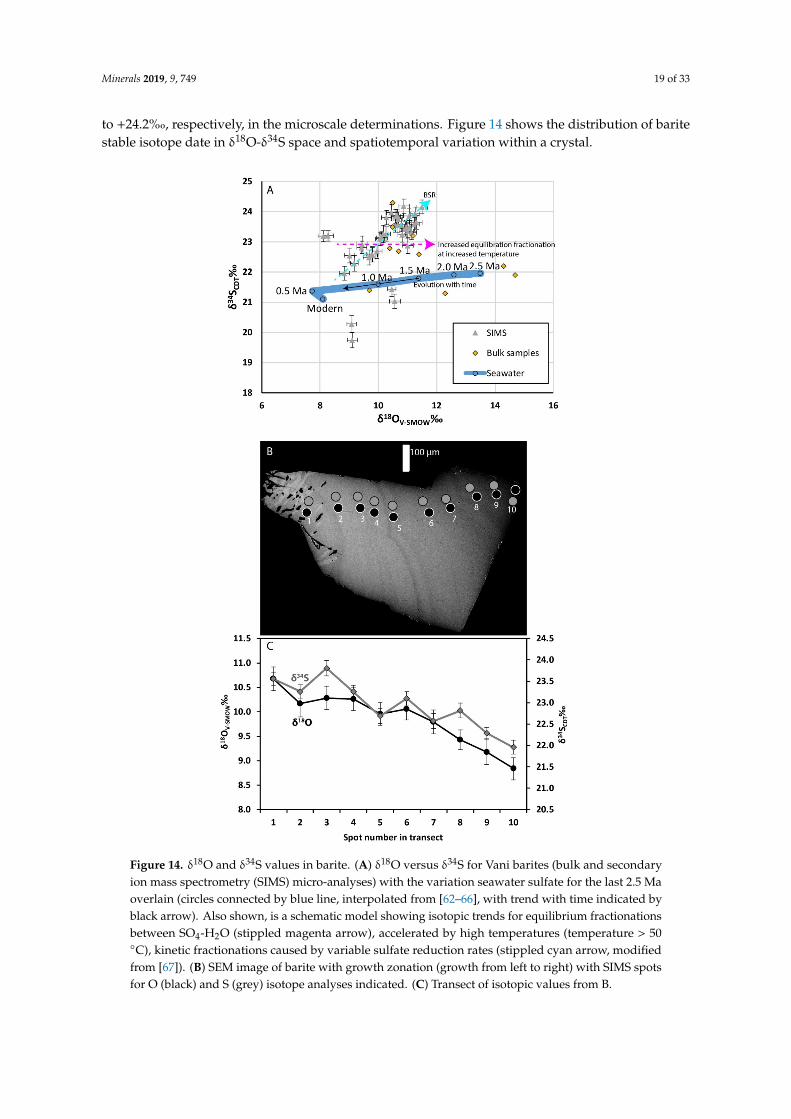
to +24.2%�, respectively, in the microscale determinations. Figure 14 shows the distribution of baritestable isotope date in δ18O-δ34S space and spatiotemporal variation within a crystal.
Minerals 2019, 9, 749 20 of 34
Figure 14. δ18O and δ34S values in barite. (A) δ18O versus δ34S for Vani barites (bulk and secondary ion mass spectrometry (SIMS) micro-analyses) with the variation seawater sulfate for the last 2.5 Ma overlain (circles connected by blue line, interpolated from [62–66], with trend with time indicated by black arrow). Also shown, is a schematic model showing isotopic trends for equilibrium fractionations between SO4-H2O (stippled magenta arrow), accelerated by high temperatures (temperature > 50 °C),
Figure 14. δ18O and δ34S values in barite. (A) δ18O versus δ34S for Vani barites (bulk and secondaryion mass spectrometry (SIMS) micro-analyses) with the variation seawater sulfate for the last 2.5 Maoverlain (circles connected by blue line, interpolated from [62–66], with trend with time indicated byblack arrow). Also shown, is a schematic model showing isotopic trends for equilibrium fractionationsbetween SO4-H2O (stippled magenta arrow), accelerated by high temperatures (temperature > 50◦C), kinetic fractionations caused by variable sulfate reduction rates (stippled cyan arrow, modifiedfrom [67]). (B) SEM image of barite with growth zonation (growth from left to right) with SIMS spotsfor O (black) and S (grey) isotope analyses indicated. (C) Transect of isotopic values from B.

Minerals 2019, 9, 749 20 of 33
4. Discussion
The emphasis of this paper is to understand the unusual nature of the biomorphic Type IIIinclusions and the conditions at which they were trapped. A possible biological origin will be evaluatedand discussed, but prior to this the environmental setting in which the proposed microorganismsexisted will be described. The mineral succession in the studied system shows that the barite predatesthe quartz and that the putative microorganisms existed in the vein conduits, or in close proximity,during barite precipitation prior to quartz formation.
4.1. The Paleoenvironment of the Hydrothermal System
4.1.1. Interpretation of the Fluid Inclusion Data
Figure 9 shows how fluid inclusion homogenization temperatures (Th) and last ice melting (Tm-ice)co-vary with data discriminated by hosting mineral phase and location within the mine. From this, anumber of observations can be made:
(i) Homogenization data in barite show significant scatter towards high temperatures, most likely dueto some post trapping modification and leakage during heating measurements. Notwithstandingthis, there is a general trend of high (−1 ◦C) to low (−10 ◦C) Tm-ice at relatively constant Th
(125–150 ◦C). This is much clearer in the quartz-hosted fluid inclusions from the mine samples.(ii) Comparing mine and stockwork fluid inclusion data samples, in spite of the scatter of the barite
data it would seem that fluid inclusions in the stockwork samples have higher Th (25–50 ◦C) thanfluid inclusions in samples from the mine.
(iii) The trend of increasing salinity at relatively constant or falling Th is analogous to that recordedin the nearby Profitis Ilias and Chondro Vouno Au-Ag deposits, where it is interpreted to bethe result of extensive open system boiling [34,68] and the Triades Pb-Zn-(Ag) deposit [36]. Inthese deposits, the highest homogenization temperatures and lowest salinities were interpretedto represent the composition of the hydrothermal fluid at initial boiling with the higher salinitylower Th inclusions characterizing the boiled residual fluid.
(iv) Though most of the data exhibit salinities in excess of seawater (Tm-ice < −2.1 ◦C), some inclusionsexhibit Tm-ice above −1.0 ◦C (1.5 wt.% NaCl eq.). This is somewhat like the low salinity–high Th
inclusions recorded at Profitis Ilias [68]. At Profitis Ilias, this was interpreted to result for thetrapping of condensed vapor, and a similar origin is thought to be responsible for these fluidinclusions at Cape Vani.
4.1.2. Pressure–Temperature Considerations
Comparing the distribution of Th–salinity data at Vani with the Profitis Ilias and Chondro VounoAu-Ag deposits [34,68], we suggest it is rational to conclude, by analogy, that, at Vani, the processesof open system boiling also occurred, though at lower temperatures. Thus, as boiling is a key partof mineralization process fluid inclusion Th is the temperature of the mineralizing hydrothermalfluid and accordingly the vapor pressure at homogenization is the trapping pressure. Taking fluidinclusions with salinities of 3.5 wt.% NaCl equiv. that homogenize at 125 ◦C to be representative of thehydrothermal fluid at initial boiling, we can estimate fluid densities and vapor pressures of 0.96 gcm−3
and 0.45 MPa (calculated using the method in [69]). This corresponds to a hydrostatic head of 47 m.This indicates an estimation of the maximum water depth during exhalative mineralization at Vani at~50 m, which is in line with the observed microbial mat-related sedimentary structures [41], and thefluctuating water depths and tectonic uplift of ~250 m over the last 0.8 Myr [70].
Liquid hydrocarbons may have a hydrothermal origin analogous to modern-day hydrothermalhydrocarbons venting on the seafloor (e.g., Guaymas basin) [71–76]. However, liquid petroleum thatis a typical product of sedimentary degraded organic matter has not been detected in modern-dayhydrothermal shallow-water seafloor venting off the coast of Milos [77].

Minerals 2019, 9, 749 21 of 33
4.1.3. Interpretation of the S and O Isotopes in Barite
An δ34S range of barite between +21 and +24%�V-CDT indicates a typical seawater source forthe S [63], in accordance with previous interpretations of the epithermal mineralization system atMilos [34,37]. This suggests that barite formed from the mixing of hydrothermally derived Ba2+ andseawater SO4
2−. However, as the Mn-Ba-Fe mineralization is young (<2.66 ± 0.07 Ma) [44], a moredetailed interpretation can be made as the δ34S and δ18O stable isotope composition of seawater sulfateover the last 10 Ma is well constrained [63–66].
In addition to the bulk barite δ34S and δ18O values, which define a seawater signature, the SIMSisotope data of barite crystals in close relation to the biomorphic Type III inclusions show (withscatter) two main trends. First, on a crystal scale, transects show decreasing δ34S and δ18O values fromcore to rim of the zoned crystals in the veins (Figure 14B,C), and second a similar trend of positivecorrelation occurs between δ34S and δ18O values in the whole SIMS data set. This generally makesbarite isotopically heavier in δ34S than the contemporaneous seawater (Figure 14). The increase inδ34S and positively correlated increase in δ18O values are typically explained by barite formation fromseawater sulfate that has been isotopically modified by variable degrees of bacterial sulfate reduction(BSR), such as observations at cold seeps [78]. However, the high Th (125 ◦C) of the barite fluidinclusions inhibits BSR as an in situ explanation for the isotope values; therefore, if BSR is the reason forthe increase in 34S and 18O of the barite, the process must have occurred in lower temperature regimesof the seawater pool nearby. Partial or full re-equilibration of sulfate δ18O with water δ18O, which canoccur when temperatures are 50 ◦C or above [79], may have occurred in the hydrothermal environmentof Cape Vani as an additional mechanism for the re-equilibration of δ18O in barite via interaction withheated seawater and geothermal fluids to heavier values. In addition, the fact that rims of the baritesare isotopically lighter in terms of O can be explained by lower degrees of re-equilibration over thecourse of the hydrothermal pulse and falling temperatures (Figure 14). This scenario is in line witha drop in temperatures required to allow microorganisms to colonize the outermost barite crystalfacies (see discussion of biomorphic Type III inclusions below). Seawater has over the last 2.5 Masystematically decreased in δ18O, from +13.5 to 8.0%� [63–66]. Consequently, the drop in δ18O duringthe cycle of barite precipitation could reflect decreasing δ18O of the contemporaneous seawater sulfate.Such a correlation implies that the major population of barite targeted by micro-analysis, started toprecipitate at ~1.5 Ma (Figure 14A) and continued for 1 Ma or more. Hydrothermal systems generallyhave lifetimes < 0.1 Ma [80]. As a result, the timespan, implied by the Vani barite δ18O data is an orderof magnitude longer than generally accepted for the life span of a hydrothermal system. Furthermore,if the barite δ18O data were the result of precipitation from unmodified contemporaneous seawater, thecombine δ34S-δ18O data would be expected to more closely follow the seawater evolution curve. Thus,though it is clear Cape Vani barites do not exhibit the extreme enrichments recorded in some cold seepsand open system conditions are most likely, the barite δ34S and δ18O data are best interpreted as beingderived from seawater sulfate that has undergone some modification through BSR (not in situ becauseof high Th).
The hydrothermal environment responsible for preservation of the biomorphic Type III inclusions,formed with fluids cooling to <100 ◦C near the paleo-seafloor, in response to boiling, mixing withseawater, or conductive heat loss. Small quantities of the hydrothermal mineralizing fluid werecaptured as fluid inclusions in barite and in the filamentous and spheroidal microstructures in thequartz. Our interpretation is that barite and quartz formed in boiling hydrothermal water around 125◦C and at a shallow water depth (<50 m). In the present study, the high salinity of the fluid inclusionsin barite is believed to represent the residual liquid phase of boiling seawater and implies that duringbarite precipitation the water gradually evolved from seawater salinity to an elevated salinity of 16wt.% (NaCl).
The δ13C values of the hydrocarbons indicate that the principal carbon source is organic matter [62],and the most likely source of such hydrocarbons in a hydrothermal system is decomposed biomassfrom microbial communities. As the barite surfaces were the only solid substrates, except for the vein

Minerals 2019, 9, 749 22 of 33
walls in the active hydrothermal system, it is probable they acted as substrate for microbial colonization.With time, increasing temperature in a second phase and mineral growth lead to the decompositionand slight boiling of these microbial communities and subsequent encapsulation by the growing barite.
4.2. Microbial Casts
The shape and morphologies of the Type III inclusions in quartz are far from typical for fluidinclusions in quartz, or any mineral [81], but correspond well to microbial morphologies [82]. Thepreservation as fluid inclusions suggest that the silica deposited as an amorphous accumulation inwhich the microorganisms were entombed and subsequently decomposed leaving fluid-filled cavitieswith preserved shapes of the original microorganisms on the inner walls. Some of the organic matterremained entrapped and is still present in the microstructures as hydrocarbons. The formation ofthe quartz and entombment of the microorganisms was probably an instant event at temperaturesclose to 100 ◦C, explaining the well-preserved cell walls with differing degrees of boiled cell interior.Thus, the fluid inclusions are putative casts of the original microorganisms rather than preservedorganisms. With time, the amorphous silica transformed into the fine-grained crystalline quartz withthe microorganisms preserved as fluid inclusions.
Since the structures are preserved as hollow casts, internal morphologies are missing. However,the external morphologies of the filamentous microstructures including curvilinear appearance,partitioning into separate cell-like compartments and branching are characteristic microbial filamentousmorphologies and in favor of a biological interpretation of the structures [82]. The spheroidal structureswith their range of perfect circular-, ellipsoidal-, and peanut-shaped features show characteristicmorphologies for microorganisms. The size, however, exclude most prokaryotes except giant sulfurbacteria (GSB) that can range in size from 10 to 750 µm in diameter, and large cyanobacteria that tend tooccupy spheroidal sheaths, ~60 µm in diameter. Cyanobacteria, as well as algae, which also correspondin size to the current microfossils are dependent on photosynthesis and occur exclusively in the photiczone with a few exceptions [83]. Owing to the occurrence of the presumed microorganisms at depth innarrow fractures, photobionts are not considered further as a possibility in the interpretation of thebiological affinity of the microbial casts.
The filamentous structures with disc-shaped or cylindrical cells arranged as trichomes correspondin size and morphology to filamentous GSB belonging to Beggiatoaceae [84], but they also correspondto fungal hyphae, characterized by repeated septations [12]. The ellipsoidal and near circular inclusionsare larger than most prokaryotic cells except GSB, but they correspond in size to fungal yeast cellsas well [12,85]. GSB occur as both filamentous and non-filamentous morphotypes [84,85]. The latteris characterized by a large central vacuole that is filled with a noncytoplasmic fluid. At death, themicrobes leave behind an empty core that can occupy >90% of the cell biovolume. Sulfur compoundscould not be recognized in the Milos structures. However, the cytoplasmic sulfur vesicles of GSBdisappear at death of the microorganisms with loss of the large central vacuole, thus sulfur is not to beexpected in dead or fossilized GSB [86].
The size and morphology of the spheroidal inclusions characterized by bottle-, oval-, or ellipsoid-shaped, or near-circular structures with short tail-like filamentous outgrowths, correspond to spore-likemorphologies. The transitions between filaments and near-circular structures suggest that they mightrepresent sporophores or conidiophores forming at the tip of bacterial filaments or fungal hyphae [12].Prokaryotic spores never exceed a diameter of 2–3 µm [82,87], thus spore-forming prokaryotes areexcluded for further interpretation. GSB are not spore-forming, and are thus also excluded as anoption [82]. This leaves fungi as the most likely option in respect to morphology [12]. In fact, fungalspore formation is similar to bud-like outgrowths, which is observed in our samples [12].
The successful staining with WGA-FITC of the inclusion interiors, provide biochemical supportfor a biogenic interpretation of the biomorphic inclusions. WGA-FITC binds to N-acetylglucosamine,which is a biopolymer in cell walls of many organisms. The presence of N-acetylglucosamine in thebiomorphic inclusions is in agreement with a biological origin of the inclusions, but also shows that

Minerals 2019, 9, 749 23 of 33
the organic content is indigenous to the inclusions and does not represent trapped hydrocarbonsfrom the hydrothermal fluids. The staining with WGA-FITC and detection of N-acetylglucosamineis also in support of a fungal interpretation. WGA-FITC has an especially high affinity to chitin, acomponent in fungal cell walls, not present in bacteria and archaea. WGA-FITC is widely used forselective staining, for example, to differentiate between fungal hyphae and filamentous prokaryotesin soil samples or to distinguish fungal hyphae in mycorrhizae [46,88]. Gram-negative bacteria haveN-acetylglucosamine in their inner cell walls, whereas Gram-positive bacteria have it in their entirecell walls, but in low amounts. WGA-FITC was shown to bind to a few Gram-positive bacteria by Fifeet al. [89]; however, Montgomery et al. [90] showed that WGA-FITC binds to neither Gram-negativenor Gram-positive bacteria and concluded that the amounts of N-acetylglucosamine in bacteria aretoo limited to be stained. Besides, the bacterial options for the current fossils including GSB andcyanobacteria are exclusively Gram-negative [82,85,91]. WGA-FITC has been used to detect chitinin marine sediments [90] and for studying the fungal decomposition of organic matter in aquaticsediments [92]. WGA-FITC was used to detect chitin in fossilized fungal hyphae preserved in carbonateveins in subseafloor basalts collected at Koko Seamount, Pacific Ocean [10]; thus, its usage for chitinstaining in fossil fungi in geological samples has been documented in previous studies. It is highlylikely that the staining of WGA-FITC represents detection of chitin in the microbial casts, whichrules out the possibility that the structures represent fossilized prokaryotes. Based on (1) geologicalcontext, (2) size and morphology corresponding to fungi, and (3) staining of WGA-FITC in favorof chitin detection we propose the biomorphic type III inclusions to represent remnants of fungi.The filamentous inclusions are interpreted as casts of fungal hyphae, and the spheroidal inclusions asfungal spores.
Despite being largely neglected in geomicrobiological investigations, fungi have been shownto be abundant and highly diversified in hydrothermal systems, methane seeps and marinesediments [5,93,94]. Fossilized fungi have been reported from subseafloor basalts indicating a deepand frequent presence in the ocean floors [7,8].
The large number of hydrocarbon inclusions at the barite growth zones indicates an abundanceof organic matter at the barite–quartz interface, which probably represents degraded microbialcommunities that colonized the barite surfaces. Assuming the δ13C values of bulk C representthe hydrocarbon content of the fluid inclusions, they are in support of a biological origin of thehydrocarbons. Thus, the barite surfaces at the time of fungal colonization were rich in organicmatter easily accessible for the heterotrophic fungi. The temperature of the system could have been,according to the homogenization temperatures from the fluid inclusions, ~100 ◦C. This is well abovethe known temperature limit for thermophilic fungi that have a maximum temperature of growth of62 ◦C [95]. However, the measured temperatures probably do not represent the mean temperatureregime that prevailed in the system, but merely fluids with temporarily elevated temperatures dueto extreme boiling and vaporization (fluid inclusion and amorphous silica evidence). The boiling ofthe microorganisms clearly shows that they could not tolerate temperatures around 100 ◦C and thatthe temperatures were lower in between the mineral forming events. Fluid inclusion measurementsmade on secondary carbonates in veins hosted in subseafloor basalt in which microorganisms wereentrapped and subsequently fossilized show a similar trend [96]. The fluids that formed the vein-fillingcarbonates ranged in temperatures from 100 to 250 ◦C, whereas the microorganisms that colonizedthe fracture system prior to the mineral formation must have lived at temperatures below 100 ◦C,indicating that the mineral-forming fluids were introduced as pulses in the system [96].
4.3. Mn-Coating of Spheriodal Type III Inclusions
The aqueous spheroidal Type III fluid inclusions in quartz with morphologies similar to sporesdiffer notably from the other types of inclusions in that they have Mn-oxide (birnessite, (Na, Ca)0.5(Mn4+,Mn3+)2O4·1.5H2O)-coated walls and a H2 gas phase. The ability of microorganisms to oxidize Mn(II)to Mn(III/IV) oxides is found throughout the bacterial and fungal domains of life [97]. The presence of

Minerals 2019, 9, 749 24 of 33
abundant Mn-oxides in the feeder dykes and the related Vani Mn-ore [42] shows that there was anabundance of soluble Mn(II) in the system available for microorganisms to utilize. One of the majorpathways in which microorganisms oxidize Mn(II) is via the reaction, in [98]
Mn2+ + H2O2 = MnO2 + 2H+ (1)
In this reaction, the microorganisms oxidize Mn(II) with peroxide (H2O2) using catalase as theenzyme that promotes the reaction. This is a common reaction pathway among Mn-oxidizing bacteria,and the major pathway among Mn-oxidizing fungi [99].
The presence of Mn-oxides at the inclusion walls is probably due to localized Mn-oxidation at whatrepresents the former walls of the spores. The oxidation of Mn(II) by spores but not by vegetative cellsis a phenomenon common among many spore formers [98]. A number of spore forming marine Bacillusare known to enzymatically oxidize soluble Mn(II) to Mn(IV) oxides [100]. In Bacillus, SG-1 Mn(II) arebound and oxidized by a protein in the exosporium, which results in the deposition of Mn-oxides atthe spore surface [98]. Among isolated bacilli, Mn-oxidation was shown to be absent in vegetativecells but dependent on cells that were in the process of sporulating [98]. The diameters of bacterialspores involved in Mn-oxidation are only a few micrometers and not in the size range of the currentspheroidal inclusions [82]. The diameters of fungal spores, on the other hand, fit the size range of thecurrent spore-like inclusions. Enzymatic oxidation of Mn(II) to Mn(IV) has been observed in the sporesof an Acremonium-like fungus belonging to the Ascomycetes [99]. The authors showed that Mn(II) isoxidized to Mn(IV) at the asexual reproductive structures owing to the production of extracellularsuperoxide during cell differentiation. The Mn-oxide phase birnessite and the reactive oxygen speciessuperoxide and hydrogen peroxide were colocalized at the base of asexual reproductive structures.Biomineralization of fungal spores by Mn-oxides has also been shown in fossilized zygosporic fungiobtained from dredged samples at the Vesteris Seamount, Greenland Basin. The hyphal mycelium wasfossilized by the Fe-oxide phase limonite, whereas the spores were mineralized by romanechite-likeMn-oxides [16].
The physiological reason for Mn(II) oxidation by bacteria and Ascomycetes fungi is unknown.The process has not been linked to energy conservation, and the rate or extent of growth by theorganisms has not been enhanced in the presence of Mn(II) [101,102]. Superoxide formation by theMn-oxidizing bacteria Roseobacter and the fungi Stilbella lineages, does not appear to be a response toavailable Mn(II). Cell differentiation is, for example, not enhanced in the presence of Mn(II), and thusthe Mn(II) oxidation of these organisms is likely an unintentional side reaction [99].
4.4. H2-Content of Spheriodal Type III Inclusions
Molecular hydrogen in fluid inclusions is rarely reported, either because it is extremely volatile, andthus seldom captured in fluid inclusions, or because of its tendency to diffuse out of the inclusions andtherefore almost only be found in environments associated with radiolysis, as in uranium deposits [103]or in melt inclusions [104]. The exact cause for the trapping of H2 in the current inclusions is notobvious, but there is a clear link between the presence of H2 gas and Mn-oxide coating on the inclusionwalls; thus, it is reasonable to assume that the Mn-oxides prevent the H2 from diffusing out throughthe quartz. H2 is a reactive gas that becomes oxidized in the presence of most metals with the rareexception of a few, including Mn(-oxides) [105,106]. Laboratory experiments related to fuel celldevelopment have shown that in a system containing CO and H2 Au-doped Mn-oxides is one of thebest candidates in selectively oxidizing CO while at the same time being inactive for the oxidation ofH2 [106]. The organic content in the current inclusions are, according to the Raman measurements,associated with the Mn-oxides while the H2 gas is left unreacted. The lack of CO2 in the inclusionsindicates that no oxidation of the organic material has occurred; however, a selective adsorption of theorganic matter over H2 is a likely scenario. Thus, the Mn-oxide coating would not only trap the H2 gasfrom diffusing out of the inclusions but also leave the gas intact and not oxidizing it.

Minerals 2019, 9, 749 25 of 33
The lack of serpentinization in the area greatly reduces the possibilities of an abiotic source ofH2. None of the minerals in the paleohydrothermal system of Cape Vani can give rise to formation ofH2 abiotically, and radiolysis is not likely at these shallow water depths with the present mineralogy.Investigations at active vents on Milos give a disparate understanding indicating no [40] or slight (3.2%vol) flux of dissipating H2 [77]. Methane, on the other hand, dissipates from the vents around Milos,but has been explained as mostly abiogenic (volcanic gas) in origin [107]. Most δD values of methanesupport an abiogenic source of hydrogen but some extremely low values (−377%�) indicate a differentsource [77,107,108]. These values are however explained as probably being “caused by unknownsubsurface rock alteration processes” [107]. On the other hand, the hydrogen isotopic system is notvery well understood in terms of abiotic and biological signatures. Heterotrophy seems to result inlarger fractionation towards lower values compared to autotrophy, while the lower values coincidewith abiotic fractionation [109]. In summary, the origin of H2 in non-serpentinized hosted subsurfaceenvironments is seldom discussed in detail and it is difficult to deduce the origin geochemically [30].
The lack of external sources for H2, the volatile nature of H2, and the exclusive containmentin Mn-oxide coated inclusions makes trapping of external H2 highly unlikely. Also, the lack oftrapped CO2 and CH4—two gases much more common in hydrothermal systems along the HellenicArc [40,77,107,108] and likely to be trapped in fluid inclusions—speaks against an external source forH2. Instead, an internal source confined to the microbial structures is more likely. Organic matter andwater are the two possible sources of H2 in the inclusions. Absence of CO2 in the inclusions rules outoxidation of organic matter, and splitting of water by manganese has, to our knowledge, not beenreported previously. Thus, an abiotic internal formation of H2 is unlikely. A biological origin of the H2
would be a possible alternative considering the biological origin of the inclusions. In a microbiologicalcontext, the ability to produce H2 is usually coupled to fermentation and has been observed in arelatively large number of microorganisms, usually linked to strict or facultative anaerobic metabolismamong heterotrophs or photosynthesizers [30,110]. Biological production of H2 is mediated by theenzyme hydrogenase, which catalyzes the reaction, in [111]
2e + 2H+→ H2 (2)
This reaction reflects the ability of microorganisms to dispose “excess” electrons in the formof molecular hydrogen. This is common among prokaryotes like Clostridium pasteurianum, Ralstonaeutropha, or Desulfovibrio spp [110], but also among diverse eukaryotes like ciliates, algae andfungi [112]. In eukaryotes, hydrogenases are critical to the function of the hydrogen-producingorganelles hydrogenosomes [112]. In fungi, hydrogenosomes are only known from the obligateanaerobic gut fungi of the phylum Neocallimastigomycota [17,18]. Neocallimastigomycota arealmost exclusively known from rumens of herbivores but have recently been found in environmentalsamples like the gut and coelomic fluid of the coastal sediment-dwelling sea urchin Echinocardiumcordatum [113] and in the guts of the algae-grazing marine iguana Amblyrhynchus cristatus [114]. Theyhave also been reported from landfill soils [115], as well as lacustrine [116], estuarine [117], and marinesediments [118]. This growing number of observations suggests that obligate anaerobic fungi not onlyexist as endosymbionts in rumens, but also in marine animals as well as free-living in anoxic sedimentsand soils. Hydrogen-producing anaerobic fungi have been hypothesized to play a similar ecologicalrole in deep anoxic environments as they do in the guts where they provide H2 to H2-dependentprokaryotes like methanogens or acetogens [21]. Such anaerobic consortia is still to be observed innature; however, fossilized communities of fungi and syngenetic pyrite with δ34S signals indicative ofsulfate reducing bacteria have been found in strict anoxic environments at 740 m depth in the Swedishcrystalline basement, thus partly confirming such a deep anaerobic partnership [22]. The conditionsin the current feeder veins of Milos is not supposed to be anoxic considering the presence of Fe- andMn-oxides [42]; however, it is possible that the fluids were suboxic at times due to ingress of deeperanoxic hydrothermal fluids, and locally, in association with the barite surfaces due to microbial activity.The presence of galena in the barites as well as the abundant hydrocarbons associated with the barite
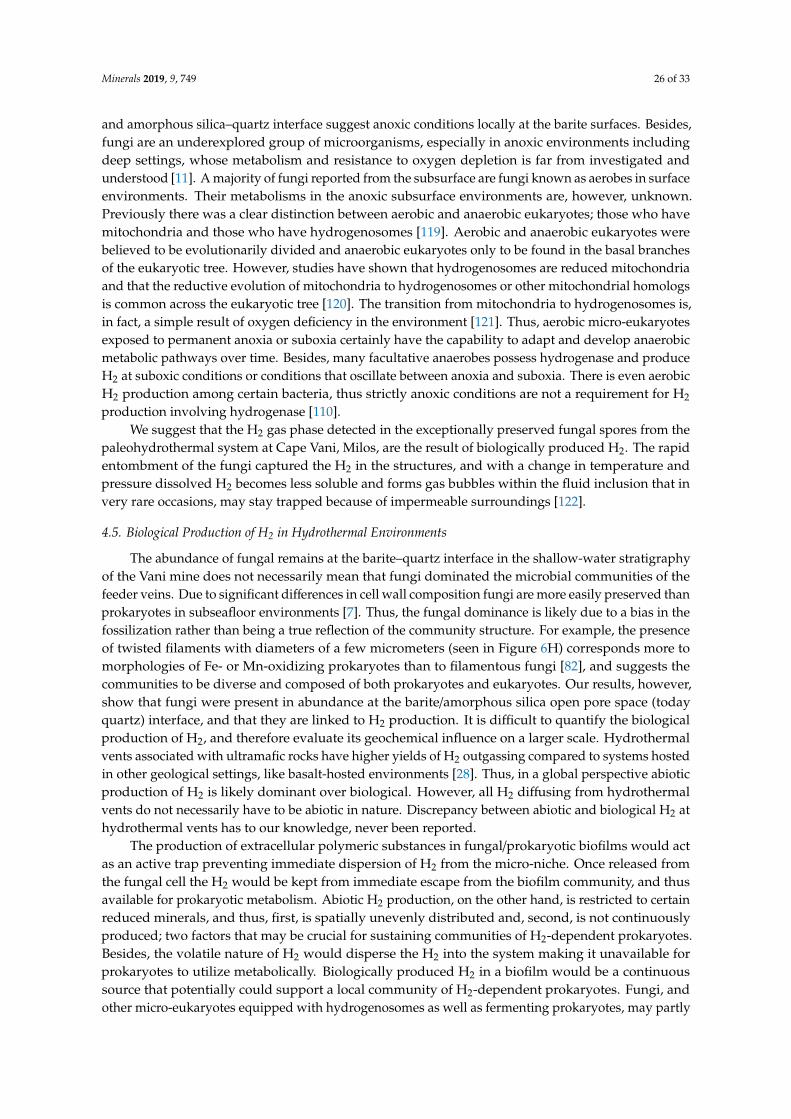
Minerals 2019, 9, 749 26 of 33
and amorphous silica–quartz interface suggest anoxic conditions locally at the barite surfaces. Besides,fungi are an underexplored group of microorganisms, especially in anoxic environments includingdeep settings, whose metabolism and resistance to oxygen depletion is far from investigated andunderstood [11]. A majority of fungi reported from the subsurface are fungi known as aerobes in surfaceenvironments. Their metabolisms in the anoxic subsurface environments are, however, unknown.Previously there was a clear distinction between aerobic and anaerobic eukaryotes; those who havemitochondria and those who have hydrogenosomes [119]. Aerobic and anaerobic eukaryotes werebelieved to be evolutionarily divided and anaerobic eukaryotes only to be found in the basal branchesof the eukaryotic tree. However, studies have shown that hydrogenosomes are reduced mitochondriaand that the reductive evolution of mitochondria to hydrogenosomes or other mitochondrial homologsis common across the eukaryotic tree [120]. The transition from mitochondria to hydrogenosomes is,in fact, a simple result of oxygen deficiency in the environment [121]. Thus, aerobic micro-eukaryotesexposed to permanent anoxia or suboxia certainly have the capability to adapt and develop anaerobicmetabolic pathways over time. Besides, many facultative anaerobes possess hydrogenase and produceH2 at suboxic conditions or conditions that oscillate between anoxia and suboxia. There is even aerobicH2 production among certain bacteria, thus strictly anoxic conditions are not a requirement for H2
production involving hydrogenase [110].We suggest that the H2 gas phase detected in the exceptionally preserved fungal spores from the
paleohydrothermal system at Cape Vani, Milos, are the result of biologically produced H2. The rapidentombment of the fungi captured the H2 in the structures, and with a change in temperature andpressure dissolved H2 becomes less soluble and forms gas bubbles within the fluid inclusion that invery rare occasions, may stay trapped because of impermeable surroundings [122].
4.5. Biological Production of H2 in Hydrothermal Environments
The abundance of fungal remains at the barite–quartz interface in the shallow-water stratigraphyof the Vani mine does not necessarily mean that fungi dominated the microbial communities of thefeeder veins. Due to significant differences in cell wall composition fungi are more easily preserved thanprokaryotes in subseafloor environments [7]. Thus, the fungal dominance is likely due to a bias in thefossilization rather than being a true reflection of the community structure. For example, the presenceof twisted filaments with diameters of a few micrometers (seen in Figure 6H) corresponds more tomorphologies of Fe- or Mn-oxidizing prokaryotes than to filamentous fungi [82], and suggests thecommunities to be diverse and composed of both prokaryotes and eukaryotes. Our results, however,show that fungi were present in abundance at the barite/amorphous silica open pore space (todayquartz) interface, and that they are linked to H2 production. It is difficult to quantify the biologicalproduction of H2, and therefore evaluate its geochemical influence on a larger scale. Hydrothermalvents associated with ultramafic rocks have higher yields of H2 outgassing compared to systems hostedin other geological settings, like basalt-hosted environments [28]. Thus, in a global perspective abioticproduction of H2 is likely dominant over biological. However, all H2 diffusing from hydrothermalvents do not necessarily have to be abiotic in nature. Discrepancy between abiotic and biological H2 athydrothermal vents has to our knowledge, never been reported.
The production of extracellular polymeric substances in fungal/prokaryotic biofilms would actas an active trap preventing immediate dispersion of H2 from the micro-niche. Once released fromthe fungal cell the H2 would be kept from immediate escape from the biofilm community, and thusavailable for prokaryotic metabolism. Abiotic H2 production, on the other hand, is restricted to certainreduced minerals, and thus, first, is spatially unevenly distributed and, second, is not continuouslyproduced; two factors that may be crucial for sustaining communities of H2-dependent prokaryotes.Besides, the volatile nature of H2 would disperse the H2 into the system making it unavailable forprokaryotes to utilize metabolically. Biologically produced H2 in a biofilm would be a continuoussource that potentially could support a local community of H2-dependent prokaryotes. Fungi, andother micro-eukaryotes equipped with hydrogenosomes as well as fermenting prokaryotes, may partly
Minerals 2019, 9, 749 27 of 33
be responsible for the H2 production in hydrothermal, deep environments, and locally play a significantrole in supporting H2-dependent prokaryotes.
5. Conclusions
Fluid inclusions with characteristic microbial morphologies hosted in quartz from feeder veinsassociated with the Vani Mn-ore deposit formed by mixing of deep hydrothermal fluids and seawaterat the Greek island Milos were investigated. Based on morphological traits and the presence of chitindetected by the staining with WGA-FITC under fluorescence microscopy, the fluid inclusions wereinterpreted as fungal imprints. Spheroidal two-phase inclusions, interpreted as fungal spores, areunique by their coating of Mn-oxide birnessite and content of gas phase H2. A fungal origin of the H2
is inferred and we suggest micro-eukaryotes like fungi to be a, so far unrecognized, but significantsource of H2 in subsurface environments. Biologically produced H2 can play an important role insupporting communities of H2-dependent prokaryotes in both modern and ancient oceanic crust.
Supplementary Materials: The following are available online at http://www.mdpi.com/2075-163X/9/12/749/s1,Table S1: Summary of Fluid Inclusion Microthermometry for the Cape Vani Fe-Ba-Mn deposit; Table S2: SIMSanalyses of S isotopes in barite, running automated sequence; Table S3: SIMS analyses of O isotopes in barite,running automated sequence.
Author Contributions: Conceptualization, M.I. and S.P.K.; methodology, M.I., S.P.K., and C.B.; formal analysis,M.I., S.P.K., C.B., J.N., A.N., H.D., M.J.W.; investigation, M.I., S.P.K., C.B., J.N., A.N., H.D., M.J.W., E.C.F., S.B.,and K.D.; writing—original draft preparation, M.I and S.P.K.; writing—review and editing, C.B., A.N., H.D., andE.C.F., S.B., J.N., and M.J.W.; visualization, M.I., S.P.K., C.B., J.N., and H.D.; project administration, M.I. and S.P.K.;funding acquisition, M.I. H.D., M.J.W., E.C.F., and J.N.
Funding: This research was funded by the Swedish Research Council (Contracts No. 2012-4364 and 2017-04129(MI) 2017-05186 to H.D.); Danish National Research Foundation (DNRF53); and Villum Investigator Grant to DonCanfield (No. 16518), Formas (contract 2017-00766 to H.D. and M.J.W.). Ernest Chi Fru was funded by a EuropeanResearch Council grant no. 336092. NordSIM is part of the NordSIM-Vegacenter infrastructure supported bythe Swedish Research Council grant 2017-00637. This is NordSIM publication No 622. JN publishes with thepermission of the Executive Director British Geological Survey (UKRI). Bulk S- and O- isotope analyses in baritewere undertaken as part of a NERC Isotope Geosciences Facilities Steering Committee grant IP-792-0507 to JN.
Acknowledgments: We wish to thank Marianne Ahlbom (SU) for assisting with the ESEM analyses, HeikeSigmund (SU) for isotope analysis, Kerstin Lindén (NRM) for sample preparation, and Gothenburg University forSEM analyses.
Conflicts of Interest: The authors declare no conflicts of interest.
References
1. Orcutt, B.N.; Sylvan, J.B.; Knab, N.J.; Edwards, K.J. Microbial ecology of the dark ocean above, at, and belowthe seafloor. Microbiol. Mol. Biol. Rev. 2011, 75, 361–422. [CrossRef] [PubMed]
2. Edgcomb, V.P.; Kysela, D.T.; Teske, A.; de vera Gomez, A.; Sogin, M.L. Benthic eukaryotic diversity in theGuaymas Basin hydrothermal vent environment. Proc. Natl. Acad. Sci. USA 2002, 99, 7658–7662. [CrossRef][PubMed]
3. López-García, P.; Vereshchaka, A.; Moreira, D. Eukaryotic diversity associated with carbonates andfluid-seawater interface in Lost-City hydrothermal field. Environ. Microbiol. 2007, 9, 546–554. [CrossRef][PubMed]
4. López-García, P.; Phillipe, H.; Gaill, F.; Moreira, D. Autochthonus eukaryotic diversity in hydrothermalsediment and experimental micro-colonizers at the Mid-Atlantic Ridge. Proc. Natl. Acad. Sci. USA 2003, 100,697–702. [CrossRef]
5. Nagano, Y.; Nagahama, T. Fungal diversity in deep-sea extreme environments. Fung. Ecol. 2012, 5, 463–471.[CrossRef]
6. Hirayama, H.; Abe, M.; Miyazaki, J.; Sakai, S.; Nagano, Y.; Takai, K. Data Report: Cultivation ofmicroorganisms from basaltic rock and sediment cores from the North Pond on the Western Flank ofthe Mid-Atlantic Ridge, IODP Expedition 336. Proc. Int. Ocean Drill. Prog. 2015, 336. [CrossRef]

Minerals 2019, 9, 749 28 of 33
7. Ivarsson, M.; Holm, N.G.; Neubeck, A. The deep biosphere of the subseafloor igneous crust. In Trace MetalBiogeochemsitry and Ecology of Deep-Sea Hydrothermal Vent Systems; Demina, L.L., Galkin, S.V., Eds.; Springer:Berlin, Germany, 2015; pp. 143–166.
8. Ivarsson, M.; Bengtson, S.; Drake, H.; Francis, W. Fungi in deep subsurface environments. In Advances inApplied Microbiology; Sariaslani, S., Gadd, G., Eds.; Academic Press: London, UK; Elsevier: London, UK,2018; Volume 102, pp. 83–116.
9. Bengtson, S.; Rasmussen, B.; Ivarsson, M.; Muhling, J.; Broman, C.; Marone, F.; Stampanoni, M.; Bekker, A.Fungus-like mycelial fossils in 2.4 billion-year-old vesicular basalt. Nat. Ecol. Evol. 2017, 1, 0141. [CrossRef]
10. Ivarsson, M.; Bengtson, S.; Belivanova, V.; Stampanoni, M.; Marone, F.; Tehler, A. Fossilized fungi insubseafloor Eocene basalts. Geology 2012, 40, 163–166. [CrossRef]
11. Drake, H.; Ivarsson, M. The role of anaerobic fungi in fundamental biogeochemical cycles in the deepbiosphere. Fungal Biol. Rev. 2018, 32, 20–25. [CrossRef]
12. Webster, J.; Weber, R.W.S. Introduction to Fungi, 3rd ed.; Cambridge University: Cambridge, UK, 2007; p. 875.13. Gadd, G. Geomycology: Biogeochemical transformations of rocks, minerals, metals and radionuclides by
fungi, bioweathering and bioremediation. Mycol. Res. 2007, 111, 3–49. [CrossRef]14. Bengtson, S.; Ivarsson, M.; Astolfo, A.; Belivanova, V.; Broman, C.; Marone, F.; Stampanoni, M. Deep-biosphere
consortium of fungi and prokaryotes in Eocene sub-seafloor basalts. Geobiology 2014, 12, 489–496. [CrossRef]15. Ivarsson, M.; Broman, C.; Gustafsson, H.; Holm, N.G. Biogenic Mn-oxides in subseafloor basalts. PLoS ONE
2015, 10. [CrossRef]16. Ivarsson, M.; Peckmann, J.; Tehler, A.; Broman, C.; Bach, W.; Behrens, K.; Reitner, J.; Böttcher, M.E.;
Norbäck-Ivarsson, L. Zygomycetes in vesicular basanites from Vesteris Seamount, Greenland Basin—A newtype of cryptoendolithic fungi. PLoS ONE 2015, 10. [CrossRef]
17. Liggenstoffer, A.S.; Youssef, N.H.; Couger, M.B.; Elsahed, M.S. Phylogenetic diversity and communitystructure of anaerobic gut fungi (phylum Neocallimastigomycota) in ruminant and non-ruminant herbivores.ISME J. 2010, 4, 1225–1235. [CrossRef]
18. Khejornsart, P.; Wanapat, M. Diversity of rumen anaerobic fungi and methanogenic archaea in swamp buffaloinfluenced by various diets. J. Anim. Vet. Adv. 2010, 9, 3062–3069.
19. Mountfort, D.O.; Asher, R.A.; Bauchop, T. Fermentation of cellulose to methane and carbon dioxide by arumen anaerobic fungus in a triculture with Methanobrevibacter sp. Strain RA1 and Methanosarcina barkeri.Appl. Environ. Microbiol. 1982, 44, 128–134. [PubMed]
20. Hook, S.E.; Wright, A.-D.G.; McBride, B.W. Methanogens: Methane producers of the rumen and mitigationstrategies. Archaea 2010, 945785. [CrossRef] [PubMed]
21. Ivarsson, M.; Schnürer, A.; Bengtson, S.; Neubeck, A. Anaerobic fungi: A potential source of biological H2 inthe oceanic crust. Front. Microbiol. 2016, 7. [CrossRef] [PubMed]
22. Drake, H.; Ivarsson, M.; Bengtson, M.; Heim, C.; Siljeström, S.; Whitehouse, M.; Broman, C.; Belivanova, V.;Åström, M.E. Anaerobic consortia of fungi and sulfate reducing bacteria in deep granite fractures. Nat.Commun. 2017, 8. [CrossRef]
23. Stevens, T.O.; McKinley, J.P. Lithoautotrophic microbial ecosystems in deep basalt aquifers. Science 1995, 270,450–454. [CrossRef]
24. Lin, L.-H.; Slater, G.F.; Sherwood Lollar, B.; Lacrampe-Couloume, G.; Onstott, T.C. The yield and isotopiccomposition of radiolytic H2, a potential energy source for the deep subsurface biosphere. Geochim.Cosmochim. Acta 2005, 69, 893–903. [CrossRef]
25. Pedersen, K. Metabolic activity of subterranean microbial communities in deep granitic groundwatersupplemented with methane and H2. ISME J. 2012, 7, 839–849. [CrossRef] [PubMed]
26. Lau, M.C.; Kieft, T.L.; Kuloyo, O.; Linage-Alvarez, B.; van Heerden, E.; Lindsay, M.R.; Magnabosco, C.;Wang, W.; Wiggins, J.B.; Guo, L.; et al. An oligotrophic deep-subsurface community dependent on syntrophyis dominated by sulfur-driven autotrophic denitrifiers. Proc. Natl Acad. Sci. USA 2016, 113, E7927–E7936.[CrossRef] [PubMed]
27. McCollom, T.M. Abiotic methane formation during experimental serpentinization of olivine. Proc. Natl Acad.Sci. USA 2016, 113, 13965–13970. [CrossRef]
28. McCollom, T.M. Geochemical constraints on sources of metabolic energy for chemolithoautotrophy inultramafic-hosted deep-sea hydrothermal systems. Astrobiology 2007, 7, 933–950. [CrossRef]
Minerals 2019, 9, 749 29 of 33
29. Anderson, R.T.; Chapelle, F.H.; Lovley, D.R. Evidence against hydrogen-based microbial ecosystems in basaltaquifers. Science 1998, 281, 976–977. [CrossRef]
30. Gregory, S.P.; Barnett, M.J.; Field, L.P.; Milodowski, A.E. Subsurface microbial hydrogen cycling: Naturaloccurrence and implications for industry. Microorganisms 2019, 7, 53. [CrossRef]
31. Fytikas, M.; Innocenti, F.; Kolios, N.; Manetti, P.; Mazzuoli, R.; Poli, G.; Rita, F.; Villari, L. Volcanology andpetrology of volcanic products from the island of Milos and Neighbouring islets. J. Vol. Geotherm. Res. 1986,28, 297–317. [CrossRef]
32. Stewart, A.L.; McPhie, J. Facies architecture and Late Ploicene—Pleistocene evolution of a felsic volcanicisland, Milo, Greece. Bull. Volcanol. 2006, 68, 703–726. [CrossRef]
33. Hannington, M.D.; de Ronde, C.E.J.; Petersen, S. Sea-floor tectonics and submarine hydrothermal systems.Econ. Geol. 100th Anniv. Vol. 2005, 100, 111–142.
34. Naden, J.; Kilias, S.P.; Darbyshire, D.P.F. Active geothermal systems with entrained seawater asmodern analogs for transitional volcanic-hosted massive sulphide and continental magmato-hydrothermalmineralization: The example of Milos Island, Greece. Geology 2005, 33, 541–544. [CrossRef]
35. Alfieris, D.; Voudouris, P.; Spry, P.G. Shallow submarine epithermal Pb–Zn–Cu–Au–Ag–Te mineralization onwestern Milos Island, Aegean Volcanic Arc, Greece: Mineralogical, geological and geochemical constraints.Ore Geol. Rev. 2013, 53, 159–180. [CrossRef]
36. Smith, D.J.; Naden, J.; Miles, A.-J.; Bennet, H.; Bicknell, S.H. Mass wasting events and their impact on theformation and preservation of submarine deposits. Ore Geol. Rev. 2018, 7, 143–151. [CrossRef]
37. Hein, J.R.; Stamatakis, M.G.; Dowling, J.S. Trace metal-rich Quaternary hydrothermal manganese oxide andbarite deposit, Milos Island, Greece. Appl. Earth Sci. 2000, 109, 67–76. [CrossRef]
38. Liakopoulos, A.; Glasby, G.P.; Papavassiliou, C.T.; Boulegue, J. Nature and origin of the Vani manganesedeposit, Milos, Greece: An overview. Ore Geol. Rev. 2001, 18, 181–209. [CrossRef]
39. Chi Fru, E.; Kilias, S.; Ivarsson, M.; Rattray, J.E.; Gkika, K.; McDonald, I.; He, Q.; Broman, C. Sedimentarymechanisms of a modern banded iron formation on Milos Island, Greece. Solid Earth 2018, 9, 573–598.[CrossRef]
40. Dando, P.R.; Hughes, J.A.; Leahy, Y.; Niven, S.J.; Taylor, L.J.; Smith, C. Gas venting from submarinehydrothermal areas around island of Milos, Hellenic Volcanic Arc. Cont. Shelf Res. 1995, 15, 913–929.[CrossRef]
41. Kilias, S.P. Microbial-mat related structures in the Quaternary Cape Vani manganese oxide (-barite) deposit,NW Milos island-Greece. In Microbial Mats in Siliciclastic Depositional Systems through Time; SEPM SpecialPublication: Athen, Greece, 2012; Volume 101, pp. 97–110.
42. Kilias, S.P.; Detsi, K.; Godelitsas, A.; Typas, M.; Naden, J.; Marrantos, Y. Evidence of Mn-oxidebiomineralization, Vani Mn deposit, Milos, Greece. In Proceedings of the Ninth Bienniela SGA Meeting,Dublin, UK, 20–23 August 2007; Andrew, C.J., Ed.; Digging Deeper: Dublin, UK, 2007; pp. 1069–1072.
43. Skarpelis, N.; Koutles, T. Geology of epithermal mineralization of the NW part of Milos Island, Greece.In Proceedings of the 5th International Symposium on Eastern Mediterranean Geology, Thessaloniki,Greece, 14–20 April 2004; Chatzipetros, A., Pavlides, S., Eds.; School of Geology, Aristotelian University ofThessaloniki: Thessaloniki, Greece, 2004; pp. 1449–1452.
44. Papavassilliou, K.; Voudouris, P.; Kanellopoulos, C.; Glasby, G.; Alfieris, D.; Mitsis, I. New geochemicaland mineralogical constraints on the genesis of the Vani hydrothermal manganese deposit at NW Milosisland, Greece: Comparison with the Aspro Gialoudi deposit and implications for the formation of the Milosmanganese mineralization. Ore Geol. 2017, 80, 594–611. [CrossRef]
45. Chi Fru, E.; Ivarsson, M.; Kilias, S.P.; Frings, S.; Hemmingsson, C.; Broman, C.; Bengtson, S.;Chatzitheodoridis, C. Biogenicity of an early Quaternary iron formation, Milos Island, Greece. Geobiology2015, 13, 225–244. [CrossRef]
46. Bonfante-Fasolo, P.; Faccio, A.; Perotto, S.; Schubert, A. Correlation between chitin distribution and cell wallmorphology in the mycorrhizal fungus Glomus versiforme. Mycol. Res. 1990, 94, 157–165. [CrossRef]
47. Coleman, M.; Moore, M. Direct reduction of sulphates to sulphur dioxide for isotopic analysis. Anal. Chem.1978, 50, 1594–1595. [CrossRef]
48. Hall, A.J.; Boyce, A.J.; Fallick, A.E.; Hamilton, P.J. Isotopic evidence of the depositional environment of LateProterozoic stratiform barite mineralization, Aberfeldy, Scotland. Chem. Geol. 1991, 87, 99–114.

Minerals 2019, 9, 749 30 of 33
49. Whitehouse, M.J. Multiple sulfur isotope analysis by SIMS: Evaluation of reference sulfides for ∆33S withobservations and a case study on determination of ∆36S. Geostand. Geoanal. Res. 2013, 37. [CrossRef]
50. Heinonen, A.; Andersen, T.; Rämö, O.T.; Whitehouse, M. The source of Proterozoic anorthosite and rapakivigranite magmatism: Evidence from combined in situ Hf–O isotopes of zircon in the Ahvenisto complex,southeastern Finland. J. Geol. Soc. 2015, 172, 103–112. [CrossRef]
51. Stern, R.A.; (University of Alberta, Edmonton, Canada). Personal communication, 2019.52. Ding, T.; Valkires, S.; Kipphardt, H.; De Bievre, P.; Taylor, P.D.P.; Gonfiantini, R.; Krouse, R. Calibrated sulfur
isotope abundance ratios of three IAEA sulfur isotope reference materials and V-CDT with a reassessment ofthe atomic weight of sulfur. Geochim. Cosmochim. Acta 2001, 65, 2433–2437. [CrossRef]
53. Coplen, T.B. Reporting of stable hydrogen, carbon, and oxygen isotopic abundances. Pure Appl. Chem. 1994,66, 273–276. [CrossRef]
54. Ivarsson, M.; Kilias, S.P.; Broman, C.; Naden, J.; Detsi, K. Fossilized microorganisms preserved as fluidinclusions in epithermal veins, Vani Mn-Ba deposit, Milos Island, Greece. In Proceedings of the XIX CBGACongress, Thessaloniki, Greece, 23–26 September 2010; Volume 100, pp. 297–307.
55. Bodnar, R.J. Revised equation and table for determining the freezing point depression of H2O-NaCl solutions.Geochim. Cosmochim. Acta 1993, 57, 683–684. [CrossRef]
56. Orange, D.; Knittle, E.; Farber, D.; Williams, Q. Raman spectroscopy of crude oils and hydrocarbon fluidinclusions: A feasibility study. In Mineral Spectroscopy: A tribute to Roger G. Burns; Dyar, M.D., McCammon, C.,Schaefer, M.J.W., Eds.; The Geochemical Society, Special Publications: Washington DC, USA, 1996; Volume 5,pp. 65–81.
57. Rahl, J.M.; Anderson, K.M.; Brandon, M.T.; Fassoulas, C. Raman spectroscopic carbonaceous materialthermometry of low-grade metamorphic rocks: Calibration and application to tectonic exhumation in Crete,Greece. Earth Planet. Sci. Lett. 2005, 240, 339–354. [CrossRef]
58. Lahfid, A.; Beyssac, O.; Deville, E.; Negro, F.; Chopin, C.; Goffé, B. Evolution of the Raman spectrum ofcarbonaceous material in low-grade metasediments of the Glarus Alps (Switzerland). Terra Nova 2010, 22,354–360. [CrossRef]
59. Julien, C.; Massot, M.; Baddour-Hadjean, R.; Franger, S.; Bach, S.; Pereira-Ramos, J.P. Raman spectra ofbirnessite manganese dioxides. Sol. Stn. Ion. 2003, 159, 345–356. [CrossRef]
60. Frezzotti, M.L.; Tecce, F.; Casagli, A. Raman spectroscopy for fluid inclusion analysis. J. Geochem. Expl. 2012,112, 1–20. [CrossRef]
61. Downs, R.T. The RRUFF Project: An integrated study of the chemistry, crystallography, Raman and infraredspectroscopy of minerals. In Proceedings of the Program and Abstracts of the 19th General Meeting of theInternational Mineralogical Association, Kobe, Japan, 23–28 July 2006; pp. 3–13.
62. Lehmann, M.F.; Bernasconi, S.M.; Barbieri, A.; McKenzie, J.A. Preservation of organic matter and alterationof its carbon and nitrogen isotope composition during simulated and in situ early sedimentary diagenesis.Geochim. Cosmochem. Acta 2002, 66, 3572–3584. [CrossRef]
63. Paytan, A.; Martinez-Ruiz, F.; Eagle, M.; Ivy, A.; Wankel, S.D. Using sulfur isotopes to elucidate theorigin of barite associated with high organic matter accumulation events in marine sediments. In SulfurBiogeochemistry—Past and Present; Amend, J.P., Edwards, K.J., Lyons, T.W., Eds.; Geological Society of AmericaSpecial Paper: Boulder, CO, USA, 2004; Volume 379, pp. 151–160.
64. Paytan, A.; Kastner, M.; Campbell, D.; Thiemens, M.H. Sulfur isotopic composition of Cenozoic seawatersulfate. Science 1998, 282, 1459–1462. [CrossRef] [PubMed]
65. Turchyn, A.V.; Schrag, D.P. Oxygen isotope constraints on the sulphur cycle over the past 10 million years.Science 2004, 303, 2004–2007. [CrossRef] [PubMed]
66. Turchyn, A.V.; Schrag, D.P. Cenozoic evolution of the sulphur cycle: Insight from oxygen isotopes in marinesulfate. Earth Planet. Sci. Lett. 2006, 241, 763–779. [CrossRef]
67. Aharon, P.; Fu, B. Microbial sulfate reduction rates and sulphur and oxygen isotope fractionations at oil andgas seeps in deepwater Gulf of Mexico. Geochim. Cosmochim Acta 2000, 64, 233–246. [CrossRef]
68. Kilias, S.; Naden, J.; Cheliotis, I.; Shepherd, T.J.; Constandinidous, H.; Crossing, J.; Simos, J. Epithermalgold mineralization in the active Aegean Volcanic Arc: The Profitis Ilias deposit, Milos Island, Greece.Miner. Depos. 2001, 36, 32–44. [CrossRef]
69. Bakker, R.J. Package FLUIDS 1. Computer programs for analysis of fluid inclusion data and for modellingbulk fluid properties. Chem. Geol. 2003, 194, 3–23. [CrossRef]
Minerals 2019, 9, 749 31 of 33
70. Papanikolaou, D.; Lekkas, E.; Syskakis, D. Tectonic analysis of the geothermal field of Milos Island. Bull. Geol.Soc. Greece 1990, 24, 27–46.
71. Peter, J.M.; Peltonen, P.; Scott, S.D.; Simoneit, B.R.T.; Kawka, O.E. 14C ages of hydrothermal petroleum andcarbonate in Guaymas Basin, Gulf of California: Implications for oil generation, expulsion, and migration.Geology 1991, 19, 253–256. [CrossRef]
72. Simoneit, B.R. Hydrothermal petroleum: Genesis, migration, and deposition in Guaymas Basin, Gulf ofCalifornia. Can. J. Earth Sci. 1985, 22, 1919–1929. [CrossRef]
73. Simoneit, B.R.T.; Leif, R.N.; Sturz, A.A.; Sturdivant, A.E.; Gieskes, J.M. Geochemistry of shallow sedimentsin Guaymas Basin, Gulf of California: Hydrothermal gas and oil migration and effects of mineralogy. Org.Geochem. 1992, 18, 765–784. [CrossRef]
74. Simoneit, B.R. Hydrothermal Petroleum. In Hydrocarbons, Oils and Lipids: Diversity, Origin, Chemistry andFate; Springer: Berlin, Germany, 2018; pp. 1–35.
75. Yamanaka, T.; Ishibashi, J.; Hashimoto, J. Organic geochemistry of hydrothermal petroleum generated in thesubmarine Wakamiko caldera, southern Kyushu, Japan. Org. Geochem. 2000, 31, 1117–1132. [CrossRef]
76. Teske, A.; De Beer, D.; McKay, L.J.; Tivey, M.K.; Biddle, J.F.; Hoer, D.; Lloyd, K.G.; Lever, M.A.; Røy, H.;Albert, D.B.; et al. The Guaymas Basin hiking guide to hydrothermal mounds, chimneys, and microbialmats: Complex seafloor expressions of subsurface hydrothermal circulation. Front. Microbial. 2016, 7, 75.[CrossRef]
77. Daskalopoulou, K.; Gagliano, A.L.; Calabrese, S.; Longo, M.; Hantzis, K.; Kyriakopoulos, K.; D’Alessandro, W.Gas geochemistry and CO2 output estimation at the island of Milos, Greece. J. Volcanol. Geotherm. Res. 2018,365, 13–22. [CrossRef]
78. Feng, D.; Roberts, H.H. Geochemical characteristics of the barite deposits at cold seeps from the northernGulf of Mexico continental slope. Earth Planet. Sci. Lett. 2011, 309, 89–99. [CrossRef]
79. Aquilina, L.; Pauwels, H.; Genter, A.; Fouillac, C. Water-rock interaction processes in the Triassic sandstoneand the granitic basement of the Rhine Graben: Geochemical investigation of a geothermal reservoir. Geochim.Cosmochim. Acta 1997, 61, 4281–4295. [CrossRef]
80. Richards, J.P. A shake-up in the porphyry world? Econ. Geol. 2018, 118, 1225–1233. [CrossRef]81. Bodnar, R.J. Introduction to aqueous-electrolyte fluid inclusions. In Fluid Inclusions: Analysis and Interpretation;
Samson, I., Anderson, A., Marshall, D., Eds.; Mineralogical Association of Canada: Quebec City, QC, Cananda,2003; Volume 32, pp. 81–99.
82. Ehrlich, H.L. Geomicrobiology; Marcel Dekker: New York, NY, USA, 2002.83. Puente-Sáncheza, F.; Arce-Rodríguez, A.; Oggerind, M.; García-Villadangosa, M.; Moreno-Paza, M.;
Blancoa, Y.; Rodríguez, N.; Birde, L.; Lincolne, S.A.; Tornos, F.; et al. Viable cyanobacteria in the deepcontinental subsurface. Proc. Natl. Acad. Sci. USA 2018, 115, 10702–10707. [CrossRef]
84. Salman, V.; Bailey, J.V.; Teske, A. Phylogenetic and morphologic complexity of giant sulphur bacteria.Antonie van Leeuwenhoek 2013, 104, 169–186. [CrossRef]
85. Schulz, H.N.; Jørgensen, B.B. Big Bacteria. Annu. Rev. Microbiol. 2001, 55, 105–137. [CrossRef]86. Cunningham, J.A.; Thomas, C.-W.; Bengtson, S.; Marone, F.; Stampanoni, M.; Turner, F.R.; Bailey, J.V.;
Raff, R.A.; Raff, E.C.; Donoghue, P.C.J. Experimental taphonomy of giant Sulphur bacteria: Implications forthe interpretation of the embryo-like Ediacaran Doushantuo fossils. Proc. R. Soc. B. 2012, 279, 1857–1864.[CrossRef]
87. Carrera, M.; Zandomeni, R.O.; Fitzgibbon, J.; Sagripanti, J.-L. Difference between the spore sizes of Bacillusanthracis and other Bacillus species. J. Appl. Microbiol. 2007, 102, 303–312. [CrossRef]
88. Perretto, R.; Bettini, V.; Favaron, F.; Alghisi, P.; Bonfante, P. Polygalacturonase activity and location inarbuscular mycorrhizal roots of Allium porrum L. Mycorrhiza 1995, 5, 157–163. [CrossRef]
89. Fife, D.J.; Bruhn, D.F.; Miller, K.S.; Stoner, D.L. Evaluation of a fluorescent lectin-based staining technique forsome acidophilic mining bacteria. Appl. Environ. Microbiol. 2000, 66, 2208–2210. [CrossRef]
90. Montgomery, M.T.; Welschmeyer, N.A.; Kirchman, D.L. A simple assay for chitin: Application to sedimenttrap samples from the subarctic Pacific. Mar. Ecol. Prog. Ser. 1990, 64, 301–308. [CrossRef]
91. Rawat, R.; Rawat, S. Colorless sulfur oxidizing bacteria from diverse habitats. Adv. Appl. Sci. Res. 2015, 6,230–235.
92. Wohl, D.L.; McArthur, J.V. Aquatic Actinomycete-fungal interactions and their effects on organic matterdecomposition: A microcosm study. Microbial. Ecol. 2001, 42, 446–457. [CrossRef]
Minerals 2019, 9, 749 32 of 33
93. Orsi, W.D.; Edgcomb, V.D.; Chrsitman, G.D.; Biddle, J.F. Gene expression in the deep biosphere. Nature 2013,499, 205–208. [CrossRef]
94. Orsi, W.D.; Biddle, J.F.; Edgcomb, V.D. Deep sequencing of subseafloor eukaryotic rRNA reveals active fungiacross marine subsurface provinces. PLoS ONE 2013, 8, 1–10. [CrossRef]
95. Maheshwani, R.; Bharadwaj, G.; Bhat, M.K. Thermophilic fungi: Their physiology and enzymes.Microbiol. Mol. Rev. 2000, 64, 461–488. [CrossRef]
96. Ivarsson, M.; Broman, C.; Lindblom, S.; Holm, N.G. Fluid inclusions as a tool to constrain the preservationconditions of sub-seafloor cryptoendoliths. Planet. Space Sci. 2009, 57, 477–490. [CrossRef]
97. Tebo, B.M.; Johnson, H.A.; McCarthy, J.K.; Templeton, A.S. Geomicrobiology of manganese (II) oxidation.Trends Microbiol. 2005, 13, 421–428. [CrossRef]
98. Ehrlich, H.L.; Newman, D.K. Geomicrobiology of manganese. In Geomicrobiology; Ehrlich, H.L.,Newman, D.K., Eds.; CRC Press: Boca Raton, FL, USA, 2009; pp. 347–420.
99. Hansel, C.M.; Zeiner, C.A.; Santelli, C.M.; Webb, S.M. Mn (II) oxidation by anascomycete fungus is linked tosuperoxide production during asexual reproduction. Proc. Natl. Acad. Sci. USA 2012, 109, 12621–12625.[CrossRef]
100. Francis, C.A.; Tebo, B.M. Enzymatic manganese (II) oxidation by metabolically dormant spores of diverseBacillus species. Appl. Environ. Microbiol. 2002, 68, 874–880. [CrossRef]
101. Santelli, C.M.; Pfister, D.H.; Lazarus, D.; Sun, L.; Burgos, W.D.; Hansel, C.M. Promotion of Mn (II) oxidationand remediation of coal mine drainage in passive treatment systems by diverse fungal and bacterialcommunities. Appl. Environ. Microbiol. 2010, 76, 4871–4875. [CrossRef]
102. Hansel, C.M.; Francis, C.A. Coupled photochemical and enzymatic Mn (II) oxidation pathways of a planktonicRoseobacter-like bacterium. Appl. Environ. Microbiol. 2006, 72, 3543–3549. [CrossRef]
103. Dubessy, J.; Pagel, M.; Beny, J.-M.; Christensen, H.; Hickel, B.; Kosztolanyi, C.; Poty, B. Radiolysis evidenceby H2-O2 and H2-bearing fluid inclusions in three uranium deposits. Geochim. Cosmochim. Acta 1988, 52,1155–1167. [CrossRef]
104. Li, J.; Chou, I.-M. Hydrogen in silicate melt inclusions in quartz from granite detected with Ramanspectroscopy. J. Ram. Spectrophotometer 2015, 46, 983–986. [CrossRef]
105. Haruta, M.; Yamada, N.; Kobayashi, T.; Iijima, S. Gold catalysts prepared by coprecipitation forlow-temperature oxidation of hydrogen and carbon monoxide. J. Catal. 1989, 115, 301–309. [CrossRef]
106. Torres Sanchez, R.M.; Ueda, A.; Tanaka, K.; Haruta, M. Selective oxidation of CO in hydrogen over goldsupported on manganese oxides. J. Catal. 1997, 168, 125–127. [CrossRef]
107. Botz, R.; Stüben, D.; Winckler, G.; Bayer, R.; Schmitt, M.; Faber, E. Hydrothermal gases offshore Milos Island,Greece. Chem. Geol. 1996, 130, 161–173. [CrossRef]
108. Daskalopoulou, K.; Calabrese, S.; Grassa, F.; Kyriakopoulos, K.; Parello, F.; Tassi, F.; D’Alessandro, W. Originof methane and light hydrocarbons in natural fluid emissions: A key study from Greece. Chem. Geol. 2018,479, 286–301. [CrossRef]
109. Sherwood Lollar, B.; Lacrampe-Couloume, G.; Slater, G.F.; Ward, J.; Moser, D.P.; Gihring, T.M.; Lin, L.-H.;Onstott, T.C. Unravelling abiogenic and biogenic sources of methane in the Earth’s deep subsurface.Chem. Geol. 2006, 226, 328–339. [CrossRef]
110. Nandi, R.; Sengupta, S. Microbial production of hydrogen: An overview. Crit. Rev. Microbiol. 1998, 24, 61–84.[CrossRef]
111. Gray, C.T.; Gest, H. Biological formation of molecular hydrogen. Science 1965, 148, 186–192. [CrossRef]112. Horner, D.S.; Foster, P.G.; Embley, T.M. Iron hydrogenases and the evolution of anaerobic eukaryotes.
Mol. Biol. Evol. 2000, 17, 1695–1709. [CrossRef]113. Thorsen, M.S. Abundance and biomass of the gut-living microorganisms (bacteria, protozoa and fungi)
in the irregular sea urchin Echinocardium cordatum (Spatangoida: Echinodermata). Mar. Ecol. 1999, 133,353–360. [CrossRef]
114. Mackie, R.I.; Rycyk, M.; Ruemmler, R.L.; Aminov, R.I.; Wikelski, M. Biochemical and microbiologicalevidence for fermentative digestion in free-living land iguanas (Conolophus pallidus) and marine ignuanas(Amblyrhynchus cristatus) on the Galapagos archipelago. Phys. Biochem. Zool. 2004, 77, 127–138. [CrossRef]
115. Lockhart, R.J.; Van Dyke, M.I.; Beadle, I.R.; Humphryes, P.; McCarthy, A.J. Molecular biological detection ofanaerobic gut fungi (Neocallimastigales) from landfill sites. Appl. Environ. Microbiol. 2006, 72, 5659–5661.[CrossRef]

Minerals 2019, 9, 749 33 of 33
116. Wurzbacher, C.; Warthmann, N.; Bourne, E.; Attermeyer, K.; Allgaier, M.; Powell, J.R.; Detering, H.; Mbedi, S.;Grossart, H.-P.; Monaghan, M.T. High habitat-specificity in fungal communities in oligo-mesotrophic,temperate Lake Stechlin (North-East Germany). MycoKeys 2016, 16, 17–44. [CrossRef]
117. Mohamed, D.J.; Martiny, J.B. Patterns of fungal diversity and composition along a salinity gradient. ISME J.2011, 5, 379–388. [CrossRef]
118. Picard, K.T. Coastal marine habitats harbour novel early-diverging fungal diversity. Fungal Ecol. 2017, 25,1–13. [CrossRef]
119. Müller, M.; Mentel, M.; van Hellemod, J.J.; Henze, K.; Woehle, C.; Goild, S.B.; Yu, R.-Y.; van der Giezen, M.;Tielens, A.G.M.; Martin, W.F. Biocemistry and evolution of anaerobic energy metabolism in eukaryotes.Microbiol. Mol. Biol. Rev. 2012, 76, 444–495. [CrossRef]
120. Hjorth, K.; Goldberg, A.V.; Tsaousis, A.D.; Hirt, R.P.; Embley, T.M. Diversity and reductive evolution ofmitochondria among microbial eukaryotes. Phil. Trans. R. Soc. B Biol. Sci. 2010, 365, 713–727. [CrossRef]
121. Embley, T.M.; O’Neill, A.H.; Thomsson, E.; Pedersen, K. Characterisation of yeasts isolated from deepigneous rock aquifers of the Fennoscandian shield. Microb. Ecol. 2003, 46, 416–428.
122. Baranenko, V.I.; Kirov, V.S. Solubility of hydrogen in water in a broad temperature and pressure range.Sov. At. Energy 1989, 66, 30–34. [CrossRef]
© 2019 by the authors. Licensee MDPI, Basel, Switzerland. This article is an open accessarticle distributed under the terms and conditions of the Creative Commons Attribution(CC BY) license (http://creativecommons.org/licenses/by/4.0/).
Related Documents