Excellence in Engineering Since 1946

Welcome message from author
This document is posted to help you gain knowledge. Please leave a comment to let me know what you think about it! Share it to your friends and learn new things together.
Transcript

Excel lence in Engineering Since 1946


Today’s Seminar Outline
• Control Parameters That Impact Performance
• Jar Testing that Simulates Process Needs
• Full Scale Testing
• Automation and In-line Monitoring

Presentation Will Not Focus on
Emerging Technologies
Parkson Pilot - Manitowoc
CoMag Pilot – Fond du Lac

Presentation Will Focus on Optimizing
Current Technologies

Phosphorus Removal Basics

Methods of Phosphorus Removal
• Chemical Phosphorus Removal
- Add lime, iron, or aluminum salt
- Precipitation/adsorption of soluble phosphorus
- Relatively simple process
- Higher sludge production
• Biological Phosphorus Removal
- Facilitate growth of Phosphorus Accumulating Organisms (PAOs)
- More complex/higher risk
- Lower sludge production than with chemical addition
Chemical P Removal - Principles

Jar Testing Should Provide Lab
Scale Simulations of Full Scale
Considerations

• Strengths of jar testing
include:
• Low cost
• Easy comparison of
many conditions
• Provides proof of
concept
• Allows communication
and training
• Limitations of jar testing
include:
• Jar tests do not always
scale-up
• Long term operation
not always reflected
• Full scale conditions
can not always be
mimicked
Jar Testing in Proper Context
Provides Value

Bench Scale Testing for CPR
Determines Key Parameters
• Precipitation/Adsorption Reactions
• Dose Rates and Costs
• Side Effects
• pH Depression
• Alkalinity Loss

Jar Testing Allows Low Cost
Comparisons
Left to Right – Ferric Chloride, Alum, SorbX
Aluminum Byproduct

Jar Testing Provides Visual
Comparisons
Impacts on Sludge Production

Jar Testing Provides Visual
Comparisons
Impacts on Clarity

Jar Testing Provides Visual
Comparisons
Jar 4
Jar 1 Jar 2 Jar 3
Jar 5

Jar Testing Provides Visual
Comparisons

0 50 100 150 250
Phosphorus 4.35 1.40 0.46 0.18 0.12
Target 0.7 0.7 0.7 0.7 0.7
Me:P ratio 1.7 2.7 3.7 6.1
4.4
1.4
0.5
0.2 0.1
1.7
2.7
3.7
6.1
0.0
1.0
2.0
3.0
4.0
5.0
6.0
0.00
0.50
1.00
1.50
2.00
2.50
3.00
3.50
4.00
4.50
5.00
Fe:P
Rati
o
Ph
osp
ho
rus C
on
cen
trati
on
(m
g/L
)
Dose Rate (gallons of ferric chloride per million gallons of wastewater)
Ferric Jar Testing Results
Phosphorus Target Me:P ratio
Typical Jar Test Result

High pH Results in High Chemical
Needs

0
1
2
3
4
5
6
7
Ferric Chloride Alum SorbX
pH
PO4-P
Emerging Chemical Performance
Suggests Future Consideration
Warranted
Results Illustrate pH impacts and phosphorus results for comparing three
chemicals at the same volumetric dose rate. SorbX removed the most
phosphorus and had the lowest impact on pH

• Samples Filtered
• Lowest P level achievable
8.1
0.4 0.3 0.2 0.2 0.2
0
1
2
3
4
5
6
7
8
9
To
tal P
ho
sp
ho
rus C
on
cen
trati
on
(m
g/L
)
Total Phosphorus - Bench Scale Stress Test
TP
Effluent P with BPR and 100 ppmv alum Dose Typically ~ 0.8
mg/L P
Jar Stress Tests Can Isolate
Performance
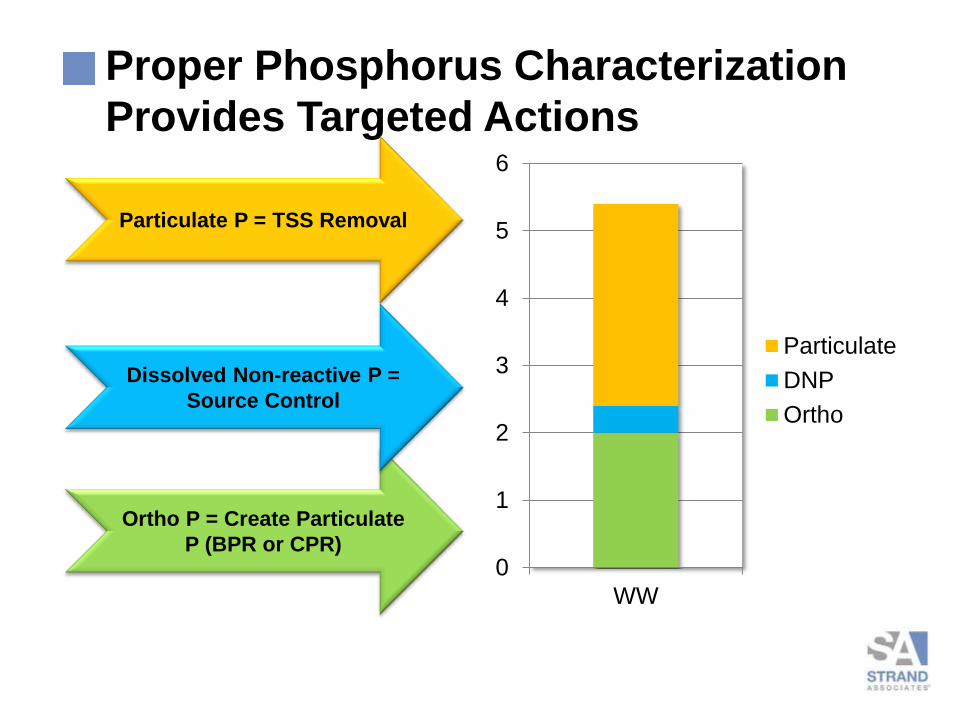
Proper Phosphorus Characterization
Provides Targeted Actions
0
1
2
3
4
5
6
WW
Particulate
DNP
Ortho
Ortho P = Create Particulate
P (BPR or CPR)
Particulate P = TSS Removal
Dissolved Non-reactive P =
Source Control
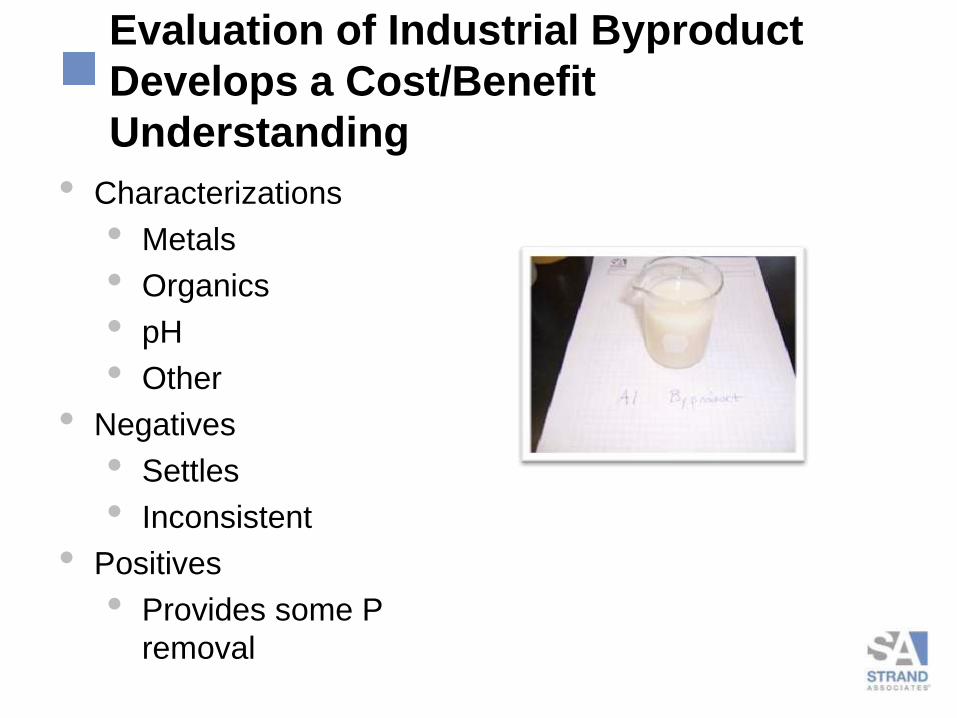
Evaluation of Industrial Byproduct
Develops a Cost/Benefit
Understanding
• Characterizations
• Metals
• Organics
• pH
• Other
• Negatives
• Settles
• Inconsistent
• Positives
• Provides some P
removal

Evaluation of Industrial Byproduct
0
5
10
15
20
25
30
0
0.5
1
1.5
2
2.5
3
3.5
0 1000 2000 3000 4000 5000 6000 7000 8000 9000 10000
Mo
lar
Rati
o
TP
Co
ncen
trati
on
(m
g/L
)
Dose (ppmV)
Primary Influent - Aluminum Byproduct
Total Phosphorus
Future WQBEL (6-monthaverage)
Molar Ratio

• Multiple Application Points
• Reduce loses to competing reactions
• Potentially develop residual value in multiple systems
• Inherent redundancy
CPR Pilot – Multiple Application Points

Each Facility Offers Unique
Opportunities
Phosphorus is removed where solids are removed, such as:
1. Primary clarifiers
2. Secondary clarifiers
3. Tertiary clarifiers
4. Filters
1
2
3 4

Baseline Data
0.00
0.10
0.20
0.30
0.40
0.50
0.60
0.70
Sep-11 Dec-11 Apr-12 Jul-12 Oct-12 Jan-13 May-13 Aug-13 Nov-13 Mar-14 Jun-14 Sep-14 Dec-14 Apr-15
TP C
on
cen
trat
ion
(m
g/L)
Effluent TP Concentration Effluent TP Concentration

Multiple Application Points Result in
Multiple P Removal Mechanisms
Primary
Application
Point
Primary
Application
Point
Residual
Primary
Application
Point
Residual
Secondary
Application
Point
Secondary
Application
Point
Residual

0
1
2
3
4
5
6
7
Influent PRE Sec. Eff. Coag Eff. Effluent
Co
nc
en
tra
tio
n (
mg
/L)
Phosphorus Concentration
2013 2014 (thru June)
Second
Application
Point
Increased
Dose and
Second
Application
Point
Understanding Removal Mechanisms
Improves Process Understanding


Con
ce
ntr
atio
n (
mg/L
)
Ferric
Pump Fail
– Filter
Serves as
Barrier
Initiation of
Stress
Testing


BPR Pilot Tests Can Focus on Full
Scale Trials With Little Capital
Expenditure

Phosphorus cycle involves release in anaerobic zone,“luxury” uptake in aerobic zone
TIME
AEROBICANAEROBIC
Soluble BOD
Soluble Phosphorus(Normal w/BPR)
0.5 to 2 hrs 2 to 10 hrs
BPR Encourages Luxury P Uptake

EFFLUENT
PRE-ANOXIC ANAEROBIC AEROBIC
FINALCLARIFIER
AERATION TANKS
RAS WAS
PRIMARYEFFLUENT
Typical BPR Process Schematic

Pilot Considerations
• Cost Considerations
• Consumables such as
chemical
• Engineering
• Lab
• Manpower
• Utilities
• Capitol Improvements
• Repeatability and/or
Isolation
• Full Scale or Full Time
Implementation
• Effluent Quality
• Reliability
• Termination Planning

Full Scale Testing
Full Scale BPR Testing in Conventional AS Plants
• Install cloth, wood, or block baffle walls and submersible
mixers for ~2 zones; turn off air to zones
• Install temporary or permanent gates/piping as needed to
route PRE/RAS where needed
• Measure SBOD, PO4, nitrate, and DO at various locations
• Monitor changes in sludge production and
settleability/dewaterability

Pilot Provides Long Term Treatment
Benefits
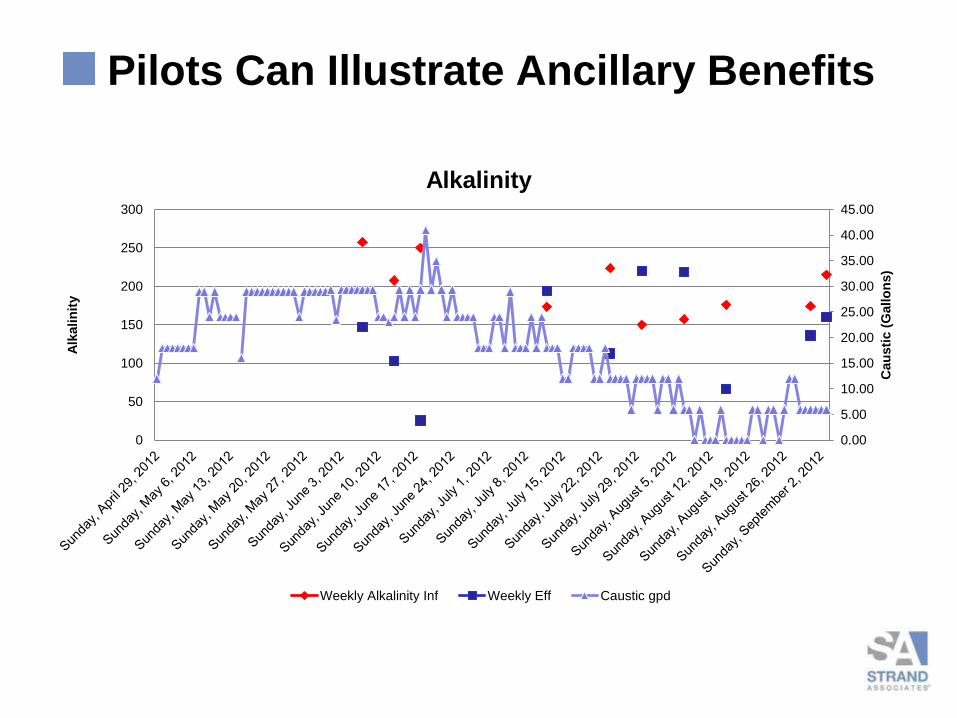
Pilots Can Illustrate Ancillary Benefits
0.00
5.00
10.00
15.00
20.00
25.00
30.00
35.00
40.00
45.00
0
50
100
150
200
250
300
Cau
sti
c (
Gallo
ns)
Alk
alin
ity
Alkalinity
Weekly Alkalinity Inf Weekly Eff Caustic gpd

Target Key Process Mechanisms by
Piloting Operational Adjustments

BPR Requires Proper Substrate to
Support a Specific “Habitat”
Oxygen Demand
COD
Biological
BOD
Readily Available
SBOD, rbsCOD
VFAs

Organic Load Impacts Process Reliability
Oxygen Demand
COD
Biological
BOD
Readily Available
SBOD, rbsCOD
VFAs
TBOD:TP > 20 COD:TP > 45
Oxygen Demand
COD
Biological
BOD
Readily Available
SBOD, rbsCOD
VFAs
Because of the
preference of the
substrate VFA
concentrations
ultimately determine
potential success.
7 to 9 mg of VFA
required to remove
each mg P.(1)
VFA losses to competing
reactions need to be
considered.
(1) Barnard

Aera
tio
n
Load
Treatment Objectives Define Balance for
Each Facility
BNR Requires BOD Load Nitrification Likes it Lighter
BPR Requires P Removal
Nitrification Requires Aging
Denitrification Requires No O2
Nitrification Requires Oxygen
BPR Requires No NO3 or O2
BPR Prefers Low RAS rates
BNR Prefers High RAS rates

Mixer On
Anaerobic Zone
In a complete
mix tank the SRT
and HRT are
approximately
the same.
Therefore, VFA
formation will be
limited to HRT.
BPR Pilot Element – Mixer Cycling

Mixer Off
Anaerobic Zone
If cycling the
mixer solids will
tend to settle
and remain in
tank making SRT
> HRT.
Therefore, VFA
formation can
extended
regardless of
HRT.
BPR Pilot Element – RAS Rate Control

Case Study – Fond du Lac: Ongoing
Goal – Identify if the anoxic zones can be operated
differently promoting anaerobic conditions resulting in
BPR.
Step 1 Develop Plan
Identify,
isolate,
and
prioritize
test
activities
Determine additional
monitoring and indices.
Organize all
information.

Industrial Loadings Provide Promise of
BPR
5
15
25
35
45
55
65
75
85
95
BO
D:P
Rati
o
Biochemical Oxygen Demand
SBOD:SP PRE Ratio BOD:P PRE Ratio

AM-40-03
M-40-04 Tank
No. 2
NRP-40-02
Stopped
Full Scale Example AO Process Initiated (BPR)

Early Efforts Were Impacted By Wet
Weather
0.000
5.000
10.000
15.000
20.000
25.000
30.000
35.000
40.000
Flo
w (
mg
d)
Influent and RAS Flow
Inf mgd RAS mgd

Currently Nitrate Interference is Being
Addressed
0
20
40
60
80
100
120
140
160
180
0.00
1.00
2.00
3.00
4.00
5.00
6.00
7.00
Influent Primary Effluent Anaerobic Zone - In Anaerobic Zone -Out
Aerobic Zone Effluent Ch
em
ical
Oxyg
en
Dem
an
d C
on
cen
trati
on
s (
mg
/)
Ph
osp
hate
an
d N
itra
te C
on
cen
trati
on
s (
mg
/L)
Train 1 - BPR Profile
P mg/L Train 1 Nitrate mg/L Train 1 COD mg/L

ORP Provides a Spectrum of Biological
Activity
- ORP Range from Negative to Positive +
Anaerobic Activity
Anoxic Activity
Aerobic Activity
Nitrification
Aerobic Oxidation
Denitrification
P Release
Others:
Acid Formation
Sulfur Reduction
Methanogenisis

Capacity Impacts Environments
-400
-300
-200
-100
0
100
200
300O
RP
(m
V)
Oxidation Reduction Potential
Min Average Max
3 Tanks in
Service
Average ORP
-24 mV
2 Tanks in Service
Average ORP
-113 mV
3 Tanks in
Service
Average ORP
-39 mV

Fond du Lac Interim Understanding
• Industrial loads provide unique dichotomy
• Heavy BOD could drive process
• Tendency to slug loads limits aeration tank configurations
• Other processes can be upset if optimum BPR tankage
were implemented
• Cleaning chemical changes from phosphorus based
chemicals to nitric acid based chemicals may have created
too much nitrate
• Wet weather impacts add to the difficulty
• Attempts to create an environment to support BPR have not been
successful
• Efforts to better understand the system have been successful

• Piloting operational changes can provide greater
understanding of facility and improved performance.
• Jar scale testing can aid in training and proof of concept
analysis.
• Impending phosphorus limits has contributed to improvements
and increased knowledge base…
• …you wont know if you don’t try.

• Fond du Lac
• Jeremy Cramer
• Dave Carlson
• Autumn Fisher
• Waukesha
• Randy Thater
• Jeff Harenda
• Nate Tillis
• Tim Young
• Brooklyn
• Leif Spilde
• Marathon City
• Ken Bloom
• Merrill
• Terry Vanden Heuvel
• Strand
• Jane Carlson
• Rachel Lee
• Jeremy Bril

Excel lence in Engineering Since 1946
Related Documents