Excellence and Equity in Brazilian Schools Paula Louzano [email protected] Cartagena, 21/09/2011.
Jan 01, 2016
Welcome message from author
This document is posted to help you gain knowledge. Please leave a comment to let me know what you think about it! Share it to your friends and learn new things together.
Transcript


Brazil: an unequal country
• GDP per capta: US$11,127 PPP (Chile: $15,026)
• Gini Coefficient: .49 (Chile .52)
• Tasa de pobreza: 25% (Chile: 11,5%)
Enrollment (1987 – 2009)
Source: PNAD (Household Survey)

School Completion for 22 year olds (1992 – 2009)
Source: PNAD (Household Survey)

Mathmatics Achievement (1995 – 2007)
Source: INEP (Saeb and Prova Brasil)

Brazil: an unequal and multiracial country
• Racial composition: Whites: 49%Mixed race : 43%Blacks: 6%Others: 2%
• Blacks and mixed race comprise 70% of the extremely poor
• Holds university degree: Whites: 15% Blacks/Mixed 5%

Enrollment for 7 to 14 year olds
Source: PNAD (Household Survey)

Enrollment by age and race
30%
40%
50%
60%
70%
80%
90%
100%
6 7 8 9 10 11 12 13 14 15 16 17 18 19Age
En
rolm
ent
Whites
Blacks/Mulattos
Source: PNAD (Household Survey)2003

Where are the 12 year olds?
33%
84%
67%
2%1%16%
0%
10%
20%
30%
40%
50%
60%
70%
80%
90%
100%
Whites Blacks
grades5-8
grades1-4
out ofschool
Source: 2003 PNAD

Where are the 15 year olds?
?
3%
12%
45%
55%
44%
21%
8%12%
0%
10%
20%
30%
40%
50%
60%
70%
80%
90%
100%
Whites Blacks
highschool
grades 5-8
grades 1-4
out ofschool
Source: 2003 PNAD

Context of the study
Inequality in the distribution of wealth is only part of the explanation for inequalities in education.
Literature on school effectiveness shows importance of school.

Research Questions
1. Are Brazilian children from different socio-economic and demographic backgrounds channeled to different primary schools? How is their mathematics achievement associated with the school they attend?
2. Among students within the same school, how is children’s achievement associated with their race and repetition history? Do such race and repetition gaps in achievement vary between schools?

Research Questions
3. How are the characteristics of the school, defined by social composition, resources, and teaching, associated with average mathematics achievement?
4. How are these same characteristics of schools associated with the race and repetition gaps within schools?

Data and methodology
2003 Brazilian National Educational Assessment (SAEB) survey data.
21,619 4th grade students and 1,532 schools from two main regions of the country (SE &NE)
Multilevel regression model which measures characteristics associated to all students (average) and to each school in particular

Analytical Model
Race AGenderSES School Context
SectorLocationRegion
School CompositionRacial CompositionAverage SESPercentage Overage
School ResourcesRemedial ProgramsClass SizeText BooksPedagogical MaterialCurriculum Coverage
TeachingTeacher EducationTeacher ExperienceInstructional Practices
BHistory of Repetition Variables measured atPre-school Student Level
Variables measured at School Level
E
Student SocioBackground
Student AcademicBackground
MathematicsAchievment
C
D
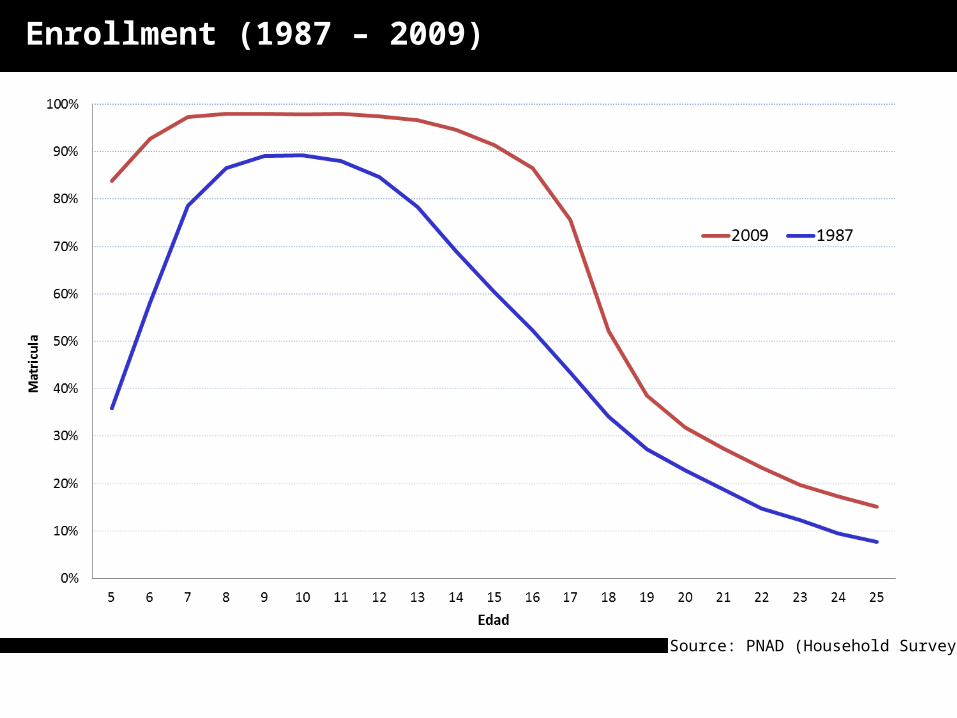
Proficiency Levels for 5th grade mathematics ( Algebra)

Repetition by race
% Frequency
Whites 33.7 3,015
Mixed 42.3 4,446
Black 51.4 1,278
Total 39.9 8,739

Achievement by race

Research Question 1a
•Are Brazilian children from different socio-economic and demographic backgrounds channeled to different primary schools?

Research Question 1a
High SES
Low SES
High concentration of black children 10% 63%
More than 50% de repeaters 1% 72%
Offer remedial programs 46% 44%
No programs but report learning problems 1% 32%
Lack of resources undermine work 0% 7%
Curriculum coverage (80% or more) 75% 8%
Textbooks available on time for all children 34% 18%

Research Question 1b
•How is their mathematics achievement associated with the school they attend?

Research Question 1b
aluno 61%
escola39%

Research Question 2 a
• Among students within the same school, how is children’s achievement associated with their race and repetition history?
• Race and history of repetition are associated with achievement, controlling for student’s SES, gender, and having attended pre-school.

Research Question 2 b
• Do such race and repetition gaps in achievement vary between schools?
• The effect of history of repetition varies among schools.
• The effect of race does not varies among schools.

Research Question 3
How are the characteristics of the school, defined by social composition, resources, and teaching, associated with average mathematics achievement?

School Effect
Social composition of the school (peer effects) has a big impact on student achievement.
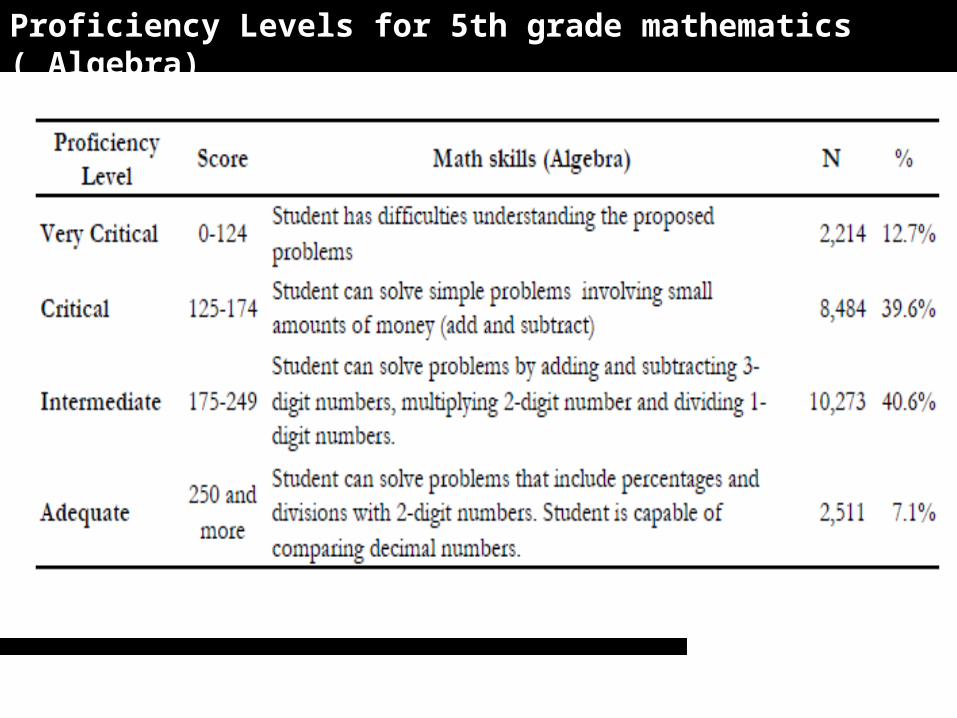
Resources: curricular coverage and textbook positively impact student achievement
Teacher: only Magistério training has positive and significant impact on student achievement
Teaching Practice: Use of high order thinking has a positive effect and intensive use of memorization has a negative effect on student achievement

Research Question 4
•How are these same characteristics of schools associated with the race and repetition gaps within schools?
Curriculum and achievement for repeaters and non repeaters

Textbooks and achievement for repeaters and non repeaters
0
0.1
0.2
0.3
0.4
0.5
0.6
no yes
Textbooks
Ach
ieve
men
t E
ffct
s (S
D u
nits)
Repeater
Non-Repeater

Discussion: REPETITION
40% of the 5th graders have repeated once or twice.
2/3 of these do not understand the problems in the text and when they do so they show the lowest math habilities.
This phenomena is more intense in schools with higher concentration of black and low SES students (72% of the repeaters are in low SES schools).
These schools have less resources to fight school failure (22% of the schools that admit having the problem have no remedial program).

Discussion: RACE
Half of the black students in 5th grade have repeated at least once.
At the age of 15, 1 in 4 black youth is either out of school or trying to finish 5th grade.
Among students of the same SES, black students are half a school year behind white students in math
70% of the black students score at the lowest levels (critical or highly critical), and only 1% are adequate.

Discussion: SCHOOL
Textbooks, Magisterio training, and use of high level thinking in classroom are among the school factors positively associated with achievement.
Children educational experience is highly unequal in Brazil.
Schools with high concentration of poor and black students has lower curriculum coverage, more problems with distribution of textbooks, less experienced teachers who use more memorization techniques to teach math.

Discussion: EQUITY
An effective school system should be able to deliver high level education to all the students, thus equity should be consider a criteria to define quality.
In Brazil, none of the characteristics associated with excellence is also associated with quality.
Related Documents