Excel: Unlimited Excel: Unlimited Possibilities Possibilities Graphs, Imputing Data, Graphs, Imputing Data, and Automatic and Automatic Calculations Calculations Secondary Mathematics Pre-School Inservice Cape Coral High School August 3, 2006

Welcome message from author
This document is posted to help you gain knowledge. Please leave a comment to let me know what you think about it! Share it to your friends and learn new things together.
Transcript

Excel: Unlimited Possibilities Excel: Unlimited Possibilities
Graphs, Imputing Data, and Graphs, Imputing Data, and Automatic CalculationsAutomatic Calculations
Secondary Mathematics Pre-School InserviceCape Coral High School
August 3, 2006
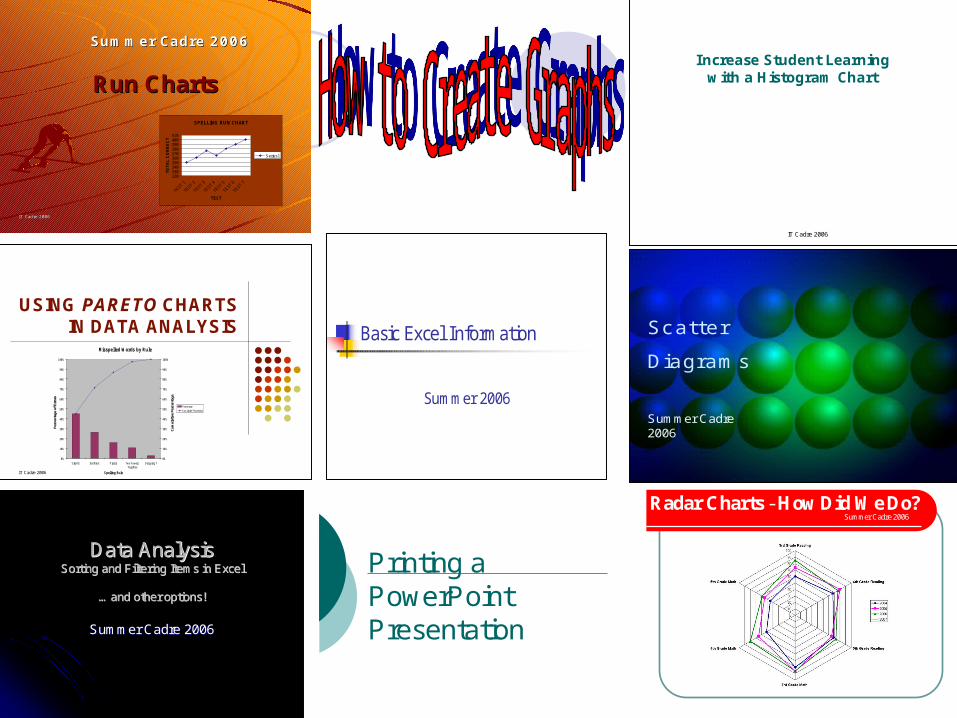
Basic Excel Information
Summer 2006
IT Cadre 2006
Increase Student Learning with a Histogram Chart
IT IT Cadre 2006Cadre 2006
Run ChartsRun Charts
Summer Cadre 2006Summer Cadre 2006
SPELLING RUN CHART
320330340350360370380390400410
TEST 1
TEST 2
TEST 3
TEST 4
TEST 5
TEST 6
TEST 7
TEST
TO
TA
L C
OR
RE
CT
Series1
Scatter
Diagrams
Summer Cadre 2006
IT Cadre 2006
USING PARETO CHARTSIN DATA ANALYSIS
Misspelled Words by Rule
0%
10%
20%
30%
40%
50%
60%
70%
80%
90%
100%
Silent E I before E Plurals Two VowelsTogether
Dropping Y
Spelling Rule
Perc
enta
ge o
f Err
ors
0%
10%
20%
30%
40%
50%
60%
70%
80%
90%
100%
Cum
ulat
ive
Perc
enta
ge
Percentage
Cumulative Percentage
Data AnalysisData AnalysisSorting and Filtering Items in ExcelSorting and Filtering Items in Excel
……and other options!and other options!
Summer Cadre 2006Summer Cadre 2006
Printing a PowerPoint Presentation
Radar ChartsRadar Charts - How Did We Do?
Summer Cadre 2006
Summer Cadre 2006

Importance of Run Chart?
Graph progress over time.
Shows progress toward a stated goal.
Increases student success.
Easy for students to graph own progress.
SPELLING RUN CHART
320330340350360370380390400410
TEST 1
TEST 2
TEST 3
TEST 4
TEST 5
TEST 6
TEST 7
TESTT
OT
AL
CO
RR
EC
T
Series1

Do Not Give Students Permission to Forget Graph student success
on math vocabulary. A quiz will be given
every other week. The quiz will be
charted in a Histogram.
Share the chart and plan to increase student success.
L to J chart
Bi-Weekly Quiz 1
02468
1012141618
0-10
11-2
0
21-3
0
31-4
0
41-5
0
51-6
0
61-7
0
71-8
0
81-9
0
91-1
00
Scores
Nu
mb
er
of
Stu
de
nts
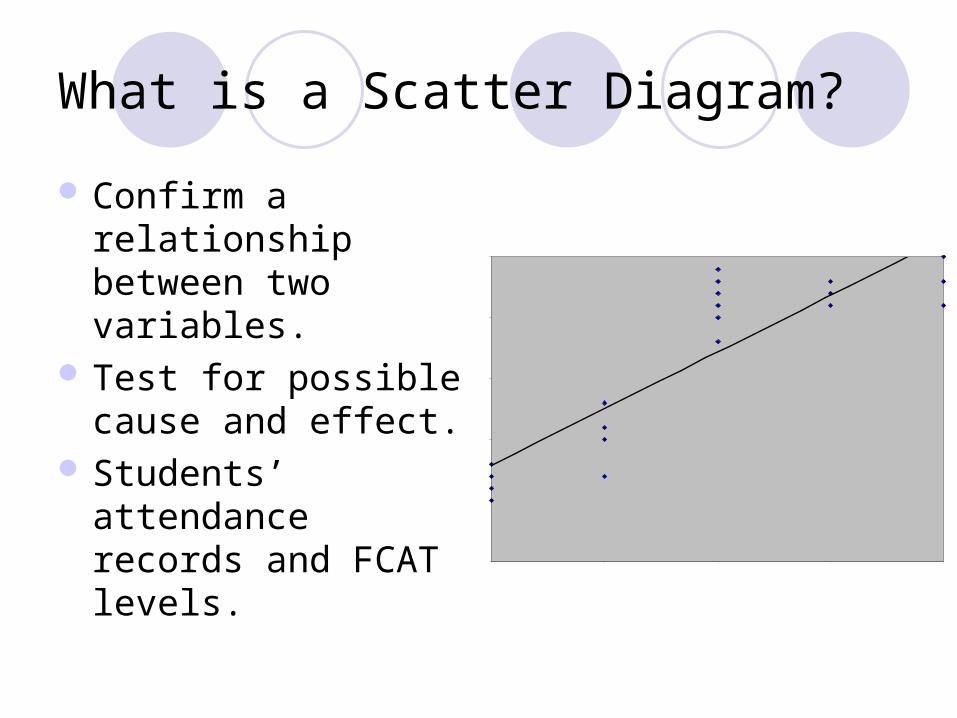
What is a Scatter Diagram?
Confirm a relationship between two variables.
Test for possible cause and effect.
Students’ attendance records and FCAT levels.
Attendance VS FCAT Levels
155
160
165
170
175
180
1 2 3 4 5
FCAT Level
Atte
ndan
ce: D
ays
Pre
sent
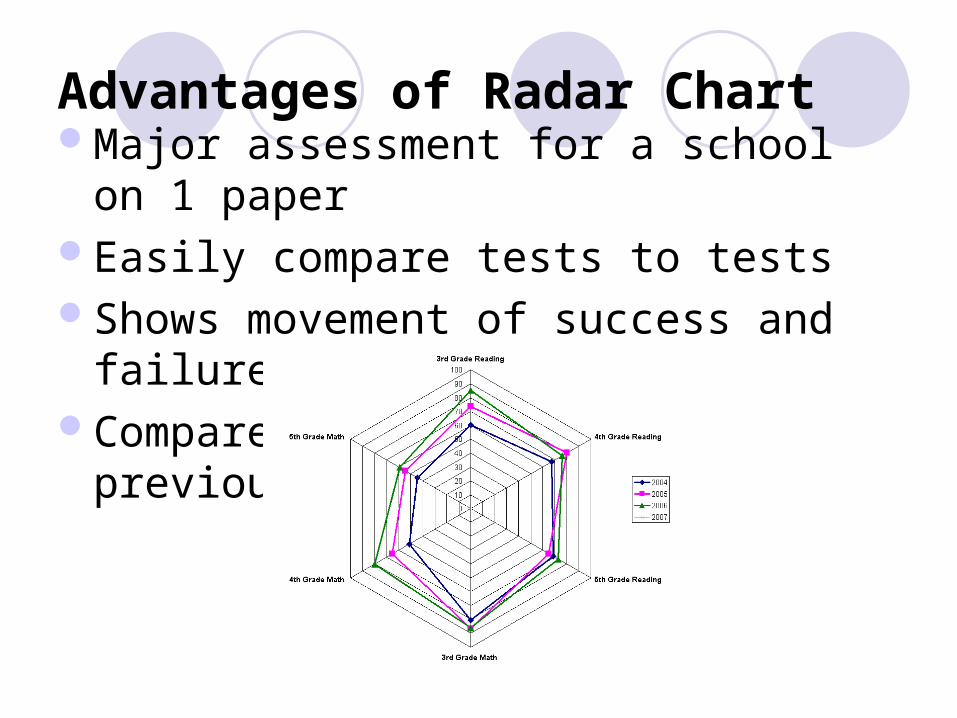
Advantages of Radar ChartMajor assessment for a school on 1 paperEasily compare tests to testsShows movement of success and failureCompare current year to previous years.
Purpose of Pareto Chart
To identify frequency of events.
Rate events frequency from greatest to least.

Track Student Progress with a Run Chart
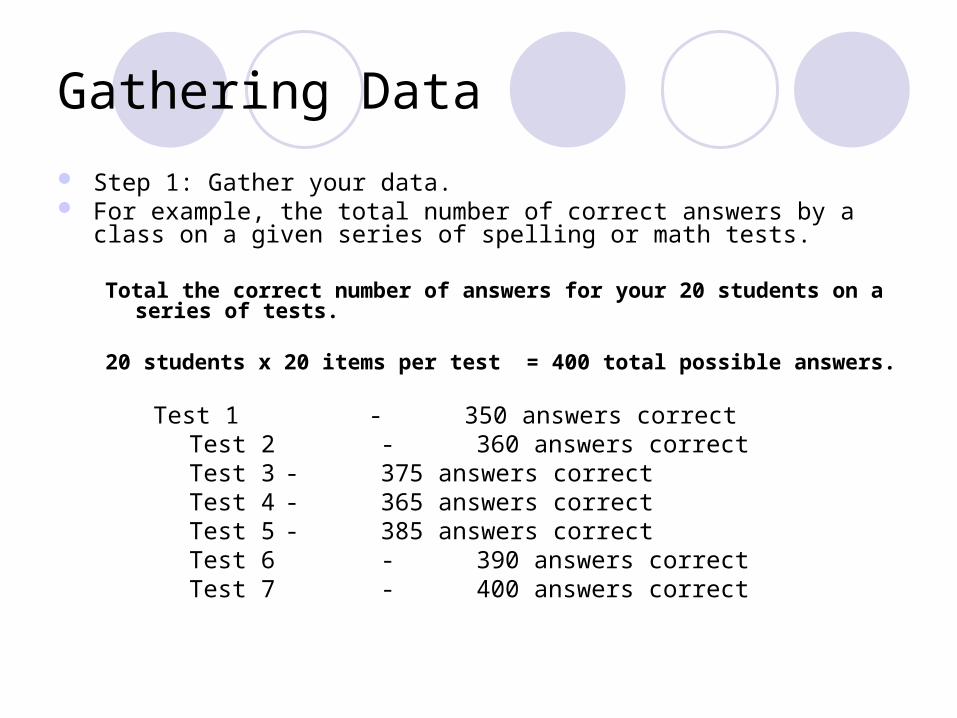
Gathering Data
Step 1: Gather your data. For example, the total number of correct answers by a class on a given
series of spelling or math tests.
Total the correct number of answers for your 20 students on a series of tests.
20 students x 20 items per test = 400 total possible answers.
Test 1 - 350 answers correctTest 2 - 360 answers correctTest 3 - 375 answers correctTest 4 - 365 answers correctTest 5 - 385 answers correctTest 6 - 390 answers correctTest 7 - 400 answers correct

Enter the Data in a Spreadsheet
Open a new worksheet in ExcelEnter your data:

Making the Run Chart
Highlight the data
‘To highlight, Click cell A2 and then
hold the left mouse button down
as you drag the cursor down
to last cell’
A2
Last Cell
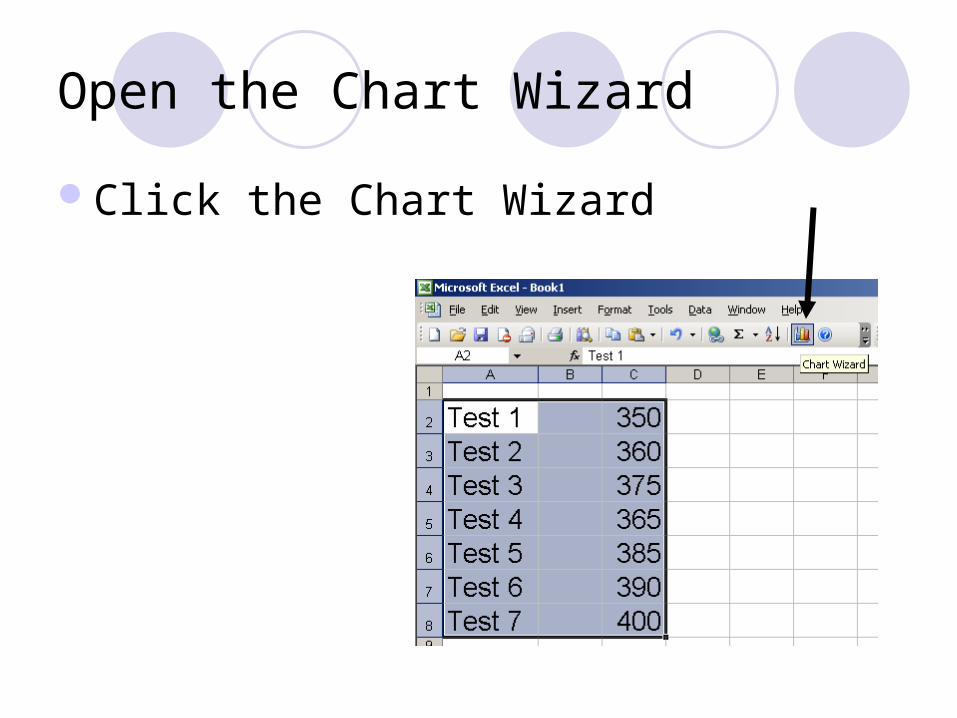
Open the Chart Wizard
Click the Chart Wizard

Step 1 of the Chart Wizard
Click the type ‘Line’ and then ‘Next’
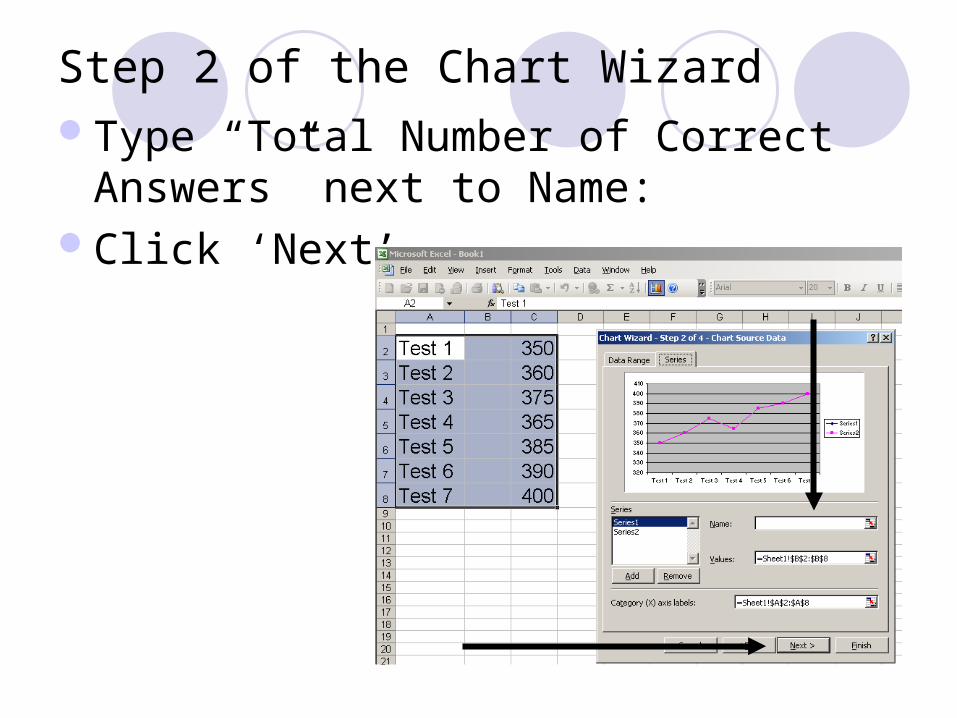
Step 2 of the Chart WizardType “Total Number of Correct Answers”
next to Name: Click ‘Next’

Step 3 of the Chart Wizard
Label your graph
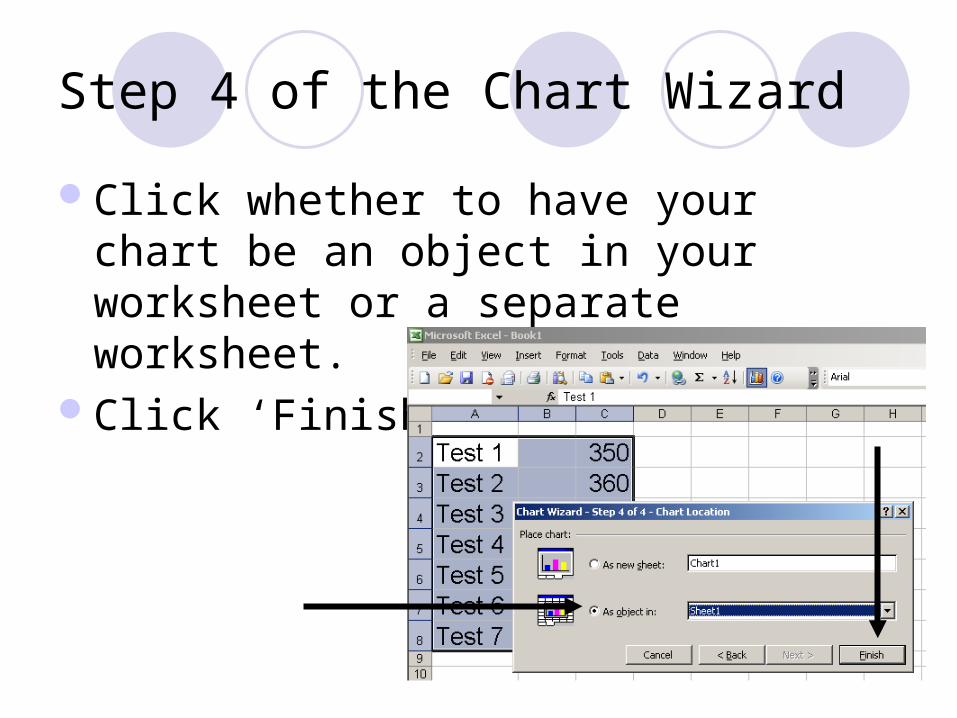
Step 4 of the Chart Wizard
Click whether to have your chart be an object in your worksheet or a separate worksheet.
Click ‘Finish’

Here is the Run Chart
Increase Student Learning with a Histogram Chart
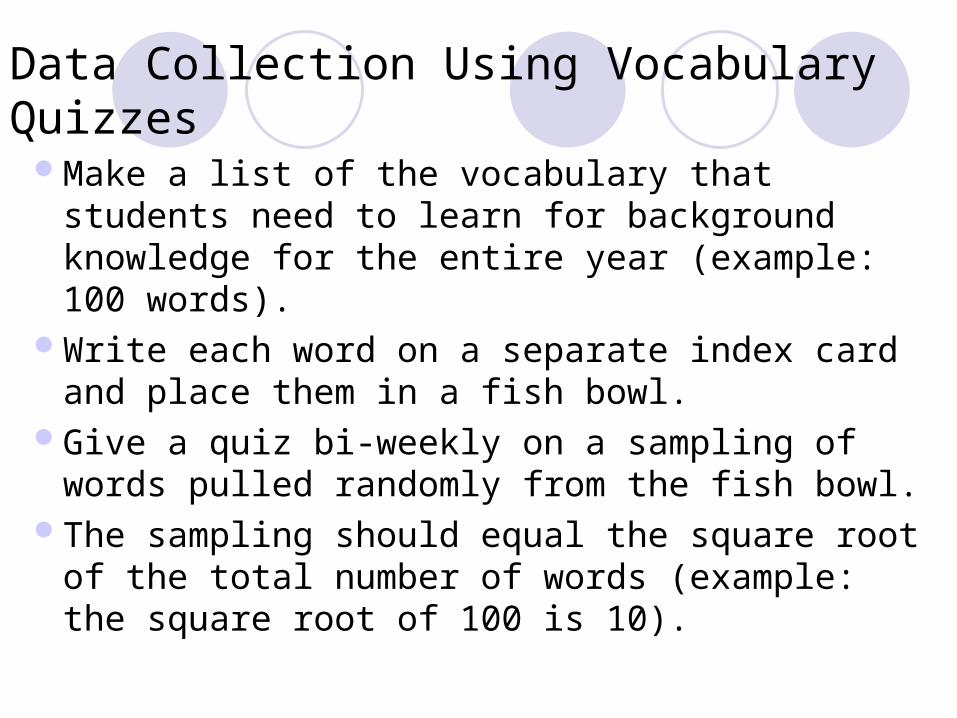
Data Collection Using Vocabulary Quizzes
Make a list of the vocabulary that students need to learn for background knowledge for the entire year (example: 100 words).
Write each word on a separate index card and place them in a fish bowl.
Give a quiz bi-weekly on a sampling of words pulled randomly from the fish bowl.
The sampling should equal the square root of the total number of words (example: the square root of 100 is 10).

Quiz
Give the quiz.Put the results in an Excel Spreadsheet.Create a bar graph (Histogram) to illustrate
your results.Share and discuss your results with the class.

Creating a Histogram Chart in Excel

Entering Data into Excel.
Open a new worksheet in Excel.
Enter your data.
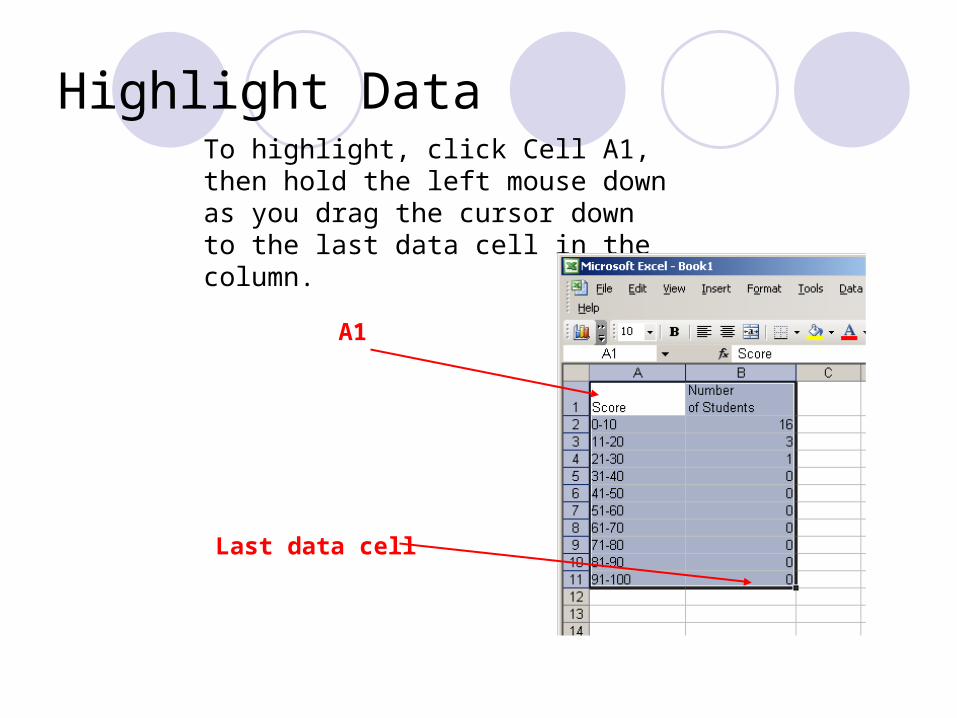
Highlight DataTo highlight, click Cell A1, then hold the left mouse down as you drag the cursor down to the last data cell in the column.
A1
Last data cell
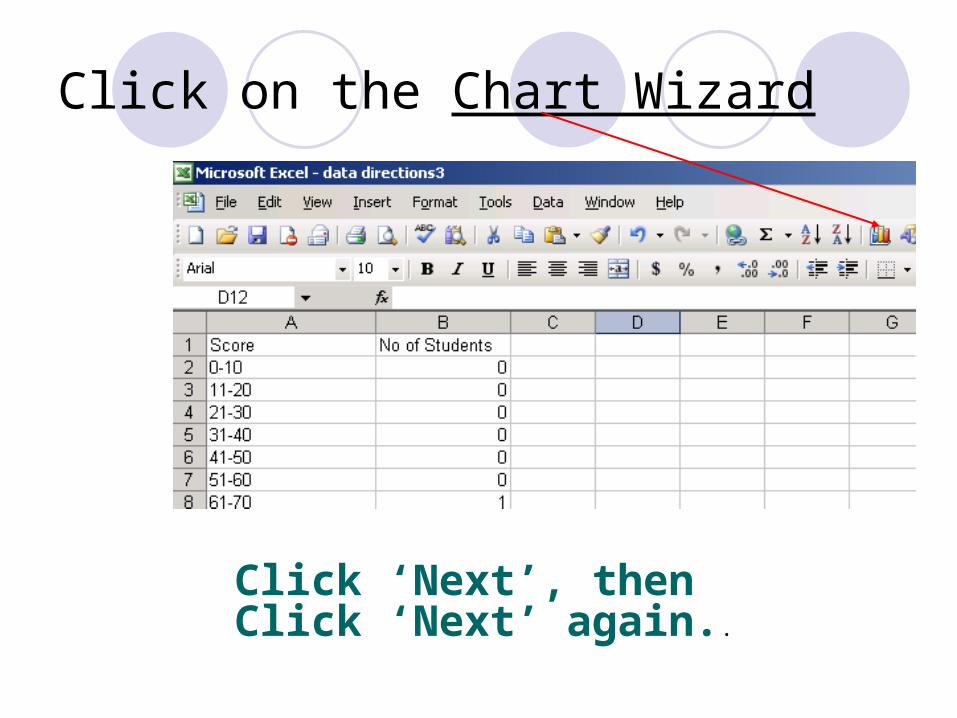
Click on the Chart Wizard
Click ‘Next’, then Click ‘Next’ again..
Click Next.
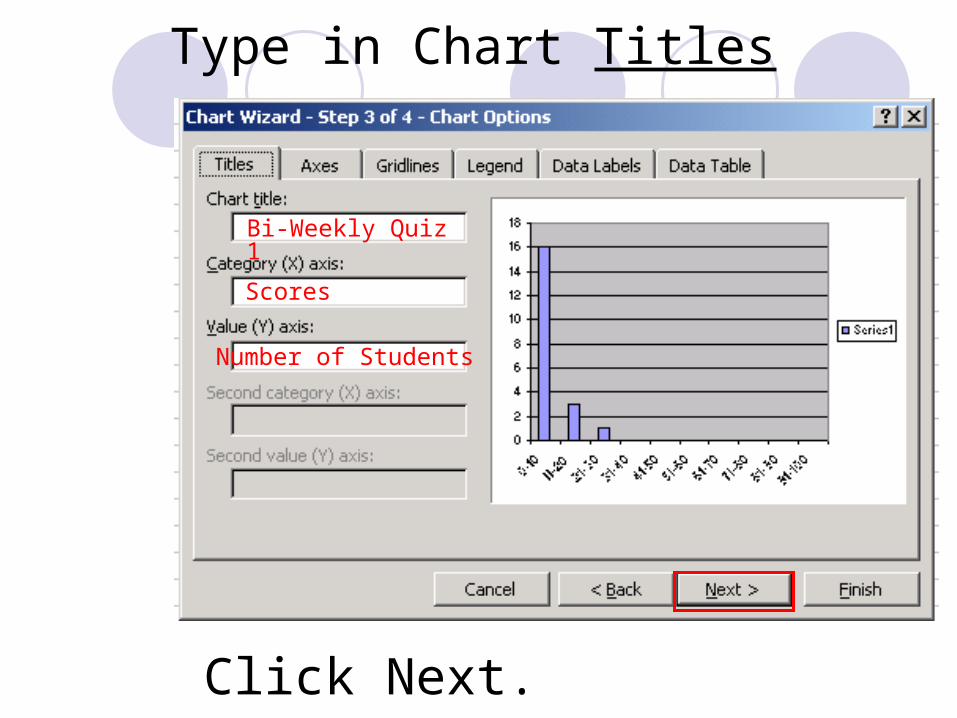
Bi-Weekly Quiz 1
Scores
Number of Students
Type in Chart Titles

Choosing your Chart Location:
If you choose the default As object in: it will place it one your spreadsheet.
If you choose As new sheet: it will save it as a separate sheet.
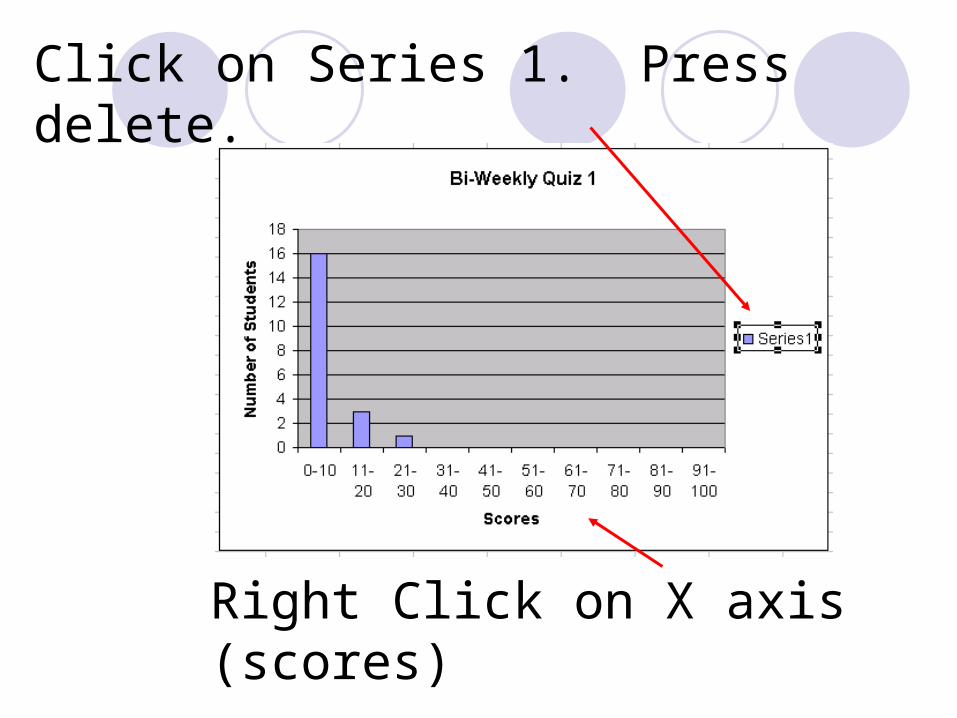
Right Click on X axis (scores)
Click on Series 1. Press delete.
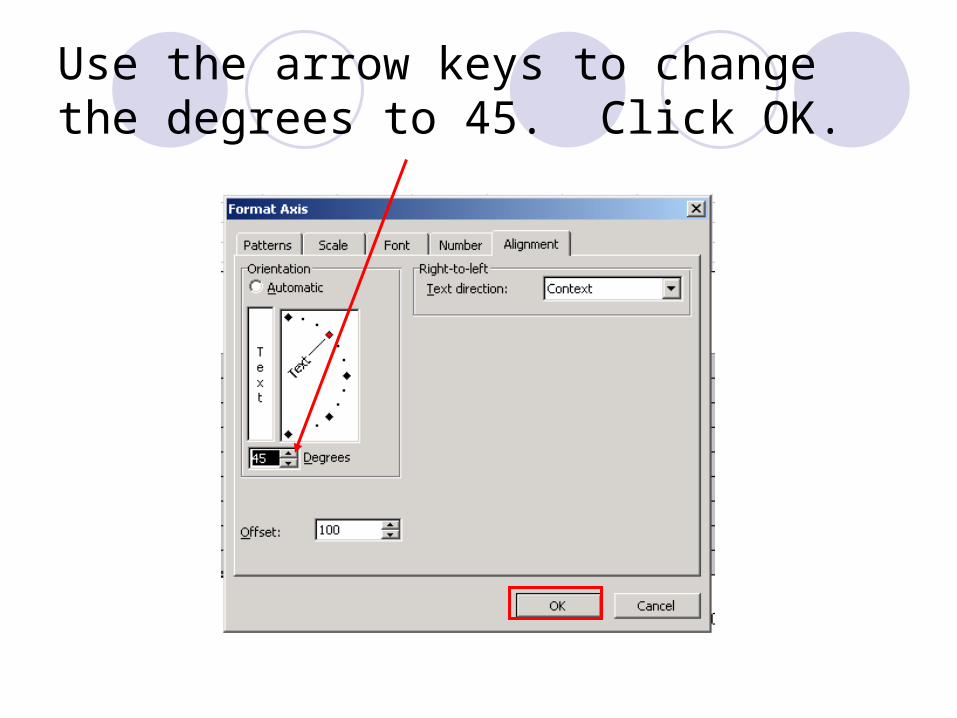
Use the arrow keys to change the degrees to 45. Click OK.
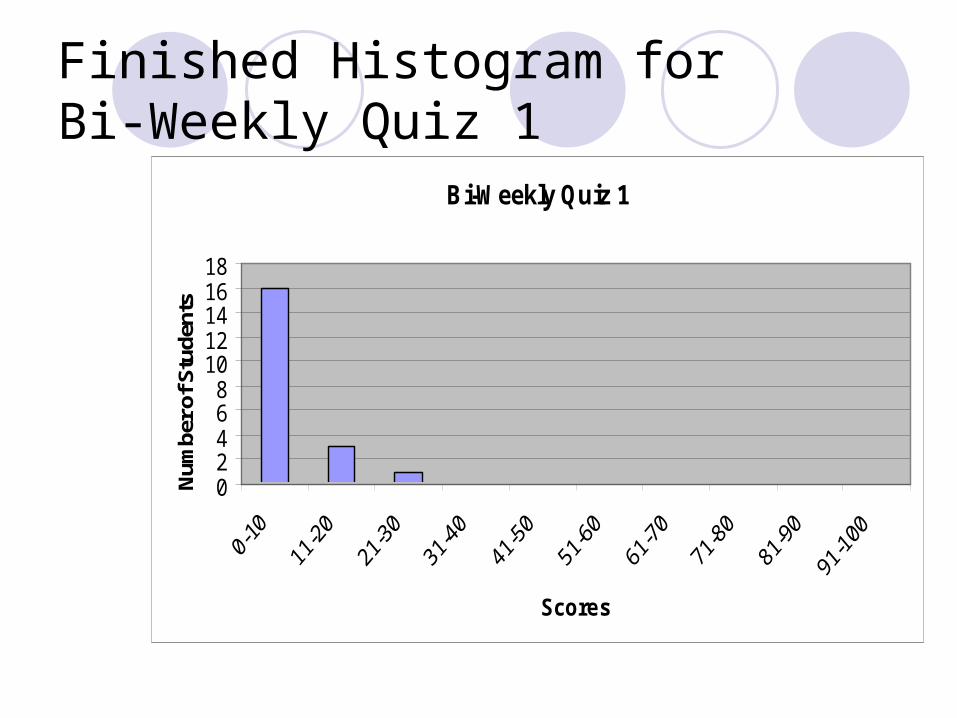
Finished Histogram for Bi-Weekly Quiz 1
Bi-Weekly Quiz 1
02468
1012141618
Scores
Num
ber o
f Stu
dent
s

Feedback
Ask students.. ”How can we improve our scores on our next quiz?”
Help the class to agree on a plan to improve.
Continue to give a quiz every other week throughout the school year.
Discuss the results of each quiz using the histogram.

Finished Histogram for Bi-Weekly Quiz 18

L ChartBi-Weekly Quiz 1
02468
1012141618
0-10
11-2
0
21-3
0
31-4
0
41-5
0
51-6
0
61-7
0
71-8
0
81-9
0
91-1
00
Scores
Nu
mb
er
of
Stu
de
nts
J Chart

Now choose one graph to try on your own:
Pareto ChartScatter Diagram
Radar Chart

Pareto Chart Data
FCAT Errors by subtest for one studentStrand Frequency of
ErrorsPercentage of
ErrorsCumulative Percentage
Geometry 7
Measurement 5
Algebra 5
Number Sense 4
Data Analysis 3
Total 24 100%
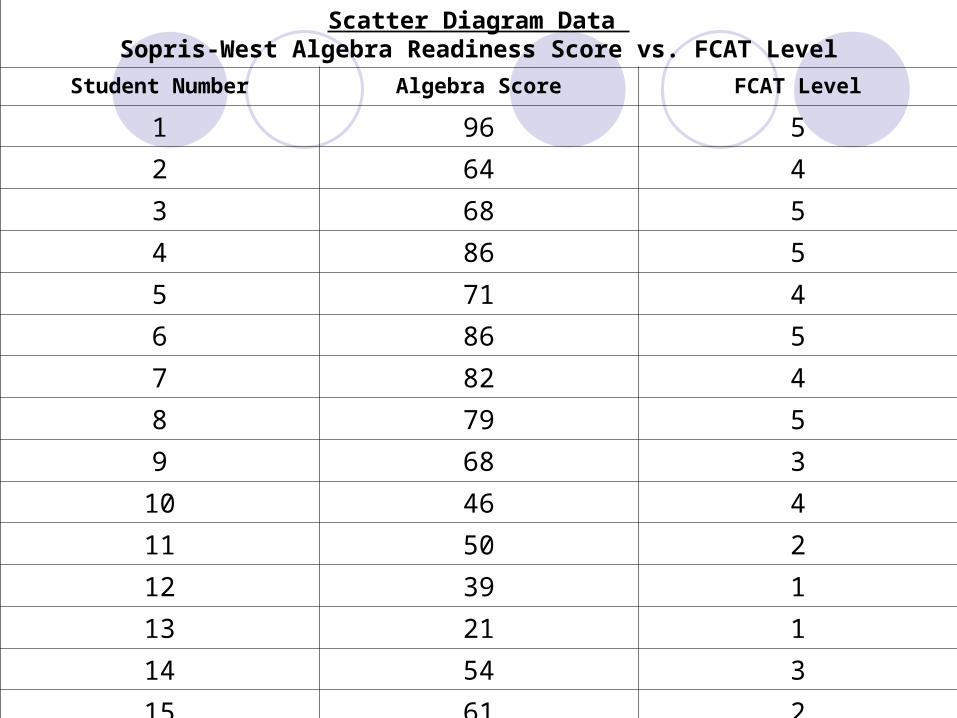
Scatter Diagram Data Sopris-West Algebra Readiness Score vs. FCAT Level
Student Number Algebra Score FCAT Level
1 96 5
2 64 4
3 68 5
4 86 5
5 71 4
6 86 5
7 82 4
8 79 5
9 68 3
10 46 4
11 50 2
12 39 1
13 21 1
14 54 3
15 61 2

Radar Chart Data
Related Documents