Excel as a Tool to Troubleshoot SIS Data for EMIS Reporting

Welcome message from author
This document is posted to help you gain knowledge. Please leave a comment to let me know what you think about it! Share it to your friends and learn new things together.
Transcript

Excel as a Tool to Troubleshoot SIS Data for
EMIS Reporting

Overview
• Basic Excel techniques can be used to analyze EMIS data from Student Information Systems (SISs), from the Data Collector and on ODE EMIS reports
• This session will demonstrate Excel functions and practical applications that can be helpful in all phases of the EMIS data review process
2

Outline
• Basic Excel Functions
• Text to Columns
• Filtering to Verify Attendance Patterns
• VLOOKUP to Add Names to a Report
• Conditional Formatting to Verify RIMP Code Reporting
3

Basic Excel Functions
• Wrap Text Header Row
• Freeze Top Row
• Expand All Columns
• Sort
• Filters
• Tabs in a Workbook
• Create a Workbook
4

Wrap Text Header Row
5
Select the header row by clicking on the number “1”
Then select “Wrap Text”

Freeze Top Row
6
Select the “View” Tab
Then select “Freeze Panes” And “Freeze Top Row”

Expand all Columns
7
Click on the triangle between Column A and Row 1 to select the entire spreadsheet
Place cursor between any two column headers and double click

Sort
8
From the “Data” tab choose “Sort”
Check “My Data has Headers”
Sort by “State Student ID”Sort on “Values” Order “A to Z”

Filters
9
From the “Data” tab choose “Filter”
Filters will be available to select in each column header

Filters, cont’d
10
Filters show all values in the selected column
Filters are an effective way to divide and conquer data by one or more filtered values at a time
In this filter example, only values of N and Y appear in this column

Tabs in a Workbook
11
Tabs are located at the bottom of the spreadsheet
Some EMIS reports contain multiple spreadsheets which make a workbook
Using tabs is an effective way to organize multiple spreadsheets of data such as reviewed copies of the same report

Create a Workbook
12
Open an existing spreadsheet or a new spreadsheet
Click on the plus symbol to add a new tab
To name a tab, right click on the tab and select “rename”
Cut and paste data into your workbook Ctrl A = Select AllCtrl C = Copy Ctrl V = Paste

Quick Check
• Can you use basic functions to set your spreadsheet up to be user friendly?
• Can you sort and filter to troubleshoot a spreadsheet of data?
• Can you use tabs and create a workbook?
Basic Excel functions can be used to check accuracy and completeness of EMIS data at any point during the EMIS data reporting process.
13

Text to Columns
14

Opening CSV files with Excel
• Sometimes when opening a CSV file the data is not separated into columns
• The data is “comma separated” and is all contained within Column A
• To separate the data into columns, use the Excel “Text to Columns” function
15

Text to Columns
Open “EXCEL_2_Text_to_Columns1.xls”
16
Select Column A

Text to Columns, cont’d
17
Select the “Data” tab and then Choose “Text to Columns”

Convert Text to Columns Wizard Step 1
18
Choose “Delimited” and “Next”
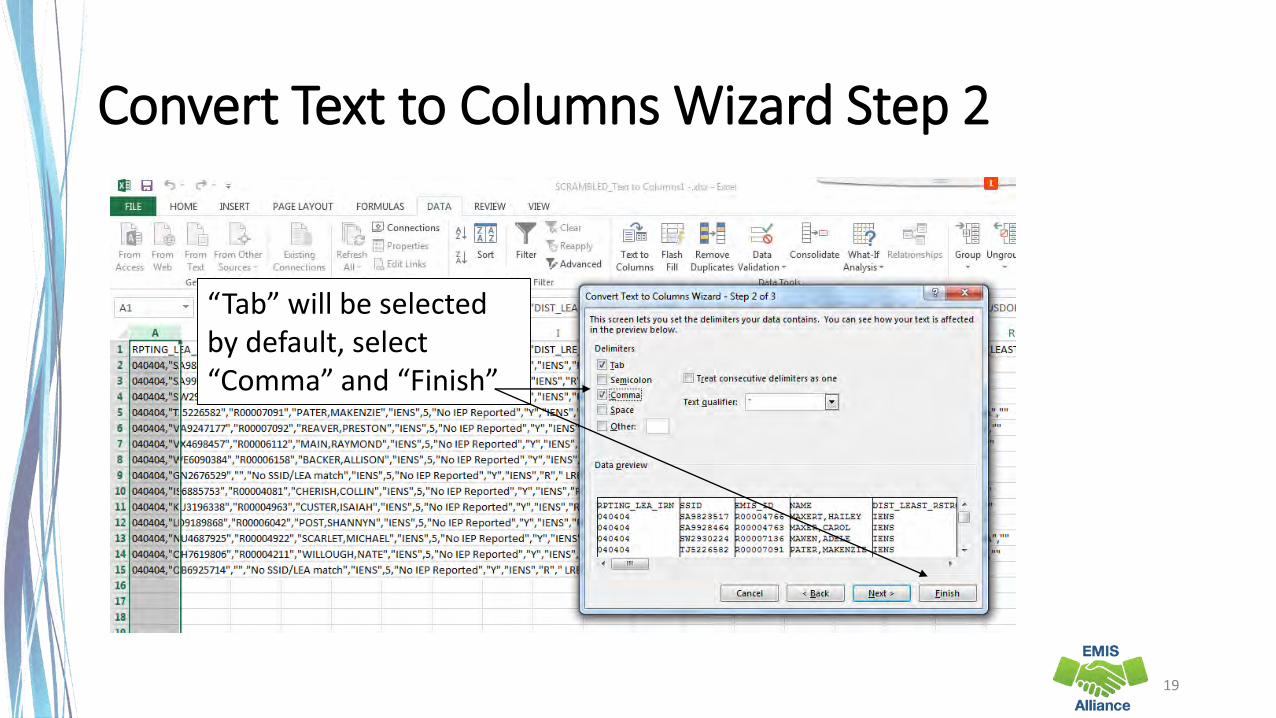
Convert Text to Columns Wizard Step 2
19
“Tab” will be selected by default, select “Comma” and “Finish”
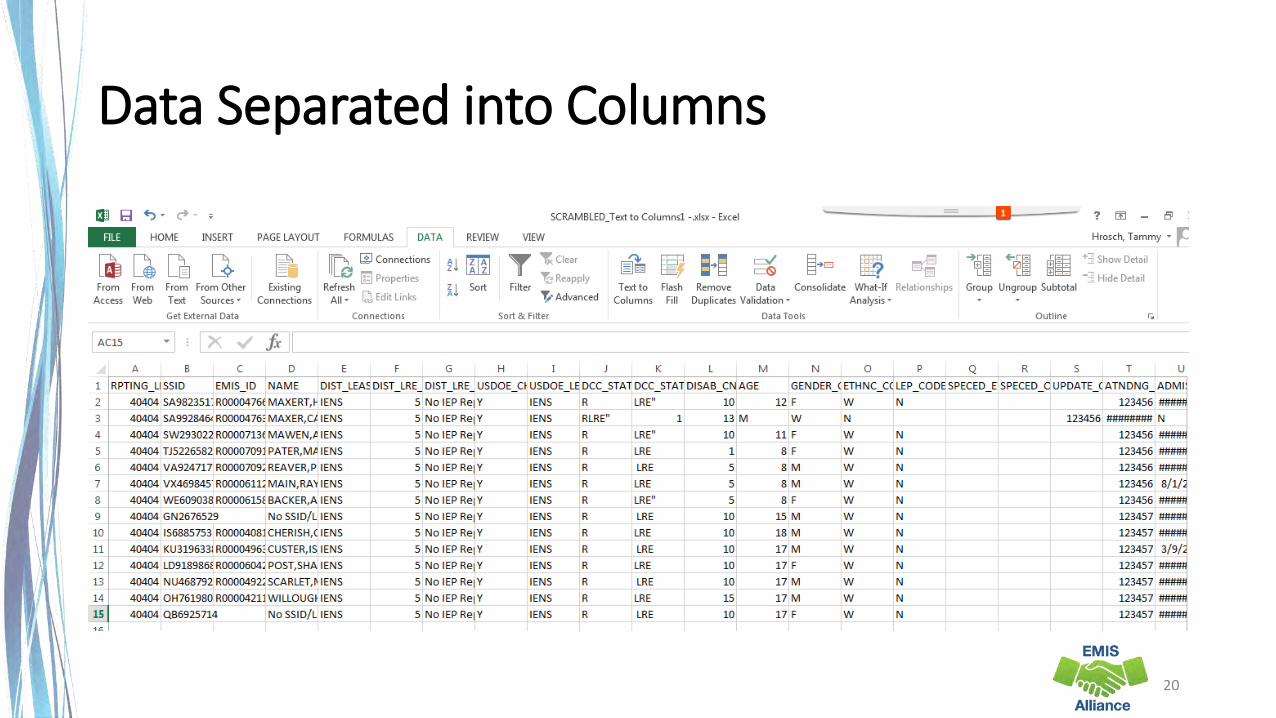
Data Separated into Columns
20
Quick Check • Can you use the Text to Columns feature to separate data into columns?
• Can you identify other situations when the Text to Columns Wizard might be helpful?
EMIS data is often in CSV (Comma-Separated Values) format and typically opens within Excel with the data separated into columns. Sometimes the data does not separate into columns automatically. Use “Text to Columns” to separate the data into columns.
21

Filtering to Verify Attendance Patterns
22
Filtering to Verify Attendance Patterns
The next set of slides will use filters to verify that calendar data makes sense with student attendance patterns• Students are reported with Attendance Patterns• EMIS Calendars contain Attendance Patterns• Use Excel to cross check the data
23

Attendance Patterns and Calendars
24
This is a scrambled query of SIS Data that includes student Percent of Time, Grade Levels, Attendance Patterns as well as Attending IRNs
Verify that the calendar collection contains the same combinations of Building IRN, Grade Level and Attendance Pattern
Filter Calendar Display Report
25
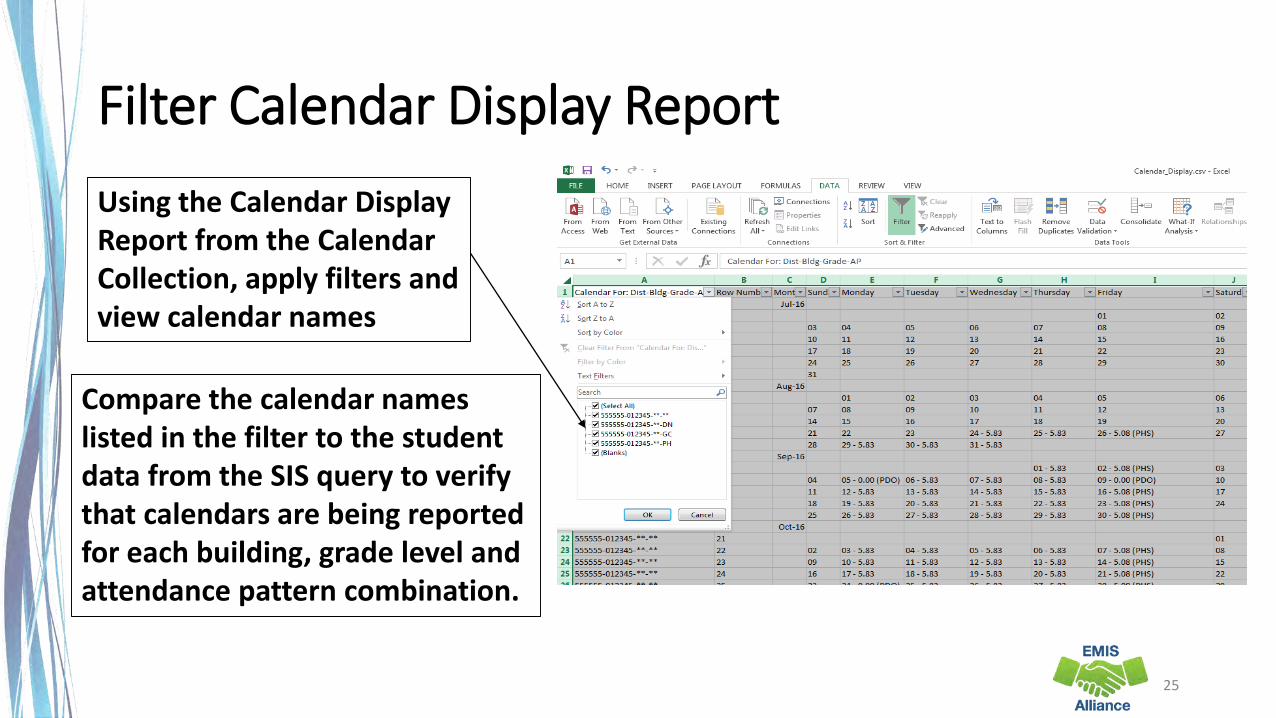
Using the Calendar Display Report from the Calendar Collection, apply filters and view calendar names
Compare the calendar names listed in the filter to the student data from the SIS query to verify that calendars are being reported for each building, grade level and attendance pattern combination.
Quick Check • Are you able to run a SIS query of calendar related student data?
• Are all student building, grade level and attendance pattern combinations appearing in the Calendar Display report?
• Are students on appropriate calendars?
Student Attendance Patterns are reported in Student (S) Collections, while Calendar data with matching Attendance Patterns are reported in Calendar (C) Collections. The data doesn’t meet until Level 2 FTE Reports are generated. Comparing the data could prevent issues when the FTE reports cannot determine a student’s calendar.
26

VLOOKUP to Add Student Names to a Report
27

VLOOKUP to Add Student Names to a Report
The next series of slides will demonstrate how to use the VLOOKUP function to add names to the Prep for Success report
• The FY16 Prep for Success report was loaded into the Files tab of the Data Collector and contained FY15 and FY16 Graduates (more specifically 2015 5Yr and 2016 4Yr graduates)
• In this demonstration we can use the Student Demographic (GI) Files from the FY15 and FY16 Graduate (G) Collections since they contain both SSIDs and Student Names
28

Files Needed for this Demonstration
• Log into the Data Collector and uncheck “Don’t show expired collections”
• At the “Data Set” filter choose “G” • click on “Review” for both Graduation Collection FY15 and Graduation
Collection FY16
• save the Student Demographic (GI) CSV files
• From the Files tab • select “Run Query”
• locate the most recent version of the Prep for Success Report 2016G_Prep_for_Success_Detail_20161031.xls
29

Open Demographic Files
30
EXCEL_5_2015G_Student_Demographic_(GI).xlsEXCEL_6_2016G_Student_Demographic

Copy Data from 2016G Demographic File
31
Highlight data from 2016G Demographic spreadsheet and click “Copy”

Paste Data into 2015G Demographic File
32
Select the cell below the last row of data on the 2016G Demographic spreadsheet in this example, Cell A17then select “Paste”
Sort Student Combined Demographic Spreadsheet by SSID
33
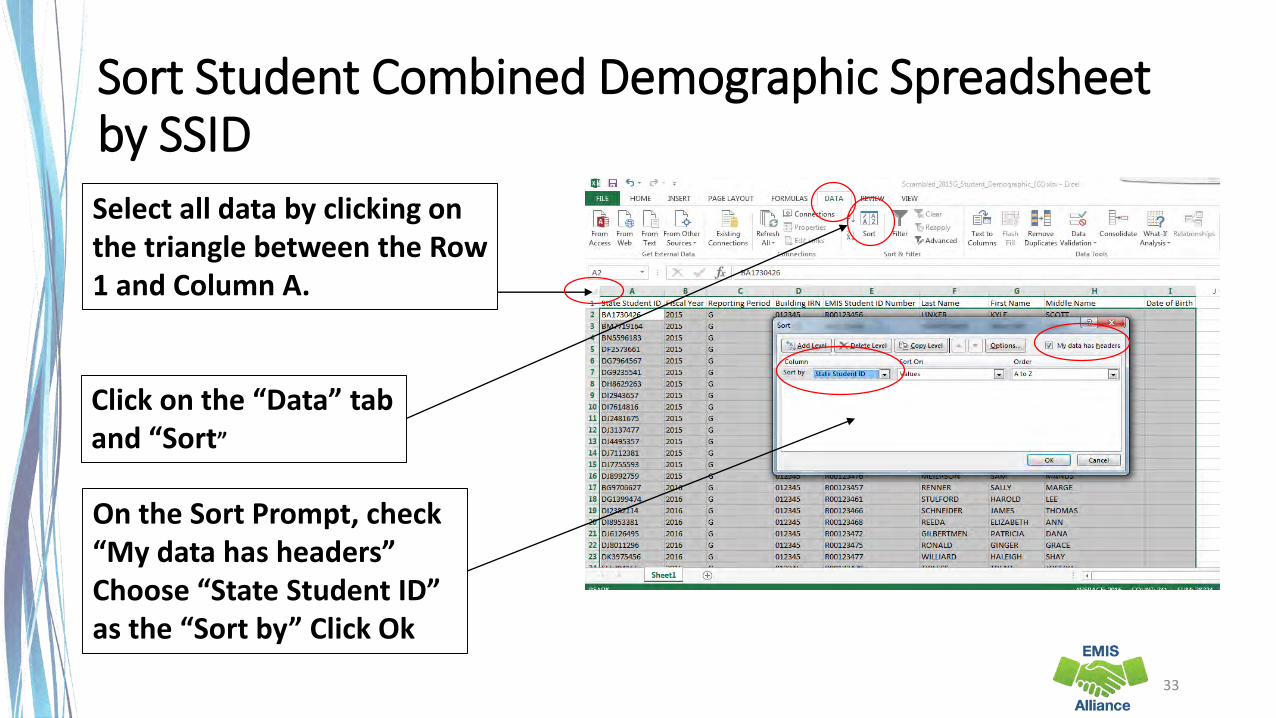
On the Sort Prompt, check “My data has headers”Choose “State Student ID” as the “Sort by” Click Ok
Select all data by clicking on the triangle between the Row 1 and Column A.
Click on the “Data” taband “Sort”
Open and Sort the Prep for Success Report
34
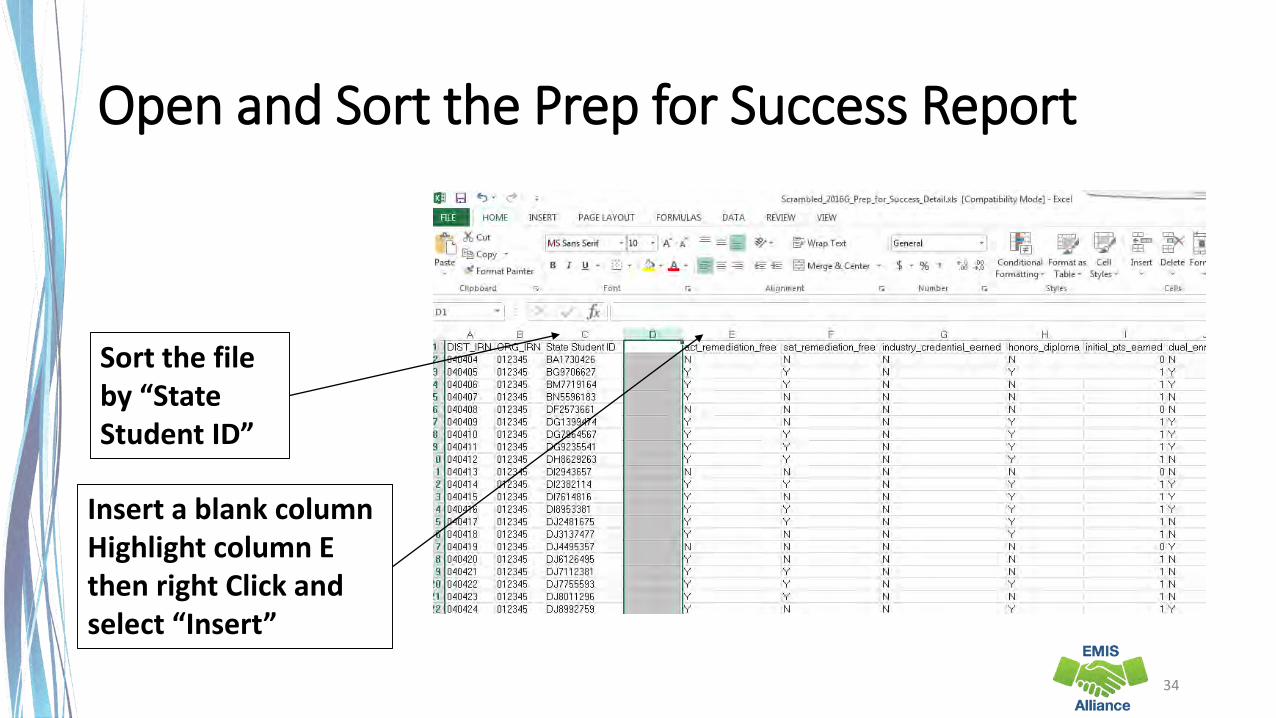
Insert a blank column Highlight column E then right Click and select “Insert”
Sort the file by “State Student ID”
Building a VLOOKUP Function
To build the VLOOKUP Function, we need
• The value to lookup (SSID from Prep for Success Report)
• The range of cells on the Demographic (GI) file to find the values
• The column number within the selected range that contains the value to return (from the Demographic (GI) file)
• Exact Match (FALSE)
35

VLOOKUP Step One
36
Select Cell D2 on the Prep for Success Report and type =VLOOKUP(
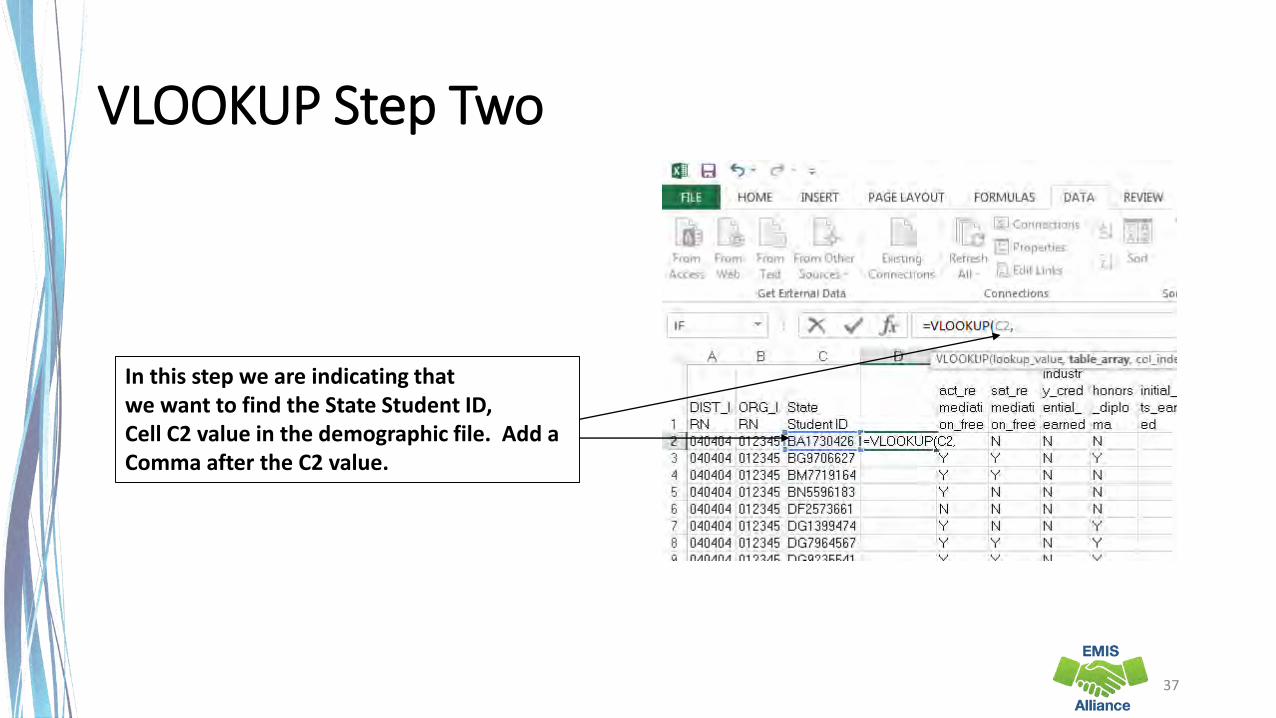
VLOOKUP Step Two
37
In this step we are indicating that we want to find the State Student ID, Cell C2 value in the demographic file. Add a Comma after the C2 value.

VLOOKUP Step Three
38
Place your cursor in cell A2 and drag over and down to select all values on the Demographic file.

VLOOKUP Step Four
39
See that the VLOOKUP values willautomatically appear in the formula bar on the Prep for Success report based on the value range selected from the demographic spreadsheet.
Enter a comma after the last valuein the formula.
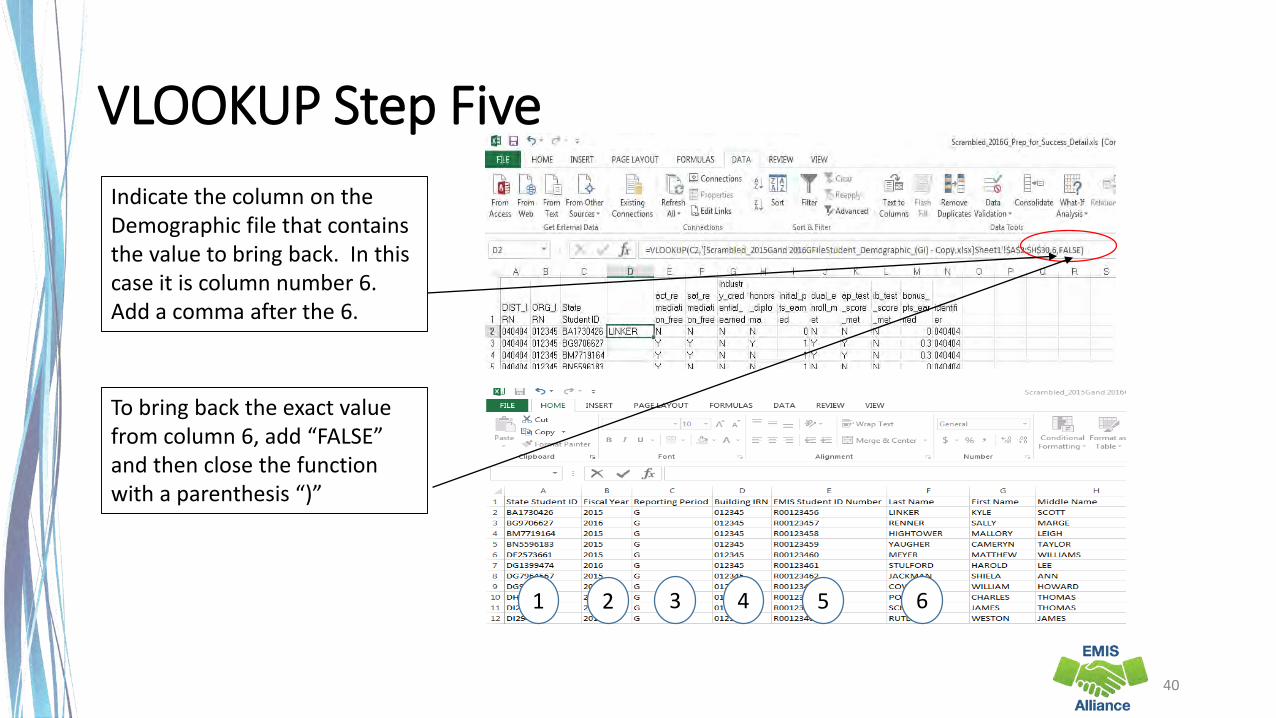
VLOOKUP Step Five
40
Indicate the column on the Demographic file that contains the value to bring back. In this case it is column number 6. Add a comma after the 6.
1 2 3 4 5 6
To bring back the exact value from column 6, add “FALSE” and then close the function with a parenthesis “)”

VLOOKUP Step Six
41
After pressing “Enter” the student’s last name appears in the search.
Click at the bottom right of the D2 cell and get a + symbol and then drag down to populate the same function into the cells below.
The same process can be done to bring in first and middle names into the Prep for Success report.

Quick Check
• Can you find a source file that contains the SSIDs and student names that are missing from your report?
• Are you able to write a VLOOKUP function to bring the names into the report?
• Can you think of other instances where the VLOOKUP could be used?
The VLOOKUP function in Excel can be used to bring data from one spreadsheet to another. When ODE EMIS reports are void of names, or missing a large number of names, the VLOOKUP can be used to add names to the report to aid in troubleshooting the report.
42

Conditional Formatting to Verify RIMP Code Reporting
43

Conditional Formatting to Verify RIMP Code Reporting
• The next series of slides will look at third grade students, Reading Diagnostic Values, and Reading Improvement and Monitoring Plans (RIMPs)
• Reference data reporting rules for the diagnostic values, which are in EMIS Manual Section 2.6 Student Attributes–No Date (FN) Record• ODE Home > Data > EMIS > Documentation > EMIS Manual
44

SIS Query
45
This is a sample SIS query (scrambled) of third grade students, disability conditions and Reading Diagnostic values
Sort or filter to identify students with a diagnostic value of “EX” anda disability condition and verify for accuracy
Sort or filter by diagnostic value of “NO” and verify that a RIMP code is being reported

List of Students Not on Track
46
Students who are not on track for the Third Grade Reading Diagnostic (NO) should be on a (RIMP)

Verify Not on Track Students are on RIMPs
47
Query the SIS or view the Student Program File (GQ) from the Data Collector current Student Collection
Use filters to identify all students on RIMP Codes 151500 and all 152XXX except 152330

Combine SSIDs from Spreadsheets
48
This screenshot shows both spreadsheets(Students Not on Track and Student Program GQ) and below is a new spreadsheet containing all SSIDs from both spreadsheets
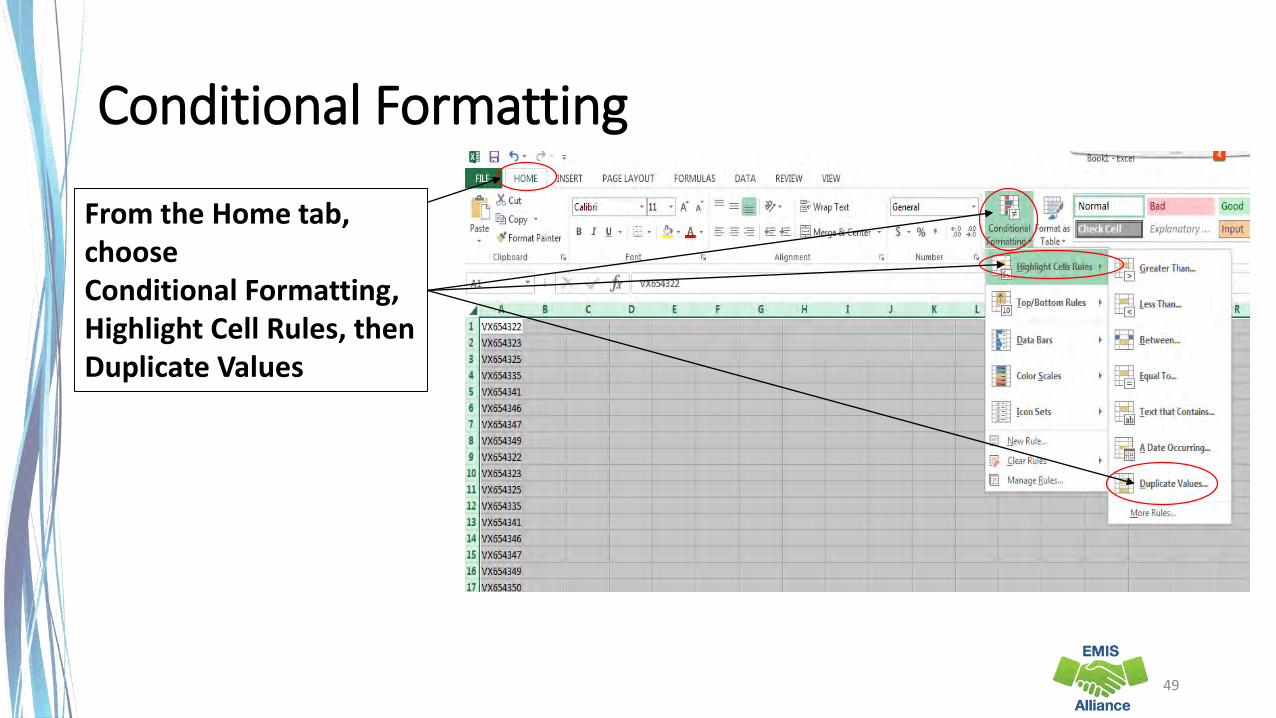
Conditional Formatting
49
From the Home tab, choose Conditional Formatting,Highlight Cell Rules, then Duplicate Values

Conditional Formatting, cont’d
50
In the Duplicate Values Prompt, leave the values as defaulted and click “OK”
This function highlighted SSIDs that were in both the “Not on Track” file and in the “RIMP Code” file. The two students who are not highlighted are Not on Track and do not have RIMP Codes reported

Quick Check • Have all RIMPs been entered into the SIS?
• Do you have students with Reading Diagnostic values of “NO” who are not on RIMPs?
• Can you think of other instances where the Conditional Formatting could be used?
Students with a Reading Diagnostic value of “NO - Not on Track” or with a Fall ELA score less than 700 must have RIMP (Reading Improvement and Monitoring Plan) program codes reported to EMIS. Districts who do not place students on required RIMPs will see a deduction in their Third Grade Reading Guarantee Local Report Card measure.
51

Summary
• Basic Excel techniques can be very useful • when troubleshooting EMIS data in the Student Information
System
• when troubleshooting EMIS reports
• when troubleshooting preview/review files
• These techniques should be part of your everyday practices
52

Resources
• Microsoft Excel Help within Excel “?” Articles and Videos
• Google it
• Microsoft Excel Classes
• Your ITC
53

54
Questions?
Related Documents


![[MODUL EXCEL 2007 - MAHIR] 2010 - · PDF file[MODUL EXCEL 2007 - MAHIR] Pilot Project EMIS-ICT Strengthening in Aceh 2010 USAID-DBE1: Management and Education Governance . ... 1 Maria](https://static.cupdf.com/doc/110x72/5a740e507f8b9aa3618b8238/modul-excel-2007-mahir-2010-modul-excel-2007-mahir-pilot-project.jpg)


