Appendix A

Welcome message from author
This document is posted to help you gain knowledge. Please leave a comment to let me know what you think about it! Share it to your friends and learn new things together.
Transcript

Appendix A
EXCEL ACADEMY
PUBLIC CHARTER SCHOOL
A PROPOSED CHARTER AMMENDMENT
MARCH 5, 2012
EXCEL ACADEMY
PUBLIC CHARTER SCHOOL
A PROPOSED CHARTER AMMENDMENT
March 5, 2012
EXCEL ACADEMY PUBLIC CHARTER SCHOOL
Table of Contents
Section Page
Executive Summary ii
Amendment Information Sheet v
Maximum Enrollment Table vii
A. Educational Plan 2
1. Mission and Purpose of Charter School 2
2. Charter School Curriculum 7
3. Student Performance 27
4. Support for Learning 30
B. Business Plan 37
1. Planning and Establishment 37
2. Governance and Management 42
3. Finance 44
4. Facilities 46
5. Recruiting and Marketing 46
C. Plan of Operations 49
1. Student Policies and Procedures 49
2. Human Resources Information 50
3. Arrangements for Meeting District and Federal Requirements 55
4. Implementation of the Charter 56
D. Public Charter School Accountability
E. Certifications
1. Certificate of Liability Insurance
2. Personal Property Insurance
3. Professional Liability Insurance
4. Workers Compensation Policy
5. Commercial General Liability
F. Budget
1. Two-Year Operating Budget
2. Cash Flow Projections
G. Appendix A: Forms
H. Board of Trustee By-Laws
I. Appendix B: Educational Plan
1. 2012-2013 Academic Year School Calendar
J. Appendix C: Governance and Management
K. Appendix D: Policies and Procedure form Selection Admission, Enrollment, Withdrawal,
Suspension, and Expulsion of Student
1. Code of Conduct from Personnel Policy Manual 2011-12
2. Discipline Policy from Student Family Handbook 2011-12
Excel Academy Public Charter School Amendment Application ii
Executive Summary
Mission Excel Academy Public Charter School will provide pre-school through eighth grade girls a solid academic
foundation and enrichment opportunities to prepare them to succeed in high school and college and to
develop the skills and confidence they need to make healthy, positive lifestyle choices.
Academic Need Educational achievement in the lower grades is one of the strongest indicators for high school graduation
rates, college attainment, and future lifetime earnings. In the District’s southeast quadrant, the situation is
especially dire with the highest concentration of children in poverty, the lowest performing schools, and
the largest number of students who are functioning basic and below basic in reading and math.
Innovative solutions are clearly needed.
Vision Excel Academy’s Board members and staff believe that with strong support and training, all students can
learn and achieve at high levels. Our selection of instructional materials, methods and school-wide
structures have been informed by the best practices of successful schools across the nation that serve
populations similar to those of the targeted student population in Ward 8.1 We are using early and
frequent assessments to gauge students’ progress and identify academic needs per cohort and per
individual student, and respond to the data such assessments provide with immediacy. We hire highly
qualified teachers and have ongoing professional development to create and maintain a community of
respect and collaboration with our staff and parents.2 We embrace students’ parents and guardians as
essential partners in their student’s education, and we reach out to families and the wider community to
support Excel Academy’s girls.
Educational Approach Research has concluded that single-sex schooling strongly supports “outcomes related to academic
achievement and more positive academic aspirations.”3 Research concerning the academic achievement
of girls suggests that in coeducational classrooms girls often defer to boys, are called on less frequently,
receive significantly less teacher attention, and are less likely to study mathematics and science. Evidence
suggests that attending single-sex schools improves many girls' academic performance and encourages
them to assume non-traditional career paths.
Since our founding day we have focused on: 1) providing a rigorous educational program for girls starting
in Preschool; 2) ensuring that students acquire the knowledge and skills that lead to success in high
school, college, and life; and 3) developing the personal characteristics in students that will serve them
throughout their lives. Our results have been significant. Our re-enrollment rate has remained higher than
90%, and our scholars show academic progress that far exceeds that of students in the peer schools in our
neighborhood. For instance, at the beginning of the 2010-2011 school year, 37% of Preschool scholars
were at or above age-equivalency according to the Brigance assessment. By the end of the school year
1 The core beliefs of Excel Academy are influenced by the best practices of North Star Academy and KIPP Team in Newark,
New Jersey; Elm City Prep and Amistad Academy of New Haven, Connecticut; and Roxbury Prep and Boston Collegiate in
Boston, Massachusetts. These schools serve student populations that are among the poorest in their states, yet demonstrate
consistent and statistically significant academic progress, as measured over time by their state assessment. 2 We have used the term parent throughout this application, but our children may be parented by guardians – by grandparents,
aunts and uncles, other family members or individuals who have become their caretakers and legal guardians. We thank all
guardians for their care for children and include them whenever we use the term parent. 3 Mael, Fred, Alex Alonso, Doug Gibson, Kelly Rogers, and Mark Smith. Single-Sex Versus Coeducation Schooling: A
Systematic Review. ED Publications, Jessup, MD. September, 2005.
Excel Academy Public Charter School Amendment Application iii
94% of our Preschool scholars were at or above age-equivalency. At the other end of our age-range, our
Second Grade scholars finished the year averaging three months ahead of pace in reading. In other words,
these scholars were reading as if they already completed the first three months of third grade.
In the 2011-2012 school year, Excel is serving 401 students in Preschool through the Third Grade. Next
school year, we will have grown to our full elementary school grade offering and size. Excel’s Middle
School, which will serve scholars in grades Fifth through Eighth, will open in 2013. We will use the
2012-2013 school year to plan for, equip, staff, and prepare for the opening of our Middle School.
Excel Academy has transitioned to the Common Core Standards as adopted by the District of Columbia
in June 2011. We believe that the Common Core Standards are well-aligned to our mission of academic
achievement and will ensure college and career readiness for our students. We will supplement the
Common Core Standards with DC Standards in science, social studies, art, music, health, and physical
education.
While we have implemented curricula, been proven successful by results, Excel is committed to looking
forward by critically assessing our curriculum and teaching methods. With the experience of the last four
years in mind, we have strengthened aspects of the curriculum that have proven successful while
remaining critical of those aspects that did not perform to the standard that Excel requires. We believe
that this process has allowed us to create an exceptional program that provides the solid academic
foundation that is essential for our scholars.
Instructional Philosophy and Focus
Excel Academy was founded on the belief that education can combat poverty, and that all children
deserve access to a high quality education, regardless of where they live or their gender. Following
extensive reviews of educational research, we believe that a high quality, single sex school for girls will
facilitate academic and personal development. Given the proper support, all children can develop a love
of learning and meet high academic and personal standards.
Excel’s focus on girls is based on a body of research that includes that of Dr. Rosemary C. Salomone
who writes in Same, Different, Equal: Rethinking Single-Sex Schooling: “…all-girls settings provide a
certain comfort level that helps girls develop greater self-confidence and broader interests, especially as
they approach adolescence.” She further indicates that single-sex schools and classes promote less-
gender-polarized attitudes toward certain subjects – math and science in the case of girls. 4
Many economically advantaged families have recognized the benefits of single sex schooling and have
exercised the option by sending their children to private girls or boys’ schools. This option has not existed
at the elementary level in the traditional public or public charter schools in the District of Columbia until
we began our school. Given the clear, well-documented benefits to girls of studying in a single-sex
environment.5 Excel is working to make high quality single-sex education available to young girls and
their families
4 Salomone, Rosemary C., Same, Different, Equal: Rethinking Single Sex Schooling, New Haven: Yale U, 2003. . 5 Karen Stabiner, All Girls, Single Sex Education and Why It Matters, Riverhead Books, New York, New York, 2002
Excel Academy Public Charter School Amendment Application vii
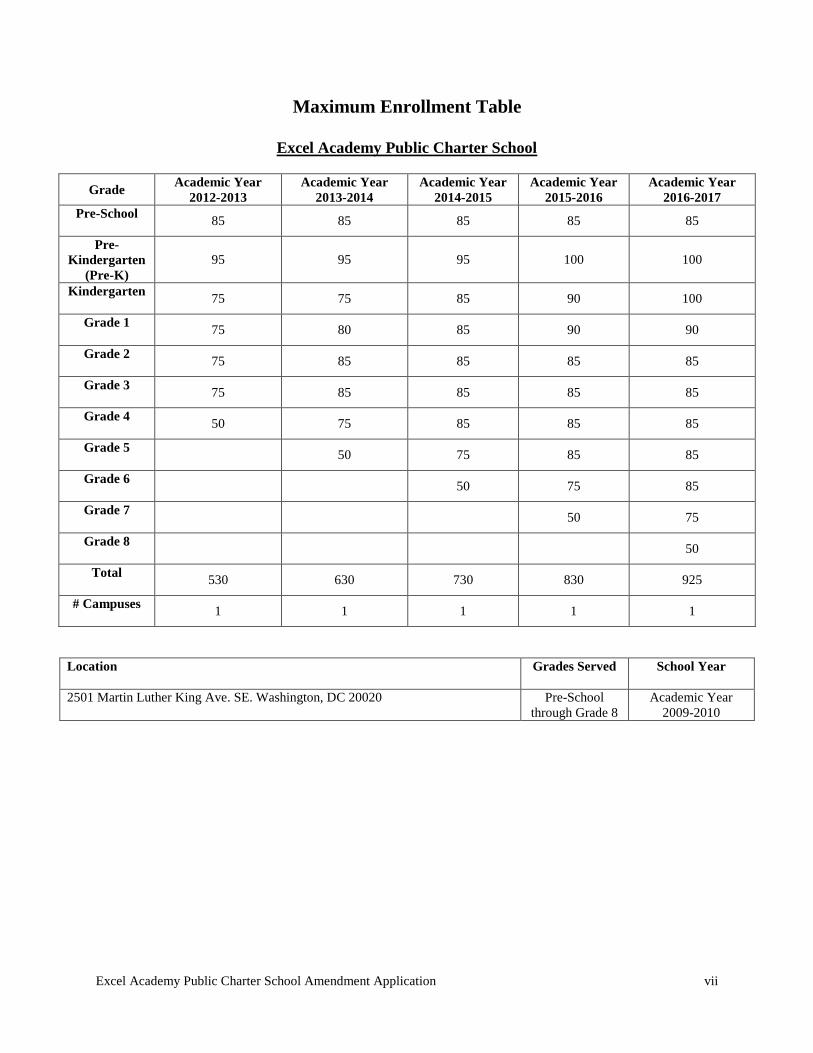
Maximum Enrollment Table
Excel Academy Public Charter School
Grade Academic Year
2012-2013
Academic Year
2013-2014
Academic Year
2014-2015
Academic Year
2015-2016
Academic Year
2016-2017
Pre-School
85 85 85 85 85
Pre-
Kindergarten
(Pre-K)
95 95 95 100 100
Kindergarten
75 75 85 90 100
Grade 1
75 80 85 90 90
Grade 2
75 85 85 85 85
Grade 3
75 85 85 85 85
Grade 4
50 75 85 85 85
Grade 5
50 75 85 85
Grade 6
50 75 85
Grade 7
50 75
Grade 8
50
Total
530 630 730 830 925
# Campuses
1 1 1 1 1
Location
Grades Served School Year
2501 Martin Luther King Ave. SE. Washington, DC 20020 Pre-School
through Grade 8
Academic Year
2009-2010

Excel Academy Public Charter School Amendment Application 2
A. Education Plan
1. Mission and Purposes of the Public Charter School
a. Educational Needs of the Target Student Population
When Excel Academy was founded 32% of children in Washington, DC lived in poverty.
6 Six years later
that number is at 29% but the major risks and obstacles to academic achievement for these children
remains the same.7
Excel’s founding group targeted the Ward 8 community it was because of the concentration of families
living in poverty. It is here, in southeast, that public schools remain lowest in academic achievement and
students constantly under-perform in comparison with those in other DC public schools.
With little change, Ward 8 still retains the highest poverty rate in the metropolitan area. Teen mothers
account for 20% of the births and single mothers head more than 74% of families. The unemployment
rate is at 17% and 21% of the population lacks a high school diploma. It is here that 48% of children live
in poverty.8 This remains the highest in both the District of Columbia and the greater metropolitan region.
In the first six years of testing aligned to the standards and assessment using the DC CAS, test results
have indicated that 50 % or more of students in local elementary schools have remained at basic or below
basic in reading and math.
Public schools in Ward 8 have the highest number of students scoring below basic and basic on the DC
CAS annual assessment and the largest number of schools not meeting Adequate Yearly Progress (AYP)
benchmarks under No Child Left Behind (NCLB) in the District. The scores reflect this and in the spring
of 2009 only 33% of students test at required standards in reading and only 32% in math. When compared
with Ward 3, the highest performing Ward, the difference in average test scores was 47 percentage points
in reading and 45 percentage points in math.
These scores continue to improve across the city and Ward 8 has made particular improvements but the
“variation across the wards reflecting the fact that high-performing schools are not distributed evenly
across the city.”9 Areas with the largest school-age population have relatively few high performing
schools and this “presents unique challenges to ensuring that every child has access to a quality
education.”10
Generally, once students fall behind academically, that is where they remain. The pattern of educational
failure points to a need for an intervention strategy that will lead to academic success for students. To
address this need, our purposes are ambitious but attainable. Excel Academy Public Charter School has
found success in meeting the educational needs of pre-school through third grade girls in the District of
Columbia through a challenging academic program with a vital character development component
delivered in a safe and structured single-sex learning environment.
6 2005 Kids Count Data Sheet, Annie E. Casey Foundation. 7 2011 Kids Count Data Sheet, Annie E. Casey Foundation. 8 Neighborhood Info DC: Neighborhood Profiles - www.neighborhoodinfodc.org/wards/nbr_prof_wrd8.html 9 State of Washington, D.C.’s Neighborhoods 2010, The Government of the District of Columbia, pg.65 10 Ibid, pg. 66
Excel Academy Public Charter School Amendment Application 3
b. Mission and Philosophy
Mission
Excel Academy Public Charter School provides pre-school through eighth grade girls a solid academic
foundation and enrichment opportunities to prepare them to succeed in high school and college and to
develop skills and confidence they need to make healthy, positive lifestyle choices.
Philosophy
Excel Academy was founded on the belief that education can combat poverty and that all children deserve
access to high quality education.
Two primary factors informed the decision to begin with a strong early childhood program serving
preschool to 3rd grade girls. The factors are shaped by community-specific factors: low academic
achievement and poverty. There is overwhelming evidence indicating the long term positive effects of
early academic intervention for children, especially children living in poverty, and their future academic
success. The Early Childhood Longitudinal Study specifically addressed the educational implications for
children when the family’s poverty status, race, and school type are reviewed. Developing and applying
early literacy and numeracy skills in a highly structured setting in the preschool through 3rd grade years is
a critical component of our academic program to ensure high levels of proficiency in core subjects:
reading, language, writing, mathematics, science, and social studies.
To meet the educational needs of families raising girls in Ward 8, Excel Academy provides:
A single-sex environment rooted in high academic achievement and learning for every student
that permits staff to focus instructional strategies on the learning needs and styles of girls;
An early education intervention model that offers preschool for three-year-olds to promote school
readiness at kindergarten, with small-group learning;
A standards–based curricula with demonstrated mastery of skill and knowledge as primary tenets;
A practice of using data from internal and external assessments to drive decisions;
An outstanding school staff and faculty focused on Excel’s mission and students;
A rich program of extracurricular endeavors, including a female mentoring program;
The use of books and resources that do not promote negative or damaging gender-stereotypes;
The use of support services to respond to academic and personal needs (i.e. mentoring, tutoring);
An extended day and extended school year; and
A non-academic training program that compliments the academic program and promotes
respectful behavior and accountability to the school’s Code of Conduct.
With a strong academic foundation and essential life skills, Excel Academy’s students will build a solid
foundation which can lead to independent, self-supporting lives.
Through our college preparatory mission starting in the youngest grades, we will build relationships with
families that culminate with our high school placement counselor working with students and their
families in the 7th grade to identify opportunities for placement at high performing senior high schools.
Our mission will be fully realized when in the 8th grade students and a family member(s) visit boarding
schools, local private and parochial schools and high performing charter or traditional public schools. We
anticipate that privately raised funds will offset testing, related application costs and provide other
resources essential to ensuring a student’s continued success in high school: uniforms, books, tutoring and
counseling. We plan to work with private sector foundations to offset the costs of providing long-term
support for students: college visits, college applications and testing, visits home if away at a boarding
school, and other types of support to ensure college graduation within five years of high school
graduation.
Excel Academy Public Charter School Amendment Application 4
c. Educational Focus
Excel Academy will provide students with the knowledge, skills, and confidence they need to succeed in
school and in life. To prepare our students, Excel Academy will provide staff with the tools, training and
curriculum to educate girls with cognitive delays, gifted and talented children and students who do not
speak English.
In the first year of operation, Excel served 3, 4, and 5 year old girls in preschool, pre-kindergarten and
kindergarten. Students progressed based on mastery of the curriculum and progress was measured
continuously using standardized assessments, rubrics and curriculum checklists. Students were grouped
and regrouped as they progress through the curriculum.
Developing and applying early literacy and numeracy skills in a highly structured setting in the preschool
through 3rd
grade years is a critical component of our academic program to ensure strong foundational
skills in the core subjects: reading, language, writing, mathematics, science and social studies.
Excel Academy developed a comprehensive approach to embedding language and literacy into every part
of the school day to extend and deepen a student’s learning over the course of a unit, and across units. Our
focus on language development and a later focus on literacy development are driven from the differences
in language skills among children based on family income. Simply in words heard, the average child on
welfare has half as much experience per hour (616 words per hour) as the average working-class child
(1,251 words per hour) and less than one-third that of the average child in a professional family (2,153
words per hour). These relative differences in amount of experience are durable over the more than two
years of observations and provide the best basis for estimating children’s actual life experience.
Observational data of a 100-hour week (given a 14-hour waking day) indicates the average child in the
professional families is provided with 215,000 words of language experience, the average child in a
working-class family 125,000 words, and the average child in a welfare family 62,000 words of language
experience. In a 5,200-hour year, the results are 11.2 million words or language experiences for a child in
a professional family, 6.5 million words for a child in a working-class family, and 3.2 million words for a
child in a welfare family. In four years of such experience, an average child in a professional family
accumulates experience with almost 45 million words, an average child in a working-class family would
have accumulated experience with 26 million words, and an average child in a welfare family would have
accumulated experience with 13 million words. Therefore, by age four (4), the average child in a welfare
family might have 13 million fewer words of cumulative experience than the average child in a working-
class family.
Children’s language experiences also differed in the number and quality of words heard and in hourly
experience with parent affirmatives (encouraging words) and prohibitions. The average child in a
professional family was accumulating 32 affirmatives and five prohibitions per hour, a ratio of six (6)
encouragements to one (1) discouragement. The average child in a working-class family was
accumulating 12 affirmatives and seven (7) prohibitions per hour, a ratio of two (2) encouragements to
one (1) discouragement. The average child in a welfare family, though, was accumulating five
affirmatives and 11 prohibitions per hour, a ratio of 1 encouragement to 2 discouragements. In a 5,200-
hour year, that would be 166,000 encouragements to 26,000 discouragements in a professional family,
62,000 encouragements to 36,000 discouragements in a working-class family, and 26,000
encouragements to 57,000 discouragements in a welfare family.
Extrapolated to the first four years of life, the average child in a professional family would accumulate
560,000 more instances of encouraging feedback than discouraging feedback, and an average child in a
working-class family would accumulate 100,000 more encouragements than discouragements. An
Excel Academy Public Charter School Amendment Application 5
average child in a welfare family would accumulate 125,000 more instances of prohibitions than
encouragements. 11
Excel Academy structured a longer school day to allow for extended periods of reading and writing
instruction. The school day is 1.5 hours longer than that provided in a traditional public school. To
address the longer school day for very young children, the youngest children will have quiet time and a
reading block after lunch. We plan a 192 day school year to allow teachers the flexibility to teach subjects
in a more comprehensive manner and address the academic needs of each student.
Excel Academy uses a comprehensive and integrative curriculum model that focuses on children’s
developmental progress and mastery of content knowledge and skills. We use the Core Knowledge
Preschool-8th Grade Scope and Sequence to ensure that our scholars have coherent, cumulative, content-
specific educational sequence that responds to the demands of the Common Core Standards. In the early
childhood program, we will also use Jolly Phonics (phonics and decoding skills).
In addition to anchoring the PS-8th-grade program in the Core Knowledge Scope and Sequence, the
elementary program, grades K-5, will also use the following research-based curricula: Core Knowledge
Listening & Learning Language Arts Program (listening comprehension); SRA Reading Mastery
Signature Edition for reading/English language arts conventions (decoding skills); Readers Workshop;
Writers Workshop; the computer-based istation Reading; Saxon Math for mathematical content standards
(skills); and Singapore Math for mathematical practice standards (concepts). All of these curricula have
produced exceptional results in urban schools and meet or exceed the District standards. In the area of
early literacy – a key focus of No Child Left Behind legislation – SRA Reading Mastery Signature
Edition, Jolly Phonics, and Core Knowledge Listening & Learning Language Arts all directly teach the
five elements outlined by the federal government: phonemic awareness, phonics, vocabulary, fluency, and
comprehension. Jolly Phonics and Reading Mastery in particular stress the direct teaching of sound-
symbol relationships.
In order to achieve success in a competitive world, and to serve as the next generation of leaders in their
communities, Excel Academy has integrated a rigorous academic program with a character education
component and enrichment activities including the arts, nutrition and physical education in an extended
day and extended year model. Our school is strengthened by a comprehensive, faculty created character
education program based on culturally responsive practices and the IDEALS values: integrity, discipline,
enjoyment, achievement, leadership, sisterhood. We found that the emphasis and explicit teaching of
these values foster a positive environment where good choices, personal responsibility, and excellence are
the expectation.
Research indicates that character education can lead to improved academic achievement along with other
benefits.12
The American Psychological Association reports in one well-researched school-based
program, children learned to generate a variety of solutions to interpersonal problems, considering the
consequences of these solutions and recognizing thoughts, feelings, and motives that generate problem
situations. Outcomes include significantly improved academic performance for those in kindergarten and
first grade, better problem solving, more positive pro-social behavior and decreased high-risk behaviors at
home and school.13
In a second example, schools introduced a classroom program for all children that
included social skills training, academic tutoring, parent training, and home visiting for target children.
High-risk children throughout school districts were identified in kindergarten and followed through
11 Hart,Betty and Todd Risley; “The Early Catastrophe: The 30 Million Word Gap by Age 3,” American Educator, Spring 2003. 12 The Ethics Resource Center. http://www.ethics.org
13 Aberson, B., & Shure, M. B. (2002). “Problem solving training as a form of crisis prevention.” In S.E. Brock and P.J. Lazurus
(Eds.), Best practices in crisis prevention and intervention in the schools. Bethesda, MD: National Association of School
Psychologists.
Excel Academy Public Charter School Amendment Application 6
elementary school. Outcomes included decreased special education use, improved academic skills, and
greater parent involvement in school, more positive peer interactions, and fewer conduct problems.14
d. Goals
In order to develop successful students prepared to attend, succeed in and graduate from high school and
college, Excel Academy holds all stakeholders of our school community accountable: staff, faculty,
students, family, and other supporters.
To succeed we have identified thirteen goals in three key categories: Academic Performance,
Nonacademic Performance, and Organizational Performance. Excel Academy’s goals are listed below.
Academic Goals
Pre-school and Pre-kindergarten students are school ready in the language arts.
Pre-school and Pre-kindergarten students are school ready in mathematics.
Students at each grade level will meet or exceed standards for reading and writing: students will be able to
articulate what they read and hear and express their ideas orally and in writing.
Students at each grade level will be able to use numerical, geometric and probability concepts to solve
challenging problems and will meet or exceed standards for math.
Students at each grade level will meet or exceed the standards for civics and social studies and use grade-
appropriate concepts of geography, time, community, and other elements to describe their own and other
civilizations and engage in positive civic behavior.
Students at each grade level will demonstrate science proficiency by meeting or exceeding the grade-
specific standards for science, describing and dissecting the elements of the natural world around them,
and taking concrete action toward a healthy self and community.
Nonacademic Goals
Students learn the IDEALS values (integrity, discipline, enjoyment, achievement, leadership, sisterhood.)
Students will participate in regular physical activity, learn to make healthy food choices, practice personal
hygiene, and dress appropriately.
Students will learn to become comfortable in a variety of settings through monthly field trips: museums,
plays, concerts, and visits to other schools.
Organizational Goals
Parents and families will play active roles in their daughters’ education.
The Board will be an active and responsible governing body, ensuring that the school works toward
achieving its mission, that business operations are well managed, and that necessary resources are
available to operate the school.
The school will recruit and retain students to maintain enrollment projections.
Excel will demonstrate effective systems of home-school communication.
For more details, please see Section D: Public Charter School Accountability Plan. The Accountability
Plan serves as the primary tool to evaluate progress toward goal achievement and mission
accomplishment. Excel Academy will use a data driven model to evaluate student and teacher
performances. The need for modifying instruction will be based on analysis of the data provided by a
number of assessment tools, and action plans to support student learning will be implemented
immediately. The Principal and the Data Analyst review data assessment weekly to identify students
whose performances indicate the need for additional instructional support, teachers who may need
14 Ibid.
Excel Academy Public Charter School Amendment Application 7
classroom support in selected areas and strategic topics for professional development. During the two
week school orientation and continuing professional development institutes throughout the year, teachers
will review, analyze and evaluate student assessment data. The Principal and the Data Analyst use this
data to inform staff evaluations and implement performance interventions, if indicated.
2. Charter School Curriculum
a. Student Learning Standards
Academic Standards
Excel Academy transitioned to the Common Core Standards as adopted by the District of Columbia in
June 2011. We believe that the Common Core Standards are well-aligned to our mission of academic
achievement and will ensure college and career readiness for our students. We will supplement the
Common Core Standards with DC State Standards in science, social studies, art, music, health, and
physical education.
In spring 2012, the Academic Dean, Instructional Coaches, and Grade-Levels Chairs will prioritize and
vertically aligned the Common Core Standards in ELA and Mathematics to identify the key areas of
emphasis for each grade-level. In the summer of 2012, this team will create year-long plans, unit plans,
and teacher-created assessments to deliver the prioritized standards. Each summer thereafter, the
academic team will convene to review the prioritized standards alongside the previous year’s data. Based
on the outcomes of this review, this team will revise each grade-level’s year-long plan, unit plans, and
teacher-created assessments as needed to ensure alignment with academic knowledge and skill mastery.
Nonacademic Standards
To promote high academic achievement for every student, Excel Academy has established and
maintained a learning environment conducive to academic excellence; students are to reflect internal
discipline, responsibility, and address conflicts in a positive, respectful manner. These standards of
personal excellence are employed through three different vehicles: Our Code of Conduct, daily use of
IDEALS, and our Discipline Policy.
Diverse Learners
Our curricula are implemented to ensure every student, regardless of learning style, capability, English
Language Learner (ELL) or Special Education (SPED) status, can fully participate. Our assessment data
facilitates the identification of those students who have achieved mastery and those who need further
challenges. This also allows us to identify those students struggling with skills who have either re-
teaching or an alternative way to master a skill. To the maximum extent possible, all students achieve the
curricular objectives and performance goals.
Accelerated Learners
Excel provides a challenging academic experience to all students and recognizes that accelerated students
often become disinterested in learning. The needs of accelerated learners will be met through
differentiated instruction by offering varied learning experiences. We will vary learning activities and
materials by difficulty to challenge students at different readiness levels and by topic in response to
students' interests. Differentiation for advanced learners will involve the adjustment of curriculum and
instruction by using one or more of the following four dimensions: depth, complexity, novelty, and
acceleration or pacing.
Depth will be used to challenge learners by enabling them to venture further, deeper, and more
elaborately into the area under study;
Excel Academy Public Charter School Amendment Application 8
Complexity will be used to broaden the learner's understanding of the area or areas under study
by asking her to make connections, relationships, and associations between, within, and across
subjects and disciplines;
Novelty will be used to gain a personal understanding of the area under study or constructing
meaning of knowledge in an individualized manner; and
Acceleration or pacing will be used to alter the pace or speed of learning and provide more
sophisticated resources for learning to challenge learners.
Students in Need of Additional Supports
Students who are struggling with content receive additional and individualized learning opportunities.
Excel is committed to meeting the needs of all students and especially students requiring extra assistance.
Supplemental materials are used to assist struggling students with comprehension and mastery of
knowledge and skill sets and support and extend the level of learning include:
Fountas and Pinnell Leveled Literacy Intervention
The Fountas & Pinnell Leveled Literacy Intervention System (LLI) is a small-group, supplementary
intervention program designed to help teachers provide powerful, daily, small-group instruction for
the lowest achieving children in kindergarten – 2nd-grade. Supported by Fountas & Pinnell’s
Continuum of Literacy Learning, LLI’s lessons include: a combination of reading, writing, phonics
and word study; emphasis on comprehending strategies; attention to the features of nonfiction and
fiction texts; specific work on sounds, letters, and words in activities designed to help children notice
the details of written language and learn how words “work”; help for students in expanding their
vocabularies; explicit teaching for fluent and phrased reading; opportunities to write about reading to
learn a variety of writing strategies.
Soar to Success
Grounded in research and classroom tested with powerful results, Soar to Success helps struggling
students in grades 3-8 achieve reading success. It provides the following: systematic, scaffolded,
small-group instruction in comprehension and the use of proven strategies, including decoding,
reciprocal teaching, and graphic organizers; a comprehensive Teacher's Manual with complete lesson
plans plus effective assessment tools; 18 authentic trade books per level, sequenced from easy to
more challenging, grade-level reading.
SRA Lesson Connection
SRA Lesson Connections are a powerful supplement to the Reading Mastery Signature Edition
program. The Lessons Connections resources provide additional support and differentiated instruction
to students engaged in the Reading Mastery program. Each lesson begins with twenty minutes of
strategic, targeted literacy based instruction. These short lessons are interconnected with the daily
lesson objective being covered in the Reading Mastery program. Important literacy skills such as
phonemic and phonological awareness, letter recognition and formation, and comprehension
strategies are the main focus of these short powerful supplemental lessons. This kind of instruction
not only reinforces what is taught in the Reading Mastery program, but also enhances it through
carefully tailored activities that promote student participation, engagement and extended learning.
Excel uses curricula with 10 lesson built-in assessments/evaluations: there are tests after each 10 lessons.
Test data is analyzed weekly by teachers and the Principal. When data indicates individual learning
challenges, teachers will identify students who need to receive differentiated instruction tailored for
struggling scholars. Students who are referred for review have their academic progress closely monitored
in all subjects. During weekly Grade Level Team meetings, student progress is discussed, reviewed and
evaluated. For those students who continue to experience academic challenges, Grade Level Team
referrals trigger push-in support in the classroom. If challenges continue to persist, students are evaluated
for pull-out classroom support.
Excel Academy Public Charter School Amendment Application 9
b. Resources and Instructional Materials
Excel Academy’s academic program is rooted in research-proven curricula, which have demonstrated
accelerated progress of mastery for low-income students, including those with disabilities. To help
students hone decoding skills and guided reading to build fluency and comprehension abilities in English
Language Arts, we will implement curricula that emphasize vocabulary-building and phonics-based
reading. Excel Academy will use a systematic approach for teaching basic math facts, computational
skills, and higher-level problem solving abilities. The math curriculum incorporates a literacy component
as early as first grade and students will benefit from the inquiry-based science curriculum that emphasizes
critical thinking skills and literacy as early as first grade.
Excel Academy will assess all students within two weeks of school opening to ensure proper placement,
especially for English Language Learners, students with disabilities, and students who are lagging in
vocabulary development.
Since the original charter application we increased our expected total enrollment ceiling to 925 scholars in
pre-school through the eighth grade. The school will be programmatically divided into three separate and
distinct divisions. The Early Childhood School Division will house students in pre-school and pre-
kindergarten. The Elementary School will house students from first, second, third and fourth grade. The
Middle School will house students in fifth through eighth grades. These divisions will facilitate student
management, instruction and age appropriate groupings and create a small school environment at each
developmental stage to better support our students and allow Excel Academy staff to more closely
monitor and evaluate student progress The curriculum identified will be strategically designed to support
academic goals across divisions.
With the adoption of the Common Core State Standards by the District of Columbia in June 2011, we
implemented curricular changes to ensure that our academic program aligned to the spirit and substance
of Common Core. The Common Core Standards for English Language Arts and Literacy in
History/Social Studies, Science, and Technical Subjects note the following:
To build a foundation for college and career readiness, students must read widely and
deeply from among a broad range of high-quality, increasingly challenging literary and
informational texts. Through extensive reading of stories, dramas, poems, and myths
from diverse cultures and different time periods, students gain literary and cultural
knowledge as well as familiarity with various text structures and elements. By reading
texts in history/social studies, science, and other disciplines, students build a foundation
of knowledge in these fields that will also give them the background to be better readers
in all content areas. Students can only gain this foundation when the curriculum is
intentionally and coherently structured to develop rich content knowledge within and
across grades. Students also acquire the habits of reading independently and closely,
which are essential to their future success (p. 10).
We adopted the Core Knowledge Preschool-8th Grade Scope and Sequence to ensure that we deliver a
coherent, cumulative, and content-specific curriculum across the grades. Core Knowledge is designed to
build students’ cultural literacy and background knowledge so that they become strong readers in all
content areas. We also adopted Core Knowledge’s Listening and Learning Language Arts Program to
systematically expose students to listening comprehension skills using high quality, increasingly
challenging literary and informational texts.
Excel Academy Public Charter School Amendment Application 10
Preschool – Pre-Kindergarten
In Excel’s Early Childhood program, we lay the foundation for the academic, social, and developmental
needs of our youngest students. While we teach skills in all of these areas, we focus on early literacy
development with the support of two curricular resources: The Core Knowledge Preschool Sequence and
Jolly Phonics.
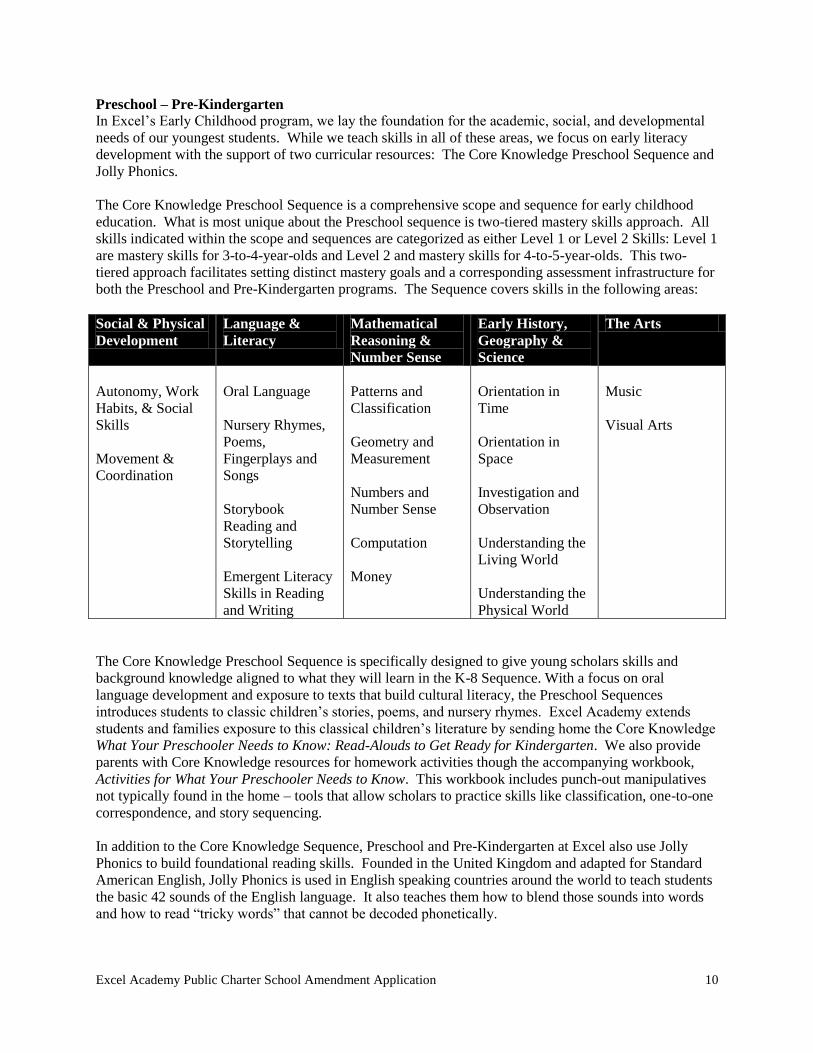
The Core Knowledge Preschool Sequence is a comprehensive scope and sequence for early childhood
education. What is most unique about the Preschool sequence is two-tiered mastery skills approach. All
skills indicated within the scope and sequences are categorized as either Level 1 or Level 2 Skills: Level 1
are mastery skills for 3-to-4-year-olds and Level 2 and mastery skills for 4-to-5-year-olds. This two-
tiered approach facilitates setting distinct mastery goals and a corresponding assessment infrastructure for
both the Preschool and Pre-Kindergarten programs. The Sequence covers skills in the following areas:
Social & Physical
Development
Language &
Literacy
Mathematical
Reasoning &
Number Sense
Early History,
Geography &
Science
The Arts
Autonomy, Work
Habits, & Social
Skills
Movement &
Coordination
Oral Language
Nursery Rhymes,
Poems,
Fingerplays and
Songs
Storybook
Reading and
Storytelling
Emergent Literacy
Skills in Reading
and Writing
Patterns and
Classification
Geometry and
Measurement
Numbers and
Number Sense
Computation
Money
Orientation in
Time
Orientation in
Space
Investigation and
Observation
Understanding the
Living World
Understanding the
Physical World
Music
Visual Arts
The Core Knowledge Preschool Sequence is specifically designed to give young scholars skills and
background knowledge aligned to what they will learn in the K-8 Sequence. With a focus on oral
language development and exposure to texts that build cultural literacy, the Preschool Sequences
introduces students to classic children’s stories, poems, and nursery rhymes. Excel Academy extends
students and families exposure to this classical children’s literature by sending home the Core Knowledge
What Your Preschooler Needs to Know: Read-Alouds to Get Ready for Kindergarten. We also provide
parents with Core Knowledge resources for homework activities though the accompanying workbook,
Activities for What Your Preschooler Needs to Know. This workbook includes punch-out manipulatives
not typically found in the home – tools that allow scholars to practice skills like classification, one-to-one
correspondence, and story sequencing.
In addition to the Core Knowledge Sequence, Preschool and Pre-Kindergarten at Excel also use Jolly
Phonics to build foundational reading skills. Founded in the United Kingdom and adapted for Standard
American English, Jolly Phonics is used in English speaking countries around the world to teach students
the basic 42 sounds of the English language. It also teaches them how to blend those sounds into words
and how to read “tricky words” that cannot be decoded phonetically.
Excel Academy Public Charter School Amendment Application 11
Kindergarten - 8th grade
Excel Academy has selected the following curricula for kindergarten through eighth grade students,
which have produced positive results in measurably improving academic achievement in urban schools.
These curricula meet or exceed the District of Columbia content standards:
Core Knowledge K-8 Sequence (K-8)
Core Knowledge Listening & Learning Language Arts (K-5, as available)
SRA Reading Mastery Signature Edition (K-2)
istation Reading (K-1)
Readers Workshop & Literature Circles (K-8)
Writers Workshop (K-8)
Jolly Grammar (K-1)
Saxon Math (K-8)
Singapore Math (K-8)
Scott Foresman Science Materials (K-6)
Pearson’s Core Knowledge History & Geography (K-6)
English Language Arts – Reading & Listening
The school’s English Language Arts reading and listening curricula is designed to ensure students:
master skills, strategies, and applications for listening and speaking;
master reading, including word recognition, fluency, vocabulary development, comprehension,
literary response and analysis; and
demonstrate proficiency in the writing process and English language conventions.
Excel Academy utilizes several research-based literacy curricula to build a comprehensive balanced
literacy program. A continuity of curricular resources and instructional strategies are woven throughout
the grades. Our school’s balanced literacy framework in the elementary years is designed to help students
transition successfully from year to year and into a rigorous middle school literature and writing program.
Elementary students at Excel Academy will be engaged in literacy activities for the majority of the school
day. Excel’s literacy curriculum framework will ensure students have an unwavering foundation in
reading and writing.
Excel Academy will use a combination of Reading Mastery, Readers Workshop, and Core Knowledge
Listening & Learning Language Arts K-3 to develop a complete reading and listening comprehension
program taught primarily through small groups. This approach to reading comprehension will give early
elementary students experiences in high-quality children’s literature, build their critical thinking and
literacy skills, and prepare them to be effective independent readers. This approach is closely aligned to
the textual analysis and novel studies through Literature Circles students will participate in during upper
elementary and middle school.
SRA Reading Mastery Signature Edition
SRA Reading Mastery meets the federal guidelines as research-proven curricula in the area of early
literacy, a key focus of No Child Left Behind legislation. This program is built upon a mastery of the five
essential components of reading as identified by Reading First: phonemic awareness, phonics and word
analysis, reading comprehension, fluency, and vocabulary.
This allows us to offer a highly explicit, systematic approach to accelerate reading and help students
achieve high levels of success. Reading Mastery is separated into three complementary strands, reading,
language, and literature, which can be used in tandem or combined as a stand-alone comprehension
Excel Academy Public Charter School Amendment Application 12
reading program. The separation of stands allows Excel Academy to easily structure the literacy block of
the academic day into small, intensive teacher directed groups. The strategy based approach to phonics,
fluency, decoding, and word recognition allows students to learn the science of reading more effectively.
istation Reading Program
Alongside Reading Mastery, phonemic awareness, alphabetic knowledge, vocabulary, comprehension,
and fluency skills will be reinforced through computer-based individualized instruction using istation
Reading software. In istation, students participate in leveled lessons, based on the system’s most recent
assessment, and are prevented from moving ahead until proficiency at a given level is achieved. This
instructional strategy allows teachers to work with students in very small reading groups while other
students complete computer-based lessons. This program will support the development of foundational
reading skills for all Kindergarten and 1st grade students and will be available on all classroom computers
in through 5th grade to be used at the teacher’s discretion.
Core Knowledge Listening & Learning Language Arts
Excel will use the Core Knowledge Listening and Learning Language Arts Curriculum to respond to
several calls in the Common Core State Standards for English Language Arts and Literacy in
History/Social Studies, Science, and Technical Subjects: exposure to texts of increasing complexity
within the study of particular content domains; history/social studies and science-infused literacy
instruction; a focus on academic and content-specific vocabulary (Tier 2 and 3 words); and increased
exposure to non-fiction read-alouds in the elementary grades.
Listening and Learning draws upon twenty years of research conducted by E. D. Hirsch, Jr., into the
foundations of reading and comprehension. Dr. Hirsch’s central insight—detailed in his books Cultural
Literacy, The Knowledge Deficit, and, most recently, The Making of Americans—is that, beyond the
necessary mastery of basic decoding skills, the ability to comprehend what is read is very much
dependent upon both language and content knowledge. General language competence along with domain-
specific knowledge and vocabulary are essential if students are to understand the words and sentences
they are decoding.
Listening and Learning lessons, comprised of read-alouds and oral language exercises, build on the fact
that students’ listening comprehension abilities outpace their reading comprehension abilities throughout
elementary school. At each grade level, approximately 150 lessons are divided into 12 domains. Each
domain is dedicated to a particular topic or theme and consists of read-alouds that the teacher shares with
students in a large group setting over the course of 10-15 days of instruction. The topics addressed in
these domains go well beyond standard elementary language arts topics and include important historical
and scientific content.
While contemporary reading programs have begun to increasingly include nonfiction in the reading
selections offered during the language arts block, the Listening and Learning Core Knowledge Language
Arts program is unique in presenting grade appropriate nonfiction topics, selected from the tried and true
grade specific content guidelines of the Core Knowledge Sequence, in a coherent and systematic way.
Unlike other reading programs in which a potpourri of unrelated nonfiction texts are presented, the
Listening and Learning read-alouds allow students to build cumulative knowledge and vocabulary about a
specific domain both within and across grade levels.
In the fall of 2011, Listening and Learning was released by the Core Knowledge Foundation for
Kindergarten and 1st grade and, in Fall 2012, it will be released for 2nd and 3rd grades. In subsequent years
the foundation will release Listening and Learning for 4th and 5th grades, and Excel will adopt each
grade’s curriculum as it comes available.
Excel Academy Public Charter School Amendment Application 13
Readers Workshop & Literature Circles
Readers Workshop is an approach to reading comprehension that systematically builds comprehension
skills and students’ love of reading. Developed by Lucy Calkins and the faculty at Columbia Teachers
College, students select literature to read and are encouraged to do as good reader's do in exploring
different genres, authors, and texts. The program emphasizes the interaction between readers and text.
Students learn to ask questions, make connections with prior knowledge and previously read texts, and
ask questions to clarify faulty comprehension they recognize has occurred. The program includes peer
conferences and teacher conferences with students but emphasizes students' independence and allows
them to become successful readers outside of the classroom.
Reader's Workshop uses a similar format to Writer's Workshop, and, while implemented differently in
different classrooms, there are several consistent components:
Mini-lessons on some aspect of literature or a reading strategy.
Independent Reading Time, where students keep a journal and respond to the literature in terms
of what they think or how they feel about what they are reading.
Sharing Time where students share with another person their journal entries and the other person
gives feedback.
During Independent Reading Time, the teacher engages in student conferences on an individual or group
basis. Teachers can also engage in guided reading with groups of students who need additional support.
Beginning in 4th grade, Readers Workshop will focus on Literature Circles. In Literature Circles, small
groups of students gather together to discuss a piece of literature in depth. The discussion is guided by
students' response to what they have read. Literature circles provide a way for students to engage in
critical thinking and reflection as they read, discuss, and respond to books. Collaboration is at the heart of
this approach, and students reshape and add onto their understanding as they construct meaning with other
readers. Finally, literature circles guide students to deeper understanding of what they read through
structured discussion and extended written and artistic response.
English Language Arts – Writing
In order to develop strong critical writers, Excel introduced Writer’s Workshop as our primary writing
curriculum. Lucy Calkins and the faculty at Columbia’s Teachers College have supported hundreds of
thousands of educators perfect the art of teaching writing. This approach to writing lays a strong
foundation for writing in the primary and intermediate years and fosters an authentic appreciation and
understanding for the writing process. Through targeted mini-lessons, teacher-student conferences, and
authentic writing assignments, Unites of Study for Primary Writing helps move students in the lower
elementary form oral and pictorial storytelling to fluent writing. In upper elementary and middle school
students continue to explore more advanced forms and writing genre. The spiraled curriculum and
workshop format allow for differentiation and lesson extension.
Jolly Grammar
Jolly Grammar builds on the skills learned in Jolly Phonics in Excel’s early childhood program and uses
an active and multi-sensory approach to develop students’ understanding of how grammar works. By
teaching key essential grammar rules, it helps children bring diversity to their writing and improve their
spelling in a structured way. Jolly Grammar teaches a wide range of language forms including the parts
of speech, plurals, punctuation, and the tenses past, present, and future. It also teaches a wide range of
spelling rules, including defining aspects such as the short vowels. Jolly Grammar is designed for two
years of teaching and will be used in Kindergarten and 1st grade.
Excel Academy Public Charter School Amendment Application 14
Mathematics
Saxon Math
Saxon Math provides one of the most thoroughly researched skills-based K-12 mathematics program..
Saxon's unique pedagogical approach, based on instruction, practice and assessment distributed across the
grade level, incorporates 20 years of research and classroom experience. Saxon has two unique aspects:
explicit instruction and a distributed approach to instruction, practice and assessment. Teachers and
researchers alike recognize the correlation between the explicit instruction of concepts and the long-term
success of students. Educational researchers have confirmed that explicit instruction is a critical element
of student learning and that it is more effective than non-explicit instruction in teaching mathematics
(Darch, Carnine, & Gersten, 1984). They have also determined that explicit instruction is the most
effective way to teach critical-thinking skills (Bangert-Downs & Bankert, 1990). The explicit instruction
provided in Saxon Math activates prior knowledge, incorporates teacher models, provides guided and
independent practice, ensures teacher-student interaction, and includes frequent instructional assessments.
Every daily lesson has been extensively field-tested to guarantee its grade level appropriateness and
effectiveness.
The pedagogy used in Saxon Math is unique, effective and research-based. The authors of Saxon Math
began developing the series by first breaking complex concepts into related increments, recognizing that
smaller pieces of information are easier to teach and easier to learn. Then they systematically distributed
the instruction, practice and assessment of those increments across a grade level. Well-established
research has shown that this spaced (distributed) approach has produced significantly higher levels of
student learning than massed presentations such as those found in programs with a chapter-based
approach (Dempster & Farris, 1990).
Saxon Math assists students in kindergarten through eighth grades to develop age-appropriate skills and
content knowledge in number sense, computation, algebra and functions, geometry, measurement, data
analysis, probability, and problem solving. Specifically, students will be expected to:
use basic symbols to solve simple and complex problems;
gather and interpret data using graphs and charts;
predict outcomes of probability experiments; and
solve problems involving proportional relationships.
Singapore Math
In addition to Saxon Math, we will supplement the K-8 math curriculum using Singapore Math. In
addition to traditional standards in mathematical content, the Common Core State Standards also have
additional standards in mathematical practice. While Saxon is a very strong curriculum for building
mathematical content knowledge and skills, Singapore adds conceptual knowledge that will deepen
students understanding of the new mathematical practice standards:
Common Core State Standards: Mathematical Practices
1. Make sense of problems and persevere in solving them.
2. Reason abstractly and quantitatively.
3. Construct viable arguments and critique the reasoning of others.
4. Model with mathematics.
5. Use appropriate tools strategically.
6. Attend to precision.
7. Look for and make use of structure.
8. Look for and express regularity in repeated reasoning.
Excel Academy Public Charter School Amendment Application 15
Singapore Math (Standards Edition) is a complete program based on the highly successful series from
Singapore. Designed to equip students with a strong foundation in mathematics, topics are covered in
depth and taught to mastery. By focusing on mathematical understanding, the program aims to help
students develop logical thinking and critical lifelong problem-solving skills. The program uses direct
instruction and focuses on mathematical thinking with immediate application of new skills to problem
solving. By encouraging students to solve problems in a variety of ways, this program stretches the mind
and promotes understanding of the way mathematical processes work.
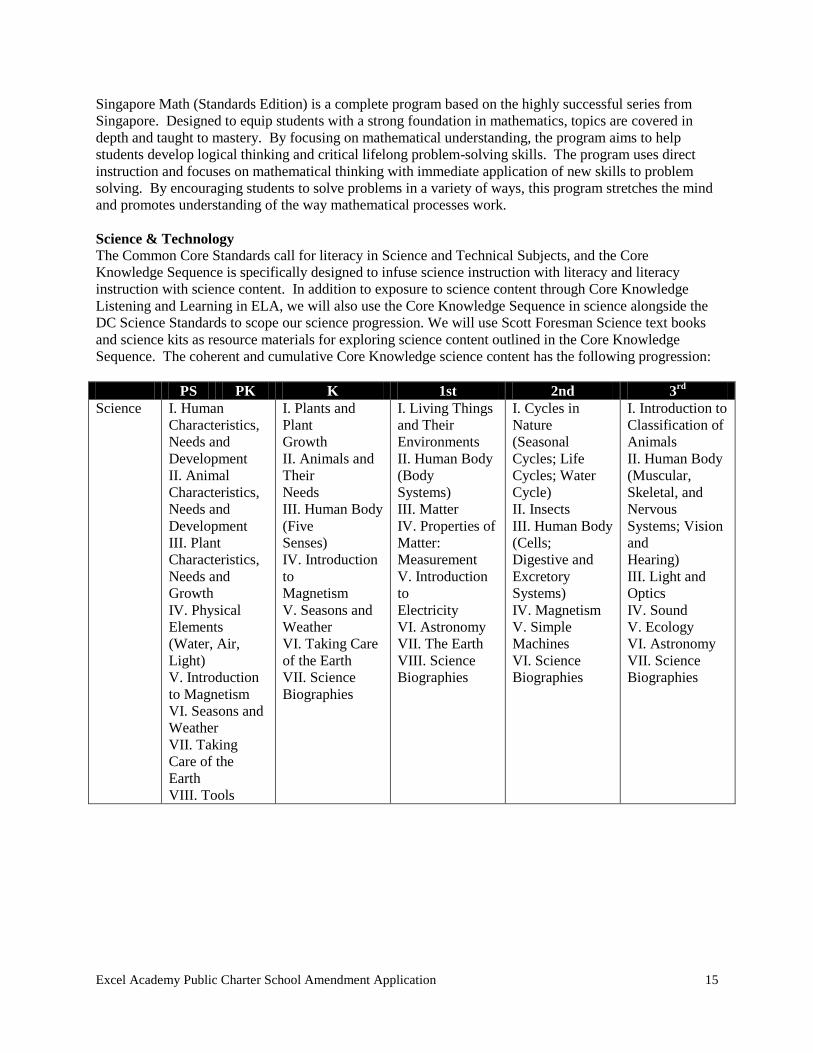
Science & Technology
The Common Core Standards call for literacy in Science and Technical Subjects, and the Core
Knowledge Sequence is specifically designed to infuse science instruction with literacy and literacy
instruction with science content. In addition to exposure to science content through Core Knowledge
Listening and Learning in ELA, we will also use the Core Knowledge Sequence in science alongside the
DC Science Standards to scope our science progression. We will use Scott Foresman Science text books
and science kits as resource materials for exploring science content outlined in the Core Knowledge
Sequence. The coherent and cumulative Core Knowledge science content has the following progression:
PS PK K 1st 2nd 3rd
Science I. Human
Characteristics,
Needs and
Development
II. Animal
Characteristics,
Needs and
Development
III. Plant
Characteristics,
Needs and
Growth
IV. Physical
Elements
(Water, Air,
Light)
V. Introduction
to Magnetism
VI. Seasons and
Weather
VII. Taking
Care of the
Earth
VIII. Tools
I. Plants and
Plant
Growth
II. Animals and
Their
Needs
III. Human Body
(Five
Senses)
IV. Introduction
to
Magnetism
V. Seasons and
Weather
VI. Taking Care
of the Earth
VII. Science
Biographies
I. Living Things
and Their
Environments
II. Human Body
(Body
Systems)
III. Matter
IV. Properties of
Matter:
Measurement
V. Introduction
to
Electricity
VI. Astronomy
VII. The Earth
VIII. Science
Biographies
I. Cycles in
Nature
(Seasonal
Cycles; Life
Cycles; Water
Cycle)
II. Insects
III. Human Body
(Cells;
Digestive and
Excretory
Systems)
IV. Magnetism
V. Simple
Machines
VI. Science
Biographies
I. Introduction to
Classification of
Animals
II. Human Body
(Muscular,
Skeletal, and
Nervous
Systems; Vision
and
Hearing)
III. Light and
Optics
IV. Sound
V. Ecology
VI. Astronomy
VII. Science
Biographies
Excel Academy Public Charter School Amendment Application 16
4th 5th 6th 7th 8th
Science I. Human Body
(Circulatory and
Respiratory
Systems)
II. Chemistry:
Basic Terms and
Concepts
III. Electricity
IV. Geology:
The Earth and
Its
Changes
V. Meteorology
VI. Science
Biographies
I. Classifying
Living Things
II. Cells:
Structures and
Processes
III. Plant
Structures and
Processes
IV. Life Cycles
and
Reproduction
V. Human Body
(Endocrine and
Reproductive
Systems)
VI. Chemistry:
Matter and
Change
VII. Science
Biographies
I. Plate
Tectonics
II. Oceans
III. Astronomy:
Gravity, Stars,
and Galaxies
IV. Energy,
Heat, and
Energy
Transfer
V. The Human
Body:
Lymphatic
and Immune
Systems
VI. Science
Biographies
I. Atomic
Structure
II. Chemical
Bonds and
Reactions
III. Cell Division
and Genetics
IV. History of
the Earth and
Life
Forms
V. Evolution
VI. Science
Biographies
I. Physics
II. Electricity
and Magnetism
III.
Electromagnetic
Radiation
and Light
IV. Sound
Waves
V. Chemistry of
Food and
Respiration
VI. Science
Biographies
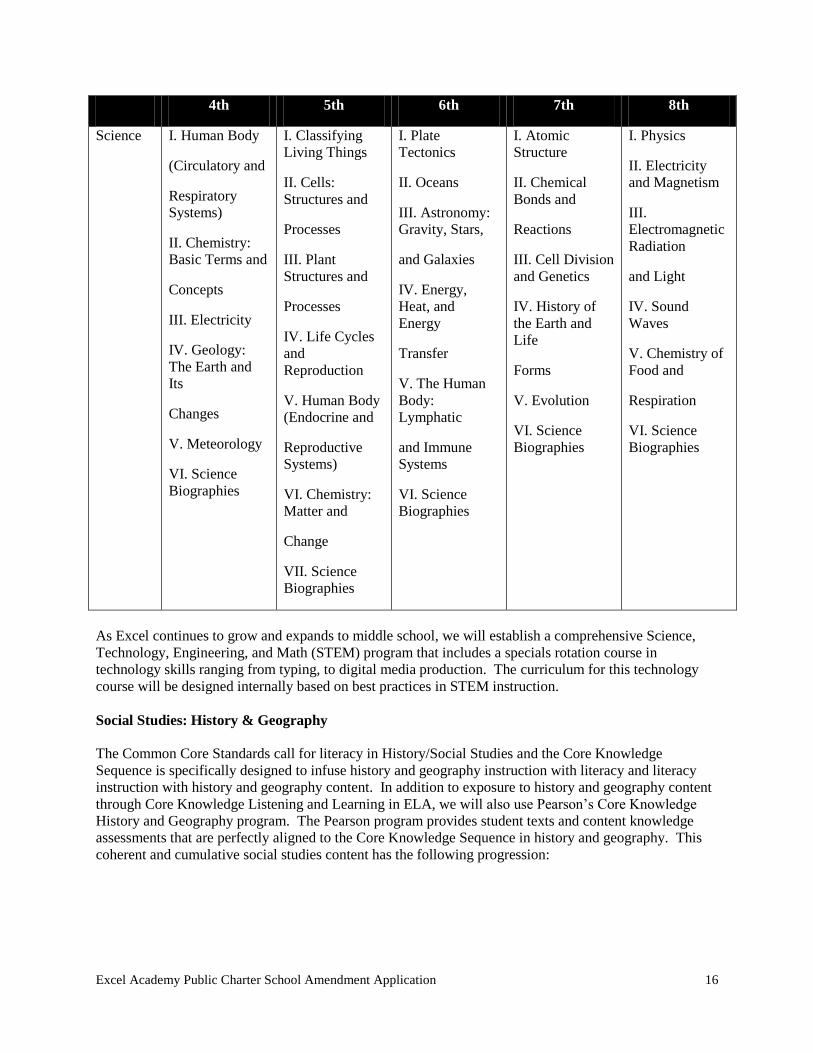
As Excel continues to grow and expands to middle school, we will establish a comprehensive Science,
Technology, Engineering, and Math (STEM) program that includes a specials rotation course in
technology skills ranging from typing, to digital media production. The curriculum for this technology
course will be designed internally based on best practices in STEM instruction.
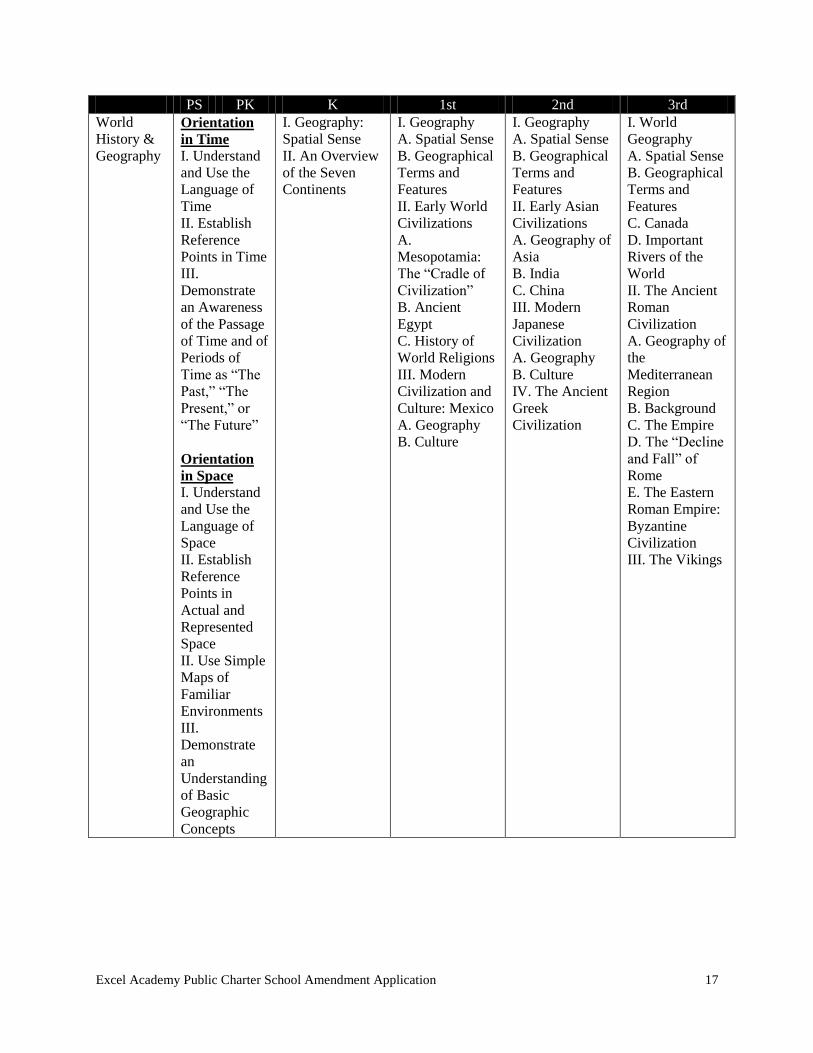
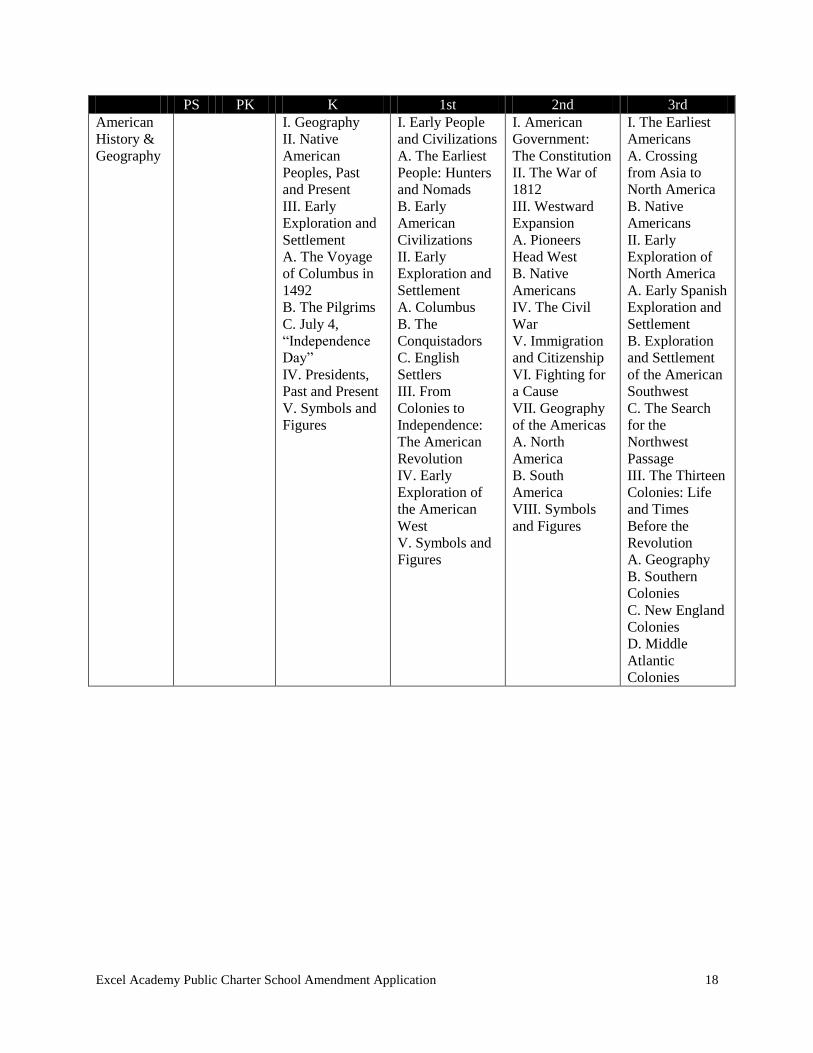
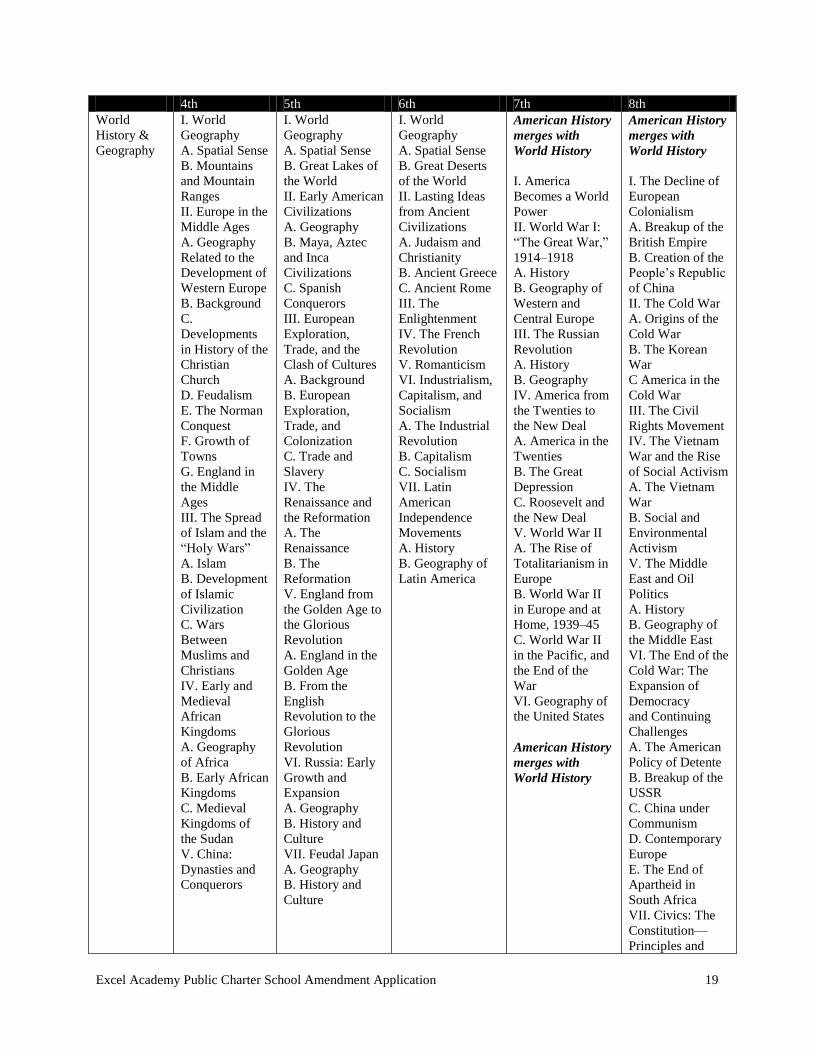
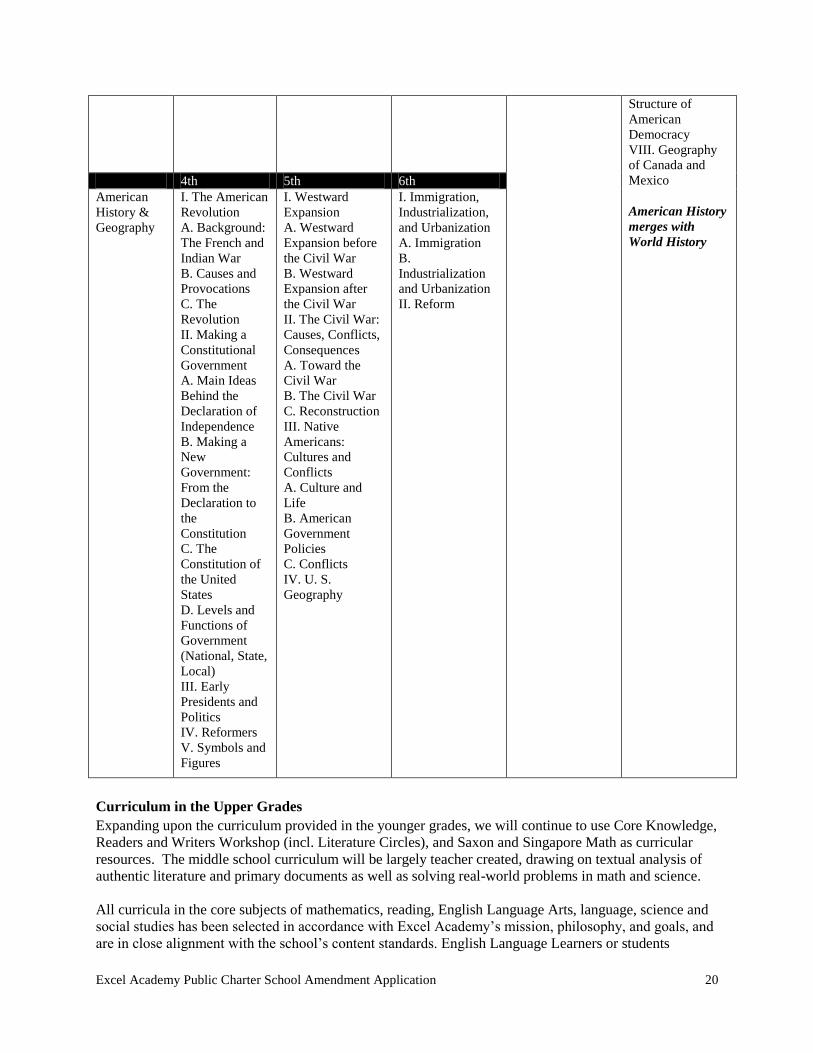
Social Studies: History & Geography
The Common Core Standards call for literacy in History/Social Studies and the Core Knowledge
Sequence is specifically designed to infuse history and geography instruction with literacy and literacy
instruction with history and geography content. In addition to exposure to history and geography content
through Core Knowledge Listening and Learning in ELA, we will also use Pearson’s Core Knowledge
History and Geography program. The Pearson program provides student texts and content knowledge
assessments that are perfectly aligned to the Core Knowledge Sequence in history and geography. This
coherent and cumulative social studies content has the following progression:
Excel Academy Public Charter School Amendment Application 17
PS PK K 1st 2nd 3rd
World
History &
Geography
Orientation
in Time
I. Understand
and Use the
Language of
Time
II. Establish
Reference
Points in Time
III.
Demonstrate
an Awareness
of the Passage
of Time and of
Periods of
Time as “The
Past,” “The
Present,” or
“The Future”
Orientation
in Space
I. Understand
and Use the
Language of
Space
II. Establish
Reference
Points in
Actual and
Represented
Space
II. Use Simple
Maps of
Familiar
Environments
III.
Demonstrate
an
Understanding
of Basic
Geographic
Concepts
I. Geography:
Spatial Sense
II. An Overview
of the Seven
Continents
I. Geography
A. Spatial Sense
B. Geographical
Terms and
Features
II. Early World
Civilizations
A.
Mesopotamia:
The “Cradle of
Civilization”
B. Ancient
Egypt
C. History of
World Religions
III. Modern
Civilization and
Culture: Mexico
A. Geography
B. Culture
I. Geography
A. Spatial Sense
B. Geographical
Terms and
Features
II. Early Asian
Civilizations
A. Geography of
Asia
B. India
C. China
III. Modern
Japanese
Civilization
A. Geography
B. Culture
IV. The Ancient
Greek
Civilization
I. World
Geography
A. Spatial Sense
B. Geographical
Terms and
Features
C. Canada
D. Important
Rivers of the
World
II. The Ancient
Roman
Civilization
A. Geography of
the
Mediterranean
Region
B. Background
C. The Empire
D. The “Decline
and Fall” of
Rome
E. The Eastern
Roman Empire:
Byzantine
Civilization
III. The Vikings
Excel Academy Public Charter School Amendment Application 18
PS PK K 1st 2nd 3rd
American
History &
Geography
I. Geography
II. Native
American
Peoples, Past
and Present
III. Early
Exploration and
Settlement
A. The Voyage
of Columbus in
1492
B. The Pilgrims
C. July 4,
“Independence
Day”
IV. Presidents,
Past and Present
V. Symbols and
Figures
I. Early People
and Civilizations
A. The Earliest
People: Hunters
and Nomads
B. Early
American
Civilizations
II. Early
Exploration and
Settlement
A. Columbus
B. The
Conquistadors
C. English
Settlers
III. From
Colonies to
Independence:
The American
Revolution
IV. Early
Exploration of
the American
West
V. Symbols and
Figures
I. American
Government:
The Constitution
II. The War of
1812
III. Westward
Expansion
A. Pioneers
Head West
B. Native
Americans
IV. The Civil
War
V. Immigration
and Citizenship
VI. Fighting for
a Cause
VII. Geography
of the Americas
A. North
America
B. South
America
VIII. Symbols
and Figures
I. The Earliest
Americans
A. Crossing
from Asia to
North America
B. Native
Americans
II. Early
Exploration of
North America
A. Early Spanish
Exploration and
Settlement
B. Exploration
and Settlement
of the American
Southwest
C. The Search
for the
Northwest
Passage
III. The Thirteen
Colonies: Life
and Times
Before the
Revolution
A. Geography
B. Southern
Colonies
C. New England
Colonies
D. Middle
Atlantic
Colonies
Excel Academy Public Charter School Amendment Application 19
4th 5th 6th 7th 8th
World
History &
Geography
I. World
Geography
A. Spatial Sense
B. Mountains
and Mountain
Ranges
II. Europe in the
Middle Ages
A. Geography
Related to the
Development of
Western Europe
B. Background
C.
Developments
in History of the
Christian
Church
D. Feudalism
E. The Norman
Conquest
F. Growth of
Towns
G. England in
the Middle
Ages
III. The Spread
of Islam and the
“Holy Wars”
A. Islam
B. Development
of Islamic
Civilization
C. Wars
Between
Muslims and
Christians
IV. Early and
Medieval
African
Kingdoms
A. Geography
of Africa
B. Early African
Kingdoms
C. Medieval
Kingdoms of
the Sudan
V. China:
Dynasties and
Conquerors
I. World
Geography
A. Spatial Sense
B. Great Lakes of
the World
II. Early American
Civilizations
A. Geography
B. Maya, Aztec
and Inca
Civilizations
C. Spanish
Conquerors
III. European
Exploration,
Trade, and the
Clash of Cultures
A. Background
B. European
Exploration,
Trade, and
Colonization
C. Trade and
Slavery
IV. The
Renaissance and
the Reformation
A. The
Renaissance
B. The
Reformation
V. England from
the Golden Age to
the Glorious
Revolution
A. England in the
Golden Age
B. From the
English
Revolution to the
Glorious
Revolution
VI. Russia: Early
Growth and
Expansion
A. Geography
B. History and
Culture
VII. Feudal Japan
A. Geography
B. History and
Culture
I. World
Geography
A. Spatial Sense
B. Great Deserts
of the World
II. Lasting Ideas
from Ancient
Civilizations
A. Judaism and
Christianity
B. Ancient Greece
C. Ancient Rome
III. The
Enlightenment
IV. The French
Revolution
V. Romanticism
VI. Industrialism,
Capitalism, and
Socialism
A. The Industrial
Revolution
B. Capitalism
C. Socialism
VII. Latin
American
Independence
Movements
A. History
B. Geography of
Latin America
American History
merges with
World History
I. America
Becomes a World
Power
II. World War I:
“The Great War,”
1914–1918
A. History
B. Geography of
Western and
Central Europe
III. The Russian
Revolution
A. History
B. Geography
IV. America from
the Twenties to
the New Deal
A. America in the
Twenties
B. The Great
Depression
C. Roosevelt and
the New Deal
V. World War II
A. The Rise of
Totalitarianism in
Europe
B. World War II
in Europe and at
Home, 1939–45
C. World War II
in the Pacific, and
the End of the
War
VI. Geography of
the United States
American History
merges with
World History
American History
merges with
World History
I. The Decline of
European
Colonialism
A. Breakup of the
British Empire
B. Creation of the
People’s Republic
of China
II. The Cold War
A. Origins of the
Cold War
B. The Korean
War
C America in the
Cold War
III. The Civil
Rights Movement
IV. The Vietnam
War and the Rise
of Social Activism
A. The Vietnam
War
B. Social and
Environmental
Activism
V. The Middle
East and Oil
Politics
A. History
B. Geography of
the Middle East
VI. The End of the
Cold War: The
Expansion of
Democracy
and Continuing
Challenges
A. The American
Policy of Detente
B. Breakup of the
USSR
C. China under
Communism
D. Contemporary
Europe
E. The End of
Apartheid in
South Africa
VII. Civics: The
Constitution—
Principles and
Excel Academy Public Charter School Amendment Application 20
Structure of
American
Democracy
VIII. Geography
of Canada and
Mexico
American History
merges with
World History
4th 5th 6th
American
History &
Geography
I. The American
Revolution
A. Background:
The French and
Indian War
B. Causes and
Provocations
C. The
Revolution
II. Making a
Constitutional
Government
A. Main Ideas
Behind the
Declaration of
Independence
B. Making a
New
Government:
From the
Declaration to
the
Constitution
C. The
Constitution of
the United
States
D. Levels and
Functions of
Government
(National, State,
Local)
III. Early
Presidents and
Politics
IV. Reformers
V. Symbols and
Figures
I. Westward
Expansion
A. Westward
Expansion before
the Civil War
B. Westward
Expansion after
the Civil War
II. The Civil War:
Causes, Conflicts,
Consequences
A. Toward the
Civil War
B. The Civil War
C. Reconstruction
III. Native
Americans:
Cultures and
Conflicts
A. Culture and
Life
B. American
Government
Policies
C. Conflicts
IV. U. S.
Geography
I. Immigration,
Industrialization,
and Urbanization
A. Immigration
B.
Industrialization
and Urbanization
II. Reform
Curriculum in the Upper Grades
Expanding upon the curriculum provided in the younger grades, we will continue to use Core Knowledge,
Readers and Writers Workshop (incl. Literature Circles), and Saxon and Singapore Math as curricular
resources. The middle school curriculum will be largely teacher created, drawing on textual analysis of
authentic literature and primary documents as well as solving real-world problems in math and science.
All curricula in the core subjects of mathematics, reading, English Language Arts, language, science and
social studies has been selected in accordance with Excel Academy’s mission, philosophy, and goals, and
are in close alignment with the school’s content standards. English Language Learners or students
Excel Academy Public Charter School Amendment Application 21
identified with learning disabilities will be able to engage in the curriculum and learn along with their
classmates. Our multi-tiered assessment model, faculty observation, and instructional leader data analysis
will inform the efficacy of our curriculum and its implementation. If a student’s academic needs are not
being fully addressed, our faculty and instructional leader will make necessary adjustments or
accommodations to lessons and curriculum.
Character Education
Excel Academy Public Charter School is committed to maintaining a welcoming, safe, fair and courteous
environment in which students are expected to demonstrate daily personal behaviors to help build a
respectful, tolerant community. We have high personal and academic expectations for all Excel Academy
scholars. To complement the academic program, Excel Academy created a character education program
based on the IDEALS values, culturally responsive pedagogy, character role models from literature, and
best practices for girls. Character education is an integral part of our school’s program and will evolve as
our students grow, mature, and develop.
Excel Academy is built around six core IDEALS: integrity, discipline, enjoyment, achievement,
leadership and sisterhood.
The IDEALS are reinforced throughout the day, beginning with our Breakfast for the Brain program in
morning meeting. Teachers use IDEALS values to set classroom and school-wide behavior. Time each
day is devoted to explicit teaching and modeling of our IDEALS values.
Every week exemplary demonstration of the IDEALS is highlighted at our school-wide Community
Circle. Teachers select a handful of student to recognize weekly at Community Circle. Teachers recognize
members of their class by stating a specific student action and which IDEALS value it demonstrated.
In addition to the IDEALS, Excel’s character education program utilizes culturally responsive pedagogy
and focus on empowering young girls. Excel Academy’s single-sex school model is a cornerstone in our
program, both academics and character development. As the first all-girls’ public school in Washington,
DC we have a unique opportunity to be truly innovative, deliberate, and purposeful in our lessons.
Monthly character themes will feature a variety of strong female role models, literature with women and
girls in non-traditional roles, and we will showcase girls and women making empowered decisions. Our
character education program fosters an appreciated of self, inner strength, and one’s own unique identity.
Additionally, Excel Academy faculty weaves culturally responsive pedagogy including African proverbs,
folktales, music, and poetry into our program. These elements have helped our students become socially
conscious, engaged local and global citizens.
A faculty created character education program rooted in several strong values systems, literature, and
character education instructional strategies have allowed for staff to tailor our program to the specific
needs of our student population. As our students continue to grow and mature, it is imperative that faculty
have the flexibility and freedom to use students discipline data, anecdotal notes, parent and family
observations, and explicit feedback from our own students to create meaningful monthly themes,
corresponding until plans, and daily lessons. Particularly as our young female students enter into middle
school, we will structure discussion groups, open forums, and workshops to support their individual and
collective concerns and needs. Middle school scholars will serve as peer mentors and character
development coaches for our younger students.
c. Methods of Instruction
Excel Academy uses a combination of instructional strategies to optimize academic learning and promote
the development of the whole child. Although several scripted curricula have been chosen, Excel still
Excel Academy Public Charter School Amendment Application 22
believes that each teacher possesses a unique teaching style and talent. Teachers are encouraged to
incorporate various methods of instruction for students when necessary. Each scripted curriculum serves
as a framework for instruction. Small group instruction, differentiated instruction and supplemental
manipulatives are welcome additions to the classroom and overall instructional program.
Direct Instruction
We have seen that through standards driven, teacher-led direct instruction in the core subjects, students
have developed the skills and knowledge to academic achievement. Reading Mastery, Core Knowledge
Listening & Learning Language Arts, Jolly Phonics, Saxon Math, and Singapore Math employ teacher-
centered direct instruction. High achieving urban elementary schools in high poverty areas tend to use
teacher-centered direct instruction, a method with teachers as the key transmitters of knowledge.
Direct instruction is characterized by teaching in small, logically sequential steps with student practice
after each step, guiding students after initial practice, and ensuring that all students experience a high
level of successful practice which supports the development of self-confidence in girls. This process is
sometimes referred to as “I do, we do, you do,” as the process entails carefully guided direct instruction
from the teacher to introduce a new skill or content knowledge (“I do”), followed by the teacher working
closely with students to practice the skill (“we do”), followed by students mastering that skill
independently under the support of the teacher (“you do”). Direct instruction emphasizes carefully
planned lessons designed around highly specific knowledge and well-defined skills for each subject. It
asks teachers to use “presentation books,” lesson plans that feature highly scripted, rapid-paced
instruction. These presentation books provide instructions for monitoring and assessing student progress
and provide immediate feedback to teachers and students.
Direct instruction facilitates the data assessment model as it allows staff to modify instruction, lesson
planning and best use professional development institutes and team meetings, and students are tested
frequently to monitor their academic progress in the acquisition of highly specific skills. Excel’s
empirically proven, research-based curricula are teacher-centered direct instruction programs which direct
how reading, mathematics, and other core subjects will be taught.
In English Language Arts, direct instruction is associated with phonics reading instruction for a variety of
reasons, including the sequential nature of phonics instruction (e.g., moving from letter recognition to
letter/sound recognition to reading based on sounds) and emphasis on review and practice. Writing will be
led via direct instruction with the teacher modeling the writing process from start to finish. Math will also
be taught by teacher-centered direct instruction. Practice devices ensure student mastery of mathematical
facts and skills. Scripted lessons provide strategies for students to construct mathematical concepts. In-
class practice guided by teachers and frequent assessments are critical. Saxon Math emphasizes
incremental increases in knowledge development and continual practice and review.
Collaborative Learning
Excel Academy will also use collaborative instructional strategies for teaching and learning that involves
groups of students working together to solve problems, complete tasks, or create products. Students will
have opportunities for collaborative learning experiences based on the concept that learning is a naturally
social act in which the participants talk among themselves. Collaborative learning activities will vary
widely. Many will center on students’ exploration or application of the course material. Reading Mastery,
Core Knowledge Listening & Learning Language Arts, Writers Workshop, Saxon Math, Singapore Math,
and Core Knowledge History and Geography all provide ample opportunities for collaborative learning
and partner work. This includes long-term projects, which may require intense teacher preparation, or
those which require less preparation, such as posing a question and asking students to discuss their ideas
with their neighbors.
Excel Academy Public Charter School Amendment Application 23
Excel’s balanced literacy program has embedded opportunities for collaborative learning within its
lessons. The separate strands within Reading Mastery program allow teachers to customize and integrate
additional components and instructional practice more easily. The emphasis on guided reading and
authentic literature as the foundation for our reading comprehension program lends itself naturally to
collaborative learning, discussion, and student centered instruction. Guided Reading is a widely
recognized and highly successful balanced approach to reading and will allow us to vary our instruction to
the diverse needs and literacy levels of our student population. As literature is used to demonstrate and
practice comprehension, students will learn to question and find answers through the explicit teaching of
inquiry and investigation strategies and use a concept/question board to post questions to spur discussion.
Within this context, students will use strategies such as “think-pair-share” to promote an exchange and
discussion of ideas, perceptions, opinions, and predications. Incorporating this strategy teaches students to
be reflective and conscious of their own thoughts and helps them to recognize and gain appreciation for
the thoughts of others.
Saxon Math’s scripted lessons systematically distribute instruction and assessment throughout the
academic year. Multiple opportunities for collaborative learning will occur at the beginning of each Saxon
lesson which requires interactive activities including counting, calendar activities, graphing, and weather
tracking at the primary level and challenging dialogue where students are given opportunities to ask
questions and explain their reasoning as they progress through the grades.
Collaborative learning is at the heart of Writer’s Workshop approach to instruction. The teacher begins
each writing lesson with a short instructor-directed mini-lesson. Following the mini-lesson students
discuss sample model texts and writing samples with partners. While seated in a large group setting,
students often “turn and talk” with a partner and a particular aspect of published writing or their own
work. Writer’s Workshop teachers utilize model literature as exemplars for students to focus. During the
drafting, revising, and editing stages of the writing process, students work closely to conference with
faculty and peers. Students will share original writings, allowing students to benefit when exposed to
diverse viewpoints from people with varied backgrounds with varied experiences.
Self-paced Instruction
istation Reading is a data-driven reading intervention program for students in Pre-K through Grade 5.
istation Reading promotes reading acceleration and progress through a high-interest online interactive
curriculum. At the heart of istation is the ISIP – istation Indicators of Progress. This comprehensive
assessment is for developing readers and assesses all critical areas of early reading development
including: Phonemic Awareness; Alphabetic Knowledge; Vocabulary; Comprehension; and Fluency.
Excel Academy will use istation computer workstations as part of the daily curriculum for kindergarten
and first grade students. istation will also be made available for student use during literacy centers
through 5th grade. Students will use earphones to block distractions and attain a high level of engagement
in the istation program. In istation, students will also participate in leveled lessons, based on the system’s
most recent assessment, and are prevented from moving ahead until proficiency at a given level is
achieved. This instructional strategy allows teachers to work with students in very small reading groups
while other students complete computer-based lessons.
Teachers and administrators can track student progress in istation through reports that can be shared with
parents as well.
Hands-On
Experience Science modules encourage cooperative learning, collaboration, and hands-on activities to
encourage and promote divergent thinking and inquiry skill development. The investigative approach to
science content and topics gives students a depth of understanding and application. Engaging in science,
Excel Academy Public Charter School Amendment Application 24
mathematics, and literacy based content and concepts through exploration helps students develop the
necessary independent work skills, questioning strategies, and critical thinking necessary for success in
high school and college.
Project-Based Instruction
As appropriate, teachers will also use project-based instruction with older students to allow them to plan,
implement and evaluate projects that have real world applications that extend beyond the classroom. This
approach will motivate and challenge students to learn by allowing them to select topics that are
interesting and relevant to their lives. This vehicle for learning will provide additional strategies to
introduce a wider range of learning opportunities. Students may choose topics related to their own
experiences, allowing for more individualized learning styles.
Projects-based instruction and related assessments can enrich the lives of our students in multiple areas
including dramatic play, construction, painting and drawing by relating these activities to life outside
school. It will offer our older students opportunities to conduct first hand research in science and social
studies and to represent their findings in a variety of ways. The project-based approach creates a learning
environment where all learning is valued. Project-Based Instruction
d. Students with Exceptional Needs
Excel Academy provides high quality instruction to all students. For special education purposes, Excel
Academy continues to be its own Local Education Agency (LEA). We will comply with all provisions of
the Individuals with Disabilities Education Act (IDEA); Section 504 of the Rehabilitation Act of 1974;
and the Americans with Disabilities Act of 1990, Title II. Excel Academy ensures that students receiving
special educational services receive a Free and Appropriate Public Education within the Least Restrictive
Environment. Excel Academy will educate students with disabilities in the least restrictive environment
and with their non-disabled peers to the extent appropriate and allowed by each student’s individualized
education plan (IEP). Excel Academy will not discriminate in admission and enrollment against students
having or suspected of having disabilities. Special educators on staff will be responsible for evaluations of
students with special needs in a timely manner. Excel Academy will involve parents in the development
of and decisions regarding IEPs and implement appropriate procedures to ensure due process and resolve
disagreements or disputes. Excel Academy’s intensive focus and extended time in the core subjects,
supplemental supports, and individualized approach provide the best opportunity for all students,
including those with special needs, to progress academically within the regular education classroom. A
highly structured, disciplined environment where expectations are clear and supports are ample will serve
all students well, and most particularly, those students with special needs.
The school’s philosophy is that by minimizing the impact of disabilities and maximizing opportunities for
learning, all students can achieve high levels of academic success — an approach advocated by Thomas
Hehir, a nationally recognized expert on Special Education, professor at Harvard Graduate School of
Education, and former director of the U.S. Department of Education’s office of Special Education
Programs from 1993-1996. This approach is in keeping with the school’s mission of helping all students
achieve mastery of core subjects. As our student population increases so will the number of students
qualifying for special education related services. To ensure adequate support and resources, Excel
Academy will employ three full time special education teachers for the 2012-2013 school year. Related
services for Occupational therapy, Physical therapy, and speech/language therapy will be contracted
through Chesapeake Children's Therapy Center.
Identification of Students with Disabilities
Excel Academy will secure any existing IEPs and provide services accordingly. As part of the overall
focus on closely tracking student progress, teachers will carefully monitor student performance and
Excel Academy Public Charter School Amendment Application 25
identify students not progressing academically. A pre-referral process will be implemented for these
students and appropriate interventions will be determined to address apparent issues in order to get the
student back on track academically or behaviorally. If interventions do not succeed, the school will
recommend to the student’s parents that the student be formally evaluated. The request will identify the
reasons for the referral, including any applicable test results, reports, or records, outline interventions
implemented, and describe parent involvement in the Pre-referral Process. Initial evaluations, re-
evaluations, and revisions to IEPs will be conducted in accordance with federal law.
Implementation of IEPs
When a student has an IEP, Excel Academy’s special education teachers oversee the implementation of
required services by certified staff or licensed consultants. Services may include speech therapy,
occupational therapy, physical therapy, and counseling. A copy of the IEP will be provided to the
student’s parents and teachers to ensure complete understanding of the student’s needs and the services
being provided. Staff training will be provided to fully support the implementation of the IEP and the
academic success of the student.
Review, Re-Evaluation, and Revision of IEPs
If a student arrives at Excel Academy with an existing IEP that we believe will not allow the student Free
and Appropriate Public Education (FAPE) in the Least Restrictive Environment, we will implement the
IEP as written. We will then seek parental consent for a reevaluation, which may or may not revise the
IEP. As the student develops, staff will monitor progress and request re-evaluation of students as
appropriate; revisions to the IEPs will be made as needed. Staff will review each student’s IEP two times
each school year to evaluate any need to request modifications. Students’ with IEPs will be re-evaluated
at least once every three years.
Assessment of Students with Disabilities
Ongoing assessment of student progress is essential to school design. Students with IEPs will take
District, national, and internal assessments except in cases in which the student’s IEP states that students
cannot participate in such assessments. In these cases, alternative assessments will be administered as
required by law.
Reporting of Information Related to Special Education
Excel Academy will provide all reports required by law.
e. English Language Learners
Supporting English Language Learners
Excel Academy serves Limited English Proficiency (LEP) students in accordance with all applicable
Federal Laws and regulations. In serving students identified as having limited language proficiency,
educate students in Structured English Immersion (SEI) classrooms
Total immersion into mainstream classrooms from the beginning, often referred to as “submersion,”
works for very young children. LEP students respond well to a plan of instruction in which each aspect of
the language builds on another, with plenty of opportunities for practice. Our empirically based curricula
are designed for this methodology. The goal is for LEP students to gain fluency in English quickly. SEI
discourages the use of native language in educational settings and provides a more structured approach to
learning English. SEI blends English grammar and vocabulary instruction with the teaching of content.
Federal law expects school programs for LEP students to be based on sound educational theory, to
provide LEP students the opportunity to participate with the other students in the educational offerings,
and to show evidence of producing academic success. Excel Academy’s SEI program is designed to:
mainstream all LEP students; accelerate achievement since the program focuses on teaching English to
Excel Academy Public Charter School Amendment Application 26
learners from the beginning; ensure academic progress is continuous since content-area subjects are
taught; and continually assess LEP students’ academic progress.
Staff is responsible for overseeing learning strategies and support of LEP students in regular classrooms
by co-teaching with the classroom teacher for all content-based learning. Faculty will receive professional
development to enhance skills in working with LEP students.
Identification of Limited Proficiency Students
In compliance with the U.S. Department of Education Office for Civil Rights (OCR) requirements, when
a student enrolls at Excel Academy, her parents will complete a language questionnaire, written in
languages most likely spoken by the parent. If a parent provides a single affirmative answer to whether
the child learned to speak a language other than English first, whether the child currently speaks a
language other than English, or whether a language other than English is spoken in the home, the child
will be classified as primary home language other than English (PHLOTE). The child may have spent
only his/her infancy in a foreign country, foreign-born grandparents may be living in the home, or perhaps
members of the family are learning a foreign language together. Such situations may not have a negative
impact on a child’s ability to speak English and should not lead to a child being placed in a program for
LEP students. Excel Academy will administer an Oral Language Proficiency Test to those students whose
parents answered affirmatively to any question on the language questionnaire before school commences.
Implementation of Structured English Immersion
All LEP students will be in regular classrooms for instructional time to the greatest degree possible. Our
curricula allow for teacher-centered direct-instruction programs, which are geared to all literacy learners,
especially LEP students.
Assessment, Monitoring, and Exit Criteria for LEP Students
LEP students will be assessed annually. Students who score above the established cut-off point will be
deemed no longer LEP, while those who score below the cut-off point will continue to be classified as
LEP. Preschool and pre-kindergarten students should be proficient within one school year. A student who
is not proficient within that time will be tested for language-learning disabilities by appropriate staff.
f. Strategies for Providing Intensive Academic Support
Excel Academy begins with pre-school, pre-kindergarten, and kindergarten. After our first year of
enrollment, the primary entry point is at the pre-kindergarten level children; our goal is to prevent
students from falling behind. Through the effective and efficient implementation of an academic program
based on a rigorous academic study which concentrates on reading, writing, and mathematics, Excel
Academy will develop students who demonstrate skill and knowledge mastery and score at a proficient
level on standardized assessments. This is the expectation for all students, even those with skills
significantly below grade level. Students will be evaluated within two weeks of starting school and this
data will establish a baseline of academic performance and will provide longitudinal measurement of
future growth; critical data on students’ knowledge and skill sets will inform class and group assignments.
Differentiated instruction in class will address knowledge and skill set deficits and the need for
remediation; more intensive need for student learning supports will be provided through push-in and pull-
out interventions.
Excel Academy will establish an after school tutoring programs and a Saturday Academy. The Saturday
Academy will provide academic, physical and cultural enrichment programs: swimming lessons, soccer
meets, field hockey, tutoring, special field trips (museums, plays, and concerts). We will use partnerships
with the Junior League of Metropolitan Washington to assist with these programmatic initiatives.
Excel Academy Public Charter School Amendment Application 27
Students assigned mandatory Saturday Academy will be tutored based on individualized need and as
indicated by test results. Students will be assigned tutoring sessions with student teachers or retired
teacher volunteers and will be frequently assessed to determine on-going need for tutoring or other
support. The student’s primary teachers will evaluate student performance as a result of the enrichment
programming.
In an effort to address the learning “gaps” of children who live in poverty, Excel Academy will have an
extended school day, school week and school year. The school calendar and schedule can be found in
Appendix A.
3. Student Performance
a. Student Progress and Achievement
Excel Academy will assess student learning frequently to gauge progress toward all academic goals as
outlined in the school’s Accountability Plan. We will use assessments to provide multiple measures of
absolute scores, identify within-year student gains and losses, and evaluate year-to-year student gains and
losses by looking at each cohort’s educational progress.
The data generated from internal and external assessments will inform instruction and instructional
practices and pacing will be modified per reported student performance data. If a majority of students are
not performing adequately as indicated by built-in lesson student assessments, lessons will be re-taught.
The Principal, Instructional Coach, and Data Analyst will work closely with teachers who are having
challenges in particular areas. Professional development institutes will focus on the use of data analysis to
inform and modify lesson plans and instruction. Grade level team meetings will provide weekly support
for this strategy. The Principal, Instructional Coach, and Data Analyst will work with individual teachers
who are experiencing difficulty getting students to master knowledge and skill sets as indicated by student
assessments. Ongoing assessments compared to baseline data will measure student learning
longitudinally, both for individual students and cohorts of students. Frequent assessments will identify
both student and teacher strengths and weaknesses. Instruction will be modified to accommodate the pace
of learning. When too many challenges surface in an individual classroom, the Principal will work with a
teacher on a daily basis to move class progress to expected levels. If progress does not gain traction in a
timely fashion, The Principal, Instructional Coach, and Data Analyst will develop a course of action for
the teacher: a plan to be implemented and evaluated weekly blocks for a three week period. If progress is
not adequate as indicated by student data, additional interventions and program supports will be provided:
the Instructional Coach and grade level team leader will develop weekly lesson plans with the teacher and
model best practices for classroom instruction.
District of Columbia Comprehensive Assessment System (DCCAS)
Excel Academy will administer the District of Columbia Comprehensive Assessment System (DCCAS)
at all grade levels required. The DCCAS will provide a criterion referenced assessment measure that will
allow us to evaluate the degree to which students are learning the District’s curriculum standards and thus
the efficacy of our educational program. The DCCAS will also provide a comparative measure, allowing
us to compare our students’ academic achievement against that of students in all other public District
schools. Analysis of student performance will be shared with students, teachers, administrators, and
parents. School leadership will collect reliable data to evaluate progress towards meeting the standards
established by No Child Left Behind, the District of Columbia Public Charter School Board and Excel
Academy’s Board of Trustees.
Excel will administer the PARCC Assessment in place of the DCCAS in 2014.
Excel Academy Public Charter School Amendment Application 28
Terra Nova
As a nationally normed assessment, the Terra Nova will be used for pre- and post-testing students each
year beginning in Kindergarten. The Terra Nova will provide a benchmark of student achievement at the
start of the year, and provide a measure of longitudinal growth per individual student and per cohort. The
reading subtest measures the spectrum of reading components from recognizing sounds to word
identification, and from vocabulary skills to comprehension. The math subtest measures content and
processes adapted from the new National Council of Mathematics Principles and Standards for School
Mathematics (PSSM) and public school District standards including: number sense and operations;
patterns, relationships, and algebra; geometry and measurement; and data, statistics, and probability. The
language subtest measures student achievement in effective writing, word, and sentence-level skills. The
separate spelling subtest assesses objectives based upon phonetic and structural principles. The listening
subtest assesses both listening vocabulary and listening comprehension. Science and social science
subtests measure disciplines of life science, earth science, physical science, and concepts important for
the development of citizenship respectively.
mCLASS, DIBELS, TRC, and Math
The Dynamic Indicators of Basic Early Literacy Skills (DIBELS), used for the youngest students, will be
administered individually to assess early literacy development. Pre-testing will ensure appropriate
placement and curriculum alignment for individual students; this will be important to identifying and
addressing student weaknesses before they become more severe problems that impede learning.
The Text Reading Comprehension (TRC) assessment provided Fountas and Pinnell reading levels for
each student while giving additional details on their fluency and accuracy while reading. And the
mCLASS Math assessment evaluates fluency on K-3 math skills including number facts, computation,
missing numbers (patterns), and concepts. All of the mCLASS measures and norm-referenced and
provide proficiency score banding allowing for strategic intervention with struggling scholars.
DCCAS, Terra Nova, and mCLASS will allow Excel Academy to gather multiple measures of student
achievement, identify within-year student gains and losses, and evaluate year-to-year student gains and
losses by looking at cohort educational progress. Excel Academy will also assess student learning using
GRADE and GMADE assessments as formative, diagnostic assessments.
Brigance Inventory of Early Development II (IED-II)
For Preschool and Pre-kindergarten students, we will administer both the norm-referenced (standardized)
and the criterion referenced versions of the Brigance IED-II. The standardized version will be
administered once a year as an achievement measure, determining if students are at or above their age
equivalency in pre-reading and early mathematics. And the criterion-referenced version will be
administered throughout the school year to monitor students’ development in a variety of domains,
including academic-cognitive development, physical development, and language development.
Internal Assessments – PS to 8th Grade The internal assessment system will include graded pre- and post-tests (focused on specific baseline
knowledge/skills and measures of progress/skill) in all core subjects and that include comprehensive
examinations, informal assessments, quizzes and tests, and homework. This internal assessment structure
provides school leadership and faculty a picture of student academic skill acquisition. Data from these
assessments are constantly evaluated and curricula adjustments are made as required.
Comprehensive Examinations. A teacher-created common summative assessment will be
administered as a diagnostic at the start of school to establish a baseline for student knowledge
and skill. At the start and end of every unit, teachers will administer a common formative
Excel Academy Public Charter School Amendment Application 29
assessment as a pre-test and post-test to guide instruction and re-teaching. These examinations
will be oral for Preschool and Pre-Kindergarten, oral and written for Kindergarten and 1st grade,
and written for 2nd
-8th grades. The common formative and summative assessments will be
created by grad-level chairs during a summer institute for curriculum development.
Informal Assessments. Informal teacher-created observation tools used to record students’
social, emotional, cognitive, and physical development will be conducted on a weekly basis.
These anecdotal records will provide an additional snapshot of each student. This information
will be used to track individual student growth and development and identify both academic and
nonacademic problem areas.
Quizzes and Tests. These weekly assessments are a regular part of the academic program. Both
quizzes and tests will be administered to determine skill acquisition and levels of mastery. The
majority of tests will use a combination of open-ended and multiple-choice questions.
Homework. Homework is viewed as a critical element of the learning process at Excel
Academy. Teachers will rely on homework to reinforce understanding of concepts introduced and
discussed in class and to ensure fluency in the material. Each day, homework will include
(depending upon grade) at least 15 minutes of reading.
b. Gateway Measures
Excel Academy will use student performance on content and performance assessments as the basis for
grade to grade promotion from preschool to 8th grade. Data will be collected regularly and analyzed
thoroughly by the Principal, Instructional Coach and Data Analyst to determine whether instructional
methods are effective in promoting student learning. We believe students should be promoted when they
have demonstrated mastery of academic standards. Excel Academy is founded upon the understanding
that promoting students to the next grade because of their age rather than their knowledge and skills, as
evidenced in their ability to do the work, damages students in the long run. To build a culture of learning
and achievement, and to hold students accountable for their own efforts in their education, Excel
Academy will implement a strict promotion policy. For students to be promoted to the next grade,
students will pass core academic subjects with a minimum 75% average or higher.
Promotion Policy
Assessment
Student progress towards mastery in all basic skills shall be assessed on at least a weekly basis. The
assessment data will be used to both tailor instruction and to maintain a record of skill acquisition. If a
student does not meet benchmarks for success, a conference will be held with the student’s family as the
student is in jeopardy of repeating the grade. Any student in danger of repeating a grade will be informed
by the end of the second trimester marking period.
Grades
Every student is required to achieve a 60% average in all subjects. Grades are formally issued four times
per year and, if a student is not achieving this average, a conference is held with the family. The family is
encouraged to support the child; faculty members and other instructional staff will work with the student
to ensure the student has all the necessary resources to achieve at least a 60% average in all subjects
Nonacademic Goals
Through our character development program, the Code of Conduct, and our discipline policy, students are
expected to learn, apply, and demonstrate the values, habits and practices expected of an Excel student.
Students are expected to score in the top levels of the IDEALS rubric.
Excel Academy Public Charter School Amendment Application 30
Progress Reports
Each Friday, students and their parents will receive progress reports and graded student work in student
folders. These folders will contain student work for the week. Teachers will be available to discuss the
progress report with the students and families. Parents will be asked to sign and return the progress
reports and all graded school work. Teachers will maintain school folders with student progress reports,
journals and graded assignments. Teachers will meet regularly with the Principal and Instructional Coach,
to review student performance and discuss student academic performance, class participation,
engagement, effort, ability to follow directions, and organization. The Principal, Instructional Coach, and
teachers will identify students in need of intervention and work out intervention strategies as needed.
c. Leading Indicators
Excel has developed a robust and comprehensive attendance policy. At the start of every academic year,
during our Orientation day, we outline what is expected of our families so that they understand the vision
and purpose of the school, the elements that guide its educational philosophy and its extended day and
year format. During this time we have direct one-on-one meetings with family members of re-enrolling
scholars who struggled with attendance the previous year. Our policies are reviewed and family members
are required to sign an acknowledgement of understanding.
The Policy for attendance can be found in Appendix B. This is included in the Parents and Student
Handbook that is provided to every family.
Excel has consistently had a re-enrollment rate above 90%
4. Support for Learning
a. Parent Involvement
The U.S. Department of Education found that children achieve at higher academic levels, attend school
more regularly, complete more homework, graduate from high school at higher rates, and are more likely
to enroll in higher education when their families are meaningfully involved in their education. 15
Excel
Founders will work to ensure that families have the knowledge, skills and supports to be full partners in
their children’s educational success. We will work with other parent serving organizations to prepare
parents to advocate for equitable opportunities for their children. Effectively engaging parents and
families in the education of their children has the potential to be far more transformational than any other
type of education reform. The only other factor of similar significance is the impact of fully qualified,
certified classroom teachers.16
Excel will establish from inception a strong partnership between the school
and the parents focused on the individual child’s learning. Excel views parents as partners in their child’s
early learning; indeed, they are the first teachers. Two parents will serve as members of the Board of
Trustees. Parents will continue to be invited to school events and encouraged to participate as they are
willing. No student will be penalized for her parent’s failure to participate; however, in those instances
where there are concerns about abuse, neglect or other severe circumstances, referrals will be made to the
appropriate authorities.
Parents will be asked to sign a Family School Covenant, a written commitment to help their daughters
become scholars and responsible citizens of the community. Our Family-School Covenant makes
expectations clear regarding attendance, timeliness, uniform compliance, homework support and sign off,
15
Strong Families, Strong Schools (U.S. Department of Education, 1994) 16
Trumbull, E., Rothstein-Fisch, C., Greenfield, P. M., & Quiroz, B. (2001). Bridging cultures between home & school.
Mahwah, NJ: Erlbaum.
Excel Academy Public Charter School Amendment Application 31
school communication, the discipline code, and IDEALS values. The Covenant will be discussed with
families in a detailed manner to ensure that roles and responsibilities are understood. Teachers and school
leaders will sign each covenant as well.
School-family interactions also include:
Community information meetings, during the planning year, with potential parents to share a
detailed vision of the school and incorporate the input of parents;
Enrollment meetings with school leaders to ensure that the family understands the vision and
purpose of the school, the elements that guide its educational philosophy and its extended day and
year format.
Orientation sessions prior to the start of the school year explaining Excel’s unique single-sex
culture, information on the educational program and on parental responsibilities as partners in
their child’s learning.
Weekly student progress reports for preschool, pre-kindergarten, kindergarten, and 1st Grade. In
Grades 2-8, reports will inform parents about their daughter’s progress every two weeks.
Parental review of homework and graded assignments (quizzes, tests, projects). Parents will be
asked to sign and return the graded work to school. Teachers will save signed work in student
portfolios.
Parent teacher conferences throughout the school year.
Participation in the PCC and observation or participation in the classroom.
Excel sends home monthly newsletters and weekly student progress reports. The school’s annual report is
be made available to all families and will describe our educational program, progress toward the goals
identified in our accountability plan, financial health, teacher qualifications, and other related issues.
Meeting the No Child Left Behind (NCLB) Parental Information Requirements Excel reports on the adequate yearly progress of students as required by NCLB. Excel will serve as its
own Local Education Agency (LEA). We disseminate information as required, disaggregated by
subgroups, citing the percentage of students tested and giving the percentage of students not tested. The
information will indicate the student performance, i.e. advanced, proficient, basic and below basic. Excel
will include the NCLB data in a special newsletter to parents, in parent/teacher conferences, and in its
public Annual Report. Excel will comply with NCLB regarding the parents’ “right to know” provisions
on teacher qualifications, including the right to request and receive information about the professional and
educational background of the teacher instructing their child and notification when their child has been
taught for four or more weeks by an instructor who is not “highly qualified.”
b. Community Participation
Excel augments its rich academic program with cultural enrichment opportunities for students funded
through grants and individual donations. We use the resources of founding members to access a variety of
private funding opportunities.
c. School Organization and Culture
Excel creates a school environment where all school stakeholders feel a sense of ownership and pride in
academic, social, and organizational achievements. Excel will foster cooperation between and among
students, staff, families and the broader community. We want students to learn the joy of hard work,
doing well and having fun. We want parents to be a part of these efforts and reinforce these values at
home; we also want parents to be an integral part of a supportive school culture.
Excel Academy Public Charter School Amendment Application 32
Teachers are supported through training and development opportunities and expect that these efforts will
contribute to high retention rates. We will strive to keep class size to approximately 20-25 students,
allowing a favorable adult to student ratio.
Our staff has deep knowledge of early childhood development and the positive energy needed to work
with young children. Staff will participate in Professional Development Institutes (PDIs) throughout the
school year to improve and increase their knowledge and skills, especially in the areas of student
performance data analysis and language and literacy with the young learners.
The school culture will be developed to increase the likelihood of student success and pride in social and
academic achievement. We want students to develop cooperative behaviors, a sense of personal and
community responsibility, and the academic and social skills that reflect growth, development and
progress. Excel Academy will create an orderly and predictable learning environment to minimize the
loss of instructional time. We have implemented a uniform lesson plan format and blackboard
configuration to reduce time lost to student confusion and a strict, clear consistently enforced code of
conduct.
Furthermore, at Excel Academy we focus unrelentingly on the details. This thinking aligns with John
Wilson’s Broken Window Theory: “if the first broken window in a building is not repaired, then people
who like breaking windows will assume that no one cares about the building and more windows will be
broken. Soon the building will have no windows.” 17
Staff addresses minor infractions to ensure that they
do not become larger dilemmas. Disrespect of other students and staff will be immediately addressed;
students will receive warnings for both verbal and no verbal signs of disrespect. All staff consistently
enforces a clearly identified and enforced code of conduct.
Classroom Organization
Classrooms are systematically designed and will feature high quality student work on display, along with
the IDEALS, a schedule for the day, the calendar for the month and the duty chart. Students have age-
appropriate duties: passing out papers, collecting papers, passing out snacks, erasing the board, etc.
d. Extracurricular Activities
Excel’s extended school day structure makes it possible to implement a variety of extracurricular
activities that will help reach our mission:
1. Nutritional programs: Breakfast and daily snacks are provided to all students free of charge
2. Academic and non-academic program integration: Excel works with a range of community
partners to provide a variety of enrichment activities including dance, music, and physical fitness
for students.
3. Physical fitness: Students have daily recess block which provides opportunity for free play.
4. Gardening: We will include a garden to relate children’s learning about science and the natural
world to nutritional outcomes and goals.
e. Safety, Order, and Student Discipline
Excel continues to foster environment of academic excellence and achievement, civility, personal safety
and caring. Staff training will include techniques that help support and reinforce good citizenship in very
young children, training on how girls develop, and discussions about best practices for teaching girls.
Guiding the behavior of young children involves establishing mutual respect and expecting cooperation.
17 Wilson, James Q., Kelling, George E., Broken Windows: The Police and Neighborhood Safety, Atlantic Monthly, March 1982
Excel Academy Public Charter School Amendment Application 33
Effective discipline is positive and child-focused. It encourages self-control and appropriate behavior.
Through effective discipline, children can learn to make positive choices, learn problem-solving skills,
and learn values of respect and responsibility. Adults teaching and working with young children often
need specific training and tools in focusing on behavior without undermining the personhood of the
child.18
A variety of additional strategies will be used by Excel to address ongoing safety, order, and discipline
issues:
Parent drop off and pick up of children.
Requirements for staff including nationwide background checks and all other safeguards as
required by law and as referenced in the human resources section.
Training for staff in child abuse laws and designated reporting requirements.
Plans for disaster and communication with parents in place and practiced, with advice and
participation of local and city police, fire other emergency officials.
Plans for school entry.
Violence intervention strategies.
Cooperation with police, fire, and other organizations committed to individual and public safety.
Excel will feature a clear set of consequences linked to behavior that undermines student success and is
based on immediately addressing and correcting minor infractions. Our goal is to create a school culture
where minor infractions are immediately addressed to preclude the onset of larger, more challenging
behaviors that could require suspension or expulsion.
The managing Discipline Policy for suspension, expulsion and withdrawal can be found in Appendix B.
This is included in the Parents and Student Handbook that is provided to every family.
f. Professional Development for Teachers, Administrators and Other School Staff.
Professional Development (PD) Philosophy
Excel will implement an internally created professional development program to meet goals using both
original in-house programs as well as training offered in conjunction with curricula (e.g., Jolly Phonics
and Reader & Writers Workshop) as the school’s budget allows. As appropriate, we will identify faculty
who have developed effective practices and share their experiences and expertise to train their colleagues.
We will use and cultivate staff leadership for professional development which will allow financial
resources to remain in-house, ensure the professional development program is relevant to staff needs, and
provide staff opportunities to develop additional skills by training colleagues. The Chief Academic
Officer, Principal, and Dean of Culture will identify consultants to train staff on best practices. When
teachers need additional support, The Chief Academic Officer, Principal, and Dean of Culture will work
with the teacher for a period of time. Excel will support two levels of Professional Development: the
Administration Level and Staff Level
Summer Professional Development Institute
Our summer professional development begins three weeks before students arrive and will focus on three
key areas: Culture Building, Teaching and Learning, and Administrative Procedures. The Chief
Academic Officer, Principal, and Dean of Culture will model school culture, discuss faculty and staff
culture, academic expectations, and parent and family relationships. A significant amount of professional
development will focus on how to evaluate student performances thorough reviewing and analyzing
student performance data. The Chief Academic Officer, Principal, and Dean of Culture will develop and
instruct data analysis modules for PDs; these efforts will be designed for teachers to assist in the
18 Practical Guide Solving Preschool Behavior Problems 5th Edition By Eva Essa, Ph.D. ISBN: 0766830772
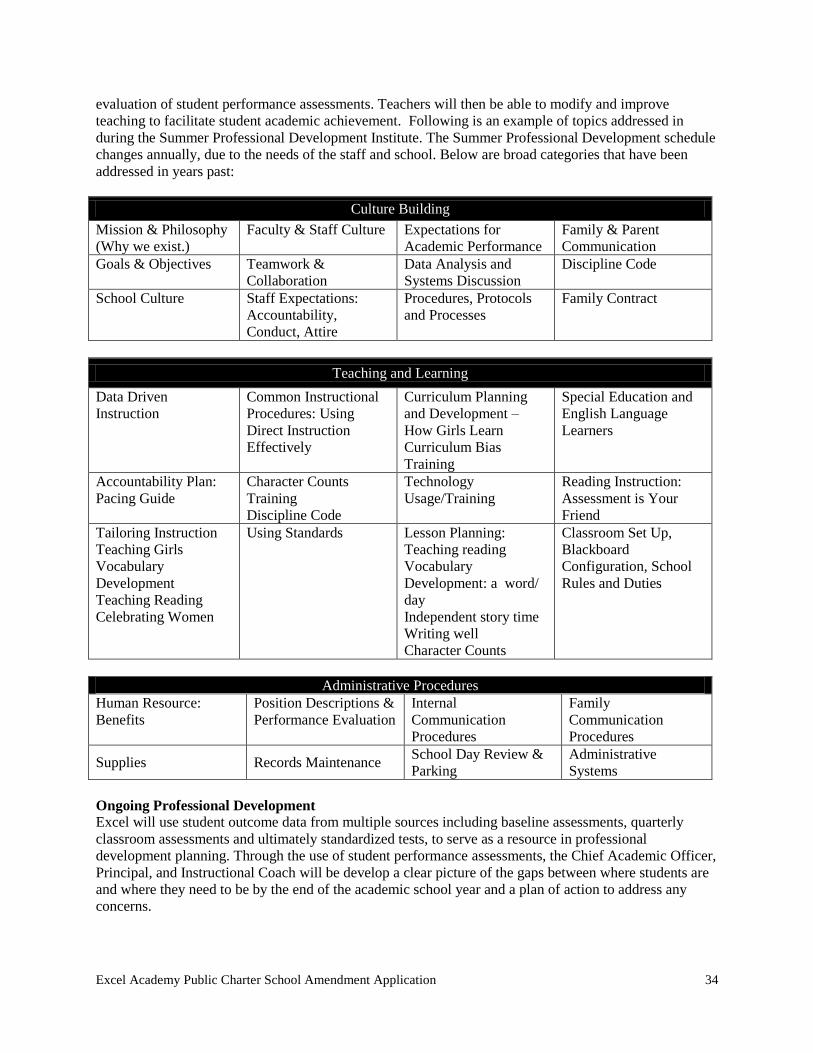
Excel Academy Public Charter School Amendment Application 34
evaluation of student performance assessments. Teachers will then be able to modify and improve
teaching to facilitate student academic achievement. Following is an example of topics addressed in
during the Summer Professional Development Institute. The Summer Professional Development schedule
changes annually, due to the needs of the staff and school. Below are broad categories that have been
addressed in years past:
Culture Building
Mission & Philosophy
(Why we exist.)
Faculty & Staff Culture Expectations for
Academic Performance
Family & Parent
Communication
Goals & Objectives Teamwork &
Collaboration
Data Analysis and
Systems Discussion
Discipline Code
School Culture Staff Expectations:
Accountability,
Conduct, Attire
Procedures, Protocols
and Processes
Family Contract
Teaching and Learning
Data Driven
Instruction
Common Instructional
Procedures: Using
Direct Instruction
Effectively
Curriculum Planning
and Development –
How Girls Learn
Curriculum Bias
Training
Special Education and
English Language
Learners
Accountability Plan:
Pacing Guide
Character Counts
Training
Discipline Code
Technology
Usage/Training
Reading Instruction:
Assessment is Your
Friend
Tailoring Instruction
Teaching Girls
Vocabulary
Development
Teaching Reading
Celebrating Women
Using Standards Lesson Planning:
Teaching reading
Vocabulary
Development: a word/
day
Independent story time
Writing well
Character Counts
Classroom Set Up,
Blackboard
Configuration, School
Rules and Duties
Administrative Procedures
Human Resource:
Benefits
Position Descriptions &
Performance Evaluation
Internal
Communication
Procedures
Family
Communication
Procedures
Supplies Records Maintenance School Day Review &
Parking
Administrative
Systems
Ongoing Professional Development
Excel will use student outcome data from multiple sources including baseline assessments, quarterly
classroom assessments and ultimately standardized tests, to serve as a resource in professional
development planning. Through the use of student performance assessments, the Chief Academic Officer,
Principal, and Instructional Coach will be develop a clear picture of the gaps between where students are
and where they need to be by the end of the academic school year and a plan of action to address any
concerns.
Excel Academy Public Charter School Amendment Application 35
Through the disaggregation of data, clear indicators of students’ strengths and weaknesses will be
highlighted, thereby making skill mastery and deficits more apparent for instructional use. This will
allow the Principal and DSS to plan and facilitate professional development sessions around research-
based strategies that support and promote support continuous academic growth. Excel will consistently
use data to inform instruction, develop practice lessons, and re-teach lessons as indicated by student
performance data.
During the academic year, we will have day-long professional development sessions for teachers based on
ongoing teacher observations, weak areas in student data, and areas for growth as identified in teachers’
Individual Professional Development Plans. These PDs will most-often focus on data-driven instructional
practices that ensure student achievement and will be delivered by the Chief Academic Officer, Principal,
and Instructional Coach.
Twice each month, staff will come together to model effective practices, review and refine policies
directly impacting classroom instructions. The Chief Academic Officer, Principal, and Instructional
Coach will guide faculty in refining instructional practices to more effectively deliver literacy instruction.
They will also develop and improve team teaching models and review the effective use of data assessment
to promote student achievement. Other topics for the professional development program will be selected
from formal and informal classroom observations and themes.
In addition, staff will be encouraged to pursue independent professional development opportunities.
Tuition reimbursements will be offered as incentives. Staff evaluations will include a component related
to upgrading professional credentials. Staff evaluations will be informed by student performance data.
The school’s three-instructor model provides opportunities for in-class practicum in professional
development, as teachers (and aides) mentor and learn from one another.
g. Structure of the School Day and Year
Excel offers an extended day and extended calendar schedule in order to maximize learning opportunities
for students. The school day begins with breakfast and ends with an integrated curricular and extra-
curricular program. Students will attend school 192 days per year.
Excel Academy Public Charter School Amendment Application 37
B. Business Plan
1. Planning and Establishment
a. Profile of Board of Trustees
Kaye Savage - Founder & CEO
Kaye Savage began her career as a certified special education teacher working with low-income students
in Prince George’s County, Maryland. Her passion to make a difference led to policy research work at the
Urban Institute and later into the public service arena concentrating on local and federal government
programs targeting urban economically distressed communities. Kaye worked in the White House on the
Historical Black College and Universities (HBCUs) Initiative. Most recently, she served the Program
Manager for the District of Columbia Family Education Network, a special parent training initiative of
Fight for Children. She has also worked as the National Director for the 21st Century School Fund and as
special Project Manager on a staff augmentation contract in the Office of Facilities Management of the
District of Columbia Public Schools. Kaye began her college education at Mary Washington College of
the University of Virginia and completed her undergraduate work with high honors at Howard University
where she also earned a Master’s of Science degree with distinction with a concentration in
developmental psychology. Kaye was an Intergovernmental Fellow during her tenure at the Department
of Housing and Urban Development and earned her MPA from the University of Southern California.
Kaye is a Building Excellent Schools Fellow and member of the Board of Trustees for the National
Coalition of Girls’ Schools.
Vito John Germinario – Chairman of the Board
Vito Germinario is the President/Partner of the architectural wall systems company GPR, Inc. in McLean,
VA. He also is the managing partner of Trinity Partners, LLC, a McLean consulting group. Throughout
his career, Mr. Germinario has held major leadership positions in architectural wall systems companies in
Maryland, New York, and New Jersey. Some of his partnership projects include: Andrews Air Force
Bard Visitor’s Quarters, Baltimore-Washington International Airport, Bicycle Transit Center, Herbert
Hoover Building Renovation, International Monetary Fund, The Ronald Reagan Building, World Bank
Restoration and Renovation, IBM Corporate Headquarters, and Pennsylvania Station Central Control.
Mr. Germinario is also a member of the National Italian American Foundation, St. Peter’s Preparatory
School, and the Friends of Jaclyn Foundation, an organization that seeks to improve the quality of life for
children suffering from brain tumors by pairing them with high school and college athletic teams.
Malcolm Poole – Vice Chairman
Malcolm Poole is a professional educator with more than 13 years of experience. Currently, he works in
education policy as a Senior Project Associate for the National Association of State Boards of Education
(NASBE), where he oversees national initiatives to improve student achievement, increase graduation
rates and improve student fitness, health and well-being. Mr. Poole specializes in working with at-risk-
youth and special needs students. Prior to joining NASBE he worked in various administrative capacities,
most recently as an Assistant Principal and Dean of Students in the District of Columbia Public Schools.
He began his education career as a Special Education Teacher in Camden, NJ.
Mr. Poole received dual Bachelor of Arts degrees in Criminal Justice and Spanish from Mount Saint
Mary’s College, where he still holds national titles in Track and Field. He also holds a Master of Arts in
Education Leadership from George Mason University. He is the father to one very bright and precocious
7 year old little girl, the apple of his eye. Committed to improving the lives of youth, Poole mentors
several young-men and works with youth to improve their health and physical condition through exercise
Excel Academy Public Charter School Amendment Application 38
and nutrition. Recently appointed to serve as a member of the Board of the Excel Academy for Girls,
Poole is pleased to share his knowledge and resources with the Academy and its students.
Meridel Bulle-Vu - Secretary
Meridel Bulle-Vu is a staff attorney in the Family Law Unit at the Legal Aid Society of the District of
Columbia. Prior to joining Legal Aid, Ms. Bulle-Vu was the recipient of the Georgetown/Howrey Pro
Bono Fellowship at Howrey LLP, where she represented clients exclusively on pro bono matters. Ms.
Bulle-Vu has also worked as a law clerk at the Lawyers' Committee for Civil Rights Under Law, the
National Health Law Program, and The Door - Legal Services. During law school, Ms. Bulle-Vu was a
student attorney in the Juvenile Justice Clinic, defending youth accusing of misdemeanors and felonies in
the District of Columbia. She was also a Note and Comment Editor for the Georgetown Journal on
Poverty Law and Policy. Prior to law school, Ms. Bulle-Vu worked as a researcher at the Center for
Research on Child Wellbeing at Princeton University.
Ms. Bulle-Vu graduated from Princeton University, cum laude, with a Bachelor of Arts degree in the
Woodrow Wilson School of Public and International Affairs. She received her Juris Doctorate cum laude
from Georgetown University.
Michael T. Vu – Treasurer
Michael Vu is an associate in the U.S. Real Estate Acquisitions group of The Carlyle Group. Previously,
Mr. Vu was an analyst in the real estate investment banking group at Lazard Frères & Co. in New York.
He worked on major strategic advisory assignments, special committee advisory assignments and real
estate portfolio sales. Mr. Vu had extensive experience in the mortgage financing, senior housing, office
and land development sectors and has completed assignments for multi-billion dollar affordable-mortgage
financing, lodging, and office companies. Prior to joining Lazard, Mr. Vu had spent time with the
National Geo-Spatial Intelligence Agency and the National Telecommunications and Information Agency
within the U.S. Department of Commerce.
Mr. Vu graduated magna cum laude degree from Princeton University where received his Bachelor of
Arts in Political Science with certificates in Finance and American Studies
John Barron
John Barron serves as the President of Foulger-Pratt Contracting, LLC. Previous to his present position,
Mr. Barron was the Washington D.C. Division President of Manhattan Construction Company.
Throughout his twenty-eight year career in the construction industry, John has contributed to a number of
high-profile projects in nearly every capacity. His work has been widely recognized and praised. He was
influential in the management, construction and/or development of many notable metro area projects,
including work at the U.S. Capitol Visitor Center, Portals, the George Washington University
replacement hospital, the Columbarium at Arlington National Cemetery, FDR Memorial Forecourt, the
Pope John Paul II Cultural Center, and renovations to the Jefferson Memorial and National Gallery of Art.
At the beginning of his career, John served seven years on active-duty as an officer in the U.S. Army
Corps of Engineers. His service included project management for several major Department of Defense
construction projects at Fort Belvoir for which he received an Army Commendation Medal for superior
performance. He also has experience in local school construction and it was under his leadership that both
the Bell Lincoln Multicultural School and Randle Highlands Elementary School addition were built. John
received a Master of Business Administration Degree from Virginia Tech and a Bachelor of Science
Degree in Chemical Engineering with Distinction from the University of Virginia.
Bridget Bond
Bridget Bond, a professional administrative manager with more than 25 years of experience, works at a
law firm, where she serves on the Public Policy Committee and coordinates various morale boosting

Excel Academy Public Charter School Amendment Application 39
events for the team. Previously, Ms. Bond worked in the Procurement and Legislative Affairs fields in the
federal government.
She serves as a volunteer Girl Scouts of America, Daisy Troop Leader. For more than 10 years, Ms. Bond
has been a mentor for teenage girls and at-risk-youth, working to strengthen families and give our youth a
voice. Ms. Bond is the mother of two children, one of whom is a first grade scholar at Excel.
Determined to make a difference in the lives of not only her children but of the youth especially girls, Ms.
Bond continues to display her commitment to education. Ms. Bond is thrilled to contribute her knowledge
and time to Excel and our scholars.
Valerie Holt
Valerie Holt is the Vice President for Audit for the Metropolitan Washington Airports Authority. Her
responsibilities include providing audit services to ensure that the Metropolitan Washington Airports
Authority has an effective system of internal controls for its accounting, finance, administration,
operations and technology management. She also oversees the conduct of the annual financial statement
audit.
Ms. Holt previously served as the Chief Financial Officer and the Controller for the District of Columbia,
as a Director for the District of Columbia Financial Responsibility and Management Assistance
Authority, and as a Deputy Director for the District of Columbia Public Housing Authority. Her 30 years
plus work experience also includes eight years of public accounting experience including two "Big Four"
firms. Mr. Holt holds undergraduate degrees from George Washington University (B.A in accounting)
and Eastern Michigan University (B.S. in Sociology) and a Master Degree in Social Work from the
University of Michigan. Ms. Holt is the President of the Association of Airport Internal Auditors. She is
a member of the American Institute of Certified Public Accountants, the Internal Audit Institute and the
Associate of American Airport Executives. She is the past president and state representative for the
Greater Washington Area Government Finance Officers Association. Ms. Holt also served as the past
chairman of the Committee on Auditing and Financial Reporting and as the President of the Black Caucus
of the Government Finance Officers Association of North America.
Elizabeth Davenport Hughes
Elizabeth Davenport Hughes serves as the Advisory Board’s Managing Director of Business Intelligence
Services where she is responsible for the company’s newest product introductions in the broader
healthcare sector. Prior to assuming her current role, Liz led the launch of the Advisory Board’s third
business division, the Advisory Board Academies from 2001-2006. The company’s most successful new
product launch to date, the Nursing Leadership Academy, was Liz’s primary responsibility beginning in
2001. Liz serves as the firm’s leading expert on management and expansion of the largest health system
contracts with the firm’s most progressive and valuable clients.
Elizabeth graduated from Vanderbilt University in 1995 with BS in Human and Organizational
Development. She was selected to continue her studies in the United Kingdom at Cambridge University,
allowing her to serve a formal internship at Cambridge’s Madingley Hall with a dedicated focus on
expanding their Legal Studies continuing education programs.
Audwin Levasseur
Audwin Levasseur holds a B.S. in Administrations of Justice, and a B.A. in African American Studies
from Rutgers University. He received his J.D. from Columbia Law School in New York. While at
Columbia, Mr. Levasseur served as the Northeast Regional Director for the National Black Law Student's
Association and was an associate editor for the Human Rights Law Review. Currently, Mr. Levasseur is
an associate with the antitrust practice group at Skadden, Arps, Slate, Meagher & Flom LLP in
Washington, D.C. His strength lies in entrepreneurial business development and fundraising. Mr.
Excel Academy Public Charter School Amendment Application 40
Levasseur's expertise in research, analysis, and law is particularly valuable to the Excel Academy team.
He resides in Ward 8 of the District of Columbia.
Advisory Board Members
Deborah Lockhart
Ms. Lockhart’s expertise lies in the areas of human resources, marketing, and technical services. She has
successfully launched and operated programs for corporate entities for more than two decades. Among
the clients served, both domestically and internationally, are the Metropolitan Washington Airports
Authority, Washington, DC; Riverside Hospital/Riverside Treatment Services, Inc., Washington, DC;
Orion Marketing & Engineering Services, Frankfurt, West Germany; and International Business
Machines (IBM) Corporation, Riverside, CA.
Ms. Lockhart’s most fulfilling achievements are those associated with the success of the many young
people that she has been fortunate enough to mentor and assist in their development. She also counts
among her achievements the development of the Human Resources Department for a major hospital,
including its recruiting, hiring, orientation and training, and retention of personnel functions; the
establishment of a broad-based marketing and technical services firm for sales and installation of office
products, telephone systems, intercom systems, and other support services; and spearheading the
development team transitioning the human resources system at one of the largest airport facilities in the
United States from a family of antiquated software and hardware systems to a multimillion-dollar state-
of-the-art system affecting hundreds of employees at multiple base sites; and the development of a student
program which seeks to optimize the potential of young people.
Ms. Lockhart’s undergraduate and graduate degrees are from California State University in Northridge,
CA. As well, she is currently pursuing a graduate degree in human resources at Villanova University.
Chanelle Hardy
Chanelle Hardy is the Senior Vice President for Policy for the National Urban League and Executive
Director of the National Urban League Policy Institute, with primary responsibility for developing the
League’s policy, research and advocacy agenda and expanding its impact and influence inside the
beltway. She serves as editor-in-chief of the NULPI signature publication, “The State of Black
America,” and coordinates the NUL Legislative Policy Conference. She is the former Chief of Staff and
Counsel to US Representative Artur Davis, who represented the Seventh Congressional District of
Alabama and served on the powerful House Ways and Means Committee and the Committee on House
Administration. Prior to coming to the Hill, Chanelle was a Staff Attorney at the Federal Trade
Commission, a Policy Fellow and Legislative Counsel at Consumers Union, and a Teach for America
Corps member, teaching fifth graders in Washington, DC.
Chanelle received her JD from the Howard University School of Law, where she finished fifth in her
class, and was a member of the Huver I. Brown Trial Advocacy Moot Court Team. She received her
undergraduate degree in English, with Honors, and Piano Performance from the University of Maryland
at College Park (UMCP). She is a member of the board of the UMCP College of Arts and Humanities,
Vice President of the Howard University Law Alumni Association and Secretary of the board of Industry
Ears, a non-profit think tank dedicated to improving media literacy for young people of color. She is a
member of Alfred Street Baptist Church and a native of the Washington, DC area.
The work of the Board of Trustees
Excel Academy is governed by a Board of Trustees. The Board of Trustees governs Excel Academy,
holds the charter, and ensures that the school fulfills its mission. The Board ensures that the school is
faithful to and complies with the terms of its charter and succeeds financially. The Board hires,
Excel Academy Public Charter School Amendment Application 41
supervises, and supports the CEO, who hires, supervises, and supports the Chief Academic Officer, Chief
Advancement Officer and Chief Operating Officer. Together, the CEO, Principal, and Executive
Management Team are responsible for the implementation of the mission of Excel Academy. The CEO
reports monthly to the Board of Trustees on the state of the school. The Board evaluates the CEO
annually, providing detailed performance feedback and adjusting compensation accordingly.
The Board of Trustees is a group comprised of up to eleven individuals who share a common vision and
commitment to Excel Academy and its mission. Board members hold three year terms and the Chair has
been elected annually. The Board of Excel Academy has transitioned from a “Founding Board” to a
“Governing Board,” and members have been recruited to serve based upon the value that they can add to
the oversight of the school. As the members’ biographies demonstrate, the Board members possess a
diverse set of skills and experiences which lend great benefit to Excel Academy. The Board includes two
elected Parent Representatives, who share equal voting rights with the other members and who attend the
monthly meetings. The Board of Trustees has received training support from Building Excellent Schools.
As Excel moves into the next phase of its growth, a robust and involved Board will be essential to the
school’s continued success.
Following are the major policy areas and the committees responsible for effective oversight and
researching best practices for Excel:
Education and Accountability Committee
The Education and Accountability Committee oversees the educational program and outcomes at Excel
Academy in conjunction with the Executive Director. The committee works with the Executive Director
to set policies and standards for teaching and learning, the facilities and materials needed to achieve the
standards, and the security and safety of all school participants. The committee advises the Executive
Director on goals and plans for the school’s outreach to families and communities as well as participation
in the broader academic community of the District. The Committee analyzes the educational outcomes of
the school against the standards and the school’s Accountability Plan, and shares these results with the
full Board on a regular basis.
Finance, Audit and Facilities Committee The Finance, Audit and Facilities Committee coordinates the Board’s financial oversight responsibilities
by recommending financial, procurement and other relevant policy to the Board, interpreting it for the
staff, and monitoring its implementation. The committee monitors the results of audits by independent
agencies. This committee also sets facilities policy, ensures the financial security of property leased
and/or owned, and prudent risk management policies. The committee monitors the organization’s
financial records; reviews and oversees the development of accurate, timely, and meaningful financial
statements to be presented to the Board; reviews the annual budget and recommends it to the full Board
for approval; monitors budget implementation and financial procedures; monitors budget assets; monitors
compliance with federal, state, and other reporting requirements; and helps the full Board understand the
organization’s finances. The committee also recommends financial performance measures and
implements those adopted by the board for a continuous evaluation of progress.
Development Committee The Development Committee leads the Trustees’ participation in resource development and fund-raising.
The committee works with the staff to develop the fundraising plan. It also develops policies, plans,
procedures, and schedules for Board involvement in fundraising. The committee recommends policies
for funding assets through a capital budget and for investments of assets. The committee helps educate the
other Trustees about the organization’s program plans and the resources needed to realize those plans. It
familiarizes the Trustees with door-opening and fund-raising strategies, skills and techniques to increase
their comfort level with raising money. The committee is the Board’s central source of information about
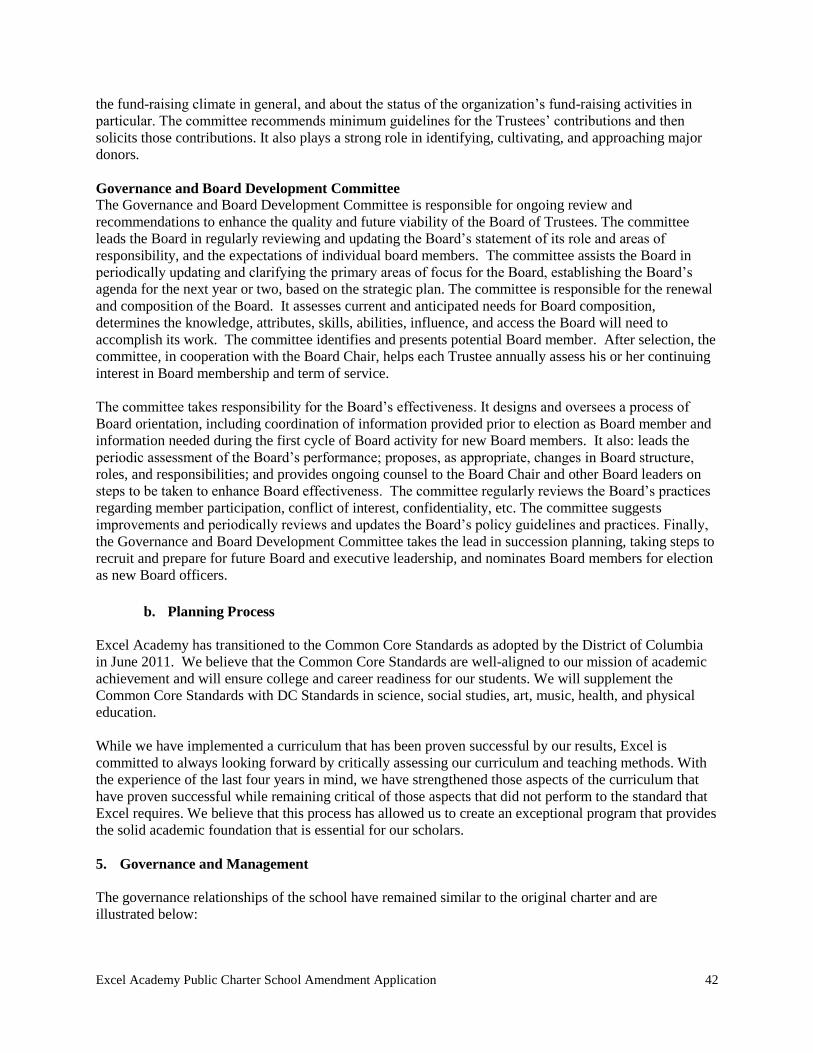
Excel Academy Public Charter School Amendment Application 42
the fund-raising climate in general, and about the status of the organization’s fund-raising activities in
particular. The committee recommends minimum guidelines for the Trustees’ contributions and then
solicits those contributions. It also plays a strong role in identifying, cultivating, and approaching major
donors.
Governance and Board Development Committee
The Governance and Board Development Committee is responsible for ongoing review and
recommendations to enhance the quality and future viability of the Board of Trustees. The committee
leads the Board in regularly reviewing and updating the Board’s statement of its role and areas of
responsibility, and the expectations of individual board members. The committee assists the Board in
periodically updating and clarifying the primary areas of focus for the Board, establishing the Board’s
agenda for the next year or two, based on the strategic plan. The committee is responsible for the renewal
and composition of the Board. It assesses current and anticipated needs for Board composition,
determines the knowledge, attributes, skills, abilities, influence, and access the Board will need to
accomplish its work. The committee identifies and presents potential Board member. After selection, the
committee, in cooperation with the Board Chair, helps each Trustee annually assess his or her continuing
interest in Board membership and term of service.
The committee takes responsibility for the Board’s effectiveness. It designs and oversees a process of
Board orientation, including coordination of information provided prior to election as Board member and
information needed during the first cycle of Board activity for new Board members. It also: leads the
periodic assessment of the Board’s performance; proposes, as appropriate, changes in Board structure,
roles, and responsibilities; and provides ongoing counsel to the Board Chair and other Board leaders on
steps to be taken to enhance Board effectiveness. The committee regularly reviews the Board’s practices
regarding member participation, conflict of interest, confidentiality, etc. The committee suggests
improvements and periodically reviews and updates the Board’s policy guidelines and practices. Finally,
the Governance and Board Development Committee takes the lead in succession planning, taking steps to
recruit and prepare for future Board and executive leadership, and nominates Board members for election
as new Board officers.
b. Planning Process
Excel Academy has transitioned to the Common Core Standards as adopted by the District of Columbia
in June 2011. We believe that the Common Core Standards are well-aligned to our mission of academic
achievement and will ensure college and career readiness for our students. We will supplement the
Common Core Standards with DC Standards in science, social studies, art, music, health, and physical
education.
While we have implemented a curriculum that has been proven successful by our results, Excel is
committed to always looking forward by critically assessing our curriculum and teaching methods. With
the experience of the last four years in mind, we have strengthened those aspects of the curriculum that
have proven successful while remaining critical of those aspects that did not perform to the standard that
Excel requires. We believe that this process has allowed us to create an exceptional program that provides
the solid academic foundation that is essential for our scholars.
5. Governance and Management
The governance relationships of the school have remained similar to the original charter and are
illustrated below:
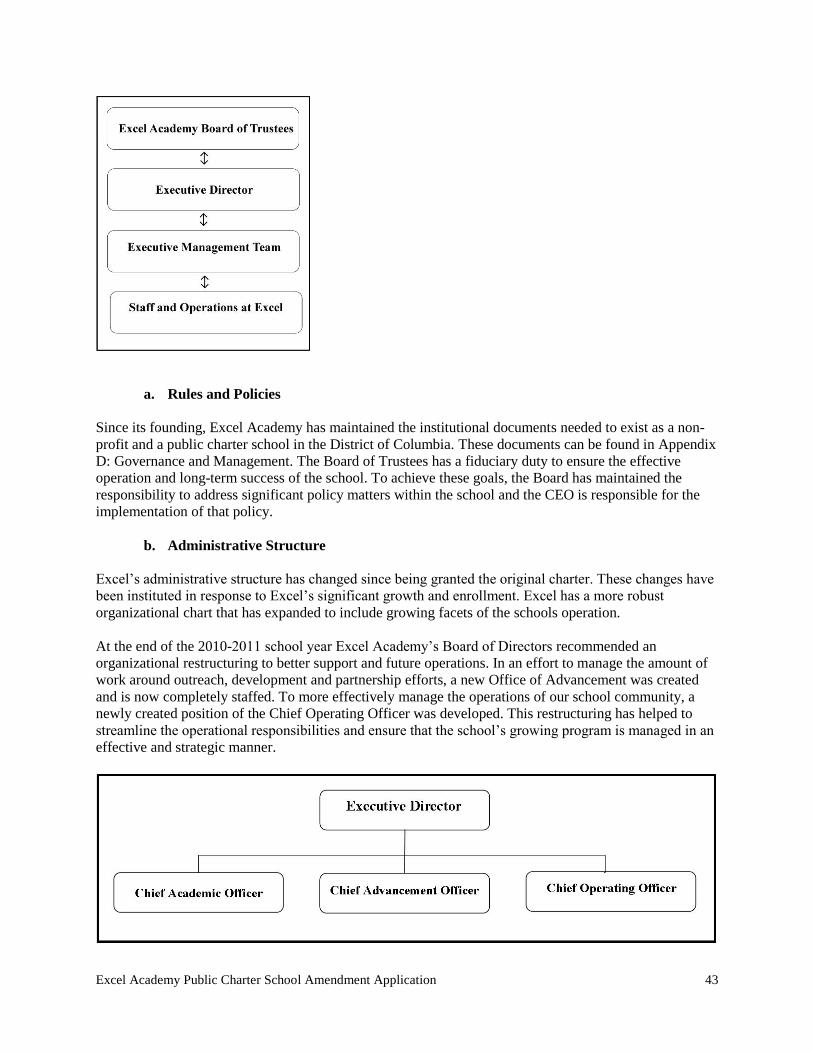
Excel Academy Public Charter School Amendment Application 43
a. Rules and Policies
Since its founding, Excel Academy has maintained the institutional documents needed to exist as a non-
profit and a public charter school in the District of Columbia. These documents can be found in Appendix
D: Governance and Management. The Board of Trustees has a fiduciary duty to ensure the effective
operation and long-term success of the school. To achieve these goals, the Board has maintained the
responsibility to address significant policy matters within the school and the CEO is responsible for the
implementation of that policy.
b. Administrative Structure
Excel’s administrative structure has changed since being granted the original charter. These changes have
been instituted in response to Excel’s significant growth and enrollment. Excel has a more robust
organizational chart that has expanded to include growing facets of the schools operation.
At the end of the 2010-2011 school year Excel Academy’s Board of Directors recommended an
organizational restructuring to better support and future operations. In an effort to manage the amount of
work around outreach, development and partnership efforts, a new Office of Advancement was created
and is now completely staffed. To more effectively manage the operations of our school community, a
newly created position of the Chief Operating Officer was developed. This restructuring has helped to
streamline the operational responsibilities and ensure that the school’s growing program is managed in an
effective and strategic manner.
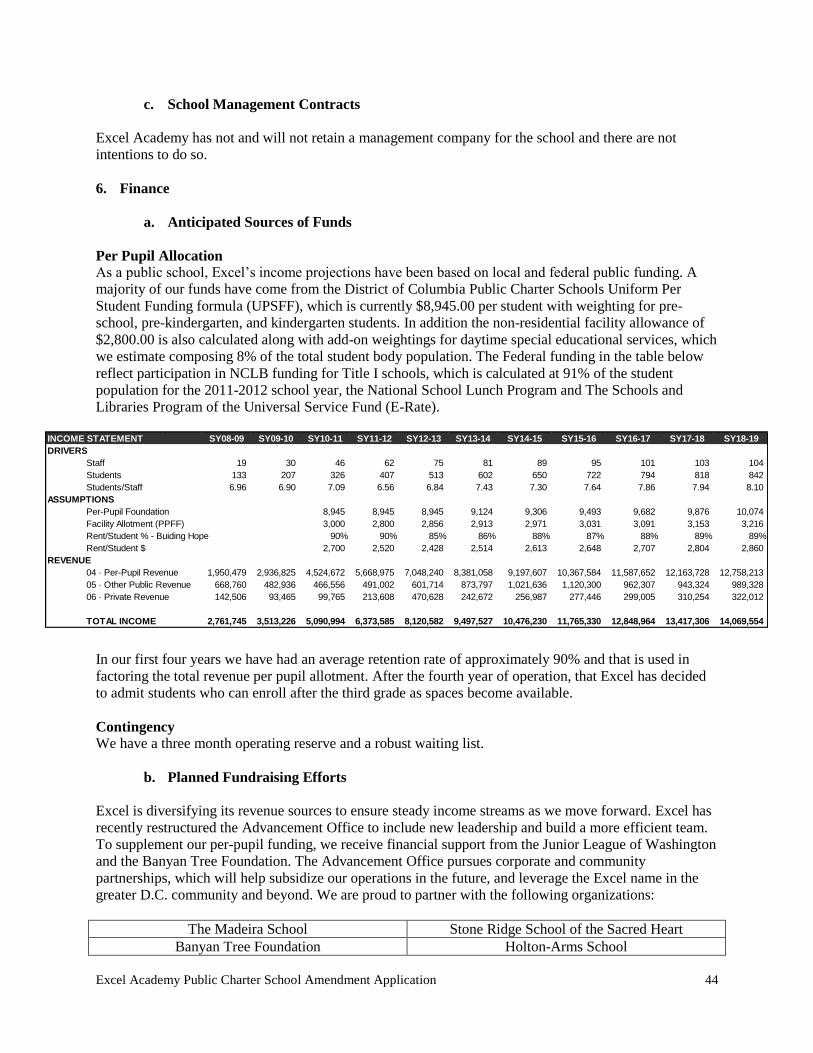
Excel Academy Public Charter School Amendment Application 44
INCOME STATEMENT SY08-09 SY09-10 SY10-11 SY11-12 SY12-13 SY13-14 SY14-15 SY15-16 SY16-17 SY17-18 SY18-19
DRIVERS
Staff 19 30 46 62 75 81 89 95 101 103 104
Students 133 207 326 407 513 602 650 722 794 818 842
Students/Staff 6.96 6.90 7.09 6.56 6.84 7.43 7.30 7.64 7.86 7.94 8.10
ASSUMPTIONS
Per-Pupil Foundation 8,945 8,945 8,945 9,124 9,306 9,493 9,682 9,876 10,074
Facility Allotment (PPFF) 3,000 2,800 2,856 2,913 2,971 3,031 3,091 3,153 3,216
Rent/Student % - Buiding Hope 90% 90% 85% 86% 88% 87% 88% 89% 89%
Rent/Student $ 2,700 2,520 2,428 2,514 2,613 2,648 2,707 2,804 2,860
REVENUE
04 · Per-Pupil Revenue 1,950,479 2,936,825 4,524,672 5,668,975 7,048,240 8,381,058 9,197,607 10,367,584 11,587,652 12,163,728 12,758,213
05 · Other Public Revenue 668,760 482,936 466,556 491,002 601,714 873,797 1,021,636 1,120,300 962,307 943,324 989,328
06 · Private Revenue 142,506 93,465 99,765 213,608 470,628 242,672 256,987 277,446 299,005 310,254 322,012
TOTAL INCOME 2,761,745 3,513,226 5,090,994 6,373,585 8,120,582 9,497,527 10,476,230 11,765,330 12,848,964 13,417,306 14,069,554
c. School Management Contracts
Excel Academy has not and will not retain a management company for the school and there are not
intentions to do so.
6. Finance
a. Anticipated Sources of Funds
Per Pupil Allocation
As a public school, Excel’s income projections have been based on local and federal public funding. A
majority of our funds have come from the District of Columbia Public Charter Schools Uniform Per
Student Funding formula (UPSFF), which is currently $8,945.00 per student with weighting for pre-
school, pre-kindergarten, and kindergarten students. In addition the non-residential facility allowance of
$2,800.00 is also calculated along with add-on weightings for daytime special educational services, which
we estimate composing 8% of the total student body population. The Federal funding in the table below
reflect participation in NCLB funding for Title I schools, which is calculated at 91% of the student
population for the 2011-2012 school year, the National School Lunch Program and The Schools and
Libraries Program of the Universal Service Fund (E-Rate).
In our first four years we have had an average retention rate of approximately 90% and that is used in
factoring the total revenue per pupil allotment. After the fourth year of operation, that Excel has decided
to admit students who can enroll after the third grade as spaces become available.
Contingency
We have a three month operating reserve and a robust waiting list.
b. Planned Fundraising Efforts
Excel is diversifying its revenue sources to ensure steady income streams as we move forward. Excel has
recently restructured the Advancement Office to include new leadership and build a more efficient team.
To supplement our per-pupil funding, we receive financial support from the Junior League of Washington
and the Banyan Tree Foundation. The Advancement Office pursues corporate and community
partnerships, which will help subsidize our operations in the future, and leverage the Excel name in the
greater D.C. community and beyond. We are proud to partner with the following organizations:
The Madeira School Stone Ridge School of the Sacred Heart
Banyan Tree Foundation Holton-Arms School
Excel Academy Public Charter School Amendment Application 45
DC Arts & Humanities Collaborative Washington Performing Arts Society
National Symphony Orchestra Achievement Network
Urban Teacher Center Junior League of Washington
Athletes for Hope Sidwell Friends School
New Schools Venture Fund The New Teacher Project
DC United Soccer Club Girls on the Run
Excel secured a start-up grant from the Walton Family Foundation which supported the start-up costs
related to application preparation, school planning, and curriculum development. We now are pursuing
additional expansion funding from the Walton Family Foundation; our steady growth requires additional
support to carry us through the crucial expansion phase of our middle school planning and development.
c. Financial Management and Accounting
Since being granted the original charter Excel Academy developed, established and maintained financial
systems and records’ in accordance with Generally Accepted Accounting Principles (GAAP). These
accounting practices are effective and comply with all public finance and donor requirements. From our
planning year forward, adopted policies and procedures to establish internal controls to safeguard assets
from unauthorized use, produce verifiable financial reports in a timely manner, and comply with
established local and federal regulations, policies and procedures.
Excel has been contracted with GoldStar Group since being granted the original charter.
Excel maintains a low student-teacher ratio of 13:1 even with fewer government resources than a
traditional public school. Last year, we were rated A- by the District of Columbia Public Charter School
Board for our financial management, and have never had a budget deficit.
Annual Budgeting
As established in our original charter, Excel Academy’s fiscal year begins on 1 July and ends on 30 June.
Excel uses a monthly operating budget, based upon a two-year budgeting process that is prepared
annually by the CEO and GoldStar. This process comes after proper consultation with the Principal, Chief
Academic Officer, Chief Advancement Officer and Chief Operating Officer. The Finance and Facility
Committee reviews the budget before a presentation to the full Board for final approval. The budget is
approved two months prior to the start of the new fiscal year.
Internal Controls
Since being granted the original charter Excel has operated with a system of checks and balances that is
implemented by the CEO and monitored by the Board of Trustees. Central to Excel is ensuring that there
is responsible stewardship of public trust and funds. Below are policies that we have had successfully
implemented:
We require a pre-authorization form for all purchases that require the signatures of the CEO and
the Principal or the COO.
Mandate a monthly reconciliation of bank statements, credit card accounts, and accrued
expenditures.
Monthly review of accounts receivable.
Have established a three-month contingency fund reserve to ensure that the Excel meets it
obligations in a timely manner.
We balance responsibilities between the Business Manager and GoldStar to ensure proper
segregation of duties.
Excel Academy Public Charter School Amendment Application 46
Excel has had a relationship with GoldStar for more than 4 years; The Financial Committee of the
Board receives monthly financial statements, which are reviewed and discussed at monthly Board
meetings.
d. Provision for Audit
Excel has, and will continue to, contract on an annual basis for a full audit of finances by an external
Certified Public Accountant, selected from a list of auditors approved by the District of Columbia Public
Charter School Board. The firm Kendall, Prebola & Jones has conducted a full audit for the previous four
years and ensured that the school’s financial records are in accordance with Generally Accepted
Accounting Principles. These audits will continue to be submitted to the D.C. Public Charter School
Board in accordance with published deadlines.
7. Facilities
a. Identification of a Site
Excel currently serves girls of Ward 8 and other District communities at 2501 Martin Luther King Ave.
SE. Washington, DC 20020
b. Site Renovation
Renovations are a necessary and consistent aspect of our facility needs; we ensure compliance with
applicable building codes, obtain occupancy permits, and meet all other related health and safety codes
and ordinance requirements.
c. Financing Plan for Facilities
The per pupil facility allowance will support the facility costs and associated utilities, to include trash
removal.
d. Building Maintenance
The Charter School Incubator Initiative has a contract with PMM for custodial services and maintenance
for the facilities.
8. Recruiting and Marketing
a. Outreach to the Community
Our success has proven that word-of-mouth communication is the most valuable means of recruitment.
Ward 8 is a unique community in which face-to-face contact or entry/access facilitated by a respected
community member is a wise and productive strategy for informing families and recruiting students. We
have experienced a robust enrollment and have gained significant capital within the community in
response to our success.
b. Recruitment of Students
Family Outreach and Student Recruitment Our experience has shown that Word-of-mouth communication is the most valuable means of recruitment
given our commitment to serving students from diverse and economically disadvantaged backgrounds.
Excel Academy Public Charter School Amendment Application 47
Application, Lottery, and Waitlist If the number of applications exceeds the number of available student enrollment seats, all completed
applications will be subject to the lottery. Families will be notified that Excel will hold a lottery. All
applicants’ names will be pulled, and students will be identified as having a seat in the school or having a
particular spot on the waitlist. Sibling preference will be provided through the lottery, such that a student
who earns or has a seat in the school will allow the sibling to access the next available seat at the
appropriate grade level. Upon completion of the lottery and written notification of results, families who
wish to accept the seat for their child must return a signed Letter of Intent to Enroll form by a
predetermined date. The Principal carefully maintains the waitlist. Students are contacted from the top of
the waitlist as seats become available.
c. Future Expansion and Improvements
Since the original charter we have increased our expected total enrollment to be 925 scholars in pre-
school through the eighth grade. The school will be programmatically divided into three separate and
distinct divisions. The Early Childhood School Division will house students in pre-school and pre-
kindergarten. The Elementary School will house students from the first, second, third and fourth grade.
The Middle School will house students in fifth through eighth grade.
Excel Academy Public Charter School Amendment Application 49
C. Plan of Operation
1. Student Policies and Procedures
a. Timetable for Registering and Admitting
Excel remains committed to provide preschool through eighth grade girls a solid academic foundation and
enrichment opportunities to prepare them to succeed in high school and college as well as to develop in
them the skills and confidence they need to make healthy, positive lifestyle choices.
To provide this opportunity for the families that enroll their daughters, Excel has used the following
timetable to properly facilitate that process. Compared to the original charter, this timetable reflects
lessons learned during the enrollment and re-enrollment periods of four operational years.
Timetable for Recruiting, Admitting and Registering Students
Date Recruiting, Admitting and Registering Students
November 16, 2012 Review and revise re-enrollment application
November 18, 2012 Establish new student enrollment window on website, to include updated
application
November 18, 2012 –
January 1, 2013
New student enrollment window
December 7, 2012 –
December 14, 2012
Re-enrollment application sent home with scholars; re-enrollment window
December 9, 2012 Set up automatic response email for online application. Response email will
indicate that the application was successfully submitted
December 14, 2012 Final list of missing re-enrollment packets
December 14, 2012 –
December 16, 2012
Follow-up phone calls to families missing information
January 4, 2013 Identify grade level vacancies
February 8, 15 & 20,
2013
New Student Enrollment Sessions
March 12, 2013 Lottery Held (if necessary)
March 14, 2013 Open House
July 2013 New Student and Family Day
August 7, 8 & 15, 2013 Orientation Day for New and Returning Families
August 21, 2013 School Begins
b. Policies and Procedures for Enrollment, Withdrawal, Suspension, and Expulsion of
Students
Selection and Admission
The admission to Excel is open to any student of proper grade level who is resident of the District of
Columbia. No child is ever discriminated against because of race, color, national origin, ability or
disability or any other basis prohibited by law. Non-residents of the District of Columbia who wish to
attend Excel are required to follow the same enrollment procedures as residents, pay tuition and fill out
any additional paperwork that is required by the government of the District of Columbia or the DCPCSB.
To enroll at Excel a student is required to have completed the fourth grade by August 21st. The student’s
family must complete the necessary forms, attend family orientations sessions and provide all required
Excel Academy Public Charter School Amendment Application 50
documentation to the school prior to the first day of school. Female students from the District are eligible
for enrollment. Parents or caregivers must submit a signed application in order to enroll. Students whose
families have not submitted the appropriate form will not be eligible for enrollment. Students are not able
to attend school until the school receives all required records, forms, and enrollment application materials.
Enrollment
Excel Academy begins the new student enrollment process in the fall of every year, and conducts very
limited recruitment as we receive many more applications than there are available seats. An updated
online application form is provided on Excel's website, as well as an updated downloadable application
for hard-copy submission. Hard-copy enrollment applications are also available at Excel Academy
throughout the year.
In keeping with our mission and charter we do not allow boys to enter into our lottery since we are a
single-sex school. Excel is strategically located in Ward 8 of Washington, DC in order to encourage
students from the Ward 8 community to attend our school, but we do not place geographic lottery
restrictions on our enrollment for any student who is a District resident
Suspension and/or Expulsion
For a complete review of the Excel Academy disciplinary policy that establishes our criteria for making
these critical decisions please see the excerpt from the Student/Family Handbook entitled School-Wide
Discipline found in Appendix E.
Rights of Students with IEP’s or in Need of a Review for and IEP
Withdrawal
We recognize that situations may arise; families may need to withdraw their students and move to other
schools. Families must complete a withdrawal form. Families are invited to an exit interview with the
Principal to better understand the motivation behind the withdraw decision. This feedback is channeled to
the ED and onto the Board. All records will be copied for Excel’s files and the original student record will
be forwarded to the receiving school.
2. Human Resources Information
a. Key Leadership Roles
Executive Director
Kaye Savage began her career as a certified special education teacher working with low-income students
in Prince George’s County, Maryland. Her passion to make a difference led to policy research work at the
Urban Institute and later into the public service arena concentrating on local and federal government
programs targeting urban economically distressed communities. Kaye worked in the White House on the
Historical Black College and Universities (HBCUs) Initiative. Most recently, she served the Program
Manager for the District of Columbia Family Education Network, a special parent training initiative of
Fight for Children. She has also worked as the National Director for the 21st Century School Fund and as
special Project Manager on a staff augmentation contract in the Office of Facilities Management of the
District of Columbia Public Schools. Kaye began her college education at Mary Washington College of
the University of Virginia and completed her undergraduate work with high honors at Howard University
where she also earned a Master’s of Science degree with distinction with a concentration in
developmental psychology. Kaye was an Intergovernmental Fellow during her tenure at the Department
of Housing and Urban Development and earned her MPA from the University of Southern California.
Kaye is a Building Excellent Schools Fellow and member of the Board of Trustees for the National
Coalition of Girls’ Schools.
Excel Academy Public Charter School Amendment Application 51
Principal Lela Johnson is originally from Rockville, Maryland and received her B.A. in Psychology from
University of Maryland Baltimore County. She also holds a Master’s in Special Education and Human
Development from George Washington University. Mrs. Johnson has devoted the past ten years to
supporting children with special academic, emotional, and social needs. These experiences have included
working for Community Services for Autistic Adults and Children (CSAAC) in Rockville, MD, where
she provided intensive early intervention services for preschool children with autism. She spent 6 years
teaching students with emotional and learning disabilities within Prince George’s County and the District
of Columbia. Prior to Excel Academy, Mrs. Johnson served as a Special Education Specialist, monitoring
special education programs throughout the District of Columbia Public School System.
Mrs. Johnson joined the Excel Academy founding team as the Special Education Coordinator in 2008.
Throughout the founding year, she served as an integral member of the Academic Leadership Team by
providing academic and behavioral support for some of the neediest scholars. In year two, Mrs. Johnson
accepted the role of Dean of Students, where she continued to provide support for students receiving
special education services, coordinated the Student Support Team, developed and monitored the school-
wide behavior management system, developed the character education program, and oversaw parent
accountability issues. Mrs. Johnson has dedicated her time unselfishly to the students and families of
Excel Academy and firmly believes that by pairing high expectations with an unrelenting work ethic,
students from the most underserved communities can achieve very high academic outcomes.
Chief Academic Officer
Nikki Ayanna Stewart is no stranger to academic achievement. She was born into a family of educators
and is a fifth generation teacher. She completed her undergraduate education at Spelman College where
she served as the only student on a Ford Foundation committee that designed a new major for the college
in Comparative Women's Studies. While at Spelman she interned for SAGE: A Scholarly Journal on
Black Women and received the DeWitt-Wallace Academic Excellence Scholarship, providing full tuition
to the student with the highest grade point average in the senior class.
After graduating Summa Cum Laude from Spelman, Ms. Stewart received numerous graduate fellowships
and awards for her research and writing on African American girls and education. Among those honors
are the University Fellowships to Northwestern University and University of Maryland; the Rockefeller
Fellowship to work on the journal, Womanist Theory and Research, at the University of Georgia; and
highly competitive national fellowships from the Ford Foundation and the American Association of
University Women.
Ms. Stewart joined Excel as a founding teacher in 2008, after teaching at the Washington Middle School
for Girls, School Without Walls High School and the University of Maryland. She is widely recognized
for her work in the field of Women's Studies and inaugurated a new Women's Studies column in the
legendary Ms. Magazine with her articles, "Transform the World: What You Can Do With a Degree in
Women's Studies" and "Black Girls' Dreams". She is also a long-time girls' rights activist, having served
as DC Community Coordinator for Girls Incorporated, a consultant for DC Campaign to Prevent Teen
Pregnancy, and Community Education Director at DC Rape Crisis Center.
Chief Operating Officer
Valencia Warnock, an accomplished executive who received her Bachelor’s degree in Social Work at
Savannah State University, and is a seasoned professional with a proven track record of accomplishments
during thirteen years of progressively increasing levels of responsibility. Ms. Warnock, originally from
Savannah Georgia, began her career as a Program Manager at a homeless shelter for youth; this
experience stirred her passion to help young people succeed by providing resources that would allow
youth to live up to their fullest potential.
Excel Academy Public Charter School Amendment Application 52
Valencia served as executive director for the, Boys and Girls Club and the National Centers for
Addictions and Substance Abuse. Prior to arriving to Excel, Valencia was Director of the Carmelo
Anthony Youth Development Center and CARE After-school Programs at the Living Classrooms
Foundation in Baltimore Maryland.
Valencia is devoted to empowering young people with the tools necessary to become successful, healthy
and productive citizens. She strongly believes that education is essential for a solid foundation. Joining
team Excel in November 2011, she brings visionary leadership, pragmatic management and key
partnership development.
Chief Advancement Officer
Kate joined the team at Excel Academy in May 2011. Prior to arriving at Excel, Kate served as the
Assistant Director of Admissions and Financial Aid at Sidwell Friends School, where she oversaw the
admissions process for Middle and Upper School. Kate also previously worked as a High School
Placement Counselor at KIPP DC: KEY Academy, helping students and their families make the transition
from KIPP to high-performing public, charter, Catholic, and independent high schools. Kate's experience
with the educational landscape of D.C. began during her role as the Education Director for Horton's Kids,
a nonprofit that provides comprehensive services for children and families in a Ward 8 neighborhood just
up the street from Excel Academy. Kate earned her Master's in Education and Human Development at
The George Washington University, where she participated in an Individualized Master's program with a
course of study specifically designed to focus on supporting at-risk children and families. She earned her
undergraduate degree at Duke University. Kate is deeply committed to the community that surrounds
Excel Academy and is very happy to return to this neighborhood.
b. Qualification of School Staff
We remain relentless about recruiting teachers who embrace Excel’s philosophy, are committed to
ensuring dramatic and measurable gains in the students’ academic skills, and demonstrate an
understanding and commitment to girl’s education.
Recruitment Strategies for Faculty
Excel Academy begins a selective teacher recruitment process every January. This is to ensure sufficient
time is given to begin screening candidates of the highest caliber for the upcoming school year.
Recruitment includes attendance in several local college education and job recruitment fairs as well as
utilizing a variety of local and national networks to procure top talent. We are committed to recruiting
locally, regionally, and nationally.
We have found some of our most successful and passionate teachers through the development of strategic
partnerships with selective organizations such as Teach for America, Capital Teaching Residency, DC
Teaching Fellows and Urban Teacher Corps. Combining these resources has provided Excel the ability to
recruit and hire a combination of both experienced and new teachers.
As part of a multi-phase screening and selection process candidates are scheduled for a phone interview,
followed by a sample teaching lesson and concluding with a panel interview with members of the
leadership team. This process allowed us to hire teachers and staff with demonstrable experience and a
commitment to single-sex education.
Through receiving the Teacher Compensation Grant, we provide merit based bonuses to those who
achieve exemplary ratings in their Teacher evaluations. Excel Academy is pleased to also provide current
teachers with a referral bonus for any teacher that they refer and is ultimately hired to work at Excel. We
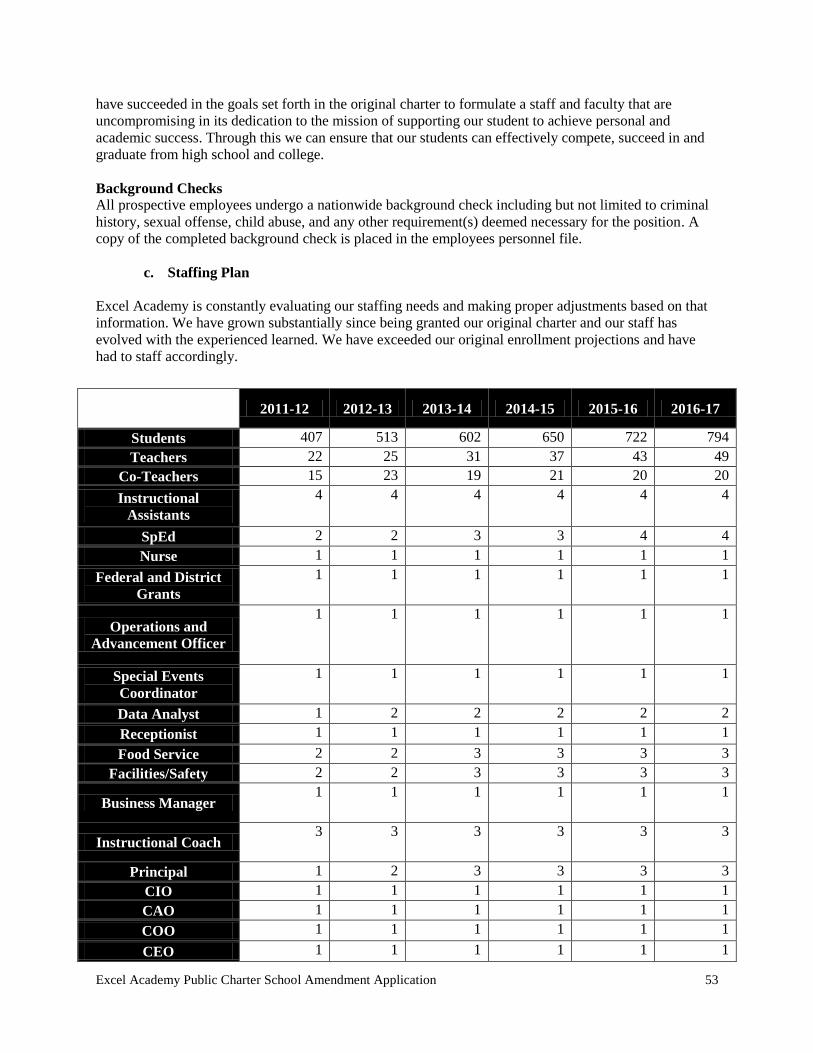
Excel Academy Public Charter School Amendment Application 53
have succeeded in the goals set forth in the original charter to formulate a staff and faculty that are
uncompromising in its dedication to the mission of supporting our student to achieve personal and
academic success. Through this we can ensure that our students can effectively compete, succeed in and
graduate from high school and college.
Background Checks
All prospective employees undergo a nationwide background check including but not limited to criminal
history, sexual offense, child abuse, and any other requirement(s) deemed necessary for the position. A
copy of the completed background check is placed in the employees personnel file.
c. Staffing Plan
Excel Academy is constantly evaluating our staffing needs and making proper adjustments based on that
information. We have grown substantially since being granted our original charter and our staff has
evolved with the experienced learned. We have exceeded our original enrollment projections and have
had to staff accordingly.
2011-12 2012-13 2013-14 2014-15 2015-16 2016-17
Students 407 513 602 650 722 794
Teachers 22 25 31 37 43 49
Co-Teachers 15 23 19 21 20 20
Instructional
Assistants
4 4 4 4 4 4
SpEd 2 2 3 3 4 4
Nurse 1 1 1 1 1 1
Federal and District
Grants
1 1 1 1 1 1
Operations and
Advancement Officer
1 1 1 1 1 1
Special Events
Coordinator
1 1 1 1 1 1
Data Analyst 1 2 2 2 2 2
Receptionist 1 1 1 1 1 1
Food Service 2 2 3 3 3 3
Facilities/Safety 2 2 3 3 3 3
Business Manager 1 1 1 1 1 1
Instructional Coach 3 3 3 3 3 3
Principal 1 2 3 3 3 3
CIO 1 1 1 1 1 1
CAO 1 1 1 1 1 1
COO 1 1 1 1 1 1
CEO 1 1 1 1 1 1
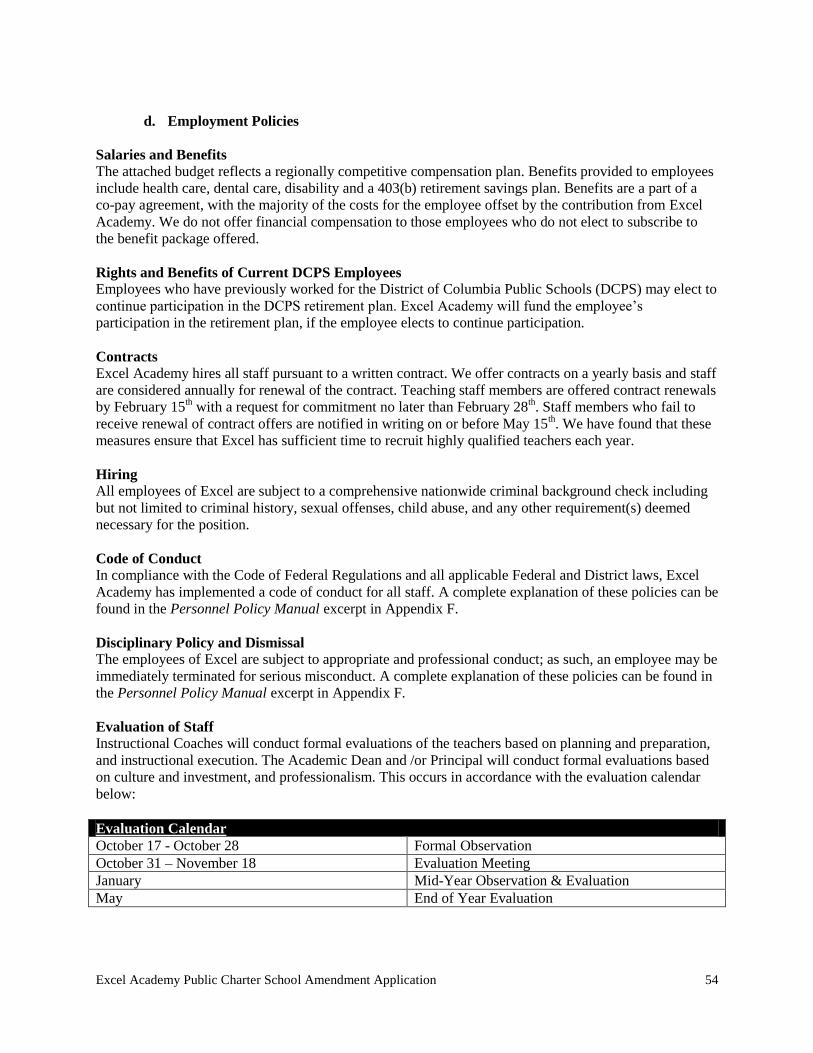
Excel Academy Public Charter School Amendment Application 54
d. Employment Policies
Salaries and Benefits
The attached budget reflects a regionally competitive compensation plan. Benefits provided to employees
include health care, dental care, disability and a 403(b) retirement savings plan. Benefits are a part of a
co-pay agreement, with the majority of the costs for the employee offset by the contribution from Excel
Academy. We do not offer financial compensation to those employees who do not elect to subscribe to
the benefit package offered.
Rights and Benefits of Current DCPS Employees
Employees who have previously worked for the District of Columbia Public Schools (DCPS) may elect to
continue participation in the DCPS retirement plan. Excel Academy will fund the employee’s
participation in the retirement plan, if the employee elects to continue participation.
Contracts
Excel Academy hires all staff pursuant to a written contract. We offer contracts on a yearly basis and staff
are considered annually for renewal of the contract. Teaching staff members are offered contract renewals
by February 15th with a request for commitment no later than February 28
th. Staff members who fail to
receive renewal of contract offers are notified in writing on or before May 15th. We have found that these
measures ensure that Excel has sufficient time to recruit highly qualified teachers each year.
Hiring
All employees of Excel are subject to a comprehensive nationwide criminal background check including
but not limited to criminal history, sexual offenses, child abuse, and any other requirement(s) deemed
necessary for the position.
Code of Conduct
In compliance with the Code of Federal Regulations and all applicable Federal and District laws, Excel
Academy has implemented a code of conduct for all staff. A complete explanation of these policies can be
found in the Personnel Policy Manual excerpt in Appendix F.
Disciplinary Policy and Dismissal
The employees of Excel are subject to appropriate and professional conduct; as such, an employee may be
immediately terminated for serious misconduct. A complete explanation of these policies can be found in
the Personnel Policy Manual excerpt in Appendix F.
Evaluation of Staff
Instructional Coaches will conduct formal evaluations of the teachers based on planning and preparation,
and instructional execution. The Academic Dean and /or Principal will conduct formal evaluations based
on culture and investment, and professionalism. This occurs in accordance with the evaluation calendar
below:
Evaluation Calendar
October 17 - October 28 Formal Observation
October 31 – November 18 Evaluation Meeting
January Mid-Year Observation & Evaluation
May End of Year Evaluation
Excel Academy Public Charter School Amendment Application 55
Equal Opportunity Employment
Excel Academy is an Equal Opportunity Employer. It is our policy and commitment to recruit, hire, train
and promote individuals, as well as administer all Governance actions, without regard to race, color,
religion, creed, age, sex, national origin, ancestry, marital status, veteran status, sexual orientation, status
as a qualified individual with a disability, personal appearance, family responsibilities, matriculation,
political affiliation, place of residence, or membership in any other class protected in accordance with
applicable laws. Any form of discrimination in violation is not tolerated. Violators are subject to
disciplinary action, including termination.
Maintenance of a Drug Free Workplace
Excel experience proves that fostering a drug-free workplace encourages employee productivity and
promotes the accomplishment of the school’s mission and goals. Because Excel’s work involves children,
employees’ conduct with respect to drug, alcohol and tobacco is of special importance. Alcohol and
drugs are prohibited within the School or during Excel Academy related activities. As a condition of
employment, all employees are required to review the Alcohol and Drug-Free Workplace Policy and to
sign a separate acknowledgment of receipt and review of the Alcohol and Drug-Free Workplace Policy. If
an employee violates any part of the Alcohol and Drug-Free Workplace Policy, the employee may be
subject to disciplinary action, including immediate termination.
3. Arrangements for Meeting District and Federal Requirements
a. Health and Safety
Excel has remained in compliance with all applicable health and safety laws and regulations as described
in §38-1802.02(11) and §38-1802.04(c)(4), DC Reform Act and 325 Health Requirements, DCMR 29
Public Welfare Chapter 3 Child Development Facilities. Our premises conform to all applicable federal
and District health, fire, safety, building, and zoning regulations and codes,
b. Safety and Fire Codes for Buildings
Excel Academy has ensured that its premises comply with the American with Disabilities Act.
Additionally, we abide by the fire code requirements from DC Code sec. 5-501.
c. Transportation
Excel has diligently ensured that all families are informed of their ability to receive reduced fares on
public transportation (Metrobus and Metrorail). Excel will continue to transport students with disabilities
as required by District law.
d. Enrollment Data
As outlined in §38-1802.04(c) (12), DC School Reform Act, Excel has been diligent in maintaining daily
attendance and enrollment records. These records and reports will continue to be provided to the
appropriate authorities on a timely basis.
e. Maintenance and Dissemination of Student Records
Excel has developed and maintains a comprehensive database to house all student data including personal
and health data, attendance, grade and performance assessment data. The school administration is in
charge of student records. They will discuss, explain, and/or make available to the student or his
parents/guardians any records on file. If a parent/guardian would like to examine their child’s record, the
Excel Academy Public Charter School Amendment Application 56
parent/guardian should submit a request in writing to the Chief Operating Officer. Within 10 days, the
parent will be allowed to inspect the file and may request a copy of some or all of the information
contained in the record. This system has also allowed Excel to disseminate information, records and
reports as required by the District of Columbia School Reform Act, Part B and D and other applicable
law, including D.C. Code sec. 31-401 et seq. (Compulsory School Attendance); D.C. Code sec. 31-501 et
seq. (Immunization of School Students); D.C. Code sec. 31-601 et seq. (Tuition of Nonresidents); D.C.
Code sec. 29-501 et seq. (Non-profit Corporations).
f. Compulsory Attendance Laws
Excel Academy recognizes that regular school attendance is the most critical variable in ensuring
academic success. Attendance information is reviewed on a daily basis and routine meetings will be held
with parents of scholars who have accumulated 5 or more absences and/or 15 or more tardy arrivals
within an advisory period. Scholars with excessive absences/tardy arrivals (15 or more absences and/or
45 or more tardies) will be in danger of retention and a possible referral to Child Family Services
Association (CFSA) for Educational Neglect.
g. Subchapter B of the Individuals with Disabilities Education Act (20 U.S.C. 1411 et seq.)
and Section 504 of the Rehabilitation Act of 1973 (29 U.S.C. 794).
Excel Academy has developed a special education program that complies with all aspects of the federal
special education regulations. Our program outlined in our Educational Plan has allowed us to remain
compliant with the provisions of Subchapter B of the Individuals with Disabilities Education Act (20
U.S.C. 1411 et seq.) and Section 504 of the Rehabilitation Act of 1973 (29 U.S.C. 794).
h. Title I of the Improving America's Schools Act
Excel receives supplemental federal funds through No Child Left Behind. These Title I funds serve our
students who are eligible for free and reduced lunch: currently 91% of our student body are eligible. We
conduct annual Back to School night meetings to provide information to the parents and guardians to
understand what it required of a Title 1 school.
Excel has been successful in using these funds to meet the objectives of Title I – closing the achievement
gap and improving student academic achievement among those who most at-risk of failing. We have used
these funds to strengthen leadership and instructional capacity within the school and support reform
measures as well as provide intensive academic intervention to those students who are most in need. Both
these measures have allowed us to see measureable results and benefited school community greatly. Excel
has remained in compliance the District and Federal requirements for the use of these funds.
i. Compliance with Civil Rights Statutes and Regulations of the Federal Government and
the District of Columbia
Excel Academy has maintained compliance with §38-1802.02(11) and §38-1802.04 (c) (5) of the DC
School Reform Act. Excel remains in compliance with all Federal and District regulations on civil rights.
In our policies, practices, and procedures we ensure that all students and employees are appropriately
protected.
Excel Academy Public Charter School Amendment Application 57
4. Implementation of the Charter
a. Timetable and Tasks for Implementation of Charter
Excel has incorporated the curriculum changes in the upcoming summer professional
development.
All curriculum pieces have been scheduled to be ordered through the summer.
b. Major Contracts Planned
During the course of the charter Excel has entered into relationships with various vendors and suppliers.
The value of these relationships has been a great asset to Excel and the students we serve. Currently our
contracts that exceed $25,000 are:
At Home Management – At Home Management provides all of Excel’s meal service. We are currently
in the first year of a two year contract that concluded after the 2012-2013 Academic Year.
Building Hope – Building Hope provides Excel with E-Rate Desktop Maintenance which is contracted
out and performed by Dynamic Network Solutions.
Charter School Incubator Initiative – Excel Academy is currently in a five year lease with the Charter
School Incubator Initiative program with Building Hope for the rent of our current facilities.
Chesapeake Children's Therapy Center – Since the 2009-2010 Academic Year the Chesapeake
Children’s Therapy Center has provided Excel with special-education and the services provided.
GoldStar Group – Currently Excel is in the last year of a two year contract with GoldStar to provide
accounting services. We have been with GoldStar since being granted the original charter.
MDM Office Systems, Inc. – Excel is in a one year contract with MDM Office Systems for all furniture
purchases made on behalf of the school.
Pearson Education – Excel purchases curriculum items through Pearson Education.
Verizon Wireless – Excel participates in a yearly bid process through E-Rate. Currently we are in
contract with Verizon Wireless who provides Excel’s wireless phone service.

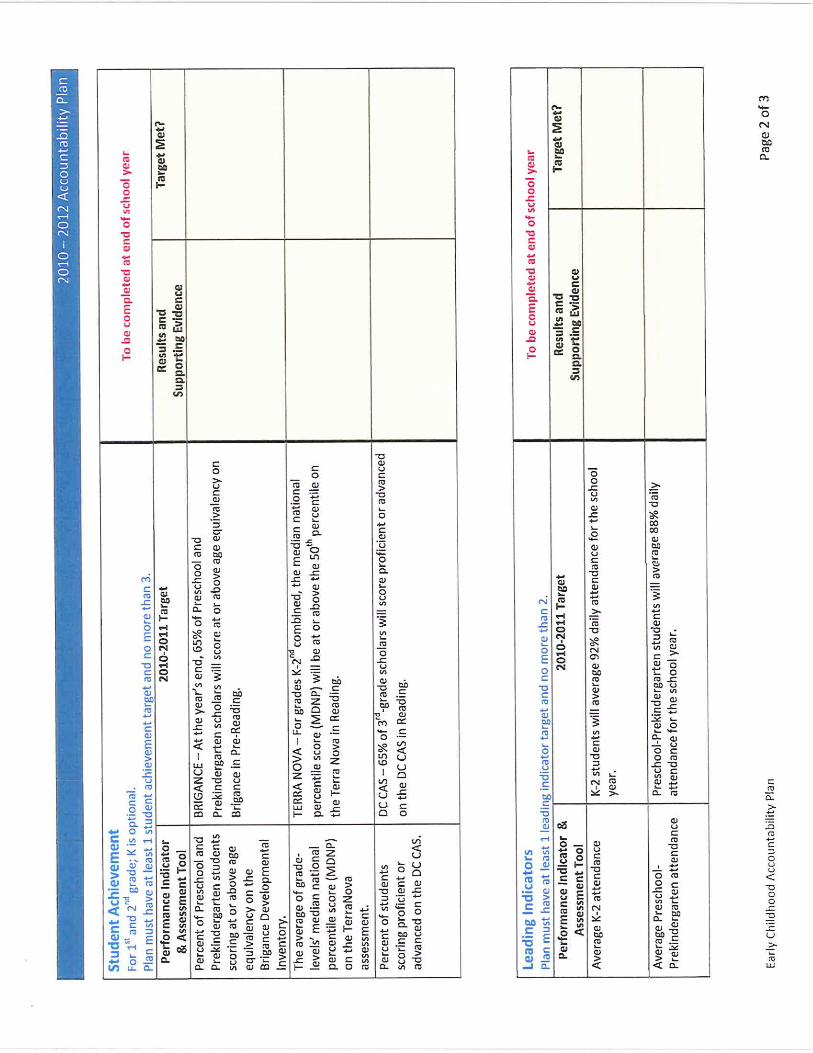
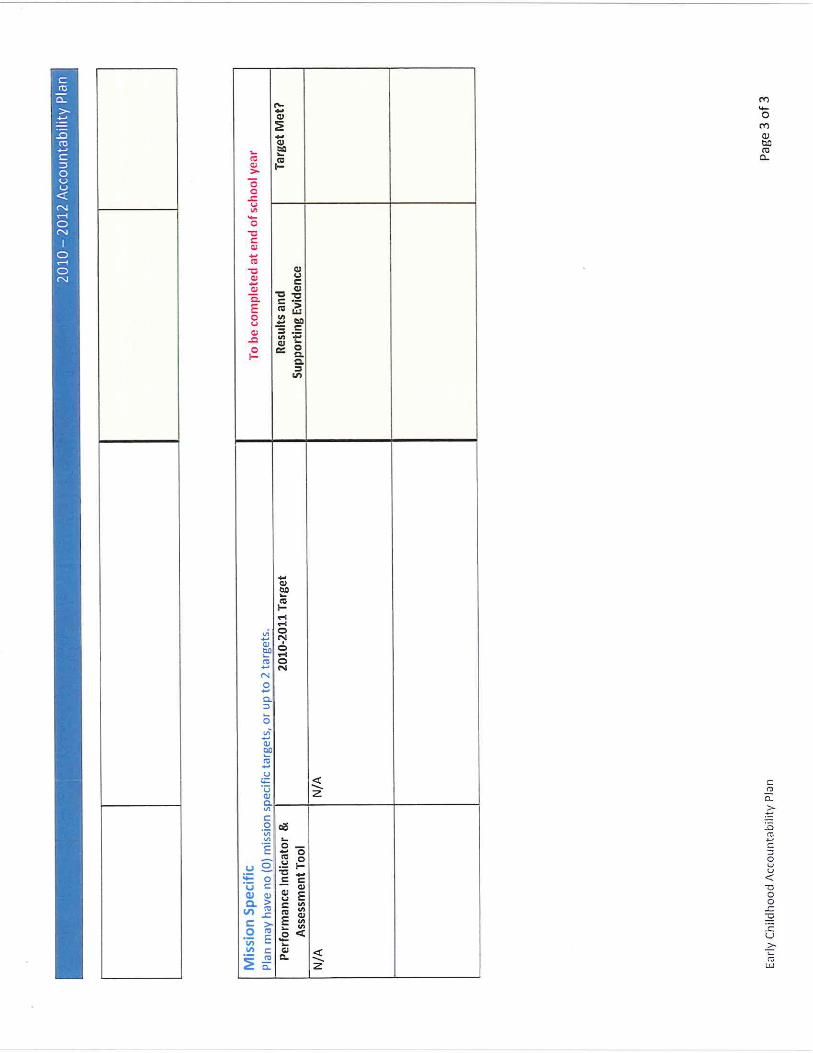
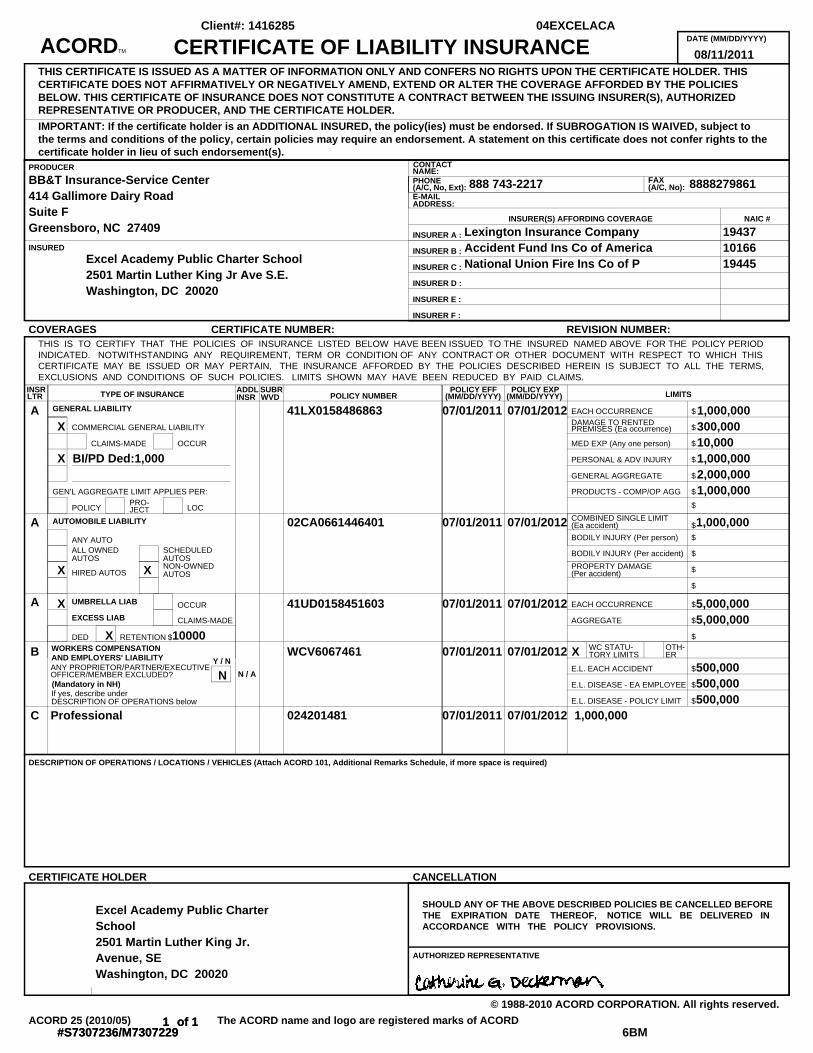
INSR ADDL SUBRLTR INSR WVD
DATE (MM/DD/YYYY)
PRODUCER CONTACTNAME:
FAXPHONE(A/C, No):(A/C, No, Ext):
E-MAILADDRESS:
INSURER A :
INSURED INSURER B :
INSURER C :
INSURER D :
INSURER E :
INSURER F :
POLICY NUMBERPOLICY EFF POLICY EXP
TYPE OF INSURANCE LIMITS(MM/DD/YYYY) (MM/DD/YYYY)
GENERAL LIABILITY
AUTOMOBILE LIABILITY
UMBRELLA LIAB
EXCESS LIAB
WORKERS COMPENSATIONAND EMPLOYERS' LIABILITY
DESCRIPTION OF OPERATIONS / LOCATIONS / VEHICLES (Attach ACORD 101, Additional Remarks Schedule, if more space is required)
AUTHORIZED REPRESENTATIVE
INSURER(S) AFFORDING COVERAGE NAIC #
Y / N
N / A(Mandatory in NH)
ANY PROPRIETOR/PARTNER/EXECUTIVEOFFICER/MEMBER EXCLUDED?
EACH OCCURRENCE $DAMAGE TO RENTED
COMMERCIAL GENERAL LIABILITY $PREMISES (Ea occurrence)
CLAIMS-MADE OCCUR MED EXP (Any one person) $
PERSONAL & ADV INJURY $
GENERAL AGGREGATE $
GEN'L AGGREGATE LIMIT APPLIES PER: PRODUCTS - COMP/OP AGG $
$PRO-POLICY LOCJECT
COMBINED SINGLE LIMIT$(Ea accident)
BODILY INJURY (Per person) $ANY AUTOALL OWNED SCHEDULED BODILY INJURY (Per accident) $AUTOS AUTOS
HIRED AUTOSNON-OWNED PROPERTY DAMAGE $AUTOS (Per accident)
$
OCCUR EACH OCCURRENCE $
CLAIMS-MADE AGGREGATE $
DED RETENTION $ $WC STATU- OTH-TORY LIMITS ER
E.L. EACH ACCIDENT $
E.L. DISEASE - EA EMPLOYEE $If yes, describe under
E.L. DISEASE - POLICY LIMIT $DESCRIPTION OF OPERATIONS below
SHOULD ANY OF THE ABOVE DESCRIBED POLICIES BE CANCELLED BEFORETHE EXPIRATION DATE THEREOF, NOTICE WILL BE DELIVERED INACCORDANCE WITH THE POLICY PROVISIONS.
THIS IS TO CERTIFY THAT THE POLICIES OF INSURANCE LISTED BELOW HAVE BEEN ISSUED TO THE INSURED NAMED ABOVE FOR THE POLICY PERIODINDICATED. NOTWITHSTANDING ANY REQUIREMENT, TERM OR CONDITION OF ANY CONTRACT OR OTHER DOCUMENT WITH RESPECT TO WHICH THISCERTIFICATE MAY BE ISSUED OR MAY PERTAIN, THE INSURANCE AFFORDED BY THE POLICIES DESCRIBED HEREIN IS SUBJECT TO ALL THE TERMS,EXCLUSIONS AND CONDITIONS OF SUCH POLICIES. LIMITS SHOWN MAY HAVE BEEN REDUCED BY PAID CLAIMS.
THIS CERTIFICATE IS ISSUED AS A MATTER OF INFORMATION ONLY AND CONFERS NO RIGHTS UPON THE CERTIFICATE HOLDER. THISCERTIFICATE DOES NOT AFFIRMATIVELY OR NEGATIVELY AMEND, EXTEND OR ALTER THE COVERAGE AFFORDED BY THE POLICIESBELOW. THIS CERTIFICATE OF INSURANCE DOES NOT CONSTITUTE A CONTRACT BETWEEN THE ISSUING INSURER(S), AUTHORIZEDREPRESENTATIVE OR PRODUCER, AND THE CERTIFICATE HOLDER.
IMPORTANT: If the certificate holder is an ADDITIONAL INSURED, the policy(ies) must be endorsed. If SUBROGATION IS WAIVED, subject tothe terms and conditions of the policy, certain policies may require an endorsement. A statement on this certificate does not confer rights to thecertificate holder in lieu of such endorsement(s).
COVERAGES CERTIFICATE NUMBER: REVISION NUMBER:
CERTIFICATE HOLDER CANCELLATION
© 1988-2010 ACORD CORPORATION. All rights reserved.
The ACORD name and logo are registered marks of ACORDACORD 25 (2010/05)
ACORDTM CERTIFICATE OF LIABILITY INSURANCE 08/11/2011
BB&T Insurance-Service Center414 Gallimore Dairy RoadSuite FGreensboro, NC 27409
888 743-2217 8888279861
Excel Academy Public Charter School2501 Martin Luther King Jr Ave S.E.Washington, DC 20020
Lexington Insurance CompanyAccident Fund Ins Co of AmericaNational Union Fire Ins Co of P
194371016619445
AX
X BI/PD Ded:1,000
41LX0158486863 07/01/2011 07/01/2012 1,000,000300,00010,0001,000,0002,000,0001,000,000
A
X X
02CA0661446401 07/01/2011 07/01/2012 1,000,000
A X
X 10000
41UD0158451603 07/01/2011 07/01/2012 5,000,0005,000,000
B
N
WCV6067461 07/01/2011 07/01/2012 X500,000
500,000500,000
C Professional 024201481 07/01/2011 07/01/2012 1,000,000
Excel Academy Public CharterSchool2501 Martin Luther King Jr.Avenue, SEWashington, DC 20020
1 of 1#S7307236/M7307229
04EXCELACAClient#: 1416285
6BM1 of 1
#S7307236/M7307229
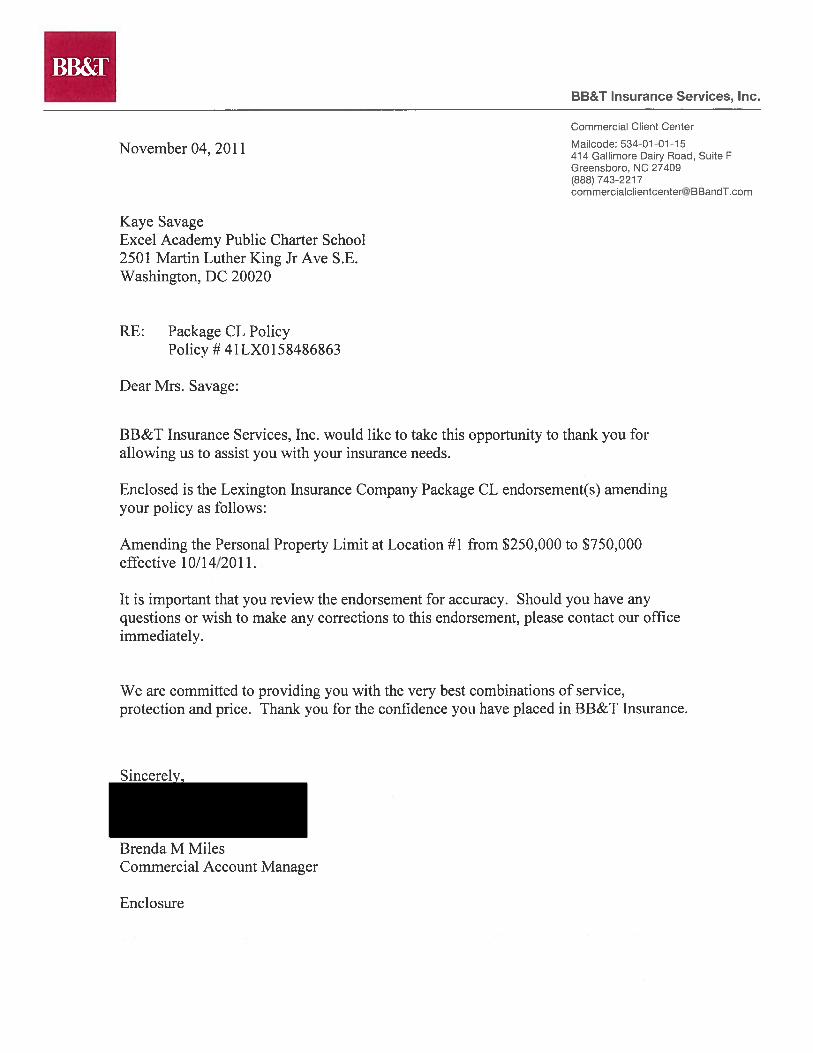
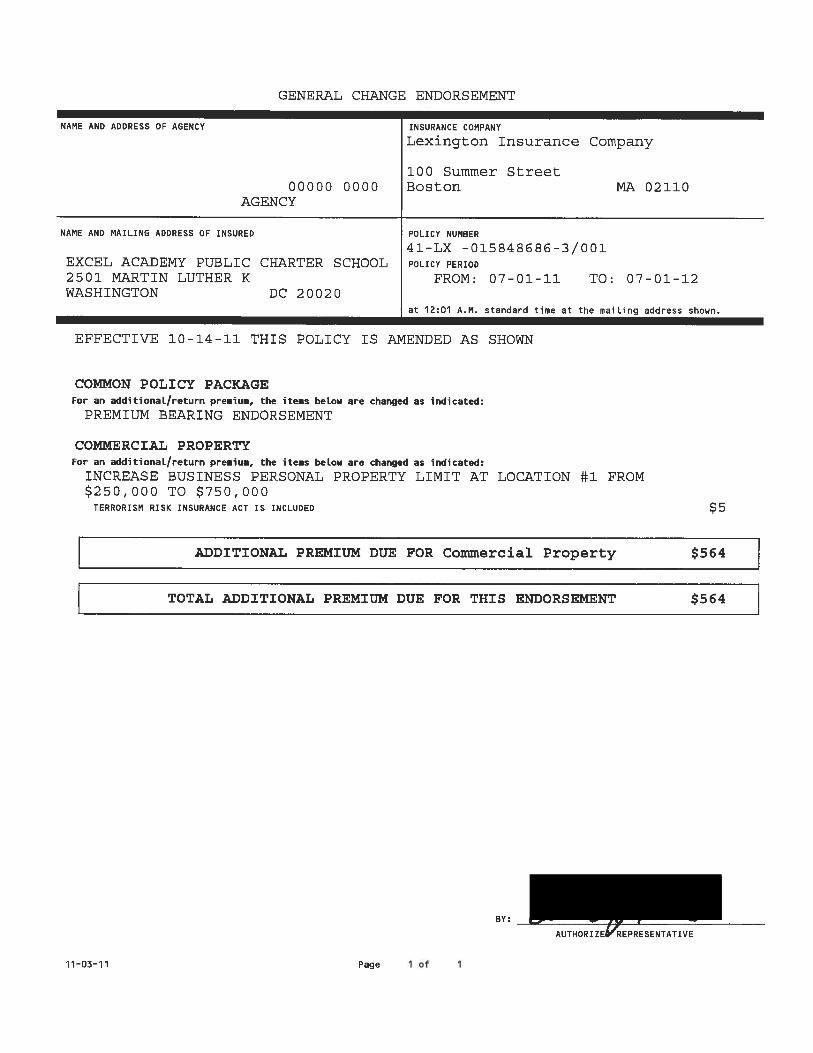
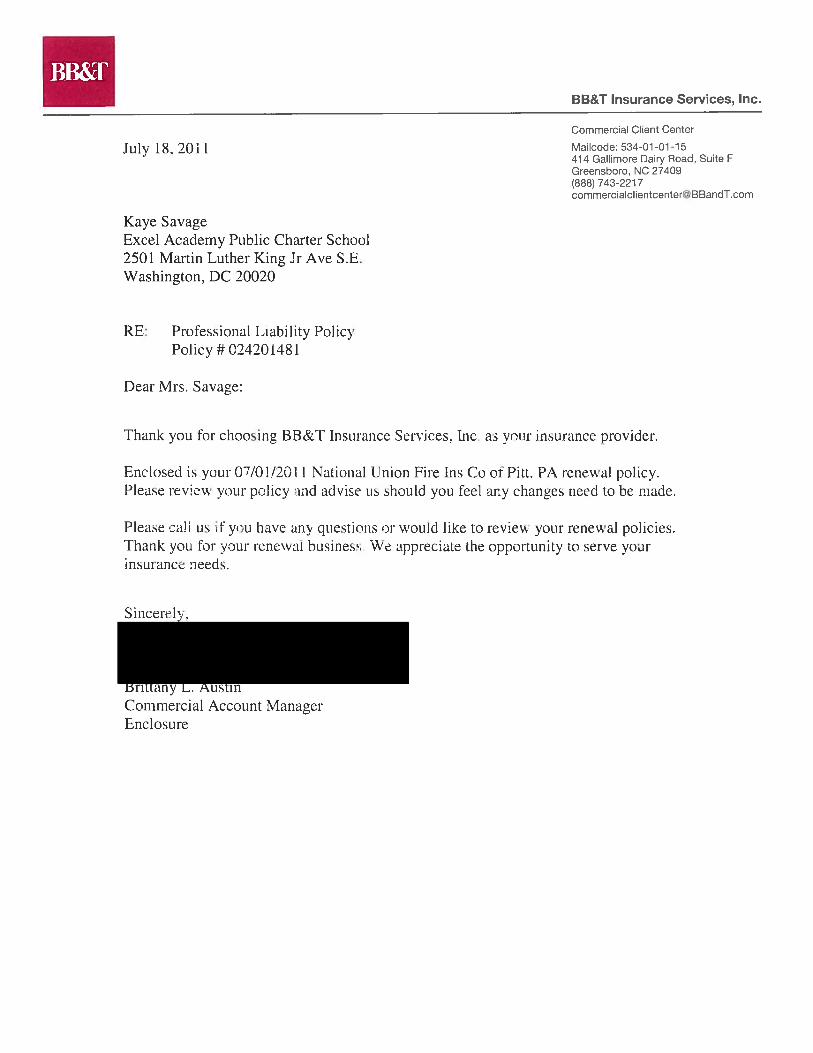
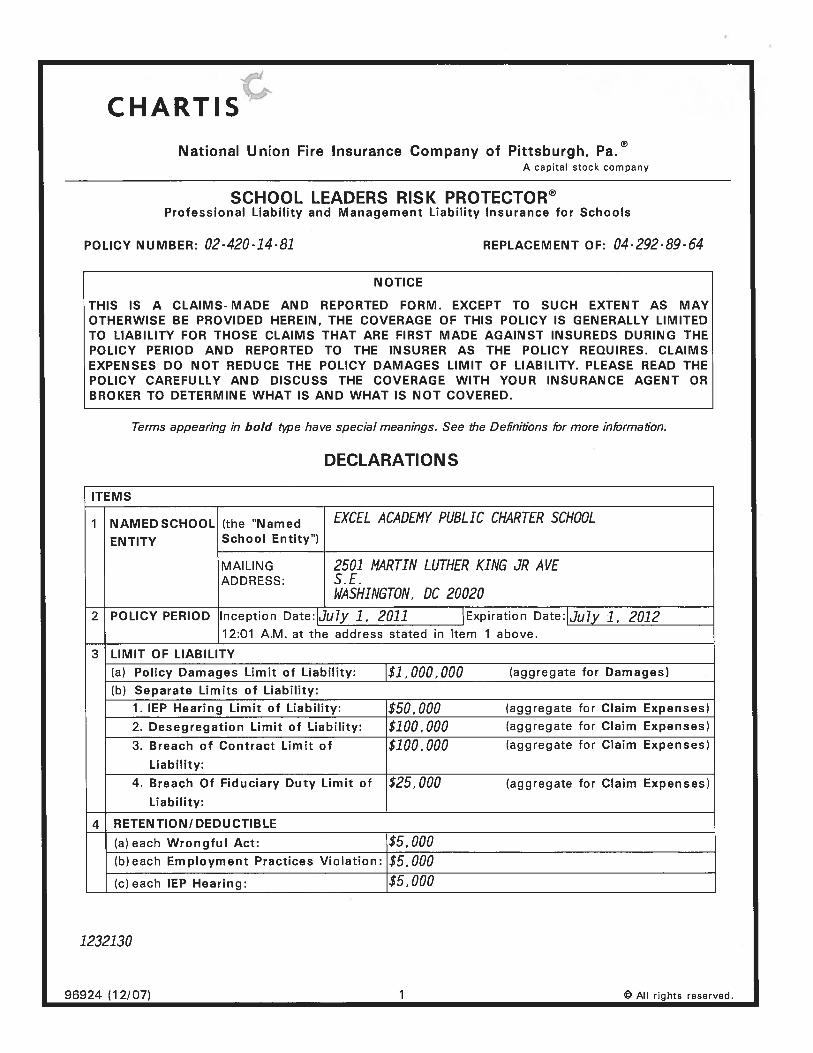
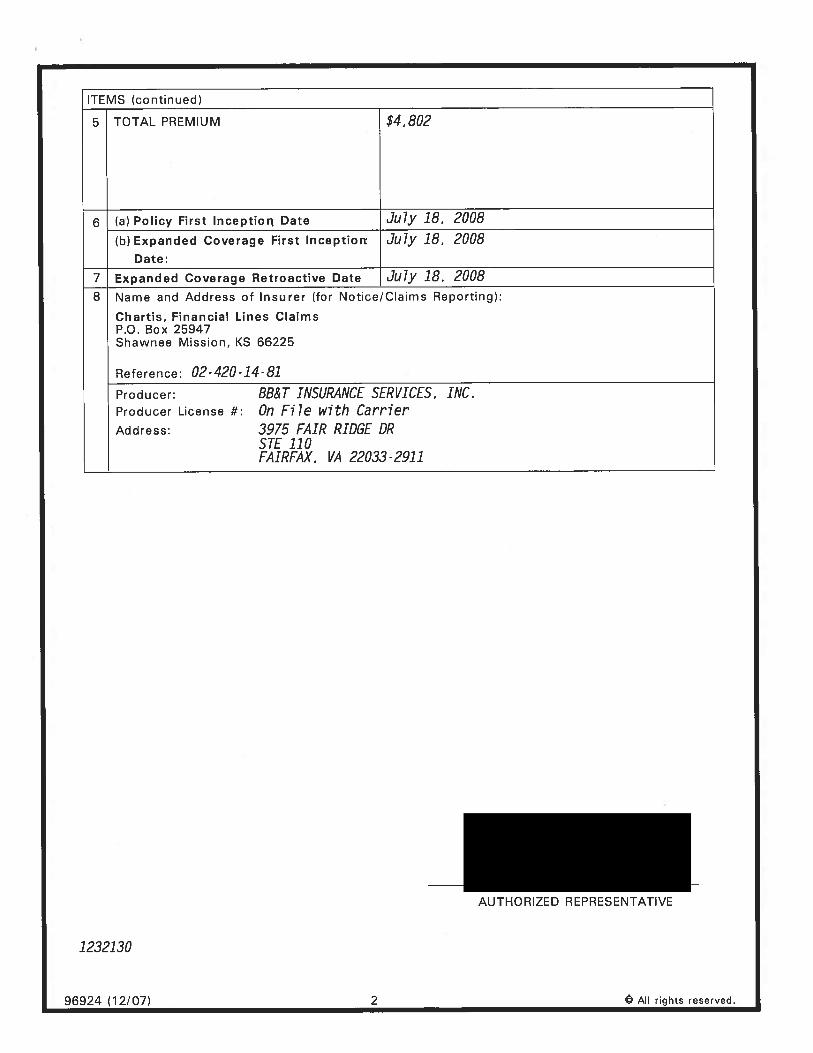
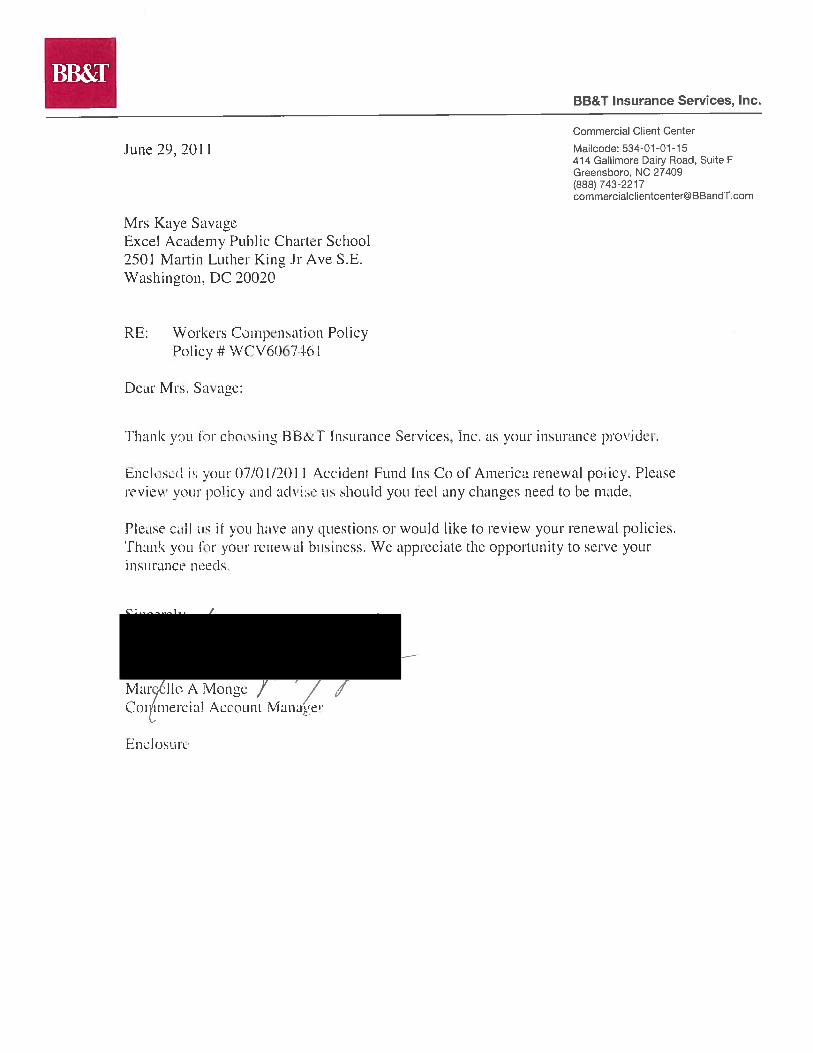
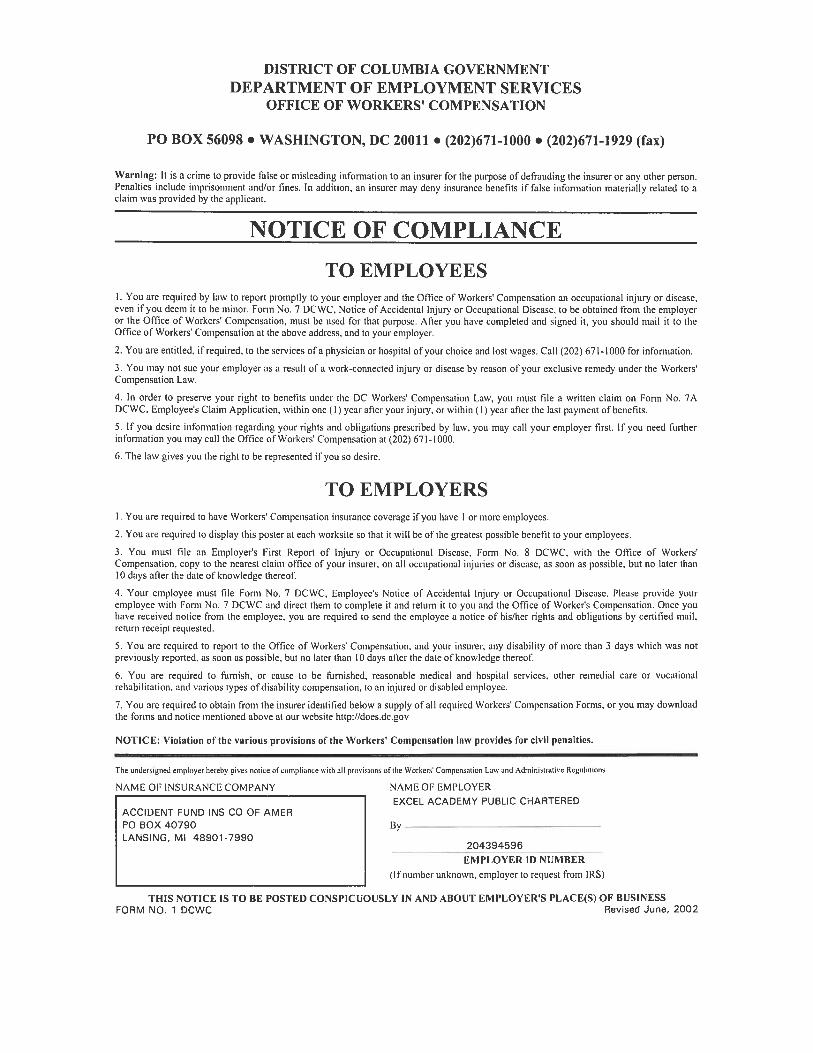
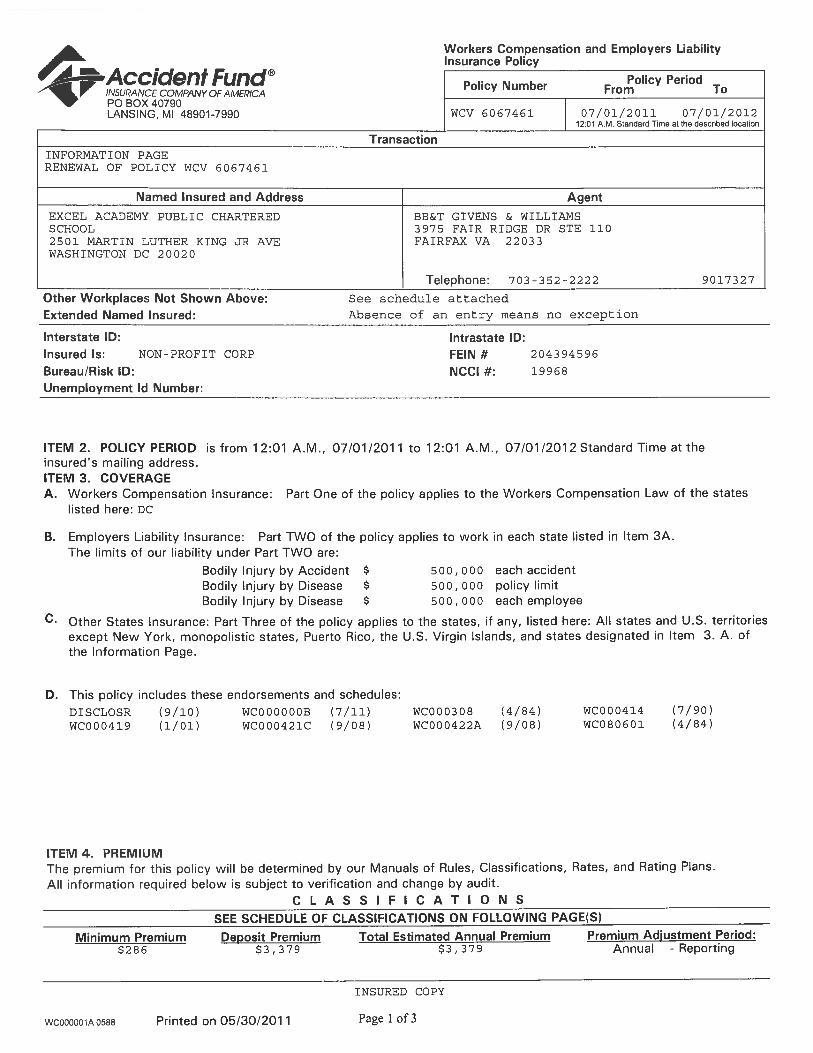
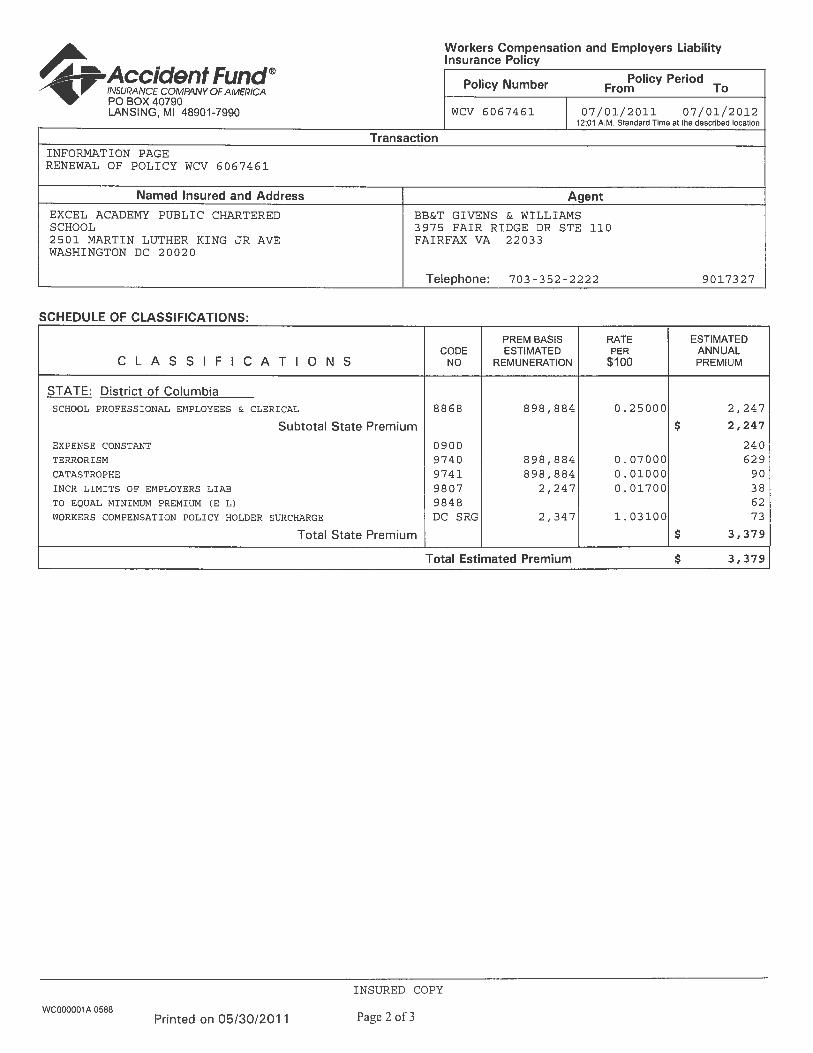
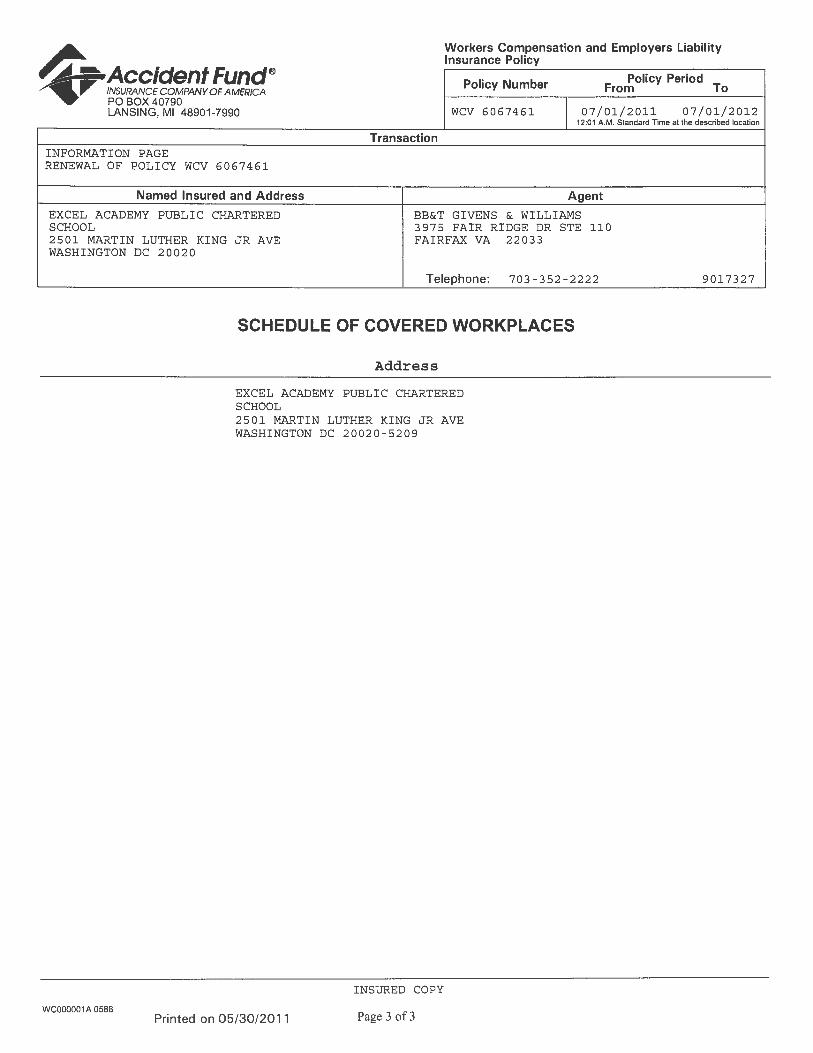
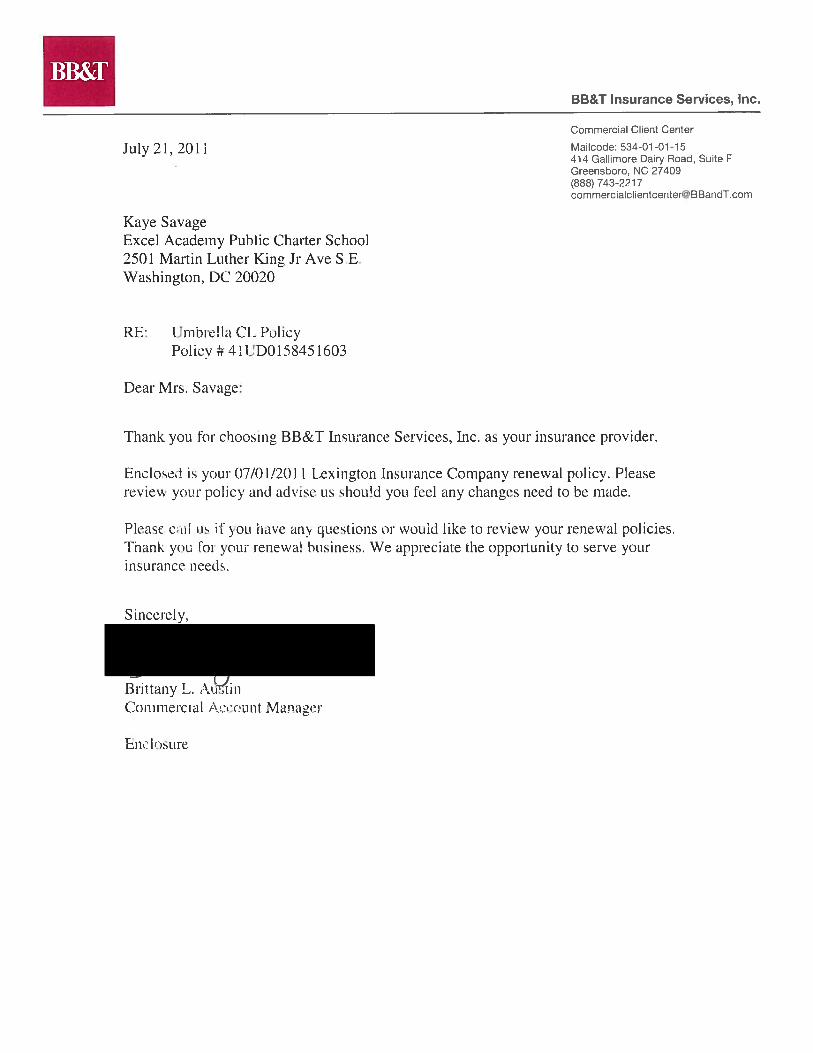
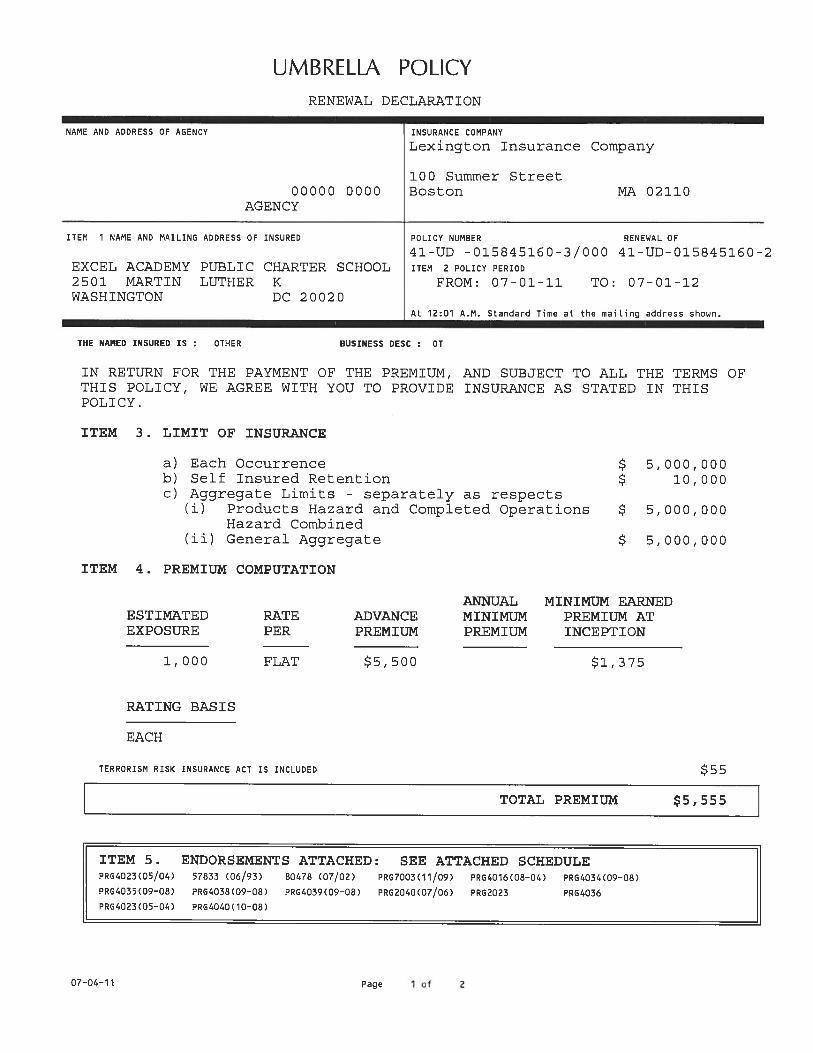
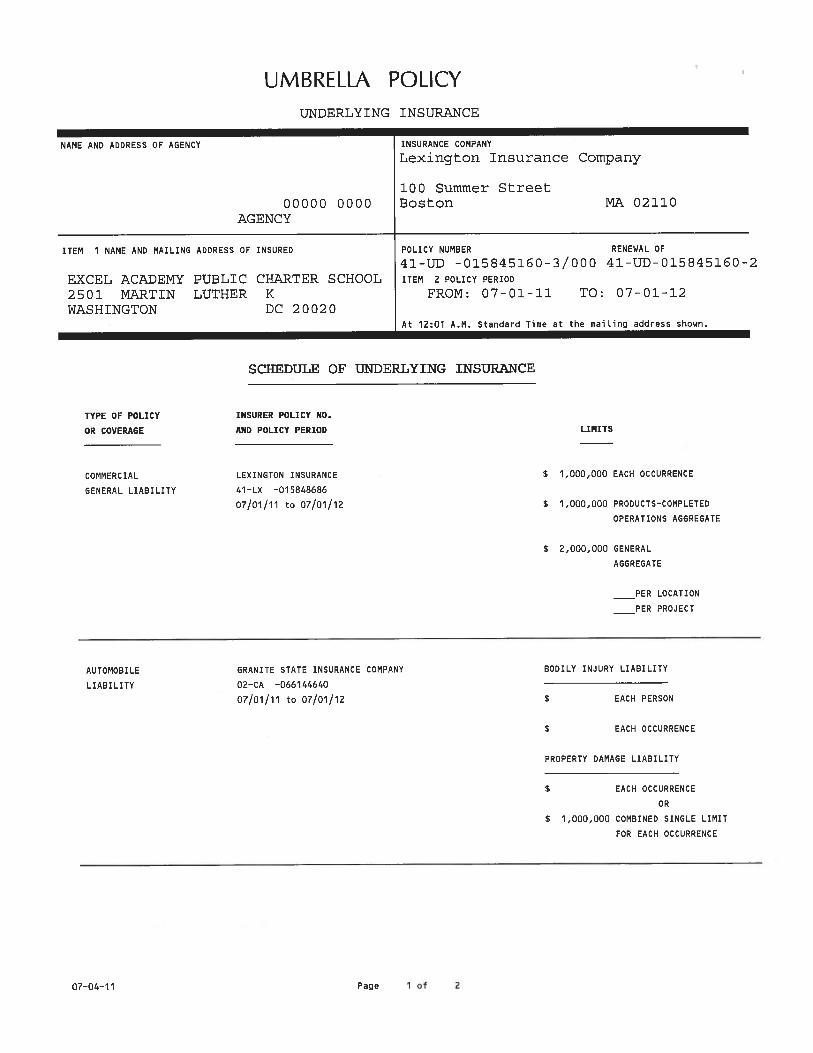
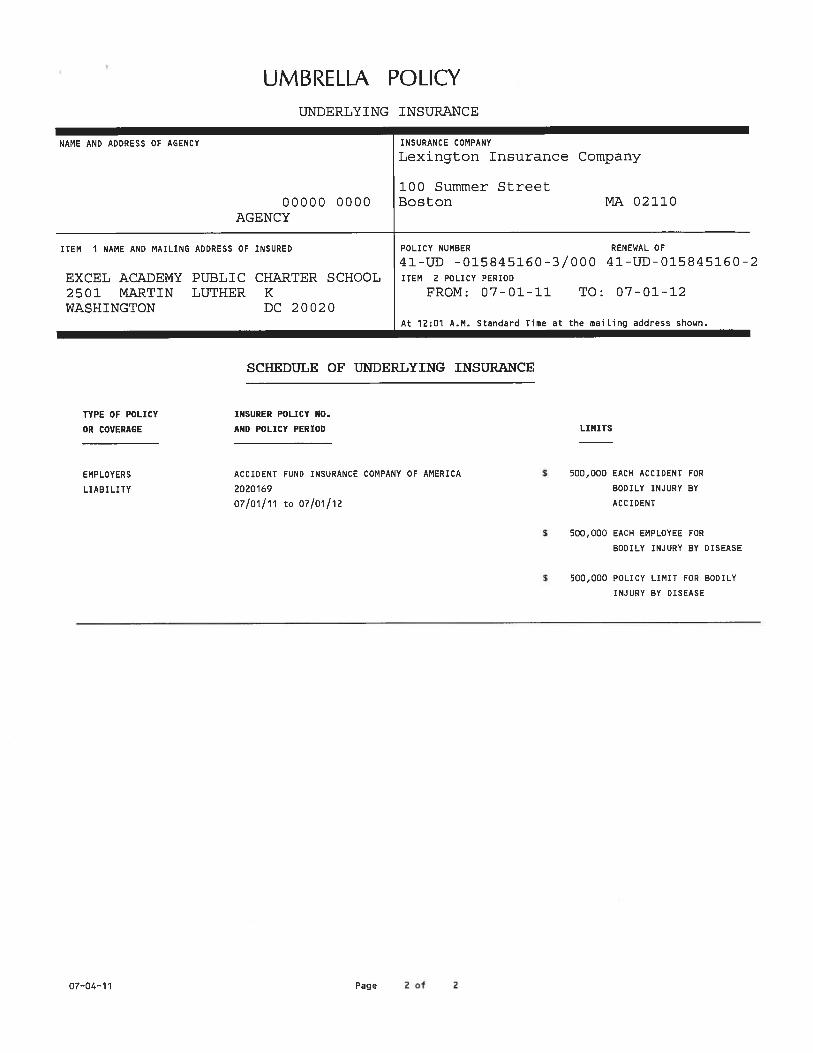
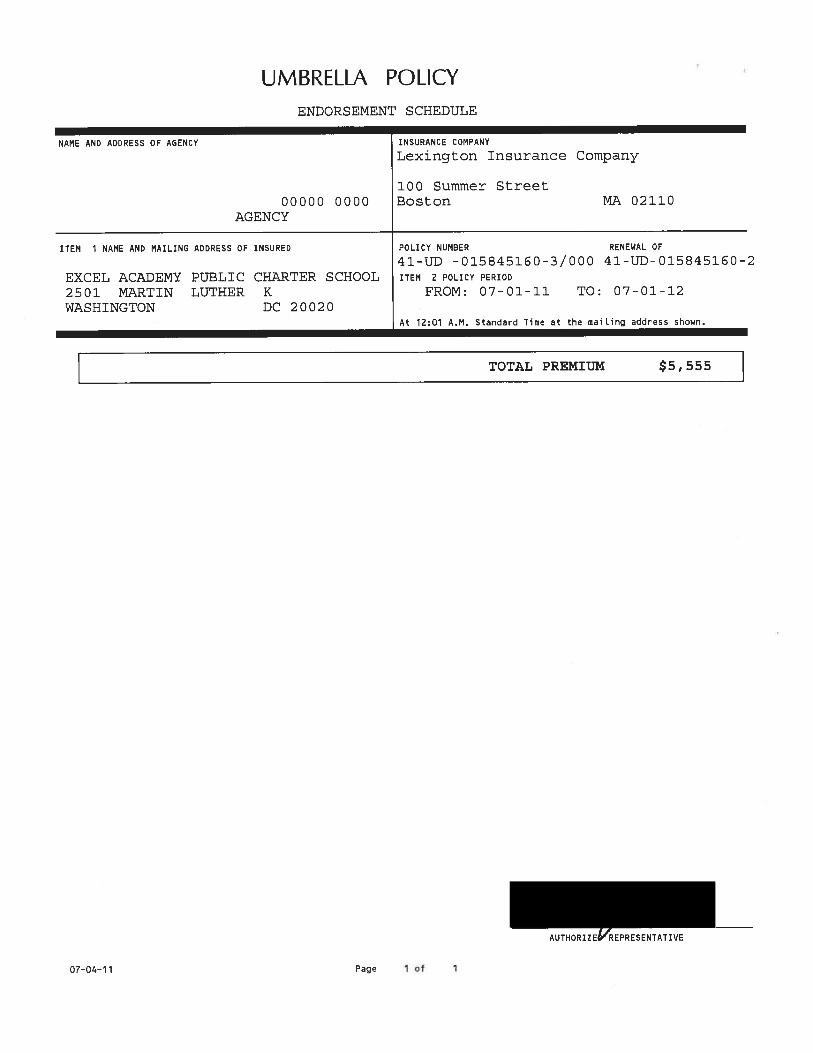
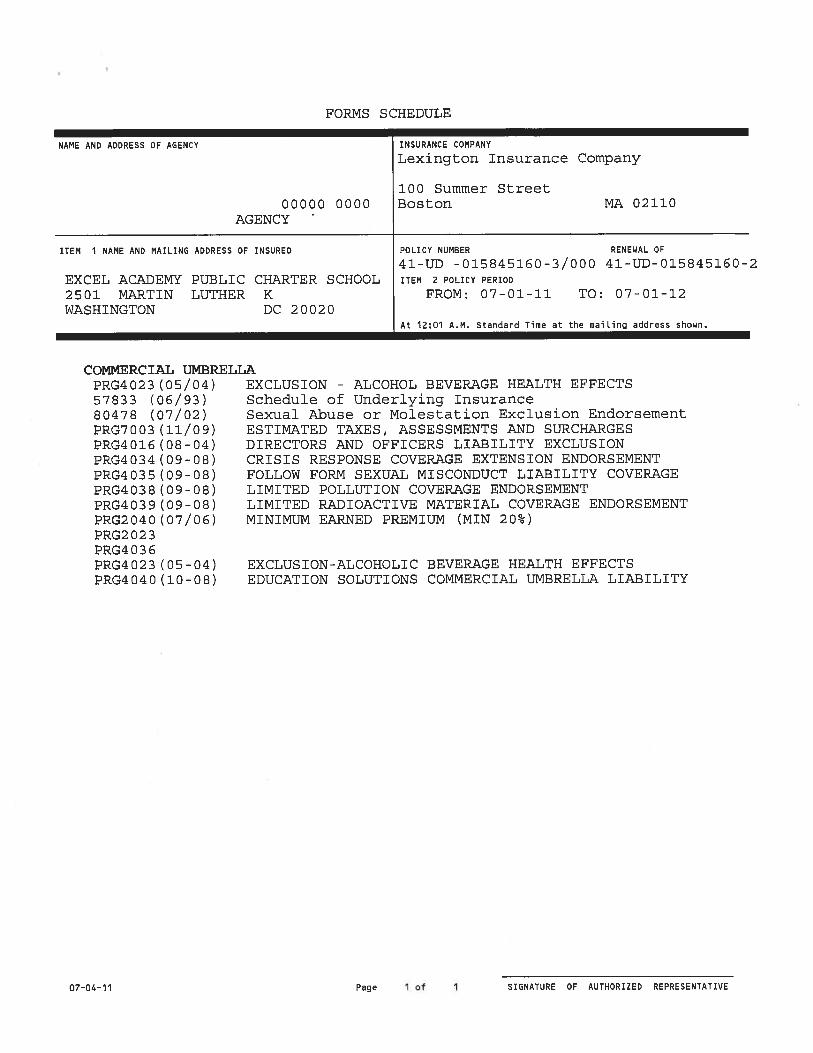
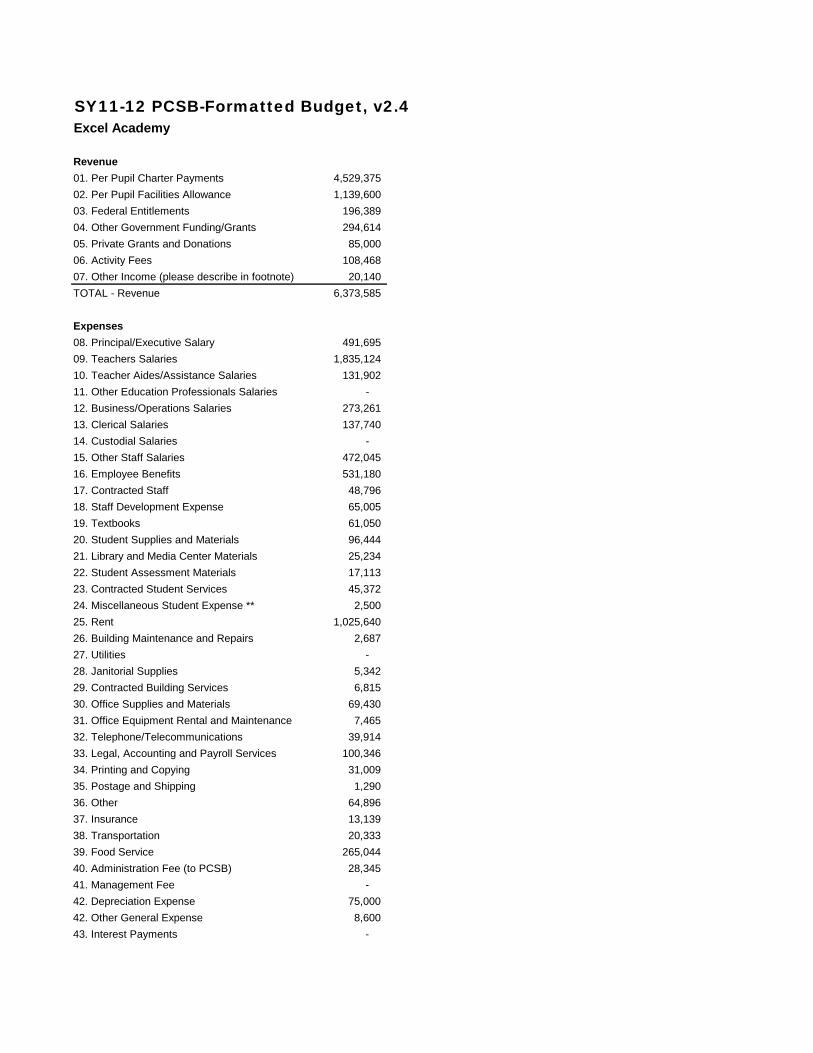
SY11-12 PCSB-Formatted Budget, v2.4Excel Academy
Revenue
01. Per Pupil Charter Payments 4,529,375
02. Per Pupil Facilities Allowance 1,139,600
03. Federal Entitlements 196,389
04. Other Government Funding/Grants 294,614
05. Private Grants and Donations 85,000
06. Activity Fees 108,468
07. Other Income (please describe in footnote) 20,140
TOTAL - Revenue 6,373,585
Expenses
08. Principal/Executive Salary 491,695
09. Teachers Salaries 1,835,124
10. Teacher Aides/Assistance Salaries 131,902
11. Other Education Professionals Salaries -
12. Business/Operations Salaries 273,261
13. Clerical Salaries 137,740
14. Custodial Salaries -
15. Other Staff Salaries 472,045
16. Employee Benefits 531,180
17. Contracted Staff 48,796
18. Staff Development Expense 65,005
19. Textbooks 61,050
20. Student Supplies and Materials 96,444
21. Library and Media Center Materials 25,234
22. Student Assessment Materials 17,113
23. Contracted Student Services 45,372
24. Miscellaneous Student Expense ** 2,500
25. Rent 1,025,640
26. Building Maintenance and Repairs 2,687
27. Utilities -
28. Janitorial Supplies 5,342
29. Contracted Building Services 6,815
30. Office Supplies and Materials 69,430
31. Office Equipment Rental and Maintenance 7,465
32. Telephone/Telecommunications 39,914
33. Legal, Accounting and Payroll Services 100,346
34. Printing and Copying 31,009
35. Postage and Shipping 1,290
36. Other 64,896
37. Insurance 13,139
38. Transportation 20,333
39. Food Service 265,044
40. Administration Fee (to PCSB) 28,345
41. Management Fee -
42. Depreciation Expense 75,000
42. Other General Expense 8,600
43. Interest Payments -

43. Unforeseen Expenses -
TOTAL - Expenses 5,999,756
NET INCOME 373,829
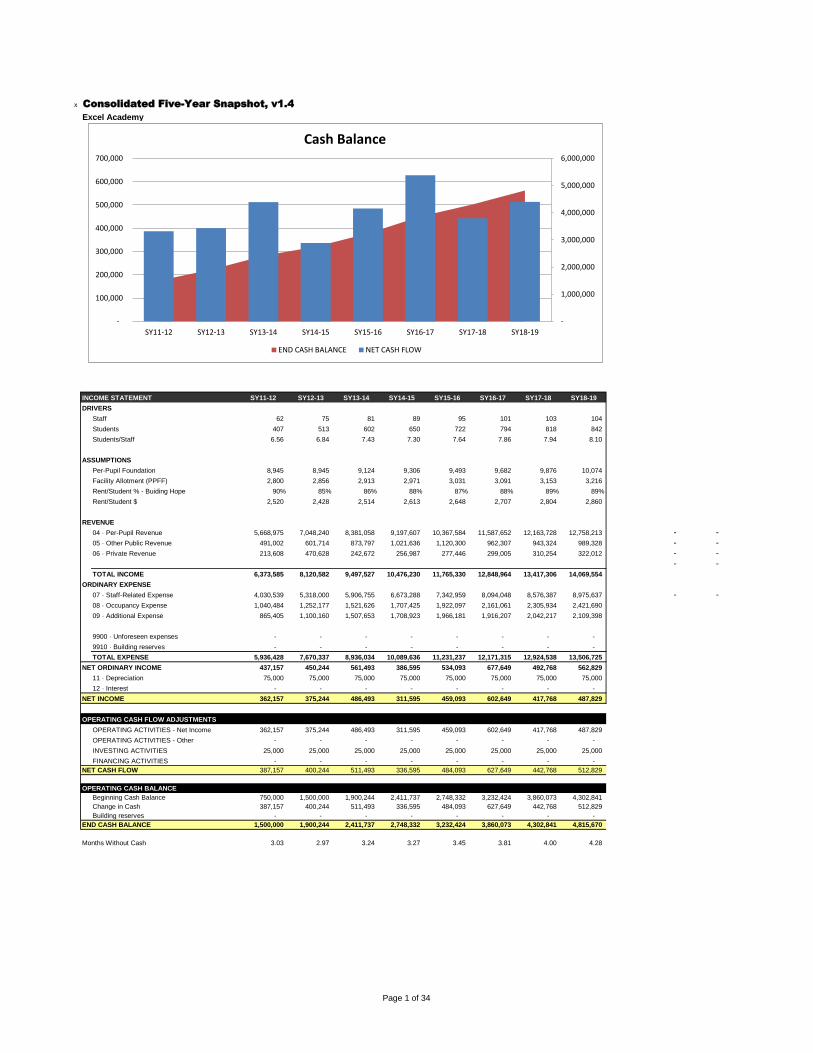
x Consolidated Five-Year Snapshot, v1.4
Excel Academy
INCOME STATEMENT SY11-12 SY12-13 SY13-14 SY14-15 SY15-16 SY16-17 SY17-18 SY18-19
DRIVERS
Staff 62 75 81 89 95 101 103 104
Students 407 513 602 650 722 794 818 842
Students/Staff 6.56 6.84 7.43 7.30 7.64 7.86 7.94 8.10
ASSUMPTIONS
Per-Pupil Foundation 8,945 8,945 9,124 9,306 9,493 9,682 9,876 10,074
Facility Allotment (PPFF) 2,800 2,856 2,913 2,971 3,031 3,091 3,153 3,216
Rent/Student % - Buiding Hope 90% 85% 86% 88% 87% 88% 89% 89%
Rent/Student $ 2,520 2,428 2,514 2,613 2,648 2,707 2,804 2,860
REVENUE
04 · Per-Pupil Revenue 5,668,975 7,048,240 8,381,058 9,197,607 10,367,584 11,587,652 12,163,728 12,758,213 - -
05 · Other Public Revenue 491,002 601,714 873,797 1,021,636 1,120,300 962,307 943,324 989,328 - -
06 · Private Revenue 213,608 470,628 242,672 256,987 277,446 299,005 310,254 322,012 - -
- -
TOTAL INCOME 6,373,585 8,120,582 9,497,527 10,476,230 11,765,330 12,848,964 13,417,306 14,069,554
ORDINARY EXPENSE
07 · Staff-Related Expense 4,030,539 5,318,000 5,906,755 6,673,288 7,342,959 8,094,048 8,576,387 8,975,637 - -
08 · Occupancy Expense 1,040,484 1,252,177 1,521,626 1,707,425 1,922,097 2,161,061 2,305,934 2,421,690
09 · Additional Expense 865,405 1,100,160 1,507,653 1,708,923 1,966,181 1,916,207 2,042,217 2,109,398
9900 · Unforeseen expenses - - - - - - - -
9910 · Building reserves - - - - - - - -
TOTAL EXPENSE 5,936,428 7,670,337 8,936,034 10,089,636 11,231,237 12,171,315 12,924,538 13,506,725
NET ORDINARY INCOME 437,157 450,244 561,493 386,595 534,093 677,649 492,768 562,829
11 · Depreciation 75,000 75,000 75,000 75,000 75,000 75,000 75,000 75,000
12 · Interest - - - - - - - -
NET INCOME 362,157 375,244 486,493 311,595 459,093 602,649 417,768 487,829
OPERATING CASH FLOW ADJUSTMENTS
OPERATING ACTIVITIES - Net Income 362,157 375,244 486,493 311,595 459,093 602,649 417,768 487,829
OPERATING ACTIVITIES - Other - - - - - - - -
INVESTING ACTIVITIES 25,000 25,000 25,000 25,000 25,000 25,000 25,000 25,000
FINANCING ACTIVITIES - - - - - - - -
NET CASH FLOW 387,157 400,244 511,493 336,595 484,093 627,649 442,768 512,829
OPERATING CASH BALANCE
Beginning Cash Balance 750,000 1,500,000 1,900,244 2,411,737 2,748,332 3,232,424 3,860,073 4,302,841
Change in Cash 387,157 400,244 511,493 336,595 484,093 627,649 442,768 512,829
Building reserves - - - - - - - -
END CASH BALANCE 1,500,000 1,900,244 2,411,737 2,748,332 3,232,424 3,860,073 4,302,841 4,815,670
Months Without Cash 3.03 2.97 3.24 3.27 3.45 3.81 4.00 4.28
-
1,000,000
2,000,000
3,000,000
4,000,000
5,000,000
6,000,000
-
100,000
200,000
300,000
400,000
500,000
600,000
700,000
SY11-12 SY12-13 SY13-14 SY14-15 SY15-16 SY16-17 SY17-18 SY18-19
Cash Balance
END CASH BALANCE NET CASH FLOW
Page 1 of 34
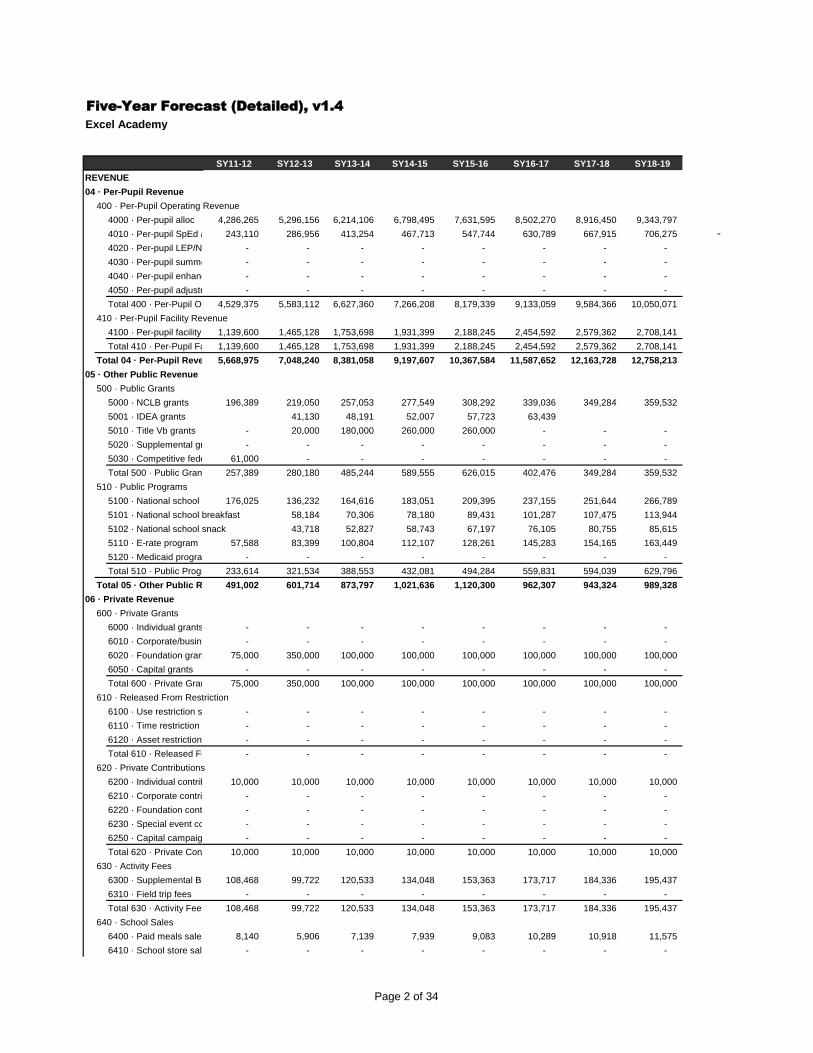
Five-Year Forecast (Detailed), v1.4
Excel Academy
SY11-12 SY12-13 SY13-14 SY14-15 SY15-16 SY16-17 SY17-18 SY18-19
REVENUE
04 · Per-Pupil Revenue
400 · Per-Pupil Operating Revenue
4000 · Per-pupil alloc 4,286,265 5,296,156 6,214,106 6,798,495 7,631,595 8,502,270 8,916,450 9,343,797
4010 · Per-pupil SpEd alloc 243,110 286,956 413,254 467,713 547,744 630,789 667,915 706,275 -
4020 · Per-pupil LEP/NEP alloc - - - - - - - -
4030 · Per-pupil summer alloc - - - - - - - -
4040 · Per-pupil enhancement - - - - - - - -
4050 · Per-pupil adjustment - - - - - - - -
Total 400 · Per-Pupil Operating Revenue4,529,375 5,583,112 6,627,360 7,266,208 8,179,339 9,133,059 9,584,366 10,050,071
410 · Per-Pupil Facility Revenue
4100 · Per-pupil facility alloc1,139,600 1,465,128 1,753,698 1,931,399 2,188,245 2,454,592 2,579,362 2,708,141
Total 410 · Per-Pupil Facility Revenue1,139,600 1,465,128 1,753,698 1,931,399 2,188,245 2,454,592 2,579,362 2,708,141
Total 04 · Per-Pupil Revenue5,668,975 7,048,240 8,381,058 9,197,607 10,367,584 11,587,652 12,163,728 12,758,213
05 · Other Public Revenue
500 · Public Grants
5000 · NCLB grants 196,389 219,050 257,053 277,549 308,292 339,036 349,284 359,532
5001 · IDEA grants 41,130 48,191 52,007 57,723 63,439
5010 · Title Vb grants - 20,000 180,000 260,000 260,000 - - -
5020 · Supplemental grants - - - - - - - -
5030 · Competitive federal grants61,000 - - - - - - -
Total 500 · Public Grants 257,389 280,180 485,244 589,555 626,015 402,476 349,284 359,532
510 · Public Programs
5100 · National school lunch 176,025 136,232 164,616 183,051 209,395 237,155 251,644 266,789
5101 · National school breakfast 58,184 70,306 78,180 89,431 101,287 107,475 113,944
5102 · National school snack 43,718 52,827 58,743 67,197 76,105 80,755 85,615
5110 · E-rate program 57,588 83,399 100,804 112,107 128,261 145,283 154,165 163,449
5120 · Medicaid program - - - - - - - -
Total 510 · Public Programs 233,614 321,534 388,553 432,081 494,284 559,831 594,039 629,796
Total 05 · Other Public Revenue491,002 601,714 873,797 1,021,636 1,120,300 962,307 943,324 989,328
06 · Private Revenue
600 · Private Grants
6000 · Individual grants - - - - - - - -
6010 · Corporate/business grants - - - - - - - -
6020 · Foundation grants 75,000 350,000 100,000 100,000 100,000 100,000 100,000 100,000
6050 · Capital grants - - - - - - - -
Total 600 · Private Grants 75,000 350,000 100,000 100,000 100,000 100,000 100,000 100,000
610 · Released From Restriction
6100 · Use restriction satisfied - - - - - - - -
6110 · Time restriction satisfied - - - - - - - -
6120 · Asset restriction satisfied - - - - - - - -
Total 610 · Released From Restriction- - - - - - - -
620 · Private Contributions
6200 · Individual contributions10,000 10,000 10,000 10,000 10,000 10,000 10,000 10,000
6210 · Corporate contributions - - - - - - - -
6220 · Foundation contributions - - - - - - - -
6230 · Special event contributions- - - - - - - -
6250 · Capital campaign contributions- - - - - - - -
Total 620 · Private Contributions10,000 10,000 10,000 10,000 10,000 10,000 10,000 10,000
630 · Activity Fees
6300 · Supplemental BC/AC fees108,468 99,722 120,533 134,048 153,363 173,717 184,336 195,437
6310 · Field trip fees - - - - - - - -
Total 630 · Activity Fees 108,468 99,722 120,533 134,048 153,363 173,717 184,336 195,437
640 · School Sales
6400 · Paid meals sales 8,140 5,906 7,139 7,939 9,083 10,289 10,918 11,575
6410 · School store sales - - - - - - - -
Page 2 of 34
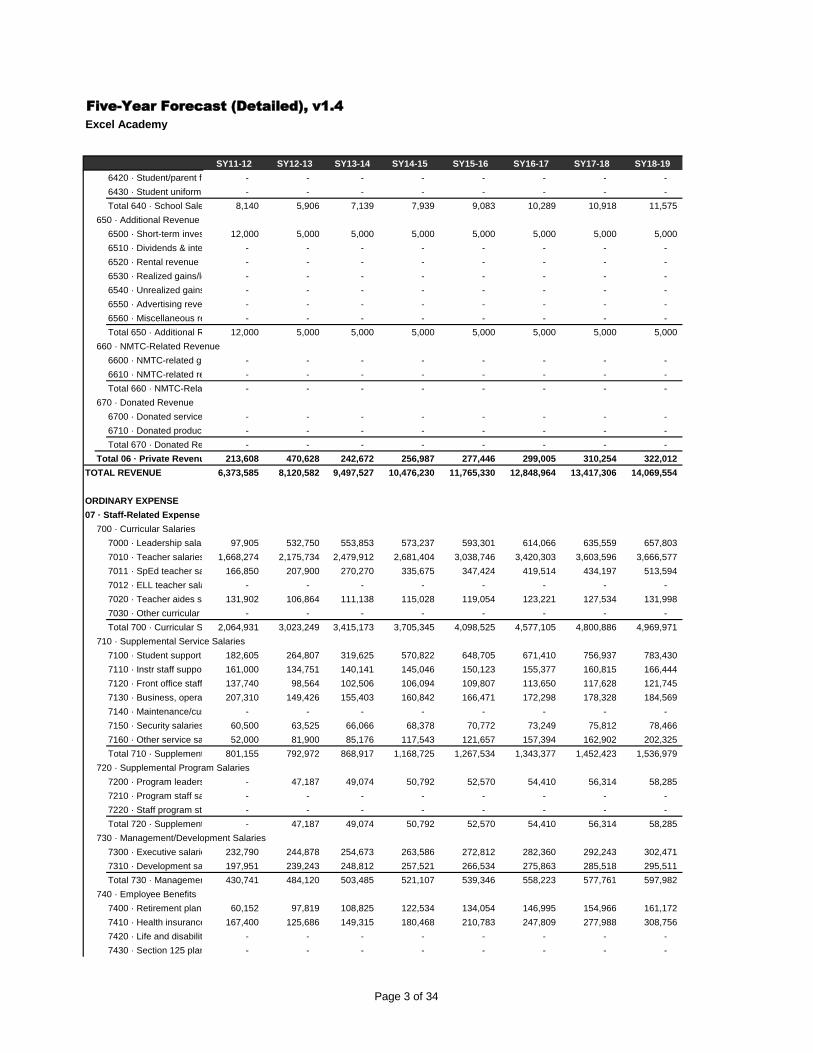
Five-Year Forecast (Detailed), v1.4
Excel Academy
SY11-12 SY12-13 SY13-14 SY14-15 SY15-16 SY16-17 SY17-18 SY18-19
6420 · Student/parent fundraising - - - - - - - -
6430 · Student uniform sales - - - - - - - -
Total 640 · School Sales 8,140 5,906 7,139 7,939 9,083 10,289 10,918 11,575
650 · Additional Revenue
6500 · Short-term investments12,000 5,000 5,000 5,000 5,000 5,000 5,000 5,000
6510 · Dividends & interest securities- - - - - - - -
6520 · Rental revenue - - - - - - - -
6530 · Realized gains/losses - - - - - - - -
6540 · Unrealized gains/losses - - - - - - - -
6550 · Advertising revenue - - - - - - - -
6560 · Miscellaneous revenue - - - - - - - -
Total 650 · Additional Revenue12,000 5,000 5,000 5,000 5,000 5,000 5,000 5,000
660 · NMTC-Related Revenue
6600 · NMTC-related grants - - - - - - - -
6610 · NMTC-related reimbursements- - - - - - - -
Total 660 · NMTC-Related Revenue- - - - - - - -
670 · Donated Revenue
6700 · Donated services revenue - - - - - - - -
6710 · Donated products/goods revenue- - - - - - - -
Total 670 · Donated Revenue - - - - - - - -
Total 06 · Private Revenue 213,608 470,628 242,672 256,987 277,446 299,005 310,254 322,012
TOTAL REVENUE 6,373,585 8,120,582 9,497,527 10,476,230 11,765,330 12,848,964 13,417,306 14,069,554
ORDINARY EXPENSE
07 · Staff-Related Expense
700 · Curricular Salaries
7000 · Leadership salaries 97,905 532,750 553,853 573,237 593,301 614,066 635,559 657,803
7010 · Teacher salaries 1,668,274 2,175,734 2,479,912 2,681,404 3,038,746 3,420,303 3,603,596 3,666,577
7011 · SpEd teacher salaries166,850 207,900 270,270 335,675 347,424 419,514 434,197 513,594
7012 · ELL teacher salaries - - - - - - - -
7020 · Teacher aides salaries131,902 106,864 111,138 115,028 119,054 123,221 127,534 131,998
7030 · Other curricular salaries - - - - - - - -
Total 700 · Curricular Salaries2,064,931 3,023,249 3,415,173 3,705,345 4,098,525 4,577,105 4,800,886 4,969,971
710 · Supplemental Service Salaries
7100 · Student support salaries182,605 264,807 319,625 570,822 648,705 671,410 756,937 783,430
7110 · Instr staff support salaries161,000 134,751 140,141 145,046 150,123 155,377 160,815 166,444
7120 · Front office staff salaries137,740 98,564 102,506 106,094 109,807 113,650 117,628 121,745
7130 · Business, operations salaries207,310 149,426 155,403 160,842 166,471 172,298 178,328 184,569
7140 · Maintenance/custodial salaries- - - - - - - -
7150 · Security salaries 60,500 63,525 66,066 68,378 70,772 73,249 75,812 78,466
7160 · Other service salaries 52,000 81,900 85,176 117,543 121,657 157,394 162,902 202,325
Total 710 · Supplemental Service Salaries801,155 792,972 868,917 1,168,725 1,267,534 1,343,377 1,452,423 1,536,979
720 · Supplemental Program Salaries
7200 · Program leadership salaries- 47,187 49,074 50,792 52,570 54,410 56,314 58,285
7210 · Program staff salaries - - - - - - - -
7220 · Staff program stipends - - - - - - - -
Total 720 · Supplemental Program Salaries- 47,187 49,074 50,792 52,570 54,410 56,314 58,285
730 · Management/Development Salaries
7300 · Executive salaries 232,790 244,878 254,673 263,586 272,812 282,360 292,243 302,471
7310 · Development salaries197,951 239,243 248,812 257,521 266,534 275,863 285,518 295,511
Total 730 · Management/Development Salaries430,741 484,120 503,485 521,107 539,346 558,223 577,761 597,982
740 · Employee Benefits
7400 · Retirement plan contrib60,152 97,819 108,825 122,534 134,054 146,995 154,966 161,172
7410 · Health insurance 167,400 125,686 149,315 180,468 210,783 247,809 277,988 308,756
7420 · Life and disability insurance- - - - - - - -
7430 · Section 125 plan - - - - - - - -
Page 3 of 34
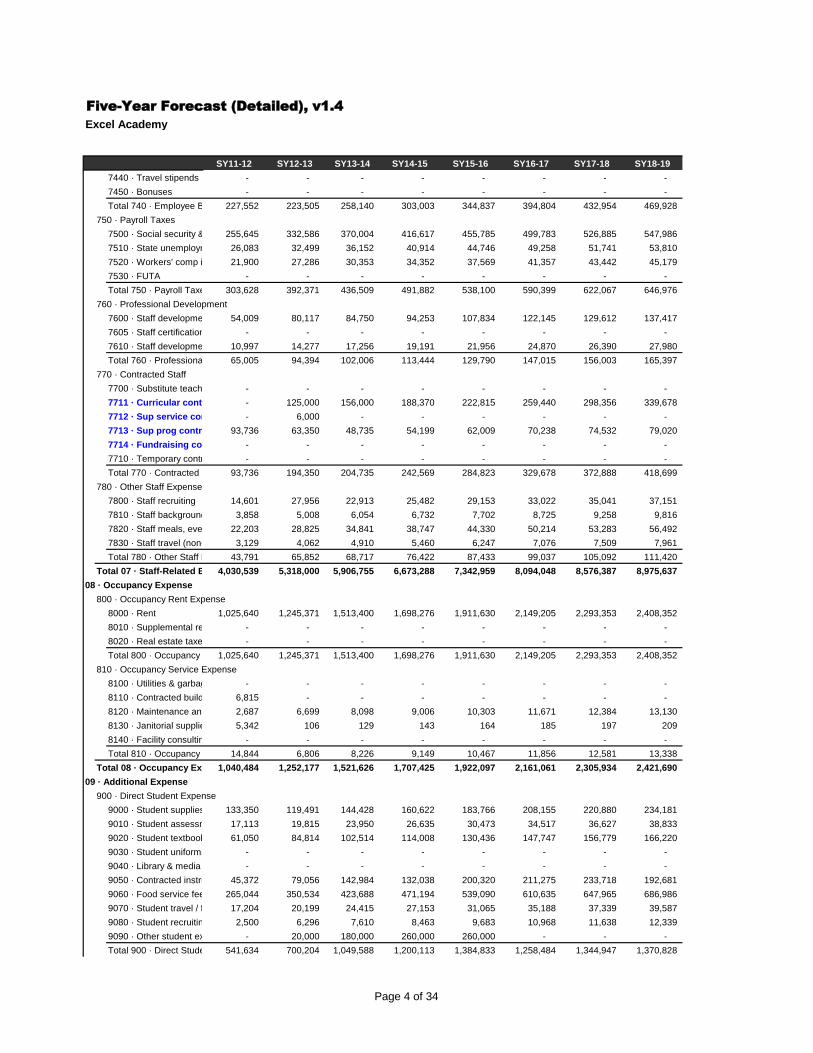
Five-Year Forecast (Detailed), v1.4
Excel Academy
SY11-12 SY12-13 SY13-14 SY14-15 SY15-16 SY16-17 SY17-18 SY18-19
7440 · Travel stipends - - - - - - - -
7450 · Bonuses - - - - - - - -
Total 740 · Employee Benefits227,552 223,505 258,140 303,003 344,837 394,804 432,954 469,928
750 · Payroll Taxes
7500 · Social security & medicare255,645 332,586 370,004 416,617 455,785 499,783 526,885 547,986
7510 · State unemployment tax26,083 32,499 36,152 40,914 44,746 49,258 51,741 53,810
7520 · Workers' comp insurance21,900 27,286 30,353 34,352 37,569 41,357 43,442 45,179
7530 · FUTA - - - - - - - -
Total 750 · Payroll Taxes 303,628 392,371 436,509 491,882 538,100 590,399 622,067 646,976
760 · Professional Development
7600 · Staff development (non-travel)54,009 80,117 84,750 94,253 107,834 122,145 129,612 137,417
7605 · Staff certification - - - - - - - -
7610 · Staff development travel10,997 14,277 17,256 19,191 21,956 24,870 26,390 27,980
Total 760 · Professional Development65,005 94,394 102,006 113,444 129,790 147,015 156,003 165,397
770 · Contracted Staff
7700 · Substitute teachers - - - - - - - -
7711 · Curricular contract staff - 125,000 156,000 188,370 222,815 259,440 298,356 339,678
7712 · Sup service contract staff- 6,000 - - - - - -
7713 · Sup prog contract staff93,736 63,350 48,735 54,199 62,009 70,238 74,532 79,020
7714 · Fundraising contract staff- - - - - - - -
7710 · Temporary contract help - - - - - - - -
Total 770 · Contracted Staff 93,736 194,350 204,735 242,569 284,823 329,678 372,888 418,699
780 · Other Staff Expense
7800 · Staff recruiting 14,601 27,956 22,913 25,482 29,153 33,022 35,041 37,151
7810 · Staff background checks3,858 5,008 6,054 6,732 7,702 8,725 9,258 9,816
7820 · Staff meals, events, & awards22,203 28,825 34,841 38,747 44,330 50,214 53,283 56,492
7830 · Staff travel (non-development)3,129 4,062 4,910 5,460 6,247 7,076 7,509 7,961
Total 780 · Other Staff Expense43,791 65,852 68,717 76,422 87,433 99,037 105,092 111,420
Total 07 · Staff-Related Expense4,030,539 5,318,000 5,906,755 6,673,288 7,342,959 8,094,048 8,576,387 8,975,637
08 · Occupancy Expense
800 · Occupancy Rent Expense
8000 · Rent 1,025,640 1,245,371 1,513,400 1,698,276 1,911,630 2,149,205 2,293,353 2,408,352
8010 · Supplemental rent - - - - - - - -
8020 · Real estate taxes - - - - - - - -
Total 800 · Occupancy Rent Expense1,025,640 1,245,371 1,513,400 1,698,276 1,911,630 2,149,205 2,293,353 2,408,352
810 · Occupancy Service Expense
8100 · Utilities & garbage removal- - - - - - - -
8110 · Contracted building services6,815 - - - - - - -
8120 · Maintenance and repairs2,687 6,699 8,098 9,006 10,303 11,671 12,384 13,130
8130 · Janitorial supplies 5,342 106 129 143 164 185 197 209
8140 · Facility consulting fees - - - - - - - -
Total 810 · Occupancy Service Expense14,844 6,806 8,226 9,149 10,467 11,856 12,581 13,338
Total 08 · Occupancy Expense1,040,484 1,252,177 1,521,626 1,707,425 1,922,097 2,161,061 2,305,934 2,421,690
09 · Additional Expense
900 · Direct Student Expense
9000 · Student supplies, snacks133,350 119,491 144,428 160,622 183,766 208,155 220,880 234,181
9010 · Student assessment materials17,113 19,815 23,950 26,635 30,473 34,517 36,627 38,833
9020 · Student textbooks 61,050 84,814 102,514 114,008 130,436 147,747 156,779 166,220
9030 · Student uniforms - - - - - - - -
9040 · Library & media materials - - - - - - - -
9050 · Contracted instruction fees45,372 79,056 142,984 132,038 200,320 211,275 233,718 192,681
9060 · Food service fees 265,044 350,534 423,688 471,194 539,090 610,635 647,965 686,986
9070 · Student travel / field trips17,204 20,199 24,415 27,153 31,065 35,188 37,339 39,587
9080 · Student recruiting 2,500 6,296 7,610 8,463 9,683 10,968 11,638 12,339
9090 · Other student expenses - 20,000 180,000 260,000 260,000 - - -
Total 900 · Direct Student Expense541,634 700,204 1,049,588 1,200,113 1,384,833 1,258,484 1,344,947 1,370,828
Page 4 of 34
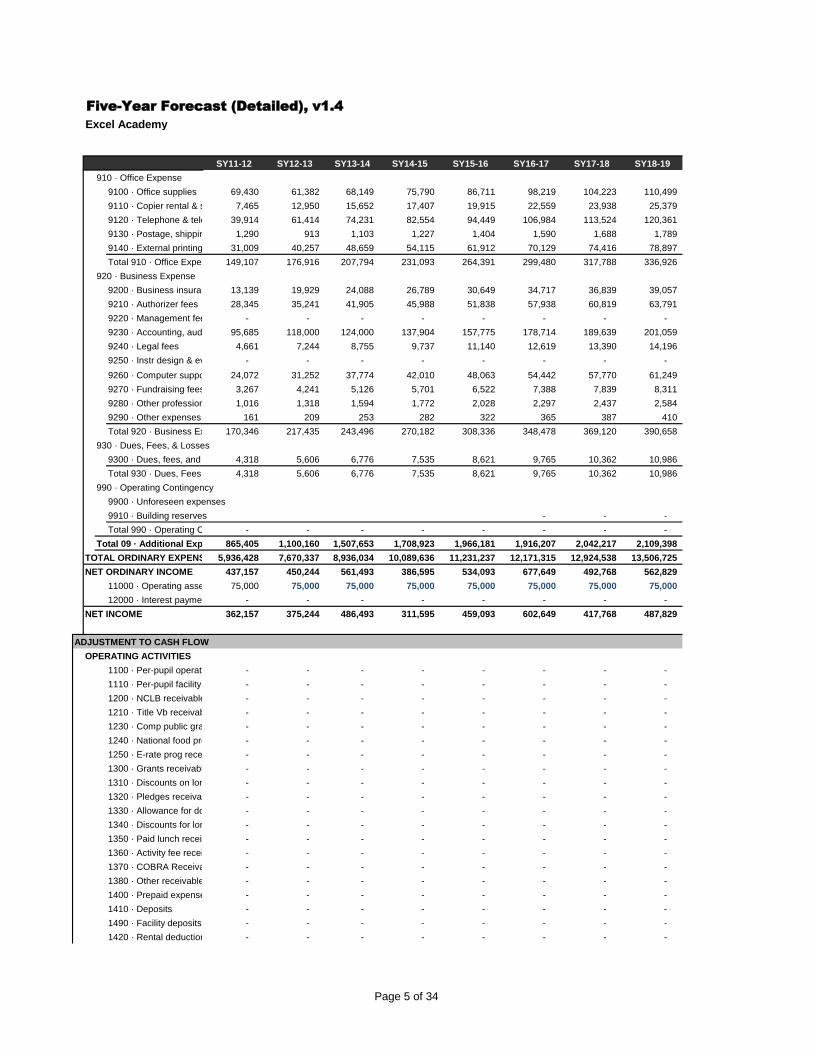
Five-Year Forecast (Detailed), v1.4
Excel Academy
SY11-12 SY12-13 SY13-14 SY14-15 SY15-16 SY16-17 SY17-18 SY18-19
910 · Office Expense
9100 · Office supplies 69,430 61,382 68,149 75,790 86,711 98,219 104,223 110,499
9110 · Copier rental & services 7,465 12,950 15,652 17,407 19,915 22,559 23,938 25,379
9120 · Telephone & telecommunications39,914 61,414 74,231 82,554 94,449 106,984 113,524 120,361
9130 · Postage, shipping, delivery1,290 913 1,103 1,227 1,404 1,590 1,688 1,789
9140 · External printing 31,009 40,257 48,659 54,115 61,912 70,129 74,416 78,897
Total 910 · Office Expense 149,107 176,916 207,794 231,093 264,391 299,480 317,788 336,926
920 · Business Expense
9200 · Business insurance 13,139 19,929 24,088 26,789 30,649 34,717 36,839 39,057
9210 · Authorizer fees 28,345 35,241 41,905 45,988 51,838 57,938 60,819 63,791
9220 · Management fees - - - - - - - -
9230 · Accounting, auditing, payroll95,685 118,000 124,000 137,904 157,775 178,714 189,639 201,059
9240 · Legal fees 4,661 7,244 8,755 9,737 11,140 12,619 13,390 14,196
9250 · Instr design & eval fees - - - - - - - -
9260 · Computer support fees24,072 31,252 37,774 42,010 48,063 54,442 57,770 61,249
9270 · Fundraising fees 3,267 4,241 5,126 5,701 6,522 7,388 7,839 8,311
9280 · Other professional fees 1,016 1,318 1,594 1,772 2,028 2,297 2,437 2,584
9290 · Other expenses 161 209 253 282 322 365 387 410
Total 920 · Business Expense170,346 217,435 243,496 270,182 308,336 348,478 369,120 390,658
930 · Dues, Fees, & Losses
9300 · Dues, fees, and fines 4,318 5,606 6,776 7,535 8,621 9,765 10,362 10,986
Total 930 · Dues, Fees, & Losses4,318 5,606 6,776 7,535 8,621 9,765 10,362 10,986
990 · Operating Contingency
9900 · Unforeseen expenses
9910 · Building reserves - - -
Total 990 · Operating Contingency- - - - - - - -
Total 09 · Additional Expense 865,405 1,100,160 1,507,653 1,708,923 1,966,181 1,916,207 2,042,217 2,109,398
TOTAL ORDINARY EXPENSE 5,936,428 7,670,337 8,936,034 10,089,636 11,231,237 12,171,315 12,924,538 13,506,725
NET ORDINARY INCOME 437,157 450,244 561,493 386,595 534,093 677,649 492,768 562,829
11000 · Operating asset depreciation75,000 75,000 75,000 75,000 75,000 75,000 75,000 75,000
12000 · Interest payments - - - - - - - -
NET INCOME 362,157 375,244 486,493 311,595 459,093 602,649 417,768 487,829
ADJUSTMENT TO CASH FLOW
OPERATING ACTIVITIES
1100 · Per-pupil operating receivable- - - - - - - -
1110 · Per-pupil facility receivable- - - - - - - -
1200 · NCLB receivable - - - - - - - -
1210 · Title Vb receivable - - - - - - - -
1230 · Comp public grants receivable- - - - - - - -
1240 · National food prog receivable- - - - - - - -
1250 · E-rate prog receivable - - - - - - - -
1300 · Grants receivable - - - - - - - -
1310 · Discounts on long-term grants- - - - - - - -
1320 · Pledges receivable - - - - - - - -
1330 · Allowance for doubtful pledges- - - - - - - -
1340 · Discounts for long-term pledges- - - - - - - -
1350 · Paid lunch receivable - - - - - - - -
1360 · Activity fee receivable - - - - - - - -
1370 · COBRA Receivable - - - - - - - -
1380 · Other receivable - - - - - - - -
1400 · Prepaid expenses - - - - - - - -
1410 · Deposits - - - - - - - -
1490 · Facility deposits - - - - - - - -
1420 · Rental deductions - - - - - - - -
Page 5 of 34
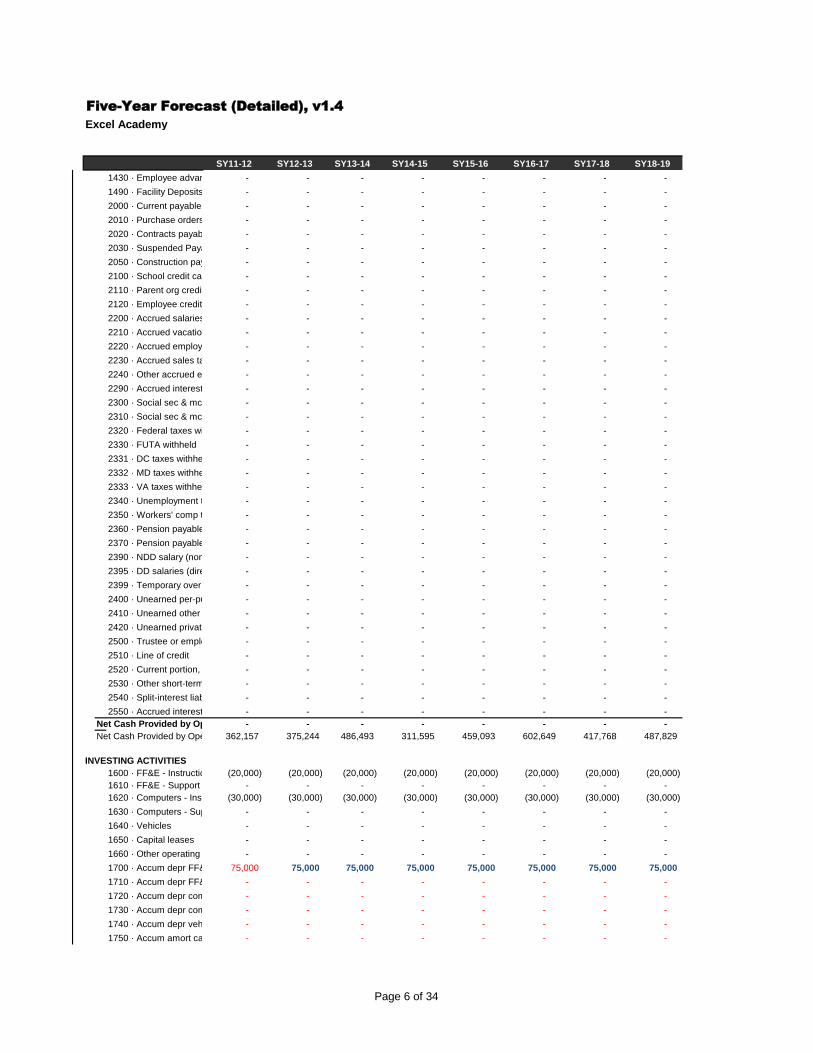
Five-Year Forecast (Detailed), v1.4
Excel Academy
SY11-12 SY12-13 SY13-14 SY14-15 SY15-16 SY16-17 SY17-18 SY18-19
1430 · Employee advances - - - - - - - -
1490 · Facility Deposits - - - - - - - -
2000 · Current payable - - - - - - - -
2010 · Purchase orders - - - - - - - -
2020 · Contracts payable - - - - - - - -
2030 · Suspended Payable - - - - - - - -
2050 · Construction payable - - - - - - - -
2100 · School credit card - - - - - - - -
2110 · Parent org credit account - - - - - - - -
2120 · Employee credit account - - - - - - - -
2200 · Accrued salaries - - - - - - - -
2210 · Accrued vacations - - - - - - - -
2220 · Accrued employee benefits- - - - - - - -
2230 · Accrued sales tax payable - - - - - - - -
2240 · Other accrued expenses - - - - - - - -
2290 · Accrued interest - - - - - - - -
2300 · Social sec & mc w/h - employee- - - - - - - -
2310 · Social sec & mc w/h - employer- - - - - - - -
2320 · Federal taxes withheld - - - - - - - -
2330 · FUTA withheld - - - - - - - -
2331 · DC taxes withheld - - - - - - - -
2332 · MD taxes withheld - - - - - - - -
2333 · VA taxes withheld - - - - - - - -
2340 · Unemployment taxes payable- - - - - - - -
2350 · Workers' comp taxes payable- - - - - - - -
2360 · Pension payable (EE) - - - - - - - -
2370 · Pension payable (ER) - - - - - - - -
2390 · NDD salary (non-direct deposit)- - - - - - - -
2395 · DD salaries (direct deposit)- - - - - - - -
2399 · Temporary over / under - - - - - - - -
2400 · Unearned per-pupil revenue- - - - - - - -
2410 · Unearned other public revenue- - - - - - - -
2420 · Unearned private revenue - - - - - - - -
2500 · Trustee or employee loan - - - - - - - -
2510 · Line of credit - - - - - - - -
2520 · Current portion, long-term debt- - - - - - - -
2530 · Other short-term liabilities - - - - - - - -
2540 · Split-interest liabilities - - - - - - - -
2550 · Accrued interest - - - - - - - -
Net Cash Provided by Op Activities, less NI- - - - - - - -
Net Cash Provided by Operating Activities362,157 375,244 486,493 311,595 459,093 602,649 417,768 487,829
INVESTING ACTIVITIES
1600 · FF&E - Instruction (20,000) (20,000) (20,000) (20,000) (20,000) (20,000) (20,000) (20,000)
1610 · FF&E - Support - - - - - - - -
1620 · Computers - Instruction(30,000) (30,000) (30,000) (30,000) (30,000) (30,000) (30,000) (30,000)
1630 · Computers - Support - - - - - - - -
1640 · Vehicles - - - - - - - -
1650 · Capital leases - - - - - - - -
1660 · Other operating assets - - - - - - - -
1700 · Accum depr FF&E - Students75,000 75,000 75,000 75,000 75,000 75,000 75,000 75,000
1710 · Accum depr FF&E - Admin- - - - - - - -
1720 · Accum depr computers - Students- - - - - - - -
1730 · Accum depr computers - Admin- - - - - - - -
1740 · Accum depr vehicles - - - - - - - -
1750 · Accum amort capital leases- - - - - - - -
Page 6 of 34
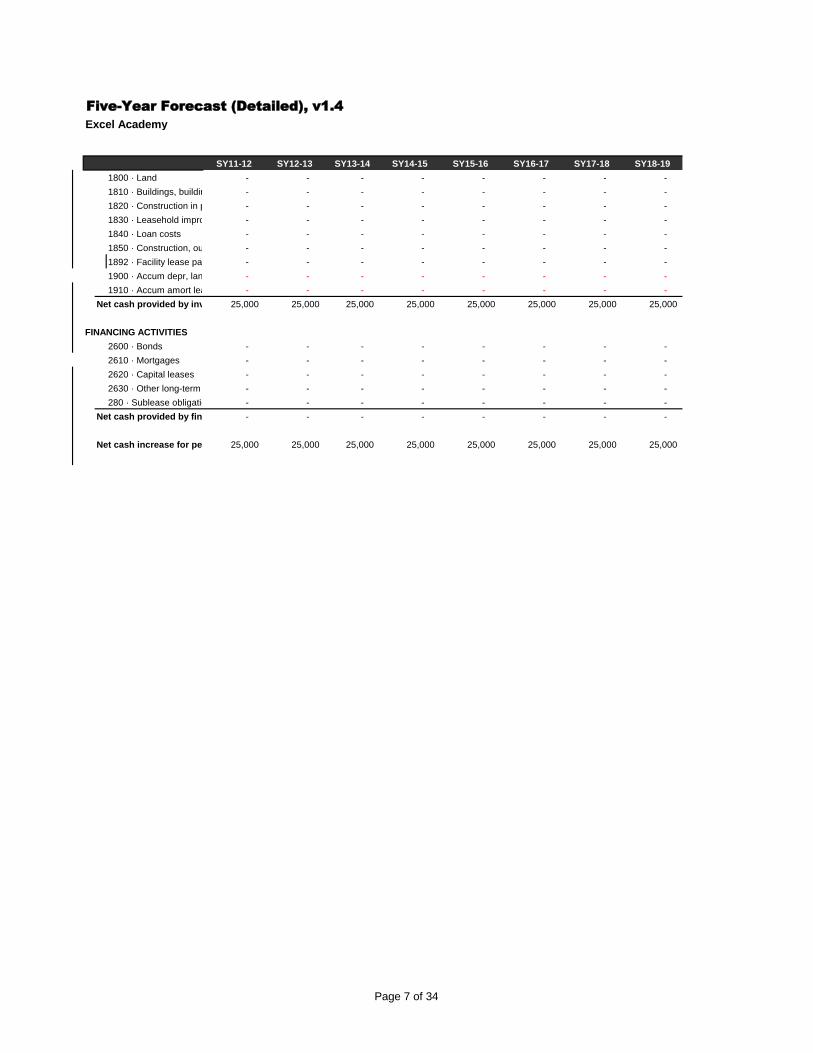
Five-Year Forecast (Detailed), v1.4
Excel Academy
SY11-12 SY12-13 SY13-14 SY14-15 SY15-16 SY16-17 SY17-18 SY18-19
1800 · Land - - - - - - - -
1810 · Buildings, building improvement- - - - - - - -
1820 · Construction in progress - - - - - - - -
1830 · Leasehold improvements - - - - - - - -
1840 · Loan costs - - - - - - - -
1850 · Construction, outside project- - - - - - - -
1892 · Facility lease payment reserve- - - - - - - -
1900 · Accum depr, landlord premises- - - - - - - -
1910 · Accum amort lease imp - - - - - - - -
Net cash provided by investing activities25,000 25,000 25,000 25,000 25,000 25,000 25,000 25,000
FINANCING ACTIVITIES
2600 · Bonds - - - - - - - -
2610 · Mortgages - - - - - - - -
2620 · Capital leases - - - - - - - -
2630 · Other long-term liabilities - - - - - - - -
280 · Sublease obligation - - - - - - - -
Net cash provided by financing activities- - - - - - - -
Net cash increase for period 25,000 25,000 25,000 25,000 25,000 25,000 25,000 25,000
Page 7 of 34
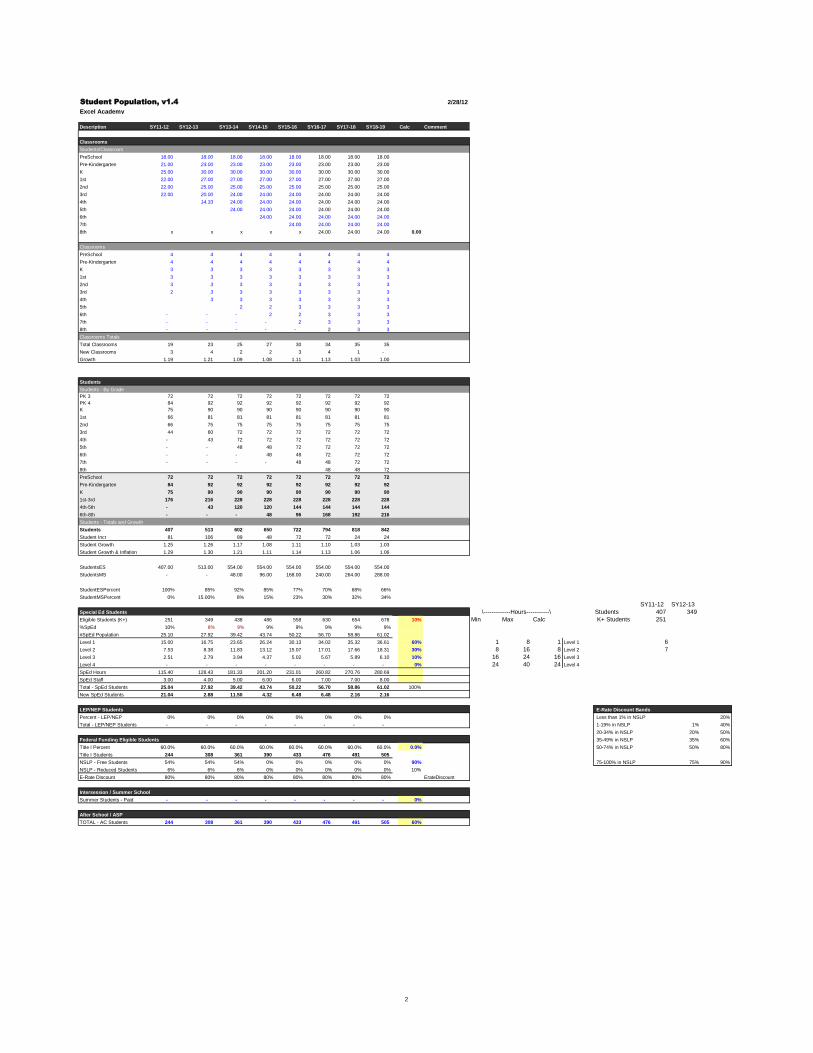
Student Population, v1.4 2/28/12
Excel Academy
Description SY11-12 SY12-13 SY13-14 SY14-15 SY15-16 SY16-17 SY17-18 SY18-19 Calc Comment
Classrooms
Students/Classroom
PreSchool 18.00 18.00 18.00 18.00 18.00 18.00 18.00 18.00
Pre-Kindergarten 21.00 23.00 23.00 23.00 23.00 23.00 23.00 23.00
K 25.00 30.00 30.00 30.00 30.00 30.00 30.00 30.00
1st 22.00 27.00 27.00 27.00 27.00 27.00 27.00 27.00
2nd 22.00 25.00 25.00 25.00 25.00 25.00 25.00 25.00
3rd 22.00 20.00 24.00 24.00 24.00 24.00 24.00 24.00
4th 14.33 24.00 24.00 24.00 24.00 24.00 24.00
5th 24.00 24.00 24.00 24.00 24.00 24.00
6th 24.00 24.00 24.00 24.00 24.00
7th 24.00 24.00 24.00 24.00
8th x x x x x 24.00 24.00 24.00 0.00
Classrooms
PreSchool 4 4 4 4 4 4 4 4
Pre-Kindergarten 4 4 4 4 4 4 4 4
K 3 3 3 3 3 3 3 3
1st 3 3 3 3 3 3 3 3
2nd 3 3 3 3 3 3 3 3
3rd 2 3 3 3 3 3 3 3
4th 3 3 3 3 3 3 3
5th 2 2 3 3 3 3
6th - - - 2 2 3 3 3
7th - - - - 2 3 3 3
8th - - - - - 2 3 3
Classrooms Totals
Total Classrooms 19 23 25 27 30 34 35 35
New Classrooms 3 4 2 2 3 4 1 -
Growth 1.19 1.21 1.09 1.08 1.11 1.13 1.03 1.00
Students
Students - By Grade
PK 3 72 72 72 72 72 72 72 72
PK 4 84 92 92 92 92 92 92 92
K 75 90 90 90 90 90 90 90
1st 66 81 81 81 81 81 81 81
2nd 66 75 75 75 75 75 75 75
3rd 44 60 72 72 72 72 72 72
4th - 43 72 72 72 72 72 72
5th - - 48 48 72 72 72 72
6th - - - 48 48 72 72 72
7th - - - - 48 48 72 72
8th 48 48 72
PreSchool 72 72 72 72 72 72 72 72
Pre-Kindergarten 84 92 92 92 92 92 92 92
K 75 90 90 90 90 90 90 90
1st-3rd 176 216 228 228 228 228 228 228
4th-5th - 43 120 120 144 144 144 144
6th-8th - - - 48 96 168 192 216
Students - Totals and Growth
Students 407 513 602 650 722 794 818 842
Student Incr 81 106 89 48 72 72 24 24
Student Growth 1.25 1.26 1.17 1.08 1.11 1.10 1.03 1.03
Student Growth & Inflation 1.29 1.30 1.21 1.11 1.14 1.13 1.06 1.06
StudentsES 407.00 513.00 554.00 554.00 554.00 554.00 554.00 554.00
StudentsMS - - 48.00 96.00 168.00 240.00 264.00 288.00
StudentESPercent 100% 85% 92% 85% 77% 70% 68% 66%
StudentMSPercent 0% 15.00% 8% 15% 23% 30% 32% 34%
SY11-12 SY12-13
Special Ed Students \-------------Hours-----------\ Students 407 349
Eligible Students (K+) 251 349 438 486 558 630 654 678 10% Min Max Calc K+ Students 251
%SpEd 10% 8% 9% 9% 9% 9% 9% 9%
#SpEd Population 25.10 27.92 39.42 43.74 50.22 56.70 58.86 61.02
Level 1 15.00 16.75 23.65 26.24 30.13 34.02 35.32 36.61 60% 1 8 1 Level 1 6
Level 2 7.53 8.38 11.83 13.12 15.07 17.01 17.66 18.31 30% 8 16 8 Level 2 7
Level 3 2.51 2.79 3.94 4.37 5.02 5.67 5.89 6.10 10% 16 24 16 Level 3
Level 4 - - - - - - - - 0% 24 40 24 Level 4
SpEd Hours 115.40 128.43 181.33 201.20 231.01 260.82 270.76 280.69
SpEd Staff 3.00 4.00 5.00 6.00 6.00 7.00 7.00 8.00
Total - SpEd Students 25.04 27.92 39.42 43.74 50.22 56.70 58.86 61.02 100%
New SpEd Students 21.04 2.88 11.50 4.32 6.48 6.48 2.16 2.16
LEP/NEP Students E-Rate Discount Bands
Percent - LEP/NEP 0% 0% 0% 0% 0% 0% 0% 0% Less than 1% in NSLP 20%
Total - LEP/NEP Students - - - - - - - - 1-19% in NSLP 1% 40%
20-34% in NSLP 20% 50%
Federal Funding Eligible Students 35-49% in NSLP 35% 60%
Title I Percent 60.0% 60.0% 60.0% 60.0% 60.0% 60.0% 60.0% 60.0% 0.0% 50-74% in NSLP 50% 80%
Title I Students 244 308 361 390 433 476 491 505
NSLP - Free Students 54% 54% 54% 0% 0% 0% 0% 0% 90% 75-100% in NSLP 75% 90%
NSLP - Reduced Students 6% 6% 6% 0% 0% 0% 0% 0% 10%
E-Rate Discount 80% 80% 80% 80% 80% 80% 80% 80% ErateDiscount
Intersession / Summer School
Summer Students - Paid - - - - - - - - 0%
After School / ASP
TOTAL - AC Students 244 308 361 390 433 476 491 505 60%
2
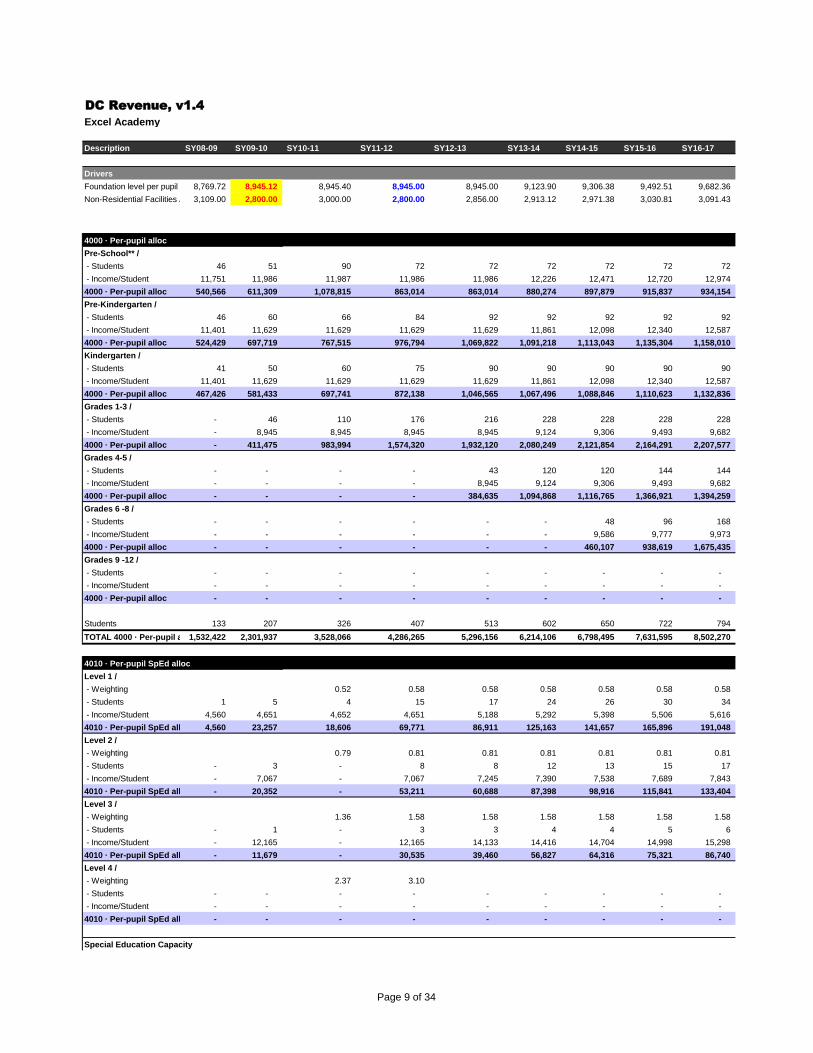
DC Revenue, v1.4
Excel Academy
Description SY08-09 SY09-10 SY10-11 SY11-12 SY12-13 SY13-14 SY14-15 SY15-16 SY16-17
Drivers
Foundation level per pupil 8,769.72 8,945.12 8,945.40 8,945.00 8,945.00 9,123.90 9,306.38 9,492.51 9,682.36
Non-Residential Facilities Allotment:3,109.00 2,800.00 3,000.00 2,800.00 2,856.00 2,913.12 2,971.38 3,030.81 3,091.43
4000 · Per-pupil alloc
Pre-School** /
- Students 46 51 90 72 72 72 72 72 72
- Income/Student 11,751 11,986 11,987 11,986 11,986 12,226 12,471 12,720 12,974
4000 · Per-pupil alloc 540,566 611,309 1,078,815 863,014 863,014 880,274 897,879 915,837 934,154
Pre-Kindergarten /
- Students 46 60 66 84 92 92 92 92 92
- Income/Student 11,401 11,629 11,629 11,629 11,629 11,861 12,098 12,340 12,587
4000 · Per-pupil alloc 524,429 697,719 767,515 976,794 1,069,822 1,091,218 1,113,043 1,135,304 1,158,010
Kindergarten /
- Students 41 50 60 75 90 90 90 90 90
- Income/Student 11,401 11,629 11,629 11,629 11,629 11,861 12,098 12,340 12,587
4000 · Per-pupil alloc 467,426 581,433 697,741 872,138 1,046,565 1,067,496 1,088,846 1,110,623 1,132,836
Grades 1-3 /
- Students - 46 110 176 216 228 228 228 228
- Income/Student - 8,945 8,945 8,945 8,945 9,124 9,306 9,493 9,682
4000 · Per-pupil alloc - 411,475 983,994 1,574,320 1,932,120 2,080,249 2,121,854 2,164,291 2,207,577
Grades 4-5 /
- Students - - - - 43 120 120 144 144
- Income/Student - - - - 8,945 9,124 9,306 9,493 9,682
4000 · Per-pupil alloc - - - - 384,635 1,094,868 1,116,765 1,366,921 1,394,259
Grades 6 -8 /
- Students - - - - - - 48 96 168
- Income/Student - - - - - - 9,586 9,777 9,973
4000 · Per-pupil alloc - - - - - - 460,107 938,619 1,675,435
Grades 9 -12 /
- Students - - - - - - - - -
- Income/Student - - - - - - - - -
4000 · Per-pupil alloc - - - - - - - - -
Students 133 207 326 407 513 602 650 722 794
TOTAL 4000 · Per-pupil alloc1,532,422 2,301,937 3,528,066 4,286,265 5,296,156 6,214,106 6,798,495 7,631,595 8,502,270
4010 · Per-pupil SpEd alloc
Level 1 /
- Weighting 0.52 0.58 0.58 0.58 0.58 0.58 0.58
- Students 1 5 4 15 17 24 26 30 34
- Income/Student 4,560 4,651 4,652 4,651 5,188 5,292 5,398 5,506 5,616
4010 · Per-pupil SpEd alloc 4,560 23,257 18,606 69,771 86,911 125,163 141,657 165,896 191,048
Level 2 /
- Weighting 0.79 0.81 0.81 0.81 0.81 0.81 0.81
- Students - 3 - 8 8 12 13 15 17
- Income/Student - 7,067 - 7,067 7,245 7,390 7,538 7,689 7,843
4010 · Per-pupil SpEd alloc - 20,352 - 53,211 60,688 87,398 98,916 115,841 133,404
Level 3 /
- Weighting 1.36 1.58 1.58 1.58 1.58 1.58 1.58
- Students - 1 - 3 3 4 4 5 6
- Income/Student - 12,165 - 12,165 14,133 14,416 14,704 14,998 15,298
4010 · Per-pupil SpEd alloc - 11,679 - 30,535 39,460 56,827 64,316 75,321 86,740
Level 4 /
- Weighting 2.37 3.10
- Students - - - - - - - - -
- Income/Student - - - - - - - - -
4010 · Per-pupil SpEd alloc - - - - - - - - -
Special Education Capacity
Page 9 of 34
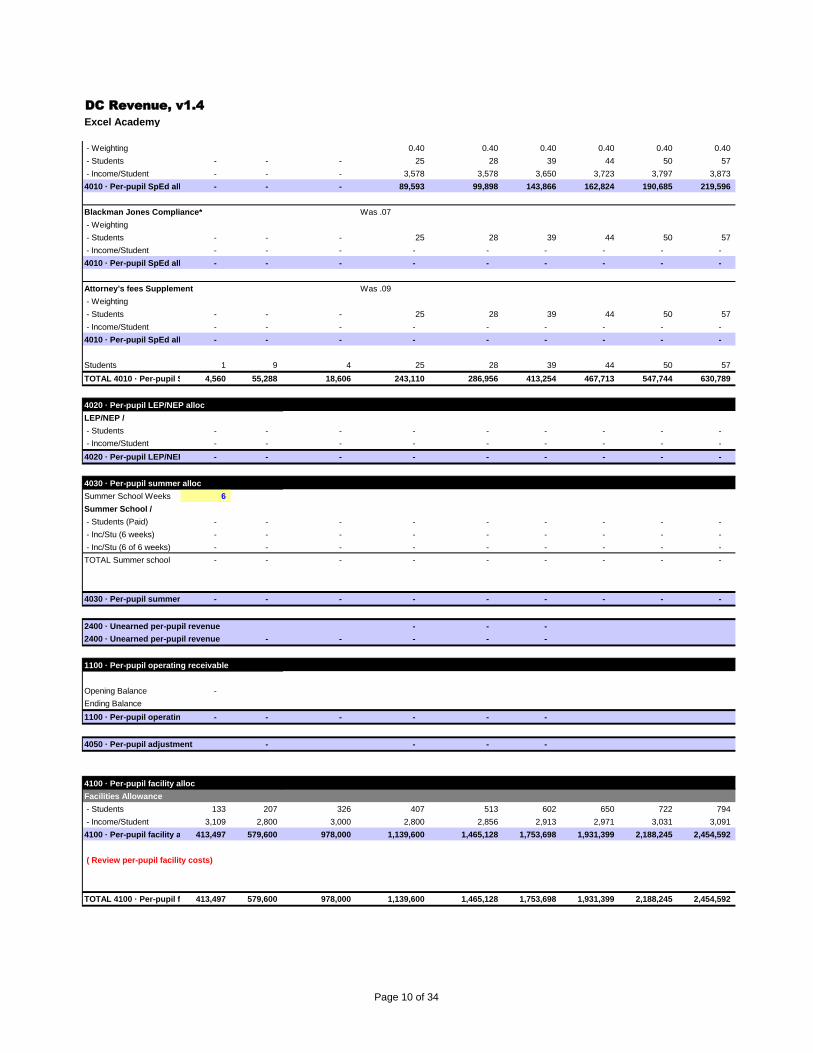
DC Revenue, v1.4
Excel Academy
- Weighting 0.40 0.40 0.40 0.40 0.40 0.40
- Students - - - 25 28 39 44 50 57
- Income/Student - - - 3,578 3,578 3,650 3,723 3,797 3,873
4010 · Per-pupil SpEd alloc - - - 89,593 99,898 143,866 162,824 190,685 219,596
Blackman Jones Compliance* Was .07
- Weighting
- Students - - - 25 28 39 44 50 57
- Income/Student - - - - - - - - -
4010 · Per-pupil SpEd alloc - - - - - - - - -
Attorney's fees Supplement Was .09
- Weighting
- Students - - - 25 28 39 44 50 57
- Income/Student - - - - - - - - -
4010 · Per-pupil SpEd alloc - - - - - - - - -
Students 1 9 4 25 28 39 44 50 57
TOTAL 4010 · Per-pupil SpEd alloc4,560 55,288 18,606 243,110 286,956 413,254 467,713 547,744 630,789
4020 · Per-pupil LEP/NEP alloc
LEP/NEP /
- Students - - - - - - - - -
- Income/Student - - - - - - - - -
4020 · Per-pupil LEP/NEP alloc - - - - - - - - -
4030 · Per-pupil summer alloc
Summer School Weeks 6
Summer School /
- Students (Paid) - - - - - - - - -
- Inc/Stu (6 weeks) - - - - - - - - -
- Inc/Stu (6 of 6 weeks) - - - - - - - - -
TOTAL Summer school - - - - - - - - -
4030 · Per-pupil summer alloc - - - - - - - - -
2400 · Unearned per-pupil revenue - - -
2400 · Unearned per-pupil revenue - - - - -
1100 · Per-pupil operating receivable
Opening Balance -
Ending Balance
1100 · Per-pupil operating receivable- - - - - -
4050 · Per-pupil adjustment - - - -
4100 · Per-pupil facility alloc
Facilities Allowance
- Students 133 207 326 407 513 602 650 722 794
- Income/Student 3,109 2,800 3,000 2,800 2,856 2,913 2,971 3,031 3,091
4100 · Per-pupil facility alloc413,497 579,600 978,000 1,139,600 1,465,128 1,753,698 1,931,399 2,188,245 2,454,592
( Review per-pupil facility costs)
TOTAL 4100 · Per-pupil facility alloc413,497 579,600 978,000 1,139,600 1,465,128 1,753,698 1,931,399 2,188,245 2,454,592
Page 10 of 34
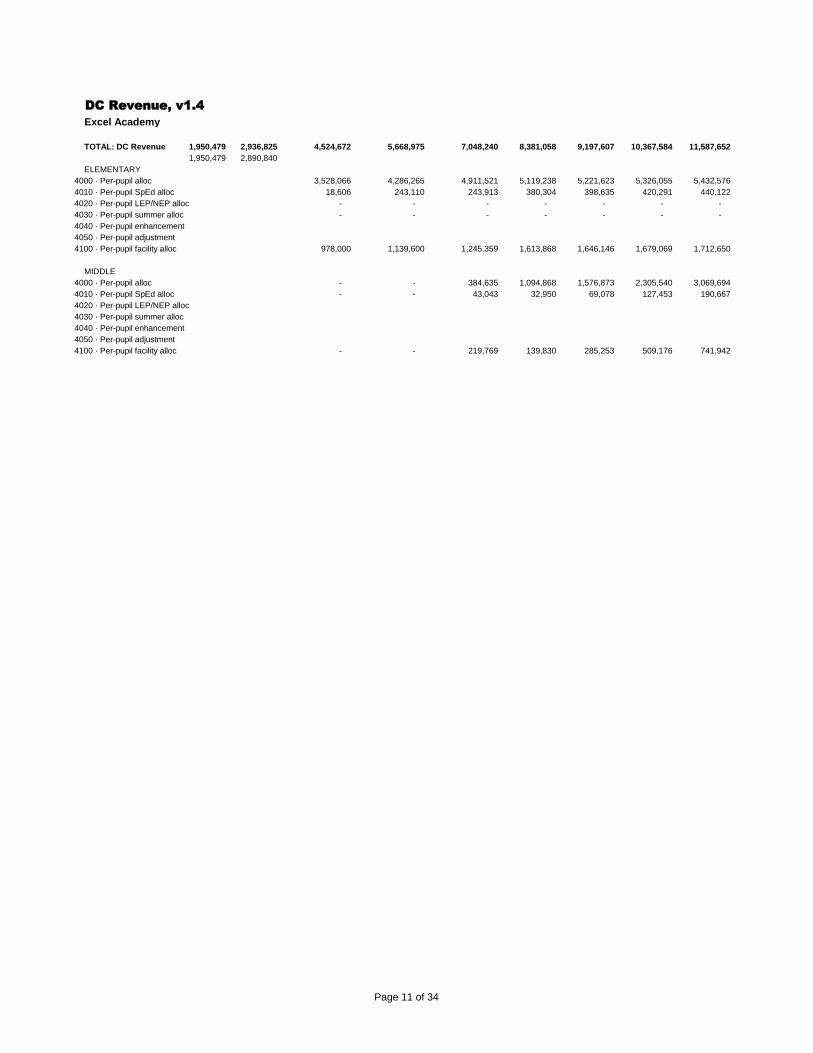
DC Revenue, v1.4
Excel Academy
TOTAL: DC Revenue 1,950,479 2,936,825 4,524,672 5,668,975 7,048,240 8,381,058 9,197,607 10,367,584 11,587,652
1,950,479 2,890,840
ELEMENTARY
4000 · Per-pupil alloc 3,528,066 4,286,265 4,911,521 5,119,238 5,221,623 5,326,055 5,432,576
4010 · Per-pupil SpEd alloc 18,606 243,110 243,913 380,304 398,635 420,291 440,122
4020 · Per-pupil LEP/NEP alloc - - - - - - -
4030 · Per-pupil summer alloc - - - - - - -
4040 · Per-pupil enhancement
4050 · Per-pupil adjustment
4100 · Per-pupil facility alloc 978,000 1,139,600 1,245,359 1,613,868 1,646,146 1,679,069 1,712,650
MIDDLE
4000 · Per-pupil alloc - - 384,635 1,094,868 1,576,873 2,305,540 3,069,694
4010 · Per-pupil SpEd alloc - - 43,043 32,950 69,078 127,453 190,667
4020 · Per-pupil LEP/NEP alloc
4030 · Per-pupil summer alloc
4040 · Per-pupil enhancement
4050 · Per-pupil adjustment
4100 · Per-pupil facility alloc - - 219,769 139,830 285,253 509,176 741,942
Page 11 of 34
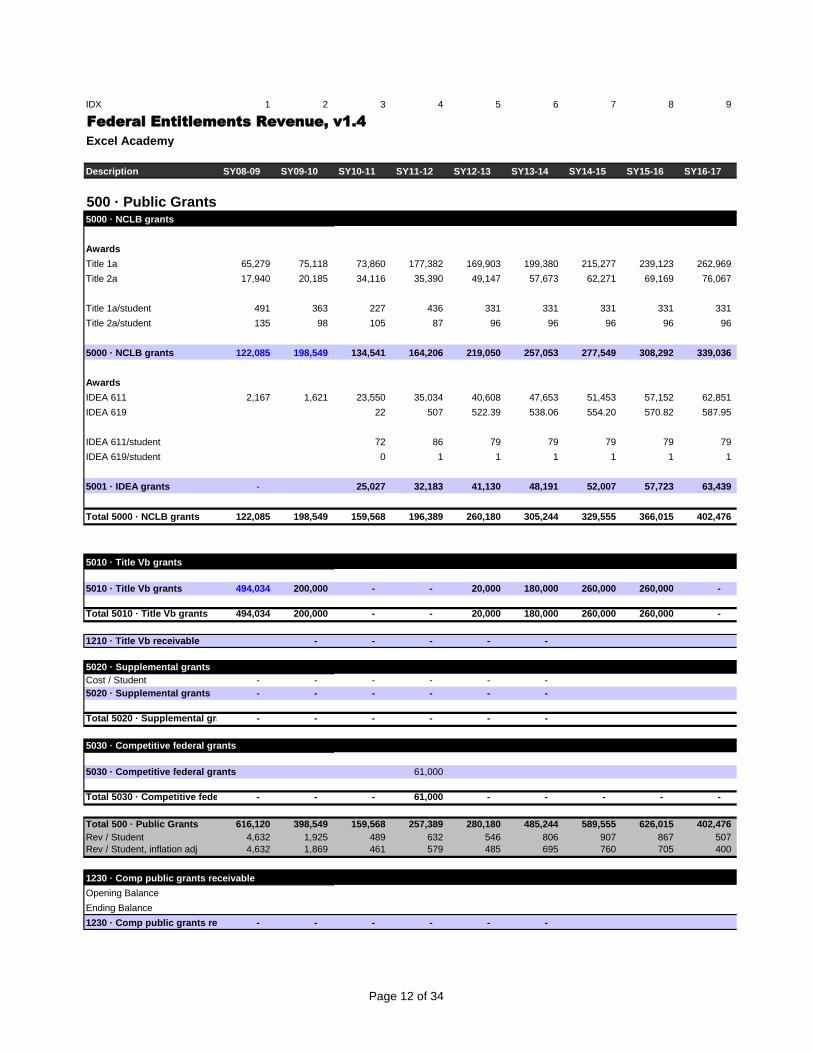
IDX 1 2 3 4 5 6 7 8 9
Federal Entitlements Revenue, v1.4
Excel Academy
Description SY08-09 SY09-10 SY10-11 SY11-12 SY12-13 SY13-14 SY14-15 SY15-16 SY16-17
500 · Public Grants5000 · NCLB grants
Awards
Title 1a 65,279 75,118 73,860 177,382 169,903 199,380 215,277 239,123 262,969
Title 2a 17,940 20,185 34,116 35,390 49,147 57,673 62,271 69,169 76,067
Title 1a/student 491 363 227 436 331 331 331 331 331
Title 2a/student 135 98 105 87 96 96 96 96 96
5000 · NCLB grants 122,085 198,549 134,541 164,206 219,050 257,053 277,549 308,292 339,036
Awards
IDEA 611 2,167 1,621 23,550 35,034 40,608 47,653 51,453 57,152 62,851
IDEA 619 22 507 522.39 538.06 554.20 570.82 587.95
IDEA 611/student 72 86 79 79 79 79 79
IDEA 619/student 0 1 1 1 1 1 1
5001 · IDEA grants - 25,027 32,183 41,130 48,191 52,007 57,723 63,439
Total 5000 · NCLB grants 122,085 198,549 159,568 196,389 260,180 305,244 329,555 366,015 402,476
5010 · Title Vb grants
5010 · Title Vb grants 494,034 200,000 - - 20,000 180,000 260,000 260,000 -
Total 5010 · Title Vb grants 494,034 200,000 - - 20,000 180,000 260,000 260,000 -
1210 · Title Vb receivable - - - - -
5020 · Supplemental grants
Cost / Student - - - - - -
5020 · Supplemental grants - - - - - -
Total 5020 · Supplemental grants - - - - - -
5030 · Competitive federal grants
5030 · Competitive federal grants 61,000
Total 5030 · Competitive federal grants- - - 61,000 - - - - -
Total 500 · Public Grants 616,120 398,549 159,568 257,389 280,180 485,244 589,555 626,015 402,476
Rev / Student 4,632 1,925 489 632 546 806 907 867 507
Rev / Student, inflation adj 4,632 1,869 461 579 485 695 760 705 400
1230 · Comp public grants receivable
Opening Balance
Ending Balance
1230 · Comp public grants receivable - - - - - -
Page 12 of 34
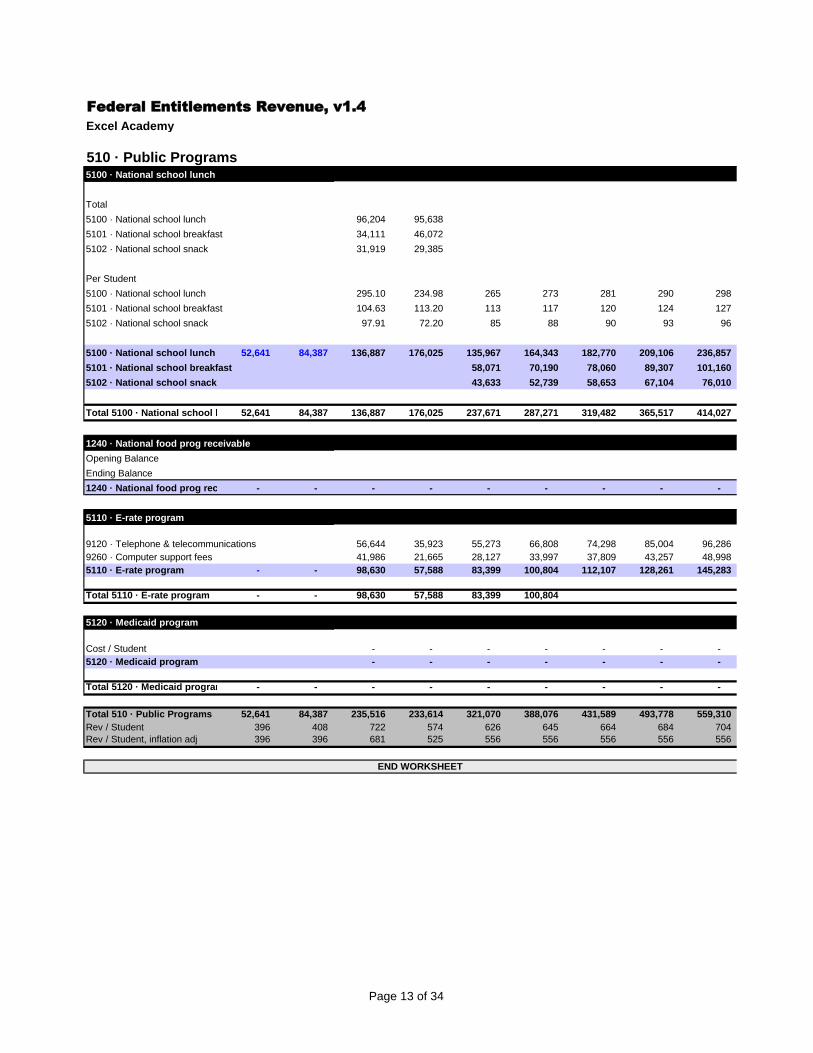
Federal Entitlements Revenue, v1.4
Excel Academy
510 · Public Programs5100 · National school lunch
Total
5100 · National school lunch 96,204 95,638
5101 · National school breakfast 34,111 46,072
5102 · National school snack 31,919 29,385
Per Student
5100 · National school lunch 295.10 234.98 265 273 281 290 298
5101 · National school breakfast 104.63 113.20 113 117 120 124 127
5102 · National school snack 97.91 72.20 85 88 90 93 96
5100 · National school lunch 52,641 84,387 136,887 176,025 135,967 164,343 182,770 209,106 236,857
5101 · National school breakfast 58,071 70,190 78,060 89,307 101,160
5102 · National school snack 43,633 52,739 58,653 67,104 76,010
Total 5100 · National school lunch52,641 84,387 136,887 176,025 237,671 287,271 319,482 365,517 414,027
1240 · National food prog receivable
Opening Balance
Ending Balance
1240 · National food prog receivable - - - - - - - - -
5110 · E-rate program
9120 · Telephone & telecommunications 56,644 35,923 55,273 66,808 74,298 85,004 96,286
9260 · Computer support fees 41,986 21,665 28,127 33,997 37,809 43,257 48,998
5110 · E-rate program - - 98,630 57,588 83,399 100,804 112,107 128,261 145,283
Total 5110 · E-rate program - - 98,630 57,588 83,399 100,804
5120 · Medicaid program
Cost / Student - - - - - - -
5120 · Medicaid program - - - - - - -
Total 5120 · Medicaid program - - - - - - - - -
Total 510 · Public Programs 52,641 84,387 235,516 233,614 321,070 388,076 431,589 493,778 559,310
Rev / Student 396 408 722 574 626 645 664 684 704
Rev / Student, inflation adj 396 396 681 525 556 556 556 556 556
END WORKSHEET
Page 13 of 34

Federal Programs Revenue, v1.4
Excel Academy
Description SY08-09 SY09-10 SY10-11 SY11-12 SY12-13 SY13-14 SY14-15 SY15-16 SY16-17
Page 14 of 34
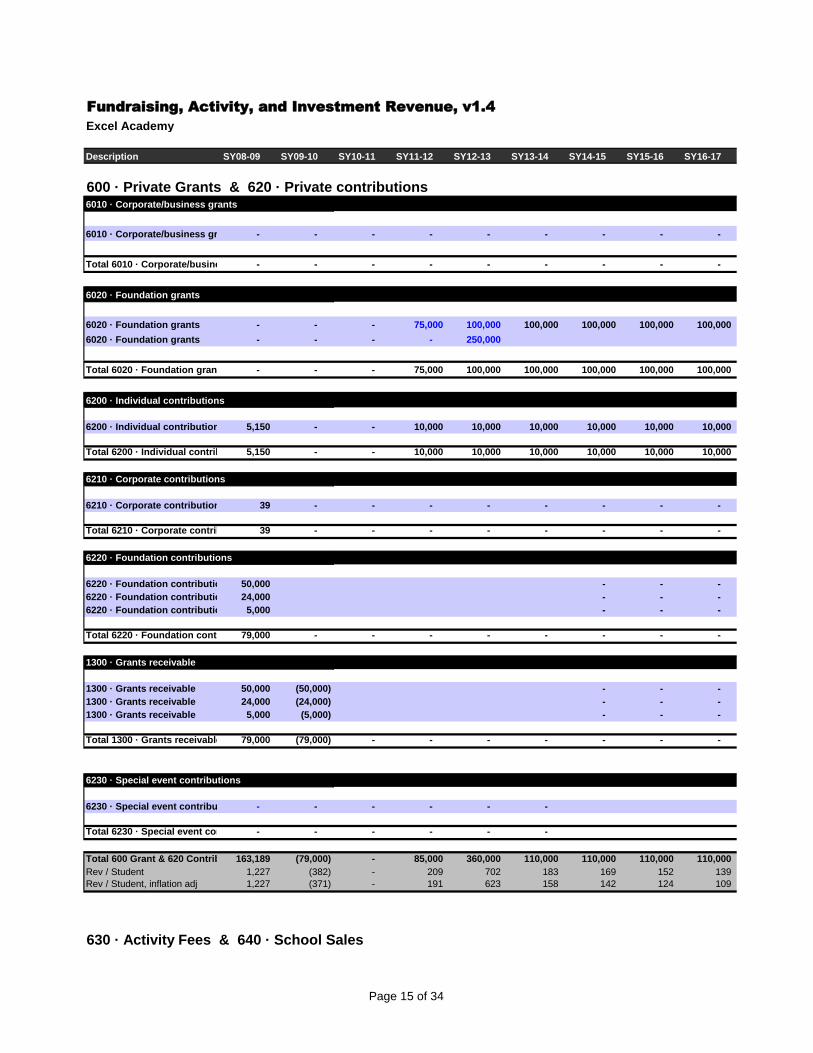
Fundraising, Activity, and Investment Revenue, v1.4
Excel Academy
Description SY08-09 SY09-10 SY10-11 SY11-12 SY12-13 SY13-14 SY14-15 SY15-16 SY16-17
600 · Private Grants & 620 · Private contributions6010 · Corporate/business grants
6010 · Corporate/business grants - - - - - - - - -
Total 6010 · Corporate/business grants- - - - - - - - -
6020 · Foundation grants
6020 · Foundation grants - - - 75,000 100,000 100,000 100,000 100,000 100,000
6020 · Foundation grants - - - - 250,000
Total 6020 · Foundation grants - - - 75,000 100,000 100,000 100,000 100,000 100,000
6200 · Individual contributions
6200 · Individual contributions 5,150 - - 10,000 10,000 10,000 10,000 10,000 10,000
Total 6200 · Individual contributions5,150 - - 10,000 10,000 10,000 10,000 10,000 10,000
6210 · Corporate contributions
6210 · Corporate contributions 39 - - - - - - - -
Total 6210 · Corporate contributions 39 - - - - - - - -
6220 · Foundation contributions
6220 · Foundation contributions 50,000 - - -
6220 · Foundation contributions 24,000 - - -
6220 · Foundation contributions 5,000 - - -
Total 6220 · Foundation contributions79,000 - - - - - - - -
1300 · Grants receivable
1300 · Grants receivable 50,000 (50,000) - - -
1300 · Grants receivable 24,000 (24,000) - - -
1300 · Grants receivable 5,000 (5,000) - - -
Total 1300 · Grants receivable 79,000 (79,000) - - - - - - -
6230 · Special event contributions
6230 · Special event contributions - - - - - -
Total 6230 · Special event contributions- - - - - -
Total 600 Grant & 620 Contributions163,189 (79,000) - 85,000 360,000 110,000 110,000 110,000 110,000
Rev / Student 1,227 (382) - 209 702 183 169 152 139
Rev / Student, inflation adj 1,227 (371) - 191 623 158 142 124 109
630 · Activity Fees & 640 · School Sales
Page 15 of 34
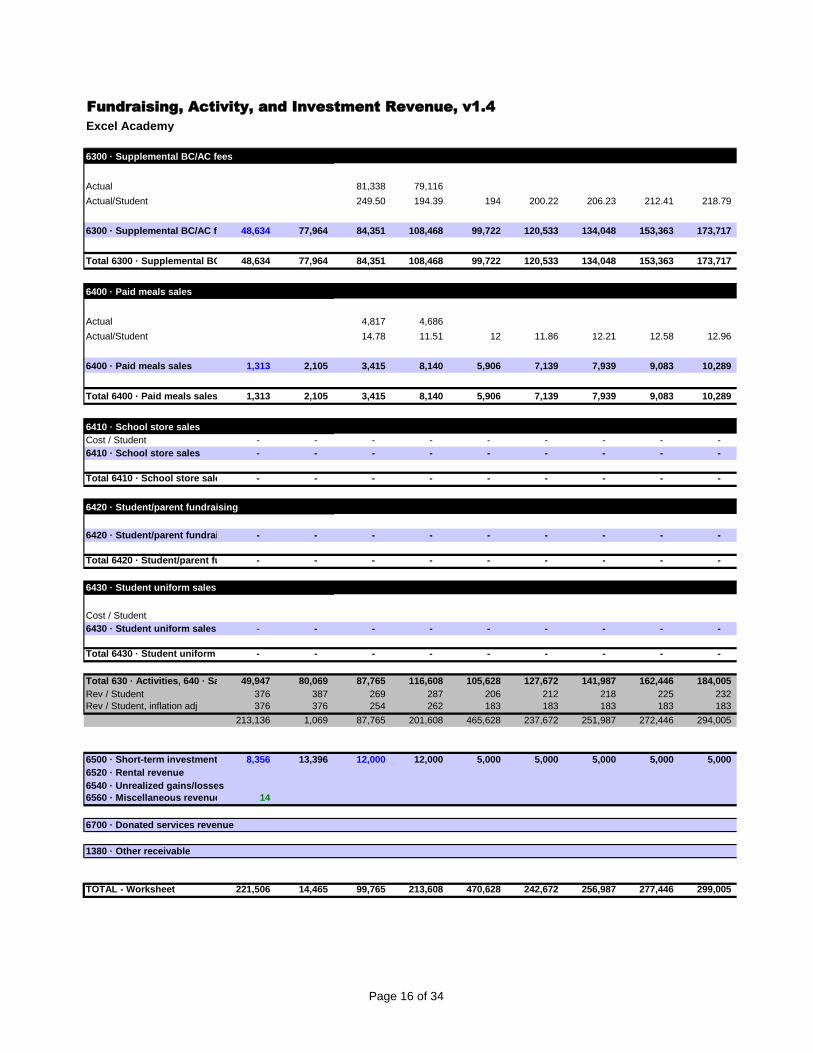
Fundraising, Activity, and Investment Revenue, v1.4
Excel Academy
6300 · Supplemental BC/AC fees
Actual 81,338 79,116
Actual/Student 249.50 194.39 194 200.22 206.23 212.41 218.79
6300 · Supplemental BC/AC fees 48,634 77,964 84,351 108,468 99,722 120,533 134,048 153,363 173,717
Total 6300 · Supplemental BC/AC fees48,634 77,964 84,351 108,468 99,722 120,533 134,048 153,363 173,717
6400 · Paid meals sales
Actual 4,817 4,686
Actual/Student 14.78 11.51 12 11.86 12.21 12.58 12.96
6400 · Paid meals sales 1,313 2,105 3,415 8,140 5,906 7,139 7,939 9,083 10,289
Total 6400 · Paid meals sales 1,313 2,105 3,415 8,140 5,906 7,139 7,939 9,083 10,289
6410 · School store sales
Cost / Student - - - - - - - - -
6410 · School store sales - - - - - - - - -
Total 6410 · School store sales - - - - - - - - -
6420 · Student/parent fundraising
6420 · Student/parent fundraising - - - - - - - - -
Total 6420 · Student/parent fundraising- - - - - - - - -
6430 · Student uniform sales
Cost / Student
6430 · Student uniform sales - - - - - - - - -
Total 6430 · Student uniform sales - - - - - - - - -
Total 630 · Activities, 640 · Sales 49,947 80,069 87,765 116,608 105,628 127,672 141,987 162,446 184,005
Rev / Student 376 387 269 287 206 212 218 225 232
Rev / Student, inflation adj 376 376 254 262 183 183 183 183 183
213,136 1,069 87,765 201,608 465,628 237,672 251,987 272,446 294,005
6500 · Short-term investments 8,356 13,396 12,000 12,000 5,000 5,000 5,000 5,000 5,000
6520 · Rental revenue
6540 · Unrealized gains/losses
6560 · Miscellaneous revenue 14
6700 · Donated services revenue
1380 · Other receivable
TOTAL - Worksheet 221,506 14,465 99,765 213,608 470,628 242,672 256,987 277,446 299,005
Page 16 of 34
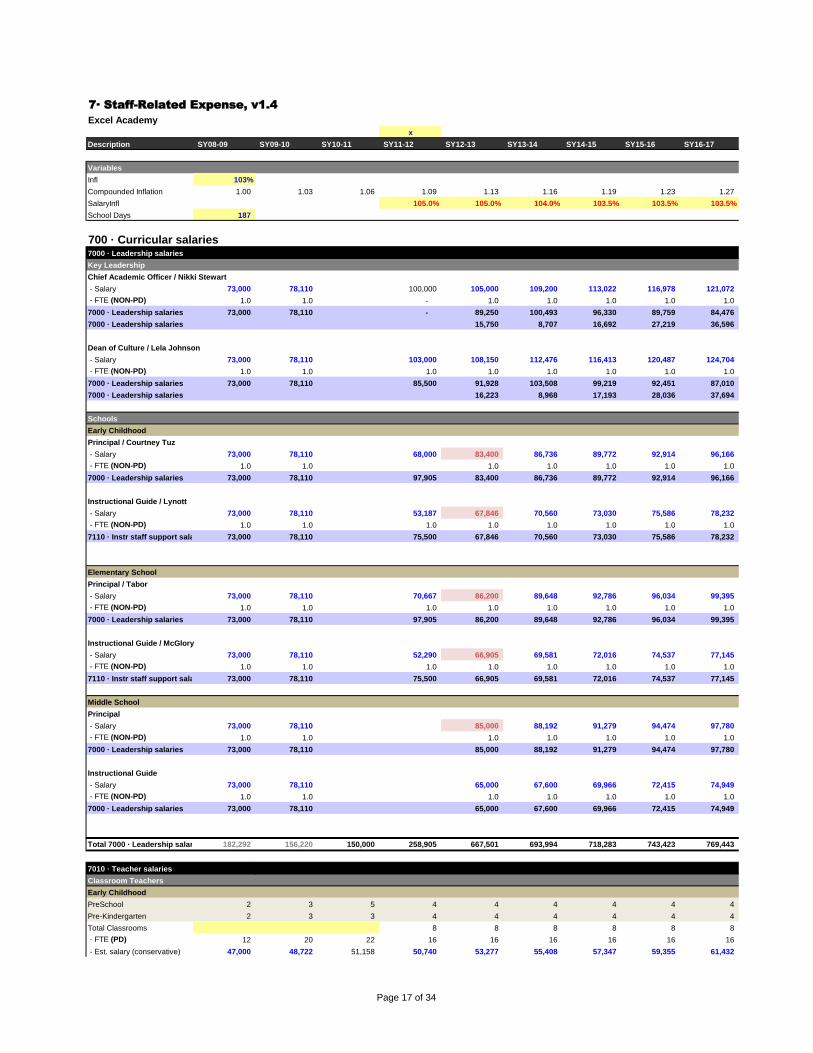
7· Staff-Related Expense, v1.4
Excel Academy
x
Description SY08-09 SY09-10 SY10-11 SY11-12 SY12-13 SY13-14 SY14-15 SY15-16 SY16-17
Variables
Infl 103%
Compounded Inflation 1.00 1.03 1.06 1.09 1.13 1.16 1.19 1.23 1.27
SalaryInfl 105.0% 105.0% 104.0% 103.5% 103.5% 103.5%
School Days 187
700 · Curricular salaries7000 · Leadership salaries
Key Leadership
Chief Academic Officer / Nikki Stewart
- Salary 73,000 78,110 100,000 105,000 109,200 113,022 116,978 121,072
- FTE (NON-PD) 1.0 1.0 - 1.0 1.0 1.0 1.0 1.0
7000 · Leadership salaries 73,000 78,110 - 89,250 100,493 96,330 89,759 84,476
7000 · Leadership salaries 15,750 8,707 16,692 27,219 36,596
Dean of Culture / Lela Johnson
- Salary 73,000 78,110 103,000 108,150 112,476 116,413 120,487 124,704
- FTE (NON-PD) 1.0 1.0 1.0 1.0 1.0 1.0 1.0 1.0
7000 · Leadership salaries 73,000 78,110 85,500 91,928 103,508 99,219 92,451 87,010
7000 · Leadership salaries 16,223 8,968 17,193 28,036 37,694
Schools
Early Childhood
Principal / Courtney Tuz
- Salary 73,000 78,110 68,000 83,400 86,736 89,772 92,914 96,166
- FTE (NON-PD) 1.0 1.0 1.0 1.0 1.0 1.0 1.0
7000 · Leadership salaries 73,000 78,110 97,905 83,400 86,736 89,772 92,914 96,166
Instructional Guide / Lynott
- Salary 73,000 78,110 53,187 67,846 70,560 73,030 75,586 78,232
- FTE (NON-PD) 1.0 1.0 1.0 1.0 1.0 1.0 1.0 1.0
7110 · Instr staff support salaries 73,000 78,110 75,500 67,846 70,560 73,030 75,586 78,232
Elementary School
Principal / Tabor
- Salary 73,000 78,110 70,667 86,200 89,648 92,786 96,034 99,395
- FTE (NON-PD) 1.0 1.0 1.0 1.0 1.0 1.0 1.0 1.0
7000 · Leadership salaries 73,000 78,110 97,905 86,200 89,648 92,786 96,034 99,395
Instructional Guide / McGlory
- Salary 73,000 78,110 52,290 66,905 69,581 72,016 74,537 77,145
- FTE (NON-PD) 1.0 1.0 1.0 1.0 1.0 1.0 1.0 1.0
7110 · Instr staff support salaries 73,000 78,110 75,500 66,905 69,581 72,016 74,537 77,145
Middle School
Principal
- Salary 73,000 78,110 85,000 88,192 91,279 94,474 97,780
- FTE (NON-PD) 1.0 1.0 1.0 1.0 1.0 1.0 1.0
7000 · Leadership salaries 73,000 78,110 85,000 88,192 91,279 94,474 97,780
Instructional Guide
- Salary 73,000 78,110 65,000 67,600 69,966 72,415 74,949
- FTE (NON-PD) 1.0 1.0 1.0 1.0 1.0 1.0 1.0
7000 · Leadership salaries 73,000 78,110 65,000 67,600 69,966 72,415 74,949
Total 7000 · Leadership salaries 182,292 156,220 150,000 258,905 667,501 693,994 718,283 743,423 769,443
7010 · Teacher salaries
Classroom Teachers
Early Childhood
PreSchool 2 3 5 4 4 4 4 4 4
Pre-Kindergarten 2 3 3 4 4 4 4 4 4
Total Classrooms 8 8 8 8 8 8
- FTE (PD) 12 20 22 16 16 16 16 16 16
- Est. salary (conservative) 47,000 48,722 51,158 50,740 53,277 55,408 57,347 59,355 61,432
Page 17 of 34
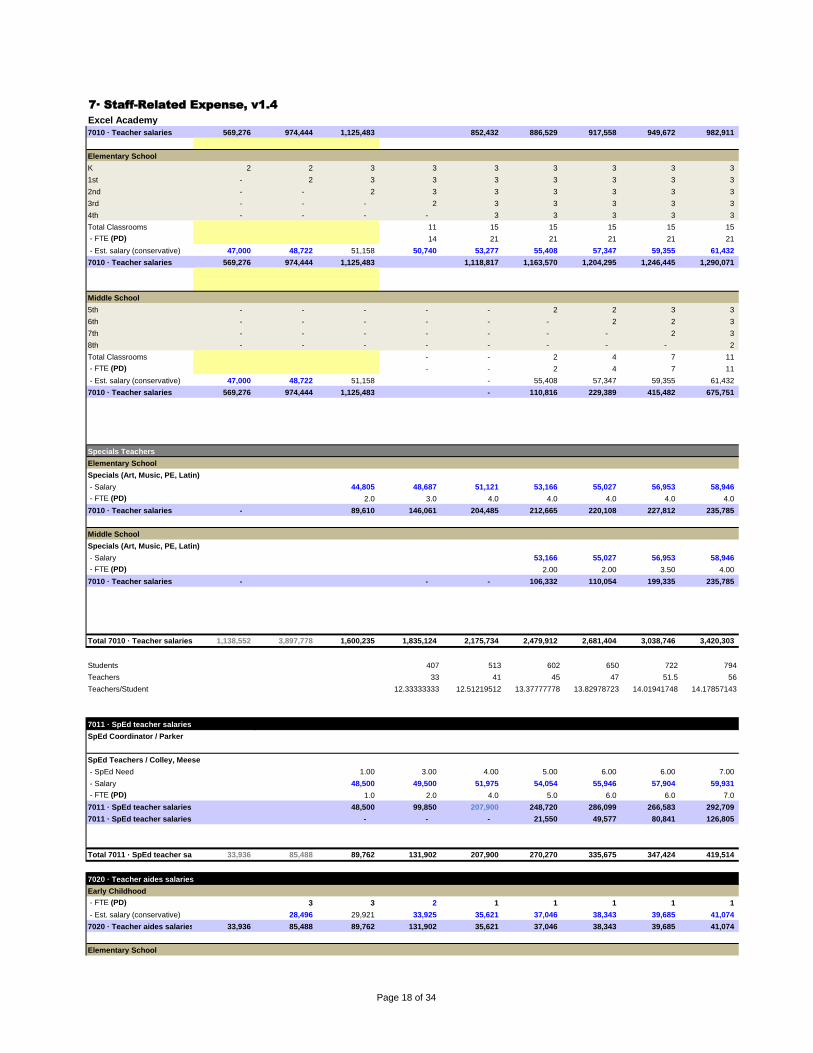
7· Staff-Related Expense, v1.4
Excel Academy
7010 · Teacher salaries 569,276 974,444 1,125,483 852,432 886,529 917,558 949,672 982,911
Elementary School
K 2 2 3 3 3 3 3 3 3
1st - 2 3 3 3 3 3 3 3
2nd - - 2 3 3 3 3 3 3
3rd - - - 2 3 3 3 3 3
4th - - - - 3 3 3 3 3
Total Classrooms 11 15 15 15 15 15
- FTE (PD) 14 21 21 21 21 21
- Est. salary (conservative) 47,000 48,722 51,158 50,740 53,277 55,408 57,347 59,355 61,432
7010 · Teacher salaries 569,276 974,444 1,125,483 1,118,817 1,163,570 1,204,295 1,246,445 1,290,071
Middle School
5th - - - - - 2 2 3 3
6th - - - - - - 2 2 3
7th - - - - - - - 2 3
8th - - - - - - - - 2
Total Classrooms - - 2 4 7 11
- FTE (PD) - - 2 4 7 11
- Est. salary (conservative) 47,000 48,722 51,158 - 55,408 57,347 59,355 61,432
7010 · Teacher salaries 569,276 974,444 1,125,483 - 110,816 229,389 415,482 675,751
Specials Teachers
Elementary School
Specials (Art, Music, PE, Latin)
- Salary 44,805 48,687 51,121 53,166 55,027 56,953 58,946
- FTE (PD) 2.0 3.0 4.0 4.0 4.0 4.0 4.0
7010 · Teacher salaries - 89,610 146,061 204,485 212,665 220,108 227,812 235,785
Middle School
Specials (Art, Music, PE, Latin)
- Salary 53,166 55,027 56,953 58,946
- FTE (PD) 2.00 2.00 3.50 4.00
7010 · Teacher salaries - - - 106,332 110,054 199,335 235,785
Total 7010 · Teacher salaries 1,138,552 3,897,778 1,600,235 1,835,124 2,175,734 2,479,912 2,681,404 3,038,746 3,420,303
Students 407 513 602 650 722 794
Teachers 33 41 45 47 51.5 56
Teachers/Student 12.33333333 12.51219512 13.37777778 13.82978723 14.01941748 14.17857143
7011 · SpEd teacher salaries
SpEd Coordinator / Parker
SpEd Teachers / Colley, Meese
- SpEd Need 1.00 3.00 4.00 5.00 6.00 6.00 7.00
- Salary 48,500 49,500 51,975 54,054 55,946 57,904 59,931
- FTE (PD) 1.0 2.0 4.0 5.0 6.0 6.0 7.0
7011 · SpEd teacher salaries 48,500 99,850 207,900 248,720 286,099 266,583 292,709
7011 · SpEd teacher salaries - - - 21,550 49,577 80,841 126,805
Total 7011 · SpEd teacher salaries 33,936 85,488 89,762 131,902 207,900 270,270 335,675 347,424 419,514
7020 · Teacher aides salaries
Early Childhood
- FTE (PD) 3 3 2 1 1 1 1 1
- Est. salary (conservative) 28,496 29,921 33,925 35,621 37,046 38,343 39,685 41,074
7020 · Teacher aides salaries 33,936 85,488 89,762 131,902 35,621 37,046 38,343 39,685 41,074
Elementary School
Page 18 of 34
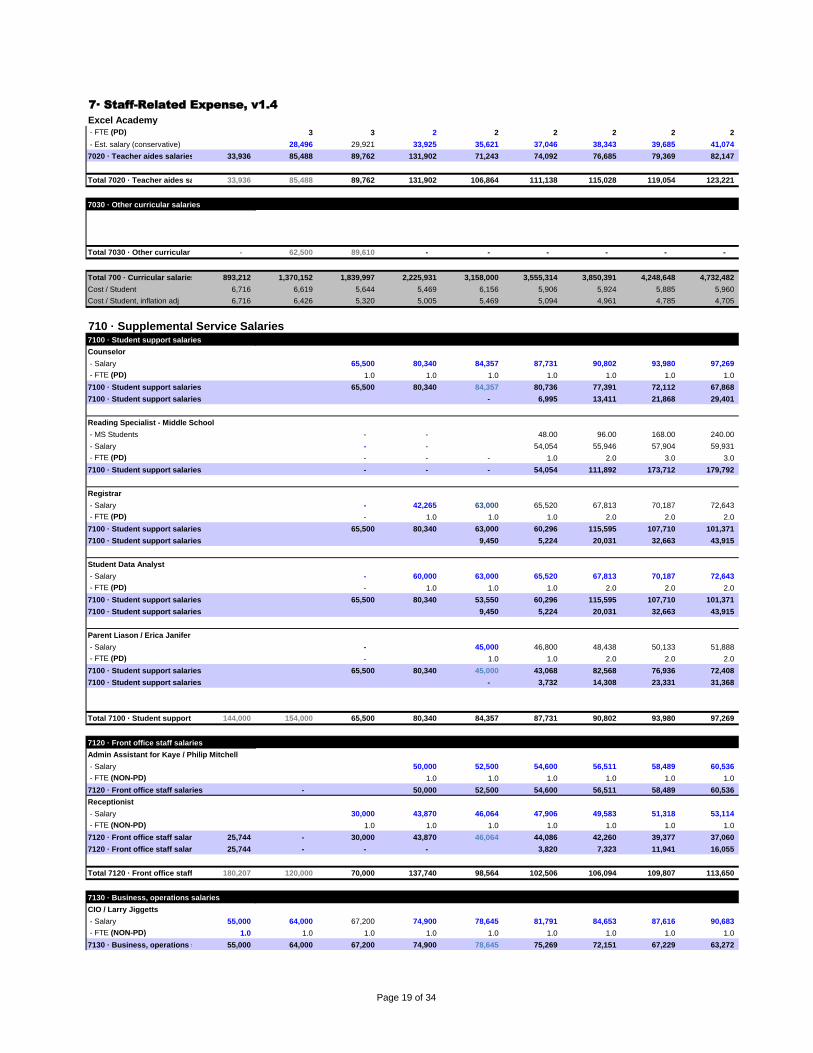
7· Staff-Related Expense, v1.4
Excel Academy
- FTE (PD) 3 3 2 2 2 2 2 2
- Est. salary (conservative) 28,496 29,921 33,925 35,621 37,046 38,343 39,685 41,074
7020 · Teacher aides salaries 33,936 85,488 89,762 131,902 71,243 74,092 76,685 79,369 82,147
Total 7020 · Teacher aides salaries 33,936 85,488 89,762 131,902 106,864 111,138 115,028 119,054 123,221
7030 · Other curricular salaries
Total 7030 · Other curricular salaries - 62,500 89,610 - - - - - -
Total 700 · Curricular salaries 893,212 1,370,152 1,839,997 2,225,931 3,158,000 3,555,314 3,850,391 4,248,648 4,732,482
Cost / Student 6,716 6,619 5,644 5,469 6,156 5,906 5,924 5,885 5,960
Cost / Student, inflation adj 6,716 6,426 5,320 5,005 5,469 5,094 4,961 4,785 4,705
710 · Supplemental Service Salaries7100 · Student support salaries
Counselor
- Salary 65,500 80,340 84,357 87,731 90,802 93,980 97,269
- FTE (PD) 1.0 1.0 1.0 1.0 1.0 1.0 1.0
7100 · Student support salaries 65,500 80,340 84,357 80,736 77,391 72,112 67,868
7100 · Student support salaries - 6,995 13,411 21,868 29,401
Reading Specialist - Middle School
- MS Students - - 48.00 96.00 168.00 240.00
- Salary - - 54,054 55,946 57,904 59,931
- FTE (PD) - - - 1.0 2.0 3.0 3.0
7100 · Student support salaries - - - 54,054 111,892 173,712 179,792
Registrar
- Salary - 42,265 63,000 65,520 67,813 70,187 72,643
- FTE (PD) - 1.0 1.0 1.0 2.0 2.0 2.0
7100 · Student support salaries 65,500 80,340 63,000 60,296 115,595 107,710 101,371
7100 · Student support salaries 9,450 5,224 20,031 32,663 43,915
Student Data Analyst
- Salary - 60,000 63,000 65,520 67,813 70,187 72,643
- FTE (PD) - 1.0 1.0 1.0 2.0 2.0 2.0
7100 · Student support salaries 65,500 80,340 53,550 60,296 115,595 107,710 101,371
7100 · Student support salaries 9,450 5,224 20,031 32,663 43,915
Parent Liason / Erica Janifer
- Salary - 45,000 46,800 48,438 50,133 51,888
- FTE (PD) - 1.0 1.0 2.0 2.0 2.0
7100 · Student support salaries 65,500 80,340 45,000 43,068 82,568 76,936 72,408
7100 · Student support salaries - 3,732 14,308 23,331 31,368
Total 7100 · Student support salaries 144,000 154,000 65,500 80,340 84,357 87,731 90,802 93,980 97,269
7120 · Front office staff salaries
Admin Assistant for Kaye / Philip Mitchell
- Salary 50,000 52,500 54,600 56,511 58,489 60,536
- FTE (NON-PD) 1.0 1.0 1.0 1.0 1.0 1.0
7120 · Front office staff salaries - 50,000 52,500 54,600 56,511 58,489 60,536
Receptionist
- Salary 30,000 43,870 46,064 47,906 49,583 51,318 53,114
- FTE (NON-PD) 1.0 1.0 1.0 1.0 1.0 1.0 1.0
7120 · Front office staff salaries 25,744 - 30,000 43,870 46,064 44,086 42,260 39,377 37,060
7120 · Front office staff salaries 25,744 - - - 3,820 7,323 11,941 16,055
Total 7120 · Front office staff salaries180,207 120,000 70,000 137,740 98,564 102,506 106,094 109,807 113,650
7130 · Business, operations salaries
CIO / Larry Jiggetts
- Salary 55,000 64,000 67,200 74,900 78,645 81,791 84,653 87,616 90,683
- FTE (NON-PD) 1.0 1.0 1.0 1.0 1.0 1.0 1.0 1.0 1.0
7130 · Business, operations salaries 55,000 64,000 67,200 74,900 78,645 75,269 72,151 67,229 63,272
Page 19 of 34
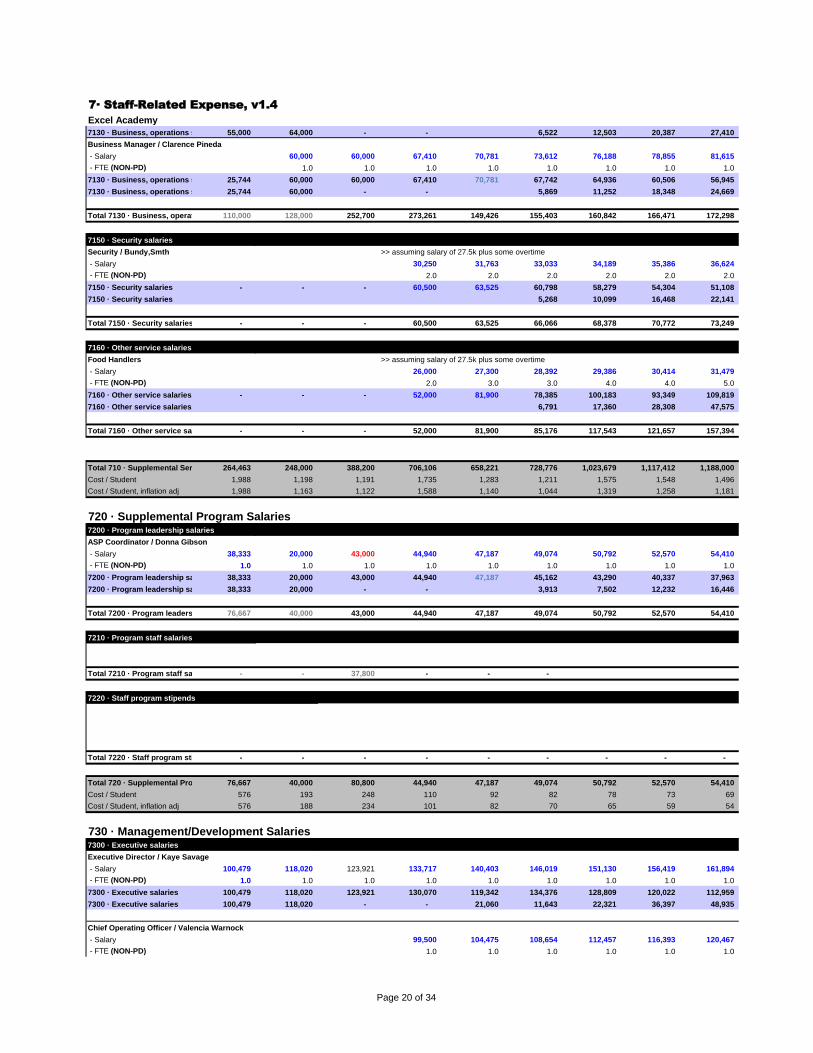
7· Staff-Related Expense, v1.4
Excel Academy
7130 · Business, operations salaries 55,000 64,000 - - 6,522 12,503 20,387 27,410
Business Manager / Clarence Pineda
- Salary 60,000 60,000 67,410 70,781 73,612 76,188 78,855 81,615
- FTE (NON-PD) 1.0 1.0 1.0 1.0 1.0 1.0 1.0 1.0
7130 · Business, operations salaries 25,744 60,000 60,000 67,410 70,781 67,742 64,936 60,506 56,945
7130 · Business, operations salaries 25,744 60,000 - - 5,869 11,252 18,348 24,669
Total 7130 · Business, operations salaries110,000 128,000 252,700 273,261 149,426 155,403 160,842 166,471 172,298
7150 · Security salaries
Security / Bundy,Smth >> assuming salary of 27.5k plus some overtime
- Salary 30,250 31,763 33,033 34,189 35,386 36,624
- FTE (NON-PD) 2.0 2.0 2.0 2.0 2.0 2.0
7150 · Security salaries - - - 60,500 63,525 60,798 58,279 54,304 51,108
7150 · Security salaries 5,268 10,099 16,468 22,141
Total 7150 · Security salaries - - - 60,500 63,525 66,066 68,378 70,772 73,249
7160 · Other service salaries
Food Handlers >> assuming salary of 27.5k plus some overtime
- Salary 26,000 27,300 28,392 29,386 30,414 31,479
- FTE (NON-PD) 2.0 3.0 3.0 4.0 4.0 5.0
7160 · Other service salaries - - - 52,000 81,900 78,385 100,183 93,349 109,819
7160 · Other service salaries 6,791 17,360 28,308 47,575
Total 7160 · Other service salaries - - - 52,000 81,900 85,176 117,543 121,657 157,394
Total 710 · Supplemental Service Salaries264,463 248,000 388,200 706,106 658,221 728,776 1,023,679 1,117,412 1,188,000
Cost / Student 1,988 1,198 1,191 1,735 1,283 1,211 1,575 1,548 1,496
Cost / Student, inflation adj 1,988 1,163 1,122 1,588 1,140 1,044 1,319 1,258 1,181
720 · Supplemental Program Salaries7200 · Program leadership salaries
ASP Coordinator / Donna Gibson
- Salary 38,333 20,000 43,000 44,940 47,187 49,074 50,792 52,570 54,410
- FTE (NON-PD) 1.0 1.0 1.0 1.0 1.0 1.0 1.0 1.0 1.0
7200 · Program leadership salaries 38,333 20,000 43,000 44,940 47,187 45,162 43,290 40,337 37,963
7200 · Program leadership salaries 38,333 20,000 - - 3,913 7,502 12,232 16,446
Total 7200 · Program leadership salaries76,667 40,000 43,000 44,940 47,187 49,074 50,792 52,570 54,410
7210 · Program staff salaries
Total 7210 · Program staff salaries - - 37,800 - - -
7220 · Staff program stipends
Total 7220 · Staff program stipends - - - - - - - - -
Total 720 · Supplemental Program Salaries76,667 40,000 80,800 44,940 47,187 49,074 50,792 52,570 54,410
Cost / Student 576 193 248 110 92 82 78 73 69
Cost / Student, inflation adj 576 188 234 101 82 70 65 59 54
730 · Management/Development Salaries7300 · Executive salaries
Executive Director / Kaye Savage
- Salary 100,479 118,020 123,921 133,717 140,403 146,019 151,130 156,419 161,894
- FTE (NON-PD) 1.0 1.0 1.0 1.0 1.0 1.0 1.0 1.0 1.0
7300 · Executive salaries 100,479 118,020 123,921 130,070 119,342 134,376 128,809 120,022 112,959
7300 · Executive salaries 100,479 118,020 - - 21,060 11,643 22,321 36,397 48,935
Chief Operating Officer / Valencia Warnock
- Salary 99,500 104,475 108,654 112,457 116,393 120,467
- FTE (NON-PD) 1.0 1.0 1.0 1.0 1.0 1.0
Page 20 of 34
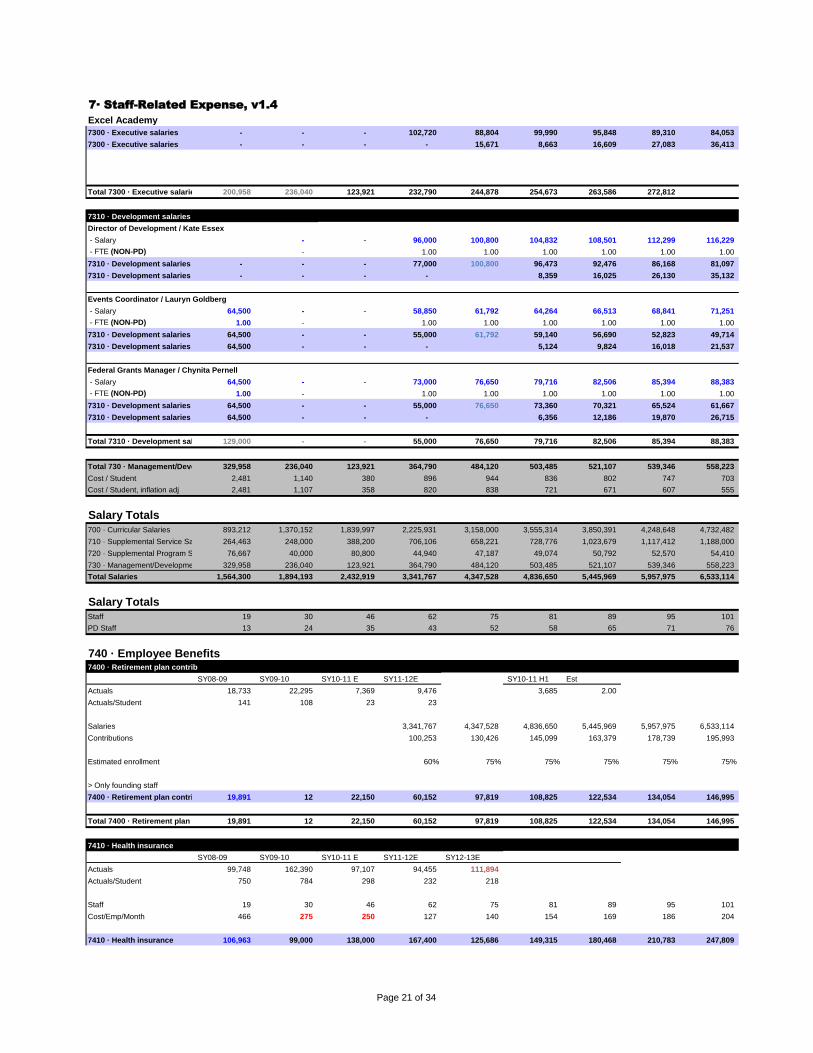
7· Staff-Related Expense, v1.4
Excel Academy
7300 · Executive salaries - - - 102,720 88,804 99,990 95,848 89,310 84,053
7300 · Executive salaries - - - - 15,671 8,663 16,609 27,083 36,413
Total 7300 · Executive salaries 200,958 236,040 123,921 232,790 244,878 254,673 263,586 272,812
7310 · Development salaries
Director of Development / Kate Essex
- Salary - - 96,000 100,800 104,832 108,501 112,299 116,229
- FTE (NON-PD) - 1.00 1.00 1.00 1.00 1.00 1.00
7310 · Development salaries - - - 77,000 100,800 96,473 92,476 86,168 81,097
7310 · Development salaries - - - - 8,359 16,025 26,130 35,132
Events Coordinator / Lauryn Goldberg
- Salary 64,500 - - 58,850 61,792 64,264 66,513 68,841 71,251
- FTE (NON-PD) 1.00 - 1.00 1.00 1.00 1.00 1.00 1.00
7310 · Development salaries 64,500 - - 55,000 61,792 59,140 56,690 52,823 49,714
7310 · Development salaries 64,500 - - - 5,124 9,824 16,018 21,537
Federal Grants Manager / Chynita Pernell
- Salary 64,500 - - 73,000 76,650 79,716 82,506 85,394 88,383
- FTE (NON-PD) 1.00 - 1.00 1.00 1.00 1.00 1.00 1.00
7310 · Development salaries 64,500 - - 55,000 76,650 73,360 70,321 65,524 61,667
7310 · Development salaries 64,500 - - - 6,356 12,186 19,870 26,715
Total 7310 · Development salaries 129,000 - - 55,000 76,650 79,716 82,506 85,394 88,383
Total 730 · Management/Development Salaries329,958 236,040 123,921 364,790 484,120 503,485 521,107 539,346 558,223
Cost / Student 2,481 1,140 380 896 944 836 802 747 703
Cost / Student, inflation adj 2,481 1,107 358 820 838 721 671 607 555
Salary Totals700 · Curricular Salaries 893,212 1,370,152 1,839,997 2,225,931 3,158,000 3,555,314 3,850,391 4,248,648 4,732,482
710 · Supplemental Service Salaries 264,463 248,000 388,200 706,106 658,221 728,776 1,023,679 1,117,412 1,188,000
720 · Supplemental Program Salaries 76,667 40,000 80,800 44,940 47,187 49,074 50,792 52,570 54,410
730 · Management/Development Salaries329,958 236,040 123,921 364,790 484,120 503,485 521,107 539,346 558,223
Total Salaries 1,564,300 1,894,193 2,432,919 3,341,767 4,347,528 4,836,650 5,445,969 5,957,975 6,533,114
Salary TotalsStaff 19 30 46 62 75 81 89 95 101
PD Staff 13 24 35 43 52 58 65 71 76
740 · Employee Benefits7400 · Retirement plan contrib
SY08-09 SY09-10 SY10-11 E SY11-12E SY10-11 H1 Est
Actuals 18,733 22,295 7,369 9,476 3,685 2.00
Actuals/Student 141 108 23 23
Salaries 3,341,767 4,347,528 4,836,650 5,445,969 5,957,975 6,533,114
Contributions 100,253 130,426 145,099 163,379 178,739 195,993
Estimated enrollment 60% 75% 75% 75% 75% 75%
> Only founding staff
7400 · Retirement plan contrib 19,891 12 22,150 60,152 97,819 108,825 122,534 134,054 146,995
Total 7400 · Retirement plan contrib 19,891 12 22,150 60,152 97,819 108,825 122,534 134,054 146,995
7410 · Health insurance
SY08-09 SY09-10 SY10-11 E SY11-12E SY12-13E
Actuals 99,748 162,390 97,107 94,455 111,894
Actuals/Student 750 784 298 232 218
Staff 19 30 46 62 75 81 89 95 101
Cost/Emp/Month 466 275 250 127 140 154 169 186 204
7410 · Health insurance 106,963 99,000 138,000 167,400 125,686 149,315 180,468 210,783 247,809
Page 21 of 34
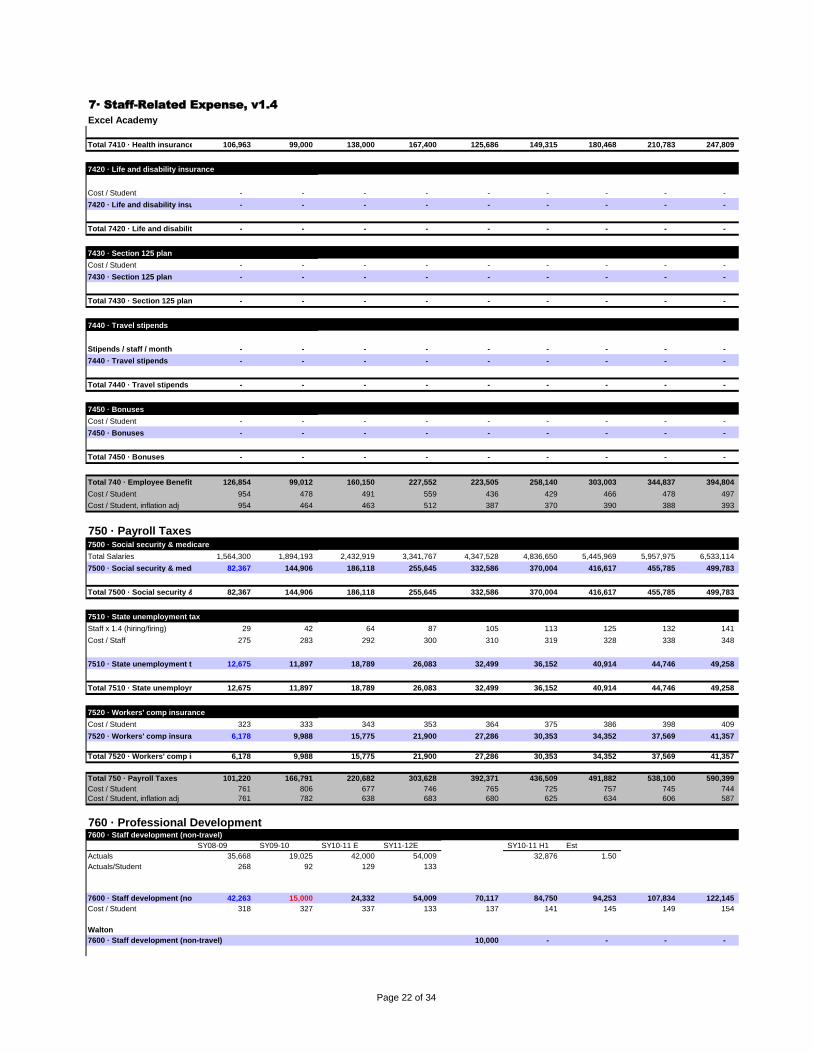
7· Staff-Related Expense, v1.4
Excel Academy
Total 7410 · Health insurance 106,963 99,000 138,000 167,400 125,686 149,315 180,468 210,783 247,809
7420 · Life and disability insurance
Cost / Student - - - - - - - - -
7420 · Life and disability insurance - - - - - - - - -
Total 7420 · Life and disability insurance - - - - - - - - -
7430 · Section 125 plan
Cost / Student - - - - - - - - -
7430 · Section 125 plan - - - - - - - - -
Total 7430 · Section 125 plan - - - - - - - - -
7440 · Travel stipends
Stipends / staff / month - - - - - - - - -
7440 · Travel stipends - - - - - - - - -
Total 7440 · Travel stipends - - - - - - - - -
7450 · Bonuses
Cost / Student - - - - - - - - -
7450 · Bonuses - - - - - - - - -
Total 7450 · Bonuses - - - - - - - - -
Total 740 · Employee Benefits 126,854 99,012 160,150 227,552 223,505 258,140 303,003 344,837 394,804
Cost / Student 954 478 491 559 436 429 466 478 497
Cost / Student, inflation adj 954 464 463 512 387 370 390 388 393
750 · Payroll Taxes7500 · Social security & medicare
Total Salaries 1,564,300 1,894,193 2,432,919 3,341,767 4,347,528 4,836,650 5,445,969 5,957,975 6,533,114
7500 · Social security & medicare 82,367 144,906 186,118 255,645 332,586 370,004 416,617 455,785 499,783
Total 7500 · Social security & medicare82,367 144,906 186,118 255,645 332,586 370,004 416,617 455,785 499,783
7510 · State unemployment tax
Staff x 1.4 (hiring/firing) 29 42 64 87 105 113 125 132 141
Cost / Staff 275 283 292 300 310 319 328 338 348
7510 · State unemployment tax 12,675 11,897 18,789 26,083 32,499 36,152 40,914 44,746 49,258
Total 7510 · State unemployment tax 12,675 11,897 18,789 26,083 32,499 36,152 40,914 44,746 49,258
7520 · Workers' comp insurance
Cost / Student 323 333 343 353 364 375 386 398 409
7520 · Workers' comp insurance 6,178 9,988 15,775 21,900 27,286 30,353 34,352 37,569 41,357
Total 7520 · Workers' comp insurance 6,178 9,988 15,775 21,900 27,286 30,353 34,352 37,569 41,357
Total 750 · Payroll Taxes 101,220 166,791 220,682 303,628 392,371 436,509 491,882 538,100 590,399
Cost / Student 761 806 677 746 765 725 757 745 744
Cost / Student, inflation adj 761 782 638 683 680 625 634 606 587
760 · Professional Development7600 · Staff development (non-travel)
SY08-09 SY09-10 SY10-11 E SY11-12E SY10-11 H1 Est
Actuals 35,668 19,025 42,000 54,009 32,876 1.50
Actuals/Student 268 92 129 133
7600 · Staff development (non-travel) 42,263 15,000 24,332 54,009 70,117 84,750 94,253 107,834 122,145
Cost / Student 318 327 337 133 137 141 145 149 154
Walton
7600 · Staff development (non-travel) 10,000 - - - -
Page 22 of 34
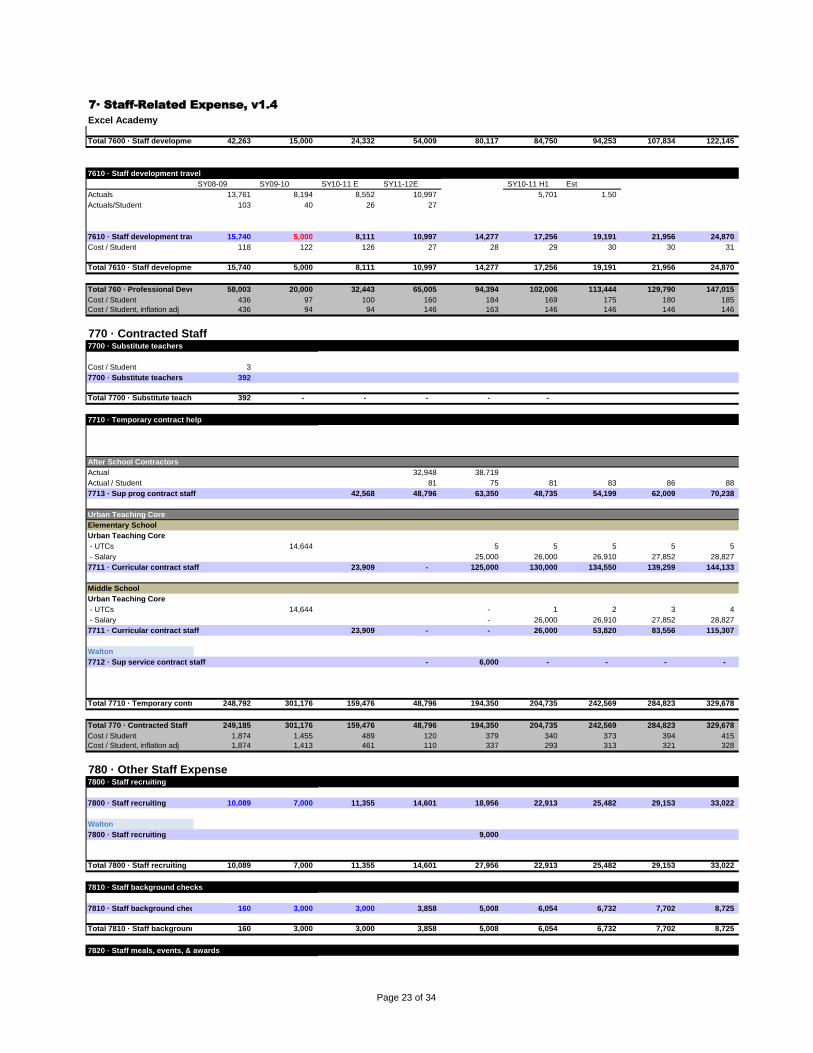
7· Staff-Related Expense, v1.4
Excel Academy
Total 7600 · Staff development (non-travel)42,263 15,000 24,332 54,009 80,117 84,750 94,253 107,834 122,145
7610 · Staff development travel
SY08-09 SY09-10 SY10-11 E SY11-12E SY10-11 H1 Est
Actuals 13,761 8,194 8,552 10,997 5,701 1.50
Actuals/Student 103 40 26 27
7610 · Staff development travel 15,740 5,000 8,111 10,997 14,277 17,256 19,191 21,956 24,870
Cost / Student 118 122 126 27 28 29 30 30 31
Total 7610 · Staff development travel 15,740 5,000 8,111 10,997 14,277 17,256 19,191 21,956 24,870
Total 760 · Professional Development 58,003 20,000 32,443 65,005 94,394 102,006 113,444 129,790 147,015
Cost / Student 436 97 100 160 184 169 175 180 185
Cost / Student, inflation adj 436 94 94 146 163 146 146 146 146
770 · Contracted Staff7700 · Substitute teachers
Cost / Student 3
7700 · Substitute teachers 392
Total 7700 · Substitute teachers 392 - - - - -
7710 · Temporary contract help
After School Contractors
Actual 32,948 38,719
Actual / Student 81 75 81 83 86 88
7713 · Sup prog contract staff 42,568 48,796 63,350 48,735 54,199 62,009 70,238
Urban Teaching Core
Elementary School
Urban Teaching Core
- UTCs 14,644 5 5 5 5 5
- Salary 25,000 26,000 26,910 27,852 28,827
7711 · Curricular contract staff 23,909 - 125,000 130,000 134,550 139,259 144,133
Middle School
Urban Teaching Core
- UTCs 14,644 - 1 2 3 4
- Salary - 26,000 26,910 27,852 28,827
7711 · Curricular contract staff 23,909 - - 26,000 53,820 83,556 115,307
Walton
7712 · Sup service contract staff - 6,000 - - - -
Total 7710 · Temporary contract help248,792 301,176 159,476 48,796 194,350 204,735 242,569 284,823 329,678
Total 770 · Contracted Staff 249,185 301,176 159,476 48,796 194,350 204,735 242,569 284,823 329,678
Cost / Student 1,874 1,455 489 120 379 340 373 394 415
Cost / Student, inflation adj 1,874 1,413 461 110 337 293 313 321 328
780 · Other Staff Expense7800 · Staff recruiting
7800 · Staff recruiting 10,089 7,000 11,355 14,601 18,956 22,913 25,482 29,153 33,022
Walton
7800 · Staff recruiting 9,000
Total 7800 · Staff recruiting 10,089 7,000 11,355 14,601 27,956 22,913 25,482 29,153 33,022
7810 · Staff background checks
7810 · Staff background checks 160 3,000 3,000 3,858 5,008 6,054 6,732 7,702 8,725
Total 7810 · Staff background checks 160 3,000 3,000 3,858 5,008 6,054 6,732 7,702 8,725
7820 · Staff meals, events, & awards
Page 23 of 34
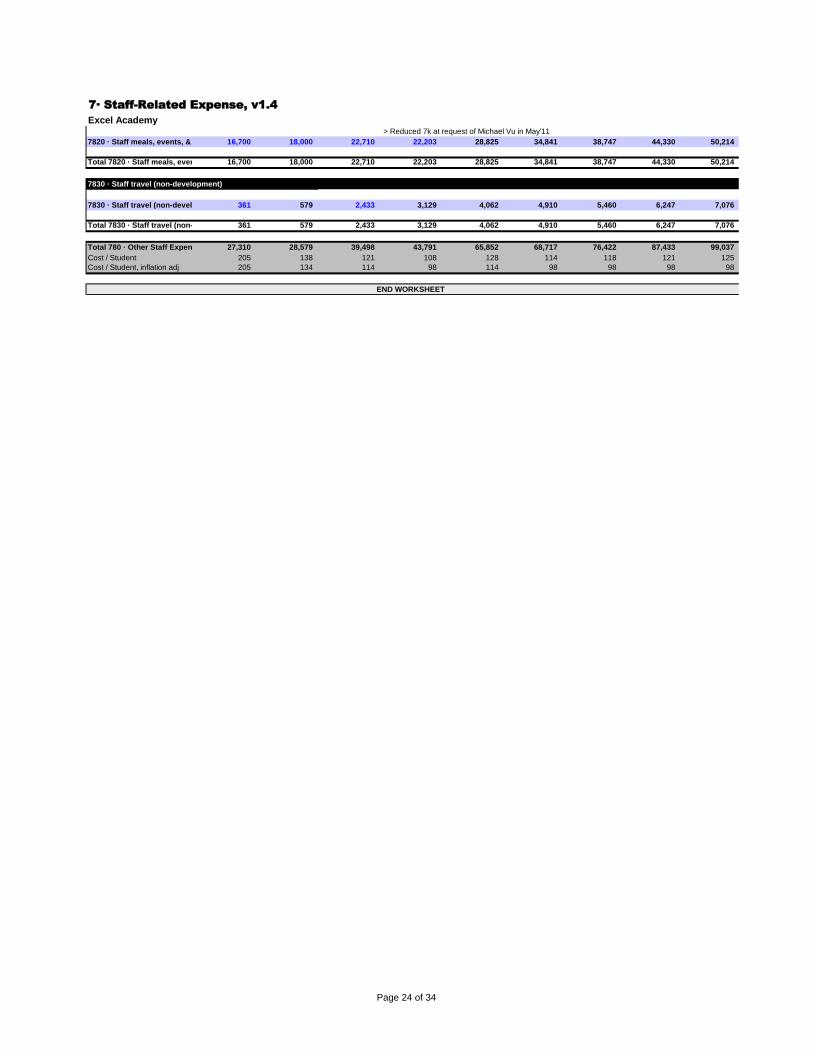
7· Staff-Related Expense, v1.4
Excel Academy> Reduced 7k at request of Michael Vu in May'11
7820 · Staff meals, events, & awards 16,700 18,000 22,710 22,203 28,825 34,841 38,747 44,330 50,214
Total 7820 · Staff meals, events, & awards16,700 18,000 22,710 22,203 28,825 34,841 38,747 44,330 50,214
7830 · Staff travel (non-development)
7830 · Staff travel (non-development) 361 579 2,433 3,129 4,062 4,910 5,460 6,247 7,076
Total 7830 · Staff travel (non-development)361 579 2,433 3,129 4,062 4,910 5,460 6,247 7,076
Total 780 · Other Staff Expense 27,310 28,579 39,498 43,791 65,852 68,717 76,422 87,433 99,037
Cost / Student 205 138 121 108 128 114 118 121 125
Cost / Student, inflation adj 205 134 114 98 114 98 98 98 98
END WORKSHEET
Page 24 of 34
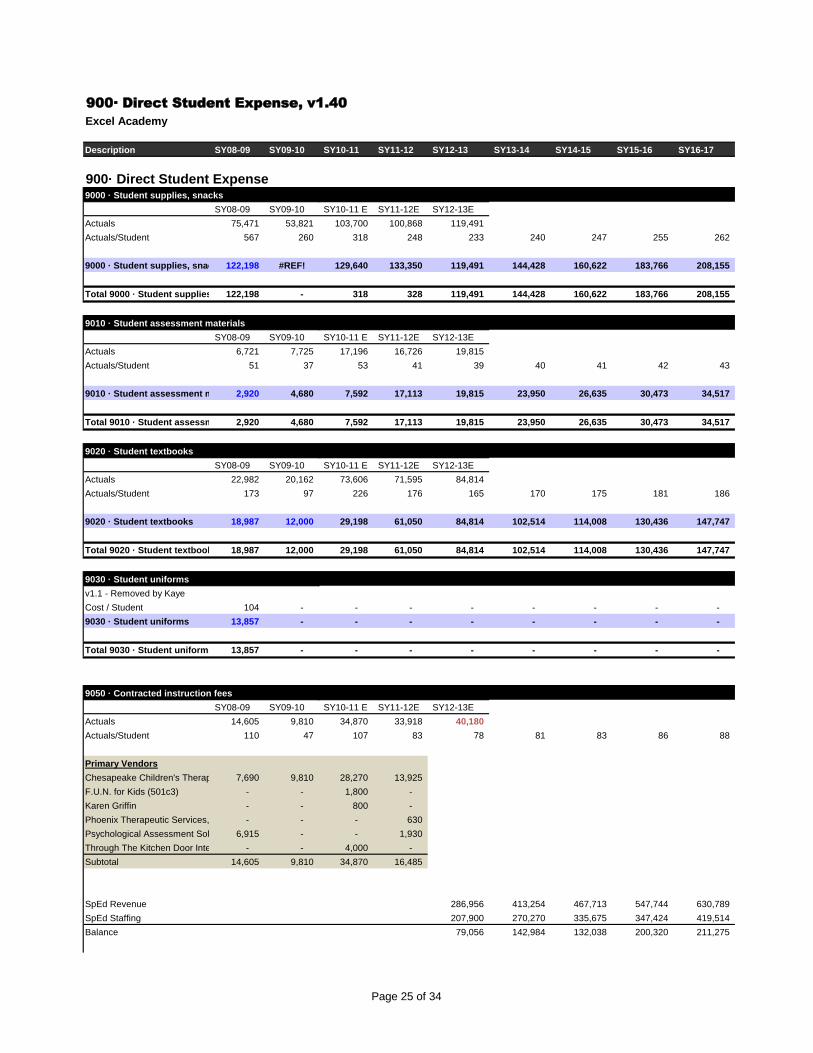
900· Direct Student Expense, v1.40
Excel Academy
Description SY08-09 SY09-10 SY10-11 SY11-12 SY12-13 SY13-14 SY14-15 SY15-16 SY16-17
900· Direct Student Expense9000 · Student supplies, snacks
SY08-09 SY09-10 SY10-11 E SY11-12E SY12-13E
Actuals 75,471 53,821 103,700 100,868 119,491
Actuals/Student 567 260 318 248 233 240 247 255 262
9000 · Student supplies, snacks 122,198 #REF! 129,640 133,350 119,491 144,428 160,622 183,766 208,155
Total 9000 · Student supplies, snacks122,198 - 318 328 119,491 144,428 160,622 183,766 208,155
9010 · Student assessment materials
SY08-09 SY09-10 SY10-11 E SY11-12E SY12-13E
Actuals 6,721 7,725 17,196 16,726 19,815
Actuals/Student 51 37 53 41 39 40 41 42 43
9010 · Student assessment materials2,920 4,680 7,592 17,113 19,815 23,950 26,635 30,473 34,517
Total 9010 · Student assessment materials2,920 4,680 7,592 17,113 19,815 23,950 26,635 30,473 34,517
9020 · Student textbooks
SY08-09 SY09-10 SY10-11 E SY11-12E SY12-13E
Actuals 22,982 20,162 73,606 71,595 84,814
Actuals/Student 173 97 226 176 165 170 175 181 186
9020 · Student textbooks 18,987 12,000 29,198 61,050 84,814 102,514 114,008 130,436 147,747
Total 9020 · Student textbooks 18,987 12,000 29,198 61,050 84,814 102,514 114,008 130,436 147,747
9030 · Student uniforms
v1.1 - Removed by Kaye
Cost / Student 104 - - - - - - - -
9030 · Student uniforms 13,857 - - - - - - - -
Total 9030 · Student uniforms 13,857 - - - - - - - -
9050 · Contracted instruction fees
SY08-09 SY09-10 SY10-11 E SY11-12E SY12-13E
Actuals 14,605 9,810 34,870 33,918 40,180
Actuals/Student 110 47 107 83 78 81 83 86 88
Primary Vendors
Chesapeake Children's Therapy Center7,690 9,810 28,270 13,925
F.U.N. for Kids (501c3) - - 1,800 -
Karen Griffin - - 800 -
Phoenix Therapeutic Services, Inc. - - - 630
Psychological Assessment Solutions, LLC6,915 - - 1,930
Through The Kitchen Door International- - 4,000 -
Subtotal 14,605 9,810 34,870 16,485
SpEd Revenue 286,956 413,254 467,713 547,744 630,789
SpEd Staffing 207,900 270,270 335,675 347,424 419,514
Balance 79,056 142,984 132,038 200,320 211,275
Page 25 of 34
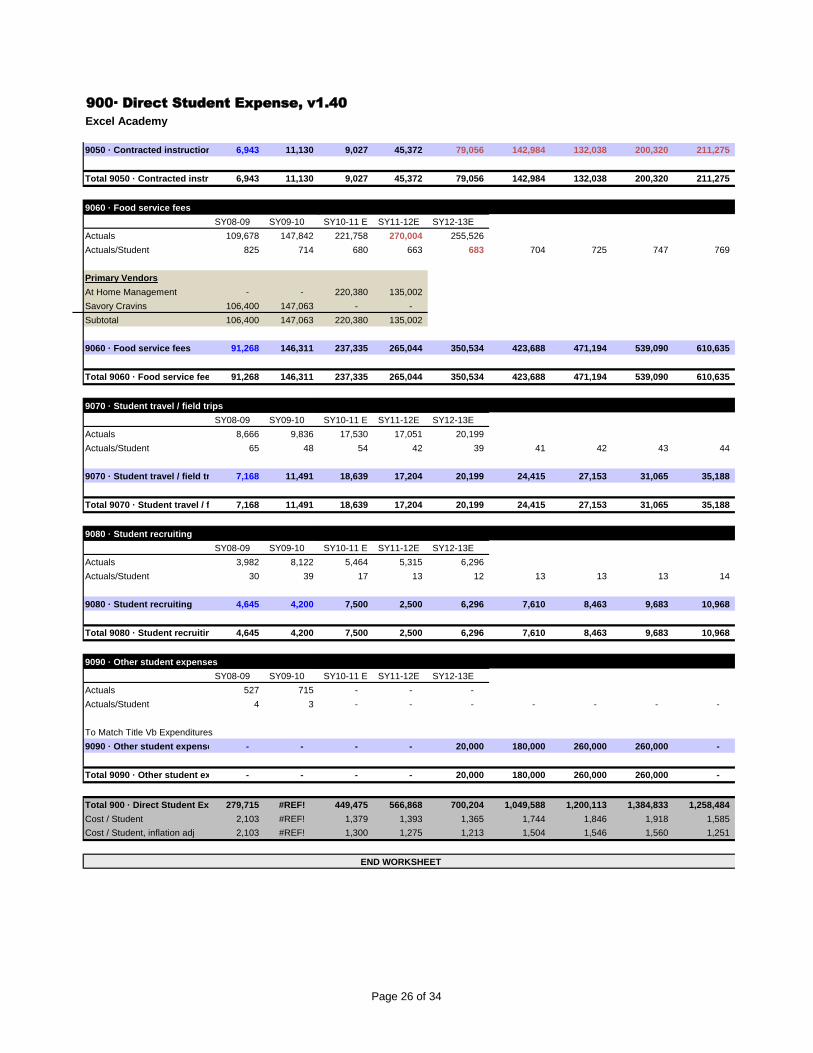
900· Direct Student Expense, v1.40
Excel Academy
9050 · Contracted instruction fees 6,943 11,130 9,027 45,372 79,056 142,984 132,038 200,320 211,275
Total 9050 · Contracted instruction fees6,943 11,130 9,027 45,372 79,056 142,984 132,038 200,320 211,275
9060 · Food service fees
SY08-09 SY09-10 SY10-11 E SY11-12E SY12-13E
Actuals 109,678 147,842 221,758 270,004 255,526
Actuals/Student 825 714 680 663 683 704 725 747 769
Primary Vendors
At Home Management - - 220,380 135,002
Savory Cravins 106,400 147,063 - -
Subtotal 106,400 147,063 220,380 135,002
9060 · Food service fees 91,268 146,311 237,335 265,044 350,534 423,688 471,194 539,090 610,635
Total 9060 · Food service fees 91,268 146,311 237,335 265,044 350,534 423,688 471,194 539,090 610,635
9070 · Student travel / field trips
SY08-09 SY09-10 SY10-11 E SY11-12E SY12-13E
Actuals 8,666 9,836 17,530 17,051 20,199
Actuals/Student 65 48 54 42 39 41 42 43 44
9070 · Student travel / field trips 7,168 11,491 18,639 17,204 20,199 24,415 27,153 31,065 35,188
Total 9070 · Student travel / field trips7,168 11,491 18,639 17,204 20,199 24,415 27,153 31,065 35,188
9080 · Student recruiting
SY08-09 SY09-10 SY10-11 E SY11-12E SY12-13E
Actuals 3,982 8,122 5,464 5,315 6,296
Actuals/Student 30 39 17 13 12 13 13 13 14
9080 · Student recruiting 4,645 4,200 7,500 2,500 6,296 7,610 8,463 9,683 10,968
Total 9080 · Student recruiting 4,645 4,200 7,500 2,500 6,296 7,610 8,463 9,683 10,968
9090 · Other student expenses
SY08-09 SY09-10 SY10-11 E SY11-12E SY12-13E
Actuals 527 715 - - -
Actuals/Student 4 3 - - - - - - -
To Match Title Vb Expenditures
9090 · Other student expenses - - - - 20,000 180,000 260,000 260,000 -
Total 9090 · Other student expenses - - - - 20,000 180,000 260,000 260,000 -
Total 900 · Direct Student Expense279,715 #REF! 449,475 566,868 700,204 1,049,588 1,200,113 1,384,833 1,258,484
Cost / Student 2,103 #REF! 1,379 1,393 1,365 1,744 1,846 1,918 1,585
Cost / Student, inflation adj 2,103 #REF! 1,300 1,275 1,213 1,504 1,546 1,560 1,251
END WORKSHEET
Page 26 of 34
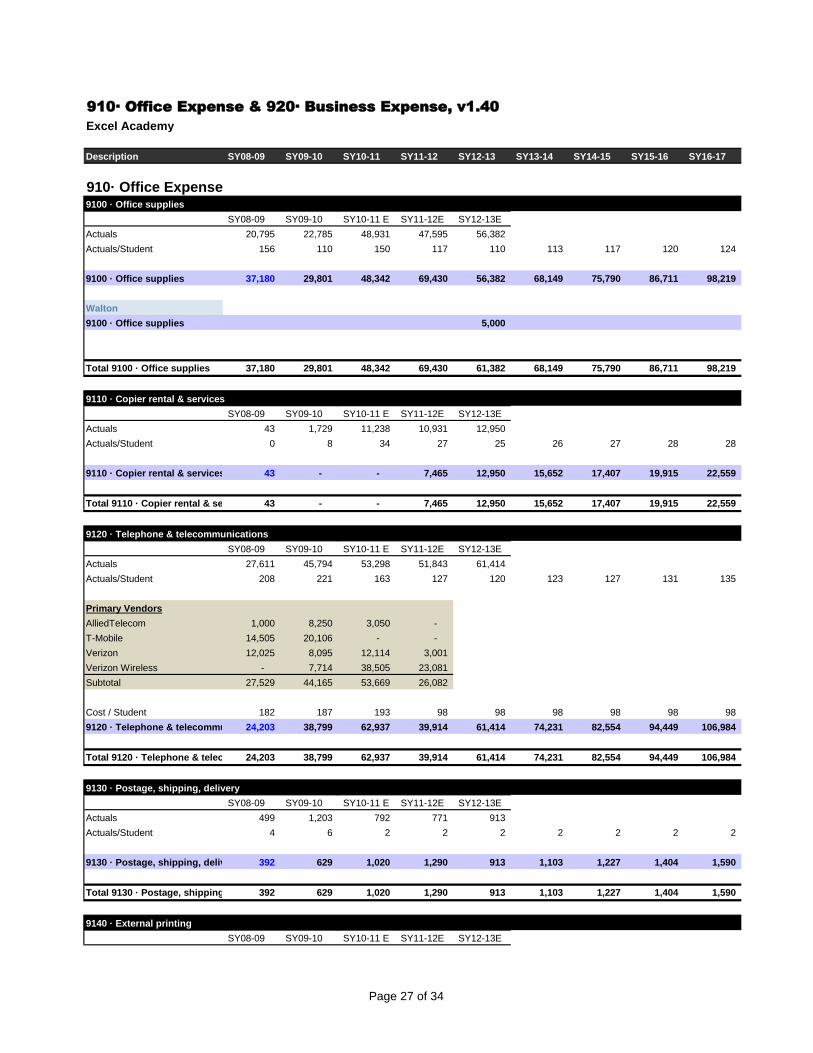
910· Office Expense & 920· Business Expense, v1.40
Excel Academy
Description SY08-09 SY09-10 SY10-11 SY11-12 SY12-13 SY13-14 SY14-15 SY15-16 SY16-17
910· Office Expense9100 · Office supplies
SY08-09 SY09-10 SY10-11 E SY11-12E SY12-13E
Actuals 20,795 22,785 48,931 47,595 56,382
Actuals/Student 156 110 150 117 110 113 117 120 124
9100 · Office supplies 37,180 29,801 48,342 69,430 56,382 68,149 75,790 86,711 98,219
Walton
9100 · Office supplies 5,000
Total 9100 · Office supplies 37,180 29,801 48,342 69,430 61,382 68,149 75,790 86,711 98,219
9110 · Copier rental & services
SY08-09 SY09-10 SY10-11 E SY11-12E SY12-13E
Actuals 43 1,729 11,238 10,931 12,950
Actuals/Student 0 8 34 27 25 26 27 28 28
9110 · Copier rental & services 43 - - 7,465 12,950 15,652 17,407 19,915 22,559
Total 9110 · Copier rental & services 43 - - 7,465 12,950 15,652 17,407 19,915 22,559
9120 · Telephone & telecommunications
SY08-09 SY09-10 SY10-11 E SY11-12E SY12-13E
Actuals 27,611 45,794 53,298 51,843 61,414
Actuals/Student 208 221 163 127 120 123 127 131 135
Primary Vendors
AlliedTelecom 1,000 8,250 3,050 -
T-Mobile 14,505 20,106 - -
Verizon 12,025 8,095 12,114 3,001
Verizon Wireless - 7,714 38,505 23,081
Subtotal 27,529 44,165 53,669 26,082
Cost / Student 182 187 193 98 98 98 98 98 98
9120 · Telephone & telecommunications24,203 38,799 62,937 39,914 61,414 74,231 82,554 94,449 106,984
Total 9120 · Telephone & telecommunications24,203 38,799 62,937 39,914 61,414 74,231 82,554 94,449 106,984
9130 · Postage, shipping, delivery
SY08-09 SY09-10 SY10-11 E SY11-12E SY12-13E
Actuals 499 1,203 792 771 913
Actuals/Student 4 6 2 2 2 2 2 2 2
9130 · Postage, shipping, delivery 392 629 1,020 1,290 913 1,103 1,227 1,404 1,590
Total 9130 · Postage, shipping, delivery392 629 1,020 1,290 913 1,103 1,227 1,404 1,590
9140 · External printing
SY08-09 SY09-10 SY10-11 E SY11-12E SY12-13E
Page 27 of 34
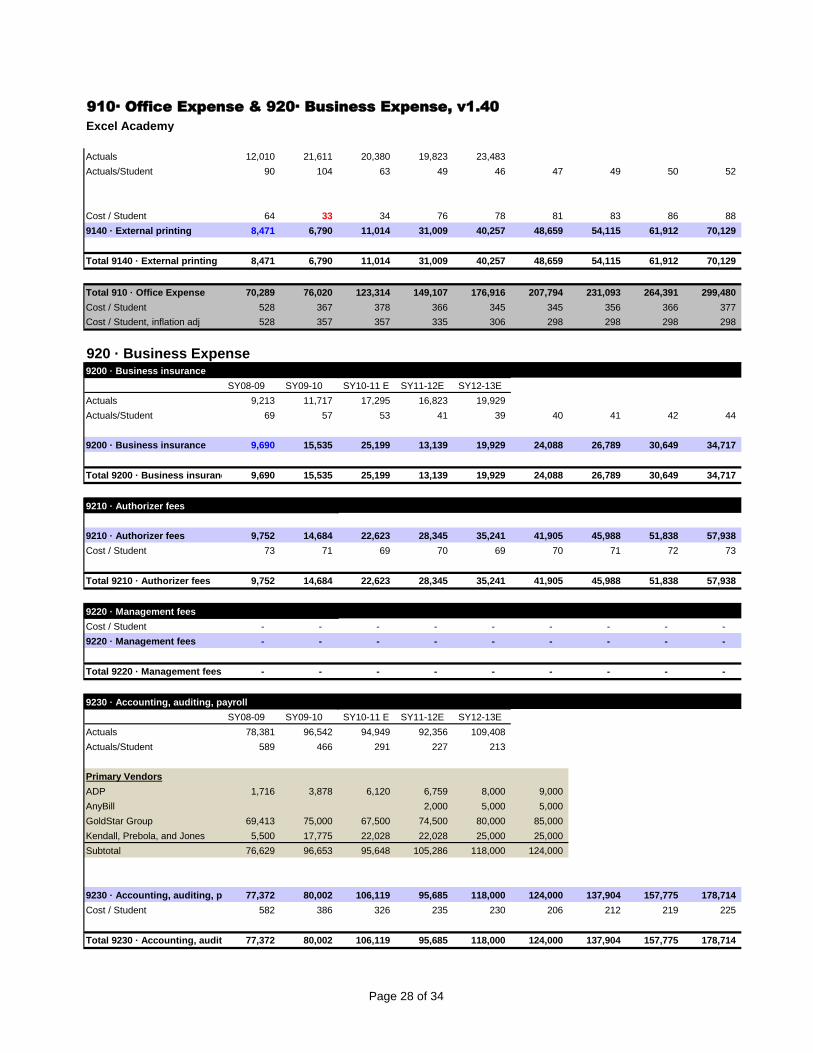
910· Office Expense & 920· Business Expense, v1.40
Excel Academy
Actuals 12,010 21,611 20,380 19,823 23,483
Actuals/Student 90 104 63 49 46 47 49 50 52
Cost / Student 64 33 34 76 78 81 83 86 88
9140 · External printing 8,471 6,790 11,014 31,009 40,257 48,659 54,115 61,912 70,129
Total 9140 · External printing 8,471 6,790 11,014 31,009 40,257 48,659 54,115 61,912 70,129
Total 910 · Office Expense 70,289 76,020 123,314 149,107 176,916 207,794 231,093 264,391 299,480
Cost / Student 528 367 378 366 345 345 356 366 377
Cost / Student, inflation adj 528 357 357 335 306 298 298 298 298
920 · Business Expense9200 · Business insurance
SY08-09 SY09-10 SY10-11 E SY11-12E SY12-13E
Actuals 9,213 11,717 17,295 16,823 19,929
Actuals/Student 69 57 53 41 39 40 41 42 44
9200 · Business insurance 9,690 15,535 25,199 13,139 19,929 24,088 26,789 30,649 34,717
Total 9200 · Business insurance 9,690 15,535 25,199 13,139 19,929 24,088 26,789 30,649 34,717
9210 · Authorizer fees
9210 · Authorizer fees 9,752 14,684 22,623 28,345 35,241 41,905 45,988 51,838 57,938
Cost / Student 73 71 69 70 69 70 71 72 73
Total 9210 · Authorizer fees 9,752 14,684 22,623 28,345 35,241 41,905 45,988 51,838 57,938
9220 · Management fees
Cost / Student - - - - - - - - -
9220 · Management fees - - - - - - - - -
Total 9220 · Management fees - - - - - - - - -
9230 · Accounting, auditing, payroll
SY08-09 SY09-10 SY10-11 E SY11-12E SY12-13E
Actuals 78,381 96,542 94,949 92,356 109,408
Actuals/Student 589 466 291 227 213
Primary Vendors
ADP 1,716 3,878 6,120 6,759 8,000 9,000
AnyBill 2,000 5,000 5,000
GoldStar Group 69,413 75,000 67,500 74,500 80,000 85,000
Kendall, Prebola, and Jones 5,500 17,775 22,028 22,028 25,000 25,000
Subtotal 76,629 96,653 95,648 105,286 118,000 124,000
9230 · Accounting, auditing, payroll77,372 80,002 106,119 95,685 118,000 124,000 137,904 157,775 178,714
Cost / Student 582 386 326 235 230 206 212 219 225
Total 9230 · Accounting, auditing, payroll77,372 80,002 106,119 95,685 118,000 124,000 137,904 157,775 178,714
Page 28 of 34
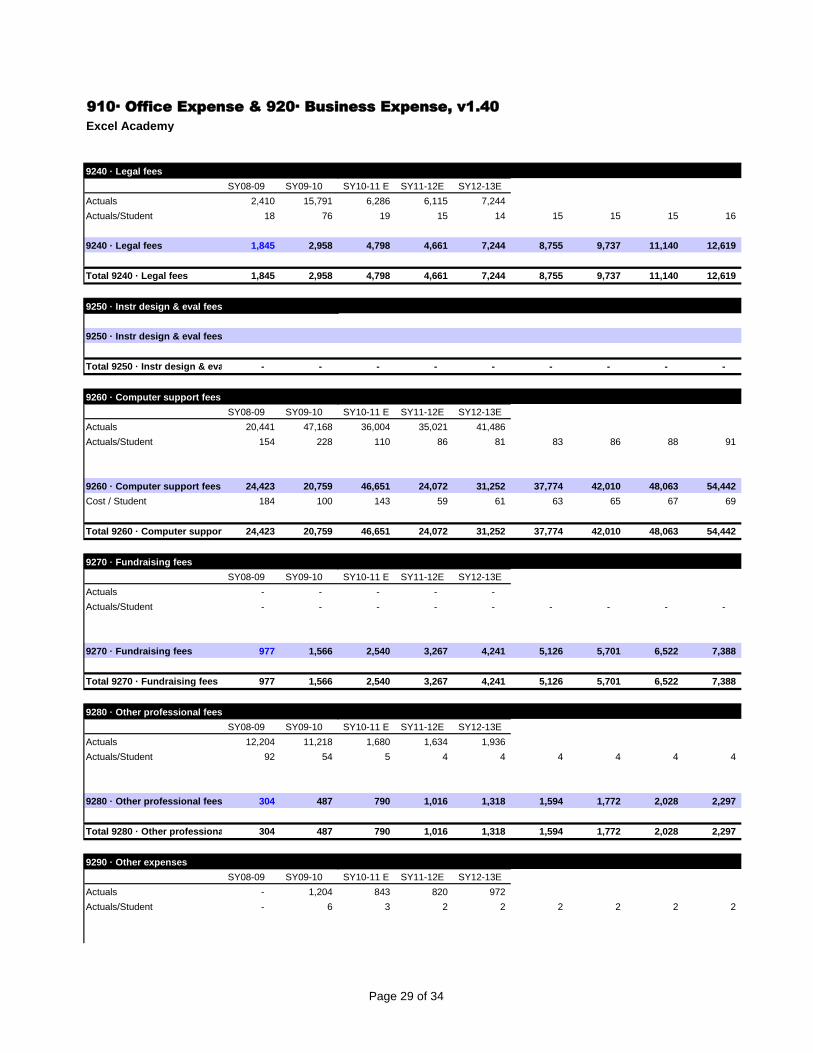
910· Office Expense & 920· Business Expense, v1.40
Excel Academy
9240 · Legal fees
SY08-09 SY09-10 SY10-11 E SY11-12E SY12-13E
Actuals 2,410 15,791 6,286 6,115 7,244
Actuals/Student 18 76 19 15 14 15 15 15 16
9240 · Legal fees 1,845 2,958 4,798 4,661 7,244 8,755 9,737 11,140 12,619
Total 9240 · Legal fees 1,845 2,958 4,798 4,661 7,244 8,755 9,737 11,140 12,619
9250 · Instr design & eval fees
9250 · Instr design & eval fees
Total 9250 · Instr design & eval fees - - - - - - - - -
9260 · Computer support fees
SY08-09 SY09-10 SY10-11 E SY11-12E SY12-13E
Actuals 20,441 47,168 36,004 35,021 41,486
Actuals/Student 154 228 110 86 81 83 86 88 91
9260 · Computer support fees 24,423 20,759 46,651 24,072 31,252 37,774 42,010 48,063 54,442
Cost / Student 184 100 143 59 61 63 65 67 69
Total 9260 · Computer support fees24,423 20,759 46,651 24,072 31,252 37,774 42,010 48,063 54,442
9270 · Fundraising fees
SY08-09 SY09-10 SY10-11 E SY11-12E SY12-13E
Actuals - - - - -
Actuals/Student - - - - - - - - -
9270 · Fundraising fees 977 1,566 2,540 3,267 4,241 5,126 5,701 6,522 7,388
Total 9270 · Fundraising fees 977 1,566 2,540 3,267 4,241 5,126 5,701 6,522 7,388
9280 · Other professional fees
SY08-09 SY09-10 SY10-11 E SY11-12E SY12-13E
Actuals 12,204 11,218 1,680 1,634 1,936
Actuals/Student 92 54 5 4 4 4 4 4 4
9280 · Other professional fees 304 487 790 1,016 1,318 1,594 1,772 2,028 2,297
Total 9280 · Other professional fees 304 487 790 1,016 1,318 1,594 1,772 2,028 2,297
9290 · Other expenses
SY08-09 SY09-10 SY10-11 E SY11-12E SY12-13E
Actuals - 1,204 843 820 972
Actuals/Student - 6 3 2 2 2 2 2 2
Page 29 of 34
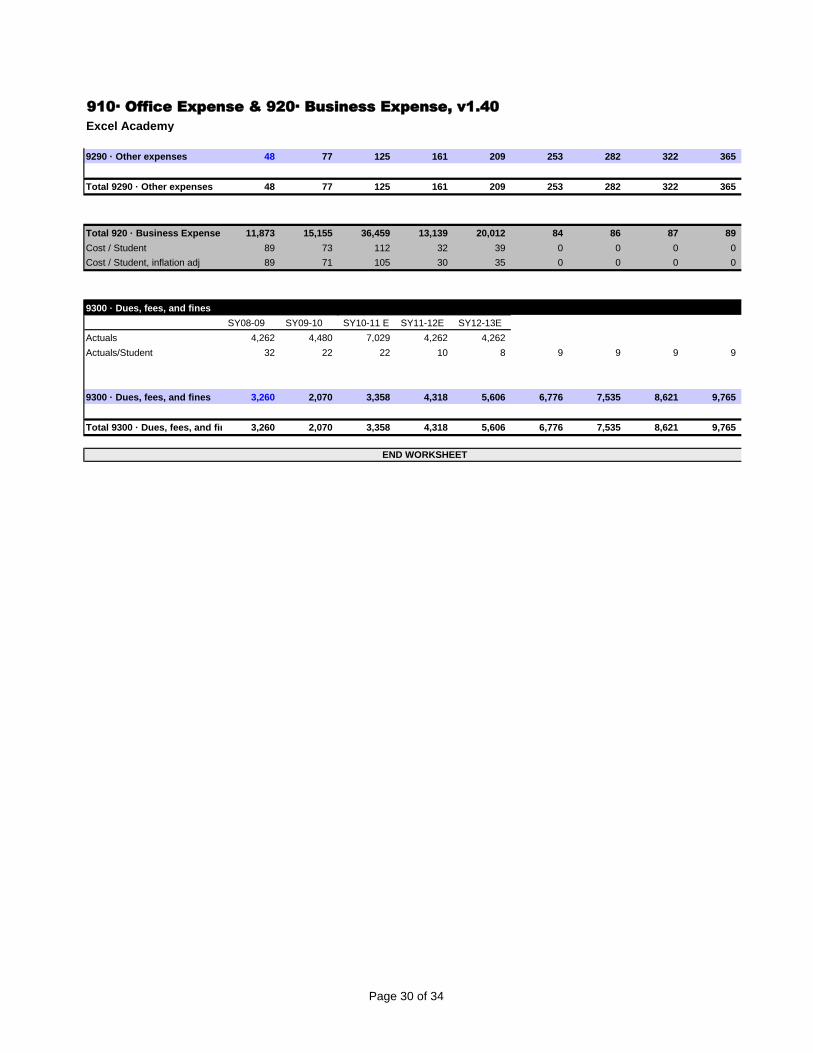
910· Office Expense & 920· Business Expense, v1.40
Excel Academy
9290 · Other expenses 48 77 125 161 209 253 282 322 365
Total 9290 · Other expenses 48 77 125 161 209 253 282 322 365
Total 920 · Business Expense 11,873 15,155 36,459 13,139 20,012 84 86 87 89
Cost / Student 89 73 112 32 39 0 0 0 0
Cost / Student, inflation adj 89 71 105 30 35 0 0 0 0
9300 · Dues, fees, and fines
SY08-09 SY09-10 SY10-11 E SY11-12E SY12-13E
Actuals 4,262 4,480 7,029 4,262 4,262
Actuals/Student 32 22 22 10 8 9 9 9 9
9300 · Dues, fees, and fines 3,260 2,070 3,358 4,318 5,606 6,776 7,535 8,621 9,765
Total 9300 · Dues, fees, and fines 3,260 2,070 3,358 4,318 5,606 6,776 7,535 8,621 9,765
END WORKSHEET
Page 30 of 34
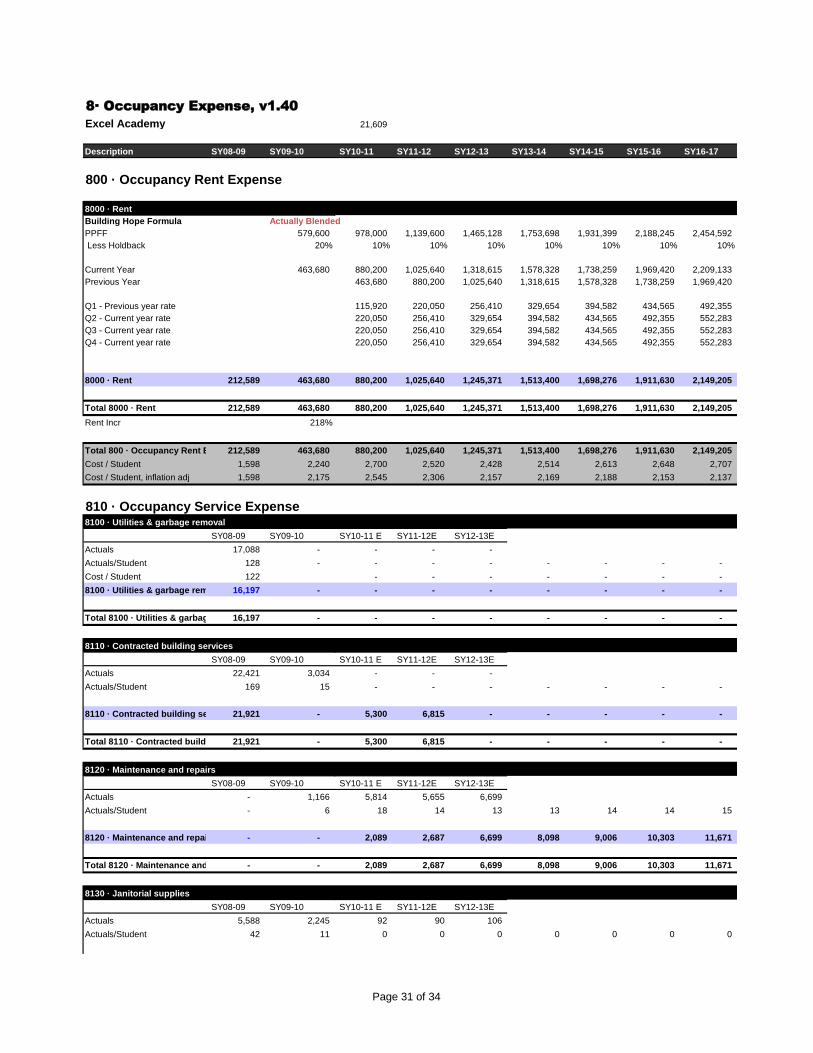
8· Occupancy Expense, v1.40
Excel Academy 21,609
Description SY08-09 SY09-10 SY10-11 SY11-12 SY12-13 SY13-14 SY14-15 SY15-16 SY16-17
800 · Occupancy Rent Expense
8000 · Rent
Building Hope Formula Actually Blended
PPFF 579,600 978,000 1,139,600 1,465,128 1,753,698 1,931,399 2,188,245 2,454,592
Less Holdback 20% 10% 10% 10% 10% 10% 10% 10%
Current Year 463,680 880,200 1,025,640 1,318,615 1,578,328 1,738,259 1,969,420 2,209,133
Previous Year 463,680 880,200 1,025,640 1,318,615 1,578,328 1,738,259 1,969,420
Q1 - Previous year rate 115,920 220,050 256,410 329,654 394,582 434,565 492,355
Q2 - Current year rate 220,050 256,410 329,654 394,582 434,565 492,355 552,283
Q3 - Current year rate 220,050 256,410 329,654 394,582 434,565 492,355 552,283
Q4 - Current year rate 220,050 256,410 329,654 394,582 434,565 492,355 552,283
8000 · Rent 212,589 463,680 880,200 1,025,640 1,245,371 1,513,400 1,698,276 1,911,630 2,149,205
Total 8000 · Rent 212,589 463,680 880,200 1,025,640 1,245,371 1,513,400 1,698,276 1,911,630 2,149,205
Rent Incr 218%
Total 800 · Occupancy Rent Expense212,589 463,680 880,200 1,025,640 1,245,371 1,513,400 1,698,276 1,911,630 2,149,205
Cost / Student 1,598 2,240 2,700 2,520 2,428 2,514 2,613 2,648 2,707
Cost / Student, inflation adj 1,598 2,175 2,545 2,306 2,157 2,169 2,188 2,153 2,137
810 · Occupancy Service Expense8100 · Utilities & garbage removal
SY08-09 SY09-10 SY10-11 E SY11-12E SY12-13E
Actuals 17,088 - - - -
Actuals/Student 128 - - - - - - - -
Cost / Student 122 - - - - - - -
8100 · Utilities & garbage removal 16,197 - - - - - - - -
Total 8100 · Utilities & garbage removal16,197 - - - - - - - -
8110 · Contracted building services
SY08-09 SY09-10 SY10-11 E SY11-12E SY12-13E
Actuals 22,421 3,034 - - -
Actuals/Student 169 15 - - - - - - -
8110 · Contracted building services21,921 - 5,300 6,815 - - - - -
Total 8110 · Contracted building services21,921 - 5,300 6,815 - - - - -
8120 · Maintenance and repairs
SY08-09 SY09-10 SY10-11 E SY11-12E SY12-13E
Actuals - 1,166 5,814 5,655 6,699
Actuals/Student - 6 18 14 13 13 14 14 15
8120 · Maintenance and repairs - - 2,089 2,687 6,699 8,098 9,006 10,303 11,671
Total 8120 · Maintenance and repairs - - 2,089 2,687 6,699 8,098 9,006 10,303 11,671
8130 · Janitorial supplies
SY08-09 SY09-10 SY10-11 E SY11-12E SY12-13E
Actuals 5,588 2,245 92 90 106
Actuals/Student 42 11 0 0 0 0 0 0 0
Page 31 of 34
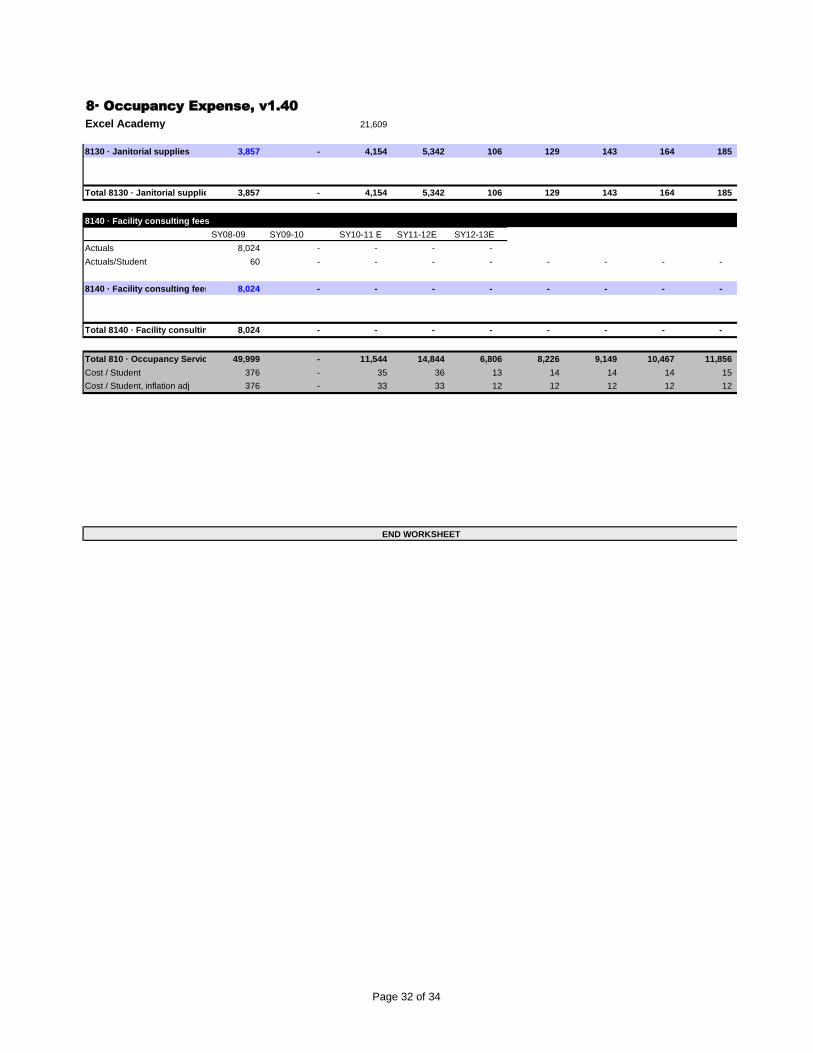
8· Occupancy Expense, v1.40
Excel Academy 21,609
8130 · Janitorial supplies 3,857 - 4,154 5,342 106 129 143 164 185
Total 8130 · Janitorial supplies 3,857 - 4,154 5,342 106 129 143 164 185
8140 · Facility consulting fees
SY08-09 SY09-10 SY10-11 E SY11-12E SY12-13E
Actuals 8,024 - - - -
Actuals/Student 60 - - - - - - - -
8140 · Facility consulting fees 8,024 - - - - - - - -
Total 8140 · Facility consulting fees 8,024 - - - - - - - -
Total 810 · Occupancy Service Expense49,999 - 11,544 14,844 6,806 8,226 9,149 10,467 11,856
Cost / Student 376 - 35 36 13 14 14 14 15
Cost / Student, inflation adj 376 - 33 33 12 12 12 12 12
END WORKSHEET
Page 32 of 34
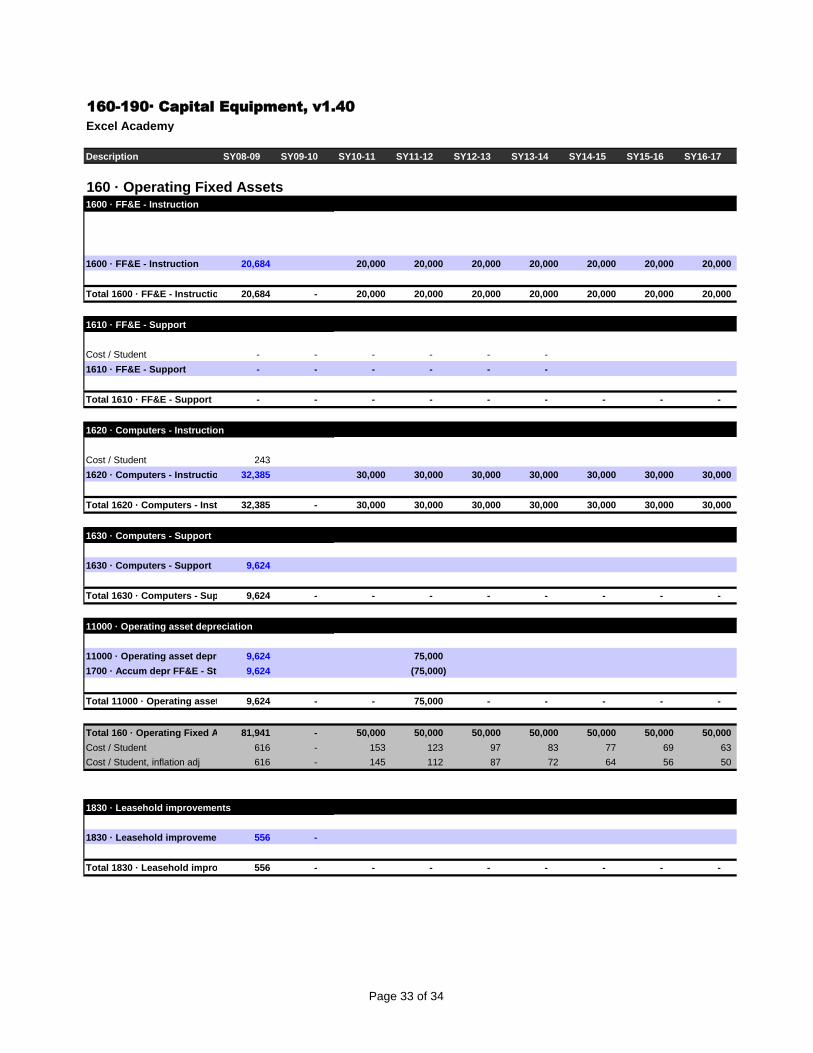
160-190· Capital Equipment, v1.40
Excel Academy
Description SY08-09 SY09-10 SY10-11 SY11-12 SY12-13 SY13-14 SY14-15 SY15-16 SY16-17
160 · Operating Fixed Assets1600 · FF&E - Instruction
1600 · FF&E - Instruction 20,684 20,000 20,000 20,000 20,000 20,000 20,000 20,000
Total 1600 · FF&E - Instruction 20,684 - 20,000 20,000 20,000 20,000 20,000 20,000 20,000
1610 · FF&E - Support
Cost / Student - - - - - -
1610 · FF&E - Support - - - - - -
Total 1610 · FF&E - Support - - - - - - - - -
1620 · Computers - Instruction
Cost / Student 243
1620 · Computers - Instruction 32,385 30,000 30,000 30,000 30,000 30,000 30,000 30,000
Total 1620 · Computers - Instruction32,385 - 30,000 30,000 30,000 30,000 30,000 30,000 30,000
1630 · Computers - Support
1630 · Computers - Support 9,624
Total 1630 · Computers - Support 9,624 - - - - - - - -
11000 · Operating asset depreciation
11000 · Operating asset depreciation9,624 75,000
1700 · Accum depr FF&E - Students9,624 (75,000)
Total 11000 · Operating asset depreciation9,624 - - 75,000 - - - - -
Total 160 · Operating Fixed Assets81,941 - 50,000 50,000 50,000 50,000 50,000 50,000 50,000
Cost / Student 616 - 153 123 97 83 77 69 63
Cost / Student, inflation adj 616 - 145 112 87 72 64 56 50
1830 · Leasehold improvements
1830 · Leasehold improvements 556 -
Total 1830 · Leasehold improvements556 - - - - - - - -
Page 33 of 34
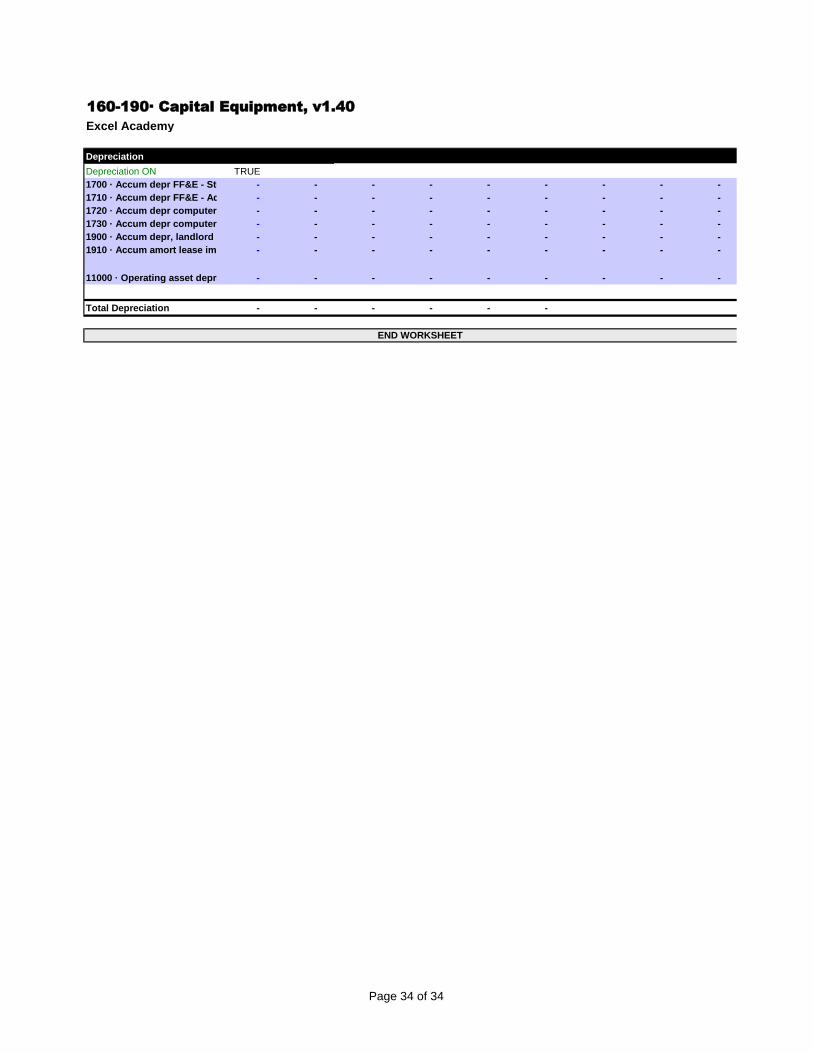
160-190· Capital Equipment, v1.40
Excel Academy
Depreciation
Depreciation ON TRUE
1700 · Accum depr FF&E - Students - - - - - - - - -
1710 · Accum depr FF&E - Admin - - - - - - - - -
1720 · Accum depr computers - Students- - - - - - - - -
1730 · Accum depr computers - Admin- - - - - - - - -
1900 · Accum depr, landlord premises- - - - - - - - -
1910 · Accum amort lease imp - - - - - - - - -
11000 · Operating asset depreciation - - - - - - - - -
Total Depreciation - - - - - -
END WORKSHEET
Page 34 of 34
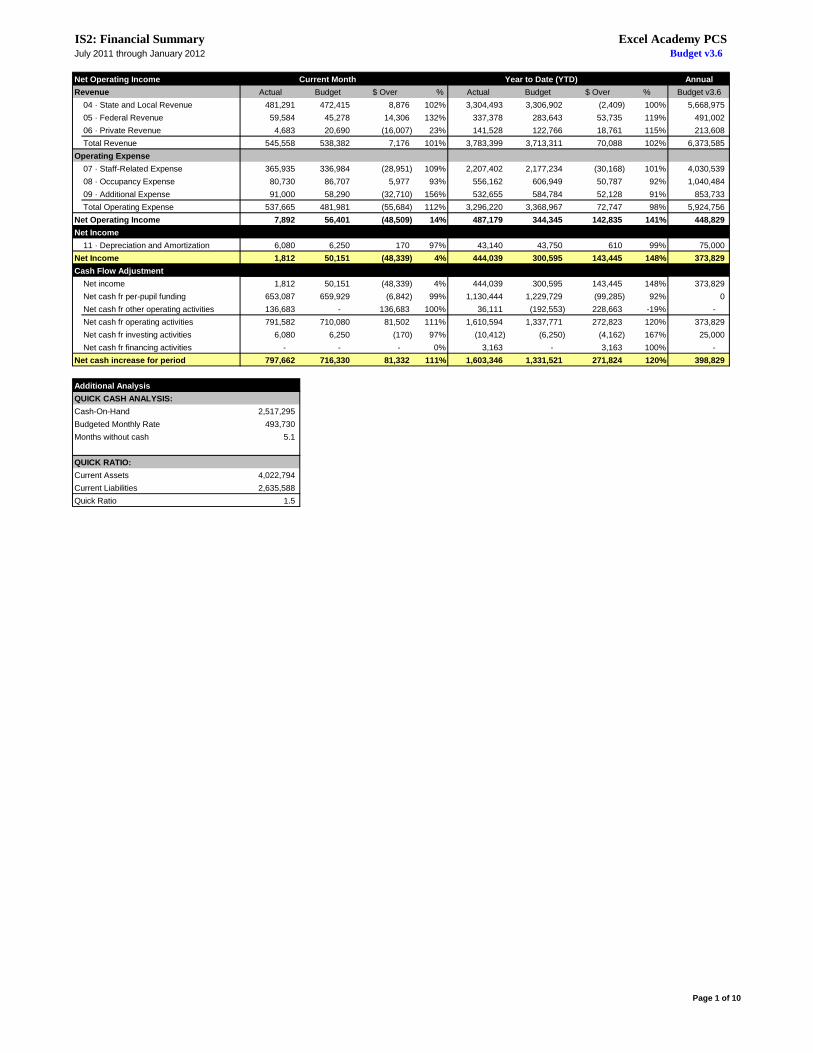
IS2: Financial Summary Excel Academy PCSJuly 2011 through January 2012 Budget v3.6
Net Operating Income Current Month Year to Date (YTD) Annual
Revenue Actual Budget $ Over % Actual Budget $ Over % Budget v3.6
04 · State and Local Revenue 481,291 472,415 8,876 102% 3,304,493 3,306,902 (2,409) 100% 5,668,975
05 · Federal Revenue 59,584 45,278 14,306 132% 337,378 283,643 53,735 119% 491,002
06 · Private Revenue 4,683 20,690 (16,007) 23% 141,528 122,766 18,761 115% 213,608
Total Revenue 545,558 538,382 7,176 101% 3,783,399 3,713,311 70,088 102% 6,373,585
Operating Expense
07 · Staff-Related Expense 365,935 336,984 (28,951) 109% 2,207,402 2,177,234 (30,168) 101% 4,030,539
08 · Occupancy Expense 80,730 86,707 5,977 93% 556,162 606,949 50,787 92% 1,040,484
09 · Additional Expense 91,000 58,290 (32,710) 156% 532,655 584,784 52,128 91% 853,733
Total Operating Expense 537,665 481,981 (55,684) 112% 3,296,220 3,368,967 72,747 98% 5,924,756
Net Operating Income 7,892 56,401 (48,509) 14% 487,179 344,345 142,835 141% 448,829
Net Income
11 · Depreciation and Amortization 6,080 6,250 170 97% 43,140 43,750 610 99% 75,000
Net Income 1,812 50,151 (48,339) 4% 444,039 300,595 143,445 148% 373,829
Cash Flow Adjustment
Net income 1,812 50,151 (48,339) 4% 444,039 300,595 143,445 148% 373,829
Net cash fr per-pupil funding 653,087 659,929 (6,842) 99% 1,130,444 1,229,729 (99,285) 92% 0
Net cash fr other operating activities 136,683 - 136,683 100% 36,111 (192,553) 228,663 -19% -
Net cash fr operating activities 791,582 710,080 81,502 111% 1,610,594 1,337,771 272,823 120% 373,829
Net cash fr investing activities 6,080 6,250 (170) 97% (10,412) (6,250) (4,162) 167% 25,000
Net cash fr financing activities - - - 0% 3,163 - 3,163 100% -
Net cash increase for period 797,662 716,330 81,332 111% 1,603,346 1,331,521 271,824 120% 398,829
Additional Analysis
QUICK CASH ANALYSIS:
Cash-On-Hand 2,517,295
Budgeted Monthly Rate 493,730
Months without cash 5.1
QUICK RATIO:
Current Assets 4,022,794
Current Liabilities 2,635,588
Quick Ratio 1.5
Page 1 of 10
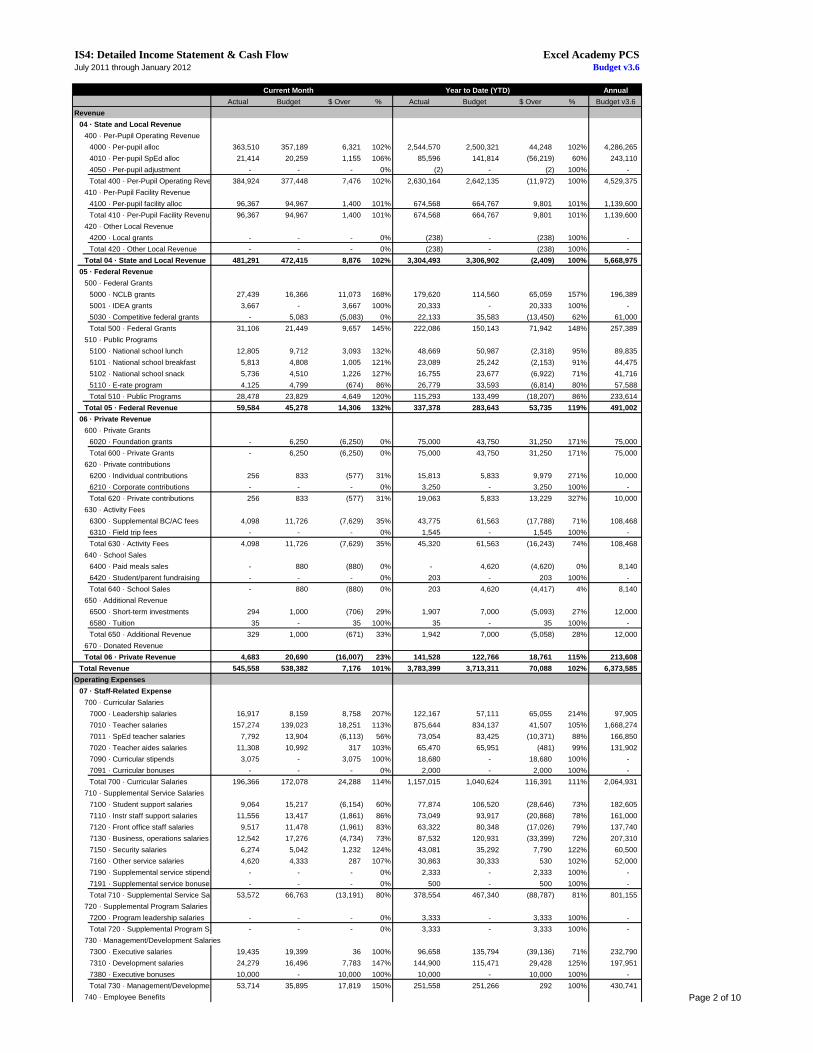
IS4: Detailed Income Statement & Cash Flow Excel Academy PCSJuly 2011 through January 2012 Budget v3.6
Current Month Year to Date (YTD) Annual
Actual Budget $ Over % Actual Budget $ Over % Budget v3.6
Revenue
04 · State and Local Revenue
400 · Per-Pupil Operating Revenue
4000 · Per-pupil alloc 363,510 357,189 6,321 102% 2,544,570 2,500,321 44,248 102% 4,286,265
4010 · Per-pupil SpEd alloc 21,414 20,259 1,155 106% 85,596 141,814 (56,219) 60% 243,110
4050 · Per-pupil adjustment - - - 0% (2) - (2) 100% -
Total 400 · Per-Pupil Operating Revenue 384,924 377,448 7,476 102% 2,630,164 2,642,135 (11,972) 100% 4,529,375
410 · Per-Pupil Facility Revenue
4100 · Per-pupil facility alloc 96,367 94,967 1,400 101% 674,568 664,767 9,801 101% 1,139,600
Total 410 · Per-Pupil Facility Revenue 96,367 94,967 1,400 101% 674,568 664,767 9,801 101% 1,139,600
420 · Other Local Revenue
4200 · Local grants - - - 0% (238) - (238) 100% -
Total 420 · Other Local Revenue - - - 0% (238) - (238) 100% -
Total 04 · State and Local Revenue 481,291 472,415 8,876 102% 3,304,493 3,306,902 (2,409) 100% 5,668,975
05 · Federal Revenue
500 · Federal Grants
5000 · NCLB grants 27,439 16,366 11,073 168% 179,620 114,560 65,059 157% 196,389
5001 · IDEA grants 3,667 - 3,667 100% 20,333 - 20,333 100% -
5030 · Competitive federal grants - 5,083 (5,083) 0% 22,133 35,583 (13,450) 62% 61,000
Total 500 · Federal Grants 31,106 21,449 9,657 145% 222,086 150,143 71,942 148% 257,389
510 · Public Programs
5100 · National school lunch 12,805 9,712 3,093 132% 48,669 50,987 (2,318) 95% 89,835
5101 · National school breakfast 5,813 4,808 1,005 121% 23,089 25,242 (2,153) 91% 44,475
5102 · National school snack 5,736 4,510 1,226 127% 16,755 23,677 (6,922) 71% 41,716
5110 · E-rate program 4,125 4,799 (674) 86% 26,779 33,593 (6,814) 80% 57,588
Total 510 · Public Programs 28,478 23,829 4,649 120% 115,293 133,499 (18,207) 86% 233,614
Total 05 · Federal Revenue 59,584 45,278 14,306 132% 337,378 283,643 53,735 119% 491,002
06 · Private Revenue
600 · Private Grants
6020 · Foundation grants - 6,250 (6,250) 0% 75,000 43,750 31,250 171% 75,000
Total 600 · Private Grants - 6,250 (6,250) 0% 75,000 43,750 31,250 171% 75,000
620 · Private contributions
6200 · Individual contributions 256 833 (577) 31% 15,813 5,833 9,979 271% 10,000
6210 · Corporate contributions - - - 0% 3,250 - 3,250 100% -
Total 620 · Private contributions 256 833 (577) 31% 19,063 5,833 13,229 327% 10,000
630 · Activity Fees
6300 · Supplemental BC/AC fees 4,098 11,726 (7,629) 35% 43,775 61,563 (17,788) 71% 108,468
6310 · Field trip fees - - - 0% 1,545 - 1,545 100% -
Total 630 · Activity Fees 4,098 11,726 (7,629) 35% 45,320 61,563 (16,243) 74% 108,468
640 · School Sales
6400 · Paid meals sales - 880 (880) 0% - 4,620 (4,620) 0% 8,140
6420 · Student/parent fundraising - - - 0% 203 - 203 100% -
Total 640 · School Sales - 880 (880) 0% 203 4,620 (4,417) 4% 8,140
650 · Additional Revenue
6500 · Short-term investments 294 1,000 (706) 29% 1,907 7,000 (5,093) 27% 12,000
6580 · Tuition 35 - 35 100% 35 - 35 100% -
Total 650 · Additional Revenue 329 1,000 (671) 33% 1,942 7,000 (5,058) 28% 12,000
670 · Donated Revenue
Total 06 · Private Revenue 4,683 20,690 (16,007) 23% 141,528 122,766 18,761 115% 213,608
Total Revenue 545,558 538,382 7,176 101% 3,783,399 3,713,311 70,088 102% 6,373,585
Operating Expenses
07 · Staff-Related Expense
700 · Curricular Salaries
7000 · Leadership salaries 16,917 8,159 8,758 207% 122,167 57,111 65,055 214% 97,905
7010 · Teacher salaries 157,274 139,023 18,251 113% 875,644 834,137 41,507 105% 1,668,274
7011 · SpEd teacher salaries 7,792 13,904 (6,113) 56% 73,054 83,425 (10,371) 88% 166,850
7020 · Teacher aides salaries 11,308 10,992 317 103% 65,470 65,951 (481) 99% 131,902
7090 · Curricular stipends 3,075 - 3,075 100% 18,680 - 18,680 100% -
7091 · Curricular bonuses - - - 0% 2,000 - 2,000 100% -
Total 700 · Curricular Salaries 196,366 172,078 24,288 114% 1,157,015 1,040,624 116,391 111% 2,064,931
710 · Supplemental Service Salaries
7100 · Student support salaries 9,064 15,217 (6,154) 60% 77,874 106,520 (28,646) 73% 182,605
7110 · Instr staff support salaries 11,556 13,417 (1,861) 86% 73,049 93,917 (20,868) 78% 161,000
7120 · Front office staff salaries 9,517 11,478 (1,961) 83% 63,322 80,348 (17,026) 79% 137,740
7130 · Business, operations salaries 12,542 17,276 (4,734) 73% 87,532 120,931 (33,399) 72% 207,310
7150 · Security salaries 6,274 5,042 1,232 124% 43,081 35,292 7,790 122% 60,500
7160 · Other service salaries 4,620 4,333 287 107% 30,863 30,333 530 102% 52,000
7190 · Supplemental service stipends - - - 0% 2,333 - 2,333 100% -
7191 · Supplemental service bonuses - - - 0% 500 - 500 100% -
Total 710 · Supplemental Service Salaries 53,572 66,763 (13,191) 80% 378,554 467,340 (88,787) 81% 801,155
720 · Supplemental Program Salaries
7200 · Program leadership salaries - - - 0% 3,333 - 3,333 100% -
Total 720 · Supplemental Program Salaries - - - 0% 3,333 - 3,333 100% -
730 · Management/Development Salaries
7300 · Executive salaries 19,435 19,399 36 100% 96,658 135,794 (39,136) 71% 232,790
7310 · Development salaries 24,279 16,496 7,783 147% 144,900 115,471 29,428 125% 197,951
7380 · Executive bonuses 10,000 - 10,000 100% 10,000 - 10,000 100% -
Total 730 · Management/Development Salaries53,714 35,895 17,819 150% 251,558 251,266 292 100% 430,741
740 · Employee Benefits Page 2 of 10
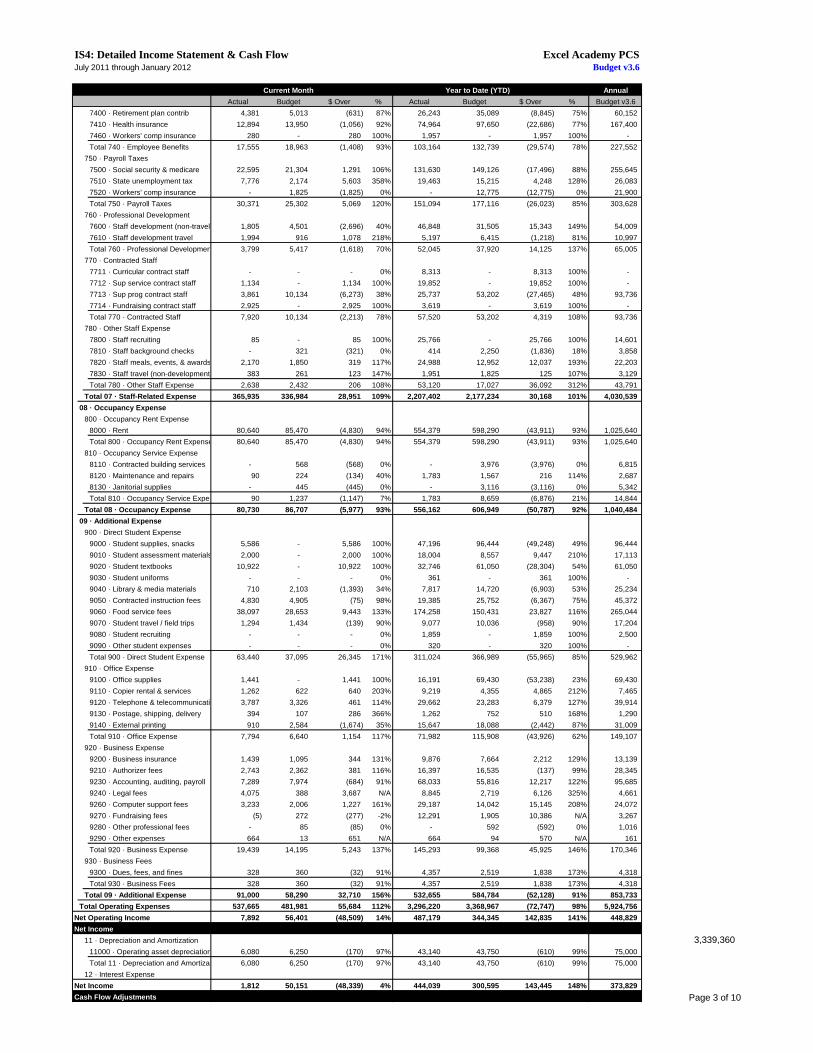
IS4: Detailed Income Statement & Cash Flow Excel Academy PCSJuly 2011 through January 2012 Budget v3.6
Current Month Year to Date (YTD) Annual
Actual Budget $ Over % Actual Budget $ Over % Budget v3.6
7400 · Retirement plan contrib 4,381 5,013 (631) 87% 26,243 35,089 (8,845) 75% 60,152
7410 · Health insurance 12,894 13,950 (1,056) 92% 74,964 97,650 (22,686) 77% 167,400
7460 · Workers' comp insurance 280 - 280 100% 1,957 - 1,957 100% -
Total 740 · Employee Benefits 17,555 18,963 (1,408) 93% 103,164 132,739 (29,574) 78% 227,552
750 · Payroll Taxes
7500 · Social security & medicare 22,595 21,304 1,291 106% 131,630 149,126 (17,496) 88% 255,645
7510 · State unemployment tax 7,776 2,174 5,603 358% 19,463 15,215 4,248 128% 26,083
7520 · Workers' comp insurance - 1,825 (1,825) 0% - 12,775 (12,775) 0% 21,900
Total 750 · Payroll Taxes 30,371 25,302 5,069 120% 151,094 177,116 (26,023) 85% 303,628
760 · Professional Development
7600 · Staff development (non-travel) 1,805 4,501 (2,696) 40% 46,848 31,505 15,343 149% 54,009
7610 · Staff development travel 1,994 916 1,078 218% 5,197 6,415 (1,218) 81% 10,997
Total 760 · Professional Development 3,799 5,417 (1,618) 70% 52,045 37,920 14,125 137% 65,005
770 · Contracted Staff
7711 · Curricular contract staff - - - 0% 8,313 - 8,313 100% -
7712 · Sup service contract staff 1,134 - 1,134 100% 19,852 - 19,852 100% -
7713 · Sup prog contract staff 3,861 10,134 (6,273) 38% 25,737 53,202 (27,465) 48% 93,736
7714 · Fundraising contract staff 2,925 - 2,925 100% 3,619 - 3,619 100% -
Total 770 · Contracted Staff 7,920 10,134 (2,213) 78% 57,520 53,202 4,319 108% 93,736
780 · Other Staff Expense
7800 · Staff recruiting 85 - 85 100% 25,766 - 25,766 100% 14,601
7810 · Staff background checks - 321 (321) 0% 414 2,250 (1,836) 18% 3,858
7820 · Staff meals, events, & awards 2,170 1,850 319 117% 24,988 12,952 12,037 193% 22,203
7830 · Staff travel (non-development) 383 261 123 147% 1,951 1,825 125 107% 3,129
Total 780 · Other Staff Expense 2,638 2,432 206 108% 53,120 17,027 36,092 312% 43,791
Total 07 · Staff-Related Expense 365,935 336,984 28,951 109% 2,207,402 2,177,234 30,168 101% 4,030,539
08 · Occupancy Expense
800 · Occupancy Rent Expense
8000 · Rent 80,640 85,470 (4,830) 94% 554,379 598,290 (43,911) 93% 1,025,640
Total 800 · Occupancy Rent Expense 80,640 85,470 (4,830) 94% 554,379 598,290 (43,911) 93% 1,025,640
810 · Occupancy Service Expense
8110 · Contracted building services - 568 (568) 0% - 3,976 (3,976) 0% 6,815
8120 · Maintenance and repairs 90 224 (134) 40% 1,783 1,567 216 114% 2,687
8130 · Janitorial supplies - 445 (445) 0% - 3,116 (3,116) 0% 5,342
Total 810 · Occupancy Service Expense 90 1,237 (1,147) 7% 1,783 8,659 (6,876) 21% 14,844
Total 08 · Occupancy Expense 80,730 86,707 (5,977) 93% 556,162 606,949 (50,787) 92% 1,040,484
09 · Additional Expense
900 · Direct Student Expense
9000 · Student supplies, snacks 5,586 - 5,586 100% 47,196 96,444 (49,248) 49% 96,444
9010 · Student assessment materials 2,000 - 2,000 100% 18,004 8,557 9,447 210% 17,113
9020 · Student textbooks 10,922 - 10,922 100% 32,746 61,050 (28,304) 54% 61,050
9030 · Student uniforms - - - 0% 361 - 361 100% -
9040 · Library & media materials 710 2,103 (1,393) 34% 7,817 14,720 (6,903) 53% 25,234
9050 · Contracted instruction fees 4,830 4,905 (75) 98% 19,385 25,752 (6,367) 75% 45,372
9060 · Food service fees 38,097 28,653 9,443 133% 174,258 150,431 23,827 116% 265,044
9070 · Student travel / field trips 1,294 1,434 (139) 90% 9,077 10,036 (958) 90% 17,204
9080 · Student recruiting - - - 0% 1,859 - 1,859 100% 2,500
9090 · Other student expenses - - - 0% 320 - 320 100% -
Total 900 · Direct Student Expense 63,440 37,095 26,345 171% 311,024 366,989 (55,965) 85% 529,962
910 · Office Expense
9100 · Office supplies 1,441 - 1,441 100% 16,191 69,430 (53,238) 23% 69,430
9110 · Copier rental & services 1,262 622 640 203% 9,219 4,355 4,865 212% 7,465
9120 · Telephone & telecommunications 3,787 3,326 461 114% 29,662 23,283 6,379 127% 39,914
9130 · Postage, shipping, delivery 394 107 286 366% 1,262 752 510 168% 1,290
9140 · External printing 910 2,584 (1,674) 35% 15,647 18,088 (2,442) 87% 31,009
Total 910 · Office Expense 7,794 6,640 1,154 117% 71,982 115,908 (43,926) 62% 149,107
920 · Business Expense
9200 · Business insurance 1,439 1,095 344 131% 9,876 7,664 2,212 129% 13,139
9210 · Authorizer fees 2,743 2,362 381 116% 16,397 16,535 (137) 99% 28,345
9230 · Accounting, auditing, payroll 7,289 7,974 (684) 91% 68,033 55,816 12,217 122% 95,685
9240 · Legal fees 4,075 388 3,687 N/A 8,845 2,719 6,126 325% 4,661
9260 · Computer support fees 3,233 2,006 1,227 161% 29,187 14,042 15,145 208% 24,072
9270 · Fundraising fees (5) 272 (277) -2% 12,291 1,905 10,386 N/A 3,267
9280 · Other professional fees - 85 (85) 0% - 592 (592) 0% 1,016
9290 · Other expenses 664 13 651 N/A 664 94 570 N/A 161
Total 920 · Business Expense 19,439 14,195 5,243 137% 145,293 99,368 45,925 146% 170,346
930 · Business Fees
9300 · Dues, fees, and fines 328 360 (32) 91% 4,357 2,519 1,838 173% 4,318
Total 930 · Business Fees 328 360 (32) 91% 4,357 2,519 1,838 173% 4,318
Total 09 · Additional Expense 91,000 58,290 32,710 156% 532,655 584,784 (52,128) 91% 853,733
Total Operating Expenses 537,665 481,981 55,684 112% 3,296,220 3,368,967 (72,747) 98% 5,924,756
Net Operating Income 7,892 56,401 (48,509) 14% 487,179 344,345 142,835 141% 448,829
Net Income
11 · Depreciation and Amortization 3,339,360
11000 · Operating asset depreciation 6,080 6,250 (170) 97% 43,140 43,750 (610) 99% 75,000
Total 11 · Depreciation and Amortization 6,080 6,250 (170) 97% 43,140 43,750 (610) 99% 75,000
12 · Interest Expense
Net Income 1,812 50,151 (48,339) 4% 444,039 300,595 143,445 148% 373,829
Cash Flow Adjustments Page 3 of 10
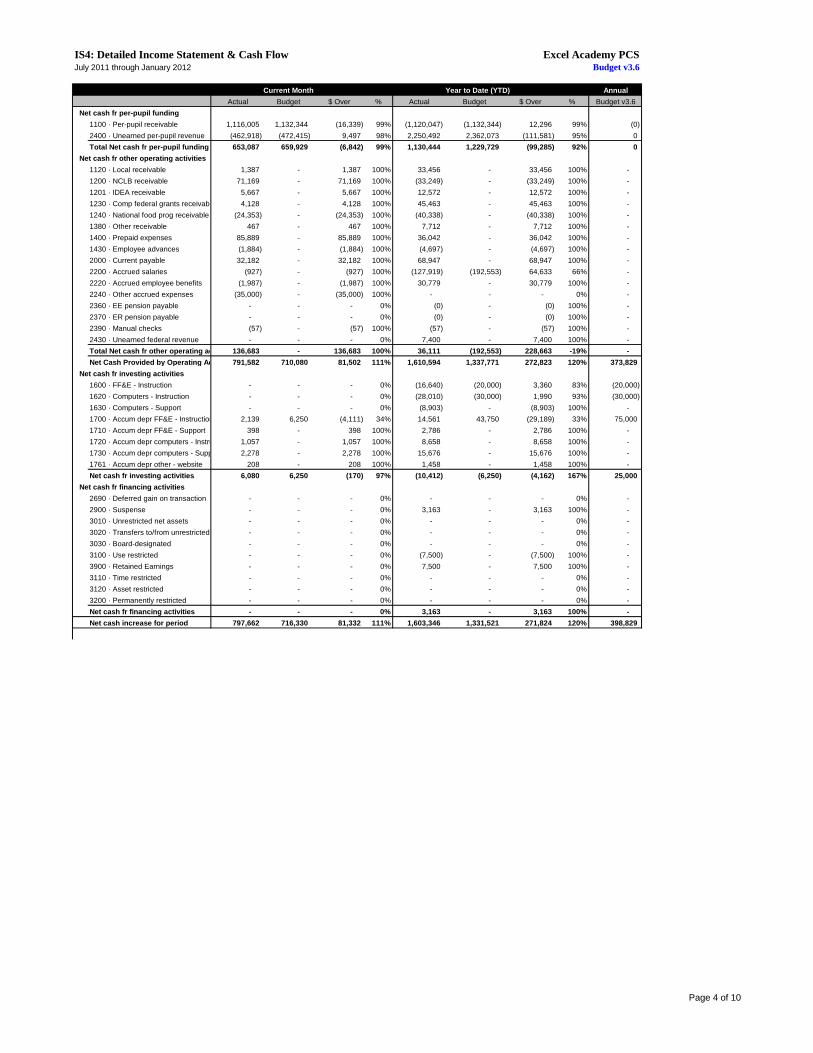
IS4: Detailed Income Statement & Cash Flow Excel Academy PCSJuly 2011 through January 2012 Budget v3.6
Current Month Year to Date (YTD) Annual
Actual Budget $ Over % Actual Budget $ Over % Budget v3.6
Net cash fr per-pupil funding
1100 · Per-pupil receivable 1,116,005 1,132,344 (16,339) 99% (1,120,047) (1,132,344) 12,296 99% (0)
2400 · Unearned per-pupil revenue (462,918) (472,415) 9,497 98% 2,250,492 2,362,073 (111,581) 95% 0
Total Net cash fr per-pupil funding 653,087 659,929 (6,842) 99% 1,130,444 1,229,729 (99,285) 92% 0
Net cash fr other operating activities
1120 · Local receivable 1,387 - 1,387 100% 33,456 - 33,456 100% -
1200 · NCLB receivable 71,169 - 71,169 100% (33,249) - (33,249) 100% -
1201 · IDEA receivable 5,667 - 5,667 100% 12,572 - 12,572 100% -
1230 · Comp federal grants receivable 4,128 - 4,128 100% 45,463 - 45,463 100% -
1240 · National food prog receivable (24,353) - (24,353) 100% (40,338) - (40,338) 100% -
1380 · Other receivable 467 - 467 100% 7,712 - 7,712 100% -
1400 · Prepaid expenses 85,889 - 85,889 100% 36,042 - 36,042 100% -
1430 · Employee advances (1,884) - (1,884) 100% (4,697) - (4,697) 100% -
2000 · Current payable 32,182 - 32,182 100% 68,947 - 68,947 100% -
2200 · Accrued salaries (927) - (927) 100% (127,919) (192,553) 64,633 66% -
2220 · Accrued employee benefits (1,987) - (1,987) 100% 30,779 - 30,779 100% -
2240 · Other accrued expenses (35,000) - (35,000) 100% - - - 0% -
2360 · EE pension payable - - - 0% (0) - (0) 100% -
2370 · ER pension payable - - - 0% (0) - (0) 100% -
2390 · Manual checks (57) - (57) 100% (57) - (57) 100% -
2430 · Unearned federal revenue - - - 0% 7,400 - 7,400 100% -
Total Net cash fr other operating activities136,683 - 136,683 100% 36,111 (192,553) 228,663 -19% -
Net Cash Provided by Operating Activities791,582 710,080 81,502 111% 1,610,594 1,337,771 272,823 120% 373,829
Net cash fr investing activities
1600 · FF&E - Instruction - - - 0% (16,640) (20,000) 3,360 83% (20,000)
1620 · Computers - Instruction - - - 0% (28,010) (30,000) 1,990 93% (30,000)
1630 · Computers - Support - - - 0% (8,903) - (8,903) 100% -
1700 · Accum depr FF&E - Instruction 2,139 6,250 (4,111) 34% 14,561 43,750 (29,189) 33% 75,000
1710 · Accum depr FF&E - Support 398 - 398 100% 2,786 - 2,786 100% -
1720 · Accum depr computers - Instruct 1,057 - 1,057 100% 8,658 - 8,658 100% -
1730 · Accum depr computers - Support 2,278 - 2,278 100% 15,676 - 15,676 100% -
1761 · Accum depr other - website 208 - 208 100% 1,458 - 1,458 100% -
Net cash fr investing activities 6,080 6,250 (170) 97% (10,412) (6,250) (4,162) 167% 25,000
Net cash fr financing activities
2690 · Deferred gain on transaction - - - 0% - - - 0% -
2900 · Suspense - - - 0% 3,163 - 3,163 100% -
3010 · Unrestricted net assets - - - 0% - - - 0% -
3020 · Transfers to/from unrestricted - - - 0% - - - 0% -
3030 · Board-designated - - - 0% - - - 0% -
3100 · Use restricted - - - 0% (7,500) - (7,500) 100% -
3900 · Retained Earnings - - - 0% 7,500 - 7,500 100% -
3110 · Time restricted - - - 0% - - - 0% -
3120 · Asset restricted - - - 0% - - - 0% -
3200 · Permanently restricted - - - 0% - - - 0% -
Net cash fr financing activities - - - 0% 3,163 - 3,163 100% -
Net cash increase for period 797,662 716,330 81,332 111% 1,603,346 1,331,521 271,824 120% 398,829
Page 4 of 10
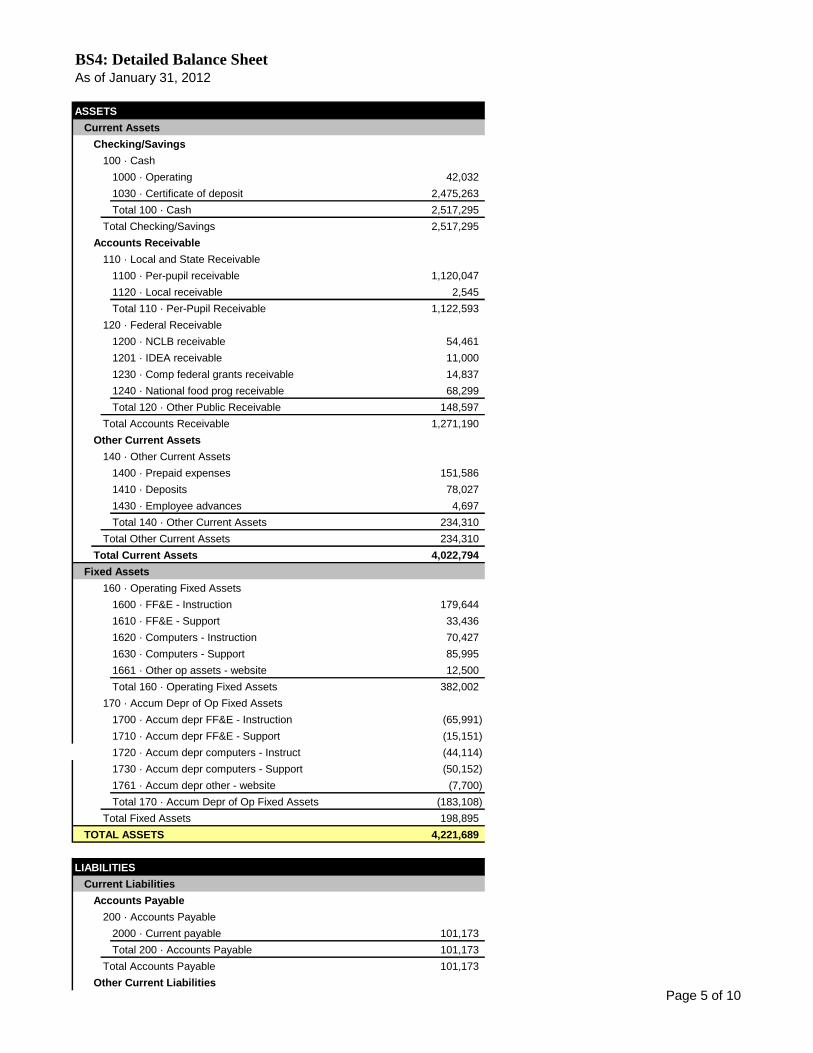
BS4: Detailed Balance SheetAs of January 31, 2012
ASSETS
Current Assets
Checking/Savings
100 · Cash
1000 · Operating 42,032
1030 · Certificate of deposit 2,475,263
Total 100 · Cash 2,517,295
Total Checking/Savings 2,517,295
Accounts Receivable
110 · Local and State Receivable
1100 · Per-pupil receivable 1,120,047
1120 · Local receivable 2,545
Total 110 · Per-Pupil Receivable 1,122,593
120 · Federal Receivable
1200 · NCLB receivable 54,461
1201 · IDEA receivable 11,000
1230 · Comp federal grants receivable 14,837
1240 · National food prog receivable 68,299
Total 120 · Other Public Receivable 148,597
Total Accounts Receivable 1,271,190
Other Current Assets
140 · Other Current Assets
1400 · Prepaid expenses 151,586
1410 · Deposits 78,027
1430 · Employee advances 4,697
Total 140 · Other Current Assets 234,310
Total Other Current Assets 234,310
Total Current Assets 4,022,794
Fixed Assets
160 · Operating Fixed Assets
1600 · FF&E - Instruction 179,644
1610 · FF&E - Support 33,436
1620 · Computers - Instruction 70,427
1630 · Computers - Support 85,995
1661 · Other op assets - website 12,500
Total 160 · Operating Fixed Assets 382,002
170 · Accum Depr of Op Fixed Assets
1700 · Accum depr FF&E - Instruction (65,991)
1710 · Accum depr FF&E - Support (15,151)
1720 · Accum depr computers - Instruct (44,114)
1730 · Accum depr computers - Support (50,152)
1761 · Accum depr other - website (7,700)
Total 170 · Accum Depr of Op Fixed Assets (183,108)
Total Fixed Assets 198,895
TOTAL ASSETS 4,221,689
LIABILITIES
Current Liabilities
Accounts Payable
200 · Accounts Payable
2000 · Current payable 101,173
Total 200 · Accounts Payable 101,173
Total Accounts Payable 101,173
Other Current Liabilities
Page 5 of 10
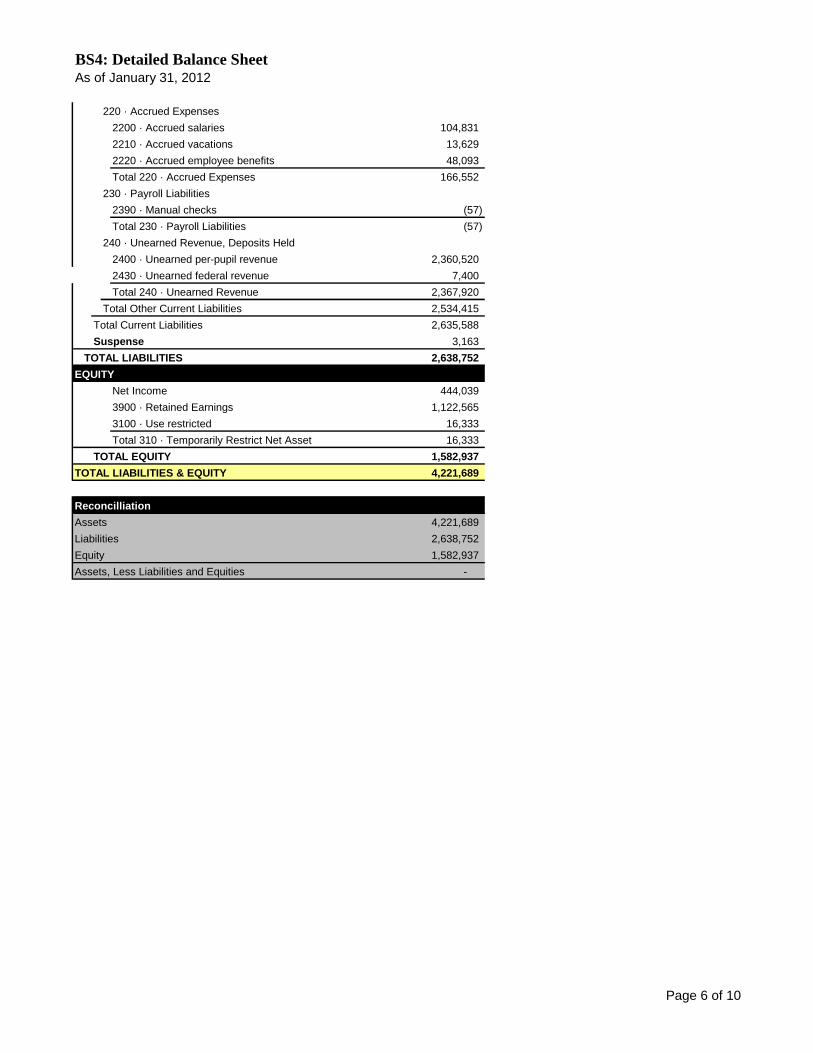
BS4: Detailed Balance SheetAs of January 31, 2012
220 · Accrued Expenses
2200 · Accrued salaries 104,831
2210 · Accrued vacations 13,629
2220 · Accrued employee benefits 48,093
Total 220 · Accrued Expenses 166,552
230 · Payroll Liabilities
2390 · Manual checks (57)
Total 230 · Payroll Liabilities (57)
240 · Unearned Revenue, Deposits Held
2400 · Unearned per-pupil revenue 2,360,520
2430 · Unearned federal revenue 7,400
Total 240 · Unearned Revenue 2,367,920
Total Other Current Liabilities 2,534,415
Total Current Liabilities 2,635,588
Suspense 3,163
TOTAL LIABILITIES 2,638,752
EQUITY
Net Income 444,039
3900 · Retained Earnings 1,122,565
3100 · Use restricted 16,333
Total 310 · Temporarily Restrict Net Asset 16,333
TOTAL EQUITY 1,582,937
TOTAL LIABILITIES & EQUITY 4,221,689
Reconcilliation
Assets 4,221,689
Liabilities 2,638,752
Equity 1,582,937
Assets, Less Liabilities and Equities -
Page 6 of 10
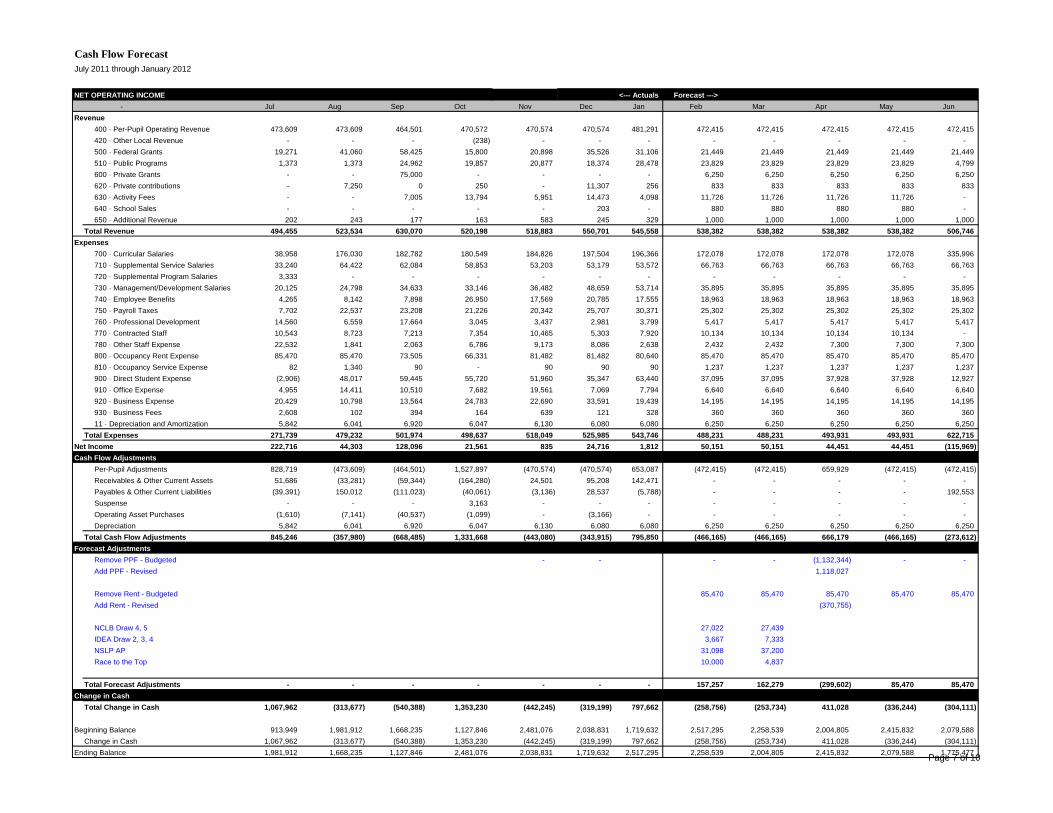
Cash Flow Forecast
July 2011 through January 2012
NET OPERATING INCOME <--- Actuals Forecast --->
- Jul Aug Sep Oct Nov Dec Jan Feb Mar Apr May Jun
Revenue
400 · Per-Pupil Operating Revenue 473,609 473,609 464,501 470,572 470,574 470,574 481,291 472,415 472,415 472,415 472,415 472,415
420 · Other Local Revenue - - - (238) - - - - - - - -
500 · Federal Grants 19,271 41,060 58,425 15,800 20,898 35,526 31,106 21,449 21,449 21,449 21,449 21,449
510 · Public Programs 1,373 1,373 24,962 19,857 20,877 18,374 28,478 23,829 23,829 23,829 23,829 4,799
600 · Private Grants - - 75,000 - - - - 6,250 6,250 6,250 6,250 6,250
620 · Private contributions - 7,250 0 250 - 11,307 256 833 833 833 833 833
630 · Activity Fees - - 7,005 13,794 5,951 14,473 4,098 11,726 11,726 11,726 11,726 -
640 · School Sales - - - - - 203 - 880 880 880 880 -
650 · Additional Revenue 202 243 177 163 583 245 329 1,000 1,000 1,000 1,000 1,000
Total Revenue 494,455 523,534 630,070 520,198 518,883 550,701 545,558 538,382 538,382 538,382 538,382 506,746
Expenses
700 · Curricular Salaries 38,958 176,030 182,782 180,549 184,826 197,504 196,366 172,078 172,078 172,078 172,078 335,996
710 · Supplemental Service Salaries 33,240 64,422 62,084 58,853 53,203 53,179 53,572 66,763 66,763 66,763 66,763 66,763
720 · Supplemental Program Salaries 3,333 - - - - - - - - - - -
730 · Management/Development Salaries 20,125 24,798 34,633 33,146 36,482 48,659 53,714 35,895 35,895 35,895 35,895 35,895
740 · Employee Benefits 4,265 8,142 7,898 26,950 17,569 20,785 17,555 18,963 18,963 18,963 18,963 18,963
750 · Payroll Taxes 7,702 22,537 23,208 21,226 20,342 25,707 30,371 25,302 25,302 25,302 25,302 25,302
760 · Professional Development 14,560 6,559 17,664 3,045 3,437 2,981 3,799 5,417 5,417 5,417 5,417 5,417
770 · Contracted Staff 10,543 8,723 7,213 7,354 10,465 5,303 7,920 10,134 10,134 10,134 10,134 -
780 · Other Staff Expense 22,532 1,841 2,063 6,786 9,173 8,086 2,638 2,432 2,432 7,300 7,300 7,300
800 · Occupancy Rent Expense 85,470 85,470 73,505 66,331 81,482 81,482 80,640 85,470 85,470 85,470 85,470 85,470
810 · Occupancy Service Expense 82 1,340 90 - 90 90 90 1,237 1,237 1,237 1,237 1,237
900 · Direct Student Expense (2,906) 48,017 59,445 55,720 51,960 35,347 63,440 37,095 37,095 37,928 37,928 12,927
910 · Office Expense 4,955 14,411 10,510 7,682 19,561 7,069 7,794 6,640 6,640 6,640 6,640 6,640
920 · Business Expense 20,429 10,798 13,564 24,783 22,690 33,591 19,439 14,195 14,195 14,195 14,195 14,195
930 · Business Fees 2,608 102 394 164 639 121 328 360 360 360 360 360
11 · Depreciation and Amortization 5,842 6,041 6,920 6,047 6,130 6,080 6,080 6,250 6,250 6,250 6,250 6,250
Total Expenses 271,739 479,232 501,974 498,637 518,049 525,985 543,746 488,231 488,231 493,931 493,931 622,715
Net Income 222,716 44,303 128,096 21,561 835 24,716 1,812 50,151 50,151 44,451 44,451 (115,969)
Cash Flow Adjustments
Per-Pupil Adjustments 828,719 (473,609) (464,501) 1,527,897 (470,574) (470,574) 653,087 (472,415) (472,415) 659,929 (472,415) (472,415)
Receivables & Other Current Assets 51,686 (33,281) (59,344) (164,280) 24,501 95,208 142,471 - - - - -
Payables & Other Current Liabilities (39,391) 150,012 (111,023) (40,061) (3,136) 28,537 (5,788) - - - - 192,553
Suspense - - - 3,163 - - - - - - - -
Operating Asset Purchases (1,610) (7,141) (40,537) (1,099) - (3,166) - - - - - -
Depreciation 5,842 6,041 6,920 6,047 6,130 6,080 6,080 6,250 6,250 6,250 6,250 6,250
Total Cash Flow Adjustments 845,246 (357,980) (668,485) 1,331,668 (443,080) (343,915) 795,850 (466,165) (466,165) 666,179 (466,165) (273,612)
Forecast Adjustments
Remove PPF - Budgeted - - - - (1,132,344) - -
Add PPF - Revised 1,118,027
Remove Rent - Budgeted 85,470 85,470 85,470 85,470 85,470
Add Rent - Revised (370,755)
NCLB Draw 4, 5 27,022 27,439
IDEA Draw 2, 3, 4 3,667 7,333
NSLP AP 31,098 37,200
Race to the Top 10,000 4,837
Total Forecast Adjustments - - - - - - - 157,257 162,279 (299,602) 85,470 85,470
Change in Cash
Total Change in Cash 1,067,962 (313,677) (540,388) 1,353,230 (442,245) (319,199) 797,662 (258,756) (253,734) 411,028 (336,244) (304,111)
Beginning Balance 913,949 1,981,912 1,668,235 1,127,846 2,481,076 2,038,831 1,719,632 2,517,295 2,258,539 2,004,805 2,415,832 2,079,588
Change in Cash 1,067,962 (313,677) (540,388) 1,353,230 (442,245) (319,199) 797,662 (258,756) (253,734) 411,028 (336,244) (304,111)
Ending Balance 1,981,912 1,668,235 1,127,846 2,481,076 2,038,831 1,719,632 2,517,295 2,258,539 2,004,805 2,415,832 2,079,588 1,775,477 Page 7 of 10
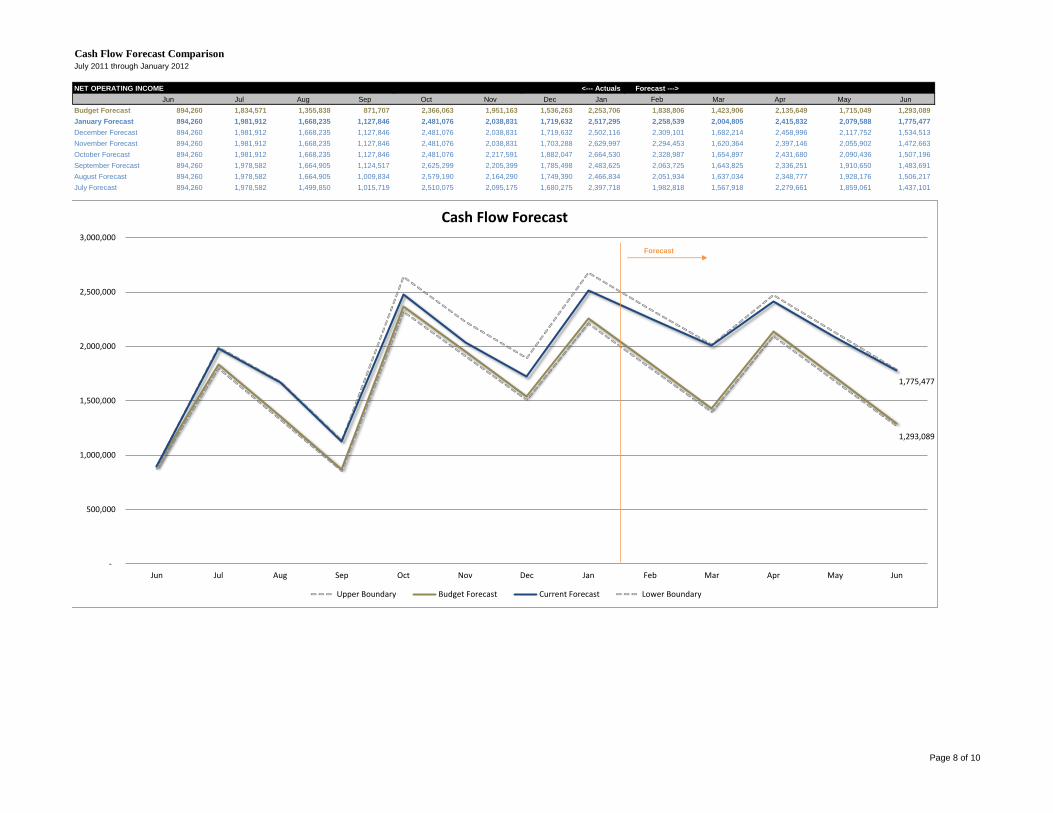
Cash Flow Forecast ComparisonJuly 2011 through January 2012
NET OPERATING INCOME <--- Actuals Forecast --->
Jun Jul Aug Sep Oct Nov Dec Jan Feb Mar Apr May Jun
Budget Forecast 894,260 1,834,571 1,355,838 871,707 2,366,063 1,951,163 1,536,263 2,253,706 1,838,806 1,423,906 2,135,649 1,715,049 1,293,089
January Forecast 894,260 1,981,912 1,668,235 1,127,846 2,481,076 2,038,831 1,719,632 2,517,295 2,258,539 2,004,805 2,415,832 2,079,588 1,775,477
December Forecast 894,260 1,981,912 1,668,235 1,127,846 2,481,076 2,038,831 1,719,632 2,502,116 2,309,101 1,682,214 2,458,996 2,117,752 1,534,513
November Forecast 894,260 1,981,912 1,668,235 1,127,846 2,481,076 2,038,831 1,703,288 2,629,997 2,294,453 1,620,364 2,397,146 2,055,902 1,472,663
October Forecast 894,260 1,981,912 1,668,235 1,127,846 2,481,076 2,217,591 1,882,047 2,664,530 2,328,987 1,654,897 2,431,680 2,090,436 1,507,196
September Forecast 894,260 1,978,582 1,664,905 1,124,517 2,625,299 2,205,399 1,785,498 2,483,625 2,063,725 1,643,825 2,336,251 1,910,650 1,483,691
August Forecast 894,260 1,978,582 1,664,905 1,009,834 2,579,190 2,164,290 1,749,390 2,466,834 2,051,934 1,637,034 2,348,777 1,928,176 1,506,217
July Forecast 894,260 1,978,582 1,499,850 1,015,719 2,510,075 2,095,175 1,680,275 2,397,718 1,982,818 1,567,918 2,279,661 1,859,061 1,437,101
Upper Boundary 898,731 1,991,821 1,676,576 1,133,485 2,638,425 2,228,679 1,891,457 2,677,853 2,340,632 2,014,829 2,471,291 2,128,341 1,784,355
Budget Forecast 894,260 1,834,571 1,355,838 871,707 2,366,063 1,951,163 1,536,263 2,253,706 1,838,806 1,423,906 2,135,649 1,715,049 1,293,089
Current Forecast 894,260 1,981,912 1,668,235 1,127,846 2,481,076 2,038,831 1,719,632 2,517,295 2,258,539 2,004,805 2,415,832 2,079,588 1,775,477
Lower Boundary 876,375 1,797,879 1,328,721 854,273 2,318,742 1,912,140 1,505,537 2,208,632 1,802,030 1,395,428 2,092,936 1,680,748 1,267,227
1,293,089
1,775,477
-
500,000
1,000,000
1,500,000
2,000,000
2,500,000
3,000,000
Jun Jul Aug Sep Oct Nov Dec Jan Feb Mar Apr May Jun
Cash Flow Forecast
Upper Boundary Budget Forecast Current Forecast Lower Boundary
Forecast
Page 8 of 10
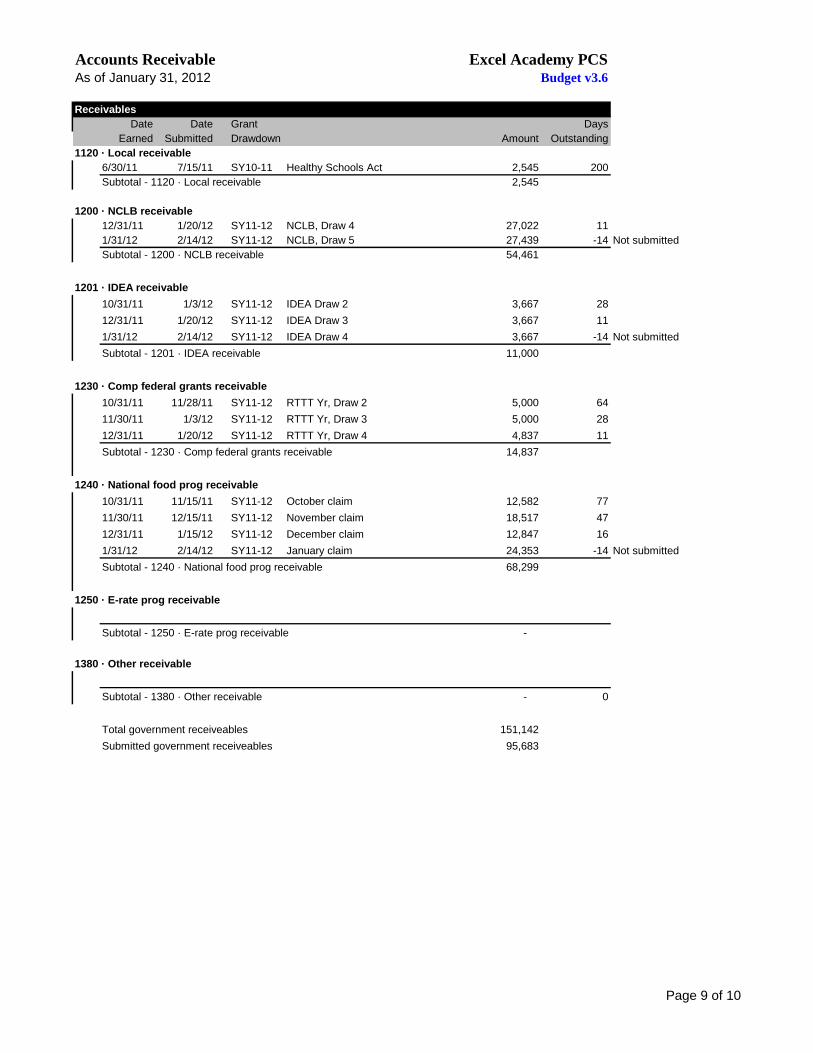
Accounts Receivable Excel Academy PCSAs of January 31, 2012 Budget v3.6
Receivables
Date Date Grant Days
Earned Submitted Drawdown Amount Outstanding
1120 · Local receivable
6/30/11 7/15/11 SY10-11 Healthy Schools Act 2,545 200
Subtotal - 1120 · Local receivable 2,545
1200 · NCLB receivable
12/31/11 1/20/12 SY11-12 NCLB, Draw 4 27,022 11
1/31/12 2/14/12 SY11-12 NCLB, Draw 5 27,439 -14 Not submitted
Subtotal - 1200 · NCLB receivable 54,461
1201 · IDEA receivable
10/31/11 1/3/12 SY11-12 IDEA Draw 2 3,667 28
12/31/11 1/20/12 SY11-12 IDEA Draw 3 3,667 11
1/31/12 2/14/12 SY11-12 IDEA Draw 4 3,667 -14 Not submitted
Subtotal - 1201 · IDEA receivable 11,000
1230 · Comp federal grants receivable
10/31/11 11/28/11 SY11-12 RTTT Yr, Draw 2 5,000 64
11/30/11 1/3/12 SY11-12 RTTT Yr, Draw 3 5,000 28
12/31/11 1/20/12 SY11-12 RTTT Yr, Draw 4 4,837 11
Subtotal - 1230 · Comp federal grants receivable 14,837
1240 · National food prog receivable
10/31/11 11/15/11 SY11-12 October claim 12,582 77
11/30/11 12/15/11 SY11-12 November claim 18,517 47
12/31/11 1/15/12 SY11-12 December claim 12,847 16
1/31/12 2/14/12 SY11-12 January claim 24,353 -14 Not submitted
Subtotal - 1240 · National food prog receivable 68,299
1250 · E-rate prog receivable
Subtotal - 1250 · E-rate prog receivable -
1380 · Other receivable
Subtotal - 1380 · Other receivable - 0
Total government receiveables 151,142
Submitted government receiveables 95,683
Page 9 of 10
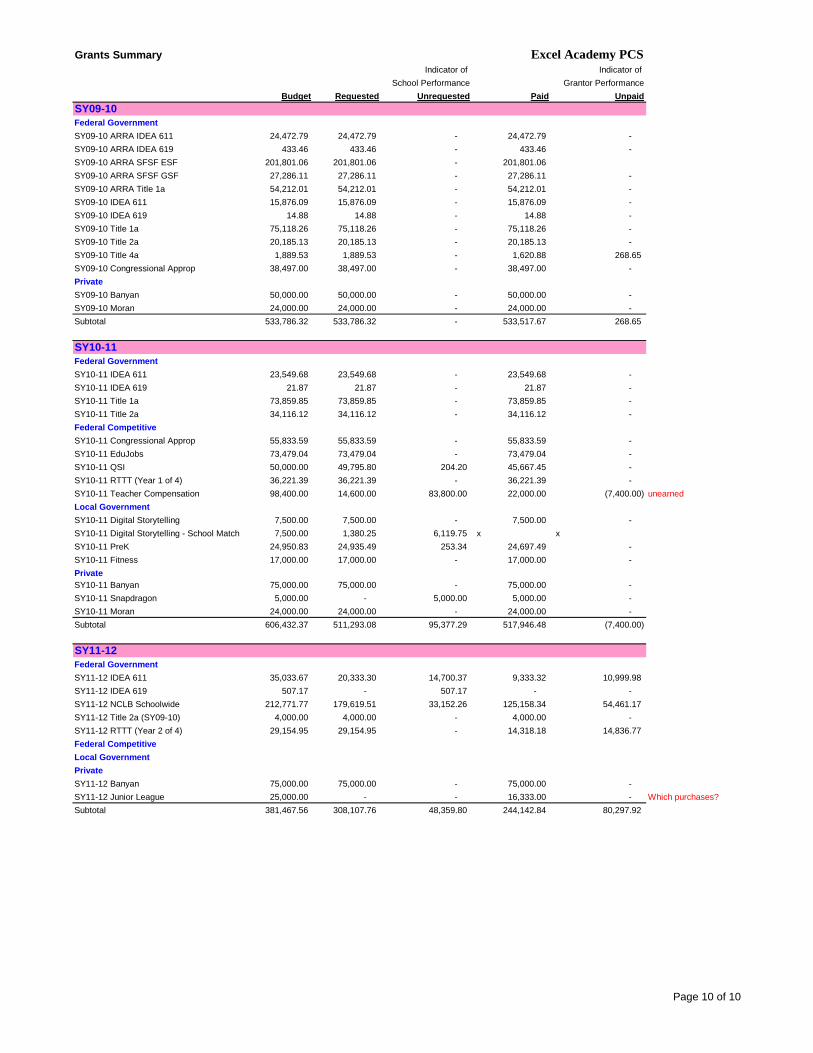
Grants Summary Excel Academy PCSIndicator of Indicator of
School Performance Grantor Performance
Budget Requested Unrequested Paid Unpaid
SY09-10
Federal Government
SY09-10 ARRA IDEA 611 24,472.79 24,472.79 - 24,472.79 -
SY09-10 ARRA IDEA 619 433.46 433.46 - 433.46 -
SY09-10 ARRA SFSF ESF 201,801.06 201,801.06 - 201,801.06
SY09-10 ARRA SFSF GSF 27,286.11 27,286.11 - 27,286.11 -
SY09-10 ARRA Title 1a 54,212.01 54,212.01 - 54,212.01 -
SY09-10 IDEA 611 15,876.09 15,876.09 - 15,876.09 -
SY09-10 IDEA 619 14.88 14.88 - 14.88 -
SY09-10 Title 1a 75,118.26 75,118.26 - 75,118.26 -
SY09-10 Title 2a 20,185.13 20,185.13 - 20,185.13 -
SY09-10 Title 4a 1,889.53 1,889.53 - 1,620.88 268.65
SY09-10 Congressional Approp 38,497.00 38,497.00 - 38,497.00 -
Private
SY09-10 Banyan 50,000.00 50,000.00 - 50,000.00 -
SY09-10 Moran 24,000.00 24,000.00 - 24,000.00 -
Subtotal 533,786.32 533,786.32 - 533,517.67 268.65
SY10-11
Federal Government
SY10-11 IDEA 611 23,549.68 23,549.68 - 23,549.68 -
SY10-11 IDEA 619 21.87 21.87 - 21.87 -
SY10-11 Title 1a 73,859.85 73,859.85 - 73,859.85 -
SY10-11 Title 2a 34,116.12 34,116.12 - 34,116.12 -
Federal Competitive
SY10-11 Congressional Approp 55,833.59 55,833.59 - 55,833.59 -
SY10-11 EduJobs 73,479.04 73,479.04 - 73,479.04 -
SY10-11 QSI 50,000.00 49,795.80 204.20 45,667.45 -
SY10-11 RTTT (Year 1 of 4) 36,221.39 36,221.39 - 36,221.39 -
SY10-11 Teacher Compensation 98,400.00 14,600.00 83,800.00 22,000.00 (7,400.00) unearned
Local Government
SY10-11 Digital Storytelling 7,500.00 7,500.00 - 7,500.00 -
SY10-11 Digital Storytelling - School Match 7,500.00 1,380.25 6,119.75 x x
SY10-11 PreK 24,950.83 24,935.49 253.34 24,697.49 -
SY10-11 Fitness 17,000.00 17,000.00 - 17,000.00 -
Private
SY10-11 Banyan 75,000.00 75,000.00 - 75,000.00 -
SY10-11 Snapdragon 5,000.00 - 5,000.00 5,000.00 -
SY10-11 Moran 24,000.00 24,000.00 - 24,000.00 -
Subtotal 606,432.37 511,293.08 95,377.29 517,946.48 (7,400.00)
SY11-12
Federal Government
SY11-12 IDEA 611 35,033.67 20,333.30 14,700.37 9,333.32 10,999.98
SY11-12 IDEA 619 507.17 - 507.17 - -
SY11-12 NCLB Schoolwide 212,771.77 179,619.51 33,152.26 125,158.34 54,461.17
SY11-12 Title 2a (SY09-10) 4,000.00 4,000.00 - 4,000.00 -
SY11-12 RTTT (Year 2 of 4) 29,154.95 29,154.95 - 14,318.18 14,836.77
Federal Competitive
Local Government
Private
SY11-12 Banyan 75,000.00 75,000.00 - 75,000.00 -
SY11-12 Junior League 25,000.00 - - 16,333.00 - Which purchases?
Subtotal 381,467.56 308,107.76 48,359.80 244,142.84 80,297.92
Page 10 of 10
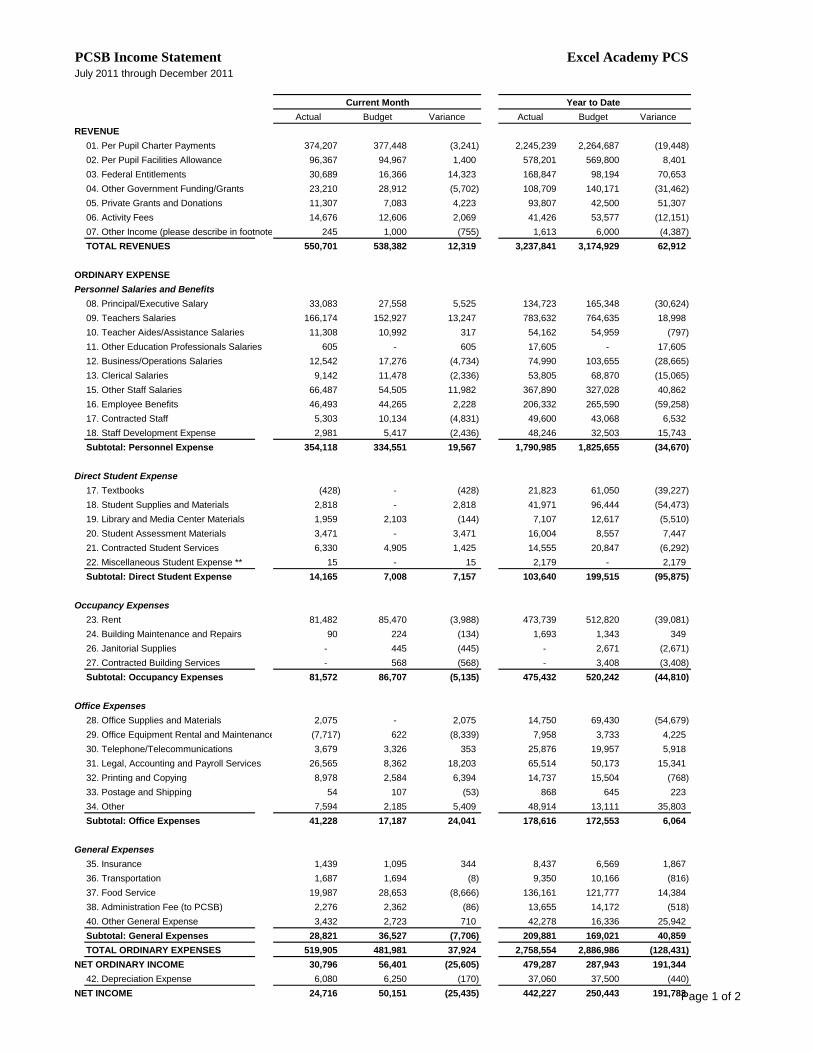
PCSB Income Statement Excel Academy PCSJuly 2011 through December 2011
Current Month Year to Date
Actual Budget Variance Actual Budget Variance
REVENUE
01. Per Pupil Charter Payments 374,207 377,448 (3,241) 2,245,239 2,264,687 (19,448)
02. Per Pupil Facilities Allowance 96,367 94,967 1,400 578,201 569,800 8,401
03. Federal Entitlements 30,689 16,366 14,323 168,847 98,194 70,653
04. Other Government Funding/Grants 23,210 28,912 (5,702) 108,709 140,171 (31,462)
05. Private Grants and Donations 11,307 7,083 4,223 93,807 42,500 51,307
06. Activity Fees 14,676 12,606 2,069 41,426 53,577 (12,151)
07. Other Income (please describe in footnote) 245 1,000 (755) 1,613 6,000 (4,387)
TOTAL REVENUES 550,701 538,382 12,319 3,237,841 3,174,929 62,912
ORDINARY EXPENSE
Personnel Salaries and Benefits
08. Principal/Executive Salary 33,083 27,558 5,525 134,723 165,348 (30,624)
09. Teachers Salaries 166,174 152,927 13,247 783,632 764,635 18,998
10. Teacher Aides/Assistance Salaries 11,308 10,992 317 54,162 54,959 (797)
11. Other Education Professionals Salaries 605 - 605 17,605 - 17,605
12. Business/Operations Salaries 12,542 17,276 (4,734) 74,990 103,655 (28,665)
13. Clerical Salaries 9,142 11,478 (2,336) 53,805 68,870 (15,065)
15. Other Staff Salaries 66,487 54,505 11,982 367,890 327,028 40,862
16. Employee Benefits 46,493 44,265 2,228 206,332 265,590 (59,258)
17. Contracted Staff 5,303 10,134 (4,831) 49,600 43,068 6,532
18. Staff Development Expense 2,981 5,417 (2,436) 48,246 32,503 15,743
Subtotal: Personnel Expense 354,118 334,551 19,567 1,790,985 1,825,655 (34,670)
Direct Student Expense
17. Textbooks (428) - (428) 21,823 61,050 (39,227)
18. Student Supplies and Materials 2,818 - 2,818 41,971 96,444 (54,473)
19. Library and Media Center Materials 1,959 2,103 (144) 7,107 12,617 (5,510)
20. Student Assessment Materials 3,471 - 3,471 16,004 8,557 7,447
21. Contracted Student Services 6,330 4,905 1,425 14,555 20,847 (6,292)
22. Miscellaneous Student Expense ** 15 - 15 2,179 - 2,179
Subtotal: Direct Student Expense 14,165 7,008 7,157 103,640 199,515 (95,875)
Occupancy Expenses
23. Rent 81,482 85,470 (3,988) 473,739 512,820 (39,081)
24. Building Maintenance and Repairs 90 224 (134) 1,693 1,343 349
26. Janitorial Supplies - 445 (445) - 2,671 (2,671)
27. Contracted Building Services - 568 (568) - 3,408 (3,408)
Subtotal: Occupancy Expenses 81,572 86,707 (5,135) 475,432 520,242 (44,810)
Office Expenses
28. Office Supplies and Materials 2,075 - 2,075 14,750 69,430 (54,679)
29. Office Equipment Rental and Maintenance (7,717) 622 (8,339) 7,958 3,733 4,225
30. Telephone/Telecommunications 3,679 3,326 353 25,876 19,957 5,918
31. Legal, Accounting and Payroll Services 26,565 8,362 18,203 65,514 50,173 15,341
32. Printing and Copying 8,978 2,584 6,394 14,737 15,504 (768)
33. Postage and Shipping 54 107 (53) 868 645 223
34. Other 7,594 2,185 5,409 48,914 13,111 35,803
Subtotal: Office Expenses 41,228 17,187 24,041 178,616 172,553 6,064
General Expenses
35. Insurance 1,439 1,095 344 8,437 6,569 1,867
36. Transportation 1,687 1,694 (8) 9,350 10,166 (816)
37. Food Service 19,987 28,653 (8,666) 136,161 121,777 14,384
38. Administration Fee (to PCSB) 2,276 2,362 (86) 13,655 14,172 (518)
40. Other General Expense 3,432 2,723 710 42,278 16,336 25,942
Subtotal: General Expenses 28,821 36,527 (7,706) 209,881 169,021 40,859
TOTAL ORDINARY EXPENSES 519,905 481,981 37,924 2,758,554 2,886,986 (128,431)
NET ORDINARY INCOME 30,796 56,401 (25,605) 479,287 287,943 191,344
42. Depreciation Expense 6,080 6,250 (170) 37,060 37,500 (440)
NET INCOME 24,716 50,151 (25,435) 442,227 250,443 191,783 Page 1 of 2

PCSB Balance Sheet Excel Academy PCSAs of December 31, 2011
ASSETS
Current Assets
Checking/Savings 1,719,632
Accounts Receivable 2,445,660
Other Current Assets 318,315
Total Current Assets $4,483,608
Fixed Assets (Net)
Operating Fixed Assets 204,975
Facilities -
Total Fixed Assets $204,975
TOTAL ASSETS $4,688,582
LIABILITES
Current Liabilities
Short-Term Debt 3,163
Other Current Liabilities 3,104,294
Total Current Liabilities 3,107,457
Long-term liabilities -
TOTAL LIABILITIES 3,107,457
NET ASSETS
Beginning net assets 1,138,898
Net income for the year 442,227
TOTAL NET ASSETS $1,581,125
TOTAL LIABILITIES AND NET ASSETS $4,688,582
Reconcilliation
Assets 4,688,582
Liabilities 3,107,457
Equity 1,581,125
Assets, Less Liabilities and Equities -
Page 2 of 2
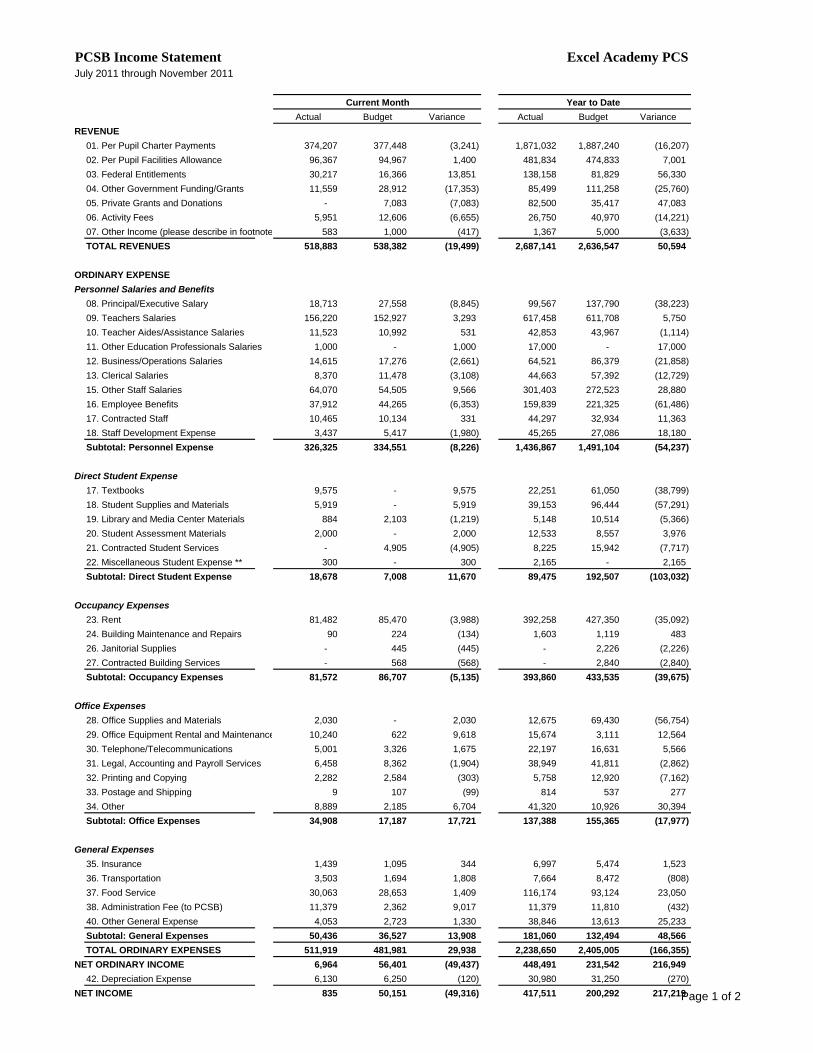
PCSB Income Statement Excel Academy PCSJuly 2011 through November 2011
Current Month Year to Date
Actual Budget Variance Actual Budget Variance
REVENUE
01. Per Pupil Charter Payments 374,207 377,448 (3,241) 1,871,032 1,887,240 (16,207)
02. Per Pupil Facilities Allowance 96,367 94,967 1,400 481,834 474,833 7,001
03. Federal Entitlements 30,217 16,366 13,851 138,158 81,829 56,330
04. Other Government Funding/Grants 11,559 28,912 (17,353) 85,499 111,258 (25,760)
05. Private Grants and Donations - 7,083 (7,083) 82,500 35,417 47,083
06. Activity Fees 5,951 12,606 (6,655) 26,750 40,970 (14,221)
07. Other Income (please describe in footnote) 583 1,000 (417) 1,367 5,000 (3,633)
TOTAL REVENUES 518,883 538,382 (19,499) 2,687,141 2,636,547 50,594
ORDINARY EXPENSE
Personnel Salaries and Benefits
08. Principal/Executive Salary 18,713 27,558 (8,845) 99,567 137,790 (38,223)
09. Teachers Salaries 156,220 152,927 3,293 617,458 611,708 5,750
10. Teacher Aides/Assistance Salaries 11,523 10,992 531 42,853 43,967 (1,114)
11. Other Education Professionals Salaries 1,000 - 1,000 17,000 - 17,000
12. Business/Operations Salaries 14,615 17,276 (2,661) 64,521 86,379 (21,858)
13. Clerical Salaries 8,370 11,478 (3,108) 44,663 57,392 (12,729)
15. Other Staff Salaries 64,070 54,505 9,566 301,403 272,523 28,880
16. Employee Benefits 37,912 44,265 (6,353) 159,839 221,325 (61,486)
17. Contracted Staff 10,465 10,134 331 44,297 32,934 11,363
18. Staff Development Expense 3,437 5,417 (1,980) 45,265 27,086 18,180
Subtotal: Personnel Expense 326,325 334,551 (8,226) 1,436,867 1,491,104 (54,237)
Direct Student Expense
17. Textbooks 9,575 - 9,575 22,251 61,050 (38,799)
18. Student Supplies and Materials 5,919 - 5,919 39,153 96,444 (57,291)
19. Library and Media Center Materials 884 2,103 (1,219) 5,148 10,514 (5,366)
20. Student Assessment Materials 2,000 - 2,000 12,533 8,557 3,976
21. Contracted Student Services - 4,905 (4,905) 8,225 15,942 (7,717)
22. Miscellaneous Student Expense ** 300 - 300 2,165 - 2,165
Subtotal: Direct Student Expense 18,678 7,008 11,670 89,475 192,507 (103,032)
Occupancy Expenses
23. Rent 81,482 85,470 (3,988) 392,258 427,350 (35,092)
24. Building Maintenance and Repairs 90 224 (134) 1,603 1,119 483
26. Janitorial Supplies - 445 (445) - 2,226 (2,226)
27. Contracted Building Services - 568 (568) - 2,840 (2,840)
Subtotal: Occupancy Expenses 81,572 86,707 (5,135) 393,860 433,535 (39,675)
Office Expenses
28. Office Supplies and Materials 2,030 - 2,030 12,675 69,430 (56,754)
29. Office Equipment Rental and Maintenance 10,240 622 9,618 15,674 3,111 12,564
30. Telephone/Telecommunications 5,001 3,326 1,675 22,197 16,631 5,566
31. Legal, Accounting and Payroll Services 6,458 8,362 (1,904) 38,949 41,811 (2,862)
32. Printing and Copying 2,282 2,584 (303) 5,758 12,920 (7,162)
33. Postage and Shipping 9 107 (99) 814 537 277
34. Other 8,889 2,185 6,704 41,320 10,926 30,394
Subtotal: Office Expenses 34,908 17,187 17,721 137,388 155,365 (17,977)
General Expenses
35. Insurance 1,439 1,095 344 6,997 5,474 1,523
36. Transportation 3,503 1,694 1,808 7,664 8,472 (808)
37. Food Service 30,063 28,653 1,409 116,174 93,124 23,050
38. Administration Fee (to PCSB) 11,379 2,362 9,017 11,379 11,810 (432)
40. Other General Expense 4,053 2,723 1,330 38,846 13,613 25,233
Subtotal: General Expenses 50,436 36,527 13,908 181,060 132,494 48,566
TOTAL ORDINARY EXPENSES 511,919 481,981 29,938 2,238,650 2,405,005 (166,355)
NET ORDINARY INCOME 6,964 56,401 (49,437) 448,491 231,542 216,949
42. Depreciation Expense 6,130 6,250 (120) 30,980 31,250 (270)
NET INCOME 835 50,151 (49,316) 417,511 200,292 217,219 Page 1 of 2

PCSB Balance Sheet Excel Academy PCSAs of November 30, 2011
ASSETS
Current Assets
Checking/Savings 2,038,831
Accounts Receivable 2,450,517
Other Current Assets 408,667
Total Current Assets $4,898,015
Fixed Assets (Net)
Operating Fixed Assets 207,889
Facilities -
Total Fixed Assets $207,889
TOTAL ASSETS $5,105,904
LIABILITES
Current Liabilities
Short-Term Debt 3,163
Other Current Liabilities 3,546,331
Total Current Liabilities 3,549,494
Long-term liabilities -
TOTAL LIABILITIES 3,549,494
NET ASSETS
Beginning net assets 1,138,898
Net income for the year 417,511
TOTAL NET ASSETS $1,556,409
TOTAL LIABILITIES AND NET ASSETS $5,105,904
Reconcilliation
Assets 5,105,904
Liabilities 3,549,494
Equity 1,556,409
Assets, Less Liabilities and Equities -
Page 2 of 2
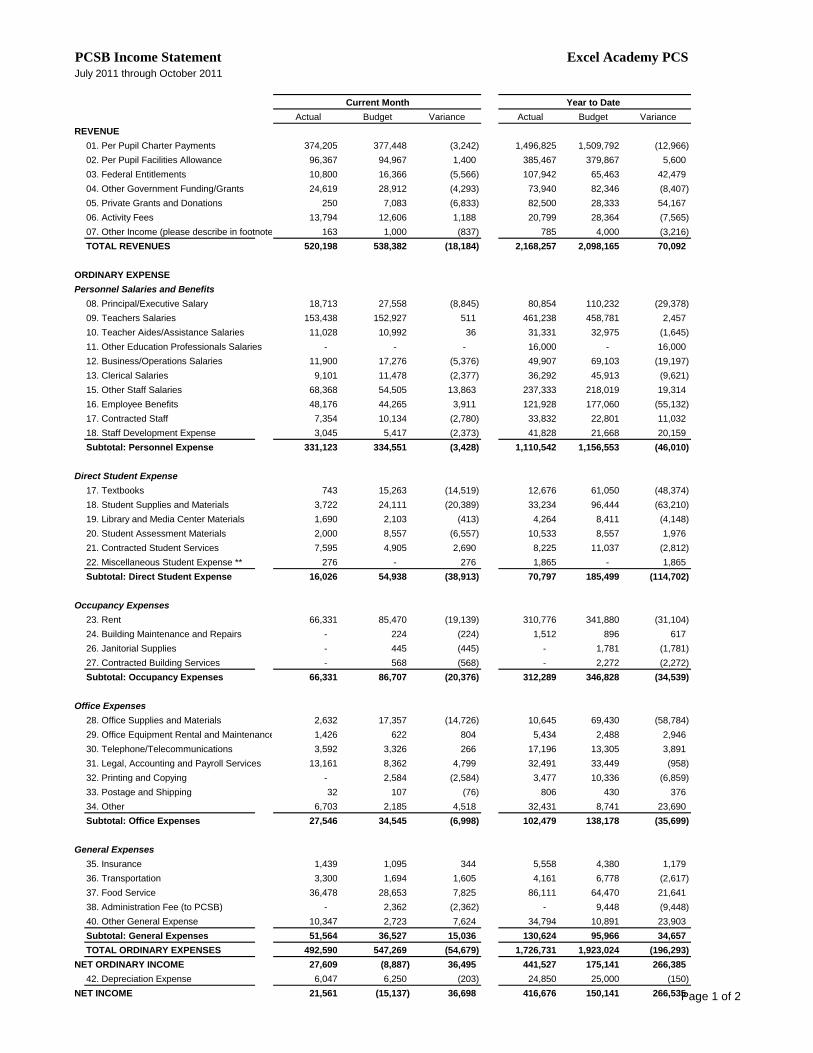
PCSB Income Statement Excel Academy PCSJuly 2011 through October 2011
Current Month Year to Date
Actual Budget Variance Actual Budget Variance
REVENUE
01. Per Pupil Charter Payments 374,205 377,448 (3,242) 1,496,825 1,509,792 (12,966)
02. Per Pupil Facilities Allowance 96,367 94,967 1,400 385,467 379,867 5,600
03. Federal Entitlements 10,800 16,366 (5,566) 107,942 65,463 42,479
04. Other Government Funding/Grants 24,619 28,912 (4,293) 73,940 82,346 (8,407)
05. Private Grants and Donations 250 7,083 (6,833) 82,500 28,333 54,167
06. Activity Fees 13,794 12,606 1,188 20,799 28,364 (7,565)
07. Other Income (please describe in footnote) 163 1,000 (837) 785 4,000 (3,216)
TOTAL REVENUES 520,198 538,382 (18,184) 2,168,257 2,098,165 70,092
ORDINARY EXPENSE
Personnel Salaries and Benefits
08. Principal/Executive Salary 18,713 27,558 (8,845) 80,854 110,232 (29,378)
09. Teachers Salaries 153,438 152,927 511 461,238 458,781 2,457
10. Teacher Aides/Assistance Salaries 11,028 10,992 36 31,331 32,975 (1,645)
11. Other Education Professionals Salaries - - - 16,000 - 16,000
12. Business/Operations Salaries 11,900 17,276 (5,376) 49,907 69,103 (19,197)
13. Clerical Salaries 9,101 11,478 (2,377) 36,292 45,913 (9,621)
15. Other Staff Salaries 68,368 54,505 13,863 237,333 218,019 19,314
16. Employee Benefits 48,176 44,265 3,911 121,928 177,060 (55,132)
17. Contracted Staff 7,354 10,134 (2,780) 33,832 22,801 11,032
18. Staff Development Expense 3,045 5,417 (2,373) 41,828 21,668 20,159
Subtotal: Personnel Expense 331,123 334,551 (3,428) 1,110,542 1,156,553 (46,010)
Direct Student Expense
17. Textbooks 743 15,263 (14,519) 12,676 61,050 (48,374)
18. Student Supplies and Materials 3,722 24,111 (20,389) 33,234 96,444 (63,210)
19. Library and Media Center Materials 1,690 2,103 (413) 4,264 8,411 (4,148)
20. Student Assessment Materials 2,000 8,557 (6,557) 10,533 8,557 1,976
21. Contracted Student Services 7,595 4,905 2,690 8,225 11,037 (2,812)
22. Miscellaneous Student Expense ** 276 - 276 1,865 - 1,865
Subtotal: Direct Student Expense 16,026 54,938 (38,913) 70,797 185,499 (114,702)
Occupancy Expenses
23. Rent 66,331 85,470 (19,139) 310,776 341,880 (31,104)
24. Building Maintenance and Repairs - 224 (224) 1,512 896 617
26. Janitorial Supplies - 445 (445) - 1,781 (1,781)
27. Contracted Building Services - 568 (568) - 2,272 (2,272)
Subtotal: Occupancy Expenses 66,331 86,707 (20,376) 312,289 346,828 (34,539)
Office Expenses
28. Office Supplies and Materials 2,632 17,357 (14,726) 10,645 69,430 (58,784)
29. Office Equipment Rental and Maintenance 1,426 622 804 5,434 2,488 2,946
30. Telephone/Telecommunications 3,592 3,326 266 17,196 13,305 3,891
31. Legal, Accounting and Payroll Services 13,161 8,362 4,799 32,491 33,449 (958)
32. Printing and Copying - 2,584 (2,584) 3,477 10,336 (6,859)
33. Postage and Shipping 32 107 (76) 806 430 376
34. Other 6,703 2,185 4,518 32,431 8,741 23,690
Subtotal: Office Expenses 27,546 34,545 (6,998) 102,479 138,178 (35,699)
General Expenses
35. Insurance 1,439 1,095 344 5,558 4,380 1,179
36. Transportation 3,300 1,694 1,605 4,161 6,778 (2,617)
37. Food Service 36,478 28,653 7,825 86,111 64,470 21,641
38. Administration Fee (to PCSB) - 2,362 (2,362) - 9,448 (9,448)
40. Other General Expense 10,347 2,723 7,624 34,794 10,891 23,903
Subtotal: General Expenses 51,564 36,527 15,036 130,624 95,966 34,657
TOTAL ORDINARY EXPENSES 492,590 547,269 (54,679) 1,726,731 1,923,024 (196,293)
NET ORDINARY INCOME 27,609 (8,887) 36,495 441,527 175,141 266,385
42. Depreciation Expense 6,047 6,250 (203) 24,850 25,000 (150)
NET INCOME 21,561 (15,137) 36,698 416,676 150,141 266,535 Page 1 of 2

PCSB Balance Sheet Excel Academy PCSAs of October 31, 2011
ASSETS
Current Assets
Checking/Savings 2,481,076
Accounts Receivable 2,413,031
Other Current Assets 470,653
Total Current Assets $5,364,760
Fixed Assets (Net)
Operating Fixed Assets 214,019
Facilities -
Total Fixed Assets $214,019
TOTAL ASSETS $5,578,779
LIABILITES
Current Liabilities
Short-Term Debt 3,163
Other Current Liabilities 4,020,041
Total Current Liabilities 4,023,204
Long-term liabilities -
TOTAL LIABILITIES 4,023,204
NET ASSETS
Beginning net assets 1,138,898
Net income for the year 416,676
TOTAL NET ASSETS $1,555,575
TOTAL LIABILITIES AND NET ASSETS $5,578,779
Reconcilliation
Assets 5,578,779
Liabilities 4,023,204
Equity 1,555,575
Assets, Less Liabilities and Equities -
Page 2 of 2
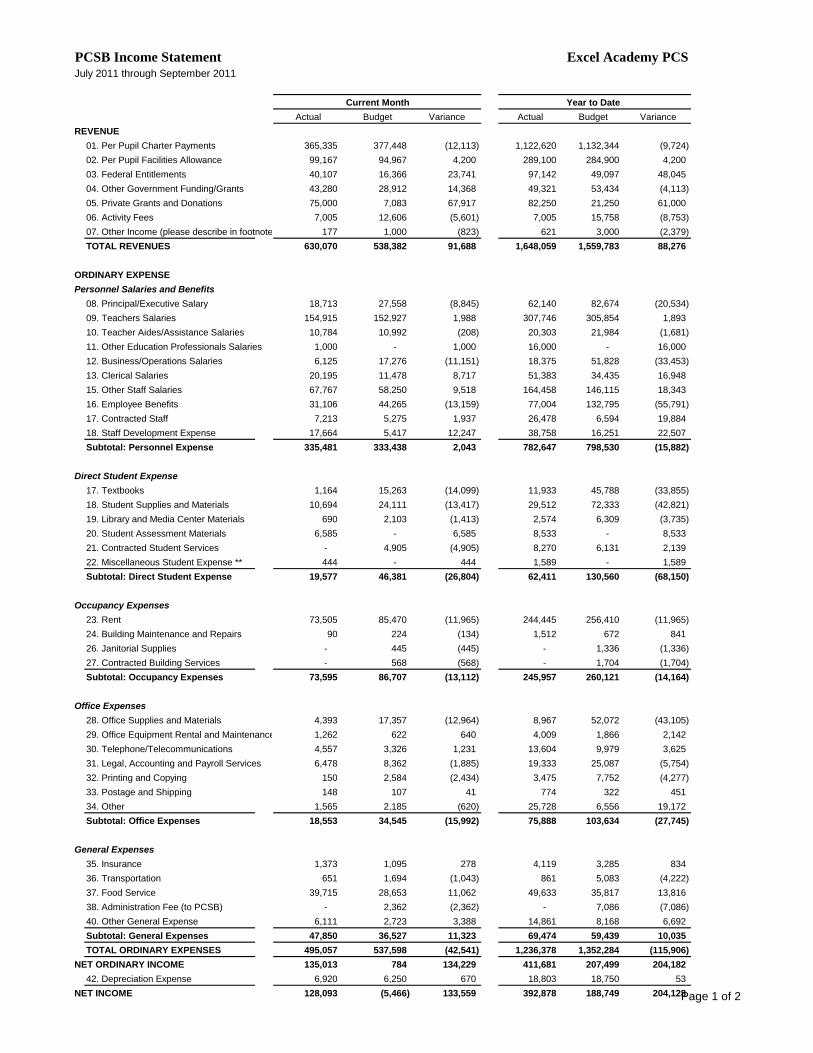
PCSB Income Statement Excel Academy PCSJuly 2011 through September 2011
Current Month Year to Date
Actual Budget Variance Actual Budget Variance
REVENUE
01. Per Pupil Charter Payments 365,335 377,448 (12,113) 1,122,620 1,132,344 (9,724)
02. Per Pupil Facilities Allowance 99,167 94,967 4,200 289,100 284,900 4,200
03. Federal Entitlements 40,107 16,366 23,741 97,142 49,097 48,045
04. Other Government Funding/Grants 43,280 28,912 14,368 49,321 53,434 (4,113)
05. Private Grants and Donations 75,000 7,083 67,917 82,250 21,250 61,000
06. Activity Fees 7,005 12,606 (5,601) 7,005 15,758 (8,753)
07. Other Income (please describe in footnote) 177 1,000 (823) 621 3,000 (2,379)
TOTAL REVENUES 630,070 538,382 91,688 1,648,059 1,559,783 88,276
ORDINARY EXPENSE
Personnel Salaries and Benefits
08. Principal/Executive Salary 18,713 27,558 (8,845) 62,140 82,674 (20,534)
09. Teachers Salaries 154,915 152,927 1,988 307,746 305,854 1,893
10. Teacher Aides/Assistance Salaries 10,784 10,992 (208) 20,303 21,984 (1,681)
11. Other Education Professionals Salaries 1,000 - 1,000 16,000 - 16,000
12. Business/Operations Salaries 6,125 17,276 (11,151) 18,375 51,828 (33,453)
13. Clerical Salaries 20,195 11,478 8,717 51,383 34,435 16,948
15. Other Staff Salaries 67,767 58,250 9,518 164,458 146,115 18,343
16. Employee Benefits 31,106 44,265 (13,159) 77,004 132,795 (55,791)
17. Contracted Staff 7,213 5,275 1,937 26,478 6,594 19,884
18. Staff Development Expense 17,664 5,417 12,247 38,758 16,251 22,507
Subtotal: Personnel Expense 335,481 333,438 2,043 782,647 798,530 (15,882)
Direct Student Expense
17. Textbooks 1,164 15,263 (14,099) 11,933 45,788 (33,855)
18. Student Supplies and Materials 10,694 24,111 (13,417) 29,512 72,333 (42,821)
19. Library and Media Center Materials 690 2,103 (1,413) 2,574 6,309 (3,735)
20. Student Assessment Materials 6,585 - 6,585 8,533 - 8,533
21. Contracted Student Services - 4,905 (4,905) 8,270 6,131 2,139
22. Miscellaneous Student Expense ** 444 - 444 1,589 - 1,589
Subtotal: Direct Student Expense 19,577 46,381 (26,804) 62,411 130,560 (68,150)
Occupancy Expenses
23. Rent 73,505 85,470 (11,965) 244,445 256,410 (11,965)
24. Building Maintenance and Repairs 90 224 (134) 1,512 672 841
26. Janitorial Supplies - 445 (445) - 1,336 (1,336)
27. Contracted Building Services - 568 (568) - 1,704 (1,704)
Subtotal: Occupancy Expenses 73,595 86,707 (13,112) 245,957 260,121 (14,164)
Office Expenses
28. Office Supplies and Materials 4,393 17,357 (12,964) 8,967 52,072 (43,105)
29. Office Equipment Rental and Maintenance 1,262 622 640 4,009 1,866 2,142
30. Telephone/Telecommunications 4,557 3,326 1,231 13,604 9,979 3,625
31. Legal, Accounting and Payroll Services 6,478 8,362 (1,885) 19,333 25,087 (5,754)
32. Printing and Copying 150 2,584 (2,434) 3,475 7,752 (4,277)
33. Postage and Shipping 148 107 41 774 322 451
34. Other 1,565 2,185 (620) 25,728 6,556 19,172
Subtotal: Office Expenses 18,553 34,545 (15,992) 75,888 103,634 (27,745)
General Expenses
35. Insurance 1,373 1,095 278 4,119 3,285 834
36. Transportation 651 1,694 (1,043) 861 5,083 (4,222)
37. Food Service 39,715 28,653 11,062 49,633 35,817 13,816
38. Administration Fee (to PCSB) - 2,362 (2,362) - 7,086 (7,086)
40. Other General Expense 6,111 2,723 3,388 14,861 8,168 6,692
Subtotal: General Expenses 47,850 36,527 11,323 69,474 59,439 10,035
TOTAL ORDINARY EXPENSES 495,057 537,598 (42,541) 1,236,378 1,352,284 (115,906)
NET ORDINARY INCOME 135,013 784 134,229 411,681 207,499 204,182
42. Depreciation Expense 6,920 6,250 670 18,803 18,750 53
NET INCOME 128,093 (5,466) 133,559 392,878 188,749 204,128 Page 1 of 2
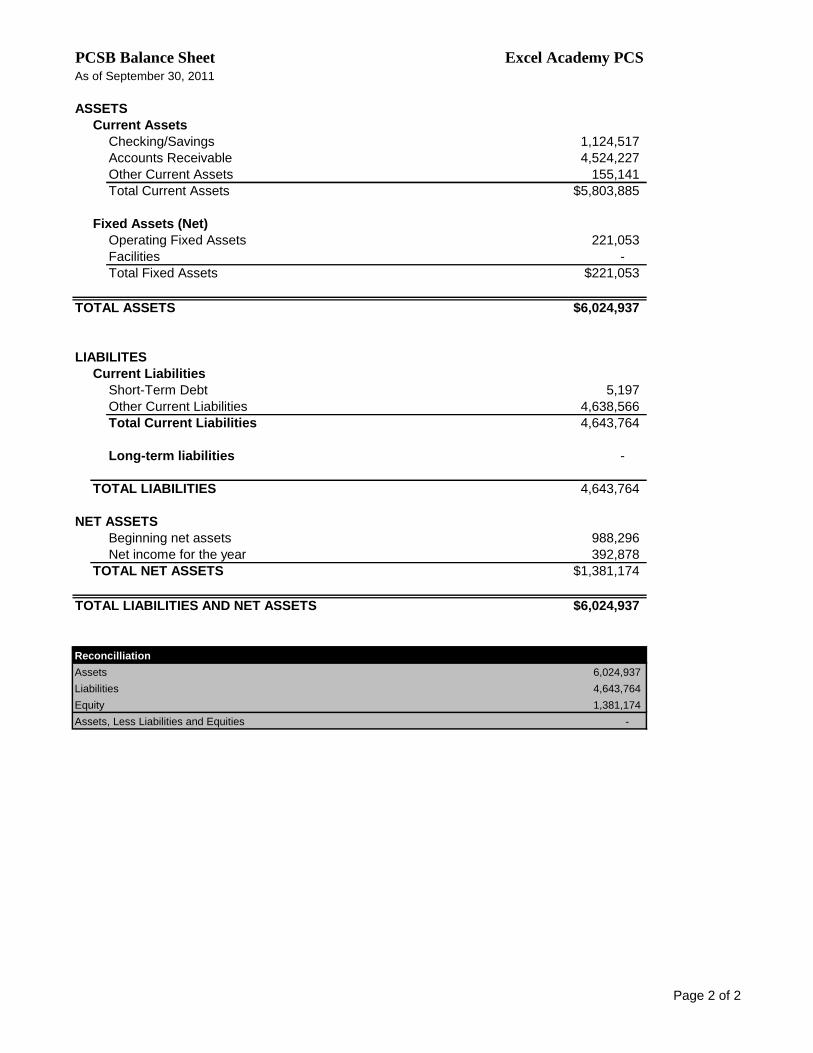
PCSB Balance Sheet Excel Academy PCSAs of September 30, 2011
ASSETS
Current Assets
Checking/Savings 1,124,517
Accounts Receivable 4,524,227
Other Current Assets 155,141
Total Current Assets $5,803,885
Fixed Assets (Net)
Operating Fixed Assets 221,053
Facilities -
Total Fixed Assets $221,053
TOTAL ASSETS $6,024,937
LIABILITES
Current Liabilities
Short-Term Debt 5,197
Other Current Liabilities 4,638,566
Total Current Liabilities 4,643,764
Long-term liabilities -
TOTAL LIABILITIES 4,643,764
NET ASSETS
Beginning net assets 988,296
Net income for the year 392,878
TOTAL NET ASSETS $1,381,174
TOTAL LIABILITIES AND NET ASSETS $6,024,937
Reconcilliation
Assets 6,024,937
Liabilities 4,643,764
Equity 1,381,174
Assets, Less Liabilities and Equities -
Page 2 of 2
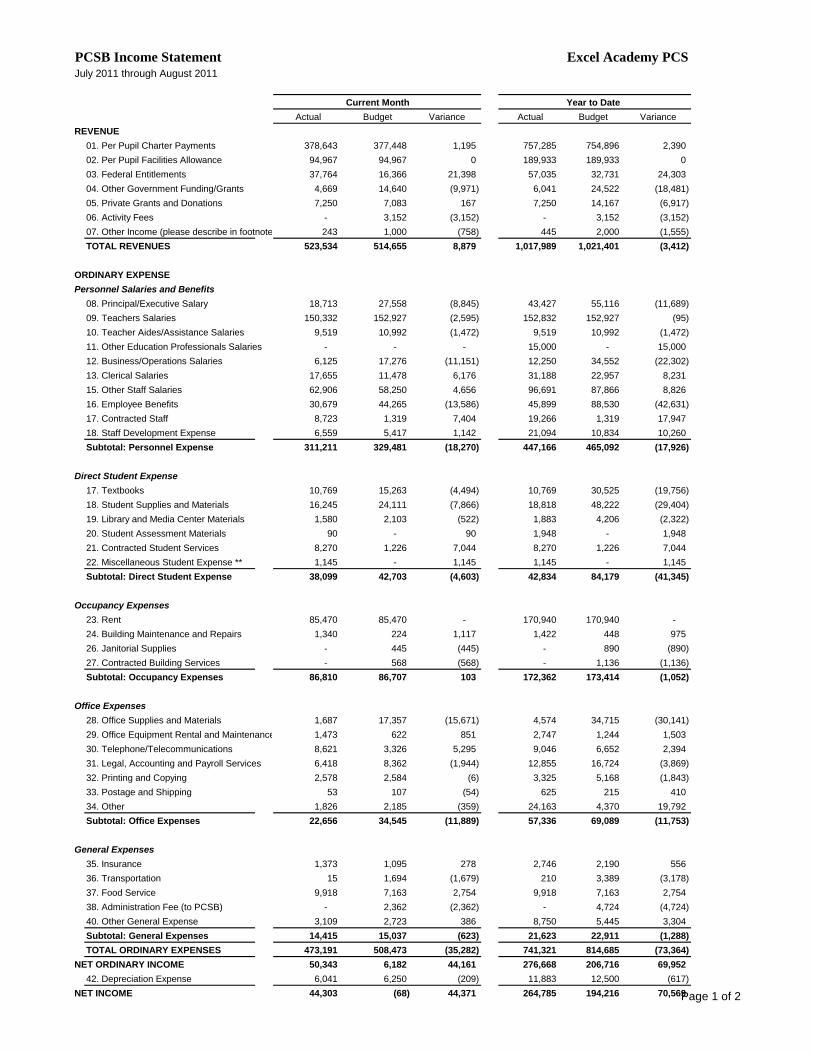
PCSB Income Statement Excel Academy PCSJuly 2011 through August 2011
Current Month Year to Date
Actual Budget Variance Actual Budget Variance
REVENUE
01. Per Pupil Charter Payments 378,643 377,448 1,195 757,285 754,896 2,390
02. Per Pupil Facilities Allowance 94,967 94,967 0 189,933 189,933 0
03. Federal Entitlements 37,764 16,366 21,398 57,035 32,731 24,303
04. Other Government Funding/Grants 4,669 14,640 (9,971) 6,041 24,522 (18,481)
05. Private Grants and Donations 7,250 7,083 167 7,250 14,167 (6,917)
06. Activity Fees - 3,152 (3,152) - 3,152 (3,152)
07. Other Income (please describe in footnote) 243 1,000 (758) 445 2,000 (1,555)
TOTAL REVENUES 523,534 514,655 8,879 1,017,989 1,021,401 (3,412)
ORDINARY EXPENSE
Personnel Salaries and Benefits
08. Principal/Executive Salary 18,713 27,558 (8,845) 43,427 55,116 (11,689)
09. Teachers Salaries 150,332 152,927 (2,595) 152,832 152,927 (95)
10. Teacher Aides/Assistance Salaries 9,519 10,992 (1,472) 9,519 10,992 (1,472)
11. Other Education Professionals Salaries - - - 15,000 - 15,000
12. Business/Operations Salaries 6,125 17,276 (11,151) 12,250 34,552 (22,302)
13. Clerical Salaries 17,655 11,478 6,176 31,188 22,957 8,231
15. Other Staff Salaries 62,906 58,250 4,656 96,691 87,866 8,826
16. Employee Benefits 30,679 44,265 (13,586) 45,899 88,530 (42,631)
17. Contracted Staff 8,723 1,319 7,404 19,266 1,319 17,947
18. Staff Development Expense 6,559 5,417 1,142 21,094 10,834 10,260
Subtotal: Personnel Expense 311,211 329,481 (18,270) 447,166 465,092 (17,926)
Direct Student Expense
17. Textbooks 10,769 15,263 (4,494) 10,769 30,525 (19,756)
18. Student Supplies and Materials 16,245 24,111 (7,866) 18,818 48,222 (29,404)
19. Library and Media Center Materials 1,580 2,103 (522) 1,883 4,206 (2,322)
20. Student Assessment Materials 90 - 90 1,948 - 1,948
21. Contracted Student Services 8,270 1,226 7,044 8,270 1,226 7,044
22. Miscellaneous Student Expense ** 1,145 - 1,145 1,145 - 1,145
Subtotal: Direct Student Expense 38,099 42,703 (4,603) 42,834 84,179 (41,345)
Occupancy Expenses
23. Rent 85,470 85,470 - 170,940 170,940 -
24. Building Maintenance and Repairs 1,340 224 1,117 1,422 448 975
26. Janitorial Supplies - 445 (445) - 890 (890)
27. Contracted Building Services - 568 (568) - 1,136 (1,136)
Subtotal: Occupancy Expenses 86,810 86,707 103 172,362 173,414 (1,052)
Office Expenses
28. Office Supplies and Materials 1,687 17,357 (15,671) 4,574 34,715 (30,141)
29. Office Equipment Rental and Maintenance 1,473 622 851 2,747 1,244 1,503
30. Telephone/Telecommunications 8,621 3,326 5,295 9,046 6,652 2,394
31. Legal, Accounting and Payroll Services 6,418 8,362 (1,944) 12,855 16,724 (3,869)
32. Printing and Copying 2,578 2,584 (6) 3,325 5,168 (1,843)
33. Postage and Shipping 53 107 (54) 625 215 410
34. Other 1,826 2,185 (359) 24,163 4,370 19,792
Subtotal: Office Expenses 22,656 34,545 (11,889) 57,336 69,089 (11,753)
General Expenses
35. Insurance 1,373 1,095 278 2,746 2,190 556
36. Transportation 15 1,694 (1,679) 210 3,389 (3,178)
37. Food Service 9,918 7,163 2,754 9,918 7,163 2,754
38. Administration Fee (to PCSB) - 2,362 (2,362) - 4,724 (4,724)
40. Other General Expense 3,109 2,723 386 8,750 5,445 3,304
Subtotal: General Expenses 14,415 15,037 (623) 21,623 22,911 (1,288)
TOTAL ORDINARY EXPENSES 473,191 508,473 (35,282) 741,321 814,685 (73,364)
NET ORDINARY INCOME 50,343 6,182 44,161 276,668 206,716 69,952
42. Depreciation Expense 6,041 6,250 (209) 11,883 12,500 (617)
NET INCOME 44,303 (68) 44,371 264,785 194,216 70,569 Page 1 of 2

PCSB Balance Sheet Excel Academy PCSAs of August 31, 2011
ASSETS
Current Assets
Checking/Savings 1,664,905
Accounts Receivable 4,518,241
Other Current Assets 138,216
Total Current Assets $6,321,362
Fixed Assets (Net)
Operating Fixed Assets 187,436
Facilities -
Total Fixed Assets $187,436
TOTAL ASSETS $6,508,798
LIABILITES
Current Liabilities
Short-Term Debt 5,197
Other Current Liabilities 5,250,520
Total Current Liabilities 5,255,717
Long-term liabilities -
TOTAL LIABILITIES 5,255,717
NET ASSETS
Beginning net assets 988,296
Net income for the year 264,785
TOTAL NET ASSETS $1,253,081
TOTAL LIABILITIES AND NET ASSETS $6,508,798
Reconcilliation
Assets 6,508,798
Liabilities 5,255,717
Equity 1,253,081
Assets, Less Liabilities and Equities -
Page 2 of 2
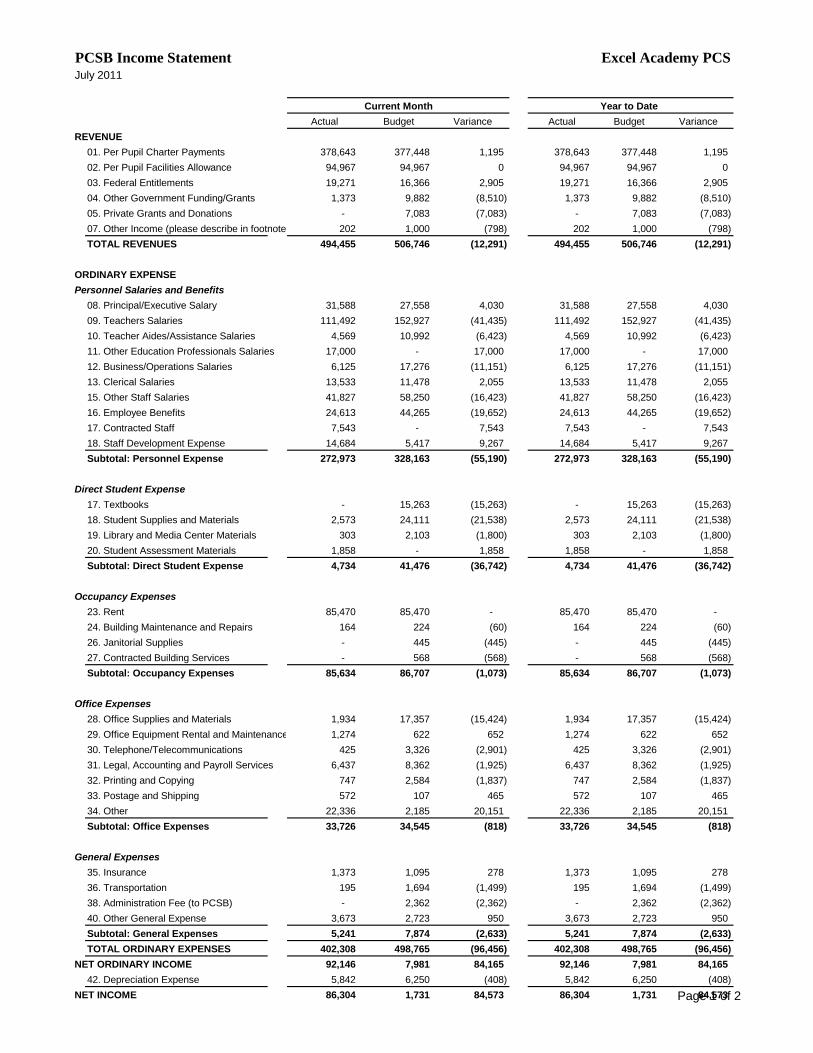
PCSB Income Statement Excel Academy PCSJuly 2011
Current Month Year to Date
Actual Budget Variance Actual Budget Variance
REVENUE
01. Per Pupil Charter Payments 378,643 377,448 1,195 378,643 377,448 1,195
02. Per Pupil Facilities Allowance 94,967 94,967 0 94,967 94,967 0
03. Federal Entitlements 19,271 16,366 2,905 19,271 16,366 2,905
04. Other Government Funding/Grants 1,373 9,882 (8,510) 1,373 9,882 (8,510)
05. Private Grants and Donations - 7,083 (7,083) - 7,083 (7,083)
07. Other Income (please describe in footnote) 202 1,000 (798) 202 1,000 (798)
TOTAL REVENUES 494,455 506,746 (12,291) 494,455 506,746 (12,291)
ORDINARY EXPENSE
Personnel Salaries and Benefits
08. Principal/Executive Salary 31,588 27,558 4,030 31,588 27,558 4,030
09. Teachers Salaries 111,492 152,927 (41,435) 111,492 152,927 (41,435)
10. Teacher Aides/Assistance Salaries 4,569 10,992 (6,423) 4,569 10,992 (6,423)
11. Other Education Professionals Salaries 17,000 - 17,000 17,000 - 17,000
12. Business/Operations Salaries 6,125 17,276 (11,151) 6,125 17,276 (11,151)
13. Clerical Salaries 13,533 11,478 2,055 13,533 11,478 2,055
15. Other Staff Salaries 41,827 58,250 (16,423) 41,827 58,250 (16,423)
16. Employee Benefits 24,613 44,265 (19,652) 24,613 44,265 (19,652)
17. Contracted Staff 7,543 - 7,543 7,543 - 7,543
18. Staff Development Expense 14,684 5,417 9,267 14,684 5,417 9,267
Subtotal: Personnel Expense 272,973 328,163 (55,190) 272,973 328,163 (55,190)
Direct Student Expense
17. Textbooks - 15,263 (15,263) - 15,263 (15,263)
18. Student Supplies and Materials 2,573 24,111 (21,538) 2,573 24,111 (21,538)
19. Library and Media Center Materials 303 2,103 (1,800) 303 2,103 (1,800)
20. Student Assessment Materials 1,858 - 1,858 1,858 - 1,858
Subtotal: Direct Student Expense 4,734 41,476 (36,742) 4,734 41,476 (36,742)
Occupancy Expenses
23. Rent 85,470 85,470 - 85,470 85,470 -
24. Building Maintenance and Repairs 164 224 (60) 164 224 (60)
26. Janitorial Supplies - 445 (445) - 445 (445)
27. Contracted Building Services - 568 (568) - 568 (568)
Subtotal: Occupancy Expenses 85,634 86,707 (1,073) 85,634 86,707 (1,073)
Office Expenses
28. Office Supplies and Materials 1,934 17,357 (15,424) 1,934 17,357 (15,424)
29. Office Equipment Rental and Maintenance 1,274 622 652 1,274 622 652
30. Telephone/Telecommunications 425 3,326 (2,901) 425 3,326 (2,901)
31. Legal, Accounting and Payroll Services 6,437 8,362 (1,925) 6,437 8,362 (1,925)
32. Printing and Copying 747 2,584 (1,837) 747 2,584 (1,837)
33. Postage and Shipping 572 107 465 572 107 465
34. Other 22,336 2,185 20,151 22,336 2,185 20,151
Subtotal: Office Expenses 33,726 34,545 (818) 33,726 34,545 (818)
General Expenses
35. Insurance 1,373 1,095 278 1,373 1,095 278
36. Transportation 195 1,694 (1,499) 195 1,694 (1,499)
38. Administration Fee (to PCSB) - 2,362 (2,362) - 2,362 (2,362)
40. Other General Expense 3,673 2,723 950 3,673 2,723 950
Subtotal: General Expenses 5,241 7,874 (2,633) 5,241 7,874 (2,633)
TOTAL ORDINARY EXPENSES 402,308 498,765 (96,456) 402,308 498,765 (96,456)
NET ORDINARY INCOME 92,146 7,981 84,165 92,146 7,981 84,165
42. Depreciation Expense 5,842 6,250 (408) 5,842 6,250 (408)
NET INCOME 86,304 1,731 84,573 86,304 1,731 84,573 Page 1 of 2

PCSB Balance Sheet Excel Academy PCSAs of July 31, 2011
ASSETS
Current Assets
Checking/Savings 1,978,582
Accounts Receivable 4,488,686
Other Current Assets 120,883
Total Current Assets $6,588,151
Fixed Assets (Net)
Operating Fixed Assets 186,479
Facilities -
Total Fixed Assets $186,479
TOTAL ASSETS $6,774,631
LIABILITES
Current Liabilities
Short-Term Debt 200
Other Current Liabilities 5,565,240
Total Current Liabilities 5,565,440
Long-term liabilities -
TOTAL LIABILITIES 5,565,440
NET ASSETS
Beginning net assets 1,122,887
Net income for the year 86,304
TOTAL NET ASSETS $1,209,191
TOTAL LIABILITIES AND NET ASSETS $6,774,631
Reconcilliation
Assets 6,774,631
Liabilities 5,565,440
Equity 1,209,191
Assets, Less Liabilities and Equities -
Page 2 of 2

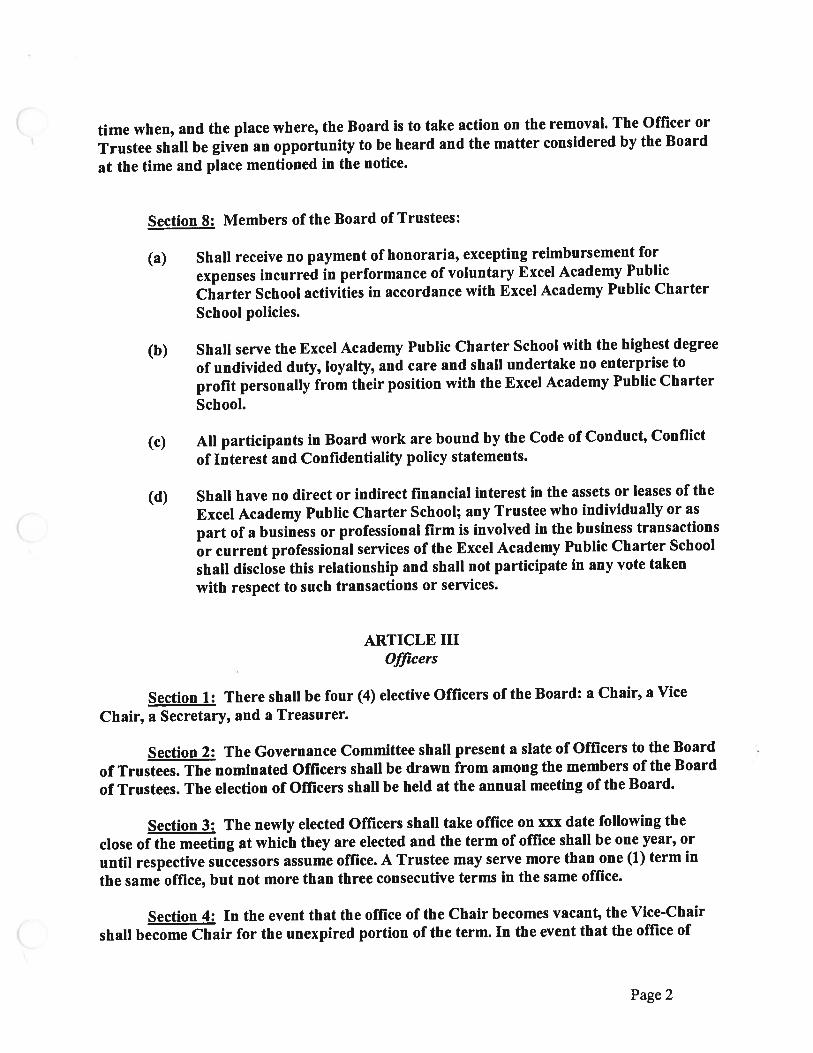
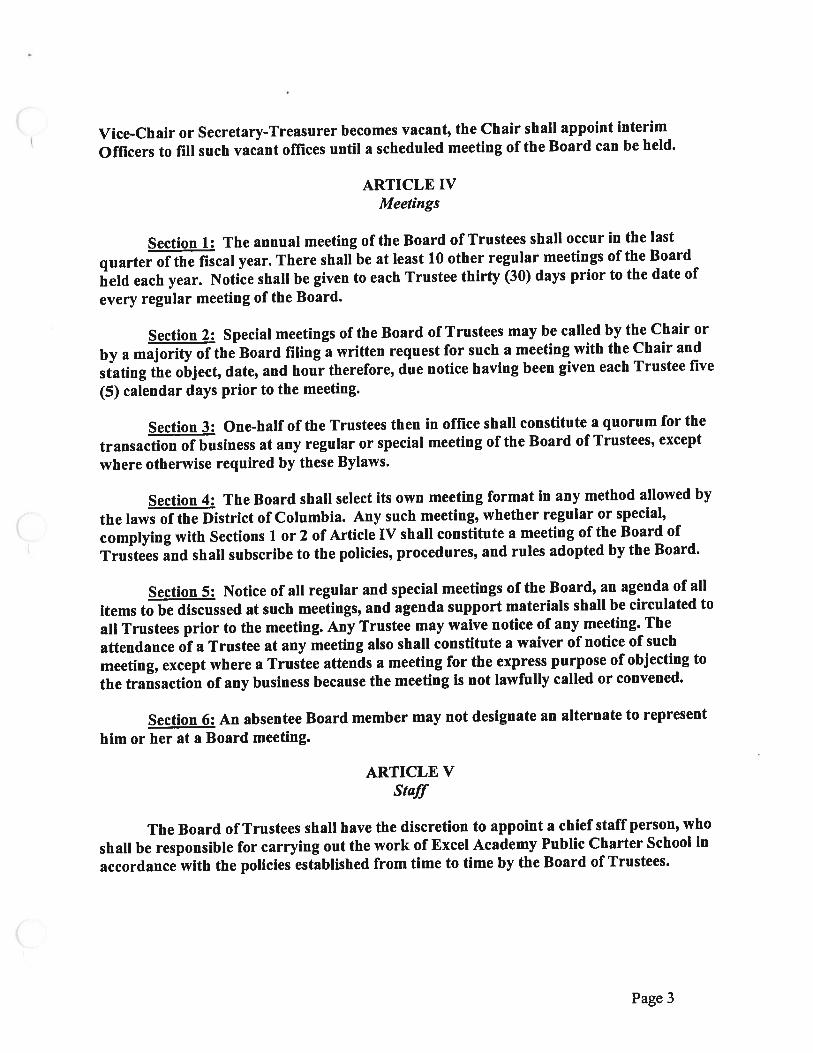
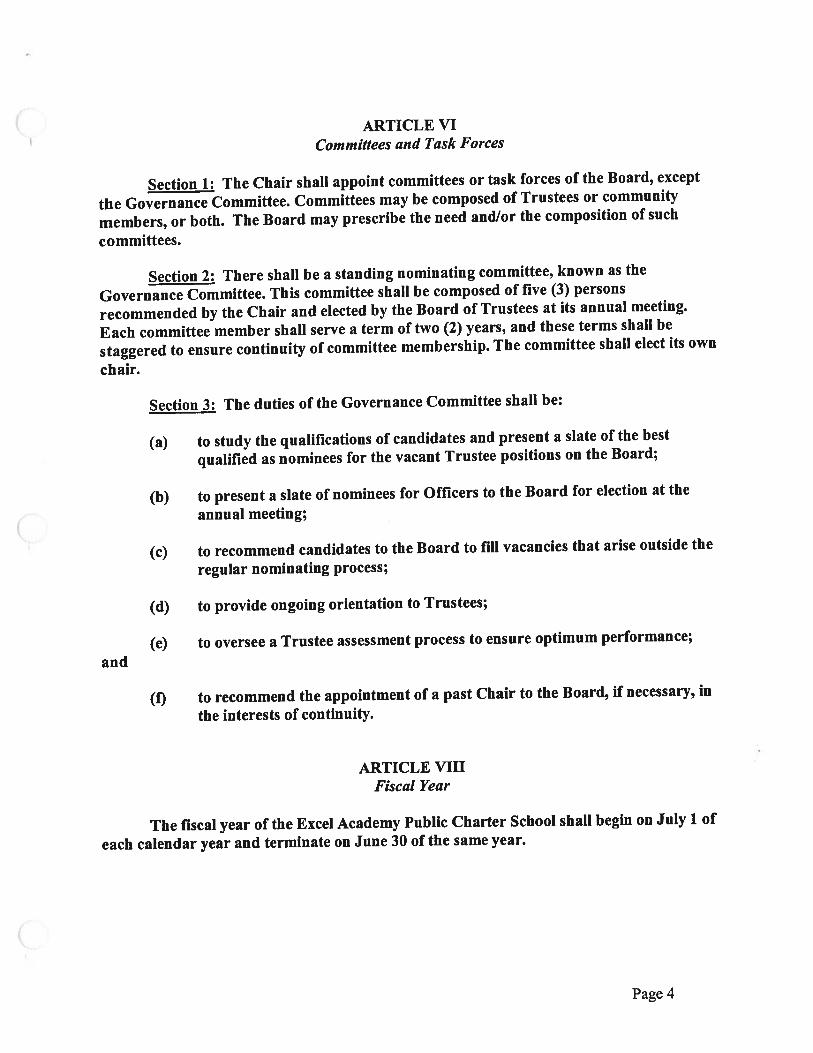
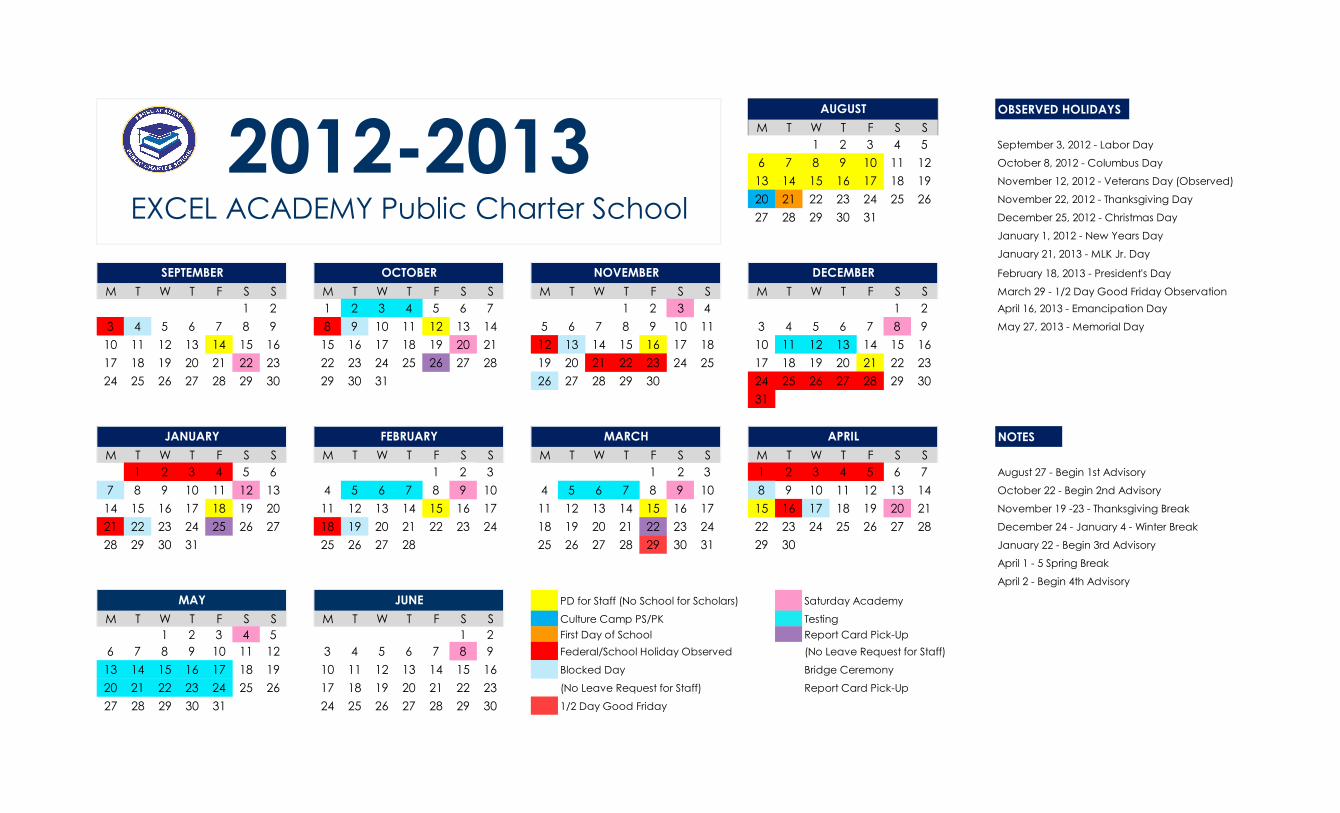
OBSERVED HOLIDAYS
M T W T F S S
1 2 3 4 5 September 3, 2012 - Labor Day
6 7 8 9 10 11 12 October 8, 2012 - Columbus Day
13 14 15 16 17 18 19 November 12, 2012 - Veterans Day (Observed)
20 21 22 23 24 25 26 November 22, 2012 - Thanksgiving Day
27 28 29 30 31 December 25, 2012 - Christmas Day
January 1, 2012 - New Years Day
January 21, 2013 - MLK Jr. Day
February 18, 2013 - President's Day
M T W T F S S M T W T F S S M T W T F S S M T W T F S S March 29 - 1/2 Day Good Friday Observation
1 2 1 2 3 4 5 6 7 1 2 3 4 1 2 April 16, 2013 - Emancipation Day
3 4 5 6 7 8 9 8 9 10 11 12 13 14 5 6 7 8 9 10 11 3 4 5 6 7 8 9 May 27, 2013 - Memorial Day
10 11 12 13 14 15 16 15 16 17 18 19 20 21 12 13 14 15 16 17 18 10 11 12 13 14 15 16
17 18 19 20 21 22 23 22 23 24 25 26 27 28 19 20 21 22 23 24 25 17 18 19 20 21 22 23
24 25 26 27 28 29 30 29 30 31 26 27 28 29 30 24 25 26 27 28 29 30
31
NOTES
M T W T F S S M T W T F S S M T W T F S S M T W T F S S
1 2 3 4 5 6 1 2 3 1 2 3 1 2 3 4 5 6 7 August 27 - Begin 1st Advisory
7 8 9 10 11 12 13 4 5 6 7 8 9 10 4 5 6 7 8 9 10 8 9 10 11 12 13 14 October 22 - Begin 2nd Advisory
14 15 16 17 18 19 20 11 12 13 14 15 16 17 11 12 13 14 15 16 17 15 16 17 18 19 20 21 November 19 -23 - Thanksgiving Break
21 22 23 24 25 26 27 18 19 20 21 22 23 24 18 19 20 21 22 23 24 22 23 24 25 26 27 28 December 24 - January 4 - Winter Break
28 29 30 31 25 26 27 28 25 26 27 28 29 30 31 29 30 January 22 - Begin 3rd Advisory
April 1 - 5 Spring Break
April 2 - Begin 4th Advisory
PD for Staff (No School for Scholars) Saturday Academy
M T W T F S S M T W T F S S Culture Camp PS/PK Testing
1 2 3 4 5 1 2 First Day of School Report Card Pick-Up
6 7 8 9 10 11 12 3 4 5 6 7 8 9 Federal/School Holiday Observed (No Leave Request for Staff)
13 14 15 16 17 18 19 10 11 12 13 14 15 16 Blocked Day Bridge Ceremony
20 21 22 23 24 25 26 17 18 19 20 21 22 23 (No Leave Request for Staff) Report Card Pick-Up
27 28 29 30 31 24 25 26 27 28 29 30 1/2 Day Good Friday
SEPTEMBER OCTOBER NOVEMBER
2012-2013EXCEL ACADEMY Public Charter School
AUGUST
FEBRUARY
DECEMBER
MAY
APRILMARCH
JUNE
JANUARY
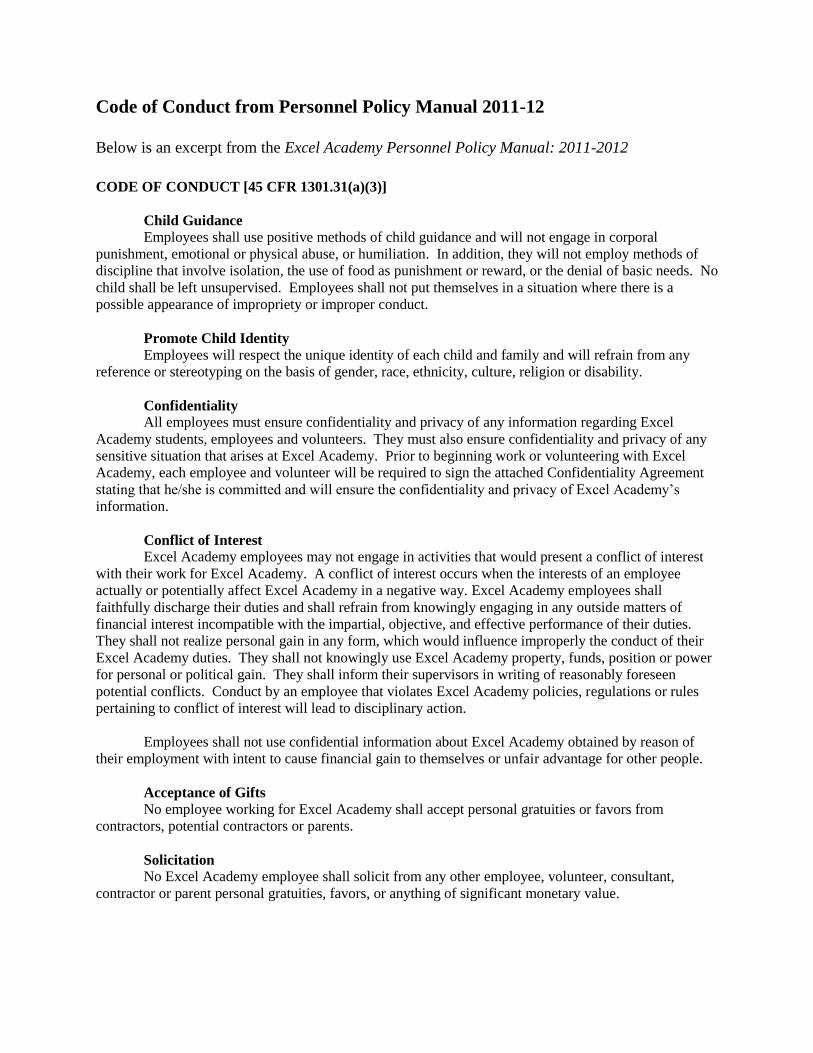
Code of Conduct from Personnel Policy Manual 2011-12
Below is an excerpt from the Excel Academy Personnel Policy Manual: 2011-2012
CODE OF CONDUCT [45 CFR 1301.31(a)(3)]
Child Guidance
Employees shall use positive methods of child guidance and will not engage in corporal
punishment, emotional or physical abuse, or humiliation. In addition, they will not employ methods of
discipline that involve isolation, the use of food as punishment or reward, or the denial of basic needs. No
child shall be left unsupervised. Employees shall not put themselves in a situation where there is a
possible appearance of impropriety or improper conduct.
Promote Child Identity
Employees will respect the unique identity of each child and family and will refrain from any
reference or stereotyping on the basis of gender, race, ethnicity, culture, religion or disability.
Confidentiality
All employees must ensure confidentiality and privacy of any information regarding Excel
Academy students, employees and volunteers. They must also ensure confidentiality and privacy of any
sensitive situation that arises at Excel Academy. Prior to beginning work or volunteering with Excel
Academy, each employee and volunteer will be required to sign the attached Confidentiality Agreement
stating that he/she is committed and will ensure the confidentiality and privacy of Excel Academy’s
information.
Conflict of Interest
Excel Academy employees may not engage in activities that would present a conflict of interest
with their work for Excel Academy. A conflict of interest occurs when the interests of an employee
actually or potentially affect Excel Academy in a negative way. Excel Academy employees shall
faithfully discharge their duties and shall refrain from knowingly engaging in any outside matters of
financial interest incompatible with the impartial, objective, and effective performance of their duties.
They shall not realize personal gain in any form, which would influence improperly the conduct of their
Excel Academy duties. They shall not knowingly use Excel Academy property, funds, position or power
for personal or political gain. They shall inform their supervisors in writing of reasonably foreseen
potential conflicts. Conduct by an employee that violates Excel Academy policies, regulations or rules
pertaining to conflict of interest will lead to disciplinary action.
Employees shall not use confidential information about Excel Academy obtained by reason of
their employment with intent to cause financial gain to themselves or unfair advantage for other people.
Acceptance of Gifts
No employee working for Excel Academy shall accept personal gratuities or favors from
contractors, potential contractors or parents.
Solicitation
No Excel Academy employee shall solicit from any other employee, volunteer, consultant,
contractor or parent personal gratuities, favors, or anything of significant monetary value.
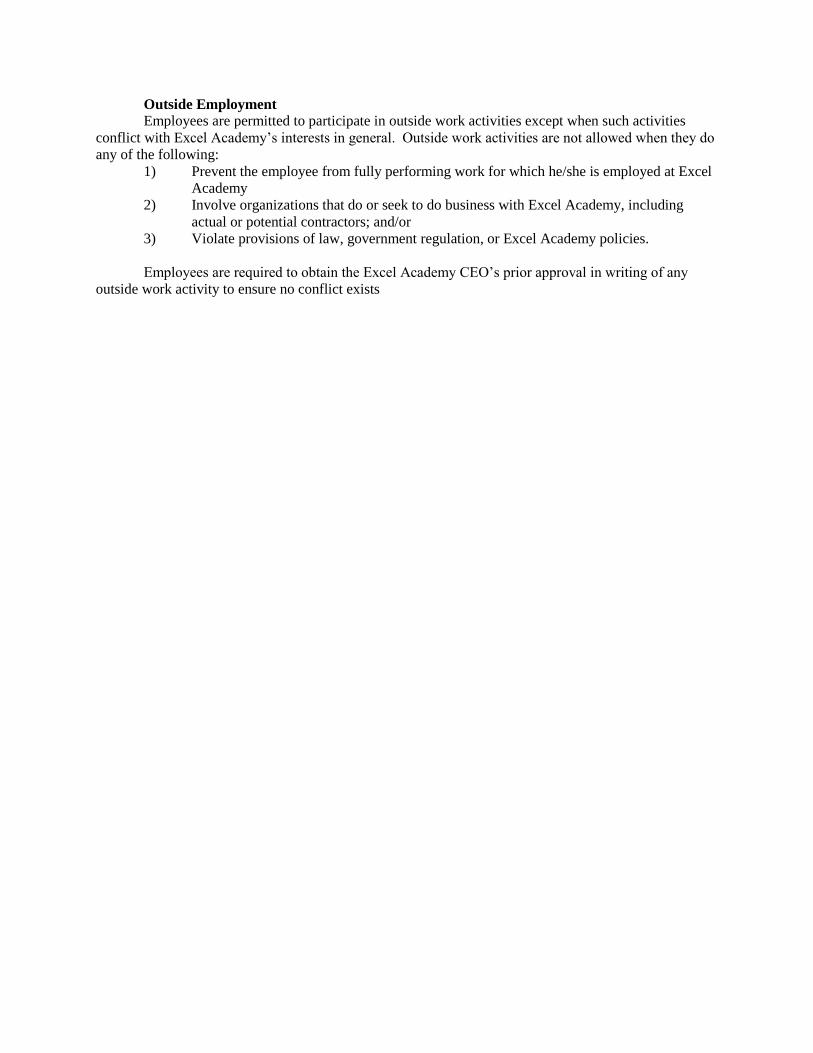
Outside Employment
Employees are permitted to participate in outside work activities except when such activities
conflict with Excel Academy’s interests in general. Outside work activities are not allowed when they do
any of the following:
1) Prevent the employee from fully performing work for which he/she is employed at Excel
Academy
2) Involve organizations that do or seek to do business with Excel Academy, including
actual or potential contractors; and/or
3) Violate provisions of law, government regulation, or Excel Academy policies.
Employees are required to obtain the Excel Academy CEO’s prior approval in writing of any
outside work activity to ensure no conflict exists
Discipline Policy from the Student Family Handbook 2011-12
Below is an excerpt from the Excel Academy Student/Family Handbook 2011-2012:
School-Wide Discipline The Vision Walking through the halls of Excel Academy is a remarkable experience. In every classroom, teachers are presenting rigorous, engaging lessons and students are rising to the challenge. Excel Academy teachers hold students to high academic expectations and are able to focus on effective instruction because consistent discipline and classroom management practices are employed every day by every member of the Excel Academy staff. Teachers proactively plan to prevent misbehavior. Teachers deliver great lessons; students are engaged and on-task throughout the entire class period. Consistency in the timely application of corrective actions and consequences promotes desired student behaviors. Academic success and opportunity are our greatest motivators. Teachers use school-wide systems, classroom management techniques, strong student-teacher relationships, and strong teacher-family relationships to promote and reinforce high behavioral expectations. Staff, teachers, students, and families work together to realize the mission of Excel Academy.
The Philosophy All Excel Academy scholars are capable of making choices. It is our job to develop a renewed sense of discipline, in which we prepare scholars for choices they will be making by teaching the skills and providing the tools they will need. As educators, it is our responsibility to clearly define and teach expectations for student behavior at Excel Academy. Our early intervention model provides us with the rare opportunity to receive students at three and four years old. For the large majority of our scholars, Excel Academy is their introduction to school. We are the position of laying the foundation for school-wide expectations. From the moment our scholars first come to Excel Academy, they learn the Excel Way. The Excel Way means that there is a specific way that we behave every day we come to school. Our scholars quickly begin to understand that, “When I come to school at Excel Academy this is what is expected of me.” Once these expectations have been explicitly taught and reinforced, students who do not meet the school community’s clearly defined behavioral expectations will not be permitted to disrupt the education of others. Understandably, scholars will not always behave appropriately. When they do not, we are responsible for correcting their inappropriate behavior and providing the supportive feedback they need to sustain the desired behaviors. At Excel Academy the mission is clear, to provide pre-school through eighth grade girls a highly rigorous academic program to prepare them to succeed in high school and college. Additionally, we are driven to develop the skills and confidence they will need to make healthy and positive lifestyle choices. It is for these reasons that the Excel Academy discipline policy is paramount. The only way teachers can ensure that scholars master academic goals and meet high expectations is to eliminate classroom distractions and disruptions. The Excel Way means that learning time is sacred. We do not allow disruptions to our scholars’ lessons and learning.
Clearly stated rules and expectations, coupled with consistently applied corrective actions and consequences make clear to students what is expected of them and what is unacceptable. No
misbehavior, however small, will go unchecked at any time for any reason. We acknowledge misbehavior, address it immediately, and provide a corrective action or consequence every time. Studies show that it is not the severity of the punishment that deters people from breaking rules, but the consistent application of consequences.
We believe that intrinsic motivators work. The belief that our girls want to learn and become successful is the foundation of our philosophy. Excel Academy created a culture where students are serious about their academic achievements. We set ambitious goals and make it clear to our students that they can be incredibly successful. Our strongest motivator is a student’s own desire to succeed and our unwavering belief in their ability to accomplish this goal. We develop our students’ rational understanding that they can achieve by working hard (“I can”) as well as the understanding that they will benefit from achievement (“I want”). We employ appropriate role models so students have opportunities to identify with people who work hard toward achievement (“I can”) and value academic achievement (“I want”). We consistently reinforce academic efforts toward the big goals through praise and public recognition of success, extrinsic rewards and competition, cooperation, student-teacher relationships, etc. Finally, we mobilize our scholars’ families and other outside influences to actively invest students in working hard toward the big goals.
Excel Academy is proactive in discipline, building a strong sense of community, getting students excited about achievement, and giving teachers and staff the support they need to fulfill the school’s mission. We work as a team to establish, refine, and implement clear school and classroom procedures for all activities, reduce confusion, rule breaking, and maximize efficiency. A positive school culture benefits students and teachers in the classroom. Good classroom management is a means to an end, not an end itself. The goal is to create a culture of excellence to facilitate academic achievement. We place the highest value on student achievement and show students the path to success. We all create a community where students would rather learn than distract or disrupt.
Parents are our partners. Students know we communicate frequently with families, reporting academic successes and missteps. The school staff enlists parent help in correcting student behavior. Parents and students are accountable for continued inappropriate behavior.
We believe in a community where students know what is expected of them, using structure and predictability to allow students to feel comfortable, safe, protected, and included. In this community space, girls can thrive as students and as people. This sense of community will come from showing and earning respect, being firm and positive.
We realize that consequences, rewards and structures alone will not serve our students; we must equip them with and teach them how to use the tools to make good choices. We strive to educate students around the true costs, benefits, and future implications of their behavior choices. We will know our efforts are succeeding when students learn to make the right decisions when no one is watching, because it is the right thing to do, to be accountable to themselves. This education will serve our students long after they leave our school and the structure that we provide.
EXCEL ACADEMY’S CLASSROOM BEHAVIOR MANAGEMENT SYSTEM
Excel Academy scholars have their behavior monitored with the following color coded management system:
Brown – Scholar exceeds expectation and has gone above and beyond
Green – Scholar meets expectation
Gray – Neutral (home base; all scholars begin their day here)
Yellow – Scholar required 1-2 reminders
Red – Scholar required 3 or more reminders
Consistent use of this system ensures that students, parents, and fellow faculty are all aware of student behavior. Additionally, consistent use of consequences tied to a student’s change in color provides real time feedback around appropriate classroom actions and expectations.
Teachers in every homeroom have a behavior chart with space to record a scholar’s color.
Preschool/Pre-K Transition For our youngest scholars, the first few weeks of school are critical. The investment made in discipline and classroom management during this time will determine how the rest of the school year will unfold. It is imperative that teachers utilize this time to establish clear limits and expectations, practice routines and compliance, and teach students how to behave appropriately. If students are to work and play cooperatively, they must first learn to work within the structures of school and classroom, obey rules, follow procedures and comply with directions. Effective discipline is the key component that will enable teachers to accomplish their academic goals. Beginning school for the first time can often be a scary and difficult transition, especially at three and four years old. It is not uncommon for students at this age to display such disruptive and aggressive behaviors as: excessive crying, tantrums, hitting, biting, throwing objects running out of class, etc. It is our job to maintain clean and consistent rules and expectations for The Excel Way. It is through the consistent and relentless application of these rules and expectations that our scholars will learn that certain behaviors are just not allowable at school. Once these rules and expectations have been explicitly taught and scholars have demonstrated a clear understanding of them, their behavior will be monitored using the classroom management system.
Kindergarten through Third Grade As is the case with our youngest scholars in preschool and pre-k, the first weeks of school are of significant importance for our kindergarten through second grade scholars as well. For our new scholars, this time serves as their introduction to The Excel Way. It is our opportunity to lay the foundation for high behavioral expectations. For our returning scholars, it is a review of The Excel Way. During this time, teachers will focus on teaching classroom routines and procedures, establishing clear limits and rules, and teaching scholars to behave appropriately. Once these rules and expectations have been explicitly taught and scholars have demonstrated a clear understanding of them, their behavior will be monitored utilizing the classroom management system.
Change of Color and Timed Observation The behavior chart is posted in each classroom with the scholars’ names clearly attached. Names are in large print and easily accessible for teachers. If a scholar does not exemplify the Excel Academy IDEALS (Integrity, Discipline, Enjoyment, Achievement, Leadership, Sisterhood) the teacher will move her name to the appropriate color based on the check and plus system. When possible, teachers should deliver this consequence in an individual manner without drawing unnecessary attention to the student. If a scholar moves to red, the teacher will signal that the scholar needs to
assign herself to Observation. This process should be done in a manner that minimizes classroom interruption and protects the integrity of the student. The purpose of Observation is to separate the scholar from the group so she can observe other scholars displaying the appropriate behaviors. Teachers will communicate the offense to the student at the time of the infraction so that all parties are clear on the expectation and subsequent consequence. All classrooms have a designated Observation area. The Observations area is marked and is away from other classroom activities. Scholars are expected to sit in scholar position (hands folded and feet flat on the floor) while in Observation. All classroom teachers and assistants explain the expectations around Observation during the beginning of the year and review these procedures as needed.
Returning from Observation Helping scholars articulate their problems and articulate their mistakes is an important part of helping our students develop strong critical thinking, problem solving, and independence. We believe that we must help our scholars identify their mistakes and brainstorm possible solutions to problems. Once a scholar is seated in scholar position, a classroom teacher or teaching assistant will start the timer for their observation to begin. Scholars are expected to sit quietly during observation and watch their classmates continue participating in designated activities without causing any further disruptions or distractions. Students will not be permitted to return to the group until they have sat quietly for the specified time period (see below for corresponding observation times). Additionally, kindergarten, first and second grade scholars must complete a reflection sheet prior to returning to the group. The purpose of this reflection sheet is to introduce scholars to the process of identifying behaviors as inappropriate and thinking proactively about appropriate behaviors and better choices that can be made next time they are in similar situations. Teachers are responsible for taking the time to process with scholars so that they are clear about the specific rule broken and/or expectation that was not met. While teachers will tailor the language of these conversations to meet the needs of scholars depending on age, all students are required to move through this process of problem solving if they have spent time in Observation.
Green-Red Behaviors When teachers establish and teach clear rules and procedures, consistently enforce consequences and utilize the school behavior system consistently, they reduce the likelihood that larger infractions will occur in the classroom. However, there are certain behaviors that warrant more significant and immediate consequences. If a student displays the following behaviors they move immediately from Green to Red and are referred to the Behavior Specialist (BS) Physical aggression towards a teacher or fellow classmate
Throwing items
Excessive crying and continual disruptions that negatively impact the teaching and learning
Blatant acts of disrespect
Threats
Intentional use of profanity
Tantrums
Safety issues
Behavior Support/Office Referrals Excel Academy will not tolerate disruption of academic time. To this end, we have developed policies that nearly eliminate procedural interruptions of class time (announcements, tardiness, early dismissals, etc.). We have increased consistency and clarity of expectations. We have clearly defined
positive and negative consequences and develop consistent structures across classrooms and within the school. We design ways to increase student investment and family involvement.
However, in the event that a student is sufficiently disruptive or upset to the point that their ability to learn is inhibited, the teacher should complete an office referral to remove the student from the classroom.
If a teacher requires behavioral support within the classroom, he/she should follow the procedures for an office referral. These procedures are based on our goal to get the student back to class, participating appropriately. If a student goes back to class, this does not mean that there will not be further consequences. There will occasionally be situations in which the student will not be allowed to return to class.
Positive Incentives In order to be successful, our discipline system must have more positive motivators then negative consequences. These positive motivators can be intrinsic or extrinsic. Students who follow the roles are rewarded with academic success, greater freedom, opportunity, positive recognition, and individual rewards. Classes that support each other in achieving respect, enthusiasm, achievement, citizenship, and hard work can also earn recognition and privileges.
The Treasure Box (Preschool/Pre-K) Consistent demonstration of the IDEALS values earns scholars a trip to the Treasure Box to select a small tangible prize. During this time, scholars and teachers praise and recognize students as a class community. Scholar of the Week As a school community, we take advantage of every opportunity to recognize the accomplishments of our scholars. Every Friday, homerooms will identify a scholar who has exemplified The Excel Way, by following classroom rules, improving behavior, demonstrating IDEALS, etc. Scholars of the Week will be celebrated during Community Circle.
Suspensions (In School/Out of School/Reverse) At Excel Academy we understand that even the best discipline plans must allow for extreme situations. The only way to consistently preserve the quality of instructional time in the classroom is to ensure that disruptions are minimized to the greatest extent possible. In extreme cases, when scholars have failed to respond to explicit teaching/re-teaching of skills and received immediate consequences for inappropriate behavior, additional steps must be taken to allow the rest of the scholars to continue in a safe learning environment that is free from distractions and disruptions. In more challenging cases, the Administrative team will determine the most appropriate next steps based on the individual scholar, their individual needs, and the specific behavioral incident. These next steps can include the following: In-School Suspension – Scholar remains in class for instructional/academic time, but is not permitted to interact with peers and does not participate in any specials. Out of School Suspension – Scholar remains home for specified number of days. Infractions include, but are not limited to:
Repeated disregard for school policies and procedures
Cheating or copying anyone else’s work
Gross disrespect of a fellow student
Gross disrespect of an Excel faculty or staff member
Gross disrespect or vandalism of school property
Using or possessing medication or drugs inappropriately
Damaging, stealing or destroying school property
Committing sexual, racial or any form of harassment or bullying
Skipping school or class, including after school detentions
Excessive demerits and/or repeated afterschool detentions
Speaking or behaving with excessive vulgar, abusive, or profane language and actions
Making verbal or physical threats, empty or otherwise
Fighting, pushing, shoving or unwanted physical contact
Setting off false alarms or calling in threats
Gambling
Departing, without permission, from classrooms, floors, school grounds, or school-sponsored activity
Forgery of any sort, including parental signature Parents and families will be informed if their student needs to be removed from class. The student will receive the following prior to suspension of one to three days:
a) Oral or written notice of the charges b) If student denies charges, an oral or written explanation of the evidence against her; and c) An opportunity to present her version of the relevant facts
Expulsion Our Discipline Policy has been created to develop a school culture where minor infractions are
immediately addressed and positive behavior choices are explicitly taught. Excel’s clear set of
consequences and consistent systems are in place to address small issues to preclude the onset of
larger, more challenging behaviors that could require expulsion. However, under certain
circumstances, students may be subject to suspension/expulsion by the Principal and/or Chief Executive Officer as explained below:
According to District regulations:
a) Any student who is found on the school premises or at a school-sponsored event, in possession of a dangerous weapon, including, but not limited to, a gun or a knife; or a controlled substance as defined in chapter 94-C, including but not limited to, marijuana, cocaine, and heroine, may be subject to expulsion from the school by the Principal and/or Chief Executive Officer.
b) Any student, who assaults an Excel Academy faculty member on school premises or at a school-sponsored event, may be subject to expulsion from the school by the Principal and/or Chief Executive Officer.
In addition to those categories provided by the statute, students may face expulsion as a result of the following infractions:
Repeated or excessive out-of-school suspensions
Repeated and fundamental disregard of school policies and procedures
Assault against fellow students or other members of the school community
Destruction or attempted destruction of school property including arson
Possession of alcohol on school premises or at a school sponsored event
Procedural Due Process Excel Academy is in compliance with the District of Columbia Public Charter School Board’s guidelines with respect to due process. Procedural Due Process applies to any student violation which may require or merit long term suspension or expulsion.
Withdrawal Our goal is to educate every student to her highest potential. We do this in partnership with families, staff, and community. We believe that the staff of Excel must work to ensure every family understands the school’s mission, goals, policies, and expectations. We recognize that many situations may arise, and families may need to withdraw their students and move to other schools. Families must complete a withdrawal form. Families will be invited to an exit interview with the Principal. All records will be copied for Excel’s files and the original student record will be forwarded to the receiving school.
Student Restraint Excel Academy Public Charter School maintains a firm, consistent Code of Conduct. Our school has very clear disciplinary structures and policies. These procedures do not allow for corporal punishment but include clear rules and consequences. In accordance with DC law, corporal punishment is prohibited. School personnel can use reasonable force only as necessary to protect students, other community members, or themselves from assault by a pupil. Should such an incident occur, a Principal shall file a detailed report of the event with the Chief Executive Officer. All staff authorized to administer restraint or therapeutic holds shall be trained annually in accordance with the Department of Education guidelines.
Complaint Process Excel Academy PCS works closely with the Board of Trustees to hear and resolve any complaints brought forward by staff, students, or parents. If a problem arises, both the school and the Board encourage the party to first address the problem directly with the staff member(s). Complainants must schedule a meeting with the party in question before bringing formal complaints to the Board. After the initial meeting, if the complainant is dissatisfied with the solution proposed by the appropriate staff member, a meeting will be scheduled with the Principal. If the situation has still not been resolved to the satisfaction of the complainant, a meeting will be arranged between parties and the Chief Executive Officer. If these meetings do not resolve the relevant complaint, the concerned party should follow the guidelines set by DC Public Charter School Board. If the concerned party believes the school is in violation of any provision of the charter school law or regulations, he or she may file a formal complaint with the DC Public Charter School Board. If a parent or guardian believes Excel Academy has violated any federal or state law, he or she may file a complaint with the Office of the State Superintendent of Education at any time.
Respecting the Community
All members of the Excel Academy family are expected to be highly respectful of those who live and work nearby.
Scholars traveling to and from school on foot or via the Metro bus need to conduct themselves as if they were in school hallways: traveling on the sidewalk in a safe and orderly fashion; throwing away trash in appropriate bins, moving with purpose to and from school; and keeping hands and feet away from anything that may be private property or possessions.
Families who drive their students to or from school must be mindful of blocking traffic or causing other disruptions with traffic patterns.
In general, all Excel Academy community members must be sensitive to how their actions affect the neighbors and our school reputation in the community.
Field Trips/End-of-Year Events Excel Academy believes that great education takes place both in and out of the traditional classroom setting. Many of our academic standards and experiences can be supplemented and enhanced by taking field trips and participating in activities outside of school. During these activities it is important for students to be responsible for their behavior. The field trip destination is an extension of the school grounds for learning. Excel Academy will send home written permission slips prior to the field trip. This form must be signed by a parent or guardian. Students who fail to return the signed slip or who have displayed negative behaviors in school will not be allowed to participate and will be required to remain at school that day. Students are expected to treat parents, guardians, or volunteers acting as chaperones in the same manner they treat Excel Academy faculty and staff. Students must display the appropriate behavior when attending school trips. The use of portable electronics is prohibited unless staff chaperones give explicit permission. Inappropriate behavior while on school sponsored trips and events is grounds for demerits, detention, out of or in school suspension, and/or other loss of privileges.

Appendix B
Carlos Rosario International Public Charter School 1100 Harvard St., NW Washington, DC 20009
April 23, 2012
6:30pm
Public Hearing
Board Members in attendance: Mr. Brian Jones (Chair); Mr. John “Skip” McKoy; Mr. Don Soifer; Ms. Emily Bloomfield; Dr. Darren Woodruff; Mr. Scott Pearson (ex-officio) Mr. Brian Jones called the public hearing to order at 6:38pm School Oversight Committee- Request for Charter Amendment- Excel Academy Public Charter School Representatives- Kay Savage, Founder and CEO; Lela Johnson, Principal; Nikki Ayanna Stewart, Academic Dean Ms. Rashida Kennedy from Staff introduced Excel Academy’s request to amend their charter to adopt the Core Knowledge curriculum before the Board.
Ms. Nikki Stewart said that they are requesting changing to Core Knowledge because they were at the table during the writing of the Common Core Standards, and feel that this curriculum is much better aligned with those standards, which they are adopting.
Dr. Woodruff asked if this curriculum is used in other places.
Ms. Nikki Stewart said that it is used nationwide.
Mr. Jones thanked the representatives and said the Board will vote on this at a subsequent time.
Hearing on Proposed Board Policies- Charter Amendment Policy, Data Submission Policy, Revision of Performance Management Framework Guidelines Mr. Jones asked that anyone who wants to comment on the proposed policies to come up and make a public statement.
Seeing no one, Mr. Jones closed to public comment.
Public hearing adjourned at 6:46pm
Public Meeting
Mr. Jones called the public meeting to order at 6:48pm Acknowledgement of Public Officials No elected officials were present. Approval of the Agenda Mr. Jones asked to add an item to the agenda. He asked that the Board vote on Excel Academy’s charter amendment and asked for any objections. Hearing no objections Mr. Brian Jones asked for a motion to approve the agenda for the evening. Dr. Darren Woodruff moved the motion and Mr. Don Soifer seconded. The motion passed unanimously. Public Comment None. Approval of the Minutes from March 12, 19, and 20 Mr. Jones asked for a motion to approve the minutes from March 12, 19, and 20. Mr. Don Soifer moved the motion and Mr. Skip McKoy seconded. The motion passed unanimously.
Administrative Committee Mr. Jones read the contracts for January 2012 for more than $25,000 that were received by the PCSB and were read and accepted into the record. Approval of Proposed Board Policies- Charter Amendment Policy, Data Submission Policy, Revision of Performance Management Framework (PMF) Guidelines Mr. Jones asked for discussion among Board Members. Dr. Woodruff asked for a brief summary of each proposal. Mr. Jones introduced Ms. Naomi DeVeaux from Staff who summarized the proposed revision to the PMF guidelines.
Mr. Jones asked for a motion.
Dr. Woodruff moved to approve the policy and Mr. McKoy seconded. The motion passed unanimously. Mr. Brian Jones entered Ms. Sara Mead’s aye vote by proxy.
Ms. DeVeaux summarized the charter amendment policy.
Mr. Jones asked if Ms. DeVeaux could give a sense of how many comments we have received on these proposed policies.
Ms. DeVeaux answered that for the PMF guidelines we received one comment, for the proposed charter amendment we received three, and for data submission we received fifteen.
Mr. McKoy moved to accept the policy and Dr. Darren Woodruff seconded. The motion passed unanimously.
Ms. DeVeaux next introduced the data submission policy.
Mr. Jones asked for a motion.
Mr. Soifer moved to approve the motion, and Dr. Woodruff seconded. The motion passed unanimously.
Schools Oversight Committee- Request for Replication- KIPP DC Public Charter School Representatives- Laura Bowen, Chief Academic Officer; Irene Holtzman, Director of Student Data and Accountability; Alex Shawe, Director of Real Estate and General Counsel
Ms. Miller from Staff introduced KIPP DC’s request to replicate its early childhood, elementary, and middle school programs starting in the 2013-2014 school year before the Board.
Mr. Jones asked the representatives from KIPP DC if they wanted to add anything
Ms. Irene Holtzman said that KIPP DC has had to turn away 2,600 kids and that they want to expand to meet the needs of the children of the District of Columbia.
Dr. Woodruff asked if they know where they prefer to locate.
Mr. Alex Shawe said that they have been tracking the results of the IFF study and want to focus on Cluster 23 in Ward 5 if possible
Ms. Bloomfield moved the motion to approve the request for replication and Mr. Don Soifer seconded. Motion passed unanimously. Mr. Skip McKoy abstained.
Schools Oversight Committee- Request to Approve Charter Amendment- Excel Academy Public Charter School
Mr. Jones asked for a motion. Dr. Woodruff moved to approve the charter amendment and Mr. Skip McKoy seconded. The motion passed unanimously.
Adoption of Statement on Maya Angelou and Options Public Charter Schools Mr. Jones said that the reason for the statement concerning these schools is because they are two of the schools in the PCSB’s portfolio that serve uniquely challenged populations, and that while their PMF scores do not reflect strong performance, it could be because of the population they serve. The PCSB has been working on a PMF evaluation that better reflects the population these schools serve. This statement makes clear our intentions on this regard and that this will help those schools with their financing. Mr. Jones read the statement into the record. He said that it is dated April 17 but that the date can be changed.
Mr. Brian Jones asked for comment.
Ms. Emily Bloomfield said that she was recently at Options and that it is difficult for schools to attract and retain high quality staff if the school is constantly under the shadow of revocation, and they needed a sense of a timeframe in which they could operate without this shadow hanging over them. She added that with that said, while we are looking at alternative frameworks, we should be looking at best in class quality frameworks.
Mr. Jones said that it is an important clarification. He added that this makes clear that the Board, pending the development of a more appropriate measure, will not move to close the school on PMF scores, but that the Board will still reserve the right under the School Reform Act to close the schools under other criteria such as financial or legal infractions.
Mr. McKoy asked why we are calling this a statement rather than a policy or interim policy.
Mr. Pearson said that he thinks that it could be called a policy as well, but since that it is a one time thing for certain schools that it doesn’t rise to that level.
Mr. McKoy wanted to clarify that it has no less enforcement on our part than a policy.
Dr. Woodruff wanted to underscore the spirit of whether this is a statement or policy our support as a Board to have schools that have a variety of missions and curricula for working with students. He added that we do not want to have an accountability rubric that is one size fits all. We want to encourage schools in D.C and outside who want to move in who want to work with these populations.
Mr. Jones said that Mr. McKoy asks a good question but that it is his sense that categorizing it as a statement is appropriate due to its limited scope and duration.
Ms. Bloomfield concurred with Mr. Jones and moved to approve the statement. Mr. Soifer seconded. The motion passed unanimously.
Approval to Open Public Comment Period on the PCSB Budget Proposal Mr. Pearson introduced the budget proposal to raise the administration fee on schools to affect all public revenues to the Board in the form of a PowerPoint presentation. Mr. Pearson explained that the reasons for the raise in the administration fee stems from the decline in PCSB’s revenues from having to spend on school closures, which has not previously been a budgeted item. He added that the PCSB is also uncertain of the amount of federal and OSSE funds that it would receive, that there has been a decline of appropriations from the DC Council, and that certain foundation dollars are scheduled to end. It is for these reasons that the PCSB is proposing to expand their current administrative fee on schools to cover all public revenues instead of just local public revenue. Even with this increase in the administrative fee, PCSB’s budget would still be at its lowest since 2008.
Mr. Jones thanked Mr. Scott Pearson and the staff for their work on the proposal. He said that it took a great deal of effort and that these are challenging times for this Board and other public institutions. He then asked for any questions.
Dr. Woodruff asked if this presentation could be shared with the different groups that appropriate funds to us. From this overview there is a strong argument to be made for either increased funding or for more consistency.
Mr. Pearson said that the federal funds come late in the year and that the funds from OSSE are three-sector funds. Our relationship with OSSE is a good one and we do not expect that OSSE would withhold funds this year.
Mr. Jones said that this is the beginning of the process and that any vote we have here today is a vote for public comment. He suggested that as we post these proposals we also post this PowerPoint presentation as well.
Mr. Jones asked Mr. Pearson to speak on the impact on our work and for his sense on finding savings and cost reductions and if that has impacted the work of the staff.
Mr. Pearson said that while it was his impression that the initial proposals had the Staff concerned, it has been positive for the Staff. In previous years we used outside consultants to review the charter applications and staff managed them. By having Staff review applications we
had a better process that was less subjective. It allowed us to tap into the expertise of our staff for a better process at a lower cost.
Ms. Bloomfield said that she thinks that the presentation is helpful, but that it would be more helpful to juxtapose this against the growth in number in LEAs and pupils. While we have had a decline in revenue we have had a growth in the sector. She also asked that we include information on the Board’s focus over time and the diversity of schools in our portfolio and how we’ll need different performance management frameworks to measure those schools.
Dr. Woodruff wondered what the connection between oversight fees and academic outcomes is. One might infer that we are undercharging for what we are producing.
Mr. Pearson said that we charge less than other authorizers from around the country but that we also have appropriations from the Council and OSSE.
Mr. Jones said that on his part that he would only be comfortable making this proposal if we have a value proposal that we could make. The Board and the Staff are committed to bringing the strong talents of our Staff more directly to bear. We have made a move to become a more vocal and assertive and advocate for our school partners. That is an important part of the value proposition here. I would argue that what we are seeing out of our Staff and leadership today is an ever improving focus on a value proposition to the schools.
Ms. Bloomfield added that at that point the cost of closure is a factor as well. If we want to be doing closure of underperforming schools, we want to do it that is least disruptive to families and that we need funding to be able to do that. There is a possibility of having new schools provide a security deposit against closure like some authorizers currently do. It is an option that we should look at.
Mr. Jones agreed and said that the Board and the Staff are committed to improving the overall quality of the schools that we authorize in our portfolio.
Mr. McKoy said that it is necessary to have our own general counsel to enable us to have better decisions and to save us money in the long run. Another part of what would over time help improve the portfolio is more time and dedication of the Staff and Board to look out in the field the work of outstanding CMOs and providers so that we can work to attract excellent schools.
Mr. Jones agreed and then asked for a motion.
Mr. Soifer moved to submit the proposal for public comment, and Mr. McKoy seconded. The motion passed unanimously.
Request to Approve Public Comment Period on Model Charter Amendment
Mr. Pearson introduced before the Board the proposal for the creation of a model charter amendment that would allow for the closure of a single campus of a school without having to revoke the entire charter. He added that this is a messy and unpredictable process that can damage the schools other campuses. It is in the PCSB’s interest to be able to close low performing campuses. We are proposing an amendment to close an individual campus. Mr. Jones asked for comment.
Dr. Woodruff said that he very much supports this policy. It is similar to approving an alternative PMF for certain schools. It offers the Board more flexibility in its options with dealing with schools.
Mr. Soifer moved to submit the proposed policy for public comment, and Mr. McKoy seconded. The motion passed unanimously.
Approval/Denial of 2012 Charter Applicants Ms. DeVeaux from Staff introduced the recommendations for the 2012 charter applicants before the Board.
Community College Preparatory Academy PCSB staff recommends that the application for Community College Preparatory Academy Public Charter School be accepted with conditions.
The applicant group presented compelling statistical data that underscore the need for a school that addresses the enormous problem of aging adult dropouts and high numbers of disconnected youth in Washington, D.C. The program goals and offerings reflect the mission: “To provide the education and skills development that will empower and prepare under-credited adults for postsecondary education success, viable employment and lifelong learning.” The program focus is designed to include cross-curricular thematic strands across vocational and academic learning tracks with the purposeful articulation between the Community College and the University of the District of Columbia’s Work Force. However, there are aspects of the application that need to be strengthened for the staff to recommend granting full approval. These conditions include a significantly more developed curriculum, more clarity on instructional strategies, greater clarity on the vocational program, and a formal agreement with UDCCC. Moreover greater care needs to be taken in developing the school’s business plan: payroll and occupancy for years one and two make up a combined total of 88% and 81% of revenues, respectively, leaving less than 20% for all other implementation costs. Members on the Founding Board clearly possess the expertise and the capacity to satisfy all conditions and oversee the development and successful implementation of the program.
Mr. Jones asked for comments.
Mr. McKoy asked about the school’s proposal to work with young people to achieve a two year increase in scores in three months. He asked if Ms. DeVeaux recalls any statistics to bring them up that quick.
Ms. DeVeaux said that it was one year and that they answered how they would do that in their interview.
Dr. Woodruff said that it was one of the more exciting applications. It becomes more and more difficult to meet the areas of unmet need, but this application if approved will serve a population that did not have the best experience in their academic careers. These are adults looking for a bridge to get them from school to college.
Mr. Jones agreed with Dr. Woodruff. He said that it creates a seamless ecosystem from pre-k to post-secondary. It is important and exciting.
Mr. Soifer agreed with virtually everything that has been said. What has stood out most to him was that the statement of need was compelling. The school has very specific and ambitious goals, and how will these be translated into an evaluation mechanism for the PMF.
Ms. DeVeaux said that we are currently developing an adult education PMF and we are researching the best way to do this.
Ms. Bloomfield moved to approve the application with conditions outlined by Staff. Dr. Darren Woodruff seconded. The motion passed unanimously. Mr. Brian Jones entered Ms. Sara Mead’s aye vote by proxy.
DC Flex PCSB staff recommends that the application for the DC Flex Public Charter School be denied. While the petition established a strong case for the need for a blended-learning program in the District, the founding group did not demonstrate the capacity to design and implement a program serving elementary, middle, and high school students in a blended-learning environment. The founding group identified the management company K12 to provide the curriculum and virtual instruction. K12 has mixed results for its existing blended-learning and virtual public schools, which typically do not serve high percentages of at-risk students, such as English language learners, students with disabilities, homeless students, and students receiving free or reduced price meals. The founding group failed to address how they would offer additional support to these at-risk populations so they could be successful at their school. Furthermore, the interview revealed an inequity between the role of the Board and the K12management company; this concern extends to both budgetary constraints and uncertainty in the ability of the founding
group to independently oversee and monitor the performance of K12 as a management organization. The founding group did not present a contingency plan for management services and curricula if they were dissatisfied with the K12 management company. Finally, the founding group did not show a full understanding of the Flex school model that K12 runs in other states and that was mentioned in the application. Mr. McKoy was excited by the potential of this proposal and said that we really want to encourage that mode of instruction to come to the District, but he was disappointed that this application was not yet at the quality for approval.
Dr. Woodruff agreed and said that what was concerning for him was the grade scope from K-12. To serve those grades you would need a stronger curriculum than what was offered in their application.
Mr. Jones added the situation between the schools board and the management company. It’s an issue that this Board has faced before. We grant a charter to a non-profit entity that is responsible. It’s important for us to know that at the end of the day that it is that Board that knows how to evaluate the work of the third party entity. At the end of the day he has to know that it is the board that is in the driver’s seat and not the management company.
Ms. Bloomfield moved to deny request for charter, and Mr. Skip McKoy seconded. The motion passed unanimously. Mr. Brian Jones entered Ms. Sara Mead’s aye vote by proxy.
Ms. DeVeaux added that the conditions she read for Community College previously are not all of the conditions that PCSB has set.
FLOW PCSB staff recommends that the application for the FLOW Public Charter School be denied. The target population for this adult school includes students who have been unsuccessful in school and who are searching for careers. However, the application does not clearly outline methods to meet the academic needs of these students, especially those with disabilities or who are English language learners. The educational plan does not contain the basic components of an academic program including goals and objectives, curricula, and assessments aligned to academic learning standards. The proposed school also does not have a non-profit status and, in the interview, the panel stated that they did not see the urgency in obtaining one. The budget raises concerns as they have included the facilities allowance but plan to operate at least part of their program as a virtual school and 92% of the entire budget is allocated for staff salaries, which is higher than PCSB recommends.
Mr. Soifer said that he thinks that the school’s recommendation was on target and that the group’s assessment of need was not clear. He did not get a sense that during the reading of the application and subsequent discussions that this group had what it took to succeed.
Ms. Bloomfield said that she thinks that the target population is one that we want providers to think about, but we are looking for academic framework, rigor, and metrics for success, and that was not clearly expressed.
Mr. McKoy said that if the group comes back to Staff to see what their application lacked, that they spend some time looking at their budget.
Mr. Jones added that every applicant group will receive a decision letter that details the reason for the Board’s decision.
Mr. Soifer moved a motion to deny and Dr. Woodruff seconded. The motion passed unanimously. Mr. Jones entered Ms. Mead’s aye vote by proxy.
Ingenuity Prep Staff recommends that the Ingenuity Prep Public Charter School be approved with conditions. Ingenuity Prep Public Charter School has shown the capacity to implement a comprehensive educational model that has both strong academic and non- academic components including 21st Century learning skills, early literacy, and blended-learning. Additional aspects of their educational plan that have had proven success in other schools are well thought-out academic interventions and enrichment, before and after school services, extended school day and year, and data-driven instruction. The founding group has most of the necessary expertise to lead the academic components of an elementary school and they have the support of peers, community members, and respected educational entities; however, there are aspects of the application that need to be strengthened for the staff to recommend granting full approval. Some of the conditions Ingenuity Prep PCS must meet include, establishing a governing board and a school leadership team with early childhood and operational experience; acquiring a facility; developing the early childhood curriculum; and establishing a timeline for the development of curricula for subsequent grades, including the 21st Century Content and Civic Leadership which were described in the application as mission specific programs. Ms. Bloomfield said that one thing she wanted to say that she thinks that it is a good thing that we are putting conditions on the schools that we are approving. She was also impressed by the experience of this group and the amount of time they took to go into other schools for guidance, feedback and mentorship.
Mr. McKoy said that in the case of this group they spent an appropriate amount of time looking at blended learning.
Dr. Woodruff added that it was an enjoyable application to read and that he is also excited about the potential and promise of blended learning. He is interested in the civics component and the school’s proposed location. It is encouraging to see applications that are seeking to operate in some of the city’s most high-need areas.
Mr. Soifer agreed that this was one of the strongest applications that he has read. He agrees with Ms. Emily Bloomfield that it is the right thing to do to approve with conditions. It is this Board’s best tool to moving forward on an application that we have great faith in.
Mr. Jones concurred with everything that has been said. This group struck him as one that did a great deal of homework. What we are authorizing here are start-up enterprises. When we entrust the taxpayers capital what is important to him is the quality of the team that is going to implement this on the ground.
Mr. McKoy moved for approval and Ms. Emily Bloomfield seconded. The motion passed unanimously. Mr. Brian Jones entered Ms. Sara Mead’s aye vote by proxy.
Lee Montessori PCSB staff recommends that the application for the Lee Montessori Public Charter School be denied. The Lee Montessori petition, based on the written application and interviews, does not meet the standards for approval. While the applicant group was able to both demonstrate the need for a public Montessori school in D.C. and articulate an understanding of Montessori principles and curricula, they lacked experience running non-profits and managing staff, essential components of successful public charter schools. This lack of operational knowledge was clear in their incomplete business and operations plans and their budget, which was incorrectly put together. If the applicant group wishes to re-apply in the future, it should expand the founding group to include members with business and managerial experience and substantially revise the application.
Mr. Soifer concurred with the Staff analysis. This is not the rejection of another Montessori school in the District. It was just that this application had significant problems.
Mr. Soifer moved the motion to deny and Ms. Bloomfield seconded. The motion passed unanimously. Mr. Jones entered Ms. Mead’s aye vote by proxy.
MaiAngel Leadership Overall, the MaiAngel charter application does not meet the standards for approval.
The applicants have proposed an alternative competency-based education program designed to address the learning needs of at-risk, disconnected youth ages 16 to 21. However, neither the program’s goals nor their exit outcomes are clearly explained; i.e. it is unclear whether they ultimately wish to operate an adult education, alternative education, or a high school. To support the high school diploma objective, the school plans to engage Diploma Plus to develop and implement a highly individualized blended-learning, performance-based curriculum. However, the performance of schools that use the Diploma Plus curriculum varies greatly from school to school with the key factor being its academic leader, which this DC group has yet to identify. The performance outcomes and expectations for the African American population observed in the Baltimore Liberation model were low and the effective achievement of a highly individualized blended-learning approach was not readily apparent during the site visit by the PCSB. PCSB recommends the founding group visit the Liberation Plus model in New York City run by Ms. April Leong and revise and resubmit this very promising proposal.
Mr. Skip McKoy said that he thinks that the quality of this team is inspirational. The proposal addresses a need and that the presenters had an enthusiasm that was obvious. The problem was the lack of educational leadership experience. With some more work they can come back with something that they could look favorably on.
Dr. Woodruff said that he wants to reiterate his enthusiasm for the population that they are seeking to serve, and that he would encourage this group to look at the successful applications, particularly in curriculum and business to strengthen their application and reapply.
Mr.Soifer agreed with Staff and his colleagues. He asked that the group take the feedback the Staff provides and consider it.
Mr. Jones said not to be discouraged. Work with our Staff and that I hope to see you next February.
Mr. McKoy moved a motion to deny, and Dr. Woodruff seconded. The motion passed unanimously. Mr. Jones entered Ms. Mead’s aye vote by proxy.
Sela PCSB staff recommends that the application for Sela Public Charter School be accepted with conditions. The D.C.-based founding group demonstrated that it has not only the necessary experience in language immersion education and non-profit management but also the financial and academic
support, through its relationship with the Hebrew Charter Schools Center, to implement its well thought-out charter petition. They clearly show that there is a need for another language immersion public charter school in the District, based on the current oversubscription at language schools, and that a Hebrew language immersion public school will bring a novel and valuable program to all District residents. Their education plan thoroughly describes how they will provide developmentally appropriate academic offerings in dual language immersion to all types of learners—including at-risk students, students with disabilities, and English language learners—underscoring their strong commitment to serve a diverse population from across the city. Additionally, the applicant group has designed a fiscally conservative budget and has positioned themselves to have yearly reserves. However, there are aspects of the application that need to be strengthened for the staff to recommend granting full approval. PCSB staff recommends that the founding group be granted a charter for Sela PCS to operate grades Pre-Kindergarten through five, only, and suggest they apply for a charter amendment in a few years to serve middle school grades. Additional conditions include: establishing a DC-based governing board; acquiring a facility; developing curricula and assessments for all grade levels to be served in year one and a timeline for the completion of curricula and assessment for all subsequent grade levels to be served; recruiting a staff able to deliver the dual-language model; and developing a robust recruitment plan, including outreach to the socio-economically, racially, and ethnically diverse target population outlined in their application.
Mr.Jones added that there can always be more conditions than what was read in the Staff recommendation.
Mr. Jones went on to say that this was an inspired and inspiring application. It struck him as a group with a unique vision and exciting to bring to DC an innovative and different model that is at the same time focused on academic rigor and achievement. He was very impressed with the founding team.
Mr. McKoy was impressed by the team and they really thought about the DC population that they will be serving. Yes, their mission is unique but they recognize the type of children that will be coming to this school.
Mr. Soifer agreed with his colleagues comments said that it was one of the better applications that he saw.
Dr. Woodruff moved to approve with conditions and Mr. Skip McKoy seconded. The motion passed unanimously. Mr. Brian Jones entered Ms. Sara Mead’s aye vote by proxy.
Somerset Preparatory Academy PCSB staff recommends that the application for Somerset Preparatory Academy Public Charter School be accepted with conditions.
The proposed school will be supported by Academica and Somerset Inc.; together, these organizations run successful schools in Florida, Texas, Arizona, and California and have the resources to support a school in Washington D.C. The academic results of Somerset schools in Florida are consistently strong and include schools with high concentrations of low income, Latino and African American students. According to Florida’s school rating system, of the 23 Somerset campuses, 18 received an A; one received a B; three received a C; and one received a D; the school that received a D rating was in its first year as a Somerset school. However, there are aspects of the application that need to be strengthened for the staff to recommend granting full approval, especially in the design of their high school component. Therefore, PCSB staff recommends that conditional approval be granted for the school to open with grades 6 through 8 in its first year of operation and, after they have demonstrated that they have a fully-developed high school curriculum, they may grow one grade per year thereafter until serving grades 6-12. Some of the other conditions that Somerset PCS must meet before being granted full approval include establishing an independent D.C. governing board that will create impartial contracts with Academica and Somerset that clearly outline their supports; securing a facility; and replicating the entire 6-12 curriculum used in Florida schools, including the summative assessments—such as the PERT and end-of-course exams, data dashboards, interventions, and the other programmatic systems.
Mr. McKoy asked why we are only adding high school grades one year at a time when we’re asking for a full 4 year high school curriculum.
Ms. DeVeaux said that the group wanted to grow one year at a time.
Mr. Pearson added that there is increasing evidence that schools open one year at a time tend to do better.
Mr. McKoy said that he voted to deny his application last year, but that this was a much stronger application.
Ms. Bloomfield said that visiting the schools helped to inform the decision making process. She is also excited about bringing the type of exam systems are in place in Florida. For example they use an assessment that assesses college readiness which is different than graduation.
Dr. Woodruff added that we have heard a lot about the need for effective middle and high schools. We’ve been looking at effective charter operators who have a track record of success on this to come operate in the District.
Mr. Soifer agreed with the Staff analysis and his colleagues points.
Mr. Jones said that he voted in favor of this application last year, but that this year’s application was a much stronger one. It is a good thing for the families and kids in DC that successful charter operators from around the country find the District an inviting place to be.
Mr. McKoy moved to approve with conditions and Dr. Woodruff seconded. The motion passed unanimously. Mr. Jones entered Ms. Mead’s aye vote by proxy.
Student Parent Achievement Center of Excellency (SPACE) PCSB staff recommends that the application for the SPACE Public Charter School be denied. The petition, based on the written application, interview, and due diligence does not meet the standards for approval for several reasons, but most importantly, the founding group could not clearly explain how its proposed Arab language immersion program met the principles of total language immersion, which requires that academic content be delivered in the second language. The program, as described, made no distinction between Arab language instruction, used when teaching a second language, and content area instruction delivered in Arabic, which is the crux of a language immersion program. The basis for their language immersion program for students in grades 2 and higher is the Rosetta Stone Language Program. This is not a language immersion tool, but a program to learn a second language, usually used for older students and adults. Furthermore, none of the founding group members have extensive and relevant experience with language immersion or primary education. The applicants are not knowledgeable about the requirements in the School Reform Act in that they propose to offer a separate fee-based pre-school and childcare program in which the students, without going through the application process, will feed into the kindergarten program, the initial grade offered for the proposed school. The proposed school’s budget will not meet the school’s programmatic requirements. For example, there is no line item for the Saturday Academy, which is an integral part of the program. The school plans to recruit highly qualified teachers who are dually certified either in elementary education or a related discipline, as well as special education or English as a Second Language, yet the average teacher’s salary is budgeted for well below average for the DC metro area.
Mr. McKoy said that the mission and vision of this group were pretty exciting, but unfortunately the details did not match the excitement. He agrees with the Staff critique.
Ms. Bloomfield added that she thinks that the Staff did a good job on the areas of the need. There should be more on children with special needs and English language learners.
Mr. Soifer moved to deny, and Mr. McKoy seconded. The motion passed unanimously. Mr.Jones entered Ms.Mead’s aye vote by proxy.

Washington Day PCSB staff recommends that the application for the Washington Day Public Charter School be denied. Washington Day Public Charter School’s application lacked clarity, consistency and coherency. Most notably, the Executive Summary did not mention the International Baccalaureate (IB) program, which the founding group describes as a fundamental component of their school. Other mission-critical components were not mentioned during the interview or were mentioned in some sections of the application but not others or were not described in enough detail to fully understand. The application was replete with typographical, syntax, and grammatical errors. These inconsistencies and errors, along with concerns about the founding group’s track record at Public Charter Schools, hindered staff from fully understanding the proposed school’s educational program and raised the question of whether the school would be run professionally.
Mr. Jones said that his sense was that the Staff analysis was accurate and that this application hit far from the mark.
Mr. Soifer moved to deny and Mr. McKoy seconded. The motion passed unanimously. Mr. Jones entered Ms. Mead’s aye vote by proxy.
Washington DC Clean Energy PCSB staff recommends that the application for the Washington DC Clean Energy Adult Public Charter School be denied. While the founding group provided sufficient explanation of its proposed clean energy program and for the need of this type of vocational education for District of Columbia residents, it did not give sufficient evidence that, upon completion, Washington DC Clean Energy students would find local apprenticeships and/or get national certification. The application also lacked a description of a comprehensive GED program. In contrast to the flexible schedule that was developed for the clean energy career courses, which span days, nights, and weekends, no GED evening courses are offered, hindering accessibility for adult learners who have daytime jobs. The application lacked an educational plan for addressing the needs of all types of learners and skill levels. This is most apparent in the applicant group’s decision not to allocate funds in the budget or develop a plan to serve English language learners during their first five years of operation. Instead, their program focuses on serving students with a high-intermediate level of literacy, not those students who may be significantly below grade level, which is in violation of the School Reform Act. Finally, the salaries for the GED teachers outlined in the budget are low for full-time teachers with Bachelor’s degrees.

Ms. Emily Bloomfield said that she thinks that Staff did an excellent job summarizing concerns. She feels that this is a group of students that we want to offer more providers and that serving ESL and SPED students is a legal and moral obligation.
Dr. Woodruff moved to deny and Ms. Bloomfield seconded. The motion passed unanimously. Mr. Jones entered Ms. Mead’s aye vote by proxy.
Public Comment None.
Meeting adjourned at 9:08pm

Appendix C
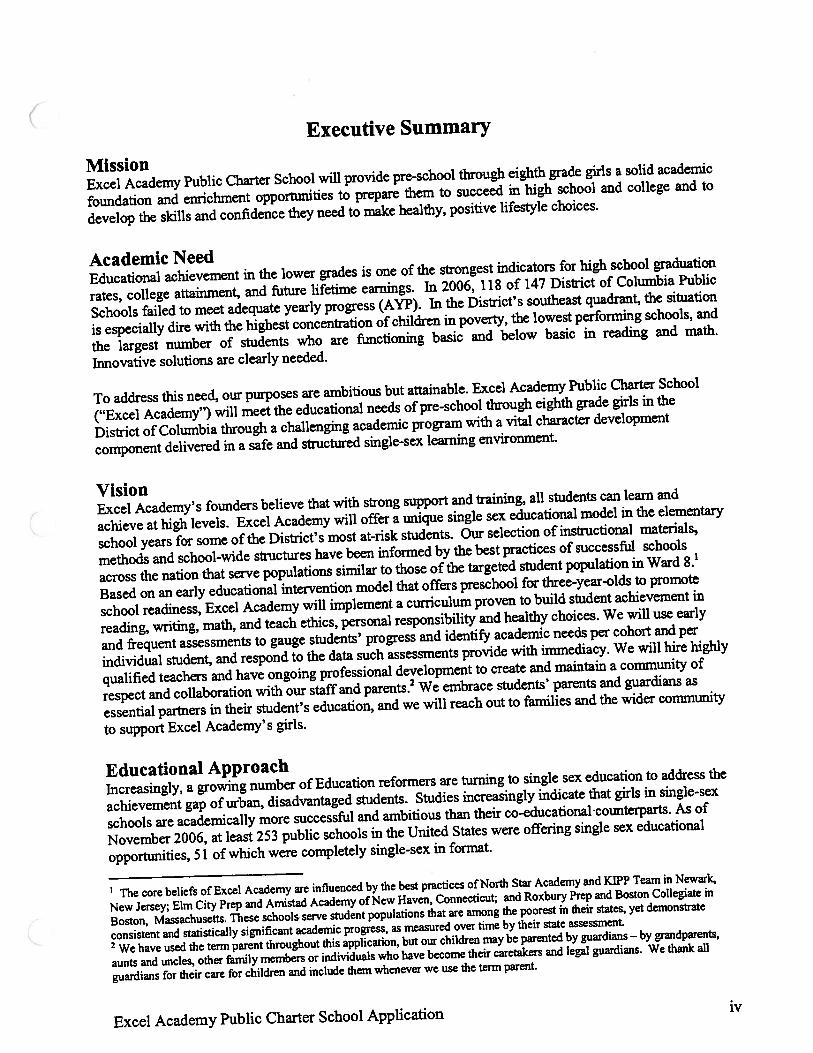
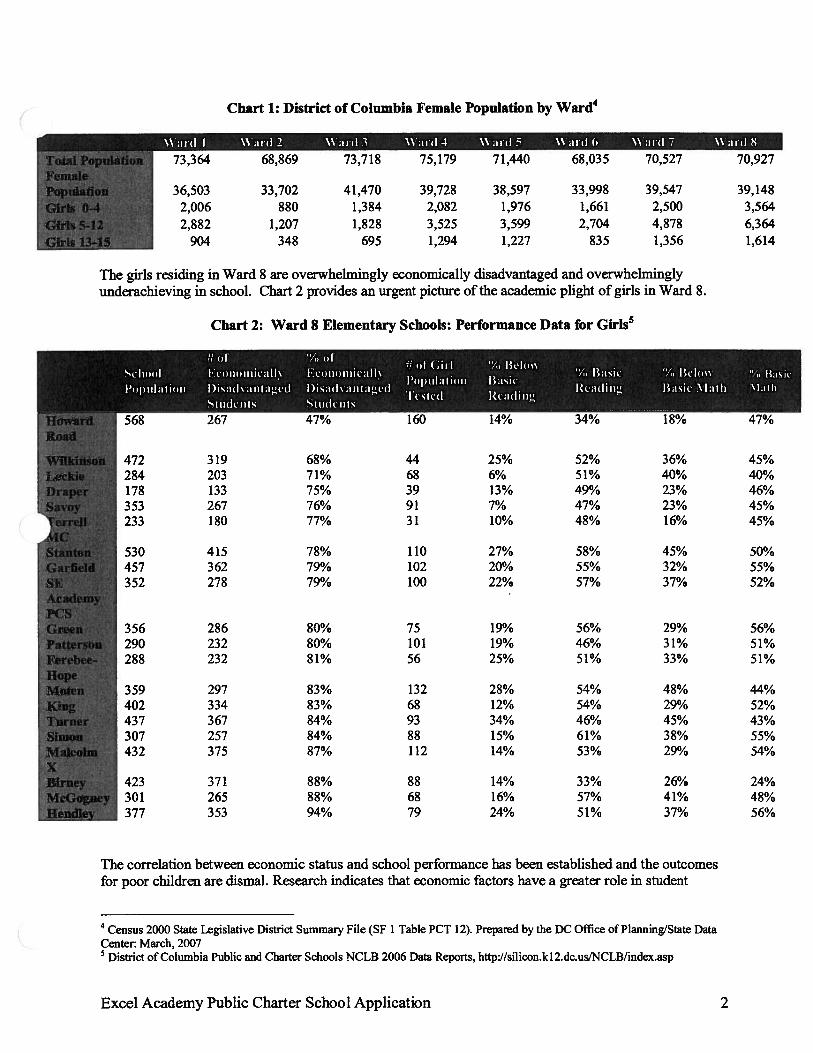
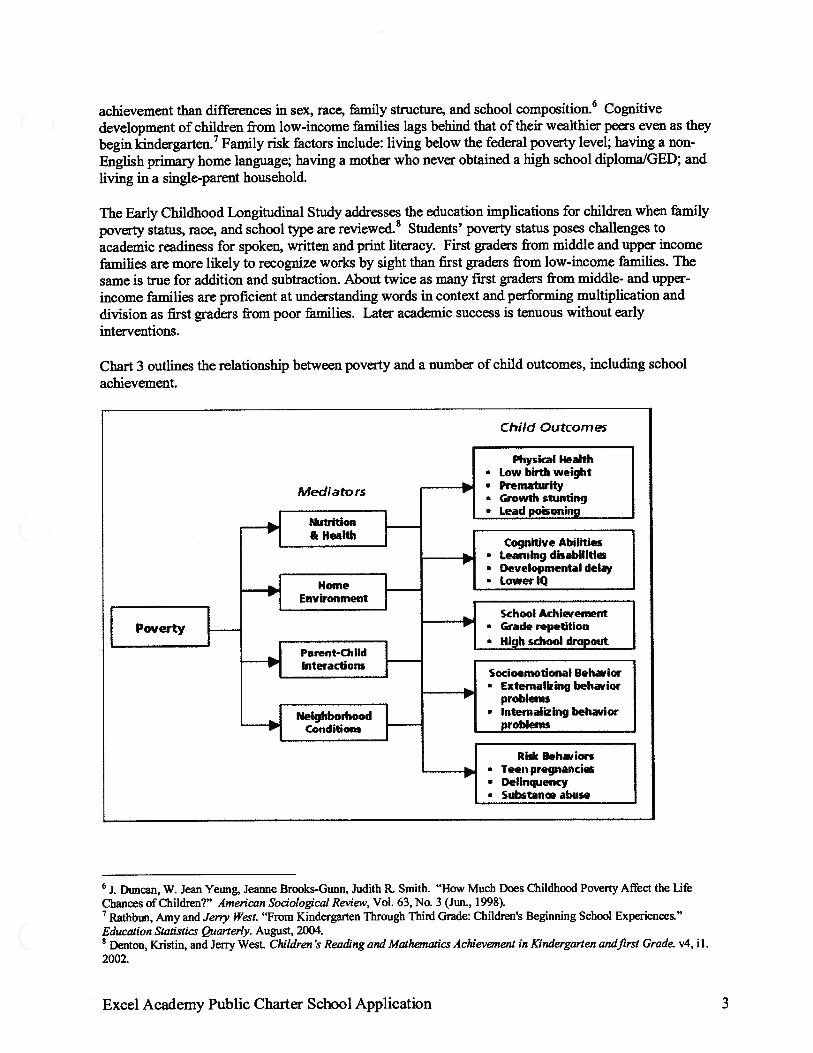
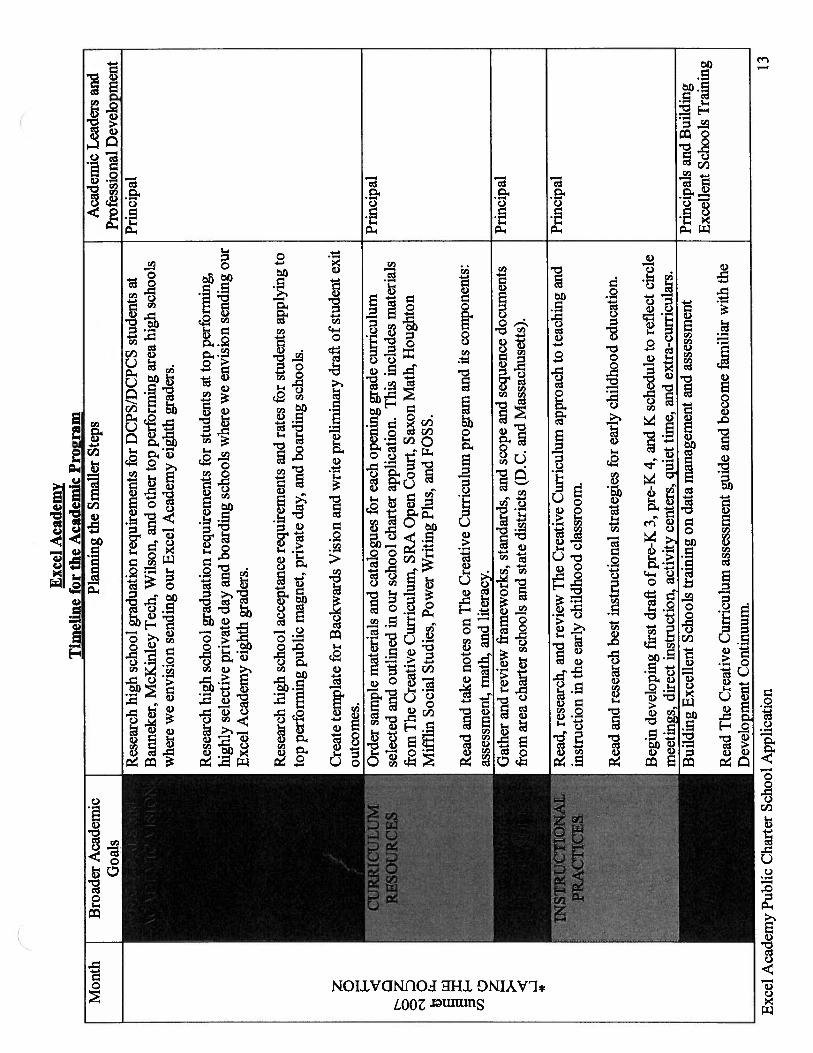
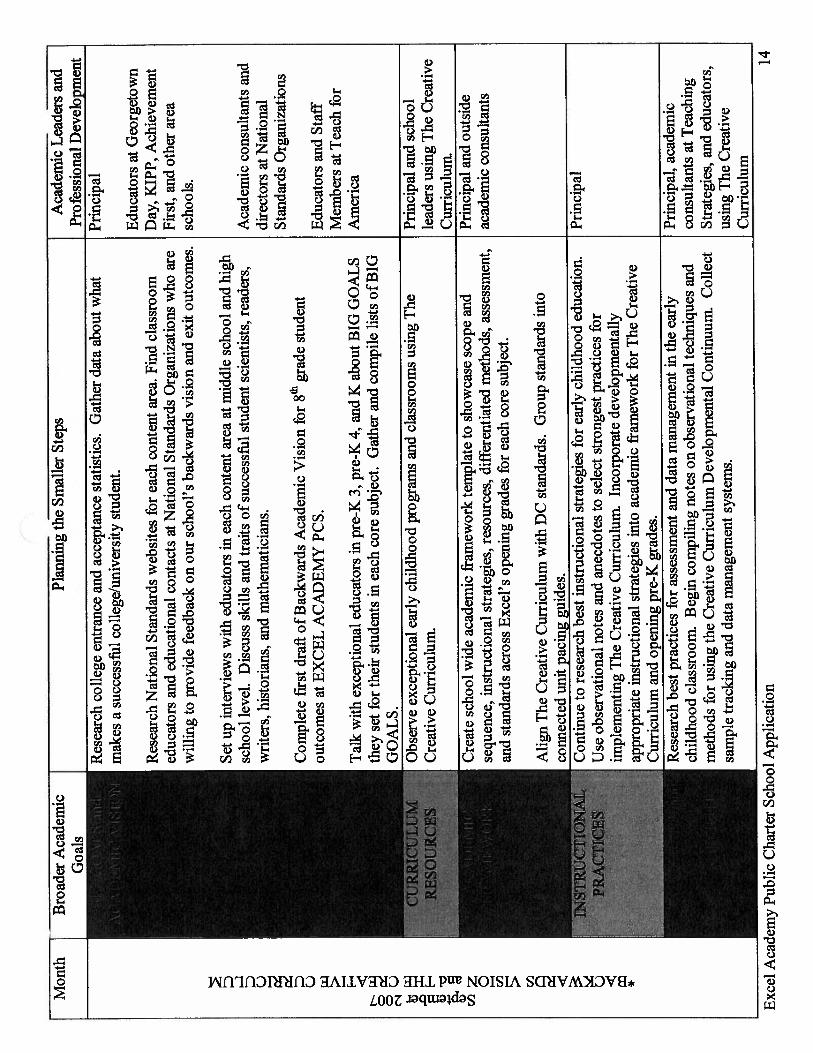
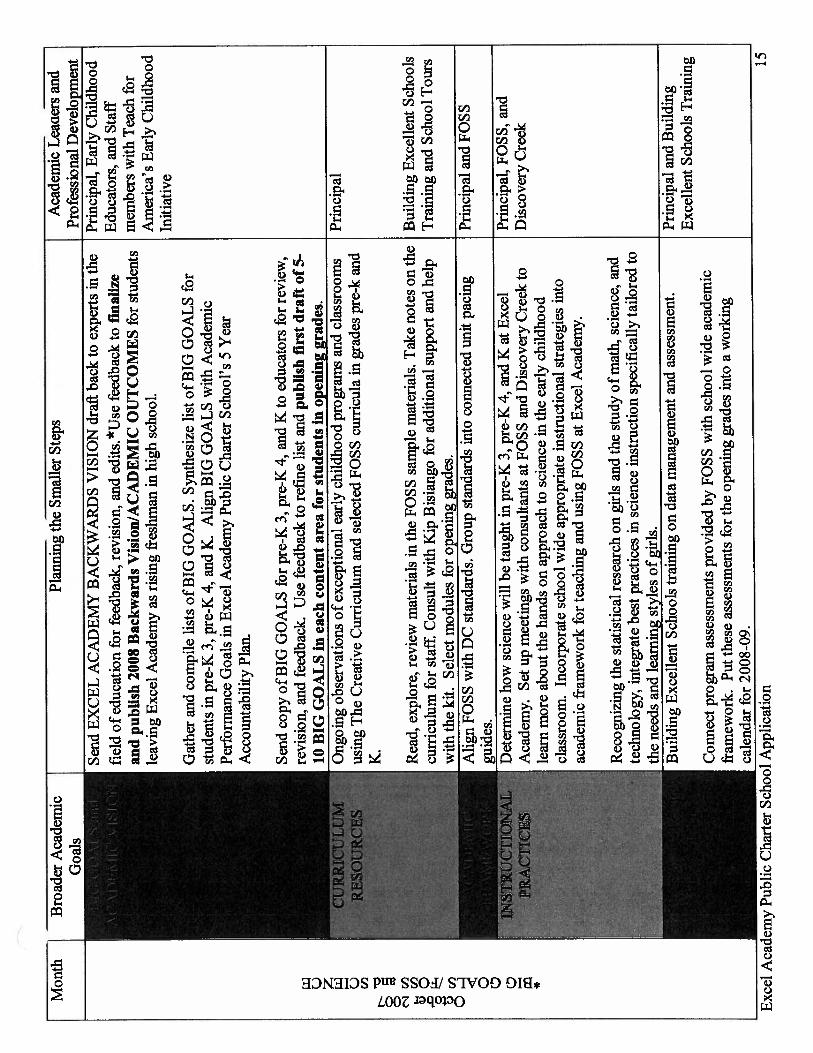
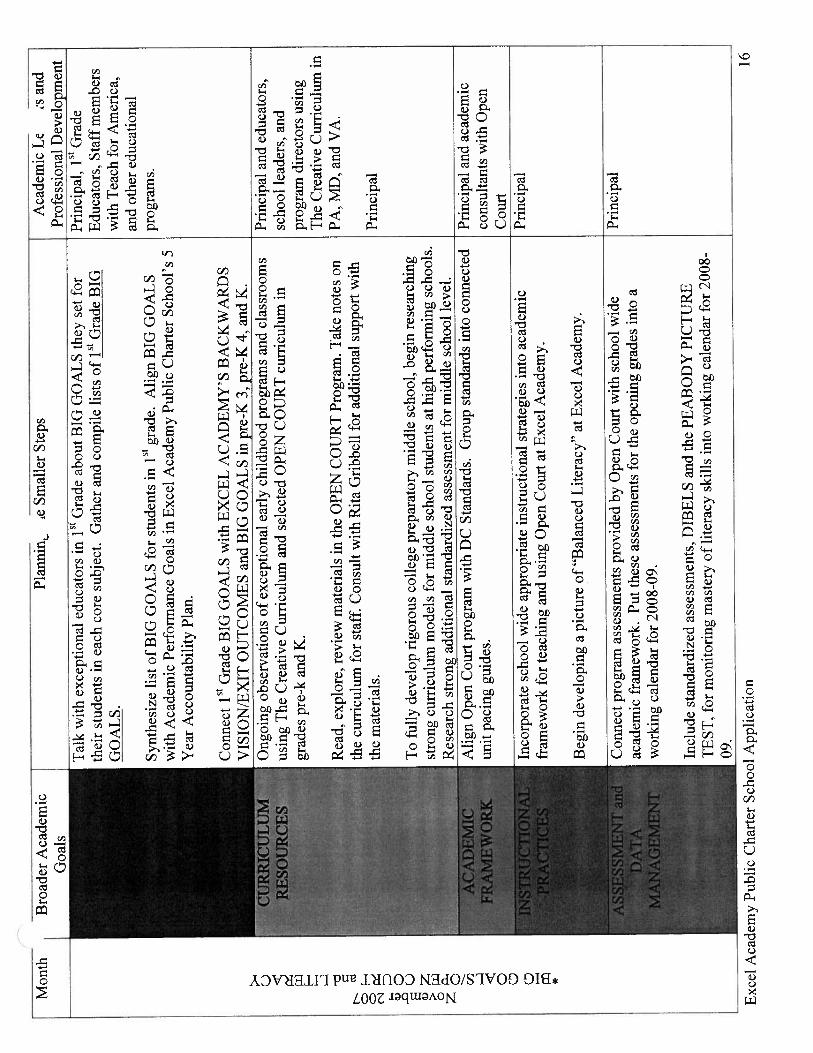
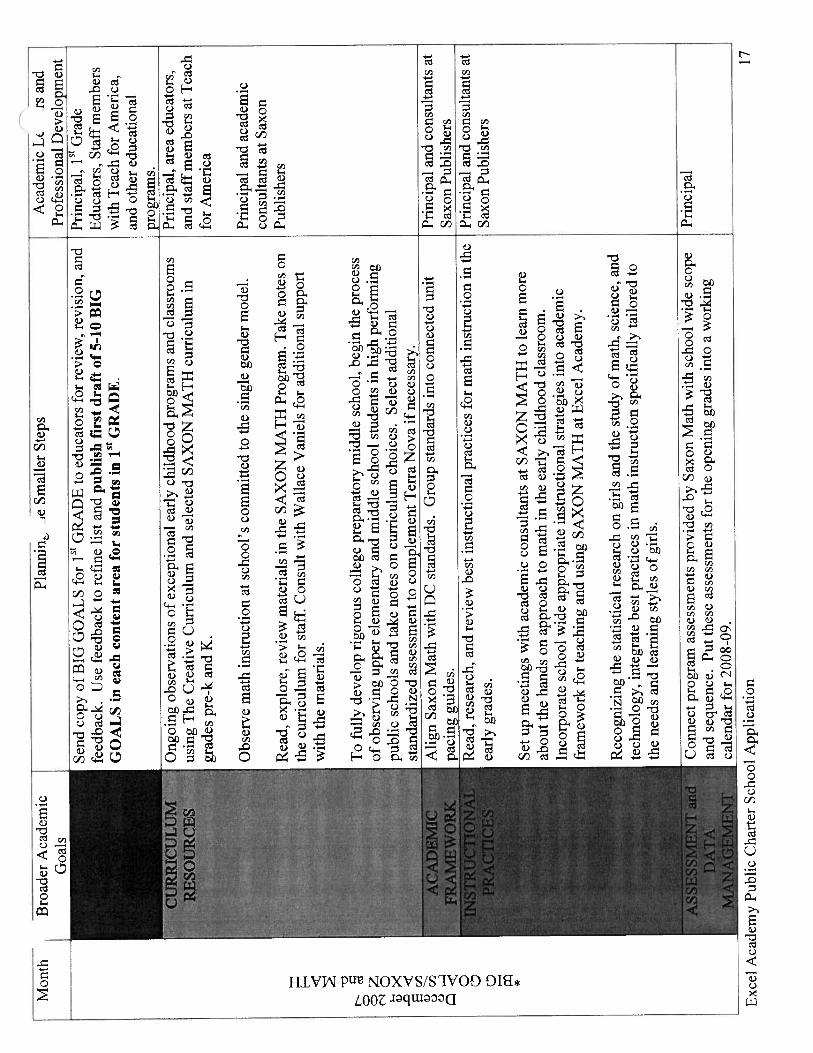
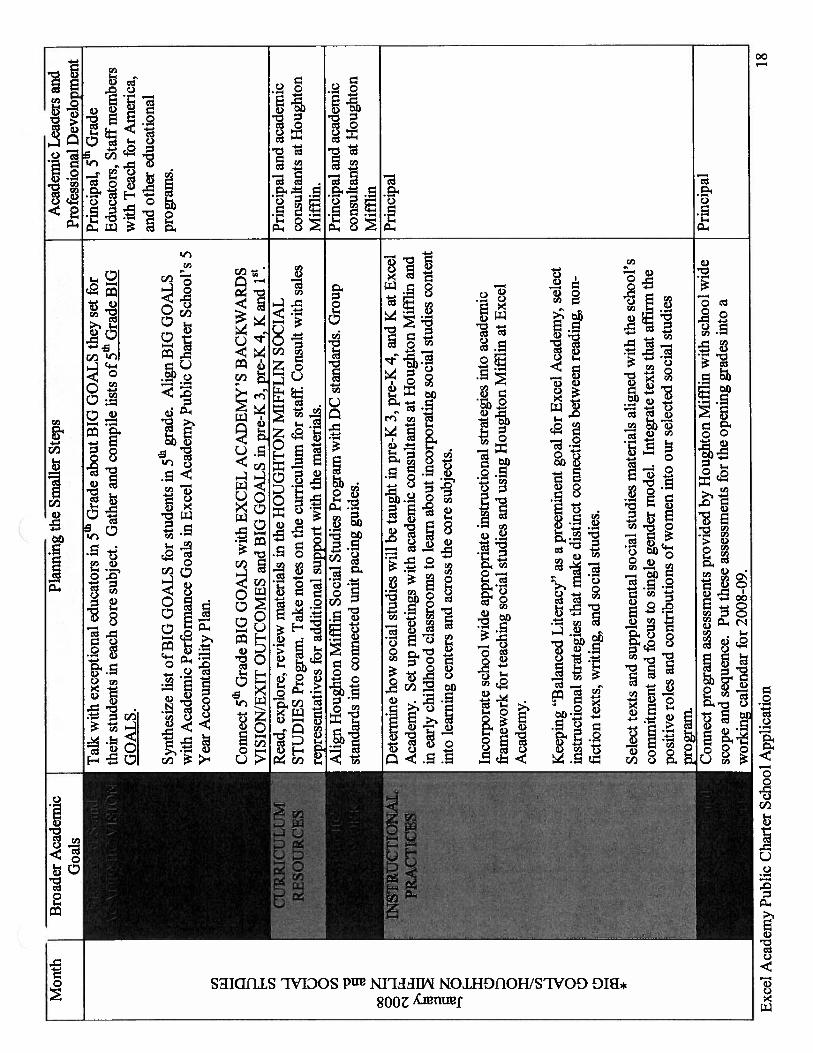
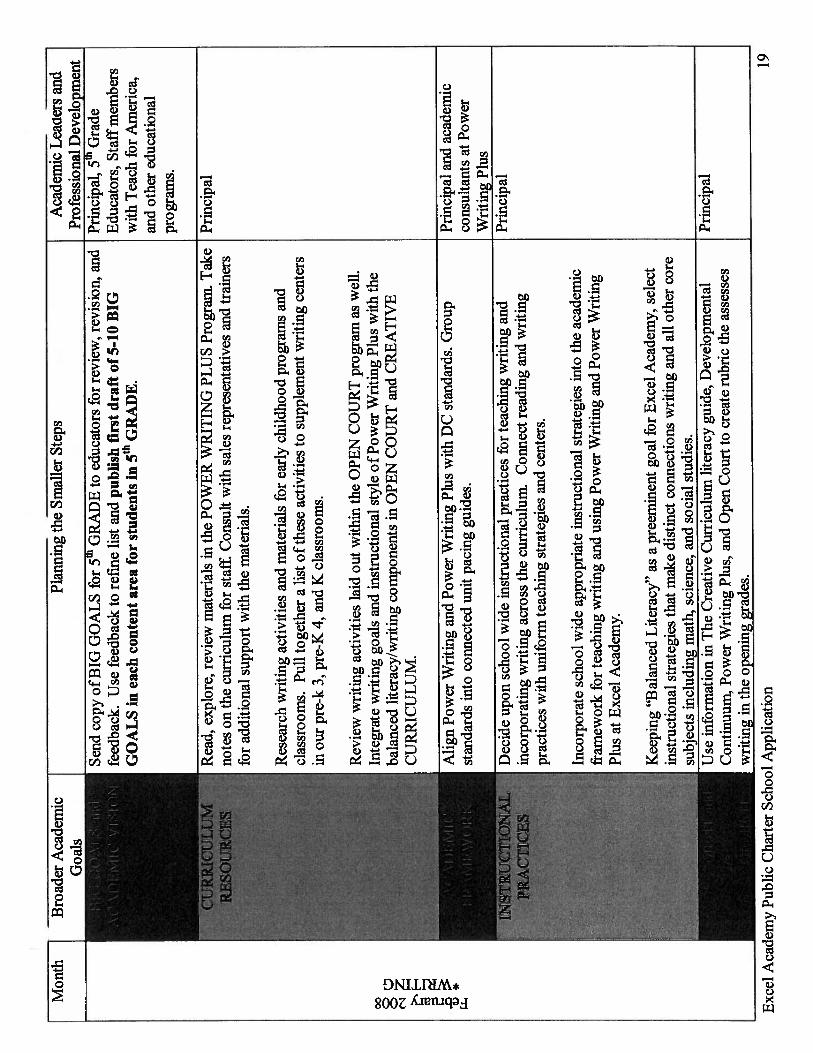
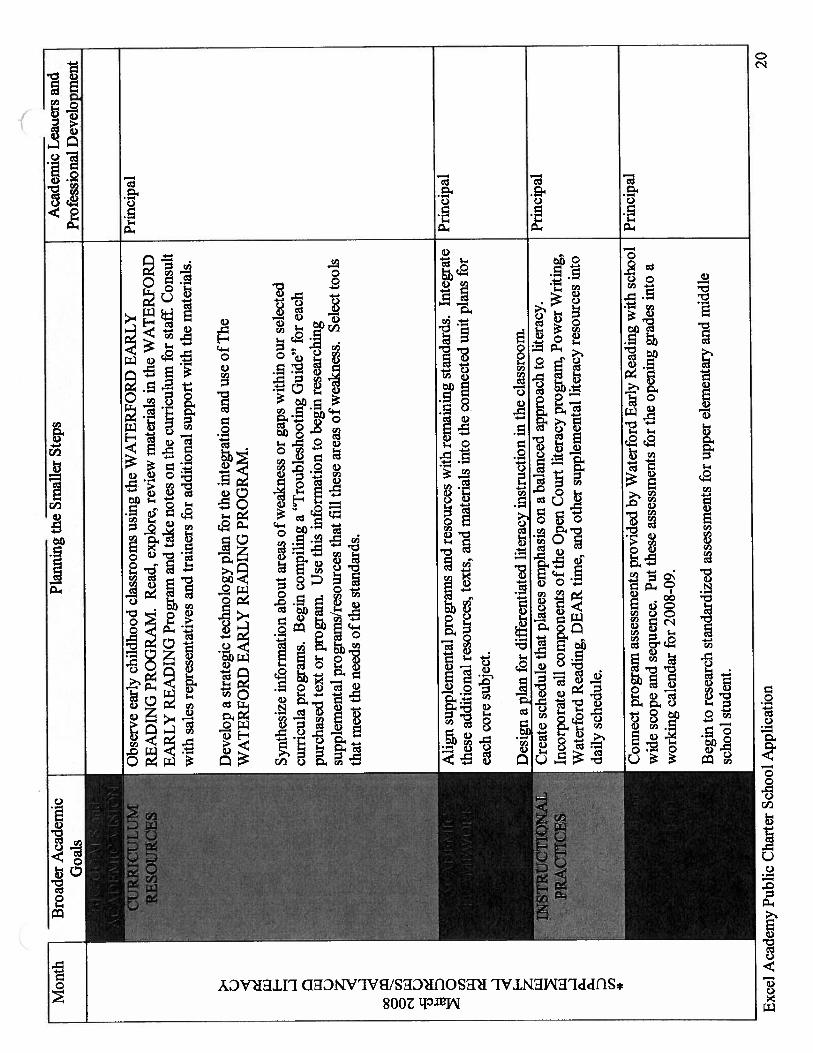
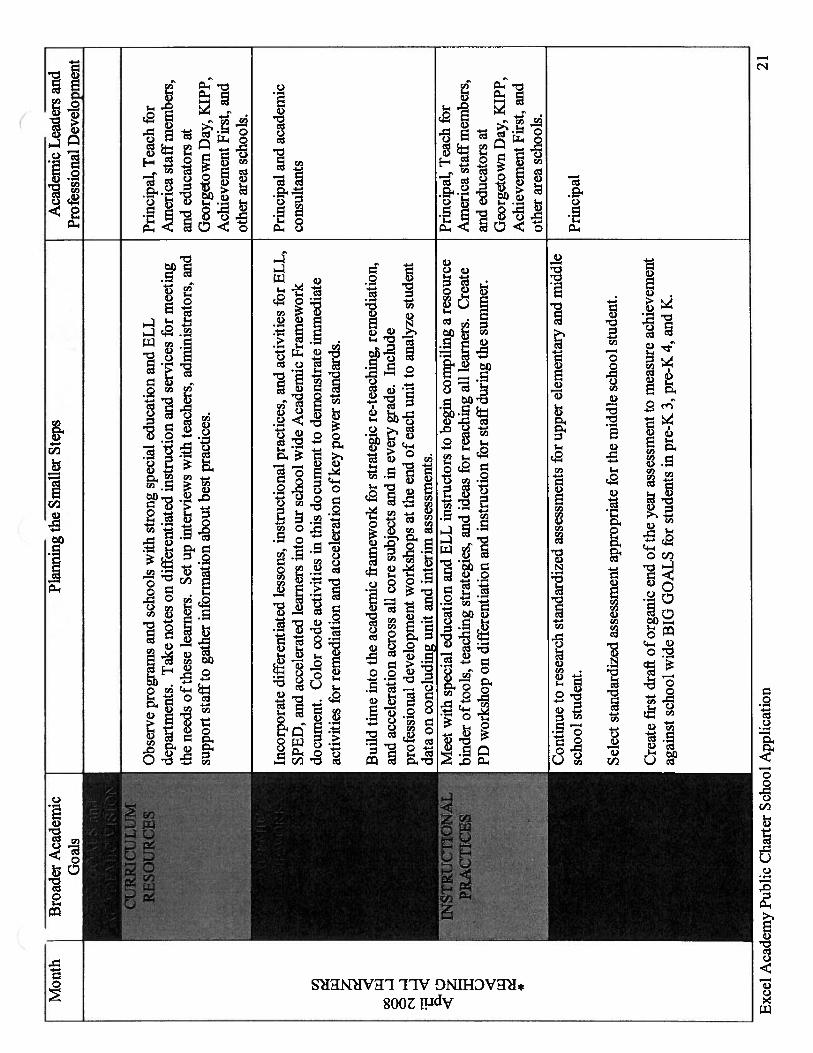
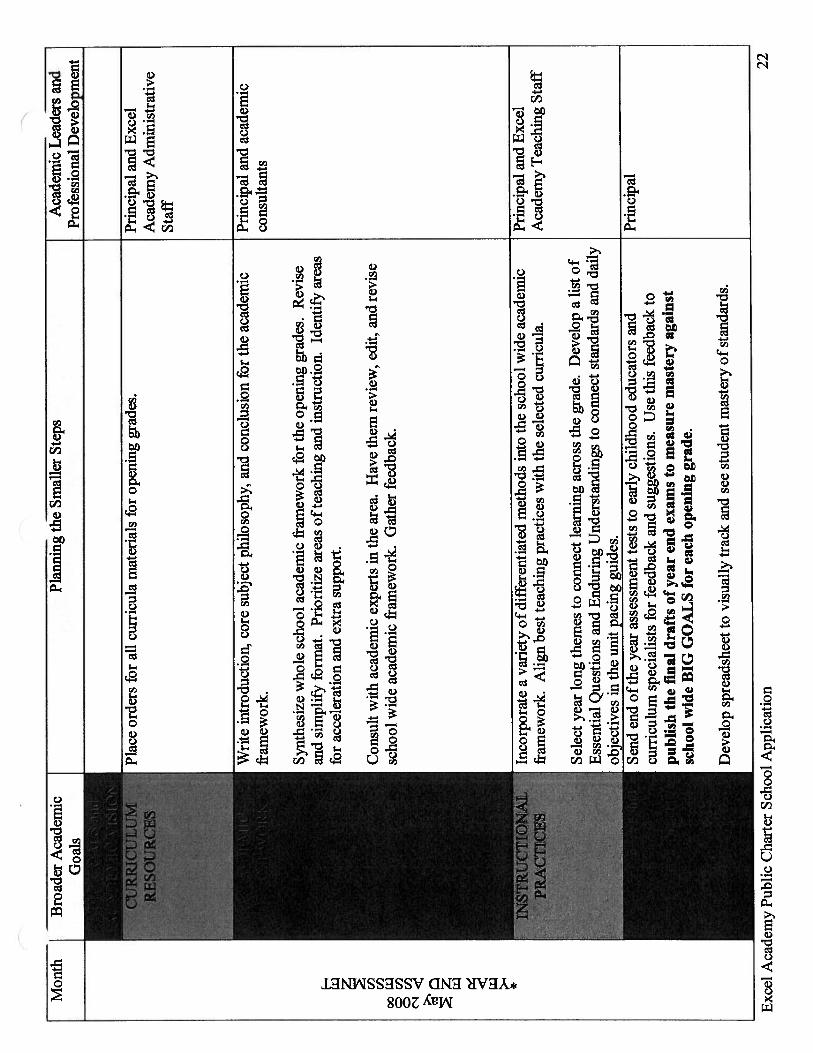
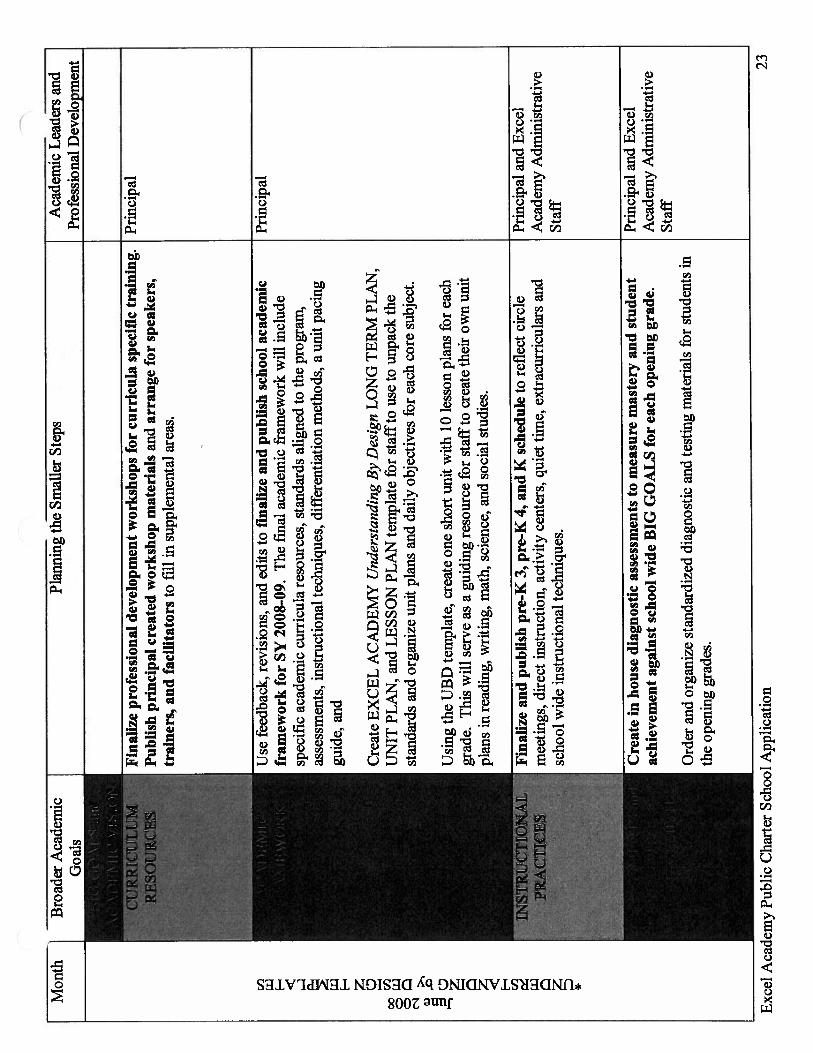
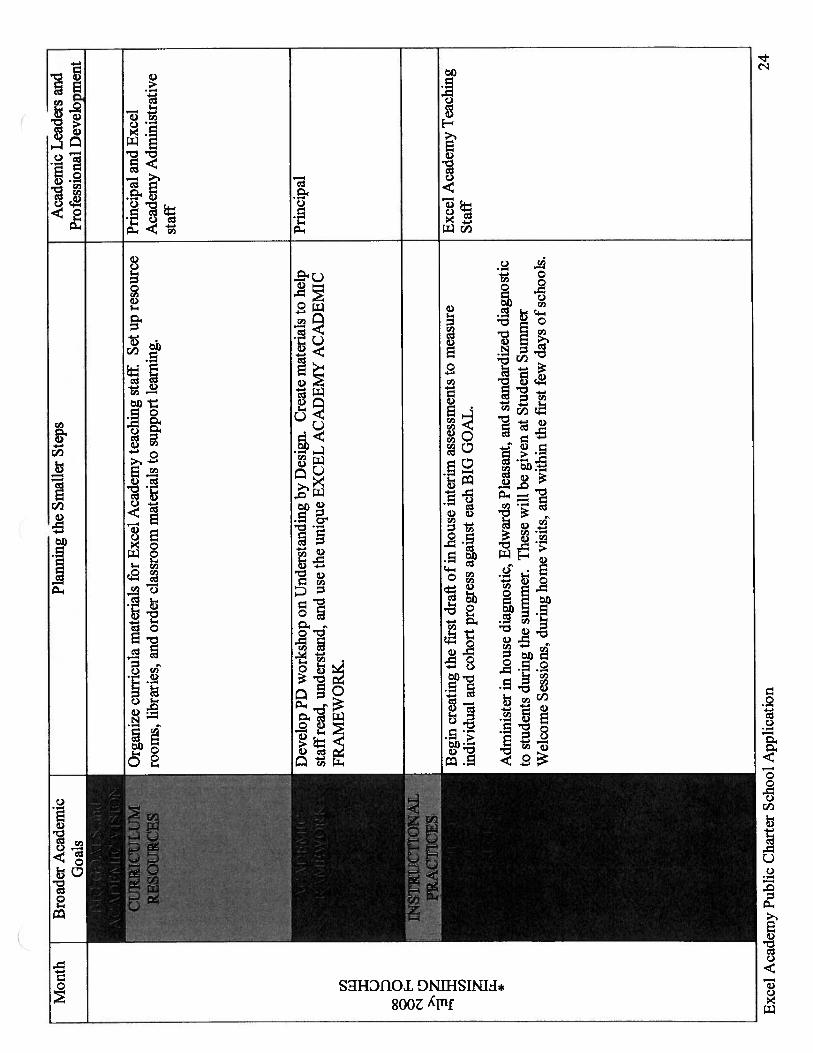
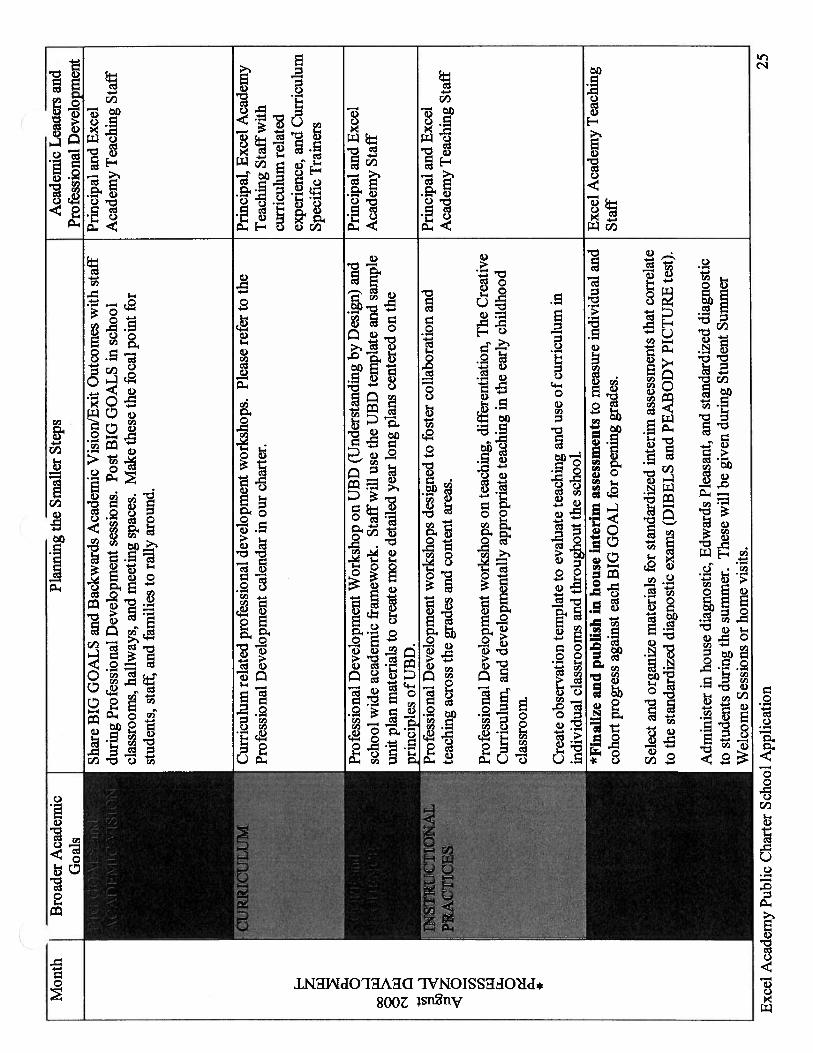
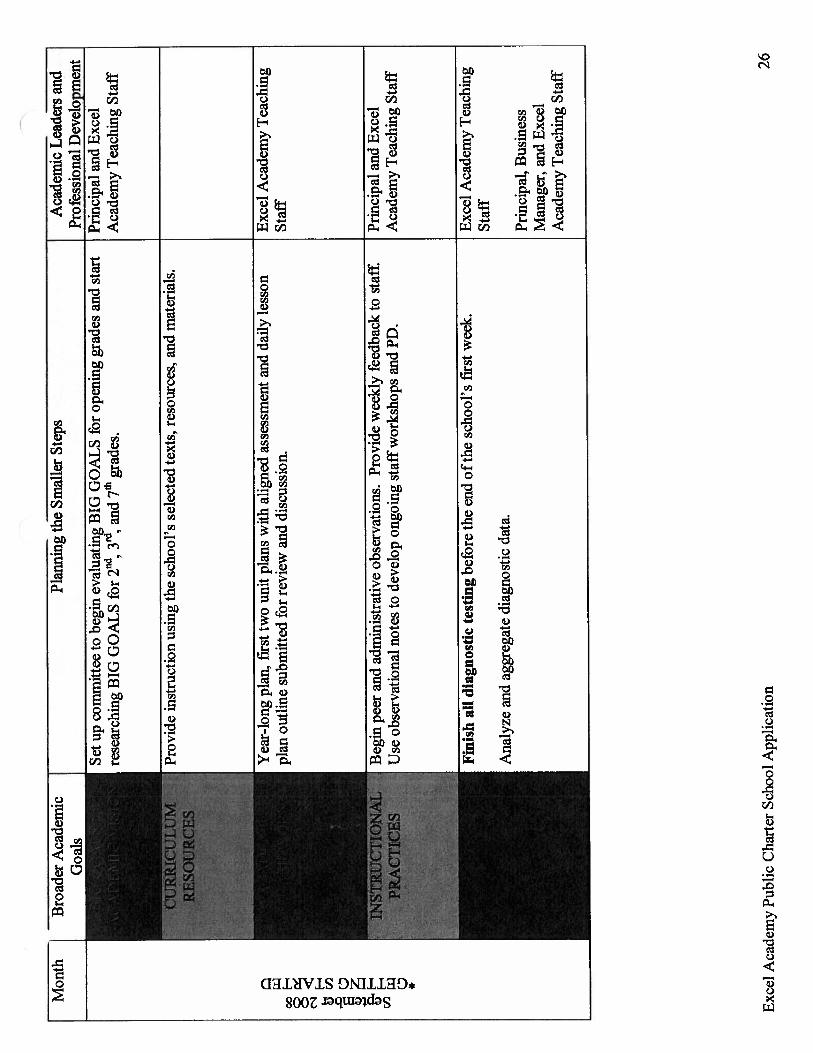
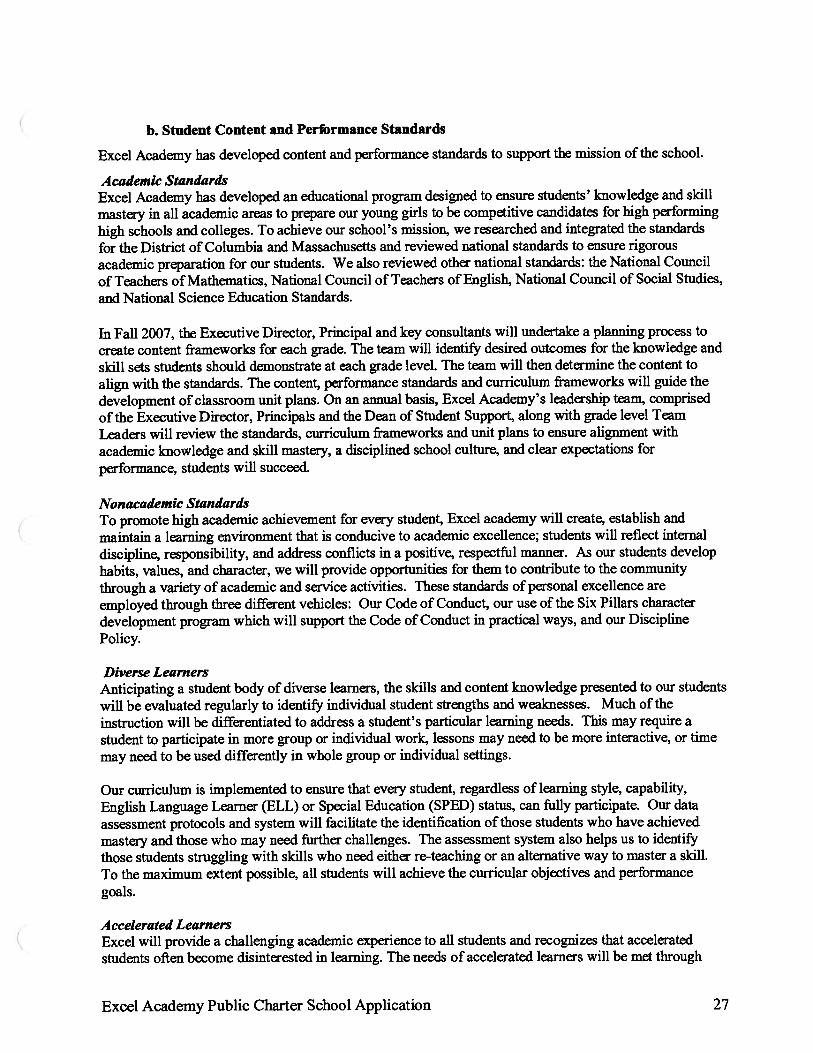
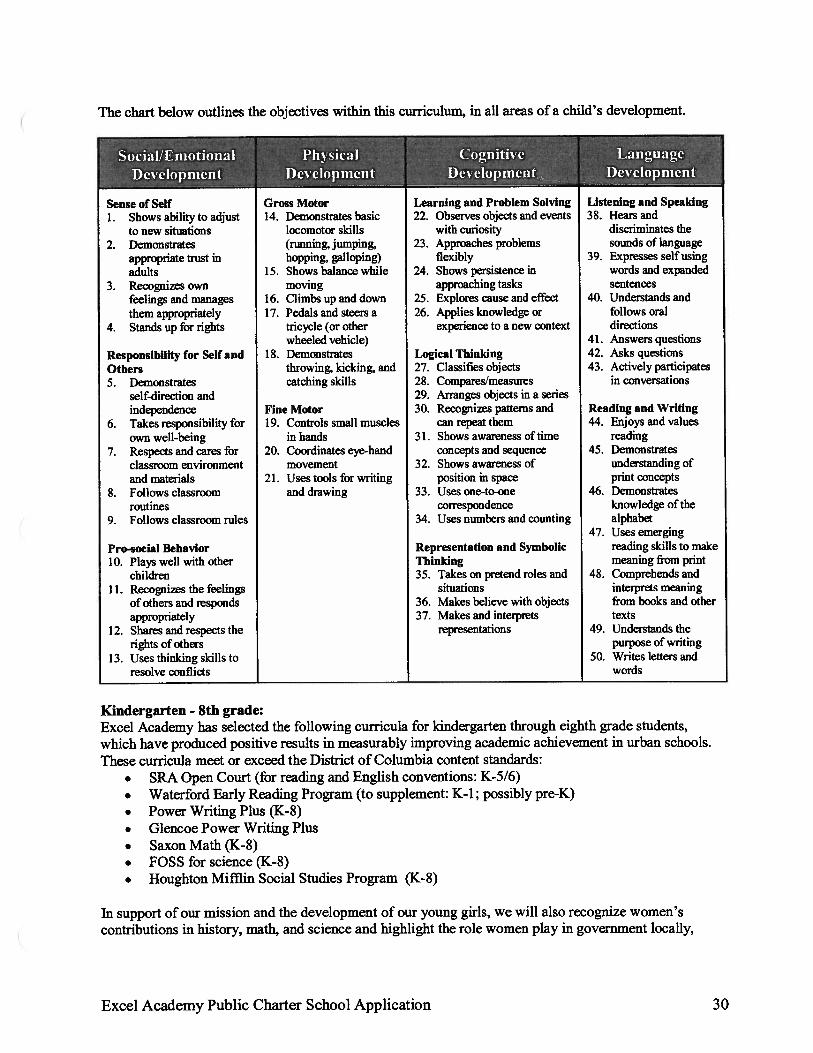
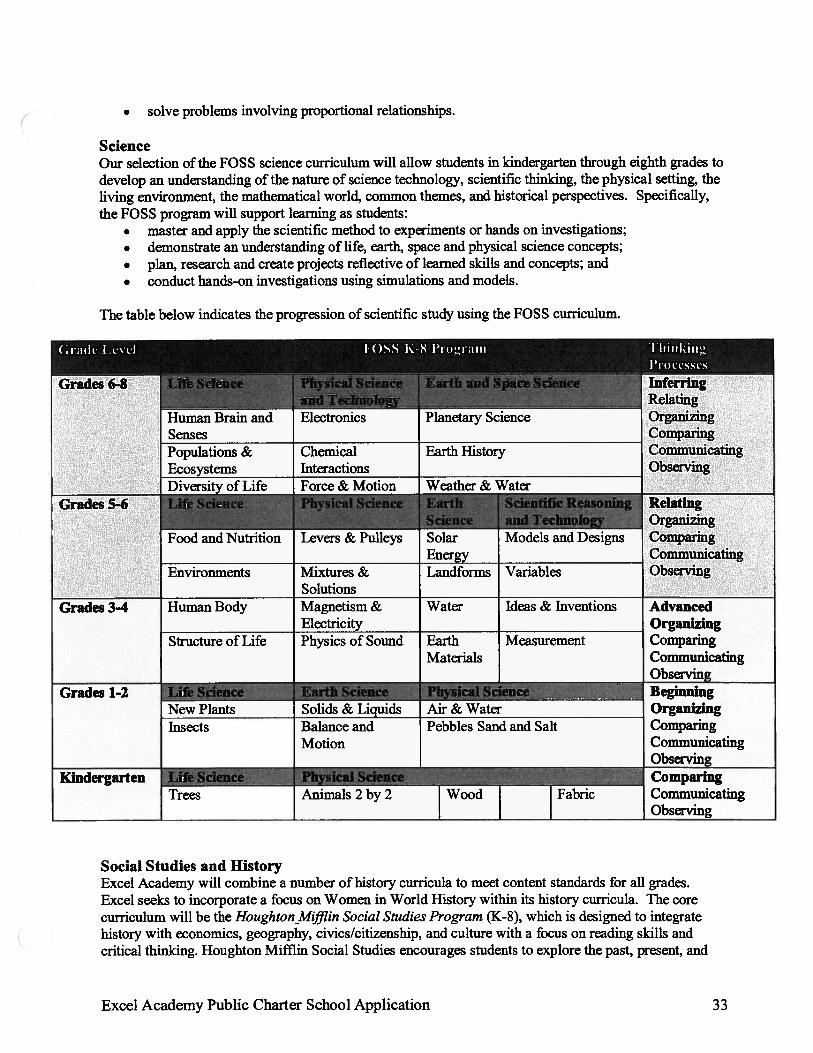
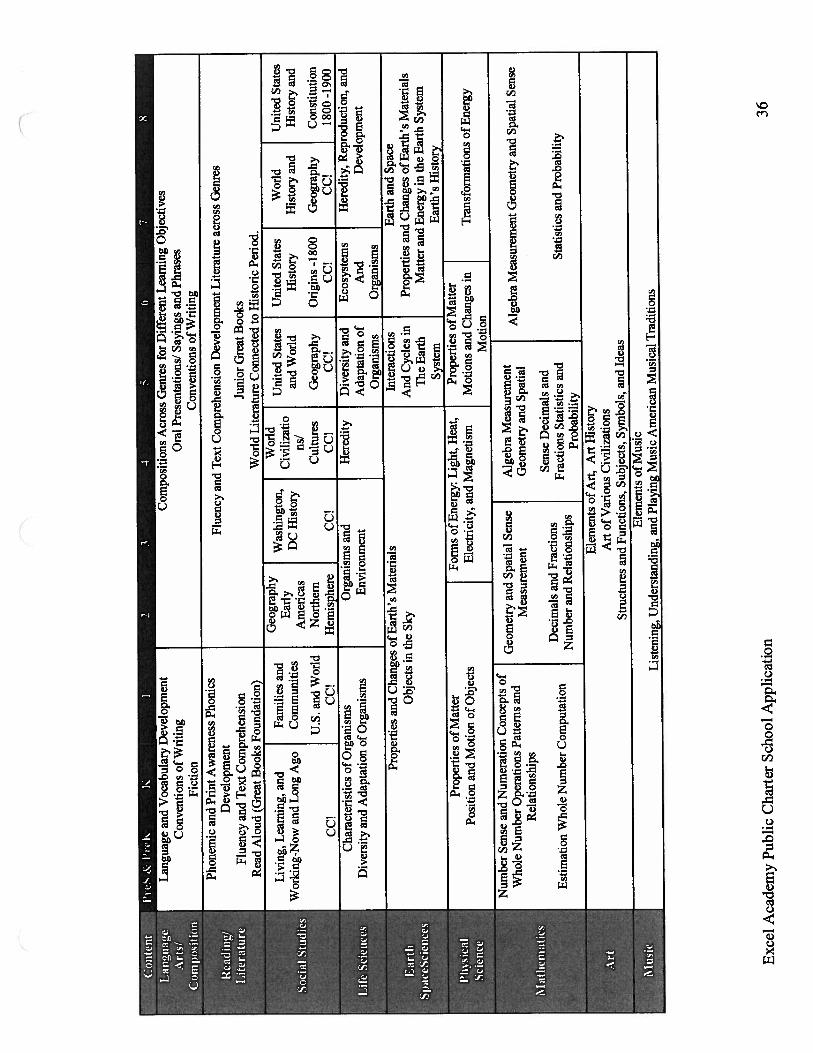
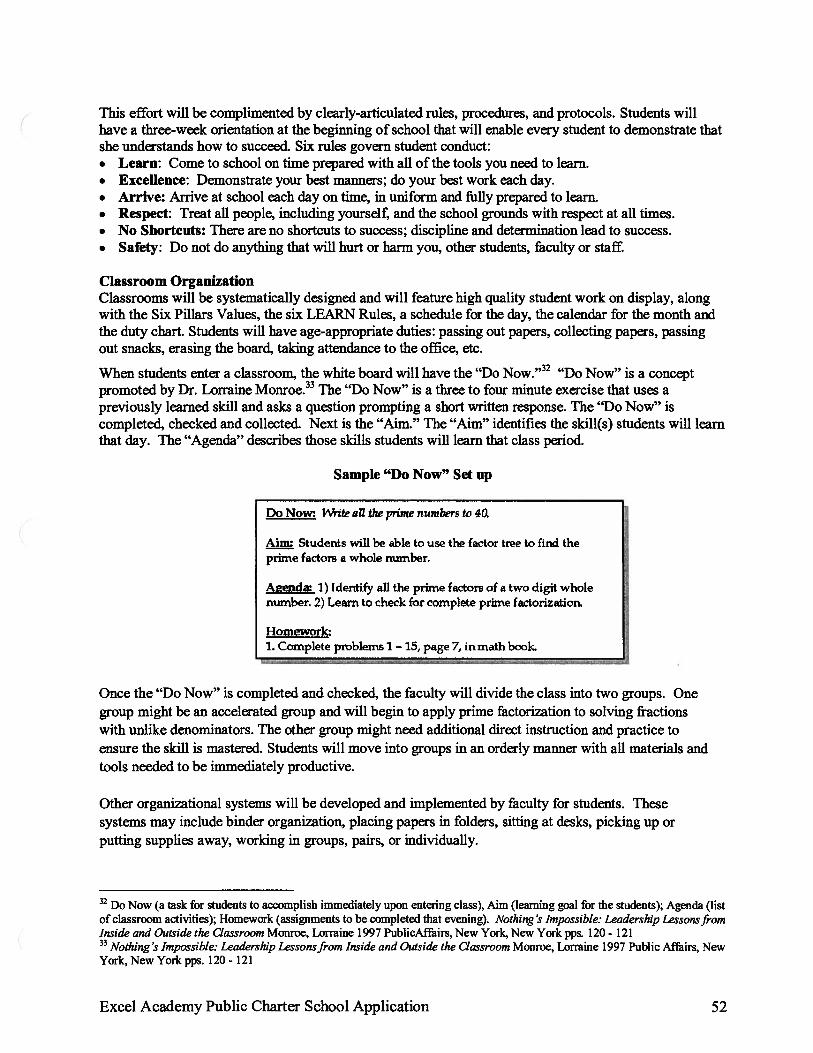

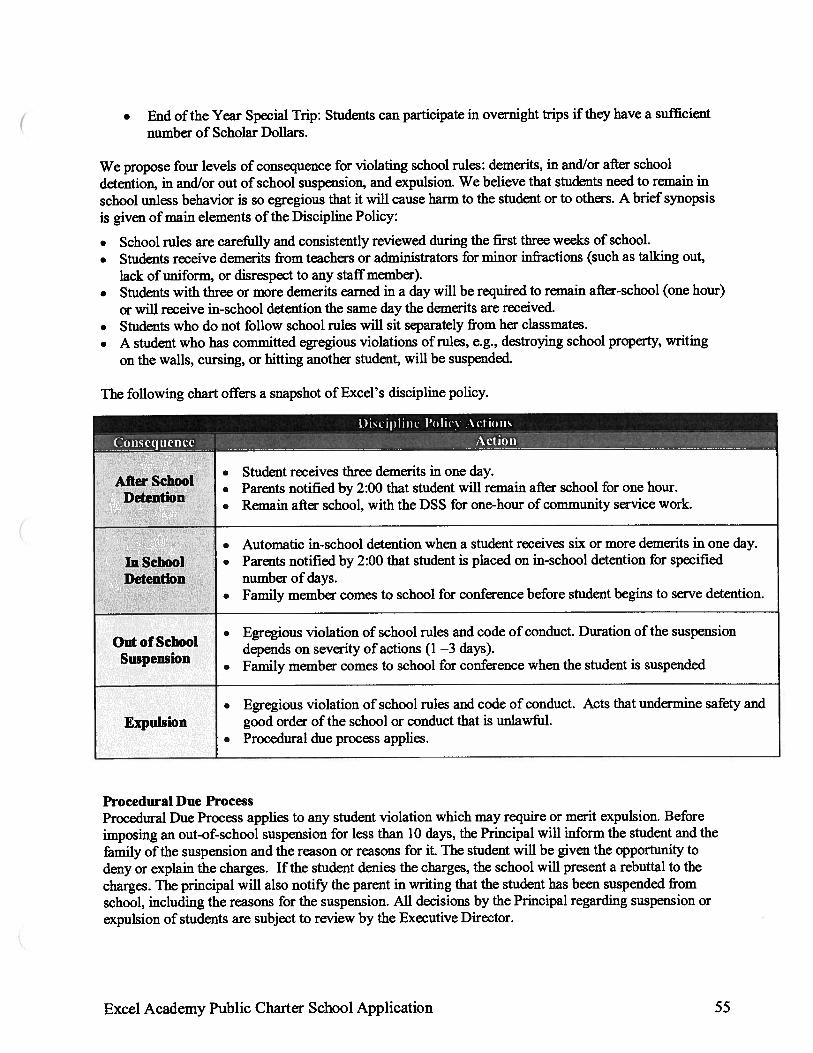
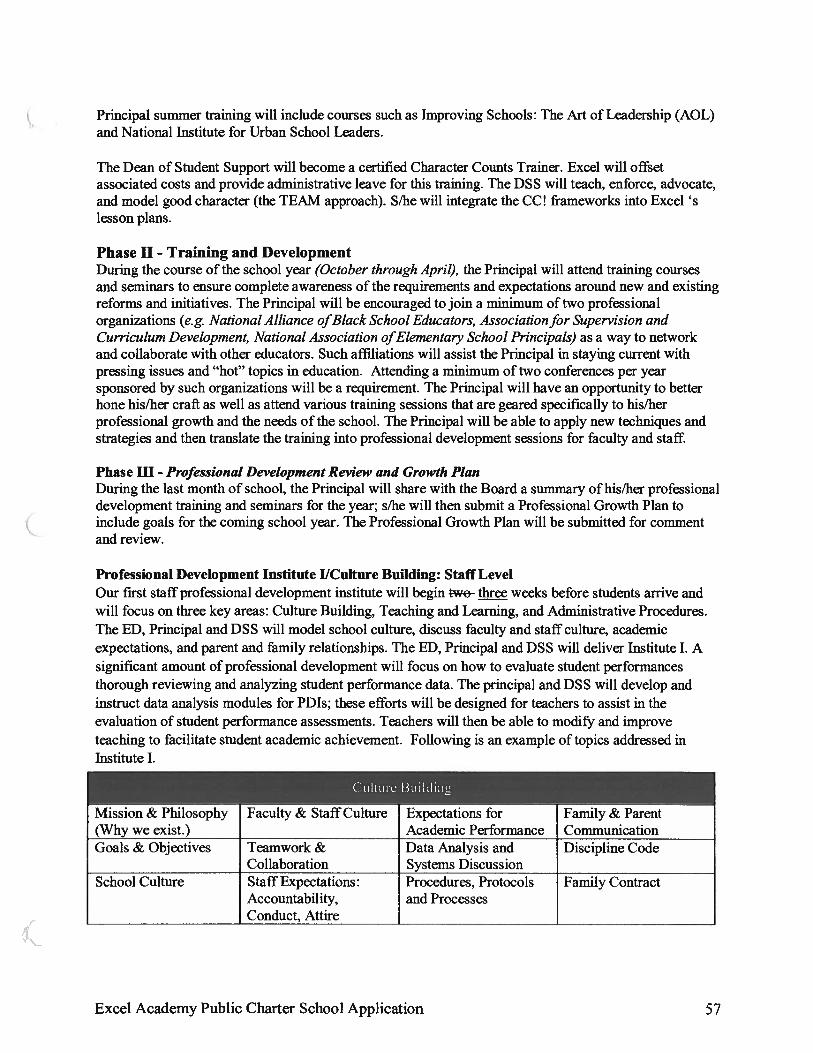
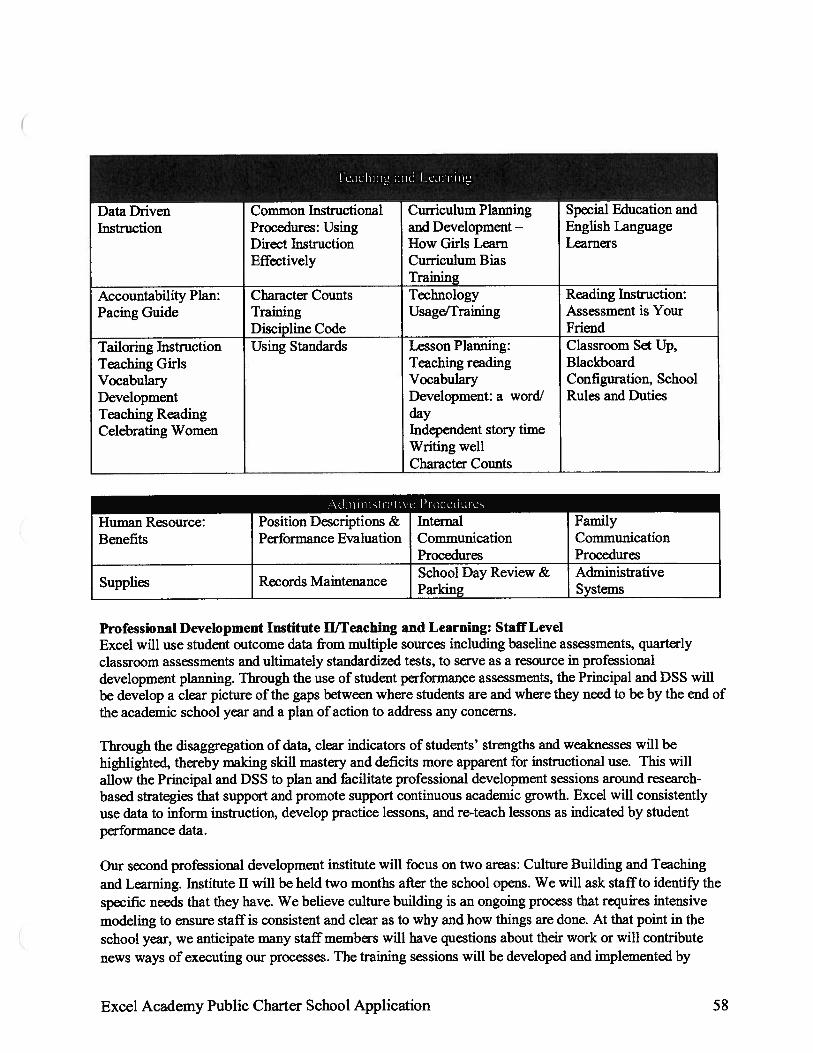
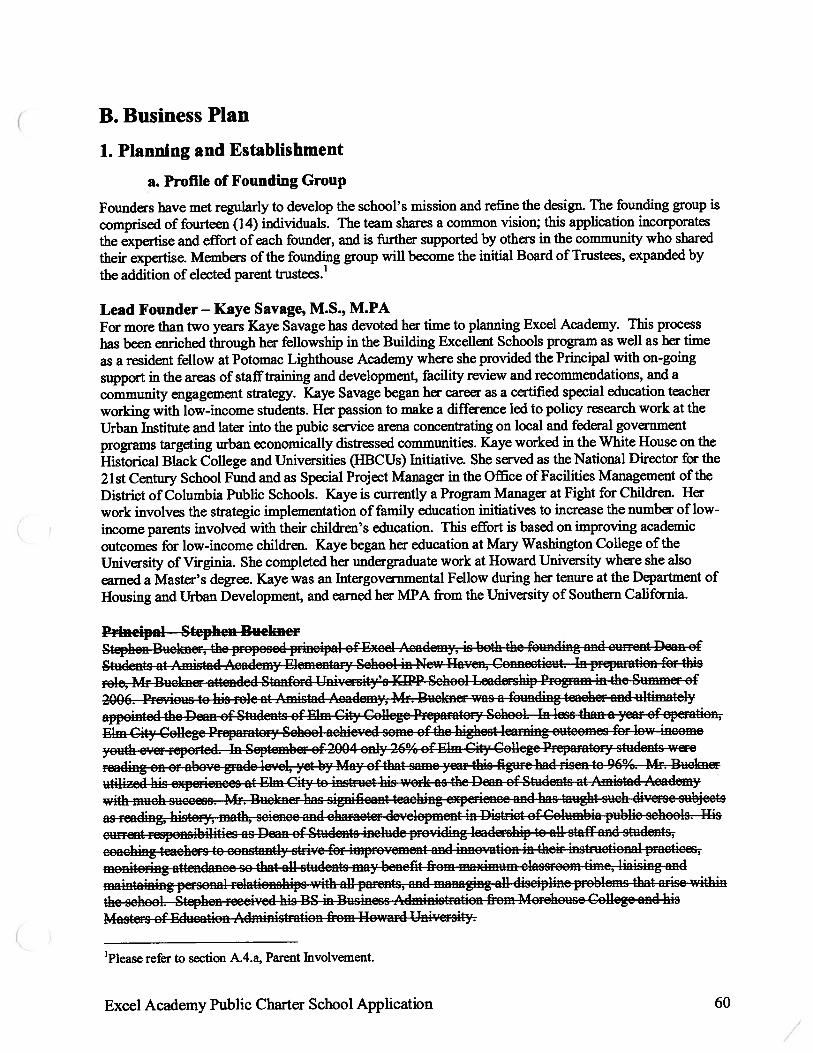
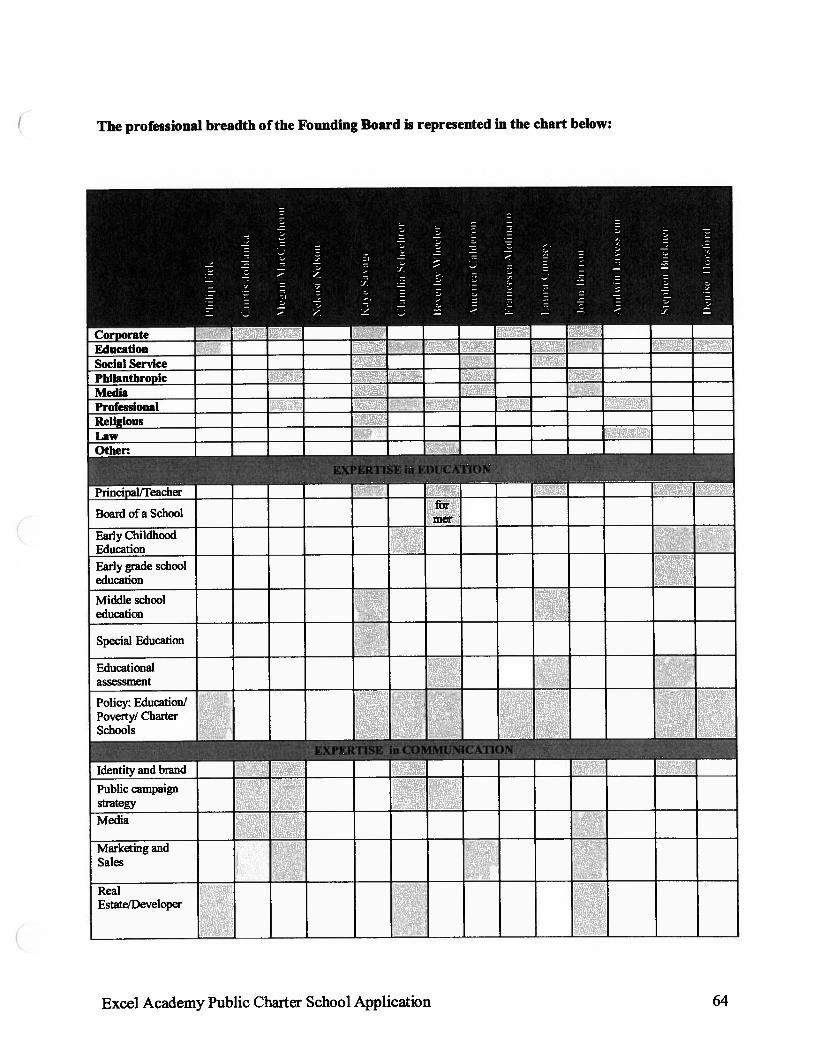
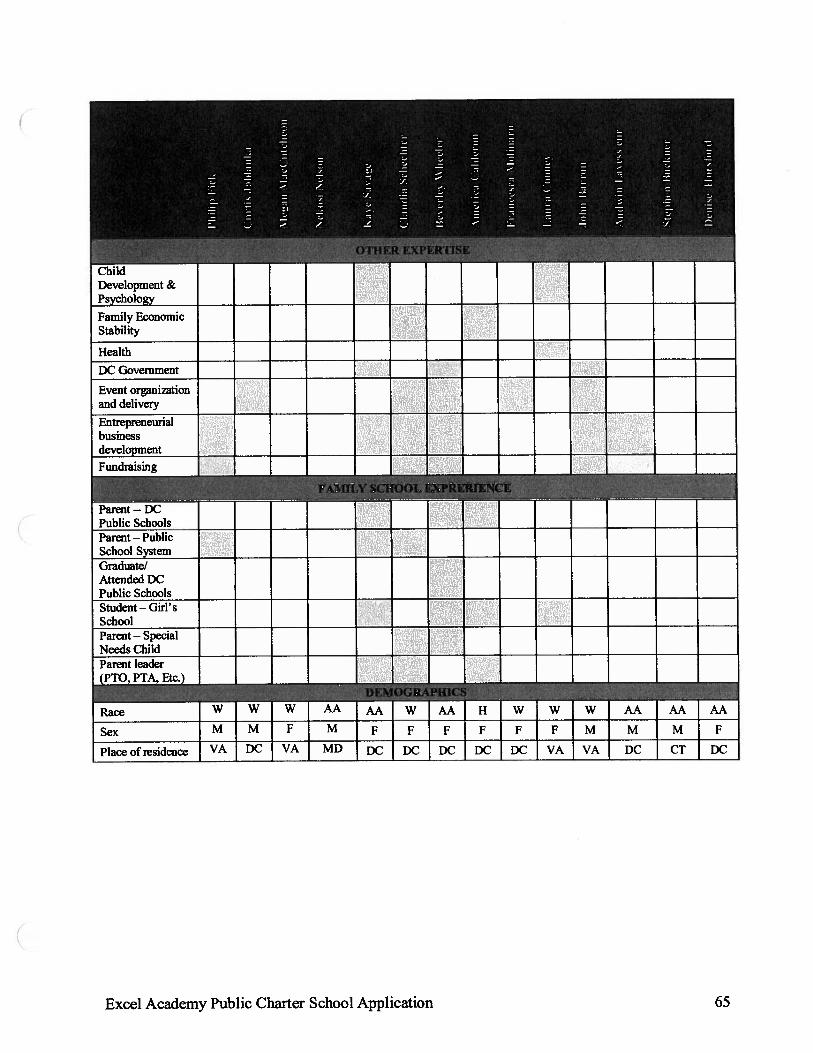
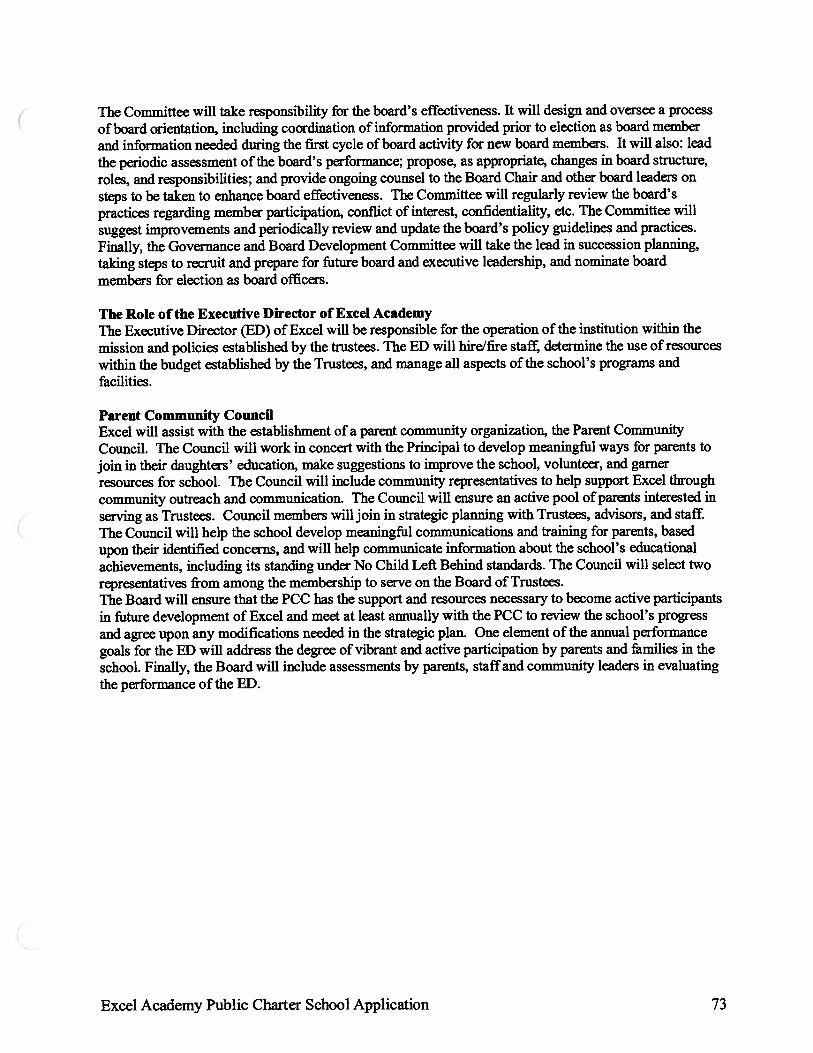
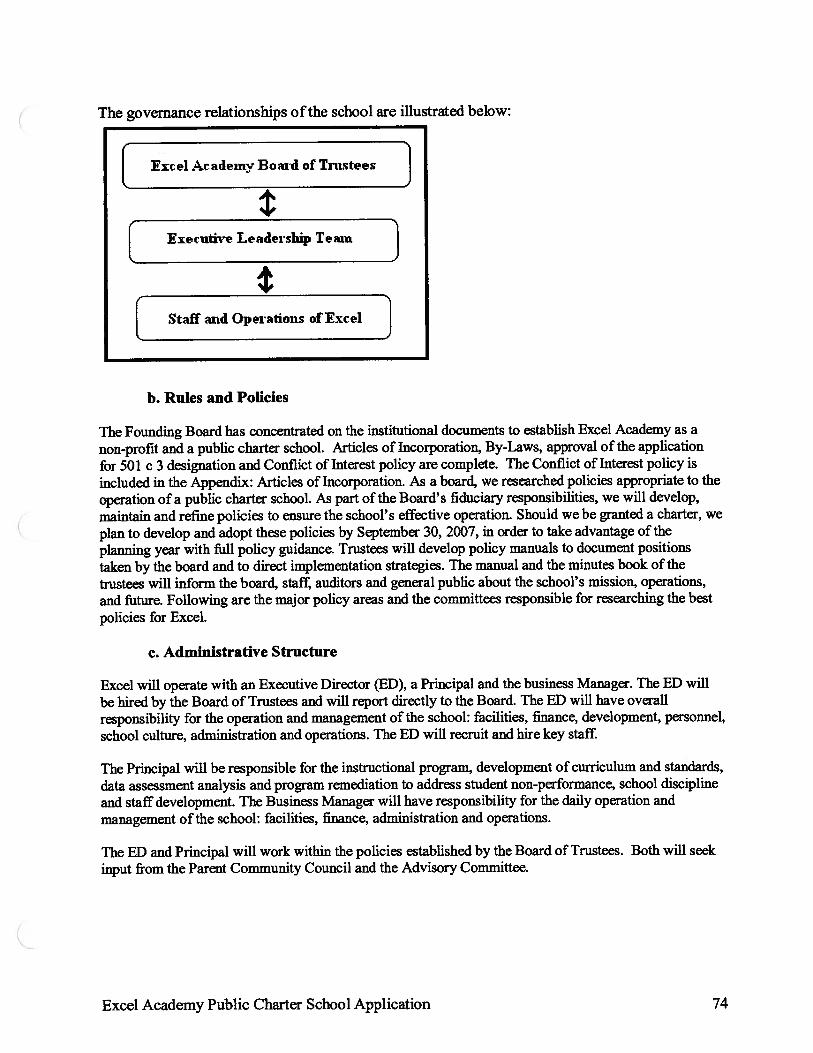
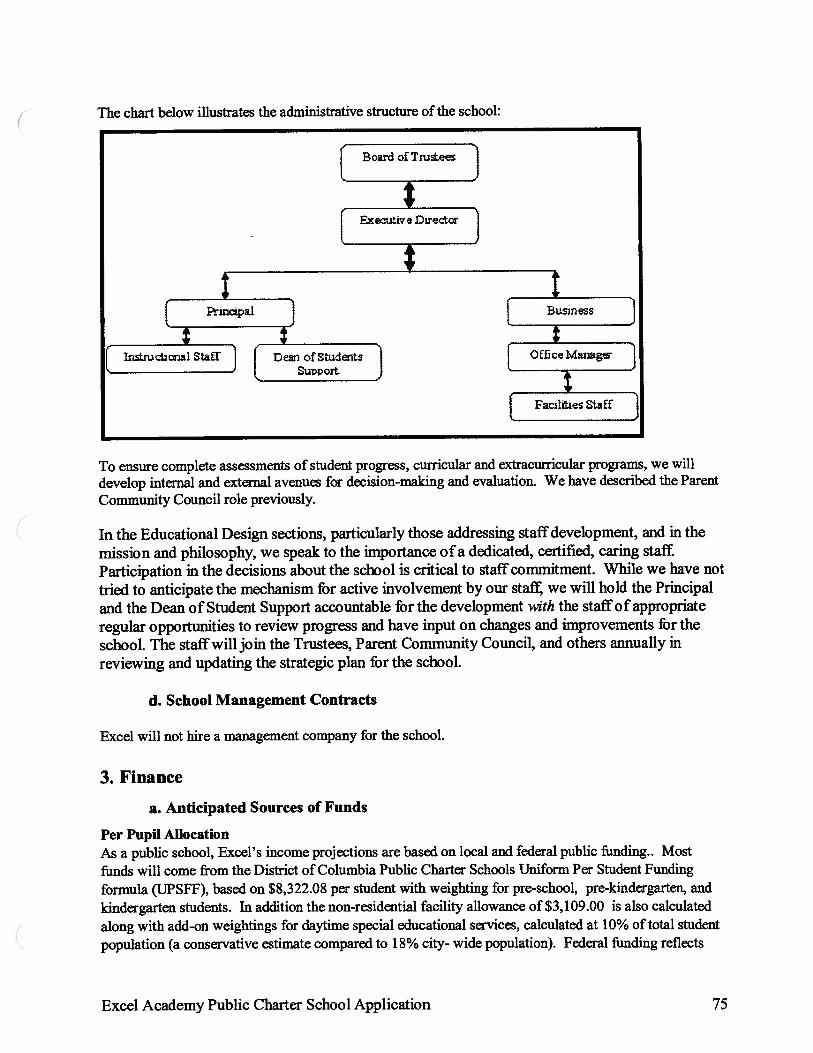
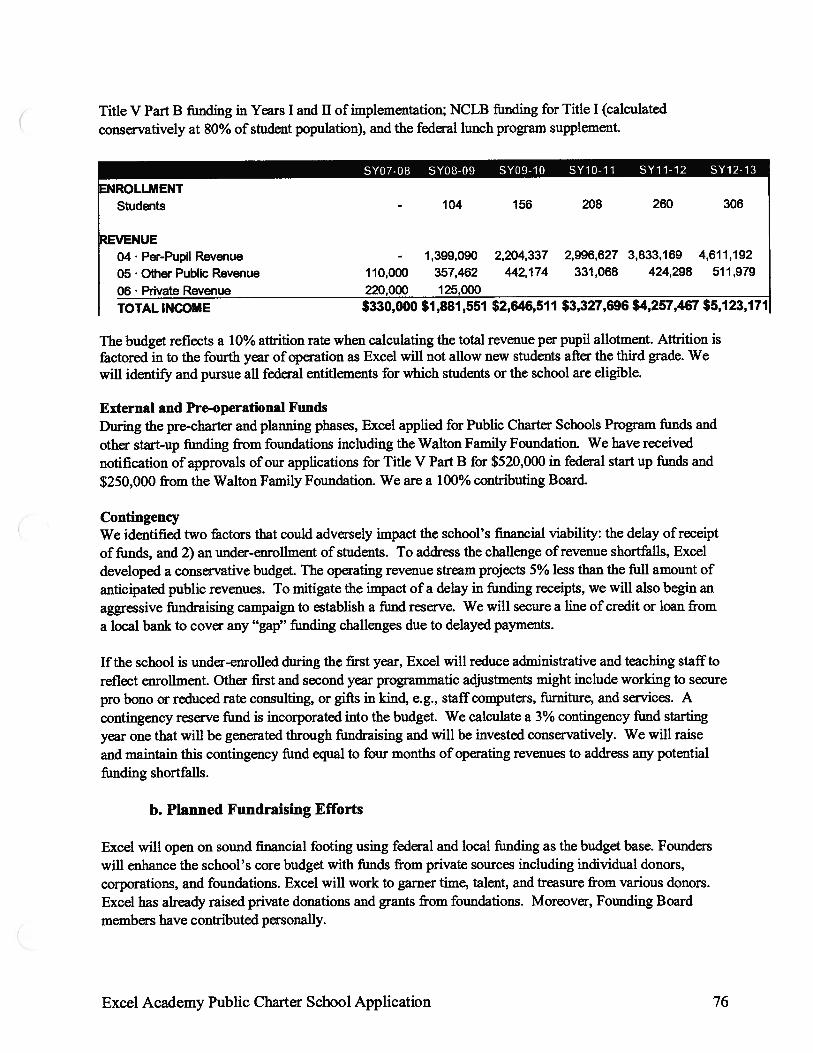

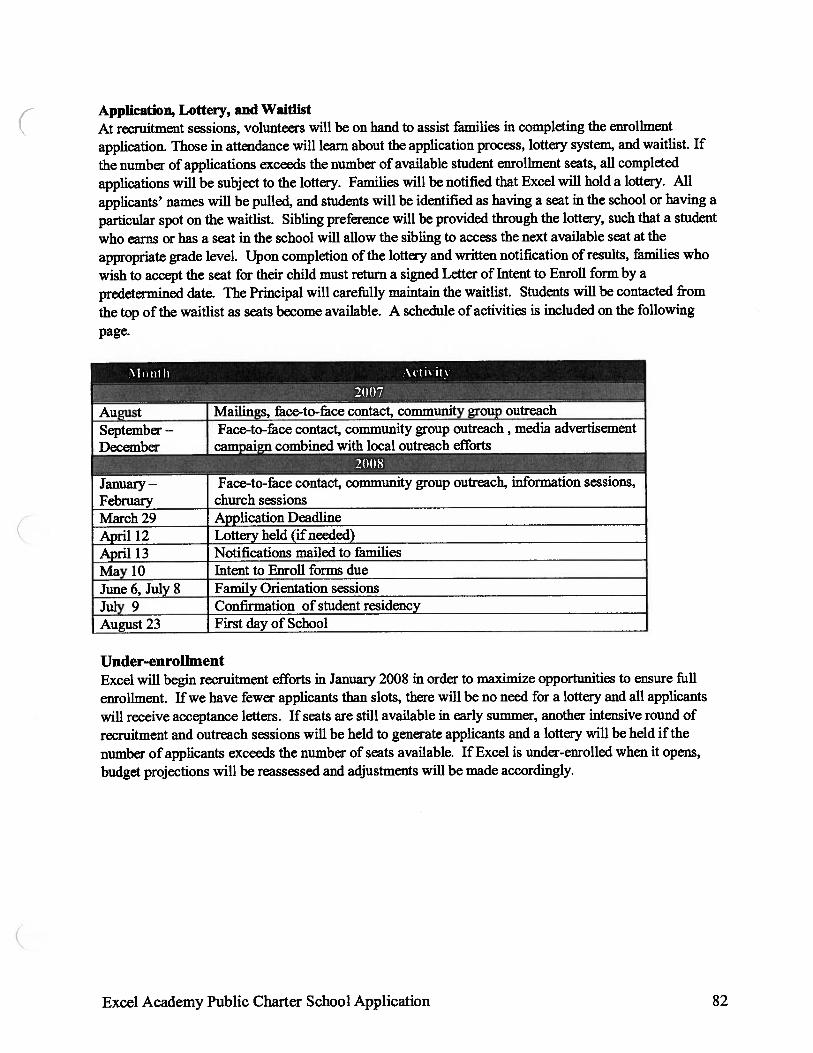
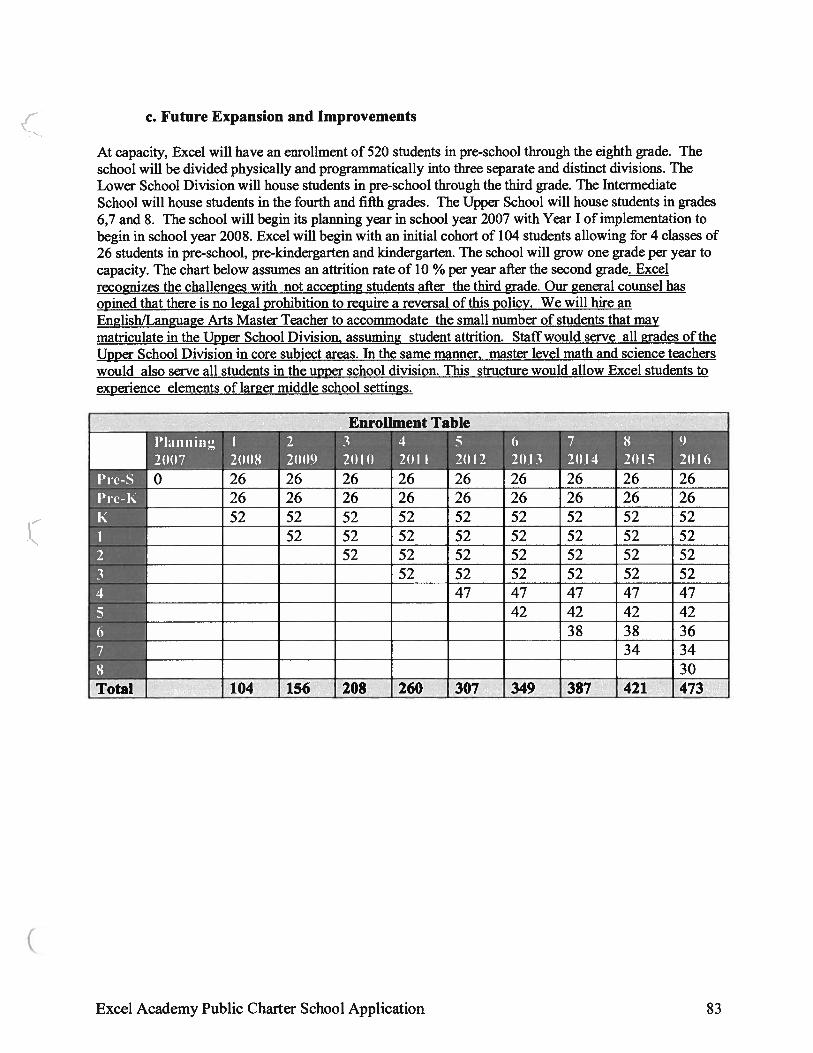
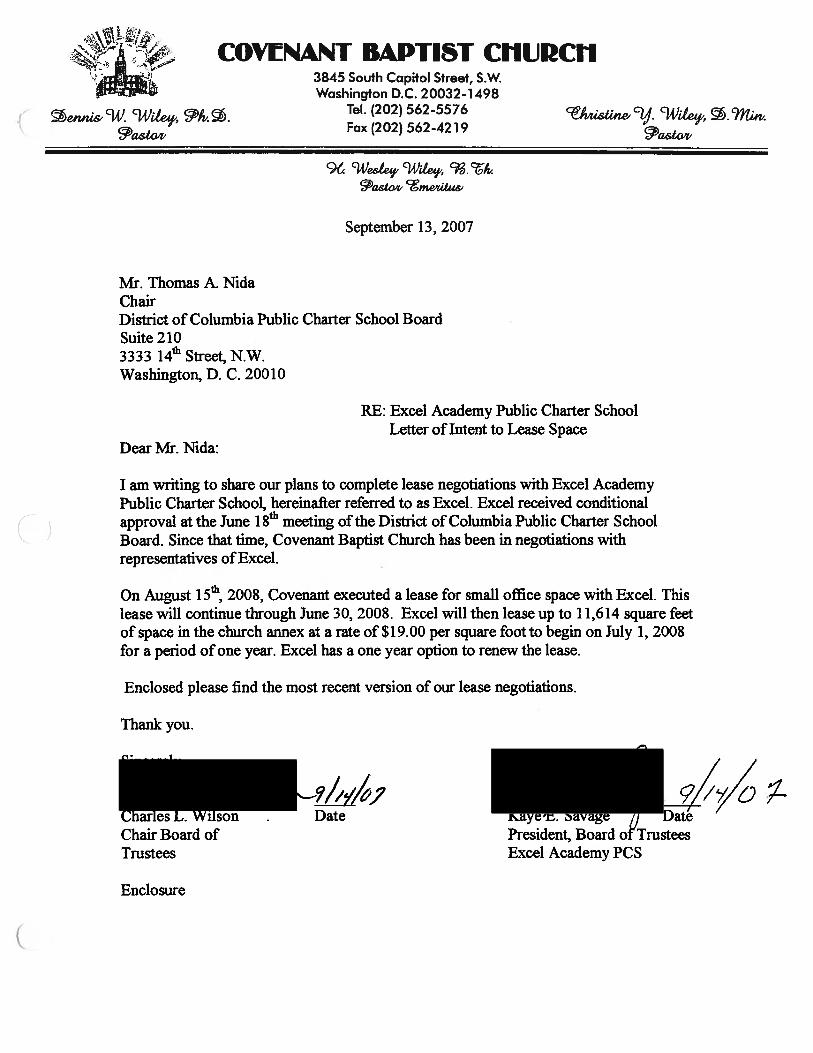
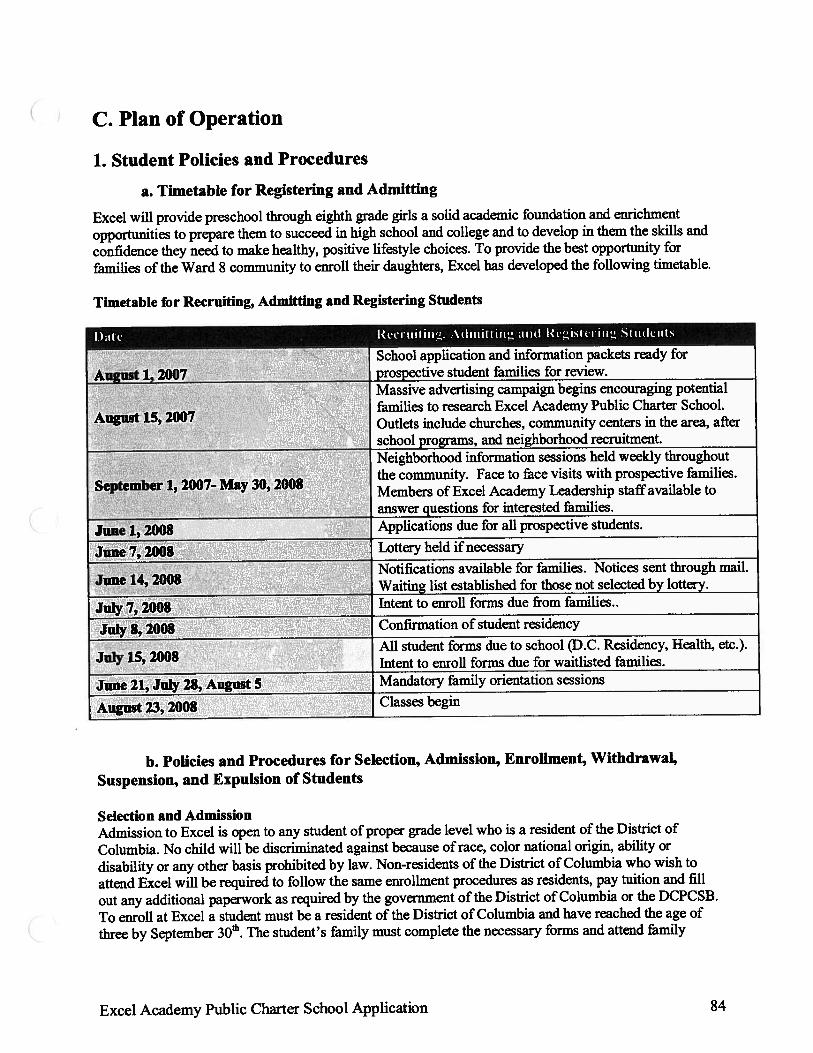

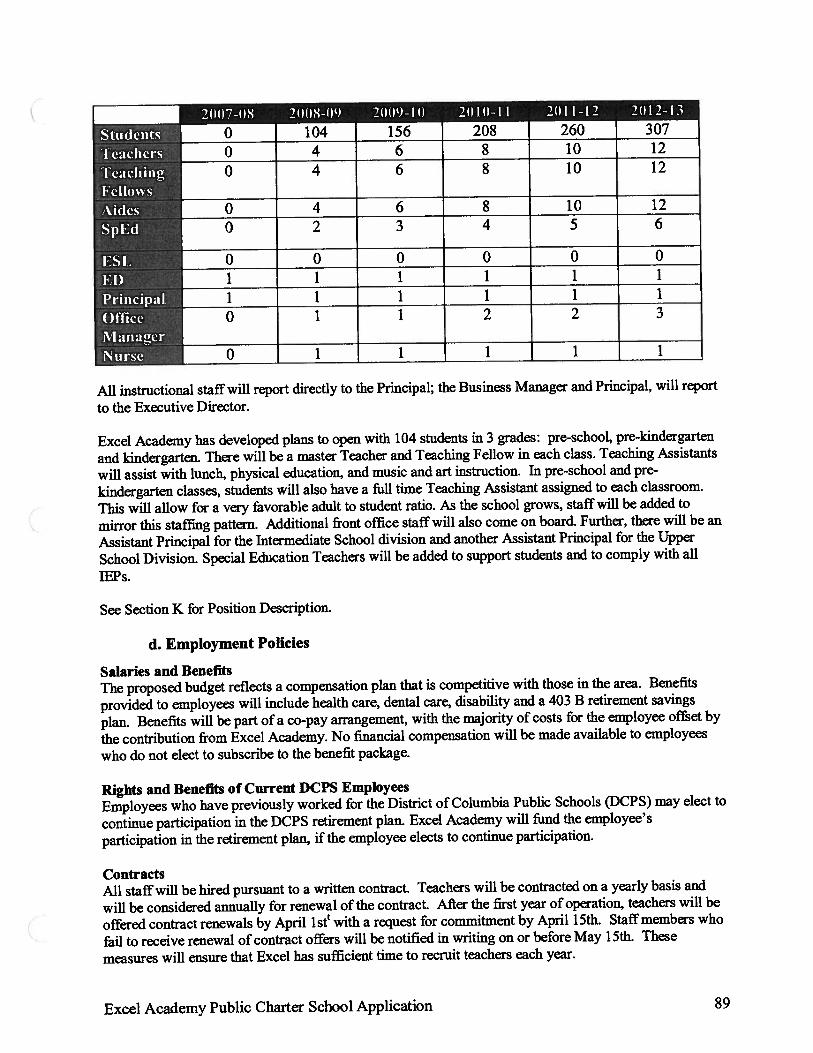
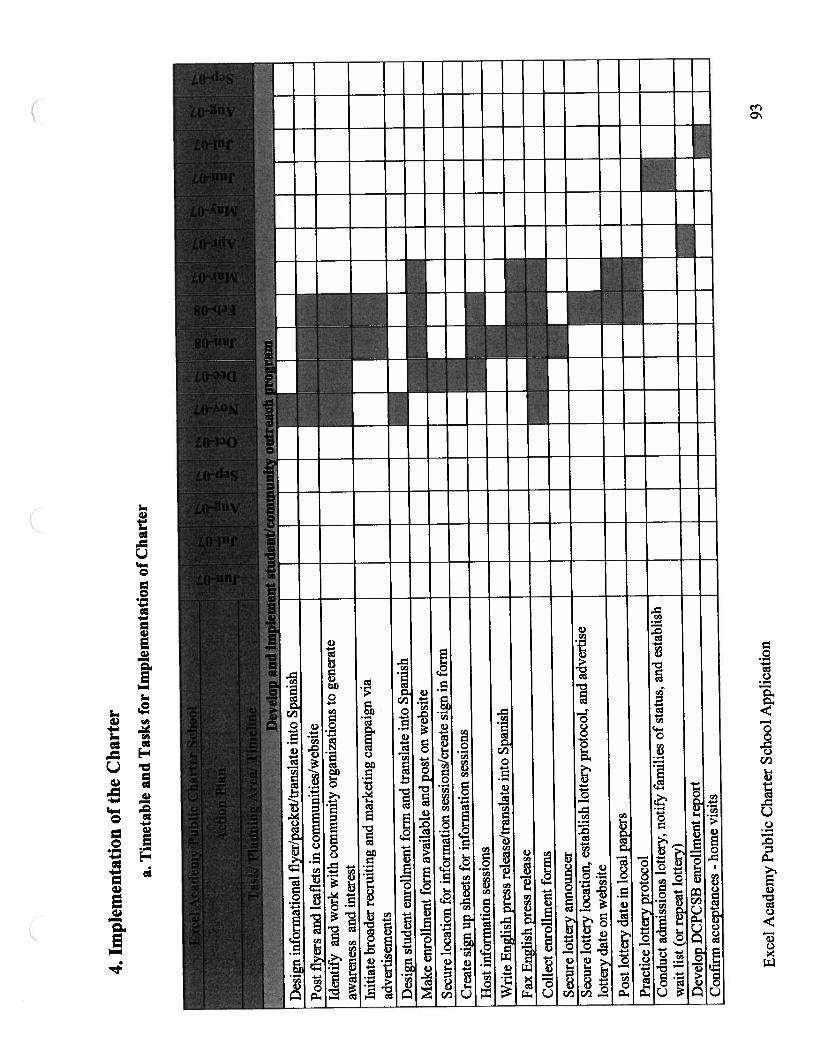
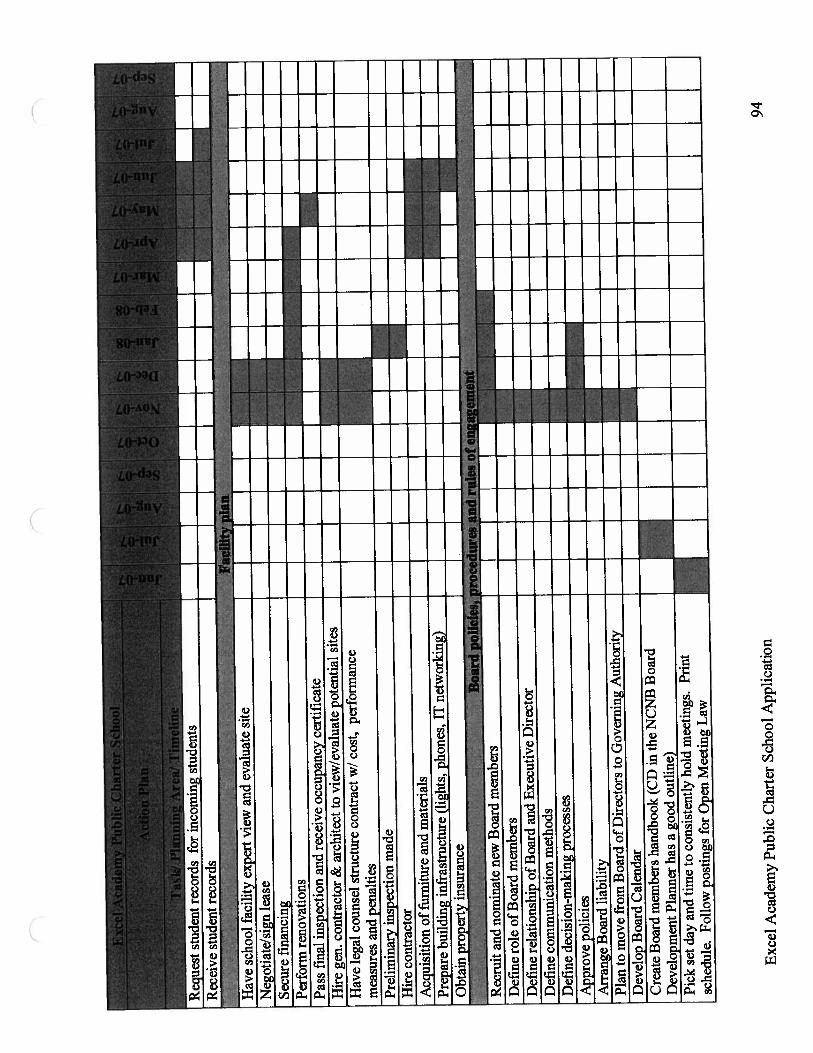
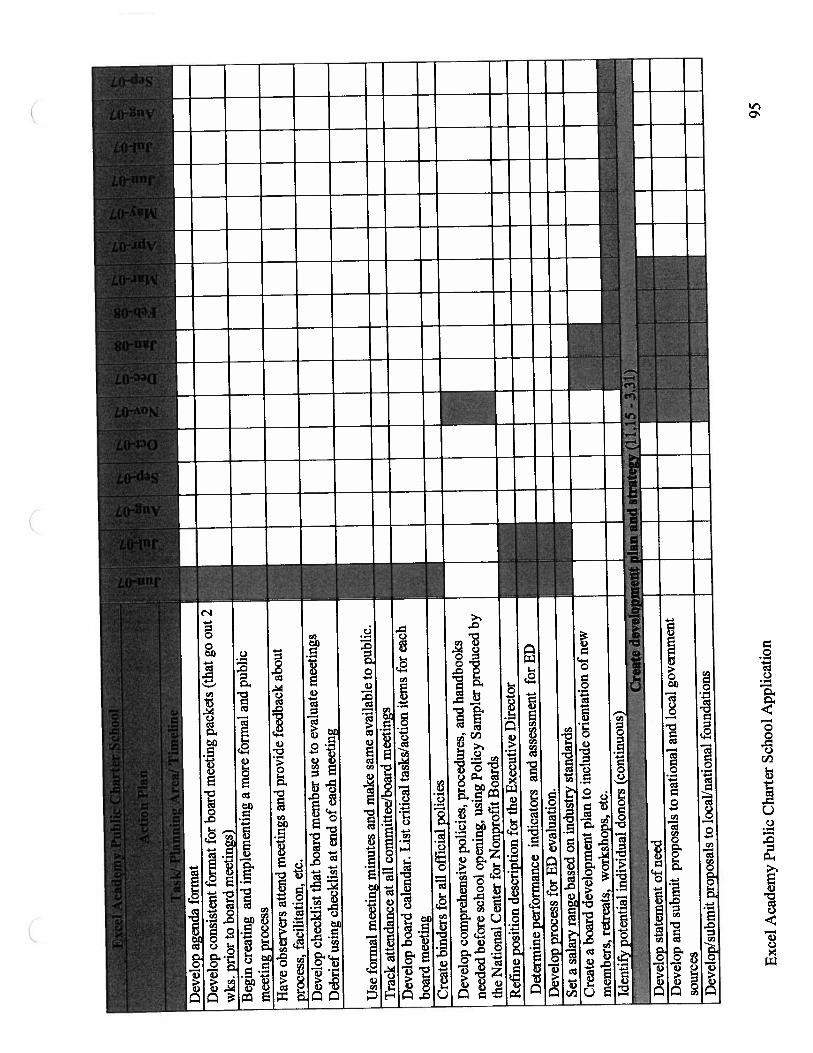
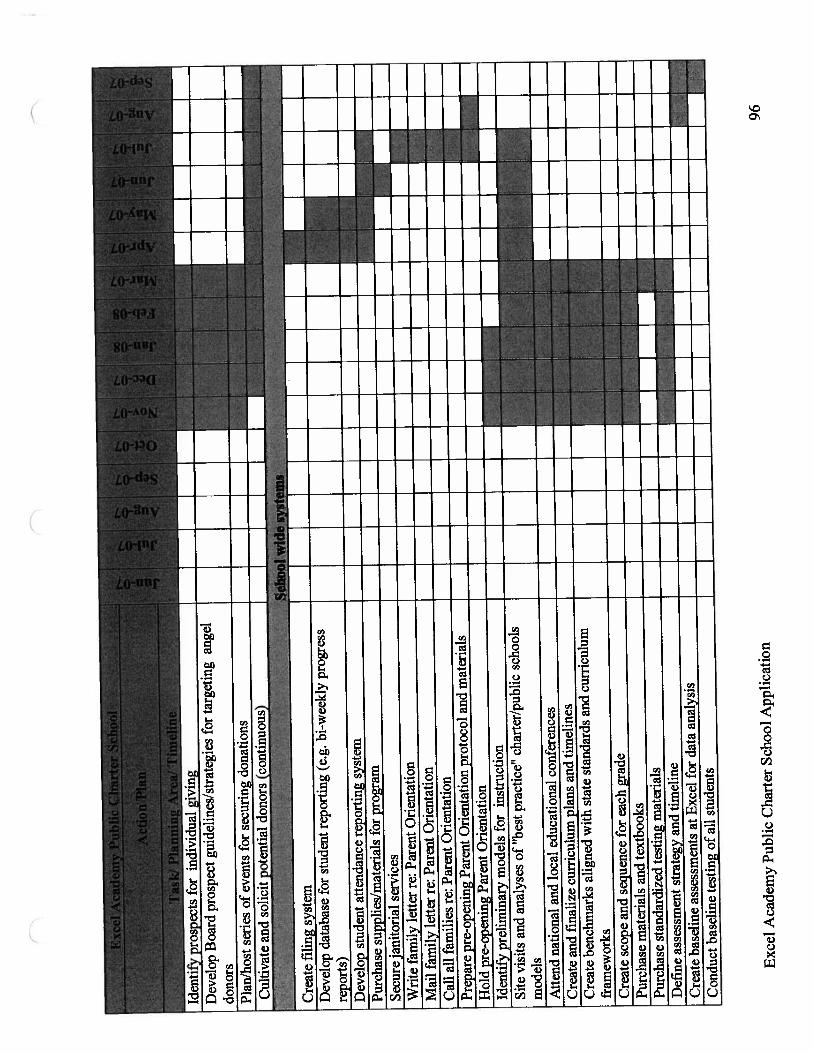
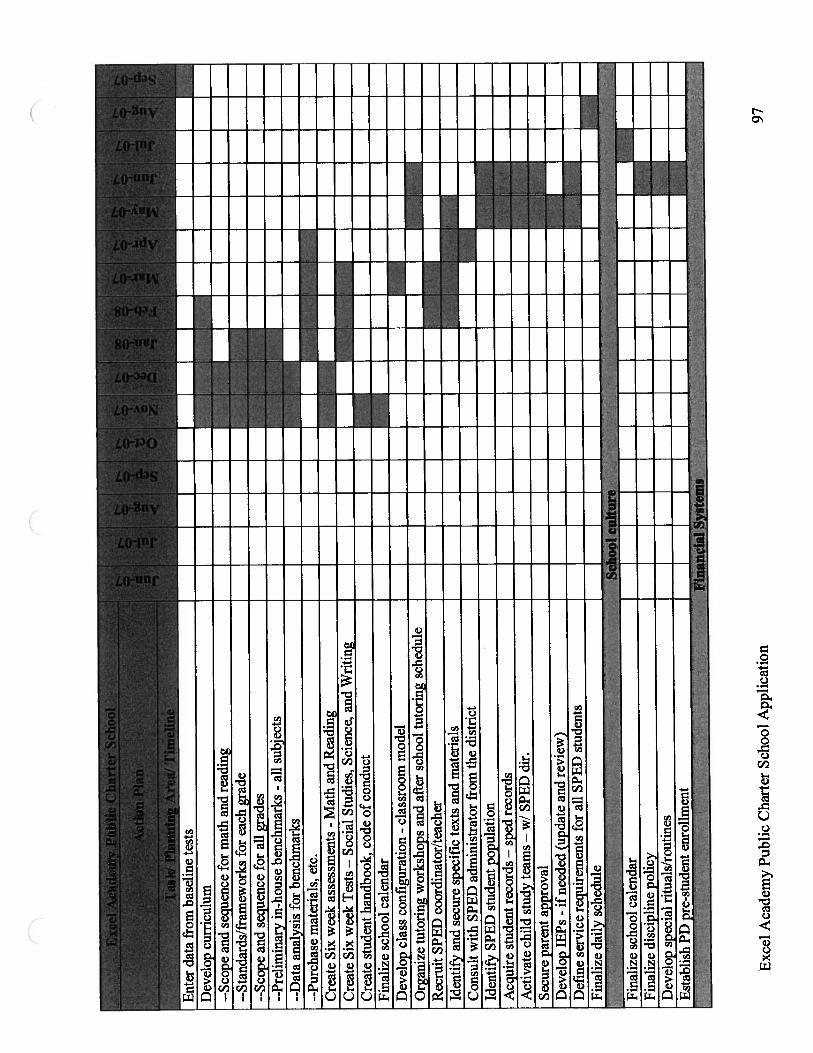
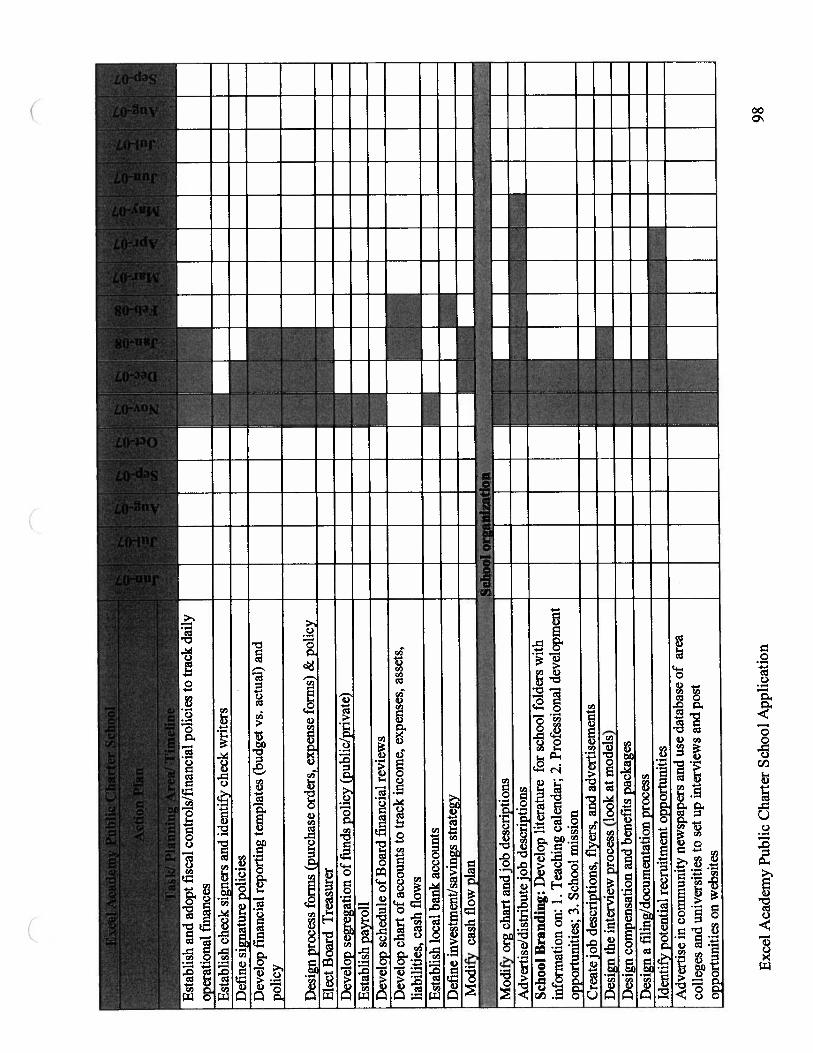
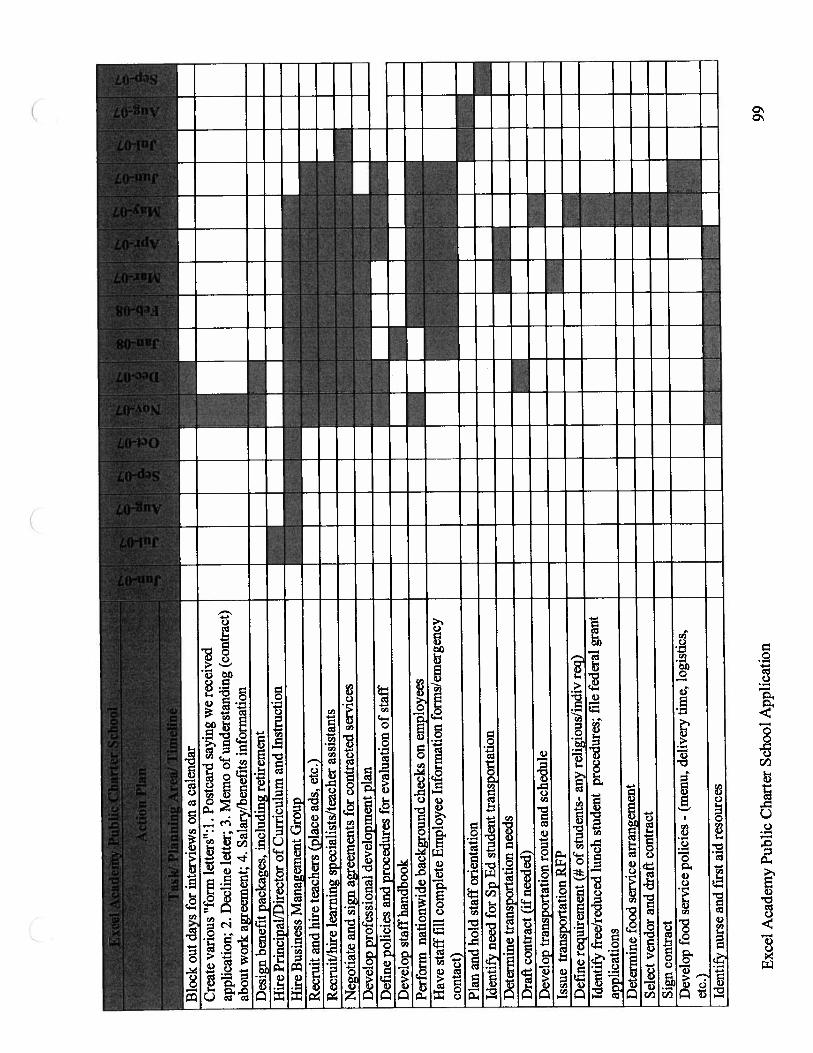
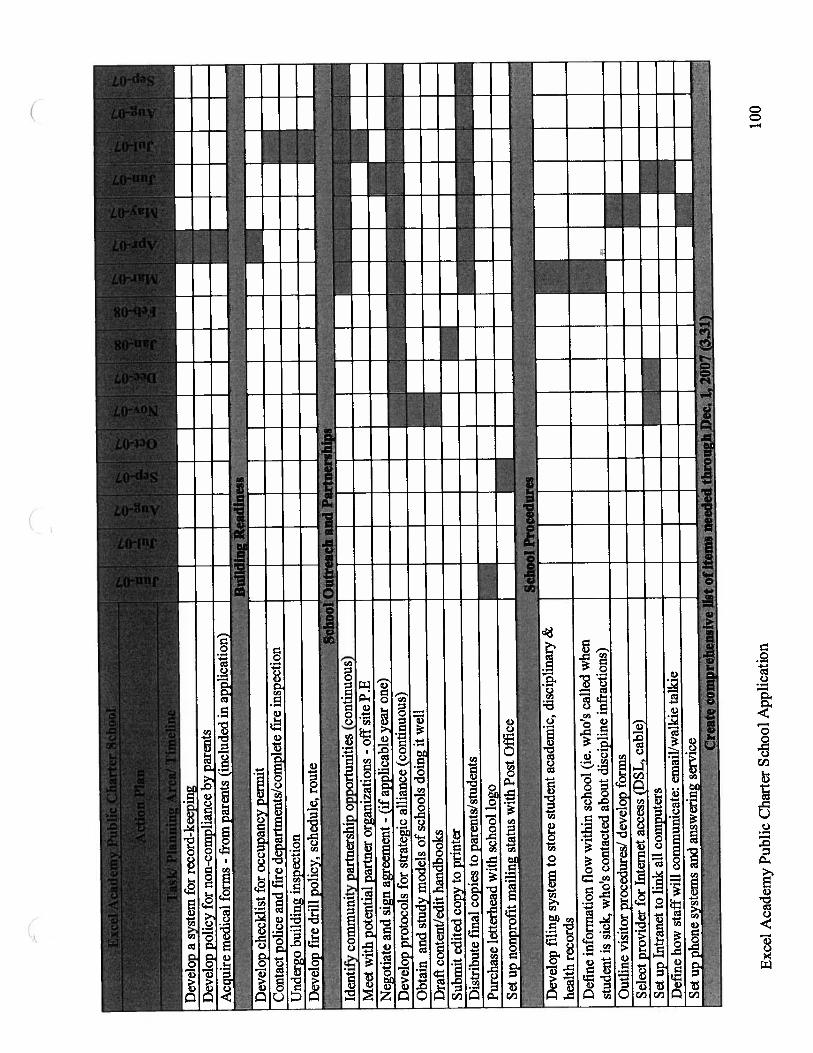
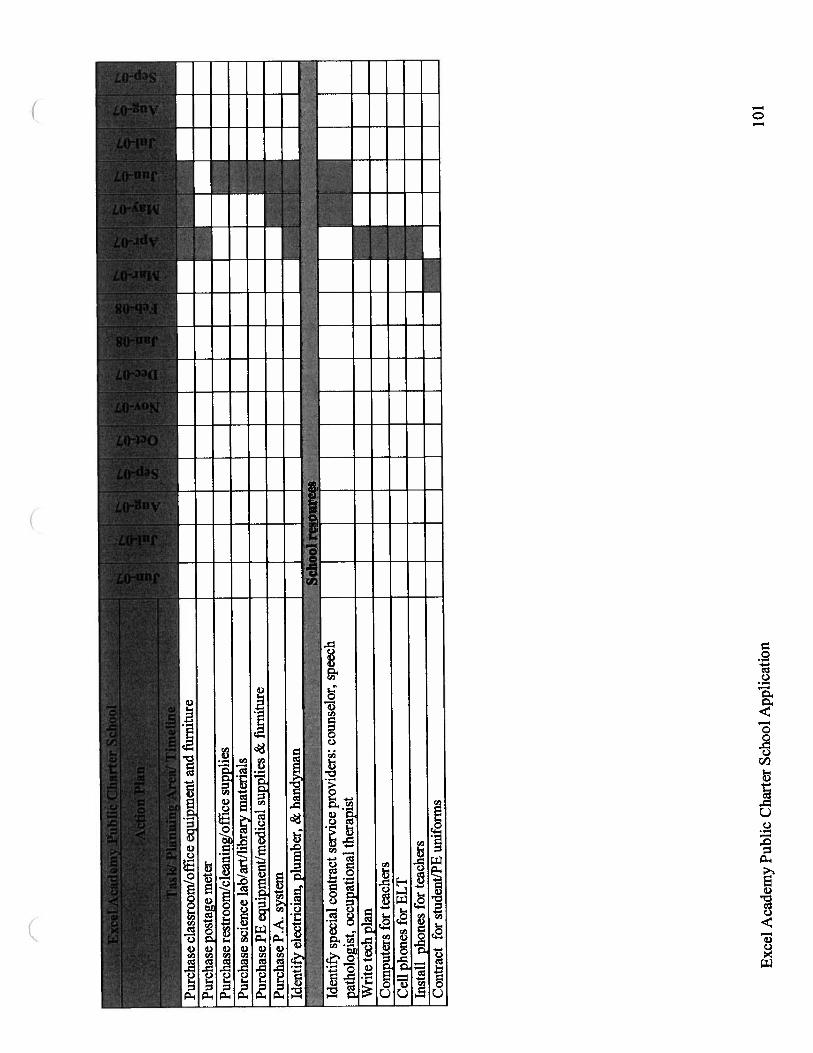
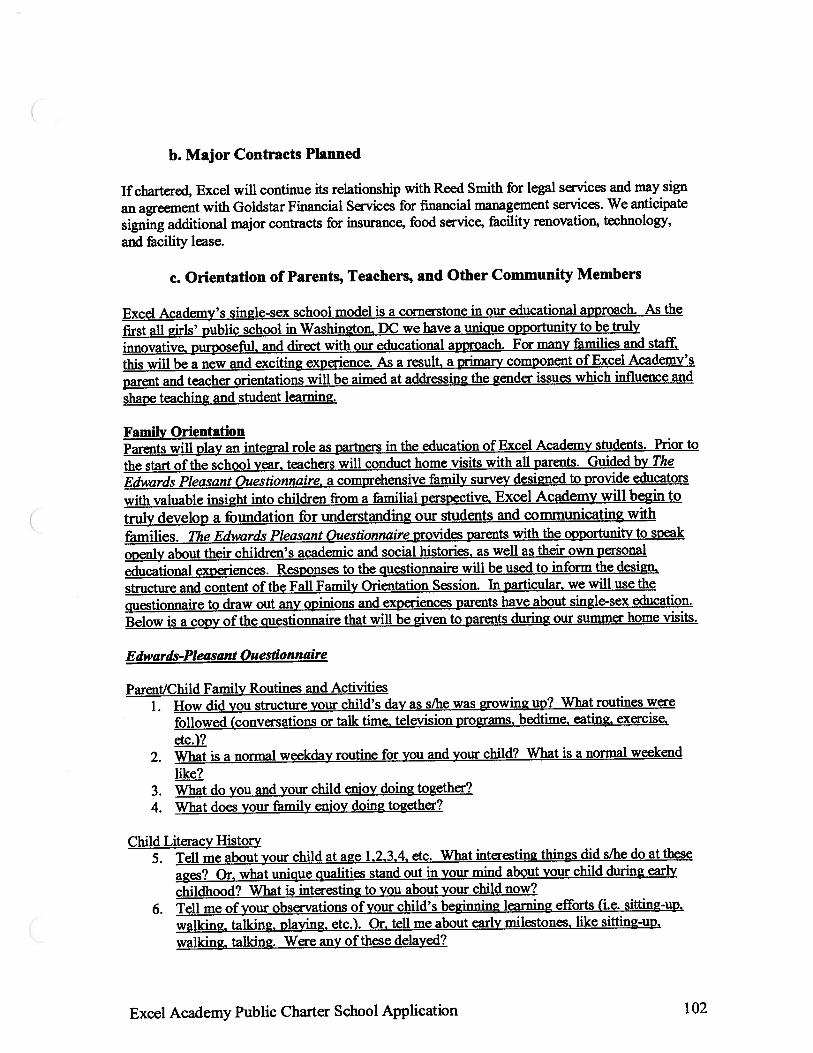
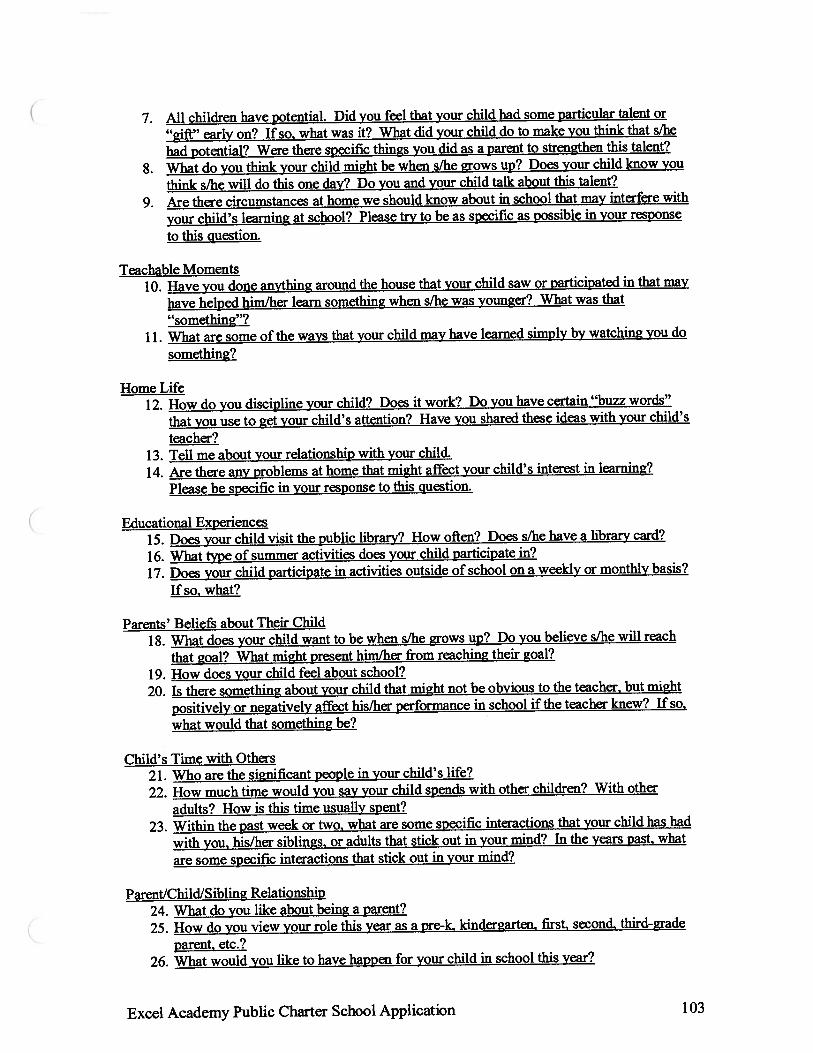
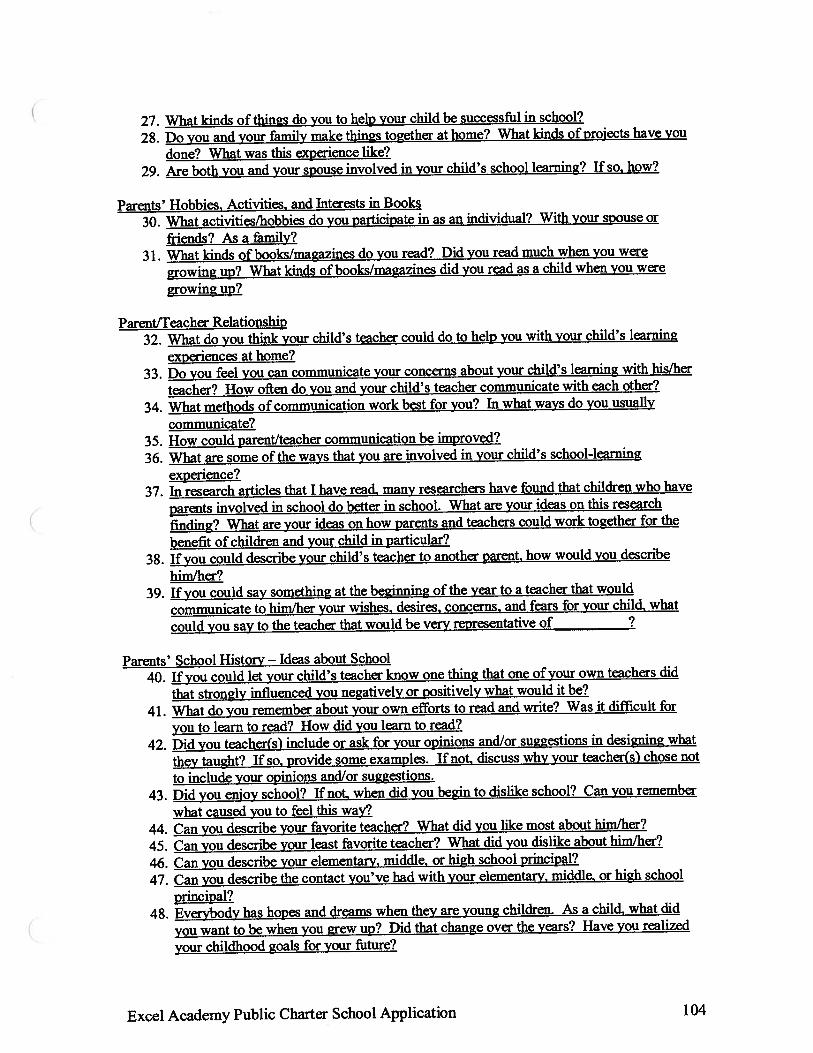
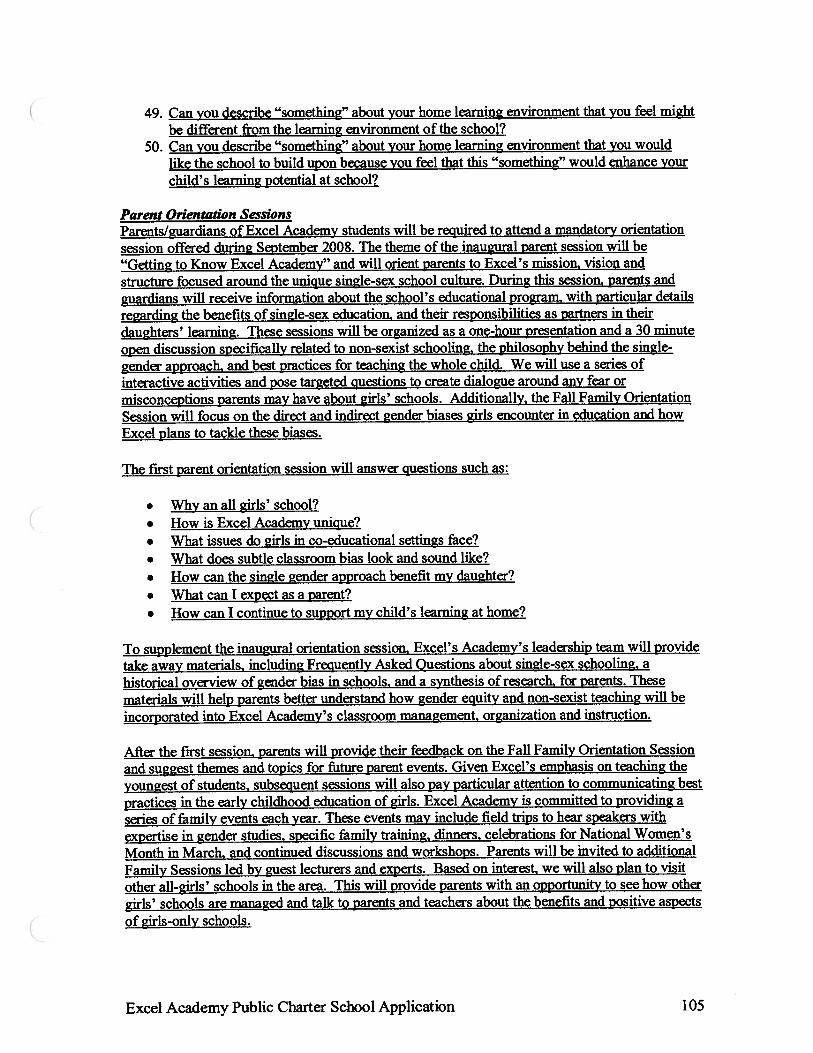
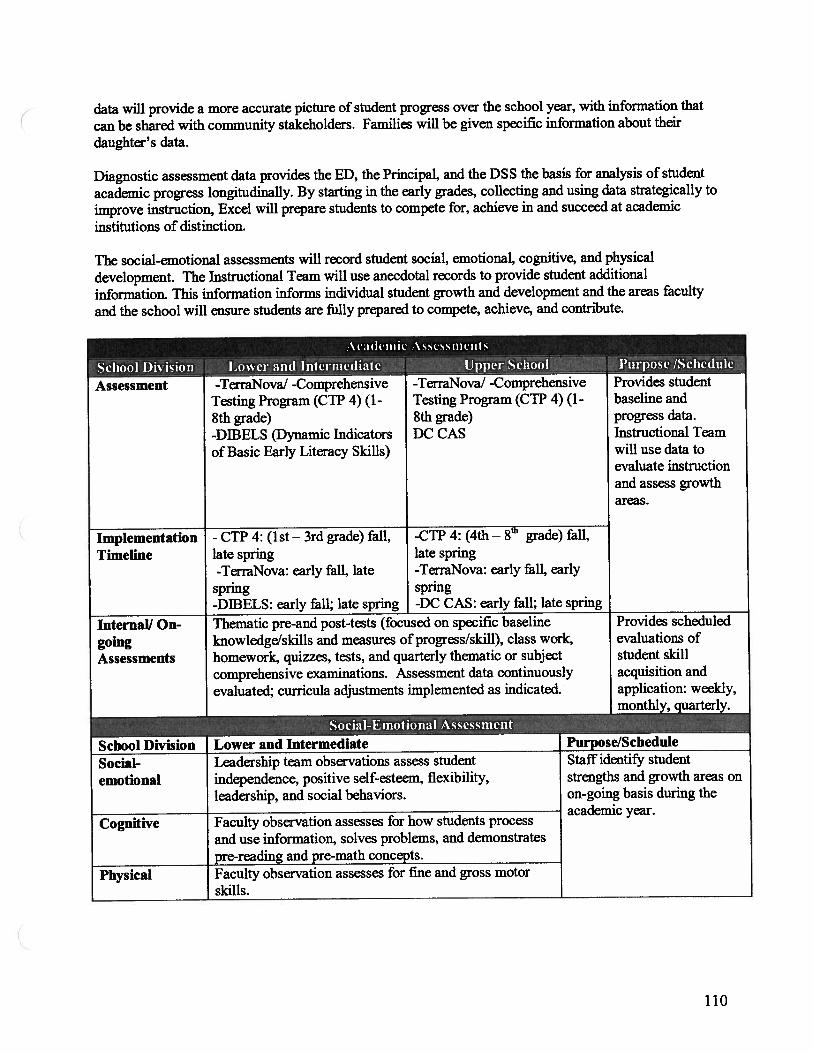
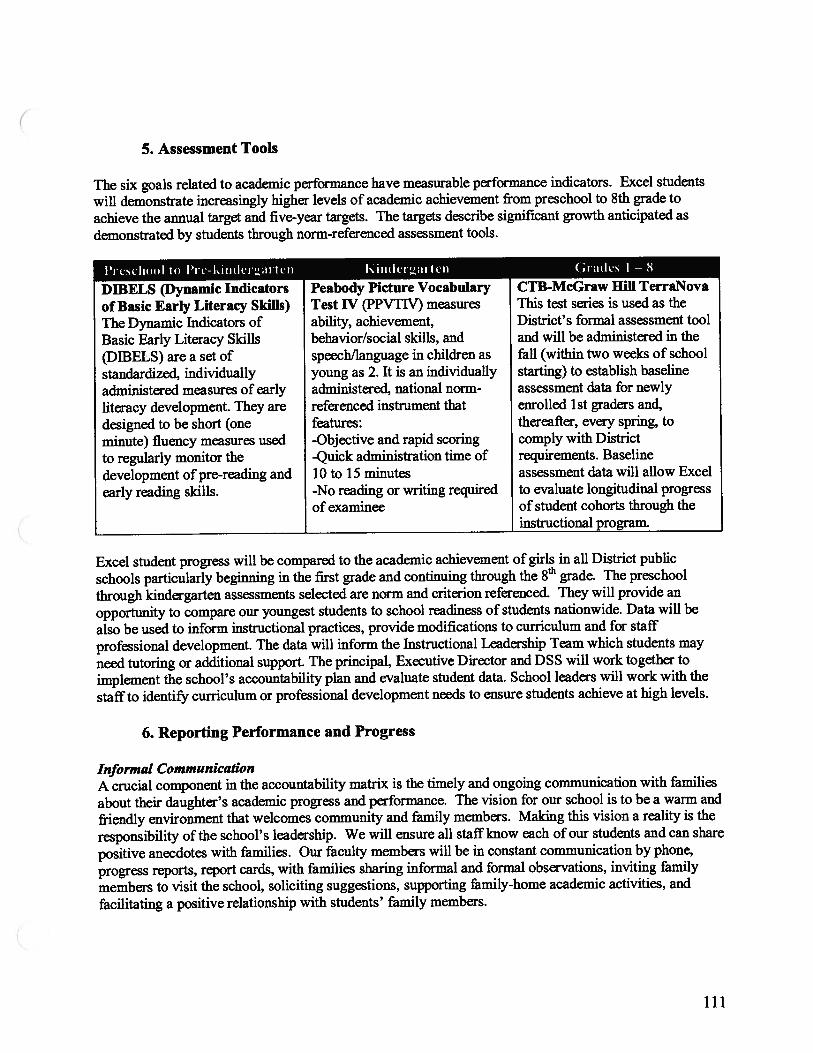
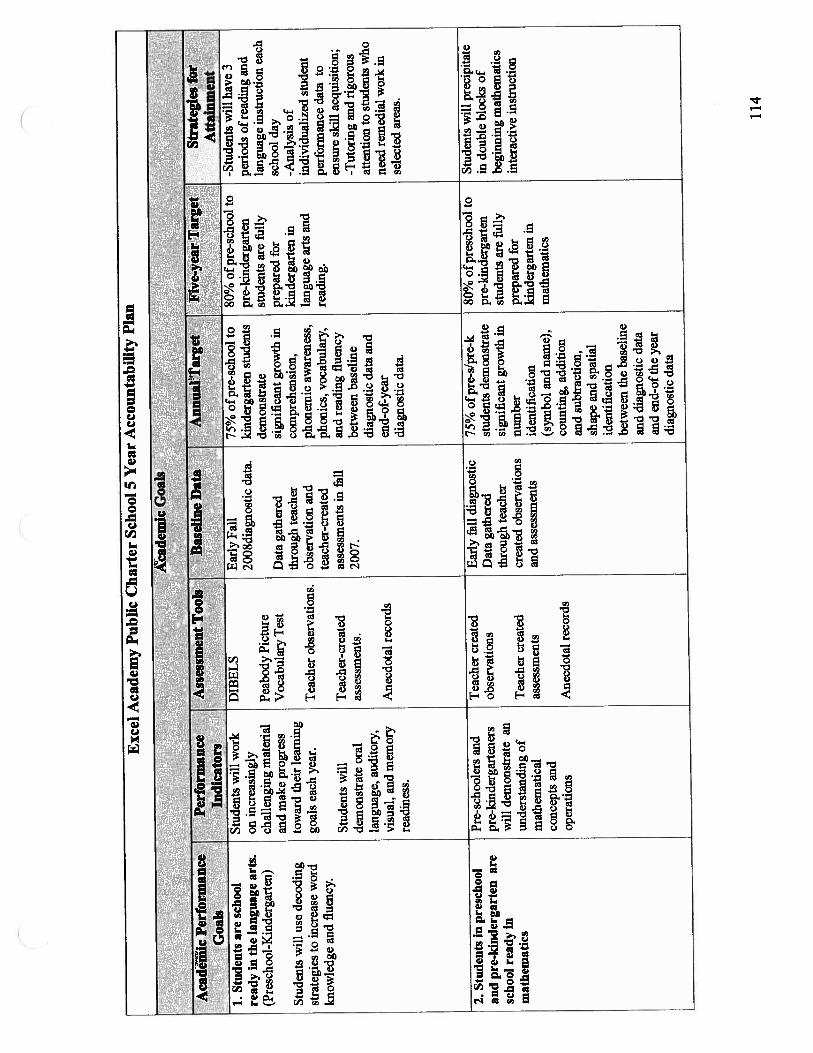
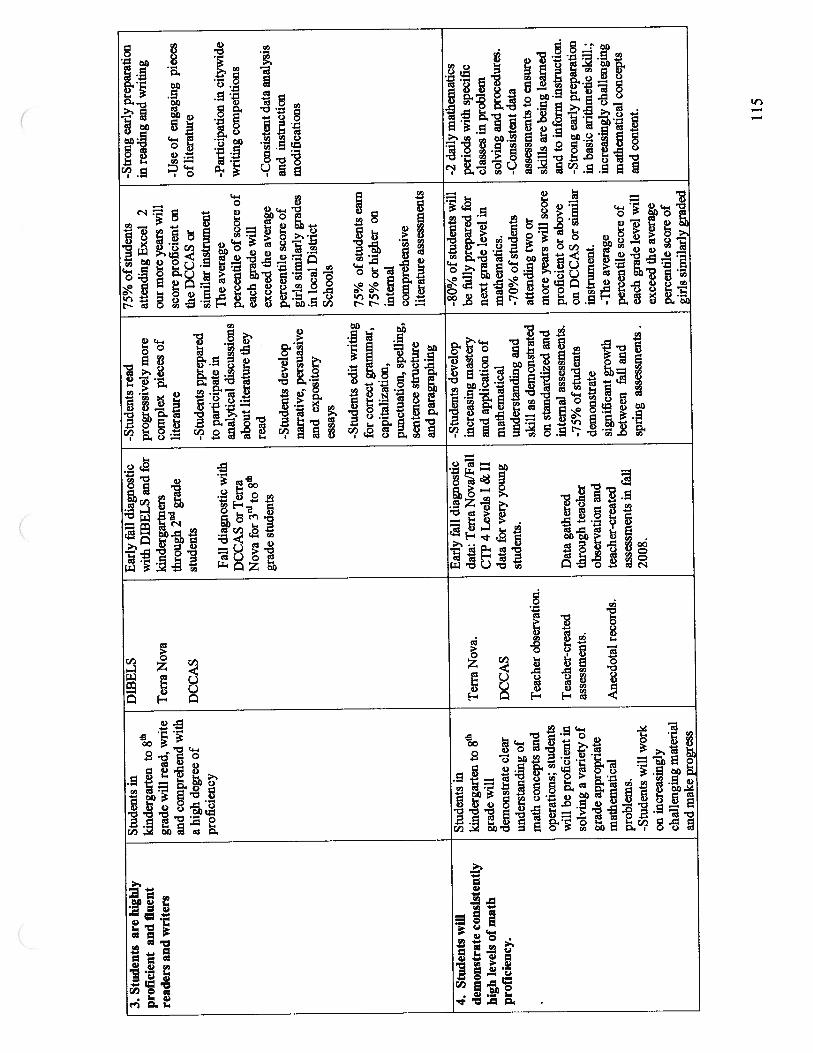
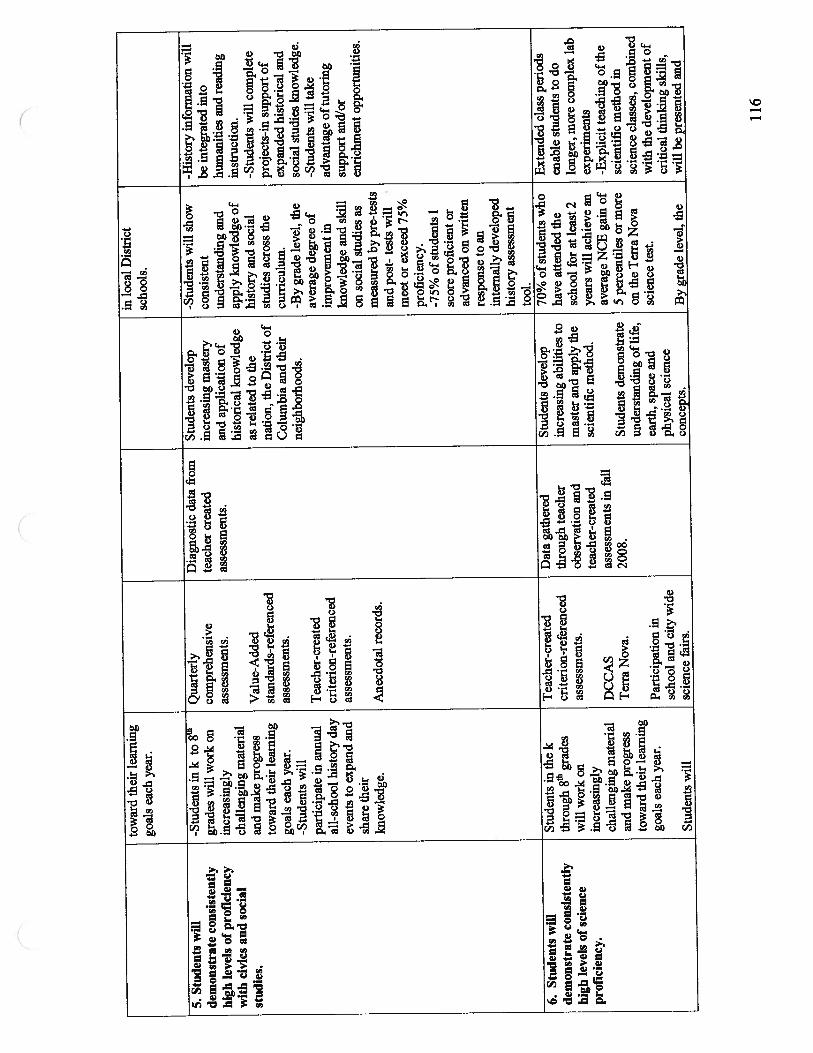
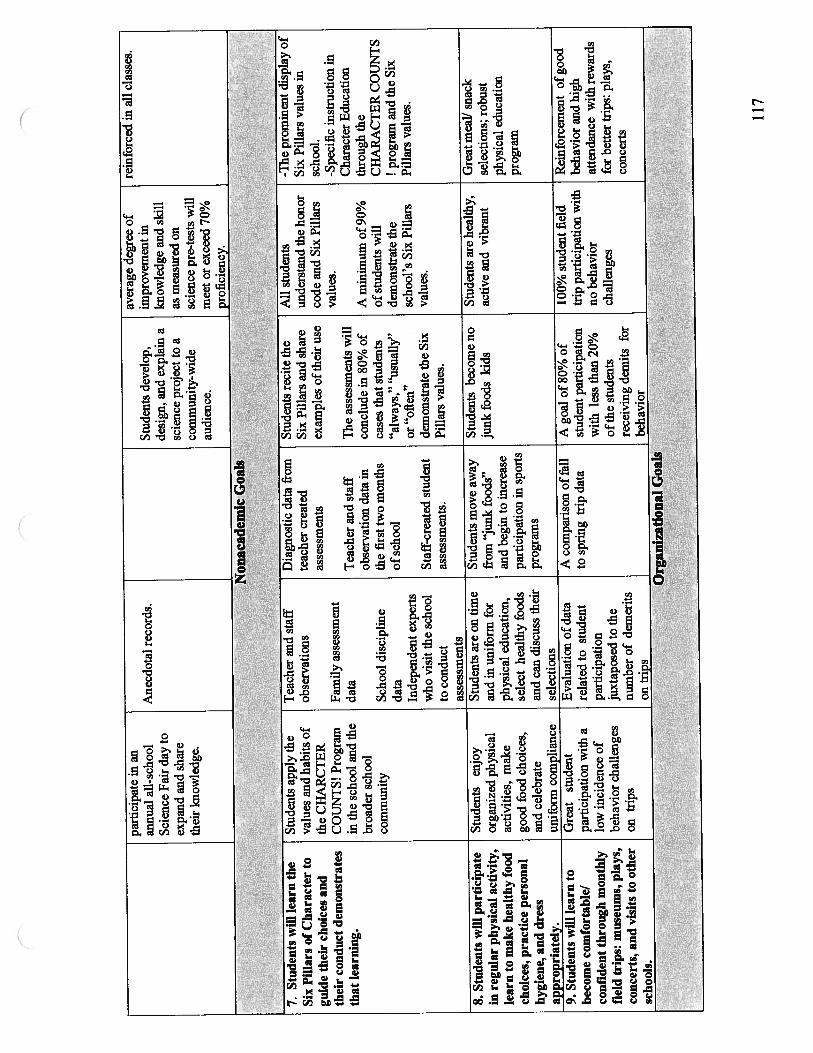
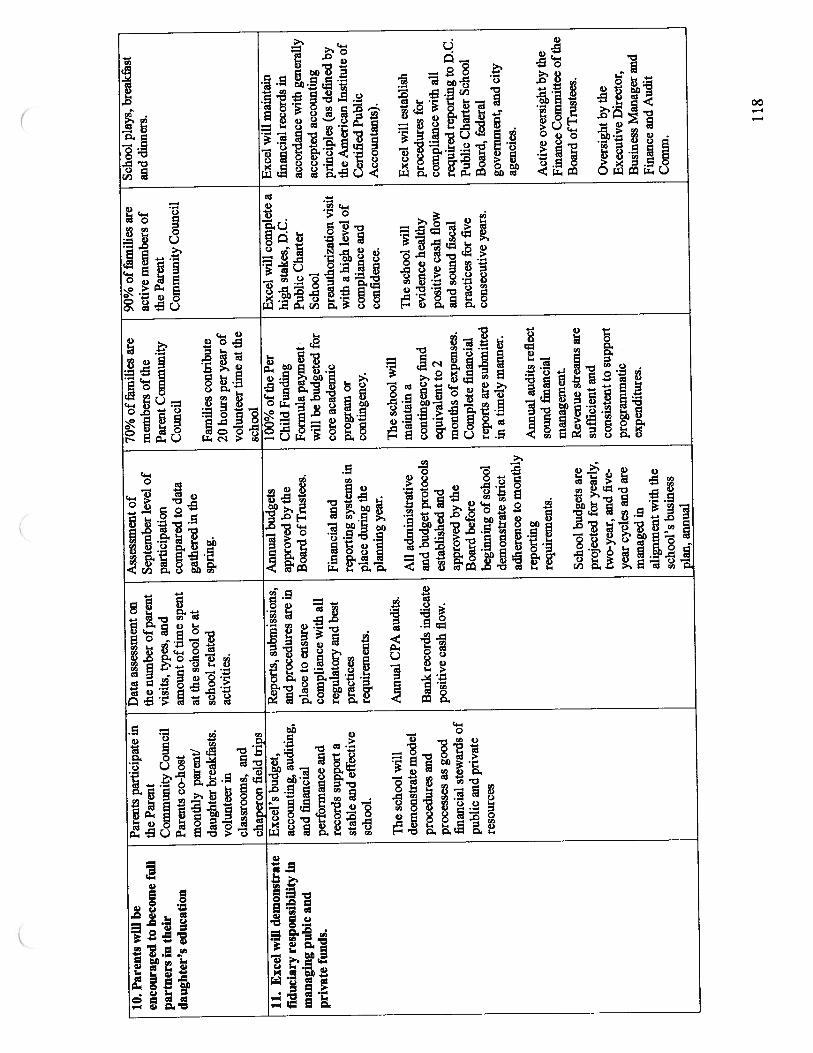
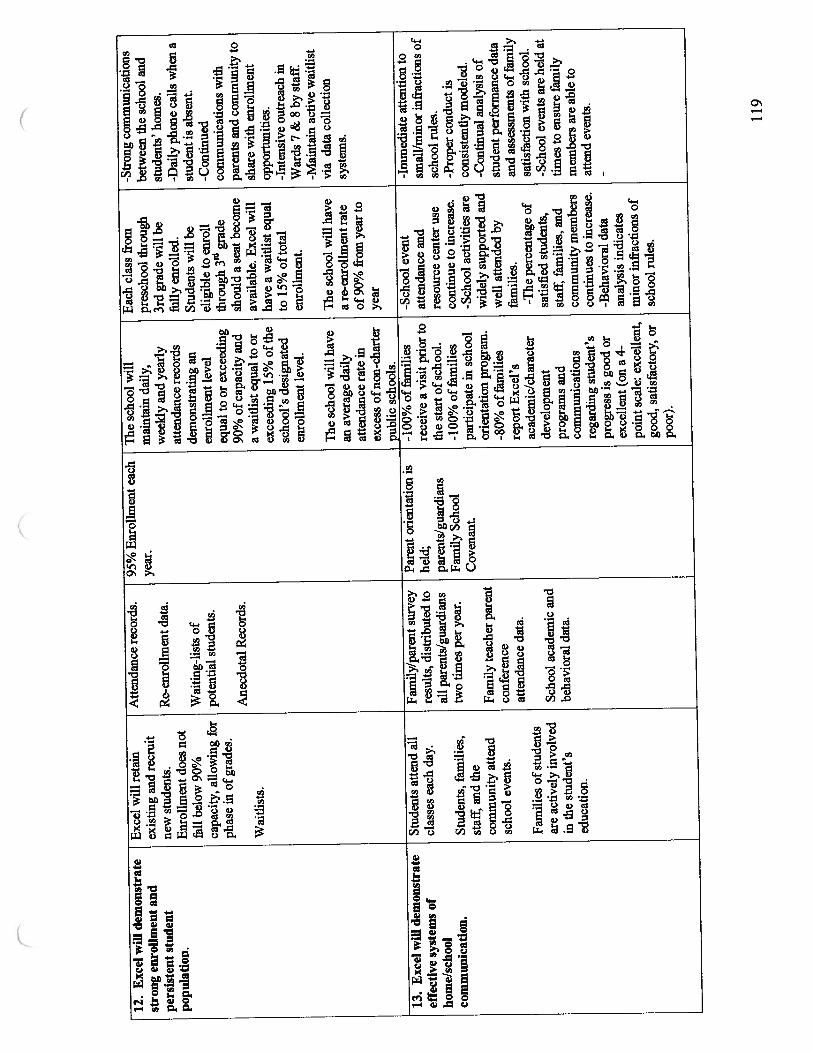
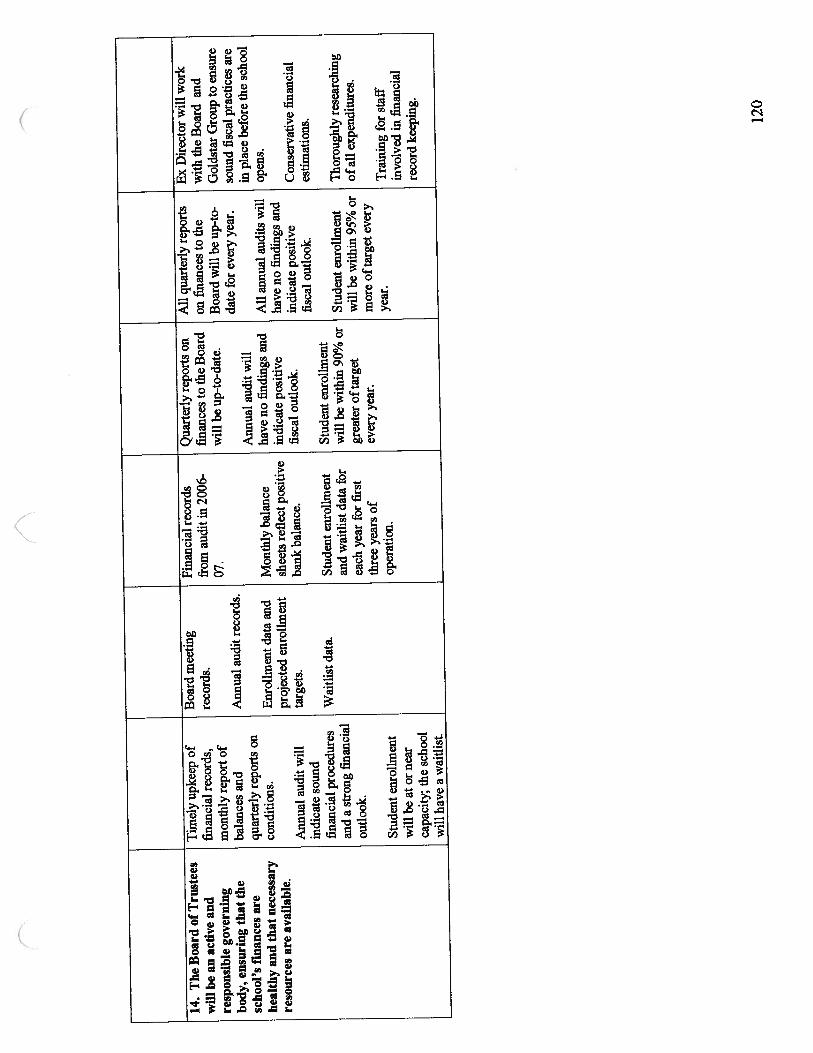
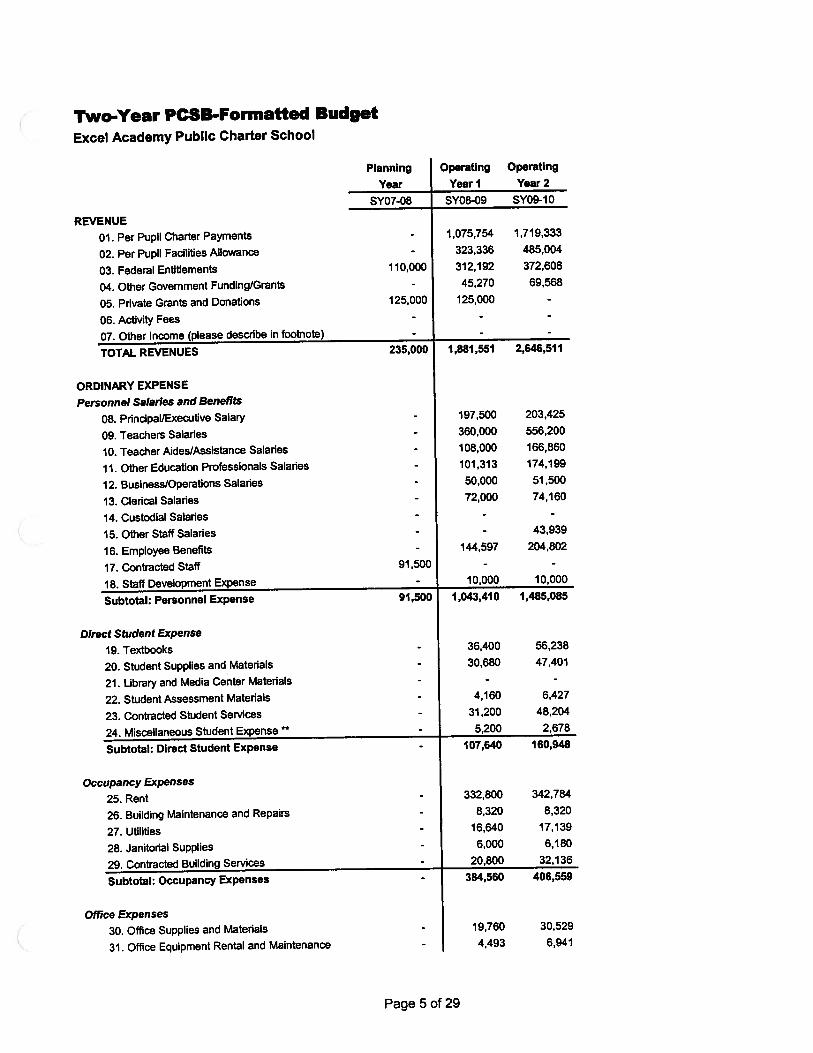
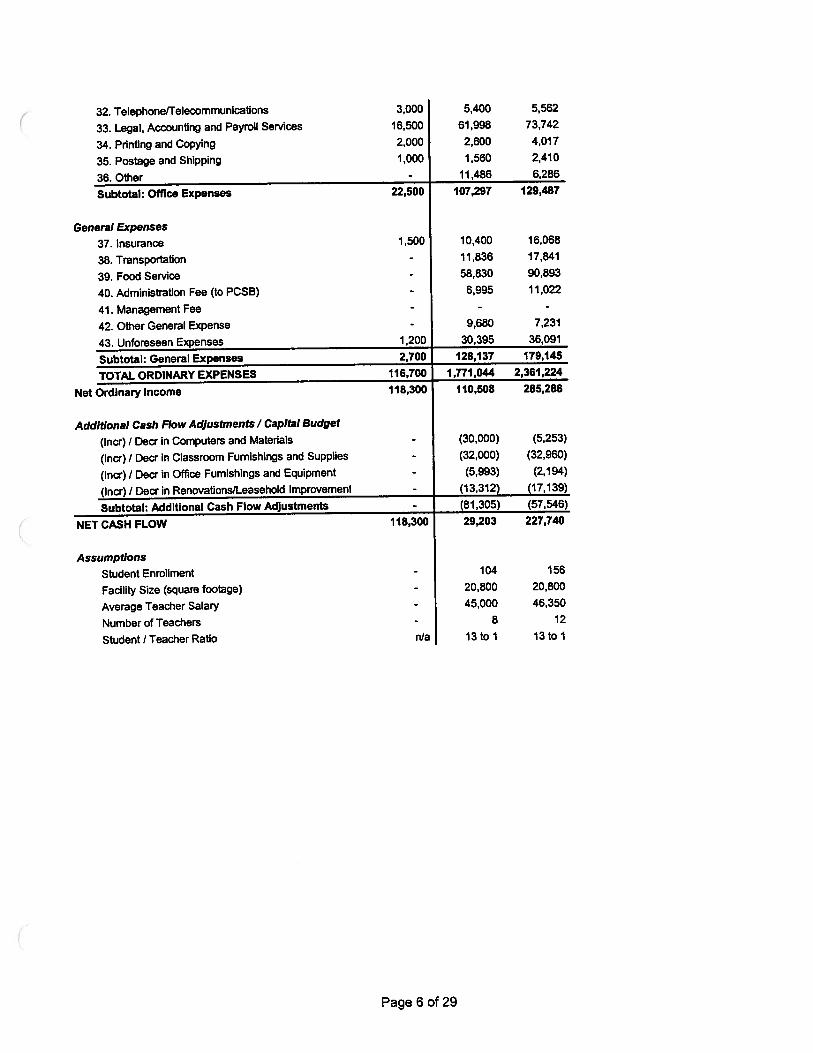
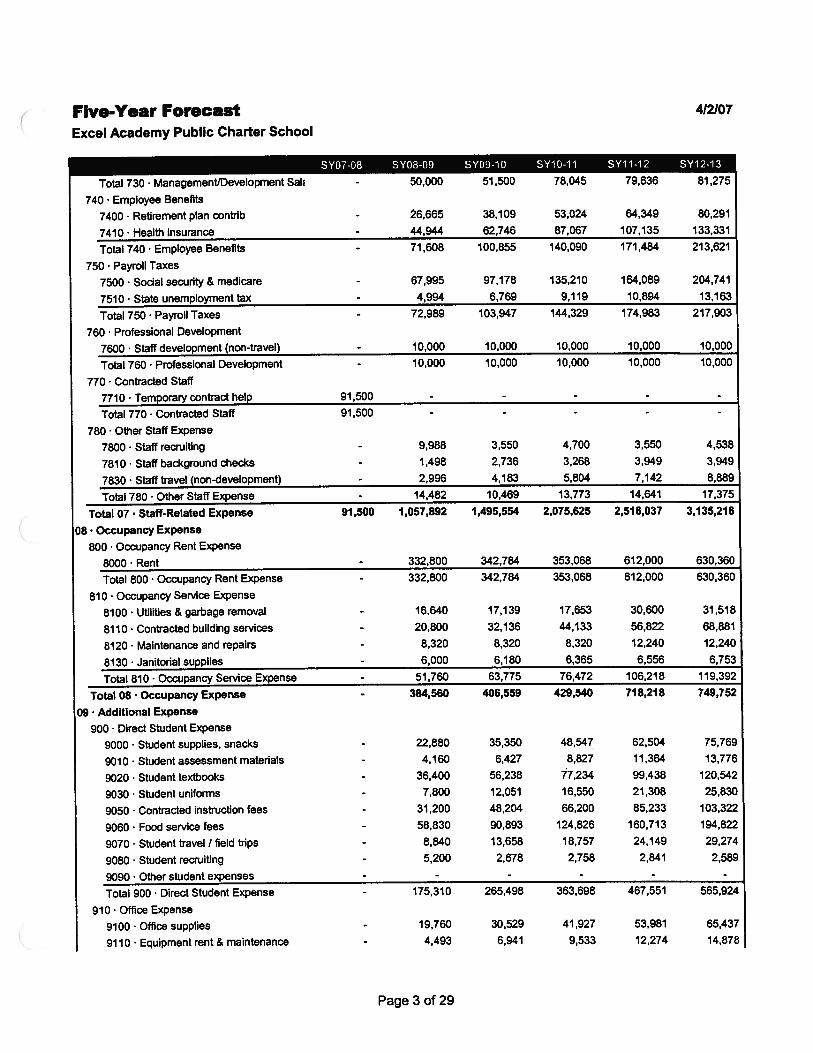
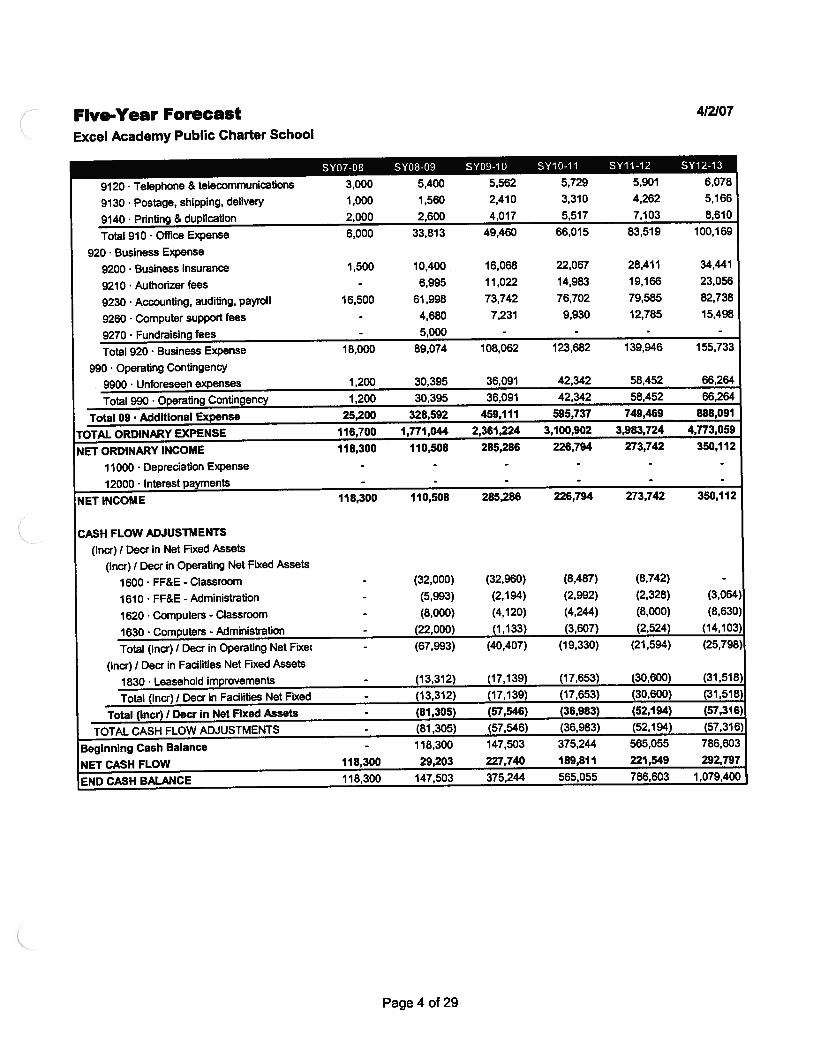

Appendix D
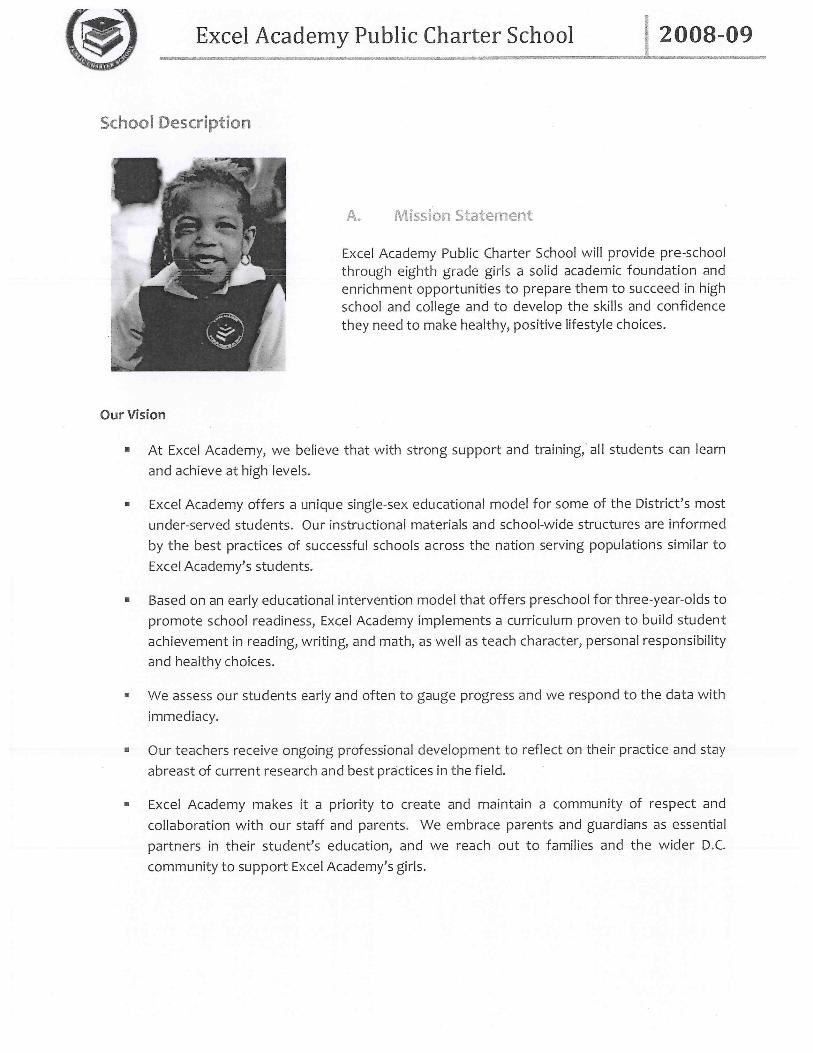
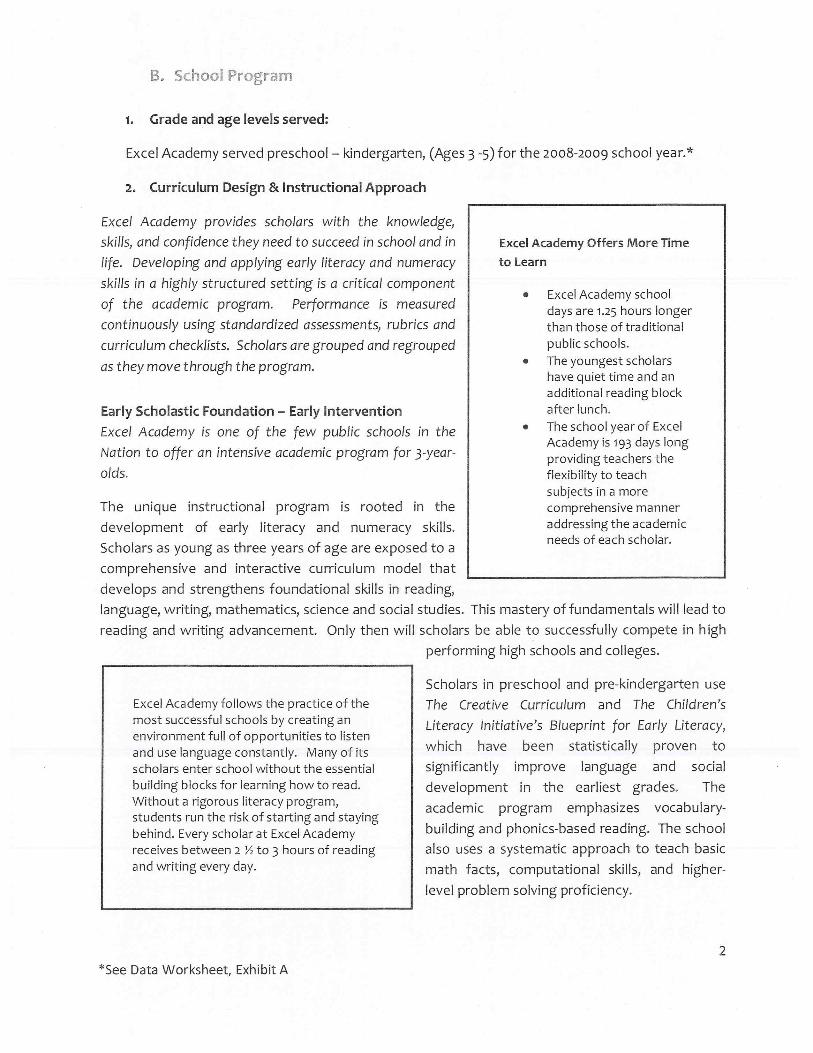
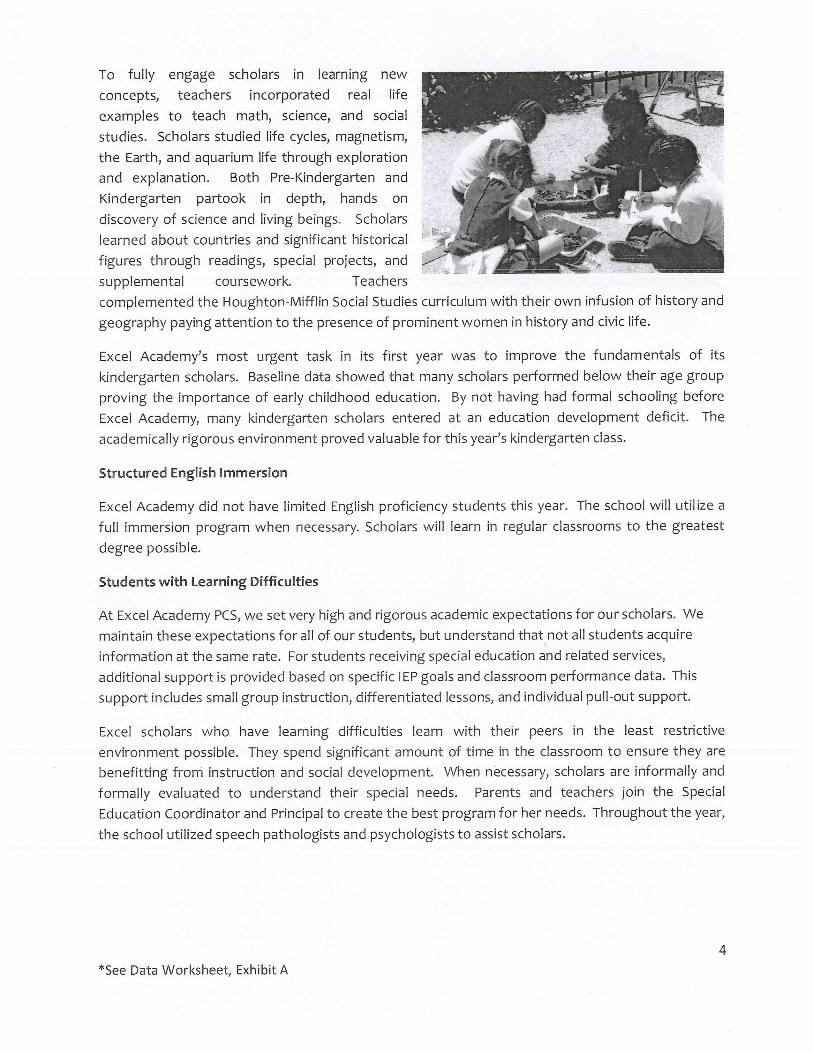
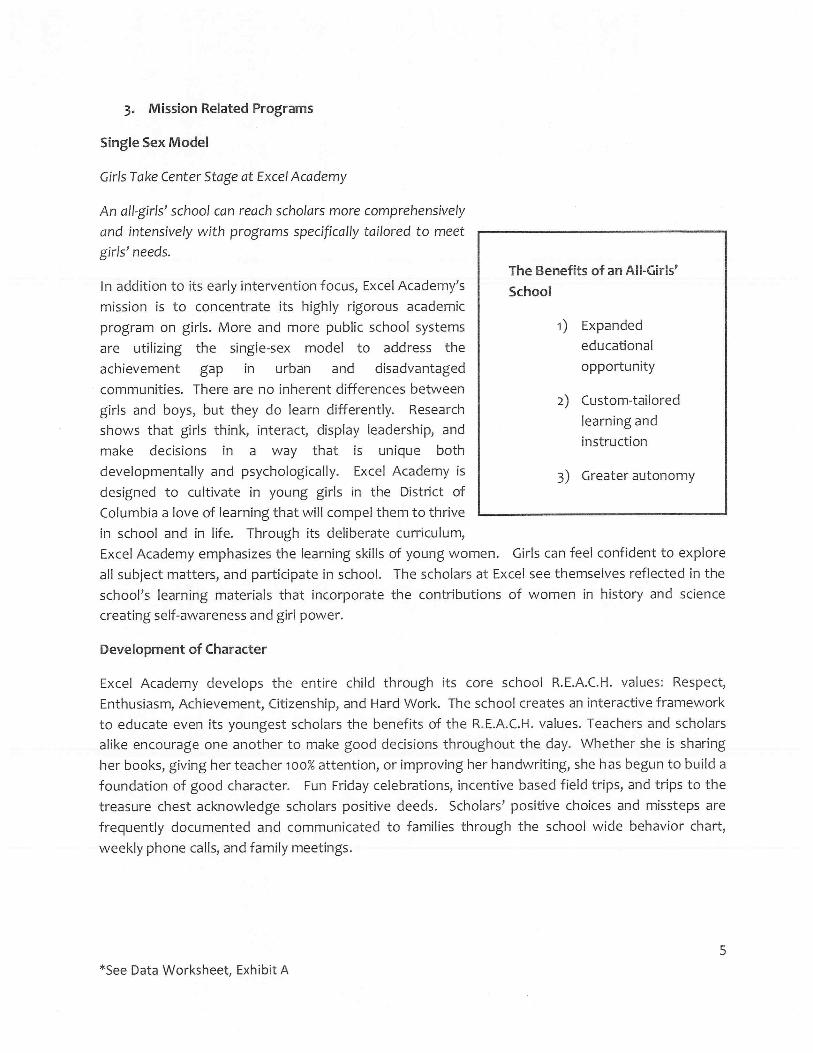
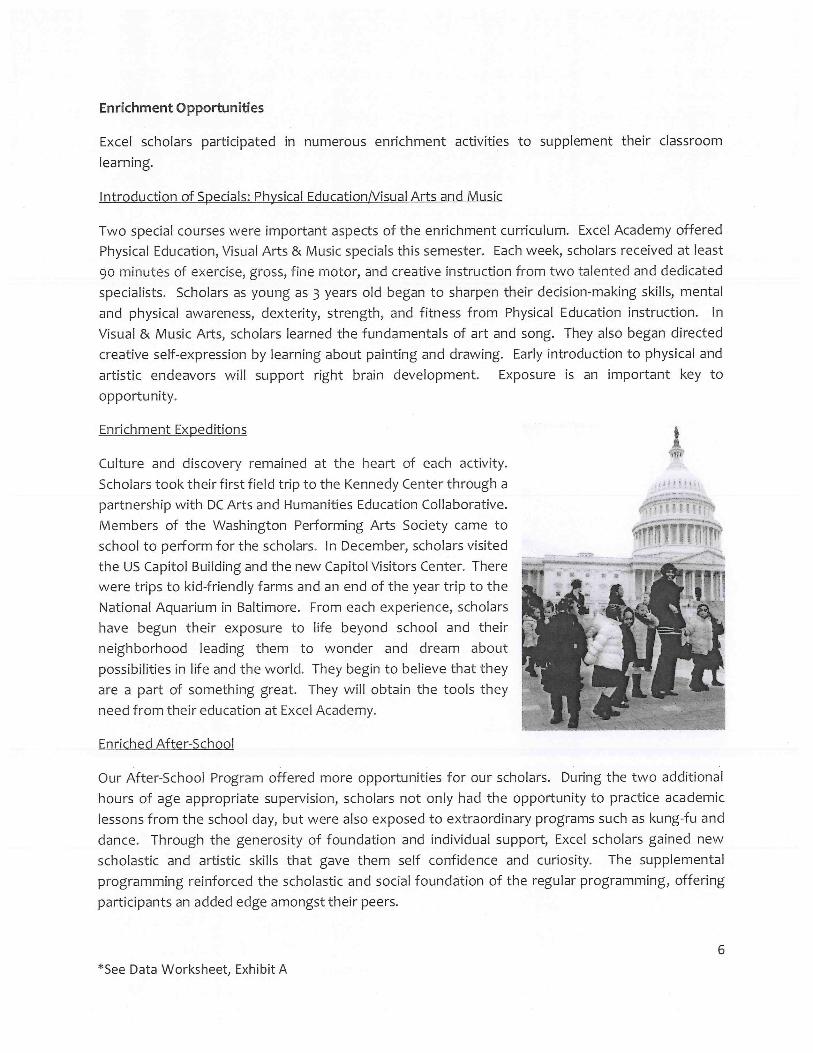
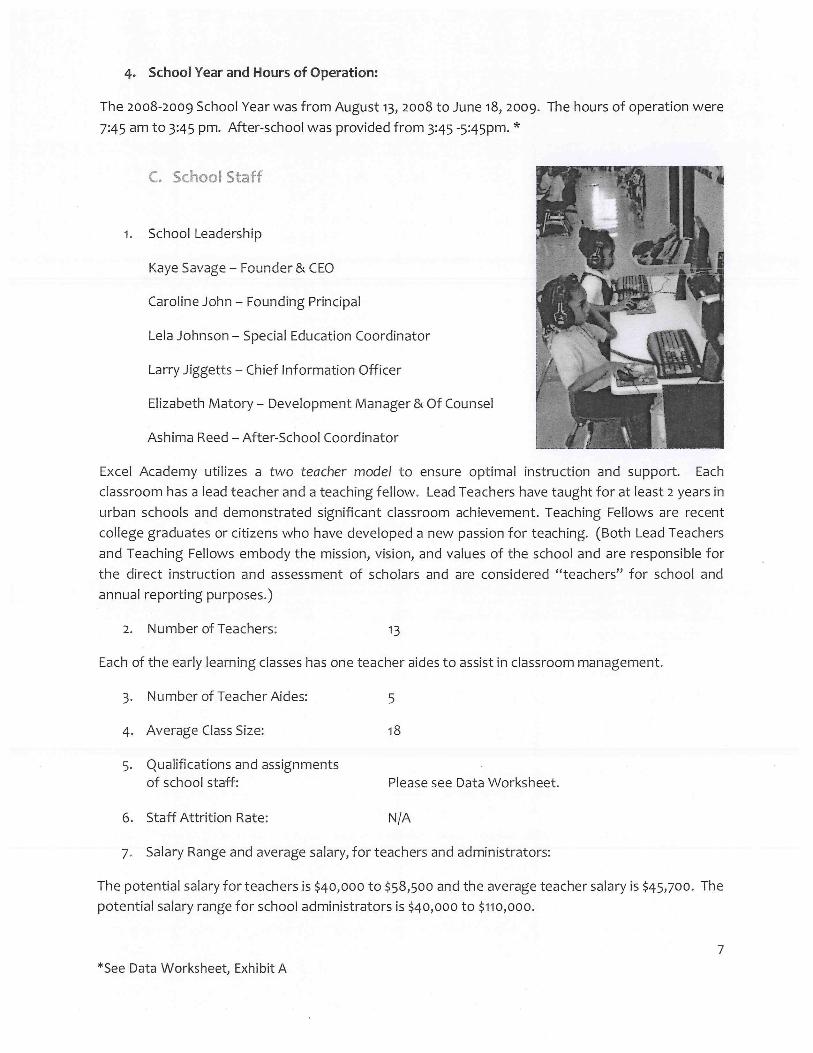

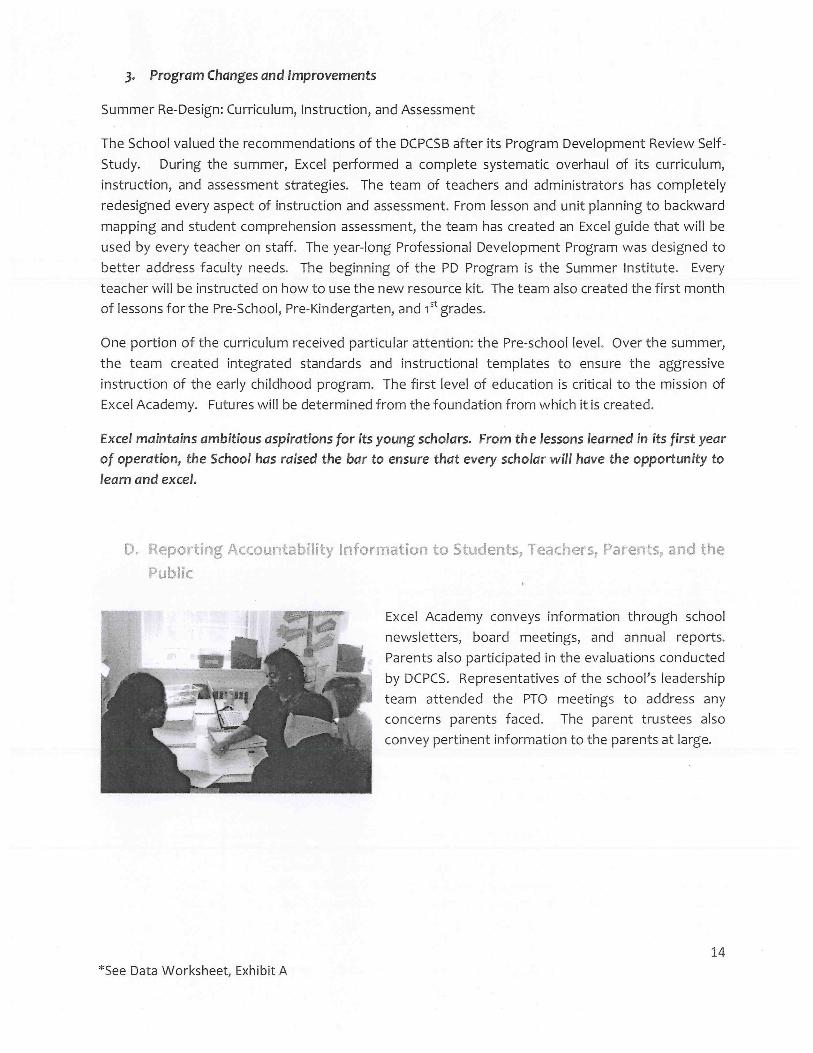
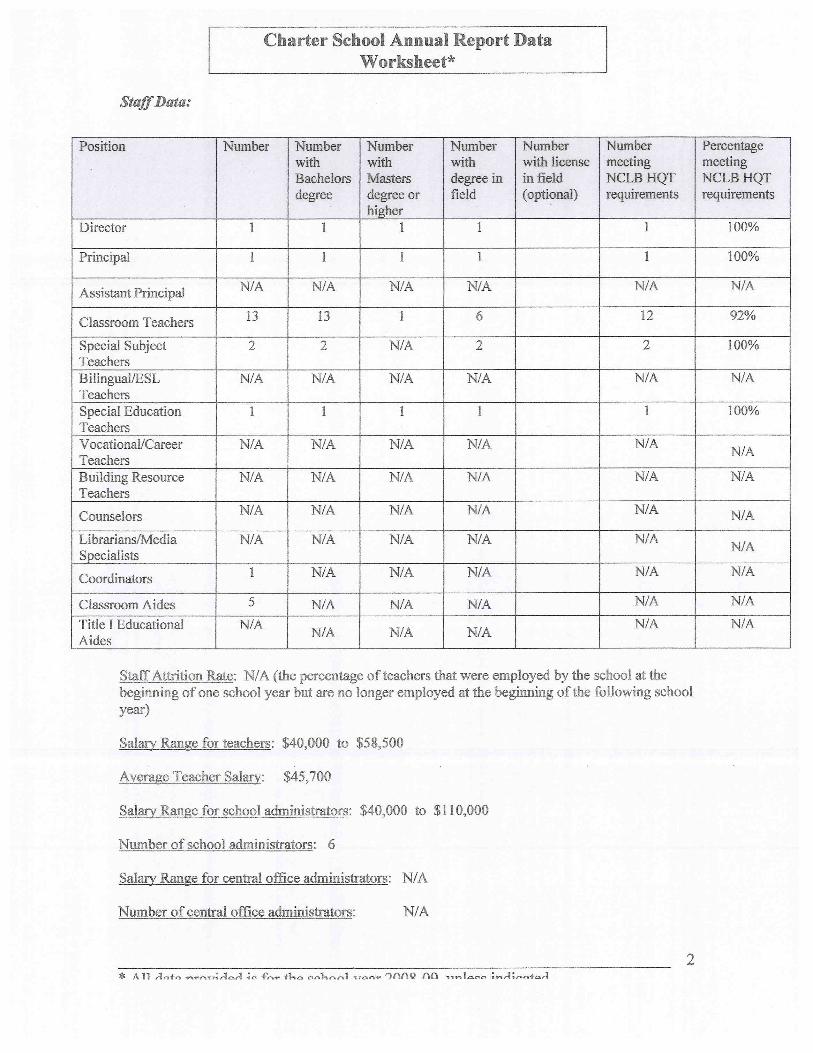
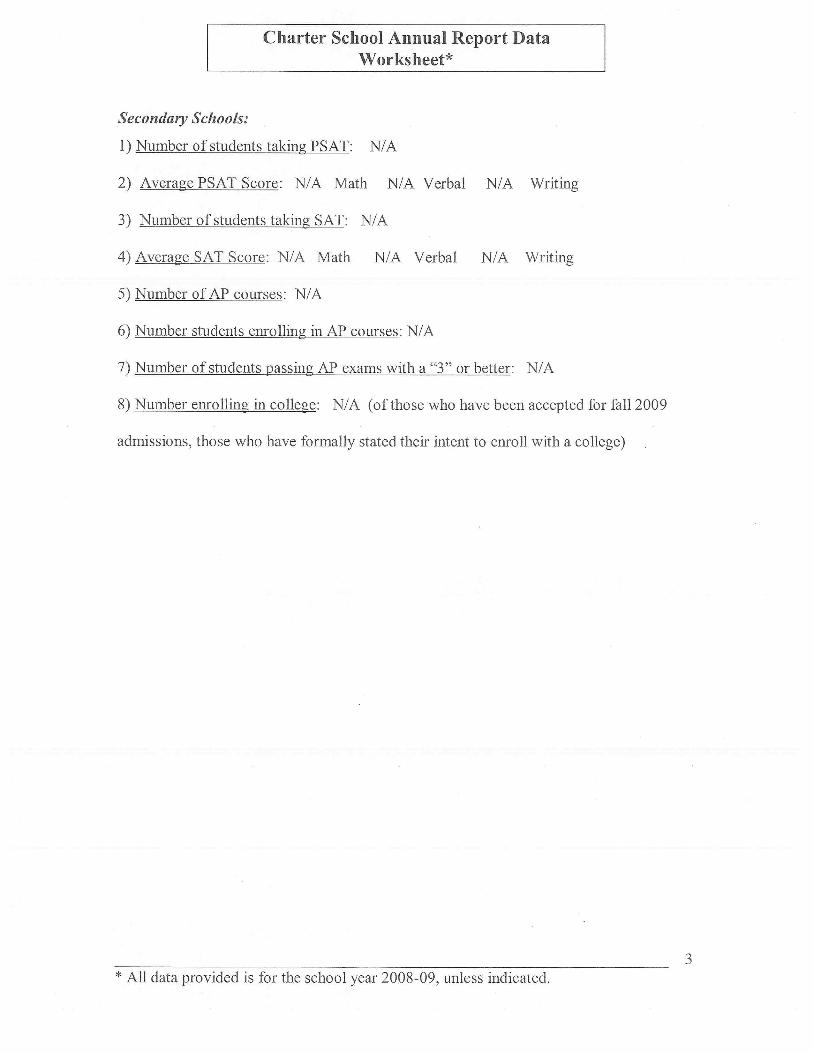
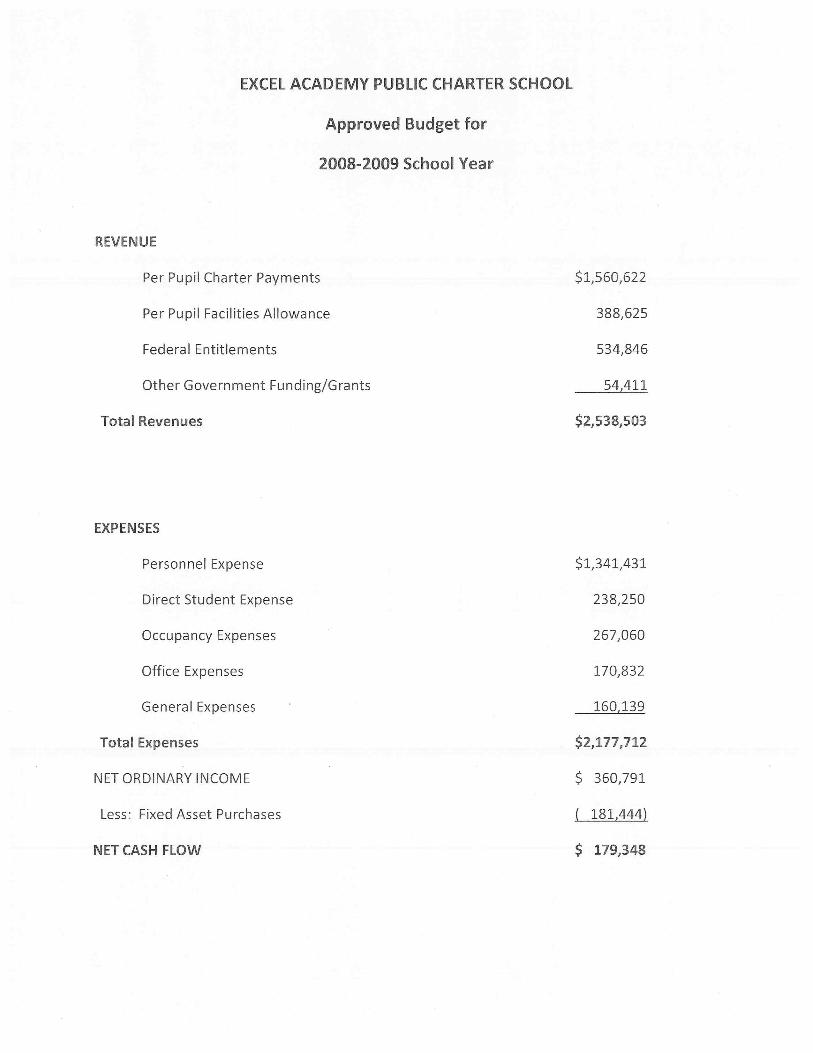
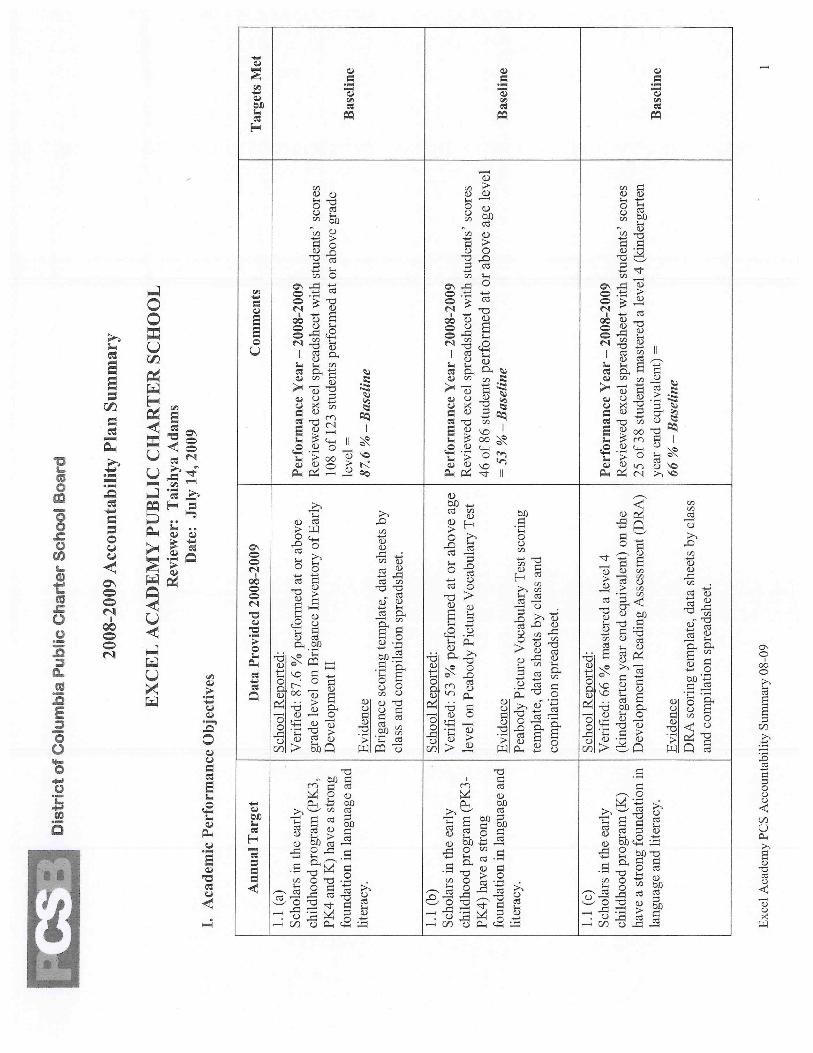
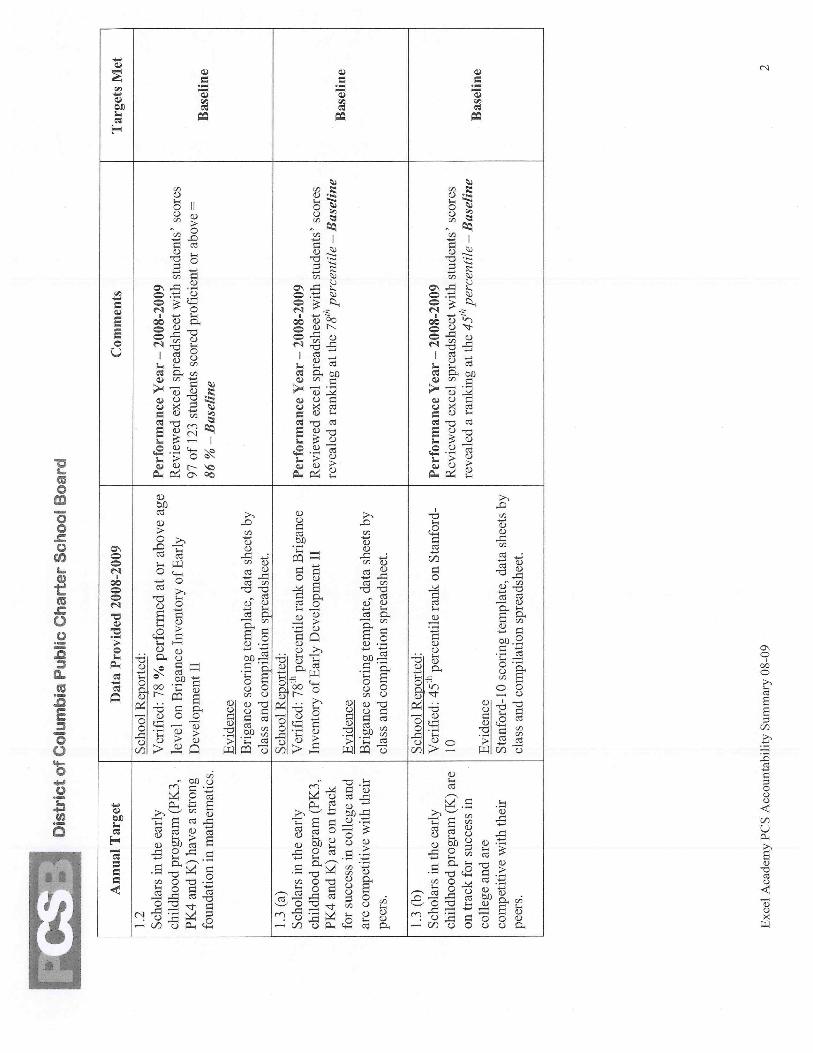
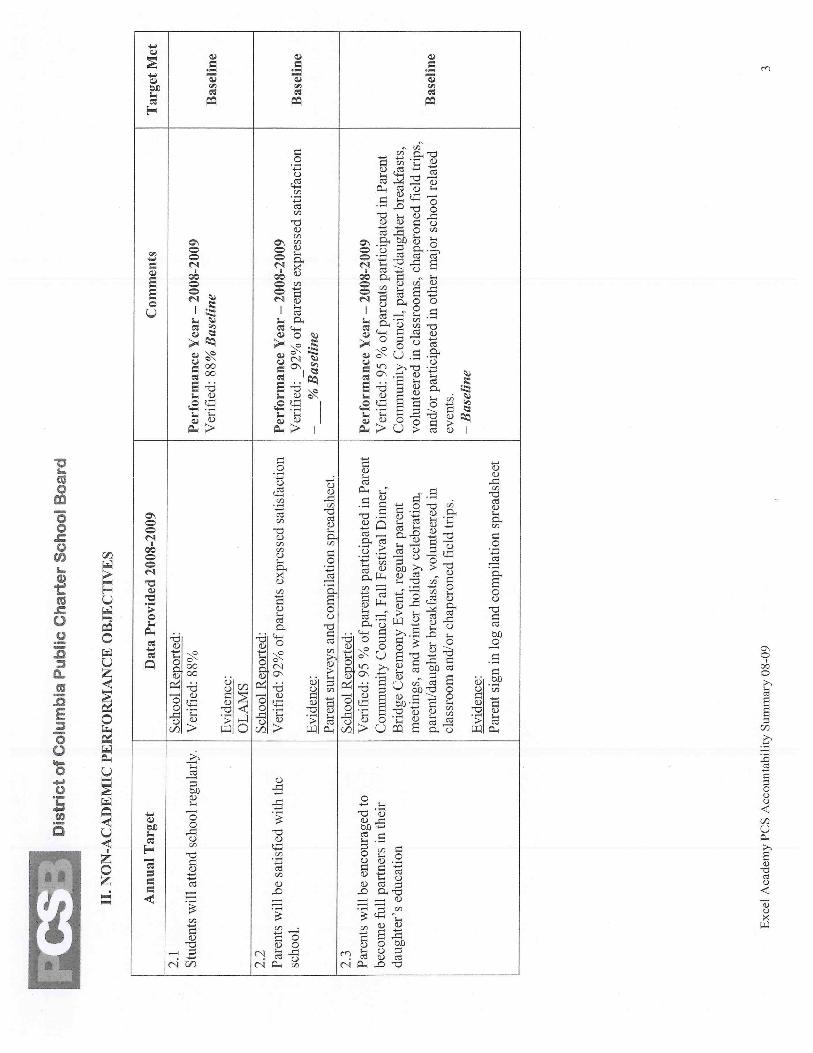
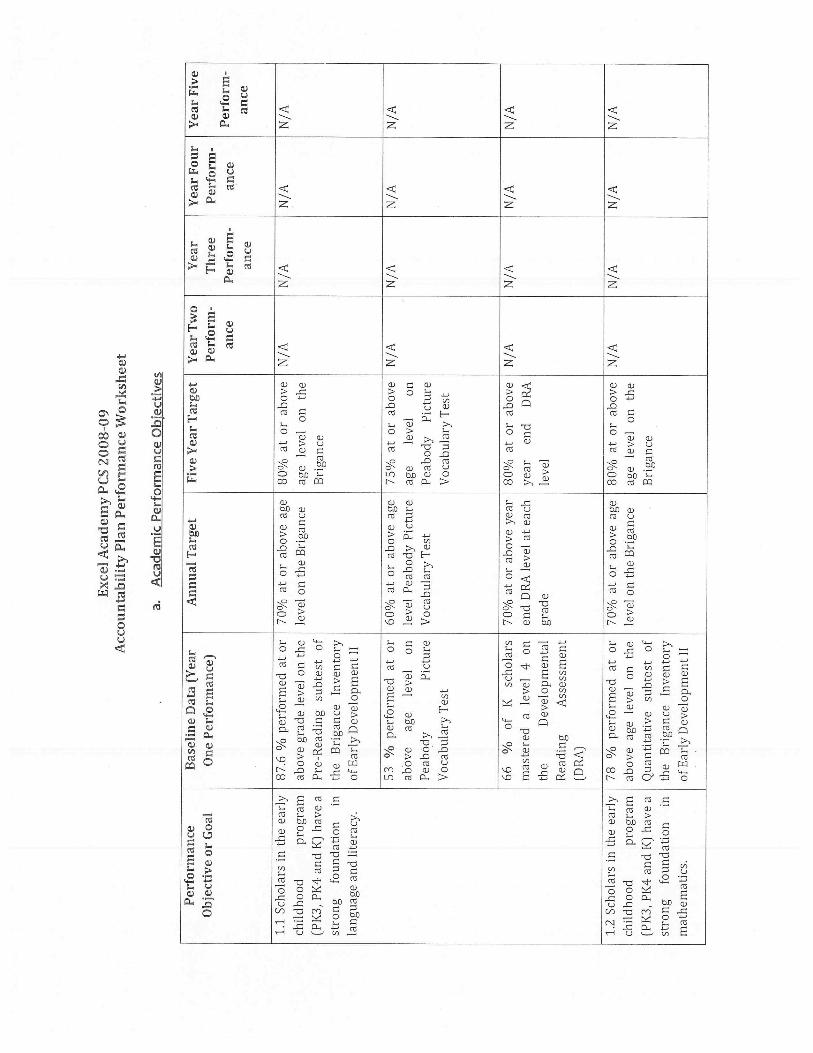
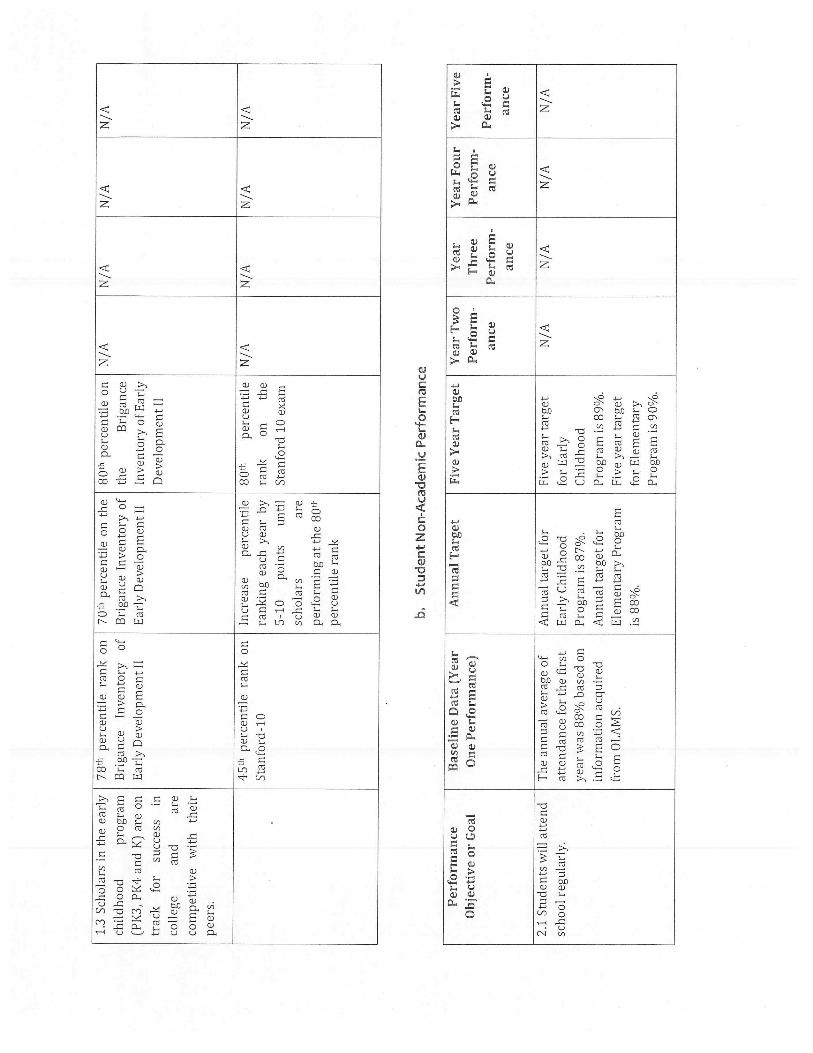
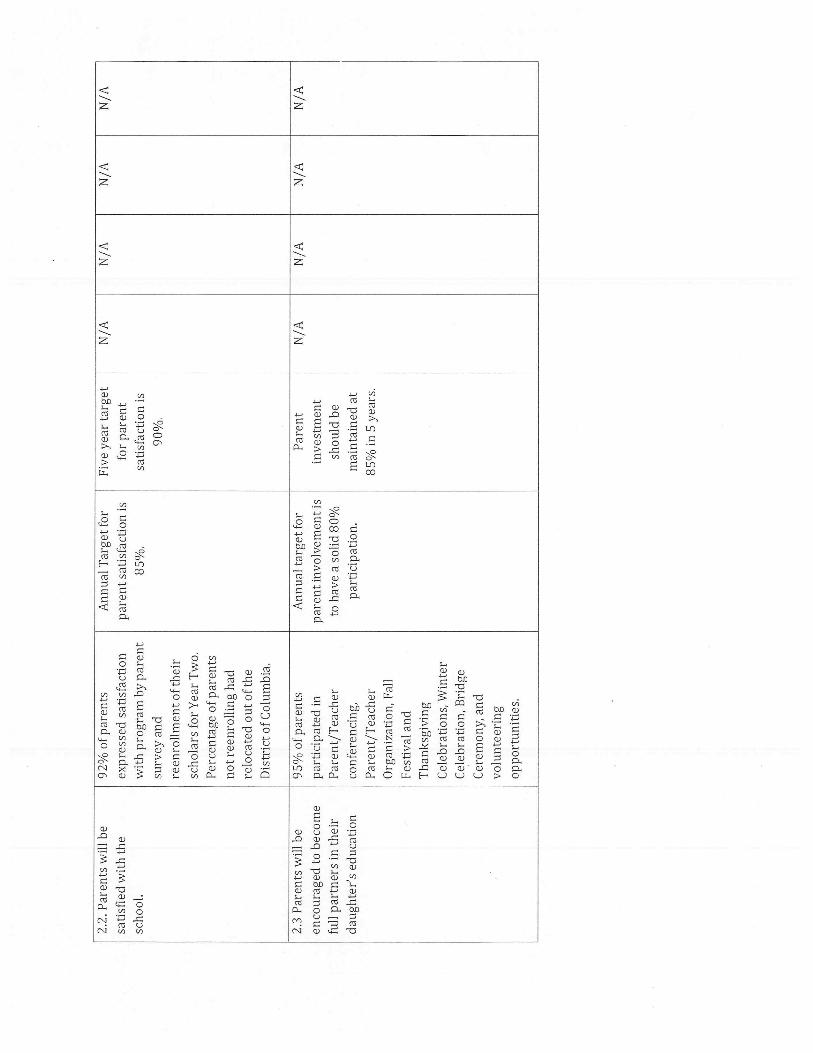

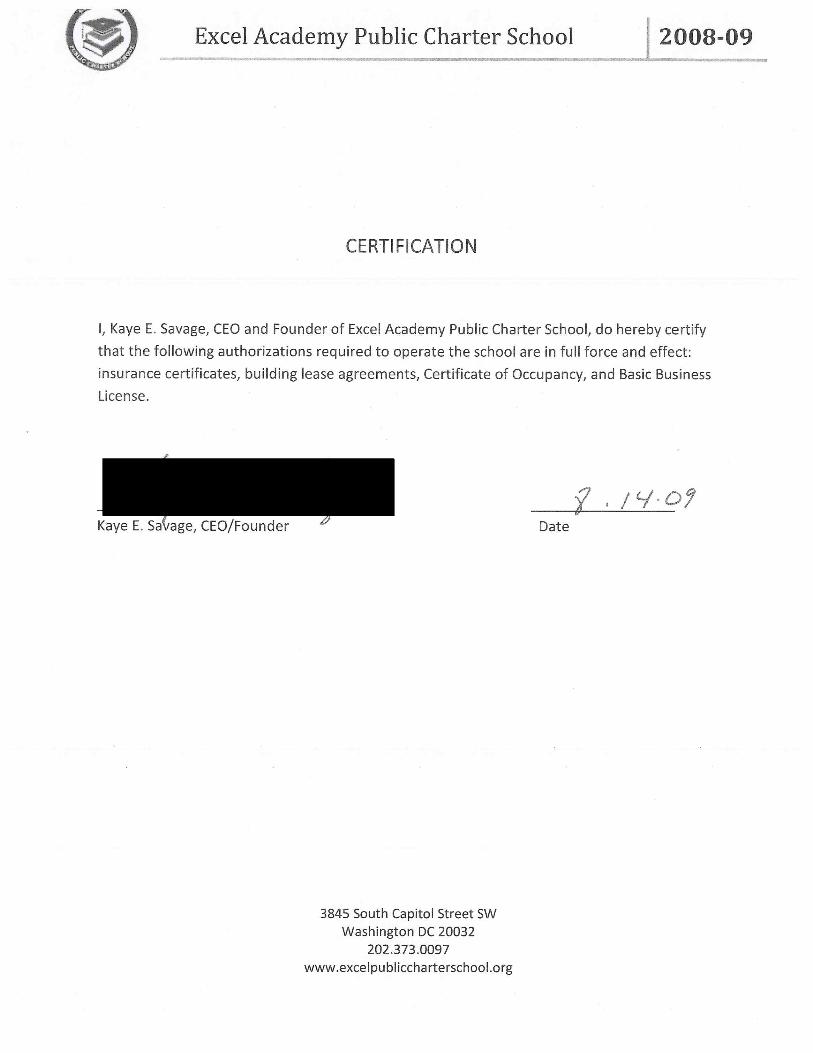

Appendix E
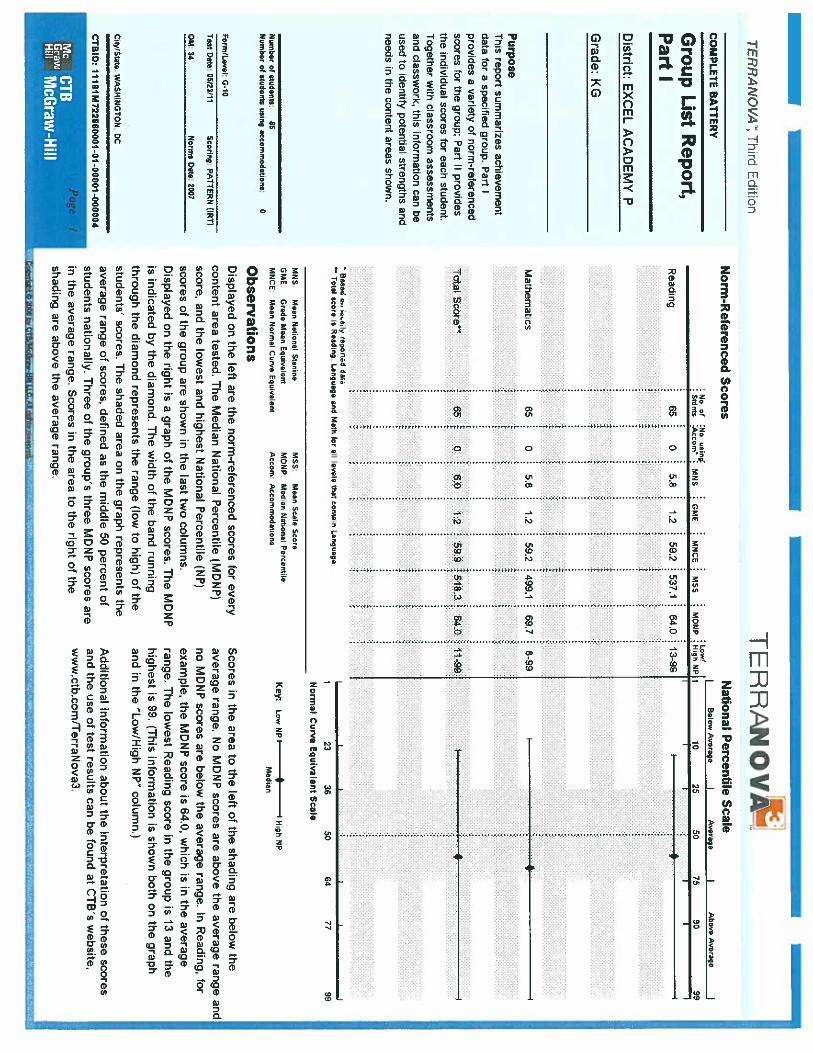
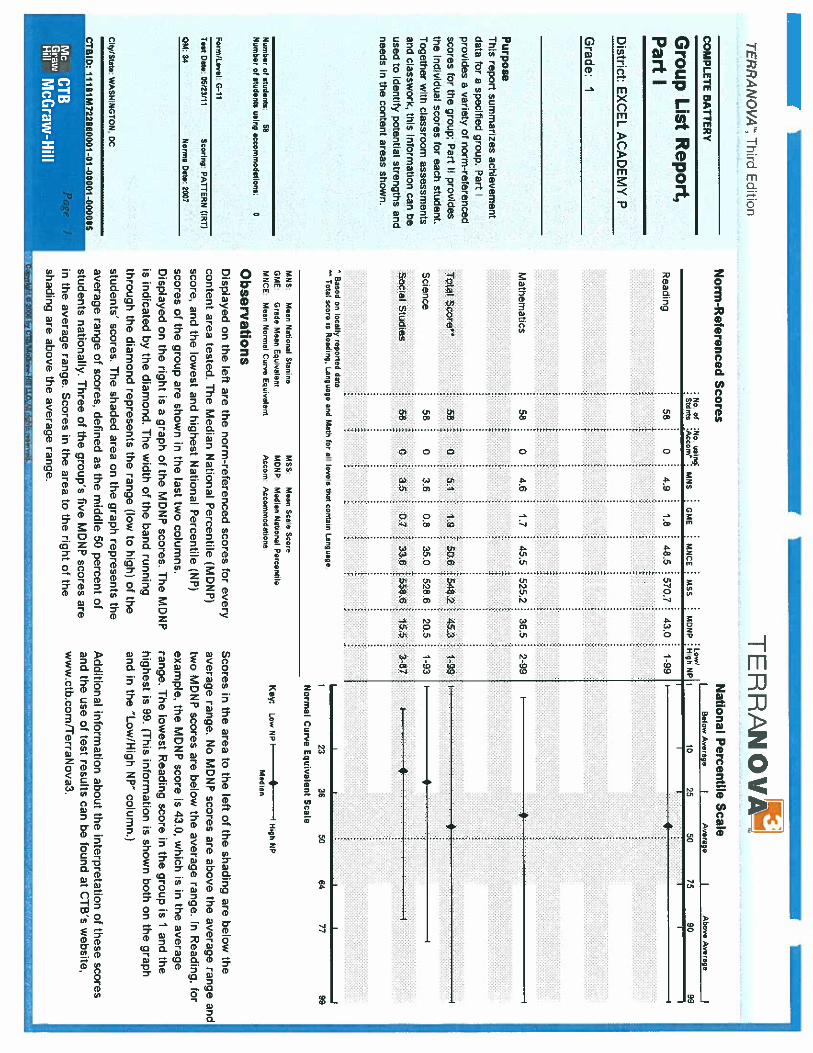
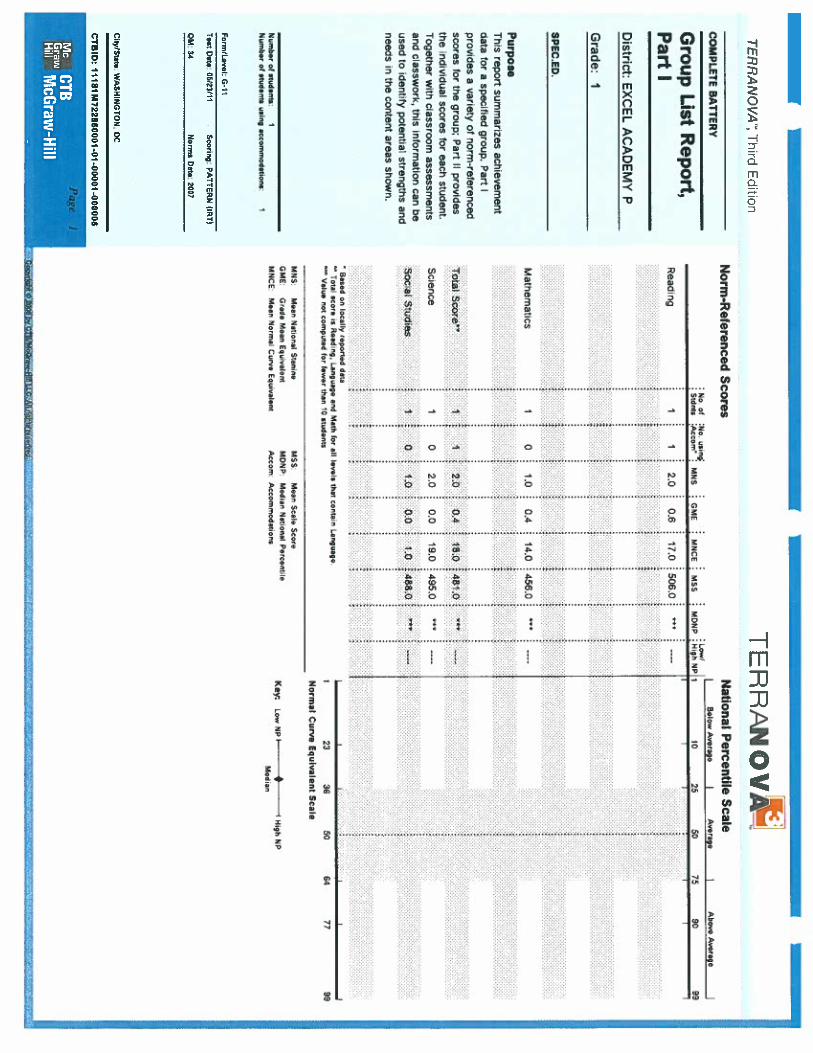
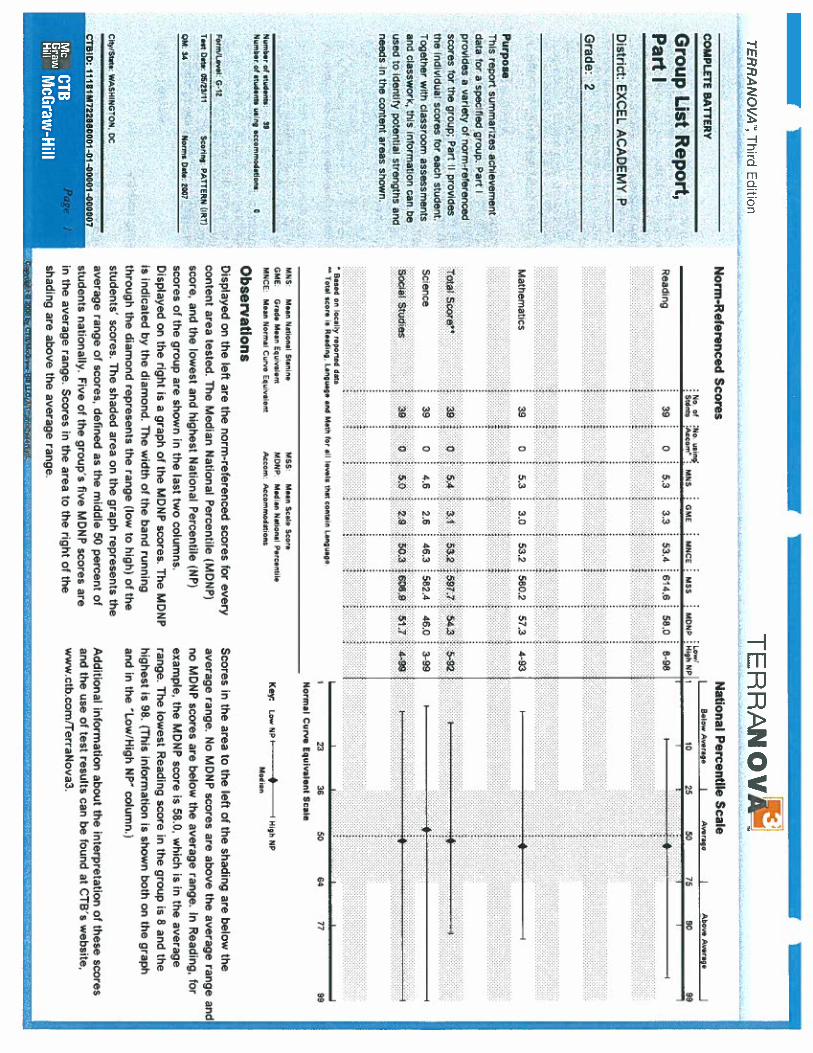
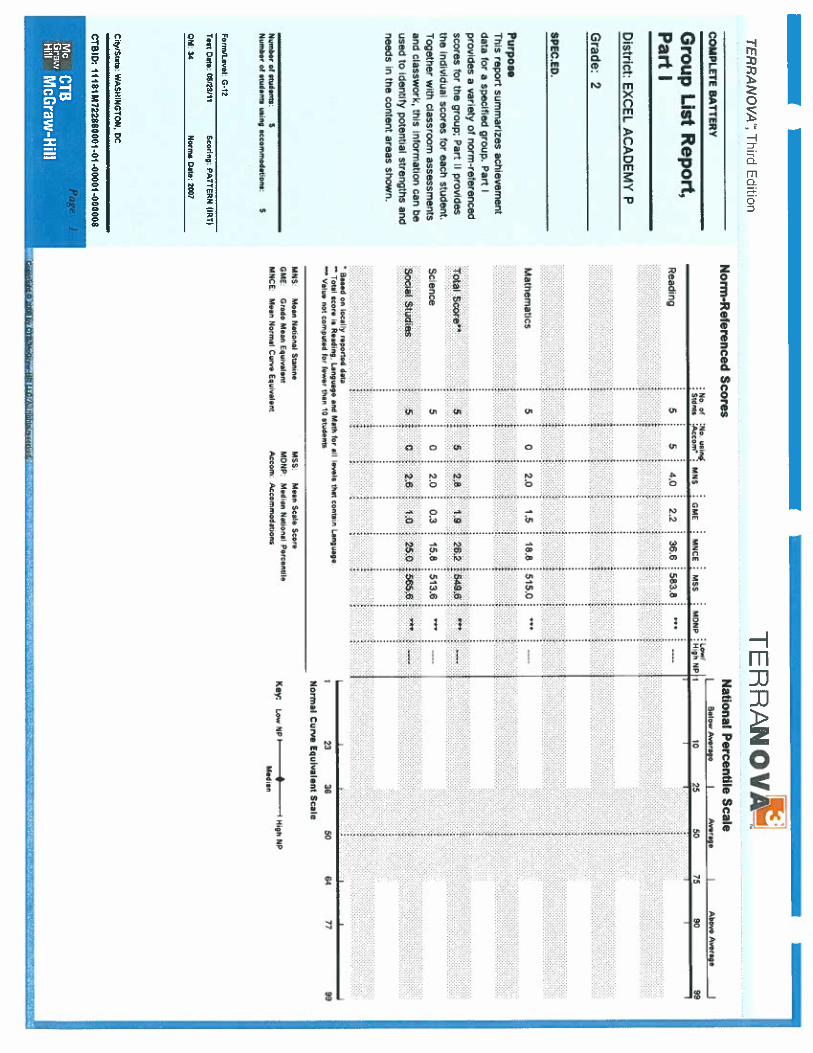

Appendix F
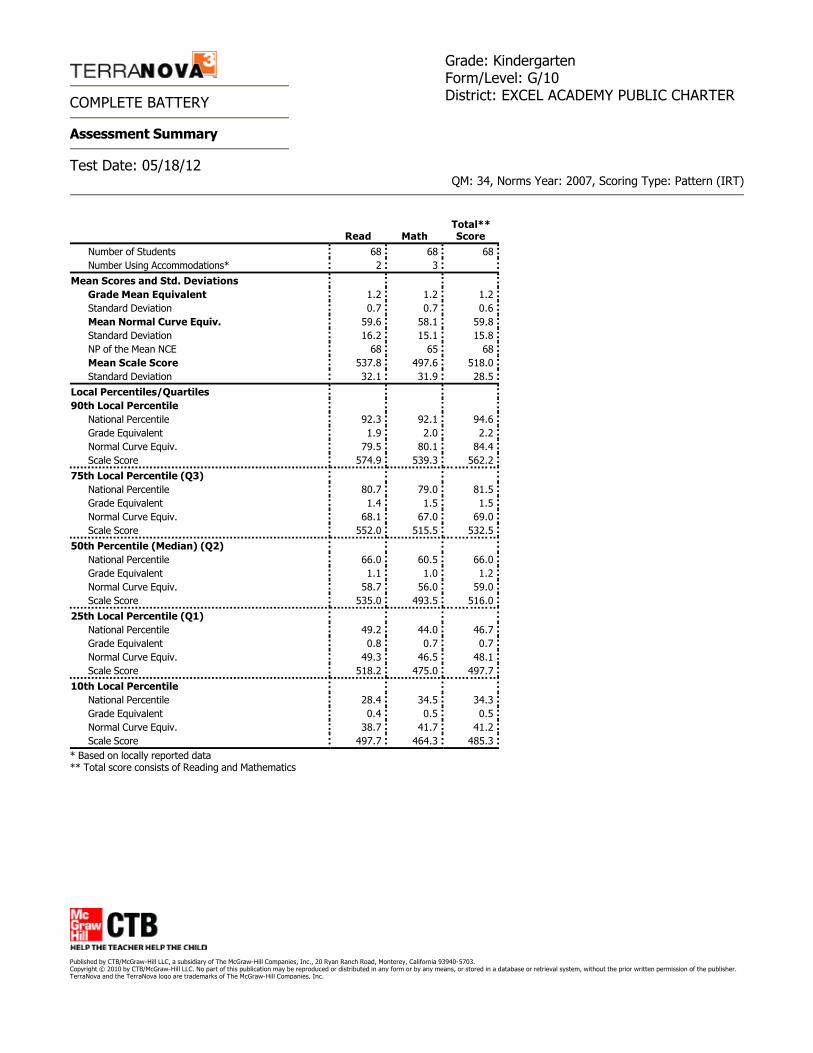
* Based on locally reported data ** Total score consists of Reading and Mathematics
QM: 34, Norms Year: 2007, Scoring Type: Pattern (IRT)
COMPLETE BATTERY
Assessment Summary
Test Date: 05/18/12
Grade: Kindergarten Form/Level: G/10 District: EXCEL ACADEMY PUBLIC CHARTER
Read MathTotal** Score
Number of Students 68 68 68Number Using Accommodations* 2 3
Mean Scores and Std. Deviations Grade Mean Equivalent 1.2 1.2 1.2Standard Deviation 0.7 0.7 0.6Mean Normal Curve Equiv. 59.6 58.1 59.8Standard Deviation 16.2 15.1 15.8NP of the Mean NCE 68 65 68Mean Scale Score 537.8 497.6 518.0Standard Deviation 32.1 31.9 28.5
Local Percentiles/Quartiles 90th Local Percentile
National Percentile 92.3 92.1 94.6Grade Equivalent 1.9 2.0 2.2Normal Curve Equiv. 79.5 80.1 84.4Scale Score 574.9 539.3 562.2
75th Local Percentile (Q3) National Percentile 80.7 79.0 81.5Grade Equivalent 1.4 1.5 1.5Normal Curve Equiv. 68.1 67.0 69.0Scale Score 552.0 515.5 532.5
50th Percentile (Median) (Q2) National Percentile 66.0 60.5 66.0Grade Equivalent 1.1 1.0 1.2Normal Curve Equiv. 58.7 56.0 59.0Scale Score 535.0 493.5 516.0
25th Local Percentile (Q1) National Percentile 49.2 44.0 46.7Grade Equivalent 0.8 0.7 0.7Normal Curve Equiv. 49.3 46.5 48.1Scale Score 518.2 475.0 497.7
10th Local Percentile National Percentile 28.4 34.5 34.3Grade Equivalent 0.4 0.5 0.5Normal Curve Equiv. 38.7 41.7 41.2Scale Score 497.7 464.3 485.3
Published by CTB/McGraw-Hill LLC, a subsidiary of The McGraw-Hill Companies, Inc., 20 Ryan Ranch Road, Monterey, California 93940-5703. Copyright © 2010 by CTB/McGraw-Hill LLC. No part of this publication may be reproduced or distributed in any form or by any means, or stored in a database or retrieval system, without the prior written permission of the publisher. TerraNova and the TerraNova logo are trademarks of The McGraw-Hill Companies, Inc.
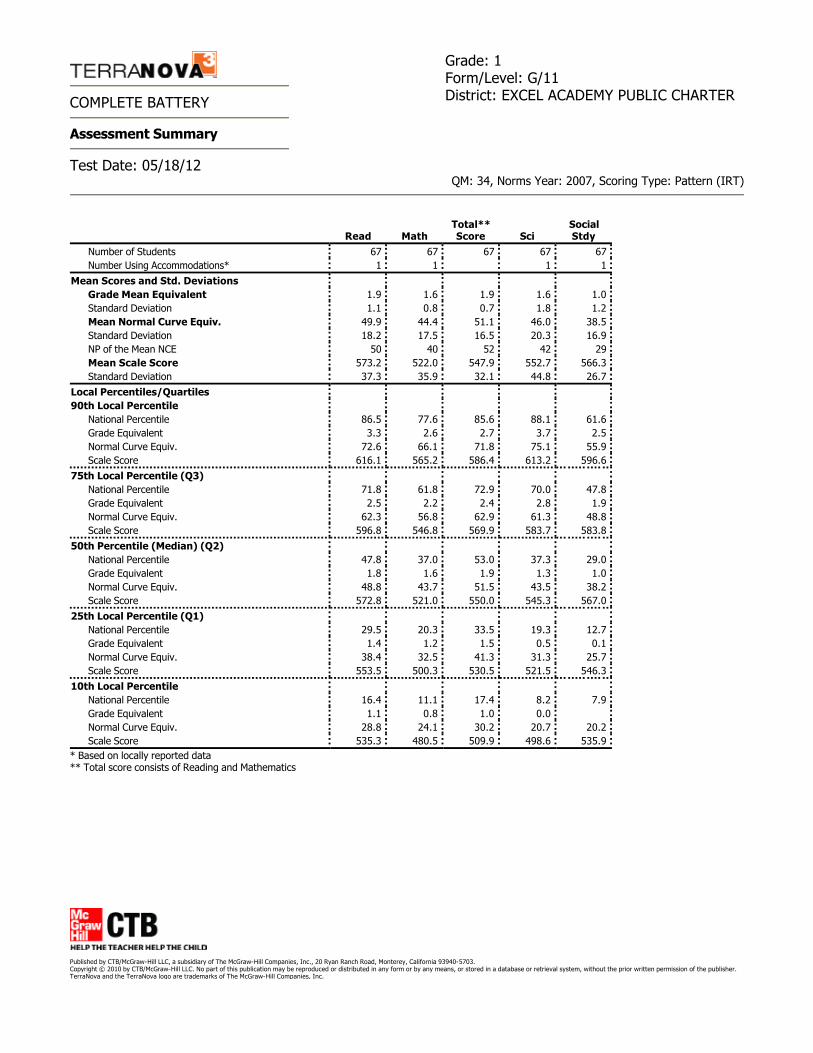
* Based on locally reported data ** Total score consists of Reading and Mathematics
QM: 34, Norms Year: 2007, Scoring Type: Pattern (IRT)
COMPLETE BATTERY
Assessment Summary
Test Date: 05/18/12
Grade: 1 Form/Level: G/11 District: EXCEL ACADEMY PUBLIC CHARTER
Read MathTotal** Score Sci
Social Stdy
Number of Students 67 67 67 67 67Number Using Accommodations* 1 1 1 1
Mean Scores and Std. Deviations Grade Mean Equivalent 1.9 1.6 1.9 1.6 1.0Standard Deviation 1.1 0.8 0.7 1.8 1.2Mean Normal Curve Equiv. 49.9 44.4 51.1 46.0 38.5Standard Deviation 18.2 17.5 16.5 20.3 16.9NP of the Mean NCE 50 40 52 42 29Mean Scale Score 573.2 522.0 547.9 552.7 566.3Standard Deviation 37.3 35.9 32.1 44.8 26.7
Local Percentiles/Quartiles 90th Local Percentile
National Percentile 86.5 77.6 85.6 88.1 61.6Grade Equivalent 3.3 2.6 2.7 3.7 2.5Normal Curve Equiv. 72.6 66.1 71.8 75.1 55.9Scale Score 616.1 565.2 586.4 613.2 596.6
75th Local Percentile (Q3) National Percentile 71.8 61.8 72.9 70.0 47.8Grade Equivalent 2.5 2.2 2.4 2.8 1.9Normal Curve Equiv. 62.3 56.8 62.9 61.3 48.8Scale Score 596.8 546.8 569.9 583.7 583.8
50th Percentile (Median) (Q2) National Percentile 47.8 37.0 53.0 37.3 29.0Grade Equivalent 1.8 1.6 1.9 1.3 1.0Normal Curve Equiv. 48.8 43.7 51.5 43.5 38.2Scale Score 572.8 521.0 550.0 545.3 567.0
25th Local Percentile (Q1) National Percentile 29.5 20.3 33.5 19.3 12.7Grade Equivalent 1.4 1.2 1.5 0.5 0.1Normal Curve Equiv. 38.4 32.5 41.3 31.3 25.7Scale Score 553.5 500.3 530.5 521.5 546.3
10th Local Percentile National Percentile 16.4 11.1 17.4 8.2 7.9Grade Equivalent 1.1 0.8 1.0 0.0Normal Curve Equiv. 28.8 24.1 30.2 20.7 20.2Scale Score 535.3 480.5 509.9 498.6 535.9
Published by CTB/McGraw-Hill LLC, a subsidiary of The McGraw-Hill Companies, Inc., 20 Ryan Ranch Road, Monterey, California 93940-5703. Copyright © 2010 by CTB/McGraw-Hill LLC. No part of this publication may be reproduced or distributed in any form or by any means, or stored in a database or retrieval system, without the prior written permission of the publisher. TerraNova and the TerraNova logo are trademarks of The McGraw-Hill Companies, Inc.
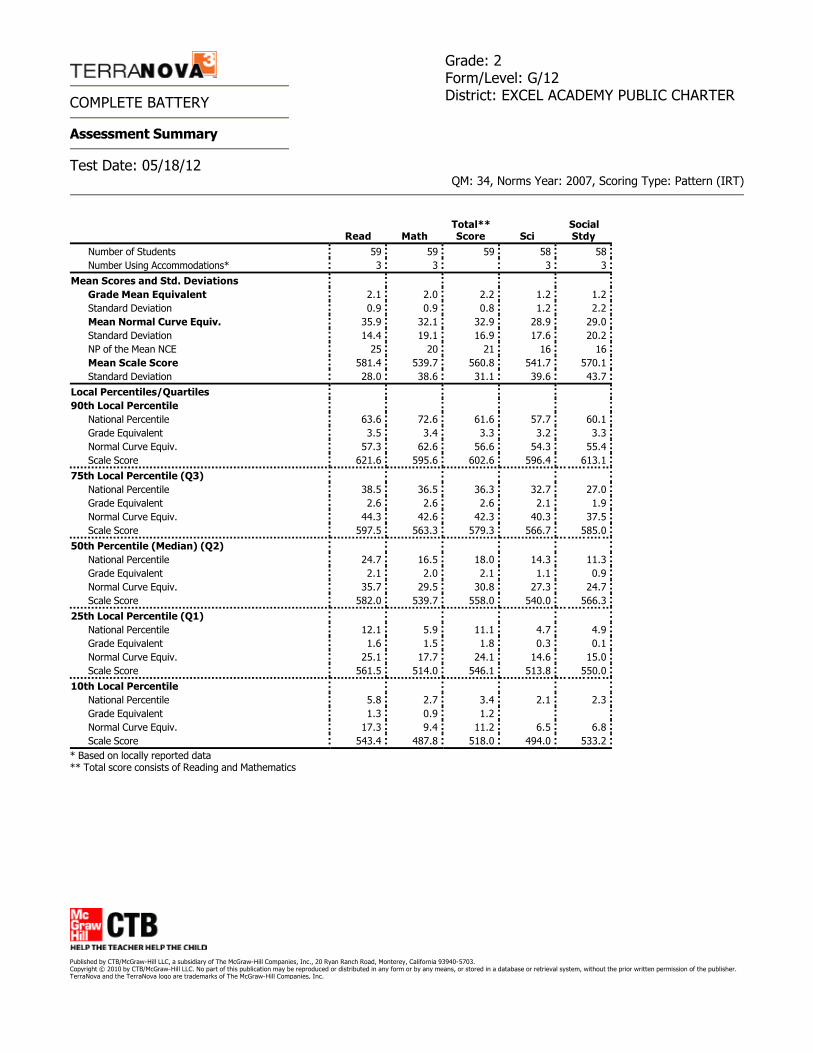
* Based on locally reported data ** Total score consists of Reading and Mathematics
QM: 34, Norms Year: 2007, Scoring Type: Pattern (IRT)
COMPLETE BATTERY
Assessment Summary
Test Date: 05/18/12
Grade: 2 Form/Level: G/12 District: EXCEL ACADEMY PUBLIC CHARTER
Read MathTotal** Score Sci
Social Stdy
Number of Students 59 59 59 58 58Number Using Accommodations* 3 3 3 3
Mean Scores and Std. Deviations Grade Mean Equivalent 2.1 2.0 2.2 1.2 1.2Standard Deviation 0.9 0.9 0.8 1.2 2.2Mean Normal Curve Equiv. 35.9 32.1 32.9 28.9 29.0Standard Deviation 14.4 19.1 16.9 17.6 20.2NP of the Mean NCE 25 20 21 16 16Mean Scale Score 581.4 539.7 560.8 541.7 570.1Standard Deviation 28.0 38.6 31.1 39.6 43.7
Local Percentiles/Quartiles 90th Local Percentile
National Percentile 63.6 72.6 61.6 57.7 60.1Grade Equivalent 3.5 3.4 3.3 3.2 3.3Normal Curve Equiv. 57.3 62.6 56.6 54.3 55.4Scale Score 621.6 595.6 602.6 596.4 613.1
75th Local Percentile (Q3) National Percentile 38.5 36.5 36.3 32.7 27.0Grade Equivalent 2.6 2.6 2.6 2.1 1.9Normal Curve Equiv. 44.3 42.6 42.3 40.3 37.5Scale Score 597.5 563.3 579.3 566.7 585.0
50th Percentile (Median) (Q2) National Percentile 24.7 16.5 18.0 14.3 11.3Grade Equivalent 2.1 2.0 2.1 1.1 0.9Normal Curve Equiv. 35.7 29.5 30.8 27.3 24.7Scale Score 582.0 539.7 558.0 540.0 566.3
25th Local Percentile (Q1) National Percentile 12.1 5.9 11.1 4.7 4.9Grade Equivalent 1.6 1.5 1.8 0.3 0.1Normal Curve Equiv. 25.1 17.7 24.1 14.6 15.0Scale Score 561.5 514.0 546.1 513.8 550.0
10th Local Percentile National Percentile 5.8 2.7 3.4 2.1 2.3Grade Equivalent 1.3 0.9 1.2Normal Curve Equiv. 17.3 9.4 11.2 6.5 6.8Scale Score 543.4 487.8 518.0 494.0 533.2
Published by CTB/McGraw-Hill LLC, a subsidiary of The McGraw-Hill Companies, Inc., 20 Ryan Ranch Road, Monterey, California 93940-5703. Copyright © 2010 by CTB/McGraw-Hill LLC. No part of this publication may be reproduced or distributed in any form or by any means, or stored in a database or retrieval system, without the prior written permission of the publisher. TerraNova and the TerraNova logo are trademarks of The McGraw-Hill Companies, Inc.

Appendix G
March 8, 2013 Vito Germinario, Board Chair Excel Academy Public Charter School 2501 Martin Luther King Jr. Ave., SE Washington, DC 20020 Dear Mr. Germinario: The Public Charter School Board (PCSB) conducts Qualitative Site Reviews to gather and document authentic evidence to support the oversight of PCSB schools. According to the School Reform Act § 38-1802.11, PCSB shall monitor the progress of each school in meeting student academic achievement expectations specified in the charter granted to such school. Your school was selected to undergo a Qualitative Site Review during the 2012-13 school year for the following reason(s):
o School eligible for 5-year Charter Review o School met less than 30% of targets in Accountability Plan during the 2010-11 school year
Qualitative Site Review Report On December 4 and 6, 2012, a Qualitative Site Review team conducted on-site reviews of Excel Academy PCS. The purpose of the site review is for PCSB to gauge the extent to which the school’s goals and student academic achievement expectations were evident in the everyday operations of the public charter school. To ascertain this, PCSB staff and consultants evaluated your classroom teaching by using an abridged version of the Charlotte Danielson Framework for Teaching observation rubric. We also visited a parent event, and conducted focus groups with a random selection of students, a group of teachers, and your administrators. Enclosed is the team’s report. You will find that the Qualitative Site Review Report is focused primarily on the following areas: mission/goals of the schools charter, classroom environments, instructional delivery, meeting the needs of all learners, professional development, and school climate. We appreciate the assistance and hospitality that you and your staff gave the monitoring team in conducting the Qualitative Site Review at Excel Academy PCS. Thank you for your continued cooperation as PCSB makes every effort to ensure that Excel Academy PCS is in compliance with its charter. Sincerely, Scott Pearson Executive Director
Enclosures cc: Kaye Savage
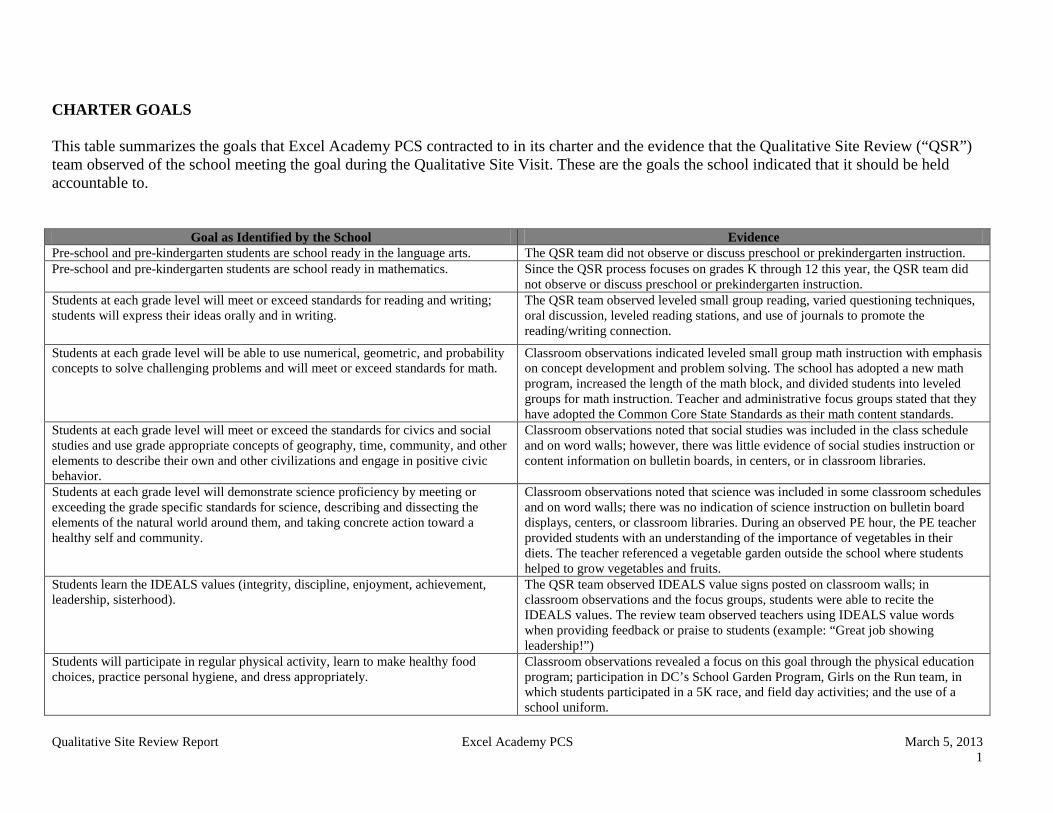
Qualitative Site Review Report Excel Academy PCS March 5, 2013 1
CHARTER GOALS This table summarizes the goals that Excel Academy PCS contracted to in its charter and the evidence that the Qualitative Site Review (“QSR”) team observed of the school meeting the goal during the Qualitative Site Visit. These are the goals the school indicated that it should be held accountable to.
Goal as Identified by the School Evidence Pre-school and pre-kindergarten students are school ready in the language arts. The QSR team did not observe or discuss preschool or prekindergarten instruction. Pre-school and pre-kindergarten students are school ready in mathematics. Since the QSR process focuses on grades K through 12 this year, the QSR team did
not observe or discuss preschool or prekindergarten instruction. Students at each grade level will meet or exceed standards for reading and writing; students will express their ideas orally and in writing.
The QSR team observed leveled small group reading, varied questioning techniques, oral discussion, leveled reading stations, and use of journals to promote the reading/writing connection.
Students at each grade level will be able to use numerical, geometric, and probability concepts to solve challenging problems and will meet or exceed standards for math.
Classroom observations indicated leveled small group math instruction with emphasis on concept development and problem solving. The school has adopted a new math program, increased the length of the math block, and divided students into leveled groups for math instruction. Teacher and administrative focus groups stated that they have adopted the Common Core State Standards as their math content standards.
Students at each grade level will meet or exceed the standards for civics and social studies and use grade appropriate concepts of geography, time, community, and other elements to describe their own and other civilizations and engage in positive civic behavior.
Classroom observations noted that social studies was included in the class schedule and on word walls; however, there was little evidence of social studies instruction or content information on bulletin boards, in centers, or in classroom libraries.
Students at each grade level will demonstrate science proficiency by meeting or exceeding the grade specific standards for science, describing and dissecting the elements of the natural world around them, and taking concrete action toward a healthy self and community.
Classroom observations noted that science was included in some classroom schedules and on word walls; there was no indication of science instruction on bulletin board displays, centers, or classroom libraries. During an observed PE hour, the PE teacher provided students with an understanding of the importance of vegetables in their diets. The teacher referenced a vegetable garden outside the school where students helped to grow vegetables and fruits.
Students learn the IDEALS values (integrity, discipline, enjoyment, achievement, leadership, sisterhood).
The QSR team observed IDEALS value signs posted on classroom walls; in classroom observations and the focus groups, students were able to recite the IDEALS values. The review team observed teachers using IDEALS value words when providing feedback or praise to students (example: “Great job showing leadership!”)
Students will participate in regular physical activity, learn to make healthy food choices, practice personal hygiene, and dress appropriately.
Classroom observations revealed a focus on this goal through the physical education program; participation in DC’s School Garden Program, Girls on the Run team, in which students participated in a 5K race, and field day activities; and the use of a school uniform.
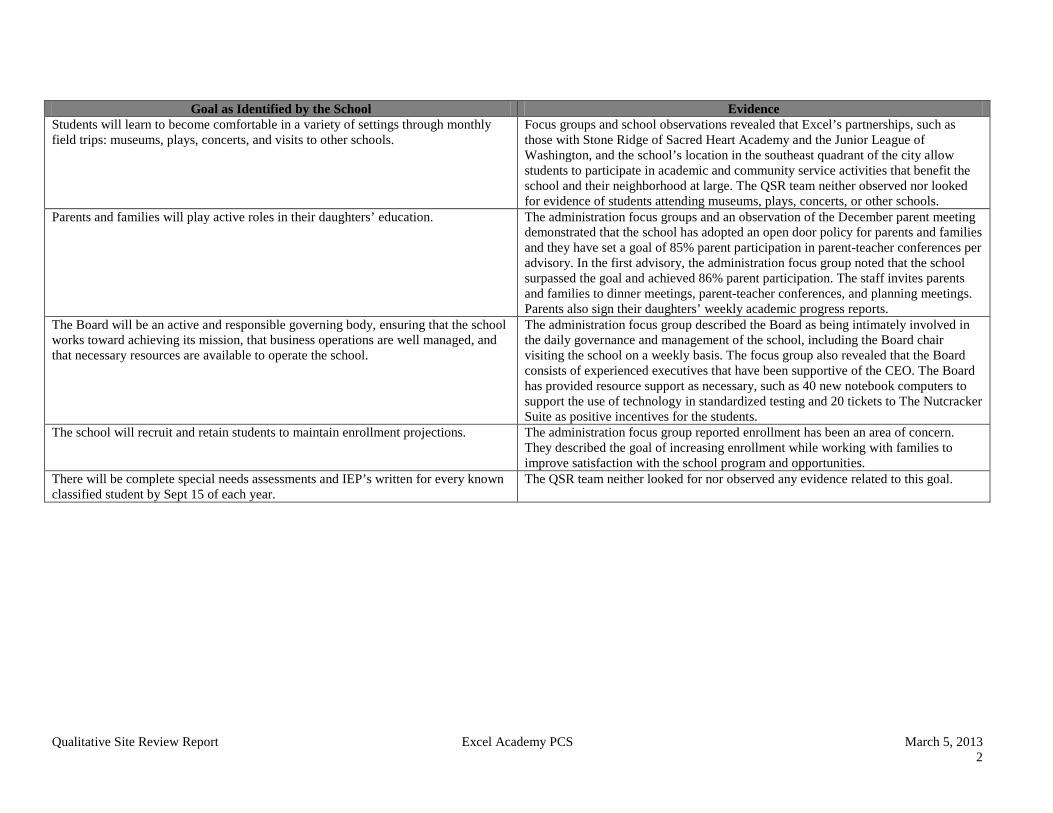
Qualitative Site Review Report Excel Academy PCS March 5, 2013 2
Goal as Identified by the School Evidence Students will learn to become comfortable in a variety of settings through monthly field trips: museums, plays, concerts, and visits to other schools.
Focus groups and school observations revealed that Excel’s partnerships, such as those with Stone Ridge of Sacred Heart Academy and the Junior League of Washington, and the school’s location in the southeast quadrant of the city allow students to participate in academic and community service activities that benefit the school and their neighborhood at large. The QSR team neither observed nor looked for evidence of students attending museums, plays, concerts, or other schools.
Parents and families will play active roles in their daughters’ education. The administration focus groups and an observation of the December parent meeting demonstrated that the school has adopted an open door policy for parents and families and they have set a goal of 85% parent participation in parent-teacher conferences per advisory. In the first advisory, the administration focus group noted that the school surpassed the goal and achieved 86% parent participation. The staff invites parents and families to dinner meetings, parent-teacher conferences, and planning meetings. Parents also sign their daughters’ weekly academic progress reports.
The Board will be an active and responsible governing body, ensuring that the school works toward achieving its mission, that business operations are well managed, and that necessary resources are available to operate the school.
The administration focus group described the Board as being intimately involved in the daily governance and management of the school, including the Board chair visiting the school on a weekly basis. The focus group also revealed that the Board consists of experienced executives that have been supportive of the CEO. The Board has provided resource support as necessary, such as 40 new notebook computers to support the use of technology in standardized testing and 20 tickets to The Nutcracker Suite as positive incentives for the students.
The school will recruit and retain students to maintain enrollment projections. The administration focus group reported enrollment has been an area of concern. They described the goal of increasing enrollment while working with families to improve satisfaction with the school program and opportunities.
There will be complete special needs assessments and IEP’s written for every known classified student by Sept 15 of each year.
The QSR team neither looked for nor observed any evidence related to this goal.
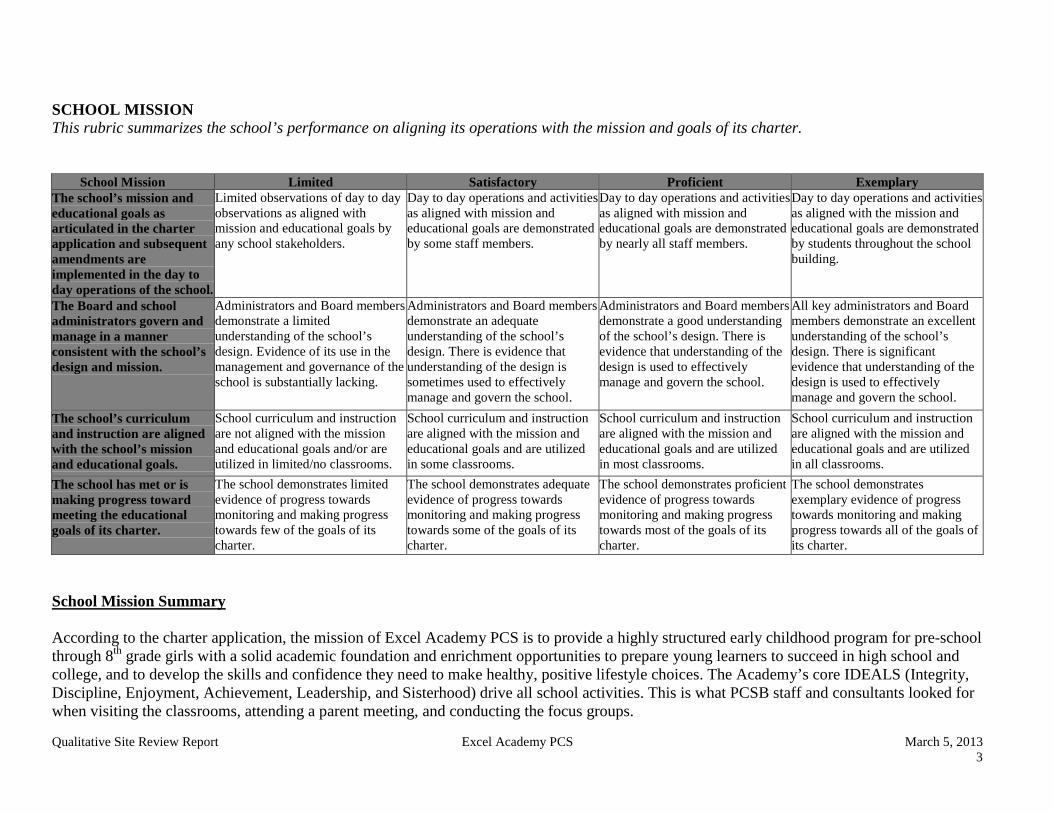
Qualitative Site Review Report Excel Academy PCS March 5, 2013 3
SCHOOL MISSION This rubric summarizes the school’s performance on aligning its operations with the mission and goals of its charter.
School Mission Limited Satisfactory Proficient Exemplary The school’s mission and educational goals as articulated in the charter application and subsequent amendments are implemented in the day to day operations of the school.
Limited observations of day to day observations as aligned with mission and educational goals by any school stakeholders.
Day to day operations and activities as aligned with mission and educational goals are demonstrated by some staff members.
Day to day operations and activities as aligned with mission and educational goals are demonstrated by nearly all staff members.
Day to day operations and activities as aligned with the mission and educational goals are demonstrated by students throughout the school building.
The Board and school administrators govern and manage in a manner consistent with the school’s design and mission.
Administrators and Board members demonstrate a limited understanding of the school’s design. Evidence of its use in the management and governance of the school is substantially lacking.
Administrators and Board members demonstrate an adequate understanding of the school’s design. There is evidence that understanding of the design is sometimes used to effectively manage and govern the school.
Administrators and Board members demonstrate a good understanding of the school’s design. There is evidence that understanding of the design is used to effectively manage and govern the school.
All key administrators and Board members demonstrate an excellent understanding of the school’s design. There is significant evidence that understanding of the design is used to effectively manage and govern the school.
The school’s curriculum and instruction are aligned with the school’s mission and educational goals.
School curriculum and instruction are not aligned with the mission and educational goals and/or are utilized in limited/no classrooms.
School curriculum and instruction are aligned with the mission and educational goals and are utilized in some classrooms.
School curriculum and instruction are aligned with the mission and educational goals and are utilized in most classrooms.
School curriculum and instruction are aligned with the mission and educational goals and are utilized in all classrooms. The school has met or is
making progress toward meeting the educational goals of its charter.
The school demonstrates limited evidence of progress towards monitoring and making progress towards few of the goals of its charter.
The school demonstrates adequate evidence of progress towards monitoring and making progress towards some of the goals of its charter.
The school demonstrates proficient evidence of progress towards monitoring and making progress towards most of the goals of its charter.
The school demonstrates exemplary evidence of progress towards monitoring and making progress towards all of the goals of its charter.
School Mission Summary According to the charter application, the mission of Excel Academy PCS is to provide a highly structured early childhood program for pre-school through 8th grade girls with a solid academic foundation and enrichment opportunities to prepare young learners to succeed in high school and college, and to develop the skills and confidence they need to make healthy, positive lifestyle choices. The Academy’s core IDEALS (Integrity, Discipline, Enjoyment, Achievement, Leadership, and Sisterhood) drive all school activities. This is what PCSB staff and consultants looked for when visiting the classrooms, attending a parent meeting, and conducting the focus groups.
Qualitative Site Review Report Excel Academy PCS March 5, 2013 4
The QSR review team observed evidence that this mission provides the foundation for the all aspects of Excel PCS’s educational program. In our meeting with the administrative team, the principal reported that, initially, the school’s primary focus was to provide a “disciplined and joyful learning environment to support great teaching and learning.” The team’s focus now is on maintaining a positive school culture while developing an outstanding academic program to meet local and state standards. To this end, the school has hired a Chief Academic Officer whose primary responsibility is to oversee the instructional program and support professional development. During the site visit, the review team observed lessons that suggested collaboration across grade levels and small rotating groups in both reading and mathematics. The administration provides teachers with reading and math mastery classes to supplement classroom instruction in these areas. The administration stated the school has adopted a new reading program and has created a reading schedule that supports level-specific differentiated small group instruction. Additionally, the math instruction has a conceptual focus driven by a block schedule that supports leveled cross-classroom grouping and rotation. The school addressed the needs of diverse learners primarily through inclusion with a special education teacher or paraprofessional providing push-in support in a general education environment. For learners that required more intensive support pursuant to their level of need, pull out services by a special education teacher was provided in both small group or on an individual basis. The administration focus group described the Board as being intimately involved in the daily governance and management of the school, including the Board chair attending the school on a weekly basis. The focus group also revealed that the Board consists of experienced executives that have been supportive of the CEO. The Board has provided resource support as necessary, such as 40 new notebook computers to support the use of technology in standardized testing and 20 tickets to The Nutcracker Suite as positive incentives for the students.
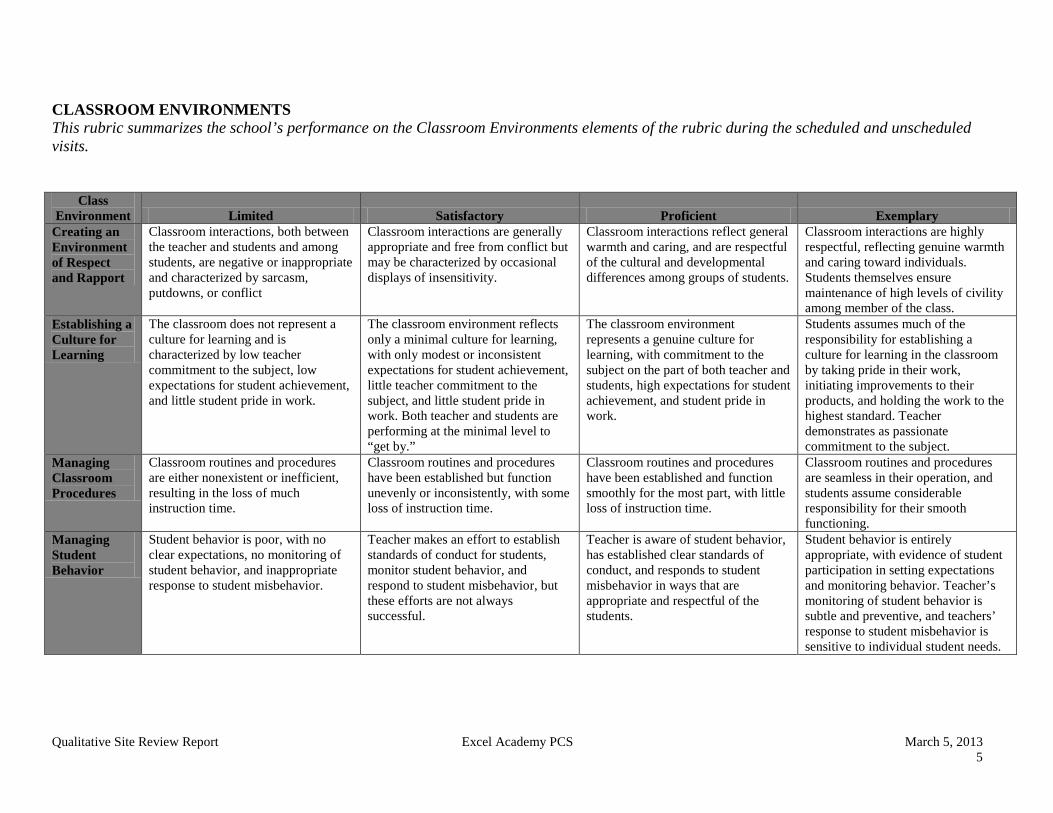
Qualitative Site Review Report Excel Academy PCS March 5, 2013 5
CLASSROOM ENVIRONMENTS This rubric summarizes the school’s performance on the Classroom Environments elements of the rubric during the scheduled and unscheduled visits.
Class Environment Limited Satisfactory Proficient Exemplary
Creating an Environment of Respect and Rapport
Classroom interactions, both between the teacher and students and among students, are negative or inappropriate and characterized by sarcasm, putdowns, or conflict
Classroom interactions are generally appropriate and free from conflict but may be characterized by occasional displays of insensitivity.
Classroom interactions reflect general warmth and caring, and are respectful of the cultural and developmental differences among groups of students.
Classroom interactions are highly respectful, reflecting genuine warmth and caring toward individuals. Students themselves ensure maintenance of high levels of civility among member of the class.
Establishing a Culture for Learning
The classroom does not represent a culture for learning and is characterized by low teacher commitment to the subject, low expectations for student achievement, and little student pride in work.
The classroom environment reflects only a minimal culture for learning, with only modest or inconsistent expectations for student achievement, little teacher commitment to the subject, and little student pride in work. Both teacher and students are performing at the minimal level to “get by.”
The classroom environment represents a genuine culture for learning, with commitment to the subject on the part of both teacher and students, high expectations for student achievement, and student pride in work.
Students assumes much of the responsibility for establishing a culture for learning in the classroom by taking pride in their work, initiating improvements to their products, and holding the work to the highest standard. Teacher demonstrates as passionate commitment to the subject.
Managing Classroom Procedures
Classroom routines and procedures are either nonexistent or inefficient, resulting in the loss of much instruction time.
Classroom routines and procedures have been established but function unevenly or inconsistently, with some loss of instruction time.
Classroom routines and procedures have been established and function smoothly for the most part, with little loss of instruction time.
Classroom routines and procedures are seamless in their operation, and students assume considerable responsibility for their smooth functioning.
Managing Student Behavior
Student behavior is poor, with no clear expectations, no monitoring of student behavior, and inappropriate response to student misbehavior.
Teacher makes an effort to establish standards of conduct for students, monitor student behavior, and respond to student misbehavior, but these efforts are not always successful.
Teacher is aware of student behavior, has established clear standards of conduct, and responds to student misbehavior in ways that are appropriate and respectful of the students.
Student behavior is entirely appropriate, with evidence of student participation in setting expectations and monitoring behavior. Teacher’s monitoring of student behavior is subtle and preventive, and teachers’ response to student misbehavior is sensitive to individual student needs.
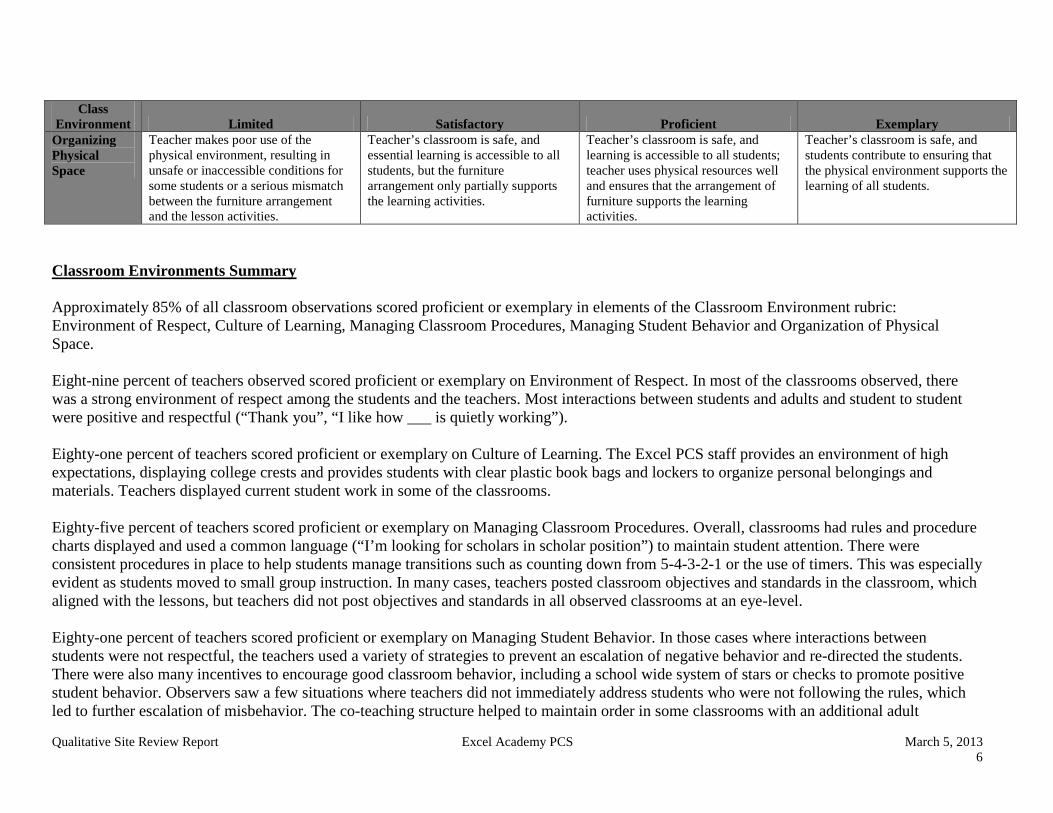
Qualitative Site Review Report Excel Academy PCS March 5, 2013 6
Class Environment Limited Satisfactory Proficient Exemplary
Organizing Physical Space
Teacher makes poor use of the physical environment, resulting in unsafe or inaccessible conditions for some students or a serious mismatch between the furniture arrangement and the lesson activities.
Teacher’s classroom is safe, and essential learning is accessible to all students, but the furniture arrangement only partially supports the learning activities.
Teacher’s classroom is safe, and learning is accessible to all students; teacher uses physical resources well and ensures that the arrangement of furniture supports the learning activities.
Teacher’s classroom is safe, and students contribute to ensuring that the physical environment supports the learning of all students.
Classroom Environments Summary Approximately 85% of all classroom observations scored proficient or exemplary in elements of the Classroom Environment rubric: Environment of Respect, Culture of Learning, Managing Classroom Procedures, Managing Student Behavior and Organization of Physical Space. Eight-nine percent of teachers observed scored proficient or exemplary on Environment of Respect. In most of the classrooms observed, there was a strong environment of respect among the students and the teachers. Most interactions between students and adults and student to student were positive and respectful (“Thank you”, “I like how ___ is quietly working”). Eighty-one percent of teachers scored proficient or exemplary on Culture of Learning. The Excel PCS staff provides an environment of high expectations, displaying college crests and provides students with clear plastic book bags and lockers to organize personal belongings and materials. Teachers displayed current student work in some of the classrooms. Eighty-five percent of teachers scored proficient or exemplary on Managing Classroom Procedures. Overall, classrooms had rules and procedure charts displayed and used a common language (“I’m looking for scholars in scholar position”) to maintain student attention. There were consistent procedures in place to help students manage transitions such as counting down from 5-4-3-2-1 or the use of timers. This was especially evident as students moved to small group instruction. In many cases, teachers posted classroom objectives and standards in the classroom, which aligned with the lessons, but teachers did not post objectives and standards in all observed classrooms at an eye-level. Eighty-one percent of teachers scored proficient or exemplary on Managing Student Behavior. In those cases where interactions between students were not respectful, the teachers used a variety of strategies to prevent an escalation of negative behavior and re-directed the students. There were also many incentives to encourage good classroom behavior, including a school wide system of stars or checks to promote positive student behavior. Observers saw a few situations where teachers did not immediately address students who were not following the rules, which led to further escalation of misbehavior. The co-teaching structure helped to maintain order in some classrooms with an additional adult
Qualitative Site Review Report Excel Academy PCS March 5, 2013 7
supervising the classroom while the other teacher taught. However, in a majority of classrooms, the co-teaching model consisted of “one teach, one observe,” though in some cases, the observing teacher did not appear to be fully engaged with the primary teacher’s instruction. Ninety-three percent of teachers scored proficient or exemplary on Organization of Physical Space. Teachers organized classrooms with furniture, such as partner desks and large rugs, and space to facilitate student learning. Each classroom had clearly defined instruction, small group, and independent learning areas for students. While teachers structured seating arrangements in the classrooms to facilitate cooperative learning through turn and talk or think-pair-share, the observers did not witness the full utilization of these arrangements in all classrooms. Smartboards were available in each classroom and teachers generally used them to present lessons or to post warm-up questions. Supplies and instructional materials are easily accessible.
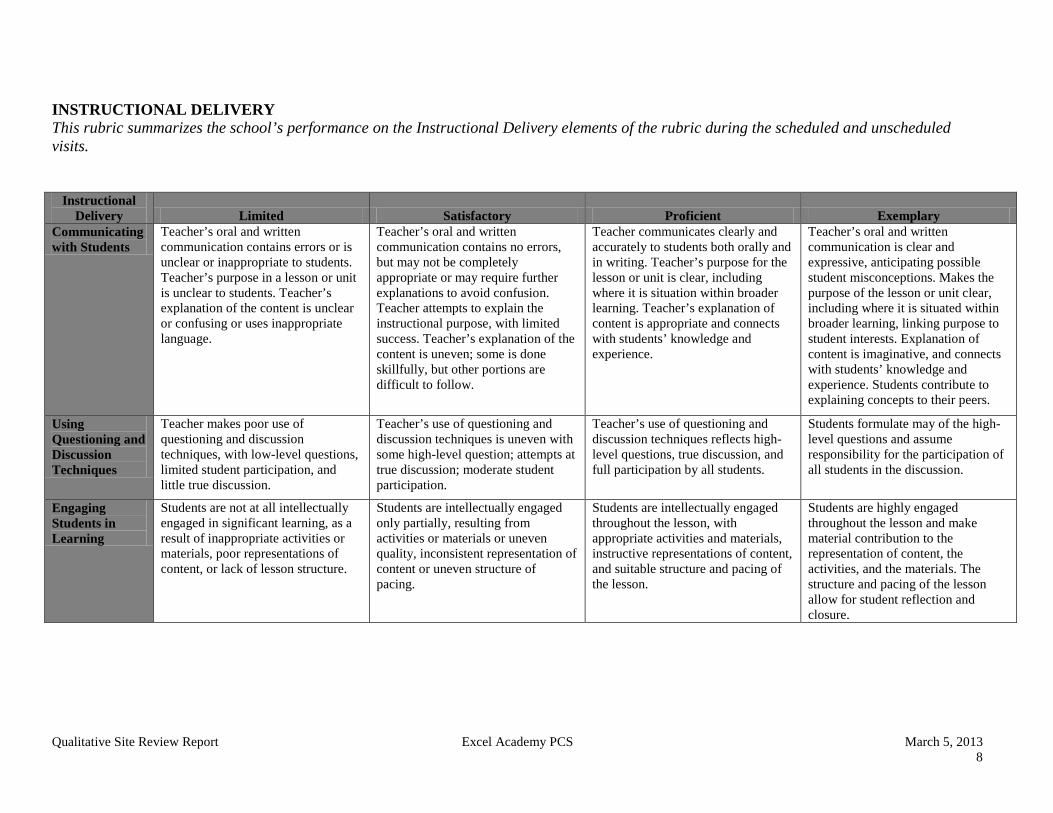
Qualitative Site Review Report Excel Academy PCS March 5, 2013 8
INSTRUCTIONAL DELIVERY This rubric summarizes the school’s performance on the Instructional Delivery elements of the rubric during the scheduled and unscheduled visits.
Instructional Delivery Limited Satisfactory Proficient Exemplary
Communicating with Students
Teacher’s oral and written communication contains errors or is unclear or inappropriate to students. Teacher’s purpose in a lesson or unit is unclear to students. Teacher’s explanation of the content is unclear or confusing or uses inappropriate language.
Teacher’s oral and written communication contains no errors, but may not be completely appropriate or may require further explanations to avoid confusion. Teacher attempts to explain the instructional purpose, with limited success. Teacher’s explanation of the content is uneven; some is done skillfully, but other portions are difficult to follow.
Teacher communicates clearly and accurately to students both orally and in writing. Teacher’s purpose for the lesson or unit is clear, including where it is situation within broader learning. Teacher’s explanation of content is appropriate and connects with students’ knowledge and experience.
Teacher’s oral and written communication is clear and expressive, anticipating possible student misconceptions. Makes the purpose of the lesson or unit clear, including where it is situated within broader learning, linking purpose to student interests. Explanation of content is imaginative, and connects with students’ knowledge and experience. Students contribute to explaining concepts to their peers.
Using Questioning and Discussion Techniques
Teacher makes poor use of questioning and discussion techniques, with low-level questions, limited student participation, and little true discussion.
Teacher’s use of questioning and discussion techniques is uneven with some high-level question; attempts at true discussion; moderate student participation.
Teacher’s use of questioning and discussion techniques reflects high-level questions, true discussion, and full participation by all students.
Students formulate may of the high-level questions and assume responsibility for the participation of all students in the discussion.
Engaging Students in Learning
Students are not at all intellectually engaged in significant learning, as a result of inappropriate activities or materials, poor representations of content, or lack of lesson structure.
Students are intellectually engaged only partially, resulting from activities or materials or uneven quality, inconsistent representation of content or uneven structure of pacing.
Students are intellectually engaged throughout the lesson, with appropriate activities and materials, instructive representations of content, and suitable structure and pacing of the lesson.
Students are highly engaged throughout the lesson and make material contribution to the representation of content, the activities, and the materials. The structure and pacing of the lesson allow for student reflection and closure.
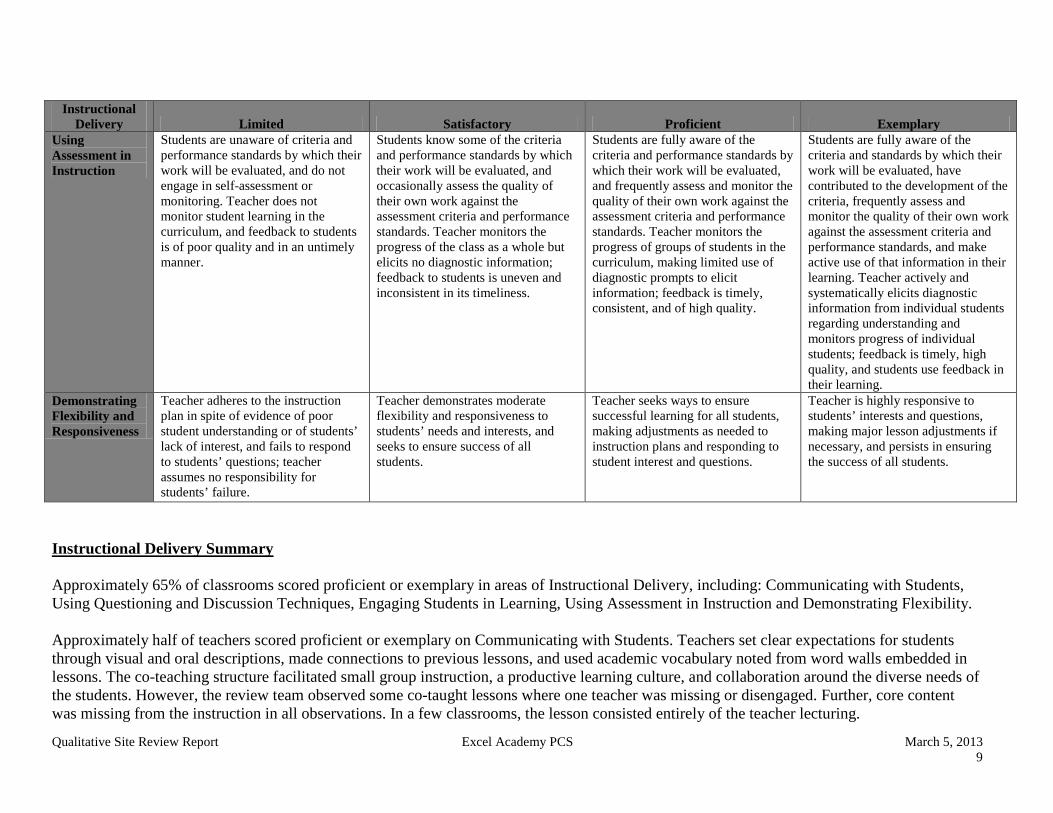
Qualitative Site Review Report Excel Academy PCS March 5, 2013 9
Instructional Delivery Limited Satisfactory Proficient Exemplary
Using Assessment in Instruction
Students are unaware of criteria and performance standards by which their work will be evaluated, and do not engage in self-assessment or monitoring. Teacher does not monitor student learning in the curriculum, and feedback to students is of poor quality and in an untimely manner.
Students know some of the criteria and performance standards by which their work will be evaluated, and occasionally assess the quality of their own work against the assessment criteria and performance standards. Teacher monitors the progress of the class as a whole but elicits no diagnostic information; feedback to students is uneven and inconsistent in its timeliness.
Students are fully aware of the criteria and performance standards by which their work will be evaluated, and frequently assess and monitor the quality of their own work against the assessment criteria and performance standards. Teacher monitors the progress of groups of students in the curriculum, making limited use of diagnostic prompts to elicit information; feedback is timely, consistent, and of high quality.
Students are fully aware of the criteria and standards by which their work will be evaluated, have contributed to the development of the criteria, frequently assess and monitor the quality of their own work against the assessment criteria and performance standards, and make active use of that information in their learning. Teacher actively and systematically elicits diagnostic information from individual students regarding understanding and monitors progress of individual students; feedback is timely, high quality, and students use feedback in their learning.
Demonstrating Flexibility and Responsiveness
Teacher adheres to the instruction plan in spite of evidence of poor student understanding or of students’ lack of interest, and fails to respond to students’ questions; teacher assumes no responsibility for students’ failure.
Teacher demonstrates moderate flexibility and responsiveness to students’ needs and interests, and seeks to ensure success of all students.
Teacher seeks ways to ensure successful learning for all students, making adjustments as needed to instruction plans and responding to student interest and questions.
Teacher is highly responsive to students’ interests and questions, making major lesson adjustments if necessary, and persists in ensuring the success of all students.
Instructional Delivery Summary Approximately 65% of classrooms scored proficient or exemplary in areas of Instructional Delivery, including: Communicating with Students, Using Questioning and Discussion Techniques, Engaging Students in Learning, Using Assessment in Instruction and Demonstrating Flexibility. Approximately half of teachers scored proficient or exemplary on Communicating with Students. Teachers set clear expectations for students through visual and oral descriptions, made connections to previous lessons, and used academic vocabulary noted from word walls embedded in lessons. The co-teaching structure facilitated small group instruction, a productive learning culture, and collaboration around the diverse needs of the students. However, the review team observed some co-taught lessons where one teacher was missing or disengaged. Further, core content was missing from the instruction in all observations. In a few classrooms, the lesson consisted entirely of the teacher lecturing.
Qualitative Site Review Report Excel Academy PCS March 5, 2013 10
Approximately half of teachers scored proficient or exemplary on Using Questioning and Discussion Techniques. Teachers used a variety of questioning techniques, including open-ended questions and 5 W questions, and probing statements. However, the team observed some classrooms that did not use higher-level critical thinking questions to foster problem solving skills for reading and math. About eighty percent of teachers scored proficient or exemplary on Engaging Students in Learning. Observers noted teachers using verbal reminders, proximity to students to keep them focused during lessons, and multi-modality lessons (clapping, chanting, gesturing, etc.). In some classrooms, students used the Smartboards along with teachers during lessons. Teachers spoke with enthusiasm when introducing ideas or new topics, while also maintaining consistent systems so students knew what to expect. Observers did note a lack of variety in student assignments with the majority of outputs consisting of workbooks and worksheets in almost all observed classrooms. Three-quarters of teachers scored proficient or exemplary on Using Assessment in Instruction. Observers saw some evidence of assessment during small and large group lessons through hand-signals, completion of graphic organizers, and question and answer sessions. However, although feedback was solicited from students through question and answers, not all teachers followed-up and provided feedback in ways that would cultivate higher order thinking. Approximately sixty percent of teachers scored proficient or exemplary on Demonstrating Flexibility. Observers saw teachers persisting with students that did not know the answer on a number of occasions. Some teachers made connections to previous lessons or relatable topics. In two or three observations, the observer noted minor lesson adjustments being made and creative centers used to support flexibility in the lessons. Because not all classrooms had schedules posted, it was difficult for the observers to determine if the observed lessons were in fact aligned to the schedule for the day.
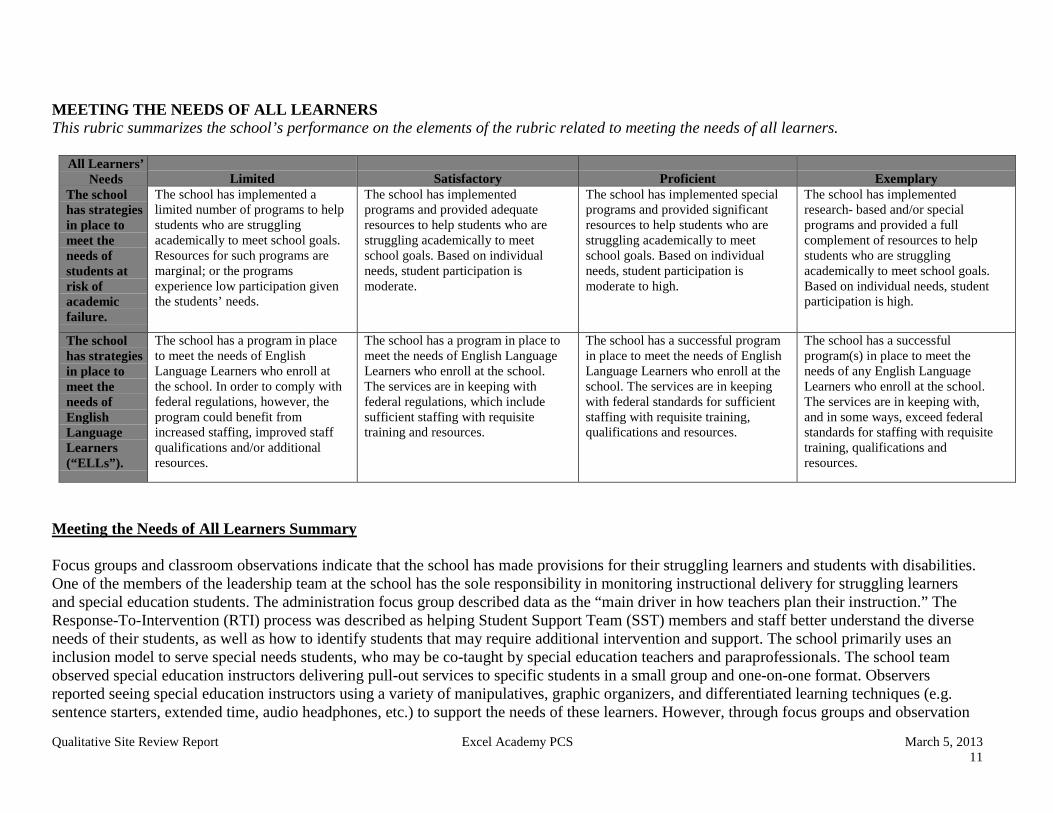
Qualitative Site Review Report Excel Academy PCS March 5, 2013 11
MEETING THE NEEDS OF ALL LEARNERS This rubric summarizes the school’s performance on the elements of the rubric related to meeting the needs of all learners.
All Learners’ Needs Limited Satisfactory Proficient Exemplary
The school has strategies in place to meet the needs of students at risk of academic failure.
The school has implemented a limited number of programs to help students who are struggling academically to meet school goals. Resources for such programs are marginal; or the programs experience low participation given the students’ needs.
The school has implemented programs and provided adequate resources to help students who are struggling academically to meet school goals. Based on individual needs, student participation is moderate.
The school has implemented special programs and provided significant resources to help students who are struggling academically to meet school goals. Based on individual needs, student participation is moderate to high.
The school has implemented research- based and/or special programs and provided a full complement of resources to help students who are struggling academically to meet school goals. Based on individual needs, student participation is high.
The school has strategies in place to meet the needs of English Language Learners (“ELLs”).
The school has a program in place to meet the needs of English Language Learners who enroll at the school. In order to comply with federal regulations, however, the program could benefit from increased staffing, improved staff qualifications and/or additional resources.
The school has a program in place to meet the needs of English Language Learners who enroll at the school. The services are in keeping with federal regulations, which include sufficient staffing with requisite training and resources.
The school has a successful program in place to meet the needs of English Language Learners who enroll at the school. The services are in keeping with federal standards for sufficient staffing with requisite training, qualifications and resources.
The school has a successful program(s) in place to meet the needs of any English Language Learners who enroll at the school. The services are in keeping with, and in some ways, exceed federal standards for staffing with requisite training, qualifications and resources.
Meeting the Needs of All Learners Summary Focus groups and classroom observations indicate that the school has made provisions for their struggling learners and students with disabilities. One of the members of the leadership team at the school has the sole responsibility in monitoring instructional delivery for struggling learners and special education students. The administration focus group described data as the “main driver in how teachers plan their instruction.” The Response-To-Intervention (RTI) process was described as helping Student Support Team (SST) members and staff better understand the diverse needs of their students, as well as how to identify students that may require additional intervention and support. The school primarily uses an inclusion model to serve special needs students, who may be co-taught by special education teachers and paraprofessionals. The school team observed special education instructors delivering pull-out services to specific students in a small group and one-on-one format. Observers reported seeing special education instructors using a variety of manipulatives, graphic organizers, and differentiated learning techniques (e.g. sentence starters, extended time, audio headphones, etc.) to support the needs of these learners. However, through focus groups and observation
Qualitative Site Review Report Excel Academy PCS March 5, 2013 12
of resource rooms, the QSR team learned that a full continuum of services was not available for those students who may require full-time pull-out support. At this time, the school reported no enrolled students requiring this level of support. The observers were unable to assess the area of collaboration between special and general education teachers in delivering services to this population. The school team did mention that they have a Saturday Academy, but there was no evidence observed or discussed about an after-school or summer programs available to support these students at this time. There are currently no English Language Learners (“ELLs”) enrolled at the school, thus the school’s performance on this criterion was not assessed.
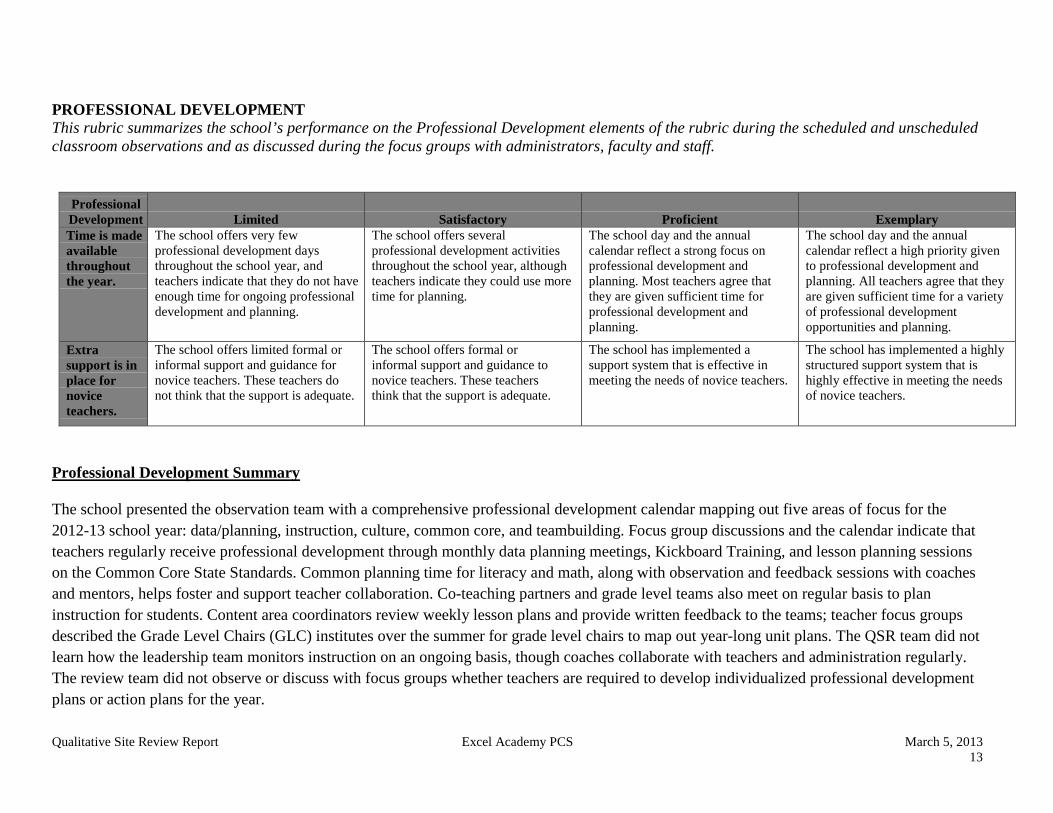
Qualitative Site Review Report Excel Academy PCS March 5, 2013 13
PROFESSIONAL DEVELOPMENT This rubric summarizes the school’s performance on the Professional Development elements of the rubric during the scheduled and unscheduled classroom observations and as discussed during the focus groups with administrators, faculty and staff.
Professional Development Limited Satisfactory Proficient Exemplary Time is made available throughout the year.
The school offers very few professional development days throughout the school year, and teachers indicate that they do not have enough time for ongoing professional development and planning.
The school offers several professional development activities throughout the school year, although teachers indicate they could use more time for planning.
The school day and the annual calendar reflect a strong focus on professional development and planning. Most teachers agree that they are given sufficient time for professional development and planning.
The school day and the annual calendar reflect a high priority given to professional development and planning. All teachers agree that they are given sufficient time for a variety of professional development opportunities and planning. Extra
support is in place for novice teachers.
The school offers limited formal or informal support and guidance for novice teachers. These teachers do not think that the support is adequate.
The school offers formal or informal support and guidance to novice teachers. These teachers think that the support is adequate.
The school has implemented a support system that is effective in meeting the needs of novice teachers.
The school has implemented a highly structured support system that is highly effective in meeting the needs of novice teachers.
Professional Development Summary The school presented the observation team with a comprehensive professional development calendar mapping out five areas of focus for the 2012-13 school year: data/planning, instruction, culture, common core, and teambuilding. Focus group discussions and the calendar indicate that teachers regularly receive professional development through monthly data planning meetings, Kickboard Training, and lesson planning sessions on the Common Core State Standards. Common planning time for literacy and math, along with observation and feedback sessions with coaches and mentors, helps foster and support teacher collaboration. Co-teaching partners and grade level teams also meet on regular basis to plan instruction for students. Content area coordinators review weekly lesson plans and provide written feedback to the teams; teacher focus groups described the Grade Level Chairs (GLC) institutes over the summer for grade level chairs to map out year-long unit plans. The QSR team did not learn how the leadership team monitors instruction on an ongoing basis, though coaches collaborate with teachers and administration regularly. The review team did not observe or discuss with focus groups whether teachers are required to develop individualized professional development plans or action plans for the year.

Qualitative Site Review Report Excel Academy PCS March 5, 2013 14
The teacher focus group discussed that all new teachers attend a “teacher college” in the summer prior to their first year where they create a one-year growth plan. They also receive additional support from instructional coaches throughout the first year.
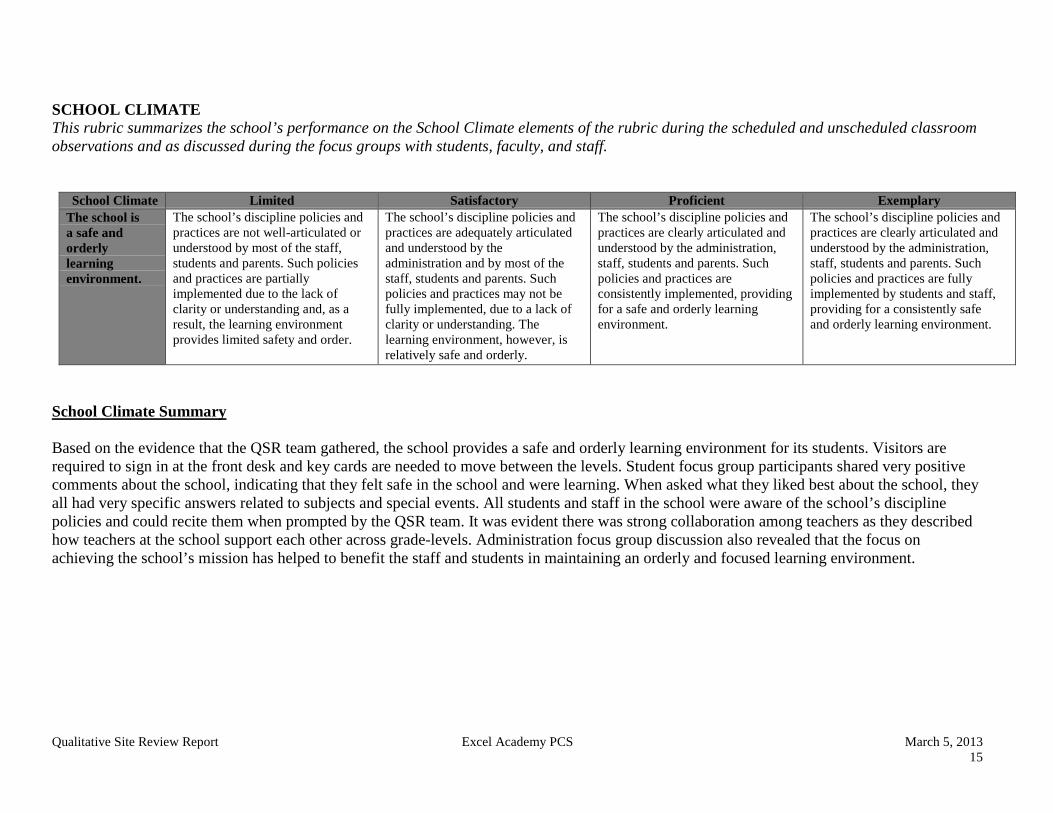
Qualitative Site Review Report Excel Academy PCS March 5, 2013 15
SCHOOL CLIMATE This rubric summarizes the school’s performance on the School Climate elements of the rubric during the scheduled and unscheduled classroom observations and as discussed during the focus groups with students, faculty, and staff.
School Climate Limited Satisfactory Proficient Exemplary The school is a safe and orderly learning environment.
The school’s discipline policies and practices are not well-articulated or understood by most of the staff, students and parents. Such policies and practices are partially implemented due to the lack of clarity or understanding and, as a result, the learning environment provides limited safety and order.
The school’s discipline policies and practices are adequately articulated and understood by the administration and by most of the staff, students and parents. Such policies and practices may not be fully implemented, due to a lack of clarity or understanding. The learning environment, however, is relatively safe and orderly.
The school’s discipline policies and practices are clearly articulated and understood by the administration, staff, students and parents. Such policies and practices are consistently implemented, providing for a safe and orderly learning environment.
The school’s discipline policies and practices are clearly articulated and understood by the administration, staff, students and parents. Such policies and practices are fully implemented by students and staff, providing for a consistently safe and orderly learning environment.
School Climate Summary Based on the evidence that the QSR team gathered, the school provides a safe and orderly learning environment for its students. Visitors are required to sign in at the front desk and key cards are needed to move between the levels. Student focus group participants shared very positive comments about the school, indicating that they felt safe in the school and were learning. When asked what they liked best about the school, they all had very specific answers related to subjects and special events. All students and staff in the school were aware of the school’s discipline policies and could recite them when prompted by the QSR team. It was evident there was strong collaboration among teachers as they described how teachers at the school support each other across grade-levels. Administration focus group discussion also revealed that the focus on achieving the school’s mission has helped to benefit the staff and students in maintaining an orderly and focused learning environment.

Appendix H
Annual Report Excel Academy Public Charter School 2105 Martin Luther King Avenue, SE Washington, DC 20020 Contact Person: Kaye Savage, CEO
(202) 373-‐0097 Board Chair: Vito Germinario
Excel Academy Public Charter School 1
TABLE OF CONTENTS
1. Cover Page 2. Table of Contents 3. Board List 4. Staff List 5. Annual Report Narrative 6. Annual Report Data Collection Template 7. Appendix A –2011-‐12 Unaudited Financials Approved 8. Appendix B – 2012-‐12 Approved Budget 9. Appendix C – 2011-‐12 Accountability Plan
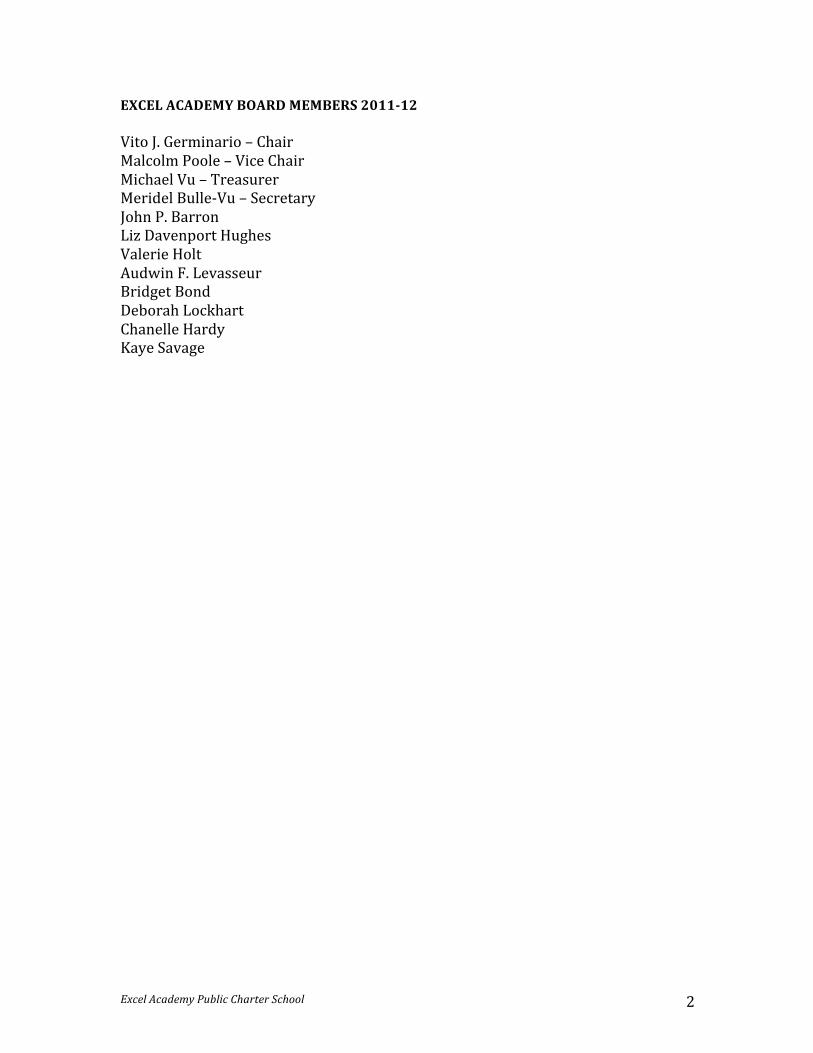
Excel Academy Public Charter School 2
EXCEL ACADEMY BOARD MEMBERS 2011-‐12 Vito J. Germinario – Chair Malcolm Poole – Vice Chair Michael Vu – Treasurer Meridel Bulle-‐Vu – Secretary John P. Barron Liz Davenport Hughes Valerie Holt Audwin F. Levasseur Bridget Bond Deborah Lockhart Chanelle Hardy Kaye Savage
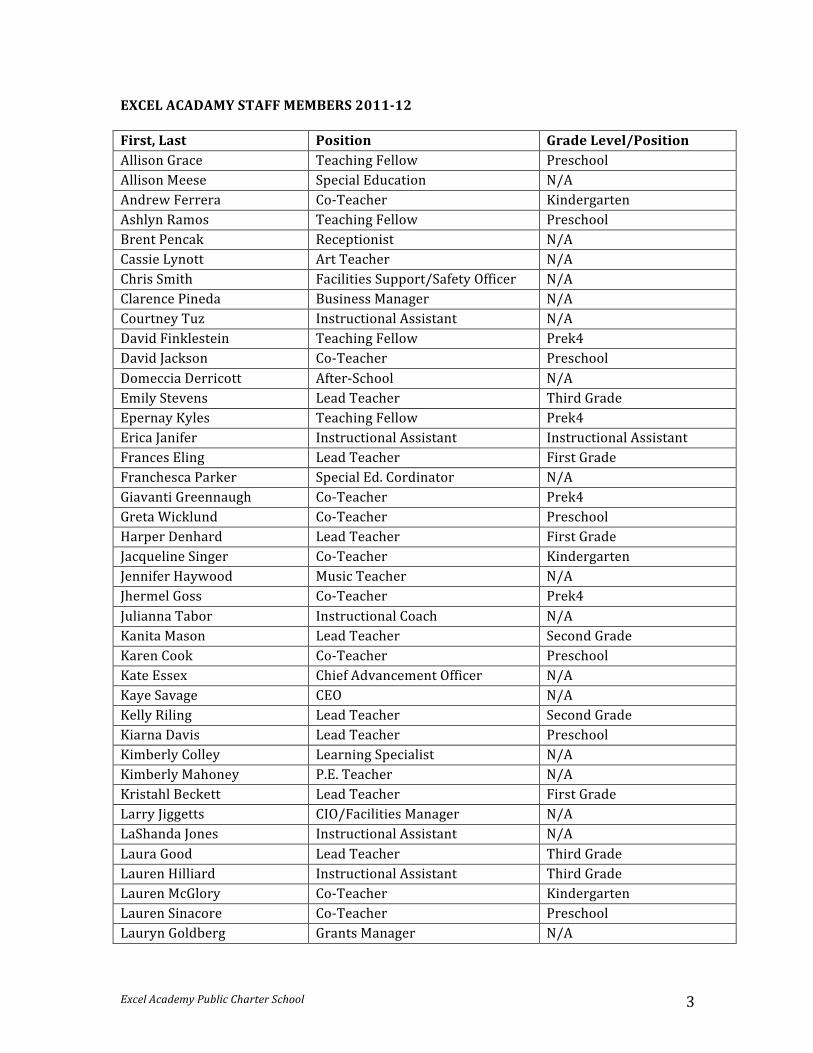
Excel Academy Public Charter School 3
EXCEL ACADAMY STAFF MEMBERS 2011-‐12 First, Last Position Grade Level/Position Allison Grace Teaching Fellow Preschool Allison Meese Special Education N/A Andrew Ferrera Co-‐Teacher Kindergarten Ashlyn Ramos Teaching Fellow Preschool Brent Pencak Receptionist N/A Cassie Lynott Art Teacher N/A Chris Smith Facilities Support/Safety Officer N/A Clarence Pineda Business Manager N/A Courtney Tuz Instructional Assistant N/A David Finklestein Teaching Fellow Prek4 David Jackson Co-‐Teacher Preschool Domeccia Derricott After-‐School N/A Emily Stevens Lead Teacher Third Grade Epernay Kyles Teaching Fellow Prek4 Erica Janifer Instructional Assistant Instructional Assistant Frances Eling Lead Teacher First Grade Franchesca Parker Special Ed. Cordinator N/A Giavanti Greennaugh Co-‐Teacher Prek4 Greta Wicklund Co-‐Teacher Preschool Harper Denhard Lead Teacher First Grade Jacqueline Singer Co-‐Teacher Kindergarten Jennifer Haywood Music Teacher N/A Jhermel Goss Co-‐Teacher Prek4 Julianna Tabor Instructional Coach N/A Kanita Mason Lead Teacher Second Grade Karen Cook Co-‐Teacher Preschool Kate Essex Chief Advancement Officer N/A Kaye Savage CEO N/A Kelly Riling Lead Teacher Second Grade Kiarna Davis Lead Teacher Preschool Kimberly Colley Learning Specialist N/A Kimberly Mahoney P.E. Teacher N/A Kristahl Beckett Lead Teacher First Grade Larry Jiggetts CIO/Facilities Manager N/A LaShanda Jones Instructional Assistant N/A Laura Good Lead Teacher Third Grade Lauren Hilliard Instructional Assistant Third Grade Lauren McGlory Co-‐Teacher Kindergarten Lauren Sinacore Co-‐Teacher Preschool Lauryn Goldberg Grants Manager N/A
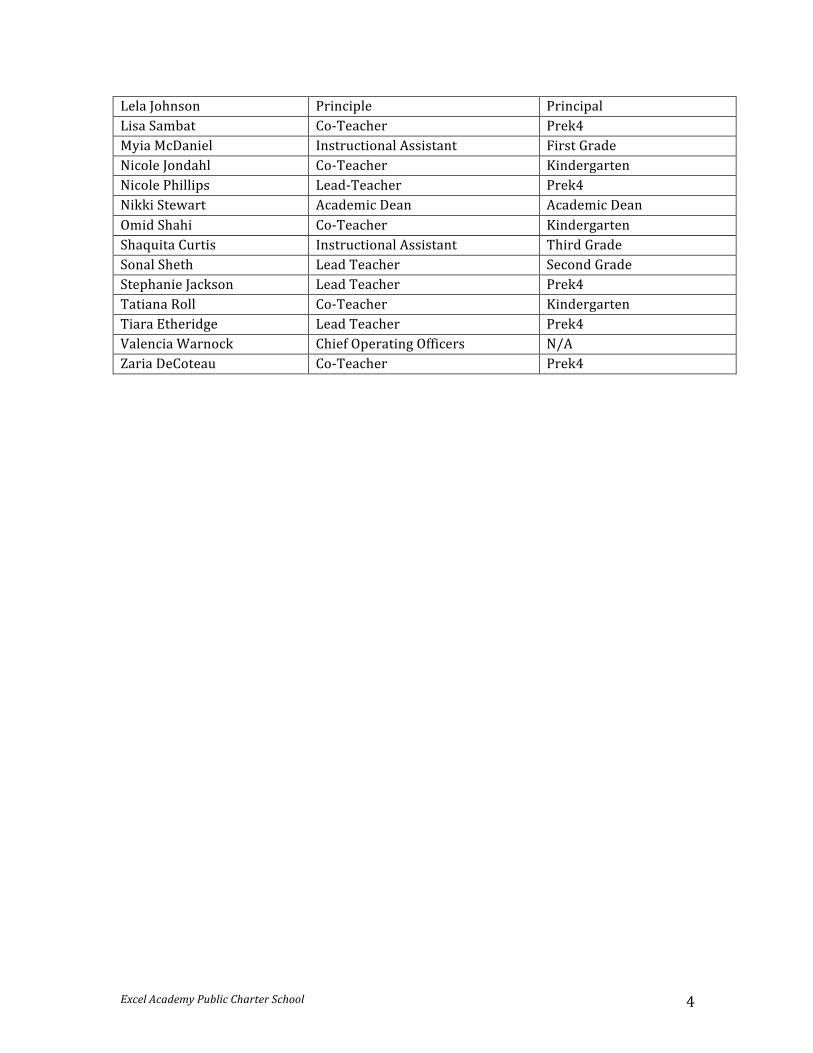
Excel Academy Public Charter School 4
Lela Johnson Principle Principal Lisa Sambat Co-‐Teacher Prek4 Myia McDaniel Instructional Assistant First Grade Nicole Jondahl Co-‐Teacher Kindergarten Nicole Phillips Lead-‐Teacher Prek4 Nikki Stewart Academic Dean Academic Dean Omid Shahi Co-‐Teacher Kindergarten Shaquita Curtis Instructional Assistant Third Grade Sonal Sheth Lead Teacher Second Grade Stephanie Jackson Lead Teacher Prek4 Tatiana Roll Co-‐Teacher Kindergarten Tiara Etheridge Lead Teacher Prek4 Valencia Warnock Chief Operating Officers N/A Zaria DeCoteau Co-‐Teacher Prek4
Excel Academy Public Charter School 5
2011-‐12 ANNUAL REPORT NARRATIVE Excel Academy Public Charter School I. School Description A. Mission/Vision Statement Mission Excel Academy Public Charter School will provide pre-‐school through eighth grade girls a solid academic foundation and enrichment opportunities to prepare them to succeed in high school and college and to develop the skills and confidence they need to make healthy, positive lifestyle choices. Vision Excel Academy’s Board members and staff believe that with strong support and training, all students can learn and achieve at high levels. Our selection of instructional materials, methods and school-‐wide structures have been informed by the best practices of successful schools across the nation that serve populations similar to those of the targeted student population in Ward 8.1 We are using early and frequent assessments to gauge students’ progress and identify academic needs per cohort and per individual student, and respond to the data such assessments provide with immediacy. We hire highly qualified teachers and have ongoing professional development to create and maintain a community of respect and collaboration with our staff and parents.2 We embrace students’ parents and guardians as essential partners in their student’s education, and we reach out to families and the wider community to support Excel Academy scholars. B. School Program 1. Grade and Age Levels Served Grade Age PK-‐3 3 PK-‐4 4 KG 5 1 6 2 7 3 8
1 The core beliefs of Excel Academy are influenced by the best practices of North Star Academy and KIPP Team in Newark, New Jersey; Elm City Prep and Amistad Academy of New Haven, Connecticut; and Roxbury Prep and Boston Collegiate in Boston, Massachusetts. These schools serve student populations that are among the poorest in their states, yet demonstrate consistent and statistically significant academic progress, as measured over time by their state assessment. 2 We have used the term parent throughout this application, but our children may be parented by guardians – by grandparents, aunts and uncles, other family members or individuals who have become their caretakers and legal guardians. We thank all guardians for their care for children and include them whenever we use the term parent.
Excel Academy Public Charter School 6
2. Summary of Curriculum Design and Instructional Approach Curriculum Design and Instructional Approach Excel Academy is an urban school strategically located in Ward 8 of Washington, D.C. We firmly believe that an outstanding education will prepare our scholars to effectively compete, achieve and succeed in the larger society. We are a “no-‐excuses” charter school, meaning we believe there are no excuses for accepting anything other than excellence, both from our scholars and our staff. The results we deliver encompass not only improved test scores from our scholars, but the ambition, discipline and confidence that are derived from our high expectations. Benefits of Excel Academy’s Early Childhood Program · Scholars develop a stronger sense of self, an ability to adjust to new circumstances, and recognize their own feelings and how to manage them.
· Scholars begin to take responsibility for their own well-‐being, and learn to respect and care for themselves, teachers, classmates, and the classroom.
· Curiosity, perception, and persistence grow as scholars begin to explore, apply new concepts, and develop the confidence to take academic and personal risks.
Early Scholastic Foundation – Early Intervention Excel Academy is one of the few District public schools to offer an intensive academic program for three year-‐olds. In our early childhood program, we use a specialized instruction model, which designates two teachers per classroom. Excel’s model focuses on objectives-‐driven small group instruction and center-‐based experiential learning. In order to measure our success, teachers set goals for each lesson and use both teacher-‐created benchmarks and standardized assessments to measure student progress. Excel’s unique early intervention program is rooted in the development of early literacy and numeracy skills in Preschool and Prekindergarten scholars. Students as young as three years of age are exposed to a comprehensive and interactive curriculum to build foundational skills in reading, language, writing, mathematics, science and social studies. Excel has developed a comprehensive approach to embedding language and literacy into every part of the school day to extend and deepen a student’s learning over the course of a unit, and across units. Excel’s early intervention program aims to close the word gap so that our students are ready to succeed in Kindergarten. Rigorous Learning Environment Excel scholars engage in literacy activities for most of their school day. Scholars in Preschool and Prekindergarten use Core Knowledge, a curriculum based on the latest research in early childhood education that presents explicitly sequenced content and skill guidelines. Early childhood students work in small groups of 5-‐7 students to ensure a depth of understanding and thorough learning of each objective. Excel scholars study thematic high-‐quality children’s books with intentional read alouds to emphasize vocabulary and comprehension skills and build contextual knowledge. Language skills are taught sequentially and rhyming games are used to help scholars with phonics and vocabulary. We also use a sequenced approach to teach basic math facts, computational skills, and higher-‐level problem solving proficiency.
Excel Academy Public Charter School 7
Starting in Kindergarten and continuing through Second Grade, Excel scholars participate in specialized courses in reading, writing, mathematics, science, and social studies. Excel build its own standards-‐based curriculum, drawing on the following curricular sources: The curricula used include: SRA Reading Mastery Signature Edition, Writer’s Workshop, Saxon Math, Singapore Math, Core Knowledge History and Geography, Core Knowledge Listening and Learning, Scott Foresman Science, and Words Their Way. Literacy is taught through listening and speaking, word recognition, fluency, comprehension, and analysis. Reading centers, where scholars break into small groups to practice their critical thinking and literacy skills, are an important aspect of the school day. Writing is practiced through guided assignments and storytelling. Explicit instruction is the core of the math curriculum. Teachers provide students with regular instruction, practice, and hands-‐on experience to facilitate the mastery of math skills. Excel’s curriculum integrates prior knowledge, teacher modeling, independent application, and assessment to ensure optimum student-‐teacher interaction and the development of critical thinking skills. To fully engage scholars in learning new concepts, teachers incorporate real life examples to teach math, science, and social studies. Scholars study life cycles, magnetism, the Earth, and aquatic life through exploration and explanation. Scholars learn about countries and significant historical figures through readings, special projects, and supplemental coursework. Scholars learn about prominent women in history and civic life through in-‐depth studies of strong female leaders. Structured English Immersion Excel Academy did not have limited English proficiency students during the 2011-‐2012 school year. Our school will utilize a fully inclusive language immersion program when/if necessary. Scholars will learn in regular classrooms to the greatest extent possible. Students with Learning Disabilities Excel Academy is committed to supporting the individual needs of all scholars. Excel scholars with Individualized Education Plans (IEPs) learn with their peers in an inclusive environment. While receiving individual support from our Special Education team, these scholars spend a significant amount of time in the classroom to ensure that they are being exposed to grade-‐level curricula, benefiting from classroom instruction and developing socially. Scholars with IEPs are regularly assessed, both informally and formally, to monitor progress and make adjustments to their academic program as needed. During the 2011-‐2012 school year, the Special Education team met regularly to develop and update IEPs for the thirteen scholars receiving special education support. The special education team collaborated to provide these scholars with a combination of inclusive push-‐in and small group pull-‐out support, in addition to individualized lesson plans for lessons and activities. To further support scholars in need of related services, Excel Academy contracted with a Clinical Psychologist, School Social Worker, Speech/Language Pathologist, Physical Therapist, and an Occupational Therapist.
Excel Academy Public Charter School 8
3. Description of Key Mission-‐related Programs Mission Related Programs: The Benefits of an All-‐Girls School · Expanded educational opportunity
· Custom-‐tailored learning and instruction
· Greater autonomy Single Sex Model Through a deliberately female-‐focused curriculum, Excel emphasizes the learning skills of young women. Teachers create lessons that build knowledge, academic skills and self-‐awareness in girls. Scholars at Excel see themselves reflected in the school’s learning materials that incorporate the contributions of women throughout history. Excel Academy teaches girls beginning at age three to be proud to be a girl, and delivers instruction best suited to how girls learn. Excel reaches scholars more comprehensively and intensively with research-‐based programs specifically tailored to meet girls’ needs. Through a single-‐sex model, Excel provides girls with an environment where girls lead in every role, are free from pressure to please boys, and are valued for their intellect and compassion. Development of Character To complement the academic program, Excel Academy faculty created a character education program based on the IDEALS values, culturally responsive pedagogy, character role models from literature, and best practices for girls. This program is built around six core IDEALS: integrity, discipline, enjoyment, achievement, leadership and sisterhood. The IDEALS are reinforced throughout the day, beginning with our Breakfast for the Brain program in morning meeting. Teachers use IDEALS values to set classroom and school-‐wide behavior. Time each day is devoted to explicit teaching and modeling of our IDEALS values. Every week exemplary demonstration of the IDEALS is highlighted at our school-‐wide Community Circle. Teachers select a handful of student to recognize weekly at Community Circle. Teachers recognize members of their class by stating a specific student action and which IDEALS value it demonstrated. In addition to the IDEALS, Excel’s character education program utilizes culturally responsive pedagogy and focus on empowering young girls. Monthly character themes feature a variety of strong female role models, literature with women and girls in non-‐traditional roles, and showcase girls and women making empowered decisions, African proverbs, folktales, music, and poetry. Our character education program fosters an appreciated of self, inner strength, and one’s own unique identity, and help our students become socially conscious, engaged local and global citizens. A faculty created character education program rooted in several strong values systems, literature, and character education instructional strategies have allowed for staff to tailor our program to the specific needs of our student population. In SY 2011-‐12, we focused on peace-‐building in our character education class, My Sister, My Self.
Excel Academy Public Charter School 9
Physical Education Excel scholars participate in at least 30 minutes of Physical Education per week. During this time, scholars receive guided exercise, gross motor, fine motor, and social skills instruction from the Physical Education teacher. Scholars as young as three years of age begin to sharpen their decision-‐making skills, mental and physical awareness, dexterity, strength, and fitness. An early introduction to Physical Education supports right brain development and introduces scholars to a healthy and balanced fitness regimen. Providing this exposure to students at an early age is critical to laying the foundation for scholars to make healthy choices for their bodies. Saturday Academy Once a month, Excel’s staff and scholars come together for Saturday Academy. By design, Saturday Academy offers scholars educationally targeted enrichment programs to expose them to a wide array of ideas and subjects that provide a space for creative exploration. This year, Saturday Academy enrichment programs included sports clinics run by the Naval Academy Women’s Soccer team, Georgetown Women’s basketball team, Peace Club, Book Club, sports and games. Enrichment Expeditions During the 2011-‐2012 school year, Excel scholars embarked on many enriched learning opportunities outside of our school building. These experiences allowed scholars to connect the skills and concepts acquired in the classroom with the world around them. They toured the White House, visited local farms and pumpkin patches, performed at the U.S. Capitol and a fundraising gala, visited Stone Ridge Academy of the Sacred Heart and Holton Arms schools to connect with their sister-‐scholars. From each experience, scholars expanded their exposure to life beyond school and their neighborhood, leading them to wonder and dream about possibilities in a larger world. After School Excel Academy’s After School program strives to help girls grow into well-‐rounded individuals as they explore structured activity and creative play. This school year, the After School Program at Excel offered a wide array of services to Excel scholars. In addition to providing daily help with homework and healthy snacks, the After School program allowed for an expansion in the number of extracurricular activities in which scholars had the option of participating. Throughout the year, scholars participated in the DC United Soccer program, Girls on the Run, and a basketball program, run by former Washington Mystic, Sonia Chase. Additionally, on early dismissal days the After School Program offered painting, pottery, doll making, yoga and cooking. 4. Parent Involvement Efforts Excel Academy recognizes the critical role that parents play in the education of their children. There was intentional focus this year on increasing the opportunities that parents had to become engaged in the learning process. Specifically, school-‐wide goals were set around Parent-‐Teacher conferences, which occurred at the end of every advisory (7-‐9 weeks). By the end of the year, 85% of parents had participated in their scholar’s parent-‐teacher conference. Teachers ensured that this goal was met by providing a flexible schedule for parents to meet, coming in before and staying after school, as well as, holding conferences by phone. Additionally, Excel Academy held quarterly parent dinner meetings.
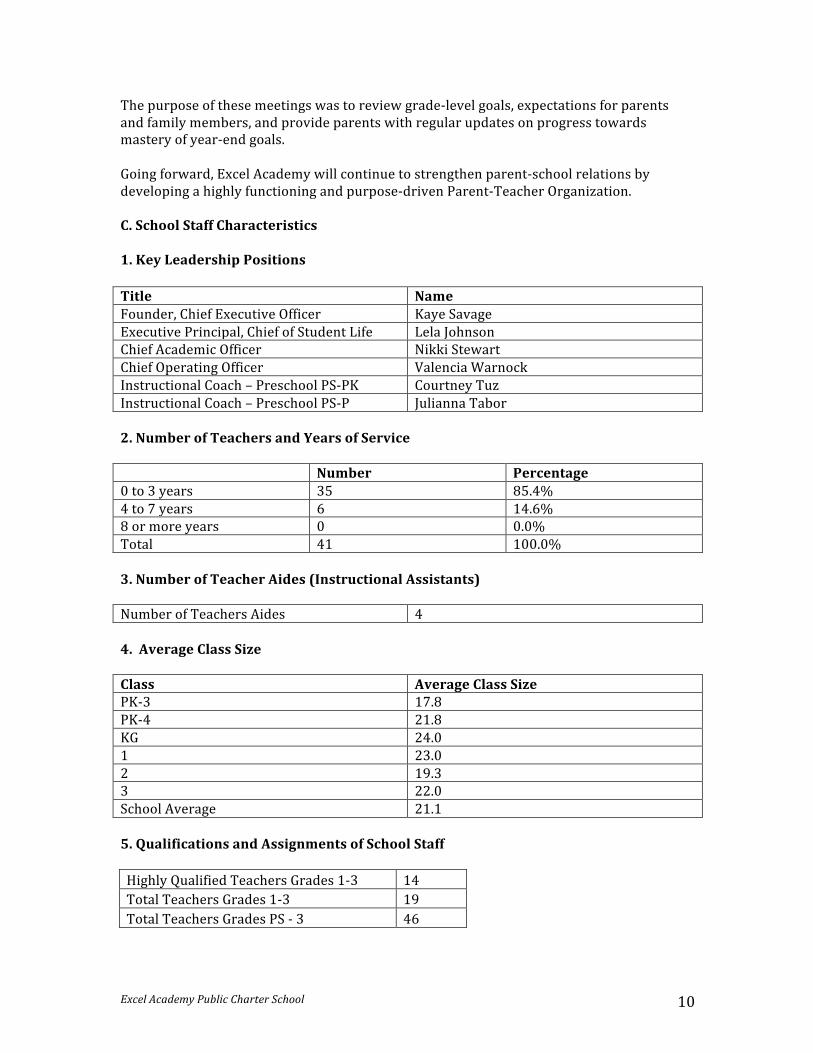
Excel Academy Public Charter School 10
The purpose of these meetings was to review grade-‐level goals, expectations for parents and family members, and provide parents with regular updates on progress towards mastery of year-‐end goals. Going forward, Excel Academy will continue to strengthen parent-‐school relations by developing a highly functioning and purpose-‐driven Parent-‐Teacher Organization. C. School Staff Characteristics 1. Key Leadership Positions Title Name Founder, Chief Executive Officer Kaye Savage Executive Principal, Chief of Student Life Lela Johnson Chief Academic Officer Nikki Stewart Chief Operating Officer Valencia Warnock Instructional Coach – Preschool PS-‐PK Courtney Tuz Instructional Coach – Preschool PS-‐P Julianna Tabor 2. Number of Teachers and Years of Service Number Percentage 0 to 3 years 35 85.4% 4 to 7 years 6 14.6% 8 or more years 0 0.0% Total 41 100.0% 3. Number of Teacher Aides (Instructional Assistants) Number of Teachers Aides 4 4. Average Class Size Class Average Class Size PK-‐3 17.8 PK-‐4 21.8 KG 24.0 1 23.0 2 19.3 3 22.0 School Average 21.1 5. Qualifications and Assignments of School Staff Highly Qualified Teachers Grades 1-‐3 14 Total Teachers Grades 1-‐3 19 Total Teachers Grades PS -‐ 3 46
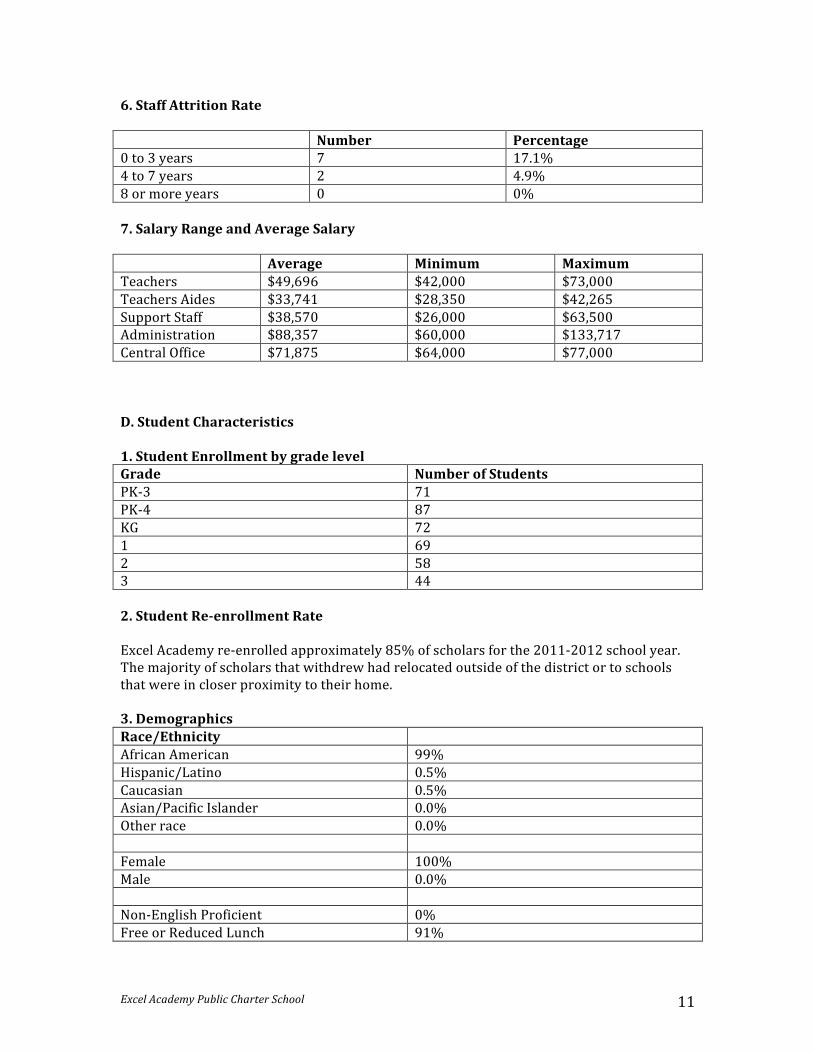
Excel Academy Public Charter School 11
6. Staff Attrition Rate Number Percentage 0 to 3 years 7 17.1% 4 to 7 years 2 4.9% 8 or more years 0 0% 7. Salary Range and Average Salary Average Minimum Maximum Teachers $49,696 $42,000 $73,000 Teachers Aides $33,741 $28,350 $42,265 Support Staff $38,570 $26,000 $63,500 Administration $88,357 $60,000 $133,717 Central Office $71,875 $64,000 $77,000 D. Student Characteristics 1. Student Enrollment by grade level Grade Number of Students PK-‐3 71 PK-‐4 87 KG 72 1 69 2 58 3 44 2. Student Re-‐enrollment Rate Excel Academy re-‐enrolled approximately 85% of scholars for the 2011-‐2012 school year. The majority of scholars that withdrew had relocated outside of the district or to schools that were in closer proximity to their home. 3. Demographics Race/Ethnicity African American 99% Hispanic/Latino 0.5% Caucasian 0.5% Asian/Pacific Islander 0.0% Other race 0.0% Female 100% Male 0.0% Non-‐English Proficient 0% Free or Reduced Lunch 91%
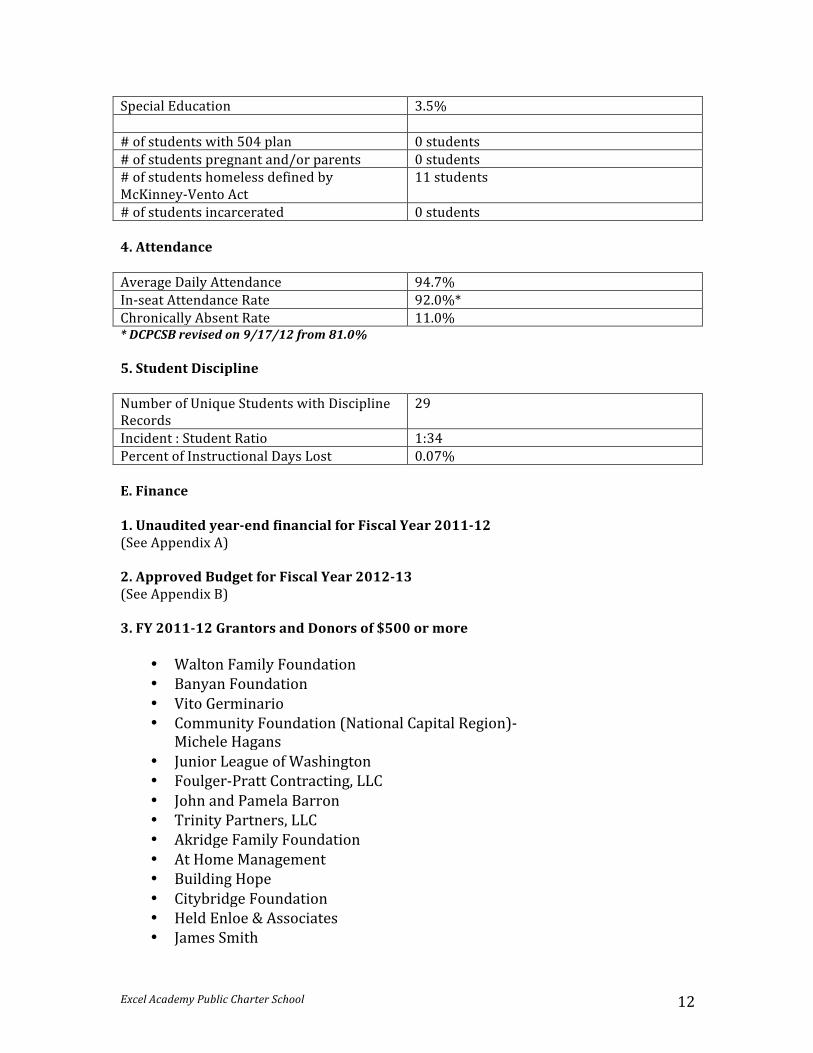
Excel Academy Public Charter School 12
Special Education 3.5% # of students with 504 plan 0 students # of students pregnant and/or parents 0 students # of students homeless defined by McKinney-‐Vento Act
11 students
# of students incarcerated 0 students 4. Attendance Average Daily Attendance 94.7% In-‐seat Attendance Rate 92.0%* Chronically Absent Rate 11.0% * DCPCSB revised on 9/17/12 from 81.0% 5. Student Discipline Number of Unique Students with Discipline Records
29
Incident : Student Ratio 1:34 Percent of Instructional Days Lost 0.07% E. Finance 1. Unaudited year-‐end financial for Fiscal Year 2011-‐12 (See Appendix A) 2. Approved Budget for Fiscal Year 2012-‐13 (See Appendix B) 3. FY 2011-‐12 Grantors and Donors of $500 or more
• Walton Family Foundation • Banyan Foundation • Vito Germinario • Community Foundation (National Capital Region)-‐
Michele Hagans • Junior League of Washington • Foulger-‐Pratt Contracting, LLC • John and Pamela Barron • Trinity Partners, LLC • Akridge Family Foundation • At Home Management • Building Hope • Citybridge Foundation • Held Enloe & Associates • James Smith
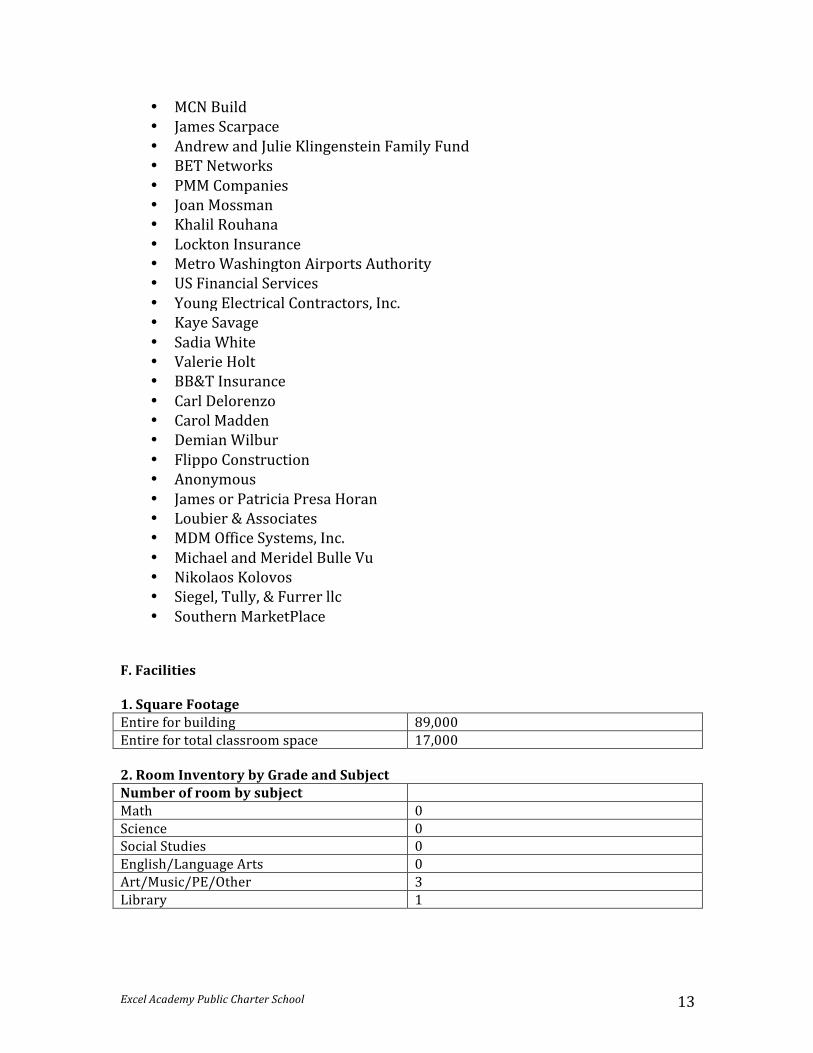
Excel Academy Public Charter School 13
• MCN Build • James Scarpace • Andrew and Julie Klingenstein Family Fund • BET Networks • PMM Companies • Joan Mossman • Khalil Rouhana • Lockton Insurance • Metro Washington Airports Authority • US Financial Services • Young Electrical Contractors, Inc. • Kaye Savage • Sadia White • Valerie Holt • BB&T Insurance • Carl Delorenzo • Carol Madden • Demian Wilbur • Flippo Construction • Anonymous • James or Patricia Presa Horan • Loubier & Associates • MDM Office Systems, Inc. • Michael and Meridel Bulle Vu • Nikolaos Kolovos • Siegel, Tully, & Furrer llc • Southern MarketPlace
F. Facilities 1. Square Footage Entire for building 89,000 Entire for total classroom space 17,000 2. Room Inventory by Grade and Subject Number of room by subject Math 0 Science 0 Social Studies 0 English/Language Arts 0 Art/Music/PE/Other 3 Library 1
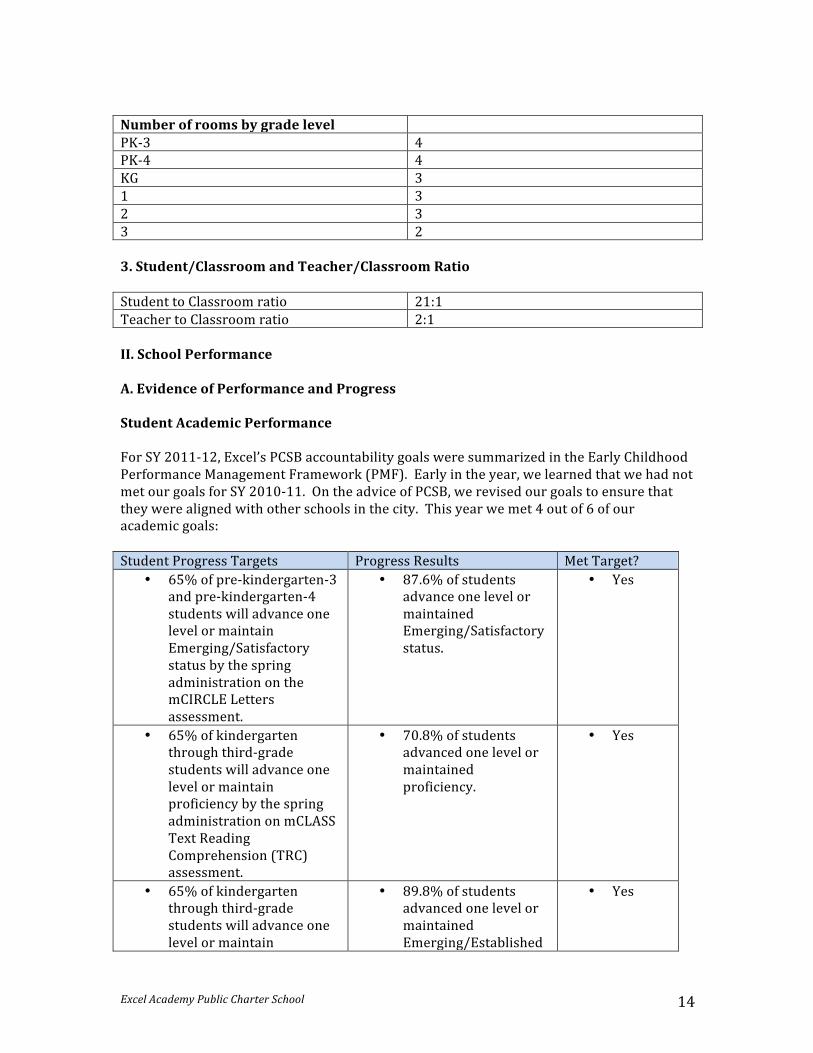
Excel Academy Public Charter School 14
Number of rooms by grade level PK-‐3 4 PK-‐4 4 KG 3 1 3 2 3 3 2 3. Student/Classroom and Teacher/Classroom Ratio Student to Classroom ratio 21:1 Teacher to Classroom ratio 2:1 II. School Performance A. Evidence of Performance and Progress Student Academic Performance For SY 2011-‐12, Excel’s PCSB accountability goals were summarized in the Early Childhood Performance Management Framework (PMF). Early in the year, we learned that we had not met our goals for SY 2010-‐11. On the advice of PCSB, we revised our goals to ensure that they were aligned with other schools in the city. This year we met 4 out of 6 of our academic goals: Student Progress Targets Progress Results Met Target?
• 65% of pre-‐kindergarten-‐3 and pre-‐kindergarten-‐4 students will advance one level or maintain Emerging/Satisfactory status by the spring administration on the mCIRCLE Letters assessment.
• 87.6% of students advance one level or maintained Emerging/Satisfactory status.
• Yes
• 65% of kindergarten through third-‐grade students will advance one level or maintain proficiency by the spring administration on mCLASS Text Reading Comprehension (TRC) assessment.
• 70.8% of students advanced one level or maintained proficiency.
• Yes
• 65% of kindergarten through third-‐grade students will advance one level or maintain
• 89.8% of students advanced one level or maintained Emerging/Established
• Yes
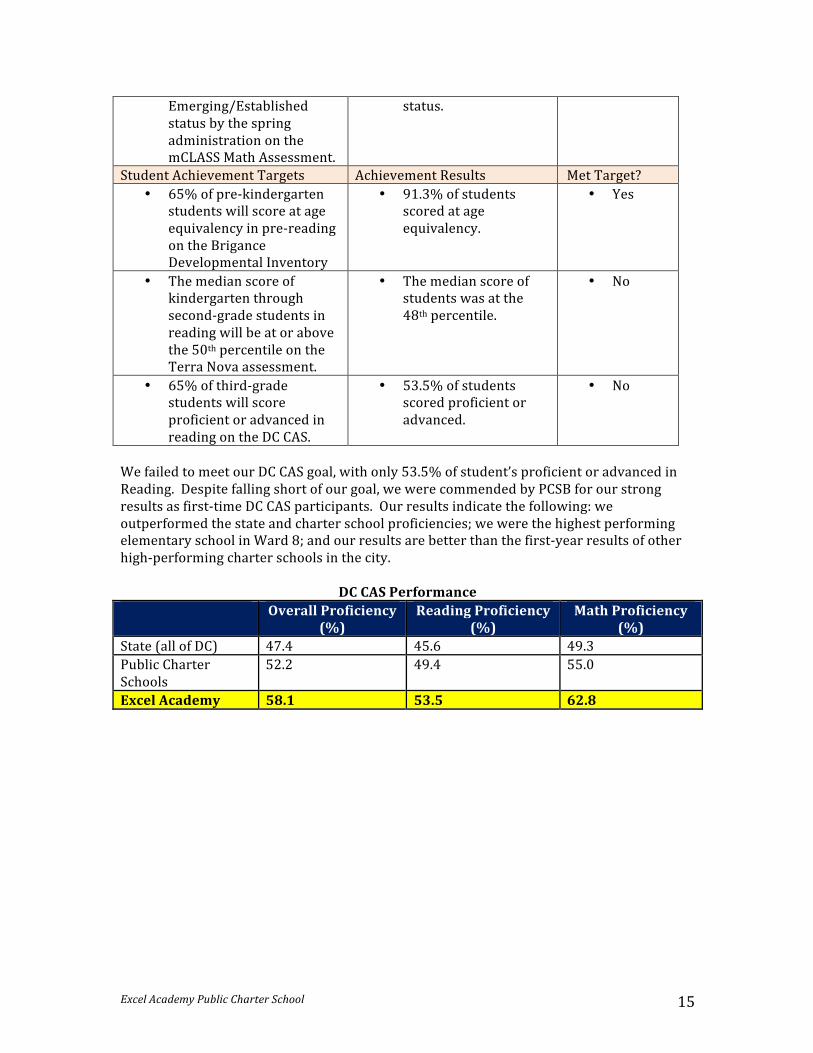
Excel Academy Public Charter School 15
Emerging/Established status by the spring administration on the mCLASS Math Assessment.
status.
Student Achievement Targets Achievement Results Met Target? • 65% of pre-‐kindergarten
students will score at age equivalency in pre-‐reading on the Brigance Developmental Inventory
• 91.3% of students scored at age equivalency.
• Yes
• The median score of kindergarten through second-‐grade students in reading will be at or above the 50th percentile on the Terra Nova assessment.
• The median score of students was at the 48th percentile.
• No
• 65% of third-‐grade students will score proficient or advanced in reading on the DC CAS.
• 53.5% of students scored proficient or advanced.
• No
We failed to meet our DC CAS goal, with only 53.5% of student’s proficient or advanced in Reading. Despite falling short of our goal, we were commended by PCSB for our strong results as first-‐time DC CAS participants. Our results indicate the following: we outperformed the state and charter school proficiencies; we were the highest performing elementary school in Ward 8; and our results are better than the first-‐year results of other high-‐performing charter schools in the city.
DC CAS Performance Overall Proficiency
(%) Reading Proficiency
(%) Math Proficiency
(%) State (all of DC) 47.4 45.6 49.3 Public Charter Schools
52.2 49.4 55.0
Excel Academy 58.1 53.5 62.8
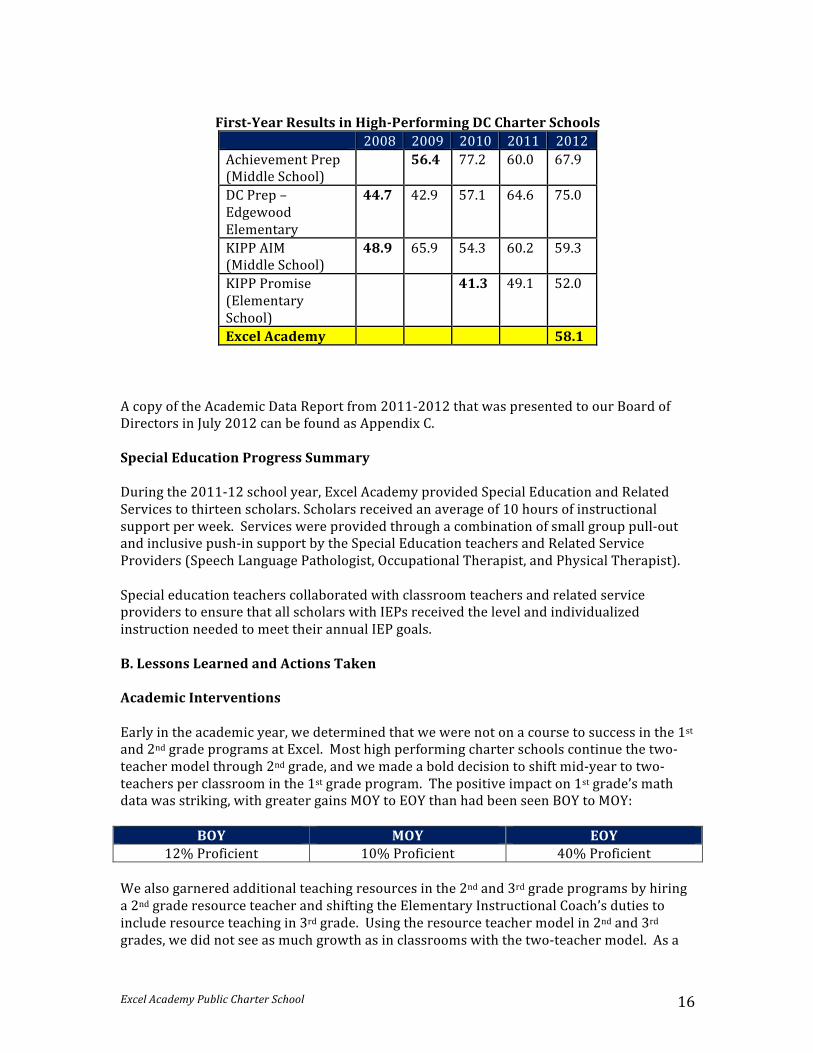
Excel Academy Public Charter School 16
First-‐Year Results in High-‐Performing DC Charter Schools
2008 2009 2010 2011 2012 Achievement Prep (Middle School)
56.4 77.2 60.0 67.9
DC Prep – Edgewood Elementary
44.7 42.9 57.1 64.6 75.0
KIPP AIM (Middle School)
48.9 65.9 54.3 60.2 59.3
KIPP Promise (Elementary School)
41.3 49.1 52.0
Excel Academy 58.1 A copy of the Academic Data Report from 2011-‐2012 that was presented to our Board of Directors in July 2012 can be found as Appendix C. Special Education Progress Summary During the 2011-‐12 school year, Excel Academy provided Special Education and Related Services to thirteen scholars. Scholars received an average of 10 hours of instructional support per week. Services were provided through a combination of small group pull-‐out and inclusive push-‐in support by the Special Education teachers and Related Service Providers (Speech Language Pathologist, Occupational Therapist, and Physical Therapist). Special education teachers collaborated with classroom teachers and related service providers to ensure that all scholars with IEPs received the level and individualized instruction needed to meet their annual IEP goals. B. Lessons Learned and Actions Taken Academic Interventions Early in the academic year, we determined that we were not on a course to success in the 1st and 2nd grade programs at Excel. Most high performing charter schools continue the two-‐teacher model through 2nd grade, and we made a bold decision to shift mid-‐year to two-‐teachers per classroom in the 1st grade program. The positive impact on 1st grade’s math data was striking, with greater gains MOY to EOY than had been seen BOY to MOY:
BOY MOY EOY 12% Proficient 10% Proficient 40% Proficient
We also garnered additional teaching resources in the 2nd and 3rd grade programs by hiring a 2nd grade resource teacher and shifting the Elementary Instructional Coach’s duties to include resource teaching in 3rd grade. Using the resource teacher model in 2nd and 3rd grades, we did not see as much growth as in classrooms with the two-‐teacher model. As a
Excel Academy Public Charter School 17
result, we plan to begin SY 2012-‐13 with a two-‐teacher model in 2nd grade, and 3rd graders will have both a dedicated math teacher and Urban Teaching Center resident contribute to their daily instruction. We have learned that, rather than outside interventions, dedicated teaching staff is key to student achievement. In addition to expanding the staff, we also secured a targeted literacy intervention program for our struggling 1st and 2nd grade scholars. These students received an additional reading instruction block per day. Overall, our interventions came too late in the year to impact student learning at the level we hoped. This has been remedied by building intervention blocks into the daily schedules for SY 2012-‐13 – set-‐aside times for homeroom teachers to work with their struggling scholars from the first days of school. We have also ensured that, for the first time, EOY student data is passed to the scholar’s new teacher so that no time is lost in identifying students in need of intervention. Program Changes Based on end-‐of-‐year feedback from our teachers, Excel decided to restructure its Academic Leadership Team to enhance support for our instructional staff across all grade levels. For the 2011-‐2012 school year, a lead Second Grade teacher transitioned out of the classroom and served as an Instructional Coach focusing on grades K-‐3. In addition, a Preschool teacher also transitioned to a new role as Instructional Coach for Preschool and Prekindergarten. A former lead Preschool teacher and Instructional Coach became the Academic Dean, responsible for supporting the implementation and continuity of our academic vision. These staff members are incredibly passionate and talented educators who played instrumental roles in providing support to the Principal. In an effort to manage the workload generated from our outreach, development and partnership efforts, a new Office of Advancement was created and staffed. Additionally, to better manage the operations of our school community, a newly created position of Chief Operations Officer was developed. This restructuring helped to streamline operational responsibilities and ensured the school’s growing program was managed in an effective and strategic manner. Supporting Students with Learning Disabilities For the 2011-‐2012 school year, Excel Academy identified improving the Special Education referral and evaluation process as a major goal. To achieve this goal, we increased staffing for Special Education services. Academic Leadership also revised the Student Support Team (SST) process and created an action plan for each student receiving SST services. An SST coordinator monitored this process. Excel continues to be committed to ensuring that the process is conducted in full accordance with IDEA requirements and that our scholars with learning differences are given the support they need to succeed. Reporting Performance Management Framework and Accountability Plan Information to Students, Teachers, Parents, and the Public Excel Academy conveys information through school newsletters, weekly class updates sent home to parents, board meetings, and the Annual Report. Representatives of the school’s leadership team attend PTO meetings to address parent concerns. The parent Board trustees also convey pertinent information to the parents at large.
Excel Academy Public Charter School 18
C. Unique Accomplishments Strategic Partnerships As part of our mission to offer programs that provide scholars opportunities to explore their interests and passions, we continued to develop strategic partnerships during the 2011-‐2012 school year. Stone Ridge Academy of the Sacred Heart, through their Social Action program, placed nineteen Junior and Senior students at Excel Academy. Throughout the 2011-‐2012 academic year, the Stone Ridge girls traveled to Excel twice a month to assist in classrooms and connect with our scholars. Our partnership with the Holton-‐Arms School created several opportunities for third grade scholars from both campuses to bond together as part of a book share club and end-‐of-‐year picnic. The Madeira School athletic department supported our end-‐of-‐year field day by running several sports clinics. This partnership will continue, during the 2012-‐2013 school year, through Madeira’s work with our Saturday Academy program. Our relationship with the Junior League of Washington was an integral piece of our school-‐wide literacy development. Junior League volunteers visited classrooms and read with scholars, as well as, provided a set of new books for every scholar by participating in a book give-‐away. The Junior League was also a leading donor of funds for the creation of our lending library. We look forward to continuing the development of these and other partnerships to allow our scholars to acquire skills within and outside of the classroom. Partnerships explore and expand our scholars’ idea of community and give broader context to and application of their skills and knowledge.
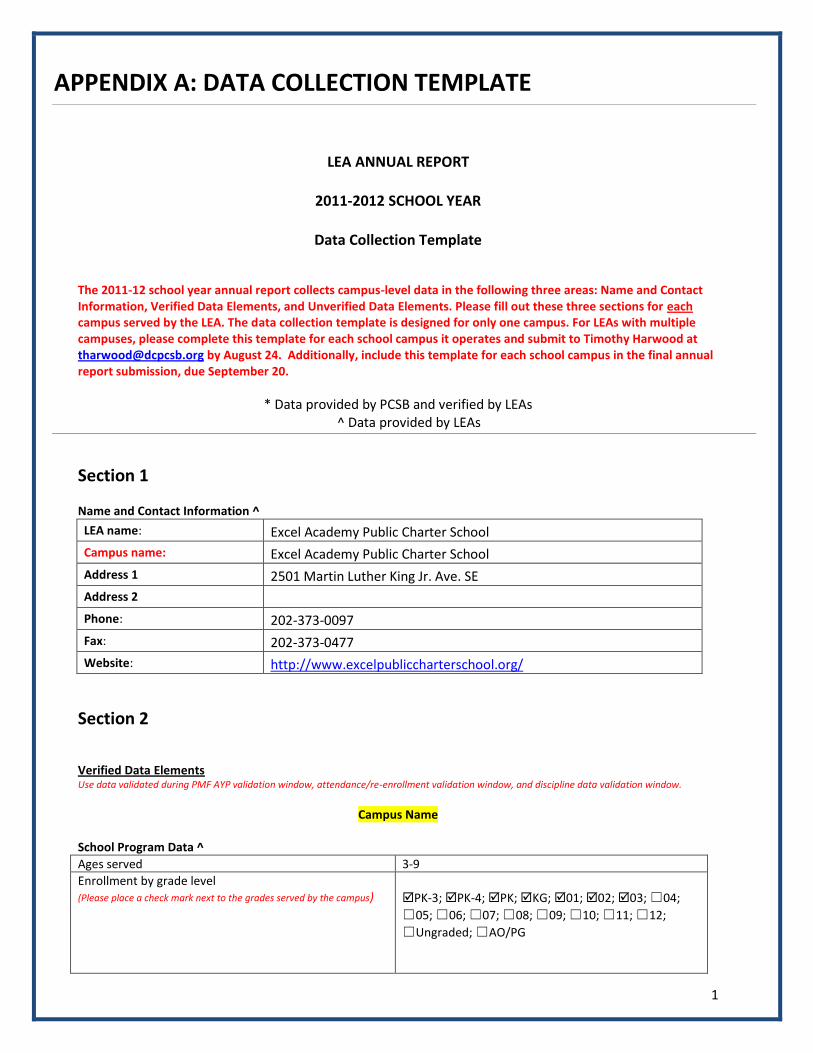
1
APPENDIX A: DATA COLLECTION TEMPLATE
LEA ANNUAL REPORT
2011-2012 SCHOOL YEAR
Data Collection Template The 2011-12 school year annual report collects campus-level data in the following three areas: Name and Contact Information, Verified Data Elements, and Unverified Data Elements. Please fill out these three sections for each campus served by the LEA. The data collection template is designed for only one campus. For LEAs with multiple campuses, please complete this template for each school campus it operates and submit to Timothy Harwood at [email protected] by August 24. Additionally, include this template for each school campus in the final annual report submission, due September 20.
* Data provided by PCSB and verified by LEAs ^ Data provided by LEAs
Section 1 Name and Contact Information ^
LEA name: Excel Academy Public Charter School
Campus name: Excel Academy Public Charter School
Address 1 2501 Martin Luther King Jr. Ave. SE
Address 2
Phone: 202-373-0097
Fax: 202-373-0477
Website: http://www.excelpubliccharterschool.org/
Section 2 Verified Data Elements Use data validated during PMF AYP validation window, attendance/re-enrollment validation window, and discipline data validation window.
Campus Name School Program Data ^
Ages served 3-9
Enrollment by grade level (Please place a check mark next to the grades served by the campus)
PK-3; PK-4; PK; KG; 01; 02; 03; ☐04;
☐05; ☐06; ☐07; ☐08; ☐09; ☐10; ☐11; ☐12;
☐Ungraded; ☐AO/PG
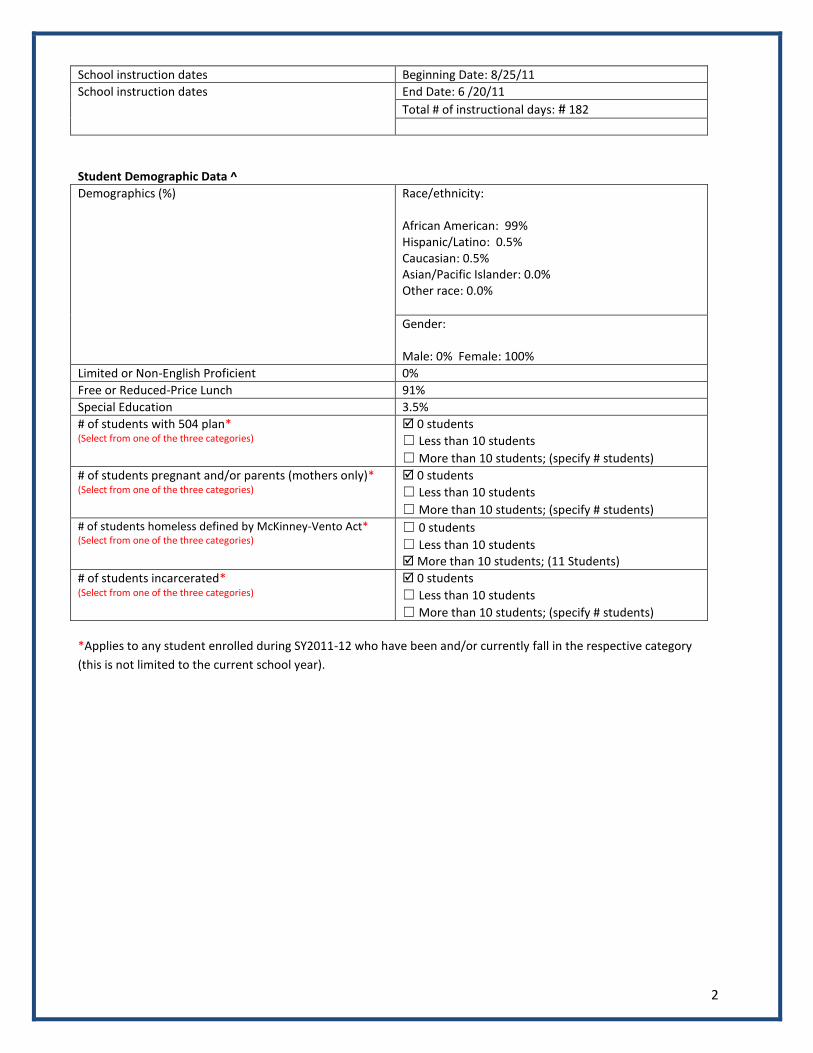
2
School instruction dates Beginning Date: 8/25/11
School instruction dates End Date: 6 /20/11
Total # of instructional days: # 182
Student Demographic Data ^
Demographics (%) Race/ethnicity: African American: 99% Hispanic/Latino: 0.5% Caucasian: 0.5% Asian/Pacific Islander: 0.0% Other race: 0.0%
Gender: Male: 0% Female: 100%
Limited or Non-English Proficient 0%
Free or Reduced-Price Lunch 91%
Special Education 3.5%
# of students with 504 plan* (Select from one of the three categories)
0 students
☐ Less than 10 students
☐ More than 10 students; (specify # students)
# of students pregnant and/or parents (mothers only)* (Select from one of the three categories)
0 students
☐ Less than 10 students
☐ More than 10 students; (specify # students) # of students homeless defined by McKinney-Vento Act* (Select from one of the three categories)
☐ 0 students
☐ Less than 10 students More than 10 students; (11 Students)
# of students incarcerated* (Select from one of the three categories)
0 students
☐ Less than 10 students
☐ More than 10 students; (specify # students)
*Applies to any student enrolled during SY2011-12 who have been and/or currently fall in the respective category
(this is not limited to the current school year).
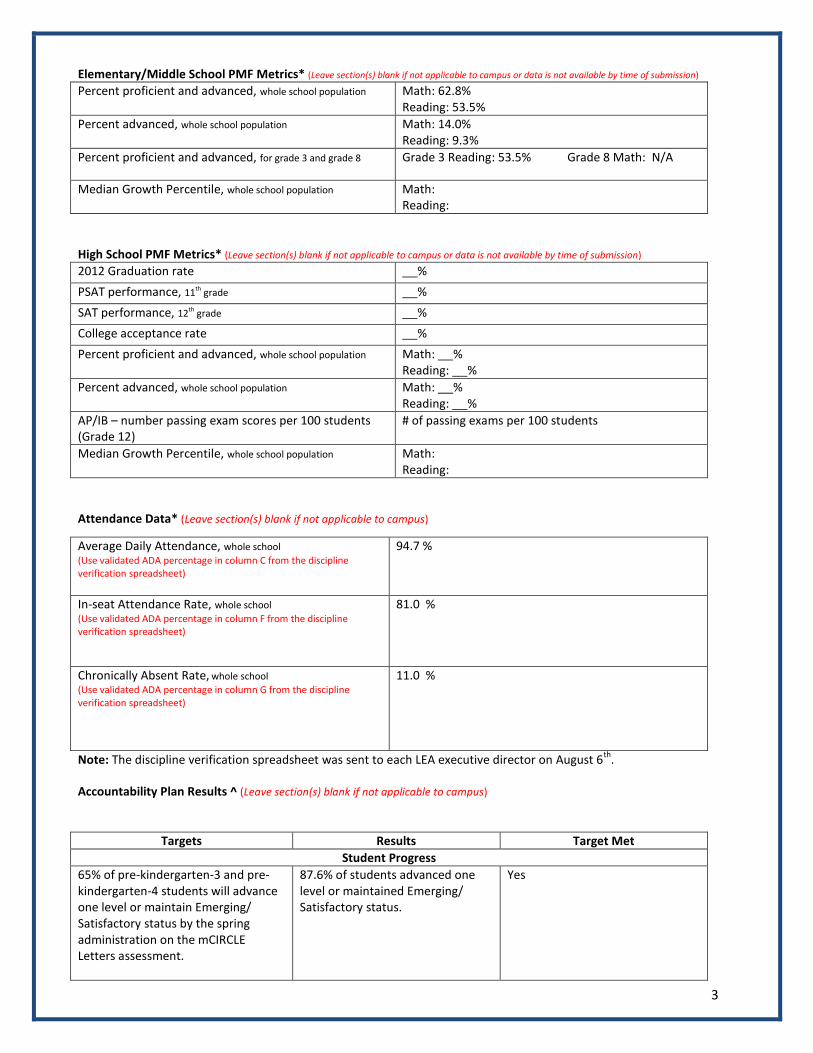
3
Elementary/Middle School PMF Metrics* (Leave section(s) blank if not applicable to campus or data is not available by time of submission)
Percent proficient and advanced, whole school population
Math: 62.8% Reading: 53.5%
Percent advanced, whole school population Math: 14.0% Reading: 9.3%
Percent proficient and advanced, for grade 3 and grade 8 Grade 3 Reading: 53.5% Grade 8 Math: N/A
Median Growth Percentile, whole school population Math: Reading:
High School PMF Metrics* (Leave section(s) blank if not applicable to campus or data is not available by time of submission)
2012 Graduation rate %
PSAT performance, 11th grade %
SAT performance, 12th grade %
College acceptance rate %
Percent proficient and advanced, whole school population Math: % Reading: %
Percent advanced, whole school population Math: % Reading: %
AP/IB – number passing exam scores per 100 students (Grade 12)
# of passing exams per 100 students
Median Growth Percentile, whole school population Math: Reading:
Attendance Data* (Leave section(s) blank if not applicable to campus)
Average Daily Attendance, whole school
(Use validated ADA percentage in column C from the discipline verification spreadsheet)
94.7 %
In-seat Attendance Rate, whole school
(Use validated ADA percentage in column F from the discipline verification spreadsheet)
81.0 %
Chronically Absent Rate, whole school
(Use validated ADA percentage in column G from the discipline verification spreadsheet)
11.0 %
Note: The discipline verification spreadsheet was sent to each LEA executive director on August 6th
.
Accountability Plan Results ^ (Leave section(s) blank if not applicable to campus)
Targets Results Target Met
Student Progress
65% of pre-kindergarten-3 and pre-kindergarten-4 students will advance one level or maintain Emerging/ Satisfactory status by the spring administration on the mCIRCLE Letters assessment.
87.6% of students advanced one level or maintained Emerging/ Satisfactory status.
Yes
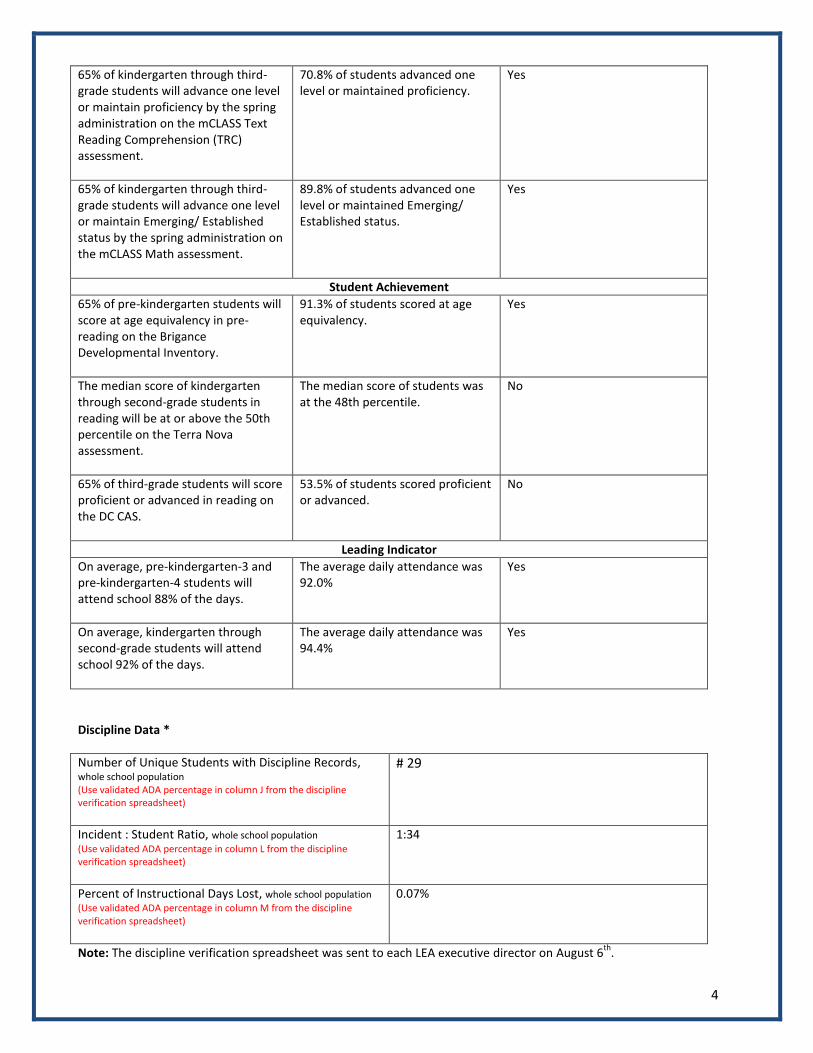
4
65% of kindergarten through third-grade students will advance one level or maintain proficiency by the spring administration on the mCLASS Text Reading Comprehension (TRC) assessment.
70.8% of students advanced one level or maintained proficiency.
Yes
65% of kindergarten through third-grade students will advance one level or maintain Emerging/ Established status by the spring administration on the mCLASS Math assessment.
89.8% of students advanced one level or maintained Emerging/ Established status.
Yes
Student Achievement
65% of pre-kindergarten students will score at age equivalency in pre-reading on the Brigance Developmental Inventory.
91.3% of students scored at age equivalency.
Yes
The median score of kindergarten through second-grade students in reading will be at or above the 50th percentile on the Terra Nova assessment.
The median score of students was at the 48th percentile.
No
65% of third-grade students will score proficient or advanced in reading on the DC CAS.
53.5% of students scored proficient or advanced.
No
Leading Indicator
On average, pre-kindergarten-3 and pre-kindergarten-4 students will attend school 88% of the days.
The average daily attendance was 92.0%
Yes
On average, kindergarten through second-grade students will attend school 92% of the days.
The average daily attendance was 94.4%
Yes
Discipline Data *
Number of Unique Students with Discipline Records, whole school population (Use validated ADA percentage in column J from the discipline verification spreadsheet)
# 29
Incident : Student Ratio, whole school population
(Use validated ADA percentage in column L from the discipline verification spreadsheet)
1:34
Percent of Instructional Days Lost, whole school population
(Use validated ADA percentage in column M from the discipline verification spreadsheet)
0.07%
Note: The discipline verification spreadsheet was sent to each LEA executive director on August 6th
.
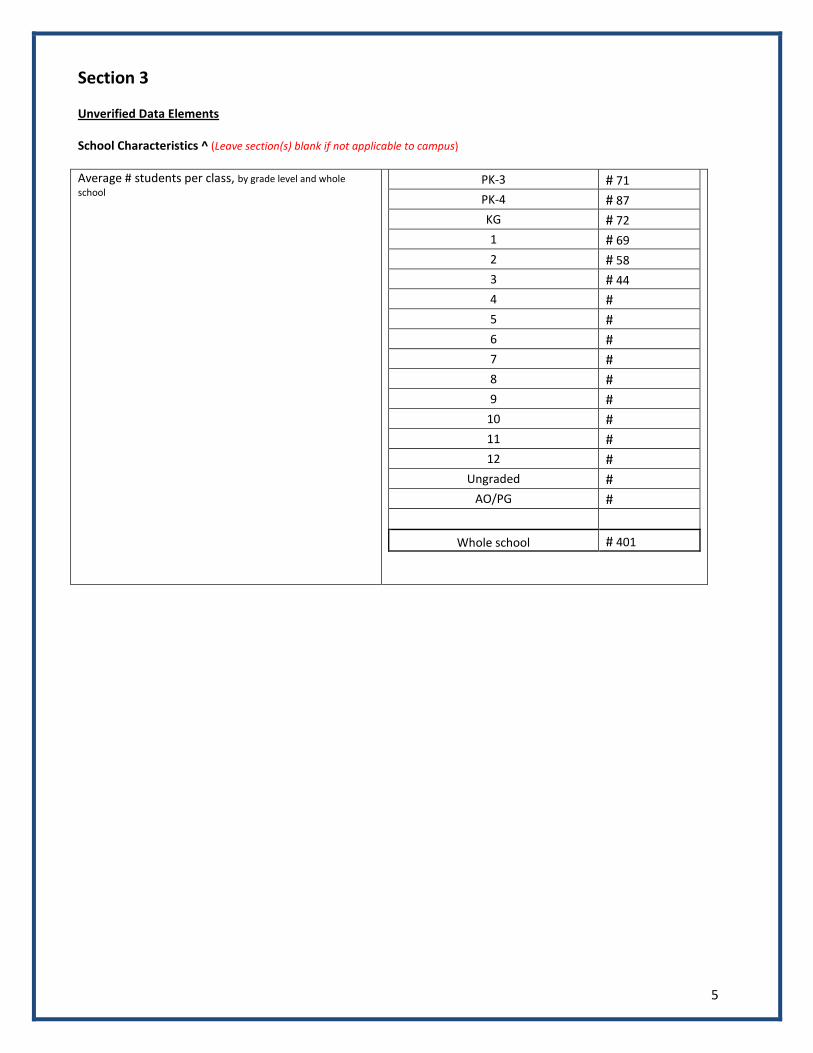
5
Section 3
Unverified Data Elements
School Characteristics ^ (Leave section(s) blank if not applicable to campus)
Average # students per class, by grade level and whole
school PK-3 # 71
PK-4 # 87
KG # 72
1 # 69
2 # 58
3 # 44
4 #
5 #
6 #
7 #
8 #
9 #
10 #
11 #
12 #
Ungraded #
AO/PG #
Whole school # 401
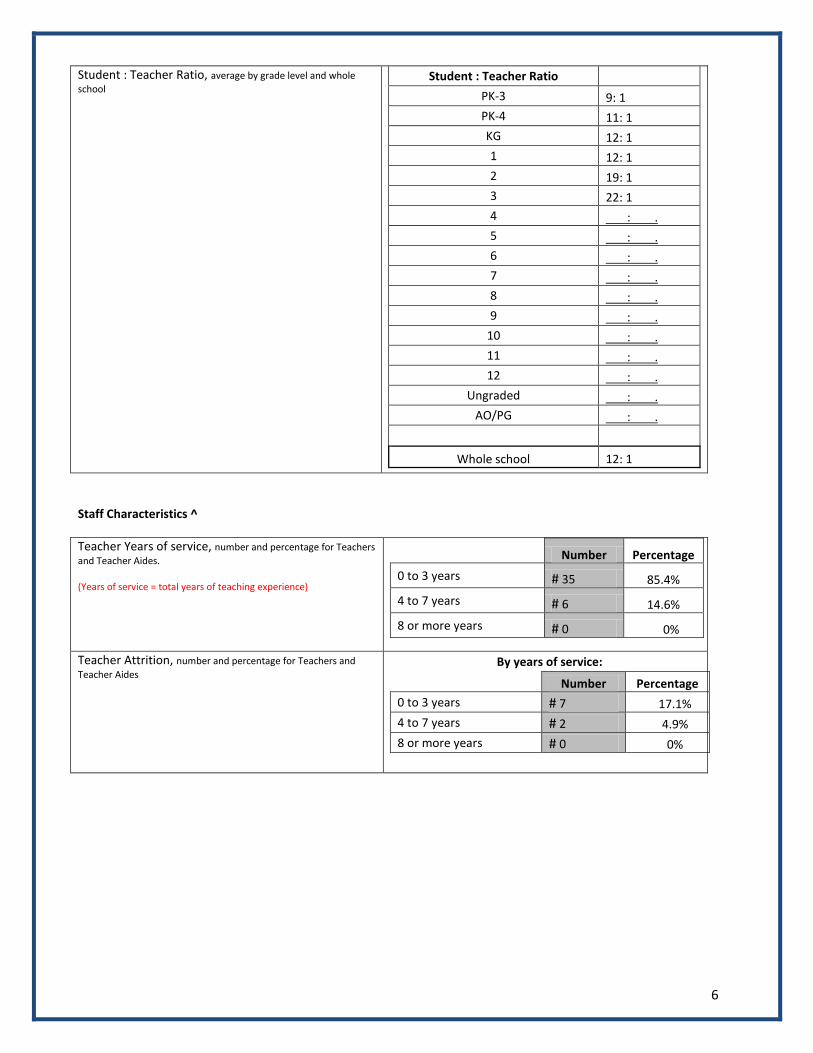
6
Student : Teacher Ratio, average by grade level and whole
school Student : Teacher Ratio
PK-3 9: 1 PK-4 11: 1 KG 12: 1 1 12: 1 2 19: 1 3 22: 1 4 : . 5 : . 6 : . 7 : . 8 : .
9 : .
10 : .
11 : .
12 : . Ungraded : .
AO/PG : .
Whole school 12: 1
Staff Characteristics ^
Teacher Years of service, number and percentage for Teachers
and Teacher Aides. (Years of service = total years of teaching experience)
Number Percentage
0 to 3 years # 35 85.4%
4 to 7 years # 6 14.6%
8 or more years # 0 0%
Teacher Attrition, number and percentage for Teachers and
Teacher Aides By years of service:
Number Percentage
0 to 3 years # 7 17.1%
4 to 7 years # 2 4.9%
8 or more years # 0 0%
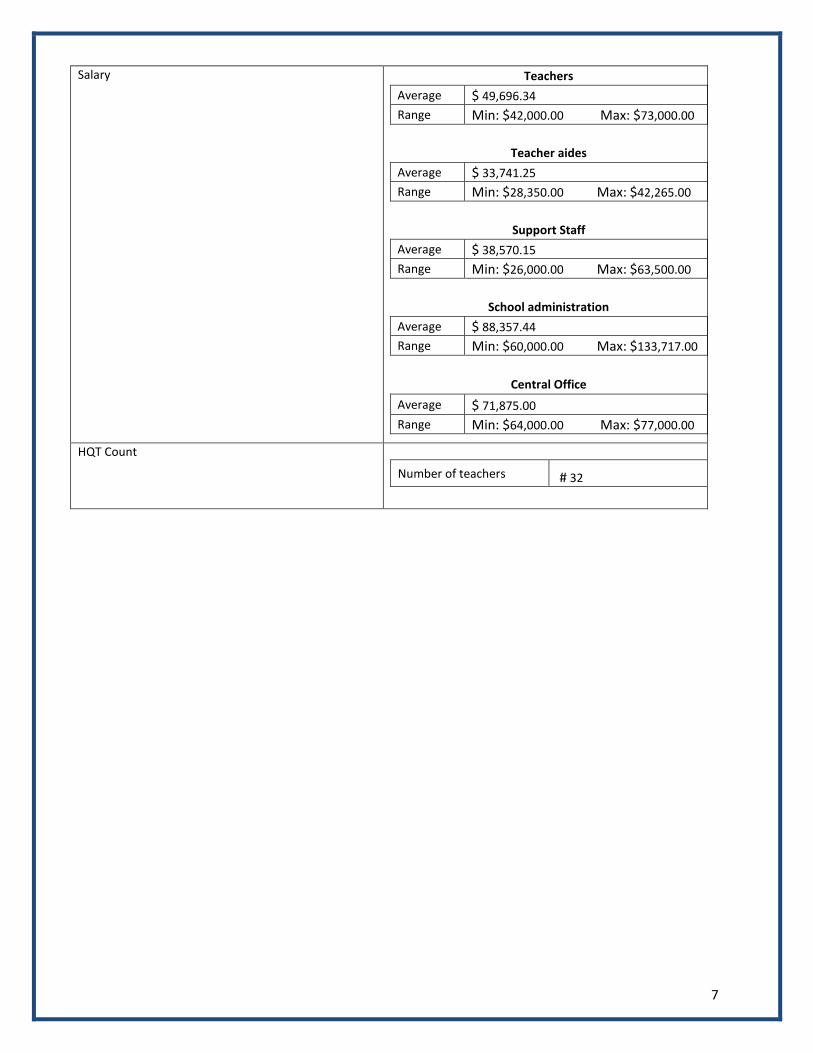
7
Salary Teachers
Average $ 49,696.34
Range Min: $42,000.00 Max: $73,000.00
Teacher aides
Average $ 33,741.25
Range Min: $28,350.00 Max: $42,265.00
Support Staff
Average $ 38,570.15
Range Min: $26,000.00 Max: $63,500.00
School administration
Average $ 88,357.44
Range Min: $60,000.00 Max: $133,717.00
Central Office
Average $ 71,875.00
Range Min: $64,000.00 Max: $77,000.00
HQT Count
Number of teachers # 32
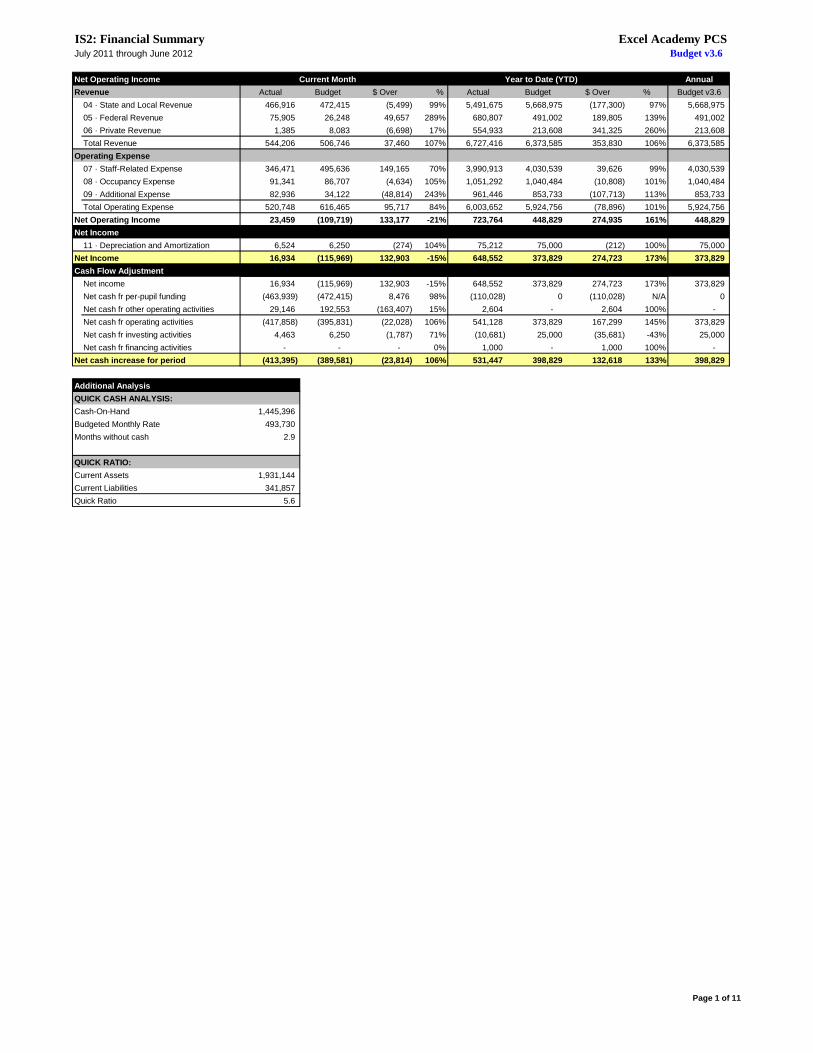
IS2: Financial Summary Excel Academy PCSJuly 2011 through June 2012 Budget v3.6
Net Operating Income Current Month Year to Date (YTD) Annual
Revenue Actual Budget $ Over % Actual Budget $ Over % Budget v3.6
04 · State and Local Revenue 466,916 472,415 (5,499) 99% 5,491,675 5,668,975 (177,300) 97% 5,668,975
05 · Federal Revenue 75,905 26,248 49,657 289% 680,807 491,002 189,805 139% 491,002
06 · Private Revenue 1,385 8,083 (6,698) 17% 554,933 213,608 341,325 260% 213,608
Total Revenue 544,206 506,746 37,460 107% 6,727,416 6,373,585 353,830 106% 6,373,585
Operating Expense
07 · Staff-Related Expense 346,471 495,636 149,165 70% 3,990,913 4,030,539 39,626 99% 4,030,539
08 · Occupancy Expense 91,341 86,707 (4,634) 105% 1,051,292 1,040,484 (10,808) 101% 1,040,484
09 · Additional Expense 82,936 34,122 (48,814) 243% 961,446 853,733 (107,713) 113% 853,733
Total Operating Expense 520,748 616,465 95,717 84% 6,003,652 5,924,756 (78,896) 101% 5,924,756
Net Operating Income 23,459 (109,719) 133,177 -21% 723,764 448,829 274,935 161% 448,829
Net Income
11 · Depreciation and Amortization 6,524 6,250 (274) 104% 75,212 75,000 (212) 100% 75,000
Net Income 16,934 (115,969) 132,903 -15% 648,552 373,829 274,723 173% 373,829
Cash Flow Adjustment
Net income 16,934 (115,969) 132,903 -15% 648,552 373,829 274,723 173% 373,829
Net cash fr per-pupil funding (463,939) (472,415) 8,476 98% (110,028) 0 (110,028) N/A 0
Net cash fr other operating activities 29,146 192,553 (163,407) 15% 2,604 - 2,604 100% -
Net cash fr operating activities (417,858) (395,831) (22,028) 106% 541,128 373,829 167,299 145% 373,829
Net cash fr investing activities 4,463 6,250 (1,787) 71% (10,681) 25,000 (35,681) -43% 25,000
Net cash fr financing activities - - - 0% 1,000 - 1,000 100% -
Net cash increase for period (413,395) (389,581) (23,814) 106% 531,447 398,829 132,618 133% 398,829
Additional Analysis
QUICK CASH ANALYSIS:
Cash-On-Hand 1,445,396
Budgeted Monthly Rate 493,730
Months without cash 2.9
QUICK RATIO:
Current Assets 1,931,144
Current Liabilities 341,857
Quick Ratio 5.6
Page 1 of 11
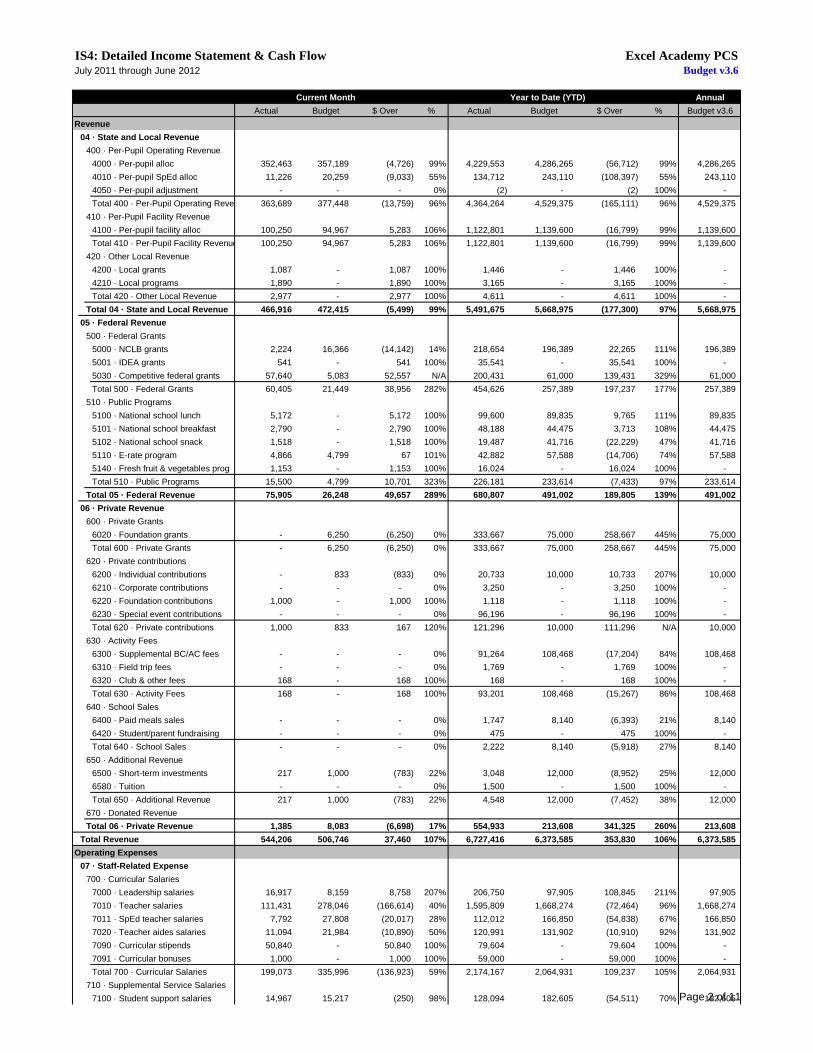
IS4: Detailed Income Statement & Cash Flow Excel Academy PCSJuly 2011 through June 2012 Budget v3.6
Current Month Year to Date (YTD) Annual
Actual Budget $ Over % Actual Budget $ Over % Budget v3.6
Revenue
04 · State and Local Revenue
400 · Per-Pupil Operating Revenue
4000 · Per-pupil alloc 352,463 357,189 (4,726) 99% 4,229,553 4,286,265 (56,712) 99% 4,286,265
4010 · Per-pupil SpEd alloc 11,226 20,259 (9,033) 55% 134,712 243,110 (108,397) 55% 243,110
4050 · Per-pupil adjustment - - - 0% (2) - (2) 100% -
Total 400 · Per-Pupil Operating Revenue 363,689 377,448 (13,759) 96% 4,364,264 4,529,375 (165,111) 96% 4,529,375
410 · Per-Pupil Facility Revenue
4100 · Per-pupil facility alloc 100,250 94,967 5,283 106% 1,122,801 1,139,600 (16,799) 99% 1,139,600
Total 410 · Per-Pupil Facility Revenue 100,250 94,967 5,283 106% 1,122,801 1,139,600 (16,799) 99% 1,139,600
420 · Other Local Revenue
4200 · Local grants 1,087 - 1,087 100% 1,446 - 1,446 100% -
4210 · Local programs 1,890 - 1,890 100% 3,165 - 3,165 100% -
Total 420 · Other Local Revenue 2,977 - 2,977 100% 4,611 - 4,611 100% -
Total 04 · State and Local Revenue 466,916 472,415 (5,499) 99% 5,491,675 5,668,975 (177,300) 97% 5,668,975
05 · Federal Revenue
500 · Federal Grants
5000 · NCLB grants 2,224 16,366 (14,142) 14% 218,654 196,389 22,265 111% 196,389
5001 · IDEA grants 541 - 541 100% 35,541 - 35,541 100% -
5030 · Competitive federal grants 57,640 5,083 52,557 N/A 200,431 61,000 139,431 329% 61,000
Total 500 · Federal Grants 60,405 21,449 38,956 282% 454,626 257,389 197,237 177% 257,389
510 · Public Programs
5100 · National school lunch 5,172 - 5,172 100% 99,600 89,835 9,765 111% 89,835
5101 · National school breakfast 2,790 - 2,790 100% 48,188 44,475 3,713 108% 44,475
5102 · National school snack 1,518 - 1,518 100% 19,487 41,716 (22,229) 47% 41,716
5110 · E-rate program 4,866 4,799 67 101% 42,882 57,588 (14,706) 74% 57,588
5140 · Fresh fruit & vegetables prog 1,153 - 1,153 100% 16,024 - 16,024 100% -
Total 510 · Public Programs 15,500 4,799 10,701 323% 226,181 233,614 (7,433) 97% 233,614
Total 05 · Federal Revenue 75,905 26,248 49,657 289% 680,807 491,002 189,805 139% 491,002
06 · Private Revenue
600 · Private Grants
6020 · Foundation grants - 6,250 (6,250) 0% 333,667 75,000 258,667 445% 75,000
Total 600 · Private Grants - 6,250 (6,250) 0% 333,667 75,000 258,667 445% 75,000
620 · Private contributions
6200 · Individual contributions - 833 (833) 0% 20,733 10,000 10,733 207% 10,000
6210 · Corporate contributions - - - 0% 3,250 - 3,250 100% -
6220 · Foundation contributions 1,000 - 1,000 100% 1,118 - 1,118 100% -
6230 · Special event contributions - - - 0% 96,196 - 96,196 100% -
Total 620 · Private contributions 1,000 833 167 120% 121,296 10,000 111,296 N/A 10,000
630 · Activity Fees
6300 · Supplemental BC/AC fees - - - 0% 91,264 108,468 (17,204) 84% 108,468
6310 · Field trip fees - - - 0% 1,769 - 1,769 100% -
6320 · Club & other fees 168 - 168 100% 168 - 168 100% -
Total 630 · Activity Fees 168 - 168 100% 93,201 108,468 (15,267) 86% 108,468
640 · School Sales
6400 · Paid meals sales - - - 0% 1,747 8,140 (6,393) 21% 8,140
6420 · Student/parent fundraising - - - 0% 475 - 475 100% -
Total 640 · School Sales - - - 0% 2,222 8,140 (5,918) 27% 8,140
650 · Additional Revenue
6500 · Short-term investments 217 1,000 (783) 22% 3,048 12,000 (8,952) 25% 12,000
6580 · Tuition - - - 0% 1,500 - 1,500 100% -
Total 650 · Additional Revenue 217 1,000 (783) 22% 4,548 12,000 (7,452) 38% 12,000
670 · Donated Revenue
Total 06 · Private Revenue 1,385 8,083 (6,698) 17% 554,933 213,608 341,325 260% 213,608
Total Revenue 544,206 506,746 37,460 107% 6,727,416 6,373,585 353,830 106% 6,373,585
Operating Expenses
07 · Staff-Related Expense
700 · Curricular Salaries
7000 · Leadership salaries 16,917 8,159 8,758 207% 206,750 97,905 108,845 211% 97,905
7010 · Teacher salaries 111,431 278,046 (166,614) 40% 1,595,809 1,668,274 (72,464) 96% 1,668,274
7011 · SpEd teacher salaries 7,792 27,808 (20,017) 28% 112,012 166,850 (54,838) 67% 166,850
7020 · Teacher aides salaries 11,094 21,984 (10,890) 50% 120,991 131,902 (10,910) 92% 131,902
7090 · Curricular stipends 50,840 - 50,840 100% 79,604 - 79,604 100% -
7091 · Curricular bonuses 1,000 - 1,000 100% 59,000 - 59,000 100% -
Total 700 · Curricular Salaries 199,073 335,996 (136,923) 59% 2,174,167 2,064,931 109,237 105% 2,064,931
710 · Supplemental Service Salaries
7100 · Student support salaries 14,967 15,217 (250) 98% 128,094 182,605 (54,511) 70% 182,605 Page 2 of 11
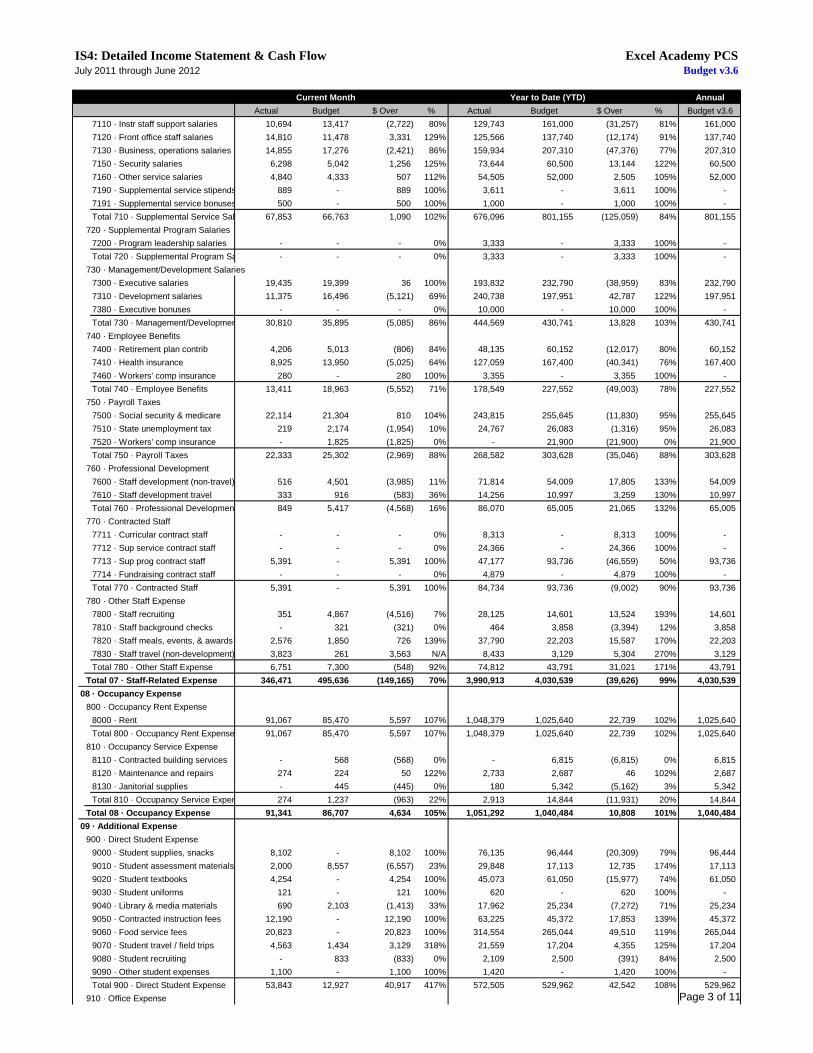
IS4: Detailed Income Statement & Cash Flow Excel Academy PCSJuly 2011 through June 2012 Budget v3.6
Current Month Year to Date (YTD) Annual
Actual Budget $ Over % Actual Budget $ Over % Budget v3.6
7110 · Instr staff support salaries 10,694 13,417 (2,722) 80% 129,743 161,000 (31,257) 81% 161,000
7120 · Front office staff salaries 14,810 11,478 3,331 129% 125,566 137,740 (12,174) 91% 137,740
7130 · Business, operations salaries 14,855 17,276 (2,421) 86% 159,934 207,310 (47,376) 77% 207,310
7150 · Security salaries 6,298 5,042 1,256 125% 73,644 60,500 13,144 122% 60,500
7160 · Other service salaries 4,840 4,333 507 112% 54,505 52,000 2,505 105% 52,000
7190 · Supplemental service stipends 889 - 889 100% 3,611 - 3,611 100% -
7191 · Supplemental service bonuses 500 - 500 100% 1,000 - 1,000 100% -
Total 710 · Supplemental Service Salaries 67,853 66,763 1,090 102% 676,096 801,155 (125,059) 84% 801,155
720 · Supplemental Program Salaries
7200 · Program leadership salaries - - - 0% 3,333 - 3,333 100% -
Total 720 · Supplemental Program Salaries - - - 0% 3,333 - 3,333 100% -
730 · Management/Development Salaries
7300 · Executive salaries 19,435 19,399 36 100% 193,832 232,790 (38,959) 83% 232,790
7310 · Development salaries 11,375 16,496 (5,121) 69% 240,738 197,951 42,787 122% 197,951
7380 · Executive bonuses - - - 0% 10,000 - 10,000 100% -
Total 730 · Management/Development Salaries30,810 35,895 (5,085) 86% 444,569 430,741 13,828 103% 430,741
740 · Employee Benefits
7400 · Retirement plan contrib 4,206 5,013 (806) 84% 48,135 60,152 (12,017) 80% 60,152
7410 · Health insurance 8,925 13,950 (5,025) 64% 127,059 167,400 (40,341) 76% 167,400
7460 · Workers' comp insurance 280 - 280 100% 3,355 - 3,355 100% -
Total 740 · Employee Benefits 13,411 18,963 (5,552) 71% 178,549 227,552 (49,003) 78% 227,552
750 · Payroll Taxes
7500 · Social security & medicare 22,114 21,304 810 104% 243,815 255,645 (11,830) 95% 255,645
7510 · State unemployment tax 219 2,174 (1,954) 10% 24,767 26,083 (1,316) 95% 26,083
7520 · Workers' comp insurance - 1,825 (1,825) 0% - 21,900 (21,900) 0% 21,900
Total 750 · Payroll Taxes 22,333 25,302 (2,969) 88% 268,582 303,628 (35,046) 88% 303,628
760 · Professional Development
7600 · Staff development (non-travel) 516 4,501 (3,985) 11% 71,814 54,009 17,805 133% 54,009
7610 · Staff development travel 333 916 (583) 36% 14,256 10,997 3,259 130% 10,997
Total 760 · Professional Development 849 5,417 (4,568) 16% 86,070 65,005 21,065 132% 65,005
770 · Contracted Staff
7711 · Curricular contract staff - - - 0% 8,313 - 8,313 100% -
7712 · Sup service contract staff - - - 0% 24,366 - 24,366 100% -
7713 · Sup prog contract staff 5,391 - 5,391 100% 47,177 93,736 (46,559) 50% 93,736
7714 · Fundraising contract staff - - - 0% 4,879 - 4,879 100% -
Total 770 · Contracted Staff 5,391 - 5,391 100% 84,734 93,736 (9,002) 90% 93,736
780 · Other Staff Expense
7800 · Staff recruiting 351 4,867 (4,516) 7% 28,125 14,601 13,524 193% 14,601
7810 · Staff background checks - 321 (321) 0% 464 3,858 (3,394) 12% 3,858
7820 · Staff meals, events, & awards 2,576 1,850 726 139% 37,790 22,203 15,587 170% 22,203
7830 · Staff travel (non-development) 3,823 261 3,563 N/A 8,433 3,129 5,304 270% 3,129
Total 780 · Other Staff Expense 6,751 7,300 (548) 92% 74,812 43,791 31,021 171% 43,791
Total 07 · Staff-Related Expense 346,471 495,636 (149,165) 70% 3,990,913 4,030,539 (39,626) 99% 4,030,539
08 · Occupancy Expense
800 · Occupancy Rent Expense
8000 · Rent 91,067 85,470 5,597 107% 1,048,379 1,025,640 22,739 102% 1,025,640
Total 800 · Occupancy Rent Expense 91,067 85,470 5,597 107% 1,048,379 1,025,640 22,739 102% 1,025,640
810 · Occupancy Service Expense
8110 · Contracted building services - 568 (568) 0% - 6,815 (6,815) 0% 6,815
8120 · Maintenance and repairs 274 224 50 122% 2,733 2,687 46 102% 2,687
8130 · Janitorial supplies - 445 (445) 0% 180 5,342 (5,162) 3% 5,342
Total 810 · Occupancy Service Expense 274 1,237 (963) 22% 2,913 14,844 (11,931) 20% 14,844
Total 08 · Occupancy Expense 91,341 86,707 4,634 105% 1,051,292 1,040,484 10,808 101% 1,040,484
09 · Additional Expense
900 · Direct Student Expense
9000 · Student supplies, snacks 8,102 - 8,102 100% 76,135 96,444 (20,309) 79% 96,444
9010 · Student assessment materials 2,000 8,557 (6,557) 23% 29,848 17,113 12,735 174% 17,113
9020 · Student textbooks 4,254 - 4,254 100% 45,073 61,050 (15,977) 74% 61,050
9030 · Student uniforms 121 - 121 100% 620 - 620 100% -
9040 · Library & media materials 690 2,103 (1,413) 33% 17,962 25,234 (7,272) 71% 25,234
9050 · Contracted instruction fees 12,190 - 12,190 100% 63,225 45,372 17,853 139% 45,372
9060 · Food service fees 20,823 - 20,823 100% 314,554 265,044 49,510 119% 265,044
9070 · Student travel / field trips 4,563 1,434 3,129 318% 21,559 17,204 4,355 125% 17,204
9080 · Student recruiting - 833 (833) 0% 2,109 2,500 (391) 84% 2,500
9090 · Other student expenses 1,100 - 1,100 100% 1,420 - 1,420 100% -
Total 900 · Direct Student Expense 53,843 12,927 40,917 417% 572,505 529,962 42,542 108% 529,962
910 · Office Expense Page 3 of 11
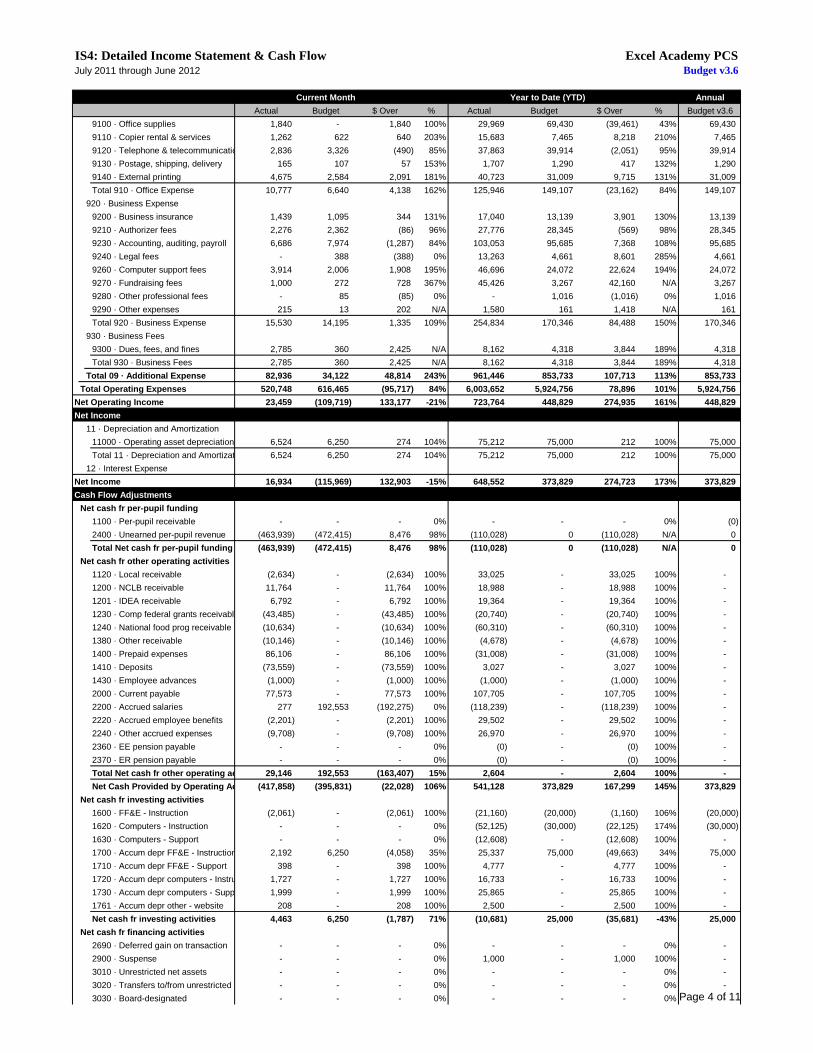
IS4: Detailed Income Statement & Cash Flow Excel Academy PCSJuly 2011 through June 2012 Budget v3.6
Current Month Year to Date (YTD) Annual
Actual Budget $ Over % Actual Budget $ Over % Budget v3.6
9100 · Office supplies 1,840 - 1,840 100% 29,969 69,430 (39,461) 43% 69,430
9110 · Copier rental & services 1,262 622 640 203% 15,683 7,465 8,218 210% 7,465
9120 · Telephone & telecommunications 2,836 3,326 (490) 85% 37,863 39,914 (2,051) 95% 39,914
9130 · Postage, shipping, delivery 165 107 57 153% 1,707 1,290 417 132% 1,290
9140 · External printing 4,675 2,584 2,091 181% 40,723 31,009 9,715 131% 31,009
Total 910 · Office Expense 10,777 6,640 4,138 162% 125,946 149,107 (23,162) 84% 149,107
920 · Business Expense
9200 · Business insurance 1,439 1,095 344 131% 17,040 13,139 3,901 130% 13,139
9210 · Authorizer fees 2,276 2,362 (86) 96% 27,776 28,345 (569) 98% 28,345
9230 · Accounting, auditing, payroll 6,686 7,974 (1,287) 84% 103,053 95,685 7,368 108% 95,685
9240 · Legal fees - 388 (388) 0% 13,263 4,661 8,601 285% 4,661
9260 · Computer support fees 3,914 2,006 1,908 195% 46,696 24,072 22,624 194% 24,072
9270 · Fundraising fees 1,000 272 728 367% 45,426 3,267 42,160 N/A 3,267
9280 · Other professional fees - 85 (85) 0% - 1,016 (1,016) 0% 1,016
9290 · Other expenses 215 13 202 N/A 1,580 161 1,418 N/A 161
Total 920 · Business Expense 15,530 14,195 1,335 109% 254,834 170,346 84,488 150% 170,346
930 · Business Fees
9300 · Dues, fees, and fines 2,785 360 2,425 N/A 8,162 4,318 3,844 189% 4,318
Total 930 · Business Fees 2,785 360 2,425 N/A 8,162 4,318 3,844 189% 4,318
Total 09 · Additional Expense 82,936 34,122 48,814 243% 961,446 853,733 107,713 113% 853,733
Total Operating Expenses 520,748 616,465 (95,717) 84% 6,003,652 5,924,756 78,896 101% 5,924,756
Net Operating Income 23,459 (109,719) 133,177 -21% 723,764 448,829 274,935 161% 448,829
Net Income
11 · Depreciation and Amortization
11000 · Operating asset depreciation 6,524 6,250 274 104% 75,212 75,000 212 100% 75,000
Total 11 · Depreciation and Amortization 6,524 6,250 274 104% 75,212 75,000 212 100% 75,000
12 · Interest Expense
Net Income 16,934 (115,969) 132,903 -15% 648,552 373,829 274,723 173% 373,829
Cash Flow Adjustments
Net cash fr per-pupil funding
1100 · Per-pupil receivable - - - 0% - - - 0% (0)
2400 · Unearned per-pupil revenue (463,939) (472,415) 8,476 98% (110,028) 0 (110,028) N/A 0
Total Net cash fr per-pupil funding (463,939) (472,415) 8,476 98% (110,028) 0 (110,028) N/A 0
Net cash fr other operating activities
1120 · Local receivable (2,634) - (2,634) 100% 33,025 - 33,025 100% -
1200 · NCLB receivable 11,764 - 11,764 100% 18,988 - 18,988 100% -
1201 · IDEA receivable 6,792 - 6,792 100% 19,364 - 19,364 100% -
1230 · Comp federal grants receivable (43,485) - (43,485) 100% (20,740) - (20,740) 100% -
1240 · National food prog receivable (10,634) - (10,634) 100% (60,310) - (60,310) 100% -
1380 · Other receivable (10,146) - (10,146) 100% (4,678) - (4,678) 100% -
1400 · Prepaid expenses 86,106 - 86,106 100% (31,008) - (31,008) 100% -
1410 · Deposits (73,559) - (73,559) 100% 3,027 - 3,027 100% -
1430 · Employee advances (1,000) - (1,000) 100% (1,000) - (1,000) 100% -
2000 · Current payable 77,573 - 77,573 100% 107,705 - 107,705 100% -
2200 · Accrued salaries 277 192,553 (192,275) 0% (118,239) - (118,239) 100% -
2220 · Accrued employee benefits (2,201) - (2,201) 100% 29,502 - 29,502 100% -
2240 · Other accrued expenses (9,708) - (9,708) 100% 26,970 - 26,970 100% -
2360 · EE pension payable - - - 0% (0) - (0) 100% -
2370 · ER pension payable - - - 0% (0) - (0) 100% -
Total Net cash fr other operating activities 29,146 192,553 (163,407) 15% 2,604 - 2,604 100% -
Net Cash Provided by Operating Activities(417,858) (395,831) (22,028) 106% 541,128 373,829 167,299 145% 373,829
Net cash fr investing activities
1600 · FF&E - Instruction (2,061) - (2,061) 100% (21,160) (20,000) (1,160) 106% (20,000)
1620 · Computers - Instruction - - - 0% (52,125) (30,000) (22,125) 174% (30,000)
1630 · Computers - Support - - - 0% (12,608) - (12,608) 100% -
1700 · Accum depr FF&E - Instruction 2,192 6,250 (4,058) 35% 25,337 75,000 (49,663) 34% 75,000
1710 · Accum depr FF&E - Support 398 - 398 100% 4,777 - 4,777 100% -
1720 · Accum depr computers - Instruct 1,727 - 1,727 100% 16,733 - 16,733 100% -
1730 · Accum depr computers - Support 1,999 - 1,999 100% 25,865 - 25,865 100% -
1761 · Accum depr other - website 208 - 208 100% 2,500 - 2,500 100% -
Net cash fr investing activities 4,463 6,250 (1,787) 71% (10,681) 25,000 (35,681) -43% 25,000
Net cash fr financing activities
2690 · Deferred gain on transaction - - - 0% - - - 0% -
2900 · Suspense - - - 0% 1,000 - 1,000 100% -
3010 · Unrestricted net assets - - - 0% - - - 0% -
3020 · Transfers to/from unrestricted - - - 0% - - - 0% -
3030 · Board-designated - - - 0% - - - 0% - Page 4 of 11
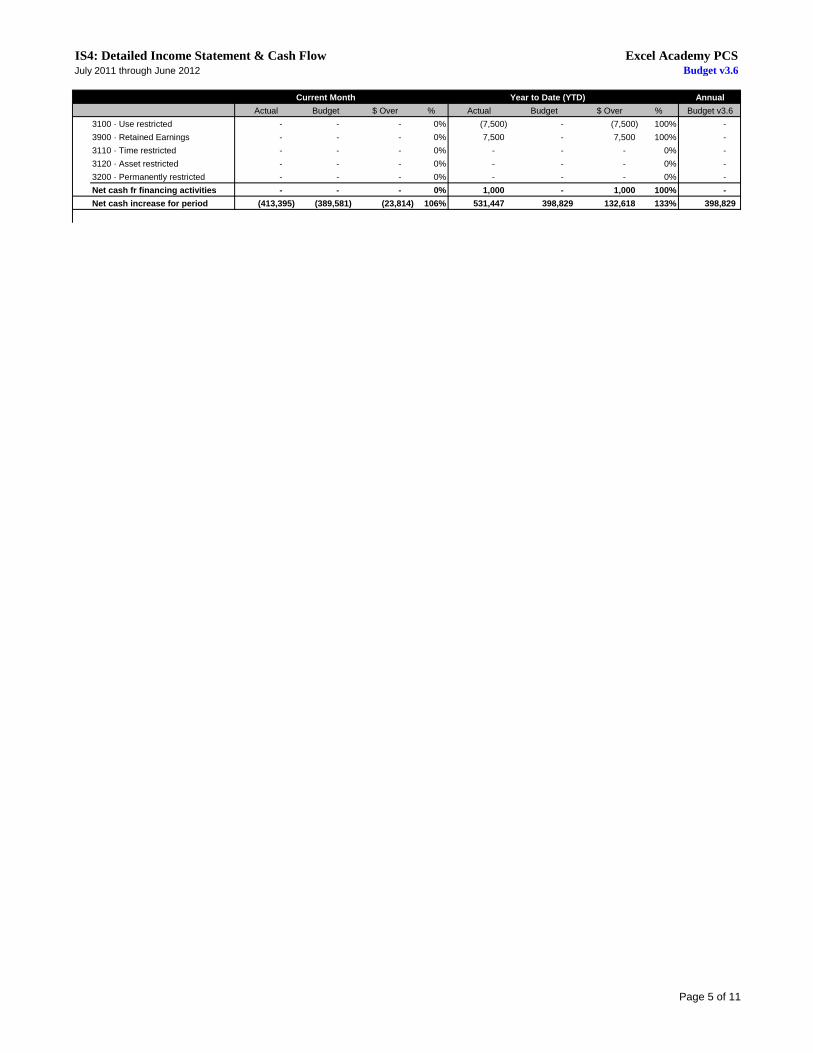
IS4: Detailed Income Statement & Cash Flow Excel Academy PCSJuly 2011 through June 2012 Budget v3.6
Current Month Year to Date (YTD) Annual
Actual Budget $ Over % Actual Budget $ Over % Budget v3.6
3100 · Use restricted - - - 0% (7,500) - (7,500) 100% -
3900 · Retained Earnings - - - 0% 7,500 - 7,500 100% -
3110 · Time restricted - - - 0% - - - 0% -
3120 · Asset restricted - - - 0% - - - 0% -
3200 · Permanently restricted - - - 0% - - - 0% -
Net cash fr financing activities - - - 0% 1,000 - 1,000 100% -
Net cash increase for period (413,395) (389,581) (23,814) 106% 531,447 398,829 132,618 133% 398,829
Page 5 of 11
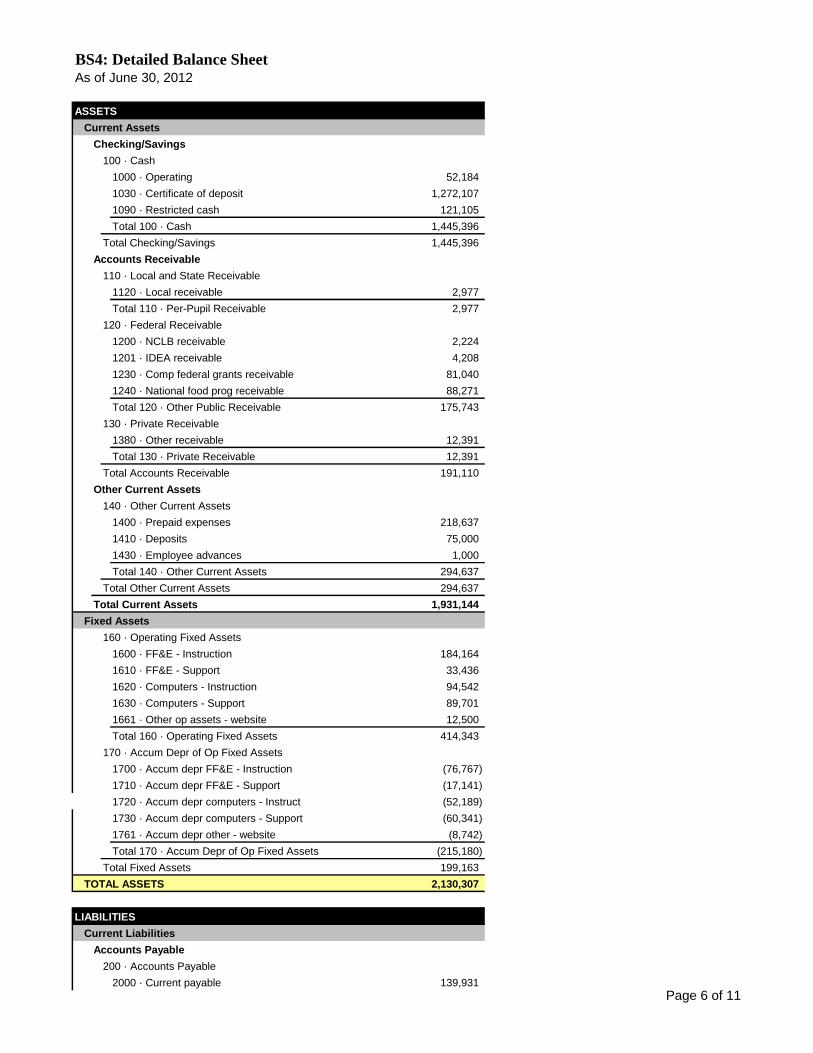
BS4: Detailed Balance SheetAs of June 30, 2012
ASSETS
Current Assets
Checking/Savings
100 · Cash
1000 · Operating 52,184
1030 · Certificate of deposit 1,272,107
1090 · Restricted cash 121,105
Total 100 · Cash 1,445,396
Total Checking/Savings 1,445,396
Accounts Receivable
110 · Local and State Receivable
1120 · Local receivable 2,977
Total 110 · Per-Pupil Receivable 2,977
120 · Federal Receivable
1200 · NCLB receivable 2,224
1201 · IDEA receivable 4,208
1230 · Comp federal grants receivable 81,040
1240 · National food prog receivable 88,271
Total 120 · Other Public Receivable 175,743
130 · Private Receivable
1380 · Other receivable 12,391
Total 130 · Private Receivable 12,391
Total Accounts Receivable 191,110
Other Current Assets
140 · Other Current Assets
1400 · Prepaid expenses 218,637
1410 · Deposits 75,000
1430 · Employee advances 1,000
Total 140 · Other Current Assets 294,637
Total Other Current Assets 294,637
Total Current Assets 1,931,144
Fixed Assets
160 · Operating Fixed Assets
1600 · FF&E - Instruction 184,164
1610 · FF&E - Support 33,436
1620 · Computers - Instruction 94,542
1630 · Computers - Support 89,701
1661 · Other op assets - website 12,500
Total 160 · Operating Fixed Assets 414,343
170 · Accum Depr of Op Fixed Assets
1700 · Accum depr FF&E - Instruction (76,767)
1710 · Accum depr FF&E - Support (17,141)
1720 · Accum depr computers - Instruct (52,189)
1730 · Accum depr computers - Support (60,341)
1761 · Accum depr other - website (8,742)
Total 170 · Accum Depr of Op Fixed Assets (215,180)
Total Fixed Assets 199,163
TOTAL ASSETS 2,130,307
LIABILITIES
Current Liabilities
Accounts Payable
200 · Accounts Payable
2000 · Current payable 139,931
Page 6 of 11
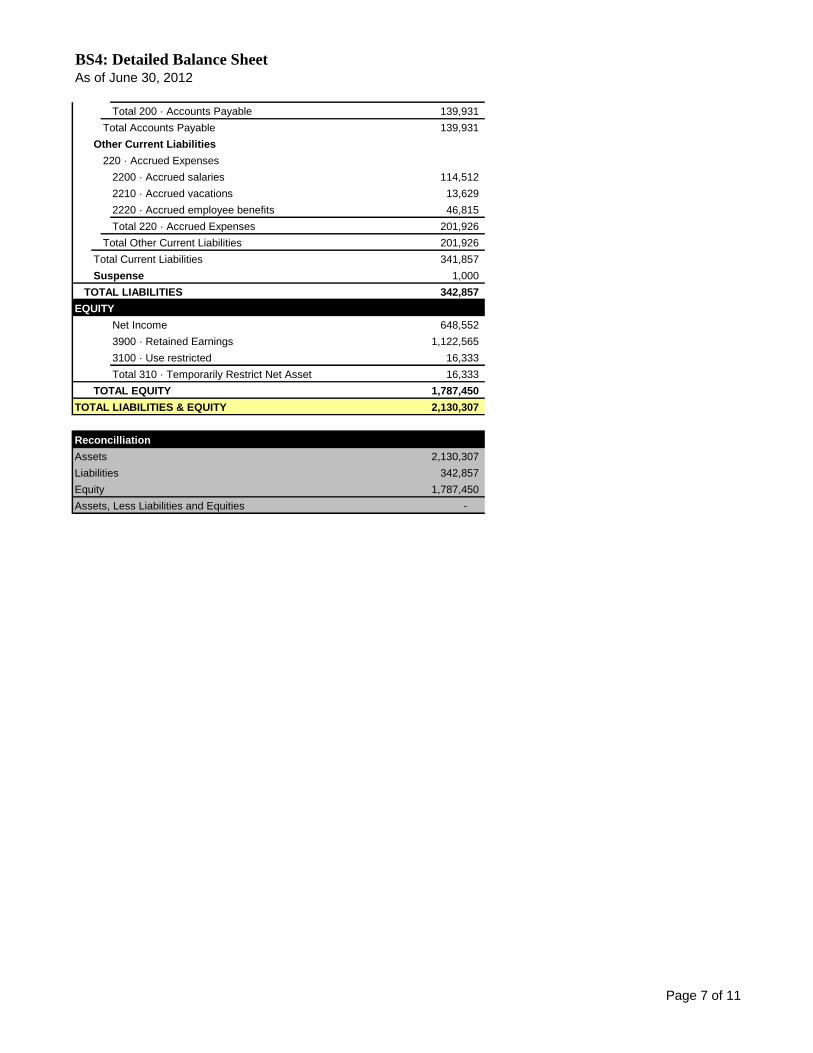
BS4: Detailed Balance SheetAs of June 30, 2012
Total 200 · Accounts Payable 139,931
Total Accounts Payable 139,931
Other Current Liabilities
220 · Accrued Expenses
2200 · Accrued salaries 114,512
2210 · Accrued vacations 13,629
2220 · Accrued employee benefits 46,815
Total 220 · Accrued Expenses 201,926
Total Other Current Liabilities 201,926
Total Current Liabilities 341,857
Suspense 1,000
TOTAL LIABILITIES 342,857
EQUITY
Net Income 648,552
3900 · Retained Earnings 1,122,565
3100 · Use restricted 16,333
Total 310 · Temporarily Restrict Net Asset 16,333
TOTAL EQUITY 1,787,450
TOTAL LIABILITIES & EQUITY 2,130,307
Reconcilliation
Assets 2,130,307
Liabilities 342,857
Equity 1,787,450
Assets, Less Liabilities and Equities -
Page 7 of 11
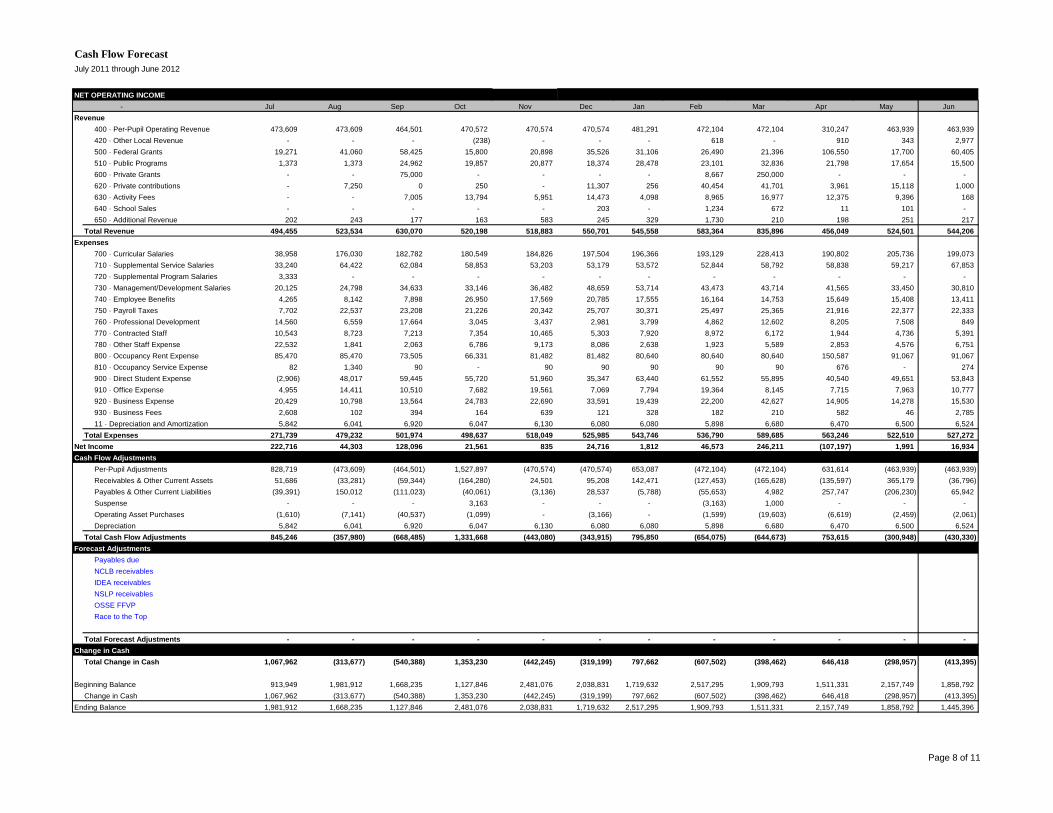
Cash Flow Forecast
July 2011 through June 2012
NET OPERATING INCOME
- Jul Aug Sep Oct Nov Dec Jan Feb Mar Apr May Jun
Revenue
400 · Per-Pupil Operating Revenue 473,609 473,609 464,501 470,572 470,574 470,574 481,291 472,104 472,104 310,247 463,939 463,939
420 · Other Local Revenue - - - (238) - - - 618 - 910 343 2,977
500 · Federal Grants 19,271 41,060 58,425 15,800 20,898 35,526 31,106 26,490 21,396 106,550 17,700 60,405
510 · Public Programs 1,373 1,373 24,962 19,857 20,877 18,374 28,478 23,101 32,836 21,798 17,654 15,500
600 · Private Grants - - 75,000 - - - - 8,667 250,000 - - -
620 · Private contributions - 7,250 0 250 - 11,307 256 40,454 41,701 3,961 15,118 1,000
630 · Activity Fees - - 7,005 13,794 5,951 14,473 4,098 8,965 16,977 12,375 9,396 168
640 · School Sales - - - - - 203 - 1,234 672 11 101 -
650 · Additional Revenue 202 243 177 163 583 245 329 1,730 210 198 251 217
Total Revenue 494,455 523,534 630,070 520,198 518,883 550,701 545,558 583,364 835,896 456,049 524,501 544,206
Expenses
700 · Curricular Salaries 38,958 176,030 182,782 180,549 184,826 197,504 196,366 193,129 228,413 190,802 205,736 199,073
710 · Supplemental Service Salaries 33,240 64,422 62,084 58,853 53,203 53,179 53,572 52,844 58,792 58,838 59,217 67,853
720 · Supplemental Program Salaries 3,333 - - - - - - - - - - -
730 · Management/Development Salaries 20,125 24,798 34,633 33,146 36,482 48,659 53,714 43,473 43,714 41,565 33,450 30,810
740 · Employee Benefits 4,265 8,142 7,898 26,950 17,569 20,785 17,555 16,164 14,753 15,649 15,408 13,411
750 · Payroll Taxes 7,702 22,537 23,208 21,226 20,342 25,707 30,371 25,497 25,365 21,916 22,377 22,333
760 · Professional Development 14,560 6,559 17,664 3,045 3,437 2,981 3,799 4,862 12,602 8,205 7,508 849
770 · Contracted Staff 10,543 8,723 7,213 7,354 10,465 5,303 7,920 8,972 6,172 1,944 4,736 5,391
780 · Other Staff Expense 22,532 1,841 2,063 6,786 9,173 8,086 2,638 1,923 5,589 2,853 4,576 6,751
800 · Occupancy Rent Expense 85,470 85,470 73,505 66,331 81,482 81,482 80,640 80,640 80,640 150,587 91,067 91,067
810 · Occupancy Service Expense 82 1,340 90 - 90 90 90 90 90 676 - 274
900 · Direct Student Expense (2,906) 48,017 59,445 55,720 51,960 35,347 63,440 61,552 55,895 40,540 49,651 53,843
910 · Office Expense 4,955 14,411 10,510 7,682 19,561 7,069 7,794 19,364 8,145 7,715 7,963 10,777
920 · Business Expense 20,429 10,798 13,564 24,783 22,690 33,591 19,439 22,200 42,627 14,905 14,278 15,530
930 · Business Fees 2,608 102 394 164 639 121 328 182 210 582 46 2,785
11 · Depreciation and Amortization 5,842 6,041 6,920 6,047 6,130 6,080 6,080 5,898 6,680 6,470 6,500 6,524
Total Expenses 271,739 479,232 501,974 498,637 518,049 525,985 543,746 536,790 589,685 563,246 522,510 527,272
Net Income 222,716 44,303 128,096 21,561 835 24,716 1,812 46,573 246,211 (107,197) 1,991 16,934
Cash Flow Adjustments
Per-Pupil Adjustments 828,719 (473,609) (464,501) 1,527,897 (470,574) (470,574) 653,087 (472,104) (472,104) 631,614 (463,939) (463,939)
Receivables & Other Current Assets 51,686 (33,281) (59,344) (164,280) 24,501 95,208 142,471 (127,453) (165,628) (135,597) 365,179 (36,796)
Payables & Other Current Liabilities (39,391) 150,012 (111,023) (40,061) (3,136) 28,537 (5,788) (55,653) 4,982 257,747 (206,230) 65,942
Suspense - - - 3,163 - - - (3,163) 1,000 - - -
Operating Asset Purchases (1,610) (7,141) (40,537) (1,099) - (3,166) - (1,599) (19,603) (6,619) (2,459) (2,061)
Depreciation 5,842 6,041 6,920 6,047 6,130 6,080 6,080 5,898 6,680 6,470 6,500 6,524
Total Cash Flow Adjustments 845,246 (357,980) (668,485) 1,331,668 (443,080) (343,915) 795,850 (654,075) (644,673) 753,615 (300,948) (430,330)
Forecast Adjustments
Payables due
NCLB receivables
IDEA receivables
NSLP receivables
OSSE FFVP
Race to the Top
Total Forecast Adjustments - - - - - - - - - - - -
Change in Cash
Total Change in Cash 1,067,962 (313,677) (540,388) 1,353,230 (442,245) (319,199) 797,662 (607,502) (398,462) 646,418 (298,957) (413,395)
Beginning Balance 913,949 1,981,912 1,668,235 1,127,846 2,481,076 2,038,831 1,719,632 2,517,295 1,909,793 1,511,331 2,157,749 1,858,792
Change in Cash 1,067,962 (313,677) (540,388) 1,353,230 (442,245) (319,199) 797,662 (607,502) (398,462) 646,418 (298,957) (413,395)
Ending Balance 1,981,912 1,668,235 1,127,846 2,481,076 2,038,831 1,719,632 2,517,295 1,909,793 1,511,331 2,157,749 1,858,792 1,445,396
Page 8 of 11
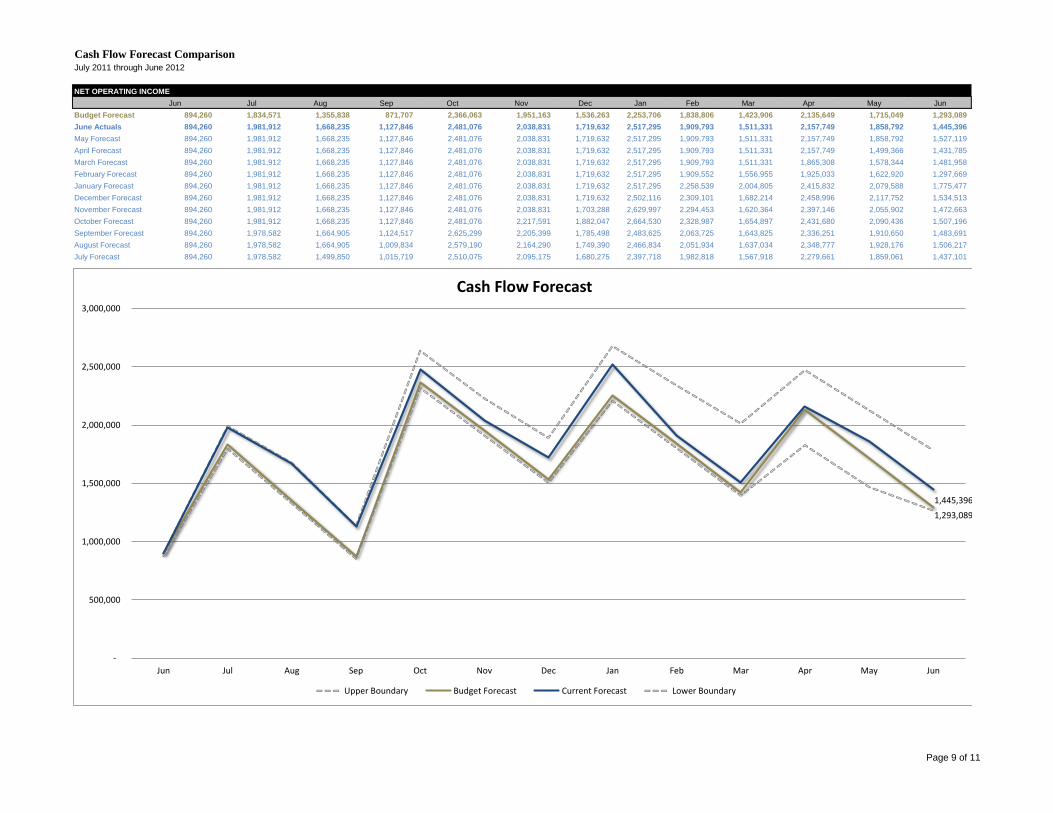
Cash Flow Forecast ComparisonJuly 2011 through June 2012
NET OPERATING INCOME
Jun Jul Aug Sep Oct Nov Dec Jan Feb Mar Apr May Jun
Budget Forecast 894,260 1,834,571 1,355,838 871,707 2,366,063 1,951,163 1,536,263 2,253,706 1,838,806 1,423,906 2,135,649 1,715,049 1,293,089
June Actuals 894,260 1,981,912 1,668,235 1,127,846 2,481,076 2,038,831 1,719,632 2,517,295 1,909,793 1,511,331 2,157,749 1,858,792 1,445,396
May Forecast 894,260 1,981,912 1,668,235 1,127,846 2,481,076 2,038,831 1,719,632 2,517,295 1,909,793 1,511,331 2,157,749 1,858,792 1,527,119
April Forecast 894,260 1,981,912 1,668,235 1,127,846 2,481,076 2,038,831 1,719,632 2,517,295 1,909,793 1,511,331 2,157,749 1,499,366 1,431,785
March Forecast 894,260 1,981,912 1,668,235 1,127,846 2,481,076 2,038,831 1,719,632 2,517,295 1,909,793 1,511,331 1,865,308 1,578,344 1,481,958
February Forecast 894,260 1,981,912 1,668,235 1,127,846 2,481,076 2,038,831 1,719,632 2,517,295 1,909,552 1,556,955 1,925,033 1,622,920 1,297,669
January Forecast 894,260 1,981,912 1,668,235 1,127,846 2,481,076 2,038,831 1,719,632 2,517,295 2,258,539 2,004,805 2,415,832 2,079,588 1,775,477
December Forecast 894,260 1,981,912 1,668,235 1,127,846 2,481,076 2,038,831 1,719,632 2,502,116 2,309,101 1,682,214 2,458,996 2,117,752 1,534,513
November Forecast 894,260 1,981,912 1,668,235 1,127,846 2,481,076 2,038,831 1,703,288 2,629,997 2,294,453 1,620,364 2,397,146 2,055,902 1,472,663
October Forecast 894,260 1,981,912 1,668,235 1,127,846 2,481,076 2,217,591 1,882,047 2,664,530 2,328,987 1,654,897 2,431,680 2,090,436 1,507,196
September Forecast 894,260 1,978,582 1,664,905 1,124,517 2,625,299 2,205,399 1,785,498 2,483,625 2,063,725 1,643,825 2,336,251 1,910,650 1,483,691
August Forecast 894,260 1,978,582 1,664,905 1,009,834 2,579,190 2,164,290 1,749,390 2,466,834 2,051,934 1,637,034 2,348,777 1,928,176 1,506,217
July Forecast 894,260 1,978,582 1,499,850 1,015,719 2,510,075 2,095,175 1,680,275 2,397,718 1,982,818 1,567,918 2,279,661 1,859,061 1,437,101
Upper Boundary 898,731 1,991,821 1,676,576 1,133,485 2,638,425 2,228,679 1,891,457 2,677,853 2,340,632 2,014,829 2,471,291 2,128,341 1,784,355
Budget Forecast 894,260 1,834,571 1,355,838 871,707 2,366,063 1,951,163 1,536,263 2,253,706 1,838,806 1,423,906 2,135,649 1,715,049 1,293,089
Current Forecast 894,260 1,981,912 1,668,235 1,127,846 2,481,076 2,038,831 1,719,632 2,517,295 1,909,793 1,511,331 2,157,749 1,858,792 1,445,396
Lower Boundary 876,375 1,797,879 1,328,721 854,273 2,318,742 1,912,140 1,505,537 2,208,632 1,802,030 1,395,428 1,828,002 1,469,379 1,267,227
1,293,089
1,445,396
-
500,000
1,000,000
1,500,000
2,000,000
2,500,000
3,000,000
Jun Jul Aug Sep Oct Nov Dec Jan Feb Mar Apr May Jun
Cash Flow Forecast
Upper Boundary Budget Forecast Current Forecast Lower Boundary
Page 9 of 11
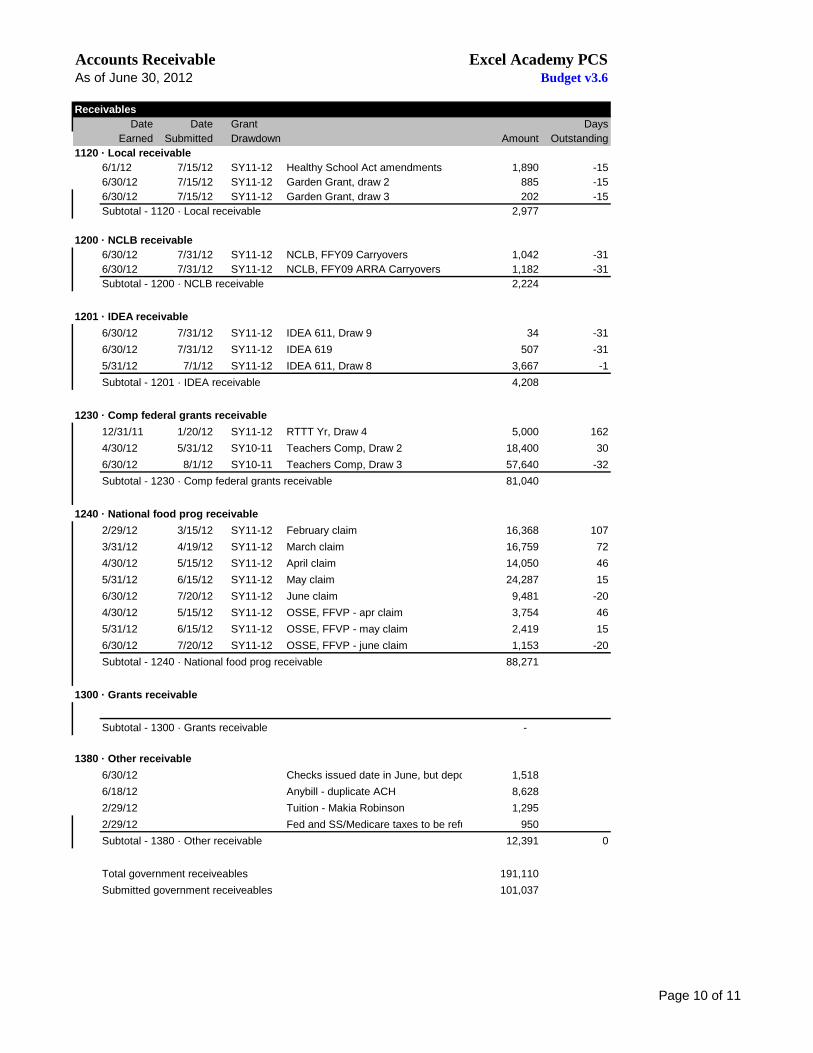
Accounts Receivable Excel Academy PCSAs of June 30, 2012 Budget v3.6
Receivables
Date Date Grant Days
Earned Submitted Drawdown Amount Outstanding
1120 · Local receivable
6/1/12 7/15/12 SY11-12 Healthy School Act amendments 1,890 -15
6/30/12 7/15/12 SY11-12 Garden Grant, draw 2 885 -15
6/30/12 7/15/12 SY11-12 Garden Grant, draw 3 202 -15
Subtotal - 1120 · Local receivable 2,977
1200 · NCLB receivable
6/30/12 7/31/12 SY11-12 NCLB, FFY09 Carryovers 1,042 -31
6/30/12 7/31/12 SY11-12 NCLB, FFY09 ARRA Carryovers 1,182 -31
Subtotal - 1200 · NCLB receivable 2,224
1201 · IDEA receivable
6/30/12 7/31/12 SY11-12 IDEA 611, Draw 9 34 -31
6/30/12 7/31/12 SY11-12 IDEA 619 507 -31
5/31/12 7/1/12 SY11-12 IDEA 611, Draw 8 3,667 -1
Subtotal - 1201 · IDEA receivable 4,208
1230 · Comp federal grants receivable
12/31/11 1/20/12 SY11-12 RTTT Yr, Draw 4 5,000 162
4/30/12 5/31/12 SY10-11 Teachers Comp, Draw 2 18,400 30
6/30/12 8/1/12 SY10-11 Teachers Comp, Draw 3 57,640 -32
Subtotal - 1230 · Comp federal grants receivable 81,040
1240 · National food prog receivable
2/29/12 3/15/12 SY11-12 February claim 16,368 107
3/31/12 4/19/12 SY11-12 March claim 16,759 72
4/30/12 5/15/12 SY11-12 April claim 14,050 46
5/31/12 6/15/12 SY11-12 May claim 24,287 15
6/30/12 7/20/12 SY11-12 June claim 9,481 -20
4/30/12 5/15/12 SY11-12 OSSE, FFVP - apr claim 3,754 46
5/31/12 6/15/12 SY11-12 OSSE, FFVP - may claim 2,419 15
6/30/12 7/20/12 SY11-12 OSSE, FFVP - june claim 1,153 -20
Subtotal - 1240 · National food prog receivable 88,271
1300 · Grants receivable
Subtotal - 1300 · Grants receivable -
1380 · Other receivable
6/30/12 Checks issued date in June, but deposited in July1,518
6/18/12 Anybill - duplicate ACH 8,628
2/29/12 Tuition - Makia Robinson 1,295
2/29/12 Fed and SS/Medicare taxes to be refunded via check from IRS950
Subtotal - 1380 · Other receivable 12,391 0
Total government receiveables 191,110
Submitted government receiveables 101,037
Page 10 of 11
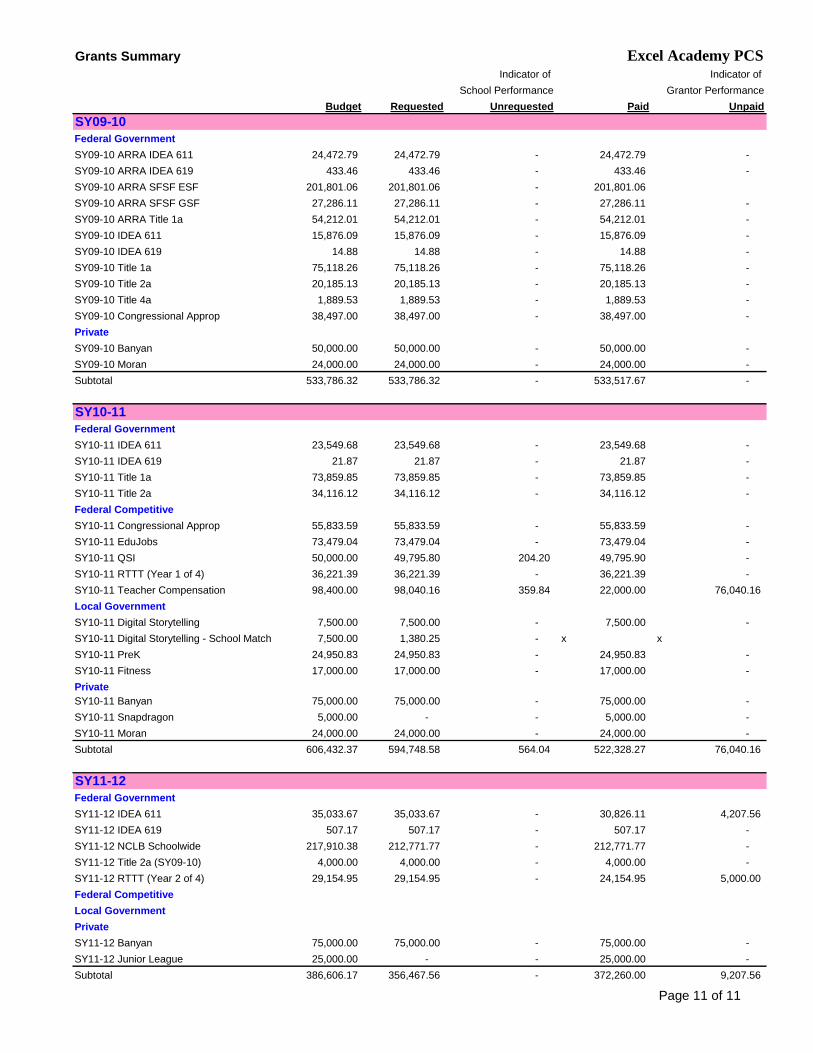
Grants Summary Excel Academy PCSIndicator of Indicator of
School Performance Grantor Performance
Budget Requested Unrequested Paid Unpaid
SY09-10
Federal Government
SY09-10 ARRA IDEA 611 24,472.79 24,472.79 - 24,472.79 -
SY09-10 ARRA IDEA 619 433.46 433.46 - 433.46 -
SY09-10 ARRA SFSF ESF 201,801.06 201,801.06 - 201,801.06
SY09-10 ARRA SFSF GSF 27,286.11 27,286.11 - 27,286.11 -
SY09-10 ARRA Title 1a 54,212.01 54,212.01 - 54,212.01 -
SY09-10 IDEA 611 15,876.09 15,876.09 - 15,876.09 -
SY09-10 IDEA 619 14.88 14.88 - 14.88 -
SY09-10 Title 1a 75,118.26 75,118.26 - 75,118.26 -
SY09-10 Title 2a 20,185.13 20,185.13 - 20,185.13 -
SY09-10 Title 4a 1,889.53 1,889.53 - 1,889.53 -
SY09-10 Congressional Approp 38,497.00 38,497.00 - 38,497.00 -
Private
SY09-10 Banyan 50,000.00 50,000.00 - 50,000.00 -
SY09-10 Moran 24,000.00 24,000.00 - 24,000.00 -
Subtotal 533,786.32 533,786.32 - 533,517.67 -
SY10-11
Federal Government
SY10-11 IDEA 611 23,549.68 23,549.68 - 23,549.68 -
SY10-11 IDEA 619 21.87 21.87 - 21.87 -
SY10-11 Title 1a 73,859.85 73,859.85 - 73,859.85 -
SY10-11 Title 2a 34,116.12 34,116.12 - 34,116.12 -
Federal Competitive
SY10-11 Congressional Approp 55,833.59 55,833.59 - 55,833.59 -
SY10-11 EduJobs 73,479.04 73,479.04 - 73,479.04 -
SY10-11 QSI 50,000.00 49,795.80 204.20 49,795.90 -
SY10-11 RTTT (Year 1 of 4) 36,221.39 36,221.39 - 36,221.39 -
SY10-11 Teacher Compensation 98,400.00 98,040.16 359.84 22,000.00 76,040.16
Local Government
SY10-11 Digital Storytelling 7,500.00 7,500.00 - 7,500.00 -
SY10-11 Digital Storytelling - School Match 7,500.00 1,380.25 - x x
SY10-11 PreK 24,950.83 24,950.83 - 24,950.83 -
SY10-11 Fitness 17,000.00 17,000.00 - 17,000.00 -
Private
SY10-11 Banyan 75,000.00 75,000.00 - 75,000.00 -
SY10-11 Snapdragon 5,000.00 - - 5,000.00 -
SY10-11 Moran 24,000.00 24,000.00 - 24,000.00 -
Subtotal 606,432.37 594,748.58 564.04 522,328.27 76,040.16
SY11-12
Federal Government
SY11-12 IDEA 611 35,033.67 35,033.67 - 30,826.11 4,207.56
SY11-12 IDEA 619 507.17 507.17 - 507.17 -
SY11-12 NCLB Schoolwide 217,910.38 212,771.77 - 212,771.77 -
SY11-12 Title 2a (SY09-10) 4,000.00 4,000.00 - 4,000.00 -
SY11-12 RTTT (Year 2 of 4) 29,154.95 29,154.95 - 24,154.95 5,000.00
Federal Competitive
Local Government
Private
SY11-12 Banyan 75,000.00 75,000.00 - 75,000.00 -
SY11-12 Junior League 25,000.00 - - 25,000.00 -
Subtotal 386,606.17 356,467.56 - 372,260.00 9,207.56
Page 11 of 11
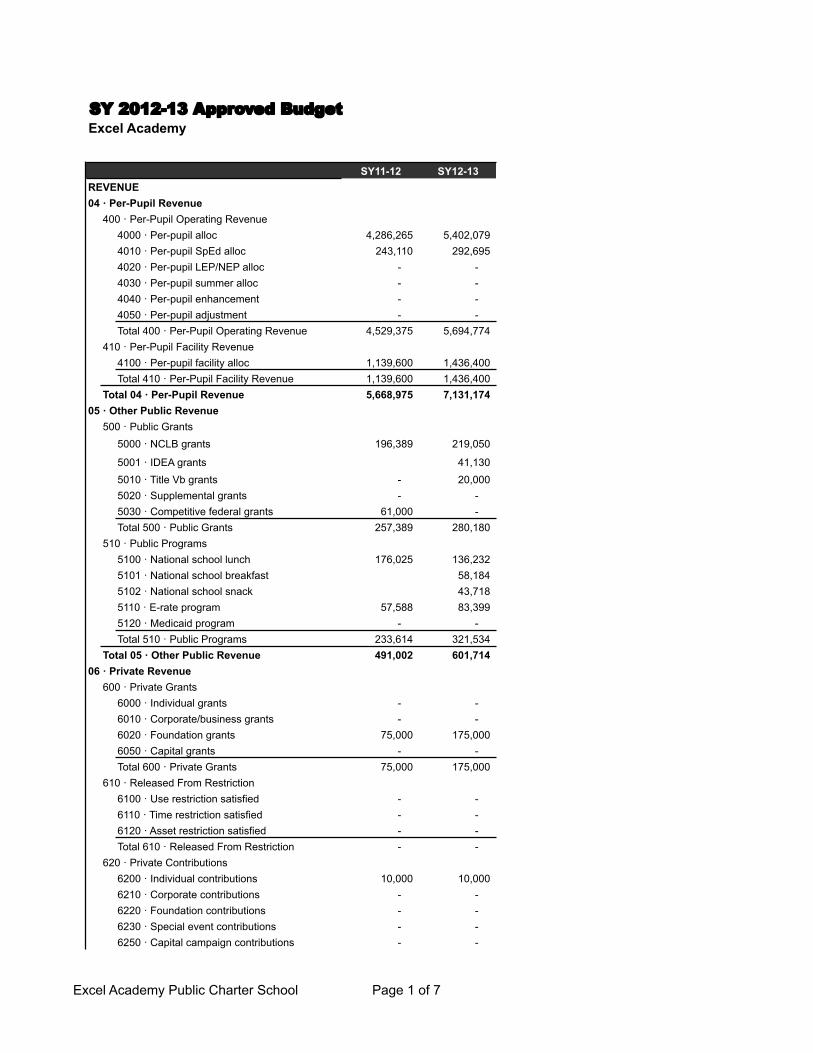
Excel Academy Public Charter School Page 1 of 7
SY 2012-13 Approved BudgetExcel Academy
SY11-12 SY12-13REVENUE04 · Per-Pupil Revenue
400 · Per-Pupil Operating Revenue4000 · Per-pupil alloc 4,286,265 5,402,079 4010 · Per-pupil SpEd alloc 243,110 292,695 4020 · Per-pupil LEP/NEP alloc - - 4030 · Per-pupil summer alloc - - 4040 · Per-pupil enhancement - - 4050 · Per-pupil adjustment - - Total 400 · Per-Pupil Operating Revenue 4,529,375 5,694,774
410 · Per-Pupil Facility Revenue4100 · Per-pupil facility alloc 1,139,600 1,436,400 Total 410 · Per-Pupil Facility Revenue 1,139,600 1,436,400
Total 04 · Per-Pupil Revenue 5,668,975 7,131,174 05 · Other Public Revenue
500 · Public Grants5000 · NCLB grants 196,389 219,050
5001 · IDEA grants 41,130 5010 · Title Vb grants - 20,000 5020 · Supplemental grants - - 5030 · Competitive federal grants 61,000 - Total 500 · Public Grants 257,389 280,180
510 · Public Programs5100 · National school lunch 176,025 136,232 5101 · National school breakfast 58,184 5102 · National school snack 43,718 5110 · E-rate program 57,588 83,399 5120 · Medicaid program - - Total 510 · Public Programs 233,614 321,534
Total 05 · Other Public Revenue 491,002 601,714 06 · Private Revenue
600 · Private Grants6000 · Individual grants - - 6010 · Corporate/business grants - - 6020 · Foundation grants 75,000 175,000 6050 · Capital grants - - Total 600 · Private Grants 75,000 175,000
610 · Released From Restriction6100 · Use restriction satisfied - - 6110 · Time restriction satisfied - - 6120 · Asset restriction satisfied - - Total 610 · Released From Restriction - -
620 · Private Contributions6200 · Individual contributions 10,000 10,000 6210 · Corporate contributions - - 6220 · Foundation contributions - - 6230 · Special event contributions - - 6250 · Capital campaign contributions - -
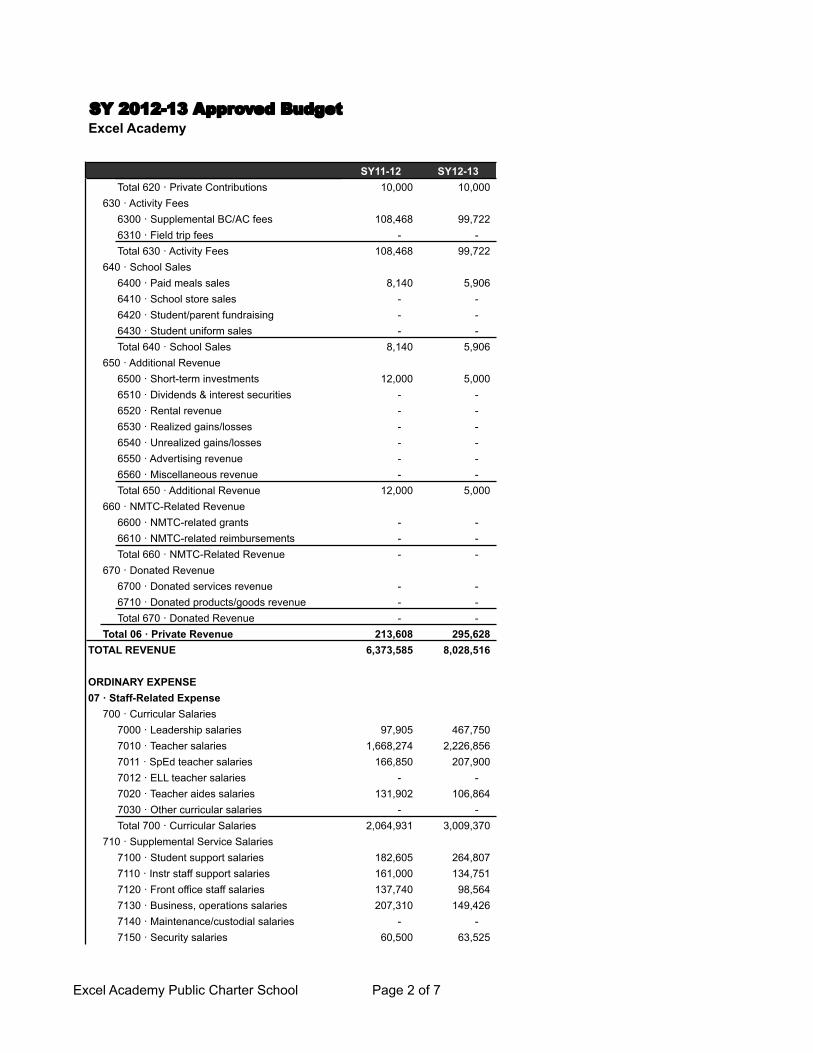
Excel Academy Public Charter School Page 2 of 7
SY 2012-13 Approved BudgetExcel Academy
SY11-12 SY12-13Total 620 · Private Contributions 10,000 10,000
630 · Activity Fees6300 · Supplemental BC/AC fees 108,468 99,722 6310 · Field trip fees - - Total 630 · Activity Fees 108,468 99,722
640 · School Sales6400 · Paid meals sales 8,140 5,906 6410 · School store sales - - 6420 · Student/parent fundraising - - 6430 · Student uniform sales - - Total 640 · School Sales 8,140 5,906
650 · Additional Revenue6500 · Short-term investments 12,000 5,000 6510 · Dividends & interest securities - - 6520 · Rental revenue - - 6530 · Realized gains/losses - - 6540 · Unrealized gains/losses - - 6550 · Advertising revenue - - 6560 · Miscellaneous revenue - - Total 650 · Additional Revenue 12,000 5,000
660 · NMTC-Related Revenue6600 · NMTC-related grants - - 6610 · NMTC-related reimbursements - - Total 660 · NMTC-Related Revenue - -
670 · Donated Revenue6700 · Donated services revenue - - 6710 · Donated products/goods revenue - - Total 670 · Donated Revenue - -
Total 06 · Private Revenue 213,608 295,628 TOTAL REVENUE 6,373,585 8,028,516
ORDINARY EXPENSE07 · Staff-Related Expense
700 · Curricular Salaries7000 · Leadership salaries 97,905 467,750 7010 · Teacher salaries 1,668,274 2,226,856 7011 · SpEd teacher salaries 166,850 207,900 7012 · ELL teacher salaries - - 7020 · Teacher aides salaries 131,902 106,864 7030 · Other curricular salaries - - Total 700 · Curricular Salaries 2,064,931 3,009,370
710 · Supplemental Service Salaries7100 · Student support salaries 182,605 264,807 7110 · Instr staff support salaries 161,000 134,751 7120 · Front office staff salaries 137,740 98,564 7130 · Business, operations salaries 207,310 149,426 7140 · Maintenance/custodial salaries - - 7150 · Security salaries 60,500 63,525
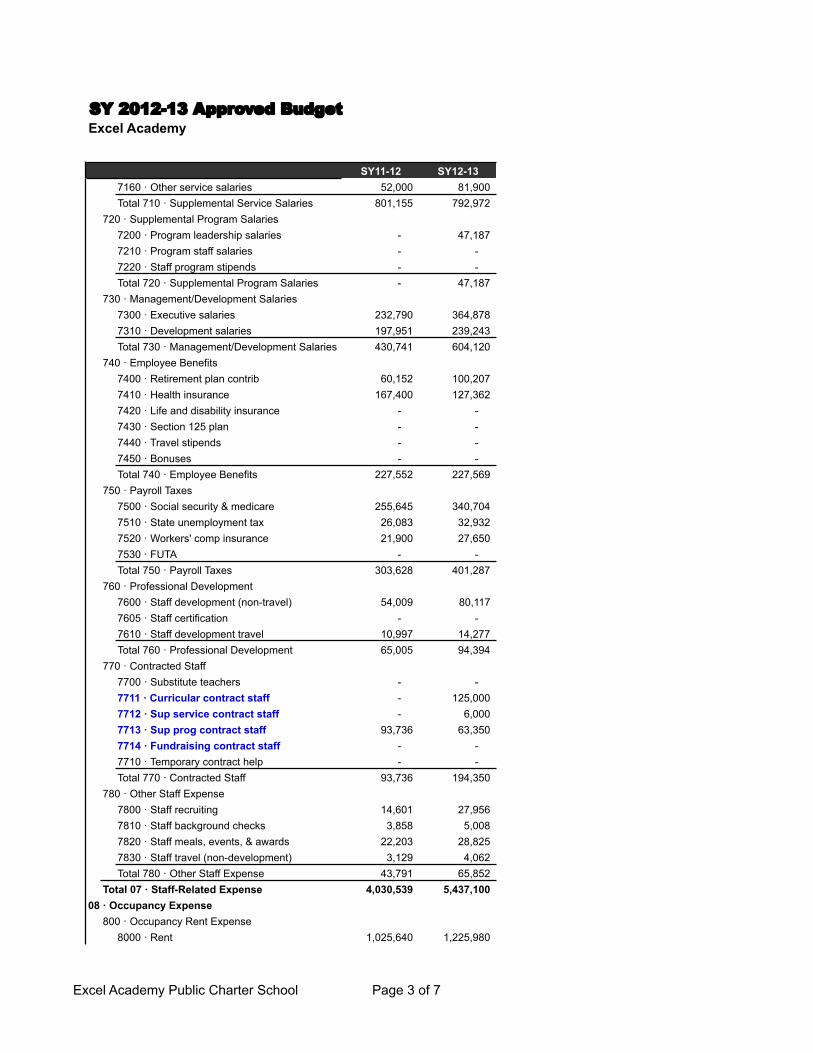
Excel Academy Public Charter School Page 3 of 7
SY 2012-13 Approved BudgetExcel Academy
SY11-12 SY12-137160 · Other service salaries 52,000 81,900 Total 710 · Supplemental Service Salaries 801,155 792,972
720 · Supplemental Program Salaries7200 · Program leadership salaries - 47,187 7210 · Program staff salaries - - 7220 · Staff program stipends - - Total 720 · Supplemental Program Salaries - 47,187
730 · Management/Development Salaries7300 · Executive salaries 232,790 364,878 7310 · Development salaries 197,951 239,243 Total 730 · Management/Development Salaries 430,741 604,120
740 · Employee Benefits7400 · Retirement plan contrib 60,152 100,207 7410 · Health insurance 167,400 127,362 7420 · Life and disability insurance - - 7430 · Section 125 plan - - 7440 · Travel stipends - - 7450 · Bonuses - - Total 740 · Employee Benefits 227,552 227,569
750 · Payroll Taxes7500 · Social security & medicare 255,645 340,704 7510 · State unemployment tax 26,083 32,932 7520 · Workers' comp insurance 21,900 27,650 7530 · FUTA - - Total 750 · Payroll Taxes 303,628 401,287
760 · Professional Development7600 · Staff development (non-travel) 54,009 80,117 7605 · Staff certification - - 7610 · Staff development travel 10,997 14,277 Total 760 · Professional Development 65,005 94,394
770 · Contracted Staff7700 · Substitute teachers - - 7711 · Curricular contract staff - 125,000 7712 · Sup service contract staff - 6,000 7713 · Sup prog contract staff 93,736 63,350 7714 · Fundraising contract staff - - 7710 · Temporary contract help - - Total 770 · Contracted Staff 93,736 194,350
780 · Other Staff Expense7800 · Staff recruiting 14,601 27,956 7810 · Staff background checks 3,858 5,008 7820 · Staff meals, events, & awards 22,203 28,825 7830 · Staff travel (non-development) 3,129 4,062 Total 780 · Other Staff Expense 43,791 65,852
Total 07 · Staff-Related Expense 4,030,539 5,437,100 08 · Occupancy Expense
800 · Occupancy Rent Expense8000 · Rent 1,025,640 1,225,980
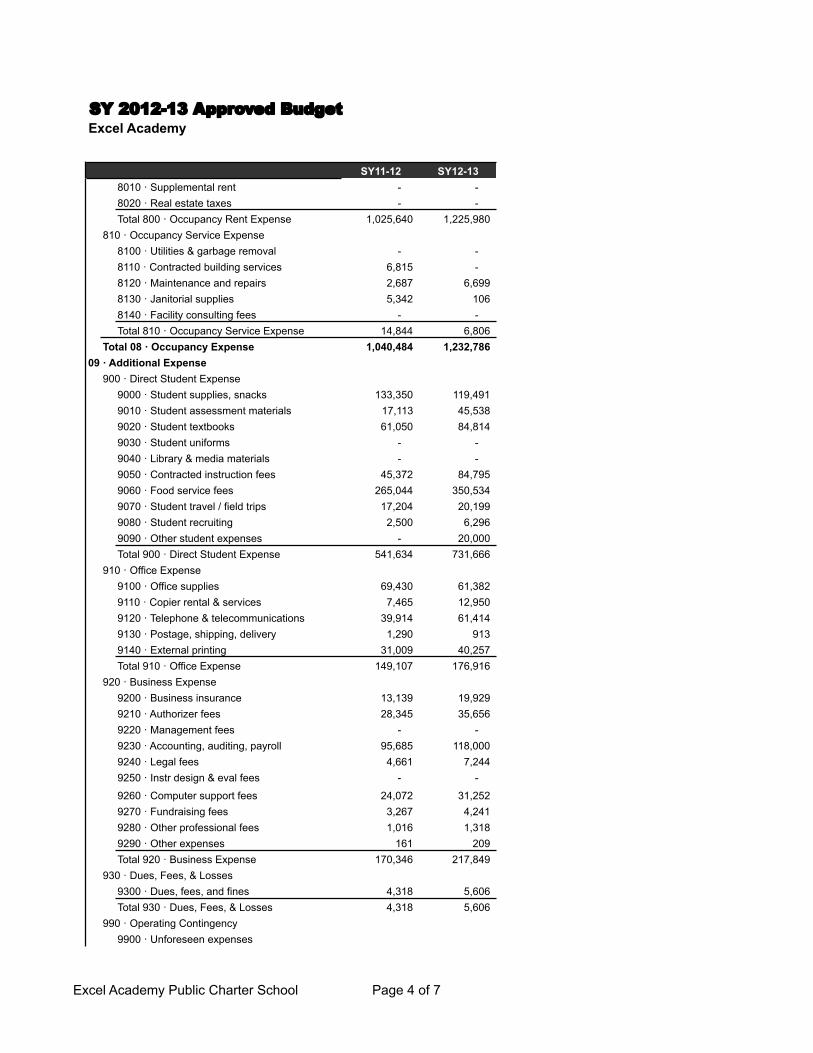
Excel Academy Public Charter School Page 4 of 7
SY 2012-13 Approved BudgetExcel Academy
SY11-12 SY12-138010 · Supplemental rent - - 8020 · Real estate taxes - - Total 800 · Occupancy Rent Expense 1,025,640 1,225,980
810 · Occupancy Service Expense8100 · Utilities & garbage removal - - 8110 · Contracted building services 6,815 - 8120 · Maintenance and repairs 2,687 6,699 8130 · Janitorial supplies 5,342 106 8140 · Facility consulting fees - - Total 810 · Occupancy Service Expense 14,844 6,806
Total 08 · Occupancy Expense 1,040,484 1,232,786 09 · Additional Expense
900 · Direct Student Expense9000 · Student supplies, snacks 133,350 119,491 9010 · Student assessment materials 17,113 45,538 9020 · Student textbooks 61,050 84,814 9030 · Student uniforms - - 9040 · Library & media materials - - 9050 · Contracted instruction fees 45,372 84,795 9060 · Food service fees 265,044 350,534 9070 · Student travel / field trips 17,204 20,199 9080 · Student recruiting 2,500 6,296 9090 · Other student expenses - 20,000 Total 900 · Direct Student Expense 541,634 731,666
910 · Office Expense9100 · Office supplies 69,430 61,382 9110 · Copier rental & services 7,465 12,950 9120 · Telephone & telecommunications 39,914 61,414 9130 · Postage, shipping, delivery 1,290 913 9140 · External printing 31,009 40,257 Total 910 · Office Expense 149,107 176,916
920 · Business Expense9200 · Business insurance 13,139 19,929 9210 · Authorizer fees 28,345 35,656 9220 · Management fees - - 9230 · Accounting, auditing, payroll 95,685 118,000 9240 · Legal fees 4,661 7,244 9250 · Instr design & eval fees - -
9260 · Computer support fees 24,072 31,252 9270 · Fundraising fees 3,267 4,241 9280 · Other professional fees 1,016 1,318 9290 · Other expenses 161 209 Total 920 · Business Expense 170,346 217,849
930 · Dues, Fees, & Losses9300 · Dues, fees, and fines 4,318 5,606 Total 930 · Dues, Fees, & Losses 4,318 5,606
990 · Operating Contingency9900 · Unforeseen expenses
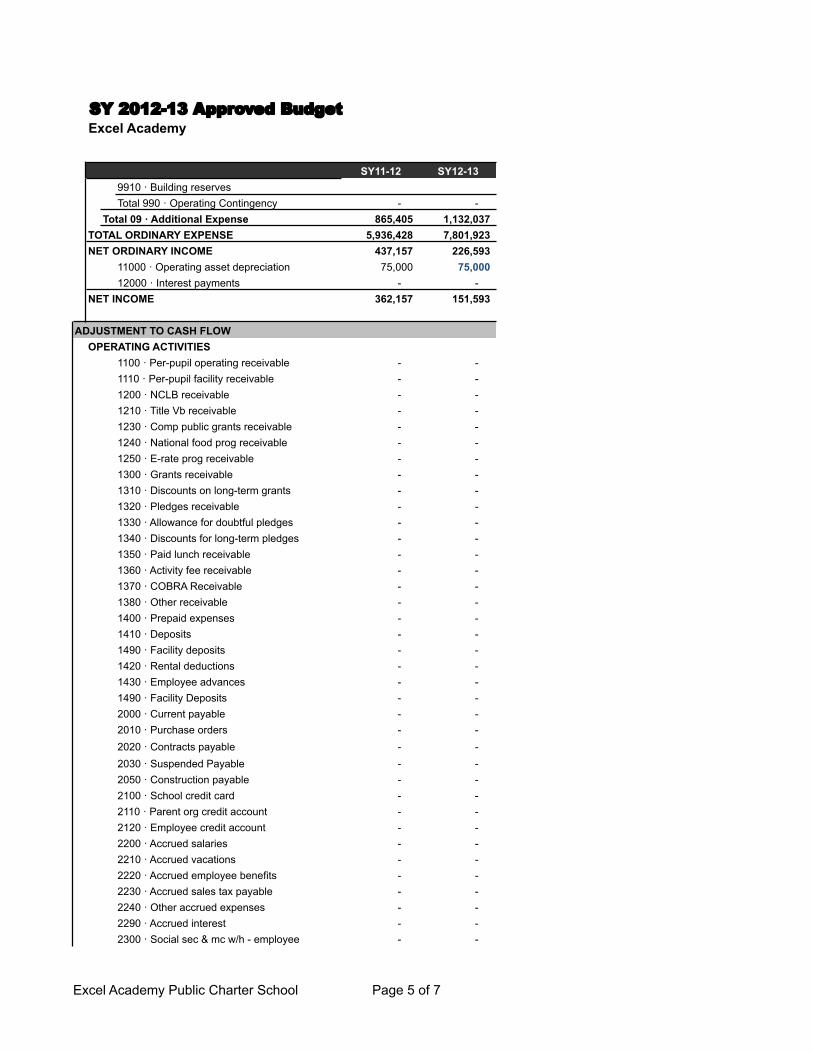
Excel Academy Public Charter School Page 5 of 7
SY 2012-13 Approved BudgetExcel Academy
SY11-12 SY12-139910 · Building reservesTotal 990 · Operating Contingency - -
Total 09 · Additional Expense 865,405 1,132,037 TOTAL ORDINARY EXPENSE 5,936,428 7,801,923 NET ORDINARY INCOME 437,157 226,593
11000 · Operating asset depreciation 75,000 75,000 12000 · Interest payments - -
NET INCOME 362,157 151,593
ADJUSTMENT TO CASH FLOWOPERATING ACTIVITIES
1100 · Per-pupil operating receivable - - 1110 · Per-pupil facility receivable - - 1200 · NCLB receivable - - 1210 · Title Vb receivable - - 1230 · Comp public grants receivable - - 1240 · National food prog receivable - - 1250 · E-rate prog receivable - - 1300 · Grants receivable - - 1310 · Discounts on long-term grants - - 1320 · Pledges receivable - - 1330 · Allowance for doubtful pledges - - 1340 · Discounts for long-term pledges - - 1350 · Paid lunch receivable - - 1360 · Activity fee receivable - - 1370 · COBRA Receivable - - 1380 · Other receivable - - 1400 · Prepaid expenses - - 1410 · Deposits - - 1490 · Facility deposits - - 1420 · Rental deductions - - 1430 · Employee advances - - 1490 · Facility Deposits - - 2000 · Current payable - - 2010 · Purchase orders - - 2020 · Contracts payable - - 2030 · Suspended Payable - - 2050 · Construction payable - - 2100 · School credit card - - 2110 · Parent org credit account - - 2120 · Employee credit account - - 2200 · Accrued salaries - - 2210 · Accrued vacations - - 2220 · Accrued employee benefits - - 2230 · Accrued sales tax payable - - 2240 · Other accrued expenses - - 2290 · Accrued interest - - 2300 · Social sec & mc w/h - employee - -
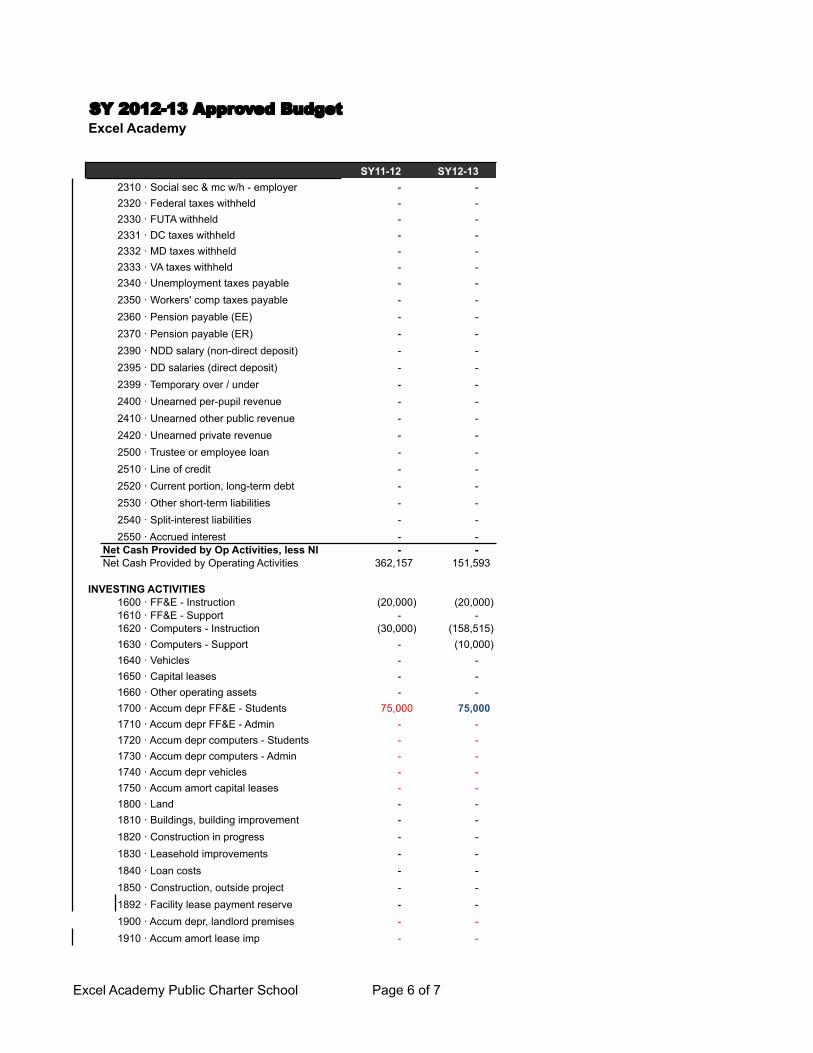
Excel Academy Public Charter School Page 6 of 7
SY 2012-13 Approved BudgetExcel Academy
SY11-12 SY12-132310 · Social sec & mc w/h - employer - - 2320 · Federal taxes withheld - - 2330 · FUTA withheld - - 2331 · DC taxes withheld - - 2332 · MD taxes withheld - - 2333 · VA taxes withheld - - 2340 · Unemployment taxes payable - - 2350 · Workers' comp taxes payable - - 2360 · Pension payable (EE) - - 2370 · Pension payable (ER) - - 2390 · NDD salary (non-direct deposit) - - 2395 · DD salaries (direct deposit) - - 2399 · Temporary over / under - - 2400 · Unearned per-pupil revenue - - 2410 · Unearned other public revenue - - 2420 · Unearned private revenue - - 2500 · Trustee or employee loan - - 2510 · Line of credit - - 2520 · Current portion, long-term debt - - 2530 · Other short-term liabilities - - 2540 · Split-interest liabilities - - 2550 · Accrued interest - -
Net Cash Provided by Op Activities, less NI - - Net Cash Provided by Operating Activities 362,157 151,593
INVESTING ACTIVITIES1600 · FF&E - Instruction (20,000) (20,000) 1610 · FF&E - Support - - 1620 · Computers - Instruction (30,000) (158,515) 1630 · Computers - Support - (10,000) 1640 · Vehicles - - 1650 · Capital leases - - 1660 · Other operating assets - - 1700 · Accum depr FF&E - Students 75,000 75,000 1710 · Accum depr FF&E - Admin - - 1720 · Accum depr computers - Students - - 1730 · Accum depr computers - Admin - - 1740 · Accum depr vehicles - - 1750 · Accum amort capital leases - - 1800 · Land - - 1810 · Buildings, building improvement - - 1820 · Construction in progress - - 1830 · Leasehold improvements - - 1840 · Loan costs - - 1850 · Construction, outside project - - 1892 · Facility lease payment reserve - - 1900 · Accum depr, landlord premises - - 1910 · Accum amort lease imp - -
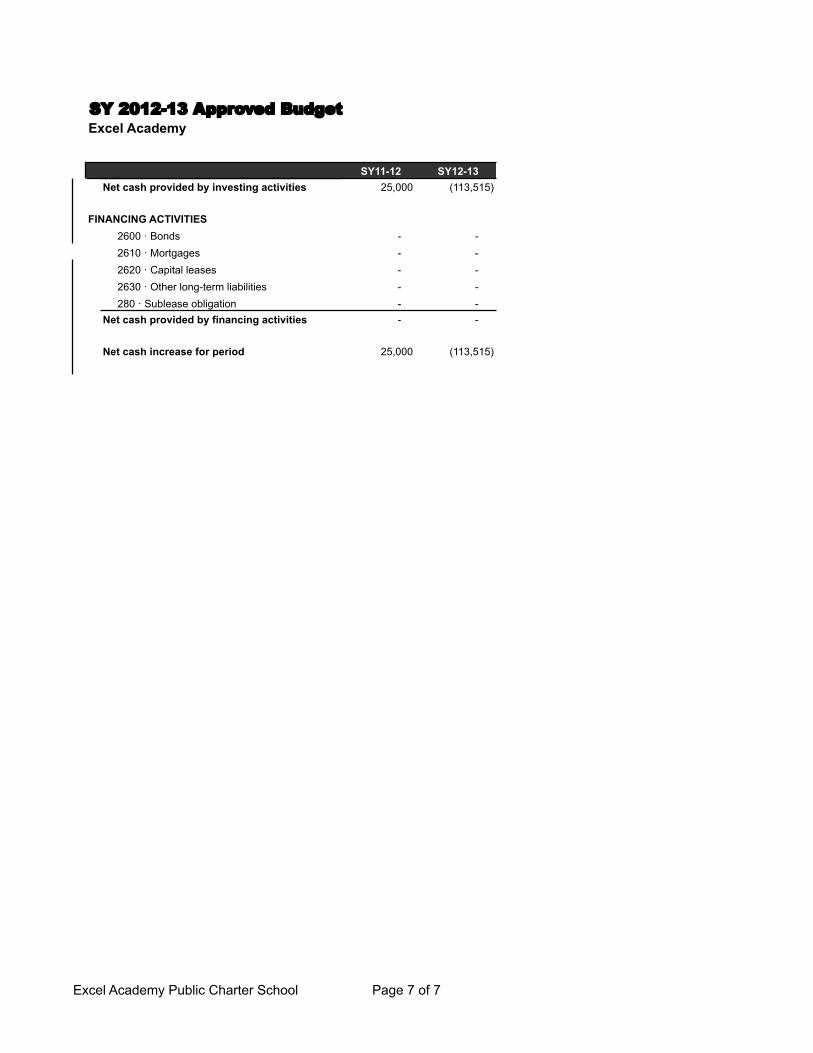
Excel Academy Public Charter School Page 7 of 7
SY 2012-13 Approved BudgetExcel Academy
SY11-12 SY12-13Net cash provided by investing activities 25,000 (113,515)
FINANCING ACTIVITIES2600 · Bonds - - 2610 · Mortgages - - 2620 · Capital leases - - 2630 · Other long-term liabilities - - 280 · Sublease obligation - -
Net cash provided by financing activities - -
Net cash increase for period 25,000 (113,515)
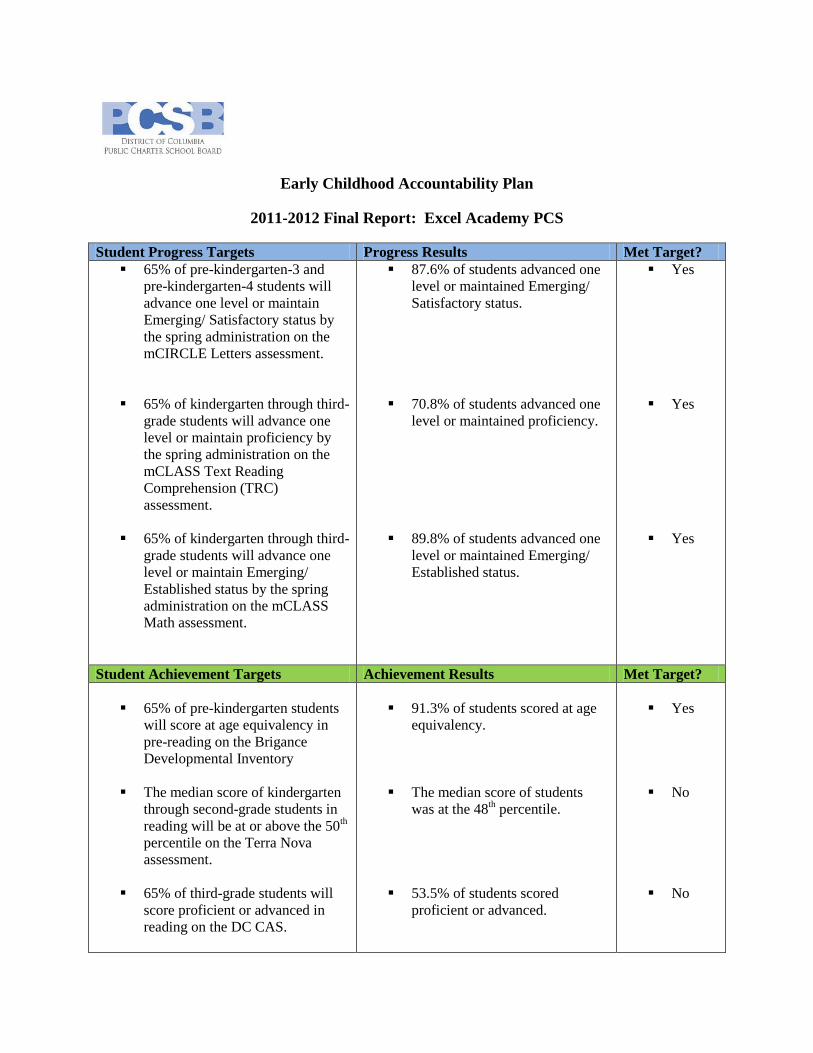
Early Childhood Accountability Plan
2011-2012 Final Report: Excel Academy PCS
Student Progress Targets Progress Results Met Target?
65% of pre-kindergarten-3 and
pre-kindergarten-4 students will
advance one level or maintain
Emerging/ Satisfactory status by
the spring administration on the
mCIRCLE Letters assessment.
65% of kindergarten through third-
grade students will advance one
level or maintain proficiency by
the spring administration on the
mCLASS Text Reading
Comprehension (TRC)
assessment.
65% of kindergarten through third-
grade students will advance one
level or maintain Emerging/
Established status by the spring
administration on the mCLASS
Math assessment.
87.6% of students advanced one
level or maintained Emerging/
Satisfactory status.
70.8% of students advanced one
level or maintained proficiency.
89.8% of students advanced one
level or maintained Emerging/
Established status.
Yes
Yes
Yes
Student Achievement Targets Achievement Results Met Target?
65% of pre-kindergarten students
will score at age equivalency in
pre-reading on the Brigance
Developmental Inventory
The median score of kindergarten
through second-grade students in
reading will be at or above the 50th
percentile on the Terra Nova
assessment.
65% of third-grade students will
score proficient or advanced in
reading on the DC CAS.
91.3% of students scored at age
equivalency.
The median score of students
was at the 48th percentile.
53.5% of students scored
proficient or advanced.
Yes
No
No
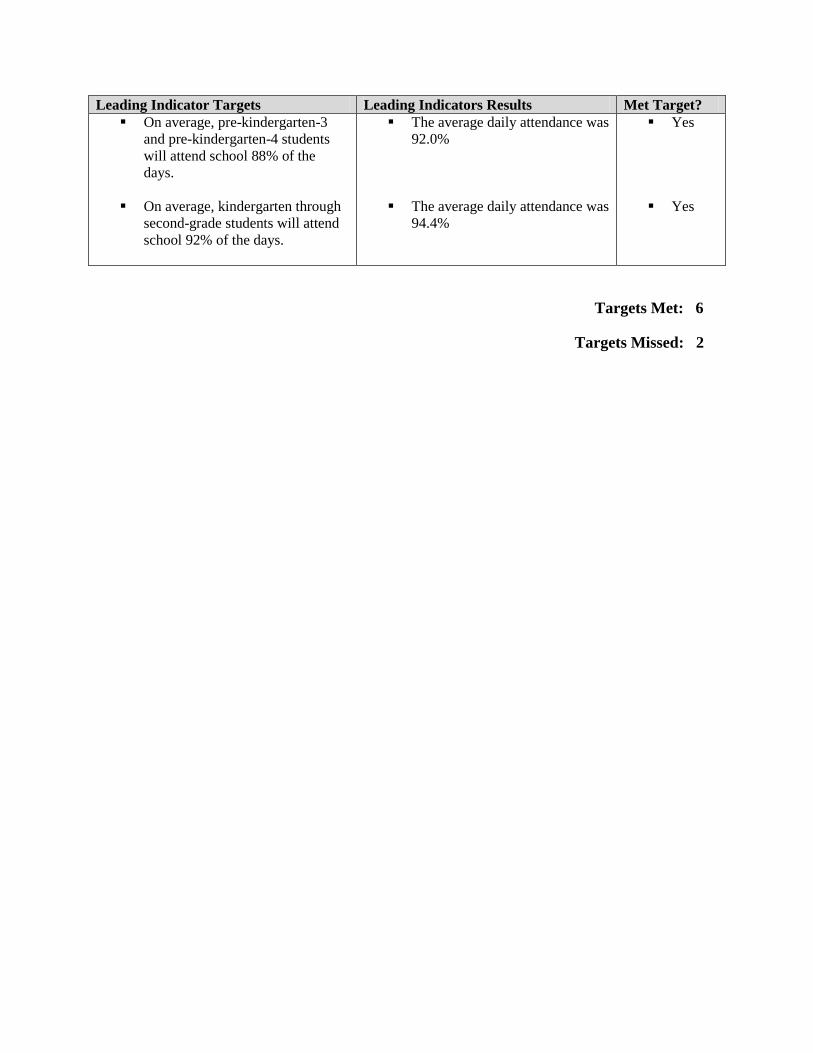
Leading Indicator Targets Leading Indicators Results Met Target?
On average, pre-kindergarten-3
and pre-kindergarten-4 students
will attend school 88% of the
days.
On average, kindergarten through
second-grade students will attend
school 92% of the days.
The average daily attendance was
92.0%
The average daily attendance was
94.4%
Yes
Yes
Targets Met: 6
Targets Missed: 2
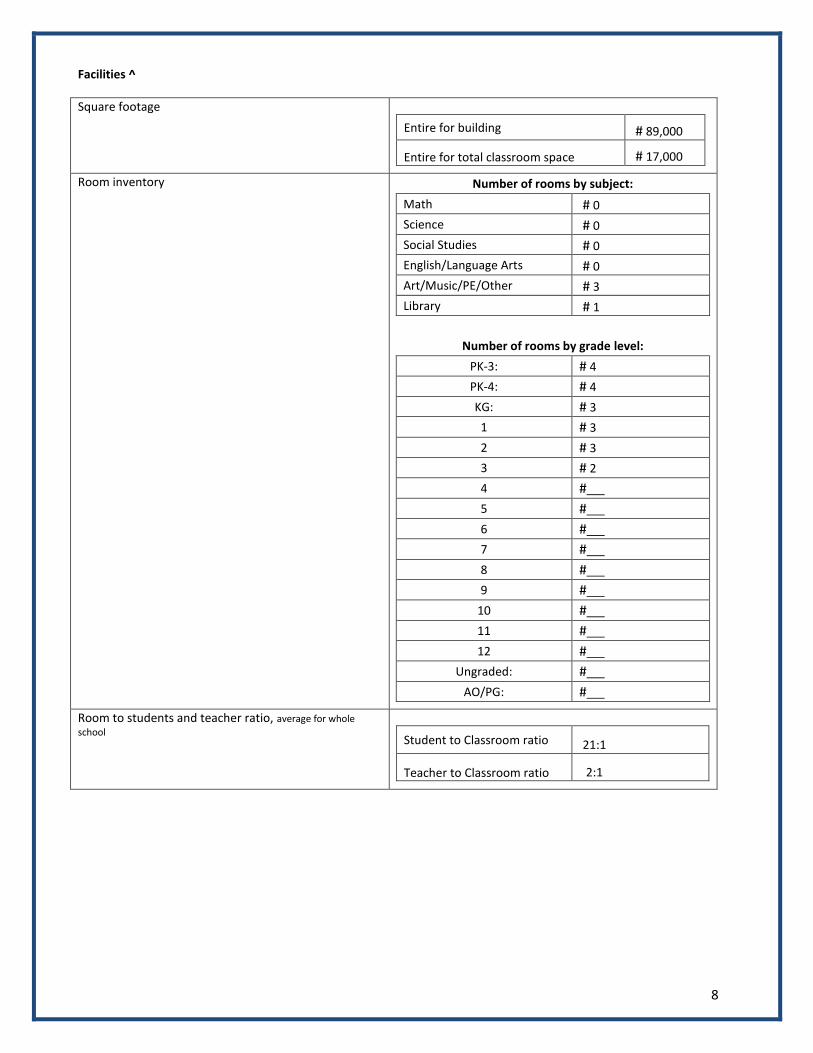
8
Facilities ^
Square footage
Entire for building # 89,000
Entire for total classroom space # 17,000
Room inventory Number of rooms by subject:
Math # 0
Science # 0
Social Studies # 0
English/Language Arts # 0
Art/Music/PE/Other # 3
Library # 1
Number of rooms by grade level:
PK-3: # 4
PK-4: # 4
KG: # 3
1 # 3
2 # 3
3 # 2
4 #
5 #
6 #
7 #
8 #
9 #
10 #
11 #
12 #
Ungraded: #
AO/PG: #
Room to students and teacher ratio, average for whole
school
Student to Classroom ratio 21:1
Teacher to Classroom ratio 2:1

Appendix I
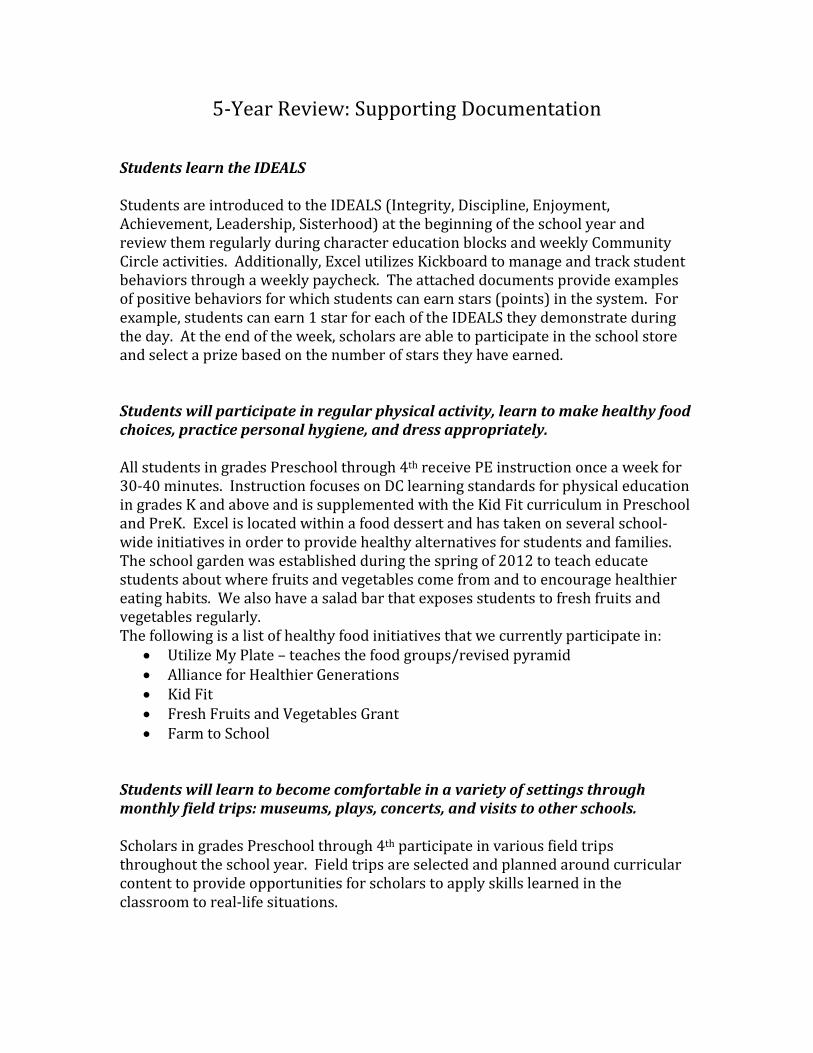
5-Year Review: Supporting Documentation
Students learn the IDEALS Students are introduced to the IDEALS (Integrity, Discipline, Enjoyment, Achievement, Leadership, Sisterhood) at the beginning of the school year and review them regularly during character education blocks and weekly Community Circle activities. Additionally, Excel utilizes Kickboard to manage and track student behaviors through a weekly paycheck. The attached documents provide examples of positive behaviors for which students can earn stars (points) in the system. For example, students can earn 1 star for each of the IDEALS they demonstrate during the day. At the end of the week, scholars are able to participate in the school store and select a prize based on the number of stars they have earned. Students will participate in regular physical activity, learn to make healthy food choices, practice personal hygiene, and dress appropriately. All students in grades Preschool through 4th receive PE instruction once a week for 30-40 minutes. Instruction focuses on DC learning standards for physical education in grades K and above and is supplemented with the Kid Fit curriculum in Preschool and PreK. Excel is located within a food dessert and has taken on several school-wide initiatives in order to provide healthy alternatives for students and families. The school garden was established during the spring of 2012 to teach educate students about where fruits and vegetables come from and to encourage healthier eating habits. We also have a salad bar that exposes students to fresh fruits and vegetables regularly. The following is a list of healthy food initiatives that we currently participate in:
• Utilize My Plate – teaches the food groups/revised pyramid • Alliance for Healthier Generations • Kid Fit • Fresh Fruits and Vegetables Grant • Farm to School
Students will learn to become comfortable in a variety of settings through monthly field trips: museums, plays, concerts, and visits to other schools. Scholars in grades Preschool through 4th participate in various field trips throughout the school year. Field trips are selected and planned around curricular content to provide opportunities for scholars to apply skills learned in the classroom to real-life situations.
The following is a list of some of the field trips that scholars have participated in: • National Zoo • Baltimore Aquarium • National Building Museum • Imagination Theater • Cox Farm • Clark Elioak Farm • Port Discovery • Arcadia Farm • Anacostia Watershed • Anacostia Library • White House • Air and Space Museum • Museum of Natural History • Butler’s Orchard • Anacostia Park • Capitol Building • Stone Ridge School of the Sacred Heart • Holton Arms School • Madeira School • Kennedy Center • Teach for America Gala (choral performance) • National Charter Schools Week (choral performance)
Parents and families will play active roles in their daughters’ education. Excel Academy holds quarterly parent / teacher conferences to provide regular opportunities for parents and teachers to discuss student progress. On average, 80% of Excel scholars have a parent participate in conferences throughout the school year. During the 2012-2013 school year Excel began holding Advisory Showcases. During these showcases, parents and family members are invited to their scholar’s presentation of grade level material learned during that advisory. Scholars use songs, skits, and video to show parents what they know. Excel has recently been awarded a partnership grant with Flamboyan Foundation for the 2013-2014 school year. Through this partnership, we will continue to strengthen parent/teacher relationships and increase the role that parents play in their daughters’ education. Excel will demonstrate effective systems of home-school communication. Scholars receive a weekly behavior chart (see attached) that provides parents with a daily overview of their child’s behavior each day. This chart also has space for teachers and parents to write notes back and forth regarding any questions or

concerns. The chart must be signed by the parent/guardian and returned to school daily. Parents also receive a weekly Scholar Report (see attached) that gives an overview of academic and behavioral performance. Teachers maintain regular communication with parents during dismissal. Excel has recently been awarded a partnership grant with Flamboyan Foundation for the 2013-2014 school year. Through this partnership, we will continue to strengthen parent/teacher relationships and increase the role that parents play in their daughters’ education.
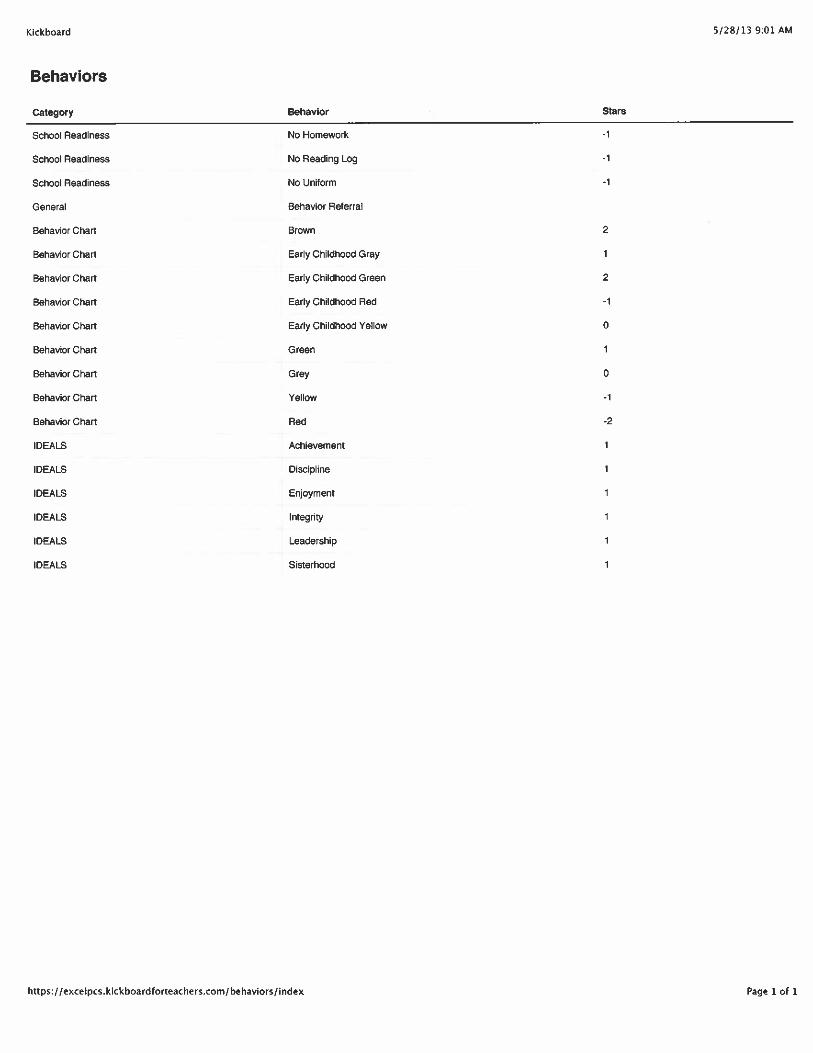
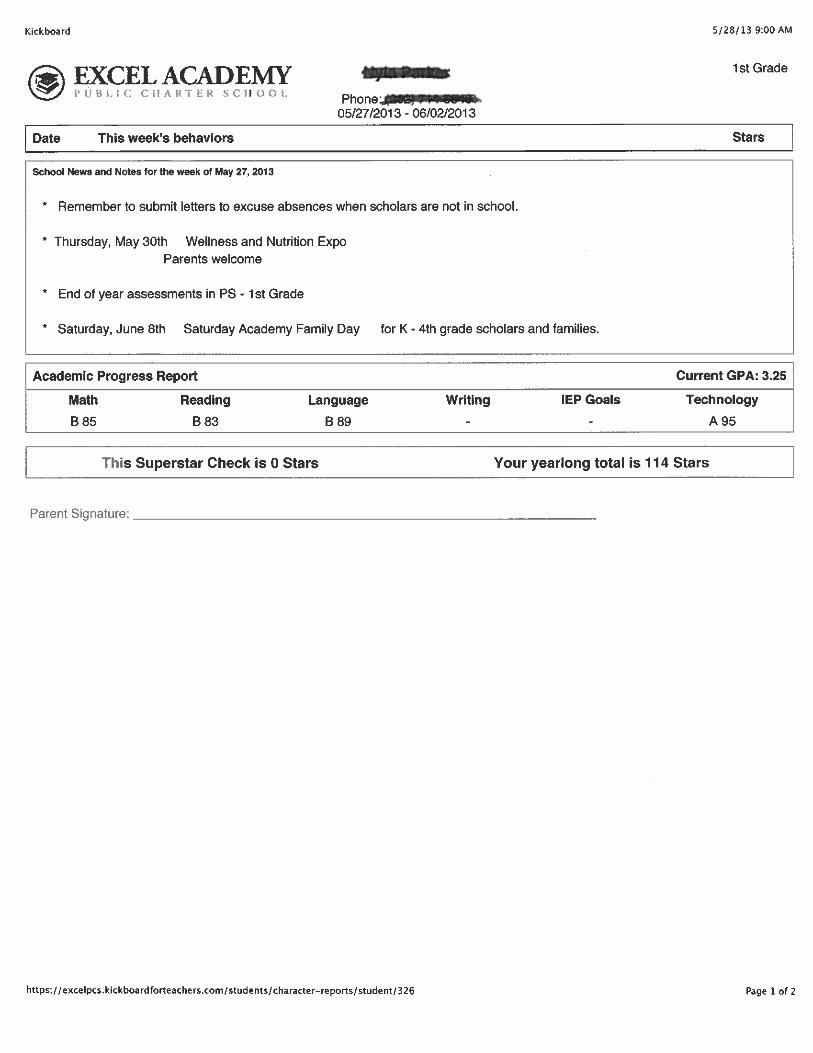
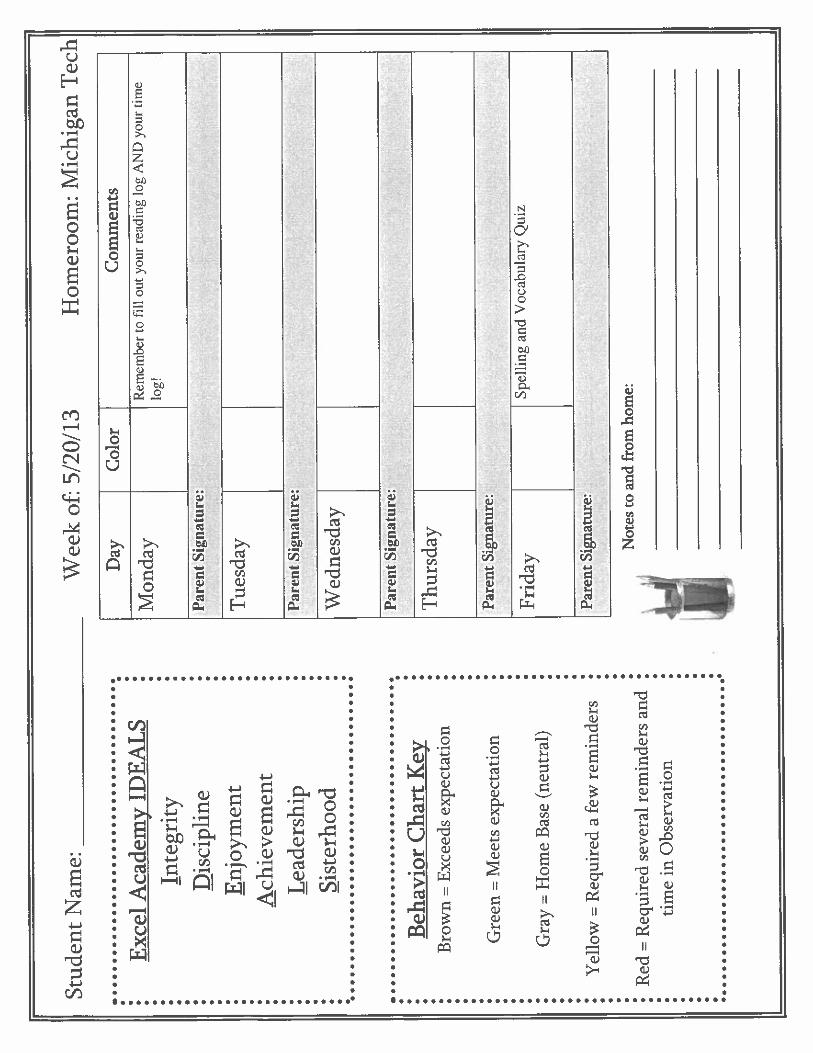
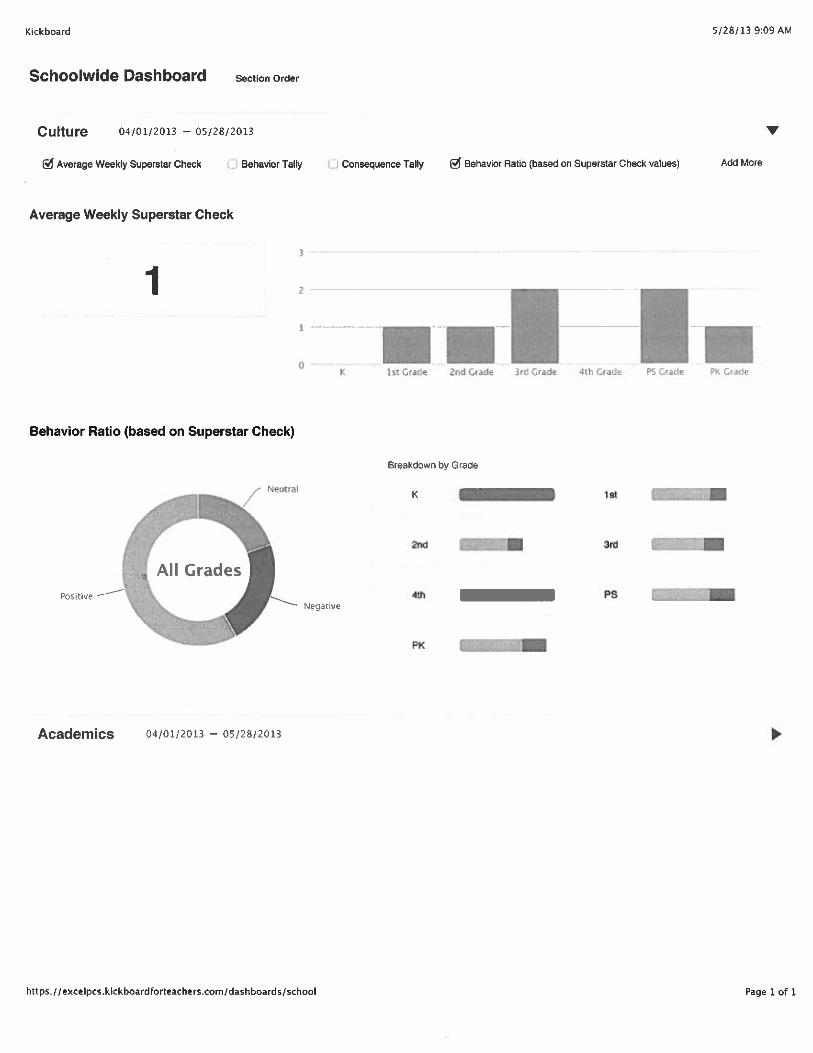

Appendix J
Excel Academy
Public Charter School
2009-2010
Annual Report Prepared for
The District of Columbia Public Charter School Board
Submitted by: Audwin Levasseur 2501 Martin Luther King Jr., Avenue, SE
Washington DC 20020 202.373.0097 Office
1
TABLE OF CONTENTS
Board and School Leaders ............................................................................................. 2
School Descriptions ......................................................................................................... 3 A. Mission Statement .............................................................................................................................. 3
B. School Program .................................................................................................................................. 4
C. School Staff ......................................................................................................................................... 8
D. Student Characteristics....................................................................................................................... 9
E. Governance ...................................................................................................................................... 10
F. Finance ............................................................................................................................................. 12
School Descriptions ................................................................................................................... 13
A. Evident of Performance and Progress ............................................................................................... 13
B. Unique Accomplishments ................................................................................................................. 14
C. Lessons Learned and Action Taken ................................................................................................... 15
D. Reporting Accountability Information .............................................................................................. 16
Attachments
Approved Budget for Fiscal Year 2009-2010 ............................................................... Attachment A
Data Worksheet ........................................................................................................... Attachment B
Certifications ................................................................................................................ Attachment C
2
BOARD AND SCHOOL LEADERS 2009-2010
Kaye Savage – Founder & CEO
Audwin F. Levasseur – Board Chair
Michael Vu – Board Treasurer
Meridel Bulle-Vu – Board Secretary
Caroline John - Principal
Lela Johnson – Dean of Students
Joyanna Smith – Director of Finance and Operations

3
Annual Report for School Year 2009-2010
School Description
A. Mission Statement Excel Academy Public Charter School will provide preschool
through eighth grade girls a solid academic foundation and
enrichment opportunities to prepare them to succeed in high
school and college and to develop the skills and confidence they
need to make healthy, positive lifestyle choices.
Our Vision
At Excel Academy, we believe that with strong classroom support and great teaching all
students can learn and achieve at high levels.
We believe that Excel Academy’s unique single-sex educational model will build a
community of well-educated and empowered young women who will mitigate
intergenerational patterns of poverty within their communities.
We believe that by beginning with preschool for three-year-olds, we will ensure that Excel
Academy students will be able to compete, achieve, and succeed.
We believe that customized ongoing professional development and support for Excel
Academy teachers will foster excellence in our teaching staff.
We believe that parents and guardians are essential partners in their child’s education; we
form and maintain a community of respect and collaboration promote partnerships with
Excel Academy parents.
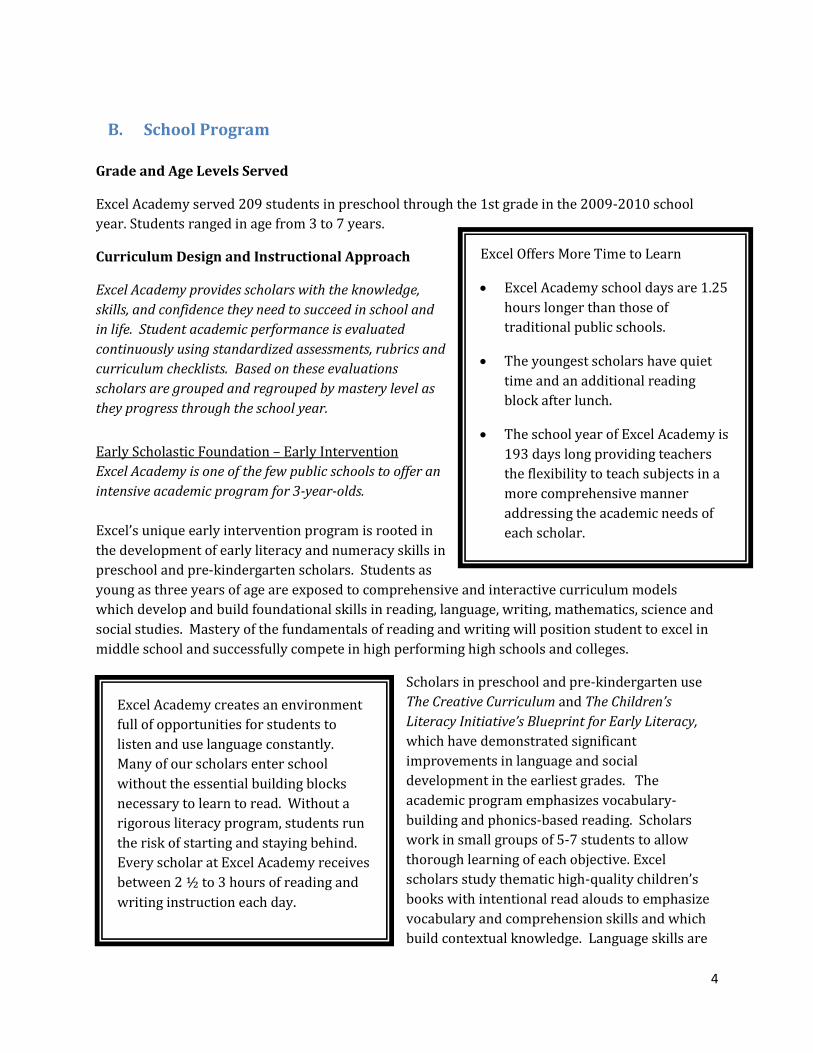
4
B. School Program
Grade and Age Levels Served
Excel Academy served 209 students in preschool through the 1st grade in the 2009-2010 school
year. Students ranged in age from 3 to 7 years.
Curriculum Design and Instructional Approach
Excel Academy provides scholars with the knowledge,
skills, and confidence they need to succeed in school and
in life. Student academic performance is evaluated
continuously using standardized assessments, rubrics and
curriculum checklists. Based on these evaluations
scholars are grouped and regrouped by mastery level as
they progress through the school year.
Early Scholastic Foundation – Early Intervention
Excel Academy is one of the few public schools to offer an
intensive academic program for 3-year-olds.
Excel’s unique early intervention program is rooted in
the development of early literacy and numeracy skills in
preschool and pre-kindergarten scholars. Students as
young as three years of age are exposed to comprehensive and interactive curriculum models
which develop and build foundational skills in reading, language, writing, mathematics, science and
social studies. Mastery of the fundamentals of reading and writing will position student to excel in
middle school and successfully compete in high performing high schools and colleges.
Scholars in preschool and pre-kindergarten use
The Creative Curriculum and The Children’s
Literacy Initiative’s Blueprint for Early Literacy,
which have demonstrated significant
improvements in language and social
development in the earliest grades. The
academic program emphasizes vocabulary-
building and phonics-based reading. Scholars
work in small groups of 5-7 students to allow
thorough learning of each objective. Excel
scholars study thematic high-quality children’s
books with intentional read alouds to emphasize
vocabulary and comprehension skills and which
build contextual knowledge. Language skills are
Excel Offers More Time to Learn
Excel Academy school days are 1.25
hours longer than those of
traditional public schools.
The youngest scholars have quiet
time and an additional reading
block after lunch.
The school year of Excel Academy is
193 days long providing teachers
the flexibility to teach subjects in a
more comprehensive manner
addressing the academic needs of
each scholar.
Excel Academy creates an environment
full of opportunities for students to
listen and use language constantly.
Many of our scholars enter school
without the essential building blocks
necessary to learn to read. Without a
rigorous literacy program, students run
the risk of starting and staying behind.
Every scholar at Excel Academy receives
between 2 ½ to 3 hours of reading and
writing instruction each day.
5
taught sequentially and rhyming games are used to help scholars with phonics and vocabulary. The
school also uses a sequenced approach to teach basic math facts, computational skills, and higher-
level problem solving proficiency.
Rigorous Learning Environment
Excel scholars engage in literacy activities for most of their school day.
Starting in kindergarten, Excel scholars participate in specialized courses in reading, writing,
mathematics, science, and social studies. The curricula used include: SRA Reading Mastery
Signature Edition, Writer’s Workshop, Saxon Math, Houghton Mifflin Experience Science and Socials
Studies Programs, and Words Their Way. Literacy is taught through listening and speaking, word
recognition, fluency, comprehension, and analysis. Reading centers, where scholars break into
small groups to practice their critical thinking and literacy skills, are an important aspect of the
school day. Writing is practiced through guided assignments and storytelling.
Explicit instruction is the core of the math curriculum. Teachers provide students with regular
instruction, practice, and hands on experience to facilitate the mastery of math skills. Excel’s
curriculum integrates prior knowledge, teacher modeling, independent application, and assessment
to ensure optimum student-teacher interaction and the development of critical thinking skills.
Benefits of Excel Academy’s Early Childhood Program
Scholars develop a stronger sense of self, an ability to adjust to new
circumstances, and recognize their own feelings and how to manage them.
Scholars begin to take responsibility for their own well-being, and learn to
respect and care for themselves, teachers, classmates, and the classroom.
Curiosity, perception, and persistence grow as scholars begin to explore,
apply new concepts, and develop the confidence to take academic and personal
risks.
Children expand their logical thought processes through comparisons,
patterns, time, space and sequence.
Literacy is cultivated through listening, use of words, inquisition, and
imagination.
6
To fully engage scholars in learning new concepts, teachers incorporated real life examples to teach
math, science, and social studies. Scholars studied life cycles, magnetism, the Earth, and aquatic life
through exploration and explanation. Scholars learned about countries and significant historical
figures through readings, special projects, and supplemental coursework. Scholars learned about
prominent women in history and civic life through in-depth studies of strong female leaders.
Structured English Immersion
Excel Academy did not have limited English proficiency students during the 2009-2010 school year.
The school will utilize a fully inclusive language immersion program when necessary. Scholars will
learn in regular classrooms to the greatest extent possible.
Students with Learning Difficulties
Excel Academy is committed to supporting the individual needs of all scholars. Excel scholars with
Individualized Education Plans (IEPs) learn with their peers in an inclusive environment. They
spend a significant amount of time in the classroom to ensure that they are being exposed to grade-
level curricula, benefiting from classroom instruction and developing socially. Scholars with IEPs
are regularly assessed, both informally and formally, to monitor progress and make adjustments to
their academic program as needed. During the 2009-2010 school year, the Special Education team,
composed of parents, teachers, the Special Education Coordinator, School Psychologist, and the
Special Education Teacher met to develop IEPs for five Excel scholars. Scholars with IEPs were
provided with targeted push-in and pull-out instruction as well as specialized lesson plans. To
further support scholars in need of related services, Excel Academy contracted a Speech/Language
Pathologist and an Occupational Therapist.
Mission Related Programs
Single Sex Model
Girls Take Center Stage at Excel Academy
Excel can reach scholars more comprehensively and intensively
with programs specifically tailored to meet girls’ needs.
Excel Academy’s mission is designed to provide girls with a
highly rigorous academic program. Excel cultivates in young
girls from the District of Columbia a love of learning to
compel them to thrive in school and life. Through a single-sex
model Excel provides girls with an environment where girls
lead in every role, are free from pressure to please boys, and
are valued for their intellect and compassion.
Through a deliberately girl-focused curriculum, Excel emphasizes the learning skills of young
women. Teachers combine academic standards with girl-focused content to create lesson
objectives that build knowledge, academic skills and self-awareness in girls. Scholars at Excel see
themselves reflected in the school’s learning materials that incorporate the contributions of women
The Benefits of an All-Girls’
School
Expanded educational
opportunity
Custom-tailored
learning and
instruction
Greater autonomy
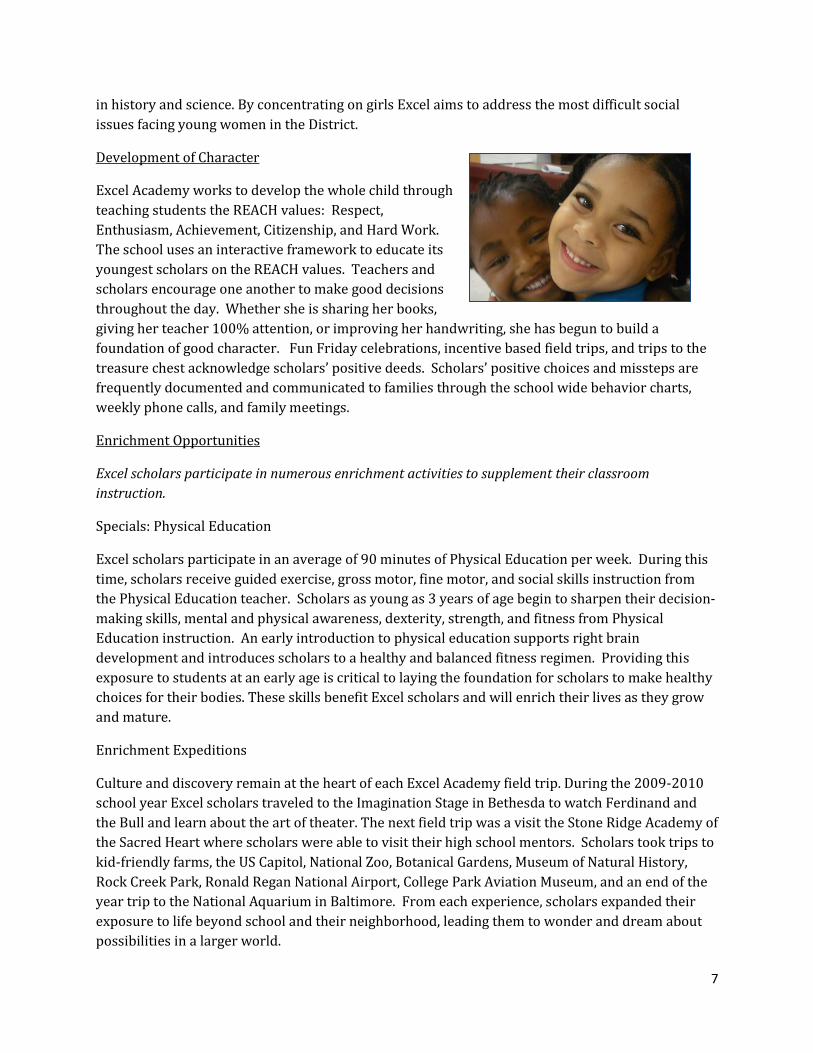
7
in history and science. By concentrating on girls Excel aims to address the most difficult social
issues facing young women in the District.
Development of Character
Excel Academy works to develop the whole child through
teaching students the REACH values: Respect,
Enthusiasm, Achievement, Citizenship, and Hard Work.
The school uses an interactive framework to educate its
youngest scholars on the REACH values. Teachers and
scholars encourage one another to make good decisions
throughout the day. Whether she is sharing her books,
giving her teacher 100% attention, or improving her handwriting, she has begun to build a
foundation of good character. Fun Friday celebrations, incentive based field trips, and trips to the
treasure chest acknowledge scholars’ positive deeds. Scholars’ positive choices and missteps are
frequently documented and communicated to families through the school wide behavior charts,
weekly phone calls, and family meetings.
Enrichment Opportunities
Excel scholars participate in numerous enrichment activities to supplement their classroom
instruction.
Specials: Physical Education
Excel scholars participate in an average of 90 minutes of Physical Education per week. During this
time, scholars receive guided exercise, gross motor, fine motor, and social skills instruction from
the Physical Education teacher. Scholars as young as 3 years of age begin to sharpen their decision-
making skills, mental and physical awareness, dexterity, strength, and fitness from Physical
Education instruction. An early introduction to physical education supports right brain
development and introduces scholars to a healthy and balanced fitness regimen. Providing this
exposure to students at an early age is critical to laying the foundation for scholars to make healthy
choices for their bodies. These skills benefit Excel scholars and will enrich their lives as they grow
and mature.
Enrichment Expeditions
Culture and discovery remain at the heart of each Excel Academy field trip. During the 2009-2010
school year Excel scholars traveled to the Imagination Stage in Bethesda to watch Ferdinand and
the Bull and learn about the art of theater. The next field trip was a visit the Stone Ridge Academy of
the Sacred Heart where scholars were able to visit their high school mentors. Scholars took trips to
kid-friendly farms, the US Capitol, National Zoo, Botanical Gardens, Museum of Natural History,
Rock Creek Park, Ronald Regan National Airport, College Park Aviation Museum, and an end of the
year trip to the National Aquarium in Baltimore. From each experience, scholars expanded their
exposure to life beyond school and their neighborhood, leading them to wonder and dream about
possibilities in a larger world.
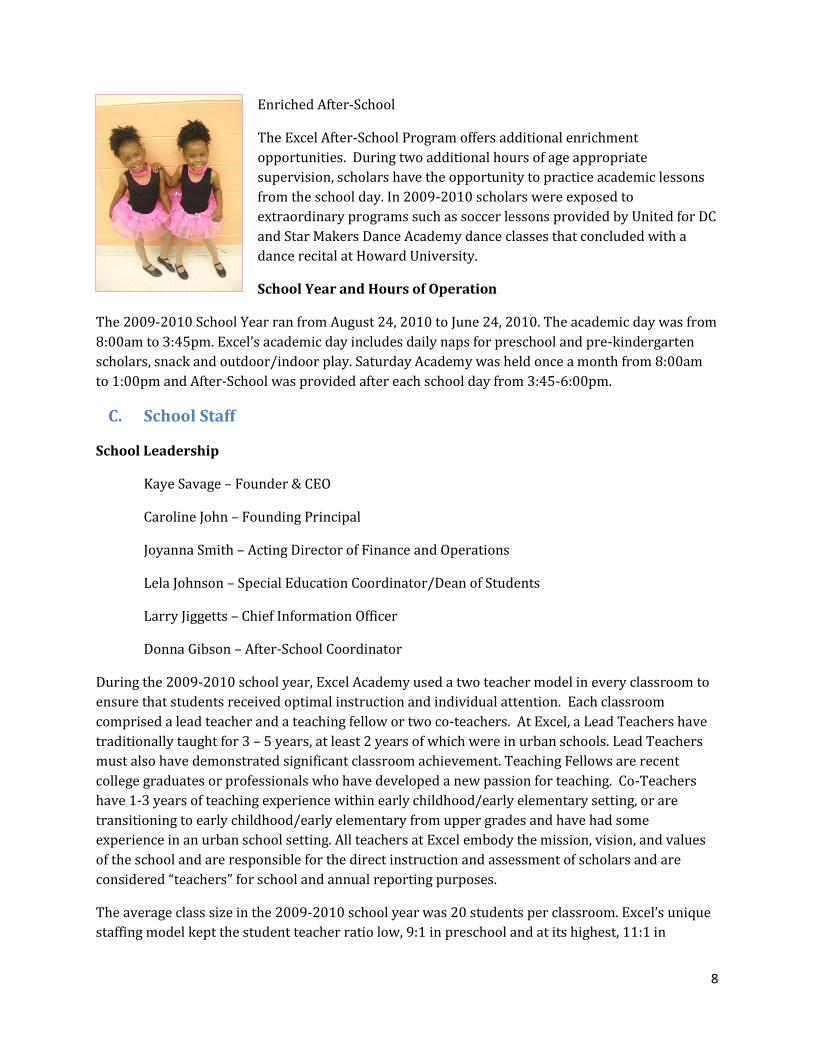
8
Enriched After-School
The Excel After-School Program offers additional enrichment
opportunities. During two additional hours of age appropriate
supervision, scholars have the opportunity to practice academic lessons
from the school day. In 2009-2010 scholars were exposed to
extraordinary programs such as soccer lessons provided by United for DC
and Star Makers Dance Academy dance classes that concluded with a
dance recital at Howard University.
School Year and Hours of Operation
The 2009-2010 School Year ran from August 24, 2010 to June 24, 2010. The academic day was from
8:00am to 3:45pm. Excel’s academic day includes daily naps for preschool and pre-kindergarten
scholars, snack and outdoor/indoor play. Saturday Academy was held once a month from 8:00am
to 1:00pm and After-School was provided after each school day from 3:45-6:00pm.
C. School Staff
School Leadership
Kaye Savage – Founder & CEO
Caroline John – Founding Principal
Joyanna Smith – Acting Director of Finance and Operations
Lela Johnson – Special Education Coordinator/Dean of Students
Larry Jiggetts – Chief Information Officer
Donna Gibson – After-School Coordinator
During the 2009-2010 school year, Excel Academy used a two teacher model in every classroom to
ensure that students received optimal instruction and individual attention. Each classroom
comprised a lead teacher and a teaching fellow or two co-teachers. At Excel, a Lead Teachers have
traditionally taught for 3 – 5 years, at least 2 years of which were in urban schools. Lead Teachers
must also have demonstrated significant classroom achievement. Teaching Fellows are recent
college graduates or professionals who have developed a new passion for teaching. Co-Teachers
have 1-3 years of teaching experience within early childhood/early elementary setting, or are
transitioning to early childhood/early elementary from upper grades and have had some
experience in an urban school setting. All teachers at Excel embody the mission, vision, and values
of the school and are responsible for the direct instruction and assessment of scholars and are
considered “teachers” for school and annual reporting purposes.
The average class size in the 2009-2010 school year was 20 students per classroom. Excel’s unique
staffing model kept the student teacher ratio low, 9:1 in preschool and at its highest, 11:1 in
9
kindergarten. Excel’s teaching staff were highly motivated and well-educated professionals. All
Excel teachers had a minimum of a Bachelors Degree and a number of teachers also had or were
pursuing Masters Degrees. Over half of Excel teachers had a degree in the field of education.
Excel provided teachers with excellent support staff to ensure their success. Excel employed two
Instructional Assistants during the 2009-2010 school year. The Instructional Assistants floated
between classrooms and provided invaluable support to regular classroom teachers.
Three new positions were added to Excel’s staffing model for the 2009-2010 school year. Excel
hired a School Psychologist to assist teachers, parents, and students with learning and behavioral
challenges. The Dean of Students position was created and filled to provide additional behavior
support. A Data Consultant was hired to create a data warehousing system to aggregate and analyze
student achievement and demographic data. These new positions resulted from expanded
enrollment and increased grade offerings.
The staff attrition rate between fall 2009 and fall 2010 school years was 41.9%. The unusually high
attrition rate can be attributed to the departure of the school Principal. Upon her departure the
outgoing Principal hired six Excel teachers to work at her new school. Two teachers left Excel at the
end of the 2009-2010 school year to return to school full-time and two moved to another State.
D. Student Characteristics
Excel Academy is an urban school strategically located in Ward 8 of Washington, DC. During the
2009-2010 school year, Excel’s student population was 99% African-American and 1% Caucasian;
83% of scholars qualified for free or reduced lunch, and 2.5% received special education services as
required by their IEPs. The average student profile reflects Excel’s mission and strategy: to look for
the challenges and rewards of educating at-risk students within the District of Columbia.
Excel Academy began the 2009-2010 school year providing high quality education to 209 girls.
Student attrition due to family relocations or removal from school by Child Protective Services
reduced the school size to 197 students by year-end. The impetus for hiring a School Psychologist
was to set-up a family outreach program to support families. The family outreach program sought
to mitigate family issues such as high mobility rates caused by unemployment, family instability, or
housing discrimination. Once the program became operational Excel provided referrals for families
to community resources for housing counseling and workforce development.
Excel’s re-enrollment rate from 2008-2009 to 2009-2010 was 81%. Between the 2008-2009 and
2009-2010 school years Excel moved into a surplused District of Columbia Public School, the old
Birney Elementary School. Excel’s re-enrollment remained strong despite the move due to:
dedicated staff, strong parent-teacher relationships, and quantifiable academic and behavioral
progress.
The average daily attendance for the 2009-2010 school year was 88%. During the second half of the
school year Excel’s average daily attendance increased to 91% due to an increase school-wide
attendance push from the administration.
10
E. Governance
1. Board of Trustees Members Kaye Savage – Founder & CEO
Audwin F. Levasseur – Board Chair
John P. Barron
Dionne Perkins - Parent Trustee
Laura Cooney
Kelechi Ebi, Esq.
Nekosi J. Nelson
Shawndra Allen
Michael Vu
Valerie Holt
Liz Davenport Hughes
Vito Germinario
Salvatore Misuraca
Meridel Bulle-Vu - Secretary
Curtis Jablonka
11
2. Board Committees Development Vito Germinario Liz Davenport Hughes Valerie Holt Laura Cooney Education and Accountability Audwin Levasseur Laura Cooney Dionne Perkins Meridel Bulle-Vu Shawndra Allen Finance and Facilities John Barron Vito Germinario Valerie Holt Michael Vu Governance Audwin Levasseur Dionne Perkins Meridel Bulle-Vu Michael Vu
3. Training
In the Fall of the 2009-2010 school year Excel’s Board of Directors received a full day of training
from Building Excellent Schools (BES). The training was conducted by the Fellowship Director of
BES, Sue Walsh. The Board of Directors were trained in the best practices of board functions, rolls,
and responsibilities of board members on public charter school boards. The training was designed
to complement the Spring 2009 BES training. Taishya Adams, a Non-Academic Performance Officer
for the District of Columbia Public Charter School Board, also presented during part of the training.
12
F. Finance
1. Annual Budget for Fiscal Year 2009-210
See Attachment A.
2. Major Supporters of Excel Academy
Anonymous
Moran Family Foundation
SnapDragon Book Foundation
Mr. and Mrs. John Barron
Vito Germinario
Michael Vu
The Carlyle Group
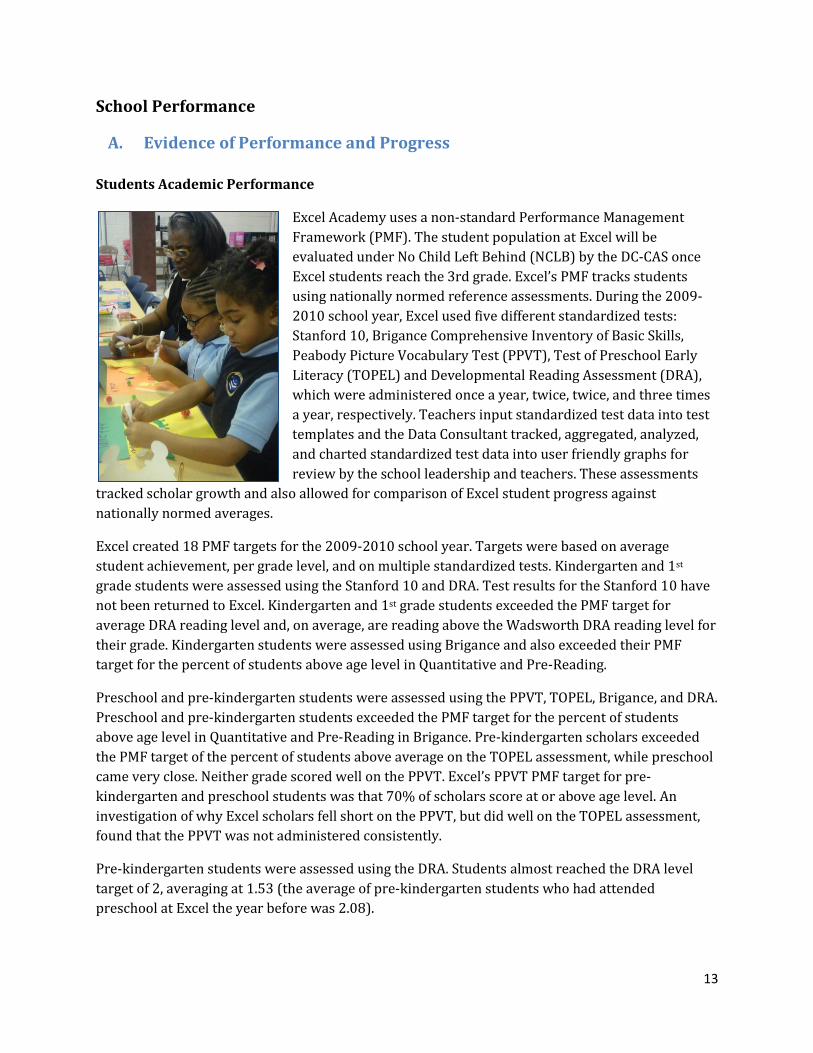
13
School Performance
A. Evidence of Performance and Progress
Students Academic Performance
Excel Academy uses a non-standard Performance Management
Framework (PMF). The student population at Excel will be
evaluated under No Child Left Behind (NCLB) by the DC-CAS once
Excel students reach the 3rd grade. Excel’s PMF tracks students
using nationally normed reference assessments. During the 2009-
2010 school year, Excel used five different standardized tests:
Stanford 10, Brigance Comprehensive Inventory of Basic Skills,
Peabody Picture Vocabulary Test (PPVT), Test of Preschool Early
Literacy (TOPEL) and Developmental Reading Assessment (DRA),
which were administered once a year, twice, twice, and three times
a year, respectively. Teachers input standardized test data into test
templates and the Data Consultant tracked, aggregated, analyzed,
and charted standardized test data into user friendly graphs for
review by the school leadership and teachers. These assessments
tracked scholar growth and also allowed for comparison of Excel student progress against
nationally normed averages.
Excel created 18 PMF targets for the 2009-2010 school year. Targets were based on average
student achievement, per grade level, and on multiple standardized tests. Kindergarten and 1st
grade students were assessed using the Stanford 10 and DRA. Test results for the Stanford 10 have
not been returned to Excel. Kindergarten and 1st grade students exceeded the PMF target for
average DRA reading level and, on average, are reading above the Wadsworth DRA reading level for
their grade. Kindergarten students were assessed using Brigance and also exceeded their PMF
target for the percent of students above age level in Quantitative and Pre-Reading.
Preschool and pre-kindergarten students were assessed using the PPVT, TOPEL, Brigance, and DRA.
Preschool and pre-kindergarten students exceeded the PMF target for the percent of students
above age level in Quantitative and Pre-Reading in Brigance. Pre-kindergarten scholars exceeded
the PMF target of the percent of students above average on the TOPEL assessment, while preschool
came very close. Neither grade scored well on the PPVT. Excel’s PPVT PMF target for pre-
kindergarten and preschool students was that 70% of scholars score at or above age level. An
investigation of why Excel scholars fell short on the PPVT, but did well on the TOPEL assessment,
found that the PPVT was not administered consistently.
Pre-kindergarten students were assessed using the DRA. Students almost reached the DRA level
target of 2, averaging at 1.53 (the average of pre-kindergarten students who had attended
preschool at Excel the year before was 2.08).
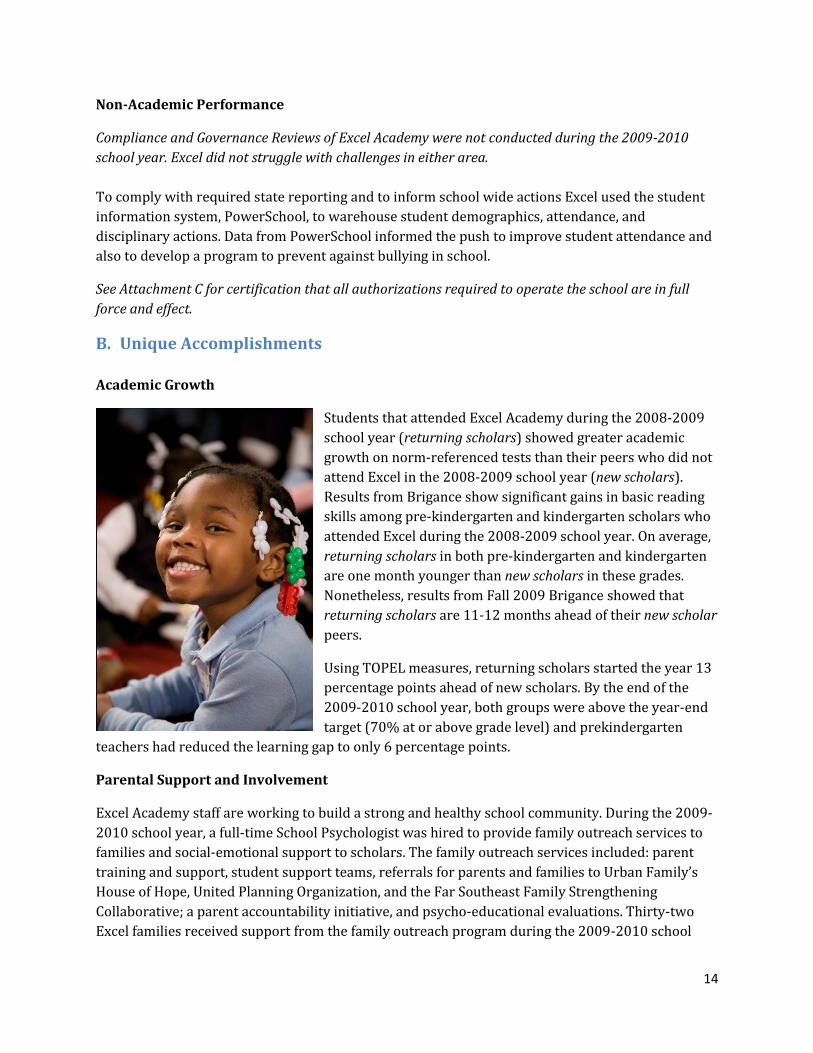
14
Non-Academic Performance
Compliance and Governance Reviews of Excel Academy were not conducted during the 2009-2010
school year. Excel did not struggle with challenges in either area.
To comply with required state reporting and to inform school wide actions Excel used the student
information system, PowerSchool, to warehouse student demographics, attendance, and
disciplinary actions. Data from PowerSchool informed the push to improve student attendance and
also to develop a program to prevent against bullying in school.
See Attachment C for certification that all authorizations required to operate the school are in full
force and effect.
B. Unique Accomplishments
Academic Growth
Students that attended Excel Academy during the 2008-2009
school year (returning scholars) showed greater academic
growth on norm-referenced tests than their peers who did not
attend Excel in the 2008-2009 school year (new scholars).
Results from Brigance show significant gains in basic reading
skills among pre-kindergarten and kindergarten scholars who
attended Excel during the 2008-2009 school year. On average,
returning scholars in both pre-kindergarten and kindergarten
are one month younger than new scholars in these grades.
Nonetheless, results from Fall 2009 Brigance showed that
returning scholars are 11-12 months ahead of their new scholar
peers.
Using TOPEL measures, returning scholars started the year 13
percentage points ahead of new scholars. By the end of the
2009-2010 school year, both groups were above the year-end
target (70% at or above grade level) and prekindergarten
teachers had reduced the learning gap to only 6 percentage points.
Parental Support and Involvement
Excel Academy staff are working to build a strong and healthy school community. During the 2009-
2010 school year, a full-time School Psychologist was hired to provide family outreach services to
families and social-emotional support to scholars. The family outreach services included: parent
training and support, student support teams, referrals for parents and families to Urban Family’s
House of Hope, United Planning Organization, and the Far Southeast Family Strengthening
Collaborative; a parent accountability initiative, and psycho-educational evaluations. Thirty-two
Excel families received support from the family outreach program during the 2009-2010 school
15
year. Since the implementation of the outreach program, Excel has sustained improvements in
scholar behavior (as evidenced by decreased office referrals) and improved student attendance.
C. Lessons Learned and Actions Taken Based on Accountability Information
and Review Findings
Excel Academy had a strong second year. The school realized an increased enrollment, improved
student academic achievement as evidenced by achievement data, and the development of a
stronger school culture. To become a truly great school, Excel has committed additional time,
resources, and energy towards fine-tuning our academic program. The school used the District of
Columbia Public Charter School Board (DCPCSB) recommendations to inform and improve the
school’s instructional plans.
Collecting and Reporting Data
Excel performed baseline, middle-of- the-year, and end-of-the-year standardized assessments to
evaluate scholar’s growth in language, literacy and mathematics. Teachers incurred several
assessment challenges during the 2009-2010 school year. Challenges included: space limitations,
administration time and scoring time. In response to these challenges, Excel Academy hired a Data
Consultant to create a school-wide student data tracking system and analysis process. The 2009-
2010 student assessments advised teachers often and notified them when to re-teach or regroup
scholars to ensure that scholars achieved mastery of each academic objective. Excel also used
student assessments to ensure scholars’ preparedness for the next grade level.
Excel Academy made significant changes to the manner and mode by which standardized
assessment data was gathered and analyzed. In response to the challenges faced during the 2009-
2010 school year, specifically, the time required to administer and score several different
assessments, Excel has entered into a partnership with NewSchools Venture Fund. Through this
partnership, Excel will utilize the mCLASS:CIRCLE (Center for Improving the Readiness of Children
for Learning and Education) assessment for preschool and pre-kindergarten scholars and the
Dynamic Indicators of Basic Early Literacy Skills (DIBLES)/ Text Reading Comprehension
assessment and the TerraNova Achievement test for kindergarten through 2nd grade scholars. The
new assessments will provide data to permit progress monitoring of scholars’ academic growth
throughout the year and improve real time data on each student. Additionally, these assessment
will provide teachers with information regarding student groupings and teaching
strategies/activities that can be used to target specific learning strengths and weakness in students.
Academic Performance
The school initially grappled with identifying academic goals for benchmark assessments and
developing end of the year summative assessments. Working to refine the curricula and
benchmark assessments took teachers away from lesson planning. Entering into the 2010-2011
school year Excel purchased additional curricula which more closely aligned with our rigorous
standards for preschool and pre-kindergarten as well as kindergarten through 2nd grade. These
16
curricula along with two new Academy Directors (Early Education and kindergarten through 2nd
grade) will provide teachers with the tools they need to be more effective.
Program Changes and Improvements
Curriculum and Standards, Instruction, and Assessments
Excel Academy valued the recommendations provided in the Program Development Review by the
District of Columbia Public Charter School Board (DCPCSB). During the second half of the 2009-
2010 school year, Excel implemented the recommendations in targeted areas. Excel’s major point
of progress was to hire two Academy Directors, one for preschool/pre-kindergarten and a second
for kindergarten through 2nd grade. Their primary focus for this year will be to map curricula, coach
teachers, and target professional development based on specific Academy needs.
Excel changed the structure of the school day to increase learning time in centers and lengthen
guided reading blocks for kindergarten and 1st grade. Math centers with manipulatives were added
as well as child centered exploration and “Words Their Way” phonics for kindergarten. Focus and
consistency on weekly grade level read alouds were stressed and a common shared read aloud
vocabulary was developed.
To strengthen the special education program, Excel implemented a Powerhour for struggling
students to provide 30 minutes of reading and math intervention pull-out sessions. The school
increased time spent in small group instruction and pull-out instruction for students with IEPs as
well as Student Study Team(SST) pop-ins. IEP goals for new special education students were
developed with the special education team and the student’s academic teachers.
Excel maintains ambitious aspirations for its young scholars. From the lessons learned in its
first two years of operation, the School has raised the bar to ensure that every scholar will
have the opportunity to learn and excel.
D. Reporting Accountability Information to Students, Teachers, Parents, and
the Public
Excel Academy conveys information through school newsletters, weekly class updates sent home to
parents, board meetings, and annual reports. Representatives of the school’s leadership team
attend PTO meetings to address parent concerns. The parent Board trustees also convey pertinent
information to the parents at large.
EXCEL ACADEMY PUBLIC CHARTER SCHOOL
Attachment A 2009-2010 Budget
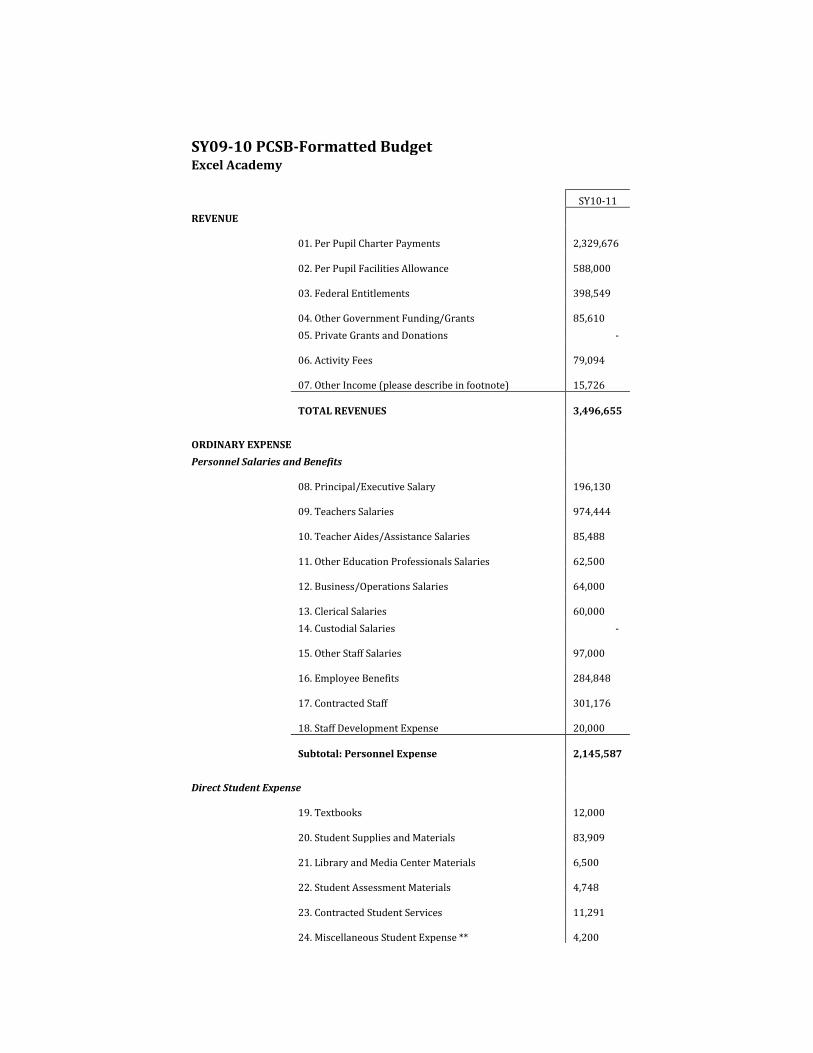
SY09-10 PCSB-Formatted Budget Excel Academy
SY10-11
REVENUE
01. Per Pupil Charter Payments 2,329,676
02. Per Pupil Facilities Allowance 588,000
03. Federal Entitlements 398,549
04. Other Government Funding/Grants 85,610
05. Private Grants and Donations -
06. Activity Fees 79,094
07. Other Income (please describe in footnote) 15,726
TOTAL REVENUES 3,496,655
ORDINARY EXPENSE
Personnel Salaries and Benefits
08. Principal/Executive Salary 196,130
09. Teachers Salaries 974,444
10. Teacher Aides/Assistance Salaries 85,488
11. Other Education Professionals Salaries 62,500
12. Business/Operations Salaries 64,000
13. Clerical Salaries 60,000
14. Custodial Salaries -
15. Other Staff Salaries 97,000
16. Employee Benefits 284,848
17. Contracted Staff 301,176
18. Staff Development Expense 20,000
Subtotal: Personnel Expense 2,145,587
Direct Student Expense
19. Textbooks 12,000
20. Student Supplies and Materials 83,909
21. Library and Media Center Materials 6,500
22. Student Assessment Materials 4,748
23. Contracted Student Services 11,291
24. Miscellaneous Student Expense ** 4,200
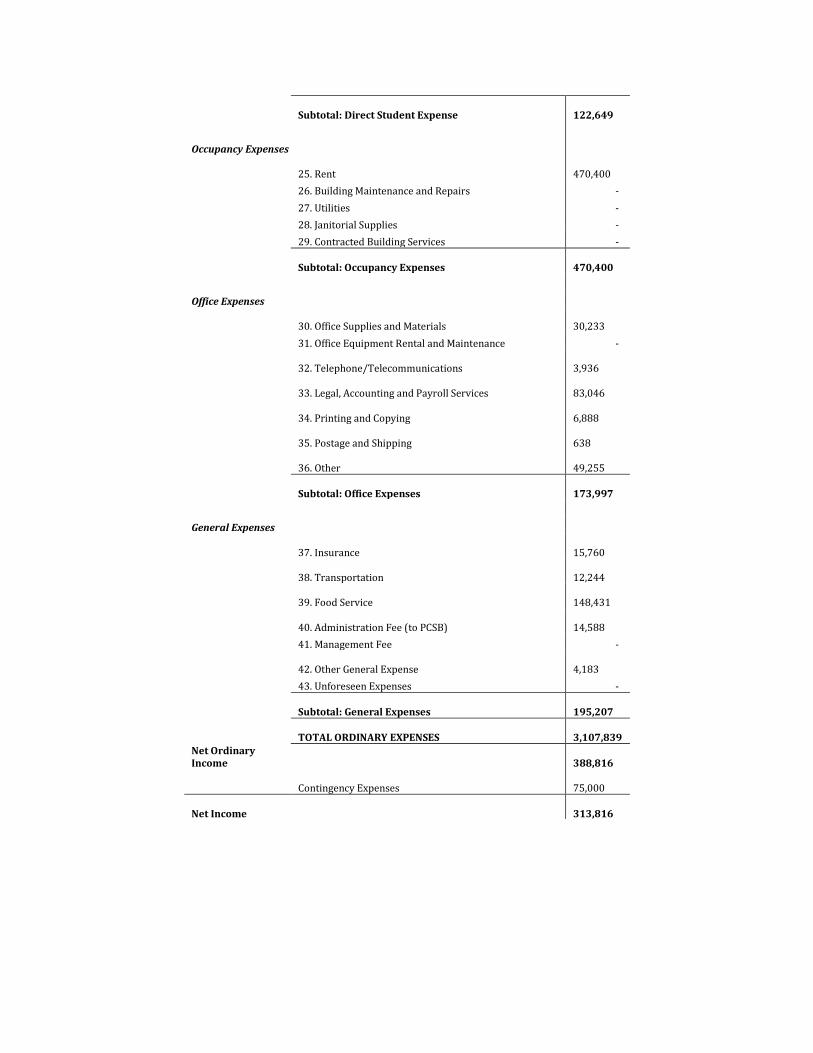
Subtotal: Direct Student Expense 122,649
Occupancy Expenses
25. Rent 470,400
26. Building Maintenance and Repairs -
27. Utilities -
28. Janitorial Supplies -
29. Contracted Building Services -
Subtotal: Occupancy Expenses 470,400
Office Expenses
30. Office Supplies and Materials 30,233
31. Office Equipment Rental and Maintenance -
32. Telephone/Telecommunications 3,936
33. Legal, Accounting and Payroll Services 83,046
34. Printing and Copying 6,888
35. Postage and Shipping 638
36. Other 49,255
Subtotal: Office Expenses 173,997
General Expenses
37. Insurance 15,760
38. Transportation 12,244
39. Food Service 148,431
40. Administration Fee (to PCSB) 14,588
41. Management Fee -
42. Other General Expense 4,183
43. Unforeseen Expenses -
Subtotal: General Expenses 195,207
TOTAL ORDINARY EXPENSES 3,107,839
Net Ordinary Income
388,816
Contingency Expenses 75,000
Net Income 313,816
EXCEL ACADEMY PUBLIC CHATER SCHOOL
Attachment B Data Worksheet
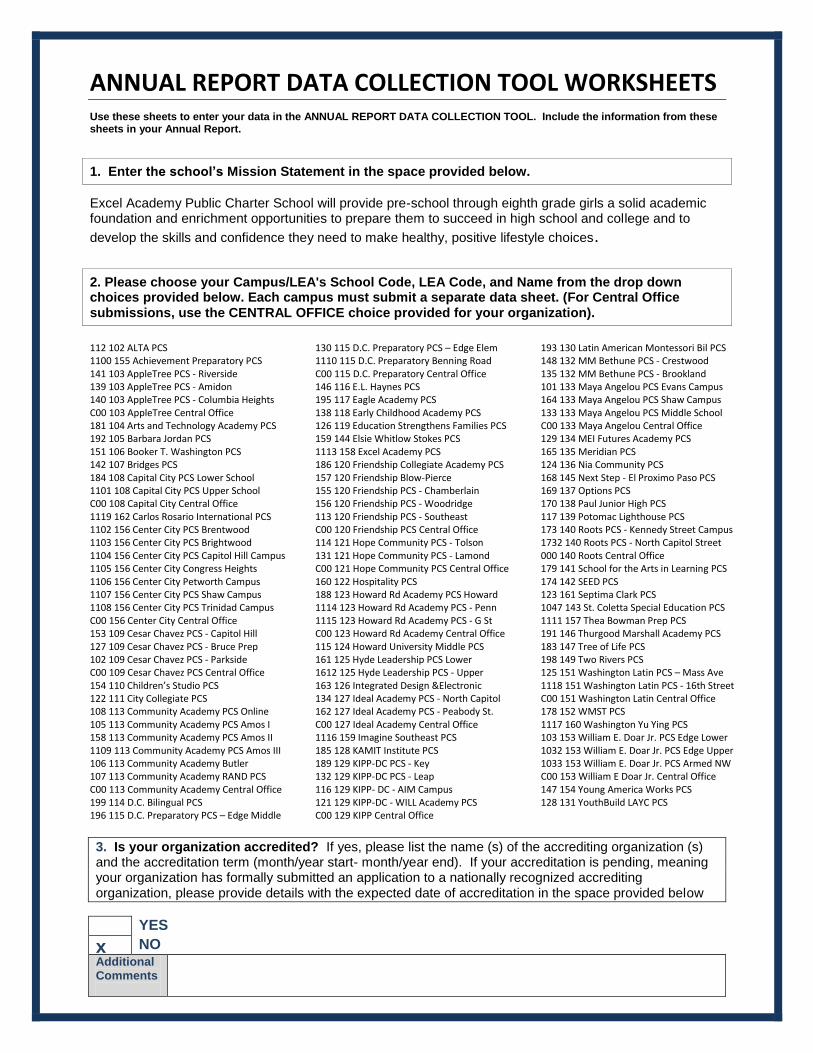
ANNUAL REPORT DATA COLLECTION TOOL WORKSHEETS Use these sheets to enter your data in the ANNUAL REPORT DATA COLLECTION TOOL. Include the information from these sheets in your Annual Report.
1. Enter the school’s Mission Statement in the space provided below.
Excel Academy Public Charter School will provide pre-school through eighth grade girls a solid academic foundation and enrichment opportunities to prepare them to succeed in high school and college and to
develop the skills and confidence they need to make healthy, positive lifestyle choices.
2. Please choose your Campus/LEA's School Code, LEA Code, and Name from the drop down choices provided below. Each campus must submit a separate data sheet. (For Central Office submissions, use the CENTRAL OFFICE choice provided for your organization).
112 102 ALTA PCS 1100 155 Achievement Preparatory PCS 141 103 AppleTree PCS - Riverside 139 103 AppleTree PCS - Amidon 140 103 AppleTree PCS - Columbia Heights C00 103 AppleTree Central Office 181 104 Arts and Technology Academy PCS 192 105 Barbara Jordan PCS 151 106 Booker T. Washington PCS 142 107 Bridges PCS 184 108 Capital City PCS Lower School 1101 108 Capital City PCS Upper School C00 108 Capital City Central Office 1119 162 Carlos Rosario International PCS 1102 156 Center City PCS Brentwood 1103 156 Center City PCS Brightwood 1104 156 Center City PCS Capitol Hill Campus 1105 156 Center City Congress Heights 1106 156 Center City Petworth Campus 1107 156 Center City PCS Shaw Campus 1108 156 Center City PCS Trinidad Campus C00 156 Center City Central Office 153 109 Cesar Chavez PCS - Capitol Hill 127 109 Cesar Chavez PCS - Bruce Prep 102 109 Cesar Chavez PCS - Parkside C00 109 Cesar Chavez PCS Central Office 154 110 Children’s Studio PCS 122 111 City Collegiate PCS 108 113 Community Academy PCS Online 105 113 Community Academy PCS Amos I 158 113 Community Academy PCS Amos II 1109 113 Community Academy PCS Amos III 106 113 Community Academy Butler 107 113 Community Academy RAND PCS C00 113 Community Academy Central Office 199 114 D.C. Bilingual PCS 196 115 D.C. Preparatory PCS – Edge Middle
130 115 D.C. Preparatory PCS – Edge Elem 1110 115 D.C. Preparatory Benning Road C00 115 D.C. Preparatory Central Office 146 116 E.L. Haynes PCS 195 117 Eagle Academy PCS 138 118 Early Childhood Academy PCS 126 119 Education Strengthens Families PCS 159 144 Elsie Whitlow Stokes PCS 1113 158 Excel Academy PCS 186 120 Friendship Collegiate Academy PCS 157 120 Friendship Blow-Pierce 155 120 Friendship PCS - Chamberlain 156 120 Friendship PCS - Woodridge 113 120 Friendship PCS - Southeast C00 120 Friendship PCS Central Office 114 121 Hope Community PCS - Tolson 131 121 Hope Community PCS - Lamond C00 121 Hope Community PCS Central Office 160 122 Hospitality PCS 188 123 Howard Rd Academy PCS Howard 1114 123 Howard Rd Academy PCS - Penn 1115 123 Howard Rd Academy PCS - G St C00 123 Howard Rd Academy Central Office 115 124 Howard University Middle PCS 161 125 Hyde Leadership PCS Lower 1612 125 Hyde Leadership PCS - Upper 163 126 Integrated Design &Electronic 134 127 Ideal Academy PCS - North Capitol 162 127 Ideal Academy PCS - Peabody St. C00 127 Ideal Academy Central Office 1116 159 Imagine Southeast PCS 185 128 KAMIT Institute PCS 189 129 KIPP-DC PCS - Key 132 129 KIPP-DC PCS - Leap 116 129 KIPP- DC - AIM Campus 121 129 KIPP-DC - WILL Academy PCS C00 129 KIPP Central Office
193 130 Latin American Montessori Bil PCS 148 132 MM Bethune PCS - Crestwood 135 132 MM Bethune PCS - Brookland 101 133 Maya Angelou PCS Evans Campus 164 133 Maya Angelou PCS Shaw Campus 133 133 Maya Angelou PCS Middle School C00 133 Maya Angelou Central Office 129 134 MEI Futures Academy PCS 165 135 Meridian PCS 124 136 Nia Community PCS 168 145 Next Step - El Proximo Paso PCS 169 137 Options PCS 170 138 Paul Junior High PCS 117 139 Potomac Lighthouse PCS 173 140 Roots PCS - Kennedy Street Campus 1732 140 Roots PCS - North Capitol Street 000 140 Roots Central Office 179 141 School for the Arts in Learning PCS 174 142 SEED PCS 123 161 Septima Clark PCS 1047 143 St. Coletta Special Education PCS 1111 157 Thea Bowman Prep PCS 191 146 Thurgood Marshall Academy PCS 183 147 Tree of Life PCS 198 149 Two Rivers PCS 125 151 Washington Latin PCS – Mass Ave 1118 151 Washington Latin PCS - 16th Street C00 151 Washington Latin Central Office 178 152 WMST PCS 1117 160 Washington Yu Ying PCS 103 153 William E. Doar Jr. PCS Edge Lower 1032 153 William E. Doar Jr. PCS Edge Upper 1033 153 William E. Doar Jr. PCS Armed NW C00 153 William E Doar Jr. Central Office 147 154 Young America Works PCS 128 131 YouthBuild LAYC PCS
3. Is your organization accredited? If yes, please list the name (s) of the accrediting organization (s) and the accreditation term (month/year start- month/year end). If your accreditation is pending, meaning your organization has formally submitted an application to a nationally recognized accrediting organization, please provide details with the expected date of accreditation in the space provided below
YES x NO Additional
Comments
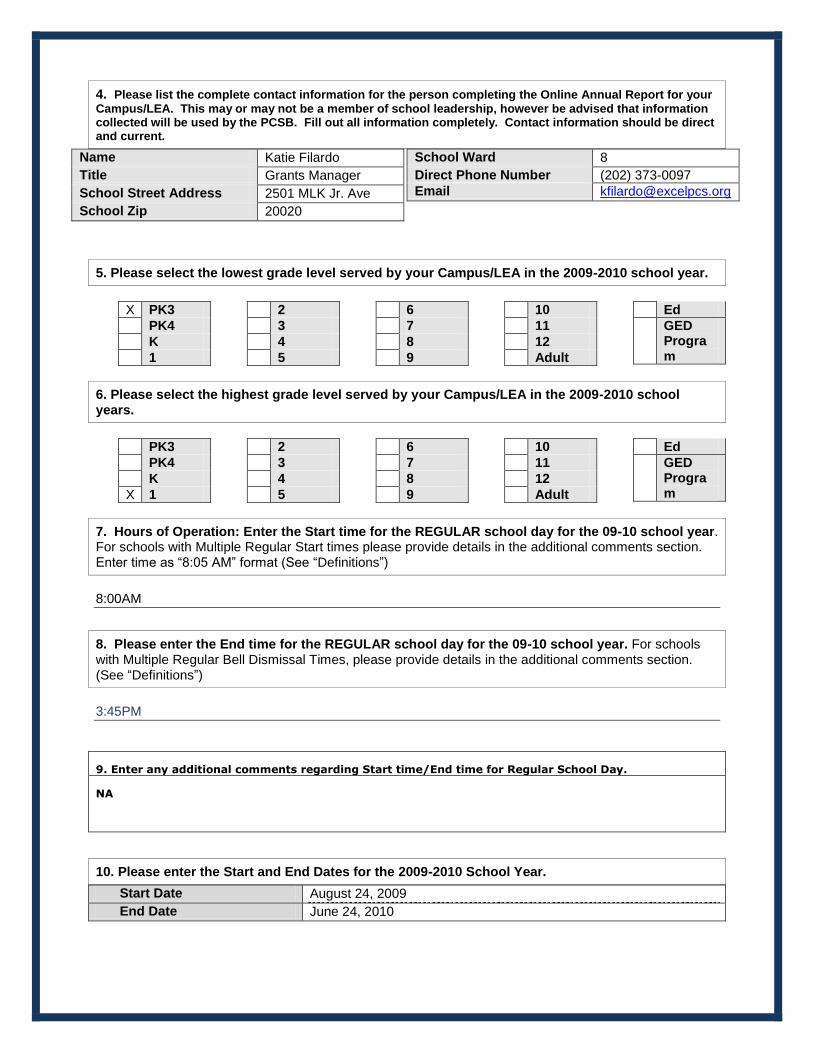
4. Please list the complete contact information for the person completing the Online Annual Report for your
Campus/LEA. This may or may not be a member of school leadership, however be advised that information collected will be used by the PCSB. Fill out all information completely. Contact information should be direct and current.
Name Katie Filardo
Title Grants Manager
School Street Address 2501 MLK Jr. Ave
School Zip 20020
School Ward 8
Direct Phone Number (202) 373-0097
Email [email protected]
5. Please select the lowest grade level served by your Campus/LEA in the 2009-2010 school year.
X PK3
PK4
K
1
2
3
4
5
6
7
8
9
10
11
12
Adult
Ed
GED Program
6. Please select the highest grade level served by your Campus/LEA in the 2009-2010 school years.
PK3
PK4
K
X 1
2
3
4
5
6
7
8
9
10
11
12
Adult
Ed
GED Program
7. Hours of Operation: Enter the Start time for the REGULAR school day for the 09-10 school year. For schools with Multiple Regular Start times please provide details in the additional comments section. Enter time as “8:05 AM” format (See “Definitions”)
8:00AM
8. Please enter the End time for the REGULAR school day for the 09-10 school year. For schools with Multiple Regular Bell Dismissal Times, please provide details in the additional comments section. (See “Definitions”)
3:45PM
9. Enter any additional comments regarding Start time/End time for Regular School Day.
NA
10. Please enter the Start and End Dates for the 2009-2010 School Year.
Start Date August 24, 2009
End Date June 24, 2010
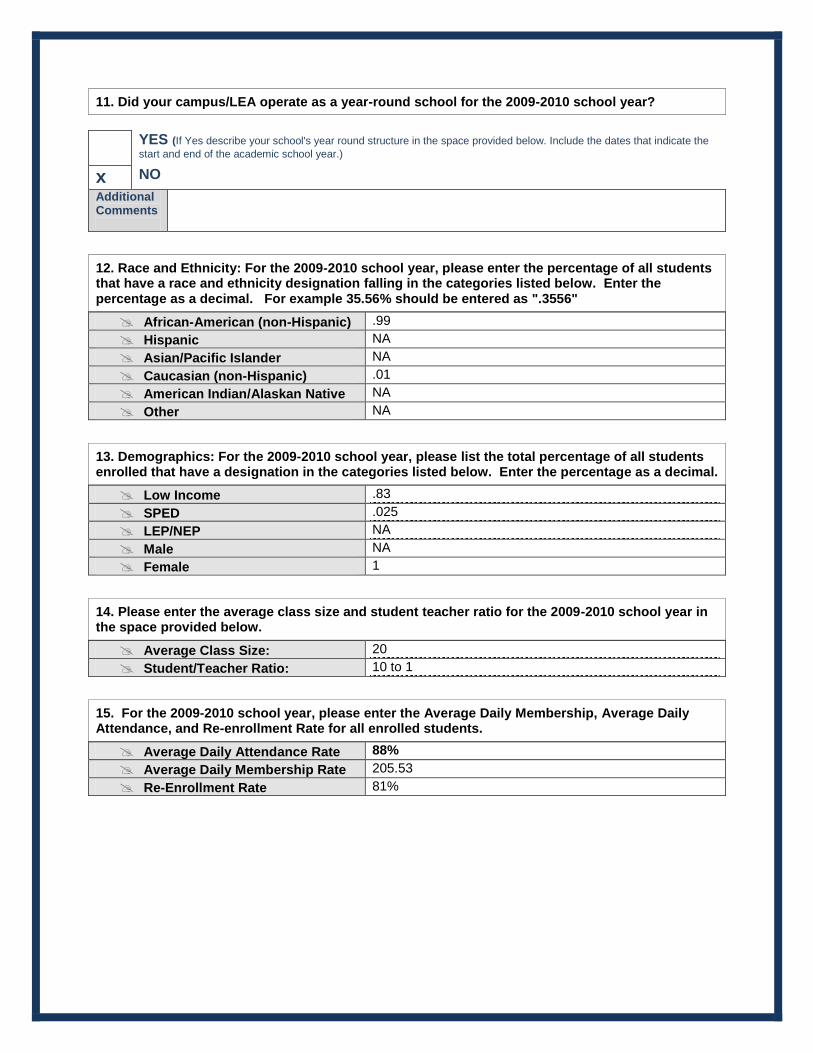
11. Did your campus/LEA operate as a year-round school for the 2009-2010 school year?
YES (If Yes describe your school's year round structure in the space provided below. Include the dates that indicate the
start and end of the academic school year.)
x NO Additional
Comments
12. Race and Ethnicity: For the 2009-2010 school year, please enter the percentage of all students that have a race and ethnicity designation falling in the categories listed below. Enter the percentage as a decimal. For example 35.56% should be entered as ".3556"
African-American (non-Hispanic) .99
Hispanic NA
Asian/Pacific Islander NA
Caucasian (non-Hispanic) .01
American Indian/Alaskan Native NA
Other NA
13. Demographics: For the 2009-2010 school year, please list the total percentage of all students enrolled that have a designation in the categories listed below. Enter the percentage as a decimal.
Low Income .83
SPED .025
LEP/NEP NA
Male NA
Female 1
14. Please enter the average class size and student teacher ratio for the 2009-2010 school year in the space provided below.
Average Class Size: 20
Student/Teacher Ratio: 10 to 1
15. For the 2009-2010 school year, please enter the Average Daily Membership, Average Daily Attendance, and Re-enrollment Rate for all enrolled students.
Average Daily Attendance Rate 88%
Average Daily Membership Rate 205.53
Re-Enrollment Rate 81%
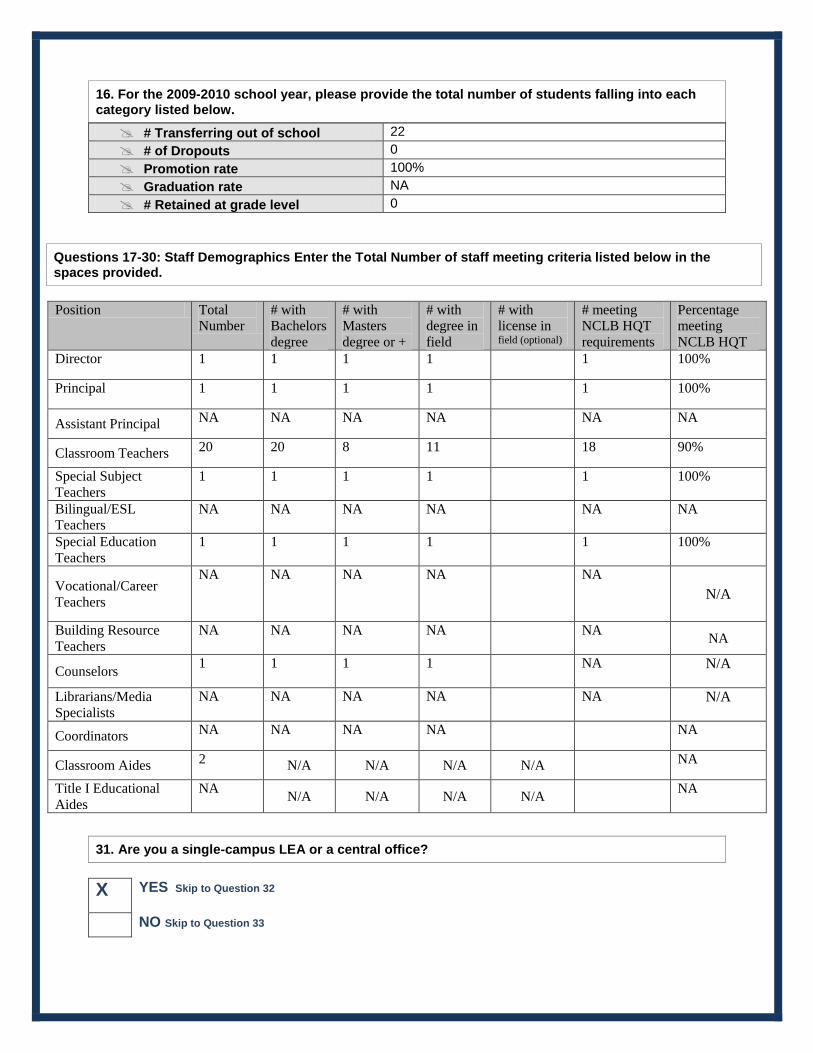
16. For the 2009-2010 school year, please provide the total number of students falling into each category listed below.
# Transferring out of school 22
# of Dropouts 0
Promotion rate 100%
Graduation rate NA
# Retained at grade level 0
Questions 17-30: Staff Demographics Enter the Total Number of staff meeting criteria listed below in the spaces provided.
Position Total
Number
# with
Bachelors
degree
# with
Masters
degree or +
# with
degree in
field
# with
license in field (optional)
# meeting
NCLB HQT
requirements
Percentage
meeting
NCLB HQT
Director 1 1 1 1 1 100%
Principal 1 1 1 1 1 100%
Assistant Principal NA NA NA NA NA NA
Classroom Teachers 20 20 8 11 18 90%
Special Subject
Teachers
1 1 1 1 1 100%
Bilingual/ESL
Teachers
NA NA NA NA NA NA
Special Education
Teachers
1 1 1 1 1 100%
Vocational/Career
Teachers
NA NA NA NA NA
N/A
Building Resource
Teachers
NA NA NA NA NA NA
Counselors 1 1 1 1 NA N/A
Librarians/Media
Specialists
NA NA NA NA NA N/A
Coordinators NA NA NA NA NA
Classroom Aides 2
N/A N/A N/A N/A NA
Title I Educational
Aides
NA N/A N/A N/A N/A
NA
31. Are you a single-campus LEA or a central office?
X YES Skip to Question 32
NO Skip to Question 33
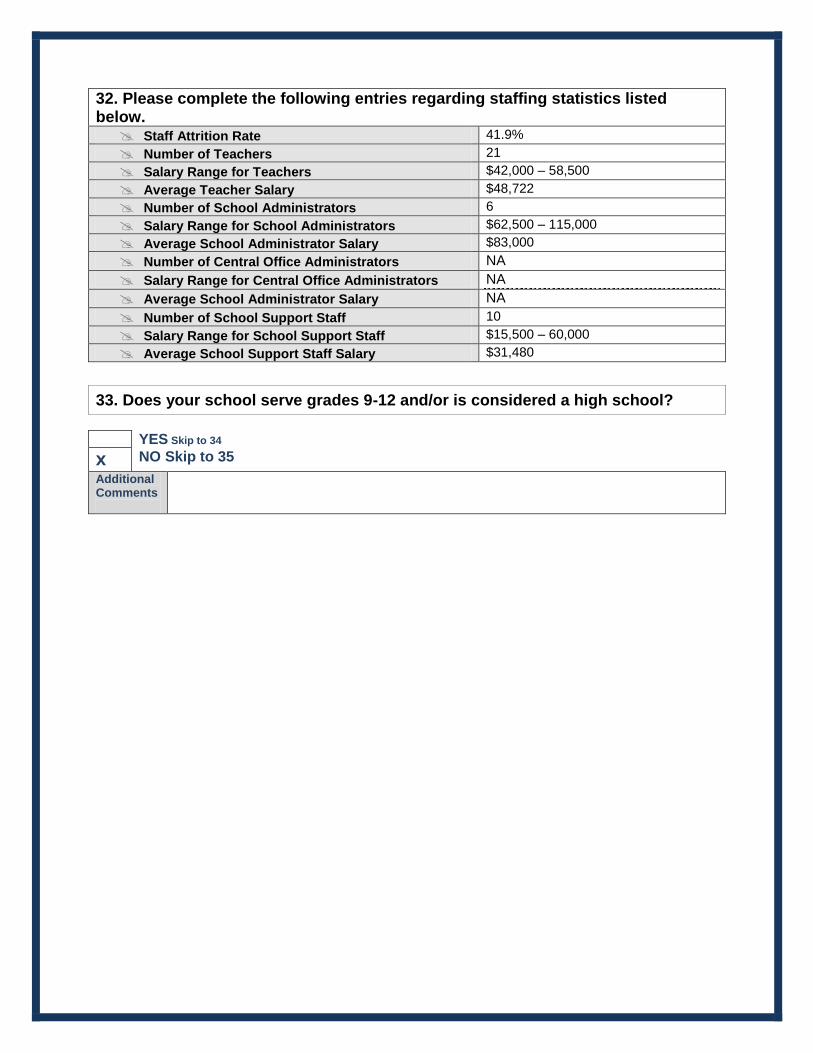
32. Please complete the following entries regarding staffing statistics listed below. Staff Attrition Rate 41.9%
Number of Teachers 21
Salary Range for Teachers $42,000 – 58,500
Average Teacher Salary $48,722
Number of School Administrators 6
Salary Range for School Administrators $62,500 – 115,000
Average School Administrator Salary $83,000
Number of Central Office Administrators NA
Salary Range for Central Office Administrators NA
Average School Administrator Salary NA
Number of School Support Staff 10
Salary Range for School Support Staff $15,500 – 60,000
Average School Support Staff Salary $31,480
33. Does your school serve grades 9-12 and/or is considered a high school?
YES Skip to 34
x NO Skip to 35 Additional
Comments
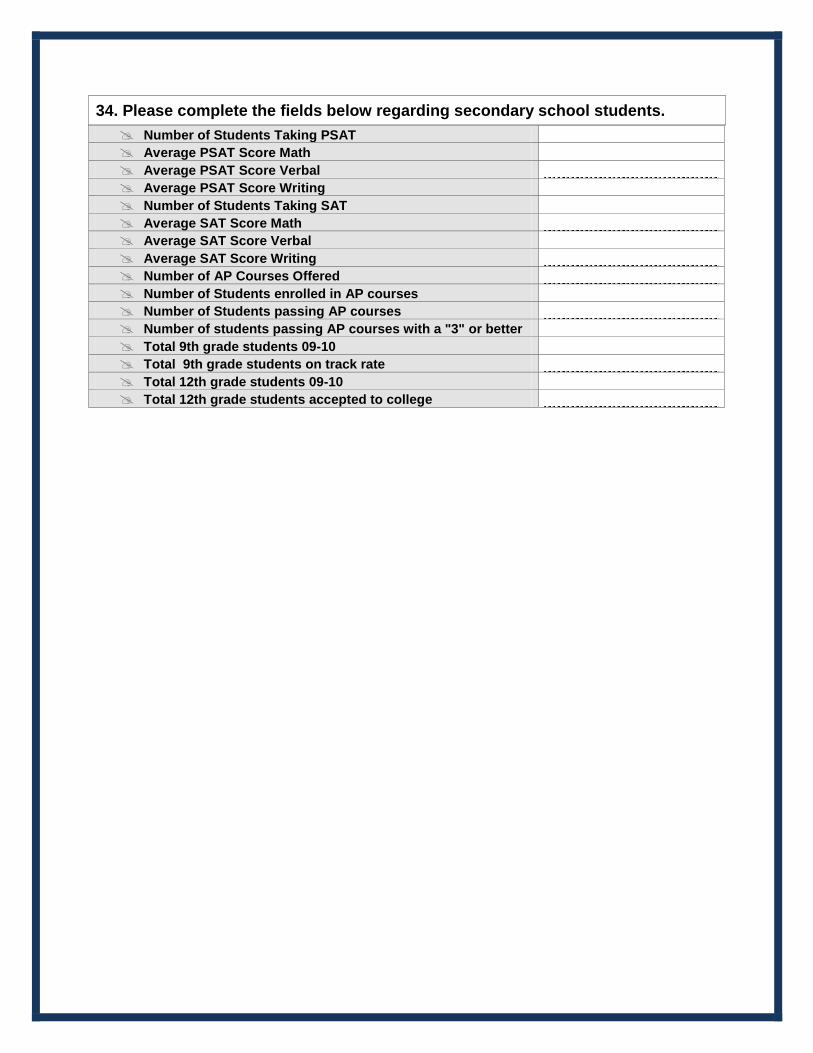
34. Please complete the fields below regarding secondary school students.
Number of Students Taking PSAT
Average PSAT Score Math
Average PSAT Score Verbal
Average PSAT Score Writing
Number of Students Taking SAT
Average SAT Score Math
Average SAT Score Verbal
Average SAT Score Writing
Number of AP Courses Offered
Number of Students enrolled in AP courses
Number of Students passing AP courses
Number of students passing AP courses with a "3" or better
Total 9th grade students 09-10
Total 9th grade students on track rate
Total 12th grade students 09-10
Total 12th grade students accepted to college
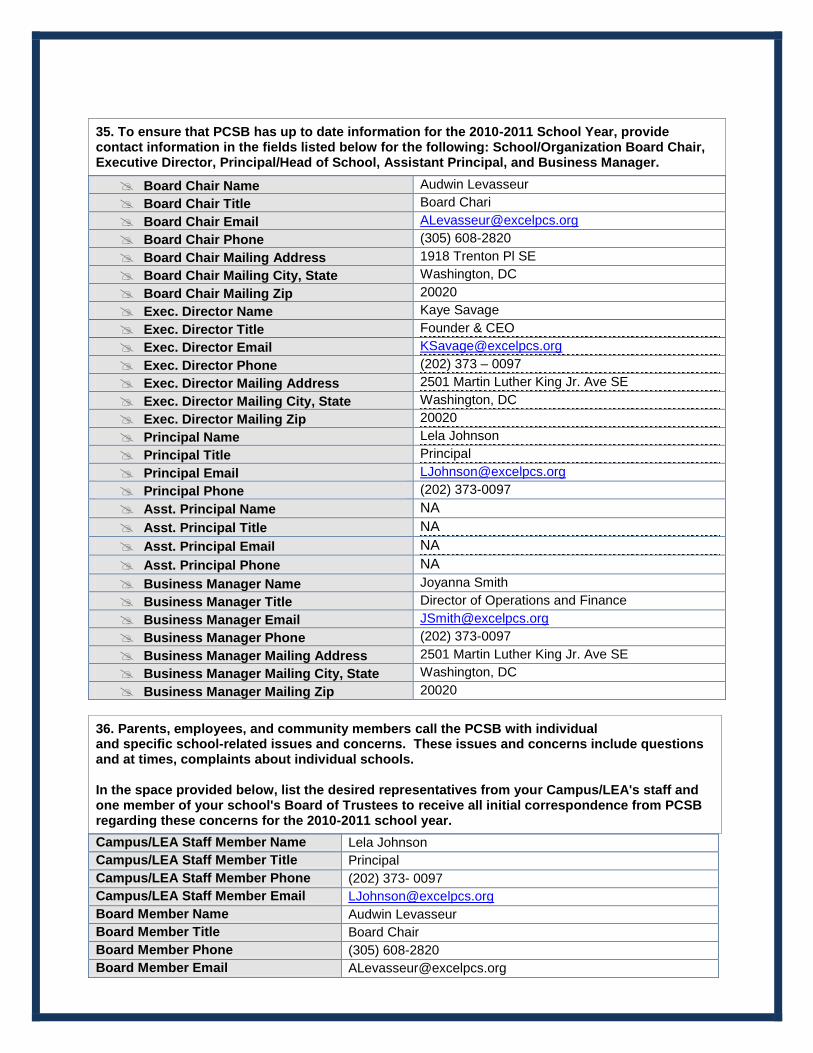
35. To ensure that PCSB has up to date information for the 2010-2011 School Year, provide contact information in the fields listed below for the following: School/Organization Board Chair, Executive Director, Principal/Head of School, Assistant Principal, and Business Manager.
Board Chair Name Audwin Levasseur
Board Chair Title Board Chari
Board Chair Email [email protected]
Board Chair Phone (305) 608-2820
Board Chair Mailing Address 1918 Trenton Pl SE
Board Chair Mailing City, State Washington, DC
Board Chair Mailing Zip 20020
Exec. Director Name Kaye Savage
Exec. Director Title Founder & CEO
Exec. Director Email [email protected]
Exec. Director Phone (202) 373 – 0097
Exec. Director Mailing Address 2501 Martin Luther King Jr. Ave SE
Exec. Director Mailing City, State Washington, DC
Exec. Director Mailing Zip 20020
Principal Name Lela Johnson
Principal Title Principal
Principal Email [email protected]
Principal Phone (202) 373-0097
Asst. Principal Name NA
Asst. Principal Title NA
Asst. Principal Email NA
Asst. Principal Phone NA
Business Manager Name Joyanna Smith
Business Manager Title Director of Operations and Finance
Business Manager Email [email protected]
Business Manager Phone (202) 373-0097
Business Manager Mailing Address 2501 Martin Luther King Jr. Ave SE
Business Manager Mailing City, State Washington, DC
Business Manager Mailing Zip 20020
36. Parents, employees, and community members call the PCSB with individual and specific school-related issues and concerns. These issues and concerns include questions and at times, complaints about individual schools. In the space provided below, list the desired representatives from your Campus/LEA's staff and one member of your school's Board of Trustees to receive all initial correspondence from PCSB regarding these concerns for the 2010-2011 school year.
Campus/LEA Staff Member Name Lela Johnson
Campus/LEA Staff Member Title Principal
Campus/LEA Staff Member Phone (202) 373- 0097
Campus/LEA Staff Member Email [email protected]
Board Member Name Audwin Levasseur
Board Member Title Board Chair
Board Member Phone (305) 608-2820
Board Member Email [email protected]
EXCEL ACADEMY PUBLIC CHARTER SCHOOL
Attachment C Certifications

Appendix K
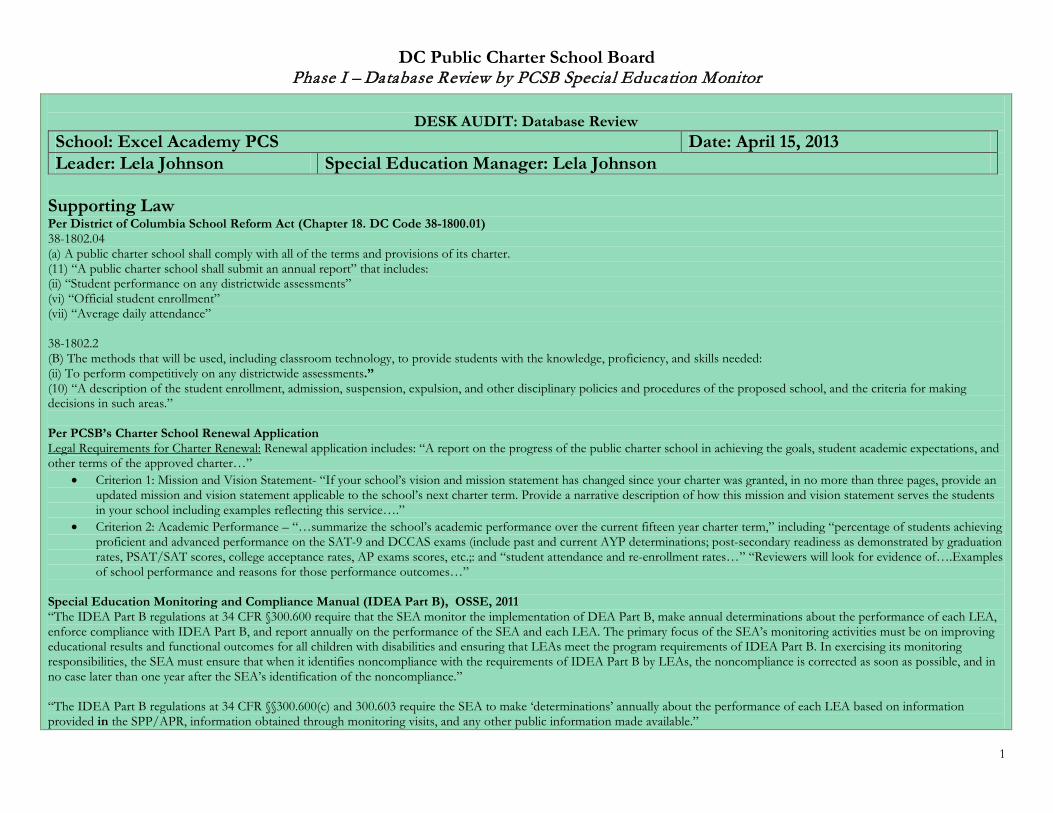
1
DC Public Charter School Board Phase I – Database Review by PCSB Special Education Monitor
DESK AUDIT: Database Review
School: Excel Academy PCS Date: April 15, 2013 Leader: Lela Johnson Special Education Manager: Lela Johnson
Supporting Law Per District of Columbia School Reform Act (Chapter 18. DC Code 38-1800.01) 38-1802.04 (a) A public charter school shall comply with all of the terms and provisions of its charter. (11) “A public charter school shall submit an annual report” that includes: (ii) “Student performance on any districtwide assessments” (vi) “Official student enrollment” (vii) “Average daily attendance” 38-1802.2 (B) The methods that will be used, including classroom technology, to provide students with the knowledge, proficiency, and skills needed: (ii) To perform competitively on any districtwide assessments.” (10) “A description of the student enrollment, admission, suspension, expulsion, and other disciplinary policies and procedures of the proposed school, and the criteria for making decisions in such areas.” Per PCSB’s Charter School Renewal Application Legal Requirements for Charter Renewal: Renewal application includes: “A report on the progress of the public charter school in achieving the goals, student academic expectations, and other terms of the approved charter…”
• Criterion 1: Mission and Vision Statement- “If your school’s vision and mission statement has changed since your charter was granted, in no more than three pages, provide an updated mission and vision statement applicable to the school’s next charter term. Provide a narrative description of how this mission and vision statement serves the students in your school including examples reflecting this service….”
• Criterion 2: Academic Performance – “…summarize the school’s academic performance over the current fifteen year charter term,” including “percentage of students achieving proficient and advanced performance on the SAT-9 and DCCAS exams (include past and current AYP determinations; post-secondary readiness as demonstrated by graduation rates, PSAT/SAT scores, college acceptance rates, AP exams scores, etc.;: and “student attendance and re-enrollment rates…” “Reviewers will look for evidence of….Examples of school performance and reasons for those performance outcomes…”
Special Education Monitoring and Compliance Manual (IDEA Part B), OSSE, 2011 “The IDEA Part B regulations at 34 CFR §300.600 require that the SEA monitor the implementation of DEA Part B, make annual determinations about the performance of each LEA, enforce compliance with IDEA Part B, and report annually on the performance of the SEA and each LEA. The primary focus of the SEA’s monitoring activities must be on improving educational results and functional outcomes for all children with disabilities and ensuring that LEAs meet the program requirements of IDEA Part B. In exercising its monitoring responsibilities, the SEA must ensure that when it identifies noncompliance with the requirements of IDEA Part B by LEAs, the noncompliance is corrected as soon as possible, and in no case later than one year after the SEA’s identification of the noncompliance.” “The IDEA Part B regulations at 34 CFR §§300.600(c) and 300.603 require the SEA to make ‘determinations’ annually about the performance of each LEA based on information provided in the SPP/APR, information obtained through monitoring visits, and any other public information made available.”
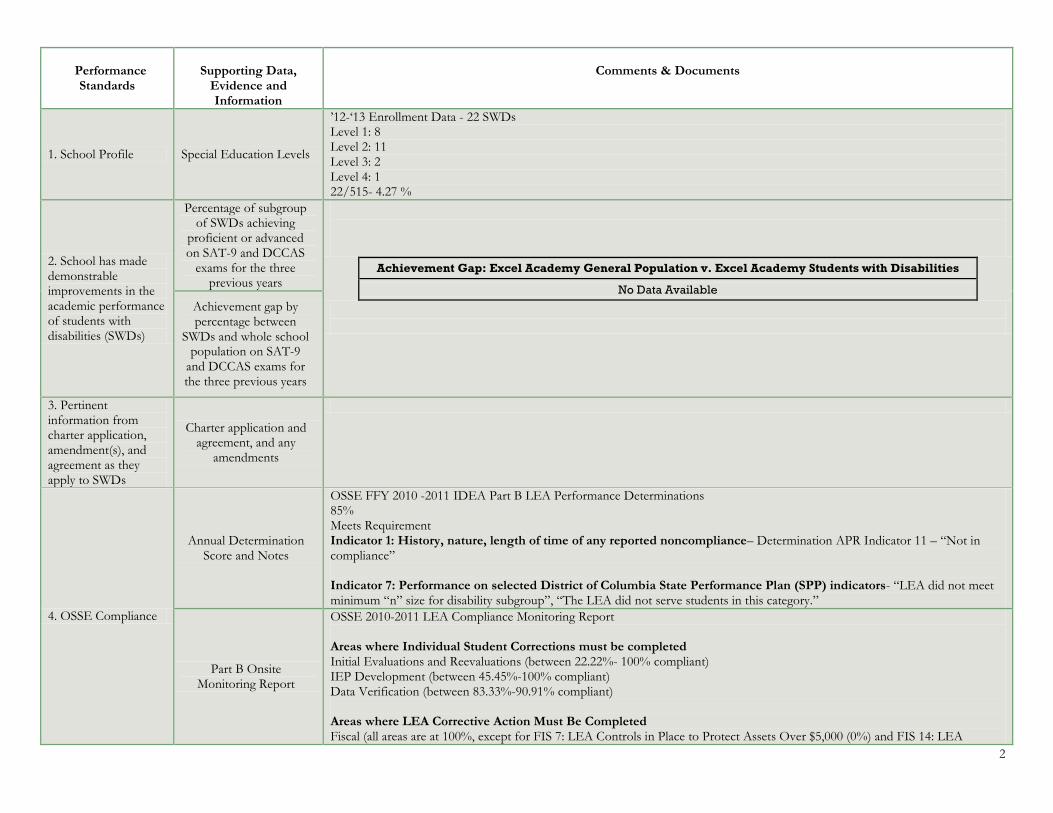
2
Performance
Standards
Supporting Data,
Evidence and Information
Comments & Documents
1. School Profile Special Education Levels
’12-‘13 Enrollment Data - 22 SWDs Level 1: 8 Level 2: 11 Level 3: 2 Level 4: 1 22/515- 4.27 %
2. School has made demonstrable improvements in the academic performance of students with disabilities (SWDs)
Percentage of subgroup of SWDs achieving
proficient or advanced on SAT-9 and DCCAS
exams for the three previous years
Achievement Gap: Excel Academy General Population v. Excel Academy Students with Disabilities
No Data Available Achievement gap by percentage between
SWDs and whole school population on SAT-9
and DCCAS exams for the three previous years
3. Pertinent information from charter application, amendment(s), and agreement as they apply to SWDs
Charter application and agreement, and any
amendments
4. OSSE Compliance
Annual Determination Score and Notes
OSSE FFY 2010 -2011 IDEA Part B LEA Performance Determinations 85% Meets Requirement Indicator 1: History, nature, length of time of any reported noncompliance– Determination APR Indicator 11 – “Not in compliance” Indicator 7: Performance on selected District of Columbia State Performance Plan (SPP) indicators- “LEA did not meet minimum “n” size for disability subgroup”, “The LEA did not serve students in this category.”
Part B Onsite Monitoring Report
OSSE 2010-2011 LEA Compliance Monitoring Report Areas where Individual Student Corrections must be completed Initial Evaluations and Reevaluations (between 22.22%- 100% compliant) IEP Development (between 45.45%-100% compliant) Data Verification (between 83.33%-90.91% compliant) Areas where LEA Corrective Action Must Be Completed Fiscal (all areas are at 100%, except for FIS 7: LEA Controls in Place to Protect Assets Over $5,000 (0%) and FIS 14: LEA
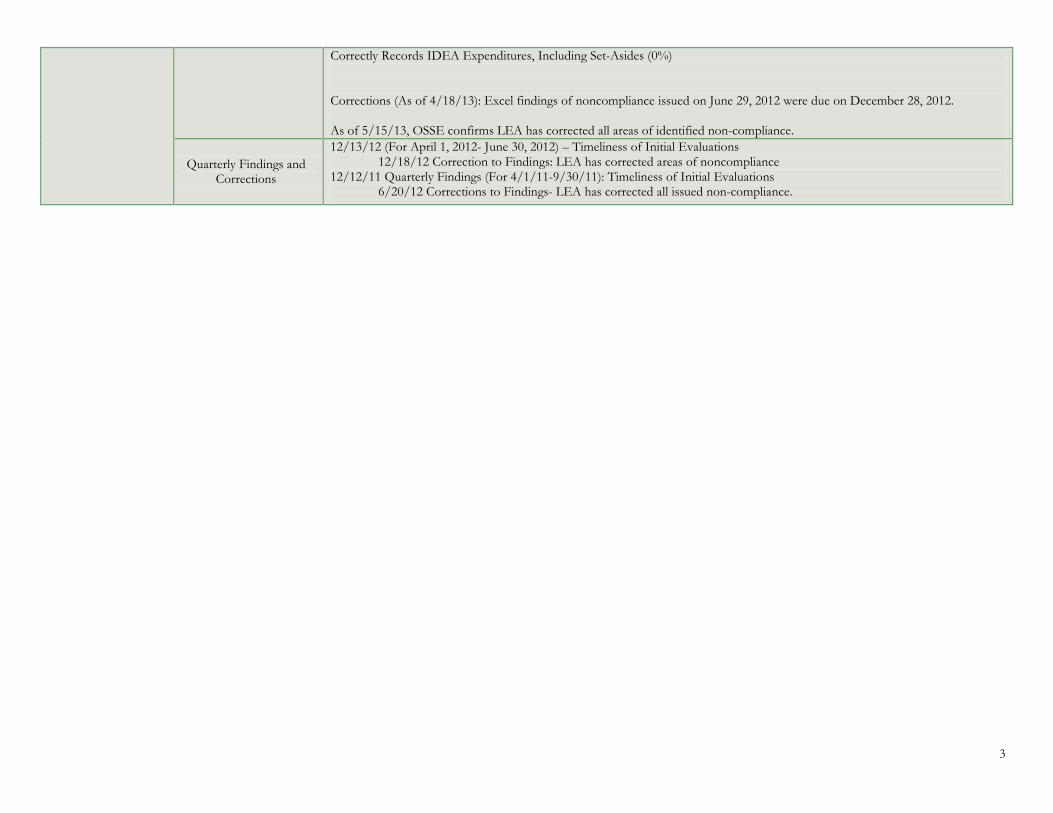
3
Correctly Records IDEA Expenditures, Including Set-Asides (0%) Corrections (As of 4/18/13): Excel findings of noncompliance issued on June 29, 2012 were due on December 28, 2012. As of 5/15/13, OSSE confirms LEA has corrected all areas of identified non-compliance.
Quarterly Findings and Corrections
12/13/12 (For April 1, 2012- June 30, 2012) – Timeliness of Initial Evaluations 12/18/12 Correction to Findings: LEA has corrected areas of noncompliance
12/12/11 Quarterly Findings (For 4/1/11-9/30/11): Timeliness of Initial Evaluations 6/20/12 Corrections to Findings- LEA has corrected all issued non-compliance.

Appendix L
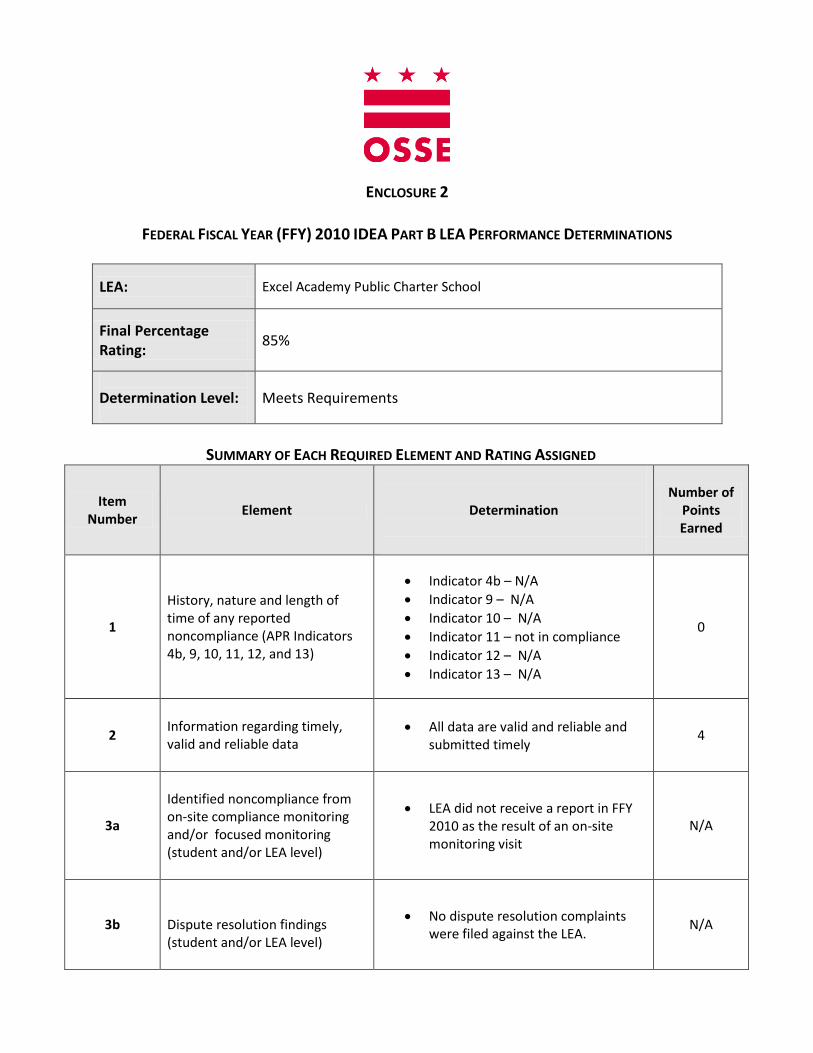
ENCLOSURE 2
FEDERAL FISCAL YEAR (FFY) 2010 IDEA PART B LEA PERFORMANCE DETERMINATIONS
LEA: Excel Academy Public Charter School
Final Percentage Rating:
85%
Determination Level:
Meets Requirements
SUMMARY OF EACH REQUIRED ELEMENT AND RATING ASSIGNED
Item Number
Element
Determination
Number of Points Earned
1
History, nature and length of time of any reported noncompliance (APR Indicators 4b, 9, 10, 11, 12, and 13)
Indicator 4b – N/A
Indicator 9 – N/A
Indicator 10 – N/A
Indicator 11 – not in compliance
Indicator 12 – N/A
Indicator 13 – N/A
0
2
Information regarding timely, valid and reliable data
All data are valid and reliable and submitted timely
4
3a
Identified noncompliance from on-site compliance monitoring and/or focused monitoring (student and/or LEA level)
LEA did not receive a report in FFY 2010 as the result of an on-site monitoring visit
N/A
3b
Dispute resolution findings (student and/or LEA level)
No dispute resolution complaints were filed against the LEA.
N/A
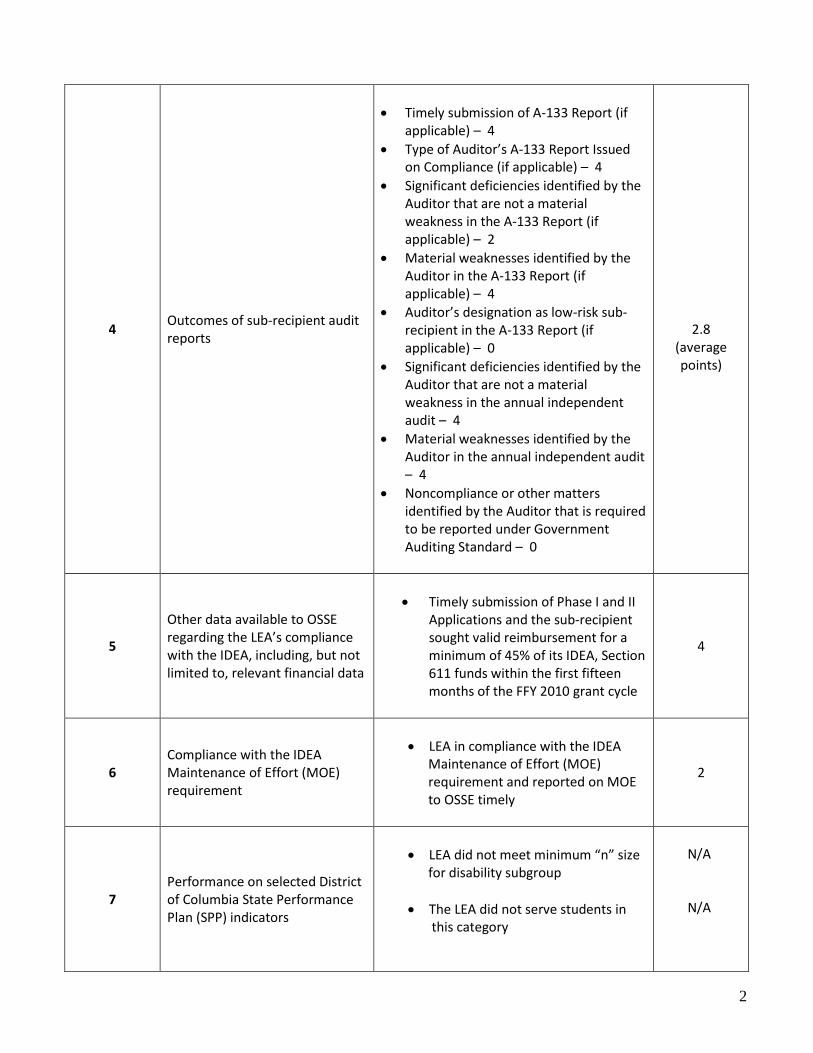
2
4
Outcomes of sub-recipient audit reports
Timely submission of A-133 Report (if applicable) – 4
Type of Auditor’s A-133 Report Issued on Compliance (if applicable) – 4
Significant deficiencies identified by the Auditor that are not a material weakness in the A-133 Report (if applicable) – 2
Material weaknesses identified by the Auditor in the A-133 Report (if applicable) – 4
Auditor’s designation as low-risk sub-recipient in the A-133 Report (if applicable) – 0
Significant deficiencies identified by the Auditor that are not a material weakness in the annual independent audit – 4
Material weaknesses identified by the Auditor in the annual independent audit – 4
Noncompliance or other matters identified by the Auditor that is required to be reported under Government Auditing Standard – 0
2.8 (average points)
5
Other data available to OSSE regarding the LEA’s compliance with the IDEA, including, but not limited to, relevant financial data
Timely submission of Phase I and II Applications and the sub-recipient sought valid reimbursement for a minimum of 45% of its IDEA, Section 611 funds within the first fifteen months of the FFY 2010 grant cycle
4
6 Compliance with the IDEA Maintenance of Effort (MOE) requirement
LEA in compliance with the IDEA Maintenance of Effort (MOE) requirement and reported on MOE to OSSE timely
2
7
Performance on selected District of Columbia State Performance Plan (SPP) indicators
LEA did not meet minimum “n” size for disability subgroup
The LEA did not serve students in this category
N/A N/A
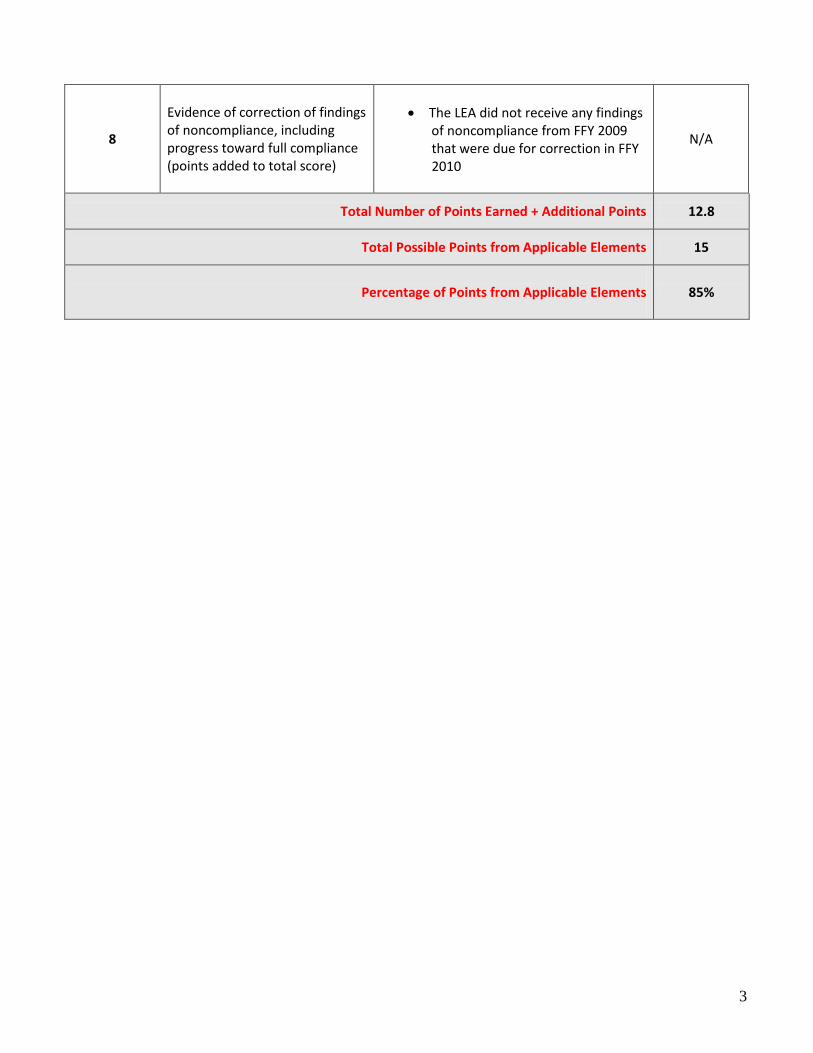
3
8
Evidence of correction of findings of noncompliance, including progress toward full compliance (points added to total score)
The LEA did not receive any findings of noncompliance from FFY 2009 that were due for correction in FFY 2010
N/A
Total Number of Points Earned + Additional Points 12.8
Total Possible Points from Applicable Elements 15
Percentage of Points from Applicable Elements
85%

Appendix M
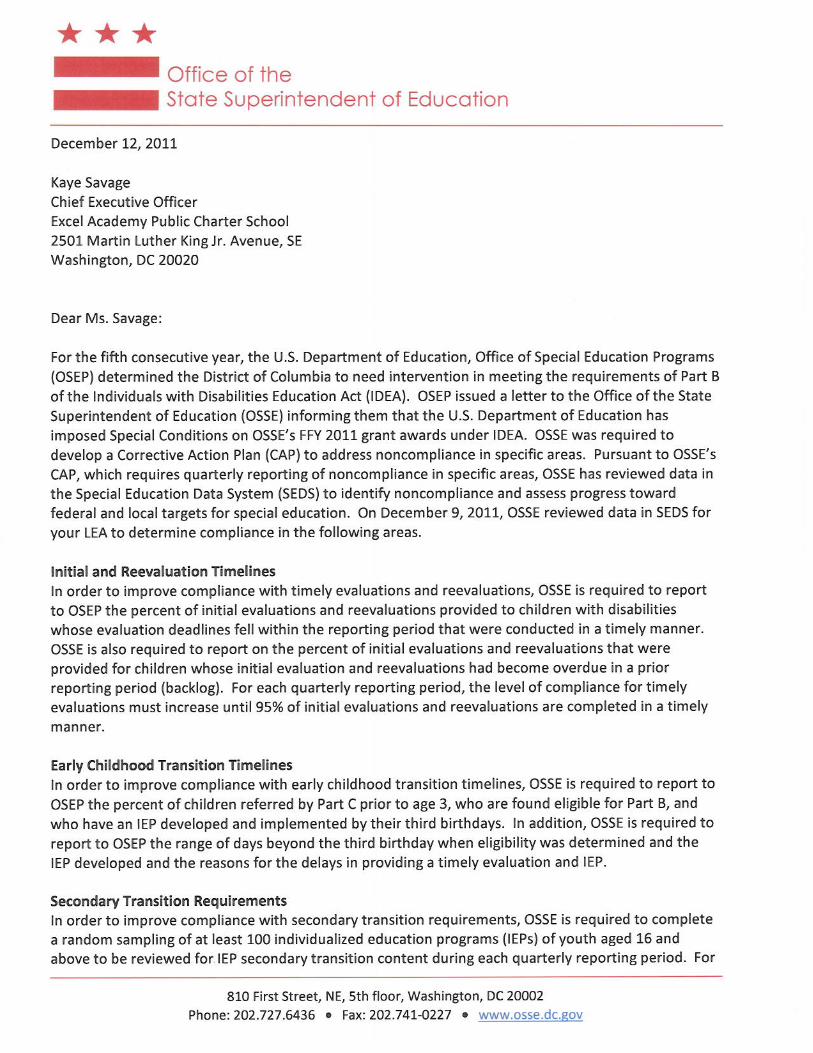
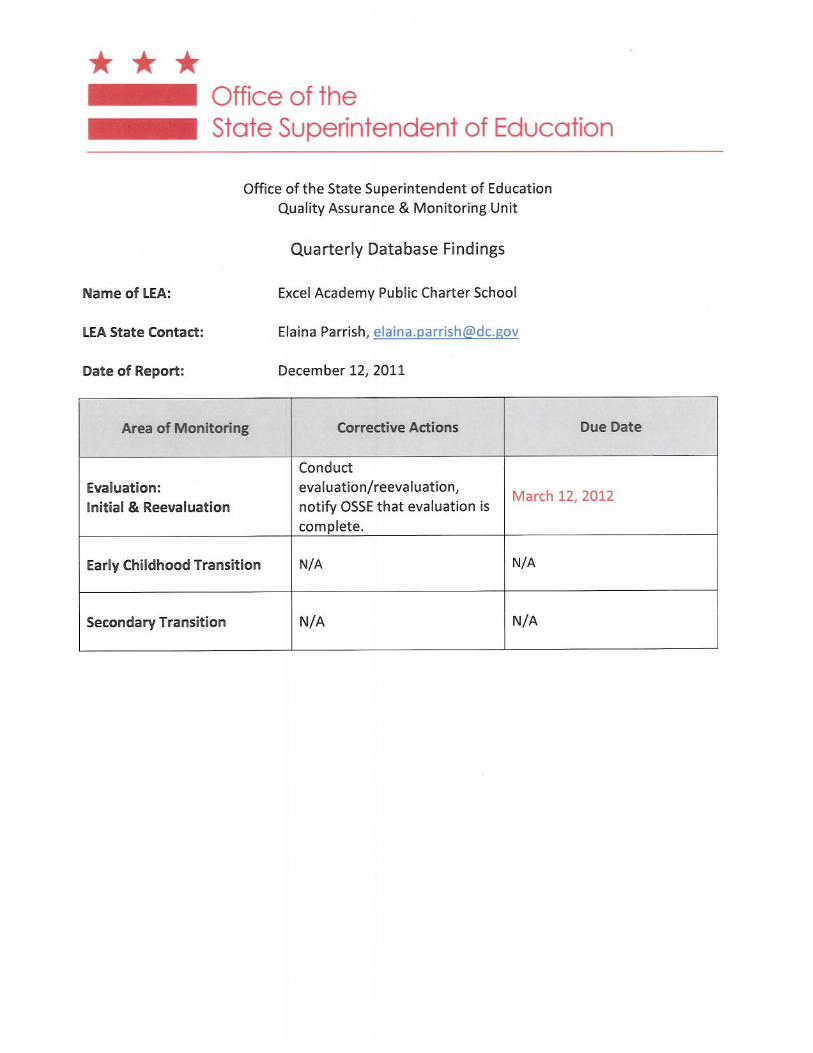
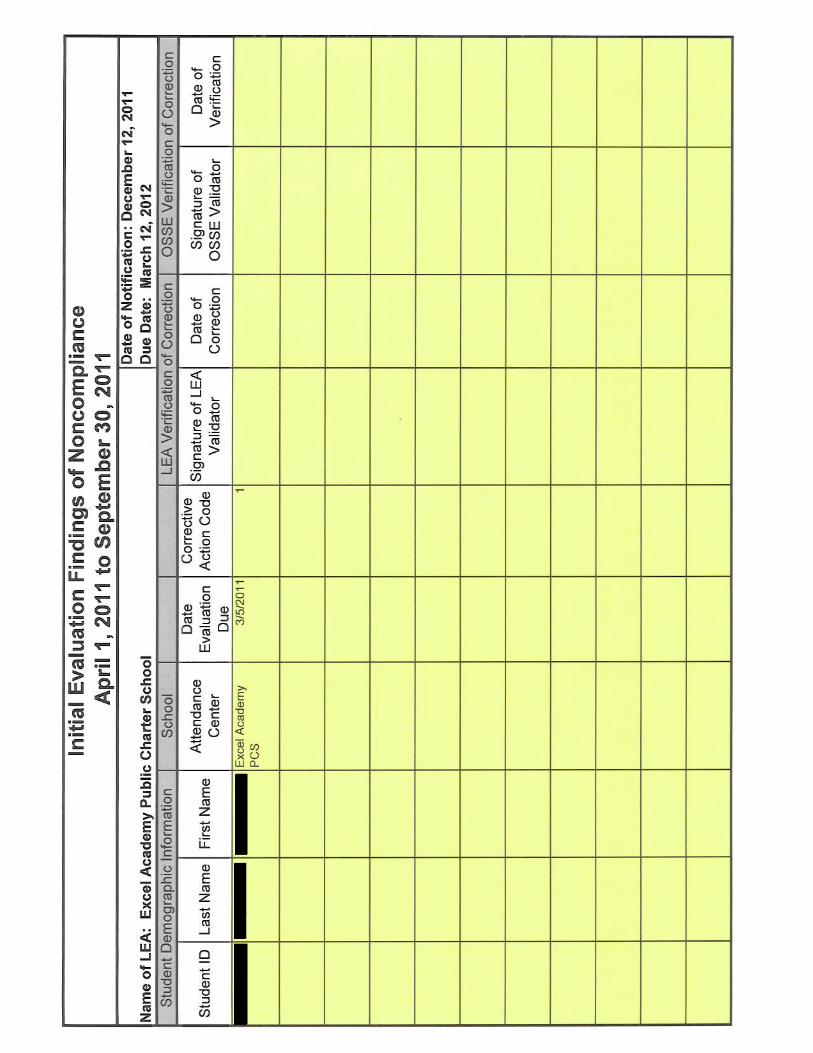

Appendix N
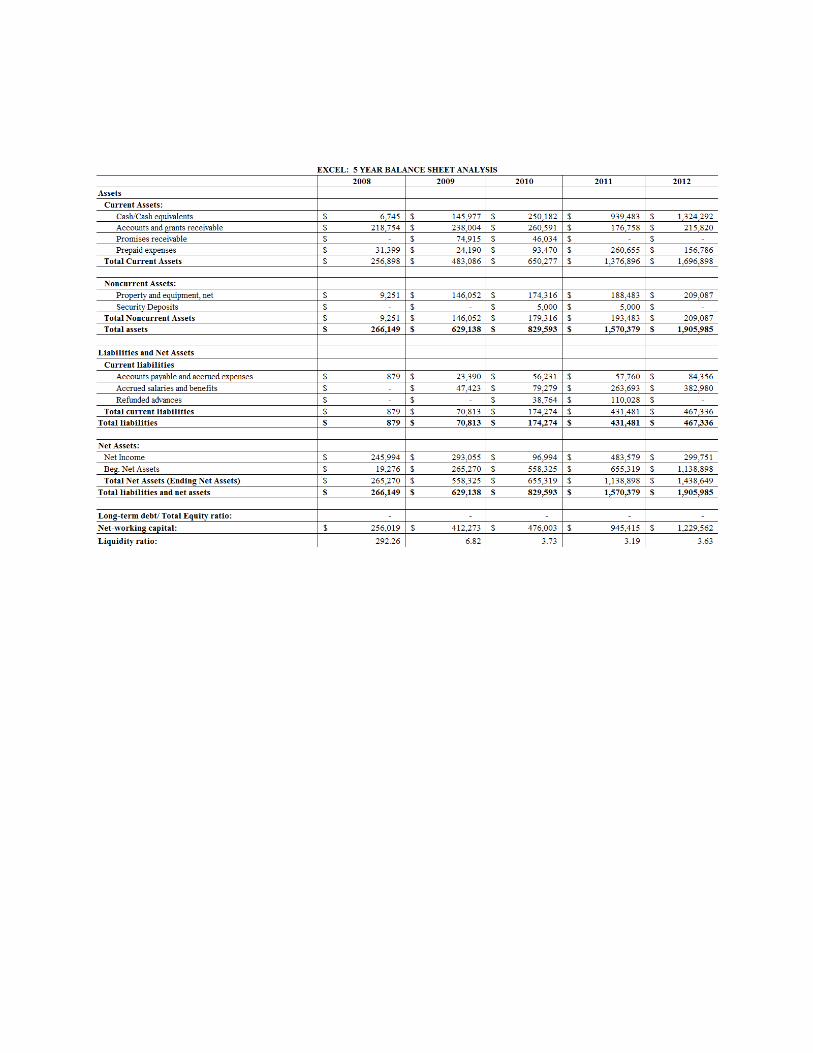
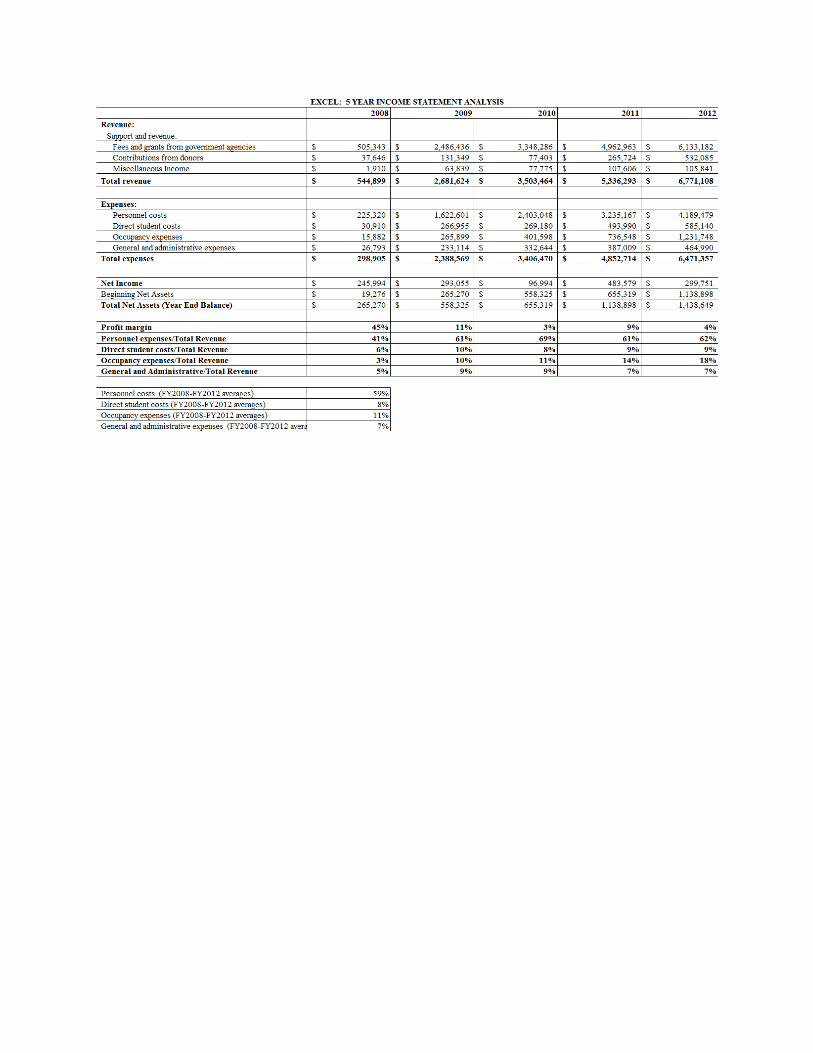
Related Documents