NATIONAL CENTER FOR STATE COURTS Examining the Work of State Courts: An Analysis of 2007 State Court Caseloads www.courtstatistics.org

Welcome message from author
This document is posted to help you gain knowledge. Please leave a comment to let me know what you think about it! Share it to your friends and learn new things together.
Transcript
NATIONAL CENTER FOR STATE COURTS
Examining the Work of State Courts: An Analysis of 2007 State Court Caseloads
www.courtstatistics.org
COURT STATISTICS PROJECT STAFF
Director
Richard Y. Schauffler
Senior court reSearch analyStS
Robert C. LaFountain Shauna M. Strickland
court reSearch analyStS
Chantal G. BromageSarah A. Gibson Ashley N. Mason
William E. Raftery
PRoGRAM SPECiALiSt
Brenda G. otto
iNFoRMAtioN DESiGN
Neal B. Kauder, VisualResearch, inc.
NATIONAL CENTER FOR STATE COURTS
Examining the Work of State Courts: An Analysis of 2007 State Court Caseloads
www.courtstatistics.org
A joint project of the Conference of State Court Administrators, the Bureau of Justice Statistics, and the National Center for State Courts.
R. LaFountain, R. Schauffler, S. Strickland, C. Bromage, S. Gibson, A. Mason, & W. Raftery
Examining the Work of State Courts: A National Perspective from the Court Statistics Project (National Center for State Courts 2009)
© Copyright 2009National Center for State CourtsISBN 0-89656-271-9
This project was supported by Grant No. 2008-BJ-CX-K054, awarded by the Bureau of Justice Statistics, Office of Justice Programs, U.S. Department of Justice. Points of view in this document are those of the authors and do not necessarily represent the official position or policies of the U.S. Department of Justice.
Suggested Citation

The Court Statistics Project (CSP) is made possible by the continued support of state court administrators. We owe a special debt of gratitude to the staff of the administrative offices of the courts and of the appellate courts who serve as liaisons between their offices and the CSP and who continuously seek to improve the quality, depth, and consistency of their state court data.
In an effort to recognize the efforts of particular states to improve their statistical reporting, the CSP is initiating a new feature in this publication: the CSP Reporting Excellence Award. This icon appears on pages that highlight particular states whose data reflects the counting rules, case type definitions, and case status categories defined in the State Court Guide to Statistical Reporting. These feature pages will highlight the benefits and insights that these complete data make possible.
A number of states made significant improvements in the level of detail provided by their trial courts this year. The enhancements to this data come as a result of implementing the data definitions, counting rules, and reporting framework published in the State Court Guide to Statistical Reporting.
We would also like to acknowledge the work of the offices of the state court administrator in the following states for their important data improvement efforts: Alabama (traffic/ordinance), Connecticut (criminal/juvenile), Idaho (domestic relations), Iowa (civil, domestic relations, criminal, juvenile, traffic/ordinance), Hawaii (criminal, traffic/ordinance), Maine (civil), Maryland (civil), Massachusetts (domestic relations, criminal), Michigan (civil, domestic relations, criminal, juvenile, traffic/ordinance), Mississippi (civil, domestic relations, juvenile), Nevada (civil), New Mexico (civil), Ohio (domestic relations), Oklahoma (civil, domestic relations, criminal), Oregon (civil), Pennsylvania (criminal), Puerto Rico ( juvenile), South Dakota (criminal), Virginia (domestic, juvenile), Washington ( juvenile), West Virginia (domestic relations) and Wyoming (District Court data).
This year also marks the debut of the new reporting framework for appellate court caseload statistics, the product of an intensive, multiyear collaboration between the National Conference of Appellate Court Clerks (NCACC) and CSP project staff. We appreciate the involvement of NCACC, its Special Statistics Committee, and the guidance they provided in the creation and implementation of the appellate section of the State Court Guide to Statistical Reporting.
The content and design of CSP’s reports and Web site are guided by the members of the Court Statistics Committee of the Conference of State Court Administrators (COSCA). The committee members have given generously of their time, talent, and experience, and their participation has been invaluable to project staff.
The Court Statistics Project is funded through a cooperative agreement with the Bureau of Justice Statistics (BJS). The authors wish to acknowledge the editorial review and helpful comments provided by Duren Banks at BJS.
Special thanks as always to Neal Kauder of VisualResearch, Inc., for his innovative information design.
Acknowledgments
i

Donald D. Goodnow, Chair (2000 to present), Director, Administrative office of the Courts, New Hampshire
Ron titus, Vice-Chair (2005 to present), State Court Administrator, Nevada
Daniel Becker (2008 to present), State Court Administrator, Supreme Court of Utah
Hugh M. Collins (1982 to present), Judicial Administrator, Supreme Court of Louisiana
Debra Dailey (2005 to present), Manager of Research and Evaluation, State Court Administrator’s office, Minnesota
theodore Eisenberg (2002 to present), Professor, Cornell Law School, New York
James D. Gingerich (2009 to present), Director, Administrative office of the Courts, Arkansas
Steven C. Hollon (2008 to present), Administrative Director, Supreme Court of ohio
Collins ijoma (2005 to present), trial Court Administrator, Superior Court of New Jersey
Gerald A. Marroney (2003 to present), State Court Administrator, Supreme Court of Colorado
Hon. Aaron Ment (1991 to present), Senior Judge, Supreme Court of Connecticut
John t. olivier (1991 to present), Clerk, Supreme Court of Louisiana
Beth Riggert (2007 to present), Communications Counsel, Supreme Court of Missouri
Robert Wessels (1995 to present), Court Manager, County Criminal Courts at Law, Houston, texas
Christine M. Durham, Chair, Chief Justice, Supreme Court of Utah
Steven C. Hollon, Vice-Chair, Administrative Director, Supreme Court of ohio
Daniel J. Becker, State Court Administrator, Supreme Court of Utah
Roxanne B. Conlin, Roxanne Conlin & Associates, P.C., Des Moines, iowa
George S. Frazza, Esq., Patterson Belknap Webb & tyler LLP, New York, New York
Rosalyn W. Frierson, Director, South Carolina Court Administration
Richard Godfrey, Kirkland & Ellis LLP, Chicago, illinois
Wallace B. Jefferson, Chief Justice, Supreme Court of texas
Lilia G. Judson, Executive Director, Division of State Court Administration, indiana Supreme Court
Eileen A. Kato, Judge, King County District Court, Washington
Rufus G. King, iii, Senior Judge, Superior Court of District of Columbia
Dale R. Koch, Senior Judge, oregon Circuit Court, Portland, oregon
Brenda S. Loftin, Associate Circuit Judge, St. Louis County Circuit Court, Missouri
Margaret H. Marshall, Chief Justice, Supreme Judicial Court of Massachusetts
Charles W. Matthews, Jr., Vice President & General Counsel, ExxonMobil Corporation, irving, texas
Mary McCormick, President, Fund for the City of New York, New York
Manuel A. Medrano, Reporter, KtLA News, Los Angeles, California
Donna D. Melby, Esq., Paul Hastings Janofsky & Walker, LLP, Los Angeles, California
Edward W. Mullins, Jr., Esq., Nelson Mullins Riley & Scarborough LLP, Columbia, South Carolina
Barbara R. Mundell, Presiding Judge, Maricopa County Superior Court, Arizona
theodore B. olson, Gibson, Dunn & Crutcher LLP, Washington, DC
Robert S. Peck, President, Center for Constitutional Litigation, P.C. Washington, DC
Ronald B. Robie, Associate Justice, Court of Appeal, third Appellate District, Sacramento, California
Suzanne H. Stinson, Court Administrator, 26th Judicial District Court, Benton, Louisiana
Larry D. thompson, Senior Vice President & General Counsel, PepsiCo, Purchase, New York
Eric t. Washington, Chief Judge, District of Columbia Court of Appeals
Mary Campbell McQueen, President, National Center for State Courts, Williamsburg, Virginia
Court Statistics Committee, Conference of State Court Administrators
Board of Directors, National Center for State Courts
ii

The Court Statistics Project (CSP) provides the most comprehensive, up-to-date information regarding the nation’s state courts through its annual print publication, Examining the Work of State Courts, and on-line publication, State Court Caseload Statistics. These reference works are supplemented by the Caseload Highlights and Notes from the Field series. All of these publications are available at the Court Statistics Project’s Web site, www.courtstatistics.org.
The purpose of Examining the Work of State Courts is to provide a concise, graphically oriented volume that makes state court statistics highly accessible. Examining the Work of State Courts has been designed to be interactive, giving the reader on-line access in its interactive PDF version to information that cannot reasonably be included in the text of the document. The links provided in this format encourage the use of the Web and provide the reader with additional resources that help to facilitate the understanding of the work of state courts.
State Court Caseload Statistics is a discrete on-line reference volume, containing structure charts, statewide aggregate caseload data and reporting practices, population trends, and a detailed explanation of the Court Statistics Project methodology. State Court Caseload Statistics is exclusively available on the Web at www.courtstatistics.org.
The Caseload Highlights series continues to provide short, periodic reports on specific, significant, and timely issues. Notes from the Field is a platform for use by practitioners from the state courts from which they can share their experiences and knowledge of court statistics and the implementation of data systems. The CSP recognizes that informed judges and court managers want information on a range of policy-relevant topics, and want it in a timely fashion and in a condensed, readable format.
These publications are developed through a cooperative agreement with and generous support from the Bureau of Justice Statistics (BJS), part of the Office of Justice Planning at the U.S. Department of Justice.
Detailed descriptive information on court structure is provided by another National Center for State Courts (NCSC) and BJS joint project, State Court Organization. Topics covered include: the number of courts and judges; judicial selection; jury qualifications and verdict rules; and processing and sentencing procedures of criminal cases. Court structure diagrams summarize the key features of each state's court organization. The most recent edition is available through BJS and at www.ojp.usdoj.gov/bjs/abstract/sco04.htm.
Finally, the CSP continues to promote the implementation and use of the State Court Guide to Statistical Reporting (hereafter referred to as the Guide). Developed with support from the State Justice Institute and with close guidance from the Conference of State Court Administrators’ Court Statistics Committee, the Guide is a tool for improving court administration by providing a national model for data reporting with concise descriptions and definitions of case types and disposition types, as well as a standardized framework in which to report these categories. The recently revised version of the Guide is available in PDF on the NCSC Web site at www.courtstatistics.org.
The firm processed more than a terabyte of data every day . . . The trick, he said, was to “find the very faint phenomena amidst the cacophony of static.”Glen Whitney, former hedge fund mathematician, quoted in the New Yorker.
Foreword
iii

Examining the Work of State Courts is the authoritative analysis of the best available state court case filing and disposition data. Approximately ninety-five percent of all legal cases initiated in the United States are filed in the state courts. Whether the reader’s objective is to assess the current legal landscape, to improve the management of a court or a state court system, to develop public policy, or to gain a better understanding of the work of our third branch of government, this publication provides the independent interpretation of reliable data that will speak to the reader’s need. In fact, without the benefit of this foundational data and its expert analysis, state court leaders and managers, policy makers, and the media are too often left with little more than random anecdote and unsupported opinion as the basis for their work.
The analysis in this publication is provided by the staff of the Court Statistics Project of the National Center for State Courts. With over thirty years of experience in the collection, compilation, and interpretation of state court data, the Court Statistics Project has no peer.
State Court Administrators from the fifty states, the District of Columbia, and Puerto Rico have all contributed to the data that are presented in this publication. The commitment of these state court leaders and their staff to the accuracy and consistency of these data ensures the integrity of the data and analysis reported here.
While anecdote and opinion may have been useful in the past, the demand today is for accountability, performance measures, and evidence-based programs. Reliable empirical data provide the basis for the modern tools of court administration, including workload studies, performance measures like the CourTools developed by the National Center for State Courts, and the analysis of court process and outcome that can lead to improved administration of justice, enhanced service to the public, and informed public policy.
In the current era of declining state revenues and shrinking state court budgets, the need for reliable data and for the expert analysis of those data is greater than ever. Examining the Work of State Courts illustrates the value of good data and dependable analysis and offers a high-level perspective of the current work and prevailing trends in state courts.
Don Goodnow
Chair, Court Statistics Committee Conference of State Court Administrators
A Comment from the Chair
iv
Table of Contents
table of Contents
Suggested Citation 4
Acknowledgments i
Court Statistics Committee, Conference of State Court Administrators ii
Board of Directors, National Center for State Courts ii
Foreword iii
A Comment from the Chair iv
table of Contents v
Glossary of terms vi
What Follows: A Print and Electronic Document Design vii
Civil Caseloads 1
Summary 1
total incoming Civil Caseloads, 1998-2007 1
over 18 million civil cases were processed in state trial courts in 2007 2
Small claims and contract disputes represent 70 percent of civil caseloads 2
Civil Caseload Composition in 7 States, 2007 2
total incoming Cases in State Courts, by Jurisdiction, 2007 (in millions) 2
Court structure and caseload composition affect how civil cases are processed 3
Distribution of Civil Caseloads in 16 States with two-tiered Court Systems, 2007 3
Contracts are up, torts are down 3
Contract and tort Caseloads, 1998-2007 3
Contract rates were nearly 9 times greater than tort rates in 2007 4
incoming tort and Contract Rates in 12 States, 2007 4
incoming Small Claims Cases in 33 States, 2007 5
incoming Probate Caseloads in 33 States, 2007 5
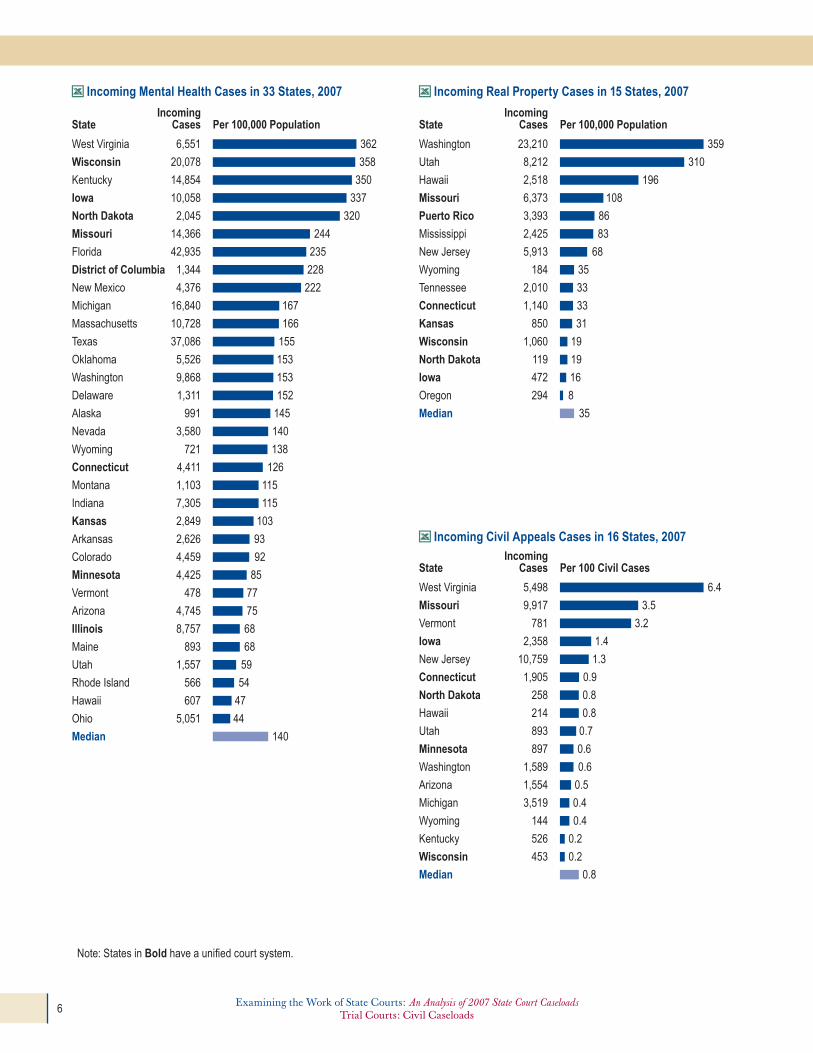
incoming Mental Health Cases in 33 States, 2007 6
incoming Real Property Cases in 15 States, 2007 6
incoming Civil Appeals Cases in 16 States, 2007 6
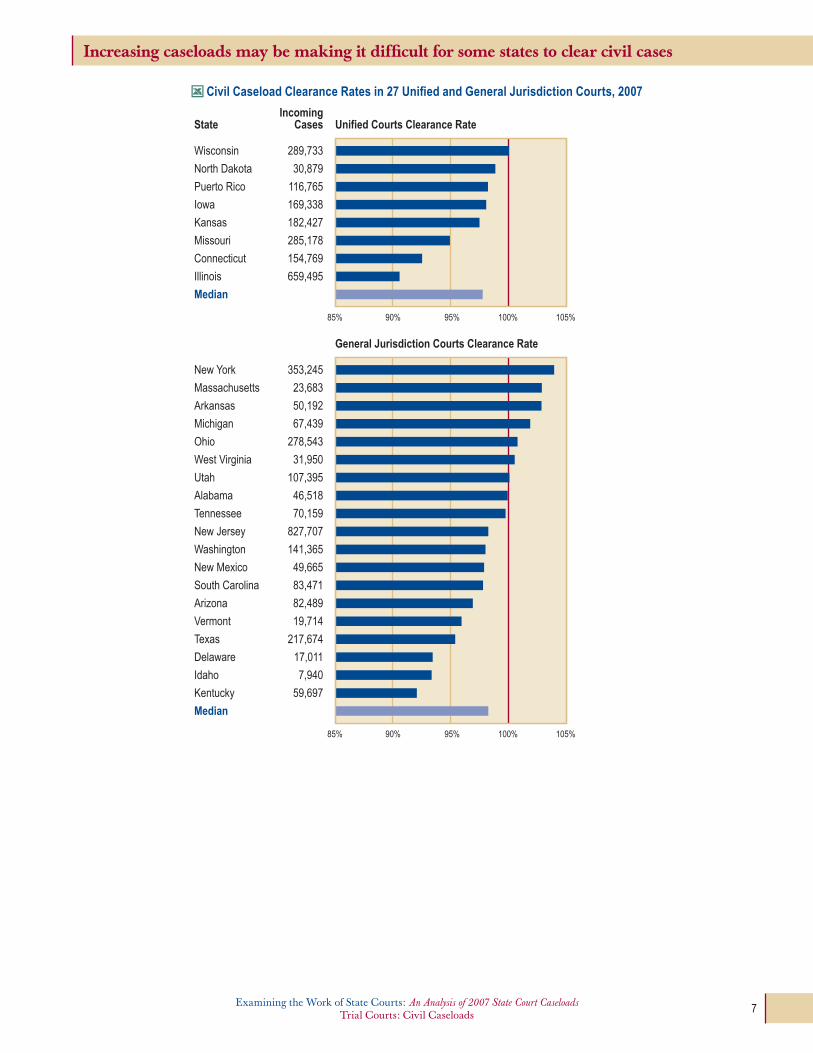
increasing caseloads may be making it difficult for some states to clear civil cases 7
Civil Caseload Clearance Rates in 27 Unified and General Jurisdiction Courts, 2007 7
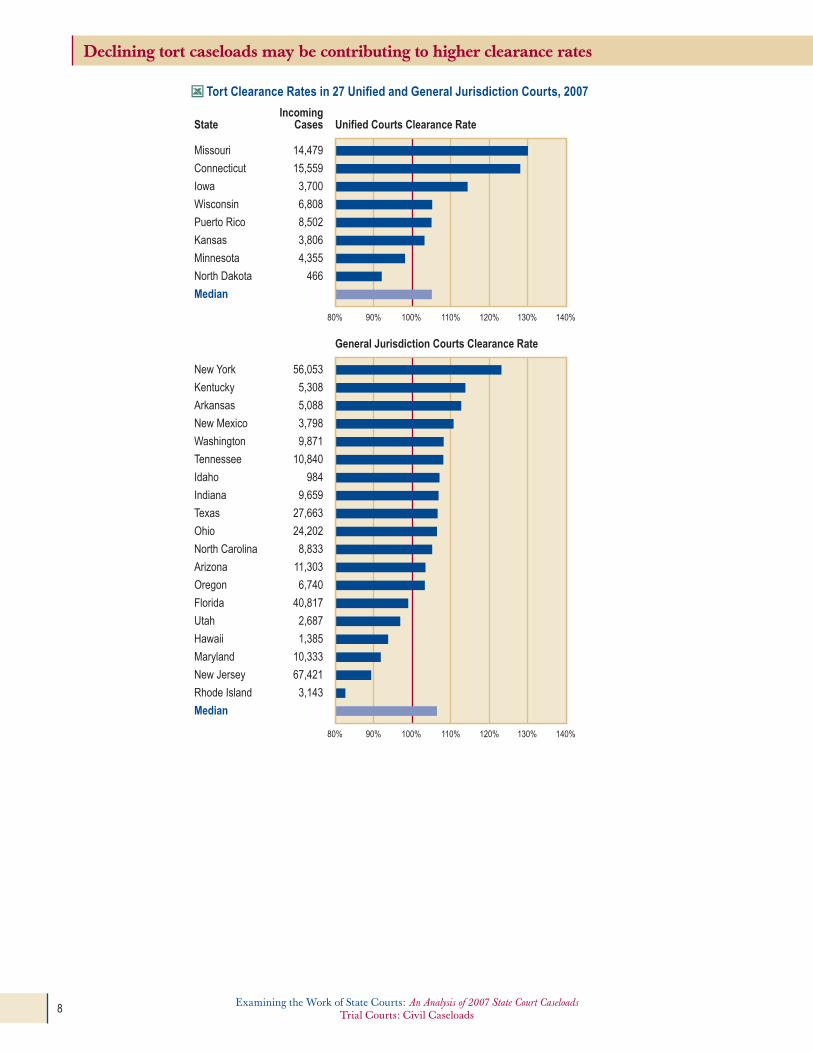
Declining tort caseloads may be contributing to higher clearance rates 8
tort Clearance Rates in 27 Unified and General Jurisdiction Courts, 2007 8
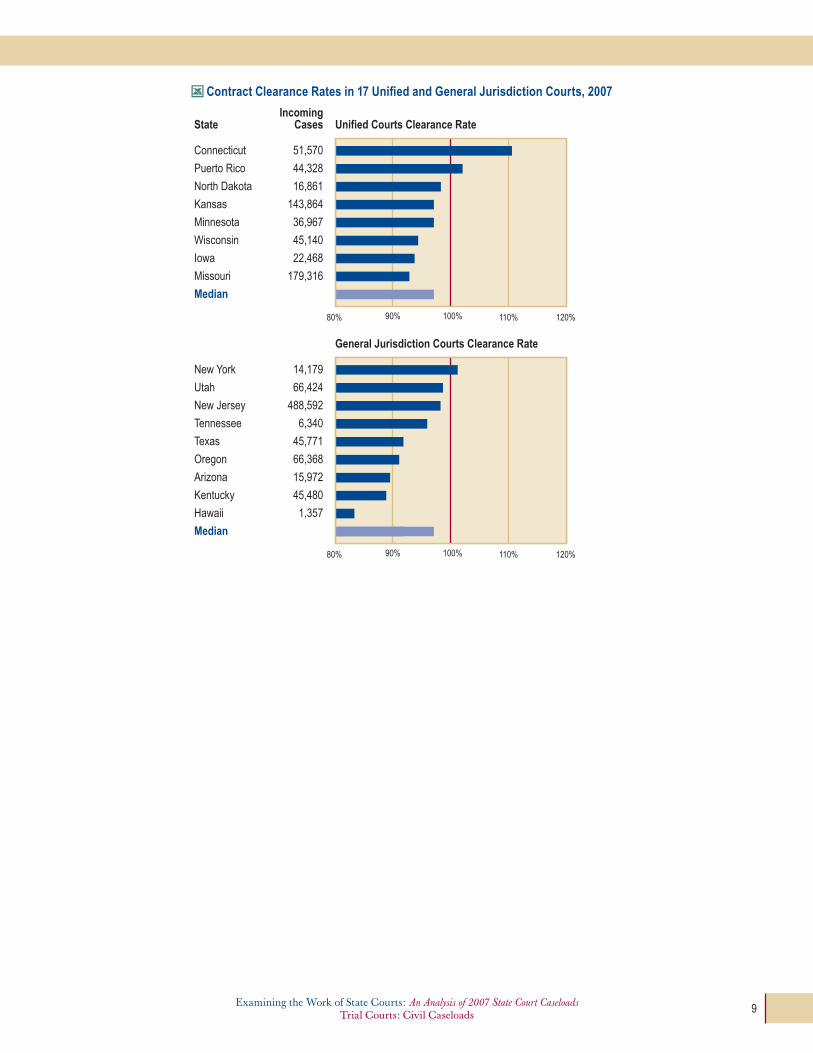
Contract Clearance Rates in 17 Unified and General Jurisdiction Courts, 2007 9
Four of five civil cases in Kansas are contract cases 10
Civil Caseload Composition in the Kansas District Court, 2007 10
Contract Caseload Composition in the Kansas District Court, 2007 10
tort Caseload Composition in the Kansas District Court, 2007 10
tort cases comprise only 2 percent of the Kansas civil caseload 11
Kansas District Court Civil Caseload, 2007 11
Domestic Relations Caseloads 12
Summary 12
total incoming Domestic Relations Caseloads, 1998-2007 12
Although great in their consequences, domestic relations cases are relatively few in number 13
total incoming Cases in State Courts, by Jurisdiction, 2007 (in millions) 13
Estimated Domestic Relations Caseload Composition, 2007 13
Support cases show the greatest increase over the past decade 14
incoming Domestic Relations Caseloads, by Case type, 1998-2007 14
States have chosen different venues in which to process certain domestic relations case types 14
Distribution of incoming Domestic Relations Caseloads in 4 States, 2007 14
Divorce and support cases dominate domestic relations caseloads in most states 15
Percent of total incoming Domestic Relations Caseloads by Case type in 23 States, 2007 15
Divorce and support cases dominate domestic relations caseloads of most states 16
incoming Divorce Caseloads in 25 States, 2007 16
incoming Visitation Caseloads in 5 States, 2007 16
incoming Paternity Caseloads in 17 States, 2007 16
incoming Support Caseloads in 14 States, 2007 16
incoming Adoption Caseloads in 26 States, 2007 17
incoming Child Custody Caseloads in 5 States, 2007 17
Civil Protection order Cases in 22 States, 2007 17
Glossary ........................................................................................... vi
What Follows: A Print and Electronic Document Design ............ vii
Trial Courts 1Civil Caseloads ................................................................................ 1
Domestic Relations Caseloads ........................................................ 12
Criminal Caseloads ......................................................................... 21
Juvenile Caseloads ........................................................................... 30
Traffic/Violations Caseloads ........................................................... 36
Appellate Courts 40Appellate Caseloads ......................................................................... 40
Appeal Caseloads ............................................................................ 46
Death Penalty Caseloads ................................................................. 51
Original Proceeding/Other Appellate Matter Caseloads .............. 52
Appendices 57Index of States Included in Section Graphics ................................. 58
Court Statistics Project Methodology ............................................. 64
State Court Caseload Statistics ....................................................... 65
v
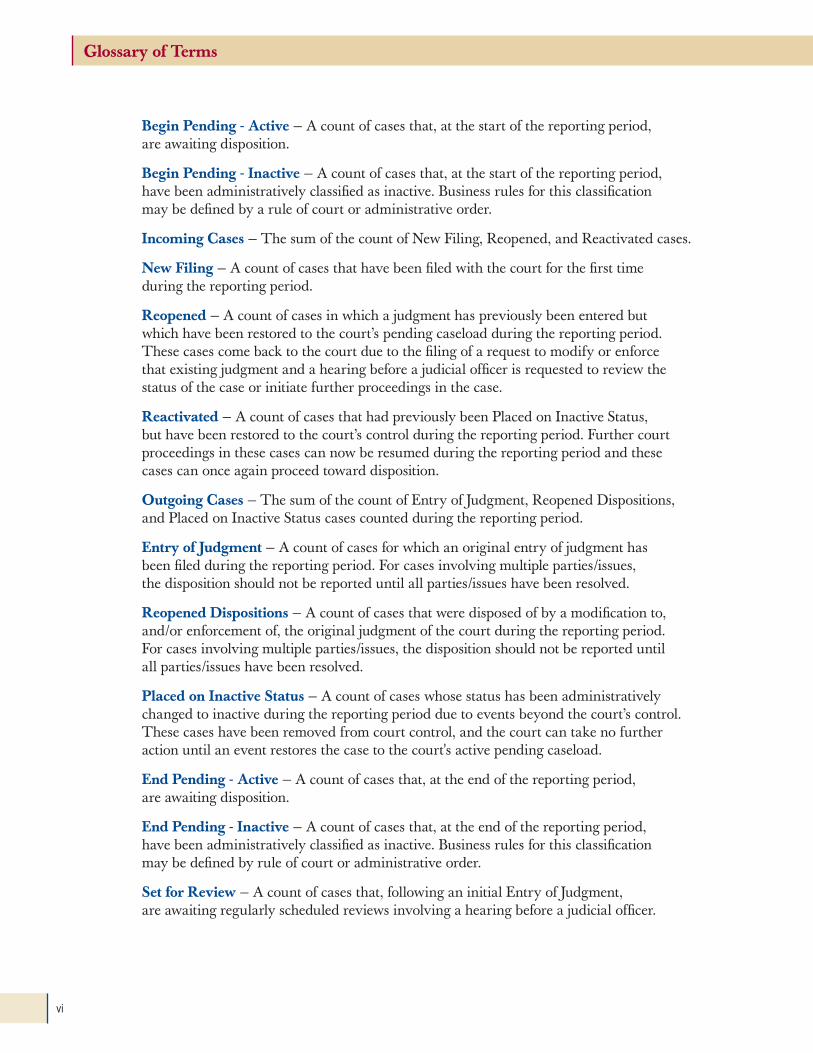
Begin Pending - Active — A count of cases that, at the start of the reporting period, are awaiting disposition.
Begin Pending - Inactive — A count of cases that, at the start of the reporting period, have been administratively classified as inactive. Business rules for this classification may be defined by a rule of court or administrative order.
Incoming Cases — The sum of the count of New Filing, Reopened, and Reactivated cases.
New Filing — A count of cases that have been filed with the court for the first time during the reporting period.
Reopened — A count of cases in which a judgment has previously been entered but which have been restored to the court’s pending caseload during the reporting period. These cases come back to the court due to the filing of a request to modify or enforce that existing judgment and a hearing before a judicial officer is requested to review the status of the case or initiate further proceedings in the case.
Reactivated — A count of cases that had previously been Placed on Inactive Status, but have been restored to the court’s control during the reporting period. Further court proceedings in these cases can now be resumed during the reporting period and these cases can once again proceed toward disposition.
Outgoing Cases — The sum of the count of Entry of Judgment, Reopened Dispositions, and Placed on Inactive Status cases counted during the reporting period.
Entry of Judgment — A count of cases for which an original entry of judgment has been filed during the reporting period. For cases involving multiple parties/issues, the disposition should not be reported until all parties/issues have been resolved.
Reopened Dispositions — A count of cases that were disposed of by a modification to, and/or enforcement of, the original judgment of the court during the reporting period. For cases involving multiple parties/issues, the disposition should not be reported until all parties/issues have been resolved.
Placed on Inactive Status — A count of cases whose status has been administratively changed to inactive during the reporting period due to events beyond the court’s control. These cases have been removed from court control, and the court can take no further action until an event restores the case to the court's active pending caseload.
End Pending - Active — A count of cases that, at the end of the reporting period, are awaiting disposition.
End Pending - Inactive — A count of cases that, at the end of the reporting period, have been administratively classified as inactive. Business rules for this classification may be defined by rule of court or administrative order.
Set for Review — A count of cases that, following an initial Entry of Judgment, are awaiting regularly scheduled reviews involving a hearing before a judicial officer.
Glossary of Terms
vi

For the third year, Examining the Work of State Courts (EWSC) is being published in both a print and electronic format. By closely aligning their designs, the printed and electronic documents provide the user with an efficient on-line experience by delivering an interactive and seamless transition from one reading platform to another. The user still has complete access to the printed document, but also has a portable electronic document (PDF) that gives instant access to underlying data and links to external resources that give broader context to traditional Court Statistics Project data analysis. The added functionality will be seen by readers through special symbols and icons on EWSC pages (in both printed and PDF formats). Features and the corresponding navigation aides are as follows:
Bookmarks — a listing of section headings, tables, and charts located in a separate window on the left side of the electronic (PDF) file which allows quick and efficient navigation throughout the document.
Data Icon — clicking the icon opens a file containing the underlying data for the graphic.
US Map Icon — The map indicates which states are included in the adjacent information graphic, when state names are not listed in the table or chart
Hot Links — integrated into the text with programmed Web site destinations. Hot links are indicated by blue underlined type and supplement the subject being discussed.
CSP Reporting Excellence Award — appears on section title pages and directs the reader to the states that are highlighted at the end of each section. These states report data that reflects the counting rules, case type definitions, and case status categories defined in the State Court Guide to Statistical Reporting. These feature pages will highlight the benefits and insights that these complete data make possible.
What Follows: A Print and Electronic Document Design
vii
Special Recognition:
The Case for a Civil Cover Sheet: Spotlight on Kansas
The Case for a Civil Cover Sheet: Spotlight on Kansas
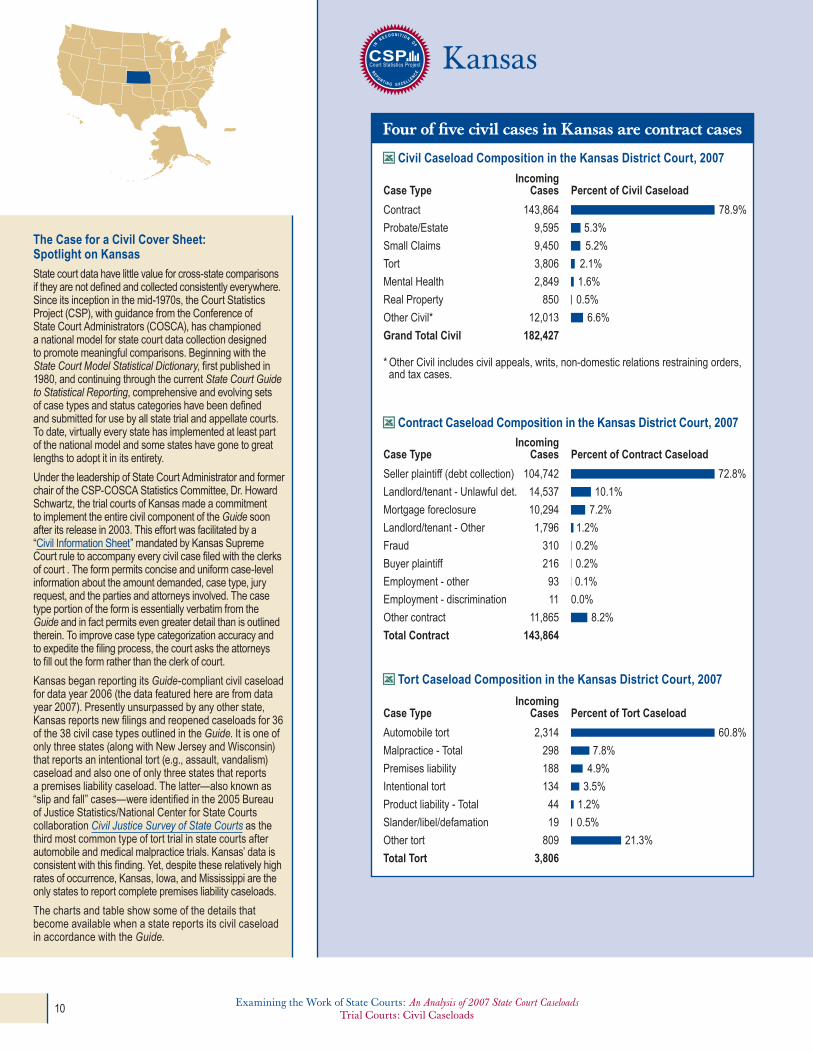
State court data have little value for cross-state comparisons if they are not defined and collected consistently everywhere. Since its inception in the mid-1970s, the Court Statistics Project (CSP), with guidance from the Conference of State Court Administrators (COSCA), has championed a national model for state court data collection designed to promote meaningful comparisons. Beginning with the State Court Model Statistical Dictionary, first published in 1980, and continuing through the current State Court Guide to Statistical Reporting, comprehensive and evolving sets of case types and status categories have been defined and submitted for use by all state trial and appellate courts. To date, virtually every state has implemented at least part of the national model and some states have gone to great lengths to adopt it in its entirety.
Under the leadership of State Court Administrator and former chair of the CSP-COSCA Statistics Committee, Dr. Howard Schwartz, the trial courts of Kansas made a commitment to implement the entire civil component of the Guide soon after its release in 2003. This effort was facilitated by a “Civil Information Sheet” mandated by Kansas Supreme Court rule to accompany every civil case filed with the clerks of court . The form permits concise and uniform case-level information about the amount demanded, case type, jury request, and the parties and attorneys involved. The case type portion of the form is essentially verbatim from the Guide and in fact permits even greater detail than is outlined therein. To improve case type categorization accuracy and to expedite the filing process, the court asks the attorneys to fill out the form rather than the clerk of court.
Kansas began reporting its Guide-compliant civil caseload for data year 2006 (the data featured here are from data year 2007). Presently unsurpassed by any other state, Kansas reports new filings and reopened caseloads for 36 of the 38 civil case types outlined in the Guide. It is one of only three states (along with New Jersey and Wisconsin) that reports an intentional tort (e.g., assault, vandalism) caseload and also one of only three states that reports a premises liability caseload. The latter—also known as “slip and fall” cases—were identified in the 2005 Bureau of Justice Statistics/National Center for State Courts collaboration Civil Justice Survey of State Courts as the third most common type of tort trial in state courts after automobile and medical malpractice trials. Kansas’ data is consistent with this finding. Yet, despite these relatively high rates of occurrence, Kansas, Iowa, and Mississippi are the only states to report complete premises liability caseloads.
The charts and table show some of the details that become available when a state reports its civil caseload in accordance with the Guide.
IncomingCasesCase Type
Grand Total Civil 182,427
* Other Civil includes civil appeals, writs, non-domestic relations restraining orders, and tax cases.
Contract 143,864
Probate/Estate 9,595
Small Claims 9,450
Tort 3,806
Mental Health 2,849
Real Property 850
Other Civil* 12,013
Percent of Civil Caseload
78.9%
5.3%
5.2%
2.1%
1.6%
0.5%
6.6%
IncomingCasesCase Type Percent of Contract Caseload
Total Contract 143,864
Seller plaintiff (debt collection) 104,742 72.8%
Landlord/tenant - Unlawful det. 14,537 10.1%
Mortgage foreclosure 10,294 7.2%
Landlord/tenant - Other 1,796 1.2%
Fraud 310 0.2%
Buyer plaintiff 216 0.2%
Employment - other 93 0.1%
Employment - discrimination 11 0.0%
Other contract 11,865 8.2%
IncomingCasesCase Type Percent of Tort Caseload
Total Tort 3,806
Automobile tort 2,314 60.8%
Malpractice - Total 298 7.8%
Premises liability 188 4.9%
Intentional tort 134 3.5%
Product liability - Total 44 1.2%
Slander/libel/defamation 19 0.5%
Other tort 809 21.3%
Four of five civil cases in Kansas are contract cases
Civil Caseload Composition in the Kansas District Court, 2007
Contract Caseload Composition in the Kansas District Court, 2007
Tort Caseload Composition in the Kansas District Court, 2007
Kansas
Examining the Work of State Courts: An Analysis of 2007 State Court CaseloadsTrial Courts: Civil Caseloads10 Examining the Work of State Courts: An Analysis of 2007 State Court Caseloads
Trial Courts: Civil Caseloads
Tort cases comprise only 2 percent of the Kansas civil caseload
Kansas District Court Civil Caseload, 2007
Civil Case Type
New Filings
Reopened Cases
Total Incoming
Entries of Judgment
Clearance Rate
Percent Reopened
Automobile tort 2,273 41 2,314 2,280 99% 1.8%Intentional tort 132 2 134 112 84% 1.5% Malpractice - medical 248 6 254 193 76% 2.4% Malpractice - legal 29 0 29 18 62% 0.0%Malpractice - other 15 0 15 11 73% 0.0% Premises liability 186 2 188 165 88% 1.1% Product liability - asbestos 20 0 20 22 110% 0.0% Product liability - tobacco 1 0 1 0 0% 0.0% Product liability - other 21 2 23 25 109% 8.7% Slander/libel/defamation 19 0 19 21 111% 0.0%Other tort 777 32 809 1,081 134% 4.0% Buyer plaintiff 212 4 216 238 110% 1.9%Employment - discrimination 11 0 11 10 91% 0.0%Employment - other 93 0 93 63 68% 0.0% Fraud 305 5 310 331 107% 1.6%Landlord/tenant - unlawful detainer 14,481 56 14,537 12,564 86% 0.4% Landlord/tenant - other 1,776 20 1,796 1,914 107% 1.1% Mortgage foreclosure 9,698 596 10,294 10,874 106% 5.8% Seller plaintiff (debt collection) 103,953 789 104,742 107,232 102% 0.8% Other contract 11,551 314 11,865 6,458 54% 2.6% Eminent domain 125 0 125 103 82% 0.0%Other real property 689 36 725 969 134% 5.0% Small Claims 9,450 n/a 9,450 9,450 100% n/aGuardianship - adult 899 0 899 873 97% 0.0%Guardianship - juvenile 811 0 811 809 100% 0.0%Conservatorship/trusteeship 331 0 331 260 79% 0.0%Probate/wills/intestate 4,849 9 4,858 5,058 104% 0.2% Other probate/estate 2,691 5 2,696 2,311 86% 0.2%Mental Health 2,849 n/a 2,849 2,849 100% n/aAppeals from admin. agency 547 0 547 501 92% 0.0%Appeals from ltd juris. trial court n/a n/a n/a n/a n/a n/aOther civil appeals 225 0 225 196 87% 0.0% Habeas corpus 324 9 333 422 127% 2.7%Non-dom. rel. restraining order 4,067 9 4,076 3,854 95% 0.2% Tax cases n/a n/a n/a n/a n/a n/aWrit involving prison conditions 204 9 213 233 109% 4.2% Other writs 99 0 99 147 148% 0.0%Total other civil 6,456 64 6,520 5,900 90% 1.0%Grand Total Civil 180,417 2,010 182,427 177,547 97% 1.1%
Notes: n/a = not available. Distinguishes Civil subcategories in the Guide.
Examining the Work of State Courts: An Analysis of 2007 State Court CaseloadsTrial Courts: Civil Caseloads
Examining the Work of State Courts: An Analysis of 2007 State Court CaseloadsTrial Courts: Civil Caseloads 11
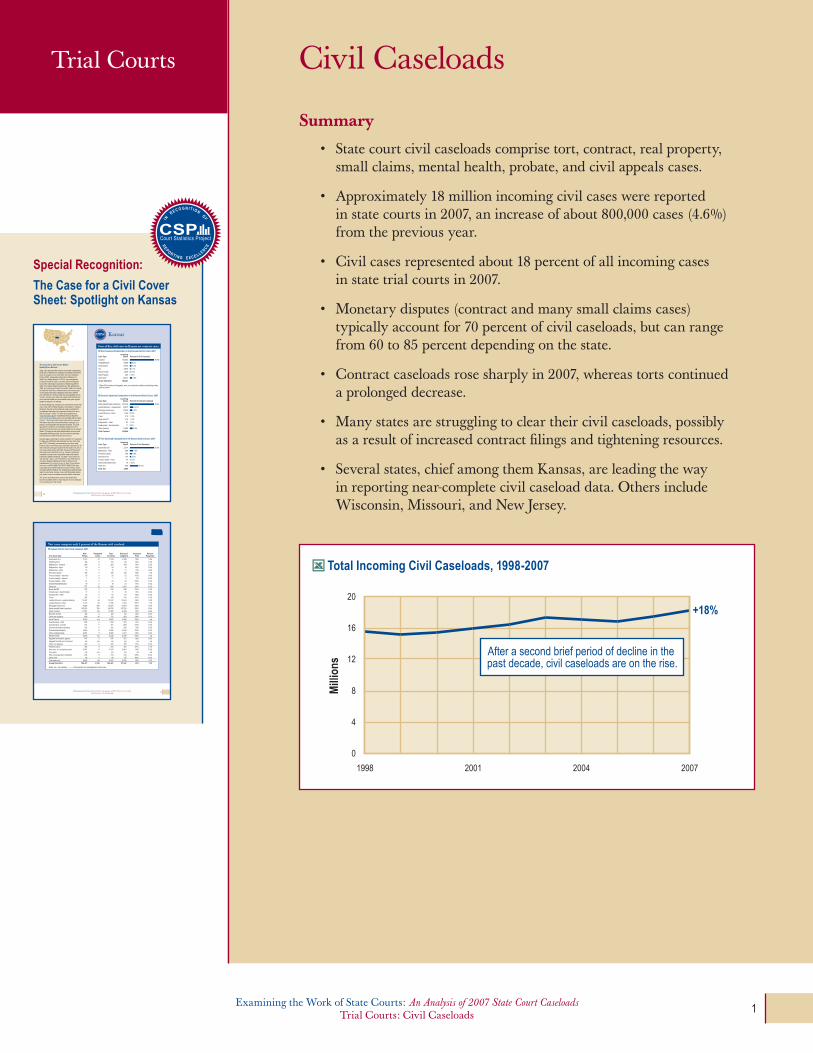
Summary
• Statecourtcivilcaseloadscomprisetort,contract,realproperty,small claims, mental health, probate, and civil appeals cases.
• Approximately18millionincomingcivilcaseswerereported in state courts in 2007, an increase of about 800,000 cases (4.6%) from the previous year.
• Civilcasesrepresentedabout18percentofallincomingcases in state trial courts in 2007.
• Monetarydisputes(contractandmanysmallclaimscases)typically account for 70 percent of civil caseloads, but can range from 60 to 85 percent depending on the state.
• Contractcaseloadsrosesharplyin2007,whereastortscontinued a prolonged decrease.
• Manystatesarestrugglingtocleartheircivilcaseloads,possibly as a result of increased contract filings and tightening resources.
• Severalstates,chiefamongthemKansas,areleadingthewayin reporting near-complete civil caseload data. Others include Wisconsin, Missouri, and New Jersey.
Total Incoming Civil Caseloads, 1998-2007
1998 2001 2004 2007
0
4
8
12
16
20
Mill
ions
+18%
After a second brief period of decline in the past decade, civil caseloads are on the rise.
Civil CaseloadsTrial Courts
Examining the Work of State Courts: An Analysis of 2007 State Court CaseloadsTrial Courts: Civil Caseloads 1
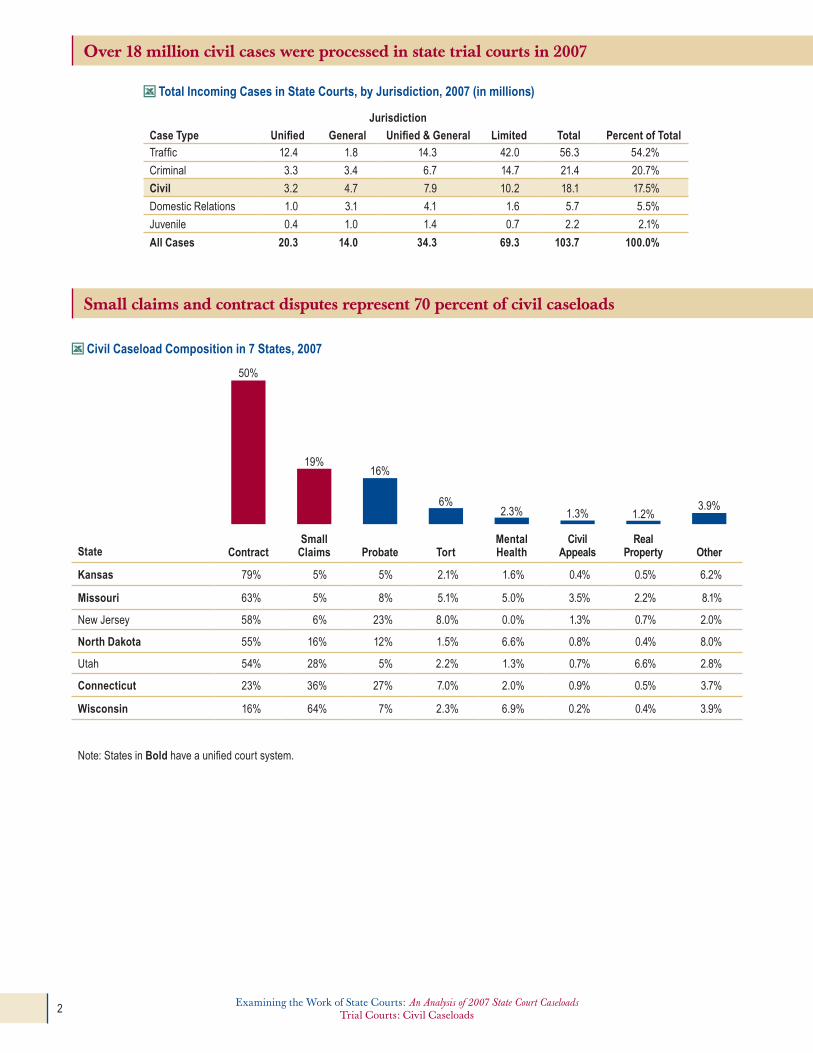
Over 18 million civil cases were processed in state trial courts in 2007
Small claims and contract disputes represent 70 percent of civil caseloads
Civil Caseload Composition in 7 States, 2007
3.9%1.2%1.3%2.3%
6%
16%19%
50%
State ContractSmall
Claims Probate TortMental Health
Civil Appeals
Real Property Other
Kansas 79% 5% 5% 2.1% 1.6% 0.4% 0.5% 6.2%
Missouri 63% 5% 8% 5.1% 5.0% 3.5% 2.2% 8.1%
New Jersey 58% 6% 23% 8.0% 0.0% 1.3% 0.7% 2.0%
North Dakota 55% 16% 12% 1.5% 6.6% 0.8% 0.4% 8.0%
Utah 54% 28% 5% 2.2% 1.3% 0.7% 6.6% 2.8%
Connecticut 23% 36% 27% 7.0% 2.0% 0.9% 0.5% 3.7%
Wisconsin 16% 64% 7% 2.3% 6.9% 0.2% 0.4% 3.9%
Note: States in Bold have a unified court system.
Total Incoming Cases in State Courts, by Jurisdiction, 2007 (in millions)
Jurisdiction
Case Type Unified General Unified & General Limited Total Percent of Totaltraffic 12.4 1.8 14.3 42.0 56.3 54.2%
Criminal 3.3 3.4 6.7 14.7 21.4 20.7%
Civil 3.2 4.7 7.9 10.2 18.1 17.5%
Domestic Relations 1.0 3.1 4.1 1.6 5.7 5.5%
Juvenile 0.4 1.0 1.4 0.7 2.2 2.1%
All Cases 20.3 14.0 34.3 69.3 103.7 100.0%
Examining the Work of State Courts: An Analysis of 2007 State Court CaseloadsTrial Courts: Civil Caseloads2 Examining the Work of State Courts: An Analysis of 2007 State Court Caseloads
Trial Courts: Civil Caseloads

Court structure and caseload composition affect how civil cases are processed
Distribution of Civil Caseloads in 16 States with Two-tiered Court Systems, 2007
■ General Jursdiction Courts ■ Limited Jurisdiction Courts
0%
20%
40%
60%
80%
100%
NJ UT VT WA FL WV HI OH AR DE CO AZ KY WY ID MI
Contract and Tort Caseloads, 1998-2007
1998 2001 2004 2007
Thou
sand
s
14 General Jurisdiction Courts
0
200
400
600
800
1,000
1,200
Tort caseloads fell by 9 percent between 2006 and 2007.
Contract caseloads grew by 11 percent from 2006 to 2007.+37%
-24%
Contracts are up, torts are down
Examining the Work of State Courts: An Analysis of 2007 State Court CaseloadsTrial Courts: Civil Caseloads
Examining the Work of State Courts: An Analysis of 2007 State Court CaseloadsTrial Courts: Civil Caseloads 3

Incoming Tort and Contract Rates in 12 States, 2007
IncomingTort
Cases
IncomingContract
CasesState Per 100,000 Population
New Jersey 67,421 488,592
Kansas 3,806 143,864
Missouri 14,479 179,316
North Dakota 466 16,861
Utah 2,687 66,424
Connecticut 15,559 51,570
Mississippi 6,349 35,746
Puerto Rico 8,502 44,328
Wisconsin 6,808 45,140
Iowa 3,700 22,468
Hawaii 2,176 9,162
Minnesota 4,355 36,967
Median 153
0 1,000 2,000 3,000 4,000 5,000 6,000
1,349■ Contract Cases■ Tort Cases
Contract rates were nearly 9 times greater than tort rates in 2007
Note: States in Bold have a unified court system.
Examining the Work of State Courts: An Analysis of 2007 State Court CaseloadsTrial Courts: Civil Caseloads4 Examining the Work of State Courts: An Analysis of 2007 State Court Caseloads
Trial Courts: Civil Caseloads

IncomingCasesState Per 100,000 Population
IncomingCasesState Per 100,000 Population
Indiana 281,530 4,437
South Carolina 187,554 4,255
Iowa 103,107 3,451
Wisconsin 184,311 3,290
North Carolina 264,194 2,916
West Virginia 49,365 2,724
Oklahoma 98,444 2,721
Alabama 106,596 2,303
Connecticut 79,801 2,279
District of Columbia 12,335 2,097
New Mexico 39,414 2,001
Massachusetts 122,833 1,904
Rhode Island 19,453 1,839
Florida 324,407 1,777
Vermont 9,105 1,466
Utah 34,881 1,319
Illinois 166,855 1,298
Idaho 19,177 1,279
Wyoming 6,680 1,278
Minnesota 59,156 1,138
Arkansas 25,942 915
Michigan 86,370 858
North Dakota 5,094 796
Ohio 88,969 776
Maine 8,880 674
New Jersey 52,920 609
Arizona 25,205 398
Nebraska 6,542 369
Kentucky 15,572 367
Washington 22,411 346
Kansas 9,450 340
Hawaii 3,822 298
Missouri 15,493 264
Median 1,298
New Jersey 195,718 2,253
Connecticut 60,514 1,728
Massachusetts 52,019 807
Vermont 4,767 767
Florida 136,766 749
New York 144,013 746
South Carolina 32,011 726
North Carolina 62,028 685
Ohio 74,969 654
North Dakota 3,578 559
Michigan 47,311 470
District of Columbia 2,735 465
Nebraska 8,152 459
Mississippi 12,286 421
Arkansas 11,732 414
Montana 3,695 386
Delaware 3,314 383
Missouri 22,085 376
Wisconsin 20,727 370
Oklahoma 12,905 357
Kansas 9,595 346
Indiana 21,444 338
Wyoming 1,671 320
South Dakota 2,480 311
Washington 19,283 298
Alaska 1,819 266
Nevada 6,351 248
Minnesota 12,290 236
Colorado 11,198 230
Utah 5,687 215
Hawaii 2,642 206
Arizona 12,652 200
West Virginia 924 51
Median 383
Note: States in Bold have a unified court system.
Incoming Small Claims Cases in 33 States, 2007 Incoming Probate Caseloads in 33 States, 2007
Examining the Work of State Courts: An Analysis of 2007 State Court CaseloadsTrial Courts: Civil Caseloads
Examining the Work of State Courts: An Analysis of 2007 State Court CaseloadsTrial Courts: Civil Caseloads 5
IncomingCasesState Per 100,000 Population
IncomingCasesState Per 100 Civil Cases
IncomingCasesState Per 100,000 Population
Washington 23,210 359
Utah 8,212 310
Hawaii 2,518 196
Missouri 6,373 108
Puerto Rico 3,393 86
Mississippi 2,425 83
New Jersey 5,913 68
Wyoming 184 35
Tennessee 2,010 33
Connecticut 1,140 33
Kansas 850 31
Wisconsin 1,060 19
North Dakota 119 19
Iowa 472 16
Oregon 294 8
Median 35
Arizona 4,745
West Virginia 6,551 362
Wisconsin 20,078 358
Kentucky 14,854 350
Iowa 10,058 337
North Dakota 2,045 320
Missouri 14,366 244
Florida 42,935 235
District of Columbia 1,344 228
New Mexico 4,376 222
Michigan 16,840 167
Massachusetts 10,728 166
Texas 37,086 155
Oklahoma 5,526 153
Washington 9,868 153
Delaware 1,311 152
Alaska 991 145
Nevada 3,580 140
Wyoming 721 138
Connecticut 4,411 126
Montana 1,103 115
Indiana 7,305 115
Kansas 2,849 103
Arkansas 2,626 93
Colorado 4,459 92
Minnesota 4,425 85
Vermont 478 77
75
Illinois 8,757 68
Maine 893 68
Utah 1,557 59
Rhode Island 566 54
Hawaii 607 47
Ohio 5,051 44
Median 140
West Virginia 5,498 6.4
Missouri 9,917 3.5
Vermont 781 3.2
Iowa 2,358 1.4
New Jersey 10,759 1.3
Connecticut 1,905 0.9
North Dakota 258 0.8
Hawaii 214 0.8
0.8
Utah 893 0.7
Minnesota 897 0.6
Washington 1,589 0.6
Arizona 1,554 0.5
Michigan 3,519 0.4
Wyoming 144 0.4
Kentucky 526 0.2
Wisconsin 453 0.2
Median
Note: States in Bold have a unified court system.
Incoming Mental Health Cases in 33 States, 2007 Incoming Real Property Cases in 15 States, 2007
Incoming Civil Appeals Cases in 16 States, 2007
Examining the Work of State Courts: An Analysis of 2007 State Court CaseloadsTrial Courts: Civil Caseloads6 Examining the Work of State Courts: An Analysis of 2007 State Court Caseloads
Trial Courts: Civil Caseloads
IncomingCasesState Unified Courts Clearance Rate
General Jurisdiction Courts Clearance Rate
85% 90% 95% 100% 105%
289,733Wisconsin
30,879North Dakota
116,765Puerto Rico
169,338Iowa
182,427Kansas
285,178Missouri
154,769Connecticut
659,495Illinois
Median
353,245New York
23,683Massachusetts
50,192Arkansas
67,439Michigan
278,543Ohio
31,950West Virginia
107,395Utah
46,518Alabama
70,159Tennessee
827,707New Jersey
141,365Washington
49,665New Mexico
83,471South Carolina
82,489Arizona
19,714Vermont
217,674Texas
17,011Delaware
7,940Idaho
59,697Kentucky
Median
85% 90% 95% 100% 105%
Increasing caseloads may be making it difficult for some states to clear civil cases
Civil Caseload Clearance Rates in 27 Unified and General Jurisdiction Courts, 2007
Examining the Work of State Courts: An Analysis of 2007 State Court CaseloadsTrial Courts: Civil Caseloads
Examining the Work of State Courts: An Analysis of 2007 State Court CaseloadsTrial Courts: Civil Caseloads 7
80% 90% 100% 110% 120% 130% 140%
IncomingCasesState Unified Courts Clearance Rate
General Jurisdiction Courts Clearance Rate
Missouri 14,479
Connecticut 15,559
Iowa 3,700
Wisconsin 6,808
Puerto Rico 8,502
Kansas 3,806
Minnesota 4,355
North Dakota 466
Median
New York 56,053
Kentucky 5,308
Arkansas 5,088
New Mexico 3,798
Washington 9,871
Tennessee 10,840
Idaho 984
Indiana 9,659
Texas 27,663
Ohio 24,202
North Carolina 8,833
Arizona 11,303
Oregon 6,740
Florida 40,817
Utah 2,687
Hawaii 1,385
Maryland 10,333
New Jersey 67,421
Rhode Island 3,143
Median
80% 90% 100% 110% 120% 130% 140%
Tort Clearance Rates in 27 Unified and General Jurisdiction Courts, 2007
Declining tort caseloads may be contributing to higher clearance rates
Examining the Work of State Courts: An Analysis of 2007 State Court CaseloadsTrial Courts: Civil Caseloads8 Examining the Work of State Courts: An Analysis of 2007 State Court Caseloads
Trial Courts: Civil Caseloads
IncomingCasesState Unified Courts Clearance Rate
General Jurisdiction Courts Clearance Rate
Connecticut 51,570
Puerto Rico 44,328
North Dakota 16,861
Kansas 143,864
Minnesota 36,967
Wisconsin 45,140
Iowa 22,468
Missouri 179,316
Median
New York 14,179
Utah 66,424
New Jersey 488,592
Tennessee 6,340
Texas 45,771
Oregon 66,368
Arizona 15,972
Kentucky 45,480
Hawaii 1,357
Median
80% 90% 100% 110% 120%
80% 90% 100% 110% 120%
Contract Clearance Rates in 17 Unified and General Jurisdiction Courts, 2007
Examining the Work of State Courts: An Analysis of 2007 State Court CaseloadsTrial Courts: Civil Caseloads
Examining the Work of State Courts: An Analysis of 2007 State Court CaseloadsTrial Courts: Civil Caseloads 9
The Case for a Civil Cover Sheet: Spotlight on Kansas
State court data have little value for cross-state comparisons if they are not defined and collected consistently everywhere. Since its inception in the mid-1970s, the Court Statistics Project (CSP), with guidance from the Conference of State Court Administrators (CoSCA), has championed a national model for state court data collection designed to promote meaningful comparisons. Beginning with the State Court Model Statistical Dictionary, first published in 1980, and continuing through the current State Court Guide to Statistical Reporting, comprehensive and evolving sets of case types and status categories have been defined and submitted for use by all state trial and appellate courts. to date, virtually every state has implemented at least part of the national model and some states have gone to great lengths to adopt it in its entirety.
Under the leadership of State Court Administrator and former chair of the CSP-CoSCA Statistics Committee, Dr. Howard Schwartz, the trial courts of Kansas made a commitment to implement the entire civil component of the Guide soon after its release in 2003. this effort was facilitated by a “Civil information Sheet” mandated by Kansas Supreme Court rule to accompany every civil case filed with the clerks of court . the form permits concise and uniform case-level information about the amount demanded, case type, jury request, and the parties and attorneys involved. the case type portion of the form is essentially verbatim from the Guide and in fact permits even greater detail than is outlined therein. to improve case type categorization accuracy and to expedite the filing process, the court asks the attorneys to fill out the form rather than the clerk of court.
Kansas began reporting its Guide-compliant civil caseload for data year 2006 (the data featured here are from data year 2007). Presently unsurpassed by any other state, Kansas reports new filings and reopened caseloads for 36 of the 38 civil case types outlined in the Guide. it is one of only three states (along with New Jersey and Wisconsin) that reports an intentional tort (e.g., assault, vandalism) caseload and also one of only three states that reports a premises liability caseload. the latter—also known as “slip and fall” cases—were identified in the 2005 Bureau of Justice Statistics/National Center for State Courts collaboration Civil Justice Survey of State Courts as the third most common type of tort trial in state courts after automobile and medical malpractice trials. Kansas’ data is consistent with this finding. Yet, despite these relatively high rates of occurrence, Kansas, iowa, and Mississippi are the only states to report complete premises liability caseloads.
the charts and table show some of the details that become available when a state reports its civil caseload in accordance with the Guide.
IncomingCasesCase Type
Grand Total Civil 182,427
* Other Civil includes civil appeals, writs, non-domestic relations restraining orders, and tax cases.
Contract 143,864
Probate/Estate 9,595
Small Claims 9,450
Tort 3,806
Mental Health 2,849
Real Property 850
Other Civil* 12,013
Percent of Civil Caseload
78.9%
5.3%
5.2%
2.1%
1.6%
0.5%
6.6%
IncomingCasesCase Type Percent of Contract Caseload
Total Contract 143,864
Seller plaintiff (debt collection) 104,742 72.8%
Landlord/tenant - Unlawful det. 14,537 10.1%
Mortgage foreclosure 10,294 7.2%
Landlord/tenant - Other 1,796 1.2%
Fraud 310 0.2%
Buyer plaintiff 216 0.2%
Employment - other 93 0.1%
Employment - discrimination 11 0.0%
Other contract 11,865 8.2%
IncomingCasesCase Type Percent of Tort Caseload
Total Tort 3,806
Automobile tort 2,314 60.8%
Malpractice - Total 298 7.8%
Premises liability 188 4.9%
Intentional tort 134 3.5%
Product liability - Total 44 1.2%
Slander/libel/defamation 19 0.5%
Other tort 809 21.3%
Four of five civil cases in Kansas are contract cases
Civil Caseload Composition in the Kansas District Court, 2007
Contract Caseload Composition in the Kansas District Court, 2007
Tort Caseload Composition in the Kansas District Court, 2007
Kansas
Examining the Work of State Courts: An Analysis of 2007 State Court CaseloadsTrial Courts: Civil Caseloads10 Examining the Work of State Courts: An Analysis of 2007 State Court Caseloads
Trial Courts: Civil Caseloads

Tort cases comprise only 2 percent of the Kansas civil caseload
Kansas District Court Civil Caseload, 2007
Civil Case Type
New Filings
Reopened Cases
Total Incoming
Entries of Judgment
Clearance Rate
Percent Reopened
Automobile tort 2,273 41 2,314 2,280 99% 1.8%intentional tort 132 2 134 112 84% 1.5% Malpractice - medical 248 6 254 193 76% 2.4% Malpractice - legal 29 0 29 18 62% 0.0%Malpractice - other 15 0 15 11 73% 0.0% Premises liability 186 2 188 165 88% 1.1% Product liability - asbestos 20 0 20 22 110% 0.0% Product liability - tobacco 1 0 1 0 0% 0.0% Product liability - other 21 2 23 25 109% 8.7% Slander/libel/defamation 19 0 19 21 111% 0.0%other tort 777 32 809 1,081 134% 4.0% Buyer plaintiff 212 4 216 238 110% 1.9%Employment - discrimination 11 0 11 10 91% 0.0%Employment - other 93 0 93 63 68% 0.0% Fraud 305 5 310 331 107% 1.6%Landlord/tenant - unlawful detainer 14,481 56 14,537 12,564 86% 0.4% Landlord/tenant - other 1,776 20 1,796 1,914 107% 1.1% Mortgage foreclosure 9,698 596 10,294 10,874 106% 5.8% Seller plaintiff (debt collection) 103,953 789 104,742 107,232 102% 0.8% other contract 11,551 314 11,865 6,458 54% 2.6% Eminent domain 125 0 125 103 82% 0.0%other real property 689 36 725 969 134% 5.0% Small Claims 9,450 n/a 9,450 9,450 100% n/aGuardianship - adult 899 0 899 873 97% 0.0%Guardianship - juvenile 811 0 811 809 100% 0.0%Conservatorship/trusteeship 331 0 331 260 79% 0.0%Probate/wills/intestate 4,849 9 4,858 5,058 104% 0.2% other probate/estate 2,691 5 2,696 2,311 86% 0.2%Mental Health 2,849 n/a 2,849 2,849 100% n/aAppeals from admin. agency 547 0 547 501 92% 0.0%Appeals from ltd juris. trial court n/a n/a n/a n/a n/a n/aother civil appeals 225 0 225 196 87% 0.0% Habeas corpus 324 9 333 422 127% 2.7%Non-dom. rel. restraining order 4,067 9 4,076 3,854 95% 0.2% tax cases n/a n/a n/a n/a n/a n/aWrit involving prison conditions 204 9 213 233 109% 4.2% other writs 99 0 99 147 148% 0.0%total other civil 6,456 64 6,520 5,900 90% 1.0%Grand Total Civil 180,417 2,010 182,427 177,547 97% 1.1%
Notes: n/a = not available. Distinguishes Civil subcategories in the Guide.
Examining the Work of State Courts: An Analysis of 2007 State Court CaseloadsTrial Courts: Civil Caseloads
Examining the Work of State Courts: An Analysis of 2007 State Court CaseloadsTrial Courts: Civil Caseloads 11
Summary
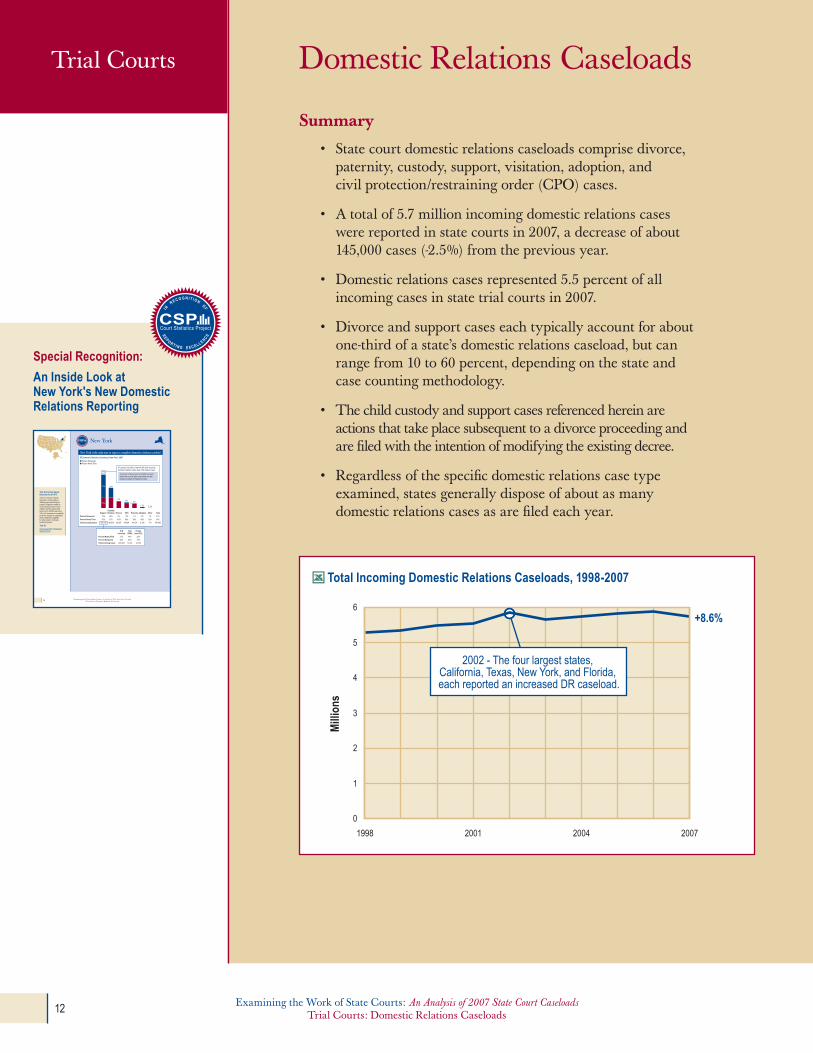
• Statecourtdomesticrelationscaseloadscomprisedivorce,paternity, custody, support, visitation, adoption, and civil protection/restraining order (CPO) cases.
• Atotalof5.7millionincomingdomesticrelationscases were reported in state courts in 2007, a decrease of about 145,000 cases (-2.5%) from the previous year.
• Domesticrelationscasesrepresented5.5percentofallincoming cases in state trial courts in 2007.
• Divorceandsupportcaseseachtypicallyaccountforaboutone-third of a state’s domestic relations caseload, but can range from 10 to 60 percent, depending on the state and case counting methodology.
• Thechildcustodyandsupportcasesreferencedhereinareactions that take place subsequent to a divorce proceeding and are filed with the intention of modifying the existing decree.
• Regardlessofthespecificdomesticrelationscasetypeexamined, states generally dispose of about as many domestic relations cases as are filed each year.
Total Incoming Domestic Relations Caseloads, 1998-2007
0
1
2
3
4
5
6
1998 2001 2004 2007
Mill
ions
+8.6%
2002 - The four largest states, California, Texas, New York, and Florida, each reported an increased DR caseload.
Special Recognition:
An Inside Look at New York's New Domestic Relations Reporting
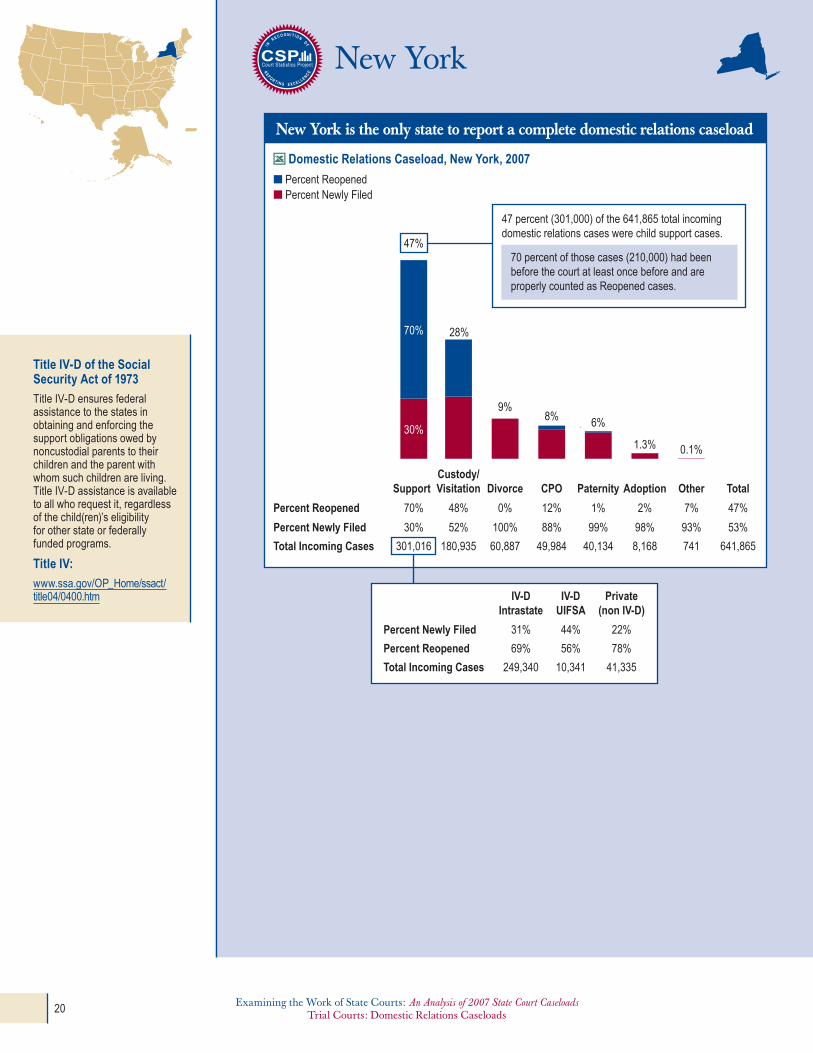
Title IV-D of the Social Security Act of 1973
Title IV-D ensures federal assistance to the states in obtaining and enforcing the support obligations owed by noncustodial parents to their children and the parent with whom such children are living. Title IV-D assistance is available to all who request it, regardless of the child(ren)’s eligibility for other state or federally funded programs.
Title IV:
www.ssa.gov/OP_Home/ssact/title04/0400.htm
■ Percent Reopened■ Percent Newly Filed
Percent Newly Filed
Total Incoming Cases
30%
Support
30%
301,016
1.3%
Adoption
98%
8,168
8%
CPO
88%
49,984
0.1%
Other
93%
741
Total
53%
641,865
28%
Custody/Visitation
52%
180,935
6%
Paternity
99%
40,134
9%
Divorce
100%
Percent Reopened 70% 2%12% 7% 47%48% 1%0%
60,887
47%
47 percent (301,000) of the 641,865 total incoming domestic relations cases were child support cases.
70 percent of those cases (210,000) had been before the court at least once before and are properly counted as Reopened cases.
70%
New York is the only state to report a complete domestic relations caseload
IV-DIntrastate
IV-DUIFSA
Private(non IV-D)
Percent Newly Filed 31% 44% 22%
Percent Reopened 69% 56% 78%
Total Incoming Cases 249,340 10,341 41,335
New York
Domestic Relations Caseload, New York, 2007
Examining the Work of State Courts: An Analysis of 2007 State Court CaseloadsTrial Courts: Domestic Relations Caseloads20 Examining the Work of State Courts: An Analysis of 2007 State Court Caseloads
Trial Courts: Criminal Caseloads
Domestic Relations CaseloadsTrial Courts
Examining the Work of State Courts: An Analysis of 2007 State Court CaseloadsTrial Courts: Domestic Relations Caseloads12 Examining the Work of State Courts: An Analysis of 2007 State Court Caseloads
Trial Courts: Domestic Relations Caseloads

Estimated Domestic Relations Caseload Composition, 2007
31%
Support(14 States)
29%
Divorce(25 States)
20%
CPO(22 States)
10%
Paternity(17 States)
3.4%
Custody(5 States)
2.5%
Adoption(26 States)
1.3%
Visitation(5 States)
Note: this composition was derived by calculating the percentage that each individual case type comprised of the total domestic relations caseload in the states that reported complete and accurate data for the specific case type. For example, in the 14 states that reported complete support caseloads, the sum of all support cases was 31 percent of the sum of all domestic relations cases. this methodology suggests that about 3 percent of cases would have been reported in the residual “other domestic relations” case type.
Although great in their consequences, domestic relations cases are relatively few in number
Total Incoming Cases in State Courts, by Jurisdiction, 2007 (in millions)
Jurisdiction
Case Type Unified General Unified & General Limited Total Percent of Totaltraffic 12.4 1.8 14.3 42.0 56.3 54.2%
Criminal 3.3 3.4 6.7 14.7 21.4 20.7%
Civil 3.2 4.7 7.9 10.2 18.1 17.5%
Domestic Relations 1.0 3.1 4.1 1.6 5.7 5.5%
Juvenile 0.4 1.0 1.4 0.7 2.2 2.1%
All Cases 20.3 14.0 34.3 69.3 103.7 100.0%
Examining the Work of State Courts: An Analysis of 2007 State Court CaseloadsTrial Courts: Domestic Relations Caseloads
Examining the Work of State Courts: An Analysis of 2007 State Court CaseloadsTrial Courts: Domestic Relations Caseloads 13

Incoming Domestic Relations Caseloads, by Case Type, 1998-2007
Note: trend data for visitation cases were not available.
Distribution of Incoming Domestic Relations Caseloads in 4 States, 2007
Case Type
Divorce
Paternity
Custody
Support
Visitation
Adoption
CPO
96%
4%
Washington
■
■
■
■
■
■
■
86%
14%
Colorado
■
■
■
■
■
■
■
72%
28%
Tennessee
■
■
■
■
■
■
■
9%
91%
New York
■
■
■
■
■
■
■
■ General Jursdiction Courts ■ Limited Jurisdiction Courts ■ Shared Jurisdiction
Support cases show the greatest increase over the past decade
States have chosen different venues in which to process certain domestic relations case types
0
250,000
500,000
750,000
1,000,000
1,250,000
Num
ber o
f Cas
es
0
250,000
500,000
750,000
1,000,000
1,250,000Custody
Civil Protection OrderSupportDivorce
Paternity
1998 2001 2004 20071998 2001 2004 2007 1998 2001 2004 2007
Adoption
-3%
+15%
+25%
-4% -8%
+13%
Examining the Work of State Courts: An Analysis of 2007 State Court CaseloadsTrial Courts: Domestic Relations Caseloads14 Examining the Work of State Courts: An Analysis of 2007 State Court Caseloads
Trial Courts: Domestic Relations Caseloads

Percent of Total Incoming Domestic Relations Caseloads by Case Type in 23 States, 2007
State Adoption Divorce CPO Paternity Support Custody Visitation
Missouri 3% 26% 46% 8% 13% 0.5%
Puerto Rico 1% 52% 1% 34% 4.8% 2.8%
New York 1% 9% 8% 6% 47% 28% Reported as one aggregate caseload.
Colorado 5% 52% 5% 14% 8.2%
Connecticut 5% 38% 23% 5% 15%
Iowa 5% 36% 15% 15% 3.3%
Michigan 4% 35% 21% 15% 1.6%
New Mexico 2% 39% 30% 14% 12%
North Dakota 2% 24% 5% 9% 59%
ohio 2% 20% 8% 9% 1.4%
Utah 8% 61% 21% 5% 0.2%
Washington 4% 44% 26% 11% 2.5%
Wisconsin 4% 38% 14% 26% 17%
Wyoming 5% 42% 17% 6% 29%
Arizona 2% 21% 30% 31%
Arkansas 4% 39% 19% 11%
Hawaii 5% 42% 35% 14%
Maryland 2% 30% 24% 18%
Minnesota 5% 36% 25% 29%
Florida 40% 25% 15%
idaho 4% 21% 16%
Illinois 3% 43% 35%
West Virginia 2% 23% 60%
Number of States Reporting 22 22 21 17 13 6 5
Divorce and support cases dominate domestic relations caseloads in most states
Notes: States in Bold have a unified court system. Blank cells indicate the state did not report data for this case type.
Examining the Work of State Courts: An Analysis of 2007 State Court CaseloadsTrial Courts: Domestic Relations Caseloads
Examining the Work of State Courts: An Analysis of 2007 State Court CaseloadsTrial Courts: Domestic Relations Caseloads 15
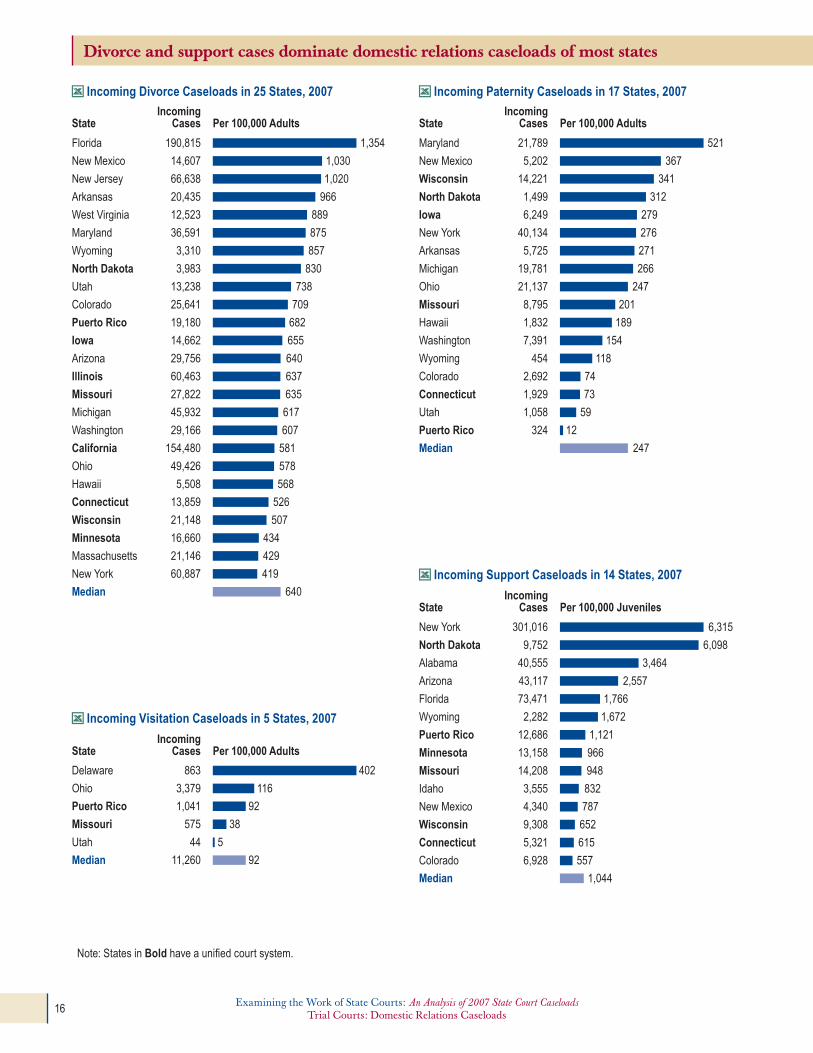
Divorce and support cases dominate domestic relations caseloads of most states
Note: States in Bold have a unified court system.
IncomingCasesState Per 100,000 Adults
Florida 190,815
New Mexico 14,607
New Jersey 66,638
Arkansas 20,435
West Virginia 12,523
Maryland 36,591
Wyoming 3,310
North Dakota 3,983
Utah 13,238
Colorado 25,641
Puerto Rico 19,180
Iowa 14,662
Arizona 29,756
Illinois 60,463
Missouri 27,822
Michigan 45,932
Washington 29,166
California 154,480
Ohio 49,426
Hawaii 5,508
Connecticut 13,859
Wisconsin 21,148
Minnesota 16,660
Massachusetts 21,146
New York 60,887
1,354
1,030
1,020
966
889
875
857
830
738
709
682
655
640
637
635
617
607
581
578
568
526
507
434
429
419
640Median
Median
IncomingCasesState Per 100,000 Adults
Maryland 21,789
New Mexico 5,202
Wisconsin 14,221
North Dakota 1,499
Iowa 6,249
New York 40,134
Arkansas 5,725
Michigan 19,781
Ohio 21,137
Missouri 8,795
Hawaii 1,832
Washington 7,391
Wyoming 454
Colorado 2,692
Connecticut 1,929
Utah 1,058
Puerto Rico 324
521
367
341
312
279
276
271
266
247
201
189
154
118
74
73
59
12
247
IncomingCasesState Per 100,000 Juveniles
Median
New York
North Dakota
Alabama
Arizona
Florida
Wyoming
Puerto Rico
Minnesota
Missouri
Idaho
New Mexico
Wisconsin
Connecticut
Colorado
301,016
9,752
40,555
43,117
73,471
2,282
12,686
13,158
14,208
3,555
4,340
9,308
5,321
6,928
6,315
6,098
3,464
2,557
1,766
1,672
1,121
966
948
832
787
652
615
557
1,044
IncomingCasesState Per 100,000 Adults
Delaware 863 402
Ohio 3,379 116
Puerto Rico 1,041 92
Missouri 575 38
Utah 44 5
Median 11,260 92
Incoming Divorce Caseloads in 25 States, 2007
Incoming Visitation Caseloads in 5 States, 2007
Incoming Paternity Caseloads in 17 States, 2007
Incoming Support Caseloads in 14 States, 2007
Examining the Work of State Courts: An Analysis of 2007 State Court CaseloadsTrial Courts: Domestic Relations Caseloads16 Examining the Work of State Courts: An Analysis of 2007 State Court Caseloads
Trial Courts: Domestic Relations Caseloads
IncomingCasesState
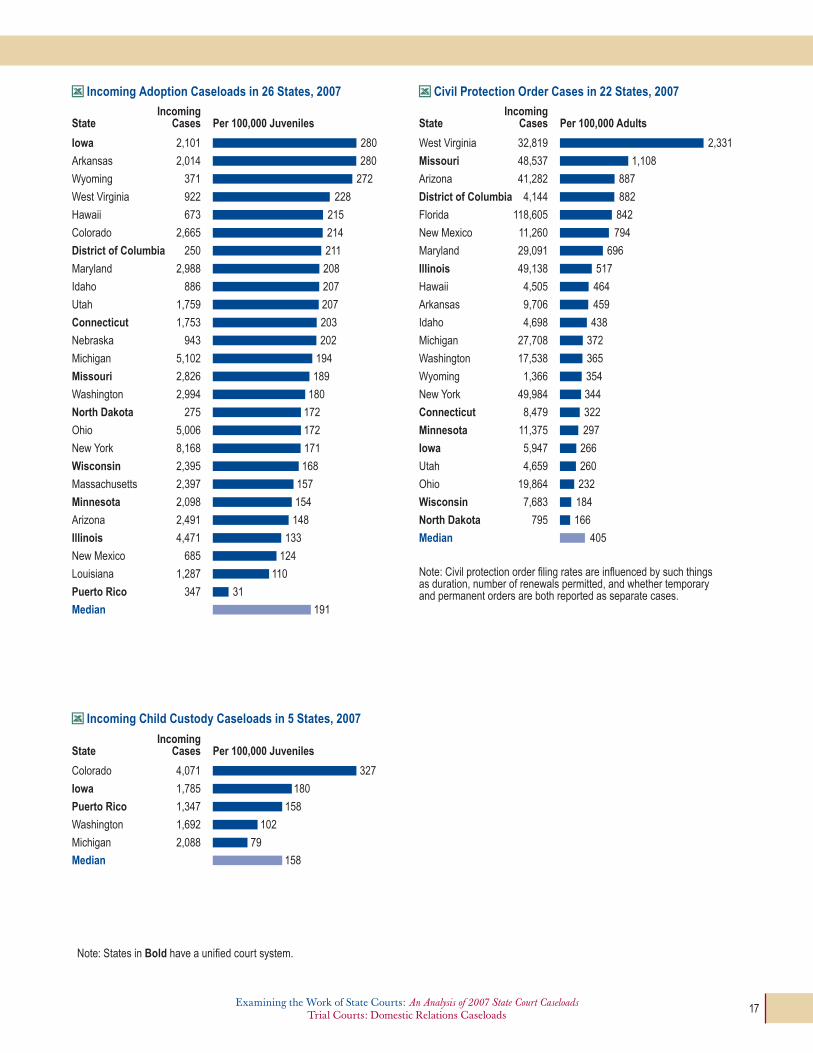
Iowa 2,101
Arkansas 2,014
Wyoming 371
West Virginia 922
Hawaii 673
Colorado 2,665
District of Columbia 250
Maryland 2,988
Idaho 886
Utah 1,759
Connecticut 1,753
Nebraska 943
Michigan 5,102
Missouri 2,826
Washington 2,994
North Dakota 275
Ohio 5,006
New York 8,168
Wisconsin 2,395
Massachusetts 2,397
Minnesota 2,098
Arizona 2,491
Illinois 4,471
New Mexico 685
Louisiana 1,287
Puerto Rico 347
Median
Per 100,000 Juveniles
280
280
272
215
228
214
211
208
207
207
203
202
194
189
180
172
172
171
168
157
154
148
133
124
110
31
191
Note: Civil protection order filing rates are influenced by such things as duration, number of renewals permitted, and whether temporary and permanent orders are both reported as separate cases.
IncomingCasesState Per 100,000 Adults
West Virginia 32,819
Missouri 48,537
Arizona 41,282
District of Columbia 4,144
Florida 118,605
New Mexico 11,260
Maryland 29,091
Illinois 49,138
Hawaii 4,505
Arkansas 9,706
Idaho 4,698
Michigan 27,708
Washington 17,538
Wyoming 1,366
New York 49,984
Connecticut 8,479
Minnesota 11,375
Iowa 5,947
Utah 4,659
Ohio 19,864
Wisconsin 7,683
North Dakota 795
Median
2,331
1,108
887
882
842
794
696
517
464
459
438
372
365
354
344
322
297
266
260
232
184
166
405
Median
IncomingCasesState Per 100,000 Juveniles
Colorado 4,071
Iowa 1,785
Puerto Rico 1,347
Washington 1,692
Michigan 2,088
327
180
158
102
79
158
Note: States in Bold have a unified court system.
Incoming Adoption Caseloads in 26 States, 2007 Civil Protection Order Cases in 22 States, 2007
Incoming Child Custody Caseloads in 5 States, 2007
Examining the Work of State Courts: An Analysis of 2007 State Court CaseloadsTrial Courts: Domestic Relations Caseloads
Examining the Work of State Courts: An Analysis of 2007 State Court CaseloadsTrial Courts: Domestic Relations Caseloads 17
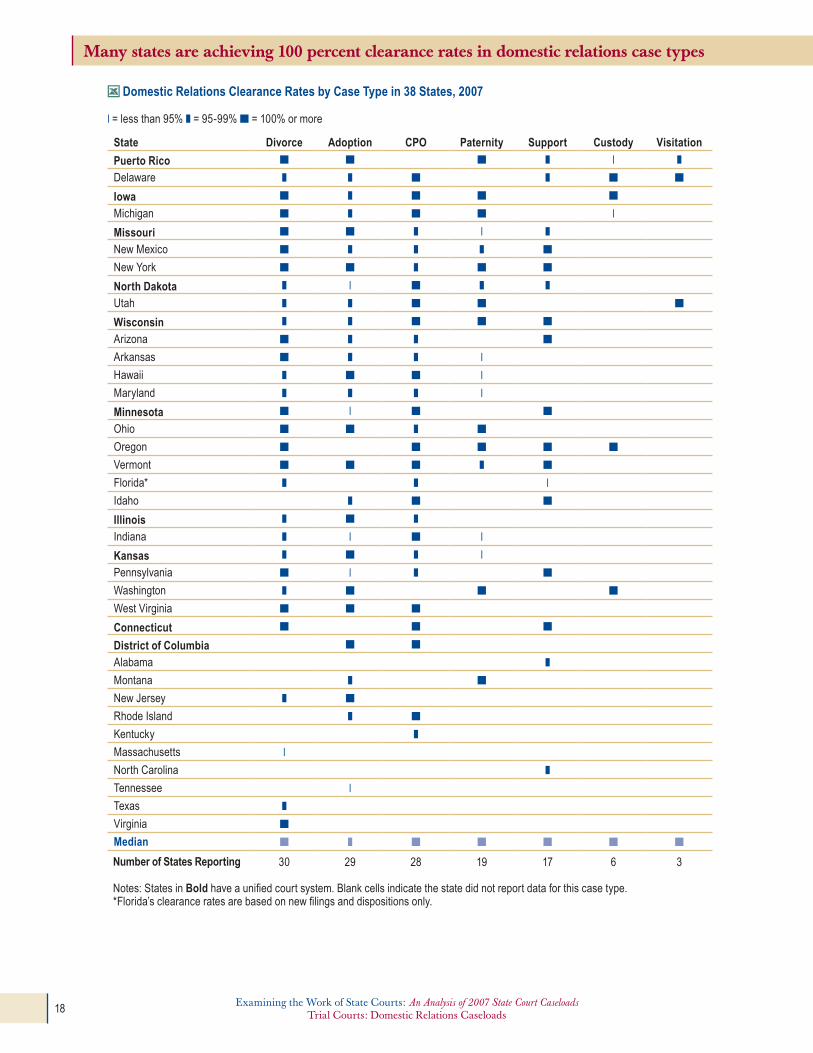
Many states are achieving 100 percent clearance rates in domestic relations case types
Domestic Relations Clearance Rates by Case Type in 38 States, 2007
State Divorce Adoption CPO Paternity Support Custody Visitation
Puerto Rico ■ ■ ■ ❚ ❘ ❚
Delaware ❚ ❚ ■ ❚ ■ ■
Iowa ■ ❚ ■ ■ ■
Michigan ■ ❚ ■ ■ ❘
Missouri ■ ■ ❚ ❘ ❚
New Mexico ■ ❚ ❚ ❚ ■
New York ■ ■ ❚ ■ ■
North Dakota ❚ ❘ ■ ❚ ❚
Utah ❚ ❚ ■ ■ ■
Wisconsin ❚ ❚ ■ ■ ■
Arizona ■ ❚ ❚ ■
Arkansas ■ ❚ ❚ ❘
Hawaii ❚ ■ ■ ❘
Maryland ❚ ❚ ❚ ❘
Minnesota ■ ❘ ■ ■
ohio ■ ■ ❚ ■
oregon ■ ■ ■ ■ ■
Vermont ■ ■ ■ ❚ ■
Florida* ❚ ❚ ❘
idaho ❚ ■ ■
Illinois ❚ ■ ❚
indiana ❚ ❘ ■ ❘
Kansas ❚ ■ ❚ ❘
Pennsylvania ■ ❘ ❚ ■
Washington ❚ ■ ■ ■
West Virginia ■ ■ ■
Connecticut ■ ■ ■
District of Columbia ■ ■
Alabama ❚
Montana ❚ ■
New Jersey ❚ ■
Rhode island ❚ ■
Kentucky ❚
Massachusetts ❘
North Carolina ❚
tennessee ❘
texas ❚
Virginia ■
Median ■ ❚ ■ ■ ■ ■ ■
Number of States Reporting 30 29 28 19 17 6 3
Notes: States in Bold have a unified court system. Blank cells indicate the state did not report data for this case type. *Florida’s clearance rates are based on new filings and dispositions only.
❘ = less than 95% ❚ = 95-99% ■ = 100% or more
Examining the Work of State Courts: An Analysis of 2007 State Court CaseloadsTrial Courts: Domestic Relations Caseloads18 Examining the Work of State Courts: An Analysis of 2007 State Court Caseloads
Trial Courts: Domestic Relations Caseloads
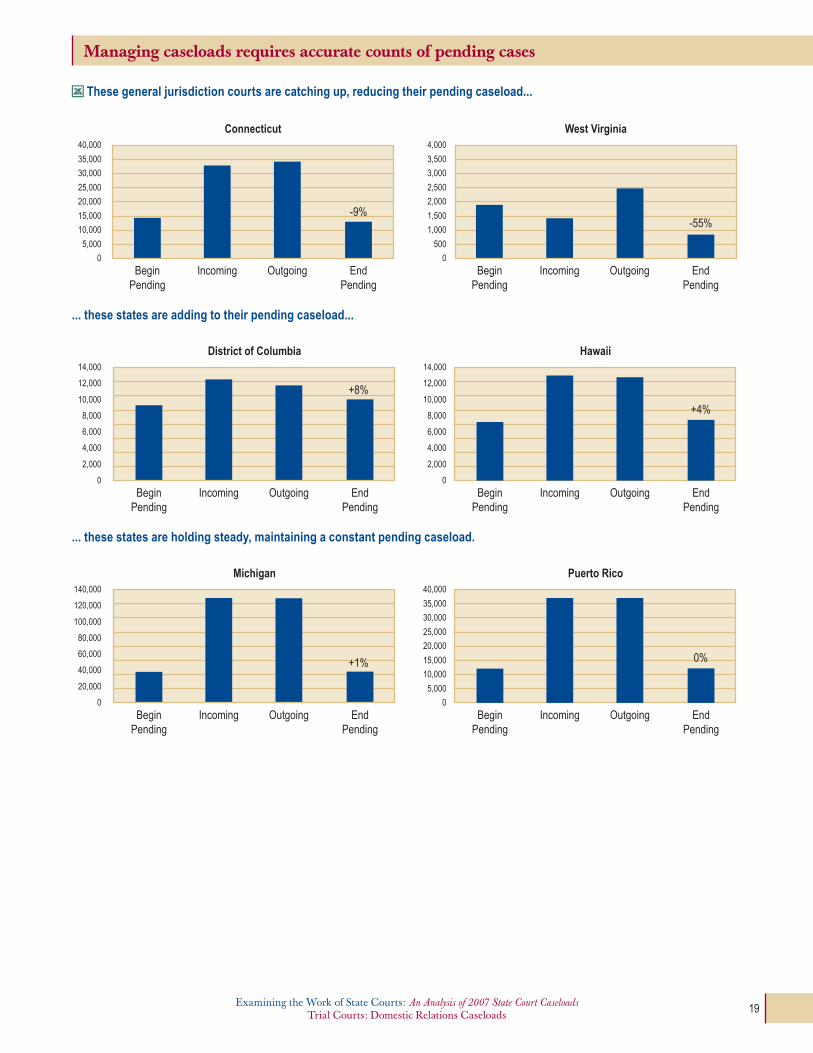
Managing caseloads requires accurate counts of pending cases
Connecticut
0
5,000
10,000
15,000
20,000
25,000
30,000
35,000
40,000
BeginPending
Incoming Outgoing EndPending
-9%
West Virginia
0
500
1,000
1,500
2,000
2,500
3,000
3,500
4,000
BeginPending
Incoming Outgoing EndPending
-55%
0
2,000
4,000
6,000
8,000
10,000
12,000
14,000
BeginPending
Incoming Outgoing EndPending
Hawaii
0
2,000
4,000
6,000
8,000
10,000
12,000
14,000
District of Columbia
BeginPending
Incoming Outgoing EndPending
0
20,000
40,000
60,000
80,000
100,000
120,000
140,000
Michigan
BeginPending
Incoming Outgoing EndPending
0
5,000
10,000
15,000
20,000
25,000
30,000
35,000
40,000
Puerto Rico
BeginPending
Incoming Outgoing EndPending
+8%
+1%
+4%
0%
These general jurisdiction courts are catching up, reducing their pending caseload...
... these states are adding to their pending caseload...
... these states are holding steady, maintaining a constant pending caseload.
Examining the Work of State Courts: An Analysis of 2007 State Court CaseloadsTrial Courts: Domestic Relations Caseloads
Examining the Work of State Courts: An Analysis of 2007 State Court CaseloadsTrial Courts: Domestic Relations Caseloads 19
Title IV-D of the Social Security Act of 1973
title iV-D ensures federal assistance to the states in obtaining and enforcing the support obligations owed by noncustodial parents to their children and the parent with whom such children are living. title iV-D assistance is available to all who request it, regardless of the child(ren)’s eligibility for other state or federally funded programs.
Title IV:
www.ssa.gov/oP_Home/ssact/title04/0400.htm
■ Percent Reopened■ Percent Newly Filed
Percent Newly Filed
Total Incoming Cases
30%
Support
30%
301,016
1.3%
Adoption
98%
8,168
8%
CPO
88%
49,984
0.1%
Other
93%
741
Total
53%
641,865
28%
Custody/Visitation
52%
180,935
6%
Paternity
99%
40,134
9%
Divorce
100%
Percent Reopened 70% 2%12% 7% 47%48% 1%0%
60,887
47%
47 percent (301,000) of the 641,865 total incoming domestic relations cases were child support cases.
70 percent of those cases (210,000) had been before the court at least once before and are properly counted as Reopened cases.
70%
New York is the only state to report a complete domestic relations caseload
IV-DIntrastate
IV-DUIFSA
Private(non IV-D)
Percent Newly Filed 31% 44% 22%
Percent Reopened 69% 56% 78%
Total Incoming Cases 249,340 10,341 41,335
New York
Domestic Relations Caseload, New York, 2007
Examining the Work of State Courts: An Analysis of 2007 State Court CaseloadsTrial Courts: Domestic Relations Caseloads20 Examining the Work of State Courts: An Analysis of 2007 State Court Caseloads
Trial Courts: Criminal Caseloads
Special Recognition:
Utah Improves Criminal Caseload Reporting
Utah
■ District Court (General Jurisdiction)■ Justice Court (Limited Jurisdiction)
32%
68%
Total Criminal(122,760 Cases)
100%
0%
Felony(21,586 Cases)
17%
83%
Misdemeanor(100,087 Cases)
100%
0%
Other Criminal(1,087 Cases)
The Justice Courts process two thirds of Utah’s criminal caseloads
Criminal Caseload Distribution in the Utah District and Justice Courts, 2007
Utah Improves Criminal Caseload Reporting
Since its release in 2003, several states have made notable progress implementing portions of the State Court Guide to Statistical Reporting, but not all in the same way. Some have chosen a specific case category such as civil or domestic relations on which to concentrate. Others have applied their resources toward counting and reporting in new status categories (e.g., reopened or reactivated), while still others have tackled the Guide in its entirety, undertaking a long and methodical route to complete implementation. Regardless of the approach, progress by any state helps the cause of improved court data and comparability among the states.
Utah has three state-level trial courts or “reporting units” as recognized by the Court Statistics Project. First is the general jurisdiction District Court, with at least partial jurisdiction over all case types except juvenile. Second is the Justice (formerly Justice of the Peace) Court, with small claims, misdemeanor, and traffic jurisdiction. Finally, the Juvenile Court has jurisdiction over all juvenile matters.
Following a concerted imple-mentation effort, the District Court of Utah has done an outstanding job reporting many of the case types outlined in the Guide, especially in the criminal section. Only elder abuse and misdemeanor protection order violations cases are absent from their criminal case inventory. In 2007, roughly one-third of Utah’s 123,000 incoming criminal cases were processed in the District Court. This included all of the state’s 22,000 felonies and over 17,000 misdemeanors.
■ Utah District Court■ National Estimate
35%
29%
Drug
33%
28%
Property
9%
14%
Person
8.3%
4.1%
MotorVehicle
3.4% 2.6%
DomesticViolence
1.8%
6.0%
Weapon
1.0%
5.0%
PublicOrder
7%
11%
OtherFelony
Detailed reporting permits more meaningful comparisons
Felony Caseload Composition, Utah District Court vs. National Estimate, 2007
Note: The National Estimate was derived by calculating the percentage that each individual case type comprised of the total felony caseload in the states that reported complete and accurate data for the specific case type. For example, in the 13 states that reported complete felony drug caseloads, the sum of all felony drug cases was 29 percent of the sum of all felony cases. This methodology suggests that about 11 percent of cases would have been reported in the residual “other felony” case type.
Examining the Work of State Courts: An Analysis of 2007 State Court CaseloadsTrial Courts: Criminal Caseloads28 Examining the Work of State Courts: An Analysis of 2007 State Court Caseloads
Trial Courts: Criminal Caseloads
Criminal Caseload Summary - Utah District Court, 2007
Felony
New Filings
Criminal Caseload
Entries of Judgment
Clearance Rate
Drug 7,606 19.0% 7,714 101%Property 7,207 18.0% 6,752 94%Person 2,043 5.0% 1,968 96%Motor vehicle - DWI/DUI 981 2.5% 891 91%Motor vehicle - Other 803 2.0% 827 103%Domestic violence 741 1.9% 704 95%Weapon 385 1.0% 355 92%Public order 202 0.5% 157 78%Motor vehicle - Reckless driving 14 0.0% 24 171%Other felony 1,604 4.0% 1,554 97%Total Felony 21,586 54.0% 20,946 97%
Misdemeanor
Property 3,387 9.0% 4,108 121%Domestic violence 2,510 6.0% 2,925 117%Drug 1,821 4.6% 1,919 105%Person 1,748 4.4% 1,840 105%Motor vehicle - DWI/DUI 1,556 3.9% 1,782 115%Public order 1,525 3.8% 1,596 105%Motor vehicle - Other 199 0.5% 237 119%Weapon 194 0.5% 203 105%Motor vehicle - Reckless driving 12 0.0% 18 150%Other misdemeanor 4,111 10.0% 5,279 128%Total Misdemeanor 17,063 43.0% 19,907 117%
Appeals from Ltd Juris. Courts 764 2.0% 471 62%Other Criminal 323 1.0% 542 168%Grand Total Criminal 39,736 100.0% 41,866 105%
Also includes elder abuse cases. Also includes elder abuse and protection order violation cases.
Drug and property cases dominate Utah’s felony caseload
Examining the Work of State Courts: An Analysis of 2007 State Court CaseloadsTrial Courts: Criminal Caseloads
Examining the Work of State Courts: An Analysis of 2007 State Court CaseloadsTrial Courts: Criminal Caseloads 29
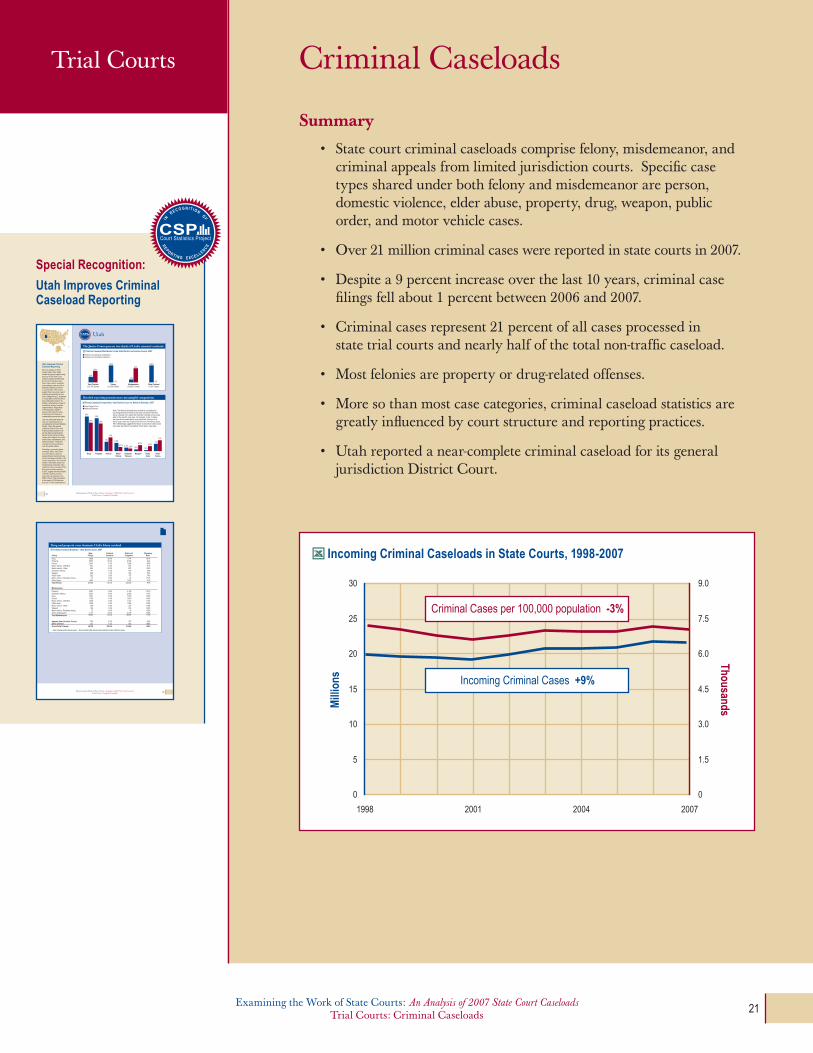
Summary
• Statecourtcriminalcaseloadscomprisefelony,misdemeanor,andcriminal appeals from limited jurisdiction courts. Specific case types shared under both felony and misdemeanor are person, domestic violence, elder abuse, property, drug, weapon, public order, and motor vehicle cases.
• Over21millioncriminalcaseswerereportedinstatecourtsin2007.
• Despitea9percentincreaseoverthelast10years,criminalcasefilings fell about 1 percent between 2006 and 2007.
• Criminalcasesrepresent21percentofallcasesprocessedin state trial courts and nearly half of the total non-traffic caseload.
• Mostfeloniesarepropertyordrug-relatedoffenses.
• Moresothanmostcasecategories,criminalcaseloadstatisticsaregreatly influenced by court structure and reporting practices.
• Utahreportedanear-completecriminalcaseloadforitsgeneraljurisdiction District Court.
Incoming Criminal Caseloads in State Courts, 1998-2007
0
5
10
15
20
25
30
0
1.5
3.0
4.5
6.0
7.5
9.0
1998 2001 2004 2007
Mill
ions
Thousands
Incoming Criminal Cases +9%
Criminal Cases per 100,000 population -3%
Criminal CaseloadsTrial Courts
Examining the Work of State Courts: An Analysis of 2007 State Court CaseloadsTrial Courts: Domestic Relations Caseloads
Examining the Work of State Courts: An Analysis of 2007 State Court CaseloadsTrial Courts: Criminal Caseloads 21
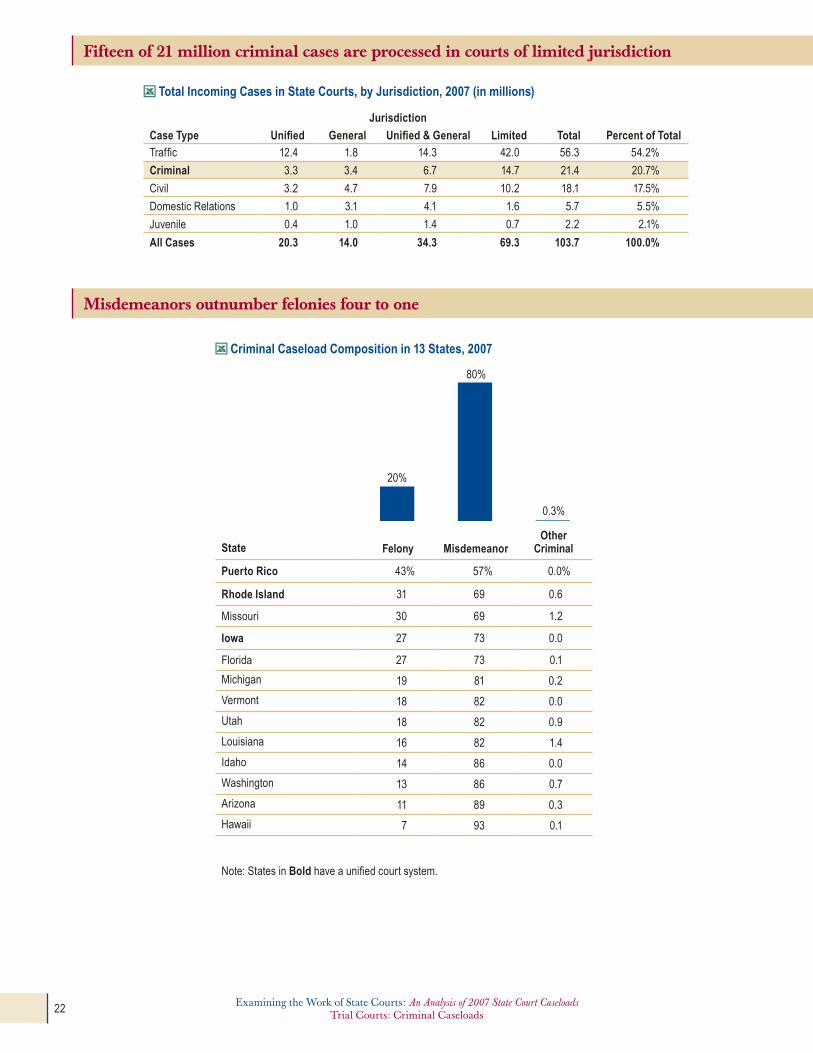
Fifteen of 21 million criminal cases are processed in courts of limited jurisdiction
Misdemeanors outnumber felonies four to one
Criminal Caseload Composition in 13 States, 2007
20%
80%
0.3%
State Felony MisdemeanorOther
Criminal
Puerto Rico 43% 57% 0.0%
Rhode Island 31 69 0.6
Missouri 30 69 1.2
Iowa 27 73 0.0
Florida 27 73 0.1
Michigan 19 81 0.2
Vermont 18 82 0.0
Utah 18 82 0.9
Louisiana 16 82 1.4
idaho 14 86 0.0
Washington 13 86 0.7
Arizona 11 89 0.3
Hawaii 7 93 0.1
Note: States in Bold have a unified court system.
Total Incoming Cases in State Courts, by Jurisdiction, 2007 (in millions)
Jurisdiction
Case Type Unified General Unified & General Limited Total Percent of Totaltraffic 12.4 1.8 14.3 42.0 56.3 54.2%
Criminal 3.3 3.4 6.7 14.7 21.4 20.7%
Civil 3.2 4.7 7.9 10.2 18.1 17.5%
Domestic Relations 1.0 3.1 4.1 1.6 5.7 5.5%
Juvenile 0.4 1.0 1.4 0.7 2.2 2.1%
All Cases 20.3 14.0 34.3 69.3 103.7 100.0%
Examining the Work of State Courts: An Analysis of 2007 State Court CaseloadsTrial Courts: Criminal Caseloads22 Examining the Work of State Courts: An Analysis of 2007 State Court Caseloads
Trial Courts: Criminal Caseloads

Crime rates, court structure, and charging practices affect criminal caseloads and rates
Incoming Criminal Caseloads and Rates in 17 States, 2007
Incoming Criminal Cases Criminal Cases per 100,000 Adults
State
General Jurisdiction
Limited Jurisdiction
Total
General Jurisdiction
Limited Jurisdiction
Total
Unified CourtsPuerto Rico 84,299 84,299 2,999 2,999
iowa 87,656 87,656 4,296 4,296
Missouri 198,878 198,878 4,541 4,541
South Dakota 29,124 29,124 4,997 4,997
illinois 542,453 542,453 5,711 5,711
Median 4,541 4,541
Two-tiered Courts
Vermont 18,990 n/j 18,990 4,033 n/j 4,033
Rhode island 6,233 37,969 44,202 771 4,698 5,469
Utah 39,736 83,024 122,760 2,216 4,629 6,845
indiana 247,084 50,799 297,883 5,255 1,080 6,335
Washington 50,399 326,215 376,614 1,049 6,788 7,836
Kentucky 31,840 219,642 251,482 996 6,868 7,864
Florida 389,993 1,060,987 1,450,980 2,768 7,530 10,298
Hawaii 7,606 104,351 111,957 784 10,755 11,539
Louisiana 175,478 206,524 382,002 5,622 6,617 12,239
South Carolina 126,155 278,427 404,582 3,826 8,445 12,271
idaho 12,135 138,685 150,820 1,132 12,936 14,068
Michigan 72,476 982,271 1,054,747 974 13,197 14,171
Median 1,674 6,868 9,081
Note: n/j = no jurisdiction
Examining the Work of State Courts: An Analysis of 2007 State Court CaseloadsTrial Courts: Criminal Caseloads
Examining the Work of State Courts: An Analysis of 2007 State Court CaseloadsTrial Courts: Criminal Caseloads 23

Felony cases leveled out in 2007 after several years of increases
Incoming Felony Caseloads in General Jurisdiction Courts in 22 States, 1998-2007
1998 2001 2004 2007
Changes in counting and reporting practices clearly influence caseload trends. For example, Florida began reporting felony probation revocations in 2003. This resulted in almost 100,000
more felony cases in Florida and added to the already increasing overall trend reported here.
0
200,000
400,000
600,000
800,000
1,000,000
+38%1,200,000
1,400,000
Reopened/Reactivated Criminal Caseloads in 12 States, 2007
18%
82%
16%
84%
Unified/General Jurisdiction(11 States)
Limited Jurisdiction(6 States)
■ Newly Filed■ Reopened/Reactivated
Relatively few criminal cases are reported as reopened or reactivated
Examining the Work of State Courts: An Analysis of 2007 State Court CaseloadsTrial Courts: Criminal Caseloads24 Examining the Work of State Courts: An Analysis of 2007 State Court Caseloads
Trial Courts: Criminal Caseloads
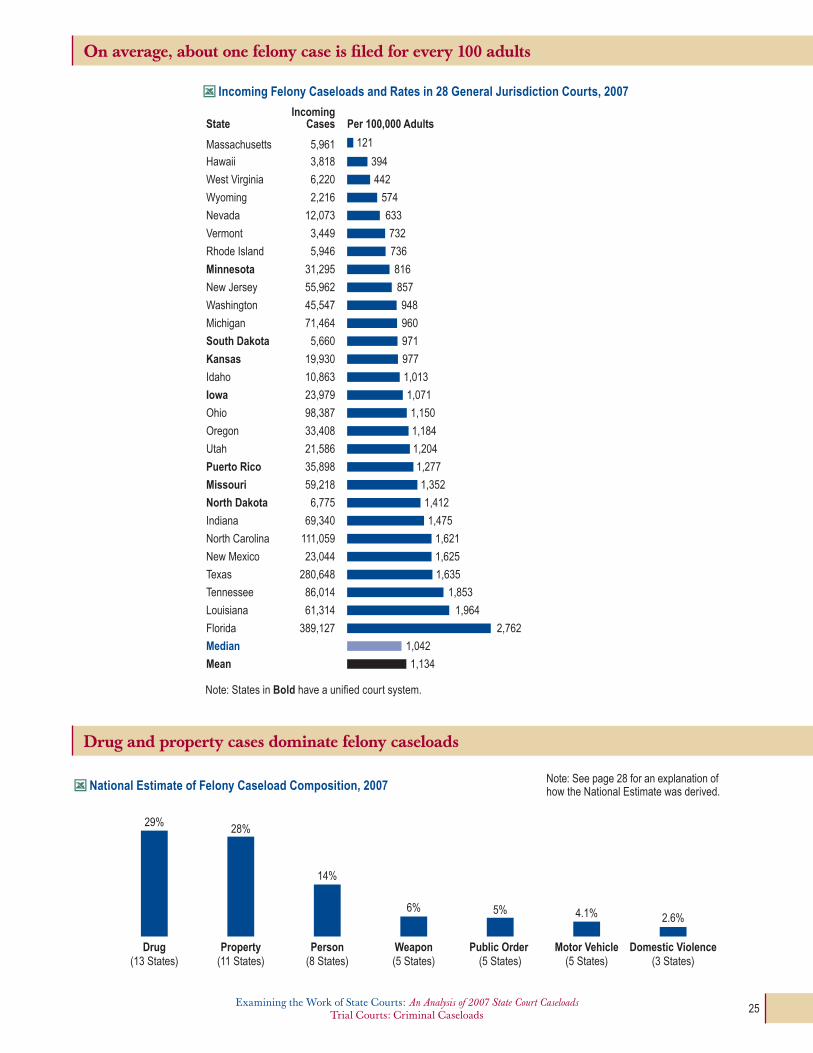
On average, about one felony case is filed for every 100 adults
IncomingCasesState Per 100,000 Adults
5,961
3,818
6,220
2,216
12,073
3,449
5,946
31,295
55,962
45,547
71,464
5,660
19,930
10,863
23,979
98,387
33,408
21,586
35,898
59,218
6,775
69,340
111,059
23,044
280,648
86,014
61,314
389,127
Massachusetts
Hawaii
West Virginia
Wyoming
Nevada
Vermont
Rhode Island
Minnesota
New Jersey
Washington
Michigan
South Dakota
Kansas
Idaho
Iowa
Ohio
Oregon
Utah
Puerto Rico
Missouri
North Dakota
Indiana
North Carolina
New Mexico
Texas
Tennessee
Louisiana
Florida
Median
Mean
121
394
442
574
633
732
736
816
857
948
960
971
977
1,013
1,071
1,150
1,184
1,204
1,277
1,352
1,412
1,475
1,621
1,625
1,635
1,853
1,964
2,762
1,042
1,134
Drug and property cases dominate felony caseloads
National Estimate of Felony Caseload Composition, 2007
28%
14%
6% 5% 4.1% 2.6%
29%
Drug(13 States)
Property(11 States)
Person(8 States)
Weapon(5 States)
Public Order (5 States)
Motor Vehicle(5 States)
Domestic Violence(3 States)
Note: States in Bold have a unified court system.
Incoming Felony Caseloads and Rates in 28 General Jurisdiction Courts, 2007
Note: See page 28 for an explanation of how the National Estimate was derived.
Examining the Work of State Courts: An Analysis of 2007 State Court CaseloadsTrial Courts: Criminal Caseloads
Examining the Work of State Courts: An Analysis of 2007 State Court CaseloadsTrial Courts: Criminal Caseloads 25

Most states are keeping up with felony caseloads
IncomingCasesState Unified Courts Clearance Rate
General Jurisdiction Courts Clearance Rate
31,295
18,610
59,218
19,930
6,775
35,898
Minnesota
Iowa*
Missouri
Kansas
North Dakota
Puerto Rico
Median
10,863
33,408
6,220
3,449
71,464
44,245
57,050
98,387
55,962
86,014
5,946
69,340
230,417
21,586
5,961
23,044
280,648
111,059
57,551
45,547
Idaho
Oregon
West Virginia
Vermont
Michigan
Colorado
Arkansas
Ohio
New Jersey
Tennessee
Rhode Island
Indiana
Florida*
Utah
Massachusetts
New Mexico
Texas
North Carolina
Arizona
Washington
Median
85% 90% 95% 100% 105% 110% 115%
85% 90% 95% 100% 105% 110% 115%
*these rates are based on new filings and dispositions only.
Felony Clearance Rates in Unified and General Jurisdiction Courts in 26 States, 2007
Examining the Work of State Courts: An Analysis of 2007 State Court CaseloadsTrial Courts: Criminal Caseloads26 Examining the Work of State Courts: An Analysis of 2007 State Court Caseloads
Trial Courts: Criminal Caseloads

Misdemeanor cases increased while the population-adjusted rate of incoming cases declined
High misdemeanor clearance rates are being achieved despite voluminous caseloads
Incoming Misdemeanor Caseloads and Rates in Limited Jurisdiction Courts in 13 States, 1998-2007 M
illio
ns
Thousands0
2
4
6
8
0
1
2
3
4
1998 2001 2004 2007
Incoming Misdemeanors +11%
Note: Despite generally increasing caseloads, the aggregate adult population-adjusted rate of incoming misdemeanors in these 13 states is 3 percent lower now than it was in 1998.
Misdemeanors per 100,000 Adults -3%
IncomingCasesState Clearance Rate
130,417
100,087
323,653
687,037
54,492
855,820
137,228
48,401
32,439
15,541
201,070
104,410
Idaho
Utah
Washington
Arizona
Iowa*
Michigan
Missouri
Puerto Rico
Alaska
Vermont
Indiana
Hawaii
Median
90% 95% 100% 105% 110%
Notes: States in Bold have a unified court system. *iowa’s rate is based on new filings and dispositions only.
Misdemeanor Clearance Rates in 12 States, 2007
Examining the Work of State Courts: An Analysis of 2007 State Court CaseloadsTrial Courts: Criminal Caseloads
Examining the Work of State Courts: An Analysis of 2007 State Court CaseloadsTrial Courts: Criminal Caseloads 27
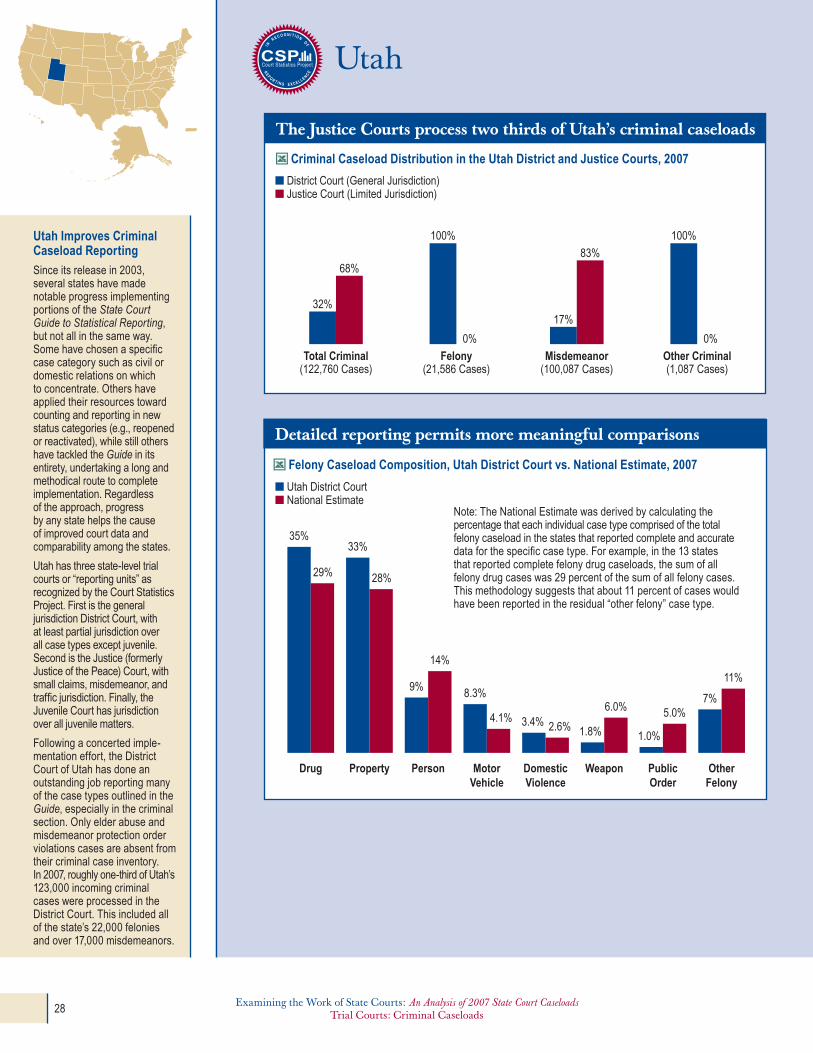
Utah
■ District Court (General Jurisdiction)■ Justice Court (Limited Jurisdiction)
32%
68%
Total Criminal(122,760 Cases)
100%
0%
Felony(21,586 Cases)
17%
83%
Misdemeanor(100,087 Cases)
100%
0%
Other Criminal(1,087 Cases)
The Justice Courts process two thirds of Utah’s criminal caseloads
Criminal Caseload Distribution in the Utah District and Justice Courts, 2007
Utah Improves Criminal Caseload Reporting
Since its release in 2003, several states have made notable progress implementing portions of the State Court Guide to Statistical Reporting, but not all in the same way. Some have chosen a specific case category such as civil or domestic relations on which to concentrate. others have applied their resources toward counting and reporting in new status categories (e.g., reopened or reactivated), while still others have tackled the Guide in its entirety, undertaking a long and methodical route to complete implementation. Regardless of the approach, progress by any state helps the cause of improved court data and comparability among the states.
Utah has three state-level trial courts or “reporting units” as recognized by the Court Statistics Project. First is the general jurisdiction District Court, with at least partial jurisdiction over all case types except juvenile. Second is the Justice (formerly Justice of the Peace) Court, with small claims, misdemeanor, and traffic jurisdiction. Finally, the Juvenile Court has jurisdiction over all juvenile matters.
Following a concerted imple-mentation effort, the District Court of Utah has done an outstanding job reporting many of the case types outlined in the Guide, especially in the criminal section. only elder abuse and misdemeanor protection order violations cases are absent from their criminal case inventory. in 2007, roughly one-third of Utah’s 123,000 incoming criminal cases were processed in the District Court. this included all of the state’s 22,000 felonies and over 17,000 misdemeanors.
■ Utah District Court■ National Estimate
35%
29%
Drug
33%
28%
Property
9%
14%
Person
8.3%
4.1%
MotorVehicle
3.4% 2.6%
DomesticViolence
1.8%
6.0%
Weapon
1.0%
5.0%
PublicOrder
7%
11%
OtherFelony
Detailed reporting permits more meaningful comparisons
Felony Caseload Composition, Utah District Court vs. National Estimate, 2007
Note: the National Estimate was derived by calculating the percentage that each individual case type comprised of the total felony caseload in the states that reported complete and accurate data for the specific case type. For example, in the 13 states that reported complete felony drug caseloads, the sum of all felony drug cases was 29 percent of the sum of all felony cases. this methodology suggests that about 11 percent of cases would have been reported in the residual “other felony” case type.
Examining the Work of State Courts: An Analysis of 2007 State Court CaseloadsTrial Courts: Criminal Caseloads28 Examining the Work of State Courts: An Analysis of 2007 State Court Caseloads
Trial Courts: Criminal Caseloads

Criminal Caseload Summary - Utah District Court, 2007
Felony
New Filings
Criminal Caseload
Entries of Judgment
Clearance Rate
Drug 7,606 19.0% 7,714 101%
Property 7,207 18.0% 6,752 94%
Person 2,043 5.0% 1,968 96%
Motor vehicle - DWi/DUi 981 2.5% 891 91%
Motor vehicle - other 803 2.0% 827 103%
Domestic violence 741 1.9% 704 95%
Weapon 385 1.0% 355 92%
Public order 202 0.5% 157 78%
Motor vehicle - Reckless driving 14 0.0% 24 171%
other felony1 1,604 4.0% 1,554 97%
Total Felony 21,586 54.0% 20,946 97%
Misdemeanor
Property 3,387 9.0% 4,108 121%
Domestic violence 2,510 6.0% 2,925 117%
Drug 1,821 4.6% 1,919 105%
Person 1,748 4.4% 1,840 105%
Motor vehicle - DWi/DUi 1,556 3.9% 1,782 115%
Public order 1,525 3.8% 1,596 105%
Motor vehicle - other 199 0.5% 237 119%
Weapon 194 0.5% 203 105%
Motor vehicle - Reckless driving 12 0.0% 18 150%
other misdemeanor2 4,111 10.0% 5,279 128%Total Misdemeanor 17,063 43.0% 19,907 117%
Appeals from Ltd Juris. Courts 764 2.0% 471 62%
Other Criminal 323 1.0% 542 168%
Grand Total Criminal 39,736 100.0% 41,866 105%
1 Also includes elder abuse cases. 2 Also includes elder abuse and protection order violation cases.
Drug and property cases also dominate Utah’s felony caseload
Examining the Work of State Courts: An Analysis of 2007 State Court CaseloadsTrial Courts: Criminal Caseloads
Examining the Work of State Courts: An Analysis of 2007 State Court CaseloadsTrial Courts: Criminal Caseloads 29

Summary
• Statecourtjuvenilecaseloadscomprisedelinquency,dependency,and status offense cases. Specific case types under delinquency are drug, person, property, and public order cases. Dependency caseloads include abuse, neglect, dependent (no fault), and termination of parental rights (TPR) cases.
• Over2.1millionjuvenilepetitionswerefiledinstatecourtsin 2007. This was an increase of less than 1 percent from the previous year.
• Reopenedorreactivatedjuvenilecaseloadpercentagesrange from almost none to over 50 percent.
• Delinquencycasesdominatemostjuvenilecaseloads.
• Kansasistheonlystatepresentlyreportingnewfilingsand entry of judgment data for each of the case types recommended in the State Court Guide to Statistical Reporting.
Incoming Juvenile Caseloads in State Courts, 1998-2007
0
0.5
1.0
1.5
2.0
2.5
0
7
14
21
28
35
1998 2001 2004 2007
Mill
ions
Hundreds
Incoming Juvenile Cases -3%
Juvenile Cases per 100,000 Juveniles -13%
Special Recognition:
Comparing Juvenile Caseloads: Kansas and Utah
Comparing Juvenile Caseloads: Kansas and Utah
Utah reports enough detail in the juvenile category to compare with the data reported by Kansas. The first chart shows that the composition of the two states’ caseloads is more similar than not. Kansas reports a higher percentage of dependency cases; it is interesting to note that Kansas does not report a single case under the “Other Juvenile” case type. This would indicate that every juvenile case filed in the state was identified as a delinquency, dependency, or status offense case.
Utah’s web site (www.utcourts.gov/stats/) contains trial court data from each court and district from 1997 to the present as well as results from its implementation of the CourTools performance measures (www.utcourts.gov/courtools).
A Detailed Look at Juvenile Cases in Kansas
Kansas, in addition to making huge strides in reporting complete civil caseloads, has done an admirable job in reporting its juvenile caseload. Juvenile caseloads are composed primarily of delinquency, dependency, and status offense cases, but delin-quency and dependency each encompass four more detailed case types. About 20 states report a complete juvenile caseload composition at the higher level but, at present, only Kansas reports each of the four case types under both delinquency and dependency. The top chart on page 35 shows that delinquency cases comprise two-thirds of Kansas’ juvenile caseload; the bottom chart reveals that most of those cases are either property- or person-related.
■ Utah■ Kansas
■ Utah■ Kansas
67%71%
Delinquency
20%
10%
Dependency
13% 15%
Status Offense/Petitions
0%5%
Other Juvenile
5%
18%
Other
11%8%
Drug
20%
29%
Public Order
30%
12%
Person
34% 33%
Property
When states report greater detail, more meaningful comparisons can be made
Kansas and Utah
Juvenile Caseload Composition in Kansas and Utah, 2007
Juvenile Delinquency Caseload Composition in Kansas and Utah, 2007
Examining the Work of State Courts: An Analysis of 2007 State Court CaseloadsTrial Courts: Juvenile Caseloads34 Examining the Work of State Courts: An Analysis of 2007 State Court Caseloads
Trial Courts: Juvenile Caseloads
A Detailed Look at Juvenile Cases in Kansas
23%Property
20%Person
13%Public Order
8%Drug
3%Other Delinquency
9%Neglect
7%Abuse
2%Dependent (No Fault)
0.2%Termination of Parental Rights
1%Other Dependency/Child Victim
67% 20% 13%
DependencyDelinquency
Status Offense/Petitions
IncomingCasesDelinquency
Dependency
Clearance Rate
75% 100% 125% 150% 175%
Property 4,716
Public Order 2,792
Drug 1,578
Person 4,177
Other Delinquency 674
Total Delinquency 13,937
Termination of Parental Rights 39
Neglect 1,831
Abuse 1,551
Dependent (No Fault) 424
Other Dependency/Child Victim 214
Total Dependency 4,059
Total Status Offense/Petitions 2,778
Grand Total Juvenile 20,774
Kansas reports all of the Juvenile case types
Knowing clearance rates by case type can help determine where resources are most needed
Juvenile Caseload Clearance Rates in Kansas, 2007
Juvenile Caseload Distribution in Kansas, 2007
Examining the Work of State Courts: An Analysis of 2007 State Court CaseloadsTrial Courts: Juvenile Caseloads
Examining the Work of State Courts: An Analysis of 2007 State Court CaseloadsTrial Courts: Juvenile Caseloads 35
Juvenile CaseloadsTrial Courts
Examining the Work of State Courts: An Analysis of 2007 State Court CaseloadsTrial Courts: Juvenile Caseloads30 Examining the Work of State Courts: An Analysis of 2007 State Court Caseloads
Trial Courts: Juvenile Caseloads
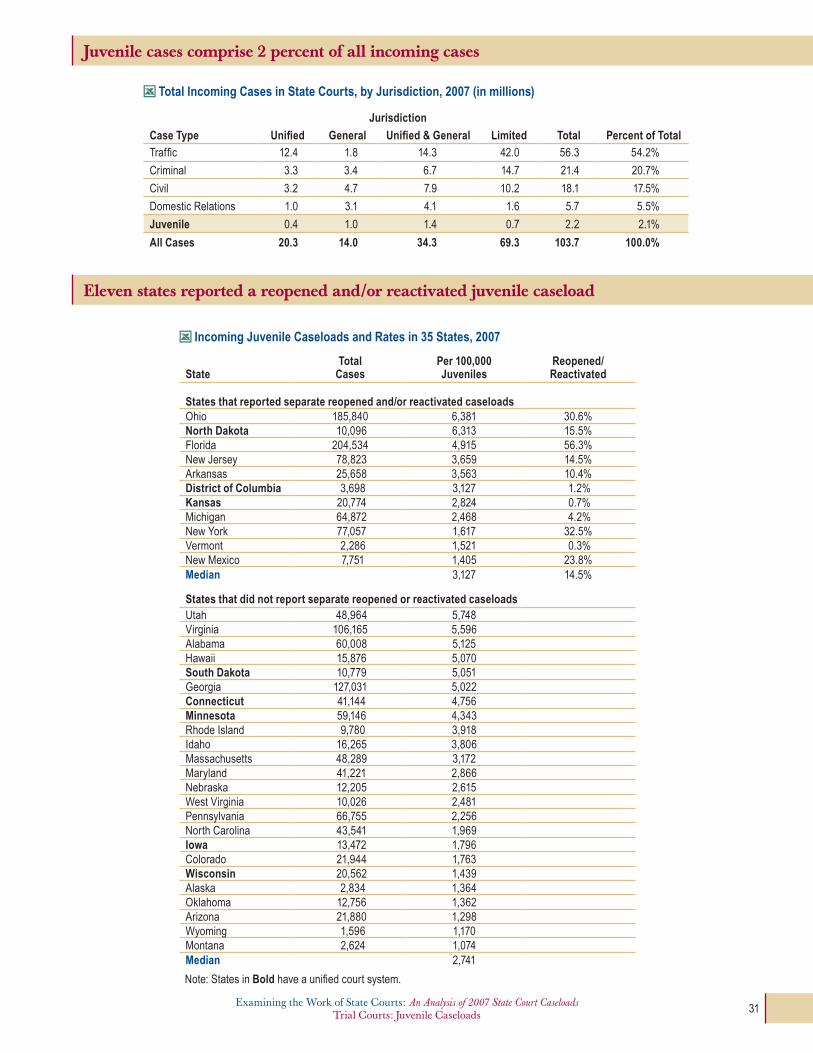
Incoming Juvenile Caseloads and Rates in 35 States, 2007
State
Total Cases
Per 100,000 Juveniles
Reopened/Reactivated
States that reported separate reopened and/or reactivated caseloadsohio 185,840 6,381 30.6%North Dakota 10,096 6,313 15.5%Florida 204,534 4,915 56.3%New Jersey 78,823 3,659 14.5%Arkansas 25,658 3,563 10.4%District of Columbia 3,698 3,127 1.2%Kansas 20,774 2,824 0.7%Michigan 64,872 2,468 4.2%New York 77,057 1,617 32.5%Vermont 2,286 1,521 0.3%New Mexico 7,751 1,405 23.8%Median 3,127 14.5%
States that did not report separate reopened or reactivated caseloadsUtah 48,964 5,748Virginia 106,165 5,596Alabama 60,008 5,125Hawaii 15,876 5,070South Dakota 10,779 5,051Georgia 127,031 5,022Connecticut 41,144 4,756Minnesota 59,146 4,343Rhode island 9,780 3,918idaho 16,265 3,806Massachusetts 48,289 3,172Maryland 41,221 2,866Nebraska 12,205 2,615West Virginia 10,026 2,481Pennsylvania 66,755 2,256North Carolina 43,541 1,969Iowa 13,472 1,796Colorado 21,944 1,763Wisconsin 20,562 1,439Alaska 2,834 1,364oklahoma 12,756 1,362Arizona 21,880 1,298Wyoming 1,596 1,170Montana 2,624 1,074Median 2,741
Note: States in Bold have a unified court system.
Juvenile cases comprise 2 percent of all incoming cases
Eleven states reported a reopened and/or reactivated juvenile caseload
Total Incoming Cases in State Courts, by Jurisdiction, 2007 (in millions)
Jurisdiction
Case Type Unified General Unified & General Limited Total Percent of Totaltraffic 12.4 1.8 14.3 42.0 56.3 54.2%
Criminal 3.3 3.4 6.7 14.7 21.4 20.7%
Civil 3.2 4.7 7.9 10.2 18.1 17.5%
Domestic Relations 1.0 3.1 4.1 1.6 5.7 5.5%
Juvenile 0.4 1.0 1.4 0.7 2.2 2.1%
All Cases 20.3 14.0 34.3 69.3 103.7 100.0%
Examining the Work of State Courts: An Analysis of 2007 State Court CaseloadsTrial Courts: Juvenile Caseloads
Examining the Work of State Courts: An Analysis of 2007 State Court CaseloadsTrial Courts: Juvenile Caseloads 31
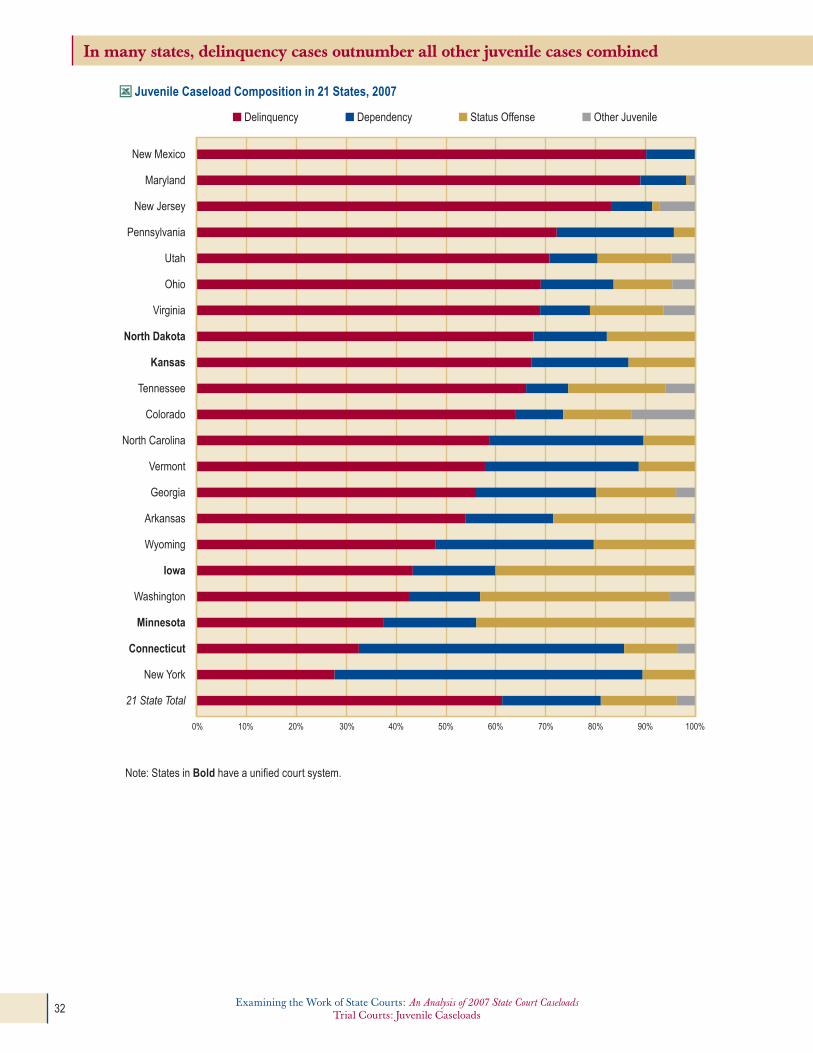
■ Delinquency ■ Dependency ■ Status Offense ■ Other Juvenile
0% 10% 20% 30% 40% 50% 60% 70% 80% 90% 100%
New Mexico
Maryland
New Jersey
Pennsylvania
Utah
Ohio
Virginia
North Dakota
Kansas
Tennessee
Colorado
North Carolina
Vermont
Georgia
Arkansas
Wyoming
Iowa
Washington
Minnesota
Connecticut
New York
21 State Total
In many states, delinquency cases outnumber all other juvenile cases combined
Note: States in Bold have a unified court system.
Juvenile Caseload Composition in 21 States, 2007
Examining the Work of State Courts: An Analysis of 2007 State Court CaseloadsTrial Courts: Juvenile Caseloads32 Examining the Work of State Courts: An Analysis of 2007 State Court Caseloads
Trial Courts: Juvenile Caseloads
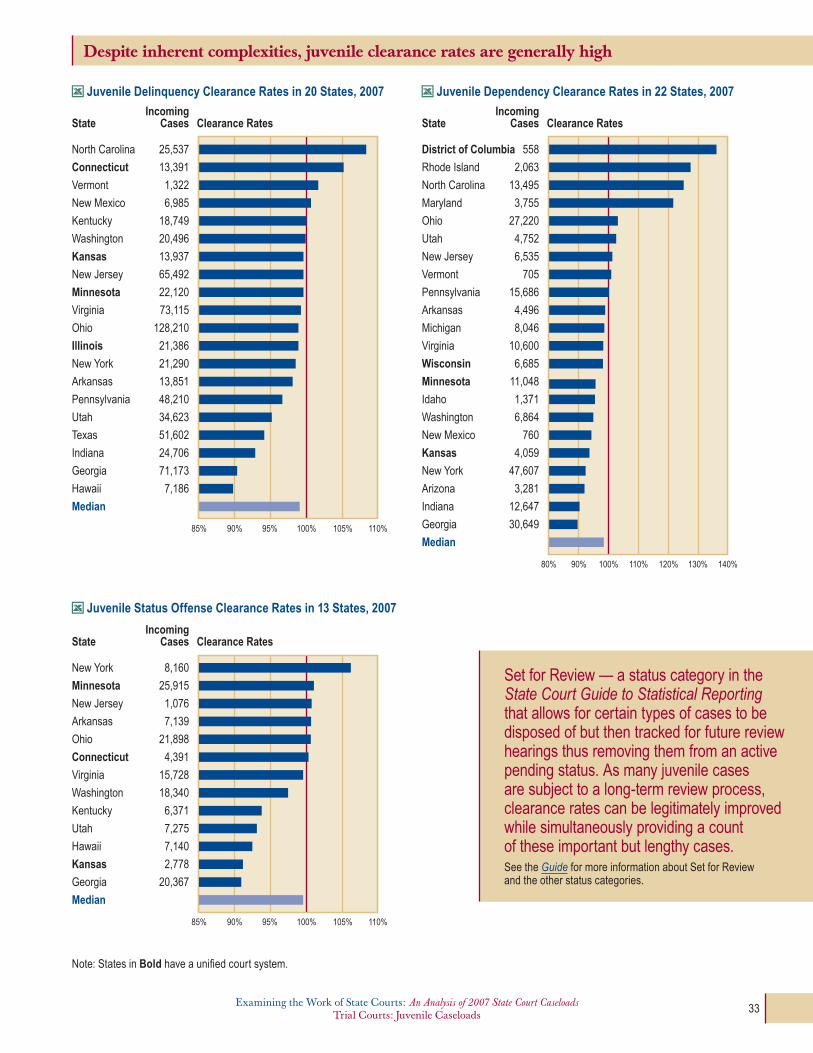
Despite inherent complexities, juvenile clearance rates are generally high
IncomingCases Clearance RatesState
North Carolina 25,537
Connecticut 13,391
Vermont 1,322
New Mexico 6,985
Kentucky 18,749
Washington 20,496
Kansas 13,937
New Jersey 65,492
Minnesota 22,120
Virginia 73,115
Ohio 128,210
Illinois 21,386
New York 21,290
Arkansas 13,851
Pennsylvania 48,210
Utah 34,623
Texas 51,602
Indiana 24,706
Georgia 71,173
Hawaii 7,186
Median
85% 90% 95% 100% 105% 110%
80% 90% 100% 110% 120% 130% 140%
IncomingCases Clearance RatesState
District of Columbia 558
Rhode Island 2,063
North Carolina 13,495
Maryland 3,755
Ohio 27,220
Utah 4,752
New Jersey 6,535
Vermont 705
Pennsylvania 15,686
Arkansas 4,496
Michigan 8,046
Virginia 10,600
Wisconsin 6,685
Minnesota 11,048
Idaho 1,371
Washington 6,864
New Mexico 760
Kansas 4,059
New York 47,607
Arizona 3,281
Indiana 12,647
Georgia 30,649
Median
IncomingCases Clearance RatesState
85% 90% 95% 100% 105% 110%
New York 8,160
Minnesota 25,915
New Jersey 1,076
Arkansas 7,139
Ohio 21,898
Connecticut 4,391
Virginia 15,728
Washington 18,340
Kentucky 6,371
Utah 7,275
Hawaii 7,140
Kansas 2,778
Georgia 20,367
Median
Note: States in Bold have a unified court system.
Juvenile Dependency Clearance Rates in 22 States, 2007
Juvenile Status Offense Clearance Rates in 13 States, 2007
Juvenile Delinquency Clearance Rates in 20 States, 2007
Set for Review — a status category in the State Court Guide to Statistical Reporting that allows for certain types of cases to be disposed of but then tracked for future review hearings thus removing them from an active pending status. As many juvenile cases are subject to a long-term review process, clearance rates can be legitimately improved while simultaneously providing a count of these important but lengthy cases. See the Guide for more information about Set for Review and the other status categories.
Examining the Work of State Courts: An Analysis of 2007 State Court CaseloadsTrial Courts: Juvenile Caseloads
Examining the Work of State Courts: An Analysis of 2007 State Court CaseloadsTrial Courts: Juvenile Caseloads 33

Comparing Juvenile Caseloads: Kansas and Utah
Utah reports enough detail in the juvenile category to compare with the data reported by Kansas. the first chart shows that the composition of the two states’ caseloads is more similar than not. Kansas reports a higher percentage of dependency cases; it is interesting to note that Kansas does not report a single case under the “other Juvenile” case type. this would indicate that every juvenile case filed in the state was identified as a delinquency, dependency, or status offense case.
Utah’s web site (www.utcourts.gov/stats/) contains trial court data from each court and district from 1997 to the present as well as results from its implementation of the CourTools performance measures (www.utcourts.gov/courtools).
A Detailed Look at Juvenile Cases in Kansas
Kansas, in addition to making huge strides in reporting complete civil caseloads, has done an admirable job in reporting its juvenile caseload. Juvenile caseloads are composed primarily of delinquency, dependency, and status offense cases, but delin-quency and dependency each encompass four more detailed case types. About 20 states report a complete juvenile caseload composition at the higher level but, at present, only Kansas reports each of the four case types under both delinquency and dependency. the top chart on page 35 shows that delinquency cases comprise two-thirds of Kansas’ juvenile caseload; the bottom chart reveals that most of those cases are either property- or person-related.
■ Utah■ Kansas
■ Utah■ Kansas
67%71%
Delinquency
20%
10%
Dependency
13% 15%
Status Offense/Petitions
0%5%
Other Juvenile
5%
18%
Other
11%8%
Drug
20%
29%
Public Order
30%
12%
Person
34% 33%
Property
When states report greater detail, more meaningful comparisons can be made
Kansas and Utah
Juvenile Caseload Composition in Kansas and Utah, 2007
Juvenile Delinquency Caseload Composition in Kansas and Utah, 2007
Examining the Work of State Courts: An Analysis of 2007 State Court CaseloadsTrial Courts: Juvenile Caseloads34 Examining the Work of State Courts: An Analysis of 2007 State Court Caseloads
Trial Courts: Juvenile Caseloads
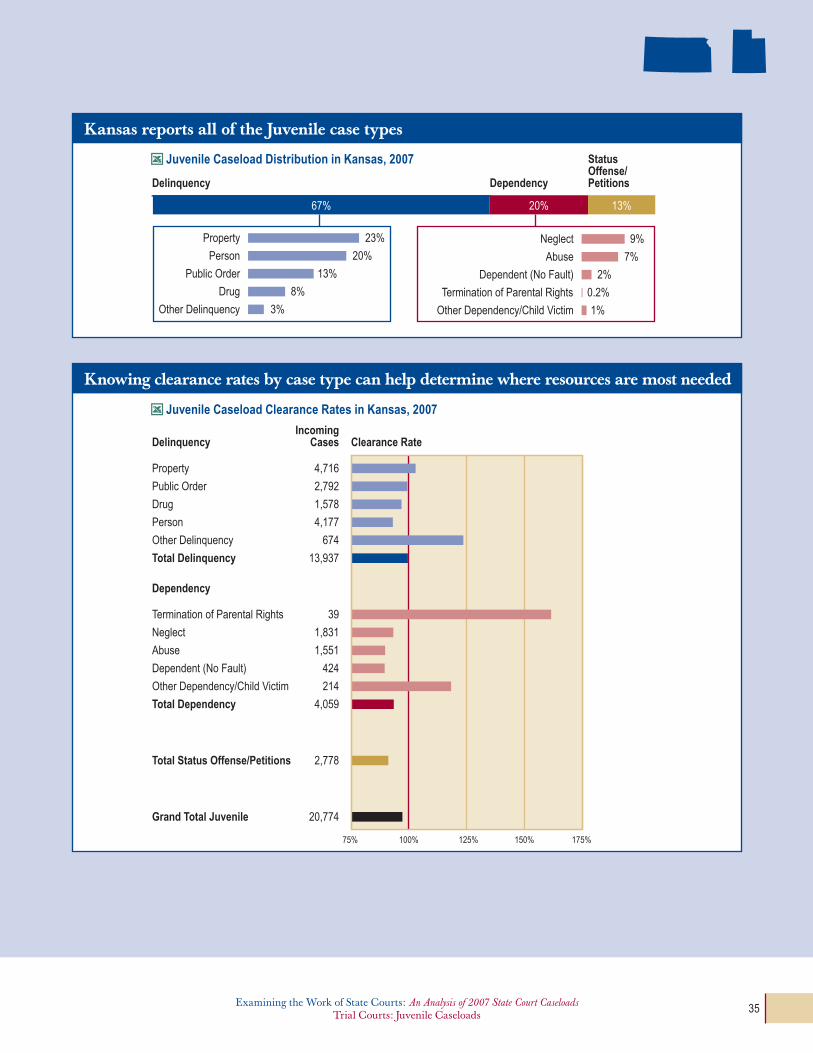
23%Property
20%Person
13%Public Order
8%Drug
3%Other Delinquency
9%Neglect
7%Abuse
2%Dependent (No Fault)
0.2%Termination of Parental Rights
1%Other Dependency/Child Victim
67% 20% 13%
DependencyDelinquency
Status Offense/Petitions
IncomingCasesDelinquency
Dependency
Clearance Rate
75% 100% 125% 150% 175%
Property 4,716
Public Order 2,792
Drug 1,578
Person 4,177
Other Delinquency 674
Total Delinquency 13,937
Termination of Parental Rights 39
Neglect 1,831
Abuse 1,551
Dependent (No Fault) 424
Other Dependency/Child Victim 214
Total Dependency 4,059
Total Status Offense/Petitions 2,778
Grand Total Juvenile 20,774
Kansas reports all of the Juvenile case types
Knowing clearance rates by case type can help determine where resources are most needed
Juvenile Caseload Clearance Rates in Kansas, 2007
Juvenile Caseload Distribution in Kansas, 2007
Examining the Work of State Courts: An Analysis of 2007 State Court CaseloadsTrial Courts: Juvenile Caseloads
Examining the Work of State Courts: An Analysis of 2007 State Court CaseloadsTrial Courts: Juvenile Caseloads 35

Summary
• StatecourtTraffic/Violationscaseloadscomprisenon-criminal motor vehicle violations, parking violations, and ordinance violations cases.
• Over56millionTraffic/Violationscaseswerefiledinstatecourts in 2007. This was an increase of slightly more than 1 percent from 2006.
• Whenadjustedforpopulationincreases,Traffic/Violationscaseloads have fallen 4 percent over the last 10 years.
• HawaiiisthefirststatetoimplementtheTraffic/Violationssection of the Guide in its entirety.
Traffic/Violations Caseloads
Special Recognition:
Hawaii’s Implementation Strategy
Hawaii
Hawaii is the first state to implement the complete Traffic/Violations section of the Guide
Traffic/Violations Caseload Summary - Hawaii District Court, 2007
Caseload Status
Non- criminal Traffic Parking Ordinance Other
Total Traffic/
Violations
Violations cases
transferred to admin. agencies*
Begin Pending
Active 48,361 93,231 7,435 371 149,398 471
Inactive 86,109 691 0 138 86,938 0
Incoming
New Filings 223,255 182,434 2,551 1 408,241 6,191
Reopened 1,930 654 0 0 2,584 2,387
Reactivated 18,993 60 0 0 19,053 0
Total Incoming 244,178 183,148 2,551 1 429,878 8,578
Outgoing
Entries of Judgment 187,723 136,725 2,156 8 326,612 6,117
Reopened Dispositions 1,912 822 0 0 2,734 2,502
Placed Inactive 12,484 16 0 0 12,500 0
Total Outgoing 202,119 137,563 2,156 8 341,846 8,619
End Pending
Active 90,420 138,816 7,830 364 237,430 430
Inactive 79,600 647 0 138 80,385 0
Clearance Rates
Overall 83% 75% 85% -- 80%
Reopened 99% 126% -- -- 106%
Hawaii’s Implementation Strategy
Hawaii chose to begin its implementation of the State Court Guide to Statistical Reporting by focusing on a single case category, Traffic. Taking advantage of the implementation of a new statewide case management system, Hawaii worked with its vendor to ensure that the new system was based on the case type definitions and case status categories recommended in the Guide. The result has been that Hawaii is the first and only state to report an entire Traffic/Violations caseload, including all four case types and 10 status categories, as complete statewide totals. (The eleventh status category, “Set for Review,” does not typically apply to Traffic/Violations caseloads.)
Complete implementation of the Guide provides a sizeable amount of information for the total caseload as well as each individual case type. Hawaii has now created a detailed, accurate baseline against which it can measure the effects of efforts to improve caseflow management as well as changes in its caseload. Additionally, Hawaii can turn these caseload data into management knowledge by performing the following relatively straightforward analyses on their Traffic/Violations data:
• Incoming caseloads and population-adjusted rates of incoming cases
• Clearance rates for all case types
• Proportions of active versus inactive cases in the pending caseloads at the beginning and end of each reporting period
• Percentage changes from the beginning to the end of the reporting period for active, inactive, and total pending caseloads
Since Hawaii is a state with a high volume of tourists who no doubt contribute to both its parking and traffic/violations caseloads, getting a firm grip on the Traffic/Violations caseload is essential for effectively adjudicating these cases. Distinguishing between active and inactive cases is essential for properly computing the age of the pending cases, which in turn is used to manage effective dismissal and write-off policies for parking violations and traffic violations, as well as ensuring timely handling of these cases.
See Measures 3 & 4 at www.courtools.org
Note: *Hawaii reports that a small but important caseload, license revocation hearings, is transferred to an administrative agency for processing, reducing its Traffic/Violations caseload by about 2 percent each year.
Examining the Work of State Courts: An Analysis of 2007 State Court CaseloadsTrial Courts: Traffic/Violations Caseloads
Examining the Work of State Courts: An Analysis of 2007 State Court CaseloadsTrial Courts: Traffic/Violations Caseloads 39
Incoming Traffic/Violations Caseloads in State Courts, 1998-2007
0
10
20
30
40
50
60
0
4
8
12
16
20
24
1998 2001 2004 2007
Mill
ions
Thousands
Incoming Traffic/Violations Cases +8%
In a pattern very similar to that of criminal caseloads, incoming traffic cases have increased by 8 percent
since 1998. However, when standardized on the total U.S. population, the rate has decreased by 4 percent.
Traffic/Violations Cases per 100,000 Population -4%
Trial Courts
Examining the Work of State Courts: An Analysis of 2007 State Court CaseloadsTrial Courts: Traffic/Violations Caseloads36 Examining the Work of State Courts: An Analysis of 2007 State Court Caseloads
Trial Courts: Traffic/Violations Caseloads
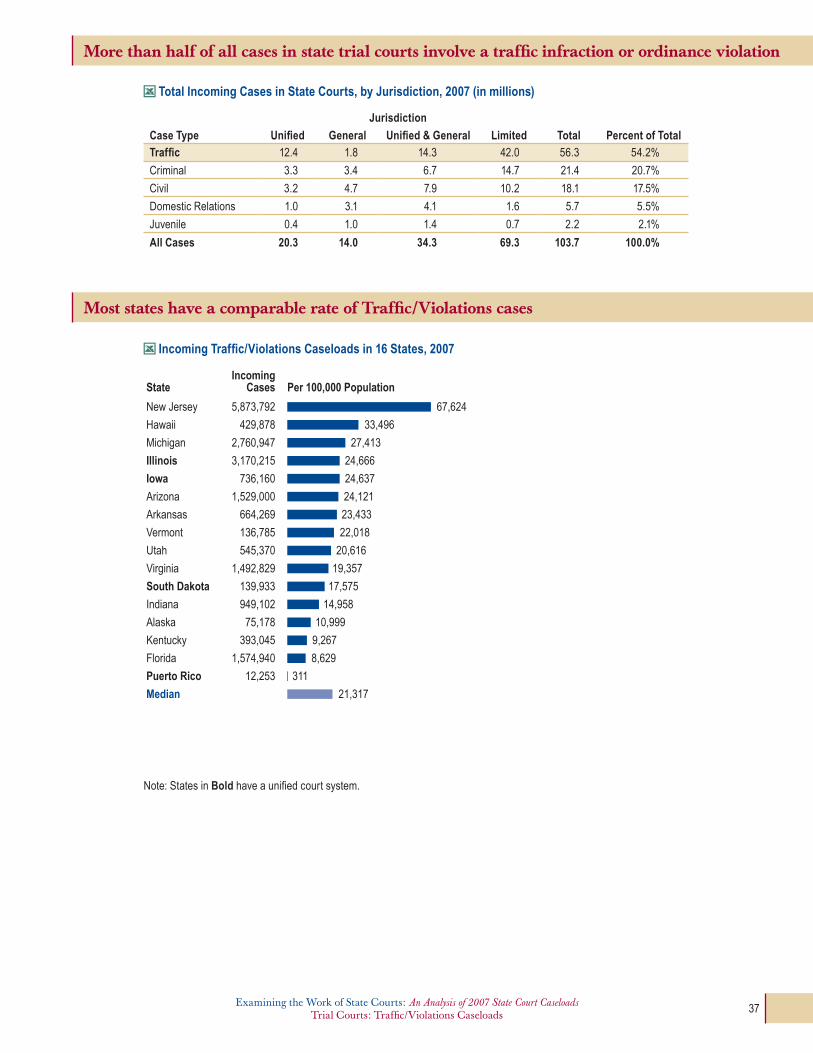
Incoming Traffic/Violations Caseloads in 16 States, 2007
IncomingCasesState Per 100,000 Population
Florida 1,574,940 8,629
New Jersey 5,873,792 67,624
Hawaii 429,878 33,496
Michigan 2,760,947 27,413
Illinois 3,170,215 24,666
Iowa 736,160 24,637
Arizona 1,529,000 24,121
Arkansas 664,269 23,433
Vermont 136,785 22,018
Utah 545,370 20,616
Virginia 1,492,829 19,357
South Dakota 139,933 17,575
Indiana 949,102 14,958
Alaska 75,178 10,999
Kentucky 393,045 9,267
Puerto Rico 12,253 311
Median 21,317
More than half of all cases in state trial courts involve a traffic infraction or ordinance violation
Most states have a comparable rate of Traffic/Violations cases
Note: States in Bold have a unified court system.
Total Incoming Cases in State Courts, by Jurisdiction, 2007 (in millions)
Jurisdiction
Case Type Unified General Unified & General Limited Total Percent of TotalTraffic 12.4 1.8 14.3 42.0 56.3 54.2%
Criminal 3.3 3.4 6.7 14.7 21.4 20.7%
Civil 3.2 4.7 7.9 10.2 18.1 17.5%
Domestic Relations 1.0 3.1 4.1 1.6 5.7 5.5%
Juvenile 0.4 1.0 1.4 0.7 2.2 2.1%
All Cases 20.3 14.0 34.3 69.3 103.7 100.0%
Examining the Work of State Courts: An Analysis of 2007 State Court CaseloadsTrial Courts: Traffic/Violations Caseloads
Examining the Work of State Courts: An Analysis of 2007 State Court CaseloadsTrial Courts: Traffic/Violations Caseloads 37

Excellent clearance rates are achieved even with caseloads numbering in the millions
Parking caseloads can have a dramatic effect on Traffic/Violations caseload composition
TotalCasesState Clearance Rate
Alaska 75,178
Utah 545,370
Arizona 1,529,000
Puerto Rico 12,253
Iowa 736,160
New Jersey 5,873,792
Virginia 1,492,829
Kentucky 393,045
Indiana 949,102
South Dakota 139,933
Illinois 3,170,215
Vermont 136,785
Michigan 2,760,947
Florida 1,574,940
Hawaii 429,878
Median
70% 80% 90% 100% 110% 120%
Illinois reports no parking violation cases as they are all handled administratively
outside of the court system.
0%
8%
43%
■ Illinois (3,170,215 Cases)
■ Hawaii (429,878 Cases)■ Arizona (1,529,000 Cases)
95%90%
57%
5% 2% 1%
Non-Criminal Motor Vehicle Parking Ordinance Violation
Note: States in Bold have a unified court system.
Traffic/Violations Clearance Rates in 15 States, 2007
Traffic/Violations Caseload Composition in Three States, 2007
Examining the Work of State Courts: An Analysis of 2007 State Court CaseloadsTrial Courts: Traffic/Violations Caseloads38 Examining the Work of State Courts: An Analysis of 2007 State Court Caseloads
Trial Courts: Traffic/Violations Caseloads

Hawaii
Hawaii is the first state to implement the complete Traffic/Violations section of the Guide
Traffic/Violations Caseload Summary - Hawaii District Court, 2007
Caseload Status
Non- criminal Traffic Parking Ordinance Other
Total Traffic/
Violations
Violations cases
transferred to admin. agencies*
Begin Pending
Active 48,361 93,231 7,435 371 149,398 471
inactive 86,109 691 0 138 86,938 0
Incoming
New Filings 223,255 182,434 2,551 1 408,241 6,191
Reopened 1,930 654 0 0 2,584 2,387
Reactivated 18,993 60 0 0 19,053 0
Total Incoming 244,178 183,148 2,551 1 429,878 8,578
Outgoing
Entries of Judgment 187,723 136,725 2,156 8 326,612 6,117
Reopened Dispositions 1,912 822 0 0 2,734 2,502
Placed inactive 12,484 16 0 0 12,500 0
Total Outgoing 202,119 137,563 2,156 8 341,846 8,619
End Pending
Active 90,420 138,816 7,830 364 237,430 430
inactive 79,600 647 0 138 80,385 0
Clearance Rates
overall 83% 75% 85% -- 80%
Reopened 99% 126% -- -- 106%
Hawaii’s Implementation Strategy
Hawaii chose to begin its implementation of the State Court Guide to Statistical Reporting by focusing on a single case category, traffic. taking advantage of the implementation of a new statewide case management system, Hawaii worked with its vendor to ensure that the new system was based on the case type definitions and case status categories recommended in the Guide. the result has been that Hawaii is the first and only state to report an entire traffic/Violations caseload, including all four case types and 10 status categories, as complete statewide totals. (the eleventh status category, “Set for Review,” does not typically apply to traffic/Violations caseloads.)
Complete implementation of the Guide provides a sizeable amount of information for the total caseload as well as each individual case type. Hawaii has now created a detailed, accurate baseline against which it can measure the effects of efforts to improve caseflow management as well as changes in its caseload. Additionally, Hawaii can turn these caseload data into management knowledge by performing the following relatively straightforward analyses on their traffic/Violations data:
• incoming caseloads and population-adjusted rates of incoming cases
• Clearance rates for all case types
• Proportions of active versus inactive cases in the pending caseloads at the beginning and end of each reporting period
• Percentage changes from the beginning to the end of the reporting period for active, inactive, and total pending caseloads
Since Hawaii is a state with a high volume of tourists who no doubt contribute to both its parking and traffic/violations caseloads, getting a firm grip on the traffic/Violations caseload is essential for effectively adjudicating these cases. Distinguishing between active and inactive cases is essential for properly computing the age of the pending cases, which in turn is used to manage effective dismissal and write-off policies for parking violations and traffic violations, as well as ensuring timely handling of these cases.
See Measures 3 & 4 at www.courtools.org
Note: *Hawaii reports that a small but important caseload, license revocation hearings, is transferred to an administrative agency for processing, reducing its traffic/Violations caseload by about 2 percent each year.
Examining the Work of State Courts: An Analysis of 2007 State Court CaseloadsTrial Courts: Traffic/Violations Caseloads
Examining the Work of State Courts: An Analysis of 2007 State Court CaseloadsTrial Courts: Traffic/Violations Caseloads 39
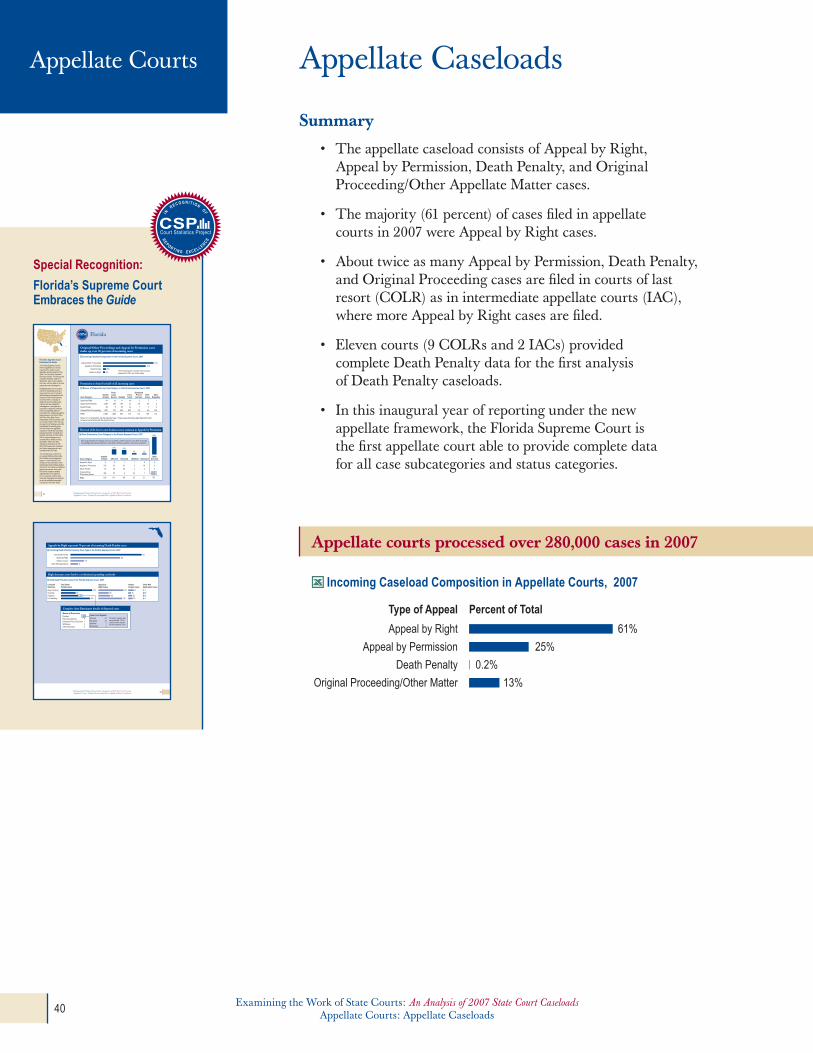
Summary
• TheappellatecaseloadconsistsofAppealbyRight, Appeal by Permission, Death Penalty, and Original Proceeding/Other Appellate Matter cases.
• Themajority(61percent)ofcasesfiledinappellate courts in 2007 were Appeal by Right cases.
• AbouttwiceasmanyAppealbyPermission,DeathPenalty,and Original Proceeding cases are filed in courts of last resort (COLR) as in intermediate appellate courts (IAC), where more Appeal by Right cases are filed.
• Elevencourts(9COLRsand2IACs)provided complete Death Penalty data for the first analysis of Death Penalty caseloads.
• Inthisinauguralyearofreportingunderthenew appellate framework, the Florida Supreme Court is the first appellate court able to provide complete data for all case subcategories and status categories.
Incoming Caseload Composition in Appellate Courts, 2007
61%
25%
0.2%
13%
Appeal by Right
Appeal by Permission
Death Penalty
Original Proceeding/Other Matter
Type of Appeal Percent of Total
Special Recognition:
Florida’s Supreme Court Embraces the Guide
Florida’s Supreme Court Embraces the Guide
The Florida Supreme Court is the first appellate court to fully implement the newly revised appellate reporting section of the State Court Guide to Statistical Reporting (Guide). Florida reported complete caseload, manner of disposition, type of court opinion, and case outcome data for all case categories and subcategories.
Realizing that the Court’s current manner of classifying cases and case outcomes was inconsistent with the data recommended in the Guide, the Clerk of the Supreme Court launched a campaign to assign the Court’s existing case codes to the case categories, subcategories, case types and case status categories contained in the new reporting matrix. To accomplish this, collaborative efforts began between the Clerk’s Office, the Office of the State Courts Administrator (OSCA), and the CSP, to manually map the 2007 data into the new format. Meetings were held to familiarize the working group with the Guide’s new appellate categories; OSCA data specialists prepared reports to reclassify and translate their data; and the Clerk’s Office recoded categories and reviewed files to identify missing information. After some final definitional clarification by CSP staff, OSCA personnel completed the Guide’s reporting matrix and submitted their 2007 data.
The working group continues to incorporate additional data codes into Florida’s case management system. In future iterations, this will allow for the automation of the national data report without altering the Court’s own internal and external reporting processes. As a result, Florida has created a detailed representation of its Supreme Court’s caseload, which should assist with managing that caseload as well as facilitating meaningful comparisons with other states.
2%Appeal by Right
3%Death Penalty
43%Appeal by Permission
51%Original/Other Proceedings
The Florida Supreme Court's total incoming caseload for 2007 was 2,525 cases.
Original/Other Proceedings and Appeal by Permission cases make up over 90 percent of incoming cases
Permission is denied in half of all incoming cases
Reversal of the lower court decision is most common in Appeals by Permission
Florida
Case CategoryNumber of Cases
Perm- ission Denied Decided
Trans- ferred
Dismissed Prior to
DecisionWith- drawn
Other Resolution
Appeal by Right 64 n/j 11 43* 2 7 1
Appeal by Permission 1,095 876 106 n/j 75 36 2
Death Penalty 96 5 87 n/j 1 3 0
Original/Other Proceedings 1,270 373 426 267 35 60 109
Total 2,525 1,254 630 310 113 106 112
Notes: n/j = no jurisdication over the disposition type. *These cases should have been filed with the IAC, but were incorrectly filed with the Supreme Court.
17% 15%
5% 3%
59%
Most Original/Other Proceeding cases are included in Other Outcome since 91% of decided proceedings deal with bar/judiciary proceedings, certified questions, and advisory opinions.
Incoming Caseload Composition in the Florida Supreme Court, 2007
Case Outcome by Case Category in the Florida Supreme Court, 2007
Manner of Disposition by Case Category in the Florida Supreme Court, 2007
Case CategoryNumber of Cases Affirmed Reversed Modified Dismissed
Other Outcome
Appeal by Right 11 9 1 1 0 0
Appeal by Permission 106 25 61 2 18 0
Death Penalty 87 54 29 2 2 0
Original/Other Proceeding Cases 426 22 5 25 1 373
Total 630 110 96 30 21 373
Examining the Work of State Courts: An Analysis of 2007 State Court CaseloadsAppellate Courts: Original Proceeding/Other Appellate Matter Caseloads54 Examining the Work of State Courts: An Analysis of 2007 State Court Caseloads
Appellate Courts: Original Proceeding/Other Appellate Matter Caseloads
Manner of Disposition
Decided 87Permission Denied 5Dismissed Prior to Decision 1Withdrawn 3Other Resolution 0
Lower Court Appeals
Affirmed 54Reversed 29Modified 2Dismissed 2
Of the 87 appeals that were decided, 75 full opinions were issued by the Supreme Court
Appeals by Right represent 70 percent of incoming Death Penalty cases
High clearance rates lead to a reduction in pending caseloads
Complete data illuminates details of disposed cases
9Other Writ Applications
16Habeas Corpus
58Appeal by Right
83Total Death Penalty
Total Death Penalty Cases
CaseloadSummary
17683
96IncomingBegin Pending
OutgoingEnd Pending 163
Appeal by Right Cases
14158
66133
Habeas Corpus Cases
3116
2225
Other Writ Application Cases
498
5
Incoming Death Penalty Cases by Case Type in the Florida Supreme Court, 2007
Total Death Penalty Cases in the Florida Supreme Court, 2007
Examining the Work of State Courts: An Analysis of 2007 State Court CaseloadsAppellate Courts: Original Proceeding/Other Appellate Matter Caseloads
Examining the Work of State Courts: An Analysis of 2007 State Court CaseloadsAppellate Courts: Original Proceeding/Other Appellate Matter Caseloads 55
Appellate courts processed over 280,000 cases in 2007
Appellate CaseloadsAppellate Courts
Examining the Work of State Courts: An Analysis of 2007 State Court CaseloadsAppellate Courts: Appellate Caseloads40 Examining the Work of State Courts: An Analysis of 2007 State Court Caseloads
Appellate Courts: Appellate Caseloads

Implementing the State Court Guide to Statistical Reporting
The IACs process roughly two thirds of incoming appellate cases
This year the Court Statistics Project (CSP) implemented the newly revised appellate section of the State Court Guide to Statistical Reporting (Guide), the result of a multi-year collaboration with the National Conference of Appellate Court Clerks (NCACC). The new reporting framework divides the work of the appellate courts into four major categories: Appeal by Right, Appeal by Permission, Death Penalty, and Original Proceeding/Other Appellate Matter.
Each major category includes:
a caseload summary to report incoming, 1. outgoing, and pending caseloads;
the manner of disposition to show how cases 2. were disposed before the court;
the type of court opinion to capture the extent 3. to which the court elaborated on the merits of the case or the reasoning for its decision; and
the case outcome to describe how the court 4. ruled in a case.
With this new reporting framework, the CSP and NCACC are attempting to improve consistency by using terms and definitions that conform to existing court rules and practices. Additionally, with its enhanced set of case types and expanded disposition options, the new model gives court leaders, policy makers, and others a more detailed, objective, and accurate picture of the caseloads of the state appellate courts.
In implementing the new reporting framework, CSP staff focused their efforts on mapping each state’s current court data to the data elements recommended in the Guide. Every state has been introduced to the new appellate categories and definitions, whether by launching a campaign to map existing codes according to the new reporting matrix (e.g., Florida Supreme Court) or through phone calls and email exchanges with CSP staff (e.g., Tennessee). As a result of the efforts put forth by the clerks and staff in nearly all state appellate courts, the CSP was able to collect 2007 data from 94 of the 100 appellate reporting units.
Type of Appeal Total Appellate Caseload Distribution
Appeal by Right 173,539 9% 91%
Appeal by Permission 72,047 69% 31%
Death Penalty 469 92% 8%
Original Proceeding/Other Matter 36,673 63% 37%
Total Appellate 282,728 32% 68%
■ Percent in IACs■ Percent in COLRs Incoming Cases in Appellate Courts, 2007
Examining the Work of State Courts: An Analysis of 2007 State Court CaseloadsAppellate Courts: Appellate Caseloads
Examining the Work of State Courts: An Analysis of 2007 State Court CaseloadsAppellate Courts: Appellate Caseloads 41
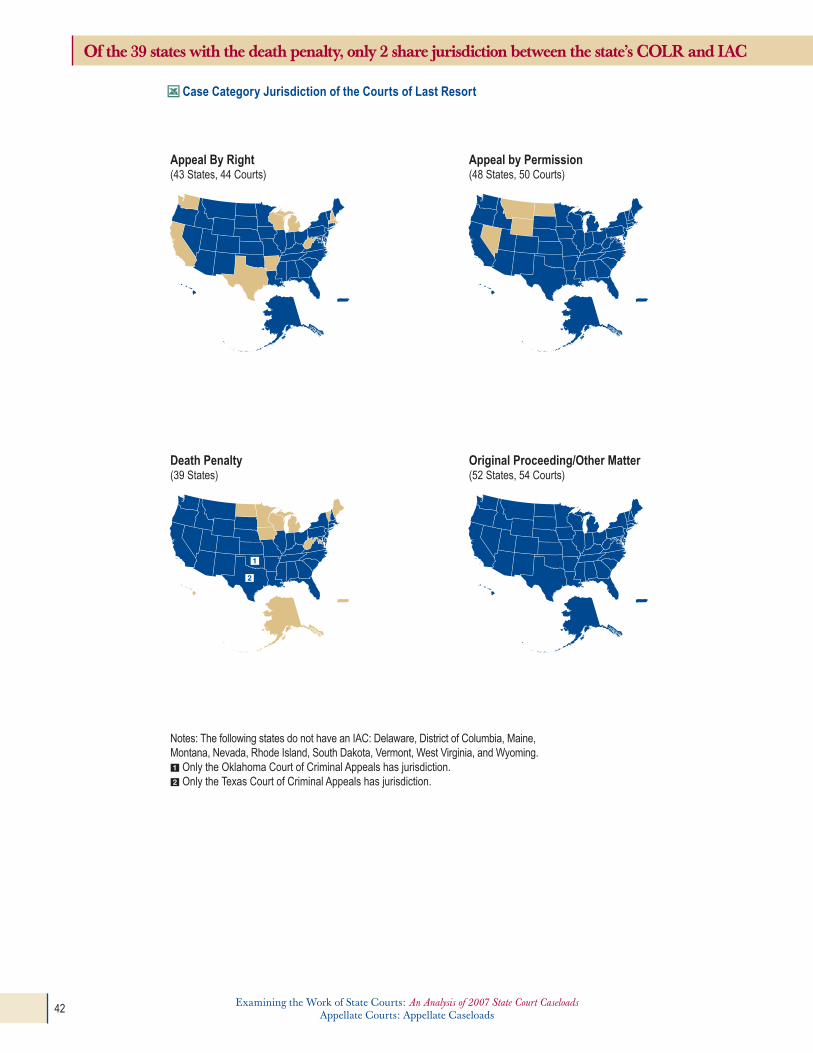
Of the 39 states with the death penalty, only 2 share jurisdiction between the state’s COLR and IAC
Notes: The following states do not have an IAC: Delaware, District of Columbia, Maine, Montana, Nevada, Rhode Island, South Dakota, Vermont, West Virginia, and Wyoming. Only the Oklahoma Court of Criminal Appeals has jurisdiction. Only the Texas Court of Criminal Appeals has jurisdiction.
Original Proceeding/Other Matter (52 States, 54 Courts)
Appeal By Right (43 States, 44 Courts)
Appeal by Permission (48 States, 50 Courts)
Death Penalty (39 States)
Case Category Jurisdiction of the Courts of Last Resort
Examining the Work of State Courts: An Analysis of 2007 State Court CaseloadsAppellate Courts: Appellate Caseloads42 Examining the Work of State Courts: An Analysis of 2007 State Court Caseloads
Appellate Courts: Appellate Caseloads
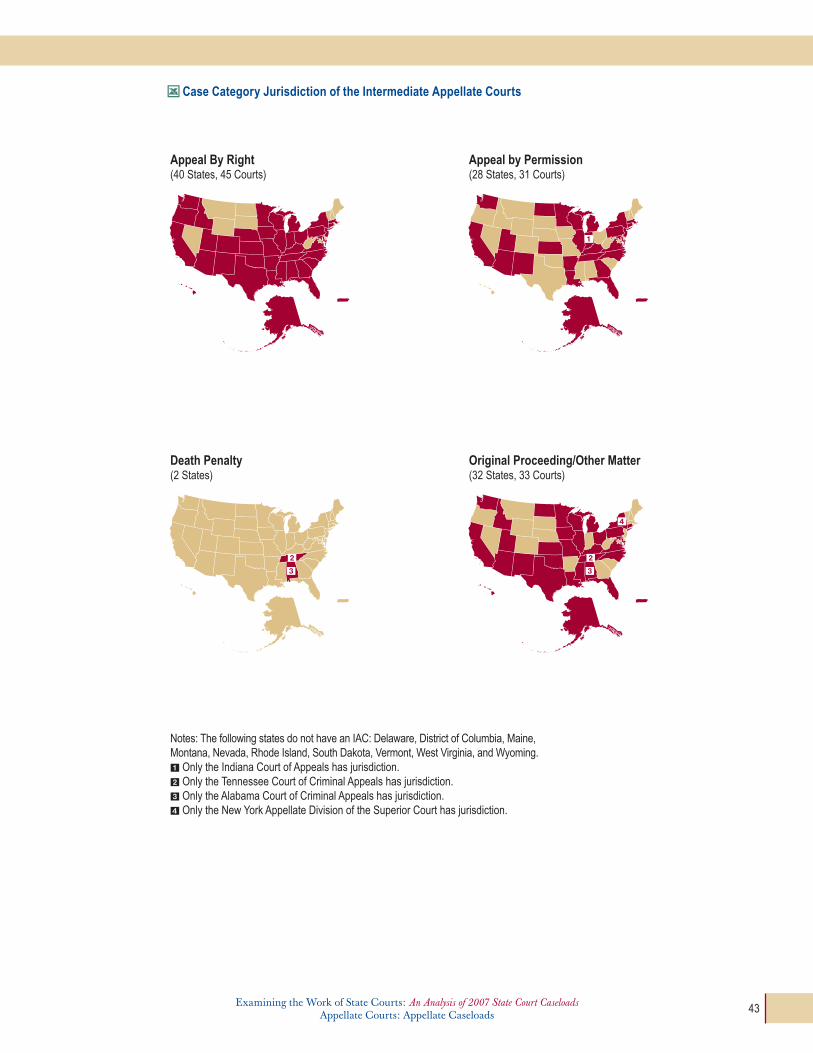
Of the 39 states with the death penalty, only 2 share jurisdiction between the state’s COLR and IAC
Appeal By Right (40 States, 45 Courts)
Appeal by Permission (28 States, 31 Courts)
Death Penalty (2 States)
Original Proceeding/Other Matter (32 States, 33 Courts)
Notes: The following states do not have an IAC: Delaware, District of Columbia, Maine, Montana, Nevada, Rhode Island, South Dakota, Vermont, West Virginia, and Wyoming. Only the Indiana Court of Appeals has jurisdiction. Only the Tennessee Court of Criminal Appeals has jurisdiction. Only the Alabama Court of Criminal Appeals has jurisdiction. Only the New York Appellate Division of the Superior Court has jurisdiction.
Case Category Jurisdiction of the Intermediate Appellate Courts
Examining the Work of State Courts: An Analysis of 2007 State Court CaseloadsAppellate Courts: Appellate Caseloads
Examining the Work of State Courts: An Analysis of 2007 State Court CaseloadsAppellate Courts: Appellate Caseloads 43
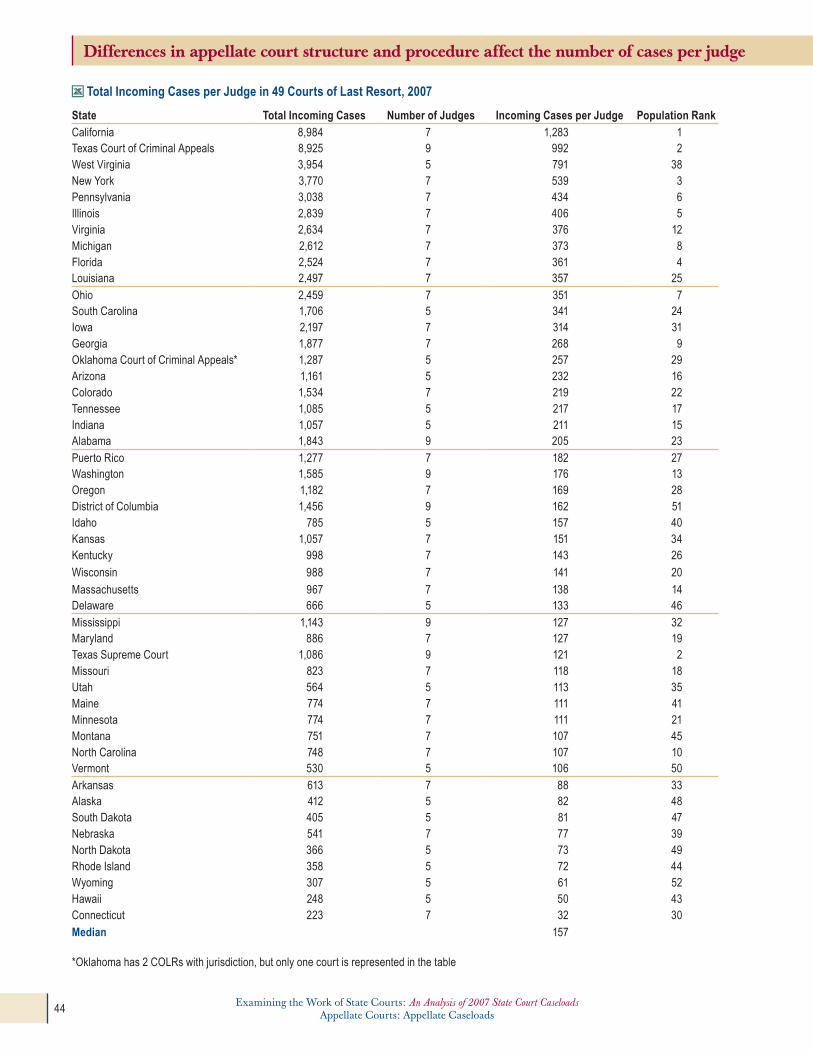
Differences in appellate court structure and procedure affect the number of cases per judge
Total Incoming Cases per Judge in 49 Courts of Last Resort, 2007
State Total Incoming Cases Number of Judges Incoming Cases per Judge Population RankCalifornia 8,984 7 1,283 1texas Court of Criminal Appeals 8,925 9 992 2West Virginia 3,954 5 791 38New York 3,770 7 539 3Pennsylvania 3,038 7 434 6illinois 2,839 7 406 5Virginia 2,634 7 376 12Michigan 2,612 7 373 8Florida 2,524 7 361 4Louisiana 2,497 7 357 25
ohio 2,459 7 351 7South Carolina 1,706 5 341 24iowa 2,197 7 314 31Georgia 1,877 7 268 9oklahoma Court of Criminal Appeals* 1,287 5 257 29Arizona 1,161 5 232 16Colorado 1,534 7 219 22tennessee 1,085 5 217 17indiana 1,057 5 211 15Alabama 1,843 9 205 23
Puerto Rico 1,277 7 182 27Washington 1,585 9 176 13oregon 1,182 7 169 28District of Columbia 1,456 9 162 51idaho 785 5 157 40Kansas 1,057 7 151 34Kentucky 998 7 143 26
Wisconsin 988 7 141 20
Massachusetts 967 7 138 14Delaware 666 5 133 46
Mississippi 1,143 9 127 32Maryland 886 7 127 19texas Supreme Court 1,086 9 121 2Missouri 823 7 118 18Utah 564 5 113 35Maine 774 7 111 41Minnesota 774 7 111 21Montana 751 7 107 45North Carolina 748 7 107 10Vermont 530 5 106 50
Arkansas 613 7 88 33Alaska 412 5 82 48South Dakota 405 5 81 47Nebraska 541 7 77 39North Dakota 366 5 73 49Rhode island 358 5 72 44Wyoming 307 5 61 52Hawaii 248 5 50 43Connecticut 223 7 32 30
Median 157
*oklahoma has 2 CoLRs with jurisdiction, but only one court is represented in the table
Examining the Work of State Courts: An Analysis of 2007 State Court CaseloadsAppellate Courts: Appellate Caseloads44 Examining the Work of State Courts: An Analysis of 2007 State Court Caseloads
Appellate Courts: Appellate Caseloads

Median rates of cases per judge are similar in COLRs and IACs despite vastly different caseload sizes
Total Incoming Cases per Judge in 43 Intermediate Appellate Courts, 2007
State Total Incoming Cases Number of Judges Incoming Cases per Judge Population RankPennsylvania Superior Court 8,354 15 557 6Alabama Court of Criminal Appeals 2,287 5 457 23Pennsylvania Commonwealth Court 3,922 9 436 6Florida 25,628 62 413 4oregon 3,312 10 331 28Virginia 3,095 11 281 12Georgia 3,280 12 273 9Michigan 7,580 28 271 8Alabama Court of Civil Appeals 1,200 5 240 23California 24,934 105 237 1
Nebraska 1,311 6 219 39New Jersey 6,975 34 205 11Wisconsin 3,181 16 199 20South Carolina 1,729 9 192 24indiana Court of Appeals 2,867 15 191 15idaho 572 3 191 40Kentucky 2,599 14 186 26New York Appellate Div. of Supreme Court 10,204 56 182 3Washington 4,067 24 169 13North Carolina 2,484 15 166 10
Arizona 3,565 22 162 16Kansas 1,935 12 161 34Colorado 2,548 16 159 22ohio 10,787 68 159 7Maryland 2,031 13 156 19New York Appellate terms of Supreme Court 2,258 15 151 3Louisiana 7,895 53 149 25illinois 7,997 54 148 5Minnesota 2,328 16 146 21texas 11,317 80 141 2
Utah 922 7 132 35Puerto Rico 4,940 39 127 27Missouri 3,811 32 119 18Connecticut 1,172 10 117 30Arkansas 1,402 12 117 33iowa 984 9 109 31Massachusetts 2,631 25 105 14tennessee Court of Criminal Appeals 1,237 12 103 17
New Mexico 976 10 98 37tennessee Court of Appeals 1,169 12 97 17Alaska 270 3 90 48Hawaii 524 6 87 43indiana tax Court 80 1 80 15Median 161
Note: in states with more than one iAC, the name(s) of the court is shown with the name of the state.
Examining the Work of State Courts: An Analysis of 2007 State Court CaseloadsAppellate Courts: Appellate Caseloads
Examining the Work of State Courts: An Analysis of 2007 State Court CaseloadsAppellate Courts: Appellate Caseloads 45
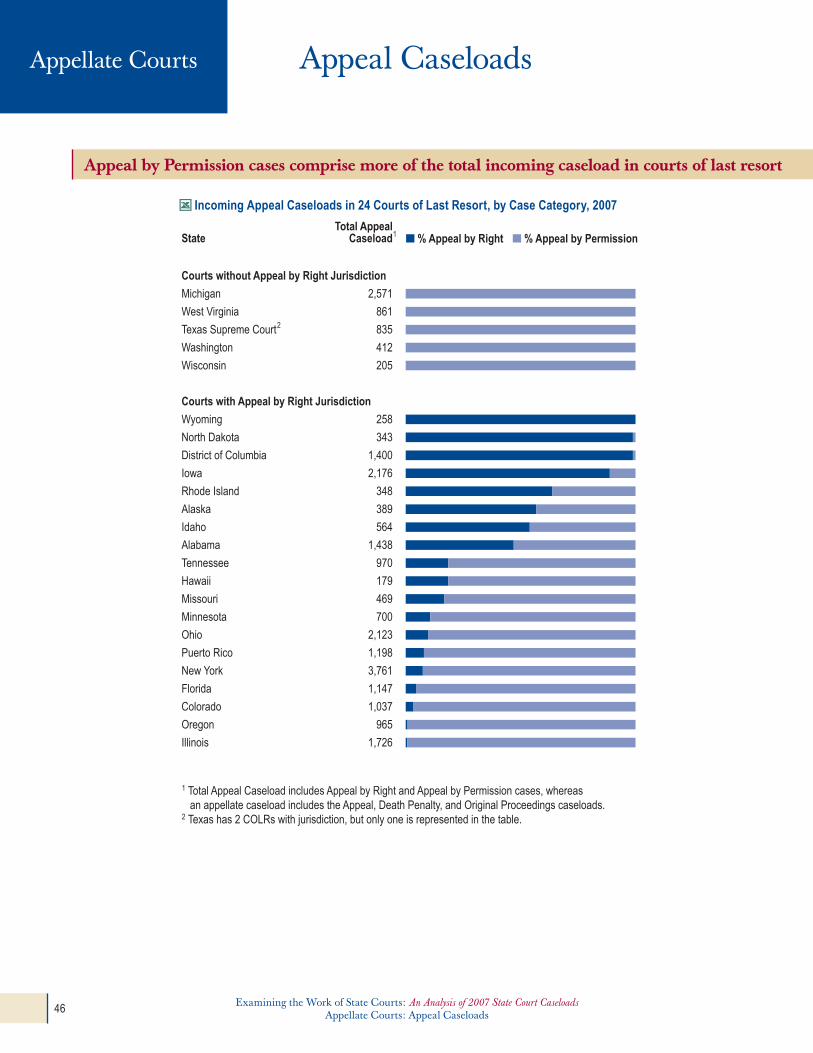
State
1 Total Appeal Caseload includes Appeal by Right and Appeal by Permission cases, whereas an appellate caseload includes the Appeal, Death Penalty, and Original Proceedings caseloads.2 Texas has 2 COLRs with jurisdiction, but only one is represented in the table.
Total AppealCaseload1
2
Michigan 2,571
West Virginia 861
Courts without Appeal by Right Jurisdiction
Texas Supreme Court 835
Washington 412
Wisconsin 205
Wyoming 258
North Dakota 343
District of Columbia 1,400
Iowa 2,176
Rhode Island 348
Alaska 389
Idaho 564
Alabama 1,438
Tennessee 970
Hawaii 179
Missouri 469
Minnesota 700
Ohio 2,123
Puerto Rico 1,198
New York 3,761
Florida 1,147
Colorado 1,037
Oregon 965
Illinois 1,726
Courts with Appeal by Right Jurisdiction
■ % Appeal by Right ■ % Appeal by Permission
Appeal by Permission cases comprise more of the total incoming caseload in courts of last resort
Appeal CaseloadsAppellate Courts
Incoming Appeal Caseloads in 24 Courts of Last Resort, by Case Category, 2007
Examining the Work of State Courts: An Analysis of 2007 State Court CaseloadsAppellate Courts: Appeal Caseloads46 Examining the Work of State Courts: An Analysis of 2007 State Court Caseloads
Appellate Courts: Appeal Caseloads
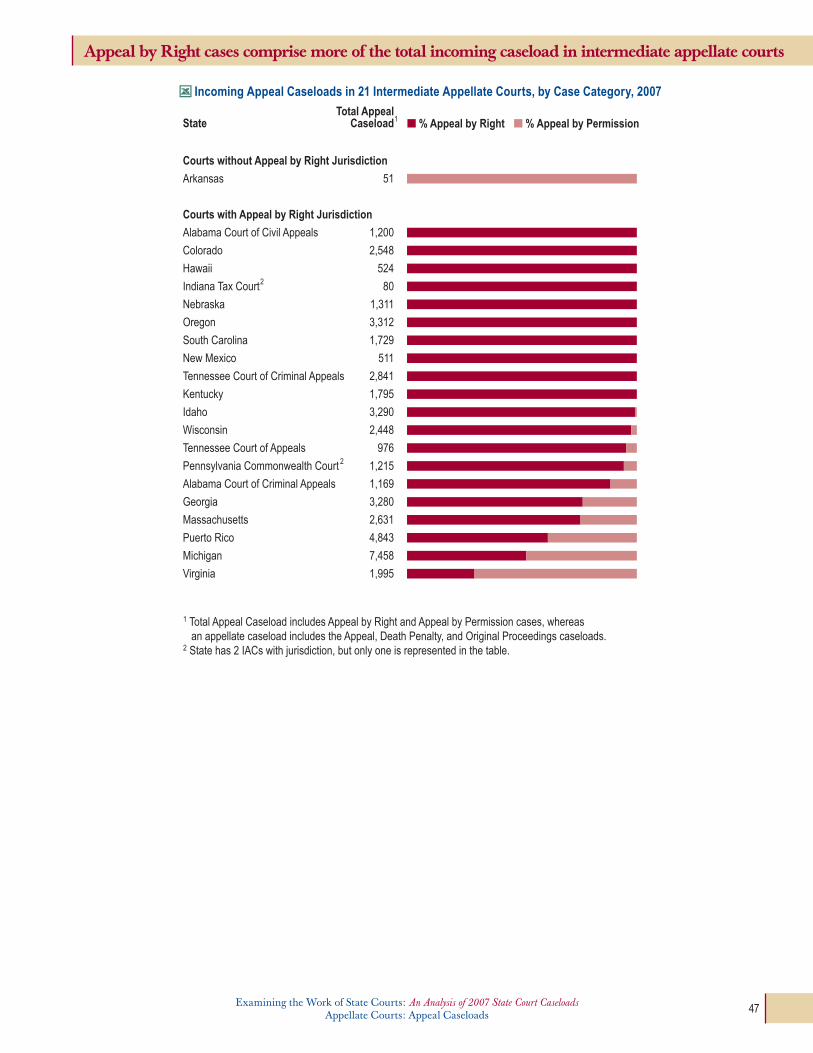
StateTotal Appeal
Caseload
Courts without Appeal by Right Jurisdiction
■ % Appeal by Right ■ % Appeal by Permission
Courts with Appeal by Right Jurisdiction
Arkansas 51
Alabama Court of Civil Appeals 1,200
Colorado 2,548
Hawaii 524
Indiana Tax Court 80
Nebraska 1,311
Oregon 3,312
South Carolina 1,729
New Mexico 511
Tennessee Court of Criminal Appeals 2,841
Kentucky 1,795
Idaho 3,290
Wisconsin 2,448
Tennessee Court of Appeals 976
Pennsylvania Commonwealth Court 1,215
Alabama Court of Criminal Appeals 1,169
Georgia 3,280
Massachusetts 2,631
Puerto Rico 4,843
1 Total Appeal Caseload includes Appeal by Right and Appeal by Permission cases, whereas an appellate caseload includes the Appeal, Death Penalty, and Original Proceedings caseloads.2 State has 2 IACs with jurisdiction, but only one is represented in the table.
Michigan 7,458
Virginia 1,995
1
2
2
Appeal by Right cases comprise more of the total incoming caseload in intermediate appellate courts
Incoming Appeal Caseloads in 21 Intermediate Appellate Courts, by Case Category, 2007
Examining the Work of State Courts: An Analysis of 2007 State Court CaseloadsAppellate Courts: Appeal Caseloads
Examining the Work of State Courts: An Analysis of 2007 State Court CaseloadsAppellate Courts: Appeal Caseloads 47
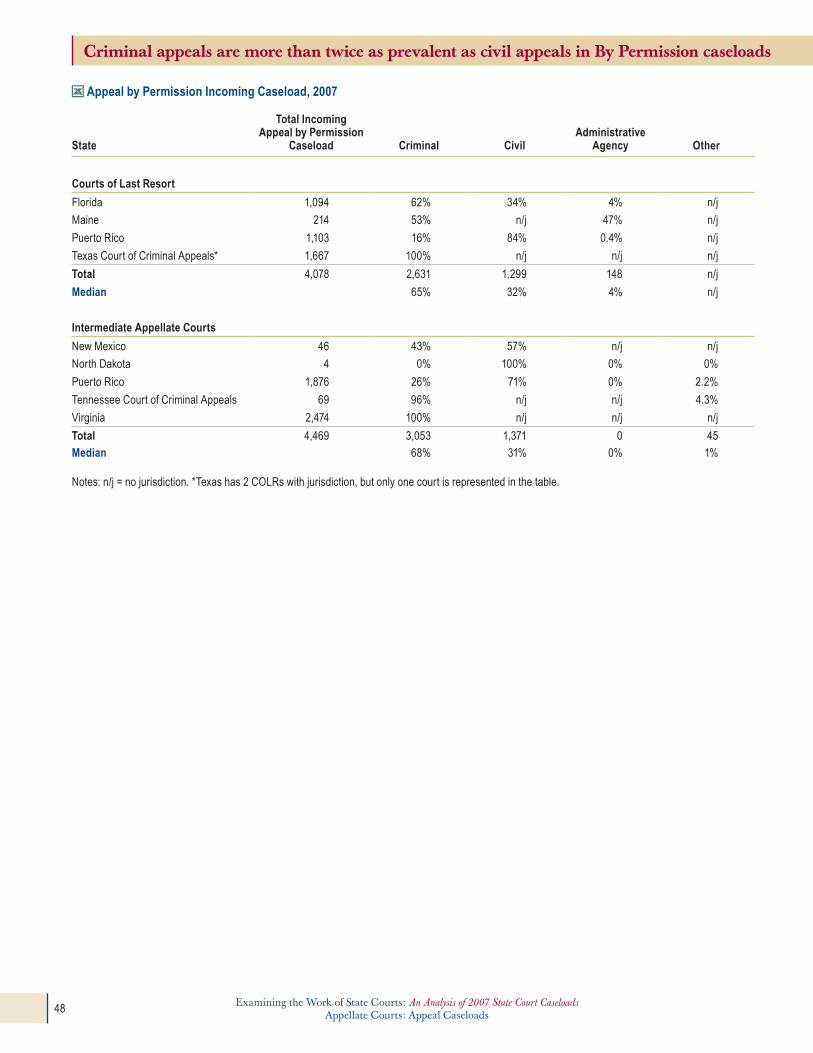
Criminal appeals are more than twice as prevalent as civil appeals in By Permission caseloads
Appeal by Permission Incoming Caseload, 2007
State
Total Incoming Appeal by Permission
Caseload Criminal CivilAdministrative
Agency Other
Courts of Last Resort
Florida 1,094 62% 34% 4% n/j
Maine 214 53% n/j 47% n/j
Puerto Rico 1,103 16% 84% 0.4% n/j
texas Court of Criminal Appeals* 1,667 100% n/j n/j n/j
Total 4,078 2,631 1,299 148 n/j
Median 65% 32% 4% n/j
Intermediate Appellate Courts
New Mexico 46 43% 57% n/j n/j
North Dakota 4 0% 100% 0% 0%
Puerto Rico 1,876 26% 71% 0% 2.2%
tennessee Court of Criminal Appeals 69 96% n/j n/j 4.3%
Virginia 2,474 100% n/j n/j n/j
Total 4,469 3,053 1,371 0 45
Median 68% 31% 0% 1%
Notes: n/j = no jurisdiction. *texas has 2 CoLRs with jurisdiction, but only one court is represented in the table.
Examining the Work of State Courts: An Analysis of 2007 State Court CaseloadsAppellate Courts: Appeal Caseloads48 Examining the Work of State Courts: An Analysis of 2007 State Court Caseloads
Appellate Courts: Appeal Caseloads

Appellate court structure and organization clearly influence Appeal by Right composition
Appeal by Right Incoming Caseload Composition, 2007
State
Total Incoming Appeal by Right
Caseload Criminal CivilAdministrative
Agency Other
Courts of Last Resort with at least one IAC
Florida 53 53% 38% 9% n/jHawaii 33 48% 52% 0% n/j
indiana 4 75% 25% n/j n/j
Minnesota 75 64% 1.3% 35% n/j
Missouri 79 9% 30% n/j 61%
North Dakota 339 41% 51% 7% 0%
oregon 8 n/j n/j 100% n/j
Puerto Rico 95 n/j 100% 0% n/j
tennessee 179 n/j n/j 98% 2.2%
Utah 329 17% 80% 3.3% 0%
Total 1,194 25% 50% 21% 4%
Courts of Last Resort with no IAC
District of Columbia 1,383 45% 36% 16% 4%
Rhode island 222 33% 67% 0.5% n/j
Wyoming 258 39% 53% 8% 0%
Total 1,863 43% 42% 13% 2.7%
Intermediate Appellate Courts
Alabama Court of Criminal Appeals* 1,795 94% 0.8% n/j 5%
Arizona 2,564 40% 56% 5% n/j
Colorado 2,548 44% 47% 9% n/j
Hawaii 524 35% 61% 3.8% n/j
indiana 80 n/j n/j 100% n/j
Kentucky 2,389 31% 63% 5% n/j
Massachusetts 1,984 43% 54% 2.7% n/j
New Mexico 930 45% 41% 5% 8%
oregon 3,312 55% 31% 14% 0%
Pennsylvania Commonwealth Court* 3,266 1.3% 9% 87% 108
Puerto Rico 2,967 8% 51% 41% n/j
tennessee Court of Criminal Appeals* 1,146 100% n/j n/j n/j
Utah 881 26% 20% 6% 48%
Virginia 585 n/j 47% 35% 18%
Total 24,971 38% 37% 22% 3%
Notes: n/j = no jurisdiction. *State has 2 iACs with jurisdiction, but only one is represented in the table.
Examining the Work of State Courts: An Analysis of 2007 State Court CaseloadsAppellate Courts: Appeal Caseloads
Examining the Work of State Courts: An Analysis of 2007 State Court CaseloadsAppellate Courts: Appeal Caseloads 49

COLRs tend to have higher clearance rates for By Right appeals
Most IACs have higher clearance rates for By Permission appeals
Clearance Rate
80% 100% 120% 140% 160% 180% 200%
State
Illinois
Florida
Tennessee
Missouri
Colorado
Minnesota
Puerto Rico
Alaska
Idaho
Rhode Island
Alabama
■ Appeal by Permission■ Appeal by Right
State Clearance Rate
80% 90% 100% 110% 120%
■ Appeal by Permission■ Appeal by Right
Tennessee Court of Appeals
Kentucky
Arkansas
Massachusetts
Michigan
Puerto Rico
Virginia
Tennessee Court of Criminal Appeals
Clearance Rates in 11 Courts of Last Resort, 2007
Clearance Rates in 8 Intermediate Appellate Courts, 2007
Examining the Work of State Courts: An Analysis of 2007 State Court CaseloadsAppellate Courts: Appeal Caseloads50 Examining the Work of State Courts: An Analysis of 2007 State Court Caseloads
Appellate Courts: Death Penalty Caseloads
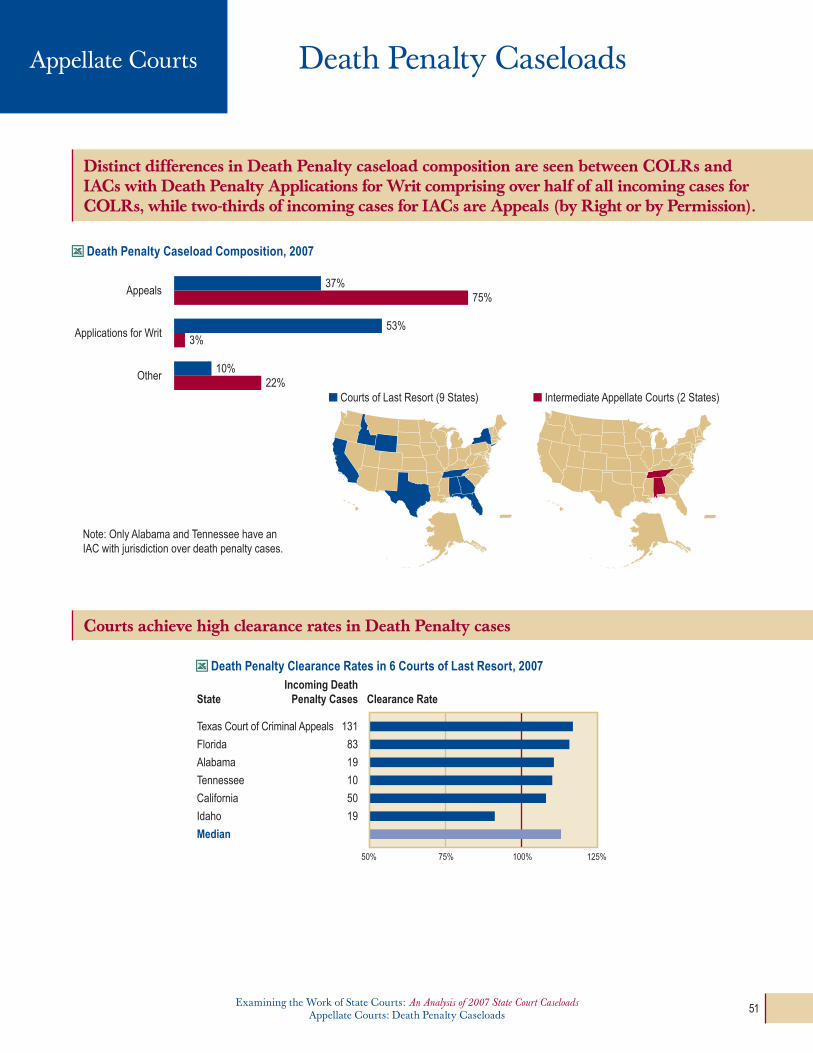
Courts achieve high clearance rates in Death Penalty cases
StateIncoming Death
Penalty Cases
Texas Court of Criminal Appeals 131
Florida 83
Alabama 19
Tennessee 10
California 50
Idaho 19
Median
50% 75% 100% 125%
Clearance Rate
Death Penalty CaseloadsAppellate Courts
Distinct differences in Death Penalty caseload composition are seen between COLRs and IACs with Death Penalty Applications for Writ comprising over half of all incoming cases for COLRs, while two-thirds of incoming cases for IACs are Appeals (by Right or by Permission).
37%75%
Appeals
53%3%
Applications for Writ
10%22%
Other
Note: Only Alabama and Tennessee have an IAC with jurisdiction over death penalty cases.
■ Courts of Last Resort (9 States) ■ Intermediate Appellate Courts (2 States)
Death Penalty Caseload Composition, 2007
Death Penalty Clearance Rates in 6 Courts of Last Resort, 2007
Examining the Work of State Courts: An Analysis of 2007 State Court CaseloadsAppellate Courts: Appeal Caseloads
Examining the Work of State Courts: An Analysis of 2007 State Court CaseloadsAppellate Courts: Death Penalty Caseloads 51
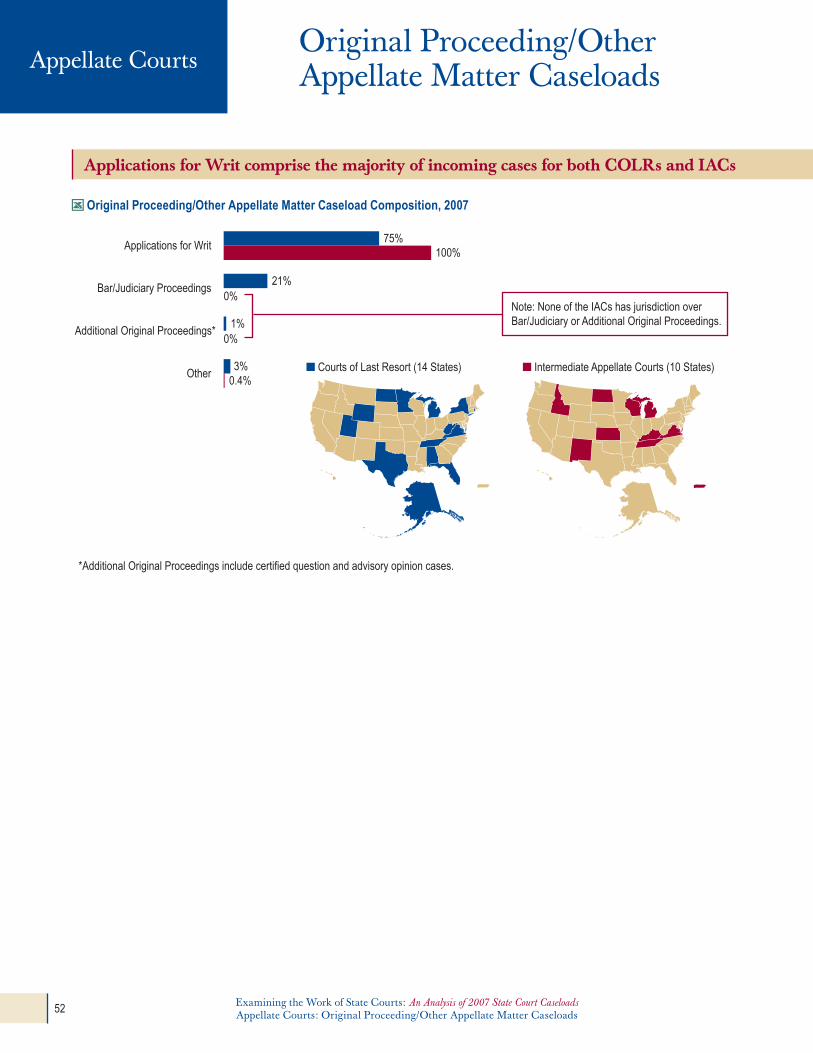
Original Proceeding/Other Appellate Matter CaseloadsAppellate Courts
Applications for Writ comprise the majority of incoming cases for both COLRs and IACs
75%100%
21%
1%
3%0.4%
Applications for Writ
Bar/Judiciary Proceedings
Additional Original Proceedings*
Other ■ Courts of Last Resort (14 States) ■ Intermediate Appellate Courts (10 States)
Note: None of the IACs has jurisdiction over Bar/Judiciary or Additional Original Proceedings.
*Additional Original Proceedings include certified question and advisory opinion cases.
0%
0%
Original Proceeding/Other Appellate Matter Caseload Composition, 2007
Examining the Work of State Courts: An Analysis of 2007 State Court CaseloadsAppellate Courts: Original Proceeding/Other Appellate Matter Caseloads52 Examining the Work of State Courts: An Analysis of 2007 State Court Caseloads
Appellate Courts: Original Proceeding/Other Appellate Matter Caseloads

Most courts are able to keep pace with their Original Proceedings/Other Appellate Matter caseloads
50% 75% 100% 125% 150% 175%
Courts of Last ResortIncoming Original/Other Proceedings Clearance Rate
*These states have 2 COLRs or IACs with jurisdiction, but only one is represented in the table.
Wisconsin 127
Alaska 23
Idaho 202
Minnesota 74
Texas Supreme Court* 251
Tennessee 105
Wyoming 49
Rhode Island 10
West Virginia 319
Hawaii 69
Florida 1,294
Alabama 386
Vermont 32
North Dakota 27
Median
50% 75% 100% 125% 150% 175%
Intermediate Apellate Courts
Virginia 36
Wisconsin 135
Ohio 837
Michigan 122
Tennessee Court of Criminal Appeals* 12
Alabama Court of Criminal Appeals* 466
Minnesota 108
Pennsylvania Commonwealth Court* 632
Puerto Rico 97
Kentucky 151
Median
Original/Other Proceedings Clearance Rates in Courts of Last Resort and Intermediate Appellate Courts, 2007
Examining the Work of State Courts: An Analysis of 2007 State Court CaseloadsAppellate Courts: Original Proceeding/Other Appellate Matter Caseloads
Examining the Work of State Courts: An Analysis of 2007 State Court CaseloadsAppellate Courts: Original Proceeding/Other Appellate Matter Caseloads 53

Florida’s Supreme Court Embraces the Guide
the Florida Supreme Court is the first appellate court to fully implement the newly revised appellate reporting section of the State Court Guide to Statistical Reporting (Guide). Florida reported complete caseload, manner of disposition, type of court opinion, and case outcome data for all case categories and subcategories.
Realizing that the Court’s current manner of classifying cases and case outcomes was inconsistent with the data recommended in the Guide, the Clerk of the Supreme Court launched a campaign to assign the Court’s existing case codes to the case categories, subcategories, case types and case status categories contained in the new reporting matrix. to accomplish this, collaborative efforts began between the Clerk’s office, the office of the State Courts Administrator (oSCA), and the CSP, to manually map the 2007 data into the new format. Meetings were held to familiarize the working group with the Guide’s new appellate categories; oSCA data specialists prepared reports to reclassify and translate their data; and the Clerk’s office recoded categories and reviewed files to identify missing information. After some final definitional clarification by CSP staff, oSCA personnel completed the Guide’s reporting matrix and submitted their 2007 data.
the working group continues to incorporate additional data codes into Florida’s case management system. in future iterations, this will allow for the automation of the national data report without altering the Court’s own internal and external reporting processes. As a result, Florida has created a detailed representation of its Supreme Court’s caseload, which should assist with managing that caseload as well as facilitating meaningful comparisons with other states.
2%Appeal by Right
3%Death Penalty
43%Appeal by Permission
51%Original/Other Proceedings
The Florida Supreme Court's total incoming caseload for 2007 was 2,525 cases.
Original/Other Proceedings and Appeal by Permission cases make up over 90 percent of incoming cases
Permission is denied in half of all incoming cases
Reversal of the lower court decision is most common in Appeals by Permission
Florida
Case CategoryNumber of Cases
Perm- ission Denied Decided
Trans- ferred
Dismissed Prior to
DecisionWith- drawn
Other Resolution
Appeal by Right 64 n/j 11 43* 2 7 1
Appeal by Permission 1,095 876 106 n/j 75 36 2
Death Penalty 96 5 87 n/j 1 3 0
original/other Proceedings 1,270 373 426 267 35 60 109
Total 2,525 1,254 630 310 113 106 112
Notes: n/j = no jurisdication over the disposition type. *these cases should have been filed with the iAC, but were incorrectly filed with the Supreme Court.
17% 15%
5% 3%
59%
Most original/other Proceeding cases are included in other outcome since 91% of decided proceedings deal with bar/judiciary proceedings, certified questions, and advisory opinions.
Incoming Caseload Composition in the Florida Supreme Court, 2007
Case Outcome by Case Category in the Florida Supreme Court, 2007
Manner of Disposition by Case Category in the Florida Supreme Court, 2007
Case CategoryNumber of Cases Affirmed Reversed Modified Dismissed
Other Outcome
Appeal by Right 11 9 1 1 0 0
Appeal by Permission 106 25 61 2 18 0
Death Penalty 87 54 29 2 2 0
original/other Proceeding Cases 426 22 5 25 1 373
Total 630 110 96 30 21 373
Examining the Work of State Courts: An Analysis of 2007 State Court CaseloadsAppellate Courts: Original Proceeding/Other Appellate Matter Caseloads54 Examining the Work of State Courts: An Analysis of 2007 State Court Caseloads
Appellate Courts: Original Proceeding/Other Appellate Matter Caseloads

Manner of Disposition
Decided 87Permission Denied 5Dismissed Prior to Decision 1Withdrawn 3Other Resolution 0
Lower Court Appeals
Affirmed 54Reversed 29Modified 2Dismissed 2
Of the 87 appeals that were decided, 75 full opinions were issued by the Supreme Court
Appeals by Right represent 70 percent of incoming Death Penalty cases
High clearance rates lead to a reduction in pending caseloads
Complete data illuminates details of disposed cases
9Other Writ Applications
16Habeas Corpus
58Appeal by Right
83Total Death Penalty
Total Death Penalty Cases
CaseloadSummary
17683
96IncomingBegin Pending
OutgoingEnd Pending 163
Appeal by Right Cases
14158
66133
Habeas Corpus Cases
3116
2225
Other Writ Application Cases
498
5
Incoming Death Penalty Cases by Case Type in the Florida Supreme Court, 2007
Total Death Penalty Cases in the Florida Supreme Court, 2007
Examining the Work of State Courts: An Analysis of 2007 State Court CaseloadsAppellate Courts: Original Proceeding/Other Appellate Matter Caseloads
Examining the Work of State Courts: An Analysis of 2007 State Court CaseloadsAppellate Courts: Original Proceeding/Other Appellate Matter Caseloads 55

Examining the Work of State Courts: An Analysis of 2007 State Court CaseloadsAppendices56 Examining the Work of State Courts: An Analysis of 2007 State Court Caseloads
Appendices

Summary
• IndexofStatesIncludedinSectionGraphics
• CourtStatisticsProjectMethodology
• StateCourtCaseloadStatistics
Appendices
Examining the Work of State Courts: An Analysis of 2007 State Court CaseloadsAppendices
Examining the Work of State Courts: An Analysis of 2007 State Court CaseloadsAppendices 57
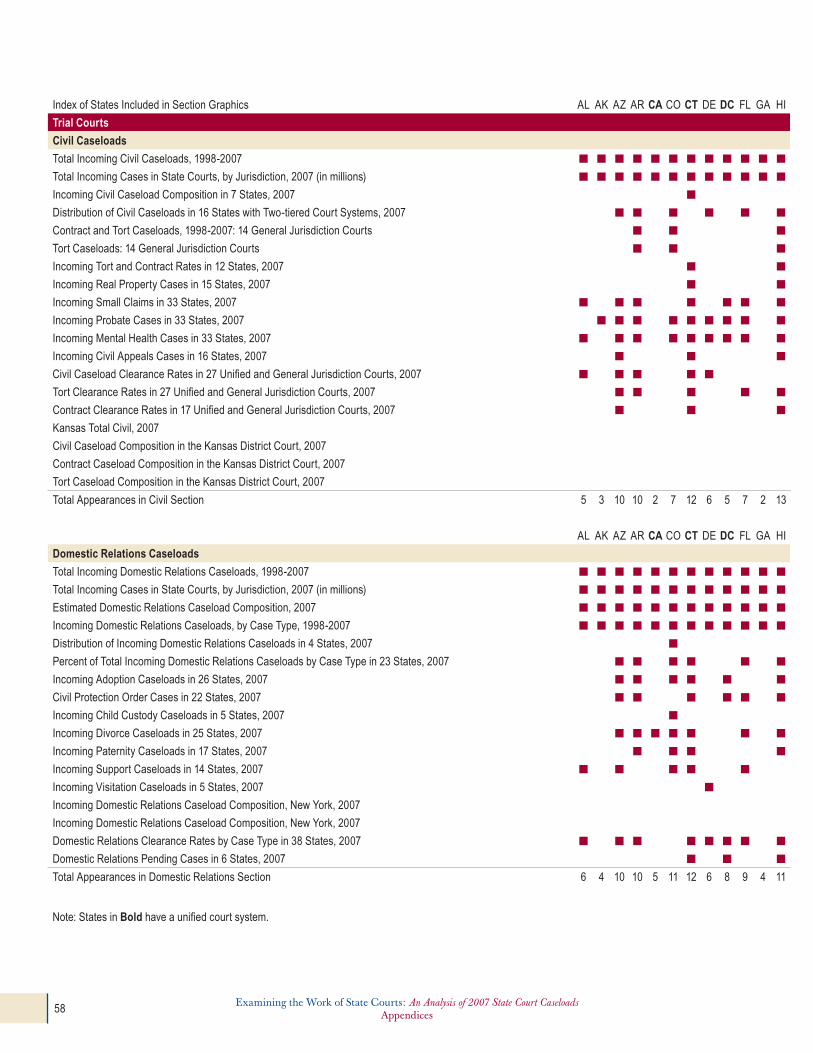
Examining the Work of State Courts: An Analysis of 2007 State Court CaseloadsAppendices58 Examining the Work of State Courts: An Analysis of 2007 State Court Caseloads
Appendices
index of States included in Section Graphics al AK aZ ar CA co CT De DC FL GA hi iD IL in IA KS KY la ME MD MA Mi MN MS MO Mt ne nV nh NJ NM ny nc ND oh oK or Pa PR RI Sc SD tn tX ut Vt Va Wa WV WI Wy total
Trial Courts
Civil Caseloads
total incoming Civil Caseloads, 1998-2007 ■ ■ ■ ■ ■ ■ ■ ■ ■ ■ ■ ■ ■ ■ ■ ■ ■ ■ ■ ■ ■ ■ ■ ■ ■ ■ ■ ■ ■ ■ ■ ■ ■ ■ ■ ■ ■ ■ ■ ■ ■ ■ ■ ■ ■ ■ ■ ■ ■ ■ ■ ■ 52
total incoming Cases in State Courts, by Jurisdiction, 2007 (in millions) ■ ■ ■ ■ ■ ■ ■ ■ ■ ■ ■ ■ ■ ■ ■ ■ ■ ■ ■ ■ ■ ■ ■ ■ ■ ■ ■ ■ ■ ■ ■ ■ ■ ■ ■ ■ ■ ■ ■ ■ ■ ■ ■ ■ ■ ■ ■ ■ ■ ■ ■ ■ 52
incoming Civil Caseload Composition in 7 States, 2007 ■ ■ ■ ■ ■ ■ ■ 7
Distribution of Civil Caseloads in 16 States with two-tiered Court Systems, 2007 ■ ■ ■ ■ ■ ■ ■ ■ ■ ■ ■ ■ ■ ■ ■ ■ 16
Contract and tort Caseloads, 1998-2007: 14 General Jurisdiction Courts ■ ■ ■ ■ ■ ■ ■ ■ ■ ■ ■ ■ ■ ■ 14
tort Caseloads: 14 General Jurisdiction Courts ■ ■ ■ ■ ■ ■ ■ ■ ■ ■ ■ ■ ■ ■ 14
incoming tort and Contract Rates in 12 States, 2007 ■ ■ ■ ■ ■ ■ ■ ■ ■ ■ ■ ■ 12
incoming Real Property Cases in 15 States, 2007 ■ ■ ■ ■ ■ ■ ■ ■ ■ ■ ■ ■ ■ ■ ■ 15
incoming Small Claims in 33 States, 2007 ■ ■ ■ ■ ■ ■ ■ ■ ■ ■ ■ ■ ■ ■ ■ ■ ■ ■ ■ ■ ■ ■ ■ ■ ■ ■ ■ ■ ■ ■ ■ ■ ■ 33
incoming Probate Cases in 33 States, 2007 ■ ■ ■ ■ ■ ■ ■ ■ ■ ■ ■ ■ ■ ■ ■ ■ ■ ■ ■ ■ ■ ■ ■ ■ ■ ■ ■ ■ ■ ■ ■ ■ ■ 33
incoming Mental Health Cases in 33 States, 2007 ■ ■ ■ ■ ■ ■ ■ ■ ■ ■ ■ ■ ■ ■ ■ ■ ■ ■ ■ ■ ■ ■ ■ ■ ■ ■ ■ ■ ■ ■ ■ ■ ■ 33
incoming Civil Appeals Cases in 16 States, 2007 ■ ■ ■ ■ ■ ■ ■ ■ ■ ■ ■ ■ ■ ■ ■ ■ 16
Civil Caseload Clearance Rates in 27 Unified and General Jurisdiction Courts, 2007 ■ ■ ■ ■ ■ ■ ■ ■ ■ ■ ■ ■ ■ ■ ■ ■ ■ ■ ■ ■ ■ ■ ■ ■ ■ ■ ■ 27
tort Clearance Rates in 27 Unified and General Jurisdiction Courts, 2007 ■ ■ ■ ■ ■ ■ ■ ■ ■ ■ ■ ■ ■ ■ ■ ■ ■ ■ ■ ■ ■ ■ ■ ■ ■ ■ ■ 27
Contract Clearance Rates in 17 Unified and General Jurisdiction Courts, 2007 ■ ■ ■ ■ ■ ■ ■ ■ ■ ■ ■ ■ ■ ■ ■ ■ ■ 17
Kansas total Civil, 2007 ■ 1
Civil Caseload Composition in the Kansas District Court, 2007 ■ 1
Contract Caseload Composition in the Kansas District Court, 2007 ■ 1
tort Caseload Composition in the Kansas District Court, 2007 ■ 1
total Appearances in Civil Section 5 3 10 10 2 7 12 6 5 7 2 13 6 5 6 10 15 9 2 6 3 6 8 11 7 14 4 4 4 2 14 6 8 5 14 8 5 7 2 7 5 5 3 8 6 15 8 2 12 8 12 8
al AK aZ ar CA co CT De DC FL GA hi iD IL in IA KS KY la ME MD MA Mi MN MS MO Mt ne nV nh NJ NM ny nc ND oh oK or Pa PR RI Sc SD tn tX ut Vt Va Wa WV WI Wy total
Domestic Relations Caseloads
total incoming Domestic Relations Caseloads, 1998-2007 ■ ■ ■ ■ ■ ■ ■ ■ ■ ■ ■ ■ ■ ■ ■ ■ ■ ■ ■ ■ ■ ■ ■ ■ ■ ■ ■ ■ ■ ■ ■ ■ ■ ■ ■ ■ ■ ■ ■ ■ ■ ■ ■ ■ ■ ■ ■ ■ ■ ■ ■ ■ 52
total incoming Cases in State Courts, by Jurisdiction, 2007 (in millions) ■ ■ ■ ■ ■ ■ ■ ■ ■ ■ ■ ■ ■ ■ ■ ■ ■ ■ ■ ■ ■ ■ ■ ■ ■ ■ ■ ■ ■ ■ ■ ■ ■ ■ ■ ■ ■ ■ ■ ■ ■ ■ ■ ■ ■ ■ ■ ■ ■ ■ ■ ■ 52
Estimated Domestic Relations Caseload Composition, 2007 ■ ■ ■ ■ ■ ■ ■ ■ ■ ■ ■ ■ ■ ■ ■ ■ ■ ■ ■ ■ ■ ■ ■ ■ ■ ■ ■ ■ ■ ■ ■ ■ ■ ■ ■ ■ ■ ■ ■ ■ ■ ■ ■ ■ ■ ■ ■ ■ ■ ■ ■ ■ 52
incoming Domestic Relations Caseloads, by Case type, 1998-2007 ■ ■ ■ ■ ■ ■ ■ ■ ■ ■ ■ ■ ■ ■ ■ ■ ■ ■ ■ ■ ■ ■ ■ ■ ■ ■ ■ ■ ■ ■ ■ ■ ■ ■ ■ ■ ■ ■ ■ ■ ■ ■ ■ ■ ■ ■ ■ ■ ■ ■ ■ ■ 52
Distribution of incoming Domestic Relations Caseloads in 4 States, 2007 ■ ■ ■ ■ 4
Percent of total incoming Domestic Relations Caseloads by Case type in 23 States, 2007 ■ ■ ■ ■ ■ ■ ■ ■ ■ ■ ■ ■ ■ ■ ■ ■ ■ ■ ■ ■ ■ ■ ■ 23
incoming Adoption Caseloads in 26 States, 2007 ■ ■ ■ ■ ■ ■ ■ ■ ■ ■ ■ ■ ■ ■ ■ ■ ■ ■ ■ ■ ■ ■ ■ ■ ■ ■ 26
Civil Protection order Cases in 22 States, 2007 ■ ■ ■ ■ ■ ■ ■ ■ ■ ■ ■ ■ ■ ■ ■ ■ ■ ■ ■ ■ ■ ■ 22
incoming Child Custody Caseloads in 5 States, 2007 ■ ■ ■ ■ ■ 5
incoming Divorce Caseloads in 25 States, 2007 ■ ■ ■ ■ ■ ■ ■ ■ ■ ■ ■ ■ ■ ■ ■ ■ ■ ■ ■ ■ ■ ■ ■ ■ ■ 25
incoming Paternity Caseloads in 17 States, 2007 ■ ■ ■ ■ ■ ■ ■ ■ ■ ■ ■ ■ ■ ■ ■ ■ ■ 17
incoming Support Caseloads in 14 States, 2007 ■ ■ ■ ■ ■ ■ ■ ■ ■ ■ ■ ■ ■ ■ 14
incoming Visitation Caseloads in 5 States, 2007 ■ ■ ■ ■ ■ 5
incoming Domestic Relations Caseload Composition, New York, 2007 ■ 1
incoming Domestic Relations Caseload Composition, New York, 2007 ■ 1
Domestic Relations Clearance Rates by Case type in 38 States, 2007 ■ ■ ■ ■ ■ ■ ■ ■ ■ ■ ■ ■ ■ ■ ■ ■ ■ ■ ■ ■ ■ ■ ■ ■ ■ ■ ■ ■ ■ ■ ■ ■ ■ ■ ■ ■ ■ ■ 38
Domestic Relations Pending Cases in 6 States, 2007 ■ ■ ■ ■ ■ ■ 6
total Appearances in Domestic Relations Section 6 4 10 10 5 11 12 6 8 9 4 11 9 9 5 11 5 5 5 4 10 7 12 10 4 12 5 5 4 4 6 11 14 5 11 11 4 5 5 13 5 4 4 6 5 11 5 5 12 10 11 10
Note: States in Bold have a unified court system.
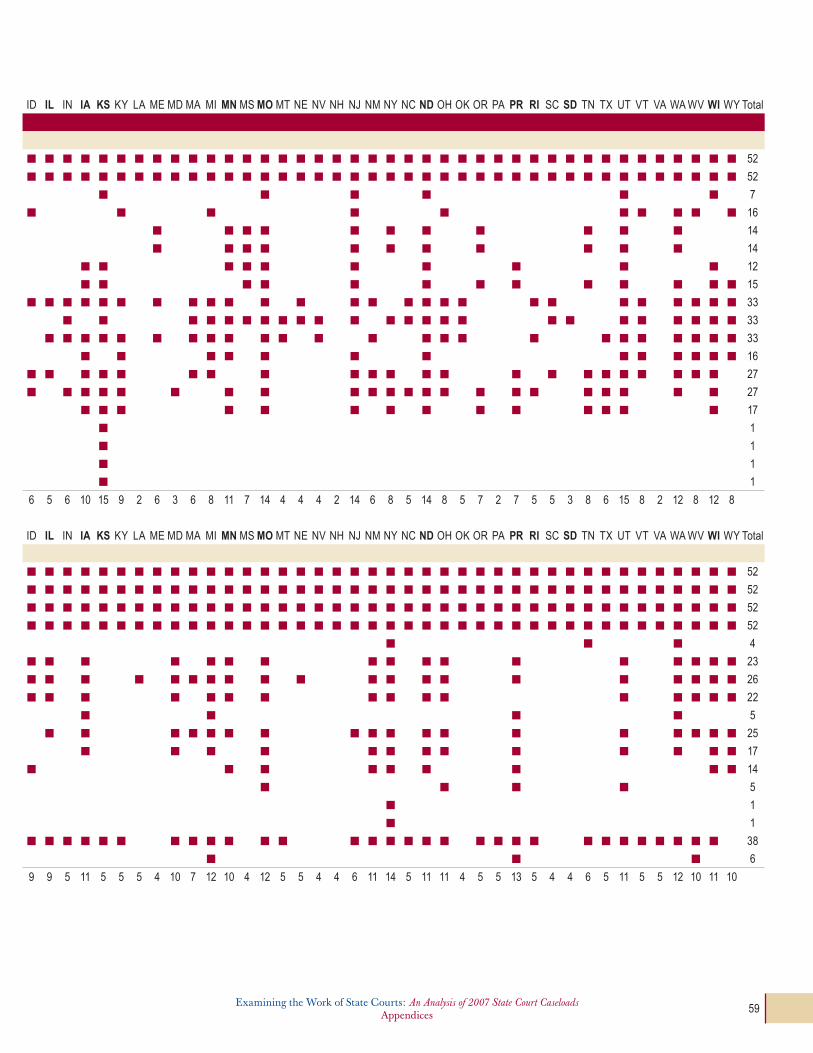
Examining the Work of State Courts: An Analysis of 2007 State Court CaseloadsAppendices
Examining the Work of State Courts: An Analysis of 2007 State Court CaseloadsAppendices 59
index of States included in Section Graphics al AK aZ ar CA co CT De DC FL GA hi iD IL in IA KS KY la ME MD MA Mi MN MS MO Mt ne nV nh NJ NM ny nc ND oh oK or Pa PR RI Sc SD tn tX ut Vt Va Wa WV WI Wy total
Trial Courts
Civil Caseloads
total incoming Civil Caseloads, 1998-2007 ■ ■ ■ ■ ■ ■ ■ ■ ■ ■ ■ ■ ■ ■ ■ ■ ■ ■ ■ ■ ■ ■ ■ ■ ■ ■ ■ ■ ■ ■ ■ ■ ■ ■ ■ ■ ■ ■ ■ ■ ■ ■ ■ ■ ■ ■ ■ ■ ■ ■ ■ ■ 52
total incoming Cases in State Courts, by Jurisdiction, 2007 (in millions) ■ ■ ■ ■ ■ ■ ■ ■ ■ ■ ■ ■ ■ ■ ■ ■ ■ ■ ■ ■ ■ ■ ■ ■ ■ ■ ■ ■ ■ ■ ■ ■ ■ ■ ■ ■ ■ ■ ■ ■ ■ ■ ■ ■ ■ ■ ■ ■ ■ ■ ■ ■ 52
incoming Civil Caseload Composition in 7 States, 2007 ■ ■ ■ ■ ■ ■ ■ 7
Distribution of Civil Caseloads in 16 States with two-tiered Court Systems, 2007 ■ ■ ■ ■ ■ ■ ■ ■ ■ ■ ■ ■ ■ ■ ■ ■ 16
Contract and tort Caseloads, 1998-2007: 14 General Jurisdiction Courts ■ ■ ■ ■ ■ ■ ■ ■ ■ ■ ■ ■ ■ ■ 14
tort Caseloads: 14 General Jurisdiction Courts ■ ■ ■ ■ ■ ■ ■ ■ ■ ■ ■ ■ ■ ■ 14
incoming tort and Contract Rates in 12 States, 2007 ■ ■ ■ ■ ■ ■ ■ ■ ■ ■ ■ ■ 12
incoming Real Property Cases in 15 States, 2007 ■ ■ ■ ■ ■ ■ ■ ■ ■ ■ ■ ■ ■ ■ ■ 15
incoming Small Claims in 33 States, 2007 ■ ■ ■ ■ ■ ■ ■ ■ ■ ■ ■ ■ ■ ■ ■ ■ ■ ■ ■ ■ ■ ■ ■ ■ ■ ■ ■ ■ ■ ■ ■ ■ ■ 33
incoming Probate Cases in 33 States, 2007 ■ ■ ■ ■ ■ ■ ■ ■ ■ ■ ■ ■ ■ ■ ■ ■ ■ ■ ■ ■ ■ ■ ■ ■ ■ ■ ■ ■ ■ ■ ■ ■ ■ 33
incoming Mental Health Cases in 33 States, 2007 ■ ■ ■ ■ ■ ■ ■ ■ ■ ■ ■ ■ ■ ■ ■ ■ ■ ■ ■ ■ ■ ■ ■ ■ ■ ■ ■ ■ ■ ■ ■ ■ ■ 33
incoming Civil Appeals Cases in 16 States, 2007 ■ ■ ■ ■ ■ ■ ■ ■ ■ ■ ■ ■ ■ ■ ■ ■ 16
Civil Caseload Clearance Rates in 27 Unified and General Jurisdiction Courts, 2007 ■ ■ ■ ■ ■ ■ ■ ■ ■ ■ ■ ■ ■ ■ ■ ■ ■ ■ ■ ■ ■ ■ ■ ■ ■ ■ ■ 27
tort Clearance Rates in 27 Unified and General Jurisdiction Courts, 2007 ■ ■ ■ ■ ■ ■ ■ ■ ■ ■ ■ ■ ■ ■ ■ ■ ■ ■ ■ ■ ■ ■ ■ ■ ■ ■ ■ 27
Contract Clearance Rates in 17 Unified and General Jurisdiction Courts, 2007 ■ ■ ■ ■ ■ ■ ■ ■ ■ ■ ■ ■ ■ ■ ■ ■ ■ 17
Kansas total Civil, 2007 ■ 1
Civil Caseload Composition in the Kansas District Court, 2007 ■ 1
Contract Caseload Composition in the Kansas District Court, 2007 ■ 1
tort Caseload Composition in the Kansas District Court, 2007 ■ 1
total Appearances in Civil Section 5 3 10 10 2 7 12 6 5 7 2 13 6 5 6 10 15 9 2 6 3 6 8 11 7 14 4 4 4 2 14 6 8 5 14 8 5 7 2 7 5 5 3 8 6 15 8 2 12 8 12 8
al AK aZ ar CA co CT De DC FL GA hi iD IL in IA KS KY la ME MD MA Mi MN MS MO Mt ne nV nh NJ NM ny nc ND oh oK or Pa PR RI Sc SD tn tX ut Vt Va Wa WV WI Wy total
Domestic Relations Caseloads
total incoming Domestic Relations Caseloads, 1998-2007 ■ ■ ■ ■ ■ ■ ■ ■ ■ ■ ■ ■ ■ ■ ■ ■ ■ ■ ■ ■ ■ ■ ■ ■ ■ ■ ■ ■ ■ ■ ■ ■ ■ ■ ■ ■ ■ ■ ■ ■ ■ ■ ■ ■ ■ ■ ■ ■ ■ ■ ■ ■ 52
total incoming Cases in State Courts, by Jurisdiction, 2007 (in millions) ■ ■ ■ ■ ■ ■ ■ ■ ■ ■ ■ ■ ■ ■ ■ ■ ■ ■ ■ ■ ■ ■ ■ ■ ■ ■ ■ ■ ■ ■ ■ ■ ■ ■ ■ ■ ■ ■ ■ ■ ■ ■ ■ ■ ■ ■ ■ ■ ■ ■ ■ ■ 52
Estimated Domestic Relations Caseload Composition, 2007 ■ ■ ■ ■ ■ ■ ■ ■ ■ ■ ■ ■ ■ ■ ■ ■ ■ ■ ■ ■ ■ ■ ■ ■ ■ ■ ■ ■ ■ ■ ■ ■ ■ ■ ■ ■ ■ ■ ■ ■ ■ ■ ■ ■ ■ ■ ■ ■ ■ ■ ■ ■ 52
incoming Domestic Relations Caseloads, by Case type, 1998-2007 ■ ■ ■ ■ ■ ■ ■ ■ ■ ■ ■ ■ ■ ■ ■ ■ ■ ■ ■ ■ ■ ■ ■ ■ ■ ■ ■ ■ ■ ■ ■ ■ ■ ■ ■ ■ ■ ■ ■ ■ ■ ■ ■ ■ ■ ■ ■ ■ ■ ■ ■ ■ 52
Distribution of incoming Domestic Relations Caseloads in 4 States, 2007 ■ ■ ■ ■ 4
Percent of total incoming Domestic Relations Caseloads by Case type in 23 States, 2007 ■ ■ ■ ■ ■ ■ ■ ■ ■ ■ ■ ■ ■ ■ ■ ■ ■ ■ ■ ■ ■ ■ ■ 23
incoming Adoption Caseloads in 26 States, 2007 ■ ■ ■ ■ ■ ■ ■ ■ ■ ■ ■ ■ ■ ■ ■ ■ ■ ■ ■ ■ ■ ■ ■ ■ ■ ■ 26
Civil Protection order Cases in 22 States, 2007 ■ ■ ■ ■ ■ ■ ■ ■ ■ ■ ■ ■ ■ ■ ■ ■ ■ ■ ■ ■ ■ ■ 22
incoming Child Custody Caseloads in 5 States, 2007 ■ ■ ■ ■ ■ 5
incoming Divorce Caseloads in 25 States, 2007 ■ ■ ■ ■ ■ ■ ■ ■ ■ ■ ■ ■ ■ ■ ■ ■ ■ ■ ■ ■ ■ ■ ■ ■ ■ 25
incoming Paternity Caseloads in 17 States, 2007 ■ ■ ■ ■ ■ ■ ■ ■ ■ ■ ■ ■ ■ ■ ■ ■ ■ 17
incoming Support Caseloads in 14 States, 2007 ■ ■ ■ ■ ■ ■ ■ ■ ■ ■ ■ ■ ■ ■ 14
incoming Visitation Caseloads in 5 States, 2007 ■ ■ ■ ■ ■ 5
incoming Domestic Relations Caseload Composition, New York, 2007 ■ 1
incoming Domestic Relations Caseload Composition, New York, 2007 ■ 1
Domestic Relations Clearance Rates by Case type in 38 States, 2007 ■ ■ ■ ■ ■ ■ ■ ■ ■ ■ ■ ■ ■ ■ ■ ■ ■ ■ ■ ■ ■ ■ ■ ■ ■ ■ ■ ■ ■ ■ ■ ■ ■ ■ ■ ■ ■ ■ 38
Domestic Relations Pending Cases in 6 States, 2007 ■ ■ ■ ■ ■ ■ 6
total Appearances in Domestic Relations Section 6 4 10 10 5 11 12 6 8 9 4 11 9 9 5 11 5 5 5 4 10 7 12 10 4 12 5 5 4 4 6 11 14 5 11 11 4 5 5 13 5 4 4 6 5 11 5 5 12 10 11 10
Note: States in Bold have a unified court system.

Examining the Work of State Courts: An Analysis of 2007 State Court CaseloadsAppendices60 Examining the Work of State Courts: An Analysis of 2007 State Court Caseloads
Appendices
index of States included in Section Graphics (continued) al AK aZ ar CA co CT De DC FL GA hi iD IL in IA KS KY la ME MD MA Mi MN MS MO Mt ne nV nh NJ NM ny nc ND oh oK or Pa PR RI Sc SD tn tX ut Vt Va Wa WV WI Wy total
Trial Courts
Criminal Caseloads
incoming Criminal Caseloads in State Courts, 1998-2007 ■ ■ ■ ■ ■ ■ ■ ■ ■ ■ ■ ■ ■ ■ ■ ■ ■ ■ ■ ■ ■ ■ ■ ■ ■ ■ ■ ■ ■ ■ ■ ■ ■ ■ ■ ■ ■ ■ ■ ■ ■ ■ ■ ■ ■ ■ ■ ■ ■ ■ ■ ■ 52
total incoming Cases in State Courts, by Jurisdiction, 2007 (in millions) ■ ■ ■ ■ ■ ■ ■ ■ ■ ■ ■ ■ ■ ■ ■ ■ ■ ■ ■ ■ ■ ■ ■ ■ ■ ■ ■ ■ ■ ■ ■ ■ ■ ■ ■ ■ ■ ■ ■ ■ ■ ■ ■ ■ ■ ■ ■ ■ ■ ■ ■ ■ 52
Criminal Composition Caseload in 13 States, 2007 ■ ■ ■ ■ ■ ■ ■ ■ ■ ■ ■ ■ ■ 13
incoming Criminal Caseloads and Rates in 17 States, 2007 ■ ■ ■ ■ ■ ■ ■ ■ ■ ■ ■ ■ ■ ■ ■ ■ ■ 17
Reopened/Reactivated Criminal Caseloads in 12 States, 2007 ■ ■ ■ ■ ■ ■ ■ ■ ■ ■ ■ ■ 12
incoming Felony Caseloads in General Jurisdiction Courts in 22 States, 1998-2007 ■ ■ ■ ■ ■ ■ ■ ■ ■ ■ ■ ■ ■ ■ ■ ■ ■ ■ ■ ■ ■ ■ 22
incoming Felony Caseloads in 28 General Jurisdiction Courts, 2007 ■ ■ ■ ■ ■ ■ ■ ■ ■ ■ ■ ■ ■ ■ ■ ■ ■ ■ ■ ■ ■ ■ ■ ■ ■ ■ ■ ■ 28
Estimated Felony Caseload Composition, 2007 ■ ■ ■ ■ ■ ■ ■ ■ ■ ■ ■ ■ ■ ■ ■ ■ ■ ■ ■ ■ ■ ■ ■ ■ ■ ■ ■ ■ ■ ■ ■ ■ ■ ■ ■ ■ ■ ■ ■ ■ ■ ■ ■ ■ ■ ■ ■ ■ ■ ■ ■ ■ 52
Felony Clearance Rates in Unified and General Jurisdiction Courts in 26 States, 2007 ■ ■ ■ ■ ■ ■ ■ ■ ■ ■ ■ ■ ■ ■ ■ ■ ■ ■ ■ ■ ■ ■ ■ ■ ■ ■ 26
incoming Misdemeanor Caseloads and Rates in Limited Jurisdiction Courts in 13 States, 1998-2007 ■ ■ ■ ■ ■ ■ ■ ■ ■ ■ ■ ■ ■ 13
Misdemeanor Clearance Rates in 12 States, 2007 ■ ■ ■ ■ ■ ■ ■ ■ ■ ■ ■ ■ 12
Criminal Caseload Distribution in the Utah District and Justice Courts, 2007 ■ 1
Felony Caseload Summary - Utah District Court, 2007 ■ 1
Felony Caseload Composition in the Utah District Court, 2007 ■ 1
Felony Caseload Composition, Utah District Court vs. National Estimate, 2007 ■ 1
total Appearances in Criminal Section 3 4 7 7 3 5 3 4 3 10 3 7 10 5 9 9 6 4 7 3 3 7 9 5 3 9 3 3 4 3 8 7 3 6 7 7 3 6 4 10 9 4 6 5 6 12 10 5 10 7 3 4
al AK aZ ar CA co CT De DC FL GA hi iD IL in IA KS KY la ME MD MA Mi MN MS MO Mt ne nV nh NJ NM ny nc ND oh oK or Pa PR RI Sc SD tn tX ut Vt Va Wa WV WI Wy total
Juvenile Caseloads
incoming Juvenile Caseloads in State Courts, 1998-2007 ■ ■ ■ ■ ■ ■ ■ ■ ■ ■ ■ ■ ■ ■ ■ ■ ■ ■ ■ ■ ■ ■ ■ ■ ■ ■ ■ ■ ■ ■ ■ ■ ■ ■ ■ ■ ■ ■ ■ ■ ■ ■ ■ ■ ■ ■ ■ ■ ■ ■ ■ ■ 52
total incoming Cases in State Courts, by Jurisdiction, 2007 (in millions) ■ ■ ■ ■ ■ ■ ■ ■ ■ ■ ■ ■ ■ ■ ■ ■ ■ ■ ■ ■ ■ ■ ■ ■ ■ ■ ■ ■ ■ ■ ■ ■ ■ ■ ■ ■ ■ ■ ■ ■ ■ ■ ■ ■ ■ ■ ■ ■ ■ ■ ■ ■ 52
incoming Juvenile Caseloads and Rates in 35 States, 2007 ■ ■ ■ ■ ■ ■ ■ ■ ■ ■ ■ ■ ■ ■ ■ ■ ■ ■ ■ ■ ■ ■ ■ ■ ■ ■ ■ ■ ■ ■ ■ ■ ■ ■ ■ 35
Juvenile Caseload Composition in 21 States, 2007 ■ ■ ■ ■ ■ ■ ■ ■ ■ ■ ■ ■ ■ ■ ■ ■ ■ ■ ■ ■ ■ 21
Juvenile Delinquency Clearance Rates in 20 States, 2007 ■ ■ ■ ■ ■ ■ ■ ■ ■ ■ ■ ■ ■ ■ ■ ■ ■ ■ ■ ■ 20
Juvenile Dependency Clearance Rates in 22 States, 2007 ■ ■ ■ ■ ■ ■ ■ ■ ■ ■ ■ ■ ■ ■ ■ ■ ■ ■ ■ ■ ■ ■ 22
Juvenile Status offense Clearance Rates in 13 States, 2007 ■ ■ ■ ■ ■ ■ ■ ■ ■ ■ ■ ■ ■ 13
Juvenile Caseload Composition in Kansas and Utah, 2007 ■ ■ 2
Juvenile Delinquency Caseload Composition in Kansas and Utah, 2007 ■ ■ 2
Juvenile Caseload Composition in Kansas, 2007 ■ 1
Juvenile Caseload Clearance Rates in Kansas, 2007 ■ 1
total Appearances in Juvenile Section 3 3 4 7 2 4 6 2 4 3 7 5 4 3 4 4 11 4 2 2 5 3 4 7 2 2 3 3 2 2 7 6 7 6 4 7 3 2 6 2 4 2 3 3 3 9 6 7 6 3 4 4
al AK aZ ar CA co CT De DC FL GA hi iD IL in IA KS KY la ME MD MA Mi MN MS MO Mt ne nV nh NJ NM ny nc ND oh oK or Pa PR RI Sc SD tn tX ut Vt Va Wa WV WI Wy total
Traffic/Violations Caseloads
incoming traffic/Violations Caseload in State Courts, 1998-2007 ■ ■ ■ ■ ■ ■ ■ ■ ■ ■ ■ ■ ■ ■ ■ ■ ■ ■ ■ ■ ■ ■ ■ ■ ■ ■ ■ ■ ■ ■ ■ ■ ■ ■ ■ ■ ■ ■ ■ ■ ■ ■ ■ ■ ■ ■ ■ ■ ■ ■ ■ ■ 52
total incoming Cases in State Courts, by Jurisdiction, 2007 (in millions) ■ ■ ■ ■ ■ ■ ■ ■ ■ ■ ■ ■ ■ ■ ■ ■ ■ ■ ■ ■ ■ ■ ■ ■ ■ ■ ■ ■ ■ ■ ■ ■ ■ ■ ■ ■ ■ ■ ■ ■ ■ ■ ■ ■ ■ ■ ■ ■ ■ ■ ■ ■ 52
incoming traffic/Violations Caseloads in 16 States, 2007 ■ ■ ■ ■ ■ ■ ■ ■ ■ ■ ■ ■ ■ ■ ■ ■ 16
traffic/Violations Clearance Rates in 15 States, 2007 ■ ■ ■ ■ ■ ■ ■ ■ ■ ■ ■ ■ ■ ■ ■ 15
traffic/Violations Composition in 3 States, 2007 ■ ■ ■ 3
Hawaii District Court total traffic/Violations Caseload Summary, 2007 ■ 1
total Appearances in traffic/Violations Section 2 4 5 3 2 2 2 2 2 4 2 6 2 5 4 4 2 4 2 2 2 2 4 2 2 2 2 2 2 2 4 2 2 2 2 2 2 2 2 4 2 2 4 2 2 4 4 4 2 2 2 2
Note: States in Bold have a unified court system.

Examining the Work of State Courts: An Analysis of 2007 State Court CaseloadsAppendices
Examining the Work of State Courts: An Analysis of 2007 State Court CaseloadsAppendices 61
index of States included in Section Graphics (continued) al AK aZ ar CA co CT De DC FL GA hi iD IL in IA KS KY la ME MD MA Mi MN MS MO Mt ne nV nh NJ NM ny nc ND oh oK or Pa PR RI Sc SD tn tX ut Vt Va Wa WV WI Wy total
Trial Courts
Criminal Caseloads
incoming Criminal Caseloads in State Courts, 1998-2007 ■ ■ ■ ■ ■ ■ ■ ■ ■ ■ ■ ■ ■ ■ ■ ■ ■ ■ ■ ■ ■ ■ ■ ■ ■ ■ ■ ■ ■ ■ ■ ■ ■ ■ ■ ■ ■ ■ ■ ■ ■ ■ ■ ■ ■ ■ ■ ■ ■ ■ ■ ■ 52
total incoming Cases in State Courts, by Jurisdiction, 2007 (in millions) ■ ■ ■ ■ ■ ■ ■ ■ ■ ■ ■ ■ ■ ■ ■ ■ ■ ■ ■ ■ ■ ■ ■ ■ ■ ■ ■ ■ ■ ■ ■ ■ ■ ■ ■ ■ ■ ■ ■ ■ ■ ■ ■ ■ ■ ■ ■ ■ ■ ■ ■ ■ 52
Criminal Composition Caseload in 13 States, 2007 ■ ■ ■ ■ ■ ■ ■ ■ ■ ■ ■ ■ ■ 13
incoming Criminal Caseloads and Rates in 17 States, 2007 ■ ■ ■ ■ ■ ■ ■ ■ ■ ■ ■ ■ ■ ■ ■ ■ ■ 17
Reopened/Reactivated Criminal Caseloads in 12 States, 2007 ■ ■ ■ ■ ■ ■ ■ ■ ■ ■ ■ ■ 12
incoming Felony Caseloads in General Jurisdiction Courts in 22 States, 1998-2007 ■ ■ ■ ■ ■ ■ ■ ■ ■ ■ ■ ■ ■ ■ ■ ■ ■ ■ ■ ■ ■ ■ 22
incoming Felony Caseloads in 28 General Jurisdiction Courts, 2007 ■ ■ ■ ■ ■ ■ ■ ■ ■ ■ ■ ■ ■ ■ ■ ■ ■ ■ ■ ■ ■ ■ ■ ■ ■ ■ ■ ■ 28
Estimated Felony Caseload Composition, 2007 ■ ■ ■ ■ ■ ■ ■ ■ ■ ■ ■ ■ ■ ■ ■ ■ ■ ■ ■ ■ ■ ■ ■ ■ ■ ■ ■ ■ ■ ■ ■ ■ ■ ■ ■ ■ ■ ■ ■ ■ ■ ■ ■ ■ ■ ■ ■ ■ ■ ■ ■ ■ 52
Felony Clearance Rates in Unified and General Jurisdiction Courts in 26 States, 2007 ■ ■ ■ ■ ■ ■ ■ ■ ■ ■ ■ ■ ■ ■ ■ ■ ■ ■ ■ ■ ■ ■ ■ ■ ■ ■ 26
incoming Misdemeanor Caseloads and Rates in Limited Jurisdiction Courts in 13 States, 1998-2007 ■ ■ ■ ■ ■ ■ ■ ■ ■ ■ ■ ■ ■ 13
Misdemeanor Clearance Rates in 12 States, 2007 ■ ■ ■ ■ ■ ■ ■ ■ ■ ■ ■ ■ 12
Criminal Caseload Distribution in the Utah District and Justice Courts, 2007 ■ 1
Felony Caseload Summary - Utah District Court, 2007 ■ 1
Felony Caseload Composition in the Utah District Court, 2007 ■ 1
Felony Caseload Composition, Utah District Court vs. National Estimate, 2007 ■ 1
total Appearances in Criminal Section 3 4 7 7 3 5 3 4 3 10 3 7 10 5 9 9 6 4 7 3 3 7 9 5 3 9 3 3 4 3 8 7 3 6 7 7 3 6 4 10 9 4 6 5 6 12 10 5 10 7 3 4
al AK aZ ar CA co CT De DC FL GA hi iD IL in IA KS KY la ME MD MA Mi MN MS MO Mt ne nV nh NJ NM ny nc ND oh oK or Pa PR RI Sc SD tn tX ut Vt Va Wa WV WI Wy total
Juvenile Caseloads
incoming Juvenile Caseloads in State Courts, 1998-2007 ■ ■ ■ ■ ■ ■ ■ ■ ■ ■ ■ ■ ■ ■ ■ ■ ■ ■ ■ ■ ■ ■ ■ ■ ■ ■ ■ ■ ■ ■ ■ ■ ■ ■ ■ ■ ■ ■ ■ ■ ■ ■ ■ ■ ■ ■ ■ ■ ■ ■ ■ ■ 52
total incoming Cases in State Courts, by Jurisdiction, 2007 (in millions) ■ ■ ■ ■ ■ ■ ■ ■ ■ ■ ■ ■ ■ ■ ■ ■ ■ ■ ■ ■ ■ ■ ■ ■ ■ ■ ■ ■ ■ ■ ■ ■ ■ ■ ■ ■ ■ ■ ■ ■ ■ ■ ■ ■ ■ ■ ■ ■ ■ ■ ■ ■ 52
incoming Juvenile Caseloads and Rates in 35 States, 2007 ■ ■ ■ ■ ■ ■ ■ ■ ■ ■ ■ ■ ■ ■ ■ ■ ■ ■ ■ ■ ■ ■ ■ ■ ■ ■ ■ ■ ■ ■ ■ ■ ■ ■ ■ 35
Juvenile Caseload Composition in 21 States, 2007 ■ ■ ■ ■ ■ ■ ■ ■ ■ ■ ■ ■ ■ ■ ■ ■ ■ ■ ■ ■ ■ 21
Juvenile Delinquency Clearance Rates in 20 States, 2007 ■ ■ ■ ■ ■ ■ ■ ■ ■ ■ ■ ■ ■ ■ ■ ■ ■ ■ ■ ■ 20
Juvenile Dependency Clearance Rates in 22 States, 2007 ■ ■ ■ ■ ■ ■ ■ ■ ■ ■ ■ ■ ■ ■ ■ ■ ■ ■ ■ ■ ■ ■ 22
Juvenile Status offense Clearance Rates in 13 States, 2007 ■ ■ ■ ■ ■ ■ ■ ■ ■ ■ ■ ■ ■ 13
Juvenile Caseload Composition in Kansas and Utah, 2007 ■ ■ 2
Juvenile Delinquency Caseload Composition in Kansas and Utah, 2007 ■ ■ 2
Juvenile Caseload Composition in Kansas, 2007 ■ 1
Juvenile Caseload Clearance Rates in Kansas, 2007 ■ 1
total Appearances in Juvenile Section 3 3 4 7 2 4 6 2 4 3 7 5 4 3 4 4 11 4 2 2 5 3 4 7 2 2 3 3 2 2 7 6 7 6 4 7 3 2 6 2 4 2 3 3 3 9 6 7 6 3 4 4
al AK aZ ar CA co CT De DC FL GA hi iD IL in IA KS KY la ME MD MA Mi MN MS MO Mt ne nV nh NJ NM ny nc ND oh oK or Pa PR RI Sc SD tn tX ut Vt Va Wa WV WI Wy total
Traffic/Violations Caseloads
incoming traffic/Violations Caseload in State Courts, 1998-2007 ■ ■ ■ ■ ■ ■ ■ ■ ■ ■ ■ ■ ■ ■ ■ ■ ■ ■ ■ ■ ■ ■ ■ ■ ■ ■ ■ ■ ■ ■ ■ ■ ■ ■ ■ ■ ■ ■ ■ ■ ■ ■ ■ ■ ■ ■ ■ ■ ■ ■ ■ ■ 52
total incoming Cases in State Courts, by Jurisdiction, 2007 (in millions) ■ ■ ■ ■ ■ ■ ■ ■ ■ ■ ■ ■ ■ ■ ■ ■ ■ ■ ■ ■ ■ ■ ■ ■ ■ ■ ■ ■ ■ ■ ■ ■ ■ ■ ■ ■ ■ ■ ■ ■ ■ ■ ■ ■ ■ ■ ■ ■ ■ ■ ■ ■ 52
incoming traffic/Violations Caseloads in 16 States, 2007 ■ ■ ■ ■ ■ ■ ■ ■ ■ ■ ■ ■ ■ ■ ■ ■ 16
traffic/Violations Clearance Rates in 15 States, 2007 ■ ■ ■ ■ ■ ■ ■ ■ ■ ■ ■ ■ ■ ■ ■ 15
traffic/Violations Composition in 3 States, 2007 ■ ■ ■ 3
Hawaii District Court total traffic/Violations Caseload Summary, 2007 ■ 1
total Appearances in traffic/Violations Section 2 4 5 3 2 2 2 2 2 4 2 6 2 5 4 4 2 4 2 2 2 2 4 2 2 2 2 2 2 2 4 2 2 2 2 2 2 2 2 4 2 2 4 2 2 4 4 4 2 2 2 2
Note: States in Bold have a unified court system.
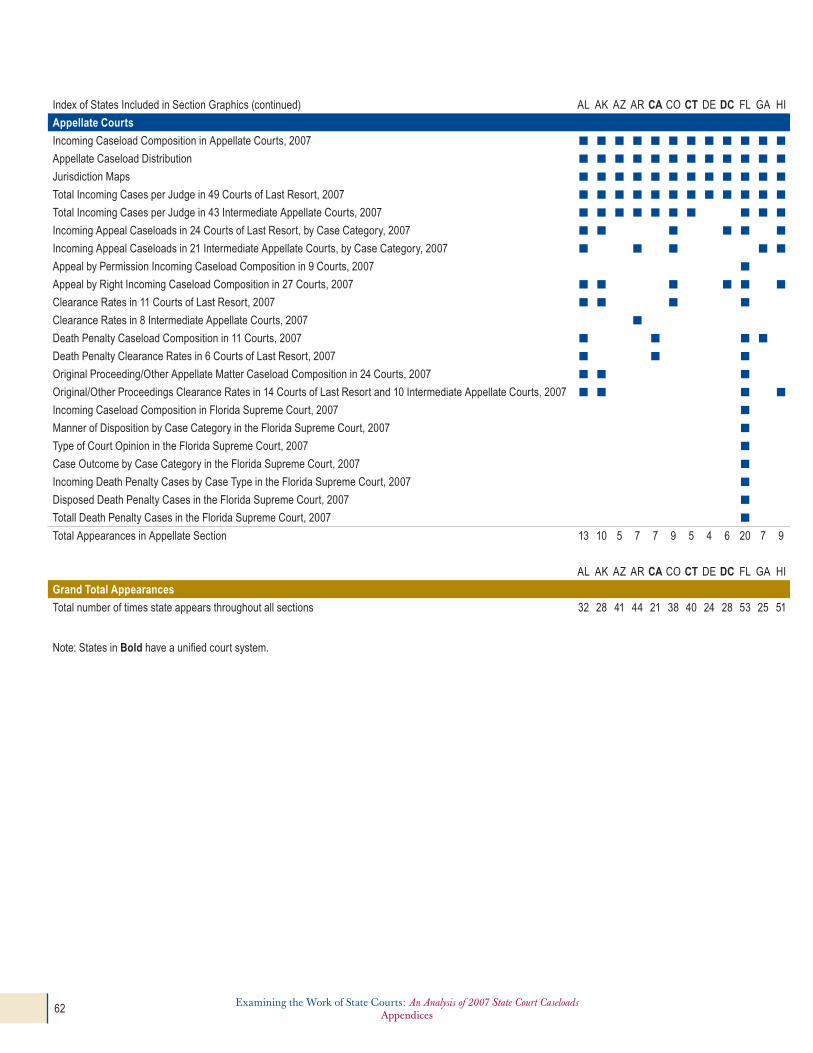
Examining the Work of State Courts: An Analysis of 2007 State Court CaseloadsAppendices62 Examining the Work of State Courts: An Analysis of 2007 State Court Caseloads
Appendices
index of States included in Section Graphics (continued) al AK aZ ar CA co CT De DC FL GA hi iD IL in IA KS KY la ME MD MA Mi MN MS MO Mt ne nV nh NJ NM ny nc ND oh oK or Pa PR RI Sc SD tn tX ut Vt Va Wa WV WI Wy total
Appellate Courts
incoming Caseload Composition in Appellate Courts, 2007 ■ ■ ■ ■ ■ ■ ■ ■ ■ ■ ■ ■ ■ ■ ■ ■ ■ ■ ■ ■ ■ ■ ■ ■ ■ ■ ■ ■ ■ ■ ■ ■ ■ ■ ■ ■ ■ ■ ■ ■ ■ ■ ■ ■ ■ ■ ■ ■ ■ ■ ■ ■ 52
Appellate Caseload Distribution ■ ■ ■ ■ ■ ■ ■ ■ ■ ■ ■ ■ ■ ■ ■ ■ ■ ■ ■ ■ ■ ■ ■ ■ ■ ■ ■ ■ ■ ■ ■ ■ ■ ■ ■ ■ ■ ■ ■ ■ ■ ■ ■ ■ ■ ■ ■ ■ ■ ■ ■ ■ 52
Jurisdiction Maps ■ ■ ■ ■ ■ ■ ■ ■ ■ ■ ■ ■ ■ ■ ■ ■ ■ ■ ■ ■ ■ ■ ■ ■ ■ ■ ■ ■ ■ ■ ■ ■ ■ ■ ■ ■ ■ ■ ■ ■ ■ ■ ■ ■ ■ ■ ■ ■ ■ ■ ■ ■ 52
total incoming Cases per Judge in 49 Courts of Last Resort, 2007 ■ ■ ■ ■ ■ ■ ■ ■ ■ ■ ■ ■ ■ ■ ■ ■ ■ ■ ■ ■ ■ ■ ■ ■ ■ ■ ■ ■ ■ ■ ■ ■ ■ ■ ■ ■ ■ ■ ■ ■ ■ ■ ■ ■ ■ ■ ■ ■ 48
total incoming Cases per Judge in 43 intermediate Appellate Courts, 2007 ■ ■ ■ ■ ■ ■ ■ ■ ■ ■ ■ ■ ■ ■ ■ ■ ■ ■ ■ ■ ■ ■ ■ ■ ■ ■ ■ ■ ■ ■ ■ ■ ■ ■ ■ ■ ■ ■ 38
incoming Appeal Caseloads in 24 Courts of Last Resort, by Case Category, 2007 ■ ■ ■ ■ ■ ■ ■ ■ ■ ■ ■ ■ ■ ■ ■ ■ ■ ■ ■ ■ ■ ■ ■ ■ 24
incoming Appeal Caseloads in 21 intermediate Appellate Courts, by Case Category, 2007 ■ ■ ■ ■ ■ ■ ■ ■ ■ ■ ■ ■ ■ ■ ■ ■ ■ ■ ■ 19
Appeal by Permission incoming Caseload Composition in 9 Courts, 2007 ■ ■ ■ ■ ■ ■ ■ ■ 8
Appeal by Right incoming Caseload Composition in 27 Courts, 2007 ■ ■ ■ ■ ■ ■ ■ ■ ■ ■ ■ ■ ■ ■ ■ ■ ■ ■ ■ ■ ■ 21
Clearance Rates in 11 Courts of Last Resort, 2007 ■ ■ ■ ■ ■ ■ ■ ■ ■ ■ ■ 11
Clearance Rates in 8 intermediate Appellate Courts, 2007 ■ ■ ■ ■ ■ ■ ■ 7
Death Penalty Caseload Composition in 11 Courts, 2007 ■ ■ ■ ■ ■ ■ ■ ■ ■ 9
Death Penalty Clearance Rates in 6 Courts of Last Resort, 2007 ■ ■ ■ ■ ■ ■ 6
original Proceeding/other Appellate Matter Caseload Composition in 24 Courts, 2007 ■ ■ ■ ■ ■ ■ ■ ■ ■ ■ ■ ■ ■ ■ ■ ■ ■ ■ ■ ■ 20
original/other Proceedings Clearance Rates in 14 Courts of Last Resort and 10 intermediate Appellate Courts, 2007 ■ ■ ■ ■ ■ ■ ■ ■ ■ ■ ■ ■ ■ ■ ■ ■ ■ ■ ■ ■ 20
incoming Caseload Composition in Florida Supreme Court, 2007 ■ 1
Manner of Disposition by Case Category in the Florida Supreme Court, 2007 ■ 1
type of Court opinion in the Florida Supreme Court, 2007 ■ 1
Case outcome by Case Category in the Florida Supreme Court, 2007 ■ 1
incoming Death Penalty Cases by Case type in the Florida Supreme Court, 2007 ■ 1
Disposed Death Penalty Cases in the Florida Supreme Court, 2007 ■ 1
totall Death Penalty Cases in the Florida Supreme Court, 2007 ■ 1
total Appearances in Appellate Section 13 10 5 7 7 9 5 4 6 20 7 9 11 7 7 7 6 10 5 5 5 8 10 10 4 8 4 6 3 3 4 8 8 5 9 7 4 8 8 13 9 6 4 15 11 7 5 11 6 7 9 9
al AK aZ ar CA co CT De DC FL GA hi iD IL in IA KS KY la ME MD MA Mi MN MS MO Mt ne nV nh NJ NM ny nc ND oh oK or Pa PR RI Sc SD tn tX ut Vt Va Wa WV WI Wy
Grand Total Appearances
total number of times state appears throughout all sections 32 28 41 44 21 38 40 24 28 53 25 51 42 34 35 45 45 36 23 22 28 33 47 45 22 47 21 23 19 16 43 40 42 29 47 42 21 30 27 49 34 23 24 39 33 58 38 34 48 37 41 37
Note: States in Bold have a unified court system.

Examining the Work of State Courts: An Analysis of 2007 State Court CaseloadsAppendices
Examining the Work of State Courts: An Analysis of 2007 State Court CaseloadsAppendices 63
index of States included in Section Graphics (continued) al AK aZ ar CA co CT De DC FL GA hi iD IL in IA KS KY la ME MD MA Mi MN MS MO Mt ne nV nh NJ NM ny nc ND oh oK or Pa PR RI Sc SD tn tX ut Vt Va Wa WV WI Wy total
Appellate Courts
incoming Caseload Composition in Appellate Courts, 2007 ■ ■ ■ ■ ■ ■ ■ ■ ■ ■ ■ ■ ■ ■ ■ ■ ■ ■ ■ ■ ■ ■ ■ ■ ■ ■ ■ ■ ■ ■ ■ ■ ■ ■ ■ ■ ■ ■ ■ ■ ■ ■ ■ ■ ■ ■ ■ ■ ■ ■ ■ ■ 52
Appellate Caseload Distribution ■ ■ ■ ■ ■ ■ ■ ■ ■ ■ ■ ■ ■ ■ ■ ■ ■ ■ ■ ■ ■ ■ ■ ■ ■ ■ ■ ■ ■ ■ ■ ■ ■ ■ ■ ■ ■ ■ ■ ■ ■ ■ ■ ■ ■ ■ ■ ■ ■ ■ ■ ■ 52
Jurisdiction Maps ■ ■ ■ ■ ■ ■ ■ ■ ■ ■ ■ ■ ■ ■ ■ ■ ■ ■ ■ ■ ■ ■ ■ ■ ■ ■ ■ ■ ■ ■ ■ ■ ■ ■ ■ ■ ■ ■ ■ ■ ■ ■ ■ ■ ■ ■ ■ ■ ■ ■ ■ ■ 52
total incoming Cases per Judge in 49 Courts of Last Resort, 2007 ■ ■ ■ ■ ■ ■ ■ ■ ■ ■ ■ ■ ■ ■ ■ ■ ■ ■ ■ ■ ■ ■ ■ ■ ■ ■ ■ ■ ■ ■ ■ ■ ■ ■ ■ ■ ■ ■ ■ ■ ■ ■ ■ ■ ■ ■ ■ ■ 48
total incoming Cases per Judge in 43 intermediate Appellate Courts, 2007 ■ ■ ■ ■ ■ ■ ■ ■ ■ ■ ■ ■ ■ ■ ■ ■ ■ ■ ■ ■ ■ ■ ■ ■ ■ ■ ■ ■ ■ ■ ■ ■ ■ ■ ■ ■ ■ ■ 38
incoming Appeal Caseloads in 24 Courts of Last Resort, by Case Category, 2007 ■ ■ ■ ■ ■ ■ ■ ■ ■ ■ ■ ■ ■ ■ ■ ■ ■ ■ ■ ■ ■ ■ ■ ■ 24
incoming Appeal Caseloads in 21 intermediate Appellate Courts, by Case Category, 2007 ■ ■ ■ ■ ■ ■ ■ ■ ■ ■ ■ ■ ■ ■ ■ ■ ■ ■ ■ 19
Appeal by Permission incoming Caseload Composition in 9 Courts, 2007 ■ ■ ■ ■ ■ ■ ■ ■ 8
Appeal by Right incoming Caseload Composition in 27 Courts, 2007 ■ ■ ■ ■ ■ ■ ■ ■ ■ ■ ■ ■ ■ ■ ■ ■ ■ ■ ■ ■ ■ 21
Clearance Rates in 11 Courts of Last Resort, 2007 ■ ■ ■ ■ ■ ■ ■ ■ ■ ■ ■ 11
Clearance Rates in 8 intermediate Appellate Courts, 2007 ■ ■ ■ ■ ■ ■ ■ 7
Death Penalty Caseload Composition in 11 Courts, 2007 ■ ■ ■ ■ ■ ■ ■ ■ ■ 9
Death Penalty Clearance Rates in 6 Courts of Last Resort, 2007 ■ ■ ■ ■ ■ ■ 6
original Proceeding/other Appellate Matter Caseload Composition in 24 Courts, 2007 ■ ■ ■ ■ ■ ■ ■ ■ ■ ■ ■ ■ ■ ■ ■ ■ ■ ■ ■ ■ 20
original/other Proceedings Clearance Rates in 14 Courts of Last Resort and 10 intermediate Appellate Courts, 2007 ■ ■ ■ ■ ■ ■ ■ ■ ■ ■ ■ ■ ■ ■ ■ ■ ■ ■ ■ ■ 20
incoming Caseload Composition in Florida Supreme Court, 2007 ■ 1
Manner of Disposition by Case Category in the Florida Supreme Court, 2007 ■ 1
type of Court opinion in the Florida Supreme Court, 2007 ■ 1
Case outcome by Case Category in the Florida Supreme Court, 2007 ■ 1
incoming Death Penalty Cases by Case type in the Florida Supreme Court, 2007 ■ 1
Disposed Death Penalty Cases in the Florida Supreme Court, 2007 ■ 1
totall Death Penalty Cases in the Florida Supreme Court, 2007 ■ 1
total Appearances in Appellate Section 13 10 5 7 7 9 5 4 6 20 7 9 11 7 7 7 6 10 5 5 5 8 10 10 4 8 4 6 3 3 4 8 8 5 9 7 4 8 8 13 9 6 4 15 11 7 5 11 6 7 9 9
al AK aZ ar CA co CT De DC FL GA hi iD IL in IA KS KY la ME MD MA Mi MN MS MO Mt ne nV nh NJ NM ny nc ND oh oK or Pa PR RI Sc SD tn tX ut Vt Va Wa WV WI Wy
Grand Total Appearances
total number of times state appears throughout all sections 32 28 41 44 21 38 40 24 28 53 25 51 42 34 35 45 45 36 23 22 28 33 47 45 22 47 21 23 19 16 43 40 42 29 47 42 21 30 27 49 34 23 24 39 33 58 38 34 48 37 41 37
Note: States in Bold have a unified court system.

Court Statistics Project Methodology
Examining the Work of State Courts: An Analysis of 2007 State Court CaseloadsAppendices64 Examining the Work of State Courts: An Analysis of 2007 State Court Caseloads
Appendices
Information for the CSP's national caseload databases comes from published and unpublished sources supplied by state court administrators and appellate court clerks. Published data are typically taken from official state court annual reports and Web sites. Data from published sources are often supplemented by unpublished data received from the state courts in many formats, including internal management reports and computer-generated output. States report and verify data electronically through spreadsheet templates provided by the Court Statistics Project.
The CSP data collection effort to build a comprehensive statistical profile of the work of state appellate and trial courts nationally is underway throughout the year. Extensive telephone contacts and follow-up correspondence are used to collect missing data, confirm the accuracy of available data, and verify the legal jurisdiction of each court. Information is also collected on the number of judges per court or court system (from annual reports, offices of state court administrators, and appellate court clerks); the state population (based on U.S. Bureau of the Census revised estimates); and special characteristics regarding subject matter jurisdiction and court structure.
Examining the Work of State Courts is intended to enhance the potential for meaningful state court caseload comparisons. Because this volume examines 50 states, the District of Columbia, and the Commonwealth of Puerto Rico (and thus 52 different court systems) the biggest challenge is to organize the data for valid state-to-state comparison among states and over time.
The Court Statistics Project can provide advice and clarification on the use of the statistics from this and previous reports. Project staff can also provide the full range of information available from each state. Most states provide far more detailed caseload information than can be presented in project publications. Information from the CSP is also available on the NCSC Web site at: www.courtstatistics.org.
Comments, corrections, suggestions, and requests for information from readers of Examining the Work of State Courts, State Court Caseload Statistics, and the Caseload Highlights series are invited; please submit on the form on the CSP Web page at: www.courtstatistics.org.

State Court Caseload Statistics
Examining the Work of State Courts: An Analysis of 2007 State Court CaseloadsAppendices
Examining the Work of State Courts: An Analysis of 2007 State Court CaseloadsAppendices 65
The analysis presented in Examining the Work of State Courts is derived in part from the data found in State Court Caseload Statistics. State Court Caseload Statistics is published exclusively online at the Court Statistics Project’s Web site: www.courtstatistics.org. This Web-based format allows users to take advantage of improved functionality and make possible electronic access to the data.
The information and tables found in State Court Caseload Statistics are intended to serve as a detailed reference on the work of the nation's state courts, and are organized in the following manner:
State Court Structure Charts display the overall structure of each state court system on a one-page chart. Each state's chart identifies all the courts in operation in that state during 2006, describes their geographic and subject matter jurisdiction, notes the number of authorized judicial positions, indicates whether funding is primarily local or state, outlines the routes of appeal between courts, and provides links to each court with its own Web site.
Jurisdiction and State Court Reporting Practices review basic information that affects the comparability of caseload information reports by the courts. Information is also provided that defines what constitutes a case in each court, making it possible to determine which appellate and trial courts compile caseload statistics on a similar basis. Finally, the numbers of judges and justices working in state trial and appellate courts are displayed.
State Court Caseload Tables contain detailed information from the nation's state courts. Six tables detail information on appellate courts, and an additional six tables contain data on trial courts. Other tables describe trends in the volume of incoming and outgoing cases for the period 1997-2006. The tables also indicate the extent of standardization in the data for each state and the comparability of caseload information across the states.

National Center for State Courts
Examining the Work of State Courts: An Analysis of 2007 State Court CaseloadsAppendices66
WILLIAMSBURG, VA300 Newport AvenueWilliamsburg, VA 23185-4747
DENVER, CO707 Seventeenth Street, Suite 2900Denver, Co 80202-3429
ARLINGTON, VA 2425 Wilson Boulevard, Suite 350Arlington, VA 22201
Association Services 800.616.6165
Consulting 800.466.3063
Education 800.616.6206
Government Relations 800.532.0204
Information 800.616.6164
International Programs 800.797.2545
Publications888.228.6272
Research 800.616.6109
Technology888.846.6746
The National Center for State Courts is an independent, nonprofit, tax-exempt organization in accordance with Section 501(c)(3) of the Internal Revenue code. To find out about supporting the work and mission of the National Center, contact the National Center’s Development Office by phone at 800.616.6110 or by email at: [email protected]
reSearch DiViSion 800.616.6109
www.courtstatistics.org
Court Statistics ProjectSince 1975, the Court Statistics Project has provided a comprehensive analysis of the work of state courts by gathering caseload data and creating meaningful comparisons for identifying trends, comparing caseloads, and highlighting policy issues.
© Copyright 2009National Center for State CourtsISBN 0-89656-271-9
A joint project of the Conference of State Court Administrators, the Bureau of Justice Statistics, and the National Center for State Courts.
Related Documents