University of Louisville University of Louisville ThinkIR: The University of Louisville's Institutional Repository ThinkIR: The University of Louisville's Institutional Repository Electronic Theses and Dissertations 5-2015 Examining the perceptions of first-year STEM students on Examining the perceptions of first-year STEM students on retention factors at the University of the West Indies. retention factors at the University of the West Indies. Joy A. Harewood Cox University of Louisville Follow this and additional works at: https://ir.library.louisville.edu/etd Part of the Counseling Commons Recommended Citation Recommended Citation Harewood Cox, Joy A., "Examining the perceptions of first-year STEM students on retention factors at the University of the West Indies." (2015). Electronic Theses and Dissertations. Paper 2087. https://doi.org/10.18297/etd/2087 This Doctoral Dissertation is brought to you for free and open access by ThinkIR: The University of Louisville's Institutional Repository. It has been accepted for inclusion in Electronic Theses and Dissertations by an authorized administrator of ThinkIR: The University of Louisville's Institutional Repository. This title appears here courtesy of the author, who has retained all other copyrights. For more information, please contact [email protected].

Welcome message from author
This document is posted to help you gain knowledge. Please leave a comment to let me know what you think about it! Share it to your friends and learn new things together.
Transcript
University of Louisville University of Louisville
ThinkIR: The University of Louisville's Institutional Repository ThinkIR: The University of Louisville's Institutional Repository
Electronic Theses and Dissertations
5-2015
Examining the perceptions of first-year STEM students on Examining the perceptions of first-year STEM students on
retention factors at the University of the West Indies. retention factors at the University of the West Indies.
Joy A. Harewood Cox University of Louisville
Follow this and additional works at: https://ir.library.louisville.edu/etd
Part of the Counseling Commons
Recommended Citation Recommended Citation Harewood Cox, Joy A., "Examining the perceptions of first-year STEM students on retention factors at the University of the West Indies." (2015). Electronic Theses and Dissertations. Paper 2087. https://doi.org/10.18297/etd/2087
This Doctoral Dissertation is brought to you for free and open access by ThinkIR: The University of Louisville's Institutional Repository. It has been accepted for inclusion in Electronic Theses and Dissertations by an authorized administrator of ThinkIR: The University of Louisville's Institutional Repository. This title appears here courtesy of the author, who has retained all other copyrights. For more information, please contact [email protected].
EXAMINING THE PERCEPTIONS OF FIRST-YEAR STEM STUDENTS ON
RETENTION FACTORS AT THE UNIVERSITY OF THE WEST INDIES
By
Joy A. Harewood Cox
B.Sc., University of the West Indies, Cave Hill, Barbados, 1985
M.B.A. Education Management, University of Leicester, UK, 2002
M.Ed., University of Louisville, KY, U.S.A., 2008
A Dissertation
Submitted to the Faculty of the
College of Education and Human Development of the University of Louisville
in Partial Fulfillment of the Requirements
for the Degree of
Doctor of Philosophy
in
Counseling and Personnel Services
Department of Educational and Counseling Psychology
University of Louisville
Louisville, KY
May, 2015

Copyright 2015 by Joy A. Cox
All rights reserved

ii
EXAMINING THE PERCEPTIONS OF FIRST-YEAR STEM STUDENTS ON
RETENTION FACTORS AT THE UNIVERSITY OF THE WEST INDIES
By
Joy A. Harewood Cox
B.Sc., University of the West Indies, Cave Hill, Barbados, 1985
M.B.A. Education Management, University of Leicester, UK, 2002
M.Ed., University of Louisville, KY, U.S.A., 2008
A Dissertation Approved on
April 1, 2015
by the following Dissertation Committee
_______________________________________
Dissertation Chair, Amy S. Hirschy, Ph.D.
_________________________________________
Second Committee Member, Michael J. Cuyjet, Ed.D.
_________________________________________
Third Committee Member, Jacob Gross, Ph.D.
___________________________________________
Fourth Committee Member, Bridgette O. Pregliasco, Ed.D.
iii
DEDICATION
This dissertation is dedicated to my parents Mr. Eustace Leroy Harewood and
Mrs. Norma Esther Harewood (deceased), who are responsible for making me the
individual I am today; my brothers, Junior, Noel, and Tony, and their families, to Edgar,
and to my two beautiful daughters Maisha Makeda Cox and Shanika Akilah Cox, true
blessings in my life. You all stood by me and encouraged me to keep going when things
got really stressful.
iv
ACKNOWLEDGEMENTS
I would like to thank Dr. Amy Hirschy for accepting the responsibility of my
dissertation chair and my advisor. Dr. Hirschy has worked feverishly to help me complete
the dissertation in less than a year. I am also grateful to Dr. Michael Cuyjet for
introducing me to the idea of attempting an international Caribbean study and introducing
me to folks who later became instrumental in assisting me in conducting this dissertation.
Thanks for the opportunity to be your teaching assistant for the International Service
Learning class. Through this experience I was able to travel to Trinidad and Tobago and
meet wonderful people who later became my resources. Even after retiring, Dr. Cuyjet
was still amendable to serving on my dissertation committee. Thanks Dr. Bridgette
Pregliasco and Dr. Jacob Gross for participating as a member of my dissertation
committee, providing feedback and guidance to modify my drafts and reflect on my
work.
I am very thankful to the National Academic Advising Association (NACADA)
for providing me with a travel grant to fund my trip to Barbados and Trinidad to collect
the data, making this dream a reality. Special thanks to Dr. Jason Osborne for showing
me how to have fun with Statistics! I learned a great deal about best practices in Statistics
from him which I will be able to use in future research. Thank you Dr. Tia Dumas for
being my mentor and organizing Sunday evening writing sessions for your previous
doctoral classmates, helping us stay on track through the dissertation writing process.
v
I would also like to thank Ms. Dale Lynch and Dr. Deirdre Charles, the Directors
of Student Services at the University of the West Indies: Cave Hill campus, Barbados and
St. Augustine campus, Trinidad respectively. Ms. Lynch has become a great friend,
resource, and supporter. She requested permission from the faculty to allow me to pilot
my questionnaire in a first year experience class. She also went above and beyond to
make sure that my IRB submission was received and reviewed in a timely manner,
contacted the School Deans on my behalf, and assisted me in determining class schedules
for faculty. Also, I am grateful to the Deans and faculty of the Schools of Science and
Technology and Medical Sciences at UWI, Cave Hill for allowing me to distribute the
surveys during class periods.
Dr. Charles has also been a great friend, organizing my living arrangements
during my visit to Trinidad. She also offered the services of her staff member, Miss.
Derrick in collecting the data. Miss Derrick was instrumental in creating ways to
distribute the questionnaires to math, science, and engineering first year majors during
classes and in their halls and dormitories, as well as organizing transportation to
distribute and collect the surveys at the medical school.
I am grateful to Dean Nassim, Dean Haub, and Dr. Wyandotte, Associate Vice
Chancellor for Academic Affairs at Indiana University Southeast for allowing me to work
part time as an academic advisor. I would also like to thank the faculty, academic
advisors, and staff at Indiana University Southeast for believing in me and offering me
words of encouragement and support. Particular mention goes out to Lavenia, Becky and
Paula in the Natural Sciences office as well as advisors Jessica, Valeria, Shane, Sarah,
Greg, and Dana. Thank you all!

vi
ABSTRACT
EXAMINING THE PERCEPTIONS OF FIRST-YEAR STEM STUDENTS ON
RETENTION FACTORS AT THE UNIVERSITY OF THE WEST INDIES
Joy A. Harewood Cox
April 1, 2015
The study explored the relationships between student attributes and institutional
experiences associated with re-enrollment status in first-year Caribbean students enrolled
in science, technology, engineering, and mathematics (STEM) fields. The research was
conducted during student’s first semester at two campuses of the premier Caribbean
university. The nature of academic advising and student’s satisfaction with the advising
process, a program perceived in the literature as contributing to student’s persistence and
retention, was also explored. This study tested the relevance of Tinto’s (1993)
Longitudinal Model of Institutional Departure to the Caribbean tertiary level education
system. The study adopted a survey research design and binary logistic regression
analysis was used to determine the effects of the independent variables on re-enrollment.
The predictor variables included the campus that the student attended as well as student
attributes (sex, race/ethnicity, secondary school academic achievement, degree aspiration,
parental education, residency status, and financial concerns). Additionally, the
institutional experiences predictor variables comprised student interaction with faculty,
faculty concern for students, academic and intellectual development, institutional and
vii
goal commitments, and peer-group interaction as measured by the Institutional
Integration Scale (Pascarella & Terenzini, 1980). The binary outcome variable was
students ‘intent to re-enroll’ in the university in the second semester.
The results indicated that the chances of a first-year student re-enrolling at the
Cave Hill campus were greater than the chances of a student re-enrolling at the St.
Augustine campus. The significant predictors of re-enrollment status for the second
semester were secondary school science and math GPA, parental education, and student’s
institutional and goal commitments. Student’s secondary school science and math GPA
increases the chances that a student re-enrolls increase. On the other hand, as parental
education increases, the probability that a student re-enrolls decreases. Furthermore,
student’s institutional and goal commitments are shown to increase the likelihood that a
student re-enrolls. The nature of academic advising at both campuses was measured using
the Academic Advising Inventory (Winston & Sandor, 2002). The outcomes deemed that
the faculty advising approaches at both campuses were more related to prescriptive
learning for personalizing education items but developmental advising-teaching for items
describing academic decision-making and selecting courses. Students seemed to be
dissatisfied with the overall academic advising process. Implications for practice and
future research were also considered.
viii
TABLE OF CONTENTS
PAGE
DEDICATION
iii
ACKNOWLEDGEMENTS
iv
ABSTRACT
vi
CHAPTER 1: INTRODUCTION 1
Rationale for Study 2
Tertiary Education in the Anglophone Caribbean 4
The Research Setting 6
The St. Augustine Campus 10
The Cave Hill Campus 11
Comparison of the St. Augustine and Cave Hill
Campuses
12
First Year Student Retention 12
Problem Statement 14
Conceptual Framework 18
Purpose Statement 21
Research Questions 21
Definition of Terms 22
Overview 27
ix
CHAPTER 2: LITERATURE REVIEW 28
Conceptual Framework 29
Caribbean Culture Identity 29
Tinto’s Model of Institutional Departure 31
Student Attributes and Student Retention 35
Student Background Characteristics 35
Student Enrollment Factors 39
Institutional Experiences 41
Academic System and Student Retention 41
Faculty Interactions and Concern for Student
Development
42
Academic and Intellectual Development 43
Developmental versus Prescriptive Academic
Advising
44
Social System and Student Retention 48
Commitments and Student Retention 49
Chapter Summary 50
CHAPTER 3: METHODOLOGY 51
Research Design 53
Context: The University of the West Indies 54
Population and Sample 55
Variables and Instrument 56
Description of Survey 62
x
Instrument Reliability and Validity 66
Procedures and Data Collection 67
Data Analysis 70
Role of Researcher 76
Study Limitations 77
CHAPTER 4: RESULTS 81
Data Cleaning and Assumptions 83
Testing for Linearity on the Logit 84
Testing for Multicollinearity 84
Testing for Independence of Errors 85
Descriptive Statistics 85
Psychometric Properties of the Instrument 91
Binary Logistic Regression Analysis 93
Campus versus Re-Enrollment Status 93
Student Attributes versus Re-Enrollment Status
94
Institutional Experiences versus Re-Enrollment Status
97
Academic Advising Analysis 101
Academic Advising on a Developmental-Prescriptive
Continuum
102
Student Satisfaction with Academic Advising 105
Summary of Results 107
CHAPTER 5: DISCUSSION 108
Campus and Re-Enrollment Status 108
xi
Student Attributes and Re-Enrollment Status
109
Institutional Experiences and Re-Enrollment Status
114
The Nature of and Satisfaction with Academic Advising 116
Implications of the Study 117
Recommendations for Future Research 123
Conclusions 125
REFERENCES 128
APPENDICES 144
CURRICULUM VITAE 172

xii
LISTS OF TABLES
TABLE PAGE
1: Demographic Profiles of Barbados versus Trinidad and Tobago
(2013)
9
2: Prescriptive Learning versus Developmental Advising-Teaching 46
3: Statistics of Undergraduate STEM Students at the two UWI
Campuses during the 2013-2014 Academic Year
55
4: Description, Coding, and Recoding of Study Variables 57
5: Description and Coding of Study Variables 58
6: Statistical Analyses Used in The Study 71
7: Dummy Coding for the Race Categorical Variable 73
8: Scoring the AAI: Recoding the Items 75
9: Scoring the AAI: Interpreting the Scores 76
10: Comparison of Sex and Race Statistics in the Population (Pop)
versus the Sample
87
11: Frequencies (%), Means (M), and Standard Deviations (SD) of
Student Attributes of First-Year STEM Students at UWI: St.
Augustine and Cave Hill Campuses
89
12: Testing for Reliability Using Cronbach’s Alpha Analysis 92
xiii
13: Predictors of Campus Variable on STEM Students’ Re-enrollment at
UWI
94
14: Predictors of Student Attributes on STEM Students’ Re-enrollment
at UWI
97
15: Frequencies (%), Means (M), and Standard Deviations (SD) of
Institutional Integration Scale (IIS) of First-Year STEM Students at
UWI: St. Augustine and Cave Hill Campuses
99
16: Predictors of Academic and Social Integration Factors on Student
Re-enrollment at UWI
101
17: Means and Standard Deviations (SD) of the Developmental-
Prescriptive Advising Scale of First-Year STEM Students at UWI:
St. Augustine and Cave Hill Campuses
103
18: Developmental-Prescriptive Advising Scores for First-Year STEM
Students at UWI
104
19: Means and Standard Deviations (SD) of Student Satisfaction with
Academic Advising of First Year STEM Students at UWI: St.
Augustine and Cave Hill Campuses
106
20: Summary of Results 107
xiv
LIST OF FIGURES
FIGURE PAGE
1: Conceptual Model for First Year STEM Caribbean Students’
Institutional Departure
20
2: Tinto’s Longitudinal Model of Institutional Departure (1993) 33
3: Amended Conceptual Model for First Year STEM Caribbean
Students’ Institutional Departure
82
1
CHAPTER 1
INTRODUCTION
Retention, persistence, and student success are pressing issues at many
universities globally. Student participation in higher education institutions is expanding
considerably in the United Kingdom and there is a dynamic movement towards increased
student access and increased student involvement in Australia. These events generate
intense interest and activities intending to improve retention rates of undergraduate
students in colleges and universities (Yorke & Longden, 2004). In higher education in the
United States (U.S.), retention and student success rates have been important (particularly
as state performance indicators) and have created a long-standing challenge to colleges
and universities (Braxton, 2006; Yorke & Longden, 2004).
According to the Organization for Economic Co-operation and Development
(OECD, 2014), only 39% of young adults between the ages of 25 and 34 have completed
tertiary education worldwide. At the University of the West Indies (UWI), the premier
University in the Caribbean, Paterson and Gordon (2010) conducted a study on full-time,
first degree entrants, and found that the six-year graduation or throughput rate (2001-
2007) ranged from 68.5% in Pure and Applied Sciences to 94.5% in Education. This rate
appears higher than in the U.S. where 59% of all undergraduates who began their studies
in a four-year university in the 2005-2006 academic year graduated with a bachelor’s
degree within six years (National Center for Educational Statistics [NCES], 2014). In
spite of this positivity, the UWI attrition rates, explained by student voluntary
2
withdrawal, have been increasing over the last decade, and this trend is cause for concern
(Paterson & Gordon, 2010; Tewarie, 2010a). When students withdraw from a university
it not only has a personal impact on the individual but it affects the institution and has
financial consequences for the economy and society through the loss of prospective
knowledge and skills (Crosling, Heagney, & Thomas, 2009). In some countries, for
example, Denmark, and some U.S. states (Florida, Indiana, and Tennessee) policy makers
use retention and graduation rates as an indicator of student performance for funding
institutions (Jongbloed & Vossensteyn, 2001). Subsequently, retention of students in
tertiary education is seen as one student outcome which benefits all stakeholders:
students, parents, faculty, administrators, student affairs professionals, and policy makers
(Astin & Oseguera, 2012). By enhancing student retention in tertiary education, more
students are prepared for a challenging and more dynamic world of work.
Chapter one examines the rationale for the study and describes the research
setting and the concept of tertiary education in the Caribbean. Following is the problem
statement, conceptual framework, purpose statement, research questions, and definitions
of terms. Finally, an overview of the study is presented.
Rationale for Study
Research on retention has provided a great deal of insight on student persistence
in the U.S. and the factors that contribute to it (Astin & Oseguera, 2012; Braxton &
Hirschy, 2005; Pascarella & Terenzini, 1980; Tinto, 1985, 1993), but there seems to be
very little research conducted on the status of retention at any of the four campuses of the
University of the West Indies (UWI). In the Caribbean, having a university degree is a
3
means to social mobility and access to economic capital, not only for the individual but
for their future generations (Gordon, 1987; Pascarella & Terenzini, 2005). Completing a
university degree will increase the likelihood of maintaining a well-paid job (Baum, Ma,
& Payea, 2013; Tinto, 2012). Additionally, tertiary education is a public good. The
Caribbean governments have adopted a human capital approach to higher education and
perceive that the success of their national economies is contingent on the degree to which
their labor force is educated (Yorke & Longden, 2004). In the Caribbean, shifting to a
science and technology based economy will bring great advantages to the developing
nations (Vision 2020, 2013). Knowledge in science, technology, engineering and
mathematics (known collectively as STEM) fields is seen as a factor for rapid economic
and industrial growth: creating jobs, a wealthy society, and promoting sustainable human
capital (Vision 2020, 2003). However, the ability to maintain a highly educated society
will depend on the ability of the regional universities to graduate highly qualified
citizens, particularly in STEM fields. Research has shown that as more citizens are
educated, it stimulates the economy and benefits society since more tax revenue and
economic activities are generated (Perna, 2006). Educated individuals require fewer
social services, civic responsibility increases, and there is reduced criminal activity
(Perna, 2006). Education also provides trained workers needed to keep the Caribbean
competitive on the global and money market.
From the institutional perspective, being able to predict the chances that a student
will return to the institution and complete a degree, and to control the types of programs
or services to offer the student are quite valuable. According to Tewarie (2010a), high
student attrition rates present challenges for the UWI since government financial support
4
is an issue on some campuses; therefore, if those campuses lose tuition dollars they may
be deemed “at risk”. Also, high attrition rates may indicate institutional academic failure
or student dissatisfaction with their experiences at the institution. Consequently, student
retention is essential for “financial stability and to sustain academic programs” (Tewarie,
2010a, p.1).
Tertiary Education in the Anglophone Caribbean
Similar to higher education in the U.S., tertiary education in the Caribbean is
“voluntary in nature, androgogical, and student centered in orientation, and caters to the
intellectual, social and occupational needs of young and adult learners, preparing them to
function as productive and adaptive citizens in a global environment” (Roberts, 2002, p.
2). Tertiary education in the Caribbean has also been influenced by elitism,
decentralization, globalization, and technology (Roberts, 2003). However, there are many
differences between the U.S. educational system and that in the Anglophone (English-
speaking) Caribbean since the latter is fashioned after the British educational system.
One of the main differences is access to secondary school, college, and university.
Throughout the Anglophone Caribbean, students are required to take an examination
commonly known as the Common Entrance Examination or the Secondary Entrance
Assessment at the end of their primary school education at the ages of 10-11 years, which
grants them access to secondary education. Secondary education is mandatory for
students 11-16 years old for five years, at the end of which students take the Caribbean
Secondary Education Certification (CSEC), prepared by the Caribbean Examination
Council (CXC). Students can receive a grade from one to six on the CSEC examination,
5
where grades one, two, and three are considered a passing grade, with a grade one
showing that they have a comprehensive understanding of the concepts, knowledge, skills
and competencies in the subject area (CXC, 2014).
On completing their CXC, CSEC examinations, students then have the option to
continue for two additional years in a “sixth form”, equivalent to grades 11 and 12, and
take the Caribbean Advanced Proficiency Examination (CAPE), also prepared by CXC or
they can continue their education in a tertiary institution. In Barbados, where there are 23
public and 7 private secondary schools, but only four of them have a sixth form, entrance
to a sixth form school is competitive, and most students planning to continue their
education attend the Barbados Community College first and attain an associate degree.
Therefore, the role of a community college in the Caribbean tertiary education system
differs from its role in the United States. In the U.S. community college students tend to
be nontraditional, part-time enrolled, working, first-generation, and mainly commuters,
while in the Caribbean, where most students complete their secondary education at age
16 (grade 10), community college students are usually traditional aged (16-24 years),
full-time students. Community colleges provide a transition stage to university.
To be admitted to the UWI as an undergraduate, matriculation requires students to
have at least five acceptable passes in CXC, CSEC examinations, including English
Language and either Foreign Language or Mathematics and two approved science
subjects. Students entering with only these requirements commence their program with
preliminary courses. However, as previously mentioned, most students enter the UWI
after attending a sixth form school or community college. Normal matriculation requires
passes in five subjects of which at least two must be in CXC, CAPE or an associate
6
degree from an approved Caribbean tertiary level institution with a minimum GPA of 2.5
(UWI, St. Augustine, 2014). The typical first year student at the UWI is therefore not a
first-time college “freshman”. According to U.S. classification, these students are first
year, transfer students.
Another major difference between the educational systems in the U.S. and the
Caribbean relates to how tertiary education is financed. In the U.S. financing higher
education is the responsibility of students and their families or they rely on federal and
state financial aid in the form of grants and loans. In Trinidad and Tobago the
government subsidizes students’ tertiary education by paying students’ full tuition.
Students at the Cave Hill and St. Augustine campuses have benefited from free tuition for
over five decades. However, beginning in the first semester, 2014, all students at the
UWI, Cave Hill campus were asked to pay the full tuition fees as well. In Barbados, the
situation has therefore become similar to that in the U.S. However, financial assistance in
Barbados is currently mainly in the form of student revolving loans. Scholarships and
grants awarded are currently merit-based more so than needs-based.
The Research Setting
The University of the West Indies (UWI) serves the Anglophone (English
speaking) Caribbean region and is comprised of four campuses. The University College,
established in 1948 at Mona, Jamaica, was the first campus of the University of the West
Indies. It was established as a public institution with a special relationship with the
University of London, England (Roberts, 2003). Later, campuses were established at St.
Augustine, Trinidad and Tobago in 1960 and at Cave Hill, Barbados in 1962. Today, the
7
University of the West Indies is comprised of these three main campuses and one Open
Campus in Antigua and Barbuda that serves students online (Roberts, 2003; UWI, 2014).
The mission of the UWI is: “To advance education and create knowledge through
excellence in teaching, research, innovation, public service, intellectual leadership and
outreach in order to support the inclusive (social, economic, political, cultural,
environmental) development of the Caribbean region and beyond” (UWI, 2014, para. 6).
The campuses of the university have institutional accreditation with national accreditation
agencies. Currently, three fully functioning agencies exist. These agencies are the
Accreditation Council of Trinidad and Tobago, the Barbados Accreditation Council, and
the University Council of Jamaica (UWI, 2014). The UWI was ranked in the top seven
percent of 12,000 universities in the world (UWI stats, 2010).
At the UWI, the sticker price of an undergraduate degree program is composed of
economic cost, a tuition fee, and university registration fees (UWI, 2014). The four
campuses are funded jointly by the governments of the 17 contributing countries.
However, the payment of tuition fees differs between the governments of the contributing
nations. At the St. Augustine campus, the economic cost is 100% of the cost of the
academic programs and is paid by the government. On the other hand, at the Cave Hill
campus in Barbados, the tuition fee constitutes 20% of the total cost of academic
programs. The remaining 80% is called the ‘economic cost’ and is paid by the
government. Most other territories normally sponsor their citizens by paying their
economic cost including tuition fee while students are only required to pay university
fees. These university fees may include student guild fees, amenities fees, and a charge
8
for an identification card. Amenities include facilities and services such as computer labs,
wireless facilities, health facilities, and scheduled bus service.
Traditionally, each of the UWI campuses had specialized in a particular major. At
the Mona campus, that area of focus was Medical Sciences, at St. Augustine campus –
Engineering, and at the Cave Hill campus - Law. However, recently a College of Medical
Science has been established in Barbados as well as Trinidad and Tobago. The UWI is
considered a regional university since 98% of UWI students are from the 17 Caribbean
contributing nations. Students relocate to the particular campus to pursue their degree in
those specific fields. Consequently, decreasing retention at any of these universities will
adversely affect the entire Caribbean region. For practical and logistical reasons, this
study focused on two of the three main campuses: St. Augustine in Trinidad and Tobago
and Cave Hill in Barbados.
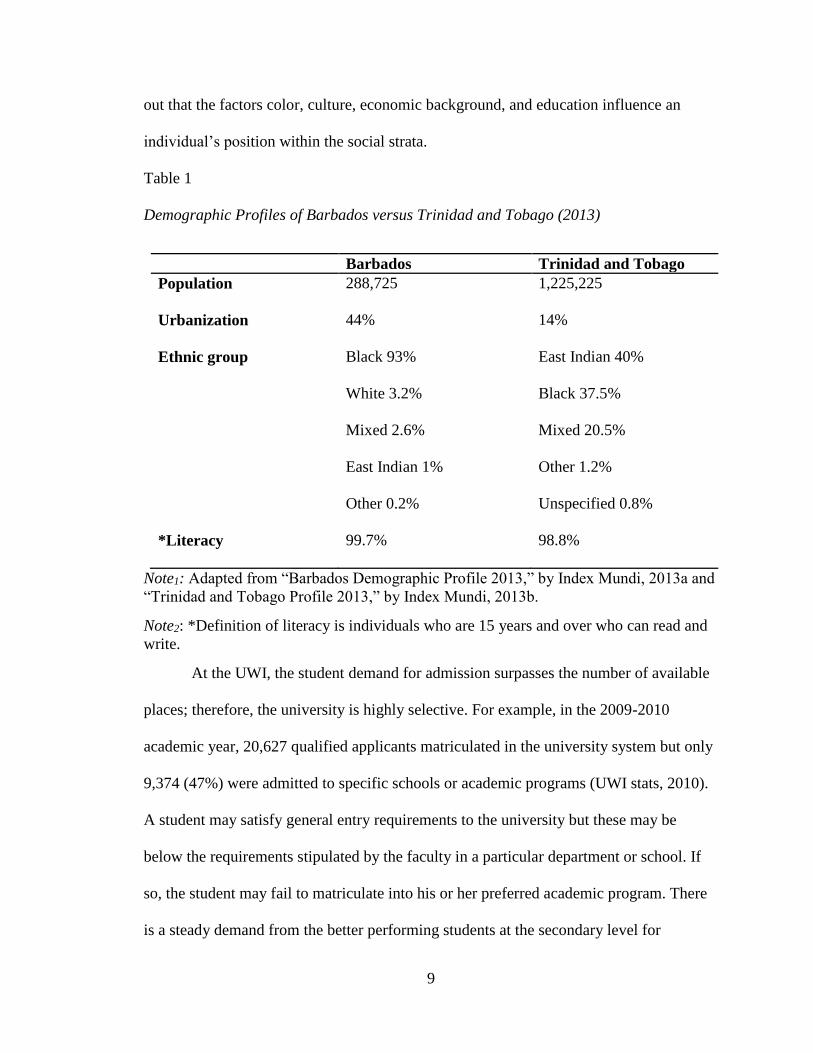
Table 1 shows a comparison of the demographic profiles of the two countries. As
displayed in Table 1, Caribbean societies are generally small and multiracial. Gordon
(1987) argued that Caribbean societies are based on class stratification: upper class,
middle class, and working class. Though based on the original plantation model, class
stratification still applies to contemporary Caribbean societies (Gordon, 1987). In this
model, the upper class were traditionally Caucasian and owned wealth which was a
means of political power; the middle class were mulatto (mixed), usually educated,
owned some wealth, but lacked political power; while the working class were the Blacks,
who lacked wealth and political power. Smith (1965) argues that most Caribbean
societies are plural societies where division is not along class. However, significant
cultural diversity exists, and social inequality occurs between ethnic groups. Smith points
9
out that the factors color, culture, economic background, and education influence an
individual’s position within the social strata.
Table 1
Demographic Profiles of Barbados versus Trinidad and Tobago (2013)
Barbados Trinidad and Tobago
Population 288,725 1,225,225
Urbanization 44% 14%
Ethnic group Black 93%
White 3.2%
Mixed 2.6%
East Indian 1%
Other 0.2%
East Indian 40%
Black 37.5%
Mixed 20.5%
Other 1.2%
Unspecified 0.8%
*Literacy 99.7% 98.8%
Note1: Adapted from “Barbados Demographic Profile 2013,” by Index Mundi, 2013a and
“Trinidad and Tobago Profile 2013,” by Index Mundi, 2013b.
Note2: *Definition of literacy is individuals who are 15 years and over who can read and
write.
At the UWI, the student demand for admission surpasses the number of available
places; therefore, the university is highly selective. For example, in the 2009-2010
academic year, 20,627 qualified applicants matriculated in the university system but only
9,374 (47%) were admitted to specific schools or academic programs (UWI stats, 2010).
A student may satisfy general entry requirements to the university but these may be
below the requirements stipulated by the faculty in a particular department or school. If
so, the student may fail to matriculate into his or her preferred academic program. There
is a steady demand from the better performing students at the secondary level for
10
available places (UWI stats, 2010). As such, the students at UWI tend to be high
achievers, the faculty members have rigorous expectations of students, and the institution
is highly competitive (Roberts, 2003). According to Braxton and Hirschy (2005), high
selectivity in the admissions process and perceived success of graduates contribute to
cultural capital. Additionally, researchers found that institutions which are highly
selective had the highest rate of retention when controlling for other predictors of student
persistence (Astin, 1993; Astin, 2005; Bean, 2005; Titus, 2004). Astin (1993) felt that at
highly selective universities, students motivate each other, during peer-groups interaction,
towards high aspirations. In fact, Astin and Oseguera (2005) believed that peer-group
motivation in selective institutions is so important that if students contemplated stopping
out, their peers would convince them to reconsider. However, Astin (2005) found that
even among institutions with similar selectivity, there was a significant disparity in
degree attainment rates.
The Saint Augustine Campus
The UWI, St. Augustine, offers undergraduate and postgraduate certificates,
diploma and degree options in six colleges and schools or faculties: Engineering;
Humanities, and Education; Medical Sciences; Science and Technology; Food and
Agriculture; and Social Sciences. The majors offered in Science and Technology at UWI,
St. Augustine are Biochemistry, Biology, Chemistry, Computer Science, Ecology,
Electronics, Information Technology, Mathematics, Microbiology, and Physics. Medical
Science offers one major-Medicine. St. Augustine has the largest student enrollment of
all UWI institutions of approximately 17,500 students of whom approximately 3,500 are
first-years (UWI, St. Augustine, 2014). St. Augustine graduates approximately 4,000
11
undergraduates annually, but enrollment in science and technology fields decreased from
51% in 2000 to 48% in 2010 (UWI stats, 2010; UWI, St. Augustine, 2014). Additionally,
in the 2008-2009 academic year St. Augustine campus had the highest attrition rate of the
three campuses. Approximately 14% of their first-year students did not return for the
2009-2010 academic year (Tewarie, 2010a). The undergraduate degrees are generally
three-year programs and the professional programs, medical sciences and engineering for
example, are five years. However, the institution has seen a recent trend in which
undergraduate students are completing their programs two or more years after their
expected graduation time (Paterson & Gordon, 2010).
The Cave Hill Campus
The UWI, Cave Hill, Barbados, is the smallest of the three campuses with a
student enrollment of about 9,500 of whom approximately 2,000 are first-year students.
The campus houses five faculties (colleges and schools): Humanities and Education;
Science and Technology; Social Sciences; Medical Science, and their main area of focus,
Law (UWI, Cave Hill, 2014). Science and Technology is comprised of two departments,
namely the Department of Biological and Chemical Science and Department of
Computer Science, Math, and Physics. The degrees offered are generally three years
programs. However, like at St. Augustine, some first year Cave Hill students may take
preliminary courses, depending on whether they were admitted to the university directly
from secondary school or from another tertiary institution such as the Barbados
Community College. The majors offered in Science and Technology are similar to those
offered at St. Augustine. Also, the Cave Hill campus has seen a decline in students
enrolled in the science and technology fields over the past decade (25% of the total
12
enrollment in 2000 to 17% in 2010). Approximately 10% of their first-year students did
not return for the 2009-2010 academic year (Tewarie, 2010a).
Comparison of the St. Augustine and Cave Hill Campuses
The two UWI campuses studied are similar in governance, selectivity, and
students’ age and sex, but they differ in size, STEM enrollment, financial support, as well
as race/culture/ethnicities. Currently, the major difference between the two institutions is
that from the fall semester, 2014, the Government of Barbados has asked students to be
responsible for the full payment of the tuition fees for their program of study (Henry,
2014), while in Trinidad and Tobago the government continues to finance 100% of
student tuition. According to Madden (2014) all five faculties (colleges and schools) at
UWI, Cave Hill have recorded declines in first year enrollment for the 2014-2015
academic year. Science and Technology has reported a 13% decrease in enrollment from
331 in 2013 to 289 in 2014 and Medical Science has a total enrollment of 51 compared to
64 for 2013. Madden (2014) article states, “An official from the UWI has blamed the
noticeable fall off on the Government’s decision to have students pay their full tuition
cost from September” (p. 2).
First Year Student Retention
The first year of college has been viewed as the most overwhelming year for first
time college students and the year in which student voluntary departure is the highest
(Habley & McClanahan, 2004; Pascarella & Terenzini, 1978; Tinto, 2012). Tinto (2012)
argued that there are four conditions that encourage student retention in this critical first
year of college. These are expectations, support, feedback, and involvement. First, first
13
year students attending institutions that have high and clear expectations for student
achievement are more likely to persist and graduate; second, the availability of academic
and social support promotes retention; third, students are more likely to persist and
graduate in institutions that provide feedback about their performance; and fourth, the
more involved or engaged first year students are with faculty, staff, and peers, the more
likely they are to persist and attain a degree (academic and social integration). In this
study, since the typical first year student at the UWI may not be a first-time college
student but a first year, transfer student Tinto’s (2012) four conditions may need to be
modified to this unique Caribbean student population.
Additionally, Wardley, Bélanger, and Leonard (2013) found that first year
students’ voluntary withdrawal from an institution can be related to students’ perception
of the university created through advertisement and marketing prior to attendance, and to
the university's environment in terms of what they actually offer and deliver. Dissonance
between expectations and realities is positively related to attrition. Consequently, if
administrators are able to identify the areas of institutional culture that are most closely
associated with retention and persistence in the students’ first year of college, they will be
able to modify and develop their policies and programs to fit the students’ needs and
expectation, as well as reduce the revenue and institutional resources related to student
departure and the extra cost associated with recruiting new students (Habley &
McClanahan, 2004; Pascarella & Terenzini, 1978; Tinto, 2012). Furthermore, research
has shown that it is better, financially, to retain students than to recruit new students
(Schultz, Dickman, Campbell, & Snow, 1992).
14
The time students take to attain a college degree is cause for concern. According
to the National Center for Education Statistics (NCES, 2014), 57% of first-time, full-time
students who began seeking a bachelor’s degree at a 4-year public institution in fall 2006
completed the degree at that institution within six years (para. 2). Generally speaking,
medical science and engineering degrees require more than four years of full-time study,
but most regular STEM full-time students are also taking at least six years to earn a three
or four-year degree (Tinto, 2012). There is a great deal of literature and statistics on
student retention and persistence in the U.S. but very little research has been done on this
topic at the UWI. The data presented may not be a perfect correlation to the UWI but it
provides some context and bolsters the need for this study.
Problem Statement
The number of students returning to the UWI after their first year in science and
technology fields has recently decreased annually. Overall, 11% of the student body
admitted at the UWI in the 2009-2010 academic year did not resume their studies in fall
2010. The difference was three percentage points higher than the 2008-2009 first year
cohort with Pure and Applied Science having the highest student attrition rate (19%) for
the fall 2010 semester (Tewarie, 2010a; Tewarie, 2010b).
Research in the U.S. has shown that undergraduate students who declare a major
in science, technology, engineering, and mathematics (STEM) are more likely to stop out
of the university than students declaring other majors (Chen, 2013; Shaw & Barbuti,
2010). Chen (2013) found that about one-half (48%) of the students who declared a
STEM major in their first year at a 4-year institution switched to another non STEM
15
major over their next six years. Furthermore, 25% of these students dropped out of
college without earning a degree or certificate. This percentage varied across the STEM
areas from 38% amongst math majors to 59% amongst computer/information technology
majors (Chen, 2013). Additionally, only 27% of the students who entered in the STEM
fields graduated with a bachelor’s degree in that major (Chen, 2013).
Consequently, student departure from the university after the first semester
reflects a loss of the individual’s time and talent, institutional resources, as well as a
national economic loss (Reason, Terenzini, & Domingo, 2006). The UWI functions as a
regional entity and impacts the human resource development and public policy needs of
the region. It cost the UWI over BD$851 million (US$425.5 million) to educate over
46,000 tertiary level students during the 2009-2010 academic year. The significant
contribution of the regional governments was just over BD$460 million (US$230
million) or 51% of the total expenditure (UWI Stats, 2010). At the St. Augustine campus,
the expenditure of tertiary education was TT$991.5 (US$165) million, and the
government contributed 48% (UWI St. Augustine, Annual Report, 2013). Subsequently,
at St. Augustine, where the local students’ tuition is paid by the government of Trinidad
and Tobago, retention is very significant because when a student stops out, that ‘human
resource’ is not being utilized to its full potential. In addition, according to the UWI
Strategic Plan (2013), a SWOT analysis identified a declining average student entry
scores as a threat to the institutions since this will likely negatively affect the University’s
retention rates.
At the UWI, Cave Hill where the government of Barbados has asked all students
to pay full tuition from the first semester, 2014 the financial changes may impact first-
16
year students’ decision to return to the institution in their second semester. Additionally,
UWI has a policy that no student who is working for more than 12 hours weekly may
enroll as a full-time student (UWI, Cave Hill, 2014-2015). In the literature, financial
concerns were found to be the single most important enrollment variable that influenced
whether first-year students re-enrolled in the university in the U.S. (Cabrera, Stampen, &
Hansen, 1990; Murdock, 1987; Tinto, 2012).
Additionally, a first year retention study conducted by the Pro-Vice Chancellor
for Planning and Development at UWI found that approximately 22-23% of students
surveyed at each on-campus institution identified inadequate academic advising as a
factor influencing their decision not to return to the institution after completing their first
year (Tewarie, 2010a). Research has shown that academic advising positively impacts
student persistence and subsequently retention (Cuseo, 2002; Habley & McClanahan,
2004; Nutt, 2003). Academic advising is perceived as the only structured activity on a
campus in which students have the opportunity for that one-to-one interaction to develop
a relationship with a person who is interested in their success (Drake, 2011; Nutt, 2003).
“Good advising may be the single most underestimated characteristic of a successful
college experience” (Light, 2001, p. 81).
At UWI, the purpose of academic advising is:
To help students, particularly new students, in planning, monitoring and
successfully managing their chosen field of study, in relation to clear career
objectives. Students are guided to accept responsibility for their learning, to be
informed of the services provided for them, to access information, and to be
managers of their time (UWI, 2014, para.1).
17
According to Drake (2011), “academic advising is more than clerical recordkeeping; it is
the very human art of building relationships with students and helping them connect with
their personal strengths and interest with their academic and life goals” (p. 10).
At the UWI, students’ transitioning from secondary school to the university were
deemed underprepared for the demands of their specific program and this contributed to
subsequent withdrawal from the program (Tewarie, 2010a). In the recent literature,
students’ secondary school achievement has been linked to retention and persistence in
college (Astin, 1993; Pascarella & Terenzini, 2005; Tinto, 1993). Reason (2009) stated
that a rigorous secondary school curriculum is a strong predictor of a students’
persistence in college. He also noted that this is particularly reflected in the students’ first
years in college.
The two UWI campuses, St. Augustine and Cave Hill, differ in relations to the sex
of their STEM students, the race/ethnicity of the student population and the source of
funding for student tuition. First, at UWI, Cave Hill campus, females predominate in all
departments including science and technology in a 2:1 ratio (UWI stats, 2010), while at
St. Augustine, males are the majority in Engineering, and this skews the male to female
ratio in STEM fields at this institution to a 1:1 ratio (UWI stats, 2010; UWI, St.
Augustine Stats, 2012-2013). Second, the race/ethnicity at each institution should reflect
the population of the country. In Trinidad, the East Indian race makes up the majority,
while in Barbados, the Black race predominates. Third, due to the new stipulations at
Cave Hill campus, students attending Cave Hill in first semester, 2014 experienced
different financial concerns from first year students at St. Augustine.
18
To explore these problems, a study was conducted during the first semester, 2014
at the two campuses of the UWI. A survey was administered to determine the
characteristics, attitudes, and perceptions of first-time degree seeking freshman who
declared a major in a STEM field in first semester, 2014. Retention rates were perceived
as an indicator of student success and measured by the students’ intent to return and re-
enroll at the UWI for the second semester. This study differs from other studies since it
examines student attitudes and perceptions on retention status at the largest university
system in the Caribbean and explores students’ concerns about institutional practices. The
study contributes to a gap in the literature since there is very little research on this topic at
UWI or in the Caribbean region, so this study is a pioneering study and provides a
foundation for other researchers.
Conceptual Framework
Since the study examined the perceptions of first year, STEM students as they
relate to student retention at the University of the West Indies (UWI), it is appropriate to
view the study through the lens of a Caribbean cultural identity. Kuh and Love (2000)
posit that students’ decision to withdraw from a university is facilitated by the students’
“cultural meaning-making system” (p. 201). Hall (2001) argues that the Caribbean
identity is a hybrid of various cultures and is grounded in the survival and assimilation of
its peoples. Consequently, the perception and attitudes of Caribbean youths will differ
from youths in the U.S. in relation to educational norms, advising and counseling, and
educational goals and achievement.
19
Additionally, since student departure from tertiary institutions is described as an
ill-structured problem (Braxton & Mundy, 2001-2002), a phenomenon which cannot be
explained by a single theory or model, the study utilizes a framework with two theoretical
models to predict student retention from an institutional perspective. Tinto’s (1993)
Longitudinal Model of Institutional Departure is used as the context for understanding
student departure. Researchers have at least partially supported the predictive validity of
Tinto’s (1993) model by operationalizing the main postulates of the theory and predicting
students’ decision to re-enroll in the institution (Braxton & Hirschy, 2005; Caison, 2007;
Pascarella & Terenzini, 1980). Pascarella and Terenzini (1980) identified faculty as the
main factor of students’ institutional integration. Students’ interaction with faculty and
their perception of the level of faculty concern were found to be the strongest contributor
to students’ decision to re-enroll. Second, Crookston’s (1994) Advising as Teaching
model addresses one institutionally developed activity, faculty advising, that a student
can access prior to his or her decision to voluntarily withdraw from the institution.
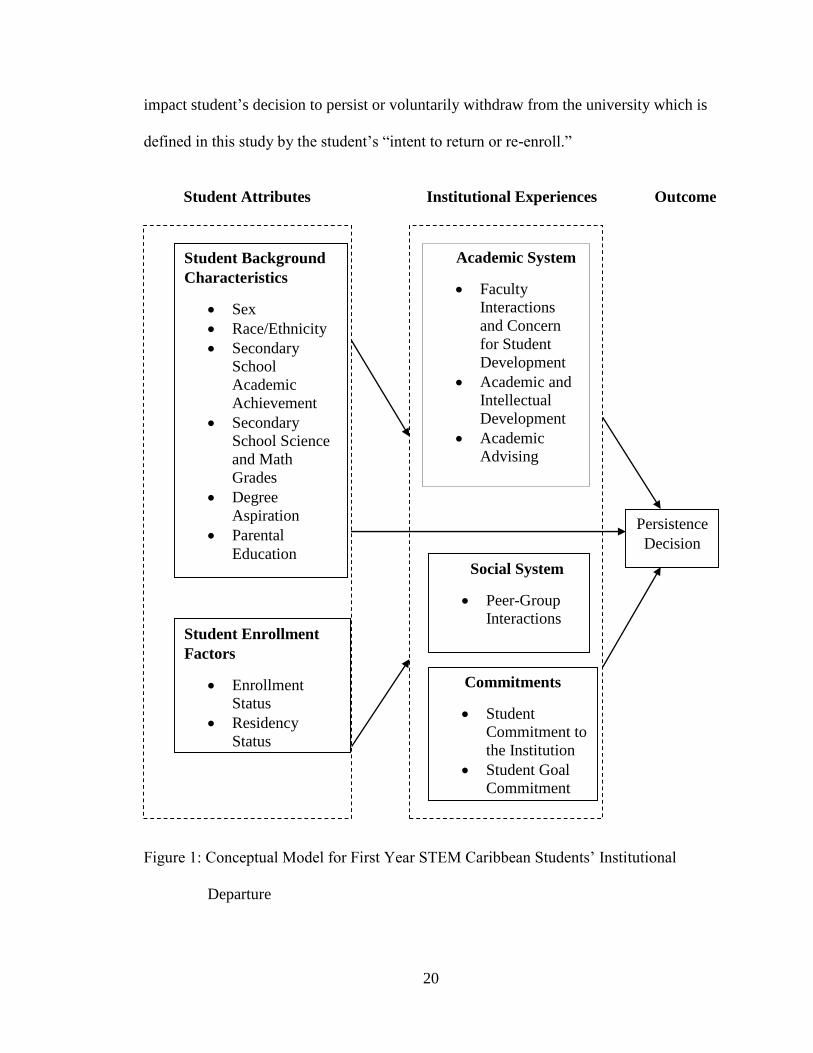
Figure 1 illustrates a conceptual model for the study. The model asserts that first
year students at the university commence college with certain traits and influences
including students’ background characteristics (sex, race/ethnicity, secondary school
academic achievement, secondary school science and math grades, degree aspiration,
parental education), and enrollment factors (enrollment status, residency status, financial
concerns) which impact how they will integrate academically (faculty interactions and
concern for student development, academic and intellectual development, academic
advising) and socially (peer-group interactions). Along with their institutional and goal
commitments (importance of attending and graduating from UWI), these traits will
20
impact student’s decision to persist or voluntarily withdraw from the university which is
defined in this study by the student’s “intent to return or re-enroll.”
Student Attributes Institutional Experiences Outcome
Figure 1: Conceptual Model for First Year STEM Caribbean Students’ Institutional
Departure
Persistence
Decision
Student Background
Characteristics
Sex
Race/Ethnicity
Secondary
School
Academic
Achievement
Secondary
School Science
and Math
Grades
Degree
Aspiration
Parental
Education
Academic System
Faculty
Interactions
and Concern
for Student
Development
Academic and
Intellectual
Development
Academic
Advising
Social System
Peer-Group
Interactions
Commitments
Student
Commitment to
the Institution
Student Goal
Commitment
Student Enrollment
Factors
Enrollment
Status
Residency
Status
Financial
21
Purpose Statement
The purposes of this study are twofold; first, to examine the students’ attributes
and the institutional experiences that contribute to retention of first year, Caribbean
students in science, technology, engineering and mathematics (STEM) majors during the
first semester, 2014. Secondly, this study seeks to determine the nature of and student
satisfaction with the academic advising students received during their 2014 semester.
Research Questions
The research questions in the study are:
1. Does the campus attended predict intent to re-enroll at the two UWI
campuses: St. Augustine and Cave Hill, in first year STEM students?
2. What student attributes are associated with intent to re-enroll the following
semester in first year STEM students at the UWI: St. Augustine and Cave
Hill, controlling for campus?
3. What institutional experiences are associated with intent to re-enroll the
following semester in first year STEM students at the UWI: St. Augustine and
Cave Hill, controlling for campus?
4. What perceptions do first year STEM students at the UWI have about the type
of academic advising they received?
a. The nature of academic advising on a developmental-prescriptive
continuum.
b. Students’ satisfaction with academic advising.
22
Definition of Terms
In order to facilitate a greater understanding of the study, operational definitions
of key terms and concepts have been provided below.
Academic Advising
Academic advising refers to “the situations in which an institutional
representative gives insight or direction to a student about an academic, social or
personal matter. The nature of this direction may be to inform, suggest, counsel,
discipline, coach, mentor or teach” (Kuhn, 2008, p. 3).
Anglophone Caribbean
The Anglophone Caribbean is the English-speaking Caribbean, especially where
one or more language is spoken. The Anglophone Caribbean includes Anguilla,
Antigua, Bahamas, Barbados, Belize, British Virgin Islands, Cayman Islands,
Dominica, Grenada, Guyana, Jamaica, Montserrat, St. Kitts and Nevis, St. Lucia,
St. Vincent and the Grenadines, Trinidad and Tobago, and Turks and Caicos
(Roberts, 2003, p. 3).
Archipelago
An archipelago is a “string of related, but not necessarily connected,
geographically and social pods in physical proximity” (Evans, Forney, Guido,
Patton, & Renn, 2010, p. 285). In this study it is also used as a metaphor for
Caribbean identity (Hall, 2001).
Attrition
Attrition is the act of a student who fails to re-enroll at a tertiary level institution
in consecutive semesters (Berger, Ramírez, & Lyons, 2012).

23
Caribbean Contributing Countries
Member countries of the English speaking Caribbean that contributes to the
finances of the University of West Indies (UWI Stats, 2010). The 17 territories are
Anguilla, Antigua, Bahamas, Barbados, Belize, Bermuda, British Virgin Islands,
Cayman Islands, Dominica, Grenada, Jamaica, Montserrat, St. Kitts and Nevis, St.
Lucia, St. Vincent, Trinidad and Tobago, and Turks and Caicos (UWI, 2014).
Cultural Capital
Cultural capital refers to the resources such as language skills, cultural knowledge
and manners derived in part from one’s parents as well as educational credentials,
which can be used to maintain and advance an individual’s social status
(Bourdieu, 1986).
Developmental Advising
Developmental advising is “a systematic process based on a close student-advisor
relationship intended to aid students in achieving educational, career, and personal
goals through the utilization of the full range of institutional and community
resources” (Winston, Miller, Ender, Grites, & Associates, 1984, p. 19).
Faculty
At the University of the West Indies, the Faculty is comprised of the colleges or
schools, their departments, and faculty members.
Faculty-Only Advising Model
In a faculty-only model, all students are “assigned to an institutional faculty
member for advising. There is no advising office” (Kuhn, 2008, p. 7). In contrast,
some universities employ academic advisors with administrative appointments.
24
Full-time Student
At the UWI, registered students who carry the full course load associated with
their university program for the academic year are considered full-time (UWI
stats, 2010, p. 11). This is not associated with a credit hour as observed in the U.S.
system.
Human Capital
Human capital is the personal investment in education, training or other types of
learning opportunities which contribute to an individual’s economic investment
(time, money, energy) (Becker, 1964).
Institutional Accreditation
Institutional accreditation is an external peer evaluation process which an
institution undergoes under the umbrella of a recognized accreditation agency. It
is also a status conferred or the outcome of the evaluation process (UWI, 2014).
Matriculation
Matriculation means to enroll as a member of a university, but not necessarily all
academic units. “A student may satisfy matriculation requirements for the
University but may not equal to the demands of the Department and faculty”
(UWI Stats, 2010, p. 4).
Part-time Student
At the UWI, registered students who carry less than the full course load associated with
their program for the academic year are considered part-time (UWI stats, 2010, p. 11).
Part-time refers to the number of courses taken rather than the time of day and is not
associated with a credit hour as observed in the U.S. system.
25
Persistence
Persistence refers to the desire and action of students to stay within the system of
higher education from beginning year to degree completion (Berger, Ramírez, &
Lyons, 2012, p. 12).
Rastafarianism
Rastafarianism is a Black conscious movement amongst the Afro Caribbean
people. The term refers to both a religious group and a social conscious group
(Hall, 2001).
Retention
Retention refers to the ability of an institution to retain a student from admission
through graduation completion (Berger, Ramírez, & Lyons, 2012, p. 12).
STEM
STEM stands for science, technology, engineering, and mathematics majors.
Science and engineer majors are students enrolled in one or more of the following
two categories: physical, mathematical, and engineering science, or life science
and allied health (Vision 2020, 2003). Technology refers to the students enrolled
in computer science and information technology.
Social Capital
Social capital focuses on how individuals acquire forms of capital through their
membership in social network, norms and social trust that facilitate coordination
and cooperation for mutual benefit through their relationships with faculty,
advisors and peers (Bourdieu, 1986). Social capital differs from cultural capital

26
and human capital in that in emphases the value of social networks as opposed to
social mobility or economic value.
Stop Out
A ‘stop out’ refers to a student who temporarily withdraws from an institution or
system (Berger, Ramírez, & Lyons, 2012, p. 12). It does not include students who
were forced to leave for academic reasons (Tinto, 2012).
Student Success
Student success is defined using measures of academic achievement and degree
attainment. It can also be defined by the degree to which students are satisfied
with their educational experience and feel comfortable and affirmed in their
learning environment (Kuh, Kinzie, Buckley, Bridges, & Hayek, 2006).
Tertiary Education
The third stage of education which builds on secondary education (Roberts,
2003).
Throughput Rate
The term throughput rate is used at the University of the West Indies to refer
generally to the academic progression of students from entry to graduation. It is a
time-to-degree measure much like the federally prescribed (NCES) graduation
rate in the United States (Paterson & Gordon, 2010, p. 5).
27
Overview
This study focuses on retention factors in two UWI campuses: St. Augustine and
Cave Hill for students declaring a Science, Technology, Engineering, or Mathematics
(STEM) major. The study is organized into five chapters, references, and appendices.
Chapter 2 presents a review of the literature and a synthesis of recent articles on issues
and concerns relating to student persistence and retention in a university setting. Chapter
3 outlines the methodology and research design of the study. It describes the population
and determination of the sample, the instruments used to collect the data, and the
procedures for collecting the data. Chapter 4 contains an analysis and a discussion of the
findings. The final chapter presents a summary and conclusions of the study as well as
recommendations for future research and implications for practice.

28
CHAPTER 2
LITERATURE REVIEW
The transition to university from either secondary school or community college is
usually challenging for first year students generally, but especially for first year students
declaring science, technology, engineering and mathematics (STEM) major (Chen,
2013). First year students enter the university with expectations and preferences about
their first year at a university which may be based on secondary school achievement or
information from parents, peers, marketing, or society. However, these expectations may
be altered by their first year experiences, including academic advising, and this may
influence students’ decision to return to the university after the first semester. Tinto
(2012) states that once a university has admitted a student, it has the obligation to do
whatever it can to help the student stay and graduate.
This study examined the relationship between first year students’ characteristics
and institutional experiences associated with retention in first year students declaring
STEM majors. The study utilizes the theory of student departure described by Tinto’s
(1993) Longitudinal Model of Institutional Departure as the conceptual framework in the
Caribbean tertiary education system.
29
Conceptual Framework
Tinto’s theory of student departure (1975) is regarded as seminal in student
retention research and has formed the framework for many studies. It is viewed as “the
most studied, tested, revised and critiqued in the literature” (Braxton & Hirschy, 2005, p.
66). A Google scholar search (26th July, 2014) showed that Tinto’s theory was cited over
7,450 times in the literature. Informed by a Caribbean cultural perspective, the study used
Tinto’s model of student retention as the framework for understanding why first-year
students stop out of the university.
Caribbean Cultural Identity
“The Caribbean is the original and the purest diaspora” (Hall, 2001, p. 28). Hall
describes the cultural identity of the Caribbean people from a nationalist perspective, and
this viewpoint is also used to understand the ethnic identity of the students in this study.
The Caribbean islands form an ‘archipelago’ and the Anglophone Caribbean is viewed as
a melting pot, since all the islands’ inhabitants differ in terms of their ethnic composition,
producing an interesting combination of inherited, physical features and traits on each
island as well as different cultural traditions which reflect elements of the various
colonizing cultures: British, Africans, Chinese, Indians, Portuguese, Syrians, Jews and
Lebanese. In the process of combining cultures, a new distinctive culture developed
called creolization (Evans, Forney, Guido, Patton, & Renn, 2010; Hall, 2001).
Additionally, according to Hall (2001), every cultural characteristic has its own class,
color, and race. In some islands however, a significant proportion of the population is
mixed and biracial. This distinction is observed especially in Trinidad and Tobago where
20.5% of the population identifies as mixed.
30
Hall (2001) identifies two processes which contribute to Caribbean cultural
identity. These are survival and assimilation. Survival of the Caribbean people, especially
those that were enslaved, are described in the context of the retention of old customs, and
cultural traits from Africa and “traditions that were retained in and through slavery, in
plantations, in religion, partly in language, in folk customs, in music, in dance, in all
forms of expressive culture that allowed men and women to survive the trauma of
slavery” (Hall, 2001, p. 29). These cultures were developed within the English culture
and Christian traditions, “always surrounded by the colonizing culture” but “retaining
something of the connection” (Hall, 2001, p. 29) to the motherland. The second process is
assimilation where Caribbean people strived to be the “Black Englishman” (Hall, 2001,
p. 32). However, during the 1960s, Caribbean cultural identity evolved and its people
became more conscious of their roots and the religions of the motherland, Africa
including the religious beliefs and social consciousness of Rastafarianism (Evans et al.,
2010; Hall, 2001).
The social structure of the Caribbean is basically a hierarchical one which has
been influenced by colonialism. According to Gordon (1987), education has been a
powerful factor in social mobility, producing the contemporary “middle class” in society.
He argues however, that although some Blacks have moved up from the working class
through education to the middle class, they will never attain “upper class” strata, and
inequality continues to exist throughout the region. This factor may impact student
retention in tertiary education since students from the upper class in society are more
likely to have resources that may not be available to the student from the middle or
working class.
31
In the last three decades, the Caribbean region has been exposed to American
culture due to the influence of media, particularly television. American dress, foods,
music, and means of communication are currently a part of Caribbean life. At the UWI,
where over 50% of the undergraduate student population is 24 years and under, the
culture of the millennial generation emerges. However, Caribbean youth have not
completely loss their ancestral cultural identity. As such, the students’ cultural identity
and cultural capital may affect their perceptions of degree attainment, generally and
institutional practices like advising, specifically. For example, in Caribbean cultures,
students experiencing challenges may prefer to get advice from a priest, family member,
or peer rather than from a faculty advisor or counselor. Jordan (1997) identifies this
practice as cultural mistrust, where students (particularly Black women) are cautious of
not only counselors but of the counseling process as a factor in advising or counseling.
The researcher speculates whether Caribbean cultural identity and cultural capital affects
students’ decision to return to or stop out of college after their first semester.
Tinto’s Model of Institutional Departure
Tinto’s interactional model on student departure uses an adaptation of Durkheim’s
(1951) theory of suicide to explain attrition as the failure to be academically or socially
integrated into a college or university (Tinto, 1975). Tinto argues that students enter the
college and the academic and social integration students experience in college enhances
each other. In Tinto’s model, academic integration is defined as academic performance
and interaction with faculty and/or peers while social integration relates to being involved
with social subcultures, such as extra-curricular activities and socially interacting with
faculty and/or peers. Academic and social integration are comprised of normative
32
congruence and structural integration. Normative congruence addresses the idea of fit
where individuals question whether or not their value patterns fit with those of the college
collectively while structural integration relates to how the student interacts with faculty,
student affairs professionals, and peers in the institution (Tinto, 1975).
Tinto (1993) postulates that students enter the university with diverse background
characteristics and goal commitments (highest degree expected, importance of graduating
from college). These traits not only influence how the students will perform in college
but also how they will interact with, and subsequently become integrated into the social
and academic system of the university (Pascarella & Terenzini, 1980). Subsequently, the
more the students’ traits and the mission of the institution match, the greater will be the
students’ goal commitment (commitment to complete college) and institutional
commitment (commitment to remain at their respective institution). Tinto (1993) made
revisions to this model by including financial resources in student’s pre-college
characteristics and recognizing the role external commitments (family, work and
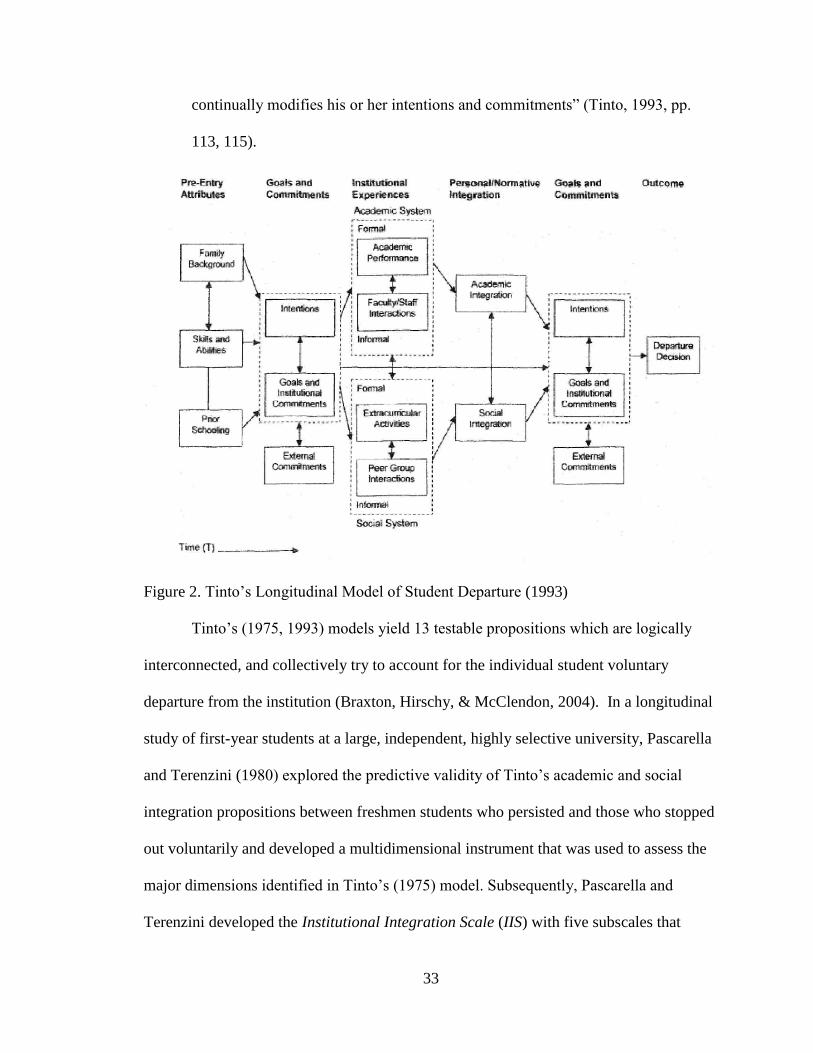
community) play in students’ decision to withdraw from the university. Tinto (1993)
presents a longitudinal model of institutional departure (Figure 2) that focuses on the
individual student and the concept of integration. He argues:
Individual departure from institutions can be viewed as arising out of a
longitudinal process of interactions between an individual with given attributes,
skills, financial resources, prior educational experiences, and dispositions
(intentions and commitments) and other members of the academic and social
systems of the institution. The individual’s experience in those systems, as
indicated by his/her intellectual (academic) and social (personal) integration,
33
continually modifies his or her intentions and commitments” (Tinto, 1993, pp.
113, 115).
Figure 2. Tinto’s Longitudinal Model of Student Departure (1993)
Tinto’s (1975, 1993) models yield 13 testable propositions which are logically
interconnected, and collectively try to account for the individual student voluntary
departure from the institution (Braxton, Hirschy, & McClendon, 2004). In a longitudinal
study of first-year students at a large, independent, highly selective university, Pascarella
and Terenzini (1980) explored the predictive validity of Tinto’s academic and social
integration propositions between freshmen students who persisted and those who stopped
out voluntarily and developed a multidimensional instrument that was used to assess the
major dimensions identified in Tinto’s (1975) model. Subsequently, Pascarella and
Terenzini developed the Institutional Integration Scale (IIS) with five subscales that
34
contributed to student persistence. The subscales were identified as peer-group
interactions, interactions with faculty, faculty concern for student development and
teaching, academic and intellectual development, and institutional and goal
commitments. Pascarella and Terenzini (1980) found that these five constructs are useful
in identifying potential stop out in first year students during the second semester of their
freshman year.
Tinto’s (1975) model of student departure has been criticized in the literature
because it did not include the role of external factors (family approval, financial
constraints, opportunity to transfer to another university, work) in shaping students’
perceptions, and influencing the students’ institutional commitment and decisions to
voluntarily withdraw (Bean, 1982; Braxton & Hirschy, 2005; Cabrera, Castañeda, Nora,
& Hengstler, 1992). Bean (1980, 1982) developed a model which claimed that students’
withdrawal is analogous to turnover in work organizations. Bean’s (1982) model
identified factors external to the institution that influence students’ satisfaction and
subsequently decision to leave the institution. In this respect the Bean model appears
stronger than Tinto’s model. However, Tinto’s (1993) and Bean’s (1982) models have
some features in common. They both postulate that student attributes influence student’s
stop out decision, the student’s decision to persist or withdraw depends on a multifaceted
set of interactions over time, and the individual’s fit with the institution is crucial to
student retention and persistence (Yorke, 1999). Another critique of Tinto’s (1975, 1993)
model is that it does not work equally well in all contexts and is not supported across all
types of institutions (Braxton, Doyle, Hartley III, Hirschy, Jones, & McLendon, 2014).
35
However, the predictive value of the model’s postulates has been tested for first year
students in a highly selective university setting (Pascarella & Terenzini, 1980).
Student Attributes and Student Retention
Several pre-college experiences and entry characteristics have been shown in the
literature to influence a student’s decision to persist in college and complete a bachelor’s
degree (Astin & Oseguera, 2012; Pascarella & Terenzini, 2005; Tinto, 1993). These
student attributes include student’s background characteristics such as sex, race/ethnicity,
secondary school academic achievement, secondary school math and science scores,
degree aspiration, and parental education as well as enrollment factors such as residency
status, and financial concerns.
Student Background Characteristics
The literature on the relationship between sex and student retention varies,
especially as it pertains to STEM majors. According to Tinto (2012), “data from a six-
year longitudinal study of students who began higher education in 1995 indicated that
women earn bachelor’s degrees more frequently than men (21.9% versus 19.6%)” (p. 2).
Tinto (1993) posited that the institutional experiences of females are somewhat different
from the male experiences, and female voluntary departure is more associated with social
integration than academic integration. Additionally, Pascarella and Terenzini (1980)
observed that the quality of peer-group interactions in the decision to stop out of the
institution was more important in females than males. In the latter, institutional and goal
commitments seemed to be more strongly related with the student’s decision to stop out.
In more recent studies, females generally had a higher graduation rate than males at
36
public universities (NCES, 2014). However, Whalen and Shelley (2010) presented
evidence that the females in STEM majors were significantly less likely to persist than
their male counterparts. Conversely, Chen (2013) added that more males (24%) than
females (14%) seemed to withdraw from STEM majors because they stopped out of the
university.
Similarly, student’s race and ethnicity are depicted in the literature as factors
influencing student retention (Tinto, 1993). Race is defined as “a family, tribe, people, or
nation belonging to the same stock (Lee, 1997, p. 17). Although, this definition inherently
addresses the concept of ethnic groups, ethnic relates to “large groups of people classified
according to common racial, national, tribal, religious, linguistic, or cultural origin or
background” (Lee, 1997, p. 17). Tinto (1993) posited that the more predominant race is
generally linked positively with student retention in tertiary education. However, Berger
(2000) suggested using cultural capital for studying student persistence. He posited that
students with high social and cultural capital perceived college attendance and degree
attainment as an entitlement. He argues, “Students with higher levels of cultural capital
are more likely to persist, across all types of institutions, than are students with less
access to cultural capital” (Berger, 2000, p. 114). Cultural capital (Bourdieu, 1986) helps
define an individual’s class in society. Wells (2008-2009) supported Berger’s (2000)
theory by examining the role of social and cultural capital in first year student’s
persistence in college and how race and ethnicity are related to initial levels of social and
cultural capital. His findings suggested that there is a significantly positive association
between student’s prior social and cultural capital and student’s persistence across all
racial and ethnic groups. Additionally, Wells (2008-2009) noted that the variables which
37
contributed to the highest retention rates were higher parental education and peer
interaction and the overall culture in which college attendance and degree attainment
were perceived as a norm.
Research on student retention from an individual student perspective has shown
that secondary school preparation and academic achievement were the strongest
predictors to student persistence and retention in undergraduates, and students with
stronger past academic performance and better grades were more likely to persist (Astin,
1985; Astin & Astin, 1992; Reason, 2009; Tinto, 1993, 2012), especially for students
who declared a major in a STEM field (Astin & Oseguera, 2012; Chen, 2013; Shaw &
Barbuti, 2010; Whalen & Shelly, 2010). Tinto (2012) hypothesized that students whose
grade point average was greater than 3.25 (29.6%) were more likely to persist than
students whose grade point average was less than 2.5 (7.5%).
In this study, the number of CSEC examinations that the student acquired in
secondary school was used to determine secondary school academic achievement.
Students who passed eight or more CSEC examinations were considered high achievers.
Academic achievement in mathematics and science prior to entering the university was
operationalized by the mean score obtained in CSEC biology, chemistry, physics, and
mathematics. A mean score of three or above was used as an indicator of high
achievement. In the literature, academic achievement in mathematics and science prior to
entering the university, and achieving high scores in advanced placement examinations in
STEM fields in secondary school were significantly associated with persistence across all
STEM majors (Chen, 2013; Shaw & Barbuti, 2010). Chen (2013) stated that 41% of
undergraduate students who did not take Algebra II, trigonometry, or any higher math
38
course in secondary school, was not only more likely to withdraw from their STEM
majors, but to stop out of the university. Astin (1993) found that students attending a 4-
year institution who entered the university with a strong past research focus were more
likely to major in engineering.
The initial degree aspirations, goals, and values of students are also viewed in the
literature as significant predictors of student persistence and retention (Astin & Oseguera,
2012; Shaw & Barbuti, 2010; Tinto, 1993). Students with higher degree aspiration or
occupational aspirations were viewed as more likely to persist (Astin, 1975; Astin &
Oseguera, 2012). Shaw and Barbuti (2010) observed that undergraduate students who
expressed a goal of obtaining a doctorate were more likely to persist and graduate in a
declared STEM field. They found that the greater the student’s aspirations and goals, the
higher the self-efficacy and motivation and the more likely the student was to re-enroll
and graduate from the university.
Parental education has also been widely used in the research literature as a
variable that is positively correlated with student persistence and retention since students
with more educated parents were more likely to persist (Astin, 1975; Astin & Oseguera,
2012; Bean, 2005; Tinto, 1993, 2012). Tinto (2012) presented evidence that students
from college-educated families (37%) were more likely to graduate from tertiary
education than the first generation college student (12.2%). Generally, in the literature,
first-generation college students were associated with lower GPA, had a decreased
likelihood of persistence, and deemed “at-risk” for attrition (Chen, 2005; Jehangir, 2010;
Pike & Kuh, 2005). Alternately, students whose parents had some college experience
were more likely to receive support and encouragement from their family towards
39
graduating and this increased his or her chances of degree attainment (Horn & Carroll,
1998). This characteristic was even more evident in STEM majors. Chen (2013) stated
that STEM students whose parents had only a secondary school degree stopped out of the
university at a higher rate than students whose parents had some college experience.
However, Ishitani (2006) suggested that the effects of first generation status may be
alleviated by higher levels of academic preparation in secondary school.
In this study, parental education was used as an indicator for socioeconomic status
(SES) since some of the measures used in the U.S. to define the SES variable, such as
“items in the home, parental occupation, and family income” (Cabrera, Burkum, La Nasa,
& Bibo, 2012, p. 196), did not adequately ‘fit’ the Caribbean context. For example, for
family income, the currency used would be problematics because it would be difficult for
students to convert between the three different currencies (U.S., Barbados, and Trinidad
and Tobago) and the meaning of ‘family income’ as a variable varies from country to
country.
Student Enrollment Factors
The student enrollment factor in the literature that was viewed as the most
consistent with student persistence and degree attainment in undergraduates was student
residency status (Astin, 1993; Astin & Oseguera, 2012; Pascarella & Terenzini, 1991).
Astin and Oseguera (2012) reported that the chances of completing a bachelor’s degree
are significantly improved if the student lived on campus in their first year of college.
Students in STEM majors, especially, who lived on campus have a higher success rate
than students who lived off campus (Pascarella & Terenzini, 2005; Whalen & Shelly,
2010). Students living on campus were more likely to participate in extracurricular

40
activities and form peer groups (social integration), which contributed to their persistence
(Whalen & Shelley, 2010).
Financing college and its association with student persistence and degree
attainment was traditionally portrayed in the literature with ambiguous conclusions
(Cabrera, Stampen & Hansen, 1990; St. John, 2000). However, St. John (2000) argued
that as government assistance decreased, student finances was then recognized as a
critical factor in student persistence and further research discovered that finances does
have an impact on student persistence and retention. St. John et al. (1994) found that
tuition charges had a consistently negative influence on student persistence by traditional
aged students in four-year colleges.
The variable finances have been measured in the literature by various indicators
such as financial aid, socioeconomic status, student and parent’s income, and student
perception of their finances (Cabrera et al., 2012; Gross, Torres, & Zerquera, 2013; St.
John, Andrieu, Oescher, & Starkey, 1994; Solomon & Gordon, 1981). However, similar
to the SES indicators, these constructs are not defined in the Caribbean context.
Consequently, in this study, the degree of financial concern was used as an indicator of
student perception on finances (Pryor, Hurtado, De Angelo, Blake, & Trans, 2009;
Solomon & Gordon, 1981). Solomon and Gordon (1981), in examining the field of study
which students had the most concern about their abilities to finance college, found that
the biological and science majors were the most concerned. They concluded that these
concerns may be reflected by the long period of time that the student anticipated staying
in a university. Pryor et al. (2009) found that more than half of first year students (55.4%)
had ‘some’ concern about financing college and the concerns increased “2.2 percentages

41
points and continued to climb to its highest level since 1971” (p. 6). However, the
literature connecting financial concerns and student persistence was very limited. Braxton
and Hirschy (2005) found in residential colleges that the students who had ongoing
financial concerns were less likely to be socially integrated into the institution.
Institutional Experiences
The broader construct of institutional experiences are comprised of social
integration and academic integration, significant components of the student withdrawal
process in tertiary education (Tinto, 1975, 1993). However, Pascarella and Terenzini
(1980) included institutional and goal commitments to the student’s institutional
experience in their model. Tinto (1993) suggested that students who are more engaged
academically and socially in the university and more goals and institutionally committed
are less likely to voluntarily withdraw from tertiary education than students who are less
engaged and less committed.
Academic System and Student Retention
The academic system in the university is how a student interacts with academic
resources and is associated with the formal and informal structures of the institution
(Tinto, 1993). The ways in which a student interacts with the academic environment
include student’s interaction with faculty, academic and intellectual development, and
academic advising (Bean, 2005; Pascarella & Terenzini, 1980; Tinto, 1993). Bean argues
that “the combination of the student’s background, interaction with the institution related
to academic matters, and a belief in one’s ability to perform academic work have a
cumulative mutual influence resulting in academic integration” (p. 226).
42
Faculty interactions and concern for student development. Tinto (1993)
suggested that out- of- classroom interactions between students and faculty members had
a great effect on students who were considering withdrawing from the institution.
Pascarella and Terenzini (1980) found that items designed to assess the quality of
student’s interaction with faculty, separated into two factors: interaction with faculty and
faculty concerns for student development and teaching.
Student’s interaction with faculty focused on faculty’s availability to students and
the impact of student-faculty informal contact (Pascarella & Terenzini, 1980). The
researchers presented evidence that there is a significant relationship between the
frequency of student-faculty contact outside the classroom and student persistence to the
second year of college. The more frequently student-faculty interaction occurred, the
more likely students were to remain at the institution (Bean, 2005). Pascarella and
Terenzini (1980) concluded that, “the quality and impact of student-faculty informal
contacts may be as important to students’ institutional integration, and thereby, their
likelihood of persisting in college as the frequency with which such interactions occur”
(p. 72).
Student contact with faculty was also viewed as having a direct positive
relationship to learning, academic performance, and degree attainment (Astin, 1993).
Hossler (1990) suggested that both academic and out-of classroom activities encouraged
student-faculty interaction. Furthermore, it was suggested that faculty interaction
“reinforce or challenge a student’s self-image as a person outside the classroom” (Bean,
2005, p. 225). The out-of classroom activities included advising student organizations;
participating in orientation; eating in the cafeteria with students, and serving on student
43
committees. Pascarella and Terenzini (1980) also found that out-of-classroom
interactions between faculty and students had a positive influence on first year students’
personal and intellectual growth, values, and attitudes as well as their career goals and
aspirations and that these attributes were significantly positively associated with student
persistence.
Pascarella and Terenzini (1980) identified faculty concerns for student
development and teaching as a separate construct from faculty interaction. They found
that when students perceived the faculty as being generally interested in them and helping
them grow in more than just academics, and the faculty were willing to spend time out of
the classroom discussing issues that they were interested in and important to the students,
as well as the faculty being genuinely interested in teaching, the first year students were
more likely to persist in the institution. Bean (2005) added that when a student felt that
faculty members did not care about their development, their commitment to the
institution weakened.
Academic and intellectual development. Tinto (1993) postulated that academic
and intellectual development is a key component of student retention in his longitudinal
model of student departure. Pascarella and Terenzini (1980) supported this postulate and
found that when students are satisfied with their academic experience at the university
and perceive that their academic experiences have had a positive influence on their
intellectual growth, and their courses are intellectually stimulating, they are more likely
to persist. Bean (2005) argues that the importance of the effect of academic development
in college retention should not be taken lightly since it helps students develop a sense of
44
“academic self-efficacy” (p. 227), students feel more committed to the university, and are
more likely to re-enroll.
Developmental versus prescriptive academic advising. At the UWI ineffective
institutional practices were identified by first-year students as an important influence on
their decision to withdraw from the university (Tewarie, 2010a). She found that 22% of
first year students surveyed at UWI identified academic advising as a reason for not
returning to the institution since the first year students did not know who to turn to when
they were having financial difficulties, family issues or health related issues. Tewarie felt
that an advisor would have known who to refer students to with these issues. According
to Tewarie, students transferred to other institutions because UWI did not have an
adequate support system in place at any of their campuses by which students could rely
on for assistance. Habley and McClanahan (2004) identified academic advising as an
institutional practice that has the most impact on students’ intent to persist in the
university.
Advising is viewed in the literature as positively impacting student persistence
and subsequently retention (Nutt, 2003; Cuseo, 2002). According to Cuseo (2002),
advising has a strong influence on student retention through (1) student’s satisfaction of
the college experience; (2) effective educational and career planning and decision
making; (3) student utilization of campus support services; (4) student-faculty contact
outside the classroom; and (5) student mentoring (p. 1). Bean (2005) summarized that
good advising links a students’ academic capabilities with his or her major, access to
learning resources and career choice. The UWI employs a faculty-only advising model.
The purpose of academic advising at UWI is to “help students, particularly new students,
45
in planning, monitoring and successfully managing their chosen field of study, in relation
to clear career objectives. Students are guided to accept responsibility for their learning,
to be informed of the services provided for them, to access information, and to be
managers of their time” (UWI, 2014, para. 1). Crookston (1994) describes this traditional
relationship, based on the advisor as an authority figure, between the academic advisor
and advisee as “prescriptive” (p. 5). He adds that “some faculty members see the
prescriptive advising as convenient and desirable” (p. 6).
The literature on the nature of academic advising advocates for the delivery of
advising from a more developmental perspective which emphasizes building
relationships, coaching, mentoring, and/or teaching (Crookston, 1994; Cuseo, 2002;
Drake, 2011; Kuhn, 2008; Nutt, 2003). In developmental advising, the advisor and
advisee engage in a series of “developmental tasks” (p. 6), which is described as more
holistic and student-centered (Kramer, 2003). Table 2 differentiates prescriptive learning
from the developmental approaches in advising.
Developmental advising is perceived as having a positive impact on student
retention since it “increases students’ involvement in institutional programs and services
and increases the overall impact of educational experiences for students” (Winston, 1994,
p. 114). According to Crookston (1994), advisors who practice developmental advising
are not only concerned with specific personal decisions or career planning but with
“facilitating the students’ rational process, environmental and personal interactions,
behavioral awareness and problem-solving, decision-making and evaluation skills” (p. 5).
Crookston points out that not only are these advising tasks but also aspects of teaching;
hence the adage Advising as Teaching.
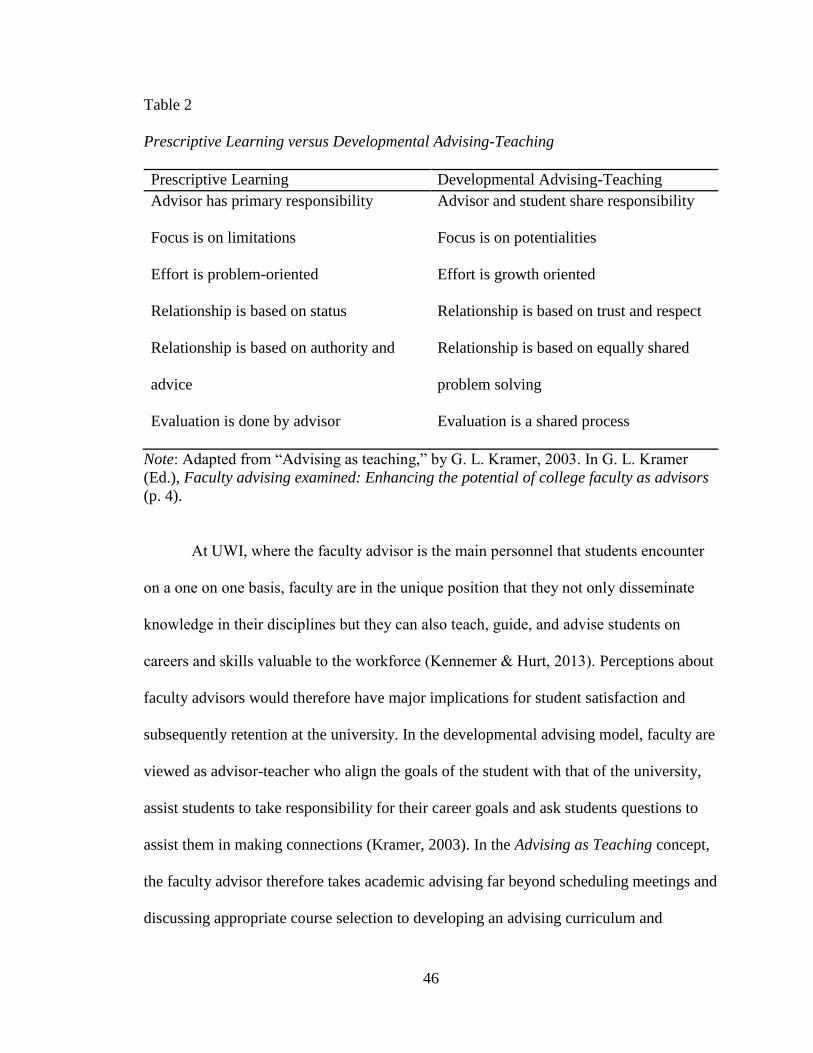
46
Table 2
Prescriptive Learning versus Developmental Advising-Teaching
Prescriptive Learning Developmental Advising-Teaching
Advisor has primary responsibility Advisor and student share responsibility
Focus is on limitations Focus is on potentialities
Effort is problem-oriented Effort is growth oriented
Relationship is based on status Relationship is based on trust and respect
Relationship is based on authority and
advice
Relationship is based on equally shared
problem solving
Evaluation is done by advisor Evaluation is a shared process
Note: Adapted from “Advising as teaching,” by G. L. Kramer, 2003. In G. L. Kramer
(Ed.), Faculty advising examined: Enhancing the potential of college faculty as advisors
(p. 4).
At UWI, where the faculty advisor is the main personnel that students encounter
on a one on one basis, faculty are in the unique position that they not only disseminate
knowledge in their disciplines but they can also teach, guide, and advise students on
careers and skills valuable to the workforce (Kennemer & Hurt, 2013). Perceptions about
faculty advisors would therefore have major implications for student satisfaction and
subsequently retention at the university. In the developmental advising model, faculty are
viewed as advisor-teacher who align the goals of the student with that of the university,
assist students to take responsibility for their career goals and ask students questions to
assist them in making connections (Kramer, 2003). In the Advising as Teaching concept,
the faculty advisor therefore takes academic advising far beyond scheduling meetings and
discussing appropriate course selection to developing an advising curriculum and
47
advising syllabus. However, when Allen and Smith (2008) examined faculty attitudes
towards and experiences with academic advising, they found a gap in the advising
services in relation to what faculty believed their responsibility was as an advisor. The
faculty believed that they were responsible for providing the most accurate information
that students needed but when it came to assisting students in navigating the institution by
understandings its policies and procedures, faculty felt this was important but that it was
not their role. Allen and Smith (2008) observed that the faculty felt that it was their
responsibility to refer students only for academic reasons and were not concerned with
student’s personal issues.
Ender (1994) reported that faculty members are ineffective in developmental
advising practices without adequate training since it requires “skills, competencies, and
knowledge beyond any given academic discipline” (p. 106). Cuseo (2002) suggested that
faculty advisors be required to attend professional development workshops to acquire
these skills to practice developmental advising. Bean (2005) added that the debate about
whether first year student advising should be done by a professional or faculty is
unnecessary. He argued that what is important is that advising is done well so the student
can make informed academic decisions and either staff or faculty can provide this
information.
Tewarie’s (2010a) study suggested that there are several university functions,
including academic advising, that if improved, could provide personal support to the first
year students. Kennemer and Hurt (2013, p. 2) summarized the traits from the literature
that have been determined to be essential for effective academic advising. According to
Kennemer and Hurt, advisors should:
48
Possess the ability to disseminate accurate information, to give appropriate
guidance, and to be knowledgeable about university and degree
requirements (Baker & Griffin, 2010; Creamer, 2000; Dillon & Fisher,
2000; Harrison, 2009; Upcraft & Garner, 1989)
Understand student development and be able to effectively guide students
toward setting and reaching goals (Harrison, 2009; Johnson & Morgan,
2005)
Know how and when to effectively guide students to additional campus
resources that are needed (Johnson & Morgan, 2005)
Develop relationships with the student (Upcraft & Gardner, 1989)
Show courtesy and respect toward the advisee (Hester, 2008)
Show interest in advisee’s academic program (Hester, 2008)
Exhibit approachability (Harrison, 2009) and be a good listener (Hester,
2008)
Social System and Student Retention
The relationship in Tinto’s (1975) model that was best supported by empirical
evidence from the literature was the effect of social interaction on institutional
commitment and student retention (Braxton et al., 2004). While interaction with faculty is
important, research has shown that interaction with peers is also vital for improved
retention (Pascarella & Terenzini, 1980). Social interaction is also formed through both
the formal and informal structures of the institution and is mainly a function of the
quality of peer-group interactions. Bean (2005) posited that social support and close
friendships formed the core components of social integration. These social interactions
49
with peers may develop either in the class or outside the classroom at social events such
as fraternities and sororities, clubs, or other student organizations. Researchers found that
students who were more socially engaged on campus were more likely to persist and
graduate (Astin & Oseguera, 2012; Oseguera & Rhee, 2009; Bean, 2005; Braxton & Lee,
2005; Tinto, 1975). Bean argued that as the first year student becomes more connected to
other students, their self-confidence increased, the institution is perceived as a good “fit”
and he or she is more likely to re-enroll. Therefore, establishing that strong support
network is important for a successful transition to the university. Developing
interpersonal relationships with other students on campus have been shown to have a
positive influence on students’ personal growth, attitudes, and values as well as their
interest and ideas and these were positively associated with first year persistence in
college students (Astin & Oseguera, 2012; Cabrera et al., 1993; Pascarella & Terenzini,
1980). However, Astin and Oseguera (2012) warned that engaging in activities such as
partying and drinking are negatively related to persistence and degree attainment.
Commitments and Student Retention
Social and academic integration lead to commitment (Tinto, 1993). According to
Tinto (1975), “Other things being equal, the higher the degree of integration of the
individual into the college system, the greater will be his commitment” (p. 96). This
commitment is to a particular higher education institution and to the student’s goals,
which are associated with degree attainment and career decision making. Institutional
commitment is defined as the student’s obligation to remain and graduate at his or her
institution while goal commitment refers to the personal importance that a student places
on attaining a college degree (Pascarella & Terenzini, 1980). Unlike Tinto’s (1993)
50
model of longitudinal student retention, Pascarella and Terenzini (1980) found that the
items constructed to measure goal commitment and institutional commitment “tended to
cluster together and yield a single, composite factor” (p. 65). According to the literature,
as the level of institutional and goal commitments increases, the likelihood of student
persistence at the institution increases (Braxton & Hirschy, 2005; Pascarella & Terenzini,
1980; Tinto, 1993).
Chapter Summary
This chapter presented an overview of the literature and empirical studies
that conceptualize student attributes and institutional experiences in persistence and
retention. Several studies reveal that student’s demographic and enrollment
characteristics are associated with student’s decision to persist and graduate from a
university. Additionally, student’s perception of his or her experiences at the institution,
including experiences with academic advising, was identified as predicting degree
attainment. Astin and Oseguera (2012, p. 132) summarize,
Those with the best chances of finishing college thus tend to have good grades in
high school, to come from intact families that are affluent and well educated, and
show a propensity to become highly involved or engaged in the social and
academic life of the institution.
The following chapter examines the methodology utilized in the study. Chapter 3
outlines the research design, the population and sample of the students’ investigated,
description of the instrument used, the variables explored, and the methods used to
analyze the data collected. The chapter culminates with the limitations of the study.
51
CHAPTER 3
METHODOLOGY
The study explored issues pertaining to retention and persistence at a public
university system in the Caribbean during the 2014-2015 academic year. The study
focused on first year students in STEM majors at the University of the West Indies, St.
Augustine campus in Trinidad and Tobago, and the Cave Hill campus in Barbados. The
purposes of this study are twofold; first, to examine the students’ attributes and the
institutional experiences that contribute to retention of first year, Caribbean students in
science, technology, engineering and mathematics (STEM) majors during the first
semester, 2014. Second, to determine the nature of and student satisfaction with the
academic advising students received during their first 2014 semester.
The research questions and hypotheses are:
1. Does the campus the student attended predict intent to re-enroll at the two UWI
campuses: St. Augustine and Cave Hill, in first year STEM students?
H1: There will be a significant relationship between the campus students attended
and first year STEM students’ intent to re-enroll at the UWI. Students are more
likely to re-enroll at the Cave Hill campus.
2. What student attributes (including sex, race/ethnicity, secondary school academic
achievement, secondary school science and mathematics grades, degree
aspiration, parental education, residency status, and financial concerns) are
52
associated with intent to re-enroll the following semester for first year STEM
students at the UWI: St. Augustine and Cave Hill, controlling for campus?
H2: There will be a significant relationship between the predominant sex (none at
St. Augustine and females at Cave Hill), the predominant race/ethnicity (East
Indians at St. Augustine and Blacks at Cave Hill), stronger secondary school
academic achievement, higher secondary school science and mathematics scores,
higher degree aspiration, higher educated parents, on campus residency, and
financial concerns (none at St. Augustine and higher at Cave Hill), with first year
STEM students’ intent to re-enroll at the UWI.
3. What institutional experiences (including interactions with faculty, faculty
concern for student development, academic and intellectual development,
institutional and goal commitments, and peer-group interaction) are associated
with intent to re-enroll the following semester in first-year STEM students at the
UWI: St. Augustine and Cave Hill, controlling for campus?
H3: There will be a significant relationship between higher interaction with
faculty, higher faculty concern for students, stronger academic and intellectual
development, stronger institutional and goal commitments, and higher peer group
interaction with first year STEM students’ intent to re-enroll at the UWI.
4. What perceptions do first-year STEM students at UWI have about the type of
academic advising they received as measured by the Academic Advising Inventory
(AAI) (see Appendix A)?
H4: First-year students will perceive:
53
a. The nature of academic advising at the UWI as being more
prescriptive than developmental.
b. The overall academic advising experience at UWI will be below the
average score (< 2.5) which indicates dissatisfaction.
Research Design
A quantitative research design was used to determine the perceptions and attitudes
of first year students in STEM fields at the Caribbean university system. Teddlie and
Tashakkori (2009) defined quantitative design as the strategies associated with gathering,
analyzing, interpreting, and presenting numerical information. The correlation study
adopted a non-experimental, survey research design in which self-reported data were
collected using a questionnaire, The UWI Survey of First-Year Students’ Perceptions, to
answer the research questions and predict the attitudes and perceptions of the target
population during the first semester, 2014. A survey instrument was used since it
provided good generalizability and external validity to the population (Teddlie &
Tashakkori, 2009).
Binary logistic regression analysis was used to determine the variance and effect
of the predictor variables on the likelihood of spring enrollment in research questions one
and two. Logistic regression was an appropriate approach to measure student retention
for the study because it allowed the researcher to “regress” the continuous and categorical
predictor variables on the binary, categorical dependent variable, intent to re-enroll
(Osborne, 2014). Intent to re-enroll at the university is operationalized as 0=do not
intend to re-enrolled; 1= intend to re-enroll. Research question three is assessed using
54
descriptive statistics (mean standard deviation, frequency charts, and graphs). It was
important that the study was completed during the first semester because academic
advising policies at the institutions only mandate advising at the beginning of the
freshmen year during orientation and registration, and the literature supports conducting
the research during their first semester (Pascarella & Terenzini, 1980).
Context: The University of the West Indies
The research was conducted at two of the regional campuses of the University of
the West Indies, the St. Augustine campus in Trinidad and Tobago and the Cave Hill
campus in Barbados, with a total undergraduate enrollment of about 19,329 students,
approximately 4,891 of whom are ‘new first time’ students (Table 3). The undergraduate
population at UWI comprised approximately 75% of the student body and approximately
51% of the students are 24 years and under (UWI stats, 2010). The UWI undergraduate
student population has a ratio of 1:2 males to females across all campuses, except in
STEM fields, where there is a 1:1 ratio of males to females (Table 3). According to UWI
stats (2010), approximately 37% of the student body (17% Science/Technology; 12%
Medical Science; 7% Engineering) enrolled in STEM based programs annually. Table 3
shows the distribution of STEM majors at the two UWI institutions.
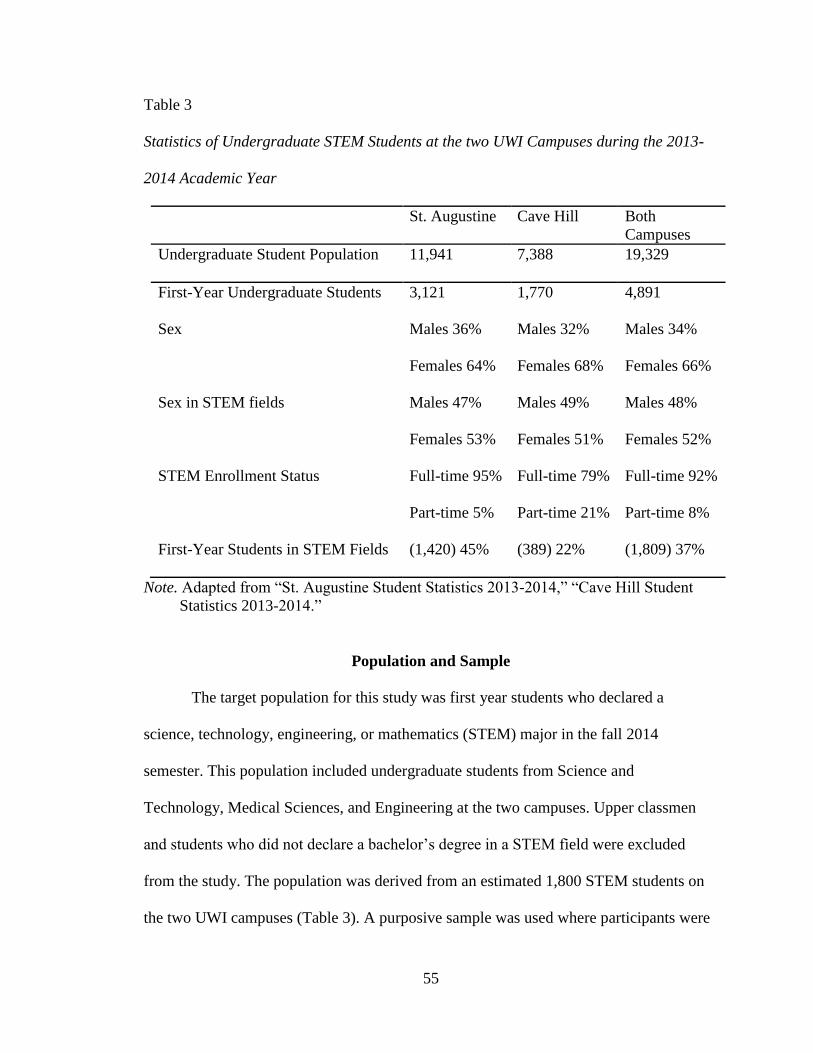
55
Table 3
Statistics of Undergraduate STEM Students at the two UWI Campuses during the 2013-
2014 Academic Year
St. Augustine Cave Hill Both
Campuses
Undergraduate Student Population 11,941 7,388 19,329
First-Year Undergraduate Students 3,121 1,770 4,891
Sex Males 36%
Females 64%
Males 32%
Females 68%
Males 34%
Females 66%
Sex in STEM fields Males 47%
Females 53%
Males 49%
Females 51%
Males 48%
Females 52%
STEM Enrollment Status Full-time 95%
Part-time 5%
Full-time 79%
Part-time 21%
Full-time 92%
Part-time 8%
First-Year Students in STEM Fields
(1,420) 45% (389) 22% (1,809) 37%
Note. Adapted from “St. Augustine Student Statistics 2013-2014,” “Cave Hill Student
Statistics 2013-2014.”
Population and Sample
The target population for this study was first year students who declared a
science, technology, engineering, or mathematics (STEM) major in the fall 2014
semester. This population included undergraduate students from Science and
Technology, Medical Sciences, and Engineering at the two campuses. Upper classmen
and students who did not declare a bachelor’s degree in a STEM field were excluded
from the study. The population was derived from an estimated 1,800 STEM students on
the two UWI campuses (Table 3). A purposive sample was used where participants were
56
deliberately selected to be in the sample based on their class standing and major (Shadish,
Cook, & Campbell, 2002). At the Cave Hill campus, the researcher identified 13
preliminary and introductory (1000-level) courses offered in the first semester of
students’ first year (see Appendix B). Two sampling frames for the Cave Hill campus
(Science/Technology and Medical Science majors) were used. Each sampling frame
included students who were registered in the introductory courses identified (see
Appendix B, Table B1). At the St. Augustine campus, the sample was determined using a
snowball sampling method where respondents were asked to identify additional
participants to include in the study (Patton, 2002). The three sampling frames used for the
St. Augustine campus were Science, Technology, and Agriculture; Medical Science; and
Engineering The snowball sampling started by contacting one or two persons in each
sampling frame and encouraging them to pass on the survey to peers and other students in
their dormitories and classes who matched the criteria given.
Variables and Instrument
The study examined student retention in first year, full-time students, in STEM
majors at the UWI during their first semester, 2014. There is one dependent variable and
16 independent variables (Tables 4 and 5). The dependent variable (intent to re-enroll)
was defined as the student’s intent to return during the second semester, 2015. Tables 4
and 5 describe each independent variable and how it is operationally defined and coded.
Table 4 also shows how intent to re-enroll, race/ethnicity, and secondary school math and
science GPA variables were recoded.
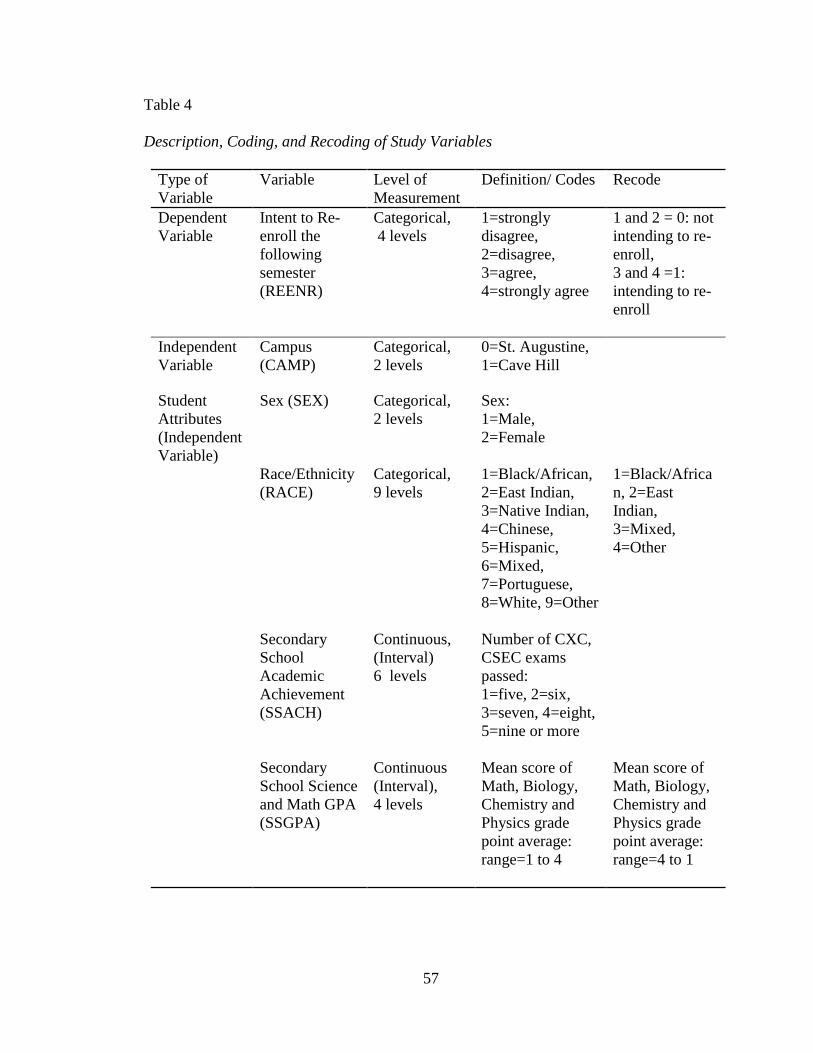
57
Table 4
Description, Coding, and Recoding of Study Variables
Type of
Variable
Variable Level of
Measurement
Definition/ Codes Recode
Dependent
Variable
Intent to Re-
enroll the
following
semester
(REENR)
Categorical,
4 levels
1=strongly
disagree,
2=disagree,
3=agree,
4=strongly agree
1 and 2 = 0: not
intending to re-
enroll,
3 and 4 =1:
intending to re-
enroll
Independent
Variable
Campus
(CAMP)
Categorical,
2 levels
0=St. Augustine,
1=Cave Hill
Student
Attributes
(Independent
Variable)
Sex (SEX) Categorical,
2 levels
Sex:
1=Male,
2=Female
Race/Ethnicity
(RACE)
Categorical,
9 levels
1=Black/African,
2=East Indian,
3=Native Indian,
4=Chinese,
5=Hispanic,
6=Mixed,
7=Portuguese,
8=White, 9=Other
1=Black/Africa
n, 2=East
Indian,
3=Mixed,
4=Other
Secondary
School
Academic
Achievement
(SSACH)
Continuous,
(Interval)
6 levels
Number of CXC,
CSEC exams
passed:
1=five, 2=six,
3=seven, 4=eight,
5=nine or more
Secondary
School Science
and Math GPA
(SSGPA)
Continuous
(Interval),
4 levels
Mean score of
Math, Biology,
Chemistry and
Physics grade
point average:
range=1 to 4
Mean score of
Math, Biology,
Chemistry and
Physics grade
point average:
range=4 to 1
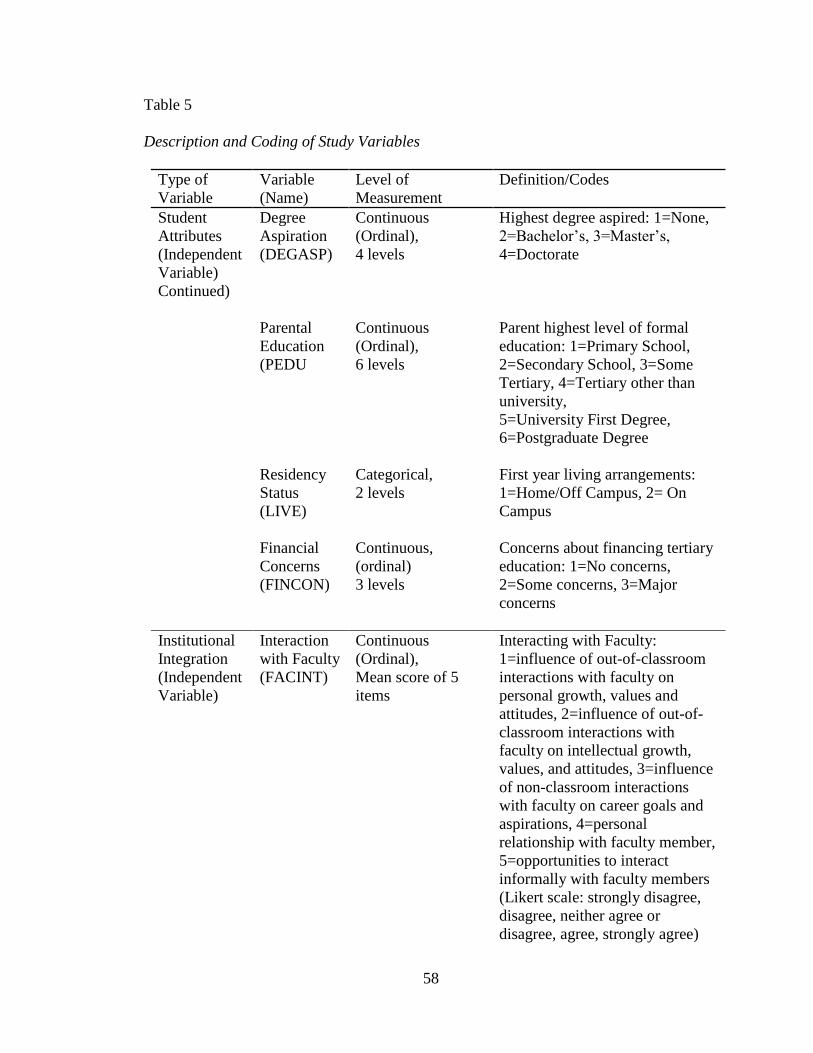
58
Table 5
Description and Coding of Study Variables
Type of
Variable
Variable
(Name)
Level of
Measurement
Definition/Codes
Student
Attributes
(Independent
Variable)
Continued)
Degree
Aspiration
(DEGASP)
Continuous
(Ordinal),
4 levels
Highest degree aspired: 1=None,
2=Bachelor’s, 3=Master’s,
4=Doctorate
Parental
Education
(PEDU
Continuous
(Ordinal),
6 levels
Parent highest level of formal
education: 1=Primary School,
2=Secondary School, 3=Some
Tertiary, 4=Tertiary other than
university,
5=University First Degree,
6=Postgraduate Degree
Residency
Status
(LIVE)
Categorical,
2 levels
First year living arrangements:
1=Home/Off Campus, 2= On
Campus
Financial
Concerns
(FINCON)
Continuous,
(ordinal)
3 levels
Concerns about financing tertiary
education: 1=No concerns,
2=Some concerns, 3=Major
concerns
Institutional
Integration
(Independent
Variable)
Interaction
with Faculty
(FACINT)
Continuous
(Ordinal),
Mean score of 5
items
Interacting with Faculty:
1=influence of out-of-classroom
interactions with faculty on
personal growth, values and
attitudes, 2=influence of out-of-
classroom interactions with
faculty on intellectual growth,
values, and attitudes, 3=influence
of non-classroom interactions
with faculty on career goals and
aspirations, 4=personal
relationship with faculty member,
5=opportunities to interact
informally with faculty members
(Likert scale: strongly disagree,
disagree, neither agree or
disagree, agree, strongly agree)
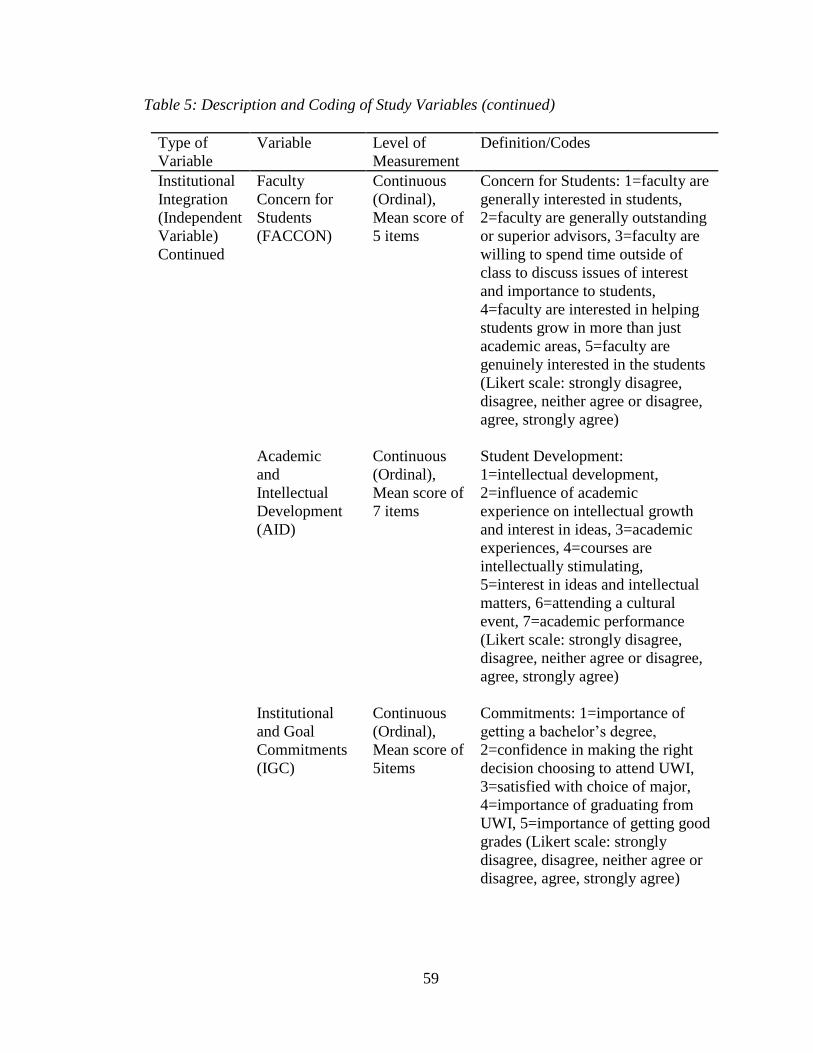
59
Table 5: Description and Coding of Study Variables (continued)
Type of
Variable
Variable Level of
Measurement
Definition/Codes
Institutional
Integration
(Independent
Variable)
Continued
Faculty
Concern for
Students
(FACCON)
Continuous
(Ordinal),
Mean score of
5 items
Concern for Students: 1=faculty are
generally interested in students,
2=faculty are generally outstanding
or superior advisors, 3=faculty are
willing to spend time outside of
class to discuss issues of interest
and importance to students,
4=faculty are interested in helping
students grow in more than just
academic areas, 5=faculty are
genuinely interested in the students
(Likert scale: strongly disagree,
disagree, neither agree or disagree,
agree, strongly agree)
Academic
and
Intellectual
Development
(AID)
Continuous
(Ordinal),
Mean score of
7 items
Student Development:
1=intellectual development,
2=influence of academic
experience on intellectual growth
and interest in ideas, 3=academic
experiences, 4=courses are
intellectually stimulating,
5=interest in ideas and intellectual
matters, 6=attending a cultural
event, 7=academic performance
(Likert scale: strongly disagree,
disagree, neither agree or disagree,
agree, strongly agree)
Institutional
and Goal
Commitments
(IGC)
Continuous
(Ordinal),
Mean score of
5items
Commitments: 1=importance of
getting a bachelor’s degree,
2=confidence in making the right
decision choosing to attend UWI,
3=satisfied with choice of major,
4=importance of graduating from
UWI, 5=importance of getting good
grades (Likert scale: strongly
disagree, disagree, neither agree or
disagree, agree, strongly agree)
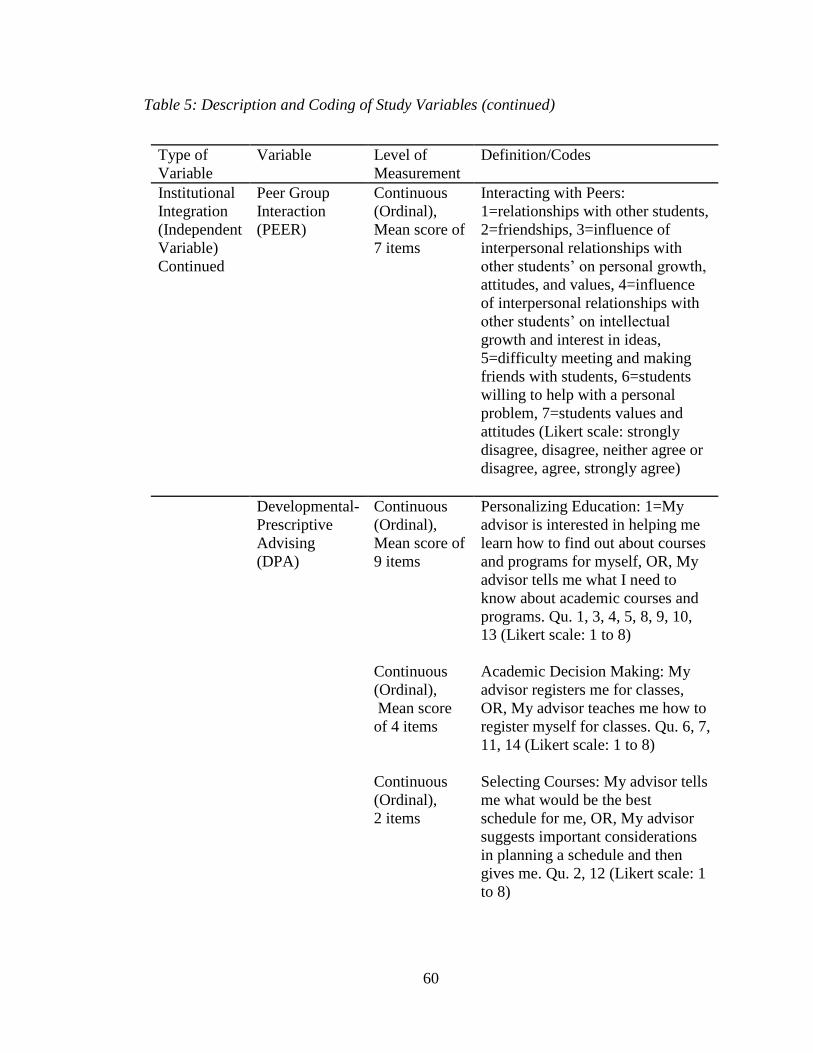
60
Table 5: Description and Coding of Study Variables (continued)
Type of
Variable
Variable Level of
Measurement
Definition/Codes
Institutional
Integration
(Independent
Variable)
Continued
Peer Group
Interaction
(PEER)
Continuous
(Ordinal),
Mean score of
7 items
Interacting with Peers:
1=relationships with other students,
2=friendships, 3=influence of
interpersonal relationships with
other students’ on personal growth,
attitudes, and values, 4=influence
of interpersonal relationships with
other students’ on intellectual
growth and interest in ideas,
5=difficulty meeting and making
friends with students, 6=students
willing to help with a personal
problem, 7=students values and
attitudes (Likert scale: strongly
disagree, disagree, neither agree or
disagree, agree, strongly agree)
Developmental-
Prescriptive
Advising
(DPA)
Continuous
(Ordinal),
Mean score of
9 items
Personalizing Education: 1=My
advisor is interested in helping me
learn how to find out about courses
and programs for myself, OR, My
advisor tells me what I need to
know about academic courses and
programs. Qu. 1, 3, 4, 5, 8, 9, 10,
13 (Likert scale: 1 to 8)
Continuous
(Ordinal),
Mean score
of 4 items
Academic Decision Making: My
advisor registers me for classes,
OR, My advisor teaches me how to
register myself for classes. Qu. 6, 7,
11, 14 (Likert scale: 1 to 8)
Continuous
(Ordinal),
2 items
Selecting Courses: My advisor tells
me what would be the best
schedule for me, OR, My advisor
suggests important considerations
in planning a schedule and then
gives me. Qu. 2, 12 (Likert scale: 1
to 8)
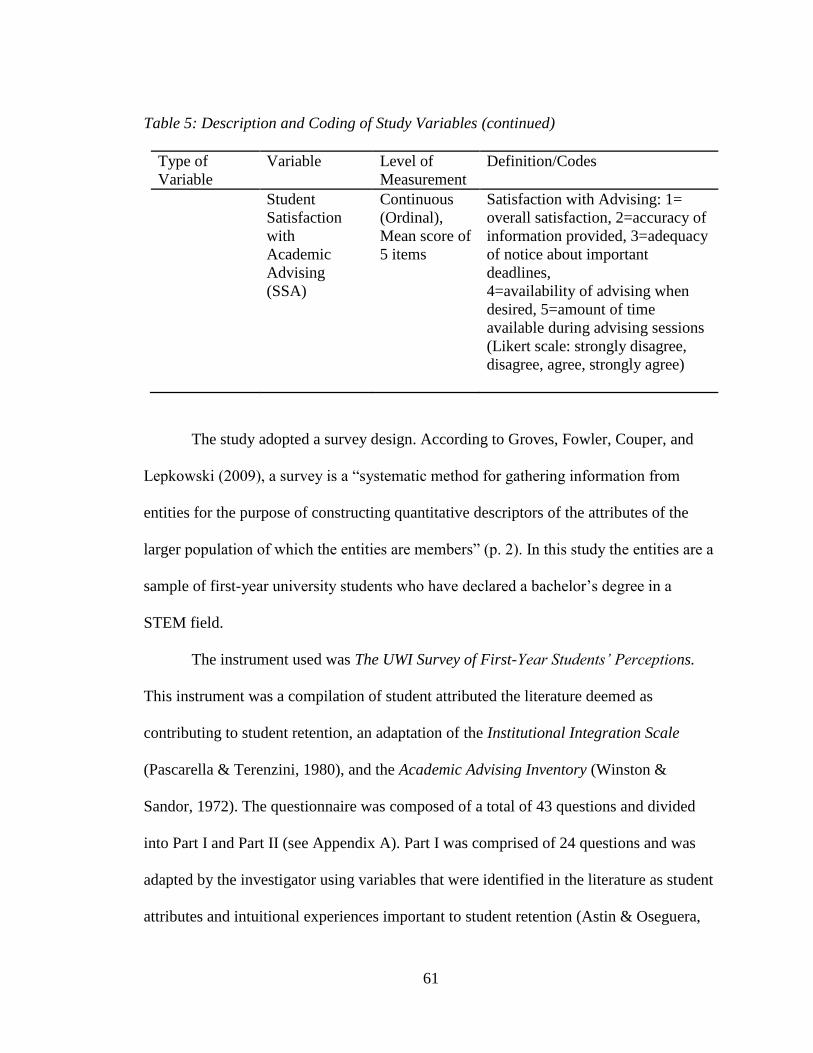
61
Table 5: Description and Coding of Study Variables (continued)
Type of
Variable
Variable Level of
Measurement
Definition/Codes
Student
Satisfaction
with
Academic
Advising
(SSA)
Continuous
(Ordinal),
Mean score of
5 items
Satisfaction with Advising: 1=
overall satisfaction, 2=accuracy of
information provided, 3=adequacy
of notice about important
deadlines,
4=availability of advising when
desired, 5=amount of time
available during advising sessions
(Likert scale: strongly disagree,
disagree, agree, strongly agree)
The study adopted a survey design. According to Groves, Fowler, Couper, and
Lepkowski (2009), a survey is a “systematic method for gathering information from
entities for the purpose of constructing quantitative descriptors of the attributes of the
larger population of which the entities are members” (p. 2). In this study the entities are a
sample of first-year university students who have declared a bachelor’s degree in a
STEM field.
The instrument used was The UWI Survey of First-Year Students’ Perceptions.
This instrument was a compilation of student attributed the literature deemed as
contributing to student retention, an adaptation of the Institutional Integration Scale
(Pascarella & Terenzini, 1980), and the Academic Advising Inventory (Winston &
Sandor, 1972). The questionnaire was composed of a total of 43 questions and divided
into Part I and Part II (see Appendix A). Part I was comprised of 24 questions and was
adapted by the investigator using variables that were identified in the literature as student
attributes and intuitional experiences important to student retention (Astin & Oseguera,
62
2012; Bean, 1980, 1982; Cabrera et al., 2012; Pascarella & Terenzini, 1980; Tinto, 1975,
1993). Part II had two sections (Sections A and B). Section A was comprised of 14
questions and Section B had 5 questions. These sections were developed by Winston and
Sandor (1984b) as part of the Academic Advising Inventory (AAI). The AAI instrument is
nationally used and available to all members of the National Academic Advising
Association (NACADA), without cost provided that the member observes the following:
NACADA members have permission to use AAI Parts I and II in their entirety,
but individual items may not be removed from these two parts for use in other
instruments. NACADA members have permission to use individual items from
Parts III and IV. Items in Parts III and IV may be altered or eliminated to fit local
conditions (Winston & Sandor, 2002, para. 2).
The researcher is a member of NACADA and qualifies to use parts I and III of the survey
under the specified conditions. In this study parts I and III have been relabeled sections A
and B.
Description of Survey
In the UWI Survey of First-Year Students’ Perceptions, Part I, the constructs are
divided into two units: Student attributes and the Institutional Integration Scale (IIS).
Student attributes consisted of nine questions that provided students’ background
characteristics and enrollment information, factors deemed by literature as contributing to
student retention (Astin & Oseguera, 2012; Pascarella & Terenzini, 1980; Tinto, 1975,
1993). These factors were sex, race/ethnicity, secondary school academic achievement,
secondary school math and science grades, degree aspiration, parent education,
enrollment status, residency status, and financial concerns.
63
The second unit consisted of the Institutional Interaction Scale (IIS) developed by
Pascarella and Terenzini (1980) to measure the dimensions identified by Tinto as
contributing to student persistence. The scales consisted of 30 Likert-type items arranged
in five subscales. The subscales were peer-group interactions (7 items, “Since coming to
this university, I have developed close personal relationships with other students”),
interactions with faculty (5 items, “My non-classroom interaction with faculty have had a
positive influence on my personal growth, values and attitudes”), Faculty concern for
students development and teaching (5 items, “Most of the faculty I have had contact with
are interested in helping students grow in more than just academic areas”), academic and
intellectual development (7 items, “I am satisfied with the extent of my intellectual
development since enrolling in UWI”), and institutional and goal commitments (6 items,
“I am satisfied with choice of major” and “It is important for me to graduate from UWI”)
(Pascarella & Terenzini, 1980). The IIS has been used in various forms in student
retention research and has been found to generally support the predictive validity of the
key measurements of Tinto’s theory of student integration in identifying first-year
students who voluntarily drop out of tertiary institutions (Caison, 2007; French & Oaks,
2004; Mannan, 2001). The IIS possesses desirable traits that were appealing to university
students since it was relatively short and easy to administer (French & Oaks, 2004).
Students were asked to indicate their level of agreement with the items that were related
to institutional satisfaction. The items were coded on a five-point Likert scale where 5=
strongly disagree to 1 = strongly agree (see Appendix A). However, prior to analysis,
items which loaded negatively, such as “Few of the faculty members I have had contact
64
with are generally interested in students,” were re-coded 1=strongly agree to 5=strongly
disagree.
The UWI Survey of First-Year Students’ Perceptions, Part II explored the
Academic Advising Inventory (AAI) designed by Winston and Sandor (1984a). Part II-
Section A of the inventory consisted of 14 items on a Likert-type scale that best described
the nature of the advising process (Winston & Sandor, 2002). The scale measured
academic advising approaches between the two complementary behavioral styles and
attitude (developmental advising and prescriptive advising) on a continuum, and the
student was asked to respond to his or her preferred approach and their perception of the
advisor’s approach to academic advising. The total scale was composed of three
subscales: Personalizing education (PE), academic decision making (ADM), and
selecting courses (SC). PE was defined in items 1, 3, 4, 5, 8, 9, 10, and 13, and revealed
student’s concerns about their total education: “Career/vocational planning,
extracurricular activities, personal concerns, goal setting, and identification and
utilization of resources on the campus” (Winston & Sandor, 2002, p. 11). ADM was
defined in items 6, 7, 11 and 14, and focused on whose responsibility it was (advisor
versus advisee) for making and implementing academic decisions. The ADM subscale
included “monitoring academic progress, collecting information and assessing the
student’s interests and abilities concerning academic concentrations, as well as other
areas, and then carrying through by registering for appropriate courses” (Winston &
Sandor, 2002, p. 11). SC was defined by items 2 and 12, and dealt with selecting
appropriate courses and academic and degree planning. Higher scores on all the scales
and subscales indicated a more developmental approach to academic advising (Table 8).
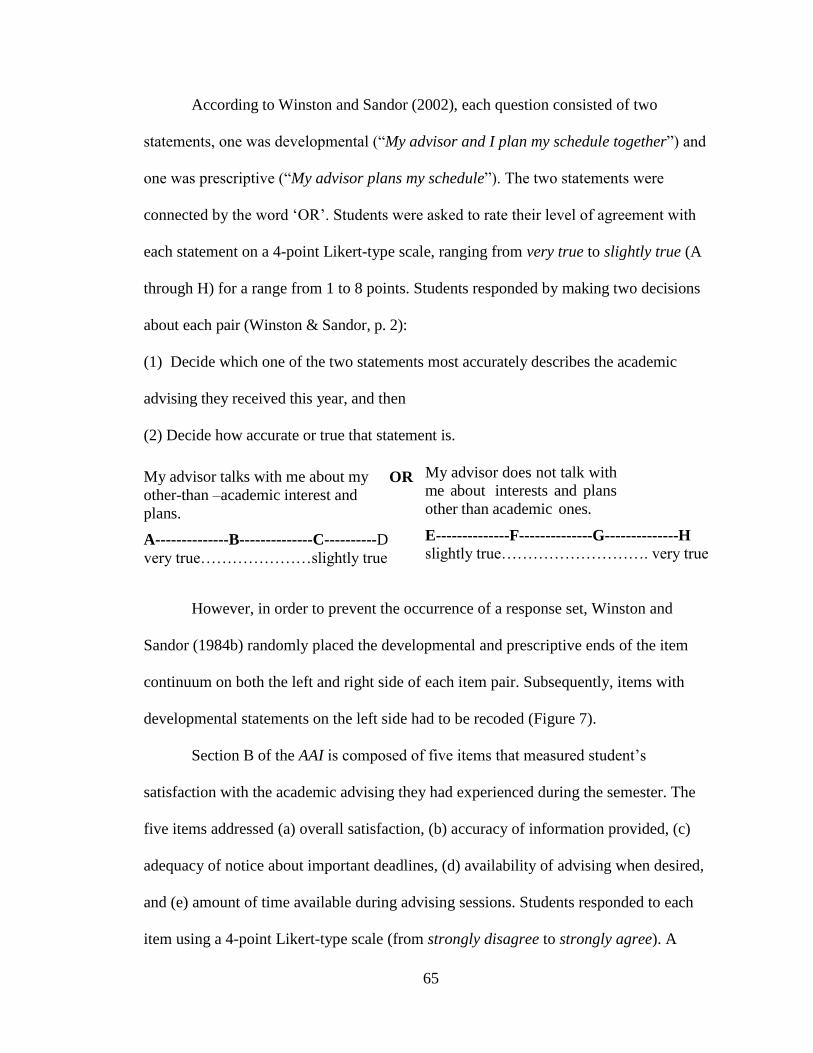
65
According to Winston and Sandor (2002), each question consisted of two
statements, one was developmental (“My advisor and I plan my schedule together”) and
one was prescriptive (“My advisor plans my schedule”). The two statements were
connected by the word ‘OR’. Students were asked to rate their level of agreement with
each statement on a 4-point Likert-type scale, ranging from very true to slightly true (A
through H) for a range from 1 to 8 points. Students responded by making two decisions
about each pair (Winston & Sandor, p. 2):
(1) Decide which one of the two statements most accurately describes the academic
advising they received this year, and then
(2) Decide how accurate or true that statement is.
My advisor talks with me about my
other-than –academic interest and
plans.
A--------------B--------------C----------D
very true…………………slightly true
OR My advisor does not talk with
me about interests and plans
other than academic ones.
E--------------F--------------G--------------H slightly true………………………. very true
However, in order to prevent the occurrence of a response set, Winston and
Sandor (1984b) randomly placed the developmental and prescriptive ends of the item
continuum on both the left and right side of each item pair. Subsequently, items with
developmental statements on the left side had to be recoded (Figure 7).
Section B of the AAI is composed of five items that measured student’s
satisfaction with the academic advising they had experienced during the semester. The
five items addressed (a) overall satisfaction, (b) accuracy of information provided, (c)
adequacy of notice about important deadlines, (d) availability of advising when desired,
and (e) amount of time available during advising sessions. Students responded to each
item using a 4-point Likert-type scale (from strongly disagree to strongly agree). A
66
correlation between the students’ overall satisfaction with academic advising items (The
UWI Survey of First-Year Students’ Perception, Part II-B) was reported.
The data were analyzed and the reliability and validity of the research was
recorded. According to Osborne (2012), “the better your reliability, the more accurate
and replicable your results” (p. 262).
Instrument Reliability and Validity
Pascarella and Terenzini (1980) found that alpha reliabilities of the Institutional
Integration Scales ranged from .71 to .84 where Peer-Group Interactions (α= .84),
Interaction with Faculty (α = .83), Faculty Concern for Student Development and
Teaching (α = .82), Academic and Intellectual Development (α = .74), and Institutional
and Goal and Commitments (α = .71) were all deemed adequate to use in further
analyses. A reliability coefficient of .70 or higher is considered acceptable in social
science research.
Additionally, Pascarella and Terenzini (1980) established that the
intercorrelations among the five IIS scales were modest, ranging from .01 to .33 with a
median correlation of .23. This correlation showed that the subscales were assessing the
measurements of the Institutional Integration Scale independently. Using principal
component factor analysis, multivariate analysis of covariance and discriminant analysis,
Pascarella and Terenzini (1980) determined the predictive validity of the Institutional
Integration Scale in accurately identifying freshmen who subsequently persisted or
stopped out voluntarily.
The Academic Advising Inventory (AAI) is also a widely used instrument with
high internal consistency and reliability, estimated through the use of the Cronbach alpha
67
procedure. According to Winston and Sandor (1984b, 2002), the alpha coefficient for the
total developmental-prescriptive advising (DPA) scale was .78, with coefficients ranging
from .42 for the items on the selecting course (SC) subscale to .81 for the items on the
personalizing education (PE) subscale. Winston and Sandor (2002) concluded that the
DPA and its subscales are relatively “homogeneous and stable enough measures” (p. 15)
to use to determine advising approaches.
Construct validity of the AAI was determined using contrasted groups in
freshmen. One group was “specially-admitted, academically-marginally-prepared
freshmen students” (Winston & Sandor, 2002, p. 19) enrolled in the Developmental
Studies Division at the University of Georgia who received intensive developmental
advising while the comparison group of regularly admitted freshmen received more
prescriptive advising, planning and arranging class schedules. The group in
Developmental Studies Division was predicted to perceive more developmental advising
than the group that was regularly admitted. The results demonstrated that scores on the
DPA and PE scales were statistically significantly different for the groups (p< .001). This
test was used as providing strong support for the construct validity of the DPA and PE
scales of the AAI (Winston & Sandor, 1984b, 2002). Additionally, the intercorrelations
among the five scales in Part II-B of the AAI were adequate, ranging from 0.33 to 0.67
with a median correlation of 0.50.
Procedures and Data Collection
The UWI Survey of First-Year Students’ Perceptions was administered to a
sample of first year students during the first semester of their freshmen year. The survey
68
instrument was piloted prior to distributing the questionnaire. The pilot test was done by
the researcher who collected the information from ten first-year students at Cave Hill
campus, Barbados, during the first fifteen minutes of a first year experience class. The ten
students were asked to complete the survey and make comments on the relationship
between the purpose of the study and the clarity of the questions (Wortman & Upcraft,
2001). This pilot indicated that the instructions for the Academic Advising Inventory
needed clarification. Subsequently, the instructions were modified by including an
example and its possible response.
The survey was administered by the researcher to students at the University of the
West Indies during November 4th and 21st, 2014, near the end of their first semester. IRB
permission was approved at the University of Louisville and at the UWI, Cave Hill
campus prior to conducting this research. The UWI, St. Augustine did not have a research
ethical review board.
At the UWI, Cave Hill campus, 13 preliminary and introductory courses were
identified in the Science, Technology, and Medical Science, departments. The researcher
e-mailed the Deputy Dean of Science and Technology, and the Dean of Medical Sciences
at the UWI, Cave Hill, Barbados, seeking their assistance in collecting data for the
research study. The e-mails were forwarded to the science and technology, and medical
science faculty (see Appendix B). The researcher obtained the names of the professors
and their class schedules for each course identified from student services personnel.
Faculty members were contacted via e-mail to schedule day and time to distribute the
survey for 10 minutes from November 4 – 11, 2014. The survey was then circulated by
the researcher to first year students only during a regularly scheduled class. Winston and
69
Sandor (2002) argued, “Data collected in a relatively controlled setting, such as a class
provides the most complete and reliable results” (p. 13). To avoid repetition, the
researcher asked students to take the survey only once. The survey’s consent form
included contact information for the Office of Research at UWI, Cave Hill and asked to
exclude students under 18 years of age. The data were collected using a pencil and paper
collection method which allowed the researcher to collect the information from the
targeted audience, which resides outside the U.S. in the most efficient manner (Wortman
& Upcraft, 2001).
At the UWI, St. Augustine campus, an e-mail was sent to the registrar of the
institution with the research proposal, outlining the purpose of the study, questions to be
asked, and how the information in the final project will be treated. However, the registrar
did not receive approval from the faculty at St. Augustine campus to conduct the research
during their scheduled class time. The researcher further contacted the Director of
Student Services at UWI, St. Augustine to seek her assistance, outlining the purpose of
the study, the research design, target population, and the survey. The Director assigned
one of her staff to assist the researcher with collecting the data. First year science and
technology students as well as engineering students were non-randomly identified and
asked to complete the survey. A snowballing technique was employed where students
were asked to invite other students in their halls and dormitories to complete the surveys.
For example, 20 surveys were given to a Master’s in Engineering student who I met
while staying in the graduate flats and asked him to distribute them to first-year science
students. He took the surveys to an undergraduate hall and the next day returned 16
completed surveys. He also gave a few of the surveys to his roommate who was majoring
70
in Agricultural Science and his roommate distributed the surveys to two of his
classmates. Student services staff at the UWI Medical School (Mount Hope) in Trinidad
and Tobago were also asked to distribute the surveys to their first year students. The
medical science staff distributed the questionnaires during scheduled classes. Surveys
were collected at St. Augustine between November 13th and 22nd, 2014.
In order to ascertain student’s intent to re-enroll at the beginning of the second
semester, the question was posed in the survey: “I intend to return to UWI in the spring
2015 semester (second semester).” Student’s intent to return or re-enroll has been used by
researchers as an alternative variable for re-enrollment status (DaDeppo, 2009; Taylor,
2012). The dependent variable is dichotomous and can be analyzed using binary logistic
regression. The unit of analysis is the individual student.
Data Analysis
Descriptive statistics were used to review the demographic and institutional data
which were collected for informational purposes. These items were secondary school
graduation year, major, and financial support.
Data cleaning and appropriate assumptions (linearity, multicollinearity,
independence of errors) were conducted, prior to analyzing the results, to determine any
violations. Data cleaning was performed since “careful screening of your data can pay
large dividends in terms of goodness of your results” (Osborne, 2012, p. 262).
Consequently, each analysis of the continuous variables examined standardized residuals
for error analysis as well as DfBetas to remove inappropriate influential cases.

71
To analyze the data to predict the influence of the campus and student attributes
on student retention in research questions one and two and to examine if institutional
experiences influence the student’s decision to re-enroll at the institution after the first
semester in research question three, binary logistic regression was used (Table 6).
Table 6
Statistical Analyses Used in the Study
Research
Question
Analysis
Independent
variables
Dependent
Variables
1 Logistic
Regression
Campus
Intent to Re-
enroll
2 Logistic
Regression
Student Attributes Intent to Re-
enroll
3 Logistic
Regression
Institutional
Experiences
Intent to Re-
enroll
4 Descriptive
Statistics
Advising
Approaches
__
Logistic regression is appropriate to measure student retention because it allows
the researcher to regress both the continuous and categorical predictor variables on the
binary dependent variable (Osborne, 2014). Linear regression allows the researcher to
predict which of the two categories a student is most likely to belong to based on the
treatment. Additionally, Peduzzi, Concat, Kemper, Holford, and Feinstein (1996)
introduced ‘events per variable’ (EPV). EVP refers to the number of participants who
experience the event in the dependent variable. In this case, that event is “intend to re-
enroll” in the institution. These researchers argued that there should be at least 10 events
per independent variable in order to have a valid logistic regression equation. In this
72
study, with 16 independent variables, a minimum of 160 “intend to re-enroll” cases are
needed.
In logistic regression, the effect of the predictor on the population is expressed as
the odds ratio (OR) or the ratio of success to the ratio of failures. In assessing the model,
the -2log-likelihood (-2LL) indicates the unexplained variance and provides an indication
of goodness-of-fit of the model using the chi-square distribution. A large value indicates
a poor fitting model. The Wald statistic is then used to assess the significance of the
predictors. In the study, the method of regression used in analyzing the data was ‘forced
entry’ where all variables were entered into the model simultaneously (Field, 2009;
Osborne, 2014). Logistic regression allows the researcher to use a continuous
independent variable, such as secondary school math and science grades, if he or she
assumes, “that the logit is linear in the variable” (Hosmer & Lemeshow, 2000, p. 63).
Equation 1 denotes the general form of the logit model where b0 is the intercept, and b1
through b10 represent the slope coefficients for the predictor variables, corresponding to
each construct (x1 through x 10) in our conceptual model.
Equation 1. General Form of the Logistic Regression Model
Logit (Ỳ) = b0 + b1 x1 + b2 x2 + b3 x3 …… b10 x10
Binary logistic regression was employed in this study since the outcome variable
is categorical with two levels (0=did not intend to re-enroll, 1=intend to re-enroll) and the
predictor variables are continuous and categorical (Field, 2009; Osborne, 2014). The
dependent variable was measured on a 4-point Likert-type scale from 1=strongly disagree
to 4=strongly agree. Responses on the “disagree” side of the scale (1-2) were collapsed
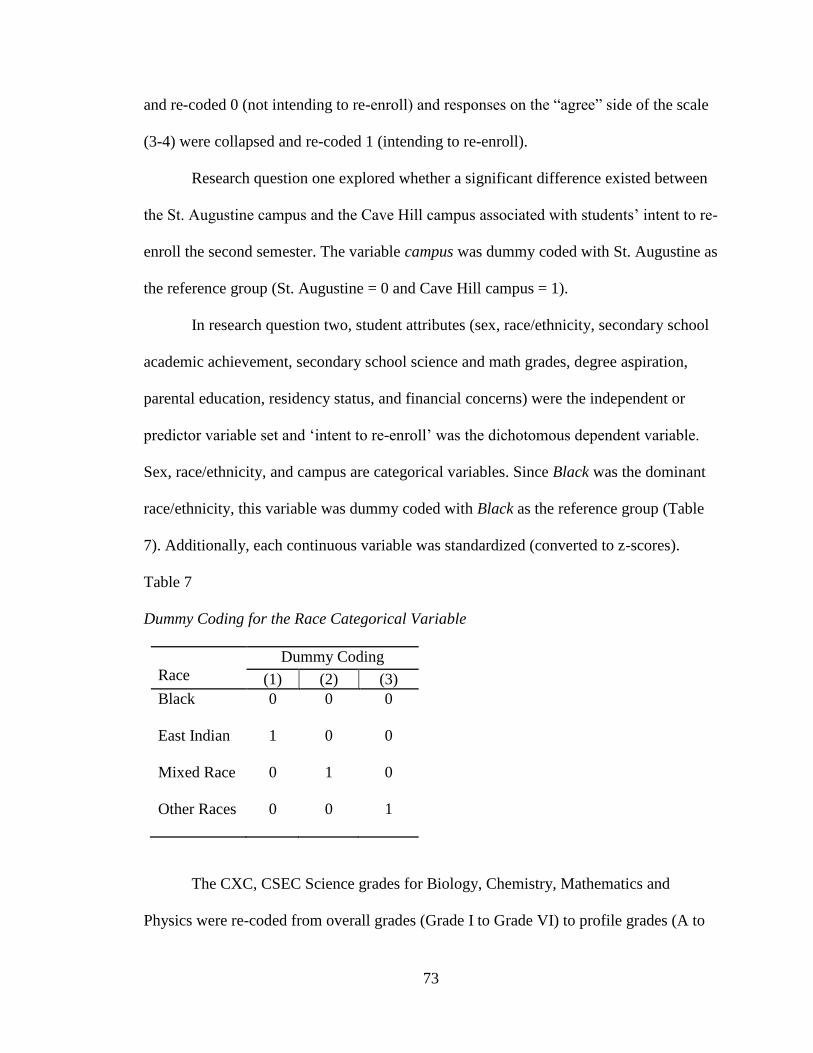
73
and re-coded 0 (not intending to re-enroll) and responses on the “agree” side of the scale
(3-4) were collapsed and re-coded 1 (intending to re-enroll).
Research question one explored whether a significant difference existed between
the St. Augustine campus and the Cave Hill campus associated with students’ intent to re-
enroll the second semester. The variable campus was dummy coded with St. Augustine as
the reference group (St. Augustine = 0 and Cave Hill campus = 1).
In research question two, student attributes (sex, race/ethnicity, secondary school
academic achievement, secondary school science and math grades, degree aspiration,
parental education, residency status, and financial concerns) were the independent or
predictor variable set and ‘intent to re-enroll’ was the dichotomous dependent variable.
Sex, race/ethnicity, and campus are categorical variables. Since Black was the dominant
race/ethnicity, this variable was dummy coded with Black as the reference group (Table
7). Additionally, each continuous variable was standardized (converted to z-scores).
Table 7
Dummy Coding for the Race Categorical Variable
Race
Dummy Coding
(1) (2) (3)
Black 0 0 0
East Indian 1 0 0
Mixed Race
0 1 0
Other Races 0 0 1
The CXC, CSEC Science grades for Biology, Chemistry, Mathematics and
Physics were re-coded from overall grades (Grade I to Grade VI) to profile grades (A to
74
F) where Grade I = A, Grade II = B, Grade III = C, Grade IV = D, Grade V = E, and
Grade VI = F (CXC, 2014). Each student’s combined science and math grade was then
converted as follows: A = 4, B = 3, C = 2, D = 1, E = 0, and F = 0 and the student’s grade
point average (GPA) was determined by computing the mean score. All other student
attribute variables were analyzed as coded in Table 4.
For research question three, the IIS subscales (interaction with faculty, faculty
concern for student development, academic and intellectual development, institutional
and goal commitments, and peer interaction) were the independent variables, with intent
to re-enroll as the dependent variable. Three items from the faculty concern for student
development subscale were re-coded (1=5, 2=4, 4=2, 5=1). These items were “few of the
faculty members I have had contact with are generally interested in students,” “few of the
faculty members I have had contact with are generally outstanding or superior advisors,”
and “few of the faculty members I have had contact with are willing to spend time outside
of class to discuss issues of interest and importance to students.” One item was re-coded
(1=5, 2=4, 4=2, 5=1) in the academic and intellectual development subscale. This was
“few of my courses this semester have been intellectually stimulating,” and three items
were re-coded (1=5, 2=4, 4=2, 5=1) from the peer interaction subscale. These items were:
“it has been difficult for me to meet and make friends with other students,” “few of the
students I know would be willing to help me if I had a personal problem,” and “most
students at UWI have values and attitudes different from my own.” On the institutional
goal and commitment scale, the last item, “It is likely that I will enroll at UWI in the fall
2015 semester” was not used in the data analysis since this item is synonymous with the
dependent variable. Since each subscale has a different number of items, the mean score
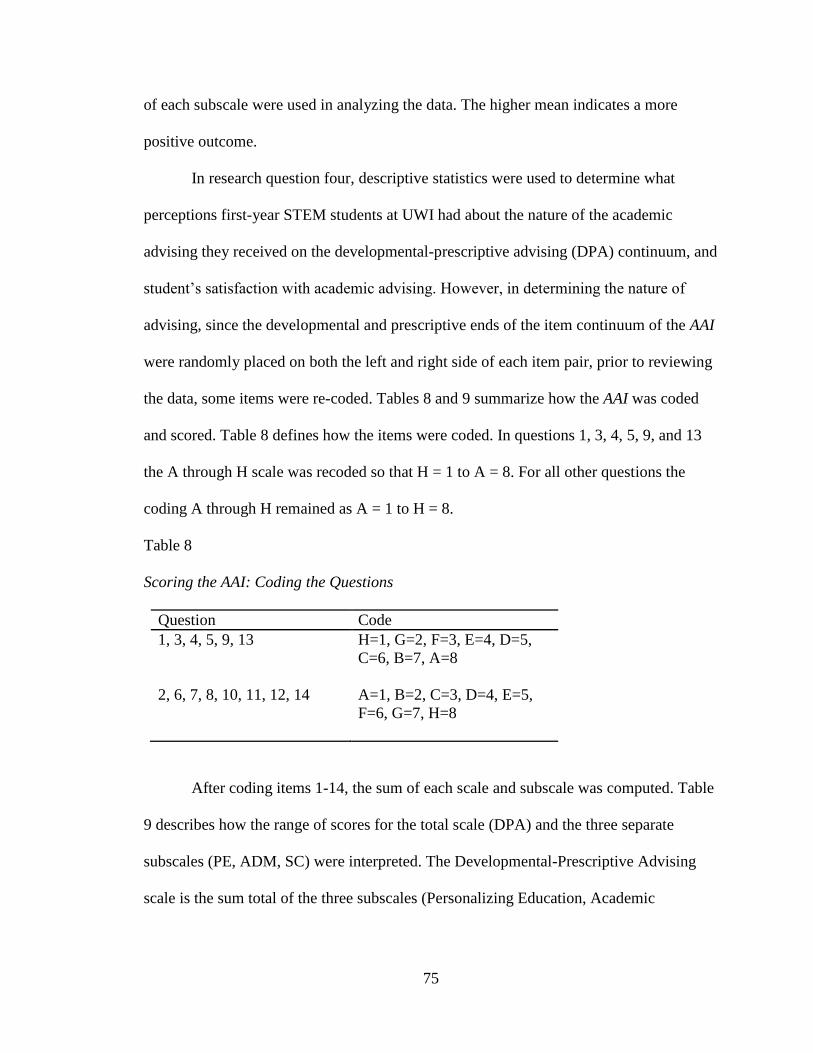
75
of each subscale were used in analyzing the data. The higher mean indicates a more
positive outcome.
In research question four, descriptive statistics were used to determine what
perceptions first-year STEM students at UWI had about the nature of the academic
advising they received on the developmental-prescriptive advising (DPA) continuum, and
student’s satisfaction with academic advising. However, in determining the nature of
advising, since the developmental and prescriptive ends of the item continuum of the AAI
were randomly placed on both the left and right side of each item pair, prior to reviewing
the data, some items were re-coded. Tables 8 and 9 summarize how the AAI was coded
and scored. Table 8 defines how the items were coded. In questions 1, 3, 4, 5, 9, and 13
the A through H scale was recoded so that H = 1 to A = 8. For all other questions the
coding A through H remained as A = 1 to H = 8.
Table 8
Scoring the AAI: Coding the Questions
Question Code
1, 3, 4, 5, 9, 13 H=1, G=2, F=3, E=4, D=5,
C=6, B=7, A=8
2, 6, 7, 8, 10, 11, 12, 14 A=1, B=2, C=3, D=4, E=5,
F=6, G=7, H=8
After coding items 1-14, the sum of each scale and subscale was computed. Table
9 describes how the range of scores for the total scale (DPA) and the three separate
subscales (PE, ADM, SC) were interpreted. The Developmental-Prescriptive Advising
scale is the sum total of the three subscales (Personalizing Education, Academic
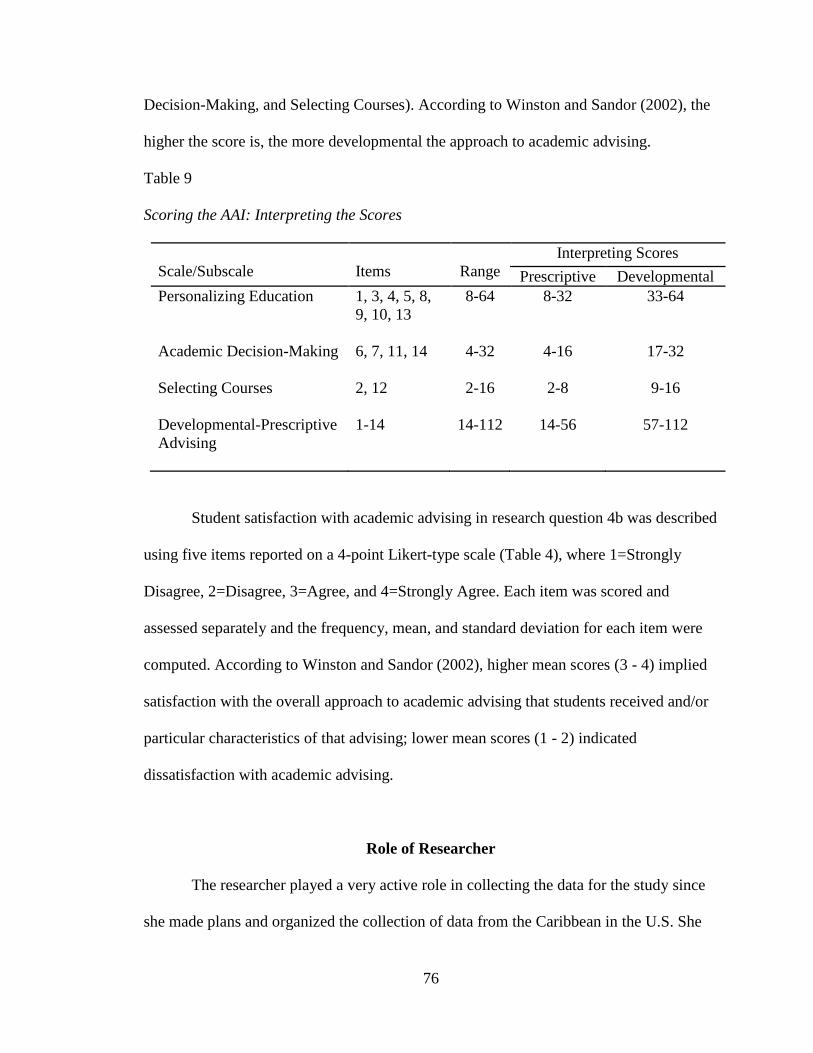
76
Decision-Making, and Selecting Courses). According to Winston and Sandor (2002), the
higher the score is, the more developmental the approach to academic advising.
Table 9
Scoring the AAI: Interpreting the Scores
Scale/Subscale
Items
Range
Interpreting Scores
Prescriptive Developmental
Personalizing Education
1, 3, 4, 5, 8,
9, 10, 13
8-64 8-32 33-64
Academic Decision-Making
6, 7, 11, 14 4-32 4-16 17-32
Selecting Courses 2, 12 2-16 2-8 9-16
Developmental-Prescriptive
Advising
1-14 14-112 14-56 57-112
Student satisfaction with academic advising in research question 4b was described
using five items reported on a 4-point Likert-type scale (Table 4), where 1=Strongly
Disagree, 2=Disagree, 3=Agree, and 4=Strongly Agree. Each item was scored and
assessed separately and the frequency, mean, and standard deviation for each item were
computed. According to Winston and Sandor (2002), higher mean scores (3 - 4) implied
satisfaction with the overall approach to academic advising that students received and/or
particular characteristics of that advising; lower mean scores (1 - 2) indicated
dissatisfaction with academic advising.
Role of Researcher
The researcher played a very active role in collecting the data for the study since
she made plans and organized the collection of data from the Caribbean in the U.S. She
77
travelled to the Caribbean islands, Barbados and Trinidad from the U.S. to collect the
data. Prior to the trip, she contacted at least one individual at each institution, initially, to
find out the feasibility of conducting the study and later getting advice on how best to
proceed.
Prior to conducting the research, the study proposal was submitted to the
Institutional Review Board (IRB) in Human Subject Protection office at the University of
Louisville, and The University of the West Indies, Cave Hill. The proposal summarized
the purpose of the study, research questions and hypotheses, methodology, survey
instrument, and participant’s role, along with the consent letter. The University of the
West Indies, St. Augustine did not have an IRB in Human Subject Protection office so a
letter of proposal was submitted to the Registrar’s office outlining the purpose of the
study, the research questions, and how the information that goes into the final product
will be treated. The IRB approved the research study at the University of the Louisville
and the University of the West Indies, Cave Hill campus.
Study Limitations
This study is limited in several ways. First, the study used Tinto’s (1975, 1993)
model, which was partially validated by Pascarella & Terenzini (1980) in a U.S.
university to investigate students in a Caribbean university system. The researcher used
Tinto’s model because there is very little research on student retention and persistent in a
Caribbean university so models derived from a Caribbean tertiary level student
population were not available. Subsequently, the scales and subscales used did not appear
to be appropriate to the campus culture in examining STEM student’s retention issues for
78
the two UWI campuses investigated. Moreover, the education system, organizational
structure (mission, culture and governance) differed in the Caribbean territories from that
of the U.S. education system. This limitation is tempered somewhat because the
researcher was educated in the Caribbean and the United States and knowledgeable about
both systems.
Second, the sample size may affect the accuracy and replicability of the study.
Logistic regression generally requires large sample sizes in order to produce “accurate,
replicable population parameter estimates… small samples produce substantial volatility
in parameter estimates” (Osborne, 2014, p. 349). In this population with a small sample
size (N = 293), the range of the confidence interval was relatively wide, when predicting
the effect of campus on re-enrollment status, indicating poor precision.
Third, using surveys only to collect data introduced self-reported data as a
limitation of the study. Dillman (2007) points out that in self-reporting surveys students
will chose their responses on the Likert scale quickly with as little contemplation as
possible. Furthermore, pen and paper surveys were considered the most efficient way of
collecting the data. However, transcribing data from a paper survey may introduce error
into the results.
Fourth, the investigated variables only begin to reflect the complexity of the
model used and there may be other factors which contributed to student withdrawal on
each campus that was not considered. Furthermore, the construct used in this study to
determine student retention was based on the student’s intent to re-enroll at the institution
in their second semester and student’s intent to re-enroll is not synonymous with re-
enrollment status and may not perfectly correlate with the student’s actual re-enrollment
79
behavior in the spring semester. In the study, voluntary withdrawal does not differentiate
between students who dropped out, stopped out for a period of time and returned to the
university at a later date, or students who transferred to another university.
Fifth, the findings must be generalized cautiously. The study was only conducted
in two of the three main UWI campuses and the traits specific to the institutions in the
study could be a threat to external validity or generalization of the findings to other
student populations in the Caribbean region, particularly Mona campus, the flagship
campus of the UWI. Additionally, the study concentrated on only one cohort of students
in this university system, that is STEM majors, and they might not be representative of
other student cohorts in other majors. Subsequently, the findings of this study may need
to be replicated in various settings. Additionally, selection bias was assumed to be
present since students were non-randomly assigned at the two institutions and the method
of data collection was different on both campuses.
Sixth, statistical conclusion validity may have occurred due to the inapplicability
of the academic advising measure. It was assumed that the AAI would accurately measure
the advising approach and the student’s satisfaction with the advising they were
experiencing on the campuses, but the majority of the respondents stated that it was not
applicable to their program. Furthermore, some students found the AAI instrument
confusing. As a result, the number of responses for the developmental-prescriptive
advising and student satisfaction with academic advising variables was less than the
responses for the other variables.
Seventh, the internal validity of the study may have also been compromised by a
history threat since the procedures during the study might have affected one campus but
80
not the other (Teddlie & Tashakkori, 2009). Although purposive and non-random
sampling were employed on both campuses, at the Cave Hill campus in Barbados the
researcher distributed the surveys in a controlled environment and was available to
answer any questions the respondent had, particularly about the AAI, while at the St.
Augustine campus in Trinidad since student service personnel and students distributed
the surveys, the researcher was not present. Randomly assigning individual students
would have improved internal validity but this was not practical at both campuses.
Eighth, the sample from the St. Augustine campus was an under representation of
the first year STEM student population while the sample from the Cave Hill campus was
an over representation of the STEM student population.
Finally, the effects of researcher bias may be inherent in the study. The researcher
is a graduate of this university system and her views and perceptions may affect the
inferences made of the results. Employing a second external researcher to replicate the
study would alleviate this limitation.
81
CHAPTER 4
RESULTS
This chapter presents the research findings. The current study explored issues
pertaining to first-year STEM students’ persistence and retention at a public university
system in the Caribbean during the fall 2014 semester. The chapter is organized by the
four specific research questions and their corresponding hypotheses discussed in Chapter
3. Descriptive statistics and logistic regression analyses are outlined for research
questions one, two, and three. Following are the analysis and outcomes of research
question four. Prior to analyzing the data, the researcher reports the tests performed for
data cleaning and assumptions and examines the reliability of the instrument used.
The conceptual model for the first year STEM Caribbean student’s institutional
departure was amended to exclude enrollment status and academic advising as predictor
variables of student’s decision to re-enroll the second semester (Figure 3). Of the data
collected only 2% of the students were enrolled part-time, and the natural log of the
probability of the event/probability of the non-event was too small to be significant. In
relation to the academic advising variable, STEM students indicated that they were
unable to complete the developmental-prescriptive advising questionnaire in the
Academic Advising Inventory (AAI). Only 47% of the sample attempted part 1 of the
AAI. Subsequently, adding the advising variables simultaneously to the logistic regression
model reduced the odds ratio and power of the other predictor variables.
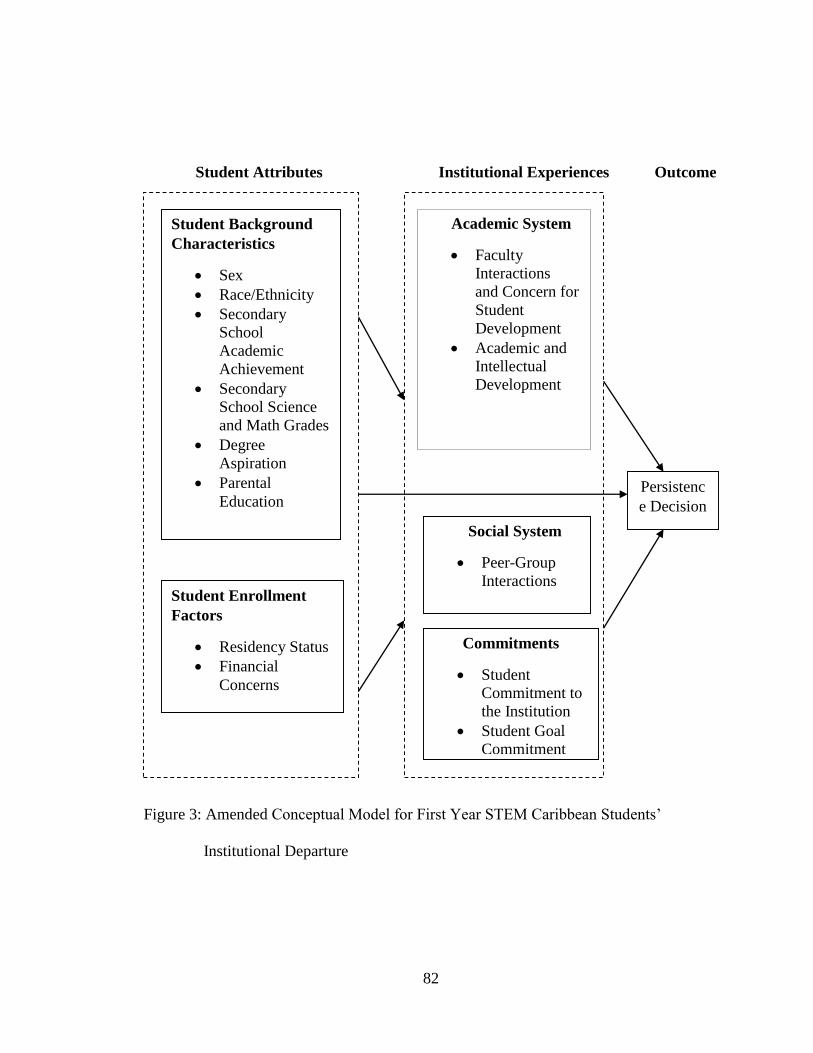
82
Student Attributes Institutional Experiences Outcome
Figure 3: Amended Conceptual Model for First Year STEM Caribbean Students’
Institutional Departure
Persistenc
e Decision
Student Background
Characteristics
Sex
Race/Ethnicity
Secondary
School
Academic
Achievement
Secondary
School Science
and Math Grades
Degree
Aspiration
Parental
Education
Academic System
Faculty
Interactions
and Concern for
Student
Development
Academic and
Intellectual
Development
Social System
Peer-Group
Interactions
Commitments
Student
Commitment to
the Institution
Student Goal
Commitment
Student Enrollment
Factors
Residency Status
Financial
Concerns
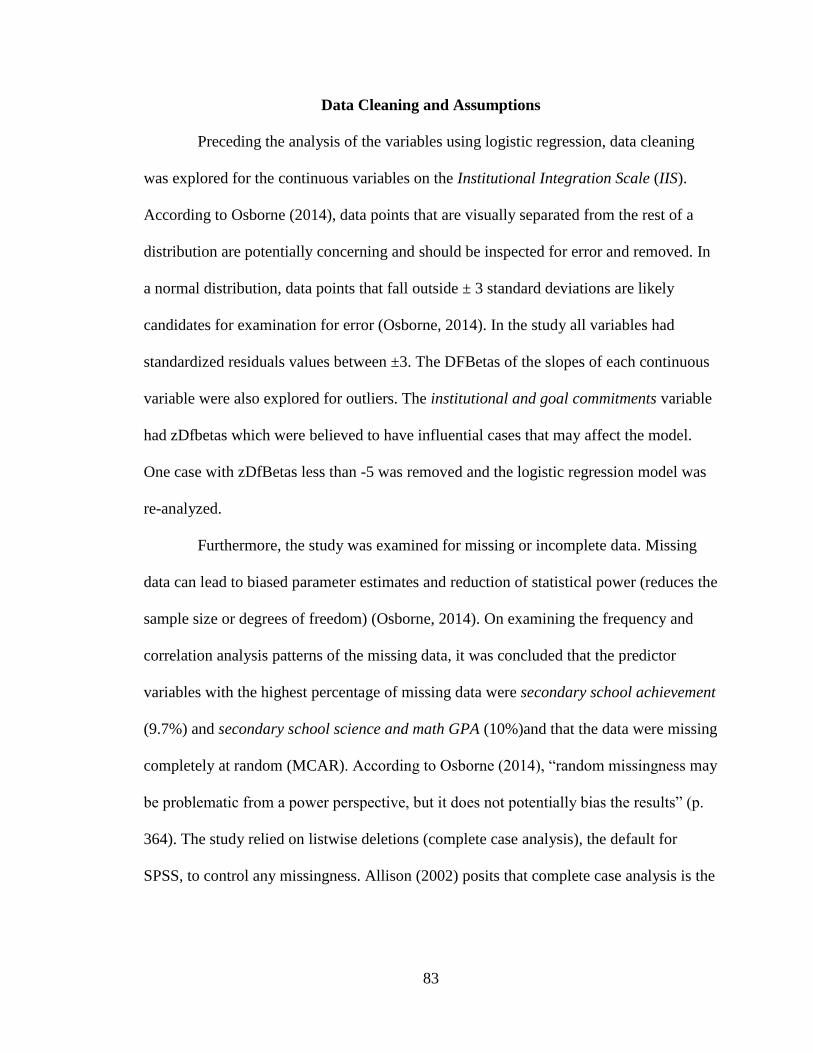
83
Data Cleaning and Assumptions
Preceding the analysis of the variables using logistic regression, data cleaning
was explored for the continuous variables on the Institutional Integration Scale (IIS).
According to Osborne (2014), data points that are visually separated from the rest of a
distribution are potentially concerning and should be inspected for error and removed. In
a normal distribution, data points that fall outside ± 3 standard deviations are likely
candidates for examination for error (Osborne, 2014). In the study all variables had
standardized residuals values between ±3. The DFBetas of the slopes of each continuous
variable were also explored for outliers. The institutional and goal commitments variable
had zDfbetas which were believed to have influential cases that may affect the model.
One case with zDfBetas less than -5 was removed and the logistic regression model was
re-analyzed.
Furthermore, the study was examined for missing or incomplete data. Missing
data can lead to biased parameter estimates and reduction of statistical power (reduces the
sample size or degrees of freedom) (Osborne, 2014). On examining the frequency and
correlation analysis patterns of the missing data, it was concluded that the predictor
variables with the highest percentage of missing data were secondary school achievement
(9.7%) and secondary school science and math GPA (10%)and that the data were missing
completely at random (MCAR). According to Osborne (2014), “random missingness may
be problematic from a power perspective, but it does not potentially bias the results” (p.
364). The study relied on listwise deletions (complete case analysis), the default for
SPSS, to control any missingness. Allison (2002) posits that complete case analysis is the
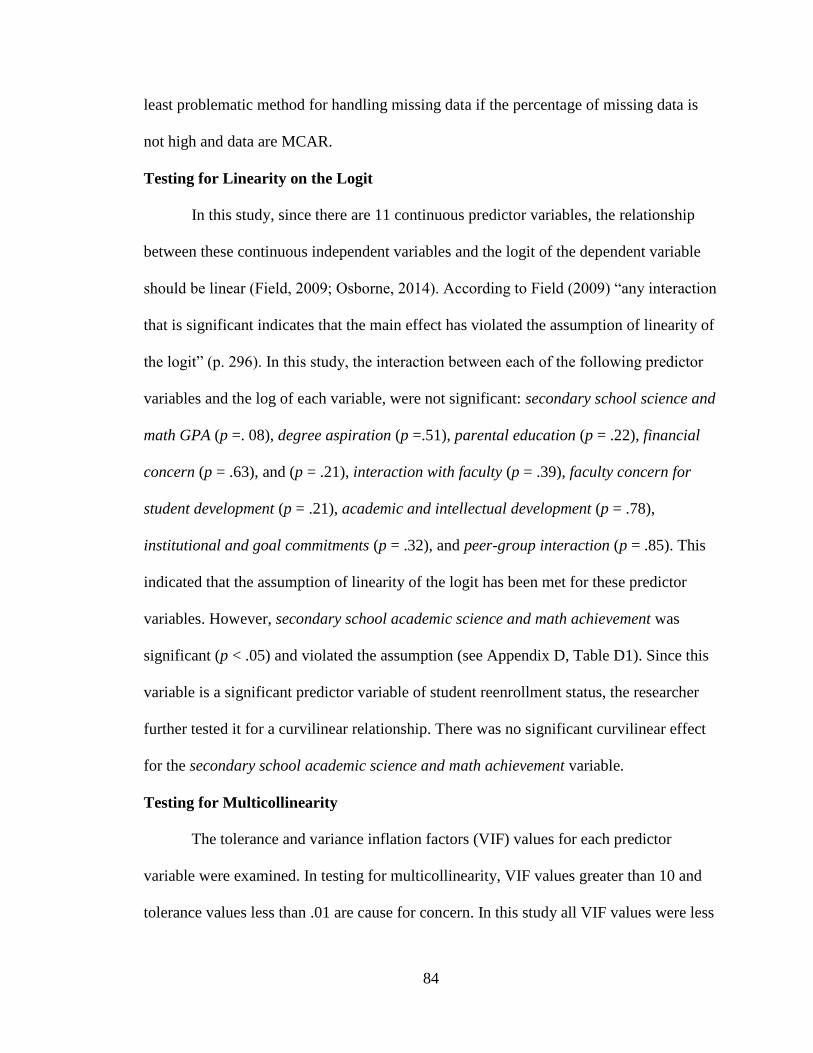
84
least problematic method for handling missing data if the percentage of missing data is
not high and data are MCAR.
Testing for Linearity on the Logit
In this study, since there are 11 continuous predictor variables, the relationship
between these continuous independent variables and the logit of the dependent variable
should be linear (Field, 2009; Osborne, 2014). According to Field (2009) “any interaction
that is significant indicates that the main effect has violated the assumption of linearity of
the logit” (p. 296). In this study, the interaction between each of the following predictor
variables and the log of each variable, were not significant: secondary school science and
math GPA (p =. 08), degree aspiration (p =.51), parental education (p = .22), financial
concern (p = .63), and (p = .21), interaction with faculty (p = .39), faculty concern for
student development (p = .21), academic and intellectual development (p = .78),
institutional and goal commitments (p = .32), and peer-group interaction (p = .85). This
indicated that the assumption of linearity of the logit has been met for these predictor
variables. However, secondary school academic science and math achievement was
significant (p < .05) and violated the assumption (see Appendix D, Table D1). Since this
variable is a significant predictor variable of student reenrollment status, the researcher
further tested it for a curvilinear relationship. There was no significant curvilinear effect
for the secondary school academic science and math achievement variable.
Testing for Multicollinearity
The tolerance and variance inflation factors (VIF) values for each predictor
variable were examined. In testing for multicollinearity, VIF values greater than 10 and
tolerance values less than .01 are cause for concern. In this study all VIF values were less

85
than 10, and tolerance values for the variables were all greater than .1. This value
indicates that the assumption multicollinearity has not been violated (see Appendix D,
Table D2).
Testing for Independence of Errors
The Durbin-Watson test was further conducted for serial correlations between
errors. Values less than 1 or greater than 3 are cause for concern since violation of this
assumption leads to a Type I error. The Durbin-Watson was 2.01 so the errors are
uncorrelated and the assumption of independence of errors was not violated (see
Appendix D, Table D3). Logistic regression is robust to the assumptions of normal
distribution of residuals and homoscedasticity due to maximum likelihood estimation.
Descriptive Statistics
This study consisted of first year STEM students attending the University of the
West Indies, St Augustine and Cave Hill campuses, during the first semester, 2014. The
sampling technique in the study was purposive sampling. The UWI Survey of First-Year
Students’ Perceptions instrument was distributed by the researcher and student services
personnel. A total of 425 surveys were printed and approximately 400 were distributed.
Undergraduate students on both campuses returned a total of 351 surveys (a response rate
of 87.8%). Of these, 293 met the criteria stipulated in the study for an approximately
73.3% response rate. These surveys, representing 16.3% of the first-year undergraduate
STEM population on both campuses, were subsequently used in the statistical analysis.
Fifty eight (58) questionnaires were deemed invalid because the student was either an
upperclassman (n = 50), the student declared a non-STEM major (n = 4), the instrument
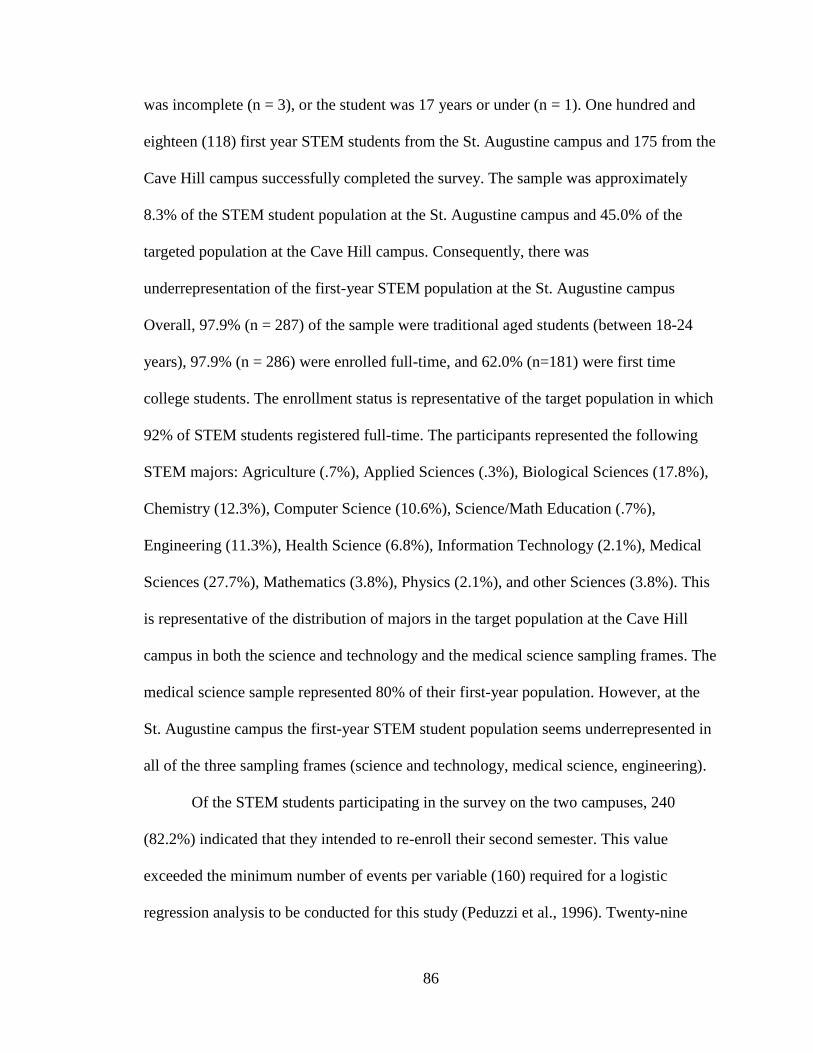
86
was incomplete (n = 3), or the student was 17 years or under (n = 1). One hundred and
eighteen (118) first year STEM students from the St. Augustine campus and 175 from the
Cave Hill campus successfully completed the survey. The sample was approximately
8.3% of the STEM student population at the St. Augustine campus and 45.0% of the
targeted population at the Cave Hill campus. Consequently, there was
underrepresentation of the first-year STEM population at the St. Augustine campus
Overall, 97.9% (n = 287) of the sample were traditional aged students (between 18-24
years), 97.9% (n = 286) were enrolled full-time, and 62.0% (n=181) were first time
college students. The enrollment status is representative of the target population in which
92% of STEM students registered full-time. The participants represented the following
STEM majors: Agriculture (.7%), Applied Sciences (.3%), Biological Sciences (17.8%),
Chemistry (12.3%), Computer Science (10.6%), Science/Math Education (.7%),
Engineering (11.3%), Health Science (6.8%), Information Technology (2.1%), Medical
Sciences (27.7%), Mathematics (3.8%), Physics (2.1%), and other Sciences (3.8%). This
is representative of the distribution of majors in the target population at the Cave Hill
campus in both the science and technology and the medical science sampling frames. The
medical science sample represented 80% of their first-year population. However, at the
St. Augustine campus the first-year STEM student population seems underrepresented in
all of the three sampling frames (science and technology, medical science, engineering).
Of the STEM students participating in the survey on the two campuses, 240
(82.2%) indicated that they intended to re-enroll their second semester. This value
exceeded the minimum number of events per variable (160) required for a logistic
regression analysis to be conducted for this study (Peduzzi et al., 1996). Twenty-nine
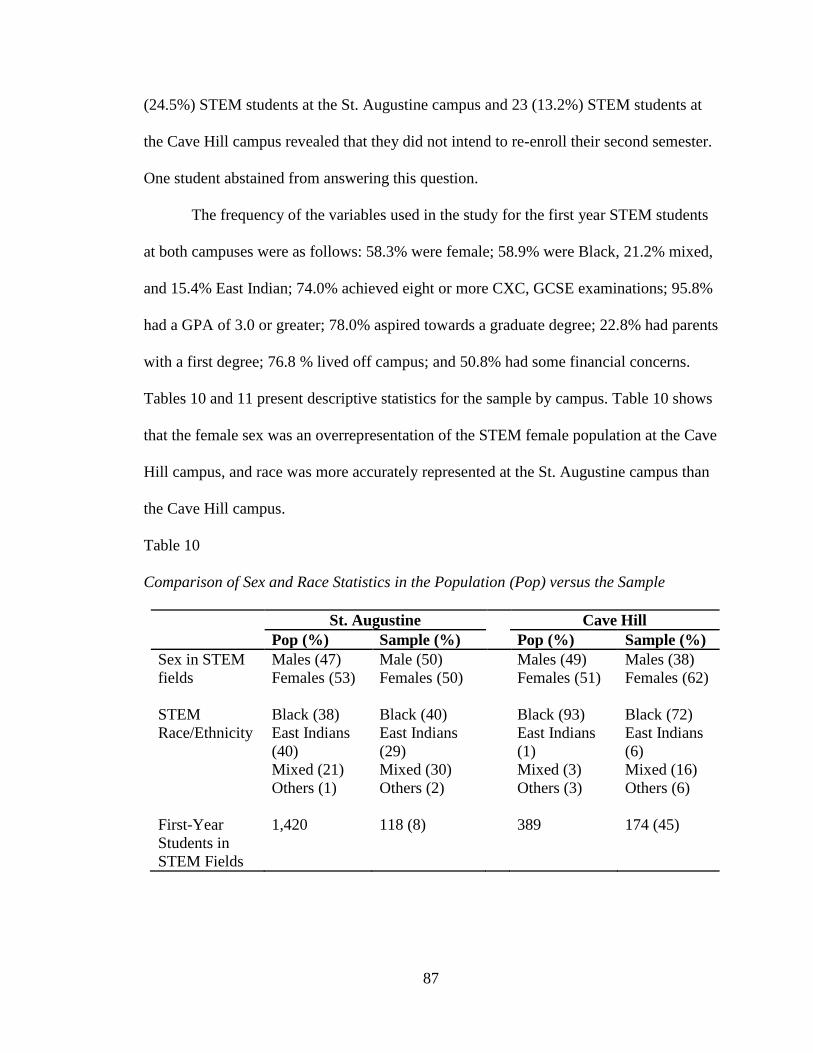
87
(24.5%) STEM students at the St. Augustine campus and 23 (13.2%) STEM students at
the Cave Hill campus revealed that they did not intend to re-enroll their second semester.
One student abstained from answering this question.
The frequency of the variables used in the study for the first year STEM students
at both campuses were as follows: 58.3% were female; 58.9% were Black, 21.2% mixed,
and 15.4% East Indian; 74.0% achieved eight or more CXC, GCSE examinations; 95.8%
had a GPA of 3.0 or greater; 78.0% aspired towards a graduate degree; 22.8% had parents
with a first degree; 76.8 % lived off campus; and 50.8% had some financial concerns.
Tables 10 and 11 present descriptive statistics for the sample by campus. Table 10 shows
that the female sex was an overrepresentation of the STEM female population at the Cave
Hill campus, and race was more accurately represented at the St. Augustine campus than
the Cave Hill campus.
Table 10
Comparison of Sex and Race Statistics in the Population (Pop) versus the Sample
St. Augustine Cave Hill
Pop (%) Sample (%) Pop (%) Sample (%)
Sex in STEM
fields
Males (47)
Females (53)
Male (50)
Females (50)
Males (49)
Females (51)
Males (38)
Females (62)
STEM
Race/Ethnicity
Black (38)
East Indians
(40)
Mixed (21)
Others (1)
Black (40)
East Indians
(29)
Mixed (30)
Others (2)
Black (93)
East Indians
(1)
Mixed (3)
Others (3)
Black (72)
East Indians
(6)
Mixed (16)
Others (6)
First-Year
Students in
STEM Fields
1,420 118 (8) 389 174 (45)
88
Comparing the mean scores of the continuous variables studied for the St.
Augustine and the Cave Hill campuses showed the following: In relation to academic
achievement, STEM students at both campuses had on average eight or more CXC,
CSEC passes indicating a high level of achievement (M = 4.14). The STEM students’
secondary school combined math and science GPA was also relatively high (M= 3.47).
Additionally, students on both campuses aspired to attain at least a master’s degree (M =
3.37) and most parents had at least some tertiary level education (M = 3.92). However,
STEM students at Cave Hill had on average slightly higher educated parents than STEM
students at St. Augustine. There were some financial concerns on both campuses but the
students at Cave Hill, Barbados had slightly more concerns about their financial status.
This was not surprising since the government of Barbados required students to pay tuition
for the first time in the history of the university. The Pearson’s correlations coefficients
between each of the predictor variables are shown in Appendix C.
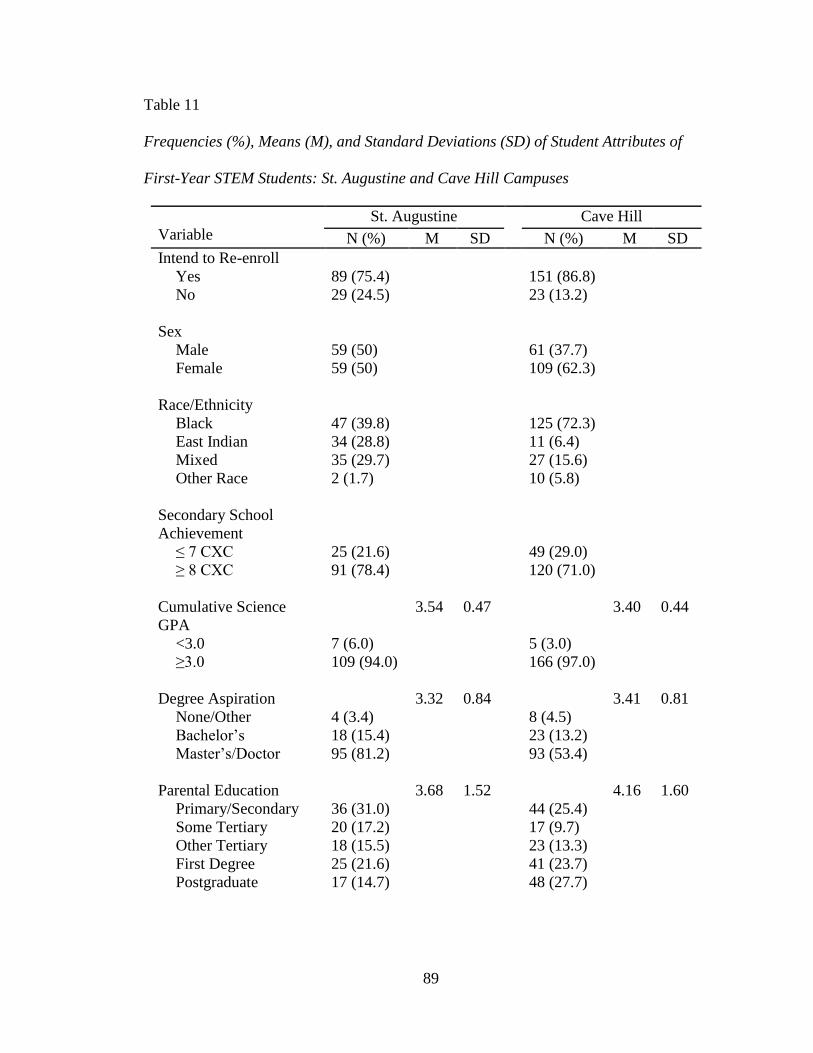
89
Table 11
Frequencies (%), Means (M), and Standard Deviations (SD) of Student Attributes of
First-Year STEM Students: St. Augustine and Cave Hill Campuses
Variable
St. Augustine Cave Hill
N (%) M SD N (%) M SD
Intend to Re-enroll
Yes 89 (75.4) 151 (86.8)
No 29 (24.5) 23 (13.2)
Sex
Male 59 (50) 61 (37.7)
Female 59 (50) 109 (62.3)
Race/Ethnicity
Black 47 (39.8) 125 (72.3)
East Indian 34 (28.8) 11 (6.4)
Mixed 35 (29.7) 27 (15.6)
Other Race 2 (1.7) 10 (5.8)
Secondary School
Achievement
≤ 7 CXC 25 (21.6) 49 (29.0)
≥ 8 CXC 91 (78.4) 120 (71.0)
Cumulative Science
GPA
3.54 0.47 3.40 0.44
<3.0 7 (6.0) 5 (3.0)
≥3.0 109 (94.0) 166 (97.0)
Degree Aspiration 3.32 0.84 3.41 0.81
None/Other 4 (3.4) 8 (4.5)
Bachelor’s 18 (15.4) 23 (13.2)
Master’s/Doctor 95 (81.2) 93 (53.4)
Parental Education 3.68 1.52 4.16 1.60
Primary/Secondary 36 (31.0) 44 (25.4)
Some Tertiary 20 (17.2) 17 (9.7)
Other Tertiary 18 (15.5) 23 (13.3)
First Degree 25 (21.6) 41 (23.7)
Postgraduate 17 (14.7) 48 (27.7)
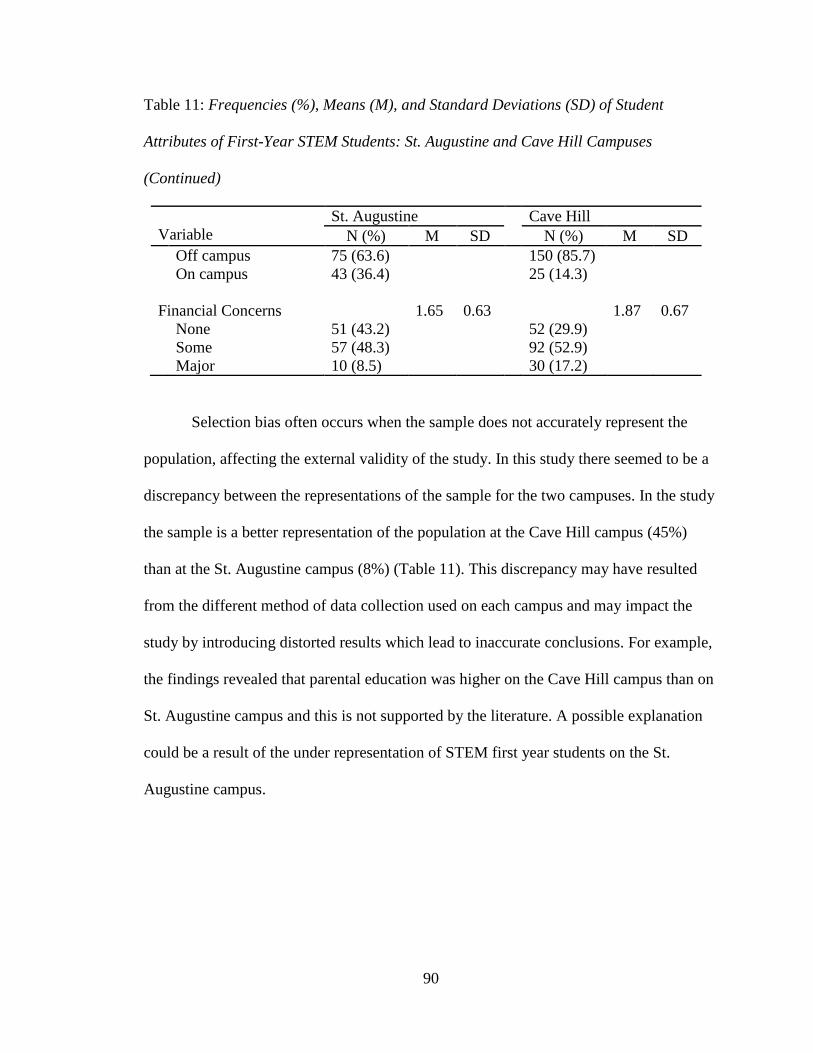
90
Table 11: Frequencies (%), Means (M), and Standard Deviations (SD) of Student
Attributes of First-Year STEM Students: St. Augustine and Cave Hill Campuses
(Continued)
Variable
St. Augustine Cave Hill
N (%) M SD N (%) M SD
Off campus 75 (63.6) 150 (85.7)
On campus 43 (36.4) 25 (14.3)
Financial Concerns 1.65 0.63 1.87 0.67
None 51 (43.2) 52 (29.9)
Some 57 (48.3) 92 (52.9)
Major 10 (8.5) 30 (17.2)
Selection bias often occurs when the sample does not accurately represent the
population, affecting the external validity of the study. In this study there seemed to be a
discrepancy between the representations of the sample for the two campuses. In the study
the sample is a better representation of the population at the Cave Hill campus (45%)
than at the St. Augustine campus (8%) (Table 11). This discrepancy may have resulted
from the different method of data collection used on each campus and may impact the
study by introducing distorted results which lead to inaccurate conclusions. For example,
the findings revealed that parental education was higher on the Cave Hill campus than on
St. Augustine campus and this is not supported by the literature. A possible explanation
could be a result of the under representation of STEM first year students on the St.
Augustine campus.
91
Psychometric Properties of the Instrument
The reliability and internal and external validity threats of the study were
determined for The UWI Survey of First-Year Students’ Perceptions survey. The data
collected were entered into Statistical Package for the Social Sciences (SPSS) 22. Prior to
analysis of the Institutional Institution Scale (IIS), the mean scores of the items were
computed for each participant (Caison, 2007; Pascarella & Terenzini, 1980). One score
was computed for each of the five sub-scales. The reliability of each subscale was also
investigated using a Cronbach-alpha analysis (Fields, 2009). Reliability refers to
consistency in measurement and validity is the extent to which the instrument measures
what it claims to measure (Stevens, 2009) and the generalizability of the study’s findings.
The results for the IIS ranged from .83 to .67, with faculty concern for student
development performing the highest and academic and intellectual development the
lowest. The reliability coefficients of the IIS subscales are shown in Table 12. Similarly
for the Academic Advising Inventory, one score was computed for the developmental-
prescriptive advising scales (.78) and one for the student satisfaction with academic
advising scale (.88). As previously mentioned, a reliability coefficient of .70 or higher is
considered acceptable in social science research for a sub-scale to be considered reliable
(Field, 2009). With the exception of the academic and intellectual development, all other
subscales for this study were deemed reliable and relatively consistent with previous
research findings (Table 12).
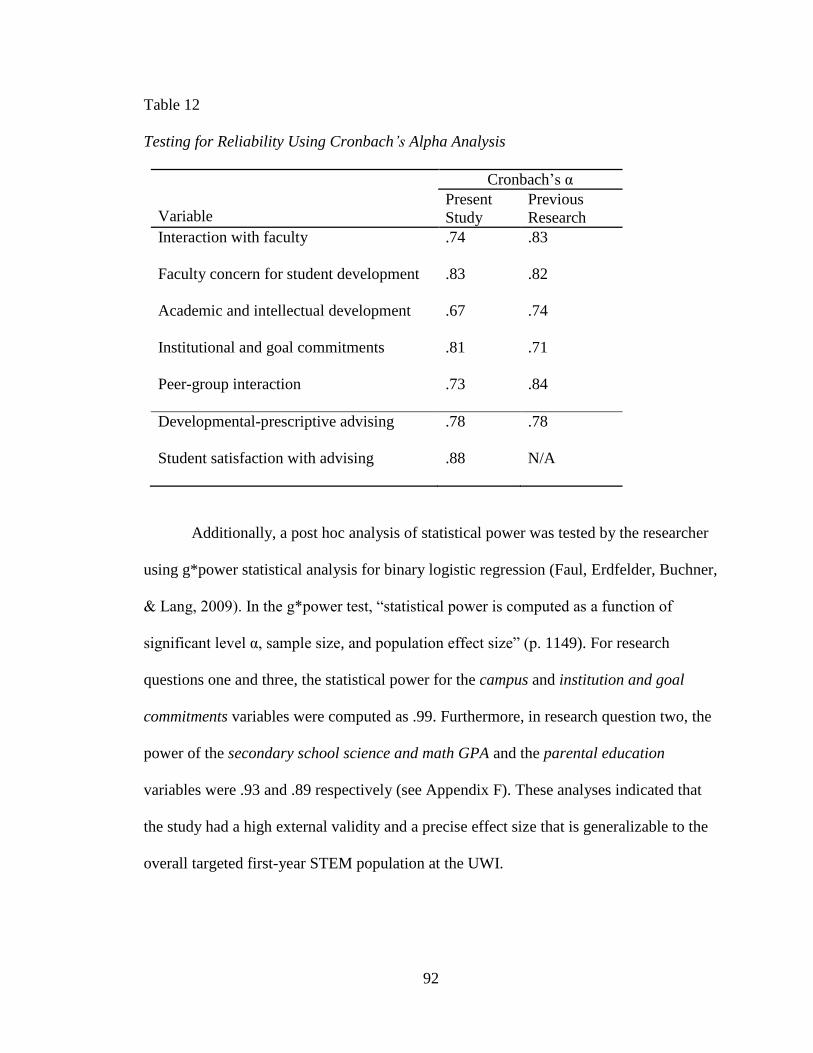
92
Table 12
Testing for Reliability Using Cronbach’s Alpha Analysis
Variable
Cronbach’s α
Present
Study
Previous
Research
Interaction with faculty .74 .83
Faculty concern for student development .83 .82
Academic and intellectual development .67 .74
Institutional and goal commitments .81 .71
Peer-group interaction .73 .84
Developmental-prescriptive advising .78 .78
Student satisfaction with advising .88 N/A
Additionally, a post hoc analysis of statistical power was tested by the researcher
using g*power statistical analysis for binary logistic regression (Faul, Erdfelder, Buchner,
& Lang, 2009). In the g*power test, “statistical power is computed as a function of
significant level α, sample size, and population effect size” (p. 1149). For research
questions one and three, the statistical power for the campus and institution and goal
commitments variables were computed as .99. Furthermore, in research question two, the
power of the secondary school science and math GPA and the parental education
variables were .93 and .89 respectively (see Appendix F). These analyses indicated that
the study had a high external validity and a precise effect size that is generalizable to the
overall targeted first-year STEM population at the UWI.
93
Binary Logistic Regression Analysis
One purpose of the study was to predict the student attributes and institutional
experiences that contribute to student retention in first year students in science,
technology, engineering, and mathematics (STEM) majors. Binary logistic regression
analysis examined the relationship between first, student attributes and secondly,
institutional experiences and STEM student re-enrollment status. All continuous variables
were converted to z-scores prior to analysis and assumptions were met. The weighted
means were used to analyze the data. Equation 2 shows how the model is constructed
Equation 2. General Form of the Logistic Regression Model for Campus Attended on
Retention Status
Logit (Ỳ) = b0 + b1(CAMPUS)
Campus versus Re-Enrollment Status
RQ 1: Does the campus students attended predict intent to re-enroll at the two
UWI campuses: St. Augustine and Cave Hill, in first year STEM students?
Research question one explored whether there was a significant difference
between the St. Augustine campus and the Cave Hill campus associated with students’
intent to re-enroll the second semester.
First, the researcher evaluated the fit of the model. On entering campus into the
model there was a significant improvement in model fit (null -2LL = 273.59, final -2LL =
267.78, χ2 = 5.81, p < .05) (see Appendix E, Table E2). The findings showed that the
variable campus was a significant predictor of re-enrollment status. The overall accuracy
of the prediction is 82.2%. As shown in Table 13, the odds of a student re-enrolling at
the Cave Hill campus are 2.10 times that the odds of a student re-enrolling at the St.
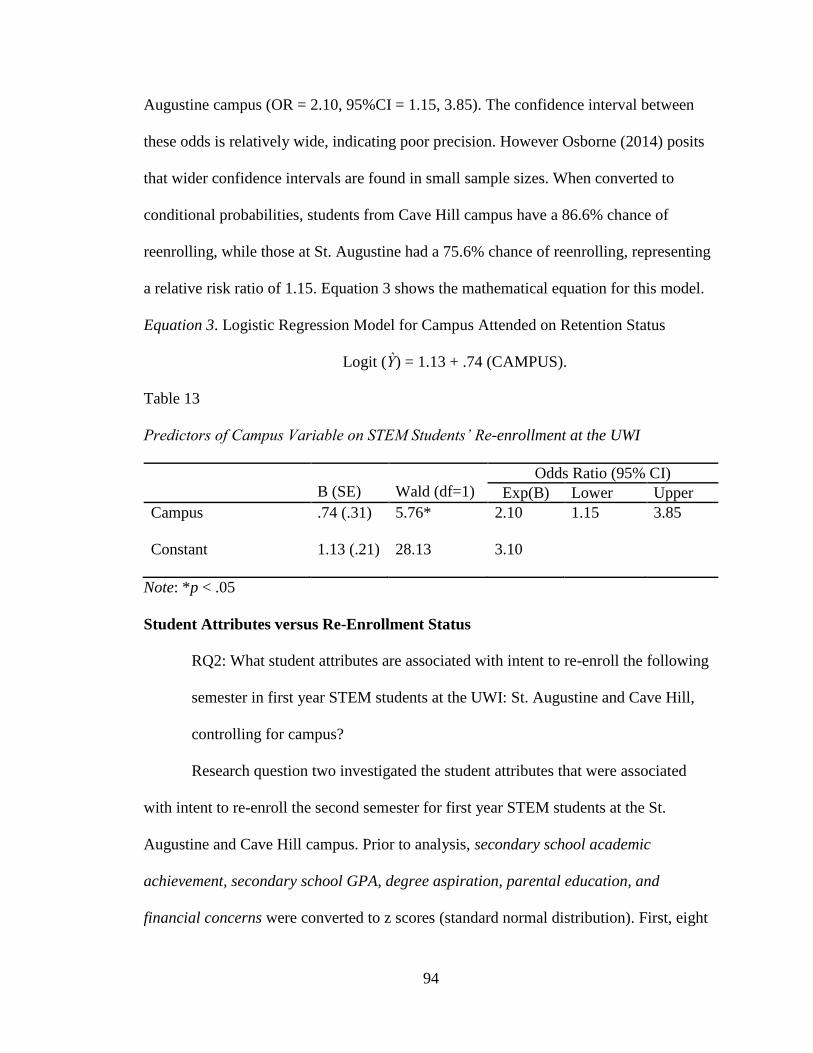
94
Augustine campus (OR = 2.10, 95%CI = 1.15, 3.85). The confidence interval between
these odds is relatively wide, indicating poor precision. However Osborne (2014) posits
that wider confidence intervals are found in small sample sizes. When converted to
conditional probabilities, students from Cave Hill campus have a 86.6% chance of
reenrolling, while those at St. Augustine had a 75.6% chance of reenrolling, representing
a relative risk ratio of 1.15. Equation 3 shows the mathematical equation for this model.
Equation 3. Logistic Regression Model for Campus Attended on Retention Status
Logit (Ỳ) = 1.13 + .74 (CAMPUS).
Table 13
Predictors of Campus Variable on STEM Students’ Re-enrollment at the UWI
B (SE)
Wald (df=1)
Odds Ratio (95% CI)
Exp(B) Lower Upper
Campus .74 (.31) 5.76* 2.10 1.15 3.85
Constant 1.13 (.21) 28.13 3.10
Note: *p < .05
Student Attributes versus Re-Enrollment Status
RQ2: What student attributes are associated with intent to re-enroll the following
semester in first year STEM students at the UWI: St. Augustine and Cave Hill,
controlling for campus?
Research question two investigated the student attributes that were associated
with intent to re-enroll the second semester for first year STEM students at the St.
Augustine and Cave Hill campus. Prior to analysis, secondary school academic
achievement, secondary school GPA, degree aspiration, parental education, and
financial concerns were converted to z scores (standard normal distribution). First, eight
95
predictor variables of student attributes on student re-enrollment status and the campus
variable were entered into the equation simultaneously (Table 14). Equation 4 shows
how the model was constructed.
Equation 4. General Form of the Logistic Regression Model for Student Attributes on
Retention Status
Logit (Ỳ) = b0 + b1(SEX) + b2(RACE) + b3(zSSACH) + b4(zSSGPA) + b5(zDEGASP) +
b6(zPEDU) + b7(LIVE) + b8(FINCON)
The results revealed that of the eight variables investigated, only secondary
school science and math GPA and parental education were significant unique predictors
of re-enrollment status. Entry of the student attribute variables into the model
significantly improved model fit (null -2LL = 261.18, final -2LL = 239.48, χ2 = 21.70, p
< .05) (see Appendix E, Table E8). The overall accuracy of the prediction is 81.5%. After
controlling for all other variables in the analysis, including campus, a high level of
secondary school science and math GPA was associated with an increase in student re-
enrollment status (b3 = -.44, SEb = .18, p < .05). Specifically, as student’s secondary
school science and math GPA increased the odds of the student re-enrolling increased
(OR = 1.55, 95%CI = 1.09, 2.20). When converted to conditional probabilities, assuming
that all other variables are held constant, it was found that students with secondary school
science and math GPA two standard deviations above the mean had a probability of
77.4% of re-enrolling, while students with secondary school science and math GPA two
standard deviations below the mean had a 37.1% chance of re-enrolling. The relative risk
of students two standard deviations above the mean re-enrolling compared with students
two standard deviations below the mean is 2.08.
96
Similarly, parental education was a significant unique predictor of re-enrollment
status (Table 14). After controlling for all other variables in the analysis, an increase in
the level of parental education was associated with a decrease in student’s re-enrollment
status (b6 = -.46, SEb = .19, p < .05). Students with highly educated parents had an
increased odds of not re-enrolling in the institution (OR = .64, 95%CI = .44, .92). When
converted to conditional probabilities it was found that students with parental education
two standard deviations below the mean have a 78.1% chance of re-enrolling, while
students with parental education two standard deviations above the mean have a
probability of 36.1% of re-enrolling. The relative risk of students two standard deviations
below the mean re-enrolling compared with students two standard deviations above the
mean is 2.16. Equation 5 shows the mathematical equation for the model.
Equation 5. Logistic Regression Model for Student Attributes on Retention Status
Logit (Ỳ) = .35 + .44 (zSSGPA) - .46 (zPEDU)
Second, an interaction effect was examined between the variable campus and each
student attribute variable (See Appendix E, Table E15). On entering the interaction with
campus into block two following the main effect, there was a non-significant model (χ2 =
10.20, p = .42), indicating that there is no significant differences between the campus the
student attended and the student’s attributes.
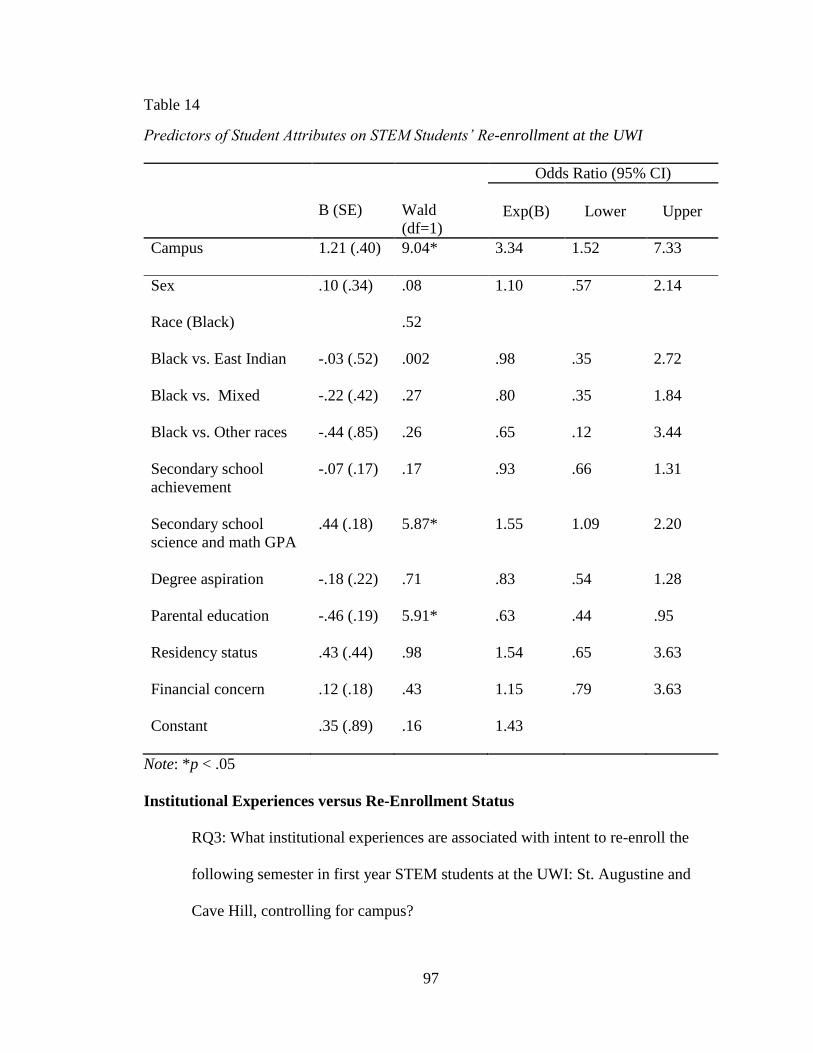
97
Table 14
Predictors of Student Attributes on STEM Students’ Re-enrollment at the UWI
B (SE)
Wald
(df=1)
Odds Ratio (95% CI)
Exp(B)
Lower
Upper
Campus 1.21 (.40) 9.04* 3.34 1.52 7.33
Sex .10 (.34) .08 1.10 .57 2.14
Race (Black) .52
Black vs. East Indian -.03 (.52) .002 .98 .35 2.72
Black vs. Mixed -.22 (.42) .27 .80 .35 1.84
Black vs. Other races -.44 (.85) .26 .65 .12 3.44
Secondary school
achievement
-.07 (.17) .17 .93 .66 1.31
Secondary school
science and math GPA
.44 (.18) 5.87* 1.55 1.09 2.20
Degree aspiration -.18 (.22) .71 .83 .54 1.28
Parental education -.46 (.19) 5.91* .63 .44 .95
Residency status .43 (.44) .98 1.54 .65 3.63
Financial concern .12 (.18) .43 1.15 .79 3.63
Constant .35 (.89) .16 1.43
Note: *p < .05
Institutional Experiences versus Re-Enrollment Status
RQ3: What institutional experiences are associated with intent to re-enroll the
following semester in first year STEM students at the UWI: St. Augustine and
Cave Hill, controlling for campus?
98
Research question three explored the institutional experiences associated with
STEM students’ at the St. Augustine and Cave Hill campuses and intent to re-enroll the
second semester, controlling for campus. Prior to analysis, the IIS subscales were
standardized. Equation 6 shows how the logistic regression model was constructed.
Equation 6. General Form of the Logistic Regression Model for Institutional Experiences
on Retention Status
Logit (Ỳ) = b0 + b1(FACINT) + b2(FACCON) + b3(AID) + b4(IGC) + b5(PEER)
First, the mean scores and standard deviations for each IIS subscale were
computed for each campus as shown in Table 15. At the St. Augustine campus, the
STEM student’s mean scores on subscales from greatest to least was institutional and
goal commitment (M = 4.30), peer-group interaction (M = 3.42), academic and
intellectual development (M = 3.32), interactions with faculty (M = 3.18), and faculty
concern for student development and teaching (M = 3.00). Similarly, for the Cave Hill
campus, the STEM student’s mean scores on subscales from greatest to least were
institutional and goal commitment (M = 4.33), peer-group interaction (M = 3.29),
academic and intellectual development (M = 3.21), interactions with faculty (M = 3.11),
and faculty concern for student development and teaching (M = 3.07). Both campuses
showed institutional and goal commitments with the greatest mean score, indicating that
students on both campuses agreed that it was important for them to graduate from UWI,
they were confident that they made the right decision attending UWI, they had an idea
what they wanted to major in, and getting good grades was important to them.
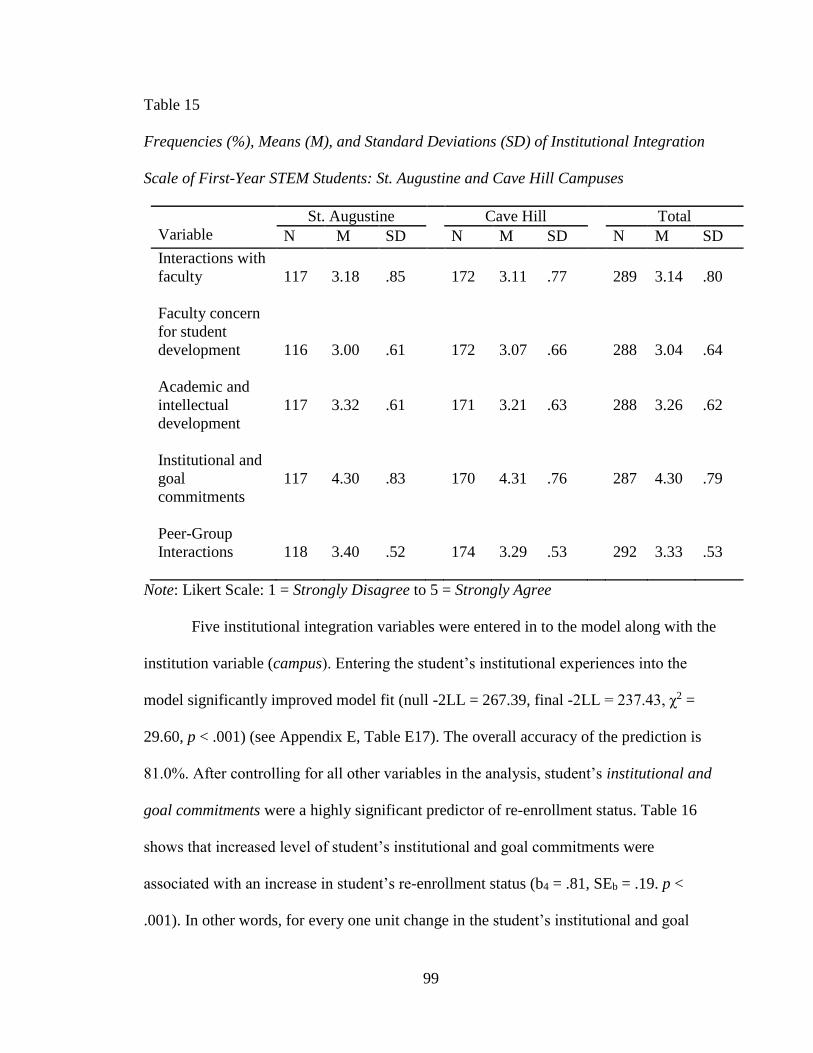
99
Table 15
Frequencies (%), Means (M), and Standard Deviations (SD) of Institutional Integration
Scale of First-Year STEM Students: St. Augustine and Cave Hill Campuses
Variable
St. Augustine Cave Hill Total
N M SD N M SD N M SD
Interactions with
faculty
117
3.18
.85
172
3.11
.77
289
3.14
.80
Faculty concern
for student
development
116
3.00
.61
172
3.07
.66
288
3.04
.64
Academic and
intellectual
development
117
3.32
.61
171
3.21
.63
288
3.26
.62
Institutional and
goal
commitments
117
4.30
.83
170
4.31
.76
287
4.30
.79
Peer-Group
Interactions
118
3.40
.52
174
3.29
.53
292
3.33
.53
Note: Likert Scale: 1 = Strongly Disagree to 5 = Strongly Agree
Five institutional integration variables were entered in to the model along with the
institution variable (campus). Entering the student’s institutional experiences into the
model significantly improved model fit (null -2LL = 267.39, final -2LL = 237.43, χ2 =
29.60, p < .001) (see Appendix E, Table E17). The overall accuracy of the prediction is
81.0%. After controlling for all other variables in the analysis, student’s institutional and
goal commitments were a highly significant predictor of re-enrollment status. Table 16
shows that increased level of student’s institutional and goal commitments were
associated with an increase in student’s re-enrollment status (b4 = .81, SEb = .19. p <
.001). In other words, for every one unit change in the student’s institutional and goal
100
commitments there is a .81 increase in the likelihood that the student will re-enroll in the
institution. Additionally, the odds of students with a high level of commitment to the
institution and high goal commitments re-enrolling in the institution are 2.26 times
greater than the odds for students with lower levels of commitments (OR = 2.26, 95%CI
= 1.56, 3.27). When converted to conditional probabilities, students with institutional and
goal commitments two standard deviations, above the mean had a 94.6% chance of re-
enrolling and students with institution and goal commitments two standard deviations
below the mean had a 40.6% chance of re-enrolling. The relative risk of students two
standard deviations above the mean re-enrolling compared with those two standard
deviations below the mean is 2.32. Equation 7 shows the mathematical equation for this
research question.
Equation 7. Logistic Regression Model for Institutional Experiences on Retention Status
Logit (Ỳ) = 1.24 + .81 (zIGC)
The institutional and goal commitments findings confirm the literature. Braxton
and Hirschy (2005) found that as the level of a student’s institutional and goal
commitments increase, the chances that the student will graduate from the institution
increases. Moreover, researchers found that in commuter universities, the higher the
student’s degree of subsequent institutional commitment, the higher the chances of
student’s persistence (Braxton et al., 2014).
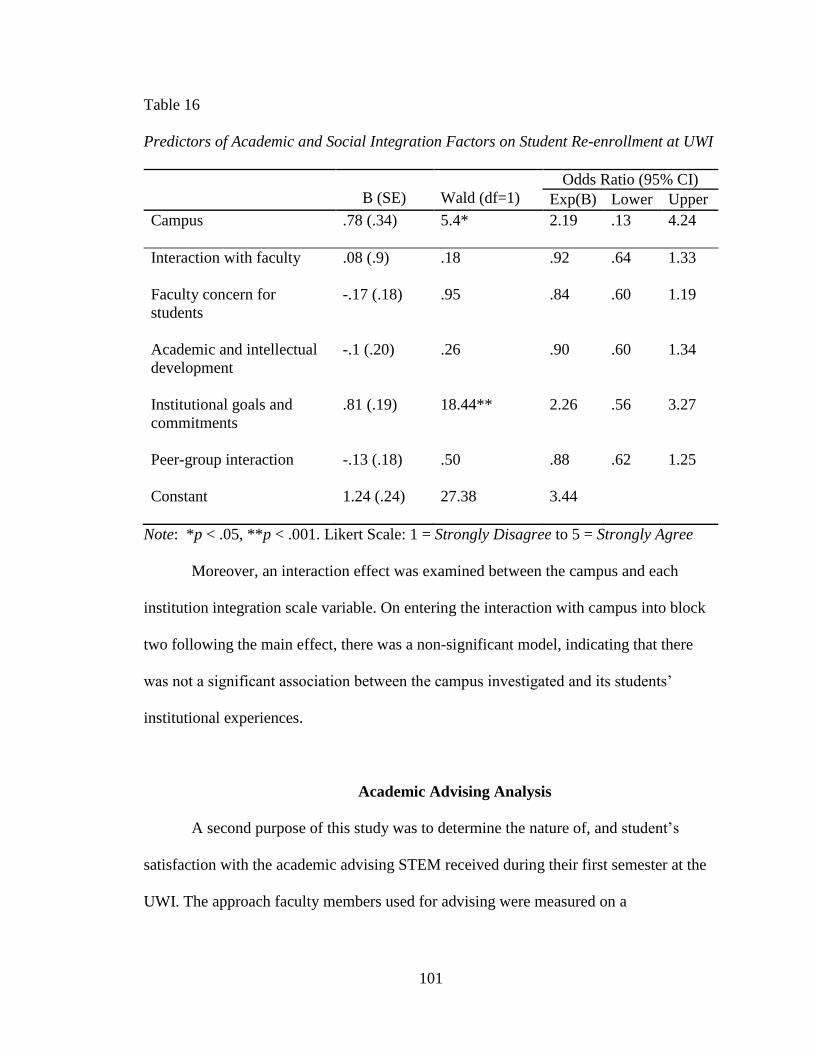
101
Table 16
Predictors of Academic and Social Integration Factors on Student Re-enrollment at UWI
B (SE)
Wald (df=1)
Odds Ratio (95% CI)
Exp(B) Lower Upper
Campus .78 (.34)
5.4* 2.19 .13 4.24
Interaction with faculty .08 (.9) .18 .92 .64 1.33
Faculty concern for
students
-.17 (.18) .95 .84 .60 1.19
Academic and intellectual
development
-.1 (.20) .26 .90 .60 1.34
Institutional goals and
commitments
.81 (.19) 18.44** 2.26 .56 3.27
Peer-group interaction -.13 (.18) .50 .88 .62 1.25
Constant 1.24 (.24) 27.38 3.44
Note: *p < .05, **p < .001. Likert Scale: 1 = Strongly Disagree to 5 = Strongly Agree
Moreover, an interaction effect was examined between the campus and each
institution integration scale variable. On entering the interaction with campus into block
two following the main effect, there was a non-significant model, indicating that there
was not a significant association between the campus investigated and its students’
institutional experiences.
Academic Advising Analysis
A second purpose of this study was to determine the nature of, and student’s
satisfaction with the academic advising STEM received during their first semester at the
UWI. The approach faculty members used for advising were measured on a
102
developmental-prescriptive continuum. The means and standard deviations of the nature
of advising and the student’s satisfaction with the program were used to analyze the data.
Academic Advising on a Developmental-Prescriptive Continuum
RQ 4a: What perceptions do first year STEM students at the UWI have about the
type of academic advising they received in relation to the nature of academic
advising on a developmental-prescriptive continuum?
Research question 4a investigated the perceptions that first-year STEM students
had about the approach to academic advising they received as measured by the Winston
and Sandor (1972), Academic Advising Inventory (AAI). The developmental-prescriptive
advising (DPA) approach was examined (Crookston, 1994). However, at both campuses,
STEM students indicated that they were unable to complete the developmental-
prescriptive advising questions in Section 1 of the AAI and they were asked by the
researcher to make a comment on this decision. At the St. Augustine campus, only 56
students or 47.5% of the sample attempted the DPA while at the Cave Hill campus, 83
students or 47.4% of the sample attempted the 14 questions (Table 17). When asked by
the researcher to comment on the decision to not complete the survey instrument, some
students indicated that they were unaware of the intent and process of academic advising;
some stated they had not been assigned advisors, while others said they had not yet met
with an advisor. These findings are not consistent with the institution’s advising mission
and the posting on their website: “Students are assigned an advisor when enrolling at the
university during Orientation Week” (UWI, St. Augustine, 2014-2015). Some students
also pointed out that the Academic Advising Inventory did not provide an option for ‘not
true’ and this limited their choices. Table 16 showed that, at both campuses, students
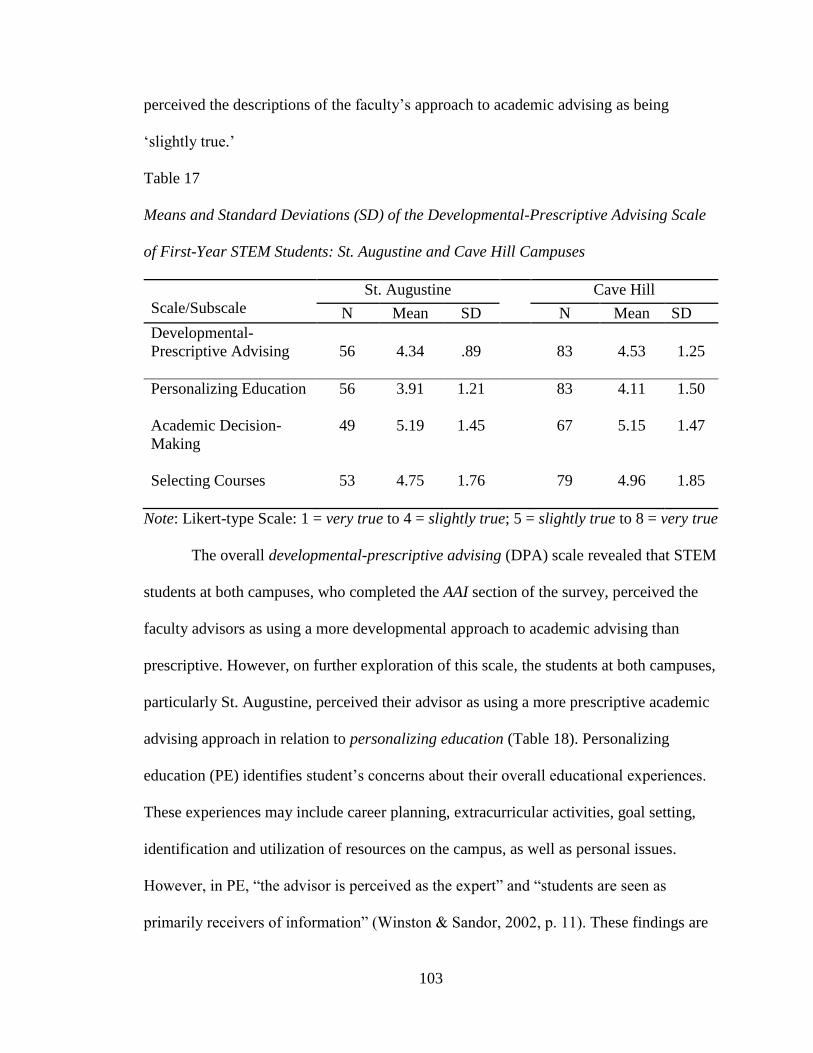
103
perceived the descriptions of the faculty’s approach to academic advising as being
‘slightly true.’
Table 17
Means and Standard Deviations (SD) of the Developmental-Prescriptive Advising Scale
of First-Year STEM Students: St. Augustine and Cave Hill Campuses
Scale/Subscale
St. Augustine Cave Hill
N Mean SD N Mean SD
Developmental-
Prescriptive Advising
56
4.34
.89
83
4.53
1.25
Personalizing Education
56 3.91 1.21 83 4.11 1.50
Academic Decision-
Making
49 5.19 1.45 67 5.15 1.47
Selecting Courses
53 4.75 1.76 79 4.96 1.85
Note: Likert-type Scale: 1 = very true to 4 = slightly true; 5 = slightly true to 8 = very true
The overall developmental-prescriptive advising (DPA) scale revealed that STEM
students at both campuses, who completed the AAI section of the survey, perceived the
faculty advisors as using a more developmental approach to academic advising than
prescriptive. However, on further exploration of this scale, the students at both campuses,
particularly St. Augustine, perceived their advisor as using a more prescriptive academic
advising approach in relation to personalizing education (Table 18). Personalizing
education (PE) identifies student’s concerns about their overall educational experiences.
These experiences may include career planning, extracurricular activities, goal setting,
identification and utilization of resources on the campus, as well as personal issues.
However, in PE, “the advisor is perceived as the expert” and “students are seen as
primarily receivers of information” (Winston & Sandor, 2002, p. 11). These findings are
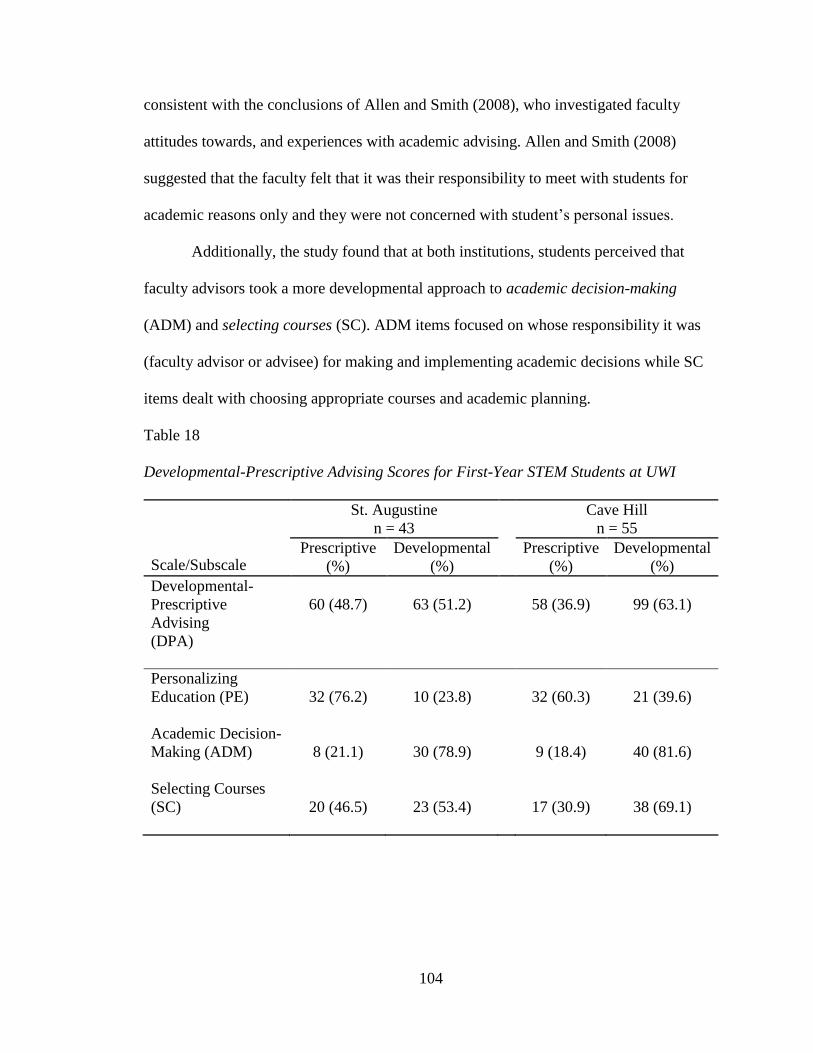
104
consistent with the conclusions of Allen and Smith (2008), who investigated faculty
attitudes towards, and experiences with academic advising. Allen and Smith (2008)
suggested that the faculty felt that it was their responsibility to meet with students for
academic reasons only and they were not concerned with student’s personal issues.
Additionally, the study found that at both institutions, students perceived that
faculty advisors took a more developmental approach to academic decision-making
(ADM) and selecting courses (SC). ADM items focused on whose responsibility it was
(faculty advisor or advisee) for making and implementing academic decisions while SC
items dealt with choosing appropriate courses and academic planning.
Table 18
Developmental-Prescriptive Advising Scores for First-Year STEM Students at UWI
Scale/Subscale
St. Augustine
n = 43
Cave Hill
n = 55
Prescriptive
(%)
Developmental
(%)
Prescriptive
(%)
Developmental
(%)
Developmental-
Prescriptive
Advising
(DPA)
60 (48.7)
63 (51.2)
58 (36.9)
99 (63.1)
Personalizing
Education (PE)
32 (76.2)
10 (23.8)
32 (60.3)
21 (39.6)
Academic Decision-
Making (ADM)
8 (21.1)
30 (78.9)
9 (18.4)
40 (81.6)
Selecting Courses
(SC)
20 (46.5)
23 (53.4)
17 (30.9)
38 (69.1)
105
Students’ Satisfaction with Academic Advising
RQ 4b: What perceptions do first year STEM students at the UWI have about the
type of academic advising they received in relation to students’ satisfaction with
academic advising?
Research question 4b investigated the STEM student’s perception and satisfaction
with the academic advising experience at St. Augustine and Cave Hill campuses.
However, only 98 surveys or 33.4% of the sample were completed for this question and
subsequently used in its analysis. When asked to consider and respond to the academic
advising they had participated in this year at the university, 41 students left all five
statements unanswered. Table 19 shows that the mean scores for student’s satisfaction
with academic advising and its five items all hover around the average score (2.5) with
St. Augustine students more slightly satisfied than students at the Cave Hill campus. This
result indicates that overall about half the students participating in the study on each
campus were dissatisfied with the academic advising program that they received.
However, a little over half the student from the St. Augustine campus agreed that
information provided by faculty advisors was accurate and that they were given adequate
notice about important deadlines.
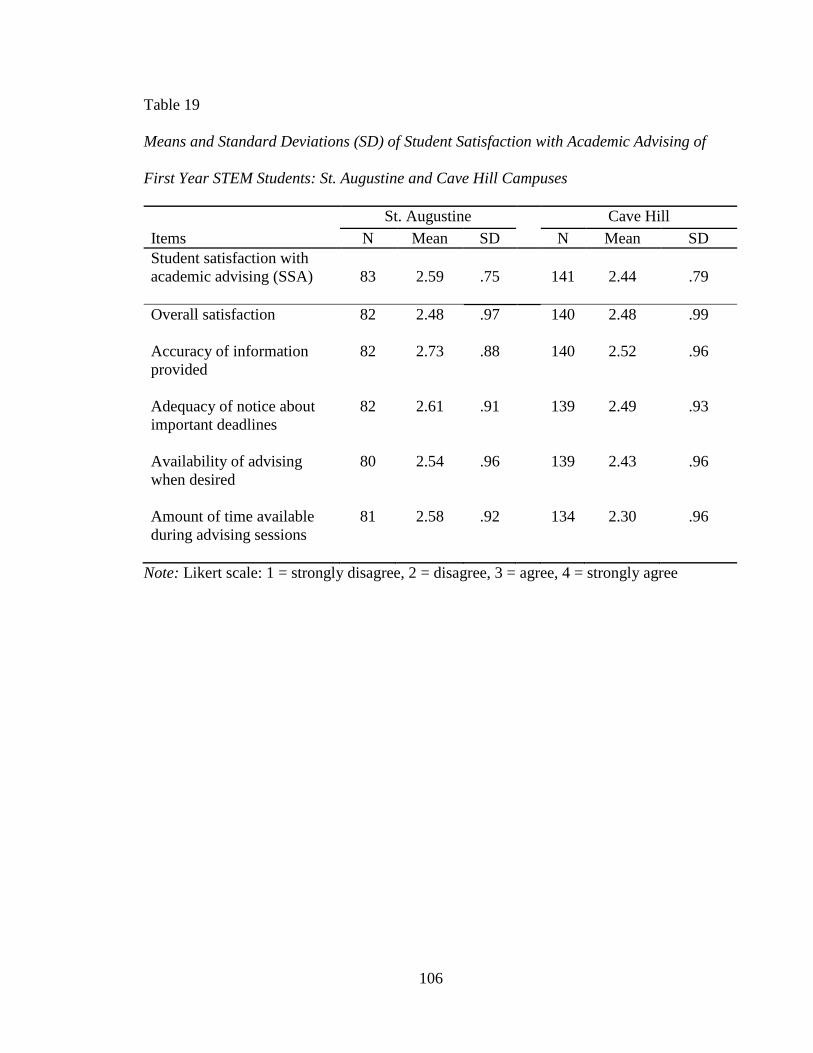
106
Table 19
Means and Standard Deviations (SD) of Student Satisfaction with Academic Advising of
First Year STEM Students: St. Augustine and Cave Hill Campuses
St. Augustine Cave Hill
Items N Mean SD N Mean SD
Student satisfaction with
academic advising (SSA)
83
2.59
.75
141
2.44
.79
Overall satisfaction 82 2.48 .97 140 2.48 .99
Accuracy of information
provided
82 2.73 .88 140 2.52 .96
Adequacy of notice about
important deadlines
82 2.61 .91 139 2.49 .93
Availability of advising
when desired
80 2.54 .96 139 2.43 .96
Amount of time available
during advising sessions
81 2.58 .92 134 2.30 .96
Note: Likert scale: 1 = strongly disagree, 2 = disagree, 3 = agree, 4 = strongly agree
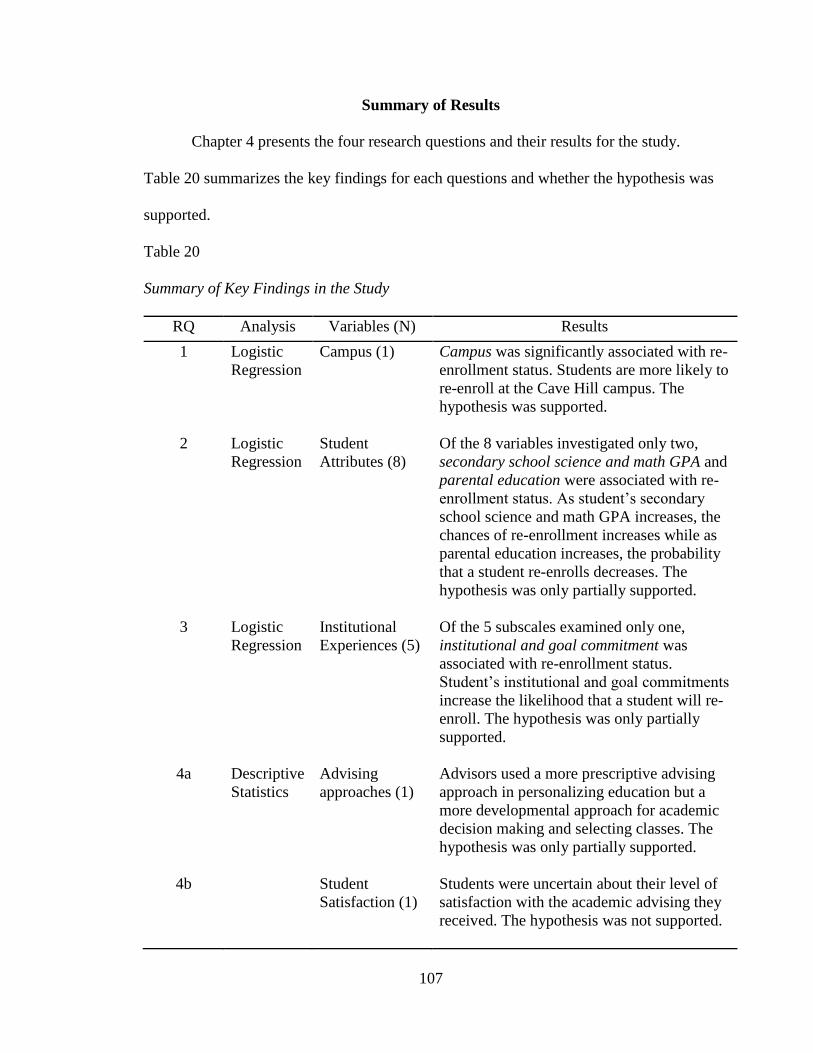
107
Summary of Results
Chapter 4 presents the four research questions and their results for the study.
Table 20 summarizes the key findings for each questions and whether the hypothesis was
supported.
Table 20
Summary of Key Findings in the Study
RQ Analysis Variables (N) Results
1 Logistic
Regression
Campus (1)
Campus was significantly associated with re-
enrollment status. Students are more likely to
re-enroll at the Cave Hill campus. The
hypothesis was supported.
2 Logistic
Regression
Student
Attributes (8)
Of the 8 variables investigated only two,
secondary school science and math GPA and
parental education were associated with re-
enrollment status. As student’s secondary
school science and math GPA increases, the
chances of re-enrollment increases while as
parental education increases, the probability
that a student re-enrolls decreases. The
hypothesis was only partially supported.
3 Logistic
Regression
Institutional
Experiences (5)
Of the 5 subscales examined only one,
institutional and goal commitment was
associated with re-enrollment status.
Student’s institutional and goal commitments
increase the likelihood that a student will re-
enroll. The hypothesis was only partially
supported.
4a Descriptive
Statistics
Advising
approaches (1)
Advisors used a more prescriptive advising
approach in personalizing education but a
more developmental approach for academic
decision making and selecting classes. The
hypothesis was only partially supported.
4b Student
Satisfaction (1)
Students were uncertain about their level of
satisfaction with the academic advising they
received. The hypothesis was not supported.
108
CHAPTER 5
DISCUSSION AND CONCLUSIONS
This chapter presents a summary of the study and important conclusions drawn
from the data presented in Chapter 4 and reflect on these findings. It provides a
discussion of implications for practice and recommendations for future research. The
study examined the student attributes and perceptions of institutional experiences of first
year STEM students at two campuses of the University of the West Indies: St. Augustine
campus and Cave Hill campus on the student’s intent to re-enroll at the university. The
study further sought to determine the nature of, and student’s satisfaction with the
academic advising received during his or her first semester at the university. A survey
instrument was distributed to STEM students at each university to ascertain their attitudes
and perceptions. Binary logistic regression was used to analyze the data and provide the
results.
Campus Attended and Re-enrollment Status
Research question one explored whether there was a significant difference
between the St. Augustine campus and the Cave Hill campus in relation to student’s
intent to re-enroll the second semester. The results indicated that there was a significant
association between the campus the student attended and student’s intent to re-enroll the
second semester. The chances of a student re-enrolling at the Cave Hill campus were
greater than the chances of re-enrollment at the St. Augustine campus. These findings are

109
consistent with the literature. According to Tewarie (2010a), the St. Augustine campus
has the higher stop out rate of the two campuses. Additionally, the campus a student
attended was highly correlated to whether the student resided on campus or off campus.
Both campuses tended to be commuter campuses but the Cave Hill campus had a higher
percentage of students who lived off campus and their chances of re-enrolling were
higher than the St. Augustine student. This outcome contradicted previous research
findings. According to Pascarella and Terenzini (2005) and Whalen and Shelly (2010),
students in STEM majors who lived on campus have a higher success rate than students
who lived off campus since students living on campus were more likely to participate in
extracurricular activities and form peer groups (social integration), which contributed to
their persistence (Whalen & Shelley, 2010). Barbados is a smaller island (166 square
miles, 12.1 miles long by 7.58 miles wide) than Trinidad and it is more practical for the
first year local students to reside at home with parents and/or extended family members.
Moreover, first year students from contributing countries attending Cave Hill, Barbados
tend to live 1 to 3 miles off campus in neighboring environs due to the close proximity to
the university. As a result, students living off-campus are equally as able to participate in
the extra-curricular activities on campus as students who live on-campus which improves
the student’s chances of graduating (Astin & Oseguera, 2012; Whallen & Shelley, 2010).
Student Attributes and Re-Enrollment Status
Research question two investigated the association of the student attributes sex,
race/ethnicity, secondary school academic achievement, secondary school science and
mathematics GPA, degree aspiration, parental education, residency status, and financial
110
concerns, with intent to re-enroll the following semester for first year STEM students at
the St. Augustine and Cave Hill campuses, controlling for campus. The findings
indicated that there was no relationship between sex, race/ethnicity, secondary school
achievement, degree aspiration, residency status, and financial concerns on student’s
intent to re-enroll the following semester for first year STEM students at the UWI. These
findings did not support the student persistence and retention literature (Astin, 1993;
Astin & Oseguera, 2012; Bean, 1980; Chen 2013; Pascarella & Terenzini, 1980; Tinto,
1993). These researchers suggested that student’s demographic characteristics and
enrollment factors are significant dimensions of student’s re-enrolment status. There was
no difference between race/ethnicity and student’s re-enrollment status. One reason
proposed for this was that, in the U.S. literature ‘minorities and underrepresented’
students are identified as being less likely to persist in the universities. In the Caribbean
culture, this delineation does not exist between races. Caribbean people are generally
classified by social class structure (Gordon, 1987). Additionally, the campus a student
attended was highly correlated to the student’s race or ethnicity. Students at the Cave Hill
campus were predominantly Black. At the St. Augustine campus, even though the
participants were mainly of the Black race, race and ethnicity was more evenly
distributed across Black, East Indian, and mixed race. This distribution is similar to the
ethnic group profile of both countries (Index Mundi, 2013a, Index Mundi 2013b).
Secondary school achievement and degree aspiration were also not significant
predictors of re-enrollment status. The researcher suggested that Caribbean students,
whether they plan to return to the university or not the following semester, had high
secondary school achievement and high levels of motivation to attain a degree and that
111
some of the students in the study may have been transferring to another university or
stopping out to work with the intent to return at a later date. There was also no significant
association between financial concerns and student’s retention status and there was no
interaction effect between financial concerns and campus attended. The researcher
purports that most students, in spite of the financial changes at the Cave Hill campus,
would have made the decision to attend UWI knowing their financial status and whether
they could support themselves for their first academic year. In other words, the effects of
financial status on student retention would become more apparent at the beginning of
student’s second academic year more so than their second semester.
In this study the student’s secondary school math and science GPA and his or her
parent’s level of education were significantly associated with re-enrollment status. A
student with a high secondary school science and math GPA is more likely to re-enroll in
the institution. Tinto’s model of institutional departure (1993) demonstrated that
academic integration is a key element of the student departure puzzle and secondary
school GPA has been shown to provide insight into academic performance in the
university as well as a strong positive predictor for student’s persistence. Furthermore,
researchers found that academic achievement in mathematics and science prior to
entering the university was significantly associated with persistence across all STEM
majors (Chen, 2013; Shaw & Barbuti, 2010). The researcher proposes that lower math
and science scores in secondary school may have been the result of student’s lack of
motivation and student’s anxiety in these subject areas, which is prevalent in Caribbean
society. Recommendations are suggested for assisting these students later.
112
Surprisingly, students with highly educated parents were less likely to re-enroll.
The literature contends that students with parents who are highly educated are more
likely to receive encouragement and support from their parents which makes the student
more likely to persist and graduate from a tertiary level institution than their first
generation counterparts. However, they may be other events occurring and influencing
this result or the culture of the region may have contributed to this finding. Moreover, the
majority of the students who participated in the study had parents who had some tertiary
education: St. Augustine (81.2%) and Cave Hill (74.6%), so the respondents were
predominantly not first generation college students. One suggestion for these findings is
the idea that both campuses were commuter campuses. Braxton et al. (2014) discovered
that in commuter universities as the level of parental education increased, the likelihood
of student persistence decreased. They suggested that more educated parents preferred
their sons and daughters to attend residential universities. From a Caribbean cultural
perspective, parental and family influences in career decision making and attaining a
degree is very high. Highly educated parents, especially those who may have studied
outside the Caribbean (North America or United Kingdom), would anticipate that their
children will attend the UWI for their first semester or first year with the intention that
they will be transferring to a university outside the Caribbean to complete their degree.
Parental education was also negatively significantly correlated with the student’s
financial concerns (r = -.18, p < .001). Students whose parents were highly educated had
less financial concerns. This is consistent with the literature (Chen, 2013). Nevertheless,
more than half of the students on both campuses had ‘some’ to ‘major’ financial concerns
(St. Augustine, 56.8%; Cave Hill, 70.1%). This supported previous research findings that
113
more than half of first year students studied had some financial concerns (Pryor et al.,
2009). However, financial concerns were not a factor contributing to student’s re-
enrollment status on either campus. An interaction effect between these students
attributes and campus found a non-significant model indicating that there is not a
significant association between the campus the student attended and the student
attributes.
The examination showed that 83.2% of the respondents had made the decision to
re-enroll in the second semester and those who had made the decision to withdraw did
not relate that choice to most of the factors identified by U.S. researchers. This researcher
proposes that the one main reason for this conclusion is that the UWI is a highly selective
institution where access is based on achievement and merit only, priority is given to
students based on their educational abilities, and first year students compete for
placement into the STEM fields at the institution (Roberts, 2003). The medical science
and engineering programs particularly, since they are in high demand, are forced to be
highly selective. In the U.S., access to higher education is more equitable and embraces
measures which compensate for the inclusion of underrepresented and disadvantaged
students as well as merit. High selectivity for access in the Caribbean contributes to
cultural capital which is positively associated with student persistence (Berger, 2000;
Braxton & Hirschy, 2005). Subsequently, at the UWI, students are more motivated to
persist, whatever the circumstances. Also, a student who is contemplating stopping out
may be encouraged by his or her peers to reconsider (Astin & Oseguera, 2012).
Secondly, the characteristics of the Caribbean student may have influenced these
results. According to Roberts (2003), in the Caribbean university, students are expected
114
to take full responsibility for most of their learning. Furthermore, the sample selected by
the researcher was comprised of first year students in science and technology, medicine,
and engineering. These students are most likely considered the ‘elite’ on both campuses
with highly educated parents who encouraged them to persist and graduate.
A third reason proposed for these findings is related to the culture of the
Caribbean people. In the Caribbean territories where Caribbean identity is grounded in
survival and assimilation, education is a pivotal factor in survival and social mobility,
(Gordon, 1987; Hall, 2001) more than it in the U.S. society. As previously mentioned, the
student’s cultural identity may affect the way he or she perceives degree attainment and
his or her decision to return or stop out of the university. Consequently, graduating from
the UWI becomes important regardless of demographic characteristics and enrollment
issues.
Institutional Experiences and Re-enrollment Status
Research question three examined the Institutional and Integration Scales (IIS)
adapted from Pascarella and Terenzini (1980). The findings suggested that interaction
with faculty, faculty concern for student development, and academic and intellectual
development, and peer interaction did not increase the chances of student’s persistence as
indicated by the literature (Astin & Oseguera, 2012; Caison, 2009; Tinto, 2012). This
could have resulted from the campus culture at both universities. For example, in the U.S.
sports defines campus culture and is a bigger activity on many campuses than in the
Caribbean. Sports build campus communities, and encourage interpersonal interactions
between students as well as between faculty and students. Since both campuses are
115
predominantly commuter campuses, they may lack strong social communities, faculty
interaction, and peer-group activities. According to Roberts (2003) in the Caribbean
tertiary level education, personal interactions with peers are more distant and less
supported and the student’s relationships with their faculty are more impersonal than in
the U.S. higher education system where faculty members play a more nurturing role.
Interestingly, there was a strong, positive significant correlation between faculty
interaction and all other academic and social institutional interactions investigated (see
Appendix C).
The student’s institutional and goal commitments were positively significant
predictor of student’s intent to re-enroll. This supported Tinto (1993) model which
established that institutional and goal commitments are significant components in a
student’s decision to persist or withdraw from a tertiary institution. This theory has also
been partially supported using predictive validity by other researchers (Astin & Oseguera,
2012; Braxton & Hirschy, 2005; Pascarella & Terenzini, 1980). Moreover,
approximately 40% of the STEM students surveyed had previously attended a tertiary
level institution. Subsequently, students might be more responsible, dedicated, and adept
to the expectations in a university setting. Student’s confidence that they made the right
decision in attending the UWI and that graduating was important to them increased the
chances that they will re-enroll. Furthermore, the campus culture has high expectations
for student success and this is identified in the literature as encouraging student
persistence and retention, particularly in the student’s first year (Braxton & Hirschy,
2005; Tinto, 2012). Additionally, the study examined mathematics, science, medical
science, and engineering students. The researcher proposes that most of the sample had
116
set short term and long term goals and the few who were probably in these majors as a
result of their parent’s influence, would be more likely to withdraw at the end of the first
semester.
The Nature of and Satisfaction with Academic Advising
Research question 4a explored the nature and approach of academic advising and
student’s satisfaction with the academic advising process at the university. Many students
seemed unaware of the intent and purpose of the academic advising process. Only 47% of
the respondents completed the section on academic advising. Most of the remaining
students commented that they did not receive academic advising beyond course selection
at the beginning of the semester and in some cases the course selection process was done
by faculty during a group session. According to Hall (2001), academic counseling is
perceived differently by Caribbean people than U.S. residents.
The students who received academic advising at both campuses felt that the
overall approach was developmental in nature. However, as anticipated, the faculty
advisors tended to take a more traditional prescriptive approach rather than
developmental in personalizing education. In the latter approach, the faculty is seen more
as an authority figure (Crookston, 1994). Personalizing education refers to the total
educational experiences of a student (Winston & Sandor, 2002). This result confirmed
Tewarie’s (2010a) findings that first year students at the UWI did not know who to turn
to when they had non-academic concerns or were experiencing personal challenges. On
the positive side, students who participated in academic advising felt that faculty were
using a more developmental approach in the academic decision-making scales and the
117
selecting courses subscales. These task involved faculty monitoring student’s academic
progress, as well as advising students in selecting and registering for the appropriate
courses and academic scheduling (Winston & Sandor, 2002).
Overall, first year STEM students at UWI seemed uncertain about their degree of
satisfaction with the academic advising process. According to the UWI (2014) website,
the purpose of academic advising at the university is to “help students, particularly new
students, in planning, monitoring and successfully managing their chosen field of study,
in relation to clear career objectives. Students are guided to accept responsibility for their
learning, to be informed of the services provided for them, to access information, and to
be managers of their time” (UWI, 2014, para. 1). The UWI website implies that academic
advising is part of the culture of the institution and it is the student’s responsibility to
know the advising process but the student’s comments indicated otherwise. The results
verified that faculty advisors assisted first-year students with academic planning and
monitoring pertaining to their major and career, but unfortunately this service seemed to
be only available to a small group or specific majors within the STEM fields on the
campuses. There seemed to be some disconnect between what the institution identified as
the faculty advisor’s responsibilities, as indicated on their website, and the student’s
expectations. This is consistent with the results founded by Allen and Smith (2008).
Implications of the Study
The results of this study have implications for research, theory, and practice
particularly for first-year students who need guidance and direction in the environs of a
new university. The study is important for institutional researchers and higher education
professionals conducting student retention research. Further research on the factors
118
associated with student persistence and retention on each of the two campuses: St.
Augustine and Cave Hill, and developing theories specific to this Caribbean STEM
student population is needed. Additionally, administrators, faculty, and student service
personnel at each campus can draw on the outcomes of the study to inform practice by
designing and implementing interventions and programs for STEM students who are at
risk of stopping out of the university. For example, with the knowledge that secondary
school math and science grades affect persistence, personnel can organize tutoring
centers or supplemental instruction for students who may need assistance, especially in
mathematics. Additionally, assigning peer mentors for first-year students campus-wide
may not only provide them with a sense of belonging at the university but also create
connections and peer interactions for academic assistance and social relations if needed.
Student services at the UWI are more “formalized and institutionalized” (Roberts,
2003, p. 28) than in the U.S. universities. The study sought to inform student services
personnel on learning outcomes and objectives for the first year initiatives program. One
purpose of an effective first year initiative program is to help students make connections
at the university. At the UWI, first year programs strive to facilitate the personal,
academic, career, and social success of all first year students. First year experience
workshops are held weekly for all first year students. However, students are not
mandated to attend these workshops. At the Cave Hill campus, for example, with over
1,700 first year students campus-wide, only about 15 to 20 students attended the first year
experiences workshop. Since institutional and goal commitments was a contributor to
student persistence, focusing on making connections with faculty, peers and the campus
as a whole should affect student persistence and retention. Assigning the first year
119
workshops as a required course for all full time, first year students has been shown to
help students make these connections during their first year of college (Dahlgren, 2012).
Moreover, goals setting and prioritizing may be an important topic to discuss in a first
year seminar class. Setting goals will not only help to motivate students but also provide
them with targets to work towards, a sense of accomplishment when they do achieve the
goals, and assist students in managing their priorities. Coaching students on strategies for
successful time management, scheduling, and planning are also integral to setting goals.
Furthermore, focusing on the development of effective and efficient study habits and test
taking skills may assist students who transitioned from secondary school with a low
science and math GPA. Faculty members teaching first-year seminar courses have the
advantage that they can encourage student’s participation and involvement in campus
activities. This level of involvement is usually difficult to achieve on commuter campuses
but offering students incentives, awards, and recognition for participation may contribute
to student’s institutional commitment and subsequent persistence.
The positive, significant correlation between campus and financial concern is
disheartening. Administrators at the Cave Hill campus should implement needs based
scholarships and grants for STEM students experiencing financial concerns. One other
interesting significant correlation existed between the student’s sex and degree aspiration
where females in STEM fields generally had higher degree aspirations than males.
Members of the faculty and student services personnel should consider providing
workshops and summer camps with interactive activities to encourage secondary school
Caribbean males to pursue STEM fields even though the study shows that gender does
not significantly affect student persistence and retention in STEM majors.
120
One program, identified and investigated in the study was academic advising.
University administrators, faculty members, and student services personnel should
embrace a commitment to an effective academic advising program on each of the two
campuses which cater not only to student’s academic experiences but encompasses the
student’s personal situations and decision-making skills. This commitment should reflect
and relay the importance of an effective and efficient academic advising program not
only to the student, but to all stakeholders and the institution as a whole. With this end in
mind, administrators should develop a set of clear goals and objectives, clarify the role
faculty members and student service personnel will play in the decision-making process,
and discover ways to motivate faculty to strive to deliver a high quality academic
advising program.
First, create a small task force of about four members (Dean of science and
technology, an assistant professor, director of student services, student services
representative) led by a well-respected full time faculty member to explore, monitor, and
coordinator the academic advising process and to spearhead new ideas and direction for a
well-structured academic advising program based on an effective and efficient faculty
advising model. The model should embrace the mission, vision and values of the
university system and be appropriate and applicable to the student population being
served on each campus. Kennemer and Hurt (2013) summarized characteristics from the
literature that have been determined to be essential for effective academic advising.
Benchmarking, by researching effective academic advising programs in other
Caribbean institutions, particularly the flagship campus, would provide initial thoughts
and insight and the committee can determine how best they can adapt this model to their
121
campus. To get administrators and faculty full buy-in, the task force should provide
faculty with valuable information and sound research on effective academic advising
practices: the advantages and positive outcomes, especially as they pertain to student
persistence and retention at a tertiary level Caribbean institution. Other recommendations
for research for the task force are outlined in the following section.
Second, administrators should offer incentives, recognition, and rewards to
faculty in an effort to motivate them to accept academic advising as not just an added
responsibility that increases their already heavy workload. These incentives may be
tangible or intangible and may include time off, funding to attend professional
development workshops, a reduced schedule, providing faculty with authority, and/or
personal and professional support (Hossler, Zinkin, & Gross, 2009; Wallace, 2011).
Hossler et al. (2009) argue that a criticism of why faculty advising practices do not
provide high quality advising is due to a lack of incentives and system disincentives.
Next, administrators should offer a position to one full time faculty member to
take on the role and responsibilities of the faculty advisors in Science and Technology
and Medicine on each campus as well as Engineering at St. Augustine campus. First-year
students should be encouraged by student service personnel to meet with their academic
advisors on a regular basis and not only at the beginning of the semester. The researcher
proposes that administrators should prepare faculty advisors with the tools and resources
needed for effective advising, including accurate and timely information to share with
students. They should articulate procedures and expectations for each advising session, as
well as supply faculty with resources for students experiencing challenges. Having
122
knowledge of campus activities and student involvement opportunities to share with
students would also increase institutional commitment.
Moreover, faculty advisors, especially the newer faculty, at each campus should
be trained in the pedagogy of academic advising including techniques of developmental
approaches to advising (Allen & Smith, 2008; Crookston, 1994, 2009; Cuseo, 2002). The
university should provide funding for professional development so academic advisors can
attend workshops and conferences, particularly to attend the regional and annual
conferences held by the National Academic Advising Association (NACADA) whose
mission is to enhance the educational development of college students both in the U.S.
and internationally.
Alternately, the university system may employ professional academic advisors
whose exclusive role is to assist students in not only selecting courses but with their
growth and development during the college years and designing meaningful educational
goals and plans, with frequent contact between advisor and advisee. Furthermore,
ongoing evaluation and assessment of the effectiveness of the implemented academic
advising process and also its effect on student persistence and retention should be
ongoing. Providing information and the resources to engage effectively during the
advising process should exhibit the institutions commitment to delivering a high quality
advising program, clarify and understand student’s perception of academic advising and
clearly articulate what advising is and the advising process.
123
Recommendations for Future Research
Research on this area of student persistence and retention has increased in recent
years. However, research specifically focusing on this population: STEM students in the
Caribbean, remains almost nonexistent. The following recommendations are aimed at
closing the gap in the literature on this topic at the UWI or any tertiary level education
institution in the Caribbean region:
1. This study relied on a survey of STEM student’s perception of the factors they
perceive are influencing their decision to re-enroll in the university. Using this
study as a pioneer study, as it was intended; researchers can explore a mixed
methods design and conduct follow up research.
2. A qualitative approach design is recommended for research questions one, two
and three to explore and identify specific reasons and factors associated with this
particular population of STEM students in the Caribbean. Conducting focus
groups among faculty members, student services personnel and students would
provide additional insight about the dynamics of this university system.
Additionally, interviewing the Campus Registrar (his office is responsible for
Student Affairs) and Director of Student Services at each campus would explore
the perceptions and views of the administrators. Two questions suggested by
Wallace (2011) are: (i) What value do administrators, faculty, and students place
on faculty advising at the UWI? (ii) What structures at UWI could better inform
and encourage faculty participation in advising? After thorough investigations, the
researcher would be able to develop a theory that is unique to the Caribbean
tertiary level system.
124
3. To explore research questions two and three further, conduct a longitudinal
research over a span of a one academic year period (first semester 2014 and
second semester, 2015) and review student’s records at the beginning of the
spring semester, 2015 and fall semester, 2015 as the re-enrollment status variable.
4. Replicate the study with a larger sample size, extending the population to students
external to STEM fields. This approach would make the findings more
generalizable to the campus population and provide better implications for
practice to administrators and students service personnel.
5. The study showed that the campuses student’s attended were predominantly
commuter campuses. A new study should be conducted using the theory of
student persistence in commuter universities as the conceptual framework
(Braxton et al., 2004; Braxton et al., 2014). This study would examine the
following student attributes: motivation, self-efficacy, empathy, affiliation needs,
control issues, and anticipatory socialization as well as support, community, and
family on student persistence.
6. The Academic Advising Inventory used in research question four may need
updating so that it is more applicable to the needs of diverse and international
college and university students. Additionally, the 8 point range for each item is
not a suitable Likert scale since it does not include a ‘not true’ option for
respondents. Designing an instrument for more diverse and international groups
of students with a more user friendly range is suggested.
125
Conclusions
Student persistence and retention are now one of the leading challenges faced by
colleges and universities. At the University of the West Indies (UWI)), the premier
university system in the Caribbean, retention rates of first-year science, technology, math,
and engineering students (STEM) students have been declining gradually over the last ten
years, and this decline is cause for concern. STEM graduates provide the human capital
needed to keep these developing nations competitive on the money market and
internationally. Additionally, increasing student stop outs after their first year affect the
university since student retention is necessary for financial management and to maintain
academic programs, particularly on campuses where the contributions of the governments
have decreased (Tewarie, 2010a).
The UWI has three main campuses and this study focused on student persistence
in two of its campuses: the St. Augustine Campus in Trinidad and Tobago and the Cave
Hill campus in Barbados. This study fills a gap in the persistence and retention literature
for first year STEM students since there is very little research or literature related to this
student population in the Caribbean tertiary education system. It is a pioneering study and
provides a foundation for other researchers.
The focus of the study was to explore STEM student’s attitudes and perception on
issues deemed by the literature to contribute to student persistence and retention (Tinto,
1993, Pascarella & Terenzini, 1980, Cuseo, 2002). Student attributes and institutional
experiences that are associated with student retention in first year STEM students were
examined at these two UWI campuses. The nature and student satisfaction with one
institutional experience, academic advising, was further explored in STEM students.
126
The researcher employed a quantitative design in the form of a survey. Sixteen
predictor variables, including campus, and one categorical dependent variable were used.
The dependent variable was intent to re-enroll in the second semester. Data from the
surveys were analyzed using binary logistic regression, a research method specifically
design for categorical dependent variables (Field, 2009; Osborne, 2014).
The results of the study revealed that the campus was a significant predictor of re-
enrollment status. STEM students at the Cave Hill campus were more likely to re-enroll
that those at the St. Augustine campus. However, only two of the students attributes
examined were significant predictors of student retention in this population and these
variables were not associated with the campus. These were secondary school math and
science GPA and parental education. Of the five institutional experiences investigated
only one was a significant predictor of student’s re-enrollment status. This was
institutional and goal commitments. Since the statistical power of these models were
high, both the effects of the null findings and significant findings of this study are
supported as being accurate.
Students indicated that they were not receiving academic advising and they were
not fully satisfied with the faculty advising program at the institution. Recommendations
were presented to improve academic advising on both campuses. These recommendations
included offering incentives, recognitions, or rewards to faculty advisors or employing
full time professional advisors whose role would be solely advising. Additional
recommendations asked researchers to replicate the study using a mixed research design
approach and extend it to the campus population external to STEM majors. On reflection,
using the theory of student persistence in commuter universities (Braxton et al., 2004;
127
Braxton et al., 2014) as a conceptual framework for the study may have been more
applicable to this Caribbean STEM student population than Tinto’s (1993) model.
Additionally, the study was only conducted over one semester at the UWI and explored
first year STEM student’s intent to re-enroll the following semester. A longitudinal study
conducted over the 2014-2015 academic year, followed by a review of student records to
determine the student’s actual re-enrollment status in January 2015 and again in October
2015 might have provided the researcher with more comprehensive conclusions.
Overall, addressing student retention issues will need a multidisciplinary approach
which engages the entire campus (Braxton et al., 2004). Changing traditions and the
culture of the campus towards solutions for student persistence and retention should be
gradual, but with clear and effective instructions and information.
128
REFERENCES
Allen, J. M., & Smith, C. L. (2008). Importance of, responsibility for, and satisfaction
with academic advising: A faculty perspective. Journal of College Student
Development, 49, 397-411.
Allison, P. D. (2002). Missing data. Thousand Oaks, CA: Sage.
Astin, A. W. (1985). Achieving educational excellence. San Francisco, CA: Jossey-Bass.
Astin, A. W. (1993). What matters in college: Four critical years revisited. San
Francisco, CA: Jossey-Bass.
Astin, A. W. (2005). Making sense out of degree completion rates. Journal of College
Student Retention: Research, Theory and Practice, 7, 5-17.
Astin, A. W., & Astin, H. S. (1992). Undergraduate science education: The impact of
different college environments on the educational pipeline in the sciences. Final
Report to the National Science Foundation (Grant Number SPA-8955365). Los
Angeles: The Higher Education Research Institute, University of California.
Astin, A. W., & Oseguera, L. (2012). Pre-college and institutional influences on degree
attainment. In A. Seidman (Ed.), College student retention: Formula for student
success (2nd edition) (pp. 119-143). Westport, CT: Praeger Publishers.
Baker, V. L., & Griffin, K. A. (2010). Beyond mentoring and advising: Toward
understanding the role of faculty “developers” in student success. About Campus
(January-February). Wiley InterScience (www.interscience.wiley.com): American
College Personnel Association.
129
Baum, S., Ma, J., & Payea, K. (2013). Education pays 2013: The benefits of higher
education for individuals and society. New York, NY: The College Board.
Bean, J. P. (1980). Dropouts and turnovers: The synthesis and test of a causal model of
student attrition. Research in Higher Education, 12, 155-187.
Bean, J. P. (1982). Student attrition, intention and confidence. Research in Higher
Education, 17, 291-319.
Bean, J. P. (2005). Nine themes of college student retention. In A. Seidman (Ed.),
College student retention: Formula for student success (pp. 216-243). Westport,
CT: Praeger Publishers.
Becker, G. (1964). Human capital. Chicago, IL: University of Chicago.
Berger, J. B. (2000). Optimizing capital, social reproduction, and undergraduate
persistence. In J. M. Braxton (Ed.), Reworking the student departure puzzle (pp.
95-124). Nashville, TN: Vanderbilt University Press.
Berger, J. B., Ramírez, G. B., & Lyons, S. (2012). Past to present: A historical look at
retention. In A. Seidman (Ed.), College student retention: Formula for student
success (2nd edition) (pp. 7-34). Westport, CT: Praeger Publishers.
Bourdieu, P. (1986). The forms of capital. In J. G. Richardson (Ed.), Handbook of theory
and research for the sociology of education (pp. 241-258). New York, NY:
Greenwood.
Braxton, J. M., Doyle, W. R., Hartley III, H. V., Hirschy, A. S., Jones, W. A., &
McLendon, M. K. (2014). Rethinking college student retention. San Francisco,
CA: Jossey-Bass.
130
Braxton, J. M., & Lee, S. D. (2005). Toward reliable knowledge about college student
departure. In A. Seidman (Ed.), College student retention: Formula for student
success (pp. 107-127). San Francisco, CA: Jossey-Bass.
Braxton, J. M., & Hirschy, A. (2005). Theoretical developments in the study of college
student departure. In A. Seidman (Ed.), College student retention: Formula for
student success (pp. 61-87). Westport, CT: Praeger Publishers.
Braxton, J. M., Hirschy, A. S., & McClendon, S. A. (2004). Toward understanding and
reducing college student departure. ASHE-ERIC Higher Education Report, 30(3).
San Francisco, CA: Jossey-Bass.
Braxton, J. M., & Mundy, M. E. (2001-2002). Powerful institutional levers to reduce
college student departure. Journal of College Student Retention, 3, 91-118.
Cabrera, A. F., Burkum, K. R., & La Nasa, S. M. (2005). Pathways to a four year degree:
Determinants of transfer and degree completion. In A. Seidman (Ed.), College
student retention: Formula for student success (pp. 155-214). Westport, CT:
Praeger Publishers.
Cabrera, A. F., Burkum, K. R., La Nasa, S. M., & Bibo, E. W. (2012). Pathways to a four
year degree: Determinants of degree completion among socioeconomically
disadvantaged students. In A. Seidman (Ed.), College student retention: Formula
for student success (2nd edition) (pp. 167-210). Westport, CT: Praeger Publishers.
Cabrera, A. F., Castañeda, M. B., Nora, A., & Hengstler, D. (1992). The convergence
between two theories of college persistence. Journal of Higher Education, 63,
143-164.
131
Cabrera, A. F., Stampen, J. O., & Hansen, W. L. (1990). Exploring the effects of ability
to pay on college persistence. The Review of Higher Education, 13, 303-336.
Caison, A. L. (2007). Analysis of institutionally specific retention research: A
comparison between survey and institutional database methods. Research in
Higher Education, 48, 435-451.
Caribbean Examination Council (CXC, 2014). The six point grading scheme. Retrieved
from http://www.cxc.org/?q=examinations/exams/csec/grading-scheme-csec
Chen, X. (2005). First generation students in postsecondary education: A look at their
college transcripts (NCES 2005-171). U.S. Department of Education, National
Center for Education Statistics. Washington, DC: U.S. Government Printing
Office.
Chen, X. (2013). STEM attrition: College students’ path into and out of STEM fields
(NCES, 2014-001). Washington, DC: National Center for Education Statistics,
Institute of Education Science, U.S. Department of Education.
Creamer, E. G., & Scott, D. W. (2000). Assessing individual advisor effectiveness. In V.
N. Gordon & W. R. Habley (Eds.). Academic advising: A comprehensive
handbook, San Francisco, CA: Jossey-Bass.
Crookston, B. B. (1994). A developmental view of academic advising as teaching.
NACADA Journal, 14, 5-9.
Crosling, G., Heagney, M., & Thomas, L. (2009) Improving student retention in higher
education: Improving teaching and learning. Australian Universities’ Review,
51(2), 9-18.
132
Cuseo, J. (2002). Academic advisement and student retention: Empirical connections and
systemic interventions. NACADA Clearinghouse of Academic Advising Resources
Retrieved from
http://www.nacada.ksu.edu/Clearinghouse/AdvisingIssues/Retention.htm
DaDeppo, L. M. W. (2009). Integration factors related to the academic success and intent
to persist of college students with learning disabilities. Learning Disabilities
Research & Practice, 24, 122-131.
Dahlgren, D. J. (2012). College success guides (5th ed.). Plymouth, MI: Hayden-McNeil.
Dillman, D. A. (2007). Mail and internet surveys: The tailored design method (2nd ed.).
Hoboken, NJ: John Wiley & Sons.
Dillon, R. K., & Fisher, B. J. (2000). Faculty as part of the advising equation: An inquiry
into faculty viewpoints on advising. NACADA Journal, 20, 16-23.
Drake, J. K. (2011). The role of academic advising in student retention and persistence.
About Campus, 16(3), 8-12.
Durkheim, E. (1951). Suicide. Trans. G. Simpson. Glencoe, IL: The Free Press.
Ender, S. C. (1994). Impediments to developmental advising. NACADA Journal, 14, 105-
107.
Evans, N. J., Forney, D. S., Guido, F. M., Patton, L. D., & Renn, K. A. (2010). Student
development in college: Theory, research and practice (2nd ed.). San Francisco,
CA: Jossey-Bass.
Faul, F., Erdfelder, E., Buchner, A., & Lang, A. (2009). Statistical power analysis using
g*power 3.1: Tests for correlation and regression analyses. Behavior Research
Methods, 41, 1149-1160.
133
Field, A. (2009). Discovering statistics using SPSS (3rd ed.). London: Sage.
French, B. E., & Oaks, W. (2004). Reliability and validity evidence for the institutional
integration scale. Educational and Psychological Measurement, 64, 88-98.
Gordon, D. (1987). Class, status, and social mobility in Jamaica. Jamaica: Institute of
Social and Economic Research, University of the West Indies.
Gross, J. P. K., Torres, V., & Zerquera, D. (2013). Financial aid and attainment among
students in a state with changing demographics. Research in Higher Education,
54, 383-406.
Groves, R. M., Fowler, F. J., Couper, M. P., & Lepkowski, J. M., (2009). Survey
methodology (2nd ed.). Hoboken, NJ: Wiley.
Habley, W. R., & McClanahan, R. (2004). What works in student retention? Retrieved
from http://files.eric.ed.gov/fulltext/ED500455.pdf
Hall, S. (2001). Negotiating Caribbean identities. In B. Meeks & F. Lindahl (Eds.), New
Caribbean thought: A reader (pp. 24-39). Barbados, Trinidad and Tobago: The
University of the West Indies Press.
Harrison, E. (2009). Faculty perceptions of academic advising. Nursing Education
Perspectives, 30, 229-233.
Hester, E. J. (2008). Student evaluations of advising: Moving beyond the mean. College
Teaching, 56, 35-38.
Horn, L. J., & Carroll, C. D. (1988). Stopouts or stayouts? Undergraduates who leave
college in their first year. National Center for Education Statistics Statistical
Analysis Report No. NCES 1999-087, Washington, DC: US Department of
Education Office of Educational Research and Improvement.
134
Hosmer, D. W., & Lemeshow, S. (2000). Applied logistic regression (2nd ed.). New York,
NY: John Wiley and Sons, Inc.
Hossler, D. (1990). The strategic management of college enrollments. San Francisco, CA:
Jossey Bass.
Hossler, D., Ziskin, M., & Gross, J. P. K. (2009). Getting serious about institutional
performance in student retention: Research-based lessons on effective policies
and practices. About Campus, 13(6), 2-11.
Index Mundi (2013a). Barbados demographic profile 2013. Retrieved from
http://www.indexmundi.com/barbados/demographics_profile.html
Index Mundi (2013b). Trinidad and Tobago demographic profile 2013. Retrieved from
http://www.indexmundi.com/trinidad_and_tobago/demographics_profile.html
Ishitani, T. T. (2006). Studying attrition and degree completion behavior among first
generation college students in the United States. Journal of Higher Education, 77,
861-884.
Jehangir, R. (2010). Stories as knowledge: Bringing the lived experience of first
generation college students into the academy. Urban Education, 45, 533-553.
Johnson, E. J., & Morgan, B. L. (2005). Advice on advising: Improving a comprehensive
university’s program. Teaching of Psychology, 32(1), 15-18.
Jongbloed, B., & Vossensteyn, H. (2001). Keeping up performances: An international
survey of performance-based funding in higher education. Journal of Higher
Education Policy and Management, 23, 27-45.
Jordan, J. M. (1997). Counseling African American women from a cultural sensitivity
perspective. In C. L. Lee (Ed.), Multicultural issues in counseling: New
135
approaches to diversity (2nd edition) (pp. 109-122). Alexandria, VA: American
Counseling Association.
Kennemer, C., & Hurt, B. (2013). Faculty advising. Retrieved from the NACADA
Clearinghouse of Academic Advising Resources Web site
http://www.nacada.ksu.edu/Resources/Clearinghouse/View-Articles/Faculty-
advising.aspx
Kramer, G. L. (2003). Advising as teaching. In G. L. Kramer (Ed.), Faculty advising
examined: Enhancing the potential of college faculty as advisors (pp. 1-22).
Boston, MA: Anker Publishing Company, Inc.
Kuh, G. D., & Love, P. G. (2000). A cultural perspective on student departure. In J. M.
Braxton (Ed.), Reworking the student departure puzzle: New theory and research
on college student retention (pp. 196-212). Nashville, TN: Vanderbilt University
Press.
Kuh, G. D., Kinzie, J., Buckley, J. A., Bridges, B. K., & Hayek, J. C. (2006). What
matters to student success? A review of the literature. Commissioned Report for
the National Symposium on Postsecondary Student Success: Spearheading a
Dialog on Student Success: National Postsecondary Education Cooperative.
Kuhm, T. L. (2008). Historical foundations of academic advising. In V. N. Gordon, W.R.
Habley, & T. J. Grites (Eds.), Academic advising: A comprehensive handbook (2nd
edition) (pp. 3-16). San Francisco, CA: Jossey-Bass.
Lee, C. C. (1997). Cultural dynamics: Their importance in cultural responsive counseling.
In C. C. Lee (Ed.), Multicultural issues in counseling: New approaches to
136
diversity (2nd edition) (pp. 109-122). Alexandria, VA: American Counseling
Association.
Light, R. J. (2001). Making the most of college. Cambridge, MA: Harvard University
Press.
Madden, M. (2014, August 20). Free fall. Barbados Today. Retrieved from
http://www.barbadostoday.bb/2014/08/20/free-fall/
Mannan, M. A. (2001). An assessment of the academic and social integration as
perceived by the students in the University of Papua New Guinea. Higher
Education, 41, 283-298.
Murdock, T. A. (1987). It isn’t just about money. The effects of financial aid on
persistence. The Review of Higher Education, 11, 75-101.
National Center for Educational Statistics (NCES, 2014). Fast facts: Graduation rates.
Retrieved from http://nces.ed.gov/fastfacts/display.asp?id=40
Nutt, C. L. (2003). Academic advising and student retention and persistence. NACADA
Clearinghouse of Academic Advising, Retrieved from
http://www.nacada.ksu.edu/Resources/Clearinghouse/View-Articles/Advising-
and-Student-Retention-article.aspx
Osborne, J. (2012). Best practices in data cleaning: A complete guide to everything you
need to do before and after collecting your data. Thousand Oaks, CA: Sage
Osborne, J. (2014). Best practices in logistic regression. London, UK: Sage.
Oseguera, L. & Rhee, B. S. (2009). The influence of institutional retention climates on
student persistence to degree completion: A multilevel approach. Research in
Higher Education 50, 546-569.

137
Pascarella, E. T. (1980). Student-faculty informal contact and college outcomes. Review
of Educational Research, 50, 545-575.
Pascarella, E. T., & Terenzini, P. (1978). The relation of students’ precollege
characteristics and freshmen year experience to voluntary attrition. Research in
Higher Education 9, 347-366.
Pascarella, E. T., & Terenzini, P. (1980). Predicting freshman persistence and voluntary
dropout decisions from a theoretical model. Journal of Higher Education, 51, 60-
75.
Pascarella, E. T., & Terenzini, P. (2005). How college affects students: A third decade of
research (Vol. 2). San Francisco, CA: Jossey-Bass.
Paterson, N., & Gordon, G. (2010, May). How one university examined graduation rates
of its undergraduate student population. Paper presented at 50th Annual Forum of
the Association for Institutional Research, Chicago, IL.
Patton, M. Q. (2002). Qualitative research and evaluation methods (3rd ed.). Thousand
Oaks, CA: Sage.
Peduzzi, P., Concato, J., Kemper, E., Holford, T. R., & Feinstein, A. R. (1996). A
simulation study of the number of events per variable in logistic regression
analysis. Journal of Clinical Epidemiology, 49, 1373-1379.
Perna, L. (2006). Studying college access and choice: A proposed conceptual model. In J.
C. Smart (Ed.), Higher education: Handbook of theory and research (Vol. 21, pp.
99-157). Netherlands: Springer.
138
Pike, G. R., & Kuh, G. D. (2005). First and second generation college students: A
comparison of their engagement and intellectual development. Journal of Higher
Education, 76, 276-300.
Pryor, J. H., Hurtado, S., De Angelo, L., Blake, L. P., & Trans, S. (2009). The American
freshman: Natural norms fall 2009. Cooperative Institutional Research Program
and the Higher Education Research Institute. Los Angeles, CA: University of
California.
Reason, R. D. (2009). An examination of persistence research through the lens of a
comprehensive conceptual framework. Journal of College Student Development,
50, 659-682.
Reason, R. D., Terenzini, P. T., & Domingo, R. J. (2006). First things first: Developing
academic competence in the first year of college. Research in Higher Education,
47, 149-175.
Roberts, V. (2002, July). Overcoming barriers to access and success in tertiary education
in the Commonwealth Caribbean. Paper presented at the UWI Tertiary Level
Institutions Unit (TLIU) International Conference on Transforming Education for
Development, Durban, South Africa.
Roberts, V. (2003). The shaping of tertiary education in the Anglophone Caribbean:
Forces, forms and functions. London, UK: Commonwealth Secretariat.
Schultz, R. A., Dickman, M. M., Campbell, N. J., & Snow, B. M. (1992). Assessing a
short-term intervention to facilitate academic success. NASPA Journal, 30, 43-50.
139
Shadish, W. R., Cook, T. D., & Campbell, D. T. (2002). Experimental and quasi-
experimental designs for generalized causal inferences. Belmont, CA: Wadsworth
Cengage Learning.
Shaw, E. J., & Barbuti, S. (2010). Patterns of persistence in intended college major with a
focus on STEM majors. NACADA Journal, 30(2), 19-34.
Smith, M. G. (1965). The plural society in the British West Indies. Berkeley and Los
Angeles, CA: University of California Press.
St. John, E. P. (2000). The impact of student aid on recruitment and retention: What
research indicates, New Direction for Student Services, 89, 61-75.
St. John, E. P., Andrieu, S., Oescher, J., & Starkey, J. B. (1994). The influence of student
aid on within-year persistence by traditional college-aged students in four-year
colleges. Retention in Higher Education, 35, 455-480.
Stevens, J. P. (2009). Applied multivariate statistics for the social sciences. New York,
NY: Routledge.
Taylor, A. (2012). Second year college experiences that affect persistence and attrition
for the first generation and continuing generation students at small, private
institutions. (Doctoral dissertation). Retrieved from
http://digital.library.louisville.edu/cdm/singleitem/collection/etd/id/2554/rec/1
Teddlie, C., & Tashakkori, A. (2009). Foundations of mixed methods of research:
Integrating quantitative and qualitative approaches in the social and behavioral
sciences. London, UK: Sage.
Tewarie, B. (2010a). First year retention study. University Office of Planning and
Development, University of the West Indies. Retrieved from
140
http://www.uwi.edu/sf-docs/default-
source/planningdocs/First_Year_Student_Retention_and_Attrition_at_the_UWI.p
df?sfvrsn=0
Tewarie, B. (2010b). First year student retention survey: Class of 2009-10. Office of
Planning and Institutional Research, University of the West Indies. Retrieved
from
http://www.mona.uwi.edu/opair/managementreports/studiesandsurveys/First%20
Year%20Student%20Retention%20Survey,%20Class%20of%202009-10.pdf
The University of the West Indies (2014). Retrieved from http://www.uwi.edu/history.asp
The University of the West Indies, Cave Hill Campus (2014-2015). Retrieved from
www.uwi.cavehill.edu
The University of the West Indies, St. Augustine Campus (2014-2015). Retrieved from
www.sta.uwi.edu
The University of the West Indies, St. Augustine Campus (2012/2013), Annual Report.
Retrieved from
http://sta.uwi.edu/resources/documents/UWI_AnnualReport_12_13.pdf
The University of the West Indies, St. Augustine Campus (2013/2014). Student Statistics.
Retrieved from
http://sta.uwi.edu/resources/documents/statistics/UWI%20statistics%202013.pdf
The University of the West Indies, Cave Hill Campus (2013-2014). Statistics. Retrieved
from https://www.cavehill.uwi.edu/resources/documents/reports/cavehill-
statistics-2013-2014.pdf
141
Tinto, V. (1975). Dropout from higher education: A theoretical synthesis of recent
research. Review of Educational Research, 45, 89-125.
Tinto, V. (1993). Leaving college: Rethinking the causes and cures for student attrition
(2nd ed.). Chicago, IL: The University of Chicago Press.
Tinto, V. (2012). Completing college: Rethinking institutional action. Chicago, IL: The
University of Chicago Press.
Titus, M. A. (2004). An examination of the influence of institutional context on student
persistence at four-year colleges and universities: A multi-level approach.
Research in Higher Education, 45, 673-699.
U. S. Department of Education (1988). National Center for Education Statistics, National
Education Longitudinal Study of 1988, Third Follow-up. Retrieved from
http://nces.ed.gov/pubs98/yi/y9615a.asp
Upcraft, M. L., & Gardner, J. N. (1989). The freshman year experience: Helping students
survive and succeed in college. San Francisco, CA: Jossey-Bass.
UWI Statistical Review: Academic Year 2009/2010. Retrieved from
http://www.mona.uwi.edu/opair/statistics/2009-
2010/UWI+Statistical+Review+2009-10.pdf
UWI, Strategic Plan, (2013). Retrieved from http://www.mona.uwi.edu/opair/strategic-
plan/UWI+Strategic+Plan+2012-2017+(Final).pdf
Vision 2020 Report (2003). Retrieved from
http://sta.uwi.edu/principal/documents/Vision2020_Report_Science.pdf

142
Wallace, S. (2011). Implication for faculty advising: 2011 National Survey. Retrieved
from http://www.nacada.ksu.edu/Resources/Clearinghouse/View-
Articles/Implications-for-faculty-advising-2011-National-Survey.aspx
Wardley, L. J., Bélanger, C. H., & Leonard, V. M. (2013). Institutional commitment of
traditional and non-traditional aged students: A potential brand measurement? The
Journal of Marketing for Higher Education, 23, 90-112.
Wells, R. (2008-2009). Social and cultural capital, race and ethnicity, and college student
retention. Journal of College Student Retention, 10, 103-128.
Whalen, D. F., & Shelley, M. C. (2010). Academic success for STEM and non-STEM
majors. Journal of STEM Education, 11, 45-60.
Winston, Jr. R. B. (1994). Developmental academic advising reconsidered. Chimera or
unrealized potentiality? NACADA Journal 14(20), 112-116.
Winston, Jr. R. B., & Sandor, J. A., (1984a). The academic advising inventory. Athens,
GA: Student Development Associates.
Winston, Jr. R. B., & Sandor, J. A. (1984b). Developmental academic advising: What do
students want? National Academic Advising Association (NACADA) Journal,
4(1), 5-13.
Winston, Jr. R. B., & Sandor, J. A. (2002). Evaluating academic advising: Manual for
the academic inventory. Retrieved from
http://www.nacada.ksu.edu/Portals/0/Clearinghouse/links/documents/AAI-
Manual-02.pdf
Winston, Jr. R. B., Miller, T. K., Ender, S. C., Grites, T. J., & Associates (1984).
Developmental academic advising. San Francisco, CA: Jossey-Bass.
143
Wortman, T. I, & Upcraft, M. L. (2001). Web-based data collection. In J. H. Schuh and
M. L. Upcraft (Eds.), Assessment practice in student affairs: An application
manual (pp. 101-128). San Francisco, CA: Jossey-Bass.
Yorke, M. (1999). Leaving early undergraduate non-completion in higher education.
London, UK: Falmer.
Yorke, M., & Longden, B. (2004). Retention and student success in higher education.
Berkshire, UK: Society for Research in Higher Education and Open University.
144
APPPENDICES
A: The UWI Survey of First-Year STEM Students’ Perspectives
B: Lists of STEM Preliminary and Introductory Courses at UWI Cave Hill
C: Correlation of Predictor Variables
D: Assumptions Tables
E: Logistic Regression Tables
F: G*Power Statistical Analysis Output
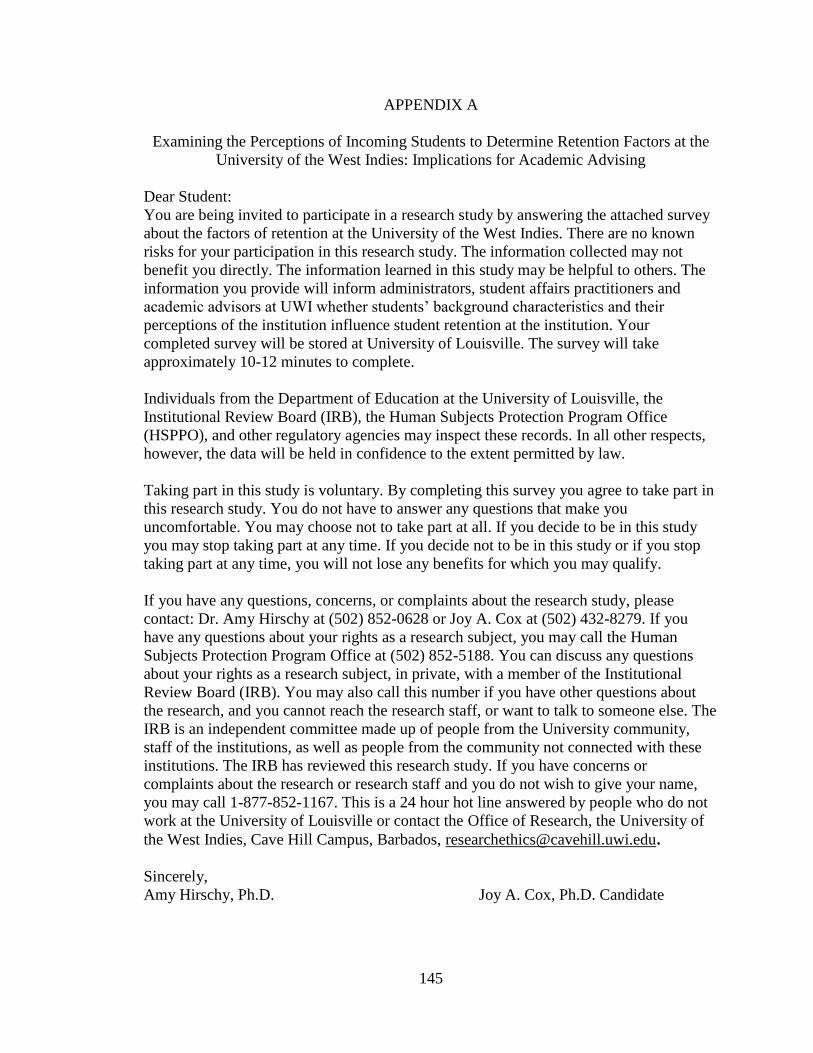
145
APPENDIX A
Examining the Perceptions of Incoming Students to Determine Retention Factors at the
University of the West Indies: Implications for Academic Advising
Dear Student:
You are being invited to participate in a research study by answering the attached survey
about the factors of retention at the University of the West Indies. There are no known
risks for your participation in this research study. The information collected may not
benefit you directly. The information learned in this study may be helpful to others. The
information you provide will inform administrators, student affairs practitioners and
academic advisors at UWI whether students’ background characteristics and their
perceptions of the institution influence student retention at the institution. Your
completed survey will be stored at University of Louisville. The survey will take
approximately 10-12 minutes to complete.
Individuals from the Department of Education at the University of Louisville, the
Institutional Review Board (IRB), the Human Subjects Protection Program Office
(HSPPO), and other regulatory agencies may inspect these records. In all other respects,
however, the data will be held in confidence to the extent permitted by law.
Taking part in this study is voluntary. By completing this survey you agree to take part in
this research study. You do not have to answer any questions that make you
uncomfortable. You may choose not to take part at all. If you decide to be in this study
you may stop taking part at any time. If you decide not to be in this study or if you stop
taking part at any time, you will not lose any benefits for which you may qualify.
If you have any questions, concerns, or complaints about the research study, please
contact: Dr. Amy Hirschy at (502) 852-0628 or Joy A. Cox at (502) 432-8279. If you
have any questions about your rights as a research subject, you may call the Human
Subjects Protection Program Office at (502) 852-5188. You can discuss any questions
about your rights as a research subject, in private, with a member of the Institutional
Review Board (IRB). You may also call this number if you have other questions about
the research, and you cannot reach the research staff, or want to talk to someone else. The
IRB is an independent committee made up of people from the University community,
staff of the institutions, as well as people from the community not connected with these
institutions. The IRB has reviewed this research study. If you have concerns or
complaints about the research or research staff and you do not wish to give your name,
you may call 1-877-852-1167. This is a 24 hour hot line answered by people who do not
work at the University of Louisville or contact the Office of Research, the University of
the West Indies, Cave Hill Campus, Barbados, [email protected].
Sincerely,
Amy Hirschy, Ph.D. Joy A. Cox, Ph.D. Candidate
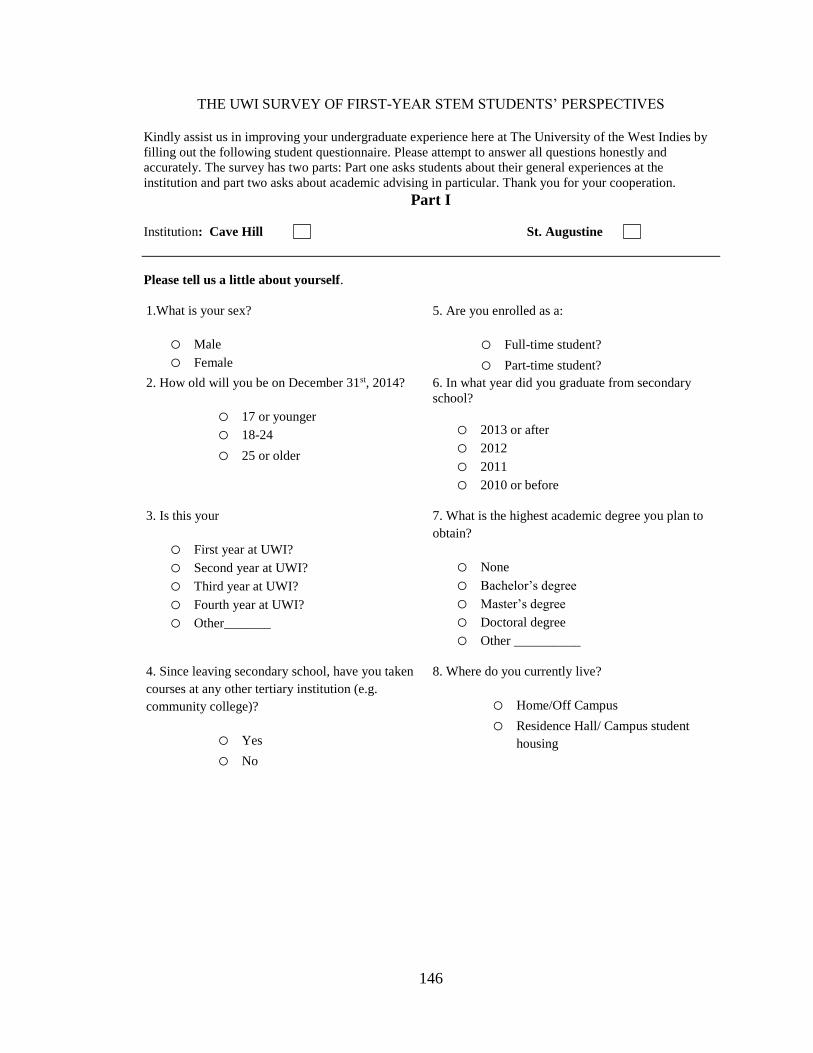
146
THE UWI SURVEY OF FIRST-YEAR STEM STUDENTS’ PERSPECTIVES
Kindly assist us in improving your undergraduate experience here at The University of the West Indies by
filling out the following student questionnaire. Please attempt to answer all questions honestly and
accurately. The survey has two parts: Part one asks students about their general experiences at the
institution and part two asks about academic advising in particular. Thank you for your cooperation. Part I
Institution: Cave Hill St. Augustine
Please tell us a little about yourself.
1.What is your sex?
o Male
o Female
5. Are you enrolled as a:
o Full-time student?
o Part-time student?
2. How old will you be on December 31st, 2014?
o 17 or younger
o 18-24
o 25 or older
6. In what year did you graduate from secondary
school?
o 2013 or after
o 2012
o 2011
o 2010 or before
3. Is this your
o First year at UWI?
o Second year at UWI?
o Third year at UWI?
o Fourth year at UWI?
o Other_______
7. What is the highest academic degree you plan to
obtain?
o None
o Bachelor’s degree
o Master’s degree
o Doctoral degree
o Other __________
4. Since leaving secondary school, have you taken
courses at any other tertiary institution (e.g.
community college)?
o Yes
o No
8. Where do you currently live?
o Home/Off Campus
o Residence Hall/ Campus student
housing
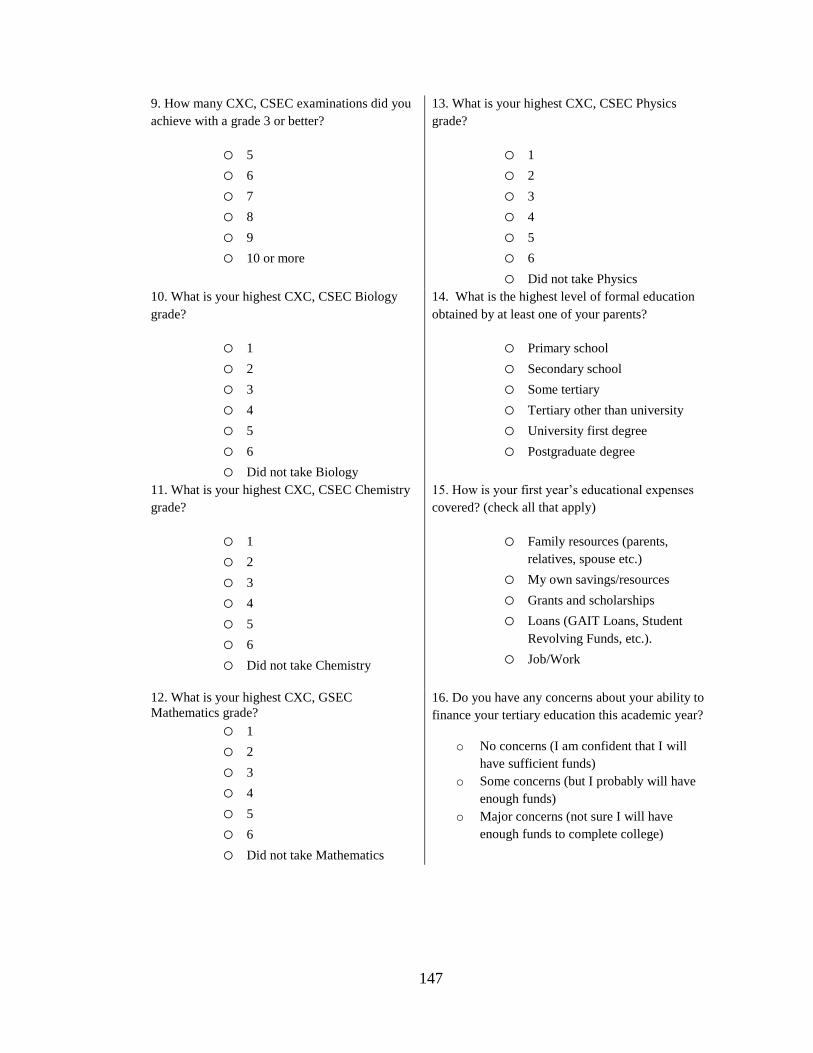
147
9. How many CXC, CSEC examinations did you
achieve with a grade 3 or better?
o 5
o 6
o 7
o 8
o 9
o 10 or more
13. What is your highest CXC, CSEC Physics
grade?
o 1
o 2
o 3
o 4
o 5
o 6
o Did not take Physics
10. What is your highest CXC, CSEC Biology
grade?
o 1
o 2
o 3
o 4
o 5
o 6
o Did not take Biology
14. What is the highest level of formal education
obtained by at least one of your parents?
o Primary school
o Secondary school
o Some tertiary
o Tertiary other than university
o University first degree
o Postgraduate degree
11. What is your highest CXC, CSEC Chemistry
grade?
o 1
o 2
o 3
o 4
o 5
o 6
o Did not take Chemistry
15. How is your first year’s educational expenses
covered? (check all that apply)
o Family resources (parents,
relatives, spouse etc.)
o My own savings/resources
o Grants and scholarships
o Loans (GAIT Loans, Student
Revolving Funds, etc.).
o Job/Work
12. What is your highest CXC, GSEC
Mathematics grade?
o 1
o 2
o 3
o 4
o 5
o 6
o Did not take Mathematics
16. Do you have any concerns about your ability to
finance your tertiary education this academic year?
o No concerns (I am confident that I will
have sufficient funds)
o Some concerns (but I probably will have
enough funds)
o Major concerns (not sure I will have
enough funds to complete college)
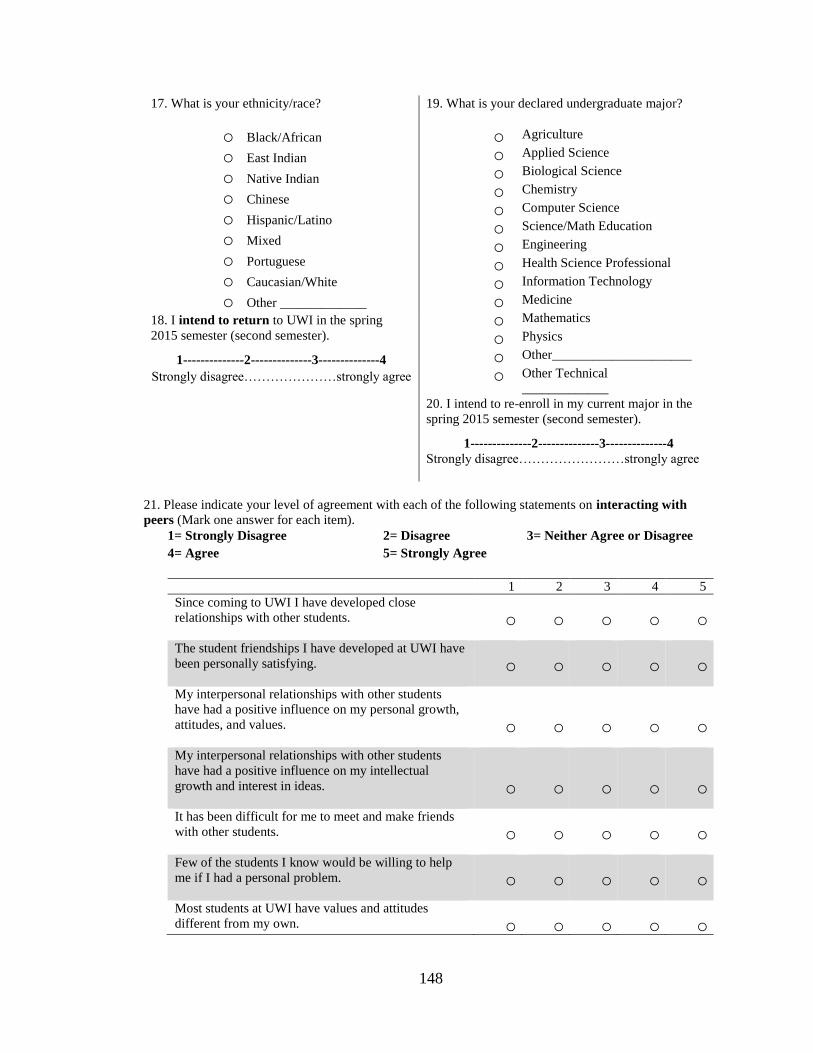
148
17. What is your ethnicity/race?
o Black/African
o East Indian
o Native Indian
o Chinese
o Hispanic/Latino
o Mixed
o Portuguese
o Caucasian/White
o Other _____________
19. What is your declared undergraduate major?
o Agriculture
o Applied Science
o Biological Science
o Chemistry
o Computer Science
o Science/Math Education
o Engineering
o Health Science Professional
o Information Technology
o Medicine
o Mathematics
o Physics
o Other_____________________
o Other Technical
_____________
20. I intend to re-enroll in my current major in the
spring 2015 semester (second semester).
1--------------2--------------3--------------4
Strongly disagree……………………strongly agree
18. I intend to return to UWI in the spring
2015 semester (second semester).
1--------------2--------------3--------------4
Strongly disagree…………………strongly agree
21. Please indicate your level of agreement with each of the following statements on interacting with
peers (Mark one answer for each item).
1= Strongly Disagree 2= Disagree 3= Neither Agree or Disagree
4= Agree 5= Strongly Agree
1 2 3 4 5
Since coming to UWI I have developed close
relationships with other students.
o
o
o
o
o
The student friendships I have developed at UWI have
been personally satisfying.
o
o
o
o
o
My interpersonal relationships with other students
have had a positive influence on my personal growth,
attitudes, and values.
o
o
o
o
o
My interpersonal relationships with other students
have had a positive influence on my intellectual
growth and interest in ideas.
o
o
o
o
o
It has been difficult for me to meet and make friends
with other students.
o
o
o
o
o
Few of the students I know would be willing to help
me if I had a personal problem.
o
o
o
o
o
Most students at UWI have values and attitudes
different from my own.
o
o
o
o
o
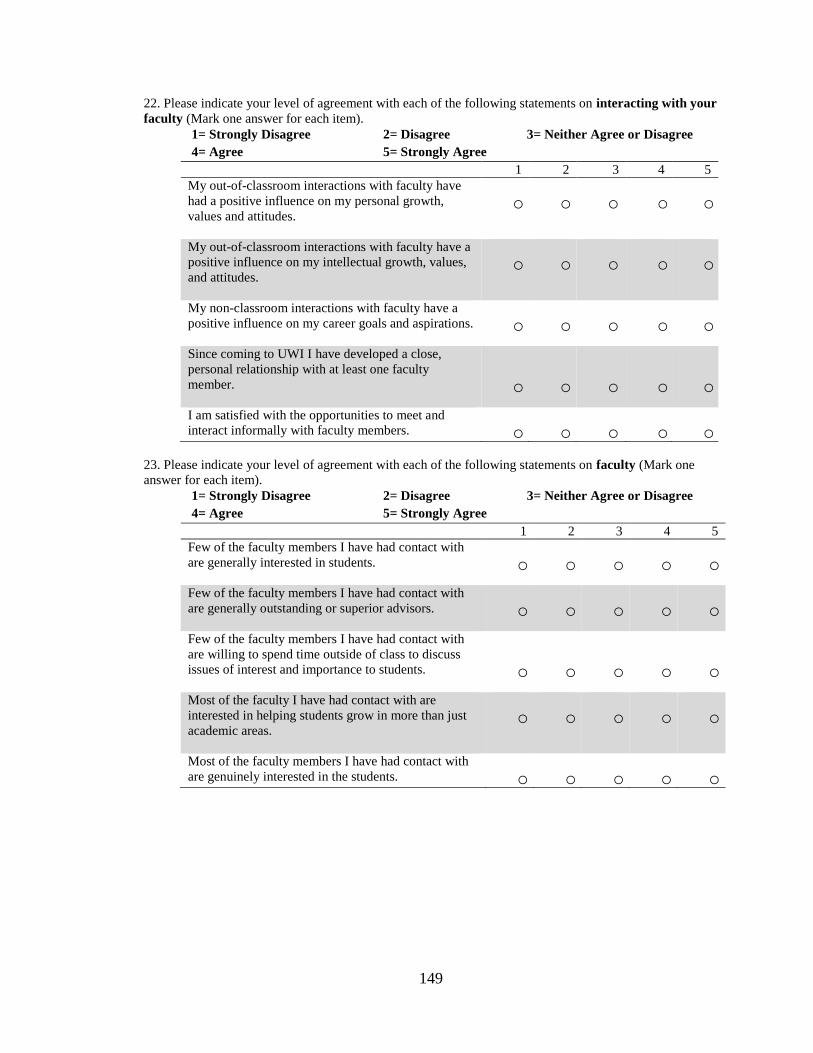
149
22. Please indicate your level of agreement with each of the following statements on interacting with your
faculty (Mark one answer for each item).
1= Strongly Disagree 2= Disagree 3= Neither Agree or Disagree
4= Agree 5= Strongly Agree
1 2 3 4 5
My out-of-classroom interactions with faculty have
had a positive influence on my personal growth,
values and attitudes.
o
o
o
o
o
My out-of-classroom interactions with faculty have a
positive influence on my intellectual growth, values,
and attitudes.
o
o
o
o
o
My non-classroom interactions with faculty have a
positive influence on my career goals and aspirations.
o
o
o
o
o
Since coming to UWI I have developed a close,
personal relationship with at least one faculty
member.
o
o
o
o
o
I am satisfied with the opportunities to meet and
interact informally with faculty members.
o
o
o
o
o
23. Please indicate your level of agreement with each of the following statements on faculty (Mark one
answer for each item).
1= Strongly Disagree 2= Disagree 3= Neither Agree or Disagree
4= Agree 5= Strongly Agree
1 2 3 4 5
Few of the faculty members I have had contact with
are generally interested in students.
o
o
o
o
o
Few of the faculty members I have had contact with
are generally outstanding or superior advisors.
o
o
o
o
o
Few of the faculty members I have had contact with
are willing to spend time outside of class to discuss
issues of interest and importance to students.
o
o
o
o
o
Most of the faculty I have had contact with are
interested in helping students grow in more than just
academic areas.
o
o
o
o
o
Most of the faculty members I have had contact with
are genuinely interested in the students.
o
o
o
o
o
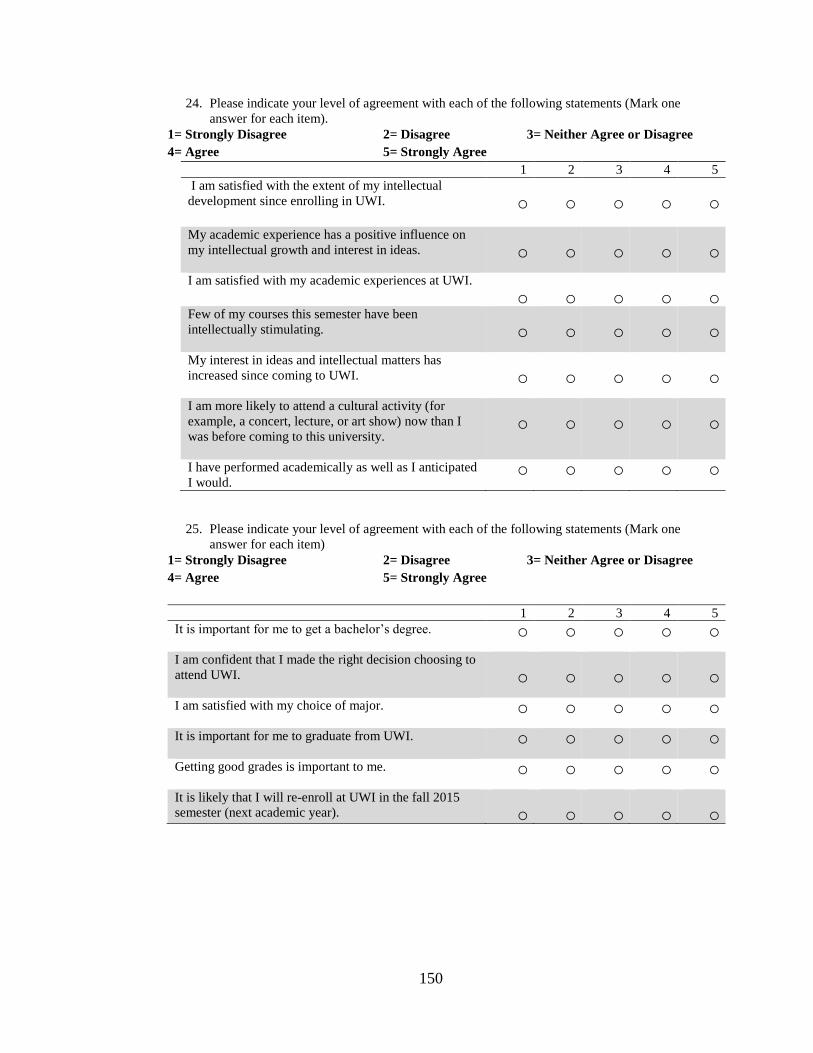
150
24. Please indicate your level of agreement with each of the following statements (Mark one
answer for each item).
1= Strongly Disagree 2= Disagree 3= Neither Agree or Disagree
4= Agree 5= Strongly Agree
1 2 3 4 5
I am satisfied with the extent of my intellectual
development since enrolling in UWI.
o
o
o
o
o
My academic experience has a positive influence on
my intellectual growth and interest in ideas.
o
o
o
o
o
I am satisfied with my academic experiences at UWI.
o
o
o
o
o
Few of my courses this semester have been
intellectually stimulating.
o
o
o
o
o
My interest in ideas and intellectual matters has
increased since coming to UWI.
o
o
o
o
o
I am more likely to attend a cultural activity (for
example, a concert, lecture, or art show) now than I
was before coming to this university.
o
o
o
o
o
I have performed academically as well as I anticipated
I would. o o o o o
25. Please indicate your level of agreement with each of the following statements (Mark one
answer for each item)
1= Strongly Disagree 2= Disagree 3= Neither Agree or Disagree
4= Agree 5= Strongly Agree
1 2 3 4 5
It is important for me to get a bachelor’s degree.
o o o o o
I am confident that I made the right decision choosing to
attend UWI.
o
o
o
o
o
I am satisfied with my choice of major.
o o o o o
It is important for me to graduate from UWI.
o o o o o
Getting good grades is important to me.
o o o o o
It is likely that I will re-enroll at UWI in the fall 2015
semester (next academic year).
o
o
o
o
o
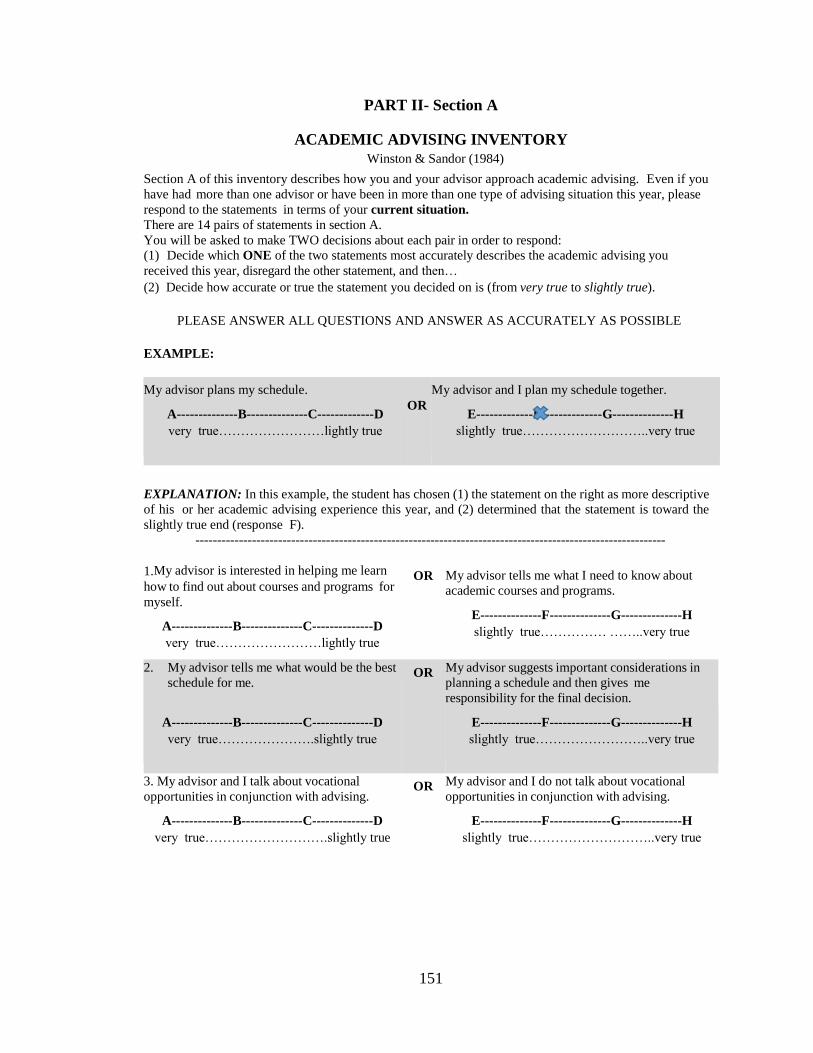
151
PART II- Section A
ACADEMIC ADVISING INVENTORY
Winston & Sandor (1984)
Section A of this inventory describes how you and your advisor approach academic advising. Even if you
have had more than one advisor or have been in more than one type of advising situation this year, please
respond to the statements in terms of your current situation.
There are 14 pairs of statements in section A.
You will be asked to make TWO decisions about each pair in order to respond:
(1) Decide which ONE of the two statements most accurately describes the academic advising you
received this year, disregard the other statement, and then…
(2) Decide how accurate or true the statement you decided on is (from very true to slightly true).
PLEASE ANSWER ALL QUESTIONS AND ANSWER AS ACCURATELY AS POSSIBLE
EXAMPLE:
My advisor plans my schedule.
A--------------B--------------C-------------D
very true……………………lightly true
OR
My advisor and I plan my schedule together.
E-------------F--------------G--------------H
slightly true………………………..very true
EXPLANATION: In this example, the student has chosen (1) the statement on the right as more descriptive
of his or her academic advising experience this year, and (2) determined that the statement is toward the
slightly true end (response F).
------------------------------------------------------------------------------------------------------------
1.My advisor is interested in helping me learn
how to find out about courses and programs for
myself.
A--------------B--------------C--------------D
very true……………………lightly true
OR My advisor tells me what I need to know about
academic courses and programs.
E--------------F--------------G--------------H
slightly true…………… ……..very true
2. My advisor tells me what would be the best
schedule for me.
A--------------B--------------C--------------D
very true………………….slightly true
OR My advisor suggests important considerations in
planning a schedule and then gives me
responsibility for the final decision.
E--------------F--------------G--------------H
slightly true……………………..very true
3. My advisor and I talk about vocational
opportunities in conjunction with advising.
A--------------B--------------C--------------D
very true……………………….slightly true
OR My advisor and I do not talk about vocational
opportunities in conjunction with advising.
E--------------F--------------G--------------H
slightly true………………………..very true

152
4. My advisor shows an interest in my outside-
of-class activities and sometimes suggests
activities.
A--------------B--------------C--------------D
very true……………………….slightly true
OR My advisor does not know what I do outside of
class.
.
E--------------F--------------G--------------H
slightly true………………………..very true
5. My advisor assist me in identifying realistic
academic goals based on what I know about
myself, as well as about test scores and grades.
A--------------B--------------C--------------D
very true……………………….slightly true
OR My advisor identifies realistic academic goals for
me based on my test scores and grades.
E--------------F--------------G--------------H
slightly true………………………..very true
6. My advisor registers me for classes.
A--------------B--------------C--------------D
very true……………………….slightly true
OR My advisor teaches me how to register myself for
classes.
E--------------F--------------G--------------H
slightly true………………………..very true
7. When I’m faced with a difficult situation, my
advisor tells me my alternatives and which one
is best for me.
A--------------B--------------C--------------D
very true……………………….slightly true
OR When I’m faced with difficult decisions, my
a dvisor assists me in identifying alternatives and in
considering the consequences of choosing each
alternative.
E--------------F--------------G--------------H
slightly true………………………..very true
8. My advisor does not know who to contact
about other-than-academic problems.
A--------------B--------------C--------------D
very true……………………….slightly true
OR My advisor knows who to contact about other-
than-academic problems.
E--------------F--------------G--------------H
slightly true………………………..very true
9. My advisor gives me tips on managing my
time better or on studying more effectively
when I seem to need them.
A--------------B--------------C--------------D
very true……………………….slightly true
OR My advisor does not spend time giving me tips on
managing my time better or on studying more
effectively.
E--------------F--------------G--------------H
slightly true………………………..very true
10. My advisor tells me what I must do in
order to be advised.
A--------------B--------------C--------------D
very true……………………….slightly true
OR My advisor and I discuss our expectations of
advising and of each other.
E--------------F--------------G--------------H
slightly true………………………..very true
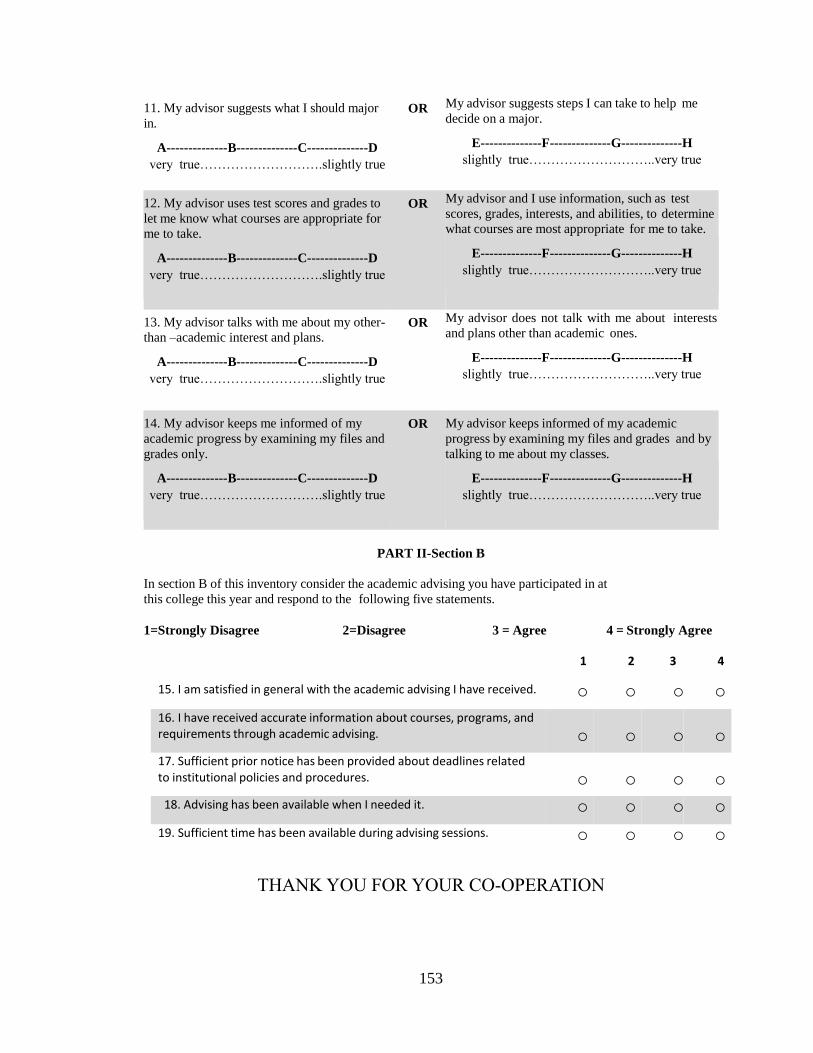
153
11. My advisor suggests what I should major
in.
A--------------B--------------C--------------D
very true……………………….slightly true
OR My advisor suggests steps I can take to help me
decide on a major.
E--------------F--------------G--------------H
slightly true………………………..very true
12. My advisor uses test scores and grades to
let me know what courses are appropriate for
me to take.
A--------------B--------------C--------------D
very true……………………….slightly true
OR My advisor and I use information, such as test
scores, grades, interests, and abilities, to determine
what courses are most appropriate for me to take.
E--------------F--------------G--------------H
slightly true………………………..very true
13. My advisor talks with me about my other-
than –academic interest and plans.
A--------------B--------------C--------------D
very true……………………….slightly true
OR My advisor does not talk with me about interests
and plans other than academic ones.
E--------------F--------------G--------------H
slightly true………………………..very true
14. My advisor keeps me informed of my
academic progress by examining my files and
grades only.
A--------------B--------------C--------------D
very true……………………….slightly true
OR My advisor keeps informed of my academic
progress by examining my files and grades and by
talking to me about my classes.
E--------------F--------------G--------------H
slightly true………………………..very true
PART II-Section B
In section B of this inventory consider the academic advising you have participated in at
this college this year and respond to the following five statements.
1=Strongly Disagree 2=Disagree 3 = Agree 4 = Strongly Agree
1 2 3 4
15. I am satisfied in general with the academic advising I have received. o o o o
16. I have received accurate information about courses, programs, and requirements through academic advising.
o
o
o
o
17. Sufficient prior notice has been provided about deadlines related to institutional policies and procedures.
o
o
o
o
18. Advising has been available when I needed it. o o o o
19. Sufficient time has been available during advising sessions. o o o o
THANK YOU FOR YOUR CO-OPERATION
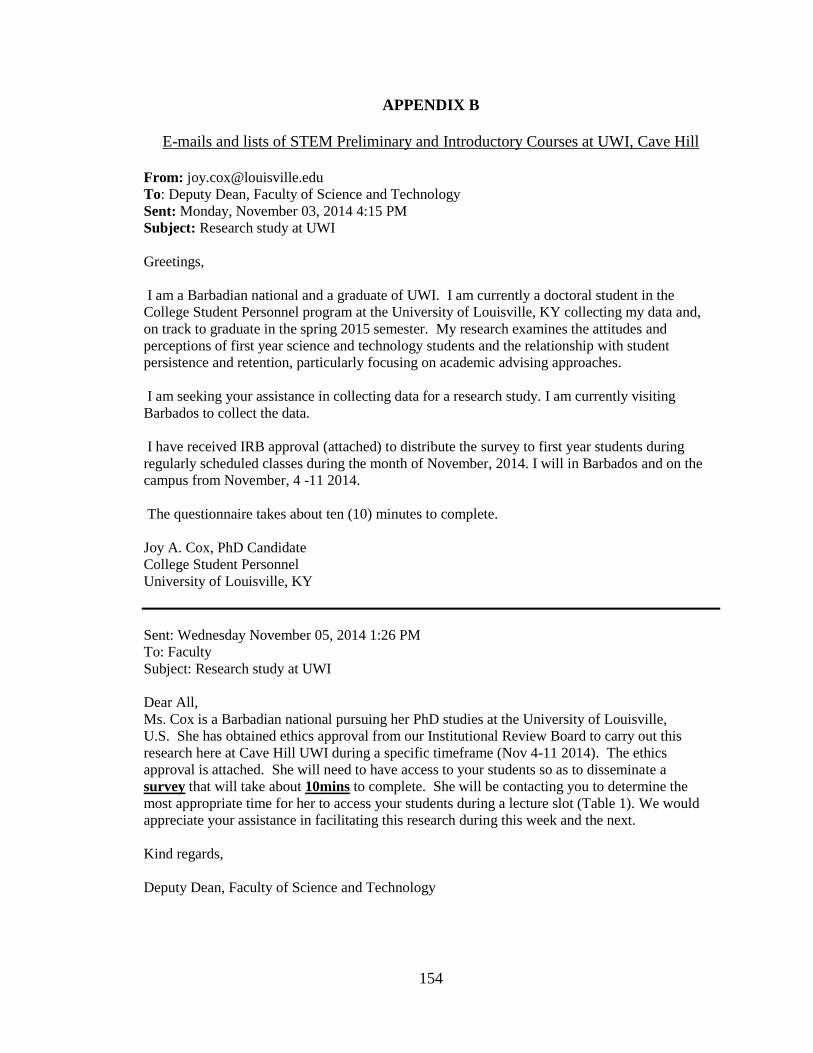
154
APPENDIX B
E-mails and lists of STEM Preliminary and Introductory Courses at UWI, Cave Hill
From: [email protected]
To: Deputy Dean, Faculty of Science and Technology
Sent: Monday, November 03, 2014 4:15 PM
Subject: Research study at UWI
Greetings,
I am a Barbadian national and a graduate of UWI. I am currently a doctoral student in the
College Student Personnel program at the University of Louisville, KY collecting my data and,
on track to graduate in the spring 2015 semester. My research examines the attitudes and
perceptions of first year science and technology students and the relationship with student
persistence and retention, particularly focusing on academic advising approaches.
I am seeking your assistance in collecting data for a research study. I am currently visiting
Barbados to collect the data.
I have received IRB approval (attached) to distribute the survey to first year students during
regularly scheduled classes during the month of November, 2014. I will in Barbados and on the
campus from November, 4 -11 2014.
The questionnaire takes about ten (10) minutes to complete.
Joy A. Cox, PhD Candidate
College Student Personnel
University of Louisville, KY
Sent: Wednesday November 05, 2014 1:26 PM
To: Faculty
Subject: Research study at UWI
Dear All,
Ms. Cox is a Barbadian national pursuing her PhD studies at the University of Louisville,
U.S. She has obtained ethics approval from our Institutional Review Board to carry out this
research here at Cave Hill UWI during a specific timeframe (Nov 4-11 2014). The ethics
approval is attached. She will need to have access to your students so as to disseminate a
survey that will take about 10mins to complete. She will be contacting you to determine the
most appropriate time for her to access your students during a lecture slot (Table 1). We would
appreciate your assistance in facilitating this research during this week and the next.
Kind regards,
Deputy Dean, Faculty of Science and Technology
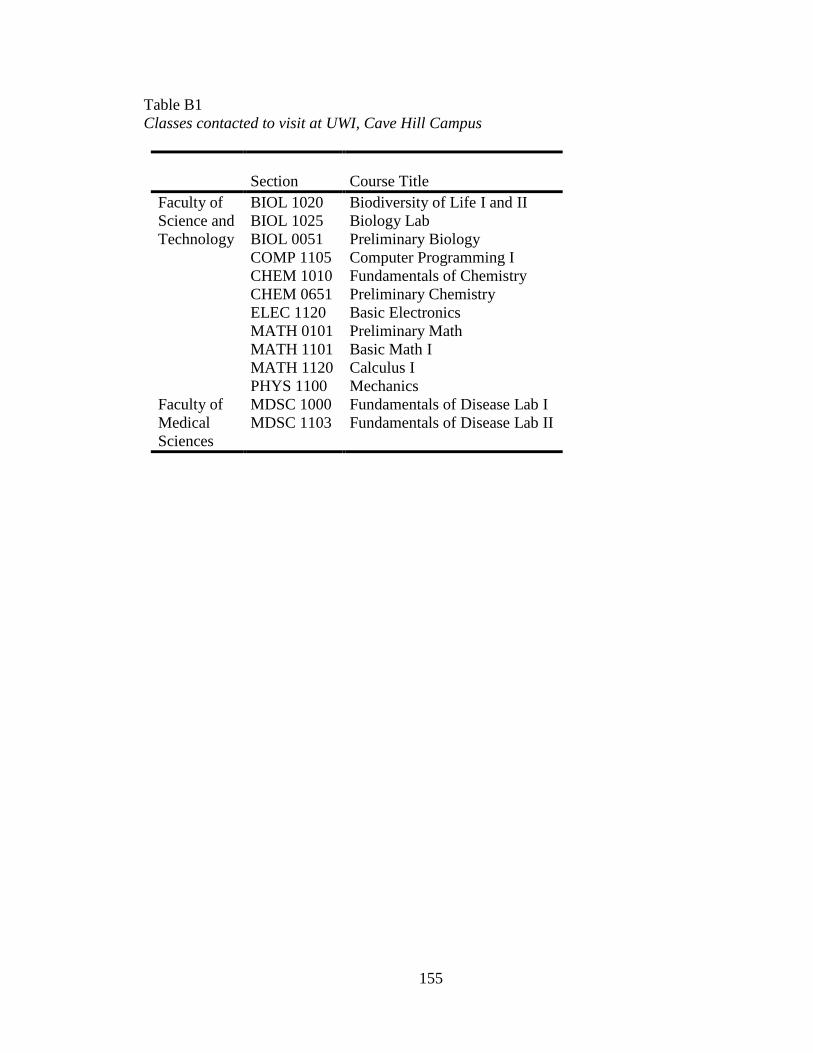
155
Table B1
Classes contacted to visit at UWI, Cave Hill Campus
Section
Course Title
Faculty of
Science and
Technology
BIOL 1020
BIOL 1025
Biodiversity of Life I and II
Biology Lab
BIOL 0051 Preliminary Biology
COMP 1105 Computer Programming I
CHEM 1010 Fundamentals of Chemistry
CHEM 0651 Preliminary Chemistry
ELEC 1120 Basic Electronics
MATH 0101 Preliminary Math
MATH 1101 Basic Math I
MATH 1120 Calculus I
PHYS 1100 Mechanics
Faculty of
Medical
Sciences
MDSC 1000 Fundamentals of Disease Lab I
MDSC 1103 Fundamentals of Disease Lab II
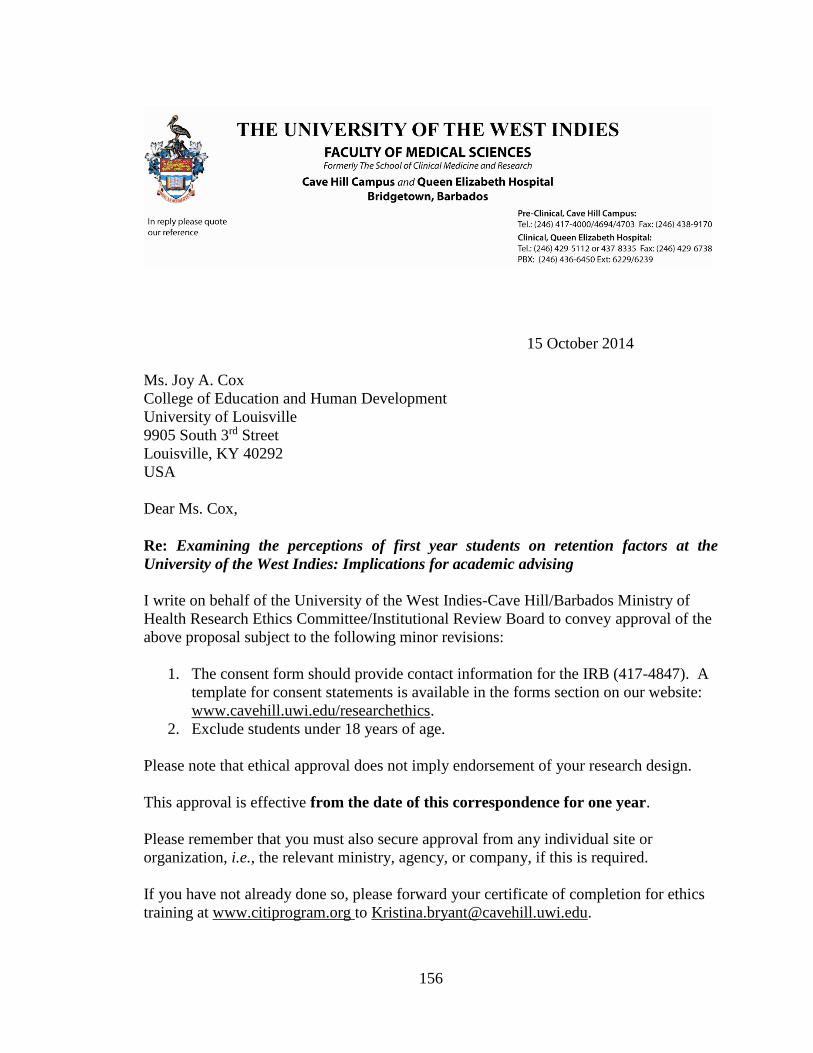
156
15 October 2014
Ms. Joy A. Cox
College of Education and Human Development
University of Louisville
9905 South 3rd Street
Louisville, KY 40292
USA
Dear Ms. Cox,
Re: Examining the perceptions of first year students on retention factors at the
University of the West Indies: Implications for academic advising
I write on behalf of the University of the West Indies-Cave Hill/Barbados Ministry of
Health Research Ethics Committee/Institutional Review Board to convey approval of the
above proposal subject to the following minor revisions:
1. The consent form should provide contact information for the IRB (417-4847). A
template for consent statements is available in the forms section on our website:
www.cavehill.uwi.edu/researchethics.
2. Exclude students under 18 years of age.
Please note that ethical approval does not imply endorsement of your research design.
This approval is effective from the date of this correspondence for one year.
Please remember that you must also secure approval from any individual site or
organization, i.e., the relevant ministry, agency, or company, if this is required.
If you have not already done so, please forward your certificate of completion for ethics
training at www.citiprogram.org to [email protected].
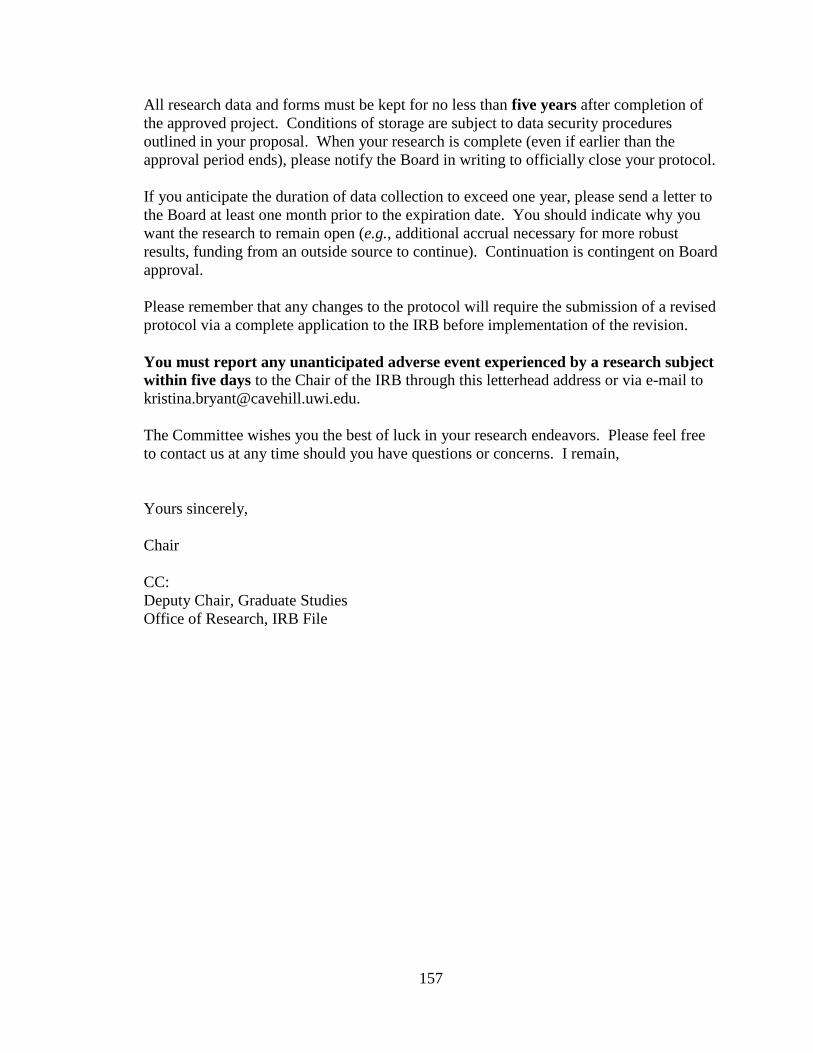
157
All research data and forms must be kept for no less than five years after completion of
the approved project. Conditions of storage are subject to data security procedures
outlined in your proposal. When your research is complete (even if earlier than the
approval period ends), please notify the Board in writing to officially close your protocol.
If you anticipate the duration of data collection to exceed one year, please send a letter to
the Board at least one month prior to the expiration date. You should indicate why you
want the research to remain open (e.g., additional accrual necessary for more robust
results, funding from an outside source to continue). Continuation is contingent on Board
approval.
Please remember that any changes to the protocol will require the submission of a revised
protocol via a complete application to the IRB before implementation of the revision.
You must report any unanticipated adverse event experienced by a research subject
within five days to the Chair of the IRB through this letterhead address or via e-mail to
The Committee wishes you the best of luck in your research endeavors. Please feel free
to contact us at any time should you have questions or concerns. I remain,
Yours sincerely,
Chair
CC:
Deputy Chair, Graduate Studies
Office of Research, IRB File
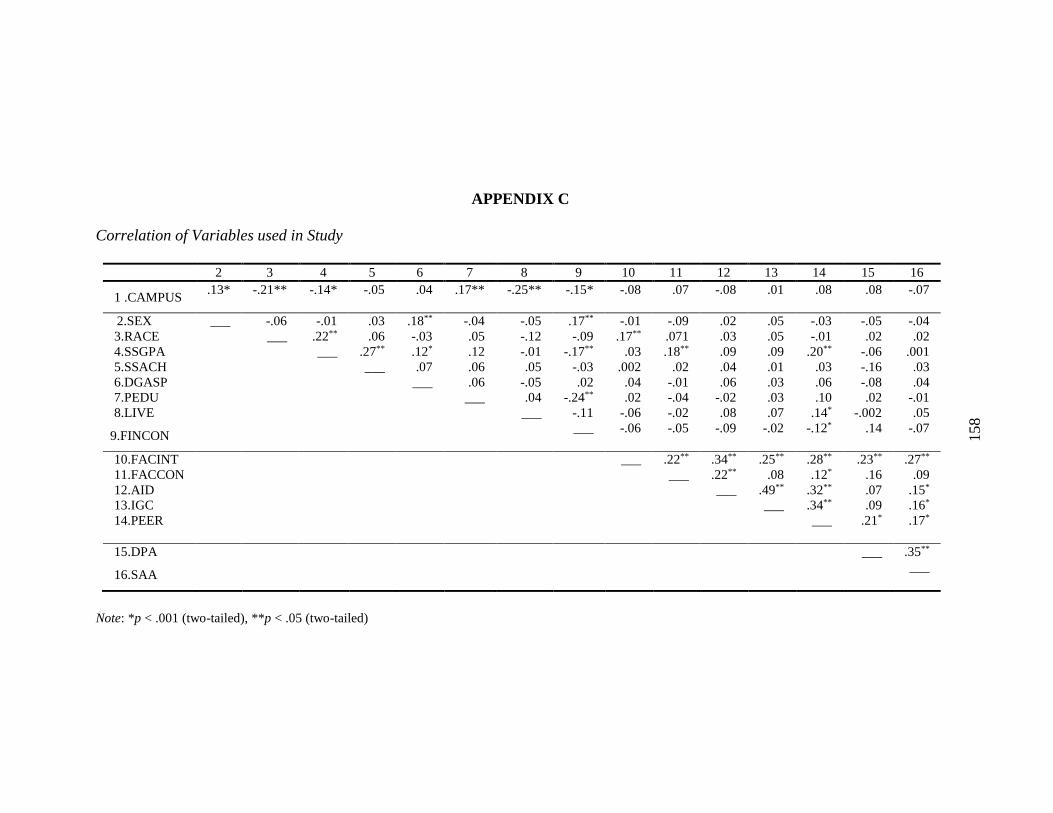
158
APPENDIX C
Correlation of Variables used in Study
2 3 4 5 6 7 8 9 10 11 12 13 14 15 16
1 .CAMPUS .13* -.21** -.14* -.05 .04 .17** -.25** -.15* -.08 .07 -.08 .01 .08 .08 -.07
2.SEX ___ -.06 -.01 .03 .18** -.04 -.05 .17** -.01 -.09 .02 .05 -.03 -.05 -.04
3.RACE ___ .22** .06 -.03 .05 -.12 -.09 .17** .071 .03 .05 -.01 .02 .02
4.SSGPA ___ .27** .12* .12 -.01 -.17** .03 .18** .09 .09 .20** -.06 .001
5.SSACH ___ .07 .06 .05 -.03 .002 .02 .04 .01 .03 -.16 .03
6.DGASP ___ .06 -.05 .02 .04 -.01 .06 .03 .06 -.08 .04
7.PEDU ___ .04 -.24** .02 -.04 -.02 .03 .10 .02 -.01
8.LIVE ___ -.11 -.06 -.02 .08 .07 .14* -.002 .05
9.FINCON ___ -.06 -.05 -.09 -.02 -.12* .14 -.07
10.FACINT ___ .22** .34** .25** .28** .23** .27**
11.FACCON ___ .22** .08 .12* .16 .09
12.AID ___ .49** .32** .07 .15*
13.IGC ___ .34** .09 .16*
14.PEER
___ .21* .17*
15.DPA ___ .35**
16.SAA ___
Note: *p < .001 (two-tailed), **p < .05 (two-tailed)
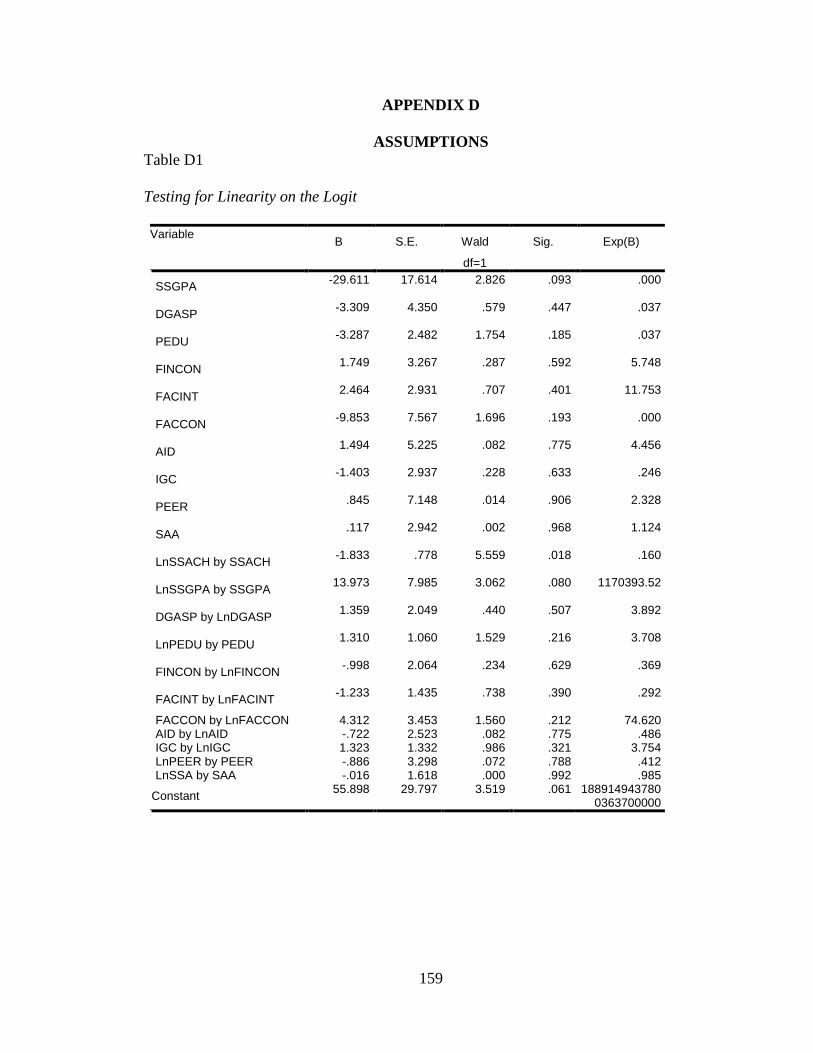
159
APPENDIX D
ASSUMPTIONS
Table D1
Testing for Linearity on the Logit
Variable B S.E. Wald
df=1
Sig. Exp(B)
SSGPA -29.611 17.614 2.826
.093 .000
DGASP -3.309 4.350 .579
.447 .037
PEDU -3.287 2.482 1.754
.185 .037
FINCON 1.749 3.267 .287
.592 5.748
FACINT 2.464 2.931 .707
.401 11.753
FACCON -9.853 7.567 1.696
.193 .000
AID 1.494 5.225 .082
.775 4.456
IGC -1.403 2.937 .228
.633 .246
PEER .845 7.148 .014
.906 2.328
SAA .117 2.942 .002
.968 1.124
LnSSACH by SSACH -1.833 .778 5.559
.018 .160
LnSSGPA by SSGPA 13.973 7.985 3.062
.080 1170393.52
DGASP by LnDGASP 1.359 2.049 .440
.507 3.892
LnPEDU by PEDU 1.310 1.060 1.529
.216 3.708
FINCON by LnFINCON -.998 2.064 .234
.629 .369
FACINT by LnFACINT -1.233 1.435 .738
.390 .292
FACCON by LnFACCON 4.312 3.453 1.560 1 .212 74.620 AID by LnAID -.722 2.523 .082 1 .775 .486 IGC by LnIGC 1.323 1.332 .986 1 .321 3.754 LnPEER by PEER -.886 3.298 .072 1 .788 .412 LnSSA by SAA -.016 1.618 .000 1 .992 .985
Constant 55.898 29.797 3.519 1 .061 188914943780
0363700000
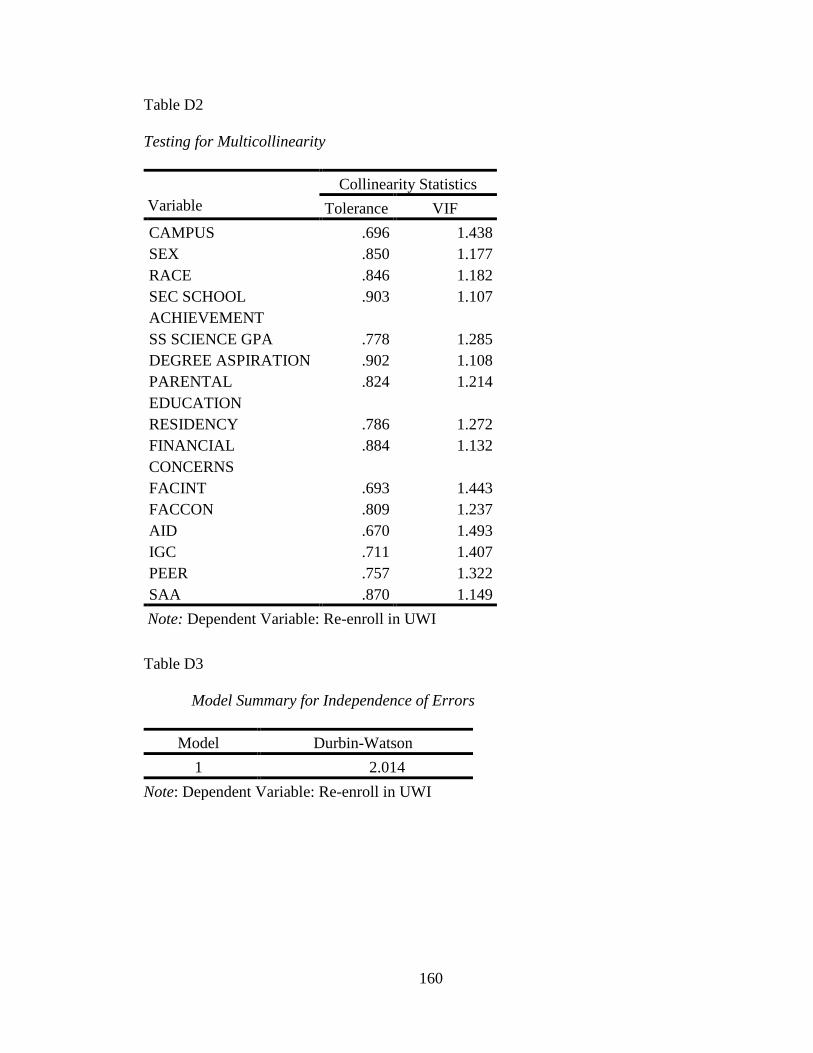
160
Table D2
Testing for Multicollinearity
Variable
Collinearity Statistics
Tolerance VIF
1
CAMPUS .696 1.438
SEX .850 1.177
RACE .846 1.182
SEC SCHOOL
ACHIEVEMENT
.903 1.107
SS SCIENCE GPA .778 1.285
DEGREE ASPIRATION .902 1.108
PARENTAL
EDUCATION
.824 1.214
RESIDENCY .786 1.272
FINANCIAL
CONCERNS
.884 1.132
FACINT .693 1.443
FACCON .809 1.237
AID .670 1.493
IGC .711 1.407
PEER .757 1.322
SAA .870 1.149
Note: Dependent Variable: Re-enroll in UWI
Table D3
Model Summary for Independence of Errors
Model Durbin-Watson
1 2.014
Note: Dependent Variable: Re-enroll in UWI
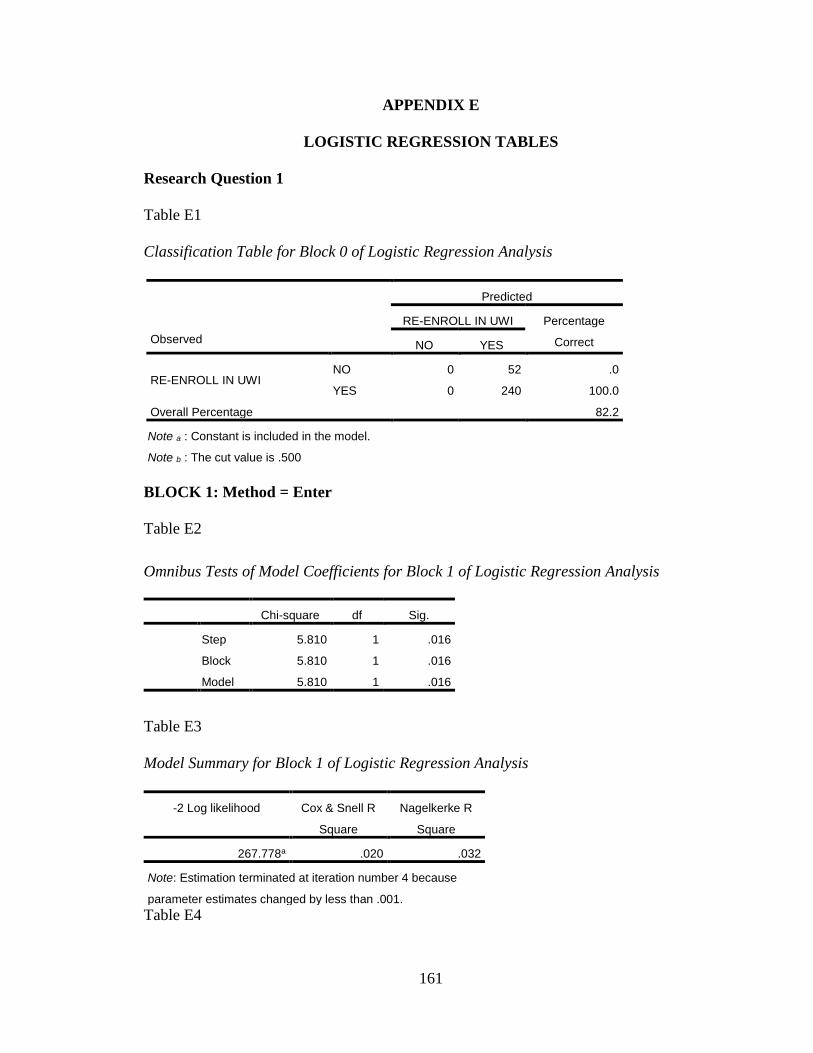
161
APPENDIX E
LOGISTIC REGRESSION TABLES
Research Question 1
Table E1
Classification Table for Block 0 of Logistic Regression Analysis
Observed
Predicted
RE-ENROLL IN UWI Percentage
Correct NO YES
RE-ENROLL IN UWI
NO 0 52 .0
YES 0 240 100.0
Overall Percentage 82.2
Note a : Constant is included in the model.
Note b : The cut value is .500
BLOCK 1: Method = Enter
Table E2
Omnibus Tests of Model Coefficients for Block 1 of Logistic Regression Analysis
Table E3
Model Summary for Block 1 of Logistic Regression Analysis
-2 Log likelihood Cox & Snell R
Square
Nagelkerke R
Square
267.778a .020 .032
Note: Estimation terminated at iteration number 4 because
parameter estimates changed by less than .001.
Table E4
Chi-square df Sig.
Step 5.810 1 .016
Block 5.810 1 .016
Model 5.810 1 .016
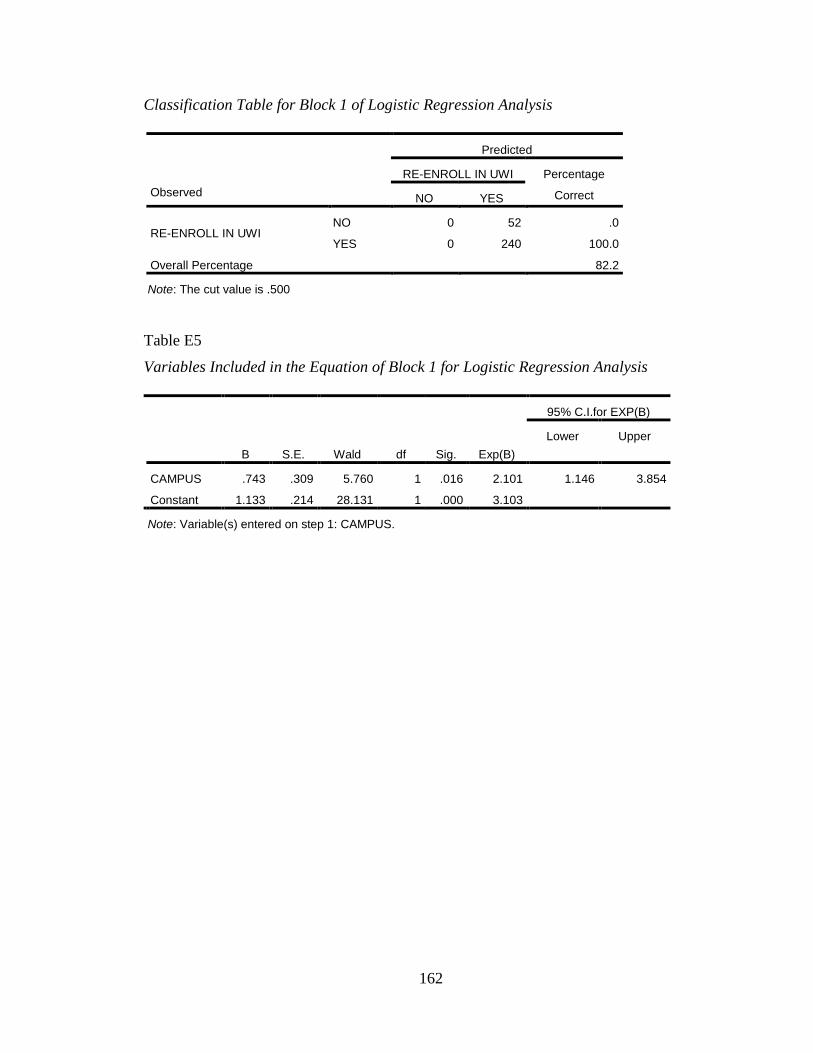
162
Classification Table for Block 1 of Logistic Regression Analysis
Observed
Predicted
RE-ENROLL IN UWI Percentage
Correct NO YES
RE-ENROLL IN UWI
NO 0 52 .0
YES 0 240 100.0
Overall Percentage 82.2
Note: The cut value is .500
Table E5
Variables Included in the Equation of Block 1 for Logistic Regression Analysis
B
S.E.
Wald
df
Sig.
Exp(B)
95% C.I.for EXP(B)
Lower Upper
CAMPUS .743 .309 5.760 1 .016 2.101 1.146 3.854
Constant 1.133 .214 28.131 1 .000 3.103
Note: Variable(s) entered on step 1: CAMPUS.
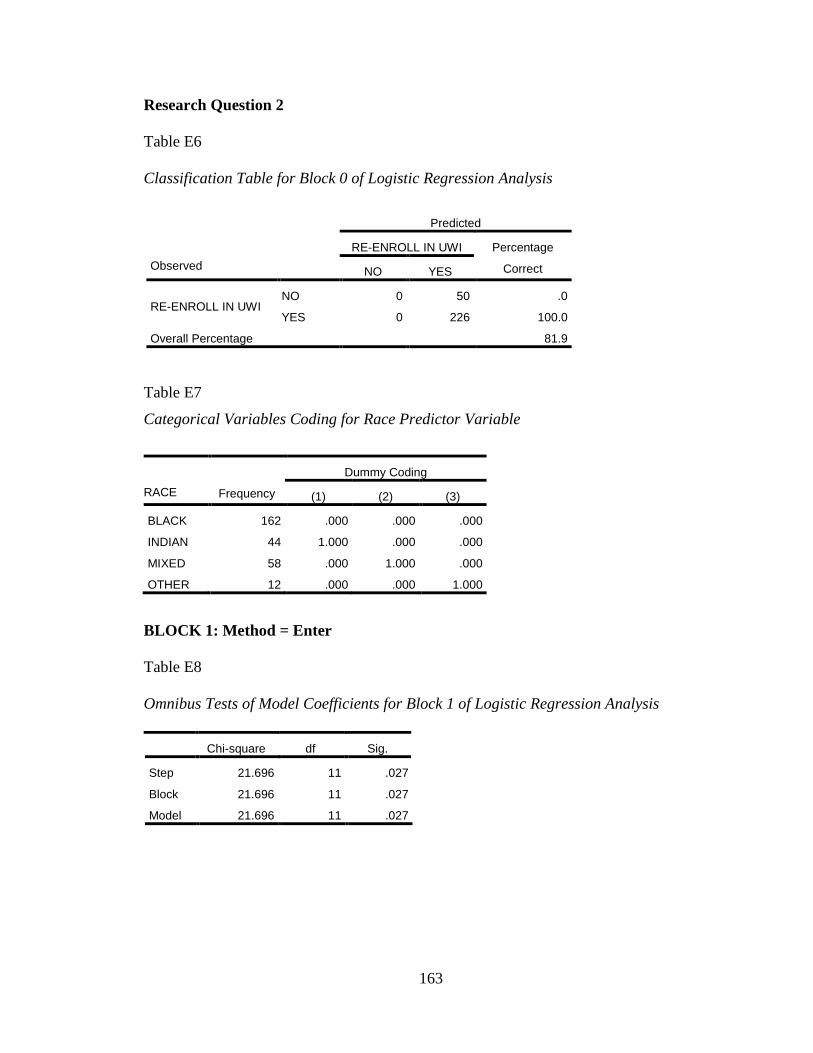
163
Research Question 2
Table E6
Classification Table for Block 0 of Logistic Regression Analysis
Observed
Predicted
RE-ENROLL IN UWI Percentage
Correct NO YES
RE-ENROLL IN UWI
NO 0 50 .0
YES 0 226 100.0
Overall Percentage 81.9
Table E7
Categorical Variables Coding for Race Predictor Variable
RACE
Frequency
Dummy Coding
(1) (2) (3)
BLACK 162 .000 .000 .000
INDIAN 44 1.000 .000 .000
MIXED 58 .000 1.000 .000
OTHER 12 .000 .000 1.000
BLOCK 1: Method = Enter
Table E8
Omnibus Tests of Model Coefficients for Block 1 of Logistic Regression Analysis
Chi-square df Sig.
Step 21.696 11 .027
Block 21.696 11 .027
Model 21.696 11 .027
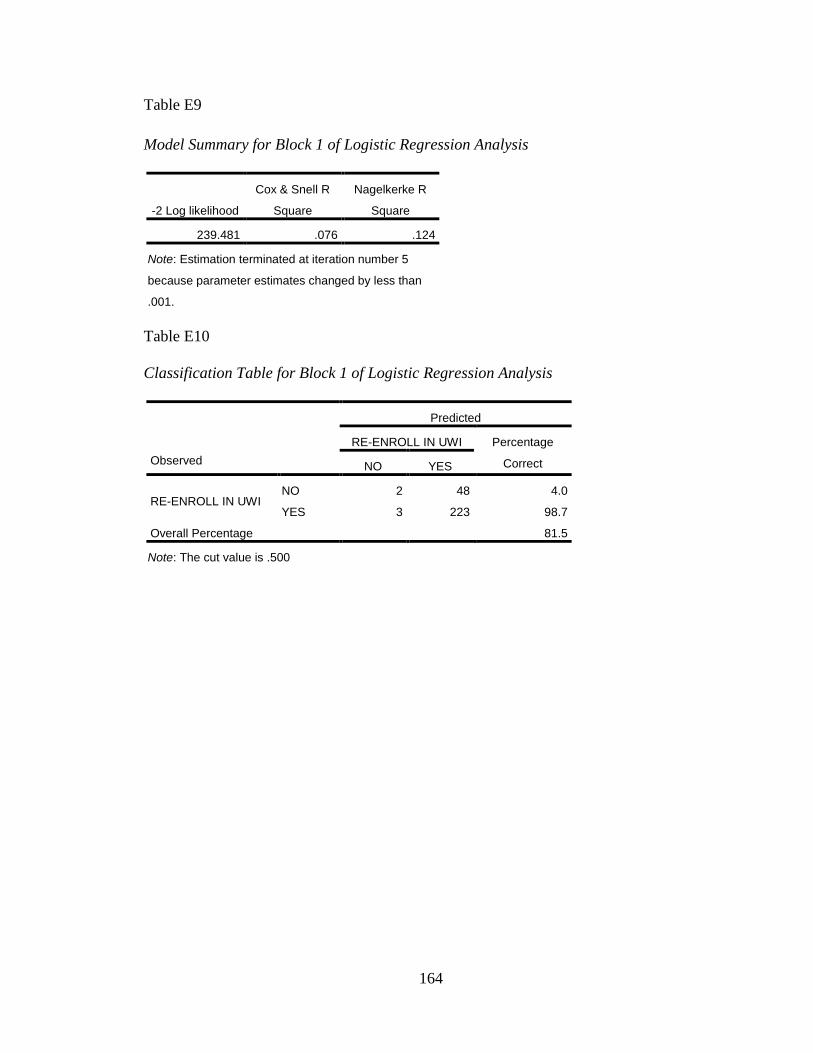
164
Table E9
Model Summary for Block 1 of Logistic Regression Analysis
-2 Log likelihood
Cox & Snell R
Square
Nagelkerke R
Square
1 239.481 .076 .124
Note: Estimation terminated at iteration number 5
because parameter estimates changed by less than
.001.
Table E10
Classification Table for Block 1 of Logistic Regression Analysis
Observed
Predicted
RE-ENROLL IN UWI Percentage
Correct NO YES
RE-ENROLL IN UWI
NO 2 48 4.0
YES 3 223 98.7
Overall Percentage 81.5
Note: The cut value is .500
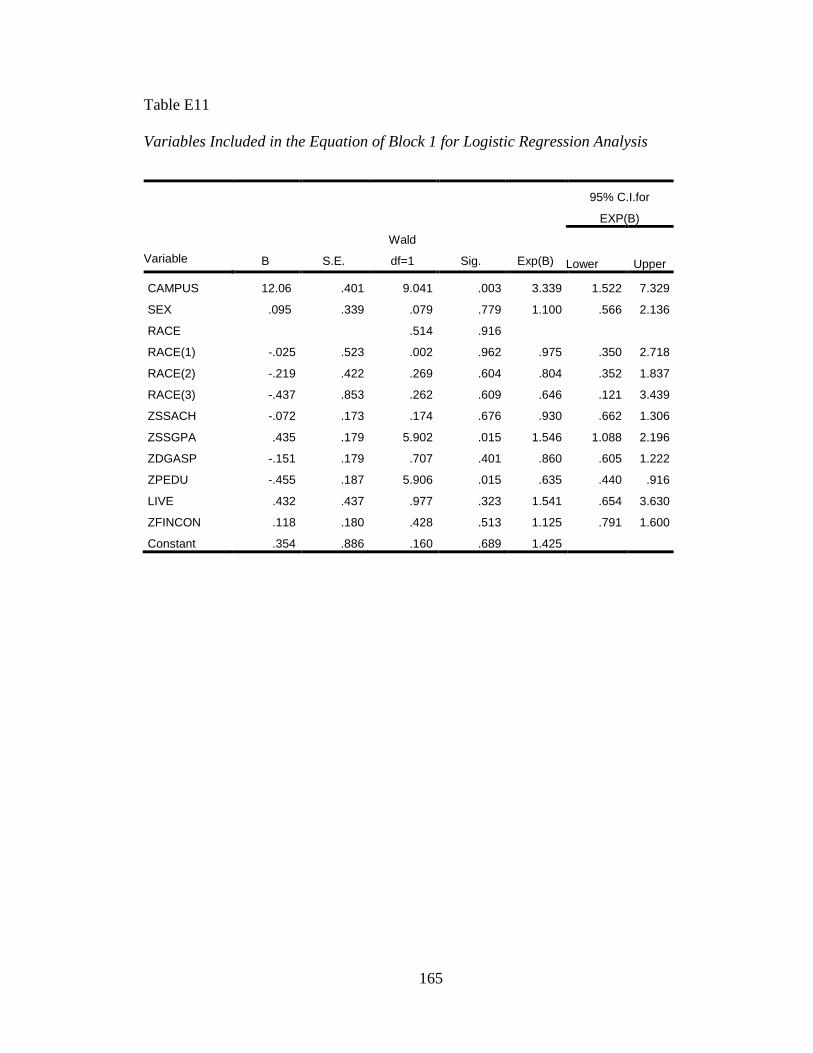
165
Table E11
Variables Included in the Equation of Block 1 for Logistic Regression Analysis
Variable
B
S.E.
Wald
df=1
Sig.
Exp(B)
95% C.I.for
EXP(B)
Lower
Upper
CAMPUS 12.06 .401 9.041 .003 3.339 1.522 7.329
SEX .095 .339 .079 .779 1.100 .566 2.136
RACE .514 .916
RACE(1) -.025 .523 .002 .962 .975 .350 2.718
RACE(2) -.219 .422 .269 .604 .804 .352 1.837
RACE(3) -.437 .853 .262 .609 .646 .121 3.439
ZSSACH -.072 .173 .174 .676 .930 .662 1.306
ZSSGPA .435 .179 5.902 .015 1.546 1.088 2.196
ZDGASP -.151 .179 .707 .401 .860 .605 1.222
ZPEDU -.455 .187 5.906 .015 .635 .440 .916
LIVE .432 .437 .977 .323 1.541 .654 3.630
ZFINCON .118 .180 .428 .513 1.125 .791 1.600
Constant .354 .886 .160 .689 1.425
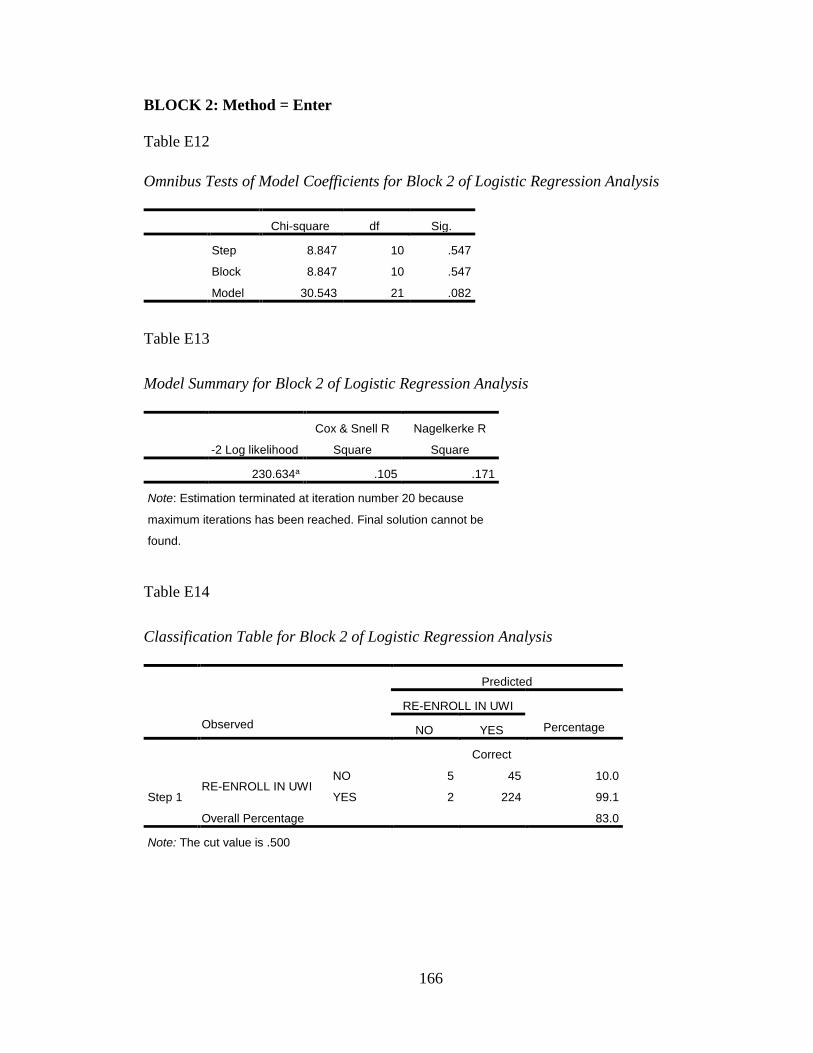
166
BLOCK 2: Method = Enter
Table E12
Omnibus Tests of Model Coefficients for Block 2 of Logistic Regression Analysis
Chi-square df Sig.
Step 8.847 10 .547
Block 8.847 10 .547
Model 30.543 21 .082
Table E13
Model Summary for Block 2 of Logistic Regression Analysis
-2 Log likelihood
Cox & Snell R
Square
Nagelkerke R
Square
230.634a .105 .171
Note: Estimation terminated at iteration number 20 because
maximum iterations has been reached. Final solution cannot be
found.
Table E14
Classification Table for Block 2 of Logistic Regression Analysis
Observed
Predicted
RE-ENROLL IN UWI
Percentage NO YES
Correct
Step 1 RE-ENROLL IN UWI
NO 5 45 10.0
YES 2 224 99.1
Overall Percentage 83.0
Note: The cut value is .500
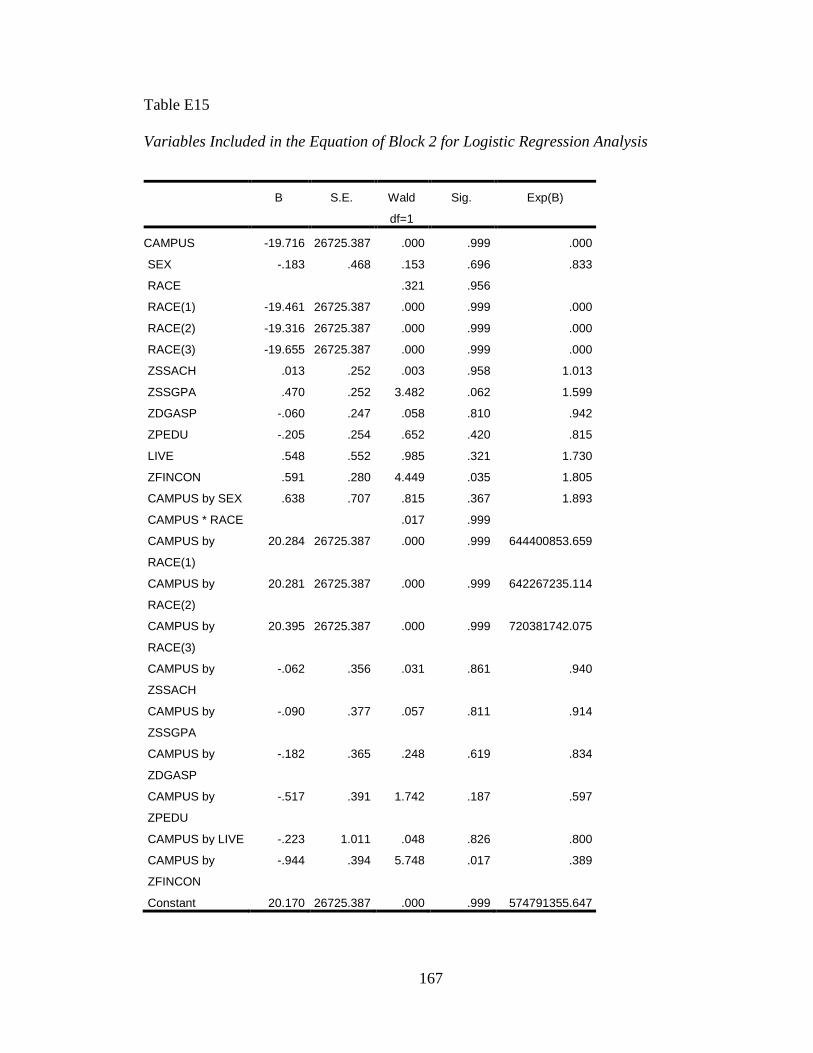
167
Table E15
Variables Included in the Equation of Block 2 for Logistic Regression Analysis
B S.E. Wald
df=1
Sig. Exp(B)
CAMPUS -19.716 26725.387 .000 .999 .000
SEX -.183 .468 .153 .696 .833
RACE .321 .956
RACE(1) -19.461 26725.387 .000 .999 .000
RACE(2) -19.316 26725.387 .000 .999 .000
RACE(3) -19.655 26725.387 .000 .999 .000
ZSSACH .013 .252 .003 .958 1.013
ZSSGPA .470 .252 3.482 .062 1.599
ZDGASP -.060 .247 .058 .810 .942
ZPEDU -.205 .254 .652 .420 .815
LIVE .548 .552 .985 .321 1.730
ZFINCON .591 .280 4.449 .035 1.805
CAMPUS by SEX .638 .707 .815 .367 1.893
CAMPUS * RACE .017 .999
CAMPUS by
RACE(1)
20.284 26725.387 .000 .999 644400853.659
CAMPUS by
RACE(2)
20.281 26725.387 .000 .999 642267235.114
CAMPUS by
RACE(3)
20.395 26725.387 .000 .999 720381742.075
CAMPUS by
ZSSACH
-.062 .356 .031 .861 .940
CAMPUS by
ZSSGPA
-.090 .377 .057 .811 .914
CAMPUS by
ZDGASP
-.182 .365 .248 .619 .834
CAMPUS by
ZPEDU
-.517 .391 1.742 .187 .597
CAMPUS by LIVE -.223 1.011 .048 .826 .800
CAMPUS by
ZFINCON
-.944 .394 5.748 .017 .389
Constant 20.170 26725.387 .000 .999 574791355.647
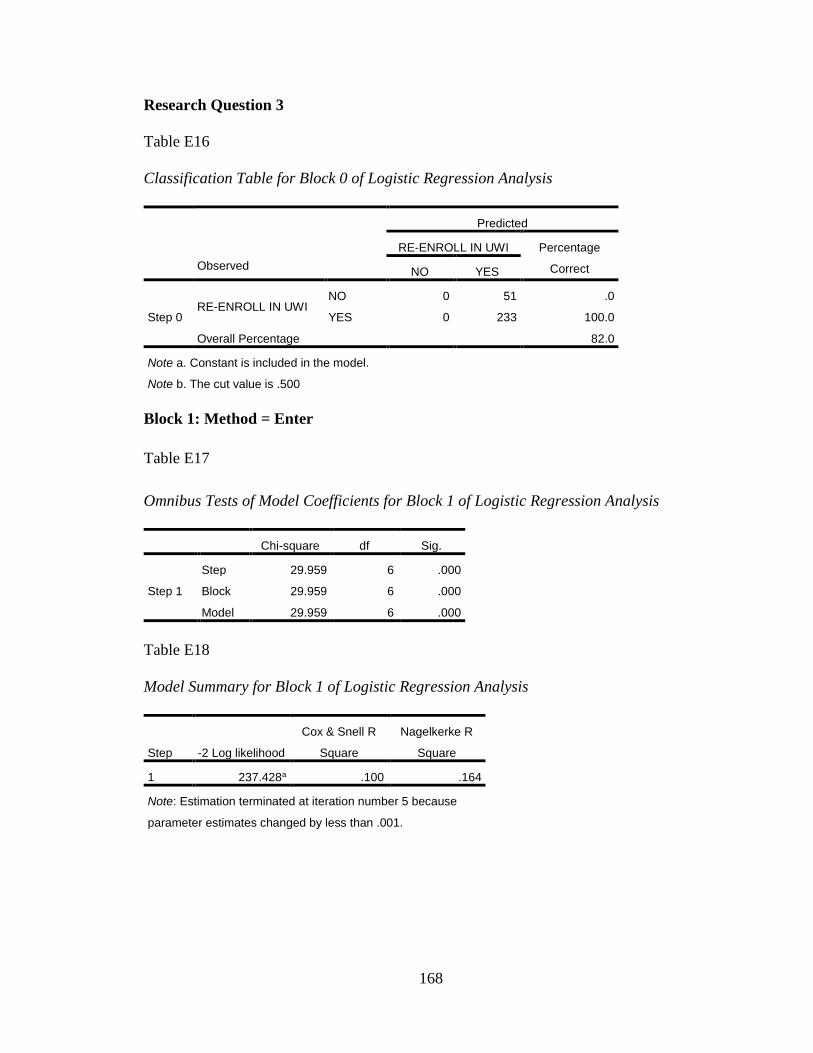
168
Research Question 3
Table E16
Classification Table for Block 0 of Logistic Regression Analysis
Observed
Predicted
RE-ENROLL IN UWI Percentage
Correct NO YES
Step 0 RE-ENROLL IN UWI
NO 0 51 .0
YES 0 233 100.0
Overall Percentage 82.0
Note a. Constant is included in the model.
Note b. The cut value is .500
Block 1: Method = Enter
Table E17
Omnibus Tests of Model Coefficients for Block 1 of Logistic Regression Analysis
Chi-square df Sig.
Step 1
Step 29.959 6 .000
Block 29.959 6 .000
Model 29.959 6 .000
Table E18
Model Summary for Block 1 of Logistic Regression Analysis
Step
-2 Log likelihood
Cox & Snell R
Square
Nagelkerke R
Square
1 237.428a .100 .164
Note: Estimation terminated at iteration number 5 because
parameter estimates changed by less than .001.
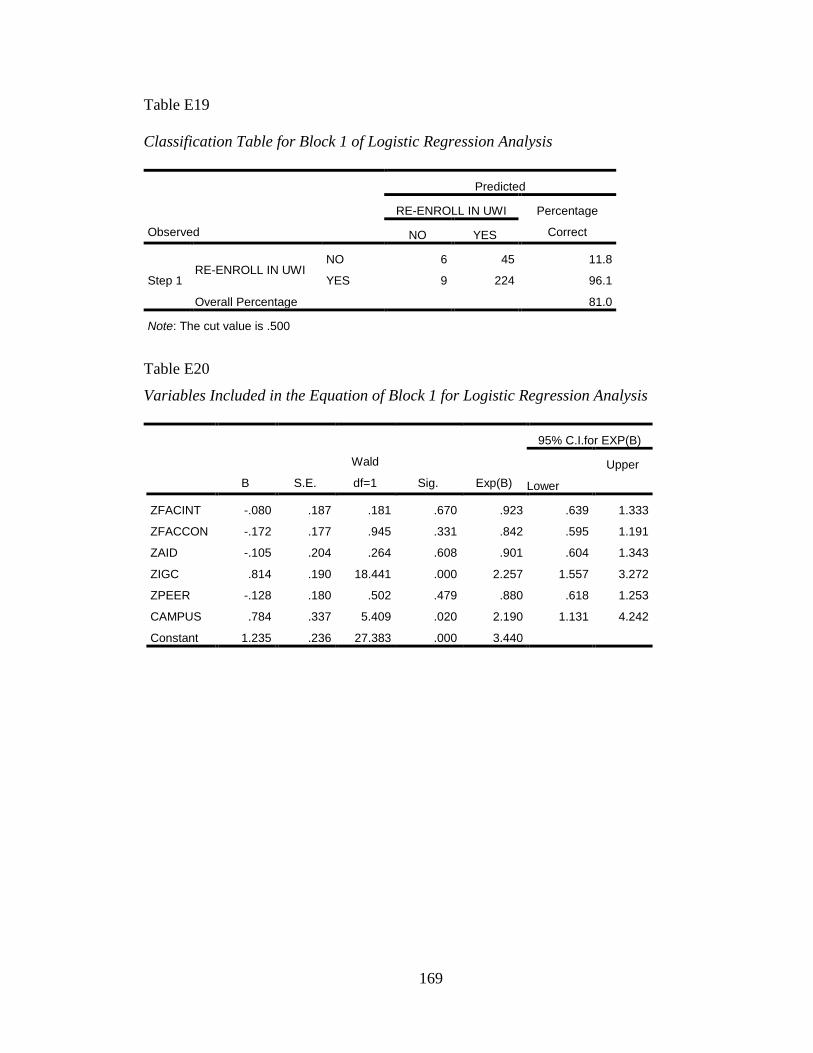
169
Table E19
Classification Table for Block 1 of Logistic Regression Analysis
Observed
Predicted
RE-ENROLL IN UWI Percentage
Correct NO YES
Step 1 RE-ENROLL IN UWI
NO 6 45 11.8
YES 9 224 96.1
Overall Percentage 81.0
Note: The cut value is .500
Table E20
Variables Included in the Equation of Block 1 for Logistic Regression Analysis
B
S.E.
Wald
df=1
Sig.
Exp(B)
95% C.I.for EXP(B)
Lower
Upper
S
t
e
p
1
a
ZFACINT -.080 .187 .181 .670 .923 .639 1.333
ZFACCON -.172 .177 .945 .331 .842 .595 1.191
ZAID -.105 .204 .264 .608 .901 .604 1.343
ZIGC .814 .190 18.441 .000 2.257 1.557 3.272
ZPEER -.128 .180 .502 .479 .880 .618 1.253
CAMPUS .784 .337 5.409 .020 2.190 1.131 4.242
Constant 1.235 .236 27.383 .000 3.440
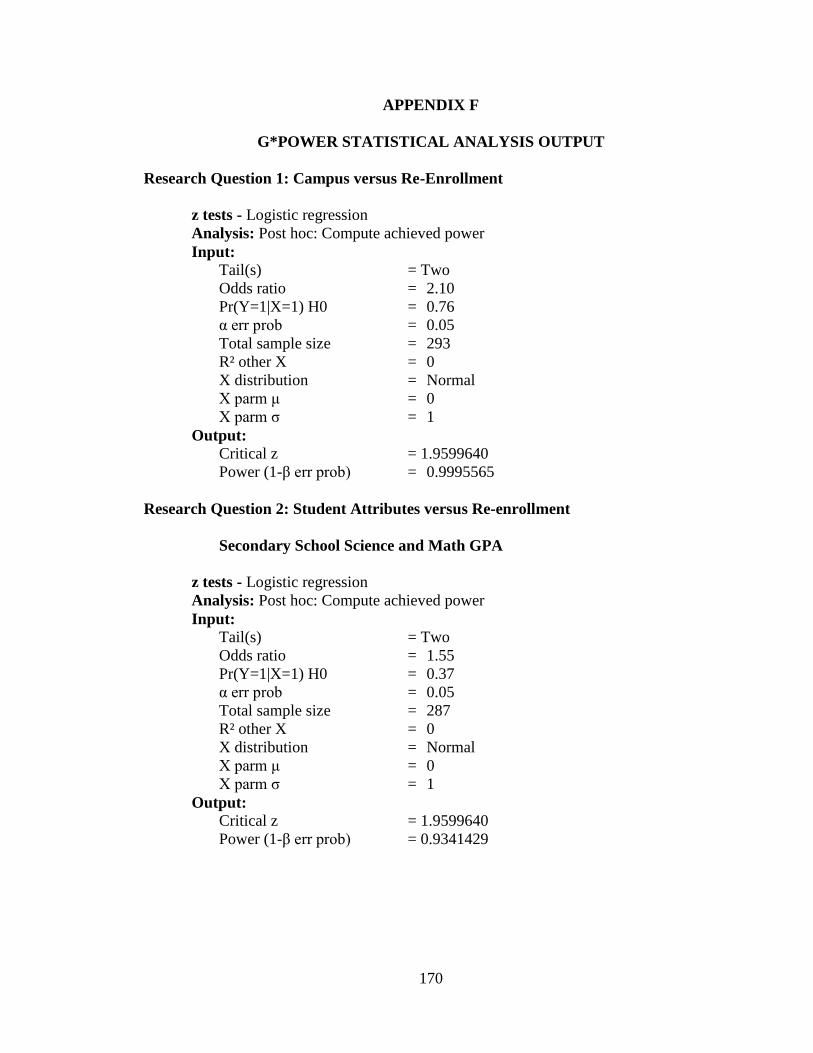
170
APPENDIX F
G*POWER STATISTICAL ANALYSIS OUTPUT
Research Question 1: Campus versus Re-Enrollment
z tests - Logistic regression
Analysis: Post hoc: Compute achieved power
Input: Tail(s) = Two
Odds ratio = 2.10
Pr(Y=1|X=1) H0 = 0.76
α err prob = 0.05
Total sample size = 293
R² other X = 0
X distribution = Normal
X parm μ = 0
X parm σ = 1
Output: Critical z = 1.9599640
Power (1-β err prob) = 0.9995565
Research Question 2: Student Attributes versus Re-enrollment
Secondary School Science and Math GPA
z tests - Logistic regression
Analysis: Post hoc: Compute achieved power
Input: Tail(s) = Two
Odds ratio = 1.55
Pr(Y=1|X=1) H0 = 0.37
α err prob = 0.05
Total sample size = 287
R² other X = 0
X distribution = Normal
X parm μ = 0
X parm σ = 1
Output: Critical z = 1.9599640
Power (1-β err prob) = 0.9341429
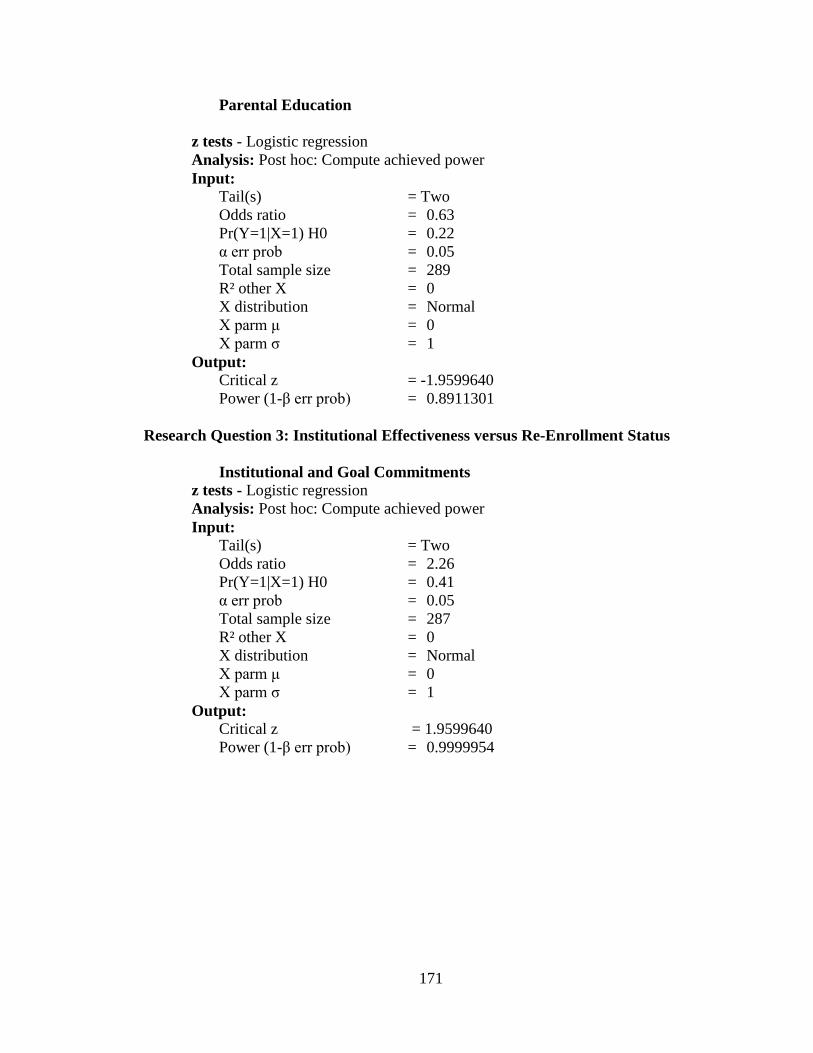
171
Parental Education
z tests - Logistic regression
Analysis: Post hoc: Compute achieved power
Input: Tail(s) = Two
Odds ratio = 0.63
Pr(Y=1|X=1) H0 = 0.22
α err prob = 0.05
Total sample size = 289
R² other X = 0
X distribution = Normal
X parm μ = 0
X parm σ = 1
Output: Critical z = -1.9599640
Power (1-β err prob) = 0.8911301
Research Question 3: Institutional Effectiveness versus Re-Enrollment Status
Institutional and Goal Commitments
z tests - Logistic regression
Analysis: Post hoc: Compute achieved power
Input: Tail(s) = Two
Odds ratio = 2.26
Pr(Y=1|X=1) H0 = 0.41
α err prob = 0.05
Total sample size = 287
R² other X = 0
X distribution = Normal
X parm μ = 0
X parm σ = 1
Output: Critical z = 1.9599640
Power (1-β err prob) = 0.9999954
172
CURRICULUM VITAE
Joy A. Harewood Cox 6319 Hackel Drive
Louisville, KY 40258 (502) 432-8279
EDUCATION Doctor of Philosophy (College Student Personnel): Examining the Perceptions of First-Year
STEM Students on Retention Factors at the University of the West Indies
University of Louisville, Louisville, KY Spring 2015
Master of Education (M.Ed.) (School Counseling) Dec 2008 University of Louisville, Louisville, KY MBA in Education Jul 2002 University of Leicester, Northampton, England Diploma in Education Jun 1987 University of the West Indies, Cave Hill Campus, Barbados Bachelor of Science (Biology) Jun 1985 University of the West Indies, Cave Hill Campus, Barbados
PROFESSIONAL EXPERIENCE Graduate Assistant, College Student Personnel Program Aug 2012- present University of Louisville, Louisville, KY
Teaching Assistant: “Applied Multiple Regression” (ELFH 702), Spring 2015
Teaching Assistant: International Service Learning “Seminar of Student Services in the Caribbean” (ECPY 697), Spring 2013 and Spring 2014
Research Assistant: Dr. Michael Cuyjet, Professor, University of Louisville, 2012-2014
Planning and organizing Preview Weekend Program for prospective graduate students
Representing College Student Personnel (CSP) program on the DSO (Doctoral Student Organization) committee and GAPSA (Graduate Association Professionals in Student Affairs)
Academic Advisor Sept 2007- July 2014 Indiana University Southeast, New Albany, IN
Delivered advising to individual underrepresented students, particularly with transitioning to college issues
Designed curriculum, implemented, and assessed a course for students on academic suspension seeking reinstatement, resulting in a decrease in probationary numbers
Initiated, created curriculum, and taught a career advising course in the School of Natural Sciences in collaboration with career services, resulting in 94% of the students expressed more confidence about their career choices
173
Monitored academic progress of at-risk students using an early alert system to improve student persistence
Developed and conducted workshops for new academic advisors campus-wide
Hired and trained three academic advisors and office staff
Discussed majors with prospective students after completion of interest inventories
Mentored twelve freshmen students ensuring a smooth transition from high school to college
Oriented and trained faculty on a variety of academic advising topics including new student support techniques and first-year orientation
TEACHING EXPERIENCE Adjunct Faculty Aug 2008- April 2012 Indiana University Southeast, New Albany, IN
“Strategies for Success in College and Life” (EDUC-X100) for students on academic probation with 95% success rate
“Pathways: First Year Seminar II” (COAS-S154)
“First Year Seminar I” (COAS-S100)
“Career Advising in Science Fields” (NATS-S200)
“Humans and the Biological World” (BIOL-L100) High School Science Teacher Aug 2004-Jun 2007 Butler Traditional High School, Louisville, KY
Taught grade 9 Integrated Science and grade 10 Biology
Sponsored the Minority Teachers Recruitment Program (MTRP)
Sponsored Gospel Choir for minority students Biology Faculty Aug 2002-Jun 2004 Barbados Community College, St. Michael, Barbados
Tutored Biology to students seeking an Associate Degree in Natural Sciences
OTHER EXPERIENCES VP Student Affairs Internship Fall 2014 - present University of Louisville, KY
Assessing student learning outcomes for ISLP
Researching International Service Learning Programs at benchmark institutions
Assisted with service learning classes in Education and Engineering School Counseling Practicum Fall 2008 Butler Traditional High School, Louisville, KY
Counseled juniors and seniors about transitioning to college
Presented at workshop for Seniors College Night
Attended college visits with seniors
Organized DARE to CARE can collection project
174
PROFESSIONAL AFFILIATIONS NACADA (National Academic Advising Association) (2008- Present) Presentations:
Cox, J. A. (2014). “Strategies for Success in College for Students on Academic Probation.” Workshop presented at the national conference for National Academic Advising Association (NACADA)
Cox, J. A. (2013). “Hot Topics on Probation, Dismissal and Reinstatement Issues.” Workshop presented at the national conference for National Academic Advising Association (NACADA)
Gerhke, S. & Cox, J. A. (2012). “Probation, Dismissal, Reinstatement Hot Topic, co-presenter, national conference for National Academic Advising Association (NACADA)
Cox, J. A. & Gohmann, D. M. (2011). “Survivor: The Academic Jungle”, Poster presentation, presented at national conference for NACADA
Publications:
Cox, J. A. (2014). In S. Gehrke & S. Braun. Advising students on academic probation (pp.27-28). NACADA Pocket Guide Series. Manhattan, KS: National Academic Advising Association
Cox, J. A. (2013, December). Teaching coping skills to first year college students on academic probation. Academic Advising Today 36(4). Manhattan, KS: National Academic Advising Association
Cox, J. A. (2012). International transfer students [Monograph]. In T.J. Grites and C. Duncan (Eds.). Advising student transfers: Strategies for today’s realities and tomorrow challenges (pp. 66-67). Manhattan, KS: National Academic Advising Association
Cox, J. A. (2012). Workforce and Unemployed [Monograph]. In T.J. Grites and C. Duncan (Eds.). Advising student transfers: Strategies for today’s realities and tomorrow challenges (pp. 61-62). Manhattan, KS: National Academic Advising Association
Offices & Committees: Chair, Probation Dismissal Reinstatement Interest Group (2012- present) Commission & Interest Group Division Committee (2012- present) Diversity Committee (2012-2014)
Grants & Awards: Research Grant, the National Academic Advising Association (NACADA) to fund
doctoral dissertation ($3,400) Emerging Leaders Mentoring Program (2010-2012) NACADA award recipient
($1,500) Indiana Academic Advising Network (IAAN) 2008-2012
Presentations: Cox, J. A. (2012). “Academic Advising Techniques”; “Advising International
Students,” & “Advising Scenes for Learning & Reflection,” New Advisor Orientation & Training Workshop, Indiana University Southeast
Cox, J. A. (2011). “Advising Week: Captain Advisor”, Indiana Academic Advising Network (IAAN)
Cox, J. A. (2008). “Advanced Advising: How Academic Advisors can assist high school counselors to meet the postsecondary needs of students” at Indiana Academic Advising Network (IAAN)
175
College Personnel Association of Kentucky (CPAK) 2013-present Awards:
2013 CPAK Graduate Case Study Competition Runner-up Southern Association for College Student Affairs (SACSA) 2014-present UNIVERSITY LEADERSHIP & COMMITTEES Indiana University Southeast
President IUSAC (Indiana University Southeast Advising Council) 2010-2011 Registrar: Academic Suspension Committee, 2012-2014 Restructuring of academic advising committees, January – March, 2012 Search Committees for three academic advisors and one advising office assistant Center for Mentoring: Collegiate Summer Institute committee to plan programs and curriculum for first generation and minority students transitioning from high school to college 2009-2012 Financial Aid: Satisfactory Academic Progress (SAP) committee, 2009-2011 Search Committee: Director of Career Development Center, 2011 Financial Aid: Scholarship committee, 2009-2011 Campus Life: Freshman Orientation committee 2009-2011 Transfer Orientation committee to address the specific needs of transfer students
University of Louisville
Search Committee for Assistant Professor, College Student Personnel, Department of Educational and Counseling Psychology, College of Education & Human Development, November, 2014
Executive committee for Doctoral Student Organization August 2014-2015
Related Documents