Examining psychological distress across intersections of immigrant generational status, race, poverty, and gender Amanda Mancenido A thesis submitted in partial fulfillment of the requirements for the degree of Master of Public Health University of Washington 2018 Committee: Anjum Hajat Emily Williams Program Authorized to Offer Degree: Department of Epidemiology

Welcome message from author
This document is posted to help you gain knowledge. Please leave a comment to let me know what you think about it! Share it to your friends and learn new things together.
Transcript

Examining psychological distress across intersections of immigrant generational status, race,
poverty, and gender
Amanda Mancenido
A thesis
submitted in partial fulfillment of the
requirements for the degree of
Master of Public Health
University of Washington
2018
Committee:
Anjum Hajat
Emily Williams
Program Authorized to Offer Degree:
Department of Epidemiology

©Copyright 2018
Amanda Mancenido

University of Washington
Abstract
Examining psychological distress across intersections of immigrant generational status, race,
poverty, and gender
Amanda Mancenido
Chair of the Supervisory Committee:
Anjum Hajat
Department of Epidemiology
Introduction: While many studies have documented the health outcomes of immigrants, little is
known about the direct and intersectional influences of generational status on mental health.
Methods: We conducted a population-based cross-sectional study using data from the
California Health Interview Survey from 2015-2016 (N=41,754) to examine the prevalence of
psychological distress (self-reported experience in the past 12 months) across generational
status. We used log-binomial regression models adjusted for demographic and health-related
factors to compare the likelihood of psychological distress among first-generation immigrants
and non-immigrants relative to second-generation immigrants, overall and across intersections
of race, poverty status, and gender.
Results: Second-generation and non-immigrant respondents had a significantly higher
prevalence (10.1% and 9.4%, respectively) of psychological distress compared to first-
generation immigrants (5.9%). Generational status was not statistically significantly associated
with psychological stress; estimates for first-generation and non-immigrants relative to second-
generation immigrants were 0.81 (95% CI 0.63-0.04) and 1.12 (95% CI 0.84-1.50), respectively.
Discussion: Though no statistically significant association was shown between generational

status and psychological distress, the direction of estimates across iteratively adjusted models
suggests a protective effect for first-generation immigrants. Further research is needed in bigger
samples to explore associations between generational status and psychological distress, overall
and across intersections of the population.

1
INTRODUCTION
First-generation immigrants and second-generation immigrants, or U.S.-born individuals
with one or more foreign-born parents, currently comprise almost 27% of the United States
population, and this percentage is continuing to increase.1 Previous studies focused on
immigrant health suggest that first-generation immigrants are healthier and more resilient than
non-immigrants, with first-generation immigrant youth showing fewer depressive symptoms and
a lower likelihood of attempting suicide than their U.S.-born peers.2,3 Other studies suggest that,
compared to non-immigrant populations, second-generation immigrants may experience greater
stress, and consequently greater prevalence of poor mental health outcomes, due to their
limited material and social resources and greater exposure to discrimination.4,5 While these
studies suggest that the stressors associated with being a second-generation immigrant may
negatively influence health, few studies have evaluated the direct influence of immigrant
generational status on the prevalence of psychological distress using a population-based
sample of adults.
Second-generation immigrants may face significantly different historical, economic, and
sociocultural factors than first-generation and non-immigrant populations. First-generation
immigrants often keep strong ties to their cultural community, including language, spirituality,
and cultural traditions.6 The non-immigrant population, or those who are born in the U.S. and
have U.S.-born parents, is a heterogenous group that is more likely to be accustomed to
American culture and norms, whether their families immigrated more recently or hundreds of
years ago.6 Second-generation immigrants, on the other hand, may have bicultural identities
that encompass characteristics from both heritage and mainstream American culture and are
often discussed as living “between two worlds”.6 In addition to greater exposure to interpersonal
and institutional stress, second-generation immigrants may struggle to balance the conflicting
2
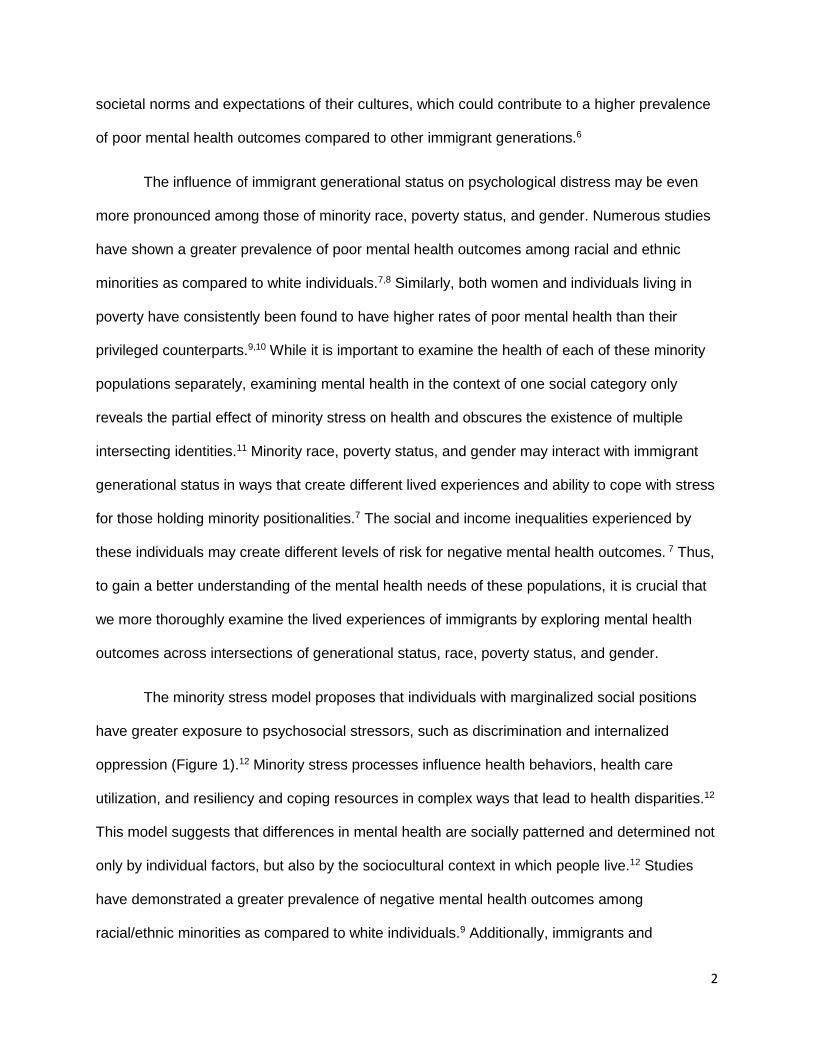
societal norms and expectations of their cultures, which could contribute to a higher prevalence
of poor mental health outcomes compared to other immigrant generations.6
The influence of immigrant generational status on psychological distress may be even
more pronounced among those of minority race, poverty status, and gender. Numerous studies
have shown a greater prevalence of poor mental health outcomes among racial and ethnic
minorities as compared to white individuals.7,8 Similarly, both women and individuals living in
poverty have consistently been found to have higher rates of poor mental health than their
privileged counterparts.9,10 While it is important to examine the health of each of these minority
populations separately, examining mental health in the context of one social category only
reveals the partial effect of minority stress on health and obscures the existence of multiple
intersecting identities.11 Minority race, poverty status, and gender may interact with immigrant
generational status in ways that create different lived experiences and ability to cope with stress
for those holding minority positionalities.7 The social and income inequalities experienced by
these individuals may create different levels of risk for negative mental health outcomes. 7 Thus,
to gain a better understanding of the mental health needs of these populations, it is crucial that
we more thoroughly examine the lived experiences of immigrants by exploring mental health
outcomes across intersections of generational status, race, poverty status, and gender.
The minority stress model proposes that individuals with marginalized social positions
have greater exposure to psychosocial stressors, such as discrimination and internalized
oppression (Figure 1).12 Minority stress processes influence health behaviors, health care
utilization, and resiliency and coping resources in complex ways that lead to health disparities.12
This model suggests that differences in mental health are socially patterned and determined not
only by individual factors, but also by the sociocultural context in which people live.12 Studies
have demonstrated a greater prevalence of negative mental health outcomes among
racial/ethnic minorities as compared to white individuals.9 Additionally, immigrants and

3
racial/ethnic minorities have historically held stigmatized views of mental illness and lacked
access to culturally appropriate and affirming health care, which may discourage them from
addressing their mental health needs.8,13 This lack of care, in combination with the daily life
stressors they encounter, act together to contribute to the mental health disparities for these
populations.
The intersectionality framework posits that people who inhabit multiple social categories
of “identity, difference, and disadvantage” experience the simultaneous and interlocking
systems of oppression of each of their identities.11,14 Thus, to gain a richer understanding of
mental health outcomes across generations of immigrant health, we must consider how race,
poverty status, and gender hierarchies may be acting to simultaneously and synergistically
burden immigrant health.15 Utilizing the minority stress model in combination with the
intersectionality framework in examining generational status and psychological distress will
allow us to elucidate and address health disparities that occur across the diverse spectrum of
immigrants and their children.
In order to better understand mental health outcomes across generations of immigrants,
the present study – conducted in a statewide sample of U.S. residents – aimed to describe
direct and intersectional influences of immigrant generational status on psychological distress.
Specifically, we evaluated the association between generational status and psychological
distress and assessed variation across subgroups based on race, poverty status, and gender.
We hypothesized that second-generation immigrants would have a higher prevalence of
psychological distress than first-generation and non-immigrant populations and that the
influence of generational status would be greater for those of minority racial/ethnic groups,
women, and those living in greater poverty. Findings have potential to contribute to the evidence
base needed to understand the unique mental health needs of immigrants across generational
status, including identifying key vulnerable subgroups.

4
METHODS Study Setting and Subjects
We conducted a population-based cross-sectional study using data from the California
Health Interview Survey from 2015-2016. The CHIS annually samples approximately 21,000
randomly selected adults from all 58 counties of California. With nearly 27% of the U.S.
population comprised of first- and second-generation immigrants, and Hispanic and Asian
Americans making up between 50 to 70% of this population, the CHIS’ large representation of
these groups makes it an ideal dataset to look at the intersection of generational status, race,
poverty status, and gender.16,17
Using respondents to the CHIS in the years 2015-2016, we examined a total of 41,754
non-institutionalized civilian adults 18 years and older living in California. Individuals living in
California with a household telephone or with a cell phone were eligible for selection for this
survey. CHIS respondents who refused to answer or were missing data on immigrant status and
generation, psychological distress, or included covariates were excluded from this study.
Data Collection
The CHIS sampled California residents using a random digit-dialing method, including
telephone numbers assigned to both landline and cellular service. Counties were grouped into
geographic sampling strata, residential and cellular phone numbers were selected within each
stratum, and then within each household, one adult (age 18 and over) respondent was randomly
selected. The sample was designed such that the number of completed adult interviews would
come from approximately 50% landline and 50% cellular phone numbers. To capture
California’s diverse population, racial/ethnic minorities were oversampled, and interviews were
conducted in six languages (English, Spanish, Chinese, Vietnamese, Korean, and Tagalog)
using a computer-assisted telephone interviewing system. Data are publicly available for

5
download on the UCLA Center for Health Policy Research website. Response rates among
adults for the 2015 and 2016 surveys were 41.8% and 41.3%, respectively.
Measurement
Dependent variable: Generational status. Immigrant generational status was defined by
the place of birth of the respondent and the respondent’s parents. Respondents were defined as
first-generation if they were born outside of the U.S., second-generation if they were born in the
U.S. with one or more foreign-born parents, and non-immigrant if the respondent and both
parents were born in the U.S. Additional data on grandparent birth place was not available,
therefore we could not distinguish third or later generation immigrants.
Outcome of Interest: Psychological distress. The outcome of interest was non-specific
psychological distress in the past 12 months based on self-report on the Kessler Psychological
Distress Scale (K6).18 This 6-item scale assessed psychological distress through self-report of
how frequently respondents experienced the following six symptoms: felt nervous, hopeless,
restless or fidgety, worthless, depressed, and felt that everything was an effort. Responses to
these six items were measured on a scale of 0-4 from “none of the time” to “all of the time.”
Responses were summed and those with scores greater than 12 were classified as having
psychological distress.
Demographic Measures/Intersectional Effect Modifiers. Race was categorized into five
groups (Asian, Hispanic, other, white, non-white), percent of federal poverty level (<100%, 100-
199%, ≥200%) was used as a measure of poverty status, and gender was classified as either
female or male.
Other demographic characteristics. Age in years at time of survey was categorized into:
18-25, 26-44, 45-64, and 65+ years. Current marital status was categorized as: married, never
married, and other (living with partner, divorced, separated, widowed). Time spent in the U.S.
6
and English use and proficiency were both highly correlated with immigrant generational status
and were thus not measured as potential confounders.
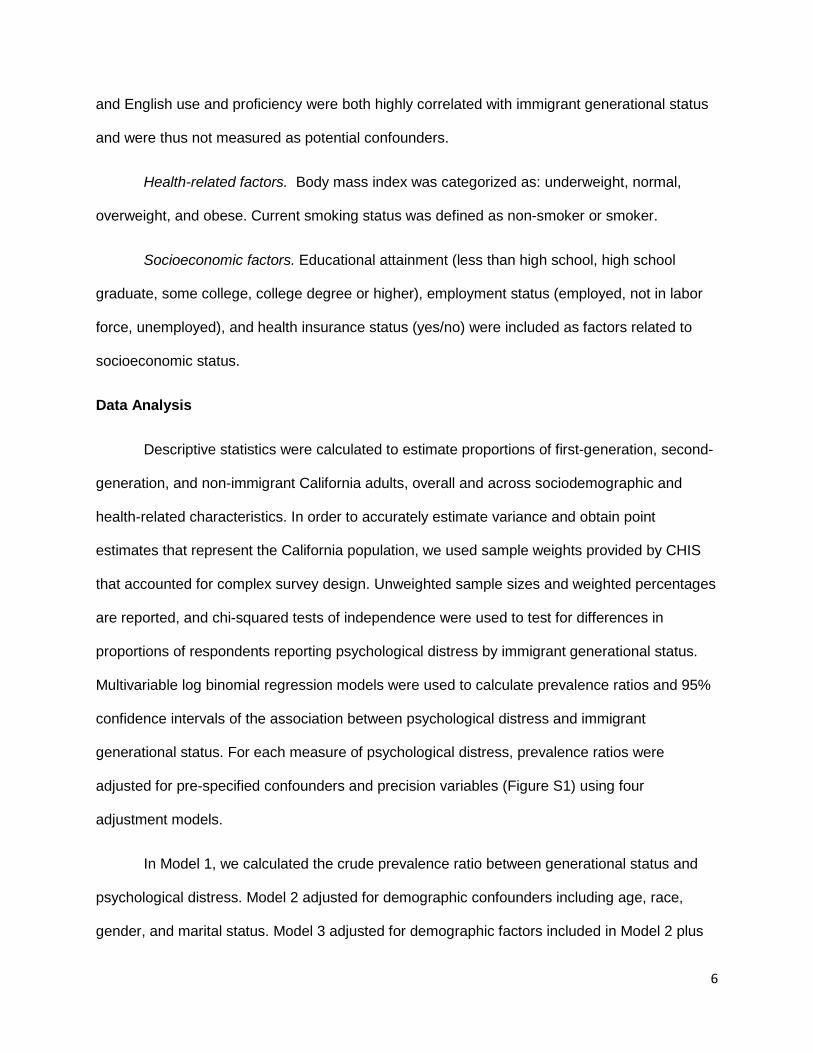
Health-related factors. Body mass index was categorized as: underweight, normal,
overweight, and obese. Current smoking status was defined as non-smoker or smoker.
Socioeconomic factors. Educational attainment (less than high school, high school
graduate, some college, college degree or higher), employment status (employed, not in labor
force, unemployed), and health insurance status (yes/no) were included as factors related to
socioeconomic status.
Data Analysis
Descriptive statistics were calculated to estimate proportions of first-generation, second-
generation, and non-immigrant California adults, overall and across sociodemographic and
health-related characteristics. In order to accurately estimate variance and obtain point
estimates that represent the California population, we used sample weights provided by CHIS
that accounted for complex survey design. Unweighted sample sizes and weighted percentages
are reported, and chi-squared tests of independence were used to test for differences in
proportions of respondents reporting psychological distress by immigrant generational status.
Multivariable log binomial regression models were used to calculate prevalence ratios and 95%
confidence intervals of the association between psychological distress and immigrant
generational status. For each measure of psychological distress, prevalence ratios were
adjusted for pre-specified confounders and precision variables (Figure S1) using four
adjustment models.
In Model 1, we calculated the crude prevalence ratio between generational status and
psychological distress. Model 2 adjusted for demographic confounders including age, race,
gender, and marital status. Model 3 adjusted for demographic factors included in Model 2 plus

7
health-related factors including body mass index and smoking status. Model 4 was adjusted for
all variables in Model 3, as well as socioeconomic factors (educational attainment, employment
status, poverty status, and health insurance status) that may mediate the association between
generational status and psychological distress. Model 3 is designated as our primary model
because it includes all pre-specified confounders but does not include factors that are on the
causal pathway between immigrant generational status and psychological distress.
We presented results from our primary model stratified by race, poverty status, and
gender to examine our association of interest at these various intersections. Specifically, we
estimated the association between immigrant generational status and psychological distress
within each race, poverty, and gender subgroup, including assessment of the prevalence ratio
and 95% confidence interval of experiencing psychological distress for first-generation and non-
immigrant populations relative to second-generation immigrants. In a sensitivity analysis, we
used generalized linear models to examine the influence of immigrant generational status on the
continuous variable for psychological distress (K6 scale, 0-24) as shown in the supplementary
material.
All statistical analyses were carried out using Stata version 14 (StataCorp, College
Station, TX).19 This research was considered exempt from review by the University of
Washington Institutional Review Board because all data were de-identified.
RESULTS Among 42,025 respondents to the CHIS in 2015 and 2016, 41,754 persons met
inclusion criteria for this analysis. Among those, 10,465 (25.1%) were first-generation
immigrants, 6,863 (16.4%) were second-generation immigrants, and 24,426 (58.5%) were non-
immigrants. 3,158 respondents reported psychological distress in the past 12 months, among
whom 688 (24.2%) were first-generation, 555 (23.5%) were second-generation, and 1,915
(52.3%) were non-immigrants.

8
Sample characteristics are presented across immigrant generational status in Table 1.
The majority of first-generation immigrants were between the ages of 26-64 years, female,
Hispanic, married, in the U.S for greater than 40% of their life, and proficient in English. Most
first-generation immigrants obtained a high school degree or less, were employed, had a
household income above the 100% federal poverty level, and had health insurance. The
majority of second-generation immigrants were between the ages of 18-44, male, Hispanic,
married or of other marital status, and proficient in English. Second-generation immigrants were
mostly employed, attended some college, had an income greater than 199% of the federal
poverty level, and had health insurance. The majority of non-immigrant respondents were 45
years or older, female, white, never married or of other marital status, and proficient only in
English. Most non-immigrant respondents attended some college, were employed, had income
greater than 199% of the federal poverty level, and had health insurance. The majority of all
respondents s were non-smokers and were overweight or obese with little variation across
generational status.
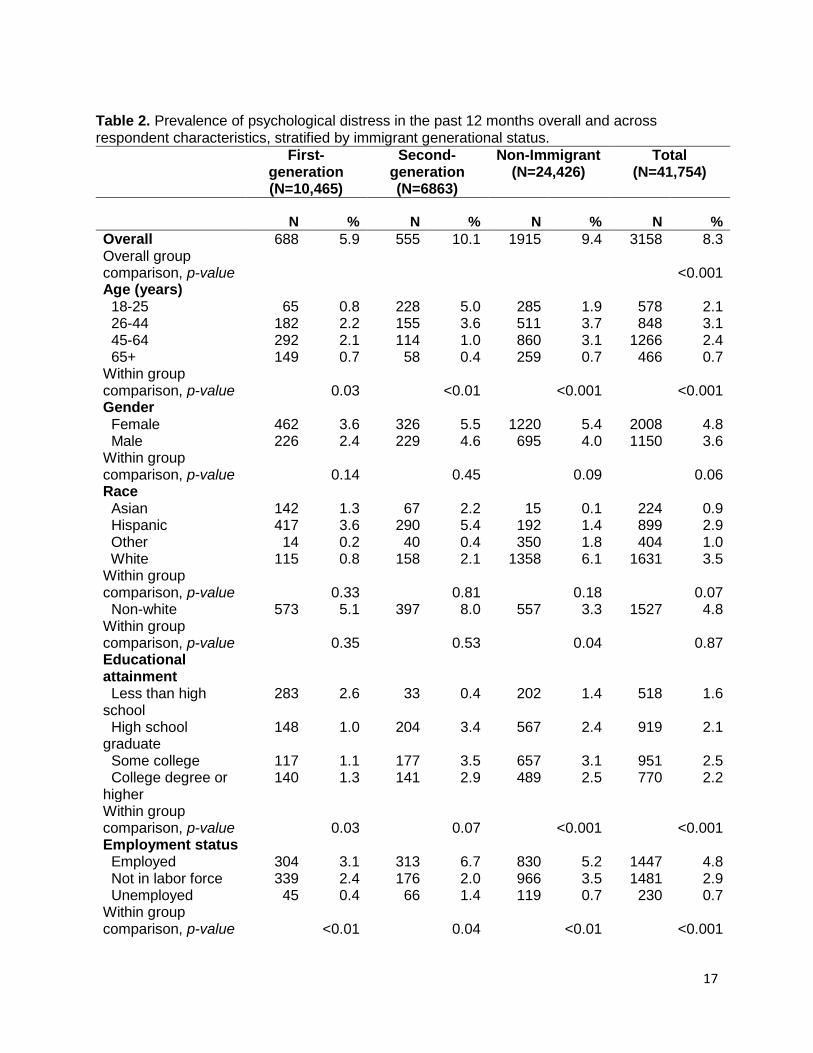
As shown in Table 2, psychological distress was more common among second-
generation immigrants (10.1%) and non-immigrant respondents (9.4%) than first-generation
immigrants (5.9%). Prevalence of psychological distress among second-generation and non-
immigrant respondents was significantly different from that of first-generation immigrants, but
there was no significant difference for second-generation immigrants relative to non-immigrant
respondents. Among first-generation immigrants, respondents age 26-64, with less than a high
school education, employed, with income less than 100% of the federal poverty level, married,
and non-smokers were more likely to report psychological distress. Among second-generation
immigrants, those 18-25 years old, employed, with income greater than 200% of federal poverty
level, of other marital status, and non-smoking were more likely to report psychological distress
in the past 12 months. Among non-immigrant respondents, those 26-44 years old, white, had

9
attended some college, employed, with income greater than 200% of poverty level, of other
marital status, and non-smoking were more likely to report psychological distress.
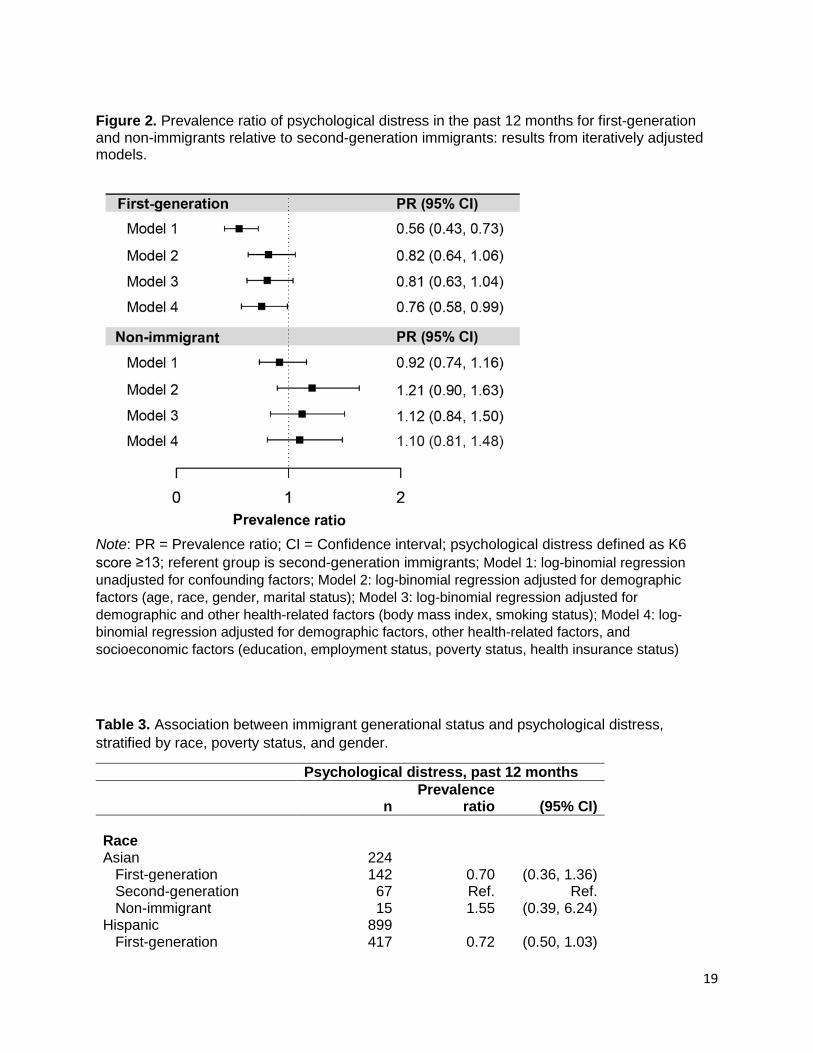
Prevalence ratios for first-generation and non-immigrant respondents relative to second-
generation immigrants are presented in Figure 2. No significant association was observed
between generational status and psychological distress in the primary model (Model 3, adjusted
for age, race, gender, and marital status). Estimates for the association comparing first-
generation immigrants to second-generation immigrants showed a prevalence ratio less than
1.0 across all four models, with the magnitude of the effect varied depending on which
confounders were included in the model. No differences in prevalence of psychological distress
were observed between non-immigrants and second-generation immigrants in any model.
Iteratively adjusted linear regression models examining continuous changes in psychological
distress by generational status are shown in Table S1 and are similar in magnitude and
direction to the results from the binomial models presented in Figure 2.
Table 3 shows prevalence ratios for first-generation and non-immigrant respondents
compared to second-generation immigrants across intersections of race, poverty, and gender.
Among all non-white respondents combined (Asian, Hispanic, and other races), first-generation
immigrants had a lower prevalence of psychological distress than second-generation
immigrants (PR, 95% CI: 0.73, 0.56-0.97). However, no differences in prevalence of
psychological distress were found between first-generation and non-immigrant respondents
relative to second-generation immigrants when stratified by poverty status, gender, or
undichotomized subgroups of race (i.e. Asian, Hispanic, other, white).
DISCUSSION
In this statewide sample of U.S. residents, psychological distress in the past 12 months
was common, particularly among second-generation and non-immigrant respondents, with 9.4
to 10.1% reporting psychological distress compared to 5.9% of first-generation immigrants.

10
Though no significant differences in prevalence of psychological distress were observed
between generations in fully adjusted models, the direction of the estimates are suggestive of a
protective effect of generational status for first-generation immigrants, relative to second-
generation immigrants.
Previous studies evaluating mental health among immigrant communities have focused
mainly on first-generation immigrants, and studies that have examined the health of second-
generation immigrants have focused mostly on youth, adolescent, and college-age
groups.3,5,20,21 Studies evaluating the mental health of these groups have had mixed results
possibly because they neglected to examine these associations across multiple intersecting
identities.10 Furthermore, many studies collapse all U.S.-born generations into one category and
thus lose the distinction between second-generation and non-immigrant subgroups.22 Our study
adds to the literature by examining the effects of first-generation, second-generation and non-
immigrant status on psychological distress across intersections of race, poverty, and gender.
Our findings support studies that have found second-generation and non-immigrants to
have higher prevalence of mental illness than first-generation immigrants.6,23 This research
theorizes that because of increased exposure to discrimination in combination with fewer
protective cultural ties, second-generation and non-immigrant populations may have greater
prevalence of poor mental health outcomes.6,23 Unlike previous studies suggesting that second-
generation immigrants may have higher levels of mental illness than non-immigrants, our
analysis showed that second-generation immigrants have a similar prevalence of psychological
distress as non-immigrant respondents.3 One possible explanation for these findings could be
that second-generation immigrants’ cultural ties are not strong enough to influence the stress
processes in either a protective or detrimental manner.6 However, further research is needed to
understand the role of cultural identity and social support as buffers to minority stress.

11
Unlike previous studies that observed an association between immigrant generational
status and negative mental health outcomes, we found no statistically significant differences in
likelihood of psychological distress across immigrant generations, overall and stratified by race,
poverty status, and gender.3 However, when examining the association between generational
status and psychological distress using iteratively adjusted models, a protective effect was
shown for first-generation immigrants across all four models. The direction of these estimates,
while not statistically significant, were consistently below 1.0 and are thus suggestive of a
protective effect of generational status on psychological distress for first-generation immigrants
compared to second-generation immigrants. Examining this association across multiple
intersections of identities resulted in insufficient sample sizes to detect statistically significant
results. Further research is needed in larger and more diverse samples to confirm these effects
and explore associations between generational status and psychological distress, overall and
across intersections of the population.
This study has several features that may limit the interpretation of our findings. The
variation in experiences throughout the life course due to age, experiences of a population
during a specific period, and social and historical changes affecting specific cohorts may all
impact an individual’s risk of psychological distress. However, due to the cross-sectional design
of the survey, we were limited in our ability to distinguish between these age, period, and cohort
effects. Measures of social support, alcohol use, diet and exercise patterns, and health care
utilization were not included in this analysis, and study results may have been affected by these
unmeasured confounders and mediators. Furthermore, the study design does not allow us to
determine causation. Finally, the study sample was restricted to California residents and
therefore may not be generalizable to the rest of the U.S. population, as California is one of the
most racially diverse states in the nation.

12
Despite these limitations, our findings showed a higher prevalence of psychological
distress among second-generation and non-immigrant respondents relative to first-generation
immigrants. Further, though there was no statistically significant association between
generational status and prevalence of psychological distress, the direction of our results suggest
a protective effect for first-generation immigrants. Previous literature suggests that, while
second-generation immigrants will assimilate to the language and culture of the U.S., whether
they join the mainstream middle class or the marginalized and racialized population at the
bottom of the socioeconomic hierarchy may differentially affect their health.24 Thus, in addition
to using bigger sample sizes, future studies should examine the association between immigrant
generational status and mental health across various measures of socioeconomic status,
cultural connectedness, and social support. Potential findings could help elucidate what factors
contribute to the increased prevalence of psychological distress observed among second-
generation and non-immigrant populations.
Our findings, in conjunction with previous literature showing increased prevalence of
psychological distress among second-generation immigrants, suggest that generational status
may be useful for primary care and mental health care providers to include in patient family
histories as a marker to screen for psychological distress. This marker could remind providers to
initiate conversations with patients about stress and coping strategies and could help reduce
stigma in communities which historically disregard mental health. With an ever-growing
population of second-generation immigrants, further elucidating the influence of immigrant
generational status on psychological distress across intersections of social identities has the
potential to impact mental health care and thus public health.
13
REFERENCES
1. Trevelyan E, Gambino C, Gryn T, Larsen L, Acosta Y, Grieco E, Harris D, Walters N. Characteristics of the US population by generational status: 2013. US Government Printing Office, Washington, DC. 2016. https://www.census.gov/content/dam/Census/library/publications/2016/demo/P23-214.pdf
2. Harker K. Immigrant generation, assimilation, and adolescent psychological well-being. Social forces. 2001 Mar 1;79(3):969-1004.Gee GC, Ro A, Shariff-Marco S, Chae D. Racial discrimination and health among Asian Americans: evidence, assessment, and directions for future research. Epidemiologic reviews. 2009 Oct 4;31(1):130-51.
3. Peña JB, Wyman PA, Brown CH, Matthieu MM, Olivares TE, Hartel D, Zayas LH. Immigration generation status and its association with suicide attempts, substance use, and depressive symptoms among Latino adolescents in the USA. Prevention science. 2008 Dec 1;9(4):299-310.
4. Lara-Cinisomo S, Xue Y, Brooks-Gunn J. Latino youth's internalising behaviours: links to immigrant status and neighbourhood characteristics. Ethnicity & health. 2013 Jun 1;18(3):315-35.
5. Kim J, Nicodimos S, Kushner SE, Rhew IC, McCauley E, Vander Stoep A. Comparing Mental Health of US Children of Immigrants and Non‐Immigrants in 4 Racial/Ethnic Groups. Journal of School Health. 2018 Feb 1;88(2):167-75.
6. Giguère B, Lalonde R, Lou E. Living at the crossroads of cultural worlds: The experience of normative conflicts by second generation immigrant youth. Social and Personality Psychology Compass. 2010 Feb 1;4(1):14-29.
7. Burns JK. Poverty, inequality and a political economy of mental health. Epidemiology and psychiatric sciences. 2015 Apr;24(2):107-13.
8. Lorant V, Deliège D, Eaton W, Robert A, Philippot P, Ansseau M. Socioeconomic inequalities in depression: a meta-analysis. American journal of epidemiology. 2003 Jan 15;157(2):98-112.
9. Kinser PA, Lyon DE. A conceptual framework of stress vulnerability, depression, and health outcomes in women: potential uses in research on complementary therapies for depression. Brain and behavior. 2014 Sep 1;4(5):665-74.
10. Bowleg L. The problem with the phrase women and minorities: intersectionality—an important theoretical framework for public health. American journal of public health. 2012 Jul;102(7):1267-73.
11. Myers HF. Ethnicity-and socio-economic status-related stresses in context: an integrative review and conceptual model. Journal of behavioral medicine. 2009 Feb 1;32(1):9-19.
12. Williams DR, Neighbors HW, Jackson JS. Racial/ethnic discrimination and health: findings from community studies. American journal of public health. 2003 Feb;93(2):200-8.

14
13. Nadeem E, Lange JM, Edge D, Fongwa M, Belin T, Miranda J. Does stigma keep poor young immigrant and US-born black and Latina women from seeking mental health care?. Psychiatric Services. 2007 Dec;58(12):1547-54.
14. Crenshaw K. Mapping the margins: Intersectionality, identity politics, and violence against women of color. Stanford law review. 1991 Jul 1:1241-99.
15. Viruell-Fuentes EA, Miranda PY, Abdulrahim S. More than culture: structural racism, intersectionality theory, and immigrant health. Social science & medicine. 2012 Dec 31;75(12):2099-106.
16. Current Population Survey. U.S. Census Bureau, U.S. Bureau of Labor Statistics. 2016.
17. Taylor, P., Cohn, D. and Livingston, G. (2013). Second-Generation Americans. [online] Pew Research Center’s Social & Demographic Trends Project. Available at: http://www.pewsocialtrends.org/2013/02/07/second-generation-americans/ [Accessed 6 Feb. 2018].
18. Kessler RC, Andrews G, Colpe LJ, Hiripi E, Mroczek DK, Normand SL, Walters EE, Zaslavsky AM. Short screening scales to monitor population prevalences and trends in non-specific psychological distress. Psychological medicine. 2002 Aug;32(6):959-76.
19. StataCorp. 2015. Stata Statistical Software: Release 14. College Station, TX: StataCorp LP.
20. Hamilton HA, Noh S, Adlaf EM. Adolescent risk behaviours and psychological distress across immigrant generations. Canadian Journal of Public Health/Revue Canadienne de Sante'e Publique. 2009 May 1:221-5.
21. Burgos-Cienfuegos R, Vasquez-Salgado Y, Ruedas-Gracia N, Greenfield PM. Disparate cultural values and modes of conflict resolution in peer relations: The experience of Latino first-generation college students. Hispanic Journal of Behavioral Sciences. 2015 Aug;37(3):365-97.
22. Leong F, Park YS, Kalibatseva Z. Disentangling immigrant status in mental health: Psychological protective and risk factors among Latino and Asian American immigrants. American Journal of Orthopsychiatry. 2013 Apr 1;83(2pt3):361-71.
23. Pumariega AJ, Rothe E, Pumariega JB. Mental health of immigrants and refugees. Community mental health journal. 2005 Oct 1;41(5):581-97.
24. Portes A, Fernandez-Kelly P, Haller W. Segmented assimilation on the ground: The new second generation in early adulthood. Ethnic and racial studies. 2005 Nov 1;28(6):1000-40.

15
Tables and Figures Figure 1. Conceptual model of minority stress and mental health among first-generation, second-generation, and non-immigrant status.
Table 1. Demographic characteristics of adults in California, age 18 years or older, by immigrant generational status, California Health Interview Survey (2015-2016). First-
generation (N=10,465)
Second-generation (N=6863)
Non-Immigrant (N=24,426)
Total sample (N=41,754)
N
%
N
%
N
%
N
%
Age (years) 18-25 629 7.2 1544 33.7 1747 12.5 3920 14.8 26-44 2852 39.8 1548 36.7 3795 29.0 8195 34.2 45-64 4095 38.6 1458 16.6 9066 37.1 14,619 33.6 65+ 2889 14.4 2313 13.1 9818 21.4 15,020 17.4 Gender Female 5940 51.8 3743 49.7 13,937 51.4 23,620 51.2 Male 4525 48.2 3120 50.3 10,489 48.6 18,134 48.8 Race Asian 2965 28.7 941 19.9 396 1.3 4302 10.3 Hispanic 5501 57.9 2858 51.4 1851 12.2 10,210 24.4

16
Other 231 1.9 331 5.0 3178 14.8 3740 8.9 White 1768 11.6 2765 23.7 19,001 71.7 23,502 56.4 Non-white 8697 88.4 4130 76.3 5425 28.3 18,252 58.2 Educational attainment
Less than high school
3236 37.6 363 6.5 1098 6.5 4697 17.1
High school graduate
2239 18.1 1894 26.5 5484 22.7 9617 21.9
Some college 1534 12.6 1910 29.4 7292 29.4 10,736 23.6 College degree or higher
3456 31.7 2696 37.6 10,552 41.4 16,704 37.4
Employment status Employed 5820 66.9 3651 68.8 11,833 61.6 21,304 64.8 Not in labor force 4220 28.3 2855 24.1 11,921 34.3 18,996 30.3 Unemployed 425 4.7 357 7.1 672 4.1 1455 4.9 % of federal poverty level
<100 2940 27.2 966 14.3 2864 12.3 6770 17.8 100-199 2690 26.4 1248 18.8 3669 13.5 7607 18.9 ≥ 200 4835 46.4 4649 66.9 17,893 74.2 27,377 63.3 Marital status Married 5740 58.6 2436 34.3 10,621 45.3 18,797 47.7 Never married 1669 23.5 2369 18.5 4801 28.2 14,118 24.7 Other 3056 17.8 2058 47.1 9004 26.5 8839 27.6 Health insurance Yes 9098 83.9 6459 92.1 23,426 94.3 39,983 90.3 No 1367 16.1 404 7.9 1000 5.7 2771 9.7 % life in US 0-20 1005 11.4 N/A N/A N/A N/A 1005 3.9 21-40 2269 21.2 N/A N/A N/A N/A 2269 7.3 41-60 3340 32.0 N/A N/A N/A N/A 3340 10.9 61-80 2497 22.6 N/A N/A N/A N/A 2497 7.7 81+ 1354 12.7 6863 100.0 24,426 100.0 32,643 70.2 English use and proficiency
Only English 1563 11.4 3829 44.1 22,460 90.5 27,852 54.5 Very well/well 4256 44.2 2934 54.6 1943 9.4 9133 30.1 Not well/not at all 4646 44.4 100 1.3 23 0.1 4769 15.5 Smoking status Non-smoker 9561 89.9 6238 89.2 21,051 85.1 36,850 87.5 Smoker 904 10.1 625 10.8 3375 14.9 4904 12.5 Body mass index Underweight 231 1.9 132 2.3 454 1.7 817 1.9 Normal 3789 33.5 2630 39.0 8615 35.3 15,034 35.4 Overweight 3699 36.1 2298 31.1 8509 35.2 14,506 34.7 Obese 2746 28.5 1803 27.6 6848 27.7 11,397 28.0
Note: N = Sample Size; N/A = Not Applicable; All percents are weighted to account for complex survey design, but numbers of respondents are unweighted
17
Table 2. Prevalence of psychological distress in the past 12 months overall and across respondent characteristics, stratified by immigrant generational status. First-
generation (N=10,465)
Second-generation (N=6863)
Non-Immigrant (N=24,426)
Total (N=41,754)
N
%
N
%
N
%
N
%
Overall 688 5.9 555 10.1 1915 9.4 3158 8.3 Overall group comparison, p-value
<0.001
Age (years) 18-25 65 0.8 228 5.0 285 1.9 578 2.1 26-44 182 2.2 155 3.6 511 3.7 848 3.1 45-64 292 2.1 114 1.0 860 3.1 1266 2.4 65+ 149 0.7 58 0.4 259 0.7 466 0.7 Within group comparison, p-value
0.03
<0.01
<0.001
<0.001
Gender Female 462 3.6 326 5.5 1220 5.4 2008 4.8 Male 226 2.4 229 4.6 695 4.0 1150 3.6 Within group comparison, p-value
0.14
0.45
0.09
0.06
Race Asian 142 1.3 67 2.2 15 0.1 224 0.9 Hispanic 417 3.6 290 5.4 192 1.4 899 2.9 Other 14 0.2 40 0.4 350 1.8 404 1.0 White 115 0.8 158 2.1 1358 6.1 1631 3.5 Within group comparison, p-value
0.33
0.81
0.18
0.07
Non-white 573 5.1 397 8.0 557 3.3 1527 4.8 Within group comparison, p-value
0.35
0.53
0.04
0.87
Educational attainment
Less than high school
283 2.6 33 0.4 202 1.4 518 1.6
High school graduate
148 1.0 204 3.4 567 2.4 919 2.1
Some college 117 1.1 177 3.5 657 3.1 951 2.5 College degree or higher
140 1.3 141 2.9 489 2.5 770 2.2
Within group comparison, p-value
0.03
0.07
<0.001
<0.001
Employment status Employed 304 3.1 313 6.7 830 5.2 1447 4.8 Not in labor force 339 2.4 176 2.0 966 3.5 1481 2.9 Unemployed 45 0.4 66 1.4 119 0.7 230 0.7 Within group comparison, p-value
<0.01
0.04
<0.01
<0.001

18
% of federal poverty level
<100 316 2.4 149 2.0 545 2.4 1010 2.4 100-199 189 1.6 152 2.8 450 1.9 791 2.0 ≥ 200 183 1.9 254 5.2 920 5.1 1357 4.0 Within group comparison, p-value
<0.01
<0.01
<0.001
<0.001
Marital status Married 258 2.3 83 1.5 457 2.2 798 2.1 Never married 134 2.1 322 1.9 635 3.3 1091 2.6 Other 296 1.5 150 6.7 823 3.9 1269 3.6 Within group comparison, p-value
<0.01
<0.001
<0.001
<0.001
Health insurance Yes 590 4.9 515 9.2 1796 8.8 2901 7.6 No 98 1.0 40 0.9 119 0.6 257 0.8 Within group comparison, p-value
0.77
0.83
0.74
0.80
Smoking status Non-smoker 581 4.9 438 8.0 1291 6.5 2310 6.2 Smoker 107 1.1 117 2.1 624 2.9 848 2.1 Within group comparison, p-value
0.02
<0.001
<0.001
<0.001
Body mass index Underweight 17 0.0 17 0.5 49 2.0 83 0.2 Normal 241 2.1 207 4.2 670 3.5 1118 3.1 Overweight 207 2.8 149 2.3 530 2.7 886 2.3 Obese 223 1.9 182 3.2 666 3.0 1071 2.7 Within group comparison, p-value
0.46
0.12
0.28
0.04
Note: N = Sample Size; All percents are weighted to account for complex survey design, but numbers of respondents are unweighted
19
Figure 2. Prevalence ratio of psychological distress in the past 12 months for first-generation and non-immigrants relative to second-generation immigrants: results from iteratively adjusted models.
Note: PR = Prevalence ratio; CI = Confidence interval; psychological distress defined as K6 score ≥13; referent group is second-generation immigrants; Model 1: log-binomial regression unadjusted for confounding factors; Model 2: log-binomial regression adjusted for demographic factors (age, race, gender, marital status); Model 3: log-binomial regression adjusted for demographic and other health-related factors (body mass index, smoking status); Model 4: log-binomial regression adjusted for demographic factors, other health-related factors, and socioeconomic factors (education, employment status, poverty status, health insurance status)
Table 3. Association between immigrant generational status and psychological distress, stratified by race, poverty status, and gender.
Psychological distress, past 12 months
n Prevalence
ratio
(95% CI) Race
Asian 224 First-generation 142 0.70 (0.36, 1.36) Second-generation 67 Ref. Ref. Non-immigrant 15 1.55 (0.39, 6.24) Hispanic 899 First-generation 417 0.72 (0.50, 1.03)

20
Second-generation 290 Ref. Ref. Non-immigrant 192 1.20 (0.70, 2.05) Other 404 First-generation 14 2.13 (0.54, 8.39) Second-generation 40 Ref. Ref. Non-immigrant 350 1.71 (0.77, 3.78) White 1631 First-generation 115 0.77 (0.41, 1.45) Second-generation 158 Ref. Ref. Non-immigrant 1358 0.85 (0.52, 1.37) Non-white* 1527 First-generation 573 0.73 (0.56, 0.97) Second-generation 397 Ref. Ref. Non-immigrant 557 1.27 (0.89, 1.83) Poverty status
0-99% 1010 First-generation 316 0.74 (0.44, 1.27) Second-generation 149 Ref. Ref. Non-immigrant 545 1.26 (0.62, 2.56) 100-199% 791 First-generation 189 0.51 (0.26, 1.00) Second-generation 152 Ref. Ref. Non-immigrant 450 1.03 (0.61, 1.75) ≥200% 1357 First-generation 183 0.76 (0.48, 1.19) Second-generation 254 Ref. Ref. Non-immigrant 920 1.05 (0.67, 1.66) Gender
Female 2008 First-generation 462 0.85 (0.60, 1.21) Second-generation 326 Ref. Ref. Non-immigrant 1220 1.03 (0.67, 1.58) Male 1150 First-generation 226 0.76 (0.48, 1.22) Second-generation 229 Ref. Ref. Non-immigrant 695 1.24 (0.84, 1.84)
Note: PR = prevalence ratio; CI = confidence interval; psychological distress defined as K6 score ≥13; Race-stratified models are adjusted for age, gender, body mass index, smoking status, and marital status; Poverty status-stratified models are adjusted for age, race, gender, marital status, body mass index, and smoking status; Gender-stratified models are adjusted for age, race, marital status, body mass index, and smoking status; *Non-white group is Asian, Hispanic, and other categories of race combined.

21
Supplementary material
Figure S1. Directed acyclic graph displaying confounders and precision variables of the association between immigrant generational status and psychological distress.
Table S1. Association between immigrant generational status and non-specific psychological distress in the past 12 months using the continuous K6 score, CHIS (2015-2016).
Psychological distress, past 12 months Model 1 Model 2 Model 3 Model 4 % PR (95% CI) PR (95% CI) PR (95% CI) PR (95% CI) First-generation
5.9 0.46 (0.33, 0.64)
0.67 (0.48, 0.93)
0.85 (0.61, 1.19)
0.72 (0.51, 1.02)
Second-generation
10.1
Referent
Referent
Referent
Referent
Non-Immigrant
9.4
0.77 (0.55, 1.07)
1.50 (1.00, 2.25)
1.27 (0.87, 1.87)
1.24 (0.84, 1.84)
Note: PR = Prevalence ratio, CI = confidence interval; All percents are weighted to account for complex survey design; psychological distress measured as a continuous K6 score (0-24); Model 1: linear regression model unadjusted for confounding factors; Model 2: linear regression

22
adjusted for demographic factors (age, race, gender, marital status); Model 3: linear regression adjusted for demographic and other health-related factors (body mass index, smoking status); Model 4: linear regression adjusted for demographic factors, other health-related factors, and socioeconomic factors (education, employment status, poverty status, health insurance status)
Related Documents


