Journal of Interactive Online Learning www.ncolr.org/jiol Volume 11, Number 3, Winter 2012 ISSN: 1541-4914 "#$ Examining Pictorial Models and Virtual Manipulatives for Third-Grade Fraction Instruction Patricia S. Moyer-Packenham Utah State University Lori A. Ulmer George Mason University Katie L. Anderson Utah State University Abstract The purpose of this study was to examine pictorial representations, whether in static or dynamic modalities, and their impact on student learning in a classroom with low-achieving students. The investigation emerged from a classroom teacher’s action research project. During a three-week fraction unit, nineteen third-grade low-achieving students participated in two groups – a Dynamic Virtual Manipulatives (DVM) group using virtual manipulatives, and a Static Pictorial Models (SPM) group using pictorial models. Students in both the DVM and SPM groups showed significant improvements between the pre- and post-tests of fraction concepts. Students’ visualization skills increased while using pictorial models, in both the static and dynamic modalities. The Common Core State Standards emphasize Standards for Mathematical Practice. Standard #4 “model with mathematics” (http://www.corestandards.org/the-standards) emphasizes students’ use of models to communicate their mathematical thinking. The National Council of Teachers of Mathematics (NCTM, 2000) Principles and Standards for School Mathematics (PSSM) encourage teachers and students to use multiple representations during mathematics instruction. The PSSM states that all students should “create and use representations to organize, record, and communicate mathematical ideas; select, apply, and translate among mathematical representations to solve problems; [and] use representations to model and interpret physical, social, and mathematical phenomena” (p. 67). This means that visual or pictorial representations should be used in school mathematics. Mathematics education research has demonstrated the benefits of mathematics instruction that employs a variety of representational forms (Cuoco & Curcio, 2001). Representations may include manipulatives, pictures, written symbols, spoken language, real-life situations (Lesh, Post, & Behr, 1987) or virtual manipulatives (Moyer, Bolyard, & Spikell, 2002). Evidence suggests that the use of pictorial representations in mathematics can be an important way for children to express their mathematical thinking (Woleck, 2001). The use of pictorial representations as an option for children to think about mathematics concepts is further supported by research on multiple intelligences and students’ different learning styles (e.g., Gardner, 1997, 2002; Marzano, 2010). Although the use of

Welcome message from author
This document is posted to help you gain knowledge. Please leave a comment to let me know what you think about it! Share it to your friends and learn new things together.
Transcript

Journal of Interactive Online Learning www.ncolr.org/jiol
Volume 11, Number 3, Winter 2012 ISSN: 1541-4914
! "#$!
Examining Pictorial Models and Virtual Manipulatives
for Third-Grade Fraction Instruction
Patricia S. Moyer-Packenham Utah State University
Lori A. Ulmer
George Mason University
Katie L. Anderson Utah State University
!
!Abstract
The purpose of this study was to examine pictorial representations, whether in static or dynamic modalities, and their impact on student learning in a classroom with low-achieving students. The investigation emerged from a classroom teacher’s action research project. During a three-week fraction unit, nineteen third-grade low-achieving students participated in two groups – a Dynamic Virtual Manipulatives (DVM) group using virtual manipulatives, and a Static Pictorial Models (SPM) group using pictorial models. Students in both the DVM and SPM groups showed significant improvements between the pre- and post-tests of fraction concepts. Students’ visualization skills increased while using pictorial models, in both the static and dynamic modalities.
The Common Core State Standards emphasize Standards for Mathematical Practice. Standard #4 “model with mathematics” (http://www.corestandards.org/the-standards) emphasizes students’ use of models to communicate their mathematical thinking. The National Council of Teachers of Mathematics (NCTM, 2000) Principles and Standards for School Mathematics (PSSM) encourage teachers and students to use multiple representations during mathematics instruction. The PSSM states that all students should “create and use representations to organize, record, and communicate mathematical ideas; select, apply, and translate among mathematical representations to solve problems; [and] use representations to model and interpret physical, social, and mathematical phenomena” (p. 67). This means that visual or pictorial representations should be used in school mathematics.
Mathematics education research has demonstrated the benefits of mathematics instruction that employs a variety of representational forms (Cuoco & Curcio, 2001). Representations may include manipulatives, pictures, written symbols, spoken language, real-life situations (Lesh, Post, & Behr, 1987) or virtual manipulatives (Moyer, Bolyard, & Spikell, 2002). Evidence suggests that the use of pictorial representations in mathematics can be an important way for children to express their mathematical thinking (Woleck, 2001). The use of pictorial representations as an option for children to think about mathematics concepts is further supported by research on multiple intelligences and students’ different learning styles (e.g., Gardner, 1997, 2002; Marzano, 2010). Although the use of

Journal of Interactive Online Learning Moyer-Packenham, Ulmer, and Anderson
104
concrete (or physical) manipulatives is well situated in the mainstream of school mathematics as a teaching tool (Kamii, Lewis, Kirkland, 2001; Martin, Svihla, Smith, 2012; Moyer, 2001a; Moyer, 2001b; Moyer & Bolyard, 2002; Moyer & Jones, 2004; Raphael & Wahlstrom, 1989; Sowell, 1989; Suydam, 1985; Uribe-Florez & Wilkins, 2010), less attention has been given to the use of pictorial representations as a part of daily mathematics instruction (Larkin & Simon, 1987). The purpose of this study was to examine pictorial representations and their impact on student learning in a classroom with low-achieving students. Of particular interest in this study were the pictorial representations that students used for fraction learning, whether those pictorial representations were in static or dynamic forms, and the influence on learning for a group of low-achieving students. Research reports that high-achieving students are quite capable at visualization, in comparison with low-achieving students, who have much more difficulty with this mathematical practice (Moreno & Mayer, 1999). Because this study was a teaching experiment conducted by a classroom teacher for her Master’s Degree action research project, the purpose of the study was not to generalize the results, but to inform the classroom teacher’s own instruction when teaching mathematics using pictorial representations. Visual (or Pictorial) Representations
Numerous studies have been conducted on the use of manipulatives for classroom instruction (Kamii, Lewis, & Kirkland, 2001; Martin, Svihla, & Smith, 2012; Moyer, 2001; Moyer & Jones, 2004; Raphael & Wahlstrom, 1989; Sowell, 1989; Suydam, 1985; Uribe-Florez & Wilkins, 2010), but fewer studies focus specifically on teachers using visual (or pictorial) representations (Larkin & Simon, 1987). Static or dynamic pictorial models support students’ visualization of mathematical ideas. Arcavi (2003) defines visualization in mathematics as the ability to create, interpret, use, and reflect on images in the mind, on paper, or with technological tools. Visualization provides some students with the opportunity to see physical objects and pictorial representations with meaning, and to connect these to abstract concepts in the mathematics curricula. Van Garderen (2006) highlighted the importance of mathematics visualization in a study that examined students of varying achievement levels and use of visual imagery and spatial visualization. The findings indicated that high achieving students displayed the highest levels of spatial visualization. Based on this study, students’ ability to visualize has a significant correlation with the ability to understand mathematics.
Virtual manipulatives have been defined as “computer based renditions of common mathematics manipulatives and tools” (Dorward, 2002, p. 329) and “an interactive, web-based visual representation of a dynamic object that presents opportunities for constructing mathematical knowledge” (Moyer, Bolyard, & Spikell, 2002, p. 373). Virtual manipulatives can develop students’ visualization skills by connecting words, pictures, and symbols simultaneously. This simultaneous presentation can assist students in developing a solid understanding of mathematical concepts (Paivio, 2007). The effective use of virtual manipulatives in mathematics classrooms relies greatly on the visual images presented to students and students’ ability to visualize mathematics concepts beyond the use of the virtual manipulatives.
A recent meta-analysis compared the effects of virtual manipulatives on student achievement with other instructional treatments. Findings from 29 research reports, containing 79 effect size scores, yielded a moderate averaged effect size of 0.44 for virtual manipulatives as compared with other instructional treatments (Moyer-Packenham, Westenskow, & Salkind, 2012). Among these articles, four specifically focused on the instruction of fractions (with a moderate effect size, 0.66), and four others reported the effect of virtual manipulatives with students of different achievement levels.
The majority of studies focusing on fraction instruction reported significant differences in achievement in favor of the virtual manipulatives (Lin, 2010; Moyer, Niezgoda, & Stanley, 2005; Reimer & Moyer, 2005; Suh, 2005). For example, Reimer and Moyer (2005) studied 19 third-grade

Journal of Interactive Online Learning Moyer-Packenham, Ulmer, and Anderson
105
students during a two-week classroom investigation of students’ use of virtual fraction applets. Pre- and post-test scores on conceptual knowledge and procedural computation indicated that students showed significant improvement on a conceptual knowledge post-test. Interviews and attitude surveys collected by Reimer and Moyer showed that improvements on the conceptual knowledge post-test could be attributed, in part, to the tutorial nature of the virtual fraction applets and the specific feedback provided. Other studies report similar findings related to learning fractions (Lin, 2010; Moyer, Niezgoda, & Stanley, 2005; Suh, 2005). For example, Lin (2010) attributed greater gains in pre-service teachers’ understanding of fractions using fraction applets to the interactive and learner-centered nature of the virtual manipulatives. Lin based these findings on three factors: (a) the virtual manipulatives captured the students’ attention, focusing their attention on learner-active mastery rather than on teacher presentation; (b) the dynamic and animated nature of the virtual manipulatives provided tools for improving students’ visual and conceptual abilities and permitted students to explore the concepts; and (c) the virtual manipulatives provided immediate feedback and required that students obtain the correct answers. Lin’s assessment gathered data on the procedural and conceptual understanding of fraction operations of addition, subtraction, multiplication and division. Reimer and Moyer (2005) and Lin (2010) also commented on the potential of virtual fraction applets to positively impact students’ ability to visualize mathematics concepts. Virtual manipulatives offer students many opportunities to practice using a visual model. The active manipulation of this model may contribute to increasing students’ growth in conceptual understanding (Reimer & Moyer, 2005). Many virtual manipulatives incorporate animations that “permit students to explore complex and dynamic relationships in the subject matter” (Lin, 2010, p. 67). For example, through the use of dynamic virtual models of fractions, students can identify the need for equivalent fractions during fraction addition and represent them accordingly. These tutorial types of virtual manipulatives aid students in visualizing the division of fractions (e.g., in the problem 1/3 ÷ 1/6, students visualize how many 1/6 pieces it takes to make 1/3) – a difficult concept for most students to comprehend.
The four studies on virtual manipulatives that described outcomes with students of varying achievement levels reported mixed findings (Drickey, 2000; Kim, 1993; Moreno & Mayer, 1999; Moyer-Packenham & Suh, 2012). Drickey (2000) and Kim (1993) each indicated no statistically significant difference in learning gains between low- and high-achieving groups. Although the low-achieving students made numerically greater gains than other groups on tests of conceptual knowledge, these gains were not statistically significant. Moreno and Mayer (1999) examined students’ work with multi-representational tools and reported that high-achieving students and those students with higher spatial ability (or visualization skills) significantly outperformed students of lower achievement and ability. The researchers attributed these differences to the working memory of individual students (Clark, Nguyen, & Sweller, 2006). Those in the high-spatial or high-achieving groups did not become overloaded in their working memory, and thus performed more successfully on assessment tasks.
In contrast, other research indicates that tutorial features built into virtual manipulatives significantly influence students of varying achievement levels (Moyer-Packenham & Suh, 2012). Moyer-Packenham and Suh (2012) found statistically significant gains for low-achieving students using virtual manipulatives, but only numerical gains for average- and high-achieving students. Additionally, they observed that high-achieving students quickly recognized patterns and transitioned to symbolic representations. Low-achieving students in the study relied more explicitly on pictorial representations as they worked with mathematical symbols. These mixed findings suggest that virtual manipulatives have different learning effects for students of varying achievement levels.

Journal of Interactive Online Learning Moyer-Packenham, Ulmer, and Anderson
106
Action Research in the Classroom Teachers engage in classroom action research to better understand the effects of their own
instructional practices and what they can do to improve the educational experience of their students (Beckett, McIntosh, Byrd, & McKinney, 2011; Bonner, 2006; Herbel-Eisenmann, Drake, & Cirillo, 2009). In 1946, Kurt Lewin originally described action research as a three-step spiral process involving: (a) planning, (b) taking actions, and (c) systematically collecting information on the results of the actions. For the classroom teacher, this means: (a) making observations of what is happening in his or her classroom, (b) doing something to improve outcomes, and (c) seeing if what was done made a difference in what or how students learned. More recently, Mills (2003) defined action research in terms of the school context:
Action research is any systematic inquiry conducted by teacher researchers…to gather information about how their particular schools operate, how they teach, and how well students learn. This information is gathered with the goals of gaining insight, developing reflective practice, effecting positive changes in the school environment (and on education practices in general), and improving student outcomes and the lives of those involved (p. 5). Classroom action research, as discussed in this study, refers to one teacher systematically
addressing a perceived need in her own classroom. The research questions naturally emerged from the teacher’s desire to improve her instruction. The teacher conducting the action research in this project believed that pictorial models help some students to visualize mathematics concepts. The teacher was interested in how static and dynamic representations may benefit learning with different groups of students in different contexts providing an opportunity for greater learning and understanding of mathematical content. Her classroom teaching experiment sought to contribute to the research on mathematics representations by examining how pictorial images, in teachers’ drawings or pictures (static) and in virtual manipulatives (dynamic), influenced low-achieving students’ learning in a fraction unit.
The Current Classroom Project
This investigation emerged from a classroom teacher’s (one of the authors of this paper)
action research project in a course taught by a professor at the university where she was earning her Master’s Degree. The design of the investigation was a classroom teaching experiment in which the classroom teacher wanted to address the needs of her low-achieving students through the use of pictorial models and virtual manipulatives. The teacher conjectured that greater use of pictorial representations would help her students make connections between pictures, concepts, and symbols. The study focused on the following research question: How do static and dynamic pictorial representations influence learning for low-achieving third-grade students during a fraction unit?
School Context
The elementary school that served as the context for this study was in a suburban city and was built in the 1950s, with permanent trailers surrounding the school to serve as additional classroom space. There were four or five classes in each grade level, K-6. Almost 600 students attended the school with 48% eligible for free/reduced lunch. The ethnicities of the students in the school included Hispanic (45.61%), Asian (25.84%), White (20.44%), and Black (1.69%). English Speakers of Other Languages (ESOL) comprised 40.37% of the student population with students speaking Spanish, Vietnamese, Chinese, Portuguese, and Urdu. Many of the students’ parents did not speak English.

Journal of Interactive Online Learning Moyer-Packenham, Ulmer, and Anderson
107
Participants At the beginning of the study, a fraction pre-test was administered to all 78 of the students in
the five third-grade classrooms to identify the students in the lowest one-third of the third grade class prior to the instructional unit. Teachers regularly used these pre-tests to group students in the third grade according to their needs and performance. One-third of the third-grade class (i.e., 26 students) were identified and invited to participate in the study. Nineteen of the 26 students in the lowest one-third of the third-grade class agreed to participate. The teacher divided the low achieving students into two groups—a Dynamic Virtual Manipulatives (DVM) group and a Static Pictorial Models (SPM) group—and matched the students based on similar characteristics (e.g., gender, ability, special needs status). She matched the students in the two groups to keep them as similar as possible for the teaching experiment. Nine students (five girls and four boys) were placed in the DVM group and ten students (six girls and four boys) were placed in the SPM group. Both groups had similar backgrounds and learning abilities. The DVM group contained two students under review for learning disabilities and one ESOL student. The SPM group contained one special education student and one ESOL student. The ethnicities of the DVM group included Hispanic, African American, and Native American. Seven students were of Hispanic background and spoke both English and Spanish at home. The other two students in the DVM group spoke only English (one African American and one Native American). Hispanic and Caucasian students comprised the SPM group. Five of the students were of Hispanic background and spoke both English and Spanish at home. Five of the students were Caucasian and spoke only English.
The teacher’s original action research question emerged from a desire to know if the use of static or dynamic pictorial representations made a difference in students’ learning. Based on her own experience and study of the research literature, she believed the use of pictorial representations to be more effective than traditional algorithmic-only instructional techniques (Arcavi, 2003; van Garderen, 2006). Therefore, she valued the use of pictorial representations for all students, and did not wish to use a control group receiving only algorithmic instruction. This decision aligns with the nature of action research, in that research questions arise from classroom situations and the purpose is to improve instruction for that particular group of children (Mills, 2003). Teachers
The classroom teacher who conducted the action research in this study was in her fifth year of teaching third grade. This teacher taught the DVM group. She had a Bachelor’s Degree in Education, a K-6 Elementary Teaching Certificate, and she was completing her final project before earning her Master’s Degree in Education at the time of this study. The teacher had professional leadership experiences in mathematics that demonstrated a high level of expertise in this area. Experiences that exemplified her level of expertise included: (a) a refereed journal publication based on teaching activities in her classroom, which she co-authored, published in the National Council of Teachers of Mathematics (NCTM) journal, Teaching Children Mathematics; and (b) a presentation titled Impacting Mathematical Learning at Multiple Levels through School and University Collaboration, which she presented with a team of colleagues at the Annual Meeting of the American Association of Colleges for Teacher Education (AACTE) in Washington, DC. The teacher had learned about the use of virtual manipulatives and visual representations in her teacher licensing program and had used various instructional modalities in her teaching of mathematics.
The classroom teacher who taught the SPM group was in her eleventh year of teaching, and she had taught fourth grade for four years and third grade for seven years. She had a Bachelor’s Degree in Education, a K-6 Elementary Teaching License, and a Master’s Degree in Elementary Education. During the study, she had been serving as the third-grade team leader for the past three years. The teacher participated in continuing professional development for mathematics teaching after earning her Master’s Degree.
Journal of Interactive Online Learning Moyer-Packenham, Ulmer, and Anderson
108
Classroom Environments
The DVM group received instruction in the classroom and in the computer lab. Student centers located around the perimeter of the classroom served as mathematics rotation centers. In addition, five student tables in the center of the classroom housed four student workspaces. Physical manipulatives were readily available for student use at these workspaces. The computer lab had two printers and 30 computers allowing students to work individually with the computers. In addition to written work on the chalkboard, student and teacher interactions were facilitated through whole group discussions as the teacher used an LCD projector to demonstrate the virtual manipulatives.
The SPM group received instruction in a separate third-grade classroom. This classroom was set up in much the same way as the DVM classroom with physical manipulatives readily available for student use and student centers for mathematics around the perimeter of the classroom. The teachers of the SPM and DVM groups shared the belief that teachers should incorporate learning centers into their daily routines. The SPM classroom and its resources mirrored the DVM classroom.
Procedures
During a three-week fraction unit, students in the DVM group used virtual manipulatives
from the National Library of Virtual Manipulatives (NLVM) website: http://nlvm.usu.edu. Applets used during the project included: Fraction Pieces, Fractions Equivalent, Fractions Adding, Fractions Parts of a Whole, Fractions Visualizing, and Fractions Number Line Bars. Students used the NLVM website for independent work in the computer lab six times during the unit in 45-minute sessions. All other lessons took place in the classroom setting.
Students in the SPM group used static pictorial models during fraction instruction. The teacher selected multiple examples of pictorial models that demonstrated the concepts that the students were studying. The teacher also drew pictorial models for the students in her explanations of fraction concepts. In both the DVM and the SPM classrooms, the lessons were the same, with the exception of students’ independent work. Both groups focused on the same daily objectives, the same lessons, and the same homework assignments. The SPM group teacher and the DVM group teacher shared similar teaching philosophies and strategies—that students need to develop a deep conceptual understanding of mathematics through active problem solving. In both classrooms, students had opportunities to represent their mathematical knowledge in a variety of ways through physical manipulatives, pictorial representations, and symbolic notation.
Instruments and Analysis
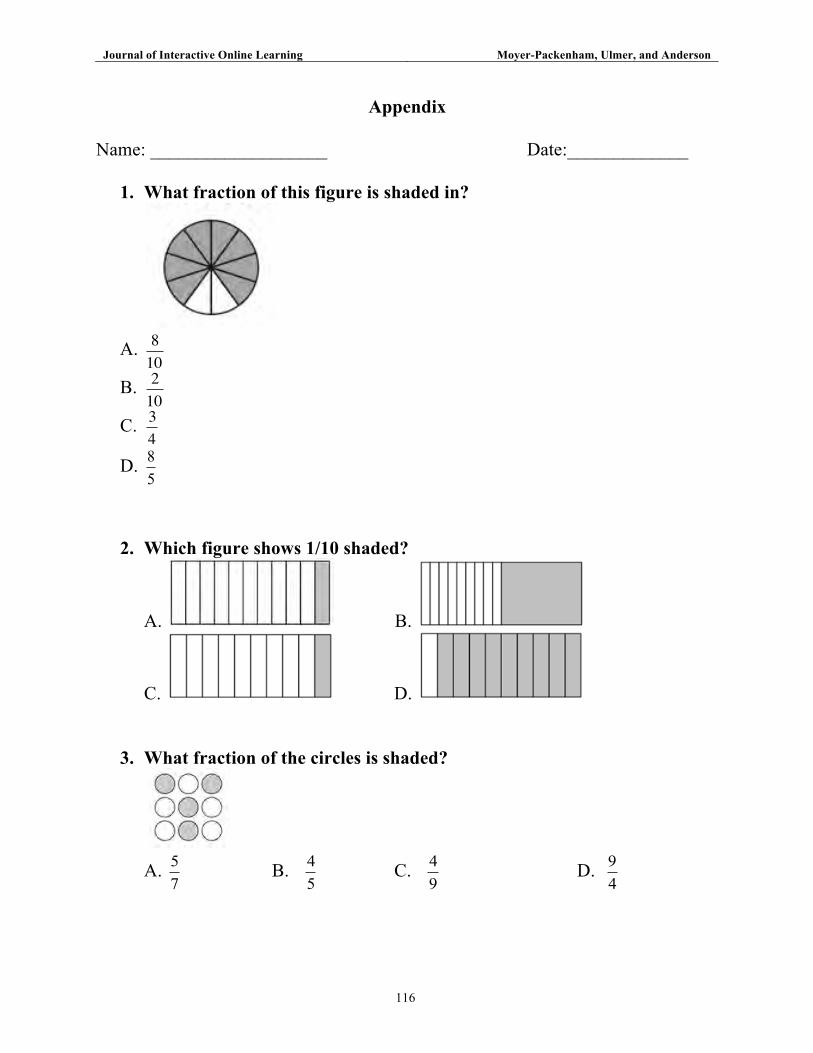
Pre- and post-test. Students completed a pre-test on the fraction concepts prior to classroom instruction (see Appendix). This teacher-created pre-test contained 12 multiple-choice questions based on the state’s standardized tests. The questions addressed each objective in the unit (e.g., identifying parts of a whole, identifying parts of a set, comparing fractions, and adding fractions). To assess students’ ability to interpret a pictorial representation, each item on the test included a picture as part of the question. The post-test included the same items as the pre-test and was administered immediately following the three-week fraction unit. Students’ pre- and post-test scores were analyzed using a paired samples t-test for each group using SPSS software. The independent variable was the type of instructional treatment: DVM or SPM. The dependent variable was the gain score between the pre-test and the post-test.
Student surveys and written work. Students in the DVM group also completed a follow-up
survey related to their use of the virtual manipulatives in the classroom. The four questions on the survey asked students to identify the usefulness of the virtual manipulatives for interpreting the

Journal of Interactive Online Learning Moyer-Packenham, Ulmer, and Anderson
109
pictorial items on the post-test. Two closed-ended items required students to circle a yes or a no response. Two open-ended items required students to follow up their yes or no with a narrative response. In addition to the pre- and post-test measures and student surveys, students completed written work during daily classroom instruction and through homework assignments. These documents were collected for review as part of the teacher’s analysis. Researchers analyzed student surveys from the DVM group for the two open-ended and two closed-ended items. The closed items were tabulated and the open-ended items were combined in a narrative summary using basic techniques of narrative analysis (Shank, 2002). Students’ class work and homework was examined daily by the teacher to determine student progress and support individual learning and differentiation.
Results
Group Findings
The means and standard deviations on the pre- and post-tests are reported in Table 1.
Table 1 Mean Performance Scores of Students in DVM and SPM Groups
Group Pre-test
M (SD)
Post-test
M (SD) t p
DVM (n = 9) 5.44 (1.67) 10.22 (1.48) -6.615 .000*
SPM (n = 10) 7.20 (2.49) 10.40 (2.01) -3.588 .006*
Note. * indicates statistically significant difference at the .01 level. Students in the DVM group made a statistically significant gain between the pre-test (M = 5.44, SD = 1.67) and post-test (M = 10.22, SD = 1.48), t = -6.615, p = .00. Students in the SPM group also made a statistically significant gain between the pre-test (M = 7.20, SD = 2.49) and post-test (M = 10.40, SD = 2.01), t = -3.588, p = .006. Although there were numerical differences between the DVM group and SPM group on the pre-test, these differences were not statistically significant. These results indicate that all students showed a marked improvement on the post-test.
Further analysis of the DVM group’s pre- and post-test scores showed that only one out of nine students met the objective of the unit prior to instruction. Following instruction with the virtual manipulatives, eight out of nine students met the objective for the unit, achieving a score of 75% or higher. Analysis of the SPM group’s pre- and post-test scores showed that only two out of ten students met the objective of the unit prior to instruction. After instruction, eight out of ten students in the SPM group met the objective for the unit, achieving a score of 75% or higher. Comparing the Groups
The comparison of the DVM and SPM group results on the pre- and post-tests, as reported in Table 1, showed that both groups improved significantly. Therefore, it did not matter whether the students learned the fraction concepts using static pictorial models or the dynamic virtual manipulatives; both groups performed equally well on test questions with pictorial representations.
The mean score on the pre-test for the DVM group was 5.44 (45%). The mean score on the pre-test for the SPM group was 7.20 (60%). The gain scores for each student indicate the improved achievement between the pre- and post-test. The mean gain score of the DVM group was 4.78
Journal of Interactive Online Learning Moyer-Packenham, Ulmer, and Anderson
110
(37.9%). The mean gain score of the SPM group was 3.20 (26.8%). Although not statistically significant (t(17) = 1.37, p > .05), the students in the DVM group began the unit with a collectively lower score than the SPM group, and their numerical improvement exceeded that of the SPM group.
Analysis of Student Surveys
An analysis of the student surveys administered only to students in the DVM group indicated that all students felt that the use of virtual manipulatives helped them to learn fractions. The students also reported that their experience with the virtual manipulatives helped them to answer test questions associated with pictures. Although students were asked to explain how the virtual manipulatives were helpful to learning fractions and answering the test questions, their explanations did not provide enough detail to be useful to the teacher for analysis or discussion. The DVM Teacher’s Observations
During the project the DVM teacher wrote down her reflections and observations on students’ interactions with the virtual manipulatives. She noted that students verbally or in written form began focusing on the pictorial elements of the fraction pictures in the virtual manipulatives. One fraction applet required students to use the appropriate fraction pieces and to mark or shade the correct number of pieces within the wholes to accurately represent the fractions. This forced students to focus on the pictorial model and to match their model with the fraction numbers they were typing into the applet or writing on their papers. The virtual manipulatives helped them to recognize that the fraction pieces on the applet were always the same size (or equal) when they were manipulating different fraction representations.
Students quickly mastered the task of clicking and dragging fraction pieces into the available wholes to equally divide the whole, yet choosing the appropriate fraction piece was challenging for many of the students on some of the applets. Once fractions were created using one of the applets, students were observed pointing to the computer screen to count the number of pieces to be sure the correct fraction was created. The teacher observed the students counting the shaded pieces and the total number of pieces to create the numerator and denominator of the fractions. This was true also when students began to add and subtract fractions. Students would audibly count the number of shaded pieces and either add or subtract the number of shaded pieces created on the second fraction. This showed that students needed the pictorial model to scaffold their visualization and that they needed to use basic counting to determine the symbolic notation for each fraction amount.
The discussions among students were especially rich when students compared fractions. Comments such as “This one looks bigger” and “This one has more pieces but the fraction is smaller than the one with less pieces” were heard repeatedly. During the group discussion, students compared their discoveries with classmates’ and came to a consensus on which fraction was greater. Discussions between the teacher and the students also took place during the lessons, particularly after students printed the fractions they created. Immediately after students successfully created each fraction or fraction set using the fraction applet, students printed their work. The teacher and students then discussed how these printed pictorial representations of the fractions were equivalent. Students compared the printed pictorial representations to one another by holding them side by side or placing one copy on top of another copy. Some students attempted to compare the pictorial representations by holding the printed copies up to the computer monitor. By doing this, students made visual connections between the dynamic virtual manipulatives and the static pictorial images of fraction amounts.

Journal of Interactive Online Learning Moyer-Packenham, Ulmer, and Anderson
111
Limitations of the Study One of the limitations of this study was the small number of participants. This group of 19
students was too small to generalize results to other third-grade populations. However, as a teaching experiment conducted by a classroom teacher, its purpose was not to generalize the findings but to inform the classroom teacher’s instruction with this group of low-achieving students. Because the study was conducted as a teacher’s action research project, another limitation was that the research focused only on this group of students and did not use an experimental design with a control group of students. Both the DVM and SPM groups were low-achieving groups of students and there was no additional low-achieving group to use as a control group for comparison. The teacher’s research question focused on the comparison between dynamic images and static images, rather than on a comparison with using no type of images at all for mathematics instruction. An important rationale for not using a control group was also an ethical reason: The classroom teacher believed that low-achieving students would benefit from learning mathematics with visual support. Therefore, to withhold any visual support while teaching a low-achieving group would be an unethical disadvantage to the students. The DVM and SPM groups of low achievers were compared with each other, which limited the classroom teacher in making comparisons between this group of students and students in another classroom.
Discussion
The purpose of this paper was to examine dynamic and static pictorial representations and their impact on student learning in a classroom with low-achieving students. As the results showed, students in both the DVM and SPM groups had significant improvements between the pre- and post-tests of fraction concepts. Both static and dynamic forms of pictorial representations positively impacted student learning. Interpreting Our Results
The results of this study demonstrate that both static and dynamic forms of pictorial representations can positively influence learning for low-achieving students when learning fraction concepts. As noted by Arcavi (2003), providing students with opportunities to visualize fraction amounts can support students’ thinking about the fraction concepts they are studying. The opportunity to visualize was one way to scaffold learning for the low-achieving students in both groups. Because visual imagery and spatial visualization is associated with high-achieving students (van Garderen, 2006), opportunities and support for visualization of the fraction concepts may have acted as a bridge for student learning in this project, whether students used static or dynamic pictorial models. The teachers’ descriptions of classroom activities in the computer lab showed that the students were connecting the dynamic objects in the virtual manipulatives with the static pictures they printed out on paper to preserve their work. The positive findings for student learning and achievement may be attributed to students’ use of pictorial models (static and dynamic) as well as the physical manipulatives that were present in the classrooms during this study. Another explanation for the results is that the two teachers participating in the study were both excellent instructors, and their pedagogy helped students to learn the mathematics concepts regardless of the static or dynamic modality used during instruction. The significant gains between pre- and post-tests by the DVM and SPM groups are consistent with other studies reporting positive effects of virtual manipulatives on the learning of fraction concepts (Lin, 2010; Moyer, Niezgoda, & Stanley, 2005; Moyer-Packenham & Suh, 2012; Reimer & Moyer, 2005) particularly for low-achieving students (Moyer-Packenham & Suh, 2012). The results also might suggest that pictorial models, in general, influence students’ understanding of fraction concepts. This would be consistent with previous research that has documented the positive effects of students’

Journal of Interactive Online Learning Moyer-Packenham, Ulmer, and Anderson
112
visualization experiences on their mathematical understanding (Lin, 2010; Moreno & Mayer, 1999; Reimer & Moyer, 2005). However, the lack of significant difference between the DVM and SPM groups seems to suggest that static and dynamic pictorial models can both produce positive learning outcomes. One important factor to keep in mind was that the two groups, DVM and SPM, had numerical differences (5.44 versus 7.20, respectively, out of 12 points) on the pre-test. Although these differences on the pre-test were not statistically significant, they may indicate differences in the students that were assigned to the two treatment groups. Therefore, it would be inappropriate to generalize that the dynamic and static models have the same effects on all students during mathematics instruction. Implications for Practice
The results of this teaching experiment demonstrate that different pictorial representations, either static pictures and drawings or dynamic virtual manipulatives, can be effective instructional strategies for supporting students who may learn mathematics better through visualization. As a result of this study, the classroom teacher increased the use of virtual manipulatives and pictorial models in her teaching practices. She also brought students’ attention to the relationship between the virtual manipulatives and the printed copies of the work students completed with the virtual manipulatives. She designed several activities in which the students began with the virtual manipulatives and then made a printed copy and discussed what the dynamic object could do. In other class sessions, the teacher first showed students a printed copy of a virtual manipulative. Then she asked students to visualize the static picture as a dynamic object and conjecture about what they thought they might be able to do with the dynamic virtual manipulative. Then students went to the computer lab and used the virtual manipulatives to explore what they had conjectured about. In this way, the teacher supported the development of the students’ visualization skills by encouraging the students to connect static and dynamic representations. The teacher believed that making this connection explicit with the low-achieving students helped them to better visualize mathematical representations.
This project also influenced the other teachers on the third-grade team. Other members of the teacher’s third-grade team adopted a teaching approach that included the use of more pictorial representations during mathematics instruction. The teachers are working toward being much more explicit about how they connect work with pictorial models, physical manipulatives, and virtual manipulatives. Some of their lessons specifically focus on examples of the picture models students will encounter on the statewide standard assessment and how to visualize the mathematics when they see those picture models.
The project also influenced teachers’ use of computers for mathematics. Teachers began taking students to the computer lab and using virtual manipulatives from the NLVM website for instruction in topics beyond the fraction unit. The teachers began to use their classroom computers more frequently as a mathematics center for students to visit during mathematics rotations. This action research process helped the teacher to understand the flexibility required of classroom research as opposed to scientific research. It enabled her to take her own personal inquiries to a deeper level of classroom study using a more systematic approach to researching her own teaching and her students’ learning. Good teachers are constantly asking questions about their teaching practice and about the learning that occurs within their classrooms. However, conducting action research allowed the teacher to formalize the questioning she was already doing. It required her to keep records, informative notes, student work, and routinely and accurately measure student learning as a result of her teaching methods and approaches.
Journal of Interactive Online Learning Moyer-Packenham, Ulmer, and Anderson
113
Conclusion
Visualization in mathematics does not come naturally to all students. High-achieving students already have a solid visual image, while their lower achieving peers tend to struggle to visualize mathematical concepts (Moreno & Mayer, 1999; Moyer-Packenham & Suh, 2012; van Garderen, 2006). Research suggests that the pictorial nature of virtual manipulatives may assist students in developing visualization skills needed for understanding mathematics concepts, such as fractions (Lin 2010; Reimer & Moyer, 2005; Suh, 2005). In this study, low-achieving students demonstrated significant gains while using dynamic virtual models and static pictorial models in their learning of fraction concepts. Through the use of these pictorial models, students developed a greater understanding and visualization of fractions and achieved better results on test questions with pictorial representations. These findings suggest that the use of pictorial models may assist low-achieving students in developing the visualization skills necessary for success in mathematics classrooms.
References
Arcavi, A. (2003). The role of visual representations in the learning of mathematics. Educational Studies in Mathematics, 52(3), 215-241.
Beckett, P. F., McIntosh, D., Byrd, L. A., & McKinney, S. E. (2011). Action research improves math instruction. Teaching Children Mathematics, 17(7), 398–401.
Bonner, P. J. (2006). Transformation of teacher attitude and approach to math instruction through collaborative action research. Teacher Education Quarterly, 33(3), 27–44.
Clark, R., Nguyen, F., & Sweller, J. (2006). Efficiency in learning: Evidence-based guidelines to manage cognitive load. San Francisco, CA: Pfeiffer.
Common Core State Standards. http://www.corestandards.org/the-standards. Cuoco, A. A., & Curcio, F. R. (2001). 2001 Yearbook: The roles of representation in school
mathematics. Reston, VA: NCTM. Dorward, J. (2002). Intuition and research: Are they compatible? Teaching Children Mathematics,
8(6), 329-332. Drickey, N. A. (2000). A comparison of virtual and physical manipulatives in teaching visualization
and spatial reasoning to middle school mathematics students (Doctoral dissertation, Utah State University, 2000). Dissertation Abstracts International, 62(02A), 499.
Gardner, H. (1997). Fostering diversity through personalized education: Implications of a new understanding of human intelligence. Prospects, 27(3), 347–363. doi:10.1007/BF02736635
Gardner, H. (2002). On the three faces of intelligence. Daedalus, 131(1), 139. Herbel-Eisenmann, B., Drake, C., & Cirillo, M. (2009). “Muddying the clear waters”: Teachers’
take-up of the linguistic idea of revoicing. Teaching and Teacher Education, 25(2), 268–277. doi:10.1016/j.tate.2008.07.004
Kamii, C., Lewis, B., & Kirkland, L. (2001). Manipulatives: When are they useful? Journal of Mathematical Behavior, 20(1), 21-31.
Kim, S. (1993). The relative effectiveness of hand-on and computer simulated manipulatives in teaching seriation, classification, geometric, and arithmetic concepts to kindergarten children (Unpublished doctoral dissertation). University of Oregon, Eugene, Oregon.
Larkin, J., & Simon, H. (1987). Why a diagram is (sometimes) worth ten thousand words. Cognitive Science, 11(1), 65-100.
Lesh, R., Post, T., & Behr, M. (1987). Representations and translations among representations in mathematics learning and problem solving. In C. Janvier (Ed.). Problems of representation in

Journal of Interactive Online Learning Moyer-Packenham, Ulmer, and Anderson
114
the teaching and learning of mathematics (pp. 33-40). Hillsdale, NJ: Lawrence Erlbaum Associates.
Lewin, K. (1946). Action research and minority problems. Journal of Social Issues, 2(4), 34–46. Lin, C. (2010). Web-based instruction on preservice teachers’ knowledge of fraction operations.
School Science and Mathematics, 110(2), 59-71. Martin, T., Svihla, V., & Smith, C. P. (2012). The role of physical action in fraction learning. Journal
of Education and Human Development, 5(1), 1-17. Marzano, R. J. (2010). Representing knowledge nonlinguistically. Educational Leadership, 67(8),
84–86. Mills, G. E. (2003). Action research: A guide for the teacher researcher (2nd ed.). Upper Saddle
River, NJ: Merrill Prentice-Hall, Inc. Moreno, R., & Mayer, R. E. (1999). Multi-media supported metaphors for meaning making in
mathematics. Cognition and Instruction, 17(3), 215-248. Moyer, P. S. (2001a). Are we having fun yet? How teachers use manipulatives to teach mathematics.
Educational Studies in Mathematics, 47(2), 175-197. Moyer, P. S. (2001b). Using representations to explore perimeter and area. Teaching Children
Mathematics, 8(1), 52-59. Moyer, P. S., & Bolyard, J. J. (2002). Exploring representation in the middle grades: Investigations in
geometry with virtual manipulatives. The Australian Mathematics Teacher, 58(1), 19-25. Moyer, P. S., Bolyard, J. J., & Spikell, M. A. (2002). What are virtual manipulatives? Teaching
Children Mathematics, 8(6), 372-377. Moyer, P. S., & Jones, M. G. (2004). Controlling choice: Teachers, students, and manipulatives in
mathematics classrooms. School Science and Mathematics, 104(1), 16-31. Moyer, P. S., Niezgoda, D., & Stanley, J. (2005). Young children’s use of virtual manipulatives and
other forms of mathematical representations. In W. J. Masalski & P.C. Elliott (Eds.), Technology-Supported Mathematics Learning Environments, 67th Yearbook (pp. 17-34). Reston, VA: National Council of Teachers of Mathematics.
Moyer-Packenham, P. S., & Suh, J. M. (2012). Learning mathematics with technology: The influence of virtual manipulatives on different achievement groups. Journal of Computers in Mathematics and Science Teaching, 31(1), 39-59.
Moyer-Packenham, P. S., Westenskow, A., & Salkind, G. (2012). Effects of virtual manipulatives on student achievement and mathematics learning. Paper presented at the American Educational Research Association Annual Meeting, Vancouver, Canada.
National Council of Teachers of Mathematics. (2000). Principles and standards for school mathematics. Reston, VA: Author.
National Library of Virtual Manipulatives. http://nlvm.usu.edu. Paivio, A. (2007). Mind and its evolution: A dual coding theoretical approach. Mahwah, NJ:
Erlbaum. Raphael, D., & Wahlstrom, M. (1989). The influence of instructional aids on mathematics
achievement. Journal for Research in Mathematics Education, 20(2), 173-190. Reimer, K., & Moyer, P. (2005). Third graders learn about fractions using virtual manipulatives: A classroom study. Journal of Computers in Mathematics and Science Teaching, 24(1), 5-25. Shank, G. D. (2002). Qualitative research: A personal skills approach. Upper Saddle Rver, NJ:
Merrill Prentice Hall. Sowell, E. J. (1989). Effects of manipulative materials in mathematics instruction. Journal for
Research in Mathematics Education, 20(5), 498-505.
Journal of Interactive Online Learning Moyer-Packenham, Ulmer, and Anderson
115
Suydam, M. N. (1985). Research on instructional materials for mathematics. Columbus, OH: ERIC Clearinghouse for Science, Mathematics, and Environmental Education. (ERIC Document Reproduction Service No. 276 569).
Suh, J. M. (2005). Third graders' mathematics achievement and representation preference using virtual and physical manipulatives for adding fractions and balancing equations. Unpublished doctoral dissertation, George Mason University, Fairfax, Virginia.
Uribe-Florez, L. J., & Wilkins, J. L. M. (2010). Elementary school teachers' manipulative use. School Science and Mathematics, 110(7), 363-371.
van Garderen, D. (2006). Spatial visualization, visual imagery, and mathematical problem solving of students with varying abilities. Journal of Learning Disabilities, 39(6), 496-506.
Woleck, K. R. (2001). Listen to their pictures: An investigation of children’s mathematical drawings. In A. A. Cuoco & F. R. Curcio (Eds.), 2001 Yearbook: The roles of representation in school mathematics (pp. 215-227). Reston, VA: NCTM.
Journal of Interactive Online Learning Moyer-Packenham, Ulmer, and Anderson
116
Appendix
Name: ___________________ Date:_____________
1. What fraction of this figure is shaded in?
A.
810
B.
210
C.
34
D. 58
2. Which figure shows 1/10 shaded?
A. B.
C. D.
3. What fraction of the circles is shaded?
A.
75 B.
54
C.
94 D.
49

Journal of Interactive Online Learning Moyer-Packenham, Ulmer, and Anderson
117
4. Lisa ate 1/8 of the pizza. How much of the pizza did she eat?
A. B.
C. D.
5. In which group do exactly
45
of the beach balls have starts on them?
A. B.
C. D.
6. Which figure shows 21
of the shape shaded?
A. B.
C. D.

Journal of Interactive Online Learning Moyer-Packenham, Ulmer, and Anderson
118
7. The figure shown below is shaded to represent a fraction.
Which of the following is shaded to represent a fraction with a value EQUAL TO the one above?
A.
B.
C.
D.
8. This model is shaded to show a fraction of a whole.
Which of the following is shaded to show a fraction with a value LESS THAN the model above?
A. B.
C. D.

Journal of Interactive Online Learning Moyer-Packenham, Ulmer, and Anderson
119
9. The shaded part of the circle can be represented by which pairs of
equivalent fractions?
A. !!! !!
B. !!! !!
C. !!! !"!"
D. !!! !!
10. Each figure below is shaded to represent a fraction. Which pair of figures makes a statement that is true?
A.
B.
C.
D.

Journal of Interactive Online Learning Moyer-Packenham, Ulmer, and Anderson
120
11. This is a whole.
What is
A.
41 B.
83
C.
85 D.
165
12. This is a whole.
What is
A.
21 B.
41
C. 124 D.
13
%!
%! !!
!"
Related Documents