
Welcome message from author
This document is posted to help you gain knowledge. Please leave a comment to let me know what you think about it! Share it to your friends and learn new things together.
Transcript
ii
EXAMINING OVERSEAS STUDENT
PERCEPTION OF HOTEL’S SERVICE QUALITY
IN MAINLAND CHINA
By
AKOTO AMA OTUKWA
Email: [email protected]
A Postgraduate thesis submitted to the department of
tourism management in partial fulfillment of the
requirements for the degree of MASTERS OF ARTS IN
TOURISM MANAGEMENT
Academic Supervisor
Dr. Yu Qin
March 2013
iii
iv
ACKNOWLEDGEMENT
This dissertation would not have been possible without the guidance and advice of
several individuals who in one way or another contributed and extended their valuable
assistance in the preparation and completion of this study.
I must express profound gratitude to my supervisor, Prof. Yu Qin, Head of Hotel
Management Department, whose sincerity, encouragement and guidance I will never
forget. Prof. Yu Qin has been my inspiration as I hurdle all the obstacles in the
completion of my dissertation.
My gratitude to all the lectures that inspired me throughout my program, to Prof.
Tony Zou the dean, Prof. Gu Huimin the deputy dean, Ms. Molly Wang and to Ms.
Wang Xue Fei, foreign students affairs office for all what they did for me during my
study at BISU.
To all BICF (Beijing International Christian Fellowship) members and international
students who permitted me to interview and participated in the survey for my
dissertation, I express my gratitude.
Last but not the least, my Parents and Sisters, and the one above all of us, the
omnipresent God, for answering my prayers and giving me strength to overcome all
obstacles during my study.
v
ABSTRACT
EXAMINING OVERSEAS STUDENT PERCEPTION OF
HOTEL’S SERVICE QUALITY IN MAINLAND CHINA
This study is aimed at examining overseas student perception of hotel’s service
quality in Mainland China, and subsequently identifying dimensions of service quality
that influences their perception.
The target population of the study was overseas student (International students)
studying in Universities in Chaoyang and Haidian district of Beijing. In all 200
overseas students were selected as the sample size of the study.
The findings of the study revealed that dimensions of service quality that influence
overseas student perceptions of hotels in general in mainland China were named:
Physical quality, Function quality, and Interactive quality. Overseas student’s
(International student) overall perception of the hotels service quality was found to be
moderate.
However, overseas student perception of the level of Physical quality and Interactive
quality were found to be the highest to influence their perceptions.
The findings of the study revealed that the most influential dimension that drives
overseas students’ perception of overall service quality is Physical quality.
It was found that these three dimensions (Physical, Function and Interactive) have
positive significant influence on overseas students’. It is recommended that much
vi
emphasis should be placed on physical quality since it is found to be the most
influential factor of overall perception of hotel service quality of these overseas
students. Policy makers, Hoteliers and Managers of hotels should factor these
dimension when dealing with international guests since overseas student fall within
such category. Future studies are encouraged to conduct research on international
tourist perceptions on budget hotels in Mainland China with the results of the current
study.
A literature review of publications was used. Primary research comprised
semi-structured interviews with international students in Beijing International Studies
University and Questionnaire survey. This helps the researcher to understand the
perceptions of overseas student and assist the researcher in examining their
perceptions of hotels service quality.
Key words: Overseas student, Hotels in Mainland China, Perceptions of Service
quality
vii
Table of Contents
CHAPTER ONE .................................................................................................................................. 1
INTRODUCTION .................................................................................................................................... 1 BACKGROUND .......................................................................................................................................... 1
1.1.1 Overseas Student in (Mainland China) .................................................................................... 3 1.1.2. Statement of the problem ...................................................................................................... 6
1.2. TOPIC AND OBJECTIVE ......................................................................................................................... 7 1.2.1. Research Topic ....................................................................................................................... 7 1.2.2. Research questions ................................................................................................................ 7 1.2.3. Scope of study ........................................................................................................................ 7
1.3. SIGNIFICANCE OF THE STUDY (IMPLICATIONS) ........................................................................................... 8
CHAPTER TWO ................................................................................................................................. 9
LITERATURE REVIEW ............................................................................................................................ 9 2.1. DEFINITIONS OF KEY TERMS. ................................................................................................................. 9
2.1.1. Perception .............................................................................................................................. 9 2.1.2. Service quality ...................................................................................................................... 11 2.1.3. Service Quality and Customer Perception ............................................................................ 18
2.2. OVERSEAS STUDENT IN CHINA ............................................................................................................. 19 2.3. PERCEPTION OF HOTELS IN CHINA ....................................................................................................... 22 2.4. OVERSEAS STUDENT PERCEPTION OF HOTEL SERVICE QUALITY .................................................................... 25
2.4.1. Research Conceptual Model ................................................................................................. 28
CHAPTER THREE ............................................................................................................................. 31
METHODOLOGY ................................................................................................................................. 31 3.1. QUALITATIVE AND QUANTITATIVE MIXED METHOD .................................................................................. 31 3.2. RESEARCH DESIGN ............................................................................................................................ 31
3.2.1. Interview design and Implementation ................................................................................. 32 3.2.2. Interview data analysis ........................................................................................................ 32 3.2.3. Questionnaire design ........................................................................................................... 40 3.2.4. Sample ................................................................................................................................. 43 3.2.5. Data collection tools ............................................................................................................ 43
3.3. ANALYTICAL APPROACH ..................................................................................................................... 44
CHAPTER FOUR .............................................................................................................................. 45
RESULTS AND FINDINGS ..................................................................................................................... 45 4.1. DESCRIPTIVE ANALYSIS ....................................................................................................................... 45 4.2. EXPLORATORY FACTOR ANALYSIS ......................................................................................................... 51
4.2.1. Hypothesis and proposed research model ........................................................................... 57 4.3. REGRESSION ANALYSIS ....................................................................................................................... 58
4.3.1. Model of perception of service quality ................................................................................. 59
viii
CHAPTER FIVE ................................................................................................................................ 63
CONCLUSION AND DISCUSSION ......................................................................................................... 63 5.1. CONCLUSION ................................................................................................................................... 63 5.2 NEW CONCEPTUAL MODEL .................................................................................................................. 64 5.3. IMPLICATIONS .................................................................................................................................. 67 5.4. LIMITATION ..................................................................................................................................... 69 5.5. FUTURE RESEARCH DIRECTION ............................................................................................................. 70
REFERENCES ................................................................................................................................... 71
WEBSITE SOURCES: ................................................................................................................................. 74
APPENDIX ...................................................................................................................................... 75
ix
List of Tables
Tables
Page
Table 1: Determinants and issues of service quality involved in the research 29
Table 2: Qualitative data from Interview Responses 32
Table 3: An overview of the determinants and issues involved in the research 42
Table 4: Gender 46
Table 5: Ages 46
Table 6: Nationality 47
Table 7: Category of student 47
Table 8: Educational qualification of respondent 48
Table 9: Monthly allowances for spending 48
Table 10: Duration of study 49
Table 11: District of School 49
Table 12: Frequency of stay in hotel 50
Table 13: Price for a night stay 50
Table 14: Mean ranking for perception of service quality 51
Table 15: Reliability Item – total statistics (Without item p9) 52
Table 16: Reliability statistics 53
Table 17: KMO and Bartlett’s Test 53
Table 18: Extracted factors of service quality and their respective scale items 54
Table 19: Overall Perception of hotel service quality 56
Table 20: Model Summary 58
Table 21: Regression Analysis of three dimensions of service quality 59
and overall service quality.
x
Table of Figures
Lists Page
Figure 1 Overseas Student distribution (Mainland China)………………………………………..5 Figure 2: Conceptual research model (Parasuraman, Zeithaml &Berry)…………………………28 Figure 3: New Research Conceptual Model………………………………………………………57 Figure 4: Hypothesis Analysis ………………………………………………………………… 60
1
CHAPTER ONE
INTRODUCTION
This chapter presents introduction to the study. It entails the research background,
research problem statement, research topic and objective, research questions, Scope of
study, Significance of the study.
Background
Described by Encyclopedia Britannica, as a country of East Asia, largest of all Asian
countries, and also officially known as People’s Republic of China was established in
1949. Being the most populous country in the world, boasts one of the world’s most
ancient cultures and largest most advanced continuous civilizations. In recent years,
this vast country in East Asia has attracted many international visitors for Leisure,
Education and Business, and to cater for this demand, many hotels have been built on
a par with those in the rest of the world while striving to offer international standards
in terms of service quality.
In 1974 Deng Xiaoping decided to extensively promote tourism in China as a means
of earning foreign exchange. Following this decision, many major hotels were built;
many historic and scenic sites were renovated, many guest houses were also built and
many tour guide training programs were also developed (Ebrey, 2010; Oosterhaven &
2
Fan, 2006; Zhang, Pine, & Zhang, 2000). Also tourism as an academic discipline was
introduced in many universities and colleges thereby attracting overseas students.
Hotel development has been considered a very important part of China’s tourism
development, and it was given priority for development in the Sixth Five-Year Plan
(1981-1985) for China’s Economic and Social Development (Yu, 1992). As a result
great effort has been put into hotel construction and renovation in the last 12 years.
However, according to Yu (1992) the supply of hotel beds appeared to have expanded
beyond the demand of international tourists during the period 1986 to 1994 and, for
the first time, the overdevelopment of hotel accommodation became a problem
confronting the Chinese government.
In spite of the overdevelopment of Chinese hotels, some studies (Choy et al., 1986;
Cook, 1989; Schrock et al., 1989; Boyd, 1993; Cai &Woods, 1993) found that the
standard and quality of services provided by the hotels were still far below
international standards. Some problems included poor language ability and
communication skills, unreliable reservations systems and poor sanitation. Most
service workers in China lack an understanding or appreciation for international
service standards. Many hotel employees had service attitude problems which have
drawn constant complaints from international tourist.
The trend of world markets has changed noticeably from agricultural to service
markets (Asian Development Outlook, 2007). All of the service businesses are trying
their best to improve their service quality in order to make customers satisfied.
3
As research indicates, in today’s competitive environment, rendering quality service is
a key for success, and many experts concur that the most powerful competitive tool
currently reshaping marketing and business strategy is service quality.
Service quality is a pervasive strategic force and a key strategic issue in any
organization. With services especially in the hotel industry, hotel operators now focus
more on the quality standards in order to meet the basic needs and expectations of the
customers. Once customers and requirements are clearly identified and understood,
hotel operators are more likely to anticipate and fulfill their customers’ needs and
wants (Juwaheer & Ross, 2003)
It is no surprise that practitioners and academics alike are keen on accurately
measuring and understanding issues affecting service quality delivery.
1.1.1 Overseas Student in (Mainland China)
International education in recent years has increasingly been marketed as a
commodity in the higher education sector. Current trends indicate that the general
patterns of global student mobility are influenced by a wide variety of factors that
include geographical location, historical connections, and language and education
systems.
Since 1978 when China initiated her reform and opening- up policy, international
student education has entered into a new stage. As an important component of
4
international exchange and cooperation, international student’s education has been
given great importance by the Chinese government. Due to China’s success in
maintaining social and political stability and the rapid growth of economy, this has
given rise to international students which consist of scholarship student and self-
financed students in Mainland China.
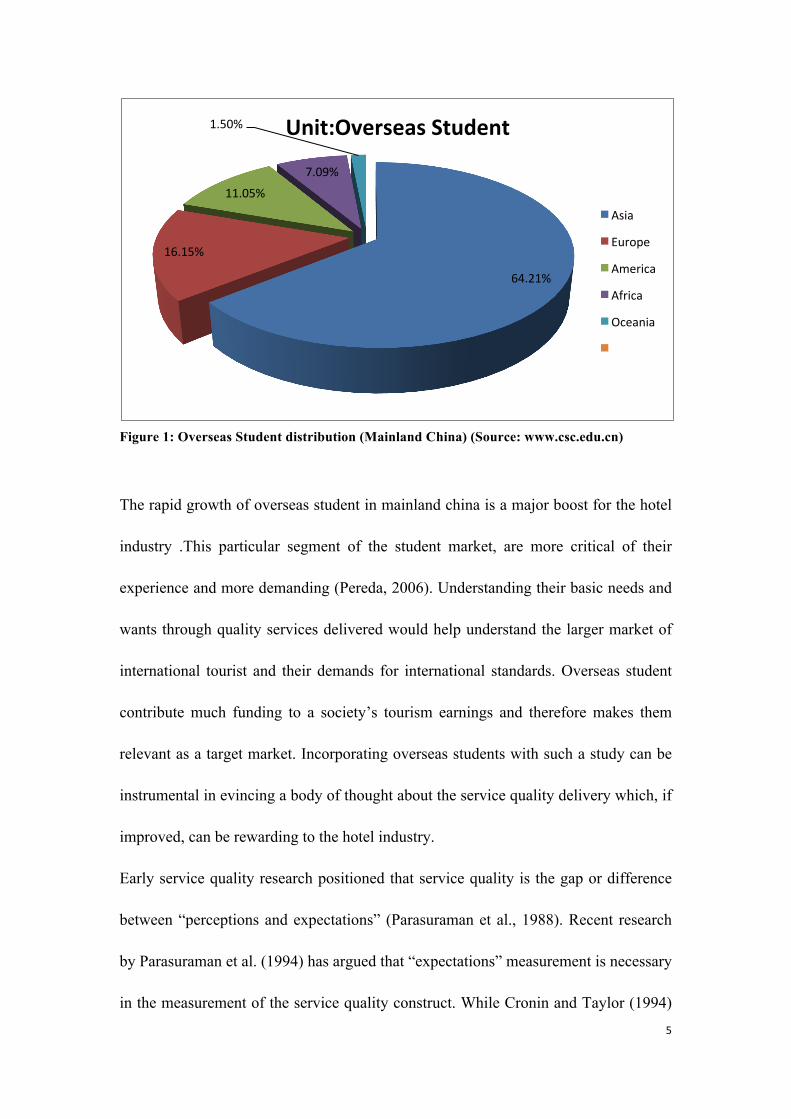
According to the China Scholarship Council (CSC), in 2011, the total number of
international students studying in China exceeded 290,000 for the first time. 292,711
international students from 194 countries and regions have pursued their study in 660
higher education institutions, research institutes and other education institution in 31
provinces, autonomous regions and municipalities (Taiwan, Hongkong and Macao
excluded). International students from Asia top the list of overseas student in China
totaled 187,871 accounting 64.21% (see Figure 1). (42,271) students from Europe
accounting for 16.15%; (32,333) from America accounting for 11.05 %; ( 20,744)
from Africa accounting for 7.09%, and (4,492) from Oceania accounting for 1.50%.
(Figure Below)
For the categories of international students, the number of degree students mounts to
118,837, 40.61% of the total. Among the degree students, there are 88,461 junior
college students and undergraduate students, 23,453 master students, and 6,923 PhD
students, taking up 74.44%, 19.74% and 5.83% of the total, respectively. There are
173,774 non-degree students, 59.39% of the international students.
5
Figure 1: Overseas Student distribution (Mainland China) (Source: www.csc.edu.cn)
The rapid growth of overseas student in mainland china is a major boost for the hotel
industry .This particular segment of the student market, are more critical of their
experience and more demanding (Pereda, 2006). Understanding their basic needs and
wants through quality services delivered would help understand the larger market of
international tourist and their demands for international standards. Overseas student
contribute much funding to a society’s tourism earnings and therefore makes them
relevant as a target market. Incorporating overseas students with such a study can be
instrumental in evincing a body of thought about the service quality delivery which, if
improved, can be rewarding to the hotel industry.
Early service quality research positioned that service quality is the gap or difference
between “perceptions and expectations” (Parasuraman et al., 1988). Recent research
by Parasuraman et al. (1994) has argued that “expectations” measurement is necessary
in the measurement of the service quality construct. While Cronin and Taylor (1994)
64.21%
16.15%
11.05%
7.09%
1.50% Unit:Overseas Student
Asia
Europe
America
Africa
Oceania
6
have argued the reverse, that one need not measure “expectations” to measure service
quality. Evidence presented by Cronin and Taylor (1994) was collected in the
American context and no cross-cultural samples were involved. This research paper
examines the perception of overseas on service quality in hotels in mainland china.
1.1.2. Statement of the problem
China’s tourism industry is one of the fastest-growing industries in the national
economy and is also one of the industries with a very distinct global competitive edge.
This study will explore overseas student perceptions as well as factors that influence
their perceptions towards service quality specifically within mainland China hotels
and how they are viewed in delivering quality services..
In highly competitive hotel industry like China’s Mainland hotel industry, individual
hoteliers must find ways to make their products and services stand out among the
others. To achieve this, hotel operators must understand their customers’ needs and
then set out to meet (or exceed) these needs.
There is therefore the need to understand how overseas students as customers perceive
of the service quality in the hotel industry and find ways in which the service quality
can be enhanced.
7
1.2. Topic and Objective
1.2.1. Research Topic
Examining Overseas student perception on hotel’s service quality in Mainland China.
The objective of the study is to examine in general overseas student perception of
hotel service quality. Specifically; we will examine overseas student perception of
hotel service quality in mainland China and factors that influences their perception.
1.2.2. Research questions
1. What are the perceptions of overseas student on hotel service quality in Mainland
China?
2. What factors influence overseas student perception of service quality in Mainland
China hotels?
1.2.3. Scope of study
The study on overseas student perception on service quality in mainland China hotels
will rely on foreign students studying in Beijing who have stayed in a hotel in
mainland China. For this study, we will survey 200 overseas students in randomly
selected universities within Haidian district and Chaoyang district all in Beijing who
have lodged in hotels in mainland china.
8
1.3. Significance of the study (Implications)
This research is unique because it is the first being conducted in Mainland China from
its context.
Theoretically, it will be significant to variant research field including service quality,
hotel management and inbound tourism. It will provide a deeper understanding of
what overseas student perceive of China’s hotel industry.
Practically implications will also be variant to stakeholders like hotel industry, CNTA
(China National Tourism Authority) and to DOE (Department of Education). It will
help managers; service providers and planners in the hospitality industry identify
issues in the industry which could lead to improved service quality.
9
CHAPTER TWO
LITERATURE REVIEW
This chapter is in five parts, the first part is on literature on general theories of
perceptions of service quality and definition of key terms, followed by overseas
student in China; Perception on Chinese Hotels; Overseas student perception of
service quality, then a conceptual model and determinants of issues involved in
service quality.
With the opening of more attractions for sightseeing and the increase of inbound
leisure, business and educational travelers, China’s tourism industry has experienced
continuous growth since the early 1980’s, and has given rise to its hotel industry.
China’s hotel industry has blossomed in the last decade and is regarded as a fertile
field for future expansions. In recent years, many hotels have been built to cater for
the demand of tourists whilst striving to offer international standards in terms of
service quality.
2.1. Definitions of key terms.
2.1.1. Perception
Our perception is an approximation of reality. Our brain attempts to make sense
out of the stimuli to which we are exposed. This works well when we are about
10
to perceive familiar facts. However, our perception is sometimes “off” when we are
not clear about concepts.
Perception is a process by which an individual select, organize &Interpret stimuli in a
meaningful picture of the world Also, we can describe as “how we see the world
around us” Perception is the process of selecting, organizing, & Interpreting or
attaching meaning to events happening in environment
Perceptions can be defined as “the reception and processing of information from the
environment” (Proshansky et al., 1976). The word perception comes from the Latin
words perceptio, and perceptio, means “receiving, collecting and action of taking
possession, apprehension with the mind or senses. It is the process of using the human
senses to acquire information about the surrounding environment or situation. It is
also an attitude or understanding based on what is observed or thought
It further explains that, though necessarily based on incomplete and unverified (or
unreliable) information, perception is ‘the reality’ and guides human behavior in
general. Naturally people have different perceptions. Various people may have
different opinions regarding the level of development of the tourism industry or its
environmental aspects. Similarly various people may have differing viewpoints about
the economic and social-cultural dimensions of the service quality in the hotel sector.
11
2.1.2. Service quality
In the service industry, definitions of service quality tend to focus on meeting
customers’ needs and requirements and how well the service delivered meets the
expectations (Lewis and Booms, 1983). Service quality is also the result of the
discrepancy between customers’ expectations on services and their perceptions on the
services actually received; measured by the SERVQUAL instrumentation in five
dimensions for service, also known as the (RATER) model. Service quality has thus
been distinguished as a “gap” between customers’ expectations and the performance
they actually receive (Parasuraman et al., 1985). The SERVQUAL instrument
recognized ten dimensions of service quality. Later, these ten dimensions were
lessened into five dimensions (Sultan &Simpson).
Parasuraman et al. (1988) also suggested that service quality was a
multi-dimensional concept consisting of five dimensions:
Reliability refers to the ability to perform the promised service dependably and
accurately. Promises made to an organization’s promotional efforts can contribute to
participant expectations. Consistency of performance at the highest standard is crucial
to reliability;
Assurance indicates knowledge and courtesy of employees and their ability to convey
trust and confidence, Assurance contains elements of the organization’s credibility,
competence and security;
Tangibles refer to the appearance of the physical facilities, equipments, personnel and
communication materials. The tangible aspect of a service is one of the few
12
dimensions that a potential service patron can know and evaluate in advance of
participation;
Empathy dimension includes caring, individualized attention to customers; Empathy
expresses an understanding of the customers’ need.
Responsiveness refers to the willingness to help customers and to provide prompt
services that is hotel customers expect their requests to be handled quickly and
accurately.
The majority of research on service quality has been built around the SERVQUAL
(Parasuraman et al., 1988) methodology.
The SERVQUAL model suggests that service quality can be measured by identifying
the gaps between customers’ expectations and perceptions of the performance of the
service.
Ladhari (2008) summarized a list of theoretical and empirical criticisms of the
gap model. First, he argued that the use of gap scores is not the right method because
of the lack of support in literature to consumers evaluating service quality in terms of
perceptions – minus- expectation. He stated that it has been recommended that service
quality is more precisely and correctly evaluated by measuring only perceptions of
quality.
According to Zeithaml et al. (2009), service quality is focused evaluation that
reflects customers’ perceptions of reliability, assurance, responsiveness, empathy and
13
tangibles.
How customers perceive service quality is critical because it determines how they
evaluate the service. Customers evaluate a service based on their expectations.
Because expectations are dynamic, evaluations may also shift from time to time. Thus,
how customers evaluate what they term as a quality service today, (based on some
criterion) may change tomorrow. This calls for continuous monitoring and evaluations
of service quality in any service firm.
According to Gronroos (1984), the service quality experienced by a customer has
two dimensions; namely technical quality and functional quality. Functional quality
describes how the service is delivered and technical quality describes what the
customers received during a service delivery. Customers bring their earlier
experiences and overall perceptions of a service firm to each encounter because
customers often have continuous contacts with the same service firm (Gronroos,
2001)
Gronroos also emphasized the importance of corporate image in the experience of
service quality, similar to the idea proposed by Lehtinen and Lehtinen (1982). The
image concept was introduced as yet another important component in the perceived
service quality model, so that the dynamic aspect of the service perception process
was considered as well.
A favorable and well-known image is an asset for any firm, because image has an
14
impact on customer perceptions of the communication and operations of the firms in
many respects.
If a service provider has a positive image in the minds of the customers, minor
mistakes will be forgiven. If mistakes were often to occur however, the image will be
damaged. If a provider’s image is negative, the impact of any mistakes will often be
magnified in the customer’s mind. In a word, image can be viewed as a filter in terms
of a consumer’s perception of quality.
Lewis (1993) also viewed service quality dimensions from the same point of view
as Gronroos (1984) did. However, Lawis considered corporate image as the third
dimension of service quality. He explained the technical dimension to include the
systems and technology that provides the outcome. For example, in the banking sector,
technical dimension encompasses the quality of ATM machines, credit cards, internal
banking, etc. he describes that functional quality consists of interpersonal relations
and interactions between employees and customers, appearance , personality and
approachability of service personnel, and all that affects the way a service is delivered.
Lawis noted that corporate dimension is expected to be built by the technical quality
dimension, and the functional quality dimension.
15
Another school of thought on three- dimensional construct of service quality is
that of Lehtinen and Lehtinen (1991). According to them service quality is a
three-dimensional concept and the dimensions include physical quality, interactive
quality and corporate quality. In the opinion of Lehtinen and Lehtinen (1991) the
physical quality consists of how customers perceive the physical environment within
which service is obtained and mentioned tableware in a restaurant as an example.
In hotel industry, example of the constituent of physical quality dimension could
be the design of the hotel and all the facilities and machines used in the service
process. They explained interactive quality as the extent to which interactive style of
service providers meets the participation style of customers. They also describe
corporate quality as customers’ evaluation of corporate image of service providers.
Previous studies have suggested that service personnel play an important role in
customers’ evaluations and perceptions of service quality (Bebko and Sciulli, 2009;
Heskett et al., 1994, Mattson, 1994; Tansuhajm et al., 1988)
Because services are inherently intangible and characterized by inseparability
(Bateson 1989; Lovelock 1981; Shostack 1977), the interpersonal interactions that
take place during service delivery often has the greatest effect on service quality
perceptions (Bitner; Booms, and Mohr, 1994) Bowen and Schneider 1985; Gronroos
16
1982; Hartline and Ferrell 1996; Suprenant and Solomon 1987). These Interactions
have been identified as the employee- customer interface (Hartline and Ferrell 1996)
and key element in a service exchange (Zepiel 1990). Their significance is captured in
Suprenant and Solomon’s (1987) suggestion that service quality is more the result of
process than outcomes.
The SERVQUAL instrument has been widely used in the marketing literature in a
variety of sectors, including leisure related organizations, such as hotels (Ingram and
Daskslakis, 1999; Oh, 1999), travel agencies (Luk, 1997), parks and recreation
(Mckay and Crompton, 1990), tourism attractions / resorts (Bigne et al., 2001),
Leisure/sport centre’s (Howart et al., 1999; Lentell, 2000), and also in the banking
sector.
A study on customer perception in the Banking industry by (Hema Bhalakrishnan)
indicated that banking operations are becoming increasingly customer dictated. Thus
the ability of the banks to offer clients access to several markets for different classes
of financial instruments has become a valuable competitive edge.
It furthered on to say that with phenomenal increase in a country’s population and the
increased demand for banking services, speed, and service quality and customer
satisfaction are going to be key differentiators for each bank’s future success.
Therefore it was imperative for banks to get useful feedback on their actual response
time and customer service quality aspects of retail banking, which in turn will help

17
them take positive steps to maintain a competitive edge.
Service quality assesses the performance of products and services from a
customer’s perspective (Manjunatha and Shivalingaiah, 2004). Thus the customer
plays a pivotal role in determining the level of satisfaction with a given product or
service. Service has been recognized as an effective tool for a competitive advantage
(Veron, 2007), which is why much attention is currently focused on it.
Examining service quality across small, medium and large hotels in Scotland, Briggs
et al. (2007) note major inconsistencies in service quality performance across the
sector. The study further suggest that most customers are not in fact overly demanding
and are satisfied with a personal service that represents value for money and provides
accurate information. The main difference between excellent and poor service for
them relates to the absence of the personal touch and how stuff deal with their
complaints (Briggs et al., 2007).
Taking into account the Irish hotel industry, Keating and Harrington (2003) suggest in
their study that many quality programs fail from lack of commitment on the part of
senior ad middle management, and front-line employees.
Wuest et al. (1996) defined perceptions of a hotel attributes as the degree to which
travelers find various services and facilities important in promoting their satisfaction
18
with the hotel stays.
Service quality has been identified as a key element of success in attracting repeat
customers in the hotel industry (Heskett et al., 1994) and is often valuable in
distinguishing itself from competitors to gain a competitive advantage in the service –
oriented world (Rapert and Wren, 1998).
Sultan and Simpson (2000) demonstrated empirically that there are significant
differences in service quality expectations and perceptions based on nationality as
well as overall perceptions of service quality
It is also suggested that irrespective of efforts positioned into producing quality
service, it is the perceptions of customers that really matter (Getty and Getty, 2003).
Hence there seems to be a need to study hotels’ customer perceptions.
2.1.3. Service Quality and Customer Perception
The main function a hospitality organization’s members must perform is the
delivery of quality service to its customers. Service quality has been defined as how
well a customer’s needs are met, and how well the service delivered meets the
customer’s expectations. Customer perception is an important component of our
relationship with our customers.
Gronroos (1984) indicated that the perceived quality of service is dependent on a
comparison between expected and perceived service, and is thus the outcome of a
19
comparative evaluation process.
Parasuraman et al. (1985) defined “service quality “as the degree and direction of
discrepancy between a customer’s perceptions and expectations.
Barsky (1996) suggests that the customers may be excellent sources of information
for management on how the organization can provide quality service.
Through surveys and focus groups, customers can help management to determine
which service areas are most in need of improvement.
Customer perceptions are influenced by a variety of factors. Besides the actual
outcome – i.e. did the product or service deliver the expected function and did it fulfill
the customer’s need- the whole process of consumption and all interactions involved
are of crucial importance.
Customer perceptions are dynamic. First of all, with the developing relationship
between customer and company (hotel), his perceptions of the hotel and its services
will change, thus altering his or her perception of the best offer around.
2.2. Overseas student in China
The expression “international students” is a broad categorization which subsumes
a high level of diversity, for instance in cultural, linguistic, religious, pedagogical,
social and vocational backgrounds; in age, level of study, personal circumstances and
20
financial means; in tastes, preferences, needs and interests; and in personal
motivations for, and expectations of, studying abroad.
According to Wikipedia (Free Encyclopedia), typically, an international student is
simply a student from another country.
They are often times referred as overseas students. For the purpose of this research,
the term “international student” will serve the same purpose as “overseas student”.
According to Organization of Economic Cooperation and Development (OECD),
international student are those who travel to a country different from their own for the
purpose of tertiary study. Despite that, the definition of international students varies in
each Country in accordance to their own national education system.
People’s Republic of China refers international students as an individual of foreign
nationality, who has never held a nationality status from the Republic of China and
who does not possess an overseas Chinese student status at the time of his/ her
application.
Australia, “International students” are defined as those studying onshore only with
visa subclasses 570 to 575, excluding students on Australian funded scholarships or
sponsorship or students undertaking study while in possession of other temporary
visas.
United States of America, “International student” are defined as students who are
enrolled at institutions of higher education in the US who are not citizens of the US,
21
immigrants or refugees.
Based on the above, international students are basically referred to those students
studying in foreign educational institutions outside their Country of origin. This
includes either those doing the long term or the short term programs.
International student carry certain characteristics that make them very unique,
such characteristics include; having diverse knowledge worldwide, comprehending
international dimensions, communicating effectively in another language and / or
cross-culturally, exhibiting cross-cultural sensitivity and adaptability and carrying
global competencies throughout life.
China, Malaysia and Singapore are the emerging destinations for international
students. These three countries have combined share of approximately 12% of the
global student market with somewhere between 250,000 and 300,000 students having
decided to pursue higher education studies in these countries during the year
2005-2006.
The number of foreigners studying in china has been rising approximately 20%
annually since the reform and opening period began. This makes China the world’s
sixth- largest study abroad destination.
The number of international students opting to study in China has only increase in the
recent past. Introduction of new study reforms to facilitate international students and
handing out of scholarships to deserving candidates from various countries has also
22
contributed towards China’s aim to attract as many international students as possible.
Students from African countries have increased considerable in the recent past due to
Chinese government scholarship program.
As China understands the need to provide quality education to attract more
international students, universities there just encourage students to join educational
institute to pursue masters and doctoral degrees.
Some universities have started to offer courses directly in foreign languages to make
it easier for international students to study in China. With the country’s rich and
diverse culture, adding valuable inputs to a student’s perspective, more and more
international students from various parts of the world are choosing to study in China,
knowing and understanding new cultures, traditions and people.
2.3. Perception of Hotels in China
The fast growing tourism market has boosted China’s hotel development (WTTC
2006). The Chinese hotel industry has undergone a significant transformation within
the last two decades. Major cities like Shanghai and Beijing have blossomed with
high rise buildings and hotels that mirror the facilities and resources of their western
counterparts.
The hotel industry in China is considered to be one of the most important parts of
23
tourism and a symbol of “opening and reform”, which not only generates most of the
tourist revenues, but also contributes significantly to employment and acts as an
accelerator of economic and social development.
According a market research report (IBIS World, 2013) on hotels in China, in the
five years through 2013, the Hotel industry in China has been growing 6.9% on
average to an estimated $44.1 billion. However, growth has been volatile over the
period due to a number of macro-economic conditions like the global recession in
2009 and non-economic factors like natural disasters and strict visa limits during the
2008 Beijing Olympic Games. A particularly bright year for the industry was 2010,
due to the Shanghai Expo and the Guangzhou Asian Games, which resulted in a surge
in foreign tourists entering the county.
Pine and Phillips (2005) comment that the Chinese hotel industry has really only
existed from 1978 with the commencement of the ‘open door’ policy.
According to data derived from the China National Tourism Administration (2006) in
2005 there were 1,332,110 rooms distributed between 11,828 hotels.
Pine and Phillips (2005) again argue that hotels on the Chinese mainland lag
significantly behind their counterparts in Hong Kong, Macau, and Taiwan, and that
hotels owned by Chinese groups that operate both within and outside the People’s
24
Republic tend to outperform purely domestic operations due to a combination of
applying international best practices and knowledge of local conditions.
Yu (1995) has expressed that the concept of service was non-existent during the era
that Mao Zedong ruled China. Many hotel employees had service attitude problems
which drew constant complaints from international tourists. Further, Zhang (1987)
also pointed out that lack of education and training in tourism management was the
major reason for the problem of poor service in the hotel industry in China.
It is important to consider the international competitiveness of China’s hotel industry.
China has to compete for the same market with counterparts in the Asia-Pacific region,
such as Singapore, Hong Kong and Thailand, most of which are well established and
have a sophisticated hotel industry, with similar products but better service (Tisdell
and Wen, 1991)
In China’s bid to implement the guiding spirit of State’s Council’s opinions on
speeding up the development of the Tourism industry as well as other activities on the
development of star-rated hotels ordered by the State Council, a conference with the
aim to boost the development of tourist hotels and service quality of luxury hotels
across the country was held in Chongqing City on hotels and service quality of hotels
across the country on July 26 2010.
During the meeting, past achievements of the industry were summed up, problems
25
laid ahead were explored deeply, and a sweeping campaign, which is advocated by
the tourism administrative authority with the intention to boost service quality and
push up the transition and upgrade of the industry.
2.4. Overseas student perception of hotel service quality
The migration of international students is by no means a new phenomenon.
Schachner (1962:25), for example, refers to students in medieval times who “poured
in an increasing flood to the centers where they could literally sit at the feet of the
great teachers and absorb wisdom”.
To some extent the search for knowledge remains an important driver for international
movement in education today, but in other ways, motives, influences and indeed
origin and destination countries have changed radically.
The search for knowledge has been joined by a range of factors in driving growth.
These include: the perceived value of a foreign degree in terms of employment
enhancement (Pereda, 2006).
There has been much research on overseas or international student perception of
service quality in higher education however much has not been researched into
overseas or international student perception of hotel service quality. However there
seems to be some common factors that influence students’ perception both in higher
26
education and other service industries.
This seems to explain why to an extent, universities have increasingly involved in
defining service quality and measuring customer satisfaction in ways that are familiar
to service marketing specialists (Gronroos, 1984; Kotler, 1985), who themselves were
developing measures of service quality from the 1980s.
An empirical study conducted in Japan and Thailand with university students
identified a total of 10 factors of service quality which were grouped into three
categories of services such as (Gamage, et al, 2008): academic; nonacademic; and
facilities categories of service. In terms of the academic category, students considered
quality of academic staff, quality of programs, and university reputation as important
factors that influenced their perceptions service quality.
In the case of non-academic; financial assistance and tuition fees, counseling and
support services, job placement services, and grievance procedures contributed to
students’ perceptions of service quality. Finally with respect to facilities, students
considered physical plants and facilities, library and computing facilities and student
organizations as important factors in their perception of service quality.
A related study was done by Douglas et al. (2008) in the UK at Liverpool John
Moores University, the purpose of the study was to identify variables / determinants
of student perceived quality and the impact of those variables on student satisfaction
27
and/or dissatisfaction with the overall student experience.
Their findings indicated that responsiveness, communication and access are the
critical areas that education managers need to focus upon. For students, the main
sources of dissatisfaction are attitude, responsiveness, tangibles, teamwork,
communication, management, access and socialization.
A bigger change driven in part by the need for Universities to maintain numbers of
international students, particularly where these pay full tuition fees, has been the
recognition of such students as an important ‘market’ that needs to be satisfied in an
increasingly competitive world.
More recently, in a paper presented to the 1999 Australian International Education
Conference (Qinglin 1999) it was claimed that ‘full- fee paying international students
expect to be treated like customers and to receive high quality of service’.
The author agrees with the fact that overseas student are known to be a market
segment that are generally low budget travelers but also due to the fact that they, or
their families are normally paying full fees, may partly explain the extent to which
they are more critical of their experience and demanding (Pereda, 2006).
In other words, they are critical in demanding value for their money paid for services.
Van Der Wagen (1994, p.3), states that “individual customers have many different
perceptions which are influenced by their education, upbringing, experience and many
other factors”.
Hence based on these considerations from the literature, a conceptual model has been
28
developed using the five dimensions of service quality as possible factors that might
influence overseas student’s perceptions on hotel’s service quality.
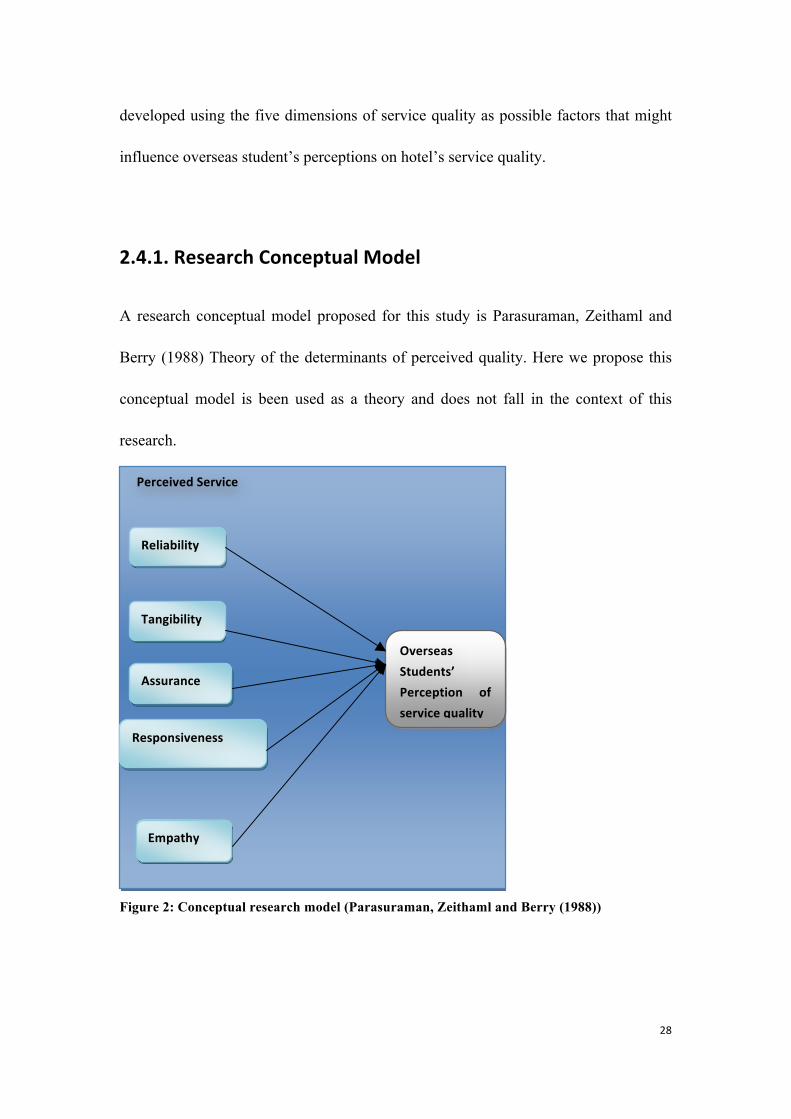
2.4.1. Research Conceptual Model
A research conceptual model proposed for this study is Parasuraman, Zeithaml and
Berry (1988) Theory of the determinants of perceived quality. Here we propose this
conceptual model is been used as a theory and does not fall in the context of this
research.
Figure 2: Conceptual research model (Parasuraman, Zeithaml and Berry (1988))
Perceived Service
Reliability
Tangibility
Assurance
Responsiveness
Empathy
Overseas Students’ Perception of service quality
29
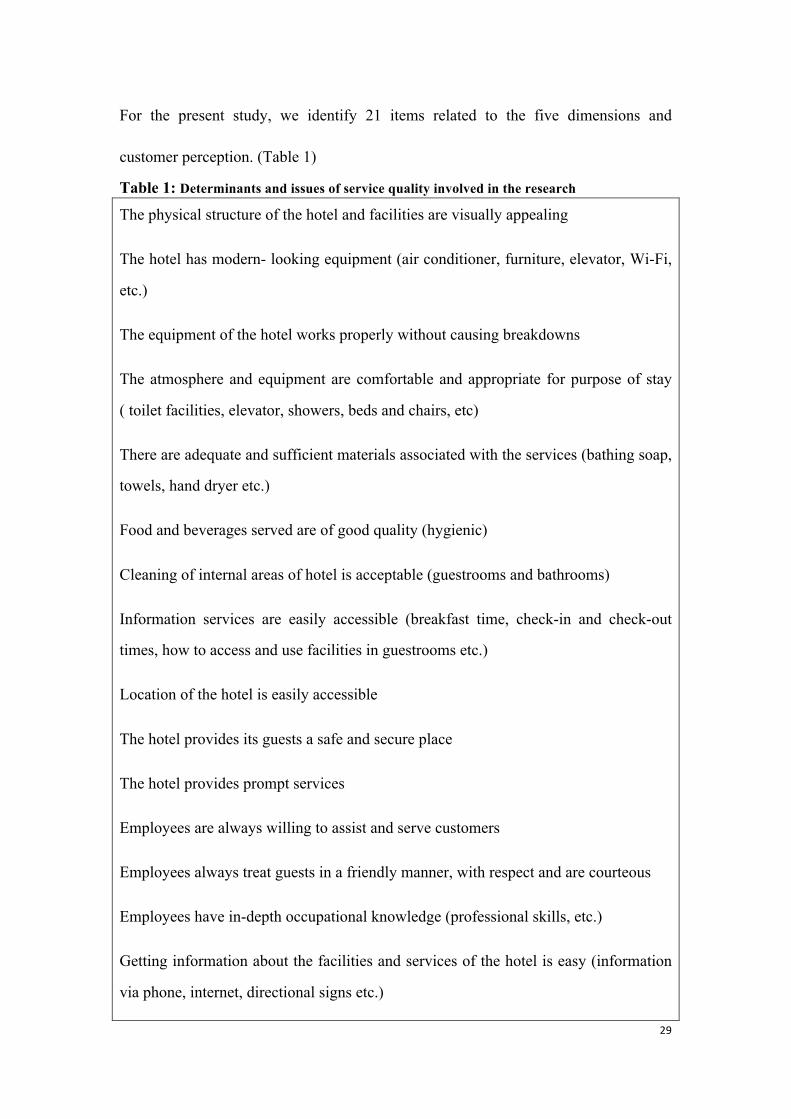
For the present study, we identify 21 items related to the five dimensions and
customer perception. (Table 1)
Table 1: Determinants and issues of service quality involved in the research
The physical structure of the hotel and facilities are visually appealing
The hotel has modern- looking equipment (air conditioner, furniture, elevator, Wi-Fi,
etc.)
The equipment of the hotel works properly without causing breakdowns
The atmosphere and equipment are comfortable and appropriate for purpose of stay
( toilet facilities, elevator, showers, beds and chairs, etc)
There are adequate and sufficient materials associated with the services (bathing soap,
towels, hand dryer etc.)
Food and beverages served are of good quality (hygienic)
Cleaning of internal areas of hotel is acceptable (guestrooms and bathrooms)
Information services are easily accessible (breakfast time, check-in and check-out
times, how to access and use facilities in guestrooms etc.)
Location of the hotel is easily accessible
The hotel provides its guests a safe and secure place
The hotel provides prompt services
Employees are always willing to assist and serve customers
Employees always treat guests in a friendly manner, with respect and are courteous
Employees have in-depth occupational knowledge (professional skills, etc.)
Getting information about the facilities and services of the hotel is easy (information
via phone, internet, directional signs etc.)
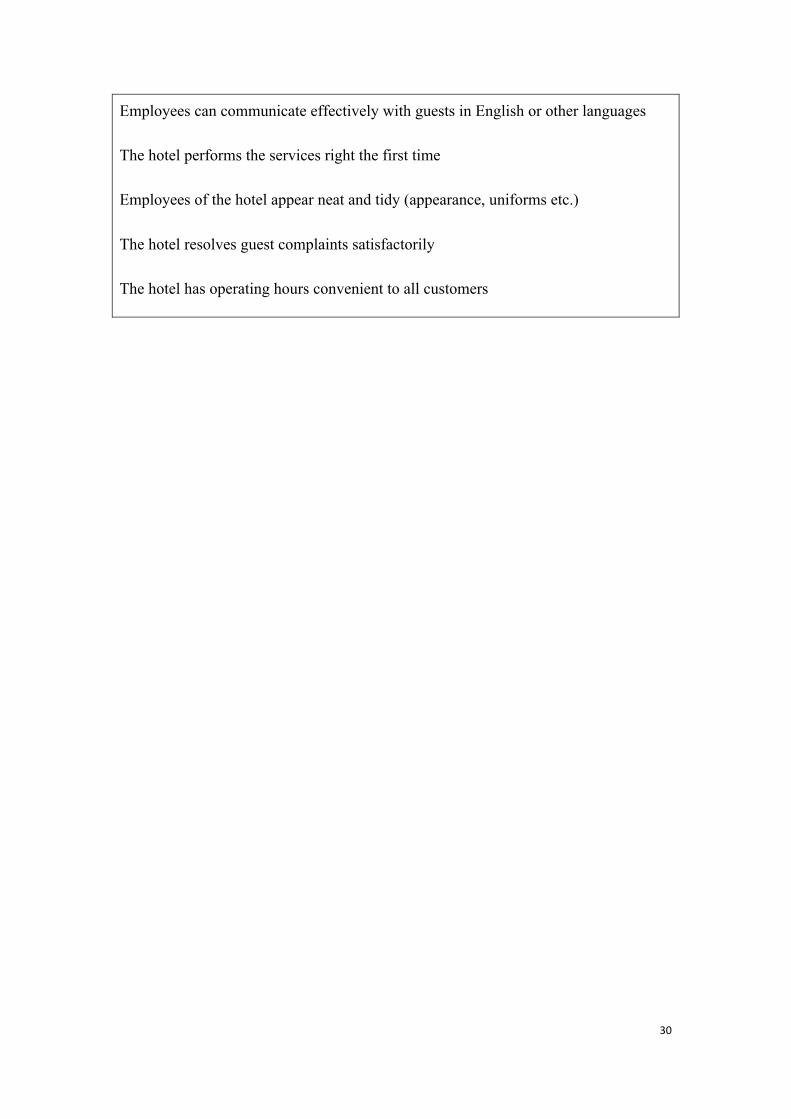
30
Employees can communicate effectively with guests in English or other languages
The hotel performs the services right the first time
Employees of the hotel appear neat and tidy (appearance, uniforms etc.)
The hotel resolves guest complaints satisfactorily
The hotel has operating hours convenient to all customers
31
CHAPTER THREE
METHODOLOGY
This chapter presents the methodology of the study. It covers the research design,
population sample and sampling techniques, data collection instruments, procedures
and method of analysis of the study.
3.1. Qualitative and Quantitative mixed method
Both qualitative and quantitative methods were used for collecting and analyzing
data.
However, Quantitative research is the main method used. Qualitative research method
was used for Semi- Structured Interview to gather questions for quantitative
questionnaire. The unit of analysis is individual, and the time horizon is
cross-sectional because the research is conducted specifically and in a short period of
time.
3.2. Research Design
The technique of personal interviewing was undertaken in order to reach the
objectives since it is the most flexible and productive method of communication,
enabled spontaneity, and also provided with: “The skill of guiding the discussion back
to the topic outlined when discussions are unfruitful” (Aaker & Day, 1990).
32
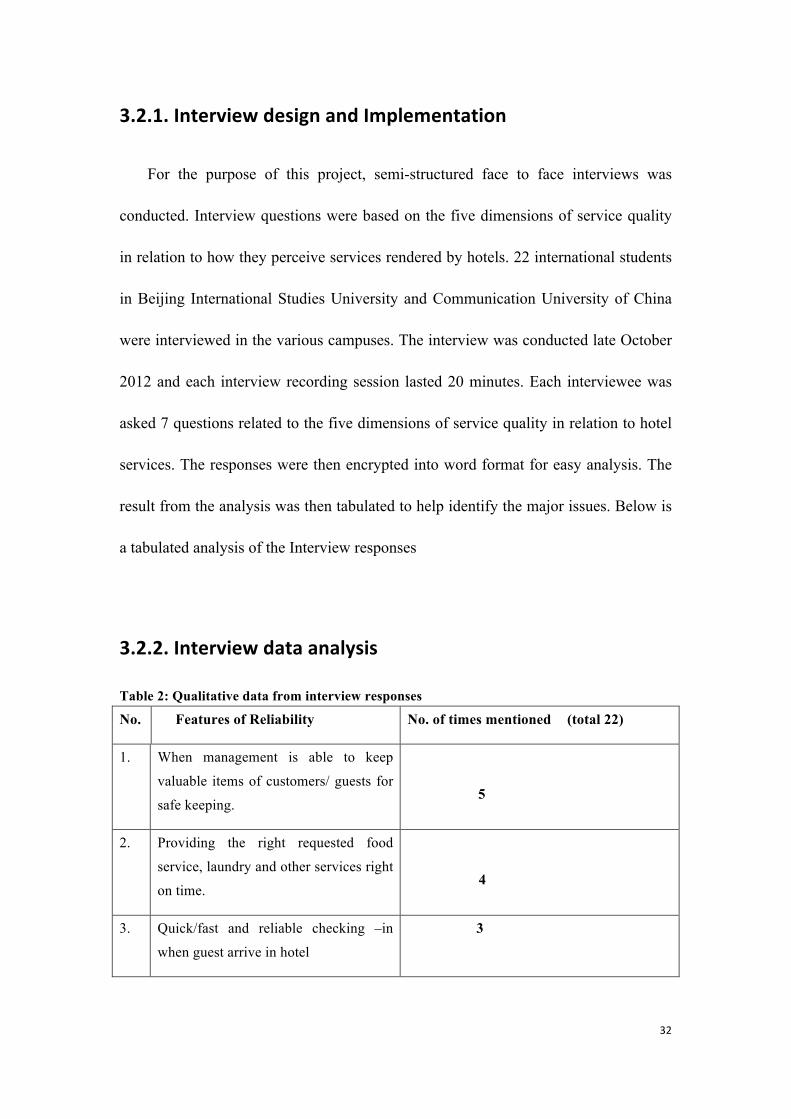
3.2.1. Interview design and Implementation
For the purpose of this project, semi-structured face to face interviews was
conducted. Interview questions were based on the five dimensions of service quality
in relation to how they perceive services rendered by hotels. 22 international students
in Beijing International Studies University and Communication University of China
were interviewed in the various campuses. The interview was conducted late October
2012 and each interview recording session lasted 20 minutes. Each interviewee was
asked 7 questions related to the five dimensions of service quality in relation to hotel
services. The responses were then encrypted into word format for easy analysis. The
result from the analysis was then tabulated to help identify the major issues. Below is
a tabulated analysis of the Interview responses
3.2.2. Interview data analysis
Table 2: Qualitative data from interview responses
No. Features of Reliability No. of times mentioned (total 22)
1. When management is able to keep
valuable items of customers/ guests for
safe keeping.
5
2. Providing the right requested food
service, laundry and other services right
on time.
4
3. Quick/fast and reliable checking –in
when guest arrive in hotel
3
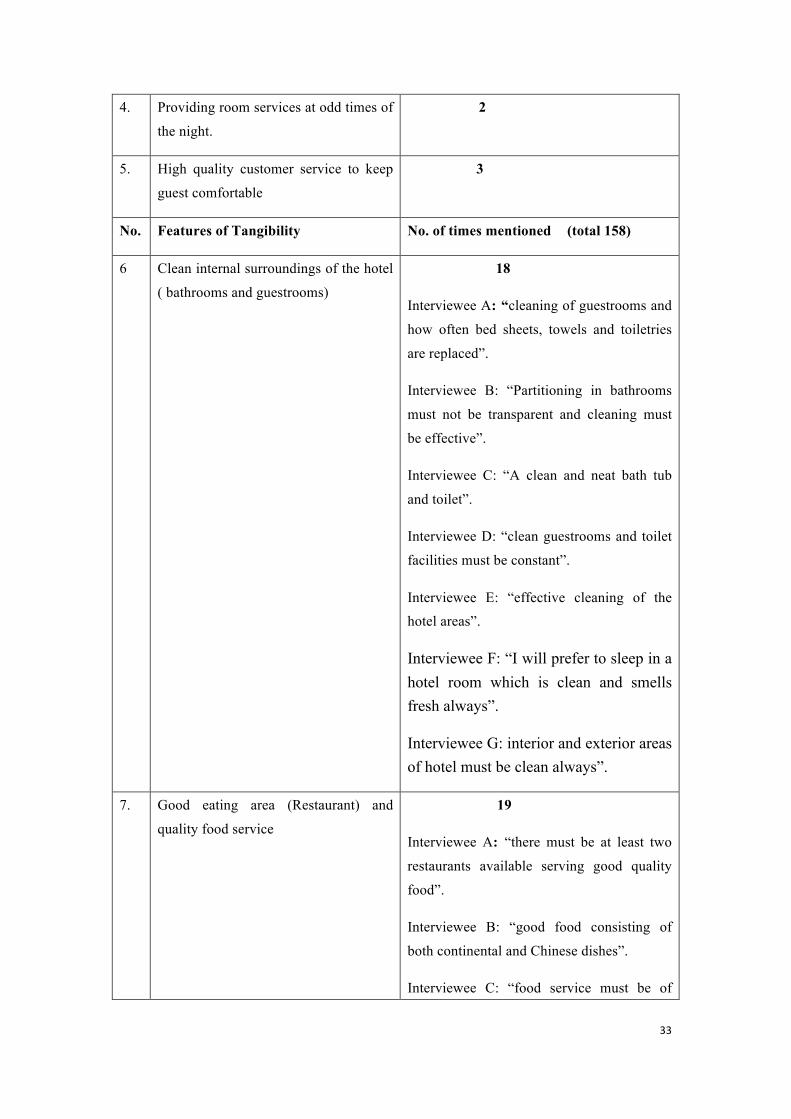
33
4. Providing room services at odd times of
the night.
2
5. High quality customer service to keep
guest comfortable
3
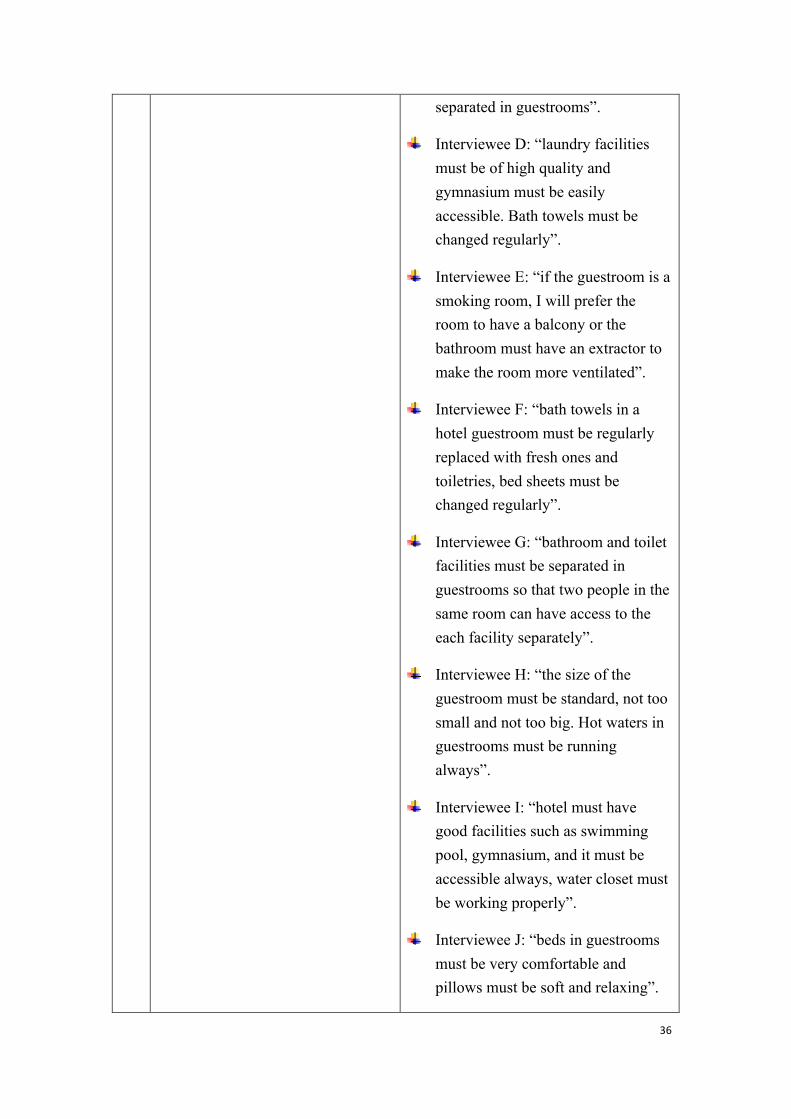
No. Features of Tangibility No. of times mentioned (total 158)
6
Clean internal surroundings of the hotel
( bathrooms and guestrooms)
18
Interviewee A: “cleaning of guestrooms and
how often bed sheets, towels and toiletries
are replaced”.
Interviewee B: “Partitioning in bathrooms
must not be transparent and cleaning must
be effective”.
Interviewee C: “A clean and neat bath tub
and toilet”.
Interviewee D: “clean guestrooms and toilet
facilities must be constant”.
Interviewee E: “effective cleaning of the
hotel areas”.
Interviewee F: “I will prefer to sleep in a hotel room which is clean and smells fresh always”.
Interviewee G: interior and exterior areas of hotel must be clean always”.
7. Good eating area (Restaurant) and
quality food service
19
Interviewee A: “there must be at least two
restaurants available serving good quality
food”.
Interviewee B: “good food consisting of
both continental and Chinese dishes”.
Interviewee C: “food service must be of
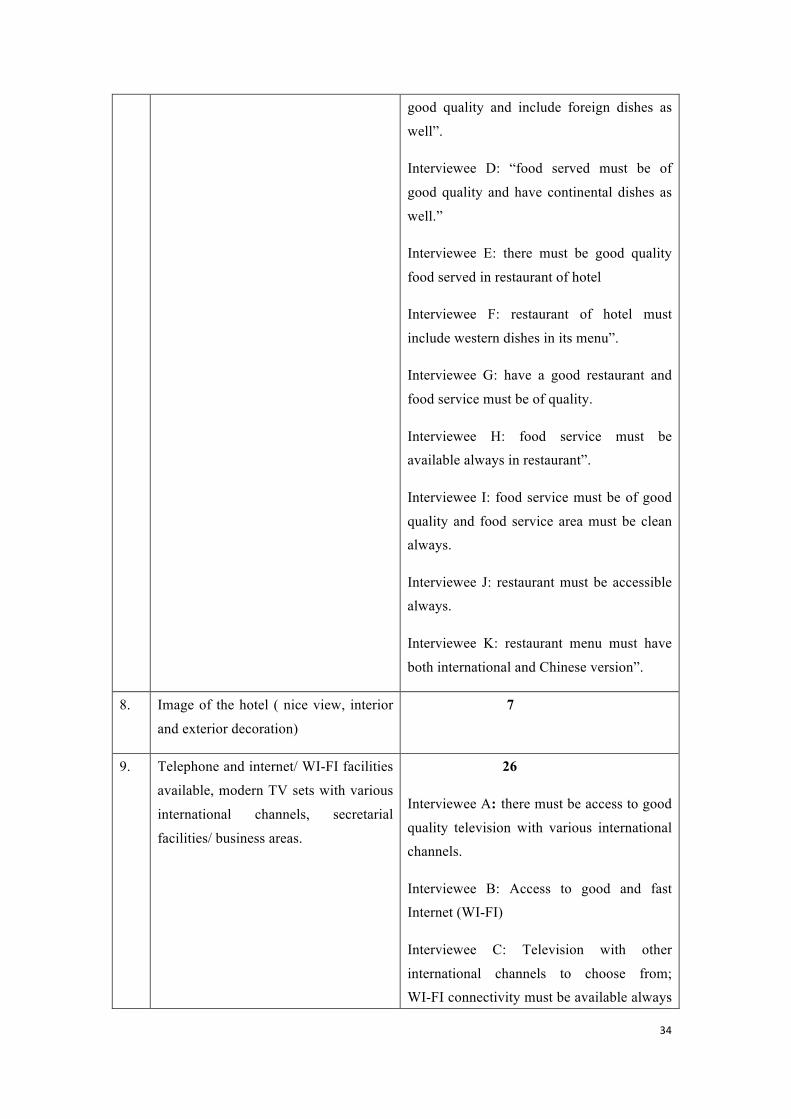
34
good quality and include foreign dishes as
well”.
Interviewee D: “food served must be of
good quality and have continental dishes as
well.”
Interviewee E: there must be good quality
food served in restaurant of hotel
Interviewee F: restaurant of hotel must
include western dishes in its menu”.
Interviewee G: have a good restaurant and
food service must be of quality.
Interviewee H: food service must be
available always in restaurant”.
Interviewee I: food service must be of good
quality and food service area must be clean
always.
Interviewee J: restaurant must be accessible
always.
Interviewee K: restaurant menu must have
both international and Chinese version”.
8. Image of the hotel ( nice view, interior
and exterior decoration)
7
9. Telephone and internet/ WI-FI facilities
available, modern TV sets with various
international channels, secretarial
facilities/ business areas.
26
Interviewee A: there must be access to good
quality television with various international
channels.
Interviewee B: Access to good and fast
Internet (WI-FI)
Interviewee C: Television with other
international channels to choose from;
WI-FI connectivity must be available always
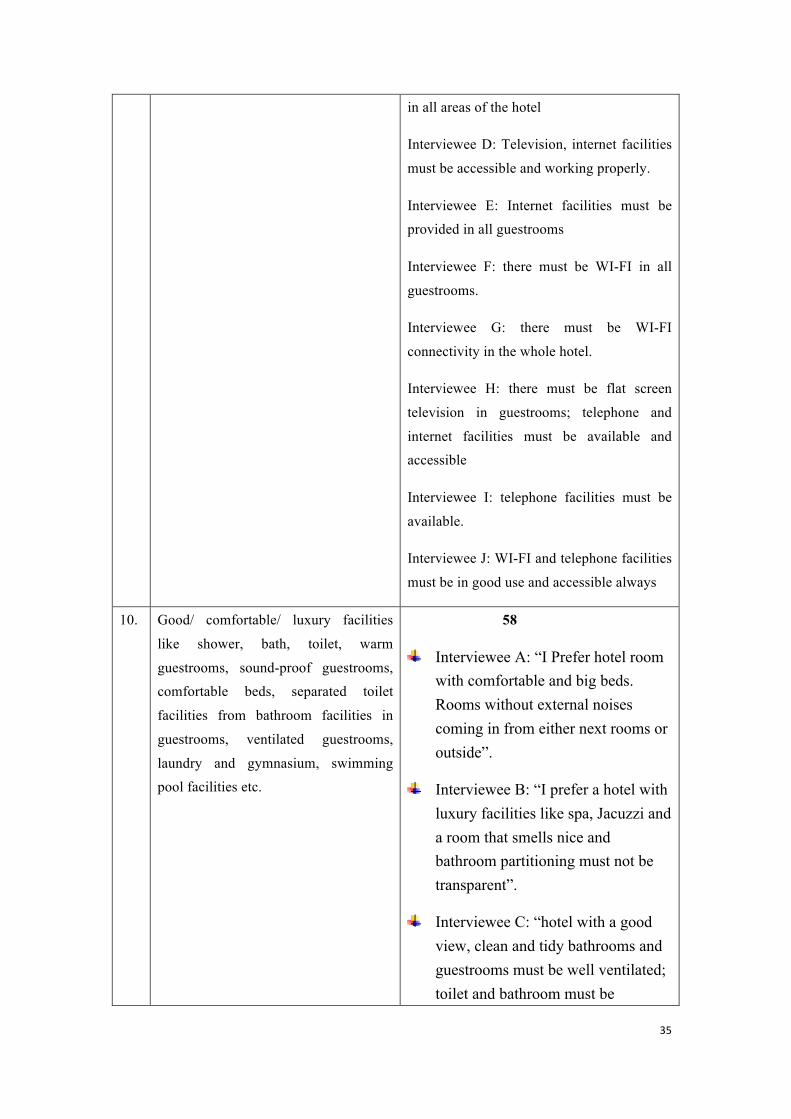
35
in all areas of the hotel
Interviewee D: Television, internet facilities
must be accessible and working properly.
Interviewee E: Internet facilities must be
provided in all guestrooms
Interviewee F: there must be WI-FI in all
guestrooms.
Interviewee G: there must be WI-FI
connectivity in the whole hotel.
Interviewee H: there must be flat screen
television in guestrooms; telephone and
internet facilities must be available and
accessible
Interviewee I: telephone facilities must be
available.
Interviewee J: WI-FI and telephone facilities
must be in good use and accessible always
10. Good/ comfortable/ luxury facilities
like shower, bath, toilet, warm
guestrooms, sound-proof guestrooms,
comfortable beds, separated toilet
facilities from bathroom facilities in
guestrooms, ventilated guestrooms,
laundry and gymnasium, swimming
pool facilities etc.
58
Interviewee A: “I Prefer hotel room with comfortable and big beds. Rooms without external noises coming in from either next rooms or outside”.
Interviewee B: “I prefer a hotel with luxury facilities like spa, Jacuzzi and a room that smells nice and bathroom partitioning must not be transparent”.
Interviewee C: “hotel with a good view, clean and tidy bathrooms and guestrooms must be well ventilated; toilet and bathroom must be
36
separated in guestrooms”.
Interviewee D: “laundry facilities must be of high quality and gymnasium must be easily accessible. Bath towels must be changed regularly”.
Interviewee E: “if the guestroom is a smoking room, I will prefer the room to have a balcony or the bathroom must have an extractor to make the room more ventilated”.
Interviewee F: “bath towels in a hotel guestroom must be regularly replaced with fresh ones and toiletries, bed sheets must be changed regularly”.
Interviewee G: “bathroom and toilet facilities must be separated in guestrooms so that two people in the same room can have access to the each facility separately”.
Interviewee H: “the size of the guestroom must be standard, not too small and not too big. Hot waters in guestrooms must be running always”.
Interviewee I: “hotel must have good facilities such as swimming pool, gymnasium, and it must be accessible always, water closet must be working properly”.
Interviewee J: “beds in guestrooms must be very comfortable and pillows must be soft and relaxing”.
37
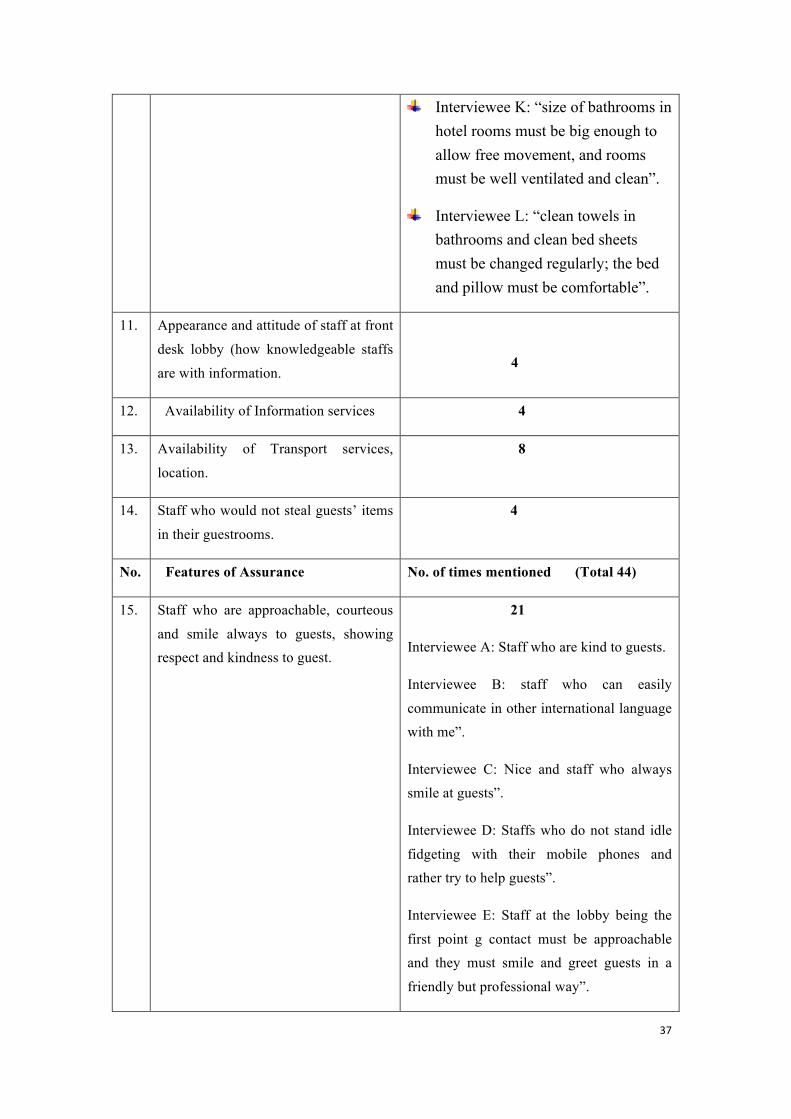
Interviewee K: “size of bathrooms in hotel rooms must be big enough to allow free movement, and rooms must be well ventilated and clean”.
Interviewee L: “clean towels in bathrooms and clean bed sheets must be changed regularly; the bed and pillow must be comfortable”.
11. Appearance and attitude of staff at front
desk lobby (how knowledgeable staffs
are with information.
4
12. Availability of Information services 4
13. Availability of Transport services,
location.
8
14. Staff who would not steal guests’ items
in their guestrooms.
4
No. Features of Assurance No. of times mentioned (Total 44)
15. Staff who are approachable, courteous
and smile always to guests, showing
respect and kindness to guest.
21
Interviewee A: Staff who are kind to guests.
Interviewee B: staff who can easily
communicate in other international language
with me”.
Interviewee C: Nice and staff who always
smile at guests”.
Interviewee D: Staffs who do not stand idle
fidgeting with their mobile phones and
rather try to help guests”.
Interviewee E: Staff at the lobby being the
first point g contact must be approachable
and they must smile and greet guests in a
friendly but professional way”.
38
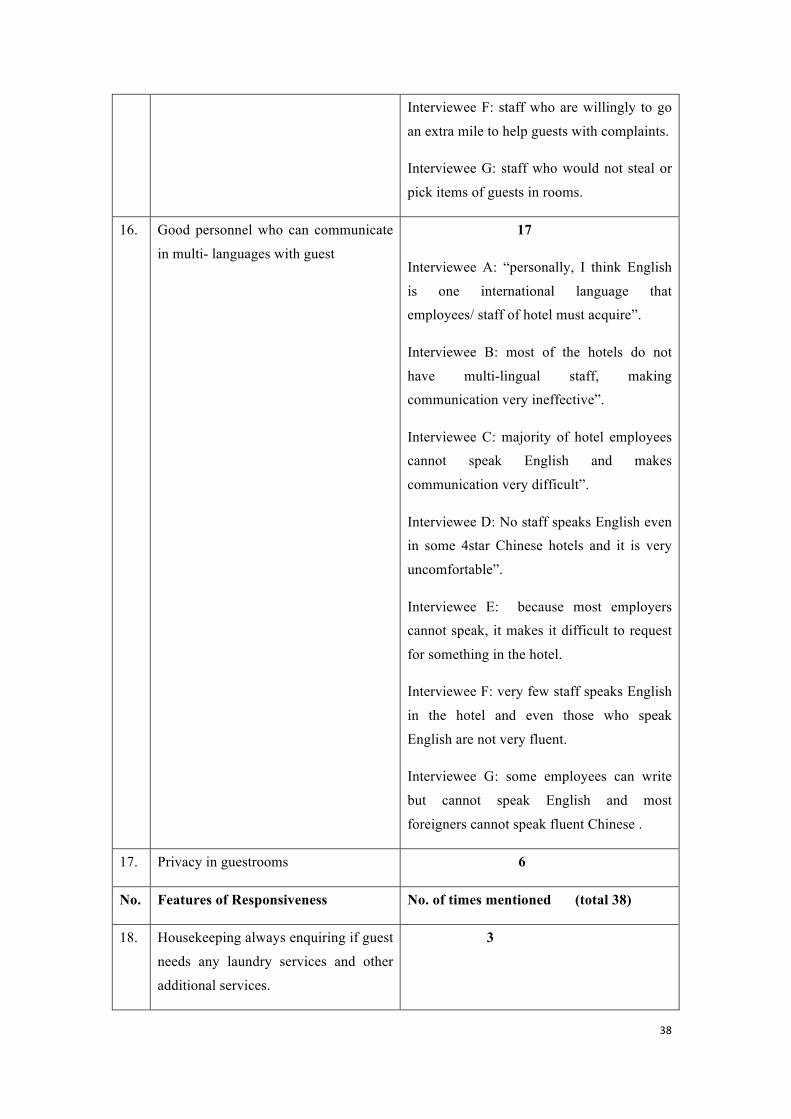
Interviewee F: staff who are willingly to go
an extra mile to help guests with complaints.
Interviewee G: staff who would not steal or
pick items of guests in rooms.
16. Good personnel who can communicate
in multi- languages with guest
17
Interviewee A: “personally, I think English
is one international language that
employees/ staff of hotel must acquire”.
Interviewee B: most of the hotels do not
have multi-lingual staff, making
communication very ineffective”.
Interviewee C: majority of hotel employees
cannot speak English and makes
communication very difficult”.
Interviewee D: No staff speaks English even
in some 4star Chinese hotels and it is very
uncomfortable”.
Interviewee E: because most employers
cannot speak, it makes it difficult to request
for something in the hotel.
Interviewee F: very few staff speaks English
in the hotel and even those who speak
English are not very fluent.
Interviewee G: some employees can write
but cannot speak English and most
foreigners cannot speak fluent Chinese .
17. Privacy in guestrooms 6
No. Features of Responsiveness No. of times mentioned (total 38)
18.
Housekeeping always enquiring if guest
needs any laundry services and other
additional services.
3
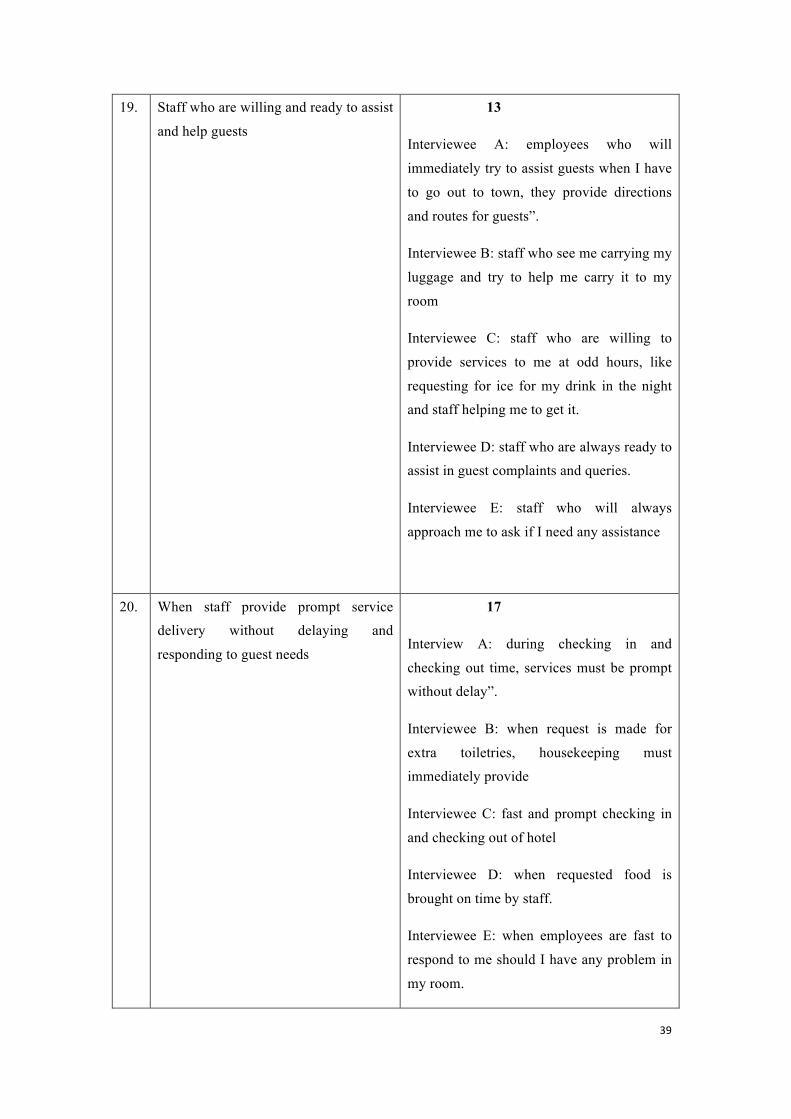
39
19. Staff who are willing and ready to assist
and help guests
13
Interviewee A: employees who will
immediately try to assist guests when I have
to go out to town, they provide directions
and routes for guests”.
Interviewee B: staff who see me carrying my
luggage and try to help me carry it to my
room
Interviewee C: staff who are willing to
provide services to me at odd hours, like
requesting for ice for my drink in the night
and staff helping me to get it.
Interviewee D: staff who are always ready to
assist in guest complaints and queries.
Interviewee E: staff who will always
approach me to ask if I need any assistance
20. When staff provide prompt service
delivery without delaying and
responding to guest needs
17
Interview A: during checking in and
checking out time, services must be prompt
without delay”.
Interviewee B: when request is made for
extra toiletries, housekeeping must
immediately provide
Interviewee C: fast and prompt checking in
and checking out of hotel
Interviewee D: when requested food is
brought on time by staff.
Interviewee E: when employees are fast to
respond to me should I have any problem in
my room.
40
21. Quick and fast checking –in and
checking out procedures
3
22. Fast delivery of food service in
restaurants
1
23. When services are readily available to
guests without reminding employees for
them
1
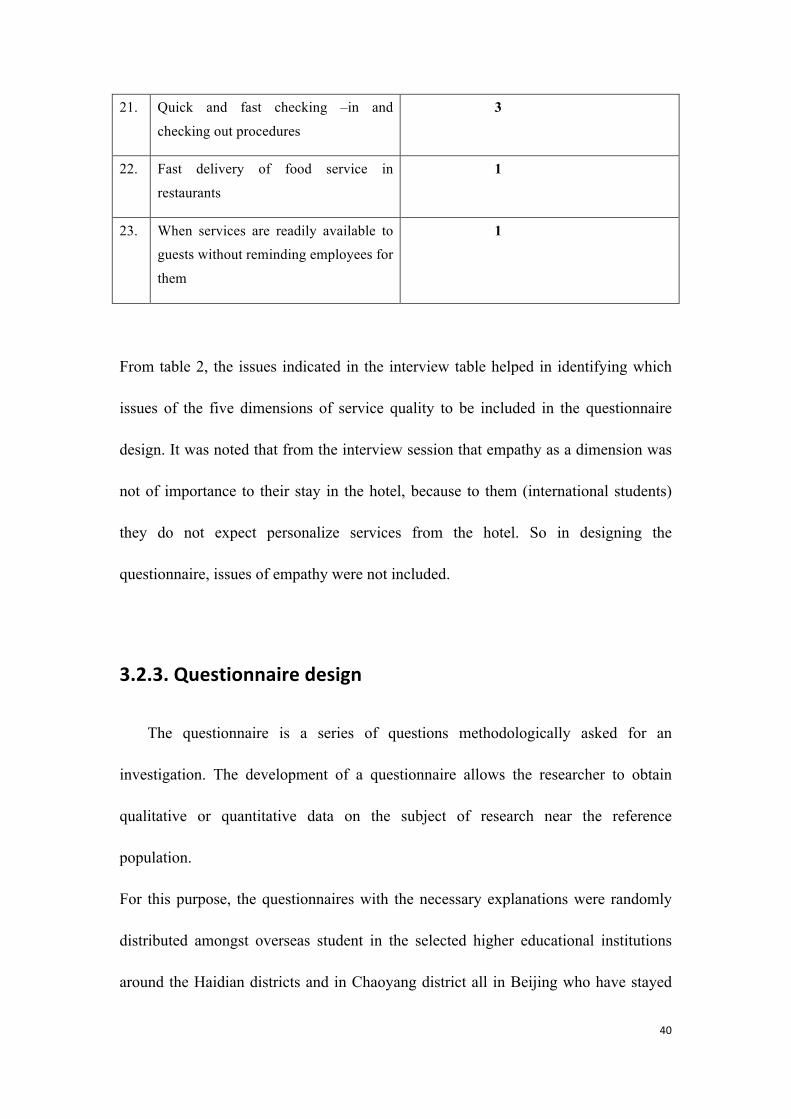
From table 2, the issues indicated in the interview table helped in identifying which
issues of the five dimensions of service quality to be included in the questionnaire
design. It was noted that from the interview session that empathy as a dimension was
not of importance to their stay in the hotel, because to them (international students)
they do not expect personalize services from the hotel. So in designing the
questionnaire, issues of empathy were not included.
3.2.3. Questionnaire design
The questionnaire is a series of questions methodologically asked for an
investigation. The development of a questionnaire allows the researcher to obtain
qualitative or quantitative data on the subject of research near the reference
population.
For this purpose, the questionnaires with the necessary explanations were randomly
distributed amongst overseas student in the selected higher educational institutions
around the Haidian districts and in Chaoyang district all in Beijing who have stayed
41
before in hotels within Mainland China. The information from questionnaires was
used for testing the questions.
The questionnaire selected for this study is structured closed type in which the
researcher wants to promote the responder to answer one of the five questions
prepared based on Likert Scale, 1 to 5 (5 is from the highest perception, whereas, 1 is
the lowest perception) by designing some special and purposeful questions from
interview responses (including the dimensions in Servqual model: Reliability.
tangibility, Assurance, Responsiveness,) and other options (overall perception).
It should be noted however that, questions on Empathy dimension were not included
in the questionnaire because from the initial interview responses, there were no
responses under Empathy.
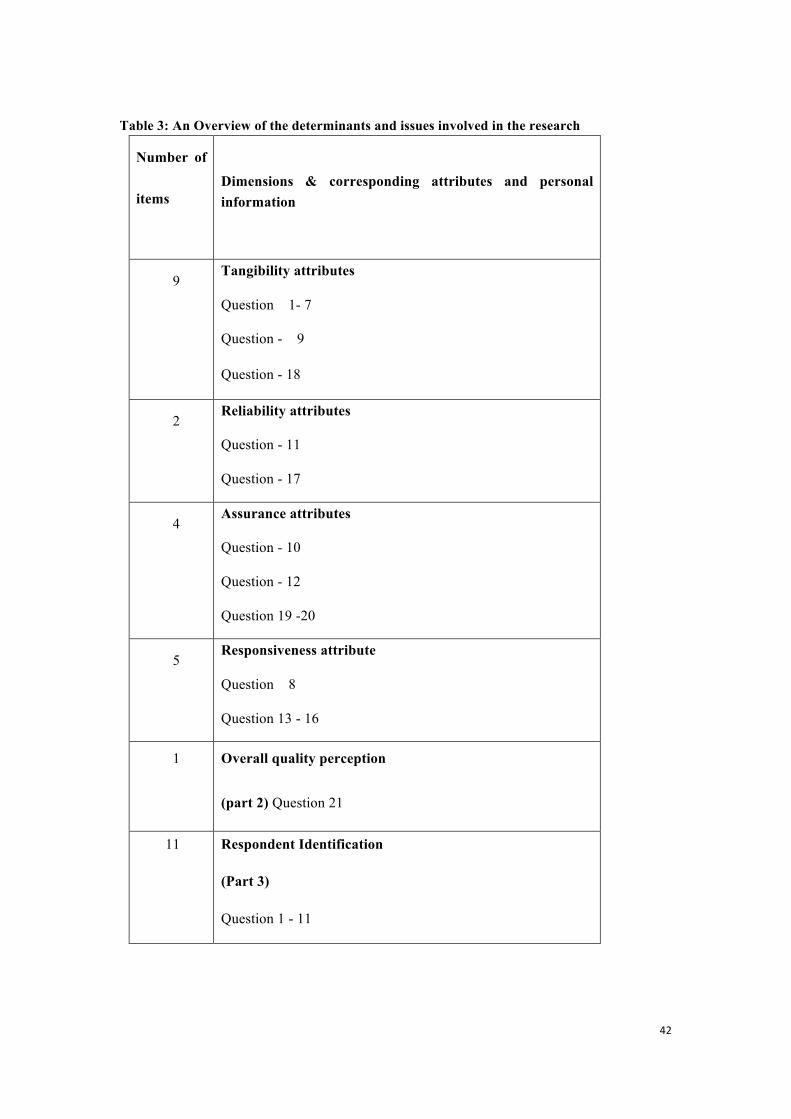
The questionnaire used for this study contains 32 questions: 20 items for service
quality and 1 item for overall perception and 11 questions for the general information
of the respondent. It contains of three parts.
Part I: this section consists of various categories of descriptions about service quality
Part II: Overall perception
Part III: General Information of respondents
42
Table 3: An Overview of the determinants and issues involved in the research
Number of
items
Dimensions & corresponding attributes and personal information
9 Tangibility attributes
Question 1- 7
Question - 9
Question - 18
2 Reliability attributes
Question - 11
Question - 17
4 Assurance attributes
Question - 10
Question - 12
Question 19 -20
5 Responsiveness attribute
Question 8
Question 13 - 16
1 Overall quality perception
(part 2) Question 21
11 Respondent Identification
(Part 3)
Question 1 - 11
43
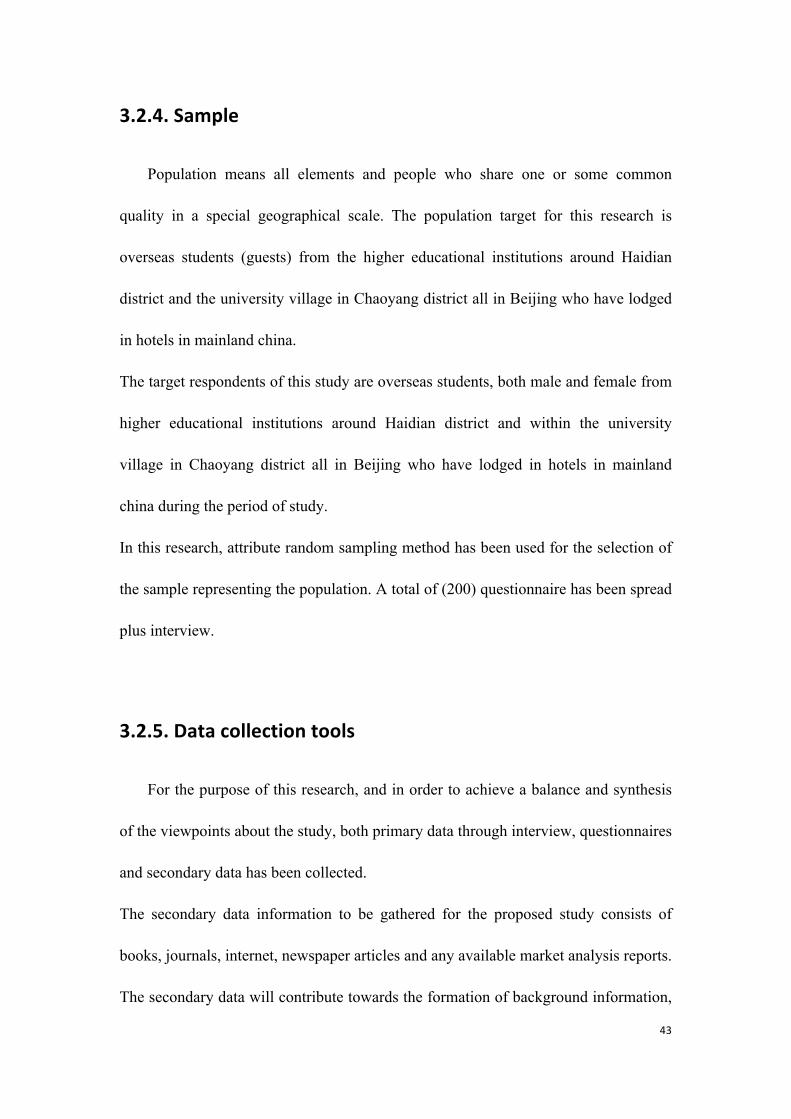
3.2.4. Sample
Population means all elements and people who share one or some common
quality in a special geographical scale. The population target for this research is
overseas students (guests) from the higher educational institutions around Haidian
district and the university village in Chaoyang district all in Beijing who have lodged
in hotels in mainland china.
The target respondents of this study are overseas students, both male and female from
higher educational institutions around Haidian district and within the university
village in Chaoyang district all in Beijing who have lodged in hotels in mainland
china during the period of study.
In this research, attribute random sampling method has been used for the selection of
the sample representing the population. A total of (200) questionnaire has been spread
plus interview.
3.2.5. Data collection tools
For the purpose of this research, and in order to achieve a balance and synthesis
of the viewpoints about the study, both primary data through interview, questionnaires
and secondary data has been collected.
The secondary data information to be gathered for the proposed study consists of
books, journals, internet, newspaper articles and any available market analysis reports.
The secondary data will contribute towards the formation of background information,
44
needed by both the researcher in order to build constructively the project and the
reader to comprehend more thoroughly the survey outcome.
The researcher randomly distributed the questionnaire to campuses of various
universities in Haidian and Chaoyang district for overseas student. A total of 200
questionnaires were handed out. The data was collected from December 20th to
January 23rd 2013 by self administration.
Amongst the returned questionnaires, there were 187 completed questionnaires, 5
invalid questionnaires and 8 were not returned.
3.3. Analytical approach
Data collected in this study was analyzed using descriptive-inferential statistics
and SPSS (statistical package social science). In using descriptive statistics, data was
analyzed using statistical indexes such as frequency, percentage and average. Factor
analysis was performed on responses from the questionnaire using Likert scale.
Finally an analysis of variance (ANOVA) was employed to test whether differences in
the factors that were identified.
45
CHAPTER FOUR
RESULTS AND FINDINGS
This Chapter presents the findings and results of this study consisting of the personal
data of the respondents, level of overseas student expectation and perception, and the
factors that will influence perception of hotel service quality in Mainland China.
Participants of this study consisted of 187 overseas student who are currently studying
in Universities within Haidian and Chaoyang district and have stayed in a hotel within
mainland China. The researcher used the random sampling method to select
respondents.
4.1. Descriptive analysis
Descriptive analysis will be used to describe the personal data of respondents
such as; number of males and females involved in this research, country of origin,
mean age etc, and it will also be used to examine the form of the data, whether the
data is normal distributed.
The analysis process consisted of analyzing the frequency distribution of the variables
which were used in order to identify the respondent’s profiles and to examine the
form of the data.
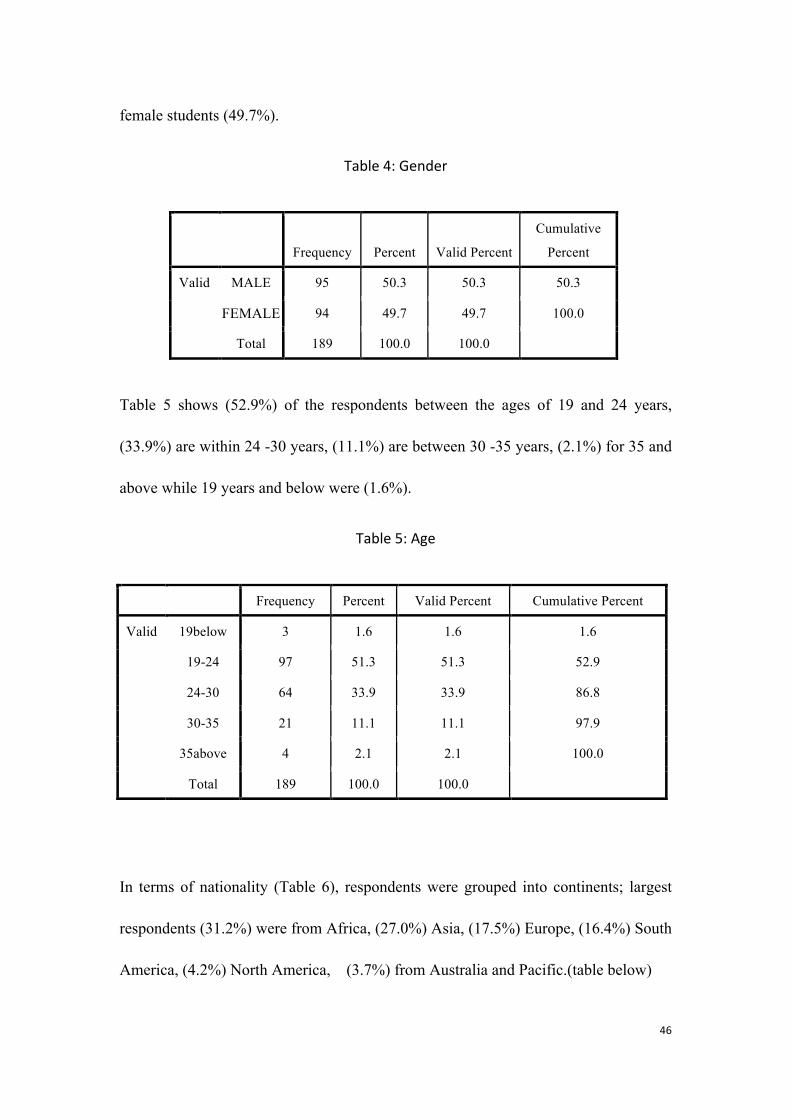
Table 4 shows that male overseas student (50.3%) stayed in hotels as compared to
46
female students (49.7%).
Table 4: Gender
Frequency Percent Valid Percent
Cumulative
Percent
Valid MALE 95 50.3 50.3 50.3
FEMALE 94 49.7 49.7 100.0
Total 189 100.0 100.0
Table 5 shows (52.9%) of the respondents between the ages of 19 and 24 years,
(33.9%) are within 24 -30 years, (11.1%) are between 30 -35 years, (2.1%) for 35 and
above while 19 years and below were (1.6%).
Table 5: Age
Frequency Percent Valid Percent Cumulative Percent
Valid 19below 3 1.6 1.6 1.6
19-24 97 51.3 51.3 52.9
24-30 64 33.9 33.9 86.8
30-35 21 11.1 11.1 97.9
35above 4 2.1 2.1 100.0
Total 189 100.0 100.0
In terms of nationality (Table 6), respondents were grouped into continents; largest
respondents (31.2%) were from Africa, (27.0%) Asia, (17.5%) Europe, (16.4%) South
America, (4.2%) North America, (3.7%) from Australia and Pacific.(table below)
47
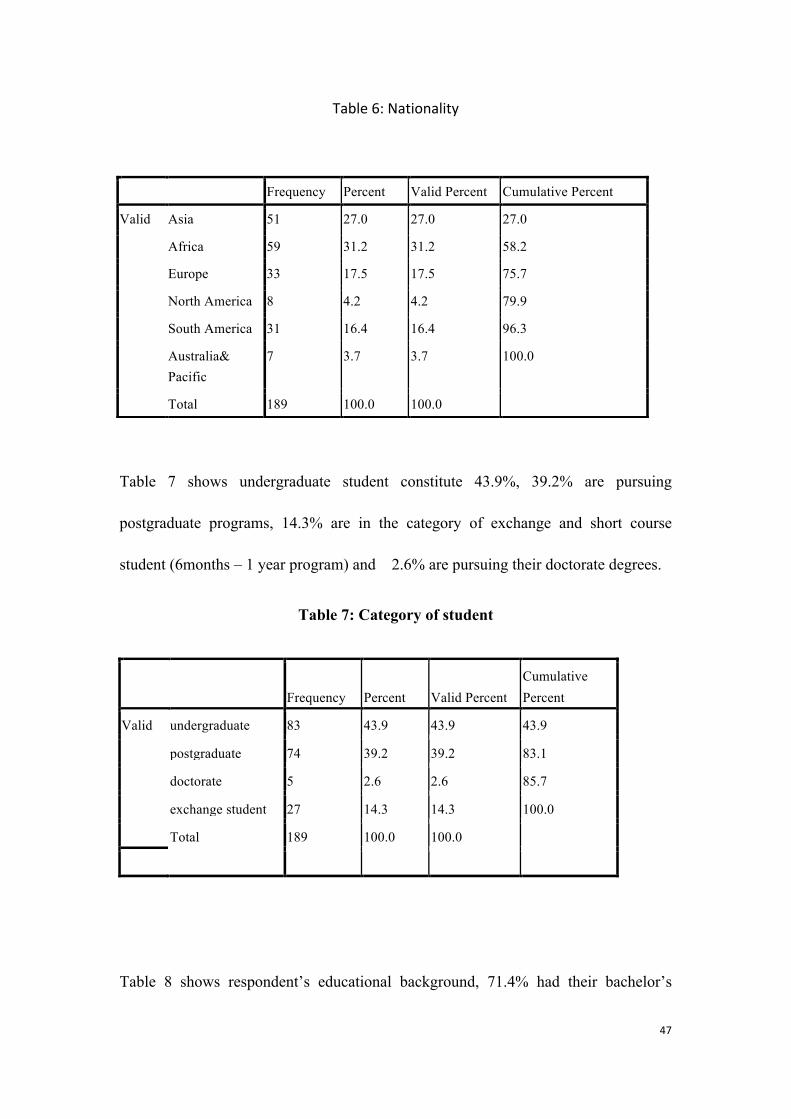
Table 6: Nationality
Table 7 shows undergraduate student constitute 43.9%, 39.2% are pursuing
postgraduate programs, 14.3% are in the category of exchange and short course
student (6months – 1 year program) and 2.6% are pursuing their doctorate degrees.
Table 7: Category of student
Frequency Percent Valid Percent Cumulative Percent
Valid undergraduate 83 43.9 43.9 43.9
postgraduate 74 39.2 39.2 83.1
doctorate 5 2.6 2.6 85.7
exchange student 27 14.3 14.3 100.0
Total 189 100.0 100.0
Table 8 shows respondent’s educational background, 71.4% had their bachelor’s
Frequency Percent Valid Percent Cumulative Percent
Valid Asia 51 27.0 27.0 27.0
Africa 59 31.2 31.2 58.2
Europe 33 17.5 17.5 75.7
North America 8 4.2 4.2 79.9
South America 31 16.4 16.4 96.3
Australia& Pacific
7 3.7 3.7 100.0
Total 189 100.0 100.0
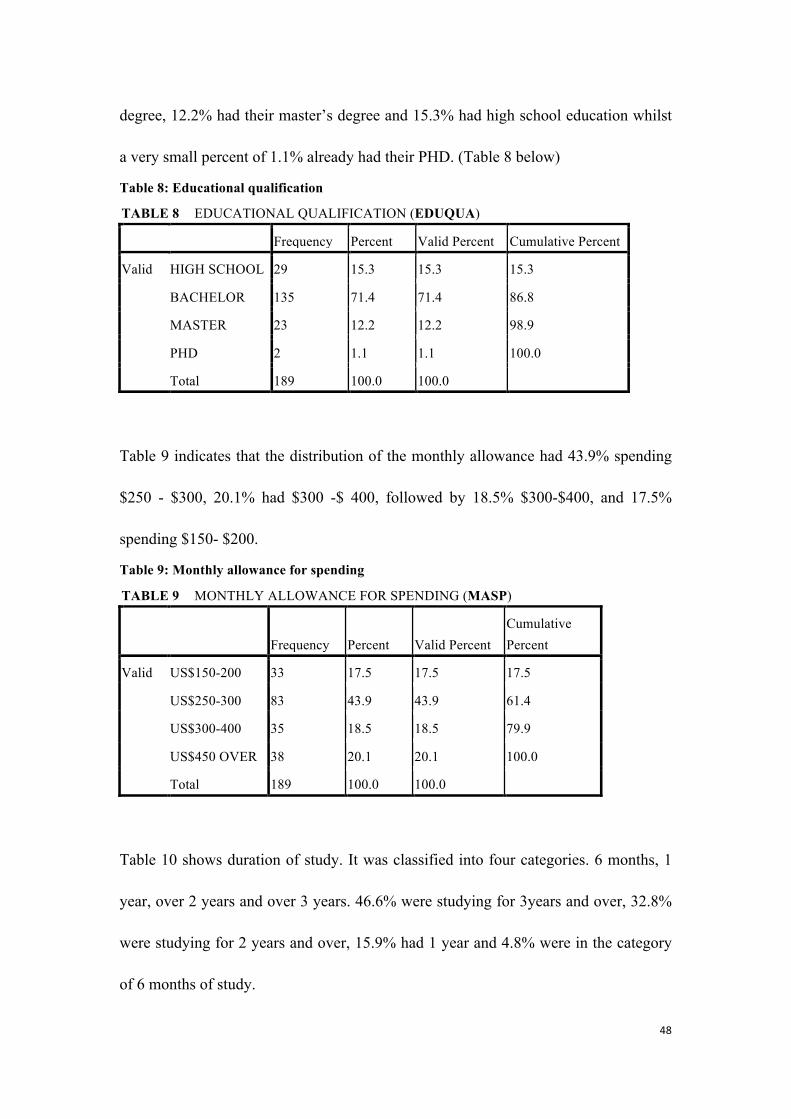
48
degree, 12.2% had their master’s degree and 15.3% had high school education whilst
a very small percent of 1.1% already had their PHD. (Table 8 below)
Table 8: Educational qualification
TABLE 8 EDUCATIONAL QUALIFICATION (EDUQUA)
Frequency Percent Valid Percent Cumulative Percent
Valid HIGH SCHOOL 29 15.3 15.3 15.3
BACHELOR 135 71.4 71.4 86.8
MASTER 23 12.2 12.2 98.9
PHD 2 1.1 1.1 100.0
Total 189 100.0 100.0
Table 9 indicates that the distribution of the monthly allowance had 43.9% spending
$250 - $300, 20.1% had $300 -$ 400, followed by 18.5% $300-$400, and 17.5%
spending $150- $200.
Table 9: Monthly allowance for spending
TABLE 9 MONTHLY ALLOWANCE FOR SPENDING (MASP)
Frequency Percent Valid Percent Cumulative Percent
Valid US$150-200 33 17.5 17.5 17.5
US$250-300 83 43.9 43.9 61.4
US$300-400 35 18.5 18.5 79.9
US$450 OVER 38 20.1 20.1 100.0
Total 189 100.0 100.0
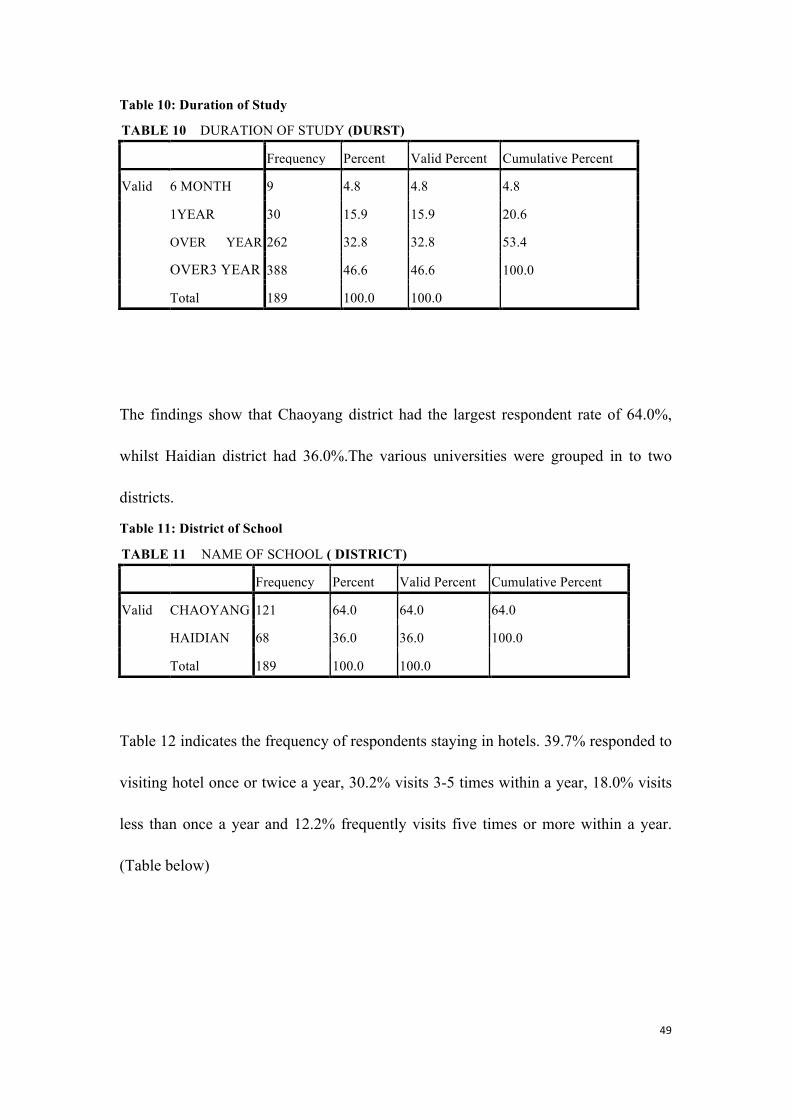
Table 10 shows duration of study. It was classified into four categories. 6 months, 1
year, over 2 years and over 3 years. 46.6% were studying for 3years and over, 32.8%
were studying for 2 years and over, 15.9% had 1 year and 4.8% were in the category
of 6 months of study.
49
Table 10: Duration of Study
TABLE 10 DURATION OF STUDY (DURST)
Frequency Percent Valid Percent Cumulative Percent
Valid 6 MONTH 9 4.8 4.8 4.8
1YEAR 30 15.9 15.9 20.6
OVER YEAR 262 32.8 32.8 53.4
OVER3 YEAR 388 46.6 46.6 100.0
Total 189 100.0 100.0
The findings show that Chaoyang district had the largest respondent rate of 64.0%,
whilst Haidian district had 36.0%.The various universities were grouped in to two
districts.
Table 11: District of School
TABLE 11 NAME OF SCHOOL ( DISTRICT)
Frequency Percent Valid Percent Cumulative Percent
Valid CHAOYANG 121 64.0 64.0 64.0
HAIDIAN 68 36.0 36.0 100.0
Total 189 100.0 100.0
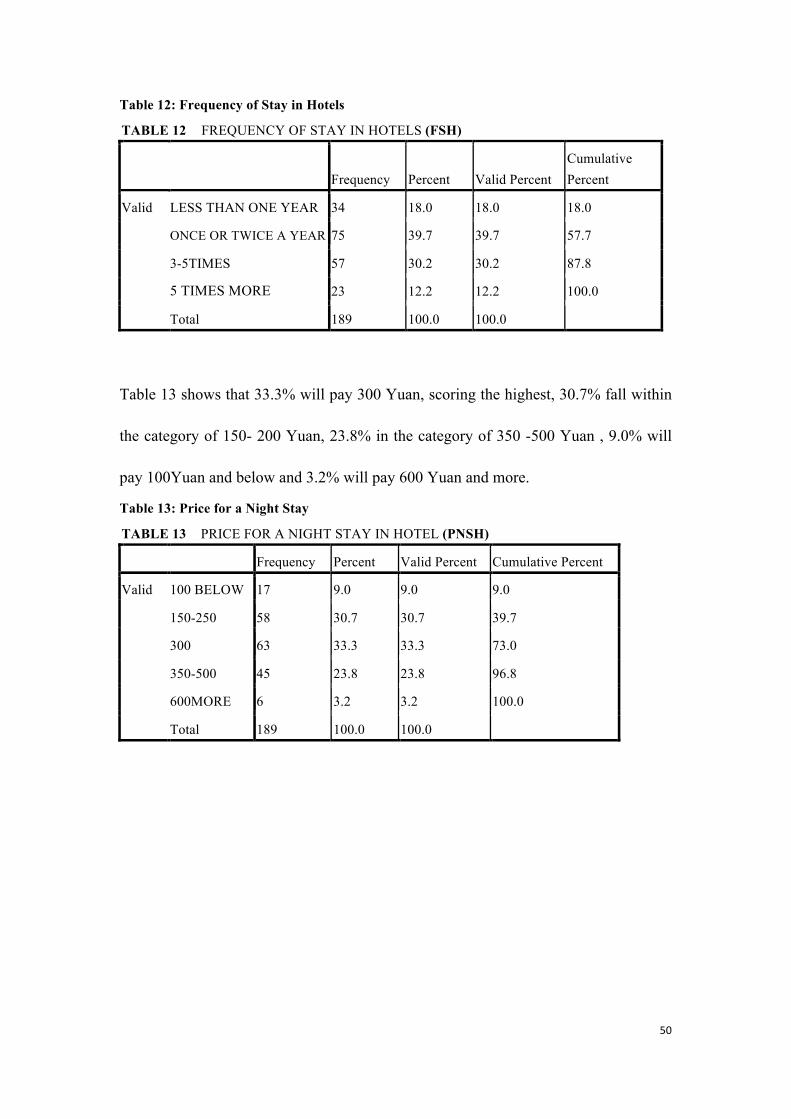
Table 12 indicates the frequency of respondents staying in hotels. 39.7% responded to
visiting hotel once or twice a year, 30.2% visits 3-5 times within a year, 18.0% visits
less than once a year and 12.2% frequently visits five times or more within a year.
(Table below)
50
Table 12: Frequency of Stay in Hotels
TABLE 12 FREQUENCY OF STAY IN HOTELS (FSH)
Frequency Percent Valid Percent Cumulative Percent
Valid LESS THAN ONE YEAR 34 18.0 18.0 18.0
ONCE OR TWICE A YEAR 75 39.7 39.7 57.7
3-5TIMES 57 30.2 30.2 87.8
5 TIMES MORE 23 12.2 12.2 100.0
Total 189 100.0 100.0
Table 13 shows that 33.3% will pay 300 Yuan, scoring the highest, 30.7% fall within
the category of 150- 200 Yuan, 23.8% in the category of 350 -500 Yuan , 9.0% will
pay 100Yuan and below and 3.2% will pay 600 Yuan and more.
Table 13: Price for a Night Stay
TABLE 13 PRICE FOR A NIGHT STAY IN HOTEL (PNSH)
Frequency Percent Valid Percent Cumulative Percent
Valid 100 BELOW 17 9.0 9.0 9.0
150-250 58 30.7 30.7 39.7
300 63 33.3 33.3 73.0
350-500 45 23.8 23.8 96.8
600MORE 6 3.2 3.2 100.0
Total 189 100.0 100.0
51
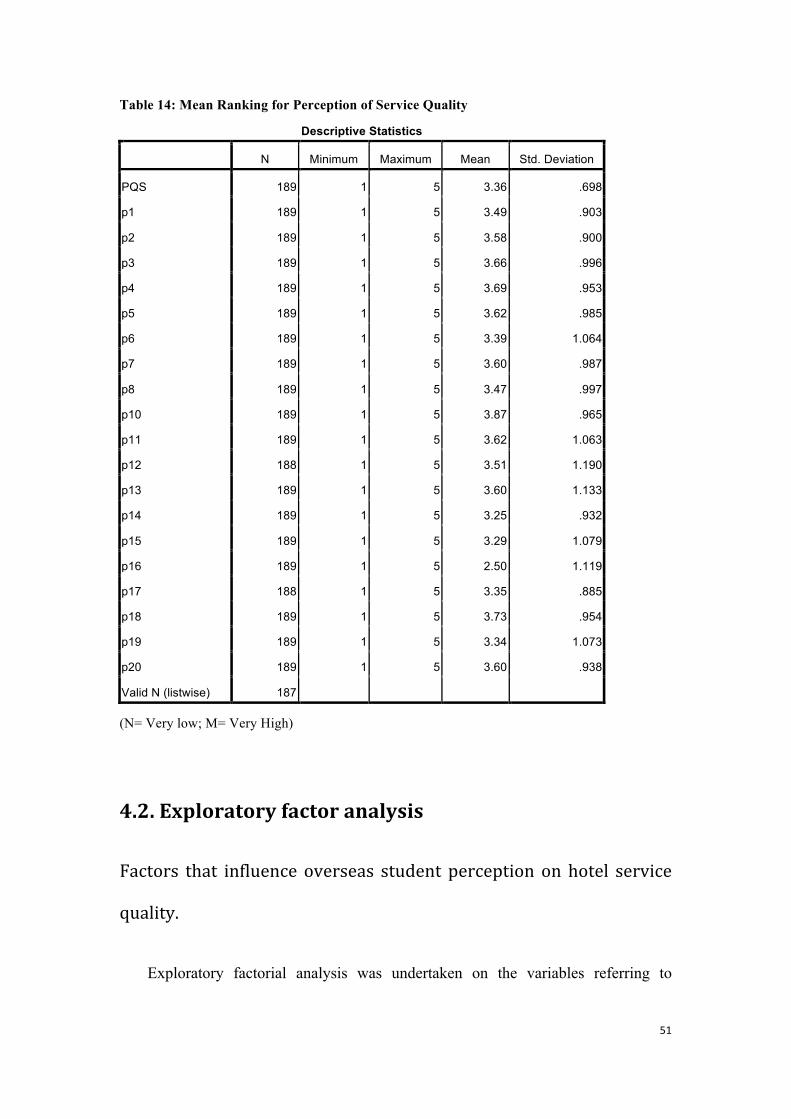
Table 14: Mean Ranking for Perception of Service Quality
Descriptive Statistics
N Minimum Maximum Mean Std. Deviation
PQS 189 1 5 3.36 .698
p1 189 1 5 3.49 .903
p2 189 1 5 3.58 .900
p3 189 1 5 3.66 .996
p4 189 1 5 3.69 .953
p5 189 1 5 3.62 .985
p6 189 1 5 3.39 1.064
p7 189 1 5 3.60 .987
p8 189 1 5 3.47 .997
p10 189 1 5 3.87 .965
p11 189 1 5 3.62 1.063
p12 188 1 5 3.51 1.190
p13 189 1 5 3.60 1.133
p14 189 1 5 3.25 .932
p15 189 1 5 3.29 1.079
p16 189 1 5 2.50 1.119
p17 188 1 5 3.35 .885
p18 189 1 5 3.73 .954
p19 189 1 5 3.34 1.073
p20 189 1 5 3.60 .938
Valid N (listwise) 187
(N= Very low; M= Very High)
4.2. Exploratory factor analysis
Factors that influence overseas student perception on hotel service
quality.
Exploratory factorial analysis was undertaken on the variables referring to
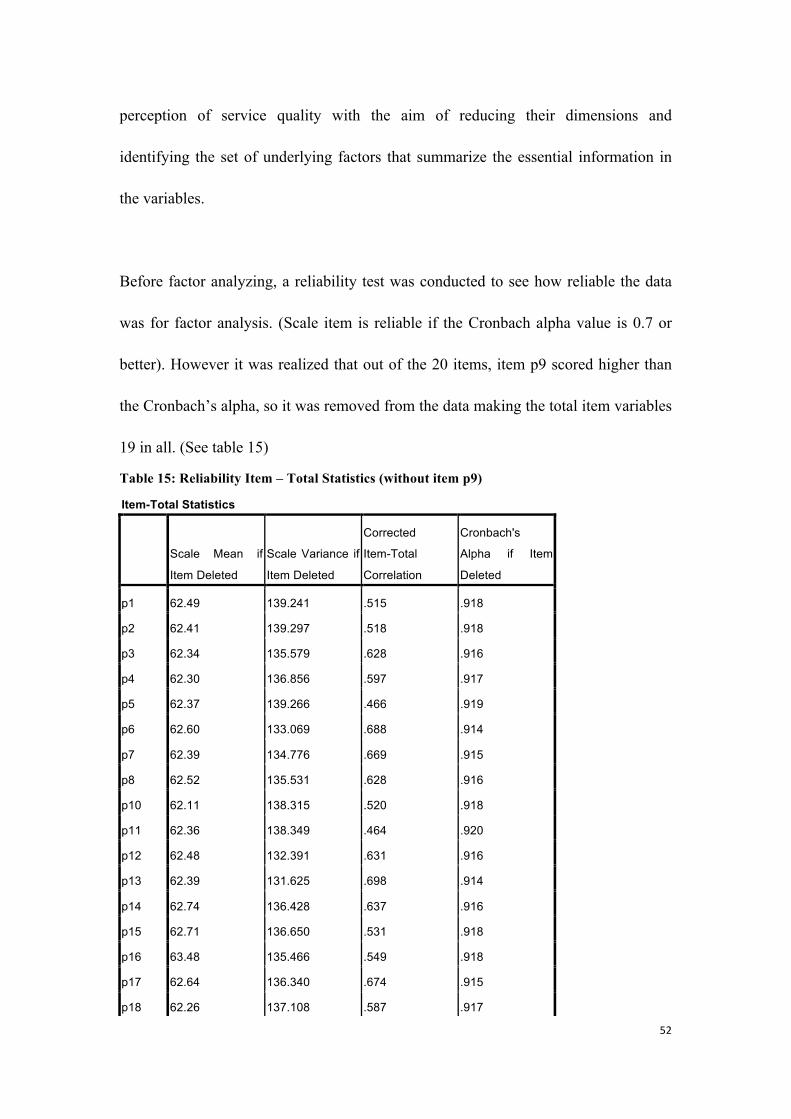
52
perception of service quality with the aim of reducing their dimensions and
identifying the set of underlying factors that summarize the essential information in
the variables.
Before factor analyzing, a reliability test was conducted to see how reliable the data
was for factor analysis. (Scale item is reliable if the Cronbach alpha value is 0.7 or
better). However it was realized that out of the 20 items, item p9 scored higher than
the Cronbach’s alpha, so it was removed from the data making the total item variables
19 in all. (See table 15)
Table 15: Reliability Item – Total Statistics (without item p9)
Item-Total Statistics
Scale Mean if
Item Deleted
Scale Variance if
Item Deleted
Corrected
Item-Total
Correlation
Cronbach's
Alpha if Item
Deleted
p1 62.49 139.241 .515 .918
p2 62.41 139.297 .518 .918
p3 62.34 135.579 .628 .916
p4 62.30 136.856 .597 .917
p5 62.37 139.266 .466 .919
p6 62.60 133.069 .688 .914
p7 62.39 134.776 .669 .915
p8 62.52 135.531 .628 .916
p10 62.11 138.315 .520 .918
p11 62.36 138.349 .464 .920
p12 62.48 132.391 .631 .916
p13 62.39 131.625 .698 .914
p14 62.74 136.428 .637 .916
p15 62.71 136.650 .531 .918
p16 63.48 135.466 .549 .918
p17 62.64 136.340 .674 .915
p18 62.26 137.108 .587 .917
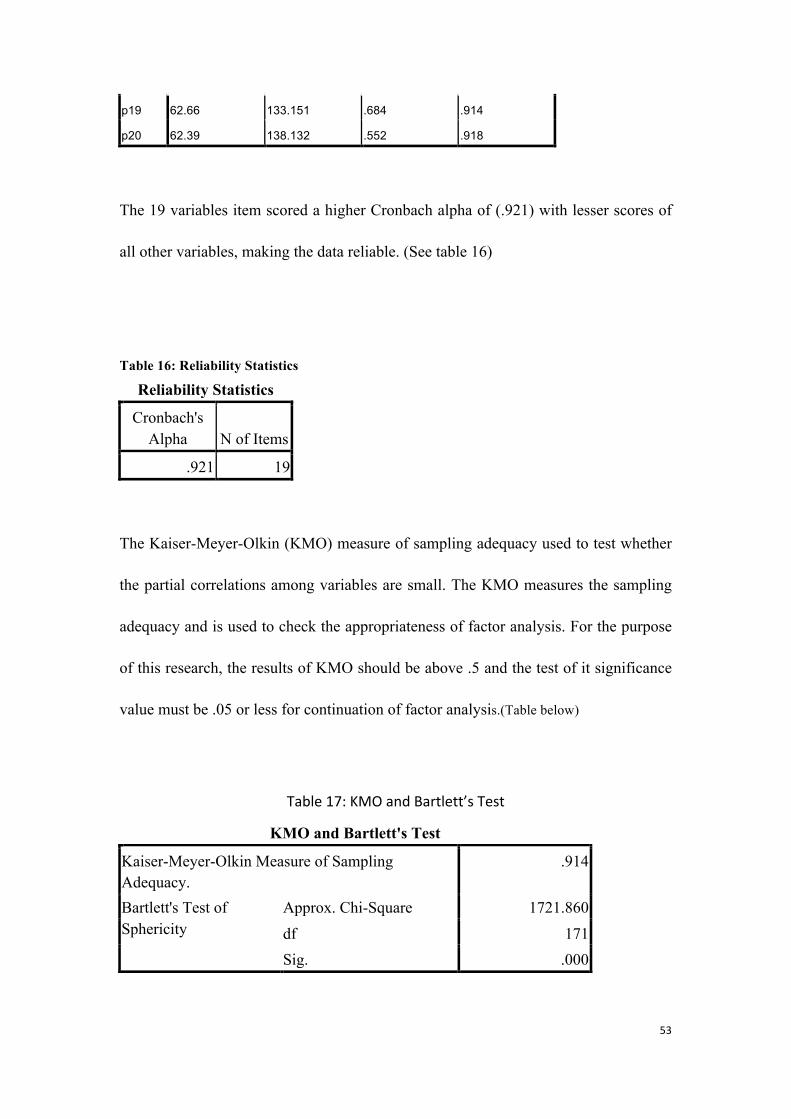
53
p19 62.66 133.151 .684 .914
p20 62.39 138.132 .552 .918
The 19 variables item scored a higher Cronbach alpha of (.921) with lesser scores of
all other variables, making the data reliable. (See table 16)
Table 16: Reliability Statistics
Reliability Statistics
Cronbach's Alpha N of Items
.921 19
The Kaiser-Meyer-Olkin (KMO) measure of sampling adequacy used to test whether
the partial correlations among variables are small. The KMO measures the sampling
adequacy and is used to check the appropriateness of factor analysis. For the purpose
of this research, the results of KMO should be above .5 and the test of it significance
value must be .05 or less for continuation of factor analysis.(Table below)
Table 17: KMO and Bartlett’s Test
KMO and Bartlett's Test
Kaiser-Meyer-Olkin Measure of Sampling Adequacy.
.914
Bartlett's Test of Sphericity
Approx. Chi-Square 1721.860 df 171 Sig. .000
54
The 19 variables were then analyzed. For the purposes of optimizing and checking the
stability of the solution, the data was run twice with principal components analysis
and Varimax rotation analysis. The choice of the three –factor solution (see Table 18)
was based on the following criteria:
l The Eigenvalues for all factors were greater than 1.00
l The total variance explained was 57.519%
l Variables with weightings below 0.4 were excluded.
Table 18: Extracted factors of service quality and their respective scale items Dimension(Factors) Loadings % of Variance
1. Physical quality P1 – 0.747
P4 – 0.727
P2 – 0.725
P7 – 0.690
P6 – 0.676
P3 – 0.630
P18 – 0.536
P5 – 0.495
P10 – 0.481
41.830
2. Function quality P15 – 0.784
P8 – 0.720
P16 – 0.693
P11 – 0.675
P20 – 0. 596
P14 – 0.457
9.682
55
3. Interactive quality P12 – 0.819
P13 – 0. 730
P19 – 0. 573
P17 – 0. 570
6.006
Total 19 57.519
The three factors that were identified as the most important factors identified by
overseas student can be labeled as Physical quality, Function quality and
Interactive quality.
The first factor (see table 18) extracted was composed of nine attribute statements and
labeled as “Physical” based on the statements such as visual appealing of physical
structure of hotels, modern looking equipments, comfortable atmosphere and
equipment, etc. the other statement were related since they emphasized the physical
elements of hotels. This factor had the highest Eigenvalue (7.948) and explained
41.830% of the variance.
The second factor, “Function”, was composed of six attribute statements such as
information services are easily accessible, hotel provides prompt services, employees
communicate effectively with guests , hotel has operating hours convenient for guests,
etc. This factor had an Eigenvalue of (1.840) and explained 9.682% of variance.
The third factor, “Interactive” was composed of four attribute statements which
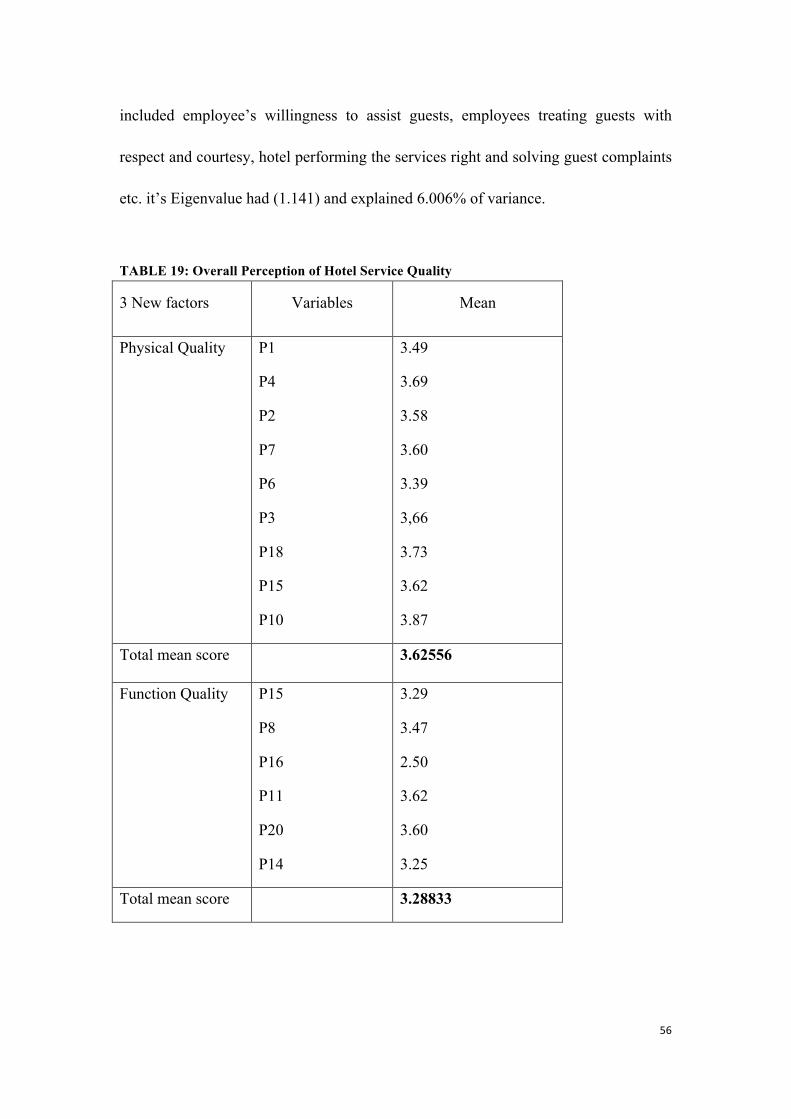
56
included employee’s willingness to assist guests, employees treating guests with
respect and courtesy, hotel performing the services right and solving guest complaints
etc. it’s Eigenvalue had (1.141) and explained 6.006% of variance.
TABLE 19: Overall Perception of Hotel Service Quality
3 New factors Variables Mean
Physical Quality
P1
P4
P2
P7
P6
P3
P18
P15
P10
3.49
3.69
3.58
3.60
3.39
3,66
3.73
3.62
3.87
Total mean score 3.62556
Function Quality
P15
P8
P16
P11
P20
P14
3.29
3.47
2.50
3.62
3.60
3.25
Total mean score 3.28833
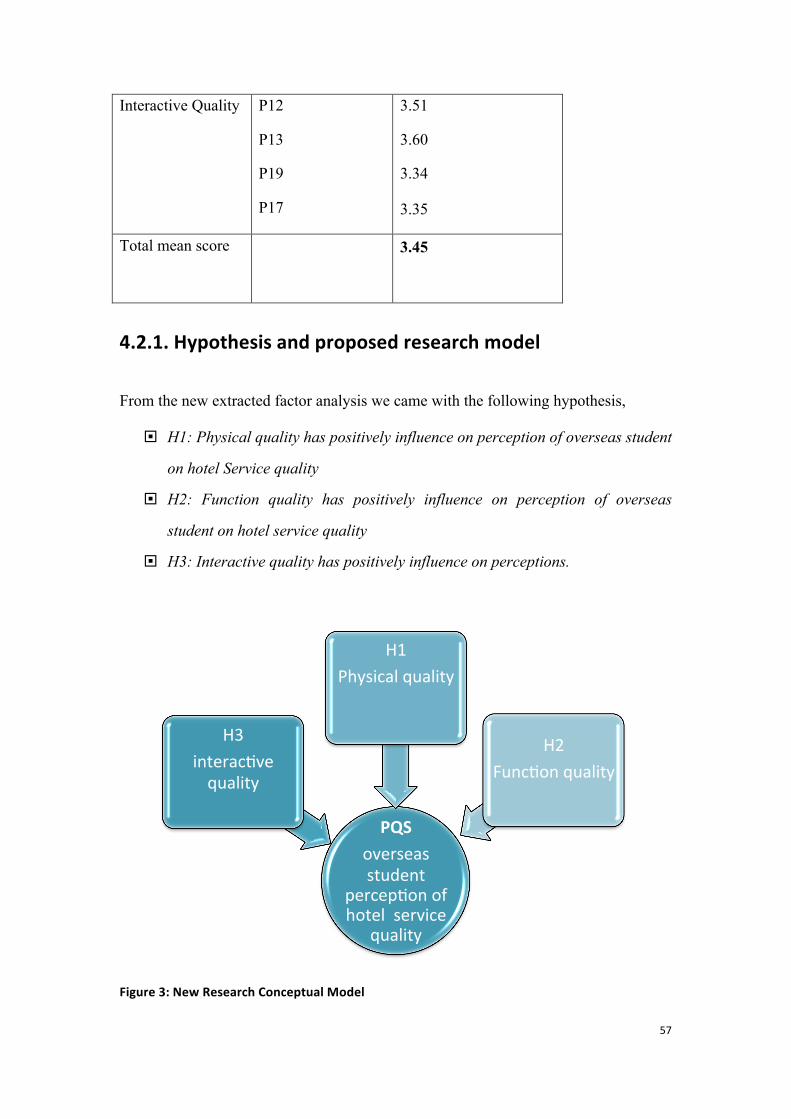
57
Interactive Quality
P12
P13
P19
P17
3.51
3.60
3.34
3.35
Total mean score
3.45
4.2.1. Hypothesis and proposed research model
From the new extracted factor analysis we came with the following hypothesis,
¨ H1: Physical quality has positively influence on perception of overseas student
on hotel Service quality
¨ H2: Function quality has positively influence on perception of overseas
student on hotel service quality
¨ H3: Interactive quality has positively influence on perceptions.
Figure 3: New Research Conceptual Model
PQS overseas student
percepLon of hotel service
quality
H3 interacLve quality
H1 Physical quality
H2
FuncLon quality
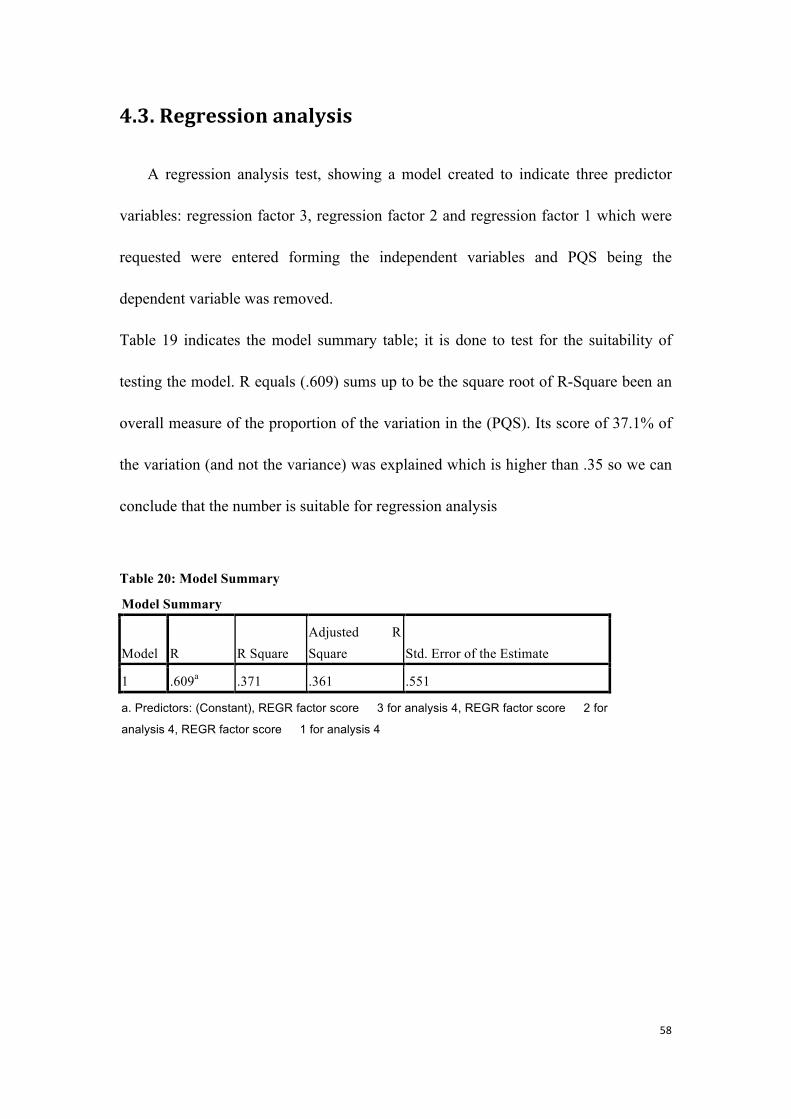
58
4.3. Regression analysis
A regression analysis test, showing a model created to indicate three predictor
variables: regression factor 3, regression factor 2 and regression factor 1 which were
requested were entered forming the independent variables and PQS being the
dependent variable was removed.
Table 19 indicates the model summary table; it is done to test for the suitability of
testing the model. R equals (.609) sums up to be the square root of R-Square been an
overall measure of the proportion of the variation in the (PQS). Its score of 37.1% of
the variation (and not the variance) was explained which is higher than .35 so we can
conclude that the number is suitable for regression analysis
Table 20: Model Summary
Model Summary
Model R R Square Adjusted R Square Std. Error of the Estimate
1 .609a .371 .361 .551
a. Predictors: (Constant), REGR factor score 3 for analysis 4, REGR factor score 2 for
analysis 4, REGR factor score 1 for analysis 4
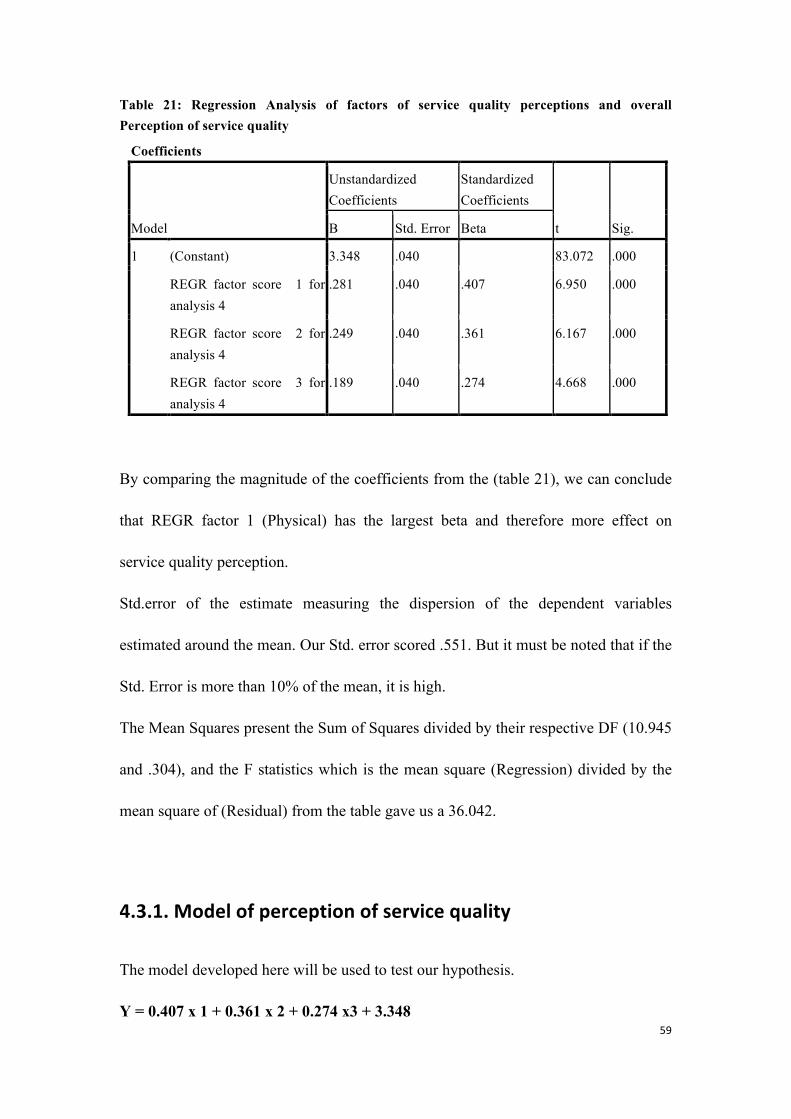
59
Table 21: Regression Analysis of factors of service quality perceptions and overall Perception of service quality
Coefficients
Model
Unstandardized Coefficients
Standardized Coefficients
t Sig. B Std. Error Beta
1 (Constant) 3.348 .040 83.072 .000
REGR factor score 1 for analysis 4
.281 .040 .407 6.950 .000
REGR factor score 2 for analysis 4
.249 .040 .361 6.167 .000
REGR factor score 3 for analysis 4
.189 .040 .274 4.668 .000
By comparing the magnitude of the coefficients from the (table 21), we can conclude
that REGR factor 1 (Physical) has the largest beta and therefore more effect on
service quality perception.
Std.error of the estimate measuring the dispersion of the dependent variables
estimated around the mean. Our Std. error scored .551. But it must be noted that if the
Std. Error is more than 10% of the mean, it is high.
The Mean Squares present the Sum of Squares divided by their respective DF (10.945
and .304), and the F statistics which is the mean square (Regression) divided by the
mean square of (Residual) from the table gave us a 36.042.
4.3.1. Model of perception of service quality
The model developed here will be used to test our hypothesis.
Y = 0.407 x 1 + 0.361 x 2 + 0.274 x3 + 3.348
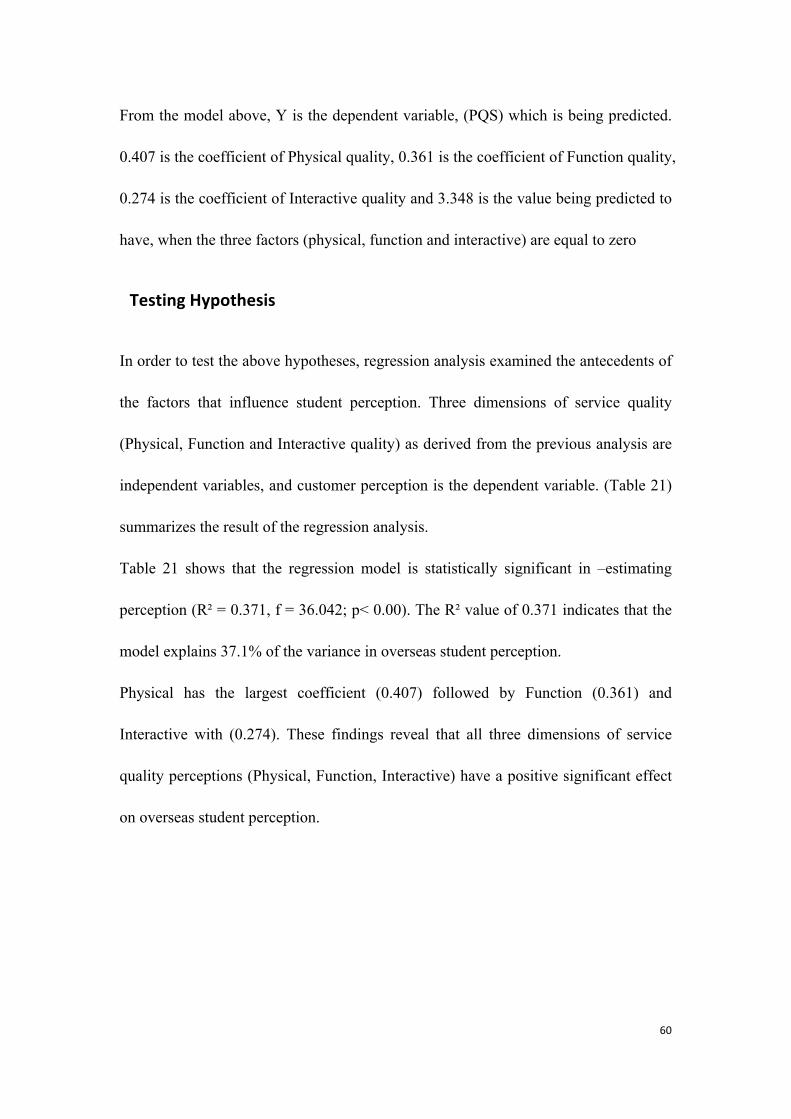
60
From the model above, Y is the dependent variable, (PQS) which is being predicted.
0.407 is the coefficient of Physical quality, 0.361 is the coefficient of Function quality,
0.274 is the coefficient of Interactive quality and 3.348 is the value being predicted to
have, when the three factors (physical, function and interactive) are equal to zero
Testing Hypothesis
In order to test the above hypotheses, regression analysis examined the antecedents of
the factors that influence student perception. Three dimensions of service quality
(Physical, Function and Interactive quality) as derived from the previous analysis are
independent variables, and customer perception is the dependent variable. (Table 21)
summarizes the result of the regression analysis.
Table 21 shows that the regression model is statistically significant in –estimating
perception (R² = 0.371, f = 36.042; p< 0.00). The R² value of 0.371 indicates that the
model explains 37.1% of the variance in overseas student perception.
Physical has the largest coefficient (0.407) followed by Function (0.361) and
Interactive with (0.274). These findings reveal that all three dimensions of service
quality perceptions (Physical, Function, Interactive) have a positive significant effect
on overseas student perception.
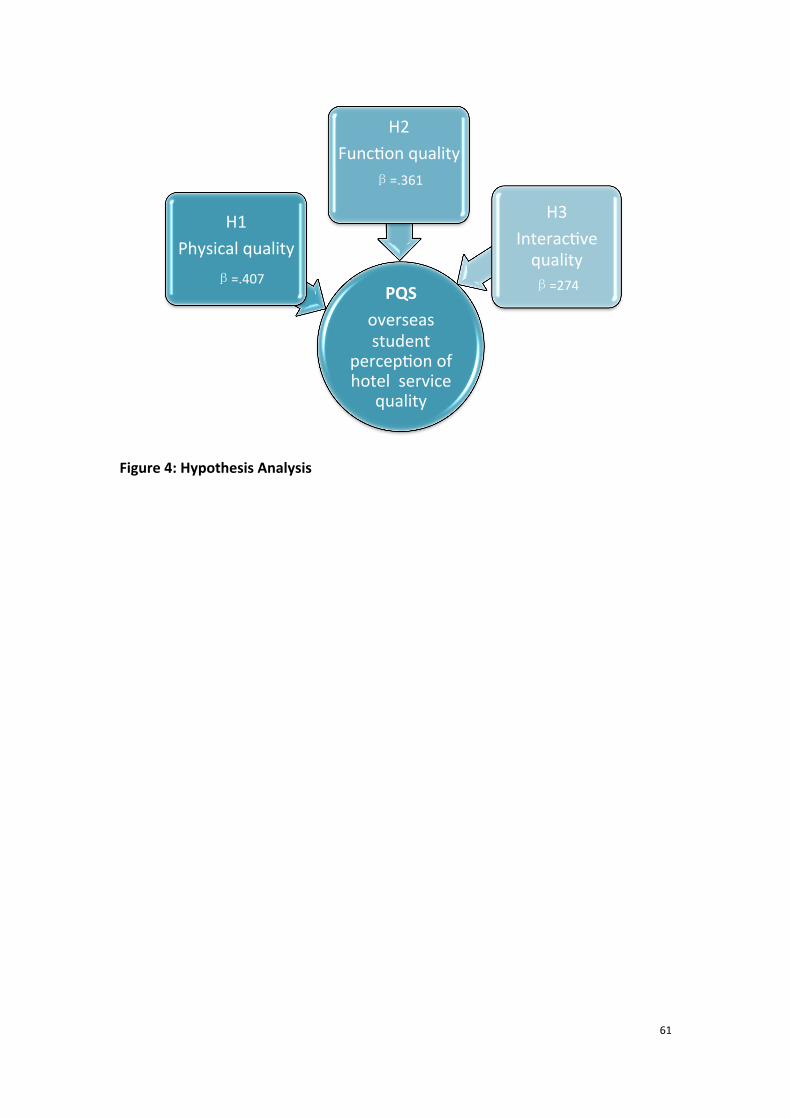
61
Figure 4: Hypothesis Analysis
PQS overseas student
percepLon of hotel service
quality
H1 Physical quality
β=.407
H2 FuncLon quality
β=.361
H3 InteracLve quality β=274
62
CHAPTER FIVE
CONCLUSION AND DISCUSSION
This chapter of the study presents the summary of findings, discussion, implications,
limitations and future research direction.
5.1. Conclusion
From the findings of the study, the following conclusions were drawn.
Overseas student, form service quality perceptions on the basis of their evaluations on
three factors namely Physical quality, Function quality and Interaction quality.
First and foremost, the nineteen (19) scale factors used for the study were found to be
reliable in examining the perceptions of service quality.
The findings revealed that all three factors have significant positive influence on
overseas student overall perception of hotel service quality, but the most influential
factor was found to be Physical quality which consists of (modern looking equipment
in hotel, comfortable atmosphere and equipment appropriate for purpose, good and
hygienic quality of food served, neat and groomed appearance of employees, visually
appealing facilities and physical structure of hotel and hotel providing safe and secure
place for guest.
63
Secondly, the findings revealed that the overall perception of overseas student on
hotel’s service quality in mainland China was moderate. The findings reveals that
perception (PQS) was (3.36) on the scale of 1 (very low) to 5 (very high) meaning
moderate as shown in (table 14).
Qualitative results derived for this research from interview responses suggests that
overseas students prefer and are attracted to physical facilities and visible facilities
and services which are included in the highest factor, physical quality This implies
that overseas student are a particular market segment who prefer and appreciate
facilities or services that can be visually seen in the hotel and pay least attention to
individual personalized services or services which cannot be seen physically. This can
be related to (Gamage, et al, 2008) study on university student, who identified 10
factors that will influence their perception. These were grouped into three categories
(Academic, Non-academic and facilities). Furthermore, with respect to facilities,
students considered physical plants and facilities, library and computing facilities and
student organizations as important factors in their perception of service quality.
5.2 New conceptual model
As indicated by Culiberg and Rojsek (2010), consensus about the nature and
dimensionality of service quality is still an issue. It could be attributed to various
factors including the nature of service, the type of service and the context of the study
such as Location and respondents characteristics.
64
In this study, service quality was proposed to have five dimensions, which are
tangibility, reliability, assurance; responsiveness and empathy (see (Parasuraman et al.,
1985). A factor analysis of the collected and analyzed data extracted three main
factors as the thesis already proposed. These factors are Physical quality, Functional
quality, and Interaction.
However, the findings of this research could not support SERVQUAL model of
Parasuraman et al., 1985). A new model- construct of three factors of service quality
was developed in this study consisting of Physical quality, function quality and
interactive quality. All the three extracted factors have a significantly positive
influence on overseas student perception of hotel service quality in Mainland China.
Moreover, this model is different from the theory of five dimensions of service quality,
due to the fact that, there is no aspect of empathy as a dimension in this model as
compared to previous research results on hotel service quality perceptions of
international tourist in China. Furthermore, this model can be supported by some
interview responses gathered for the qualitative part of the research when some
overseas student were interviewed as to what influences their perceptions on hotel
service quality;”what factors will influence your perception towards hotel service
quality”? Responses such as “Good facilities such as bath shower, appearance of
staff and physical surroundings of the hotel, accessibility to the hotel, staff who can
communicate effectively in English, good quality food, prompt services of hotel such
as checking in and checking out, employees willingness to assist customers,
comfortable beds and pillow, WI-FI and internet services readily available etc”.
65
From their responses, it can be realized that, there was no mention of issues related to
empathy as a dimension of service quality
This model unlike the service quality model of five dimensions which has been
adopted by most researchers and used to examine and measure international tourist
perception on hotel service quality with reliability and empathy greatly influencing
tourist perception, this new construct model has Physical quality with its contents
being identified with tangibility and assurance. This similarly supports three-
dimensional construct of service quality of Lehtinen and Lehtinen (1991). According
to them, service quality is a three-dimensional concept and the dimensions include
physical quality, interactive quality and corporate quality.
Interactive quality, the third factor which was extracted can also be related to
(Bateson 1989; Lovelock 1981; Shostack 1977) study on interpersonal interactions
that take place during service delivery having the greatest effect on service quality
perceptions.
The nature and features of the three dimension extract by this study is almost the same
as the original SERVQUAL model except some slight differences in the scale items in
few dimensions.
The findings discussed under this section provide an answer to research question two
(RQ2: “What factors influence overseas student perception of service quality in
Mainland China hotels?”)
From the above discussion the factors are three elements – Physical quality,
Functional quality and Interactive quality.
66
Regarding the proposed hypothesis;
¨ H1 Physical quality will positively have influence on perception of overseas
student on hotel Service quality
¨ H2: Function quality will positively have influence on perception.
¨ H3: “Interactive quality will positively have influence on perceptions.
The findings have shown that this hypothesis should be accepted.
5.3. Implications
The study had the following implications:
This research however has important theoretical contributions firstly, key
contribution of this research is that it provides a comprehensive research model of
overseas student perception for the hotel management, quality management, and
inbound tourism since overseas student are grouped under inbound tourism, however
service management will be the main focus.
Secondly, with this three new dimensions namely (physical, function and interaction)
derived within service quality, it will also improve, add and provide more literature on
overseas student perception on hotels service quality for further and future research
since much has not been researched within this context.
The findings furthermore has major practical implications for management of
hotel operations, CNTA (China National Tourism Authority), and DOE (Department
67
of Education)
It will help management of hotel operations to understand that instead of giving all
aspects of the service operation the same attention, they will need to identify “key
factors” and concentrate resources on these.
Secondly, because this research is in respect to a different customer segment, which is
overseas student, it can help hotel organizations to develop and formulate marketing
strategies to meet the needs of this specific market segment more effectively.
It will also help CNTA on how to better improve and develop tourism facilities and
sites that will attract overseas students to visit hence, improving and increasing high
tourism visitor receipts at tourist attraction sites.
Using these results of the study, DOE’s could plan effective marketing strategies to
target international students into the country in terms of their accommodation needs
and educational needs.
The following recommendations are made
Firstly, function quality was shown to be the lowest factor of overseas student
perception of hotel’s service quality. Therefore, hotel management should train
employees to be able to communicate effectively in other international languages
(English) and have in-depth occupational knowledge, make information about their
facilities and services easily available, and have operating hours convenient for all
customers. Management of hotel facilities must arrange multinational language
training (English) for all staff especially front desk and housekeeping to be able to
enhance effective communication with the numerous clienteles.
68
Secondly, physical and Interactive qualities are shown to be the strongest with
Physical showing much more influence on perception. Therefore, hotel management
should maintain the attributes of physical and Interactive service quality at the hotel.
5.4. Limitation
A research has ever been made without difficulties. For these reasons here are some
limitations.
Firstly, it was difficult getting previous study regarding overseas student perception of
hotel services.
Secondly, when questionnaires were distributed to respondents, it was difficult to
collect data in time. Some overseas student refused to participate in this survey and
moreover some did not fill questionnaires on time. If respondent were more willing to
offer feedback, the results would have been useful for improving service quality.
Thirdly, the study focus on only overseas students studying in Beijing thereby making
sample size small, a larger size perhaps might provide different results.
Last but not the least, survey was conducted in English language and quite a number
of Asian students could not partake in the survey making the sample size to be
reduced.
69
5.5. Future research direction
This research has provided hotel managers, stakeholders and tourism educational
planners’ important insights into elements that stand in the way of improving overseas’
student perception of service quality. There has not been any research on this theme in
China, particularly with overseas student perception on hotel service quality. Overseas
student may not be the main target market segment in the hospitality industry, but
from this research, there seems to be a growing number of international student
especially in China and who tend to use hotel facilities during their study, perhaps this
is due to the fact that China has got many historical and cultural attractions all over
and international students will definitely be attracted to visit such sites during the
period of study.
Hence the present study provides a basis for further research into the perception of
service quality in budget hotels in Mainland China.
Future research can also be conducted to explicitly conclude if the three factor
dimensions (physical, function and interaction) will play a bigger role in the
perception of service quality of international tourist in budget hotels.
70
References
Asad M., Tim L., (2010) Customer perceptions of service quality in luxury hotels in New Delhi, India: an exploratory study, International journal of Contemporary Hospitality Management, 22(2), 160-173 Athiyaman A., (1997), linking student satisfaction and service quality perceptions: the case of university education, European Journal of Marketing, 31(7)528-540 Bebko, C., Sciulli, L. (2009). The spillover affect’ of perceived quality if employees in predictions of provider service quality. The Journal of American Academy of Business 14 (2), 1-7 Briggs, S., Sutherland, J. and Drummond, S. (2007), “Are hotels serving quality? An exploratory study of service quality in the Scottish hotel sector”, Tourism Management, 28(4), 1006-19. Cai, L. and Woods, R. (1993), “China’s tourism service failure”, The Cornell Hotel—Restaurant Administration Quarterly, Vol, 34 (4), 30-39. Choy, D.J.L., Guan, L. D. and Zhang, W. (1986). “Tourism in PR China: Marketing trends and changing policies”, Tourism Management, 30(3), 64-71. Cook, D. (1989), “China’s hotels: still playing catch-up”, The Cornell Hotel & Restaurant Administration Quarterly, 30(3) ,64-71 Cronin J.J. and Taylor, S.A. (1994), “SERVPERF versus SERVQUAL: reconciling performance- based and perceptions –minus –expectations measurement of service quality”, Journal of Marketing, 58, 125-131. Douglas, J., McClelland, R., & Davies, J. (2008). The development of a conceptual model of student satisfaction with their experience in higher education. Journal of Quality Assurance in Education. 16 (1). 19-35. Ebrey, P.B. (2010). Cambridge Illustrated: The History of China. New York: Cambridge University Press. Girish P., (2007) Assessing international tourists’ perceptions of service quality at Air Mauritius. International journal of Quality &Reliability Management, 24(5), 492-514 Getty, J.M. and Getty, R.L. (2003), “Lodging quality index: assessing customers’ perceptions of quality delivery”, International journal of Contemporary Hospitality Management, 15(2).94-104.
71
Gamage, D.T., Suwanabroma, J., Ueyama, T., Hada, S., & Sekikawa, E. (2008). The impact of quality assurance measures on student services at the Japanese and Thai private universities. Journal of Quality Assurance in Education 16(2).181-198 Ganesan –Lim, C., Russell-Bennett, R., Dagger T. (2008), The Impact of service contact type and demographic characteristics on service quality perceptions, Journal of Services Marketing, 22(7)550-561. Gallifa J., Batalle, P. (2010), Student perceptions of service quality in a multi-campus higher education in Spain. Quality Assurance in Education.18 (2)156-170 Gronroos, C. (1984) A Service Quality model and its Marketing implications. European Journal of Marketing, 18, 139-150. Groth, J.C., Dye, R.T. (1999), Service quality: perceived value, expectations, shortfalls, and bonuses, Managing Service Quality. 9(4) 274-286 Heskett, J.L., Jones, T.O., Loveman, G.W., Sasser, W.E., Schlesinger, L.A.(1994). Putting the service –profit chain to work. Harvard Business Review 72(2), 164-174. Keating, M. and Harrington, D. (2003), “The challenges of implementing quality in the Irish hotel industry”, Journal of European Industrial training, 27(9), 441-53. Konstantinos A., Nikos D., Dimitra M. (2002), can perceptions of service quality predict behavioral intentions? An exploratory study in the hotel sector in Greece, Managing Service Quality, 12(4), 224-231 Kotler, P. (1985) Strategic Marketing for Educational institutions. London: Prentice-Hall. Lehtinen, U. and Lehtinen, J.R. (1991), “Two approaches to service quality dimensions”, The Service Industries Journal, Vol. 11 No.3, pp.287-303 Lewis, B. (1993). Service quality: recent developments in financial services. International journal of Bank Marketing, 11 (6), 19-25 Lewis, R.C. and Booms. B (1983), “The marketing aspects of service quality”, in Berry, L., Shostack, G. and Upah, G. (Eds), Emerging Perspective on Services Marketing, American Marketing Association, Chicago, IL, 99-107 Manjunatha, K. and Shivalingaiah, D. (2004), “Customer’s perception of service quality in libraries”, Annals pd Library and Information Studies, 51(4). 145-151
72
Nadiri H., Hussain K., (2005), Perceptions of service quality in North Cyprus hotels, International journal of Contemporary Hospitality Management, 17(6)469-480. Oosterhaven, J., & Fan, T. (2006). Impact of international tourism on the Chinese economy. International journal of Tourism Research, 8(5), 347-354. Parasuraman, A., Zeithaml, V.A., Berry, L.L. (1985). A conceptual model of quality and its implications for future research. Journal of Marketing 49(4), 41-50 Parasuraman, A., Zeithaml, V.A., Berry, L.L. (1988), ‘SERVQUAL: a multiple item scale for measuring consumer perceptions of service quality”, Journal of Retailing, 64(1), 12-40. Pereda, M. (2006) An Examination of the Impact of Service Quality Dimensions on Students’ Satisfaction in Higher Education in the UK. Thesis, (PhD). University of Surrey. Pine, R.., Phillips, P., 2005. Performance comparisons of hotels in China. International Journal of Hospitality Management 24, 57-73 Proshansky, H., Ittelson, W., & Rivlin, L. (1976). Environment Psychology. People and physical settings (2nd edition). New York: Holt, Rinehart and Winston Santos J. (2002) from intangibility to tangibility on service quality perceptions: a comparison study between consumers and service providers in four service industries, Managing Service Quality, 12(5).292-302 Schachner, N. (1962), the Medieval Universities. New York: A.S. Barnes and Co. Schembri S., Sandberg J., (2002), Service quality and the consumers’ experience: towards an interpretive approach, Marketing Theory. 2(2)189-205 Thaniker D.J., Darren L.R. (2003), a study of hotel guest perceptions in Mauritius. International journal of Contemporary Hospitality Management, 15(2), 105-115. Tisdell, C. and Wen, J. (1991), “Foreign tourism as an element in PR China’s economic development strategy”, Tourism Management, 12(1), 55-67. Tsang, N. and Qu, H. (2000), “Service quality in China’s hotel industry: a perspective from tourists and hotel managers”, International journal of Contemporary Hospitality Management, 12(5).316-326 Wuest, B.E.S., Tas, R.F. and Emenheiser, D.A. (1996), “What do mature travelers perceive as important hotel/motel customer service?” Hospitality Research Journal
73
20(2), 77-93. Yu, L. (1995). “China’s hotel landscape: a marker of economic development and social change”, in Lew, A. and Yu, L.(Eds), Tourism in China: Geographic, political and Economic Perspectives, West view Press Inc., Boulder, CO,pp. 89-106. Zeithaml, V.A. and Bitner, M.J. (2000), Services Marketing: Integrating Customer Focus across the Firm, McGraw- Hill, New York, NY. Zeithaml, V.A. and Bitner, M.J. & Glemler D.D. (2009). Service marketing: Integrating Customer Focus across the Firm, 5th Ed. McGraw- Hill, publishing company, New Delhi. Zhang, G. (1987), “Tourism education in PR China”, Tourism Management, 8(3) 262-266. Zhang, G., Pine, R., & Zhang, H. Q. (2000). China’s international tourism development: present and future. International Journal of Contemporary Tourism Management, 12(5), 282-290.
Website Sources:
Ministry of Education of, P.R. China (MEPRC) (Undated). International students in China.Retrieved11thSeptember,2012 http://www.moe.edu.cn/edoas/internationalstudents. Hotels in China: Market Research Report. Retrieved 18th march, 2013 http://www.ibisworld.com/industry/china/hotels.html China- An Emerging Study Destination for International Students http://scholarship-positions.com/blog/china-an-emerging-study-destination-for-international-students/201208/

74
Appendix
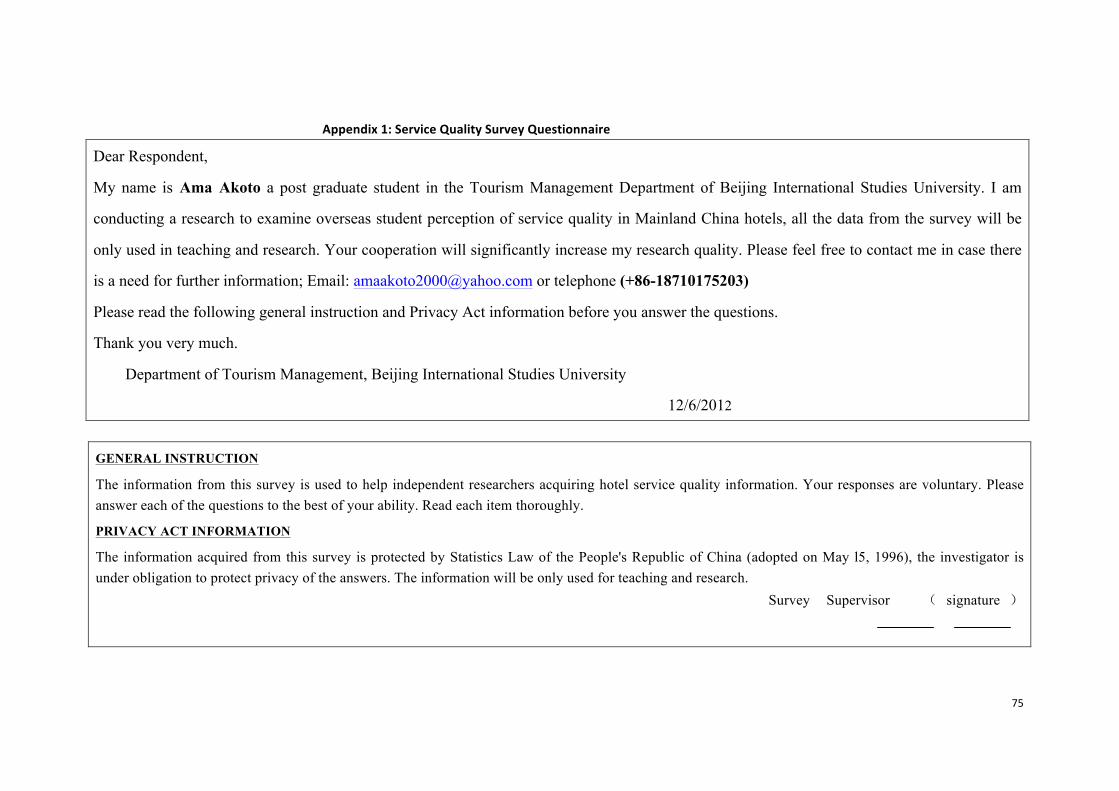
75
Appendix 1: Service Quality Survey Questionnaire
Dear Respondent,
My name is Ama Akoto a post graduate student in the Tourism Management Department of Beijing International Studies University. I am
conducting a research to examine overseas student perception of service quality in Mainland China hotels, all the data from the survey will be
only used in teaching and research. Your cooperation will significantly increase my research quality. Please feel free to contact me in case there
is a need for further information; Email: [email protected] or telephone (+86-18710175203)
Please read the following general instruction and Privacy Act information before you answer the questions.
Thank you very much.
Department of Tourism Management, Beijing International Studies University
12/6/2012
GENERAL INSTRUCTION
The information from this survey is used to help independent researchers acquiring hotel service quality information. Your responses are voluntary. Please answer each of the questions to the best of your ability. Read each item thoroughly.
PRIVACY ACT INFORMATION
The information acquired from this survey is protected by Statistics Law of the People's Republic of China (adopted on May l5, 1996), the investigator is under obligation to protect privacy of the answers. The information will be only used for teaching and research.
Survey Supervisor ( signature )
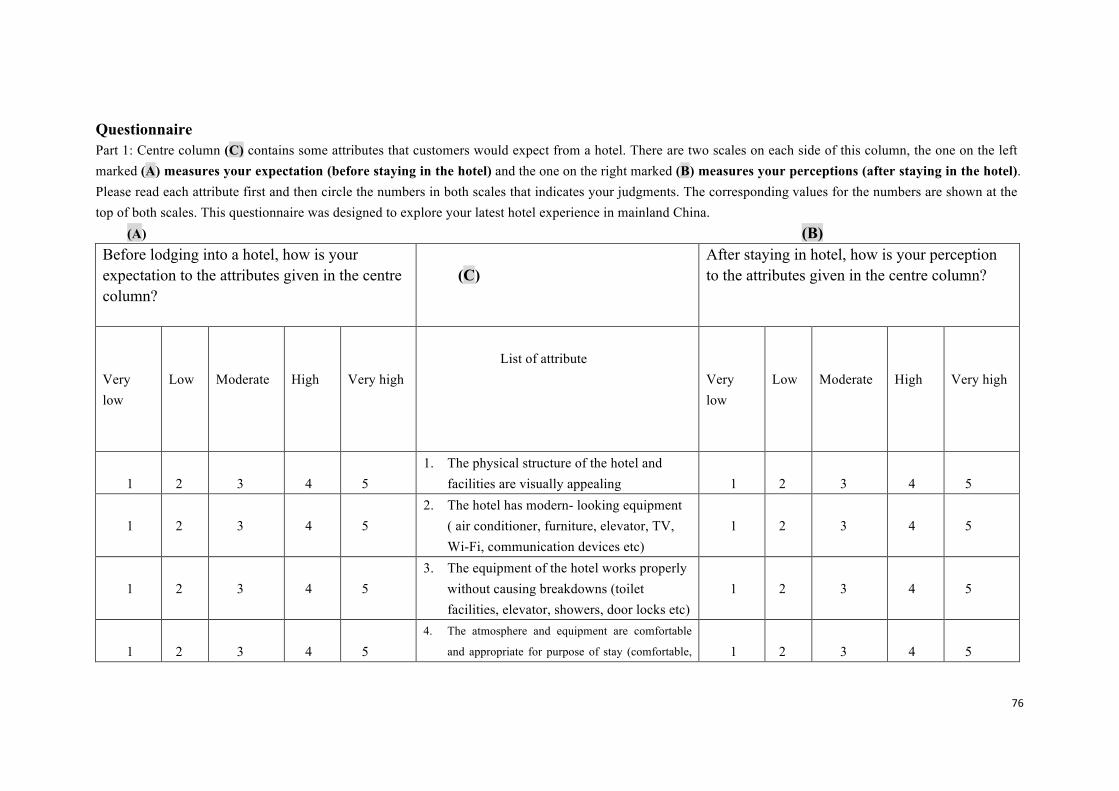
76
Questionnaire Part 1: Centre column (C) contains some attributes that customers would expect from a hotel. There are two scales on each side of this column, the one on the left marked (A) measures your expectation (before staying in the hotel) and the one on the right marked (B) measures your perceptions (after staying in the hotel). Please read each attribute first and then circle the numbers in both scales that indicates your judgments. The corresponding values for the numbers are shown at the top of both scales. This questionnaire was designed to explore your latest hotel experience in mainland China.
(A) (B) Before lodging into a hotel, how is your expectation to the attributes given in the centre column?
(C)
After staying in hotel, how is your perception to the attributes given in the centre column?
Very low
Low
Moderate
High
Very high
List of attribute
Very low
Low
Moderate
High
Very high
1
2
3
4
5
1. The physical structure of the hotel and facilities are visually appealing
1
2
3
4
5
1
2
3
4
5
2. The hotel has modern- looking equipment ( air conditioner, furniture, elevator, TV, Wi-Fi, communication devices etc)
1
2
3
4
5
1
2
3
4
5
3. The equipment of the hotel works properly without causing breakdowns (toilet facilities, elevator, showers, door locks etc)
1
2
3
4
5
1
2
3
4
5
4. The atmosphere and equipment are comfortable
and appropriate for purpose of stay (comfortable,
1
2
3
4
5
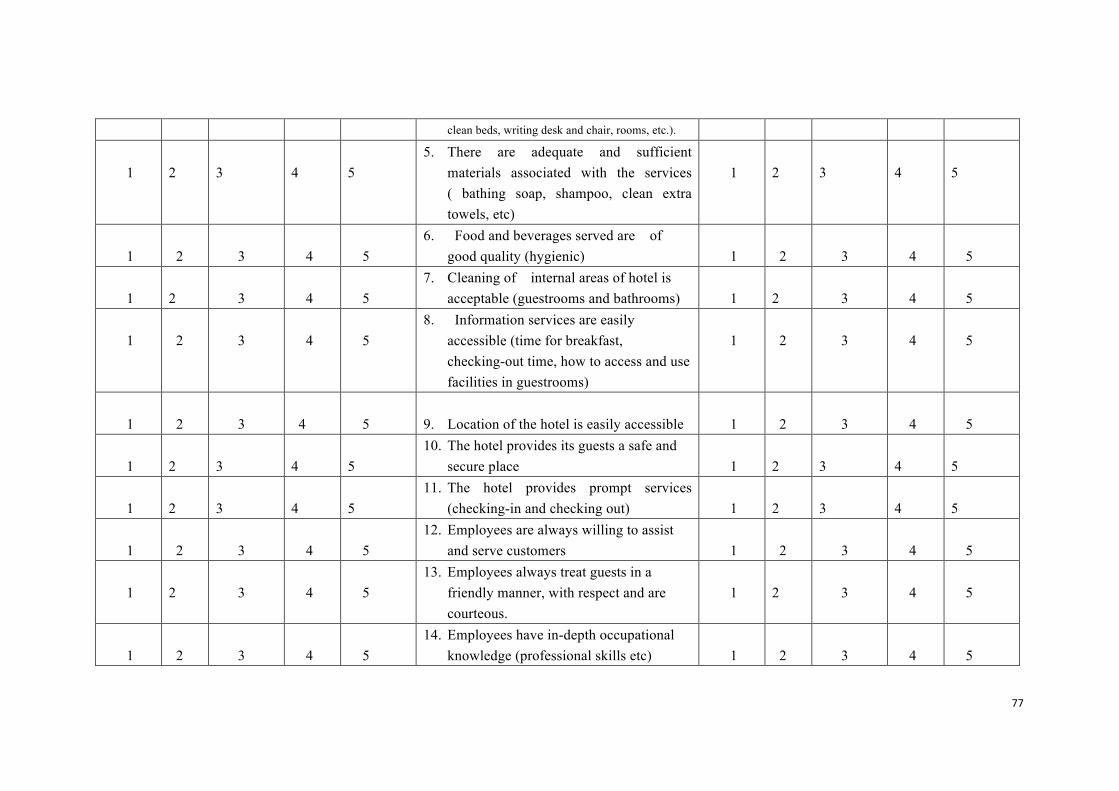
77
clean beds, writing desk and chair, rooms, etc.).
1
2
3
4
5
5. There are adequate and sufficient materials associated with the services ( bathing soap, shampoo, clean extra towels, etc)
1
2
3
4
5
1
2
3
4
5
6. Food and beverages served are of good quality (hygienic)
1
2
3
4
5
1
2
3
4
5
7. Cleaning of internal areas of hotel is acceptable (guestrooms and bathrooms)
1
2
3
4
5
1
2
3
4
5
8. Information services are easily accessible (time for breakfast, checking-out time, how to access and use facilities in guestrooms)
1
2
3
4
5
1
2
3
4
5
9. Location of the hotel is easily accessible
1
2
3
4
5
1
2
3
4
5
10. The hotel provides its guests a safe and secure place
1
2
3
4
5
1
2
3
4
5
11. The hotel provides prompt services (checking-in and checking out)
1
2
3
4
5
1
2
3
4
5
12. Employees are always willing to assist and serve customers
1
2
3
4
5
1
2
3
4
5
13. Employees always treat guests in a friendly manner, with respect and are courteous.
1
2
3
4
5
1
2
3
4
5
14. Employees have in-depth occupational knowledge (professional skills etc)
1
2
3
4
5
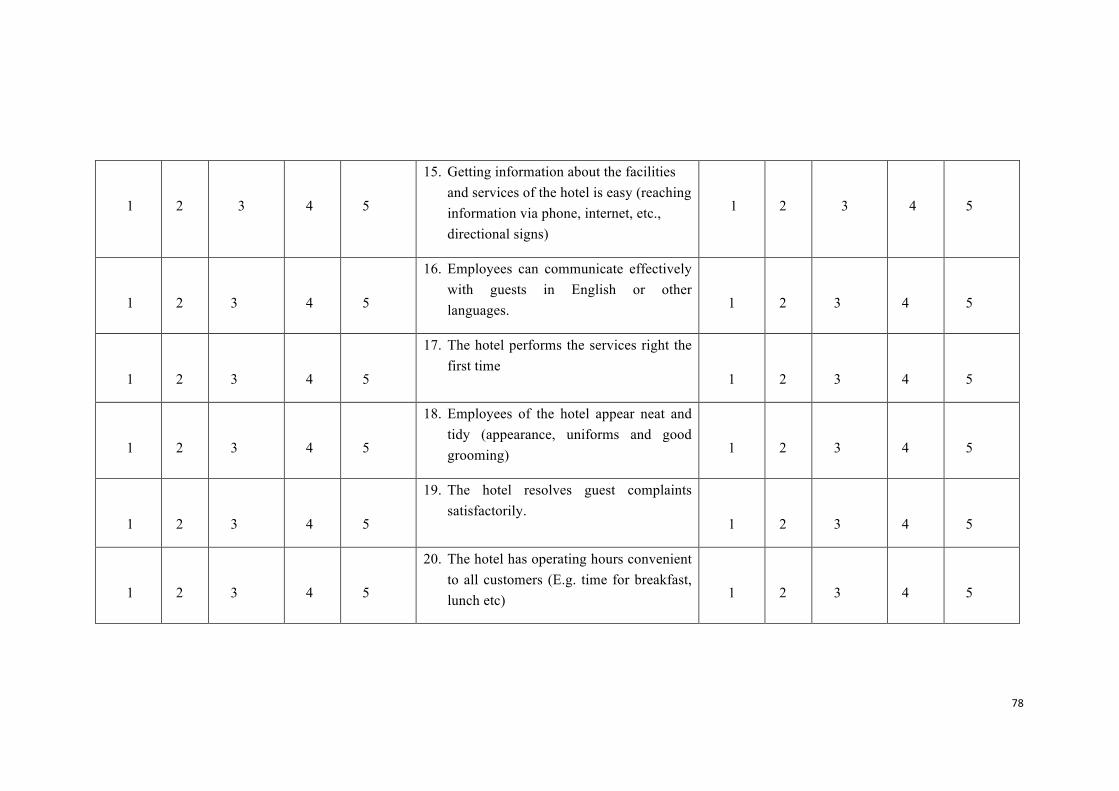
78
1
2
3
4
5
15. Getting information about the facilities and services of the hotel is easy (reaching information via phone, internet, etc., directional signs)
1
2
3
4
5
1
2
3
4
5
16. Employees can communicate effectively with guests in English or other languages.
1
2
3
4
5
1
2
3
4
5
17. The hotel performs the services right the first time
1
2
3
4
5
1
2
3
4
5
18. Employees of the hotel appear neat and tidy (appearance, uniforms and good grooming)
1
2
3
4
5
1
2
3
4
5
19. The hotel resolves guest complaints satisfactorily.
1
2
3
4
5
1
2
3
4
5
20. The hotel has operating hours convenient to all customers (E.g. time for breakfast, lunch etc)
1
2
3
4
5
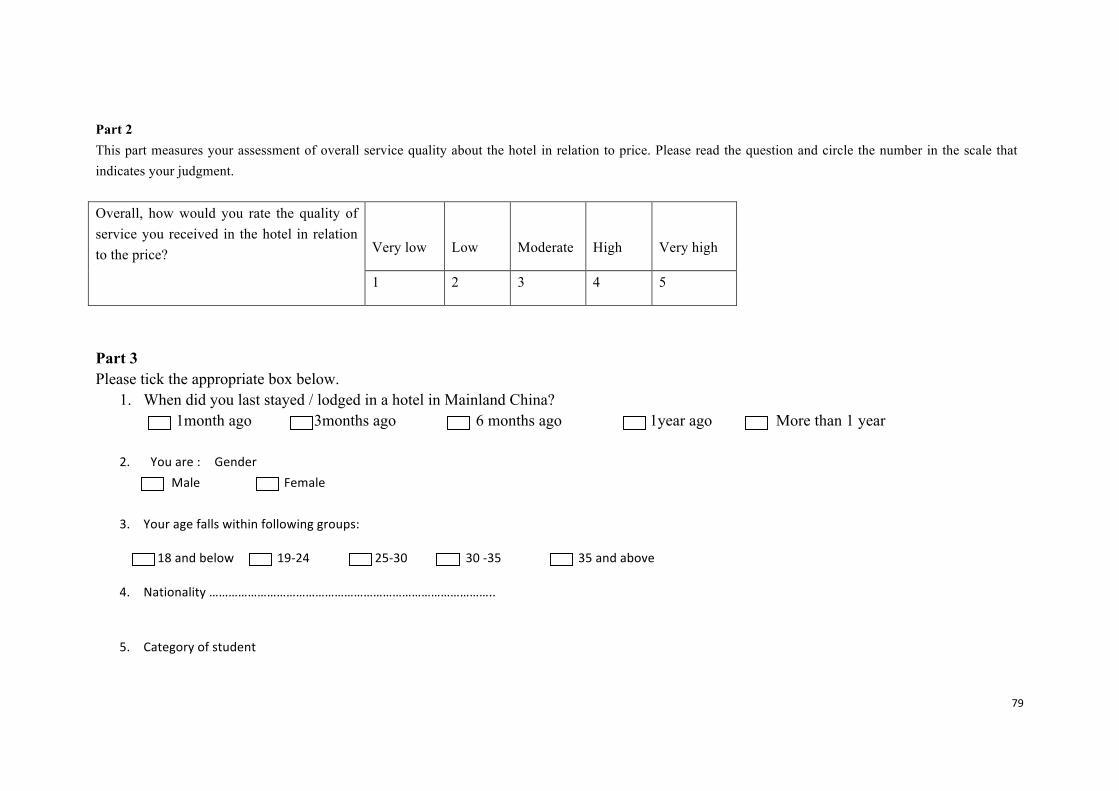
79
Part 2 This part measures your assessment of overall service quality about the hotel in relation to price. Please read the question and circle the number in the scale that indicates your judgment. Overall, how would you rate the quality of service you received in the hotel in relation to the price?
Very low
Low
Moderate
High
Very high
1 2 3 4 5
Part 3 Please tick the appropriate box below.
1. When did you last stayed / lodged in a hotel in Mainland China? 1month ago 3months ago 6 months ago 1year ago More than 1 year
2. You are : Gender
Male Female
3. Your age falls within following groups:
18 and below 19-‐24 25-‐30 30 -‐35 35 and above
4. Nationality ……………………………………………………………………………..
5. Category of student
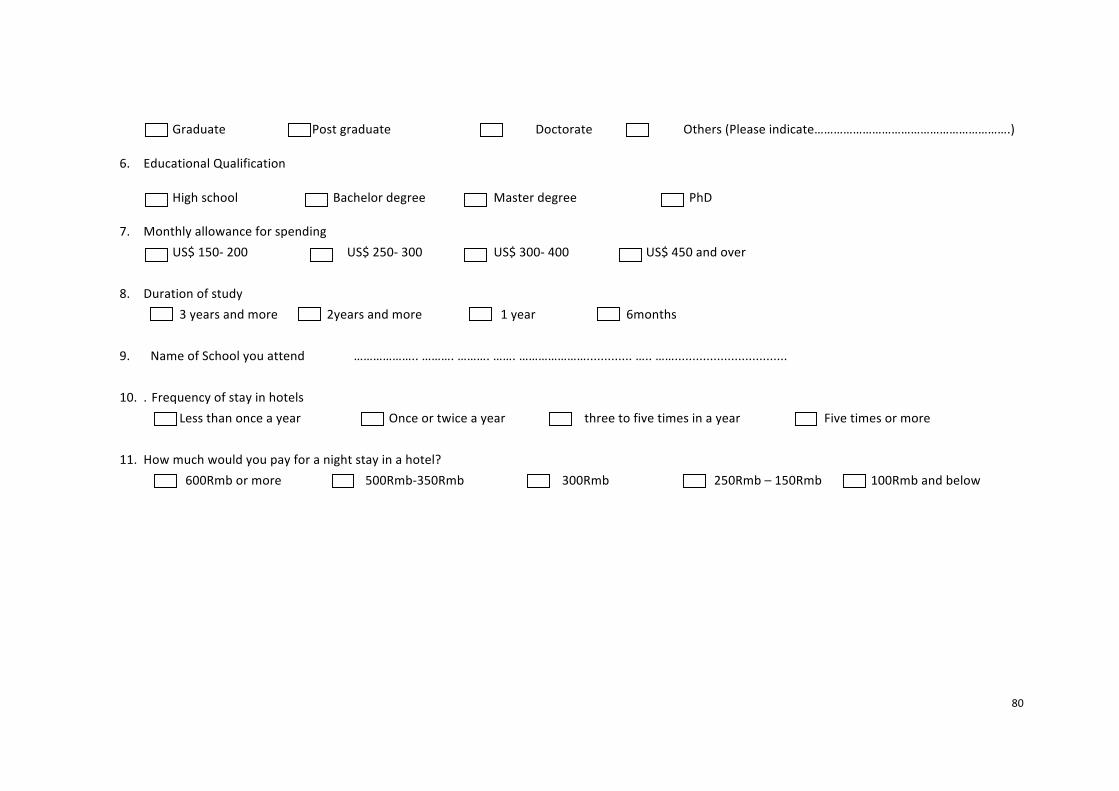
80
Graduate Post graduate Doctorate Others (Please indicate…………………………………………………….)
6. Educational Qualification
High school Bachelor degree Master degree PhD
7. Monthly allowance for spending US$ 150-‐ 200 US$ 250-‐ 300 US$ 300-‐ 400 US$ 450 and over
8. Duration of study 3 years and more 2years and more 1 year 6months
9. Name of School you attend ……………….. ………. ………. ……. …………………............. ….. ……................................
10. . Frequency of stay in hotels Less than once a year Once or twice a year three to five times in a year Five times or more
11. How much would you pay for a night stay in a hotel?
600Rmb or more 500Rmb-‐350Rmb 300Rmb 250Rmb – 150Rmb 100Rmb and below
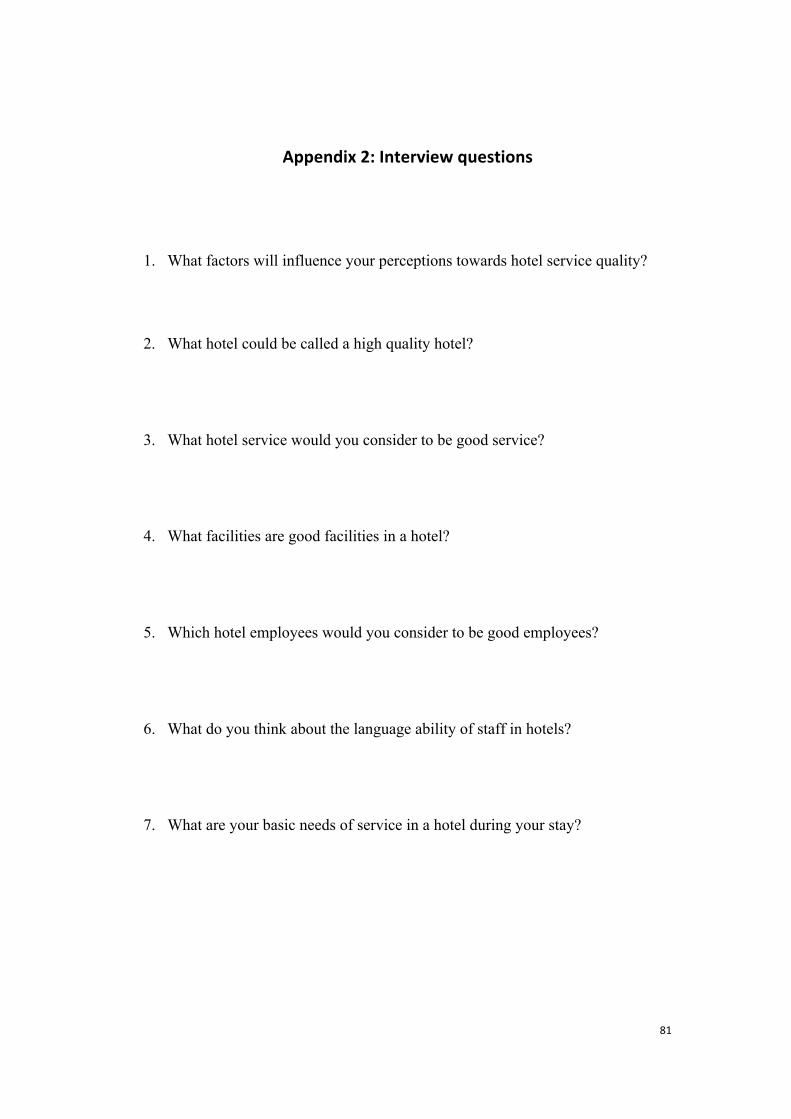
81
Appendix 2: Interview questions
1. What factors will influence your perceptions towards hotel service quality?
2. What hotel could be called a high quality hotel?
3. What hotel service would you consider to be good service?
4. What facilities are good facilities in a hotel?
5. Which hotel employees would you consider to be good employees?
6. What do you think about the language ability of staff in hotels?
7. What are your basic needs of service in a hotel during your stay?
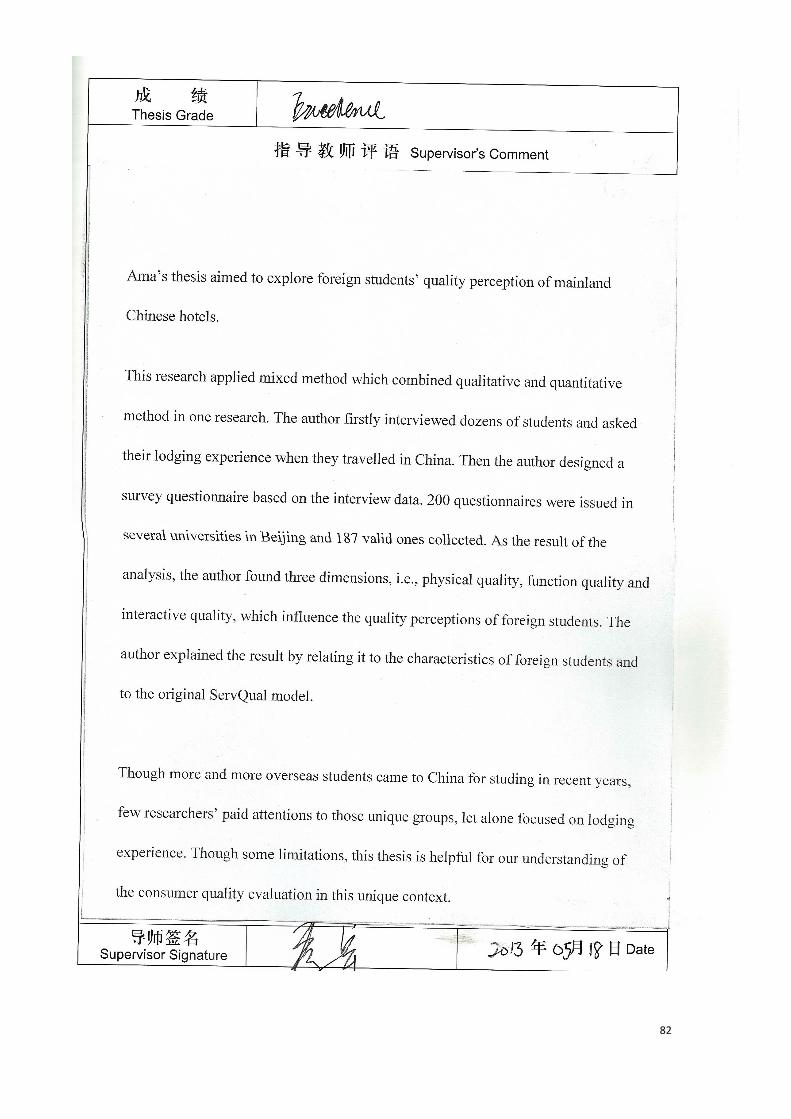
82
Related Documents


