Examining Flood Map Changes in New Jersey Report Prepared for New Jersey Realtors ® Governmental Research Foundation January 2017 Prepared by: Resources for the Future Carolyn Kousky, Research Fellow

Welcome message from author
This document is posted to help you gain knowledge. Please leave a comment to let me know what you think about it! Share it to your friends and learn new things together.
Transcript

Examining Flood Map Changes in New Jersey
Report Prepared for New Jersey Realtors® Governmental Research Foundation
January 2017
Prepared by:Resources for the FutureCarolyn Kousky, Research Fellow

Examining Flood Map Changes in New JerseyContents1. Introduction 12. FEMA Flood Hazard Mapping 2 2.1. Background on the NFIP 2 2.2. Mapping Overview 2 2.3. Mapping Methods and the Map Adoption Process 3 2.4. The Role of Maps in Building Regulations and Insurance Pricing 4 2.5. Critiques of FEMA Flood Mapping 5 2.6 Mapping Future Conditions 63. New Jersey Flood Risk 74. Coastal Updates to New Jersey FIRMs 11 4.1. FIRM Disputes and the New York Appeal 185. Conclusion 18Appendix A. Flood Zone Definitions 19References 20
Carolyn Kousky: Fellow, Resources for the Future. The author would like to thank the New Jersey Realtors® Governmental Research Foundation for supporting this work. She would also like to thank Brett Lingle for outstanding research assistance on this report.
Resources for the Future is an independent, nonpartisan organization that conducts rigorous economic research and analysis to help leaders make better decisions and craft smarter policies about natural resources and the environment.
© 2017, New Jersey Realtors® Governmental Research Foundation | njrealtor.com

1. INTRODUCTION
The National Flood Insurance Program, housed in the Federal Emergency Management Agency, provides flood insurance to participating communities. As part of this program, FEMA maps flood hazards on Flood Insurance Rate Maps, depicting areas of different flood risk and other information about the flood hazard, referred to as flood “zones.” These maps are used to price insurance policies and ensure compliance with NFIP requirements. Homeowners in a mapped high-risk zone are required to purchase flood insurance if they have a mortgage from a federally backed or regulated lender. New construction in high-risk zones is also subject to building regulations.
FIRMs can become out-of-date for a number of reasons. Improved data or methods might become available. New development and pervious cover in a watershed can alter the flood hazard. Erosion, sea-level rise, and changing storm and rainfall patterns can also change flood hazards. FIRMs must therefore be routinely updated. FEMA’s Region II office is currently revising the FIRMs for coastal New Jersey and New York, updating the storm surge and overland wave modeling as well as using more detailed topographic data. Once the new FIRMs are finalized and adopted by communities, the updated information will be used for building regulations, other NFIP requirements, and the pricing of flood insurance. The change in flood maps will thus have implications for residents, in terms of new construction, rebuilding after a flood, and the cost of insurance. FIRMs are often the only available and comprehensive source of flood hazard information readily accessible to property owners, community officials, and others. As such, they may be used for purposes beyond just the needs of implementing the NFIP. FIRMs, however, may not be the best source of generalized flood hazard information. For instance, identifying the 1 percent annual chance flood line is essential to NFIP requirements and pricing, but this line can create a false sense that flood risk changes abruptly at the boundary. In reality, of course, flood risk varies continuously across the landscape.
The next section of this report provides an overview of FEMA flood hazard mapping and the production of FIRMs. Section 3 discusses flood risk in New Jersey and the history of major flood events in the state. Section 4 then provides background on the new coastal FIRMs and analyzes how the flood hazard depicted in these new maps compares with the earlier FIRMs. The final section concludes.
© 2017, New Jersey Realtors® Governmental Research Foundation | njrealtor.com 1

2. FEMA FLOOD HAZARD MAPPING
2.1. Background on the NFIP The NFIP was created in 1968 largely in response to the unavailability of private sector flood insurance. Communities can voluntarily join the program by adopting minimum floodplain management regulations; their residents then become eligible to purchase flood insurance policies through the program. A residential property can be insured up to $250,000 for the building and up to $100,000 for the contents. A business can insure both structure and contents up to $500,000. In 1973, the Flood Disaster Protection Act established the mandatory purchase requirement, which made flood insurance mandatory for homeowners in a 100-year floodplain, referred to as the Special Flood Hazard Area (SFHA), who purchase property with a loan from a federally backed or regulated lender. This act also required communities to participate in the NFIP to be eligible for federal disaster aid. In 1974, Congress added a notification requirement that federally regulated lenders inform borrowers if their property is in an SFHA. As part of the program, FEMA maps the flood hazard in participating communities to inform participants of both the mandatory purchase requirement (by identifying the SFHA) and rating flood insurance policies, the cost of which varies by the flood zones depicted on the maps, as discussed in more detail below. Premiums for policies also vary by aspects of the structure, such as the number of stories and presence of a basement. For more details on NFIP pricing, see [1, 2].
2.2. Mapping Overview
FEMA develops and updates flood hazard maps in NFIP communities throughout the United States on a regular basis. When FEMA maps the flood hazards in a given community, it generally produces a Flood Insurance Study and a FIRM. FIRMs show the extent of the various flood risk zones throughout a community (see Appendix A for flood zone definitions) as well as the floodway. FIRMs delineate the Special Flood Hazard Area, which is equivalent to the 1 percent annual chance (or 100-year) floodplain. The SFHA comprises
two zones: the A zone is the inland 100-year floodplain or coastal floodplain subject to waves less than 3 feet, and the V zone is subject to breaking waves of at least 3 feet. For certain zones, the FIRM may also show base flood elevations, the estimated height of water in a 100-year (1 percent annual chance) flood. FIRMs are the basis for NFIP ratings, building code requirements, and enforcement of the mandatory purchase requirement.
A flood map may cover a variety of jurisdictions, such as counties or parishes, towns, townships, and cities. To identify communities in a uniform way, FEMA assigns each NFIP-participating community a six-digit community identifier, which is listed on each map. Because a community’s flood map may cover a substantial geographic area, FEMA divides the community area into sections called flood map panels. Panels are the actual documents used to identify a particular property’s flood risk. To indicate which panels correspond to which specific areas, FEMA provides an “index” map that covers an entire community or county, showing the location and extent of each panel.
The maps were originally produced on paper, but in the past 15 years, the vast majority of the nation’s FIRMs have been converted into more accessible digital versions, referred to as DFIRMs. The digital conversion was the focus of FEMA’s Map Modernization program, which spent $1.2 billion between 2003 and 2008 [3]. In addition to the maps for individual communities, FEMA also maintains the National Flood Hazard Layer, a publicly available digital database with spatial flood hazard data derived from engineering and hydrological studies, FIRMs, and official map revisions. The NFHL also contains NFIP community information, cross-section and hydraulic information, and base map information such as road, stream, and public survey land data—all of which can be viewed in a geographic information systems application. As of June 2013, the NFHL data covered about 92 percent of the U.S. population [4].
Copies of FIRMs, FISs, and other related products can be found in a community’s map repository (which is usually the local planning, zoning, or engineering office) or obtained online or in print from FEMA’s Map
© 2017, New Jersey Realtors® Governmental Research Foundation | njrealtor.com 2

Service Center. For communities with digitally produced FIRMs, the spatial data and maps are available from the MSC, and for communities that do not yet have digital FIRMs, scanned digital versions of the paper FIRM panels are available. And as noted earlier, spatial flood hazard data are also available through the NFHL.
FEMA launched the Risk Mapping, Assessment, and Planning program in 2009 to improve flood mapping data, risk assessment, and risk communication and thereby help communities with mitigation planning. Risk MAP, undertaken with local partners, focuses on developing products and services beyond the standard FIRM. The five goals of the program are to (1) address gaps in hazard data; (2) increase the awareness and understanding of flood risk among the public; (3) aid mitigation planning; (4) develop a digital platform; and (5) synergize across different program components. Each Risk MAP project is designed to meet the needs of individual communities and can involve different phases, services, and tools.
The Biggert-Waters Flood Insurance Reform Act of 2012 (PL 112-141) established an ongoing mapping effort to update maps. The law required that maps for populated areas show the 100-year and the 500-year floodplain, as well as areas of residual risk, the level of protection provided by flood control structures, and information on coastal erosion, changing lake levels, and subsidence. Funds for mapping were authorized. The act also created the Technical Mapping Advisory Council to review and make recommendations related to FEMA’s mapping efforts. Council representatives come from the public and private sector and from all levels of government. The council was tasked with examining the quality and distribution of FIRMs, developing performance metrics for mapping, setting standards for mapping and data, finding ways to maintain and update FIRMs, maintaining relationships with local partners, developing approaches for improving interagency coordination, and determining how to incorporate the best available climate data into mapping.
2.3. Mapping Methods and the Map Adoption Process
Conducting a flood study and implementing a new FIRM involve several steps. FEMA first holds a discovery meeting with communities and local stakeholders to understand a community’s flood issues, risks, and potential for further mitigation. This meeting helps FEMA determine whether new or updated flood hazard data and a new FIRM or FIS, are needed. If such an update is deemed necessary, FEMA works with community stakeholders to define the parameters of the project and determine what flooding sources will need careful study.
Then, working with its technical partners, FEMA conducts the study and eventually produces a new FIRM for the community. For map production, FEMA works with engineers and hydrologists in individual states and communities to conduct detailed surveys and analyses of the flood hazard in a given area. The information is compiled into a formal FIS, which provides flood risk and elevation data on a community’s waterways, lakes, and coastal zones. An FIS is based on historical information, meteorological data, topographic data, hydrologic and hydraulic data, land cover, and flood control studies. The FIS process is aptly summarized in a 2013 Congressional Research Service report:
A typical [FIS] begins with modeling of rainfall and storm tide records for the local areas. The data are then simulated to determine the likely discharge that could result from storms of various probabilities. These discharge data are applied to a cross section of the floodplain to estimate flood depths at various locations. Once FEMA determines water surface elevation data in various areas in the community, the next steps are to calculate the depth of flooding for buildings in the area and calculate the dollar damages using a vulnerability function (state-damage curve) derived from past flood events. The [BFE] of the first floor of the structure relative to the flood depth on the floodplain determines property-specific flood risk data to guide construction and insurance decisions. [5]
© 2017, New Jersey Realtors® Governmental Research Foundation | njrealtor.com 3

In coastal areas, FEMA also conducts storm surge modeling and takes account of coastal structures and natural features, such as seawalls, jetties, and dunes. The modeling for FIRMs is often done using the ADCIRC (Advanced CIRCulation) and SWAN (Simulating Waves Nearshore) models. To account for waves, an overland wave model takes water depth, wind speed, land cover, and other inputs to determine wave heights and hence flood elevations. FEMA also models wave runup and overtopping (when a wave is pushed over structures as it comes ashore).1
In some communities, local partners help with the production of flood maps through FEMA’s Cooperating Technical Partners program, established in 1999. The objective of the CTP program is to optimize limited mapping funds and create a process for incorporating unique local conditions. CTPs may be local governments, regional authorities, or state agencies that have the capabilities and resources to actively contribute to the flood-mapping process. CTP funds are made available each fiscal year, and eligible applicants may request funding for program activities. Once selected, a CTP enters into a formal partnership that allows FEMA to fund activities such as program management, base map acquisition, floodplain analyses, plus up to 10 percent of scoping and outreach costs. As of 2012, about 250 local partners had worked with FEMA to identify flood risks and update flood hazard maps in their communities. Beyond CTPs, many other groups may assist in map production. This includes FEMA contractors and also other federal agencies, which may share data or discuss risk in an area or methods used for analysis.
Once the FIS is complete and a draft FIRM is generated, FEMA provides preliminary versions for community review and will hold public meetings to explain the documents and hear comments. A 90-day appeal period then follows to allow community members to present scientific or technical information if they think the updated flood hazard information needs to be revised.
When the appeal period closes, FEMA addresses all appeals and finalizes the new FIS and FIRM before sending out a “letter of final determination.” This letter presents the flood hazard data, establishes the effective date for the new FIRM and FIS, and begins the six-month adoption period, during which the community is required to update its floodplain management regulations. At the end of this period, the FIRM and FIS become official and are the basis for flood insurance rates and requirements in the community [6]. As a condition of NFIP participation, a community must adopt the most up-to-date FIRM and use it for floodplain management regulations. Failure to do so could result in probation or suspension from the program.
Beyond the appeal period, individual property owners, renters, or leasers can contest their inclusion in the SFHA by submitting a “letter of map change.” The process allows for parcel-level changes to be made to an effective FIRM, and thus it is done after the map is adopted, not before. Changes may be warranted for two possible reasons. First, a property may be in an area that is elevated above the BFE, but the area was too small to be shown on the effective FIRM. For these properties, a “letter of map amendment” can be issued to remove the property from the SFHA. Second, during construction, a structure may have been raised on fill, putting it above the BFE. In this case, a “letter of map revision based on fill” can be issued to remove the property from the SFHA. This requires providing documentation to FEMA, including an elevation certificate.
1 For more information, see: www.region2coastal.com/resources/coastal-mapping-basics/
© 2017, New Jersey Realtors® Governmental Research Foundation | njrealtor.com 4

2.4. The Role of Maps in Building Regulations and Insurance Pricing
The flood zones and BFEs depicted on the effective FIRM are used for setting NFIP rates. Rates vary by flood zone. Within the SFHA, they also vary by elevation of the property relative to the BFE. (Rates also may vary by characteristics of a property, such as the presence of a basement.) Only the effective FIRM is used for rating flood insurance, not preliminary FIRMs. Preliminary maps, however, can give homeowners an indication of how their rates may change once the new map is adopted. Note that if a new FIRM moves a property from outside the SFHA to inside the SFHA or changes the BFE, the property may be eligible for a grandfathered premium. Grandfathering allows a policyholder to keep the rate associated with the old map. For more details on NFIP rating, please see the companion publications: Kousky, Lingle, and Shabman [1] and Kousky, Lingle, and Shabman [7].
The effective FIRM also must be used as the basis for the community floodplain regulations that are required by the NFIP [8]. The required regulations vary according to the flood zone but include the following features: (1) the community must require that all new development in an SFHA obtain a permit; (2) new development in floodways (the central portion of a floodplain that carries deep and/or high-velocity flows) must not be permitted if it increases flood heights; and (3) all new construction, or substantially improved or damaged properties in an SFHA, must be elevated so that the lowest floor is at or above the BFE, or the estimated height of floodwaters in a 100-year flood (nonresidential structures can also be dry flood-proofed). In V zones, additional building requirements apply to address the force of waves. A community can choose to use preliminary maps as the basis of regulations if they are more conservative than the effective FIRM (i.e., the BFEs are higher or the SFHA is more extensive).
V zones depicts areas where wave heights are 3 feet or greater. Areas where waves are 1.5 feet to 3 feet may be referred to as “coastal A zones.” They are shown on coastal FIRMs as the area landward of the V zone up to the Limit of Moderate Wave Action (LiMWA) line. The LiMWA is where the 1 percent annual chance wave height is 1.5 feet. Coastal A zones are not differentiated in rate-setting: all A zones, inland or coastal, have the same insurance rate. However, some jurisdictions might require stricter building codes in coastal A zones, since these areas are subject to wave action. FEMA encourages communities to do this because of the damage that waves can cause.
2.5. Critiques of FEMA Flood Mapping
FEMA’s flood hazard mapping process has been critiqued and criticized over the years in the academic literature, by the popular press, and among policymakers. Many of these critiques fault the FIRMs for what they are not: FIRMS are developed to guide NFIP rating and other program requirements, not to precisely communicate flood risk. Since they are often the only consistent set of flood hazard maps produced, however, they are routinely used for broader purposes.
FEMA spends a substantial amount of resources identifying the 1 percent annual chance flood line or the boundary of the SFHA.2 This is critical to the program, since inside the SFHA, purchase of insurance is mandatory, certain building regulations must be enforced, and rating of NFIP policies is different. The SFHA boundary has sometimes created a false sense of security among communities and residents who may misinterpret areas outside the SFHA as being safe [9]. This, of course, is a false dichotomy. Flood risk varies both across and beyond the SFHA. In an analysis of flood claims data throughout the country between 1978 and 2012, roughly 30 percent of claims were for properties outside SFHAs [12]. Many recent storms, including Hurricanes Katrina, Ike, and Sandy, all led to flooding that extended beyond the SFHA and generated flood depths that exceeded the BFE by several feet [10]. Residents may not be aware that in a 20-year period, there is an 18 percent chance that the 100-year flood level will be exceeded [10]. In addition to events severe
2 Some have argued that the 1% standard is insufficient. Many local communities have adopted higher levels of flood protection for their residents. In January 2015, the President issued Executive Order 13690, which established the Federal Flood Risk Management Standard. This does not impact the NFIP FIRMs or building regulations. It directs federal agencies to use a higher vertical flood elevation and corresponding horizontal floodplain for siting, design, and construction in floodplains, either using climate science, 2 feet of additional freeboard, or the 500-year floodplain.© 2017, New Jersey Realtors® Governmental Research Foundation | njrealtor.com 5
enough to cause flooding beyond an SFHA, extreme downpours that overwhelm local drainage have become an increasing problem, flooding homeowners who did not realize they were at risk from floods. The Technical Mapping Advisory Council has suggested that FEMA move toward a structure-specific depiction of risk, as opposed to the simplistic message of being “in” or “out” of the SFHA [11]. For risk communication, a gradated map that showed progressive changes in flood risk across the landscape and beyond the SFHA would be useful.
Another criticism of FEMA maps is that they can be outdated. Flood risk can change because of changes in pervious surface area, erosion, and climate change. In addition, data and methods improve over time. This creates a need to continually update FIRMs. The National Flood Insurance Reform Act of 1994 instructed FEMA to review all maps at least every five years. In July 2014, FEMA administrator Craig Fugate noted that approximately 50 percent of all flood maps were current, 40 percent were in review, and 10 percent were out of date [13]. FEMA has noted that FIRMs produced after 2005 use current flood models and engineering procedures, but earlier studies likely understate flood risk; even recent FIRMs may use old surge models, as was the case for the New York City 2007 FIRM, which was based on models and analysis from the 1980s [10].
One of the most urgent issues with outdated maps is a lack of high-quality topographic data—information a committee of the National Academies of Sciences described as the most important factor in determining flood map accuracy [14]. Outdated FIRMs generally rely on US Geological Survey topographic maps, many of which were drawn 30 to 40 years ago using technology and methods much less accurate than those used today [15]. LIDAR-generated vertical elevation data are about 10 times more accurate than USGS data and provide the level of detail needed to properly delineate floodplain boundaries and risk zones [16].
FEMA has actively promoted the use of LIDAR and is working to incorporate it into new FIRMs.
2.6 Mapping Future Conditions
FIRMs are a snapshot of flood risk in a community: sufficient for setting today’s insurance prices, but inadequate for making development and infrastructure siting decisions in areas where flood risk is changing over time. A recent study for FEMA evaluated how population growth and climate change might alter flood risk in the United States [17]. The study estimated a 45 percent median increase in the area of the 100-year floodplain in riverine environments nationwide, with large regional variation. On average, roughly 30 percent of this increase is attributable to population growth and 70 percent to climate change. In coastal areas, the median growth in the SFHA was projected to be 55 percent.
In 2001, FEMA issued a rule that allowed communities to use future-conditions hydrology resulting from changes in land use and development (but not possible new flood control structures) for mapping. If communities request this, FEMA will show the future-conditions 100-year floodplain on the FIRM and designate it as a shaded zone X with no BFEs (although these could be provided in the FIS). Rating and regulation requirements are not based on future conditions. BW12 mandated that the Technical Mapping Advisory Council provide recommendations on ensuring that FIRMs include the best available climate science and the best methods to consider sea-level rise and projections of future development. The council’s report, released last year [18], presents seven recommendations and multiple subrecommendations on how FEMA could proceed with providing nonregulatory, but nonetheless valuable, information on future flood risk to communities. This includes using a scenario approach to consider changes from erosion and sea-level rise.
© 2017, New Jersey Realtors® Governmental Research Foundation | njrealtor.com 6

3. NEW JERSEY FLOOD RISK
New Jersey can suffer from various types of flooding, including storm surge, swelling rivers, flash floods, and poor drainage. This susceptibility to floods can be seen in presidential disaster declaration data. If a governor believes that damage exceeds the state’s ability to handle a disaster on its own, he or she can make a request, through FEMA, for the president to declare a disaster. A disaster declaration can activate several assistance programs. FEMA provides data on disaster declarations going back to 1964 on its website. Figure 1 shows total disaster declarations in New Jersey between 1964 and 2015, by county, the usual unit of designation. Figure 2 shows declarations possibly related to flooding (this includes hurricanes and storms that may have also caused damage from high winds). Unsurprisingly, more flood-related declarations have been made for coastal counties than inland.
FEMA makes data on disaster aid spending publicly available on its website through OpenFEMA.3 Once a disaster has been declared, FEMA may provide funds to local governments for response and repair through the Public Assistance program or to households through the Individual Assistance program. The PA program funds debris removal, emergency protective measures, and repair and replacement of public facilities. The IA program funds temporary housing, repair and replacement of property, and other needs assistance associated with the disaster, such as cleanup items or disaster-related medical expenses.
Looking at the PA database, we find that between 2004 and 2015, New Jersey received 16 disaster declarations, 11 of which were for severe storms and 2 for hurricanes. For these declarations, New Jersey received $2.3 billion in Public Assistance, the largest portion of which was from Sandy, at almost 84 percent of the total (Table 1).
Over that same time period, the IA program was authorized in seven declarations (in many disaster declarations, only PA is authorized), with total spending of $687 million (Table 2). Of this spending, the highest amount was for Hurricane Sandy and 93 percent of the total is attributable to two hurricanes, Irene and Sandy. The average IA grant to a household across these declarations was $5,326.
© 2017, New Jersey Realtors® Governmental Research Foundation | njrealtor.com 7
3 www.fema.gov/media-library/assets/documents/28331
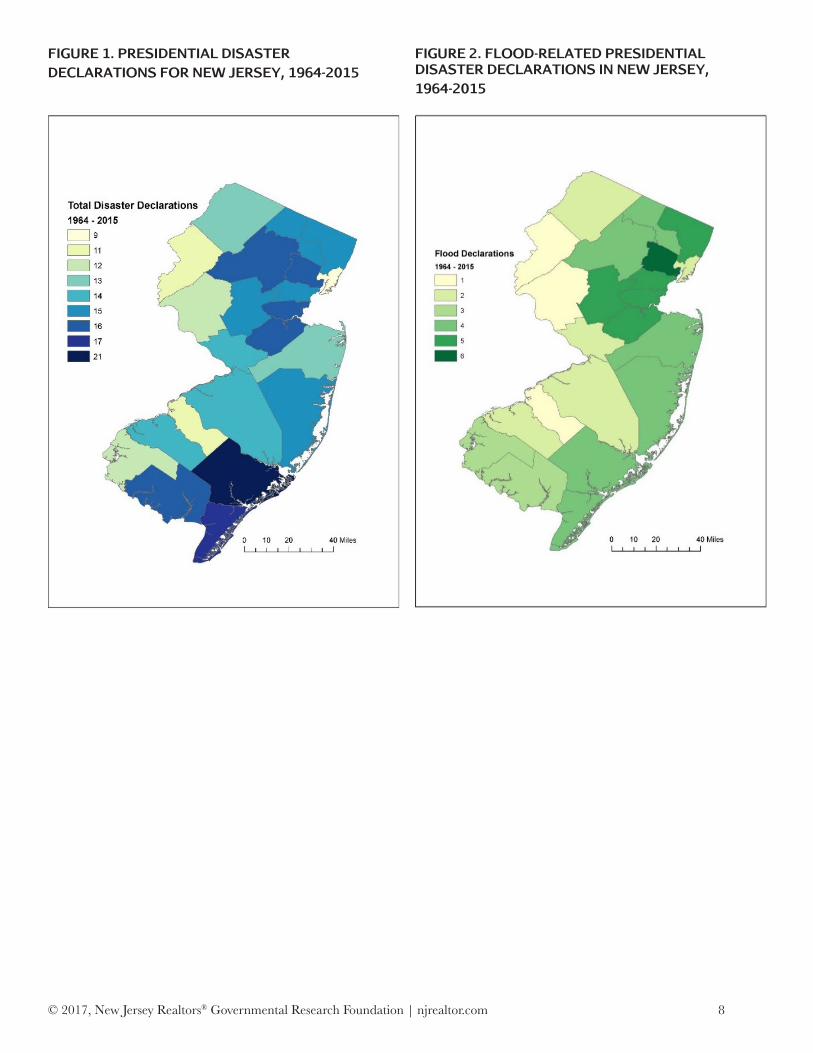
FIGURE 1. PRESIDENTIAL DISASTER DECLARATIONS FOR NEW JERSEY, 1964-2015
FIGURE 2. FLOOD-RELATED PRESIDENTIAL DISASTER DECLARATIONS IN NEW JERSEY, 1964-2015
© 2017, New Jersey Realtors® Governmental Research Foundation | njrealtor.com 8

TABLE 1. MAJOR DISASTER DECLARATIONS AND PUBLIC ASSISTANCE SPENDING FOR NEW JERSEY, 2004-2015
Declaration Year Hazard PA funding (2015$) 1530 2004 Severe storm(s) $10,200,000 1563 2004 Severe storm(s) 5,880,984 1653 2006 Severe storm(s) 2,756,383 1694 2007 Severe storm(s) 21,500,000 1867 2009 Severe storm(s) 13,900,000 1873 2010 Snow 16,000,000 1889 2010 Snow 16,300,000 1897 2010 Severe storm(s) 35,600,000 1954 2011 Snow 56,700,000 4021 2011 Hurricane (Irene) 127,000,000 4033 2011 Severe storm(s) 8,130,798 4039 2011 Severe storm(s) 4,344,224 4048 2011 Severe storm(s) 28,500,000 4070 2012 Severe storm(s) 9,851,246 4086 2012 Hurricane (Sandy) 1,960,000,000 4231 2015 Severe storm(s) 12,000,000 Total $2,328,663,635
TABLE 2. NEW JERSEY MAJOR DISASTER DECLARATIONS AND INDIVIDUAL ASSISTANCE FUNDING, 2004-2015
Declaration Year Hazard Approvals IA average (2015$) IA funding (2015$) 1563 2004 Severe storm(s) 457 $5,605.35 $2,561,646 1588 2005 Severe storm(s) 1,010 3,380.19 3,413,994 1653 2006 Severe storm(s) 325 2,123.43 690,115 1694 2007 Severe storm(s) 9,840 2,320.65 22,835,186 1897 2010 Severe storm(s) 6,716 2,831.89 19,018,951 4021 2011 Hurricane (Irene) 49,268 3,872.63 190,796,921 4086 2012 Hurricane (Sandy) 61,314 7,296.39 447,371,003 Total 128,930 $5,326.05 $686,687,816
© 2017, New Jersey Realtors® Governmental Research Foundation | njrealtor.com 9
© 2017, New Jersey Realtors® Governmental Research Foundation | njrealtor.com 10
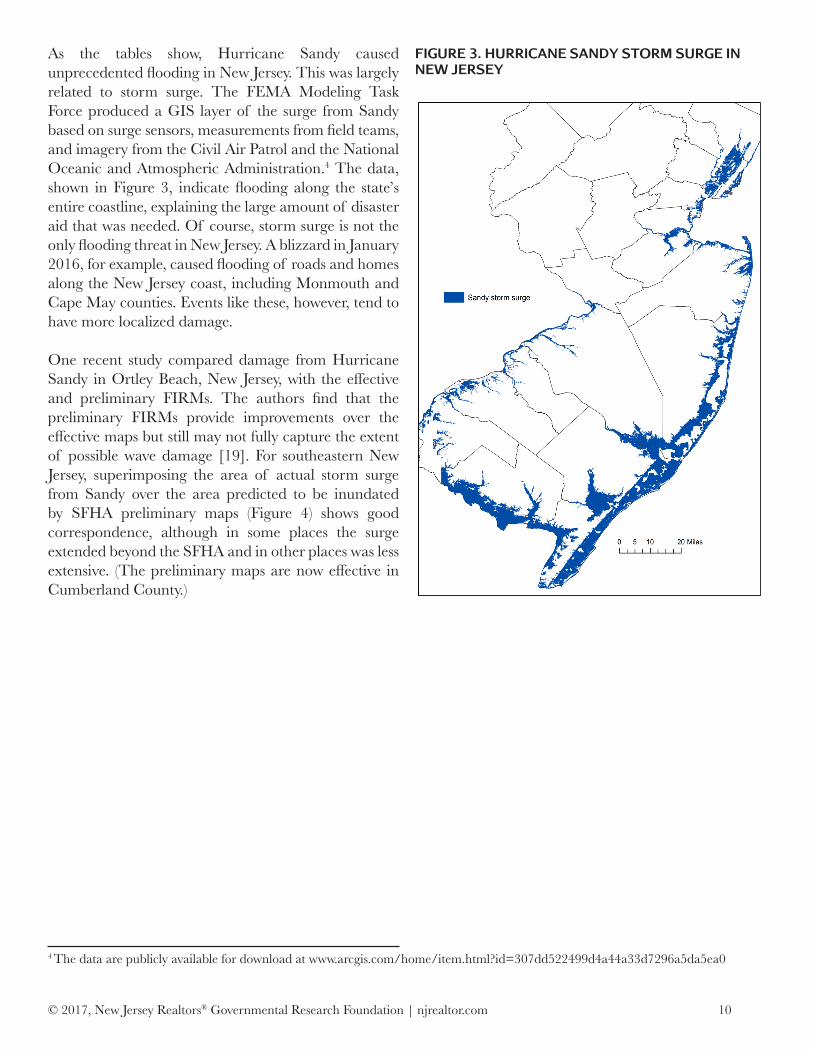
As the tables show, Hurricane Sandy caused unprecedented flooding in New Jersey. This was largely related to storm surge. The FEMA Modeling Task Force produced a GIS layer of the surge from Sandy based on surge sensors, measurements from field teams, and imagery from the Civil Air Patrol and the National Oceanic and Atmospheric Administration.4 The data, shown in Figure 3, indicate flooding along the state’s entire coastline, explaining the large amount of disaster aid that was needed. Of course, storm surge is not the only flooding threat in New Jersey. A blizzard in January 2016, for example, caused flooding of roads and homes along the New Jersey coast, including Monmouth and Cape May counties. Events like these, however, tend to have more localized damage.
One recent study compared damage from Hurricane Sandy in Ortley Beach, New Jersey, with the effective and preliminary FIRMs. The authors find that the preliminary FIRMs provide improvements over the effective maps but still may not fully capture the extent of possible wave damage [19]. For southeastern New Jersey, superimposing the area of actual storm surge from Sandy over the area predicted to be inundated by SFHA preliminary maps (Figure 4) shows good correspondence, although in some places the surge extended beyond the SFHA and in other places was less extensive. (The preliminary maps are now effective in Cumberland County.)
FIGURE 3. HURRICANE SANDY STORM SURGE IN NEW JERSEY
4 The data are publicly available for download at www.arcgis.com/home/item.html?id=307dd522499d4a44a33d7296a5da5ea0

4. COASTAL UPDATES TO NEW JERSEY’S FIRMs
In 2009, FEMA’s Region II office began a study to revise and update the coastal storm surge elevations in New Jersey and New York, including bays, sounds, and tributaries.5 The new studies are generating new FIRMs for the affected communities, which will also be switched to the North American Vertical Datum of 1988.6 For New Jersey, this effort includes developing new FIRMs for coastal counties (or parts of counties), as well as digitizing FIRMs for coastal counties that previously had no DFIRMs.
Until the updated FIRMS are finalized and adopted by the community, the FIRM that is currently in effect will be used for rate setting and floodplain regulations. Table 3 indicates, for all the counties in New Jersey, whether they were included in this new coastal mapping effort; whether they had a DFIRM as of July 2016; and the date the preliminary map was issued or the date of the effective FIRM. Note that Camden, Gloucester, and Mercer counties now have pending maps. FEMA is also updating (or may soon update) other New Jersey FIRMs but not as part of the coastal study; Passaic County and Morris County, for example, have preliminary FIRMs that are now under review.
5 FEMA is providing information on this effort to the public at www.region2coastal.com6 Vertical datums are base measurement points to determine elevations. FEMA is updating maps to a more accurate and more widely used datum.© 2017, New Jersey Realtors® Governmental Research Foundation | njrealtor.com 11
FIGURE 4. COMPARISON OF SFHA AND HURRICANE SANDY STORM SURGE
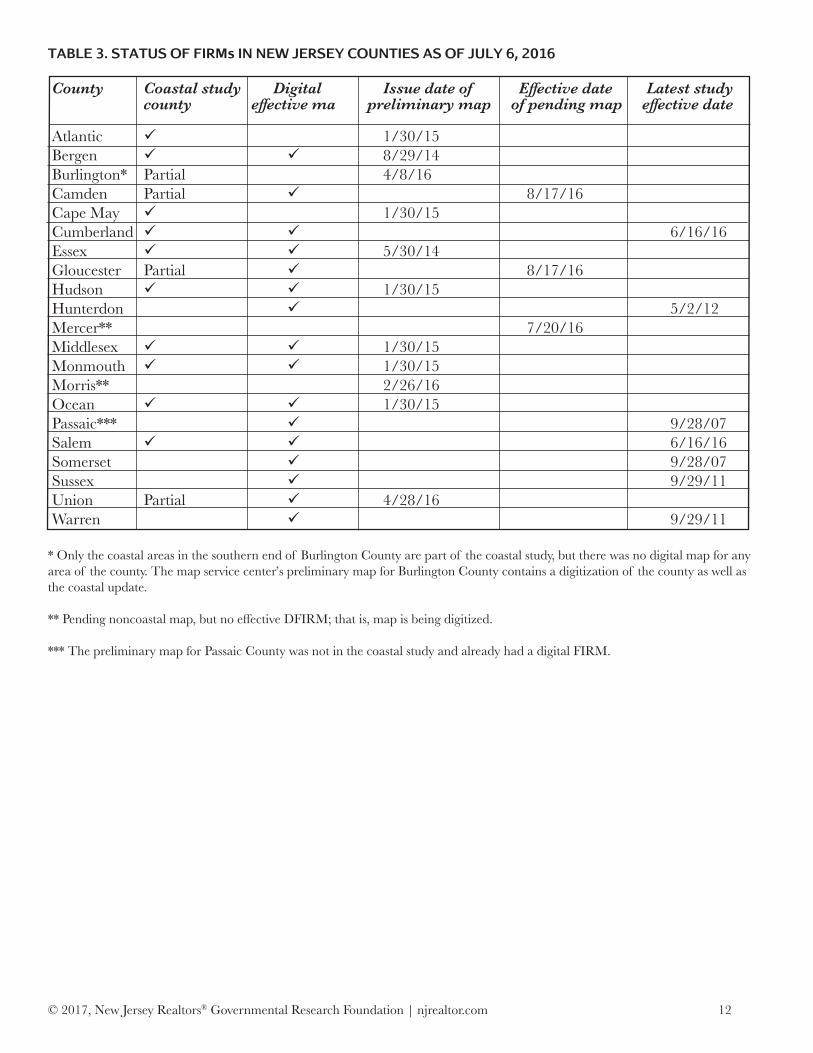
TABLE 3. STATUS OF FIRMs IN NEW JERSEY COUNTIES AS OF JULY 6, 2016
County Coastal study Digital Issue date of Effective date Latest study county effective ma preliminary map of pending map effective date Atlantic ü 1/30/15 Bergen ü ü 8/29/14 Burlington* Partial 4/8/16 Camden Partial ü 8/17/16 Cape May ü 1/30/15 Cumberland ü ü 6/16/16 Essex ü ü 5/30/14 Gloucester Partial ü 8/17/16 Hudson ü ü 1/30/15 Hunterdon ü 5/2/12 Mercer** 7/20/16 Middlesex ü ü 1/30/15 Monmouth ü ü 1/30/15 Morris** 2/26/16 Ocean ü ü 1/30/15 Passaic*** ü 9/28/07 Salem ü ü 6/16/16 Somerset ü 9/28/07 Sussex ü 9/29/11 Union Partial ü 4/28/16 Warren ü 9/29/11
* Only the coastal areas in the southern end of Burlington County are part of the coastal study, but there was no digital map for any area of the county. The map service center’s preliminary map for Burlington County contains a digitization of the county as well as the coastal update.
** Pending noncoastal map, but no effective DFIRM; that is, map is being digitized.
*** The preliminary map for Passaic County was not in the coastal study and already had a digital FIRM.
© 2017, New Jersey Realtors® Governmental Research Foundation | njrealtor.com 12
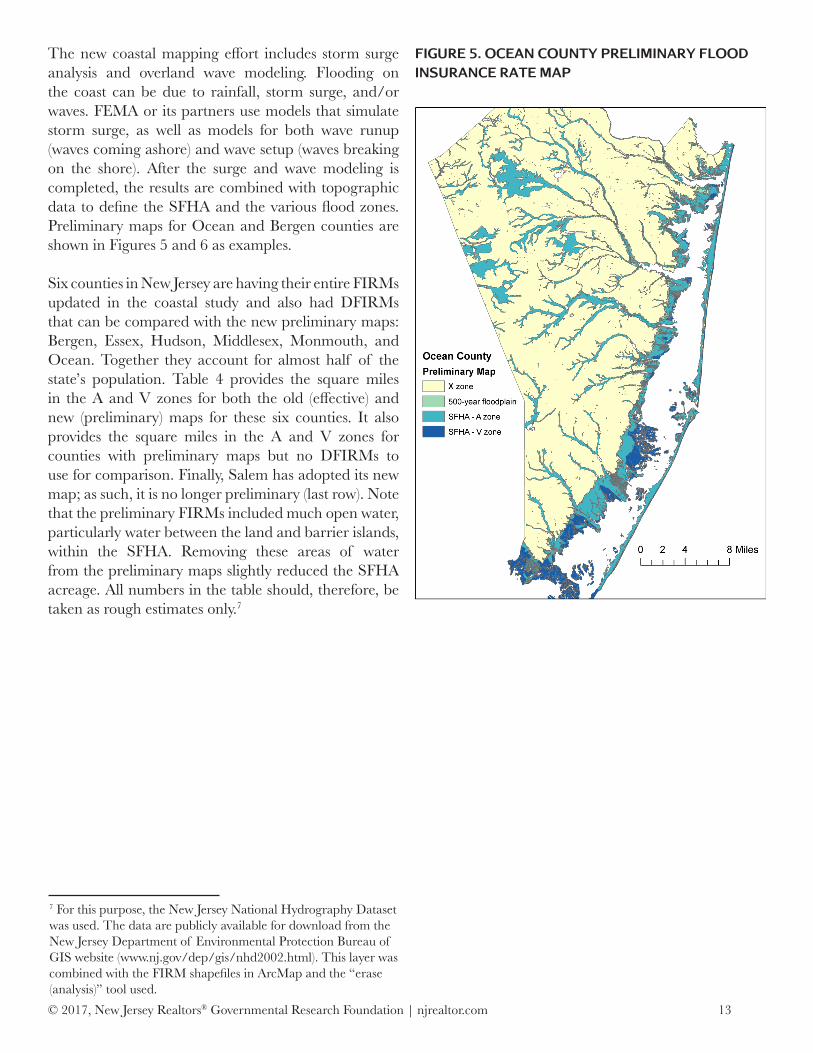
The new coastal mapping effort includes storm surge analysis and overland wave modeling. Flooding on the coast can be due to rainfall, storm surge, and/or waves. FEMA or its partners use models that simulate storm surge, as well as models for both wave runup (waves coming ashore) and wave setup (waves breaking on the shore). After the surge and wave modeling is completed, the results are combined with topographic data to define the SFHA and the various flood zones. Preliminary maps for Ocean and Bergen counties are shown in Figures 5 and 6 as examples.
Six counties in New Jersey are having their entire FIRMs updated in the coastal study and also had DFIRMs that can be compared with the new preliminary maps: Bergen, Essex, Hudson, Middlesex, Monmouth, and Ocean. Together they account for almost half of the state’s population. Table 4 provides the square miles in the A and V zones for both the old (effective) and new (preliminary) maps for these six counties. It also provides the square miles in the A and V zones for counties with preliminary maps but no DFIRMs to use for comparison. Finally, Salem has adopted its new map; as such, it is no longer preliminary (last row). Note that the preliminary FIRMs included much open water, particularly water between the land and barrier islands, within the SFHA. Removing these areas of water from the preliminary maps slightly reduced the SFHA acreage. All numbers in the table should, therefore, be taken as rough estimates only.7
FIGURE 5. OCEAN COUNTY PRELIMINARY FLOOD INSURANCE RATE MAP
7 For this purpose, the New Jersey National Hydrography Dataset was used. The data are publicly available for download from the New Jersey Department of Environmental Protection Bureau of GIS website (www.nj.gov/dep/gis/nhd2002.html). This layer was combined with the FIRM shapefiles in ArcMap and the “erase (analysis)” tool used.© 2017, New Jersey Realtors® Governmental Research Foundation | njrealtor.com 13

FIGURE 6. BERGEN COUNTY PRELIMINARY FLOOD INSURANCE RATE MAP
In many counties, parts of the FIRM—effective and/or preliminary—showed no BFEs. For the six counties where we had BFE data to compare both the previous effective map and the new preliminary map, we calculated the difference in BFEs (Table 5). 8
Overall, the updated maps generally increased BFEs, although in some places BFEs were reduced.
BFEs in and of themselves do not provide information on NFIP rates: what matters is the difference between the elevation of the property and the BFE. To the extent that BFEs are being raised, however, the given property stock will face higher rates because that difference will now be smaller. New Jersey does not have aggregated data on property elevations to analyze how many properties may face rate increases due to the new maps. The number should be small, however, since many properties will be able to grandfather their old rate [see: 1]. Ocean County has begun collecting elevation certificates for properties that have them and uploading the pdfs on a public website. A property’s elevation certificate, if one exists, may indicate the BFE; the public can also use FEMA’s online tool to look up the BFEs for particular properties.9 As an example, Figure 7 maps the BFEs from the preliminary map for Ocean County.
© 2017, New Jersey Realtors® Governmental Research Foundation | njrealtor.com 14
8 For this calculation, we used the intersect tool in ArcMap 10.3.1 to match the effective and preliminary FIRMs and the “select by attributes” tool to identify those areas with estimated BFEs in both maps. The difference in BFEs was calculated using the Field Calculator and the area calculated using the Calculate Geometry tool.
9 www.region2coastal.com/view-flood-maps-data/what-is-my-bfe-address-lookup-tool/
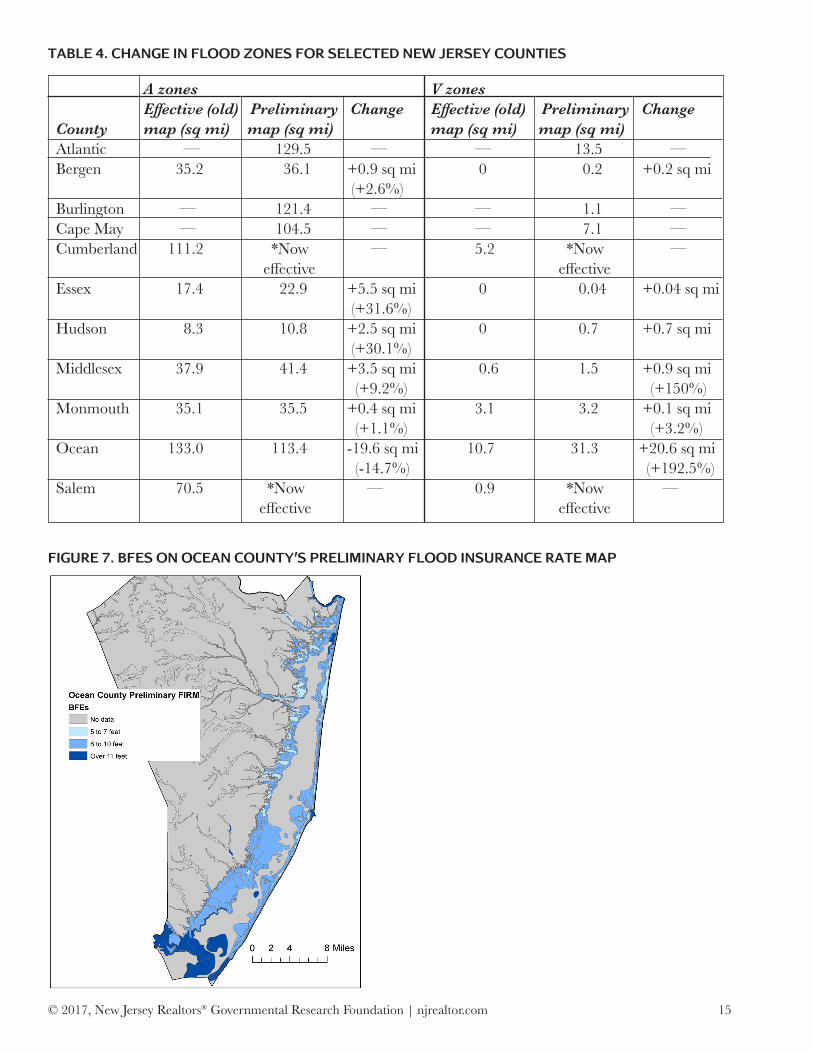
TABLE 4. CHANGE IN FLOOD ZONES FOR SELECTED NEW JERSEY COUNTIES
A zones V zones Effective (old) Preliminary Change Effective (old) Preliminary Change County map (sq mi) map (sq mi) map (sq mi) map (sq mi) Atlantic — 129.5 — — 13.5 — Bergen 35.2 36.1 +0.9 sq mi 0 0.2 +0.2 sq mi (+2.6%) Burlington — 121.4 — — 1.1 — Cape May — 104.5 — — 7.1 — Cumberland 111.2 *Now — 5.2 *Now — effective effective Essex 17.4 22.9 +5.5 sq mi 0 0.04 +0.04 sq mi (+31.6%) Hudson 8.3 10.8 +2.5 sq mi 0 0.7 +0.7 sq mi (+30.1%) Middlesex 37.9 41.4 +3.5 sq mi 0.6 1.5 +0.9 sq mi (+9.2%) (+150%) Monmouth 35.1 35.5 +0.4 sq mi 3.1 3.2 +0.1 sq mi (+1.1%) (+3.2%) Ocean 133.0 113.4 -19.6 sq mi 10.7 31.3 +20.6 sq mi (-14.7%) (+192.5%) Salem 70.5 *Now — 0.9 *Now — effective effective
© 2017, New Jersey Realtors® Governmental Research Foundation | njrealtor.com 15
FIGURE 7. BFES ON OCEAN COUNTY’S PRELIMINARY FLOOD INSURANCE RATE MAP

© 2017, New Jersey Realtors® Governmental Research Foundation | njrealtor.com 16
TABLE 5. CHANGE IN BFES FROM EFFECTIVE TO PRELIMINARY FIRMS (FOR AREAS WITH BFES)
County Difference between effective (old) Square miles and preliminary (new) BFEs Bergen 1 ft. decrease 12.1 no change 9.8 1 to 3 ft. increase 2.4 4 to 6 ft. increase 1.1 over 6 ft. increase 1.2 Essex 1 to 3 ft. increase 2.0 4 to 6 ft. increase 1.0 Hudson 1 to 2 ft. decrease 0.1 no change 0.1 1 to 3 ft. increase 6.2 4 to 6 ft. increase 3.4 over 6 ft. increase 2.3 Middlesex 1 ft. decrease 0.01 no change 0.07 1 to 3 ft. increase 3.1 4 to 6 ft. increase 8.0 over 6 ft. increase 2.0 Monmouth 2 or more ft. decrease 2.5 1 ft. decrease 2.7 no change 4.8 1 to 3 ft. increase 12.8 4 to 6 ft. increase 2.5 over 6 ft. increase 0.7 Ocean 2 or more ft. decrease 1.3 1 ft. decrease 5.8 no change 10.1 1 to 3 ft. increase 27.5 4 to 6 ft. increase 25.8 over 6 ft. increase 0.2

The preliminary maps provide a snapshot of the exposure to flood risk in the coastal counties of New Jersey. Parcel data for New Jersey are publicly available online through the New Jersey Geographic Information Network.10 We used the data to estimate in GIS the number of properties in each flood zone for a subset of New Jersey counties (Figure 8).11 V zones have substantially fewer properties because they are very narrow.
Ocean and Cape May are the only counties with more than 2,000 parcels in the V zone; Monmouth comes in third with a little over 1,200. The majority of properties in A zones are residential, ranging from a low of 60 percent of parcels in Middlesex to a high of 85 percent in Cape May.
FIGURE 8. PARCELS IN SPECIAL FLOOD HAZARD AREAS
© 2017, New Jersey Realtors® Governmental Research Foundation | njrealtor.com 17
Note: The total number of parcels includes vacant lots and undeveloped parcels but does not include parcels for which no data on occupancy type were available. Thus these numbers are not exact counts and are rounded to the nearest 10.
10 njgin.state.nj.us/NJ_NJGINExplorerIW.jsp?DLayer=Parcels11 When a flood zone boundary crossed a parcel, we assigned the flood zone that applied to the majority of the parcel area.

4.1. FIRM Disputes and the New York Appeal
As FEMA has updated and revised FIRMs throughout New Jersey, a number of disputes have arisen. These disagreements typically involve residents frustrated about being mapped into a high-risk flood zone, when the previous map indicated their risk (and flood insurance costs) were lower. The concern may or may not be justified. In Paterson, New Jersey, for example, hundreds of homes and businesses were mapped into high-risk zones, apparently because of old sewage and drainage systems; the community is working with FEMA to revise the maps [20].
Larger-scale disputes have also arisen in the coastal FIRM-updating process. For instance, FEMA issued advisory maps in advance of the preliminary maps to help guide rebuilding after Hurricane Sandy. When these advisory maps were issued for Atlantic, Hudson, Monmouth, and Ocean counties in late 2012, residents and officials were surprised by the substantial expansion of the V zone, arguing that FEMA did not take town- and neighborhood-specific conditions into account. Since the V zone has much stricter building standards, this had costly implications for any rebuilding, should residents be subject to regulations based on the new maps. In June 2013, however, FEMA released preliminary FIRMs that shrunk the V zone depicted in the advisory maps by at least 45 percent; Atlantic County saw a reduction of V zones of 80 percent and Hudson County saw a 76 percent reduction in the V zone [21]. Maps of New York’s coastal areas are also undergoing revision, and New York City is appealing the preliminary maps, arguing that there was insufficient extratropical storm model validation and a misrepresentation of tidal effects. More detail on its appeal can be found in the documentation the Mayor’s Office of Recovery and Resiliency for the City of New York submitted to FEMA Region II on June 26, 2015, available online.12
5. CONCLUSION New Jersey faces flood risk from a range of sources, including overbank river flooding, poor drainage, and storm surge. Hurricane Sandy caused unprecedented flood damage along the entire state and was responsible for the largest amount of disaster aid New Jersey has received over the past decade. In some places, the storm surge from Sandy extended beyond the SFHA on effective Flood Insurance Rate Maps and certainly extended outside the V zone, typically considered to be the area of possible surge damage. The V zone, however, shows only areas that are estimated to have waves of at least 3 feet in the 1 percent annual chance flood. A zones in coastal communities can also be subject to smaller waves that are nonetheless damaging. And floods can and do occur that exceed the 1 percent chance storm. This demonstrates the limitations of FEMA maps. They are not an accurate depiction of the full range of flood risk a property faces; instead, they are designed to indicate which properties are required to purchase flood insurance at what rates, and which properties are subject to certain building codes. FEMA is now completing updates to New Jersey’s coastal flood insurance rate maps, which should more accurately depict the 100-year floodplain and associated base flood elevations. There will be homes outside the SFHA, however, that still face flood risk.
© 2017, New Jersey Realtors® Governmental Research Foundation | njrealtor.com 18
12 www1.nyc.gov/assets/floodmaps/images/content/pages/1-NYC%20FEMA%20Appeal%20FINAL%20with%20Appendices%20and%20Cover%20Letter%2006252015_web.pdf

APPENDIX A. FLOOD ZONE DEFINITIONS
Table A1 defines the flood zones depicted on FEMA Flood Insurance Rate Maps. The descriptions are taken from the FEMA website,13 as well as CoreLogic [22]. Areas subject to the mandatory purchase requirement are shaded in light gray.
TABLE A1. FEMA FLOOD ZONESFlood zone A
AE, A1-A30
AH
AO
AR
A99
V
VE, V1-V30
D
X (shaded), B
X (unshaded), C
Description
Areas subject to inundation by flood with 1% or greater annual chance of occurrence but for which no detailed hydraulic analyses have been done. These zones thus do not show base flood elevations.
Areas subject to inundation by flood with 1% or greater annual chance of occurrence. BFEs are shown. Note: Numbered A zones are being replaced with zone AE on new FIRMs.
Areas subject to inundation by shallow flood with 1% or greater annual chance of occurrence. Flooding in this zone is usually from sheet flow, with average depths of 1 to 3 feet. BFEs are shown.
Areas subject to inundation by shallow flood with 1% or greater annual chance of occurrence. Flooding in this zone is usually from sheet flow, with average depths of 1 to 3 feet. BFEs are shown.
Areas subject to inundation by flood with 1% or greater annual chance of occurrence because of temporarily increased flood risk caused by ongoing restoration of flood protection system.
Areas subject to inundation by flood with 1% or greater annual chance of occurrence but that will ultimately be protected by federal flood protection system that has made enough progress to be considered complete for insurance rating purposes. BFEs are not given.
Coastal areas subject to inundation by flood with 1% or greater annual chance of occurrence and subject to storm-induced waves. No detailed hydraulic analyses have been done and so these zones do not show BFEs.
Coastal areas subject to inundation by flood with 1% or greater annual chance of occurrence and subject to storm-induced waves. BFEs are shown. Note: Numbered V zones are being replaced with zone VE on new FIRMs.
Areas with possible but undetermined flood risk.
Areas of moderate flood hazard between limits of 100-year and 500-year floodplain. Note: zone B is being replaced with shaded zone X on new FIRMs.
Areas of minimal flood hazards outside 500-year floodplain. Note: zone C is being replaced with unshaded zone X on new FIRMs.
13 Retrieved May 12, 2016, from www.fema.gov/flood-zones.
© 2017, New Jersey Realtors® Governmental Research Foundation | njrealtor.com 19

© 2017, New Jersey Realtors® Governmental Research Foundation | njrealtor.com 20
REFERENCES 1. Kousky, C., B. Lingle, and L. Shabman. 2016. NFIP Premiums for Single-Family Residential Properties: Today and Tomorrow. Policy Brief 16-10. Washington, DC: Resources for the Future.
2. Kousky, C., and L. Shabman. 2014. Pricing Flood Insurance: How and Why the NFIP Differs from a Private Insurance Company. RFF Discussion Paper 14-37. Washington, DC: Resources for the Future.
3. Garcia-Diaz, D. 2014. Testimony to the Subcommittee on Housing and Insurance, Committee on Financial Services, House of Representatives. Washington, DC.
4. FEMA. 2013. The National Flood Hazard Layer: Products and Services Using FEMA’s Flood Hazard Data. Washington, DC.
5. King, R.O. 2013. The National Flood Insurance Program: Status and Remaining Issues for Congress. Washington, DC: Congressional Research Service.
6. FEMA. 2012. Adoption of Flood Insurance Rate Maps by Participating Communities. Washington, DC.
7. Kousky, C., B. Lingle, and L. Shabman. 2016. Understanding the National Flood Insurance Program in New Jersey. Washington, DC: Resources for the Future.
8. FEMA. 1998. Managing Floodplain Development through the National Flood Insurance Program. In Home Study Course. Washington, DC.
9. ASFPM Foundation. 2004. Is the 1% Chance Flood Standard Sufficient? In Report of the 2004 Assembly of the Gilbert F. White National Flood Policy Forum. Washington, DC: ASFPM Foundation in collaboration with the National Academies Disasters Roundtable.
10. FEMA. 2015. Designing for Flood Levels above the BFE after Hurricane Sandy. In Hurricane Sandy Recovery Advisory, RA52013. Washington, DC.
11. Technical Mapping Advisory Council. 2015. 2015 Annual Report Summary.
12. Kousky, C., and E. Michel-Kerjan. 2015. Examining Flood Insurance Claims in the United States. Journal of Risk and Insurance. DOI: 10.1111/jori.12106.
13. Simpson, A.G. 2014. With Premium Refunds in Process, Washington Criticism of Flood Insurance Ebbs. Insurance Journal July 28.
14. National Academy of Sciences. 2009. Mapping the Zone: Improving Flood Map Accuracy. Washington, DC.
15. Meyer, T. 2013. Why So Many Flood Maps Are Still Out of Date. Pro Publica July 8.
16. Government Accountability Office. 2010. FEMA Flood Maps: Some Standards and Processes in Place to Promote Map Accuracy and Outreach, but Opportunities Exist to Address Implementation Challenges. Washington, DC.
17. AECOM. 2013. The Impact of Climate Change and Population Growth on the National Flood Insurance Program through 2100. Report prepared for Federal Insurance and Mitigation Administration, FEMA. Arlington, VA.
18. Technical Mapping Advisory Council. 2015. Future Conditions Risk Assessment and Modeling.
19. Xian, S., N. Lin, and A. Hatzikyriakou. 2015. Storm Surge Damage to Residential Areas: A Quantiative Analysis for Hurricane Sandy in Comparison with FEMA Flood Maps. Natural Hazards 79: 1867–88.
20. Pinto, F.G. 2016. Paterson Neighborhoods That Never Flood to Be Removed from Flood Zones. NJ.com, January 28.
21. Paik, E. 2013. New Flood Maps Shrink Riskiest Areas in 4 N.J. Counties by at Least 45 Percent. NJ.com, June 17.
22. CoreLogic. 2010. Definitions of FEMA Flood Zone Designations. Irvine, CA.
Related Documents