EXAMINING EXPLANATORY STYLE’S RELATIONSHIP TO EFFICACY AND BURNOUT IN TEACHERS by AMY CHEEK FINEBURG A DISSERTATION Submitted in partial fulfillment of the requirements for the degree of Doctor of Philosophy in the Department of Educational Studies in Psychology, Research, Methodology, and Counseling in the Graduate School of The University of Alabama TUSCALOOSA, ALABAMA 2010

Welcome message from author
This document is posted to help you gain knowledge. Please leave a comment to let me know what you think about it! Share it to your friends and learn new things together.
Transcript

EXAMINING EXPLANATORY STYLE’S RELATIONSHIP TO EFFICACY
AND BURNOUT IN TEACHERS
by
AMY CHEEK FINEBURG
A DISSERTATION
Submitted in partial fulfillment of the requirements for the degree of Doctor of Philosophy
in the Department of Educational Studies in Psychology, Research, Methodology, and Counseling
in the Graduate School of The University of Alabama
TUSCALOOSA, ALABAMA
2010

Copyright Amy Cheek Fineburg 2010 ALL RIGHTS RESERVED
ii
ABSTRACT
Explanatory style, the ways in which people explain both good and bad events (Seligman,
1998), shares theoretical components with teachers’ sense of efficacy (Tshannon-Moran &
Woolfolk-Hoy, 2001), which is how capable teachers feel about teaching. According to Bandura
(1994), efficacy informs explanatory style, but this assertion does not explain how hard-fought
classroom mastery experiences are overcome with little or no efficacy. The three studies
presented here suggest that explanatory style mediates teachers’ sense of efficacy in predicting
burnout in teachers, providing a way to develop efficacy using positive and negative events.
Study one provides a conceptual overview of teacher self-efficacy, explanatory style and
teacher burnout research and examines the theoretical relationships among these constructs. This
study provides the theoretical foundation for studies two and three.
In study two, the Educator Attributional Style Questionnaire (EdASQ), based on the more
general Attributrional Style Questionnaire (ASQ), was developed to measure teachers’
explanatory style. Study two surveyed 350 teachers from three school districts, two of which
were used as a cross-validation group for comparison with the other district. The items of
EdASQ have high internal reliability and convergent validity, for it correlates with the
Rosenberg Self-Esteem Scale (RSES) in a similar fashion as the ASQ. Confirmatory factor
analysis supports two distinct measurement models for the EdASQ, one for positive event items
and one for negative event items.
Study three tests the relationships among explanatory style, teachers’ sense of efficacy
and teacher burnout. The responses from all the teachers from study two were used for this study.
iii
Structural models where explanatory style is a mediator for teachers’ sense of efficacy in
predicting burnout, as measured by the Oldenburg Burnout Inventory (OLBI) and the number of
upcoming professional development hours teachers expect to participate in, were superior to the
alternative models. The models suggest that pessimists’ explanations of good events mediate
their efficacy in predicting burnout while optimists’ explanations of bad events mediate their
efficacy in predicting burnout. Future research is discussed, including the development of teacher
training that capitalizes on explanatory style’s role in building efficacy to avoid burnout in
teachers.
iv
DEDICATION
This dissertation is dedicated to my family, who loved and supported me throughout this
process. I am a better person for their being in my life. Thanks to them for letting me in theirs.
v
LIST OF ABBREVIATIONS AND SYMBOLS
a Cronbach’s index of internal consistency
χ2 Chi-square: a goodness-of-fit statistic that shows the difference between the
observed covariance matrix and the model covariance matrix.
CFI Comparative Fit Index: also known as the Bentler Comparative Fit Index, which
compares the existing model with an independent model.
CI Confidence interval: the range of numbers which is likely to contain the true
parameter value.
df Degrees of freedom: number of values free to vary after certain restrictions have
been placed on the data
e.g. exempli gratia (meaning “for example”)
et al et alia (meaning “and others”)
F Fisher’s F ratio: A ratio of two variances
i.e. id est (meaning “that is”)
M Mean: the sum of a set of measurements divided by the number of measurements in
the set
p Probability associated with the occurrence under the null hypothesis of a value as
extreme as or more extreme than the observed value
r Pearson product-moment correlation

vi
RMSEA Root Mean Square Error of Approximation: discrepancy per degree of freedom
t Computed value of t test
> Less than
= Equal to
% percent
vii
ACKNOWLEDGMENTS
I actively thank my family for their support of me throughout this entire dissertation
process. My husband Ben and son Micah have graciously allowed me to pursue this work, and
without my husband’s tireless support, I would not have accomplished this feat.
My appreciation extends also to Cecil Robinson, PhD, my advisor at the University of
Alabama, who indulged me in this line of research. I also am thankful for the other members of
my committee – Steven Thoma, PhD, Randall Schumacker, PhD, Douglas McKnight, PhD, and
Christopher Peterson, PhD – for graciously agreeing to work with me on this effort.
I especially thank the superintendents of Hoover City Schools (AL), Elmore County
Schools (AL), and Lincoln Public Schools (NE) for supporting this research. I appreciate the
faculty of these districts for taking the time to participate and promote research in education.
I was inspired to pursue this research after reading Learned Optimism by Martin E.P.
Seligman. Reading how an optimistic explanatory style helped people facing challenges in
multiple venues made me wonder whether this type of style influences the lives of teachers and
students. I appreciate the extensive research literature in explanatory style that continues to
reinforce my belief that a teacher with an optimistic explanatory style is a good thing indeed.

viii
CONTENTS
ABSTRACT ............................................................................................ ii-iii
DEDICATION ........................................................................................... iv
LIST OF ABBREVIATIONS AND SYMBOLS ................................... v-vi
ACKNOWLEDGMENTS ........................................................................ vii
LIST OF TABLES ................................................................................. ix-xi
LIST OF FIGURES ............................................................................ xii-xiii
1. INTRODUCTION ...................................................................................1
2. How Explanatory Style and Teachers’ Sense of Efficacy Work Together to Reduce Burnout in Teachers ..............................................11 3. Development and Validation of an Educator-Specific Attributional Style Questionnaire (EdASQ) ................................................................35 4. Clarifying the Relationship Between Explanatory Style and Efficacy: A Model of Teacher Burnout .................................................70 5. CONCLUSIONS AND DISCUSSION ...............................................116 REFERENCES ........................................................................................129 APPENDIX A: Measures of Explanatory Style, Self- Esteem, Teachers’ Sense of Efficacy, and Burnout .......................................... 133 APPENDIX B: Means, Standard Deviations, T-values, P-values,
Variances, Regression Weights and Factor Score Weights for Educator Attributional Style Questionnaire Items ............................... 142

ix
LIST OF TABLES
1.1 Optimistic vs. Pessimistic Explanatory Style ........................................4
2.1 Optimistic vs. Pessimistic Explanatory Style ......................................24
3.1 Demographics for Study 1 and Study 2 ...............................................44
3.2 Descriptive Statistics for Educator Attributional Style
Questionnaire, Attributional Style Questionnaire, and Rosenberg
Self-Esteem Scale for Study 1 ............................................................48
3.3a Correlation matrix (Pearson’s r) of Educator Attributional Style
Questionnaire and Rosenberg Self-Esteem Scale for Study 1 ...........50
3.3b Correlation matrix (Pearson’s r) of Attributional Style
Questionnaire and Rosenberg Self-Esteem Scale for Study 1 ...........51
3.4 Confirmatory factor analysis using structural equation modeling
for Educator Attributional Style Questionnaire for Study 1 ...............56
3.5 Descriptives for Educator Attributional Style Questionnaire and
Rosenberg Self-Esteem Scale for Study 2 ..........................................61
3.6 Correlation matrix (Pearson’s r) of Attributional Style
Questionnaire and Rosenberg Self-Esteem Scale for Study 2 ............63
3.7 Confirmatory factor analysis using structural equation modeling
for Educator Attributional Style Questionnaire for Study 2 ...............64

x
4.1 Optimistic vs. Pessimistic Explanatory Style ......................................77
4.2 Demographics for Teachers (N = 350) ................................................81
4.3 Summative descriptive analysis of Educator Attributional Style
Questionnaire, Teachers’ Sense of Efficacy Scale-Long Form,
and Burnout .........................................................................................89
4.4 Correlation matrix (Pearson’s r) of Educator Attributional Style
Questionnaire, Teachers’ Sense of Efficacy Scale-Long Form,
and Burnout .........................................................................................90
4.5 Fit Statistics for Teachers’ Sense of Efficacy Scale-Long Form
preceding Burnout ...............................................................................92
4.6 Fit Statistics for Teachers’ Sense of Efficacy Scale-Long Form
Preceding Educator Attributional Style Questionnaire Predicting
Burnout ...............................................................................................94
4.7 Fit Statistics for Explanatory Style Preceding Teachers’ Sense
of Efficacy Scale-Long Form Predicting Burnout .............................. 96
4.8 Change in Standardized Estimates for Paths from Competing
Models................................................................................................. 97
4.9 Correlation matrix (Pearson’s r) for Pessimistic Teachers for
Educator Attributional Style Questionnaire, Teachers’ Sense of
Efficacy Scale-Long Form and Burnout ........................................... 100
4.10 Correlation matrix (Pearson’s r) for Optimistic Teachers for
Educator Attributional Style Questionnaire, Teachers’ Sense of
Efficacy Scale-Long Form and Burnout ...........................................101

xi
4.11 Analysis of Variance for Pessimists and Optimists Comparing
Attributional Style Questionnaire, Teachers’ Sense of Efficacy
Scale-Long Form and Burnout ........................................................102
4.12 Fit Statistics for Pessimists ..............................................................103
4.13 Fit Statistics for Optimists ...............................................................104
xii
LIST OF FIGURES
2.1 The Relationship Between Efficacy and Causal Attributions
(Based on Bandura, 1994)...................................................................14
2.2 New Theoretical Model for the Relationship Between Efficacy
and Causal Attributions.......................................................................16
3.1 Three-Factor Measurement Model for the Attributional Style
Questionnaires.....................................................................................40
3.2 Structual Equation Model for Educator Attributional Style
Questionnaire for Positive Item Sets ...................................................57
3.3 Structual Equation Model for Educator Attributional Style
Questionnaire for Negative Item Sets .................................................58
4.1 The Relationship Between Efficacy and Causal Attributions
(Based on Bandura, 1994)...................................................................79
4.2 Structural Model Framework for the Relationship Among
Educator Explanatory Style, Teachers’ Sense of Efficacy,
and Burnout .........................................................................................87
4.3 Structural Model Framework for Teachers’ Sense of Efficacy
Scale-Long Form Predicting Burnout .................................................91
4.4 Structural Model Framework for Teachers’ Sense of Efficacy

xiii
Scale-Long Form Mediating Educator Attributional Style
Questionnaire Predicting Burnout.......................................................93
4.5 New Theoretical Model for the Relationship Between Efficacy
and Causal Attributions.....................................................................105

1
CHAPTER 1
INTRODUCTION
Education is a service industry, much like medicine. The patients in education are the
children who must attend school each day and the parents who trust the system to prepare their
children for the world beyond school. The providers and practitioners in education are the
teachers, administrators, counselors, and paraprofessionals who try to figure out each day what to
do with the children with whom they are entrusted. Just as in medicine, there are aspects of
science and art to teaching. The science of teaching involves buzzwords like “best practices” and
tried-and-true strictures like standardized tests. The art of teaching involves the interaction of
personalities, the nuance of charisma, and the intuition of appropriateness. Just as in medicine,
researchers spend countless hours exploring these scientific and artistic domains of teaching,
mainly to conclude that it’s all complicated at best. Teaching is the interaction of science and art,
creating a nifty Venn diagram whose lines are fuzzy at best. To isolate any one variable as the
cause of another is difficult and rare in medicine, and it’s almost impossible for education.
However, such a quixotic goal must not deter the adventure. To improve the service provided by
education, we must investigate the variables involved.
This dissertation was born with the desire to uncover the science behind how an art
variable – the way teachers think about classroom events – affects teachers’ levels of burnout.
The science of how people think and explain events that occur to them – known variously as
attribution theory or explanatory style – is well researched in other domains such as clinical
psychology, sports, and motivation (Seligman, Nolen-Hoeksema, Thornton & Thornton, 1990;

2
Seligman, Reivich, Jaycox, & Gillham, 1995; Seligman & Schulman, 1986). Some subsets of
these theories have been examined in education – namely Elliott and Dweck’s (1988)
performance orientation literature or Tschannen-Moran and Woolfolk-Hoy’s (2001) teacher’s
sense of efficacy research. However, in all this literature, little research has explored how
teachers explain good and bad events within the framework of explanatory styles. Intuitively, it
seems as though the way a teacher thinks about good and bad events in the classroom would
affect the aspects of the school day, but the certainty of this assertion is unexamined. This
research hopes to shed a light on this intuition to see if it can stand the scrutiny.
Positive Psychology and Explanatory Style
In preparation for creating curricular materials for positive psychology, I did extensive
reading of seminal works in the field and discovered that many of the questions I had about the
science of teaching could be addressed by areas already vibrant in positive psychology. I was
especially drawn to explanatory style, which is defined as the ways in which people explain good
and bad events that occur in their lives (see Seligman, 1998, for a review). Simply put,
explanatory style research demonstrates that the types of explanations people give for good and
bad events predict whether a person will feel helpless or will persist in the face of failure.
Patterns of explanatory style are based on the learned helplessness model of depression,
reformulated by Abramson, Seligman, and Teasdale (1978), which proposes that people will
attribute their helplessness in the face of uncontrollable circumstances to a particular cause.
People then determine whether the cause will have a chronic, broad, and detrimental impact to
future self-esteem and agency. The explanatory style patterns of people in studies of learned
helplessness fell along three dimensions – global/specific (projection of cause across different

3
situations), stable/temporary (projection of cause across time), and internal/external (projection
of cause to internal traits versus external factors) (Seligman, 1998).
Researchers eventually categorized optimists and pessimists as having diametrically
opposed explanatory styles of good and bad events (Table 1.1; Peterson & Vaidya, 2001;
Seligman, 1998). Pessimistic explanatory style seems to have an impact on the incidence of
depression, and by extension, lower academic achievement (e.g., Fazio & Palm, 1998; Hilsman
& Garber, 1995; Nolen-Hoeksema, Girgus, & Seligman, 1986; Peterson & Barrett, 1987;
Ritchie, 2000; Tiggeman & Crowley, 1993; Yates & Yates, 1995). Seligman (1998) proposes
that the explanatory style theory of optimism provides pessimistic people with an avenue to alter
their pessimistic thinking patterns to be more optimistic, thus fostering mastery and resilience.
For example, studies with middle school children show that retraining pessimistic thinking into
optimistic thinking can significantly reduce the incidence of depression (Seligman, Reivich,
Jaycox, & Gillham, 1995). In reading Martin E.P. Seligman’s book, Learned Optimism (1998), I
heard my students in his descriptions of depressed patients and Olympic swimmers. I heard
pessimism in my students as they got test scores back. They’d say, “I’m so stupid!” or “I never
do well in this class!” I began to dispute these proclamations students were making, and they
seemed taken aback at my attempts. I would ask them, “Why do you say such things to yourself?
Would you allow someone else to say that to you?” I began to think about how a teacher’s
explanatory style could influence students. Could a pessimistic teacher incite pessimism in her
students? Could an optimistic teacher inspire optimism? I realized these were empirical questions
that needed to be answered.
4
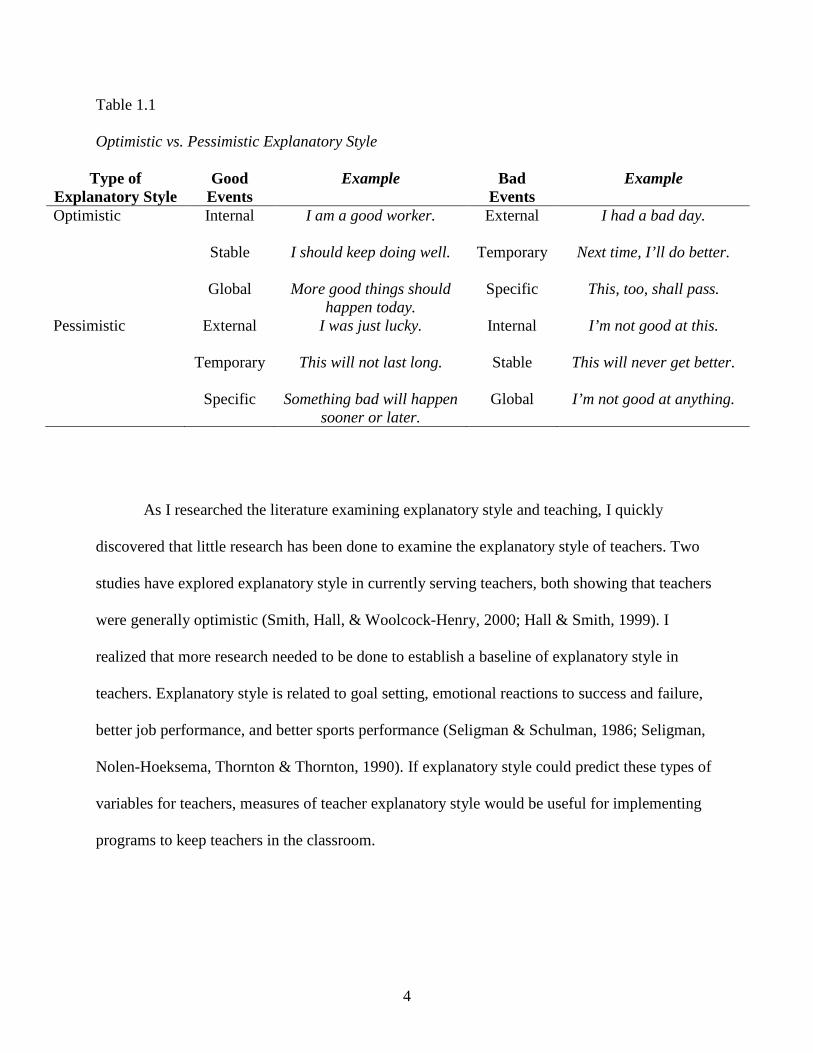
Table 1.1
Optimistic vs. Pessimistic Explanatory Style
Type of Explanatory Style
Good Events
Example Bad Events
Example
Optimistic Internal I am a good worker. External I had a bad day.
Stable I should keep doing well. Temporary Next time, I’ll do better.
Global More good things should happen today.
Specific This, too, shall pass.
Pessimistic External I was just lucky. Internal I’m not good at this.
Temporary This will not last long. Stable This will never get better.
Specific Something bad will happen sooner or later.
Global I’m not good at anything.
As I researched the literature examining explanatory style and teaching, I quickly
discovered that little research has been done to examine the explanatory style of teachers. Two
studies have explored explanatory style in currently serving teachers, both showing that teachers
were generally optimistic (Smith, Hall, & Woolcock-Henry, 2000; Hall & Smith, 1999). I
realized that more research needed to be done to establish a baseline of explanatory style in
teachers. Explanatory style is related to goal setting, emotional reactions to success and failure,
better job performance, and better sports performance (Seligman & Schulman, 1986; Seligman,
Nolen-Hoeksema, Thornton & Thornton, 1990). If explanatory style could predict these types of
variables for teachers, measures of teacher explanatory style would be useful for implementing
programs to keep teachers in the classroom.
5
A Practical Use for Explanatory Style: Teacher Burnout
One important way explanatory style could affect teaching is through teacher burnout.
Burnout has generally been studied as a phenomenon found in human service professions, like
teaching. The most widely researched definition of burnout was developed by Maslach (1982),
which defines burnout as including feelings of exhaustion, depersonalization, and lack of
personal accomplishment. Other researchers suggest the burnout encompasses two overall
components – exhaustion and disengagement – which more appropriately reflects a job-
demands/job-resources model (Demerouti, Bakker, Nachreiner, & Schaufeli, 2001). This
alternative definition of burnout addresses criticism of the original Maslach (1982)
conceptualization by measuring burnout using only negatively worded items and disregarding
the weakly correlated personal accomplishment component (Demerouti, Bakker, Nachreiner, &
Schaufeli, 2001).
Teacher burnout is one factor contributing to teachers leaving their jobs. The problem of
teacher attrition is pressing and troubling. The teaching profession faces attrition rates that vary
from 5% to 9% annually (Zumwalt & Craig, 2005), with an overall attrition rate of 40 to 50
percent within 5 years (Ingersoll, 2003). Teacher job dissatisfaction is the second most cited
reason for teacher attrition (Zumwalt & Craig, 2005). Teachers feel increasingly powerless to
effect change in their classrooms or schools. Teachers regularly report that lack of administrative
support as a main reason for feeling dissatisfied and leaving teaching (Baker & Smith, 1997;
Boe, Bobbit, Cook, Barkanic, & Maislin, 1998; Ingersoll, 1999). Other similar reasons for
attrition include problems with discipline and student motivation, low salary, and limited input
from faculty in school decision making. Ingersoll (1999) concluded that retirement was a
relatively minor reason for leaving teaching – dissatisfaction accounted for a greater proportion

6
of teachers either leaving the field or transferring positions. Ingersoll proposed the revolving
door is more detrimental to teaching than retirement levels, and adjusting organizational
conditions to give teachers more say in decision making would help fill teaching vacancies more
than recruitment efforts. If teachers explained the disempowering events that occurred in the
classroom and school at-large in more optimistic ways, more teachers may feel satisfied with
their jobs and stay in the field longer.
Attrition and Professionalism
Research indicates that attending professional development seminars, workshops,
conferences, and courses helps keep teachers in the field longer (Erickson, 2008). Some of the
most successful professional development programs involve training new teachers to be prepared
for the coming school year (Brill & McCartney, 2008). Often, these intensive new-teacher
mentoring programs involve numerous hours of professional development opportunities
involving interactions with veteran teachers, and these programs boast high rates of teacher
retention (Kapadia, Coca, & Easton, 2007; Serpell & Bozeman, 1999). Beyond new-teacher
mentoring, teachers must participate in a specified number of required professional development
hours in order to remain certified to teach. Many school districts offer the minimum required
number of hours, but many teachers participate in professional development above and beyond
the required minimum. These teachers seem to be more engaged in teaching than those who do
not seek extra professional development. Therefore, if schools can invest in high quality,
relational professional development opportunities for teachers, they should see a decrease in the
number of teachers who leave the field early.
The problem of teacher attrition perplexes those in education who make policy decisions
and who hire teachers for their schools. Teachers who are transient may cost more in the long run
7
than those who need intensive supervision and mentoring during their careers. Aside from
loosening the qualifications required to become a teacher, solutions to addressing the teacher
attrition problem are scattershot at best. Some programs in some districts seem to work, but a
comprehensive understanding of why teachers leave the field and what can be done to keep them
remains elusive. Little has been done to explore how teachers think about good and bad
classroom events to see if perhaps a revolution needs to take place in the efforts to retain good
teachers.
But Wait – What About Efficacy?
While the role of explanatory style in teaching has been largely unexamined, efficacy has
a rich connection with positive outcomes in academic settings. Efficacy deals with the beliefs
people have about their own capabilities. Bandura (1986) defines self-efficacy as the belief about
how well one can organize and carry out actions required for a goal. Bandura’s social cognitive
theory suggests that people maintain two types of expectations in any given situation. Efficacy
expectations are future-oriented and relate the confidence felt about one’s “capabilities to
organize and execute the courses of action required to produce given attainments” (Bandura,
1997, p. 3). Efficacy expectations affect the thoughts and emotions needed to make people take
the steps necessary to expend effort toward a goal. Outcome expectations refer to the likelihood
that a particular consequence will occur in a given situation given one’s level of ability (Bandura,
1986). Bandura believed that while outcome expectations would provide the incentive or
disincentive to work toward a goal, these expectations do little to influence efficacy. Bandura
(1994) suggested four main ways that efficacy is fostered: mastery experiences, vicarious
experiences, social persuasion, and emotional and physical reactions. Most researchers agree

8
with Bandura that mastery experiences provide the most successful way to build efficacy in that
success breeds success while failure breeds failure.
A teachers’ sense of efficacy, a domain-specific conceptualization of efficacy, has been
linked to numerous positive outcomes and predicts teacher practices and student achievement
(Graham, Harris, Fink, & MacArthur, 2001; Tschannen-Moran & Woolfolk Hoy, 2001).
Teachers’ sense of efficacy seems to be a powerful force in determining teacher behavior and
student success, but the construct has met with challenges in measurement and interpretation. In
1984, Ashton claimed that teachers’ sense of efficacy was the most promising construct to
emerge from teacher research, but in 2005, Wheatley argues that despite years of research into
the construct, it holds little practical significance for teachers or administrators seeking ways to
improve student performance since developing teachers’ sense of efficacy relies heavily on the
experience of mastery. Henson (2001) argued that teachers’ sense of efficacy was experiencing a
troubled adolescence of sorts in its development as a viable construct to affect teacher education
and practice. Henson suggests that researchers often do not examine the sources of efficacy
beliefs to determine how powerful they are in predicting efficacy or outcome behaviors.
Specifically, Henson wonders how much a teacher’s analysis of tasks they engage in affects the
sources of efficacy. This issue is largely unanswered in the literature.
Mastery experiences are the most powerful factor in developing teachers’ sense of
efficacy (Woolfolk-Hoy & Spero, 2005). Thus, if teachers experience success, then efficacy
increases. The more authentic the successful experience, it is more likely efficacy will be
increased. While these types of successful mastery experiences would be important for
developing teachers’ sense of efficacy, teachers in difficult school environments might not have
enough successful experiences to promote meaningful gains in efficacy. They may be able to

9
imagine what mastery would look like in their own context, but without authentic mastery
experiences, they may never reach a healthy level of efficacy sufficient to get them through a
challenging school year. However, if the explanations teachers give for both positive and
negative classroom experiences were important to developing efficacy, teacher training and
professional development programs could focus on developing optimistic explanations of both
success and failure to cultivate efficacy and, by extension, teacher behaviors that affect attrition.
In addition, understanding how explanations of events can develop efficacy may also tap into the
other ways Bandura suggests efficacy is cultivated. By analyzing how teachers explain good and
bad events in the classroom, administrators and teacher trainers can use vicarious experiences of
both mastery and non-mastery events more to cultivate efficacy. Explanatory style can also be
used to strengthen the emotional and physical reactions to success and failure needed to build
efficacy.
Teachers’ sense of efficacy has been measured differently by researchers who
conceptualize it according to different theoretical perspectives (Skaalvik & Skaalvik, 2007).
Because of competing conceptual ideas about teacher efficacy, claims of its value to educators
and students are suspect at best (Denzine, Cooney & McKenzie, 2005). Wheatley (2005)
suggests that research on teachers’ sense of efficacy should focus on teachers’ interpretations of
teaching experiences instead of on just their beliefs and goals about student learning. This
research seeks to address these concerns by investigating how one type of teachers’
interpretations – teachers’ explanatory style of school-related events – relates to teachers’ sense
of efficacy.
10
Purpose
This dissertation investigates the role of explanatory style in teaching. This dissertation
includes three studies that address teachers’ explanatory style and how explanatory style and
efficacy are related. Chapter 2 explores the conceptual basis for how explanatory style could be
related to a teacher’s sense of efficacy and burnout. If explanatory style can show the same types
of benefits for teachers that it shows for insurance sales, collegiate swimmers, and middle school
students, intervention programs that hone an optimistic explanatory style can be used for teachers
during their careers as they deal with the challenges of teaching. Using the conceptual analysis of
Chapter 2, Chapter 3 develops and validates an educator-specific Attributional Style
Questionnaire (EdASQ). Recent research suggests that using domain-specific measures could
account for better model fit and more variance than using the generic attributional style measure
(Higgins, Zumbo, & Hay, 1999). Research by Peterson and Barrett (1987) suggests that
explanatory style can be measured effectively by modifying the ASQ to fit particular situations
or domains. Therefore, an educator-specific attributional style measure would provide a way to
measure teachers’ specific ways of explaining good and bad events in the classroom. Chapter 4
fully investigates the relationship between explanatory style and a teacher’s sense of efficacy
using the conceptual framework from Chapter 2, and the EdASQ and structural measurement
model from Chapter 3. Chapter 4 points to explanatory style as a mediator of efficacy and
burnout. In addition, Chapter 4 examines how differently optimists and pessimists think about
positive and negative classroom events and recommends teachers aspire to a slightly, as opposed
to overly, optimistic explanatory style in order to be most resistant to burnout. Chapter 5
summarizes the findings of the three studies, discussing the strengths and limitations of each and
proposing future directions for research.
11
CHAPTER 2
How Explanatory Style and Teachers’ Sense of Efficacy Work Together to Reduce Burnout in Teachers
A typical day in the life of a teacher is a study in contrasts. Teachers can be at one
moment respected and then in another reviled. Teachers are praised for their positive influence
on the next generation and chastised for sucking the fun out of learning. Teachers feel
empowered within their own classrooms to make instructional and management decisions, but
once the door is opened into the school at large, feelings of disillusionment can be overpowering
as administrators impose regulations that cut into instructional time. One group of students can
be electrified by the day’s lesson while another can sit back apathetically waiting for the bell to
ring. It is not difficult to imagine that teaching is a profession that is both rewarding and
frustrating. When frustration outweighs reward, burnout can occur. Previous research highlights
multiple sources of burnout in teachers, including lack of administrative support, discipline
issues, low student motivation, low salary, and limited input from faculty in school decision
making. (see Baker & Smith, 1997; Boe, Bobbit, Cook, Barkanic, & Maislin, 1998; Ingersoll,
1999). Little research explores cognitive reasons why teachers burn out.
The purpose of this paper is to present a cognitive framework that may buffer teachers
against burnout. Specifically, I explore how teachers’ beliefs about their capabilities as teachers
(also known as teachers’ sense of efficacy) and their explanations of good and bad events (also
known as explanatory style) forms a cognitive system that capitalizes on successes and maintains
healthy beliefs about failures that buffer against burnout. Teachers’ sense of efficacy and
12
explanatory style overlap conceptually, but they have not often been studied together. High
teachers’ sense of efficacy buffers against failure, but developing high efficacy requires the
experience of success. For teachers who do not consistently experience success (for instance,
those in struggling, high-failure and low-resource schools), a high teachers’ sense of efficacy
may never develop properly. The question becomes, how do teachers with low teachers’ sense of
efficacy develop high efficacy in the face of failure? Explanatory style may offer a means to
developing high teachers’ sense of efficacy in low-success circumstances. The positive effects of
optimistic explanatory style are not contingent on success or failure, as teachers’ sense of
efficacy is, but how teachers explain successes or failures allow teachers to persevere while they
are experiencing failure. Having a healthy explanatory style may allow teachers to persevere
through failure until success occurs, and thus develop a high teachers’ sense of efficacy.
Explanatory Style and Efficacy: Conceptual Overlap
Research examining explanatory style, the characteristic ways in which people explain
good and bad events (Seligman, 1998), shows that those with more pessimistic types of
explanatory style are more at risk for depression (Peterson & Vaidya, 2001) and are more likely
to give up in the face of challenge (Seligman, Nolen-Hoeksema, Thornton, & Thornton, 1992).
Helping teachers maximize the positive and de-emphasize the negative may help them feel more
satisfied with teaching and stay in the field longer. They may believe they are more capable as
teachers, which is referred to as a teacher’s sense of efficacy (Tschannen-Moran & Woolfolk-
Hoy, 2001). Teachers with a high sense of efficacy about teaching tend to use a larger variety of
teaching strategies and more proactive disciplinary procedures (Graham, Harris, Fink, &
MacArthur, 2001; Tschannen-Moran & Woolfolk Hoy, 2001). These two concepts
independently provide positive outcomes. Yet, discovering how these two constructs work
13
together may provide a mechanism for using how teachers think about success and failure to
promote higher efficacy. While there are many variables that influence whether teachers will stay
in the field longer, the ways teachers think about classroom experiences may be important to
mediating how capable teachers feel to enact change in their own classrooms.
The relationship between explanatory style and efficacy in general is dealt with
tangentially in the literature. Both theories are based on experiences of success and failure. For
efficacy, mastery (i.e., successful) experiences develop high efficacy, so experiencing success
and avoiding failure are keys to having a healthy sense of efficacy. For explanatory style, how
people interpret successes and failures defines their type of explanatory style (optimist or
pessimist), and interventions exist that help pessimists become more optimistic (Seligman,
Reivich, Jaycox, & Gillham, 1995). Thus, while efficacy is a good predictor of many positive
teaching outcomes, one must first experience success to achieve more success later. This is
problematic in high-failure situations like teaching and sales. If optimistic explanatory style
helps develop high self-efficacy, then considering explanatory style and self-efficacy in high-
failure situations may explain why people persevere through failure and create opportunities for
interventions that go beyond mastery experiences.
Hard-Fought Mastery Experiences: Explaining Setbacks to Gain Efficacy
The problem is that research has not examined whether efficacy precedes causal
explanations of mastery experiences or vice versa. Bandura (1994) argues that efficacy precedes
causal explanations and proposes that causal attributions are affected by efficacy beliefs. He
theorizes that those with high efficacy attribute failure to low effort while those with low
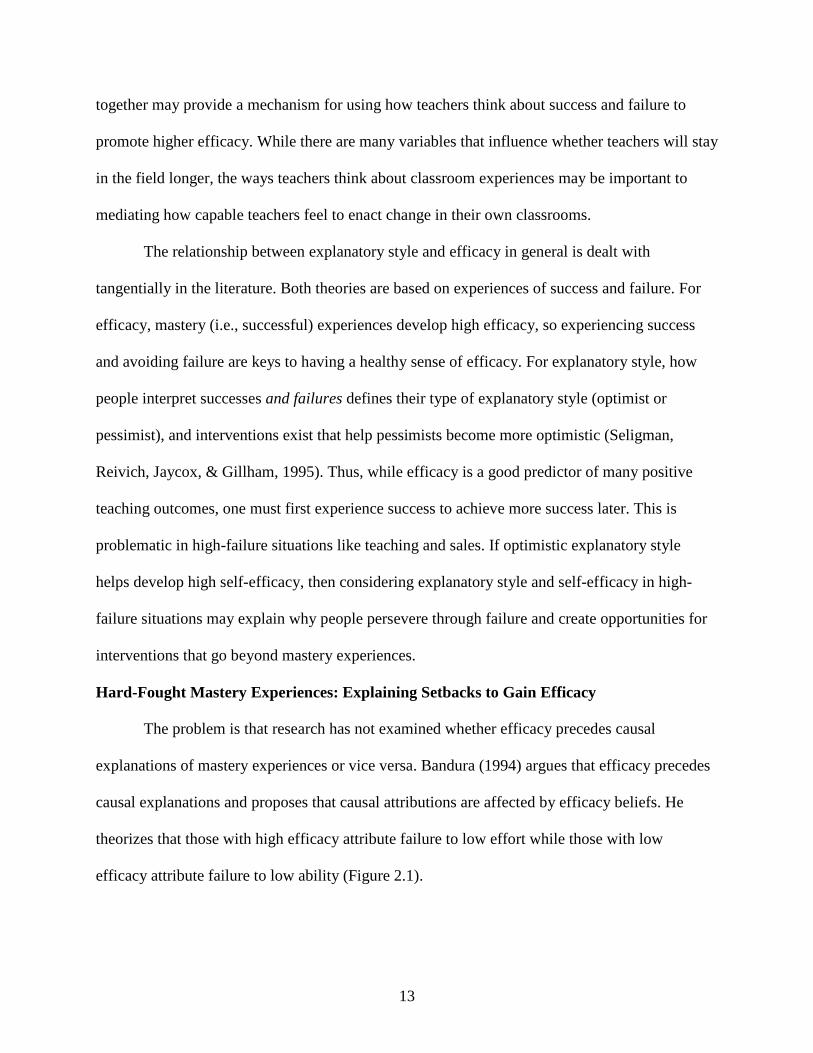
efficacy attribute failure to low ability (Figure 2.1).
14
Figure 2.1
The Relationship Between Efficacy and Causal Attributions (Based on Bandura, 1994)
Figure 1: According to Bandura’s (1994) theory, efficacy determines how people explain events they experience.
Even though Bandura states that mastery experiences are one of the best ways to develop
efficacy, he acknowledges that not all mastery experiences are created equal. Easy successes are
not as valuable as those that are won via perseverance through setbacks and adversity. Bandura
does not explain, however, how those with little or no efficacy at the outset get through setbacks.
If experiencing success breeds efficacy, then only in the end after success is gained would
experiences fraught with setbacks and adversity contribute to a higher sense of efficacy.
Bandura’s theory does not explain how one works through the setbacks and adversity except to
say that if one has higher efficacy, perseverance is more likely. If people do not have high
efficacy in the first place, it is unclear how they would get through to the end of a hard-fought
mastery experience without it. It would seem, then, that a variable between setbacks and success
exists that would be important to determining whether efficacy is developed through hard-fought
mastery experiences. Yet, Bandura is clear that this variable is not causal attributions, since
efficacy precedes causal attributions, not the other way around.
Experience of Failure
Low Sense of Efficacy
High Sense of Efficacy
Attribution of Low Ability
Attribution of Low Effort
Experience of Failure
15
So schools are now faced with a problem – what to do with current teachers who have
low efficacy. A better understanding of how efficacy is developed should help schools create
ways to foster teachers’ sense of efficacy outside of mastery experiences. The types of causal
explanations teachers make about success and failure may provide the perseverance they need to
weather difficult teaching situations. If so, explanations of success and failure may contribute to
an increased sense of efficacy. An optimistic teacher would view successful teaching as internal,
global and stable but would view unsuccessful teaching as external, isolated, and unstable. Thus,
not only would successful experiences lead to increased efficacy, but experiences of failure could
also develop high efficacy. These types of explanations about the causes of events, both
successful and unsuccessful, could lead to the teacher having a higher sense of efficacy, which
could, in turn, lead to more resilience and less burnout.
To address this problem, I propose a different theoretical model (Figure 2.2). This model
proposes that explanatory style is a mediator of efficacy and incorporates experiences of both
success and failure. Previous research suggests that teachers’ sense of efficacy research examine
how efficacy beliefs are developed to determine what role causal attributions play in the
efficacy-development process (Henson, 2001). This model considers this suggestion and
promotes the idea that explanatory style is important to developing teachers’ sense of efficacy by
enabling teachers to persevere through setbacks and achieve efficacy through hard-fought
mastery experiences by tapping into the emotional sources of efficacy.
One practical way this model can influence teaching today is by alleviating the problem
of teacher burnout and attrition. Teachers experience burnout at high rates, and this burnout is
often the result of negative experiences in the classroom and as part of the school climate. If
teachers can explain those negative experiences in optimistic ways, they can develop a high
16
sense of efficacy and work toward mastery more effectively. This model highlights why
examining the ways teachers think about daily events is important.
Figure 2.2
New Theoretical Model for the Relationship Between Efficacy and Causal Attributions
Figure 2.2: A new model showing that explanatory style influences a sense of efficacy when experiencing both success and failure.
Teacher Burnout and Attrition
Understanding why teachers leave the field and what factors increase their likelihood of
staying is important. Burnout has generally been studied as a phenomenon found in human
service professions, like teaching. The most widely researched definition of burnout was
developed by Maslach (1982), which defines burnout as including feelings of exhaustion,
depersonalization, and lack of personal accomplishment. Other researchers suggest the burnout
encompasses two overall components – exhaustion and disengagement – which more
appropriately reflects a job-demands/job-resources model (Demerouti, Bakker, Nachreiner, &
Experience of Success and Failure
Sense of Efficacy
Explanatory Style
17
Schaufeli, 2001). This alternative definition of burnout addresses criticism of the original
Maslach (1982) conceptualization by measuring burnout using only negatively worded items and
disregarding the weakly correlated personal accomplishment component (Demerouti, Bakker,
Nachreiner, & Schaufeli, 2001).
The teaching profession faces attrition rates that vary from 5% to 9% annually (Zumwalt
& Craig, 2005), with an overall attrition rate of 40 to 50 percent within 5 years (Ingersoll, 2003).
Teacher job dissatisfaction is the second most cited reason for teacher attrition (Zumwalt &
Craig, 2005). Teachers regularly report that lack of administrative support as a main reason for
leaving teaching (Baker & Smith, 1997; Boe, Bobbit, Cook, Barkanic, & Maislin, 1998;
Ingersoll, 1999). The other main reasons for attrition include problems with discipline and
student motivation, low salary, and limited input from faculty in school decision making, all of
which could lead to teachers feeling burned out. Teachers feel increasingly powerless to effect
change in their classrooms or schools. Ingersoll (1999) concluded that retirement was a relatively
minor reason for leaving teaching – dissatisfaction accounted for a greater proportion of teachers
either leaving the field or transferring positions. Ingersoll proposed that adjusting organizational
conditions to give teachers more say in decision making would help fill teaching vacancies more
than recruitment efforts. If teachers explained the disempowering events that occurred in the
classroom and school at-large in more optimistic ways, more teachers may feel satisfied with
their jobs, less exhausted, and stay in the field longer.
Attrition and Professional Development
Research indicates that attending professional development seminars, workshops,
conferences, and courses helps keep teachers in the field longer (Erickson, 2008). Most states
require teachers to participate in a prescribed number of professional development hours in order
18
to remain certified. Most school districts, as a result, offer programs adding up to at least the
minimum number of hours through faculty meetings and other in-house opportunities. Yet, many
teachers participate in hours beyond those required. They may take college courses to earn
advanced degrees or certification or attend conferences in their teaching field. Teachers who go
above and beyond in their professional development activities may be seen as more engaged in
teaching than their “only-the-required” colleagues. Some of the most successful professional
development programs involve training new teachers to be prepared for the coming school year
(Brill & McCartney, 2008). Often, these intensive new-teacher mentoring programs involve
interactions with veteran teachers (Kapadia, Coca, & Easton, 2007; Serpell & Bozeman, 1999).
If schools can invest in high quality professional development opportunities for teachers, they
should see a decrease in the number of teachers who leave the field early because if teachers
believe they can effect change, they are more likely to engage in teaching and remain in the field.
Attrition: A Costly Problem
The problem of teacher attrition perplexes those in education who make policy decisions
and who hire teachers for their schools. Teachers who are transient may cost more in the long run
than those who need intensive supervision and mentoring during their careers (Villar & Strong,
2007). The National Commission on Teaching and America’s Future (NCTAF) projects that
teacher turnover could cost the nation’s public schools over $7.3 billion (NCTAF, 2007).
Solutions to addressing the teacher attrition problem are scattershot at best. Some states have
loosened teacher qualifications to attract people outside of education into teaching. Some
teacher-mentoring programs in some districts seem to help keep teachers longer, but they have
rarely been tested rigorously with teachers in other districts.

19
Understanding the cognitive contributors to burnout may lead to the development of
programs that might help stem the outflow of talented people from the teaching workforce. But
simply providing these programs is usually not enough. Schools would need to provide programs
that teachers would find helpful and that would address their main reasons for dissatisfaction.
Almost no research has examined how teachers think about classroom events and whether those
thoughts are a factor in predicting job burnout.
A Teacher’s Sense of Efficacy
Efficacy deals with the beliefs people have about their own capabilities. Bandura (1986)
defines self-efficacy as the belief about how well one can organize and carry out actions required
for a goal. Bandura’s social cognitive theory suggests that people maintain two types of
expectations in any given situation. Efficacy expectations are future-oriented and relate the
confidence felt about one’s “capabilities to organize and execute the courses of action required to
produce given attainments” (Bandura, 1997, p. 3). Efficacy expectations affect the thoughts and
emotions needed to make people take the steps necessary to expend effort toward a goal.
Outcome expectations refer to the likelihood that a particular consequence will occur in a given
situation given one’s level of ability (Bandura, 1986). Bandura believed that while outcome
expectations would provide the incentive or disincentive to work toward a goal, these
expectations do little to influence efficacy.
Bandura (1994) suggested four main ways that efficacy is fostered: mastery experiences,
vicarious experiences, social persuasion, and emotional and physical reactions. Teaching
presents interesting challenges to each of these ways of developing efficacy. Mastery
experiences can be elusive, especially in schools where administrative support, student
motivation, and access to resources are low. Teachers typically work in isolation, working in a

20
classroom of students by themselves with little interaction with other teachers or administrators.
Rarely are teachers given the opportunity to collaborate with other teachers to discuss teaching
and management practices or to observe master teachers in action, providing little opportunity
for developing efficacy through vicarious experiences. Media reporting and policy initiatives in
public education are often negative, focusing on low test scores, low performing schools, or
teacher misbehavior, leaving little opportunity for social persuasion to provide sources of
efficacy. Teachers also experience a wide range of emotional and physical reactions while
teaching, from elation that lessons go well to disappointment when they don’t. Most researchers
agree with Bandura that mastery experiences provide the most successful way to build efficacy
in that success breeds success while failure breeds failure. Since teachers rarely experience
vicarious experiences and receive little efficacy-building social persuasion, whether they
experience mastery and how they handle the emotional and physical reactions during teaching
provide the most promising ways to develop efficacy in teachers.
A teachers’ sense of efficacy has been linked to numerous positive outcomes and predicts
teacher practices and student achievement (Graham, Harris, Fink, & MacArthur, 2001;
Tschannen-Moran & Woolfolk Hoy, 2001). Teachers’ sense of efficacy seems to be a powerful
force in determining teacher behavior and student success, and some claim that teachers’ sense
of efficacy is the most promising construct to emerge from teacher research (Ashton, 1984).
However, others have argued that despite years of research, it holds little practical significance
for teachers or administrators seeking ways to improve student performance since developing
teachers’ sense of efficacy relies heavily on the experience of mastery (Wheatley, 2005), which
may be difficult to experience easily.
21
Henson (2001) argued that teachers’ sense of efficacy lacks practicality and viability due
to a lack of understanding of how efficacy is developed. Researchers often do not examine the
sources of efficacy beliefs to determine how powerful they are in predicting efficacy or outcome
behaviors. Since the sources of teachers’ sense of efficacy are limited for teachers in the age of
accountability, ways to mediate mastery experiences and emotional and physical reactions are
important to developing teachers’ sense of efficacy successfully.
Mastery Experiences and Developing Efficacy
Bandura believes that mastery experiences are the most powerful factor in developing
teachers’ sense of efficacy; that is, if teachers experience success, then efficacy increases
(Woolfolk-Hoy & Spero, 2005). Further, the more authentic and hard-fought the successful
experience, the more likely that efficacy will be increased. Those with high efficacy can weather
these setbacks well, achieving mastery and building higher efficacy. However, in order to
experience the final success of mastery experiences, especially through hard-fought experiences,
people need to persevere through the setbacks to accomplish success. Those with low efficacy
have difficulty weathering these setbacks and may not achieve mastery. Those with low efficacy
in difficult teaching environments may face the greatest challenge to staying in the field and
might not have enough authentic successful experiences to promote meaningful gains in efficacy.
Teachers may be able to imagine what mastery looks like, but without authentic mastery
experiences, they may never reach a healthy level of efficacy to get them through a challenging
school year without developing a feeling of burnout. How teachers with low efficacy –
specifically, those who are new to teaching or those who experience significant setbacks early in
their careers – have no clear way to develop efficacy in the midst of hard-fought, authentic

22
mastery experiences. The literature is unclear about how these teachers can gain the efficacy they
need to persevere.
I argue that one way forward is to consider the emotional and physical reactions together
with mastery experiences. How teachers explain good and bad events in the classroom may
decrease emotional reactions to failure like disengagement and physical reactions to failure like
exhaustion. If the explanations teachers give for both positive and negative classroom
experiences were important to developing efficacy, teacher training and professional
development programs could focus on developing optimistic explanations of both success and
failure to cultivate efficacy and, by extension, teacher behaviors that affect burnout. Teachers
would not have to wait on authentic mastery experiences, vicarious experiences, or social
persuasion to gain efficacy. They could use any kind of experience in the classroom, good or
bad, and use those explanations to build efficacy. This type of efficacy-building program would
be more efficient by using experiences from each day rather than waiting through to the end of a
mastery experience to build efficacy.
Explanatory Style: A Deeper Look
Explanatory style has its roots in Martin E.P. Seligman’s studies of learned helplessness
(Seligman & Maier, 1967). As this research evolved, patterns of explanatory style became
evident in humans based on the learned helplessness model of depression, which proposes that
people will attribute their helplessness in the face of uncontrollable circumstances to a particular
cause (Abramson, Seligman & Teasdale, 1978). People then determine whether the cause will
have a chronic, broad, and detrimental impact to future self-esteem and agency. The explanatory
style patterns of people in studies of learned helplessness fall along three dimensions –
global/specific (projection of cause across different situations), stable/temporary (projection of

23
cause across time), and internal/external (projection of cause to internal traits versus external
factors) (Seligman, 1998).
Researchers eventually categorized optimists and pessimists as having diametrically
opposed explanatory styles of good and bad events (Table 2.1; Peterson & Vaidya, 2001;
Seligman, 1998). Pessimistic explanatory style impacts the incidence of depression (Fazio &
Palm, 1998; Hilsman & Garber, 1995; Nolen-Hoeksema, Girgus, & Seligman, 1986; Peterson &
Barrett, 1987; Ritchie, 2000; Tiggeman & Crowley, 1993; Yates & Yates, 1995) and negative
health effects (Brennan & Charnetski, 2000; Love, 1988). Pessimistic explanatory style leads to
depression because viewing bad events as personally caused, stable, and global do not see
alternatives for those bad events. This type of thinking leaves people feeling hopeless to enact
change. In theory, people who are pessimistic should also experience low sense of efficacy since
their hopeless feelings leave them feeling incapable of action. Seligman (1998) proposes that the
explanatory style theory of optimism provides pessimistic people with an avenue to alter their
pessimistic thinking patterns to be more optimistic, thus fostering mastery and resilience. For
example, middle school children can be taught to retrain pessimistic thinking into optimistic
thinking and significantly reduce the incidence of depression (Seligman, Reivich, Jaycox, &
Gillham, 1995).
Explanatory Style and Failure
One of the primary reasons for considering explanatory style as a mediator of teachers’ sense of
efficacy is that explanatory style addresses how teachers can build efficacy and persevere
through setbacks and failures. Several studies show the impact of pessimistic explanatory style
when people are presented with failure. Seligman and Schulman (1986) found that insurance

24
Table 2.1
Optimistic vs. Pessimistic Explanatory Style
Explanatory Style
Good Events
Example Bad Events
Example
Optimistic Internal I am a good worker. External I had a bad day.
Stable I should always do well at this task.
Temporary Next time, I’ll do better.
Global More good things should happen today.
Specific This, too, shall pass.
Pessimistic External I was just lucky. Internal I’m not good at this.
Temporary This will not last long. Stable This will never get better.
Specific Something bad will happen sooner or later.
Global I’m not good at anything.
salespeople who exhibited a pessimistic explanatory style sold less insurance and left the field
earlier than their more optimistic counterparts. Insurance sales is a business fraught with the
possibility of failure. Sales personnel must weather several “no” cold calls for every “yes” call.
By choosing sales personnel who are more optimistic than pessimistic, insurance companies
could be more successful and retain employees longer. In another venue, varsity collegiate
swimmers were given false failure feedback regarding their performance in practice races.
Optimistic swimmers subsequently performed better (by swimming faster than expected)
whereas pessimistic swimmers demonstrated decreased performance (by swimming slower than
expected) (Seligman, Nolen-Hoeksema, Thornton, & Thornton, 1990). Another study provided
false failure feedback to middle school students during a basketball dribbling activity. Optimistic
students were less anxious, more confident, and performed better than their pessimistic
25
counterparts (Martin-Krumm, Sarrazin, & Peterson, 2003). From these studies, those with an
optimistic explanatory style weathered failure better than those with pessimistic styles.
Explanatory Style and Teaching
Overall, optimists tend to regard failure as a challenge to overcome rather than an
obstacle to crumble before. Such findings may have important implications for teachers because
teaching is a profession fraught with opportunities for both failure and success. As shown in the
teacher attrition literature, teachers often complain of difficulties in teaching with limited
supplies or resources, scant support from administrators and parents, and lack of cooperation
from students. A lesson that may work for one group of students might fail miserably with
another. Directives from administrators or government officials might overburden even the most
efficient teachers with paperwork or content to incorporate into already crowded lessons. If
teachers could weather these difficulties, they may not feel burned out and thus stay in the field
longer.
Perhaps teachers with an optimistic explanatory style could weather these potential
failures more fluidly than their pessimistic counterparts. For instance, when lesson plans do not
win over students, the optimistic teacher may chalk up the failure to fluid, temporary distractions
(“It’s a pep rally day” or “Second semester seniors are difficult to reach”) instead of to
uncontrollable personal teaching failure (“I am a bad teacher”) or to unchangeable student ability
(“My students are just not as smart as other teachers.”). The optimistic teacher would then devise
new lesson plans or adjust expectations to increase chances for success. An optimistic teacher
would handle hostile parent conferences more effectively as well. Instead of thinking the hostile
parent has a personal hatred toward him or her, the optimistic teacher might devise several
external, unstable, and specific reasons for the parent’s outbursts. Perhaps the parent had a hard

26
day at work or is worried about their child’s performance and is taking out this frustration or
worry on the school. An optimistic teacher would also handle administrative demands more
effectively. When given high standards and few resources, optimistic teachers would seek
options they can personally control and devise ways to meet those controllable challenges (i.e.
grant writing or fundraising in the community). This resiliency may inoculate optimistic teachers
from many of the frustrations that drive teachers from the profession.
If teachers have a more optimistic explanatory style in the face of these failure
experiences, they might view each failure as an opportunity to try a new method or seek
alternative explanations for the events that unfold. Optimistic teachers may also avoid burnout
and avoid ill physical effects such as exhaustion and remain engaged when bad teaching
experiences occur. Teachers with a more pessimistic style may give up in the face of these
failures and not try alternative strategies or fail to appreciate alternative evidence of their success
in other areas and ultimately quit teaching. Such pessimism may lead to burnout and depression,
leading more teachers to leave the profession since pessimistic teachers explain failure as their
fault, always present, and influential on other areas of their teaching and lives. Understanding
explanatory style in teachers could provide insight into the underlying reasons why teachers
leave the profession and the means to keep talented teachers in the field longer.
Explanatory Style and Conceptual Issues with Teachers’ Sense of Efficacy
Teachers’ sense of efficacy has been measured differently by researchers who
conceptualize it according to different theoretical perspectives (Skaalvik & Skaalvik, 2007).
Teacher efficacy has its roots in Rotter’s (1966) social learning theory and Bandura’s (1986,
1997) theory of self-efficacy. Through the years, some research into teacher efficacy has focused
on Rotter’s locus of control model (i.e., Guskey, 1981; Rose & Medway, 1981) while more

27
research has focused Bandura’s social-cognitive theory (i.e., Ashton, Buhr, & Crocker, 1984;
Gibson & Dembo, 1984; Tschannen-Moran & Woolfolk Hoy, 2001). Because of competing
conceptual ideas about teacher efficacy, claims of its value to educators and students are suspect
at best (Denzine, Cooney, & McKenzie, 2005). Regardless of the theoretical perspective,
researchers often do not examine the sources of efficacy beliefs to determine how powerful they
are in predicting efficacy or outcome behaviors.
Examining how explanatory style relates to teachers’ sense of efficacy may shed light on
how efficacy develops within the mastery experience. Explanatory style may be a vehicle
teachers can use to build efficacy while they are working toward mastery, providing resilience in
the face of difficult circumstances. Current teacher efficacy scales (see Tschannen-Moran &
Woolfolk Hoy, 2001) alone are not enough to obtain precise and valid information about teacher
efficacy beliefs since those measures do not account for locus of control, which is an aspect of
explanatory style (Denzine, Cooney, & McKenzie, 2005). Wheatley (2005) suggests that
research on teachers’ sense of efficacy should focus on teachers’ interpretations of teaching
experiences instead of on just their beliefs and goals about student learning. A model that
integrates explanatory style into teachers’ sense of efficacy may provide insight into how people
with low initial efficacy persevere through hard-fought circumstances to achieve mastery, and by
extension, efficacy.
Future Directions
The theoretical foundations for both explanatory style and efficacy are robust and hint at
the possible relationship between explanatory style and efficacy. First and foremost, reliable and
valid measures of explanatory style and efficacy need to be developed. Currently, measures of
teachers’ sense of efficacy exist that accomplish this, regardless of what theoretical perspective

28
one follows. The measure that holds the most promise for efficacy seems to be the Ohio State
Teachers’ Sense of Efficacy Scale (TSES; Tschannen-Moran & Woolfolk-Hoy, 2001). This
measure has better factor loadings than the Gibson and Dembo (1984) measure and possesses
better construct validity. The three factors for this scale – student engagement, instructional
strategies, and classroom management – relate more directly to different domains of teaching
that are encountered in classrooms daily.
For explanatory style, no domain-specific measure currently exists for teachers. Domain-
specific measures of explanatory style are currently vogue due to the belief that the diathesis-
stress model invokes explanatory style more effectively. A general measure of explanatory style
may not uncover more domain-specific – and stress-induced – types of explanatory style.
Domain-specific measures have been developed for children, teens, financial-services workers,
and university undergraduates. All of these measures ask respondents to provide responses to
situations specific to their own context, thus invoking stressors specific to those situations.
People may have a certain type of explanatory style in general, but a different type in more
specific contexts. Developing an educator-specific measure of explanatory style could provide
the link needed to understand whether teachers’ explanations of good and bad teaching events
mediates the emotional and physical reactions necessary to build efficacy.
A second need for this line of research is to test the theoretical model proposed in this
paper, which suggests a way in which explanatory style and efficacy are related. In order to
persevere in the face of failure, explanatory style and efficacy each matter, but it is unclear how
these two factors are related. Although each concept overlaps conceptually, they stem from
different areas of psychology. Teachers’ sense of efficacy has been extensively examined in
academic settings, whereas explanatory style has its roots as a clinical explanation for
29
depression. People with high efficacy believe themselves capable of overcoming obstacles
(Bandura, 1994). People with less pessimistic explanatory styles view obstacles as challenges to
be overcome (Seligman, 1998). Yet, it is unclear whether one needs efficacy in order to have less
pessimistic explanatory style or whether a less pessimistic explanatory style helps one build
efficacy. Bandura (1994) suggests that efficacy contributes to the development of certain types of
causal attributions. Yet, Pajares (2002) acknowledges that outcomes interpreted as successful
raise efficacy while those interpreted as failure lower it. In essence, this research attempts to
present a teaching-specific model for explanatory style and efficacy that clarifies the relationship
between these two concepts in predicting burnout.
It seems that the current state of the understanding of the relationship between
explanatory style and efficacy is circular at best. Research needs to clarify whether explanatory
style mediates efficacy or vice versa. If efficacy mediates explanatory style, then experiencing
success would be of utmost importance. Authentic mastery experiences would be necessary and
sufficient for cultivating efficacy. However, if explanatory style mediates efficacy, then any
experience one has during teaching could be used to build efficacy. Understanding what type of
explanatory style maximizes a teacher’s sense of efficacy would help researchers develop
training programs that maximize job satisfaction and professionalism. Training teachers to think
more optimistically about both success and failure could be the key to building a high sense of
efficacy and helping teachers be more effective. Understanding this relationship would help
administrators create professional development and mentoring programs that would build
efficacy and retain good teachers.
A third need for this line of research is to examine the other sources of teachers’ sense of
efficacy, such as vicarious experiences, within the context of the proposed model where

30
explanatory style mediates efficacy. A popular trend in education today involves the use of
professional learning communities (PLCs; DuFour, 2007). Professional learning communities
engage teachers in collaborative teams to discuss lesson planning, classroom management
techniques, and school-wide goals. These types of communities within schools provide sources
of vicarious learning as both master and novice teachers share ideas and learn from each other. It
would be interesting to see if teachers in schools that use a PLC-centric approach have different
explanatory styles and levels of teachers’ sense of efficacy than teachers in schools that do not
subscribe to the PLC approach.
A fourth need for this research is to test whether other, non-burnout-related, measures of
physical and emotional health are seen in teachers who have moderately optimistic explanatory
styles and high levels of efficacy. This research did not collect any health-related data, such as
immunological reactions, incidence of sick leave, depression, or hope. It would be interesting to
see if this model of explanatory style mediating teachers’ sense of efficacy also predicts
increased immunological response to stress, less time off for sickness, less depression and
greater hope.
Conclusions
I propose a theoretical model that shows how explanatory style mediates efficacy to
persevere through hard-fought mastery experiences. Further, the model highlights the ways in
which explanatory style mediates efficacy by providing the emotional responses necessary to
build efficacy. This new model addresses some theoretical issues associated with efficacy
building, specifically Bandura’s assertion that efficacy always precedes causal attributions of
events, suggesting that efficacy determines whether people have optimistic or pessimistic
explanatory styles. In addition, Bandura proposes that only successful, or mastery, experiences

31
build efficacy. He goes further to suggest that mastery experiences that include setbacks and
minor failures build the highest levels of efficacy once success is achieved. However, his
efficacy-before-explanatory-style model provides no means for those with low efficacy to
persevere through setbacks and failures to achieve ultimate mastery. However, I propose that
explanatory style mediates efficacy, providing ways to build efficacy regardless of
circumstances.
The subsequent chapters of this dissertation will examine the role of explanatory style in
predicting commonly cited reasons for teacher burnout. In order to do this, an educator-specific
explanatory style measure will be created and validated in Chapter 3. In Chapter 4, I will
examine how explanatory style and teacher efficacy are related to each other and to burnout. This
research will shed light on whether explanatory style mediates efficacy or vice versa. In addition,
I will examine how optimists and pessimists differ in their explanatory style, efficacy, and
burnout. Understanding how optimists and pessimists differ can help determine a more precise
role of explanatory style in mediating efficacy and predicting burnout. Successful interventions
already exist for promoting more optimistic explanatory style in children and adults. This
research will help determine whether similar programs should be developed in teacher
preparation and inservice programs to improve the likelihood that quality teachers avoid burnout
and stay in teaching longer.

32
References
Abramson, L.Y., Seligman, M.E.P., & Teasdale, J.D. (1978). Learned helplessness in humans: Critique and reformulation. Journal of Abnormal Psychology, 87(1), 49-74.
Ashton, P.T., (1984). A motivational paradigm for effective teacher education. Journal of Teacher Education, 35(5), 28-32.
Ashton, P., Buhr, D., & Crocker, L. (1984). Teachers’ sense of efficacy: A self-or-normed referenced construct? Florida Journal of Educational Research, 26, 29-41.
Baker, D.P., & Smith, T. (1997). Teacher turnover and teacher quality: Refocusing the issue. Teachers College Record, 99(1), 29-35.
Bandura, A., (1986). Social foundations of thought and action: A social-cognitive theory. Englewood Cliffs, NJ: Prentice Hall.
Bandura, A. (1994). Self-efficacy. In V. S. Ramachaudran (Ed.), Encyclopedia of human behavior (Vol. 4, pp. 71-81). New York: Academic Press.
Bandura, A. (1997) Self-efficacy: The exercise of control. W.H. Freeman and Company, New York.
Boe, E.E., Bobbitt, S.A., Cook, L.H., Barkanic, G., & Maislin, G. (1998). Teacher turnover in eight cognate areas: National trends and predictors. Philadelphia, PA: Center for Research and Evaluation in Social Policy.
Brennan, F., & Charnetski, C. (2000). Explanatory style and immunoglobulin A (IgA). Integrative Physiological & Behavioral Science, 35(4), 251.
Brill, S. & McCartney, A. (2008). Stopping the revolving door: Increasing teacher retention. Politics & Policy, 36(5), 750-774.
Demerouti, E., Bakker, A.B., Nachreiner, F., & Schaufeli, W.B. (2001). The job demands-resources model of burnout. Journal of Applied Psychology, 86(3), 499-512.
Denzine, G.M., Cooney, J.B., & McKenzie, R. (2005). Confirmatory factor analysis of the Teacher Efficacy Scale for prospective teachers. British Journal of Educational Psychology, 75(4), 689-708.
DuFour, R. (2007). Professional learning communities: A bandwagon, an idea worth considering, or our best hope for high levels of learning?. Middle School Journal, 39(1), 4-8. Retrieved from ERIC database.
Erickson, S.J. (2008). An examination of the relationship between professional development and teacher turnover. Dissertation Abstracts International Section A: Humanities and Social Sciences, 68(8-A), 3349.
Fazio, N.M., & Palm, L.J. (1998). Attributional style, depression, and grade point averages of college students. Psychological Reports, 83(1), 159-162.
Gibson, R.D., & Dembo, M.H. (1984). Teacher efficacy: A construct validation. Journal of Educational Psychology, 76(4), 569-582.
Graham, S., Harris, K.R., Fink, B., & MacArthur, C.A. (2001). Teacher efficacy in writing: a construct validation with primary grade teachers. Scientific Studies of Reading 5(2), 177–202.

33
Guskey, T. (1981). Measurement of responsibility teachers assume for academic successes and failures in the classroom. Journal of Teacher Education, 32, 44-51.
Henson, R. (2001). Teacher Self-Efficacy: Substantive Implications and Measurement Dilemmas. Retrieved from ERIC database.
Hilsman, R., & Garber, J. (1995). A test of the cognitive diathesis-stress model of depression in children: Academic stressors, attributional style, perceived competence, and control. Journal of Personality & Social Psychology, 69(2), 18p.
Ingersoll, R.M. (1999). The problem of underqualified teachers in American secondary schools. Educational Researcher, 28(2), 26-37.
Ingersoll, R.M. (2003). “Is there really a teacher shortage?” Co-sponsor by the Consortium for Policy Research Education and the Center for the Study of Teaching and Policy (September). Accessed on October 24, 2009. Available online at http://depts.washington.edu/ctpmail/PDFs/Shortage-RI-09-2003.pdf
Kapadia, K., Coca, V., & Easton, J.Q. (2007). “Keeping new teachers: A first look at the influences of induction in the Chicago public schools.” Consortium on Chicago School Research at the University of Chicago (January). Accessed on October 24, 2009. Available online at http://ccsr.uchicago.edu/publications/keeping_new_teachers012407.pdf
Love, A. (1988). Attributional style of depressed chronic low back patients. Journal of Clinical Psychology, 44(3), 317-321.
Martin-Krumm, C.P., Sarrazin, P.G., Peterson, C. (2003). Explanatory style and resilience after sports failure. Personality and Individual Differences, 35(7), 1685-1695.
Maslach, C. (1982). Understanding burnout: Definitional issues in analyzing a complex phenomenon. In W. S. Paine (Ed.), Job stress and burnout (pp. 29-40). Beverly Hills. CA: Sage.
National Commission on Teaching & America's Future (2007). The High Cost of Teacher Turnover. Policy Brief. National Commission on Teaching and America's Future, Retrieved from ERIC database.
Nolen-Hoeksema, S., Girgus, J.S., & Seligman, M.E.P. (1986). Learned helplessness in children: A longitudinal study of depression, achievement, and explanatory style. Journal of Personality & Social Psychology, 51(2), 13p.
Pajares, F. (2002). Self-efficacy beliefs in academic contexts: An outline. Retrieved January 18, 2010 from http://des.emory.edu/mfp/efftalk.html.
Peterson, C., & Barrett, L.C. (1987). Explanatory style and academic performance among university freshmen. Journal of Personality and Social Psychology, 53(3), 603-607.
Peterson, C., & Vaidya, R.S. (2001). Explanatory style, expectations, and depressive symptoms. Personality and Individual Differences, 31(7), 1217-1223.
Ritchie, W.F. (2000). An exploration of college student explanatory style and its relationship to academic performance. Dissertation Abstracts International: Section A: Humanities & Social Sciences, 60(7-A), 2375.
Rose, J., & Medway, F. (1981). Measurement of teachers’ beliefs in their control over student outcome. Journal of Educational Research, 74, 185-190.
Seligman, M. E. P. (1998). Learned optimism: How to change your mind and your life (2nd ed.). New York: Pocket Books.
Seligman, M.E.P., & Maier, S.F. (1967). Failure to escape traumatic shock. Journal of Experimental Psychology, 74(1), 1-9.

34
Seligman, M.E.P., Nolen-Hoeksema, S., Thornton, N, & Thornton, K.M. (1990). Explanatory style as a mechanism of disappointing athletic performance. Psychological Science, 1(2), 143-146.
Seligman, M. E. P., Reivich, K., Jaycox, L., & Gillham, J. (1995). The optimistic child: A proven program to safeguard children against depression and build lifelong resilience. New York: Harper Perennial.
Seligman, M.E.P., & Schulman, P. (1986). Explanatory style as a predictor of productivity and quitting among life insurance sales agents. Journal of Personality & Social Psychology, 50(4), 832-838.
Serpell, Z, & Bozeman, L.A. (1999). “Beginning teacher induction: A report on beginning teacher effectiveness and retention.” National Partnership for Excellence and Accountability in Teaching (November). Accessed on October 24, 2009. Available online at http://eric.ed.gov/ERICDocs/data/ericdocs2sql/content_storage_01/0000019b/80/16/b7/37.pdf
Skaalvik, E.M., & Skaalvik, S. (2007). Dimensions of teacher self-efficacy and relations with strain factors, perceived collective teacher efficacy, and teacher burnout. Journal of Educational Psychology, 99(3), 611-625.
Tiggeman, M., & Crowley, J.R. (1993). Attributions for academic failure and subsequent performance. Australian Journal of Psychology, 45(1), 35-39.
Tschannen-Moran, M., & Woolfolk-Hoy, A. (2001). Teacher efficacy: Capturing an elusive construct. Teaching and Teacher Education, 17, 783-805.
Villar, A., & Strong, M. (2007). Is mentoring worth the money? A benefit-cost analysis and five-year rate of return of a comprehensive mentoring program for beginning teachers. ERS Spectrum, 25(3), 1-17. Retrieved from ERIC database.
Wheatley, K.F. (2005). The case for reconceptualizing teacher efficacy research. Teaching and Teacher Education, 21, 747-766.
Woolfolk-Hoy, A., & Spero, R.B. (2005). Changes in teacher efficacy during the early years of teaching: A comparison of four measures. Teaching and Teacher Education, 21(4), 343-356.
Yates, S.M., & Yates, G.C.R. (1995). Explanatory style, ego-orientation, and primary school mathematics achievement. Educational Psychology, 15(1), 12p.
Zumwalt, K., & Craig, E. (2005). Teachers’ characteristics: Research on the indicators of quality. In Studying teacher education: The report of the AERA panel on research and teacher education. M. Cochran-Smith and K.M. Zeichner (Eds). Mahwah, New Jersey: Lawrence Erlbaum Associates, Inc.
35
CHAPTER 3
Development and Validation of an Educator-Specific Attributional Style Questionnaire (EdASQ)
The ways in which people explain good and bad events is predictive of many positive
outcomes in clinical, business, sport, and academic settings (i.e., Nolen-Hoeksema, Girgus, &
Seligman, 1986; Peterson & Barrett, 1987; Proudfoot, Corr, Guest, & Gray, 2001; Seligman &
Schulman, 1986; Seligman, Nolen-Hoeksema, Thornton, & Thornton, 1990). Little research has
been done to determine whether explanatory style predicts the same types of positive outcomes
in teachers. The purpose of this study is to address this gap by developing and validating an
educator-specific attributional style questionnaire, which will be referred to as the EdASQ, and
will enable future research to examine this relationship with diverse populations of teachers. A
literature review reveals only two studies (see Hall & Smith, 1999; Smith, Hall, & Woolcock-
Henry, 2000) that have explored the optimism levels of teachers in secondary school settings
using the Attributional Style Questionnaire (ASQ; Peterson et al, 1982), the most widely used
measure of explanatory style. Research indicates that modifying the general ASQ to a specific
domain is important (Peterson & Barnett, 1987). Therefore, the purpose of this study is to
develop and validate the instrument.
Explanatory Style
Explanatory style describes ways in which people explain good and bad events that
occur. The types of explanations people give for these events predict whether the person will feel
helpless or not in the face of failure. Patterns of explanatory style are evident based on the
learned helplessness model of depression, reformulated by Abramson, Seligman, and Teasdale

36
(1978), which proposes that people will attribute their helplessness in the face of uncontrollable
circumstances to a particular cause. People then determine whether the cause will have a chronic,
broad, detrimental impact to future self-esteem and agency. The explanatory style patterns of
people in studies of learned helplessness fell along three dimensions – global/specific (projection
of cause across different situations), stable/temporary (projection of cause across time), and
internal/external (projection of cause to internal traits versus external factors) (Seligman, 1998).
Researchers eventually categorized optimists and pessimists as having diametrically opposed
explanatory styles of good and bad events (Peterson & Vaidya, 2001; Seligman, 1998).
Pessimistic explanatory has an impact on the incidence of depression, and by extension, lower
academic achievement (i.e., Fazio & Palm, 1998; Hilsman & Garber, 1995; Nolen-Hoeksema,
Girgus, & Seligman, 1986; Peterson & Barrett, 1987; Ritchie, 2000; Tiggeman & Crowley,
1993; Yates & Yates, 1995). Seligman (1998) proposes that the explanatory style theory of
optimism provides pessimistic people with an avenue to alter their pessimistic thinking patterns
to be more optimistic, thus fostering mastery and resilience. Studies with middle school children
show that retraining pessimistic thinking into optimistic thinking can significantly reduce
incidence of depression (Seligman, Reivich, Jaycox, & Gillham, 1995).
Explanatory style is measured primarily by the Attributional Style Questionnaire (ASQ;
Peterson et al, 1982). The ASQ consists of 12 situations, 6 good and 6 bad, that respondents must
imagine they are experiencing. Respondents provide a written explanation for the event and then
choose on a Likert scale of 1 to 7 whether the explanation is global or specific, temporary or
permanent, and internal or external. The ASQ is moderately reliable, with estimated Cronbach
(1951) alpha internal reliability coefficients of .66 for internality, .85 for stability, and .88 for
globality (Peterson & Villanova, 1988). The ASQ significantly predicts depression as measured
37
by the Beck Depression Inventory (r = .18, p < .05 for internality; r = .19, p < .05 for stability;
and r = .40, p < .01 for globality; Peterson & Villanova, 1988). The ASQ also significantly
predicts self-esteem as measured by the Rosenberg Self-Esteem Scale (r = .34, p < .01 for
internality; r = .28, p < .01 for stability; r = .21, ns for globality, and r = .40, p < .001 for the
ASQ composite; Cheng & Furnham, 2003).
Little research has been done to assess the levels of optimism in teachers to see if these
qualities are related to teaching. Several studies show that explanatory style is related to success
in particular domains outside of clinical psychology. Seligman and Schulman (1986) found that
insurance salespeople who exhibited a pessimistic explanatory style sold less insurance and left
the field earlier than their more optimistic counterparts. By choosing sales personnel who are
more optimistic than pessimistic, insurance companies could be more successful and retain
employees longer. Seligman, Nolen-Hoeksema, Thornton, and Thornton (1990) gave varsity
collegiate swimmers false failure feedback regarding their performance in practice races.
Optimistic swimmers subsequently performed better (by swimming faster than expected)
whereas pessimistic swimmers demonstrated decreased performance (by swimming slower than
expected). If explanatory style could predict success and achievement for teachers, measures of
teacher explanatory style would be useful to those hiring teachers and for implementing
programs to keep teachers in the classroom.
Measurement Issues with the ASQ
Two measurement issues have arisen since the ASQ was developed in the early 1980s.
The first issue focuses on the factor analytic structure of the ASQ. Theoretically, the ASQ should
load on three factors – internality, stability, and globality. These domains are usually then
combined into two overarching composite scores for positive and negative events. This practice

38
suggests that the ASQ should also load well on the two main positive and negative factors. The
actual factor structure of the ASQ has not been clear in the literature, however. Cutrona, Russell,
and Jones (1985) conducted confirmatory factor analysis on the negative items of the ASQ only
and did not find the three-factor structure. Based on these results, they questioned whether
attributional style existed since the measure did not yield the theoretically based components. In
a critique of the ASQ factor structure, Arntz, Gerlsma, and Albersnagel (1985) also found overall
good and bad subscales that had three factors each, but the variance accounted for by the model
was only between 3.7% and 7.4%. They further found that stability and globality correlated
almost perfectly, leading them to conclude that stability and globality were not distinct from each
other. Other studies found non-theoretical four-factor structures. The four-factor structure found
by Corr and Gray (1996) showed bad events loading on two factors – stability/globality and
internality – and positive events loading on two factors – achievement and affiliation. Asner-Self
and Schreiber (2004) found a four-factor structure in a sample of Central American immigrants –
stability, globality, internal achievement, and internal affiliation. These studies called into
question whether the ASQ measured what the reformulated learning helplessness model
proposed.
All of the studies cited here used traditional factor analysis procedures, typically using
principal components analysis with varimax rotation, which assumes that the factors within a
measure are distinct and uncomplicated. Higgins, Zumbo, and Hay (1999) suggest that
exploratory factor analysis does not take into the account the complex interrelationships of items
within measures like the ASQ. The ASQ presents 12 hypothetical situations, 6 positive and 6
negative, for which respondents must propose a cause. Then, respondents must rate their
proposed cause as internal, stable, or global. Because the internal, stable, and global items refer
39
to the same situation, they are inextricably linked. Higgins, Zumbo, and Hay, in a critique of
Cutrona, Russell, and Jones (1985), tested structural equation models in which error variances
among items referring to the same situation were correlated. They argued that this type of
analysis took into account the more complex, interrelated nature of the items on the ASQ. The
two models that yielded good fit showed a three-factor structure for good events and bad events
separately (see Figure 3.1). The models that tested overall composite structures or overall
good/bad structures without the internal, stable, and global factors did not fit the data. Hewitt,
Foxcroft, and MacDonald (2004), using multimethod, multi-trait modeling, also showed the
three-factor structure, but for negative events only. Using structural equation modeling and
analyzing positive and negative item sets separately seems to yield the theoretical structure of
internal, stable, and global dimensions. This study will test this positive/negative three-factor
structure for the EdASQ.
The other issue centers on the low reliability coefficients, especially for the internal
dimension. The problem arose with the first study on the development of the ASQ by Peterson
and others in which they reported reliability coefficients of .46 for internality as compared with
.59 for stability and .69 for globality. Further studies examining the reliability of the ASQ show
coefficients ranging from the mid .30s to the mid .60s, none of which are considered robust (see
Cutrona, Russell, & Jones, 1985; Furnham, Sadka, & Brewin,1992; Hanrahan & Grove, 1990).
Researchers do not have definitive answers for why the internal domain is so internally
unreliable. Some speculate that the internal domain is poorly conceptualized and perhaps should
be broken down into affiliation and achievement dimensions (Asner-Self & Schreiber, 2004).
Others feel the very structure of the ASQ is questionable (Cutrona, Russell, and Jones, 1985).

40
Educator InternalPOS/NEG
Educator StablePOS/NEG
Educator GlobalPOS/NEG
edinternalPOS/NEG
e6
1
1
edinternalPOS/NEG
e51
edinternalPOS/NEG
e41
edinternalPOS/NEG
e31
edinternalPOS/NEG
e21
edinternalPOS/NEG
e11
edstablePOS/NEG
e12
1
1
edstablePOS/NEG
e111
edstablePOS/NEG
e101
edstablePOS/NEG
e91
edstablePOS/NEG
e81
edstablePOS/NEG
e71
edglobalPOS/NEG
e18
1
1
edglobalPOS/NEG
e171
edglobalPOS/NEG
e161
edglobalPOS/NEG
e151
edglobalPOS/NEG
e141
edglobalPOS/NEG
e131
Figure 3.1
Three-Factor Measurement Model for the Attributional Style Questionnaires
Figure 3.1: Measurement model for positive and negative item sets for the Educator Attributional Style Questionnaire. NOTE: edinternal = Educator Attributional Style Questionnaire items for the Internal subscale; edstable = Educator Attributional Style Questionnaire items for the Stable subscale; edglobal = Educator Attributional Style Questionnaire items for the Global subscale; POS = Positive; NEG = Negative

41
The Importance of Domain Specificity
One way to address the internal reliability problem with the general ASQ is to set the
situations posed by the ASQ into specific contexts or domains that tap more directly into
explanations of specific events. Research by Peterson and Barrett (1987) suggests that
explanatory style can be measured effectively by modifying the ASQ to fit particular situations
or domains. Higgins, Zumbo, and Hay (1999) propose that there is no such thing as a non-
situational attributional style. Their research showed that the use of context-dependent item sets
(CDIS) increases model fit and accounts for more variance than non-CDIS items. Additionally,
the diathesis-stress model of depression suggests that explanatory style may not be evident
without the presence of a stressor. Research in context-dependent attributional style suggests that
depressionogenic (pessimistic) attributional style is more apparent when faced with negative life
events in the same context and not as apparent outside of the context (Proudfoot, Corr, Guest, &
Gray, 2001). Thus, domain-specific explanatory style measures would allow respondents to
imagine situations that are actually within the realm of possibility and present an imaginary
stressor to reveal explanatory style for a specific context. The use of domain-specific measures
of explanatory style has precedence in the literature. Peterson and Barrett (1987) developed the
Academic ASQ, and explanatory style measures for children (CASQ, Seligman, et al, 1984),
teens (TASQ, Lieber, 1997), and financial-service sector workers (Proudfoot, Corr, Guest, &
Gray, 2001) exist that tap into situations often faced by these populations. The use of an
educator-specific Attributional Style Questionnaire that uses teaching-specific situations would
be consistent with domain-specific adaptations of the original ASQ to fit diverse populations.
The domain-specific measures of attributional style each used slightly different
approaches to validate the measure and to demonstrate divergent validity. Since explanatory
42
style is grounded in clinical psychology, many studies use depression measures – specifically the
Beck Depression Inventory (BDI; Beck, 1967) – to determine validity. Peterson and Barrett
(1987) used the BDI to demonstrate convergent validity of the AASQ with the ASQ. They also
used GPA and the Scholastic Aptitude Test (SAT) scores to determine divergent validity with
academic variables. The developers of the Children’s Attributional Style Questionnaire (CASQ:
Seligman, et al, 1984) used the Children’s Depression Inventory (CDI: Kovacs & Beck, 1977) to
determine validity with their child-specific measure. Lieber (1997) used inventories for
depression, anxiety, self-esteem, and academic achievement to determine validity. Finally,
Proudfoot, Corr, Guest, and Gray (2001) used several measures of intrinsic motivation, self-
control, intention to leave a job, and a general health scale in addition to the ASQ to determine
validity of their financial services sector measure. For this study, we are using a measure of self-
esteem to validate the EdASQ.
Purpose
The purpose of this research study is to develop and validate an educator-specific
attributional style questionnaire (EdASQ), which will provide a useful tool for measuring the
explanatory style in teaching-specific circumstances. Two studies comprise this research.
Study 1
Method
Participants
Participants were K-12 public school teachers (N = 169) from a suburban public school
district in the southeastern United States. Approximately 850 teachers were asked to participate.
Their participation was voluntary. Teachers received printable documentation upon completion
43
of the survey for one hour of professional development credit as an incentive for participation.
The survey was administered using an online platform and sent to teachers via email. Permission
to survey teachers was provided by the superintendent of the district.
Demographic information for Study 1 is provided in Table 3.1. For Study 1, 279 teachers
were solicited via email for the survey, but only 172 completed the entire set of measures,
resulting in a 20% response rate and a 60.5% completion rate. The majority of teachers were
female. The number of elementary and secondary teachers was the same, yet slightly fewer
middle school teachers responded. Teachers in this sample had a wide range of experience, with
the largest group of teachers having 16+ years of teaching experience. Most of the teachers had
earned a master’s degree or a bachelor’s degree. Very few had earned an Education Specialist
(EdS) degree or a doctorate. Only one teacher from this sample had earned certification through
the National Board for Professional Teaching Standards (NBPTS, also known as National Board
Certification or NBC), but many teachers expressed a desire to pursue this certification within 2-
5 years if it were available in their area.
Measures
For this development and validation study, the EdASQ was administered along with the
Attributional Style Questionnaire (ASQ) and the Rosenberg Self-Esteem Scale (RSES;
Rosenberg, 1965). Half of the participants took the EdASQ, the ASQ, and the RSES, while the
other half took the EdASQ and the RSES only. The ASQ and RSES are valid and reliable, easily
administered and scored, pose no risk to the participants, and robust across adult populations.
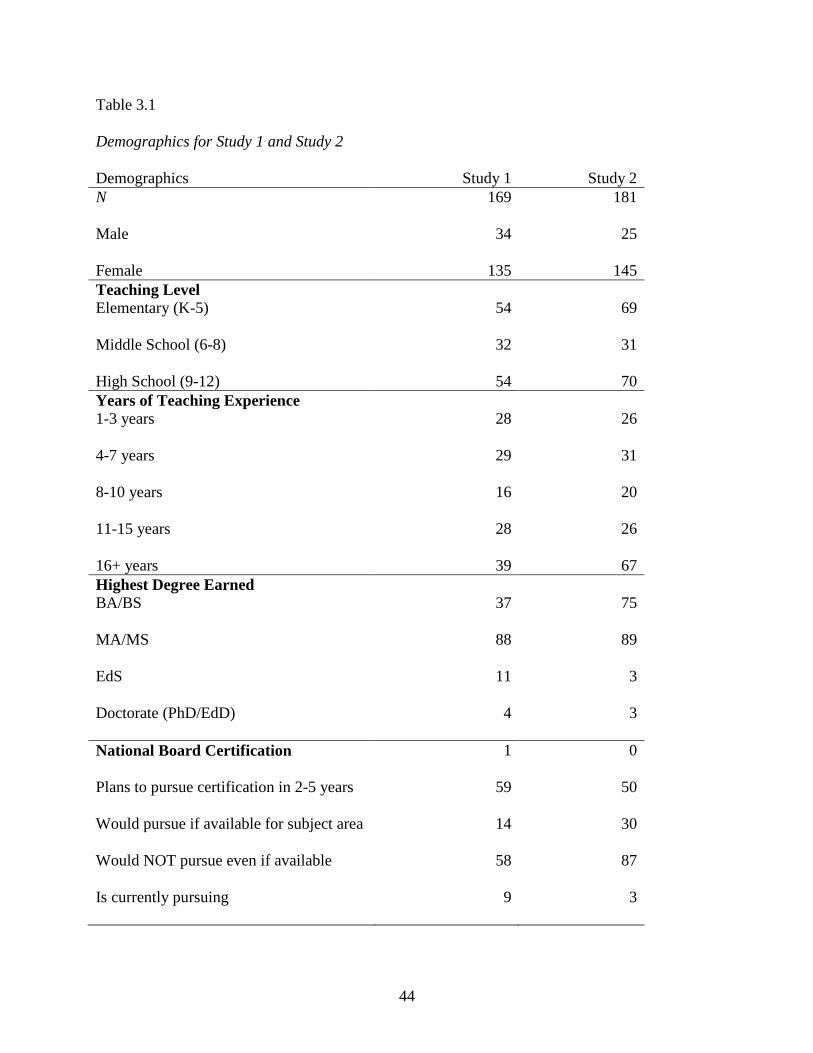
44
Table 3.1
Demographics for Study 1 and Study 2
Demographics Study 1 Study 2 N 169 181
Male 34 25
Female 135 145 Teaching Level Elementary (K-5) 54 69
Middle School (6-8) 32 31
High School (9-12) 54 70 Years of Teaching Experience 1-3 years 28 26
4-7 years 29 31
8-10 years 16 20
11-15 years 28 26
16+ years 39 67 Highest Degree Earned BA/BS 37 75
MA/MS 88 89
EdS 11 3
Doctorate (PhD/EdD) 4 3
National Board Certification 1 0
Plans to pursue certification in 2-5 years 59 50
Would pursue if available for subject area 14 30
Would NOT pursue even if available 58 87
Is currently pursuing 9 3

45
Attributional Style Questionnaire (ASQ). The ASQ consists of 12 situations, 6 good
and 6 bad, that respondents must imagine they are experiencing. Respondents provided a written
explanation for the event and then choose on a Likert scale of 1 to 7 whether the explanation is
global or specific, temporary or permanent, and internal or external. The ASQ is moderately
reliable, with estimated Cronbach’s (1951) alpha internal reliability coefficients of .66 for
internality, .85 for stability, and .88 for globality (Peterson & Villanova, 1988). The ASQ
significantly predicts depression as measured by the Beck Depression Inventory (r = .18, p < .05
for internality; r = .19, p < .05 for stability; and r = .40, p < .01 for globality; Peterson &
Villanova, 1988). The ASQ also significantly predicts self-esteem as measured by the Rosenberg
Self-Esteem Scale (r = .34, p < .01 for internality; r = .28, p < .01 for stability; r = .21, ns for
globality, and r = .40, p < .001 for the ASQ composite; Cheng & Furnham, 2003).
The scoring of the ASQ has differed since its creation. Schulman and Seligman (1986)
summed the internal, global, and stable elements from the positive and negative items to obtain
the respective composite positive (CP) and composite negative (CN) scores for insurance agents.
Then, they subtracted the CN from the CP to obtain the overall score. Corr and Gray (1996)
obtained the CP and CN scores by taking an average of the internal, stable, and global elements
for each item. Smith, Hall, and Woolcock-Henry (2000) used a complicated scoring method in
which the positive or negative items were added, multiplied by three, then by six, and finally
divided by six.
Ultimately, they obtained the composite score (CPCN) by subtracting the CP from the
CN, but only after subtracting the lowest three items. For this study, the CP and CN scores are
obtained by taking the average of the items for positive and negative items. The composite scores
for the EdASQ and the ASQ were calculated by subtracting the composite positive score from

46
the composite negative score for each measure. Scores for these composites range from -7 to +7.
Scores for the subscales range from 0 to +7. This method is similar to one employed by
Proudfoot, Corr, Guest, and Gray (2000) when they created the FSASQ. Teachers in each of
these phases of this study have neither a strong optimistic or strong pessimistic explanatory style
as shown by the composite score, with a mean of .549 on the ASQ and a mean of .984 on the
EdASQ. For financial service sector workers, CPCN scores had a mean of 1.4, which is similar
to the scores shown in this study.
Educator Attributional Style Questionnaire (EdASQ). The EdASQ is modeled after
the original ASQ, presenting 12 teaching-specific situations, 6 good and 6 bad. Teachers
provided a short written explanation of the cause of the event, and then rate their stated cause on
a 7-point Likert-scale for the 3 dimensions of explanatory style: global/specific,
permanent/temporary, and internal/external. The EdASQ was developed by modifying the
situations to reflect teacher-specific situations. For instance, an ASQ item reads, “You have been
looking for a job unsuccessfully,” but an EdASQ item reads, “You have been looking for a
teaching job unsuccessfully.” One item – “You can’t get all the work done others expect of you”
– was unchanged due to the applicability of the item to both teaching and non-teaching
situations.
Development of the EdASQ occurred in phases. Phase 1 involved altering items on the
ASQ to reflect teaching-specific situations. All but one item was modified. Phase 2 involved
examining items by content experts to determine if they fit the theoretical principles of
explanatory style. One expert recommended changing items to remove any references to specific
time frames (i.e., I have been looking unsuccessfully for a teaching job for some time) to
eliminate leading participants toward permanent attributions. Phase 3 involved giving the survey

47
to a small pilot group of teachers to determine if any wording problems existed. These teachers
reported no issues with the face validity of the measure. Phase 4 is this study.
Rosenberg Self-Esteem Scale (RSES). This measure is a 10-item scale using a 4-point
Likert scale to assess general self-esteem, with higher scores reflecting higher levels of self-
esteem. Scores range from 4 to 40, with higher scores signifying higher self-esteem. The scale
has good internal consistency with α = .89 (Sullivan, Tripp, & Catano, 1997). The scale items
load on one factor. Cheng and Furnham (2003) found that the RSES correlated with attributional
style in positive situations (r = .25, p < .05), negative situations (r = -.36, p < .001), and in a
composite of positive and negative situations (r = .40, p < .001).
Procedure
Half of the teachers completed the EdASQ, the ASQ, and the RSES. The other half took
the other measures but did not take the ASQ. The first group establishes baseline data of
explanatory style in both teaching-specific and non-domain-specific contexts. The second group
serves as a cross-validation group.
Results
Descriptive summative analysis for Study 1 is provided in Table 3.2. In general, teachers
in this sample have a neutral explanatory style on both the EdASQ and ASQ and a healthy self-
esteem.
Reliability . Reliability analysis for all measures was conducted using Cronbach’s (1951)
alpha. The coefficients for all composite measures are shown in Table 3.2. All of these alpha
coefficients for the overall composite scores for all scales are within the acceptable range. The
composite EdASQ yielded a higher reliability index than the ASQ. Each composite subscale of
the EdASQ also yielded a higher reliability index than its respective subscale in the ASQ, with

48
the exception of the composite negative subscale and the global composite subscale. Within the
global composite subscale, only the EdASQ global negative subscale yielded a lower reliability
coefficient than its counterpart in the ASQ.
Table 3.2
Descriptive and reliability statistics for Educator Attributional Style Questionnaire, Attributional Style Questionnaire, and Rosenberg Self-Esteem Scale for Study 1 Measures EdASQ ASQ N Mean SD α N Mean SD α Composite 169 .984 .891 .800 64 .549 .970 .783
Composite Positive 5.06 .700 .840 4.68 .675 .726
Composite Negative 4.08 .680 .724 4.13 .774 .818
Internal 4.43 .646 .599 4.22 .560 .334
Internal Positive 4.14 .879 .721 4.23 .883 .491
Internal Negative 4.72 .870 .504 .420 .772 .375
Stable 4.70 .671 .717 4.41 .668 .659
Stable Positive 5.28 .831 .758 4.81 .852 .584
Stable Negative 4.12 .880 .639 4.01 .849 .644
Global 4.58 .791 .715 4.58 .884 .763
Global Positive 5.18 .930 .706 4.99 1.00 .655
Global Negative 3.97 1.02 .623 4.17 1.12 .740
Rosenberg Self-Esteem (RSES) 172 34.52 4.11 .850
Note. EdASQ = Educator Attributional Style Questionnaire; ASQ = Attributional Style Questionnaire
The composite score for internality was the only subscale that did not achieve the most
acceptable level of reliability. Typically, the ASQ has only moderate reliability for internality
(c.f. Peterson & Villanova, 1988; Peterson & Barnett, 1987), making these findings consistent

49
with previous research with the ASQ. However, in examining the EdASQ internal positive and
internal negative subscales, acceptable reliability was achieved with the internal positive and not
with the internal negative. This finding suggests that teachers show a distinction between their
internal-external explanations for positive and negative events.
Validity . The correlational analysis to establish validity is presented in Table 3.3a and
Table 3.3b for Study 1. I conducted correlational analysis between the EdASQ, ASQ, and RSES.
The composite scores for the EdASQ and the ASQ were significantly correlated to each other.
To establish convergent validity, I examined the correlations between the RSES and the
attributional measures. The RSES was significantly correlated to the composite scores for both
the EdASQ and the ASQ, although the ASQ correlates better with the RSES than the EdASQ.
The RSES-ASQ composite correlation is similar to the correlation found by Cheng and Furnham
(2003; r = .40, p < .001). Neither the composite positive or composite negative subscales for the
EdASQ correlated significantly to the RSES. For the ASQ, the composite negative subscale was
negatively and significantly correlated to the RSES, but the composite positive subscale did not
correlate significantly. For the EdASQ, the internal subscale showed a significant, positive
correlation, but the stable and global subscales did not correlate. For the EdASQ, the internal-
positive, stable-positive, stable-negative, and global-negative subscales yielded significant
correlations in the expected directions. For the ASQ, the internal-positive, stable-negative, and
global-negative subscales yielded significantly correlations in the expected directions.

50
Table 3.3a
Correlational analysis (Pearson’s r) of RSES and EdASQ for Study 1
EdASQ RSES Measures CPCN CP CN Internal Internal
POS InternalNEG
Stable Stable POS
Stable NEG
Global Global POS
Global NEG
EdASQ CPCN 1.00
CP .440** 1.00
CN -.376** -.052 1.00
Internal .116 .576** .439** 1.00
Internal-POS -.427** .126 .687** .741** 1.00
Internal-NEG .606** .727** -.046 .732** .084 1.00
Stable .044 .603** .560** .262** .123 .264** 1.00
Stable-POS .519** .854** .199** .349** .072 .444** .767** 1.00
Stable-NEG -.420** .112 .664** .070 .119 -.017 .797** .224** 1.00
Global -.080 .565** .684** .295** .348** .085 .463** .455** .274** 1.00
Global-POS .452** .816** .247** .305** .142 .309** .429** .619** .069 .789** 1.00
Global-NEG -.534** .132 .833** .179* .409** -.149 .326** .142 .361** .830** .311** 1.00
RSES .326** .184 -.202 .171* .307* -.004 .011 .069 -.288* -.076 .031 -.124 1.00
* significant to .05 level ** significant to .01 level NOTE: EdASQ CPCN = Educator Attributional Style Questionnaire Composite Positive/Composite Negative; CP = Composite Positive; CN = Composite Negative; RSES = Rosenberg Self-Esteem Scale; POS = Positive; NEG = Negative
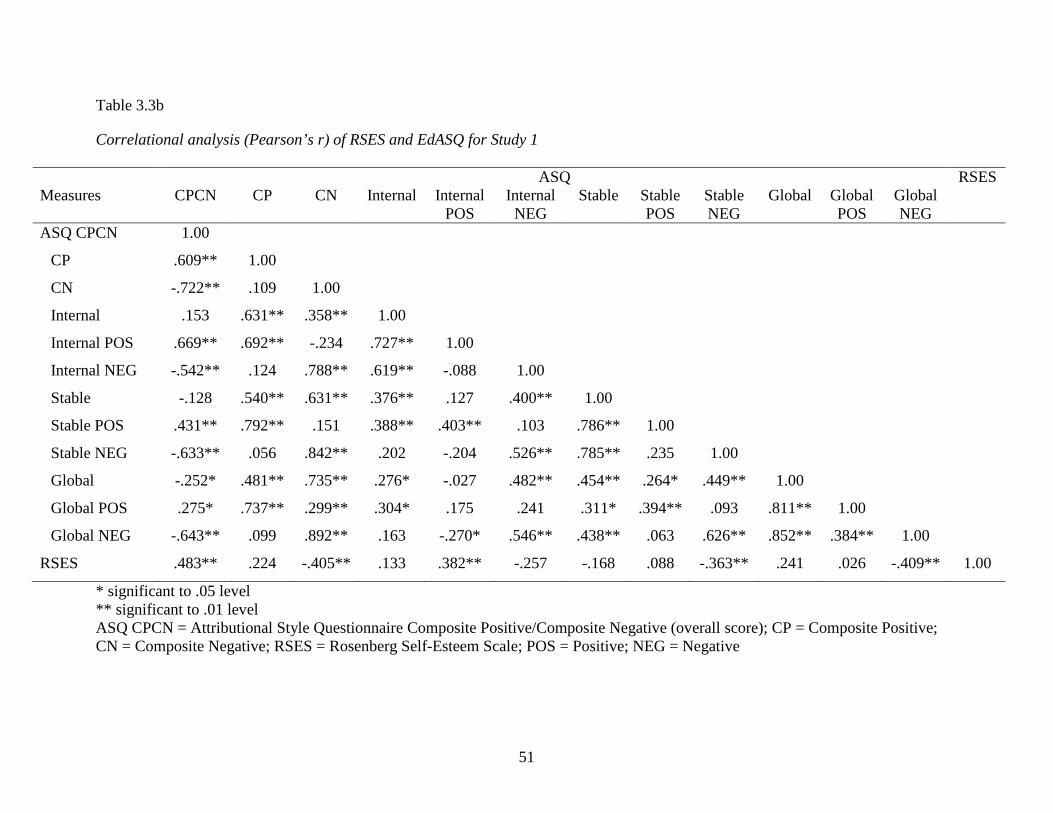
51
Table 3.3b
Correlational analysis (Pearson’s r) of RSES and EdASQ for Study 1
ASQ RSES Measures CPCN CP CN Internal Internal
POS Internal NEG
Stable Stable POS
Stable NEG
Global Global POS
Global NEG
ASQ CPCN 1.00
CP .609** 1.00
CN -.722** .109 1.00
Internal .153 .631** .358** 1.00
Internal POS .669** .692** -.234 .727** 1.00
Internal NEG -.542** .124 .788** .619** -.088 1.00
Stable -.128 .540** .631** .376** .127 .400** 1.00
Stable POS .431** .792** .151 .388** .403** .103 .786** 1.00
Stable NEG -.633** .056 .842** .202 -.204 .526** .785** .235 1.00
Global -.252* .481** .735** .276* -.027 .482** .454** .264* .449** 1.00
Global POS .275* .737** .299** .304* .175 .241 .311* .394** .093 .811** 1.00
Global NEG -.643** .099 .892** .163 -.270* .546** .438** .063 .626** .852** .384** 1.00
RSES .483** .224 -.405** .133 .382** -.257 -.168 .088 -.363** .241 .026 -.409** 1.00
* significant to .05 level ** significant to .01 level ASQ CPCN = Attributional Style Questionnaire Composite Positive/Composite Negative (overall score); CP = Composite Positive; CN = Composite Negative; RSES = Rosenberg Self-Esteem Scale; POS = Positive; NEG = Negative

55
Confirmatory factor analysis. To test the factor structure of the EdASQ, we tested six
models: (1) one composite score; (2) three overall factors – internal, stable, global; (3) two
overall factors – composite positive and composite negative; (4) two overall composite factors –
positive and negative – with three factors each – internal, stable, and global; (5) three factors for
positive events; and (6) three factors for negative events. We predict the last two models that
differentiate between positive and negative events while yielding the three theoretical
dimensions will have the best fit.
Using AMOS 17.0 (Arbuckle, 2009), we tested each of the models. The correlation table
used for testing these models is shown in Table 3.3a. The fit statistics for each model are shown
in Table 3.4. The model with the best fit to the data was Model 6, the composite negative model
with three factors. The composite positive three-factor model (Model 5) also yielded good model
fit. The sample size for this data may have contributed to the significant chi-square statistic for
this model, but the RMSEA and CFI fit statistics show good fit to the data. This finding for this
teacher sample replicates models tested by Higgins, Zumbo, and Hay (1999), confirming the
three-factor models for the positive items and negative items on ASQ-based instruments.

56
Table 3.4
Confirmatory factor analysis using structural equation modeling for Educator Attributional Style Questionnaire for Study 1
Model Factors χχχχ2 df Χ
2/df p RMSEA (90% CI)
CFI
1 1 Composite CPCN 1260.054 558 2.25 .000 .067 (.062, .072) .617
2 3 (Internal, Stable, Global) 985.769 555 1.77 .000 .053 (.047, .058) .765
3 2 Composites (1 POS; 1 NEG) 1189.472 557 2.13 .000 .064 (.059, .069) .655
4 2 Composites (1 POS; 1 NEG) with 3 each
(Internal, Stable, Global)
836.209 551 1.51 .000 .043 (.037, .049) .844
5 3 (Positive items only) 154.287 114 1.35 .007 .036 (.019, .049) .963
6 3 (Negative items only) 133.698 114 1.17 .100 .025 (.000, .041) .961
NOTE: CPCN = Composite Positive/Composite Negative; POS = Positive; NEG = Negative; RMSEA = Root Mean Square Error of Approximation; CI = Confidence Interval; CFI = Comparative Fit Index

57
Figure 3.2
Structural Equation Model for Educator Attributional Style Questionnaire Positive Item Sets
Figure 3.2: Structural model for the positive item sets from the Educator Attributional Style Questionnaire. The standardized coefficients for this model are for the best fitting model (Model 5 from Table 3.4).
Internal Positive
Stable Positive
Global Pos itive
.20edinternal12e6
.45.45edinternal10e5
.67.42
edinternal9e4
.65
.34edinternal6e3
.58
.28edinternal3e2
.53
.15edinternal1e1
.38
.37edstable12e12
.61.36
edstable10e11
.60.55
edstable9e10
.74.32
edstable6e9.57
.38edstable3e8 .61
.17edstable1e7
.41
.27edglobal12e18
.52.35edglobal10e17
.59.43
edglobal9e16
.66
.30edglobal6e15
.55
.31edglobal3e14 .56
.09edglobal1e13
.30
.45
.55
.39
.41
.44
.55
.41
.43
.54
.54
.33
.34
.43
.47
.37
.28
.21
.22
.31
.48
.69
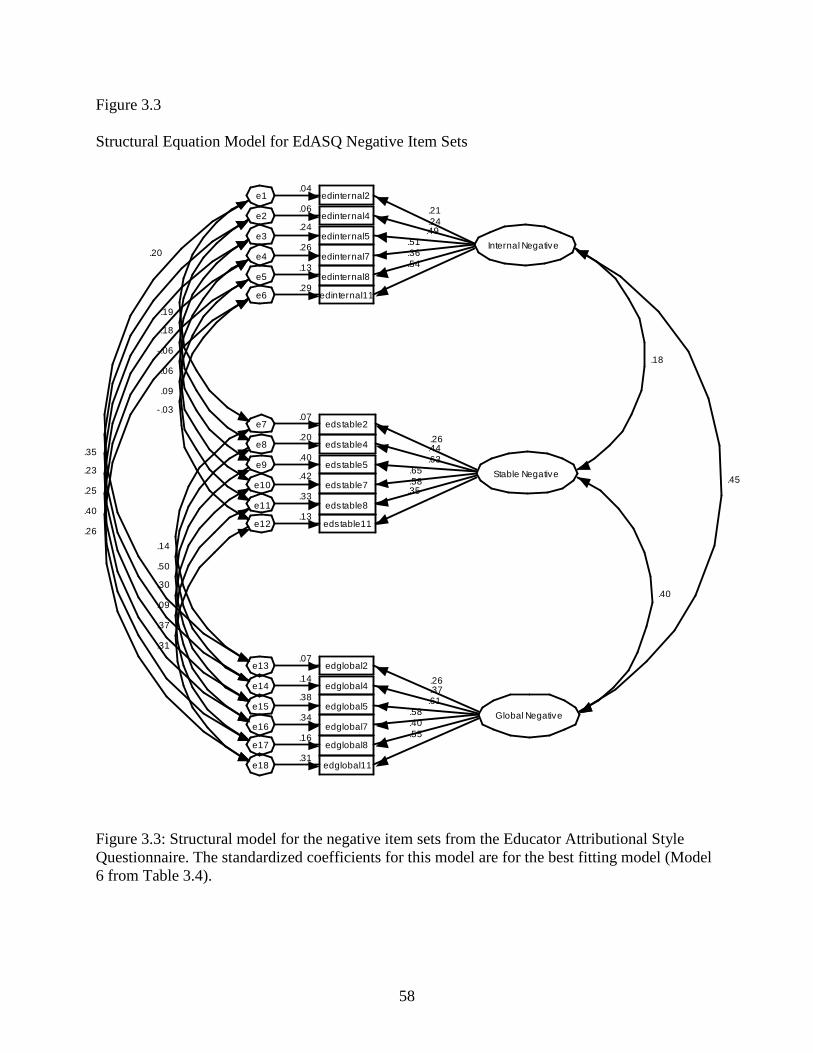
58
Figure 3.3
Structural Equation Model for EdASQ Negative Item Sets
Figure 3.3: Structural model for the negative item sets from the Educator Attributional Style Questionnaire. The standardized coefficients for this model are for the best fitting model (Model 6 from Table 3.4).
Internal Negative
Stable Negative
Global Negative
.29edinternal11e6
.54.13edinternal8e5
.36.26
edinternal7e4
.51
.24edinternal5e3
.49
.06edinternal4e2
.24
.04edinternal2e1
.21
.13edstable11e12
.35.33
edstable8e11
.58.42
edstable7e10
.65.40
edstable5e9.63
.20edstable4e8 .44
.07edstable2e7
.26
.31edglobal11e18
.55.16edglobal8e17
.40.34
edglobal7e16
.58
.38edglobal5e15
.61
.14edglobal4e14 .37
.07edglobal2e13
.26
.31
-.03
.26
.37
.09
.40
.09
.06
.25
.30
-.06
.23
.50
.18
.35
.14
.19
.20
.45
.18
.40

59
Discussion
Study 1 establishes the Educator Attributional Style Questionnaire (EdASQ) as an
internally reliable and valid measure of explanatory style. The EdASQ compares favorably with
the general ASQ in terms of internal reliability and external validity when compared with a
measure of self esteem. In addition, this study provides further validation for two measurement
models found within ASQ-based measures, one for positive items sets and one for negative item
sets (Higgins, Zumbo & Hay, 1999). Because the item sets within ASQ-based measures require
correlated error variances, measurement models that consider the positive and negative item sets
independent of each other are necessary. This research suggests that teachers in this sample may
posses independent explanatory styles for positive and negative events.
Study 2
In order to validate further the EdASQ, I cross-validated the results from Study 1 with a
sample of teachers from two other school districts. Study 1 focused on a mainly suburban school
district in the southeastern United States. Study 2 broadens the focus of Study 1 by using one
sample of teachers from a rural school district from the same southeastern state and another
sample of teachers from a mixed demographic district in the Midwest.
Method
Participants
Study 2 involved teachers from two public school districts, one a large city school district
comprised of rural, urban, and suburban populations from the Midwestern United States and the
other a mostly rural district from the southeastern United States. For Study 2, 298 teachers were
solicited for the survey, and 181 completed the set of measures, resulting in a 5.8% response rate

60
and a 60.7% completion rate. All teachers took the EdASQ and the RSES. These responses were
analyzed and compared to Study 1.
The demographic data for Study 2, shown in Table 3.5, parallels Study 1. The majority of
teachers in this sample were female. The number of elementary and secondary teachers was
almost the same. Again as in Study 1, the number of middle school teachers was less than the
other levels. Study 2 had more teachers who had 16+ years of teaching than Study 1, but the
other groups of teachers’ years of experience were similar to Study 1. Unlike Study 1, the
number of teachers with bachelor’s and master’s degrees was more even. Only three teachers
each had earned either an EdS or a doctorate. No teachers in Study 2 had earned National Board
Certification, and 87 would not pursue such certification if it were available. Many teachers in
this sample plan to pursue it within 2-5 years if it were available in their subject area.
Measures and Procedure
For Study 2, all participating teachers took the EdASQ and the RSES. These measures
are valid and reliable, easily administered and scored, pose no risk to the participants, and robust
across adult populations. Descriptions of these measures and their respective reliability history
are given in full in Study 1. For this study, the CP and CN scores are obtained by taking the
average of the items for positive and negative items. The composite scores for the EdASQ and
the ASQ were calculated by subtracting the composite positive score from the composite
negative score for each measure. Scores for these composites range from -7 to +7. Scores for the
subscales range from 0 to +7. Teachers in this study have a slightly optimistic explanatory style
as shown by the composite score, with a mean of 1.16 on the EdASQ. Scores for the RSES range
from 4 to 40, with higher scores signifying higher self-esteem.

61
Table 3.5
Descriptive statistics for Educator Attributional Style Questionnaire and Rosenberg Self-Esteem Scale for Study 2
Measures N Mean SD α EdASQ Composite 182 1.16 .949 .808
Composite Positive 5.01 .776 .876
Composite Negative 3.93 .653 .771
Internal 4.34 .639 .603
Internal Positive 4.72 .894 .747
Internal Negative 3.95 .879 .535
Stable 4.65 .656 .704
Stable Positive 5.35 .878 .786
Stable Negative 3.96 .838 .610
Global
4.56 .796 .734
Global Positive 5.23 .964 .756
Global Negative 3.88 1.03 .654
Rosenberg Self-Esteem 181 30.68 3.86 .889
Note. EdASQ = Educator Attributional Style Questionnaire
Results
Descriptive summative analysis for Study 2 is provided in Table 3.5. Teachers in this
study also demonstrated a slightly neutral explanatory style and healthy self esteem. The teachers
in this sample show similar results for the EdASQ and RSES as those in Study 1.
Reliability . Reliability analysis for all measures was conducted using Cronbach’s (1951)
alpha. The coefficients for all composite measures are shown in Table 3.5. For Study 2, the

62
reliability coefficients for the EdASQ were slightly higher for the composite score and each
subscale than for Study 1. Peterson and Villanova (1988) found internal reliability coefficients of
.66 for internality, .85 for stability, and .88 for globality for the ASQ. The only subscale yielding
a reliability coefficient lower than .60 was internal-negative. The main EdASQ subscales
(internal, stable, and global) have higher reliability coefficients than the ASQ subscales in Study
1, demonstrating that the domain-specific EdASQ is a more reliable measure of educator
explanatory style than the more general ASQ.
Validity . The correlations between the composite EdASQ and the RSES remained stable,
as shown in Table 3.6. The composite positive subscale achieved a higher correlation with the
RSES in Study 2 than was achieved by the ASQ in Study 1. The internal subscale remained
significantly correlated with the RSES in Study 2.
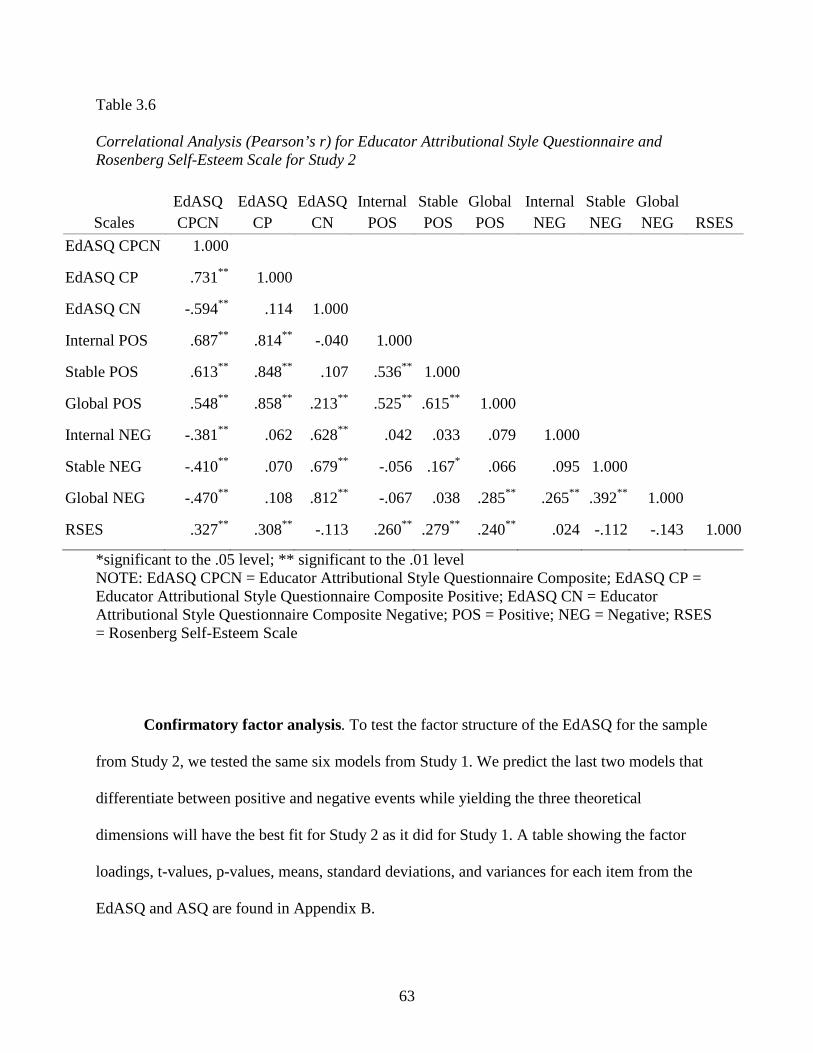
63
Table 3.6 Correlational Analysis (Pearson’s r) for Educator Attributional Style Questionnaire and Rosenberg Self-Esteem Scale for Study 2
Scales EdASQ CPCN
EdASQ CP
EdASQ CN
Internal POS
Stable POS
Global POS
Internal NEG
Stable NEG
Global NEG RSES
EdASQ CPCN 1.000
EdASQ CP .731** 1.000
EdASQ CN -.594** .114 1.000
Internal POS .687** .814** -.040 1.000
Stable POS .613** .848** .107 .536** 1.000
Global POS .548** .858** .213** .525** .615** 1.000
Internal NEG -.381** .062 .628** .042 .033 .079 1.000
Stable NEG -.410** .070 .679** -.056 .167* .066 .095 1.000
Global NEG -.470** .108 .812** -.067 .038 .285** .265** .392** 1.000
RSES .327** .308** -.113 .260** .279** .240** .024 -.112 -.143 1.000
*significant to the .05 level; ** significant to the .01 level NOTE: EdASQ CPCN = Educator Attributional Style Questionnaire Composite; EdASQ CP = Educator Attributional Style Questionnaire Composite Positive; EdASQ CN = Educator Attributional Style Questionnaire Composite Negative; POS = Positive; NEG = Negative; RSES = Rosenberg Self-Esteem Scale
Confirmatory factor analysis. To test the factor structure of the EdASQ for the sample
from Study 2, we tested the same six models from Study 1. We predict the last two models that
differentiate between positive and negative events while yielding the three theoretical
dimensions will have the best fit for Study 2 as it did for Study 1. A table showing the factor
loadings, t-values, p-values, means, standard deviations, and variances for each item from the
EdASQ and ASQ are found in Appendix B.

64
Using AMOS 17.0 (Arbuckle, 2009), we tested each of the models. The correlation table
used for testing these models is shown in Table 3.6. The fit statistics for each model are shown in
Table 3.7. The model with the best fit to the data for this study was Model 5, the composite
positive model with three factors. The composite negative three-factor model (Model 6) also
yielded good model fit. The sample size for this data may have contributed to the significant chi-
square statistics for these models, but the RMSEA and CFI fit statistics show good fit to the data.
This finding for this teacher sample replicates models tested by Higgins, Zumbo, and Hay (1999)
and models from Study 1, confirming the three-factor models for the positive items and negative
items on ASQ-based instruments.
Table 3.7 Confirmatory factor analysis using structural equation modeling for Educator Attributional Style Questionnaire for Study 2
Model Factors χχχχ2 df χ
2/df p RMSEA (90% CI)
CFI
Model 1 1 Composite 1493.062 558 2.67 .000 .075 (.070, .080) .603
Model 2 3 (Internal, Stable, Global) 1153.644 555 2.07 .000 .060 (.055, .065) .746
Model 3 2 Composites 1363.178 557 2.44 .000 .070 (.065, .074) .658
Model 4 2 Composites with 3 each (Internal, Stable, Global)
951.209 551 1.72 .000 .049 (.044, .055) .830
Model 5 3 (Positive items only) 176.702 114 1.55 .000 .043 (.030, .055) .958
Model 6 3 (Negative items only) 205.920 114 1.80 .000 .052 (.040, .063) .852
NOTE: RMSEA = Root Mean Square Error of Approximation; CI = Confidence Interval; CFI = Comparative Fit Index
65
Discussion
Study 2 further validates the findings from Study 1. The EdASQ is a reliable and valid
measure of explanatory style in two samples of teachers. In addition, the measurement models
for positive and negative item sets continue to show good fit to the data. This study demonstrates
that the EdASQ can be used with teacher populations to measure domain-specific explanatory
style, and researchers using ASQ-based measures should consider using independent
measurement models for positive and negative item sets. This approach will help researchers
understand how explanatory style affects outcome variables in more nuanced ways.
General Discussion
Both Study 1 and Study 2 indicate that the EdASQ is a reliable and valid measure of
explanatory style in teachers. The EdASQ has shown to have similar internal reliability to the
original ASQ and correlates in similar ways to self-esteem as the ASQ. In addition, the EdASQ
has a similar factor structure as the ASQ when the positive items are analyzed independently
from the negative items. These studies confirm that measures based on the original 12-situation
ASQ should be analyzed using positive items and negative items separately rather than together.
In addition, error variances for the internal, stable, and global items for each situation should be
correlated to provide the best fit for the data. These studies help support the idea that explanatory
style is context dependent in two ways. First, internal, stable, and global explanations for positive
and negative events are interdependent on each other within each situation. Second, explanatory
style for teaching specific situations differs from general explanatory style.
These studies are limited in that the results may be indicative of teacher samples rather
than a general trend. The teacher samples were relatively small for these studies when compared
to the population of teachers in the respective districts, so the results may be influenced by the

66
type of teacher who would persist in completing the survey. The ASQ and its sister measures do
tend to be quite lengthy. The greatest attrition for these administrations of the measures occurred
as teachers were filling out the ASQ and/or EdASQ. Over half of the teachers who began the
survey quit as they were taking the ASQ and/or EdASQ. Once these measures were completed,
only 1 teacher per administration quit taking the rest of the measures included in the survey. This
suggests that ASQ-based measures of explanatory style may need further tweaking to reduce
apparent survey fatigue.
This data helps establish a baseline for explanatory style in teachers that will be useful for
future research into teacher attributions about school. Teachers in this sample tend to be neutral
in their explanatory styles, showing neither a strong optimistic or pessimistic tendency.
However, the scores on the positive items did tend to be higher than the scores on the negative
items, indicating that optimistic explanatory style is more prevalent in teachers. Future research
could explore whether a teacher’s explanatory style has any influence on student explanatory
style, which has been linked to academic achievement (see Reivich, 1995, for a review). Future
research could also examine whether teacher explanatory style is related to teacher burnout. If
explanatory style is related to reduced burnout, programs to cultivate a particular explanatory
style in teachers could be developed for preservice and currently serving teachers.
67
References
Abramson, L.Y., Seligman, M.E.P., & Teasdale, J.D. (1978). Learned helplessness in humans:
Critique and reformulation. Journal of Abnormal Psychology, 87(1), 49-74. Arbuckle, J. L. (2009). Amos (Version 17.0) [Computer Program]. Chicago: SPSS. Arntz, A., Gerlsma, C., & Albersnagel, F. (1985). Attributional style questioned: Psychometric
evaluation of the ASQ in Dutch adolescents. Advances in Behaviour Research & Therapy, 7(1-2), 55-89.
Asner-Self, K., & Schreiber, J. (2004). A factor analytic study of the Attributional Style Questionnaire with central American immigrants. Measurement and Evaluation in Counseling and Development, 37(3), 144-153.
Beck, A.T. (1967). Depression: Clinical, experimental, and theoretical aspects. New York: Hoeber.
Cheng, H, & Furnham, A. (2003). Attributional study and self-esteem as predictors of psychological well being. Counselling Psychology Quarterly, 16(2), 121-130.
Corr, P.J., & Gray, J.A. (1996). Attributional style as a personality factor in insurance sales performance in the UK. Journal of Occupational and Organizational Psychology, 69, 83-87.
Cronbach, L.J. (1951). Coefficient alpha and the internal structure of tests. Psychometrika, 16, 297-334.
Cutrona, C., Russell, D., & Jones, R. (1984). Cross-situational consistency in causal attributions: Does attributional style exist?. Journal of Personality and Social Psychology, 47(5), 1043-1058.
Fazio, N.M., & Palm, L.J. (1998). Attributional style, depression, and grade point averages of college students. Psychological Reports, 83(1), 159-162.
Furnham, A., Sadka, V., & Brewin, C. (1992). The development of an occupational attributional style questionnaire. Journal of Organizational Behavior, 13(1), 27-39.
Hall, H., & Smith, B. (1999). Explanatory style of secondary vocational educators. Journal of Vocational and Technical Education, 15(2), 19-27.
Hanrahan, S., & Grove, J. (1990). Further examination of the psychometric properties of the sport attributional style scale. Journal of Sport Behavior, 13(4), 183.
Hewitt, A., Foxcroft, D., & MacDonald, J. (2004). Multitrait-multimethod confirmatory factor analysis of the Attributional Style Questionnaire. Personality and Individual Differences, 37(7), 1483-1491.
Higgins, N., Zumbo, B., & Hay, J. (1999). Construct validity of attributional style: Modeling context-dependent item sets in the Attributional Style Questionnaire. Educational and Psychological Measurement, 59(5), 804-820.
Hilsman, R., & Garber, J. (1995). A test of the cognitive diathesis-stress model of depression in children: Academic stressors, attributional style, perceived competence, and control. Journal of Personality & Social Psychology, 69(2), 18p.

68
Kovacs, M, & Beck, A.T. (1977). An empirical-clinical approach toward a definition of childhood depression. In J.G. Schulterbrandt & A. Raskin (Eds.), Depression in childhood: Diagnosis, treatment, and conceptual models (pp. 1-25). New York: Raven Press.
Lieber, E. (1997, May). The Teenage Attributional Style Questionnaire. Dissertation Abstracts International, 57, Retrieved from PsycINFO database.
Nolen-Hoeksema, S., Girgus, J.S., & Seligman, M.E.P. (1986). Learned helplessness in children: A longitudinal study of depression, achievement, and explanatory style. Journal of Personality & Social Psychology, 51(2), 13p.
Peterson, C., & Barrett, L.C. (1987). Explanatory style and academic performance among university freshmen. Journal of Personality and Social Psychology, 53(3), 603-607.
Peterson, C., Semmel, A., von Baeyer, C., Abramson, L.Y., Metalsky, G.I., & Seligman, M.E.P. (1982). The attributional style questionnaire. Cognitive Therapy and Research, 6, 287-300.
Peterson, C., & Vaidya, R.S. (2001). Explanatory style, expectations, and depressive symptoms. Personality and Individual Differences, 31(7), 1217-1223.
Peterson, C., & Villanova, P. (1988). An expanded attributional style questionnaire. Journal of Abnormal Psychology, 97, 87-89.
Proudfoot, J.G., Corr, P.J., Guest, D.E., & Gray, J.A. (2001). The development and evaluation of a scale ot measure occupational attributional style in the financial services sector. Personality and Individual Differences, 30(2), 259-270.
Reivich, K. (1995). The measurement of explanatory style. Explanatory style (pp. 21-47). Hillsdale, NJ England: Lawrence Erlbaum Associates, Inc.
Ritchie, W.F. (2000). An exploration of college student explanatory style and its relationship to academic performance. Dissertation Abstracts International: Section A: Humanities & Social Sciences, 60(7-A), 2375.
Rosenberg, M. (1965). Society and the adolescent self-image. Princeton, NJ: Princeton University Press.
Seligman, M. E. P. (1998). Learned optimism: How to change your mind and your life (2nd ed.). New York: Pocket Books.
Seligman, M., Nolen-Hoeksema, S., Thorton, N., & Thornton, K. (1990). Explanatory style as a mechanism of disappointing athletic performance. Psychological Science, 1(2), 143-146.
Seligman, M.E.P., Peterson, C., Kaslow, N.J., Tanenbaum, R.L., Alloy, L.B., & Abramson, L.Y. (1984). Explanatory style and depressive symptoms among school children. Journal of Abnormal Psychology, 93, 235-238.
Seligman, M. E. P., Reivich, K., Jaycox, L., & Gillham, J. (1995). The optimistic child: A proven program to safeguard children against depression and build lifelong resilience. New York: Harper Perennial.
Seligman, M.E.P., & Schulman, P. (1986). Explanatory style as a predictor of productivity and quitting among life insurance sales agents. Journal of Personality & Social Psychology, 50(4), 832-838.
Smith, B. P., Hall, H. C., & Woolcock-Henry, C. (2000) The effects of gender and years of teaching experience on explanatory style of secondary vocational teachers. Journal of Vocational Education Research, 25(1), 21-33.

69
Sullivan, M.J., Tripp, D.A., Catano, V. (1997). The contributions of attributional style, expectancies, depression and self-esteem in a cognition-based depression model. Canadian Journal of Behavioural Science, need vol number & page numbers.
Tiggeman, M., & Crowley, J.R. (1993). Attributions for academic failure and subsequent performance. Australian Journal of Psychology, 45(1), 35-39.
Yates, S.M., & Yates, G.C.R. (1995). Explanatory style, ego-orientation, and primary school mathematics achievement. Educational Psychology, 15(1), 12p.

70
CHAPTER 4
Examining the Relationship Between Explanatory Style and Efficacy: A Model for Teacher Burnout
Teaching is a challenging profession. The challenge of teaching lies not only in the poor
state of school funding or the lack of administrative support. Rather, teaching challenges even
the strongest of spirit with its roller coaster of successes and failures ridden every day. Each day
brings its own highs and lows. A teacher can see the spark of understanding in one student’s eye
only to turn around and see another student sleeping soundly. She may receive an email praising
her dedication for helping a struggling student one minute and face a hostile parent complaining
she is not giving enough the next. A teacher may be told to pay for her own professional
development opportunities only to find out that the athletic teams all got brand new shoes. A
lesson may work seamlessly with one class and bomb miserably with the next. Those teachers
that can ride these waves without getting sick or feeling dizzy will be more likely to keep riding
the roller coaster of teaching for many years.
If a teacher can ride the coaster, she may stay in the field longer. School administrators
often find it difficult to keep good teachers in the classroom. Teacher attrition is a continual
problem for schools across the United States (see Zumwalt & Craig, 2005; Leukens, Lyter, &
Fox, 2004; Whitener & Gruber, 1997), and much thought and effort has been invested in
exploring cultural, social, and professional explanations for teacher attrition. Teacher attrition
research has examined why teachers leave the field (see Baker & Smith, 1997; Boe, Bobbitt,
Cook, Barkanic, & Maislin, 1998) and how teacher credentials (see Andrew & Schwab, 1995),
school environment and resource access (Baker & Smith, 1997; Boe, Bobbit, Cook, Barkanic, &
71
Maislin, 1998; Ingersoll, 1999) can lead to higher rates of attrition. None of this research,
though, examines how teachers think about teaching and whether their thinking contributes to
attrition. Research has not examined how teachers’ thinking may affect how well they are able to
ride the high and low waves that teaching brings. This research examines teachers’ explanations
of their successes and failures and beliefs about their teaching effectiveness, and tests whether
these explanations and beliefs account for their ability to weather the storms of teaching by
creating a buffer against feeling burned out with teaching.
Specifically, this research examines the relationship between explanatory style—the way
in which people explain good and bad events (Seligman, 1998) and teachers’ sense of efficacy—
beliefs teachers hold about whether they are capable as a teacher (Tschannen-Moran & Woolfolk
Hoy, 2001) to explain teacher burnout. In order to persevere in the face of failure, explanatory
style and efficacy each matter, but it is unclear how these two factors are related. Although each
concept overlaps conceptually, they stem from different areas of psychology. Teacher efficacy
has been extensively examined in academic settings, whereas explanatory style has its roots as a
clinical explanation for depression. People with high efficacy believe themselves capable of
overcoming obstacles (Bandura, 1994). People with less pessimistic explanatory styles view
obstacles as challenges to be overcome (Seligman, 1998). Yet, it is unclear whether one needs
efficacy in order to have less pessimistic explanatory style or whether a less pessimistic
explanatory style helps one build efficacy. Bandura (1994) suggests that efficacy contributes to
the development of certain types of causal attributions. Yet, Pajares (2002) acknowledges that
outcomes interpreted as successful raise efficacy while those interpreted as failure lower it. In
essence, this research attempts to present a teaching-specific model for explanatory style and
efficacy that clarifies the relationship between these two concepts in predicting burnout.

72
This research is important because it can inform practice and elaborate on the theoretical
relationship between efficacy thoughts about ability and attributions about success and failure.
While successful interventions exist that promote optimistic explanatory style, few successful
interventions exist that promote high sense of efficacy in teachers. Understanding how
explanatory style and efficacy relate may shed light on how to develop interventions that
promote optimistic explanatory style and high efficacy. Teachers with both may end up being
more resilient when teaching become challenging. From a practice standpoint, if teachers’
explanations of good and bad events help them build efficacy as teachers, then teacher training
and development programs can be used to help teachers have more resilient ways of explaining
success and failure by building from established interventions (Seligman, Reivich, Jaycox, &
Gillham, 1995). From a theoretical standpoint, this research helps to clarify whether efficacy
leads to optimistic explanations or whether explanations of events lead to increases or decreases
in efficacy.
This research addresses two questions:
• What is the relationship between explanatory style and teachers’ sense of efficacy in
predicting burnout?
• How are optimists and pessimists, who have different explanatory styles, different in
regards to teachers’ sense of efficacy and burnout?
To understand how explanatory style and efficacy relate to each other and to attrition, I
discuss teacher efficacy and explanatory style; the ways in which teacher efficacy and
explanatory style overlap conceptually; and how previous efficacy research point to models for
how these two concepts work together to predict attrition.
73
Burnout
Burnout has generally been studied as a phenomenon found in human service
professions, like teaching. The most widely researched definition of burnout was developed by
Maslach (1982), which defines burnout as including feelings of exhaustion, depersonalization,
and lack of personal accomplishment. Using the Maslach definition for teaching, burnout has
been linked to environmental factors such as lack of support from families, society, the
government, and administration, in addition to personal factors such as low efficacy, internal
attributions for failure, and neuroticism (Luk, Chan, Cheong, & Ko, 2010). Other researchers
suggest the burnout encompasses two overall components – exhaustion and disengagement –
which more appropriately reflect a job-demands/job-resources model (Demerouti, Bakker,
Nachreiner, & Schaufeli, 2001). This alternative definition of burnout addresses criticism of the
original Maslach (1982) conceptualization by measuring burnout using only negatively worded
items and disregarding the weakly correlated personal accomplishment component (Demerouti,
Bakker, Nachreiner, & Schaufeli, 2001). Regardless of the definition, burnout is a likely result
when teachers feel exhausted, depersonalized, disengaged, and out of options for changing
teaching and learning outcomes (Skaalvik & Skaalvik, 2009).
Teachers’ Sense of Efficacy
Efficacy deals with the beliefs people have about their own capabilities. Bandura (1986)
defines self-efficacy as the belief about how well one can organize and carry out actions required
for a goal. Bandura’s social cognitive theory suggests that people maintain two types of
expectations in any given situation. Efficacy expectations are future-oriented and relate the
confidence felt about one’s “capabilities to organize and execute the courses of action required to
produce given attainments” (Bandura, 1997, p. 3). Efficacy expectations affect the thoughts and

74
emotions needed to make people take the steps necessary to expend effort toward a goal.
Outcome expectations refer to the likelihood that a particular consequence will occur in a given
situation given one’s level of ability (Bandura, 1986). Bandura believed that while outcome
expectations would provide the incentive or disincentive to work toward a goal, these
expectations do little to influence efficacy. Bandura (1994) suggested four main ways that
efficacy is fostered: mastery experiences, vicarious experiences, social persuasion, and emotional
and physical reactions. Most researchers agree with Bandura that mastery experiences provide
the most successful way to build efficacy in that success breeds success while failure breeds
failure.
A teachers’ sense of efficacy, a domain-specific conceptualization of efficacy, has been
linked to numerous positive outcomes and predicts teacher practices and student achievement
(Graham, Harris, Fink, & MacArthur, 2001; Tschannen-Moran & Woolfolk Hoy, 2001).
Teachers’ sense of efficacy seems to be a powerful force in determining teacher behavior and
student success, and have led some to claim that teachers’ sense of efficacy was the most
promising construct to emerge from teacher research (Ashton, 1984). However, others have
argued that despite years of research into the construct, it holds little practical significance for
teachers or administrators seeking ways to improve student performance since developing
teachers’ sense of efficacy relies heavily on the experience of mastery (Wheatley, 2005), which
may be difficult to experience easily.
Teachers’ sense of efficacy has been measured differently by researchers who
conceptualize it according to different theoretical perspectives (Skaalvik & Skaalvik, 2007).
Because of competing conceptual ideas about teacher efficacy, claims of its value to educators
and students are suspect at best (Denzine, Cooney, & McKenzie, 2005). Researchers often do not

75
examine the sources of efficacy beliefs to determine how powerful they are in predicting efficacy
or outcome behaviors. Examining how explanatory style relates to teachers’ sense of efficacy
may shed light on how efficacy develops within the mastery experience. Explanatory style may
be a vehicle teachers can use to build efficacy while they are working toward mastery, providing
resilience in the face of difficult circumstances. Current teacher efficacy scales alone are not
enough to obtain precise and valid information about teacher efficacy beliefs since those
measures do not account for locus of control, which is an aspect of explanatory style (Denzine,
Cooney, & McKenzie, 2005). Wheatley (2005) suggests that research on teachers’ sense of
efficacy should focus on teachers’ interpretations of teaching experiences instead of on just their
beliefs and goals about student learning. This research builds on Denzine et al. and Wheatley’s
suggestions by investigating how teachers’ explanatory style, or causal attributions, of school-
related events relate to teachers’ sense of efficacy.
Developing Teachers’ Sense of Efficacy
Bandura believes that mastery experiences are the most powerful factor in developing
teachers’ sense of efficacy; that is, if teachers experience success, then efficacy increases
(Woolfolk-Hoy & Spero, 2005). Further, the more authentic and hard-fought the successful
experience, the more likely that efficacy will be increased. These types of successful mastery
experiences are important for developing teachers’ sense of efficacy. However, teachers in
difficult school environments might not have enough authentic successful experiences to
promote meaningful gains in efficacy. Teachers may be able to imagine what mastery looks like,
but without authentic mastery experiences, may never reach a healthy level of efficacy sufficient
to get them through a challenging school year without developing a feeling of burnout.

76
If the explanations teachers give for both positive and negative classroom experiences
were important to developing efficacy, teacher training and professional development programs
could focus on developing optimistic explanations of both success and failure to cultivate
efficacy and, by extension, teacher behaviors that affect attrition. Teachers would not have to
wait on an authentic mastery experience to gain efficacy. They could explain each experience in
the classroom, good or bad, and use those explanations to build efficacy. This type of efficacy-
building program would be more efficient by using experiences from each day rather than
waiting through to the end of a mastery experience to build efficacy.
Explanatory Style
A prominent research thread in positive psychology involves explanatory style, which has
its roots in Martin E.P. Seligman’s studies of learned helplessness (Seligman & Maier, 1967). As
this research evolved, patterns of explanatory style became evident in humans based on the
learned helplessness model of depression, which proposes that people will attribute their
helplessness in the face of uncontrollable circumstances to a particular cause (Abramson,
Seligman & Teasdale, 1978). People then determine whether the cause will have a chronic,
broad, and detrimental impact to future self-esteem and agency. The explanatory style patterns of
people in studies of learned helplessness fall along three dimensions – global/specific (projection
of cause across different situations), stable/temporary (projection of cause across time), and
internal/external (projection of cause to internal traits versus external factors) (see Table 4.1;
Seligman, 1998).
Researchers eventually categorized optimists and pessimists as having diametrically
opposed explanatory styles of good and bad events (Peterson & Vaidya, 2001; Seligman, 1998).
Pessimistic explanatory style impacts the incidence of depression, and by extension, lower
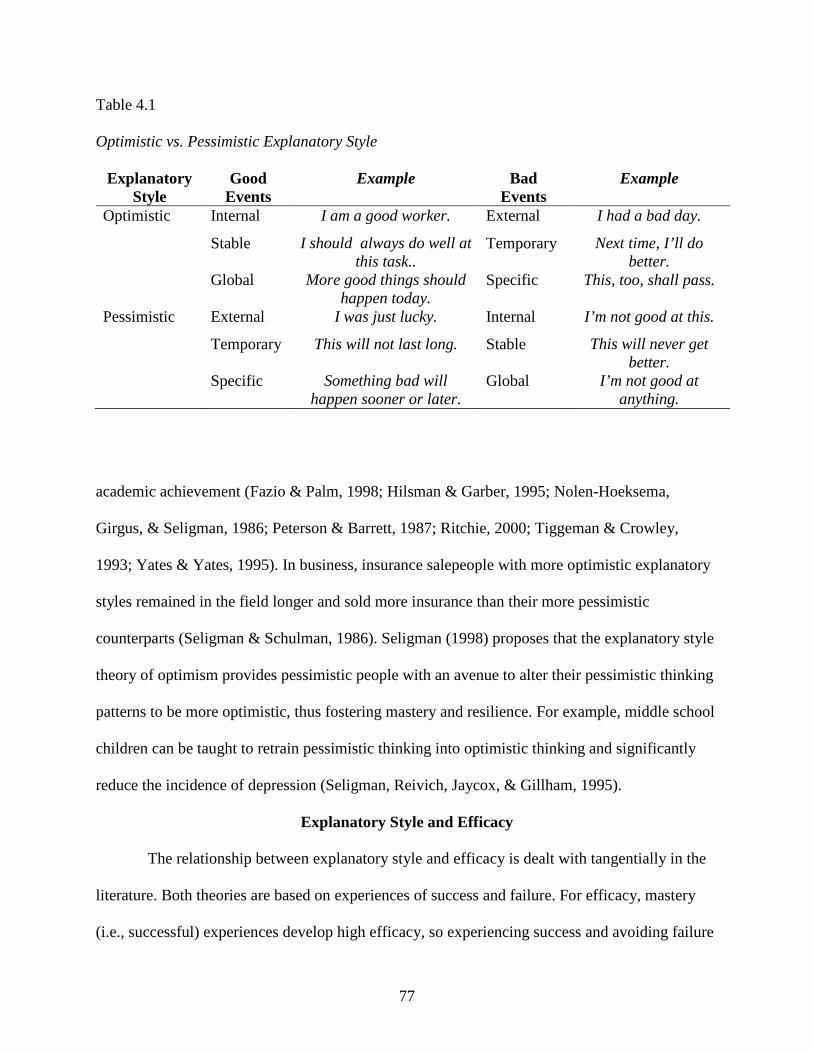
77
Table 4.1
Optimistic vs. Pessimistic Explanatory Style
Explanatory Style
Good Events
Example Bad Events
Example
Optimistic Internal I am a good worker. External I had a bad day.
Stable I should always do well at this task..
Temporary Next time, I’ll do better.
Global More good things should happen today.
Specific This, too, shall pass.
Pessimistic External I was just lucky. Internal I’m not good at this.
Temporary This will not last long. Stable This will never get better.
Specific Something bad will happen sooner or later.
Global I’m not good at anything.
academic achievement (Fazio & Palm, 1998; Hilsman & Garber, 1995; Nolen-Hoeksema,
Girgus, & Seligman, 1986; Peterson & Barrett, 1987; Ritchie, 2000; Tiggeman & Crowley,
1993; Yates & Yates, 1995). In business, insurance salepeople with more optimistic explanatory
styles remained in the field longer and sold more insurance than their more pessimistic
counterparts (Seligman & Schulman, 1986). Seligman (1998) proposes that the explanatory style
theory of optimism provides pessimistic people with an avenue to alter their pessimistic thinking
patterns to be more optimistic, thus fostering mastery and resilience. For example, middle school
children can be taught to retrain pessimistic thinking into optimistic thinking and significantly
reduce the incidence of depression (Seligman, Reivich, Jaycox, & Gillham, 1995).
Explanatory Style and Efficacy
The relationship between explanatory style and efficacy is dealt with tangentially in the
literature. Both theories are based on experiences of success and failure. For efficacy, mastery
(i.e., successful) experiences develop high efficacy, so experiencing success and avoiding failure
78
are keys to having a healthy sense of efficacy. For explanatory style, how people interpret
successes and failures defines their type of explanatory style (optimist or pessimist), and
interventions exist that help pessimists become more optimistic. Thus, while efficacy is a good
predictor of many positive teaching outcomes, one must first experience success to achieve more
success later. This is problematic in high-failure situations like teaching and sales. If optimistic
explanatory style helps develop high self-efficacy, then considering explanatory style and self-
efficacy in high-failure situations may create opportunities for interventions that go beyond
mastery experiences.
Hard-Fought Mastery Experiences: Explaining Setbacks to Gain Efficacy
The problem is that research has not examined whether efficacy precedes causal
explanations of mastery experiences or vice versa. Bandura (1994) argues that efficacy precedes
causal explanations and proposes that causal attributions are affected by efficacy beliefs. He
theorizes that those with high efficacy attribute failure to low effort while those with low
efficacy attribute failure to low ability (Figure 4.1).
Even though Bandura states that mastery experiences are one of the best ways to develop
efficacy, he acknowledges that not all mastery experiences are created equal. Easy successes are
not as valuable as those that are won via perseverance through setbacks and adversity. Bandura
does not explain, however, how those with little or no efficacy at the outset get through setbacks.
If experiencing success breeds efficacy, then only in the end after success is gained would
experiences fraught with setbacks and adversity contribute to a higher sense of efficacy.
Bandura’s theory does not explain how one works through the setbacks and adversity except to
say that if one has higher efficacy, perseverance is more likely. If people do not have high
efficacy in the first place, it is unclear how they would get through to the end of a hard-fought

79
Figure 4.1
The Relationship Between Efficacy and Causal Attributions (Based on Bandura, 1994)
Figure 1: According to Bandura’s (1994) theory, efficacy determines how people explain events they experience.
mastery experience without it. It would seem, then, that a variable between setbacks and success
exists that would be important to determining whether efficacy is developed through hard-fought
mastery experiences. Yet, Bandura is clear that this variable is not causal attributions, since
efficacy precedes causal attributions, not the other way around.
The types of causal explanations teachers make about success and failure may provide
the perseverance they need to weather difficult teaching situations. If so, explanations of success
and failure may contribute to an increased sense of efficacy. An optimistic teacher would view
successful teaching as internal, global and stable but would view unsuccessful teaching as
external, isolated, and unstable. Thus, not only would successful experiences lead to increased
efficacy, but experiences of failure could also develop high efficacy. These types of explanations
about the causes of events, both successful and unsuccessful, could lead to the teacher having a
higher sense of efficacy, which could, in turn, lead to more resiliency and less burnout.
Purpose
Experience of Failure
Low Sense of Efficacy
High Sense of Efficacy
Attribution of Low Ability
Attribution of Low Effort
Experience of Failure
80
The purpose of this study is to develop a structural model to demonstrate the relationship
between explanatory style and a teacher’s sense of efficacy and how that relationship predicts
burnout. Educator explanatory style should predict teacher efficacy which, in turn, should predict
burnout. This model suggests that educator explanatory style mediates teacher efficacy,
providing a more nuanced portrait of how teachers develop efficacy. If this model is accurate,
then the relationship between explanatory style and teacher efficacy will provide insight into
practical strategies educators and administrators can take to improve teacher explanatory style
and, thus, teacher efficacy.
METHOD
Participants
K-12 teachers from three United States school districts: one rural district in the Southeast,
one mixed socioeconomic district in the Midwest, and one suburban district in the Southeast
participated in this study. Approximately 5500 teachers were asked to participate. Their
participation was voluntary, and teachers received printable documentation upon completion of
the survey for one hour of professional development credit as an incentive for participation. Of
the 5500 possible respondents, 577 began the survey, and 350 completed the entire battery,
resulting in a 6% response rate and a 60.6% completion rate among those who began the surveys.
Demographic data for this study is found in Table 4.2. The participants were mostly
female. More high school teachers responded than elementary teachers and middle school
teachers. A little over 30% of teachers had been teaching 16 years or more, with the fewest
number of teachers responding who had been teaching 8-10 years. The number of years the
participating teachers had been teaching was roughly equivalent. A slight majority of teachers

81
held a master’s degree, followed by a large group of teachers who held a bachelor’s degree. A
very small number of teachers held either an EdS (Education Specialist) degree or a doctorate.
Table 4.2
Demographics of Participants (N = 350)
Demographic n % of Total
Male 59 16.8
Female 280 80.0
Teaching Level
Elementary (K-5) 74 21.1
Middle School (6-8) 63 18.0
High School (9-12) 124 35.4
Years of Teaching Experience
1-3 years 54 15.4
4-7 years 60 17.1
8-10 years 36 10.2
11-15 years 54 15.4
16+ years 106 30.2
Highest Degree Earned
BA/BS 112 32.0
MA/MS 177 50.5
EdS 14 4.0
Doctorate (PhD/EdD) 7 2.0

82
Measures
The models for this research are built on the theoretical assumption that both explanatory
style and efficacy are best measured using context-specific items rather than with broad, general
ones (Shaughnessy, 2004). For this study, the Educator Attributional Style Questionnaire
(EdASQ; see Chapter 3) was administered along with the Teacher’s Sense of Efficacy Scale-
Long Form (TSES-LF; Tschannen-Moran & Woolfolk-Hoy, 2001) and the Oldenburg Burnout
Inventory (OLBI; Demerouti, Bakker, Vardakou, & Kantas, 2003). Teachers were also asked to
provide the estimated number of professional development hours they planned to participate in
during the upcoming school year. These measures are valid and reliable, easily administered and
scored, pose no risk to the participants, and are robust across adult populations.
Educator Attributional Style Questionnaire (EdASQ; see Chapter 3). The EdASQ is
modeled after the original ASQ, presenting 24 teaching-specific situations, 12 good and 12 bad.
Teachers provide a short written explanation of the cause of the event, and then rate their stated
cause on a 7-point Likert-scale for the 3 dimensions of explanatory style: global/specific,
permanent/temporary, and internal/external. The EdASQ was developed by modifying the items
to reflect teaching-specific situations. EdASQ Subscale scores were calculated for internality,
stability, and globality and for each of the three measures separately for positive and negative
events, by adding the appropriate responses together and finding the average. Composite positive
and negative scores were calculated by averaging the internal, stable, and global items for
positive and negative events respectively. The overall composite scores for the EdASQ were
calculated by subtracting the composite positive score from the composite negative score for
each measure. Scores for these composites range from -7 to +7. Scores for the subscales range
from 0 to +7. To determine which teachers were optimists and which were pessimists, teachers
83
were divided into three groups based on overall composite scores. Teachers in the upper third
were labeled “optimistic.” Teachers in the middle third were labeled “neutral,” and teachers in
the bottom third were labeled “pessimistic.”
Reliability analysis shows that the EdASQ has good internal reliability using Cronbach’s
(1951) alpha coefficients. Cronbach’s alpha coefficients are all acceptable for internality,
stability, and globality. The EdASQ composite score is also significantly correlated with self
esteem as measured by the Rosenberg Self-Esteem Scale (RSES; Rosenberg, 1965).
Teachers’ Sense of Efficacy Scale – Long Form (TSES-LF; Tschannen-Moran &
Woolfolk-Hoy, 2001). The Teachers’ Sense of Efficacy Scale – Long Form contains 24 items
with a 9-point Likert-type scale. The 24 items factor into three categories: student engagement,
instructional practices, and classroom management. Student engagement taps into a teacher’s
sense of efficacy to engage students in learning (e.g., How much can you do to get through the
most difficult students? How much can you do to improve the understanding of a student who is
failing?). Instructional strategies taps into a teacher’s sense of efficacy about using different
instructional strategies (e.g., To what extent do you craft good questions for your students? How
much can you adjust your lessons to the proper level for individual students?). Classroom
management explores the teacher’s sense of efficacy regarding classroom management (e.g., To
what extent can you make your expectations clear about student behavior? How much can you
do to get children to follow classroom rules?). Scores for each subscale range from 8 to 72, with
higher scores signifying higher efficacy in each subscale.
The internal reliability score for the TSES-Long Form is α = .94. Subscale reliability
scores are α = .87 for engagement; α = .91 for instruction; and α = .90 for management. The
TSES-Long Form was chosen over the TSES-Short Form because it is more desirable to use with
84
teachers who currently teach as opposed to preservice teachers (Tschannon-Moran & Woolfolk-
Hoy, 2001).
Oldenburg Burnout Inventory (OLBI; Demerouti, Bakker, Vardakou, & Kan tas,
2003). The Oldenburg Burnout Inventory measures two components of burnout – exhaustion and
disengagement. The 14-item scale combines both positively and negatively worded items which
participants rank on a four-point Likert scale (1 = Strongly Agree; 4 = Strongly Disagree).
Positive items are reversed and then all items for each subscale are added together. The resulting
scores are inversely proportional to the concepts they measure, meaning the higher the score, the
lower disengagement or exhaustion. Scores for each subscale (exhaustion and disengagement)
range from 7 to 28, with higher scores signifying more exhaustion and disengagement,
respectively.
The OLBI has good internal reliability, with Cronbach’s alpha scores of .74 for
exhaustion and .76 for disengagement (Demerouti, Bakker, Vardakou, & Kantas, 2003). The
OLBI has been demonstrated as a good alternative to the more popularly used Maslach Burnout
Inventory-General Scale (MBI-GS; Maslach, Jackson, & Leiter, 1996). Criticisms of the MBI-
GS include the exclusion of positively worded items on the exhaustion and disengagement
factors and exclusivity of positively worded items on the personal accomplishment factor. The
personal accomplishment factor of the MBI-GS is also criticized for not being as consistent with
job-related outcomes such as job satisfaction and organizational commitment (Lee & Ashforth,
1996). In addition, the MBI-GS is only available for research at a significant cost whereas the
OLBI is freely available for research purposes. Thus, due to the OLBI offering positively and
negatively worded items, a more robust two-factor model, and cost efficiency, the OLBI was
used for this study.

85
Professional Development Hours. The number of professional development hours
teachers believe they will complete in the current academic year is a second measure of
engagement in teaching. Typically, professional development hours are calculated by the number
of clock hours the experience takes. For instance, a one-hour session at a conference is calculated
as one hour while a college course is calculated by multiplying the course credits by the weeks in
the semester (i.e., three credit hours times 14 weeks). Teachers were asked to provide the number
of hours they anticipate completing during the current academic year. The average number of
hours teachers provided was 49.93, with the range spanning from zero to 540. Teachers must
complete a certain number of professional development hours in a year to maintain their
certification. While most school districts provide enough hours for teachers to earn at least the
minimum number of hours required, teachers can participate voluntarily in conferences and
workshops or take college courses to earn additional hours. Teachers who attend more than the
required number of professional development hours are seen as more engaged in teaching.
Procedure
The survey was administered using an online commercial platform, and teachers were
recruited via email correspondence through their respective districts. Teachers received one hour
of professional development credit for their participation.
Analysis
Since the theoretical framework for how these concepts relate is unclear, developing the
structural equation models for this research involved testing several combinations of variables.
The goal of this research is to show how explanatory style and efficacy predict burnout, so the
two subscales from the OLBI and the number of professional development hours were
consistently used as the outcomes for each model. Using the measurement models established for
86
the EdASQ from Chapter 3, I only tested models that used separate three-factor models for
positive and negative events instead of testing six-factor models that combine positive and
negative events.
Due to the importance of correlating error variances for the measurement model of the
EdASQ, all three factors of explanatory style for positive and then negative events were
necessary to the eventual model. I did not achieve good model fit using a three-factor
explanatory style and a three-factor efficacy model. I separated the teachers’ sense of efficacy
factors, creating models in which the three-factor explanatory style model predicted one of the
TSES-LF factors. Theoretically, this is acceptable since each factor is considered independent of
the others. Unlike the EdASQ, the item sets for each subscale for the TSES-LF are not linked by
a situation and, therefore, can be considered separately. The analysis in this study describes the
effort to develop sound models that fit the data and clarify the relationship between explanatory
style and teachers’ sense of efficacy. The theoretical structural equation model that was tested for
this research is presented in Figure 4.2.
Results
Descriptive Statistics and Reliability
Descriptive summative analysis is provided in Table 4.3. Teachers in this study have a
neutral explanatory style as shown by the composite score, with a mean of 1.07 on the EdASQ.
The mean composite positive (CP) score was 5.08 while the mean composite negative (CN)
score was 4.00. Reliability analysis shows that the CP has a Cronbach’s alpha of .860 while the
CN has an alpha coefficient of .720. Previous studies have shown similar CP (mean of 5.48) and
CN (mean of 4.18) scores for university freshmen (Higgins, Zumbo, & Hay, 1999).
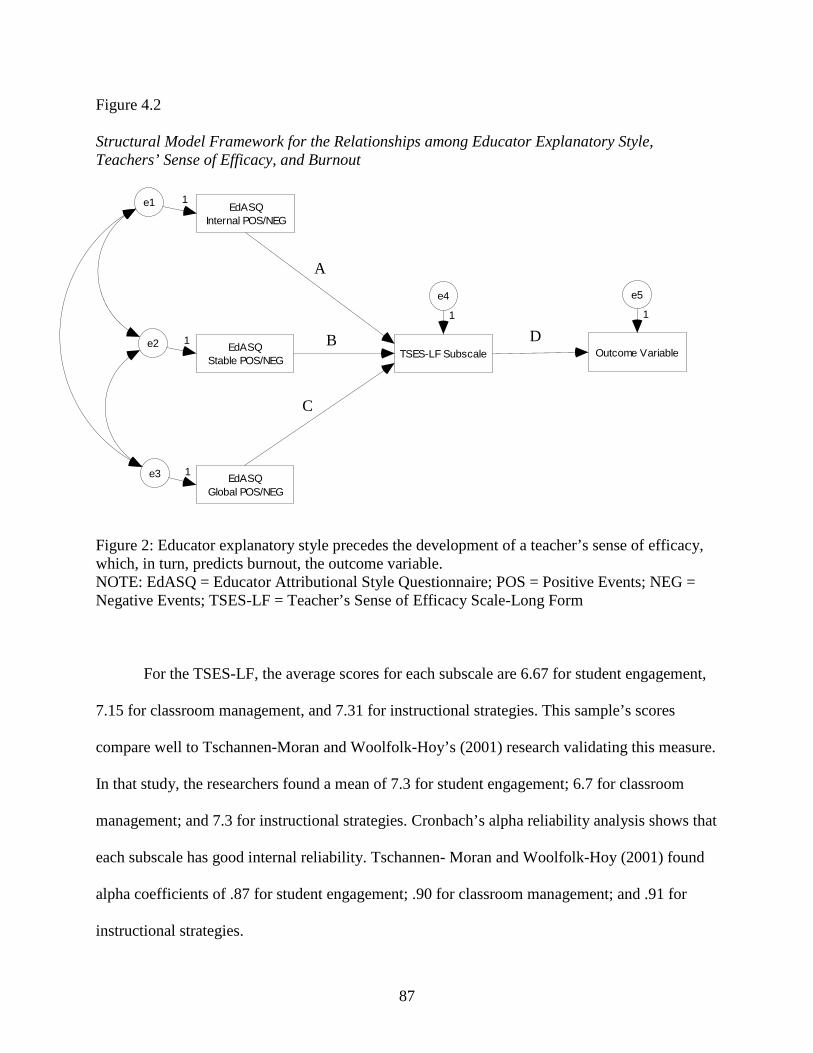
87
Figure 4.2
Structural Model Framework for the Relationships among Educator Explanatory Style, Teachers’ Sense of Efficacy, and Burnout
Figure 2: Educator explanatory style precedes the development of a teacher’s sense of efficacy, which, in turn, predicts burnout, the outcome variable. NOTE: EdASQ = Educator Attributional Style Questionnaire; POS = Positive Events; NEG = Negative Events; TSES-LF = Teacher’s Sense of Efficacy Scale-Long Form
For the TSES-LF, the average scores for each subscale are 6.67 for student engagement,
7.15 for classroom management, and 7.31 for instructional strategies. This sample’s scores
compare well to Tschannen-Moran and Woolfolk-Hoy’s (2001) research validating this measure.
In that study, the researchers found a mean of 7.3 for student engagement; 6.7 for classroom
management; and 7.3 for instructional strategies. Cronbach’s alpha reliability analysis shows that
each subscale has good internal reliability. Tschannen- Moran and Woolfolk-Hoy (2001) found
alpha coefficients of .87 for student engagement; .90 for classroom management; and .91 for
instructional strategies.
EdASQInternal POS/NEG
EdASQStable POS/NEG
EdASQGlobal POS/NEG
TSES-LF Subscale Outcome Variable
e1
e2
e3
e4
1
e5
1
1
1
1
A
B
C
D

88
For the OLBI, the average scores for each subscale are 21.4 for disengagement and 18.4
for exhaustion. In validating the English translation of the OLBI, Halbesleben and Demerouti
(2005) found mean scores similar to this study after accounting for differences in calculation
procedures. Working adults had scores equivalent to 20.9 for exhaustion and 20.0 for
disengagement. Firefighters had exhaustion scores of 23.3 and disengagement scores of 20.7.
Cronbach’s alpha reliability analysis shows that each subscale has good internal reliability.

89
Table 4.3
Summative descriptive statistics of Educator Explanatory Style, Teachers’ Sense of Efficacy and Burnout Whole Sample
(N = 350) Pessimists
(n = 118) Optimists
(n = 116)
Measures M SD α M SD M SD
OLBI
Exhaustion 18.4 3.4 .80 18.2 3.5 18.8 3.6
Disengagement 21.4 3.1 .73 21.3 3.3 21.5 3.3
Professional Development Hours 49.9 50.9 -- 43.2 32.9 55.9 50.2
TSES-LF
Student Engagement 6.7 .9 .83 6.5 .9 6.9 .9
Instructional Strategies 7.3 .9 .89 7.1 1.0 7.6 .9
Classroom Management 7.2 .9 .87 7.0 .9 7.4 .9
EdASQ
Overall Composite 1.1 .9 .80 .15 .4 2.1 .6
Composite Positive 5.1 .7 .86 4.6 .7 5.7 .5
Internal Positive 4.7 .9 .73 4.1 .8 5.3 .7
Stable Positive 5.3 .9 .77 4.8 .9 5.9 .6
Global Positive 5.2 .9 .73 4.8 1.0 5.8 .7
Composite Negative 4.0 .7 .72 4.4 .6 3.6 .6
Internal Negative 4.0 .9 .52 4.4 .9 3.7 .9
Stable Negative 4.0 .9 .63 4.5 .9 3.6 .7
Global Negative 3.9 1.0 .64 4.4 .9 3.4 .9 Note: OLBI = Oldenburg Burnout Inventory; TSES-LF = Teachers’ Sense of Efficacy Scale-Long Form; EdASQ = Educator Attributional Style Questionnaire.
The correlation table for EdASQ, TSES-LF, OLBI subscales, and the number of
professional development hours is shown in Table 4.4. This table was used to build the structural
equation models using the basic structure found in Figure 4.2. All of the correlations in the
matrix trend in expected directions.
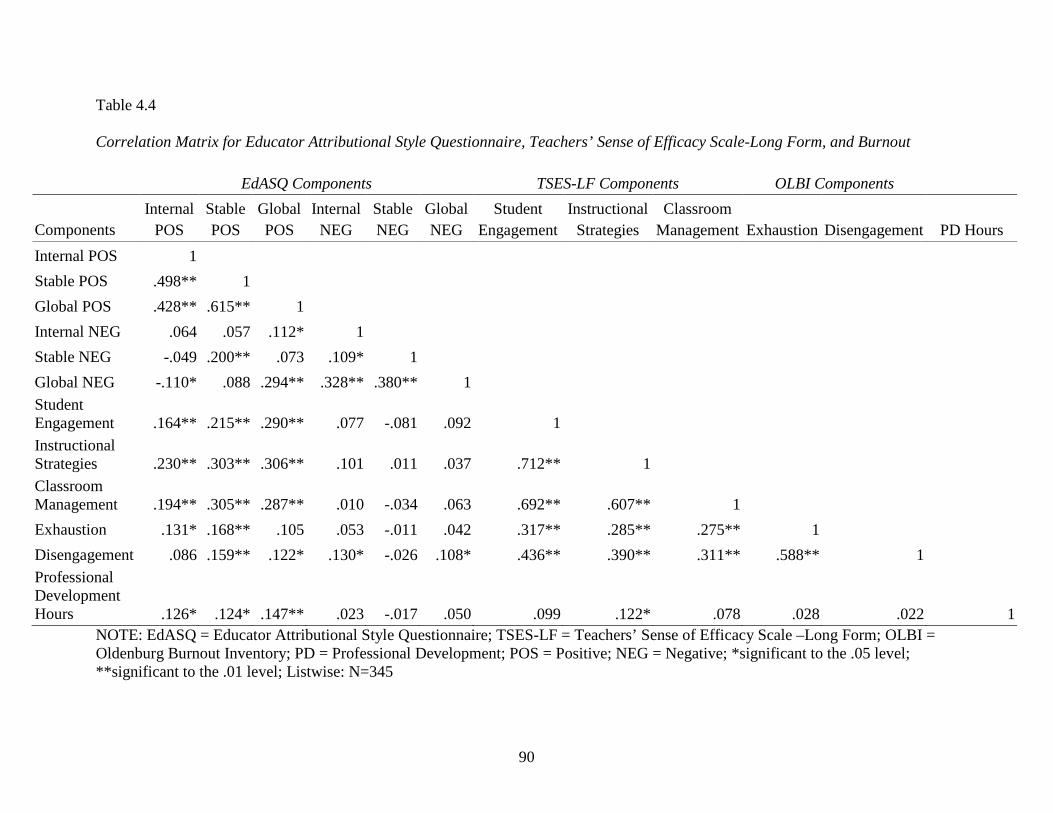
90
Table 4.4
Correlation Matrix for Educator Attributional Style Questionnaire, Teachers’ Sense of Efficacy Scale-Long Form, and Burnout
EdASQ Components TSES-LF Components OLBI Components
Components Internal
POS Stable POS
Global POS
Internal NEG
Stable NEG
Global NEG
Student Engagement
Instructional Strategies
Classroom Management Exhaustion Disengagement PD Hours
Internal POS 1
Stable POS .498** 1
Global POS .428** .615** 1
Internal NEG .064 .057 .112* 1
Stable NEG -.049 .200** .073 .109* 1
Global NEG -.110* .088 .294** .328** .380** 1
Student Engagement .164** .215** .290** .077 -.081 .092 1
Instructional Strategies .230** .303** .306** .101 .011 .037 .712** 1
Classroom Management .194** .305** .287** .010 -.034 .063 .692** .607** 1
Exhaustion .131* .168** .105 .053 -.011 .042 .317** .285** .275** 1
Disengagement .086 .159** .122* .130* -.026 .108* .436** .390** .311** .588** 1 Professional Development Hours .126* .124* .147** .023 -.017 .050 .099 .122* .078 .028 .022 1
NOTE: EdASQ = Educator Attributional Style Questionnaire; TSES-LF = Teachers’ Sense of Efficacy Scale –Long Form; OLBI = Oldenburg Burnout Inventory; PD = Professional Development; POS = Positive; NEG = Negative; *significant to the .05 level; **significant to the .01 level; Listwise: N=345

91
TSES-LFStudent Engagement
TSES-LFInstructional Strategies
TSES-LFClassroom Management
Outcome Variable
0,
e1
1
0,
e2
1
0,
e3
1
0,
e4
1
Research Question 1: What is the relationship between explanatory style and
teachers’ sense of efficacy? In order to test this research question, I followed a three-stage
process:
Stage 1: I tested models showing the three factors of the TSES-LF together predicting the
burnout measures to see the nature of the relationship between TSE and burnout (Figure 4.3).
None of these models produced good fit, as shown in Table 4.5.
Figure 4.3
Structural Model Framework for Teachers’ Sense of Efficacy Predicting Burnout
Figure 4.3: Structural model framework showing Teachers’ Sense of Efficacy-Long Form (TSES-LF) subscales predicting elements of burnout.
A
B
C
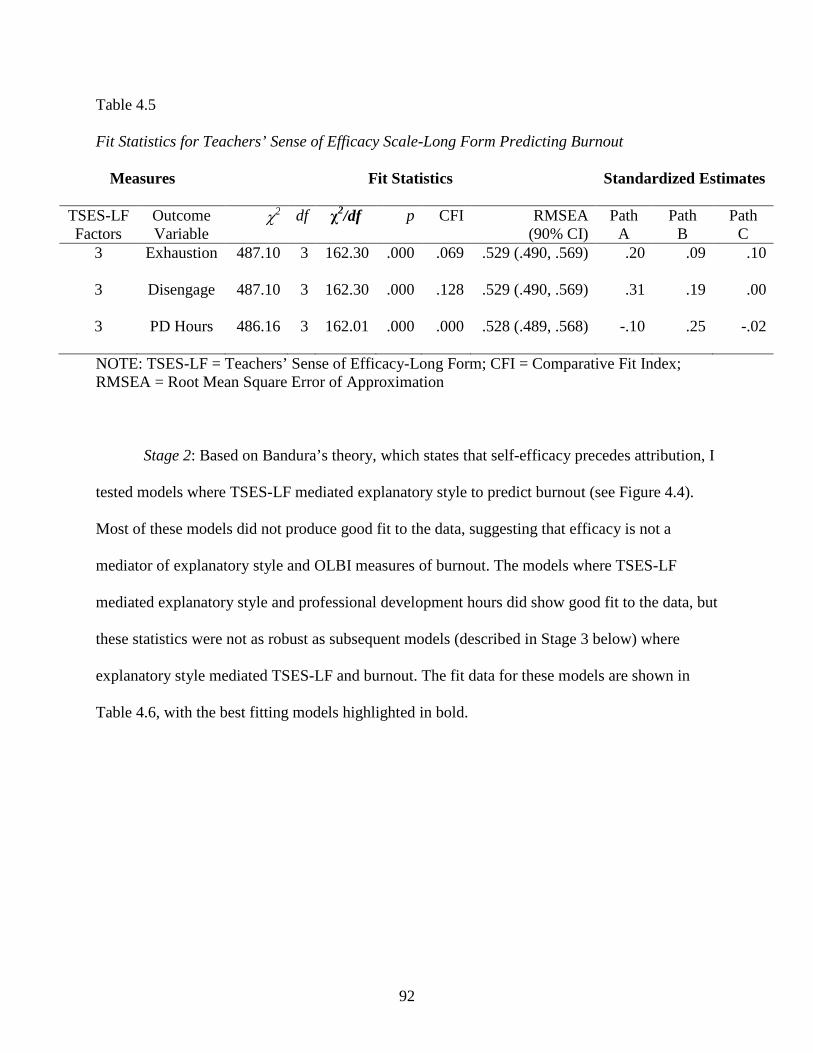
92
Table 4.5
Fit Statistics for Teachers’ Sense of Efficacy Scale-Long Form Predicting Burnout
Measures Fit Statistics Standardized Estimates
TSES-LF Factors
Outcome Variable
χ2 df χ
2/df p CFI RMSEA (90% CI)
Path A
Path B
Path C
3 Exhaustion 487.10 3 162.30 .000 .069 .529 (.490, .569) .20 .09 .10
3 Disengage 487.10 3 162.30 .000 .128 .529 (.490, .569) .31 .19 .00
3 PD Hours 486.16 3 162.01 .000 .000 .528 (.489, .568) -.10 .25 -.02
NOTE: TSES-LF = Teachers’ Sense of Efficacy-Long Form; CFI = Comparative Fit Index; RMSEA = Root Mean Square Error of Approximation
Stage 2: Based on Bandura’s theory, which states that self-efficacy precedes attribution, I
tested models where TSES-LF mediated explanatory style to predict burnout (see Figure 4.4).
Most of these models did not produce good fit to the data, suggesting that efficacy is not a
mediator of explanatory style and OLBI measures of burnout. The models where TSES-LF
mediated explanatory style and professional development hours did show good fit to the data, but
these statistics were not as robust as subsequent models (described in Stage 3 below) where
explanatory style mediated TSES-LF and burnout. The fit data for these models are shown in
Table 4.6, with the best fitting models highlighted in bold.
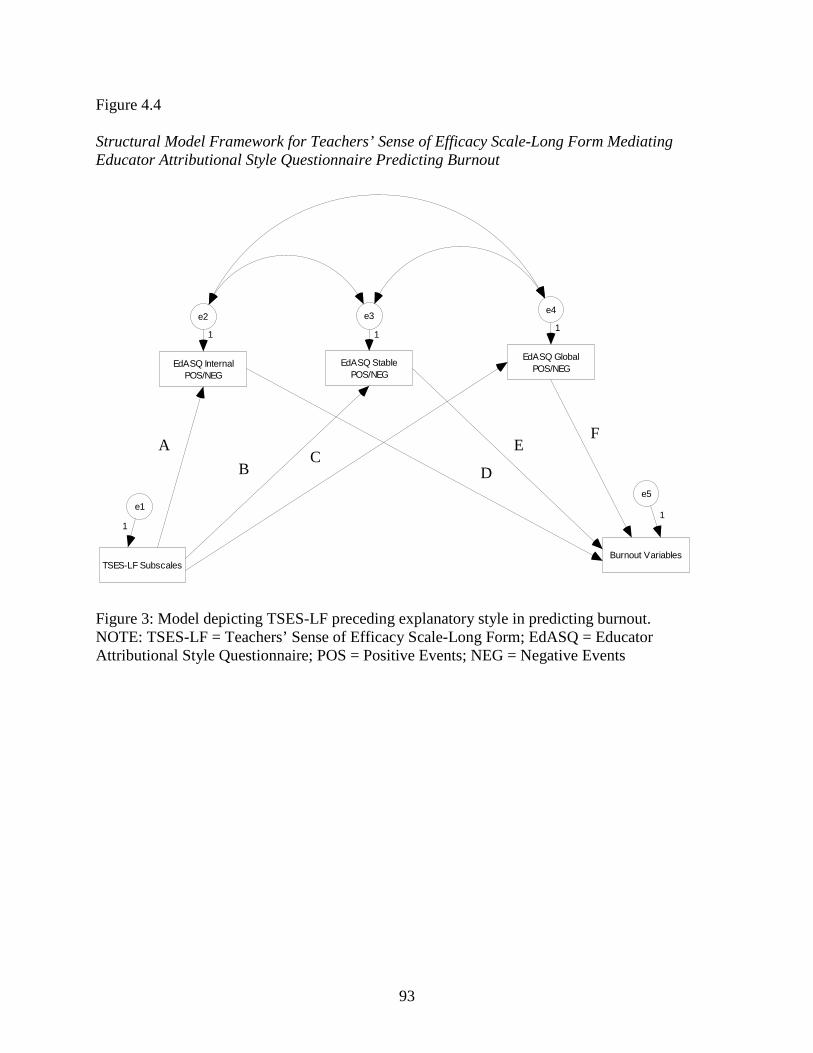
93
TSES-LF Subscales
EdASQ InternalPOS/NEG
EdASQ StablePOS/NEG
EdASQ GlobalPOS/NEG
Burnout Variables
e2
1
e3
1
e4
1
e5
1e1
1
Figure 4.4
Structural Model Framework for Teachers’ Sense of Efficacy Scale-Long Form Mediating Educator Attributional Style Questionnaire Predicting Burnout
Figure 3: Model depicting TSES-LF preceding explanatory style in predicting burnout. NOTE: TSES-LF = Teachers’ Sense of Efficacy Scale-Long Form; EdASQ = Educator Attributional Style Questionnaire; POS = Positive Events; NEG = Negative Events
E F
A
B C
D

94
Table 4.6
Fit Statistics for Teachers’ Sense of Efficacy Scale-Long Form Preceding Educator Attributional Style Questionnaire Predicting Burnout
Measures Fit Statistics Standardized Estimates TSES-LF EdASQ Burnout χ
2 df p CFI RMSEA (90% CI)
Path A
Path B
Path C
Path D
Path E
Path F
Student Engagement Negative Exhaustion 37.48 1 .000 .721 .251 (.186, .323) .08 -.08 .10 .04 -.03 .04 Instructional Strategies Negative Exhaustion 28.37 1 .000 .763 .218 (.153, .290) .10 .02 .05 .04 -.03 .04 Classroom Management Negative Exhaustion 28.74 1 .000 .760 .219 (.155, .292) .01 -.03 .07 .04 -.03 .04 Student Engagement Positive Exhaustion 33.67 1 .000 .903 .238 (.173, .310) .17 .22 .30 .06 .14 -.01 Instructional Strategies Positive Exhaustion 22.05 1 .000 .938 .191 (.127, .264) .23 .30 .32 .06 .14 -.01 Classroom Management Positive Exhaustion 22.03 1 .000 .937 .191 (.127, .264) .19 .30 .28 .06 .14 -.01 Student Engagement Negative Disengage 66.50 1 .000 .609 .337 (.271, .408) .08 -.08 .10 .10 -.08 .10 Instructional Strategies Negative Disengage 56.51 1 .000 .634 .310 (.244, .381) .10 .02 .05 .10 -.08 .10 Classroom Management Negative Disengage 35.56 1 .000 .734 .245 (.180, .317) .01 -.03 .07 .10 -.08 .10 Student Engagement Positive Disengage 65.19 1 .000 .826 .334 (.268, .405) .17 .22 .30 .00 .13 .04 Instructional Strategies Positive Disengage 50.58 1 .000 .865 .293 (.228, .365) .23 .30 .32 .00 .13 .04 Classroom Management Positive Disengage 29.04 1 .000 .917 .220 (.156, .293) .19 .30 .28 .00 .13 .04 Student Engagement Negative PD Hours 2.93 1 .087 .980 .058 (.000, .140) .08 -.08 .10 .01 -.03 .06 Instructional Strategies Negative PD Hours 5.50 1 .019 .951 .088 (.029, .166) .10 .02 .05 .01 -.03 .06 Classroom Management Negative PD Hours 1.83 1 .176 .991 .038 (.000, .125) .01 -.03 .07 .01 -.03 .06 Student Engagement Positive PD Hours 1.12 1 .290 1.000 .014 (.000, .113) .17 .22 .30 .08 .05 .10 Instructional Strategies Positive PD Hours 2.10 1 .147 .997 .044 (.000, .129) .24 .31 .32 .08 .05 .10 Classroom Management Positive PD Hours .28 1 .591 1.000 .000 (.000, .089) .19 .30 .28 .08 .05 .10
NOTE: Models in bold show those with good model fit. NOTE: TSES-LF = Teachers’ Sense of Efficacy-Long Form; EdASQ = Educator Attributional Style Questionnaire; PD Hours = Professional Development Hours; CFI = Comparative Fit Index; RMSEA = Root Mean Square Error of Approximation

95
Stage 3: I tested the theoretical model from Figure 4.2 to determine whether the three-
factor explanatory style model mediated TSES-LF and burnout. Fit statistics are shown in Table
4.6 with the best fitting models are highlighted in bold. When the models were tested using the
three-factor measurement model for the EdASQ along with one subscale from the TSES-LF and
burnout, good fits for the models were found. The best fitting models followed particular patterns
with causal explanations of positive and negative events mediating TSES-LF differently for
exhaustion and disengagement. In addition, the standardized estimates for each path (except one)
grew from the TSES-LF-only model to the EdASQ-added model (see Table 4.8). Adding
EdASQ to the model helps TSES-LF better predict burnout since the EdASQ-added models
found good model fit and provided gains to the standardized path estimates for the TSES-LF
subscales predicting burnout.
The negative items from the EdASQ mediated TSES-LF in predicting exhaustion. How
teachers explain negative events helps build efficacy when considering how exhausted and
overwhelmed in their jobs they will feel. Optimistic explanations of negative events lead to
increased sense of efficacy in teachers, which, in turn, leads to decreased exhaustion. Teachers
who explain bad events optimistically will see those events as external, temporary, and specific
to the situation at hand rather than internally caused, permanent, and global in influence. They
will not feel the effects of negative events quite as much, helping to promote a greater sense of
capability to move forward after bad experiences and avoiding burnout.
Interestingly, the positive items showed better fit when mediating TSES-LF in predicting
disengagement. Therefore, how teachers explain good events helps build teachers’ sense of
efficacy when considering the other aspect of burnout – whether teachers will feel engaged in
their work. A more optimistic explanation of positive events in the classroom helps

96
Table 4.7
Fit Statistics for Explanatory Style Preceding Teachers’ Sense of Efficacy Scale-Long Form Predicting Burnout
Measures Fit Statistics Standardized Estimates EdASQ Events
TSES-LF Burnout χ2 df χ
2/df p CFI RMSEA (90% CI)
Path A
Path B
Path C
Path D
Positive Student Engagement Exhaustion 6.176 3 2.05 .103 .991 .043 (.000, .091) .04 .04 .25 .32 Positive Instructional Strategies Exhaustion 3.900 3 1.30 .272 .997 .023 (.000, .077) .08 .15 .19 .28 Positive Classroom Management Exhaustion 4.110 3 1.37 .250 .997 .025 (.000, .079) .03 .19 .15 .28 Negative Student Engagement Exhaustion .372 3 .12 .946 1.000 .000 (.000, .010) .05 -.14 .13 .32 Negative Instructional Strategies Exhaustion .692 3 .23 .875 1.000 .000 (.000, .035) .09 .00 .02 .28 Negative Classroom Management Exhaustion 1.009 3 .33 .799 1.000 .000 (.000, .044) -.01 -.07 .10 .28 Positive Student Engagement Disengage 3.293 3 1.09 .349 .999 .013 (.000, .073) .04 .04 .25 .43 Positive Instructional Strategies Disengage 1.322 3 .44 .724 1.000 .000 (.000, .051) .08 .15 .19 .39 Positive Classroom Management Disengage 1.768 3 .58 .622 1.000 .000 (.000, .057) .03 .19 .15 .31 Negative Student Engagement Disengage 4.753 3 1.58 .191 .990 .032 (.000, .083) .05 -.14 .13 .43 Negative Instructional Strategies Disengage 7.147 3 2.38 .067 .973 .049 (.000, .096) .09 .00 .02 .39 Negative Classroom Management Disengage 8.169 3 2.72 .043 .960 .055 (.000, .044) -.01 -.07 .10 .31 Positive Student Engagement PD Hours 6.619 3 2.20 .075 .987 .012 (.000, .095) .04 .04 .25 .12 Positive Instructional Strategies PD Hours 5.808 3 1.93 .121 .991 .040 (.000, .089) .08 .15 .19 .15 Positive Classroom Management PD Hours 7.331 3 2.44 .062 .986 .013 (.000, .097) .03 .19 .15 .09 Negative Student Engagement PD Hours .483 3 .16 .923 1.000 .000 (.000, .024) .05 -.14 .13 .11 Negative Instructional Strategies PD Hours .782 3 .26 .854 1.000 .000 (.000, .038) .09 .00 .02 .15 Negative Classroom Management PD Hours .689 3 .22 .876 1.000 .000 (.000, .035) -.01 -.07 .09 .09
NOTE: Models in bold show those with good model fit. NOTE: EdASQ = Educator Attributional Style Questionnaire; TSES-LF = Teacher’s Sense of Efficacy Scale-Long Form; CFI = Comparative Fit Index; RMSEA = Root Mean Square Error of Approximation
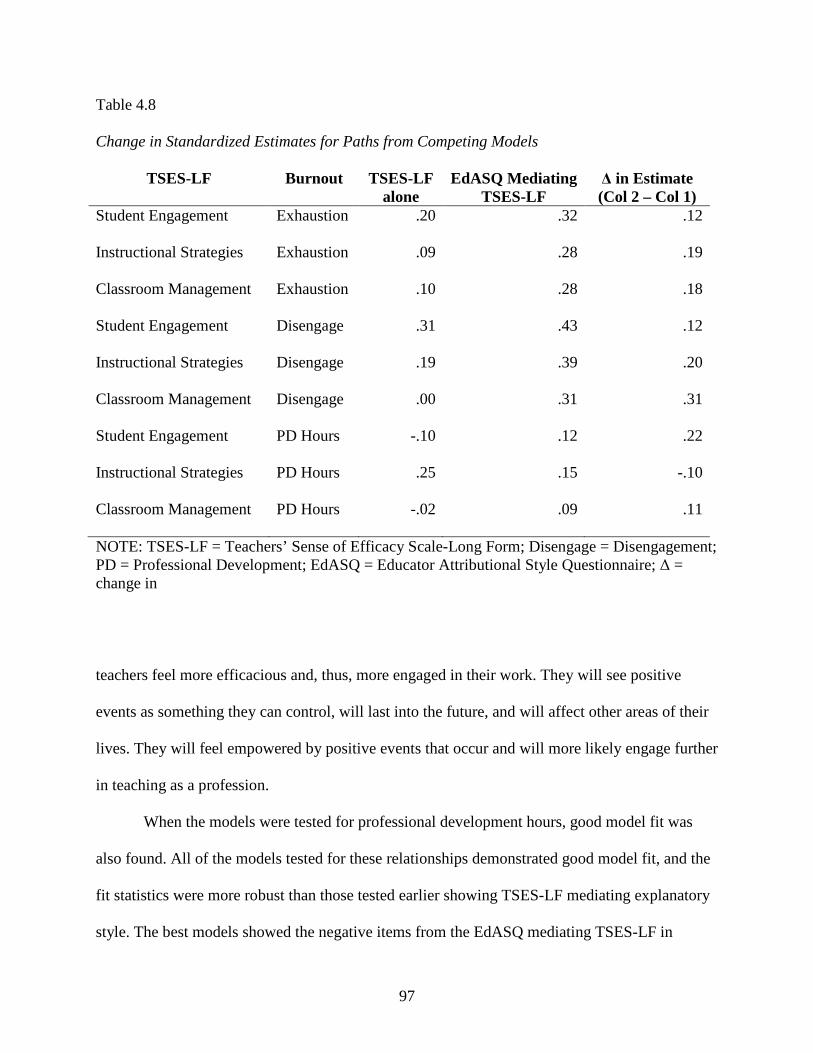
97
Table 4.8
Change in Standardized Estimates for Paths from Competing Models
TSES-LF Burnout TSES-LF alone
EdASQ Mediating TSES-LF
∆ in Estimate (Col 2 – Col 1)
Student Engagement Exhaustion .20 .32 .12
Instructional Strategies Exhaustion .09 .28 .19
Classroom Management Exhaustion .10 .28 .18
Student Engagement Disengage .31 .43 .12
Instructional Strategies Disengage .19 .39 .20
Classroom Management Disengage .00 .31 .31
Student Engagement PD Hours -.10 .12 .22
Instructional Strategies PD Hours .25 .15 -.10
Classroom Management PD Hours -.02 .09 .11
NOTE: TSES-LF = Teachers’ Sense of Efficacy Scale-Long Form; Disengage = Disengagement; PD = Professional Development; EdASQ = Educator Attributional Style Questionnaire; ∆ = change in
teachers feel more efficacious and, thus, more engaged in their work. They will see positive
events as something they can control, will last into the future, and will affect other areas of their
lives. They will feel empowered by positive events that occur and will more likely engage further
in teaching as a profession.
When the models were tested for professional development hours, good model fit was
also found. All of the models tested for these relationships demonstrated good model fit, and the
fit statistics were more robust than those tested earlier showing TSES-LF mediating explanatory
style. The best models showed the negative items from the EdASQ mediating TSES-LF in
98
predicting the number of professional development hours teachers believed they would complete
in the coming year. These models show that teachers who are more optimistic in their
explanatory style feel more efficacious and will then likely engage in more professional
development hours than their more pessimistic colleagues.
Research Question 2: How are optimists and pessimists, who have different
explanatory styles, different in regards to teachers’ sense of efficacy and burnout? To test
the second research question, I used the same model structure shown in Figure 4.2, but instead of
a correlation matrix for the entire sample, I created new matrices for the teachers with
pessimistic and optimistic explanatory styles. These matrices are shown in Table 4.9 and Table
4.10. I identified the pessimistic and optimistic teachers by dividing the original sample into
thirds. Those teachers with the lowest third of EdASQ scores were identified as pessimistic, and
those with the highest third of scores were identified as optimistic. Descriptive statistics for each
of these groups is shown in Table 4.3. I conducted analysis of variance between optimists and
pessimists on the subscales for the EdASQ, and Table 4.11 shows that optimists and pessimists
have significantly different explanatory styles across the board. Optimistic and pessimistic
teachers also differ significantly on teachers’ sense of efficacy and the number of professional
development hours estimated, but they do not differ significantly on exhaustion or
disengagement.
The fit statistics for the structural equation models for pessimists is shown in Table 4.12,
and optimists are shown in Table 4.13. As in the previous SEM analysis, most of the models
tested showed good fit. However, the best fitting models followed characteristic patterns for each
type of explanatory style. For the pessimists, their explanation of positive events best predicted
TSES-LF and burnout. Pessimistic teachers explain positive events as external, temporary, and

99
specific to the situation. When they explain positive events in these ways, the good events do not
lead to increased sense of efficacy and professional development and increases exhaustion and
disengagement. For pessimists, experiencing mastery (success) may not have the building effect
for efficacy that it should because of how they explain good events, which is contrary to Bandura
(1994) but supports Pajares (2002). For optimists, their explanation of negative events best
predicted TSES-LF and burnout. For optimistic teachers, how they explain negative events
predicts whether they will have higher efficacy and professional development and lower
exhaustion and disengagement. Optimists see bad events as external, temporary and specific.
They will not be dragged down by bad experiences in the classroom. These models show that
explanations of both positive and negative events are important to developing efficacy. In
addition, optimists and pessimists need to focus on different types of situational attributions to
build efficacy and avoid burnout.
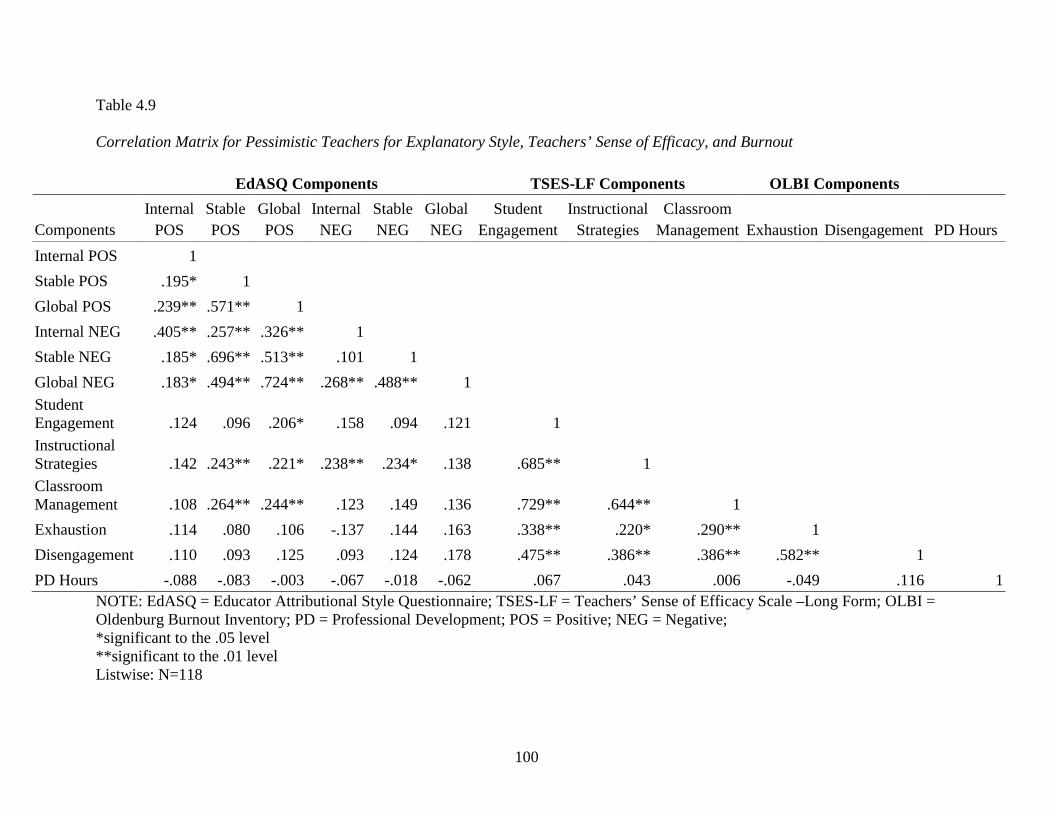
100
Table 4.9
Correlation Matrix for Pessimistic Teachers for Explanatory Style, Teachers’ Sense of Efficacy, and Burnout
EdASQ Components TSES-LF Components OLBI Components
Components Internal
POS Stable POS
Global POS
Internal NEG
Stable NEG
Global NEG
Student Engagement
Instructional Strategies
Classroom Management Exhaustion Disengagement PD Hours
Internal POS 1
Stable POS .195* 1
Global POS .239** .571** 1
Internal NEG .405** .257** .326** 1
Stable NEG .185* .696** .513** .101 1
Global NEG .183* .494** .724** .268** .488** 1
Student Engagement .124 .096 .206* .158 .094 .121 1
Instructional Strategies .142 .243** .221* .238** .234* .138 .685** 1
Classroom Management .108 .264** .244** .123 .149 .136 .729** .644** 1
Exhaustion .114 .080 .106 -.137 .144 .163 .338** .220* .290** 1
Disengagement .110 .093 .125 .093 .124 .178 .475** .386** .386** .582** 1
PD Hours -.088 -.083 -.003 -.067 -.018 -.062 .067 .043 .006 -.049 .116 1 NOTE: EdASQ = Educator Attributional Style Questionnaire; TSES-LF = Teachers’ Sense of Efficacy Scale –Long Form; OLBI = Oldenburg Burnout Inventory; PD = Professional Development; POS = Positive; NEG = Negative; *significant to the .05 level **significant to the .01 level Listwise: N=118

101
Table 4.10
Correlation Matrix for Optimistic Teachers for Explanatory Style, Teachers’ Sense of Efficacy, and Burnout
Measures EdASQ Components TSES-LF Components Burnout
Internal
POS Stable POS
Global POS
Internal NEG
Stable NEG
Global NEG
Student Engagement
Instructional Strategies
Classroom Management Exhaustion Disengage PD Hours
Internal POS 1
Stable POS .404** 1
Global POS .328** .365** 1
Internal NEG .240** .163 .160 1
Stable NEG .205* .250** .127 -.085 1
Global NEG .094 .114 .301** .123 .250** 1
Student Engagement .150 .202* .203* .053 -.060 .156 1
Instructional Strategies .226* .295** .305** .149 -.070 .161 .688** 1
Classroom Management .202* .385** .188* .024 -.021 .118 .606** .446** 1
Exhaustion .149 .274** .103 .187* -.070 .020 .264** .295** .278** 1
Disengage .089 .247** .150 .085 -.072 .103 .432** .448** .268** .593** 1
PD Hours .132 .130 .090 .029 .022 .018 -.061 .116 .042 .000 -.171 1 NOTE: EdASQ = Educator Attributional Style Questionnaire; TSES-LF = Teachers’ Sense of Efficacy Scale –Long Form; PD = Professional Development; POS = Positive; NEG = Negative *significant to the .05 level **significant to the .01 level Listwise: N=116
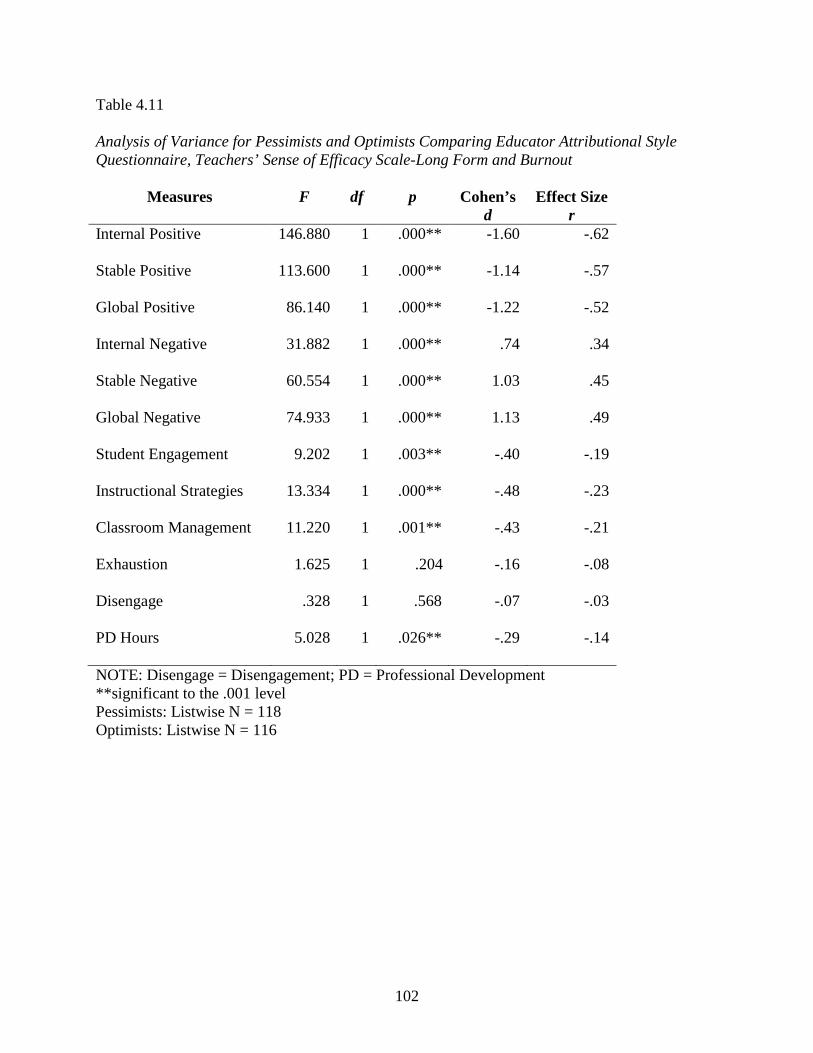
102
Table 4.11
Analysis of Variance for Pessimists and Optimists Comparing Educator Attributional Style Questionnaire, Teachers’ Sense of Efficacy Scale-Long Form and Burnout
Measures F df p Cohen’s d
Effect Size r
Internal Positive 146.880 1 .000** -1.60 -.62
Stable Positive 113.600 1 .000** -1.14 -.57
Global Positive 86.140 1 .000** -1.22 -.52
Internal Negative 31.882 1 .000** .74 .34
Stable Negative 60.554 1 .000** 1.03 .45
Global Negative 74.933 1 .000** 1.13 .49
Student Engagement 9.202 1 .003** -.40 -.19
Instructional Strategies 13.334 1 .000** -.48 -.23
Classroom Management 11.220 1 .001** -.43 -.21
Exhaustion 1.625 1 .204 -.16 -.08
Disengage .328 1 .568 -.07 -.03
PD Hours 5.028 1 .026** -.29 -.14
NOTE: Disengage = Disengagement; PD = Professional Development **significant to the .001 level Pessimists: Listwise N = 118 Optimists: Listwise N = 116

103
Table 4.12
Fit Statistics for Pessimists
Measures Fit Statistics Standardized Estimates EdASQ Events
TSES-LF Subscales
Burnout χ2 df χ
2/df p CFI RMSEA (90% CI)
Path A
Path B
Path C
Path D
Negative Student Engagement Exhaustion 9.21 3 3.07 .027 .887 .131 (.040, .232) .13 .05 .08 .33 Negative Instructional Strategies Exhaustion 8.57 3 2.85 .037 .899 .124 (.028, .225) .21 .22 .01 .21 Negative Classroom Management Exhaustion 8.00 3 2.66 .046 .900 .118 (.014, .220) .10 .11 .05 .29 Positive Student Engagement Exhaustion .823 3 .27 .844 1.000 .000 (.000, .086) .08 -.04 .22 .33 Positive Instructional Strategies Exhaustion .995 3 .33 .812 1.000 .000 (.000, .094) .08 .14 .15 .21 Positive Classroom Management Exhaustion .963 3 .32 .810 1.000 .000 (.000, .095) .04 .19 .12 .29 Negative Student Engagement Disengage 2.06 3 .68 .599 1.000 .000 (.000, .134) .13 .05 .08 .47 Negative Instructional Strategies Disengage 1.93 3 .64 .587 1.000 .000 (.000, .130) .21 .22 .01 .38 Negative Classroom Management Disengage 2.29 3 .76 .514 1.000 .000 (.000, .139) .10 .11 .05 .39 Positive Student Engagement Disengage .632 3 .21 .889 1.000 .000 (.000, .071) .08 -.04 .22 .47 Positive Instructional Strategies Disengage .518 3 .17 .915 1.000 .000 (.000, .057) .08 .14 .15 .38 Positive Classroom Management Disengage .896 3 .29 .826 1.000 .000 (.000, .091) .04 .19 .12 .39 Negative Student Engagement PD Hours 2.170 3 .72 .538 1.000 .000 (.000, .088) .13 .05 .08 .07 Negative Instructional Strategies PD Hours 2.403 3 .80 .493 1.000 .000 (.000, .088) .21 .22 .01 .05 Negative Classroom Management PD Hours 2.180 3 .72 .536 1.000 .000 (.000, .072) .10 .11 .05 .01 Positive Student Engagement PD Hours .850 3 .28 .837 1.000 .000 (.000, .136) .08 -.04 .22 .07 Positive Instructional Strategies PD Hours .846 3 .28 .838 1.000 .000 (.000, .142) .08 .14 .15 .05 Positive Classroom Management PD Hours .639 3 .21 .887 1.000 .000 (.000, .136) .04 .19 .12 .01
Listwise N = 118 NOTE: Models in bold show those with good model fit. NOTE: EdASQ = Educator Attributional Style Questionnaire; TSES-LF = Teachers’ Sense of Efficacy Scale-Long Form; PD = Professional Development; CFI = Comparative Fit Index; RMSEA = Root Mean Square Error or Approximation; CI = Confidence Interval
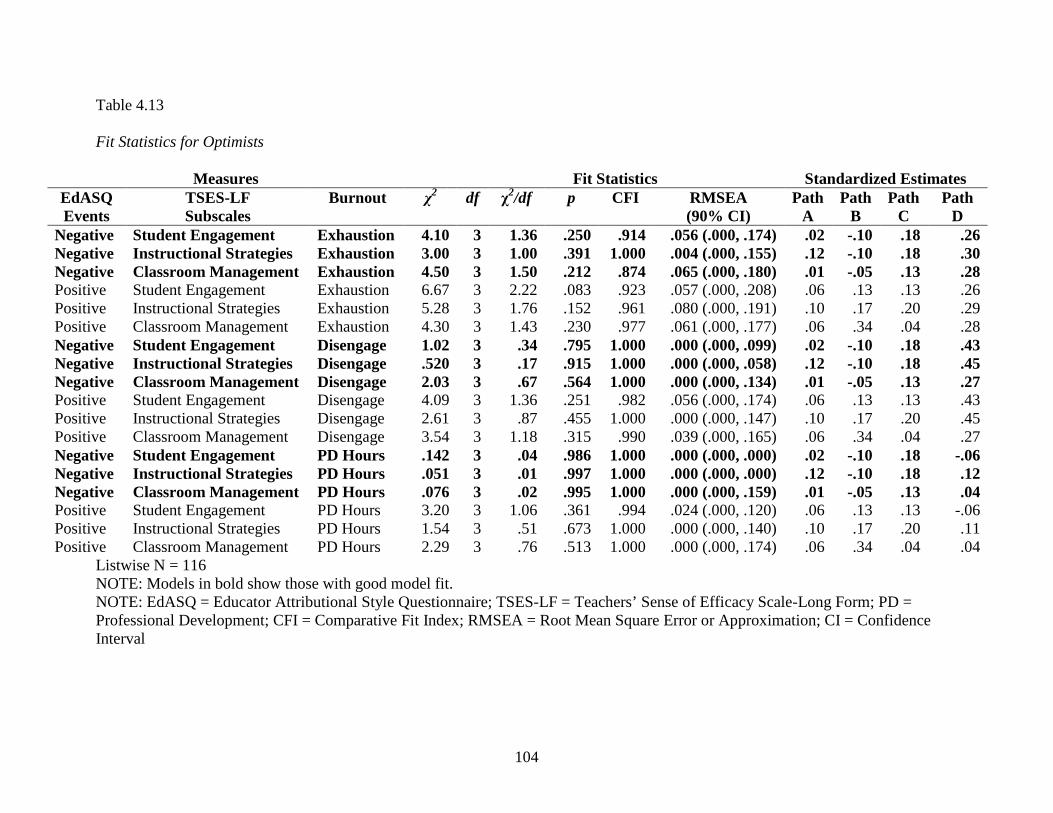
104
Table 4.13 Fit Statistics for Optimists
Measures Fit Statistics Standardized Estimates EdASQ Events
TSES-LF Subscales
Burnout χ2 df χ
2/df p CFI RMSEA (90% CI)
Path A
Path B
Path C
Path D
Negative Student Engagement Exhaustion 4.10 3 1.36 .250 .914 .056 (.000, .174) .02 -.10 .18 .26 Negative Instructional Strategies Exhaustion 3.00 3 1.00 .391 1.000 .004 (.000, .155) .12 -.10 .18 .30 Negative Classroom Management Exhaustion 4.50 3 1.50 .212 .874 .065 (.000, .180) .01 -.05 .13 .28 Positive Student Engagement Exhaustion 6.67 3 2.22 .083 .923 .057 (.000, .208) .06 .13 .13 .26 Positive Instructional Strategies Exhaustion 5.28 3 1.76 .152 .961 .080 (.000, .191) .10 .17 .20 .29 Positive Classroom Management Exhaustion 4.30 3 1.43 .230 .977 .061 (.000, .177) .06 .34 .04 .28 Negative Student Engagement Disengage 1.02 3 .34 .795 1.000 .000 (.000, .099) .02 -.10 .18 .43 Negative Instructional Strategies Disengage .520 3 .17 .915 1.000 .000 (.000, .058) .12 -.10 .18 .45 Negative Classroom Management Disengage 2.03 3 .67 .564 1.000 .000 (.000, .134) .01 -.05 .13 .27 Positive Student Engagement Disengage 4.09 3 1.36 .251 .982 .056 (.000, .174) .06 .13 .13 .43 Positive Instructional Strategies Disengage 2.61 3 .87 .455 1.000 .000 (.000, .147) .10 .17 .20 .45 Positive Classroom Management Disengage 3.54 3 1.18 .315 .990 .039 (.000, .165) .06 .34 .04 .27 Negative Student Engagement PD Hours .142 3 .04 .986 1.000 .000 (.000, .000) .02 -.10 .18 -.06 Negative Instructional Strategies PD Hours .051 3 .01 .997 1.000 .000 (.000, .000) .12 -.10 .18 .12 Negative Classroom Management PD Hours .076 3 .02 .995 1.000 .000 (.000, .159) .01 -.05 .13 .04 Positive Student Engagement PD Hours 3.20 3 1.06 .361 .994 .024 (.000, .120) .06 .13 .13 -.06 Positive Instructional Strategies PD Hours 1.54 3 .51 .673 1.000 .000 (.000, .140) .10 .17 .20 .11 Positive Classroom Management PD Hours 2.29 3 .76 .513 1.000 .000 (.000, .174) .06 .34 .04 .04
Listwise N = 116 NOTE: Models in bold show those with good model fit. NOTE: EdASQ = Educator Attributional Style Questionnaire; TSES-LF = Teachers’ Sense of Efficacy Scale-Long Form; PD = Professional Development; CFI = Comparative Fit Index; RMSEA = Root Mean Square Error or Approximation; CI = Confidence Interval

105
Discussion
Explanatory Style as a Mediator to Teachers’ Sense of Efficacy
This study demonstrates that explanatory style mediates teachers’ sense of efficacy in
predicting burnout. The models tested in this study indicate that the explanatory style of teachers
is an antecedent in developing a teacher’s sense of efficacy, which is contrary to previous
theoretical predictions that efficacy fosters causal attributions and not vice versa. How teachers
explain good and bad events in the classroom helps them develop efficacy beliefs about their
teaching. In addition, this research shows that both good and bad events contribute to the
development of efficacy in the classroom. This research suggests a new model for the
relationship between efficacy and explanatory style, which is shown in Figure 4.5.
Figure 4.5
New Theoretical Model for the Relationship Between Efficacy and Causal Attributions
Figure 4.5: A new model showing that explanatory style influences a sense of efficacy when experiencing both success and failure.
Experience of Success and Failure
Sense of Efficacy Explanatory Style
106
According to this model, efficacy and explanatory style work in a feedback loop. This
model differs from Figure 4.1 in two ways. First, Figure 4.5 includes both experiences of success
and failure. Figure 4.1 only focuses on experiences of failure. This research indicates that
experience of success and failure both influence the development of efficacy. Second, Figure 4.5
shows that explanatory style informs efficacy. Explanatory style mediates a teacher’s sense of
efficacy, which then influences how capable people feel about dealing with future experiences of
success and failure. Then, once success or failure is experienced, explanatory style occurs, which
builds the sense of efficacy further. Even though some have asserted that efficacy informs
explanatory style (Bandura, 1994; Pajares, 2002), this research does not support that assertion.
The models that tested teachers’ sense of efficacy mediating explanatory style to predict burnout
did not show good fit.
This feedback loop may explain how hard-fought mastery experiences help develop
efficacy. Hard-fought mastery experiences are those in which setbacks and obstacles occur
before mastery is achieved. While those with already high efficacy persevere through failures
and setbacks, those with low efficacy may not have the resources it takes to persevere and
ultimately achieve mastery, and by extension, efficacy. This research suggests a mechanism for
building efficacy in teachers who have may have low efficacy. Helping teachers develop a more
optimistic explanatory style will help those with both low and high efficacy build or maintain
efficacy using explanations of both successful and unsuccessful experiences in the classroom.
Thus, if explanatory style mediates efficacy during the setbacks of a hard-fought experience,
optimists are more likely to persevere and, in turn, gain efficacy through the experience of
mastery. Thus, this study indicates that mastery experiences are not the only experiential
contributors to efficacy.
107
Bad Events Matter As Well As the Good
The relationship between explanatory style and efficacy to predict burnout shows how
attending to explanations of both positive and negative events can help teachers build efficacy
and avoid burnout. An interesting finding of this study is that negative event explanations
mediate efficacy in predicting exhaustion, while positive event explanations mediate efficacy in
predicting disengagement. Exhaustion, according to the OLBI, involves how much energy one is
expending toward one’s job. People who have jobs that leave them with little energy to pursue
outside interests or to go above-and-beyond the job’s duties feel exhausted. According to this
model, if teachers explain negative events in an optimistic way (external, temporary, and
isolated), they will have higher efficacy and feel less exhausted. They will feel more energy to
pursue either their own outside interests or seek out ways to overachieve in their jobs. Explaining
negative events in optimistic ways seem to help teachers reduce the impact of those bad events
on how they feel about their capabilities as teachers and their view of their jobs. The
disengagement measure of the OLBI describes how connected one feels towards the job.
According to this study, if teachers explain positive events in the classroom in optimistic ways
(internal, stable, and global), they will have higher efficacy and thus feel more engaged.
Optimistic teachers can use the success of positive events not only to build efficacy, but also to
feel as though they have a personal connection to their jobs. By focusing on explanations of both
positive and negative experiences in the classroom, teachers can build efficacy and address both
components of burnout. Additionally, if teachers are aware of what component of burnout they
are feeling about their job, they can target their explanations of relevant events more specifically
to build efficacy and tackle their specific burnout needs.

108
This study suggests that teacher burnout relies on how they explain both positive and
negative events rather than just focusing on how teachers explain negative events only. Prior
efficacy research and theory focuses almost exclusively on the impact of successful, or positive,
events in building efficacy and suggests that bad events, or those that bring failure, have only a
negative affect on efficacy. This research indicates that not only should efficacy research focus
on how people explain events, but also how their explanations of good and bad events contribute
to a total picture of efficacy building. It is interesting to note that much of the research in
explanatory style focuses on how people explain negative events or failures. In fact, the original
ASQ has been modified to ask for responses only about negative events since these explanations
better predict depression. This study indicates that helping teachers explain both good and bad
events can lead to higher levels of efficacy and burnout.
Explanatory Style, Efficacy, and Professional Development
The relationships among explanatory style, efficacy, and professional development hours
show how attending to explanations of negative events only can help teachers build efficacy and
pursue more professional opportunities. While models for positive event explanations also
yielded good model fit, the models for negative event explanations yielded better model fit
overall. These models indicate that helping teachers explain negative events in optimistic ways
can help them have greater efficacy and, in turn, pursue more professional development hours in
a given year. Professional development is often focused on helping teachers address weaknesses
in their teaching, so it is not surprising that negative event explanations would contribute to
whether a teacher would feel as though more hours would be helpful. If teachers were
pessimistic, they would explain negative events as internal, stable, and global, and they might not
feel as though any further training would help alleviate the recurrence of negative classroom
109
events. Optimistic teachers, however, would see further training as a viable way to correct errant
instructional, classroom management, or student engagement practices. More research would be
needed to see if the explanations for both positive and negative events lead teachers to pursue
certain types of professional development activities. It would be interesting to see if how
teachers explain negative events predicts whether they pursue activities that address weakness
and if how they predict positive events predicts whether they pursue professional growth
opportunities like advanced degrees or certification.
Pessimism or Optimism? Realism Matters
Perhaps the most enlightening finding from this research is the way in which optimists
and pessimists differ in how their explanatory style mediates efficacy in predicting burnout.
Pessimists and optimists experience different cognitive processes in the journey toward efficacy
and burnout. Pessimists will experience changes in efficacy and burnout if they explain positive
events pessimistically (as external, temporary, and specific). Thus, for pessimistic teachers,
disputing the personal, permanent, and pervasive nature of good events may leave them feeling
incapable, exhausted, disengaged, and unwilling to seek training to help deficiencies in the
classroom. Good events for pessimists do not build efficacy since they dismiss their role in
making the good event happen and doubt whether the good event will have any lasting or global
effects. Therefore, mastery experiences for pessimists may not have the efficacy-building impact
that they do for optimists.
Optimists will experience changes in efficacy and burnout if they explain negative events
optimistically (as external, temporary, and specific). Thus, for optimistic teachers, dismissing the
personal, permanent, and pervasive nature of bad events may leave them feeling just as
incapable, exhausted, disengaged, and unwilling to seek professional development as their

110
pessimistic colleagues. For optimists, bad events may not have the instructive impact needed to
help them be reflective of their teaching practices. If optimistic teachers have a negative
experience in the classroom, such as when a lesson does not go as planned, they may not take
appropriate personal responsibility for its failure. They may dismiss the event as a fluke that will
not recur or influence future lessons. They may blame external factors, such as student apathy or
low ability, for the failure of the lesson. These types of explanations for negative classroom
events may lead teachers to feeling as though they can do nothing to change a bad, immutable
situation. They may feel exhausted with continually trying the same methods over and over
again, hoping for the right set of caring or high-ability students to walk in the door. They may
feel disconnected from students whom they feel are not capable of the challenging work they are
presenting. These optimistic teachers may also forego professional development opportunities
aimed at trying new instructional practices since they feel their current practice is sufficient, if
only in the right circumstances.
The implications of these findings are important for understanding why teachers of all
stripes get burned out and leave teaching. Not only should administrators be concerned with
pessimistic teachers getting burned out, but they should also be concerned about optimistic
teachers. According to this study, teachers should avoid being pessimistic about positive
classroom experiences. It is good for teachers to explain good events as internal, stable, and
global. However, teachers should also avoid being too optimistic about failures in the classroom.
It is also good for teachers to be reflective about their practice and shoulder some of the
responsibility for classroom events gone awry. It is too simple to say that teachers should be
optimists in all things. Teachers perhaps should be realists instead, taking responsibility for both
the good and the bad.

111
Future Directions
This research suggests a mechanism for building efficacy in teachers that capitalizes on
mastery experiences. Mastery experiences are one of the four main ways to develop efficacy, and
while experiencing mastery is certainly ideal, it is often difficult to capitalize on mastery
experiences in teaching situations, especially in districts that struggle. Efficacy training programs
with teachers are often difficult to administer successfully in that mastery experiences should be
authentic rather than manufactured. Instead of waiting for success to happen, teachers can learn
how to explain good and bad events in ways that maximize efficacy and reduce burnout.
Teachers can also assess their own type of explanatory style to be sensitive to the different ways
optimists and pessimists are affected by success and failure. Successful explanatory style training
programs already exist (Seligman, Reivich, Jaycox, & Gillham, 1995). The next step for this
research should involve developing teacher-training programs that incorporate explanatory style
training into efficacy-building activities.
The low response rate for this study is one major limitation for this research. The most
significant rate of survey attrition occurred during the EdASQ portion of the survey. This
indicates that the EdASQ items are likely too cumbersome for large-scale research with teachers.
Finding a way to measure explanatory style without relying on the labor-intensive way the
measure is typically administered could increase the participation rates in studies using these
measures. Teachers are typically pressed for time each day as they plan lessons, manage
administrative duties (such as taking attendance and managing discipline), and grade student
work. Having a valid and concise measure of how teachers explain events would improve the
utility of the EdASQ for future research.

112
Another limitation of this study involves the type of teacher surveyed. Although teachers
from a broad spectrum of socioeconomic levels were included in this study, no teachers from
urban districts were a part of this research. Future research should include teachers from urban
districts to see if the same relationships among explanatory style, efficacy, and burnout exist in
environments that historically pose greater challenges for teachers. Teachers in urban school
districts typically experience a higher incidence of negative experiences than those in affluent,
suburban districts. It would interesting to see if teachers in struggling districts exhibit the same
patterns of explanatory style, efficacy, and burnout as those in this study.
This research helps clarify the relationship between explanatory style and efficacy and
suggests ways to develop professional training programs that help teachers build efficacy. As the
research in this area matures, we can develop ways to help teachers navigate the good and bad
situations that occur in the classroom in ways that build efficacy and reduce burnout so we can
keep strong teachers in the field longer. This research provides an important clarification
regarding how explanatory style is an antecedent to efficacy when experiencing success and
failure. Hard-fought mastery experiences are excellent ways to build efficacy, but persevering
through the setbacks and obstacles is required to reach the goal of mastery. Without an optimistic
explanatory style, teachers do not view the obstacles as challenges to overcome. Teachers will
need to develop optimistic, but not too optimistic, explanations for failure in order to fight hard
toward mastery. This research suggests that how teachers think about the positive and the
negative matters.

113
References
Abramson, L.Y., Seligman, M.E.P., & Teasdale, J.D. (1978). Learned helplessness in humans: Critique and reformulation. Journal of Abnormal Psychology, 87(1), 49-74.
Andrew, M.D., & Schwab, R.L. (1995). Has reform in teacher education influenced teacher performance? An outcome assessment of graduates of an eleven-university consortium. Action in Teacher Education, 17(3), 43-53.
Ashton, P.T., (1984). A motivational paradigm for effective teacher education. Journal of Teacher Education, 35(5), 28-32.
Baker, D.P., & Smith, T. (1997). Teacher turnover and teacher quality: Refocusing the issue. Teachers College Record, 99(1), 29-35.
Bandura, A. (1997) Self-efficacy: The exercise of control. W.H. Freeman and Company, New York.
Bandura, A. (1994). Self-efficacy. In V. S. Ramachaudran (Ed.), Encyclopedia of human behavior (Vol. 4, pp. 71-81). New York: Academic Press.
Bandura, A., (1986). Social foundations of thought and action: A social-cognitive theory. Englewood Cliffs, NJ: Prentice Hall.
Boe, E.E., Bobbitt, S.A., Cook, L.H., Barkanic, G., & Maislin, G. (1998). Teacher turnover in eight cognate areas: National trends and predictors. Philadelphia, PA: Center for Research and Evaluation in Social Policy.
Cronbach, L.J. (1951). Coefficient alpha and the internal structure of tests. Psychometrika, 16, 297-334.
Demerouti, E., Bakker, A.B., Vardakou, I., & Kantos, A. (2003). The convergent validity of two burnout instruments: A multitrait-multimethod analysis. European Journal of Psychological Assessment, 19, 12-23.
Denzine, G.M., Cooney, J.B., & McKenzie, R. (2005). Confirmatory factor analysis of the Teacher Efficacy Scale for prospective teachers. British Journal of Educational Psychology, 75(4), 689-708.
Fazio, N.M., & Palm, L.J. (1998). Attributional style, depression, and grade point averages of college students. Psychological Reports, 83(1), 159-162.
Graham, S., Harris, K.R., Fink, B., & MacArthur, C.A. (2001). Teacher efficacy in writing: a construct validation with primary grade teachers. Scientific Studies of Reading 5(2), 177–202.
Halbesleben, J.R.B, & Demerouti, E. (2005). The construct validity of an alternative measure of burnout: Investigating the English translation of the Oldenburg Burnout Inventory. Work & Stress, 19(3), 208-220.
Higgins, N., Zumbo, B., & Hay, J. (1999). Construct validity of attributional style: Modeling context-dependent item sets in the Attributional Style Questionnaire. Educational and Psychological Measurement, 59(5), 804-820.
Hilsman, R., & Garber, J. (1995). A test of the cognitive diathesis-stress model of depression in children: Academic stressors, attributional style, perceived competence, and control. Journal of Personality & Social Psychology, 69(2), 18p.
114
Ingersoll, R.M. (1999). The problem of underqualified teachers in American secondary schools. Educational Researcher, 28(2), 26-37.
Lee, R.T., & Ashforth, B.E. (1996). A meta-analytic examination of the correlates of the three dimensions of job burnout. Journal of Applied Psychology, 81, 123-133.
Luekens, M.T., Lyter, D.M., & Fox, E.E. (2004). Teacher attrition and mobility: A report on the preparation and qualifications of public school teachers. Washington, DC: National Center for Educational Statistics, US Department of Education.
Luk, A.L., Chan, B.P.S., Cheong, S.W., & Ko, S. K.K. (2010). An exploration of the burnout situation on teachers in two schools in Macau. Social Indicators Research, 95(3), 489-502
Maslach, C., Jackson, S.E., & Leiter, M.P. (1996). Maslach Burnout Inventory manual (3rd. ed.). Mountain View, CA: Consulting Psychologists Press.
Nolen-Hoeksema, S., Girgus, J.S., & Seligman, M.E.P. (1986). Learned helplessness in children: A longitudinal study of depression, achievement, and explanatory style. Journal of Personality & Social Psychology, 51(2), 13p.
Pajares, F. (2002). Self-efficacy beliefs in academic contexts: An outline. Retrieved January 18, 2010 from http://des.emory.edu/mfp/efftalk.html.
Peterson, C., & Barrett, L.C. (1987). Explanatory style and academic performance among university freshmen. Journal of Personality and Social Psychology, 53(3), 603-607.
Peterson, C., & Vaidya, R.S. (2001). Explanatory style, expectations, and depressive symptoms. Personality and Individual Differences, 31(7), 1217-1223.
Ritchie, W.F. (2000). An exploration of college student explanatory style and its relationship to academic performance. Dissertation Abstracts International: Section A: Humanities & Social Sciences, 60(7-A), 2375.
Rosenberg, M. (1965). Society and the adolescent self-image. Princeton, NJ: Princeton University Press.
Seligman, M. E. P. (1998). Learned optimism: How to change your mind and your life (2nd ed.). New York: Pocket Books.
Seligman, M.E.P., & Maier, S.F. (1967). Failure to escape traumatic shock. Journal of Experimental Psychology, 74(1), 1-9.
Seligman, M. E. P., Reivich, K., Jaycox, L., & Gillham, J. (1995). The optimistic child: A proven program to safeguard children against depression and build lifelong resilience. New York: Harper Perennial.
Seligman, M.E.P., & Schulman, P. (1986). Explanatory style as a predictor of productivity and quitting among life insurance sales agents. Journal of Personality & Social Psychology, 50(4), 832-838.
Shaughnessy, M. (2004). An interview with Anita Woolfolk: The educational psychology of teacher efficacy. Educational Psychology Review, 16(2), 153-176.
Skaalvik, E.M., & Skaalvik, S. (2007). Dimensions of teacher self-efficacy and relations with strain factors, perceived collective teacher efficacy, and teacher burnout. Journal of Educational Psychology, 99(3), 611-625.
Skaalvik, E.M., & Skaalvik, S. (2009). Does school context matter?: Relations with teacher burnout and job satisfaction. Teaching and Teacher Education, 25(3), 518-524.
Tschannen-Moran, M., & Woolfolk-Hoy, A. (2001). Teacher efficacy: Capturing an elusive construct. Teaching and Teacher Education, 17, 783-805.
115
Tiggeman, M., & Crowley, J.R. (1993). Attributions for academic failure and subsequent performance. Australian Journal of Psychology, 45(1), 35-39.
Wheatley, K.F. (2005). The case for reconceptualizing teacher efficacy research. Teaching and Teacher Education, 21, 747-766.
Whitener, S.D., & Gruber, K. (1997). Characteristics of stayers, movers, and leavers: Results from the teacher follow-up survey: 1994-5. Washington, DC: National Center for Education Statistics, US Department of Education.
Woolfolk-Hoy, A., & Spero, R.B. (2005). Changes in teacher efficacy during the early years of teaching: A comparison of four measures. Teaching and Teacher Education, 21(4), 343-356.
Yates, S.M., & Yates, G.C.R. (1995). Explanatory style, ego-orientation, and primary school mathematics achievement. Educational Psychology, 15(1), 12p.
Zumwalt, K., & Craig, E. (2005). Teachers’ characteristics: Research on the indicators of quality. In Studying teacher education: The report of the AERA panel on research and teacher education. M. Cochran-Smith and K.M. Zeichner (Eds). Mahwah, New Jersey: Lawrence Erlbaum Associates, Inc.

116
CHAPTER 5
CONCLUSIONS AND DISCUSSION
This dissertation set out to explore two main questions. First, can educator explanatory
style be measured in context? And second, what is the theoretical and empirical relationship
between explanatory style and teachers’ sense of efficacy in reducing burnout?
This research shows that explanatory style can be measured with an educator-specific
measure, and that explanatory style matters in teaching. Explanatory style is a mediator to
teachers’ sense of efficacy in predicting burnout in teachers. Adding explanatory style to
teachers’ sense of efficacy provides it with more predictive power for burnout than when alone.
Additionally, a moderately optimistic explanatory style seems to benefit teachers most. Being too
pessimistic or too optimistic can lead to low efficacy and burnout, so aspiring to a more realistic
explanatory style seems to reduce burnout in teachers the most. This chapter examines how these
general conclusions were reached and what future directions are in store for researching further
the role of explanatory style in teaching.
Explanatory Style and Teachers’ Sense of Efficacy: Theoretically Connected
Chapter 2 examined explanatory style, teachers’ sense of efficacy, the theoretical
relationships between the two variables, and proposed a rationale for considering both in concert
to reduce teacher burnout. Research examining explanatory style, the characteristic ways in
which people explain good and bad events (Seligman, 1998), shows that those with more
pessimistic types of explanatory style are more at risk for depression (Peterson & Vaidya, 2001)
and are more likely to give up in the face of challenge (Seligman, Nolen-Hoeksema, Thornton, &
117
Thornton, 1992). Teachers who maximize the positive and de-emphasize the negative may feel
less burned out and remain in teaching longer. They may believe they are more capable as
teachers, which is referred to as a teacher’s sense of efficacy (Tschannen-Moran & Woolfolk-
Hoy, 2001). Teachers with a high sense of efficacy about teaching tend to use a larger variety of
teaching strategies and more proactive disciplinary procedures (Graham, Harris, Fink, &
MacArthur, 2001; Tschannen-Moran & Woolfolk Hoy, 2001). These two concepts
independently provide positive outcomes. Yet, discovering how these two constructs work
together provides a mechanism for using how teachers think about success and failure to promote
higher efficacy. While there are many variables that influence whether teachers will stay in the
field longer, the ways teachers think about classroom experiences is important to mediating how
capable teachers feel to enact change in their own classrooms.
Explanatory style and teachers’ sense of efficacy are based on experiences of success and
failure. For efficacy, mastery (i.e., successful) experiences are the primary means to develop high
efficacy, so experiencing success and avoiding failure are the keys to having a healthy sense of
efficacy. For explanatory style, how people interpret successes and failures defines their type of
explanatory style (optimist or pessimist), and interventions exist that help pessimists become
more optimistic. Thus, while efficacy is a good predictor of many positive teaching outcomes,
one must first experience success to achieve more success later. This is problematic in high-
failure situations like teaching. If optimistic explanatory style develops high self-efficacy, then
considering explanatory style and efficacy in high-failure situations may create opportunities for
interventions that go beyond mastery experiences.

118
The Importance of Domain Specificity: Educator Explanatory Style
Using domain-specific measures of explanatory style accounts for better model fit and
more variance than using generic attributional style measures (Higgins, Zumbo, & Hay, 1999).
Research shows that explanatory style can be measured effectively by modifying the ASQ to fit
particular situations or domains (Peterson & Barrett, 1987). Higgins, Zumbo, and Hay (1999) go
even further and propose that there is no such thing as a non-situational attributional style. Their
research showed that the use of context-dependent item sets (CDIS) increased model fit and
accounted for more variance than non-CDIS items. Additionally, the diathesis-stress model of
depression suggests that explanatory style may not be evident without the presence of a stressor.
Research in context-dependent attributional style suggests that depressionogenic (pessimistic)
attributional style is more apparent when faced with negative life events in the same context and
not as apparent outside of the context (Proudfoot, Corr, Guest, & Gray, 2001). Thus, domain-
specific explanatory style measures allows respondents to imagine situations that are actually
within the realm of possibility and present an imaginary stressor for a specific context to reveal
explanatory style. Explanatory style measures for children (CASQ, Seligman, et al, 1984), teens
(TASQ, Lieber, 1997), and financial-service sector workers (Proudfoot, Corr, Guest & Gray,
2001) exist that tap into situations often faced by these populations. This research adds to that list
of domain-specific measures with the Educator Attributional Style Questionnaire (EdASQ).
Chapter 3 indicates that the EdASQ is a reliable and valid measure of explanatory style in
teachers. The EdASQ has shown to have similar internal reliability to the original ASQ and
correlates in similar ways to self-esteem as the ASQ. Just as the ASQ is predictive of high self-
esteem, so, too, is the EdASQ. In addition, the EdASQ has a similar factor structure as the ASQ
when the positive items are analyzed independently from the negative items. According to this
119
research, teachers exhibit distinct explanatory styles for positive and negative events separately.
Chapter 3 confirms that measures based on the original 12-situation ASQ should be analyzed
using positive items and negative items separately rather than together. Considering positive and
negative events separately can provide researchers with more specific ways to develop less
pessimistic explanatory styles in teachers. In addition, error variances for the internal, stable, and
global items for each situation should be correlated to provide the best fit for the data. Since each
internal, stable, and global item is tied together by a situation, the measurement for each item is
tied together. Correlating the error variances allows for the items to be considered together
instead of separately. Chapter 3 helps establish a reliable and valid measure and a baseline for
explanatory style in teachers that will be useful for future research into teacher attributions about
school.
Explanatory Style as Mediator for Teachers’ Sense of Efficacy
Up to this point, the research has not examined whether efficacy precedes causal
explanations of mastery experiences or vice versa. Bandura (1994) argues that efficacy precedes
causal explanations and proposes that causal attributions are affected by efficacy beliefs. He
theorizes that those with high efficacy attribute failure to low effort while those with low
efficacy attribute failure to low ability (Figure 2.2).
Even though Bandura states that mastery experiences are one of the best ways to develop
efficacy, he acknowledges that not all mastery experiences are created equal. Easy successes are
not as valuable as those that are won via perseverance through setbacks and adversity. Bandura
does not explain how those with little or no efficacy at the outset get through setbacks. If
experiencing success breeds efficacy, then only in the end after success is gained would
experiences fraught with setbacks and adversity contribute to a higher sense of efficacy.

120
Bandura’s theory does not explain how one works through the setbacks and adversity except to
say that if one has higher efficacy, perseverance is more likely. If people do not have high
efficacy in the first place, it is unclear how they would get through to the end of a hard-fought
mastery experience without it. It would seem, then, that a variable between setbacks and success
exists that would be important to determining whether efficacy is developed through hard-fought
mastery experiences. While Bandura believes that this variable is not causal attributions, this
research demonstrates that explanatory style is a variable that mediates teachers’ sense of
efficacy in predicting burnout.
Chapter 4 demonstrates that explanatory style mediates teachers’ sense of efficacy in
predicting burnout. The explanatory style of teachers is an antecedent to developing a teacher’s
sense of efficacy. How teachers explain good and bad events in the classroom helps them
develop efficacy beliefs about their teaching. In addition, this research shows that good and bad
events contribute to the development of efficacy in the classroom.
This research suggests a new model for the relationship between efficacy and explanatory
style, which is shown in Figure 4.5. According to this model, efficacy and explanatory style
work in a feedback loop. Experiences of success and failure both influence the development of
efficacy. Explanatory style mediates a teacher’s sense of efficacy, which then influences how
capable people feel about dealing with future experiences of success and failure. Then, once
success or failure is experienced, explanatory style occurs, which builds or destroys the sense of
efficacy further. Even though some have asserted that efficacy informs explanatory style
(Bandura, 1994; Pajares, 2002), this research does not support that assertion. The models that
tested teachers’ sense of efficacy mediating explanatory style to predict burnout did not show
good fit.
121
This feedback loop may explain how hard-fought mastery experiences help develop
efficacy. Hard-fought mastery experiences are those in which setbacks and obstacles occur
before mastery is achieved. While those with already high efficacy persevere through failures
and setbacks, those with low efficacy may not have the resources it takes to persevere and
ultimately achieve mastery, and by extension, efficacy. This research suggests a mechanism for
building efficacy in teachers who have may have low efficacy. Interventions focusing on
teachers’ explanatory style could help those with low and high efficacy build or maintain
efficacy using explanations of successful and unsuccessful experiences in the classroom. Thus,
since explanatory style mediates efficacy during the setbacks of a hard-fought experience,
optimists are more likely to persevere and, in turn, gain efficacy through the experience of
mastery.
Bad Events Matter As Well As the Good
The types of causal explanations teachers make about success and failure provide the
efficacy they need to weather difficult teaching situations. Explanations of success and failure
contribute to an increased sense of efficacy. An optimistic teacher views successful teaching as
internal, global and stable but views unsuccessful teaching as external, isolated, and unstable.
Thus, not only do successful experiences lead to increased efficacy, but experiences of failure
also develop efficacy. These types of explanations about the causes of events, successful and
unsuccessful, lead to the teacher having a higher sense of efficacy, which, in turn, leads to more
resiliency and less burnout.
The specific relationships between explanatory style and efficacy to predict burnout
shows how attending to explanations of both positive and negative events can help teachers build
efficacy and avoid burnout. Negative event explanations mediate efficacy in predicting

122
exhaustion, while positive event explanations mediate efficacy in predicting disengagement.
Exhaustion, according to the OLBI, involves how much energy one is expending toward one’s
job. People who have jobs that leave them with little energy to pursue outside interests or to go
above-and-beyond the job’s duties feel exhausted. According to this model, if teachers explain
negative events in an optimistic way (external, temporary, and isolated), they will have higher
efficacy and feel less exhausted. They will feel more energy to pursue either their own outside
interests or seek out ways to overachieve in their jobs. Explaining negative events in optimistic
ways seem to help teachers reduce the impact of those bad events on how they feel about their
capabilities as teachers and their view of their jobs. The disengagement measure of the OLBI
describes how connected one feels towards the job. According to this study, if teachers explain
positive events in the classroom in optimistic ways (internal, stable, and global), they will have
higher efficacy and thus feel more engaged. Optimistic teachers can use the success of positive
events not only to build efficacy, but also to feel as though they have a personal connection to
their jobs. By focusing on explanations of both positive and negative experiences in the
classroom, teachers can build efficacy and address both components of burnout. Additionally, if
teachers are aware of what component of burnout they are feeling about their job, they can target
their explanations of relevant events more specifically to build efficacy and tackle their specific
burnout needs. Now, instead of using only mastery experiences to increase efficacy, experiences
of success and failure can be used to increase efficacy. In addition, interventions can target
differential explanatory styles to mediate the development of efficacy and avoid burnout. As
such, the diagnosis of low efficacy and burnout in teachers can be more detailed, making
subsequent interventions more effective.

123
Teacher burnout is influenced by teachers’ explanations of both positive and negative
events rather than just focusing on explanations of negative events only. Prior efficacy research
and theory focuses almost exclusively on the impact of successful, or positive, events in building
efficacy and suggests that bad events, or those that bring failure, have only a negative affect on
efficacy. Not only should efficacy research focus on how people explain positive, mastery
events, but also on how their explanations of bad, non-mastery events contribute to a total picture
of efficacy building. Conversely, it is interesting to note that much of the research in explanatory
style focuses on how people explain only negative events or failures. In fact, the original ASQ
has been modified to ask for responses only about negative events since these explanations better
predict depression. This study indicates that research using context-dependent item sets should
not neglect positive situations. Examining how non-depressed individuals explain good events as
well as the bad can provide a more detailed picture of the role of explanatory style in context.
Pessimism vs. Optimism? Realism Matters
Research is divided over whether pessimism is completely detrimental to performance
(i.e., Sanna & Chang, 2003; Tiggeman & Crowley, 1993). This research suggests that being
extremely pessimistic or extremely optimistic are both undesirable, but in very specific ways.
Pessimists experience changes in efficacy and burnout if they explain positive events
pessimistically (as external, temporary, and specific). Thus, for pessimistic teachers, disputing
the personal, permanent, and pervasive nature of good events may leave them feeling incapable,
exhausted, disengaged, and unwilling to seek training to help deficiencies in the classroom. Good
events for pessimists do not build efficacy since they dismiss their role in making the good event
happen and doubt whether the good event will have any lasting or global effects. Therefore,
mastery experiences for pessimists may not have the efficacy-building impact that they do for

124
optimists. Essentially, not only do bad events matter for efficacy, but some good events many not
matter for efficacy if teachers have a pessimistic explanatory style.
The models tested in Chapter 4 for pessimists and optimists show how those with each
type of explanatory style differ in how those explanations influence efficacy and burnout.
Optimists experience changes in efficacy and burnout if they explain negative events
optimistically (as external, temporary, and specific). Thus, for optimistic teachers, dismissing the
personal, permanent, and pervasive nature of bad events may leave them feeling just as
incapable, exhausted, disengaged, and unwilling to seek professional development as their
pessimistic colleagues. For optimists, bad events may not have the instructive impact needed to
help them be reflective of their teaching practices. If optimistic teachers have a negative
experience in the classroom, such as when a lesson does not go as planned, they may not take
appropriate personal responsibility for its failure. They may dismiss the event as a fluke that will
not recur or influence future lessons. They may blame external factors, such as student apathy or
low ability, for the failure of the lesson. These types of explanations for negative classroom
events may lead teachers to feeling as though they can do nothing to change a bad, immutable
situation. They may feel exhausted with continually trying the same methods over and over
again, hoping for the right set of caring or high-ability students to walk in the door. They may
feel disconnected from students whom they feel are not capable of the challenging work they are
presenting. These optimistic teachers may also forego professional development opportunities
aimed at trying new instructional practices since they feel their current practice is sufficient, if
only in the right circumstances.
Administrators should be concerned with both pessimistic and optimistic teachers getting
burned out. According to this research, teachers should avoid being pessimistic about positive

125
classroom experiences. By explaining positive events as external, temporary, and specific,
teachers can negate the efficacy-building impact of mastery experiences. Thus, it is good for
teachers to explain good events as internal, stable, and global. This type of explanation helps
build efficacy when success is experienced. However, teachers should also avoid being too
optimistic about failures in the classroom. By explaining negative events as external, temporary,
and specific, teachers may not take appropriate responsibility for what goes wrong in the
classroom. Thus, it is also good for teachers to be reflective about their practice and shoulder
some of the responsibility for classroom events gone awry. It is too simple to say that teachers
should be optimists in all things in order to build efficacy and avoid burnout. Teachers perhaps
should be realists instead, taking responsibility for both the good and the bad so they can build
efficacy and seek corrective action when needed.
Future Directions
The theoretical foundations for explanatory style and efficacy are robust and hint at the
relationship between explanatory style and efficacy. This research helps clarify this relationship.
By developing an educator explanatory style measure and using it along with established
measures of teachers’ sense of efficacy, I have shown how explanatory style mediates teachers’
sense of efficacy in predicting burnout. Since explanatory style mediates efficacy, any
experience one has during teaching could be used to build efficacy. Understanding what type of
explanatory style maximizes a teacher’s sense of efficacy will help administrators develop
training programs that maximize job satisfaction and professionalism. Training teachers to think
more realistically about success and failure could be the key to building a high sense of efficacy
and helping teachers be more effective.

126
This research suggests a mechanism for building efficacy in teachers that capitalizes on
mastery experiences. Mastery experiences are one of the four main ways to develop efficacy, and
while experiencing mastery is certainly ideal, it is often difficult to capitalize on mastery
experiences in teaching situations, especially in districts that struggle. Efficacy training programs
with teachers are often difficult to administer successfully in that mastery experiences should be
authentic rather than manufactured. Instead of waiting for success to happen, teachers can learn
how to explain good and bad events in ways that maximize efficacy and reduce burnout. They
can explain good events optimistically and bad events realistically. Teachers can assess their own
type of explanatory style to be sensitive to the different ways optimists and pessimists are
affected by success and failure. Optimistic teachers can focus on whether they are taking enough
appropriate responsibility for classroom failures. Pessimistic teachers can focus on whether they
are capitalizing on good events appropriately. Successful explanatory style training programs
already exist (Seligman, Reivich, Jaycox, & Gillham, 1995). The next step for this research
should involve developing teacher-training programs that incorporate explanatory style training
into efficacy-building activities.
The relationships among explanatory style, efficacy, and professional development hours
show how attending to explanations of negative events only can help teachers build efficacy and
pursue more professional opportunities. Helping teachers explain negative events in optimistic
ways can help them have greater efficacy and, in turn, pursue more professional development
hours in a given year. Professional development is often focused on helping teachers address
weaknesses in their teaching, so it is not surprising that negative event explanations would
contribute to whether a teacher would feel as though more hours would be helpful. If teachers
were pessimistic, they would explain negative events as internal, stable, and global, and they

127
might not feel as though any further training would help alleviate the recurrence of negative
classroom events. Optimistic teachers, however, would see further training as a viable way to
correct errant instructional, classroom management, or student engagement practices. More
research is needed to see if the explanations for positive and negative events lead teachers to
pursue certain types of professional development activities. It would be interesting to see if how
teachers explain negative events predicts whether they pursue activities that address weakness
and if how they predict positive events predicts whether they pursue professional growth
opportunities like advanced degrees or certification.
One way to evaluate explanatory style further is to analyze the causes teachers give for
each situation presented in the EdASQ. Teachers provide a short free-response cause to each
situation on the EdASQ and all ASQ-style measures. Traditionally, these responses are not
analyzed to determine if they correspond to responses given to the subsequent internal, stable,
and global Likert items. Future research should examine these free-response causes to determine
if the causes are consistent with the Likert responses and to assess the qualities of the provided
causes. This type of qualitative research could be valuable to understanding teacher cognitive
processes and how explanatory style more specifically relates to teaching.
The low response rate for this research is one major limitation for this research. The most
significant rate of survey attrition occurred during the EdASQ portion of the survey. This
indicates that the EdASQ items are likely too cumbersome for large-scale research with teachers.
Finding a way to measure explanatory style without relying on the labor-intensive way the
measure is typically administered could increase the participation rates in studies using these
measures. Teachers are typically pressed for time each day as they plan lessons, manage
administrative duties (such as taking attendance and managing discipline), and grade student
128
work. Having a valid and concise measure of how teachers explain events would improve the
utility of the EdASQ for future research.
Another limitation of this study involves the type of teacher surveyed. Although teachers
from a broad spectrum of socioeconomic levels were included in this study, no teachers from
urban districts were a part of this research. Future research should include teachers from urban
districts to see if the same relationships among explanatory style, efficacy, and burnout exist in
environments that historically pose greater challenges for teachers. Teachers in urban school
districts typically experience a higher incidence of negative experiences than those in affluent,
suburban districts. It would interesting to see if teachers in struggling districts exhibit the same
patterns of explanatory style, efficacy, and burnout as those in this study.
This research helps clarify the relationship between explanatory style and efficacy and
suggests ways to develop professional training programs that help teachers build efficacy. As the
research in this area matures, we can develop ways to help teachers navigate the good and bad
situations that occur in the classroom in ways that build efficacy and reduce burnout so we can
keep strong teachers in the field longer. This research provides an important clarification
regarding how explanatory style is a mediator to efficacy when experiencing success and failure.
Hard-fought mastery experiences are excellent ways to build efficacy, but persevering through
the setbacks and obstacles is required to reach the goal of mastery. Without an optimistic
explanatory style, teachers do not view the obstacles as challenges to overcome. Teachers will
need to develop optimistic, but not too optimistic, explanations for failure in order to fight hard
toward mastery. This research suggests that how teachers think about the positive and the
negative matters.
129
References
Abramson, L.Y., Seligman, M.E.P., & Teasdale, J.D. (1978). Learned helplessness in humans: Critique and reformulation. Journal of Abnormal Psychology, 87(1), 49-74.
Ashton, P.T., (1984). A motivational paradigm for effective teacher education. Journal of
Teacher Education, 35(5), 28-32. Baker, D.P., & Smith, T. (1997). Teacher turnover and teacher quality: Refocusing the issue.
Teachers College Record, 99(1), 29-35. Bandura, A., (1986). Social foundations of thought and action: A social-cognitive theory.
Englewood Cliffs, NJ: Prentice Hall. Bandura, A. (1994). Self-efficacy. In V. S. Ramachaudran (Ed.), Encyclopedia of human
behavior (Vol. 4, pp. 71-81). New York: Academic Press. Bandura, A. (1997) Self-efficacy: The exercise of control. W.H. Freeman and Company, New
York. Boe, E.E., Bobbitt, S.A., Cook, L.H., Barkanic, G., & Maislin, G. (1998). Teacher turnover in
eight cognate areas: National trends and predictors. Philadelphia, PA: Center for Research and Evaluation in Social Policy.
Britt, S. & McCartney, A. (2008). Stopping the revolving door: Increasing teacher retention.
Politics & Policy, 36(5), 750-774. Demerouti, E., Bakker, A.B., Nachreiner, F., & Schaufelt, W.B. (2001). The job demands-
resources model of burnout. Journal of Applied Psychology, 86(3), 499-512. Denzine, G.M., Cooney, J.B., & McKenzie, R. (2005). Confirmatory factor analysis of the
Teacher Efficacy Scale for prospective teachers. British Journal of Educational Psychology, 75(4), 689-708.
Elliott, E. S., & Dweck, C. S. (1988). Goals: An approach to motivation and achievement.
Journal of Personality and Social Psychology, 54, 5-12. Erickson, S.J. (2008). An examination of the relationship between professional development and
teacher turnover. Dissertation Abstracts International Section A: Humanities and Social Sciences, 68(8-A), 3349.

130
Fazio, N.M., & Palm, L.J. (1998). Attributional style, depression, and grade point averages of college students. Psychological Reports, 83(1), 159-162.
Graham, S., Harris, K.R., Fink, B., & MacArthur, C.A. (2001). Teacher efficacy in writing: a
construct validation with primary grade teachers. Scientific Studies of Reading 5(2), 177–202.
Hall, H., & Smith, B. (1999). Explanatory style of secondary vocational educators. Journal of
Vocational and Technical Education, 15(2), 19-27. Henson, R. (2001). Teacher Self-Efficacy: Substantive Implications and Measurement Dilemmas.
Retrieved from ERIC database. Higgins, N., Zumbo, B., & Hay, J. (1999). Construct validity of attributional style: Modeling
context-dependent item sets in the Attributional Style Questionnaire. Educational and Psychological Measurement, 59(5), 804-820.
Hilsman, R., & Garber, J. (1995). A test of the cognitive diathesis-stress model of depression in
children: Academic stressors, attributional style, perceived competence, and control. Journal of Personality & Social Psychology, 69(2), 18p.
Ingersoll, R.M. (1999). The problem of underqualified teachers in American secondary schools.
Educational Researcher, 28(2), 26-37. Ingersoll, R.M. (2003). “Is there really a teacher shortage?” Co-sponsor by the Consortium for
Policy Research Education and the Center for the Study of Teaching and Policy (September). Accessed on October 24, 2009. Available online at http://depts.washington.edu/ctpmail/PDFs/Shortage-RI-09-2003.pdf
Kapadia, K., Coca, V., & Easton, J.Q. (2007). “Keeping new teachers: A first look at the
influences of induction in the Chicago public schools.” Consortium on Chicago School Research at the University of Chicago (January). Accessed on October 24, 2009. Available online at http://ccsr.uchicago.edu/publications/keeping_new_teachers012407.pdf
Lieber, E. (1997, May). The teenage attributional style questionnaire. Dissertation Abstracts
International, 57, Retrieved from PsycINFO database. Maslach, C. (1982). Understanding burnout: Definitional issues in analyzing a complex
phenomenon. In W. S. Paine (Ed.), Job stress and burnout (pp. 29-40). Beverly Hills. CA: Sage.
Nolen-Hoeksema, S., Girgus, J.S., & Seligman, M.E.P. (1986). Learned helplessness in children:
A longitudinal study of depression, achievement, and explanatory style. Journal of Personality & Social Psychology, 51(2), 13p.
131
Pajares, F. (2002). Self-efficacy beliefs in academic contexts: An outline. Retrieved January 18, 2010 from http://des.emory.edu/mfp/efftalk.html.
Peterson, C., & Barrett, L.C. (1987). Explanatory style and academic performance among
university freshmen. Journal of Personality and Social Psychology, 53(3), 603-607. Peterson, C., & Vaidya, R.S. (2001). Explanatory style, expectations, and depressive symptoms.
Personality and Individual Differences, 31(7), 1217-1223. Proudfoot, J.G., Corr, P.J., Guest, D.E., & Gray, J.A. (2001). The development and evaluation of
a scale ot measure occupational attributional style in the financial services sector. Personality and Individual Differences, 30(2), 259-270.
Ritchie, W.F. (2000). An exploration of college student explanatory style and its relationship to
academic performance. Dissertation Abstracts International: Section A: Humanities & Social Sciences, 60(7-A), 2375.
Sanna, L.J., & Chang, E.C. (2003). The past is not what it used to be: Optimists’ use of
retroactive pessimism to diminish the sting of failure. Journal of Research in Personality, 37(5), 388-404.
Seligman, M. E. P. (1998). Learned optimism: How to change your mind and your life (2nd ed.).
New York: Pocket Books. Seligman, M.E.P., Nolen-Hoeksema, S., Thornton, N, & Thornton, K.M. (1990). Explanatory
style as a mechanism of disappointing athletic performance. Psychological Science, 1(2), 143-146.
Seligman, M.E.P., Peterson, C., Kaslow, N.J., Tanenbaum, R.L., Alloy, L.B., & Abramson, L.Y.
(1984). Explanatory style and depressive symptoms among school children. Journal of Abnormal Psychology, 93, 235-238.
Seligman, M. E. P., Reivich, K., Jaycox, L., & Gillham, J. (1995). The optimistic child: A proven
program to safeguard children against depression and build lifelong resilience. New York: Harper Perennial.
Seligman, M.E.P., & Schulman, P. (1986). Explanatory style as a predictor of productivity and
quitting among life insurance sales agents. Journal of Personality & Social Psychology, 50(4), 832-838.
Serpell, Z, & Bozeman, L.A. (1999). “Beginning teacher induction: A report on beginning
teacher effectiveness and retention.” National Partnership for Excellence and Accountability in Teaching (November). Accessed on October 24, 2009. Available online at http://eric.ed.gov/ERICDocs/data/ericdocs2sql/content_storage_01/0000019b/80/16/b7/37.pdf

132
Skaalvik, E.M., & Skaalvik, S. (2007). Dimensions of teacher self-efficacy and relations with
strain factors, perceived collective teacher efficacy, and teacher burnout. Journal of Educational Psychology, 99(3), 611-625.
Smith, B. P., Hall, H. C., & Woolcock-Henry, C. (2000) The effects of gender and years of
teaching experience on explanatory style of secondary vocational teachers. Journal of Vocational Education Research, 25(1), 21-33.
Tiggeman, M., & Crowley, J.R. (1993). Attributions for academic failure and subsequent
performance. Australian Journal of Psychology, 45(1), 35-39. Tschannen-Moran, M., & Woolfolk-Hoy, A. (2001). Teacher efficacy: Capturing an elusive
construct. Teaching and Teacher Education, 17, 783-805. Wheatley, K.F. (2005). The case for reconceptualizing teacher efficacy research. Teaching and
Teacher Education, 21, 747-766. Woolfolk-Hoy, A., & Spero, R.B. (2005). Changes in teacher efficacy during the early years of
teaching: A comparison of four measures. Teaching and Teacher Education, 21(4), 343-356.
Yates, S.M., & Yates, G.C.R. (1995). Explanatory style, ego-orientation, and primary school
mathematics achievement. Educational Psychology, 15(1), 12p. Zumwalt, K., & Craig, E. (2005). Teachers’ characteristics: Research on the indicators of quality.
In Studying teacher education: The report of the AERA panel on research and teacher education. M. Cochran-Smith and K.M. Zeichner (Eds). Mahwah, New Jersey: Lawrence Erlbaum Associates, Inc.

133
APPENDIX A
Measures of Teacher Explanatory Style, Self-Esteem, Teachers’ Sense of Efficacy, and Burnout
Explanaatory Style EDUCATOR ATTRIBUTIONAL STYLE QUESTIONNAIRE (derived from Peterson, Semmel, von Baeyer, Abramson, Metalsky, & Seligman, 1984) Directions: 1. Read each situation and vividly imagine it happening to you. 2. Decide what you believe to be the one major cause of the situation if it happened to you. 3. Write this cause in the blank provided. 4. Answer the questions about the cause by circling one number per question. Do not circle the
words. 5. Go on to the next situation.
SITUATIONS A STUDENT COMPLIMENTS YOU ON THE LESSON YOU TAUGHT HIM/HER. 1. Write down the one major cause: ________________________________________________ 2. Is the cause of your student’s compliment due to something about you or something about
other people or circumstances?
Totally due to other people 1 2 3 4 5 6 7 Totally due to me or circumstances
3. In the future, when you teach this student, will this cause again be present?
Will never be present again 1 2 3 4 5 6 7 Will always be present
4. Is this cause something that just affects interacting with students, or does it also influence
other areas of your life?
Influences just this particular 1 2 3 4 5 6 7 Influences all situation situations in my life.
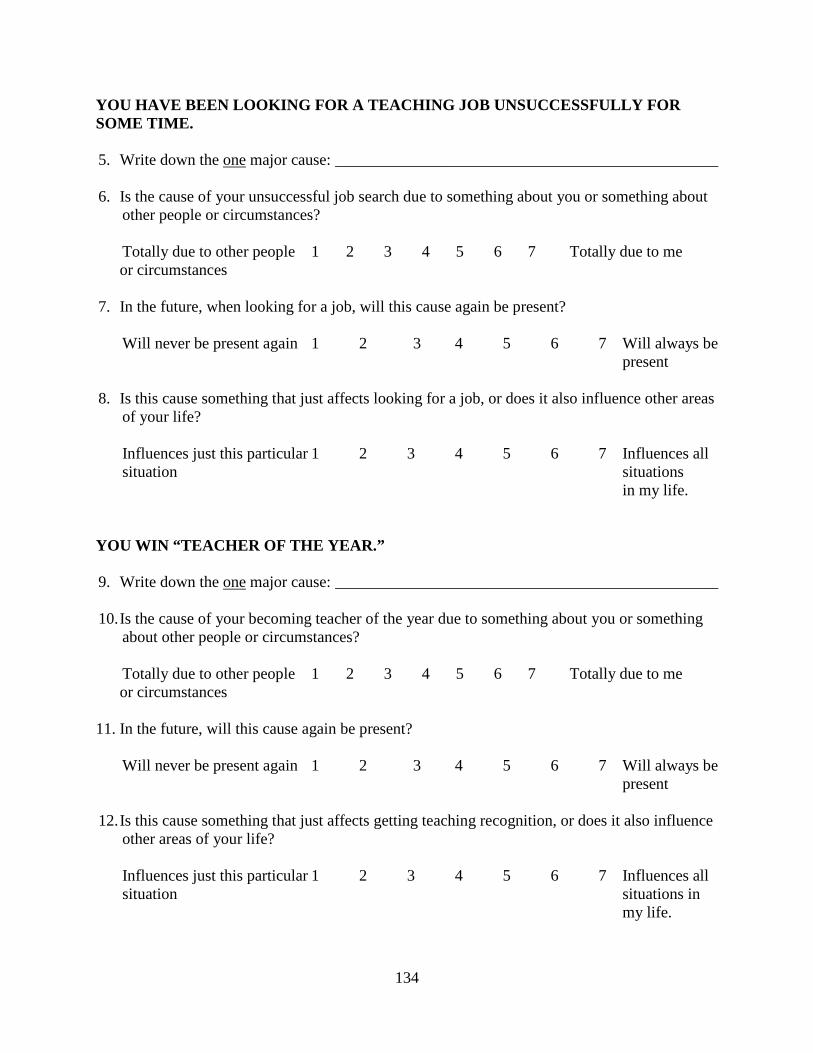
134
YOU HAVE BEEN LOOKING FOR A TEACHING JOB UNSUCCESSFULLY FOR SOME TIME.
5. Write down the one major cause: ________________________________________________ 6. Is the cause of your unsuccessful job search due to something about you or something about
other people or circumstances?
Totally due to other people 1 2 3 4 5 6 7 Totally due to me or circumstances 7. In the future, when looking for a job, will this cause again be present?
Will never be present again 1 2 3 4 5 6 7 Will always be present
8. Is this cause something that just affects looking for a job, or does it also influence other areas
of your life?
Influences just this particular 1 2 3 4 5 6 7 Influences all situation situations in my life.
YOU WIN “TEACHER OF THE YEAR.”
9. Write down the one major cause: ________________________________________________ 10. Is the cause of your becoming teacher of the year due to something about you or something
about other people or circumstances?
Totally due to other people 1 2 3 4 5 6 7 Totally due to me or circumstances 11. In the future, will this cause again be present?
Will never be present again 1 2 3 4 5 6 7 Will always be present
12. Is this cause something that just affects getting teaching recognition, or does it also influence
other areas of your life?
Influences just this particular 1 2 3 4 5 6 7 Influences all situation situations in my life.

135
A COLLEAGUE COMES TO YOU WITH A PROBLEM IN THE CLASSROOM, AND YOU DON’T TRY TO HELP HIM/HER.
13. Write down the one major cause: ________________________________________________ 14. Is the cause of your not helping your colleague due to something about you or something
about other people or circumstances?
Totally due to other people 1 2 3 4 5 6 7 Totally due to me or circumstances 15. In the future, when a colleague comes to you with a problem, will this cause again be
present?
Will never be present again 1 2 3 4 5 6 7 Will always be present
16. Is this cause something that just affects what happens when a colleague comes to you with a
problem, or does it also influence other areas of your life?
Influences just this particular 1 2 3 4 5 6 7 Influences all situation situations in my life.
YOU TEACH AN IMPORTANT LESSON AND THE STUDENTS REACTS NEGATIVELY.
17. Write down the one major cause: ________________________________________________ 18. Is the cause of the class’s negative reaction due to something about you or something about
other people or circumstances?
Totally due to other people 1 2 3 4 5 6 7 Totally due to me or circumstances 19. In the future, when you teach, will this cause again be present?
Will never be present again 1 2 3 4 5 6 7 Will always be present
20. Is this cause something that just affects teaching, or does it also influence other areas of your
life?
Influences just this particular 1 2 3 4 5 6 7 Influences all situation situations in my life.

136
YOU DO A PROJECT FOR YOUR SCHOOL WHICH IS HIGHLY PRAISED.
21. Write down the one major cause: ________________________________________________ 22. Is the cause of your being praised due to something about you or something about other
people or circumstances?
Totally due to other people 1 2 3 4 5 6 7 Totally due to me or circumstances 23. In the future, when do a project, will this cause again be present?
Will never be present again 1 2 3 4 5 6 7 Will always be present
24. Is this cause something that just affects doing projects, or does it also influence other areas of
your life?
Influences just this particular 1 2 3 4 5 6 7 Influences all situation situations in my life.
YOU HAVE A CONFERENCE WITH A PARENT WHO ACTS HOSTILELY TOWARDS YOU.
25. Write down the one major cause: ________________________________________________ 26. Is the cause of the parent acting hostile due to something about you or something about other
people or circumstances?
Totally due to other people 1 2 3 4 5 6 7 Totally due to me or circumstances 27. In the future, when interacting with parents, will this cause again be present?
Will never be present again 1 2 3 4 5 6 7 Will always be present
28. Is this cause something that just affects interacting with parents, or does it also influence
other areas of your life?
Influences just this particular 1 2 3 4 5 6 7 Influences all situation situations in my life.

137
YOU CAN’T GET ALL THE WORK DONE THAT OTHERS EXPECT OF YOU.
29. Write down the one major cause: ________________________________________________ 30. Is the cause of your not getting the work done due to something about you or something
about other people or circumstances?
Totally due to other people 1 2 3 4 5 6 7 Totally due to me or circumstances 31. In the future, when doing work that others expect, will this cause again be present?
Will never be present again 1 2 3 4 5 6 7 Will always be present
32. Is this cause something that just affects doing work that others expect of you, or does it also
influence other areas of your life?
Influences just this particular 1 2 3 4 5 6 7 Influences all situation situations in my life.
YOUR PRINCIPAL HAS GIVEN YOU SEVERAL POSITIVE EVALUATIONS .
33. Write down the one major cause: ________________________________________________ 34. Is the cause of your principal evaluating you more positively due to something about you or
something about other people or circumstances?
Totally due to other people 1 2 3 4 5 6 7 Totally due to me or circumstances 35. In the future interactions with your principal, will this cause again be present?
Will never be present again 1 2 3 4 5 6 7 Will always be present
36. Is this cause something that just affects how your principal treats you, or does it also
influence other areas of your life?
Influences just this particular 1 2 3 4 5 6 7 Influences all situation situations in my life.
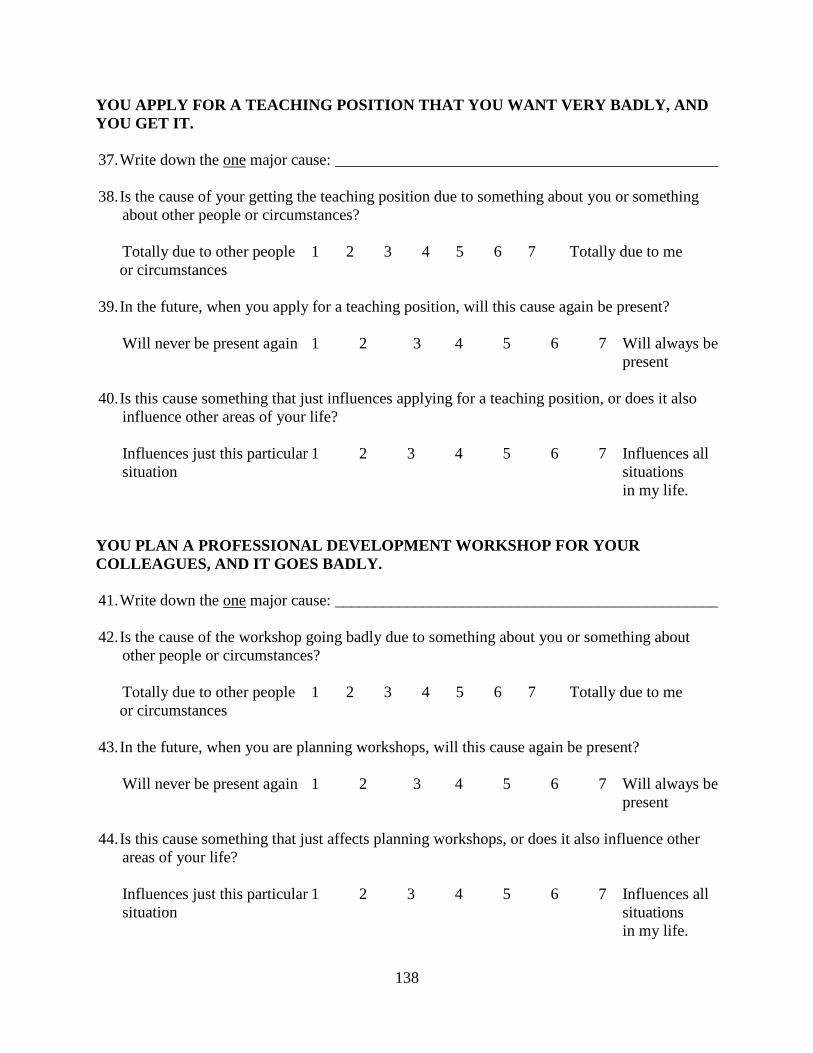
138
YOU APPLY FOR A TEACHING POSITION THAT YOU WANT VERY BADLY, AN D YOU GET IT.
37. Write down the one major cause: ________________________________________________ 38. Is the cause of your getting the teaching position due to something about you or something
about other people or circumstances?
Totally due to other people 1 2 3 4 5 6 7 Totally due to me or circumstances 39. In the future, when you apply for a teaching position, will this cause again be present?
Will never be present again 1 2 3 4 5 6 7 Will always be present
40. Is this cause something that just influences applying for a teaching position, or does it also
influence other areas of your life?
Influences just this particular 1 2 3 4 5 6 7 Influences all situation situations in my life.
YOU PLAN A PROFESSIONAL DEVELOPMENT WORKSHOP FOR YOUR COLLEAGUES, AND IT GOES BADLY.
41. Write down the one major cause: ________________________________________________ 42. Is the cause of the workshop going badly due to something about you or something about
other people or circumstances?
Totally due to other people 1 2 3 4 5 6 7 Totally due to me or circumstances 43. In the future, when you are planning workshops, will this cause again be present?
Will never be present again 1 2 3 4 5 6 7 Will always be present
44. Is this cause something that just affects planning workshops, or does it also influence other
areas of your life?
Influences just this particular 1 2 3 4 5 6 7 Influences all situation situations in my life.

139
YOU GET A LETTER FROM A FORMER STUDENT THAT THANKS YOU FOR YOUR POSITIVE INFLUENCE IN HIS/HER LIFE.
45. Write down the one major cause: ________________________________________________ 46. Is the cause of your getting the positive letter due to something about you or something about
other people or circumstances?
Totally due to other people 1 2 3 4 5 6 7 Totally due to me or circumstances 47. In the future, will this cause again be present?
Will never be present again 1 2 3 4 5 6 7 Will always be present
48. Is this cause something that just affects getting positive letters from students, or does it also
influence other areas of your life?
Influences just this particular 1 2 3 4 5 6 7 Influences all situation situations
in my life. Self-Esteem ROSENBERG SELF-ESTEEM SCALE – (Rosenberg, 1957) For each of the following statements, use the scale below to indicate your agreement or disagreement. 1 = strongly agree 2 = agree 3 = disagree 4 = strongly disagree 1. I feel that I am a person of worth, at least on an equal basis with others. 2. I feel that I have a number of good qualities. 3. All in all, I am inclined to feel that I am a failure. 4. I am able to do things as well as most people. 5. I feel I do not have much to be proud of. 6. I take a positive attitude toward myself. 7. On the whole, I am satisfied with myself. 8. I wish I could have more respect for myself. 9. I certainly feel useless at times. 10. At times I think I am no good at all.
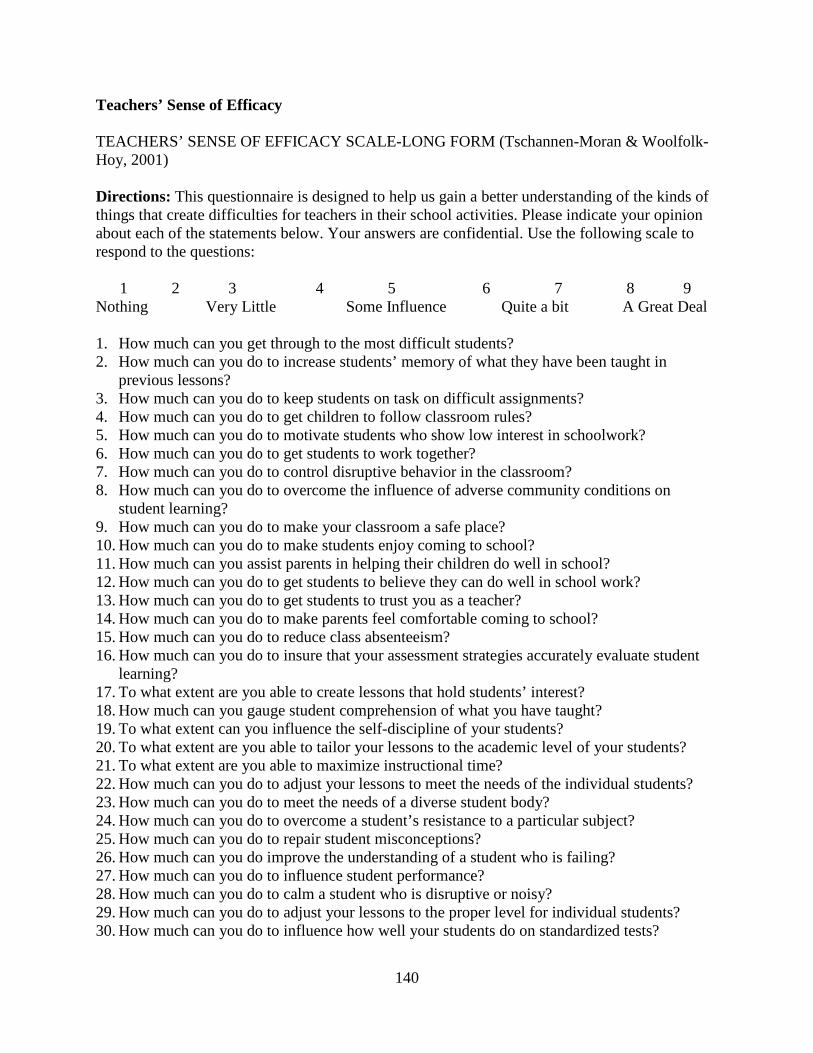
140
Teachers’ Sense of Efficacy TEACHERS’ SENSE OF EFFICACY SCALE-LONG FORM (Tschannen-Moran & Woolfolk-Hoy, 2001) Directions: This questionnaire is designed to help us gain a better understanding of the kinds of things that create difficulties for teachers in their school activities. Please indicate your opinion about each of the statements below. Your answers are confidential. Use the following scale to respond to the questions: 1 2 3 4 5 6 7 8 9 Nothing Very Little Some Influence Quite a bit A Great Deal 1. How much can you get through to the most difficult students? 2. How much can you do to increase students’ memory of what they have been taught in
previous lessons? 3. How much can you do to keep students on task on difficult assignments? 4. How much can you do to get children to follow classroom rules? 5. How much can you do to motivate students who show low interest in schoolwork? 6. How much can you do to get students to work together? 7. How much can you do to control disruptive behavior in the classroom? 8. How much can you do to overcome the influence of adverse community conditions on
student learning? 9. How much can you do to make your classroom a safe place? 10. How much can you do to make students enjoy coming to school? 11. How much can you assist parents in helping their children do well in school? 12. How much can you do to get students to believe they can do well in school work? 13. How much can you do to get students to trust you as a teacher? 14. How much can you do to make parents feel comfortable coming to school? 15. How much can you do to reduce class absenteeism? 16. How much can you do to insure that your assessment strategies accurately evaluate student
learning? 17. To what extent are you able to create lessons that hold students’ interest? 18. How much can you gauge student comprehension of what you have taught? 19. To what extent can you influence the self-discipline of your students? 20. To what extent are you able to tailor your lessons to the academic level of your students? 21. To what extent are you able to maximize instructional time? 22. How much can you do to adjust your lessons to meet the needs of the individual students? 23. How much can you do to meet the needs of a diverse student body? 24. How much can you do to overcome a student’s resistance to a particular subject? 25. How much can you do to repair student misconceptions? 26. How much can you do improve the understanding of a student who is failing? 27. How much can you do to influence student performance? 28. How much can you do to calm a student who is disruptive or noisy? 29. How much can you do to adjust your lessons to the proper level for individual students? 30. How much can you do to influence how well your students do on standardized tests?
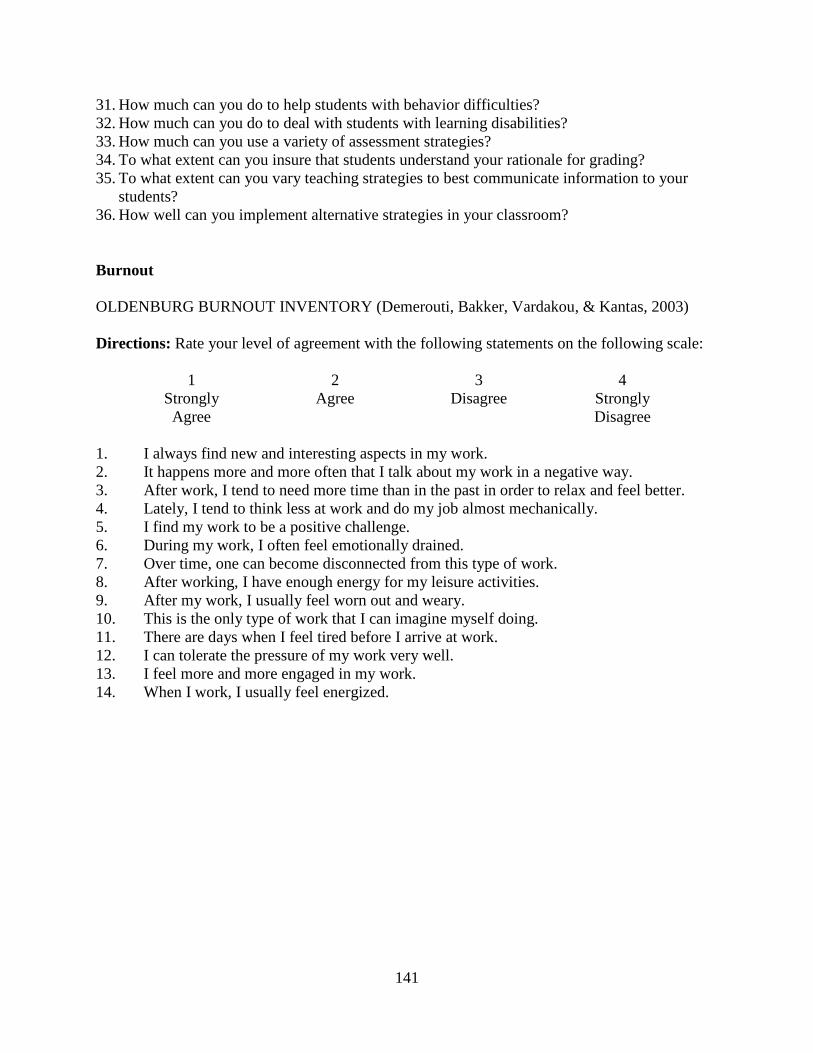
141
31. How much can you do to help students with behavior difficulties? 32. How much can you do to deal with students with learning disabilities? 33. How much can you use a variety of assessment strategies? 34. To what extent can you insure that students understand your rationale for grading? 35. To what extent can you vary teaching strategies to best communicate information to your
students? 36. How well can you implement alternative strategies in your classroom?
Burnout OLDENBURG BURNOUT INVENTORY (Demerouti, Bakker, Vardakou, & Kantas, 2003) Directions: Rate your level of agreement with the following statements on the following scale: 1 2 3 4 Strongly Agree Disagree Strongly Agree Disagree 1. I always find new and interesting aspects in my work. 2. It happens more and more often that I talk about my work in a negative way. 3. After work, I tend to need more time than in the past in order to relax and feel better. 4. Lately, I tend to think less at work and do my job almost mechanically. 5. I find my work to be a positive challenge. 6. During my work, I often feel emotionally drained. 7. Over time, one can become disconnected from this type of work. 8. After working, I have enough energy for my leisure activities. 9. After my work, I usually feel worn out and weary. 10. This is the only type of work that I can imagine myself doing. 11. There are days when I feel tired before I arrive at work. 12. I can tolerate the pressure of my work very well. 13. I feel more and more engaged in my work. 14. When I work, I usually feel energized.

142
APPENDIX B
Means, Standard Deviations, T-values, P-values, Variances, Regression Weights and Factor Score Weights for Educator Attributional Style Questionnaire Items
Item
Number Positive or Negative
M SD t p Variance Regression Weight
Factor Score Weight
Internal 1 Positive 4.57 1.26 3.98 .001** 1.73 .886 .045 Internal 3 Positive 4.26 1.49 5.08 .001** 2.15 1.468 .063 Internal 6 Positive 4.42 1.50 5.13 .001** 2.18 1.492 .083 Internal 9 Positive 5.22 1.17 5.57 .001** 1.38 1.352 .138 Internal 10 Positive 4.99 1.26 5.59 .001** 1.57 1.373 .174 Internal 12 Positive 4.89 1.32 1.76 1.000 .057 Internal 2 Negative 3.52 1.75 2.08 .037* 3.09 .447 .042 Internal 4 Negative 3.80 1.88 2.38 .017* 3.63 .576 .041 Internal 5 Negative 4.75 1.43 3.70 .001** 2.07 .900 .145 Internal 7 Negative 3.13 1.35 3.72 .001** 1.78 .854 .168 Internal 8 Negative 4.20 1.74 3.18 .001** 2.98 .781 .081 Internal 11 Negative 4.91 1.49 2.22 1.000 .170 Stable 1 Positive 5.24 1.15 4.89 .001** 1.40 .709 .054 Stable 3 Positive 5.32 1.34 7.13 .001** 1.87 1.296 .098 Stable 6 Positive 4.42 1.50 6.61 .001** 1.70 .992 .096 Stable 9 Positive 5.49 1.16 7.79 .001** 1.35 1.162 .223 Stable 10 Positive 5.29 1.30 6.79 .001** 1.67 1.044 .098 Stable 12 Positive 5.46 1.20 1.44 1.000 .139 Stable 2 Negative 4.23 1.49 2.55 .011* 2.30 .709 .030 Stable 4 Negative 3.73 1.46 3.52 .001** 2.20 1.249 .065 Stable 5 Negative 3.93 1.40 3.82 .001** 1.90 1.616 .120 Stable 7 Negative 3.93 1.38 3.78 .001** 1.88 1.557 .135 Stable 8 Negative 4.63 1.48 3.73 .001** 2.22 1.536 .101 Stable 11 Negative 3.80 1.51 2.30 1.000 .039 Global 1 Positive 4.94 1.47 3.43 .001** 2.14 .624 .034 Global 3 Positive 5.11 1.56 5.46 .001** 2.43 1.337 .082 Global 6 Positive 5.13 1.47 5.42 .001** 2.17 1.131 .096 Global 9 Positive 5.35 1.32 5.96 .001** 1.72 1.236 .163 Global 10 Positive 5.35 1.39 5.70 .001** 1.92 1.166 .117 Global 12 Positive 5.39 1.45 2.11 1.000 .092 Global 2 Negative 4.07 1.85 2.81 .005* 3.41 .517 .045 Global 4 Negative 3.78 1.81 4.08 .001** 3.27 .726 .084 Global 5 Negative 3.67 1.60 5.09 .001** 2.54 1.056 .183 Global 7 Negative 3.37 1.67 4.86 .001** 2.82 1.027 .154 Global 8 Negative 4.79 1.69 4.13 .001** 2.83 .693 .090

143
Global 11 Negative 3.95 1.69 2.86 1.000 .146 ** significant to the .001 level * significant to the .05 level
Related Documents