Examining Approaches to Quantifying Cyber Risk for Improved Cybersecurity Management by Sravya Bhamidipati Submitted to the Department of Electrical Engineering and Computer Science in partial fulfillment of the requirements for the degree of Master of Engineering in Computer Science and Engineering at the MASSACHUSETTS INSTITUTE OF TECHNOLOGY September 2019 c Massachusetts Institute of Technology 2019. All rights reserved. Author .............................................................. Department of Electrical Engineering and Computer Science August 29, 2019 Certified by .......................................................... Michael Siegel Cybersecurity at MIT Sloan, Co-Director Thesis Supervisor Accepted by ......................................................... Katrina LaCurts Chair, Master of Engineering Thesis Committee

Welcome message from author
This document is posted to help you gain knowledge. Please leave a comment to let me know what you think about it! Share it to your friends and learn new things together.
Transcript

Examining Approaches to Quantifying Cyber Risk
for Improved Cybersecurity Management
by
Sravya Bhamidipati
Submitted to the Department of Electrical Engineering and ComputerScience
in partial fulfillment of the requirements for the degree of
Master of Engineering in Computer Science and Engineering
at the
MASSACHUSETTS INSTITUTE OF TECHNOLOGY
September 2019
c© Massachusetts Institute of Technology 2019. All rights reserved.
Author . . . . . . . . . . . . . . . . . . . . . . . . . . . . . . . . . . . . . . . . . . . . . . . . . . . . . . . . . . . . . .Department of Electrical Engineering and Computer Science
August 29, 2019
Certified by. . . . . . . . . . . . . . . . . . . . . . . . . . . . . . . . . . . . . . . . . . . . . . . . . . . . . . . . . .Michael Siegel
Cybersecurity at MIT Sloan, Co-DirectorThesis Supervisor
Accepted by . . . . . . . . . . . . . . . . . . . . . . . . . . . . . . . . . . . . . . . . . . . . . . . . . . . . . . . . .Katrina LaCurts
Chair, Master of Engineering Thesis Committee

2
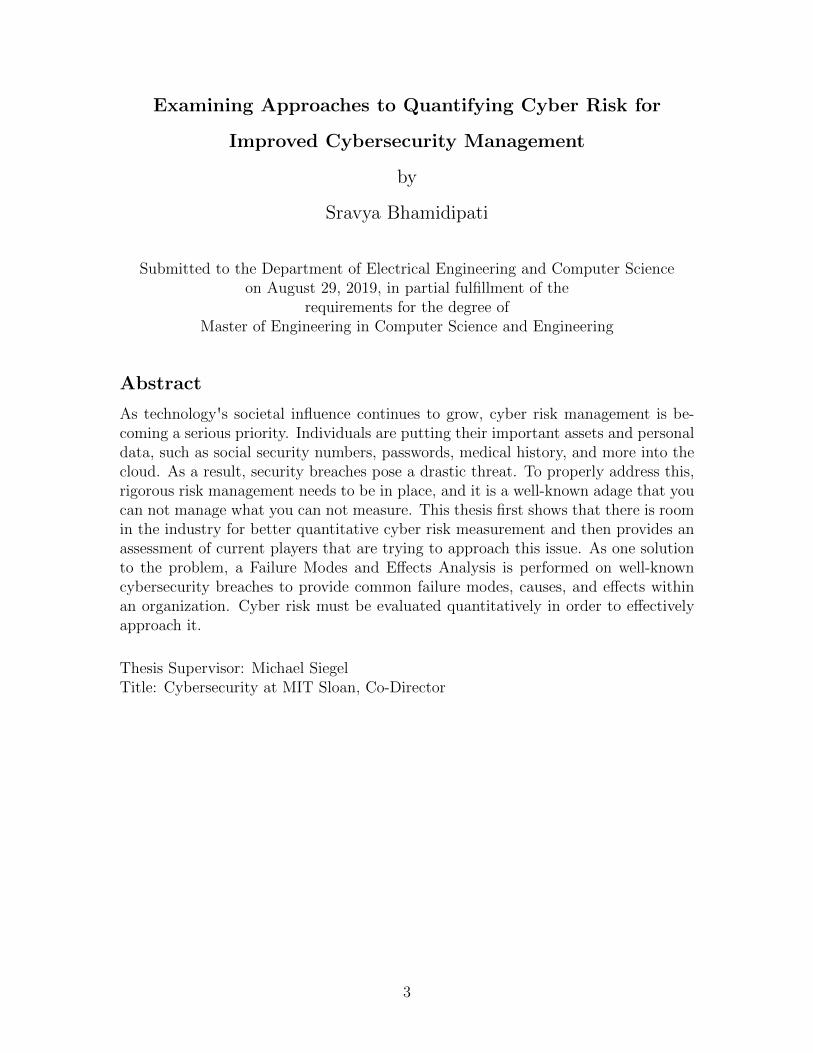
Examining Approaches to Quantifying Cyber Risk for
Improved Cybersecurity Management
by
Sravya Bhamidipati
Submitted to the Department of Electrical Engineering and Computer Scienceon August 29, 2019, in partial fulfillment of the
requirements for the degree ofMaster of Engineering in Computer Science and Engineering
Abstract
As technology's societal influence continues to grow, cyber risk management is be-coming a serious priority. Individuals are putting their important assets and personaldata, such as social security numbers, passwords, medical history, and more into thecloud. As a result, security breaches pose a drastic threat. To properly address this,rigorous risk management needs to be in place, and it is a well-known adage that youcan not manage what you can not measure. This thesis first shows that there is roomin the industry for better quantitative cyber risk measurement and then provides anassessment of current players that are trying to approach this issue. As one solutionto the problem, a Failure Modes and Effects Analysis is performed on well-knowncybersecurity breaches to provide common failure modes, causes, and effects withinan organization. Cyber risk must be evaluated quantitatively in order to effectivelyapproach it.
Thesis Supervisor: Michael SiegelTitle: Cybersecurity at MIT Sloan, Co-Director
3

4

Acknowledgments
I would like to first and foremost thank my advisor, Michael Siegel, for his vision,
encouragement, and invaluable guidance throughout my thesis process.
I would also like to thank George Wrenn for his wealth of ideas on potential contribu-
tions to the field, and for providing me with direction once I picked a path. I thank
the rest of the Cybersecurity at MIT Sloan team for sharing new work with me at
weekly meetings, and for giving me advice as I shared my own ideas.
I would like to thank Saket Bajoria, Nitin Aggarwal, Jyoti Yadav, and Saket Modi
for providing me with relevant resources and sharing their analysis metrics and meth-
ods with me. My research has been supported in part by their company, Lucideus
Incorporated.
Lastly, I would like to thank my friends and family, particularly my parents, Jagan
and Lakshmi Bhamidipati, for constantly motivating me during this journey! None
of this would be possible without my pillars of support.
5

6

Contents
1 Introduction 13
1.1 Contributions . . . . . . . . . . . . . . . . . . . . . . . . . . . . . . . 15
2 Hole in the Industry 17
2.1 Statistical Evidence of a Problem . . . . . . . . . . . . . . . . . . . . 18
2.2 Present-Day Cyber Risk Management . . . . . . . . . . . . . . . . . . 19
2.2.1 National Institute of Standards and Technology . . . . . . . . 19
2.2.2 C2M2 . . . . . . . . . . . . . . . . . . . . . . . . . . . . . . . 20
2.2.3 Risk Matrices . . . . . . . . . . . . . . . . . . . . . . . . . . . 22
2.3 Human Role in Cyber Risk Exposure . . . . . . . . . . . . . . . . . . 23
2.3.1 Insider Threat . . . . . . . . . . . . . . . . . . . . . . . . . . . 23
2.3.2 The Government . . . . . . . . . . . . . . . . . . . . . . . . . 24
2.4 Conclusion . . . . . . . . . . . . . . . . . . . . . . . . . . . . . . . . . 25
3 Current Players 27
3.1 BitSight . . . . . . . . . . . . . . . . . . . . . . . . . . . . . . . . . . 27
3.2 Security Scorecard . . . . . . . . . . . . . . . . . . . . . . . . . . . . 28
3.3 Value at Risk . . . . . . . . . . . . . . . . . . . . . . . . . . . . . . . 29
3.3.1 Factor Analysis of Information Risk . . . . . . . . . . . . . . . 30
3.3.2 RiskLens . . . . . . . . . . . . . . . . . . . . . . . . . . . . . . 30
3.4 Lucideus Security Assessment Framework for Enterprise (SAFE) . . . 31
3.5 Cyber Doppler . . . . . . . . . . . . . . . . . . . . . . . . . . . . . . 33
3.6 Conclusion . . . . . . . . . . . . . . . . . . . . . . . . . . . . . . . . . 35
7

4 Failure Modes and Effects Analysis for Cybersecurity Management 37
4.1 What is FMEA? . . . . . . . . . . . . . . . . . . . . . . . . . . . . . 38
4.2 Background . . . . . . . . . . . . . . . . . . . . . . . . . . . . . . . . 38
4.3 Applicability to the Cyber World . . . . . . . . . . . . . . . . . . . . 39
4.4 FMEA Literature Review . . . . . . . . . . . . . . . . . . . . . . . . 39
4.5 Prevalence of Breaches caused by People and Policies . . . . . . . . . 46
4.6 Methodology . . . . . . . . . . . . . . . . . . . . . . . . . . . . . . . 47
4.7 FMEA Example . . . . . . . . . . . . . . . . . . . . . . . . . . . . . . 49
4.7.1 Yahoo, 2014 . . . . . . . . . . . . . . . . . . . . . . . . . . . . 49
4.7.2 Marriott International, 2014-2018 . . . . . . . . . . . . . . . . 49
4.7.3 Adult Friend Finder, 2016 . . . . . . . . . . . . . . . . . . . . 49
4.7.4 Equifax, 2017 . . . . . . . . . . . . . . . . . . . . . . . . . . . 50
4.7.5 eBay, 2014 . . . . . . . . . . . . . . . . . . . . . . . . . . . . . 50
4.7.6 Target Stores, 2013 . . . . . . . . . . . . . . . . . . . . . . . . 50
4.7.7 JP Morgan Chase, 2014 . . . . . . . . . . . . . . . . . . . . . 50
4.7.8 Uber, 2016 . . . . . . . . . . . . . . . . . . . . . . . . . . . . . 51
4.7.9 US Office of Personnel Management (OPM), 2012-2014 . . . . 51
4.7.10 Sony Playstation Network, 2011 . . . . . . . . . . . . . . . . . 51
4.8 Results . . . . . . . . . . . . . . . . . . . . . . . . . . . . . . . . . . . 51
4.9 Analysis and Future Work . . . . . . . . . . . . . . . . . . . . . . . . 52
5 Discussion 55
5.1 Future Work . . . . . . . . . . . . . . . . . . . . . . . . . . . . . . . . 55
A Tables 57
B Figures 59
8

List of Figures
2-1 An example of MIL usage for effective management[10] . . . . . . . . 21
3-1 Security Scorecard sample report[80] . . . . . . . . . . . . . . . . . . 28
3-2 Value at Risk Flowchart[78] . . . . . . . . . . . . . . . . . . . . . . . 29
3-3 SAFE Model flow of information[33] . . . . . . . . . . . . . . . . . . . 32
3-4 BCG Cyber Doppler loss and impact calculation methodology[84] . . 34
4-1 Assigning risk based on likelihood and impact[93] . . . . . . . . . . . 41
4-2 The FAIR model assessment of risk[37] . . . . . . . . . . . . . . . . . 43
4-3 Example analysis across various failure modes[2] . . . . . . . . . . . . 45
4-4 Six Sigma's[81] severity, occurrence, detectability scoring recommen-
dations, Part 1 . . . . . . . . . . . . . . . . . . . . . . . . . . . . . . 48
4-5 Six Sigma's[81] severity, occurrence, detectability scoring recommen-
dations, Part 2 . . . . . . . . . . . . . . . . . . . . . . . . . . . . . . 48
B-1 A bar chart ranking the top 10 cyber breaches by Risk Priority Number 60
B-2 A scatter plot comparing the RPNs to number of stolen records . . . 61
9

10

List of Tables
A.1 A sample FMEA conducted on the top 10 breaches of the past decade. 58
11

12

Chapter 1
Introduction
The presence of cyber crime and efforts to thwart it have been around for about
fifty years. The first known usage of the word ”hacking” came in 1960, although it
was seen as a positive way to improve systems at that time. By the 1970s, there
was a darker turn when hackers began using their skills to act as operators and
extort personal information from unsuspecting clients. Controlling this was difficult,
as technology was still new at the time, and there was no legislation in place to
stop cyber crime as there was for other crimes. In 1986, Congress finally passed
the Federal Computer Fraud and Abuse Act, making it a felony to tamper with
computers. While this helped some cases, law enforcement became far too vigilant and
nearly ruined some innocent companies based on suspicions of cyber crime activity.
To counter this, the Electronic Frontier Foundation, a group dedicated to preventing
illegal prosecution of organizations, was formed in 1990[87].
The technological industry has been dealt the challenge of striking the delicate
balance between protecting information from malicious hackers and ensuring that
searches for these criminals are done lawfully. The management side of such attacks
has not evolved as fast as the cyber criminals have. For example, between 2016 and
2017, there was a reported 600% increase in Internet of Things (IoT)1 attacks. Though
1”The internet of things, or IoT, is a system of interrelated computing devices, mechanical anddigital machines, objects, animals or people that are provided with unique identifiers (UIDs) and theability to transfer data over a network without requiring human-to-human or human-to-computerinteraction”[74]
13
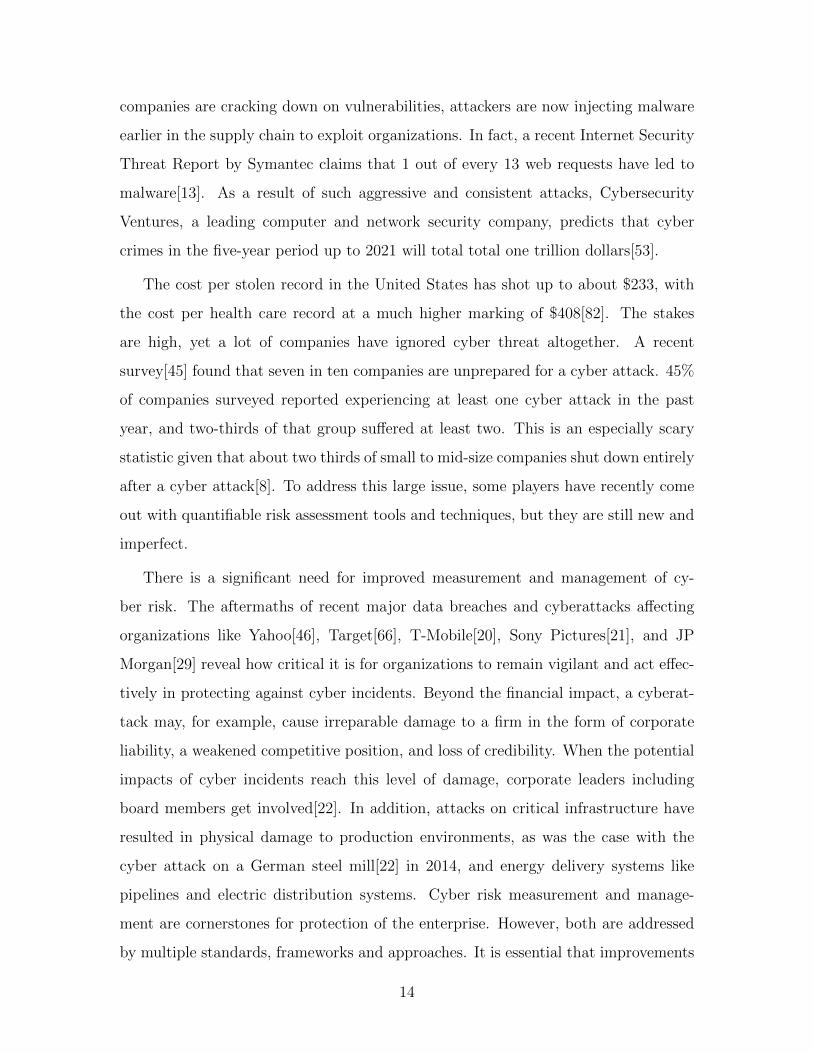
companies are cracking down on vulnerabilities, attackers are now injecting malware
earlier in the supply chain to exploit organizations. In fact, a recent Internet Security
Threat Report by Symantec claims that 1 out of every 13 web requests have led to
malware[13]. As a result of such aggressive and consistent attacks, Cybersecurity
Ventures, a leading computer and network security company, predicts that cyber
crimes in the five-year period up to 2021 will total total one trillion dollars[53].
The cost per stolen record in the United States has shot up to about $233, with
the cost per health care record at a much higher marking of $408[82]. The stakes
are high, yet a lot of companies have ignored cyber threat altogether. A recent
survey[45] found that seven in ten companies are unprepared for a cyber attack. 45%
of companies surveyed reported experiencing at least one cyber attack in the past
year, and two-thirds of that group suffered at least two. This is an especially scary
statistic given that about two thirds of small to mid-size companies shut down entirely
after a cyber attack[8]. To address this large issue, some players have recently come
out with quantifiable risk assessment tools and techniques, but they are still new and
imperfect.
There is a significant need for improved measurement and management of cy-
ber risk. The aftermaths of recent major data breaches and cyberattacks affecting
organizations like Yahoo[46], Target[66], T-Mobile[20], Sony Pictures[21], and JP
Morgan[29] reveal how critical it is for organizations to remain vigilant and act effec-
tively in protecting against cyber incidents. Beyond the financial impact, a cyberat-
tack may, for example, cause irreparable damage to a firm in the form of corporate
liability, a weakened competitive position, and loss of credibility. When the potential
impacts of cyber incidents reach this level of damage, corporate leaders including
board members get involved[22]. In addition, attacks on critical infrastructure have
resulted in physical damage to production environments, as was the case with the
cyber attack on a German steel mill[22] in 2014, and energy delivery systems like
pipelines and electric distribution systems. Cyber risk measurement and manage-
ment are cornerstones for protection of the enterprise. However, both are addressed
by multiple standards, frameworks and approaches. It is essential that improvements
14

be made to existing approaches so that cyber leaders can better measure and manage
cyber risk as an end-to-end process. This thesis provides a clear problem statement
and delves into feasible solutions for this global issue.
1.1 Contributions
This paper is a reflection of research efforts that contribute the following to the
field:
• A comprehensive literature review of present-day qualitative and quantitative
approaches to cyber risk management, showing that there is a hole in the in-
dustry for quantifying cyber risk.
• An analysis of current players in the field that are trying to quantify cyber
risk, including an overview of their features and pricing models to compare and
contrast.
• A possible new solution to be used by companies monitoring their risk: a Fail-
ure Modes and Effects Analysis performed on the top breaches from the past
decade, yielding results to use in proactively finding certain roots of failure and
correcting them before they occur.
15

16

Chapter 2
Hole in the Industry
A better understanding of an organization's cyber risk can lead to directed efforts
to reduce its exposure to attack. There are many different risk frameworks for ad-
dressing cyber risk, like the National Institute of Standards and Technology (NIST)
Risk Management Framework[9], NIST Cybersecurity Framework[57], or the Fed-
eral Financial Institutions Examination Council Cybersecurity Assessment Tool[14].
Some of these frameworks are used as guidelines while some are increasingly being
adopted as industry standards. All of the frameworks are designed to help organi-
zations lower their cyber security risk exposure. Each framework yields a different
assessment, but all of them aim to highlight gaps and weaknesses in an organization's
cyber capabilities.
Despite the presence of multiple frameworks, this industry has maintained a con-
tinuous focus on qualitative approaches to cyber risk management, mostly ignoring
the quantitative analyses that could provide deeper insights on exactly how to invest
for the most significant improvements. Below is an exploration of sources backing up
this theory, as well as a deeper dive into some specific frameworks that are popular
today.
17

2.1 Statistical Evidence of a Problem
In the United States alone, there are over 130 large-scale security breaches a year,
and this number has increased by over 25% annually. On average, every malware
attack takes 50 days to resolve and costs an organization $2.4 million[43]. The cost of
cyber crime damage is astronomical and expected to reach over $1 trillion by 2021[96].
A lot of this damage is because organizations fail to keep their information as
secure as possible to prevent a cyber breach. In a recent report[95], it was found that
88% of all companies that maintain over 1 million internal files have over 100,000 of
these available to everyone. Most files only need to be read by a subset of employees,
so this distribution is unnecessary and widens the possible exposure net. Another
malpractice within organizations is keeping stale data, which is data that is no longer
needed for company functions. An average of 54% of a company's data is stale; this
information adds no positive value to an organization, but it can do much harm if
stolen during a security breach. Additionally, since stale data is not monitored very
frequently, attackers can obtain this data and get started on testing vulnerabilities
without being easily detected. Stale information does not stop at data. 65% of
companies surveyed kept over 1000 stale, inactive user accounts as well. Almost 50%
of companies had over 1000 users with passwords that never expire. The existence of
an inactive account along with no password expiry gives attackers plenty of time to
brute force guess a password and carry out damage from the stale account.
Based on statistics from a recent study[17], including employee responses from
various organizations, only 12% of employees believe that their Information Security
function fully meets the organizations needs, and 67% say they are actively working
on improvements to this. This reflects a drop in the number of people who believe
their needs are being fully met as compared to previous years, but a negligible in-
crease in people who say they are working on fixing this. Being unable to measure
personal security needs could be a contributing factor to this hesitation to work on
improvements. 69% of respondents think that their organizations information secu-
rity budget needs to increase by 50% in order to properly protect the company the
18

way their management expects them to[17].
The industry has clearly remained apathetic towards cyber risk management. This
problem can be better approached with the implementation of formulas to measure
risk and advise organizations accordingly.
The current approaches, though helpful, fall short of being reliable end-to-end
solutions. They also fail to guide managers on how to address cyber issues with
the C-suite and board executives. Risk management should include assistance in
areas such as deciding the best investment in cybersecurity, operating a Security
Operations Center (SOC), and changing operations in high risk environments. As
such, risk management must inform and guide all levels of cyber defense decision
making.
2.2 Present-Day Cyber Risk Management
2.2.1 National Institute of Standards and Technology
NIST[57] is a standards body that has provided a framework for cybersecurity
as part of a United States government initiative. The basic process is to Identify,
Protect, Detect, Respond, and Recover. These are considered the main 'functions'
of the process. They allow an organization to gather their information, make risk
management decisions, and find, address, and prevent threats. Within each function,
there are company-determined categories, which are tied to programmatic needs.
Then there are subcategories which almost act like a checklist within each of the
categories. They include more specific action items like whether or not an activity or
piece of information was logged. Then there are Informative References, which are
guidelines and methods to actually accomplish the action items that are stated in
subcategories[57].
There are parts of NIST that discuss specific elements of cyber risk, but the
majority of it is focused on how to approach and manage it, rather than actually
quantifying it. There is a lot of room to propose more detailed quantifiable methods
19
to incorporate. There is room to add such quantification in Section 3.6 of the NIST
official documentation, where it goes over the methodology to protect privacy and civil
liberties. Here, the framework goes into governance policies, individual people and
their access to information, and training measures for both the people and governance
pieces. With more formulas and models to quantify the risk posed by abstract factors
like governance and people, this framework can provide a more detailed analysis of
how much each category or function will contribute to the programmatic needs. This
will allow leaders in an organization to make informed decisions on where to invest
time and money moving forward.
2.2.2 C2M2
C2M2[91] is a government measure by the Office of Cybersecurity, Energy Secu-
rity, and Emergency Response put in place to improve and assess our cybersecurity
capabilities. They claim that any organization can use their infrastructure to gauge
and improve their own cyber risk. C2M2 consists of 10 domains[90] which are the
recommended practices. They are as follows: risk management; asset, change, and
configuration management; identity and access management; threat and vulnerability
management, situational awareness, information sharing and communications; event
and incident response, continuity of operations; supply chain and external depen-
dencies management; workforce management; cybersecurity program management.
This framework particularly contains maturity assessments. This maturity assess-
ment allows a company to see where their cyber capabilities lie in relation to their
expectations. To interpret within the ten domains, companies establish Maturity In-
dicator Levels (MILs), which reflect effective a company is in each of these domains.
An organization sets the rubric for these MILs themselves based on their priorities.
For example, one company could decide that a certain set of practices count as MIL
1, and another may instead count that same set as MIL 2. The MIL within the level
is a cumulative measure of how established the practices are. So to reach MIL 2, an
organization would have to meet all the requirements in MIL 1 and MIL 2.
Below is an example[10] from Jason D. Christopher on how to categorize practices
20

into these MILs from the present-day and management standpoints.
Figure 2-1: An example of MIL usage for effective management[10]
This method provides a solid distribution of cybersecurity domains, but the MILs
can vary a lot based on a company's particular interests. Since a company sets that
for themselves, there is not a clear standardization, and different industries can have
different quantitative measurements of their cybersecurity despite having similar in-
frastructure in place. It will be difficult to compare organizations to one another
if this measure is subjective and not standardized. The C2M2 framework provides
an example MIL progression[60], but it only includes qualitative measurements like
having a program strategy or approval from senior management. Meeting these re-
quirements is important, but they give a bleak picture because they do not take other
nuances into account. Two companies that check-box the same items can be seen as
equivalent in their domain, even if they just happened to have different standards for
themselves as to what “good” is.
With some quantification and standardization of the Maturity Indicator Levels,
C2M2s circular method of performing evaluation, analyzing identified gaps, prioritiz-
ing and planning, implementing plans, and repeating will have more meaning.
21

2.2.3 Risk Matrices
A popular way that people try to measure cyber risk is by assessing two major
factors: the likelihood and the potential impact of an attack, sometimes called sever-
ity. Though different models have different views on the relative weightage of the
two, most agree that they are important key factors.
Some organizations decide it suffices to qualitatively categorize the likelihood of a
breach as low, medium, and high. Others recommend ways to quantify this measure
instead, like having metrics on the range of operations affected and occurrences per
year that will then be classified as low, medium, or high[7].
Each industry typically has its own set of metrics to determine severity. For in-
stance, the aviation industry ranks it with four major metrics: financial damage,
environmental damage, personnel injury, and mission damages[7]. The cybersecu-
rity industry could define it by assessing physical or digital harm, economic harm,
psychological harm, reputational harm, and social and societal harm[36].
Risk matrices as a concept, however, also have some staunch opponents. J. Eric
Bickel[4] makes the argument that risk matrices can sometimes produce placebo re-
sults that do not actually provide insight. The idea is that subjective measures of
likelihood and impact are vague, and there is not reason to use them over actual sci-
entific data on risk. There is not scientific evidence yet that risk matrices improve risk
management decisions. In fact, there are studies that show the information derived
from these matrices is often unclear and leads to mediocre insights[4].
Another problem is that there is no scientific method to design scales for risk
matrices. Instead, most use their own ordinal scales, which means they have a rank,
but no clear understanding of the ”distance” between each ranking[25]. Because of
this, we do not know how much worse a ”low” severity is than a ”medium” severity,
or how much more vulnerable a system with ”high” likelihood of attack is than one
with a ”low” likelihood. Even if we split up these rankings into more specific scales,
like one to ten, there is no guarantee that something with a ranking of eight is twice
as bad as a system with ranking four. Thus it is difficult to evaluate the tradeoffs and
22

to establish an effective cyber management portfolio using just these scales. Scoring
systems in general face the challenge of producing ordinal scales. This categorization
results in less meaningful insights for comparing to other organizations and growing
effectively.
2.3 Human Role in Cyber Risk Exposure
The role that humans play in cyber risk is difficult to quantify despite its sig-
nificance to cyber exposure. Vulnerabilities of a technological system tend to be
objective, but human behavior is subjective and harder to predict[50]. This makes
the issue of quantifying overall cyber risk more complicated because the human role in
risk exposure is non-negligible. In fact, insider threat is a common phenomenon that
is present in more than half of all breaches[89]. Proper practices, both for individual
employees and for management, play a crucial role in minimizing the risk generated
from within a company.
2.3.1 Insider Threat
One of the most significant factors behind large-scale security breaches is Insider
Threat, in which a current employee of a company is involved in a breach. As stated
above, it is present in more than half of all breaches[89]. Most people assume malicious
motivations are behind most instances of insider threat, but studies have attributed
more breaches to negligence than to malice of an employee[69]. The majority of people
who allow information to be exposed are not doing it for personal gain, thought a
considerable number still are.
To target the problem of Insider Threat, companies usually attempt to find de-
viance from normal behavior in employees. There are a few problems with this ap-
proach. An obvious one is that employees can feel disrespected if they are being
monitored so closely, but without a high level of monitoring, it is hard to gauge
sudden changes in behavior. A larger issue is that malice is not usually the prob-
lem, so searching for a deviance in behavior may prove less useful than searching for
23
general carelessness. Some early vetting processes also fall short because even mali-
cious exploiters do not necessarily enter the company intending to leak information
or harm the business; a factor introduced later, such as resentment over how they are
treated or a monetary incentive presented to them from a third-party after joining
the company, can propel them to do so[89].
Since identifying a human vulnerability is more subjective than finding a techno-
logical vulnerability, addressing the human role in cyber risk is tricky. Trying to find
a deviance from the norm is a significant time sink, and the situation is usually al-
ready out of hand by the time a conclusion is drawn. Big firms have started adopting
techniques that are more overarching and effective. Preventative rather than reactive
measures are going into place[24]. Rather than viewing the company as a whole, they
try identifying specifics like which teams have access to the most confidential data,
what factors could make an employee turn, such as low pay, and pay attention to
these instances. They work on making these groups less likely to break, instead of
just monitoring and figuring it out after the breach has already occurred. They then
cater to the groups that are potential risks ahead of time by alleviating the factors
that could drive them to it. Another way is to get ahead of a system and create a
mental profile for the kind of person who is likely to cause a breach, either through
malice or through sheer negligence. Companies can pay special attention to identify
behaviors than are present in a person like this and watch out for those who exhibit
them[89].
2.3.2 The Government
A group that plays an important role in how our country deals with cyber risk
is the government. An article[51] from McKinsey suggests that the government is
responsible for keeping its laws and regulations up to date with current, ever-evolving
technologies. As a part of this, they are responsible for giving citizens a proper
understanding of cyber risk and guidance on how to prevent personal exposure to it.
Further, they must impose appropriate punishments on people for the cyber crimes
they commit based on the impact new technologies and larger breaches of this kind
24

can have.
There are some computer crime laws in all 50 states, but most of them revolve
around accessing someone's account of computer illegally[61]. Not all states have laws
to address more specific cyber crime like phishing, ransomware, or denial of service
(DoS) attacks1.
Recently, there has been push for the United States to develop a Department of
Cybersecurity[79]. The Russian interference in the 2016 election, as detailed in the
Mueller report[72], involved campaigns spread by Russians to spread targeted and
misleading information to voters. The Department of Homeland Security has con-
firmed that Russian gained access to the election systems of twenty one states and
scanned them for vulnerabilities[83]. Michael Daniel, the United States's former cy-
bersecurity coordinator under President Barack Obama, believes that Russian officials
probably gained access to information from all fifty states. Without better security
measures in place at a higher level, the very idea of democracy can be threatened.
2.4 Conclusion
Cyber breaches continue to pose a serious threat to all organizations. Any group
affected by one faces a loss of reputation, and some shut down entirely. Better man-
agement needs to be in place to approach this widespread problem. Quantitatively
measuring cyber risk can give companies a numerical and objective standpoint from
which to assess their own cyber risk and thereby prevent it.
1A DoS attack is when an attacker manages to deny access to regular users of a website[97]
25

26

Chapter 3
Current Players
A preliminary google search for ”quantitative assessment of cyber risk” yields
around 6,170,000 results. It is a widely discussed topic, but a comprehensive and
affordable model is not yet available. There are a few major players attempting to
navigate the quantitative space. This chapter provides a closer look at their method-
ologies and specifications.
3.1 BitSight
Bitsight is the most widely used security ratings platform in the world[1]. Based
out of Cambridge, Massachusetts, they focus on using data to score and advise com-
panies dynamically on cybersecurity management. Once an organization decides to
use BitSight, they are given a score from 250-900 that is updated daily and includes
information on the organization's cybersecurity performance.
Bitsights score is a combination of data from four categories: compromised sys-
tems, diligence, user behavior, and data breaches. Compromised systems are a reflec-
tion of already successful cyber attacks on the organization, such as spam and prior
communication with botnets. These attacks need not have already resulted in a loss
of data to be considered a compromise of their systems in some manner. Diligence
reflects the steps an organization has taken to prevent an attack. By looking into
security configurations like Secure Sockets Layer (SSL), Sender Policy Framework
27
(SPF), DomainKeys Identified Mail (DKIM), and Domain Name System Security
Extensions (DNSSEC), BitSight gets an understanding of how effectively a company
implements the necessary controls.
Bitsight also regularly monitors third and fourth parties, provides alerts and intel-
ligent reporting, and allows for efficient collaboration by engaging an organization's
stakeholders in risk and security communications[5]. Their API displays the daily
score on the BitSight platform for the respective organization. In addition to this
score, the API illustrates historical trends and provides detailed descriptions of the
organizations vulnerabilities.
BitSight has gained many top customers, including Lowe's, Target, Ferrari, and
The Hartford, and T-Mobile[92]. Their pricing structure is estimated to be around
$2000-2500 per vendor per year[92].
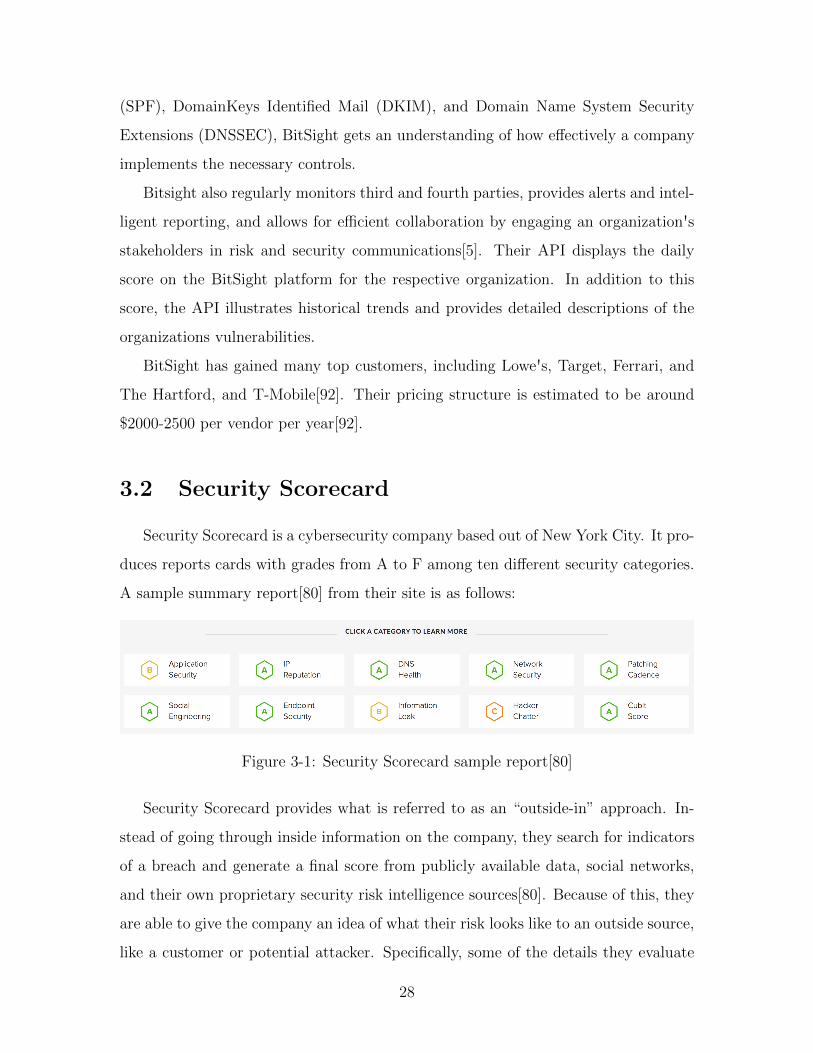
3.2 Security Scorecard
Security Scorecard is a cybersecurity company based out of New York City. It pro-
duces reports cards with grades from A to F among ten different security categories.
A sample summary report[80] from their site is as follows:
Figure 3-1: Security Scorecard sample report[80]
Security Scorecard provides what is referred to as an “outside-in” approach. In-
stead of going through inside information on the company, they search for indicators
of a breach and generate a final score from publicly available data, social networks,
and their own proprietary security risk intelligence sources[80]. Because of this, they
are able to give the company an idea of what their risk looks like to an outside source,
like a customer or potential attacker. Specifically, some of the details they evaluate
28

are “if hackers are buying and selling corporate credentials, or discussing your com-
pany as a target; the health of your DNS; the software patching cadence efficiency
of your organization; if employees are using work email addresses on social networks;
common typosquat domains of your company available on the Internet; how your
security risk changes over time; how your security posture ranks against competitors
& peers in your industry”[80].
Security Scorecard has grown to serve well-known companies like Netflix, McDon-
ald's, Allstate, Symantec, and Pepsi[92]. Users can go to their website to request
a free inital score report, but future iterations require payment. Their pricing is
not publicly available, but it is estimated to be around $1500-2000 per vendor per
year[92].
3.3 Value at Risk
Value at Risk (VaR) is generally a way to measure potential loss from an invest-
ment with some level of confidence[15]. In recent years, there has been a push to
develop more VaR models specifically within the cyber space to help quantify infor-
mation risk in an informed manner. At a high-level, the quantification is done as
follows[78]:
Figure 3-2: Value at Risk Flowchart[78]
29
With this, most VaR models calculate expected losses due to cyber attacks within
a certain timeframe.
3.3.1 Factor Analysis of Information Risk
Factor Analysis of Information Risk (FAIR) is currently the standard VaR frame-
work for cybersecurity and operational risk[34]. The FAIR Institute is a nonprofit
organization with a mission to measure and manage risk everywhere. They serve as a
community to share new ideas and best practices within the security industry. Their
analytical risk model begins by identifying the major components associated with risk
and outlines their relationship to one another[62].
As an open group standard, FAIR has gained recognition for establishing a com-
mon terminology in the industry and for starting a community to discuss cybersecu-
rity across the field. The Chief Information Security Officer of the Federal Reserve
in New York has said “FAIR is the future of information security, as that is how we
will bridge the gap and talk about risk in a common language”[76]. Another blog
post[73] credits it with helping people quantify qualitative vulnerabilities to support
better management of cyber risk.
3.3.2 RiskLens
RiskLens is a cyber risk management software that is built upon FAIR to ”sys-
tematically guides risk analysts through a FAIR analysis with data points collected
from your business and pre-populated loss tables compiled from data from your in-
dustry and embedded in the application”[62]. The report is then shown on a more
business-focused API that shows the financial losses associated with the expected risk
so that the company can make educated decisions on how to adjust their cybersecu-
rity measures moving forward. RiskLens has professional service partnerships with
companies like PwC Australia, Wipro, and TUV Rheinland Opensky[71].
Using RiskLens effectively will cost employers a lot of money. Their course on
“FAIR Analysis Fundamentals” is $1499 per person[70]. There is no publicly available
30
data for the cost of their other services, and companies must call to discuss their needs
and to receive a quote.
3.4 Lucideus Security Assessment Framework for
Enterprise (SAFE)
The SAFE (Security Assessment Framework for Enterprise) platform, built by
Lucideus Incorporated1, is described as a “Dynamic and Self Evolving Enterprise Cy-
ber Security and Risk Management Platform that integrates deep within the existing
IT Infrastructure and security tools deployed within an organization”[33].
The SAFE score that Lucideus provides is a realtime measure of how prepared
an organization is to defend against a cyber attack. It is a combination of five
other scores Lucideus calculates which are the People Awareness Score, Governance
Policy Score, Technology Score, Cybersecurity Architecture Score, and the External
Score[33]. Each of these subcategories is a product feature of information from even
more data sources.
The SAFE model is mathematically driven, and every step involves numerous
calculations to come up with a distributed and comprehensive score. Throughout the
application, they deal with graphs and charts to visualize the trends and growth of
a company's cybersecurity stance. It provides a way for enterprises to group their
crown jewels and business critical assets. It also provides a SAFE score for the group,
which allows them to objectively measure and improve cyber security risk posture of
assets that are most important to them. The ability to dissect by the five categories
and subcategories of scores gives organizations a chance to pin point exactly where
most gaps in the form of vulnerabilities or configurations lie, and this information
allows executives to build a better cybersecurity management portfolio for the future.
Below is a diagram showing the flow of information within the SAFE model.
1Lucideus is a member of the Cybersecurity at MIT Sloan team.
31

Figure 3-3: SAFE Model flow of information[33]
SAFE adds value not just through their score, but as an ecosystem. In light of
the growing complexity of the cyber risk landscape and emerging cyber threats, their
second product named SAFE Assure[48] provides a quick high-level cybersecurity
maturity assessment. It quantifies cyber security posture by providing 'one' number
(a SAFE Assure score between 0 and 5), which is an objective estimate of the total
cyber risk an organization is facing. SAFE Assure serves as their Cyber insurance and
third-party risk assessment product. The SAFE Enterprise, their flagship product,
does a realtime cybersecurity maturity assessment. SAFE Me, a product that is ready
to be released soon, is targeted towards helping employees of a company learn best
cybersecurity practices and measure and improve their own awareness. It will also
assess the overall safety practices of the employees in order to generate the people
score as part of the comprehensive SAFE score. Their overall assessment contributes
to a more mature cybersecurity approach for employees in an organization.
32

Lucideus believes that having a score enables a common language and understand-
ing of cyber risk between various stakeholders. It also helps to define the roadmap
for improvement through the actionable insights reported.
Lucideus has grown to serve over 200 enterprises (Including several MultiBillion
Dollar enterprises in Fortune 50) across 14 countries to measure and mitigate cyber
risk [49]. Their clientele includes South Asia’s largest aviation hub, the largest pri-
vate port operator in India, and the world’s largest tea manufacturer. Some of their
customers have published their SAFE Scores in their annual shareholder report[26],
where they have explained how they are using the SAFE Score to continuously mea-
sure and improve their Cyber Security posture.
The prices, as stated during a vendor interview, are as follows: SAFE Assure will
cost a company about $1200 per 3rd Party per year. SAFE Enterprise varies based
on size of the company and number of assets, which are defined as any system with an
IP address including endpoints (like Windows or Mac) servers, database, webservers,
etc. It will cost around $200,000 for Mid-size companies to around $1,000,000 for
large-cap companies.
3.5 Cyber Doppler
Boston Consulting Group (BCG) has built a Cyber Doppler tool that zones in on
quantifying two factors: the likelihood of a cyber attack and the impact of an attack
if it were to happen. BCG has come to the conclusion that companies typically fail in
seven ways at keeping themselves safe in the cyber space: limited insight into key it
assets, threats, and the control framework, failure to prioritize cybersecurity, a focus
on identification and prevention over detection and response, failure to hire talent,
weak third-party management, lack of a security-aware culture, operational stress[84].
The cyber doppler first produces a list of potential cyber threat scenarios. These
scenarios have been modeled off well known data breaches like NotPetya, Edward
Snowden's NSA information theft, Bangladesh Bank, and more. The doppler then
compares each of these scenarios to the company's control framework to find the
33

likelihood of a breach happening. Then it calculates cumulative financial impact
across all of the companies assets if that attack were to succeed. To calculate expected
loss from an attack, BCG does the following:
Figure 3-4: BCG Cyber Doppler loss and impact calculation methodology[84]
BCG's main motivation behind building their model in such a way is that com-
panies will do better if they have a comprehensive list of cyber threat scenarios to
be aware of a prepare for. The doppler also organizes the assets in order of finan-
cial impact to show which ones are more important. It further provides a threat
intensity factor which can show if the threat has increased on decreased over time.
A major motivation for using the doppler is to evaluate and select among different
cybersecurity investments. With metrics on the loss reduction per project, groups
can “construct an optimized project portfolio”[84].
BCG maintains relationships with many other cybersecurity experts like the Fi-
nancial Services Roundtable and the Geneva Association[23]. BCG is also a partner
member of Cybersecurity at MIT Sloan (CAMS).
34

3.6 Conclusion
The cyber space has players attempting to create quantifiable solutions to address
cyber risk, but they are far from perfect. Some of the groups described above have
made significant advances through their methodologies, but they can be inaccessible
because of their high cost of service. Establishing a cheaper way for organizations
to quantify their cyber risk before calling in such groups would be beneficial to the
industry as a whole.
35

36

Chapter 4
Failure Modes and Effects Analysis
for Cybersecurity Management
Failure Modes and Effects Analysis is a way for organizations to understand their
failure modes, causes, and effects. Though it is not entirely qualitative or quantitative,
it is part of a category of tried and true safety methods that can be applied to
cybersecurity. It outputs a Risk Priority Number for each failure mode, which serves
as a means to quantify significance and potential harm. This number combined with
qualitative recommendations can guide a user and provide insights.
This section provides an explanation of this method's applicability to the cyber
space and an FMEA analysis of major cyber breaches in the past decade. Orga-
nizations can use the results of this section to understand the causes of previous
large-scale cyber breaches and the effects that ensued. FMEA has served as a pow-
ertool for many organizations that go from solving complex problems with multiple
variables to understanding the relative weightages of each. In the same way it has
improved safety and predictability within the manufacturing industry, doing it on
cyber breaches can improve safety and predictability within the cyber space.
37

4.1 What is FMEA?
Failure Modes and Effects Analysis (FMEA) is a method by which to evaluate
a process by identifying at which points it tends to fail, finding the relative impact
of these failures, and advising on which parts of the process to focus on improving
in order to generate the most effective changes. It focuses on three key components
when evaluating the process: failure modes, failure causes, and failure effects. It is
primarily used as a preventative method to proactively find potential roots of failure
and correct them before the failure occurs. It is useful for evaluating a process before
implementing it, or for analyzing the risk-reduction effect of certain changes to an
existing process[35].
4.2 Background
FMEA emerged in the 1940s in the military as a way to gauge the root causes of
malfunctioning military weapons and equipment[16]. They created MIL-P-1629[59],
a military standard for running a military modes, effects, and criticality analysis. It
tracked the potential impact of each functional or hardware failure on mission suc-
cess, personnel and system safety, system performance, maintainability, and mainte-
nance requirements. It proved effective in combat and was eventually adopted by the
aerospace industry; NASA used it in planning for the moon landings and developed
a similar technique called Hazard Analysis and Critical Control Points (HACCP) to
check for contamination in the food traveling to space. In the 1970s, Ford Motor Com-
pany started using FMEA in their design process after fatal fires caused by mechanical
failures. By 1993, the Automotive Industry Action Group along with the big 3 motor
companies (General Motors, Chrysler, and Ford) made a standard called QS90001[68]
that included FMEA as a risk analysis tool for automotive production[59]. Though is
has wide use in the automotive industry, its use is not limited to that field. Any in-
dustry in which a minor problem can cause colossal damage is a candidate for FMEA
analysis.
1QS9000 has become known as IATF16949 as of November 2016
38
4.3 Applicability to the Cyber World
FMEA is an effective risk management strategy for finding common risk factors
and working towards eliminating them. These risk factors are detailed along with their
causes and effects to provide an in-depth understanding of where exactly failures are
prone to occur so that an organization may prevent them before facing consequences.
As a well-known and accepted reliability analysis standard, FMEA will generate le-
gitimate insights and valuable recommendations. As the world becomes more and
more immersed in computers, mobile applications, and electronics, the risks of such
data management must be properly studied. In the same way that the reliability of
cars have to be tested to protect people, the cyber world demands reliability of its
information online.
4.4 FMEA Literature Review
A high-level quantifiable approach to risk assessment is performing a summation
of the probability of some data loss by the measured consequences of that loss. This
method is often expressed as likelihood times impact[37], and it is commonly used to
estimate cyber risk posed by a certain threat factor. An article from the Information
Journal or Information Management[77] claims that while numerous qualitative ap-
proaches have been explored, there are not enough ways to quantitatively measure
information security risk. Their model consists of threat-impact indices and cyber-
vulnerability indices from vulnerability trees. They then encourage executives within
a company to compare the two indices against one another to find relevant security
enhancements that will best improve them. This type of calculation surrounding vul-
nerability and likelihood is present in a large portion of studies finding quantitative
ways to measure cyber risk.
While the likelihood times impact measure is so frequently discussed, it is not
always received in a posiive light. Some studies take issue with the vagueness of the
term likelihood. Impe[30] and Lowder[47] argue that such a formula should not be
39

treated as a legitimate mathematical formula, but rather a model, or simply a con-
cept. Lowder suggests that a proper analysis of likelihood requires an exhaustive and
mutually exclusive possible outcomes of a particular action and their utility, a difficult
process that cannot be simplified to vulnerability times risk. He argues, in fact, that
simplifying the formula as such could cause a negative impact, worse than no impact
at all, due to its potentially sloppy implementation. There are excellent examples
qualitatively describing the vulnerability and the resulting outcome, but assigning a
number to their severity seems arbitrary and minimally impactful. Lowder claims
that the formula Risk = Threats x Vulnerability x Impact may violate mathematical
rules of probability theory entirely, because a proper formula must take all possible
outcomes into account, which usually does not happen when an organization imple-
ments this formula. It is difficult and perhaps impossible to get such an exhaustive
list. To alleviate the usage of improper mathematical semantics, it would be advan-
tageous to rephrase this formula as just some function of threats, vulnerability, and
impacts.
NIST Special Publication 800-30[93] provides some numeric insights into measur-
ing cyber risk in the Appendix. The assessment of likelihood and impact are broken
down into five categories that are qualitatively described as very high, high, moder-
ate, low, and very low with quantitative translations to the ranges of 96-100, 80-95,
21-79, 5-20, and 1-4 respectively. The overall likelihood is a function of the threat
initiation or occurrence and the likelihood that the threat events result in adverse
impacts. It also provides a populated list of examples of adverse impacts that can
be caused by a cyber vulnerability, grouped by harm to operations, assets, individ-
uals, other organizations, and the nation. A combination of these consequences will
influence the impact score. The chart below is their risk determination chart, which
advises on how to use qualitative measures of likelihood and impact to determine the
amount of cyber risk present. It represents how this particular framework assigns
a general risk category (from very low to very high) to a threat using inputs of its
likelihood and level of impact.
40

Figure 4-1: Assigning risk based on likelihood and impact[93]
Metivier[52] suggests categorizing risk in three broad categories a final report.
Risk can be severe, such that it must be addressed immediately in order to prevent
an urgent threat to the business and operations. It can also be deemed elevated such
that risk reduction practices should be implemented within a reasonable timeframe
in order to avoid serious consequences to the organization. A low risk rating would
mean there are not immediate threats, but better risk management practices could
reduce unknown threats or minor obstacles to security. Using NIST's publication
described above, she creates a chart with a list of identified threat, such as misuse of
information and failed processes, and assigns each of them a impact score, likelihood
score, and then multiplies them together to get a final risk score which she translate
to one of the three aforementioned categories. Even her impact and likelihood scores
are qualitative, but she manages to depict them to numbers that she has mapped
out for each category. The impact is on a scale up to 100 (with 100 depicting high
impact), and the likelihood is quantified as 1.0 if high, 0.5 if medium, and 0.1 if
low. Such an approach provides better insights than an arbitrary assignment of risk
determined through qualitative means, but it is not a significant improvement from
the simple Risk = probability x impact equation.
Some guiding factors when deciding the likelihood of a threat are as follows: skill
level of the attacker, motive of the attacker, opportunity the attack has and whether
or not they have access to the information they need to attack, and the attackers
resources (like finances). The impact should take into account the technical impact
41
posed by exposure of data and loss of privacy as well as the business impact, which
could lead to some level of shut down of vital operations within the organization[?].
Again, many stress that all of these calculations are useless if people and poli-
cies are not taken into account, as human impact remains the weakest link in data
breaches[28]. Doug Hubbard from Hubbard Decision Research goes one step further
and claims the single biggest risk in cyber security is how companies measure their
cybersecurity[12]. He begins with the classic risk, which is basically a derivation of
the one above from NIST. He suggests that the simple categorization of likelihood
into low, medium, and high is enough for that part of the calculation. He cautions
against overanalysis and the placebo effect of thinking we know better from more dat-
apoint, as it can lead to diminishing returns at best and misguided estimates at worst.
Relying solely on qualitative analysis from experts in the field could create a false
sense of confidence that negatively affects companies approaches to cyber risk man-
agement. Though we do not know enough to make perfect quantitative measurements
yet, Hubbards claim is that some strides along those lines are better than the harm
of unaided expertise of soft scoring methods. Hubbard has done plenty of research
on quantitative and qualitative improvements to the aerospace and oil industry, and
has concluded that improvement of financial performance and only began after the
introduction of quantitative methods (like the Monte Carlo simulation), which were
proven more effective in estimating cost, schedule, and risk than other methods.
Hubbard is not alone in believing that many companies and executives grossly
overestimate their ability to measure their risk exposure. Renowned psychologist
and Economic Sciences Nobel Prize winner, Daniel Kahneman[38] writes extensively
about the dangers of overconfidence. He says we qualify our confidence not with
statistical evidence to support it, but rather the ease with which our statements flow
and come to mind. This creates an illusion of validity in our minds that we use
to push an agenda forward without proper backing. In fact, even people who are
aware of the failed predictions they have historically made generally have no change
in levels of confidence, as the ease with which the feeling comes remains. Managerial
overconfidence[88] is cited in many cases as a cause of failure or misdirection, with
42

executives responding disproportionately to successes and failures of their decisions.
The FAIR Institute[34], mentioned in Chapter 3, represents the standard Value
at Risk (VaR) framework for cybersecurity and operational risk. It adds detail to the
likelihood times impact approach to create an effective and commonly-accepted way
to measure cyber risk. Because it is such a prevalent framework in industry today,
it is vital that we understand it and build from parts of it as we look into ways to
quantify the cyber risk specifically posed by people and policy. The model[37] splits
risk into loss frequency and loss magnitude.
Figure 4-2: The FAIR model assessment of risk[37]
Loss frequency is a factor of the threat event frequency, which is the frequency in
a given timeframe that the threat is expected to act in a way that causes loss, and the
vulnerability, which is the probability that the threat event turns into a loss event.
Loss magnitude is primary loss along with a recurring function for secondary risk
caused by the initial risk. Forms of loss surround the major categories of productivity,
response, replacement, competitive advantage, fines and judgement, and reputation.
FAIR notes that many assume that quantitative measurements are impossible
while qualitative measurements are feasible, but they both face levels of uncertainty,
and the qualitative measurement is strictly a less detailed way to describe the same
43

phenomenon. Thus, quantitative methods are both feasible and crucial in improving
infrastructure. The uncertainty bugs many about the approach to quantification, so
we cannot restrict ourselves to perfect numbers. Rather, we can categorize to get
a more narrowed down result, without the pressure of landing on the exact valid
numbers. Take, for instance, estimating the speed of a car. If someone asked you
to say the exact MPH of a car you saw on a street, you may find yourself crippled
with indecision. If you were given categories, however, of a range of 10 MPH each,
you may find yourself closer to the actual value. Such a range is not perfect of
precise, but it is an improvement from the qualitative standpoint of just fast or slow,
and it gives us more details we need to form conclusions. Thus, FAIR recommends
using distributions for the values we are trying to quantify rather than exact values.
They bring us closer to the focus point, but allow for error. With calibration on
these numbers, people can be trained to estimate more effectively and accurately.
The process gives a guideline for estimating, and the practice refines the estimating
skills to more closely match the actual values. With these distributions in place,
calculating something like Risk = Probability x Impact becomes a lot more detailed
and influenced by more relevant factors.
We first must understand what the loss event we are trying to understand is. We
must ask tangential questions like whether sensitive information will be leaked, if
it will cause a spike in spending, and if it will lead to the unavailability of certain
products and services. Then, we get an understanding of the way in which the loss
event will occur. Will it be through a device, server, etc? The specific threat actor
and threat vector must also be identified. Is it a cyber criminal that is targeting your
service, or a customer who just does not understand it. There are of course, many
more actors at play, including factors as simple as the weather, and we need to know
how exactly they affect our systems or gain access to privileged information. The
intent must also be measured, whether there was an intent to perform this loss event,
and whether it was done with malice. The resulting numbers could be a distribution
of expected loss, bounded by the least amount of some unit stolen, highest amount,
and the expected amount.
44

Authors from Lockheed Martin[54] recommend using FMEA to manage cyber
security due to its applications in quality and reliability engineering. Such framing
will allow organizations to view cybersecurity as a contributor to the quality of their
services, the same way risk minimization in an automobile is a huge factor in the
quality of their product.
An example[2] of FMEA analysis performed on cyber risk is shown below. It
explores failure modes and specific security processes that affect them.
Figure 4-3: Example analysis across various failure modes[2]
Our literature search has proven a few things: 1) though there are a vast array of
articles on ways to qualitatively measure cyber risk, there are far fewer on ways to
quantitatively measure cyber risk, and 2) even among the papers recommending ways
to quantify cyber risk, most barely touch upon or completely ignore the element of
threat posed by people and process within a company, beyond just the broad issue of
the governance failing to conduct the quantitative assessment. They largely explore
the risk posed by the technological vulnerability, an element we will refer to as the
45

Technology Score for the remainder of this paper. Thus, we see an area for significant
improvement and contribution here, and we choose to take our project forward in this
specific direction.
4.5 Prevalence of Breaches caused by People and
Policies
We use the Privacy Right Clearinghouse database[11], and we filter down to the
results that involve insider threat or unintended disclosure, the two components that
are based on the people side of things rather than technology or device-specific side.
For relevancy purposes, we only look at breaches from the last decade, namely 2009-
2019. There are 2,040 recorded breaches fitting this description in the last decade, a
large number that can certainly be decreased with better policies and procedures in
place.
It is important to note that FMEA analysis has been done before on the tech-
nological side of cyber risk assessment[2], but there are no studies focusing solely on
FMEA for the people, policy, and procedural side of things. According to a report
by McKinsey on the human element of cyber risk, insider threat via a companys own
employees (and contractors and vendors) is one of the largest unsolved issues in cyber
security. Its present in 50% of breaches reported. The authors, amongst others in
the industry[65], believe that companies do not give insider threat enough attention
given its nefarious presence in so many documented cases. Further, they cite a mis-
guided focus on just behavior, rather than than the company culture, policies, and
governance that contribute largely to this issue. People and policy affect one another
deeply, and one without the other cannot give us a complete picture of the human
side of cyber risk. That is why we have chosen to examine not only the risk posed by
people, but also the influence of policies and procedure on this cyber problem.
46

4.6 Methodology
We look into some of the 18 biggest data breaches[3] of the 21st century, as
reported by CSO from the International Data Corporation. CSO is an organization
that shares critical information about emerging cyber threats and has insights into
best practices for cyber risk management strategies. We will craft an FMEA analysis
and glean insights from that, which will require identifying a specific set of failure
modes to move forward with in this project. The first step is a brainstorming step to
generate potential, common problems or vulnerabilities in the field. We will gather
this information by reading the post mortems of the breaches above and finding
the significant causes. We will use the FMEA template[85] provided by Lean Six
Sigma Academy to input this data, along with the evaluated severity, probability,
and detectability (all scaled from 1-10) of each failure mode. The columns in the
chart are as follows: Key Process Step or Input; Potential Failure Mode; Potential
Failure Effects; SEV; Potential Causes; OCC; Current Controls; DET; RPN; Actions
Recommended; Responsibilties; Actions Taken.
First we identify the process step or input we are examining. Then we list the
failure modes, which are ways that process step or input can fail. The failure effects
reflect the impact that this failure will have on key output variables, in terms of
either customer expectations or internal requirements. SEV denotes the severity of
the effect on a scale of one to ten, with ten being the most severe. The potential causes
are what could cause the key input or process stop to go wrong. OCC represents the
relative occurrence, which is how often the failure mode or its underlying cause occurs.
Current controls are the existing controls that are in place to prevent the failure mode
or cause. DET is the detectability, which is how well an organization can detect the
failure mode or cause. RPN is the risk priority number, which is SEV x DET x OCC.
The next column is where to list recommended actions to reduce the occurrence of
the mode/cause or to improve detection. The responsibility section is a marker of
who is responsible for carrying out the recommended actions.
An easy way to visualize the flow of data is through the IEC 60812 International
47
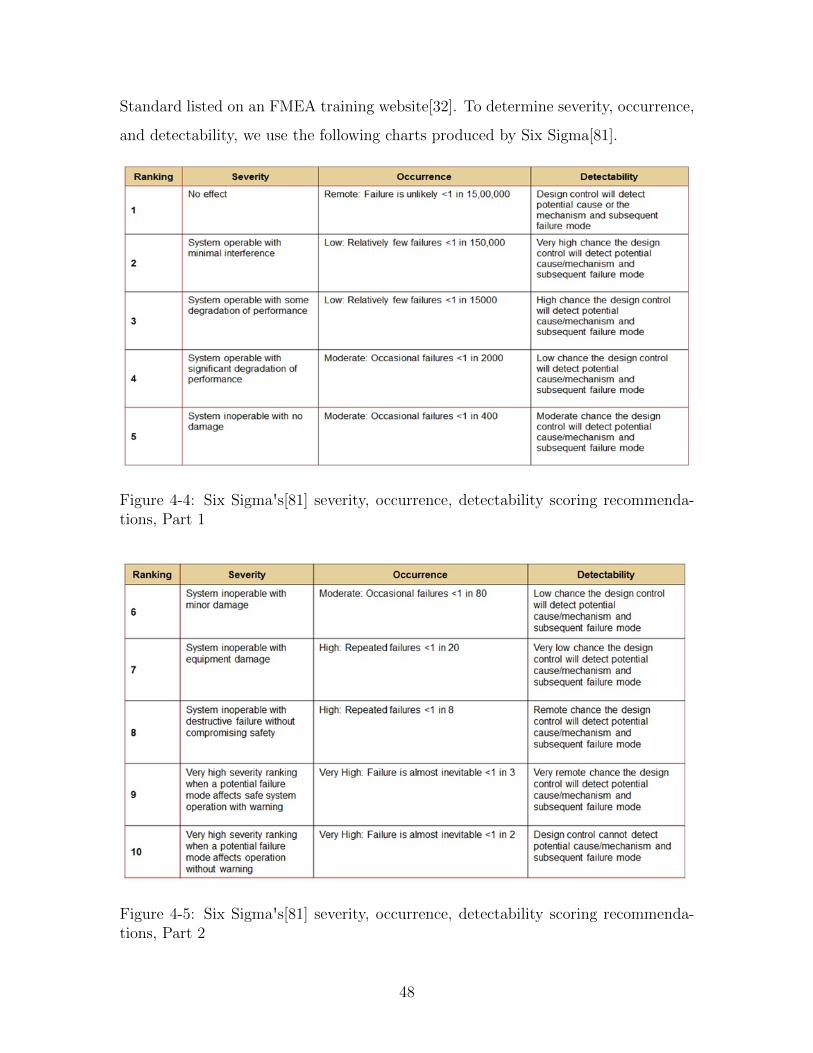
Standard listed on an FMEA training website[32]. To determine severity, occurrence,
and detectability, we use the following charts produced by Six Sigma[81].
Figure 4-4: Six Sigma's[81] severity, occurrence, detectability scoring recommenda-tions, Part 1
Figure 4-5: Six Sigma's[81] severity, occurrence, detectability scoring recommenda-tions, Part 2
48

4.7 FMEA Example
Below is an example of how to conduct an FMEA Analysis. It begins with brief
descriptions of the ten biggest cyber breaches[3] in the last decade, based on number
of user accounts or records affected.
4.7.1 Yahoo, 2014
Yahoo knew there was in intrusion in 2014, but they did not investigate it thor-
oughly or take sufficient remedial action[41]. An employee clicked on a spear phishing
email. From that, copies of back-up files with users personal data were stolen, and a
stolen database from company went on sale in the black market[39]. Security ques-
tions and answers may have been taken, and passwords hashed with security tool
bcrypt were still cracked[40]. All three billion user accounts at the time were affect
by this breach[3].
4.7.2 Marriott International, 2014-2018
A hack on Marriott systems led to 500 million stolen records. Personal information
of guests who stayed at Marriott and its partner properties from 2014-2018 were
stolen along with encrypted credit card data[56]. Some guests' passport numbers
and travel histories were also exposed. Though the exposure started in 2014, it went
undetected until 2018. It began when a contracted employee downloaded malware
sample for analysis; from there, they were able to access Marriott's internal emails[6]
and systems.
4.7.3 Adult Friend Finder, 2016
Adult Friend Finder, self-described as the ”world's largest sex and swinger community”[31]
was hacked in 2016. This breach exposed more than 412 million user accounts[98].
There was a local file inclusion flaw, which allows the attacker to remotely access files
and output them on another application[67].
49

4.7.4 Equifax, 2017
The Equifax hackers stole personal information of 147.7 million Americans[55].
This included names, addresses, and even Social Security Numbers. The breach
happened because Equifax used Apache Struts as their discussion portal for issues[86].
The company knew Struts had vulnerabilities, but they did not change it. From it,
the hackers got login in access to three server. From that, they were able to access
48. The hackers managed to take data in small increments and go undetected for
over two months before Equifax realized there was a breach.
4.7.5 eBay, 2014
The eBay hack of 2014 exposed the personal information of 145 million users[18].
Hackers obtained the login information of just three employees and were able to use
it to get the emails and encrypted passwords for all users at the time. About 145
million user accounts were affected.
4.7.6 Target Stores, 2013
The Target breach can mostly be attributed to a third party vendor, Fazio Mecha-
nial. Fazio was given access to some of Target's data in order to perform routine
checks on them. The hackers sent a phishing email to Fazio employees, one of whom
clicked on the link. As a result, they had malware downloaded on Fazio computers.
From there, they got control of Target servers and stole personal data[42]. About 110
million people had their credit and debit card information stolen[3].
4.7.7 JP Morgan Chase, 2014
Hackers managed to steal login credentials of an employee at JP Morgan. Thought
the company had some servers protected under dual authentication, the hackers found
one that was not. They exploited that and used it to compromise over 83 million
user accounts[29]. Names, home addresses, phone numbers, and emails were stolen,
further exposing these accounts to new phishing attacks.
50

4.7.8 Uber, 2016
A employee of Uber had his github credentials stolen, and from there, the hacker
was able to view code by employees at the company. In addition, he was able to
view credentials for Uber's data stores that some employees had kept on GitHub. 57
million user and driver accounts were compromised as a result of this breach[58].
4.7.9 US Office of Personnel Management (OPM), 2012-2014
The US Office of Personnel Management suffered from a lack of dual authentica-
tion as well. Hackers could just stolen username and password combinations to get
into the system without extra verification. Some extremely personal information, like
background checks and fingerprints were exposed as a result of this breach[19]. 22
million user current and former employees had their records stolen[3].
4.7.10 Sony Playstation Network, 2011
A group of hackers launched many Distributed Denial of Service (DDOS) attacks
on Sony in 2011. Sony eventually reported an external intrusion. 77 million users
had personal information stolen as a result[64].
4.8 Results
After conducting a preliminary survey of failures modes, effects, and causes from
relevant scenarios, as we did above, the next step was to synthesize this information
into an FMEA chart. Reading the post-mortems of well-known breaches gave us the
information we needed on process steps, failure modes, causes and effects involved in
each case. Next, we had to assign severity, occurrence, and detectability to each case
on a scale from 1-10, where 10 represents the most severe, most commonly occurring,
and least detectable failures. Since most cyber breaches resulted in stolen data and
records, we assigned severity based on the perceived damage from the different kinds
of data compromised. For example, eBay had the lowest severity ranking because the
51

hacker got encrypted passwords along with some personal information[63]. Since the
passwords were still encrypted, hackers needed to do some more work to actually get
into user accounts and the damage was likely less severe. In contrast, the Equifax[55]
and US OPM[19] data breaches have been assigned the highest severity because ex-
tremely confidential information like Social Security Numbers and background checks
including fingerprints were stolen. For occurrence, the highest ranking was assigned
to Yahoo's case, which involved the very common spear phishing email. Next were
the companies that directly had a username and password combination of one of their
employees stolen. Getting the information of at least one employee from either a weak
password, negligence, or brute force is fairly common. Most of the intrusions were
similarly easy to detect since they all consisted of compromised data. However, the
line with Sony's[64] case was given the lowest ranking because Sony received many
DDoS attacks, which are easier to detect than a silent invader in your system.
The final FMEA table we created with this information is in Appendix A. We
synthesize the information about the breaches above so that it can be used by com-
panies to do a preliminary safety check on their systems (to avoid falling prey to the
same mistakes as these companies). After identifying current controls, recommended
actions, and individual responsibilities, cybersecurity teams can incorporate it as a
part of their safety plan. Figure B-1 in the Appendix ranks all the results above by
RPN in a bar chart.
4.9 Analysis and Future Work
RPN is essentially a way to rank different failure cases by the most important ones
to watch out for: the most severe, most commonly occurring, and least detectable
ones.
To test if there was a correlation between RPN and number of records stolen, we
created a scatterplot of the data (Figure B-2 in the Appendix). There seems to be
no clear correlation between losses faced by the company and the RPN. This is likely
the case for multiple reasons. First, RPN is meant to be a preventative measure and
52

not a post-mortem evaluator. Second, unlike other methods of measuring cyber risk
(like VaR) which usually take both uncertainty and the exposure net into account,
the RPN is only a measure of the uncertainty. Combined with information about the
exposure net, the RPN can provide more relevant insights on total risk.
A future project could focus on the correlation between RPN and financial loss,
normalized by each company's valuation at the time, as well. This may yield more
insightful results on how good of an estimator RPN is at determining percentage of
value lost within a company after a big cyber breach.
53

54

Chapter 5
Discussion
Effective cyber risk management will become more and more important as adop-
tion of technology continues to grow. With each new technology, we subject ourselves
to new routes of cyber attack and risk our information landing in the wrong hands,
whether it is sensitive personal data like social security numbers or visual exposure
like camera data.
Quantification will need to become stronger. Important factors to consider are
ease of communication about cyber risk within an organization, better management
of cyber security investments, and end-to-end communication about cyber risk in-
volving people, the process, and the technologies. With these in mind, the industry
still demands an affordable, yet comprehensive solution for effective cyber risk man-
agement.
5.1 Future Work
There is room to explore more methods that are neither fully qualitative nor fully
quantitative for the cyber space as well. The industry will need to get creative with
its approaches to cyber risk measurement and management.
One such unconventional model to explore would be STAMP (System-Theoretic
Accident Model and Process)[44]. STAMP has emerged as a new model for accident
causality based on systems theory. It expands upon the typical practice of searching
55

for individual component failures by identifying design flaws, missing requirements,
human error, and problematic interactions between the components in a system[75].
It shifts focus away from pinpointing problems one-by-one and instead dynamically
identifies dysfunctional interactions and behaviors within the system as a whole. An
application of this model to cybersecurity can yield fascinating results about vulner-
abilities within an organization's systems.
Another possible avenue to explore is an Epidemiological Model[27], often used to
find the root cause and transmission paths of a disease. In the same way it has helped
scientists discover disease vectors and routs of transmission for over a century[94], it
can help technologists identify the roots of failure and the steps hackers take to exploit
company vulnerabilities and get access to confidential data.
56

Appendix A
Tables
57

Table A.1: A sample FMEA conducted on the top 10 breaches of the past decade.
58

Appendix B
Figures
59

Figure B-1: A bar chart ranking the top 10 cyber breaches by Risk Priority Number
60

Figure B-2: A scatter plot comparing the RPNs to number of stolen records
61

62
Bibliography
[1] BitSight. https://www.bitsight.com/.
[2] Nasim Lari Arben Asllani, Alireza Lari. Strengthening information technologysecurity through the failure modes and effects analysis approach. 2018. https:
//link.springer.com/article/10.1186/s40887-018-0025-1.
[3] Taylor Armerding. The 18 biggest data breaches of the 21st century.2018. https://www.csoonline.com/article/2130877/the-biggest-data-
breaches-of-the-21st-century.html.
[4] J. Eric Bickel. The Risk of Using Risk Matrices. 2013. https:
//www.researchgate.net/publication/266666768_The_Risk_of_Using_
Risk_Matrices.
[5] BitSight. BitSight Security Ratings. https://content.bitsight.com/
c/security-ratings-overview-datasheet?x=KTfAyt&hsCtaTracking=
ae87a95e-6298-416b-b1ee-dab2f0ae53ae%7Ced2b427d-5a88-40da-b49a-
6c34c6ae61dd.
[6] Thomas Brewster. Revealed: Marriott’s 500 Million Hack Came AfterA String Of Security Breaches. 2018. https://www.forbes.com/sites/
thomasbrewster/2018/12/03/revealed-marriotts-500-million-hack-
came-after-a-string-of-security-breaches/#562d24ac546f.
[7] Tyler Britton. How to Define Severity and Likelihood Criteria on Your RiskMatrix. 2019. http://aviationsafetyblog.asms-pro.com/blog/how-to-
define-severity-and-likelihood-criteria-on-your-risk-matrix.
[8] Don Carfagno. How Much Should Your Company Invest in Cybersecu-rity? 2018. https://www.blackstratus.com/how-much-should-your-
company-invest-in-cybersecurity/.
[9] COMPUTER SECURITY RESOURCE CENTER. Risk Management. 2019.https://csrc.nist.gov/Projects/Risk-Management/rmf-overview.
[10] Jason D. Christopher. CREATING A SECURITY METRICS PROGRAM: Howto Measure Success. 2019. https://www.sans.org/cyber-security-summit/
archives/file/summit-archive-1552942066.pdf.
63

[11] Privacy Rights Clearinghouse. DATA BREACHES. 2019. https://www.
privacyrights.org/data-breaches.
[12] RSA Conference. How to Measure Anything in Cybersecurity Risk.https://www.rsaconference.com/writable/presentations/file_upload/
grc-w05-how_to_measure_anything_in_cybersecurity_risk.pdf.
[13] Symantec Corporation. Internet Security Threat Report, Volume 23. 2018. http://images.mktgassets.symantec.com/Web/Symantec/%7B3a70beb8-c55d-
4516-98ed-1d0818a42661%7D_ISTR23_Main-FINAL-APR10.pdf?aid=elq_.
[14] Federal Financial Institutions Examination Council. Cybersecurity AssessmentTool. 2018. https://www.ffiec.gov/cyberassessmenttool.htm.
[15] Aswath Damodaran. VALUE AT RISK (VAR). http://people.stern.nyu.
edu/adamodar/pdfiles/papers/VAR.pdf.
[16] International Datalyzer. What is FMEA? https://www.datalyzer.com/
knowledge/fmea/.
[17] Ernst and Young Global Limited. Creating trust in the digital world: Eys globalinformation security survey 2015.
[18] Jim Finkle and Deepa Seetharaman. Cyber Thieves Took Data On145 Million eBay Customers By Hacking 3 Corporate Employees. 2014.https://www.businessinsider.com/cyber-thieves-took-data-on-145-
million-ebay-customers-by-hacking-3-corporate-employees-2014-5.
[19] Josh Fruhlinger. The OPM hack explained: Bad security practices meet China’sCaptain America. 2018. https://www.csoonline.com/article/3318238/the-opm-hack-explained-bad-security-practices-meet-chinas-captain-
america.html.
[20] Martin Gontovnikas. 3 Critical Lessons from the T-Mobile Data Breach.2018. https://auth0.com/blog/3-critical-lessons-from-the-t-mobile-
data-breach/.
[21] Dan Goodin. PlayStation Network breach will cost Sony $171m and counting.2011. https://www.theregister.co.uk/2011/05/24/sony_playstation_
breach_costs/.
[22] Annabelle Graham. The damaging after-effects of a data breach. 2019.https://www.itgovernance.co.uk/blog/the-damaging-after-effects-
of-a-data-breach.
[23] Boston Consulting Group. Mastering Cybersecurity with BCG. 2019.https://www.bcg.com/en-us/capabilities/technology-digital/
mastering-cybersecurity.aspx.
64

[24] Mehmood Hanif. How Top Industries Are Preparing For Evolving Cybersecu-rity Threats. 2017. https://www.globalsign.com/en/blog/top-industries-preparing-for-evolving-cybersecurity-threats/.
[25] Emily Harbottle. Whats in a number? Risk matrices and how we are be-ing misled. https://www.cgerisk.com/2018/07/whats-in-a-number-risk-
matrices-how-we-are-misled/.
[26] Havells. Havells India Limited 35th Annual Report 2017-18. 2018.https://www.havells.com/HavellsProductImages/HavellsIndia/pdf/
About-Havells/Investor-Relations/Financial/Annual-Reports/2017-
2018/Havells_AR_2017-18.pdf.
[27] Herbert W. Hethcote. Three Basic Epidemiological Models. 1989. https://
link.springer.com/chapter/10.1007/978-3-642-61317-3_5.
[28] Fran Howarth. Verizons 2016 DBIR: Humans Remain the Weakest Link.2016. https://securityintelligence.com/verizons-2016-dbir-humans-
remain-the-weakest-link/.
[29] Steven Howden. What was the cost of the JP Morgan Chase data breach?2015. https://www.morganmckinley.co.jp/en/article/what-was-cost-jp-morgan-chase-data-breach.
[30] Koen Van Impe. Simplifying Risk Management. 2017. https://
securityintelligence.com/simplifying-risk-management/.
[31] FriendFinder Networks Inc. Adult Friend Finder. AdultFriendFinder.com.
[32] Resource Engineering Inc. 10 Steps to do a Process FMEA. https://fmea-
training.com/10-steps-process-failure-mode-and-effects-analysis/.
[33] Lucideus Incorporated. SAFE Security Assessment Framework for Enterprise.https://www.lucideus.com/safe.html.
[34] The FAIR Institute. What is the FAIR Institute? 2019. https://www.
fairinstitute.org.
[35] Massachusetts USA Institute for Healthcare Improvement, Cambridge. Fail-ure Modes and Effects Analysis (FMEA) Tool. 2019. http://www.ihi.org/
resources/Pages/Tools/FailureModesandEffectsAnalysisTool.aspx.
[36] Michael Goldsmith Sadie Creese David Upton Ioannis Agrafiotis, Jason RC Nurse. A taxonomy of cyber-harms: Defining the impacts of cyber-attacksand understanding how they propagate. 2018. https://academic.oup.com/
cybersecurity/article/4/1/tyy006/5133288.
[37] Jack Jones. Modern Cyber and Technology Risk Measurement. 2017.http://isaca-denver.org/Chapter-Resources/Modern%20cyber%20and%
20tech%20risk%20measurement%20v1.pdf.
65

[38] Daniel Kahneman. Dont Blink! The Hazards of Confidence. 2011.https://www.nytimes.com/2011/10/23/magazine/dont-blink-the-
hazards-of-confidence.html.
[39] Michael Kan. 200 million Yahoo accounts go up for sale on digital black market.2016. https://www.pcworld.com/article/3102998/200m-yahoo-accounts-
go-up-for-sale-on-digital-black-market.html.
[40] Michael Kan. Yahoo data breach affects at least half a billionusers. 2016. https://www.computerworld.com/article/3123083/yahoo-
data-breach-affects-at-least-half-a-billion-users.html.
[41] Michael Kan. Yahoo execs botched its response to 2014 breach, investigationfinds. 2017. https://www.csoonline.com/article/3176181/yahoo-execs-
botched-its-response-to-2014-breach-investigation-finds.html.
[42] Michael Kassner. Anatomy of the Target data breach: Missed opportunitiesand lessons learned. 2015. https://www.zdnet.com/article/anatomy-of-
the-target-data-breach-missed-opportunities-and-lessons-learned/.
[43] Joshua Kennedy-White Kevin Richards, Floris van den Dool. 2017 COSTOF CYBER CRIME STUDY. 2017. https://www.accenture.com/us-en/
insight-cost-of-cybercrime-2017?src=SOMS.
[44] Nancy Leveson. A New Accident Model for Engineering Safer Systems. http:
//sunnyday.mit.edu/accidents/safetyscience-single.pdf.
[45] Adam Levin. How Can 73 Percent of Companies Not Be Prepared forHackers? https://www.inc.com/adam-levin/more-than-70-percent-of-
businesses-admit-theyre-unprepared-for-a-cyberattack.html.
[46] Michael Liedtke. Yahoo to pay $50M, other costs for massive security breach.2018. https://phys.org/news/2018-10-yahoo-50m-massive-breach.html.
[47] Jeff Lowder. Why the Risk = Threats x Vulnerabilities x Impact Formulais Mathematical Nonsense. 2010. https://www.bloginfosec.com/2010/
08/23/why-the-risk-threats-x-vulnerabilities-x-impact-formula-is-
mathematical-nonsense/.
[48] Lucideus. Safe assure cybersecurity maturity assessment platform.
[49] Lucideus. Brands that trust our cyber competence. 2019. https://www.
lucideus.com/customers.html.
[50] Art Markman. Unpredictability is in our nature. 2008. https:
//www.psychologytoday.com/us/blog/ulterior-motives/200811/
unpredictability-is-in-our-nature.
66

[51] Jonathan Fantini Porter Mary Calam, David Chinn and John Noble. Askingthe right questions to define governments role in cybersecurity. 2018. https:
//www.mckinsey.com/industries/public-sector/our-insights/asking-
the-right-questions-to-define-governments-role-in-cybersecurity.
[52] Becky Metivier. 6 Steps to a Cybersecurity Risk Assessment. 2017.https://www.sagedatasecurity.com/blog/6-steps-to-a-cybersecurity-
risk-assessment.
[53] Steven C. Morgan. Cybersecurity Ventures projects $1 trillion will bespent globally on cybersecurity from 2017 to 2021. 2017. https:
//www.cyberdefensemagazine.com/cybersecurity-ventures-projects-
1-trillion-will-be-spent-globally-on-cybersecurity-from-2017-to-
2021/.
[54] Michael Muckin. A Threat-Driven Approach to Cyber Security Method-ologies , Practices and Tools to Enable a Functionally Integrated CyberSecurity Organization. 2015. https://pdfs.semanticscholar.org/be09/
f7a16eb4a379e698d8f42100fd8a91943a0c.pdf.
[55] Alfred Ng. How the Equifax hack happened, and what still needs to bedone. 2018. https://www.cnet.com/news/equifaxs-hack-one-year-later-
a-look-back-at-how-it-happened-and-whats-changed/.
[56] Adam Satariano Nicole Perlroth, Amie Tsang. Marriott Hacking Exposes Dataof Up to 500 Million Guests. 2018. https://www.nytimes.com/2018/11/30/
business/marriott-data-breach.html.
[57] NIST. CYBERSECURITY FRAMEWORK. https://www.nist.gov/
cyberframework.
[58] Matt O’brien. Explainer: What the Uber data breach is all about. 2017. https://phys.org/news/2017-11-uber-breach.html.
[59] United States Department of Defense. MILITARY STANDARD PROCEDURESFOR PERFORMING A FAILURE MODE, EFFECTS AND CRITICALITYANALYSIS. 1980. http://everyspec.com/MIL-STD/MIL-STD-1600-1699/
MIL_STD_1629A_1556/.
[60] U.S. Department of Homeland Security and United States Department of En-ergy. ELECTRICITY SUBSECTOR CYBERSECURITY CAPABILITY MA-TURITY MODEL (ES-C2M2). https://www.energy.gov/sites/prod/files/2014/02/f7/ES-C2M2-v1-1-Feb2014.pdf.
[61] National Conference of State Legislatures. Computer Crime Statutes. 2018.http://www.ncsl.org/research/telecommunications-and-information-
technology/computer-hacking-and-unauthorized-access-laws.aspx.
67

[62] Paige O’Reilly. The FAIR Model Explained in 90 Seconds. 2017. https://www.risklens.com/blog/the-fair-model-in-90-seconds/.
[63] Jose Pagliery. EBay customers must reset passwords after major hack.2014. https://money.cnn.com/2014/05/21/technology/security/ebay-
passwords/.
[64] Tom Phillips. Five years ago today, Sony admitted the great PSN hack.2016. https://www.eurogamer.net/articles/2016-04-26-sony-admitted-
the-great-psn-hack-five-years-ago-today.
[65] Rodney Piercy. The Persistent Insider Threat: Is Enough Being Done?. 2017. https://www.isaca.org/Journal/archives/2017/Volume-1/Pages/
the-persistent-insider-threat-is-enough-being-done.aspx.
[66] PYMNTS. How Much Did The Target, Home Depot Breaches ReallyCost? 2015. https://www.pymnts.com/news/2015/target-home-depot-
reveal-full-breach-costs/.
[67] Steve Ragan. Researcher says Adult Friend Finder vulnerable to file inclu-sion vulnerabilities. 2016. https://www.csoonline.com/article/3132533/
researcher-says-adult-friend-finder-vulnerable-to-file-inclusion-
vulnerabilities.html.
[68] R. Dan Reid. Why QS-9000 Was Developed And What’s in Its Future.2000. http://asq.org/quality-progress/2000/04/standards-outlook/
why-qs-9000-was-developed-and-what’s-in-its-future.html.
[69] Carmen Reinicke. The biggest cybersecurity risk to US businesses is em-ployee negligence, study says. 2018. https://www.cnbc.com/2018/06/
21/the-biggest-cybersecurity-risk-to-us-businesses-is-employee-
negligence-study-says.html.
[70] RiskLens. FAIR Training and Certification. 2019. https://www.risklens.com/services-support/fair-training-and-certification/.
[71] RiskLens. RiskLens Closes $20 Million Series B to Expand Leadership in CyberRisk Quantification. 2019. https://www.globenewswire.com/news-release/
2019/04/08/1799065/0/en/RiskLens-Closes-20-Million-Series-B-to-
Expand-Leadership-in-Cyber-Risk-Quantification.html.
[72] III Robert S. Mueller. Report On The Investigation Into Russian InterferenceIn The 2016 Presidential Election. 2019. https://www.justsecurity.org/wp-content/uploads/2019/04/Muelller-Report-Redacted-Vol-I-Released-
04.18.2019-Word-Searchable.-Reduced-Size.pdf.
[73] Ben Rothke. The Cybersecurity Canon: Measuring and Managing InformationRisk: A FAIR Approach. 2015. https://blog.paloaltonetworks.com/2015/
68

09/the-cybersecurity-canon-measuring-and-managing-information-
risk-a-fair-approach/.
[74] Margaret Rouse. DEFINITION: internet of things (IoT). https:
//internetofthingsagenda.techtarget.com/definition/Internet-of-
Things-IoT.
[75] STAMP Safety and Security Consulting. WHAT IS STAMP? https://stamp-
consulting.com/what-is-stamp/.
[76] Mike Jerbic San Jose State University, Department of Economics. TheOpen Factor Analysis of Information Risk, a Standard for Cyber Risk.https://static1.squarespace.com/static/5a4f82d7a8b2b04080732f87/t/
5abc053e2b6a28c8f4289afd/1522271553678/Standardized+Risk+Jerbic.
compressed.pdf.
[77] Patricia A.S.Ralston Sandip C.Patel, James H.Graham. Quantitatively assess-ing the vulnerability of critical information systems: A new method for evaluat-ing security enhancements. 2008. https://www.sciencedirect.com/science/article/pii/S0268401208000054?via%3Dihub.
[78] Nicola Sanna. What Is a Cyber Value-at-Risk Model? 2016. https://www.
fairinstitute.org/blog/what-is-a-cyber-value-at-risk-model.
[79] Ted Schlein. The United States needs a Department of Cybersecurity.2018. https://techcrunch.com/2018/04/16/the-united-states-needs-a-
department-of-cybersecurity/.
[80] Security Scorecard. Your security posture is good in your industry. 2017. https://instant.securityscorecard.com/sample-report.
[81] Six Sigma. Six Sigma DMAIC Process - Improve Phase - Failure Mode Ef-fect Analysis (FMEA). https://www.sixsigma-institute.org/Six_Sigma_
DMAIC_Process_Improve_Phase_Failure_Mode_Effect_Analysis_FMEA.php.
[82] Stu Sjouwerman. You Cant Afford a Data Breach And Theyre Only Get-ting More Expensive. 2019. https://blog.knowbe4.com/you-cant-afford-
a-data-breach-and-theyre-only-getting-more-expensive.
[83] Tim Starks. Senate election security bill picks up momentum after stalling.2018. https://www.politico.com/newsletters/morning-cybersecurity/
2018/06/21/senate-election-security-bill-picks-up-momentum-after-
stalling-260647.
[84] Walter Bohmayr Michael Coden Dean Frankle Sukand Ramachandran, Nad-jia Yousif and Or Klier. A Smarter Way to Quantify Cybersecurity Risk.2019. https://www.bcg.com/en-us/capabilities/technology-digital/
smarter-way-to-quantify-cybersecurity-risk.aspx.
69
[85] Elisabeth Swan. Failure Modes Effects Analysis (FMEA). https://
goleansixsigma.com/failure-modes-effects-analysis-fmea/.
[86] Ken Sweet and Michael Liedtke. Equifax traced the source of its massive hack toa preventable software flaw. 2017. https://www.businessinsider.com/how-
did-equifax-get-hacked-2017-9.
[87] Florida Tech. A Brief History of Cyber Crime. 2019. https:
//www.floridatechonline.com/blog/information-technology/a-brief-
history-of-cyber-crime/.
[88] Evgenia Golubeva Tim R.Adam, Chitru S.Fernando. Managerial overconfidenceand corporate risk management. 2015. https://www.sciencedirect.com/
science/article/pii/S0378426615002113.
[89] Karthik Rajagopalan Tucker Bailey, Brian Kolo and David Ware.Insider threat: The human element of cyberrisk. 2018. https:
//www.mckinsey.com/business-functions/risk/our-insights/insider-
threat-the-human-element-of-cyberrisk.
[90] Energy Security United States Department of Energy: Office of Cybersecurityand Emergency Response. Cybersecurity Capability Maturity Model (C2M2)Frequently Asked Questions. https://www.energy.gov/sites/prod/files/
2014/02/f7/C2M2-FAQs.pdf.
[91] Energy Security United States Department of Energy: Office of Cybersecurityand Emergency Response. Cybersecurity Capability Maturity Model (C2M2)Program. https://www.energy.gov/ceser/activities/cybersecurity-
critical-energy-infrastructure/energy-sector-cybersecurity-0.
[92] UpGuard. BitSight vs SecurityScorecard. 2019. https://www.upguard.com/
articles/bitsight-vs-securityscorecard.
[93] National Institute of Standards U.S. Department of Commerce and Technology.Information Security. 2012. https://nvlpubs.nist.gov/nistpubs/Legacy/
SP/nistspecialpublication800-30r1.pdf.
[94] David Vachon. Doctor John Snow Blames Water Pollution for Cholera Epidemic.2005. https://www.ph.ucla.edu/epi/snow/fatherofepidemiology.html.
[95] Varonis. DATA UNDER ATTACK: 2018 GLOBAL DATA RISK REPORTFROM THE VARONIS DATA LAB. 2018. https://info.varonis.com/
hubfs/2018%20Varonis%20Global%20Data%20Risk%20Report.pdf.
[96] Cybersecurity Ventures. Cybercrime Damages $6 Trillion By 2021.2019. https://cybersecurityventures.com/hackerpocalypse-cybercrime-report-2016/.
70

[97] Steve Weisman. What are Denial of Service (DoS) attacks? DoS attacksexplained. 2019. https://us.norton.com/internetsecurity-emerging-
threats-dos-attacks-explained.html.
[98] Zack Whittaker. AdultFriendFinder network hack exposes 412 million accounts.2016. https://www.zdnet.com/article/adultfriendfinder-network-hack-exposes-secrets-of-412-million-users/.
71
Related Documents